UNITED STATES
SECURITIES AND EXCHANGE COMMISSION
Washington, D.C. 20549
Form N-CSR
CERTIFIED SHAREHOLDER REPORT OF REGISTERED
MANAGEMENT INVESTMENT COMPANIES
Investment Company Act File Number: 811-06563
CALVERT WORLD VALUES FUND, INC.
(Exact Name of Registrant as Specified in Charter)
1825 Connecticut Avenue NW, Suite 400, Washington, DC 20009
(Address of Principal Executive Offices)
Deidre E. Walsh
Two International Place, Boston, Massachusetts 02110
(Name and Address of Agent for Services)
(202) 238-2200
(Registrant’s Telephone Number)
September 30
Date of Fiscal Year End
September 30, 2021
Date of Reporting Period
Item 1. Reports to Stockholders
Calvert
Mid-Cap Fund
Annual Report
September 30, 2021
Commodity Futures Trading Commission Registration. The Commodity Futures Trading Commission (“CFTC”) has adopted regulations that subject registered investment companies and advisers to regulation by the CFTC if a fund invests more than a prescribed level of its assets in certain CFTC-regulated instruments (including futures, certain options and swap agreements) or markets itself as providing investment exposure to such instruments. The adviser has claimed an exclusion from the definition of “commodity pool operator” under the Commodity Exchange Act with respect to its management of the Fund and the other funds it manages. Accordingly, neither the Fund nor the adviser is subject to CFTC regulation.
Fund shares are not insured by the FDIC and are not deposits or other obligations of, or guaranteed by, any depository institution. Shares are subject to investment risks, including possible loss of principal invested.
This report must be preceded or accompanied by a current summary prospectus or prospectus. Before investing, investors should consider carefully the investment objective, risks, and charges and expenses of a mutual fund. This and other important information is contained in the summary prospectus and prospectus, which can be obtained from a financial intermediary. Prospective investors should read the prospectus carefully before investing. For further information, please call 1-800-368-2745.
Choose Planet-friendly E-delivery!
Sign up now for on-line statements, prospectuses, and fund reports. In less than five minutes you can help reduce paper mail and lower fund costs.
Just go to www.calvert.com. If you already have an online account with the Calvert funds, click on Login to access your Account and select the documents you would like to receive via e-mail.
If you’re new to online account access, click on Login, then Register to create your user name and password. Once you’re in, click on the E-delivery sign-up on the Account Portfolio page and follow the quick, easy steps.
Note: If your shares are not held directly with the Calvert funds but through a brokerage firm, you must contact your broker for electronic delivery options available through their firm.
Annual Report September 30, 2021
Calvert
Mid-Cap Fund
Calvert
Mid-Cap Fund
September 30, 2021
Management's Discussion of Fund Performance†
Economic and Market Conditions
The 12-month period that began October 1, 2020 was notable for an equity rally that began in November 2020, paused in January 2021, and then continued through the following summer. In the final month of the period, however, negative economic news overwhelmed the investor optimism that had driven markets for much of the period. In September 2021, the broad-market S&P 500® Index endured its worst month since March 2020, and many other U.S. indexes declined as well.
Nonetheless, for the period as a whole, broad U.S. indexes generally posted strong double-digit returns as investors cheered the reopening of businesses that had been affected by the COVID-19 pandemic and the rollout of several highly effective vaccines.
The virus, however, continued to have a firm grip on the U.S. and global economies. Disease rates advanced and declined with third and fourth waves of COVID infections. Worker shortages led to global supply chain issues. From computer chips to shipping containers, scarcities of key items led to temporary factory shutdowns, empty store shelves, and car dealerships short of vehicles to sell. Those shortages — combined with high demand from consumers eager to spend money they had saved earlier in the pandemic — led to higher year-over-year inflation than the U.S. economy had seen in years. Although U.S. Federal Reserve (the Fed) Chairman Jerome Powell and U.S. Treasury Secretary Janet Yellen expressed the view that inflation would likely be transitory, inflation nonetheless became a key concern for investors during the period.
While the last month of the period began auspiciously — with both the S&P 500® Index and Nasdaq Composite Index closing at all-time highs in the first days of September — the news for investors quickly turned negative. The U.S. Labor Department’s release of August job numbers showed that only 235,000 jobs had been created — a significant slowdown from earlier in the summer. COVID-19 infections rose again across the U.S. After its September meeting, the Fed indicated it might start to taper its bond purchases — which had stimulated the economy earlier — and possibly raise interest rates in 2022, a year sooner than it had previously projected. This combination of factors led investors to abandon — at least temporarily — the optimistic attitude that had driven stock prices upward during most of the period.
Despite a rough September, major U.S. indexes delivered double-digit returns for the one-year period as a whole. The S&P 500® Index, a broad measure of U.S. stocks, returned 30.00%; the blue-chip Dow Jones Industrial Average® was up 24.15%; and the technology-laden Nasdaq Composite Index rose 30.26%. Large-cap U.S. stocks, as measured by the Russell 1000® Index, underperformed their small-cap counterparts, as measured by the Russell 2000® Index, and value stocks outperformed growth stocks across the market-cap spectrum during the period.
Fund Performance
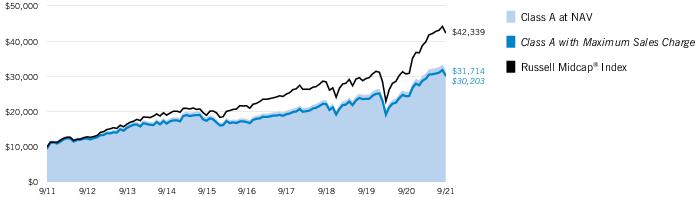
For the 12-month period ended September 30, 2021, Calvert Mid-Cap Fund (the Fund) returned 24.13% for Class A shares at net asset value (NAV), underperforming the Fund’s benchmark, the Russell Midcap® Index (the Index), which returned 38.11%.
Stock selections in the health care, information technology, and financials sectors detracted from the Fund’s performance relative to the Index during the period. An underweight exposure to the energy sector, the strongest performing sector within the Index, also hurt relative returns. Stock selections in the consumer staples and communication services sectors contributed to performance relative to the Index. A slight overweight to the financials sector also helped relative returns.
The stock price of Black Knight, Inc., a provider of technology and services to the mortgage and real estate industries, weakened as investors soured on companies exposed to the real estate market during a period of rising interest rates. Xcel Energy, Inc. (Xcel), an electric and gas utility, has been shutting down its coal plants in recent years and replacing them with renewable power generation plants. While its renewable plants are more economical than its fossil fuel plants, Xcel’s share prices, along with the utility sector as a whole, lagged the Index during the period because of the sector’s sensitivity to rising interest rates and, as noncyclical stocks, because they derived only limited benefit from an accelerating economy.
The stock price of nCino, Inc., which provides cloud-based lending software to banks, fell as interest rates rose. By period-end, the stock was sold from the Fund. Bill.com Holdings, Inc. (Bill.com) is a provider of cloud-based software used to automate the back-office financial operations of small- and mid-size businesses. Bill.com’s stock price rose on the company’s increased revenue as it attracted new customers and demand rose for its more profitable products during the period. Bill.com’s acquisition of two companies that broadened its capabilities and increased cross-sell opportunities also drove its stock price higher.
Zebra Technologies Corp. produces labels and product tag readers. Its share price rose during the period as retailers invested heavily in capabilities to broaden the channels they sell through. The stock price of Ally Financial, Inc., (Ally) an online banking company, was boosted by strong demand for automobile loans, which was driven by increases in used car prices and relatively low levels of individual debt during the period. The stock price was also strengthened by a rising differential between the interest rates Ally pays and the rates it charges customers.
See Endnotes and Additional Disclosures in this report.
Past performance is no guarantee of future results. Returns are historical and are calculated by determining the percentage change in net asset value (NAV) or offering price (as applicable) with all distributions reinvested. Investment return and principal value will fluctuate so that shares, when redeemed, may be worth more or less than their original cost. Performance for periods less than or equal to one year is cumulative. Performance is for the stated time period only; due to market volatility, current Fund performance may be lower or higher than the quoted return. For performance as of the most recent month-end, please refer to www.calvert.com.
Calvert
Mid-Cap Fund
September 30, 2021
Performance
Portfolio Manager Charles B. Gaffney of Calvert Research and Management
| % Average Annual Total Returns1,2 | Class
Inception Date | Performance
Inception Date | One Year | Five Years | Ten Years |
| Class A at NAV | 10/31/1994 | 10/31/1994 | 24.13% | 12.17% | 12.22% |
| Class A with 4.75% Maximum Sales Charge | — | — | 18.25 | 11.08 | 11.68 |
| Class C at NAV | 10/31/1994 | 10/31/1994 | 23.20 | 11.34 | 11.37 |
| Class C with 1% Maximum Sales Charge | — | — | 22.20 | 11.34 | 11.37 |
| Class I at NAV | 06/03/2003 | 10/31/1994 | 24.45 | 12.51 | 12.72 |
|
| Russell Midcap® Index | — | — | 38.11% | 14.38% | 15.51% |
| % Total Annual Operating Expense Ratios3 | Class A | Class C | Class I |
| Gross | 1.26% | 2.01% | 1.01% |
| Net | 1.18 | 1.93 | 0.93 |
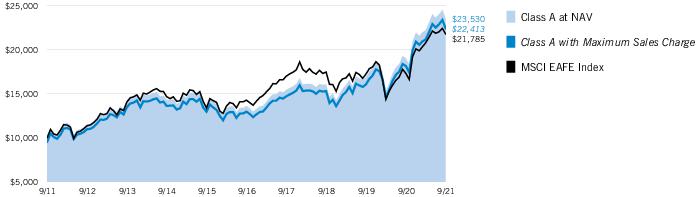
Growth of $10,000
This graph shows the change in value of a hypothetical investment of $10,000 in Class A of the Fund for the period indicated. For comparison, the same investment is shown in the indicated index.
| Growth of Investment | Amount Invested | Period Beginning | At NAV | With Maximum Sales Charge |
| Class C | $10,000 | 09/30/2011 | $29,379 | N.A. |
| Class I | $250,000 | 09/30/2011 | $829,029 | N.A. |
See Endnotes and Additional Disclosures in this report.
Past performance is no guarantee of future results. Returns are historical and are calculated by determining the percentage change in net asset value (NAV) or offering price (as applicable) with all distributions reinvested. Investment return and principal value will fluctuate so that shares, when redeemed, may be worth more or less than their original cost. Performance for periods less than or equal to one year is cumulative. Performance is for the stated time period only; due to market volatility, current Fund performance may be lower or higher than the quoted return. For performance as of the most recent month-end, please refer to www.calvert.com.
Calvert
Mid-Cap Fund
September 30, 2021
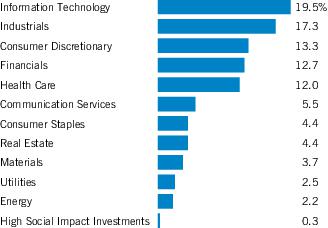
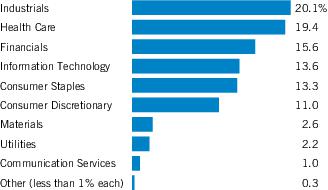
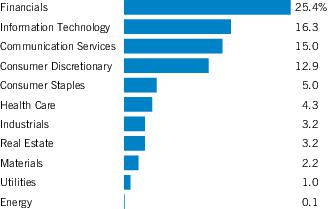
Sector Allocation (% of net assets)*
*Excludes cash and cash equivalents.
| Top 10 Holdings (% of net assets)* | |
| Motorola Solutions, Inc. | 2.5% |
| Lamar Advertising Co., Class A | 2.4 |
| ANSYS, Inc. | 2.3 |
| KeyCorp | 2.2 |
| Verisk Analytics, Inc. | 2.2 |
| Teleflex, Inc. | 2.2 |
| Baker Hughes Co. | 2.2 |
| Match Group, Inc. | 2.2 |
| Ally Financial, Inc. | 2.1 |
| Aptiv PLC | 2.1 |
| Total | 22.4% |
| * | Excludes cash and cash equivalents. |
See Endnotes and Additional Disclosures in this report.
Calvert
Mid-Cap Fund
September 30, 2021
Endnotes and Additional Disclosures
| † | The views expressed in this report are those of the portfolio manager(s) and are current only through the date stated at the top of this page. These views are subject to change at any time based upon market or other conditions, and Calvert and the Fund(s) disclaim any responsibility to update such views. These views may not be relied upon as investment advice and, because investment decisions are based on many factors, may not be relied upon as an indication of trading intent on behalf of any Calvert fund. This commentary may contain statements that are not historical facts, referred to as “forward-looking statements.” The Fund’s actual future results may differ significantly from those stated in any forward-looking statement, depending on factors such as changes in securities or financial markets or general economic conditions, the volume of sales and purchases of Fund shares, the continuation of investment advisory, administrative and service contracts, and other risks discussed from time to time in the Fund’s filings with the Securities and Exchange Commission. |
| | |
| 1 | Russell Midcap® Index is an unmanaged index of U.S. mid-cap stocks. Unless otherwise stated, index returns do not reflect the effect of any applicable sales charges, commissions, expenses, taxes or leverage, as applicable. It is not possible to invest directly in an index. |
| 2 | Total Returns at NAV do not include applicable sales charges. If sales charges were deducted, the returns would be lower. Total Returns shown with maximum sales charge reflect the stated maximum sales charge. Unless otherwise stated, performance does not reflect the deduction of taxes on Fund distributions or redemptions of Fund shares.Calvert Research and Management became the investment adviser to the Fund on December 31, 2016. Performance reflected prior to such date is that of the Fund’s former investment adviser. |
| 3 | Source: Fund prospectus. Net expense ratios reflect a contractual expense reimbursement that continues through 1/31/22. Without the reimbursement, performance would have been lower. The expense ratios for the current reporting period can be found in the Financial Highlights section of this report. |
| | Fund profile subject to change due to active management. |
| | Additional Information |
| | S&P 500® Index is an unmanaged index of large-cap stocks commonly used as a measure of U.S. stock market performance. Dow Jones Industrial Average® is a price-weighted average of 30 blue-chip stocks that are generally the leaders in their industry. S&P Dow Jones Indices are a product of S&P Dow Jones Indices LLC (“S&P DJI”) and have been licensed for use. S&P® and S&P 500® are registered trademarks of S&P DJI; Dow Jones® is a registered trademark of Dow Jones Trademark Holdings LLC (“Dow Jones”); S&P DJI, Dow Jones |
and their respective affiliates do not sponsor, endorse, sell or promote the Fund, will not have any liability with respect thereto and do not have any liability for any errors, omissions, or interruptions of the S&P Dow Jones Indices. Nasdaq Composite Index is a market capitalization-weighted index of all domestic and international securities listed on Nasdaq. Source: Nasdaq, Inc. The information is provided by Nasdaq (with its affiliates, are referred to as the “Corporations”) and Nasdaq’s third party licensors on an “as is” basis and the Corporations make no guarantees and bear no liability of any kind with respect to the information or the Fund. Russell 1000® Index is an unmanaged index of 1,000 U.S. large-cap stocks. Russell 2000® Index is an unmanaged index of 2,000 U.S. small-cap stocks.
Calvert
Mid-Cap Fund
September 30, 2021
Example
As a Fund shareholder, you incur two types of costs: (1) transaction costs, including sales charges (loads) on purchases and redemption fees (if applicable); and (2) ongoing costs, including management fees; distribution and/or service fees; and other Fund expenses. This Example is intended to help you understand your ongoing costs (in dollars) of Fund investing and to compare these costs with the ongoing costs of investing in other mutual funds. The Example is based on an investment of $1,000 invested at the beginning of the period and held for the entire period (April 1, 2021 to September 30, 2021).
Actual Expenses
The first section of the table below provides information about actual account values and actual expenses. You may use the information in this section, together with the amount you invested, to estimate the expenses that you paid over the period. Simply divide your account value by $1,000 (for example, an $8,600 account value divided by $1,000 = 8.6), then multiply the result by the number in the first section under the heading entitled “Expenses Paid During Period” to estimate the expenses you paid on your account during this period.
Hypothetical Example for Comparison Purposes
The second section of the table below provides information about hypothetical account values and hypothetical expenses based on the actual Fund expense ratio and an assumed rate of return of 5% per year (before expenses), which is not the actual Fund return. The hypothetical account values and expenses may not be used to estimate the actual ending account balance or expenses you paid for the period. You may use this information to compare the ongoing costs of investing in the Fund and other funds. To do so, compare this 5% hypothetical example with the 5% hypothetical examples that appear in the shareholder reports of the other funds.
Please note that the expenses shown in the table are meant to highlight your ongoing costs only and do not reflect any transactional costs, such as sales charges (loads) or redemption fees (if applicable). Therefore, the second section of the table is useful in comparing ongoing costs only, and will not help you determine the relative total costs of owning different funds. In addition, if these transactional costs were included, your costs would be higher.
| | Beginning
Account Value
(4/1/21) | Ending
Account Value
(9/30/21) | Expenses Paid
During Period*
(4/1/21 – 9/30/21) | Annualized
Expense
Ratio |
| Actual | | | | |
| Class A | $1,000.00 | $1,031.80 | $6.01 ** | 1.18% |
| Class C | $1,000.00 | $1,028.00 | $9.81 ** | 1.93% |
| Class I | $1,000.00 | $1,033.30 | $4.74 ** | 0.93% |
| Hypothetical | | | | |
| (5% return per year before expenses) | | | | |
| Class A | $1,000.00 | $1,019.15 | $5.97 ** | 1.18% |
| Class C | $1,000.00 | $1,015.39 | $9.75 ** | 1.93% |
| Class I | $1,000.00 | $1,020.41 | $4.71 ** | 0.93% |
| * | Expenses are equal to the Fund's annualized expense ratio for the indicated Class, multiplied by the average account value over the period, multiplied by 183/365 (to reflect the one-half year period). The Example assumes that the $1,000 was invested at the net asset value per share determined at the close of business on March 31, 2021. |
| ** | Absent a waiver and/or reimbursement of expenses by an affiliate, expenses would be higher. |
Calvert
Mid-Cap Fund
September 30, 2021
| Security | Shares | Value |
| Auto Components — 2.1% | |
| Aptiv PLC(1) | | 44,683 | $ 6,656,427 |
| | | | $ 6,656,427 |
| Banks — 2.2% | |
| KeyCorp | | 322,666 | $ 6,976,039 |
| | | | $ 6,976,039 |
| Beverages — 1.8% | |
| Coca-Cola Europacific Partners PLC | | 104,782 | $ 5,793,397 |
| | | | $ 5,793,397 |
| Biotechnology — 1.4% | |
| Neurocrine Biosciences, Inc.(1) | | 47,083 | $ 4,515,731 |
| | | | $ 4,515,731 |
| Building Products — 2.1% | |
| AZEK Co., Inc. (The)(1) | | 85,260 | $ 3,114,548 |
| Trex Co., Inc.(1) | | 33,049 | 3,368,684 |
| | | | $ 6,483,232 |
| Capital Markets — 4.9% | |
| Morningstar, Inc. | | 17,427 | $ 4,514,116 |
| MSCI, Inc. | | 7,428 | 4,518,749 |
| Tradeweb Markets, Inc., Class A | | 78,718 | 6,358,840 |
| | | | $ 15,391,705 |
| Commercial Services & Supplies — 3.7% | |
| GFL Environmental, Inc.(2) | | 166,320 | $ 6,183,490 |
| Tetra Tech, Inc. | | 36,519 | 5,453,748 |
| | | | $ 11,637,238 |
| Communications Equipment — 2.5% | |
| Motorola Solutions, Inc. | | 34,017 | $ 7,902,829 |
| | | | $ 7,902,829 |
| Consumer Finance — 2.1% | |
| Ally Financial, Inc. | | 130,735 | $ 6,674,022 |
| | | | $ 6,674,022 |
| Containers & Packaging — 2.6% | |
| AptarGroup, Inc. | | 53,873 | $ 6,429,743 |
| Packaging Corp. of America | | 13,798 | 1,896,397 |
| | | | $ 8,326,140 |
| Security | Shares | Value |
| Diversified Consumer Services — 1.1% | |
| Terminix Global Holdings, Inc.(1) | | 79,348 | $ 3,306,431 |
| | | | $ 3,306,431 |
| Electric Utilities — 1.5% | |
| Xcel Energy, Inc. | | 77,324 | $ 4,832,750 |
| | | | $ 4,832,750 |
| Electrical Equipment — 1.7% | |
| AMETEK, Inc. | | 42,104 | $ 5,221,317 |
| | | | $ 5,221,317 |
| Electronic Equipment, Instruments & Components — 3.0% | |
| TE Connectivity, Ltd. | | 36,971 | $ 5,073,161 |
| Zebra Technologies Corp., Class A(1) | | 8,320 | 4,288,294 |
| | | | $ 9,361,455 |
| Energy Equipment & Services — 2.2% | |
| Baker Hughes Co. | | 274,718 | $ 6,793,776 |
| | | | $ 6,793,776 |
| Entertainment — 2.0% | |
| Electronic Arts, Inc. | | 44,752 | $ 6,365,972 |
| | | | $ 6,365,972 |
| Equity Real Estate Investment Trusts (REITs) — 4.4% | |
| Lamar Advertising Co., Class A | | 65,214 | $ 7,398,528 |
| Mid-America Apartment Communities, Inc. | | 33,721 | 6,297,397 |
| | | | $ 13,695,925 |
| Food & Staples Retailing — 1.6% | |
| Performance Food Group Co.(1) | | 108,153 | $ 5,024,788 |
| | | | $ 5,024,788 |
| Food Products — 1.0% | |
| Lamb Weston Holdings, Inc. | | 49,193 | $ 3,018,974 |
| | | | $ 3,018,974 |
| Health Care Equipment & Supplies — 4.0% | |
| Envista Holdings Corp.(1) | | 134,561 | $ 5,625,996 |
| Teleflex, Inc. | | 18,191 | 6,849,821 |
| | | | $ 12,475,817 |
| Health Care Providers & Services — 1.7% | |
| Accolade, Inc.(1) | | 69,202 | $ 2,918,248 |
| LifeStance Health Group, Inc.(1) | | 169,775 | 2,461,738 |
| | | | $ 5,379,986 |
7
See Notes to Financial Statements.
Calvert
Mid-Cap Fund
September 30, 2021
Schedule of Investments — continued
| Security | Shares | Value |
| Hotels, Restaurants & Leisure — 1.8% | |
| Wyndham Hotels & Resorts, Inc. | | 74,825 | $ 5,775,742 |
| | | | $ 5,775,742 |
| Independent Power and Renewable Electricity Producers — 1.0% | |
| NextEra Energy Partners, L.P. | | 41,302 | $ 3,112,519 |
| | | | $ 3,112,519 |
| Insurance — 3.5% | |
| Assurant, Inc. | | 38,647 | $ 6,096,564 |
| Travelers Cos., Inc. (The) | | 31,226 | 4,746,665 |
| | | | $ 10,843,229 |
| Interactive Media & Services — 3.5% | |
| CarGurus, Inc.(1) | | 136,411 | $ 4,284,669 |
| Match Group, Inc.(1) | | 43,210 | 6,783,538 |
| | | | $ 11,068,207 |
| IT Services — 5.6% | |
| Broadridge Financial Solutions, Inc. | | 37,066 | $ 6,176,678 |
| Euronet Worldwide, Inc.(1) | | 26,130 | 3,325,827 |
| Flywire Corp.(1) | | 30,049 | 1,317,348 |
| Marqeta, Inc., Class A(1)(2) | | 49,569 | 1,096,466 |
| WEX, Inc.(1) | | 31,499 | 5,548,234 |
| | | | $ 17,464,553 |
| Life Sciences Tools & Services — 4.8% | |
| Agilent Technologies, Inc. | | 37,800 | $ 5,954,634 |
| Avantor, Inc.(1) | | 55,594 | 2,273,794 |
| PerkinElmer, Inc. | | 12,793 | 2,216,899 |
| Waters Corp.(1) | | 13,359 | 4,773,171 |
| | | | $ 15,218,498 |
| Machinery — 4.2% | |
| Colfax Corp.(1) | | 107,150 | $ 4,918,185 |
| Stanley Black & Decker, Inc. | | 29,066 | 5,095,560 |
| Westinghouse Air Brake Technologies Corp. | | 36,408 | 3,138,734 |
| | | | $ 13,152,479 |
| Metals & Mining — 1.1% | |
| Steel Dynamics, Inc. | | 57,236 | $ 3,347,161 |
| | | | $ 3,347,161 |
| Professional Services — 5.6% | |
| Booz Allen Hamilton Holding Corp. | | 72,157 | $ 5,725,658 |
| Clarivate PLC(1)(2) | | 229,610 | 5,028,459 |
| Security | Shares | Value |
| Professional Services (continued) | |
| Verisk Analytics, Inc. | | 34,606 | $ 6,930,544 |
| | | | $ 17,684,661 |
| Semiconductors & Semiconductor Equipment — 2.7% | |
| Skyworks Solutions, Inc. | | 24,952 | $ 4,111,590 |
| Teradyne, Inc. | | 38,740 | 4,229,246 |
| | | | $ 8,340,836 |
| Software — 5.8% | |
| ANSYS, Inc.(1) | | 20,866 | $ 7,103,830 |
| Bill.com Holdings, Inc.(1) | | 23,652 | 6,313,901 |
| Black Knight, Inc.(1) | | 65,734 | 4,732,848 |
| | | | $ 18,150,579 |
| Specialty Retail — 7.2% | |
| Bath & Body Works, Inc. | | 65,367 | $ 4,120,082 |
| Best Buy Co., Inc. | | 35,918 | 3,796,892 |
| Five Below, Inc.(1) | | 11,281 | 1,994,593 |
| National Vision Holdings, Inc.(1) | | 88,308 | 5,013,245 |
| Ross Stores, Inc. | | 36,220 | 3,942,547 |
| Ulta Beauty, Inc.(1) | | 10,227 | 3,691,129 |
| | | | $ 22,558,488 |
| Textiles, Apparel & Luxury Goods — 1.1% | |
| Deckers Outdoor Corp.(1) | | 9,433 | $ 3,397,767 |
| | | | $ 3,397,767 |
Total Common Stocks
(identified cost $246,429,051) | | | $305,948,670 |
| High Social Impact Investments — 0.3% |
| Security | Principal
Amount
(000's omitted) | Value |
| Calvert Impact Capital, Inc., Community Investment Notes, 1.50%, 12/15/23(3)(4) | $ | 360 | $ 353,819 |
| ImpactAssets, Inc., Global Sustainable Agriculture Notes, 0.00%, 11/3/22(4)(5) | | 309 | 293,859 |
| ImpactAssets, Inc., Microfinance Plus Notes, 0.00%, 11/3/22(4)(5) | | 398 | 364,253 |
Total High Social Impact Investments
(identified cost $1,067,000) | | | $ 1,011,931 |
8
See Notes to Financial Statements.
Calvert
Mid-Cap Fund
September 30, 2021
Schedule of Investments — continued
| Short-Term Investments — 1.8% | | | |
| Description | Units | Value |
| Calvert Cash Reserves Fund, LLC, 0.04%(6) | | 5,583,357 | $ 5,583,915 |
Total Short-Term Investments
(identified cost $5,583,357) | | | $ 5,583,915 |
Total Investments — 99.6%
(identified cost $253,079,408) | | | $312,544,516 |
| Other Assets, Less Liabilities — 0.4% | | | $ 1,306,111 |
| Net Assets — 100.0% | | | $313,850,627 |
| The percentage shown for each investment category in the Schedule of Investments is based on net assets. |
| (1) | Non-income producing security. |
| (2) | All or a portion of this security was on loan at September 30, 2021. The aggregate market value of securities on loan at September 30, 2021 was $7,324,957. |
| (3) | May be deemed to be an affiliated company (see Note 7). |
| (4) | Restricted security. Total market value of restricted securities amounts to $1,011,931, which represents 0.3% of the net assets of the Fund as of September 30, 2021. |
| (5) | Notes carry an interest rate that varies by period and is contingent on the performance of the underlying portfolio of loans to borrowers. The coupon rate shown represents the rate in effect at September 30, 2021. |
| (6) | Affiliated investment company, available to Calvert portfolios and funds, which invests in high quality, U.S. dollar denominated money market instruments. The rate shown is the annualized seven-day yield as of September 30, 2021. |
Restricted Securities
| Description | Acquisition Dates | Cost |
| Calvert Impact Capital, Inc., Community Investment Notes, 1.50%, 12/15/23 | 12/14/20 | $360,000 |
| ImpactAssets, Inc., Global Sustainable Agriculture Notes, 0.00%, 11/3/22 | 11/13/15 | 309,000 |
| ImpactAssets, Inc., Microfinance Plus Notes, 0.00%, 11/3/22 | 11/13/15 | 398,000 |
9
See Notes to Financial Statements.
Calvert
Mid-Cap Fund
September 30, 2021
Statement of Assets and Liabilities
| | September 30, 2021 |
| Assets | |
Investments in securities of unaffiliated issuers, at value (identified cost $247,136,051) - including
$7,324,957 of securities on loan | $ 306,606,782 |
| Investments in securities of affiliated issuers, at value (identified cost $5,943,357) | 5,937,734 |
| Receivable for investments sold | 4,235,545 |
| Receivable for capital shares sold | 653,376 |
| Dividends and interest receivable | 134,412 |
| Dividends and interest receivable - affiliated | 4,497 |
| Securities lending income receivable | 2,277 |
| Receivable from affiliate | 10,042 |
| Directors' deferred compensation plan | 175,456 |
| Total assets | $317,760,121 |
| Liabilities | |
| Payable for investments purchased | $ 3,313,176 |
| Payable for capital shares redeemed | 44,581 |
| Payable to affiliates: | |
| Investment advisory fee | 173,621 |
| Administrative fee | 32,053 |
| Distribution and service fees | 45,702 |
| Sub-transfer agency fee | 12,637 |
| Directors' deferred compensation plan | 175,456 |
| Accrued expenses | 112,268 |
| Total liabilities | $ 3,909,494 |
| Net Assets | $313,850,627 |
| Sources of Net Assets | |
| Paid-in capital | $ 221,861,813 |
| Distributable earnings | 91,988,814 |
| Total | $313,850,627 |
| Class A Shares | |
| Net Assets | $ 183,991,013 |
| Shares Outstanding | 4,402,580 |
Net Asset Value and Redemption Price Per Share
(net assets ÷ shares of beneficial interest outstanding) | $ 41.79 |
Maximum Offering Price Per Share
(100 ÷ 95.25 of net asset value per share) | $ 43.87 |
| Class C Shares | |
| Net Assets | $ 7,468,545 |
| Shares Outstanding | 271,266 |
Net Asset Value and Offering Price Per Share*
(net assets ÷ shares of beneficial interest outstanding) | $ 27.53 |
10
See Notes to Financial Statements.
Calvert
Mid-Cap Fund
September 30, 2021
Statement of Assets and Liabilities — continued
| | September 30, 2021 |
| Class I Shares | |
| Net Assets | $122,391,069 |
| Shares Outstanding | 2,434,209 |
Net Asset Value, Offering Price and Redemption Price Per Share
(net assets ÷ shares of beneficial interest outstanding) | $ 50.28 |
| On sales of $50,000 or more, the offering price of Class A shares is reduced. |
| * | Redemption price per share is equal to the net asset value less any applicable contingent deferred sales charge. |
11
See Notes to Financial Statements.
Calvert
Mid-Cap Fund
September 30, 2021
| | Year Ended |
| | September 30, 2021 |
| Investment Income | |
| Dividend income (net of foreign taxes withheld of $6,395) | $ 2,541,894 |
| Dividend income - affiliated issuers | 1,556 |
| Interest income | 2,000 |
| Interest income - affiliated issuers | 6,468 |
| Securities lending income, net | 8,933 |
| Total investment income | $ 2,560,851 |
| Expenses | |
| Investment advisory fee | $ 1,900,088 |
| Administrative fee | 350,785 |
| Distribution and service fees: | |
| Class A | 445,423 |
| Class C | 81,564 |
| Directors' fees and expenses | 14,481 |
| Custodian fees | 6,792 |
| Transfer agency fees and expenses | 372,477 |
| Accounting fees | 65,925 |
| Professional fees | 30,885 |
| Registration fees | 70,467 |
| Reports to shareholders | 20,413 |
| Miscellaneous | 21,851 |
| Total expenses | $ 3,381,151 |
| Waiver and/or reimbursement of expenses by affiliate | $ (132,066) |
| Net expenses | $ 3,249,085 |
| Net investment loss | $ (688,234) |
| Realized and Unrealized Gain (Loss) | |
| Net realized gain (loss): | |
| Investment securities | $ 40,077,161 |
| Investment securities - affiliated issuers | (17) |
| Foreign currency transactions | (8,944) |
| Net realized gain | $40,068,200 |
| Change in unrealized appreciation (depreciation): | |
| Investment securities | $ 18,163,399 |
| Investment securities - affiliated issuers | (2,059) |
| Net change in unrealized appreciation (depreciation) | $18,161,340 |
| Net realized and unrealized gain | $58,229,540 |
| Net increase in net assets from operations | $57,541,306 |
12
See Notes to Financial Statements.
Calvert
Mid-Cap Fund
September 30, 2021
Statements of Changes in Net Assets
| | Year Ended September 30, |
| | 2021 | 2020 |
| Increase (Decrease) in Net Assets | | |
| From operations: | | |
| Net investment income (loss) | $ (688,234) | $ 390,600 |
| Net realized gain (loss) | 40,068,200 | (818,376) |
| Net change in unrealized appreciation (depreciation) | 18,161,340 | 9,103,237 |
| Net increase in net assets from operations | $ 57,541,306 | $ 8,675,461 |
| Distributions to shareholders: | | |
| Class A | $ (1,449,640) | $ (8,276,383) |
| Class C | (106,024) | (1,104,384) |
| Class I | (801,809) | (2,242,939) |
| Total distributions to shareholders | $ (2,357,473) | $ (11,623,706) |
| Capital share transactions: | | |
| Class A | $ 352,323 | $ (4,811,134) |
| Class C | (3,016,708) | (5,091,318) |
| Class I | 27,105,326 | 28,003,139 |
| Net increase in net assets from capital share transactions | $ 24,440,941 | $ 18,100,687 |
| Net increase in net assets | $ 79,624,774 | $ 15,152,442 |
| Net Assets | | |
| At beginning of year | $ 234,225,853 | $ 219,073,411 |
| At end of year | $313,850,627 | $234,225,853 |
13
See Notes to Financial Statements.
Calvert
Mid-Cap Fund
September 30, 2021
| | Class A |
| | Year Ended September 30, |
| | 2021 | 2020 | 2019 | 2018 | 2017 |
| Net asset value — Beginning of year | $ 33.96 | $ 34.69 | $ 34.84 | $ 33.40 | $ 29.68 |
| Income (Loss) From Operations | | | | | |
| Net investment income (loss)(1) | $ (0.12) | $ 0.05 | $ 0.09 | $ 0.07 | $ 0.20 |
| Net realized and unrealized gain | 8.28 | 1.07 | 1.85 | 4.59 | 3.68 |
| Total income from operations | $ 8.16 | $ 1.12 | $ 1.94 | $ 4.66 | $ 3.88 |
| Less Distributions | | | | | |
| From net investment income | $ (0.00)(2) | $ (0.03) | $ (0.08) | $ (0.04) | $ (0.15) |
| From net realized gain | (0.33) | (1.82) | (2.01) | (3.18) | (0.01) |
| Total distributions | $ (0.33) | $ (1.85) | $ (2.09) | $ (3.22) | $ (0.16) |
| Net asset value — End of year | $ 41.79 | $ 33.96 | $ 34.69 | $ 34.84 | $ 33.40 |
| Total Return(3) | 24.13% | 3.20% | 6.56% | 15.04% | 13.11% |
| Ratios/Supplemental Data | | | | | |
| Net assets, end of year (000’s omitted) | $183,991 | $149,112 | $158,005 | $157,046 | $159,951 |
| Ratios (as a percentage of average daily net assets):(4) | | | | | |
| Total expenses | 1.22% | 1.26% | 1.30% | 1.28% | 1.34% |
| Net expenses | 1.18% | 1.18% | 1.19% | 1.21% | 1.21% |
| Net investment income (loss) | (0.30)% | 0.15% | 0.27% | 0.22% | 0.64% |
| Portfolio Turnover | 79% | 70% | 83% | 62% | 162% |
| (1) | Computed using average shares outstanding. |
| (2) | Amount is less than $(0.005). |
| (3) | Returns are historical and are calculated by determining the percentage change in net asset value with all distributions reinvested and do not reflect the effect of sales charges, if any. |
| (4) | Total expenses do not reflect amounts reimbursed and/or waived by the adviser and certain of its affiliates, if applicable. Net expenses are net of all reductions and represent the net expenses paid by the Fund. |
14
See Notes to Financial Statements.
Calvert
Mid-Cap Fund
September 30, 2021
Financial Highlights — continued
| | Class C |
| | Year Ended September 30, |
| | 2021 | 2020 | 2019 | 2018 | 2017 |
| Net asset value — Beginning of year | $ 22.64 | $ 23.83 | $ 24.65 | $ 24.55 | $ 21.87 |
| Income (Loss) From Operations | | | | | |
| Net investment loss(1) | $ (0.28) | $ (0.14) | $ (0.11) | $ (0.12) | $ (0.03) |
| Net realized and unrealized gain | 5.50 | 0.73 | 1.23 | 3.27 | 2.72 |
| Total income from operations | $ 5.22 | $ 0.59 | $ 1.12 | $ 3.15 | $ 2.69 |
| Less Distributions | | | | | |
| From net realized gain | $ (0.33) | $ (1.78) | $ (1.94) | $ (3.05) | $ (0.01) |
| Total distributions | $ (0.33) | $ (1.78) | $ (1.94) | $ (3.05) | $ (0.01) |
| Net asset value — End of year | $27.53 | $22.64 | $ 23.83 | $ 24.65 | $ 24.55 |
| Total Return(2) | 23.20% | 2.40% | 5.77% | 14.20% | 12.29% |
| Ratios/Supplemental Data | | | | | |
| Net assets, end of year (000’s omitted) | $ 7,469 | $ 8,787 | $14,535 | $17,043 | $18,146 |
| Ratios (as a percentage of average daily net assets):(3) | | | | | |
| Total expenses | 1.98% | 2.01% | 2.05% | 2.03% | 2.18% |
| Net expenses | 1.93% | 1.93% | 1.94% | 1.96% | 1.96% |
| Net investment loss | (1.05)% | (0.62)% | (0.49)% | (0.53)% | (0.12)% |
| Portfolio Turnover | 79% | 70% | 83% | 62% | 162% |
| (1) | Computed using average shares outstanding. |
| (2) | Returns are historical and are calculated by determining the percentage change in net asset value with all distributions reinvested and do not reflect the effect of sales charges, if any. |
| (3) | Total expenses do not reflect amounts reimbursed and/or waived by the adviser and certain of its affiliates, if applicable. Net expenses are net of all reductions and represent the net expenses paid by the Fund. |
15
See Notes to Financial Statements.
Calvert
Mid-Cap Fund
September 30, 2021
Financial Highlights — continued
| | Class I |
| | Year Ended September 30, |
| | 2021 | 2020 | 2019 | 2018 | 2017 |
| Net asset value — Beginning of year | $ 40.77 | $ 41.25 | $ 40.97 | $ 38.70 | $ 34.38 |
| Income (Loss) From Operations | | | | | |
| Net investment income (loss)(1) | $ (0.03) | $ 0.16 | $ 0.21 | $ 0.23 | $ 0.41 |
| Net realized and unrealized gain | 9.95 | 1.27 | 2.24 | 5.37 | 4.22 |
| Total income from operations | $ 9.92 | $ 1.43 | $ 2.45 | $ 5.60 | $ 4.63 |
| Less Distributions | | | | | |
| From net investment income | $ (0.08) | $ (0.09) | $ (0.16) | $ (0.15) | $ (0.30) |
| From net realized gain | (0.33) | (1.82) | (2.01) | (3.18) | (0.01) |
| Total distributions | $ (0.41) | $ (1.91) | $ (2.17) | $ (3.33) | $ (0.31) |
| Net asset value — End of year | $ 50.28 | $ 40.77 | $ 41.25 | $ 40.97 | $ 38.70 |
| Total Return(2) | 24.45% | 3.45% | 6.85% | 15.48% | 13.53% |
| Ratios/Supplemental Data | | | | | |
| Net assets, end of year (000’s omitted) | $122,391 | $76,327 | $46,533 | $93,198 | $68,748 |
| Ratios (as a percentage of average daily net assets):(3) | | | | | |
| Total expenses | 0.97% | 1.01% | 1.05% | 1.03% | 0.88% |
| Net expenses | 0.93% | 0.93% | 0.91% | 0.86% | 0.86% |
| Net investment income (loss) | (0.06)% | 0.40% | 0.54% | 0.59% | 1.14% |
| Portfolio Turnover | 79% | 70% | 83% | 62% | 162% |
| (1) | Computed using average shares outstanding. |
| (2) | Returns are historical and are calculated by determining the percentage change in net asset value with all distributions reinvested and do not reflect the effect of sales charges, if any. |
| (3) | Total expenses do not reflect amounts reimbursed and/or waived by the adviser and certain of its affiliates, if applicable. Net expenses are net of all reductions and represent the net expenses paid by the Fund. |
16
See Notes to Financial Statements.
Calvert
Mid-Cap Fund
September 30, 2021
Notes to Financial Statements
1 Significant Accounting Policies
Calvert Mid-Cap Fund (the Fund) is a diversified series of Calvert World Values Fund, Inc. (the Corporation). The Corporation is a Maryland corporation registered under the Investment Company Act of 1940, as amended (the 1940 Act), as an open-end management investment company. The investment objective of the Fund is to seek to provide long-term capital appreciation by investing primarily in mid-cap stocks.
The Fund offers three classes of shares. Class A shares are generally sold subject to a sales charge imposed at time of purchase. A contingent deferred sales charge of 0.80% may apply to certain redemptions of Class A shares for accounts for which no sales charge was paid, if redeemed within 12 months of purchase. Class C shares are sold without a front-end sales charge, and with certain exceptions, are charged a contingent deferred sales charge of 1% on shares redeemed within 12 months of purchase. Class C shares are only available for purchase through a financial intermediary. Effective January 25, 2019, Class C shares generally automatically convert to Class A shares ten years after their purchase and, effective November 5, 2020, automatically convert to Class A shares eight years after their purchase as described in the Fund’s prospectus. Class I shares are sold at net asset value, are not subject to a sales charge and are sold only to certain eligible investors. Each class represents a pro rata interest in the Fund, but votes separately on class-specific matters and is subject to different expenses.
The Fund applies the accounting and reporting guidance in the Financial Accounting Standards Board (FASB) Accounting Standards Codification Topic 946, Financial Services – Investment Companies (ASC 946). Subsequent events, if any, through the date that the financial statements were issued have been evaluated in the preparation of the financial statements.
A Investment Valuation— Net asset value per share is determined every business day as of the close of the regular session of the New York Stock Exchange (generally 4:00 p.m. Eastern time). The Fund uses independent pricing services approved by the Board of Directors (the Board) to value its investments wherever possible. Investments for which market quotations are not available or deemed not reliable are fair valued in good faith under the direction of the Board.
U.S. generally accepted accounting principles (U.S. GAAP) establishes a disclosure hierarchy that categorizes the inputs to valuation techniques used to value assets and liabilities at measurement date. These inputs are summarized in the three broad levels listed below:
Level 1 - quoted prices in active markets for identical securities
Level 2 - other significant observable inputs (including quoted prices for similar securities, interest rates, prepayment speeds, credit risk, etc.)
Level 3 - significant unobservable inputs (including the Fund’s own assumptions in determining the fair value of investments)
The inputs or methodologies used for valuing securities are not necessarily an indication of the risk associated with investing in those securities.
Valuation techniques used to value the Fund’s investments by major category are as follows:
Equity Securities. Equity securities (including warrants and rights) listed on a U.S. securities exchange generally are valued at the last sale or closing price as reported by an independent pricing service on the primary market or exchange on which they are traded and are categorized as Level 1 in the hierarchy. Equity securities listed on the NASDAQ National Market System are valued at the NASDAQ official closing price and are categorized as Level 1 in the hierarchy. Unlisted or listed securities for which closing sales prices or closing quotations are not available are valued at the mean between the latest available bid and ask prices and are categorized as Level 2 in the hierarchy.
Debt Securities. Debt securities are generally valued based on valuations provided by third party pricing services, as derived from such services’ pricing models. Inputs to the models may include, but are not limited to, reported trades, executable bid and ask prices, broker/dealer quotations, prices or yields of securities with similar characteristics, interest rates, anticipated prepayments, benchmark curves or information pertaining to the issuer, as well as industry and economic events. Accordingly, debt securities are generally categorized as Level 2 in the hierarchy. Short-term debt securities with a remaining maturity at time of purchase of more than sixty days are valued based on valuations provided by a third party pricing service. Such securities are generally categorized as Level 2 in the hierarchy. Short-term debt securities of sufficient credit quality purchased with remaining maturities of sixty days or less for which a valuation from a third party pricing service is not readily available may be valued at amortized cost, which approximates fair value, and are categorized as Level 2 in the hierarchy.
Affiliated Fund. The Fund may invest in Calvert Cash Reserves Fund, LLC (Cash Reserves Fund), an affiliated investment company managed by Calvert Research and Management (CRM). While Cash Reserves Fund is not a registered money market mutual fund, it conducts all of its investment activities in accordance with the requirements of Rule 2a-7 under the 1940 Act. Investments in Cash Reserves Fund are valued at the closing net asset value per unit on the valuation day and are categorized as Level 2 in the hierarchy. Cash Reserves Fund generally values its investment securities based on available market quotations provided by a third party pricing service.
Other Securities. Investments in registered investment companies (including money market funds) that do not trade on an exchange are valued at the net asset value per share on the valuation day and are categorized as Level 1 in the hierarchy.
Fair Valuation. If a market value cannot be determined for a security using the methodologies described above, or if, in the good faith opinion of the Fund's adviser, the market value does not constitute a readily available market quotation, or if a significant event has occurred that would materially affect the value of the security, the security will be fair valued as determined in good faith by or at the direction of the Board in a manner that most fairly reflects the
Calvert
Mid-Cap Fund
September 30, 2021
Notes to Financial Statements — continued
security’s “fair value”, which is the amount that the Fund might reasonably expect to receive for the security upon its current sale in the ordinary course. Each such determination is based on a consideration of relevant factors, which are likely to vary from one pricing context to another. These factors may include, but are not limited to, the type of security, the existence of any contractual restrictions on the security’s disposition, the price and extent of public trading in similar securities of the issuer or of comparable companies or entities, quotations or relevant information obtained from broker/dealers or other market participants, information obtained from the issuer, analysts, and/or the appropriate stock exchange (for exchange-traded securities), an analysis of the company’s or entity’s financial statements, and an evaluation of the forces that influence the issuer and the market(s) in which the security is purchased and sold.
The values assigned to fair value investments are based on available information and do not necessarily represent amounts that might ultimately be realized. Further, due to the inherent uncertainty of valuations of such investments, the fair values may differ significantly from the values that would have been used had an active market existed, and the differences could be material.
The following table summarizes the market value of the Fund's holdings as of September 30, 2021, based on the inputs used to value them:
| Asset Description | Level 1 | Level 2 | Level 3 | Total |
| Common Stocks | $ 305,948,670(1) | $ — | $ — | $ 305,948,670 |
| High Social Impact Investments | — | 1,011,931 | — | 1,011,931 |
| Short-Term Investments | — | 5,583,915 | — | 5,583,915 |
| Total Investments | $305,948,670 | $6,595,846 | $ — | $312,544,516 |
| (1) | The level classification by major category of investments is the same as the category presentation in the Schedule of Investments. |
B Investment Transactions and Income— Investment transactions for financial statement purposes are accounted for on trade date. Realized gains and losses are recorded on an identified cost basis and may include proceeds from litigation. Dividend income is recorded on the ex-dividend date for dividends received in cash and/or securities or, in the case of dividends on certain foreign securities, as soon as the Fund is informed of the ex-dividend date. Non-cash dividends are recorded at the fair value of the securities received. Withholding taxes on foreign dividends, if any, have been provided for in accordance with the Fund's understanding of the applicable country’s tax rules and rates. Distributions received that represent a return of capital are recorded as a reduction of cost of investments. Distributions received that represent a capital gain are recorded as a realized gain. Interest income, which includes amortization of premium and accretion of discount on debt securities, is accrued as earned.
C Share Class Accounting— Realized and unrealized gains and losses and net investment income and losses, other than class-specific expenses, are allocated daily to each class of shares based upon the relative net assets of each class to the total net assets of the Fund. Expenses arising in connection with a specific class are charged directly to that class.
D Foreign Currency Transactions— The Fund’s accounting records are maintained in U.S. dollars. For valuation of assets and liabilities on each date of net asset value determination, foreign denominations are converted into U.S. dollars using the current exchange rate. Security transactions, income and expenses are translated at the prevailing rate of exchange on the date of the event. Recognized gains or losses on investment transactions attributable to changes in foreign currency exchange rates are recorded for financial statement purposes as net realized gains and losses on investments. That portion of unrealized gains and losses on investments that results from fluctuations in foreign currency exchange rates is not separately disclosed.
E Restricted Securities— The Fund may invest in securities that are subject to legal or contractual restrictions on resale. Generally, these securities may only be sold publicly upon registration under the Securities Act of 1933 or in transactions exempt from such registration. Information regarding restricted securities (excluding Rule 144A securities) is included at the end of the Schedule of Investments.
F Distributions to Shareholders— Distributions to shareholders are recorded by the Fund on ex-dividend date. Distributions from net investment income and distributions from net realized capital gains, if any, are paid at least annually. Distributions are declared separately for each class of shares. Distributions are determined in accordance with income tax regulations, which may differ from U.S. GAAP; accordingly, periodic reclassifications are made within the Fund's capital accounts to reflect income and gains available for distribution under income tax regulations.
G Estimates— The preparation of financial statements in conformity with U.S. GAAP requires management to make estimates and assumptions that affect the reported amounts of assets and liabilities and disclosure of contingent assets and liabilities at the date of the financial statements and the reported amounts of increases and decreases in net assets from operations during the reporting period. Actual results could differ from those estimates.
H Indemnifications— The Corporation’s By-Laws provide for indemnification for Directors or officers of the Corporation and certain other parties, to the fullest extent permitted by Maryland law and the 1940 Act, provided certain conditions are met. Additionally, in the normal course of business, the Fund enters into agreements with service providers that may contain indemnification clauses. The Fund’s maximum exposure under these arrangements is unknown as this would involve future claims that may be made against the Fund that have not yet occurred.
Calvert
Mid-Cap Fund
September 30, 2021
Notes to Financial Statements — continued
I Federal Income Taxes— No provision for federal income or excise tax is required since the Fund intends to continue to qualify as a regulated investment company under the Internal Revenue Code and to distribute substantially all of its taxable earnings.
Management has analyzed the Fund's tax positions taken for all open federal income tax years and has concluded that no provision for federal income tax is required in the Fund's financial statements. A Fund's federal tax return is subject to examination by the Internal Revenue Service for a period of three years from the date of filing.
2 Related Party Transactions
The investment advisory fee is earned by CRM as compensation for investment advisory services rendered to the Fund. On March 1, 2021, Morgan Stanley acquired Eaton Vance Corp. (the “Transaction”) and CRM became an indirect, wholly-owned subsidiary of Morgan Stanley. In connection with the Transaction, the Fund entered into a new investment advisory agreement (the “New Agreement”) with CRM, which took effect on March 1, 2021. Pursuant to the New Agreement (and the Fund’s investment advisory agreement with CRM in effect prior to March 1, 2021), the fee is computed at the annual rate of 0.65% of the Fund's average daily net assets and is payable monthly. For the year ended September 30, 2021, the investment advisory fee amounted to $1,900,088. The Fund may invest its cash in Cash Reserves Fund. CRM does not currently receive a fee for advisory services provided to Cash Reserves Fund.
CRM has agreed to reimburse the Fund’s operating expenses to the extent that total annual operating expenses (relating to ordinary operating expenses only and excluding expenses such as brokerage commissions, acquired fund fees and expenses of unaffiliated funds, borrowing costs, taxes or litigation expenses) exceed 1.18%, 1.93% and 0.93% for Class A, Class C and Class I, respectively, of such class's average daily net assets. The expense reimbursement agreement with CRM may be changed or terminated after January 31, 2022. For the year ended September 30, 2021, CRM waived or reimbursed expenses of $132,066.
The administrative fee is earned by CRM as compensation for administrative services rendered to the Fund. The fee is computed at an annual rate of 0.12% of the Fund’s average daily net assets attributable to Class A, Class C and Class I and is payable monthly. For the year ended September 30, 2021, CRM was paid administrative fees of $350,785.
The Fund has in effect a distribution plan for Class A shares (Class A Plan) pursuant to Rule 12b-1 under the 1940 Act. Pursuant to the Class A Plan, the Fund pays Eaton Vance Distributors, Inc. (EVD), an affiliate of CRM and the Fund’s principal underwriter, a distribution and service fee of 0.25% per annum of its average daily net assets attributable to Class A shares for distribution services and facilities provided to the Fund by EVD, as well as for personal services and/or the maintenance of shareholder accounts. The Fund also has in effect a distribution plan for Class C shares (Class C Plan) pursuant to Rule 12b-1 under the 1940 Act. Pursuant to the Class C Plan, the Fund pays EVD amounts equal to 0.75% per annum of its average daily net assets attributable to Class C shares for providing ongoing distribution services and facilities to the Fund. In addition, pursuant to the Class C Plan, the Fund also makes payments of service fees to EVD, financial intermediaries and other persons in amounts equal to 0.25% per annum of its average daily net assets attributable to that class. Service fees paid or accrued are for personal services and/or the maintenance of shareholder accounts. Distribution and service fees paid or accrued for the year ended September 30, 2021 amounted to $445,423 and $81,564 for Class A shares and Class C shares, respectively.
The Fund was informed that EVD received $28,173 as its portion of the sales charge on sales of Class A shares for the year ended September 30, 2021. The Fund was also informed that EVD received less than $100 and $564 of contingent deferred sales charges paid by Class A and Class C shareholders, respectively, for the same period.
Eaton Vance Management (EVM), an affiliate of CRM, provides sub-transfer agency and related services to the Fund pursuant to a Sub-Transfer Agency Support Services Agreement. For the year ended September 30, 2021, sub-transfer agency fees and expenses incurred to EVM amounted to $80,412 and are included in transfer agency fees and expenses on the Statement of Operations.
Each Director of the Fund who is not an employee of CRM or its affiliates receives an annual fee of $154,000, plus an annual Committee fee ranging from $8,500 to $16,500 depending on the Committee. The Board chair receives an additional $30,000 ($20,000 prior to January 1, 2021) annual fee and Committee chairs receive an additional $6,000 annual fee. Eligible Directors may participate in a Deferred Compensation Plan (the Plan). Amounts deferred under the Plan are treated as though equal dollar amounts had been invested in shares of the Fund or other Calvert funds selected by the Directors. The Fund purchases shares of the funds selected equal to the dollar amounts deferred under the Plan, resulting in an asset equal to the deferred compensation liability. Obligations of the Plan are paid solely from the Fund's assets. Directors’ fees are allocated to each of the Calvert funds served. Salaries and fees of officers and Directors of the Fund who are employees of CRM or its affiliates are paid by CRM. Prior to December 31, 2020, an Advisory Council aided the Board and CRM in advancing the cause of responsible investing through original scholarship and thought leadership. The Advisory Council consisted of CRM’s Chief Executive Officer and three additional members. For the year ended December 31, 2020, each member (other than CRM’s Chief Executive Officer) was compensated $20,000 for their service on the Advisory Council. Such compensation, and any other compensation and/or expenses incurred by the Advisory Council as may be approved by the Board, was borne by the Calvert funds. For the year ended September 30, 2021, the Fund’s allocated portion of the Advisory Council compensation and fees was $192, which is included in miscellaneous expense on the Statement of Operations.
Calvert
Mid-Cap Fund
September 30, 2021
Notes to Financial Statements — continued
3 Investment Activity
During the year ended September 30, 2021, the cost of purchases and proceeds from sales of investments, other than short-term securities, were $243,440,288 and $227,725,080, respectively.
4 Distributions to Shareholders and Income Tax Information
The tax character of distributions declared for the years ended September 30, 2021 and September 30, 2020 was as follows:
| | Year Ended September 30, |
| | 2021 | 2020 |
| Ordinary income | $ 165,389 | $ 459,239 |
| Long-term capital gains | $2,192,084 | $11,164,467 |
During the year ended September 30, 2021, distributable earnings was decreased by $1,733,482 and paid-in capital was increased by $1,733,482 due to the Fund's use of equalization accounting. Tax equalization accounting allows the Fund to treat as a distribution that portion of redemption proceeds representing a redeeming shareholder’s portion of undistributed taxable income and net capital gains. These reclassifications had no effect on the net assets or net asset value per share of the Fund.
As of September 30, 2021, the components of distributable earnings (accumulated loss) on a tax basis were as follows:
| Undistributed ordinary income | $ 4,669,919 |
| Undistributed long-term capital gains | 28,691,799 |
| Net unrealized appreciation | 58,627,096 |
| Distributable earnings | $91,988,814 |
The cost and unrealized appreciation (depreciation) of investments of the Fund at September 30, 2021, as determined on a federal income tax basis, were as follows:
| Aggregate cost | $253,917,420 |
| Gross unrealized appreciation | $ 63,174,901 |
| Gross unrealized depreciation | (4,547,805) |
| Net unrealized appreciation | $ 58,627,096 |
5 Securities Lending
To generate additional income, the Fund may lend its securities pursuant to a securities lending agency agreement with State Street Bank and Trust Company (SSBT), the securities lending agent. Security loans are subject to termination by the Fund at any time and, therefore, are not considered illiquid investments. The Fund requires that the loan be continuously collateralized by either cash or securities in an amount at least equal to the market value of the securities on loan. The market value of securities loaned is determined daily and any additional required collateral is delivered to the Fund on the next business day. Cash collateral is generally invested in a money market fund registered under the 1940 Act that is managed by an affiliate of SSBT. Any gain or loss in the market price of the loaned securities that might occur and any interest earned or dividends declared during the term of the loan would accrue to the account of the Fund. Income earned on the investment of collateral, net of broker rebates and other expenses incurred by the securities lending agent, is split between the Fund and the securities lending agent based on agreed upon contractual terms. Non-cash collateral, if any, is held by the lending agent on behalf of the Fund and cannot be sold or re-pledged by the Fund; accordingly, such collateral is not reflected in the Statement of Assets and Liabilities.
The risks associated with lending portfolio securities include, but are not limited to, possible delays in receiving additional collateral or in the recovery of the loaned securities, possible loss of rights to the collateral should the borrower fail financially, as well as risk of loss in the value of the collateral or the value of the investments made with the collateral. The securities lending agent shall indemnify the Fund in the case of default of any securities borrower.
Calvert
Mid-Cap Fund
September 30, 2021
Notes to Financial Statements — continued
At September 30, 2021, the total value of securities on loan was $7,324,957 and the total value of collateral received was $7,735,069, comprised of U.S. government and/or agencies securities.
6 Line of Credit
The Fund participates with other portfolios and funds managed by EVM and its affiliates, including CRM, in an $800 million unsecured line of credit with a group of banks, which is in effect through October 26, 2021. Borrowings are made by the Fund solely for temporary purposes related to redemptions and other short-term cash needs. Interest is charged to the Fund based on its borrowings at an amount above either the Eurodollar rate or Federal Funds rate. In addition, a fee computed at an annual rate of 0.15% on the daily unused portion of the line of credit is allocated among the participating portfolios and funds at the end of each quarter. In connection with the renewal of the agreement in October 2020, an upfront fee and arrangement fee totaling $950,000 was incurred that was allocated to the participating portfolios and funds. Because the line of credit is not available exclusively to the Fund, it may be unable to borrow some or all of its requested amounts at any particular time.
The Fund had no borrowings outstanding pursuant to its line of credit at September 30, 2021. The Fund did not have any significant borrowings or allocated fees during the year ended September 30, 2021. Effective October 26, 2021, the Fund renewed its line of credit agreement, which expires October 25, 2022, at substantially the same terms.
7 Affiliated Issuers and Funds
The Fund has invested a portion of its assets in notes (the Notes) issued by Calvert Impact Capital, Inc. (CIC) pursuant to exemptive relief granted by the U.S. Securities and Exchange Commission (the SEC). There are certain potential points of affiliation between the Fund and CIC. CRM has licensed use of the Calvert name to CIC and provides other types of support. CRM’s President and Chief Executive Officer (and the only director/trustee on the Fund Board that is an “interested person” of the Fund) serves on the CIC Board. In addition, another director/trustee on the Fund Board serves as a director emeritus on the CIC Board.
At September 30, 2021, the value of the Fund’s investment in the Notes and affiliated funds was $5,937,734, which represents 1.9% of the Fund’s net assets. Transactions in the Notes and affiliated funds by the Fund for the year ended September 30, 2021 were as follows:
| Name | Value,
beginning
of period | Purchases | Sales
proceeds | Net
realized
gain
(loss) | Change in
unrealized
appreciation
(depreciation) | Value,
end of
period | Interest/
Dividend
income | Principal
amount/Units,
end of period |
| High Social Impact Investments | | | | | | |
| Calvert Impact Capital, Inc., Community Investment Notes: | | | | | | | | |
| 1.50%, 12/15/20(1) | $693,370 | $ — | $ (696,903) | $ — | $ 3,533 | $ — | $ 2,178 | $ — |
| 1.50%, 12/15/23(1) | — | 360,000 | — | — | (6,181) | 353,819 | 4,290 | 360,000 |
| Short-Term Investments | | | | | | |
| Calvert Cash Reserves Fund, LLC | 922,663 | 55,767,908 | (51,107,228) | (17) | 589 | 5,583,915 | 1,556 | 5,583,357 |
| Totals | | | | $ (17) | $ (2,059) | $5,937,734 | $8,024 | |
8 Capital Shares
The Corporation may issue its shares in one or more series (such as the Fund). The authorized shares of the Fund consist of 75,000,000 common shares, $0.01 par value, for each Class.
Calvert
Mid-Cap Fund
September 30, 2021
Notes to Financial Statements — continued
Transactions in capital shares for the years ended September 30, 2021 and September 30, 2020 were as follows:
| | Year Ended
September 30, 2021 | | Year Ended
September 30, 2020 |
| | Shares | Amount | | Shares | Amount |
| Class A | | | | | |
| Shares sold | 375,750 | $ 15,160,623 | | 331,253 | $ 10,737,147 |
| Reinvestment of distributions | 36,990 | 1,395,999 | | 233,552 | 7,959,447 |
| Shares redeemed | (465,944) | (18,704,612) | | (742,917) | (23,971,939) |
| Converted from Class C | 65,033 | 2,500,313 | | 14,649 | 464,211 |
| Net increase (decrease) | 11,829 | $ 352,323 | | (163,463) | $ (4,811,134) |
| Class C | | | | | |
| Shares sold | 39,443 | $ 1,049,807 | | 77,226 | $ 1,750,012 |
| Reinvestment of distributions | 4,145 | 103,674 | | 30,825 | 704,666 |
| Shares redeemed | (62,534) | (1,669,876) | | (308,138) | (7,081,785) |
| Converted to Class A | (97,920) | (2,500,313) | | (21,816) | (464,211) |
| Net decrease | (116,866) | $ (3,016,708) | | (221,903) | $ (5,091,318) |
| Class I | | | | | |
| Shares sold | 1,050,276 | $ 50,894,880 | | 1,506,537 | $ 56,667,387 |
| Reinvestment of distributions | 17,429 | 789,688 | | 51,752 | 2,113,537 |
| Shares redeemed | (505,501) | (24,579,242) | | (814,313) | (30,777,785) |
| Net increase | 562,204 | $ 27,105,326 | | 743,976 | $ 28,003,139 |
9 Risks and Uncertainties
Pandemic Risk
An outbreak of respiratory disease caused by a novel coronavirus was first detected in China in late 2019 and subsequently spread internationally. This coronavirus has resulted in closing borders, enhanced health screenings, changes to healthcare service preparation and delivery, quarantines, cancellations, disruptions to supply chains and customer activity, as well as general concern and uncertainty. Health crises caused by outbreaks, such as the coronavirus outbreak, may exacerbate other pre-existing political, social and economic risks and disrupt normal market conditions and operations. The impact of this outbreak has negatively affected the worldwide economy, the economies of individual countries, individual companies, and the market in general, and may continue to do so in significant and unforeseen ways, as may other epidemics and pandemics that may arise in the future. Any such impact could adversely affect the Fund's performance, or the performance of the securities in which the Fund invests.
10 Change in Independent Registered Public Accounting Firm
On July 30, 2021, KPMG LLP (“KPMG”) informed the Audit Committee and Board of the Corporation that it was resigning as the independent registered public accounting firm to the Corporation, as upon Morgan Stanley’s acquisition of Eaton Vance Corp., the parent company of CRM (the investment adviser to each series of the Corporation), KPMG would no longer be independent of the Corporation. The Audit Committee of the Board and the Board approved the selection of Deloitte & Touche LLP (“Deloitte”) as the independent registered public accounting firm for the funds that are series of the Corporation (the “Funds”) for the fiscal year ending September 30, 2021 to be effective upon KPMG’s resignation and Deloitte’s acceptance of the engagement which became effective July 30, 2021.
KPMG’s reports on the financial statements for the Funds for the fiscal periods ended September 30, 2019 and September 30, 2020 contained no adverse opinion or disclaimer of opinion nor were they qualified or modified as to uncertainty, audit scope or accounting principles. During the fiscal periods ended September 30, 2019 and September 30, 2020, and during the subsequent interim period through July 30, 2021: (i) there were no disagreements with KPMG on any matter of accounting principles or practices, financial statement disclosure or auditing scope or procedure, which disagreements, if not resolved to the satisfaction of KPMG, would have caused KPMG to make reference to the subject matter of the disagreements in connection with its reports on the Funds’ financial statements for such periods; and (ii) there were no “reportable events” of the kind described in Item 304(a)(1)(v) of Regulation S-K under the Securities Exchange Act of 1934, as amended.
Calvert
Mid-Cap Fund
September 30, 2021
Notes to Financial Statements — continued
During the fiscal periods ended September 30, 2019 and September 30, 2020, and during the subsequent interim period through July 30, 2021: neither the Funds, nor anyone on their behalf, consulted with Deloitte on items which: (i) concerned the application of accounting principles to a specified transaction, either completed or proposed, or the type of audit opinion that might be rendered on the Funds’ financial statements; or (ii) concerned the subject of a disagreement (as defined in paragraph (a)(1)(iv) of Item 304 of Regulation S-K) or reportable events (as described in paragraph (a)(1)(v) of Item 304).
Calvert
Mid-Cap Fund
September 30, 2021
Report of Independent Registered Public Accounting Firm
To the the Board of Directors of Calvert World Values Fund, Inc. and Shareholders of Calvert Mid-Cap Fund:
Opinion on the Financial Statements and Financial Highlights
We have audited the accompanying statement of assets and liabilities of Calvert Mid-Cap Fund (the "Fund") (one of the funds constituting Calvert World Values Fund, Inc.), including the schedule of investments, as of September 30, 2021, the related statements of operations, changes in net assets and the financial highlights for the year then ended, and the related notes. In our opinion, the financial statements and financial highlights present fairly, in all material respects, the financial position of the Fund as of September 30, 2021, and the results of its operations and changes in its net assets for the year then ended, and the financial highlights for the year then ended in conformity with accounting principles generally accepted in the United States of America. The statement of changes in net assets for the year ended September 30, 2020, and the financial highlights for the years ended September 30, 2020, 2019, 2018, and 2017 were audited by other auditors whose report, dated November 20, 2020, expressed an unqualified opinion on that financial statement and those financial highlights.
Basis for Opinion
These financial statements and financial highlights are the responsibility of the Fund's management. Our responsibility is to express an opinion on the Fund's financial statements and financial highlights based on our audit. We are a public accounting firm registered with the Public Company Accounting Oversight Board (United States) (PCAOB) and are required to be independent with respect to the Fund in accordance with the U.S. federal securities laws and the applicable rules and regulations of the Securities and Exchange Commission and the PCAOB.
We conducted our audit in accordance with the standards of the PCAOB. Those standards require that we plan and perform the audit to obtain reasonable assurance about whether the financial statements and financial highlights are free of material misstatement, whether due to error or fraud. The Fund is not required to have, nor were we engaged to perform, an audit of its internal control over financial reporting. As part of our audit we are required to obtain an understanding of internal control over financial reporting but not for the purpose of expressing an opinion on the effectiveness of the Fund’s internal control over financial reporting. Accordingly, we express no such opinion.
Our audit included performing procedures to assess the risks of material misstatement of the financial statements and financial highlights, whether due to error or fraud, and performing procedures that respond to those risks. Such procedures included examining, on a test basis, evidence regarding the amounts and disclosures in the financial statements and financial highlights. Our audit also included evaluating the accounting principles used and significant estimates made by management, as well as evaluating the overall presentation of the financial statements and financial highlights. Our procedures included confirmation of securities owned as of September 30, 2021, by correspondence with the custodian and brokers; when replies were not received from brokers, we performed other auditing procedures. We believe that our audit provides a reasonable basis for our opinion.
/s/ Deloitte & Touche LLP
Boston, Massachusetts
November 22, 2021
We have served as the auditor of one or more Calvert investment companies since 2021.
Calvert
Mid-Cap Fund
September 30, 2021
Federal Tax Information (Unaudited)
The Form 1099-DIV you receive in February 2022 will show the tax status of all distributions paid to your account in calendar year 2021. Shareholders are advised to consult their own tax adviser with respect to the tax consequences of their investment in the Fund. As required by the Internal Revenue Code and/or regulations, shareholders must be notified regarding the status of qualified dividend income for individuals, the dividends received deduction for corporations and capital gains dividends.
Qualified Dividend Income. For the fiscal year ended September 30, 2021, the Fund designates approximately $2,122,185, or up to the maximum amount of such dividends allowable pursuant to the Internal Revenue Code, as qualified dividend income eligible for the reduced tax rate of 15%.
Dividends Received Deduction. Corporate shareholders are generally entitled to take the dividends received deduction on the portion of the Fund's dividend distribution that qualifies under tax law. For the Fund's fiscal 2021 ordinary income dividends, 81.71% qualifies for the corporate dividends received deduction.
Capital Gains Dividends. The Fund hereby designates as a capital gain dividend with respect to the taxable year ended September 30, 2021, $30,160,243 or, if subsequently determined to be different, the net capital gain of such year.
Calvert
Mid-Cap Fund
September 30, 2021
Liquidity Risk Management Program
The Fund has implemented a written liquidity risk management program (Program) and related procedures to manage its liquidity in accordance with Rule 22e-4 under the Investment Company Act of 1940, as amended (Liquidity Rule). The Liquidity Rule defines “liquidity risk” as the risk that a fund could not meet requests to redeem shares issued by the fund without significant dilution of the remaining investors’ interests in the fund. The Fund’s Board of Trustees/Directors has designated the investment adviser to serve as the administrator of the Program and the related procedures. The administrator has established a Liquidity Risk Management Oversight Committee (Committee) to perform the functions necessary to administer the Program. As part of the Program, the administrator is responsible for identifying illiquid investments and categorizing the relative liquidity of the Fund’s investments in accordance with the Liquidity Rule. Under the Program, the administrator assesses, manages, and periodically reviews the Fund’s liquidity risk, and is responsible for making certain reports to the Fund’s Board of Trustees/Directors and the Securities and Exchange Commission (SEC) regarding the liquidity of the Fund’s investments, and to notify the Board of Trustees/Directors and the SEC of certain liquidity events specified in the Liquidity Rule. The liquidity of the Fund’s portfolio investments is determined based on a number of factors including, but not limited to, relevant market, trading and investment-specific considerations under the Program.
At a meeting of the Fund’s Board of Trustees/Directors on June 16, 2021, the Committee provided a written report to the Fund’s Board of Trustees/ Directors pertaining to the operation, adequacy, and effectiveness of implementation of the Program, as well as the operation of the highly liquid investment minimum (if applicable) for the period January 1, 2020 through December 31, 2020 (Review Period). The Program operated effectively during the Review Period, supporting the administrator’s ability to assess, manage and monitor Fund liquidity risk, including during periods of market volatility and net redemptions. During the Review Period, the Fund met redemption requests on a timely basis.
There can be no assurance that the Program will achieve its objectives in the future. Please refer to the Fund’s prospectus for more information regarding the Fund’s exposure to liquidity risk and other principal risks to which an investment in the Fund may be subject.
Calvert
Mid-Cap Fund
September 30, 2021
Management and Organization
Fund Management. The Directors of Calvert World Values Fund, Inc. (the Corporation) are responsible for the overall management and supervision of the Corporation’s affairs. The Directors and officers of the Corporation are listed below. Except as indicated, each individual has held the office shown or other offices in the same company for the last five years. Each Board member holds office until his or her successor is elected and qualified, or until his or her earlier death, resignation, retirement, removal or disqualification. Under the terms of the Fund's current Board member retirement policy, an Independent Board member must retire at the end of the calendar year in which he or she turns 75. However, if such retirement would cause the Fund to be out of compliance with Section 16 of the 1940 Act or any other regulations or guidance of the SEC, then such retirement and resignation will not become effective until such time as action has been taken for the Fund to be in compliance upon a Board member's retirement. The “Independent Directors” consist of those Directors who are not “interested persons” of the Corporation, as that term is defined under the 1940 Act. The business address of each Director and officer, with the exception of Ms. Walsh and Mr. Kirchner, is 1825 Connecticut Avenue NW, Suite 400, Washington, DC 20009. As used below, “CRM” refers to Calvert Research and Management. Each Director oversees 39 funds in the Calvert fund complex. Each officer serves as an officer of certain other Calvert funds.
| Name and Year of Birth | Corporation
Position(s) | Position
Start Date | Principal Occupation(s) and Other Directorships
During Past Five Years and Other Relevant Experience |
| Interested Director |
John H. Streur(1)
1960 | Director and
President | 2015 | President and Chief Executive Officer of Calvert Research and
Management (since December 31, 2016). President and Chief Executive
Officer of Calvert Investments, Inc. (January 2015 - December 2016);
Chief Executive Officer of Calvert Investment Distributors, Inc. (August
2015 - December 2016); Chief Compliance Officer of Calvert Investment
Management, Inc. (August 2015 - April 2016); President and Director,
Portfolio 21 Investments, Inc. (through October 2014); President,
Chief Executive Officer and Director, Managers Investment Group LLC
(through January 2012); President and Director, The Managers Funds
and Managers AMG Funds (through January 2012).
Other Directorships in the Last Five Years. Portfolio 21 Investments,
Inc. (asset management) (through October 2014); Managers Investment
Group LLC (asset management) (through January 2012); The Managers
Funds (asset management) (through January 2012); Managers AMG Funds
(asset management) (through January 2012); Calvert Impact Capital, Inc. |
| Independent Directors |
Richard L. Baird, Jr.
1948 | Director | 2005 | Regional Disaster Recovery Lead, American Red Cross of Greater
Pennsylvania (since 2017). Volunteer, American Red Cross (since 2015).
Former President and CEO of Adagio Health Inc. (retired in 2014) in
Pittsburgh, PA.
Other Directorships in the Last Five Years. None. |
Alice Gresham Bullock
1950 | Chair and
Director | 2016 | Professor Emerita at Howard University School of Law. Dean Emerita of
Howard University School of Law and Deputy Director of the Association
of American Law Schools (1992-1994).
Other Directorships in the Last Five Years. None. |
Cari M. Dominguez
1949 | Director | 2016 | Former Chair of the U.S. Equal Employment Opportunity Commission.
Other Directorships in the Last Five Years. Manpower, Inc. (employment
agency); Triple S Management Corporation (managed care); National
Association of Corporate Directors. |
John G. Guffey, Jr.
1948 | Director | 1992 | President of Aurora Press Inc., a privately held publisher of trade
paperbacks (since January 1997).
Other Directorships in the Last Five Years. Calvert Impact Capital, Inc.
(through December 31, 2018); Calvert Ventures, LLC. |
Miles D. Harper, III
1962 | Director | 2005 | Partner, Carr Riggs & Ingram (public accounting firm) since October 2014.
Partner, Gainer Donnelly & Desroches (public accounting firm) (now Carr
Riggs & Ingram) (November 1999 - September 2014).
Other Directorships in the Last Five Years. Bridgeway Funds (9) (asset
management). |
Joy V. Jones
1950 | Director | 2005 | Attorney.
Other Directorships in the Last Five Years. Conduit Street Restaurants
SUD 2 Limited; Palm Management Restaurant Corporation. |
Calvert
Mid-Cap Fund
September 30, 2021
Management and Organization — continued
| Name and Year of Birth | Corporation
Position(s) | Position
Start Date | Principal Occupation(s) and Other Directorships
During Past Five Years and Other Relevant Experience |
| Independent Directors (continued) |
Anthony A. Williams
1951 | Director | 2016 | CEO and Executive Director of the Federal City Council (July 2012 to
present); Senior Adviser and Independent Consultant for King and
Spalding LLP (September 2015 to present); Executive Director of Global
Government Practice at the Corporate Executive Board (January 2010 to
January 2012).
Other Directorships in the Last Five Years. Freddie Mac; Evoq
Properties/Meruelo Maddux Properties, Inc. (real estate management);
Weston Solutions, Inc. (environmental services); Bipartisan Policy Center’s
Debt Reduction Task Force; Chesapeake Bay Foundation; Catholic
University of America; Urban Institute (research organization); The Howard Hughes Corporation (real estate development). |
| Name and Year of Birth | Corporation
Position(s) | Position
Start Date | Principal Occupation(s)
During Past Five Years |
| Principal Officers who are not Directors |
Hope L. Brown
1973 | Chief
Compliance
Officer | 2014 | Chief Compliance Officer of 39 registered investment companies advised
by CRM (since 2014). Vice President and Chief Compliance Officer,
Wilmington Funds (2012-2014). |
Deidre E. Walsh(2)
1971 | Secretary,
Vice President
and Chief
Legal Officer | 2021 | Vice President of CRM and officer of 39 registered investment companies
advised by CRM (since 2021). Also Vice President of Eaton Vance and
certain of its affiliates and officer of 138 registered investment companies
advised or administered by Eaton Vance. |
James F. Kirchner(2)
1967 | Treasurer | 2016 | Vice President of CRM and officer of 39 registered investment companies
advised by CRM (since 2016). Also Vice President of Eaton Vance and
certain of its affiliates and officer of 138 registered investment companies
advised or administered by Eaton Vance. |
| (1) Mr. Streur is an interested person of the Fund because of his positions with the Fund’s adviser and certain affiliates. |
| (2) The business address for Ms. Walsh and Mr. Kirchner is Two International Place, Boston, MA 02110. |
The SAI for the Fund includes additional information about the Directors and officers of the Fund and can be obtained without charge on Calvert’s website at www.calvert.com or by calling 1-800-368-2745.
| FACTS | WHAT DOES EATON VANCE DO WITH YOUR
PERSONAL INFORMATION? |
| Why? | Financial companies choose how they share your personal information. Federal law gives consumers the right to limit some but not all sharing. Federal law also requires us to tell you how we collect, share, and protect your personal information. Please read this notice carefully to understand what we do. |
| |
| What? | The types of personal information we collect and share depend on the product or service you have with us. This information can include:■ Social Security number and income
■
investment experience and risk tolerance
■
checking account number and wire transfer instructions |
| |
| How? | All financial companies need to share customers’ personal information to run their everyday business. In the section below, we list the reasons financial companies can share their customers’ personal information; the reasons Eaton Vance chooses to share; and whether you can limit this sharing. |
Reasons we can share your
personal information | Does Eaton Vance
share? | Can you limit
this sharing? |
| For our everyday business purposes — such as to process your transactions, maintain your account(s), respond to court orders and legal investigations, or report to credit bureaus | Yes | No |
| For our marketing purposes — to offer our products and services to you | Yes | No |
| For joint marketing with other financial companies | No | We don’t share |
| For our investment management affiliates’ everyday business purposes — information about your transactions, experiences, and creditworthiness | Yes | Yes |
| For our affiliates’ everyday business purposes — information about your transactions and experiences | Yes | No |
| For our affiliates’ everyday business purposes — information about your creditworthiness | No | We don’t share |
| For our investment management affiliates to market to you | Yes | Yes |
| For our affiliates to market to you | No | We don’t share |
| For nonaffiliates to market to you | No | We don’t share |
To limit our
sharing | Call toll-free 1-800-368-2745 or email: CRMPrivacy@calvert.comPlease note:If you are a new customer, we can begin sharing your information 30 days from the date we sent this notice. When you are no longer our customer, we continue to share your information as described in this notice. However, you can contact us at any time to limit our sharing. |
| Questions? | Call toll-free 1-800-368-2745 or email: CRMPrivacy@calvert.com |
| Privacy Notice — continued | April 2021 |
| Who we are |
| Who is providing this notice? | Eaton Vance Management, Eaton Vance Distributors, Inc., Eaton Vance Trust Company, Eaton Vance Management (International) Limited, Eaton Vance Advisers International Ltd., Eaton Vance Global Advisors Limited, Eaton Vance Management’s Real Estate Investment Group, Boston Management and Research, Calvert Research and Management, Eaton Vance and Calvert Fund Families and our investment advisory affiliates (“Eaton Vance”) (see Investment Management Affiliates definition below) |
| What we do |
How does Eaton Vance
protect my personal
information? | To protect your personal information from unauthorized access and use, we use security measures that comply with federal law. These measures include computer safeguards and secured files and buildings. We have policies governing the proper handling of customer information by personnel and requiring third parties that provide support to adhere to appropriate security standards with respect to such information. |
How does Eaton Vance
collect my personal
information? | We collect your personal information, for example, when you■ open an account or make deposits or withdrawals from your account
■
buy securities from us or make a wire transfer
■
give us your contact informationWe also collect your personal information from others, such as credit bureaus, affiliates, or other companies. |
| Why can’t I limit all sharing? | Federal law gives you the right to limit only■ sharing for affiliates’ everyday business purposes — information about your creditworthiness
■
affiliates from using your information to market to you
■
sharing for nonaffiliates to market to youState laws and individual companies may give you additional rights to limit sharing. See below for more on your rights under state law. |
| Definitions |
Investment Management
Affiliates | Eaton Vance Investment Management Affiliates include registered investment advisers, registered broker- dealers, and registered and unregistered funds. Investment Management Affiliates does not include entities associated with Morgan Stanley Wealth Management, such as Morgan Stanley Smith Barney LLC and Morgan Stanley & Co. |
| Affiliates | Companies related by common ownership or control. They can be financial and nonfinancial companies.■ Our affiliates include companies with a Morgan Stanley name and financial companies such as Morgan Stanley Smith Barney LLC and Morgan Stanley & Co. |
| Nonaffiliates | Companies not related by common ownership or control. They can be financial and nonfinancial companies.■ Eaton Vance does not share with nonaffiliates so they can market to you. |
| Joint marketing | A formal agreement between nonaffiliated financial companies that together market financial products or services to you.■ Eaton Vance doesn’t jointly market. |
| Other important information |
| Vermont: Except as permitted by law, we will not share personal information we collect about Vermont residents with Nonaffiliates unless you provide us with your written consent to share such information.California: Except as permitted by law, we will not share personal information we collect about California residents with Nonaffiliates and we will limit sharing such personal information with our Affiliates to comply with California privacy laws that apply to us. |
Delivery of Shareholder Documents. The Securities and Exchange Commission (SEC) permits funds to deliver only one copy of shareholder documents, including prospectuses, proxy statements and shareholder reports, to fund investors with multiple accounts at the same residential or post office box address. This practice is often called “householding” and it helps eliminate duplicate mailings to shareholders. Calvert funds, or your financial intermediary, may household the mailing of your documents indefinitely unless you instruct Calvert funds, or your financial intermediary, otherwise. If you would prefer that your Calvert fund documents not be householded, please contact Calvert funds at 1-800-368-2745, or contact your financial intermediary. Your instructions that householding not apply to delivery of your Calvert fund documents will typically be effective within 30 days of receipt by Calvert funds or your financial intermediary. Separate statements will be generated for each separate account and will be householded as described above.
Portfolio Holdings. Each Calvert fund files a schedule of portfolio holdings on Part F to Form N-PORT with the SEC. Certain information filed on Form N-PORT may be viewed on the Calvert website at www.calvert.com, by calling Calvert at 1-800-368-2745 or in the EDGAR database on the SEC’s website at www.sec.gov.
Proxy Voting. The Proxy Voting Guidelines that each Calvert fund uses to determine how to vote proxies relating to portfolio securities is provided as an Appendix to the fund’s Statement of Additional Information. The Statement of Additional Information can be obtained free of charge by calling the Calvert funds at 1-800-368-2745, by visiting the Calvert funds’ website at www.calvert.com or visiting the SEC’s website at www.sec.gov. Information regarding how a Calvert fund voted proxies relating to portfolio securities during the most recent 12-month period ended June 30 is available by calling Calvert funds, by visiting the Calvert funds’ website at www.calvert.com or by visiting the SEC’s website at www.sec.gov.
This Page Intentionally Left Blank
Investment Adviser and Administrator
Calvert Research and Management
1825 Connecticut Avenue NW, Suite 400
Washington, DC 20009
Principal Underwriter*
Eaton Vance Distributors, Inc.
Two International Place
Boston, MA 02110
(617) 482-8260
Custodian
State Street Bank and Trust Company
State Street Financial Center, One Lincoln Street
Boston, MA 02111
Transfer Agent
DST Asset Manager Solutions, Inc.
2000 Crown Colony Drive
Quincy, MA 02169
Independent Registered Public Accounting Firm
Deloitte & Touche LLP
200 Berkeley Street
Boston, MA 02116-5022
Fund Offices
1825 Connecticut Avenue NW, Suite 400
Washington, DC 20009
* FINRA BrokerCheck. Investors may check the background of their Investment Professional by contacting the Financial Industry Regulatory Authority (FINRA). FINRA BrokerCheck is a free tool to help investors check the professional background of current and former FINRA-registered securities firms and brokers. FINRA BrokerCheck is available by calling 1-800-289-9999 and at www.FINRA.org. The FINRA BrokerCheck brochure describing this program is available to investors at www.FINRA.org.
Printed on recycled paper.
Calvert
Emerging Markets Equity Fund
Annual Report
September 30, 2021
Commodity Futures Trading Commission Registration. The Commodity Futures Trading Commission (“CFTC”) has adopted regulations that subject registered investment companies and advisers to regulation by the CFTC if a fund invests more than a prescribed level of its assets in certain CFTC-regulated instruments (including futures, certain options and swap agreements) or markets itself as providing investment exposure to such instruments. The adviser has claimed an exclusion from the definition of “commodity pool operator” under the Commodity Exchange Act with respect to its management of the Fund and the other funds it manages. Accordingly, neither the Fund nor the adviser is subject to CFTC regulation.
Fund shares are not insured by the FDIC and are not deposits or other obligations of, or guaranteed by, any depository institution. Shares are subject to investment risks, including possible loss of principal invested.
This report must be preceded or accompanied by a current summary prospectus or prospectus. Before investing, investors should consider carefully the investment objective, risks, and charges and expenses of a mutual fund. This and other important information is contained in the summary prospectus and prospectus, which can be obtained from a financial intermediary. Prospective investors should read the prospectus carefully before investing. For further information, please call 1-800-368-2745.
Choose Planet-friendly E-delivery!
Sign up now for on-line statements, prospectuses, and fund reports. In less than five minutes you can help reduce paper mail and lower fund costs.
Just go to www.calvert.com. If you already have an online account with the Calvert funds, click on Login to access your Account and select the documents you would like to receive via e-mail.
If you’re new to online account access, click on Login, then Register to create your user name and password. Once you’re in, click on the E-delivery sign-up on the Account Portfolio page and follow the quick, easy steps.
Note: If your shares are not held directly with the Calvert funds but through a brokerage firm, you must contact your broker for electronic delivery options available through their firm.
Annual Report September 30, 2021
Calvert
Emerging Markets Equity Fund
Calvert
Emerging Markets Equity Fund
September 30, 2021
Management's Discussion of Fund Performance†
Economic and Market Conditions
Emerging markets underperformed developed markets for the 12-month period ended September 30, 2021, as concerns about slowing growth in China, rising inflation, U.S. Federal Reserve tapering, a nascent energy crisis, and weaker growth weighed on investor appetites for risk. The benchmark MSCI Emerging Markets Index (the Index) returned 18.20% during the period.
At a regional level, emerging Europe and the Middle East & Africa led the way, supported by rising energy prices and the economic recovery in Europe. Latin America outperformed the Index during the period and Asia lagged as China’s underperformance weighed on the region. In emerging economies, relatively slow rates of vaccination during the year and a pick-up in daily new cases of COVID-19 led to renewed restrictions on activity in some countries. By the third quarter of 2021, several economies had made progress toward herd immunity. Cases remained very low in China and seemed to have peaked in India and Indonesia.
Meanwhile, policy tightening and regulatory concerns weighed on China’s relative performance as Chinese stocks within the Index returned (7.33)%. While credit tightening and regulatory actions in China were initial triggers for market weakness, these were compounded by the re-imposition of some COVID-19 restrictions and supply chain disruptions in August. These worries were further compounded by the financial risks associated with the potential collapse of Evergrande, a highly indebted property developer, and power shortages. China’s Purchasing Managers Index (PMI) for manufacturing, a measure of economic activity, fell into contraction territory in September for the first time since February 2020.
Energy was the strongest sector within the Index as demand recovered and nascent supply shortages drove the price of Brent crude oil above $80 a barrel for the first time in three years.
Fund Performance
For the 12-month period ended September 30, 2021, Calvert Emerging Markets Equity Fund (the Fund) returned 14.70% for Class A shares at net asset value (NAV), underperforming its benchmark, the Index, which returned 18.20%.
Stock selections detracted most from performance relative to the Index during the period. Selections were particularly detrimental in Russia, Taiwan, South Korea, and Indonesia.
On a sector level, selections in the materials and information technology (IT) sectors also weighed on relative performance during the period. IT holdings were hurt by the market’s swing toward value stocks, and cyclical weakness for computer memory stocks. A lack of exposure to energy, the best-performing sector within the Index during the period, and the Fund’s underweight exposure to materials, another strong performing sector, also detracted from returns during the period.
On the upside, allocations by country contributed to performance relative to the Index. In particular, an underweight exposure to China helped as that market underperformed the Index during the period. The Fund’s overweight exposure to India, a market that performed well, was also beneficial during the period. Selections in China and India also enhanced relative performance. Selections in the industrials and financials sectors further contributed to relative returns during the period.
Baozun, Inc. (Baozun), a Chinese e-commerce services provider, detracted from returns relative to the Index during the period. Its growth prospects were dimmed as Chinese consumers boycotted American brands like Nike and H&M, which signed the Better Cotton Initiative supporting the protest against forced labor of the Uighur people in cotton production in Zhenjiang. Baozun’s stock price was also hurt by certain international brands reining in their live-streaming and high-profile marketing over concerns about U.S.-China tensions.
Prosus NV (Prosus) operates and invests in internet assets worldwide. Prosus’s stock price fell along with Tencent Holdings, Ltd. (Tencent), a global technology conglomerate based in China in which Prosus owns a 29% stake. Tencent’s share price was pulled down by a sell-off in technology and e-commerce companies, regulatory concerns, and the company’s investment plans.
Gree Electric Appliances, Inc. of Zhuhai (Gree), a Chinese manufacturer of air conditioners and electrical appliances, reported weak year-to-date 2021 results because of slow recovery in demand for its products and increased raw materials costs. The market also reacted negatively to an employee stock ownership program.
Nari Technology Co., Ltd. (Nari), a Chinese manufacturer of power grid automation and industrial control products, contributed to relative performance during the period. Nari’s stock price rose on strong earnings growth, the company’s involvement in the development of the national smart grid, and benefits it might derive from investment in China’s decarbonization plans.
The stock price of Grupo Financiero Banorte SAB (Banorte), a Mexican bank, rose after Banorte reported solid revenue and earnings growth. Banorte was well positioned to benefit from Mexico’s accelerating economic recovery and stimulus in the U.S., given its low exposure to risky sectors, better capitalization than peers, and its diversified revenue. Banorte was also expected to pay a sizeable dividend in 2021 if it received regulatory approval.
See Endnotes and Additional Disclosures in this report.
Past performance is no guarantee of future results. Returns are historical and are calculated by determining the percentage change in net asset value (NAV) or offering price (as applicable) with all distributions reinvested. Investment return and principal value will fluctuate so that shares, when redeemed, may be worth more or less than their original cost. Performance for periods less than or equal to one year is cumulative. Performance is for the stated time period only; due to market volatility, current Fund performance may be lower or higher than the quoted return. For performance as of the most recent month-end, please refer to www.calvert.com.
Calvert
Emerging Markets Equity Fund
September 30, 2021
Management's Discussion of Fund Performance† — continued
Sales of Samsonite International S.A. (Samsonite), the world’s largest manufacturer of travel luggage, rose as domestic travel in the U.S. and China recovered during the period.
See Endnotes and Additional Disclosures in this report.
Past performance is no guarantee of future results. Returns are historical and are calculated by determining the percentage change in net asset value (NAV) or offering price (as applicable) with all distributions reinvested. Investment return and principal value will fluctuate so that shares, when redeemed, may be worth more or less than their original cost. Performance for periods less than or equal to one year is cumulative. Performance is for the stated time period only; due to market volatility, current Fund performance may be lower or higher than the quoted return. For performance as of the most recent month-end, please refer to www.calvert.com.
Calvert
Emerging Markets Equity Fund
September 30, 2021
Performance
Portfolio Manager Kunjal Gala of Hermes Investment Management Limited
| % Average Annual Total Returns1,2 | Class
Inception Date | Performance
Inception Date | One Year | Five Years | Since
Inception |
| Class A at NAV | 10/29/2012 | 10/29/2012 | 14.70% | 10.64% | 8.04% |
| Class A with 4.75% Maximum Sales Charge | — | — | 9.28 | 9.56 | 7.45 |
| Class C at NAV | 10/29/2012 | 10/29/2012 | 13.83 | 9.80 | 7.16 |
| Class C with 1% Maximum Sales Charge | — | — | 12.83 | 9.80 | 7.16 |
| Class I at NAV | 10/29/2012 | 10/29/2012 | 14.94 | 10.94 | 8.38 |
| Class R6 at NAV | 02/01/2018 | 10/29/2012 | 15.09 | 10.97 | 8.39 |
|
| MSCI Emerging Markets Index | — | — | 18.20% | 9.23% | 5.12% |
| % Total Annual Operating Expense Ratios3 | Class A | Class C | Class I | Class R6 |
| Gross | 1.27% | 2.02% | 1.02% | 0.95% |
| Net | 1.24 | 1.99 | 0.99 | 0.92 |
Growth of $10,000
This graph shows the change in value of a hypothetical investment of $10,000 in Class A of the Fund for the period indicated. For comparison, the same investment is shown in the indicated index.
| Growth of Investment2 | Amount Invested | Period Beginning | At NAV | With Maximum Sales Charge |
| Class C | $10,000 | 10/29/2012 | $18,533 | N.A. |
| Class I | $250,000 | 10/29/2012 | $512,723 | N.A. |
| Class R6 | $1,000,000 | 10/29/2012 | $2,053,113 | N.A. |
See Endnotes and Additional Disclosures in this report.
Past performance is no guarantee of future results. Returns are historical and are calculated by determining the percentage change in net asset value (NAV) or offering price (as applicable) with all distributions reinvested. Investment return and principal value will fluctuate so that shares, when redeemed, may be worth more or less than their original cost. Performance for periods less than or equal to one year is cumulative. Performance is for the stated time period only; due to market volatility, current Fund performance may be lower or higher than the quoted return. For performance as of the most recent month-end, please refer to www.calvert.com.
Calvert
Emerging Markets Equity Fund
September 30, 2021
Sector Allocation (% of net assets)*
* Excludes cash and cash equivalents.
| Top 10 Holdings (% of net assets)* | |
| Taiwan Semiconductor Manufacturing Co., Ltd. ADR | 7.5% |
| Samsung Electronics Co., Ltd. | 6.0 |
| Tencent Holdings, Ltd. | 5.8 |
| Alibaba Group Holding, Ltd. | 4.9 |
| Yandex NV, Class A | 4.0 |
| NARI Technology Co., Ltd., Class A | 3.1 |
| Techtronic Industries Co., Ltd. | 2.7 |
| AIA Group, Ltd. | 2.6 |
| Natura & Co. Holding S.A. | 2.2 |
| Delta Electronics, Inc. | 2.2 |
| Total | 41.0% |
| * | Excludes cash and cash equivalents. |
See Endnotes and Additional Disclosures in this report.
Calvert
Emerging Markets Equity Fund
September 30, 2021
Endnotes and Additional Disclosures
| † | The views expressed in this report are those of the portfolio manager(s) and are current only through the date stated at the top of this page. These views are subject to change at any time based upon market or other conditions, and Calvert and the Fund(s) disclaim any responsibility to update such views. These views may not be relied upon as investment advice and, because investment decisions are based on many factors, may not be relied upon as an indication of trading intent on behalf of any Calvert fund. This commentary may contain statements that are not historical facts, referred to as “forward-looking statements.” The Fund’s actual future results may differ significantly from those stated in any forward-looking statement, depending on factors such as changes in securities or financial markets or general economic conditions, the volume of sales and purchases of Fund shares, the continuation of investment advisory, administrative and service contracts, and other risks discussed from time to time in the Fund’s filings with the Securities and Exchange Commission. |
| | |
| 1 | MSCI Emerging Markets Index is an unmanaged index of emerging markets common stocks. MSCI indexes are net of foreign withholding taxes. Source: MSCI. MSCI data may not be reproduced or used for any other purpose. MSCI provides no warranties, has not prepared or approved this report, and has no liability hereunder. Unless otherwise stated, index returns do not reflect the effect of any applicable sales charges, commissions, expenses, taxes or leverage, as applicable. It is not possible to invest directly in an index. |
| 2 | Total Returns at NAV do not include applicable sales charges. If sales charges were deducted, the returns would be lower. Total Returns shown with maximum sales charge reflect the stated maximum sales charge. Unless otherwise stated, performance does not reflect the deduction of taxes on Fund distributions or redemptions of Fund shares.Performance prior to the inception date of a class may be linked to the performance of an older class of the Fund. This linked performance is adjusted for any applicable sales charge, but is not adjusted for class expense differences. If adjusted for such differences, the performance would be different. The performance of Class R6 is linked to Class I. Performance since inception for an index, if presented, is the performance since the Fund’s or oldest share class’ inception, as applicable. Performance presented in the Financial Highlights included in the financial statements is not linked.Calvert Research and Management became the investment adviser to the Fund on December 31, 2016. Performance reflected prior to such date is that of the Fund’s former investment adviser. |
| 3 | Source: Fund prospectus. Net expense ratios reflect a contractual expense reimbursement that continues through 1/31/22. Without the reimbursement, performance would have been lower. The expense ratios for the current reporting period can be found in the Financial Highlights section of this report. |
| Fund profile subject to change due to active management. |
| | Additional Information |
| | Purchasing Managers’ Index (PMI) is an index of the prevailing direction of economic trends in the manufacturing and service sectors. It consists of a diffusion index that summarizes whether market conditions, as viewed by purchasing managers, are expanding, staying the same, or contracting. |
Calvert
Emerging Markets Equity Fund
September 30, 2021
Example
As a Fund shareholder, you incur two types of costs: (1) transaction costs, including sales charges (loads) on purchases and redemption fees (if applicable); and (2) ongoing costs, including management fees; distribution and/or service fees; and other Fund expenses. This Example is intended to help you understand your ongoing costs (in dollars) of Fund investing and to compare these costs with the ongoing costs of investing in other mutual funds. The Example is based on an investment of $1,000 invested at the beginning of the period and held for the entire period (April 1, 2021 to September 30, 2021).
Actual Expenses
The first section of the table below provides information about actual account values and actual expenses. You may use the information in this section, together with the amount you invested, to estimate the expenses that you paid over the period. Simply divide your account value by $1,000 (for example, an $8,600 account value divided by $1,000 = 8.6), then multiply the result by the number in the first section under the heading entitled “Expenses Paid During Period” to estimate the expenses you paid on your account during this period.
Hypothetical Example for Comparison Purposes
The second section of the table below provides information about hypothetical account values and hypothetical expenses based on the actual Fund expense ratio and an assumed rate of return of 5% per year (before expenses), which is not the actual Fund return. The hypothetical account values and expenses may not be used to estimate the actual ending account balance or expenses you paid for the period. You may use this information to compare the ongoing costs of investing in the Fund and other funds. To do so, compare this 5% hypothetical example with the 5% hypothetical examples that appear in the shareholder reports of the other funds.
Please note that the expenses shown in the table are meant to highlight your ongoing costs only and do not reflect any transactional costs, such as sales charges (loads) or redemption fees (if applicable). Therefore, the second section of the table is useful in comparing ongoing costs only, and will not help you determine the relative total costs of owning different funds. In addition, if these transactional costs were included, your costs would be higher.
| | Beginning
Account Value
(4/1/21) | Ending
Account Value
(9/30/21) | Expenses Paid
During Period*
(4/1/21 – 9/30/21) | Annualized
Expense
Ratio |
| Actual | | | | |
| Class A | $1,000.00 | $ 929.60 | $ 6.00** | 1.24% |
| Class C | $1,000.00 | $ 925.90 | $ 9.61** | 1.99% |
| Class I | $1,000.00 | $ 930.30 | $ 4.79** | 0.99% |
| Class R6 | $1,000.00 | $ 931.00 | $ 4.45** | 0.92% |
| Hypothetical | | | | |
| (5% return per year before expenses) | | | | |
| Class A | $1,000.00 | $1,018.85 | $ 6.28** | 1.24% |
| Class C | $1,000.00 | $1,015.09 | $10.05 ** | 1.99% |
| Class I | $1,000.00 | $1,020.10 | $ 5.01** | 0.99% |
| Class R6 | $1,000.00 | $1,020.46 | $ 4.66** | 0.92% |
| * | Expenses are equal to the Fund's annualized expense ratio for the indicated Class, multiplied by the average account value over the period, multiplied by 183/365 (to reflect the one-half year period). The Example assumes that the $1,000 was invested at the net asset value per share determined at the close of business on March 31, 2021. |
| ** | Absent a waiver and/or reimbursement of expenses by an affiliate, expenses would be higher. |
Calvert
Emerging Markets Equity Fund
September 30, 2021
| Security | Shares | Value |
| Brazil — 4.6% | |
| Dexco S.A. | | 12,817,141 | $ 39,940,666 |
| Natura & Co. Holding S.A.(1) | | 11,298,407 | 94,544,995 |
| WEG S.A. | | 8,185,500 | 59,567,804 |
| | | | $ 194,053,465 |
| Chile — 0.5% | |
| Banco de Chile | | 235,401,410 | $ 21,736,139 |
| | | | $ 21,736,139 |
| China — 28.3% | |
| Alibaba Group Holding, Ltd.(1) | | 11,173,387 | $ 206,863,403 |
| Autohome, Inc., Class A(1) | | 141,636 | 1,636,635 |
| Autohome, Inc. ADR | | 470,342 | 22,073,150 |
| Baozun, Inc. ADR(1)(2) | | 2,646,445 | 46,392,181 |
| China Communications Services Corp., Ltd., Class H | | 57,453,563 | 31,772,924 |
| China Mengniu Dairy Co., Ltd.(1) | | 9,955,310 | 64,110,533 |
| China Merchants Bank Co., Ltd., Class H | | 8,632,000 | 68,694,670 |
| Gree Electric Appliances, Inc. of Zhuhai, Class A | | 10,517,695 | 62,803,189 |
| Hangzhou Tigermed Consulting Co., Ltd., Class A | | 2,224,408 | 59,822,827 |
| Hundsun Technologies, Inc., Class A | | 3,790,009 | 33,689,756 |
| JD.com, Inc., Class A(1) | | 2,437,250 | 87,868,487 |
| NARI Technology Co., Ltd., Class A | | 23,376,838 | 129,110,763 |
| Shenzhen International Holdings, Ltd. | | 28,916,873 | 37,278,185 |
| Tencent Holdings, Ltd. | | 4,094,296 | 244,424,217 |
| Wuxi Biologics Cayman, Inc.(1)(3) | | 3,000,000 | 48,660,864 |
| Zhongji Innolight Co., Ltd., Class A | | 7,968,433 | 42,779,754 |
| | | | $1,187,981,538 |
| Egypt — 0.2% | |
| Commercial International Bank Egypt SAE(1) | | 2,583,877 | $ 6,990,199 |
| | | | $ 6,990,199 |
| Hong Kong — 8.4% | |
| AIA Group, Ltd. | | 9,564,313 | $ 110,031,683 |
| Alibaba Health Information Technology, Ltd.(1) | | 12,490,000 | 17,986,075 |
| Samsonite International S.A.(1)(3) | | 31,835,332 | 68,366,413 |
| SITC International Holdings Co., Ltd. | | 12,012,000 | 42,743,301 |
| Techtronic Industries Co., Ltd. | | 5,843,790 | 115,482,318 |
| | | | $ 354,609,790 |
| Hungary — 1.2% | |
| Richter Gedeon Nyrt | | 1,798,576 | $ 49,142,752 |
| | | | $ 49,142,752 |
| India — 14.1% | |
| Bajaj Finserv, Ltd. | | 200,413 | $ 47,947,531 |
| Security | Shares | Value |
| India (continued) | |
| Bharat Forge, Ltd. | | 5,678,578 | $ 56,091,523 |
| Container Corp. of India, Ltd. | | 4,730,416 | 44,671,394 |
| Dabur India, Ltd. | | 6,047,998 | 50,238,057 |
| HCL Technologies, Ltd. | | 3,597,258 | 61,719,865 |
| Hero MotoCorp, Ltd. | | 1,112,644 | 42,444,962 |
| ICICI Bank, Ltd. | | 8,719,234 | 82,054,867 |
| Motherson Sumi Systems, Ltd. | | 14,795,555 | 44,839,319 |
| SBI Life Insurance Co., Ltd.(3) | | 3,348,830 | 54,539,661 |
| State Bank of India | | 8,330,693 | 50,499,295 |
| Tech Mahindra, Ltd. | | 3,076,148 | 57,009,610 |
| | | | $ 592,056,084 |
| Indonesia — 2.7% | |
| Bank Central Asia Tbk PT | | 21,713,500 | $ 52,887,927 |
| Bank Rakyat Indonesia Persero Tbk PT | | 229,986,601 | 61,302,169 |
| Unilever Indonesia Tbk PT | | 4,344,700 | 1,198,225 |
| | | | $ 115,388,321 |
| Mexico — 4.9% | |
| Grupo Aeroportuario del Pacifico SAB de CV, Class B(1) | | 3,056,841 | $ 35,542,080 |
| Grupo Financiero Banorte SAB de CV, Class O | | 14,469,421 | 92,733,556 |
| Wal-Mart de Mexico SAB de CV | | 23,425,982 | 79,386,064 |
| | | | $ 207,661,700 |
| Peru — 1.1% | |
| Credicorp, Ltd. | | 421,438 | $ 46,754,332 |
| | | | $ 46,754,332 |
| Russia — 4.9% | |
| Polymetal International PLC | | 2,162,112 | $ 36,531,708 |
| Yandex NV, Class A(1)(2) | | 2,119,298 | 168,886,857 |
| | | | $ 205,418,565 |
| South Africa — 2.2% | |
| Clicks Group, Ltd. | | 2,117,206 | $ 39,038,622 |
| Prosus NV(1)(2) | | 656,728 | 51,942,046 |
| | | | $ 90,980,668 |
| South Korea — 10.3% | |
| KB Financial Group, Inc. | | 1,386,043 | $ 64,461,376 |
| LG Household & Health Care, Ltd. | | 56,910 | 64,161,578 |
| NCSoft Corp. | | 104,257 | 52,811,760 |
| Samsung Electronics Co., Ltd. | | 4,062,809 | 251,872,223 |
| | | | $ 433,306,937 |
| Sweden — 1.1% | |
| Epiroc AB, Class A | | 2,340,159 | $ 48,515,983 |
| | | | $ 48,515,983 |
8
See Notes to Financial Statements.
Calvert
Emerging Markets Equity Fund
September 30, 2021
Schedule of Investments — continued
| Security | Shares | Value |
| Taiwan — 13.3% | |
| Accton Technology Corp. | | 8,180,000 | $ 77,092,881 |
| Chipbond Technology Corp. | | 16,144,000 | 38,755,513 |
| Delta Electronics, Inc. | | 10,389,000 | 93,087,173 |
| LandMark Optoelectronics Corp. | | 4,284,900 | 34,358,495 |
| Taiwan Semiconductor Manufacturing Co., Ltd. ADR | | 2,819,068 | 314,748,942 |
| | | | $ 558,043,004 |
| Turkey — 0.5% | |
| BIM Birlesik Magazalar AS | | 2,854,142 | $ 20,525,024 |
| | | | $ 20,525,024 |
| United States — 1.2% | |
| Micron Technology, Inc. | | 714,862 | $ 50,740,905 |
| | | | $ 50,740,905 |
Total Common Stocks
(identified cost $3,399,506,480) | | | $4,183,905,406 |
| High Social Impact Investments — 0.2% |
| Security | Principal
Amount
(000's omitted) | Value |
| Calvert Impact Capital, Inc., Community Investment Notes, 1.50%, 12/15/23(4)(5) | $ | 5,170 | $ 5,081,231 |
| ImpactAssets, Inc., Global Sustainable Agriculture Notes, 0.00%, 11/3/22(5)(6) | | 43 | 40,893 |
| ImpactAssets, Inc., Microfinance Plus Notes, 0.00%, 11/3/22(5)(6) | | 56 | 51,252 |
Total High Social Impact Investments
(identified cost $5,269,000) | | | $ 5,173,376 |
| Short-Term Investments — 0.8% |
| Affiliated Fund — 0.1% |
| Description | Units | Value |
| Calvert Cash Reserves Fund, LLC, 0.04%(7) | | 6,783,668 | $ 6,784,347 |
Total Affiliated Fund
(identified cost $6,784,346) | | | $ 6,784,347 |
| Securities Lending Collateral — 0.7% |
| Security | Shares | Value |
| State Street Navigator Securities Lending Government Money Market Portfolio, 0.03%(8) | | 28,566,985 | $ 28,566,985 |
Total Securities Lending Collateral
(identified cost $28,566,985) | | | $ 28,566,985 |
Total Short-Term Investments
(identified cost $35,351,331) | | | $ 35,351,332 |
Total Investments — 100.5%
(identified cost $3,440,126,811) | | $ 4,224,430,114 |
| Other Assets, Less Liabilities — (0.5)% | | $ (20,351,582) |
| Net Assets — 100.0% | | $ 4,204,078,532 |
| The percentage shown for each investment category in the Schedule of Investments is based on net assets. |
| (1) | Non-income producing security. |
| (2) | All or a portion of this security was on loan at September 30, 2021. The aggregate market value of securities on loan at September 30, 2021 was $67,179,813. |
| (3) | Security exempt from registration under Rule 144A of the Securities Act of 1933, as amended. These securities may be sold in certain transactions in reliance on an exemption from registration (normally to qualified institutional buyers). At September 30, 2021, the aggregate value of these securities is $171,566,938 or 4.1% of the Fund's net assets. |
| (4) | May be deemed to be an affiliated company (see Note 7). |
| (5) | Restricted security. Total market value of restricted securities amounts to $5,173,376, which represents 0.2% of the net assets of the Fund as of September 30, 2021. |
| (6) | Notes carry an interest rate that varies by period and is contingent on the performance of the underlying portfolio of loans to borrowers. The coupon rate shown represents the rate in effect at September 30, 2021. |
| (7) | Affiliated investment company, available to Calvert portfolios and funds, which invests in high quality, U.S. dollar denominated money market instruments. The rate shown is the annualized seven-day yield as of September 30, 2021. |
| (8) | Represents investment of cash collateral received in connection with securities lending. |
9
See Notes to Financial Statements.
Calvert
Emerging Markets Equity Fund
September 30, 2021
Schedule of Investments — continued
At September 30, 2021, the concentration of the Fund’s investments in the various sectors, determined as a percentage of net assets, was as follows:
| Economic Sectors | % of Net Assets |
| Information Technology | 25.1% |
| Financials | 18.1 |
| Consumer Discretionary | 15.9 |
| Industrials | 13.0 |
| Communication Services | 11.6 |
| Consumer Staples | 9.8 |
| Health Care | 4.2 |
| Materials | 1.8 |
| High Social Impact Investments | 0.2 |
| Total | 99.7% |
Restricted Securities
| Description | Acquisition Dates | Cost |
| Calvert Impact Capital, Inc., Community Investment Notes, 1.50%, 12/15/23 | 12/14/20 | $5,170,000 |
| ImpactAssets, Inc., Global Sustainable Agriculture Notes, 0.00%, 11/3/22 | 11/13/15 | 43,000 |
| ImpactAssets, Inc., Microfinance Plus Notes, 0.00%, 11/3/22 | 11/13/15 | 56,000 |
| Abbreviations: |
| ADR | – American Depositary Receipt |
10
See Notes to Financial Statements.
Calvert
Emerging Markets Equity Fund
September 30, 2021
Statement of Assets and Liabilities
| | September 30, 2021 |
| Assets | |
Investments in securities of unaffiliated issuers, at value (identified cost $3,428,172,465) - including
$67,179,813 of securities on loan | $ 4,212,564,536 |
| Investments in securities of affiliated issuers, at value (identified cost $11,954,346) | 11,865,578 |
| Cash denominated in foreign currency, at value (cost $24,031,456) | 23,965,731 |
| Receivable for investments sold | 16,080,012 |
| Receivable for capital shares sold | 18,993,743 |
| Dividends and interest receivable | 1,887,671 |
| Dividends and interest receivable - affiliated | 63,391 |
| Securities lending income receivable | 10,889 |
| Receivable from affiliate | 282,217 |
| Directors' deferred compensation plan | 789,894 |
| Total assets | $4,286,503,662 |
| Liabilities | |
| Payable for investments purchased | $ 15,598,887 |
| Payable for capital shares redeemed | 6,183,128 |
| Payable for foreign capital gain taxes | 26,465,445 |
| Deposits for securities loaned | 28,566,985 |
| Payable to affiliates: | |
| Investment advisory fee | 2,714,658 |
| Administrative fee | 434,345 |
| Distribution and service fees | 102,272 |
| Sub-transfer agency fee | 35,423 |
| Directors' deferred compensation plan | 789,894 |
| Accrued expenses | 1,534,093 |
| Total liabilities | $ 82,425,130 |
| Net Assets | $4,204,078,532 |
| Sources of Net Assets | |
| Paid-in capital | $ 3,447,501,819 |
| Distributable earnings | 756,576,713 |
| Total | $4,204,078,532 |
| Class A Shares | |
| Net Assets | $ 290,117,216 |
| Shares Outstanding | 13,831,147 |
Net Asset Value and Redemption Price Per Share
(net assets ÷ shares of beneficial interest outstanding) | $ 20.98 |
Maximum Offering Price Per Share
(100 ÷ 95.25 of net asset value per share) | $ 22.03 |
| Class C Shares | |
| Net Assets | $ 33,249,447 |
| Shares Outstanding | 1,642,055 |
Net Asset Value and Offering Price Per Share*
(net assets ÷ shares of beneficial interest outstanding) | $ 20.25 |
11
See Notes to Financial Statements.
Calvert
Emerging Markets Equity Fund
September 30, 2021
Statement of Assets and Liabilities — continued
| | September 30, 2021 |
| Class I Shares | |
| Net Assets | $3,357,832,974 |
| Shares Outstanding | 158,289,470 |
Net Asset Value, Offering Price and Redemption Price Per Share
(net assets ÷ shares of beneficial interest outstanding) | $ 21.21 |
| Class R6 Shares | |
| Net Assets | $ 522,878,895 |
| Shares Outstanding | 24,688,547 |
Net Asset Value, Offering Price and Redemption Price Per Share
(net assets ÷ shares of beneficial interest outstanding) | $ 21.18 |
| On sales of $50,000 or more, the offering price of Class A shares is reduced. |
| * | Redemption price per share is equal to the net asset value less any applicable contingent deferred sales charge. |
12
See Notes to Financial Statements.
Calvert
Emerging Markets Equity Fund
September 30, 2021
| | Year Ended |
| | September 30, 2021 |
| Investment Income | |
| Dividend income (net of foreign taxes withheld of $9,242,307) | $ 72,443,844 |
| Dividend income - affiliated issuers | 61,232 |
| Interest income | 279 |
| Interest income - affiliated issuers | 84,943 |
| Securities lending income, net | 134,078 |
| Total investment income | $ 72,724,376 |
| Expenses | |
| Investment advisory fee | $ 31,913,952 |
| Administrative fee | 5,106,232 |
| Distribution and service fees: | |
| Class A | 719,649 |
| Class C | 360,540 |
| Directors' fees and expenses | 195,695 |
| Custodian fees | 776,686 |
| Transfer agency fees and expenses | 3,474,193 |
| Accounting fees | 747,214 |
| Professional fees | 137,549 |
| Registration fees | 276,555 |
| Reports to shareholders | 297,274 |
| Miscellaneous | 139,441 |
| Total expenses | $ 44,144,980 |
| Waiver and/or reimbursement of expenses by affiliate | $ (1,148,470) |
| Net expenses | $ 42,996,510 |
| Net investment income | $ 29,727,866 |
| Realized and Unrealized Gain (Loss) | |
| Net realized gain (loss): | |
| Investment securities (net of foreign capital gains taxes of $6,714,308) | $ 103,132,089 |
| Investment securities - affiliated issuers | (9,006) |
| Foreign currency transactions | (3,279,906) |
| Net realized gain | $ 99,843,177 |
| Change in unrealized appreciation (depreciation): | |
| Investment securities (including net increase in payable for foreign capital gains taxes of $21,634,709) | $ 314,629,135 |
| Investment securities - affiliated issuers | (46,330) |
| Foreign currency | (208,993) |
| Net change in unrealized appreciation (depreciation) | $314,373,812 |
| Net realized and unrealized gain | $414,216,989 |
| Net increase in net assets from operations | $443,944,855 |
13
See Notes to Financial Statements.
Calvert
Emerging Markets Equity Fund
September 30, 2021
Statements of Changes in Net Assets
| | Year Ended September 30, |
| | 2021 | 2020 |
| Increase (Decrease) in Net Assets | | |
| From operations: | | |
| Net investment income | $ 29,727,866 | $ 19,633,726 |
| Net realized gain (loss) | 99,843,177 | (86,363,077) |
| Net change in unrealized appreciation (depreciation) | 314,373,812 | 413,151,516 |
| Net increase in net assets from operations | $ 443,944,855 | $ 346,422,165 |
| Distributions to shareholders: | | |
| Class A | $ (716,932) | $ (673,898) |
| Class I | (13,667,112) | (14,521,438) |
| Class R6 | (1,855,013) | (1,960,798) |
| Total distributions to shareholders | $ (16,239,057) | $ (17,156,134) |
| Capital share transactions: | | |
| Class A | $ 92,770,986 | $ 18,646,918 |
| Class C | (1,983,892) | (1,276,295) |
| Class I | 467,857,670 | 445,276,599 |
| Class R6 | 169,097,679 | 59,777,840 |
| Net increase in net assets from capital share transactions | $ 727,742,443 | $ 522,425,062 |
| Net increase in net assets | $1,155,448,241 | $ 851,691,093 |
| Net Assets | | |
| At beginning of year | $ 3,048,630,291 | $ 2,196,939,198 |
| At end of year | $4,204,078,532 | $3,048,630,291 |
14
See Notes to Financial Statements.
Calvert
Emerging Markets Equity Fund
September 30, 2021
| | Class A |
| | Year Ended September 30, |
| | 2021 | 2020 | 2019 | 2018 | 2017 |
| Net asset value — Beginning of year | $ 18.33 | $ 16.05 | $ 15.55 | $ 16.33 | $ 12.94 |
| Income (Loss) From Operations | | | | | |
| Net investment income(1) | $ 0.12 | $ 0.09 | $ 0.17 | $ 0.19 | $ 0.10 |
| Net realized and unrealized gain (loss) | 2.59 | 2.27 | 0.45 | (0.94) | 3.36 |
| Total income (loss) from operations | $ 2.71 | $ 2.36 | $ 0.62 | $ (0.75) | $ 3.46 |
| Less Distributions | | | | | |
| From net investment income | $ (0.06) | $ (0.08) | $ (0.12) | $ (0.03) | $ (0.07) |
| Total distributions | $ (0.06) | $ (0.08) | $ (0.12) | $ (0.03) | $ (0.07) |
| Net asset value — End of year | $ 20.98 | $ 18.33 | $ 16.05 | $ 15.55 | $ 16.33 |
| Total Return(2) | 14.70% | 14.82% | 4.02% | (4.62)% | 26.89% |
| Ratios/Supplemental Data | | | | | |
| Net assets, end of year (000’s omitted) | $290,117 | $173,728 | $132,066 | $155,735 | $62,432 |
| Ratios (as a percentage of average daily net assets):(3) | | | | | |
| Total expenses | 1.27% | 1.27% | 1.41% | 1.56% | 1.80% |
| Net expenses | 1.24% | 1.24% | 1.25% | 1.27% | 1.27% |
| Net investment income | 0.54% | 0.54% | 1.06% | 1.15% | 0.73% |
| Portfolio Turnover | 36% | 38% | 32% | 27% | 36% |
| (1) | Computed using average shares outstanding. |
| (2) | Returns are historical and are calculated by determining the percentage change in net asset value with all distributions reinvested and do not reflect the effect of sales charges, if any. |
| (3) | Total expenses do not reflect amounts reimbursed and/or waived by the adviser and certain of its affiliates, if applicable. Net expenses are net of all reductions and represent the net expenses paid by the Fund. |
15
See Notes to Financial Statements.
Calvert
Emerging Markets Equity Fund
September 30, 2021
Financial Highlights — continued
| | Class C |
| | Year Ended September 30, |
| | 2021 | 2020 | 2019 | 2018 | 2017 |
| Net asset value — Beginning of year | $ 17.78 | $ 15.62 | $ 15.18 | $ 16.04 | $ 12.76 |
| Income (Loss) From Operations | | | | | |
| Net investment income (loss)(1) | $ (0.07) | $ (0.04) | $ 0.05 | $ 0.10 | $ 0.01 |
| Net realized and unrealized gain (loss) | 2.54 | 2.20 | 0.45 | (0.96) | 3.29 |
| Total income (loss) from operations | $ 2.47 | $ 2.16 | $ 0.50 | $ (0.86) | $ 3.30 |
| Less Distributions | | | | | |
| From net investment income | $ — | $ — | $ (0.06) | $ — | $ (0.02) |
| Total distributions | $ — | $ — | $ (0.06) | $ — | $ (0.02) |
| Net asset value — End of year | $ 20.25 | $ 17.78 | $ 15.62 | $ 15.18 | $16.04 |
| Total Return(2) | 13.83% | 13.89% | 3.33% | (5.36)% | 25.88% |
| Ratios/Supplemental Data | | | | | |
| Net assets, end of year (000’s omitted) | $33,249 | $30,938 | $28,794 | $24,286 | $ 4,627 |
| Ratios (as a percentage of average daily net assets):(3) | | | | | |
| Total expenses | 2.02% | 2.02% | 2.16% | 2.31% | 3.69% |
| Net expenses | 1.99% | 1.99% | 2.00% | 2.02% | 2.02% |
| Net investment income (loss) | (0.32)% | (0.22)% | 0.35% | 0.60% | 0.08% |
| Portfolio Turnover | 36% | 38% | 32% | 27% | 36% |
| (1) | Computed using average shares outstanding. |
| (2) | Returns are historical and are calculated by determining the percentage change in net asset value with all distributions reinvested and do not reflect the effect of sales charges, if any. |
| (3) | Total expenses do not reflect amounts reimbursed and/or waived by the adviser and certain of its affiliates, if applicable. Net expenses are net of all reductions and represent the net expenses paid by the Fund. |
16
See Notes to Financial Statements.
Calvert
Emerging Markets Equity Fund
September 30, 2021
Financial Highlights — continued
| | Class I |
| | Year Ended September 30, |
| | 2021 | 2020 | 2019 | 2018 | 2017 |
| Net asset value — Beginning of year | $ 18.52 | $ 16.22 | $ 15.73 | $ 16.48 | $ 13.06 |
| Income (Loss) From Operations | | | | | |
| Net investment income(1) | $ 0.16 | $ 0.13 | $ 0.22 | $ 0.29 | $ 0.17 |
| Net realized and unrealized gain (loss) | 2.62 | 2.29 | 0.45 | (0.99) | 3.35 |
| Total income (loss) from operations | $ 2.78 | $ 2.42 | $ 0.67 | $ (0.70) | $ 3.52 |
| Less Distributions | | | | | |
| From net investment income | $ (0.09) | $ (0.12) | $ (0.18) | $ (0.05) | $ (0.10) |
| Total distributions | $ (0.09) | $ (0.12) | $ (0.18) | $ (0.05) | $ (0.10) |
| Net asset value — End of year | $ 21.21 | $ 18.52 | $ 16.22 | $ 15.73 | $ 16.48 |
| Total Return(2) | 14.94% | 15.07% | 4.36% | (4.30)% | 27.27% |
| Ratios/Supplemental Data | | | | | |
| Net assets, end of year (000’s omitted) | $3,357,833 | $2,530,135 | $1,817,479 | $1,012,574 | $126,398 |
| Ratios (as a percentage of average daily net assets):(3) | | | | | |
| Total expenses | 1.02% | 1.02% | 1.15% | 1.32% | 1.32% |
| Net expenses | 0.99% | 0.99% | 0.97% | 0.92% | 0.92% |
| Net investment income | 0.71% | 0.79% | 1.41% | 1.71% | 1.20% |
| Portfolio Turnover | 36% | 38% | 32% | 27% | 36% |
| (1) | Computed using average shares outstanding. |
| (2) | Returns are historical and are calculated by determining the percentage change in net asset value with all distributions reinvested and do not reflect the effect of sales charges, if any. |
| (3) | Total expenses do not reflect amounts reimbursed and/or waived by the adviser and certain of its affiliates, if applicable. Net expenses are net of all reductions and represent the net expenses paid by the Fund. |
17
See Notes to Financial Statements.
Calvert
Emerging Markets Equity Fund
September 30, 2021
Financial Highlights — continued
| | Class R6 |
| | Year Ended September 30, | Period Ended
September 30, |
| | 2021 | 2020 | 2019 | 2018 (1) |
| Net asset value — Beginning of period | $ 18.49 | $ 16.19 | $ 15.72 | $ 18.65 |
| Income (Loss) From Operations | | | | |
| Net investment income(2) | $ 0.17 | $ 0.14 | $ 0.27 | $ 0.26 |
| Net realized and unrealized gain (loss) | 2.62 | 2.30 | 0.40 | (3.19) |
| Total income (loss) from operations | $ 2.79 | $ 2.44 | $ 0.67 | $ (2.93) |
| Less Distributions | | | | |
| From net investment income | $ (0.10) | $ (0.14) | $ (0.20) | $ — |
| Total distributions | $ (0.10) | $ (0.14) | $ (0.20) | $ — |
| Net asset value — End of period | $ 21.18 | $ 18.49 | $ 16.19 | $ 15.72 |
| Total Return(3) | 15.09% | 15.13% | 4.35% | (15.71)% (4) |
| Ratios/Supplemental Data | | | | |
| Net assets, end of period (000’s omitted) | $522,879 | $313,830 | $218,601 | $10,217 |
| Ratios (as a percentage of average daily net assets):(5) | | | | |
| Total expenses | 0.94% | 0.95% | 1.06% | 1.24% (6) |
| Net expenses | 0.92% | 0.92% | 0.92% | 0.92% (6) |
| Net investment income | 0.78% | 0.84% | 1.67% | 2.48% (6) |
| Portfolio Turnover | 36% | 38% | 32% | 27% (7) |
| (1) | From February 1, 2018 inception. |
| (2) | Computed using average shares outstanding. |
| (3) | Returns are historical and are calculated by determining the percentage change in net asset value with all distributions reinvested and do not reflect the effect of sales charges, if any. |
| (4) | Not annualized. |
| (5) | Total expenses do not reflect amounts reimbursed and/or waived by the adviser and certain of its affiliates, if applicable. Net expenses are net of all reductions and represent the net expenses paid by the Fund. |
| (6) | Annualized. |
| (7) | For the year ended September 30, 2018. |
18
See Notes to Financial Statements.
Calvert
Emerging Markets Equity Fund
September 30, 2021
Notes to Financial Statements
1 Significant Accounting Policies
Calvert Emerging Markets Equity Fund (the Fund) is a diversified series of Calvert World Values Fund, Inc. (the Corporation). The Corporation is a Maryland corporation registered under the Investment Company Act of 1940, as amended (the 1940 Act), as an open-end management investment company. The investment objective of the Fund is to seek long-term capital appreciation by investing primarily in equity securities of companies located in emerging market countries.
The Fund offers four classes of shares. Class A shares are generally sold subject to a sales charge imposed at time of purchase. A contingent deferred sales charge of 0.80% may apply to certain redemptions of Class A shares for accounts for which no sales charge was paid, if redeemed within 12 months of purchase. Class C shares are sold without a front-end sales charge, and with certain exceptions, are charged a contingent deferred sales charge of 1% on shares redeemed within 12 months of purchase. Class C shares are only available for purchase through a financial intermediary. Effective January 25, 2019, Class C shares generally automatically convert to Class A shares ten years after their purchase and, effective November 5, 2020, automatically convert to Class A shares eight years after their purchase as described in the Fund's prospectus. Class I and Class R6 shares are sold at net asset value, are not subject to a sales charge and are sold only to certain eligible investors. Effective after the close of business on May 14, 2021, the Fund was closed to new investors, subject to limited exceptions. Each class represents a pro rata interest in the Fund, but votes separately on class-specific matters and is subject to different expenses.
The Fund applies the accounting and reporting guidance in the Financial Accounting Standards Board (FASB) Accounting Standards Codification Topic 946, Financial Services – Investment Companies (ASC 946). Subsequent events, if any, through the date that the financial statements were issued have been evaluated in the preparation of the financial statements.
A Investment Valuation— Net asset value per share is determined every business day as of the close of the regular session of the New York Stock Exchange (generally 4:00 p.m. Eastern time). The Fund uses independent pricing services approved by the Board of Directors (the Board) to value its investments wherever possible. Investments for which market quotations are not available or deemed not reliable are fair valued in good faith under the direction of the Board.
U.S. generally accepted accounting principles (U.S. GAAP) establishes a disclosure hierarchy that categorizes the inputs to valuation techniques used to value assets and liabilities at measurement date. These inputs are summarized in the three broad levels listed below:
Level 1 - quoted prices in active markets for identical securities
Level 2 - other significant observable inputs (including quoted prices for similar securities, interest rates, prepayment speeds, credit risk, etc.)
Level 3 - significant unobservable inputs (including the Fund’s own assumptions in determining the fair value of investments)
The inputs or methodologies used for valuing securities are not necessarily an indication of the risk associated with investing in those securities.
Valuation techniques used to value the Fund’s investments by major category are as follows:
Equity Securities. Equity securities (including warrants and rights) listed on a U.S. securities exchange generally are valued at the last sale or closing price as reported by an independent pricing service on the primary market or exchange on which they are traded and are categorized as Level 1 in the hierarchy. Equity securities listed on the NASDAQ National Market System are valued at the NASDAQ official closing price and are categorized as Level 1 in the hierarchy. Unlisted or listed securities for which closing sales prices or closing quotations are not available are valued at the mean between the latest available bid and ask prices and are categorized as Level 2 in the hierarchy. The daily valuation of exchange-traded foreign securities generally is determined as of the close of trading on the principal exchange on which such securities trade. Events occurring after the close of trading on foreign exchanges may result in adjustments to the valuation of foreign securities to more accurately reflect their fair value as of the close of regular trading on the New York Stock Exchange. When valuing foreign equity securities that meet certain criteria, the Fund's Board has approved the use of a fair value service that values such securities to reflect market trading that occurs after the close of the applicable foreign markets of comparable securities or other instruments that have a strong correlation to the fair-valued securities. Such securities are categorized as Level 2 in the hierarchy.
Debt Securities. Debt securities are generally valued based on valuations provided by third party pricing services, as derived from such services’ pricing models. Inputs to the models may include, but are not limited to, reported trades, executable bid and ask prices, broker/dealer quotations, prices or yields of securities with similar characteristics, interest rates, anticipated prepayments, benchmark curves or information pertaining to the issuer, as well as industry and economic events. Accordingly, debt securities are generally categorized as Level 2 in the hierarchy. Short-term debt securities with a remaining maturity at time of purchase of more than sixty days are valued based on valuations provided by a third party pricing service. Such securities are generally categorized as Level 2 in the hierarchy. Short-term debt securities of sufficient credit quality purchased with remaining maturities of sixty days or less for which a valuation from a third party pricing service is not readily available may be valued at amortized cost, which approximates fair value, and are categorized as Level 2 in the hierarchy.
Calvert
Emerging Markets Equity Fund
September 30, 2021
Notes to Financial Statements — continued
Affiliated Fund. The Fund may invest in Calvert Cash Reserves Fund, LLC (Cash Reserves Fund), an affiliated investment company managed by Calvert Research and Management (CRM). While Cash Reserves Fund is not a registered money market mutual fund, it conducts all of its investment activities in accordance with the requirements of Rule 2a-7 under the 1940 Act. Investments in Cash Reserves Fund are valued at the closing net asset value per unit on the valuation day and are categorized as Level 2 in the hierarchy. Cash Reserves Fund generally values its investment securities based on available market quotations provided by a third party pricing service.
Other Securities. Investments in registered investment companies (including money market funds) that do not trade on an exchange are valued at the net asset value per share on the valuation day and are categorized as Level 1 in the hierarchy.
Fair Valuation. If a market value cannot be determined for a security using the methodologies described above, or if, in the good faith opinion of the Fund's adviser, the market value does not constitute a readily available market quotation, or if a significant event has occurred that would materially affect the value of the security, the security will be fair valued as determined in good faith by or at the direction of the Board in a manner that most fairly reflects the security’s “fair value”, which is the amount that the Fund might reasonably expect to receive for the security upon its current sale in the ordinary course. Each such determination is based on a consideration of relevant factors, which are likely to vary from one pricing context to another. These factors may include, but are not limited to, the type of security, the existence of any contractual restrictions on the security’s disposition, the price and extent of public trading in similar securities of the issuer or of comparable companies or entities, quotations or relevant information obtained from broker/dealers or other market participants, information obtained from the issuer, analysts, and/or the appropriate stock exchange (for exchange-traded securities), an analysis of the company’s or entity’s financial statements, and an evaluation of the forces that influence the issuer and the market(s) in which the security is purchased and sold.
The values assigned to fair value investments are based on available information and do not necessarily represent amounts that might ultimately be realized. Further, due to the inherent uncertainty of valuations of such investments, the fair values may differ significantly from the values that would have been used had an active market existed, and the differences could be material.
The following table summarizes the market value of the Fund's holdings as of September 30, 2021, based on the inputs used to value them:
| Asset Description | Level 1 | Level 2 | Level 3 | Total |
| Common Stocks: | | | | |
| Brazil | $ 194,053,465 | $ — | $ — | $ 194,053,465 |
| Chile | — | 21,736,139 | — | 21,736,139 |
| China | 68,465,331 | 1,119,516,207 | — | 1,187,981,538 |
| Egypt | — | 6,990,199 | — | 6,990,199 |
| Hong Kong | — | 354,609,790 | — | 354,609,790 |
| Hungary | — | 49,142,752 | — | 49,142,752 |
| India | — | 592,056,084 | — | 592,056,084 |
| Indonesia | — | 115,388,321 | — | 115,388,321 |
| Mexico | 207,661,700 | — | — | 207,661,700 |
| Peru | 46,754,332 | — | — | 46,754,332 |
| Russia | 168,886,857 | 36,531,708 | — | 205,418,565 |
| South Africa | — | 90,980,668 | — | 90,980,668 |
| South Korea | — | 433,306,937 | — | 433,306,937 |
| Sweden | — | 48,515,983 | — | 48,515,983 |
| Taiwan | 314,748,942 | 243,294,062 | — | 558,043,004 |
| Turkey | — | 20,525,024 | — | 20,525,024 |
| United States | 50,740,905 | — | — | 50,740,905 |
| Total Common Stocks | $1,051,311,532 | $3,132,593,874 (1) | $ — | $4,183,905,406 |
| High Social Impact Investments | $ — | $ 5,173,376 | $ — | $ 5,173,376 |
| Short-Term Investments: | | | | |
| Affiliated Fund | — | 6,784,347 | — | 6,784,347 |
Calvert
Emerging Markets Equity Fund
September 30, 2021
Notes to Financial Statements — continued
| Asset Description | Level 1 | Level 2 | Level 3 | Total |
| Securities Lending Collateral | $ 28,566,985 | $ — | $ — | $ 28,566,985 |
| Total Investments | $1,079,878,517 | $3,144,551,597 | $ — | $4,224,430,114 |
| (1) | Includes foreign equity securities whose values were adjusted to reflect market trading of comparable securities or other correlated instruments that occurred after the close of trading in their applicable foreign markets. |
B Investment Transactions and Income— Investment transactions for financial statement purposes are accounted for on trade date. Realized gains and losses are recorded on an identified cost basis and may include proceeds from litigation. Dividend income is recorded on the ex-dividend date for dividends received in cash and/or securities or, in the case of dividends on certain foreign securities, as soon as the Fund is informed of the ex-dividend date. Non-cash dividends are recorded at the fair value of the securities received. Withholding taxes on foreign dividends, if any, have been provided for in accordance with the Fund's understanding of the applicable country’s tax rules and rates. Distributions received that represent a return of capital are recorded as a reduction of cost of investments. Distributions received that represent a capital gain are recorded as a realized gain. Interest income, which includes amortization of premium and accretion of discount on debt securities, is accrued as earned.
C Share Class Accounting— Realized and unrealized gains and losses and net investment income and losses, other than class-specific expenses, are allocated daily to each class of shares based upon the relative net assets of each class to the total net assets of the Fund. Expenses arising in connection with a specific class are charged directly to that class. Sub-accounting, recordkeeping and similar administrative fees payable to financial intermediaries, which are a component of transfer agency fees and expenses on the Statement of Operations, are not allocated to Class R6 shares.
D Foreign Currency Transactions— The Fund’s accounting records are maintained in U.S. dollars. For valuation of assets and liabilities on each date of net asset value determination, foreign denominations are converted into U.S. dollars using the current exchange rate. Security transactions, income and expenses are translated at the prevailing rate of exchange on the date of the event. Recognized gains or losses on investment transactions attributable to changes in foreign currency exchange rates are recorded for financial statement purposes as net realized gains and losses on investments. That portion of unrealized gains and losses on investments that results from fluctuations in foreign currency exchange rates is not separately disclosed.
E Restricted Securities— The Fund may invest in securities that are subject to legal or contractual restrictions on resale. Generally, these securities may only be sold publicly upon registration under the Securities Act of 1933 or in transactions exempt from such registration. Information regarding restricted securities (excluding Rule 144A securities) is included at the end of the Schedule of Investments.
F Distributions to Shareholders— Distributions to shareholders are recorded by the Fund on ex-dividend date. Distributions from net investment income and distributions from net realized capital gains, if any, are paid at least annually. Distributions are declared separately for each class of shares. Distributions are determined in accordance with income tax regulations, which may differ from U.S. GAAP; accordingly, periodic reclassifications are made within the Fund's capital accounts to reflect income and gains available for distribution under income tax regulations.
G Estimates— The preparation of financial statements in conformity with U.S. GAAP requires management to make estimates and assumptions that affect the reported amounts of assets and liabilities and disclosure of contingent assets and liabilities at the date of the financial statements and the reported amounts of increases and decreases in net assets from operations during the reporting period. Actual results could differ from those estimates.
H Indemnifications— The Corporation’s By-Laws provide for indemnification for Directors or officers of the Corporation and certain other parties, to the fullest extent permitted by Maryland law and the 1940 Act, provided certain conditions are met. Additionally, in the normal course of business, the Fund enters into agreements with service providers that may contain indemnification clauses. The Fund’s maximum exposure under these arrangements is unknown as this would involve future claims that may be made against the Fund that have not yet occurred.
I Federal Income Taxes— No provision for federal income or excise tax is required since the Fund intends to continue to qualify as a regulated investment company under the Internal Revenue Code and to distribute substantially all of its taxable earnings.
In addition to the requirements of the Internal Revenue Code, the Fund may also be subject to local taxes on the recognition of capital gains in certain countries. In determining the daily net asset value, the Fund estimates the accrual for such taxes, if any, based on the unrealized appreciation on certain portfolio securities and the related tax rates. Taxes attributable to unrealized appreciation are included in the change in unrealized appreciation (depreciation) on investments. Capital gains taxes on securities sold are included in net realized gain (loss) on investments.
Management has analyzed the Fund's tax positions taken for all open federal income tax years and has concluded that no provision for federal income tax is required in the Fund's financial statements. A Fund's federal tax return is subject to examination by the Internal Revenue Service for a period of three years from the date of filing.
Calvert
Emerging Markets Equity Fund
September 30, 2021
Notes to Financial Statements — continued
2 Related Party Transactions
The investment advisory fee is earned by CRM as compensation for investment advisory services rendered to the Fund. On March 1, 2021, Morgan Stanley acquired Eaton Vance Corp. (the “Transaction”) and CRM became an indirect, wholly-owned subsidiary of Morgan Stanley. In connection with the Transaction, the Fund entered into a new investment advisory agreement (the “New Agreement”) with CRM, which took effect on March 1, 2021. Pursuant to the New Agreement (and the Fund’s investment advisory agreement with CRM in effect prior to March 1, 2021), the fee is computed at an annual rate of 0.75% of the Fund’s average daily net assets and is payable monthly. For the year ended September 30, 2021, the investment advisory fee amounted to $31,913,952. The Fund may invest its cash in Cash Reserves Fund. CRM does not currently receive a fee for advisory services provided to Cash Reserves Fund.
Pursuant to an investment sub-advisory agreement, CRM has delegated the investment management of the Fund to Hermes Investment Management Limited (Hermes). In connection with the Transaction, CRM entered into a new investment sub-advisory agreement with Hermes, which took effect on March 1, 2021. CRM pays Hermes a portion of its investment advisory fee for sub-advisory services provided to the Fund.
CRM has agreed to reimburse the Fund’s operating expenses to the extent that total annual operating expenses (relating to ordinary operating expenses only and excluding expenses such as brokerage commissions, acquired fund fees and expenses of unaffiliated funds, borrowing costs, taxes or litigation expenses) exceed 1.24%, 1.99%, 0.99% and 0.92% for Class A, Class C, Class I and Class R6, respectively, of such class’s average daily net assets. The expense reimbursement agreement with CRM may be changed or terminated after January 31, 2022. For the year ended September 30, 2021, CRM waived or reimbursed expenses of $1,148,470.
The administrative fee is earned by CRM as compensation for administrative services rendered to the Fund. The fee is computed at an annual rate of 0.12% of the Fund’s average daily net assets attributable to Class A, Class C, Class I and Class R6 and is payable monthly. For the year ended September 30, 2021, CRM was paid administrative fees of $5,106,232.
The Fund has in effect a distribution plan for Class A shares (Class A Plan) pursuant to Rule 12b-1 under the 1940 Act. Pursuant to the Class A Plan, the Fund pays Eaton Vance Distributors, Inc. (EVD), an affiliate of CRM and the Fund’s principal underwriter, a distribution and service fee of 0.25% per annum of its average daily net assets attributable to Class A shares for distribution services and facilities provided to the Fund by EVD, as well as for personal services and/or the maintenance of shareholder accounts. The Fund also has in effect a distribution plan for Class C shares (Class C Plan) pursuant to Rule 12b-1 under the 1940 Act. Pursuant to the Class C Plan, the Fund pays EVD amounts equal to 0.75% per annum of its average daily net assets attributable to Class C shares for providing ongoing distribution services and facilities to the Fund. In addition, pursuant to the Class C Plan, the Fund also makes payments of service fees to EVD, financial intermediaries and other persons in amounts equal to 0.25% per annum of its average daily net assets attributable to that class. Service fees paid or accrued are for personal services and/or the maintenance of shareholder accounts. Distribution and service fees paid or accrued for the year ended September 30, 2021 amounted to $719,649 and $360,540 for Class A shares and Class C shares, respectively.
The Fund was informed that EVD received $32,235 as its portion of the sales charge on sales of Class A shares for the year ended September 30, 2021. The Fund was also informed that EVD received less than $100 and $2,005 of contingent deferred sales charges paid by Class A and Class C shareholders, respectively, for the same period. The Fund was informed that Morgan Stanley affiliated broker-dealers, which may be deemed to be affiliates of CRM and EVD, also received a portion of the sales charge on sales of Class A shares from March 1, 2021 through September 30, 2021 in the amount of $3,186.
Eaton Vance Management (EVM), an affiliate of CRM, provides sub-transfer agency and related services to the Fund pursuant to a Sub-Transfer Agency Support Services Agreement. For the year ended September 30, 2021, sub-transfer agency fees and expenses incurred to EVM amounted to $173,915 and are included in transfer agency fees and expenses on the Statement of Operations.
Each Director of the Fund who is not an employee of CRM or its affiliates receives an annual fee of $154,000, plus an annual Committee fee ranging from $8,500 to $16,500 depending on the Committee. The Board chair receives an additional $30,000 ($20,000 prior to January 1, 2021) annual fee and Committee chairs receive an additional $6,000 annual fee. Eligible Directors may participate in a Deferred Compensation Plan (the Plan). Amounts deferred under the Plan are treated as though equal dollar amounts had been invested in shares of the Fund or other Calvert funds selected by the Directors. The Fund purchases shares of the funds selected equal to the dollar amounts deferred under the Plan, resulting in an asset equal to the deferred compensation liability. Obligations of the Plan are paid solely from the Fund's assets. Directors’ fees are allocated to each of the Calvert funds served. Salaries and fees of officers and Directors of the Fund who are employees of CRM or its affiliates are paid by CRM. Prior to December 31, 2020, an Advisory Council aided the Board and CRM in advancing the cause of responsible investing through original scholarship and thought leadership. The Advisory Council consisted of CRM’s Chief Executive Officer and three additional members. For the year ended December 31, 2020, each member (other than CRM’s Chief Executive Officer) was compensated $20,000 for their service on the Advisory Council. Such compensation, and any other compensation and/or expenses incurred by the Advisory Council as may be approved by the Board, was borne by the Calvert funds. For the year ended September 30, 2021, the Fund’s allocated portion of the Advisory Council compensation and fees was $3,691, which is included in miscellaneous expense on the Statement of Operations.
Calvert
Emerging Markets Equity Fund
September 30, 2021
Notes to Financial Statements — continued
3 Investment Activity
During the year ended September 30, 2021, the cost of purchases and proceeds from sales of investments, other than short-term securities, were $2,249,633,954 and $1,489,215,952, respectively.
4 Distributions to Shareholders and Income Tax Information
The tax character of distributions declared for the years ended September 30, 2021 and September 30, 2020 was as follows:
| | Year Ended September 30, |
| | 2021 | 2020 |
| Ordinary income | $16,239,057 | $17,156,134 |
During the year ended September 30, 2021, distributable earnings was decreased by $4,118,895 and paid-in capital was increased by $4,118,895 due to the Fund's use of equalization accounting. Tax equalization accounting allows the Fund to treat as a distribution that portion of redemption proceeds representing a redeeming shareholder’s portion of undistributed taxable income and net capital gains. These reclassifications had no effect on the net assets or net asset value per share of the Fund.
As of September 30, 2021, the components of distributable earnings (accumulated loss) on a tax basis were as follows:
| Undistributed ordinary income | $ 28,685,310 |
| Deferred capital losses | (2,054,758) |
| Net unrealized appreciation | 729,946,161 |
| Distributable earnings | $756,576,713 |
At September 30, 2021, the Fund, for federal income tax purposes, had deferred capital losses of $2,054,758 which would reduce the Fund’s taxable income arising from future net realized gains on investment transactions, if any, to the extent permitted by the Internal Revenue Code, and thus would reduce the amount of distributions to shareholders, which would otherwise be necessary to relieve the Fund of any liability for federal income or excise tax. The deferred capital losses are treated as arising on the first day of the Fund’s next taxable year, can be carried forward for an unlimited period, and retain the same short-term or long-term character as when originally deferred. Of the deferred capital losses at September 30, 2021, $2,054,758 are short-term.
The cost and unrealized appreciation (depreciation) of investments of the Fund at September 30, 2021, as determined on a federal income tax basis, were as follows:
| Aggregate cost | $3,467,950,714 |
| Gross unrealized appreciation | $ 1,025,450,687 |
| Gross unrealized depreciation | (268,971,287) |
| Net unrealized appreciation | $ 756,479,400 |
5 Securities Lending
To generate additional income, the Fund may lend its securities pursuant to a securities lending agency agreement with State Street Bank and Trust Company (SSBT), the securities lending agent. Security loans are subject to termination by the Fund at any time and, therefore, are not considered illiquid investments. The Fund requires that the loan be continuously collateralized by either cash or securities in an amount at least equal to the market value of the securities on loan. The market value of securities loaned is determined daily and any additional required collateral is delivered to the Fund on the next business day. Cash collateral is generally invested in a money market fund registered under the 1940 Act that is managed by an affiliate of SSBT. Any gain or loss in the market price of the loaned securities that might occur and any interest earned or dividends declared during the term of the loan would accrue to the account of the Fund. Income earned on the investment of collateral, net of broker rebates and other expenses incurred by the securities lending agent, is split between the Fund and the securities lending agent based on agreed upon contractual terms. Non-cash collateral, if any, is held by the lending agent on behalf of the Fund and cannot be sold or re-pledged by the Fund; accordingly, such collateral is not reflected in the Statement of Assets and Liabilities.
Calvert
Emerging Markets Equity Fund
September 30, 2021
Notes to Financial Statements — continued
The risks associated with lending portfolio securities include, but are not limited to, possible delays in receiving additional collateral or in the recovery of the loaned securities, possible loss of rights to the collateral should the borrower fail financially, as well as risk of loss in the value of the collateral or the value of the investments made with the collateral. The securities lending agent shall indemnify the Fund in the case of default of any securities borrower.
At September 30, 2021, the total value of securities on loan was $67,179,813 and the total value of collateral received was $69,162,596, comprised of cash of $28,566,985 and U.S. government and/or agencies securities of $40,595,611.
The following table provides a breakdown of securities lending transactions accounted for as secured borrowings, the obligations by class of collateral pledged, and the remaining contractual maturity of those transactions as of September 30, 2021.
| | Remaining Contractual Maturity of the Transactions |
| | Overnight and
Continuous | <30 days | 30 to 90 days | >90 days | Total |
| Common Stocks | $28,566,985 | $ — | $ — | $ — | $28,566,985 |
The carrying amount of the liability for deposits for securities loaned at September 30, 2021 approximated its fair value. If measured at fair value, such liability would have been considered as Level 2 in the fair value hierarchy (see Note 1A) at September 30, 2021.
6 Line of Credit
The Fund participates with other portfolios and funds managed by EVM and its affiliates, including CRM, in an $800 million unsecured line of credit with a group of banks, which is in effect through October 26, 2021. Borrowings are made by the Fund solely for temporary purposes related to redemptions and other short-term cash needs. Interest is charged to the Fund based on its borrowings at an amount above either the Eurodollar rate or Federal Funds rate. In addition, a fee computed at an annual rate of 0.15% on the daily unused portion of the line of credit is allocated among the participating portfolios and funds at the end of each quarter. In connection with the renewal of the agreement in October 2020, an upfront fee and arrangement fee totaling $950,000 was incurred that was allocated to the participating portfolios and funds. Because the line of credit is not available exclusively to the Fund, it may be unable to borrow some or all of its requested amounts at any particular time.
The Fund had no borrowings outstanding pursuant to its line of credit at September 30, 2021. The Fund did not have any significant borrowings or allocated fees during the year ended September 30, 2021. Effective October 26, 2021, the Fund renewed its line of credit agreement, which expires October 25, 2022, at substantially the same terms.
7 Affiliated Companies and Funds
The Fund has invested a portion of its assets in notes (the Notes) issued by Calvert Impact Capital, Inc. (CIC) pursuant to exemptive relief granted by the U.S. Securities and Exchange Commission (the SEC). There are certain potential points of affiliation between the Fund and CIC. CRM has licensed use of the Calvert name to CIC and provides other types of support. CRM’s President and Chief Executive Officer (and the only director/trustee on the Fund Board that is an “interested person” of the Fund) serves on the CIC Board. In addition, another director/trustee on the Fund Board serves as a director emeritus on the CIC Board.
At September 30, 2021, the value of the Fund’s investment in the Notes and affiliated funds was $11,865,578, which represents 0.3% of the Fund’s net assets. Transactions in the Notes and affiliated funds by the Fund for the year ended September 30, 2021 were as follows:
| Name | Value,
beginning
of period | Purchases | Sales
proceeds | Net
realized
gain
(loss) | Change in
unrealized
appreciation
(depreciation) | Value,
end of
period | Interest/
Dividend
income | Principal
amount/Units,
end of period |
| High Social Impact Investments | | | | | | |
| Calvert Impact Capital, Inc., Community Investment Notes: | | | | | | | | |
| 1.50%, 12/15/20(1) | $ 7,429,013 | $ — | $ (7,466,870) | $ — | $ 37,857 | $ — | $ 23,334 | $ — |
| 1.50%, 12/15/23(1) | — | 5,170,000 | — | — | (88,769) | 5,081,231 | 61,609 | 5,170,000 |
Calvert
Emerging Markets Equity Fund
September 30, 2021
Notes to Financial Statements — continued
| Name | Value,
beginning
of period | Purchases | Sales
proceeds | Net
realized
gain
(loss) | Change in
unrealized
appreciation
(depreciation) | Value,
end of
period | Interest/
Dividend
income | Principal
amount/Units,
end of period |
| Short-Term Investments | | | | | | |
| Calvert Cash Reserves Fund, LLC | $55,663,250 | $1,091,538,339 | $(1,140,412,818) | $ (9,006) | $ 4,582 | $ 6,784,347 | $ 61,232 | 6,783,668 |
| Totals | | | | $(9,006) | $ (46,330) | $11,865,578 | $146,175 | |
8 Capital Shares
The Corporation may issue its shares in one or more series (such as the Fund). The authorized shares of the Fund consist of 75,000,000 common shares, $0.01 par value, for each Class.
Transactions in capital shares for the years ended September 30, 2021 and September 30, 2020 were as follows:
| | Year Ended
September 30, 2021 | | Year Ended
September 30, 2020 |
| | Shares | Amount | | Shares | Amount |
| Class A | | | | | |
| Shares sold | 15,904,646 | $ 347,555,284 | | 5,442,221 | $ 86,507,819 |
| Reinvestment of distributions | 31,266 | 677,539 | | 36,614 | 607,428 |
| Shares redeemed | (11,585,367) | (255,550,144) | | (4,230,039) | (68,496,871) |
| Converted from Class C | 4,116 | 88,307 | | 1,687 | 28,542 |
| Net increase | 4,354,661 | $ 92,770,986 | | 1,250,483 | $ 18,646,918 |
| Class C | | | | | |
| Shares sold | 382,860 | $ 8,383,949 | | 337,489 | $ 5,556,767 |
| Shares redeemed | (476,281) | (10,279,534) | | (439,921) | (6,804,520) |
| Converted to Class A | (4,252) | (88,307) | | (1,736) | (28,542) |
| Net decrease | (97,673) | $ (1,983,892) | | (104,168) | $ (1,276,295) |
| Class I | | | | | |
| Shares sold | 73,886,174 | $ 1,643,627,034 | | 79,141,293 | $1,295,586,705 |
| Reinvestment of distributions | 587,397 | 12,852,247 | | 822,269 | 13,756,564 |
| Shares redeemed | (52,783,871) | (1,188,621,611) | | (55,415,414) | (864,066,670) |
| Net increase | 21,689,700 | $ 467,857,670 | | 24,548,148 | $ 445,276,599 |
| Class R6 | | | | | |
| Shares sold | 13,330,886 | $ 293,926,149 | | 7,810,338 | $ 131,894,225 |
| Reinvestment of distributions | 77,754 | 1,697,360 | | 110,978 | 1,852,220 |
| Shares redeemed | (5,694,908) | (126,525,830) | | (4,447,540) | (73,968,605) |
| Net increase | 7,713,732 | $ 169,097,679 | | 3,473,776 | $ 59,777,840 |
9 Risks and Uncertainties
Risks Associated with Foreign Investments
Foreign investments can be adversely affected by political, economic and market developments abroad, including the imposition of economic and other sanctions by the United States or another country. There may be less publicly available information about foreign issuers because they may not be subject to reporting practices, requirements or regulations comparable to those to which United States companies are subject. Foreign markets may be smaller, less
Calvert
Emerging Markets Equity Fund
September 30, 2021
Notes to Financial Statements — continued
liquid and more volatile than the major markets in the United States. Trading in foreign markets typically involves higher expense than trading in the United States. The Fund may have difficulties enforcing its legal or contractual rights in a foreign country. Securities that trade or are denominated in currencies other than the U.S. dollar may be adversely affected by fluctuations in currency exchange rates.
Emerging market securities often involve greater risks than developed market securities. Investment markets within emerging market countries are typically smaller, less liquid, less developed and more volatile than those in more developed markets like the United States, and may be focused in certain economic sectors. The information available about an emerging market issuer may be less reliable than for comparable issuers in more developed capital markets. Governmental actions can have a significant effect on the economic conditions in emerging market countries. It may be more difficult to make a claim or obtain a judgment in the courts of these countries than it is in the United States. The possibility of fraud, negligence, undue influence being exerted by an issuer or refusal to recognize ownership exists in some emerging markets. Disruptions due to work stoppages and trading improprieties in foreign securities markets have caused such markets to close. Emerging market securities are also subject to speculative trading, which contributes to their volatility.
Pandemic Risk
An outbreak of respiratory disease caused by a novel coronavirus was first detected in China in late 2019 and subsequently spread internationally. This coronavirus has resulted in closing borders, enhanced health screenings, changes to healthcare service preparation and delivery, quarantines, cancellations, disruptions to supply chains and customer activity, as well as general concern and uncertainty. Health crises caused by outbreaks, such as the coronavirus outbreak, may exacerbate other pre-existing political, social and economic risks and disrupt normal market conditions and operations. The impact of this outbreak has negatively affected the worldwide economy, the economies of individual countries, individual companies, and the market in general, and may continue to do so in significant and unforeseen ways, as may other epidemics and pandemics that may arise in the future. Any such impact could adversely affect the Fund's performance, or the performance of the securities in which the Fund invests.
10 Change in Independent Registered Public Accounting Firm
On July 30, 2021, KPMG LLP (“KPMG”) informed the Audit Committee and Board of the Corporation that it was resigning as the independent registered public accounting firm to the Corporation, as upon Morgan Stanley’s acquisition of Eaton Vance Corp., the parent company of CRM (the investment adviser to each series of the Corporation), KPMG would no longer be independent of the Corporation. The Audit Committee of the Board and the Board approved the selection of Deloitte & Touche LLP (“Deloitte”) as the independent registered public accounting firm for the funds that are series of the Corporation (the “Funds”) for the fiscal year ending September 30, 2021 to be effective upon KPMG’s resignation and Deloitte’s acceptance of the engagement which became effective July 30, 2021.
KPMG’s reports on the financial statements for the Funds for the fiscal periods ended September 30, 2019 and September 30, 2020 contained no adverse opinion or disclaimer of opinion nor were they qualified or modified as to uncertainty, audit scope or accounting principles. During the fiscal periods ended September 30, 2019 and September 30, 2020, and during the subsequent interim period through July 30, 2021: (i) there were no disagreements with KPMG on any matter of accounting principles or practices, financial statement disclosure or auditing scope or procedure, which disagreements, if not resolved to the satisfaction of KPMG, would have caused KPMG to make reference to the subject matter of the disagreements in connection with its reports on the Funds’ financial statements for such periods; and (ii) there were no “reportable events” of the kind described in Item 304(a)(1)(v) of Regulation S-K under the Securities Exchange Act of 1934, as amended.
During the fiscal periods ended September 30, 2019 and September 30, 2020, and during the subsequent interim period through July 30, 2021: neither the Funds, nor anyone on their behalf, consulted with Deloitte on items which: (i) concerned the application of accounting principles to a specified transaction, either completed or proposed, or the type of audit opinion that might be rendered on the Funds’ financial statements; or (ii) concerned the subject of a disagreement (as defined in paragraph (a)(1)(iv) of Item 304 of Regulation S-K) or reportable events (as described in paragraph (a)(1)(v) of Item 304).
Calvert
Emerging Markets Equity Fund
September 30, 2021
Report of Independent Registered Public Accounting Firm
To the Board of Directors of Calvert World Values Fund, Inc. and Shareholders of Calvert Emerging Markets Equity Fund:
Opinion on the Financial Statements and Financial Highlights
We have audited the accompanying statement of assets and liabilities of Calvert Emerging Markets Equity Fund (the "Fund") (one of the funds constituting Calvert World Values Fund, Inc.), including the schedule of investments, as of September 30, 2021, the related statements of operations, changes in net assets and the financial highlights for the year then ended, and the related notes. In our opinion, the financial statements and financial highlights present fairly, in all material respects, the financial position of the Fund as of September 30, 2021, and the results of its operations and changes in its net assets for the year then ended, and the financial highlights for the year then ended in conformity with accounting principles generally accepted in the United States of America. The statement of changes in net assets for the year ended September 30, 2020, and the financial highlights for the years or periods ended September 30, 2020, 2019, 2018, and 2017 were audited by other auditors whose report, dated November 20, 2020, expressed an unqualified opinion on that financial statement and those financial highlights.
Basis for Opinion
These financial statements and financial highlights are the responsibility of the Fund's management. Our responsibility is to express an opinion on the Fund's financial statements and financial highlights based on our audit. We are a public accounting firm registered with the Public Company Accounting Oversight Board (United States) (PCAOB) and are required to be independent with respect to the Fund in accordance with the U.S. federal securities laws and the applicable rules and regulations of the Securities and Exchange Commission and the PCAOB.
We conducted our audit in accordance with the standards of the PCAOB. Those standards require that we plan and perform the audit to obtain reasonable assurance about whether the financial statements and financial highlights are free of material misstatement, whether due to error or fraud. The Fund is not required to have, nor were we engaged to perform, an audit of its internal control over financial reporting. As part of our audit we are required to obtain an understanding of internal control over financial reporting but not for the purpose of expressing an opinion on the effectiveness of the Fund’s internal control over financial reporting. Accordingly, we express no such opinion.
Our audit included performing procedures to assess the risks of material misstatement of the financial statements and financial highlights, whether due to error or fraud, and performing procedures that respond to those risks. Such procedures included examining, on a test basis, evidence regarding the amounts and disclosures in the financial statements and financial highlights. Our audit also included evaluating the accounting principles used and significant estimates made by management, as well as evaluating the overall presentation of the financial statements and financial highlights. Our procedures included confirmation of securities owned as of September 30, 2021, by correspondence with the custodian and brokers; when replies were not received from brokers, we performed other auditing procedures. We believe that our audit provides a reasonable basis for our opinion.
/s/ Deloitte & Touche LLP
Boston, Massachusetts
November 22, 2021
We have served as the auditor of one or more Calvert investment companies since 2021.
Calvert
Emerging Markets Equity Fund
September 30, 2021
Federal Tax Information (Unaudited)
The Form 1099-DIV you receive in February 2022 will show the tax status of all distributions paid to your account in calendar year 2021. Shareholders are advised to consult their own tax adviser with respect to the tax consequences of their investment in the Fund. As required by the Internal Revenue Code and/or regulations, shareholders must be notified regarding the status of qualified dividend income for individuals and the foreign tax credit.
Qualified Dividend Income. For the fiscal year ended September 30, 2021, the Fund designates approximately $56,157,206, or up to the maximum amount of such dividends allowable pursuant to the Internal Revenue Code, as qualified dividend income eligible for the reduced tax rate of 15%.
Foreign Tax Credit. For the fiscal year ended September 30, 2021, the Fund paid foreign taxes of $15,592,020 and recognized foreign source income of $81,608,835.
Calvert
Emerging Markets Equity Fund
September 30, 2021
Liquidity Risk Management Program
The Fund has implemented a written liquidity risk management program (Program) and related procedures to manage its liquidity in accordance with Rule 22e-4 under the Investment Company Act of 1940, as amended (Liquidity Rule). The Liquidity Rule defines “liquidity risk” as the risk that a fund could not meet requests to redeem shares issued by the fund without significant dilution of the remaining investors’ interests in the fund. The Fund’s Board of Trustees/Directors has designated the investment adviser to serve as the administrator of the Program and the related procedures. The administrator has established a Liquidity Risk Management Oversight Committee (Committee) to perform the functions necessary to administer the Program. As part of the Program, the administrator is responsible for identifying illiquid investments and categorizing the relative liquidity of the Fund’s investments in accordance with the Liquidity Rule. Under the Program, the administrator assesses, manages, and periodically reviews the Fund’s liquidity risk, and is responsible for making certain reports to the Fund’s Board of Trustees/Directors and the Securities and Exchange Commission (SEC) regarding the liquidity of the Fund’s investments, and to notify the Board of Trustees/Directors and the SEC of certain liquidity events specified in the Liquidity Rule. The liquidity of the Fund’s portfolio investments is determined based on a number of factors including, but not limited to, relevant market, trading and investment-specific considerations under the Program.
At a meeting of the Fund’s Board of Trustees/Directors on June 16, 2021, the Committee provided a written report to the Fund’s Board of Trustees/ Directors pertaining to the operation, adequacy, and effectiveness of implementation of the Program, as well as the operation of the highly liquid investment minimum (if applicable) for the period January 1, 2020 through December 31, 2020 (Review Period). The Program operated effectively during the Review Period, supporting the administrator’s ability to assess, manage and monitor Fund liquidity risk, including during periods of market volatility and net redemptions. During the Review Period, the Fund met redemption requests on a timely basis.
There can be no assurance that the Program will achieve its objectives in the future. Please refer to the Fund’s prospectus for more information regarding the Fund’s exposure to liquidity risk and other principal risks to which an investment in the Fund may be subject.
Calvert
Emerging Markets Equity Fund
September 30, 2021
Management and Organization
Fund Management. The Directors of Calvert World Values Fund, Inc. (the Corporation) are responsible for the overall management and supervision of the Corporation’s affairs. The Directors and officers of the Corporation are listed below. Except as indicated, each individual has held the office shown or other offices in the same company for the last five years. Each Board member holds office until his or her successor is elected and qualified, or until his or her earlier death, resignation, retirement, removal or disqualification. Under the terms of the Fund's current Board member retirement policy, an Independent Board member must retire at the end of the calendar year in which he or she turns 75. However, if such retirement would cause the Fund to be out of compliance with Section 16 of the 1940 Act or any other regulations or guidance of the SEC, then such retirement and resignation will not become effective until such time as action has been taken for the Fund to be in compliance upon a Board member's retirement. The “Independent Directors” consist of those Directors who are not “interested persons” of the Corporation, as that term is defined under the 1940 Act. The business address of each Director and officer, with the exception of Ms. Walsh and Mr. Kirchner, is 1825 Connecticut Avenue NW, Suite 400, Washington, DC 20009. As used below, “CRM” refers to Calvert Research and Management. Each Director oversees 39 funds in the Calvert fund complex. Each officer serves as an officer of certain other Calvert funds.
| Name and Year of Birth | Corporation
Position(s) | Position
Start Date | Principal Occupation(s) and Other Directorships
During Past Five Years and Other Relevant Experience |
| Interested Director |
John H. Streur(1)
1960 | Director and
President | 2015 | President and Chief Executive Officer of Calvert Research and
Management (since December 31, 2016). President and Chief Executive
Officer of Calvert Investments, Inc. (January 2015 - December 2016);
Chief Executive Officer of Calvert Investment Distributors, Inc. (August
2015 - December 2016); Chief Compliance Officer of Calvert Investment
Management, Inc. (August 2015 - April 2016); President and Director,
Portfolio 21 Investments, Inc. (through October 2014); President,
Chief Executive Officer and Director, Managers Investment Group LLC
(through January 2012); President and Director, The Managers Funds
and Managers AMG Funds (through January 2012).
Other Directorships in the Last Five Years. Portfolio 21 Investments,
Inc. (asset management) (through October 2014); Managers Investment
Group LLC (asset management) (through January 2012); The Managers
Funds (asset management) (through January 2012); Managers AMG Funds
(asset management) (through January 2012); Calvert Impact Capital, Inc. |
| Independent Directors |
Richard L. Baird, Jr.
1948 | Director | 2005 | Regional Disaster Recovery Lead, American Red Cross of Greater
Pennsylvania (since 2017). Volunteer, American Red Cross (since 2015).
Former President and CEO of Adagio Health Inc. (retired in 2014) in
Pittsburgh, PA.
Other Directorships in the Last Five Years. None. |
Alice Gresham Bullock
1950 | Chair and
Director | 2016 | Professor Emerita at Howard University School of Law. Dean Emerita of
Howard University School of Law and Deputy Director of the Association
of American Law Schools (1992-1994).
Other Directorships in the Last Five Years. None. |
Cari M. Dominguez
1949 | Director | 2016 | Former Chair of the U.S. Equal Employment Opportunity Commission.
Other Directorships in the Last Five Years. Manpower, Inc. (employment
agency); Triple S Management Corporation (managed care); National
Association of Corporate Directors. |
John G. Guffey, Jr.
1948 | Director | 1992 | President of Aurora Press Inc., a privately held publisher of trade
paperbacks (since January 1997).
Other Directorships in the Last Five Years. Calvert Impact Capital, Inc.
(through December 31, 2018); Calvert Ventures, LLC. |
Miles D. Harper, III
1962 | Director | 2005 | Partner, Carr Riggs & Ingram (public accounting firm) since October 2014.
Partner, Gainer Donnelly & Desroches (public accounting firm) (now Carr
Riggs & Ingram) (November 1999 - September 2014).
Other Directorships in the Last Five Years. Bridgeway Funds (9) (asset
management). |
Joy V. Jones
1950 | Director | 2005 | Attorney.
Other Directorships in the Last Five Years. Conduit Street Restaurants
SUD 2 Limited; Palm Management Restaurant Corporation. |
Calvert
Emerging Markets Equity Fund
September 30, 2021
Management and Organization — continued
| Name and Year of Birth | Corporation
Position(s) | Position
Start Date | Principal Occupation(s) and Other Directorships
During Past Five Years and Other Relevant Experience |
| Independent Directors (continued) |
Anthony A. Williams
1951 | Director | 2016 | CEO and Executive Director of the Federal City Council (July 2012 to
present); Senior Adviser and Independent Consultant for King and
Spalding LLP (September 2015 to present); Executive Director of Global
Government Practice at the Corporate Executive Board (January 2010 to
January 2012).
Other Directorships in the Last Five Years. Freddie Mac; Evoq
Properties/Meruelo Maddux Properties, Inc. (real estate management);
Weston Solutions, Inc. (environmental services); Bipartisan Policy Center’s
Debt Reduction Task Force; Chesapeake Bay Foundation; Catholic
University of America; Urban Institute (research organization); The Howard Hughes Corporation (real estate development). |
| Name and Year of Birth | Corporation
Position(s) | Position
Start Date | Principal Occupation(s)
During Past Five Years |
| Principal Officers who are not Directors |
Hope L. Brown
1973 | Chief
Compliance
Officer | 2014 | Chief Compliance Officer of 39 registered investment companies advised
by CRM (since 2014). Vice President and Chief Compliance Officer,
Wilmington Funds (2012-2014). |
Deidre E. Walsh(2)
1971 | Secretary,
Vice President
and Chief
Legal Officer | 2021 | Vice President of CRM and officer of 39 registered investment companies
advised by CRM (since 2021). Also Vice President of Eaton Vance and
certain of its affiliates and officer of 138 registered investment companies
advised or administered by Eaton Vance. |
James F. Kirchner(2)
1967 | Treasurer | 2016 | Vice President of CRM and officer of 39 registered investment companies
advised by CRM (since 2016). Also Vice President of Eaton Vance and
certain of its affiliates and officer of 138 registered investment companies
advised or administered by Eaton Vance. |
| (1) Mr. Streur is an interested person of the Fund because of his positions with the Fund’s adviser and certain affiliates. |
| (2) The business address for Ms. Walsh and Mr. Kirchner is Two International Place, Boston, MA 02110. |
The SAI for the Fund includes additional information about the Directors and officers of the Fund and can be obtained without charge on Calvert’s website at www.calvert.com or by calling 1-800-368-2745.
| FACTS | WHAT DOES EATON VANCE DO WITH YOUR
PERSONAL INFORMATION? |
| Why? | Financial companies choose how they share your personal information. Federal law gives consumers the right to limit some but not all sharing. Federal law also requires us to tell you how we collect, share, and protect your personal information. Please read this notice carefully to understand what we do. |
| |
| What? | The types of personal information we collect and share depend on the product or service you have with us. This information can include:■ Social Security number and income
■
investment experience and risk tolerance
■
checking account number and wire transfer instructions |
| |
| How? | All financial companies need to share customers’ personal information to run their everyday business. In the section below, we list the reasons financial companies can share their customers’ personal information; the reasons Eaton Vance chooses to share; and whether you can limit this sharing. |
Reasons we can share your
personal information | Does Eaton Vance
share? | Can you limit
this sharing? |
| For our everyday business purposes — such as to process your transactions, maintain your account(s), respond to court orders and legal investigations, or report to credit bureaus | Yes | No |
| For our marketing purposes — to offer our products and services to you | Yes | No |
| For joint marketing with other financial companies | No | We don’t share |
| For our investment management affiliates’ everyday business purposes — information about your transactions, experiences, and creditworthiness | Yes | Yes |
| For our affiliates’ everyday business purposes — information about your transactions and experiences | Yes | No |
| For our affiliates’ everyday business purposes — information about your creditworthiness | No | We don’t share |
| For our investment management affiliates to market to you | Yes | Yes |
| For our affiliates to market to you | No | We don’t share |
| For nonaffiliates to market to you | No | We don’t share |
To limit our
sharing | Call toll-free 1-800-368-2745 or email: CRMPrivacy@calvert.comPlease note:If you are a new customer, we can begin sharing your information 30 days from the date we sent this notice. When you are no longer our customer, we continue to share your information as described in this notice. However, you can contact us at any time to limit our sharing. |
| Questions? | Call toll-free 1-800-368-2745 or email: CRMPrivacy@calvert.com |
| Privacy Notice — continued | April 2021 |
| Who we are |
| Who is providing this notice? | Eaton Vance Management, Eaton Vance Distributors, Inc., Eaton Vance Trust Company, Eaton Vance Management (International) Limited, Eaton Vance Advisers International Ltd., Eaton Vance Global Advisors Limited, Eaton Vance Management’s Real Estate Investment Group, Boston Management and Research, Calvert Research and Management, Eaton Vance and Calvert Fund Families and our investment advisory affiliates (“Eaton Vance”) (see Investment Management Affiliates definition below) |
| What we do |
How does Eaton Vance
protect my personal
information? | To protect your personal information from unauthorized access and use, we use security measures that comply with federal law. These measures include computer safeguards and secured files and buildings. We have policies governing the proper handling of customer information by personnel and requiring third parties that provide support to adhere to appropriate security standards with respect to such information. |
How does Eaton Vance
collect my personal
information? | We collect your personal information, for example, when you■ open an account or make deposits or withdrawals from your account
■
buy securities from us or make a wire transfer
■
give us your contact informationWe also collect your personal information from others, such as credit bureaus, affiliates, or other companies. |
| Why can’t I limit all sharing? | Federal law gives you the right to limit only■ sharing for affiliates’ everyday business purposes — information about your creditworthiness
■
affiliates from using your information to market to you
■
sharing for nonaffiliates to market to youState laws and individual companies may give you additional rights to limit sharing. See below for more on your rights under state law. |
| Definitions |
Investment Management
Affiliates | Eaton Vance Investment Management Affiliates include registered investment advisers, registered broker- dealers, and registered and unregistered funds. Investment Management Affiliates does not include entities associated with Morgan Stanley Wealth Management, such as Morgan Stanley Smith Barney LLC and Morgan Stanley & Co. |
| Affiliates | Companies related by common ownership or control. They can be financial and nonfinancial companies.■ Our affiliates include companies with a Morgan Stanley name and financial companies such as Morgan Stanley Smith Barney LLC and Morgan Stanley & Co. |
| Nonaffiliates | Companies not related by common ownership or control. They can be financial and nonfinancial companies.■ Eaton Vance does not share with nonaffiliates so they can market to you. |
| Joint marketing | A formal agreement between nonaffiliated financial companies that together market financial products or services to you.■ Eaton Vance doesn’t jointly market. |
| Other important information |
| Vermont: Except as permitted by law, we will not share personal information we collect about Vermont residents with Nonaffiliates unless you provide us with your written consent to share such information.California: Except as permitted by law, we will not share personal information we collect about California residents with Nonaffiliates and we will limit sharing such personal information with our Affiliates to comply with California privacy laws that apply to us. |
Delivery of Shareholder Documents. The Securities and Exchange Commission (SEC) permits funds to deliver only one copy of shareholder documents, including prospectuses, proxy statements and shareholder reports, to fund investors with multiple accounts at the same residential or post office box address. This practice is often called “householding” and it helps eliminate duplicate mailings to shareholders. Calvert funds, or your financial intermediary, may household the mailing of your documents indefinitely unless you instruct Calvert funds, or your financial intermediary, otherwise. If you would prefer that your Calvert fund documents not be householded, please contact Calvert funds at 1-800-368-2745, or contact your financial intermediary. Your instructions that householding not apply to delivery of your Calvert fund documents will typically be effective within 30 days of receipt by Calvert funds or your financial intermediary. Separate statements will be generated for each separate account and will be householded as described above.
Portfolio Holdings. Each Calvert fund files a schedule of portfolio holdings on Part F to Form N-PORT with the SEC. Certain information filed on Form N-PORT may be viewed on the Calvert website at www.calvert.com, by calling Calvert at 1-800-368-2745 or in the EDGAR database on the SEC’s website at www.sec.gov.
Proxy Voting. The Proxy Voting Guidelines that each Calvert fund uses to determine how to vote proxies relating to portfolio securities is provided as an Appendix to the fund’s Statement of Additional Information. The Statement of Additional Information can be obtained free of charge by calling the Calvert funds at 1-800-368-2745, by visiting the Calvert funds’ website at www.calvert.com or visiting the SEC’s website at www.sec.gov. Information regarding how a Calvert fund voted proxies relating to portfolio securities during the most recent 12-month period ended June 30 is available by calling Calvert funds, by visiting the Calvert funds’ website at www.calvert.com or by visiting the SEC’s website at www.sec.gov.
This Page Intentionally Left Blank
This Page Intentionally Left Blank
Investment Adviser and Administrator
Calvert Research and Management
1825 Connecticut Avenue NW, Suite 400
Washington, DC 20009
Investment Sub-Adviser
Hermes Investment Management Limited
150 Cheapside
London EC2V 6ET
Principal Underwriter*
Eaton Vance Distributors, Inc.
Two International Place
Boston, MA 02110
(617) 482-8260
Custodian
State Street Bank and Trust Company
State Street Financial Center, One Lincoln Street
Boston, MA 02111
Transfer Agent
DST Asset Manager Solutions, Inc.
2000 Crown Colony Drive
Quincy, MA 02169
Independent Registered Public Accounting Firm
Deloitte & Touche LLP
200 Berkeley Street
Boston, MA 02116-5022
Fund Offices
1825 Connecticut Avenue NW, Suite 400
Washington, DC 20009
* FINRA BrokerCheck. Investors may check the background of their Investment Professional by contacting the Financial Industry Regulatory Authority (FINRA). FINRA BrokerCheck is a free tool to help investors check the professional background of current and former FINRA-registered securities firms and brokers. FINRA BrokerCheck is available by calling 1-800-289-9999 and at www.FINRA.org. The FINRA BrokerCheck brochure describing this program is available to investors at www.FINRA.org.
Printed on recycled paper.
Calvert
International Equity Fund
Annual Report
September 30, 2021
Commodity Futures Trading Commission Registration. The Commodity Futures Trading Commission (“CFTC”) has adopted regulations that subject registered investment companies and advisers to regulation by the CFTC if a fund invests more than a prescribed level of its assets in certain CFTC-regulated instruments (including futures, certain options and swap agreements) or markets itself as providing investment exposure to such instruments. The adviser has claimed an exclusion from the definition of “commodity pool operator” under the Commodity Exchange Act with respect to its management of the Fund and the other funds it manages. Accordingly, neither the Fund nor the adviser is subject to CFTC regulation.
Fund shares are not insured by the FDIC and are not deposits or other obligations of, or guaranteed by, any depository institution. Shares are subject to investment risks, including possible loss of principal invested.
This report must be preceded or accompanied by a current summary prospectus or prospectus. Before investing, investors should consider carefully the investment objective, risks, and charges and expenses of a mutual fund. This and other important information is contained in the summary prospectus and prospectus, which can be obtained from a financial intermediary. Prospective investors should read the prospectus carefully before investing. For further information, please call 1-800-368-2745.
Choose Planet-friendly E-delivery!
Sign up now for on-line statements, prospectuses, and fund reports. In less than five minutes you can help reduce paper mail and lower fund costs.
Just go to www.calvert.com. If you already have an online account with the Calvert funds, click on Login to access your Account and select the documents you would like to receive via e-mail.
If you’re new to online account access, click on Login, then Register to create your user name and password. Once you’re in, click on the E-delivery sign-up on the Account Portfolio page and follow the quick, easy steps.
Note: If your shares are not held directly with the Calvert funds but through a brokerage firm, you must contact your broker for electronic delivery options available through their firm.
Annual Report September 30, 2021
Calvert
International Equity Fund
Calvert
International Equity Fund
September 30, 2021
Management's Discussion of Fund Performance†
Economic and Market Conditions
The 12-month period that began October 1, 2020 was notable for a widespread equity rally that started in November 2020, paused in January 2021, and then continued through the following summer. But in the final month of the period, negative economic news overwhelmed the investor optimism that had driven markets for much of the period. Stock prices in September 2021 declined in the U.S. and across the globe, with the S&P 500® Index enduring its worst month since March 2020.
For the period as a whole, however, broad-market stock indexes generally posted strong double-digit returns, as investors cheered the reopening of businesses that had been closed or hobbled by COVID-19, along with the rollout of several highly effective vaccines.
The virus, however, continued to have a firm grip on the global economy. Disease rates advanced and declined with third and fourth waves of COVID-19 infections. Worker shortages led to global supply chain issues. From computer chips to shipping containers, scarcities of key items led to temporary factory shutdowns and empty store shelves. In the U.S., those shortages — combined with high demand from consumers itching to spend money they had saved earlier in the pandemic — led to higher year-over-year inflation than the economy had seen in years. Although U.S. Federal Reserve (the Fed) Chairman Jerome Powell and Treasury Secretary Janet Yellen expressed the view that inflation would likely be transitory, inflation nonetheless became a key concern for investors during the period.
While the last month of the period began auspiciously — with both the S&P 500® Index and the Nasdaq Composite Index closing at all-time highs in the first days of September — the news for investors quickly turned negative. The Labor Department’s release of August job numbers showed only 235,000 jobs had been created — a significant slowdown from earlier in the summer. COVID-19 infections rose across the globe. After its September meeting, the Fed indicated it might start to taper its bond purchases — which had stimulated the economy earlier — and possibly raise interest rates in 2022, a year earlier than it had previously projected.
In China, the world’s second-largest economy, the Communist Party’s efforts to dial back capitalism and take more control of China’s surging technology sector were not applauded by global investors. The MSCI Golden Dragon Index, a measure of Chinese large-cap and mid-cap stocks, was one of the worst-performing major stock indexes for the one-year period, returning 5.32%.
Despite a rough September, most other indexes fared significantly better. The MSCI World Index, a broad measure of global equities, returned 28.82% for the 12 months ended September 30, 2021; while the S&P 500® Index, a broad measure of U.S. stocks, returned 30.00%; and the technology-laden Nasdaq Composite Index rose 30.26%. The MSCI EAFE Index of developed-market international equities returned 25.73%, while the MSCI Emerging Markets Index returned 18.20% during the period.
Fund Performance
For the 12-month period ended September 30, 2021, Calvert International Equity Fund (the Fund) returned 23.38% for Class A shares at net asset value (NAV), underperforming its benchmark, the MSCI EAFE Index (the Index), which returned 25.73%.
A rally in cyclical, lower quality stocks during the first half of the period — set off by the development of COVID-19 vaccines — led to underperformance because the Fund tends not to invest in these types of weaker business models that typically exhibit volatile and unpredictable earnings and share-price performance.
The Fund does not seek to outperform by favoring certain sectors or regions. Rather, the Fund focuses on a bottom-up stock selection strategy that prioritizes business-model strength, which leads to the Fund’s sector and geographical underweight and overweight positions.
Accordingly, the Fund’s customary lack of exposure to the energy sector — the strongest performing sector within the Index during the period — detracted from relative returns. An overweight exposure to the less cyclical health care sector — one of the weakest performing sectors within the Index for the full period — also weighed on performance. While stock selection overall contributed, selections in consumer staples and consumer discretionary detracted.
Selections in the health care, information technology (IT), and financials sectors were particularly beneficial. An overweight exposure to the strong IT sector and an underweight exposure to the less robust communication services sector enhanced performance relative to the Index during the period.
By region, stock selections were negative overall, but allocations were positive. Stock selections in Japan were particularly detrimental; however, an underweight exposure to the country partially offset the negative impact. Returns in Asia were generally weakened by slow vaccination rates and renewed lockdowns that sharply reduced tourism and offline retail sales.
Europe was one of the best-performing regions during the period. An overweight exposure to Europe and strong stock selections within the region were beneficial.
See Endnotes and Additional Disclosures in this report.
Past performance is no guarantee of future results. Returns are historical and are calculated by determining the percentage change in net asset value (NAV) or offering price (as applicable) with all distributions reinvested. Investment return and principal value will fluctuate so that shares, when redeemed, may be worth more or less than their original cost. Performance for periods less than or equal to one year is cumulative. Performance is for the stated time period only; due to market volatility, current Fund performance may be lower or higher than the quoted return. For performance as of the most recent month-end, please refer to www.calvert.com.
Calvert
International Equity Fund
September 30, 2021
Management's Discussion of Fund Performance† — continued
Two consumer staples companies, Kao Corp. (Kao) in Japan and Unilever Plc (Unilever) in Europe, were among the largest detractors to Fund performance as investors flocked to cyclical stocks and away from defensive sectors, including consumer staples, particularly during the first six months of the period. Stock prices for Kao and Unilever were also weakened by investor concerns that the companies might not be able to pass on rising costs for raw materials to customers.
London Stock Exchange Group Plc also detracted from returns as it found that the capital expenditures for its acquisition of financial technology company Refinitiv were significantly higher than anticipated.
LVMH Moet Hennessy Louis Vuitton SE, the world’s largest luxury goods company, contributed to returns relative to the Index during the period as affluent customers — with more money and time because of the pandemic — spent heavily online. KBC Group NV, a Belgian bank, performed well along with other bank stocks as investor optimism rose with the improving direction of the world economy.
The stock price of ASML Holding NV (ASML), a Dutch manufacturer of semiconductor equipment, rose as demand for semiconductors skyrocketed during the period. ASML was well positioned to benefit as it had a near monopoly on machines used to make the most advanced semiconductor chips.
See Endnotes and Additional Disclosures in this report.
Past performance is no guarantee of future results. Returns are historical and are calculated by determining the percentage change in net asset value (NAV) or offering price (as applicable) with all distributions reinvested. Investment return and principal value will fluctuate so that shares, when redeemed, may be worth more or less than their original cost. Performance for periods less than or equal to one year is cumulative. Performance is for the stated time period only; due to market volatility, current Fund performance may be lower or higher than the quoted return. For performance as of the most recent month-end, please refer to www.calvert.com.
Calvert
International Equity Fund
September 30, 2021
Performance
Portfolio Managers Christopher M. Dyer, CFA and Ian Kirwan, each of Eaton Vance Advisers International Ltd.
| % Average Annual Total Returns1,2 | Class
Inception Date | Performance
Inception Date | One Year | Five Years | Ten Years |
| Class A at NAV | 07/02/1992 | 07/02/1992 | 23.38% | 11.53% | 8.93% |
| Class A with 4.75% Maximum Sales Charge | — | — | 17.55 | 10.46 | 8.40 |
| Class C at NAV | 03/01/1994 | 07/02/1992 | 22.51 | 10.71 | 8.05 |
| Class C with 1% Maximum Sales Charge | — | — | 21.51 | 10.71 | 8.05 |
| Class I at NAV | 02/26/1999 | 07/02/1992 | 23.75 | 11.89 | 9.43 |
| Class R6 at NAV | 03/07/2019 | 07/02/1992 | 23.79 | 11.92 | 9.45 |
|
| MSCI EAFE Index | — | — | 25.73% | 8.81% | 8.09% |
| % Total Annual Operating Expense Ratios3 | Class A | Class C | Class I | Class R6 |
| Gross | 1.27% | 2.02% | 1.02% | 0.98% |
| Net | 1.14 | 1.89 | 0.89 | 0.85 |
Growth of $10,000
This graph shows the change in value of a hypothetical investment of $10,000 in Class A of the Fund for the period indicated. For comparison, the same investment is shown in the indicated index.
| Growth of Investment2 | Amount Invested | Period Beginning | At NAV | With Maximum Sales Charge |
| Class C | $10,000 | 09/30/2011 | $21,712 | N.A. |
| Class I | $250,000 | 09/30/2011 | $616,221 | N.A. |
| Class R6 | $1,000,000 | 09/30/2011 | $2,467,720 | N.A. |
See Endnotes and Additional Disclosures in this report.
Past performance is no guarantee of future results. Returns are historical and are calculated by determining the percentage change in net asset value (NAV) or offering price (as applicable) with all distributions reinvested. Investment return and principal value will fluctuate so that shares, when redeemed, may be worth more or less than their original cost. Performance for periods less than or equal to one year is cumulative. Performance is for the stated time period only; due to market volatility, current Fund performance may be lower or higher than the quoted return. For performance as of the most recent month-end, please refer to www.calvert.com.
Calvert
International Equity Fund
September 30, 2021
Sector Allocation (% of net assets)*
* Excludes cash and cash equivalents.
| Top 10 Holdings (% of net assets)* | |
| Nestle S.A. | 4.9% |
| ASML Holding NV | 3.2 |
| adidas AG | 3.2 |
| Unilever PLC | 3.0 |
| Schneider Electric SE | 3.0 |
| AstraZeneca PLC | 3.0 |
| Novo Nordisk A/S, Class B | 2.9 |
| Sanofi | 2.7 |
| RELX PLC | 2.6 |
| CRH PLC | 2.6 |
| Total | 31.1% |
| * | Excludes cash and cash equivalents. |
See Endnotes and Additional Disclosures in this report.
Calvert
International Equity Fund
September 30, 2021
Endnotes and Additional Disclosures
| † | The views expressed in this report are those of the portfolio manager(s) and are current only through the date stated at the top of this page. These views are subject to change at any time based upon market or other conditions, and Calvert and the Fund(s) disclaim any responsibility to update such views. These views may not be relied upon as investment advice and, because investment decisions are based on many factors, may not be relied upon as an indication of trading intent on behalf of any Calvert fund. This commentary may contain statements that are not historical facts, referred to as “forward-looking statements.” The Fund’s actual future results may differ significantly from those stated in any forward-looking statement, depending on factors such as changes in securities or financial markets or general economic conditions, the volume of sales and purchases of Fund shares, the continuation of investment advisory, administrative and service contracts, and other risks discussed from time to time in the Fund’s filings with the Securities and Exchange Commission. |
| | |
| 1 | MSCI EAFE Index is an unmanaged index of equities in the developed markets, excluding the U.S. and Canada. MSCI indexes are net of foreign withholding taxes. Source: MSCI. MSCI data may not be reproduced or used for any other purpose. MSCI provides no warranties, has not prepared or approved this report, and has no liability hereunder. Unless otherwise stated, index returns do not reflect the effect of any applicable sales charges, commissions, expenses, taxes or leverage, as applicable. It is not possible to invest directly in an index. |
| 2 | Total Returns at NAV do not include applicable sales charges. If sales charges were deducted, the returns would be lower. Total Returns shown with maximum sales charge reflect the stated maximum sales charge. Unless otherwise stated, performance does not reflect the deduction of taxes on Fund distributions or redemptions of Fund shares.Performance prior to the inception date of a class may be linked to the performance of an older class of the Fund. This linked performance is adjusted for any applicable sales charge, but is not adjusted for class expense differences. If adjusted for such differences, the performance would be different. The performance of Class R6 is linked to Class I. Performance presented in the Financial Highlights included in the financial statements is not linked.Calvert Research and Management became the investment adviser to the Fund on December 31, 2016. Performance reflected prior to such date is that of the Fund’s former investment adviser. |
| 3 | Source: Fund prospectus. Net expense ratios reflect a contractual expense reimbursement that continues through 1/31/22. Without the reimbursement, performance would have been lower. The expense ratios for the current reporting period can be found in the Financial Highlights section of this report. |
| Fund profile subject to change due to active management. |
| | Additional Information |
| | S&P 500® Index is an unmanaged index of large-cap stocks commonly used as a measure of U.S. stock market performance. S&P Dow Jones Indices are a product of S&P Dow Jones Indices LLC (“S&P DJI”) and have been licensed for use. S&P® and S&P 500® are registered trademarks of S&P DJI; Dow Jones® is a registered trademark of Dow Jones Trademark Holdings LLC (“Dow Jones”); S&P DJI, Dow Jones and their respective affiliates do not sponsor, endorse, sell or promote the Fund, will not have any liability with respect thereto and do not have any liability for any errors, omissions, or interruptions of the S&P Dow Jones Indices. Nasdaq Composite Index is a market capitalization-weighted index of all domestic and international securities listed on Nasdaq. Source: Nasdaq, Inc. The information is provided by Nasdaq (with its affiliates, are referred to as the “Corporations”) and Nasdaq’s third party licensors on an “as is” basis and the Corporations make no guarantees and bear no liability of any kind with respect to the information or the Fund. MSCI Golden Dragon Index is an unmanaged index of common stocks traded in China, Hong Kong and Taiwan. MSCI World Index is an unmanaged index of equity securities in the developed markets. MSCI Emerging Markets Index is an unmanaged index of emerging markets common stocks. |
Calvert
International Equity Fund
September 30, 2021
Example
As a Fund shareholder, you incur two types of costs: (1) transaction costs, including sales charges (loads) on purchases and redemption fees (if applicable); and (2) ongoing costs, including management fees; distribution and/or service fees; and other Fund expenses. This Example is intended to help you understand your ongoing costs (in dollars) of Fund investing and to compare these costs with the ongoing costs of investing in other mutual funds. The Example is based on an investment of $1,000 invested at the beginning of the period and held for the entire period (April 1, 2021 to September 30, 2021).
Actual Expenses
The first section of the table below provides information about actual account values and actual expenses. You may use the information in this section, together with the amount you invested, to estimate the expenses that you paid over the period. Simply divide your account value by $1,000 (for example, an $8,600 account value divided by $1,000 = 8.6), then multiply the result by the number in the first section under the heading entitled “Expenses Paid During Period” to estimate the expenses you paid on your account during this period.
Hypothetical Example for Comparison Purposes
The second section of the table below provides information about hypothetical account values and hypothetical expenses based on the actual Fund expense ratio and an assumed rate of return of 5% per year (before expenses), which is not the actual Fund return. The hypothetical account values and expenses may not be used to estimate the actual ending account balance or expenses you paid for the period. You may use this information to compare the ongoing costs of investing in the Fund and other funds. To do so, compare this 5% hypothetical example with the 5% hypothetical examples that appear in the shareholder reports of the other funds.
Please note that the expenses shown in the table are meant to highlight your ongoing costs only and do not reflect any transactional costs, such as sales charges (loads) or redemption fees (if applicable). Therefore, the second section of the table is useful in comparing ongoing costs only, and will not help you determine the relative total costs of owning different funds. In addition, if these transactional costs were included, your costs would be higher.
| | Beginning
Account Value
(4/1/21) | Ending
Account Value
(9/30/21) | Expenses Paid
During Period*
(4/1/21 – 9/30/21) | Annualized
Expense
Ratio |
| Actual | | | | |
| Class A | $1,000.00 | $1,057.80 | $5.88 ** | 1.14% |
| Class C | $1,000.00 | $1,054.00 | $9.73 ** | 1.89% |
| Class I | $1,000.00 | $1,059.20 | $4.59 ** | 0.89% |
| Class R6 | $1,000.00 | $1,059.70 | $4.39 ** | 0.85% |
| Hypothetical | | | | |
| (5% return per year before expenses) | | | | |
| Class A | $1,000.00 | $1,019.35 | $5.77 ** | 1.14% |
| Class C | $1,000.00 | $1,015.59 | $9.55 ** | 1.89% |
| Class I | $1,000.00 | $1,020.61 | $4.51 ** | 0.89% |
| Class R6 | $1,000.00 | $1,020.81 | $4.31 ** | 0.85% |
| * | Expenses are equal to the Fund's annualized expense ratio for the indicated Class, multiplied by the average account value over the period, multiplied by 183/365 (to reflect the one-half year period). The Example assumes that the $1,000 was invested at the net asset value per share determined at the close of business on March 31, 2021. |
| ** | Absent a waiver and/or reimbursement of expenses by affiliates, expenses would be higher. |
Calvert
International Equity Fund
September 30, 2021
| Security | Shares | Value |
| Australia — 2.4% | |
| CSL, Ltd. | | 100,482 | $ 20,993,817 |
| | | | $ 20,993,817 |
| Belgium — 2.4% | |
| KBC Group NV | | 238,112 | $ 21,478,761 |
| | | | $ 21,478,761 |
| Denmark — 2.9% | |
| Novo Nordisk A/S, Class B | | 268,691 | $ 25,898,990 |
| | | | $ 25,898,990 |
| France — 12.3% | |
| Dassault Systemes SE | | 351,209 | $ 18,482,553 |
| LVMH Moet Hennessy Louis Vuitton SE | | 28,098 | 20,125,575 |
| Safran S.A. | | 154,873 | 19,588,431 |
| Sanofi | | 247,336 | 23,809,553 |
| Schneider Electric SE | | 158,839 | 26,455,250 |
| | | | $108,461,362 |
| Germany — 4.6% | |
| adidas AG | | 89,110 | $ 28,003,390 |
| Infineon Technologies AG | | 308,410 | 12,613,404 |
| | | | $ 40,616,794 |
| Hong Kong — 2.5% | |
| AIA Group, Ltd. | | 1,870,870 | $ 21,523,237 |
| | | | $ 21,523,237 |
| India — 2.0% | |
| HDFC Bank, Ltd. | | 839,453 | $ 17,922,407 |
| | | | $ 17,922,407 |
| Ireland — 8.4% | |
| CRH PLC | | 477,682 | $ 22,544,128 |
| DCC PLC | | 228,105 | 19,016,175 |
| Kerry Group PLC, Class A | | 121,152 | 16,276,500 |
| Kingspan Group PLC | | 165,689 | 16,527,360 |
| | | | $ 74,364,163 |
| Japan — 14.5% | |
| Kao Corp. | | 290,541 | $ 17,291,130 |
| Keyence Corp. | | 24,367 | 14,543,956 |
| Kose Corp. | | 119,100 | 14,243,798 |
| Olympus Corp. | | 780,600 | 17,085,756 |
| Pan Pacific International Holdings Corp. | | 572,000 | 11,802,267 |
| Recruit Holdings Co., Ltd. | | 321,107 | 19,627,929 |
| SMC Corp. | | 22,600 | 14,100,367 |
| Security | Shares | Value |
| Japan (continued) | |
| Yamaha Corp. | | 299,400 | $ 18,832,878 |
| | | | $127,528,081 |
| Netherlands — 3.2% | |
| ASML Holding NV | | 38,066 | $ 28,437,517 |
| | | | $ 28,437,517 |
| New Zealand — 1.3% | |
| Fisher & Paykel Healthcare Corp., Ltd. | | 532,962 | $ 11,722,857 |
| | | | $ 11,722,857 |
| Norway — 2.5% | |
| DNB Bank ASA | | 967,385 | $ 21,993,190 |
| | | | $ 21,993,190 |
| Singapore — 2.0% | |
| DBS Group Holdings, Ltd. | | 797,128 | $ 17,663,248 |
| | | | $ 17,663,248 |
| South Africa — 1.0% | |
| Vodacom Group ,Ltd. | | 929,091 | $ 8,900,550 |
| | | | $ 8,900,550 |
| Spain — 4.4% | |
| Amadeus IT Group S.A.(1) | | 287,212 | $ 18,890,442 |
| Iberdrola S.A. | | 1,951,925 | 19,637,200 |
| | | | $ 38,527,642 |
| Sweden — 5.0% | |
| Assa Abloy AB, Class B | | 482,262 | $ 13,988,783 |
| Indutrade AB | | 428,871 | 11,926,145 |
| Svenska Handelsbanken AB, Class A | | 1,610,971 | 18,041,906 |
| | | | $ 43,956,834 |
| Switzerland — 8.7% | |
| Lonza Group AG | | 29,330 | $ 22,000,708 |
| Nestle S.A. | | 358,458 | 43,190,611 |
| Straumann Holding AG | | 6,393 | 11,465,595 |
| | | | $ 76,656,914 |
| Taiwan — 1.3% | |
| Taiwan Semiconductor Manufacturing Co., Ltd. ADR | | 104,647 | $ 11,683,837 |
| | | | $ 11,683,837 |
| United Kingdom — 17.4% | |
| Abcam PLC(1) | | 576,783 | $ 11,560,688 |
| AstraZeneca PLC | | 219,104 | 26,405,917 |
| Compass Group PLC(1) | | 901,319 | 18,433,031 |
| Halma PLC | | 410,106 | 15,642,879 |
8
See Notes to Financial Statements.
Calvert
International Equity Fund
September 30, 2021
Schedule of Investments — continued
| Security | Shares | Value |
| United Kingdom (continued) | |
| London Stock Exchange Group PLC | | 190,340 | $ 19,073,620 |
| RELX PLC | | 793,571 | 22,843,922 |
| Unilever PLC | | 491,907 | 26,631,022 |
| Weir Group PLC (The)(1) | | 591,520 | 13,352,665 |
| | | | $153,943,744 |
Total Common Stocks
(identified cost $710,760,600) | | | $872,273,945 |
| High Social Impact Investments — 0.1% |
| Security | Principal
Amount
(000's omitted) | Value |
| Calvert Impact Capital, Inc., Community Investment Notes, 1.50%, 12/15/23(2)(3) | $ | 880 | $ 864,890 |
| ImpactAssets, Inc., Global Sustainable Agriculture Notes, 0.00%, 11/3/22(3)(4) | | 220 | 209,220 |
| ImpactAssets, Inc., Microfinance Plus Notes, 0.00%, 11/3/22(3)(4) | | 283 | 259,005 |
Total High Social Impact Investments
(identified cost $1,383,000) | | | $ 1,333,115 |
| Preferred Stocks — 0.0%(5) |
| Security | Shares | Value |
| Venture Capital — 0.0%(5) | |
| Bioceptive, Inc.: | | | |
| Series A(1)(3)(6) | | 582,574 | $ 0 |
| Series B(1)(3)(6) | | 40,523 | 0 |
| FINAE, Series D(1)(3)(6) | | 2,597,442 | 125,836 |
Total Preferred Stocks
(identified cost $491,304) | | | $ 125,836 |
| Venture Capital Limited Partnership Interests — 0.2% |
| Security | | | Value |
| Africa Renewable Energy Fund L.P.(1)(3)(6) | | | $ 1,165,380 |
| Blackstone Clean Technology Partners L.P.(1)(3)(6) | | | 0 |
| Emerald Sustainability Fund I L.P.(1)(3)(6) | | | 60,010 |
| gNet Defta Development Holding LLC(1)(2)(3)(6) | | | 231,604 |
| SEAF India International Growth Fund L.P.(1)(3)(6) | | | 2,513 |
Total Venture Capital Limited Partnership Interests
(identified cost $2,045,663) | | | $ 1,459,507 |
| Short-Term Investments — 0.6% |
| Description | Units | Value |
| Calvert Cash Reserves Fund, LLC, 0.04%(7) | | 5,634,992 | $ 5,635,556 |
Total Short-Term Investments
(identified cost $5,634,992) | | | $ 5,635,556 |
Total Investments — 99.7%
(identified cost $720,315,559) | | $880,827,959 |
| Other Assets, Less Liabilities — 0.3% | | $ 2,338,845 |
| Net Assets — 100.0% | | $883,166,804 |
| The percentage shown for each investment category in the Schedule of Investments is based on net assets. |
| (1) | Non-income producing security. |
| (2) | May be deemed to be an affiliated company (see Note 8). |
| (3) | Restricted security. Total market value of restricted securities amounts to $2,918,458, which represents 0.3% of the net assets of the Fund as of September 30, 2021. |
| (4) | Notes carry an interest rate that varies by period and is contingent on the performance of the underlying portfolio of loans to borrowers. The coupon rate shown represents the rate in effect at September 30, 2021. |
| (5) | Amount is less than 0.05%. |
| (6) | For fair value measurement disclosure purposes, security is categorized as Level 3 (see Note 1A). |
| (7) | Affiliated investment company, available to Calvert portfolios and funds, which invests in high quality, U.S. dollar denominated money market instruments. The rate shown is the annualized seven-day yield as of September 30, 2021. |
At September 30, 2021, the concentration of the Fund’s investments in the various sectors, determined as a percentage of net assets, was as follows:
| Economic Sectors | % of Net Assets |
| Industrials | 20.1% |
| Health Care | 19.4 |
| Financials | 15.6 |
| Information Technology | 13.6 |
| Consumer Staples | 13.3 |
| Consumer Discretionary | 11.0 |
| Materials | 2.6 |
| Utilities | 2.2 |
| Communication Services | 1.0 |
| Venture Capital | 0.2 |
| High Social Impact Investments | 0.1 |
| Total | 99.1% |
9
See Notes to Financial Statements.
Calvert
International Equity Fund
September 30, 2021
Schedule of Investments — continued
Restricted Securities
| Description | Acquisition Dates | Cost |
| Africa Renewable Energy Fund L.P. | 4/17/14-5/13/19 | $986,557 |
| Bioceptive, Inc., Series A | 10/26/12-12/18/13 | 252,445 |
| Bioceptive, Inc., Series B | 1/7/16 | 16,250 |
| Blackstone Clean Technology Partners L.P. | 7/29/10-6/25/15 | 62,975 |
| Calvert Impact Capital, Inc., Community Investment Notes, 1.50%, 12/15/23 | 12/14/20 | 880,000 |
| Emerald Sustainability Fund I L.P. | 7/19/01-5/17/11 | 393,935 |
| FINAE, Series D | 2/28/11-11/16/15 | 222,609 |
| gNet Defta Development Holding LLC | 8/30/05 | 400,000 |
| ImpactAssets, Inc., Global Sustainable Agriculture Notes, 0.00%, 11/3/22 | 11/13/15 | 220,000 |
| ImpactAssets, Inc., Microfinance Plus Notes, 0.00%, 11/3/22 | 11/13/15 | 283,000 |
| SEAF India International Growth Fund L.P. | 3/22/05-5/24/10 | 202,196 |
| Abbreviations: |
| ADR | – American Depositary Receipt |
10
See Notes to Financial Statements.
Calvert
International Equity Fund
September 30, 2021
Statement of Assets and Liabilities
| | September 30, 2021 |
| Assets | |
| Investments in securities of unaffiliated issuers, at value (identified cost $713,400,567) | $ 874,095,909 |
| Investments in securities of affiliated issuers, at value (identified cost $6,914,992) | 6,732,050 |
| Cash | 8,657,496 |
| Cash denominated in foreign currency, at value (cost $3,282,852) | 3,214,310 |
| Receivable for capital shares sold | 2,109,194 |
| Dividends and interest receivable | 445,554 |
| Dividends and interest receivable - affiliated | 10,589 |
| Tax reclaims receivable | 874,460 |
| Receivable from affiliates | 18,630 |
| Directors' deferred compensation plan | 131,519 |
| Other assets | 1,077 |
| Total assets | $896,290,788 |
| Liabilities | |
| Payable for investments purchased | $ 3,018,841 |
| Payable for capital shares redeemed | 333,913 |
| Payable to affiliates: | |
| Investment advisory fee | 502,330 |
| Administrative fee | 91,031 |
| Distribution and service fees | 47,443 |
| Sub-transfer agency fee | 15,120 |
| Directors' deferred compensation plan | 131,519 |
| Accrued expenses | 326,291 |
| Other liabilities | 8,657,496 |
| Total liabilities | $ 13,123,984 |
| Commitments and contingent liabilities (Note 11) | |
| Net Assets | $883,166,804 |
| Sources of Net Assets | |
| Paid-in capital | $ 678,539,628 |
| Distributable earnings | 204,627,176 |
| Total | $883,166,804 |
| Class A Shares | |
| Net Assets | $ 190,998,039 |
| Shares Outstanding | 7,620,727 |
Net Asset Value and Redemption Price Per Share
(net assets ÷ shares of beneficial interest outstanding) | $ 25.06 |
Maximum Offering Price Per Share
(100 ÷ 95.25 of net asset value per share) | $ 26.31 |
| Class C Shares | |
| Net Assets | $ 7,484,871 |
| Shares Outstanding | 351,798 |
Net Asset Value and Offering Price Per Share*
(net assets ÷ shares of beneficial interest outstanding) | $ 21.28 |
11
See Notes to Financial Statements.
Calvert
International Equity Fund
September 30, 2021
Statement of Assets and Liabilities — continued
| | September 30, 2021 |
| Class I Shares | |
| Net Assets | $524,520,737 |
| Shares Outstanding | 19,552,321 |
Net Asset Value, Offering Price and Redemption Price Per Share
(net assets ÷ shares of beneficial interest outstanding) | $ 26.83 |
| Class R6 Shares | |
| Net Assets | $160,163,157 |
| Shares Outstanding | 5,976,780 |
Net Asset Value, Offering Price and Redemption Price Per Share
(net assets ÷ shares of beneficial interest outstanding) | $ 26.80 |
| On sales of $50,000 or more, the offering price of Class A shares is reduced. |
| * | Redemption price per share is equal to the net asset value less any applicable contingent deferred sales charge. |
12
See Notes to Financial Statements.
Calvert
International Equity Fund
September 30, 2021
| | Year Ended |
| | September 30, 2021 |
| Investment Income | |
| Dividend income (net of foreign taxes withheld of $1,215,653) | $ 11,143,960 |
| Dividend income - affiliated issuers | 4,780 |
| Non-cash dividend income | 880,221 |
| Interest income | 1,423 |
| Interest income - affiliated issuers | 13,238 |
| Securities lending income, net | 93,059 |
| Total investment income | $ 12,136,681 |
| Expenses | |
| Investment advisory fee | $ 5,339,599 |
| Administrative fee | 965,003 |
| Distribution and service fees: | |
| Class A | 440,843 |
| Class C | 70,565 |
| Directors' fees and expenses | 34,602 |
| Custodian fees | 90,157 |
| Transfer agency fees and expenses | 737,733 |
| Accounting fees | 188,294 |
| Professional fees | 55,412 |
| Registration fees | 134,292 |
| Reports to shareholders | 37,653 |
| Miscellaneous | 57,748 |
| Total expenses | $ 8,151,901 |
| Waiver and/or reimbursement of expenses by affiliates | $ (517,664) |
| Net expenses | $ 7,634,237 |
| Net investment income | $ 4,502,444 |
| Realized and Unrealized Gain (Loss) | |
| Net realized gain (loss): | |
| Investment securities (net of foreign capital gains taxes of $55,658) | $ 56,563,435 |
| Investment securities - affiliated issuers | (5) |
| Foreign currency transactions | (121,719) |
| Net realized gain | $ 56,441,711 |
| Change in unrealized appreciation (depreciation): | |
| Investment securities | $ 86,944,550 |
| Investment securities - affiliated issuers | (18,432) |
| Foreign currency | (22,446) |
| Net change in unrealized appreciation (depreciation) | $ 86,903,672 |
| Net realized and unrealized gain | $143,345,383 |
| Net increase in net assets from operations | $147,847,827 |
13
See Notes to Financial Statements.
Calvert
International Equity Fund
September 30, 2021
Statements of Changes in Net Assets
| | Year Ended September 30, |
| | 2021 | 2020 |
| Increase (Decrease) in Net Assets | | |
| From operations: | | |
| Net investment income | $ 4,502,444 | $ 1,879,111 |
| Net realized gain | 56,441,711 | 7,589,596 |
| Net change in unrealized appreciation (depreciation) | 86,903,672 | 46,817,542 |
| Net increase in net assets from operations | $147,847,827 | $ 56,286,249 |
| Distributions to shareholders: | | |
| Class A | $ (313,091) | $ (1,227,749) |
| Class C | — | (23,398) |
| Class I | (1,619,435) | (1,178,120) |
| Class R6 | (712,823) | (769,016) |
| Total distributions to shareholders | $ (2,645,349) | $ (3,198,283) |
| Capital share transactions: | | |
| Class A | $ 18,954,832 | $ 11,502,065 |
| Class C | 5,633 | (608,336) |
| Class I | 164,196,275 | 169,404,832 |
| Class R6 | 8,652,717 | 62,129,683 |
| Net increase in net assets from capital share transactions | $191,809,457 | $242,428,244 |
| Net increase in net assets | $337,011,935 | $295,516,210 |
| Net Assets | | |
| At beginning of year | $ 546,154,869 | $ 250,638,659 |
| At end of year | $883,166,804 | $546,154,869 |
14
See Notes to Financial Statements.
Calvert
International Equity Fund
September 30, 2021
| | Class A |
| | Year Ended September 30, |
| | 2021 | 2020 | 2019 | 2018 | 2017 |
| Net asset value — Beginning of year | $ 20.35 | $ 18.18 | $ 17.53 | $ 17.10 | $ 15.49 |
| Income (Loss) From Operations | | | | | |
| Net investment income(1) | $ 0.08 | $ 0.06 | $ 0.22 | $ 0.19 | $ 0.17 |
| Net realized and unrealized gain | 4.67 | 2.30 | 0.61 | 0.50 | 1.84 |
| Total income from operations | $ 4.75 | $ 2.36 | $ 0.83 | $ 0.69 | $ 2.01 |
| Less Distributions | | | | | |
| From net investment income | $ (0.04) | $ (0.19) | $ (0.18) | $ (0.26) | $ (0.40) |
| Total distributions | $ (0.04) | $ (0.19) | $ (0.18) | $ (0.26) | $ (0.40) |
| Net asset value — End of year | $ 25.06 | $ 20.35 | $ 18.18 | $ 17.53 | $ 17.10 |
| Total Return(2) | 23.38% | 13.02% | 4.93% | 4.02% | 13.43% |
| Ratios/Supplemental Data | | | | | |
| Net assets, end of year (000’s omitted) | $190,998 | $138,810 | $112,923 | $114,915 | $126,669 |
| Ratios (as a percentage of average daily net assets):(3) | | | | | |
| Total expenses | 1.20% | 1.27% | 1.46% | 1.47% | 1.58% |
| Net expenses | 1.14% | 1.14% | 1.27% | 1.32% | 1.35% |
| Net investment income | 0.34% | 0.33% | 1.26% | 1.09% | 1.08% |
| Portfolio Turnover | 38% | 47% | 51% | 48% | 138% |
| (1) | Computed using average shares outstanding. |
| (2) | Returns are historical and are calculated by determining the percentage change in net asset value with all distributions reinvested and do not reflect the effect of sales charges, if any. |
| (3) | Total expenses do not reflect amounts reimbursed and/or waived by the adviser and certain of its affiliates, if applicable. Net expenses are net of all reductions and represent the net expenses paid by the Fund. |
15
See Notes to Financial Statements.
Calvert
International Equity Fund
September 30, 2021
Financial Highlights — continued
| | Class C |
| | Year Ended September 30, |
| | 2021 | 2020 | 2019 | 2018 | 2017 |
| Net asset value — Beginning of year | $ 17.37 | $ 15.54 | $ 15.00 | $ 14.68 | $ 13.31 |
| Income (Loss) From Operations | | | | | |
| Net investment income (loss)(1) | $ (0.09) | $ (0.07) | $ 0.03 | $ 0.06 | $ 0.05 |
| Net realized and unrealized gain | 4.00 | 1.96 | 0.58 | 0.42 | 1.59 |
| Total income from operations | $ 3.91 | $ 1.89 | $ 0.61 | $ 0.48 | $ 1.64 |
| Less Distributions | | | | | |
| From net investment income | $ — | $ (0.06) | $ (0.07) | $ (0.16) | $ (0.27) |
| Total distributions | $ — | $ (0.06) | $ (0.07) | $ (0.16) | $ (0.27) |
| Net asset value — End of year | $21.28 | $17.37 | $15.54 | $ 15.00 | $ 14.68 |
| Total Return(2) | 22.51% | 12.17% | 4.15% | 3.23% | 12.60% |
| Ratios/Supplemental Data | | | | | |
| Net assets, end of year (000’s omitted) | $ 7,485 | $ 6,157 | $ 6,122 | $11,149 | $12,013 |
| Ratios (as a percentage of average daily net assets):(3) | | | | | |
| Total expenses | 1.95% | 2.02% | 2.21% | 2.22% | 2.54% |
| Net expenses | 1.89% | 1.89% | 2.03% | 2.07% | 2.10% |
| Net investment income (loss) | (0.42)% | (0.43)% | 0.23% | 0.39% | 0.35% |
| Portfolio Turnover | 38% | 47% | 51% | 48% | 138% |
| (1) | Computed using average shares outstanding. |
| (2) | Returns are historical and are calculated by determining the percentage change in net asset value with all distributions reinvested and do not reflect the effect of sales charges, if any. |
| (3) | Total expenses do not reflect amounts reimbursed and/or waived by the adviser and certain of its affiliates, if applicable. Net expenses are net of all reductions and represent the net expenses paid by the Fund. |
16
See Notes to Financial Statements.
Calvert
International Equity Fund
September 30, 2021
Financial Highlights — continued
| | Class I |
| | Year Ended September 30, |
| | 2021 | 2020 | 2019 | 2018 | 2017 |
| Net asset value — Beginning of year | $ 21.77 | $ 19.43 | $ 18.72 | $ 18.24 | $ 16.53 |
| Income (Loss) From Operations | | | | | |
| Net investment income(1) | $ 0.16 | $ 0.13 | $ 0.28 | $ 0.27 | $ 0.21 |
| Net realized and unrealized gain | 5.00 | 2.45 | 0.66 | 0.53 | 2.01 |
| Total income from operations | $ 5.16 | $ 2.58 | $ 0.94 | $ 0.80 | $ 2.22 |
| Less Distributions | | | | | |
| From net investment income | $ (0.10) | $ (0.24) | $ (0.23) | $ (0.32) | $ (0.51) |
| Total distributions | $ (0.10) | $ (0.24) | $ (0.23) | $ (0.32) | $ (0.51) |
| Net asset value — End of year | $ 26.83 | $ 21.77 | $ 19.43 | $ 18.72 | $ 18.24 |
| Total Return(2) | 23.75% | 13.31% | 5.25% | 4.37% | 13.89% |
| Ratios/Supplemental Data | | | | | |
| Net assets, end of year (000’s omitted) | $524,521 | $279,039 | $82,261 | $64,739 | $72,503 |
| Ratios (as a percentage of average daily net assets):(3) | | | | | |
| Total expenses | 0.95% | 1.02% | 1.20% | 1.22% | 1.06% |
| Net expenses | 0.89% | 0.89% | 0.98% | 0.95% | 0.96% |
| Net investment income | 0.63% | 0.61% | 1.52% | 1.44% | 1.28% |
| Portfolio Turnover | 38% | 47% | 51% | 48% | 138% |
| (1) | Computed using average shares outstanding. |
| (2) | Returns are historical and are calculated by determining the percentage change in net asset value with all distributions reinvested and do not reflect the effect of sales charges, if any. |
| (3) | Total expenses do not reflect amounts reimbursed and/or waived by the adviser and certain of its affiliates, if applicable. Net expenses are net of all reductions and represent the net expenses paid by the Fund. |
17
See Notes to Financial Statements.
Calvert
International Equity Fund
September 30, 2021
Financial Highlights — continued
| | Class R6 |
| | Year Ended September 30, | Period Ended
September 30, |
| | 2021 | 2020 | 2019 (1) |
| Net asset value — Beginning of period | $ 21.76 | $ 19.44 | $ 17.79 |
| Income (Loss) From Operations | | | |
| Net investment income(2) | $ 0.16 | $ 0.13 | $ 0.28 |
| Net realized and unrealized gain | 5.00 | 2.46 | 1.37 |
| Total income from operations | $ 5.16 | $ 2.59 | $ 1.65 |
| Less Distributions | | | |
| From net investment income | $ (0.12) | $ (0.27) | $ — |
| Total distributions | $ (0.12) | $ (0.27) | $ — |
| Net asset value — End of period | $ 26.80 | $ 21.76 | $ 19.44 |
| Total Return(3) | 23.79% | 13.34% | 9.27% (4) |
| Ratios/Supplemental Data | | | |
| Net assets, end of period (000’s omitted) | $160,163 | $122,150 | $49,332 |
| Ratios (as a percentage of average daily net assets):(5) | | | |
| Total expenses | 0.91% | 0.98% | 1.14% (6) |
| Net expenses | 0.85% | 0.85% | 0.96% (6) |
| Net investment income | 0.63% | 0.64% | 2.62% (6) |
| Portfolio Turnover | 38% | 47% | 51% (7) |
| (1) | For the period from the commencement of operations, March 7, 2019, to September 30, 2019. |
| (2) | Computed using average shares outstanding. |
| (3) | Returns are historical and are calculated by determining the percentage change in net asset value with all distributions reinvested and do not reflect the effect of sales charges, if any. |
| (4) | Not annualized. |
| (5) | Total expenses do not reflect amounts reimbursed and/or waived by the adviser and certain of its affiliates, if applicable. Net expenses are net of all reductions and represent the net expenses paid by the Fund. |
| (6) | Annualized. |
| (7) | For the year ended September 30, 2019. |
18
See Notes to Financial Statements.
Calvert
International Equity Fund
September 30, 2021
Notes to Financial Statements
1 Significant Accounting Policies
Calvert International Equity Fund (the Fund) is a diversified series of Calvert World Values Fund, Inc. (the Corporation). The Corporation is a Maryland corporation registered under the Investment Company Act of 1940, as amended (the 1940 Act), as an open-end management investment company. The investment objective of the Fund is to seek to provide a high total return consistent with reasonable risk by investing primarily in a diversified portfolio of stocks. The Fund invests primarily in equity securities of foreign companies.
The Fund offers four classes of shares. Class A shares are generally sold subject to a sales charge imposed at time of purchase. A contingent deferred sales charge of 0.80% may apply to certain redemptions of Class A shares for accounts for which no sales charge was paid, if redeemed within 12 months of purchase. Class C shares are sold without a front-end sales charge, and with certain exceptions, are charged a contingent deferred sales charge of 1% on shares redeemed within 12 months of purchase. Class C shares are only available for purchase through a financial intermediary. Effective January 25, 2019, Class C shares generally automatically convert to Class A shares ten years after their purchase and, effective November 5, 2020, automatically convert to Class A shares eight years after their purchase as described in the Fund's prospectus. Class I and Class R6 shares are sold at net asset value, are not subject to a sales charge and are sold only to certain eligible investors. Each class represents a pro rata interest in the Fund, but votes separately on class-specific matters and is subject to different expenses.
The Fund applies the accounting and reporting guidance in the Financial Accounting Standards Board (FASB) Accounting Standards Codification Topic 946, Financial Services – Investment Companies (ASC 946). Subsequent events, if any, through the date that the financial statements were issued have been evaluated in the preparation of the financial statements.
A Investment Valuation— Net asset value per share is determined every business day as of the close of the regular session of the New York Stock Exchange (generally 4:00 p.m. Eastern time). The Fund uses independent pricing services approved by the Board of Directors (the Board) to value its investments wherever possible. Investments for which market quotations are not available or deemed not reliable are fair valued in good faith under the direction of the Board.
U.S. generally accepted accounting principles (U.S. GAAP) establishes a disclosure hierarchy that categorizes the inputs to valuation techniques used to value assets and liabilities at measurement date. These inputs are summarized in the three broad levels listed below:
Level 1 - quoted prices in active markets for identical securities
Level 2 - other significant observable inputs (including quoted prices for similar securities, interest rates, prepayment speeds, credit risk, etc.)
Level 3 - significant unobservable inputs (including the Fund’s own assumptions in determining the fair value of investments)
The inputs or methodologies used for valuing securities are not necessarily an indication of the risk associated with investing in those securities.
Valuation techniques used to value the Fund’s investments by major category are as follows:
Equity Securities. Equity securities (including warrants and rights) listed on a U.S. securities exchange generally are valued at the last sale or closing price as reported by an independent pricing service on the primary market or exchange on which they are traded and are categorized as Level 1 in the hierarchy. Equity securities listed on the NASDAQ National Market System are valued at the NASDAQ official closing price and are categorized as Level 1 in the hierarchy. Unlisted or listed securities for which closing sales prices or closing quotations are not available are valued at the mean between the latest available bid and ask prices and are categorized as Level 2 in the hierarchy. The daily valuation of exchange-traded foreign securities generally is determined as of the close of trading on the principal exchange on which such securities trade. Events occurring after the close of trading on foreign exchanges may result in adjustments to the valuation of foreign securities to more accurately reflect their fair value as of the close of regular trading on the New York Stock Exchange. When valuing foreign equity securities that meet certain criteria, the Fund’s Board has approved the use of a fair value service that values such securities to reflect market trading that occurs after the close of the applicable foreign markets of comparable securities or other instruments that have a strong correlation to the fair-valued securities. Such securities are categorized as Level 2 in the hierarchy.
Debt Securities. Debt securities are generally valued based on valuations provided by third party pricing services, as derived from such services’ pricing models. Inputs to the models may include, but are not limited to, reported trades, executable bid and ask prices, broker/dealer quotations, prices or yields of securities with similar characteristics, interest rates, anticipated prepayments, benchmark curves or information pertaining to the issuer, as well as industry and economic events. Accordingly, debt securities are generally categorized as Level 2 in the hierarchy. Short-term debt securities with a remaining maturity at time of purchase of more than sixty days are valued based on valuations provided by a third party pricing service. Such securities are generally categorized as Level 2 in the hierarchy. Short-term debt securities of sufficient credit quality purchased with remaining maturities of sixty days or less for which a valuation from a third party pricing service is not readily available may be valued at amortized cost, which approximates fair value, and are categorized as Level 2 in the hierarchy.
Venture Capital Securities. Venture capital securities for which market quotations are not readily available are generally categorized as Level 3 in the hierarchy. Venture capital equity securities are generally valued using the most appropriate and applicable method to measure fair value in light of each company’s situation. Methods may include market, income, options-pricing or cost approaches with discounts as appropriate based on assumptions of liquidation or exit risk. Examples of the market approach are subsequent rounds of financing, comparable transactions, and revenue times an industry multiple. An example of the income approach is the discounted cash flow model. Examples of the cost approach are replacement cost, salvage value, or
Calvert
International Equity Fund
September 30, 2021
Notes to Financial Statements — continued
net asset value. The options-pricing method treats common stock and preferred stock as call options on the enterprise value with strike price based on the preferred stock liquidation preference. Venture capital limited partnership interests are valued at the fair value reported by the general partner of the partnership, adjusted as necessary to reflect subsequent capital calls and distributions and any other available information. In some cases, adjustments may be made to account for daily pricing of material public holdings within the partnership.
Affiliated Fund. The Fund may invest in Calvert Cash Reserves Fund, LLC (Cash Reserves Fund), an affiliated investment company managed by Calvert Research and Management (CRM). While Cash Reserves Fund is not a registered money market mutual fund, it conducts all of its investment activities in accordance with the requirements of Rule 2a-7 under the 1940 Act. Investments in Cash Reserves Fund are valued at the closing net asset value per unit on the valuation day and are categorized as Level 2 in the hierarchy. Cash Reserves Fund generally values its investment securities based on available market quotations provided by a third party pricing service.
Other Securities. Investments in registered investment companies (including money market funds) that do not trade on an exchange are valued at the net asset value per share on the valuation day and are categorized as Level 1 in the hierarchy.
Fair Valuation. If a market value cannot be determined for a security using the methodologies described above, or if, in the good faith opinion of the Fund's adviser, the market value does not constitute a readily available market quotation, or if a significant event has occurred that would materially affect the value of the security, the security will be fair valued as determined in good faith by or at the direction of the Board in a manner that most fairly reflects the security’s “fair value”, which is the amount that the Fund might reasonably expect to receive for the security upon its current sale in the ordinary course. Each such determination is based on a consideration of relevant factors, which are likely to vary from one pricing context to another. These factors may include, but are not limited to, the type of security, the existence of any contractual restrictions on the security’s disposition, the price and extent of public trading in similar securities of the issuer or of comparable companies or entities, quotations or relevant information obtained from broker/dealers or other market participants, information obtained from the issuer, analysts, and/or the appropriate stock exchange (for exchange-traded securities), an analysis of the company’s or entity’s financial statements, and an evaluation of the forces that influence the issuer and the market(s) in which the security is purchased and sold.
The values assigned to fair value investments are based on available information and do not necessarily represent amounts that might ultimately be realized. Further, due to the inherent uncertainty of valuations of such investments, the fair values may differ significantly from the values that would have been used had an active market existed, and the differences could be material.
The following table summarizes the market value of the Fund's holdings as of September 30, 2021, based on the inputs used to value them:
| Asset Description | Level 1 | Level 2 | Level 3(1) | Total |
| Common Stocks: | | | | |
| Australia | $ — | $ 20,993,817 | $ — | $ 20,993,817 |
| Belgium | — | 21,478,761 | — | 21,478,761 |
| Denmark | — | 25,898,990 | — | 25,898,990 |
| France | — | 108,461,362 | — | 108,461,362 |
| Germany | — | 40,616,794 | — | 40,616,794 |
| Hong Kong | — | 21,523,237 | — | 21,523,237 |
| India | — | 17,922,407 | — | 17,922,407 |
| Ireland | — | 74,364,163 | — | 74,364,163 |
| Japan | — | 127,528,081 | — | 127,528,081 |
| Netherlands | — | 28,437,517 | — | 28,437,517 |
| New Zealand | — | 11,722,857 | — | 11,722,857 |
| Norway | — | 21,993,190 | — | 21,993,190 |
| Singapore | — | 17,663,248 | — | 17,663,248 |
| South Africa | — | 8,900,550 | — | 8,900,550 |
| Spain | — | 38,527,642 | — | 38,527,642 |
| Sweden | — | 43,956,834 | — | 43,956,834 |
| Switzerland | — | 76,656,914 | — | 76,656,914 |
| Taiwan | 11,683,837 | — | — | 11,683,837 |
| United Kingdom | — | 153,943,744 | — | 153,943,744 |
| Total Common Stocks | $11,683,837 | $860,590,108 (2) | $ — | $872,273,945 |
| High Social Impact Investments | $ — | $ 1,333,115 | $ — | $ 1,333,115 |
Calvert
International Equity Fund
September 30, 2021
Notes to Financial Statements — continued
| Asset Description | Level 1 | Level 2 | Level 3(1) | Total |
| Preferred Stocks - Venture Capital | $ — | $ — | $ 125,836 | $ 125,836 |
| Venture Capital Limited Partnership Interests | — | — | 1,459,507 | 1,459,507 |
| Short-Term Investments | — | 5,635,556 | — | 5,635,556 |
| Total Investments | $11,683,837 | $867,558,779 | $1,585,343 | $880,827,959 |
| (1) | None of the unobservable inputs for Level 3 assets, individually or collectively, had a material impact on the Fund. |
| (2) | Includes foreign equity securities whose values were adjusted to reflect market trading of comparable securities or other correlated instruments that occurred after the close of trading in their applicable foreign markets. |
Level 3 investments at the beginning and/or end of the period in relation to net assets were not significant and accordingly, a reconciliation of Level 3 assets for the year ended September 30, 2021 is not presented.
B Investment Transactions and Income— Investment transactions for financial statement purposes are accounted for on trade date. Realized gains and losses are recorded on an identified cost basis and may include proceeds from litigation. Dividend income is recorded on the ex-dividend date for dividends received in cash and/or securities or, in the case of dividends on certain foreign securities, as soon as the Fund is informed of the ex-dividend date. Non-cash dividends are recorded at the fair value of the securities received. Withholding taxes on foreign dividends, if any, have been provided for in accordance with the Fund's understanding of the applicable country’s tax rules and rates. In consideration of recent decisions rendered by European courts, the Fund has filed additional tax reclaims for previously withheld taxes on dividends earned in certain European Union countries. These filings are subject to various administrative and judicial proceedings within these countries. Due to the uncertainty as to the ultimate resolution of these proceedings, the likelihood of receipt of these reclaims, and the potential timing of payment, no amounts are reflected in the financial statements for such outstanding reclaims.
Distributions received that represent a return of capital are recorded as a reduction of cost of investments. Distributions received that represent a capital gain are recorded as a realized gain. Interest income, which includes amortization of premium and accretion of discount on debt securities, is accrued as earned.
C Share Class Accounting— Realized and unrealized gains and losses and net investment income and losses, other than class-specific expenses, are allocated daily to each class of shares based upon the relative net assets of each class to the total net assets of the Fund. Expenses arising in connection with a specific class are charged directly to that class. Sub-accounting, recordkeeping and similar administrative fees payable to financial intermediaries, which are a component of transfer agency fees and expenses on the Statement of Operations, are not allocated to Class R6 shares.
D Foreign Currency Transactions— The Fund’s accounting records are maintained in U.S. dollars. For valuation of assets and liabilities on each date of net asset value determination, foreign denominations are converted into U.S. dollars using the current exchange rate. Security transactions, income and expenses are translated at the prevailing rate of exchange on the date of the event. Recognized gains or losses on investment transactions attributable to changes in foreign currency exchange rates are recorded for financial statement purposes as net realized gains and losses on investments. That portion of unrealized gains and losses on investments that results from fluctuations in foreign currency exchange rates is not separately disclosed.
E Restricted Securities— The Fund may invest in securities that are subject to legal or contractual restrictions on resale. Generally, these securities may only be sold publicly upon registration under the Securities Act of 1933 or in transactions exempt from such registration. Information regarding restricted securities (excluding Rule 144A securities) is included at the end of the Schedule of Investments.
F Distributions to Shareholders— Distributions to shareholders are recorded by the Fund on ex-dividend date. Distributions from net investment income and distributions from net realized capital gains, if any, are paid at least annually. Distributions are declared separately for each class of shares. Distributions are determined in accordance with income tax regulations, which may differ from U.S. GAAP; accordingly, periodic reclassifications are made within the Fund's capital accounts to reflect income and gains available for distribution under income tax regulations.
G Estimates— The preparation of financial statements in conformity with U.S. GAAP requires management to make estimates and assumptions that affect the reported amounts of assets and liabilities and disclosure of contingent assets and liabilities at the date of the financial statements and the reported amounts of increases and decreases in net assets from operations during the reporting period. Actual results could differ from those estimates.
H Indemnifications— The Corporation’s By-Laws provide for indemnification for Directors or officers of the Corporation and certain other parties, to the fullest extent permitted by Maryland law and the 1940 Act, provided certain conditions are met. Additionally, in the normal course of business, the Fund enters into agreements with service providers that may contain indemnification clauses. The Fund’s maximum exposure under these arrangements is unknown as this would involve future claims that may be made against the Fund that have not yet occurred.
I Federal Income Taxes— No provision for federal income or excise tax is required since the Fund intends to continue to qualify as a regulated investment company under the Internal Revenue Code and to distribute substantially all of its taxable earnings.
Calvert
International Equity Fund
September 30, 2021
Notes to Financial Statements — continued
Management has analyzed the Fund's tax positions taken for all open federal income tax years and has concluded that no provision for federal income tax is required in the Fund's financial statements. A Fund's federal tax return is subject to examination by the Internal Revenue Service for a period of three years from the date of filing.
2 Related Party Transactions
The investment advisory fee is earned by CRM as compensation for investment advisory services rendered to the Fund. On March 1, 2021, Morgan Stanley acquired Eaton Vance Corp. (the “Transaction”) and CRM became an indirect, wholly-owned subsidiary of Morgan Stanley. In connection with the Transaction, the Fund entered into a new investment advisory agreement (the “New Agreement”) with CRM, which took effect on March 1, 2021. Pursuant to the New Agreement (and the Fund’s investment advisory agreement with CRM in effect prior to March 1, 2021), the fee is computed at an annual rate as a percentage of the Fund’s average daily net assets as follows and is payable monthly:
| Average Daily Net Assets | Annual Fee
Rate |
| Up to and including $250 million | 0.68% |
| Over $250 million up to and including $500 million | 0.665% |
| Over $500 million | 0.65% |
For the year ended September 30, 2021, the investment advisory fee amounted to $5,339,599 or 0.66% of the Fund’s average daily net assets. The Fund may invest its cash in Cash Reserves Fund. CRM does not currently receive a fee for advisory services provided to Cash Reserves Fund.
Pursuant to an investment sub-advisory agreement, CRM has delegated the investment management of the Fund to Eaton Vance Advisers International Ltd. (EVAIL), an affiliate of CRM and, effective March 1, 2021, an indirect, wholly-owned subsidiary of Morgan Stanley. In connection with the Transaction, CRM entered into a new investment sub-advisory agreement with EVAIL, which took effect on March 1, 2021. CRM pays EVAIL a portion of its investment advisory fee for sub-advisory services provided to the Fund.
CRM and EVAIL have agreed to reimburse the Fund’s operating expenses to the extent that total annual operating expenses (relating to ordinary operating expenses only and excluding expenses such as brokerage commissions, acquired fund fees and expenses of unaffiliated funds, borrowing costs, taxes or litigation expenses) exceed 1.14%, 1.89%, 0.89% and 0.85% for Class A, Class C, Class I and Class R6, respectively, of such class’s average daily net assets. The expense reimbursement agreement may be changed or terminated after January 31, 2022. For the year ended September 30, 2021, CRM and EVAIL waived or reimbursed expenses in total of $517,664.
The administrative fee is earned by CRM as compensation for administrative services rendered to the Fund. The fee is computed at an annual rate of 0.12% of the Fund’s average daily net assets attributable to Class A, Class C, Class I and Class R6 and is payable monthly. For the year ended September 30, 2021, CRM was paid administrative fees of $965,003.
The Fund has in effect a distribution plan for Class A shares (Class A Plan) pursuant to Rule 12b-1 under the 1940 Act. Pursuant to the Class A Plan, the Fund pays Eaton Vance Distributors, Inc. (EVD), an affiliate of CRM and the Fund’s principal underwriter, a distribution and service fee of 0.25% per annum of its average daily net assets attributable to Class A shares for distribution services and facilities provided to the Fund by EVD, as well as for personal services and/or the maintenance of shareholder accounts. The Fund also has in effect a distribution plan for Class C shares (Class C Plan) pursuant to Rule 12b-1 under the 1940 Act. Pursuant to the Class C Plan, the Fund pays EVD amounts equal to 0.75% per annum of its average daily net assets attributable to Class C shares for providing ongoing distribution services and facilities to the Fund. In addition, pursuant to the Class C Plan, the Fund also makes payments of service fees to EVD, financial intermediaries and other persons in amounts equal to 0.25% per annum of its average daily net assets attributable to that class. Service fees paid or accrued are for personal services and/or the maintenance of shareholder accounts. Distribution and service fees paid or accrued for the year ended September 30, 2021 amounted to $440,843 and $70,565 for Class A shares and Class C shares, respectively.
The Fund was informed that EVD received $42,413 as its portion of the sales charge on sales of Class A shares for the year ended September 30, 2021. The Fund was also informed that EVD received less than $100 and $336 of contingent deferred sales charges paid by Class A and Class C shareholders, respectively, for the same period.
Eaton Vance Management (EVM), an affiliate of CRM, provides sub-transfer agency and related services to the Fund pursuant to a Sub-Transfer Agency Support Services Agreement. For the year ended September 30, 2021, sub-transfer agency fees and expenses incurred to EVM amounted to $96,224 and are included in transfer agency fees and expenses on the Statement of Operations.
Each Director of the Fund who is not an employee of CRM or its affiliates receives an annual fee of $154,000, plus an annual Committee fee ranging from $8,500 to $16,500 depending on the Committee. The Board chair receives an additional $30,000 ($20,000 prior to January 1, 2021) annual fee and Committee chairs receive an additional $6,000 annual fee. Eligible Directors may participate in a Deferred Compensation Plan (the Plan). Amounts
Calvert
International Equity Fund
September 30, 2021
Notes to Financial Statements — continued
deferred under the Plan are treated as though equal dollar amounts had been invested in shares of the Fund or other Calvert funds selected by the Directors. The Fund purchases shares of the funds selected equal to the dollar amounts deferred under the Plan, resulting in an asset equal to the deferred compensation liability. Obligations of the Plan are paid solely from the Fund's assets. Directors’ fees are allocated to each of the Calvert funds served. Salaries and fees of officers and Directors of the Fund who are employees of CRM or its affiliates are paid by CRM. Prior to December 31, 2020, an Advisory Council aided the Board and CRM in advancing the cause of responsible investing through original scholarship and thought leadership. The Advisory Council consisted of CRM’s Chief Executive Officer and three additional members. For the year ended December 31, 2020, each member (other than CRM’s Chief Executive Officer) was compensated $20,000 for their service on the Advisory Council. Such compensation, and any other compensation and/or expenses incurred by the Advisory Council as may be approved by the Board, was borne by the Calvert funds. For the year ended September 30, 2021, the Fund’s allocated portion of the Advisory Council compensation and fees was $824, which is included in miscellaneous expense on the Statement of Operations.
3 Investment Activity
During the year ended September 30, 2021, the cost of purchases and proceeds from sales of investments, other than short-term securities, were $495,863,214 and $300,941,736, respectively.
4 Distributions to Shareholders and Income Tax Information
The tax character of distributions declared for the years ended September 30, 2021 and September 30, 2020 was as follows:
| | Year Ended September 30, |
| | 2021 | 2020 |
| Ordinary income | $2,645,349 | $3,198,283 |
During the year ended September 30, 2021, distributable earnings was decreased by $4,186,683 and paid-in capital was increased by $4,186,683 due to the Fund's use of equalization accounting. Tax equalization accounting allows the Fund to treat as a distribution that portion of redemption proceeds representing a redeeming shareholder’s portion of undistributed taxable income and net capital gains. These reclassifications had no effect on the net assets or net asset value per share of the Fund.
As of September 30, 2021, the components of distributable earnings (accumulated loss) on a tax basis were as follows:
| Undistributed ordinary income | $ 44,191,790 |
| Net unrealized appreciation | 160,435,386 |
| Distributable earnings | $204,627,176 |
The cost and unrealized appreciation (depreciation) of investments of the Fund at September 30, 2021, as determined on a federal income tax basis, were as follows:
| Aggregate cost | $720,387,368 |
| Gross unrealized appreciation | $ 175,694,224 |
| Gross unrealized depreciation | (15,253,633) |
| Net unrealized appreciation | $160,440,591 |
Calvert
International Equity Fund
September 30, 2021
Notes to Financial Statements — continued
5 Securities Lending
To generate additional income, the Fund may lend its securities pursuant to a securities lending agency agreement with State Street Bank and Trust Company (SSBT), the securities lending agent. Security loans are subject to termination by the Fund at any time and, therefore, are not considered illiquid investments. The Fund requires that the loan be continuously collateralized by either cash or securities in an amount at least equal to the market value of the securities on loan. The market value of securities loaned is determined daily and any additional required collateral is delivered to the Fund on the next business day. Cash collateral is generally invested in a money market fund registered under the 1940 Act that is managed by an affiliate of SSBT. Any gain or loss in the market price of the loaned securities that might occur and any interest earned or dividends declared during the term of the loan would accrue to the account of the Fund. Income earned on the investment of collateral, net of broker rebates and other expenses incurred by the securities lending agent, is split between the Fund and the securities lending agent based on agreed upon contractual terms. Non-cash collateral, if any, is held by the lending agent on behalf of the Fund and cannot be sold or re-pledged by the Fund; accordingly, such collateral is not reflected in the Statement of Assets and Liabilities.
The risks associated with lending portfolio securities include, but are not limited to, possible delays in receiving additional collateral or in the recovery of the loaned securities, possible loss of rights to the collateral should the borrower fail financially, as well as risk of loss in the value of the collateral or the value of the investments made with the collateral. The securities lending agent shall indemnify the Fund in the case of default of any securities borrower.
The Fund did not have any securities on loan at September 30, 2021.
6 Line of Credit
The Fund participates with other portfolios and funds managed by EVM and its affiliates, including CRM, in an $800 million unsecured line of credit with a group of banks, which is in effect through October 26, 2021. Borrowings are made by the Fund solely for temporary purposes related to redemptions and other short-term cash needs. Interest is charged to the Fund based on its borrowings at an amount above either the Eurodollar rate or Federal Funds rate. In addition, a fee computed at an annual rate of 0.15% on the daily unused portion of the line of credit is allocated among the participating portfolios and funds at the end of each quarter. In connection with the renewal of the agreement in October 2020, an upfront fee and arrangement fee totaling $950,000 was incurred that was allocated to the participating portfolios and funds. Because the line of credit is not available exclusively to the Fund, it may be unable to borrow some or all of its requested amounts at any particular time.
The Fund had no borrowings outstanding pursuant to its line of credit at September 30, 2021. The Fund did not have any significant borrowings or allocated fees during the year ended September 30, 2021. Effective October 26, 2021, the Fund renewed its line of credit agreement, which expires October 25, 2022, at substantially the same terms.
7 Cash Advances
Pursuant to the custodian agreement, SSBT may, in its discretion, advance funds to the Fund in connection with the sale of certain securities, including certain foreign currency transactions, on a contractual settlement basis. Simultaneously with making a cash advance, the Fund grants to SSBT a security interest and a lien on any and all assets held by it for the account of the Fund. Cash advances are repayable on demand by SSBT. At September 30, 2021, the Fund owed SSBT $8,657,496 pursuant to the foregoing arrangement, which is included in other liabilities on the Statement of Assets and Liabilities. The Fund repaid the amount subsequent to year end. Based on the short-term nature of the agreement, the carrying value of other liabilities approximated its fair value at September 30, 2021. If measured at fair value, other liabilities would have been considered as Level 2 in the fair value hierarchy (see Note 1) at September 30, 2021.
8 Affiliated Companies and Funds
The Fund has invested a portion of its assets in notes (the Notes) issued by Calvert Impact Capital, Inc. (CIC) pursuant to exemptive relief granted by the U.S. Securities and Exchange Commission (the SEC). There are certain potential points of affiliation between the Fund and CIC. CRM has licensed use of the Calvert name to CIC and provides other types of support. CRM’s President and Chief Executive Officer (and the only director/trustee on the Fund Board that is an “interested person” of the Fund) serves on the CIC Board. In addition, another director/trustee on the Fund Board serves as a director emeritus on the CIC Board.
Calvert
International Equity Fund
September 30, 2021
Notes to Financial Statements — continued
In addition to the Notes, the Fund may also invest in companies that are considered affiliated companies because the Fund has a direct or indirect ownership of, control of, or voting power of 5 percent or more of the outstanding voting shares of the company, or the company is under common ownership or control with the Fund. At September 30, 2021, the value of the Fund's investment in the Notes and affiliated companies and funds was $6,732,050, which represents 0.8% of the Fund's net assets. Transactions in the Notes and affiliated companies and funds by the Fund for the year ended September 30, 2021 were as follows:
| Name | Value,
beginning
of period | Purchases | Sales
proceeds | Net
realized
gain
(loss) | Change in
unrealized
appreciation
(depreciation) | Value,
end of
period | Interest/
Dividend
income | Principal
amount/Units,
end of period |
| High Social Impact Investments | | | | | | |
| Calvert Impact Capital, Inc., Community Investment Notes, 1.50%, 12/15/20(1) | $ 875,888 | $ — | $ (880,352) | $ — | $ 4,464 | $ — | $ 2,751 | $ — |
| Calvert Impact Capital, Inc., Community Investment Notes, 1.50%, 12/15/23(1) | — | 880,000 | — | — | (15,110) | 864,890 | 10,487 | 880,000 |
| Venture Capital Limited Partnership Interests | | | | | | |
| gNet Defta Development Holding LLC(1)(2)(3) | 240,155 | — | — | — | (8,551) | 231,604 | — | — |
| Short-Term Investments | | | | | | |
| Calvert Cash Reserves Fund, LLC | 2,460,073 | 276,015,030 | (272,840,307) | (5) | 765 | 5,635,556 | 4,780 | 5,634,992 |
| Totals | | | | $ (5) | $ (18,432) | $6,732,050 | $18,018 | |
| (1) | Restricted security. |
| (2) | For fair value measurement disclosure purposes, security is categorized as Level 3 (see Note 1A). |
| (3) | Non-income producing security. |
9 Capital Shares
The Corporation may issue its shares in one or more series (such as the Fund). The authorized shares of the Fund consist of 75,000,000 common shares, $0.01 par value, for each Class.
Transactions in capital shares for the years ended September 30, 2021 and September 30, 2020 were as follows:
| | Year Ended
September 30, 2021 | | Year Ended
September 30, 2020 |
| | Shares | Amount | | Shares | Amount |
| Class A | | | | | |
| Shares sold | 1,643,681 | $ 39,373,904 | | 1,724,584 | $ 32,394,311 |
| Reinvestment of distributions | 12,947 | 297,262 | | 58,651 | 1,173,605 |
| Shares redeemed | (907,802) | (21,869,874) | | (1,192,704) | (22,436,819) |
| Converted from Class C | 50,240 | 1,153,540 | | 20,201 | 370,968 |
| Net increase | 799,066 | $ 18,954,832 | | 610,732 | $ 11,502,065 |
| Class C | | | | | |
| Shares sold | 111,587 | $ 2,286,086 | | 62,754 | $ 1,001,289 |
| Reinvestment of distributions | — | — | | 1,299 | 22,301 |
| Shares redeemed | (55,316) | (1,126,913) | | (79,953) | (1,260,958) |
| Converted to Class A | (58,945) | (1,153,540) | | (23,600) | (370,968) |
| Net increase (decrease) | (2,674) | $ 5,633 | | (39,500) | $ (608,336) |
Calvert
International Equity Fund
September 30, 2021
Notes to Financial Statements — continued
| | Year Ended
September 30, 2021 | | Year Ended
September 30, 2020 |
| | Shares | Amount | | Shares | Amount |
| Class I | | | | | |
| Shares sold | 12,693,224 | $ 319,563,633 | | 10,517,537 | $ 207,907,620 |
| Reinvestment of distributions | 63,273 | 1,552,097 | | 51,969 | 1,110,065 |
| Shares redeemed | (6,021,538) | (156,919,455) | | (1,985,028) | (39,612,853) |
| Net increase | 6,734,959 | $ 164,196,275 | | 8,584,478 | $169,404,832 |
| Class R6 | | | | | |
| Shares sold | 1,815,279 | $ 45,216,469 | | 3,379,540 | $ 68,130,481 |
| Reinvestment of distributions | 25,420 | 622,531 | | 35,319 | 753,700 |
| Shares redeemed | (1,477,180) | (37,186,283) | | (339,429) | (6,754,498) |
| Net increase | 363,519 | $ 8,652,717 | | 3,075,430 | $ 62,129,683 |
10 Risks and Uncertainties
Risks Associated with Foreign Investments
Foreign investments can be adversely affected by political, economic and market developments abroad, including the imposition of economic and other sanctions by the United States or another country. There may be less publicly available information about foreign issuers because they may not be subject to reporting practices, requirements or regulations comparable to those to which United States companies are subject. Foreign markets may be smaller, less liquid and more volatile than the major markets in the United States. Trading in foreign markets typically involves higher expense than trading in the United States. The Fund may have difficulties enforcing its legal or contractual rights in a foreign country. Securities that trade or are denominated in currencies other than the U.S. dollar may be adversely affected by fluctuations in currency exchange rates.
Pandemic Risk
An outbreak of respiratory disease caused by a novel coronavirus was first detected in China in late 2019 and subsequently spread internationally. This coronavirus has resulted in closing borders, enhanced health screenings, changes to healthcare service preparation and delivery, quarantines, cancellations, disruptions to supply chains and customer activity, as well as general concern and uncertainty. Health crises caused by outbreaks, such as the coronavirus outbreak, may exacerbate other pre-existing political, social and economic risks and disrupt normal market conditions and operations. The impact of this outbreak has negatively affected the worldwide economy, the economies of individual countries, individual companies, and the market in general, and may continue to do so in significant and unforeseen ways, as may other epidemics and pandemics that may arise in the future. Any such impact could adversely affect the Fund's performance, or the performance of the securities in which the Fund invests.
11 Capital Commitments
In connection with certain venture capital and/or limited partnership investments, the Fund is committed to future capital calls, which will increase the Fund’s investment in these securities. The aggregate amount of the future capital commitments totaled $28,457 at September 30, 2021. The Fund had sufficient cash and/or securities to cover these commitments.
The Fund's unfunded capital commitments by investment at September 30, 2021 were as follows:
| Name of Investment | Unfunded
Commitment |
| Africa Renewable Energy Fund L.P. | $ 10,449 |
| Blackstone Clean Technology Partners L.P. | 508 |
| SEAF India International Growth Fund L.P. | 17,500 |
| Total | $28,457 |
Calvert
International Equity Fund
September 30, 2021
Notes to Financial Statements — continued
12 Change in Independent Registered Public Accounting Firm
On July 30, 2021, KPMG LLP (“KPMG”) informed the Audit Committee and Board of the Corporation that it was resigning as the independent registered public accounting firm to the Corporation, as upon Morgan Stanley’s acquisition of Eaton Vance Corp., the parent company of CRM (the investment adviser to each series of the Corporation), KPMG would no longer be independent of the Corporation. The Audit Committee of the Board and the Board approved the selection of Deloitte & Touche LLP (“Deloitte”) as the independent registered public accounting firm for the funds that are series of the Corporation (the “Funds”) for the fiscal year ending September 30, 2021 to be effective upon KPMG’s resignation and Deloitte’s acceptance of the engagement which became effective July 30, 2021.
KPMG’s reports on the financial statements for the Funds for the fiscal periods ended September 30, 2019 and September 30, 2020 contained no adverse opinion or disclaimer of opinion nor were they qualified or modified as to uncertainty, audit scope or accounting principles. During the fiscal periods ended September 30, 2019 and September 30, 2020, and during the subsequent interim period through July 30, 2021: (i) there were no disagreements with KPMG on any matter of accounting principles or practices, financial statement disclosure or auditing scope or procedure, which disagreements, if not resolved to the satisfaction of KPMG, would have caused KPMG to make reference to the subject matter of the disagreements in connection with its reports on the Funds’ financial statements for such periods; and (ii) there were no “reportable events” of the kind described in Item 304(a)(1)(v) of Regulation S-K under the Securities Exchange Act of 1934, as amended.
During the fiscal periods ended September 30, 2019 and September 30, 2020, and during the subsequent interim period through July 30, 2021: neither the Funds, nor anyone on their behalf, consulted with Deloitte on items which: (i) concerned the application of accounting principles to a specified transaction, either completed or proposed, or the type of audit opinion that might be rendered on the Funds’ financial statements; or (ii) concerned the subject of a disagreement (as defined in paragraph (a)(1)(iv) of Item 304 of Regulation S-K) or reportable events (as described in paragraph (a)(1)(v) of Item 304).
Calvert
International Equity Fund
September 30, 2021
Report of Independent Registered Public Accounting Firm
To the Board of Directors of Calvert World Values Fund, Inc. and Shareholders of Calvert International Equity Fund:
Opinion on the Financial Statements and Financial Highlights
We have audited the accompanying statement of assets and liabilities of Calvert International Equity Fund (the "Fund") (one of the funds constituting Calvert World Values Fund, Inc.), including the schedule of investments, as of September 30, 2021, the related statements of operations, changes in net assets and the financial highlights for the year then ended, and the related notes. In our opinion, the financial statements and financial highlights present fairly, in all material respects, the financial position of the Fund as of September 30, 2021, and the results of its operations and changes in its net assets for the year then ended, and the financial highlights for the year then ended in conformity with accounting principles generally accepted in the United States of America. The statement of changes in net assets for the year ended September 30, 2020, and the financial highlights for the years or periods ended September 30, 2020, 2019, 2018, and 2017 were audited by other auditors whose report, dated November 20, 2020, expressed an unqualified opinion on that financial statement and those financial highlights.
Basis for Opinion
These financial statements and financial highlights are the responsibility of the Fund's management. Our responsibility is to express an opinion on the Fund's financial statements and financial highlights based on our audit. We are a public accounting firm registered with the Public Company Accounting Oversight Board (United States) (PCAOB) and are required to be independent with respect to the Fund in accordance with the U.S. federal securities laws and the applicable rules and regulations of the Securities and Exchange Commission and the PCAOB.
We conducted our audit in accordance with the standards of the PCAOB. Those standards require that we plan and perform the audit to obtain reasonable assurance about whether the financial statements and financial highlights are free of material misstatement, whether due to error or fraud. The Fund is not required to have, nor were we engaged to perform, an audit of its internal control over financial reporting. As part of our audit we are required to obtain an understanding of internal control over financial reporting but not for the purpose of expressing an opinion on the effectiveness of the Fund’s internal control over financial reporting. Accordingly, we express no such opinion.
Our audit included performing procedures to assess the risks of material misstatement of the financial statements and financial highlights, whether due to error or fraud, and performing procedures that respond to those risks. Such procedures included examining, on a test basis, evidence regarding the amounts and disclosures in the financial statements and financial highlights. Our audit also included evaluating the accounting principles used and significant estimates made by management, as well as evaluating the overall presentation of the financial statements and financial highlights. Our procedures included confirmation of securities owned as of September 30, 2021, by correspondence with the custodian and brokers; when replies were not received from brokers, we performed other auditing procedures. We believe that our audit provides a reasonable basis for our opinion.
/s/ Deloitte & Touche LLP
Boston, Massachusetts
November 22, 2021
We have served as the auditor of one or more Calvert investment companies since 2021.
Calvert
International Equity Fund
September 30, 2021
Federal Tax Information (Unaudited)
The Form 1099-DIV you receive in February 2022 will show the tax status of all distributions paid to your account in calendar year 2021. Shareholders are advised to consult their own tax adviser with respect to the tax consequences of their investment in the Fund. As required by the Internal Revenue Code and/or regulations, shareholders must be notified regarding the status of qualified dividend income for individuals and the foreign tax credit.
Qualified Dividend Income. For the fiscal year ended September 30, 2021, the Fund designates approximately $10,206,807, or up to the maximum amount of such dividends allowable pursuant to the Internal Revenue Code, as qualified dividend income eligible for the reduced tax rate of 15%.
Foreign Tax Credit. For the fiscal year ended September 30, 2021, the Fund paid foreign taxes of $619,138 and recognized foreign source income of $11,509,425.
Calvert
International Equity Fund
September 30, 2021
Liquidity Risk Management Program
The Fund has implemented a written liquidity risk management program (Program) and related procedures to manage its liquidity in accordance with Rule 22e-4 under the Investment Company Act of 1940, as amended (Liquidity Rule). The Liquidity Rule defines “liquidity risk” as the risk that a fund could not meet requests to redeem shares issued by the fund without significant dilution of the remaining investors’ interests in the fund. The Fund’s Board of Trustees/Directors has designated the investment adviser to serve as the administrator of the Program and the related procedures. The administrator has established a Liquidity Risk Management Oversight Committee (Committee) to perform the functions necessary to administer the Program. As part of the Program, the administrator is responsible for identifying illiquid investments and categorizing the relative liquidity of the Fund’s investments in accordance with the Liquidity Rule. Under the Program, the administrator assesses, manages, and periodically reviews the Fund’s liquidity risk, and is responsible for making certain reports to the Fund’s Board of Trustees/Directors and the Securities and Exchange Commission (SEC) regarding the liquidity of the Fund’s investments, and to notify the Board of Trustees/Directors and the SEC of certain liquidity events specified in the Liquidity Rule. The liquidity of the Fund’s portfolio investments is determined based on a number of factors including, but not limited to, relevant market, trading and investment-specific considerations under the Program.
At a meeting of the Fund’s Board of Trustees/Directors on June 16, 2021, the Committee provided a written report to the Fund’s Board of Trustees/ Directors pertaining to the operation, adequacy, and effectiveness of implementation of the Program, as well as the operation of the highly liquid investment minimum (if applicable) for the period January 1, 2020 through December 31, 2020 (Review Period). The Program operated effectively during the Review Period, supporting the administrator’s ability to assess, manage and monitor Fund liquidity risk, including during periods of market volatility and net redemptions. During the Review Period, the Fund met redemption requests on a timely basis.
There can be no assurance that the Program will achieve its objectives in the future. Please refer to the Fund’s prospectus for more information regarding the Fund’s exposure to liquidity risk and other principal risks to which an investment in the Fund may be subject.
Calvert
International Equity Fund
September 30, 2021
Management and Organization
Fund Management. The Directors of Calvert World Values Fund, Inc. (the Corporation) are responsible for the overall management and supervision of the Corporation’s affairs. The Directors and officers of the Corporation are listed below. Except as indicated, each individual has held the office shown or other offices in the same company for the last five years. Each Board member holds office until his or her successor is elected and qualified, or until his or her earlier death, resignation, retirement, removal or disqualification. Under the terms of the Fund's current Board member retirement policy, an Independent Board member must retire at the end of the calendar year in which he or she turns 75. However, if such retirement would cause the Fund to be out of compliance with Section 16 of the 1940 Act or any other regulations or guidance of the SEC, then such retirement and resignation will not become effective until such time as action has been taken for the Fund to be in compliance upon a Board member's retirement. The “Independent Directors” consist of those Directors who are not “interested persons” of the Corporation, as that term is defined under the 1940 Act. The business address of each Director and officer, with the exception of Ms. Walsh and Mr. Kirchner, is 1825 Connecticut Avenue NW, Suite 400, Washington, DC 20009. As used below, “CRM” refers to Calvert Research and Management. Each Director oversees 39 funds in the Calvert fund complex. Each officer serves as an officer of certain other Calvert funds.
| Name and Year of Birth | Corporation
Position(s) | Position
Start Date | Principal Occupation(s) and Other Directorships
During Past Five Years and Other Relevant Experience |
| Interested Director |
John H. Streur(1)
1960 | Director and
President | 2015 | President and Chief Executive Officer of Calvert Research and
Management (since December 31, 2016). President and Chief Executive
Officer of Calvert Investments, Inc. (January 2015 - December 2016);
Chief Executive Officer of Calvert Investment Distributors, Inc. (August
2015 - December 2016); Chief Compliance Officer of Calvert Investment
Management, Inc. (August 2015 - April 2016); President and Director,
Portfolio 21 Investments, Inc. (through October 2014); President,
Chief Executive Officer and Director, Managers Investment Group LLC
(through January 2012); President and Director, The Managers Funds
and Managers AMG Funds (through January 2012).
Other Directorships in the Last Five Years. Portfolio 21 Investments,
Inc. (asset management) (through October 2014); Managers Investment
Group LLC (asset management) (through January 2012); The Managers
Funds (asset management) (through January 2012); Managers AMG Funds
(asset management) (through January 2012); Calvert Impact Capital, Inc. |
| Independent Directors |
Richard L. Baird, Jr.
1948 | Director | 2005 | Regional Disaster Recovery Lead, American Red Cross of Greater
Pennsylvania (since 2017). Volunteer, American Red Cross (since 2015).
Former President and CEO of Adagio Health Inc. (retired in 2014) in
Pittsburgh, PA.
Other Directorships in the Last Five Years. None. |
Alice Gresham Bullock
1950 | Chair and
Director | 2016 | Professor Emerita at Howard University School of Law. Dean Emerita of
Howard University School of Law and Deputy Director of the Association
of American Law Schools (1992-1994).
Other Directorships in the Last Five Years. None. |
Cari M. Dominguez
1949 | Director | 2016 | Former Chair of the U.S. Equal Employment Opportunity Commission.
Other Directorships in the Last Five Years. Manpower, Inc. (employment
agency); Triple S Management Corporation (managed care); National
Association of Corporate Directors. |
John G. Guffey, Jr.
1948 | Director | 1992 | President of Aurora Press Inc., a privately held publisher of trade
paperbacks (since January 1997).
Other Directorships in the Last Five Years. Calvert Impact Capital, Inc.
(through December 31, 2018); Calvert Ventures, LLC. |
Miles D. Harper, III
1962 | Director | 2005 | Partner, Carr Riggs & Ingram (public accounting firm) since October 2014.
Partner, Gainer Donnelly & Desroches (public accounting firm) (now Carr
Riggs & Ingram) (November 1999 - September 2014).
Other Directorships in the Last Five Years. Bridgeway Funds (9) (asset
management). |
Joy V. Jones
1950 | Director | 2005 | Attorney.
Other Directorships in the Last Five Years. Conduit Street Restaurants
SUD 2 Limited; Palm Management Restaurant Corporation. |
Calvert
International Equity Fund
September 30, 2021
Management and Organization — continued
| Name and Year of Birth | Corporation
Position(s) | Position
Start Date | Principal Occupation(s) and Other Directorships
During Past Five Years and Other Relevant Experience |
| Independent Directors (continued) |
Anthony A. Williams
1951 | Director | 2016 | CEO and Executive Director of the Federal City Council (July 2012 to
present); Senior Adviser and Independent Consultant for King and
Spalding LLP (September 2015 to present); Executive Director of Global
Government Practice at the Corporate Executive Board (January 2010 to
January 2012).
Other Directorships in the Last Five Years. Freddie Mac; Evoq
Properties/Meruelo Maddux Properties, Inc. (real estate management);
Weston Solutions, Inc. (environmental services); Bipartisan Policy Center’s
Debt Reduction Task Force; Chesapeake Bay Foundation; Catholic
University of America; Urban Institute (research organization); The Howard Hughes Corporation (real estate development). |
| Name and Year of Birth | Corporation
Position(s) | Position
Start Date | Principal Occupation(s)
During Past Five Years |
| Principal Officers who are not Directors |
Hope L. Brown
1973 | Chief
Compliance
Officer | 2014 | Chief Compliance Officer of 39 registered investment companies advised
by CRM (since 2014). Vice President and Chief Compliance Officer,
Wilmington Funds (2012-2014). |
Deidre E. Walsh(2)
1971 | Secretary,
Vice President
and Chief
Legal Officer | 2021 | Vice President of CRM and officer of 39 registered investment companies
advised by CRM (since 2021). Also Vice President of Eaton Vance and
certain of its affiliates and officer of 138 registered investment companies
advised or administered by Eaton Vance. |
James F. Kirchner(2)
1967 | Treasurer | 2016 | Vice President of CRM and officer of 39 registered investment companies
advised by CRM (since 2016). Also Vice President of Eaton Vance and
certain of its affiliates and officer of 138 registered investment companies
advised or administered by Eaton Vance. |
| (1) Mr. Streur is an interested person of the Fund because of his positions with the Fund’s adviser and certain affiliates. |
| (2) The business address for Ms. Walsh and Mr. Kirchner is Two International Place, Boston, MA 02110. |
The SAI for the Fund includes additional information about the Directors and officers of the Fund and can be obtained without charge on Calvert’s website at www.calvert.com or by calling 1-800-368-2745.
| FACTS | WHAT DOES EATON VANCE DO WITH YOUR
PERSONAL INFORMATION? |
| Why? | Financial companies choose how they share your personal information. Federal law gives consumers the right to limit some but not all sharing. Federal law also requires us to tell you how we collect, share, and protect your personal information. Please read this notice carefully to understand what we do. |
| |
| What? | The types of personal information we collect and share depend on the product or service you have with us. This information can include:■ Social Security number and income
■
investment experience and risk tolerance
■
checking account number and wire transfer instructions |
| |
| How? | All financial companies need to share customers’ personal information to run their everyday business. In the section below, we list the reasons financial companies can share their customers’ personal information; the reasons Eaton Vance chooses to share; and whether you can limit this sharing. |
Reasons we can share your
personal information | Does Eaton Vance
share? | Can you limit
this sharing? |
| For our everyday business purposes — such as to process your transactions, maintain your account(s), respond to court orders and legal investigations, or report to credit bureaus | Yes | No |
| For our marketing purposes — to offer our products and services to you | Yes | No |
| For joint marketing with other financial companies | No | We don’t share |
| For our investment management affiliates’ everyday business purposes — information about your transactions, experiences, and creditworthiness | Yes | Yes |
| For our affiliates’ everyday business purposes — information about your transactions and experiences | Yes | No |
| For our affiliates’ everyday business purposes — information about your creditworthiness | No | We don’t share |
| For our investment management affiliates to market to you | Yes | Yes |
| For our affiliates to market to you | No | We don’t share |
| For nonaffiliates to market to you | No | We don’t share |
To limit our
sharing | Call toll-free 1-800-368-2745 or email: CRMPrivacy@calvert.comPlease note:If you are a new customer, we can begin sharing your information 30 days from the date we sent this notice. When you are no longer our customer, we continue to share your information as described in this notice. However, you can contact us at any time to limit our sharing. |
| Questions? | Call toll-free 1-800-368-2745 or email: CRMPrivacy@calvert.com |
| Privacy Notice — continued | April 2021 |
| Who we are |
| Who is providing this notice? | Eaton Vance Management, Eaton Vance Distributors, Inc., Eaton Vance Trust Company, Eaton Vance Management (International) Limited, Eaton Vance Advisers International Ltd., Eaton Vance Global Advisors Limited, Eaton Vance Management’s Real Estate Investment Group, Boston Management and Research, Calvert Research and Management, Eaton Vance and Calvert Fund Families and our investment advisory affiliates (“Eaton Vance”) (see Investment Management Affiliates definition below) |
| What we do |
How does Eaton Vance
protect my personal
information? | To protect your personal information from unauthorized access and use, we use security measures that comply with federal law. These measures include computer safeguards and secured files and buildings. We have policies governing the proper handling of customer information by personnel and requiring third parties that provide support to adhere to appropriate security standards with respect to such information. |
How does Eaton Vance
collect my personal
information? | We collect your personal information, for example, when you■ open an account or make deposits or withdrawals from your account
■
buy securities from us or make a wire transfer
■
give us your contact informationWe also collect your personal information from others, such as credit bureaus, affiliates, or other companies. |
| Why can’t I limit all sharing? | Federal law gives you the right to limit only■ sharing for affiliates’ everyday business purposes — information about your creditworthiness
■
affiliates from using your information to market to you
■
sharing for nonaffiliates to market to youState laws and individual companies may give you additional rights to limit sharing. See below for more on your rights under state law. |
| Definitions |
Investment Management
Affiliates | Eaton Vance Investment Management Affiliates include registered investment advisers, registered broker- dealers, and registered and unregistered funds. Investment Management Affiliates does not include entities associated with Morgan Stanley Wealth Management, such as Morgan Stanley Smith Barney LLC and Morgan Stanley & Co. |
| Affiliates | Companies related by common ownership or control. They can be financial and nonfinancial companies.■ Our affiliates include companies with a Morgan Stanley name and financial companies such as Morgan Stanley Smith Barney LLC and Morgan Stanley & Co. |
| Nonaffiliates | Companies not related by common ownership or control. They can be financial and nonfinancial companies.■ Eaton Vance does not share with nonaffiliates so they can market to you. |
| Joint marketing | A formal agreement between nonaffiliated financial companies that together market financial products or services to you.■ Eaton Vance doesn’t jointly market. |
| Other important information |
| Vermont: Except as permitted by law, we will not share personal information we collect about Vermont residents with Nonaffiliates unless you provide us with your written consent to share such information.California: Except as permitted by law, we will not share personal information we collect about California residents with Nonaffiliates and we will limit sharing such personal information with our Affiliates to comply with California privacy laws that apply to us. |
Delivery of Shareholder Documents. The Securities and Exchange Commission (SEC) permits funds to deliver only one copy of shareholder documents, including prospectuses, proxy statements and shareholder reports, to fund investors with multiple accounts at the same residential or post office box address. This practice is often called “householding” and it helps eliminate duplicate mailings to shareholders. Calvert funds, or your financial intermediary, may household the mailing of your documents indefinitely unless you instruct Calvert funds, or your financial intermediary, otherwise. If you would prefer that your Calvert fund documents not be householded, please contact Calvert funds at 1-800-368-2745, or contact your financial intermediary. Your instructions that householding not apply to delivery of your Calvert fund documents will typically be effective within 30 days of receipt by Calvert funds or your financial intermediary. Separate statements will be generated for each separate account and will be householded as described above.
Portfolio Holdings. Each Calvert fund files a schedule of portfolio holdings on Part F to Form N-PORT with the SEC. Certain information filed on Form N-PORT may be viewed on the Calvert website at www.calvert.com, by calling Calvert at 1-800-368-2745 or in the EDGAR database on the SEC’s website at www.sec.gov.
Proxy Voting. The Proxy Voting Guidelines that each Calvert fund uses to determine how to vote proxies relating to portfolio securities is provided as an Appendix to the fund’s Statement of Additional Information. The Statement of Additional Information can be obtained free of charge by calling the Calvert funds at 1-800-368-2745, by visiting the Calvert funds’ website at www.calvert.com or visiting the SEC’s website at www.sec.gov. Information regarding how a Calvert fund voted proxies relating to portfolio securities during the most recent 12-month period ended June 30 is available by calling Calvert funds, by visiting the Calvert funds’ website at www.calvert.com or by visiting the SEC’s website at www.sec.gov.
This Page Intentionally Left Blank
Investment Adviser and Administrator
Calvert Research and Management
1825 Connecticut Avenue NW, Suite 400
Washington, DC 20009
Investment Sub-Adviser
Eaton Vance Advisers International Ltd.
125 Old Broad Street
London, EC2N 1AR
Principal Underwriter*
Eaton Vance Distributors, Inc.
Two International Place
Boston, MA 02110
(617) 482-8260
Custodian
State Street Bank and Trust Company
State Street Financial Center, One Lincoln Street
Boston, MA 02111
Transfer Agent
DST Asset Manager Solutions, Inc.
2000 Crown Colony Drive
Quincy, MA 02169
Independent Registered Public Accounting Firm
Deloitte & Touche LLP
200 Berkeley Street
Boston, MA 02116-5022
Fund Offices
1825 Connecticut Avenue NW, Suite 400
Washington, DC 20009
* FINRA BrokerCheck. Investors may check the background of their Investment Professional by contacting the Financial Industry Regulatory Authority (FINRA). FINRA BrokerCheck is a free tool to help investors check the professional background of current and former FINRA-registered securities firms and brokers. FINRA BrokerCheck is available by calling 1-800-289-9999 and at www.FINRA.org. The FINRA BrokerCheck brochure describing this program is available to investors at www.FINRA.org.
Printed on recycled paper.
Calvert
International Opportunities Fund
Annual Report
September 30, 2021
Commodity Futures Trading Commission Registration. The Commodity Futures Trading Commission (“CFTC”) has adopted regulations that subject registered investment companies and advisers to regulation by the CFTC if a fund invests more than a prescribed level of its assets in certain CFTC-regulated instruments (including futures, certain options and swap agreements) or markets itself as providing investment exposure to such instruments. The adviser has claimed an exclusion from the definition of “commodity pool operator” under the Commodity Exchange Act with respect to its management of the Fund and the other funds it manages. Accordingly, neither the Fund nor the adviser is subject to CFTC regulation.
Fund shares are not insured by the FDIC and are not deposits or other obligations of, or guaranteed by, any depository institution. Shares are subject to investment risks, including possible loss of principal invested.
This report must be preceded or accompanied by a current summary prospectus or prospectus. Before investing, investors should consider carefully the investment objective, risks, and charges and expenses of a mutual fund. This and other important information is contained in the summary prospectus and prospectus, which can be obtained from a financial intermediary. Prospective investors should read the prospectus carefully before investing. For further information, please call 1-800-368-2745.
Choose Planet-friendly E-delivery!
Sign up now for on-line statements, prospectuses, and fund reports. In less than five minutes you can help reduce paper mail and lower fund costs.
Just go to www.calvert.com. If you already have an online account with the Calvert funds, click on Login to access your Account and select the documents you would like to receive via e-mail.
If you’re new to online account access, click on Login, then Register to create your user name and password. Once you’re in, click on the E-delivery sign-up on the Account Portfolio page and follow the quick, easy steps.
Note: If your shares are not held directly with the Calvert funds but through a brokerage firm, you must contact your broker for electronic delivery options available through their firm.
Annual Report September 30, 2021
Calvert
International Opportunities Fund
Calvert
International Opportunities Fund
September 30, 2021
Management's Discussion of Fund Performance†
Economic and Market Conditions
The 12-month period that began October 1, 2020 was notable for a widespread equity rally that started in November 2020, paused in January 2021, and then continued through the following summer. But in the final month of the period, negative economic news overwhelmed the investor optimism that had driven markets for much of the period. Stock prices in September 2021 declined in the U.S. and across the globe, with the S&P 500® Index enduring its worst month since March 2020.
For the period as a whole, however, broad-market stock indexes generally posted strong double-digit returns, as investors cheered the reopening of businesses that had been closed or hobbled by COVID-19, along with the rollout of several highly effective vaccines.
The virus, however, continued to have a firm grip on the global economy. Disease rates advanced and declined with third and fourth waves of COVID-19 infections. Worker shortages led to global supply chain issues. From computer chips to shipping containers, scarcities of key items led to temporary factory shutdowns and empty store shelves. In the U.S., those shortages — combined with high demand from consumers itching to spend money they had saved earlier in the pandemic — led to higher year-over-year inflation than the economy had seen in years. Although U.S. Federal Reserve (the Fed) Chairman Jerome Powell and Treasury Secretary Janet Yellen expressed the view that inflation would likely be transitory, inflation nonetheless became a key concern for investors during the period.
While the last month of the period began auspiciously — with both the S&P 500® Index and the Nasdaq Composite Index closing at all-time highs in the first days of September — the news for investors quickly turned negative. The Labor Department’s release of August job numbers showed only 235,000 jobs had been created — a significant slowdown from earlier in the summer. COVID-19 infections rose across the globe. After its September meeting, the Fed indicated it might start to taper its bond purchases — which had stimulated the economy earlier — and possibly raise interest rates in 2022, a year earlier than it had previously projected.
In China, the world’s second-largest economy, the Communist Party’s efforts to dial back capitalism and take more control of China’s surging technology sector were not applauded by global investors. The MSCI Golden Dragon Index, a measure of Chinese large-cap and mid-cap stocks, was one of the worst-performing major stock indexes for the one-year period, returning 5.32%.
Despite a rough September, most other indexes fared significantly better. The MSCI World Index, a broad measure of global equities, returned 28.82% for the 12 months ended September 30, 2021; while the S&P 500® Index, a broad measure of U.S. stocks, returned 30.00%; and the technology-laden Nasdaq Composite Index rose 30.26%. The MSCI EAFE Index of developed-market international equities returned 25.73%, while the MSCI Emerging Markets Index returned 18.20% during the period.
Fund Performance
For the 12-month period ended September 30, 2021, Calvert International Opportunities Fund (the Fund) returned 25.83% for Class A shares at net asset value (NAV), underperforming the Fund’s benchmark, the MSCI EAFE Small/Mid Cap Index (the Index), which returned 26.39%.
The Fund does not seek to outperform by favoring or avoiding certain regions or sectors. However, an underweight exposure to cyclical sectors, especially materials and energy, which rebounded through much of the period, was a leading detractor from performance relative to the Index. An overweight exposure to the non-cyclical consumer staples sector was also detrimental to returns during the period. In stock selection, choices in Japan, one of the largest country allocations within the Index, weighed on relative performance. Stock selections in the materials, information technology (IT), and consumer staples sectors also detracted from returns.
From a regional perspective, stock selections contributed most to relative returns in Europe. By sector, stock selections were most beneficial in health care, industrials, and real estate. An overweight exposure to the industrials sector also contributed to relative performance during the period.
Nohmi Bosai, Ltd., a Japanese fire protection systems and services company, was among the largest performance detractors during the period. Shares of the stock sold off as investor preferences pivoted toward more cyclical companies. Itochu Techno-Solutions Corp., a Tokyo-based IT services provider that constructs computer network systems and software, underperformed the Index during the period. Miura Co., Ltd., a Japanese provider of industrial boilers and maintenance services, detracted from returns versus the Index as the company reported a decline in equipment sales and lowered year-over-year profits because of COVID-19.
BFF Bank SpA (BFF), an Italian specialty finance company and a leader in trade receivables, contributed to relative performance during the period. Share prices of BFF, the Fund’s largest holding in financials, appreciated after the company reported strong earnings. BFF’s stock price continued to rise because of favorable credit trends and an acquisition aimed at strengthening its capital and competitive positions.
Share prices of Wisetech Global, Ltd., a software developer for global logistics based in Australia, rose on strong revenue and earnings growth during the period. Invesco Office J-REIT, Inc. (J-REIT) is a Japanese real estate company investing in office buildings in Tokyo and other Japanese cities. J-REIT’s share price jumped as a well-known global real estate investment firm offered to buy the company at a significant premium. By period-end, J-REIT was sold from the Fund.
See Endnotes and Additional Disclosures in this report.
Past performance is no guarantee of future results. Returns are historical and are calculated by determining the percentage change in net asset value (NAV) or offering price (as applicable) with all distributions reinvested. Investment return and principal value will fluctuate so that shares, when redeemed, may be worth more or less than their original cost. Performance for periods less than or equal to one year is cumulative. Performance is for the stated time period only; due to market volatility, current Fund performance may be lower or higher than the quoted return. For performance as of the most recent month-end, please refer to www.calvert.com.
Calvert
International Opportunities Fund
September 30, 2021
Performance
Portfolio Manager Aidan M. Farrell of Eaton Vance Global Advisors Limited
| % Average Annual Total Returns1,2 | Class
Inception Date | Performance
Inception Date | One Year | Five Years | Ten Years |
| Class A at NAV | 05/31/2007 | 05/31/2007 | 25.83% | 12.69% | 11.40% |
| Class A with 4.75% Maximum Sales Charge | — | — | 19.84 | 11.59 | 10.85 |
| Class C at NAV | 07/31/2007 | 05/31/2007 | 24.90 | 11.84 | 10.49 |
| Class C with 1% Maximum Sales Charge | — | — | 23.90 | 11.84 | 10.49 |
| Class I at NAV | 05/31/2007 | 05/31/2007 | 26.17 | 13.02 | 11.80 |
| Class R6 at NAV | 02/01/2019 | 05/31/2007 | 26.21 | 13.05 | 11.81 |
|
| MSCI EAFE Small/Mid Cap Index | — | — | 26.39% | 9.62% | 9.88% |
| % Total Annual Operating Expense Ratios3 | Class A | Class C | Class I | Class R6 |
| | 1.32% | 2.08% | 1.07% | 1.00% |
Growth of $10,000
This graph shows the change in value of a hypothetical investment of $10,000 in Class A of the Fund for the period indicated. For comparison, the same investment is shown in the indicated index.
| Growth of Investment2 | Amount Invested | Period Beginning | At NAV | With Maximum Sales Charge |
| Class C | $10,000 | 09/30/2011 | $27,138 | N.A. |
| Class I | $250,000 | 09/30/2011 | $763,115 | N.A. |
| Class R6 | $1,000,000 | 09/30/2011 | $3,056,384 | N.A. |
See Endnotes and Additional Disclosures in this report.
Past performance is no guarantee of future results. Returns are historical and are calculated by determining the percentage change in net asset value (NAV) or offering price (as applicable) with all distributions reinvested. Investment return and principal value will fluctuate so that shares, when redeemed, may be worth more or less than their original cost. Performance for periods less than or equal to one year is cumulative. Performance is for the stated time period only; due to market volatility, current Fund performance may be lower or higher than the quoted return. For performance as of the most recent month-end, please refer to www.calvert.com.
Calvert
International Opportunities Fund
September 30, 2021
Sector Allocation (% of net assets)*
* Excludes cash and cash equivalents.
| Top 10 Holdings (% of net assets)* | |
| Ashtead Group PLC | 1.8% |
| IMCD NV | 1.6 |
| RWS Holdings PLC | 1.5 |
| WiseTech Global, Ltd. | 1.5 |
| Diploma PLC | 1.4 |
| Euronext NV | 1.4 |
| Sdiptech AB, Class B | 1.3 |
| Nomad Foods, Ltd. | 1.3 |
| Greggs PLC | 1.3 |
| Games Workshop Group PLC | 1.3 |
| Total | 14.4% |
| * | Excludes cash and cash equivalents. |
See Endnotes and Additional Disclosures in this report.
Calvert
International Opportunities Fund
September 30, 2021
Endnotes and Additional Disclosures
| † | The views expressed in this report are those of the portfolio manager(s) and are current only through the date stated at the top of this page. These views are subject to change at any time based upon market or other conditions, and Calvert and the Fund(s) disclaim any responsibility to update such views. These views may not be relied upon as investment advice and, because investment decisions are based on many factors, may not be relied upon as an indication of trading intent on behalf of any Calvert fund. This commentary may contain statements that are not historical facts, referred to as “forward-looking statements.” The Fund’s actual future results may differ significantly from those stated in any forward-looking statement, depending on factors such as changes in securities or financial markets or general economic conditions, the volume of sales and purchases of Fund shares, the continuation of investment advisory, administrative and service contracts, and other risks discussed from time to time in the Fund’s filings with the Securities and Exchange Commission. |
| | |
| 1 | MSCI EAFE Small/Mid Cap Index is an unmanaged index of small & mid-capitalization equities in the developed markets, excluding the U.S. and Canada. MSCI indexes are net of foreign withholding taxes. Source: MSCI. MSCI data may not be reproduced or used for any other purpose. MSCI provides no warranties, has not prepared or approved this report, and has no liability hereunder. Unless otherwise stated, index returns do not reflect the effect of any applicable sales charges, commissions, expenses, taxes or leverage, as applicable. It is not possible to invest directly in an index. |
| 2 | Total Returns at NAV do not include applicable sales charges. If sales charges were deducted, the returns would be lower. Total Returns shown with maximum sales charge reflect the stated maximum sales charge. Unless otherwise stated, performance does not reflect the deduction of taxes on Fund distributions or redemptions of Fund shares.Performance prior to the inception date of a class may be linked to the performance of an older class of the Fund. This linked performance is adjusted for any applicable sales charge, but is not adjusted for class expense differences. If adjusted for such differences, the performance would be different. The performance of Class R6 is linked to Class I. Performance presented in the Financial Highlights included in the financial statements is not linked.Calvert Research and Management became the investment adviser to the Fund on December 31, 2016. Performance reflected prior to such date is that of the Fund’s former investment adviser. |
| 3 | Source: Fund prospectus. The expense ratios for the current reporting period can be found in the Financial Highlights section of this report. |
| | Fund profile subject to change due to active management. |
| | Additional Information |
| | S&P 500® Index is an unmanaged index of large-cap stocks commonly used as a measure of U.S. stock market performance. S&P Dow Jones Indices are a product of S&P Dow Jones Indices LLC (“S&P DJI”) and have been licensed for use. S&P® and S&P 500® are registered trademarks of S&P DJI; Dow Jones® is a registered trademark of Dow Jones Trademark Holdings LLC (“Dow Jones”); S&P DJI, Dow Jones and their respective affiliates do not sponsor, endorse, sell or promote the Fund, will not have any liability with respect thereto and do not have any liability for any errors, omissions, or interruptions of the S&P Dow Jones Indices. Nasdaq Composite Index is a market capitalization-weighted index of all domestic and international securities listed on Nasdaq. Source: Nasdaq, Inc. The information is provided by Nasdaq (with its affiliates, are referred to as the “Corporations”) and Nasdaq’s third party licensors on an “as is” basis and the Corporations make no guarantees and bear no liability of any kind with respect to the information or the Fund. MSCI Golden Dragon Index is an unmanaged index of common stocks traded in China, Hong Kong and Taiwan. MSCI World Index is an unmanaged index of equity securities in the developed markets. MSCI EAFE Index is an unmanaged index of equities in the developed markets, excluding the U.S. and Canada. MSCI Emerging Markets Index is an unmanaged index of emerging markets common stocks. |
| | Important Notice to Shareholders |
| | Effective October 1, 2021, Aiden M. Farrell, who has managed the Fund since December 31, 2016, joined MSIM Fund Management (Ireland) Limited. Prior to October 1, 2021, Mr. Farrell was Vice President of Eaton Vance Global Advisors Limited. |
Calvert
International Opportunities Fund
September 30, 2021
Example
As a Fund shareholder, you incur two types of costs: (1) transaction costs, including sales charges (loads) on purchases and redemption fees (if applicable); and (2) ongoing costs, including management fees; distribution and/or service fees; and other Fund expenses. This Example is intended to help you understand your ongoing costs (in dollars) of Fund investing and to compare these costs with the ongoing costs of investing in other mutual funds. The Example is based on an investment of $1,000 invested at the beginning of the period and held for the entire period (April 1, 2021 to September 30, 2021).
Actual Expenses
The first section of the table below provides information about actual account values and actual expenses. You may use the information in this section, together with the amount you invested, to estimate the expenses that you paid over the period. Simply divide your account value by $1,000 (for example, an $8,600 account value divided by $1,000 = 8.6), then multiply the result by the number in the first section under the heading entitled “Expenses Paid During Period” to estimate the expenses you paid on your account during this period.
Hypothetical Example for Comparison Purposes
The second section of the table below provides information about hypothetical account values and hypothetical expenses based on the actual Fund expense ratio and an assumed rate of return of 5% per year (before expenses), which is not the actual Fund return. The hypothetical account values and expenses may not be used to estimate the actual ending account balance or expenses you paid for the period. You may use this information to compare the ongoing costs of investing in the Fund and other funds. To do so, compare this 5% hypothetical example with the 5% hypothetical examples that appear in the shareholder reports of the other funds.
Please note that the expenses shown in the table are meant to highlight your ongoing costs only and do not reflect any transactional costs, such as sales charges (loads) or redemption fees (if applicable). Therefore, the second section of the table is useful in comparing ongoing costs only, and will not help you determine the relative total costs of owning different funds. In addition, if these transactional costs were included, your costs would be higher.
| | Beginning
Account Value
(4/1/21) | Ending
Account Value
(9/30/21) | Expenses Paid
During Period*
(4/1/21 – 9/30/21) | Annualized
Expense
Ratio |
| Actual | | | | |
| Class A | $1,000.00 | $1,087.30 | $ 6.75 | 1.29% |
| Class C | $1,000.00 | $1,083.20 | $10.65 | 2.04% |
| Class I | $1,000.00 | $1,088.80 | $ 5.45 | 1.04% |
| Class R6 | $1,000.00 | $1,088.80 | $ 5.08 | 0.97% |
| Hypothetical | | | | |
| (5% return per year before expenses) | | | | |
| Class A | $1,000.00 | $1,018.60 | $ 6.53 | 1.29% |
| Class C | $1,000.00 | $1,014.84 | $10.30 | 2.04% |
| Class I | $1,000.00 | $1,019.85 | $ 5.27 | 1.04% |
| Class R6 | $1,000.00 | $1,020.21 | $ 4.91 | 0.97% |
| * | Expenses are equal to the Fund's annualized expense ratio for the indicated Class, multiplied by the average account value over the period, multiplied by 183/365 (to reflect the one-half year period). The Example assumes that the $1,000 was invested at the net asset value per share determined at the close of business on March 31, 2021. |
Calvert
International Opportunities Fund
September 30, 2021
| Security | Shares | Value |
| Australia — 4.9% | |
| Bapcor, Ltd. | | 639,227 | $ 3,447,979 |
| BlueScope Steel, Ltd. | | 84,941 | 1,230,760 |
| carsales.com, Ltd. | | 304,803 | 5,471,064 |
| Dexus | | 447,432 | 3,443,700 |
| Steadfast Group, Ltd. | | 1,214,511 | 4,192,742 |
| WiseTech Global, Ltd. | | 198,643 | 7,533,182 |
| | | | $ 25,319,427 |
| Austria — 1.6% | |
| ams AG(1) | | 158,414 | $ 2,873,382 |
| BAWAG Group AG(2) | | 86,148 | 5,452,015 |
| | | | $ 8,325,397 |
| Belgium — 2.6% | |
| KBC Group NV | | 49,072 | $ 4,426,512 |
| VGP NV | | 24,571 | 5,649,114 |
| Xior Student Housing NV | | 57,798 | 3,263,723 |
| | | | $ 13,339,349 |
| Canada — 2.4% | |
| Agnico Eagle Mines, Ltd. | | 23,642 | $ 1,226,524 |
| ATS Automation Tooling Systems, Inc.(1) | | 140,436 | 4,455,012 |
| CAE, Inc.(1) | | 103,759 | 3,099,827 |
| Lundin Mining Corp. | | 150,488 | 1,082,383 |
| TMX Group, Ltd. | | 24,037 | 2,592,147 |
| | | | $ 12,455,893 |
| France — 0.6% | |
| Rubis SCA | | 87,842 | $ 3,036,665 |
| | | | $ 3,036,665 |
| Germany — 2.6% | |
| Jenoptik AG | | 98,492 | $ 3,319,184 |
| LEG Immobilien SE | | 30,765 | 4,345,674 |
| Norma Group SE | | 136,911 | 5,761,978 |
| | | | $ 13,426,836 |
| Ireland — 1.4% | |
| Irish Residential Properties REIT PLC | | 1,934,151 | $ 3,228,426 |
| Kerry Group PLC, Class A | | 28,435 | 3,820,178 |
| | | | $ 7,048,604 |
| Italy — 6.6% | |
| Amplifon SpA | | 99,473 | $ 4,727,507 |
| BFF Bank SpA(2) | | 541,978 | 5,253,291 |
| DiaSorin SpA | | 24,863 | 5,206,594 |
| Security | Shares | Value |
| Italy (continued) | |
| FinecoBank Banca Fineco SpA(1) | | 180,954 | $ 3,268,369 |
| Interpump Group SpA | | 64,440 | 4,153,102 |
| MARR SpA(1) | | 235,874 | 5,757,988 |
| Moncler SpA | | 88,117 | 5,374,308 |
| | | | $ 33,741,159 |
| Japan — 25.3% | |
| Asahi Co., Ltd. | | 153,542 | $ 1,834,119 |
| Asahi Intecc Co., Ltd. | | 213,900 | 5,858,418 |
| Chiba Bank, Ltd. (The) | | 526,882 | 3,414,303 |
| en Japan, Inc. | | 172,500 | 6,231,413 |
| FP Corp. | | 131,060 | 4,870,279 |
| Fukuoka Financial Group, Inc. | | 165,408 | 2,959,408 |
| Itochu Techno-Solutions Corp. | | 170,010 | 5,521,008 |
| J. Front Retailing Co., Ltd. | | 428,683 | 4,132,113 |
| Kewpie Corp. | | 105,033 | 2,545,925 |
| Kose Corp. | | 24,361 | 2,913,461 |
| K's Holdings Corp. | | 419,405 | 4,333,391 |
| Kuraray Co., Ltd. | | 478,040 | 4,593,480 |
| Kyoritsu Maintenance Co., Ltd.(3) | | 114,678 | 4,462,892 |
| LaSalle Logiport REIT | | 1,985 | 3,337,762 |
| Lion Corp. | | 312,106 | 5,048,081 |
| Makita Corp. | | 59,785 | 3,287,137 |
| Mitsui Fudosan Logistics Park, Inc. | | 675 | 3,574,331 |
| Miura Co., Ltd. | | 125,186 | 5,004,262 |
| Nabtesco Corp. | | 146,063 | 5,522,616 |
| Nohmi Bosai, Ltd. | | 296,080 | 5,451,628 |
| Nomura Co., Ltd. | | 662,784 | 5,961,961 |
| OSG Corp. | | 218,622 | 3,741,966 |
| Penta-Ocean Construction Co., Ltd. | | 739,695 | 5,021,422 |
| Sakata Seed Corp. | | 100,037 | 3,136,753 |
| Sankyu, Inc. | | 114,432 | 5,262,871 |
| Ship Healthcare Holdings, Inc. | | 222,754 | 5,737,541 |
| Sumco Corp. | | 253,428 | 5,056,031 |
| Tosei Corp. | | 441,000 | 4,748,126 |
| Yamaha Corp. | | 104,462 | 6,570,875 |
| | | | $130,133,573 |
| Luxembourg — 0.3% | |
| APERAM S.A. | | 30,281 | $ 1,678,716 |
| | | | $ 1,678,716 |
| Netherlands — 5.6% | |
| Aalberts NV(3) | | 110,909 | $ 6,401,768 |
| BE Semiconductor Industries NV | | 41,400 | 3,293,599 |
| Euronext NV(2) | | 62,433 | 7,044,939 |
| IMCD NV | | 41,602 | 7,961,790 |
7
See Notes to Financial Statements.
Calvert
International Opportunities Fund
September 30, 2021
Schedule of Investments — continued
| Security | Shares | Value |
| Netherlands (continued) | |
| NN Group NV | | 79,269 | $ 4,152,287 |
| | | | $ 28,854,383 |
| New Zealand — 0.6% | |
| Fisher & Paykel Healthcare Corp., Ltd. | | 144,851 | $ 3,186,095 |
| | | | $ 3,186,095 |
| Norway — 1.3% | |
| SmartCraft ASA(1) | | 1,971,924 | $ 4,908,664 |
| SpareBank 1 SR-Bank ASA | | 121,986 | 1,690,784 |
| | | | $ 6,599,448 |
| Portugal — 0.5% | |
| NOS SGPS S.A. | | 593,316 | $ 2,390,419 |
| | | | $ 2,390,419 |
| Singapore — 1.1% | |
| Frasers Logistics & Commercial Trust | | 2,328,700 | $ 2,597,936 |
| XP Power, Ltd. | | 43,932 | 3,037,076 |
| | | | $ 5,635,012 |
| Spain — 1.5% | |
| Acciona S.A. | | 18,250 | $ 3,033,949 |
| Inmobiliaria Colonial Socimi S.A. | | 486,058 | 4,713,631 |
| | | | $ 7,747,580 |
| Sweden — 6.6% | |
| AddTech AB, Class B | | 296,457 | $ 5,259,821 |
| Autoliv, Inc. | | 46,015 | 3,944,406 |
| Boliden AB | | 48,869 | 1,564,806 |
| Bravida Holding AB(2) | | 374,617 | 5,056,073 |
| Bufab AB | | 106,925 | 3,812,776 |
| Indutrade AB | | 139,846 | 3,888,870 |
| Lagercrantz Group AB, Class B | | 306,244 | 3,665,044 |
| Sdiptech AB, Class B(1) | | 142,076 | 6,928,161 |
| | | | $ 34,119,957 |
| Switzerland — 5.6% | |
| Belimo Holding AG | | 5,412 | $ 2,856,543 |
| Galenica AG(2) | | 37,246 | 2,627,556 |
| Logitech International S.A. | | 49,737 | 4,424,957 |
| PolyPeptide Group AG(1)(2) | | 38,710 | 4,920,456 |
| Sika AG(3) | | 7,574 | 2,394,694 |
| Straumann Holding AG | | 3,360 | 6,026,028 |
| VZ Holding AG | | 56,266 | 5,603,500 |
| | | | $ 28,853,734 |
| Security | Shares | Value |
| United Kingdom — 24.1% | |
| Abcam PLC(1) | | 297,435 | $ 5,961,606 |
| Ashtead Group PLC | | 121,956 | 9,219,062 |
| Avast PLC(2) | | 827,305 | 6,322,429 |
| Bellway PLC | | 71,300 | 3,144,806 |
| Bodycote PLC | | 219,649 | 2,573,669 |
| Capital & Counties Properties PLC | | 1,591,811 | 3,537,140 |
| Compass Group PLC(1) | | 113,350 | 2,318,140 |
| Cranswick PLC | | 109,352 | 5,249,586 |
| Dechra Pharmaceuticals PLC | | 76,896 | 5,021,386 |
| Diploma PLC | | 188,530 | 7,168,894 |
| Games Workshop Group PLC | | 47,967 | 6,617,665 |
| Greggs PLC | | 168,196 | 6,631,862 |
| Halma PLC | | 105,334 | 4,017,808 |
| Howden Joinery Group PLC | | 429,712 | 5,173,195 |
| InterContinental Hotels Group PLC(1) | | 57,768 | 3,688,575 |
| Intermediate Capital Group PLC | | 109,968 | 3,011,214 |
| JTC PLC(2) | | 528,644 | 5,257,312 |
| Judges Scientific PLC | | 57,292 | 5,857,011 |
| Nomad Foods, Ltd.(1) | | 249,494 | 6,876,055 |
| RWS Holdings PLC | | 918,082 | 7,760,610 |
| St. James's Place PLC | | 215,571 | 4,348,563 |
| Volution Group PLC | | 980,765 | 6,464,681 |
| Watches of Switzerland Group PLC(1)(2) | | 391,667 | 4,959,167 |
| Weir Group PLC (The)(1) | | 133,652 | 3,016,991 |
| | | | $124,197,427 |
Total Common Stocks
(identified cost $393,435,142) | | | $490,089,674 |
| Exchange-Traded Funds — 2.2% |
| Security | Shares | Value |
| Equity Funds — 2.2% | |
| iShares MSCI Hong Kong ETF(3) | | 158,386 | $ 3,798,096 |
| iShares MSCI Singapore ETF(3) | | 85,912 | 1,956,216 |
| Vanguard MSCI Australian Small Companies Index ETF | | 110,025 | 5,573,578 |
Total Exchange-Traded Funds
(identified cost $10,950,011) | | | $ 11,327,890 |
8
See Notes to Financial Statements.
Calvert
International Opportunities Fund
September 30, 2021
Schedule of Investments — continued
| High Social Impact Investments — 0.1% |
| Security | Principal
Amount
(000's omitted) | Value |
| Calvert Impact Capital, Inc., Community Investment Notes, 1.50%, 12/15/23(4)(5) | $ | 560 | $ 550,385 |
| ImpactAssets, Inc., Global Sustainable Agriculture Notes, 0.00%, 11/3/22(5)(6) | | 111 | 105,561 |
| ImpactAssets, Inc., Microfinance Plus Notes, 0.00%, 11/3/22(5)(6) | | 142 | 129,960 |
Total High Social Impact Investments
(identified cost $813,000) | | | $ 785,906 |
| Short-Term Investments — 3.0% |
| Affiliated Fund — 1.8% |
| Description | Units | Value |
| Calvert Cash Reserves Fund, LLC, 0.04%(7) | | 9,283,087 | $ 9,284,016 |
Total Affiliated Fund
(identified cost $9,283,109) | | | $ 9,284,016 |
| Securities Lending Collateral — 1.2% |
| Security | Shares | Value |
| State Street Navigator Securities Lending Government Money Market Portfolio, 0.03%(8) | | 6,341,743 | $ 6,341,743 |
Total Securities Lending Collateral
(identified cost $6,341,743) | | | $ 6,341,743 |
Total Short-Term Investments
(identified cost $15,624,852) | | | $ 15,625,759 |
Total Investments — 100.5%
(identified cost $420,823,005) | | $ 517,829,229 |
| Other Assets, Less Liabilities — (0.5)% | | $ (2,797,801) |
| Net Assets — 100.0% | | $ 515,031,428 |
| The percentage shown for each investment category in the Schedule of Investments is based on net assets. |
| (1) | Non-income producing security. |
| (2) | Security exempt from registration under Rule 144A of the Securities Act of 1933, as amended. These securities may be sold in certain transactions in reliance on an exemption from registration (normally to qualified institutional buyers). At September 30, 2021, the aggregate value of these securities is $46,893,238 or 9.1% of the Fund's net assets. |
| (3) | All or a portion of this security was on loan at September 30, 2021. The aggregate market value of securities on loan at September 30, 2021 was $6,622,395. |
| (4) | May be deemed to be an affiliated company (see Note 7). |
| (5) | Restricted security. Total market value of restricted securities amounts to $785,906, which represents 0.1% of the net assets of the Fund as of September 30, 2021. |
| (6) | Notes carry an interest rate that varies by period and is contingent on the performance of the underlying portfolio of loans to borrowers. The coupon rate shown represents the rate in effect at September 30, 2021. |
| (7) | Affiliated investment company, available to Calvert portfolios and funds, which invests in high quality, U.S. dollar denominated money market instruments. The rate shown is the annualized seven-day yield as of September 30, 2021. |
| (8) | Represents investment of cash collateral received in connection with securities lending. |
At September 30, 2021, the concentration of the Fund’s investments in the various sectors, determined as a percentage of net assets, was as follows:
| Economic Sectors | % of Net Assets |
| Industrials | 29.1% |
| Financials | 12.2 |
| Consumer Discretionary | 11.9 |
| Information Technology | 11.0 |
| Health Care | 9.6 |
| Real Estate | 8.2 |
| Consumer Staples | 6.9 |
| Materials | 3.6 |
| Exchange-Traded Funds | 2.2 |
| Communication Services | 1.5 |
| Utilities | 1.2 |
| High Social Impact Investments | 0.1 |
| Total | 97.5% |
9
See Notes to Financial Statements.
Calvert
International Opportunities Fund
September 30, 2021
Schedule of Investments — continued
Restricted Securities
| Description | Acquisition Dates | Cost |
| Calvert Impact Capital, Inc., Community Investment Notes, 1.50%, 12/15/23 | 12/14/20 | $560,000 |
| ImpactAssets, Inc., Global Sustainable Agriculture Notes, 0.00%, 11/3/22 | 11/13/15 | 111,000 |
| ImpactAssets, Inc., Microfinance Plus Notes, 0.00%, 11/3/22 | 11/13/15 | 142,000 |
10
See Notes to Financial Statements.
Calvert
International Opportunities Fund
September 30, 2021
Statement of Assets and Liabilities
| | September 30, 2021 |
| Assets | |
Investments in securities of unaffiliated issuers, at value (identified cost $410,979,896) - including
$6,622,395 of securities on loan | $ 507,994,828 |
| Investments in securities of affiliated issuers, at value (identified cost $9,843,109) | 9,834,401 |
| Cash | 1,720,709 |
| Receivable for capital shares sold | 1,482,459 |
| Dividends and interest receivable | 766,120 |
| Dividends and interest receivable - affiliated | 7,020 |
| Securities lending income receivable | 6,100 |
| Tax reclaims receivable | 469,495 |
| Directors' deferred compensation plan | 193,112 |
| Total assets | $522,474,244 |
| Liabilities | |
| Due to custodian - foreign currency, at value (cost $43,212) | $ 42,795 |
| Payable for capital shares redeemed | 254,633 |
| Deposits for securities loaned | 6,341,743 |
| Payable to affiliates: | |
| Investment advisory fee | 332,711 |
| Administrative fee | 53,234 |
| Distribution and service fees | 25,283 |
| Sub-transfer agency fee | 6,030 |
| Directors' deferred compensation plan | 193,112 |
| Accrued expenses | 193,275 |
| Total liabilities | $ 7,442,816 |
| Net Assets | $515,031,428 |
| Sources of Net Assets | |
| Paid-in capital | $ 386,451,553 |
| Distributable earnings | 128,579,875 |
| Total | $515,031,428 |
| Class A Shares | |
| Net Assets | $ 92,235,635 |
| Shares Outstanding | 4,092,698 |
Net Asset Value and Redemption Price Per Share
(net assets ÷ shares of beneficial interest outstanding) | $ 22.54 |
Maximum Offering Price Per Share
(100 ÷ 95.25 of net asset value per share) | $ 23.66 |
| Class C Shares | |
| Net Assets | $ 6,259,775 |
| Shares Outstanding | 286,274 |
Net Asset Value and Offering Price Per Share*
(net assets ÷ shares of beneficial interest outstanding) | $ 21.87 |
| Class I Shares | |
| Net Assets | $ 348,044,459 |
| Shares Outstanding | 15,764,658 |
Net Asset Value, Offering Price and Redemption Price Per Share
(net assets ÷ shares of beneficial interest outstanding) | $ 22.08 |
11
See Notes to Financial Statements.
Calvert
International Opportunities Fund
September 30, 2021
Statement of Assets and Liabilities — continued
| | September 30, 2021 |
| Class R6 Shares | |
| Net Assets | $68,491,559 |
| Shares Outstanding | 3,102,904 |
Net Asset Value, Offering Price and Redemption Price Per Share
(net assets ÷ shares of beneficial interest outstanding) | $ 22.07 |
| On sales of $50,000 or more, the offering price of Class A shares is reduced. |
| * | Redemption price per share is equal to the net asset value less any applicable contingent deferred sales charge. |
12
See Notes to Financial Statements.
Calvert
International Opportunities Fund
September 30, 2021
| | Year Ended |
| | September 30, 2021 |
| Investment Income | |
| Dividend income (net of foreign taxes withheld of $765,720) | $ 7,637,136 |
| Dividend income - affiliated issuers | 4,822 |
| Interest income | 732 |
| Interest income - affiliated issuers | 10,296 |
| Securities lending income, net | 75,324 |
| Total investment income | $ 7,728,310 |
| Expenses | |
| Investment advisory fee | $ 3,477,123 |
| Administrative fee | 556,340 |
| Distribution and service fees: | |
| Class A | 209,204 |
| Class C | 59,884 |
| Directors' fees and expenses | 23,238 |
| Custodian fees | 54,716 |
| Transfer agency fees and expenses | 380,176 |
| Accounting fees | 121,421 |
| Professional fees | 40,132 |
| Registration fees | 89,190 |
| Reports to shareholders | 36,107 |
| Miscellaneous | 36,699 |
| Total expenses | $ 5,084,230 |
| Net investment income | $ 2,644,080 |
| Realized and Unrealized Gain (Loss) | |
| Net realized gain (loss): | |
| Investment securities | $ 66,130,626 |
| Investment securities - affiliated issuers | (471) |
| Foreign currency transactions | (347,769) |
| Net realized gain | $65,782,386 |
| Change in unrealized appreciation (depreciation): | |
| Investment securities | $ 31,310,312 |
| Investment securities - affiliated issuers | (2,560) |
| Foreign currency | (12,090) |
| Net change in unrealized appreciation (depreciation) | $31,295,662 |
| Net realized and unrealized gain | $97,078,048 |
| Net increase in net assets from operations | $99,722,128 |
13
See Notes to Financial Statements.
Calvert
International Opportunities Fund
September 30, 2021
Statements of Changes in Net Assets
| | Year Ended September 30, |
| | 2021 | 2020 |
| Increase (Decrease) in Net Assets | | |
| From operations: | | |
| Net investment income | $ 2,644,080 | $ 2,144,241 |
| Net realized gain (loss) | 65,782,386 | (15,851,827) |
| Net change in unrealized appreciation (depreciation) | 31,295,662 | 53,471,708 |
| Net increase in net assets from operations | $ 99,722,128 | $ 39,764,122 |
| Distributions to shareholders: | | |
| Class A | $ (413,572) | $ (779,888) |
| Class C | — | (27,023) |
| Class I | (2,243,218) | (3,424,730) |
| Class R6 | (497,493) | (698,083) |
| Total distributions to shareholders | $ (3,154,283) | $ (4,929,724) |
| Capital share transactions: | | |
| Class A | $ 5,722,020 | $ (1,492,764) |
| Class C | (555,571) | (1,558,025) |
| Class I | 29,139,228 | 9,133,103 |
| Class R6 | 6,866,062 | (261,820) |
| Net increase in net assets from capital share transactions | $ 41,171,739 | $ 5,820,494 |
| Net increase in net assets | $137,739,584 | $ 40,654,892 |
| Net Assets | | |
| At beginning of year | $ 377,291,844 | $ 336,636,952 |
| At end of year | $515,031,428 | $377,291,844 |
14
See Notes to Financial Statements.
Calvert
International Opportunities Fund
September 30, 2021
| | Class A |
| | Year Ended September 30, |
| | 2021 | 2020 | 2019 | 2018 | 2017 |
| Net asset value — Beginning of year | $ 18.01 | $ 16.18 | $ 18.86 | $ 18.70 | $ 14.78 |
| Income (Loss) From Operations | | | | | |
| Net investment income(1) | $ 0.08 | $ 0.07 | $ 0.18 | $ 0.17 | $ 0.03 |
| Net realized and unrealized gain (loss) | 4.56 | 1.95 | (1.51) | 1.20 | 4.04 |
| Total income (loss) from operations | $ 4.64 | $ 2.02 | $ (1.33) | $ 1.37 | $ 4.07 |
| Less Distributions | | | | | |
| From net investment income | $ (0.11) | $ (0.19) | $ (0.23) | $ (0.24) | $ (0.15) |
| From net realized gain | — | — | (1.12) | (0.97) | — |
| Total distributions | $ (0.11) | $ (0.19) | $ (1.35) | $ (1.21) | $ (0.15) |
| Net asset value — End of year | $ 22.54 | $ 18.01 | $ 16.18 | $ 18.86 | $ 18.70 |
| Total Return(2) | 25.83% | 12.57% | (6.77)% | 7.62% | 27.89% |
| Ratios/Supplemental Data | | | | | |
| Net assets, end of year (000’s omitted) | $92,236 | $68,940 | $64,070 | $65,994 | $50,552 |
| Ratios (as a percentage of average daily net assets):(3) | | | | | |
| Total expenses | 1.30% | 1.32% | 1.37% | 1.38% | 1.48% |
| Net expenses | 1.30% | 1.32% | 1.35% | 1.38% | 1.48% |
| Net investment income | 0.36% | 0.42% | 1.15% | 0.91% | 0.18% |
| Portfolio Turnover | 54% | 62% | 60% | 60% | 158% |
| (1) | Computed using average shares outstanding. |
| (2) | Returns are historical and are calculated by determining the percentage change in net asset value with all distributions reinvested and do not reflect the effect of sales charges, if any. |
| (3) | Total expenses do not reflect amounts reimbursed and/or waived by the adviser and certain of its affiliates, if applicable. Net expenses are net of all reductions and represent the net expenses paid by the Fund. |
15
See Notes to Financial Statements.
Calvert
International Opportunities Fund
September 30, 2021
Financial Highlights — continued
| | Class C |
| | Year Ended September 30, |
| | 2021 | 2020 | 2019 | 2018 | 2017 |
| Net asset value — Beginning of year | $ 17.51 | $ 15.74 | $ 18.37 | $ 18.29 | $ 14.43 |
| Income (Loss) From Operations | | | | | |
| Net investment income (loss)(1) | $ (0.08) | $ (0.06) | $ 0.06 | $ 0.03 | $ (0.04) |
| Net realized and unrealized gain (loss) | 4.44 | 1.90 | (1.47) | 1.18 | 3.91 |
| Total income (loss) from operations | $ 4.36 | $ 1.84 | $ (1.41) | $ 1.21 | $ 3.87 |
| Less Distributions | | | | | |
| From net investment income | $ — | $ (0.07) | $ (0.10) | $ (0.16) | $ (0.01) |
| From net realized gain | — | — | (1.12) | (0.97) | — |
| Total distributions | $ — | $ (0.07) | $ (1.22) | $ (1.13) | $ (0.01) |
| Net asset value — End of year | $21.87 | $17.51 | $15.74 | $18.37 | $18.29 |
| Total Return(2) | 24.90% | 11.68% | (7.49)% | 6.92% | 26.83% |
| Ratios/Supplemental Data | | | | | |
| Net assets, end of year (000’s omitted) | $ 6,260 | $ 5,527 | $ 6,532 | $ 7,603 | $ 5,850 |
| Ratios (as a percentage of average daily net assets):(3) | | | | | |
| Total expenses | 2.05% | 2.08% | 2.12% | 2.13% | 2.61% |
| Net expenses | 2.05% | 2.08% | 2.10% | 2.13% | 2.30% |
| Net investment income (loss) | (0.40)% | (0.37)% | 0.38% | 0.18% | (0.24)% |
| Portfolio Turnover | 54% | 62% | 60% | 60% | 158% |
| (1) | Computed using average shares outstanding. |
| (2) | Returns are historical and are calculated by determining the percentage change in net asset value with all distributions reinvested and do not reflect the effect of sales charges, if any. |
| (3) | Total expenses do not reflect amounts reimbursed and/or waived by the adviser and certain of its affiliates, if applicable. Net expenses are net of all reductions and represent the net expenses paid by the Fund. |
16
See Notes to Financial Statements.
Calvert
International Opportunities Fund
September 30, 2021
Financial Highlights — continued
| | Class I |
| | Year Ended September 30, |
| | 2021 | 2020 | 2019 | 2018 | 2017 |
| Net asset value — Beginning of year | $ 17.64 | $ 15.86 | $ 18.52 | $ 18.42 | $ 14.56 |
| Income (Loss) From Operations | | | | | |
| Net investment income(1) | $ 0.13 | $ 0.11 | $ 0.22 | $ 0.23 | $ 0.17 |
| Net realized and unrealized gain (loss) | 4.47 | 1.90 | (1.49) | 1.17 | 3.90 |
| Total income (loss) from operations | $ 4.60 | $ 2.01 | $ (1.27) | $ 1.40 | $ 4.07 |
| Less Distributions | | | | | |
| From net investment income | $ (0.16) | $ (0.23) | $ (0.27) | $ (0.33) | $ (0.21) |
| From net realized gain | — | — | (1.12) | (0.97) | — |
| Total distributions | $ (0.16) | $ (0.23) | $ (1.39) | $ (1.30) | $ (0.21) |
| Net asset value — End of year | $ 22.08 | $ 17.64 | $ 15.86 | $ 18.52 | $ 18.42 |
| Total Return(2) | 26.17% | 12.77% | (6.50)% | 7.95% | 28.44% |
| Ratios/Supplemental Data | | | | | |
| Net assets, end of year (000’s omitted) | $348,044 | $254,350 | $222,546 | $230,748 | $115,698 |
| Ratios (as a percentage of average daily net assets):(3) | | | | | |
| Total expenses | 1.05% | 1.07% | 1.12% | 1.13% | 1.07% |
| Net expenses | 1.05% | 1.07% | 1.10% | 1.13% | 1.07% |
| Net investment income | 0.62% | 0.67% | 1.41% | 1.23% | 1.06% |
| Portfolio Turnover | 54% | 62% | 60% | 60% | 158% |
| (1) | Computed using average shares outstanding. |
| (2) | Returns are historical and are calculated by determining the percentage change in net asset value with all distributions reinvested and do not reflect the effect of sales charges, if any. |
| (3) | Total expenses do not reflect amounts reimbursed and/or waived by the adviser and certain of its affiliates, if applicable. Net expenses are net of all reductions and represent the net expenses paid by the Fund. |
17
See Notes to Financial Statements.
Calvert
International Opportunities Fund
September 30, 2021
Financial Highlights — continued
| | Class R6 |
| | Year Ended September 30, | Period Ended
September 30, |
| | 2021 | 2020 | 2019 (1) |
| Net asset value — Beginning of period | $ 17.64 | $ 15.86 | $ 15.14 |
| Income (Loss) From Operations | | | |
| Net investment income(2) | $ 0.14 | $ 0.12 | $ 0.16 |
| Net realized and unrealized gain | 4.46 | 1.91 | 0.56 |
| Total income from operations | $ 4.60 | $ 2.03 | $ 0.72 |
| Less Distributions | | | |
| From net investment income | $ (0.17) | $ (0.25) | $ — |
| Total distributions | $ (0.17) | $ (0.25) | $ — |
| Net asset value — End of period | $ 22.07 | $ 17.64 | $ 15.86 |
| Total Return(3) | 26.21% | 12.87% | 4.76% (4) |
| Ratios/Supplemental Data | | | |
| Net assets, end of period (000’s omitted) | $68,492 | $48,475 | $43,489 |
| Ratios (as a percentage of average daily net assets):(5) | | | |
| Total expenses | 0.97% | 1.00% | 1.08% (6) |
| Net expenses | 0.97% | 1.00% | 1.05% (6) |
| Net investment income | 0.69% | 0.74% | 1.53% (6) |
| Portfolio Turnover | 54% | 62% | 60% (7) |
| (1) | For the period from the commencement of operations, February 1, 2019, to September 30, 2019. |
| (2) | Computed using average shares outstanding. |
| (3) | Returns are historical and are calculated by determining the percentage change in net asset value with all distributions reinvested and do not reflect the effect of sales charges, if any. |
| (4) | Not annualized. |
| (5) | Total expenses do not reflect amounts reimbursed and/or waived by the adviser and certain of its affiliates, if applicable. Net expenses are net of all reductions and represent the net expenses paid by the Fund. |
| (6) | Annualized. |
| (7) | For the year ended September 30, 2019. |
18
See Notes to Financial Statements.
Calvert
International Opportunities Fund
September 30, 2021
Notes to Financial Statements
1 Significant Accounting Policies
Calvert International Opportunities Fund (the Fund) is a diversified series of Calvert World Values Fund, Inc. (the Corporation). The Corporation is a Maryland corporation registered under the Investment Company Act of 1940, as amended (the 1940 Act), as an open-end management investment company. The investment objective of the Fund is to seek long-term capital appreciation. The Fund invests primarily in common and preferred stocks of non-U.S. small-cap to mid-cap companies.
The Fund offers four classes of shares. Class A shares are generally sold subject to a sales charge imposed at time of purchase. A contingent deferred sales charge of 0.80% may apply to certain redemptions of Class A shares for accounts for which no sales charge was paid, if redeemed within 12 months of purchase. Class C shares are sold without a front-end sales charge, and with certain exceptions, are charged a contingent deferred sales charge of 1% on shares redeemed within 12 months of purchase. Class C shares are only available for purchase through a financial intermediary. Effective January 25, 2019, Class C shares generally automatically convert to Class A shares ten years after their purchase and, effective November 5, 2020, automatically convert to Class A shares eight years after their purchase as described in the Fund's prospectus. Class I and Class R6 shares are sold at net asset value, are not subject to a sales charge and are sold only to certain eligible investors. Each class represents a pro rata interest in the Fund, but votes separately on class-specific matters and is subject to different expenses.
The Fund applies the accounting and reporting guidance in the Financial Accounting Standards Board (FASB) Accounting Standards Codification Topic 946, Financial Services – Investment Companies (ASC 946). Subsequent events, if any, through the date that the financial statements were issued have been evaluated in the preparation of the financial statements.
A Investment Valuation— Net asset value per share is determined every business day as of the close of the regular session of the New York Stock Exchange (generally 4:00 p.m. Eastern time). The Fund uses independent pricing services approved by the Board of Directors (the Board) to value its investments wherever possible. Investments for which market quotations are not available or deemed not reliable are fair valued in good faith under the direction of the Board.
U.S. generally accepted accounting principles (U.S. GAAP) establishes a disclosure hierarchy that categorizes the inputs to valuation techniques used to value assets and liabilities at measurement date. These inputs are summarized in the three broad levels listed below:
Level 1 - quoted prices in active markets for identical securities
Level 2 - other significant observable inputs (including quoted prices for similar securities, interest rates, prepayment speeds, credit risk, etc.)
Level 3 - significant unobservable inputs (including the Fund’s own assumptions in determining the fair value of investments)
The inputs or methodologies used for valuing securities are not necessarily an indication of the risk associated with investing in those securities.
Valuation techniques used to value the Fund’s investments by major category are as follows:
Equity Securities. Equity securities (including warrants and rights) listed on a U.S. securities exchange generally are valued at the last sale or closing price as reported by an independent pricing service on the primary market or exchange on which they are traded and are categorized as Level 1 in the hierarchy. Equity securities listed on the NASDAQ National Market System are valued at the NASDAQ official closing price and are categorized as Level 1 in the hierarchy. Unlisted or listed securities for which closing sales prices or closing quotations are not available are valued at the mean between the latest available bid and ask prices and are categorized as Level 2 in the hierarchy. The daily valuation of exchange-traded foreign securities generally is determined as of the close of trading on the principal exchange on which such securities trade. Events occurring after the close of trading on foreign exchanges may result in adjustments to the valuation of foreign securities to more accurately reflect their fair value as of the close of regular trading on the New York Stock Exchange. When valuing foreign equity securities that meet certain criteria, the Fund's Board has approved the use of a fair value service that values such securities to reflect market trading that occurs after the close of the applicable foreign markets of comparable securities or other instruments that have a strong correlation to the fair-valued securities. Such securities are categorized as Level 2 in the hierarchy.
Debt Securities. Debt securities are generally valued based on valuations provided by third party pricing services, as derived from such services’ pricing models. Inputs to the models may include, but are not limited to, reported trades, executable bid and ask prices, broker/dealer quotations, prices or yields of securities with similar characteristics, interest rates, anticipated prepayments, benchmark curves or information pertaining to the issuer, as well as industry and economic events. Accordingly, debt securities are generally categorized as Level 2 in the hierarchy. Short-term debt securities with a remaining maturity at time of purchase of more than sixty days are valued based on valuations provided by a third party pricing service. Such securities are generally categorized as Level 2 in the hierarchy. Short-term debt securities of sufficient credit quality purchased with remaining maturities of sixty days or less for which a valuation from a third party pricing service is not readily available may be valued at amortized cost, which approximates fair value, and are categorized as Level 2 in the hierarchy.
Affiliated Fund. The Fund may invest in Calvert Cash Reserves Fund, LLC (Cash Reserves Fund), an affiliated investment company managed by Calvert Research and Management (CRM). While Cash Reserves Fund is not a registered money market mutual fund, it conducts all of its investment activities in accordance with the requirements of Rule 2a-7 under the 1940 Act. Investments in Cash Reserves Fund are valued at the closing net asset value per unit on the valuation day and are categorized as Level 2 in the hierarchy. Cash Reserves Fund generally values its investment securities based on available market quotations provided by a third party pricing service.
Calvert
International Opportunities Fund
September 30, 2021
Notes to Financial Statements — continued
Other Securities. Investments in registered investment companies (including money market funds) that do not trade on an exchange are valued at the net asset value per share on the valuation day and are categorized as Level 1 in the hierarchy.
Fair Valuation. If a market value cannot be determined for a security using the methodologies described above, or if, in the good faith opinion of the Fund's adviser, the market value does not constitute a readily available market quotation, or if a significant event has occurred that would materially affect the value of the security, the security will be fair valued as determined in good faith by or at the direction of the Board in a manner that most fairly reflects the security’s “fair value”, which is the amount that the Fund might reasonably expect to receive for the security upon its current sale in the ordinary course. Each such determination is based on a consideration of relevant factors, which are likely to vary from one pricing context to another. These factors may include, but are not limited to, the type of security, the existence of any contractual restrictions on the security’s disposition, the price and extent of public trading in similar securities of the issuer or of comparable companies or entities, quotations or relevant information obtained from broker/dealers or other market participants, information obtained from the issuer, analysts, and/or the appropriate stock exchange (for exchange-traded securities), an analysis of the company’s or entity’s financial statements, and an evaluation of the forces that influence the issuer and the market(s) in which the security is purchased and sold.
The values assigned to fair value investments are based on available information and do not necessarily represent amounts that might ultimately be realized. Further, due to the inherent uncertainty of valuations of such investments, the fair values may differ significantly from the values that would have been used had an active market existed, and the differences could be material.
The following table summarizes the market value of the Fund's holdings as of September 30, 2021, based on the inputs used to value them:
| Asset Description | Level 1 | Level 2 | Level 3 | Total |
| Common Stocks: | | | | |
| Australia | $ — | $ 25,319,427 | $ — | $ 25,319,427 |
| Austria | — | 8,325,397 | — | 8,325,397 |
| Belgium | — | 13,339,349 | — | 13,339,349 |
| Canada | 12,455,893 | — | — | 12,455,893 |
| France | — | 3,036,665 | — | 3,036,665 |
| Germany | — | 13,426,836 | — | 13,426,836 |
| Ireland | — | 7,048,604 | — | 7,048,604 |
| Italy | — | 33,741,159 | — | 33,741,159 |
| Japan | — | 130,133,573 | — | 130,133,573 |
| Luxembourg | — | 1,678,716 | — | 1,678,716 |
| Netherlands | — | 28,854,383 | — | 28,854,383 |
| New Zealand | — | 3,186,095 | — | 3,186,095 |
| Norway | — | 6,599,448 | — | 6,599,448 |
| Portugal | — | 2,390,419 | — | 2,390,419 |
| Singapore | — | 5,635,012 | — | 5,635,012 |
| Spain | — | 7,747,580 | — | 7,747,580 |
| Sweden | 3,944,406 | 30,175,551 | — | 34,119,957 |
| Switzerland | — | 28,853,734 | — | 28,853,734 |
| United Kingdom | 6,876,055 | 117,321,372 | — | 124,197,427 |
| Total Common Stocks | $23,276,354 | $466,813,320 (1) | $ — | $490,089,674 |
| Exchange-Traded Funds | $ 5,754,312 | $ 5,573,578 | $ — | $ 11,327,890 |
| High Social Impact Investments | — | 785,906 | — | 785,906 |
| Short-Term Investments: | | | | |
| Affiliated Fund | — | 9,284,016 | — | 9,284,016 |
| Securities Lending Collateral | 6,341,743 | — | — | 6,341,743 |
| Total Investments | $35,372,409 | $482,456,820 | $ — | $517,829,229 |
| (1) | Includes foreign equity securities whose values were adjusted to reflect market trading of comparable securities or other correlated instruments that occurred after the close of trading in their applicable foreign markets. |
Calvert
International Opportunities Fund
September 30, 2021
Notes to Financial Statements — continued
B Investment Transactions and Income— Investment transactions for financial statement purposes are accounted for on trade date. Realized gains and losses are recorded on an identified cost basis and may include proceeds from litigation. Dividend income is recorded on the ex-dividend date for dividends received in cash and/or securities or, in the case of dividends on certain foreign securities, as soon as the Fund is informed of the ex-dividend date. Non-cash dividends are recorded at the fair value of the securities received. Withholding taxes on foreign dividends, if any, have been provided for in accordance with the Fund's understanding of the applicable country’s tax rules and rates. Distributions received that represent a return of capital are recorded as a reduction of cost of investments. Distributions received that represent a capital gain are recorded as a realized gain. Interest income, which includes amortization of premium and accretion of discount on debt securities, is accrued as earned.
C Share Class Accounting— Realized and unrealized gains and losses and net investment income and losses, other than class-specific expenses, are allocated daily to each class of shares based upon the relative net assets of each class to the total net assets of the Fund. Expenses arising in connection with a specific class are charged directly to that class. Sub-accounting, recordkeeping and similar administrative fees payable to financial intermediaries, which are a component of transfer agency fees and expenses on the Statement of Operations, are not allocated to Class R6 shares.
D Foreign Currency Transactions— The Fund’s accounting records are maintained in U.S. dollars. For valuation of assets and liabilities on each date of net asset value determination, foreign denominations are converted into U.S. dollars using the current exchange rate. Security transactions, income and expenses are translated at the prevailing rate of exchange on the date of the event. Recognized gains or losses on investment transactions attributable to changes in foreign currency exchange rates are recorded for financial statement purposes as net realized gains and losses on investments. That portion of unrealized gains and losses on investments that results from fluctuations in foreign currency exchange rates is not separately disclosed.
E Restricted Securities— The Fund may invest in securities that are subject to legal or contractual restrictions on resale. Generally, these securities may only be sold publicly upon registration under the Securities Act of 1933 or in transactions exempt from such registration. Information regarding restricted securities (excluding Rule 144A securities) is included at the end of the Schedule of Investments.
F Distributions to Shareholders— Distributions to shareholders are recorded by the Fund on ex-dividend date. Distributions from net investment income and distributions from net realized capital gains, if any, are paid at least annually. Distributions are declared separately for each class of shares. Distributions are determined in accordance with income tax regulations, which may differ from U.S. GAAP; accordingly, periodic reclassifications are made within the Fund's capital accounts to reflect income and gains available for distribution under income tax regulations.
G Estimates— The preparation of financial statements in conformity with U.S. GAAP requires management to make estimates and assumptions that affect the reported amounts of assets and liabilities and disclosure of contingent assets and liabilities at the date of the financial statements and the reported amounts of increases and decreases in net assets from operations during the reporting period. Actual results could differ from those estimates.
H Indemnifications— The Corporation’s By-Laws provide for indemnification for Directors or officers of the Corporation and certain other parties, to the fullest extent permitted by Maryland law and the 1940 Act, provided certain conditions are met. Additionally, in the normal course of business, the Fund enters into agreements with service providers that may contain indemnification clauses. The Fund’s maximum exposure under these arrangements is unknown as this would involve future claims that may be made against the Fund that have not yet occurred.
I Federal Income Taxes— No provision for federal income or excise tax is required since the Fund intends to continue to qualify as a regulated investment company under the Internal Revenue Code and to distribute substantially all of its taxable earnings.
Management has analyzed the Fund's tax positions taken for all open federal income tax years and has concluded that no provision for federal income tax is required in the Fund's financial statements. A Fund's federal tax return is subject to examination by the Internal Revenue Service for a period of three years from the date of filing.
2 Related Party Transactions
The investment advisory fee is earned by CRM as compensation for investment advisory services rendered to the Fund. On March 1, 2021, Morgan Stanley acquired Eaton Vance Corp. (the “Transaction”) and CRM became an indirect, wholly-owned subsidiary of Morgan Stanley. In connection with the Transaction, the Fund entered into a new investment advisory agreement (the “New Agreement”) with CRM, which took effect on March 1, 2021. Pursuant to the New Agreement (and the Fund's investment advisory agreement with CRM in effect prior to March 1, 2021), the fee is computed at the annual rate of 0.75% of the Fund’s average daily net assets and is payable monthly. For the year ended September 30, 2021, the investment advisory fee amounted to $3,477,123. The Fund may invest its cash in Cash Reserves Fund. CRM does not currently receive a fee for advisory services provided to Cash Reserves Fund.
Calvert
International Opportunities Fund
September 30, 2021
Notes to Financial Statements — continued
Pursuant to an investment sub-advisory agreement, CRM has delegated the investment management of the Fund to Eaton Vance Advisers International Ltd. (EVAIL), an affiliate of CRM and, effective March 1, 2021, an indirect, wholly-owned subsidiary of Morgan Stanley. In connection with the Transaction, CRM entered into a new investment sub-advisory agreement with EVAIL, which took effect on March 1, 2021. During the year ended September 30, 2021, EVAIL used the portfolio management, research and other resources of its affiliate, Eaton Vance Global Advisors Limited (EVGA), in rendering investment advisory services to the Fund. Effective October 1, 2021, EVAIL uses the portfolio management, research and other resources of its affiliate, MSIM Fund Management (Ireland) Limited (MSIM FMIL) to render investment advisory services to the Fund. EVGA had/MSIM FMIL has entered into a Memorandum of Understanding with EVAIL pursuant to which EVGA was/MSIM FMIL is considered a participating affiliate of the sub-adviser as that term is used in relief granted by the staff of the U.S. Securities and Exchange Commission allowing U.S. registered investment advisers to use portfolio management or research resources of unregistered advisory affiliates subject to the supervision of a U.S. registered adviser. CRM pays EVAIL a portion of its investment advisory fee for sub-advisory services provided to the Fund.
CRM and EVAIL have agreed to reimburse the Fund’s operating expenses to the extent that total annual operating expenses (relating to ordinary operating expenses only and excluding expenses such as brokerage commissions, acquired fund fees and expenses of unaffiliated funds, borrowing costs, taxes or litigation expenses) exceed 1.34%, 2.09%, 1.09% and 1.05% for Class A, Class C, Class I and Class R6, respectively, of such class’s average daily net assets. The expense reimbursement agreement may be changed or terminated after January 31, 2022. For the year ended September 30, 2021, no expenses were waived or reimbursed by CRM and EVAIL.
The administrative fee is earned by CRM as compensation for administrative services rendered to the Fund. The fee is computed at an annual rate of 0.12% of the Fund’s average daily net assets attributable to Class A, Class C, Class I and Class R6 and is payable monthly. For the year ended September 30, 2021, CRM was paid administrative fees of $556,340.
The Fund has in effect a distribution plan for Class A shares (Class A Plan) pursuant to Rule 12b-1 under the 1940 Act. Pursuant to the Class A Plan, the Fund pays Eaton Vance Distributors, Inc. (EVD), an affiliate of CRM and the Fund’s principal underwriter, a distribution and service fee of 0.25% per annum of its average daily net assets attributable to Class A shares for distribution services and facilities provided to the Fund by EVD, as well as for personal services and/or the maintenance of shareholder accounts. The Fund also has in effect a distribution plan for Class C shares (Class C Plan) pursuant to Rule 12b-1 under the 1940 Act. Pursuant to the Class C Plan, the Fund pays EVD amounts equal to 0.75% per annum of its average daily net assets attributable to Class C shares for providing ongoing distribution services and facilities to the Fund. In addition, pursuant to the Class C Plan, the Fund also makes payments of service fees to EVD, financial intermediaries and other persons in amounts equal to 0.25% per annum of its average daily net assets attributable to that class. Service fees paid or accrued are for personal services and/or the maintenance of shareholder accounts. Distribution and service fees paid or accrued for the year ended September 30, 2021 amounted to $209,204 and $59,884 for Class A shares and Class C shares, respectively.
The Fund was informed that EVD received $20,877 as its portion of the sales charge on sales of Class A shares for the year ended September 30, 2021. The Fund was also informed that EVD received less than $100 and $156 of contingent deferred sales charges paid by Class A and Class C shareholders, respectively, for the same period.
Eaton Vance Management (EVM), an affiliate of CRM, provides sub-transfer agency and related services to the Fund pursuant to a Sub-Transfer Agency Support Services Agreement. For the year ended September 30, 2021, sub-transfer agency fees and expenses incurred to EVM amounted to $36,693 and are included in transfer agency fees and expenses on the Statement of Operations.
During the year ended September 30, 2021, CRM reimbursed the Fund $339,170 for a net realized loss due to a trading error. Had the Fund not received the reimbursement, the impact on total return for each class would not have been material.
Each Director of the Fund who is not an employee of CRM or its affiliates receives an annual fee of $154,000, plus an annual Committee fee ranging from $8,500 to $16,500 depending on the Committee. The Board chair receives an additional $30,000 ($20,000 prior to January 1, 2021) annual fee and Committee chairs receive an additional $6,000 annual fee. Eligible Directors may participate in a Deferred Compensation Plan (the Plan). Amounts deferred under the Plan are treated as though equal dollar amounts had been invested in shares of the Fund or other Calvert funds selected by the Directors. The Fund purchases shares of the funds selected equal to the dollar amounts deferred under the Plan, resulting in an asset equal to the deferred compensation liability. Obligations of the Plan are paid solely from the Fund's assets. Directors’ fees are allocated to each of the Calvert funds served. Salaries and fees of officers and Directors of the Fund who are employees of CRM or its affiliates are paid by CRM. Prior to December 31, 2020, an Advisory Council aided the Board and CRM in advancing the cause of responsible investing through original scholarship and thought leadership. The Advisory Council consisted of CRM’s Chief Executive Officer and three additional members. For the year ended December 31, 2020, each member (other than CRM’s Chief Executive Officer) was compensated $20,000 for their service on the Advisory Council. Such compensation, and any other compensation and/or expenses incurred by the Advisory Council as may be approved by the Board, was borne by the Calvert funds. For the year ended September 30, 2021, the Fund’s allocated portion of the Advisory Council compensation and fees was $297, which is included in miscellaneous expense on the Statement of Operations.
Calvert
International Opportunities Fund
September 30, 2021
Notes to Financial Statements — continued
3 Investment Activity
During the year ended September 30, 2021, the cost of purchases and proceeds from sales of investments, other than short-term securities, were $280,608,318 and $243,910,331, respectively.
4 Distributions to Shareholders and Income Tax Information
The tax character of distributions declared for the years ended September 30, 2021 and September 30, 2020 was as follows:
| | Year Ended September 30, |
| | 2021 | 2020 |
| Ordinary income | $3,154,283 | $4,929,724 |
During the year ended September 30, 2021, distributable earnings was decreased by $2,425,863 and paid-in capital was increased by $2,425,863 due to the Fund's use of equalization accounting. Tax equalization accounting allows the Fund to treat as a distribution that portion of redemption proceeds representing a redeeming shareholder’s portion of undistributed taxable income and net capital gains. These reclassifications had no effect on the net assets or net asset value per share of the Fund.
As of September 30, 2021, the components of distributable earnings (accumulated loss) on a tax basis were as follows:
| Undistributed ordinary income | $ 5,776,524 |
| Undistributed long-term capital gains | 30,358,031 |
| Net unrealized appreciation | 92,445,320 |
| Distributable earnings | $128,579,875 |
The cost and unrealized appreciation (depreciation) of investments of the Fund at September 30, 2021, as determined on a federal income tax basis, were as follows:
| Aggregate cost | $425,391,578 |
| Gross unrealized appreciation | $ 101,065,731 |
| Gross unrealized depreciation | (8,628,080) |
| Net unrealized appreciation | $ 92,437,651 |
5 Securities Lending
To generate additional income, the Fund may lend its securities pursuant to a securities lending agency agreement with State Street Bank and Trust Company (SSBT), the securities lending agent. Security loans are subject to termination by the Fund at any time and, therefore, are not considered illiquid investments. The Fund requires that the loan be continuously collateralized by either cash or securities in an amount at least equal to the market value of the securities on loan. The market value of securities loaned is determined daily and any additional required collateral is delivered to the Fund on the next business day. Cash collateral is generally invested in a money market fund registered under the 1940 Act that is managed by an affiliate of SSBT. Any gain or loss in the market price of the loaned securities that might occur and any interest earned or dividends declared during the term of the loan would accrue to the account of the Fund. Income earned on the investment of collateral, net of broker rebates and other expenses incurred by the securities lending agent, is split between the Fund and the securities lending agent based on agreed upon contractual terms. Non-cash collateral, if any, is held by the lending agent on behalf of the Fund and cannot be sold or re-pledged by the Fund; accordingly, such collateral is not reflected in the Statement of Assets and Liabilities.
The risks associated with lending portfolio securities include, but are not limited to, possible delays in receiving additional collateral or in the recovery of the loaned securities, possible loss of rights to the collateral should the borrower fail financially, as well as risk of loss in the value of the collateral or the value of the investments made with the collateral. The securities lending agent shall indemnify the Fund in the case of default of any securities borrower.
At September 30, 2021, the total value of securities on loan was $6,622,395 and the total value of collateral received was $6,873,294, comprised of cash of $6,341,743 and U.S. government and/or agencies securities of $531,551.
Calvert
International Opportunities Fund
September 30, 2021
Notes to Financial Statements — continued
The following table provides a breakdown of securities lending transactions accounted for as secured borrowings, the obligations by class of collateral pledged, and the remaining contractual maturity of those transactions as of September 30, 2021.
| | Remaining Contractual Maturity of the Transactions |
| | Overnight and
Continuous | <30 days | 30 to 90 days | >90 days | Total |
| Common Stocks | $ 2,499,493 | $ — | $ — | $ — | $ 2,499,493 |
| Exchange-Traded Funds | 3,842,250 | — | — | — | 3,842,250 |
| Total | $6,341,743 | $ — | $ — | $ — | $6,341,743 |
The carrying amount of the liability for deposits for securities loaned at September 30, 2021 approximated its fair value. If measured at fair value, such liability would have been considered as Level 2 in the fair value hierarchy (see Note 1A) at September 30, 2021.
6 Line of Credit
The Fund participates with other portfolios and funds managed by EVM and its affiliates, including CRM, in an $800 million unsecured line of credit with a group of banks, which is in effect through October 26, 2021. Borrowings are made by the Fund solely for temporary purposes related to redemptions and other short-term cash needs. Interest is charged to the Fund based on its borrowings at an amount above either the Eurodollar rate or Federal Funds rate. In addition, a fee computed at an annual rate of 0.15% on the daily unused portion of the line of credit is allocated among the participating portfolios and funds at the end of each quarter. In connection with the renewal of the agreement in October 2020, an upfront fee and arrangement fee totaling $950,000 was incurred that was allocated to the participating portfolios and funds. Because the line of credit is not available exclusively to the Fund, it may be unable to borrow some or all of its requested amounts at any particular time.
The Fund had no borrowings outstanding pursuant to its line of credit at September 30, 2021. The Fund did not have any significant borrowings or allocated fees during the year ended September 30, 2021. Effective October 26, 2021, the Fund renewed its line of credit agreement, which expires October 25, 2022, at substantially the same terms.
7 Affiliated Companies and Funds
The Fund has invested a portion of its assets in notes (the Notes) issued by Calvert Impact Capital, Inc. (CIC) pursuant to exemptive relief granted by the U.S. Securities and Exchange Commission (the SEC). There are certain potential points of affiliation between the Fund and CIC. CRM has licensed use of the Calvert name to CIC and provides other types of support. CRM’s President and Chief Executive Officer (and the only director/trustee on the Fund Board that is an “interested person” of the Fund) serves on the CIC Board. In addition, another director/trustee on the Fund Board serves as a director emeritus on the CIC Board.
At September 30, 2021, the value of the Fund’s investment in the Notes and affiliated funds was $9,834,401, which represents 1.9% of the Fund’s net assets. Transactions in the Notes and affiliated funds by the Fund for the year ended September 30, 2021 were as follows:
| Name | Value,
beginning
of period | Purchases | Sales
proceeds | Net
realized
gain
(loss) | Change in
unrealized
appreciation
(depreciation) | Value,
end of
period | Interest/
Dividend
income | Principal
amount/Units,
end of period |
| High Social Impact Investments | | | | | | | | |
| Calvert Impact Capital, Inc., Community Investment Notes: | | | | | | | | |
| 1.50%, 12/15/20(1) | $1,153,307 | $ — | $ (1,159,184) | $ — | $ 5,877 | $ — | $ 3,623 | $ — |
| 1.50%, 12/15/23(1) | — | 560,000 | — | — | (9,615) | 550,385 | 6,673 | 560,000 |
| Short-Term Investments | | | | | | |
| Calvert Cash Reserves Fund, LLC | 3,486,807 | 142,029,981 | (136,233,479) | (471) | 1,178 | 9,284,016 | 4,822 | 9,283,087 |
| Totals | | | | $(471) | $ (2,560) | $9,834,401 | $15,118 | |
Calvert
International Opportunities Fund
September 30, 2021
Notes to Financial Statements — continued
8 Capital Shares
The Corporation may issue its shares in one or more series (such as the Fund). The authorized shares of the Fund consist of 75,000,000 common shares, $0.01 par value, for each Class.
Transactions in capital shares for the years ended September 30, 2021 and September 30, 2020 were as follows:
| | Year Ended
September 30, 2021 | | Year Ended
September 30, 2020 |
| | Shares | Amount | | Shares | Amount |
| Class A | | | | | |
| Shares sold | 760,083 | $ 16,175,778 | | 822,650 | $ 13,491,146 |
| Reinvestment of distributions | 19,781 | 396,014 | | 43,505 | 747,852 |
| Shares redeemed | (541,451) | (11,369,638) | | (1,019,287) | (16,110,110) |
| Converted from Class C | 26,177 | 519,866 | | 22,403 | 378,348 |
| Net increase (decrease) | 264,590 | $ 5,722,020 | | (130,729) | $ (1,492,764) |
| Class C | | | | | |
| Shares sold | 34,930 | $ 722,561 | | 45,986 | $ 757,758 |
| Reinvestment of distributions | — | — | | 1,462 | 24,586 |
| Shares redeemed | (37,361) | (758,266) | | (123,807) | (1,962,021) |
| Converted to Class A | (26,938) | (519,866) | | (22,963) | (378,348) |
| Net decrease | (29,369) | $ (555,571) | | (99,322) | $ (1,558,025) |
| Class I | | | | | |
| Shares sold | 5,018,088 | $103,872,491 | | 6,321,766 | $100,246,560 |
| Reinvestment of distributions | 101,329 | 1,984,025 | | 174,421 | 2,932,018 |
| Shares redeemed | (3,771,380) | (76,717,288) | | (6,114,835) | (94,045,475) |
| Net increase | 1,348,037 | $ 29,139,228 | | 381,352 | $ 9,133,103 |
| Class R6 | | | | | |
| Shares sold | 564,906 | $ 11,061,998 | | 250,188 | $ 3,942,427 |
| Reinvestment of distributions | 25,434 | 497,493 | | 41,577 | 698,083 |
| Shares redeemed | (235,237) | (4,693,429) | | (286,587) | (4,902,330) |
| Net increase (decrease) | 355,103 | $ 6,866,062 | | 5,178 | $ (261,820) |
At September 30, 2021, Calvert Moderate Allocation Fund and Calvert Growth Allocation Fund owned in the aggregate 10.2% of the value of the outstanding shares of the Fund.
9 Risks and Uncertainties
Risks Associated with Foreign Investments
Foreign investments can be adversely affected by political, economic and market developments abroad, including the imposition of economic and other sanctions by the United States or another country. There may be less publicly available information about foreign issuers because they may not be subject to reporting practices, requirements or regulations comparable to those to which United States companies are subject. Foreign markets may be smaller, less liquid and more volatile than the major markets in the United States. Trading in foreign markets typically involves higher expense than trading in the United States. The Fund may have difficulties enforcing its legal or contractual rights in a foreign country. Securities that trade or are denominated in currencies other than the U.S. dollar may be adversely affected by fluctuations in currency exchange rates.
Pandemic Risk
An outbreak of respiratory disease caused by a novel coronavirus was first detected in China in late 2019 and subsequently spread internationally. This coronavirus has resulted in closing borders, enhanced health screenings, changes to healthcare service preparation and delivery, quarantines, cancellations, disruptions to supply chains and customer activity, as well as general concern and uncertainty. Health crises caused by outbreaks, such as the coronavirus
Calvert
International Opportunities Fund
September 30, 2021
Notes to Financial Statements — continued
outbreak, may exacerbate other pre-existing political, social and economic risks and disrupt normal market conditions and operations. The impact of this outbreak has negatively affected the worldwide economy, the economies of individual countries, individual companies, and the market in general, and may continue to do so in significant and unforeseen ways, as may other epidemics and pandemics that may arise in the future. Any such impact could adversely affect the Fund's performance, or the performance of the securities in which the Fund invests.
10 Change in Independent Registered Public Accounting Firm
On July 30, 2021, KPMG LLP (“KPMG”) informed the Audit Committee and Board of the Corporation that it was resigning as the independent registered public accounting firm to the Corporation, as upon Morgan Stanley’s acquisition of Eaton Vance Corp., the parent company of CRM (the investment adviser to each series of the Corporation), KPMG would no longer be independent of the Corporation. The Audit Committee of the Board and the Board approved the selection of Deloitte & Touche LLP (“Deloitte”) as the independent registered public accounting firm for the funds that are series of the Corporation (the “Funds”) for the fiscal year ending September 30, 2021 to be effective upon KPMG’s resignation and Deloitte’s acceptance of the engagement which became effective July 30, 2021.
KPMG’s reports on the financial statements for the Funds for the fiscal periods ended September 30, 2019 and September 30, 2020 contained no adverse opinion or disclaimer of opinion nor were they qualified or modified as to uncertainty, audit scope or accounting principles. During the fiscal periods ended September 30, 2019 and September 30, 2020, and during the subsequent interim period through July 30, 2021: (i) there were no disagreements with KPMG on any matter of accounting principles or practices, financial statement disclosure or auditing scope or procedure, which disagreements, if not resolved to the satisfaction of KPMG, would have caused KPMG to make reference to the subject matter of the disagreements in connection with its reports on the Funds’ financial statements for such periods; and (ii) there were no “reportable events” of the kind described in Item 304(a)(1)(v) of Regulation S-K under the Securities Exchange Act of 1934, as amended.
During the fiscal periods ended September 30, 2019 and September 30, 2020, and during the subsequent interim period through July 30, 2021: neither the Funds, nor anyone on their behalf, consulted with Deloitte on items which: (i) concerned the application of accounting principles to a specified transaction, either completed or proposed, or the type of audit opinion that might be rendered on the Funds’ financial statements; or (ii) concerned the subject of a disagreement (as defined in paragraph (a)(1)(iv) of Item 304 of Regulation S-K) or reportable events (as described in paragraph (a)(1)(v) of Item 304).
Calvert
International Opportunities Fund
September 30, 2021
Report of Independent Registered Public Accounting Firm
To the Board of Directors of Calvert World Values Fund, Inc. and Shareholders of Calvert International Opportunities Fund:
Opinion on the Financial Statements and Financial Highlights
We have audited the accompanying statement of assets and liabilities of Calvert International Opportunities Fund (the "Fund") (one of the funds constituting Calvert World Values Fund, Inc.), including the schedule of investments, as of September 30, 2021, the related statements of operations, changes in net assets and the financial highlights for the year then ended, and the related notes. In our opinion, the financial statements and financial highlights present fairly, in all material respects, the financial position of the Fund as of September 30, 2021, and the results of its operations and changes in its net assets for the year then ended, and the financial highlights for the year then ended in conformity with accounting principles generally accepted in the United States of America. The statement of changes in net assets for the year ended September 30, 2020, and the financial highlights for the years or periods ended September 30, 2020, 2019, 2018, and 2017 were audited by other auditors whose report, dated November 20, 2020, expressed an unqualified opinion on that financial statement and those financial highlights.
Basis for Opinion
These financial statements and financial highlights are the responsibility of the Fund's management. Our responsibility is to express an opinion on the Fund's financial statements and financial highlights based on our audit. We are a public accounting firm registered with the Public Company Accounting Oversight Board (United States) (PCAOB) and are required to be independent with respect to the Fund in accordance with the U.S. federal securities laws and the applicable rules and regulations of the Securities and Exchange Commission and the PCAOB.
We conducted our audit in accordance with the standards of the PCAOB. Those standards require that we plan and perform the audit to obtain reasonable assurance about whether the financial statements and financial highlights are free of material misstatement, whether due to error or fraud. The Fund is not required to have, nor were we engaged to perform, an audit of its internal control over financial reporting. As part of our audit we are required to obtain an understanding of internal control over financial reporting but not for the purpose of expressing an opinion on the effectiveness of the Fund’s internal control over financial reporting. Accordingly, we express no such opinion.
Our audit included performing procedures to assess the risks of material misstatement of the financial statements and financial highlights, whether due to error or fraud, and performing procedures that respond to those risks. Such procedures included examining, on a test basis, evidence regarding the amounts and disclosures in the financial statements and financial highlights. Our audit also included evaluating the accounting principles used and significant estimates made by management, as well as evaluating the overall presentation of the financial statements and financial highlights. Our procedures included confirmation of securities owned as of September 30, 2021, by correspondence with the custodian and brokers; when replies were not received from brokers, we performed other auditing procedures. We believe that our audit provides a reasonable basis for our opinion.
/s/ Deloitte & Touche LLP
Boston, Massachusetts
November 22, 2021
We have served as the auditor of one or more Calvert investment companies since 2021.
Calvert
International Opportunities Fund
September 30, 2021
Federal Tax Information (Unaudited)
The Form 1099-DIV you receive in February 2022 will show the tax status of all distributions paid to your account in calendar year 2021. Shareholders are advised to consult their own tax adviser with respect to the tax consequences of their investment in the Fund. As required by the Internal Revenue Code and/or regulations, shareholders must be notified regarding the status of qualified dividend income for individuals, the foreign tax credit and capital gains dividends.
Qualified Dividend Income. For the fiscal year ended September 30, 2021, the Fund designates approximately $5,413,966, or up to the maximum amount of such dividends allowable pursuant to the Internal Revenue Code, as qualified dividend income eligible for the reduced tax rate of 15%.
Foreign Tax Credit. For the fiscal year ended September 30, 2021, the Fund paid foreign taxes of $466,757 and recognized foreign source income of $6,610,072.
Capital Gains Dividends. The Fund hereby designates as a capital gain dividend with respect to the taxable year ended September 30, 2021, $32,429,993 or, if subsequently determined to be different, the net capital gain of such year.
Calvert
International Opportunities Fund
September 30, 2021
Liquidity Risk Management Program
The Fund has implemented a written liquidity risk management program (Program) and related procedures to manage its liquidity in accordance with Rule 22e-4 under the Investment Company Act of 1940, as amended (Liquidity Rule). The Liquidity Rule defines “liquidity risk” as the risk that a fund could not meet requests to redeem shares issued by the fund without significant dilution of the remaining investors’ interests in the fund. The Fund’s Board of Trustees/Directors has designated the investment adviser to serve as the administrator of the Program and the related procedures. The administrator has established a Liquidity Risk Management Oversight Committee (Committee) to perform the functions necessary to administer the Program. As part of the Program, the administrator is responsible for identifying illiquid investments and categorizing the relative liquidity of the Fund’s investments in accordance with the Liquidity Rule. Under the Program, the administrator assesses, manages, and periodically reviews the Fund’s liquidity risk, and is responsible for making certain reports to the Fund’s Board of Trustees/Directors and the Securities and Exchange Commission (SEC) regarding the liquidity of the Fund’s investments, and to notify the Board of Trustees/Directors and the SEC of certain liquidity events specified in the Liquidity Rule. The liquidity of the Fund’s portfolio investments is determined based on a number of factors including, but not limited to, relevant market, trading and investment-specific considerations under the Program.
At a meeting of the Fund’s Board of Trustees/Directors on June 16, 2021, the Committee provided a written report to the Fund’s Board of Trustees/ Directors pertaining to the operation, adequacy, and effectiveness of implementation of the Program, as well as the operation of the highly liquid investment minimum (if applicable) for the period January 1, 2020 through December 31, 2020 (Review Period). The Program operated effectively during the Review Period, supporting the administrator’s ability to assess, manage and monitor Fund liquidity risk, including during periods of market volatility and net redemptions. During the Review Period, the Fund met redemption requests on a timely basis.
There can be no assurance that the Program will achieve its objectives in the future. Please refer to the Fund’s prospectus for more information regarding the Fund’s exposure to liquidity risk and other principal risks to which an investment in the Fund may be subject.
Calvert
International Opportunities Fund
September 30, 2021
Management and Organization
Fund Management. The Directors of Calvert World Values Fund, Inc. (the Corporation) are responsible for the overall management and supervision of the Corporation’s affairs. The Directors and officers of the Corporation are listed below. Except as indicated, each individual has held the office shown or other offices in the same company for the last five years. Each Board member holds office until his or her successor is elected and qualified, or until his or her earlier death, resignation, retirement, removal or disqualification. Under the terms of the Fund's current Board member retirement policy, an Independent Board member must retire at the end of the calendar year in which he or she turns 75. However, if such retirement would cause the Fund to be out of compliance with Section 16 of the 1940 Act or any other regulations or guidance of the SEC, then such retirement and resignation will not become effective until such time as action has been taken for the Fund to be in compliance upon a Board member's retirement. The “Independent Directors” consist of those Directors who are not “interested persons” of the Corporation, as that term is defined under the 1940 Act. The business address of each Director and officer, with the exception of Ms. Walsh and Mr. Kirchner, is 1825 Connecticut Avenue NW, Suite 400, Washington, DC 20009. As used below, “CRM” refers to Calvert Research and Management. Each Director oversees 39 funds in the Calvert fund complex. Each officer serves as an officer of certain other Calvert funds.
| Name and Year of Birth | Corporation
Position(s) | Position
Start Date | Principal Occupation(s) and Other Directorships
During Past Five Years and Other Relevant Experience |
| Interested Director |
John H. Streur(1)
1960 | Director and
President | 2015 | President and Chief Executive Officer of Calvert Research and
Management (since December 31, 2016). President and Chief Executive
Officer of Calvert Investments, Inc. (January 2015 - December 2016);
Chief Executive Officer of Calvert Investment Distributors, Inc. (August
2015 - December 2016); Chief Compliance Officer of Calvert Investment
Management, Inc. (August 2015 - April 2016); President and Director,
Portfolio 21 Investments, Inc. (through October 2014); President,
Chief Executive Officer and Director, Managers Investment Group LLC
(through January 2012); President and Director, The Managers Funds
and Managers AMG Funds (through January 2012).
Other Directorships in the Last Five Years. Portfolio 21 Investments,
Inc. (asset management) (through October 2014); Managers Investment
Group LLC (asset management) (through January 2012); The Managers
Funds (asset management) (through January 2012); Managers AMG Funds
(asset management) (through January 2012); Calvert Impact Capital, Inc. |
| Independent Directors |
Richard L. Baird, Jr.
1948 | Director | 2005 | Regional Disaster Recovery Lead, American Red Cross of Greater
Pennsylvania (since 2017). Volunteer, American Red Cross (since 2015).
Former President and CEO of Adagio Health Inc. (retired in 2014) in
Pittsburgh, PA.
Other Directorships in the Last Five Years. None. |
Alice Gresham Bullock
1950 | Chair and
Director | 2016 | Professor Emerita at Howard University School of Law. Dean Emerita of
Howard University School of Law and Deputy Director of the Association
of American Law Schools (1992-1994).
Other Directorships in the Last Five Years. None. |
Cari M. Dominguez
1949 | Director | 2016 | Former Chair of the U.S. Equal Employment Opportunity Commission.
Other Directorships in the Last Five Years. Manpower, Inc. (employment
agency); Triple S Management Corporation (managed care); National
Association of Corporate Directors. |
John G. Guffey, Jr.
1948 | Director | 1992 | President of Aurora Press Inc., a privately held publisher of trade
paperbacks (since January 1997).
Other Directorships in the Last Five Years. Calvert Impact Capital, Inc.
(through December 31, 2018); Calvert Ventures, LLC. |
Miles D. Harper, III
1962 | Director | 2005 | Partner, Carr Riggs & Ingram (public accounting firm) since October 2014.
Partner, Gainer Donnelly & Desroches (public accounting firm) (now Carr
Riggs & Ingram) (November 1999 - September 2014).
Other Directorships in the Last Five Years. Bridgeway Funds (9) (asset
management). |
Joy V. Jones
1950 | Director | 2005 | Attorney.
Other Directorships in the Last Five Years. Conduit Street Restaurants
SUD 2 Limited; Palm Management Restaurant Corporation. |
Calvert
International Opportunities Fund
September 30, 2021
Management and Organization — continued
| Name and Year of Birth | Corporation
Position(s) | Position
Start Date | Principal Occupation(s) and Other Directorships
During Past Five Years and Other Relevant Experience |
| Independent Directors (continued) |
Anthony A. Williams
1951 | Director | 2016 | CEO and Executive Director of the Federal City Council (July 2012 to
present); Senior Adviser and Independent Consultant for King and
Spalding LLP (September 2015 to present); Executive Director of Global
Government Practice at the Corporate Executive Board (January 2010 to
January 2012).
Other Directorships in the Last Five Years. Freddie Mac; Evoq
Properties/Meruelo Maddux Properties, Inc. (real estate management);
Weston Solutions, Inc. (environmental services); Bipartisan Policy Center’s
Debt Reduction Task Force; Chesapeake Bay Foundation; Catholic
University of America; Urban Institute (research organization); The Howard Hughes Corporation (real estate development). |
| Name and Year of Birth | Corporation
Position(s) | Position
Start Date | Principal Occupation(s)
During Past Five Years |
| Principal Officers who are not Directors |
Hope L. Brown
1973 | Chief
Compliance
Officer | 2014 | Chief Compliance Officer of 39 registered investment companies advised
by CRM (since 2014). Vice President and Chief Compliance Officer,
Wilmington Funds (2012-2014). |
Deidre E. Walsh(2)
1971 | Secretary,
Vice President
and Chief
Legal Officer | 2021 | Vice President of CRM and officer of 39 registered investment companies
advised by CRM (since 2021). Also Vice President of Eaton Vance and
certain of its affiliates and officer of 138 registered investment companies
advised or administered by Eaton Vance. |
James F. Kirchner(2)
1967 | Treasurer | 2016 | Vice President of CRM and officer of 39 registered investment companies
advised by CRM (since 2016). Also Vice President of Eaton Vance and
certain of its affiliates and officer of 138 registered investment companies
advised or administered by Eaton Vance. |
| (1) Mr. Streur is an interested person of the Fund because of his positions with the Fund’s adviser and certain affiliates. |
| (2) The business address for Ms. Walsh and Mr. Kirchner is Two International Place, Boston, MA 02110. |
The SAI for the Fund includes additional information about the Directors and officers of the Fund and can be obtained without charge on Calvert’s website at www.calvert.com or by calling 1-800-368-2745.
| FACTS | WHAT DOES EATON VANCE DO WITH YOUR
PERSONAL INFORMATION? |
| Why? | Financial companies choose how they share your personal information. Federal law gives consumers the right to limit some but not all sharing. Federal law also requires us to tell you how we collect, share, and protect your personal information. Please read this notice carefully to understand what we do. |
| |
| What? | The types of personal information we collect and share depend on the product or service you have with us. This information can include:■ Social Security number and income
■
investment experience and risk tolerance
■
checking account number and wire transfer instructions |
| |
| How? | All financial companies need to share customers’ personal information to run their everyday business. In the section below, we list the reasons financial companies can share their customers’ personal information; the reasons Eaton Vance chooses to share; and whether you can limit this sharing. |
Reasons we can share your
personal information | Does Eaton Vance
share? | Can you limit
this sharing? |
| For our everyday business purposes — such as to process your transactions, maintain your account(s), respond to court orders and legal investigations, or report to credit bureaus | Yes | No |
| For our marketing purposes — to offer our products and services to you | Yes | No |
| For joint marketing with other financial companies | No | We don’t share |
| For our investment management affiliates’ everyday business purposes — information about your transactions, experiences, and creditworthiness | Yes | Yes |
| For our affiliates’ everyday business purposes — information about your transactions and experiences | Yes | No |
| For our affiliates’ everyday business purposes — information about your creditworthiness | No | We don’t share |
| For our investment management affiliates to market to you | Yes | Yes |
| For our affiliates to market to you | No | We don’t share |
| For nonaffiliates to market to you | No | We don’t share |
To limit our
sharing | Call toll-free 1-800-368-2745 or email: CRMPrivacy@calvert.comPlease note:If you are a new customer, we can begin sharing your information 30 days from the date we sent this notice. When you are no longer our customer, we continue to share your information as described in this notice. However, you can contact us at any time to limit our sharing. |
| Questions? | Call toll-free 1-800-368-2745 or email: CRMPrivacy@calvert.com |
| Privacy Notice — continued | April 2021 |
| Who we are |
| Who is providing this notice? | Eaton Vance Management, Eaton Vance Distributors, Inc., Eaton Vance Trust Company, Eaton Vance Management (International) Limited, Eaton Vance Advisers International Ltd., Eaton Vance Global Advisors Limited, Eaton Vance Management’s Real Estate Investment Group, Boston Management and Research, Calvert Research and Management, Eaton Vance and Calvert Fund Families and our investment advisory affiliates (“Eaton Vance”) (see Investment Management Affiliates definition below) |
| What we do |
How does Eaton Vance
protect my personal
information? | To protect your personal information from unauthorized access and use, we use security measures that comply with federal law. These measures include computer safeguards and secured files and buildings. We have policies governing the proper handling of customer information by personnel and requiring third parties that provide support to adhere to appropriate security standards with respect to such information. |
How does Eaton Vance
collect my personal
information? | We collect your personal information, for example, when you■ open an account or make deposits or withdrawals from your account
■
buy securities from us or make a wire transfer
■
give us your contact informationWe also collect your personal information from others, such as credit bureaus, affiliates, or other companies. |
| Why can’t I limit all sharing? | Federal law gives you the right to limit only■ sharing for affiliates’ everyday business purposes — information about your creditworthiness
■
affiliates from using your information to market to you
■
sharing for nonaffiliates to market to youState laws and individual companies may give you additional rights to limit sharing. See below for more on your rights under state law. |
| Definitions |
Investment Management
Affiliates | Eaton Vance Investment Management Affiliates include registered investment advisers, registered broker- dealers, and registered and unregistered funds. Investment Management Affiliates does not include entities associated with Morgan Stanley Wealth Management, such as Morgan Stanley Smith Barney LLC and Morgan Stanley & Co. |
| Affiliates | Companies related by common ownership or control. They can be financial and nonfinancial companies.■ Our affiliates include companies with a Morgan Stanley name and financial companies such as Morgan Stanley Smith Barney LLC and Morgan Stanley & Co. |
| Nonaffiliates | Companies not related by common ownership or control. They can be financial and nonfinancial companies.■ Eaton Vance does not share with nonaffiliates so they can market to you. |
| Joint marketing | A formal agreement between nonaffiliated financial companies that together market financial products or services to you.■ Eaton Vance doesn’t jointly market. |
| Other important information |
| Vermont: Except as permitted by law, we will not share personal information we collect about Vermont residents with Nonaffiliates unless you provide us with your written consent to share such information.California: Except as permitted by law, we will not share personal information we collect about California residents with Nonaffiliates and we will limit sharing such personal information with our Affiliates to comply with California privacy laws that apply to us. |
Delivery of Shareholder Documents. The Securities and Exchange Commission (SEC) permits funds to deliver only one copy of shareholder documents, including prospectuses, proxy statements and shareholder reports, to fund investors with multiple accounts at the same residential or post office box address. This practice is often called “householding” and it helps eliminate duplicate mailings to shareholders. Calvert funds, or your financial intermediary, may household the mailing of your documents indefinitely unless you instruct Calvert funds, or your financial intermediary, otherwise. If you would prefer that your Calvert fund documents not be householded, please contact Calvert funds at 1-800-368-2745, or contact your financial intermediary. Your instructions that householding not apply to delivery of your Calvert fund documents will typically be effective within 30 days of receipt by Calvert funds or your financial intermediary. Separate statements will be generated for each separate account and will be householded as described above.
Portfolio Holdings. Each Calvert fund files a schedule of portfolio holdings on Part F to Form N-PORT with the SEC. Certain information filed on Form N-PORT may be viewed on the Calvert website at www.calvert.com, by calling Calvert at 1-800-368-2745 or in the EDGAR database on the SEC’s website at www.sec.gov.
Proxy Voting. The Proxy Voting Guidelines that each Calvert fund uses to determine how to vote proxies relating to portfolio securities is provided as an Appendix to the fund’s Statement of Additional Information. The Statement of Additional Information can be obtained free of charge by calling the Calvert funds at 1-800-368-2745, by visiting the Calvert funds’ website at www.calvert.com or visiting the SEC’s website at www.sec.gov. Information regarding how a Calvert fund voted proxies relating to portfolio securities during the most recent 12-month period ended June 30 is available by calling Calvert funds, by visiting the Calvert funds’ website at www.calvert.com or by visiting the SEC’s website at www.sec.gov.
This Page Intentionally Left Blank
This Page Intentionally Left Blank
Investment Adviser and Administrator
Calvert Research and Management
1825 Connecticut Avenue NW, Suite 400
Washington, DC 20009
Investment Sub-Adviser
Eaton Vance Advisers International Ltd.
125 Old Broad Street
London, EC2N 1AR
Principal Underwriter*
Eaton Vance Distributors, Inc.
Two International Place
Boston, MA 02110
(617) 482-8260
Custodian
State Street Bank and Trust Company
State Street Financial Center, One Lincoln Street
Boston, MA 02111
Transfer Agent
DST Asset Manager Solutions, Inc.
2000 Crown Colony Drive
Quincy, MA 02169
Independent Registered Public Accounting Firm
Deloitte & Touche LLP
200 Berkeley Street
Boston, MA 02116-5022
Fund Offices
1825 Connecticut Avenue NW, Suite 400
Washington, DC 20009
* FINRA BrokerCheck. Investors may check the background of their Investment Professional by contacting the Financial Industry Regulatory Authority (FINRA). FINRA BrokerCheck is a free tool to help investors check the professional background of current and former FINRA-registered securities firms and brokers. FINRA BrokerCheck is available by calling 1-800-289-9999 and at www.FINRA.org. The FINRA BrokerCheck brochure describing this program is available to investors at www.FINRA.org.
Printed on recycled paper.
Calvert
Emerging Markets Advancement Fund
Annual Report
September 30, 2021
Commodity Futures Trading Commission Registration. The Commodity Futures Trading Commission (“CFTC”) has adopted regulations that subject registered investment companies and advisers to regulation by the CFTC if a fund invests more than a prescribed level of its assets in certain CFTC-regulated instruments (including futures, certain options and swap agreements) or markets itself as providing investment exposure to such instruments. The adviser has claimed an exclusion from the definition of “commodity pool operator” under the Commodity Exchange Act with respect to its management of the Fund and the other funds it manages. Accordingly, neither the Fund nor the adviser is subject to CFTC regulation.
Fund shares are not insured by the FDIC and are not deposits or other obligations of, or guaranteed by, any depository institution. Shares are subject to investment risks, including possible loss of principal invested.
This report must be preceded or accompanied by a current summary prospectus or prospectus. Before investing, investors should consider carefully the investment objective, risks, and charges and expenses of a mutual fund. This and other important information is contained in the summary prospectus and prospectus, which can be obtained from a financial intermediary. Prospective investors should read the prospectus carefully before investing. For further information, please call 1-800-368-2745.
Choose Planet-friendly E-delivery!
Sign up now for on-line statements, prospectuses, and fund reports. In less than five minutes you can help reduce paper mail and lower fund costs.
Just go to www.calvert.com. If you already have an online account with the Calvert funds, click on Login to access your Account and select the documents you would like to receive via e-mail.
If you’re new to online account access, click on Login, then Register to create your user name and password. Once you’re in, click on the E-delivery sign-up on the Account Portfolio page and follow the quick, easy steps.
Note: If your shares are not held directly with the Calvert funds but through a brokerage firm, you must contact your broker for electronic delivery options available through their firm.
Annual Report September 30, 2021
Calvert
Emerging Markets Advancement Fund
Calvert
Emerging Markets Advancement Fund
September 30, 2021
Management's Discussion of Fund Performance†
Economic and Market Conditions
Emerging markets underperformed developed markets for the 12-month period ended September 30, 2021, as concerns about slowing growth in China, rising inflation, U.S. Federal Reserve tapering, a nascent energy crisis, and weaker growth weighed on investor appetites for risk. The benchmark MSCI Emerging Markets Index (the Index) returned 18.20% during the period.
At a regional level, emerging Europe and the Middle East & Africa led the way, supported by rising energy prices and the economic recovery in Europe. Latin America outperformed the Index during the period and Asia lagged as China’s underperformance weighed on the region. In emerging economies, relatively slow rates of vaccination during the year and a pick-up in daily new cases of COVID-19 led to renewed restrictions on activity in some countries. By the third quarter of 2021, several economies had made progress toward herd immunity. Cases remained very low in China and seemed to have peaked in India and Indonesia.
Meanwhile, policy tightening and regulatory concerns weighed on China’s relative performance as Chinese stocks within the Index returned (7.33)%. While credit tightening and regulatory actions in China were initial triggers for market weakness, these were compounded by the re-imposition of some COVID-19 restrictions and supply chain disruptions in August. These worries were further compounded by the financial risks associated with the potential collapse of Evergrande, a highly indebted property developer, and power shortages. China’s Purchasing Managers Index (PMI) for manufacturing, a measure of economic activity, fell into contraction territory in September for the first time since February 2020.
Energy was the strongest sector within the Index as demand recovered and nascent supply shortages drove the price of Brent crude oil above $80 a barrel for the first time in three years.
Fund Performance
For the 12-month period ended September 30, 2021, Calvert Emerging Markets Advancement Fund (the Fund) returned 16.54% for Class A shares at net asset value (NAV), underperforming the Fund’s primary benchmark, the Index, which returned 18.20%.
The Fund seeks active country-level exposures to emerging markets, overweighting countries it believes may improve Environmental, Social, and Governance (ESG) performance during the investment period, and underweighting countries it believes may not. The Fund’s investment positions are drawn from the Calvert Emerging Markets Index.
Czechia and Hungary were the two strongest performers within the Index as fiscal and monetary officials helped stave off defaults and boosted both countries’ bank-dominated indexes. India also performed well during the period as investors pivoted from the flagging Chinese market.
The Fund’s lack of exposure to Saudi Arabia detracted most from returns relative to the Index during the period. While Saudi Arabia represented approximately 3% of the Index, its 47.67% gain within the Index during the period was among the largest on a country level. Strong revenue gains followed sharp increases in the price of crude oil, Saudi Arabia’s principal export. However, despite some improvements in gender rights within the country, the Fund did not invest in Saudi Arabia because of concerns the country might backslide on governance and social issues.
An underweight exposure to India also detracted from relative returns. The Fund owned Indian stocks because of expectations there would be improvements in the country’s governance. However, the Fund maintained an underweight exposure because it believed Indian stocks were overpriced.
A lack of exposure to Russian equities further weighed on relative performance. While the Fund’s decision not to invest in Russian equities because of reduced political freedoms, poor management of COVID-19, and concerns about deteriorating governance proved warranted, certain Russian stock prices gained value because of a surge in oil prices during the period.
The Fund’s overweight exposure to the United Arab Emirates (UAE) was a strong contributor to performance relative to the Index during the period. Social policy liberalizations relating to gender and citizenship rights, including the cohabitation of unmarried individuals, made the country a more attractive place to conduct business. The UAE also liberalized business procedures, consequently lowering the costs of capital and improving cash flows for companies.
The Fund’s allocation to Greece further contributed to relative performance as investors responded positively to the country promptly addressing risks related to COVID-19. Investors also were attracted by the announcement that Greece would use European Union funds to both improve environmental standards and stimulate the economy. The country’s government also streamlined business regulations, which helped improve the vibrancy of the economy.
A modest overweight exposure to South Korea also enhanced relative performance. The Fund was attracted to South Korean stocks because shareholder rights were expected to improve over time. While the realization of improvements in governance has been slow, the country’s technology exports benefited returns during the period.
See Endnotes and Additional Disclosures in this report.
Past performance is no guarantee of future results. Returns are historical and are calculated by determining the percentage change in net asset value (NAV) or offering price (as applicable) with all distributions reinvested. Investment return and principal value will fluctuate so that shares, when redeemed, may be worth more or less than their original cost. Performance for periods less than or equal to one year is cumulative. Performance is for the stated time period only; due to market volatility, current Fund performance may be lower or higher than the quoted return. For performance as of the most recent month-end, please refer to www.calvert.com.
Calvert
Emerging Markets Advancement Fund
September 30, 2021
Performance
Portfolio Manager Marshall Stocker, Ph.D., CFA of Calvert Research and Management
| % Average Annual Total Returns1,2 | Class
Inception Date | Performance
Inception Date | One Year | Five Years | Since
Inception |
| Class A at NAV | 10/01/2019 | 10/01/2019 | 16.54% | —% | 11.64% |
| Class A with 4.75% Maximum Sales Charge | — | — | 11.01 | — | 8.95 |
| Class I at NAV | 10/01/2019 | 10/01/2019 | 16.85 | — | 11.89 |
|
| MSCI Emerging Markets Index | — | — | 18.20% | 9.23% | 14.45% |
| Calvert Emerging Markets Index | — | — | 17.26 | — | 14.88 |
| % Total Annual Operating Expense Ratios3 | Class A | Class I |
| Gross | 1.83% | 1.58% |
| Net | 1.20 | 0.95 |
Growth of $10,000
This graph shows the change in value of a hypothetical investment of $10,000 in Class A of the Fund for the period indicated. For comparison, the same investment is shown in the indicated index.
| Growth of Investment | Amount Invested | Period Beginning | At NAV | With Maximum Sales Charge |
| Class I | $250,000 | 10/01/2019 | $312,994 | N.A. |
See Endnotes and Additional Disclosures in this report.
Past performance is no guarantee of future results. Returns are historical and are calculated by determining the percentage change in net asset value (NAV) or offering price (as applicable) with all distributions reinvested. Investment return and principal value will fluctuate so that shares, when redeemed, may be worth more or less than their original cost. Performance for periods less than or equal to one year is cumulative. Performance is for the stated time period only; due to market volatility, current Fund performance may be lower or higher than the quoted return. For performance as of the most recent month-end, please refer to www.calvert.com.
Calvert
Emerging Markets Advancement Fund
September 30, 2021
Sector Allocation (% of net assets)*
* Excludes cash and cash equivalents.
| Top 10 Holdings (% of net assets)* | |
| Taiwan Semiconductor Manufacturing Co., Ltd. | 5.9% |
| Commercial International Bank Egypt SAE | 4.7 |
| Tencent Holdings, Ltd. | 4.3 |
| Samsung Electronics Co., Ltd. | 4.3 |
| Hellenic Telecommunications Organization S.A. | 3.9 |
| First Abu Dhabi Bank PJSC | 3.5 |
| Alibaba Group Holding, Ltd. ADR | 3.4 |
| Eurobank Ergasias S.A. | 2.3 |
| Bank Central Asia Tbk PT | 2.1 |
| International Holdings Co. PJSC | 2.0 |
| Total | 36.4% |
| * | Excludes cash and cash equivalents. |
See Endnotes and Additional Disclosures in this report.
Calvert
Emerging Markets Advancement Fund
September 30, 2021
Endnotes and Additional Disclosures
| † | The views expressed in this report are those of the portfolio manager(s) and are current only through the date stated at the top of this page. These views are subject to change at any time based upon market or other conditions, and Calvert and the Fund(s) disclaim any responsibility to update such views. These views may not be relied upon as investment advice and, because investment decisions are based on many factors, may not be relied upon as an indication of trading intent on behalf of any Calvert fund. This commentary may contain statements that are not historical facts, referred to as “forward-looking statements.” The Fund’s actual future results may differ significantly from those stated in any forward-looking statement, depending on factors such as changes in securities or financial markets or general economic conditions, the volume of sales and purchases of Fund shares, the continuation of investment advisory, administrative and service contracts, and other risks discussed from time to time in the Fund’s filings with the Securities and Exchange Commission. |
| | |
| 1 | MSCI Emerging Markets Index is an unmanaged index of emerging markets common stocks. MSCI indexes are net of foreign withholding taxes. Source: MSCI. MSCI data may not be reproduced or used for any other purpose. MSCI provides no warranties, has not prepared or approved this report, and has no liability hereunder. The Calvert Emerging Markets Index (the Index) is composed of equity securities of companies that are located in or tied economically to countries that Calvert Research and Management has classified as emerging market countries and that meet certain environmental, social and governance criteria. The Index is reconstituted annually and rebalanced quarterly. Unless otherwise stated, index returns do not reflect the effect of any applicable sales charges, commissions, expenses, taxes or leverage, as applicable. It is not possible to invest directly in an index. |
| 2 | Total Returns at NAV do not include applicable sales charges. If sales charges were deducted, the returns would be lower. Total Returns shown with maximum sales charge reflect the stated maximum sales charge. Unless otherwise stated, performance does not reflect the deduction of taxes on Fund distributions or redemptions of Fund shares. Performance since inception for an index, if presented, is the performance since the Fund's or oldest share class' inception, as applicable. |
| 3 | Source: Fund prospectus. Net expense ratios reflect a contractual expense reimbursement that continues through 1/31/22. Without the reimbursement, performance would have been lower. The expense ratios for the current reporting period can be found in the Financial Highlights section of this report. |
| Fund profile subject to change due to active management. |
| | Additional Information |
| | Purchasing Managers’ Index (PMI) is an index of the prevailing direction of economic trends in the manufacturing and service sectors. It consists of a diffusion index that summarizes whether market conditions, as viewed by purchasing managers, are expanding, staying the same, or contracting. |
Calvert
Emerging Markets Advancement Fund
September 30, 2021
Example
As a Fund shareholder, you incur two types of costs: (1) transaction costs, including sales charges (loads) on purchases and redemption fees (if applicable); and (2) ongoing costs, including management fees; distribution and/or service fees; and other Fund expenses. This Example is intended to help you understand your ongoing costs (in dollars) of Fund investing and to compare these costs with the ongoing costs of investing in other mutual funds. The Example is based on an investment of $1,000 invested at the beginning of the period and held for the entire period (April 1, 2021 to September 30, 2021).
Actual Expenses
The first section of the table below provides information about actual account values and actual expenses. You may use the information in this section, together with the amount you invested, to estimate the expenses that you paid over the period. Simply divide your account value by $1,000 (for example, an $8,600 account value divided by $1,000 = 8.6), then multiply the result by the number in the first section under the heading entitled “Expenses Paid During Period” to estimate the expenses you paid on your account during this period.
Hypothetical Example for Comparison Purposes
The second section of the table below provides information about hypothetical account values and hypothetical expenses based on the actual Fund expense ratio and an assumed rate of return of 5% per year (before expenses), which is not the actual Fund return. The hypothetical account values and expenses may not be used to estimate the actual ending account balance or expenses you paid for the period. You may use this information to compare the ongoing costs of investing in the Fund and other funds. To do so, compare this 5% hypothetical example with the 5% hypothetical examples that appear in the shareholder reports of the other funds.
Please note that the expenses shown in the table are meant to highlight your ongoing costs only and do not reflect any transactional costs, such as sales charges (loads) or redemption fees (if applicable). Therefore, the second section of the table is useful in comparing ongoing costs only, and will not help you determine the relative total costs of owning different funds. In addition, if these transactional costs were included, your costs would be higher.
| | Beginning
Account Value
(4/1/21) | Ending
Account Value
(9/30/21) | Expenses Paid
During Period*
(4/1/21 – 9/30/21) | Annualized
Expense
Ratio |
| Actual | | | | |
| Class A | $1,000.00 | $ 959.70 | $5.90 ** | 1.20% |
| Class I | $1,000.00 | $ 961.40 | $4.67 ** | 0.95% |
| Hypothetical | | | | |
| (5% return per year before expenses) | | | | |
| Class A | $1,000.00 | $1,019.05 | $6.07 ** | 1.20% |
| Class I | $1,000.00 | $1,020.31 | $4.81 ** | 0.95% |
| * | Expenses are equal to the Fund's annualized expense ratio for the indicated Class, multiplied by the average account value over the period, multiplied by 183/365 (to reflect the one-half year period). The Example assumes that the $1,000 was invested at the net asset value per share determined at the close of business on March 31, 2021. |
| ** | Absent a waiver and/or reimbursement of expenses by an affiliate, expenses would be higher. |
Calvert
Emerging Markets Advancement Fund
September 30, 2021
| Security | Shares | Value |
| Canada — 0.0%(1) | |
| Atlas Corp.(2) | | 1,170 | $ 17,772 |
| | | | $ 17,772 |
| China — 26.1% | |
| 360 DigiTech, Inc.(3) | | 1,120 | $ 22,758 |
| 3SBio, Inc.(3)(4) | | 6,000 | 5,878 |
| Agile Group Holdings, Ltd. | | 12,000 | 11,191 |
| Airtac International Group | | 3,000 | 93,336 |
| Akeso, Inc.(3)(4) | | 5,000 | 27,366 |
| Alibaba Group Holding, Ltd. ADR(3) | | 13,521 | 2,001,784 |
| A-Living Smart City Services Co., Ltd., Class H(2)(4) | | 2,750 | 9,766 |
| Angang Steel Co., Ltd.(2) | | 24,000 | 14,683 |
| ANTA Sports Products, Ltd. | | 10,000 | 188,835 |
| Autohome, Inc. ADR | | 887 | 41,627 |
| Bank of Communications Co., Ltd., Class H | | 281,000 | 166,323 |
| Baozun, Inc. ADR(2)(3) | | 810 | 14,199 |
| BeiGene, Ltd.(3) | | 8,300 | 237,004 |
| Beijing Enterprises Water Group, Ltd. | | 62,000 | 24,269 |
| Bilibili, Inc. ADR(2)(3) | | 2,300 | 152,191 |
| BYD Co., Ltd., Class H | | 9,500 | 295,283 |
| BYD Electronic International Co., Ltd.(2) | | 6,000 | 20,984 |
| CanSino Biologics, Inc., Class H(2)(3)(4) | | 600 | 21,222 |
| China CITIC Bank Corp, Ltd., Class H | | 242,000 | 109,076 |
| China Communications Services Corp., Ltd., Class H | | 16,000 | 8,848 |
| China Conch Venture Holdings, Ltd. | | 19,000 | 88,224 |
| China Everbright Bank Co., Ltd., Class H | | 60,000 | 21,120 |
| China Everbright Environment Group, Ltd. | | 42,000 | 31,561 |
| China International Capital Corp., Ltd., Class H(4) | | 28,400 | 74,242 |
| China International Marine Containers Group Co., Ltd. | | 6,900 | 14,521 |
| China Jinmao Holdings Group, Ltd. | | 42,000 | 15,093 |
| China Lesso Group Holdings, Ltd. | | 21,000 | 33,424 |
| China Literature, Ltd.(2)(3)(4) | | 4,800 | 36,427 |
| China Longyuan Power Group Corp., Ltd., Class H | | 38,000 | 93,245 |
| China Medical System Holdings, Ltd. | | 8,000 | 14,580 |
| China Meidong Auto Holdings, Ltd. | | 4,000 | 20,127 |
| China Mengniu Dairy Co., Ltd. | | 36,000 | 231,834 |
| China Merchants Bank Co., Ltd., Class H | | 36,500 | 290,472 |
| China Minsheng Banking Corp., Ltd., Class H(2) | | 133,500 | 53,569 |
| China National Building Material Co., Ltd., Class H | | 82,000 | 110,304 |
| China Resources Land, Ltd. | | 34,000 | 143,094 |
| China Tower Corp, Ltd., Class H(4) | | 558,000 | 72,920 |
| China Vanke Co., Ltd., Class H | | 22,300 | 60,975 |
| China Yongda Automobiles Services Holdings, Ltd. | | 8,500 | 12,266 |
| Chinasoft International, Ltd. | | 32,000 | 56,516 |
| Chongqing Iron & Steel Co., Ltd., Class H(3) | | 106,000 | 24,496 |
| Security | Shares | Value |
| China (continued) | |
| Chongqing Rural Commercial Bank Co., Ltd., Class H | | 31,000 | $ 11,269 |
| CIFI Ever Sunshine Services Group, Ltd.(2) | | 6,000 | 11,993 |
| CIFI Holdings Group Co., Ltd. | | 36,000 | 24,439 |
| Country Garden Holdings Co., Ltd.(2) | | 80,000 | 82,488 |
| Country Garden Services Holdings Co., Ltd. | | 19,000 | 150,137 |
| CSPC Pharmaceutical Group, Ltd. | | 83,600 | 99,765 |
| Dada Nexus, Ltd. ADR(3) | | 1,830 | 36,673 |
| Dali Foods Group Co., Ltd.(4) | | 17,500 | 10,541 |
| ENN Energy Holdings, Ltd. | | 9,000 | 148,441 |
| Far East Horizon, Ltd.(2) | | 43,000 | 43,585 |
| Flat Glass Group Co., Ltd., Class H(2) | | 7,000 | 32,755 |
| Fuyao Glass Industry Group Co., Ltd., Class H(4) | | 7,600 | 40,424 |
| Gaotu Techedu, Inc.(2)(3) | | 1,010 | 3,101 |
| GDS Holdings, Ltd. ADR(3) | | 2,054 | 116,277 |
| Geely Automobile Holdings, Ltd. | | 69,000 | 198,072 |
| Genscript Biotech Corp.(3) | | 10,000 | 38,379 |
| GOME Retail Holdings, Ltd.(2)(3) | | 116,000 | 10,820 |
| Great Wall Motor Co., Ltd., Class H | | 37,500 | 137,982 |
| Greentown China Holdings, Ltd.(2) | | 9,500 | 14,327 |
| Greentown Service Group Co., Ltd. | | 8,000 | 8,679 |
| Guangdong Investment, Ltd. | | 34,000 | 44,367 |
| Guangzhou Automobile Group Co., Ltd., Class H | | 22,000 | 19,332 |
| Haidilao International Holding, Ltd.(2)(4) | | 12,000 | 45,970 |
| Haitong Securities Co., Ltd., Class H | | 58,800 | 53,604 |
| Hangzhou Tigermed Consulting Co., Ltd., Class H(4) | | 1,000 | 21,146 |
| Hansoh Pharmaceutical Group Co., Ltd.(4) | | 8,000 | 20,251 |
| Hengan International Group Co., Ltd. | | 4,500 | 23,997 |
| HengTen Networks Group, Ltd.(2)(3) | | 16,000 | 4,698 |
| Huatai Securities Co., Ltd., Class H(4) | | 34,000 | 52,399 |
| Huazhu Group, Ltd. ADR(2)(3) | | 1,566 | 71,817 |
| Hygeia Healthcare Holdings Co., Ltd.(4) | | 1,800 | 13,316 |
| I-Mab ADR(3) | | 740 | 53,643 |
| InnoCare Pharma, Ltd.(3)(4) | | 5,000 | 13,391 |
| Innovent Biologics, Inc.(3)(4) | | 12,000 | 115,563 |
| JD.com, Inc. ADR(3) | | 7,560 | 546,134 |
| Jiangsu Expressway Co., Ltd., Class H | | 12,000 | 12,125 |
| Jinke Smart Services Group Co., Ltd., Class H | | 1,400 | 7,769 |
| Jinxin Fertility Group, Ltd.(2)(3)(4) | | 12,000 | 17,797 |
| Jiumaojiu International Holdings, Ltd.(2)(4) | | 6,000 | 18,072 |
| Kingdee International Software Group Co., Ltd.(3) | | 32,000 | 106,549 |
| Kingsoft Cloud Holdings, Ltd. ADR(2)(3) | | 440 | 12,461 |
| Kingsoft Corp., Ltd. | | 11,800 | 46,980 |
| KWG Property Holding, Ltd. | | 9,500 | 9,266 |
| Li Ning Co., Ltd. | | 21,500 | 247,803 |
| Lifetech Scientific Corp.(3) | | 28,000 | 14,597 |
| Logan Group Co., Ltd. | | 8,000 | 8,348 |
| Longfor Group Holdings, Ltd.(4) | | 20,000 | 91,382 |
7
See Notes to Financial Statements.
Calvert
Emerging Markets Advancement Fund
September 30, 2021
Schedule of Investments — continued
| Security | Shares | Value |
| China (continued) | |
| Meituan, Class B(3)(4) | | 30,300 | $ 967,219 |
| Ming Yuan Cloud Group Holdings, Ltd.(2) | | 6,000 | 20,801 |
| NetEase, Inc. ADR | | 3,529 | 301,377 |
| New Oriental Education & Technology Group, Inc. ADR(3) | | 12,000 | 24,600 |
| NIO, Inc. ADR(3) | | 11,843 | 421,966 |
| Nongfu Spring Co., Ltd., Class H(4) | | 20,400 | 103,283 |
| OneConnect Financial Technology Co., Ltd.(3) | | 3,890 | 15,949 |
| Pharmaron Beijing Co., Ltd.(4) | | 1,000 | 23,856 |
| Pinduoduo, Inc. ADR(3) | | 3,789 | 343,549 |
| Ping An Healthcare and Technology Co., Ltd.(2)(3)(4) | | 5,700 | 37,153 |
| Postal Savings Bank of China Co., Ltd., Class H(4) | | 184,000 | 126,492 |
| Powerlong Real Estate Holdings, Ltd. | | 14,000 | 10,553 |
| Qingdao Port International Co., Ltd., Class H(4) | | 31,000 | 16,155 |
| Shandong Weigao Group Medical Polymer Co., Ltd., Class H | | 24,000 | 42,586 |
| Shanghai Fosun Pharmaceutical Group Co., Ltd., Class H | | 3,500 | 17,918 |
| Shanghai Pharmaceuticals Holding Co., Ltd. | | 5,800 | 11,242 |
| Shenzhen International Holdings, Ltd. | | 6,500 | 8,379 |
| Shimao Group Holdings, Ltd. | | 15,000 | 27,492 |
| Sinopharm Group Co., Ltd., Class H | | 13,600 | 35,640 |
| Sunac China Holdings, Ltd. | | 30,000 | 63,944 |
| Sunac Services Holdings, Ltd., Class H(3)(4) | | 8,000 | 16,463 |
| Sunny Optical Technology Group Co., Ltd. | | 8,400 | 219,953 |
| TAL Education Group ADR(3) | | 2,999 | 14,515 |
| Tencent Holdings, Ltd. | | 42,300 | 2,525,256 |
| Tencent Music Entertainment Group(3) | | 4,140 | 30,015 |
| Tingyi (Cayman Islands) Holding Corp. | | 24,000 | 44,623 |
| Tongcheng Elong Holdings, Ltd.(3) | | 12,800 | 30,909 |
| Topsports International Holdings, Ltd.(4) | | 12,000 | 13,628 |
| TravelSky Technology, Ltd., Class H | | 12,000 | 23,145 |
| Trip.com Group, Ltd. ADR(3) | | 6,310 | 194,033 |
| Venus MedTech Hangzhou, Inc., Class H(2)(3)(4) | | 2,000 | 10,258 |
| Vipshop Holdings, Ltd. ADR(3) | | 4,313 | 48,047 |
| Want Want China Holdings, Ltd. | | 81,000 | 61,162 |
| Weibo Corp. ADR(2)(3) | | 780 | 37,042 |
| Weichai Power Co., Ltd., Class H | | 35,000 | 72,440 |
| Weimob, Inc.(2)(3)(4) | | 16,000 | 23,095 |
| WuXi AppTec Co., Ltd., Class H(4) | | 3,380 | 78,686 |
| Wuxi Biologics Cayman, Inc.(3)(4) | | 30,500 | 494,719 |
| XD, Inc.(2)(3) | | 1,800 | 9,976 |
| Xinjiang Goldwind Science & Technology Co., Ltd., Class H | | 8,200 | 17,243 |
| Xinyi Energy Holdings, Ltd. | | 20,000 | 11,605 |
| Xinyi Solar Holdings, Ltd. | | 58,000 | 118,733 |
| XPENG, Inc. ADR(3) | | 2,010 | 71,435 |
| Yadea Group Holdings, Ltd.(4) | | 10,000 | 16,334 |
| Yeahka, Ltd.(2)(3) | | 2,400 | 7,718 |
| Yihai International Holding Ltd.(2) | | 7,000 | 39,009 |
| Yum China Holdings, Inc. | | 4,143 | 240,750 |
| Security | Shares | Value |
| China (continued) | |
| Zai Lab, Ltd. ADR(2)(3) | | 735 | $ 77,462 |
| Zhejiang Expressway Co., Ltd., Class H | | 14,000 | 11,555 |
| Zhenro Properties Group, Ltd.(2) | | 25,000 | 13,628 |
| Zhongsheng Group Holdings, Ltd. | | 5,500 | 44,089 |
| Zhuzhou CRRC Times Electric Co., Class H(3) | | 10,100 | 46,275 |
| Zoomlion Heavy Industry Science and Technology Co., Ltd., Class H | | 26,000 | 23,169 |
| | | | $15,185,681 |
| Egypt — 4.7% | |
| Commercial International Bank Egypt SAE(3) | | 1,002,049 | $ 2,710,857 |
| | | | $ 2,710,857 |
| Greece — 7.6% | |
| Eurobank Ergasias S.A.(3) | | 1,435,147 | $ 1,335,988 |
| Hellenic Telecommunications Organization S.A. | | 120,351 | 2,259,136 |
| National Bank of Greece S.A.(3) | | 303,900 | 846,212 |
| | | | $ 4,441,336 |
| Hong Kong — 1.0% | |
| Alibaba Health Information Technology, Ltd.(3) | | 40,000 | $ 57,602 |
| Bosideng International Holdings, Ltd. | | 24,000 | 16,975 |
| China Education Group Holdings, Ltd.(2) | | 6,000 | 10,349 |
| China Gas Holdings, Ltd. | | 42,600 | 125,817 |
| China Overseas Land & Investment, Ltd. | | 44,000 | 99,577 |
| China Resources Gas Group, Ltd. | | 10,000 | 52,454 |
| China State Construction International Holdings, Ltd. | | 22,000 | 19,207 |
| China Traditional Chinese Medicine Holdings Co., Ltd. | | 20,000 | 10,107 |
| JS Global Lifestyle Co., Ltd.(4) | | 5,500 | 12,725 |
| Microport Scientific Corp. | | 6,400 | 35,886 |
| Nine Dragons Paper Holdings, Ltd. | | 22,000 | 26,854 |
| Sino Biopharmaceutical, Ltd. | | 97,500 | 80,900 |
| Sun Art Retail Group, Ltd. | | 16,000 | 7,398 |
| Yuexiu Property Co. Ltd. | | 9,600 | 8,995 |
| | | | $ 564,846 |
| Indonesia — 7.4% | |
| Bank Central Asia Tbk PT | | 501,100 | $ 1,220,538 |
| Bank Jago Tbk PT(3) | | 214,700 | 225,868 |
| Bank Mandiri Persero Tbk PT | | 875,300 | 374,092 |
| Bank Negara Indonesia Persero Tbk PT | | 349,600 | 130,151 |
| Bank Rakyat Indonesia Persero Tbk PT | | 3,318,343 | 884,493 |
| Elang Mahkota Teknologi Tbk PT(3) | | 484,400 | 58,950 |
| Indah Kiat Pulp & Paper Tbk PT | | 120,100 | 71,406 |
| Indofood CBP Sukses Makmur Tbk PT | | 245,000 | 142,684 |
| Kalbe Farma Tbk PT | | 943,200 | 93,989 |
| Merdeka Copper Gold Tbk PT(3) | | 1,207,700 | 211,369 |
| Sarana Menara Nusantara Tbk PT | | 1,080,000 | 99,538 |
8
See Notes to Financial Statements.
Calvert
Emerging Markets Advancement Fund
September 30, 2021
Schedule of Investments — continued
| Security | Shares | Value |
| Indonesia (continued) | |
| Telkom Indonesia Persero Tbk PT | | 2,229,600 | $ 570,924 |
| Tower Bersama Infrastructure Tbk PT | | 373,200 | 76,900 |
| Unilever Indonesia Tbk PT | | 618,000 | 170,438 |
| | | | $ 4,331,340 |
| Malaysia — 4.7% | |
| Axiata Group Bhd | | 76,300 | $ 70,962 |
| CIMB Group Holdings Bhd | | 189,700 | 215,725 |
| DiGi.Com Bhd | | 92,600 | 98,056 |
| Hartalega Holdings Bhd | | 101,700 | 149,064 |
| Hong Leong Bank Bhd | | 21,600 | 97,376 |
| Hong Leong Financial Group Bhd | | 7,300 | 31,813 |
| IHH Healthcare Bhd | | 87,600 | 140,086 |
| Kuala Lumpur Kepong Bhd | | 27,000 | 129,943 |
| Malayan Banking Bhd | | 180,300 | 346,160 |
| Maxis Bhd | | 65,000 | 72,647 |
| Nestle Malaysia Bhd | | 3,300 | 104,682 |
| Petronas Dagangan Bhd | | 13,000 | 59,211 |
| Petronas Gas Bhd | | 25,500 | 102,456 |
| PPB Group Bhd | | 33,500 | 146,856 |
| Press Metal Aluminium Holdings Bhd | | 120,400 | 164,705 |
| Public Bank Bhd | | 419,500 | 407,250 |
| QL Resources Bhd | | 52,700 | 67,735 |
| RHB Bank Bhd | | 47,600 | 61,893 |
| Sime Darby Bhd | | 98,200 | 53,168 |
| Supermax Corp. Bhd | | 54,300 | 31,031 |
| Telekom Malaysia Bhd | | 31,400 | 42,724 |
| Top Glove Corp. Bhd | | 125,200 | 86,386 |
| Westports Holdings Bhd | | 63,900 | 68,639 |
| | | | $ 2,748,568 |
| Philippines — 1.1% | |
| Aboitiz Equity Ventures, Inc. | | 55,800 | $ 53,003 |
| Bank of the Philippine Islands | | 27,970 | 44,658 |
| BDO Unibank, Inc. | | 29,650 | 64,218 |
| Globe Telecom, Inc. | | 320 | 18,705 |
| GT Capital Holdings, Inc. | | 1,200 | 11,953 |
| LT Group, Inc. | | 87,500 | 17,325 |
| PLDT, Inc. | | 1,115 | 36,711 |
| SM Investments Corp. | | 6,210 | 120,239 |
| SM Prime Holdings, Inc. | | 269,400 | 172,276 |
| Universal Robina Corp. | | 27,750 | 73,785 |
| | | | $ 612,873 |
| South Korea — 12.2% | |
| Alteogen, Inc.(3) | | 570 | $ 34,575 |
| AMOREPACIFIC Corp. | | 310 | 46,370 |
| Security | Shares | Value |
| South Korea (continued) | |
| AMOREPACIFIC Group | | 251 | $ 10,310 |
| CJ CheilJedang Corp. | | 182 | 62,621 |
| CJ ENM Co., Ltd. | | 94 | 11,911 |
| Coway Co., Ltd. | | 528 | 32,956 |
| Daewoo Engineering & Construction Co., Ltd.(3) | | 2,390 | 13,489 |
| Doosan Heavy Industries & Construction Co., Ltd.(3) | | 3,256 | 56,039 |
| Ecopro BM Co., Ltd. | | 219 | 85,029 |
| Fila Holdings Corp. | | 443 | 15,795 |
| Green Cross Corp. | | 129 | 35,785 |
| GS Engineering & Construction Corp. | | 783 | 27,891 |
| Hana Financial Group, Inc. | | 3,468 | 134,807 |
| Hanjin Kal Corp.(3) | | 200 | 10,287 |
| Hanmi Pharm Co., Ltd. | | 129 | 29,790 |
| Hanmi Science Co., Ltd. | | 314 | 16,474 |
| Hanon Systems | | 1,500 | 19,646 |
| HLB, Inc.(3) | | 1,433 | 67,973 |
| HMM Co., Ltd.(3) | | 2,776 | 78,300 |
| Hotel Shilla Co., Ltd. | | 296 | 21,460 |
| HYBE Co., Ltd.(3) | | 210 | 52,403 |
| Hyosung TNC Corp. | | 20 | 10,741 |
| Hyundai Engineering & Construction Co., Ltd. | | 901 | 38,550 |
| Hyundai Glovis Co., Ltd. | | 218 | 30,193 |
| Hyundai Mobis Co., Ltd. | | 712 | 150,245 |
| Hyundai Motor Co. | | 1,488 | 247,700 |
| Industrial Bank of Korea | | 2,763 | 24,344 |
| Kakao Corp. | | 2,925 | 287,668 |
| Kakao Games Corp.(3) | | 430 | 23,577 |
| KB Financial Group, Inc. | | 4,513 | 209,888 |
| Kia Corp. | | 2,580 | 174,244 |
| Korea Investment Holdings Co., Ltd. | | 540 | 38,806 |
| KT Corp. | | 1,281 | 35,035 |
| LG Chem, Ltd. | | 510 | 330,771 |
| LG Display Co., Ltd.(3) | | 2,267 | 35,773 |
| LG Electronics, Inc. | | 1,157 | 122,991 |
| LG Household & Health Care, Ltd. | | 90 | 101,468 |
| LG Innotek Co., Ltd. | | 100 | 17,345 |
| Lotte Chemical Corp. | | 255 | 51,325 |
| Mirae Asset Securities Co., Ltd. | | 3,998 | 28,832 |
| NAVER Corp. | | 1,278 | 414,669 |
| Netmarble Corp.(4) | | 206 | 20,334 |
| Orion Corp. of Republic of Korea | | 480 | 47,298 |
| Samsung C&T Corp. | | 1,036 | 106,770 |
| Samsung Electro-Mechanics Co., Ltd. | | 579 | 85,678 |
| Samsung Electronics Co., Ltd. | | 40,564 | 2,514,749 |
| Samsung Engineering Co., Ltd.(3) | | 1,890 | 40,225 |
| Samsung Heavy Industries Co., Ltd.(3) | | 7,430 | 38,682 |
| Samsung SDS Co., Ltd. | | 340 | 45,619 |
9
See Notes to Financial Statements.
Calvert
Emerging Markets Advancement Fund
September 30, 2021
Schedule of Investments — continued
| Security | Shares | Value |
| South Korea (continued) | |
| Samsung Securities Co., Ltd. | | 500 | $ 19,973 |
| Shin Poong Pharmaceutical Co., Ltd. | | 727 | 34,626 |
| Shinhan Financial Group Co., Ltd. | | 4,979 | 168,189 |
| Shinsegae, Inc. | | 70 | 15,421 |
| SK Biopharmaceuticals Co., Ltd.(3) | | 571 | 48,750 |
| SK Hynix, Inc. | | 4,656 | 398,583 |
| SK Materials Co., Ltd. | | 50 | 17,365 |
| SK Telecom Co., Ltd.(3) | | 404 | 109,733 |
| SsangYong C&E Co., Ltd. | | 2,590 | 17,278 |
| Woori Financial Group, Inc. | | 6,136 | 59,888 |
| Yuhan Corp. | | 1,142 | 58,964 |
| | | | $ 7,086,201 |
| Taiwan — 14.0% | |
| Accton Technology Corp. | | 4,000 | $ 37,698 |
| Acer, Inc. | | 26,000 | 22,910 |
| Advantech Co., Ltd. | | 3,299 | 42,993 |
| ASE Technology Holding Co., Ltd. | | 29,000 | 112,196 |
| AU Optronics Corp. | | 92,000 | 57,677 |
| Catcher Technology Co., Ltd. | | 13,000 | 77,710 |
| Cathay Financial Holding Co., Ltd. | | 73,000 | 150,510 |
| Chailease Holding Co., Ltd. | | 11,070 | 97,218 |
| Chang Hwa Commercial Bank, Ltd. | | 39,915 | 23,502 |
| China Development Financial Holding Corp. | | 96,000 | 48,550 |
| China Life Insurance Co., Ltd. | | 19,720 | 20,437 |
| China Steel Corp. | | 139,000 | 179,869 |
| Chroma ATE, Inc. | | 7,000 | 43,838 |
| Chunghwa Telecom Co., Ltd. | | 34,000 | 134,692 |
| Compal Electronics, Inc. | | 33,000 | 27,821 |
| CTBC Financial Holding Co., Ltd. | | 156,000 | 127,669 |
| Delta Electronics, Inc. | | 16,000 | 143,363 |
| E.Sun Financial Holding Co., Ltd. | | 92,799 | 87,325 |
| Eclat Textile Co., Ltd. | | 2,000 | 43,348 |
| Eva Airways Corp.(3) | | 27,000 | 18,155 |
| Evergreen Marine Corp. Taiwan, Ltd. | | 26,000 | 115,506 |
| Far Eastern New Century Corp. | | 25,000 | 26,622 |
| Far EasTone Telecommunications Co., Ltd. | | 13,000 | 28,669 |
| Feng TAY Enterprise Co., Ltd. | | 4,000 | 30,742 |
| First Financial Holding Co., Ltd. | | 78,881 | 63,718 |
| Fubon Financial Holding Co., Ltd. | | 59,400 | 162,330 |
| Giant Manufacturing Co., Ltd. | | 2,000 | 22,676 |
| Globalwafers Co., Ltd. | | 2,000 | 56,420 |
| Hiwin Technologies Corp. | | 5,401 | 59,621 |
| Hotai Motor Co., Ltd. | | 3,000 | 62,574 |
| Hua Nan Financial Holdings Co., Ltd. | | 70,617 | 51,553 |
| Innolux Corp. | | 82,000 | 49,357 |
| Inventec Corp. | | 15,000 | 13,820 |
| Security | Shares | Value |
| Taiwan (continued) | |
| Largan Precision Co., Ltd. | | 1,000 | $ 77,910 |
| Lite-On Technology Corp. | | 16,000 | 35,660 |
| Macronix International Co., Ltd. | | 17,000 | 22,179 |
| MediaTek, Inc. | | 12,000 | 386,250 |
| Mega Financial Holding Co., Ltd. | | 88,000 | 100,981 |
| Merida Industry Co., Ltd. | | 2,000 | 20,905 |
| Micro-Star International Co., Ltd. | | 9,000 | 41,510 |
| Nan Ya Printed Circuit Board Corp. | | 2,000 | 30,787 |
| Nanya Technology Corp. | | 9,000 | 21,016 |
| Nien Made Enterprise Co., Ltd. | | 1,000 | 14,145 |
| Novatek Microelectronics Corp. | | 5,000 | 72,644 |
| Oneness Biotech Co., Ltd.(3) | | 4,000 | 26,420 |
| Parade Technologies, Ltd. | | 1,000 | 58,535 |
| Pou Chen Corp. | | 19,000 | 22,892 |
| Powertech Technology, Inc. | | 6,000 | 22,323 |
| President Chain Store Corp. | | 4,000 | 40,140 |
| Quanta Computer, Inc. | | 23,000 | 63,648 |
| Realtek Semiconductor Corp. | | 4,000 | 70,472 |
| Ruentex Development Co., Ltd. | | 11,200 | 22,949 |
| Shanghai Commercial & Savings Bank, Ltd. (The) | | 23,000 | 36,548 |
| Shin Kong Financial Holding Co., Ltd. | | 95,011 | 31,570 |
| Sino-American Silicon Products, Inc. | | 5,000 | 32,142 |
| SinoPac Financial Holdings Co., Ltd. | | 71,000 | 35,275 |
| Synnex Technology International Corp. | | 10,000 | 18,623 |
| Ta Chen Stainless Pipe Co., Ltd. | | 22,000 | 35,749 |
| Taishin Financial Holding Co., Ltd. | | 101,032 | 65,405 |
| Taiwan Cooperative Financial Holding Co., Ltd. | | 73,950 | 58,473 |
| Taiwan Glass Industry Corp. | | 19,000 | 19,845 |
| Taiwan High Speed Rail Corp. | | 22,000 | 23,339 |
| Taiwan Mobile Co., Ltd. | | 15,000 | 53,200 |
| Taiwan Semiconductor Manufacturing Co., Ltd. | | 165,000 | 3,412,544 |
| Unimicron Technology Corp. | | 11,000 | 51,471 |
| Uni-President Enterprises Corp. | | 39,000 | 95,283 |
| United Microelectronics Corp. | | 106,000 | 240,275 |
| Vanguard International Semiconductor Corp. | | 7,000 | 37,573 |
| Voltronic Power Technology Corp. | | 1,050 | 64,029 |
| Walsin Lihwa Corp. | | 48,000 | 43,110 |
| Walsin Technology Corp. | | 6,000 | 32,513 |
| Wan Hai Lines, Ltd. | | 12,100 | 87,462 |
| Win Semiconductors Corp. | | 4,000 | 43,983 |
| Winbond Electronics Corp. | | 21,000 | 19,691 |
| Wistron Corp. | | 22,000 | 21,627 |
| Wiwynn Corp. | | 1,000 | 30,966 |
| WPG Holdings, Ltd. | | 11,000 | 19,055 |
| Yageo Corp. | | 3,000 | 47,021 |
| Yang Ming Marine Transport Corp.(3) | | 15,000 | 63,183 |
10
See Notes to Financial Statements.
Calvert
Emerging Markets Advancement Fund
September 30, 2021
Schedule of Investments — continued
| Security | Shares | Value |
| Taiwan (continued) | |
| Yuanta Financial Holding Co., Ltd. | | 75,400 | $ 66,525 |
| | | | $ 8,178,935 |
| United Arab Emirates — 9.8% | |
| Abu Dhabi Commercial Bank PJSC | | 282,273 | $ 574,465 |
| Aldar Properties PJSC | | 462,972 | 511,737 |
| Dubai Islamic Bank PJSC | | 184,552 | 247,816 |
| Emaar Development PJSC(3) | | 100,937 | 105,520 |
| Emaar Malls PJSC(3) | | 240,285 | 129,935 |
| Emirates Integrated Telecommunications Co. PJSC | | 65,917 | 118,634 |
| Emirates Telecommunications Group Co. PJSC | | 125,410 | 819,793 |
| First Abu Dhabi Bank PJSC | | 425,302 | 2,056,250 |
| International Holdings Co. PJSC(3) | | 28,893 | 1,151,613 |
| | | | $ 5,715,763 |
Total Common Stocks
(identified cost $44,623,292) | | | $51,594,172 |
| Security | Shares | Value |
| South Korea — 0.0%(1) | |
| Hyundai Engineering & Construction Co., Ltd., Exp. 10/22/21(3) | | 12 | $ 813 |
| Samsung Heavy Industries Co., Ltd., Exp. 10/29/21(3) | | 2,459 | 2,222 |
Total Rights
(identified cost $0) | | | $ 3,035 |
| Short-Term Investments — 11.0% |
| Affiliated Fund — 11.0% |
| Description | Units | Value |
| Calvert Cash Reserves Fund, LLC, 0.04%(5) | | 6,411,564 | $ 6,412,205 |
Total Affiliated Fund
(identified cost $6,411,565) | | | $ 6,412,205 |
| Securities Lending Collateral — 0.0%(1) |
| Security | Shares | Value |
| State Street Navigator Securities Lending Government Money Market Portfolio, 0.03%(6) | | 30,158 | $ 30,158 |
Total Securities Lending Collateral
(identified cost $30,158) | | | $ 30,158 |
Total Short-Term Investments
(identified cost $6,441,723) | | | $ 6,442,363 |
Total Investments — 99.6%
(identified cost $51,065,015) | | $58,039,570 |
| Other Assets, Less Liabilities — 0.4% | | $ 209,846 |
| Net Assets — 100.0% | | $58,249,416 |
| The percentage shown for each investment category in the Schedule of Investments is based on net assets. |
| (1) | Amount is less than 0.05%. |
| (2) | All or a portion of this security was on loan at September 30, 2021. The aggregate market value of securities on loan at September 30, 2021 was $920,463. |
| (3) | Non-income producing security. |
| (4) | Security exempt from registration under Rule 144A of the Securities Act of 1933, as amended. These securities may be sold in certain transactions in reliance on an exemption from registration (normally to qualified institutional buyers). At September 30, 2021, the aggregate value of these securities is $2,668,473 or 4.6% of the Fund's net assets. |
| (5) | Affiliated investment company, available to Calvert portfolios and funds, which invests in high quality, U.S. dollar denominated money market instruments. The rate shown is the annualized seven-day yield as of September 30, 2021. |
| (6) | Represents investment of cash collateral received in connection with securities lending. |
11
See Notes to Financial Statements.
Calvert
Emerging Markets Advancement Fund
September 30, 2021
Schedule of Investments — continued
At September 30, 2021, the concentration of the Fund’s investments in the various sectors, determined as a percentage of net assets, was as follows:
| Economic Sectors | % of Net Assets |
| Financials | 25.4% |
| Information Technology | 16.3 |
| Communication Services | 15.0 |
| Consumer Discretionary | 12.9 |
| Consumer Staples | 5.0 |
| Health Care | 4.3 |
| Industrials | 3.2 |
| Real Estate | 3.2 |
| Materials | 2.2 |
| Utilities | 1.0 |
| Energy | 0.1 |
| Total | 88.6% |
Forward Foreign Currency Exchange Contracts
| Currency Purchased | Currency Sold | Counterparty | Settlement
Date | Unrealized
Appreciation | Unrealized
(Depreciation) |
| USD | 4,747,989 | EUR | 4,013,169 | Standard Chartered Bank | 10/8/21 | $ 98,998 | $ — |
| USD | 1,212,053 | CNH | 7,940,000 | Standard Chartered Bank | 1/28/22 | — | (8,363) |
| USD | 4,717,124 | CNH | 31,200,000 | Standard Chartered Bank | 1/28/22 | — | (78,464) |
| AED | 246,000 | USD | 66,939 | Standard Chartered Bank | 5/31/22 | 24 | — |
| USD | 119,957 | AED | 443,000 | Standard Chartered Bank | 5/31/22 | — | (631) |
| USD | 346,596 | AED | 1,275,750 | Standard Chartered Bank | 5/31/22 | — | (672) |
| USD | 404,754 | AED | 1,495,000 | Standard Chartered Bank | 5/31/22 | — | (2,195) |
| USD | 1,035,295 | AED | 3,825,000 | Standard Chartered Bank | 5/31/22 | — | (5,896) |
| USD | 653,399 | AED | 2,400,000 | Standard Chartered Bank | 4/19/23 | 466 | — |
| USD | 290,239 | AED | 1,067,092 | Standard Chartered Bank | 4/19/23 | — | (69) |
| USD | 1,329,858 | AED | 4,888,826 | Standard Chartered Bank | 4/19/23 | — | (172) |
| | | | | | | $99,488 | $(96,462) |
Futures Contracts
| Description | Number of
Contracts | Position | Expiration
Date | Notional
Amount | Value/
Unrealized
Appreciation
(Depreciation) |
| Equity Futures | | | | | |
| SGX NIFTY 50 Index | 93 | Long | 10/28/21 | $3,273,972 | $ (65,147) |
| | | | | | $(65,147) |
| Abbreviations: |
| ADR | – American Depositary Receipt |
12
See Notes to Financial Statements.
Calvert
Emerging Markets Advancement Fund
September 30, 2021
Schedule of Investments — continued
| Currency Abbreviations: |
| AED | – United Arab Emirates Dirham |
| CNH | – Chinese Yuan Offshore Renminbi |
| EUR | – Euro |
| USD | – United States Dollar |
13
See Notes to Financial Statements.
Calvert
Emerging Markets Advancement Fund
September 30, 2021
Statement of Assets and Liabilities
| | September 30, 2021 |
| Assets | |
Investments in securities of unaffiliated issuers, at value (identified cost $44,653,450) - including
$920,463 of securities on loan | $ 51,627,365 |
| Investments in securities of affiliated issuers, at value (identified cost $6,411,565) | 6,412,205 |
| Receivable for open forward foreign currency exchange contracts | 99,488 |
| Deposits at broker for futures contracts | 173,910 |
| Cash denominated in foreign currency, at value (cost $183,270) | 188,955 |
| Receivable for capital shares sold | 10,748 |
| Dividends receivable | 59,018 |
| Dividends receivable - affiliated | 257 |
| Securities lending income receivable | 722 |
| Receivable from affiliate | 5,567 |
| Directors' deferred compensation plan | 441 |
| Total assets | $58,578,676 |
| Liabilities | |
| Payable for variation margin on open futures contracts | $ 26,034 |
| Payable for open forward foreign currency exchange contracts | 96,462 |
| Due to custodian | 51,336 |
| Payable for capital shares redeemed | 158 |
| Deposits for securities loaned | 30,158 |
| Payable to affiliates: | |
| Investment advisory fee | 30,942 |
| Administrative fee | 5,894 |
| Distribution and service fees | 100 |
| Sub-transfer agency fee | 102 |
| Directors' deferred compensation plan | 441 |
| Accrued expenses | 87,633 |
| Total liabilities | $ 329,260 |
| Net Assets | $58,249,416 |
| Sources of Net Assets | |
| Paid-in capital | $ 49,004,340 |
| Distributable earnings | 9,245,076 |
| Total | $58,249,416 |
| Class A Shares | |
| Net Assets | $ 477,197 |
| Shares Outstanding | 38,507 |
Net Asset Value and Redemption Price Per Share
(net assets ÷ shares of beneficial interest outstanding) | $ 12.39 |
Maximum Offering Price Per Share
(100 ÷ 95.25 of net asset value per share) | $ 13.01 |
| Class I Shares | |
| Net Assets | $ 57,772,219 |
| Shares Outstanding | 4,642,866 |
Net Asset Value, Offering Price and Redemption Price Per Share
(net assets ÷ shares of beneficial interest outstanding) | $ 12.44 |
| On sales of $50,000 or more, the offering price of Class A shares is reduced. |
14
See Notes to Financial Statements.
Calvert
Emerging Markets Advancement Fund
September 30, 2021
| | Year Ended |
| | September 30, 2021 |
| Investment Income | |
| Dividend income (net of foreign taxes withheld of $115,195) | $ 816,771 |
| Dividend income - affiliated issuers | 4,106 |
| Securities lending income, net | 3,690 |
| Total investment income | $ 824,567 |
| Expenses | |
| Investment advisory fee | $ 311,775 |
| Administrative fee | 59,386 |
| Distribution and service fees: | |
| Class A | 479 |
| Directors' fees and expenses | 2,369 |
| Custodian fees | 58,032 |
| Transfer agency fees and expenses | 6,374 |
| Accounting fees | 29,369 |
| Professional fees | 34,894 |
| Registration fees | 47,958 |
| Reports to shareholders | 1,405 |
| Miscellaneous | 24,609 |
| Total expenses | $ 576,650 |
| Waiver and/or reimbursement of expenses by affiliate | $ (105,519) |
| Net expenses | $ 471,131 |
| Net investment income | $ 353,436 |
| Realized and Unrealized Gain (Loss) | |
| Net realized gain (loss): | |
| Investment securities | $ 2,066,814 |
| Investment securities - affiliated issuers | (348) |
| Futures contracts | 1,623,649 |
| Foreign currency transactions | (41,325) |
| Forward foreign currency exchange contracts | 4,600 |
| Net realized gain | $3,653,390 |
| Change in unrealized appreciation (depreciation): | |
| Investment securities | $ 2,906,607 |
| Investment securities - affiliated issuers | 525 |
| Futures contracts | 8,163 |
| Foreign currency | (3,817) |
| Forward foreign currency exchange contracts | 20,051 |
| Net change in unrealized appreciation (depreciation) | $2,931,529 |
| Net realized and unrealized gain | $6,584,919 |
| Net increase in net assets from operations | $6,938,355 |
15
See Notes to Financial Statements.
Calvert
Emerging Markets Advancement Fund
September 30, 2021
Statements of Changes in Net Assets
| | Year Ended September 30, |
| | 2021 | 2020 (1) |
| Increase (Decrease) in Net Assets | | |
| From operations: | | |
| Net investment income | $ 353,436 | $ 335,411 |
| Net realized gain (loss) | 3,653,390 | (1,749,926) |
| Net change in unrealized appreciation (depreciation) | 2,931,529 | 3,986,467 |
| Net increase in net assets from operations | $ 6,938,355 | $ 2,571,952 |
| Distributions to shareholders: | | |
| Class A | $ (101) | $ (52) |
| Class I | (63,570) | (107,905) |
| Total distributions to shareholders | $ (63,671) | $ (107,957) |
| Capital share transactions: | | |
| Class A | $ 380,062 | $ 84,324 |
| Class I | 9,111,866 | 39,334,485 |
| Net increase in net assets from capital share transactions | $ 9,491,928 | $39,418,809 |
| Net increase in net assets | $16,366,612 | $41,882,804 |
| Net Assets | | |
| At beginning of year | $ 41,882,804 | $ — |
| At end of year | $58,249,416 | $41,882,804 |
| (1) | The Fund commenced operations on October 1, 2019. |
16
See Notes to Financial Statements.
Calvert
Emerging Markets Advancement Fund
September 30, 2021
| | Class A |
| | Year Ended September 30, |
| | 2021 | 2020 (1) |
| Net asset value — Beginning of year | $ 10.64 | $ 10.00 |
| Income (Loss) From Operations | | |
| Net investment income(2) | $ 0.09 | $ 0.10 |
| Net realized and unrealized gain | 1.67 | 0.59 |
| Total income from operations | $ 1.76 | $ 0.69 |
| Less Distributions | | |
| From net investment income | $ (0.01) | $ — |
| From net realized gain | — | (0.05) |
| Total distributions | $ (0.01) | $ (0.05) |
| Net asset value — End of year | $12.39 | $10.64 |
| Total Return(3) | 16.54% | 6.94% |
| Ratios/Supplemental Data | | |
| Net assets, end of year (000’s omitted) | $ 477 | $ 91 |
| Ratios (as a percentage of average daily net assets):(4) | | |
| Total expenses | 1.41% | 1.83% |
| Net expenses | 1.20% | 1.20% |
| Net investment income | 0.68% | 0.99% |
| Portfolio Turnover | 64% | 66% |
| (1) | The Fund commenced operations on October 1, 2019. |
| (2) | Computed using average shares outstanding. |
| (3) | Returns are historical and are calculated by determining the percentage change in net asset value with all distributions reinvested and do not reflect the effect of sales charges, if any. |
| (4) | Total expenses do not reflect amounts reimbursed and/or waived by the adviser and certain of its affiliates, if applicable. Net expenses are net of all reductions and represent the net expenses paid by the Fund. |
17
See Notes to Financial Statements.
Calvert
Emerging Markets Advancement Fund
September 30, 2021
Financial Highlights — continued
| | Class I |
| | Year Ended September 30, |
| | 2021 | 2020 (1) |
| Net asset value — Beginning of year | $ 10.66 | $ 10.00 |
| Income (Loss) From Operations | | |
| Net investment income(2) | $ 0.09 | $ 0.12 |
| Net realized and unrealized gain | 1.71 | 0.59 |
| Total income from operations | $ 1.80 | $ 0.71 |
| Less Distributions | | |
| From net investment income | $ (0.02) | $ — |
| From net realized gain | — | (0.05) |
| Total distributions | $ (0.02) | $ (0.05) |
| Net asset value — End of year | $ 12.44 | $ 10.66 |
| Total Return(3) | 16.85% | 7.14% |
| Ratios/Supplemental Data | | |
| Net assets, end of year (000’s omitted) | $57,772 | $41,792 |
| Ratios (as a percentage of average daily net assets):(4) | | |
| Total expenses | 1.16% | 1.58% |
| Net expenses | 0.95% | 0.95% |
| Net investment income | 0.71% | 1.15% |
| Portfolio Turnover | 64% | 66% |
| (1) | The Fund commenced operations on October 1, 2019. |
| (2) | Computed using average shares outstanding. |
| (3) | Returns are historical and are calculated by determining the percentage change in net asset value with all distributions reinvested and do not reflect the effect of sales charges, if any. |
| (4) | Total expenses do not reflect amounts reimbursed and/or waived by the adviser and certain of its affiliates, if applicable. Net expenses are net of all reductions and represent the net expenses paid by the Fund. |
18
See Notes to Financial Statements.
Calvert
Emerging Markets Advancement Fund
September 30, 2021
Notes to Financial Statements
1 Significant Accounting Policies
Calvert Emerging Markets Advancement Fund (the Fund) is a diversified series of Calvert World Values Fund, Inc. (the Corporation). The Corporation is a Maryland corporation registered under the Investment Company Act of 1940, as amended (the 1940 Act), as an open-end management investment company. The investment objective of the Fund is total return.
The Fund offers two classes of shares. Class A shares are generally sold subject to a sales charge imposed at time of purchase. A contingent deferred sales charge of 0.80% may apply to certain redemptions of Class A shares for accounts for which no sales charge was paid, if redeemed within 12 months of purchase. Class I shares are sold at net asset value, are not subject to a sales charge and are sold only to certain eligible investors. Each class represents a pro rata interest in the Fund, but votes separately on class-specific matters and is subject to different expenses.
The Fund applies the accounting and reporting guidance in the Financial Accounting Standards Board (FASB) Accounting Standards Codification Topic 946, Financial Services – Investment Companies (ASC 946). Subsequent events, if any, through the date that the financial statements were issued have been evaluated in the preparation of the financial statements.
A Investment Valuation— Net asset value per share is determined every business day as of the close of the regular session of the New York Stock Exchange (generally 4:00 p.m. Eastern time). The Fund uses independent pricing services approved by the Board of Directors (the Board) to value its investments wherever possible. Investments for which market quotations are not available or deemed not reliable are fair valued in good faith under the direction of the Board.
U.S. generally accepted accounting principles (U.S. GAAP) establishes a disclosure hierarchy that categorizes the inputs to valuation techniques used to value assets and liabilities at measurement date. These inputs are summarized in the three broad levels listed below:
Level 1 - quoted prices in active markets for identical securities
Level 2 - other significant observable inputs (including quoted prices for similar securities, interest rates, prepayment speeds, credit risk, etc.)
Level 3 - significant unobservable inputs (including the Fund’s own assumptions in determining the fair value of investments)
The inputs or methodologies used for valuing securities are not necessarily an indication of the risk associated with investing in those securities.
Valuation techniques used to value the Fund’s investments by major category are as follows:
Equity Securities. Equity securities (including warrants and rights) listed on a U.S. securities exchange generally are valued at the last sale or closing price as reported by an independent pricing service on the primary market or exchange on which they are traded and are categorized as Level 1 in the hierarchy. Equity securities listed on the NASDAQ National Market System are valued at the NASDAQ official closing price and are categorized as Level 1 in the hierarchy. Unlisted or listed securities for which closing sales prices or closing quotations are not available are valued at the mean between the latest available bid and ask prices and are categorized as Level 2 in the hierarchy. The daily valuation of exchange-traded foreign securities generally is determined as of the close of trading on the principal exchange on which such securities trade. Events occurring after the close of trading on foreign exchanges may result in adjustments to the valuation of foreign securities to more accurately reflect their fair value as of the close of regular trading on the New York Stock Exchange. When valuing foreign equity securities that meet certain criteria, the Fund's Board has approved the use of a fair value service that values such securities to reflect market trading that occurs after the close of the applicable foreign markets of comparable securities or other instruments that have a strong correlation to the fair-valued securities. Such securities are categorized as Level 2 in the hierarchy.
Affiliated Fund. The Fund may invest in Calvert Cash Reserves Fund, LLC (Cash Reserves Fund), an affiliated investment company managed by Calvert Research and Management (CRM). While Cash Reserves Fund is not a registered money market mutual fund, it conducts all of its investment activities in accordance with the requirements of Rule 2a-7 under the 1940 Act. Investments in Cash Reserves Fund are valued at the closing net asset value per unit on the valuation day and are categorized as Level 2 in the hierarchy. Cash Reserves Fund generally values its investment securities based on available market quotations provided by a third party pricing service.
Other Securities. Investments in registered investment companies (including money market funds) that do not trade on an exchange are valued at the net asset value per share on the valuation day and are categorized as Level 1 in the hierarchy.
Derivatives. Futures contracts are valued at unrealized appreciation (depreciation) based on the settlement price established each day by the board of trade or exchange on which they are traded and are categorized as Level 1 or Level 2 in the hierarchy. Forward foreign currency exchange contracts are generally valued at the mean of the average bid and average ask prices that are reported by currency dealers to a third party pricing service at the valuation time. Such third party pricing service valuations are supplied for specific settlement periods and the Fund's forward foreign currency exchange contracts are valued at an interpolated rate between the closest preceding and subsequent settlement period reported by the third party pricing service and are categorized as Level 2 in the hierarchy.
Fair Valuation. If a market value cannot be determined for a security using the methodologies described above, or if, in the good faith opinion of the Fund's adviser, the market value does not constitute a readily available market quotation, or if a significant event has occurred that would materially affect the value of the security, the security will be fair valued as determined in good faith by or at the direction of the Board in a manner that most fairly reflects the security’s “fair value”, which is the amount that the Fund might reasonably expect to receive for the security upon its current sale in the ordinary course.
Calvert
Emerging Markets Advancement Fund
September 30, 2021
Notes to Financial Statements — continued
Each such determination is based on a consideration of relevant factors, which are likely to vary from one pricing context to another. These factors may include, but are not limited to, the type of security, the existence of any contractual restrictions on the security’s disposition, the price and extent of public trading in similar securities of the issuer or of comparable companies or entities, quotations or relevant information obtained from broker/dealers or other market participants, information obtained from the issuer, analysts, and/or the appropriate stock exchange (for exchange-traded securities), an analysis of the company’s or entity’s financial statements, and an evaluation of the forces that influence the issuer and the market(s) in which the security is purchased and sold.
The values assigned to fair value investments are based on available information and do not necessarily represent amounts that might ultimately be realized. Further, due to the inherent uncertainty of valuations of such investments, the fair values may differ significantly from the values that would have been used had an active market existed, and the differences could be material.
The following table summarizes the market value of the Fund's holdings as of September 30, 2021, based on the inputs used to value them:
| Asset Description | Level 1 | Level 2 | Level 3 | Total |
| Common Stocks: | | | | |
| Canada | $ 17,772 | $ — | $ — | $ 17,772 |
| China | 4,893,405 | 10,292,276 | — | 15,185,681 |
| Egypt | — | 2,710,857 | — | 2,710,857 |
| Greece | — | 4,441,336 | — | 4,441,336 |
| Hong Kong | — | 564,846 | — | 564,846 |
| Indonesia | — | 4,331,340 | — | 4,331,340 |
| Malaysia | — | 2,748,568 | — | 2,748,568 |
| Philippines | — | 612,873 | — | 612,873 |
| South Korea | — | 7,086,201 | — | 7,086,201 |
| Taiwan | — | 8,178,935 | — | 8,178,935 |
| United Arab Emirates | — | 5,715,763 | — | 5,715,763 |
| Total Common Stocks | $4,911,177 | $46,682,995 (1) | $ — | $51,594,172 |
| Rights | $ — | $ 3,035 | $ — | $ 3,035 |
| Short-Term Investments: | | | | |
| Affiliated Fund | — | 6,412,205 | — | 6,412,205 |
| Securities Lending Collateral | 30,158 | — | — | 30,158 |
| Total Investments | $4,941,335 | $53,098,235 | $ — | $58,039,570 |
| Forward Foreign Currency Exchange Contracts | $ — | $ 99,488 | $ — | $ 99,488 |
| Total | $4,941,335 | $53,197,723 | $ — | $58,139,058 |
| Liability Description | | | | |
| Forward Foreign Currency Exchange Contracts | $ — | $ (96,462) | $ — | $ (96,462) |
| Futures Contracts | — | (65,147) | — | (65,147) |
| Total | $ — | $ (161,609) | $ — | $ (161,609) |
| (1) | Includes foreign equity securities whose values were adjusted to reflect market trading of comparable securities or other correlated instruments that occurred after the close of trading in their applicable foreign markets. |
B Investment Transactions and Income— Investment transactions for financial statement purposes are accounted for on trade date. Realized gains and losses are recorded on an identified cost basis and may include proceeds from litigation. Dividend income is recorded on the ex-dividend date for dividends received in cash and/or securities or, in the case of dividends on certain foreign securities, as soon as the Fund is informed of the ex-dividend date. Non-cash dividends are recorded at the fair value of the securities received. Withholding taxes on foreign dividends, if any, have been provided for in accordance with the Fund's understanding of the applicable country’s tax rules and rates. Distributions received that represent a return of capital are recorded as a reduction of cost of investments. Distributions received that represent a capital gain are recorded as a realized gain.
Calvert
Emerging Markets Advancement Fund
September 30, 2021
Notes to Financial Statements — continued
C Share Class Accounting— Realized and unrealized gains and losses and net investment income and losses, other than class-specific expenses, are allocated daily to each class of shares based upon the relative net assets of each class to the total net assets of the Fund. Expenses arising in connection with a specific class are charged directly to that class.
D Foreign Currency Transactions— The Fund’s accounting records are maintained in U.S. dollars. For valuation of assets and liabilities on each date of net asset value determination, foreign denominations are converted into U.S. dollars using the current exchange rate. Security transactions, income and expenses are translated at the prevailing rate of exchange on the date of the event. Recognized gains or losses on investment transactions attributable to changes in foreign currency exchange rates are recorded for financial statement purposes as net realized gains and losses on investments. That portion of unrealized gains and losses on investments that results from fluctuations in foreign currency exchange rates is not separately disclosed.
E Futures Contracts— The Fund may enter into futures contracts to buy or sell a financial instrument for a set price at a future date. Initial margin deposits of either cash or securities as required by the broker are made upon entering into the contract. While the contract is open, daily variation margin payments are made to or received from the broker reflecting the daily change in market value of the contract and are recorded for financial reporting purposes as unrealized gains or losses by the Fund. When a futures contract is closed, a realized gain or loss is recorded equal to the difference between the opening and closing value of the contract. The risks associated with entering into futures contracts may include the possible illiquidity of the secondary market which would limit the Fund’s ability to close out a futures contract prior to the settlement date, an imperfect correlation between the value of the contracts and the underlying financial instruments, or that the counterparty will fail to perform its obligations under the contracts’ terms. Futures contracts are designed by boards of trade, which are designated “contracts markets” by the Commodities Futures Trading Commission. Futures contracts trade on the contracts markets in a manner that is similar to the way a stock trades on a stock exchange, and the boards of trade, through their clearing corporations, guarantee the futures contracts against default. As a result, there is minimal counterparty credit risk to the Fund.
F Forward Foreign Currency Exchange Contracts— The Fund may enter into forward foreign currency exchange contracts for the purchase or sale of a specific foreign currency at a fixed price on a future date. The forward foreign currency exchange contracts are adjusted by the daily exchange rate of the underlying currency and any gains or losses are recorded as unrealized until such time as the contracts have been closed. Risks may arise upon entering these contracts from the potential inability of counterparties to meet the terms of their contracts and from movements in the value of a foreign currency relative to the U.S. dollar.
G Distributions to Shareholders— Distributions to shareholders are recorded by the Fund on ex-dividend date. Distributions from net investment income and distributions from net realized capital gains, if any, are paid at least annually. Distributions are declared separately for each class of shares. Distributions are determined in accordance with income tax regulations, which may differ from U.S. GAAP; accordingly, periodic reclassifications are made within the Fund's capital accounts to reflect income and gains available for distribution under income tax regulations.
H Estimates— The preparation of financial statements in conformity with U.S. GAAP requires management to make estimates and assumptions that affect the reported amounts of assets and liabilities and disclosure of contingent assets and liabilities at the date of the financial statements and the reported amounts of increases and decreases in net assets from operations during the reporting period. Actual results could differ from those estimates.
I Indemnifications— The Corporation’s By-Laws provide for indemnification for Directors or officers of the Corporation and certain other parties, to the fullest extent permitted by Maryland law and the 1940 Act, provided certain conditions are met. Additionally, in the normal course of business, the Fund enters into agreements with service providers that may contain indemnification clauses. The Fund’s maximum exposure under these arrangements is unknown as this would involve future claims that may be made against the Fund that have not yet occurred.
J Federal Income Taxes— No provision for federal income or excise tax is required since the Fund intends to continue to qualify as a regulated investment company under the Internal Revenue Code and to distribute substantially all of its taxable earnings.
Management has analyzed the Fund's tax positions taken for all open federal income tax years and has concluded that no provision for federal income tax is required in the Fund's financial statements. A Fund's federal tax return is subject to examination by the Internal Revenue Service for a period of three years from the date of filing.
2 Related Party Transactions
The investment advisory fee is earned by CRM as compensation for investment advisory services rendered to the Fund. On March 1, 2021, Morgan Stanley acquired Eaton Vance Corp. (the “Transaction”) and CRM became an indirect, wholly-owned subsidiary of Morgan Stanley. In connection with the Transaction, the Fund entered into a new investment advisory agreement (the “New Agreement”) with CRM, which took effect on March 1, 2021. Pursuant to the New Agreement (and the Fund’s investment advisory agreement with CRM in effect prior to March 1, 2021), the fee is computed at the annual rate of 0.63% of the Fund’s average daily net assets and is payable monthly. For the year ended September 30, 2021, the investment advisory fee amounted to $311,775. The Fund may invest its cash in Cash Reserves Fund. CRM does not currently receive a fee for advisory services provided to Cash Reserves Fund.
Calvert
Emerging Markets Advancement Fund
September 30, 2021
Notes to Financial Statements — continued
CRM has agreed to reimburse the Fund’s operating expenses to the extent that total annual operating expenses (relating to ordinary operating expenses only and excluding expenses such as brokerage commissions, acquired fund fees and expenses of unaffiliated funds, borrowing costs, taxes or litigation expenses) exceed 1.20% and 0.95% for Class A and Class I, respectively, of such class’s average daily net assets. The expense reimbursement agreement with CRM may be changed or terminated after January 31, 2022. For the year ended September 30, 2021, CRM waived or reimbursed expenses of $105,519.
The administrative fee is earned by CRM as compensation for administrative services rendered to the Fund. The fee is computed at an annual rate of 0.12% of the Fund’s average daily net assets attributable to Class A and Class I and is payable monthly. For the year ended September 30, 2021, CRM was paid administrative fees of $59,386.
The Fund has in effect a distribution plan for Class A shares (Class A Plan) pursuant to Rule 12b-1 under the 1940 Act. Pursuant to the Class A Plan, the Fund pays Eaton Vance Distributors, Inc. (EVD), an affiliate of CRM and the Fund’s principal underwriter, a distribution and service fee of 0.25% per annum of its average daily net assets attributable to Class A shares for distribution services and facilities provided to the Fund by EVD, as well as for personal services and/or the maintenance of shareholder accounts. Distribution and service fees paid or accrued for the year ended September 30, 2021 amounted to $479 for Class A shares.
The Fund was informed that EVD received $698 as its portion of the sales charge on sales of Class A shares for the year ended September 30, 2021.
Eaton Vance Management (EVM), an affiliate of CRM, provides sub-transfer agency and related services to the Fund pursuant to a Sub-Transfer Agency Support Services Agreement. For the year ended September 30, 2021, sub-transfer agency fees and expenses incurred to EVM amounted to $3,950 and are included in transfer agency fees and expenses on the Statement of Operations.
Each Director of the Fund who is not an employee of CRM or its affiliates receives an annual fee of $154,000, plus an annual Committee fee ranging from $8,500 to $16,500 depending on the Committee. The Board chair receives an additional $30,000 ($20,000 prior to January 1, 2021) annual fee and Committee chairs receive an additional $6,000 annual fee. Eligible Directors may participate in a Deferred Compensation Plan (the Plan). Amounts deferred under the Plan are treated as though equal dollar amounts had been invested in shares of the Fund or other Calvert funds selected by the Directors. The Fund purchases shares of the funds selected equal to the dollar amounts deferred under the Plan, resulting in an asset equal to the deferred compensation liability. Obligations of the Plan are paid solely from the Fund's assets. Directors’ fees are allocated to each of the Calvert funds served. Salaries and fees of officers and Directors of the Fund who are employees of CRM or its affiliates are paid by CRM. Prior to December 31, 2020, an Advisory Council aided the Board and CRM in advancing the cause of responsible investing through original scholarship and thought leadership. The Advisory Council consisted of CRM’s Chief Executive Officer and three additional members. For the year ended December 31, 2020, each member (other than CRM’s Chief Executive Officer) was compensated $20,000 for their service on the Advisory Council. Such compensation, and any other compensation and/or expenses incurred by the Advisory Council as may be approved by the Board, was borne by the Calvert funds. For the year ended September 30, 2021, the Fund was not allocated any portion of the Advisory Council compensation and fees.
3 Investment Activity
During the year ended September 30, 2021, the cost of purchases and proceeds from sales of investments, other than short-term securities, were $37,478,331 and $27,576,837, respectively.
4 Distributions to Shareholders and Income Tax Information
The tax character of distributions declared for the years ended September 30, 2021 and September 30, 2020 was as follows:
| | Year Ended September 30, |
| | 2021 | 2020 (1) |
| Ordinary income | $63,671 | $45,391 |
| Long-term capital gains | $ — | $62,566 |
| (1) | The Fund commenced operations on October 1, 2019. |
During the year ended September 30, 2021, distributable earnings was decreased by $93,603 and paid-in capital was increased by $93,603 due to the Fund's use of equalization accounting. Tax equalization accounting allows the Fund to treat as a distribution that portion of redemption proceeds representing a redeeming shareholder’s portion of undistributed taxable income and net capital gains. These reclassifications had no effect on the net assets or net asset value per share of the Fund.
As of September 30, 2021, the components of distributable earnings (accumulated loss) on a tax basis were as follows:
Calvert
Emerging Markets Advancement Fund
September 30, 2021
Notes to Financial Statements — continued
| Undistributed ordinary income | $ 520,570 |
| Undistributed long-term capital gains | 2,003,887 |
| Net unrealized appreciation | 6,720,619 |
| Distributable earnings | $9,245,076 |
The cost and unrealized appreciation (depreciation) of investments, including open derivative contracts, of the Fund at September 30, 2021, as determined on a federal income tax basis, were as follows:
| Aggregate cost | $51,250,221 |
| Gross unrealized appreciation | $ 9,324,554 |
| Gross unrealized depreciation | (2,609,497) |
| Net unrealized appreciation | $ 6,715,057 |
5 Financial Instruments
The Fund may trade in financial instruments with off-balance sheet risk in the normal course of its investing activities. These financial instruments may include forward foreign currency exchange contracts and futures contracts and may involve, to a varying degree, elements of risk in excess of the amounts recognized for financial statement purposes. The notional or contractual amounts of these instruments represent the investment the Fund has in particular classes of financial instruments and do not necessarily represent the amounts potentially subject to risk. The measurement of the risks associated with these instruments is meaningful only when all related and offsetting transactions are considered. A summary of obligations under these financial instruments at September 30, 2021 is included in the Schedule of Investments. At September 30, 2021, the Fund had sufficient cash and/or securities to cover commitments under these contracts.
In the normal course of pursuing its investment objective, the Fund is subject to the following risks:
Equity Price Risk: During the year ended September 30, 2021, the Fund entered into equity futures contracts to enhance total return, to manage certain investment risks and/or as a substitute for the purchase of securities.
Foreign Exchange Risk: During the year ended September 30, 2021, the Fund entered into forward foreign currency exchange contracts to seek to hedge against fluctuations in currency exchange rates and/or as a substitute for the purchase or sale of securities or currencies.
The Fund enters into forward foreign currency exchange contracts that may contain provisions whereby the counterparty may terminate the contract under certain conditions, including but not limited to a decline in the Fund’s net assets below a certain level over a certain period of time, which would trigger a payment by the Fund for those derivatives in a liability position. At September 30, 2021, the fair value of derivatives with credit-related contingent features in a net liability position was $96,462. At September 30, 2021, there were no assets pledged by the Fund for such liability.
The over-the-counter (OTC) derivatives in which the Fund invests are subject to the risk that the counterparty to the contract fails to perform its obligations under the contract. To mitigate this risk, the Fund has entered into an International Swaps and Derivatives Association, Inc. Master Agreement (“ISDA Master Agreement”) with its derivative counterparty. The ISDA Master Agreement is a bilateral agreement between the Fund and the counterparty that governs certain OTC derivatives and typically contains, among other things, set-off provisions in the event of a default and/or termination event as defined under the ISDA Master Agreement. Under the ISDA Master Agreement, the Fund may, under certain circumstances, offset with the counterparty certain derivative financial instruments’ payables and/or receivables with collateral held and/or posted and create one single net payment. The provisions of the ISDA Master Agreement typically permit a single net payment in the event of default including the bankruptcy or insolvency of the counterparty. However, bankruptcy or insolvency laws of a particular jurisdiction may impose restrictions on or prohibitions against the right of offset in bankruptcy or insolvency. The ISDA Master Agreement allows the counterparty to OTC derivatives to terminate derivative contracts prior to maturity in the event the Fund’s net assets decline by a stated percentage or the Fund fails to meet the terms of its ISDA Master Agreement, which would cause the counterparty to accelerate payment by the Fund of any net liability owed to it.
The collateral requirements for derivatives traded under the ISDA Master Agreement are governed by a Credit Support Annex to the ISDA Master Agreement. Collateral requirements are determined at the close of business each day and are typically based on changes in market values for each transaction under the ISDA Master Agreement and netted into one amount for such agreement. Generally, the amount of collateral due from or to a counterparty is subject to a minimum transfer threshold amount before a transfer is required. Collateral pledged for the benefit of the Fund and/ or counterparty is held in segregated accounts by the Fund’s custodian and cannot be sold, re-pledged, assigned or otherwise used while pledged. The portion
Calvert
Emerging Markets Advancement Fund
September 30, 2021
Notes to Financial Statements — continued
of such collateral representing cash, if any, is reflected as deposits for derivatives collateral and, in the case of cash pledged by a counterparty for the benefit of the Fund, a corresponding liability on the Statement of Assets and Liabilities. Securities pledged by the Fund as collateral, if any, are identified as such in the Schedule of Investments.
At September 30, 2021, the fair value of open derivative instruments (not considered to be hedging instruments for accounting disclosure purposes) by risk exposure was as follows:
| Risk | Derivative | Statement of Assets and Liabilities Caption | Assets | Liabilities |
| Foreign exchange | Forward foreign currency exchange contracts | Receivable/Payable for open forward foreign currency
exchange contracts | $ 99,488 | $ (96,462) |
| Equity price | Futures contracts | Distributable earnings | — | (65,147) (1) |
| Total | | | $99,488 | $(161,609) |
| Derivatives not subject to master netting agreement | $ — | $ (65,147) |
| Total Derivatives subject to master netting agreement | $99,488 | $ (96,462) |
| (1) | Only the current day's variation margin is reported within the Statement of Assets and Liabilities as Receivable or Payable for variation margin on open futures contracts, as applicable. |
The Fund’s derivative assets and liabilities at fair value by risk, which are reported gross in the Statement of Assets and Liabilities, are presented in the table above. The following tables present the Fund’s derivative assets and liabilities by counterparty, net of amounts available for offset under a master netting agreement and net of the related collateral received by the Fund for such assets and pledged by the Fund for such liabilities as of September 30, 2021.
| Counterparty | Derivative
Assets Subject to
Master Netting
Agreement | Derivatives
Available
for Offset | Non-cash
Collateral
Received(a) | Cash
Collateral
Received(a) | Net Amount
of Derivative
Assets(b) |
| Standard Chartered Bank | $99,488 | $(96,462) | $ — | $ — | $3,026 |
| Counterparty | Derivative
Liabilities Subject to
Master Netting
Agreement | Derivatives
Available
for Offset | Non-cash
Collateral
Pledged(a) | Cash
Collateral
Pledged(a) | Net Amount
of Derivative
Liabilities(c) |
| Standard Chartered Bank | $(96,462) | $96,462 | $ — | $ — | $ — |
| (a) | In some instances, the total collateral received and/or pledged may be more than the amount shown due to overcollateralization. |
| (b) | Net amount represents the net amount due from the counterparty in the event of default. |
| (c) | Net amount represents the net amount payable to the counterparty in the event of default. |
Calvert
Emerging Markets Advancement Fund
September 30, 2021
Notes to Financial Statements — continued
The effect of derivative instruments (not considered to be hedging instruments for accounting disclosure purposes) on the Statement of Operations by risk exposure for the year ended September 30, 2021 was as follows:
| Statement of Operations Caption | Equity price | Foreign exchange | Total |
| Net realized gain (loss): | | | |
| Forward foreign currency exchange contracts | $ — | $ 4,600 | $ 4,600 |
| Futures contracts | 1,623,649 | — | 1,623,649 |
| Total | $1,623,649 | $ 4,600 | $1,628,249 |
| Change in unrealized appreciation (depreciation): | | | |
| Forward foreign currency exchange contracts | $ — | $ 20,051 | $ 20,051 |
| Futures contracts | 8,163 | — | 8,163 |
| Total | $ 8,163 | $20,051 | $ 28,214 |
The average notional cost of futures contracts and average notional amounts of other derivative contracts outstanding during the year ended September 30, 2021, which are indicative of the volume of these derivative types, were approximately as follows:
Futures
Contracts — Long | Forward
Foreign Currency
Exchange Contracts* |
| $3,869,000 | $6,790,000 |
| * | The average notional amount for forward foreign currency exchange contracts is based on the absolute value of notional amounts of currency purchased and currency sold. |
6 Overdraft Advances
Pursuant to the custodian agreement, State Street Bank and Trust Company (SSBT) may, in its discretion, advance funds to the Fund to make properly authorized payments. When such payments result in an overdraft, the Fund is obligated to repay SSBT at the current rate of interest charged by SSBT for secured loans (currently, the Federal Funds rate plus 2%). This obligation is payable on demand to SSBT. SSBT has a lien on the Fund's assets to the extent of any overdraft. At September 30, 2021, the Fund had a payment due to SSBT pursuant to the foregoing arrangement of $51,336. Based on the short-term nature of these payments and the variable interest rate, the carrying value of the overdraft advances approximated its fair value at September 30, 2021. If measured at fair value, overdraft advances would have been considered as Level 2 in the fair value hierarchy (see Note 1A) at September 30, 2021. The Fund’s average overdraft advances during the year ended September 30, 2021 were not significant.
7 Securities Lending
To generate additional income, the Fund may lend its securities pursuant to a securities lending agency agreement with SSBT, the securities lending agent. Security loans are subject to termination by the Fund at any time and, therefore, are not considered illiquid investments. The Fund requires that the loan be continuously collateralized by either cash or securities in an amount at least equal to the market value of the securities on loan. The market value of securities loaned is determined daily and any additional required collateral is delivered to the Fund on the next business day. Cash collateral is generally invested in a money market fund registered under the 1940 Act that is managed by an affiliate of SSBT. Any gain or loss in the market price of the loaned securities that might occur and any interest earned or dividends declared during the term of the loan would accrue to the account of the Fund. Income earned on the investment of collateral, net of broker rebates and other expenses incurred by the securities lending agent, is split between the Fund and the securities lending agent based on agreed upon contractual terms. Non-cash collateral, if any, is held by the lending agent on behalf of the Fund and cannot be sold or re-pledged by the Fund; accordingly, such collateral is not reflected in the Statement of Assets and Liabilities.
The risks associated with lending portfolio securities include, but are not limited to, possible delays in receiving additional collateral or in the recovery of the loaned securities, possible loss of rights to the collateral should the borrower fail financially, as well as risk of loss in the value of the collateral or the value of the investments made with the collateral. The securities lending agent shall indemnify the Fund in the case of default of any securities borrower.
At September 30, 2021, the total value of securities on loan was $920,463 and the total value of collateral received was $959,255, comprised of cash of $30,158 and U.S. government and/or agencies securities of $929,097.
Calvert
Emerging Markets Advancement Fund
September 30, 2021
Notes to Financial Statements — continued
The following table provides a breakdown of securities lending transactions accounted for as secured borrowings, the obligations by class of collateral pledged, and the remaining contractual maturity of those transactions as of September 30, 2021.
| | Remaining Contractual Maturity of the Transactions |
| | Overnight and
Continuous | <30 days | 30 to 90 days | >90 days | Total |
| Common Stocks | $30,158 | $ — | $ — | $ — | $30,158 |
The carrying amount of the liability for deposits for securities loaned at September 30, 2021 approximated its fair value. If measured at fair value, such liability would have been considered as Level 2 in the fair value hierarchy (see Note 1A) at September 30, 2021.
8 Line of Credit
The Fund participates with other portfolios and funds managed by EVM and its affiliates, including CRM, in an $800 million unsecured line of credit with a group of banks, which is in effect through October 26, 2021. Borrowings are made by the Fund solely for temporary purposes related to redemptions and other short-term cash needs. Interest is charged to the Fund based on its borrowings at an amount above either the Eurodollar rate or Federal Funds rate. In addition, a fee computed at an annual rate of 0.15% on the daily unused portion of the line of credit is allocated among the participating portfolios and funds at the end of each quarter. In connection with the renewal of the agreement in October 2020, an upfront fee and arrangement fee totaling $950,000 was incurred that was allocated to the participating portfolios and funds. Because the line of credit is not available exclusively to the Fund, it may be unable to borrow some or all of its requested amounts at any particular time.
The Fund had no borrowings pursuant to its line of credit during the year ended September 30, 2021. Effective October 26, 2021, the Fund renewed its line of credit agreement, which expires October 25, 2022, at substantially the same terms.
9 Affiliated Funds
At September 30, 2021, the value of the Fund’s investment in affiliated funds was $6,412,205, which represents 11.0% of the Fund’s net assets. Transactions in affiliated funds by the Fund for the year ended September 30, 2021 were as follows:
| Name | Value,
beginning
of period | Purchases | Sales
proceeds | Net
realized
gain
(loss) | Change in
unrealized
appreciation
(depreciation) | Value,
end of
period | Dividend
income | Units,
end of
period |
| Short-Term Investments | | | | | | |
| Calvert Cash Reserves Fund, LLC | $4,546,415 | $35,108,333 | $(33,242,720) | $(348) | $525 | $6,412,205 | $4,106 | 6,411,564 |
10 Capital Shares
The Corporation may issue its shares in one or more series (such as the Fund). The authorized shares of the Fund consist of 75,000,000 common shares, $0.01 par value, for each Class.
Transactions in capital shares for the years ended September 30, 2021 and September 30, 2020 were as follows:
| | Year Ended
September 30, 2021 | | Year Ended
September 30, 2020(1) |
| | Shares | Amount | | Shares | Amount |
| Class A | | | | | |
| Shares sold | 39,025 | $ 499,974 | | 8,721 | $ 85,582 |
| Reinvestment of distributions | 8 | 101 | | 5 | 53 |
| Shares redeemed | (9,108) | (120,013) | | (144) | (1,311) |
| Net increase | 29,925 | $ 380,062 | | 8,582 | $ 84,324 |
Calvert
Emerging Markets Advancement Fund
September 30, 2021
Notes to Financial Statements — continued
| | Year Ended
September 30, 2021 | | Year Ended
September 30, 2020(1) |
| | Shares | Amount | | Shares | Amount |
| Class I | | | | | |
| Shares sold | 1,285,217 | $16,497,865 | | 4,056,737 | $ 40,660,497 |
| Reinvestment of distributions | 5,118 | 63,565 | | 10,446 | 107,904 |
| Shares redeemed | (568,417) | (7,449,564) | | (146,235) | (1,433,916) |
| Net increase | 721,918 | $ 9,111,866 | | 3,920,948 | $39,334,485 |
| (1) | The Fund commenced operations on October 1, 2019. |
At September 30, 2021, EVM, Calvert Conservative Allocation Fund, Calvert Moderate Allocation Fund and Calvert Growth Allocation Fund owned in the aggregate 91.1% of the value of the outstanding shares of the Fund.
11 Risks and Uncertainties
Risks Associated with Foreign Investments
Foreign investments can be adversely affected by political, economic and market developments abroad, including the imposition of economic and other sanctions by the United States or another country. There may be less publicly available information about foreign issuers because they may not be subject to reporting practices, requirements or regulations comparable to those to which United States companies are subject. Foreign markets may be smaller, less liquid and more volatile than the major markets in the United States. Trading in foreign markets typically involves higher expense than trading in the United States. The Fund may have difficulties enforcing its legal or contractual rights in a foreign country. Securities that trade or are denominated in currencies other than the U.S. dollar may be adversely affected by fluctuations in currency exchange rates.
Emerging market securities often involve greater risks than developed market securities. Investment markets within emerging market countries are typically smaller, less liquid, less developed and more volatile than those in more developed markets like the United States, and may be focused in certain economic sectors. The information available about an emerging market issuer may be less reliable than for comparable issuers in more developed capital markets. Governmental actions can have a significant effect on the economic conditions in emerging market countries. It may be more difficult to make a claim or obtain a judgment in the courts of these countries than it is in the United States. The possibility of fraud, negligence, undue influence being exerted by an issuer or refusal to recognize ownership exists in some emerging markets. Disruptions due to work stoppages and trading improprieties in foreign securities markets have caused such markets to close. Emerging market securities are also subject to speculative trading, which contributes to their volatility.
Pandemic Risk
An outbreak of respiratory disease caused by a novel coronavirus was first detected in China in late 2019 and subsequently spread internationally. This coronavirus has resulted in closing borders, enhanced health screenings, changes to healthcare service preparation and delivery, quarantines, cancellations, disruptions to supply chains and customer activity, as well as general concern and uncertainty. Health crises caused by outbreaks, such as the coronavirus outbreak, may exacerbate other pre-existing political, social and economic risks and disrupt normal market conditions and operations. The impact of this outbreak has negatively affected the worldwide economy, the economies of individual countries, individual companies, and the market in general, and may continue to do so in significant and unforeseen ways, as may other epidemics and pandemics that may arise in the future. Any such impact could adversely affect the Fund's performance, or the performance of the securities in which the Fund invests.
12 Change in Independent Registered Public Accounting Firm
On July 30, 2021, KPMG LLP (“KPMG”) informed the Audit Committee and Board of the Corporation that it was resigning as the independent registered public accounting firm to the Corporation, as upon Morgan Stanley’s acquisition of Eaton Vance Corp., the parent company of CRM (the investment adviser to each series of the Corporation), KPMG would no longer be independent of the Corporation. The Audit Committee of the Board and the Board approved the selection of Deloitte & Touche LLP (“Deloitte”) as the independent registered public accounting firm for the funds that are series of the Corporation (the “Funds”) for the fiscal year ending September 30, 2021 to be effective upon KPMG’s resignation and Deloitte’s acceptance of the engagement which became effective July 30, 2021.
Calvert
Emerging Markets Advancement Fund
September 30, 2021
Notes to Financial Statements — continued
KPMG’s reports on the financial statements for the Funds for the fiscal periods ended September 30, 2019 and September 30, 2020 contained no adverse opinion or disclaimer of opinion nor were they qualified or modified as to uncertainty, audit scope or accounting principles. During the fiscal periods ended September 30, 2019 and September 30, 2020, and during the subsequent interim period through July 30, 2021: (i) there were no disagreements with KPMG on any matter of accounting principles or practices, financial statement disclosure or auditing scope or procedure, which disagreements, if not resolved to the satisfaction of KPMG, would have caused KPMG to make reference to the subject matter of the disagreements in connection with its reports on the Funds’ financial statements for such periods; and (ii) there were no “reportable events” of the kind described in Item 304(a)(1)(v) of Regulation S-K under the Securities Exchange Act of 1934, as amended.
During the fiscal periods ended September 30, 2019 and September 30, 2020, and during the subsequent interim period through July 30, 2021: neither the Funds, nor anyone on their behalf, consulted with Deloitte on items which: (i) concerned the application of accounting principles to a specified transaction, either completed or proposed, or the type of audit opinion that might be rendered on the Funds’ financial statements; or (ii) concerned the subject of a disagreement (as defined in paragraph (a)(1)(iv) of Item 304 of Regulation S-K) or reportable events (as described in paragraph (a)(1)(v) of Item 304).
Calvert
Emerging Markets Advancement Fund
September 30, 2021
Report of Independent Registered Public Accounting Firm
To the Board of Directors of Calvert World Values Fund, Inc. and Shareholders of Calvert Emerging Markets Advancement Fund:
Opinion on the Financial Statements and Financial Highlights
We have audited the accompanying statement of assets and liabilities of Calvert Emerging Markets Advancement Fund (the "Fund") (one of the funds constituting Calvert World Values Fund, Inc.), including the schedule of investments, as of September 30, 2021, the related statements of operations, changes in net assets and the financial highlights for the year then ended, and the related notes. In our opinion, the financial statements and financial highlights present fairly, in all material respects, the financial position of the Fund as of September 30, 2021, and the results of its operations and changes in its net assets for the year then ended, and the financial highlights for the year then ended in conformity with accounting principles generally accepted in the United States of America. The statement of changes in net assets and the financial highlights for the year ended September 30, 2020 were audited by other auditors whose report, dated November 20, 2020, expressed an unqualified opinion on that financial statement and those financial highlights.
Basis for Opinion
These financial statements and financial highlights are the responsibility of the Fund's management. Our responsibility is to express an opinion on the Fund's financial statements and financial highlights based on our audit. We are a public accounting firm registered with the Public Company Accounting Oversight Board (United States) (PCAOB) and are required to be independent with respect to the Fund in accordance with the U.S. federal securities laws and the applicable rules and regulations of the Securities and Exchange Commission and the PCAOB.
We conducted our audit in accordance with the standards of the PCAOB. Those standards require that we plan and perform the audit to obtain reasonable assurance about whether the financial statements and financial highlights are free of material misstatement, whether due to error or fraud. The Fund is not required to have, nor were we engaged to perform, an audit of its internal control over financial reporting. As part of our audit we are required to obtain an understanding of internal control over financial reporting but not for the purpose of expressing an opinion on the effectiveness of the Fund’s internal control over financial reporting. Accordingly, we express no such opinion.
Our audit included performing procedures to assess the risks of material misstatement of the financial statements and financial highlights, whether due to error or fraud, and performing procedures that respond to those risks. Such procedures included examining, on a test basis, evidence regarding the amounts and disclosures in the financial statements and financial highlights. Our audit also included evaluating the accounting principles used and significant estimates made by management, as well as evaluating the overall presentation of the financial statements and financial highlights. Our procedures included confirmation of securities owned as of September 30, 2021, by correspondence with the custodian and brokers; when replies were not received from brokers, we performed other auditing procedures. We believe that our audit provides a reasonable basis for our opinion.
/s/ Deloitte & Touche LLP
Boston, Massachusetts
November 22, 2021
We have served as the auditor of one or more Calvert investment companies since 2021.
Calvert
Emerging Markets Advancement Fund
September 30, 2021
Federal Tax Information (Unaudited)
The Form 1099-DIV you receive in February 2022 will show the tax status of all distributions paid to your account in calendar year 2021. Shareholders are advised to consult their own tax adviser with respect to the tax consequences of their investment in the Fund. As required by the Internal Revenue Code and/or regulations, shareholders must be notified regarding the status of qualified dividend income for individuals, the foreign tax credit and capital gains dividends.
Qualified Dividend Income. For the fiscal year ended September 30, 2021, the Fund designates approximately $411,089, or up to the maximum amount of such dividends allowable pursuant to the Internal Revenue Code, as qualified dividend income eligible for the reduced tax rate of 15%.
Foreign Tax Credit. For the fiscal year ended September 30, 2021, the Fund paid foreign taxes of $114,047 and recognized foreign source income of $927,174.
Capital Gains Dividends. The Fund hereby designates as a capital gain dividend with respect to the taxable year ended September 30, 2021, $2,078,188 or, if subsequently determined to be different, the net capital gain of such year.
Calvert
Emerging Markets Advancement Fund
September 30, 2021
Liquidity Risk Management Program
The Fund has implemented a written liquidity risk management program (Program) and related procedures to manage its liquidity in accordance with Rule 22e-4 under the Investment Company Act of 1940, as amended (Liquidity Rule). The Liquidity Rule defines “liquidity risk” as the risk that a fund could not meet requests to redeem shares issued by the fund without significant dilution of the remaining investors’ interests in the fund. The Fund’s Board of Trustees/Directors has designated the investment adviser to serve as the administrator of the Program and the related procedures. The administrator has established a Liquidity Risk Management Oversight Committee (Committee) to perform the functions necessary to administer the Program. As part of the Program, the administrator is responsible for identifying illiquid investments and categorizing the relative liquidity of the Fund’s investments in accordance with the Liquidity Rule. Under the Program, the administrator assesses, manages, and periodically reviews the Fund’s liquidity risk, and is responsible for making certain reports to the Fund’s Board of Trustees/Directors and the Securities and Exchange Commission (SEC) regarding the liquidity of the Fund’s investments, and to notify the Board of Trustees/Directors and the SEC of certain liquidity events specified in the Liquidity Rule. The liquidity of the Fund’s portfolio investments is determined based on a number of factors including, but not limited to, relevant market, trading and investment-specific considerations under the Program.
At a meeting of the Fund’s Board of Trustees/Directors on June 16, 2021, the Committee provided a written report to the Fund’s Board of Trustees/ Directors pertaining to the operation, adequacy, and effectiveness of implementation of the Program, as well as the operation of the highly liquid investment minimum (if applicable) for the period January 1, 2020 through December 31, 2020 (Review Period). The Program operated effectively during the Review Period, supporting the administrator’s ability to assess, manage and monitor Fund liquidity risk, including during periods of market volatility and net redemptions. During the Review Period, the Fund met redemption requests on a timely basis.
There can be no assurance that the Program will achieve its objectives in the future. Please refer to the Fund’s prospectus for more information regarding the Fund’s exposure to liquidity risk and other principal risks to which an investment in the Fund may be subject.
Calvert
Emerging Markets Advancement Fund
September 30, 2021
Management and Organization
Fund Management. The Directors of Calvert World Values Fund, Inc. (the Corporation) are responsible for the overall management and supervision of the Corporation’s affairs. The Directors and officers of the Corporation are listed below. Except as indicated, each individual has held the office shown or other offices in the same company for the last five years. Each Board member holds office until his or her successor is elected and qualified, or until his or her earlier death, resignation, retirement, removal or disqualification. Under the terms of the Fund's current Board member retirement policy, an Independent Board member must retire at the end of the calendar year in which he or she turns 75. However, if such retirement would cause the Fund to be out of compliance with Section 16 of the 1940 Act or any other regulations or guidance of the SEC, then such retirement and resignation will not become effective until such time as action has been taken for the Fund to be in compliance upon a Board member's retirement. The “Independent Directors” consist of those Directors who are not “interested persons” of the Corporation, as that term is defined under the 1940 Act. The business address of each Director and officer, with the exception of Ms. Walsh and Mr. Kirchner, is 1825 Connecticut Avenue NW, Suite 400, Washington, DC 20009. As used below, “CRM” refers to Calvert Research and Management. Each Director oversees 39 funds in the Calvert fund complex. Each officer serves as an officer of certain other Calvert funds.
| Name and Year of Birth | Corporation
Position(s) | Position
Start Date | Principal Occupation(s) and Other Directorships
During Past Five Years and Other Relevant Experience |
| Interested Director |
John H. Streur(1)
1960 | Director and
President | 2015 | President and Chief Executive Officer of Calvert Research and
Management (since December 31, 2016). President and Chief Executive
Officer of Calvert Investments, Inc. (January 2015 - December 2016);
Chief Executive Officer of Calvert Investment Distributors, Inc. (August
2015 - December 2016); Chief Compliance Officer of Calvert Investment
Management, Inc. (August 2015 - April 2016); President and Director,
Portfolio 21 Investments, Inc. (through October 2014); President,
Chief Executive Officer and Director, Managers Investment Group LLC
(through January 2012); President and Director, The Managers Funds
and Managers AMG Funds (through January 2012).
Other Directorships in the Last Five Years. Portfolio 21 Investments,
Inc. (asset management) (through October 2014); Managers Investment
Group LLC (asset management) (through January 2012); The Managers
Funds (asset management) (through January 2012); Managers AMG Funds
(asset management) (through January 2012); Calvert Impact Capital, Inc. |
| Independent Directors |
Richard L. Baird, Jr.
1948 | Director | 2005 | Regional Disaster Recovery Lead, American Red Cross of Greater
Pennsylvania (since 2017). Volunteer, American Red Cross (since 2015).
Former President and CEO of Adagio Health Inc. (retired in 2014) in
Pittsburgh, PA.
Other Directorships in the Last Five Years. None. |
Alice Gresham Bullock
1950 | Chair and
Director | 2016 | Professor Emerita at Howard University School of Law. Dean Emerita of
Howard University School of Law and Deputy Director of the Association
of American Law Schools (1992-1994).
Other Directorships in the Last Five Years. None. |
Cari M. Dominguez
1949 | Director | 2016 | Former Chair of the U.S. Equal Employment Opportunity Commission.
Other Directorships in the Last Five Years. Manpower, Inc. (employment
agency); Triple S Management Corporation (managed care); National
Association of Corporate Directors. |
John G. Guffey, Jr.
1948 | Director | 1992 | President of Aurora Press Inc., a privately held publisher of trade
paperbacks (since January 1997).
Other Directorships in the Last Five Years. Calvert Impact Capital, Inc.
(through December 31, 2018); Calvert Ventures, LLC. |
Miles D. Harper, III
1962 | Director | 2005 | Partner, Carr Riggs & Ingram (public accounting firm) since October 2014.
Partner, Gainer Donnelly & Desroches (public accounting firm) (now Carr
Riggs & Ingram) (November 1999 - September 2014).
Other Directorships in the Last Five Years. Bridgeway Funds (9) (asset
management). |
Joy V. Jones
1950 | Director | 2005 | Attorney.
Other Directorships in the Last Five Years. Conduit Street Restaurants
SUD 2 Limited; Palm Management Restaurant Corporation. |
Calvert
Emerging Markets Advancement Fund
September 30, 2021
Management and Organization — continued
| Name and Year of Birth | Corporation
Position(s) | Position
Start Date | Principal Occupation(s) and Other Directorships
During Past Five Years and Other Relevant Experience |
| Independent Directors (continued) |
Anthony A. Williams
1951 | Director | 2016 | CEO and Executive Director of the Federal City Council (July 2012 to
present); Senior Adviser and Independent Consultant for King and
Spalding LLP (September 2015 to present); Executive Director of Global
Government Practice at the Corporate Executive Board (January 2010 to
January 2012).
Other Directorships in the Last Five Years. Freddie Mac; Evoq
Properties/Meruelo Maddux Properties, Inc. (real estate management);
Weston Solutions, Inc. (environmental services); Bipartisan Policy Center’s
Debt Reduction Task Force; Chesapeake Bay Foundation; Catholic
University of America; Urban Institute (research organization); The Howard Hughes Corporation (real estate development). |
| Name and Year of Birth | Corporation
Position(s) | Position
Start Date | Principal Occupation(s)
During Past Five Years |
| Principal Officers who are not Directors |
Hope L. Brown
1973 | Chief
Compliance
Officer | 2014 | Chief Compliance Officer of 39 registered investment companies advised
by CRM (since 2014). Vice President and Chief Compliance Officer,
Wilmington Funds (2012-2014). |
Deidre E. Walsh(2)
1971 | Secretary,
Vice President
and Chief
Legal Officer | 2021 | Vice President of CRM and officer of 39 registered investment companies
advised by CRM (since 2021). Also Vice President of Eaton Vance and
certain of its affiliates and officer of 138 registered investment companies
advised or administered by Eaton Vance. |
James F. Kirchner(2)
1967 | Treasurer | 2016 | Vice President of CRM and officer of 39 registered investment companies
advised by CRM (since 2016). Also Vice President of Eaton Vance and
certain of its affiliates and officer of 138 registered investment companies
advised or administered by Eaton Vance. |
| (1) Mr. Streur is an interested person of the Fund because of his positions with the Fund’s adviser and certain affiliates. |
| (2) The business address for Ms. Walsh and Mr. Kirchner is Two International Place, Boston, MA 02110. |
The SAI for the Fund includes additional information about the Directors and officers of the Fund and can be obtained without charge on Calvert’s website at www.calvert.com or by calling 1-800-368-2745.
| FACTS | WHAT DOES EATON VANCE DO WITH YOUR
PERSONAL INFORMATION? |
| Why? | Financial companies choose how they share your personal information. Federal law gives consumers the right to limit some but not all sharing. Federal law also requires us to tell you how we collect, share, and protect your personal information. Please read this notice carefully to understand what we do. |
| |
| What? | The types of personal information we collect and share depend on the product or service you have with us. This information can include:■ Social Security number and income
■
investment experience and risk tolerance
■
checking account number and wire transfer instructions |
| |
| How? | All financial companies need to share customers’ personal information to run their everyday business. In the section below, we list the reasons financial companies can share their customers’ personal information; the reasons Eaton Vance chooses to share; and whether you can limit this sharing. |
Reasons we can share your
personal information | Does Eaton Vance
share? | Can you limit
this sharing? |
| For our everyday business purposes — such as to process your transactions, maintain your account(s), respond to court orders and legal investigations, or report to credit bureaus | Yes | No |
| For our marketing purposes — to offer our products and services to you | Yes | No |
| For joint marketing with other financial companies | No | We don’t share |
| For our investment management affiliates’ everyday business purposes — information about your transactions, experiences, and creditworthiness | Yes | Yes |
| For our affiliates’ everyday business purposes — information about your transactions and experiences | Yes | No |
| For our affiliates’ everyday business purposes — information about your creditworthiness | No | We don’t share |
| For our investment management affiliates to market to you | Yes | Yes |
| For our affiliates to market to you | No | We don’t share |
| For nonaffiliates to market to you | No | We don’t share |
To limit our
sharing | Call toll-free 1-800-368-2745 or email: CRMPrivacy@calvert.comPlease note:If you are a new customer, we can begin sharing your information 30 days from the date we sent this notice. When you are no longer our customer, we continue to share your information as described in this notice. However, you can contact us at any time to limit our sharing. |
| Questions? | Call toll-free 1-800-368-2745 or email: CRMPrivacy@calvert.com |
| Privacy Notice — continued | April 2021 |
| Who we are |
| Who is providing this notice? | Eaton Vance Management, Eaton Vance Distributors, Inc., Eaton Vance Trust Company, Eaton Vance Management (International) Limited, Eaton Vance Advisers International Ltd., Eaton Vance Global Advisors Limited, Eaton Vance Management’s Real Estate Investment Group, Boston Management and Research, Calvert Research and Management, Eaton Vance and Calvert Fund Families and our investment advisory affiliates (“Eaton Vance”) (see Investment Management Affiliates definition below) |
| What we do |
How does Eaton Vance
protect my personal
information? | To protect your personal information from unauthorized access and use, we use security measures that comply with federal law. These measures include computer safeguards and secured files and buildings. We have policies governing the proper handling of customer information by personnel and requiring third parties that provide support to adhere to appropriate security standards with respect to such information. |
How does Eaton Vance
collect my personal
information? | We collect your personal information, for example, when you■ open an account or make deposits or withdrawals from your account
■
buy securities from us or make a wire transfer
■
give us your contact informationWe also collect your personal information from others, such as credit bureaus, affiliates, or other companies. |
| Why can’t I limit all sharing? | Federal law gives you the right to limit only■ sharing for affiliates’ everyday business purposes — information about your creditworthiness
■
affiliates from using your information to market to you
■
sharing for nonaffiliates to market to youState laws and individual companies may give you additional rights to limit sharing. See below for more on your rights under state law. |
| Definitions |
Investment Management
Affiliates | Eaton Vance Investment Management Affiliates include registered investment advisers, registered broker- dealers, and registered and unregistered funds. Investment Management Affiliates does not include entities associated with Morgan Stanley Wealth Management, such as Morgan Stanley Smith Barney LLC and Morgan Stanley & Co. |
| Affiliates | Companies related by common ownership or control. They can be financial and nonfinancial companies.■ Our affiliates include companies with a Morgan Stanley name and financial companies such as Morgan Stanley Smith Barney LLC and Morgan Stanley & Co. |
| Nonaffiliates | Companies not related by common ownership or control. They can be financial and nonfinancial companies.■ Eaton Vance does not share with nonaffiliates so they can market to you. |
| Joint marketing | A formal agreement between nonaffiliated financial companies that together market financial products or services to you.■ Eaton Vance doesn’t jointly market. |
| Other important information |
| Vermont: Except as permitted by law, we will not share personal information we collect about Vermont residents with Nonaffiliates unless you provide us with your written consent to share such information.California: Except as permitted by law, we will not share personal information we collect about California residents with Nonaffiliates and we will limit sharing such personal information with our Affiliates to comply with California privacy laws that apply to us. |
Delivery of Shareholder Documents. The Securities and Exchange Commission (SEC) permits funds to deliver only one copy of shareholder documents, including prospectuses, proxy statements and shareholder reports, to fund investors with multiple accounts at the same residential or post office box address. This practice is often called “householding” and it helps eliminate duplicate mailings to shareholders. Calvert funds, or your financial intermediary, may household the mailing of your documents indefinitely unless you instruct Calvert funds, or your financial intermediary, otherwise. If you would prefer that your Calvert fund documents not be householded, please contact Calvert funds at 1-800-368-2745, or contact your financial intermediary. Your instructions that householding not apply to delivery of your Calvert fund documents will typically be effective within 30 days of receipt by Calvert funds or your financial intermediary. Separate statements will be generated for each separate account and will be householded as described above.
Portfolio Holdings. Each Calvert fund files a schedule of portfolio holdings on Part F to Form N-PORT with the SEC. Certain information filed on Form N-PORT may be viewed on the Calvert website at www.calvert.com, by calling Calvert at 1-800-368-2745 or in the EDGAR database on the SEC’s website at www.sec.gov.
Proxy Voting. The Proxy Voting Guidelines that each Calvert fund uses to determine how to vote proxies relating to portfolio securities is provided as an Appendix to the fund’s Statement of Additional Information. The Statement of Additional Information can be obtained free of charge by calling the Calvert funds at 1-800-368-2745, by visiting the Calvert funds’ website at www.calvert.com or visiting the SEC’s website at www.sec.gov. Information regarding how a Calvert fund voted proxies relating to portfolio securities during the most recent 12-month period ended June 30 is available by calling Calvert funds, by visiting the Calvert funds’ website at www.calvert.com or by visiting the SEC’s website at www.sec.gov.
Investment Adviser and Administrator
Calvert Research and Management
1825 Connecticut Avenue NW, Suite 400
Washington, DC 20009
Principal Underwriter*
Eaton Vance Distributors, Inc.
Two International Place
Boston, MA 02110
(617) 482-8260
Custodian
State Street Bank and Trust Company
State Street Financial Center, One Lincoln Street
Boston, MA 02111
Transfer Agent
DST Asset Manager Solutions, Inc.
2000 Crown Colony Drive
Quincy, MA 02169
Independent Registered Public Accounting Firm
Deloitte & Touche LLP
200 Berkeley Street
Boston, MA 02116-5022
Fund Offices
1825 Connecticut Avenue NW, Suite 400
Washington, DC 20009
* FINRA BrokerCheck. Investors may check the background of their Investment Professional by contacting the Financial Industry Regulatory Authority (FINRA). FINRA BrokerCheck is a free tool to help investors check the professional background of current and former FINRA-registered securities firms and brokers. FINRA BrokerCheck is available by calling 1-800-289-9999 and at www.FINRA.org. The FINRA BrokerCheck brochure describing this program is available to investors at www.FINRA.org.
Printed on recycled paper.
Item 2. Code of Ethics
The registrant has adopted a code of ethics applicable to its Principal Executive Officer, Principal Financial Officer and Principal Accounting Officer. The registrant undertakes to provide a copy of such code of ethics to any person upon request, without charge, by calling 1-800-368-2745. The registrant has not amended the code of ethics as described in Form N-CSR during the period covered by this report. The registrant has not granted any waiver, including an implicit waiver, from a provision of the code of ethics as described in Form N-CSR during the period covered by this report.
Item 3. Audit Committee Financial Expert
The registrant’s Board of Directors has determined that Miles D. Harper III, an “independent” Director serving on the registrant’s audit committee, is an “audit committee financial expert,” as defined in Item 3 of Form N-CSR. Under applicable securities laws, a person who is determined to be an audit committee financial expert will not be deemed an “expert” for any purpose, including without limitation for the purposes of Section 11 of the Securities Act of 1933, as a result of being designated or identified as an audit committee financial expert. The designation or identification of a person as an audit committee financial expert does not impose on such person any duties, obligations, or liabilities that are greater than the duties, obligations, and liabilities imposed on such person as a member of the audit committee and Board of Directors in the absence of such designation or identification.
Item 4. Principal Accountant Fees and Services
(a) –(d)
The following table presents the aggregate fees billed to the registrant for the registrant’s fiscal years ended September 30, 2020 and September 30, 2021 by its principal accountant for professional services rendered for the audit of the registrant’s annual financial statements and fees billed for other services rendered by its principal accountant during such periods.
| | | | | | | | | | | | | | | | |
Fiscal Years Ended | | 9/30/20 | | | %* | | | 9/30/21 | | | %* | |
Audit Fees | | $ | 146,312 | | | | 5.9 | % | | $ | 135,500 | | | | 0 | % |
Audit-Related Fees(1) | | $ | 0 | | | | 0 | % | | $ | 0 | | | | 0 | % |
Tax Fees(2) | | $ | 44,945 | | | | 0 | % | | $ | 65,259 | | | | 0 | % |
All Other Fees(3) | | $ | 0 | | | | 0 | % | | $ | 0 | | | | 0 | % |
| | | | | | | | | | | | | | | | |
Total | | $ | 191,257 | | | | 4.5 | % | | $ | 200,759 | | | | 0 | % |
| | | | | | | | | | | | | | | | |
| * | Percentage of fees approved by the Audit Committee pursuant to (c)(7)(i)(C) of Rule 2-01 of Reg. S-X (statutory de minimis waiver of Committee’s requirement to pre-approve). |
| (1) | Audit-related fees consist of the aggregate fees billed for assurance and related services that are reasonably related to the performance of the audit of the registrant’s financial statements and are not reported under the category of audit fees. |
| (2) | Tax fees consist of the aggregate fees billed for professional services rendered by the principal accountant relating to tax compliance, tax advice, and tax planning and specifically include fees for tax return preparation and other related tax compliance/planning matters. |
| (3) | All other fees consist of the aggregate fees billed for products and services provided by the principal accountant other than audit, audit-related, and tax services. |
(e) The Audit Committee is required to pre-approve all audit and non-audit services provided to the registrant by the auditors, and to the registrant’s investment adviser, and any entity controlling, controlled by, or under common control with the adviser that provides ongoing services to the registrant. In determining whether to pre-approve non-audit services, the Audit Committee considers whether the services are consistent with maintaining the independence of the auditors. The Committee may delegate its authority to pre-approve certain matters to one or more of its members. In this regard, the Committee has delegated authority jointly to the Audit Committee Chair together with another Committee member with respect to non-audit services not exceeding $25,000 in each instance. In addition, the Committee has pre-approved the retention of the auditors to provide tax-related services related to the tax treatment and tax accounting of newly acquired securities, upon request by the investment adviser in each instance.
(f) Not applicable.
(g) ) Aggregate non-audit fees billed by the registrant’s accountant for services rendered to the registrant, and rendered to the registrant’s investment adviser, and any entity controlling, controlled by, or under common control with the adviser that provides ongoing services to the registrant for each of the last two fiscal years of the registrant:
| | | | | | | | | | | | | | |
| Fiscal Year ended 9/30/20 | | | Fiscal Year ended 9/30/2021 | |
| $ | | | %* | | | $ | | | %* | |
| | $44,945 | | | | 0 | % | | $ | 65,259 | | | | 0 | % |
| * | Percentage of fees approved by the Audit Committee pursuant to (c)(7)(i)(C) of Rule 2-01 of Reg. S-X (statutory de minimis waiver of Committee’s requirement to pre-approve). |
(h) The registrant’s audit committee has considered whether the provision by the registrant’s principal accountant of non-audit services to the registrant’s investment adviser and any entity controlling, controlled by, or under common control with the adviser that provides ongoing services to the registrant that were not pre-approved pursuant to Rule 2-01(c)(7)(ii) of Regulation S-X is compatible with maintaining the principal accountant’s independence.
Item 5. Audit Committee of Listed Registrants
Not applicable.
Item 6. Schedule of Investments
Please see schedule of investments contained in the Report to Stockholders included under Item 1 of this Form N-CSR.
Item 7. Disclosure of Proxy Voting Policies and Procedures for Closed-End Management Investment Companies
Not applicable.
Item 8. Portfolio Managers of Closed-End Management Investment Companies
Not applicable.
Item 9. Purchases of Equity Securities by Closed-End Management Investment Company and Affiliated Purchasers
Not applicable.
Item 10. Submission of Matters to a Vote of Security Holders
No material changes.
Item 11. Controls and Procedures
(a) The registrant’s principal executive and principal financial officers have concluded that the registrant’s disclosure controls and procedures (as defined in Rule 30a-3(c) under the Investment Company Act of 1940 Act, as amended (the “1940 Act”) are effective, based on the evaluation of these controls and procedures required by Rule 30a-3(b) under the 1940 Act and Rules 13a-15(b) or 15d-15(b) under the Securities Exchange Act of 1934 (“Exchange Act”), as of a date within 90 days of the filing date of this report.
(b) There was no change in the registrant’s internal control over financial reporting (as defined in Rule 30a-3(d) under the 1940 Act) that occurred during the period covered by this report that has materially affected, or is reasonably likely to materially affect, the registrant’s internal control over financial reporting.
Item 12. Disclosure of Securities Lending Activities for Closed-End Management Investment Companies
Not applicable.
Item 13. Exhibits
Signatures
Pursuant to the requirements of the Securities Exchange Act of 1934 and the Investment Company Act of 1940, the registrant has duly caused this report to be signed on its behalf by the undersigned, thereunto duly authorized.
| | |
| CALVERT WORLD VALUES FUND, INC. |
| |
| By: | | /s/ John H. Streur |
| | John H. Streur |
| | President |
| |
| Date: | | November 22, 2021 |
Pursuant to the requirements of the Securities Exchange Act of 1934 and the Investment Company Act of 1940, this report has been signed below by the following persons on behalf of the registrant and in the capacities and on the dates indicated.
| | |
| By: | | /s/ James F. Kirchner |
| | James F. Kirchner |
| | Treasurer |
| |
| Date: | | November 22, 2021 |
| | |
| By: | | /s/ John H. Streur |
| | John H. Streur |
| | President |
| |
| Date: | | November 22, 2021 |