UNITED STATES
SECURITIES AND EXCHANGE COMMISSION
Washington, D.C. 20549
Form N-CSR
CERTIFIED SHAREHOLDER REPORT OF REGISTERED
MANAGEMENT INVESTMENT COMPANIES
Investment Company Act File Number: 811-06563
CALVERT WORLD VALUES FUND, INC.
(Exact Name of Registrant as Specified in Charter)
1825 Connecticut Avenue NW, Suite 400, Washington, DC 20009
(Address of Principal Executive Offices)
Maureen A. Gemma
Two International Place, Boston, Massachusetts 02110
(Name and Address of Agent for Services)
(202) 238-2200
(Registrant’s Telephone Number)
September 30
Date of Fiscal Year End
September 30, 2020
Date of Reporting Period
| Item 1. | Reports to Stockholders |
Calvert
Mid-Cap Fund
Annual Report
September 30, 2020
Important Note. Beginning on January 1, 2021, as permitted by regulations adopted by the Securities and Exchange Commission, paper copies of the Fund’s annual and semi-annual shareholder reports will no longer be sent by mail unless you specifically request paper copies of the reports. Instead, the reports will be made available on the Fund’s website (calvert.com/prospectus), and you will be notified by mail each time a report is posted and provided with a website address to access the report.
If you already elected to receive shareholder reports electronically, you will not be affected by this change and you need not take any action. If you are a direct investor, you may elect to receive shareholder reports and other communications from the Fund electronically by signing up for e-Delivery at calvert.com. If you own your shares through a financial intermediary (such as a broker-dealer or bank), you must contact your financial intermediary to sign up.
You may elect to receive all future Fund shareholder reports in paper free of charge. If you are a direct investor, you can inform the Fund that you wish to continue receiving paper copies of your shareholder reports by calling 1-800-368-2745. If you own these shares through a financial intermediary, you must contact your financial intermediary or follow instructions included with this disclosure, if applicable, to elect to continue to receive paper copies of your shareholder reports. Your election to receive reports in paper will apply to all Calvert funds held directly or to all funds held through your financial intermediary, as applicable.
E-Delivery Sign-Up - Details Inside
Commodity Futures Trading Commission Registration. Effective December 31, 2012, the Commodity Futures Trading Commission (“CFTC”) adopted certain regulatory changes that subject registered investment companies and advisers to regulation by the CFTC if a fund invests more than a prescribed level of its assets in certain CFTC-regulated instruments (including futures, certain options and swap agreements) or markets itself as providing investment exposure to such instruments. The adviser has claimed an exclusion from the definition of “commodity pool operator” under the Commodity Exchange Act with respect to its management of the Fund and the other funds it manages. Accordingly, neither the Fund nor the adviser is subject to CFTC regulation.
Fund shares are not insured by the FDIC and are not deposits or other obligations of, or guaranteed by, any depository institution. Shares are subject to investment risks, including possible loss of principal invested.
This report must be preceded or accompanied by a current summary prospectus or prospectus. Before investing, investors should consider carefully the investment objective, risks, and charges and expenses of a mutual fund. This and other important information is contained in the summary prospectus and prospectus, which can be obtained from a financial intermediary. Prospective investors should read the prospectus carefully before investing. For further information, please call 1-800-368-2745.
Choose Planet-friendly E-delivery!
Sign up now for on-line statements, prospectuses, and fund reports. In less than five minutes you can help reduce paper mail and lower fund costs.
Just go to www.calvert.com. If you already have an online account with the Calvert funds, click on Login to access your Account and select the documents you would like to receive via e-mail.
If you’re new to online account access, click on Login, then Register to create your user name and password. Once you’re in, click on the E-delivery sign-up on the Account Portfolio page and follow the quick, easy steps.
Note: If your shares are not held directly with the Calvert funds but through a brokerage firm, you must contact your broker for electronic delivery options available through their firm.
Annual Report September 30, 2020
Calvert
Mid-Cap Fund
Calvert
Mid-Cap Fund
September 30, 2020
Management's Discussion of Fund Performance†
Economic and Market Conditions
The 12-month period that began October 1, 2019, included some of the best and worst U.S. equity performances in over a decade.
The period began with stocks rallying in the closing months of 2019, supported by better-than-expected U.S. employment reports, cautious optimism about a détente in U.S.-China trade relations, and interest rate reductions by the U.S. Federal Reserve (the Fed). In July 2019, the Fed cut rates for the first time in over a decade, followed by two additional rate cuts in September and October.
In January 2020, however, news of the novel coronavirus outbreak in China began to raise investor concerns. As the virus turned into a global pandemic in February and March, it ended the longest-ever U.S. economic expansion and brought about a global economic slowdown. Equity markets along with credit markets declined in value amid unprecedented volatility.
In response, the Fed announced two emergency rate cuts in March 2020 — lowering the federal funds rate to 0.00%-0.25% — along with other measures designed to shore up equity and credit markets. At its July meeting, the Fed provided additional reassurances that it would maintain rates around zero for the foreseeable future and use all the tools at its disposal to support the U.S. economy.
These moves helped calm the markets and initiated a new equity rally that began in April and lasted through most of the summer. As consumers started to emerge from coronavirus lockdowns and factories gradually resumed production, stock prices reflected investor optimism. In the second quarter of 2020, U.S. stocks reported their best quarterly returns since 1998 — on the heels of the worst first quarter for American stocks since the 2007-2008 global financial crisis.
In September 2020, however, the equity rally stalled, as stock prices on Wall Street began to reflect the reality on Main Street. In the final weeks of the period, coronavirus cases were on the rise in more than 30 states. Of the 22 million U.S. jobs lost in the early months of the pandemic, only 11 million jobs had returned, and 26.5 million Americans were collecting unemployment benefits. Reflecting concerns about the economic outlook for fall and winter, most U.S. stock indexes reported negative returns for the final month of the period.
For the period as a whole, largely positive equity returns belied the dramatic volatility during the period. The S&P 500® Index, a broad measure of U.S. stocks, returned 15.15%; the blue-chip Dow Jones Industrial Average® returned 5.70%; and the technology-laden Nasdaq Composite Index returned 40.96%. Large-cap U.S. stocks, as measured by the S&P 500® Index and Russell 1000® Index, generally outperformed their small-cap counterparts, as measured by the Russell 2000® Index. As a group, growth stocks significantly outpaced value stocks, which were in negative territory in both large- and small-cap categories, as measured by the Russell growth and value indexes.
Fund Performance
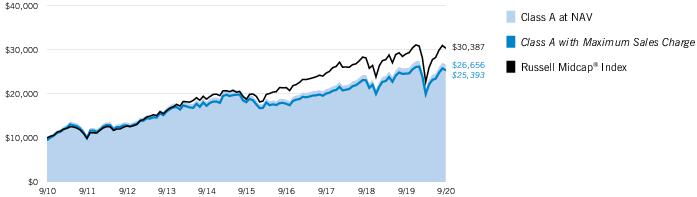
For the 12-month period ended September 30, 2020, Calvert Mid-Cap Fund (the Fund) returned 3.20% for Class A shares at net asset value, underperforming the Fund’s benchmark, the Russell Midcap® Index (the Index), which returned 4.55%.
Stock selections in the information technology (IT), consumer staples, and consumer discretionary sectors detracted from the Fund’s performance relative to the Index. An underweight exposure to the energy sector and stock selections in the utilities and communication services sectors contributed to the Fund’s relative returns during the period.
Hexcel Corp. (Hexcel), a provider of carbon fiber and other materials for the aerospace industry, was one of the largest individual detractors. Hexcel’s stock price, already hurt by problems with Boeing’s 737 MAX, was further weighed down by the spread of the COVID-19 pandemic and the resulting slowdown in airline travel. Investors also reacted negatively to Hexcel’s proposed merger with Woodward, Inc., a supplier of flight and engine controls to the aerospace industry.
National Retail Properties, Inc. (National Retail), a real estate investment trust that invests primarily in retail properties under long-term leases, was also a significant detractor. National Retail’s business, while less susceptible to business cycles in more normal times, was vulnerable to the surge in e-commerce resulting from the pandemic. Its generally stable cash flows became volatile as tenants, including restaurants, theaters, and convenience stores, sought rent relief.
In the financials sector, Discover Financial Services, a retail banking and credit card company, was another detractor. Its stock price fell on concerns that customers would have trouble paying back loans as millions of Americans lost their jobs as a result of the pandemic.
By period-end, Hexcel, National Retail and Discover Financial Services were sold from the Fund.
Emergent BioSolutions, Inc. (Emergent) was a top contributor. The company, in the health care sector, is a supplier of vaccines, antibodies, and other medications. Most of the company’s revenues come from long-term government contracts, which made Emergent particularly attractive amid volatility during the period. It benefited from the U.S. government’s heavy investment in the search for a COVID-19 vaccine as it signed several large contracts with pharmaceutical companies to manufacture their vaccines, once approved.
Skyworks Solutions, Inc., a semiconductor manufacturer in the IT sector, also contributed strongly relative to the Index during the period. Investors rewarded the company’s cost management that resulted in 50% gross margins throughout the period, even as revenue declined. The stock’s price also appreciated on the company’s prospects for being a leading provider of new chips for running 5G connections to phones and network infrastructure.
See Endnotes and Additional Disclosures in this report.
Past performance is no guarantee of future results. Returns are historical and are calculated by determining the percentage change in net asset value (NAV) or offering price (as applicable) with all distributions reinvested. Investment return and principal value will fluctuate so that shares, when redeemed, may be worth more or less than their original cost. Performance for periods less than or equal to one year is cumulative. Performance is for the stated time period only; due to market volatility, current Fund performance may be lower or higher than the quoted return. For performance as of the most recent month-end, please refer to www.calvert.com.
Calvert
Mid-Cap Fund
September 30, 2020
Management's Discussion of Fund Performance† — continued
In consumer discretionary, Best Buy Co., Inc. (Best Buy) further contributed as the pandemic magnified the benefits of the company’s ongoing shift to e-commerce. Best Buy also benefited from the pandemic-propelled shift toward working remotely, which fueled demand for laptops, monitors, and computer accessories during the period.
See Endnotes and Additional Disclosures in this report.
Past performance is no guarantee of future results. Returns are historical and are calculated by determining the percentage change in net asset value (NAV) or offering price (as applicable) with all distributions reinvested. Investment return and principal value will fluctuate so that shares, when redeemed, may be worth more or less than their original cost. Performance for periods less than or equal to one year is cumulative. Performance is for the stated time period only; due to market volatility, current Fund performance may be lower or higher than the quoted return. For performance as of the most recent month-end, please refer to www.calvert.com.
Calvert
Mid-Cap Fund
September 30, 2020
Performance
Portfolio Manager Charles B. Gaffney of Calvert Research and Management
| % Average Annual Total Returns1,2 | Class
Inception Date | Performance
Inception Date | One Year | Five Years | Ten Years |
| Class A at NAV | 10/31/1994 | 10/31/1994 | 3.20% | 6.97% | 10.29% |
| Class A with 4.75% Maximum Sales Charge | — | — | (1.70) | 5.93 | 9.76 |
| Class C at NAV | 10/31/1994 | 10/31/1994 | 2.40 | 6.17 | 9.44 |
| Class C with 1% Maximum Sales Charge | — | — | 1.45 | 6.17 | 9.44 |
| Class I at NAV | 06/03/2003 | 10/31/1994 | 3.45 | 7.34 | 10.84 |
|
| Russell Midcap® Index | — | — | 4.55% | 10.12% | 11.75% |
| % Total Annual Operating Expense Ratios3 | Class A | Class C | Class I |
| Gross | 1.30% | 2.05% | 1.05% |
| Net | 1.18 | 1.93 | 0.93 |
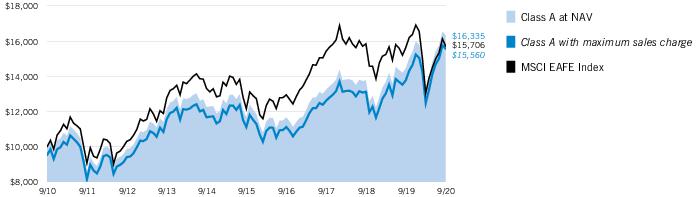
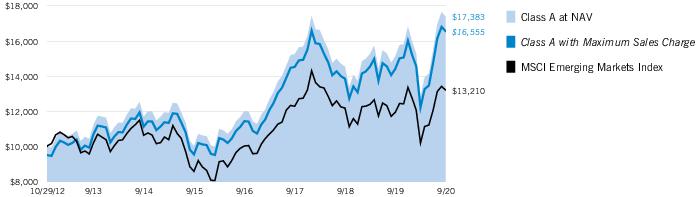
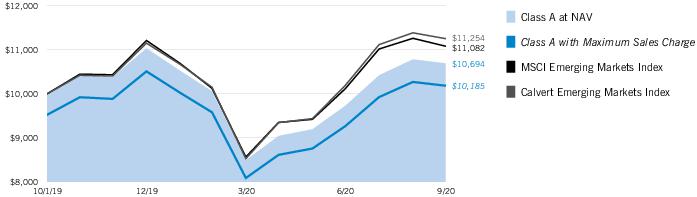
Growth of $10,000
This graph shows the change in value of a hypothetical investment of $10,000 in Class A of the Fund for the period indicated. For comparison, the same investment is shown in the indicated index.
| Growth of Investment | Amount Invested | Period Beginning | At NAV | With Maximum Sales Charge |
| Class C | $10,000 | 09/30/2010 | $24,666 | N.A. |
| Class I | $250,000 | 09/30/2010 | $699,970 | N.A. |
See Endnotes and Additional Disclosures in this report.
Past performance is no guarantee of future results. Returns are historical and are calculated by determining the percentage change in net asset value (NAV) or offering price (as applicable) with all distributions reinvested. Investment return and principal value will fluctuate so that shares, when redeemed, may be worth more or less than their original cost. Performance for periods less than or equal to one year is cumulative. Performance is for the stated time period only; due to market volatility, current Fund performance may be lower or higher than the quoted return. For performance as of the most recent month-end, please refer to www.calvert.com.
Calvert
Mid-Cap Fund
September 30, 2020
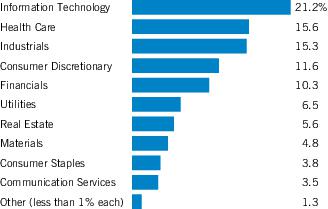
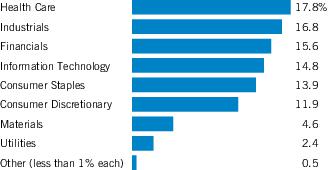
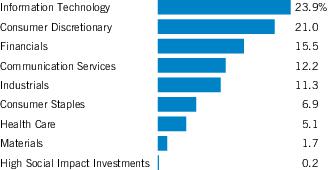
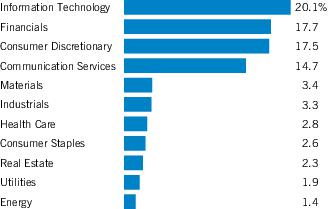
Sector Allocation (% of net assets)*
*Excludes cash and cash equivalents.
| Top 10 Holdings (% of net assets)* | |
| Black Knight, Inc. | 2.5% |
| ANSYS, Inc. | 2.4 |
| Broadridge Financial Solutions, Inc. | 2.3 |
| Xcel Energy, Inc. | 2.2 |
| Electronic Arts, Inc. | 2.1 |
| Stanley Black & Decker, Inc. | 2.1 |
| Agilent Technologies, Inc. | 2.1 |
| IHS Markit, Ltd. | 2.1 |
| Cognizant Technology Solutions Corp., Class A | 2.0 |
| ServiceMaster Global Holdings, Inc. | 2.0 |
| Total | 21.8% |
| * | Excludes cash and cash equivalents. |
See Endnotes and Additional Disclosures in this report.
Calvert
Mid-Cap Fund
September 30, 2020
Endnotes and Additional Disclosures
| † | The views expressed in this report are those of the portfolio manager(s) and are current only through the date stated at the top of this page. These views are subject to change at any time based upon market or other conditions, and Calvert and the Fund(s) disclaim any responsibility to update such views. These views may not be relied upon as investment advice and, because investment decisions are based on many factors, may not be relied upon as an indication of trading intent on behalf of any Calvert fund. This commentary may contain statements that are not historical facts, referred to as “forward-looking statements.” The Fund’s actual future results may differ significantly from those stated in any forward-looking statement, depending on factors such as changes in securities or financial markets or general economic conditions, the volume of sales and purchases of Fund shares, the continuation of investment advisory, administrative and service contracts, and other risks discussed from time to time in the Fund’s filings with the Securities and Exchange Commission. |
| | |
| 1 | Russell Midcap® Index is an unmanaged index of U.S. mid-cap stocks. Unless otherwise stated, index returns do not reflect the effect of any applicable sales charges, commissions, expenses, taxes or leverage, as applicable. It is not possible to invest directly in an index. |
| 2 | Total Returns at NAV do not include applicable sales charges. If sales charges were deducted, the returns would be lower. Total Returns shown with maximum sales charge reflect the stated maximum sales charge. Unless otherwise stated, performance does not reflect the deduction of taxes on Fund distributions or redemptions of Fund shares.Calvert Research and Management became the investment adviser to the Fund on December 31, 2016. Performance reflected prior to such date is that of the Fund’s former investment adviser. |
| 3 | Source: Fund prospectus. Net expense ratios reflect a contractual expense reimbursement that continues through 1/31/21. Without the reimbursement, performance would have been lower. The expense ratios for the current reporting period can be found in the Financial Highlights section of this report. |
| | Fund profile subject to change due to active management. |
| | Additional Information |
| | S&P 500® Index is an unmanaged index of large-cap stocks commonly used as a measure of U.S. stock market performance. Dow Jones Industrial Average® is a price-weighted average of 30 blue-chip stocks that are generally the leaders in their industry. S&P Dow Jones Indices are a product of S&P Dow Jones Indices LLC (“S&P DJI”) and have been licensed for use. S&P® and S&P 500® are registered trademarks of S&P DJI; Dow Jones® is a registered trademark of Dow Jones Trademark Holdings LLC (“Dow Jones”); S&P DJI, Dow Jones |
and their respective affiliates do not sponsor, endorse, sell or promote the Fund, will not have any liability with respect thereto and do not have any liability for any errors, omissions, or interruptions of the S&P Dow Jones Indices. Nasdaq Composite Index is a market capitalization-weighted index of all domestic and international securities listed on Nasdaq. Source: Nasdaq, Inc. The information is provided by Nasdaq (with its affiliates, are referred to as the “Corporations”) and Nasdaq’s third party licensors on an “as is” basis and the Corporations make no guarantees and bear no liability of any kind with respect to the information or the Fund. Russell 1000® Index is an unmanaged index of 1,000 U.S. large-cap stocks. Russell 2000® Index is an unmanaged index of 2,000 U.S. small-cap stocks.
Calvert
Mid-Cap Fund
September 30, 2020
Example
As a Fund shareholder, you incur two types of costs: (1) transaction costs, including sales charges (loads) on purchases and redemption fees (if applicable); and (2) ongoing costs, including management fees; distribution and/or service fees; and other Fund expenses. This Example is intended to help you understand your ongoing costs (in dollars) of Fund investing and to compare these costs with the ongoing costs of investing in other mutual funds. The Example is based on an investment of $1,000 invested at the beginning of the period and held for the entire period (April 1, 2020 to September 30, 2020).
Actual Expenses
The first section of the table below provides information about actual account values and actual expenses. You may use the information in this section, together with the amount you invested, to estimate the expenses that you paid over the period. Simply divide your account value by $1,000 (for example, an $8,600 account value divided by $1,000 = 8.6), then multiply the result by the number in the first section under the heading entitled “Expenses Paid During Period” to estimate the expenses you paid on your account during this period.
Hypothetical Example for Comparison Purposes
The second section of the table below provides information about hypothetical account values and hypothetical expenses based on the actual Fund expense ratio and an assumed rate of return of 5% per year (before expenses), which is not the actual Fund return. The hypothetical account values and expenses may not be used to estimate the actual ending account balance or expenses you paid for the period. You may use this information to compare the ongoing costs of investing in the Fund and other funds. To do so, compare this 5% hypothetical example with the 5% hypothetical examples that appear in the shareholder reports of the other funds.
Please note that the expenses shown in the table are meant to highlight your ongoing costs only and do not reflect any transactional costs, such as sales charges (loads) or redemption fees (if applicable). Therefore, the second section of the table is useful in comparing ongoing costs only, and will not help you determine the relative total costs of owning different funds. In addition, if these transactional costs were included, your costs would be higher.
| | Beginning
Account Value
(4/1/20) | Ending
Account Value
(9/30/20) | Expenses Paid
During Period*
(4/1/20 – 9/30/20) | Annualized
Expense
Ratio |
| Actual | | | | |
| Class A | $1,000.00 | $1,273.30 | $ 6.71** | 1.18% |
| Class C | $1,000.00 | $1,269.10 | $10.95 ** | 1.93% |
| Class I | $1,000.00 | $1,274.90 | $ 5.29** | 0.93% |
| Hypothetical | | | | |
| (5% return per year before expenses) | | | | |
| Class A | $1,000.00 | $1,019.10 | $ 5.96** | 1.18% |
| Class C | $1,000.00 | $1,015.35 | $ 9.72** | 1.93% |
| Class I | $1,000.00 | $1,020.35 | $ 4.70** | 0.93% |
| * | Expenses are equal to the Fund's annualized expense ratio for the indicated Class, multiplied by the average account value over the period, multiplied by 183/366 (to reflect the one-half year period). The Example assumes that the $1,000 was invested at the net asset value per share determined at the close of business on March 31, 2020. |
| ** | Absent a waiver and/or reimbursement of expenses by an affiliate, expenses would be higher. |
Calvert
Mid-Cap Fund
September 30, 2020
| Security | Shares | Value |
| Auto Components — 0.8% | |
| Aptiv PLC | | 20,393 | $ 1,869,630 |
| | | | $ 1,869,630 |
| Banks — 0.7% | |
| First Republic Bank | | 15,222 | $ 1,660,111 |
| | | | $ 1,660,111 |
| Beverages — 1.3% | |
| Coca-Cola European Partners PLC | | 81,232 | $ 3,152,614 |
| | | | $ 3,152,614 |
| Biotechnology — 1.6% | |
| Emergent BioSolutions, Inc.(1) | | 35,406 | $ 3,658,502 |
| | | | $ 3,658,502 |
| Building Products — 2.0% | |
| AZEK Co., Inc. (The)(1) | | 69,189 | $ 2,408,469 |
| Trex Co., Inc.(1) | | 31,204 | 2,234,207 |
| | | | $ 4,642,676 |
| Capital Markets — 2.6% | |
| Cboe Global Markets, Inc. | | 27,410 | $ 2,404,953 |
| Tradeweb Markets, Inc., Class A | | 62,115 | 3,602,670 |
| | | | $ 6,007,623 |
| Commercial Services & Supplies — 2.6% | |
| Republic Services, Inc. | | 33,558 | $ 3,132,639 |
| Tetra Tech, Inc. | | 31,921 | 3,048,456 |
| | | | $ 6,181,095 |
| Communications Equipment — 1.7% | |
| Motorola Solutions, Inc. | | 26,089 | $ 4,091,016 |
| | | | $ 4,091,016 |
| Containers & Packaging — 4.8% | |
| AptarGroup, Inc. | | 39,360 | $ 4,455,552 |
| Ball Corp. | | 49,199 | 4,089,421 |
| Packaging Corp. of America | | 24,973 | 2,723,306 |
| | | | $ 11,268,279 |
| Diversified Consumer Services — 2.0% | |
| ServiceMaster Global Holdings, Inc.(1) | | 115,188 | $ 4,593,697 |
| | | | $ 4,593,697 |
| Security | Shares | Value |
| Electric Utilities — 2.2% | |
| Xcel Energy, Inc. | | 75,583 | $ 5,215,983 |
| | | | $ 5,215,983 |
| Electrical Equipment — 1.9% | |
| AMETEK, Inc. | | 45,236 | $ �� 4,496,458 |
| | | | $ 4,496,458 |
| Electronic Equipment, Instruments & Components — 1.3% | |
| Zebra Technologies Corp., Class A(1) | | 12,298 | $ 3,104,753 |
| | | | $ 3,104,753 |
| Energy Equipment & Services — 0.8% | |
| Baker Hughes Co. | | 136,394 | $ 1,812,676 |
| | | | $ 1,812,676 |
| Entertainment — 2.1% | |
| Electronic Arts, Inc.(1) | | 38,336 | $ 4,999,398 |
| | | | $ 4,999,398 |
| Equity Real Estate Investment Trusts (REITs) — 5.6% | |
| Digital Realty Trust, Inc. | | 23,428 | $ 3,438,293 |
| Extra Space Storage, Inc. | | 39,924 | 4,271,469 |
| Lamar Advertising Co., Class A | | 23,940 | 1,584,110 |
| Mid-America Apartment Communities, Inc. | | 32,243 | 3,738,576 |
| | | | $ 13,032,448 |
| Food & Staples Retailing — 0.8% | |
| Performance Food Group Co.(1) | | 55,769 | $ 1,930,723 |
| | | | $ 1,930,723 |
| Food Products — 1.7% | |
| Nomad Foods, Ltd.(1) | | 154,186 | $ 3,928,659 |
| | | | $ 3,928,659 |
| Health Care Equipment & Supplies — 4.2% | |
| Cooper Cos., Inc. (The) | | 7,287 | $ 2,456,593 |
| Haemonetics Corp.(1) | | 46,556 | 4,062,011 |
| Teleflex, Inc. | | 9,740 | 3,315,691 |
| | | | $ 9,834,295 |
| Health Care Providers & Services — 4.6% | |
| Amedisys, Inc.(1) | | 9,154 | $ 2,164,280 |
| Centene Corp.(1) | | 60,951 | 3,555,272 |
| Chemed Corp. | | 5,100 | 2,449,785 |
| LHC Group, Inc.(1) | | 11,762 | 2,500,131 |
| | | | $ 10,669,468 |
8
See Notes to Financial Statements.
Calvert
Mid-Cap Fund
September 30, 2020
Schedule of Investments — continued
| Security | Shares | Value |
| Health Care Technology — 1.2% | |
| Accolade, Inc.(1) | | 69,583 | $ 2,704,691 |
| | | | $ 2,704,691 |
| Independent Power and Renewable Electricity Producers — 0.6% | |
| NextEra Energy Partners, L.P. | | 21,638 | $ 1,297,415 |
| | | | $ 1,297,415 |
| Insurance — 7.0% | |
| Alleghany Corp. | | 5,561 | $ 2,894,223 |
| Allstate Corp. (The) | | 28,287 | 2,662,938 |
| Assurant, Inc. | | 28,291 | 3,431,981 |
| First American Financial Corp. | | 46,710 | 2,378,006 |
| RLI Corp. | | 27,299 | 2,285,745 |
| Travelers Cos., Inc. (The) | | 26,126 | 2,826,572 |
| | | | $ 16,479,465 |
| Interactive Media & Services — 1.3% | |
| IAC/InterActiveCorp. (1) | | 15,318 | $ 1,834,790 |
| Match Group, Inc.(1) | | 11,766 | 1,301,908 |
| | | | $ 3,136,698 |
| Internet & Direct Marketing Retail — 0.3% | |
| Chewy, Inc., Class A(1)(2) | | 14,210 | $ 779,134 |
| | | | $ 779,134 |
| IT Services — 7.3% | |
| Black Knight, Inc.(1) | | 66,509 | $ 5,789,609 |
| Broadridge Financial Solutions, Inc. | | 41,313 | 5,453,316 |
| Cognizant Technology Solutions Corp., Class A | | 67,558 | 4,689,876 |
| WEX, Inc.(1) | | 8,058 | 1,119,820 |
| | | | $ 17,052,621 |
| Leisure Products — 0.3% | |
| Brunswick Corp. | | 13,353 | $ 786,625 |
| | | | $ 786,625 |
| Life Sciences Tools & Services — 2.1% | |
| Agilent Technologies, Inc. | | 48,625 | $ 4,908,208 |
| | | | $ 4,908,208 |
| Machinery — 3.7% | |
| Fortive Corp. | | 49,026 | $ 3,736,271 |
| Stanley Black & Decker, Inc. | | 30,529 | 4,951,804 |
| | | | $ 8,688,075 |
| Security | Shares | Value |
| Multiline Retail — 1.5% | |
| Dollar General Corp. | | 16,499 | $ 3,458,520 |
| | | | $ 3,458,520 |
| Multi-Utilities — 3.8% | |
| CMS Energy Corp. | | 71,372 | $ 4,382,954 |
| Sempra Energy | | 37,327 | 4,418,024 |
| | | | $ 8,800,978 |
| Pharmaceuticals — 2.0% | |
| Jazz Pharmaceuticals PLC(1) | | 26,479 | $ 3,775,641 |
| Royalty Pharma PLC, Class A | | 23,528 | 989,823 |
| | | | $ 4,765,464 |
| Professional Services — 5.1% | |
| Dun & Bradstreet Holdings, Inc.(1) | | 61,254 | $ 1,571,778 |
| FTI Consulting, Inc.(1) | | 17,172 | 1,819,717 |
| IHS Markit, Ltd. | | 62,260 | 4,888,033 |
| Verisk Analytics, Inc. | | 19,140 | 3,546,833 |
| | | | $ 11,826,361 |
| Semiconductors & Semiconductor Equipment — 4.7% | |
| Analog Devices, Inc. | | 25,013 | $ 2,920,018 |
| NXP Semiconductors NV | | 21,459 | 2,678,298 |
| Skyworks Solutions, Inc. | | 27,138 | 3,948,579 |
| Teradyne, Inc. | | 19,433 | 1,544,146 |
| | | | $ 11,091,041 |
| Software — 4.7% | |
| ANSYS, Inc.(1) | | 17,482 | $ 5,720,635 |
| Bill.com Holdings, Inc.(1) | | 25,621 | 2,570,042 |
| Everbridge, Inc.(1)(2) | | 8,761 | 1,101,520 |
| JFrog, Ltd.(1) | | 2,638 | 223,307 |
| nCino, Inc.(1)(2) | | 18,313 | 1,459,180 |
| | | | $ 11,074,684 |
| Specialty Retail — 5.9% | |
| AutoZone, Inc.(1) | | 3,356 | $ 3,952,160 |
| Best Buy Co., Inc. | | 38,723 | 4,309,483 |
| National Vision Holdings, Inc.(1) | | 88,156 | 3,371,085 |
| Ross Stores, Inc. | | 22,469 | 2,096,807 |
| | | | $ 13,729,535 |
| Technology Hardware, Storage & Peripherals — 1.4% | |
| HP, Inc. | | 171,723 | $ 3,261,020 |
| | | | $ 3,261,020 |
9
See Notes to Financial Statements.
Calvert
Mid-Cap Fund
September 30, 2020
Schedule of Investments — continued
| Security | Shares | Value |
| Textiles, Apparel & Luxury Goods — 0.8% | |
| Gildan Activewear, Inc.(2) | | 93,052 | $ 1,830,333 |
| | | | $ 1,830,333 |
Total Common Stocks
(identified cost $190,449,055) | | | $ 231,820,972 |
| High Social Impact Investments — 0.5% |
| Security | Principal
Amount
(000's omitted) | Value |
| Calvert Impact Capital, Inc., Community Investment Notes, 1.50%, 12/15/20(3)(4) | $ | 697 | $ 693,370 |
| ImpactAssets, Inc., Global Sustainable Agriculture Notes, 2.07%, 11/3/20(4)(5) | | 309 | 299,124 |
| ImpactAssets, Inc., Microfinance Plus Notes, 0.46%, 11/3/20(4)(5) | | 398 | 343,291 |
Total High Social Impact Investments
(identified cost $1,403,903) | | | $ 1,335,785 |
| Short-Term Investments — 1.3% | | | |
| Other — 0.4% |
| Description | Units | Value |
| Calvert Cash Reserves Fund, LLC, 0.13%(6) | | 922,571 | $ 922,663 |
Total Other
(identified cost $922,694) | | | $ 922,663 |
| Securities Lending Collateral — 0.9% |
| Security | Shares | Value |
| State Street Navigator Securities Lending Government Money Market Portfolio, 0.09%(7) | | 2,045,902 | $ 2,045,902 |
Total Securities Lending Collateral
(identified cost $2,045,902) | | | $ 2,045,902 |
Total Short-Term Investments
(identified cost $2,968,596) | | | $ 2,968,565 |
Total Investments — 100.8%
(identified cost $194,821,554) | | | $ 236,125,322 |
| Other Assets, Less Liabilities — (0.8)% | | | $ (1,899,469) |
| Net Assets — 100.0% | | | $ 234,225,853 |
| The percentage shown for each investment category in the Schedule of Investments is based on net assets. | |
| (1) | Non-income producing security. |
| (2) | All or a portion of this security was on loan at September 30, 2020. The aggregate market value of securities on loan at September 30, 2020 was $3,124,662. |
| (3) | Affiliated company (see Note 7). |
| (4) | Restricted security. Total market value of restricted securities amounts to $1,335,785, which represents 0.5% of the net assets of the Fund as of September 30, 2020. |
| (5) | Notes carry an interest rate that varies by period and is contingent on the performance of the underlying portfolio of loans to borrowers. The coupon rate shown represents the rate in effect at September 30, 2020. |
| (6) | Affiliated investment company, available to Calvert portfolios and funds, which invests in high quality, U.S. dollar denominated money market instruments. The rate shown is the annualized seven-day yield as of September 30, 2020. |
| (7) | Represents investment of cash collateral received in connection with securities lending. |
10
See Notes to Financial Statements.
Calvert
Mid-Cap Fund
September 30, 2020
Schedule of Investments — continued
Restricted Securities
| Description | Acquisition Dates | Cost |
| Calvert Impact Capital, Inc., Community Investment Notes, 1.50%, 12/15/20 | 12/13/19 | $696,903 |
| ImpactAssets, Inc., Global Sustainable Agriculture Notes, 2.07%, 11/3/20 | 11/13/15 | 309,000 |
| ImpactAssets, Inc., Microfinance Plus Notes, 0.46%, 11/3/20 | 11/13/15 | 398,000 |
11
See Notes to Financial Statements.
Calvert
Mid-Cap Fund
September 30, 2020
Statement of Assets and Liabilities
| | September 30, 2020 |
| Assets | |
Investments in securities of unaffiliated issuers, at value (identified cost $193,201,957) - including
$3,124,662 of securities on loan | $ 234,509,289 |
| Investments in securities of affiliated issuers, at value (identified cost $1,619,597) | 1,616,033 |
| Receivable for capital shares sold | 330,421 |
| Dividends and interest receivable | 221,691 |
| Dividends and interest receivable - affiliated | 8,387 |
| Securities lending income receivable | 1,354 |
| Directors' deferred compensation plan | 142,008 |
| Total assets | $236,829,183 |
| Liabilities | |
| Payable for capital shares redeemed | $ 99,734 |
| Deposits for securities loaned | 2,045,902 |
| Payable to affiliates: | |
| Investment advisory fee | 123,973 |
| Administrative fee | 22,887 |
| Distribution and service fees | 37,731 |
| Sub-transfer agency fee | 11,798 |
| Directors' deferred compensation plan | 142,008 |
| Other | 14,318 |
| Accrued expenses | 104,979 |
| Total liabilities | $ 2,603,330 |
| Net Assets | $234,225,853 |
| Sources of Net Assets | |
| Paid-in capital | $ 195,687,390 |
| Distributable earnings | 38,538,463 |
| Total | $234,225,853 |
| Class A Shares | |
| Net Assets | $ 149,111,978 |
| Shares Outstanding | 4,390,751 |
Net Asset Value and Redemption Price Per Share
(net assets ÷ shares of beneficial interest outstanding) | $ 33.96 |
Maximum Offering Price Per Share
(100 ÷ 95.25 of net asset value per share) | $ 35.65 |
| Class C Shares | |
| Net Assets | $ 8,786,810 |
| Shares Outstanding | 388,132 |
Net Asset Value and Offering Price Per Share*
(net assets ÷ shares of beneficial interest outstanding) | $ 22.64 |
12
See Notes to Financial Statements.
Calvert
Mid-Cap Fund
September 30, 2020
Statement of Assets and Liabilities — continued
| | September 30, 2020 |
| Class I Shares | |
| Net Assets | $76,327,065 |
| Shares Outstanding | 1,872,005 |
Net Asset Value, Offering Price and Redemption Price Per Share
(net assets ÷ shares of beneficial interest outstanding) | $ 40.77 |
| | On sales of $50,000 or more, the offering price of Class A shares is reduced. |
| * | Redemption price per share is equal to the net asset value less any applicable contingent deferred sales charge. |
13
See Notes to Financial Statements.
Calvert
Mid-Cap Fund
September 30, 2020
| | Year Ended |
| | September 30, 2020 |
| Investment Income | |
| Dividend income (net of foreign taxes withheld of $7,887) | $ 2,854,100 |
| Dividend income - affiliated issuers | 911 |
| Interest income | 12,743 |
| Interest income - affiliated issuers | 15,916 |
| Securities lending income, net | 24,701 |
| Total investment income | $2,908,371 |
| Expenses | |
| Investment advisory fee | $ 1,422,676 |
| Administrative fee | 262,648 |
| Distribution and service fees: | |
| Class A | 370,416 |
| Class C | 109,485 |
| Directors' fees and expenses | 9,054 |
| Custodian fees | 5,053 |
| Transfer agency fees and expenses | 319,906 |
| Accounting fees | 47,041 |
| Professional fees | 34,593 |
| Registration fees | 58,519 |
| Reports to shareholders | 26,416 |
| Miscellaneous | 29,711 |
| Total expenses | $2,695,518 |
| Waiver and/or reimbursement of expenses by affiliate | $ (174,612) |
| Reimbursement of expenses - other | (3,135) |
| Net expenses | $2,517,771 |
| Net investment income | $ 390,600 |
| Realized and Unrealized Gain (Loss) | |
| Net realized gain (loss): | |
| Investment securities | $ (817,937) |
| Investment securities - affiliated issuers | 126 |
| Foreign currency transactions | (565) |
| Net realized loss | $ (818,376) |
| Change in unrealized appreciation (depreciation): | |
| Investment securities | $ 9,092,940 |
| Investment securities - affiliated issuers | 10,293 |
| Foreign currency | 4 |
| Net change in unrealized appreciation (depreciation) | $9,103,237 |
| Net realized and unrealized gain | $8,284,861 |
| Net increase in net assets from operations | $8,675,461 |
14
See Notes to Financial Statements.
Calvert
Mid-Cap Fund
September 30, 2020
Statements of Changes in Net Assets
| | Year Ended September 30, |
| | 2020 | 2019 |
| Increase (Decrease) in Net Assets | | |
| From operations: | | |
| Net investment income | $ 390,600 | $ 707,838 |
| Net realized gain (loss) | (818,376) | 12,080,437 |
| Net change in unrealized appreciation (depreciation) | 9,103,237 | (1,504,174) |
| Net increase in net assets from operations | $ 8,675,461 | $ 11,284,101 |
| Distributions to shareholders: | | |
| Class A | $ (8,276,383) | $ (9,307,133) |
| Class C | (1,104,384) | (1,293,432) |
| Class I | (2,242,939) | (4,175,285) |
| Total distributions to shareholders | $ (11,623,706) | $ (14,775,850) |
| Capital share transactions: | | |
| Class A | $ (4,811,134) | $ 882,077 |
| Class C | (5,091,318) | (2,030,602) |
| Class I | 28,003,139 | (43,573,385) |
| Net increase (decrease) in net assets from capital share transactions | $ 18,100,687 | $ (44,721,910) |
| Net increase (decrease) in net assets | $ 15,152,442 | $ (48,213,659) |
| Net Assets | | |
| At beginning of year | $ 219,073,411 | $ 267,287,070 |
| At end of year | $234,225,853 | $219,073,411 |
15
See Notes to Financial Statements.
Calvert
Mid-Cap Fund
September 30, 2020
| | Class A |
| | Year Ended September 30, |
| | 2020 | 2019 | 2018 | 2017 | 2016 |
| Net asset value — Beginning of year | $ 34.69 | $ 34.84 | $ 33.40 | $ 29.68 | $ 33.41 |
| Income (Loss) From Operations | | | | | |
| Net investment income(1) | $ 0.05 | $ 0.09 | $ 0.07 | $ 0.20 | $ 0.02(2) |
| Net realized and unrealized gain (loss) | 1.07 | 1.85 | 4.59 | 3.68 | (0.67) |
| Total income (loss) from operations | $ 1.12 | $ 1.94 | $ 4.66 | $ 3.88 | $ (0.65) |
| Less Distributions | | | | | |
| From net investment income | $ (0.03) | $ (0.08) | $ (0.04) | $ (0.15) | $ — |
| From net realized gain | (1.82) | (2.01) | (3.18) | (0.01) | (3.08) |
| Total distributions | $ (1.85) | $ (2.09) | $ (3.22) | $ (0.16) | $ (3.08) |
| Net asset value — End of year | $ 33.96 | $ 34.69 | $ 34.84 | $ 33.40 | $ 29.68 |
| Total Return(3) | 3.20% | 6.56% | 15.04% | 13.11% | (2.08)% |
| Ratios/Supplemental Data | | | | | |
| Net assets, end of year (000’s omitted) | $149,112 | $158,005 | $157,046 | $159,951 | $192,402 |
| Ratios (as a percentage of average daily net assets):(4) | | | | | |
| Total expenses | 1.26% | 1.30% | 1.28% | 1.34% | 1.37% |
| Net expenses | 1.18% | 1.19% | 1.21% | 1.21% | 1.31% |
| Net investment income | 0.15% | 0.27% | 0.22% | 0.64% | 0.07% (2) |
| Portfolio Turnover | 70% | 83% | 62% | 162% | 199% |
| (1) | Computed using average shares outstanding. |
| (2) | Amount includes a non-recurring refund for overbilling of prior years' custody out-of-pocket fees. This amounted to $0.001 per share and 0% of average net assets. |
| (3) | Returns are historical and are calculated by determining the percentage change in net asset value with all distributions reinvested and do not reflect the effect of sales charges, if any. |
| (4) | Total expenses do not reflect amounts reimbursed and/or waived by the adviser and certain of its affiliates, if applicable. Net expenses are net of all reductions and represent the net expenses paid by the Fund. |
16
See Notes to Financial Statements.
Calvert
Mid-Cap Fund
September 30, 2020
Financial Highlights — continued
| | Class C |
| | Year Ended September 30, |
| | 2020 | 2019 | 2018 | 2017 | 2016 |
| Net asset value — Beginning of year | $ 23.83 | $ 24.65 | $ 24.55 | $ 21.87 | $ 25.62 |
| Income (Loss) From Operations | | | | | |
| Net investment loss(1) | $ (0.14) | $ (0.11) | $ (0.12) | $ (0.03) | $ (0.16)(2) |
| Net realized and unrealized gain (loss) | 0.73 | 1.23 | 3.27 | 2.72 | (0.51) |
| Total income (loss) from operations | $ 0.59 | $ 1.12 | $ 3.15 | $ 2.69 | $ (0.67) |
| Less Distributions | | | | | |
| From net realized gain | $ (1.78) | $ (1.94) | $ (3.05) | $ (0.01) | $ (3.08) |
| Total distributions | $ (1.78) | $ (1.94) | $ (3.05) | $ (0.01) | $ (3.08) |
| Net asset value — End of year | $22.64 | $ 23.83 | $ 24.65 | $ 24.55 | $ 21.87 |
| Total Return(3) | 2.40% | 5.77% | 14.20% | 12.29% | (2.87)% |
| Ratios/Supplemental Data | | | | | |
| Net assets, end of year (000’s omitted) | $ 8,787 | $14,535 | $17,043 | $18,146 | $22,885 |
| Ratios (as a percentage of average daily net assets):(4) | | | | | |
| Total expenses | 2.01% | 2.05% | 2.03% | 2.18% | 2.16% |
| Net expenses | 1.93% | 1.94% | 1.96% | 1.96% | 2.09% |
| Net investment loss | (0.62)% | (0.49)% | (0.53)% | (0.12)% | (0.72)% (2) |
| Portfolio Turnover | 70% | 83% | 62% | 162% | 199% |
| (1) | Computed using average shares outstanding. |
| (2) | Amount includes a non-recurring refund for overbilling of prior years' custody out-of-pocket fees. This amounted to $0.001 per share and 0% of average net assets. |
| (3) | Returns are historical and are calculated by determining the percentage change in net asset value with all distributions reinvested and do not reflect the effect of sales charges, if any. |
| (4) | Total expenses do not reflect amounts reimbursed and/or waived by the adviser and certain of its affiliates, if applicable. Net expenses are net of all reductions and represent the net expenses paid by the Fund. |
17
See Notes to Financial Statements.
Calvert
Mid-Cap Fund
September 30, 2020
Financial Highlights — continued
| | Class I |
| | Year Ended September 30, |
| | 2020 | 2019 | 2018 | 2017 | 2016 |
| Net asset value — Beginning of year | $ 41.25 | $ 40.97 | $ 38.70 | $ 34.38 | $ 38.05 |
| Income (Loss) From Operations | | | | | |
| Net investment income(1) | $ 0.16 | $ 0.21 | $ 0.23 | $ 0.41 | $ 0.19(2) |
| Net realized and unrealized gain (loss) | 1.27 | 2.24 | 5.37 | 4.22 | (0.78) |
| Total income (loss) from operations | $ 1.43 | $ 2.45 | $ 5.60 | $ 4.63 | $ (0.59) |
| Less Distributions | | | | | |
| From net investment income | $ (0.09) | $ (0.16) | $ (0.15) | $ (0.30) | $ — |
| From net realized gain | (1.82) | (2.01) | (3.18) | (0.01) | (3.08) |
| Total distributions | $ (1.91) | $ (2.17) | $ (3.33) | $ (0.31) | $ (3.08) |
| Net asset value — End of year | $ 40.77 | $ 41.25 | $ 40.97 | $ 38.70 | $ 34.38 |
| Total Return(3) | 3.45% | 6.85% | 15.48% | 13.53% | (1.64)% |
| Ratios/Supplemental Data | | | | | |
| Net assets, end of year (000’s omitted) | $76,327 | $46,533 | $93,198 | $68,748 | $166,759 |
| Ratios (as a percentage of average daily net assets):(4) | | | | | |
| Total expenses | 1.01% | 1.05% | 1.03% | 0.88% | 0.86% |
| Net expenses | 0.93% | 0.91% | 0.86% | 0.86% | 0.84% |
| Net investment income | 0.40% | 0.54% | 0.59% | 1.14% | 0.55% (2) |
| Portfolio Turnover | 70% | 83% | 62% | 162% | 199% |
| (1) | Computed using average shares outstanding. |
| (2) | Amount includes a non-recurring refund for overbilling of prior years' custody out-of-pocket fees. This amounted to $0.001 per share and 0% of average net assets. |
| (3) | Returns are historical and are calculated by determining the percentage change in net asset value with all distributions reinvested and do not reflect the effect of sales charges, if any. |
| (4) | Total expenses do not reflect amounts reimbursed and/or waived by the adviser and certain of its affiliates, if applicable. Net expenses are net of all reductions and represent the net expenses paid by the Fund. |
18
See Notes to Financial Statements.
Calvert
Mid-Cap Fund
September 30, 2020
Notes to Financial Statements
1 Significant Accounting Policies
Calvert Mid-Cap Fund (the Fund) is a diversified series of Calvert World Values Fund, Inc. (the Corporation). The Corporation is a Maryland corporation registered under the Investment Company Act of 1940, as amended (the 1940 Act), as an open-end management investment company. The investment objective of the Fund is to seek to provide long-term capital appreciation by investing primarily in mid-cap stocks.
The Fund offers three classes of shares. Class A shares are generally sold subject to a sales charge imposed at time of purchase. A contingent deferred sales charge of 0.80% may apply to certain redemptions of Class A shares for accounts for which no sales charge was paid, if redeemed within 12 months of purchase. Class C shares are sold without a front-end sales charge, and with certain exceptions, are charged a contingent deferred sales charge of 1% on shares redeemed within 12 months of purchase. Class C shares are only available for purchase through a financial intermediary. Effective January 25, 2019, Class C shares generally automatically convert to Class A shares ten years after their purchase and, effective November 5, 2020, automatically convert to Class A shares eight years after their purchase as described in the Fund’s prospectus. Class I shares are sold at net asset value, are not subject to a sales charge and are sold only to certain eligible investors. Each class represents a pro rata interest in the Fund, but votes separately on class-specific matters and is subject to different expenses.
The Fund applies the accounting and reporting guidance in the Financial Accounting Standards Board (FASB) Accounting Standards Codification Topic 946, Financial Services – Investment Companies (ASC 946). Subsequent events, if any, through the date that the financial statements were issued have been evaluated in the preparation of the financial statements.
A Investment Valuation— Net asset value per share is determined every business day as of the close of the regular session of the New York Stock Exchange (generally 4:00 p.m. Eastern time). The Fund uses independent pricing services approved by the Board of Directors (the Board) to value its investments wherever possible. Investments for which market quotations are not available or deemed not reliable are fair valued in good faith under the direction of the Board.
U.S. generally accepted accounting principles (U.S. GAAP) establishes a disclosure hierarchy that categorizes the inputs to valuation techniques used to value assets and liabilities at measurement date. These inputs are summarized in the three broad levels listed below:
Level 1 - quoted prices in active markets for identical securities
Level 2 - other significant observable inputs (including quoted prices for similar securities, interest rates, prepayment speeds, credit risk, etc.)
Level 3 - significant unobservable inputs (including the Fund’s own assumptions in determining the fair value of investments)
The inputs or methodologies used for valuing securities are not necessarily an indication of the risk associated with investing in those securities.
Valuation techniques used to value the Fund’s investments by major category are as follows:
Equity Securities. Equity securities (including warrants and rights) listed on a U.S. securities exchange generally are valued at the last sale or closing price as reported by an independent pricing service on the primary market or exchange on which they are traded and are categorized as Level 1 in the hierarchy. Equity securities listed on the NASDAQ Global or Global Select Market are valued at the NASDAQ official closing price and are categorized as Level 1 in the hierarchy. Unlisted or listed securities for which closing sales prices or closing quotations are not available are valued at the mean between the latest available bid and ask prices and are categorized as Level 2 in the hierarchy.
Debt Securities. Debt securities are generally valued based on valuations provided by third party pricing services, as derived from such services’ pricing models. Inputs to the models may include, but are not limited to, reported trades, executable bid and ask prices, broker/dealer quotations, prices or yields of securities with similar characteristics, interest rates, anticipated prepayments, benchmark curves or information pertaining to the issuer, as well as industry and economic events. Accordingly, debt securities are generally categorized as Level 2 in the hierarchy. Short-term debt securities with a remaining maturity at time of purchase of more than sixty days are valued based on valuations provided by a third party pricing service. Such securities are generally categorized as Level 2 in the hierarchy. Short-term debt securities of sufficient credit quality purchased with remaining maturities of sixty days or less are valued at amortized cost, which approximates fair value, and are categorized as Level 2 in the hierarchy.
Affiliated Fund. The Fund may invest in Calvert Cash Reserves Fund, LLC (Cash Reserves Fund), an affiliated investment company managed by Calvert Research and Management (CRM). While Cash Reserves Fund is not a registered money market mutual fund, it conducts all of its investment activities in accordance with the requirements of Rule 2a-7 under the 1940 Act. Investments in Cash Reserves Fund are valued at the closing net asset value per unit on the valuation day and are categorized as Level 2 in the hierarchy. Cash Reserves Fund generally values its investment securities based on available market quotations provided by a third party pricing service.
Other Securities. Investments in registered investment companies (including money market funds) that do not trade on an exchange are valued at the net asset value per share on the valuation day and are categorized as Level 1 in the hierarchy.
Fair Valuation. If a market value cannot be determined for a security using the methodologies described above, or if, in the good faith opinion of the Fund's adviser, the market value does not constitute a readily available market quotation, or if a significant event has occurred that would materially affect the value of the security, the security will be fair valued as determined in good faith by or at the direction of the Board in a manner that most fairly reflects the security’s “fair value”, which is the amount that the Fund might reasonably expect to receive for the security upon its current sale in the ordinary course.
Calvert
Mid-Cap Fund
September 30, 2020
Notes to Financial Statements — continued
Each such determination is based on a consideration of relevant factors, which are likely to vary from one pricing context to another. These factors may include, but are not limited to, the type of security, the existence of any contractual restrictions on the security’s disposition, the price and extent of public trading in similar securities of the issuer or of comparable companies or entities, quotations or relevant information obtained from broker/dealers or other market participants, information obtained from the issuer, analysts, and/or the appropriate stock exchange (for exchange-traded securities), an analysis of the company’s or entity’s financial statements, and an evaluation of the forces that influence the issuer and the market(s) in which the security is purchased and sold.
The values assigned to fair value investments are based on available information and do not necessarily represent amounts that might ultimately be realized. Further, due to the inherent uncertainty of valuations of such investments, the fair values may differ significantly from the values that would have been used had an active market existed, and the differences could be material.
The following table summarizes the market value of the Fund's holdings as of September 30, 2020, based on the inputs used to value them:
| Asset Description | Level 1 | Level 2 | Level 3 | Total |
| Common Stocks | $ 231,820,972(1) | $ — | $ — | $ 231,820,972 |
| High Social Impact Investments | — | 1,335,785 | — | 1,335,785 |
| Short-Term Investments: | | | | |
| Other | — | 922,663 | — | 922,663 |
| Securities Lending Collateral | 2,045,902 | — | — | 2,045,902 |
| Total Investments | $233,866,874 | $2,258,448 | $ — | $236,125,322 |
| (1) | The level classification by major category of investments is the same as the category presentation in the Schedule of Investments. |
B Investment Transactions and Income— Investment transactions for financial statement purposes are accounted for on trade date. Realized gains and losses are recorded on an identified cost basis and may include proceeds from litigation. Dividend income is recorded on the ex-dividend date for dividends received in cash and/or securities or, in the case of dividends on certain foreign securities, as soon as the Fund is informed of the ex-dividend date. Non-cash dividends are recorded at the fair value of the securities received. Withholding taxes on foreign dividends, if any, have been provided for in accordance with the Fund’s understanding of the applicable country’s tax rules and rates. Distributions received that represent a return of capital are recorded as a reduction of cost of investments. Distributions received that represent a capital gain are recorded as a realized gain. Interest income, which includes amortization of premium and accretion of discount on debt securities, is accrued as earned.
C Share Class Accounting— Realized and unrealized gains and losses and net investment income and losses, other than class-specific expenses, are allocated daily to each class of shares based upon the relative net assets of each class to the total net assets of the Fund. Expenses arising in connection with a specific class are charged directly to that class.
D Foreign Currency Transactions— The Fund’s accounting records are maintained in U.S. dollars. For valuation of assets and liabilities on each date of net asset value determination, foreign denominations are converted into U.S. dollars using the current exchange rate. Security transactions, income and expenses are translated at the prevailing rate of exchange on the date of the event. Recognized gains or losses on investment transactions attributable to changes in foreign currency exchange rates are recorded for financial statement purposes as net realized gains and losses on investments. That portion of unrealized gains and losses on investments that results from fluctuations in foreign currency exchange rates is not separately disclosed.
E Restricted Securities— The Fund may invest in securities that are subject to legal or contractual restrictions on resale. Generally, these securities may only be sold publicly upon registration under the Securities Act of 1933 or in transactions exempt from such registration. Information regarding restricted securities (excluding Rule 144A securities) is included at the end of the Schedule of Investments.
F Distributions to Shareholders— Distributions to shareholders are recorded by the Fund on ex-dividend date. Distributions from net investment income and distributions from net realized capital gains, if any, are paid at least annually. Distributions are declared separately for each class of shares. Distributions are determined in accordance with income tax regulations, which may differ from U.S. GAAP; accordingly, periodic reclassifications are made within the Fund's capital accounts to reflect income and gains available for distribution under income tax regulations.
G Estimates— The preparation of financial statements in conformity with U.S. GAAP requires management to make estimates and assumptions that affect the reported amounts of assets and liabilities and disclosure of contingent assets and liabilities at the date of the financial statements and the reported amounts of increases and decreases in net assets from operations during the reporting period. Actual results could differ from those estimates.
H Indemnifications— The Corporation’s By-Laws provide for indemnification for Directors or officers of the Corporation and certain other parties, to the fullest extent permitted by Maryland law and the 1940 Act, provided certain conditions are met. Additionally, in the normal course of business, the Fund enters into agreements with service providers that may contain indemnification clauses. The Fund’s maximum exposure under these arrangements is unknown as this would involve future claims that may be made against the Fund that have not yet occurred.
Calvert
Mid-Cap Fund
September 30, 2020
Notes to Financial Statements — continued
I Federal Income Taxes— No provision for federal income or excise tax is required since the Fund intends to continue to qualify as a regulated investment company under the Internal Revenue Code and to distribute substantially all of its taxable earnings.
Management has analyzed the Fund's tax positions taken for all open federal income tax years and has concluded that no provision for federal income tax is required in the Fund's financial statements. A Fund's federal tax return is subject to examination by the Internal Revenue Service for a period of three years from the date of filing.
2 Related Party Transactions
The investment advisory fee is earned by CRM, a subsidiary of Eaton Vance Management (EVM), as compensation for investment advisory services rendered to the Fund. EVM is a wholly-owned subsidiary of Eaton Vance Corp. Pursuant to the investment advisory agreement, CRM receives a fee, payable monthly, at the annual rate of 0.65% of the Fund's average daily net assets. For the year ended September 30, 2020, the investment advisory fee amounted to $1,422,676. The Fund may invest its cash in Cash Reserves Fund. CRM does not currently receive a fee for advisory services provided to Cash Reserves Fund.
CRM has agreed to reimburse the Fund’s operating expenses to the extent that total annual operating expenses (relating to ordinary operating expenses only and excluding expenses such as brokerage commissions, acquired fund fees and expenses of unaffiliated funds, borrowing costs, taxes or litigation expenses) exceed 1.18%, 1.93% and 0.93% for Class A, Class C and Class I, respectively, of such class's average daily net assets. The expense reimbursement agreement with CRM may be changed or terminated after January 31, 2021. For the year ended September 30, 2020, CRM waived or reimbursed expenses of $174,612.
The administrative fee is earned by CRM as compensation for administrative services rendered to the Fund. The fee is computed at an annual rate of 0.12% of the Fund’s average daily net assets attributable to Class A, Class C and Class I and is payable monthly. For the year ended September 30, 2020, CRM was paid administrative fees of $262,648.
The Fund has in effect a distribution plan for Class A shares (Class A Plan) pursuant to Rule 12b-1 under the 1940 Act. Pursuant to the Class A Plan, the Fund pays Eaton Vance Distributors, Inc. (EVD), an affiliate of CRM and the Fund’s principal underwriter, a distribution and service fee of 0.25% per annum of its average daily net assets attributable to Class A shares for distribution services and facilities provided to the Fund by EVD, as well as for personal services and/or the maintenance of shareholder accounts. The Fund also has in effect a distribution plan for Class C shares (Class C Plan) pursuant to Rule 12b-1 under the 1940 Act. Pursuant to the Class C Plan, the Fund pays EVD amounts equal to 0.75% per annum of its average daily net assets attributable to Class C shares for providing ongoing distribution services and facilities to the Fund. In addition, pursuant to the Class C Plan, the Fund also makes payments of service fees to EVD, financial intermediaries and other persons in amounts equal to 0.25% per annum of its average daily net assets attributable to that class. Service fees paid or accrued are for personal services and/or the maintenance of shareholder accounts. Distribution and service fees paid or accrued for the year ended September 30, 2020 amounted to $370,416 and $109,485 for Class A shares and Class C shares, respectively.
The Fund was informed that EVD received $20,014 as its portion of the sales charge on sales of Class A shares for the year ended September 30, 2020. The Fund was also informed that EVD received $11,179 of contingent deferred sales charges (CDSC) paid by Class C shareholders and no CDSC paid by Class A shareholders for the same period.
EVM provides sub-transfer agency and related services to the Fund pursuant to a Sub-Transfer Agency Support Services Agreement. For the year ended September 30, 2020, sub-transfer agency fees and expenses incurred to EVM amounted to $70,393 and are included in transfer agency fees and expenses on the Statement of Operations.
Each Director of the Fund who is not an employee of CRM or its affiliates receives an annual fee of $154,000, plus an annual Committee fee ranging from $8,500 to $16,500 depending on the Committee. The Board chair receives an additional $20,000 annual fee and Committee chairs receive an additional $6,000 annual fee. Eligible Directors may participate in a Deferred Compensation Plan (the Plan). Amounts deferred under the Plan are treated as though equal dollar amounts had been invested in shares of the Fund or other Calvert funds selected by the Directors. The Fund purchases shares of the funds selected equal to the dollar amounts deferred under the Plan, resulting in an asset equal to the deferred compensation liability. Obligations of the Plan are paid solely from the Fund's assets. Directors’ fees are allocated to each of the Calvert funds served. Salaries and fees of officers and Directors of the Fund who are employees of CRM or its affiliates are paid by CRM. In addition, an Advisory Council was established to aid the Board and CRM in advancing the cause of responsible investing through original scholarship and thought leadership. The Advisory Council consists of CRM’s Chief Executive Officer and three (four prior to December 31, 2019) additional members. Each member (other than CRM’s Chief Executive Officer) received annual compensation of $75,000, which was being reimbursed by Calvert Investment Management, Inc. (CIM), the Calvert funds’ former investment adviser and Ameritas Holding Company, CIM’s parent company, through the end of 2019. For the year ending December 31, 2020, each member (other than CRM’s Chief Executive Officer) is expected to be compensated $20,000 for their service on the Advisory Council. Such compensation, and any other compensation and/or expenses incurred by the Advisory Council as may be approved by the Board, shall be borne by the Calvert funds. For the year ended September 30, 2020, the Fund’s allocated portion of the Advisory Council compensation and fees was $3,419 and the reimbursement was $3,135, which are included in miscellaneous expense and reimbursement of expenses-other, respectively, on the Statement of Operations.
Calvert
Mid-Cap Fund
September 30, 2020
Notes to Financial Statements — continued
3 Investment Activity
During the year ended September 30, 2020, the cost of purchases and proceeds from sales of investments, other than short-term securities, were $159,663,124 and $152,548,955, respectively.
4 Distributions to Shareholders and Income Tax Information
The tax character of distributions declared for the years ended September 30, 2020 and September 30, 2019 was as follows:
| | Year Ended September 30, |
| | 2020 | 2019 |
| Ordinary income | $ 459,239 | $7,811,582 |
| Long-term capital gains | $11,164,467 | $6,964,268 |
During the year ended September 30, 2020, distributable earnings was decreased by $323,131 and paid-in capital was increased by $323,131 due to the Fund's use of equalization accounting. Tax equalization accounting allows the Fund to treat as a distribution that portion of redemption proceeds representing a redeeming shareholder’s portion of undistributed taxable income and net capital gains. These reclassifications had no effect on the net assets or net asset value per share of the Fund.
As of September 30, 2020, the components of distributable earnings (accumulated loss) on a tax basis were as follows:
| Undistributed ordinary income | $ 117,751 |
| Undistributed long-term capital gains | $ 2,216,832 |
| Post October capital losses | $ (3,597,947) |
| Net unrealized appreciation | $39,801,827 |
At September 30, 2020, the Fund had a net capital loss of $3,597,947 attributable to security transactions incurred after October 31, 2019 that it has elected to defer. This net capital loss is treated as arising on the first day of the Fund’s taxable year ending September 30, 2021.
The cost and unrealized appreciation (depreciation) of investments of the Fund at September 30, 2020, as determined on a federal income tax basis, were as follows:
| Aggregate cost | $196,323,495 |
| Gross unrealized appreciation | $ 44,156,742 |
| Gross unrealized depreciation | (4,354,915) |
| Net unrealized appreciation | $ 39,801,827 |
5 Securities Lending
To generate additional income, the Fund may lend its securities pursuant to a securities lending agency agreement with State Street Bank and Trust Company (SSBT), the securities lending agent. Security loans are subject to termination by the Fund at any time and, therefore, are not considered illiquid investments. The Fund requires that the loan be continuously collateralized by either cash or securities as collateral equal at all times to at least 102% of the market value of the domestic securities loaned and 105% of the market value of the international securities loaned (if applicable). The market value of securities loaned is determined daily and any additional required collateral is delivered to the Fund on the next business day. Cash collateral is generally invested in a money market fund registered under the 1940 Act that is managed by an affiliate of SSBT. Any gain or loss in the market price of the loaned securities that might occur and any interest earned or dividends declared during the term of the loan would accrue to the account of the Fund. Income earned on the investment of collateral, net of broker rebates and other expenses incurred by the securities lending agent, is split between the Fund and the securities lending agent based on agreed upon contractual terms. Non-cash collateral, if any, is held by the lending agent on behalf of the Fund and cannot be sold or re-pledged by the Fund; accordingly, such collateral is not reflected in the Statement of Assets and Liabilities.
Calvert
Mid-Cap Fund
September 30, 2020
Notes to Financial Statements — continued
The risks associated with lending portfolio securities include, but are not limited to, possible delays in receiving additional collateral or in the recovery of the loaned securities, possible loss of rights to the collateral should the borrower fail financially, as well as risk of loss in the value of the collateral or the value of the investments made with the collateral. The securities lending agent shall indemnify the Fund in the case of default of any securities borrower.
At September 30, 2020, the total value of securities on loan was $3,124,662 and the total value of collateral received was $3,284,393, comprised of cash of $2,045,902 and U.S. government and/or agencies securities of $1,238,491.
The following table provides a breakdown of securities lending transactions accounted for as secured borrowings, the obligations by class of collateral pledged, and the remaining contractual maturity of those transactions as of September 30, 2020.
| | Remaining Contractual Maturity of the Transactions |
| | Overnight and
Continuous | <30 days | 30 to 90 days | >90 days | Total |
| Common Stocks | $2,045,902 | $ — | $ — | $ — | $2,045,902 |
The carrying amount of the liability for deposits for securities loaned at September 30, 2020 approximated its fair value. If measured at fair value, such liability would have been considered as Level 2 in the fair value hierarchy (see Note 1A) at September 30, 2020.
6 Line of Credit
Effective October 29, 2019, the Fund participates with other portfolios and funds managed by EVM and its affiliates, including CRM, in an $800 million unsecured line of credit with a group of banks, which is in effect through October 27, 2020. Borrowings are made by the Fund solely for temporary purposes related to redemptions and other short-term cash needs. Interest is charged to the Fund based on its borrowings at an amount above either the Eurodollar rate or Federal Funds rate. In addition, a fee computed at an annual rate of 0.15% on the daily unused portion of the line of credit is allocated among the participating portfolios and funds at the end of each quarter. Because the line of credit is not available exclusively to the Fund, it may be unable to borrow some or all of its requested amounts at any particular time.
Prior to October 29, 2019, the Fund participated with other funds managed by CRM in a $100 million committed unsecured line of credit agreement with SSBT, which was terminated by the Calvert funds. Borrowings bore interest at the higher of the one-month London Interbank Offered Rate (LIBOR) in effect that day or the overnight Federal Funds rate, plus 1.00% per annum. A commitment fee of 0.20% per annum was incurred on the unused portion of the committed facility, which was allocated to all participating funds.
The Fund had no borrowings outstanding pursuant to its line of credit at September 30, 2020. The Fund did not have any significant borrowings or allocated fees during the year ended September 30, 2020. Effective October 27, 2020, the Fund renewed its line of credit agreement, which expires October 26, 2021, at substantially the same terms.
7 Affiliated Companies and Funds
The Fund has invested a portion of its assets in notes (the Notes) issued by Calvert Impact Capital, Inc. (CIC) pursuant to exemptive relief granted by the U.S. Securities and Exchange Commission (the SEC). There are certain potential points of affiliation between the Fund and CIC. CRM has licensed use of the Calvert name to CIC and provides other types of support. CRM’s President and Chief Executive Officer (and the only director/trustee on the Fund Board that is an “interested person” of the Fund) serves on the CIC Board, along with one member of the Advisory Council to the Fund Board. In addition, another director/trustee on the Fund Board and a member of the Advisory Council each serve as a director emeritus on the CIC Board.
Calvert
Mid-Cap Fund
September 30, 2020
Notes to Financial Statements — continued
At September 30, 2020, the value of the Fund’s investment in the Notes and affiliated funds was $1,616,033, which represents 0.7% of the Fund’s net assets. Transactions in the Notes and affiliated funds by the Fund for the year ended September 30, 2020 were as follows:
| Name | Value,
beginning
of period | Purchases | Sales
proceeds | Net
realized
gain
(loss) | Change in
unrealized
appreciation
(depreciation) | Value,
end of
period | Interest/
Dividend
income | Principal
amount/Units,
end of period |
| High Social Impact Investments | | | | | | | | |
| Calvert Impact Capital, Inc., Community Investment Notes, 1.50%, 12/15/19(1) | $2,605,631 | $ — | $ (2,619,488) | $ — | $ 13,857 | $ — | $ 7,640 | $ — |
| Calvert Impact Capital, Inc., Community Investment Notes, 1.50%, 12/15/20(1) | — | 696,903 | — | — | (3,533) | 693,370 | 8,276 | 696,903 |
| Short-Term Investments | | | | | | | | |
| Calvert Cash Reserves Fund, LLC | — | 29,619,038 | (28,696,470) | 126 | (31) | 922,663 | 911 | 922,571 |
| Totals | | | | $ 126 | $10,293 | $1,616,033 | $16,827 | |
8 Capital Shares
The Corporation may issue its shares in one or more series (such as the Fund). The authorized shares of the Fund consist of 75,000,000 common shares, $0.01 par value, for each Class.
Transactions in capital shares for the years ended September 30, 2020 and September 30, 2019 were as follows:
| | Year Ended
September 30, 2020 | | Year Ended
September 30, 2019 |
| | Shares | Amount | | Shares | Amount |
| Class A | | | | | |
| Shares sold | 331,253 | $ 10,737,147 | | 336,722 | $ 10,998,087 |
| Reinvestment of distributions | 233,552 | 7,959,447 | | 299,488 | 8,942,725 |
| Shares redeemed | (742,917) | (23,971,939) | | (742,143) | (23,719,620) |
| Converted from Class C | 14,649 | 464,211 | | 152,429 | 4,660,885 |
| Net increase (decrease) | (163,463) | $ (4,811,134) | | 46,496 | $ 882,077 |
| Class C | | | | | |
| Shares sold | 77,226 | $ 1,750,012 | | 220,887 | $ 4,577,767 |
| Reinvestment of distributions | 30,825 | 704,666 | | 59,723 | 1,232,088 |
| Shares redeemed | (308,138) | (7,081,785) | | (141,161) | (3,179,572) |
| Converted to Class A | (21,816) | (464,211) | | (220,894) | (4,660,885) |
| Net decrease | (221,903) | $ (5,091,318) | | (81,445) | $ (2,030,602) |
| Class I | | | | | |
| Shares sold | 1,506,537 | $ 56,667,387 | | 1,227,687 | $ 47,437,976 |
| Reinvestment of distributions | 51,752 | 2,113,537 | | 96,198 | 3,408,286 |
| Shares redeemed | (814,313) | (30,777,785) | | (2,470,818) | (94,419,647) |
| Net increase (decrease) | 743,976 | $ 28,003,139 | | (1,146,933) | $(43,573,385) |
Calvert
Mid-Cap Fund
September 30, 2020
Notes to Financial Statements — continued
9 Risks and Uncertainties
Pandemic Risk
An outbreak of respiratory disease caused by a novel coronavirus was first detected in China in December 2019 and subsequently spread internationally. This coronavirus has resulted in closing borders, enhanced health screenings, changes to healthcare service preparation and delivery, quarantines, cancellations, disruptions to supply chains and customer activity, as well as general concern and uncertainty. Health crises caused by outbreaks, such as the coronavirus outbreak, may exacerbate other pre-existing political, social and economic risks and disrupt normal market conditions and operations. The impact of this outbreak has negatively affected the worldwide economy, the economies of individual countries, individual companies, and the market in general, and may continue to do so in significant and unforeseen ways, as may other epidemics and pandemics that may arise in the future. Any such impact could adversely affect the Fund's performance, or the performance of the securities in which the Fund invests.
10 Subsequent Event
On October 8, 2020, Morgan Stanley and Eaton Vance Corp. (“Eaton Vance”) announced that they had entered into a definitive agreement under which Morgan Stanley would acquire Eaton Vance. Under the Investment Company Act of 1940, as amended, consummation of this transaction may result in the automatic termination of the Fund’s investment advisory agreement, and any related sub-advisory agreement(s), if applicable. Thus, the Fund’s Board will be asked to approve a new investment advisory agreement (and new sub-advisory agreement(s), if applicable). If approved by the Fund’s Board, the new investment advisory agreement (and new sub-advisory agreement(s), if applicable) is expected to be presented to Fund shareholders for approval, and, if approved, would take effect upon the closing of the transaction.
Calvert
Mid-Cap Fund
September 30, 2020
Report of Independent Registered Public Accounting Firm
To the Shareholders and Board of Directors
Calvert World Values Fund, Inc.:
Opinion on the Financial Statements
We have audited the accompanying statement of assets and liabilities of Calvert Mid-Cap Fund (the Fund), a series of Calvert World Values Fund, Inc., including the schedule of investments, as of September 30, 2020, the related statement of operations for the year then ended, the statements of changes in net assets for each of the years in the two-year period then ended, and the related notes (collectively, the financial statements) and the financial highlights for each of the years in the five-year period then ended. In our opinion, the financial statements and financial highlights present fairly, in all material respects, the financial position of the Fund as of September 30, 2020, the results of its operations for the year then ended, the changes in its net assets for each of the years in the two-year period then ended, and the financial highlights for each of the years in the five-year period then ended, in conformity with U.S. generally accepted accounting principles.
Basis for Opinion
These financial statements and financial highlights are the responsibility of the Fund’s management. Our responsibility is to express an opinion on these financial statements and financial highlights based on our audits. We are a public accounting firm registered with the Public Company Accounting Oversight Board (United States) (PCAOB) and are required to be independent with respect to the Fund in accordance with the U.S. federal securities laws and the applicable rules and regulations of the Securities and Exchange Commission and the PCAOB.
We conducted our audits in accordance with the standards of the PCAOB. Those standards require that we plan and perform the audit to obtain reasonable assurance about whether the financial statements and financial highlights are free of material misstatement, whether due to error or fraud. Our audits included performing procedures to assess the risks of material misstatement of the financial statements and financial highlights, whether due to error or fraud, and performing procedures that respond to those risks. Such procedures included examining, on a test basis, evidence regarding the amounts and disclosures in the financial statements and financial highlights. Such procedures also included confirmation of securities owned as of September 30, 2020, by correspondence with the custodian, brokers and agent banks. Our audits also included evaluating the accounting principles used and significant estimates made by management, as well as evaluating the overall presentation of the financial statements and financial highlights. We believe that our audits provide a reasonable basis for our opinion.

We have served as the auditor of one or more of the Calvert Funds since 2002.
Philadelphia, Pennsylvania
November 20, 2020
Calvert
Mid-Cap Fund
September 30, 2020
Federal Tax Information (Unaudited)
The Form 1099-DIV you receive in February 2021 will show the tax status of all distributions paid to your account in calendar year 2020. Shareholders are advised to consult their own tax adviser with respect to the tax consequences of their investment in the Fund. As required by the Internal Revenue Code and/or regulations, shareholders must be notified regarding the status of qualified dividend income for individuals, the dividends received deduction for corporations and capital gains dividends.
Qualified Dividend Income. For the fiscal year ended September 30, 2020, the Fund designates approximately $2,149,927, or up to the maximum amount of such dividends allowable pursuant to the Internal Revenue Code, as qualified dividend income eligible for the reduced tax rate of 15%.
Dividends Received Deduction. Corporate shareholders are generally entitled to take the dividends received deduction on the portion of the Fund's dividend distribution that qualifies under tax law. For the Fund's fiscal 2020 ordinary income dividends, 100% qualifies for the corporate dividends received deduction.
Capital Gains Dividends. The Fund hereby designates as a capital gain dividend with respect to the taxable year ended September 30, 2020, $3,302,663 or, if subsequently determined to be different, the net capital gain of such year.
Calvert
Mid-Cap Fund
September 30, 2020
Liquidity Risk Management Program
The Fund has implemented a written liquidity risk management program (Program) and related procedures to manage its liquidity in accordance with Rule 22e-4 under the Investment Company Act of 1940, as amended (Liquidity Rule). The Liquidity Rule defines “liquidity risk” as the risk that a fund could not meet requests to redeem shares issued by the fund without significant dilution of the remaining investors’ interests in the fund. The Fund’s Board of Trustees/Directors has designated the investment adviser to serve as the administrator of the Program and the related procedures. The administrator has established a Liquidity Risk Management Oversight Committee (Committee) to perform the functions necessary to administer the Program. As part of the Program, the administrator is responsible for identifying illiquid investments and categorizing the relative liquidity of the Fund’s investments in accordance with the Liquidity Rule. Under the Program, the administrator assesses, manages, and periodically reviews the Fund’s liquidity risk, and is responsible for making certain reports to the Fund’s Board of Trustees/Directors and the Securities and Exchange Commission (SEC) regarding the liquidity of the Fund’s investments, and to notify the Board of Trustees/Directors and the SEC of certain liquidity events specified in the Liquidity Rule. The liquidity of the Fund’s portfolio investments is determined based on a number of factors including, but not limited to, relevant market, trading and investment-specific considerations under the Program.
At a meeting of the Fund’s Board of Trustees/Directors, the Committee provided a written report to the Fund’s Board of Trustees/Directors pertaining to the operation, adequacy, and effectiveness of implementation of the Program, as well as the operation of the highly liquid investment minimum (if applicable) for the period December 1, 2018 through December 31, 2019 (Review Period). The Program operated effectively during the Review Period, supporting the administrator’s ability to assess, manage and monitor Fund liquidity risk, including during periods of market volatility and net redemptions. During the Review Period, the Fund met redemption requests on a timely basis.
There can be no assurance that the Program will achieve its objectives in the future. Please refer to the Fund’s prospectus for more information regarding the Fund’s exposure to liquidity risk and other principal risks to which an investment in the Fund may be subject.
Calvert
Mid-Cap Fund
September 30, 2020
Management and Organization
Fund Management. The Directors of Calvert World Values Fund, Inc. (the Corporation) are responsible for the overall management and supervision of the Corporation’s affairs. The Directors and officers of the Corporation are listed below. Except as indicated, each individual has held the office shown or other offices in the same company for the last five years. Directors and officers of the Corporation hold indefinite terms of office. The “Independent Directors” consist of those Directors who are not “interested persons” of the Corporation, as that term is defined under the 1940 Act. The business address of each Director and officer, with the exception of Ms. Gemma and Mr. Kirchner, is 1825 Connecticut Avenue NW, Suite 400, Washington, DC 20009. As used below, “CRM” refers to Calvert Research and Management. Each Director oversees 39 funds in the Calvert fund complex. Each officer serves as an officer of certain other Calvert funds.
| Name and Year of Birth | Corporation
Position(s) | Position
Start Date | Principal Occupation(s) and Other Directorships
During Past Five Years and Other Relevant Experience | |
| Interested Director | |
John H. Streur(1)
1960 | Director &
President | 2015 | President and Chief Executive Officer of Calvert Research and
Management (since December 31, 2016). President and Chief Executive
Officer of Calvert Investments, Inc. (January 2015 - December 2016);
Chief Executive Officer of Calvert Investment Distributors, Inc. (August
2015 - December 2016); Chief Compliance Officer of Calvert Investment
Management, Inc. (August 2015 - April 2016); President and Director, Portfolio 21 Investments, Inc. (through October 2014); President,
Chief Executive Officer and Director, Managers Investment Group LLC
(through January 2012); President and Director, The Managers Funds
and Managers AMG Funds (through January 2012).
Other Directorships in the Last Five Years. Portfolio 21 Investments,
Inc. (asset management) (through October 2014); Managers Investment
Group LLC (asset management) (through January 2012); The Managers
Funds (asset management) (through January 2012); Managers AMG Funds
(asset management) (through January 2012); Calvert Impact Capital, Inc. | |
| Independent Directors | |
Richard L. Baird, Jr.
1948 | Director | 2005 | Regional Disaster Recovery Lead, American Red Cross of Greater
Pennsylvania (since 2017). Volunteer, American Red Cross (since 2015).
Former President and CEO of Adagio Health Inc. (retired in 2014) in
Pittsburgh, PA.
Other Directorships in the Last Five Years. None. | |
Alice Gresham Bullock
1950 | Chair &
Director | 2016 | Professor Emerita at Howard University School of Law. Dean Emerita of
Howard University School of Law and Deputy Director of the Association
of American Law Schools (1992-1994).
Other Directorships in the Last Five Years. None. | |
Cari M. Dominguez
1949 | Director | 2016 | Former Chair of the U.S. Equal Employment Opportunity Commission.
Other Directorships in the Last Five Years. Manpower, Inc. (employment
agency); Triple S Management Corporation (managed care); National
Association of Corporate Directors. | |
John G. Guffey, Jr.(2)
1948 | Director | 1992 | President of Aurora Press Inc., a privately held publisher of trade
paperbacks (since January 1997).
Other Directorships in the Last Five Years. Calvert Impact Capital, Inc.
(through December 31, 2018); Calvert Ventures, LLC. | |
Miles D. Harper, III
1962 | Director | 2005 | Partner, Carr Riggs & Ingram (public accounting firm) since October 2014.
Partner, Gainer Donnelly & Desroches (public accounting firm) (now Carr
Riggs & Ingram), (November 1999-September 2014).
Other Directorships in the Last Five Years. Bridgeway Funds (9) (asset
management). | |
Joy V. Jones
1950 | Director | 2005 | Attorney.
Other Directorships in the Last Five Years. Conduit Street Restaurants
SUD 2 Limited; Palm Management Restaurant Corporation. | |
Calvert
Mid-Cap Fund
September 30, 2020
Management and Organization — continued
| Name and Year of Birth | Corporation
Position(s) | Position
Start Date | Principal Occupation(s) and Other Directorships
During Past Five Years and Other Relevant Experience | |
| Independent Directors (continued) |
Anthony A. Williams
1951 | Director | 2016 | CEO and Executive Director of the Federal City Council (July 2012 to
present); Senior Adviser and Independent Consultant for King and
Spalding LLP (September 2015 to present); Executive Director of Global
Government Practice at the Corporate Executive Board (January 2010 to
January 2012).
Other Directorships in the Last Five Years. Freddie Mac; Evoq
Properties/Meruelo Maddux Properties, Inc. (real estate management);
Weston Solutions, Inc. (environmental services); Bipartisan Policy Center’s
Debt Reduction Task Force; Chesapeake Bay Foundation; Catholic
University of America; Urban Institute (research organization). | |
| Name and Year of Birth | Corporation
Position(s) | Position
Start Date | Principal Occupation(s)
During Past Five Years | |
| Principal Officers who are not Directors | |
Hope L. Brown
1973 | Chief
Compliance
Officer | 2014 | Chief Compliance Officer of 39 registered investment companies advised
by CRM (since 2014). Vice President and Chief Compliance Officer,
Wilmington Funds (2012-2014). | |
Maureen A. Gemma(3)
1960 | Secretary,
Vice President
and Chief
Legal Officer | 2016 | Vice President of CRM and officer of 39 registered investment
companies advised by CRM (since 2016). Also Vice President of
Eaton Vance and certain of its affiliates and officer of 156 registered
investment companies advised or administered by Eaton Vance. | |
James F. Kirchner(3)
1967 | Treasurer | 2016 | Vice President of CRM and officer of 39 registered investment companies
advised by CRM (since 2016). Also Vice President of Eaton Vance and
certain of its affiliates and officer of 156 registered investment companies
advised or administered by Eaton Vance. | |
| (1) Mr. Streur is an interested person of the Fund because of his positions with the Fund’s adviser and certain affiliates. | |
| (2) Mr. Guffey is currently married to Rebecca L. Adamson, who served as a member of the Advisory Council through December 31, 2019. | |
| (3) The business address for Ms. Gemma and Mr. Kirchner is Two International Place, Boston, MA 02110. | |
The SAI for the Fund includes additional information about the Directors and officers of the Fund and can be obtained without charge on Calvert’s website at www.calvert.com or by calling 1-800-368-2745.
Privacy. The Eaton Vance organization is committed to ensuring your financial privacy. Each entity listed below has adopted a privacy policy and procedures (“Privacy Program”) Eaton Vance believes is reasonably designed to protect your personal information and to govern when and with whom Eaton Vance may share your personal information.
| • | At the time of opening an account, Eaton Vance generally requires you to provide us with certain information such as name, address, social security number, tax status, account numbers, and account balances. This information is necessary for us to both open an account for you and to allow us to satisfy legal requirements such as applicable anti-money laundering reviews and know-your-customer requirements. |
| • | On an ongoing basis, in the normal course of servicing your account, Eaton Vance may share your information with unaffiliated third parties that perform various services for Eaton Vance and/or your account. These third parties include transfer agents, custodians, broker/dealers and our professional advisers, including auditors, accountants, and legal counsel. Eaton Vance may additionally share your personal information with our affiliates. |
| • | We believe our Privacy Program is reasonably designed to protect the confidentiality of your personal information and to prevent unauthorized access to that information. |
| • | We reserve the right to change our Privacy Program at any time upon proper notification to you. You may want to review our Privacy Program periodically for changes by accessing the link on our homepage: www.calvert.com. |
Our pledge of protecting your personal information applies to the following entities within the Eaton Vance organization: the Eaton Vance Family of Funds, Eaton Vance Management, Eaton Vance Investment Counsel, Eaton Vance Distributors, Inc., Eaton Vance Trust Company, Eaton Vance Management (International) Limited, Eaton Vance Advisers International Ltd., Eaton Vance Global Advisors Limited, Eaton Vance Management's Real Estate Investment Group, Boston Management and Research, Calvert Research and Management, and Calvert Funds. This Privacy Notice supersedes all previously issued privacy disclosures. For more information about our Privacy Program or about how your personal information may be used, please call 1-800-368-2745.
Delivery of Shareholder Documents. The Securities and Exchange Commission (SEC) permits funds to deliver only one copy of shareholder documents, including prospectuses, proxy statements and shareholder reports, to fund investors with multiple accounts at the same residential or post office box address. This practice is often called “householding” and it helps eliminate duplicate mailings to shareholders. Calvert funds, or your financial intermediary, may household the mailing of your documents indefinitely unless you instruct Calvert funds, or your financial intermediary, otherwise. If you would prefer that your Calvert fund documents not be householded, please contact Calvert funds at 1-800-368-2745, or contact your financial intermediary. Your instructions that householding not apply to delivery of your Calvert fund documents will typically be effective within 30 days of receipt by Calvert funds or your financial intermediary. Separate statements will be generated for each separate account and will be householded as described above.
Portfolio Holdings. Each Calvert fund files a schedule of portfolio holdings on Part F to Form N-PORT with the SEC. Certain information filed on Form N-PORT may be viewed on the Calvert website at www.calvert.com, by calling Calvert at 1-800-368-2745 or in the EDGAR database on the SEC’s website at www.sec.gov.
Proxy Voting. The Proxy Voting Guidelines that each Calvert fund uses to determine how to vote proxies relating to portfolio securities is provided as an Appendix to the fund’s Statement of Additional Information. The Statement of Additional Information can be obtained free of charge by calling the Calvert funds at 1-800-368-2745, by visiting the Calvert funds’ website at www.calvert.com or visiting the SEC’s website at www.sec.gov. Information regarding how a Calvert fund voted proxies relating to portfolio securities during the most recent 12-month period ended June 30 is available by calling Calvert funds, by visiting the Calvert funds’ website at www.calvert.com or by visiting the SEC’s website at www.sec.gov.
This Page Intentionally Left Blank
Investment Adviser and Administrator
Calvert Research and Management
1825 Connecticut Avenue NW, Suite 400
Washington, DC 20009
Principal Underwriter*
Eaton Vance Distributors, Inc.
Two International Place
Boston, MA 02110
(617) 482-8260
Custodian
State Street Bank and Trust Company
State Street Financial Center, One Lincoln Street
Boston, MA 02111
Transfer Agent
DST Asset Manager Solutions, Inc.
2000 Crown Colony Drive
Quincy, MA 02169
Independent Registered Public Accounting Firm
KPMG LLP
1601 Market Street
Philadelphia, PA 19103-2499
Fund Offices
1825 Connecticut Avenue NW, Suite 400
Washington, DC 20009
* FINRA BrokerCheck. Investors may check the background of their Investment Professional by contacting the Financial Industry Regulatory Authority (FINRA). FINRA BrokerCheck is a free tool to help investors check the professional background of current and former FINRA-registered securities firms and brokers. FINRA BrokerCheck is available by calling 1-800-289-9999 and at www.FINRA.org. The FINRA BrokerCheck brochure describing this program is available to investors at www.FINRA.org.
Printed on recycled paper.
Calvert
International Opportunities Fund
Annual Report
September 30, 2020
Important Note. Beginning on January 1, 2021, as permitted by regulations adopted by the Securities and Exchange Commission, paper copies of the Fund’s annual and semi-annual shareholder reports will no longer be sent by mail unless you specifically request paper copies of the reports. Instead, the reports will be made available on the Fund’s website (calvert.com/prospectus), and you will be notified by mail each time a report is posted and provided with a website address to access the report.
If you already elected to receive shareholder reports electronically, you will not be affected by this change and you need not take any action. If you are a direct investor, you may elect to receive shareholder reports and other communications from the Fund electronically by signing up for e-Delivery at calvert.com. If you own your shares through a financial intermediary (such as a broker-dealer or bank), you must contact your financial intermediary to sign up.
You may elect to receive all future Fund shareholder reports in paper free of charge. If you are a direct investor, you can inform the Fund that you wish to continue receiving paper copies of your shareholder reports by calling 1-800-368-2745. If you own these shares through a financial intermediary, you must contact your financial intermediary or follow instructions included with this disclosure, if applicable, to elect to continue to receive paper copies of your shareholder reports. Your election to receive reports in paper will apply to all Calvert funds held directly or to all funds held through your financial intermediary, as applicable.
E-Delivery Sign-Up - Details Inside
Commodity Futures Trading Commission Registration. Effective December 31, 2012, the Commodity Futures Trading Commission (“CFTC”) adopted certain regulatory changes that subject registered investment companies and advisers to regulation by the CFTC if a fund invests more than a prescribed level of its assets in certain CFTC-regulated instruments (including futures, certain options and swap agreements) or markets itself as providing investment exposure to such instruments. The adviser has claimed an exclusion from the definition of “commodity pool operator” under the Commodity Exchange Act with respect to its management of the Fund and the other funds it manages. Accordingly, neither the Fund nor the adviser is subject to CFTC regulation.
Fund shares are not insured by the FDIC and are not deposits or other obligations of, or guaranteed by, any depository institution. Shares are subject to investment risks, including possible loss of principal invested.
This report must be preceded or accompanied by a current summary prospectus or prospectus. Before investing, investors should consider carefully the investment objective, risks, and charges and expenses of a mutual fund. This and other important information is contained in the summary prospectus and prospectus, which can be obtained from a financial intermediary. Prospective investors should read the prospectus carefully before investing. For further information, please call 1-800-368-2745.
Choose Planet-friendly E-delivery!
Sign up now for on-line statements, prospectuses, and fund reports. In less than five minutes you can help reduce paper mail and lower fund costs.
Just go to www.calvert.com. If you already have an online account with the Calvert funds, click on Login to access your Account and select the documents you would like to receive via e-mail.
If you’re new to online account access, click on Login, then Register to create your user name and password. Once you’re in, click on the E-delivery sign-up on the Account Portfolio page and follow the quick, easy steps.
Note: If your shares are not held directly with the Calvert funds but through a brokerage firm, you must contact your broker for electronic delivery options available through their firm.
Annual Report September 30, 2020
Calvert
International Opportunities Fund
Calvert
International Opportunities Fund
September 30, 2020
Management's Discussion of Fund Performance†
Economic and Market Conditions
The 12-month period that began October 1, 2019, included some of the best and worst equity performances in over a decade.
The period began with global equities rallying in the closing months of 2019, supported by interest-rate reductions by dozens of central banks worldwide. In July 2019, the U.S. Federal Reserve (the Fed) had cut rates for the first time in over a decade, followed by two additional rate cuts in September and October.
In January 2020, however, news of the novel coronavirus outbreak in China began to raise investor concerns. As the virus turned into a global pandemic in February and March, it ended the longest-ever U.S. economic expansion and brought about a global economic slowdown. Equity markets along with credit markets declined in value amid unprecedented volatility.
In response, the Fed announced two emergency rate cuts in March 2020 — lowering the federal funds rate to 0.00%-0.25% — along with other measures designed to shore up the markets. Across the globe, other central banks and governments also commenced aggressive monetary and fiscal responses to help mitigate the economic effects of the virus.
These moves helped calm the markets and initiated a global equity rally that began in late March and lasted through August. In the second quarter of 2020, U.S. stocks reported their best quarterly returns since 1998 — on the heels of the worst first quarter for American stocks since the 2007-2008 global financial crisis. As with U.S. equities, overseas stock indexes reflected investor optimism as economies started to emerge from coronavirus lockdowns and factories resumed production.
In September 2020, however, the equity rally stalled as the pandemic appeared to increase its drag on the global economy. Across Europe, nations that seemed to have beaten back the coronavirus during the summer began to brace for a second wave of infections. In the U.S., coronavirus cases were on the rise in more than 30 states. Of the 22 million U.S. jobs lost in the early months of the pandemic, only 11 million jobs had returned, and 26.5 million Americans were collecting unemployment benefits. Reflecting the increasingly grim economic outlook for fall and winter, most major global stock indexes reported negative returns for the final month of the period.
For the period as a whole, positive equity returns belied the dramatic volatility during the period. The MSCI World Index, a broad measure of global equities, returned 10.41%; while the S&P 500® Index, a broad measure of U.S. stocks, returned 15.15%; and the technology-laden Nasdaq Composite Index returned 40.96%. The MSCI EAFE Index of developed-market international equities returned 0.49%; while the MSCI Emerging Markets Index returned 10.54% in U.S. dollars.
Fund Performance
For the 12-month period ended September 30, 2020, Calvert International Opportunities Fund (the Fund) returned 12.57% for Class A shares at net asset value, outperforming the Fund’s benchmark, the MSCI EAFE Small/Mid Cap Index (the Index), which returned 5.26%.
Stock selection in the Fund was the leading contributor to outperformance during the period. Selections in industrials, consumer discretionary, real estate, and financials were especially beneficial. Although the Fund does not seek to outperform by favoring or avoiding specific regions or sectors, the Fund’s underweight exposure to the energy sector, and overweight exposure to the consumer staples and information technology sectors also contributed. An overweight exposure to European and Japanese stocks as well as stock selections in Europe also enhanced performance. While stock selections contributed overall, selections in some sectors detracted, notably in utilities, consumer staples, and communication services. An overweight exposure to U.S. equities also detracted during the period.
China Meidong Auto Holdings, Ltd., a Hong Kong-listed Chinese auto dealer that sells premium and luxury car brands, performed well as demand recovered once the COVID-19 outbreak showed signs of being under control in China. In addition, consumption trends favored premium brands as prospective buyers sought to upgrade their cars.
Games Workshop Group PLC, a consumer discretionary company in the U.K., is a tabletop gaming company whose stock price rose steadily with the advent of the COVID-19 pandemic. With stay-at-home mandates imposed worldwide to control the virus’ spread, sales of games skyrocketed as people sought to entertain themselves while being confined.
Indutrade AB (Indutrade), of Sweden, is a diversified technology and industrial business holding company in the industrials sector. Indutrade’s stock began to climb with the onset of the COVID-19 pandemic as it maintained strong earnings despite weak demand in many of its businesses. Profitability increased overall largely on the strength of Indutrade’s businesses with medical technology, pharmaceuticals, and energy customers.
Melrose Industries PLC, a London-based buyer and seller of underperforming businesses, was a leading detractor during the period. Its stock fell as sales in many of its businesses, including aerospace, automotive, and powder metallurgy, dropped sharply with the onset of the pandemic. By period-end, the stock was sold from the Fund.
SpareBank 1 SR-Bank ASA, a regional bank in Norway, was among the top detractors during the period. Its stock price fell along with many banks worldwide with the onset of the pandemic as investors worried that earnings might weaken and dividends may be cut as a result of lower interest rates and rising loan defaults.
See Endnotes and Additional Disclosures in this report.
Past performance is no guarantee of future results. Returns are historical and are calculated by determining the percentage change in net asset value (NAV) or offering price (as applicable) with all distributions reinvested. Investment return and principal value will fluctuate so that shares, when redeemed, may be worth more or less than their original cost. Performance for periods less than or equal to one year is cumulative. Performance is for the stated time period only; due to market volatility, current Fund performance may be lower or higher than the quoted return. For performance as of the most recent month-end, please refer to www.calvert.com.
Calvert
International Opportunities Fund
September 30, 2020
Management's Discussion of Fund Performance† — continued
Another leading detractor, CAE, Inc., a Canadian company that provides pilot training for the commercial airline and defense industries, was also adversely affected by the pandemic. Demand for the company’s training for commercial pilots shrank as air travel declined. By period-end, the stock was sold from the Fund.
See Endnotes and Additional Disclosures in this report.
Past performance is no guarantee of future results. Returns are historical and are calculated by determining the percentage change in net asset value (NAV) or offering price (as applicable) with all distributions reinvested. Investment return and principal value will fluctuate so that shares, when redeemed, may be worth more or less than their original cost. Performance for periods less than or equal to one year is cumulative. Performance is for the stated time period only; due to market volatility, current Fund performance may be lower or higher than the quoted return. For performance as of the most recent month-end, please refer to www.calvert.com.
Calvert
International Opportunities Fund
September 30, 2020
Performance
Portfolio Manager Aidan M. Farrell of Eaton Vance Global Advisors Limited
| % Average Annual Total Returns1,2 | Class
Inception Date | Performance
Inception Date | One Year | Five Years | Ten Years |
| Class A at NAV | 05/31/2007 | 05/31/2007 | 12.57% | 8.78% | 7.14% |
| Class A with 4.75% Maximum Sales Charge | — | — | 7.20 | 7.72 | 6.62 |
| Class C at NAV | 07/31/2007 | 05/31/2007 | 11.68 | 7.91 | 6.26 |
| Class C with 1% Maximum Sales Charge | — | — | 10.68 | 7.91 | 6.26 |
| Class I at NAV | 05/31/2007 | 05/31/2007 | 12.77 | 9.11 | 7.56 |
| Class R6 at NAV | 02/01/2019 | 05/31/2007 | 12.87 | 9.13 | 7.57 |
|
| MSCI EAFE Small/Mid Cap Index | — | — | 5.26% | 6.71% | 6.54% |
| % Total Annual Operating Expense Ratios3 | Class A | Class C | Class I | Class R6 |
| Gross | 1.37% | 2.12% | 1.12% | 1.08% |
| Net | 1.34 | 2.09 | 1.09 | 1.05 |
Growth of $10,000
This graph shows the change in value of a hypothetical investment of $10,000 in Class A of the Fund for the period indicated. For comparison, the same investment is shown in the indicated index.
| Growth of Investment2 | Amount Invested | Period Beginning | At NAV | With Maximum Sales Charge |
| Class C | $10,000 | 09/30/2010 | $18,362 | N.A. |
| Class I | $250,000 | 09/30/2010 | $518,250 | N.A. |
| Class R6 | $1,000,000 | 09/30/2010 | $2,074,887 | N.A. |
See Endnotes and Additional Disclosures in this report.
Past performance is no guarantee of future results. Returns are historical and are calculated by determining the percentage change in net asset value (NAV) or offering price (as applicable) with all distributions reinvested. Investment return and principal value will fluctuate so that shares, when redeemed, may be worth more or less than their original cost. Performance for periods less than or equal to one year is cumulative. Performance is for the stated time period only; due to market volatility, current Fund performance may be lower or higher than the quoted return. For performance as of the most recent month-end, please refer to www.calvert.com.
Calvert
International Opportunities Fund
September 30, 2020
Sector Allocation (% of net assets)*
* Excludes cash and cash equivalents.
| Top 10 Holdings (% of net assets)* | |
| Sika AG | 1.8% |
| Halma PLC | 1.7 |
| AddTech AB | 1.6 |
| IMCD NV | 1.6 |
| Indutrade AB | 1.5 |
| Interpump Group SpA | 1.5 |
| Diploma PLC | 1.5 |
| Nohmi Bosai, Ltd. | 1.4 |
| Games Workshop Group PLC | 1.4 |
| Nabtesco Corp. | 1.4 |
| Total | 15.4% |
| * | Excludes cash and cash equivalents. |
See Endnotes and Additional Disclosures in this report.
Calvert
International Opportunities Fund
September 30, 2020
Endnotes and Additional Disclosures
| † | The views expressed in this report are those of the portfolio manager(s) and are current only through the date stated at the top of this page. These views are subject to change at any time based upon market or other conditions, and Calvert and the Fund(s) disclaim any responsibility to update such views. These views may not be relied upon as investment advice and, because investment decisions are based on many factors, may not be relied upon as an indication of trading intent on behalf of any Calvert fund. This commentary may contain statements that are not historical facts, referred to as “forward-looking statements.” The Fund’s actual future results may differ significantly from those stated in any forward-looking statement, depending on factors such as changes in securities or financial markets or general economic conditions, the volume of sales and purchases of Fund shares, the continuation of investment advisory, administrative and service contracts, and other risks discussed from time to time in the Fund’s filings with the Securities and Exchange Commission. |
| | |
| 1 | MSCI EAFE Small/Mid Cap Index is an unmanaged index of small & mid-capitalization equities in the developed markets, excluding the U.S. and Canada. MSCI indexes are net of foreign withholding taxes. Source: MSCI. MSCI data may not be reproduced or used for any other purpose. MSCI provides no warranties, has not prepared or approved this report, and has no liability hereunder. Unless otherwise stated, index returns do not reflect the effect of any applicable sales charges, commissions, expenses, taxes or leverage, as applicable. It is not possible to invest directly in an index. |
| 2 | Total Returns at NAV do not include applicable sales charges. If sales charges were deducted, the returns would be lower. Total Returns shown with maximum sales charge reflect the stated maximum sales charge. Unless otherwise stated, performance does not reflect the deduction of taxes on Fund distributions or redemptions of Fund shares.Performance prior to the inception date of a class may be linked to the performance of an older class of the Fund. This linked performance is adjusted for any applicable sales charge, but is not adjusted for class expense differences. If adjusted for such differences, the performance would be different. The performance of Class R6 is linked to Class I. Performance presented in the Financial Highlights included in the financial statements is not linked.Calvert Research and Management became the investment adviser to the Fund on December 31, 2016. Performance reflected prior to such date is that of the Fund’s former investment adviser. |
| 3 | Source: Fund prospectus. Net expense ratios reflect a contractual expense reimbursement that continues through 1/31/21. Without the reimbursement, performance would have been lower. The expense ratios for the current reporting period can be found in the Financial Highlights section of this report. |
| Fund profile subject to change due to active management. |
| | Additional Information |
| | MSCI World Index is an unmanaged index of equity securities in the developed markets. MSCI EAFE Index is an unmanaged index of equities in the developed markets, excluding the U.S. and Canada. MSCI Emerging Markets Index is an unmanaged index of emerging markets common stocks. MSCI indexes are net of foreign withholding taxes. Source: MSCI. MSCI data may not be reproduced or used for any other purpose. MSCI provides no warranties, has not prepared or approved this report, and has no liability hereunder. S&P 500® Index is an unmanaged index of large-cap stocks commonly used as a measure of U.S. stock market performance. S&P Dow Jones Indices are a product of S&P Dow Jones Indices LLC (“S&P DJI”) and have been licensed for use. S&P® and S&P 500® are registered trademarks of S&P DJI; Dow Jones® is a registered trademark of Dow Jones Trademark Holdings LLC (“Dow Jones”); S&P DJI, Dow Jones and their respective affiliates do not sponsor, endorse, sell or promote the Fund, will not have any liability with respect thereto and do not have any liability for any errors, omissions, or interruptions of the S&P Dow Jones Indices. Nasdaq Composite Index is a market capitalization-weighted index of all domestic and international securities listed on Nasdaq. Source: Nasdaq, Inc. The information is provided by Nasdaq (with its affiliates, are referred to as the “Corporations”) and Nasdaq's third party licensors on an “as is” basis and the Corporations make no guarantees and bear no liability of any kind with respect to the information or the Fund. |
Calvert
International Opportunities Fund
September 30, 2020
Example
As a Fund shareholder, you incur two types of costs: (1) transaction costs, including sales charges (loads) on purchases and redemption fees (if applicable); and (2) ongoing costs, including management fees; distribution and/or service fees; and other Fund expenses. This Example is intended to help you understand your ongoing costs (in dollars) of Fund investing and to compare these costs with the ongoing costs of investing in other mutual funds. The Example is based on an investment of $1,000 invested at the beginning of the period and held for the entire period (April 1, 2020 to September 30, 2020).
Actual Expenses
The first section of the table below provides information about actual account values and actual expenses. You may use the information in this section, together with the amount you invested, to estimate the expenses that you paid over the period. Simply divide your account value by $1,000 (for example, an $8,600 account value divided by $1,000 = 8.6), then multiply the result by the number in the first section under the heading entitled “Expenses Paid During Period” to estimate the expenses you paid on your account during this period.
Hypothetical Example for Comparison Purposes
The second section of the table below provides information about hypothetical account values and hypothetical expenses based on the actual Fund expense ratio and an assumed rate of return of 5% per year (before expenses), which is not the actual Fund return. The hypothetical account values and expenses may not be used to estimate the actual ending account balance or expenses you paid for the period. You may use this information to compare the ongoing costs of investing in the Fund and other funds. To do so, compare this 5% hypothetical example with the 5% hypothetical examples that appear in the shareholder reports of the other funds.
Please note that the expenses shown in the table are meant to highlight your ongoing costs only and do not reflect any transactional costs, such as sales charges (loads) or redemption fees (if applicable). Therefore, the second section of the table is useful in comparing ongoing costs only, and will not help you determine the relative total costs of owning different funds. In addition, if these transactional costs were included, your costs would be higher.
| | Beginning
Account Value
(4/1/20) | Ending
Account Value
(9/30/20) | Expenses Paid
During Period*
(4/1/20 – 9/30/20) | Annualized
Expense
Ratio |
| Actual | | | | |
| Class A | $1,000.00 | $1,343.00 | $ 7.73 | 1.32% |
| Class C | $1,000.00 | $1,337.70 | $12.21 | 2.09% |
| Class I | $1,000.00 | $1,344.50 | $ 6.27 | 1.07% |
| Class R6 | $1,000.00 | $1,344.50 | $ 5.86 | 1.00% |
| Hypothetical | | | | |
| (5% return per year before expenses) | | | | |
| Class A | $1,000.00 | $1,018.40 | $ 6.66 | 1.32% |
| Class C | $1,000.00 | $1,014.55 | $10.53 | 2.09% |
| Class I | $1,000.00 | $1,019.65 | $ 5.40 | 1.07% |
| Class R6 | $1,000.00 | $1,020.00 | $ 5.05 | 1.00% |
| * | Expenses are equal to the Fund's annualized expense ratio for the indicated Class, multiplied by the average account value over the period, multiplied by 183/366 (to reflect the one-half year period). The Example assumes that the $1,000 was invested at the net asset value per share determined at the close of business on March 31, 2020. |
Calvert
International Opportunities Fund
September 30, 2020
| Security | Shares | Value |
| Australia — 5.2% | |
| Bapcor, Ltd.(1) | | 812,121 | $ 3,993,620 |
| BlueScope Steel, Ltd. | | 78,093 | 719,534 |
| Bravura Solutions, Ltd.(1) | | 1,132,172 | 2,792,503 |
| carsales.com, Ltd. | | 213,654 | 3,200,643 |
| Dexus | | 348,699 | 2,233,387 |
| Magellan Financial Group, Ltd. | | 39,210 | 1,617,176 |
| Steadfast Group, Ltd. | | 650,795 | 1,512,990 |
| WiseTech Global, Ltd.(1) | | 190,090 | 3,560,331 |
| | | | $ 19,630,184 |
| Austria — 1.0% | |
| BAWAG Group AG(2)(3) | | 71,799 | $ 2,595,865 |
| CA Immobilien Anlagen AG | | 43,287 | 1,279,650 |
| | | | $ 3,875,515 |
| Belgium — 1.2% | |
| Barco NV | | 80,045 | $ 1,679,625 |
| KBC Groep NV | | 52,986 | 2,657,039 |
| | | | $ 4,336,664 |
| Canada — 3.3% | |
| Agnico Eagle Mines, Ltd. | | 20,591 | $ 1,640,569 |
| Boyd Group Services, Inc. | | 14,476 | 2,235,950 |
| BRP, Inc. | | 64,475 | 3,406,418 |
| Granite Real Estate Investment Trust | | 50,668 | 2,940,650 |
| TMX Group, Ltd. | | 21,009 | 2,160,619 |
| | | | $ 12,384,206 |
| China — 1.3% | |
| China Meidong Auto Holdings, Ltd. | | 1,300,851 | $ 5,011,616 |
| | | | $ 5,011,616 |
| Denmark — 0.5% | |
| Topdanmark A/S | | 40,040 | $ 1,938,132 |
| | | | $ 1,938,132 |
| France — 0.8% | |
| Rubis SCA | | 76,111 | $ 3,047,230 |
| | | | $ 3,047,230 |
| Germany — 5.1% | |
| AIXTRON SE(3) | | 175,344 | $ 2,115,619 |
| Carl Zeiss Meditec AG | | 19,042 | 2,405,015 |
| Jenoptik AG | | 75,161 | 2,015,281 |
| LEG Immobilien AG | | 28,290 | 4,032,422 |
| Norma Group SE | | 89,141 | 2,762,339 |
| Security | Shares | Value |
| Germany (continued) | |
| Rational AG | | 3,149 | $ 2,461,809 |
| Salzgitter AG(3) | | 13,290 | 219,327 |
| TeamViewer AG(2)(3) | | 68,771 | 3,391,774 |
| | | | $ 19,403,586 |
| Hong Kong — 0.5% | |
| CITIC Telecom International Holdings, Ltd. | | 6,117,466 | $ 1,956,897 |
| | | | $ 1,956,897 |
| Ireland — 3.4% | |
| Irish Residential Properties REIT PLC | | 1,676,166 | $ 2,773,401 |
| Kerry Group PLC, Class A | | 24,635 | 3,155,387 |
| Kingspan Group PLC(3) | | 40,654 | 3,699,768 |
| UDG Healthcare PLC | | 313,685 | 3,120,217 |
| | | | $ 12,748,773 |
| Israel — 0.5% | |
| Amot Investments, Ltd. | | 380,367 | $ 1,738,278 |
| | | | $ 1,738,278 |
| Italy — 6.0% | |
| Amplifon SpA(3) | | 105,108 | $ 3,758,703 |
| Banca Farmafactoring SpA(2)(3) | | 624,549 | 3,512,483 |
| DiaSorin SpA | | 11,515 | 2,316,724 |
| FinecoBank Banca Fineco SpA(3) | | 181,719 | 2,502,945 |
| Interpump Group SpA | | 151,814 | 5,629,927 |
| MARR SpA(3) | | 98,820 | 1,587,862 |
| Moncler SpA(3) | | 76,351 | 3,124,400 |
| | | | $ 22,433,044 |
| Japan — 27.9% | |
| Asahi Co., Ltd. | | 72,767 | $ 1,277,918 |
| Chiba Bank, Ltd. (The)(1) | | 485,182 | 2,677,106 |
| Daiichikosho Co., Ltd. | | 51,958 | 1,668,757 |
| FP Corp.(1) | | 105,060 | 4,425,093 |
| Fukuoka Financial Group, Inc. | | 132,608 | 2,228,864 |
| Invesco Office J-REIT, Inc. | | 19,150 | 2,652,876 |
| Itochu Techno-Solutions Corp. | | 136,010 | 5,159,598 |
| J. Front Retailing Co., Ltd.(1) | | 343,283 | 2,485,325 |
| Japan Hotel REIT Investment Corp.(1) | | 4,507 | 2,226,928 |
| Japan Lifeline Co., Ltd. | | 172,333 | 2,286,635 |
| Kewpie Corp. | | 84,033 | 1,728,373 |
| Kose Corp. | | 19,961 | 2,443,976 |
| K's Holdings Corp. | | 242,305 | 3,280,320 |
| Kuraray Co., Ltd. | | 383,040 | 3,716,464 |
| Kyoritsu Maintenance Co., Ltd. | | 91,678 | 3,402,058 |
| Lion Corp. | | 184,906 | 3,795,952 |
| Makita Corp. | | 93,844 | 4,491,307 |
8
See Notes to Financial Statements.
Calvert
International Opportunities Fund
September 30, 2020
Schedule of Investments — continued
| Security | Shares | Value |
| Japan (continued) | |
| Mitsui Fudosan Logistics Park, Inc.(1) | | 1,037 | $ 4,955,481 |
| Miura Co., Ltd. | | 100,686 | 4,938,547 |
| Morinaga & Co., Ltd. | | 82,470 | 3,254,167 |
| Nabtesco Corp. | | 147,463 | 5,353,845 |
| Nohmi Bosai, Ltd.(1) | | 237,280 | 5,442,197 |
| Nomura Co., Ltd. | | 336,744 | 2,505,360 |
| OSG Corp. | | 175,122 | 2,806,012 |
| Penta-Ocean Construction Co., Ltd. | | 592,595 | 3,885,230 |
| Sakata Seed Corp. | | 79,937 | 2,870,077 |
| Sankyu, Inc. | | 91,832 | 3,626,522 |
| Ship Healthcare Holdings, Inc. | | 89,427 | 4,378,998 |
| Sumco Corp. | | 203,028 | 2,864,538 |
| Tosei Corp. | | 353,300 | 3,288,884 |
| Yamaha Corp. | | 105,662 | 5,067,635 |
| | | | $ 105,185,043 |
| Luxembourg — 0.2% | |
| APERAM S.A. | | 21,929 | $ 617,018 |
| | | | $ 617,018 |
| Netherlands — 3.6% | |
| Aalberts NV | | 143,049 | $ 5,143,981 |
| Core Laboratories NV | | 16,668 | 254,354 |
| Euronext NV(2) | | 17,516 | 2,194,160 |
| IMCD NV | | 50,410 | 5,995,499 |
| | | | $ 13,587,994 |
| New Zealand — 0.7% | |
| Fisher & Paykel Healthcare Corp., Ltd. | | 126,074 | $ 2,782,520 |
| | | | $ 2,782,520 |
| Norway — 1.4% | |
| Entra ASA(1)(2) | | 258,161 | $ 3,627,921 |
| SpareBank 1 SR-Bank ASA(3) | | 151,527 | 1,253,936 |
| TGS NOPEC Geophysical Co. ASA | | 38,715 | 472,478 |
| | | | $ 5,354,335 |
| Portugal — 0.5% | |
| NOS SGPS S.A. | | 514,106 | $ 1,822,769 |
| | | | $ 1,822,769 |
| Singapore — 0.8% | |
| Frasers Logistics & Commercial Trust | | 2,930,900 | $ 3,000,977 |
| | | | $ 3,000,977 |
| Spain — 0.8% | |
| Acciona S.A.(1) | | 15,810 | $ 1,715,788 |
| Security | Shares | Value |
| Spain (continued) | |
| Inmobiliaria Colonial Socimi S.A. | | 150,500 | $ 1,242,168 |
| | | | $ 2,957,956 |
| Sweden — 7.3% | |
| AddTech AB | | 467,848 | $ 6,129,110 |
| Assa Abloy AB, Class B | | 205,105 | 4,795,379 |
| Autoliv, Inc. | | 21,345 | 1,555,624 |
| Boliden AB | | 69,157 | 2,051,932 |
| Indutrade AB(3) | | 108,135 | 5,788,374 |
| Lagercrantz Group AB, Class B | | 155,065 | 3,127,710 |
| Thule Group AB(2) | | 123,741 | 4,083,391 |
| | | | $ 27,531,520 |
| Switzerland — 7.9% | |
| Belimo Holding AG | | 341 | $ 2,574,556 |
| Bossard Holding AG, Class A | | 20,292 | 3,665,439 |
| Cembra Money Bank AG | | 19,067 | 2,263,048 |
| Galenica AG(2) | | 33,438 | 2,325,170 |
| Logitech International S.A. | | 43,094 | 3,338,152 |
| Partners Group Holding AG | | 3,751 | 3,450,185 |
| Sika AG | | 27,456 | 6,741,866 |
| Straumann Holding AG | | 3,674 | 3,716,623 |
| VZ Holding AG | | 20,927 | 1,866,814 |
| | | | $ 29,941,853 |
| United Kingdom — 16.5% | |
| Abcam PLC | | 206,193 | $ 3,246,230 |
| Avast PLC(2)(3) | | 442,396 | 3,003,469 |
| Bellway PLC | | 61,766 | 1,872,080 |
| Compass Group PLC | | 126,532 | 1,900,734 |
| Cranswick PLC | | 66,148 | 3,095,485 |
| Dechra Pharmaceuticals PLC | | 100,496 | 4,178,604 |
| Diploma PLC | | 194,970 | 5,528,255 |
| First Derivatives PLC | | 45,127 | 1,926,541 |
| Games Workshop Group PLC | | 41,076 | 5,389,207 |
| Grainger PLC | | 580,733 | 2,222,032 |
| Halma PLC | | 206,405 | 6,235,877 |
| Howden Joinery Group PLC | | 447,885 | 3,408,894 |
| InterContinental Hotels Group PLC(3) | | 51,249 | 2,690,080 |
| Judges Scientific PLC | | 51,717 | 3,245,591 |
| Lancashire Holdings, Ltd. | | 227,992 | 2,037,925 |
| Nomad Foods, Ltd.(3) | | 198,361 | 5,054,238 |
| Spirax-Sarco Engineering PLC | | 24,927 | 3,549,646 |
9
See Notes to Financial Statements.
Calvert
International Opportunities Fund
September 30, 2020
Schedule of Investments — continued
| Security | Shares | Value |
| United Kingdom (continued) | |
| St. James's Place PLC | | 309,273 | $ 3,720,675 |
| | | | $ 62,305,563 |
Total Common Stocks
(identified cost $297,874,906) | | | $ 363,591,673 |
| Exchange-Traded Funds — 0.9% |
| Security | Shares | Value |
| Equity Exchange-Traded Fund — 0.9% | |
| Vanguard MSCI Australian Small Companies Index ETF | | 84,564 | $ 3,433,221 |
Total Exchange-Traded Funds
(identified cost $3,422,301) | | | $ 3,433,221 |
| High Social Impact Investments — 0.3% |
| Security | Principal
Amount
(000's omitted) | Value |
| Calvert Impact Capital, Inc., Community Investment Notes, 1.50%, 12/15/20(4)(5) | $ | 1,159 | $ 1,153,307 |
| ImpactAssets, Inc., Global Sustainable Agriculture Notes, 2.07%, 11/3/20(5)(6) | | 111 | 107,452 |
| ImpactAssets, Inc., Microfinance Plus Notes, 0.46%, 11/3/20(5)(6) | | 142 | 122,481 |
Total High Social Impact Investments
(identified cost $1,412,184) | | | $ 1,383,240 |
| Short-Term Investments — 1.4% |
| Other — 0.9% |
| Description | Units | Value |
| Calvert Cash Reserves Fund, LLC, 0.13%(7) | | 3,486,458 | $ 3,486,807 |
Total Other
(identified cost $3,487,078) | | | $ 3,486,807 |
| Securities Lending Collateral — 0.5% |
| Security | Shares | Value |
| State Street Navigator Securities Lending Government Money Market Portfolio, 0.09%(8) | | 1,635,624 | $ 1,635,624 |
Total Securities Lending Collateral
(identified cost $1,635,624) | | | $ 1,635,624 |
Total Short-Term Investments
(identified cost $5,122,702) | | | $ 5,122,431 |
Total Investments — 99.0%
(identified cost $307,832,093) | | $ 373,530,565 |
| Other Assets, Less Liabilities — 1.0% | | $ 3,761,279 |
| Net Assets — 100.0% | | $ 377,291,844 |
The percentage shown for each investment category in the Schedule of Investments is based on net assets.
| |
| (1) | All or a portion of this security was on loan at September 30, 2020. The aggregate market value of securities on loan at September 30, 2020 was $17,865,760. |
| (2) | Security exempt from registration under Rule 144A of the Securities Act of 1933, as amended. These securities may be sold in certain transactions in reliance on an exemption from registration (normally to qualified institutional buyers). At September 30, 2020, the aggregate value of these securities is $24,734,233 or 6.6% of the Fund's net assets. |
| (3) | Non-income producing security. |
| (4) | Affiliated company (see Note 7). |
| (5) | Restricted security. Total market value of restricted securities amounts to $1,383,240, which represents 0.3% of the net assets of the Fund as of September 30, 2020. |
| (6) | Notes carry an interest rate that varies by period and is contingent on the performance of the underlying portfolio of loans to borrowers. The coupon rate shown represents the rate in effect at September 30, 2020. |
| (7) | Affiliated investment company, available to Calvert portfolios and funds, which invests in high quality, U.S. dollar denominated money market instruments. The rate shown is the annualized seven-day yield as of September 30, 2020. |
| (8) | Represents investment of cash collateral received in connection with securities lending. |
At September 30, 2020, the concentration of the Fund’s investments in the various sectors, determined as a percentage of net assets, was as follows:
| Economic Sectors | % of Net Assets |
| Industrials | 25.0% |
| Consumer Discretionary | 12.9 |
| Information Technology | 12.4 |
| Financials | 10.6 |
| Real Estate | 10.1 |
| Health Care | 9.1 |
| Consumer Staples | 7.2 |
| Materials | 5.3 |
| Communication Services | 2.3 |
| Utilities | 1.3 |
| Exchange-Traded Funds | 0.9 |
| High Social Impact Investments | 0.3 |
| Energy | 0.2 |
| Total | 97.6% |
10
See Notes to Financial Statements.
Calvert
International Opportunities Fund
September 30, 2020
Schedule of Investments — continued
Restricted Securities
| Description | Acquisition Dates | Cost |
| Calvert Impact Capital, Inc., Community Investment Notes, 1.50%, 12/15/20 | 12/13/19 | $1,159,184 |
| ImpactAssets, Inc., Global Sustainable Agriculture Notes, 2.07%, 11/3/20 | 11/13/15 | 111,000 |
| ImpactAssets, Inc., Microfinance Plus Notes, 0.46%, 11/3/20 | 11/13/15 | 142,000 |
11
See Notes to Financial Statements.
Calvert
International Opportunities Fund
September 30, 2020
Statement of Assets and Liabilities
| | September 30, 2020 |
| Assets | |
Investments in securities of unaffiliated issuers, at value (identified cost $303,185,831) - including
$17,865,760 of securities on loan | $ 368,890,451 |
| Investments in securities of affiliated issuers, at value (identified cost $4,646,262) | 4,640,114 |
| Receivable for investments sold | 194,882 |
| Receivable for capital shares sold | 4,924,575 |
| Dividends and interest receivable | 631,089 |
| Dividends and interest receivable - affiliated | 14,107 |
| Securities lending income receivable | 3,451 |
| Tax reclaims receivable | 427,758 |
| Directors' deferred compensation plan | 155,442 |
| Total assets | $379,881,869 |
| Liabilities | |
| Payable for capital shares redeemed | $ 351,341 |
| Deposits for securities loaned | 1,635,624 |
| Payable to affiliates: | |
| Investment advisory fee | 227,029 |
| Administrative fee | 36,325 |
| Distribution and service fees | 18,513 |
| Sub-transfer agency fee | 5,408 |
| Directors' deferred compensation plan | 155,442 |
| Accrued expenses | 160,343 |
| Total liabilities | $ 2,590,025 |
| Net Assets | $377,291,844 |
| Sources of Net Assets | |
| Paid-in capital | $ 342,853,951 |
| Distributable earnings | 34,437,893 |
| Total | $377,291,844 |
| Class A Shares | |
| Net Assets | $ 68,939,546 |
| Shares Outstanding | 3,828,108 |
Net Asset Value and Redemption Price Per Share
(net assets ÷ shares of beneficial interest outstanding) | $ 18.01 |
Maximum Offering Price Per Share
(100 ÷ 95.25 of net asset value per share) | $ 18.91 |
| Class C Shares | |
| Net Assets | $ 5,527,305 |
| Shares Outstanding | 315,643 |
Net Asset Value and Offering Price Per Share*
(net assets ÷ shares of beneficial interest outstanding) | $ 17.51 |
| Class I Shares | |
| Net Assets | $ 254,349,724 |
| Shares Outstanding | 14,416,621 |
Net Asset Value, Offering Price and Redemption Price Per Share
(net assets ÷ shares of beneficial interest outstanding) | $ 17.64 |
12
See Notes to Financial Statements.
Calvert
International Opportunities Fund
September 30, 2020
Statement of Assets and Liabilities — continued
| | September 30, 2020 |
| Class R6 Shares | |
| Net Assets | $48,475,269 |
| Shares Outstanding | 2,747,801 |
Net Asset Value, Offering Price and Redemption Price Per Share
(net assets ÷ shares of beneficial interest outstanding) | $ 17.64 |
| | On sales of $50,000 or more, the offering price of Class A shares is reduced. |
| * | Redemption price per share is equal to the net asset value less any applicable contingent deferred sales charge. |
13
See Notes to Financial Statements.
Calvert
International Opportunities Fund
September 30, 2020
| | Year Ended |
| | September 30, 2020 |
| Investment Income | |
| Dividend income (net of foreign taxes withheld of $573,050) | $ 5,983,015 |
| Dividend income - affiliated issuers | 1,268 |
| Interest income | 17,496 |
| Interest income - affiliated issuers | 16,682 |
| Securities lending income, net | 77,899 |
| Total investment income | $ 6,096,360 |
| Expenses | |
| Investment advisory fee | $ 2,627,686 |
| Administrative fee | 420,430 |
| Distribution and service fees: | |
| Class A | 164,135 |
| Class C | 60,027 |
| Directors' fees and expenses | 14,477 |
| Custodian fees | 33,302 |
| Transfer agency fees and expenses | 323,544 |
| Accounting fees | 89,466 |
| Professional fees | 51,704 |
| Registration fees | 87,514 |
| Reports to shareholders | 32,237 |
| Miscellaneous | 52,865 |
| Total expenses | $ 3,957,387 |
| Reimbursement of expenses - other | (5,268) |
| Net expenses | $ 3,952,119 |
| Net investment income | $ 2,144,241 |
| Realized and Unrealized Gain (Loss) | |
| Net realized gain (loss): | |
| Investment securities | $ (15,863,254) |
| Investment securities - affiliated issuers | 471 |
| Foreign currency transactions | 10,956 |
| Net realized loss | $(15,851,827) |
| Change in unrealized appreciation (depreciation): | |
| Investment securities | $ 53,442,102 |
| Investment securities - affiliated issuers | (858) |
| Foreign currency | 30,464 |
| Net change in unrealized appreciation (depreciation) | $ 53,471,708 |
| Net realized and unrealized gain | $ 37,619,881 |
| Net increase in net assets from operations | $ 39,764,122 |
14
See Notes to Financial Statements.
Calvert
International Opportunities Fund
September 30, 2020
Statements of Changes in Net Assets
| | Year Ended September 30, |
| | 2020 | 2019 |
| Increase (Decrease) in Net Assets | | |
| From operations: | | |
| Net investment income | $ 2,144,241 | $ 4,182,082 |
| Net realized loss | (15,851,827) | (11,713,037) |
| Net change in unrealized appreciation (depreciation) | 53,471,708 | (11,553,508) |
| Net increase (decrease) in net assets from operations | $ 39,764,122 | $ (19,084,463) |
| Distributions to shareholders: | | |
| Class A | $ (779,888) | $ (4,792,065) |
| Class C | (27,023) | (508,198) |
| Class I | (3,424,730) | (18,400,110) |
| Class R6 | (698,083) | — |
| Total distributions to shareholders | $ (4,929,724) | $ (23,700,373) |
| Capital share transactions: | | |
| Class A | $ (1,492,764) | $ 7,425,573 |
| Class C | (1,558,025) | (31,653) |
| Class I | 9,133,103 | 23,484,318 |
| Class R6 | (261,820) | 44,198,523 (1) |
| Net increase in net assets from capital share transactions | $ 5,820,494 | $ 75,076,761 |
| Net increase in net assets | $ 40,654,892 | $ 32,291,925 |
| Net Assets | | |
| At beginning of year | $ 336,636,952 | $ 304,345,027 |
| At end of year | $377,291,844 | $336,636,952 |
| (1) | For the period from the commencement of operations, February 1, 2019, to September 30, 2019. |
15
See Notes to Financial Statements.
Calvert
International Opportunities Fund
September 30, 2020
| | Class A |
| | Year Ended September 30, |
| | 2020 | 2019 | 2018 | 2017 | 2016 |
| Net asset value — Beginning of year | $ 16.18 | $ 18.86 | $ 18.70 | $ 14.78 | $ 14.58 |
| Income (Loss) From Operations | | | | | |
| Net investment income(1) | $ 0.07 | $ 0.18 | $ 0.17 | $ 0.03 | $ 0.15(2) |
| Net realized and unrealized gain (loss) | 1.95 | (1.51) | 1.20 | 4.04 | 0.63 |
| Total income (loss) from operations | $ 2.02 | $ (1.33) | $ 1.37 | $ 4.07 | $ 0.78 |
| Less Distributions | | | | | |
| From net investment income | $ (0.19) | $ (0.23) | $ (0.24) | $ (0.15) | $ (0.11) |
| From net realized gain | — | (1.12) | (0.97) | — | (0.47) |
| Total distributions | $ (0.19) | $ (1.35) | $ (1.21) | $ (0.15) | $ (0.58) |
| Net asset value — End of year | $ 18.01 | $ 16.18 | $ 18.86 | $ 18.70 | $ 14.78 |
| Total Return(3) | 12.57% | (6.77)% | 7.62% | 27.89% | 5.49% |
| Ratios/Supplemental Data | | | | | |
| Net assets, end of year (000’s omitted) | $68,940 | $64,070 | $65,994 | $50,552 | $107,429 |
| Ratios (as a percentage of average daily net assets):(4) | | | | | |
| Total expenses | 1.32% | 1.37% | 1.38% | 1.48% | 1.49% |
| Net expenses | 1.32% | 1.35% | 1.38% | 1.48% | 1.46% |
| Net investment income | 0.42% | 1.15% | 0.91% | 0.18% | 1.07% (2) |
| Portfolio Turnover | 62% | 60% | 60% | 158% | 52% |
| (1) | Computed using average shares outstanding. |
| (2) | Amount includes a non-recurring refund for overbilling of prior years' custody out-of-pocket fees. This amounted to $0.006 per share and 0.04% of average net assets. |
| (3) | Returns are historical and are calculated by determining the percentage change in net asset value with all distributions reinvested and do not reflect the effect of sales charges, if any. |
| (4) | Total expenses do not reflect amounts reimbursed and/or waived by the adviser and certain of its affiliates, if applicable. Net expenses are net of all reductions and represent the net expenses paid by the Fund. |
16
See Notes to Financial Statements.
Calvert
International Opportunities Fund
September 30, 2020
Financial Highlights — continued
| | Class C |
| | Year Ended September 30, |
| | 2020 | 2019 | 2018 | 2017 | 2016 |
| Net asset value — Beginning of year | $ 15.74 | $ 18.37 | $ 18.29 | $ 14.43 | $ 14.28 |
| Income (Loss) From Operations | | | | | |
| Net investment income (loss)(1) | $ (0.06) | $ 0.06 | $ 0.03 | $ (0.04) | $ 0.01(2) |
| Net realized and unrealized gain (loss) | 1.90 | (1.47) | 1.18 | 3.91 | 0.61 |
| Total income (loss) from operations | $ 1.84 | $ (1.41) | $ 1.21 | $ 3.87 | $ 0.62 |
| Less Distributions | | | | | |
| From net investment income | $ (0.07) | $ (0.10) | $ (0.16) | $ (0.01) | $ — |
| From net realized gain | — | (1.12) | (0.97) | — | (0.47) |
| Total distributions | $ (0.07) | $ (1.22) | $ (1.13) | $ (0.01) | $ (0.47) |
| Net asset value — End of year | $17.51 | $15.74 | $18.37 | $18.29 | $14.43 |
| Total Return(3) | 11.68% | (7.49)% | 6.92% | 26.83% | 4.46% |
| Ratios/Supplemental Data | | | | | |
| Net assets, end of year (000’s omitted) | $ 5,527 | $ 6,532 | $ 7,603 | $ 5,850 | $ 5,037 |
| Ratios (as a percentage of average daily net assets):(4) | | | | | |
| Total expenses | 2.08% | 2.12% | 2.13% | 2.61% | 2.67% |
| Net expenses | 2.08% | 2.10% | 2.13% | 2.30% | 2.44% |
| Net investment income (loss) | (0.37)% | 0.38% | 0.18% | (0.24)% | 0.04% (2) |
| Portfolio Turnover | 62% | 60% | 60% | 158% | 52% |
| (1) | Computed using average shares outstanding. |
| (2) | Amount includes a non-recurring refund for overbilling of prior years' custody out-of-pocket fees. This amounted to $0.006 per share and 0.04% of average net assets. |
| (3) | Returns are historical and are calculated by determining the percentage change in net asset value with all distributions reinvested and do not reflect the effect of sales charges, if any. |
| (4) | Total expenses do not reflect amounts reimbursed and/or waived by the adviser and certain of its affiliates, if applicable. Net expenses are net of all reductions and represent the net expenses paid by the Fund. |
17
See Notes to Financial Statements.
Calvert
International Opportunities Fund
September 30, 2020
Financial Highlights — continued
| | Class I |
| | Year Ended September 30, |
| | 2020 | 2019 | 2018 | 2017 | 2016 |
| Net asset value — Beginning of year | $ 15.86 | $ 18.52 | $ 18.42 | $ 14.56 | $ 14.38 |
| Income (Loss) From Operations | | | | | |
| Net investment income(1) | $ 0.11 | $ 0.22 | $ 0.23 | $ 0.17 | $ 0.19(2) |
| Net realized and unrealized gain (loss) | 1.90 | (1.49) | 1.17 | 3.90 | 0.63 |
| Total income (loss) from operations | $ 2.01 | $ (1.27) | $ 1.40 | $ 4.07 | $ 0.82 |
| Less Distributions | | | | | |
| From net investment income | $ (0.23) | $ (0.27) | $ (0.33) | $ (0.21) | $ (0.17) |
| From net realized gain | — | (1.12) | (0.97) | — | (0.47) |
| Total distributions | $ (0.23) | $ (1.39) | $ (1.30) | $ (0.21) | $ (0.64) |
| Net asset value — End of year | $ 17.64 | $ 15.86 | $ 18.52 | $ 18.42 | $ 14.56 |
| Total Return(3) | 12.77% | (6.50)% | 7.95% | 28.44% | 5.84% |
| Ratios/Supplemental Data | | | | | |
| Net assets, end of year (000’s omitted) | $254,350 | $222,546 | $230,748 | $115,698 | $69,319 |
| Ratios (as a percentage of average daily net assets):(4) | | | | | |
| Total expenses | 1.07% | 1.12% | 1.13% | 1.07% | 1.17% |
| Net expenses | 1.07% | 1.10% | 1.13% | 1.07% | 1.16% |
| Net investment income | 0.67% | 1.41% | 1.23% | 1.06% | 1.35% (2) |
| Portfolio Turnover | 62% | 60% | 60% | 158% | 52% |
| (1) | Computed using average shares outstanding. |
| (2) | Amount includes a non-recurring refund for overbilling of prior years' custody out-of-pocket fees. This amounted to $0.008 per share and 0.06% of average net assets. |
| (3) | Returns are historical and are calculated by determining the percentage change in net asset value with all distributions reinvested and do not reflect the effect of sales charges, if any. |
| (4) | Total expenses do not reflect amounts reimbursed and/or waived by the adviser and certain of its affiliates, if applicable. Net expenses are net of all reductions and represent the net expenses paid by the Fund. |
18
See Notes to Financial Statements.
Calvert
International Opportunities Fund
September 30, 2020
Financial Highlights — continued
| | Class R6 |
| | Year Ended September 30, | Period Ended
September 30, |
| | 2020 | 2019 (1) |
| Net asset value — Beginning of period | $ 15.86 | $ 15.14 |
| Income (Loss) From Operations | | |
| Net investment income(2) | $ 0.12 | $ 0.16 |
| Net realized and unrealized gain | 1.91 | 0.56 |
| Total income from operations | $ 2.03 | $ 0.72 |
| Less Distributions | | |
| From net investment income | $ (0.25) | $ — |
| Total distributions | $ (0.25) | $ — |
| Net asset value — End of period | $ 17.64 | $ 15.86 |
| Total Return(3) | 12.87% | 4.76% (4) |
| Ratios/Supplemental Data | | |
| Net assets, end of period (000’s omitted) | $48,475 | $43,489 |
| Ratios (as a percentage of average daily net assets):(5) | | |
| Total expenses | 1.00% | 1.08% (6) |
| Net expenses | 1.00% | 1.05% (6) |
| Net investment income | 0.74% | 1.53% (6) |
| Portfolio Turnover | 62% | 60% (7) |
| (1) | For the period from the commencement of operations, February 1, 2019, to September 30, 2019. |
| (2) | Computed using average shares outstanding. |
| (3) | Returns are historical and are calculated by determining the percentage change in net asset value with all distributions reinvested and do not reflect the effect of sales charges, if any. |
| (4) | Not annualized. |
| (5) | Total expenses do not reflect amounts reimbursed and/or waived by the adviser and certain of its affiliates, if applicable. Net expenses are net of all reductions and represent the net expenses paid by the Fund. |
| (6) | Annualized. |
| (7) | For the year ended September 30, 2019. |
19
See Notes to Financial Statements.
Calvert
International Opportunities Fund
September 30, 2020
Notes to Financial Statements
1 Significant Accounting Policies
Calvert International Opportunities Fund (the Fund) is a diversified series of Calvert World Values Fund, Inc. (the Corporation). The Corporation is a Maryland corporation registered under the Investment Company Act of 1940, as amended (the 1940 Act), as an open-end management investment company. The investment objective of the Fund is to seek long-term capital appreciation. The Fund invests primarily in common and preferred stocks of non-U.S. small-cap to mid-cap companies.
The Fund offers four classes of shares. Class A shares are generally sold subject to a sales charge imposed at time of purchase. A contingent deferred sales charge of 0.80% may apply to certain redemptions of Class A shares for accounts for which no sales charge was paid, if redeemed within 12 months of purchase. Class C shares are sold without a front-end sales charge, and with certain exceptions, are charged a contingent deferred sales charge of 1% on shares redeemed within 12 months of purchase. Class C shares are only available for purchase through a financial intermediary. Effective January 25, 2019, Class C shares generally automatically convert to Class A shares ten years after their purchase and, effective November 5, 2020, automatically convert to Class A shares eight years after their purchase as described in the Fund's prospectus. Class I and Class R6 shares are sold at net asset value, are not subject to a sales charge and are sold only to certain eligible investors. Each class represents a pro rata interest in the Fund, but votes separately on class-specific matters and is subject to different expenses.
The Fund applies the accounting and reporting guidance in the Financial Accounting Standards Board (FASB) Accounting Standards Codification Topic 946, Financial Services – Investment Companies (ASC 946). Subsequent events, if any, through the date that the financial statements were issued have been evaluated in the preparation of the financial statements.
A Investment Valuation— Net asset value per share is determined every business day as of the close of the regular session of the New York Stock Exchange (generally 4:00 p.m. Eastern time). The Fund uses independent pricing services approved by the Board of Directors (the Board) to value its investments wherever possible. Investments for which market quotations are not available or deemed not reliable are fair valued in good faith under the direction of the Board.
U.S. generally accepted accounting principles (U.S. GAAP) establishes a disclosure hierarchy that categorizes the inputs to valuation techniques used to value assets and liabilities at measurement date. These inputs are summarized in the three broad levels listed below:
Level 1 - quoted prices in active markets for identical securities
Level 2 - other significant observable inputs (including quoted prices for similar securities, interest rates, prepayment speeds, credit risk, etc.)
Level 3 - significant unobservable inputs (including the Fund’s own assumptions in determining the fair value of investments)
The inputs or methodologies used for valuing securities are not necessarily an indication of the risk associated with investing in those securities.
Valuation techniques used to value the Fund’s investments by major category are as follows:
Equity Securities. Equity securities (including warrants and rights) listed on a U.S. securities exchange generally are valued at the last sale or closing price as reported by an independent pricing service on the primary market or exchange on which they are traded and are categorized as Level 1 in the hierarchy. Equity securities listed on the NASDAQ Global or Global Select Market are valued at the NASDAQ official closing price and are categorized as Level 1 in the hierarchy. Unlisted or listed securities for which closing sales prices or closing quotations are not available are valued at the mean between the latest available bid and ask prices and are categorized as Level 2 in the hierarchy. The daily valuation of exchange-traded foreign securities generally is determined as of the close of trading on the principal exchange on which such securities trade. Events occurring after the close of trading on foreign exchanges may result in adjustments to the valuation of foreign securities to more accurately reflect their fair value as of the close of regular trading on the New York Stock Exchange. When valuing foreign equity securities that meet certain criteria, the Fund's Board has approved the use of a fair value service that values such securities to reflect market trading that occurs after the close of the applicable foreign markets of comparable securities or other instruments that have a strong correlation to the fair-valued securities. Such securities are categorized as Level 2 in the hierarchy.
Debt Securities. Debt securities are generally valued based on valuations provided by third party pricing services, as derived from such services’ pricing models. Inputs to the models may include, but are not limited to, reported trades, executable bid and ask prices, broker/dealer quotations, prices or yields of securities with similar characteristics, interest rates, anticipated prepayments, benchmark curves or information pertaining to the issuer, as well as industry and economic events. Accordingly, debt securities are generally categorized as Level 2 in the hierarchy. Short-term debt securities with a remaining maturity at time of purchase of more than sixty days are valued based on valuations provided by a third party pricing service. Such securities are generally categorized as Level 2 in the hierarchy. Short-term debt securities of sufficient credit quality purchased with remaining maturities of sixty days or less are valued at amortized cost, which approximates fair value, and are categorized as Level 2 in the hierarchy.
Affiliated Fund. The Fund may invest in Calvert Cash Reserves Fund, LLC (Cash Reserves Fund), an affiliated investment company managed by Calvert Research and Management (CRM). While Cash Reserves Fund is not a registered money market mutual fund, it conducts all of its investment activities in accordance with the requirements of Rule 2a-7 under the 1940 Act. Investments in Cash Reserves Fund are valued at the closing net asset value per unit on the valuation day and are categorized as Level 2 in the hierarchy. Cash Reserves Fund generally values its investment securities based on available market quotations provided by a third party pricing service.
Calvert
International Opportunities Fund
September 30, 2020
Notes to Financial Statements — continued
Other Securities. Investments in registered investment companies (including money market funds) that do not trade on an exchange are valued at the net asset value per share on the valuation day and are categorized as Level 1 in the hierarchy.
Fair Valuation. If a market value cannot be determined for a security using the methodologies described above, or if, in the good faith opinion of the Fund's adviser, the market value does not constitute a readily available market quotation, or if a significant event has occurred that would materially affect the value of the security, the security will be fair valued as determined in good faith by or at the direction of the Board in a manner that most fairly reflects the security’s “fair value”, which is the amount that the Fund might reasonably expect to receive for the security upon its current sale in the ordinary course. Each such determination is based on a consideration of relevant factors, which are likely to vary from one pricing context to another. These factors may include, but are not limited to, the type of security, the existence of any contractual restrictions on the security’s disposition, the price and extent of public trading in similar securities of the issuer or of comparable companies or entities, quotations or relevant information obtained from broker/dealers or other market participants, information obtained from the issuer, analysts, and/or the appropriate stock exchange (for exchange-traded securities), an analysis of the company’s or entity’s financial statements, and an evaluation of the forces that influence the issuer and the market(s) in which the security is purchased and sold.
The values assigned to fair value investments are based on available information and do not necessarily represent amounts that might ultimately be realized. Further, due to the inherent uncertainty of valuations of such investments, the fair values may differ significantly from the values that would have been used had an active market existed, and the differences could be material.
The following table summarizes the market value of the Fund's holdings as of September 30, 2020, based on the inputs used to value them:
| Asset Description | Level 1 | Level 2 | Level 3 | Total |
| Common Stocks | | | | |
| Australia | $ — | $ 19,630,184 | $ — | $ 19,630,184 |
| Austria | — | 3,875,515 | — | 3,875,515 |
| Belgium | — | 4,336,664 | — | 4,336,664 |
| Canada | 12,384,206 | — | — | 12,384,206 |
| China | — | 5,011,616 | — | 5,011,616 |
| Denmark | — | 1,938,132 | — | 1,938,132 |
| France | — | 3,047,230 | — | 3,047,230 |
| Germany | — | 19,403,586 | — | 19,403,586 |
| Hong Kong | — | 1,956,897 | — | 1,956,897 |
| Ireland | — | 12,748,773 | — | 12,748,773 |
| Israel | — | 1,738,278 | — | 1,738,278 |
| Italy | — | 22,433,044 | — | 22,433,044 |
| Japan | — | 105,185,043 | — | 105,185,043 |
| Luxembourg | — | 617,018 | — | 617,018 |
| Netherlands | 254,354 | 13,333,640 | — | 13,587,994 |
| New Zealand | — | 2,782,520 | — | 2,782,520 |
| Norway | — | 5,354,335 | — | 5,354,335 |
| Portugal | — | 1,822,769 | — | 1,822,769 |
| Singapore | — | 3,000,977 | — | 3,000,977 |
| Spain | — | 2,957,956 | — | 2,957,956 |
| Sweden | 1,555,624 | 25,975,896 | — | 27,531,520 |
| Switzerland | — | 29,941,853 | — | 29,941,853 |
| United Kingdom | 5,054,238 | 57,251,325 | — | 62,305,563 |
| Total Common Stocks | $19,248,422 | $344,343,251 (1) | $ — | $363,591,673 |
| Exchange-Traded Funds | $ — | $ 3,433,221 | $ — | $ 3,433,221 |
| High Social Impact Investments | — | 1,383,240 | — | 1,383,240 |
| Short-Term Investments: | | | | |
| Other | — | 3,486,807 | — | 3,486,807 |
Calvert
International Opportunities Fund
September 30, 2020
Notes to Financial Statements — continued
| Asset Description | Level 1 | Level 2 | Level 3 | Total |
| Securities Lending Collateral | $ 1,635,624 | $ — | $ — | $ 1,635,624 |
| Total Investments | $20,884,046 | $352,646,519 | $ — | $373,530,565 |
| (1) | Includes foreign equity securities whose values were adjusted to reflect market trading of comparable securities or other correlated instruments that occurred after the close of trading in their applicable foreign markets. |
B Investment Transactions and Income— Investment transactions for financial statement purposes are accounted for on trade date. Realized gains and losses are recorded on an identified cost basis and may include proceeds from litigation. Dividend income is recorded on the ex-dividend date for dividends received in cash and/or securities or, in the case of dividends on certain foreign securities, as soon as the Fund is informed of the ex-dividend date. Non-cash dividends are recorded at the fair value of the securities received. Withholding taxes on foreign dividends, if any, have been provided for in accordance with the Fund’s understanding of the applicable country’s tax rules and rates. Distributions received that represent a return of capital are recorded as a reduction of cost of investments. Distributions received that represent a capital gain are recorded as a realized gain. Interest income, which includes amortization of premium and accretion of discount on debt securities, is accrued as earned.
C Share Class Accounting— Realized and unrealized gains and losses and net investment income and losses, other than class-specific expenses, are allocated daily to each class of shares based upon the relative net assets of each class to the total net assets of the Fund. Expenses arising in connection with a specific class are charged directly to that class. Sub-accounting, recordkeeping and similar administrative fees payable to financial intermediaries, which are a component of transfer agency fees and expenses on the Statement of Operations, are not allocated to Class R6 shares.
D Foreign Currency Transactions— The Fund’s accounting records are maintained in U.S. dollars. For valuation of assets and liabilities on each date of net asset value determination, foreign denominations are converted into U.S. dollars using the current exchange rate. Security transactions, income and expenses are translated at the prevailing rate of exchange on the date of the event. Recognized gains or losses on investment transactions attributable to changes in foreign currency exchange rates are recorded for financial statement purposes as net realized gains and losses on investments. That portion of unrealized gains and losses on investments that results from fluctuations in foreign currency exchange rates is not separately disclosed.
E Restricted Securities— The Fund may invest in securities that are subject to legal or contractual restrictions on resale. Generally, these securities may only be sold publicly upon registration under the Securities Act of 1933 or in transactions exempt from such registration. Information regarding restricted securities (excluding Rule 144A securities) is included at the end of the Schedule of Investments.
F Distributions to Shareholders— Distributions to shareholders are recorded by the Fund on ex-dividend date. Distributions from net investment income and distributions from net realized capital gains, if any, are paid at least annually. Distributions are declared separately for each class of shares. Distributions are determined in accordance with income tax regulations which may differ from U.S. GAAP; accordingly, periodic reclassifications are made within the Fund's capital accounts to reflect income and gains available for distribution under income tax regulations.
G Estimates— The preparation of financial statements in conformity with U.S. GAAP requires management to make estimates and assumptions that affect the reported amounts of assets and liabilities and disclosure of contingent assets and liabilities at the date of the financial statements and the reported amounts of increases and decreases in net assets from operations during the reporting period. Actual results could differ from those estimates.
H Indemnifications— The Corporation’s By-Laws provide for indemnification for Directors or officers of the Corporation and certain other parties, to the fullest extent permitted by Maryland law and the 1940 Act, provided certain conditions are met. Additionally, in the normal course of business, the Fund enters into agreements with service providers that may contain indemnification clauses. The Fund’s maximum exposure under these arrangements is unknown as this would involve future claims that may be made against the Fund that have not yet occurred.
I Federal Income Taxes— No provision for federal income or excise tax is required since the Fund intends to continue to qualify as a regulated investment company under the Internal Revenue Code and to distribute substantially all of its taxable earnings.
Management has analyzed the Fund's tax positions taken for all open federal income tax years and has concluded that no provision for federal income tax is required in the Fund's financial statements. A Fund's federal tax return is subject to examination by the Internal Revenue Service for a period of three years from the date of filing.
2 Related Party Transactions
The investment advisory fee is earned by CRM, a subsidiary of Eaton Vance Management (EVM), as compensation for investment advisory services rendered to the Fund. EVM is a wholly-owned subsidiary of Eaton Vance Corp. Pursuant to the investment advisory agreement, CRM receives a fee, payable monthly, at the annual rate of 0.75% of the Fund’s average daily net assets. For the year ended September 30, 2020, the investment advisory fee amounted to $2,627,686. The Fund may invest its cash in Cash Reserves Fund. CRM does not currently receive a fee for advisory services provided to Cash Reserves Fund.
Calvert
International Opportunities Fund
September 30, 2020
Notes to Financial Statements — continued
Eaton Vance Advisers International Ltd. (EVAIL), an indirect, wholly-owned subsidiary of Eaton Vance Corp., provides sub-advisory services to the Fund pursuant to a sub-advisory agreement with CRM. Effective October 21, 2019, EVAIL uses the portfolio management, research and other resources of its affiliate, Eaton Vance Global Advisors Limited (EVGA), in rendering investment advisory services to the Fund. EVGA has entered into a Memorandum of Understanding with EVAIL pursuant to which EVGA is considered a participating affiliate of the sub-adviser as that term is used in relief granted by the staff of the U.S. Securities and Exchange Commission allowing U.S. registered investment advisers to use portfolio management or research resources of unregistered advisory affiliates subject to the supervision of a U.S. registered adviser. Sub-advisory fees are paid by CRM from its investment advisory fee.
CRM and EVAIL have agreed to reimburse the Fund’s operating expenses to the extent that total annual operating expenses (relating to ordinary operating expenses only and excluding expenses such as brokerage commissions, acquired fund fees and expenses of unaffiliated funds, borrowing costs, taxes or litigation expenses) exceed 1.34%, 2.09%, 1.09% and 1.05% for Class A, Class C, Class I and Class R6, respectively, of such class’s average daily net assets. The expense reimbursement agreement may be changed or terminated after January 31, 2021. For the year ended September 30, 2020, no expenses were waived or reimbursed by CRM and EVAIL.
The administrative fee is earned by CRM as compensation for administrative services rendered to the Fund. The fee is computed at an annual rate of 0.12% of the Fund’s average daily net assets attributable to Class A, Class C, Class I and Class R6 and is payable monthly. For the year ended September 30, 2020, CRM was paid administrative fees of $420,430.
The Fund has in effect a distribution plan for Class A shares (Class A Plan) pursuant to Rule 12b-1 under the 1940 Act. Pursuant to the Class A Plan, the Fund pays Eaton Vance Distributors, Inc. (EVD), an affiliate of CRM and the Fund’s principal underwriter, a distribution and service fee of 0.25% per annum of its average daily net assets attributable to Class A shares for distribution services and facilities provided to the Fund by EVD, as well as for personal services and/or the maintenance of shareholder accounts. The Fund also has in effect a distribution plan for Class C shares (Class C Plan) pursuant to Rule 12b-1 under the 1940 Act. Pursuant to the Class C Plan, the Fund pays EVD amounts equal to 0.75% per annum of its average daily net assets attributable to Class C shares for providing ongoing distribution services and facilities to the Fund. In addition, pursuant to the Class C Plan, the Fund also makes payments of service fees to EVD, financial intermediaries and other persons in amounts equal to 0.25% per annum of its average daily net assets attributable to that class. Service fees paid or accrued are for personal services and/or the maintenance of shareholder accounts. Distribution and service fees paid or accrued for the year ended September 30, 2020 amounted to $164,135 and $60,027 for Class A shares and Class C shares, respectively.
The Fund was informed that EVD received $16,412 as its portion of the sales charge on sales of Class A shares for the year ended September 30, 2020. The Fund was also informed that EVD received less than $100 and $743 of contingent deferred sales charges paid by Class A and Class C shareholders, respectively, for the same period.
EVM provides sub-transfer agency and related services to the Fund pursuant to a Sub-Transfer Agency Support Services Agreement. For the year ended September 30, 2020, sub-transfer agency fees and expenses incurred to EVM amounted to $32,757 and are included in transfer agency fees and expenses on the Statement of Operations.
Each Director of the Fund who is not an employee of CRM or its affiliates receives an annual fee of $154,000, plus an annual Committee fee ranging from $8,500 to $16,500 depending on the Committee. The Board chair receives an additional $20,000 annual fee and Committee chairs receive an additional $6,000 annual fee. Eligible Directors may participate in a Deferred Compensation Plan (the Plan). Amounts deferred under the Plan are treated as though equal dollar amounts had been invested in shares of the Fund or other Calvert funds selected by the Directors. The Fund purchases shares of the funds selected equal to the dollar amounts deferred under the Plan, resulting in an asset equal to the deferred compensation liability. Obligations of the Plan are paid solely from the Fund's assets. Directors’ fees are allocated to each of the Calvert funds served. Salaries and fees of officers and Directors of the Fund who are employees of CRM or its affiliates are paid by CRM. In addition, an Advisory Council was established to aid the Board and CRM in advancing the cause of responsible investing through original scholarship and thought leadership. The Advisory Council consists of CRM’s Chief Executive Officer and three (four prior to December 31, 2019) additional members. Each member (other than CRM’s Chief Executive Officer) received annual compensation of $75,000, which was being reimbursed by Calvert Investment Management, Inc. (CIM), the Calvert funds’ former investment adviser and Ameritas Holding Company, CIM’s parent company, through the end of 2019. For the year ending December 31, 2020, each member (other than CRM’s Chief Executive Officer) is expected to be compensated $20,000 for their service on the Advisory Council. Such compensation, and any other compensation and/or expenses incurred by the Advisory Council as may be approved by the Board, shall be borne by the Calvert funds. For the year ended September 30, 2020, the Fund’s allocated portion of the Advisory Council compensation and fees was $5,699 and the reimbursement was $5,268, which are included in miscellaneous expense and reimbursement of expenses-other, respectively, on the Statement of Operations.
3 Investment Activity
During the year ended September 30, 2020, the cost of purchases and proceeds from sales of investments, other than short-term securities, were $215,158,218 and $218,368,605, respectively.
Calvert
International Opportunities Fund
September 30, 2020
Notes to Financial Statements — continued
4 Distributions to Shareholders and Income Tax Information
The tax character of distributions declared for the years ended September 30, 2020 and September 30, 2019 was as follows:
| | Year Ended September 30, |
| | 2020 | 2019 |
| Ordinary income | $4,929,724 | $11,108,689 |
| Long-term capital gains | $ — | $12,591,684 |
During the year ended September 30, 2020, distributable earnings was decreased by $561,610 and paid-in capital was increased by $561,610 due to the Fund's use of equalization accounting. Tax equalization accounting allows the Fund to treat as a distribution that portion of redemption proceeds representing a redeeming shareholder’s portion of undistributed taxable income and net capital gains.
These reclassifications had no effect on the net assets or net asset value per share of the Fund.
As of September 30, 2020, the components of distributable earnings (accumulated loss) on a tax basis were as follows:
| Undistributed ordinary income | $ 3,113,328 |
| Deferred capital losses | $(28,228,697) |
| Net unrealized appreciation | $ 59,553,262 |
At September 30, 2020, the Fund, for federal income tax purposes, had deferred capital losses of $28,228,697 which would reduce the Fund's taxable income arising from future net realized gains on investment transactions, if any, to the extent permitted by the Internal Revenue Code, and thus would reduce the amount of distributions to shareholders, which would otherwise be necessary to relieve the Fund of any liability for federal income or excise tax. The deferred capital losses are treated as arising on the first day of the Fund's next taxable year, can be carried forward for an unlimited period, and retain the same short-term or long-term character as when originally deferred. Of the deferred capital losses at September 30, 2020, $14,639,827 are short-term and $13,588,870 are long-term.
The cost and unrealized appreciation (depreciation) of investments of the Fund at September 30, 2020, as determined on a federal income tax basis, were as follows:
| Aggregate cost | $313,997,062 |
| Gross unrealized appreciation | $ 74,192,916 |
| Gross unrealized depreciation | (14,659,413) |
| Net unrealized appreciation | $ 59,533,503 |
5 Securities Lending
To generate additional income, the Fund may lend its securities pursuant to a securities lending agency agreement with State Street Bank and Trust Company (SSBT), the securities lending agent. Security loans are subject to termination by the Fund at any time and, therefore, are not considered illiquid investments. The Fund requires that the loan be continuously collateralized by either cash or securities as collateral equal at all times to at least 102% of the market value of the domestic securities loaned and 105% of the market value of the international securities loaned (if applicable). The market value of securities loaned is determined daily and any additional required collateral is delivered to the Fund on the next business day. Cash collateral is generally invested in a money market fund registered under the 1940 Act that is managed by an affiliate of SSBT. Any gain or loss in the market price of the loaned securities that might occur and any interest earned or dividends declared during the term of the loan would accrue to the account of the Fund. Income earned on the investment of collateral, net of broker rebates and other expenses incurred by the securities lending agent, is split between the Fund and the securities lending agent based on agreed upon contractual terms. Non-cash collateral, if any, is held by the lending agent on behalf of the Fund and cannot be sold or re-pledged by the Fund; accordingly, such collateral is not reflected in the Statement of Assets and Liabilities.
The risks associated with lending portfolio securities include, but are not limited to, possible delays in receiving additional collateral or in the recovery of the loaned securities, possible loss of rights to the collateral should the borrower fail financially, as well as risk of loss in the value of the collateral or the value of the investments made with the collateral. The securities lending agent shall indemnify the Fund in the case of default of any securities borrower.
Calvert
International Opportunities Fund
September 30, 2020
Notes to Financial Statements — continued
At September 30, 2020, the total value of securities on loan was $17,865,760 and the total value of collateral received was $18,833,037, comprised of cash of $1,635,624 and U.S. government and/or agencies securities of $17,197,413.
The following table provides a breakdown of securities lending transactions accounted for as secured borrowings, the obligations by class of collateral pledged, and the remaining contractual maturity of those transactions as of September 30, 2020.
| | Remaining Contractual Maturity of the Transactions |
| | Overnight and
Continuous | <30 days | 30 to 90 days | >90 days | Total |
| Common Stocks | $1,635,624 | $ — | $ — | $ — | $1,635,624 |
The carrying amount of the liability for deposits for securities loaned at September 30, 2020 approximated its fair value. If measured at fair value, such liability would have been considered as Level 2 in the fair value hierarchy (see Note 1A) at September 30, 2020.
6 Line of Credit
Effective October 29, 2019, the Fund participates with other portfolios and funds managed by EVM and its affiliates, including CRM, in an $800 million unsecured line of credit with a group of banks, which is in effect through October 27, 2020. Borrowings are made by the Fund solely for temporary purposes related to redemptions and other short-term cash needs. Interest is charged to the Fund based on its borrowings at an amount above either the Eurodollar rate or Federal Funds rate. In addition, a fee computed at an annual rate of 0.15% on the daily unused portion of the line of credit is allocated among the participating portfolios and funds at the end of each quarter. Because the line of credit is not available exclusively to the Fund, it may be unable to borrow some or all of its requested amounts at any particular time.
Prior to October 29, 2019, the Fund participated with other funds managed by CRM in a $100 million committed unsecured line of credit agreement with SSBT, which was terminated by the Calvert funds. Borrowings bore interest at the higher of the one-month London Interbank Offered Rate (LIBOR) in effect that day or the overnight Federal Funds rate, plus 1.00% per annum. A commitment fee of 0.20% per annum was incurred on the unused portion of the committed facility, which was allocated to all participating funds.
The Fund had no borrowings outstanding pursuant to its line of credit at September 30, 2020. The Fund did not have any significant borrowings or allocated fees during the year ended September 30, 2020. Effective October 27, 2020, the Fund renewed its line of credit agreement, which expires October 26, 2021, at substantially the same terms.
7 Affiliated Companies and Funds
The Fund has invested a portion of its assets in notes (the Notes) issued by Calvert Impact Capital, Inc. (CIC) pursuant to exemptive relief granted by the U.S. Securities and Exchange Commission (the SEC). There are certain potential points of affiliation between the Fund and CIC. CRM has licensed use of the Calvert name to CIC and provides other types of support. CRM’s President and Chief Executive Officer (and the only director/trustee on the Fund Board that is an “interested person” of the Fund) serves on the CIC Board, along with one member of the Advisory Council to the Fund Board. In addition, another director/trustee on the Fund Board and a member of the Advisory Council each serve as a director emeritus on the CIC Board.
Calvert
International Opportunities Fund
September 30, 2020
Notes to Financial Statements — continued
At September 30, 2020, the value of the Fund’s investment in the Notes and affiliated funds was $4,640,114, which represents 1.2% of the Fund’s net assets. Transactions in the Notes and affiliated funds by the Fund for the year ended September 30, 2020 were as follows:
| Name | Value,
beginning
of period | Purchases | Sales
proceeds | Net
realized
gain
(loss) | Change in
unrealized
appreciation
(depreciation) | Value,
end of
period | Interest/
Dividend
income | Principal
amount/Units,
end of period |
| High Social Impact Investments | | | | | | | | |
| Calvert Impact Capital, Inc., Community Investment Notes, 1.50%, 12/15/19(1) | $994,710 | $ — | $ (1,000,000) | $ — | $ 5,290 | $ — | $ 2,917 | $ — |
| Calvert Impact Capital, Inc., Community Investment Notes, 1.50%, 12/15/20(1) | — | 1,159,184 | — | — | (5,877) | 1,153,307 | 13,765 | 1,159,184 |
| Short-Term Investments | | | | | | | | |
| Calvert Cash Reserves Fund, LLC | — | 28,967,689 | (25,481,082) | 471 | (271) | 3,486,807 | 1,268 | 3,486,458 |
| Totals | | | | $ 471 | $ (858) | $4,640,114 | $17,950 | |
8 Capital Shares
The Corporation may issue its shares in one or more series (such as the Fund). The authorized shares of the Fund consist of 75,000,000 common shares, $0.01 par value, for each Class.
Transactions in capital shares for the years ended September 30, 2020 and September 30, 2019 were as follows:
| | Year Ended
September 30, 2020 | | Year Ended
September 30, 2019(1) |
| | Shares | Amount | | Shares | Amount |
| Class A | | | | | |
| Shares sold | 822,650 | $ 13,491,146 | | 1,168,879 | $ 18,769,355 |
| Reinvestment of distributions | 43,505 | 747,852 | | 294,011 | 4,571,864 |
| Shares redeemed | (1,019,287) | (16,110,110) | | (1,049,073) | (16,633,747) |
| Converted from Class C | 22,403 | 378,348 | | 46,183 | 718,101 |
| Net increase (decrease) | (130,729) | $ (1,492,764) | | 460,000 | $ 7,425,573 |
| Class C | | | | | |
| Shares sold | 45,986 | $ 757,758 | | 116,602 | $ 1,761,633 |
| Reinvestment of distributions | 1,462 | 24,586 | | 30,690 | 467,100 |
| Shares redeemed | (123,807) | (1,962,021) | | (98,857) | (1,542,285) |
| Converted to Class A | (22,963) | (378,348) | | (47,247) | (718,101) |
| Net increase (decrease) | (99,322) | $ (1,558,025) | | 1,188 | $ (31,653) |
| Class I | | | | | |
| Shares sold | 6,321,766 | $100,246,560 | | 8,454,598 | $ 130,605,151 |
| Reinvestment of distributions | 174,421 | 2,932,018 | | 1,020,569 | 15,512,650 |
| Shares redeemed | (6,114,835) | (94,045,475) | | (7,900,717) | (122,633,483) |
| Net increase | 381,352 | $ 9,133,103 | | 1,574,450 | $ 23,484,318 |
Calvert
International Opportunities Fund
September 30, 2020
Notes to Financial Statements — continued
| | Year Ended
September 30, 2020 | | Year Ended
September 30, 2019(1) |
| | Shares | Amount | | Shares | Amount |
| Class R6 | | | | | |
| Shares sold | 250,188 | $ 3,942,427 | | 2,803,060 | $ 45,144,095 |
| Reinvestment of distributions | 41,577 | 698,083 | | — | — |
| Shares redeemed | (286,587) | (4,902,330) | | (60,437) | (945,572) |
| Net increase (decrease) | 5,178 | $ (261,820) | | 2,742,623 | $ 44,198,523 |
| (1) | For Class R6, for the period from the commencement of operations, February 1, 2019, to September 30, 2019. |
9 Risks and Uncertainties
Risks Associated with Foreign Investments
Investing in foreign securities involves additional risks relating to political, social, and economic developments abroad. Other risks result from differences between regulations that apply to U.S. and foreign issuers and markets, and the potential for foreign markets to be less liquid and more volatile than U.S. markets. Securities that trade or are denominated in currencies other than the U.S. dollar may be adversely affected by fluctuations in currency exchange rates.
Pandemic Risk
An outbreak of respiratory disease caused by a novel coronavirus was first detected in China in December 2019 and subsequently spread internationally. This coronavirus has resulted in closing borders, enhanced health screenings, changes to healthcare service preparation and delivery, quarantines, cancellations, disruptions to supply chains and customer activity, as well as general concern and uncertainty. Health crises caused by outbreaks, such as the coronavirus outbreak, may exacerbate other pre-existing political, social and economic risks and disrupt normal market conditions and operations. The impact of this outbreak has negatively affected the worldwide economy, the economies of individual countries, individual companies, and the market in general, and may continue to do so in significant and unforeseen ways, as may other epidemics and pandemics that may arise in the future. Any such impact could adversely affect the Fund's performance, or the performance of the securities in which the Fund invests.
10 Subsequent Event
On October 8, 2020, Morgan Stanley and Eaton Vance Corp. (“Eaton Vance”) announced that they had entered into a definitive agreement under which Morgan Stanley would acquire Eaton Vance. Under the Investment Company Act of 1940, as amended, consummation of this transaction may result in the automatic termination of the Fund’s investment advisory agreement, and any related sub-advisory agreement(s), if applicable. Thus, the Fund’s Board will be asked to approve a new investment advisory agreement (and new sub-advisory agreement(s), if applicable). If approved by the Fund’s Board, the new investment advisory agreement (and new sub-advisory agreement(s), if applicable) is expected to be presented to Fund shareholders for approval, and, if approved, would take effect upon the closing of the transaction.
Calvert
International Opportunities Fund
September 30, 2020
Report of Independent Registered Public Accounting Firm
To the Shareholders and Board of Directors
Calvert World Values Fund, Inc.:
Opinion on the Financial Statements
We have audited the accompanying statement of assets and liabilities of Calvert International Opportunities Fund (the Fund), a series of Calvert World Values Fund, Inc., including the schedule of investments, as of September 30, 2020, the related statement of operations for the year then ended, the statements of changes in net assets for each of the years in the two-year period then ended, and the related notes (collectively, the financial statements) and the financial highlights for each of the years or periods in the five-year period then ended. In our opinion, the financial statements and financial highlights present fairly, in all material respects, the financial position of the Fund as of September 30, 2020, the results of its operations for the year then ended, the changes in its net assets for each of the years in the two-year period then ended, and the financial highlights for each of the years or periods in the five-year period then ended, in conformity with U.S. generally accepted accounting principles.
Basis for Opinion
These financial statements and financial highlights are the responsibility of the Fund’s management. Our responsibility is to express an opinion on these financial statements and financial highlights based on our audits. We are a public accounting firm registered with the Public Company Accounting Oversight Board (United States) (PCAOB) and are required to be independent with respect to the Fund in accordance with the U.S. federal securities laws and the applicable rules and regulations of the Securities and Exchange Commission and the PCAOB.
We conducted our audits in accordance with the standards of the PCAOB. Those standards require that we plan and perform the audit to obtain reasonable assurance about whether the financial statements and financial highlights are free of material misstatement, whether due to error or fraud. Our audits included performing procedures to assess the risks of material misstatement of the financial statements and financial highlights, whether due to error or fraud, and performing procedures that respond to those risks. Such procedures included examining, on a test basis, evidence regarding the amounts and disclosures in the financial statements and financial highlights. Such procedures also included confirmation of securities owned as of September 30, 2020, by correspondence with the custodian, brokers, and agent banks. Our audits also included evaluating the accounting principles used and significant estimates made by management, as well as evaluating the overall presentation of the financial statements and financial highlights. We believe that our audits provide a reasonable basis for our opinion.

We have served as the auditor of one or more of the Calvert Funds since 2002.
Philadelphia, Pennsylvania
November 20, 2020
Calvert
International Opportunities Fund
September 30, 2020
Federal Tax Information (Unaudited)
The Form 1099-DIV you receive in February 2021 will show the tax status of all distributions paid to your account in calendar year 2020. Shareholders are advised to consult their own tax adviser with respect to the tax consequences of their investment in the Fund. As required by the Internal Revenue Code and/or regulations, shareholders must be notified regarding the status of qualified dividend income for individuals and the foreign tax credit.
Qualified Dividend Income. For the fiscal year ended September 30, 2020, the Fund designates approximately $4,066,290, or up to the maximum amount of such dividends allowable pursuant to the Internal Revenue Code, as qualified dividend income eligible for the reduced tax rate of 15%.
Foreign Tax Credit. For the fiscal year ended September 30, 2020, the Fund paid foreign taxes of $368,643 and recognized foreign source income of $5,044,598.
Calvert
International Opportunities Fund
September 30, 2020
Liquidity Risk Management Program
The Fund has implemented a written liquidity risk management program (Program) and related procedures to manage its liquidity in accordance with Rule 22e-4 under the Investment Company Act of 1940, as amended (Liquidity Rule). The Liquidity Rule defines “liquidity risk” as the risk that a fund could not meet requests to redeem shares issued by the fund without significant dilution of the remaining investors’ interests in the fund. The Fund’s Board of Trustees/Directors has designated the investment adviser to serve as the administrator of the Program and the related procedures. The administrator has established a Liquidity Risk Management Oversight Committee (Committee) to perform the functions necessary to administer the Program. As part of the Program, the administrator is responsible for identifying illiquid investments and categorizing the relative liquidity of the Fund’s investments in accordance with the Liquidity Rule. Under the Program, the administrator assesses, manages, and periodically reviews the Fund’s liquidity risk, and is responsible for making certain reports to the Fund’s Board of Trustees/Directors and the Securities and Exchange Commission (SEC) regarding the liquidity of the Fund’s investments, and to notify the Board of Trustees/Directors and the SEC of certain liquidity events specified in the Liquidity Rule. The liquidity of the Fund’s portfolio investments is determined based on a number of factors including, but not limited to, relevant market, trading and investment-specific considerations under the Program.
At a meeting of the Fund’s Board of Trustees/Directors, the Committee provided a written report to the Fund’s Board of Trustees/Directors pertaining to the operation, adequacy, and effectiveness of implementation of the Program, as well as the operation of the highly liquid investment minimum (if applicable) for the period December 1, 2018 through December 31, 2019 (Review Period). The Program operated effectively during the Review Period, supporting the administrator’s ability to assess, manage and monitor Fund liquidity risk, including during periods of market volatility and net redemptions. During the Review Period, the Fund met redemption requests on a timely basis.
There can be no assurance that the Program will achieve its objectives in the future. Please refer to the Fund’s prospectus for more information regarding the Fund’s exposure to liquidity risk and other principal risks to which an investment in the Fund may be subject.
Calvert
International Opportunities Fund
September 30, 2020
Management and Organization
Fund Management. The Directors of Calvert World Values Fund, Inc. (the Corporation) are responsible for the overall management and supervision of the Corporation’s affairs. The Directors and officers of the Corporation are listed below. Except as indicated, each individual has held the office shown or other offices in the same company for the last five years. Directors and officers of the Corporation hold indefinite terms of office. The “Independent Directors” consist of those Directors who are not “interested persons” of the Corporation, as that term is defined under the 1940 Act. The business address of each Director and officer, with the exception of Ms. Gemma and Mr. Kirchner, is 1825 Connecticut Avenue NW, Suite 400, Washington, DC 20009. As used below, “CRM” refers to Calvert Research and Management. Each Director oversees 39 funds in the Calvert fund complex. Each officer serves as an officer of certain other Calvert funds.
| Name and Year of Birth | Corporation
Position(s) | Position
Start Date | Principal Occupation(s) and Other Directorships
During Past Five Years and Other Relevant Experience | |
| Interested Director | |
John H. Streur(1)
1960 | Director &
President | 2015 | President and Chief Executive Officer of Calvert Research and
Management (since December 31, 2016). President and Chief Executive
Officer of Calvert Investments, Inc. (January 2015 - December 2016);
Chief Executive Officer of Calvert Investment Distributors, Inc. (August
2015 - December 2016); Chief Compliance Officer of Calvert Investment
Management, Inc. (August 2015 - April 2016); President and Director, Portfolio 21 Investments, Inc. (through October 2014); President,
Chief Executive Officer and Director, Managers Investment Group LLC
(through January 2012); President and Director, The Managers Funds
and Managers AMG Funds (through January 2012).
Other Directorships in the Last Five Years. Portfolio 21 Investments,
Inc. (asset management) (through October 2014); Managers Investment
Group LLC (asset management) (through January 2012); The Managers
Funds (asset management) (through January 2012); Managers AMG Funds
(asset management) (through January 2012); Calvert Impact Capital, Inc. | |
| Independent Directors | |
Richard L. Baird, Jr.
1948 | Director | 2005 | Regional Disaster Recovery Lead, American Red Cross of Greater
Pennsylvania (since 2017). Volunteer, American Red Cross (since 2015).
Former President and CEO of Adagio Health Inc. (retired in 2014) in
Pittsburgh, PA.
Other Directorships in the Last Five Years. None. | |
Alice Gresham Bullock
1950 | Chair &
Director | 2016 | Professor Emerita at Howard University School of Law. Dean Emerita of
Howard University School of Law and Deputy Director of the Association
of American Law Schools (1992-1994).
Other Directorships in the Last Five Years. None. | |
Cari M. Dominguez
1949 | Director | 2016 | Former Chair of the U.S. Equal Employment Opportunity Commission.
Other Directorships in the Last Five Years. Manpower, Inc. (employment
agency); Triple S Management Corporation (managed care); National
Association of Corporate Directors. | |
John G. Guffey, Jr.(2)
1948 | Director | 1992 | President of Aurora Press Inc., a privately held publisher of trade
paperbacks (since January 1997).
Other Directorships in the Last Five Years. Calvert Impact Capital, Inc.
(through December 31, 2018); Calvert Ventures, LLC. | |
Miles D. Harper, III
1962 | Director | 2005 | Partner, Carr Riggs & Ingram (public accounting firm) since October 2014.
Partner, Gainer Donnelly & Desroches (public accounting firm) (now Carr
Riggs & Ingram), (November 1999-September 2014).
Other Directorships in the Last Five Years. Bridgeway Funds (9) (asset
management). | |
Joy V. Jones
1950 | Director | 2005 | Attorney.
Other Directorships in the Last Five Years. Conduit Street Restaurants
SUD 2 Limited; Palm Management Restaurant Corporation. | |
Calvert
International Opportunities Fund
September 30, 2020
Management and Organization — continued
| Name and Year of Birth | Corporation
Position(s) | Position
Start Date | Principal Occupation(s) and Other Directorships
During Past Five Years and Other Relevant Experience | |
| Independent Directors (continued) |
Anthony A. Williams
1951 | Director | 2016 | CEO and Executive Director of the Federal City Council (July 2012 to
present); Senior Adviser and Independent Consultant for King and
Spalding LLP (September 2015 to present); Executive Director of Global
Government Practice at the Corporate Executive Board (January 2010 to
January 2012).
Other Directorships in the Last Five Years. Freddie Mac; Evoq
Properties/Meruelo Maddux Properties, Inc. (real estate management);
Weston Solutions, Inc. (environmental services); Bipartisan Policy Center’s
Debt Reduction Task Force; Chesapeake Bay Foundation; Catholic
University of America; Urban Institute (research organization). | |
| Name and Year of Birth | Corporation
Position(s) | Position
Start Date | Principal Occupation(s)
During Past Five Years | |
| Principal Officers who are not Directors | |
Hope L. Brown
1973 | Chief
Compliance
Officer | 2014 | Chief Compliance Officer of 39 registered investment companies advised
by CRM (since 2014). Vice President and Chief Compliance Officer,
Wilmington Funds (2012-2014). | |
Maureen A. Gemma(3)
1960 | Secretary,
Vice President
and Chief
Legal Officer | 2016 | Vice President of CRM and officer of 39 registered investment
companies advised by CRM (since 2016). Also Vice President of
Eaton Vance and certain of its affiliates and officer of 156 registered
investment companies advised or administered by Eaton Vance. | |
James F. Kirchner(3)
1967 | Treasurer | 2016 | Vice President of CRM and officer of 39 registered investment companies
advised by CRM (since 2016). Also Vice President of Eaton Vance and
certain of its affiliates and officer of 156 registered investment companies
advised or administered by Eaton Vance. | |
| (1) Mr. Streur is an interested person of the Fund because of his positions with the Fund’s adviser and certain affiliates. | |
| (2) Mr. Guffey is currently married to Rebecca L. Adamson, who served as a member of the Advisory Council through December 31, 2019. | |
| (3) The business address for Ms. Gemma and Mr. Kirchner is Two International Place, Boston, MA 02110. | |
The SAI for the Fund includes additional information about the Directors and officers of the Fund and can be obtained without charge on Calvert’s website at www.calvert.com or by calling 1-800-368-2745.
Privacy. The Eaton Vance organization is committed to ensuring your financial privacy. Each entity listed below has adopted a privacy policy and procedures (“Privacy Program”) Eaton Vance believes is reasonably designed to protect your personal information and to govern when and with whom Eaton Vance may share your personal information.
| • | At the time of opening an account, Eaton Vance generally requires you to provide us with certain information such as name, address, social security number, tax status, account numbers, and account balances. This information is necessary for us to both open an account for you and to allow us to satisfy legal requirements such as applicable anti-money laundering reviews and know-your-customer requirements. |
| • | On an ongoing basis, in the normal course of servicing your account, Eaton Vance may share your information with unaffiliated third parties that perform various services for Eaton Vance and/or your account. These third parties include transfer agents, custodians, broker/dealers and our professional advisers, including auditors, accountants, and legal counsel. Eaton Vance may additionally share your personal information with our affiliates. |
| • | We believe our Privacy Program is reasonably designed to protect the confidentiality of your personal information and to prevent unauthorized access to that information. |
| • | We reserve the right to change our Privacy Program at any time upon proper notification to you. You may want to review our Privacy Program periodically for changes by accessing the link on our homepage: www.calvert.com. |
Our pledge of protecting your personal information applies to the following entities within the Eaton Vance organization: the Eaton Vance Family of Funds, Eaton Vance Management, Eaton Vance Investment Counsel, Eaton Vance Distributors, Inc., Eaton Vance Trust Company, Eaton Vance Management (International) Limited, Eaton Vance Advisers International Ltd., Eaton Vance Global Advisors Limited, Eaton Vance Management's Real Estate Investment Group, Boston Management and Research, Calvert Research and Management, and Calvert Funds. This Privacy Notice supersedes all previously issued privacy disclosures. For more information about our Privacy Program or about how your personal information may be used, please call 1-800-368-2745.
Delivery of Shareholder Documents. The Securities and Exchange Commission (SEC) permits funds to deliver only one copy of shareholder documents, including prospectuses, proxy statements and shareholder reports, to fund investors with multiple accounts at the same residential or post office box address. This practice is often called “householding” and it helps eliminate duplicate mailings to shareholders. Calvert funds, or your financial intermediary, may household the mailing of your documents indefinitely unless you instruct Calvert funds, or your financial intermediary, otherwise. If you would prefer that your Calvert fund documents not be householded, please contact Calvert funds at 1-800-368-2745, or contact your financial intermediary. Your instructions that householding not apply to delivery of your Calvert fund documents will typically be effective within 30 days of receipt by Calvert funds or your financial intermediary. Separate statements will be generated for each separate account and will be householded as described above.
Portfolio Holdings. Each Calvert fund files a schedule of portfolio holdings on Part F to Form N-PORT with the SEC. Certain information filed on Form N-PORT may be viewed on the Calvert website at www.calvert.com, by calling Calvert at 1-800-368-2745 or in the EDGAR database on the SEC’s website at www.sec.gov.
Proxy Voting. The Proxy Voting Guidelines that each Calvert fund uses to determine how to vote proxies relating to portfolio securities is provided as an Appendix to the fund’s Statement of Additional Information. The Statement of Additional Information can be obtained free of charge by calling the Calvert funds at 1-800-368-2745, by visiting the Calvert funds’ website at www.calvert.com or visiting the SEC’s website at www.sec.gov. Information regarding how a Calvert fund voted proxies relating to portfolio securities during the most recent 12-month period ended June 30 is available by calling Calvert funds, by visiting the Calvert funds’ website at www.calvert.com or by visiting the SEC’s website at www.sec.gov.
This Page Intentionally Left Blank
This Page Intentionally Left Blank
This Page Intentionally Left Blank
Investment Adviser and Administrator
Calvert Research and Management
1825 Connecticut Avenue NW, Suite 400
Washington, DC 20009
Investment Sub-Adviser
Eaton Vance Advisers International Ltd.
125 Old Broad Street
London, EC2N 1AR
Principal Underwriter*
Eaton Vance Distributors, Inc.
Two International Place
Boston, MA 02110
(617) 482-8260
Custodian
State Street Bank and Trust Company
State Street Financial Center, One Lincoln Street
Boston, MA 02111
Transfer Agent
DST Asset Manager Solutions, Inc.
2000 Crown Colony Drive
Quincy, MA 02169
Independent Registered Public Accounting Firm
KPMG LLP
1601 Market Street
Philadelphia, PA 19103-2499
Fund Offices
1825 Connecticut Avenue NW, Suite 400
Washington, DC 20009
* FINRA BrokerCheck. Investors may check the background of their Investment Professional by contacting the Financial Industry Regulatory Authority (FINRA). FINRA BrokerCheck is a free tool to help investors check the professional background of current and former FINRA-registered securities firms and brokers. FINRA BrokerCheck is available by calling 1-800-289-9999 and at www.FINRA.org. The FINRA BrokerCheck brochure describing this program is available to investors at www.FINRA.org.
Printed on recycled paper.
Calvert
International Equity Fund
Annual Report
September 30, 2020
Important Note. Beginning on January 1, 2021, as permitted by regulations adopted by the Securities and Exchange Commission, paper copies of the Fund’s annual and semi-annual shareholder reports will no longer be sent by mail unless you specifically request paper copies of the reports. Instead, the reports will be made available on the Fund’s website (calvert.com/prospectus), and you will be notified by mail each time a report is posted and provided with a website address to access the report.
If you already elected to receive shareholder reports electronically, you will not be affected by this change and you need not take any action. If you are a direct investor, you may elect to receive shareholder reports and other communications from the Fund electronically by signing up for e-Delivery at calvert.com. If you own your shares through a financial intermediary (such as a broker-dealer or bank), you must contact your financial intermediary to sign up.
You may elect to receive all future Fund shareholder reports in paper free of charge. If you are a direct investor, you can inform the Fund that you wish to continue receiving paper copies of your shareholder reports by calling 1-800-368-2745. If you own these shares through a financial intermediary, you must contact your financial intermediary or follow instructions included with this disclosure, if applicable, to elect to continue to receive paper copies of your shareholder reports. Your election to receive reports in paper will apply to all Calvert funds held directly or to all funds held through your financial intermediary, as applicable.
E-Delivery Sign-Up - Details Inside
Commodity Futures Trading Commission Registration. Effective December 31, 2012, the Commodity Futures Trading Commission (“CFTC”) adopted certain regulatory changes that subject registered investment companies and advisers to regulation by the CFTC if a fund invests more than a prescribed level of its assets in certain CFTC-regulated instruments (including futures, certain options and swap agreements) or markets itself as providing investment exposure to such instruments. The adviser has claimed an exclusion from the definition of “commodity pool operator” under the Commodity Exchange Act with respect to its management of the Fund and the other funds it manages. Accordingly, neither the Fund nor the adviser is subject to CFTC regulation.
Fund shares are not insured by the FDIC and are not deposits or other obligations of, or guaranteed by, any depository institution. Shares are subject to investment risks, including possible loss of principal invested.
This report must be preceded or accompanied by a current summary prospectus or prospectus. Before investing, investors should consider carefully the investment objective, risks, and charges and expenses of a mutual fund. This and other important information is contained in the summary prospectus and prospectus, which can be obtained from a financial intermediary. Prospective investors should read the prospectus carefully before investing. For further information, please call 1-800-368-2745.
Choose Planet-friendly E-delivery!
Sign up now for on-line statements, prospectuses, and fund reports. In less than five minutes you can help reduce paper mail and lower fund costs.
Just go to www.calvert.com. If you already have an online account with the Calvert funds, click on Login to access your Account and select the documents you would like to receive via e-mail.
If you’re new to online account access, click on Login, then Register to create your user name and password. Once you’re in, click on the E-delivery sign-up on the Account Portfolio page and follow the quick, easy steps.
Note: If your shares are not held directly with the Calvert funds but through a brokerage firm, you must contact your broker for electronic delivery options available through their firm.
Annual Report September 30, 2020
Calvert
International Equity Fund
Calvert
International Equity Fund
September 30, 2020
Management's Discussion of Fund Performance†
Economic and Market Conditions
The 12-month period that began October 1, 2019, included some of the best and worst equity performances in over a decade.
The period began with global equities rallying in the closing months of 2019, supported by interest-rate reductions by dozens of central banks worldwide. In July 2019, the U.S. Federal Reserve (the Fed) had cut rates for the first time in over a decade, followed by two additional rate cuts in September and October.
In January 2020, however, news of the novel coronavirus outbreak in China began to raise investor concerns. As the virus turned into a global pandemic in February and March, it ended the longest-ever U.S. economic expansion and brought about a global economic slowdown. Equity markets along with credit markets declined in value amid unprecedented volatility.
In response, the Fed announced two emergency rate cuts in March 2020 — lowering the federal funds rate to 0.00%-0.25% — along with other measures designed to shore up the markets. Across the globe, other central banks and governments also commenced aggressive monetary and fiscal responses to help mitigate the economic effects of the virus.
These moves helped calm the markets and initiated a global equity rally that began in late March and lasted through August. In the second quarter of 2020, U.S. stocks reported their best quarterly returns since 1998 — on the heels of the worst first quarter for American stocks since the 2007-2008 global financial crisis. As with U.S. equities, overseas stock indexes reflected investor optimism as economies started to emerge from coronavirus lockdowns and factories resumed production.
In September 2020, however, the equity rally stalled as the pandemic appeared to increase its drag on the global economy. Across Europe, nations that seemed to have beaten back the coronavirus during the summer began to brace for a second wave of infections. In the U.S., coronavirus cases were on the rise in more than 30 states. Of the 22 million U.S. jobs lost in the early months of the pandemic, only 11 million jobs had returned, and 26.5 million Americans were collecting unemployment benefits. Reflecting the increasingly grim economic outlook for fall and winter, most major global stock indexes reported negative returns for the final month of the period.
For the period as a whole, positive equity returns belied the dramatic volatility during the period. The MSCI World Index, a broad measure of global equities, returned 10.41%; while the S&P 500® Index, a broad measure of U.S. stocks, returned 15.15%; and the technology-laden Nasdaq Composite Index returned 40.96%. The MSCI EAFE Index of developed-market international equities returned 0.49%; while the MSCI Emerging Markets Index returned 10.54% in U.S. dollars.
Fund Performance
For the 12-month period ended September 30, 2020, Calvert International Equity Fund (the Fund) returned 13.02% for Class A shares at net asset value, outperforming its benchmark, the MSCI EAFE Index (the Index), which returned 0.49%.
Stock selection was the leading contributor to outperformance during the period. Although the Fund uses a bottom-up stock selection strategy that focuses on the strengths of each prospective investment rather than making strategic sector allocations, the Fund’s sector positioning also contributed positively to performance relative to the Index. Nearly all sectors in the Fund contributed to returns during the period.
While no one sector dominated, the health care sector made the largest contribution to returns during the period.
One of the top contributors in the health care sector, Fisher & Paykel Healthcare Corp., Ltd. of New Zealand, is a producer of ventilation and air-flow equipment. The COVID-19 pandemic led to a surge in demand for the company’s innovative ventilator devices during the period.
Also in the health care sector, Lonza Group AG (Lonza) of Switzerland, which produces many of the constituents used by pharmaceuticals companies, was another notable contributor to returns. Its stock price rose as many of the companies racing to develop COVID-19 vaccines and treatments heightened demand for Lonza’s products during the period.
In the information technology (IT) sector, Taiwan Semiconductor Manufacturing Co., Ltd. (Taiwan) contributed to returns as it benefited from secular growth in the semiconductor industry and missteps by competitor Intel, the longtime semiconductor leader. Taiwan seized the opportunity to increase its market share when Intel’s development of its next generation of chips ran into difficulties.
The COVID-19 pandemic also was a major factor in the performance of detractors.
Amadeus IT Group S.A. (Amadeus), a Spain-based provider of IT systems for the airline industry, was among the most significant detractors as the pandemic all but shut down air travel. Demand for Amadeus’s products fell sharply and cut revenues, compelling the company to raise equity during the period.
Another large detractor, CAE, Inc., a Canadian company that provides pilot training for the commercial airline and defense industries, was also adversely affected by the pandemic. Demand for the company’s training for commercial pilots fell sharply as air travel declined. By period-end, the stock was sold from the Fund.
See Endnotes and Additional Disclosures in this report.
Past performance is no guarantee of future results. Returns are historical and are calculated by determining the percentage change in net asset value (NAV) or offering price (as applicable) with all distributions reinvested. Investment return and principal value will fluctuate so that shares, when redeemed, may be worth more or less than their original cost. Performance for periods less than or equal to one year is cumulative. Performance is for the stated time period only; due to market volatility, current Fund performance may be lower or higher than the quoted return. For performance as of the most recent month-end, please refer to www.calvert.com.
Calvert
International Equity Fund
September 30, 2020
Management's Discussion of Fund Performance† — continued
Compass Group PLC (Compass) of the U.K., one of the world’s largest contract catering companies, detracted as a result of COVID-19. With social distancing adopted worldwide as a means of controlling the virus’s spread, the large gatherings of companies, schools, and other institutions that are at the core of Compass’s business, were greatly reduced during the period.
See Endnotes and Additional Disclosures in this report.
Past performance is no guarantee of future results. Returns are historical and are calculated by determining the percentage change in net asset value (NAV) or offering price (as applicable) with all distributions reinvested. Investment return and principal value will fluctuate so that shares, when redeemed, may be worth more or less than their original cost. Performance for periods less than or equal to one year is cumulative. Performance is for the stated time period only; due to market volatility, current Fund performance may be lower or higher than the quoted return. For performance as of the most recent month-end, please refer to www.calvert.com.
Calvert
International Equity Fund
September 30, 2020
Performance
Portfolio Managers Christopher M. Dyer, CFA and Ian Kirwan, each of Eaton Vance Advisers International Ltd.
| % Average Annual Total Returns1,2 | Class
Inception Date | Performance
Inception Date | One Year | Five Years | Ten Years |
| Class A at NAV | 07/02/1992 | 07/02/1992 | 13.02% | 6.95% | 5.02% |
| Class A with with 4.75% Maximum Sales Charge | — | — | 7.63 | 5.92 | 4.52 |
| Class C at NAV | 03/01/1994 | 07/02/1992 | 12.17 | 6.16 | 4.16 |
| Class C with with 1% Maximum Sales Charge | — | — | 11.17 | 6.16 | 4.16 |
| Class I at NAV | 02/26/1999 | 07/02/1992 | 13.31 | 7.32 | 5.56 |
| Class R6 at NAV | 03/07/2019 | 07/02/1992 | 13.34 | 7.34 | 5.57 |
|
| MSCI EAFE Index | — | — | 0.49% | 5.26% | 4.61% |
| % Total Annual Operating Expense Ratios3 | Class A | Class C | Class I | Class R6 |
| Gross | 1.40% | 2.15% | 1.14% | 1.10% |
| Net | 1.15 | 1.90 | 0.90 | 0.86 |
Growth of $10,000
This graph shows the change in value of a hypothetical investment of $10,000 in Class A of the Fund for the period indicated. For comparison, the same investment is shown in the indicated index.
| Growth of Investment | Amount Invested | Period Beginning | At NAV | With Maximum Sales Charge |
| Class C | $10,000 | 09/30/2010 | $15,040 | N.A. |
| Class I | $250,000 | 09/30/2010 | $429,631 | N.A. |
| Class R6 | $1,000,000 | 09/30/2010 | $1,719,910 | N.A. |
See Endnotes and Additional Disclosures in this report.
Past performance is no guarantee of future results. Returns are historical and are calculated by determining the percentage change in net asset value (NAV) or offering price (as applicable) with all distributions reinvested. Investment return and principal value will fluctuate so that shares, when redeemed, may be worth more or less than their original cost. Performance for periods less than or equal to one year is cumulative. Performance is for the stated time period only; due to market volatility, current Fund performance may be lower or higher than the quoted return. For performance as of the most recent month-end, please refer to www.calvert.com.
Calvert
International Equity Fund
September 30, 2020
Sector Allocation (% of net assets)
| Top 10 Holdings (% of net assets) | |
| Nestle S.A. | 4.7% |
| AIA Group, Ltd. | 3.5 |
| Unilever PLC | 3.3 |
| Sanofi | 3.2 |
| Novo Nordisk A/S, Class B | 3.1 |
| adidas AG | 2.8 |
| Schneider Electric SE | 2.5 |
| CSL, Ltd. | 2.5 |
| Santen Pharmaceutical Co., Ltd. | 2.5 |
| LVMH Moet Hennessy Louis Vuitton SE | 2.4 |
| Total | 30.5% |
See Endnotes and Additional Disclosures in this report.
Calvert
International Equity Fund
September 30, 2020
Endnotes and Additional Disclosures
| † | The views expressed in this report are those of the portfolio manager(s) and are current only through the date stated at the top of this page. These views are subject to change at any time based upon market or other conditions, and Calvert and the Fund(s) disclaim any responsibility to update such views. These views may not be relied upon as investment advice and, because investment decisions are based on many factors, may not be relied upon as an indication of trading intent on behalf of any Calvert fund. This commentary may contain statements that are not historical facts, referred to as “forward-looking statements.” The Fund’s actual future results may differ significantly from those stated in any forward-looking statement, depending on factors such as changes in securities or financial markets or general economic conditions, the volume of sales and purchases of Fund shares, the continuation of investment advisory, administrative and service contracts, and other risks discussed from time to time in the Fund’s filings with the Securities and Exchange Commission. |
| | |
| 1 | MSCI EAFE Index is an unmanaged index of equities in the developed markets, excluding the U.S. and Canada. MSCI indexes are net of foreign withholding taxes. Source: MSCI. MSCI data may not be reproduced or used for any other purpose. MSCI provides no warranties, has not prepared or approved this report, and has no liability hereunder. Unless otherwise stated, index returns do not reflect the effect of any applicable sales charges, commissions, expenses, taxes or leverage, as applicable. It is not possible to invest directly in an index. |
| 2 | Total Returns at NAV do not include applicable sales charges. If sales charges were deducted, the returns would be lower. Total Returns shown with maximum sales charge reflect the stated maximum sales charge. Unless otherwise stated, performance does not reflect the deduction of taxes on Fund distributions or redemptions of Fund shares.Performance prior to the inception date of a class may be linked to the performance of an older class of the Fund. This linked performance is adjusted for any applicable sales charge, but is not adjusted for class expense differences. If adjusted for such differences, the performance would be different. The performance of Class R6 is linked to Class I. Performance presented in the Financial Highlights included in the financial statements is not linked.Calvert Research and Management became the investment adviser to the Fund on December 31, 2016. Performance reflected prior to such date is that of the Fund’s former investment adviser. |
| 3 | Source: Fund prospectus. Net expense ratios reflect a contractual expense reimbursement that continues through 1/31/21. Without the reimbursement, performance would have been lower. The expense ratios for the current reporting period can be found in the Financial Highlights section of this report. |
| Fund profile subject to change due to active management. |
| | Additional Information |
| | MSCI World Index is an unmanaged index of equity securities in the developed markets. MSCI Emerging Markets Index is an unmanaged index of emerging markets common stocks. MSCI indexes are net of foreign withholding taxes. Source: MSCI. MSCI data may not be reproduced or used for any other purpose. MSCI provides no warranties, has not prepared or approved this report, and has no liability hereunder. S&P 500® Index is an unmanaged index of large-cap stocks commonly used as a measure of U.S. stock market performance. S&P Dow Jones Indices are a product of S&P Dow Jones Indices LLC (“S&P DJI”) and have been licensed for use. S&P® and S&P 500® are registered trademarks of S&P DJI; Dow Jones® is a registered trademark of Dow Jones Trademark Holdings LLC (“Dow Jones”); S&P DJI, Dow Jones and their respective affiliates do not sponsor, endorse, sell or promote the Fund, will not have any liability with respect thereto and do not have any liability for any errors, omissions, or interruptions of the S&P Dow Jones Indices. Nasdaq Composite Index is a market capitalization-weighted index of all domestic and international securities listed on Nasdaq. Source: Nasdaq, Inc. The information is provided by Nasdaq (with its affiliates, are referred to as the “Corporations”) and Nasdaq's third party licensors on an “as is” basis and the Corporations make no guarantees and bear no liability of any kind with respect to the information or the Fund. |
Calvert
International Equity Fund
September 30, 2020
Example
As a Fund shareholder, you incur two types of costs: (1) transaction costs, including sales charges (loads) on purchases and redemption fees (if applicable); and (2) ongoing costs, including management fees; distribution and/or service fees; and other Fund expenses. This Example is intended to help you understand your ongoing costs (in dollars) of Fund investing and to compare these costs with the ongoing costs of investing in other mutual funds. The Example is based on an investment of $1,000 invested at the beginning of the period and held for the entire period (April 1, 2020 to September 30, 2020).
Actual Expenses
The first section of the table below provides information about actual account values and actual expenses. You may use the information in this section, together with the amount you invested, to estimate the expenses that you paid over the period. Simply divide your account value by $1,000 (for example, an $8,600 account value divided by $1,000 = 8.6), then multiply the result by the number in the first section under the heading entitled “Expenses Paid During Period” to estimate the expenses you paid on your account during this period.
Hypothetical Example for Comparison Purposes
The second section of the table below provides information about hypothetical account values and hypothetical expenses based on the actual Fund expense ratio and an assumed rate of return of 5% per year (before expenses), which is not the actual Fund return. The hypothetical account values and expenses may not be used to estimate the actual ending account balance or expenses you paid for the period. You may use this information to compare the ongoing costs of investing in the Fund and other funds. To do so, compare this 5% hypothetical example with the 5% hypothetical examples that appear in the shareholder reports of the other funds.
Please note that the expenses shown in the table are meant to highlight your ongoing costs only and do not reflect any transactional costs, such as sales charges (loads) or redemption fees (if applicable). Therefore, the second section of the table is useful in comparing ongoing costs only, and will not help you determine the relative total costs of owning different funds. In addition, if these transactional costs were included, your costs would be higher.
| | Beginning
Account Value
(4/1/20) | Ending
Account Value
(9/30/20) | Expenses Paid
During Period*
(4/1/20 – 9/30/20) | Annualized
Expense
Ratio |
| Actual | | | | |
| Class A | $1,000.00 | $1,246.90 | $ 6.40** | 1.14% |
| Class C | $1,000.00 | $1,242.50 | $10.60 ** | 1.89% |
| Class I | $1,000.00 | $1,249.00 | $ 5.00** | 0.89% |
| Class R6 | $1,000.00 | $1,249.10 | $ 4.78** | 0.85% |
| Hypothetical | | | | |
| (5% return per year before expenses) | | | | |
| Class A | $1,000.00 | $1,019.30 | $ 5.76** | 1.14% |
| Class C | $1,000.00 | $1,015.55 | $ 9.52** | 1.89% |
| Class I | $1,000.00 | $1,020.55 | $ 4.50** | 0.89% |
| Class R6 | $1,000.00 | $1,020.75 | $ 4.29** | 0.85% |
| * | Expenses are equal to the Fund's annualized expense ratio for the indicated Class, multiplied by the average account value over the period, multiplied by 183/366 (to reflect the one-half year period). The Example assumes that the $1,000 was invested at the net asset value per share determined at the close of business on March 31, 2020. |
| ** | Absent a waiver and/or reimbursement of expenses by affiliates, expenses would be higher. |
Calvert
International Equity Fund
September 30, 2020
| Security | Shares | Value |
| Australia — 2.5% | |
| CSL, Ltd. | | 66,453 | $ 13,726,972 |
| | | | $ 13,726,972 |
| Belgium — 1.5% | |
| KBC Groep NV | | 167,439 | $ 8,396,404 |
| | | | $ 8,396,404 |
| Denmark — 4.3% | |
| Chr. Hansen Holding A/S | | 55,121 | $ 6,118,760 |
| Novo Nordisk A/S, Class B | | 247,180 | 17,125,763 |
| | | | $ 23,244,523 |
| France — 9.9% | |
| Dassault Systemes SE | | 49,385 | $ 9,214,355 |
| LVMH Moet Hennessy Louis Vuitton SE | | 28,546 | 13,356,685 |
| Sanofi | | 175,303 | 17,567,431 |
| Schneider Electric SE | | 111,698 | 13,883,937 |
| | | | $ 54,022,408 |
| Germany — 4.2% | |
| adidas AG(1) | | 47,278 | $ 15,268,051 |
| Infineon Technologies AG | | 275,855 | 7,775,188 |
| | | | $ 23,043,239 |
| Hong Kong — 3.5% | |
| AIA Group, Ltd. | | 1,899,993 | $ 18,886,108 |
| | | | $ 18,886,108 |
| India — 1.9% | |
| HDFC Bank, Ltd.(1) | | 721,306 | $ 10,582,743 |
| | | | $ 10,582,743 |
| Ireland — 6.1% | |
| CRH PLC | | 276,430 | $ 10,023,715 |
| DCC PLC | | 161,598 | 12,509,738 |
| Kerry Group PLC, Class A | | 85,188 | 10,911,350 |
| | | | $ 33,444,803 |
| Japan — 17.7% | |
| Kao Corp. | | 170,541 | $ 12,802,636 |
| Keyence Corp. | | 25,867 | 12,092,281 |
| ORIX Corp. | | 720,100 | 8,994,236 |
| Pan Pacific International Holdings Corp. | | 398,400 | 9,278,049 |
| Recruit Holdings Co., Ltd. | | 321,707 | 12,776,706 |
| Santen Pharmaceutical Co., Ltd. | | 666,692 | 13,631,099 |
| Shiseido Co., Ltd. | | 136,500 | 7,901,976 |
| SMC Corp. | | 16,900 | 9,427,435 |
| Security | Shares | Value |
| Japan (continued) | |
| Yamaha Corp. | | 209,700 | $ 10,057,382 |
| | | | $ 96,961,800 |
| Netherlands — 2.3% | |
| ASML Holding NV | | 33,870 | $ 12,510,659 |
| | | | $ 12,510,659 |
| New Zealand — 0.8% | |
| Fisher & Paykel Healthcare Corp., Ltd. | | 200,566 | $ 4,426,598 |
| | | | $ 4,426,598 |
| Norway — 1.8% | |
| DNB ASA(1) | | 696,391 | $ 9,701,157 |
| | | | $ 9,701,157 |
| Singapore — 2.0% | |
| DBS Group Holdings, Ltd. | | 743,628 | $ 10,932,329 |
| | | | $ 10,932,329 |
| South Africa — 1.2% | |
| Naspers, Ltd., Class N | | 35,725 | $ 6,309,886 |
| | | | $ 6,309,886 |
| Spain — 6.0% | |
| Amadeus IT Group S.A. | | 223,708 | $ 12,423,842 |
| Banco Santander S.A.(1) | | 3,888,498 | 7,253,027 |
| Iberdrola S.A. | | 1,059,357 | 13,039,185 |
| | | | $ 32,716,054 |
| Sweden — 6.2% | |
| Assa Abloy AB, Class B | | 420,636 | $ 9,834,519 |
| Indutrade AB(1) | | 212,676 | 11,384,363 |
| Sandvik AB(1) | | 643,300 | 12,579,935 |
| | | | $ 33,798,817 |
| Switzerland — 10.4% | |
| Lonza Group AG | | 16,343 | $ 10,085,840 |
| Nestle S.A. | | 217,024 | 25,828,454 |
| Sika AG | | 35,450 | 8,704,806 |
| Straumann Holding AG | | 11,912 | 12,050,195 |
| | | | $ 56,669,295 |
| Taiwan — 1.7% | |
| Taiwan Semiconductor Manufacturing Co., Ltd. ADR | | 116,134 | $ 9,414,983 |
| | | | $ 9,414,983 |
| United Kingdom — 12.2% | |
| Abcam PLC | | 548,784 | $ 8,639,863 |
| Compass Group PLC | | 718,391 | 10,791,499 |
8
See Notes to Financial Statements.
Calvert
International Equity Fund
September 30, 2020
Schedule of Investments — continued
| Security | Shares | Value |
| United Kingdom (continued) | |
| Halma PLC | | 287,107 | $ 8,674,033 |
| London Stock Exchange Group PLC | | 92,156 | 10,571,844 |
| RELX PLC | | 428,707 | 9,542,178 |
| Unilever PLC | | 294,697 | 18,168,997 |
| | | | $ 66,388,414 |
| United States — 1.6% | |
| Visa, Inc., Class A | | 43,292 | $ 8,657,101 |
| | | | $ 8,657,101 |
Total Common Stocks
(identified cost $459,222,721) | | | $ 533,834,293 |
| High Social Impact Investments — 0.2% |
| Security | Principal
Amount
(000's omitted) | Value |
| Calvert Impact Capital, Inc., Community Investment Notes, 1.50%, 12/15/20(2)(3) | $ | 880 | $ 875,888 |
| ImpactAssets, Inc., Global Sustainable Agriculture Notes, 2.07%, 11/3/20(3)(4) | | 220 | 212,969 |
| ImpactAssets, Inc., Microfinance Plus Notes, 0.46%, 11/3/20(3)(4) | | 283 | 244,099 |
Total High Social Impact Investments
(identified cost $1,383,352) | | | $ 1,332,956 |
| Preferred Stocks — 0.0%(5) |
| Security | Shares | Value |
| Venture Capital — 0.0%(5) | |
| Bioceptive, Inc.: | | | |
| Series A(1)(3)(6) | | 582,574 | $ 0 |
| Series B(1)(3)(6) | | 40,523 | 0 |
| FINAE, Series D(1)(3)(6) | | 2,597,442 | 97,500 |
Total Preferred Stocks
(identified cost $491,304) | | | $ 97,500 |
| Venture Capital Limited Partnership Interests — 0.3% |
| Security | | | Value |
| Africa Renewable Energy Fund L.P.(1)(3)(6) | | | $ 1,199,909 |
| Blackstone Clean Technology Partners L.P.(1)(3)(6) | | | 3,498 |
| Emerald Sustainability Fund I L.P.(1)(3)(6) | | | 42,963 |
| gNet Defta Development Holding LLC(1)(2)(3)(6) | | | 240,155 |
| SEAF India International Growth Fund L.P.(1)(3)(6) | | | 550 |
Total Venture Capital Limited Partnership Interests
(identified cost $2,067,964) | | | $ 1,487,075 |
| Short-Term Investments — 0.4% |
| Description | Units | Value |
| Calvert Cash Reserves Fund, LLC, 0.13%(7) | | 2,459,827 | $ 2,460,073 |
Total Short-Term Investments
(identified cost $2,460,274) | | | $ 2,460,073 |
Total Investments — 98.7%
(identified cost $465,625,615) | | $ 539,211,897 |
| Other Assets, Less Liabilities — 1.3% | | $ 6,942,972 |
| Net Assets — 100.0% | | $ 546,154,869 |
The percentage shown for each investment category in the Schedule of Investments is based on net assets.
| |
| (1) | Non-income producing security. |
| (2) | Affiliated company (see Note 7). |
| (3) | Restricted security. Total market value of restricted securities amounts to $2,917,531, which represents 0.5% of the net assets of the Fund as of September 30, 2020. |
| (4) | Notes carry an interest rate that varies by period and is contingent on the performance of the underlying portfolio of loans to borrowers. The coupon rate shown represents the rate in effect at September 30, 2020. |
| (5) | Amount is less than 0.05%. |
| (6) | For fair value measurement disclosure purposes, security is categorized as Level 3 (see Note 1A). |
| (7) | Affiliated investment company, available to Calvert portfolios and funds, which invests in high quality, U.S. dollar denominated money market instruments. The rate shown is the annualized seven-day yield as of September 30, 2020. |
9
See Notes to Financial Statements.
Calvert
International Equity Fund
September 30, 2020
Schedule of Investments — continued
At September 30, 2020, the concentration of the Fund’s investments in the various sectors, determined as a percentage of net assets, was as follows:
| Economic Sectors | % of Net Assets |
| Health Care | 17.8% |
| Industrials | 16.8 |
| Financials | 15.6 |
| Information Technology | 14.8 |
| Consumer Staples | 13.9 |
| Consumer Discretionary | 11.9 |
| Materials | 4.6 |
| Utilities | 2.4 |
| Venture Capital | 0.3 |
| High Social Impact Investments | 0.2 |
| Total | 98.3% |
Restricted Securities
| Description | Acquisition Dates | Cost |
| Africa Renewable Energy Fund L.P. | 4/17/14-5/13/19 | $986,557 |
| Bioceptive, Inc., Series A | 10/26/12-12/18/13 | 252,445 |
| Bioceptive, Inc., Series B | 1/7/16 | 16,250 |
| Blackstone Clean Technology Partners L.P. | 7/29/10-6/25/15 | 77,081 |
| Calvert Impact Capital, Inc., Community Investment Notes, 1.50%, 12/15/20 | 12/13/19 | 880,352 |
| Emerald Sustainability Fund I L.P. | 7/19/01-5/17/11 | 393,935 |
| FINAE, Series D | 2/28/11-11/16/15 | 222,609 |
| gNet Defta Development Holding LLC | 8/30/05 | 400,000 |
| ImpactAssets, Inc., Global Sustainable Agriculture Notes, 2.07%, 11/3/20 | 11/13/15 | 220,000 |
| ImpactAssets, Inc., Microfinance Plus Notes, 0.46%, 11/3/20 | 11/13/15 | 283,000 |
| SEAF India International Growth Fund L.P. | 3/22/05-5/24/10 | 210,391 |
| Abbreviations: |
| ADR | – American Depositary Receipt |
10
See Notes to Financial Statements.
Calvert
International Equity Fund
September 30, 2020
Statement of Assets and Liabilities
| | September 30, 2020 |
| Assets | |
| Investments in securities of unaffiliated issuers, at value (identified cost $461,884,989) | $ 535,635,781 |
| Investments in securities of affiliated issuers, at value (identified cost $3,740,626) | 3,576,116 |
| Cash denominated in foreign currency, at value (cost $49,453) | 49,556 |
| Receivable for capital shares sold | 6,447,360 |
| Dividends and interest receivable | 664,061 |
| Dividends and interest receivable - affiliated | 10,825 |
| Tax reclaims receivable | 537,303 |
| Receivable from affiliates | 69,231 |
| Directors' deferred compensation plan | 103,806 |
| Other assets | 3,778 |
| Total assets | $547,097,817 |
| Liabilities | |
| Payable for capital shares redeemed | $ 251,199 |
| Payable to affiliates: | |
| Investment advisory fee | 295,622 |
| Administrative fee | 52,874 |
| Distribution and service fees | 33,620 |
| Sub-transfer agency fee | 13,320 |
| Directors' deferred compensation plan | 103,806 |
| Accrued expenses | 192,507 |
| Total liabilities | $ 942,948 |
| Commitments and contingent liabilities (Note 10) | |
| Net Assets | $546,154,869 |
| Sources of Net Assets | |
| Paid-in capital | $ 482,543,488 |
| Distributable earnings | 63,611,381 |
| Total | $546,154,869 |
| Class A Shares | |
| Net Assets | $ 138,809,522 |
| Shares Outstanding | 6,821,661 |
Net Asset Value and Redemption Price Per Share
(net assets ÷ shares of beneficial interest outstanding) | $ 20.35 |
Maximum Offering Price Per Share
(100 ÷ 95.25 of net asset value per share) | $ 21.36 |
| Class C Shares | |
| Net Assets | $ 6,156,722 |
| Shares Outstanding | 354,472 |
Net Asset Value and Offering Price Per Share*
(net assets ÷ shares of beneficial interest outstanding) | $ 17.37 |
| Class I Shares | |
| Net Assets | $ 279,038,904 |
| Shares Outstanding | 12,817,362 |
Net Asset Value, Offering Price and Redemption Price Per Share
(net assets ÷ shares of beneficial interest outstanding) | $ 21.77 |
11
See Notes to Financial Statements.
Calvert
International Equity Fund
September 30, 2020
Statement of Assets and Liabilities — continued
| | September 30, 2020 |
| Class R6 Shares | |
| Net Assets | $122,149,721 |
| Shares Outstanding | 5,613,261 |
Net Asset Value, Offering Price and Redemption Price Per Share
(net assets ÷ shares of beneficial interest outstanding) | $ 21.76 |
| | On sales of $50,000 or more, the offering price of Class A shares is reduced. |
| * | Redemption price per share is equal to the net asset value less any applicable contingent deferred sales charge. |
12
See Notes to Financial Statements.
Calvert
International Equity Fund
September 30, 2020
| | Year Ended |
| | September 30, 2020 |
| Investment Income | |
| Dividend income (net of foreign taxes withheld of $510,348) | $ 5,004,844 |
| Dividend income - affiliated issuers | 1,768 |
| Non-cash dividend income | 342,938 |
| Interest income (net of foreign taxes withheld of $511) | 20,139 |
| Interest income - affiliated issuers | 24,118 |
| Securities lending income, net | 111,416 |
| Total investment income | $ 5,505,223 |
| Expenses | |
| Investment advisory fee | $ 2,489,495 |
| Administrative fee | 442,603 |
| Distribution and service fees: | |
| Class A | 307,779 |
| Class C | 61,208 |
| Directors' fees and expenses | 14,125 |
| Custodian fees | 51,285 |
| Transfer agency fees and expenses | 413,934 |
| Accounting fees | 88,808 |
| Professional fees | 61,464 |
| Registration fees | 92,252 |
| Reports to shareholders | 32,644 |
| Miscellaneous | 53,385 |
| Total expenses | $ 4,108,982 |
| Waiver and/or reimbursement of expenses by affiliates | $ (478,797) |
| Reimbursement of expenses - other | (4,073) |
| Net expenses | $ 3,626,112 |
| Net investment income | $ 1,879,111 |
| Realized and Unrealized Gain (Loss) | |
| Net realized gain (loss): | |
| Investment securities | $ 7,556,215 |
| Investment securities - affiliated issuers | 2,276 |
| Foreign currency transactions | 31,105 |
| Net realized gain | $ 7,589,596 |
| Change in unrealized appreciation (depreciation): | |
| Investment securities | $ 46,632,470 |
| Investment securities - affiliated issuers | 151,879 |
| Foreign currency | 33,193 |
| Net change in unrealized appreciation (depreciation) | $46,817,542 |
| Net realized and unrealized gain | $54,407,138 |
| Net increase in net assets from operations | $56,286,249 |
13
See Notes to Financial Statements.
Calvert
International Equity Fund
September 30, 2020
Statements of Changes in Net Assets
| | Year Ended September 30, |
| | 2020 | 2019 |
| Increase (Decrease) in Net Assets | | |
| From operations: | | |
| Net investment income | $ 1,879,111 | $ 2,926,338 |
| Net realized gain | 7,589,596 | 2,969,458 |
| Net change in unrealized appreciation (depreciation) | 46,817,542 | 6,697,143 |
| Net increase in net assets from operations | $ 56,286,249 | $ 12,592,939 |
| Distributions to shareholders: | | |
| Class A | $ (1,227,749) | $ (1,141,071) |
| Class C | (23,398) | (50,893) |
| Class I | (1,178,120) | (912,793) |
| Class R6 | (769,016) | — |
| Total distributions to shareholders | $ (3,198,283) | $ (2,104,757) |
| Capital share transactions: | | |
| Class A | $ 11,502,065 | $ (6,044,601) |
| Class C | (608,336) | (4,981,623) |
| Class I | 169,404,832 | 13,082,906 |
| Class R6 | 62,129,683 | 47,291,005 (1) |
| Net increase in net assets from capital share transactions | $242,428,244 | $ 49,347,687 |
| Net increase in net assets | $295,516,210 | $ 59,835,869 |
| Net Assets | | |
| At beginning of year | $ 250,638,659 | $ 190,802,790 |
| At end of year | $546,154,869 | $250,638,659 |
| (1) | For the period from the commencement of operations, March 7, 2019, to September 30, 2019. |
14
See Notes to Financial Statements.
Calvert
International Equity Fund
September 30, 2020
| | Class A |
| | Year Ended September 30, |
| | 2020 | 2019 | 2018 | 2017 | 2016 |
| Net asset value — Beginning of year | $ 18.18 | $ 17.53 | $ 17.10 | $ 15.49 | $ 15.62 |
| Income (Loss) From Operations | | | | | |
| Net investment income(1) | $ 0.06 | $ 0.22 | $ 0.19 | $ 0.17 | $ 0.34(2) |
| Net realized and unrealized gain (loss) | 2.30 | 0.61 | 0.50 | 1.84 | (0.33) |
| Total income from operations | $ 2.36 | $ 0.83 | $ 0.69 | $ 2.01 | $ 0.01 |
| Less Distributions | | | | | |
| From net investment income | $ (0.19) | $ (0.18) | $ (0.26) | $ (0.40) | $ (0.14) |
| Total distributions | $ (0.19) | $ (0.18) | $ (0.26) | $ (0.40) | $ (0.14) |
| Net asset value — End of year | $ 20.35 | $ 18.18 | $ 17.53 | $ 17.10 | $ 15.49 |
| Total Return(3) | 13.02% | 4.93% | 4.02% | 13.43% | 0.04% |
| Ratios/Supplemental Data | | | | | |
| Net assets, end of year (000’s omitted) | $138,810 | $112,923 | $114,915 | $126,669 | $156,757 |
| Ratios (as a percentage of average daily net assets):(4) | | | | | |
| Total expenses | 1.27% | 1.46% | 1.47% | 1.58% | 1.62% |
| Net expenses | 1.14% | 1.27% | 1.32% | 1.35% | 1.38% |
| Net investment income | 0.33% | 1.26% | 1.09% | 1.08% | 2.20% (2) |
| Portfolio Turnover | 47% | 51% | 48% | 138% | 94% |
| (1) | Computed using average shares outstanding. |
| (2) | Amount includes a non-recurring refund for overbilling of prior years' custody out-of-pocket fees. This amounted to $0.013 per share and 0.08% of average net assets. |
| (3) | Returns are historical and are calculated by determining the percentage change in net asset value with all distributions reinvested and do not reflect the effect of sales charges, if any. |
| (4) | Total expenses do not reflect amounts reimbursed and/or waived by the adviser and certain of its affiliates, if applicable. Net expenses are net of all reductions and represent the net expenses paid by the Fund. |
15
See Notes to Financial Statements.
Calvert
International Equity Fund
September 30, 2020
Financial Highlights — continued
| | Class C |
| | Year Ended September 30, |
| | 2020 | 2019 | 2018 | 2017 | 2016 |
| Net asset value — Beginning of year | $ 15.54 | $ 15.00 | $ 14.68 | $ 13.31 | $ 13.47 |
| Income (Loss) From Operations | | | | | |
| Net investment income (loss)(1) | $ (0.07) | $ 0.03 | $ 0.06 | $ 0.05 | $ 0.19(2) |
| Net realized and unrealized gain (loss) | 1.96 | 0.58 | 0.42 | 1.59 | (0.28) |
| Total income (loss) from operations | $ 1.89 | $ 0.61 | $ 0.48 | $ 1.64 | $ (0.09) |
| Less Distributions | | | | | |
| From net investment income | $ (0.06) | $ (0.07) | $ (0.16) | $ (0.27) | $ (0.07) |
| Total distributions | $ (0.06) | $ (0.07) | $ (0.16) | $ (0.27) | $ (0.07) |
| Net asset value — End of year | $17.37 | $15.54 | $ 15.00 | $ 14.68 | $ 13.31 |
| Total Return(3) | 12.17% | 4.15% | 3.23% | 12.60% | (0.68)% |
| Ratios/Supplemental Data | | | | | |
| Net assets, end of year (000’s omitted) | $ 6,157 | $ 6,122 | $11,149 | $12,013 | $13,613 |
| Ratios (as a percentage of average daily net assets):(4) | | | | | |
| Total expenses | 2.02% | 2.21% | 2.22% | 2.54% | 2.55% |
| Net expenses | 1.89% | 2.03% | 2.07% | 2.10% | 2.14% |
| Net investment income (loss) | (0.43)% | 0.23% | 0.39% | 0.35% | 1.42% (2) |
| Portfolio Turnover | 47% | 51% | 48% | 138% | 94% |
| (1) | Computed using average shares outstanding. |
| (2) | Amount includes a non-recurring refund for overbilling of prior years' custody out-of-pocket fees. This amounted to $0.011 per share and 0.08% of average net assets. |
| (3) | Returns are historical and are calculated by determining the percentage change in net asset value with all distributions reinvested and do not reflect the effect of sales charges, if any. |
| (4) | Total expenses do not reflect amounts reimbursed and/or waived by the adviser and certain of its affiliates, if applicable. Net expenses are net of all reductions and represent the net expenses paid by the Fund. |
16
See Notes to Financial Statements.
Calvert
International Equity Fund
September 30, 2020
Financial Highlights — continued
| | Class I |
| | Year Ended September 30, |
| | 2020 | 2019 | 2018 | 2017 | 2016 |
| Net asset value — Beginning of year | $ 19.43 | $ 18.72 | $ 18.24 | $ 16.53 | $ 16.73 |
| Income (Loss) From Operations | | | | | |
| Net investment income(1) | $ 0.13 | $ 0.28 | $ 0.27 | $ 0.21 | $ 0.44(2) |
| Net realized and unrealized gain (loss) | 2.45 | 0.66 | 0.53 | 2.01 | (0.36) |
| Total income from operations | $ 2.58 | $ 0.94 | $ 0.80 | $ 2.22 | $ 0.08 |
| Less Distributions | | | | | |
| From net investment income | $ (0.24) | $ (0.23) | $ (0.32) | $ (0.51) | $ (0.28) |
| Total distributions | $ (0.24) | $ (0.23) | $ (0.32) | $ (0.51) | $ (0.28) |
| Net asset value — End of year | $ 21.77 | $ 19.43 | $ 18.72 | $ 18.24 | $ 16.53 |
| Total Return(3) | 13.31% | 5.25% | 4.37% | 13.89% | 0.41% |
| Ratios/Supplemental Data | | | | | |
| Net assets, end of year (000’s omitted) | $279,039 | $82,261 | $64,739 | $72,503 | $140,129 |
| Ratios (as a percentage of average daily net assets):(4) | | | | | |
| Total expenses | 1.02% | 1.20% | 1.22% | 1.06% | 1.04% |
| Net expenses | 0.89% | 0.98% | 0.95% | 0.96% | 0.95% |
| Net investment income | 0.61% | 1.52% | 1.44% | 1.28% | 2.67% (2) |
| Portfolio Turnover | 47% | 51% | 48% | 138% | 94% |
| (1) | Computed using average shares outstanding. |
| (2) | Amount includes a non-recurring refund for overbilling of prior years' custody out-of-pocket fees. This amounted to $0.014 per share and 0.09% of average net assets. |
| (3) | Returns are historical and are calculated by determining the percentage change in net asset value with all distributions reinvested and do not reflect the effect of sales charges, if any. |
| (4) | Total expenses do not reflect amounts reimbursed and/or waived by the adviser and certain of its affiliates, if applicable. Net expenses are net of all reductions and represent the net expenses paid by the Fund. |
17
See Notes to Financial Statements.
Calvert
International Equity Fund
September 30, 2020
Financial Highlights — continued
| | Class R6 |
| | Year Ended September 30, | Period Ended
September 30, |
| | 2020 | 2019 (1) |
| Net asset value — Beginning of period | $ 19.44 | $ 17.79 |
| Income (Loss) From Operations | | |
| Net investment income(2) | $ 0.13 | $ 0.28 |
| Net realized and unrealized gain | 2.46 | 1.37 |
| Total income from operations | $ 2.59 | $ 1.65 |
| Less Distributions | | |
| From net investment income | $ (0.27) | $ — |
| Total distributions | $ (0.27) | $ — |
| Net asset value — End of period | $ 21.76 | $ 19.44 |
| Total Return(3) | 13.34% | 9.27% (4) |
| Ratios/Supplemental Data | | |
| Net assets, end of period (000’s omitted) | $122,150 | $49,332 |
| Ratios (as a percentage of average daily net assets):(5) | | |
| Total expenses | 0.98% | 1.14% (6) |
| Net expenses | 0.85% | 0.96% (6) |
| Net investment income | 0.64% | 2.62% (6) |
| Portfolio Turnover | 47% | 51% (7) |
| (1) | For the period from the commencement of operations, March 7, 2019, to September 30, 2019. |
| (2) | Computed using average shares outstanding. |
| (3) | Returns are historical and are calculated by determining the percentage change in net asset value with all distributions reinvested and do not reflect the effect of sales charges, if any. |
| (4) | Not annualized. |
| (5) | Total expenses do not reflect amounts reimbursed and/or waived by the adviser and certain of its affiliates, if applicable. Net expenses are net of all reductions and represent the net expenses paid by the Fund. |
| (6) | Annualized. |
| (7) | For the year ended September 30, 2019. |
18
See Notes to Financial Statements.
Calvert
International Equity Fund
September 30, 2020
Notes to Financial Statements
1 Significant Accounting Policies
Calvert International Equity Fund (the Fund) is a diversified series of Calvert World Values Fund, Inc. (the Corporation). The Corporation is a Maryland corporation registered under the Investment Company Act of 1940, as amended (the 1940 Act), as an open-end management investment company. The investment objective of the Fund is to seek to provide a high total return consistent with reasonable risk by investing primarily in a diversified portfolio of stocks. The Fund invests primarily in equity securities of foreign companies.
The Fund offers four classes of shares. Class A shares are generally sold subject to a sales charge imposed at time of purchase. A contingent deferred sales charge of 0.80% may apply to certain redemptions of Class A shares for accounts for which no sales charge was paid, if redeemed within 12 months of purchase. Class C shares are sold without a front-end sales charge, and with certain exceptions, are charged a contingent deferred sales charge of 1% on shares redeemed within 12 months of purchase. Class C shares are only available for purchase through a financial intermediary. Effective January 25, 2019, Class C shares generally automatically convert to Class A shares ten years after their purchase and, effective November 5, 2020, automatically convert to Class A shares eight years after their purchase as described in the Fund's prospectus. Class I and Class R6 shares are sold at net asset value, are not subject to a sales charge and are sold only to certain eligible investors. Each class represents a pro rata interest in the Fund, but votes separately on class-specific matters and is subject to different expenses.
The Fund applies the accounting and reporting guidance in the Financial Accounting Standards Board (FASB) Accounting Standards Codification Topic 946, Financial Services – Investment Companies (ASC 946). Subsequent events, if any, through the date that the financial statements were issued have been evaluated in the preparation of the financial statements.
A Investment Valuation— Net asset value per share is determined every business day as of the close of the regular session of the New York Stock Exchange (generally 4:00 p.m. Eastern time). The Fund uses independent pricing services approved by the Board of Directors (the Board) to value its investments wherever possible. Investments for which market quotations are not available or deemed not reliable are fair valued in good faith under the direction of the Board.
U.S. generally accepted accounting principles (U.S. GAAP) establishes a disclosure hierarchy that categorizes the inputs to valuation techniques used to value assets and liabilities at measurement date. These inputs are summarized in the three broad levels listed below:
Level 1 - quoted prices in active markets for identical securities
Level 2 - other significant observable inputs (including quoted prices for similar securities, interest rates, prepayment speeds, credit risk, etc.)
Level 3 - significant unobservable inputs (including the Fund’s own assumptions in determining the fair value of investments)
The inputs or methodologies used for valuing securities are not necessarily an indication of the risk associated with investing in those securities.
Valuation techniques used to value the Fund’s investments by major category are as follows:
Equity Securities. Equity securities (including warrants and rights) listed on a U.S. securities exchange generally are valued at the last sale or closing price as reported by an independent pricing service on the primary market or exchange on which they are traded and are categorized as Level 1 in the hierarchy. Equity securities listed on the NASDAQ Global or Global Select Market are valued at the NASDAQ official closing price and are categorized as Level 1 in the hierarchy. Unlisted or listed securities for which closing sales prices or closing quotations are not available are valued at the mean between the latest available bid and ask prices and are categorized as Level 2 in the hierarchy. The daily valuation of exchange-traded foreign securities generally is determined as of the close of trading on the principal exchange on which such securities trade. Events occurring after the close of trading on foreign exchanges may result in adjustments to the valuation of foreign securities to more accurately reflect their fair value as of the close of regular trading on the New York Stock Exchange. When valuing foreign equity securities that meet certain criteria, the Fund’s Board has approved the use of a fair value service that values such securities to reflect market trading that occurs after the close of the applicable foreign markets of comparable securities or other instruments that have a strong correlation to the fair-valued securities. Such securities are categorized as Level 2 in the hierarchy.
Debt Securities. Debt securities are generally valued based on valuations provided by third party pricing services, as derived from such services’ pricing models. Inputs to the models may include, but are not limited to, reported trades, executable bid and ask prices, broker/dealer quotations, prices or yields of securities with similar characteristics, interest rates, anticipated prepayments, benchmark curves or information pertaining to the issuer, as well as industry and economic events. Accordingly, debt securities are generally categorized as Level 2 in the hierarchy. Short-term debt securities with a remaining maturity at time of purchase of more than sixty days are valued based on valuations provided by a third party pricing service. Such securities are generally categorized as Level 2 in the hierarchy. Short-term debt securities of sufficient credit quality purchased with remaining maturities of sixty days or less are valued at amortized cost, which approximates fair value, and are categorized as Level 2 in the hierarchy.
Venture Capital Securities. Venture capital securities for which market quotations are not readily available are generally categorized as Level 3 in the hierarchy. Venture capital equity securities are generally valued using the most appropriate and applicable method to measure fair value in light of each company’s situation. Methods may include market, income, options-pricing or cost approaches with discounts as appropriate based on assumptions of liquidation or exit risk. Examples of the market approach are subsequent rounds of financing, comparable transactions, and revenue times an industry multiple. An example of the income approach is the discounted cash flow model. Examples of the cost approach are replacement cost, salvage value, or net asset value. The options-pricing method treats common stock and preferred stock as call options on the enterprise value with strike price based on the
Calvert
International Equity Fund
September 30, 2020
Notes to Financial Statements — continued
preferred stock liquidation preference. Venture capital limited partnership interests are valued at the fair value reported by the general partner of the partnership, adjusted as necessary to reflect subsequent capital calls and distributions and any other available information. In some cases, adjustments may be made to account for daily pricing of material public holdings within the partnership.
Affiliated Fund. The Fund may invest in Calvert Cash Reserves Fund, LLC (Cash Reserves Fund), an affiliated investment company managed by Calvert Research and Management (CRM). While Cash Reserves Fund is not a registered money market mutual fund, it conducts all of its investment activities in accordance with the requirements of Rule 2a-7 under the 1940 Act. Investments in Cash Reserves Fund are valued at the closing net asset value per unit on the valuation day and are categorized as Level 2 in the hierarchy. Cash Reserves Fund generally values its investment securities based on available market quotations provided by a third party pricing service.
Other Securities. Investments in registered investment companies (including money market funds) that do not trade on an exchange are valued at the net asset value per share on the valuation day and are categorized as Level 1 in the hierarchy.
Fair Valuation. If a market value cannot be determined for a security using the methodologies described above, or if, in the good faith opinion of the Fund's adviser, the market value does not constitute a readily available market quotation, or if a significant event has occurred that would materially affect the value of the security, the security will be fair valued as determined in good faith by or at the direction of the Board in a manner that most fairly reflects the security’s “fair value”, which is the amount that the Fund might reasonably expect to receive for the security upon its current sale in the ordinary course. Each such determination is based on a consideration of relevant factors, which are likely to vary from one pricing context to another. These factors may include, but are not limited to, the type of security, the existence of any contractual restrictions on the security’s disposition, the price and extent of public trading in similar securities of the issuer or of comparable companies or entities, quotations or relevant information obtained from broker/dealers or other market participants, information obtained from the issuer, analysts, and/or the appropriate stock exchange (for exchange-traded securities), an analysis of the company’s or entity’s financial statements, and an evaluation of the forces that influence the issuer and the market(s) in which the security is purchased and sold.
The values assigned to fair value investments are based on available information and do not necessarily represent amounts that might ultimately be realized. Further, due to the inherent uncertainty of valuations of such investments, the fair values may differ significantly from the values that would have been used had an active market existed, and the differences could be material.
The following table summarizes the market value of the Fund's holdings as of September 30, 2020, based on the inputs used to value them:
| Asset Description | Level 1 | Level 2 | Level 3(1) | Total |
| Common Stocks | | | | |
| Australia | $ — | $ 13,726,972 | $ — | $ 13,726,972 |
| Belgium | — | 8,396,404 | — | 8,396,404 |
| Denmark | — | 23,244,523 | — | 23,244,523 |
| France | — | 54,022,408 | — | 54,022,408 |
| Germany | — | 23,043,239 | — | 23,043,239 |
| Hong Kong | — | 18,886,108 | — | 18,886,108 |
| India | — | 10,582,743 | — | 10,582,743 |
| Ireland | — | 33,444,803 | — | 33,444,803 |
| Japan | — | 96,961,800 | — | 96,961,800 |
| Netherlands | — | 12,510,659 | — | 12,510,659 |
| New Zealand | — | 4,426,598 | — | 4,426,598 |
| Norway | — | 9,701,157 | — | 9,701,157 |
| Singapore | — | 10,932,329 | — | 10,932,329 |
| South Africa | — | 6,309,886 | — | 6,309,886 |
| Spain | — | 32,716,054 | — | 32,716,054 |
| Sweden | — | 33,798,817 | — | 33,798,817 |
| Switzerland | — | 56,669,295 | — | 56,669,295 |
| Taiwan | 9,414,983 | — | — | 9,414,983 |
| United Kingdom | — | 66,388,414 | — | 66,388,414 |
| United States | 8,657,101 | — | — | 8,657,101 |
| Total Common Stocks | $18,072,084 | $515,762,209 (2) | $ — | $533,834,293 |
| High Social Impact Investments | $ — | $ 1,332,956 | $ — | $ 1,332,956 |
Calvert
International Equity Fund
September 30, 2020
Notes to Financial Statements — continued
| Asset Description | Level 1 | Level 2 | Level 3(1) | Total |
| Preferred Stocks - Venture Capital | $ — | $ — | $ 97,500 | $ 97,500 |
| Venture Capital Limited Partnership Interests | — | — | 1,487,075 | 1,487,075 |
| Short-Term Investments | — | 2,460,073 | — | 2,460,073 |
| Total Investments | $18,072,084 | $519,555,238 | $1,584,575 | $539,211,897 |
| (1) | None of the unobservable inputs for Level 3 assets, individually or collectively, had a material impact on the Fund. |
| (2) | Includes foreign equity securities whose values were adjusted to reflect market trading of comparable securities or other correlated instruments that occurred after the close of trading in their applicable foreign markets. |
Level 3 investments at the beginning and/or end of the period in relation to net assets were not significant and accordingly, a reconciliation of Level 3 assets for the year ended September 30, 2020 is not presented.
B Investment Transactions and Income— Investment transactions for financial statement purposes are accounted for on trade date. Realized gains and losses are recorded on an identified cost basis and may include proceeds from litigation. Dividend income is recorded on the ex-dividend date for dividends received in cash and/or securities or, in the case of dividends on certain foreign securities, as soon as the Fund is informed of the ex-dividend date. Non-cash dividends are recorded at the fair value of the securities received. Withholding taxes on foreign dividends, if any, have been provided for in accordance with the Fund’s understanding of the applicable country’s tax rules and rates. In consideration of recent decisions rendered by European courts, the Fund has filed additional tax reclaims for previously withheld taxes on dividends earned in certain European Union countries. These filings are subject to various administrative and judicial proceedings within these countries. Due to the uncertainty as to the ultimate resolution of these proceedings, the likelihood of receipt of these reclaims, and the potential timing of payment, no amounts are reflected in the financial statements for such outstanding reclaims.
Distributions received that represent a return of capital are recorded as a reduction of cost of investments. Distributions received that represent a capital gain are recorded as a realized gain. Interest income, which includes amortization of premium and accretion of discount on debt securities, is accrued as earned.
C Share Class Accounting— Realized and unrealized gains and losses and net investment income and losses, other than class-specific expenses, are allocated daily to each class of shares based upon the relative net assets of each class to the total net assets of the Fund. Expenses arising in connection with a specific class are charged directly to that class. Sub-accounting, recordkeeping and similar administrative fees payable to financial intermediaries, which are a component of transfer agency fees and expenses on the Statement of Operations, are not allocated to Class R6 shares.
D Foreign Currency Transactions— The Fund’s accounting records are maintained in U.S. dollars. For valuation of assets and liabilities on each date of net asset value determination, foreign denominations are converted into U.S. dollars using the current exchange rate. Security transactions, income and expenses are translated at the prevailing rate of exchange on the date of the event. Recognized gains or losses on investment transactions attributable to changes in foreign currency exchange rates are recorded for financial statement purposes as net realized gains and losses on investments. That portion of unrealized gains and losses on investments that results from fluctuations in foreign currency exchange rates is not separately disclosed.
E Restricted Securities— The Fund may invest in securities that are subject to legal or contractual restrictions on resale. Generally, these securities may only be sold publicly upon registration under the Securities Act of 1933 or in transactions exempt from such registration. Information regarding restricted securities (excluding Rule 144A securities) is included at the end of the Schedule of Investments.
F Distributions to Shareholders— Distributions to shareholders are recorded by the Fund on ex-dividend date. Distributions from net investment income and distributions from net realized capital gains, if any, are paid at least annually. Distributions are declared separately for each class of shares. Distributions are determined in accordance with income tax regulations which may differ from U.S. GAAP; accordingly, periodic reclassifications are made within the Fund's capital accounts to reflect income and gains available for distribution under income tax regulations.
G Estimates— The preparation of financial statements in conformity with U.S. GAAP requires management to make estimates and assumptions that affect the reported amounts of assets and liabilities and disclosure of contingent assets and liabilities at the date of the financial statements and the reported amounts of increases and decreases in net assets from operations during the reporting period. Actual results could differ from those estimates.
H Indemnifications— The Corporation’s By-Laws provide for indemnification for Directors or officers of the Corporation and certain other parties, to the fullest extent permitted by Maryland law and the 1940 Act, provided certain conditions are met. Additionally, in the normal course of business, the Fund enters into agreements with service providers that may contain indemnification clauses. The Fund’s maximum exposure under these arrangements is unknown as this would involve future claims that may be made against the Fund that have not yet occurred.
I Federal Income Taxes— No provision for federal income or excise tax is required since the Fund intends to continue to qualify as a regulated investment company under the Internal Revenue Code and to distribute substantially all of its taxable earnings.
Calvert
International Equity Fund
September 30, 2020
Notes to Financial Statements — continued
Management has analyzed the Fund's tax positions taken for all open federal income tax years and has concluded that no provision for federal income tax is required in the Fund's financial statements. A Fund's federal tax return is subject to examination by the Internal Revenue Service for a period of three years from the date of filing.
2 Related Party Transactions
The investment advisory fee is earned by CRM, a subsidiary of Eaton Vance Management (EVM), as compensation for investment advisory services rendered to the Fund. EVM is a wholly-owned subsidiary of Eaton Vance Corp. Pursuant to an investment advisory agreement dated December 31, 2016 and an amended fee schedule to such agreement effective October 1, 2019, CRM receives a fee, payable monthly, at the following annual rates of the Fund’s average daily net assets: 0.680% on the first $250 million, 0.665% on the next $250 million and 0.650% on the excess of $500 million. For the year ended September 30, 2020, the investment advisory fee amounted to $2,489,495 or 0.67% of the Fund’s average daily net assets. The Fund may invest its cash in Cash Reserves Fund. CRM does not currently receive a fee for advisory services provided to Cash Reserves Fund.
Eaton Vance Advisers International Ltd. (EVAIL), an indirect, wholly-owned subsidiary of Eaton Vance Corp., provides sub-advisory services to the Fund pursuant to a sub-advisory agreement with CRM. Sub-advisory fees are paid by CRM from its investment advisory fee.
Effective October 1, 2019, CRM and EVAIL have agreed to reimburse the Fund’s operating expenses to the extent that total annual operating expenses (relating to ordinary operating expenses only and excluding expenses such as brokerage commissions, acquired fund fees and expenses of unaffiliated funds, borrowing costs, taxes or litigation expenses) exceed 1.14%, 1.89%, 0.89% and 0.85% for Class A, Class C, Class I and Class R6, respectively, of such class’s average daily net assets. The expense reimbursement agreement may be changed or terminated after January 31, 2021. For the year ended September 30, 2020, CRM and EVAIL waived or reimbursed expenses in total of $478,797.
The administrative fee is earned by CRM as compensation for administrative services rendered to the Fund. The fee is computed at an annual rate of 0.12% of the Fund’s average daily net assets attributable to Class A, Class C, Class I and Class R6 and is payable monthly. For the year ended September 30, 2020, CRM was paid administrative fees of $442,603.
The Fund has in effect a distribution plan for Class A shares (Class A Plan) pursuant to Rule 12b-1 under the 1940 Act. Pursuant to the Class A Plan, the Fund pays Eaton Vance Distributors, Inc. (EVD), an affiliate of CRM and the Fund’s principal underwriter, a distribution and service fee of 0.25% per annum of its average daily net assets attributable to Class A shares for distribution services and facilities provided to the Fund by EVD, as well as for personal services and/or the maintenance of shareholder accounts. The Fund also has in effect a distribution plan for Class C shares (Class C Plan) pursuant to Rule 12b-1 under the 1940 Act. Pursuant to the Class C Plan, the Fund pays EVD amounts equal to 0.75% per annum of its average daily net assets attributable to Class C shares for providing ongoing distribution services and facilities to the Fund. In addition, pursuant to the Class C Plan, the Fund also makes payments of service fees to EVD, financial intermediaries and other persons in amounts equal to 0.25% per annum of its average daily net assets attributable to that class. Service fees paid or accrued are for personal services and/or the maintenance of shareholder accounts. Distribution and service fees paid or accrued for the year ended September 30, 2020 amounted to $307,779 and $61,208 for Class A shares and Class C shares, respectively.
The Fund was informed that EVD received $20,319 as its portion of the sales charge on sales of Class A shares for the year ended September 30, 2020. The Fund was also informed that EVD received less than $100 of contingent deferred sales charges (CDSC) paid by each of Class A and Class C shareholders for the same period.
EVM provides sub-transfer agency and related services to the Fund pursuant to a Sub-Transfer Agency Support Services Agreement. For the year ended September 30, 2020, sub-transfer agency fees and expenses incurred to EVM amounted to $78,788 and are included in transfer agency fees and expenses on the Statement of Operations.
During the year ended September 30, 2020, CRM reimbursed the Fund $121,913 for a net realized loss due to a trading error. The impact of the reimbursement was less than $0.01 per share for each class and had no significant impact on total return.
Each Director of the Fund who is not an employee of CRM or its affiliates receives an annual fee of $154,000, plus an annual Committee fee ranging from $8,500 to $16,500 depending on the Committee. The Board chair receives an additional $20,000 annual fee and Committee chairs receive an additional $6,000 annual fee. Eligible Directors may participate in a Deferred Compensation Plan (the Plan). Amounts deferred under the Plan are treated as though equal dollar amounts had been invested in shares of the Fund or other Calvert funds selected by the Directors. The Fund purchases shares of the funds selected equal to the dollar amounts deferred under the Plan, resulting in an asset equal to the deferred compensation liability. Obligations of the Plan are paid solely from the Fund's assets. Directors’ fees are allocated to each of the Calvert funds served. Salaries and fees of officers and Directors of the Fund who are employees of CRM or its affiliates are paid by CRM. In addition, an Advisory Council was established to aid the Board and CRM in advancing the cause of responsible investing through original scholarship and thought leadership. The Advisory Council consists of CRM’s Chief Executive Officer and three (four prior to December 31, 2019) additional members. Each member (other than CRM’s Chief Executive Officer) received annual compensation of $75,000, which was being reimbursed by Calvert Investment Management, Inc. (CIM), the Calvert funds’ former investment adviser and Ameritas Holding Company, CIM’s parent company, through the end of 2019. For the year ending December 31, 2020, each member (other than CRM’s Chief Executive Officer) is expected to be compensated $20,000 for their service on the Advisory Council. Such compensation, and any other compensation and/or
Calvert
International Equity Fund
September 30, 2020
Notes to Financial Statements — continued
expenses incurred by the Advisory Council as may be approved by the Board, shall be borne by the Calvert funds. For the year ended September 30, 2020, the Fund’s allocated portion of the Advisory Council compensation and fees was $9,236 and the reimbursement was $4,073, which are included in miscellaneous expense and reimbursement of expenses-other, respectively, on the Statement of Operations.
3 Investment Activity
During the year ended September 30, 2020, the cost of purchases and proceeds from sales of investments, other than short-term securities, were $404,363,858 and $171,489,468, respectively.
4 Distributions to Shareholders and Income Tax Information
The tax character of distributions declared for the years ended September 30, 2020 and September 30, 2019 was as follows:
| | Year Ended September 30, |
| | 2020 | 2019 |
| Ordinary income | $3,198,283 | $2,104,757 |
During the year ended September 30, 2020, distributable earnings was decreased by $222,871 and paid-in capital was increased by $222,871 due to the Fund's use of equalization accounting. Tax equalization accounting allows the Fund to treat as a distribution that portion of redemption proceeds representing a redeeming shareholder’s portion of undistributed taxable income and net capital gains.
These reclassifications had no effect on the net assets or net asset value per share of the Fund.
As of September 30, 2020, the components of distributable earnings (accumulated loss) on a tax basis were as follows:
| Undistributed ordinary income | $ 2,629,271 |
| Deferred capital losses | $(12,205,691) |
| Net unrealized appreciation | $ 73,187,801 |
At September 30, 2020, the Fund, for federal income tax purposes, had deferred capital losses of $12,205,691 which would reduce the Fund's taxable income arising from future net realized gains on investment transactions, if any, to the extent permitted by the Internal Revenue Code, and thus would reduce the amount of distributions to shareholders, which would otherwise be necessary to relieve the Fund of any liability for federal income or excise tax. The deferred capital losses are treated as arising on the first day of the Fund's next taxable year, can be carried forward for an unlimited period, and retain the same short-term or long-term character as when originally deferred. Of the deferred capital losses at September 30, 2020, $12,205,691 are long-term.
The cost and unrealized appreciation (depreciation) of investments of the Fund at September 30, 2020, as determined on a federal income tax basis, were as follows:
| Aggregate cost | $466,041,337 |
| Gross unrealized appreciation | $ 88,673,432 |
| Gross unrealized depreciation | (15,502,872) |
| Net unrealized appreciation | $ 73,170,560 |
Calvert
International Equity Fund
September 30, 2020
Notes to Financial Statements — continued
5 Securities Lending
To generate additional income, the Fund may lend its securities pursuant to a securities lending agency agreement with State Street Bank and Trust Company (SSBT), the securities lending agent. Security loans are subject to termination by the Fund at any time and, therefore, are not considered illiquid investments. The Fund requires that the loan be continuously collateralized by either cash or securities as collateral equal at all times to at least 102% of the market value of the domestic securities loaned and 105% of the market value of the international securities loaned (if applicable). The market value of securities loaned is determined daily and any additional required collateral is delivered to the Fund on the next business day. Cash collateral is generally invested in a money market fund registered under the 1940 Act that is managed by an affiliate of SSBT. Any gain or loss in the market price of the loaned securities that might occur and any interest earned or dividends declared during the term of the loan would accrue to the account of the Fund. Income earned on the investment of collateral, net of broker rebates and other expenses incurred by the securities lending agent, is split between the Fund and the securities lending agent based on agreed upon contractual terms. Non-cash collateral, if any, is held by the lending agent on behalf of the Fund and cannot be sold or re-pledged by the Fund; accordingly, such collateral is not reflected in the Statement of Assets and Liabilities.
The risks associated with lending portfolio securities include, but are not limited to, possible delays in receiving additional collateral or in the recovery of the loaned securities, possible loss of rights to the collateral should the borrower fail financially, as well as risk of loss in the value of the collateral or the value of the investments made with the collateral. The securities lending agent shall indemnify the Fund in the case of default of any securities borrower.
The Fund did not have any securities on loan at September 30, 2020.
6 Line of Credit
Effective October 29, 2019, the Fund participates with other portfolios and funds managed by EVM and its affiliates, including CRM, in an $800 million unsecured line of credit with a group of banks, which is in effect through October 27, 2020. Borrowings are made by the Fund solely for temporary purposes related to redemptions and other short-term cash needs. Interest is charged to the Fund based on its borrowings at an amount above either the Eurodollar rate or Federal Funds rate. In addition, a fee computed at an annual rate of 0.15% on the daily unused portion of the line of credit is allocated among the participating portfolios and funds at the end of each quarter. Because the line of credit is not available exclusively to the Fund, it may be unable to borrow some or all of its requested amounts at any particular time.
Prior to October 29, 2019, the Fund participated with other funds managed by CRM in a $100 million committed unsecured line of credit agreement with SSBT, which was terminated by the Calvert funds. Borrowings bore interest at the higher of the one-month London Interbank Offered Rate (LIBOR) in effect that day or the overnight Federal Funds rate, plus 1.00% per annum. A commitment fee of 0.20% per annum was incurred on the unused portion of the committed facility, which was allocated to all participating funds.
The Fund had no borrowings outstanding pursuant to its line of credit at September 30, 2020. The Fund did not have any significant borrowings or allocated fees during the year ended September 30, 2020. Effective October 27, 2020, the Fund renewed its line of credit agreement, which expires October 26, 2021, at substantially the same terms.
7 Affiliated Companies and Funds
The Fund has invested a portion of its assets in notes (the Notes) issued by Calvert Impact Capital, Inc. (CIC) pursuant to exemptive relief granted by the U.S. Securities and Exchange Commission (the SEC). There are certain potential points of affiliation between the Fund and CIC. CRM has licensed use of the Calvert name to CIC and provides other types of support. CRM’s President and Chief Executive Officer (and the only director/trustee on the Fund Board that is an “interested person” of the Fund) serves on the CIC Board, along with one member of the Advisory Council to the Fund Board. In addition, another director/trustee on the Fund Board and a member of the Advisory Council each serve as a director emeritus on the CIC Board.
In addition to the Notes, the Fund may also invest in companies that are considered affiliated companies because the Fund has a direct or indirect ownership of, control of, or voting power of 5 percent or more of the outstanding voting shares of the company, or the company is under common ownership or control with the Fund. At September 30, 2020, the value of the Fund's investment in the Notes and affiliated companies and funds was $3,576,116, which represents 0.7% of the Fund's net assets. Transactions in the Notes and affiliated companies and funds by the Fund for the year ended September 30, 2020 were as follows:
| Name | Value,
beginning
of period | Purchases | Sales
proceeds | Net
realized
gain
(loss) | Change in
unrealized
appreciation
(depreciation) | Value,
end of
period | Interest/
Dividend
income | Principal
amount/Units,
end of period |
| High Social Impact Investments | | | | | | | | |
| Calvert Impact Capital, Inc., Community Investment Notes, 1.50%, 12/15/19(1) | $4,408,140 | $ — | $ (4,431,583) | $ — | $ 23,443 | $ — | $ 13,664 | $ — |
Calvert
International Equity Fund
September 30, 2020
Notes to Financial Statements — continued
| Name | Value,
beginning
of period | Purchases | Sales
proceeds | Net
realized
gain
(loss) | Change in
unrealized
appreciation
(depreciation) | Value,
end of
period | Interest/
Dividend
income | Principal
amount/Units,
end of period |
| Calvert Impact Capital, Inc., Community Investment Notes, 1.50%, 12/15/20(1) | $ — | $ 880,352 | $ — | $ — | $ (4,464) | $ 875,888 | $ 10,454 | $ 880,352 |
| Venture Capital Limited Partnership Interests | | | | | | | | |
| gNet Defta Development Holding LLC(1)(2)(3) | 249,584 | — | — | — | (9,429) | 240,155 | — | — |
| SEAF Central and Eastern European Growth Fund LLC | 3,570 | — | (146,100) | — | 142,530 | — | — | — |
| Short-Term Investments | | | | | | | | |
| Calvert Cash Reserves Fund, LLC | — | 86,984,013 | (84,526,015) | 2,276 | (201) | 2,460,073 | 1,768 | 2,459,827 |
| Totals | | | | $2,276 | $151,879 | $3,576,116 | $25,886 | |
| (1) | Restricted security. |
| (2) | For fair value measurement disclosure purposes, security is categorized as Level 3 (see Note 1A). |
| (3) | Non-income producing security. |
8 Capital Shares
The Corporation may issue its shares in one or more series (such as the Fund). The authorized shares of the Fund consist of 75,000,000 common shares, $0.01 par value, for each Class.
Transactions in capital shares for the years ended September 30, 2020 and September 30, 2019 were as follows:
| | Year Ended
September 30, 2020 | | Year Ended
September 30, 2019(1) |
| | Shares | Amount | | Shares | Amount |
| Class A | | | | | |
| Shares sold | 1,724,584 | $ 32,394,311 | | 463,021 | $ 7,932,556 |
| Reinvestment of distributions | 58,651 | 1,173,605 | | 70,194 | 1,067,653 |
| Shares redeemed | (1,192,704) | (22,436,819) | | (1,095,095) | (18,554,534) |
| Converted from Class C | 20,201 | 370,968 | | 217,447 | 3,509,724 |
| Net increase (decrease) | 610,732 | $ 11,502,065 | | (344,433) | $ (6,044,601) |
| Class C | | | | | |
| Shares sold | 62,754 | $ 1,001,289 | | 45,413 | $ 643,966 |
| Reinvestment of distributions | 1,299 | 22,301 | | 3,763 | 49,178 |
| Shares redeemed | (79,953) | (1,260,958) | | (145,293) | (2,165,043) |
| Converted to Class A | (23,600) | (370,968) | | (253,136) | (3,509,724) |
| Net decrease | (39,500) | $ (608,336) | | (349,253) | $ (4,981,623) |
| Class I | | | | | |
| Shares sold | 10,517,537 | $ 207,907,620 | | 3,206,610 | $ 57,269,370 |
| Reinvestment of distributions | 51,969 | 1,110,065 | | 52,583 | 852,895 |
| Shares redeemed | (1,985,028) | (39,612,853) | | (2,484,203) | (45,039,359) |
| Net increase | 8,584,478 | $169,404,832 | | 774,990 | $ 13,082,906 |
Calvert
International Equity Fund
September 30, 2020
Notes to Financial Statements — continued
| | Year Ended
September 30, 2020 | | Year Ended
September 30, 2019(1) |
| | Shares | Amount | | Shares | Amount |
| Class R6 | | | | | |
| Shares sold | 3,379,540 | $ 68,130,481 | | 2,547,114 | $ 47,468,909 |
| Reinvestment of distributions | 35,319 | 753,700 | | — | — |
| Shares redeemed | (339,429) | (6,754,498) | | (9,283) | (177,904) |
| Net increase | 3,075,430 | $ 62,129,683 | | 2,537,831 | $ 47,291,005 |
| (1) | For Class R6, for the period from the commencement of operations, March 7, 2019, to September 30, 2019. |
9 Risks and Uncertainties
Risks Associated with Foreign Investments
Investing in foreign securities involves additional risks relating to political, social, and economic developments abroad. Other risks result from differences between regulations that apply to U.S. and foreign issuers and markets, and the potential for foreign markets to be less liquid and more volatile than U.S. markets. Securities that trade or are denominated in currencies other than the U.S. dollar may be adversely affected by fluctuations in currency exchange rates.
Pandemic Risk
An outbreak of respiratory disease caused by a novel coronavirus was first detected in China in December 2019 and subsequently spread internationally. This coronavirus has resulted in closing borders, enhanced health screenings, changes to healthcare service preparation and delivery, quarantines, cancellations, disruptions to supply chains and customer activity, as well as general concern and uncertainty. Health crises caused by outbreaks, such as the coronavirus outbreak, may exacerbate other pre-existing political, social and economic risks and disrupt normal market conditions and operations. The impact of this outbreak has negatively affected the worldwide economy, the economies of individual countries, individual companies, and the market in general, and may continue to do so in significant and unforeseen ways, as may other epidemics and pandemics that may arise in the future. Any such impact could adversely affect the Fund's performance, or the performance of the securities in which the Fund invests.
10 Capital Commitments
In connection with certain venture capital and/or limited partnership investments, the Fund is committed to future capital calls, which will increase the Fund’s investment in these securities. The aggregate amount of the future capital commitments totaled $26,470 at September 30, 2020. The Fund had sufficient cash and/or securities to cover these commitments.
The Fund's unfunded capital commitments by investment at September 30, 2020 were as follows:
| Name of Investment | Unfunded
Commitment |
| Africa Renewable Energy Fund L.P. | $ 8,462 |
| Blackstone Clean Technology Partners L.P. | 508 |
| SEAF India International Growth Fund L.P. | 17,500 |
| Total | $26,470 |
11 Subsequent Event
On October 8, 2020, Morgan Stanley and Eaton Vance Corp. (“Eaton Vance”) announced that they had entered into a definitive agreement under which Morgan Stanley would acquire Eaton Vance. Under the Investment Company Act of 1940, as amended, consummation of this transaction may result in the automatic termination of the Fund’s investment advisory agreement, and any related sub-advisory agreement(s), if applicable. Thus, the Fund’s Board will be asked to approve a new investment advisory agreement (and new sub-advisory agreement(s), if applicable). If approved by the Fund’s Board, the new investment advisory agreement (and new sub-advisory agreement(s), if applicable) is expected to be presented to Fund shareholders for approval, and, if approved, would take effect upon the closing of the transaction.
Calvert
International Equity Fund
September 30, 2020
Report of Independent Registered Public Accounting Firm
To the Shareholders and Board of Directors
Calvert World Values Fund, Inc.:
Opinion on the Financial Statements
We have audited the accompanying statement of assets and liabilities of Calvert International Equity Fund (the Fund), a series of Calvert World Values Fund, Inc., including the schedule of investments, as of September 30, 2020, the related statement of operations for the year then ended, the statements of changes in net assets for each of the years in the two-year period then ended, and the related notes (collectively, the financial statements) and the financial highlights for each of the years or periods in the five-year period then ended. In our opinion, the financial statements and financial highlights present fairly, in all material respects, the financial position of the Fund as of September 30, 2020, the results of its operations for the year then ended, the changes in its net assets for each of the years in the two-year period then ended, and the financial highlights for each of the years or periods in the five-year period then ended, in conformity with U.S. generally accepted accounting principles.
Basis for Opinion
These financial statements and financial highlights are the responsibility of the Fund’s management. Our responsibility is to express an opinion on these financial statements and financial highlights based on our audits. We are a public accounting firm registered with the Public Company Accounting Oversight Board (United States) (PCAOB) and are required to be independent with respect to the Fund in accordance with the U.S. federal securities laws and the applicable rules and regulations of the Securities and Exchange Commission and the PCAOB.
We conducted our audits in accordance with the standards of the PCAOB. Those standards require that we plan and perform the audit to obtain reasonable assurance about whether the financial statements and financial highlights are free of material misstatement, whether due to error or fraud. Our audits included performing procedures to assess the risks of material misstatement of the financial statements and financial highlights, whether due to error or fraud, and performing procedures that respond to those risks. Such procedures included examining, on a test basis, evidence regarding the amounts and disclosures in the financial statements and financial highlights. Such procedures also included confirmation of securities owned as of September 30, 2020, by correspondence with the custodian, brokers and agent banks. Our audits also included evaluating the accounting principles used and significant estimates made by management, as well as evaluating the overall presentation of the financial statements and financial highlights. We believe that our audits provide a reasonable basis for our opinion.

We have served as the auditor of one or more of the Calvert Funds since 2002.
Philadelphia, Pennsylvania
November 20, 2020
Calvert
International Equity Fund
September 30, 2020
Federal Tax Information (Unaudited)
The Form 1099-DIV you receive in February 2021 will show the tax status of all distributions paid to your account in calendar year 2020. Shareholders are advised to consult their own tax adviser with respect to the tax consequences of their investment in the Fund. As required by the Internal Revenue Code and/or regulations, shareholders must be notified regarding the status of qualified dividend income for individuals and the foreign tax credit.
Qualified Dividend Income. For the fiscal year ended September 30, 2020, the Fund designates approximately $4,246,758, or up to the maximum amount of such dividends allowable pursuant to the Internal Revenue Code, as qualified dividend income eligible for the reduced tax rate of 15%.
Foreign Tax Credit. For the fiscal year ended September 30, 2020, the Fund paid foreign taxes of $434,515 and recognized foreign source income of $5,299,743.
Calvert
International Equity Fund
September 30, 2020
Liquidity Risk Management Program
The Fund has implemented a written liquidity risk management program (Program) and related procedures to manage its liquidity in accordance with Rule 22e-4 under the Investment Company Act of 1940, as amended (Liquidity Rule). The Liquidity Rule defines “liquidity risk” as the risk that a fund could not meet requests to redeem shares issued by the fund without significant dilution of the remaining investors’ interests in the fund. The Fund’s Board of Trustees/Directors has designated the investment adviser to serve as the administrator of the Program and the related procedures. The administrator has established a Liquidity Risk Management Oversight Committee (Committee) to perform the functions necessary to administer the Program. As part of the Program, the administrator is responsible for identifying illiquid investments and categorizing the relative liquidity of the Fund’s investments in accordance with the Liquidity Rule. Under the Program, the administrator assesses, manages, and periodically reviews the Fund’s liquidity risk, and is responsible for making certain reports to the Fund’s Board of Trustees/Directors and the Securities and Exchange Commission (SEC) regarding the liquidity of the Fund’s investments, and to notify the Board of Trustees/Directors and the SEC of certain liquidity events specified in the Liquidity Rule. The liquidity of the Fund’s portfolio investments is determined based on a number of factors including, but not limited to, relevant market, trading and investment-specific considerations under the Program.
At a meeting of the Fund’s Board of Trustees/Directors, the Committee provided a written report to the Fund’s Board of Trustees/Directors pertaining to the operation, adequacy, and effectiveness of implementation of the Program, as well as the operation of the highly liquid investment minimum (if applicable) for the period December 1, 2018 through December 31, 2019 (Review Period). The Program operated effectively during the Review Period, supporting the administrator’s ability to assess, manage and monitor Fund liquidity risk, including during periods of market volatility and net redemptions. During the Review Period, the Fund met redemption requests on a timely basis.
There can be no assurance that the Program will achieve its objectives in the future. Please refer to the Fund’s prospectus for more information regarding the Fund’s exposure to liquidity risk and other principal risks to which an investment in the Fund may be subject.
Calvert
International Equity Fund
September 30, 2020
Management and Organization
Fund Management. The Directors of Calvert World Values Fund, Inc. (the Corporation) are responsible for the overall management and supervision of the Corporation’s affairs. The Directors and officers of the Corporation are listed below. Except as indicated, each individual has held the office shown or other offices in the same company for the last five years. Directors and officers of the Corporation hold indefinite terms of office. The “Independent Directors” consist of those Directors who are not “interested persons” of the Corporation, as that term is defined under the 1940 Act. The business address of each Director and officer, with the exception of Ms. Gemma and Mr. Kirchner, is 1825 Connecticut Avenue NW, Suite 400, Washington, DC 20009. As used below, “CRM” refers to Calvert Research and Management. Each Director oversees 39 funds in the Calvert fund complex. Each officer serves as an officer of certain other Calvert funds.
| Name and Year of Birth | Corporation
Position(s) | Position
Start Date | Principal Occupation(s) and Other Directorships
During Past Five Years and Other Relevant Experience | |
| Interested Director | |
John H. Streur(1)
1960 | Director &
President | 2015 | President and Chief Executive Officer of Calvert Research and
Management (since December 31, 2016). President and Chief Executive
Officer of Calvert Investments, Inc. (January 2015 - December 2016);
Chief Executive Officer of Calvert Investment Distributors, Inc. (August
2015 - December 2016); Chief Compliance Officer of Calvert Investment
Management, Inc. (August 2015 - April 2016); President and Director, Portfolio 21 Investments, Inc. (through October 2014); President,
Chief Executive Officer and Director, Managers Investment Group LLC
(through January 2012); President and Director, The Managers Funds
and Managers AMG Funds (through January 2012).
Other Directorships in the Last Five Years. Portfolio 21 Investments,
Inc. (asset management) (through October 2014); Managers Investment
Group LLC (asset management) (through January 2012); The Managers
Funds (asset management) (through January 2012); Managers AMG Funds
(asset management) (through January 2012); Calvert Impact Capital, Inc. | |
| Independent Directors | |
Richard L. Baird, Jr.
1948 | Director | 2005 | Regional Disaster Recovery Lead, American Red Cross of Greater
Pennsylvania (since 2017). Volunteer, American Red Cross (since 2015).
Former President and CEO of Adagio Health Inc. (retired in 2014) in
Pittsburgh, PA.
Other Directorships in the Last Five Years. None. | |
Alice Gresham Bullock
1950 | Chair &
Director | 2016 | Professor Emerita at Howard University School of Law. Dean Emerita of
Howard University School of Law and Deputy Director of the Association
of American Law Schools (1992-1994).
Other Directorships in the Last Five Years. None. | |
Cari M. Dominguez
1949 | Director | 2016 | Former Chair of the U.S. Equal Employment Opportunity Commission.
Other Directorships in the Last Five Years. Manpower, Inc. (employment
agency); Triple S Management Corporation (managed care); National
Association of Corporate Directors. | |
John G. Guffey, Jr.(2)
1948 | Director | 1992 | President of Aurora Press Inc., a privately held publisher of trade
paperbacks (since January 1997).
Other Directorships in the Last Five Years. Calvert Impact Capital, Inc.
(through December 31, 2018); Calvert Ventures, LLC. | |
Miles D. Harper, III
1962 | Director | 2005 | Partner, Carr Riggs & Ingram (public accounting firm) since October 2014.
Partner, Gainer Donnelly & Desroches (public accounting firm) (now Carr
Riggs & Ingram), (November 1999-September 2014).
Other Directorships in the Last Five Years. Bridgeway Funds (9) (asset
management). | |
Joy V. Jones
1950 | Director | 2005 | Attorney.
Other Directorships in the Last Five Years. Conduit Street Restaurants
SUD 2 Limited; Palm Management Restaurant Corporation. | |
Calvert
International Equity Fund
September 30, 2020
Management and Organization — continued
| Name and Year of Birth | Corporation
Position(s) | Position
Start Date | Principal Occupation(s) and Other Directorships
During Past Five Years and Other Relevant Experience | |
| Independent Directors (continued) |
Anthony A. Williams
1951 | Director | 2016 | CEO and Executive Director of the Federal City Council (July 2012 to
present); Senior Adviser and Independent Consultant for King and
Spalding LLP (September 2015 to present); Executive Director of Global
Government Practice at the Corporate Executive Board (January 2010 to
January 2012).
Other Directorships in the Last Five Years. Freddie Mac; Evoq
Properties/Meruelo Maddux Properties, Inc. (real estate management);
Weston Solutions, Inc. (environmental services); Bipartisan Policy Center’s
Debt Reduction Task Force; Chesapeake Bay Foundation; Catholic
University of America; Urban Institute (research organization). | |
| Name and Year of Birth | Corporation
Position(s) | Position
Start Date | Principal Occupation(s)
During Past Five Years | |
| Principal Officers who are not Directors | |
Hope L. Brown
1973 | Chief
Compliance
Officer | 2014 | Chief Compliance Officer of 39 registered investment companies advised
by CRM (since 2014). Vice President and Chief Compliance Officer,
Wilmington Funds (2012-2014). | |
Maureen A. Gemma(3)
1960 | Secretary,
Vice President
and Chief
Legal Officer | 2016 | Vice President of CRM and officer of 39 registered investment
companies advised by CRM (since 2016). Also Vice President of
Eaton Vance and certain of its affiliates and officer of 156 registered
investment companies advised or administered by Eaton Vance. | |
James F. Kirchner(3)
1967 | Treasurer | 2016 | Vice President of CRM and officer of 39 registered investment companies
advised by CRM (since 2016). Also Vice President of Eaton Vance and
certain of its affiliates and officer of 156 registered investment companies
advised or administered by Eaton Vance. | |
| (1) Mr. Streur is an interested person of the Fund because of his positions with the Fund’s adviser and certain affiliates. | |
| (2) Mr. Guffey is currently married to Rebecca L. Adamson, who served as a member of the Advisory Council through December 31, 2019. | |
| (3) The business address for Ms. Gemma and Mr. Kirchner is Two International Place, Boston, MA 02110. | |
The SAI for the Fund includes additional information about the Directors and officers of the Fund and can be obtained without charge on Calvert’s website at www.calvert.com or by calling 1-800-368-2745.
Privacy. The Eaton Vance organization is committed to ensuring your financial privacy. Each entity listed below has adopted a privacy policy and procedures (“Privacy Program”) Eaton Vance believes is reasonably designed to protect your personal information and to govern when and with whom Eaton Vance may share your personal information.
| • | At the time of opening an account, Eaton Vance generally requires you to provide us with certain information such as name, address, social security number, tax status, account numbers, and account balances. This information is necessary for us to both open an account for you and to allow us to satisfy legal requirements such as applicable anti-money laundering reviews and know-your-customer requirements. |
| • | On an ongoing basis, in the normal course of servicing your account, Eaton Vance may share your information with unaffiliated third parties that perform various services for Eaton Vance and/or your account. These third parties include transfer agents, custodians, broker/dealers and our professional advisers, including auditors, accountants, and legal counsel. Eaton Vance may additionally share your personal information with our affiliates. |
| • | We believe our Privacy Program is reasonably designed to protect the confidentiality of your personal information and to prevent unauthorized access to that information. |
| • | We reserve the right to change our Privacy Program at any time upon proper notification to you. You may want to review our Privacy Program periodically for changes by accessing the link on our homepage: www.calvert.com. |
Our pledge of protecting your personal information applies to the following entities within the Eaton Vance organization: the Eaton Vance Family of Funds, Eaton Vance Management, Eaton Vance Investment Counsel, Eaton Vance Distributors, Inc., Eaton Vance Trust Company, Eaton Vance Management (International) Limited, Eaton Vance Advisers International Ltd., Eaton Vance Global Advisors Limited, Eaton Vance Management's Real Estate Investment Group, Boston Management and Research, Calvert Research and Management, and Calvert Funds. This Privacy Notice supersedes all previously issued privacy disclosures. For more information about our Privacy Program or about how your personal information may be used, please call 1-800-368-2745.
Delivery of Shareholder Documents. The Securities and Exchange Commission (SEC) permits funds to deliver only one copy of shareholder documents, including prospectuses, proxy statements and shareholder reports, to fund investors with multiple accounts at the same residential or post office box address. This practice is often called “householding” and it helps eliminate duplicate mailings to shareholders. Calvert funds, or your financial intermediary, may household the mailing of your documents indefinitely unless you instruct Calvert funds, or your financial intermediary, otherwise. If you would prefer that your Calvert fund documents not be householded, please contact Calvert funds at 1-800-368-2745, or contact your financial intermediary. Your instructions that householding not apply to delivery of your Calvert fund documents will typically be effective within 30 days of receipt by Calvert funds or your financial intermediary. Separate statements will be generated for each separate account and will be householded as described above.
Portfolio Holdings. Each Calvert fund files a schedule of portfolio holdings on Part F to Form N-PORT with the SEC. Certain information filed on Form N-PORT may be viewed on the Calvert website at www.calvert.com, by calling Calvert at 1-800-368-2745 or in the EDGAR database on the SEC’s website at www.sec.gov.
Proxy Voting. The Proxy Voting Guidelines that each Calvert fund uses to determine how to vote proxies relating to portfolio securities is provided as an Appendix to the fund’s Statement of Additional Information. The Statement of Additional Information can be obtained free of charge by calling the Calvert funds at 1-800-368-2745, by visiting the Calvert funds’ website at www.calvert.com or visiting the SEC’s website at www.sec.gov. Information regarding how a Calvert fund voted proxies relating to portfolio securities during the most recent 12-month period ended June 30 is available by calling Calvert funds, by visiting the Calvert funds’ website at www.calvert.com or by visiting the SEC’s website at www.sec.gov.
Investment Adviser and Administrator
Calvert Research and Management
1825 Connecticut Avenue NW, Suite 400
Washington, DC 20009
Investment Sub-Adviser
Eaton Vance Advisers International Ltd.
125 Old Broad Street
London, EC2N 1AR
Principal Underwriter*
Eaton Vance Distributors, Inc.
Two International Place
Boston, MA 02110
(617) 482-8260
Custodian
State Street Bank and Trust Company
State Street Financial Center, One Lincoln Street
Boston, MA 02111
Transfer Agent
DST Asset Manager Solutions, Inc.
2000 Crown Colony Drive
Quincy, MA 02169
Independent Registered Public Accounting Firm
KPMG LLP
1601 Market Street
Philadelphia, PA 19103-2499
Fund Offices
1825 Connecticut Avenue NW, Suite 400
Washington, DC 20009
* FINRA BrokerCheck. Investors may check the background of their Investment Professional by contacting the Financial Industry Regulatory Authority (FINRA). FINRA BrokerCheck is a free tool to help investors check the professional background of current and former FINRA-registered securities firms and brokers. FINRA BrokerCheck is available by calling 1-800-289-9999 and at www.FINRA.org. The FINRA BrokerCheck brochure describing this program is available to investors at www.FINRA.org.
Printed on recycled paper.
Calvert
Emerging Markets Equity Fund
Annual Report
September 30, 2020
Important Note. Beginning on January 1, 2021, as permitted by regulations adopted by the Securities and Exchange Commission, paper copies of the Fund’s annual and semi-annual shareholder reports will no longer be sent by mail unless you specifically request paper copies of the reports. Instead, the reports will be made available on the Fund’s website (calvert.com/prospectus), and you will be notified by mail each time a report is posted and provided with a website address to access the report.
If you already elected to receive shareholder reports electronically, you will not be affected by this change and you need not take any action. If you are a direct investor, you may elect to receive shareholder reports and other communications from the Fund electronically by signing up for e-Delivery at calvert.com. If you own your shares through a financial intermediary (such as a broker-dealer or bank), you must contact your financial intermediary to sign up.
You may elect to receive all future Fund shareholder reports in paper free of charge. If you are a direct investor, you can inform the Fund that you wish to continue receiving paper copies of your shareholder reports by calling 1-800-368-2745. If you own these shares through a financial intermediary, you must contact your financial intermediary or follow instructions included with this disclosure, if applicable, to elect to continue to receive paper copies of your shareholder reports. Your election to receive reports in paper will apply to all Calvert funds held directly or to all funds held through your financial intermediary, as applicable.
E-Delivery Sign-Up - Details Inside
Commodity Futures Trading Commission Registration. Effective December 31, 2012, the Commodity Futures Trading Commission (“CFTC”) adopted certain regulatory changes that subject registered investment companies and advisers to regulation by the CFTC if a fund invests more than a prescribed level of its assets in certain CFTC-regulated instruments (including futures, certain options and swap agreements) or markets itself as providing investment exposure to such instruments. The adviser has claimed an exclusion from the definition of “commodity pool operator” under the Commodity Exchange Act with respect to its management of the Fund and the other funds it manages. Accordingly, neither the Fund nor the adviser is subject to CFTC regulation.
Fund shares are not insured by the FDIC and are not deposits or other obligations of, or guaranteed by, any depository institution. Shares are subject to investment risks, including possible loss of principal invested.
This report must be preceded or accompanied by a current summary prospectus or prospectus. Before investing, investors should consider carefully the investment objective, risks, and charges and expenses of a mutual fund. This and other important information is contained in the summary prospectus and prospectus, which can be obtained from a financial intermediary. Prospective investors should read the prospectus carefully before investing. For further information, please call 1-800-368-2745.
Choose Planet-friendly E-delivery!
Sign up now for on-line statements, prospectuses, and fund reports. In less than five minutes you can help reduce paper mail and lower fund costs.
Just go to www.calvert.com. If you already have an online account with the Calvert funds, click on Login to access your Account and select the documents you would like to receive via e-mail.
If you’re new to online account access, click on Login, then Register to create your user name and password. Once you’re in, click on the E-delivery sign-up on the Account Portfolio page and follow the quick, easy steps.
Note: If your shares are not held directly with the Calvert funds but through a brokerage firm, you must contact your broker for electronic delivery options available through their firm.
Annual Report September 30, 2020
Calvert
Emerging Markets Equity Fund
Calvert
Emerging Markets Equity Fund
September 30, 2020
Management's Discussion of Fund Performance†
Economic and Market Conditions
Emerging market equities posted positive returns for the 12-month period ended September 30, 2020, returning 10.54% as measured by the MSCI Emerging Markets Index (the Index). Emerging markets outperformed developed markets during a volatile period propelled by the outbreak of the COVID-19 pandemic.
In the final quarter of 2019, emerging markets rose strongly, buoyed by optimism for a trade deal between the U.S. and China, easing monetary policies by the U.S. Federal Reserve and other central banks, as well as diminishing concerns about a hard Brexit. U.S. dollar weakness was also supportive of emerging markets during the period.
Equity markets recorded an unprecedented fall in the first quarter of 2020, with emerging markets dropping 23.57% because of the spread of COVID-19. Countries moved to lockdown to contain the virus, shifting the debate from whether there would be a recession to how long and deep it would be. A stronger U.S. dollar was a further headwind for emerging markets. Central banks and governments cut borrowing rates and announced hefty stimulus packages to reduce the damage. Markets rebounded strongly in the second quarter and continued to advance from their March lows in the third quarter to end the period down less than 1% year to date.
During the period, China outperformed as economic data signaled it would recover faster than anticipated from the pandemic. In fact, corporate earnings exceeded expectations in the second quarter of 2020. However, U.S.-China tensions escalated following new restrictions on technology firm Huawei by President Trump, who also ordered restrictions on U.S. companies doing business with TikTok and WeChat. Taiwan, South Korea, and India also outperformed.
Turkey, one of the worst-performing markets, was weakened by fears that the U.S. might impose sanctions in retaliation for Turkey’s purchase of Russian military hardware. Thailand, Indonesia, the Philippines, Poland, Czech Republic, and Hungary also underperformed as COVID-19 cases surged. Russia, Brazil, South Africa, and Mexico were also underperformers. In Russia, uncertainty over the impact of the U.S. presidential election on U.S. foreign policy and weak crude oil prices weighed on investor sentiment.
There was wide disparity in sector performance, as consumer discretionary, health care, and information technology gained more than 40% during the period while energy, utilities, and financials dropped more than 18%.
Fund Performance
For the 12-month period ended September 30, 2020, Calvert Emerging Markets Equity Fund (the Fund) returned 14.82% for Class A shares at net asset value, outperforming the Index, which returned 10.54%.
The Fund’s outperformance was driven primarily by stock selection, notably positions held in Russia, Taiwan, South Africa, and
Hungary. This more than offset the negative impact of a significant health care detractor in the United Arab Emirates and relatively weak stock selections in China. Meanwhile, the Fund’s overall allocation to China had a positive impact as the currency appreciated strongly during the period. A lack of exposure to Thailand, Indonesia, the Philippines, and Malaysia also benefited as these markets underperformed because of COVID-19’s impact on tourism.
Techtronic Industries Co., Ltd., a Hong Kong manufacturer of cordless power tools, rose on business growth driven by new products, the accelerating trend toward do-it-yourself projects, and strong traction in e-commerce sales.
The stock price of Yandex NV, Russia’s leading search engine and e-commerce provider, moved higher because of an improved outlook for its taxi business and due to a strong Russian economy and domestic currency. The company also benefited from the rebalancing of the Index in August and the stock’s addition to the Index.
Delta Electronics, Inc., a Taiwanese global leader in switching power supply equipment, rose on earnings growth for its power business, driven by strong personal computer and server demand. The company’s leading position in power benefitted from increasing cloud applications and telecommunications infrastructure upgrades. Its industrial automation business also benefited from ongoing supply chain relocations and increasing automation.
Trading of shares of NMC Health PLC (NMC), which owns and operates hospitals in the Middle East, was suspended February 27, 2020 after the company’s founder and an associate were alleged to have obtained $4 billion in off-balance sheet financing without the knowledge of the company’s board. The Fund wrote down its position to zero. NMC subsequently entered proceedings to avoid insolvency and shares delisted on April 28, 2020.
The sales of Samsonite International S.A. (Samsonite), a global luggage provider, declined in the first half of 2020 when demand for luggage, particularly in China, fell as COVID-19 containment efforts curtailed travel. In addition, Samsonite’s China-based supply chain faced disruptions in the first quarter.
The stock price of BB Seguridade Participacoes S.A., a Brazilian insurance and pensions provider, fell after missing first half 2020 expectations because of declining premiums and contributions in both its key business segments. The company also withdrew its 2020 guidance because of the uncertainty and high volatility stemming from the COVID-19 pandemic.
See Endnotes and Additional Disclosures in this report.
Past performance is no guarantee of future results. Returns are historical and are calculated by determining the percentage change in net asset value (NAV) or offering price (as applicable) with all distributions reinvested. Investment return and principal value will fluctuate so that shares, when redeemed, may be worth more or less than their original cost. Performance for periods less than or equal to one year is cumulative. Performance is for the stated time period only; due to market volatility, current Fund performance may be lower or higher than the quoted return. For performance as of the most recent month-end, please refer to www.calvert.com.
Calvert
Emerging Markets Equity Fund
September 30, 2020
Performance
Portfolio Managers Kunjal Gala, Lead Portfolio Manager and Elena Tedesco, CFA, Co-Portfolio Manager, each of Hermes Investment Management Limited
| % Average Annual Total Returns1,2 | Class
Inception Date | Performance
Inception Date | One Year | Five Years | Since
Inception |
| Class A at NAV | 10/29/2012 | 10/29/2012 | 14.82% | 11.59% | 7.23% |
| Class A with 4.75% Maximum Sales Charge | — | — | 9.37 | 10.51 | 6.57 |
| Class C at NAV | 10/29/2012 | 10/29/2012 | 13.89 | 10.76 | 6.34 |
| Class C with 1% Maximum Sales Charge | — | — | 12.89 | 10.76 | 6.34 |
| Class I at NAV | 10/29/2012 | 10/29/2012 | 15.07 | 11.95 | 7.58 |
| Class R6 at NAV | 02/01/2018 | 10/29/2012 | 15.13 | 11.95 | 7.58 |
|
| MSCI Emerging Markets Index | — | — | 10.54% | 8.96% | 3.57% |
| % Total Annual Operating Expense Ratios3 | Class A | Class C | Class I | Class R6 |
| Gross | 1.37% | 2.12% | 1.12% | 1.05% |
| Net | 1.24 | 1.99 | 0.99 | 0.92 |
Growth of $10,000
This graph shows the change in value of a hypothetical investment of $10,000 in Class A of the Fund for the period indicated. For comparison, the same investment is shown in the indicated index.
| Growth of Investment2 | Amount Invested | Period Beginning | At NAV | With Maximum Sales Charge |
| Class C | $10,000 | 10/29/2012 | $16,281 | N.A. |
| Class I | $250,000 | 10/29/2012 | $446,091 | N.A. |
| Class R6 | $1,000,000 | 10/29/2012 | $1,783,915 | N.A. |
See Endnotes and Additional Disclosures in this report.
Past performance is no guarantee of future results. Returns are historical and are calculated by determining the percentage change in net asset value (NAV) or offering price (as applicable) with all distributions reinvested. Investment return and principal value will fluctuate so that shares, when redeemed, may be worth more or less than their original cost. Performance for periods less than or equal to one year is cumulative. Performance is for the stated time period only; due to market volatility, current Fund performance may be lower or higher than the quoted return. For performance as of the most recent month-end, please refer to www.calvert.com.
Calvert
Emerging Markets Equity Fund
September 30, 2020
Sector Allocation (% of net assets)*
* Excludes cash and cash equivalents.
| Top 10 Holdings (% of net assets)* | |
| Alibaba Group Holding, Ltd. ADR | 8.2% |
| Samsung Electronics Co., Ltd. | 7.2 |
| Taiwan Semiconductor Manufacturing Co., Ltd. ADR | 6.7 |
| Tencent Holdings, Ltd. | 4.2 |
| Prosus NV | 4.1 |
| Yandex NV, Class A | 3.7 |
| Delta Electronics, Inc. | 3.1 |
| Techtronic Industries Co., Ltd. | 3.0 |
| NARI Technology Co., Ltd., Class A | 2.1 |
| AIA Group, Ltd. | 2.1 |
| Total | 44.4% |
| * | Excludes cash and cash equivalents. |
See Endnotes and Additional Disclosures in this report.
Calvert
Emerging Markets Equity Fund
September 30, 2020
Endnotes and Additional Disclosures
| † | The views expressed in this report are those of the portfolio manager(s) and are current only through the date stated at the top of this page. These views are subject to change at any time based upon market or other conditions, and Calvert and the Fund(s) disclaim any responsibility to update such views. These views may not be relied upon as investment advice and, because investment decisions are based on many factors, may not be relied upon as an indication of trading intent on behalf of any Calvert fund. This commentary may contain statements that are not historical facts, referred to as “forward-looking statements.” The Fund’s actual future results may differ significantly from those stated in any forward-looking statement, depending on factors such as changes in securities or financial markets or general economic conditions, the volume of sales and purchases of Fund shares, the continuation of investment advisory, administrative and service contracts, and other risks discussed from time to time in the Fund’s filings with the Securities and Exchange Commission. |
| | |
| 1 | MSCI Emerging Markets Index is an unmanaged index of emerging markets common stocks. MSCI indexes are net of foreign withholding taxes. Source: MSCI. MSCI data may not be reproduced or used for any other purpose. MSCI provides no warranties, has not prepared or approved this report, and has no liability hereunder. Unless otherwise stated, index returns do not reflect the effect of any applicable sales charges, commissions, expenses, taxes or leverage, as applicable. It is not possible to invest directly in an index. |
| 2 | Total Returns at NAV do not include applicable sales charges. If sales charges were deducted, the returns would be lower. Total Returns shown with maximum sales charge reflect the stated maximum sales charge. Unless otherwise stated, performance does not reflect the deduction of taxes on Fund distributions or redemptions of Fund shares.Performance prior to the inception date of a class may be linked to the performance of an older class of the Fund. This linked performance is adjusted for any applicable sales charge, but is not adjusted for class expense differences. If adjusted for such differences, the performance would be different. The performance of Class R6 is linked to Class I. Performance since inception for an index, if presented, is the performance since the Fund’s or oldest share class’ inception, as applicable. Performance presented in the Financial Highlights included in the financial statements is not linked. Calvert Research and Management became the investment adviser to the Fund on December 31, 2016. Performance reflected prior to such date is that of the Fund’s former investment adviser. |
| 3 | Source: Fund prospectus. Net expense ratios reflect a contractual expense reimbursement that continues through 1/31/21. Without the reimbursement, performance would have been lower. The expense ratios for the current reporting period can be found in the Financial Highlights section of this report. |
Fund profile subject to change due to active management.
| | Important Notice to Shareholders |
| | Effective September 1, 2020, the portfolio managers of the Fund are Kunjal Gala, Lead Portfolio Manager and Elena Tedesco, Co-Portfolio Manager. |
Calvert
Emerging Markets Equity Fund
September 30, 2020
Example
As a Fund shareholder, you incur two types of costs: (1) transaction costs, including sales charges (loads) on purchases and redemption fees (if applicable); and (2) ongoing costs, including management fees; distribution and/or service fees; and other Fund expenses. This Example is intended to help you understand your ongoing costs (in dollars) of Fund investing and to compare these costs with the ongoing costs of investing in other mutual funds. The Example is based on an investment of $1,000 invested at the beginning of the period and held for the entire period (April 1, 2020 to September 30, 2020).
Actual Expenses
The first section of the table below provides information about actual account values and actual expenses. You may use the information in this section, together with the amount you invested, to estimate the expenses that you paid over the period. Simply divide your account value by $1,000 (for example, an $8,600 account value divided by $1,000 = 8.6), then multiply the result by the number in the first section under the heading entitled “Expenses Paid During Period” to estimate the expenses you paid on your account during this period.
Hypothetical Example for Comparison Purposes
The second section of the table below provides information about hypothetical account values and hypothetical expenses based on the actual Fund expense ratio and an assumed rate of return of 5% per year (before expenses), which is not the actual Fund return. The hypothetical account values and expenses may not be used to estimate the actual ending account balance or expenses you paid for the period. You may use this information to compare the ongoing costs of investing in the Fund and other funds. To do so, compare this 5% hypothetical example with the 5% hypothetical examples that appear in the shareholder reports of the other funds.
Please note that the expenses shown in the table are meant to highlight your ongoing costs only and do not reflect any transactional costs, such as sales charges (loads) or redemption fees (if applicable). Therefore, the second section of the table is useful in comparing ongoing costs only, and will not help you determine the relative total costs of owning different funds. In addition, if these transactional costs were included, your costs would be higher.
| | Beginning
Account Value
(4/1/20) | Ending
Account Value
(9/30/20) | Expenses Paid
During Period*
(4/1/20 – 9/30/20) | Annualized
Expense
Ratio |
| Actual | | | | |
| Class A | $1,000.00 | $1,353.50 | $ 7.30** | 1.24% |
| Class C | $1,000.00 | $1,348.70 | $11.68 ** | 1.99% |
| Class I | $1,000.00 | $1,355.50 | $ 5.83** | 0.99% |
| Class R6 | $1,000.00 | $1,355.60 | $ 5.42** | 0.92% |
| Hypothetical | | | | |
| (5% return per year before expenses) | | | | |
| Class A | $1,000.00 | $1,018.80 | $ 6.26** | 1.24% |
| Class C | $1,000.00 | $1,015.05 | $10.02 ** | 1.99% |
| Class I | $1,000.00 | $1,020.05 | $ 5.00** | 0.99% |
| Class R6 | $1,000.00 | $1,020.40 | $ 4.65** | 0.92% |
| * | Expenses are equal to the Fund's annualized expense ratio for the indicated Class, multiplied by the average account value over the period, multiplied by 183/366 (to reflect the one-half year period). The Example assumes that the $1,000 was invested at the net asset value per share determined at the close of business on March 31, 2020. |
| ** | Absent a waiver and/or reimbursement of expenses by an affiliate, expenses would be higher. |
Calvert
Emerging Markets Equity Fund
September 30, 2020
| Security | Shares | Value |
| Brazil — 4.4% | |
| BB Seguridade Participacoes S.A. | | 8,232,067 | $ 35,576,179 |
| Duratex S.A. | | 9,587,641 | 30,610,660 |
| Hapvida Participacoes e Investimentos S.A.(1) | | 2,809,205 | 31,083,887 |
| WEG S.A. | | 3,105,700 | 36,333,355 |
| | | | $ 133,604,081 |
| China — 27.0% | |
| Aier Eye Hospital Group Co., Ltd., Class A | | 4,143,058 | $ 31,396,932 |
| Alibaba Group Holding, Ltd.(2) | | 885,056 | 31,881,962 |
| Alibaba Group Holding, Ltd. ADR(2) | | 851,892 | 250,439,209 |
| Autohome, Inc. ADR | | 395,344 | 37,953,024 |
| Baozun, Inc. ADR(2)(3) | | 1,411,995 | 45,875,718 |
| China Communications Services Corp., Ltd., Class H | | 76,696,000 | 45,277,949 |
| China Mengniu Dairy Co., Ltd. | | 11,596,310 | 54,696,833 |
| Gree Electric Appliances, Inc. of Zhuhai, Class A | | 7,502,098 | 59,068,537 |
| Hangzhou Tigermed Consulting Co., Ltd., Class A | | 2,369,349 | 35,961,830 |
| NARI Technology Co., Ltd., Class A | | 22,390,675 | 65,096,668 |
| Shenzhen International Holdings, Ltd. | | 24,067,873 | 38,399,432 |
| Tencent Holdings, Ltd. | | 1,900,996 | 128,399,676 |
| | | | $ 824,447,770 |
| Egypt — 0.5% | |
| Commercial International Bank Egypt SAE | | 3,347,740 | $ 14,117,866 |
| | | | $ 14,117,866 |
| Hong Kong — 7.2% | |
| AIA Group, Ltd. | | 6,488,953 | $ 64,500,801 |
| Alibaba Health Information Technology, Ltd.(2) | | 12,506,000 | 30,753,084 |
| Samsonite International S.A.(1)(2) | | 32,048,132 | 32,542,104 |
| Techtronic Industries Co., Ltd. | | 6,977,790 | 92,774,578 |
| | | | $ 220,570,567 |
| Hungary — 0.9% | |
| Richter Gedeon Nyrt | | 1,286,827 | $ 27,162,581 |
| | | | $ 27,162,581 |
| India — 11.6% | |
| Bajaj Finance, Ltd. | | 661,671 | $ 29,521,183 |
| Bharat Forge, Ltd. | | 4,766,984 | 28,931,950 |
| Container Corp. of India, Ltd. | | 4,864,032 | 24,249,616 |
| HCL Technologies, Ltd. | | 3,172,233 | 34,905,233 |
| HDFC Bank, Ltd. ADR(2) | | 1,158,852 | 57,896,246 |
| Hero MotoCorp, Ltd. | | 756,464 | 32,279,231 |
| ICICI Bank, Ltd.(2) | | 7,955,818 | 38,332,785 |
| Motherson Sumi Systems, Ltd. | | 22,246,074 | 34,622,616 |
| SBI Life Insurance Co., Ltd.(1)(2) | | 2,874,962 | 31,507,147 |
| Security | Shares | Value |
| India (continued) | |
| Tech Mahindra, Ltd. | | 3,852,396 | $ 41,346,324 |
| | | | $ 353,592,331 |
| Indonesia — 3.4% | |
| Bank Central Asia Tbk PT | | 21,254,400 | $ 38,797,896 |
| Bank Rakyat Indonesia Persero Tbk PT | | 140,979,391 | 28,922,520 |
| Unilever Indonesia Tbk PT | | 68,183,400 | 37,205,116 |
| | | | $ 104,925,532 |
| Mexico — 3.2% | |
| Grupo Financiero Banorte SAB de CV(2) | | 14,559,214 | $ 50,298,639 |
| Wal-Mart de Mexico SAB de CV | | 19,655,749 | 47,033,701 |
| | | | $ 97,332,340 |
| Peru — 1.2% | |
| Credicorp, Ltd. | | 289,117 | $ 35,847,617 |
| | | | $ 35,847,617 |
| Russia — 5.9% | |
| Mail.ru Group, Ltd. GDR(2) | | 1,752,248 | $ 47,944,426 |
| Polymetal International PLC | | 973,748 | 21,217,169 |
| Yandex NV, Class A(2)(3) | | 1,707,794 | 111,433,559 |
| | | | $ 180,595,154 |
| South Africa — 4.1% | |
| Prosus NV(2)(3) | | 1,360,307 | $ 124,687,115 |
| | | | $ 124,687,115 |
| South Korea — 12.2% | |
| KB Financial Group, Inc. | | 1,410,245 | $ 45,409,866 |
| LG Household & Health Care, Ltd. | | 48,675 | 60,067,630 |
| NCSoft Corp. | | 67,997 | 46,858,984 |
| Samsung Electronics Co., Ltd. | | 4,410,279 | 218,944,452 |
| | | | $ 371,280,932 |
| Sweden — 1.4% | |
| Epiroc AB, Class A | | 2,898,320 | $ 41,985,776 |
| | | | $ 41,985,776 |
| Taiwan — 14.2% | |
| Accton Technology Corp. | | 5,878,000 | $ 45,476,207 |
| Advantech Co., Ltd. | | 2,953,113 | 29,883,521 |
| Chipbond Technology Corp. | | 14,530,000 | 32,022,345 |
| Delta Electronics, Inc. | | 14,376,000 | 94,399,164 |
| LandMark Optoelectronics Corp. | | 3,202,900 | 27,657,621 |
| Taiwan Semiconductor Manufacturing Co., Ltd. ADR | | 2,522,080 | 204,465,026 |
| | | | $ 433,903,884 |
7
See Notes to Financial Statements.
Calvert
Emerging Markets Equity Fund
September 30, 2020
Schedule of Investments — continued
| Security | Shares | Value |
| Turkey — 0.4% | |
| BIM Birlesik Magazalar AS | | 1,228,385 | $ 11,013,901 |
| | | | $ 11,013,901 |
| United Arab Emirates — 0.0% | |
| NMC Health PLC(2)(3)(4) | | 2,704,917 | $ 0 |
| | | | $ 0 |
Total Common Stocks
(identified cost $2,526,930,148) | | | $ 2,975,067,447 |
| High Social Impact Investments — 0.2% |
| Security | Principal
Amount
(000's omitted) | Value |
| Calvert Impact Capital, Inc., Community Investment Notes, 1.50%, 12/15/20(5)(6) | $ | 7,467 | $ 7,429,013 |
| ImpactAssets, Inc., Global Sustainable Agriculture Notes, 2.07%, 11/3/20(6)(7) | | 43 | 41,626 |
| ImpactAssets, Inc., Microfinance Plus Notes, 0.46%, 11/3/20(6)(7) | | 56 | 48,302 |
Total High Social Impact Investments
(identified cost $7,565,870) | | | $ 7,518,941 |
| Short-Term Investments — 3.2% |
| Other — 1.8% |
| Description | Units | Value |
| Calvert Cash Reserves Fund, LLC, 0.13%(8) | | 55,657,685 | $ 55,663,250 |
Total Other
(identified cost $55,667,831) | | | $ 55,663,250 |
| Securities Lending Collateral — 1.4% |
| Security | Shares | Value |
| State Street Navigator Securities Lending Government Money Market Portfolio, 0.09%(9) | | 40,867,297 | $ 40,867,297 |
Total Securities Lending Collateral
(identified cost $40,867,297) | | | $ 40,867,297 |
Total Short-Term Investments
(identified cost $96,535,128) | | | $ 96,530,547 |
Total Investments — 101.0%
(identified cost $2,631,031,146) | | $ 3,079,116,935 |
| Other Assets, Less Liabilities — (1.0)% | | $ (30,486,644) |
| Net Assets — 100.0% | | $ 3,048,630,291 |
The percentage shown for each investment category in the Schedule of Investments is based on net assets.
| |
| (1) | Security exempt from registration under Rule 144A of the Securities Act of 1933, as amended. These securities may be sold in certain transactions in reliance on an exemption from registration (normally to qualified institutional buyers). At September 30, 2020, the aggregate value of these securities is $95,133,138 or 3.1% of the Fund's net assets. |
| (2) | Non-income producing security. |
| (3) | All or a portion of this security was on loan at September 30, 2020. The aggregate market value of securities on loan at September 30, 2020 was $184,349,354. |
| (4) | For fair value measurement disclosure purposes, security is categorized as Level 3 (see Note 1A). |
| (5) | Affiliated company (see Note 8). |
| (6) | Restricted security. Total market value of restricted securities amounts to $7,518,941, which represents 0.2% of the net assets of the Fund as of September 30, 2020. |
| (7) | Notes carry an interest rate that varies by period and is contingent on the performance of the underlying portfolio of loans to borrowers. The coupon rate shown represents the rate in effect at September 30, 2020. |
| (8) | Affiliated investment company, available to Calvert portfolios and funds, which invests in high quality, U.S. dollar denominated money market instruments. The rate shown is the annualized seven-day yield as of September 30, 2020. |
| (9) | Represents investment of cash collateral received in connection with securities lending. |
At September 30, 2020, the concentration of the Fund’s investments in the various sectors, determined as a percentage of net assets, was as follows:
| Economic Sectors | % of Net Assets |
| Information Technology | 23.9% |
| Consumer Discretionary | 21.0 |
| Financials | 15.5 |
| Communication Services | 12.2 |
| Industrials | 11.3 |
| Consumer Staples | 6.9 |
| Health Care | 5.1 |
| Materials | 1.7 |
| High Social Impact Investments | 0.2 |
| Total | 97.8% |
8
See Notes to Financial Statements.
Calvert
Emerging Markets Equity Fund
September 30, 2020
Schedule of Investments — continued
Restricted Securities
| Description | Acquisition Dates | Cost |
| Calvert Impact Capital, Inc., Community Investment Notes, 1.50%, 12/15/20 | 12/13/19 | $7,466,870 |
| ImpactAssets, Inc., Global Sustainable Agriculture Notes, 2.07%, 11/3/20 | 11/13/15 | 43,000 |
| ImpactAssets, Inc., Microfinance Plus Notes, 0.46%, 11/3/20 | 11/13/15 | 56,000 |
| Abbreviations: |
| ADR | – American Depositary Receipt |
| GDR | – Global Depositary Receipt |
9
See Notes to Financial Statements.
Calvert
Emerging Markets Equity Fund
September 30, 2020
Statement of Assets and Liabilities
| | September 30, 2020 |
| Assets | |
Investments in securities of unaffiliated issuers, at value (identified cost $2,567,896,445) - including
$184,349,354 of securities on loan | $ 3,016,024,672 |
| Investments in securities of affiliated issuers, at value (identified cost $63,134,701) | 63,092,263 |
| Cash denominated in foreign currency, at value (cost $12,292,143) | 12,445,605 |
| Receivable for investments sold | 7,162,278 |
| Receivable for capital shares sold | 10,946,132 |
| Dividends and interest receivable | 1,467,172 |
| Dividends and interest receivable - affiliated | 93,496 |
| Securities lending income receivable | 34,249 |
| Receivable from affiliate | 135,831 |
| Directors' deferred compensation plan | 623,594 |
| Total assets | $3,112,025,292 |
| Liabilities | |
| Due to custodian | $ 5,547 |
| Payable for investments purchased | 11,828,854 |
| Payable for capital shares redeemed | 2,073,554 |
| Payable for foreign capital gain taxes | 4,830,736 |
| Deposits for securities loaned | 40,867,297 |
| Payable to affiliates: | |
| Investment advisory fee | 1,859,281 |
| Administrative fee | 297,485 |
| Distribution and service fees | 60,735 |
| Sub-transfer agency fee | 17,997 |
| Directors' deferred compensation plan | 623,594 |
| Accrued expenses | 929,921 |
| Total liabilities | $ 63,395,001 |
| Net Assets | $3,048,630,291 |
| Sources of Net Assets | |
| Paid-in capital | $ 2,715,640,481 |
| Distributable earnings | 332,989,810 |
| Total | $3,048,630,291 |
| Class A Shares | |
| Net Assets | $ 173,728,005 |
| Shares Outstanding | 9,476,486 |
Net Asset Value and Redemption Price Per Share
(net assets ÷ shares of beneficial interest outstanding) | $ 18.33 |
Maximum Offering Price Per Share
(100 ÷ 95.25 of net asset value per share) | $ 19.24 |
| Class C Shares | |
| Net Assets | $ 30,937,804 |
| Shares Outstanding | 1,739,728 |
Net Asset Value and Offering Price Per Share*
(net assets ÷ shares of beneficial interest outstanding) | $ 17.78 |
10
See Notes to Financial Statements.
Calvert
Emerging Markets Equity Fund
September 30, 2020
Statement of Assets and Liabilities — continued
| | September 30, 2020 |
| Class I Shares | |
| Net Assets | $2,530,134,975 |
| Shares Outstanding | 136,599,770 |
Net Asset Value, Offering Price and Redemption Price Per Share
(net assets ÷ shares of beneficial interest outstanding) | $ 18.52 |
| Class R6 Shares | |
| Net Assets | $ 313,829,507 |
| Shares Outstanding | 16,974,815 |
Net Asset Value, Offering Price and Redemption Price Per Share
(net assets ÷ shares of beneficial interest outstanding) | $ 18.49 |
| | On sales of $50,000 or more, the offering price of Class A shares is reduced. |
| * | Redemption price per share is equal to the net asset value less any applicable contingent deferred sales charge. |
11
See Notes to Financial Statements.
Calvert
Emerging Markets Equity Fund
September 30, 2020
| | Year Ended |
| | September 30, 2020 |
| Investment Income | |
| Dividend income (net of foreign taxes withheld of $5,264,613) | $ 44,146,589 |
| Dividend income - affiliated issuers | 21,208 |
| Interest income | 1,190 |
| Interest income - affiliated issuers | 94,502 |
| Securities lending income, net | 1,254,093 |
| Total investment income | $ 45,517,582 |
| Expenses | |
| Investment advisory fee | $ 19,226,554 |
| Administrative fee | 3,076,249 |
| Distribution and service fees: | |
| Class A | 382,523 |
| Class C | 297,087 |
| Directors' fees and expenses | 103,744 |
| Custodian fees | 214,635 |
| Transfer agency fees and expenses | 1,927,613 |
| Accounting fees | 475,265 |
| Professional fees | 148,279 |
| Registration fees | 329,576 |
| Reports to shareholders | 294,912 |
| Miscellaneous | 184,999 |
| Total expenses | $ 26,661,436 |
| Waiver and/or reimbursement of expenses by affiliate | $ (742,130) |
| Reimbursement of expenses - other | (35,450) |
| Net expenses | $ 25,883,856 |
| Net investment income | $ 19,633,726 |
| Realized and Unrealized Gain (Loss) | |
| Net realized gain (loss): | |
| Investment securities (net of foreign capital gains taxes of $441) | $ (83,656,621) |
| Investment securities - affiliated issuers | 7,085 |
| Foreign currency transactions | (2,713,541) |
| Net realized loss | $ (86,363,077) |
| Change in unrealized appreciation (depreciation): | |
| Investment securities (including net increase in payable for foreign capital gains taxes of $3,833,814) | $ 413,055,750 |
| Investment securities - affiliated issuers | (31,858) |
| Foreign currency | 127,624 |
| Net change in unrealized appreciation (depreciation) | $413,151,516 |
| Net realized and unrealized gain | $326,788,439 |
| Net increase in net assets from operations | $346,422,165 |
12
See Notes to Financial Statements.
Calvert
Emerging Markets Equity Fund
September 30, 2020
Statements of Changes in Net Assets
| | Year Ended September 30, |
| | 2020 | 2019 |
| Increase (Decrease) in Net Assets | | |
| From operations: | | |
| Net investment income | $ 19,633,726 | $ 22,716,547 |
| Net realized loss | (86,363,077) | (24,321,645) |
| Net change in unrealized appreciation (depreciation) | 413,151,516 | 84,061,839 |
| Net increase in net assets from operations | $ 346,422,165 | $ 82,456,741 |
| Distributions to shareholders: | | |
| Class A | $ (673,898) | $ (830,950) |
| Class C | — | (100,965) |
| Class I | (14,521,438) | (12,937,246) |
| Class R6 | (1,960,798) | (549,482) |
| Total distributions to shareholders | $ (17,156,134) | $ (14,418,643) |
| Capital share transactions: | | |
| Class A | $ 18,646,918 | $ (24,807,970) |
| Class C | (1,276,295) | 3,743,762 |
| Class I | 445,276,599 | 742,127,821 |
| Class R6 | 59,777,840 | 205,025,396 |
| Net increase in net assets from capital share transactions | $ 522,425,062 | $ 926,089,009 |
| Net increase in net assets | $ 851,691,093 | $ 994,127,107 |
| Net Assets | | |
| At beginning of year | $ 2,196,939,198 | $ 1,202,812,091 |
| At end of year | $3,048,630,291 | $2,196,939,198 |
13
See Notes to Financial Statements.
Calvert
Emerging Markets Equity Fund
September 30, 2020
| | Class A |
| | Year Ended September 30, |
| | 2020 | 2019 | 2018 | 2017 | 2016 |
| Net asset value — Beginning of year | $ 16.05 | $ 15.55 | $ 16.33 | $ 12.94 | $ 10.90 |
| Income (Loss) From Operations | | | | | |
| Net investment income(1) | $ 0.09 | $ 0.17 | $ 0.19 | $ 0.10 | $ 0.08(2) |
| Net realized and unrealized gain (loss) | 2.27 | 0.45 | (0.94) | 3.36 | 2.06 |
| Total income (loss) from operations | $ 2.36 | $ 0.62 | $ (0.75) | $ 3.46 | $ 2.14 |
| Less Distributions | | | | | |
| From net investment income | $ (0.08) | $ (0.12) | $ (0.03) | $ (0.07) | $ (0.10) |
| Total distributions | $ (0.08) | $ (0.12) | $ (0.03) | $ (0.07) | $ (0.10) |
| Net asset value — End of year | $ 18.33 | $ 16.05 | $ 15.55 | $ 16.33 | $ 12.94 |
| Total Return(3) | 14.82% | 4.02% | (4.62)% | 26.89% | 19.75% |
| Ratios/Supplemental Data | | | | | |
| Net assets, end of year (000’s omitted) | $173,728 | $132,066 | $155,735 | $62,432 | $39,343 |
| Ratios (as a percentage of average daily net assets):(4) | | | | | |
| Total expenses | 1.27% | 1.41% | 1.56% | 1.80% | 1.95% |
| Net expenses | 1.24% | 1.25% | 1.27% | 1.27% | 1.47% |
| Net investment income | 0.54% | 1.06% | 1.15% | 0.73% | 0.66% (2) |
| Portfolio Turnover | 38% | 32% | 27% | 36% | 32% |
| (1) | Computed using average shares outstanding. |
| (2) | Amount includes a non-recurring refund for overbilling of prior years' custody out-of-pocket fees. This amounted to $0.003 per share and 0.003% of average net assets. |
| (3) | Returns are historical and are calculated by determining the percentage change in net asset value with all distributions reinvested and do not reflect the effect of sales charges, if any. |
| (4) | Total expenses do not reflect amounts reimbursed and/or waived by the adviser and certain of its affiliates, if applicable. Net expenses are net of all reductions and represent the net expenses paid by the Fund. |
14
See Notes to Financial Statements.
Calvert
Emerging Markets Equity Fund
September 30, 2020
Financial Highlights — continued
| | Class C |
| | Year Ended September 30, |
| | 2020 | 2019 | 2018 | 2017 | 2016 |
| Net asset value — Beginning of year | $ 15.62 | $ 15.18 | $ 16.04 | $ 12.76 | $ 10.74 |
| Income (Loss) From Operations | | | | | |
| Net investment income (loss)(1) | $ (0.04) | $ 0.05 | $ 0.10 | $ 0.01 | $ —(2) |
| Net realized and unrealized gain (loss) | 2.20 | 0.45 | (0.96) | 3.29 | 2.03 |
| Total income (loss) from operations | $ 2.16 | $ 0.50 | $ (0.86) | $ 3.30 | $ 2.03 |
| Less Distributions | | | | | |
| From net investment income | $ — | $ (0.06) | $ — | $ (0.02) | $ (0.01) |
| Total distributions | $ — | $ (0.06) | $ — | $ (0.02) | $ (0.01) |
| Net asset value — End of year | $ 17.78 | $ 15.62 | $ 15.18 | $16.04 | $12.76 |
| Total Return(3) | 13.89% | 3.33% | (5.36)% | 25.88% | 18.94% |
| Ratios/Supplemental Data | | | | | |
| Net assets, end of year (000’s omitted) | $30,938 | $28,794 | $24,286 | $ 4,627 | $ 994 |
| Ratios (as a percentage of average daily net assets):(4) | | | | | |
| Total expenses | 2.02% | 2.16% | 2.31% | 3.69% | 4.44% |
| Net expenses | 1.99% | 2.00% | 2.02% | 2.02% | 2.21% |
| Net investment income (loss) | (0.22)% | 0.35% | 0.60% | 0.08% | 0.02% (2) |
| Portfolio Turnover | 38% | 32% | 27% | 36% | 32% |
| (1) | Computed using average shares outstanding. |
| (2) | Amount includes a non-recurring refund for overbilling of prior years' custody out-of-pocket fees. This amounted to $0.003 per share and 0.003% of average net assets. |
| (3) | Returns are historical and are calculated by determining the percentage change in net asset value with all distributions reinvested and do not reflect the effect of sales charges, if any. |
| (4) | Total expenses do not reflect amounts reimbursed and/or waived by the adviser and certain of its affiliates, if applicable. Net expenses are net of all reductions and represent the net expenses paid by the Fund. |
15
See Notes to Financial Statements.
Calvert
Emerging Markets Equity Fund
September 30, 2020
Financial Highlights — continued
| | Class I |
| | Year Ended September 30, |
| | 2020 | 2019 | 2018 | 2017 | 2016 |
| Net asset value — Beginning of year | $ 16.22 | $ 15.73 | $ 16.48 | $ 13.06 | $ 10.99 |
| Income (Loss) From Operations | | | | | |
| Net investment income(1) | $ 0.13 | $ 0.22 | $ 0.29 | $ 0.17 | $ 0.12(2) |
| Net realized and unrealized gain (loss) | 2.29 | 0.45 | (0.99) | 3.35 | 2.09 |
| Total income (loss) from operations | $ 2.42 | $ 0.67 | $ (0.70) | $ 3.52 | $ 2.21 |
| Less Distributions | | | | | |
| From net investment income | $ (0.12) | $ (0.18) | $ (0.05) | $ (0.10) | $ (0.14) |
| Total distributions | $ (0.12) | $ (0.18) | $ (0.05) | $ (0.10) | $ (0.14) |
| Net asset value — End of year | $ 18.52 | $ 16.22 | $ 15.73 | $ 16.48 | $ 13.06 |
| Total Return(3) | 15.07% | 4.36% | (4.30)% | 27.27% | 20.31% |
| Ratios/Supplemental Data | | | | | |
| Net assets, end of year (000’s omitted) | $2,530,135 | $1,817,479 | $1,012,574 | $126,398 | $58,259 |
| Ratios (as a percentage of average daily net assets):(4) | | | | | |
| Total expenses | 1.02% | 1.15% | 1.32% | 1.32% | 1.41% |
| Net expenses | 0.99% | 0.97% | 0.92% | 0.92% | 1.12% |
| Net investment income | 0.79% | 1.41% | 1.71% | 1.20% | 1.06% (2) |
| Portfolio Turnover | 38% | 32% | 27% | 36% | 32% |
| (1) | Computed using average shares outstanding. |
| (2) | Amount includes a non-recurring refund for overbilling of prior years' custody out-of-pocket fees. This amounted to $0.003 per share and 0.003% of average net assets. |
| (3) | Returns are historical and are calculated by determining the percentage change in net asset value with all distributions reinvested and do not reflect the effect of sales charges, if any. |
| (4) | Total expenses do not reflect amounts reimbursed and/or waived by the adviser and certain of its affiliates, if applicable. Net expenses are net of all reductions and represent the net expenses paid by the Fund. |
16
See Notes to Financial Statements.
Calvert
Emerging Markets Equity Fund
September 30, 2020
Financial Highlights — continued
| | Class R6 |
| | Year Ended September 30, | Period Ended
September 30, |
| | 2020 | 2019 | 2018 (1) |
| Net asset value — Beginning of period | $ 16.19 | $ 15.72 | $ 18.65 |
| Income (Loss) From Operations | | | |
| Net investment income(2) | $ 0.14 | $ 0.27 | $ 0.26 |
| Net realized and unrealized gain (loss) | 2.30 | 0.40 | (3.19) |
| Total income (loss) from operations | $ 2.44 | $ 0.67 | $ (2.93) |
| Less Distributions | | | |
| From net investment income | $ (0.14) | $ (0.20) | $ — |
| Total distributions | $ (0.14) | $ (0.20) | $ — |
| Net asset value — End of period | $ 18.49 | $ 16.19 | $ 15.72 |
| Total Return(3) | 15.13% | 4.35% | (15.71)% (4) |
| Ratios/Supplemental Data | | | |
| Net assets, end of period (000’s omitted) | $313,830 | $218,601 | $10,217 |
| Ratios (as a percentage of average daily net assets):(5) | | | |
| Total expenses | 0.95% | 1.06% | 1.24% (6) |
| Net expenses | 0.92% | 0.92% | 0.92% (6) |
| Net investment income | 0.84% | 1.67% | 2.48% (6) |
| Portfolio Turnover | 38% | 32% | 27% (7) |
| (1) | From February 1, 2018 inception. |
| (2) | Computed using average shares outstanding. |
| (3) | Returns are historical and are calculated by determining the percentage change in net asset value with all distributions reinvested and do not reflect the effect of sales charges, if any. |
| (4) | Not annualized. |
| (5) | Total expenses do not reflect amounts reimbursed and/or waived by the adviser and certain of its affiliates, if applicable. Net expenses are net of all reductions and represent the net expenses paid by the Fund. |
| (6) | Annualized. |
| (7) | For the year ended September 30, 2018. |
17
See Notes to Financial Statements.
Calvert
Emerging Markets Equity Fund
September 30, 2020
Notes to Financial Statements
1 Significant Accounting Policies
Calvert Emerging Markets Equity Fund (the Fund) is a diversified series of Calvert World Values Fund, Inc. (the Corporation). The Corporation is a Maryland corporation registered under the Investment Company Act of 1940, as amended (the 1940 Act), as an open-end management investment company. The investment objective of the Fund is to seek long-term capital appreciation by investing primarily in equity securities of companies located in emerging market countries.
The Fund offers four classes of shares. Class A shares are generally sold subject to a sales charge imposed at time of purchase. A contingent deferred sales charge of 0.80% may apply to certain redemptions of Class A shares for accounts for which no sales charge was paid, if redeemed within 12 months of purchase. Class C shares are sold without a front-end sales charge, and with certain exceptions, are charged a contingent deferred sales charge of 1% on shares redeemed within 12 months of purchase. Class C shares are only available for purchase through a financial intermediary. Effective January 25, 2019, Class C shares generally automatically convert to Class A shares ten years after their purchase and, effective November 5, 2020, automatically convert to Class A shares eight years after their purchase as described in the Fund's prospectus. Class I and Class R6 shares are sold at net asset value, are not subject to a sales charge and are sold only to certain eligible investors. Each class represents a pro rata interest in the Fund, but votes separately on class-specific matters and is subject to different expenses.
The Fund applies the accounting and reporting guidance in the Financial Accounting Standards Board (FASB) Accounting Standards Codification Topic 946, Financial Services – Investment Companies (ASC 946). Subsequent events, if any, through the date that the financial statements were issued have been evaluated in the preparation of the financial statements.
A Investment Valuation— Net asset value per share is determined every business day as of the close of the regular session of the New York Stock Exchange (generally 4:00 p.m. Eastern time). The Fund uses independent pricing services approved by the Board of Directors (the Board) to value its investments wherever possible. Investments for which market quotations are not available or deemed not reliable are fair valued in good faith under the direction of the Board.
U.S. generally accepted accounting principles (U.S. GAAP) establishes a disclosure hierarchy that categorizes the inputs to valuation techniques used to value assets and liabilities at measurement date. These inputs are summarized in the three broad levels listed below:
Level 1 - quoted prices in active markets for identical securities
Level 2 - other significant observable inputs (including quoted prices for similar securities, interest rates, prepayment speeds, credit risk, etc.)
Level 3 - significant unobservable inputs (including the Fund’s own assumptions in determining the fair value of investments)
The inputs or methodologies used for valuing securities are not necessarily an indication of the risk associated with investing in those securities.
Valuation techniques used to value the Fund’s investments by major category are as follows:
Equity Securities. Equity securities (including warrants and rights) listed on a U.S. securities exchange generally are valued at the last sale or closing price as reported by an independent pricing service on the primary market or exchange on which they are traded and are categorized as Level 1 in the hierarchy. Equity securities listed on the NASDAQ Global or Global Select Market are valued at the NASDAQ official closing price and are categorized as Level 1 in the hierarchy. Unlisted or listed securities for which closing sales prices or closing quotations are not available are valued at the mean between the latest available bid and ask prices and are categorized as Level 2 in the hierarchy. The daily valuation of exchange-traded foreign securities generally is determined as of the close of trading on the principal exchange on which such securities trade. Events occurring after the close of trading on foreign exchanges may result in adjustments to the valuation of foreign securities to more accurately reflect their fair value as of the close of regular trading on the New York Stock Exchange. When valuing foreign equity securities that meet certain criteria, the Fund's Board has approved the use of a fair value service that values such securities to reflect market trading that occurs after the close of the applicable foreign markets of comparable securities or other instruments that have a strong correlation to the fair-valued securities. Such securities are categorized as Level 2 in the hierarchy.
Debt Securities. Debt securities are generally valued based on valuations provided by third party pricing services, as derived from such services’ pricing models. Inputs to the models may include, but are not limited to, reported trades, executable bid and ask prices, broker/dealer quotations, prices or yields of securities with similar characteristics, interest rates, anticipated prepayments, benchmark curves or information pertaining to the issuer, as well as industry and economic events. Accordingly, debt securities are generally categorized as Level 2 in the hierarchy. Short-term debt securities with a remaining maturity at time of purchase of more than sixty days are valued based on valuations provided by a third party pricing service. Such securities are generally categorized as Level 2 in the hierarchy. Short-term debt securities of sufficient credit quality purchased with remaining maturities of sixty days or less are valued at amortized cost, which approximates fair value, and are categorized as Level 2 in the hierarchy.
Affiliated Fund. The Fund may invest in Calvert Cash Reserves Fund, LLC (Cash Reserves Fund), an affiliated investment company managed by Calvert Research and Management (CRM). While Cash Reserves Fund is not a registered money market mutual fund, it conducts all of its investment activities in accordance with the requirements of Rule 2a-7 under the 1940 Act. Investments in Cash Reserves Fund are valued at the closing net asset value per unit on the valuation day and are categorized as Level 2 in the hierarchy. Cash Reserves Fund generally values its investment securities based on available market quotations provided by a third party pricing service.
Calvert
Emerging Markets Equity Fund
September 30, 2020
Notes to Financial Statements — continued
Other Securities. Investments in registered investment companies (including money market funds) that do not trade on an exchange are valued at the net asset value per share on the valuation day and are categorized as Level 1 in the hierarchy.
Fair Valuation. If a market value cannot be determined for a security using the methodologies described above, or if, in the good faith opinion of the Fund's adviser, the market value does not constitute a readily available market quotation, or if a significant event has occurred that would materially affect the value of the security, the security will be fair valued as determined in good faith by or at the direction of the Board in a manner that most fairly reflects the security’s “fair value”, which is the amount that the Fund might reasonably expect to receive for the security upon its current sale in the ordinary course. Each such determination is based on a consideration of relevant factors, which are likely to vary from one pricing context to another. These factors may include, but are not limited to, the type of security, the existence of any contractual restrictions on the security’s disposition, the price and extent of public trading in similar securities of the issuer or of comparable companies or entities, quotations or relevant information obtained from broker/dealers or other market participants, information obtained from the issuer, analysts, and/or the appropriate stock exchange (for exchange-traded securities), an analysis of the company’s or entity’s financial statements, and an evaluation of the forces that influence the issuer and the market(s) in which the security is purchased and sold.
The values assigned to fair value investments are based on available information and do not necessarily represent amounts that might ultimately be realized. Further, due to the inherent uncertainty of valuations of such investments, the fair values may differ significantly from the values that would have been used had an active market existed, and the differences could be material.
The following table summarizes the market value of the Fund's holdings as of September 30, 2020, based on the inputs used to value them:
| Asset Description | Level 1 | Level 2 | Level 3(1) | Total |
| Common Stocks | | | | |
| Brazil | $ 133,604,081 | $ — | $ — | $ 133,604,081 |
| China | 334,267,951 | 490,179,819 | — | 824,447,770 |
| Egypt | — | 14,117,866 | — | 14,117,866 |
| Hong Kong | — | 220,570,567 | — | 220,570,567 |
| Hungary | — | 27,162,581 | — | 27,162,581 |
| India | 57,896,246 | 295,696,085 | — | 353,592,331 |
| Indonesia | — | 104,925,532 | — | 104,925,532 |
| Mexico | 97,332,340 | — | — | 97,332,340 |
| Peru | 35,847,617 | — | — | 35,847,617 |
| Russia | 111,433,559 | 69,161,595 | — | 180,595,154 |
| South Africa | — | 124,687,115 | — | 124,687,115 |
| South Korea | — | 371,280,932 | — | 371,280,932 |
| Sweden | — | 41,985,776 | — | 41,985,776 |
| Taiwan | 204,465,026 | 229,438,858 | — | 433,903,884 |
| Turkey | — | 11,013,901 | — | 11,013,901 |
| United Arab Emirates | — | — | 0 | 0 |
| Total Common Stocks | $ 974,846,820 | $2,000,220,627 (2) | $ 0 | $2,975,067,447 |
| High Social Impact Investments | $ — | $ 7,518,941 | $ — | $ 7,518,941 |
| Short-Term Investments: | | | | |
| Other | — | 55,663,250 | — | 55,663,250 |
| Securities Lending Collateral | 40,867,297 | — | — | 40,867,297 |
| Total Investments | $1,015,714,117 | $2,063,402,818 | $ 0 | $3,079,116,935 |
| (1) | None of the unobservable inputs for Level 3 assets, individually or collectively, had a material impact on the Fund. |
| (2) | Includes foreign equity securities whose values were adjusted to reflect market trading of comparable securities or other correlated instruments that occurred after the close of trading in their applicable foreign markets. |
Level 3 investments at the beginning and/or end of the period were valued at zero and accordingly, a reconciliation of Level 3 assets for the year ended September 30, 2020 is not presented.
B Investment Transactions and Income— Investment transactions for financial statement purposes are accounted for on trade date. Realized gains and
Calvert
Emerging Markets Equity Fund
September 30, 2020
Notes to Financial Statements — continued
losses are recorded on an identified cost basis and may include proceeds from litigation. Dividend income is recorded on the ex-dividend date for dividends received in cash and/or securities or, in the case of dividends on certain foreign securities, as soon as the Fund is informed of the ex-dividend date. Non-cash dividends are recorded at the fair value of the securities received. Withholding taxes on foreign dividends, if any, have been provided for in accordance with the Fund's understanding of the applicable country’s tax rules and rates. Distributions received that represent a return of capital are recorded as a reduction of cost of investments. Distributions received that represent a capital gain are recorded as a realized gain. Interest income, which includes amortization of premium and accretion of discount on debt securities, is accrued as earned.
C Share Class Accounting— Realized and unrealized gains and losses and net investment income and losses, other than class-specific expenses, are allocated daily to each class of shares based upon the relative net assets of each class to the total net assets of the Fund. Expenses arising in connection with a specific class are charged directly to that class. Sub-accounting, recordkeeping and similar administrative fees payable to financial intermediaries, which are a component of transfer agency fees and expenses on the Statement of Operations, are not allocated to Class R6 shares.
D Foreign Currency Transactions— The Fund’s accounting records are maintained in U.S. dollars. For valuation of assets and liabilities on each date of net asset value determination, foreign denominations are converted into U.S. dollars using the current exchange rate. Security transactions, income and expenses are translated at the prevailing rate of exchange on the date of the event. Recognized gains or losses on investment transactions attributable to changes in foreign currency exchange rates are recorded for financial statement purposes as net realized gains and losses on investments. That portion of unrealized gains and losses on investments that results from fluctuations in foreign currency exchange rates is not separately disclosed.
E Restricted Securities— The Fund may invest in securities that are subject to legal or contractual restrictions on resale. Generally, these securities may only be sold publicly upon registration under the Securities Act of 1933 or in transactions exempt from such registration. Information regarding restricted securities (excluding Rule 144A securities) is included at the end of the Schedule of Investments.
F Distributions to Shareholders— Distributions to shareholders are recorded by the Fund on ex-dividend date. Distributions from net investment income and distributions from net realized capital gains, if any, are paid at least annually. Distributions are declared separately for each class of shares. Distributions are determined in accordance with income tax regulations, which may differ from U.S. GAAP; accordingly, periodic reclassifications are made within the Fund's capital accounts to reflect income and gains available for distribution under income tax regulations.
G Estimates— The preparation of financial statements in conformity with U.S. GAAP requires management to make estimates and assumptions that affect the reported amounts of assets and liabilities and disclosure of contingent assets and liabilities at the date of the financial statements and the reported amounts of increases and decreases in net assets from operations during the reporting period. Actual results could differ from those estimates.
H Indemnifications— The Corporation’s By-Laws provide for indemnification for Directors or officers of the Corporation and certain other parties, to the fullest extent permitted by Maryland law and the 1940 Act, provided certain conditions are met. Additionally, in the normal course of business, the Fund enters into agreements with service providers that may contain indemnification clauses. The Fund’s maximum exposure under these arrangements is unknown as this would involve future claims that may be made against the Fund that have not yet occurred.
I Federal Income Taxes— No provision for federal income or excise tax is required since the Fund intends to continue to qualify as a regulated investment company under the Internal Revenue Code and to distribute substantially all of its taxable earnings.
In addition to the requirements of the Internal Revenue Code, the Fund may also be subject to local taxes on the recognition of capital gains in certain countries. In determining the daily net asset value, the Fund estimates the accrual for such taxes, if any, based on the unrealized appreciation on certain portfolio securities and the related tax rates. Taxes attributable to unrealized appreciation are included in the change in unrealized appreciation (depreciation) on investments. Capital gains taxes on securities sold are included in net realized gain (loss) on investments.
Management has analyzed the Fund's tax positions taken for all open federal income tax years and has concluded that no provision for federal income tax is required in the Fund's financial statements. A Fund's federal tax return is subject to examination by the Internal Revenue Service for a period of three years from the date of filing.
2 Related Party Transactions
The investment advisory fee is earned by CRM, a subsidiary of Eaton Vance Management (EVM), as compensation for investment advisory services rendered to the Fund. EVM is a wholly-owned subsidiary of Eaton Vance Corp. Pursuant to an investment advisory agreement dated December 31, 2016 and an amended fee schedule to such agreement effective February 1, 2019, CRM receives a fee, payable monthly, at the annual rate of 0.75% of the Fund’s average daily net assets. For the year ended September 30, 2020, the investment advisory fee amounted to $19,226,554.
Hermes Investment Management Limited provides sub-advisory services to the Fund pursuant to a sub-advisory agreement with CRM. Sub-advisory fees are paid by CRM from its investment advisory fee.
Calvert
Emerging Markets Equity Fund
September 30, 2020
Notes to Financial Statements — continued
CRM has agreed to reimburse the Fund’s operating expenses to the extent that total annual operating expenses (relating to ordinary operating expenses only and excluding expenses such as brokerage commissions, acquired fund fees and expenses of unaffiliated funds, borrowing costs, taxes or litigation expenses) exceed 1.24%, 1.99%, 0.99% and 0.92% for Class A, Class C, Class I and Class R6, respectively, of such class’s average daily net assets. The expense reimbursement agreement with CRM may be changed or terminated after January 31, 2021. For the year ended September 30, 2020, CRM waived or reimbursed expenses of $742,130.
The administrative fee is earned by CRM as compensation for administrative services rendered to the Fund. The fee is computed at an annual rate of 0.12% of the Fund’s average daily net assets attributable to Class A, Class C, Class I and Class R6 and is payable monthly. For the year ended September 30, 2020, CRM was paid administrative fees of $3,076,249.
The Fund has in effect a distribution plan for Class A shares (Class A Plan) pursuant to Rule 12b-1 under the 1940 Act. Pursuant to the Class A Plan, the Fund pays Eaton Vance Distributors, Inc. (EVD), an affiliate of CRM and the Fund’s principal underwriter, a distribution and service fee of 0.25% per annum of its average daily net assets attributable to Class A shares for distribution services and facilities provided to the Fund by EVD, as well as for personal services and/or the maintenance of shareholder accounts. The Fund also has in effect a distribution plan for Class C shares (Class C Plan) pursuant to Rule 12b-1 under the 1940 Act. Pursuant to the Class C Plan, the Fund pays EVD amounts equal to 0.75% per annum of its average daily net assets attributable to Class C shares for providing ongoing distribution services and facilities to the Fund. In addition, pursuant to the Class C Plan, the Fund also makes payments of service fees to EVD, financial intermediaries and other persons in amounts equal to 0.25% per annum of its average daily net assets attributable to that class. Service fees paid or accrued are for personal services and/or the maintenance of shareholder accounts. Distribution and service fees paid or accrued for the year ended September 30, 2020 amounted to $382,523 and $297,087 for Class A shares and Class C shares, respectively.
The Fund was informed that EVD received $24,756 as its portion of the sales charge on sales of Class A shares for the year ended September 30, 2020. The Fund was also informed that EVD received $44 and $4,360 of contingent deferred sales charges paid by Class A and Class C shareholders, respectively, for the same period.
EVM provides sub-transfer agency and related services to the Fund pursuant to a Sub-Transfer Agency Support Services Agreement. For the year ended September 30, 2020, sub-transfer agency fees and expenses incurred to EVM amounted to $106,520 and are included in transfer agency fees and expenses on the Statement of Operations.
Each Director of the Fund who is not an employee of CRM or its affiliates receives an annual fee of $154,000, plus an annual Committee fee ranging from $8,500 to $16,500 depending on the Committee. The Board chair receives an additional $20,000 annual fee and Committee chairs receive an additional $6,000 annual fee. Eligible Directors may participate in a Deferred Compensation Plan (the Plan). Amounts deferred under the Plan are treated as though equal dollar amounts had been invested in shares of the Fund or other Calvert funds selected by the Directors. The Fund purchases shares of the funds selected equal to the dollar amounts deferred under the Plan, resulting in an asset equal to the deferred compensation liability. Obligations of the Plan are paid solely from the Fund's assets. Directors’ fees are allocated to each of the Calvert funds served. Salaries and fees of officers and Directors of the Fund who are employees of CRM or its affiliates are paid by CRM. In addition, an Advisory Council was established to aid the Board and CRM in advancing the cause of responsible investing through original scholarship and thought leadership. The Advisory Council consists of CRM’s Chief Executive Officer and three (four prior to December 31, 2019) additional members. Each member (other than CRM’s Chief Executive Officer) received annual compensation of $75,000, which was being reimbursed by Calvert Investment Management, Inc. (CIM), the Calvert funds’ former investment adviser and Ameritas Holding Company, CIM’s parent company, through the end of 2019. For the year ending December 31, 2020, each member (other than CRM’s Chief Executive Officer) is expected to be compensated $20,000 for their service on the Advisory Council. Such compensation, and any other compensation and/or expenses incurred by the Advisory Council as may be approved by the Board, shall be borne by the Calvert funds. For the year ended September 30, 2020, the Fund’s allocated portion of the Advisory Council compensation and fees was $38,777 and the reimbursement was $35,450, which are included in miscellaneous expense and reimbursement of expenses-other, respectively, on the Statement of Operations.
3 Investment Activity
During the year ended September 30, 2020, the cost of purchases and proceeds from sales of investments, other than short-term securities, were $1,530,977,683 and $957,478,355, respectively.
Calvert
Emerging Markets Equity Fund
September 30, 2020
Notes to Financial Statements — continued
4 Distributions to Shareholders and Income Tax Information
The tax character of distributions declared for the years ended September 30, 2020 and September 30, 2019 was as follows:
| | Year Ended September 30, |
| | 2020 | 2019 |
| Ordinary income | $17,156,134 | $14,418,643 |
During the year ended September 30, 2020, distributable earnings was decreased by $2,495,708 and paid-in capital was increased by $2,495,708 due to the Fund's use of equalization accounting. Tax equalization accounting allows the Fund to treat as a distribution that portion of redemption proceeds representing a redeeming shareholder’s portion of undistributed taxable income and net capital gains.
These reclassifications had no effect on the net assets or net asset value per share of the Fund.
As of September 30, 2020, the components of distributable earnings (accumulated loss) on a tax basis were as follows:
| Undistributed ordinary income | $ 13,039,316 |
| Deferred capital losses | $ (94,510,639) |
| Net unrealized appreciation | $414,461,133 |
At September 30, 2020, the Fund, for federal income tax purposes, had deferred capital losses of $94,510,639 which would reduce the Fund’s taxable income arising from future net realized gains on investment transactions, if any, to the extent permitted by the Internal Revenue Code, and thus would reduce the amount of distributions to shareholders, which would otherwise be necessary to relieve the Fund of any liability for federal income or excise tax. The deferred capital losses are treated as arising on the first day of the Fund’s next taxable year, can be carried forward for an unlimited period, and retain the same short-term or long-term character as when originally deferred. Of the deferred capital losses at September 30, 2020, $67,730,997 are short-term and $26,779,642 are long-term.
The cost and unrealized appreciation (depreciation) of investments of the Fund at September 30, 2020, as determined on a federal income tax basis, were as follows:
| Aggregate cost | $2,659,966,265 |
| Gross unrealized appreciation | $ 630,553,576 |
| Gross unrealized depreciation | (211,402,906) |
| Net unrealized appreciation | $ 419,150,670 |
5 Overdraft Advances
Pursuant to the custodian agreement, State Street Bank and Trust Company (SSBT) may, in its discretion, advance funds to the Fund to make properly authorized payments. When such payments result in an overdraft, the Fund is obligated to repay SSBT at the current rate of interest charged by SSBT for secured loans (currently, the Federal Funds rate plus 2%). This obligation is payable on demand to SSBT. SSBT has a lien on the Fund's assets to the extent of any overdraft. At September 30, 2020, the Fund had a payment due to SSBT pursuant to the foregoing arrangement of $5,547. Based on the short-term nature of these payments and the variable interest rate, the carrying value of the overdraft advances approximated its fair value at September 30, 2020. If measured at fair value, overdraft advances would have been considered as Level 2 in the fair value hierarchy (see Note 1A) at September 30, 2020. The Fund’s average overdraft advances during the year ended September 30, 2020 were not significant.
Calvert
Emerging Markets Equity Fund
September 30, 2020
Notes to Financial Statements — continued
6 Securities Lending
To generate additional income, the Fund may lend its securities pursuant to a securities lending agency agreement with SSBT, the securities lending agent. Security loans are subject to termination by the Fund at any time and, therefore, are not considered illiquid investments. The Fund requires that the loan be continuously collateralized by either cash or securities as collateral equal at all times to at least 102% of the market value of the domestic securities loaned and 105% of the market value of the international securities loaned (if applicable). The market value of securities loaned is determined daily and any additional required collateral is delivered to the Fund on the next business day. Cash collateral is generally invested in a money market fund registered under the 1940 Act that is managed by an affiliate of SSBT. Any gain or loss in the market price of the loaned securities that might occur and any interest earned or dividends declared during the term of the loan would accrue to the account of the Fund. Income earned on the investment of collateral, net of broker rebates and other expenses incurred by the securities lending agent, is split between the Fund and the securities lending agent based on agreed upon contractual terms. Non-cash collateral, if any, is held by the lending agent on behalf of the Fund and cannot be sold or re-pledged by the Fund; accordingly, such collateral is not reflected in the Statement of Assets and Liabilities.
The risks associated with lending portfolio securities include, but are not limited to, possible delays in receiving additional collateral or in the recovery of the loaned securities, possible loss of rights to the collateral should the borrower fail financially, as well as risk of loss in the value of the collateral or the value of the investments made with the collateral. The securities lending agent shall indemnify the Fund in the case of default of any securities borrower.
At September 30, 2020, the total value of securities on loan was $184,349,354 and the total value of collateral received was $194,696,126, comprised of cash of $40,867,297 and U.S. government and/or agencies securities of $153,828,829.
The following table provides a breakdown of securities lending transactions accounted for as secured borrowings, the obligations by class of collateral pledged, and the remaining contractual maturity of those transactions as of September 30, 2020.
| | Remaining Contractual Maturity of the Transactions |
| | Overnight and
Continuous | <30 days | 30 to 90 days | >90 days | Total |
| Common Stocks | $40,867,297 | $ — | $ — | $ — | $40,867,297 |
The carrying amount of the liability for deposits for securities loaned at September 30, 2020 approximated its fair value. If measured at fair value, such liability would have been considered as Level 2 in the fair value hierarchy (see Note 1A) at September 30, 2020.
7 Line of Credit
Effective October 29, 2019, the Fund participates with other portfolios and funds managed by EVM and its affiliates, including CRM, in an $800 million unsecured line of credit with a group of banks, which is in effect through October 27, 2020. Borrowings are made by the Fund solely for temporary purposes related to redemptions and other short-term cash needs. Interest is charged to the Fund based on its borrowings at an amount above either the Eurodollar rate or Federal Funds rate. In addition, a fee computed at an annual rate of 0.15% on the daily unused portion of the line of credit is allocated among the participating portfolios and funds at the end of each quarter. Because the line of credit is not available exclusively to the Fund, it may be unable to borrow some or all of its requested amounts at any particular time.
Prior to October 29, 2019, the Fund participated with other funds managed by CRM in a $100 million committed unsecured line of credit agreement with SSBT, which was terminated by the Calvert funds. Borrowings bore interest at the higher of the one-month London Interbank Offered Rate (LIBOR) in effect that day or the overnight Federal Funds rate, plus 1.00% per annum. A commitment fee of 0.20% per annum was incurred on the unused portion of the committed facility, which was allocated to all participating funds.
The Fund had no borrowings outstanding pursuant to its line of credit at September 30, 2020. The Fund did not have any significant borrowings or allocated fees during the year ended September 30, 2020. Effective October 27, 2020, the Fund renewed its line of credit agreement, which expires October 26, 2021, at substantially the same terms.
8 Affiliated Companies and Funds
The Fund has invested a portion of its assets in notes (the Notes) issued by Calvert Impact Capital, Inc. (CIC) pursuant to exemptive relief granted by the U.S. Securities and Exchange Commission (the SEC). There are certain potential points of affiliation between the Fund and CIC. CRM has licensed use of the Calvert name to CIC and provides other types of support. CRM’s President and Chief Executive Officer (and the only director/trustee on the Fund Board that is an “interested person” of the Fund) serves on the CIC Board, along with one member of the Advisory Council to the Fund Board. In addition, another director/trustee on the Fund Board and a member of the Advisory Council each serve as a director emeritus on the CIC Board.
Calvert
Emerging Markets Equity Fund
September 30, 2020
Notes to Financial Statements — continued
At September 30, 2020, the value of the Fund’s investment in the Notes and affiliated funds was $63,092,263, which represents 2.0% of the Fund’s net assets. Transactions in the Notes and affiliated funds by the Fund for the year ended September 30, 2020 were as follows:
| Name | Value,
beginning
of period | Purchases | Sales
proceeds | Net
realized
gain
(loss) | Change in
unrealized
appreciation
(depreciation) | Value,
end of
period | Interest/
Dividend
income | Principal
amount/Units,
end of period |
| High Social Impact Investments | | | | | | | | |
| Calvert Impact Capital, Inc., Community Investment Notes, 1.50%, 12/15/19(1) | $ 1,989,420 | $ — | $ (2,000,000) | $ — | $ 10,580 | $ — | $ 5,833 | $ — |
| Calvert Impact Capital, Inc., Community Investment Notes, 1.50%, 12/15/20(1) | — | 7,466,870 | — | — | (37,857) | 7,429,013 | 88,669 | 7,466,870 |
| Short-Term Investments | | | | | | | | |
| Calvert Cash Reserves Fund, LLC | — | 285,487,720 | (229,826,974) | 7,085 | (4,581) | 55,663,250 | 21,208 | 55,657,685 |
| Totals | | | | $ 7,085 | $(31,858) | $63,092,263 | $115,710 | |
9 Capital Shares
The Corporation may issue its shares in one or more series (such as the Fund). The authorized shares of the Fund consist of 75,000,000 common shares, $0.01 par value, for each Class.
Transactions in capital shares for the years ended September 30, 2020 and September 30, 2019 were as follows:
| | Year Ended
September 30, 2020 | | Year Ended
September 30, 2019 |
| | Shares | Amount | | Shares | Amount |
| Class A | | | | | |
| Shares sold | 5,442,221 | $ 86,507,819 | | 5,131,302 | $ 80,055,643 |
| Reinvestment of distributions | 36,614 | 607,428 | | 49,242 | 739,118 |
| Shares redeemed | (4,230,039) | (68,496,871) | | (6,985,125) | (105,845,381) |
| Converted from Class C | 1,687 | 28,542 | | 15,904 | 242,650 |
| Net increase (decrease) | 1,250,483 | $ 18,646,918 | | (1,788,677) | $ (24,807,970) |
| Class C | | | | | |
| Shares sold | 337,489 | $ 5,556,767 | | 684,007 | $ 10,374,888 |
| Reinvestment of distributions | — | — | | 6,731 | 98,943 |
| Shares redeemed | (439,921) | (6,804,520) | | (429,880) | (6,487,419) |
| Converted to Class A | (1,736) | (28,542) | | (16,277) | (242,650) |
| Net increase (decrease) | (104,168) | $ (1,276,295) | | 244,581 | $ 3,743,762 |
| Class I | | | | | |
| Shares sold | 79,141,293 | $1,295,586,705 | | 91,075,131 | $1,420,261,887 |
| Reinvestment of distributions | 822,269 | 13,756,564 | | 817,003 | 12,369,427 |
| Shares redeemed | (55,415,414) | (864,066,670) | | (44,204,094) | (690,503,493) |
| Net increase | 24,548,148 | $ 445,276,599 | | 47,688,040 | $ 742,127,821 |
Calvert
Emerging Markets Equity Fund
September 30, 2020
Notes to Financial Statements — continued
| | Year Ended
September 30, 2020 | | Year Ended
September 30, 2019 |
| | Shares | Amount | | Shares | Amount |
| Class R6 | | | | | |
| Shares sold | 7,810,338 | $ 131,894,225 | | 16,658,520 | $ 266,753,381 |
| Reinvestment of distributions | 110,978 | 1,852,220 | | 36,389 | 549,482 |
| Shares redeemed | (4,447,540) | (73,968,605) | | (3,843,934) | (62,277,467) |
| Net increase | 3,473,776 | $ 59,777,840 | | 12,850,975 | $ 205,025,396 |
10 Risks and Uncertainties
Risks Associated with Foreign Investments
Investing in foreign securities involves additional risks relating to political, social, and economic developments abroad. Other risks result from differences between regulations that apply to U.S. and foreign issuers and markets, and the potential for foreign markets to be less liquid and more volatile than U.S. markets. Securities that trade or are denominated in currencies other than the U.S. dollar may be adversely affected by fluctuations in currency exchange rates.
The risks of investing in emerging market securities are greater than those of investing in securities of developed foreign countries. These risks include volatile currency exchange rates, periods of high inflation, increased risk of default, greater social, economic and political uncertainty and instability, less governmental supervision and regulation of securities markets, weaker auditing and financial reporting standards, lack of liquidity in the markets, and the significantly smaller market capitalization of emerging market issuers.
Pandemic Risk
An outbreak of respiratory disease caused by a novel coronavirus was first detected in China in December 2019 and subsequently spread internationally. This coronavirus has resulted in closing borders, enhanced health screenings, changes to healthcare service preparation and delivery, quarantines, cancellations, disruptions to supply chains and customer activity, as well as general concern and uncertainty. Health crises caused by outbreaks, such as the coronavirus outbreak, may exacerbate other pre-existing political, social and economic risks and disrupt normal market conditions and operations. The impact of this outbreak has negatively affected the worldwide economy, the economies of individual countries, individual companies, and the market in general, and may continue to do so in significant and unforeseen ways, as may other epidemics and pandemics that may arise in the future. Any such impact could adversely affect the Fund's performance, or the performance of the securities in which the Fund invests.
11 Subsequent Event
On October 8, 2020, Morgan Stanley and Eaton Vance Corp. (“Eaton Vance”) announced that they had entered into a definitive agreement under which Morgan Stanley would acquire Eaton Vance. Under the Investment Company Act of 1940, as amended, consummation of this transaction may result in the automatic termination of the Fund’s investment advisory agreement, and any related sub-advisory agreement(s), if applicable. Thus, the Fund’s Board will be asked to approve a new investment advisory agreement (and new sub-advisory agreement(s), if applicable). If approved by the Fund’s Board, the new investment advisory agreement (and new sub-advisory agreement(s), if applicable) is expected to be presented to Fund shareholders for approval, and, if approved, would take effect upon the closing of the transaction.
Calvert
Emerging Markets Equity Fund
September 30, 2020
Report of Independent Registered Public Accounting Firm
To the Shareholders and Board of Directors
Calvert World Values Fund, Inc.:
Opinion on the Financial Statements
We have audited the accompanying statement of assets and liabilities of Calvert Emerging Markets Equity Fund (the Fund), a series of Calvert World Values Fund, Inc., including the schedule of investments, as of September 30, 2020, the related statement of operations for the year then ended, the statements of changes in net assets for each of the years in the two-year period then ended, and the related notes (collectively, the financial statements) and the financial highlights for each of the years or periods in the five-year period then ended. In our opinion, the financial statements and financial highlights present fairly, in all material respects, the financial position of the Fund as of of September 30, 2020, the results of its operations for the year then ended, the changes in its net assets for each of the years in the two-year period then ended, and the financial highlights for each of the years or periods in the five-year period then ended, in conformity with U.S. generally accepted accounting principles.
Basis for Opinion
These financial statements and financial highlights are the responsibility of the Fund’s management. Our responsibility is to express an opinion on these financial statements and financial highlights based on our audits. We are a public accounting firm registered with the Public Company Accounting Oversight Board (United States) (PCAOB) and are required to be independent with respect to the Fund in accordance with the U.S. federal securities laws and the applicable rules and regulations of the Securities and Exchange Commission and the PCAOB.
We conducted our audits in accordance with the standards of the PCAOB. Those standards require that we plan and perform the audit to obtain reasonable assurance about whether the financial statements and financial highlights are free of material misstatement, whether due to error or fraud. Our audits included performing procedures to assess the risks of material misstatement of the financial statements and financial highlights, whether due to error or fraud, and performing procedures that respond to those risks. Such procedures included examining, on a test basis, evidence regarding the amounts and disclosures in the financial statements and financial highlights. Such procedures also included confirmation of securities owned as of September 30, 2020, by correspondence with the custodian, brokers and agent banks. Our audits also included evaluating the accounting principles used and significant estimates made by management, as well as evaluating the overall presentation of the financial statements and financial highlights. We believe that our audits provide a reasonable basis for our opinion.

We have served as the auditor of one or more of the Calvert Funds since 2002.
Philadelphia, Pennsylvania
November 20, 2020
Calvert
Emerging Markets Equity Fund
September 30, 2020
Federal Tax Information (Unaudited)
The Form 1099-DIV you receive in February 2021 will show the tax status of all distributions paid to your account in calendar year 2020. Shareholders are advised to consult their own tax adviser with respect to the tax consequences of their investment in the Fund. As required by the Internal Revenue Code and/or regulations, shareholders must be notified regarding the status of qualified dividend income for individuals and the foreign tax credit.
Qualified Dividend Income. For the fiscal year ended September 30, 2020, the Fund designates approximately $24,424,419, or up to the maximum amount of such dividends allowable pursuant to the Internal Revenue Code, as qualified dividend income eligible for the reduced tax rate of 15%.
Foreign Tax Credit. For the fiscal year ended September 30, 2020, the Fund paid foreign taxes of $5,099,396 and recognized foreign source income of $46,379,364.
Calvert
Emerging Markets Equity Fund
September 30, 2020
Liquidity Risk Management Program
The Fund has implemented a written liquidity risk management program (Program) and related procedures to manage its liquidity in accordance with Rule 22e-4 under the Investment Company Act of 1940, as amended (Liquidity Rule). The Liquidity Rule defines “liquidity risk” as the risk that a fund could not meet requests to redeem shares issued by the fund without significant dilution of the remaining investors’ interests in the fund. The Fund’s Board of Trustees/Directors has designated the investment adviser to serve as the administrator of the Program and the related procedures. The administrator has established a Liquidity Risk Management Oversight Committee (Committee) to perform the functions necessary to administer the Program. As part of the Program, the administrator is responsible for identifying illiquid investments and categorizing the relative liquidity of the Fund’s investments in accordance with the Liquidity Rule. Under the Program, the administrator assesses, manages, and periodically reviews the Fund’s liquidity risk, and is responsible for making certain reports to the Fund’s Board of Trustees/Directors and the Securities and Exchange Commission (SEC) regarding the liquidity of the Fund’s investments, and to notify the Board of Trustees/Directors and the SEC of certain liquidity events specified in the Liquidity Rule. The liquidity of the Fund’s portfolio investments is determined based on a number of factors including, but not limited to, relevant market, trading and investment-specific considerations under the Program.
At a meeting of the Fund’s Board of Trustees/Directors, the Committee provided a written report to the Fund’s Board of Trustees/Directors pertaining to the operation, adequacy, and effectiveness of implementation of the Program, as well as the operation of the highly liquid investment minimum (if applicable) for the period December 1, 2018 through December 31, 2019 (Review Period). The Program operated effectively during the Review Period, supporting the administrator’s ability to assess, manage and monitor Fund liquidity risk, including during periods of market volatility and net redemptions. During the Review Period, the Fund met redemption requests on a timely basis.
There can be no assurance that the Program will achieve its objectives in the future. Please refer to the Fund’s prospectus for more information regarding the Fund’s exposure to liquidity risk and other principal risks to which an investment in the Fund may be subject.
Calvert
Emerging Markets Equity Fund
September 30, 2020
Management and Organization
Fund Management. The Directors of Calvert World Values Fund, Inc. (the Corporation) are responsible for the overall management and supervision of the Corporation’s affairs. The Directors and officers of the Corporation are listed below. Except as indicated, each individual has held the office shown or other offices in the same company for the last five years. Directors and officers of the Corporation hold indefinite terms of office. The “Independent Directors” consist of those Directors who are not “interested persons” of the Corporation, as that term is defined under the 1940 Act. The business address of each Director and officer, with the exception of Ms. Gemma and Mr. Kirchner, is 1825 Connecticut Avenue NW, Suite 400, Washington, DC 20009. As used below, “CRM” refers to Calvert Research and Management. Each Director oversees 39 funds in the Calvert fund complex. Each officer serves as an officer of certain other Calvert funds.
| Name and Year of Birth | Corporation
Position(s) | Position
Start Date | Principal Occupation(s) and Other Directorships
During Past Five Years and Other Relevant Experience | |
| Interested Director | |
John H. Streur(1)
1960 | Director &
President | 2015 | President and Chief Executive Officer of Calvert Research and
Management (since December 31, 2016). President and Chief Executive
Officer of Calvert Investments, Inc. (January 2015 - December 2016);
Chief Executive Officer of Calvert Investment Distributors, Inc. (August
2015 - December 2016); Chief Compliance Officer of Calvert Investment
Management, Inc. (August 2015 - April 2016); President and Director, Portfolio 21 Investments, Inc. (through October 2014); President,
Chief Executive Officer and Director, Managers Investment Group LLC
(through January 2012); President and Director, The Managers Funds
and Managers AMG Funds (through January 2012).
Other Directorships in the Last Five Years. Portfolio 21 Investments,
Inc. (asset management) (through October 2014); Managers Investment
Group LLC (asset management) (through January 2012); The Managers
Funds (asset management) (through January 2012); Managers AMG Funds
(asset management) (through January 2012); Calvert Impact Capital, Inc. | |
| Independent Directors | |
Richard L. Baird, Jr.
1948 | Director | 2005 | Regional Disaster Recovery Lead, American Red Cross of Greater
Pennsylvania (since 2017). Volunteer, American Red Cross (since 2015).
Former President and CEO of Adagio Health Inc. (retired in 2014) in
Pittsburgh, PA.
Other Directorships in the Last Five Years. None. | |
Alice Gresham Bullock
1950 | Chair &
Director | 2016 | Professor Emerita at Howard University School of Law. Dean Emerita of
Howard University School of Law and Deputy Director of the Association
of American Law Schools (1992-1994).
Other Directorships in the Last Five Years. None. | |
Cari M. Dominguez
1949 | Director | 2016 | Former Chair of the U.S. Equal Employment Opportunity Commission.
Other Directorships in the Last Five Years. Manpower, Inc. (employment
agency); Triple S Management Corporation (managed care); National
Association of Corporate Directors. | |
John G. Guffey, Jr.(2)
1948 | Director | 1992 | President of Aurora Press Inc., a privately held publisher of trade
paperbacks (since January 1997).
Other Directorships in the Last Five Years. Calvert Impact Capital, Inc.
(through December 31, 2018); Calvert Ventures, LLC. | |
Miles D. Harper, III
1962 | Director | 2005 | Partner, Carr Riggs & Ingram (public accounting firm) since October 2014.
Partner, Gainer Donnelly & Desroches (public accounting firm) (now Carr
Riggs & Ingram), (November 1999 - September 2014).
Other Directorships in the Last Five Years. Bridgeway Funds (9) (asset
management). | |
Joy V. Jones
1950 | Director | 2005 | Attorney.
Other Directorships in the Last Five Years. Conduit Street Restaurants
SUD 2 Limited; Palm Management Restaurant Corporation. | |
Calvert
Emerging Markets Equity Fund
September 30, 2020
Management and Organization — continued
| Name and Year of Birth | Corporation
Position(s) | Position
Start Date | Principal Occupation(s) and Other Directorships
During Past Five Years and Other Relevant Experience | |
| Independent Directors (continued) |
Anthony A. Williams
1951 | Director | 2016 | CEO and Executive Director of the Federal City Council (July 2012 to
present); Senior Adviser and Independent Consultant for King and
Spalding LLP (September 2015 to present); Executive Director of Global
Government Practice at the Corporate Executive Board (January 2010 to
January 2012).
Other Directorships in the Last Five Years. Freddie Mac; Evoq
Properties/Meruelo Maddux Properties, Inc. (real estate management);
Weston Solutions, Inc. (environmental services); Bipartisan Policy Center’s
Debt Reduction Task Force; Chesapeake Bay Foundation; Catholic
University of America; Urban Institute (research organization). | |
| Name and Year of Birth | Corporation
Position(s) | Position
Start Date | Principal Occupation(s)
During Past Five Years | |
| Principal Officers who are not Directors | |
Hope L. Brown
1973 | Chief
Compliance
Officer | 2014 | Chief Compliance Officer of 39 registered investment companies advised
by CRM (since 2014). Vice President and Chief Compliance Officer,
Wilmington Funds (2012-2014). | |
Maureen A. Gemma(3)
1960 | Secretary,
Vice President
and Chief
Legal Officer | 2016 | Vice President of CRM and officer of 39 registered investment
companies advised by CRM (since 2016). Also Vice President of
Eaton Vance and certain of its affiliates and officer of 156 registered
investment companies advised or administered by Eaton Vance. | |
James F. Kirchner(3)
1967 | Treasurer | 2016 | Vice President of CRM and officer of 39 registered investment companies
advised by CRM (since 2016). Also Vice President of Eaton Vance and
certain of its affiliates and officer of 156 registered investment companies
advised or administered by Eaton Vance. | |
| (1) Mr. Streur is an interested person of the Fund because of his positions with the Fund’s adviser and certain affiliates. | |
| (2) Mr. Guffey is currently married to Rebecca L. Adamson, who served as a member of the Advisory Council through December 31, 2019. | |
| (3) The business address for Ms. Gemma and Mr. Kirchner is Two International Place, Boston, MA 02110. | |
The SAI for the Fund includes additional information about the Directors and officers of the Fund and can be obtained without charge on Calvert’s website at www.calvert.com or by calling 1-800-368-2745.
Privacy. The Eaton Vance organization is committed to ensuring your financial privacy. Each entity listed below has adopted a privacy policy and procedures (“Privacy Program”) Eaton Vance believes is reasonably designed to protect your personal information and to govern when and with whom Eaton Vance may share your personal information.
| • | At the time of opening an account, Eaton Vance generally requires you to provide us with certain information such as name, address, social security number, tax status, account numbers, and account balances. This information is necessary for us to both open an account for you and to allow us to satisfy legal requirements such as applicable anti-money laundering reviews and know-your-customer requirements. |
| • | On an ongoing basis, in the normal course of servicing your account, Eaton Vance may share your information with unaffiliated third parties that perform various services for Eaton Vance and/or your account. These third parties include transfer agents, custodians, broker/dealers and our professional advisers, including auditors, accountants, and legal counsel. Eaton Vance may additionally share your personal information with our affiliates. |
| • | We believe our Privacy Program is reasonably designed to protect the confidentiality of your personal information and to prevent unauthorized access to that information. |
| • | We reserve the right to change our Privacy Program at any time upon proper notification to you. You may want to review our Privacy Program periodically for changes by accessing the link on our homepage: www.calvert.com. |
Our pledge of protecting your personal information applies to the following entities within the Eaton Vance organization: the Eaton Vance Family of Funds, Eaton Vance Management, Eaton Vance Investment Counsel, Eaton Vance Distributors, Inc., Eaton Vance Trust Company, Eaton Vance Management (International) Limited, Eaton Vance Advisers International Ltd., Eaton Vance Global Advisors Limited, Eaton Vance Management's Real Estate Investment Group, Boston Management and Research, Calvert Research and Management, and Calvert Funds. This Privacy Notice supersedes all previously issued privacy disclosures. For more information about our Privacy Program or about how your personal information may be used, please call 1-800-368-2745.
Delivery of Shareholder Documents. The Securities and Exchange Commission (SEC) permits funds to deliver only one copy of shareholder documents, including prospectuses, proxy statements and shareholder reports, to fund investors with multiple accounts at the same residential or post office box address. This practice is often called “householding” and it helps eliminate duplicate mailings to shareholders. Calvert funds, or your financial intermediary, may household the mailing of your documents indefinitely unless you instruct Calvert funds, or your financial intermediary, otherwise. If you would prefer that your Calvert fund documents not be householded, please contact Calvert funds at 1-800-368-2745, or contact your financial intermediary. Your instructions that householding not apply to delivery of your Calvert fund documents will typically be effective within 30 days of receipt by Calvert funds or your financial intermediary. Separate statements will be generated for each separate account and will be householded as described above.
Portfolio Holdings. Each Calvert fund files a schedule of portfolio holdings on Part F to Form N-PORT with the SEC. Certain information filed on Form N-PORT may be viewed on the Calvert website at www.calvert.com, by calling Calvert at 1-800-368-2745 or in the EDGAR database on the SEC’s website at www.sec.gov.
Proxy Voting. The Proxy Voting Guidelines that each Calvert fund uses to determine how to vote proxies relating to portfolio securities is provided as an Appendix to the fund’s Statement of Additional Information. The Statement of Additional Information can be obtained free of charge by calling the Calvert funds at 1-800-368-2745, by visiting the Calvert funds’ website at www.calvert.com or visiting the SEC’s website at www.sec.gov. Information regarding how a Calvert fund voted proxies relating to portfolio securities during the most recent 12-month period ended June 30 is available by calling Calvert funds, by visiting the Calvert funds’ website at www.calvert.com or by visiting the SEC’s website at www.sec.gov.
This Page Intentionally Left Blank
Investment Adviser and Administrator
Calvert Research and Management
1825 Connecticut Avenue NW, Suite 400
Washington, DC 20009
Investment Sub-Adviser
Hermes Investment Management Limited
150 Cheapside
London EC2V 6ET
Principal Underwriter*
Eaton Vance Distributors, Inc.
Two International Place
Boston, MA 02110
(617) 482-8260
Custodian
State Street Bank and Trust Company
State Street Financial Center, One Lincoln Street
Boston, MA 02111
Transfer Agent
DST Asset Manager Solutions, Inc.
2000 Crown Colony Drive
Quincy, MA 02169
Independent Registered Public Accounting Firm
KPMG LLP
1601 Market Street
Philadelphia, PA 19103-2499
Fund Offices
1825 Connecticut Avenue NW, Suite 400
Washington, DC 20009
* FINRA BrokerCheck. Investors may check the background of their Investment Professional by contacting the Financial Industry Regulatory Authority (FINRA). FINRA BrokerCheck is a free tool to help investors check the professional background of current and former FINRA-registered securities firms and brokers. FINRA BrokerCheck is available by calling 1-800-289-9999 and at www.FINRA.org. The FINRA BrokerCheck brochure describing this program is available to investors at www.FINRA.org.
Printed on recycled paper.
Calvert
Emerging Markets Advancement Fund
Annual Report
September 30, 2020
Important Note. Beginning on January 1, 2021, as permitted by regulations adopted by the Securities and Exchange Commission, paper copies of the Fund’s annual and semi-annual shareholder reports will no longer be sent by mail unless you specifically request paper copies of the reports. Instead, the reports will be made available on the Fund’s website (calvert.com/prospectus), and you will be notified by mail each time a report is posted and provided with a website address to access the report.
If you already elected to receive shareholder reports electronically, you will not be affected by this change and you need not take any action. If you are a direct investor, you may elect to receive shareholder reports and other communications from the Fund electronically by signing up for e-Delivery at calvert.com. If you own your shares through a financial intermediary (such as a broker-dealer or bank), you must contact your financial intermediary to sign up.
You may elect to receive all future Fund shareholder reports in paper free of charge. If you are a direct investor, you can inform the Fund that you wish to continue receiving paper copies of your shareholder reports by calling 1-800-368-2745. If you own these shares through a financial intermediary, you must contact your financial intermediary or follow instructions included with this disclosure, if applicable, to elect to continue to receive paper copies of your shareholder reports. Your election to receive reports in paper will apply to all Calvert funds held directly or to all funds held through your financial intermediary, as applicable.
E-Delivery Sign-Up - Details Inside
Commodity Futures Trading Commission Registration. Effective December 31, 2012, the Commodity Futures Trading Commission (“CFTC”) adopted certain regulatory changes that subject registered investment companies and advisers to regulation by the CFTC if a fund invests more than a prescribed level of its assets in certain CFTC-regulated instruments (including futures, certain options and swap agreements) or markets itself as providing investment exposure to such instruments. The adviser has claimed an exclusion from the definition of “commodity pool operator” under the Commodity Exchange Act with respect to its management of the Fund and the other funds it manages. Accordingly, neither the Fund nor the adviser is subject to CFTC regulation.
Fund shares are not insured by the FDIC and are not deposits or other obligations of, or guaranteed by, any depository institution. Shares are subject to investment risks, including possible loss of principal invested.
This report must be preceded or accompanied by a current summary prospectus or prospectus. Before investing, investors should consider carefully the investment objective, risks, and charges and expenses of a mutual fund. This and other important information is contained in the summary prospectus and prospectus, which can be obtained from a financial intermediary. Prospective investors should read the prospectus carefully before investing. For further information, please call 1-800-368-2745.
Choose Planet-friendly E-delivery!
Sign up now for on-line statements, prospectuses, and fund reports. In less than five minutes you can help reduce paper mail and lower fund costs.
Just go to www.calvert.com. If you already have an online account with the Calvert funds, click on Login to access your Account and select the documents you would like to receive via e-mail.
If you’re new to online account access, click on Login, then Register to create your user name and password. Once you’re in, click on the E-delivery sign-up on the Account Portfolio page and follow the quick, easy steps.
Note: If your shares are not held directly with the Calvert funds but through a brokerage firm, you must contact your broker for electronic delivery options available through their firm.
Annual Report September 30, 2020
Calvert
Emerging Markets Advancement Fund
Calvert
Emerging Markets Advancement Fund
September 30, 2020
Management's Discussion of Fund Performance†
Economic and Market Conditions
Emerging market equities posted positive returns for the 12-month period ended September 30, 2020, returning 10.54% as measured by the MSCI Emerging Markets Index (the Index). Emerging markets outperformed developed markets during a volatile period propelled by the outbreak of the COVID-19 pandemic.
In the final quarter of 2019, emerging markets rose strongly, buoyed by optimism for a trade deal between the U.S. and China, easing monetary policies by the U.S. Federal Reserve and other central banks, as well as diminishing concerns about a hard Brexit. U.S. dollar weakness was also supportive of emerging markets during the period.
Equity markets recorded an unprecedented fall in the first quarter of 2020, with emerging markets dropping 23.57% because of the spread of COVID-19. Countries moved to lockdown to contain the virus, shifting the debate from whether there would be a recession to how long and deep it would be. A stronger U.S. dollar was a further headwind for emerging markets. Central banks and governments cut borrowing rates and announced hefty stimulus packages to reduce the damage. Markets rebounded strongly in the second quarter and continued to advance from their March lows in the third quarter to end the period down less than 1% year to date.
During the period, China outperformed as economic data signaled it would recover faster than anticipated from the pandemic. In fact, corporate earnings exceeded expectations in the second quarter of 2020. However, U.S.-China tensions escalated following new restrictions on technology firm Huawei by President Trump, who also ordered restrictions on U.S. companies doing business with TikTok and WeChat. Taiwan, South Korea, and India also outperformed.
Turkey, one of the worst-performing markets, was weakened by fears that the U.S. might impose sanctions in retaliation for Turkey’s purchase of Russian military hardware. Thailand, Indonesia, the Philippines, Poland, Czech Republic, and Hungary also underperformed as COVID-19 cases surged. Russia, Brazil, South Africa, and Mexico were also underperformers. In Russia, uncertainty over the impact of the U.S. presidential election on U.S. foreign policy and weak crude oil prices weighed on investor sentiment.
There was wide disparity in sector performance, as consumer discretionary, health care, and information technology gained more than 40% during the period while energy, utilities, and financials dropped more than 18%.
Fund Performance
For the 12-month period ended September 30, 2020, Calvert Emerging Markets Advancement Fund (the Fund) returned 6.94% for Class A shares at net asset value, underperforming its primary benchmark, the Index, which returned 10.54%.
The Fund commenced operations on October 1, 2019. Being a new fund hurt performance as it took time to become fully invested.
The Fund takes active country-level exposures, overweighting those countries it believes will improve their Environmental, Social, and Governance (ESG) performance during the investment period and underweighting those countries it believes will not. The constituents of its positions are drawn from the Calvert Emerging Markets Index.
During the period, while some countries with high ESG standards were rewarded with a low occurrence of COVID-19, some countries’ efforts to improve ESG performance were stalled by the pandemic and punished by investors.
The Fund’s underweight exposure to China accounted for much of its underperformance relative to the Index during the period. The Fund’s overweight exposure to South Korea was the most significant contributor to relative returns.
China was the strongest performing country in the Index during the period as it recovered faster than anticipated from the COVID-19 pandemic. However, the Fund had a substantial underweight exposure to China because of human rights abuses against Muslims in the western province of Xinjiang and elsewhere. Many investors, though, focused on economic policy improvements and ignored growing social risks, causing the Fund’s position to detract from performance relative to the Index during the period.
The Fund’s overweight position in Brazil was also a leading detractor during the period. The government had shown signs of curbing its rising indebtedness, improving the prospects for equities. However, its expensive and ill-conceived policy response to the pandemic reversed this trend. As a result, Brazil was the worst-performing emerging market during the period.
Stock selections in China and Brazil also weighed on relative performance because stocks in the Index, which are not evaluated for ESG factors, performed better than the ESG-stocks in the Fund that constituted its China and Brazil allocations.
The Fund’s overweight position in Greece also detracted from performance relative to the Index during the period. Governance and the rule of law had been improving in Greece, but the pandemic’s negative impact on the country’s vital service industry overwhelmed investor sentiment and turned it negative.
The Fund’s overweight exposure to South Korea, premised on the expectation that corporate governance would improve, was the largest contributor as South Korea was one of the top performers in the Index during the period.
The Fund’s lack of exposure to Mexico was also a leading contributor to performance relative to the Index. As anticipated, the policies of Mexico’s new president led to a deterioration in the rule of law and investor confidence during the period.
Although a modest underweight exposure to Taiwan — one of the Index’s best performers — detracted, the strong performances of the Fund’s ESG holdings in the country more than offset its underweight position and made Taiwan one of the largest contributors to the Fund during the period.
See Endnotes and Additional Disclosures in this report.
Past performance is no guarantee of future results. Returns are historical and are calculated by determining the percentage change in net asset value (NAV) or offering price (as applicable) with all distributions reinvested. Investment return and principal value will fluctuate so that shares, when redeemed, may be worth more or less than their original cost. Performance for periods less than or equal to one year is cumulative. Performance is for the stated time period only; due to market volatility, current Fund performance may be lower or higher than the quoted return. For performance as of the most recent month-end, please refer to www.calvert.com.
Calvert
Emerging Markets Advancement Fund
September 30, 2020
Performance
Portfolio Manager Marshall Stocker, Ph.D., CFA of Calvert Research and Management
| % Average Annual Total Returns1,2 | Class
Inception Date | Performance
Inception Date | One Year | Five Years | Since
Inception |
| Class A at NAV | 10/01/2019 | 10/01/2019 | 6.94% | —% | 6.94% |
| Class A with 4.75% Maximum Sales Charge | — | — | 1.85 | — | 1.85 |
| Class I at NAV | 10/01/2019 | 10/01/2019 | 7.14 | — | 7.14 |
|
| MSCI Emerging Markets Index | — | — | 10.54% | 8.96% | 10.54% |
| Calvert Emerging Markets Index | — | — | 12.31 | — | 12.31 |
| % Total Annual Operating Expense Ratios3 | Class A | Class I |
| Gross | 1.35% | 1.10% |
| Net | 1.20 | 0.95 |
Growth of $10,000
This graph shows the change in value of a hypothetical investment of $10,000 in Class A of the Fund for the period indicated. For comparison, the same investment is shown in the indicated index.
| Growth of Investment2 | Amount Invested | Period Beginning | At NAV | With Maximum Sales Charge |
| Class I | $250,000 | 10/01/2019 | $267,859 | N.A. |
See Endnotes and Additional Disclosures in this report.
Past performance is no guarantee of future results. Returns are historical and are calculated by determining the percentage change in net asset value (NAV) or offering price (as applicable) with all distributions reinvested. Investment return and principal value will fluctuate so that shares, when redeemed, may be worth more or less than their original cost. Performance for periods less than or equal to one year is cumulative. Performance is for the stated time period only; due to market volatility, current Fund performance may be lower or higher than the quoted return. For performance as of the most recent month-end, please refer to www.calvert.com.
Calvert
Emerging Markets Advancement Fund
September 30, 2020
Sector Allocation (% of net assets)*
* Excludes cash and cash equivalents.
| Top 10 Holdings (% of net assets)* | |
| Alibaba Group Holding, Ltd. ADR | 7.2% |
| Taiwan Semiconductor Manufacturing Co., Ltd. | 6.9 |
| Samsung Electronics Co., Ltd. | 6.1 |
| Tencent Holdings, Ltd. | 6.0 |
| Commercial International Bank Egypt SAE | 3.4 |
| Meituan Dianping, Class B | 1.9 |
| Hellenic Telecommunications Organization S.A. | 1.8 |
| JD.com, Inc. ADR | 1.6 |
| First Abu Dhabi Bank PJSC | 1.3 |
| Ping An Insurance (Group) Co. of China, Ltd., Class H | 1.0 |
| Total | 37.2% |
| * | Excludes cash and cash equivalents. |
See Endnotes and Additional Disclosures in this report.
Calvert
Emerging Markets Advancement Fund
September 30, 2020
Endnotes and Additional Disclosures
| † | The views expressed in this report are those of the portfolio manager(s) and are current only through the date stated at the top of this page. These views are subject to change at any time based upon market or other conditions, and Calvert and the Fund(s) disclaim any responsibility to update such views. These views may not be relied upon as investment advice and, because investment decisions are based on many factors, may not be relied upon as an indication of trading intent on behalf of any Calvert fund. This commentary may contain statements that are not historical facts, referred to as “forward-looking statements.” The Fund’s actual future results may differ significantly from those stated in any forward-looking statement, depending on factors such as changes in securities or financial markets or general economic conditions, the volume of sales and purchases of Fund shares, the continuation of investment advisory, administrative and service contracts, and other risks discussed from time to time in the Fund’s filings with the Securities and Exchange Commission. |
| | |
| 1 | MSCI Emerging Markets Index is an unmanaged index of emerging markets common stocks. MSCI indexes are net of foreign withholding taxes. Source: MSCI. MSCI data may not be reproduced or used for any other purpose. MSCI provides no warranties, has not prepared or approved this report, and has no liability hereunder. The Calvert Emerging Markets Index (the Index) is composed of equity securities of companies that are located in or tied economically to countries that Calvert Research and Management has classified as emerging market countries and that meet certain environmental, social and governance criteria. The Index is reconstituted annually and rebalanced quarterly. Unless otherwise stated, index returns do not reflect the effect of any applicable sales charges, commissions, expenses, taxes or leverage, as applicable. It is not possible to invest directly in an index. |
| 2 | Total Returns at NAV do not include applicable sales charges. If sales charges were deducted, the returns would be lower. Total Returns shown with maximum sales charge reflect the stated maximum sales charge. Unless otherwise stated, performance does not reflect the deduction of taxes on Fund distributions or redemptions of Fund shares. Performance since inception for an index, if presented, is the performance since the Fund's or oldest share class' inception, as applicable. |
| 3 | Source: Fund prospectus. Net expense ratios reflect a contractual expense reimbursement that continues through 1/31/21. Without the reimbursement, performance would have been lower. The expense ratios for the current reporting period can be found in the Financial Highlights section of this report. |
| | Fund profile subject to change due to active management. |
Calvert
Emerging Markets Advancement Fund
September 30, 2020
Example
As a Fund shareholder, you incur two types of costs: (1) transaction costs, including sales charges (loads) on purchases and redemption fees (if applicable); and (2) ongoing costs, including management fees; distribution and/or service fees; and other Fund expenses. This Example is intended to help you understand your ongoing costs (in dollars) of Fund investing and to compare these costs with the ongoing costs of investing in other mutual funds. The Example is based on an investment of $1,000 invested at the beginning of the period and held for the entire period (April 1, 2020 to September 30, 2020).
Actual Expenses
The first section of the table below provides information about actual account values and actual expenses. You may use the information in this section, together with the amount you invested, to estimate the expenses that you paid over the period. Simply divide your account value by $1,000 (for example, an $8,600 account value divided by $1,000 = 8.6), then multiply the result by the number in the first section under the heading entitled “Expenses Paid During Period” to estimate the expenses you paid on your account during this period.
Hypothetical Example for Comparison Purposes
The second section of the table below provides information about hypothetical account values and hypothetical expenses based on the actual Fund expense ratio and an assumed rate of return of 5% per year (before expenses), which is not the actual Fund return. The hypothetical account values and expenses may not be used to estimate the actual ending account balance or expenses you paid for the period. You may use this information to compare the ongoing costs of investing in the Fund and other funds. To do so, compare this 5% hypothetical example with the 5% hypothetical examples that appear in the shareholder reports of the other funds.
Please note that the expenses shown in the table are meant to highlight your ongoing costs only and do not reflect any transactional costs, such as sales charges (loads) or redemption fees (if applicable). Therefore, the second section of the table is useful in comparing ongoing costs only, and will not help you determine the relative total costs of owning different funds. In addition, if these transactional costs were included, your costs would be higher.
| | Beginning
Account Value
(4/1/20) | Ending
Account Value
(9/30/20) | Expenses Paid
During Period*
(4/1/20 – 9/30/20) | Annualized
Expense
Ratio |
| Actual | | | | |
| Class A | $1,000.00 | $1,259.20 | $6.78 ** | 1.20% |
| Class I | $1,000.00 | $1,260.00 | $5.37 ** | 0.95% |
| Hypothetical | | | | |
| (5% return per year before expenses) | | | | |
| Class A | $1,000.00 | $1,019.00 | $6.06 ** | 1.20% |
| Class I | $1,000.00 | $1,020.25 | $4.80 ** | 0.95% |
| * | Expenses are equal to the Fund's annualized expense ratio for the indicated Class, multiplied by the average account value over the period, multiplied by 183/366 (to reflect the one-half year period). The Example assumes that the $1,000 was invested at the net asset value per share determined at the close of business on March 31, 2020. |
| ** | Absent a waiver and/or reimbursement of expenses by an affiliate, expenses would be higher. |
Calvert
Emerging Markets Advancement Fund
September 30, 2020
| Security | Shares | Value |
| Brazil — 0.1% | |
| Banco Bradesco S.A., PFC Shares | | 3,450 | $ 11,924 |
| Cia de Saneamento do Parana, PFC Shares | | 10,000 | 9,064 |
| | | | $ 20,988 |
| China — 33.5% | |
| 3SBio, Inc.(1)(2) | | 6,000 | $ 6,798 |
| AAC Technologies Holdings, Inc.(3) | | 5,000 | 27,203 |
| Agile Group Holdings, Ltd. | | 12,000 | 15,810 |
| Agricultural Bank of China, Ltd., Class H | | 278,000 | 87,224 |
| Alibaba Group Holding, Ltd. ADR(2) | | 10,191 | 2,995,950 |
| A-Living Services Co., Ltd., Class H(1) | | 2,750 | 14,070 |
| Anhui Conch Cement Co., Ltd., Class H | | 14,500 | 100,431 |
| ANTA Sports Products, Ltd. | | 7,000 | 73,055 |
| Autohome, Inc. ADR | | 1,007 | 96,672 |
| Bank of China, Ltd., Class H | | 635,000 | 197,498 |
| Bank of Communications Co., Ltd., Class H | | 243,000 | 117,119 |
| Baozun, Inc. ADR(2)(3) | | 300 | 9,747 |
| BeiGene, Ltd.(2) | | 4,600 | 101,454 |
| Beijing Capital International Airport Co., Ltd., Class H | | 14,000 | 8,465 |
| Beijing Enterprises Water Group, Ltd. | | 30,000 | 11,691 |
| BEST, Inc. ADR(2)(3) | | 1,955 | 5,865 |
| Brilliance China Automotive Holdings, Ltd. | | 16,000 | 15,121 |
| BYD Co., Ltd., Class H(3) | | 7,000 | 112,883 |
| China Aoyuan Group, Ltd. | | 10,000 | 10,306 |
| China Biologic Products Holdings, Inc.(2)(3) | | 219 | 24,340 |
| China CITIC Bank Corp, Ltd., Class H | | 116,000 | 44,955 |
| China Communications Services Corp., Ltd., Class H | | 16,000 | 9,446 |
| China Conch Venture Holdings, Ltd. | | 13,000 | 60,477 |
| China Everbright Bank Co., Ltd., Class H | | 60,000 | 18,975 |
| China Everbright Environment Group, Ltd. | | 19,000 | 10,863 |
| China Evergrande Group(3) | | 15,000 | 38,496 |
| China Galaxy Securities Co., Ltd., Class H | | 65,500 | 37,072 |
| China Hongqiao Group, Ltd. | | 18,500 | 11,590 |
| China International Capital Corp., Ltd., Class H(1)(2)(3) | | 19,600 | 45,585 |
| China Jinmao Holdings Group, Ltd. | | 22,000 | 12,249 |
| China Lesso Group Holdings, Ltd. | | 11,000 | 19,977 |
| China Literature, Ltd.(1)(2)(3) | | 1,800 | 13,575 |
| China Longyuan Power Group Corp., Ltd., Class H | | 22,000 | 13,823 |
| China Medical System Holdings, Ltd. | | 8,000 | 8,852 |
| China Mengniu Dairy Co., Ltd. | | 22,000 | 103,768 |
| China Merchants Bank Co., Ltd., Class H | | 33,000 | 156,599 |
| China Minsheng Banking Corp., Ltd., Class H | | 79,000 | 41,510 |
| China Mobile, Ltd. | | 44,500 | 285,658 |
| China National Building Material Co., Ltd., Class H | | 38,000 | 48,429 |
| China Oilfield Services, Ltd., Class H | | 12,000 | 8,399 |
| Security | Shares | Value |
| China (continued) | |
| China Pacific Insurance Group Co., Ltd., Class H | | 33,000 | $ 94,248 |
| China Resources Cement Holdings, Ltd. | | 18,000 | 24,745 |
| China Resources Land, Ltd. | | 20,000 | 91,216 |
| China Telecom Corp, Ltd., Class H | | 66,000 | 19,830 |
| China Tower Corp, Ltd., Class H(1) | | 400,000 | 69,591 |
| China Unicom (Hong Kong), Ltd. | | 30,000 | 19,692 |
| China Vanke Co., Ltd., Class H | | 10,700 | 32,890 |
| CIFI Holdings Group Co., Ltd. | | 34,000 | 25,257 |
| CNOOC, Ltd. | | 150,000 | 144,282 |
| Country Garden Holdings Co., Ltd. | | 65,000 | 80,485 |
| Country Garden Services Holdings Co., Ltd. | | 11,000 | 71,439 |
| CRRC Corp., Ltd., Class H | | 24,000 | 9,613 |
| CSPC Pharmaceutical Group, Ltd. | | 36,000 | 70,274 |
| Dali Foods Group Co., Ltd.(1) | | 17,500 | 10,718 |
| ENN Energy Holdings, Ltd. | | 5,300 | 58,158 |
| Far East Horizon, Ltd. | | 40,000 | 32,642 |
| GDS Holdings, Ltd. ADR(2) | | 1,172 | 95,905 |
| Geely Automobile Holdings, Ltd. | | 47,000 | 94,283 |
| Genscript Biotech Corp.(2) | | 4,000 | 6,594 |
| GF Securities Co., Ltd., Class H | | 10,400 | 13,233 |
| GOME Retail Holdings, Ltd.(2)(3) | | 67,000 | 8,874 |
| Great Wall Motor Co., Ltd., Class H(3) | | 15,000 | 19,134 |
| Greentown Service Group Co., Ltd. | | 8,000 | 9,914 |
| Guangdong Investment, Ltd. | | 20,000 | 31,800 |
| Guangzhou Automobile Group Co., Ltd., Class H | | 12,000 | 10,067 |
| Guangzhou R&F Properties Co., Ltd., Class H | | 7,200 | 9,325 |
| Guotai Junan Securities Co., Ltd., Class H(1) | | 17,200 | 24,008 |
| Haidilao International Holding, Ltd.(1) | | 5,000 | 36,229 |
| Haitong Securities Co., Ltd., Class H(2) | | 38,000 | 32,497 |
| Hengan International Group Co., Ltd. | | 3,000 | 21,960 |
| Huaneng Power International, Inc., Class H | | 22,000 | 8,536 |
| Huatai Securities Co., Ltd., Class H(1) | | 20,600 | 33,893 |
| Huazhu Group, Ltd. ADR(3) | | 2,276 | 98,414 |
| Innovent Biologics, Inc.(1)(2) | | 7,500 | 55,929 |
| iQIYI, Inc. ADR(2)(3) | | 2,054 | 46,379 |
| JD.com, Inc. ADR(2) | | 8,780 | 681,416 |
| Jiangsu Expressway Co., Ltd., Class H | | 10,000 | 10,095 |
| JOYY, Inc. ADR | | 586 | 47,273 |
| Kingdee International Software Group Co., Ltd. | | 16,000 | 41,733 |
| Kingsoft Corp., Ltd.(3) | | 5,000 | 25,190 |
| Kunlun Energy Co., Ltd. | | 20,000 | 13,206 |
| KWG Property Holding, Ltd. | | 9,500 | 16,361 |
| Li Ning Co., Ltd. | | 12,000 | 56,464 |
| Logan Group Co., Ltd. | | 8,000 | 12,730 |
| Longfor Group Holdings, Ltd.(1) | | 11,000 | 62,328 |
| Meituan Dianping, Class B(2) | | 25,100 | 790,682 |
| Minth Group, Ltd. | | 4,000 | 17,467 |
7
See Notes to Financial Statements.
Calvert
Emerging Markets Advancement Fund
September 30, 2020
Schedule of Investments — continued
| Security | Shares | Value |
| China (continued) | |
| Momo, Inc. ADR | | 1,100 | $ 15,136 |
| NetEase, Inc. ADR | | 500 | 227,335 |
| New China Life Insurance Co., Ltd., Class H | | 11,000 | 41,350 |
| New Oriental Education & Technology Group, Inc. ADR(2) | | 1,040 | 155,480 |
| NIO, Inc. ADR(2) | | 6,033 | 128,020 |
| People's Insurance Co. Group of China Ltd. (The), Class H | | 155,000 | 46,126 |
| Pinduoduo, Inc. ADR(2) | | 2,441 | 181,000 |
| Ping An Healthcare and Technology Co., Ltd.(1)(2)(3) | | 3,100 | 39,999 |
| Ping An Insurance (Group) Co. of China, Ltd., Class H | | 41,500 | 430,805 |
| Postal Savings Bank of China Co., Ltd., Class H(1) | | 120,000 | 50,552 |
| Seazen Group, Ltd. | | 24,000 | 20,444 |
| Semiconductor Manufacturing International Corp.(2)(3) | | 26,000 | 60,870 |
| Shandong Weigao Group Medical Polymer Co., Ltd., Class H | | 16,000 | 32,013 |
| Shanghai Fosun Pharmaceutical Group Co., Ltd., Class H | | 3,500 | 14,652 |
| Shenzhen International Holdings, Ltd. | | 6,500 | 10,371 |
| Shimao Group Holdings, Ltd. | | 8,000 | 33,376 |
| Silergy Corp. | | 1,000 | 59,287 |
| Sinopharm Group Co., Ltd., Class H | | 7,200 | 15,215 |
| Sinotruk Hong Kong, Ltd. | | 4,500 | 11,597 |
| Sunac China Holdings, Ltd. | | 21,000 | 82,736 |
| Sunny Optical Technology Group Co., Ltd. | | 5,900 | 91,641 |
| TAL Education Group ADR(2) | | 2,783 | 211,619 |
| Tencent Holdings, Ltd. | | 36,900 | 2,492,350 |
| Tingyi (Cayman Islands) Holding Corp. | | 10,000 | 17,707 |
| Tongcheng Elong Holdings, Ltd.(2) | | 6,000 | 11,006 |
| TravelSky Technology, Ltd., Class H | | 5,000 | 10,747 |
| Trip.com Group, Ltd. ADR(2) | | 2,729 | 84,981 |
| Uni-President China Holdings, Ltd. | | 12,000 | 11,005 |
| United Energy Group, Ltd. | | 88,000 | 12,533 |
| Vipshop Holdings, Ltd. ADR(2) | | 3,993 | 62,450 |
| Want Want China Holdings, Ltd. | | 42,000 | 29,349 |
| Weibo Corp. ADR(2)(3) | | 500 | 18,215 |
| Weichai Power Co., Ltd., Class H | | 11,000 | 22,258 |
| WuXi AppTec Co., Ltd., Class H(1) | | 1,400 | 20,245 |
| Wuxi Biologics Cayman, Inc.(1)(2) | | 6,500 | 159,302 |
| Xiaomi Corp., Class B(1)(2) | | 112,600 | 304,811 |
| Xinyi Solar Holdings, Ltd. | | 22,000 | 35,073 |
| Yihai International Holding Ltd. | | 4,000 | 62,828 |
| Yum China Holdings, Inc. | | 2,850 | 150,907 |
| Zai Lab, Ltd. ADR(2) | | 275 | 22,872 |
| Zhaojin Mining Industry Co., Ltd., Class H | | 13,500 | 16,603 |
| ZhongAn Online P&C Insurance Co., Ltd., Class H(1)(2)(3) | | 7,800 | 39,093 |
| Zhongsheng Group Holdings, Ltd. | | 3,500 | 22,017 |
| Zhuzhou CRRC Times Electric Co., Ltd., Class H | | 3,900 | 13,104 |
| ZTO Express Cayman, Inc. ADR | | 4,144 | 123,988 |
| | | | $ 14,012,067 |
| Security | Shares | Value |
| Colombia — 4.6% | |
| Banco Davivienda S.A., PFC Shares | | 16,277 | $ 116,538 |
| Bancolombia S.A. | | 46,113 | 292,559 |
| Cementos Argos S.A. | | 160,305 | 193,941 |
| Empresa de Energia de Bogota S.A. ESP | | 361,939 | 231,709 |
| Grupo de Inversiones Suramericana S.A. | | 42,432 | 228,625 |
| Grupo Nutresa S.A. | | 27,638 | 163,647 |
| Interconexion Electrica S.A. ESP | | 57,781 | 307,702 |
| Millicom International Cellular S.A. SDR | | 13,504 | 407,967 |
| | | | $ 1,942,688 |
| Egypt — 3.9% | |
| Commercial International Bank Egypt SAE | | 331,390 | $ 1,397,516 |
| Egypt Kuwait Holding Co. SAE | | 207,730 | 222,358 |
| | | | $ 1,619,874 |
| Greece — 5.4% | |
| Alpha Bank AE(2) | | 313,326 | $ 189,455 |
| Eurobank Ergasias S.A.(2) | | 568,295 | 249,995 |
| Hellenic Telecommunications Organization S.A. | | 51,287 | 738,647 |
| JUMBO S.A. | | 23,806 | 416,802 |
| Motor Oil (Hellas) Corinth Refineries S.A. | | 13,500 | 159,000 |
| Mytilineos S.A. | | 23,900 | 256,062 |
| National Bank of Greece S.A.(2) | | 124,200 | 155,636 |
| Piraeus Bank S.A.(2) | | 73,200 | 90,441 |
| | | | $ 2,256,038 |
| Hong Kong — 1.1% | |
| Alibaba Health Information Technology, Ltd.(2) | | 22,000 | $ 54,099 |
| Alibaba Pictures Group, Ltd.(2) | | 80,000 | 11,941 |
| China Gas Holdings, Ltd. | | 25,600 | 73,260 |
| China Overseas Land & Investment, Ltd. | | 26,000 | 65,675 |
| China Resources Gas Group, Ltd. | | 8,000 | 35,919 |
| China State Construction International Holdings, Ltd. | | 14,000 | 9,184 |
| China Taiping Insurance Holdings Co., Ltd. | | 26,800 | 41,090 |
| Haier Electronics Group Co., Ltd. | | 6,000 | 21,813 |
| Hutchison China MediTech, Ltd. ADR(2) | | 500 | 16,150 |
| Kingboard Chemical Holdings, Ltd. | | 4,500 | 14,888 |
| Nine Dragons Paper Holdings, Ltd. | | 13,000 | 16,413 |
| Sino Biopharmaceutical, Ltd. | | 76,500 | 83,771 |
| Sun Art Retail Group, Ltd. | | 16,000 | 17,764 |
| | | | $ 461,967 |
| Indonesia — 0.9% | |
| Ace Hardware Indonesia Tbk PT | | 190,700 | $ 20,463 |
| Bank Central Asia Tbk PT | | 50,600 | 92,366 |
| Bank Mandiri Persero Tbk PT | | 88,400 | 29,563 |
| Bank Negara Indonesia Persero Tbk PT | | 72,200 | 21,658 |
8
See Notes to Financial Statements.
Calvert
Emerging Markets Advancement Fund
September 30, 2020
Schedule of Investments — continued
| Security | Shares | Value |
| Indonesia (continued) | |
| Bank Rakyat Indonesia Persero Tbk PT | | 248,200 | $ 50,919 |
| Barito Pacific Tbk PT(2) | | 229,600 | 12,274 |
| Charoen Pokphand Indonesia Tbk PT | | 62,200 | 23,809 |
| Indocement Tunggal Prakarsa Tbk PT | | 24,600 | 17,235 |
| Indofood CBP Sukses Makmur Tbk PT | | 19,300 | 13,082 |
| Telekomunikasi Indonesia Persero Tbk PT | | 224,800 | 38,815 |
| Unilever Indonesia Tbk PT | | 78,300 | 42,725 |
| | | | $ 362,909 |
| Peru — 1.1% | |
| Credicorp, Ltd. | | 3,200 | $ 396,768 |
| InRetail Peru Corp.(1) | | 1,100 | 36,850 |
| Intercorp Financial Services Inc. | | 1,400 | 32,900 |
| | | | $ 466,518 |
| Philippines — 0.9% | |
| Aboitiz Equity Ventures, Inc. | | 17,000 | $ 16,248 |
| Ayala Corp. | | 2,300 | 32,887 |
| Ayala Land, Inc. | | 61,400 | 37,789 |
| Bank of the Philippine Islands | | 13,400 | 17,743 |
| BDO Unibank, Inc. | | 14,200 | 25,338 |
| Globe Telecom, Inc. | | 600 | 25,736 |
| GT Capital Holdings, Inc. | | 1,200 | 9,604 |
| JG Summit Holdings, Inc. | | 21,700 | 27,036 |
| Jollibee Foods Corp. | | 4,300 | 12,891 |
| Manila Electric Co. | | 1,900 | 10,652 |
| Metro Pacific Investments Corp. | | 166,000 | 11,995 |
| Metropolitan Bank & Trust Co. | | 13,500 | 10,688 |
| Puregold Price Club, Inc. | | 12,100 | 12,263 |
| Robinsons Retail Holdings, Inc. | | 8,100 | 10,875 |
| SM Investments Corp. | | 3,600 | 65,654 |
| SM Prime Holdings, Inc. | | 69,900 | 42,598 |
| Universal Robina Corp. | | 6,700 | 18,582 |
| | | | $ 388,579 |
| Russia — 1.8% | |
| Magnit PJSC | | 799 | $ 51,047 |
| Mail.Ru Group, Ltd. GDR(2)(4) | | 1,200 | 32,880 |
| Mobile TeleSystems PJSC | | 10,951 | 47,643 |
| Moscow Exchange MICEX-RTS PJSC | | 21,800 | 41,091 |
| Polymetal International PLC | | 3,400 | 74,154 |
| Polyus PJSC | | 400 | 84,074 |
| Surgutneftegas PJSC | | 122,723 | 54,742 |
| Tatneft PJSC | | 13,732 | 81,751 |
| Transneft PJSC, PFC Shares(2) | | 24 | 45,667 |
| VTB Bank PJSC(2) | | 77,899,700 | 34,676 |
| X5 Retail Group NV GDR(4) | | 1,220 | 45,140 |
| Security | Shares | Value |
| Russia (continued) | |
| Yandex NV, Class A(2)(3) | | 2,584 | $ 168,606 |
| | | | $ 761,471 |
| South Korea — 16.2% | |
| AMOREPACIFIC Corp. | | 252 | $ 35,131 |
| AMOREPACIFIC Group | | 251 | 10,459 |
| BGF retail Co., Ltd. | | 79 | 8,355 |
| BNK Financial Group, Inc. | | 2,840 | 12,288 |
| Celltrion Healthcare Co., Ltd.(2) | | 990 | 74,262 |
| Celltrion, Inc.(2) | | 1,328 | 292,112 |
| Cheil Worldwide, Inc. | | 1,539 | 27,568 |
| CJ CheilJedang Corp. | | 167 | 56,369 |
| CJ Corp. | | 333 | 23,123 |
| CJ Logistics Corp.(2) | | 102 | 15,466 |
| Coway Co., Ltd. | | 528 | 35,910 |
| DB Insurance Co., Ltd. | | 408 | 15,768 |
| Doosan Bobcat, Inc. | | 551 | 12,719 |
| Douzone Bizon Co., Ltd. | | 175 | 15,595 |
| Fila Holdings Corp. | | 443 | 13,844 |
| GS Holdings Corp. | | 974 | 25,788 |
| Hana Financial Group, Inc. | | 2,641 | 63,445 |
| Hankook Tire & Technology Co., Ltd. | | 439 | 11,830 |
| Hanmi Pharm Co., Ltd. | | 100 | 23,379 |
| Hanon Systems | | 1,500 | 15,839 |
| Helixmith Co., Ltd.(2) | | 285 | 8,653 |
| HLB, Inc.(2) | | 415 | 36,584 |
| Hotel Shilla Co., Ltd. | | 143 | 9,261 |
| Hyundai Engineering & Construction Co., Ltd. | | 1,615 | 41,923 |
| Hyundai Glovis Co., Ltd. | | 106 | 13,033 |
| Hyundai Heavy Industries Holdings Co., Ltd. | | 102 | 18,964 |
| Hyundai Marine & Fire Insurance Co., Ltd. | | 547 | 10,464 |
| Hyundai Mobis Co., Ltd. | | 881 | 172,838 |
| Hyundai Motor Co. | | 1,985 | 302,355 |
| Industrial Bank of Korea | | 1,200 | 8,197 |
| Kakao Corp. | | 493 | 153,300 |
| KB Financial Group, Inc. | | 3,581 | 115,308 |
| KMW Co., Ltd.(2) | | 237 | 15,840 |
| Korea Investment Holdings Co., Ltd. | | 213 | 13,164 |
| Korea Zinc Co., Ltd. | | 239 | 77,135 |
| KT Corp. | | 2,198 | 43,008 |
| Kumho Petrochemical Co., Ltd. | | 193 | 18,106 |
| LG Chem, Ltd. | | 585 | 326,529 |
| LG Corp. | | 1,050 | 66,669 |
| LG Display Co., Ltd.(2) | | 2,188 | 28,663 |
| LG Electronics, Inc. | | 1,097 | 85,931 |
| LG Household & Health Care, Ltd. | | 86 | 106,129 |
| LG Innotek Co., Ltd. | | 100 | 13,197 |
9
See Notes to Financial Statements.
Calvert
Emerging Markets Advancement Fund
September 30, 2020
Schedule of Investments — continued
| Security | Shares | Value |
| South Korea (continued) | |
| LG Uplus Corp. | | 2,080 | $ 20,435 |
| Lotte Chemical Corp. | | 149 | 24,979 |
| Mirae Asset Daewoo Co., Ltd. | | 1,777 | 12,857 |
| NAVER Corp. | | 1,398 | 355,261 |
| NCSoft Corp. | | 155 | 106,816 |
| Netmarble Corp.(1)(2) | | 331 | 46,829 |
| NH Investment & Securities Co., Ltd. | | 1,530 | 11,948 |
| Orion Corp. of Republic of Korea | | 538 | 60,284 |
| Pearl Abyss Corp.(2) | | 70 | 12,055 |
| S-1 Corp. | | 177 | 13,272 |
| Samsung C&T Corp. | | 791 | 70,987 |
| Samsung Electro-Mechanics Co., Ltd. | | 529 | 62,691 |
| Samsung Electronics Co., Ltd. | | 51,817 | 2,572,410 |
| Samsung Engineering Co., Ltd.(2) | | 4,208 | 37,807 |
| Samsung Fire & Marine Insurance Co., Ltd. | | 235 | 36,609 |
| Samsung Heavy Industries Co., Ltd.(2) | | 5,123 | 23,288 |
| Samsung SDI Co., Ltd. | | 492 | 181,754 |
| Samsung SDS Co., Ltd. | | 268 | 38,798 |
| Samsung Securities Co., Ltd. | | 500 | 13,066 |
| Shinhan Financial Group Co., Ltd. | | 3,998 | 93,795 |
| Shinsegae, Inc. | | 60 | 10,856 |
| SK Hynix, Inc. | | 5,417 | 388,305 |
| SK Telecom Co., Ltd. | | 255 | 51,837 |
| Woori Financial Group, Inc. | | 4,526 | 33,095 |
| Yuhan Corp. | | 723 | 39,707 |
| | | | $ 6,794,242 |
| Taiwan — 14.3% | |
| Accton Technology Corp. | | 2,000 | $ 15,473 |
| Acer, Inc. | | 26,000 | 22,403 |
| Advantech Co., Ltd. | | 3,299 | 33,384 |
| Airtac International Group | | 3,000 | 68,246 |
| ASE Technology Holding Co., Ltd. | | 19,000 | 39,119 |
| Asustek Computer, Inc. | | 4,000 | 35,193 |
| AU Optronics Corp.(2) | | 35,000 | 13,632 |
| Catcher Technology Co., Ltd. | | 11,000 | 69,503 |
| Cathay Financial Holding Co., Ltd. | | 62,000 | 83,001 |
| Chailease Holding Co., Ltd. | | 10,400 | 47,640 |
| Chang Hwa Commercial Bank, Ltd. | | 39,520 | 23,786 |
| Cheng Shin Rubber Industry Co., Ltd. | | 7,000 | 8,959 |
| Chicony Electronics Co., Ltd. | | 5,000 | 14,597 |
| China Development Financial Holding Corp. | | 91,000 | 26,917 |
| China Life Insurance Co., Ltd. | | 12,000 | 8,283 |
| China Steel Corp. | | 101,000 | 71,534 |
| Chroma ATE, Inc. | | 8,000 | 42,643 |
| Chunghwa Telecom Co., Ltd. | | 33,000 | 121,959 |
| Compal Electronics, Inc. | | 17,000 | 11,243 |
| Security | Shares | Value |
| Taiwan (continued) | |
| CTBC Financial Holding Co., Ltd. | | 147,000 | $ 93,919 |
| Delta Electronics, Inc. | | 16,000 | 105,063 |
| E.Sun Financial Holding Co., Ltd. | | 87,455 | 77,886 |
| Elite Material Co., Ltd. | | 4,000 | 20,333 |
| Far Eastern New Century Corp. | | 11,000 | 9,664 |
| Far EasTone Telecommunications Co., Ltd. | | 13,000 | 27,457 |
| First Financial Holding Co., Ltd. | | 72,100 | 51,453 |
| Formosa Petrochemical Corp. | | 9,000 | 24,975 |
| Foxconn Technology Co., Ltd. | | 8,000 | 14,302 |
| Fubon Financial Holding Co., Ltd. | | 59,000 | 85,852 |
| Genius Electronic Optical Co., Ltd. | | 1,000 | 20,459 |
| Giant Manufacturing Co., Ltd. | | 2,000 | 18,951 |
| Globalwafers Co., Ltd. | | 1,000 | 13,380 |
| Hiwin Technologies Corp. | | 4,120 | 40,940 |
| Hotai Motor Co., Ltd. | | 3,000 | 67,151 |
| Hua Nan Financial Holdings Co., Ltd. | | 52,801 | 32,371 |
| Inventec Corp. | | 15,000 | 11,685 |
| Largan Precision Co., Ltd. | | 1,000 | 117,109 |
| Lite-On Technology Corp. | | 8,000 | 12,814 |
| Macronix International | | 9,000 | 10,039 |
| MediaTek, Inc. | | 12,000 | 254,267 |
| Mega Financial Holding Co., Ltd. | | 76,000 | 73,352 |
| Micro-Star International Co., Ltd. | | 4,000 | 18,466 |
| Nanya Technology Corp. | | 5,000 | 10,049 |
| Nien Made Enterprise Co., Ltd. | | 2,000 | 23,900 |
| Novatek Microelectronics Corp. | | 4,000 | 36,897 |
| Parade Technologies, Ltd. | | 1,000 | 36,560 |
| Pegatron Corp. | | 14,000 | 31,086 |
| Phison Electronics Corp. | | 1,000 | 9,222 |
| Pou Chen Corp. | | 8,000 | 7,266 |
| Powertech Technology, Inc. | | 3,000 | 9,022 |
| President Chain Store Corp. | | 4,000 | 36,408 |
| Quanta Computer, Inc. | | 17,000 | 44,641 |
| Radiant Opto-Electronics Corp. | | 4,000 | 15,341 |
| Realtek Semiconductor Corp. | | 2,000 | 25,637 |
| Shanghai Commercial & Savings Bank, Ltd. (The) | | 23,000 | 31,042 |
| Shin Kong Financial Holding Co., Ltd. | | 89,946 | 25,135 |
| Silicon Motion Technology Corp. ADR(3) | | 324 | 12,241 |
| Simplo Technology Co., Ltd. | | 1,000 | 10,384 |
| Sino-American Silicon Products, Inc. | | 5,000 | 16,844 |
| SinoPac Financial Holdings Co., Ltd. | | 71,000 | 26,771 |
| Synnex Technology International Corp. | | 10,000 | 14,329 |
| Taishin Financial Holding Co., Ltd. | | 72,642 | 32,320 |
| Taiwan Business Bank | | 28,350 | 9,395 |
| Taiwan Cement Corp. | | 34,650 | 49,853 |
| Taiwan Cooperative Financial Holding Co., Ltd. | | 51,500 | 34,865 |
| Taiwan Fertilizer Co., Ltd. | | 16,000 | 28,144 |
10
See Notes to Financial Statements.
Calvert
Emerging Markets Advancement Fund
September 30, 2020
Schedule of Investments — continued
| Security | Shares | Value |
| Taiwan (continued) | |
| Taiwan High Speed Rail Corp. | | 8,000 | $ 8,775 |
| Taiwan Mobile Co., Ltd. | | 11,000 | 36,765 |
| Taiwan Semiconductor Manufacturing Co., Ltd. | | 192,000 | 2,888,461 |
| Teco Electric and Machinery Co., Ltd. | | 32,000 | 33,052 |
| Tripod Technology Corp. | | 4,000 | 15,332 |
| Unimicron Technology Corp. | | 13,000 | 33,711 |
| Uni-President Enterprises Corp. | | 34,000 | 73,636 |
| United Microelectronics Corp. | | 86,000 | 84,828 |
| Vanguard International Semiconductor Corp. | | 4,000 | 13,381 |
| Voltronic Power Technology Corp. | | 1,050 | 35,667 |
| Walsin Lihwa Corp. | | 54,000 | 30,083 |
| Walsin Technology Corp. | | 6,000 | 32,329 |
| Win Semiconductors Corp. | | 3,000 | 29,914 |
| Wistron Corp. | | 11,000 | 11,408 |
| Wiwynn Corp. | | 1,000 | 22,729 |
| WPG Holdings, Ltd. | | 11,000 | 14,833 |
| Yageo Corp. | | 2,000 | 24,559 |
| Yuanta Financial Holding Co., Ltd. | | 88,400 | 54,731 |
| Zhen Ding Technology Holding, Ltd. | | 2,000 | 8,779 |
| | | | $ 5,989,728 |
| United Arab Emirates — 3.9% | |
| Abu Dhabi Commercial Bank PJSC | | 115,630 | $ 178,450 |
| Abu Dhabi Islamic Bank PJSC | | 29,740 | 34,889 |
| Aldar Properties PJSC | | 160,880 | 88,790 |
| Dana Gas PJSC | | 143,100 | 27,762 |
| Dubai Islamic Bank PJSC | | 75,640 | 89,197 |
| Emaar Development PJSC(2) | | 35,100 | 23,003 |
| Emaar Malls PJSC(2) | | 65,860 | 26,944 |
| Emaar Properties PJSC(2) | | 146,550 | 112,548 |
| Emirates NBD Bank PJSC | | 58,945 | 172,167 |
| Emirates Telecommunications Group Co. PJSC | | 72,650 | 330,185 |
| First Abu Dhabi Bank PJSC | | 182,390 | 562,809 |
| | | | $ 1,646,744 |
Total Common Stocks
(identified cost $32,656,505) | | | $ 36,723,813 |
| Short-Term Investments — 10.9% |
| Other — 10.8% |
| Description | Units | Value |
| Calvert Cash Reserves Fund, LLC, 0.13%(5) | | 4,545,961 | $ 4,546,415 |
Total Other
(identified cost $4,546,300) | | | $ 4,546,415 |
| Securities Lending Collateral — 0.1% |
| Security | Shares | Value |
| State Street Navigator Securities Lending Government Money Market Portfolio, 0.09%(6) | | 44,507 | $ 44,507 |
Total Securities Lending Collateral
(identified cost $44,507) | | | $ 44,507 |
Total Short-Term Investments
(identified cost $4,590,807) | | | $ 4,590,922 |
Total Investments — 98.6%
(identified cost $37,247,312) | | $ 41,314,735 |
| Other Assets, Less Liabilities — 1.4% | | $ 568,069 |
| Net Assets — 100.0% | | $ 41,882,804 |
The percentage shown for each investment category in the Schedule of Investments is based on net assets.
| |
| (1) | Security exempt from registration under Rule 144A of the Securities Act of 1933, as amended. These securities may be sold in certain transactions in reliance on an exemption from registration (normally to qualified institutional buyers). At September 30, 2020, the aggregate value of these securities is $1,070,405 or 2.6% of the Fund's net assets. |
| (2) | Non-income producing security. |
| (3) | All or a portion of this security was on loan at September 30, 2020. The aggregate market value of securities on loan at September 30, 2020 was $653,141. |
| (4) | Security exempt from registration under Regulation S of the Securities Act of 1933, as amended, which exempts from registration securities offered and sold outside the United States. Security may not be offered or sold in the United States except pursuant to an exemption from, or in a transaction not subject to, the registration requirements of the Securities Act of 1933, as amended. At September 30, 2020, the aggregate value of these securities is $78,020 or 0.2% of the Fund's net assets. |
| (5) | Affiliated investment company, available to Calvert portfolios and funds, which invests in high quality, U.S. dollar denominated money market instruments. The rate shown is the annualized seven-day yield as of September 30, 2020. |
| (6) | Represents investment of cash collateral received in connection with securities lending. |
11
See Notes to Financial Statements.
Calvert
Emerging Markets Advancement Fund
September 30, 2020
Schedule of Investments — continued
At September 30, 2020, the concentration of the Fund’s investments in the various sectors, determined as a percentage of net assets, was as follows:
| Economic Sectors | % of Net Assets |
| Information Technology | 20.1% |
| Financials | 17.7 |
| Consumer Discretionary | 17.5 |
| Communication Services | 14.7 |
| Materials | 3.4 |
| Industrials | 3.3 |
| Health Care | 2.8 |
| Consumer Staples | 2.6 |
| Real Estate | 2.3 |
| Utilities | 1.9 |
| Energy | 1.4 |
| Total | 87.7% |
Forward Foreign Currency Exchange Contracts
| Currency Purchased | Currency Sold | Counterparty | Settlement
Date | Unrealized
Appreciation | Unrealized
(Depreciation) |
| USD | 2,520,027 | EUR | 2,158,193 | Standard Chartered Bank | 10/30/20 | $ — | $ (11,807) |
| USD | 119,957 | AED | 443,000 | Standard Chartered Bank | 5/31/22 | — | (362) |
| USD | 404,754 | AED | 1,495,000 | Standard Chartered Bank | 5/31/22 | — | (1,286) |
| USD | 1,035,295 | AED | 3,825,000 | Standard Chartered Bank | 5/31/22 | — | (3,570) |
| | | | | | | $ — | $(17,025) |
Futures Contracts
| Description | Number of
Contracts | Position | Expiration
Date | Notional
Amount | Value/
Unrealized
Appreciation
(Depreciation) |
| Equity Futures | | | | | |
| MSCI Emerging Markets Index | 53 | Long | 12/18/20 | $2,884,525 | $ (79,110) |
| SGX NIFTY 50 Index | 63 | Long | 10/29/20 | 1,418,004 | 5,800 |
| | | | | | $(73,310) |
| Abbreviations: |
| ADR | – American Depositary Receipt |
| GDR | – Global Depositary Receipt |
| PFC Shares | – Preference Shares |
| SDR | – Swedish Depositary Receipt |
12
See Notes to Financial Statements.
Calvert
Emerging Markets Advancement Fund
September 30, 2020
Schedule of Investments — continued
| Currency Abbreviations: |
| AED | – United Arab Emirates Dirham |
| EUR | – Euro |
| USD | – United States Dollar |
13
See Notes to Financial Statements.
Calvert
Emerging Markets Advancement Fund
September 30, 2020
Statement of Assets and Liabilities
| | September 30, 2020 |
| Assets | |
Investments in securities of unaffiliated issuers, at value (identified cost $32,701,012) - including
$653,141 of securities on loan | $ 36,768,320 |
| Investments in securities of affiliated issuers, at value (identified cost $4,546,300) | 4,546,415 |
| Receivable for variation margin on open futures contracts | 48,261 |
| Deposits at broker for futures contracts | 425,635 |
| Cash denominated in foreign currency, at value (cost $102,609) | 112,169 |
| Receivable for investments sold | 4,164 |
| Receivable for capital shares sold | 54,341 |
| Dividends receivable | 42,075 |
| Dividends receivable - affiliated | 469 |
| Securities lending income receivable | 221 |
| Receivable from affiliate | 40,108 |
| Directors' deferred compensation plan | 175 |
| Other assets | 187 |
| Total assets | $42,042,540 |
| Liabilities | |
| Payable for open forward foreign currency exchange contracts | $ 17,025 |
| Payable for capital shares redeemed | 2,218 |
| Deposits for securities loaned | 44,507 |
| Payable to affiliates: | |
| Investment advisory fee | 21,631 |
| Administrative fee | 4,120 |
| Distribution and service fees | 16 |
| Sub-transfer agency fee | 38 |
| Directors' deferred compensation plan | 175 |
| Accrued expenses | 70,006 |
| Total liabilities | $ 159,736 |
| Net Assets | $41,882,804 |
| Sources of Net Assets | |
| Paid-in capital | $ 39,418,809 |
| Distributable earnings | 2,463,995 |
| Total | $41,882,804 |
| Class A Shares | |
| Net Assets | $ 91,290 |
| Shares Outstanding | 8,582 |
Net Asset Value and Redemption Price Per Share
(net assets ÷ shares of beneficial interest outstanding) | $ 10.64 |
Maximum Offering Price Per Share
(100 ÷ 95.25 of net asset value per share) | $ 11.17 |
| Class I Shares | |
| Net Assets | $ 41,791,514 |
| Shares Outstanding | 3,920,948 |
Net Asset Value, Offering Price and Redemption Price Per Share
(net assets ÷ shares of beneficial interest outstanding) | $ 10.66 |
| | On sales of $50,000 or more, the offering price of Class A shares is reduced. |
14
See Notes to Financial Statements.
Calvert
Emerging Markets Advancement Fund
September 30, 2020
| | Year Ended |
| | September 30, 2020(1) |
| Investment Income | |
| Dividend income (net of foreign taxes withheld of $74,987) | $ 583,514 |
| Dividend income - affiliated issuers | 1,768 |
| Interest income | 25,816 |
| Securities lending income, net | 2,568 |
| Total investment income | $ 613,666 |
| Expenses | |
| Investment advisory fee | $ 183,014 |
| Administrative fee | 34,860 |
| Distribution and service fees: | |
| Class A | 74 |
| Directors' fees and expenses | 1,157 |
| Custodian fees | 86,919 |
| Transfer agency fees and expenses | 2,184 |
| Accounting fees | 23,070 |
| Professional fees | 38,760 |
| Registration fees | 75,351 |
| Reports to shareholders | 4,662 |
| Miscellaneous | 11,867 |
| Total expenses | $ 461,918 |
| Waiver and/or reimbursement of expenses by affiliate | $ (183,512) |
| Reimbursement of expenses - other | (151) |
| Net expenses | $ 278,255 |
| Net investment income | $ 335,411 |
| Realized and Unrealized Gain (Loss) | |
| Net realized gain (loss): | |
| Investment securities (net of foreign capital gains taxes of $2,828) | $ (1,971,129) |
| Investment securities - affiliated issuers | 307 |
| Futures contracts | 508,395 |
| Foreign currency transactions | (114,734) |
| Forward foreign currency exchange contracts | (172,765) |
| Net realized loss | $(1,749,926) |
| Change in unrealized appreciation (depreciation): | |
| Investment securities | $ 4,067,308 |
| Investment securities - affiliated issuers | 115 |
| Futures contracts | (73,310) |
| Foreign currency | 9,379 |
| Forward foreign currency exchange contracts | (17,025) |
| Net change in unrealized appreciation (depreciation) | $ 3,986,467 |
| Net realized and unrealized gain | $ 2,236,541 |
| Net increase in net assets from operations | $ 2,571,952 |
| (1) | The Fund commenced operations on October 1, 2019. |
15
See Notes to Financial Statements.
Calvert
Emerging Markets Advancement Fund
September 30, 2020
Statement of Changes in Net Assets
| | Year Ended
September 30, 2020(1) |
| Increase (Decrease) in Net Assets | |
| From operations: | |
| Net investment income | $ 335,411 |
| Net realized loss | (1,749,926) |
| Net change in unrealized appreciation (depreciation) | 3,986,467 |
| Net increase in net assets from operations | $ 2,571,952 |
| Distributions to shareholders: | |
| Class A | $ (52) |
| Class I | (107,905) |
| Total distributions to shareholders | $ (107,957) |
| Capital share transactions: | |
| Class A | $ 84,324 |
| Class I | 39,334,485 |
| Net increase in net assets from capital share transactions | $39,418,809 |
| Net increase in net assets | $41,882,804 |
| Net Assets | |
| At beginning of year | $ — |
| At end of year | $41,882,804 |
| (1) | The Fund commenced operations on October 1, 2019. |
16
See Notes to Financial Statements.
Calvert
Emerging Markets Advancement Fund
September 30, 2020
| | Class A |
| | Year Ended
September 30, |
| | 2020 (1) |
| Net asset value — Beginning of year | $ 10.00 |
| Income (Loss) From Operations | |
| Net investment income(2) | $ 0.10 |
| Net realized and unrealized gain | 0.59 |
| Total income from operations | $ 0.69 |
| Less Distributions | |
| From net realized gain | $ (0.05) |
| Total distributions | $ (0.05) |
| Net asset value — End of year | $10.64 |
| Total Return(3) | 6.94% |
| Ratios/Supplemental Data | |
| Net assets, end of year (000’s omitted) | $ 91 |
| Ratios (as a percentage of average daily net assets):(4) | |
| Total expenses | 1.83% |
| Net expenses | 1.20% |
| Net investment income | 0.99% |
| Portfolio Turnover | 66% |
| (1) | The Fund commenced operations on October 1, 2019. |
| (2) | Computed using average shares outstanding. |
| (3) | Returns are historical and are calculated by determining the percentage change in net asset value with all distributions reinvested and do not reflect the effect of sales charges, if any. |
| (4) | Total expenses do not reflect amounts reimbursed and/or waived by the adviser and certain of its affiliates, if applicable. Net expenses are net of all reductions and represent the net expenses paid by the Fund. |
17
See Notes to Financial Statements.
Calvert
Emerging Markets Advancement Fund
September 30, 2020
Financial Highlights — continued
| | Class I |
| | Year Ended
September 30, |
| | 2020 (1) |
| Net asset value — Beginning of year | $ 10.00 |
| Income (Loss) From Operations | |
| Net investment income(2) | $ 0.12 |
| Net realized and unrealized gain | 0.59 |
| Total income from operations | $ 0.71 |
| Less Distributions | |
| From net realized gain | $ (0.05) |
| Total distributions | $ (0.05) |
| Net asset value — End of year | $ 10.66 |
| Total Return(3) | 7.14% |
| Ratios/Supplemental Data | |
| Net assets, end of year (000’s omitted) | $41,792 |
| Ratios (as a percentage of average daily net assets):(4) | |
| Total expenses | 1.58% |
| Net expenses | 0.95% |
| Net investment income | 1.15% |
| Portfolio Turnover | 66% |
| (1) | The Fund commenced operations on October 1, 2019. |
| (2) | Computed using average shares outstanding. |
| (3) | Returns are historical and are calculated by determining the percentage change in net asset value with all distributions reinvested and do not reflect the effect of sales charges, if any. |
| (4) | Total expenses do not reflect amounts reimbursed and/or waived by the adviser and certain of its affiliates, if applicable. Net expenses are net of all reductions and represent the net expenses paid by the Fund. |
18
See Notes to Financial Statements.
Calvert
Emerging Markets Advancement Fund
September 30, 2020
Notes to Financial Statements
1 Significant Accounting Policies
Calvert Emerging Markets Advancement Fund (the Fund) is a diversified series of Calvert World Values Fund, Inc. (the Corporation). The Corporation is a Maryland corporation registered under the Investment Company Act of 1940, as amended (the 1940 Act), as an open-end management investment company. The investment objective of the Fund is total return. The Fund commenced operations on October 1, 2019.
The Fund offers two classes of shares. Class A shares are generally sold subject to a sales charge imposed at time of purchase. A contingent deferred sales charge of 0.80% may apply to certain redemptions of Class A shares for accounts for which no sales charge was paid, if redeemed within 12 months of purchase. Class I shares are sold at net asset value, are not subject to a sales charge and are sold only to certain eligible investors. Each class represents a pro rata interest in the Fund, but votes separately on class-specific matters and is subject to different expenses.
The Fund applies the accounting and reporting guidance in the Financial Accounting Standards Board (FASB) Accounting Standards Codification Topic 946, Financial Services – Investment Companies (ASC 946). Subsequent events, if any, through the date that the financial statements were issued have been evaluated in the preparation of the financial statements.
A Investment Valuation— Net asset value per share is determined every business day as of the close of the regular session of the New York Stock Exchange (generally 4:00 p.m. Eastern time). The Fund uses independent pricing services approved by the Board of Directors (the Board) to value its investments wherever possible. Investments for which market quotations are not available or deemed not reliable are fair valued in good faith under the direction of the Board.
U.S. generally accepted accounting principles (U.S. GAAP) establishes a disclosure hierarchy that categorizes the inputs to valuation techniques used to value assets and liabilities at measurement date. These inputs are summarized in the three broad levels listed below:
Level 1 - quoted prices in active markets for identical securities
Level 2 - other significant observable inputs (including quoted prices for similar securities, interest rates, prepayment speeds, credit risk, etc.)
Level 3 - significant unobservable inputs (including the Fund’s own assumptions in determining the fair value of investments)
The inputs or methodologies used for valuing securities are not necessarily an indication of the risk associated with investing in those securities.
Valuation techniques used to value the Fund’s investments by major category are as follows:
Equity Securities. Equity securities (including warrants and rights) listed on a U.S. securities exchange generally are valued at the last sale or closing price as reported by an independent pricing service on the primary market or exchange on which they are traded and are categorized as Level 1 in the hierarchy. Equity securities listed on the NASDAQ Global or Global Select Market are valued at the NASDAQ official closing price and are categorized as Level 1 in the hierarchy. Unlisted or listed securities for which closing sales prices or closing quotations are not available are valued at the mean between the latest available bid and ask prices and are categorized as Level 2 in the hierarchy. The daily valuation of exchange-traded foreign securities generally is determined as of the close of trading on the principal exchange on which such securities trade. Events occurring after the close of trading on foreign exchanges may result in adjustments to the valuation of foreign securities to more accurately reflect their fair value as of the close of regular trading on the New York Stock Exchange. When valuing foreign equity securities that meet certain criteria, the Fund's Board has approved the use of a fair value service that values such securities to reflect market trading that occurs after the close of the applicable foreign markets of comparable securities or other instruments that have a strong correlation to the fair-valued securities. Such securities are categorized as Level 2 in the hierarchy.
Short-Term Debt Securities. Short-term debt securities with a remaining maturity at time of purchase of more than sixty days are valued based on valuations provided by a third party pricing service. Such securities are generally categorized as Level 2 in the hierarchy. Short-term debt securities of sufficient credit quality purchased with remaining maturities of sixty days or less are valued at amortized cost, which approximates fair value, and are categorized as Level 2 in the hierarchy.
Affiliated Fund. The Fund may invest in Calvert Cash Reserves Fund, LLC (Cash Reserves Fund), an affiliated investment company managed by Calvert Research and Management (CRM). While Cash Reserves Fund is not a registered money market mutual fund, it conducts all of its investment activities in accordance with the requirements of Rule 2a-7 under the 1940 Act. Investments in Cash Reserves Fund are valued at the closing net asset value per unit on the valuation day and are categorized as Level 2 in the hierarchy. Cash Reserves Fund generally values its investment securities based on available market quotations provided by a third party pricing service.
Other Securities. Investments in registered investment companies (including money market funds) that do not trade on an exchange are valued at the net asset value per share on the valuation day and are categorized as Level 1 in the hierarchy.
Derivatives. Futures contracts are valued at unrealized appreciation (depreciation) based on the settlement price established each day by the board of trade or exchange on which they are traded and are categorized as Level 1 or Level 2 in the hierarchy. Forward foreign currency exchange contracts are generally valued at the mean of the average bid and average ask prices that are reported by currency dealers to a third party pricing service at the valuation time. Such third party pricing service valuations are supplied for specific settlement periods and the Fund's forward foreign currency exchange contracts are valued at an interpolated rate between the closest preceding and subsequent settlement period reported by the third party pricing service and are categorized as Level 2 in the hierarchy.
Calvert
Emerging Markets Advancement Fund
September 30, 2020
Notes to Financial Statements — continued
Fair Valuation. If a market value cannot be determined for a security using the methodologies described above, or if, in the good faith opinion of the Fund's adviser, the market value does not constitute a readily available market quotation, or if a significant event has occurred that would materially affect the value of the security, the security will be fair valued as determined in good faith by or at the direction of the Board in a manner that most fairly reflects the security’s “fair value”, which is the amount that the Fund might reasonably expect to receive for the security upon its current sale in the ordinary course. Each such determination is based on a consideration of relevant factors, which are likely to vary from one pricing context to another. These factors may include, but are not limited to, the type of security, the existence of any contractual restrictions on the security’s disposition, the price and extent of public trading in similar securities of the issuer or of comparable companies or entities, quotations or relevant information obtained from broker/dealers or other market participants, information obtained from the issuer, analysts, and/or the appropriate stock exchange (for exchange-traded securities), an analysis of the company’s or entity’s financial statements, and an evaluation of the forces that influence the issuer and the market(s) in which the security is purchased and sold.
The values assigned to fair value investments are based on available information and do not necessarily represent amounts that might ultimately be realized. Further, due to the inherent uncertainty of valuations of such investments, the fair values may differ significantly from the values that would have been used had an active market existed, and the differences could be material.
The following table summarizes the market value of the Fund's holdings as of September 30, 2020, based on the inputs used to value them:
| Asset Description | Level 1 | Level 2 | Level 3 | Total |
| Common Stocks | | | | |
| Brazil | $ 20,988 | $ — | $ — | $ 20,988 |
| China | 5,483,964 | 8,528,103 | — | 14,012,067 |
| Colombia | 1,534,721 | 407,967 | — | 1,942,688 |
| Egypt | — | 1,619,874 | — | 1,619,874 |
| Greece | — | 2,256,038 | — | 2,256,038 |
| Hong Kong | 16,150 | 445,817 | — | 461,967 |
| Indonesia | — | 362,909 | — | 362,909 |
| Peru | 466,518 | — | — | 466,518 |
| Philippines | — | 388,579 | — | 388,579 |
| Russia | 246,626 | 514,845 | — | 761,471 |
| South Korea | — | 6,794,242 | — | 6,794,242 |
| Taiwan | 12,241 | 5,977,487 | — | 5,989,728 |
| United Arab Emirates | — | 1,646,744 | — | 1,646,744 |
| Total Common Stocks | $7,781,208 | $28,942,605 (1) | $ — | $36,723,813 |
| Short-Term Investments: | | | | |
| Other | $ — | $ 4,546,415 | $ — | $ 4,546,415 |
| Securities Lending Collateral | 44,507 | — | — | 44,507 |
| Total Investments | $7,825,715 | $33,489,020 | $ — | $41,314,735 |
| Futures Contracts | $ — | $ 5,800 | $ — | $ 5,800 |
| Total | $7,825,715 | $33,494,820 | $ — | $41,320,535 |
| Liability Description | | | | |
| Forward Foreign Currency Exchange Contracts | $ — | $ (17,025) | $ — | $ (17,025) |
| Futures Contracts | (79,110) | — | — | (79,110) |
| Total | $ (79,110) | $ (17,025) | $ — | $ (96,135) |
| (1) | Includes foreign equity securities whose values were adjusted to reflect market trading of comparable securities or other correlated instruments that occurred after the close of trading in their applicable foreign markets. |
Calvert
Emerging Markets Advancement Fund
September 30, 2020
Notes to Financial Statements — continued
B Investment Transactions and Income— Investment transactions for financial statement purposes are accounted for on trade date. Realized gains and losses are recorded on an identified cost basis and may include proceeds from litigation. Dividend income is recorded on the ex-dividend date for dividends received in cash and/or securities or, in the case of dividends on certain foreign securities, as soon as the Fund is informed of the ex-dividend date. Non-cash dividends are recorded at the fair value of the securities received. Withholding taxes on foreign dividends, if any, have been provided for in accordance with the Fund’s understanding of the applicable country’s tax rules and rates. Distributions received that represent a return of capital are recorded as a reduction of cost of investments. Distributions received that represent a capital gain are recorded as a realized gain. Interest income, which includes amortization of premium and accretion of discount on debt securities, is accrued as earned.
C Share Class Accounting— Realized and unrealized gains and losses and net investment income and losses, other than class-specific expenses, are allocated daily to each class of shares based upon the relative net assets of each class to the total net assets of the Fund. Expenses arising in connection with a specific class are charged directly to that class.
D Foreign Currency Transactions— The Fund’s accounting records are maintained in U.S. dollars. For valuation of assets and liabilities on each date of net asset value determination, foreign denominations are converted into U.S. dollars using the current exchange rate. Security transactions, income and expenses are translated at the prevailing rate of exchange on the date of the event. Recognized gains or losses on investment transactions attributable to changes in foreign currency exchange rates are recorded for financial statement purposes as net realized gains and losses on investments. That portion of unrealized gains and losses on investments that results from fluctuations in foreign currency exchange rates is not separately disclosed.
E Futures Contracts— The Fund may enter into futures contracts to buy or sell a financial instrument for a set price at a future date. Initial margin deposits of either cash or securities as required by the broker are made upon entering into the contract. While the contract is open, daily variation margin payments are made to or received from the broker reflecting the daily change in market value of the contract and are recorded for financial reporting purposes as unrealized gains or losses by the Fund. When a futures contract is closed, a realized gain or loss is recorded equal to the difference between the opening and closing value of the contract. The risks associated with entering into futures contracts may include the possible illiquidity of the secondary market which would limit the Fund’s ability to close out a futures contract prior to the settlement date, an imperfect correlation between the value of the contracts and the underlying financial instruments, or that the counterparty will fail to perform its obligations under the contracts’ terms. Futures contracts are designed by boards of trade, which are designated “contracts markets” by the Commodities Futures Trading Commission. Futures contracts trade on the contracts markets in a manner that is similar to the way a stock trades on a stock exchange, and the boards of trade, through their clearing corporations, guarantee the futures contracts against default. As a result, there is minimal counterparty credit risk to the Fund.
F Forward Foreign Currency Exchange Contracts— The Fund may enter into forward foreign currency exchange contracts for the purchase or sale of a specific foreign currency at a fixed price on a future date. The forward foreign currency exchange contracts are adjusted by the daily exchange rate of the underlying currency and any gains or losses are recorded as unrealized until such time as the contracts have been closed. Risks may arise upon entering these contracts from the potential inability of counterparties to meet the terms of their contracts and from movements in the value of a foreign currency relative to the U.S. dollar.
G Options Contracts— Upon the purchase of a call or put option, the premium paid by the Fund is included in the Statement of Assets and Liabilities as an investment. The amount of the investment is subsequently marked-to-market to reflect the current market value of the option purchased, in accordance with the Fund’s policies on investment valuations discussed above. Premiums paid for purchasing options that expire are treated as realized losses. Premiums paid for purchasing options that are exercised or closed are added to the amounts paid or offset against the proceeds on the underlying investment transaction to determine the realized gain or loss. As the purchaser of an index option, the Fund has the right to receive a cash payment equal to any depreciation in the value of the index below the exercise price of the option (in the case of a put) or equal to any appreciation in the value of the index over the exercise price of the option (in the case of a call) as of the valuation date of the option. The risk associated with purchasing options is limited to the premium originally paid. Purchased options traded over-the-counter involve risk that the issuer or counterparty will fail to perform its contractual obligations.
H Distributions to Shareholders— Distributions to shareholders are recorded by the Fund on ex-dividend date. Distributions from net investment income and distributions from net realized capital gains, if any, are paid at least annually. Distributions are declared separately for each class of shares. Distributions are determined in accordance with income tax regulations, which may differ from U.S. GAAP; accordingly, periodic reclassifications are made within the Fund's capital accounts to reflect income and gains available for distribution under income tax regulations.
I Estimates— The preparation of financial statements in conformity with U.S. GAAP requires management to make estimates and assumptions that affect the reported amounts of assets and liabilities and disclosure of contingent assets and liabilities at the date of the financial statements and the reported amounts of increases and decreases in net assets from operations during the reporting period. Actual results could differ from those estimates.
J Indemnifications— The Corporation’s By-Laws provide for indemnification for Directors or officers of the Corporation and certain other parties, to the fullest extent permitted by Maryland law and the 1940 Act, provided certain conditions are met. Additionally, in the normal course of business, the Fund enters into agreements with service providers that may contain indemnification clauses. The Fund’s maximum exposure under these arrangements is unknown as this would involve future claims that may be made against the Fund that have not yet occurred.
Calvert
Emerging Markets Advancement Fund
September 30, 2020
Notes to Financial Statements — continued
K Federal Income Taxes— No provision for federal income or excise tax is required since the Fund intends to qualify as a regulated investment company under the Internal Revenue Code and to distribute substantially all of its taxable earnings.
In addition to the requirements of the Internal Revenue Code, the Fund may also be subject to local taxes on the recognition of capital gains in certain countries. In determining the daily net asset value, the Fund estimates the accrual for such taxes, if any, based on the unrealized appreciation on certain portfolio securities and the related tax rates. Taxes attributable to unrealized appreciation are included in the change in unrealized appreciation (depreciation) on investments. Capital gains taxes on securities sold are included in net realized gain (loss) on investments.
Management has analyzed the Fund's tax positions taken for all open federal income tax years and has concluded that no provision for federal income tax is required in the Fund's financial statements. A Fund's federal tax return is subject to examination by the Internal Revenue Service for a period of three years from the date of filing.
2 Related Party Transactions
The investment advisory fee is earned by CRM, a subsidiary of Eaton Vance Management (EVM), as compensation for investment advisory services rendered to the Fund. EVM is a wholly-owned subsidiary of Eaton Vance Corp. Pursuant to the investment advisory agreement, CRM receives a fee, payable monthly, at the annual rate of 0.63% of the Fund’s average daily net assets. For the year ended September 30, 2020, the investment advisory fee amounted to $183,014. The Fund may invest its cash in Cash Reserves Fund. CRM does not currently receive a fee for advisory services provided to Cash Reserves Fund.
CRM has agreed to reimburse the Fund’s operating expenses to the extent that total annual operating expenses (relating to ordinary operating expenses only and excluding expenses such as brokerage commissions, acquired fund fees and expenses of unaffiliated funds, borrowing costs, taxes or litigation expenses) exceed 1.20% and 0.95% for Class A and Class I, respectively, of such class’s average daily net assets. The expense reimbursement agreement with CRM may be changed or terminated after January 31, 2021. For the year ended September 30, 2020, CRM waived or reimbursed expenses of $183,512.
The administrative fee is earned by CRM as compensation for administrative services rendered to the Fund. The fee is computed at an annual rate of 0.12% of the Fund’s average daily net assets attributable to Class A and Class I and is payable monthly. For the year ended September 30, 2020, CRM was paid administrative fees of $34,860.
The Fund has in effect a distribution plan for Class A shares (Class A Plan) pursuant to Rule 12b-1 under the 1940 Act. Pursuant to the Class A Plan, the Fund pays Eaton Vance Distributors, Inc. (EVD), an affiliate of CRM and the Fund’s principal underwriter, a distribution and service fee of 0.25% per annum of its average daily net assets attributable to Class A shares for distribution services and facilities provided to the Fund by EVD, as well as for personal services and/or the maintenance of shareholder accounts. Distribution and service fees paid or accrued for the year ended September 30, 2020 amounted to $74 for Class A shares.
EVM provides sub-transfer agency and related services to the Fund pursuant to a Sub-Transfer Agency Support Services Agreement. For the year ended September 30, 2020, sub-transfer agency fees and expenses incurred to EVM amounted to $161 and are included in transfer agency fees and expenses on the Statement of Operations.
Each Director of the Fund who is not an employee of CRM or its affiliates receives an annual fee of $154,000, plus an annual Committee fee ranging from $8,500 to $16,500 depending on the Committee. The Board chair receives an additional $20,000 annual fee and Committee chairs receive an additional $6,000 annual fee. Eligible Directors may participate in a Deferred Compensation Plan (the Plan). Amounts deferred under the Plan are treated as though equal dollar amounts had been invested in shares of the Fund or other Calvert funds selected by the Directors. The Fund purchases shares of the funds selected equal to the dollar amounts deferred under the Plan, resulting in an asset equal to the deferred compensation liability. Obligations of the Plan are paid solely from the Fund's assets. Directors’ fees are allocated to each of the Calvert funds served. Salaries and fees of officers and Directors of the Fund who are employees of CRM or its affiliates are paid by CRM. In addition, an Advisory Council was established to aid the Board and CRM in advancing the cause of responsible investing through original scholarship and thought leadership. The Advisory Council consists of CRM’s Chief Executive Officer and three (four prior to December 31, 2019) additional members. Each member (other than CRM’s Chief Executive Officer) received annual compensation of $75,000, which was being reimbursed by Calvert Investment Management, Inc. (CIM), the Calvert funds’ former investment adviser and Ameritas Holding Company, CIM’s parent company, through the end of 2019. For the year ending December 31, 2020, each member (other than CRM’s Chief Executive Officer) is expected to be compensated $20,000 for their service on the Advisory Council. Such compensation, and any other compensation and/or expenses incurred by the Advisory Council as may be approved by the Board, shall be borne by the Calvert funds. For the year ended September 30, 2020, the Fund’s allocated portion of the Advisory Council compensation and fees was $198 and the reimbursement was $151, which are included in miscellaneous expense and reimbursement of expenses-other, respectively, on the Statement of Operations.
3 Investment Activity
During the year ended September 30, 2020, the cost of purchases and proceeds from sales of investments, other than short-term securities, were $51,293,993 and $16,713,106, respectively.
Calvert
Emerging Markets Advancement Fund
September 30, 2020
Notes to Financial Statements — continued
4 Distributions to Shareholders and Income Tax Information
The tax character of distributions declared for the year ended September 30, 2020 was as follows:
| | Year Ended
September 30, 2020(1) |
| |
| Ordinary income | $45,391 |
| Long-term capital gains | $62,566 |
| (1) | The Fund commenced operations on October 1, 2019. |
As of September 30, 2020, the components of distributable earnings (accumulated loss) on a tax basis were as follows:
| Post October capital losses | $(1,379,255) |
| Net unrealized appreciation | $ 3,843,250 |
At September 30, 2020, the Fund had a net capital loss of $1,379,255 attributable to security transactions incurred after October 31, 2019 that it has elected to defer. This net capital loss is treated as arising on the first day of the Fund’s taxable year ending September 30, 2021.
The cost and unrealized appreciation (depreciation) of investments, including open derivative contracts, of the Fund at September 30, 2020, as determined on a federal income tax basis, were as follows:
| Aggregate cost | $37,481,446 |
| Gross unrealized appreciation | $ 5,979,103 |
| Gross unrealized depreciation | (2,145,232) |
| Net unrealized appreciation | $ 3,833,871 |
5 Financial Instruments
The Fund may trade in financial instruments with off-balance sheet risk in the normal course of its investing activities. These financial instruments may include forward foreign currency exchange contracts and futures contracts and may involve, to a varying degree, elements of risk in excess of the amounts recognized for financial statement purposes. The notional or contractual amounts of these instruments represent the investment the Fund has in particular classes of financial instruments and do not necessarily represent the amounts potentially subject to risk. The measurement of the risks associated with these instruments is meaningful only when all related and offsetting transactions are considered. A summary of obligations under these financial instruments at September 30, 2020 is included in the Schedule of Investments. At September 30, 2020, the Fund had sufficient cash and/or securities to cover commitments under these contracts.
In the normal course of pursuing its investment objective, the Fund is subject to the following risks:
Equity Price Risk: During the year ended September 30, 2020, the Fund entered into equity futures contracts to enhance total return, to manage certain investment risks and/or as a substitute for the purchase of securities.
Foreign Exchange Risk: During the year ended September 30, 2020, the Fund entered into forward foreign currency exchange contracts and currency options to enhance total return, to seek to hedge against fluctuations in currency exchange rates and/or as a substitute for the purchase or sale of securities or currencies.
The Fund enters into forward foreign currency exchange contracts that may contain provisions whereby the counterparty may terminate the contract under certain conditions, including but not limited to a decline in the Fund’s net assets below a certain level over a certain period of time, which would trigger a payment by the Fund for those derivatives in a liability position. At September 30, 2020, the fair value of derivatives with credit-related contingent features in a net liability position was $17,025. At September 30, 2020, there were no assets pledged by the Fund for such liability.
The over-the-counter (OTC) derivatives in which the Fund invests are subject to the risk that the counterparty to the contract fails to perform its obligations under the contract. To mitigate this risk, the Fund has entered into an International Swaps and Derivatives Association, Inc. Master Agreement (“ISDA Master Agreement”) with its derivative counterparty. The ISDA Master Agreement is a bilateral agreement between the Fund and the counterparty that
Calvert
Emerging Markets Advancement Fund
September 30, 2020
Notes to Financial Statements — continued
governs certain OTC derivatives and typically contains, among other things, set-off provisions in the event of a default and/or termination event as defined under the ISDA Master Agreement. Under the ISDA Master Agreement, the Fund may, under certain circumstances, offset with the counterparty certain derivative financial instruments’ payables and/or receivables with collateral held and/or posted and create one single net payment. The provisions of the ISDA Master Agreement typically permit a single net payment in the event of default including the bankruptcy or insolvency of the counterparty. However, bankruptcy or insolvency laws of a particular jurisdiction may impose restrictions on or prohibitions against the right of offset in bankruptcy or insolvency. The ISDA Master Agreement allows the counterparty to OTC derivatives to terminate derivative contracts prior to maturity in the event the Fund’s net assets decline by a stated percentage or the Fund fails to meet the terms of its ISDA Master Agreement, which would cause the counterparty to accelerate payment by the Fund of any net liability owed to it.
The collateral requirements for derivatives traded under the ISDA Master Agreement are governed by a Credit Support Annex to the ISDA Master Agreement. Collateral requirements are determined at the close of business each day and are typically based on changes in market values for each transaction under the ISDA Master Agreement and netted into one amount for such agreement. Generally, the amount of collateral due from or to a counterparty is subject to a minimum transfer threshold amount before a transfer is required. Collateral pledged for the benefit of the Fund and/ or counterparty is held in segregated accounts by the Fund’s custodian and cannot be sold, re-pledged, assigned or otherwise used while pledged. The portion of such collateral representing cash, if any, is reflected as deposits for derivatives collateral and, in the case of cash pledged by a counterparty for the benefit of the Fund, a corresponding liability on the Statement of Assets and Liabilities. Securities pledged by the Fund as collateral, if any, are identified as such in the Schedule of Investments.
At September 30, 2020, the fair value of open derivative instruments (not considered to be hedging instruments for accounting disclosure purposes) by risk exposure was as follows:
| Risk | Derivative | Statement of Assets and Liabilities Caption | Assets | Liabilities |
| Foreign exchange | Forward foreign currency exchange contracts | Receivable/Payable for open forward foreign currency
exchange contracts | $ — | $ (17,025) |
| Equity price | Futures contracts | Distributable earnings | 5,800 (1) | (79,110) (1) |
| Total | | | $5,800 | $(96,135) |
| Derivatives not subject to master netting agreement | $5,800 | $(79,110) |
| Total Derivatives subject to master netting agreement | $ — | $(17,025) |
| (1) | Only the current day's variation margin is reported within the Statement of Assets and Liabilities as Receivable or Payable for variation margin on open futures contracts, as applicable. |
The Fund’s derivative assets and liabilities at fair value by risk, which are reported gross in the Statement of Assets and Liabilities, are presented in the table above. The following table presents the Fund’s derivative liabilities by counterparty, net of amounts available for offset under a master netting agreement and net of the related collateral pledged by the Fund for such liabilities as of September 30, 2020.
| Counterparty | Derivative
Liabilities Subject to
Master Netting
Agreement | Derivatives
Available
for Offset | Non-cash
Collateral
Pledged(a) | Cash
Collateral
Pledged(a) | Net Amount
of Derivative
Liabilities(b) |
| Standard Chartered Bank | $(17,025) | $ — | $ — | $ — | $(17,025) |
| (a) | In some instances, the total collateral received and/or pledged may be more than the amount shown due to overcollateralization. |
| (b) | Net amount represents the net amount payable to the counterparty in the event of default. |
Calvert
Emerging Markets Advancement Fund
September 30, 2020
Notes to Financial Statements — continued
The effect of derivative instruments (not considered to be hedging instruments for accounting disclosure purposes) on the Statement of Operations by risk exposure for the year ended September 30, 2020 was as follows:
| Statement of Operations Caption | Equity price | Foreign exchange | Total |
| Net realized gain (loss): | | | |
| Investment securities(1) | $ — | $ (15,092) | $ (15,092) |
| Forward foreign currency exchange contracts | — | (172,765) | (172,765) |
| Futures contracts | 508,395 | — | 508,395 |
| Total | $508,395 | $(187,857) | $ 320,538 |
| Change in unrealized appreciation (depreciation): | | | |
| Forward foreign currency exchange contracts | $ — | $ (17,025) | $ (17,025) |
| Futures contracts | (73,310) | — | (73,310) |
| Total | $ (73,310) | $ (17,025) | $ (90,335) |
| (1) | Relates to purchased options. |
The average notional cost of futures contracts and average notional amounts of other derivative contracts outstanding during the year ended September 30, 2020, which are indicative of the volume of these derivative types, were approximately as follows:
Futures
Contracts — Long | Forward
Foreign Currency
Exchange Contracts* |
| $3,259,000 | $6,821,000 |
| * | The average notional amount for forward foreign currency exchange contracts is based on the absolute value of notional amounts of currency purchased and currency sold. |
The average principal amount of purchased currency options contracts outstanding during the year ended September 30, 2020, which is indicative of the volume of this derivative type, was approximately $665,000.
6 Securities Lending
To generate additional income, the Fund may lend its securities pursuant to a securities lending agency agreement with State Street Bank and Trust Company (SSBT), the securities lending agent. Security loans are subject to termination by the Fund at any time and, therefore, are not considered illiquid investments. The Fund requires that the loan be continuously collateralized by either cash or securities as collateral equal at all times to at least 102% of the market value of the domestic securities loaned and 105% of the market value of the international securities loaned (if applicable). The market value of securities loaned is determined daily and any additional required collateral is delivered to the Fund on the next business day. Cash collateral is generally invested in a money market fund registered under the 1940 Act that is managed by an affiliate of SSBT. Any gain or loss in the market price of the loaned securities that might occur and any interest earned or dividends declared during the term of the loan would accrue to the account of the Fund. Income earned on the investment of collateral, net of broker rebates and other expenses incurred by the securities lending agent, is split between the Fund and the securities lending agent based on agreed upon contractual terms. Non-cash collateral, if any, is held by the lending agent on behalf of the Fund and cannot be sold or re-pledged by the Fund; accordingly, such collateral is not reflected in the Statement of Assets and Liabilities.
The risks associated with lending portfolio securities include, but are not limited to, possible delays in receiving additional collateral or in the recovery of the loaned securities, possible loss of rights to the collateral should the borrower fail financially, as well as risk of loss in the value of the collateral or the value of the investments made with the collateral. The securities lending agent shall indemnify the Fund in the case of default of any securities borrower.
At September 30, 2020, the total value of securities on loan was $653,141 and the total value of collateral received was $684,388, comprised of cash of $44,507 and U.S. government and/or agencies securities of $639,881.
Calvert
Emerging Markets Advancement Fund
September 30, 2020
Notes to Financial Statements — continued
The following table provides a breakdown of securities lending transactions accounted for as secured borrowings, the obligations by class of collateral pledged, and the remaining contractual maturity of those transactions as of September 30, 2020.
| | Remaining Contractual Maturity of the Transactions |
| | Overnight and
Continuous | <30 days | 30 to 90 days | >90 days | Total |
| Common Stocks | $44,507 | $ — | $ — | $ — | $44,507 |
The carrying amount of the liability for deposits for securities loaned at September 30, 2020 approximated its fair value. If measured at fair value, such liability would have been considered as Level 2 in the fair value hierarchy (see Note 1A) at September 30, 2020.
7 Line of Credit
Effective October 29, 2019, the Fund participates with other portfolios and funds managed by EVM and its affiliates, including CRM, in an $800 million unsecured line of credit with a group of banks, which is in effect through October 27, 2020. Borrowings are made by the Fund solely for temporary purposes related to redemptions and other short-term cash needs. Interest is charged to the Fund based on its borrowings at an amount above either the Eurodollar rate or Federal Funds rate. In addition, a fee computed at an annual rate of 0.15% on the daily unused portion of the line of credit is allocated among the participating portfolios and funds at the end of each quarter. Because the line of credit is not available exclusively to the Fund, it may be unable to borrow some or all of its requested amounts at any particular time.
The Fund had no borrowings pursuant to its line of credit during the year ended September 30, 2020. Effective October 27, 2020, the Fund renewed its line of credit agreement, which expires October 26, 2021, at substantially the same terms.
8 Affiliated Funds
At September 30, 2020, the value of the Fund’s investment in affiliated funds was $4,546,415, which represents 10.8% of the Fund’s net assets. Transactions in affiliated funds by the Fund for the year ended September 30, 2020 were as follows:
| Name | Value,
beginning
of period | Purchases | Sales
proceeds | Net
realized
gain
(loss) | Change in
unrealized
appreciation
(depreciation) | Value,
end of
period | Dividend
income | Units,
end of
period |
| Short-Term Investments | | | | | | | | |
| Calvert Cash Reserves Fund, LLC | $ — | $16,732,593 | $(12,186,600) | $307 | $115 | $4,546,415 | $1,768 | 4,545,961 |
9 Capital Shares
The Corporation may issue its shares in one or more series (such as the Fund). The authorized shares of the Fund consist of 75,000,000 common shares, $0.01 par value, for each Class.
Transactions in capital shares for the year ended September 30, 2020 were as follows:
| | Year Ended
September 30, 2020(1) |
| | Shares | Amount |
| Class A | | |
| Shares sold | 8,721 | $ 85,582 |
| Reinvestment of distributions | 5 | 53 |
| Shares redeemed | (144) | (1,311) |
| Net increase | 8,582 | $ 84,324 |
Calvert
Emerging Markets Advancement Fund
September 30, 2020
Notes to Financial Statements — continued
| | Year Ended
September 30, 2020(1) |
| | Shares | Amount |
| Class I | | |
| Shares sold | 4,056,737 | $ 40,660,497 |
| Reinvestment of distributions | 10,446 | 107,904 |
| Shares redeemed | (146,235) | (1,433,916) |
| Net increase | 3,920,948 | $39,334,485 |
| (1) | The Fund commenced operations on October 1, 2019. |
At September 30, 2020, EVM, Calvert Conservative Allocation Fund, Calvert Moderate Allocation Fund and Calvert Growth Allocation Fund owned in the aggregate 94.4% of the value of the outstanding shares of the Fund.
10 Risks and Uncertainties
Risks Associated with Foreign Investments
Investing in foreign securities involves additional risks relating to political, social, and economic developments abroad. Other risks result from differences between regulations that apply to U.S. and foreign issuers and markets, and the potential for foreign markets to be less liquid and more volatile than U.S. markets. Securities that trade or are denominated in currencies other than the U.S. dollar may be adversely affected by fluctuations in currency exchange rates.
The risks of investing in emerging market securities are greater than those of investing in securities of developed foreign countries. These risks include volatile currency exchange rates, periods of high inflation, increased risk of default, greater social, economic and political uncertainty and instability, less governmental supervision and regulation of securities markets, weaker auditing and financial reporting standards, lack of liquidity in the markets, and the significantly smaller market capitalization of emerging market issuers.
Pandemic Risk
An outbreak of respiratory disease caused by a novel coronavirus was first detected in China in December 2019 and subsequently spread internationally. This coronavirus has resulted in closing borders, enhanced health screenings, changes to healthcare service preparation and delivery, quarantines, cancellations, disruptions to supply chains and customer activity, as well as general concern and uncertainty. Health crises caused by outbreaks, such as the coronavirus outbreak, may exacerbate other pre-existing political, social and economic risks and disrupt normal market conditions and operations. The impact of this outbreak has negatively affected the worldwide economy, the economies of individual countries, individual companies, and the market in general, and may continue to do so in significant and unforeseen ways, as may other epidemics and pandemics that may arise in the future. Any such impact could adversely affect the Fund's performance, or the performance of the securities in which the Fund invests.
11 Subsequent Event
On October 8, 2020, Morgan Stanley and Eaton Vance Corp. (“Eaton Vance”) announced that they had entered into a definitive agreement under which Morgan Stanley would acquire Eaton Vance. Under the Investment Company Act of 1940, as amended, consummation of this transaction may result in the automatic termination of the Fund’s investment advisory agreement, and any related sub-advisory agreement(s), if applicable. Thus, the Fund’s Board will be asked to approve a new investment advisory agreement (and new sub-advisory agreement(s), if applicable). If approved by the Fund’s Board, the new investment advisory agreement (and new sub-advisory agreement(s), if applicable) is expected to be presented to Fund shareholders for approval, and, if approved, would take effect upon the closing of the transaction.
Calvert
Emerging Markets Advancement Fund
September 30, 2020
Report of Independent Registered Public Accounting Firm
To the Shareholders and Board of Directors
Calvert World Values Fund, Inc.:
Opinion on the Financial Statements
We have audited the accompanying statement of assets and liabilities of Calvert Emerging Markets Advancement Fund (the Fund), a series of Calvert World Values Fund, Inc., including the schedule of investments, as of September 30, 2020, the related statement of operations for the year then ended, the statement of changes in net assets for the year ended September 30, 2020 and the related notes (collectively, the financial statements) and the financial highlights for the year then ended. In our opinion, the financial statements and financial highlights present fairly, in all material respects, the financial position of the Fund as of September 30, 2020, and the results of its operations, changes in its net assets, and the financial highlights for the year then ended, in conformity with U.S. generally accepted accounting principles.
Basis for Opinion
These financial statements and financial highlights are the responsibility of the Fund’s management. Our responsibility is to express an opinion on these financial statements and financial highlights based on our audit. We are a public accounting firm registered with the Public Company Accounting Oversight Board (United States) (PCAOB) and are required to be independent with respect to the Fund in accordance with the U.S. federal securities laws and the applicable rules and regulations of the Securities and Exchange Commission and the PCAOB.
We conducted our audit in accordance with the standards of the PCAOB. Those standards require that we plan and perform the audit to obtain reasonable assurance about whether the financial statements and financial highlights are free of material misstatement, whether due to error or fraud. Our audit included performing procedures to assess the risks of material misstatement of the financial statements and financial highlights, whether due to error or fraud, and performing procedures that respond to those risks. Such procedures included examining, on a test basis, evidence regarding the amounts and disclosures in the financial statements and financial highlights. Such procedures also included confirmation of securities owned as of September 30, 2020, by correspondence with the custodian, brokers, and agent banks. Our audit also included evaluating the accounting principles used and significant estimates made by management, as well as evaluating the overall presentation of the financial statements and financial highlights. We believe that our audit provides a reasonable basis for our opinion.

We have served as the auditor of one or more of the Calvert Funds since 2002.
Philadelphia, Pennsylvania
November 20, 2020
Calvert
Emerging Markets Advancement Fund
September 30, 2020
Federal Tax Information (Unaudited)
The Form 1099-DIV you receive in February 2021 will show the tax status of all distributions paid to your account in calendar year 2020. Shareholders are advised to consult their own tax adviser with respect to the tax consequences of their investment in the Fund. As required by the Internal Revenue Code and/or regulations, shareholders must be notified regarding the status of qualified dividend income for individuals, the foreign tax credit and capital gains dividends.
Qualified Dividend Income. For the fiscal year ended September 30, 2020, the Fund designates approximately $269,128, or up to the maximum amount of such dividends allowable pursuant to the Internal Revenue Code, as qualified dividend income eligible for the reduced tax rate of 15%.
Foreign Tax Credit. For the fiscal year ended September 30, 2020, the Fund paid foreign taxes of $75,855 and recognized foreign source income of $676,545.
Capital Gains Dividends. The Fund hereby designates as a capital gain dividend with respect to the taxable year ended September 30, 2020, $62,566 or, if subsequently determined to be different, the net capital gain of such year.
Calvert
Emerging Markets Advancement Fund
September 30, 2020
Liquidity Risk Management Program
The Fund has implemented a written liquidity risk management program (Program) and related procedures to manage its liquidity in accordance with Rule 22e-4 under the Investment Company Act of 1940, as amended (Liquidity Rule). The Liquidity Rule defines “liquidity risk” as the risk that a fund could not meet requests to redeem shares issued by the fund without significant dilution of the remaining investors’ interests in the fund. The Fund’s Board of Trustees/Directors has designated the investment adviser to serve as the administrator of the Program and the related procedures. The administrator has established a Liquidity Risk Management Oversight Committee (Committee) to perform the functions necessary to administer the Program. As part of the Program, the administrator is responsible for identifying illiquid investments and categorizing the relative liquidity of the Fund’s investments in accordance with the Liquidity Rule. Under the Program, the administrator assesses, manages, and periodically reviews the Fund’s liquidity risk, and is responsible for making certain reports to the Fund’s Board of Trustees/Directors and the Securities and Exchange Commission (SEC) regarding the liquidity of the Fund’s investments, and to notify the Board of Trustees/Directors and the SEC of certain liquidity events specified in the Liquidity Rule. The liquidity of the Fund’s portfolio investments is determined based on a number of factors including, but not limited to, relevant market, trading and investment-specific considerations under the Program.
At a meeting of the Fund’s Board of Trustees/Directors, the Committee provided a written report to the Fund’s Board of Trustees/Directors pertaining to the operation, adequacy, and effectiveness of implementation of the Program, as well as the operation of the highly liquid investment minimum (if applicable) for the period December 1, 2018 through December 31, 2019 (Review Period). The Program operated effectively during the Review Period, supporting the administrator’s ability to assess, manage and monitor Fund liquidity risk, including during periods of market volatility and net redemptions. During the Review Period, the Fund met redemption requests on a timely basis.
There can be no assurance that the Program will achieve its objectives in the future. Please refer to the Fund’s prospectus for more information regarding the Fund’s exposure to liquidity risk and other principal risks to which an investment in the Fund may be subject.
Calvert
Emerging Markets Advancement Fund
September 30, 2020
Management and Organization
Fund Management. The Directors of Calvert World Values Fund, Inc. (the Corporation) are responsible for the overall management and supervision of the Corporation's affairs. The Directors and officers of the Corporation are listed below. Except as indicated, each individual has held the office shown or other offices in the same company for the last five years. Directors and officers of the Corporation hold indefinite terms of office. The “Independent Directors” consist of those Directors who are not “interested persons” of the Corporation, as that term is defined under the 1940 Act. The business address of each Director and officer, with the exception of Ms. Gemma and Mr. Kirchner, is 1825 Connecticut Avenue NW, Suite 400, Washington, DC 20009. As used below, “CRM” refers to Calvert Research and Management. Each Director oversees 39 funds in the Calvert fund complex. Each officer serves as an officer of certain other Calvert funds.
| Name and Year of Birth | Corporation
Position(s) | Position
Start Date | Principal Occupation(s) and Other Directorships
During Past Five Years and Other Relevant Experience | |
| Interested Director | |
John H. Streur(1)
1960 | Director &
President | 2015 | President and Chief Executive Officer of Calvert Research and
Management (since December 31, 2016). President and Chief Executive
Officer of Calvert Investments, Inc. (January 2015 - December 2016);
Chief Executive Officer of Calvert Investment Distributors, Inc. (August
2015 - December 2016); Chief Compliance Officer of Calvert Investment
Management, Inc. (August 2015 - April 2016); President and Director, Portfolio 21 Investments, Inc. (through October 2014); President,
Chief Executive Officer and Director, Managers Investment Group LLC
(through January 2012); President and Director, The Managers Funds
and Managers AMG Funds (through January 2012).
Other Directorships in the Last Five Years. Portfolio 21 Investments,
Inc. (asset management) (through October 2014); Managers Investment
Group LLC (asset management) (through January 2012); The Managers
Funds (asset management) (through January 2012); Managers AMG Funds
(asset management) (through January 2012); Calvert Impact Capital, Inc. | |
| Independent Directors | |
Richard L. Baird, Jr.
1948 | Director | 2005 | Regional Disaster Recovery Lead, American Red Cross of Greater
Pennsylvania (since 2017). Volunteer, American Red Cross (since 2015).
Former President and CEO of Adagio Health Inc. (retired in 2014) in
Pittsburgh, PA.
Other Directorships in the Last Five Years. None. | |
Alice Gresham Bullock
1950 | Chair &
Director | 2016 | Professor Emerita at Howard University School of Law. Dean Emerita of
Howard University School of Law and Deputy Director of the Association
of American Law Schools (1992-1994).
Other Directorships in the Last Five Years. None. | |
Cari M. Dominguez
1949 | Director | 2016 | Former Chair of the U.S. Equal Employment Opportunity Commission.
Other Directorships in the Last Five Years. Manpower, Inc. (employment
agency); Triple S Management Corporation (managed care); National
Association of Corporate Directors. | |
John G. Guffey, Jr.(2)
1948 | Director | 1992 | President of Aurora Press Inc., a privately held publisher of trade
paperbacks (since January 1997).
Other Directorships in the Last Five Years. Calvert Impact Capital, Inc.
(through December 31, 2018); Calvert Ventures, LLC. | |
Miles D. Harper, III
1962 | Director | 2005 | Partner, Carr Riggs & Ingram (public accounting firm) since October 2014.
Partner, Gainer Donnelly & Desroches (public accounting firm) (now Carr
Riggs & Ingram), (November 1999-September 2014).
Other Directorships in the Last Five Years. Bridgeway Funds (9) (asset
management). | |
Joy V. Jones
1950 | Director | 2005 | Attorney.
Other Directorships in the Last Five Years. Conduit Street Restaurants
SUD 2 Limited; Palm Management Restaurant Corporation. | |
Calvert
Emerging Markets Advancement Fund
September 30, 2020
Management and Organization — continued
| Name and Year of Birth | Corporation
Position(s) | Position
Start Date | Principal Occupation(s) and Other Directorships
During Past Five Years and Other Relevant Experience | |
| Independent Directors (continued) |
Anthony A. Williams
1951 | Director | 2016 | CEO and Executive Director of the Federal City Council (July 2012 to
present); Senior Adviser and Independent Consultant for King and
Spalding LLP (September 2015 to present); Executive Director of Global
Government Practice at the Corporate Executive Board (January 2010 to
January 2012).
Other Directorships in the Last Five Years. Freddie Mac; Evoq
Properties/Meruelo Maddux Properties, Inc. (real estate management);
Weston Solutions, Inc. (environmental services); Bipartisan Policy Center’s
Debt Reduction Task Force; Chesapeake Bay Foundation; Catholic
University of America; Urban Institute (research organization). | |
| Name and Year of Birth | Corporation
Position(s) | Position
Start Date | Principal Occupation(s)
During Past Five Years | |
| Principal Officers who are not Directors | |
Hope L. Brown
1973 | Chief
Compliance
Officer | 2014 | Chief Compliance Officer of 39 registered investment companies advised
by CRM (since 2014). Vice President and Chief Compliance Officer,
Wilmington Funds (2012-2014). | |
Maureen A. Gemma(3)
1960 | Secretary,
Vice President
and Chief
Legal Officer | 2016 | Vice President of CRM and officer of 39 registered investment
companies advised by CRM (since 2016). Also Vice President of
Eaton Vance and certain of its affiliates and officer of 156 registered
investment companies advised or administered by Eaton Vance. | |
James F. Kirchner(3)
1967 | Treasurer | 2016 | Vice President of CRM and officer of 39 registered investment companies
advised by CRM (since 2016). Also Vice President of Eaton Vance and
certain of its affiliates and officer of 156 registered investment companies
advised or administered by Eaton Vance. | |
| (1) Mr. Streur is an interested person of the Fund because of his positions with the Fund’s adviser and certain affiliates. | |
| (2) Mr. Guffey is currently married to Rebecca L. Adamson, who served as a member of the Advisory Council through December 31, 2019. | |
| (3) The business address for Ms. Gemma and Mr. Kirchner is Two International Place, Boston, MA 02110. | |
The SAI for the Fund includes additional information about the Directors and officers of the Fund and can be obtained without charge on Calvert’s website at www.calvert.com or by calling 1-800-368-2745.
Privacy. The Eaton Vance organization is committed to ensuring your financial privacy. Each entity listed below has adopted a privacy policy and procedures (“Privacy Program”) Eaton Vance believes is reasonably designed to protect your personal information and to govern when and with whom Eaton Vance may share your personal information.
| • | At the time of opening an account, Eaton Vance generally requires you to provide us with certain information such as name, address, social security number, tax status, account numbers, and account balances. This information is necessary for us to both open an account for you and to allow us to satisfy legal requirements such as applicable anti-money laundering reviews and know-your-customer requirements. |
| • | On an ongoing basis, in the normal course of servicing your account, Eaton Vance may share your information with unaffiliated third parties that perform various services for Eaton Vance and/or your account. These third parties include transfer agents, custodians, broker/dealers and our professional advisers, including auditors, accountants, and legal counsel. Eaton Vance may additionally share your personal information with our affiliates. |
| • | We believe our Privacy Program is reasonably designed to protect the confidentiality of your personal information and to prevent unauthorized access to that information. |
| • | We reserve the right to change our Privacy Program at any time upon proper notification to you. You may want to review our Privacy Program periodically for changes by accessing the link on our homepage: www.calvert.com. |
Our pledge of protecting your personal information applies to the following entities within the Eaton Vance organization: the Eaton Vance Family of Funds, Eaton Vance Management, Eaton Vance Investment Counsel, Eaton Vance Distributors, Inc., Eaton Vance Trust Company, Eaton Vance Management (International) Limited, Eaton Vance Advisers International Ltd., Eaton Vance Global Advisors Limited, Eaton Vance Management's Real Estate Investment Group, Boston Management and Research, Calvert Research and Management, and Calvert Funds. This Privacy Notice supersedes all previously issued privacy disclosures. For more information about our Privacy Program or about how your personal information may be used, please call 1-800-368-2745.
Delivery of Shareholder Documents. The Securities and Exchange Commission (SEC) permits funds to deliver only one copy of shareholder documents, including prospectuses, proxy statements and shareholder reports, to fund investors with multiple accounts at the same residential or post office box address. This practice is often called “householding” and it helps eliminate duplicate mailings to shareholders. Calvert funds, or your financial intermediary, may household the mailing of your documents indefinitely unless you instruct Calvert funds, or your financial intermediary, otherwise. If you would prefer that your Calvert fund documents not be householded, please contact Calvert funds at 1-800-368-2745, or contact your financial intermediary. Your instructions that householding not apply to delivery of your Calvert fund documents will typically be effective within 30 days of receipt by Calvert funds or your financial intermediary. Separate statements will be generated for each separate account and will be householded as described above.
Portfolio Holdings. Each Calvert fund files a schedule of portfolio holdings on Part F to Form N-PORT with the SEC. Certain information filed on Form N-PORT may be viewed on the Calvert website at www.calvert.com, by calling Calvert at 1-800-368-2745 or in the EDGAR database on the SEC’s website at www.sec.gov.
Proxy Voting. The Proxy Voting Guidelines that each Calvert fund uses to determine how to vote proxies relating to portfolio securities is provided as an Appendix to the fund’s Statement of Additional Information. The Statement of Additional Information can be obtained free of charge by calling the Calvert funds at 1-800-368-2745, by visiting the Calvert funds’ website at www.calvert.com or visiting the SEC’s website at www.sec.gov. Information regarding how a Calvert fund voted proxies relating to portfolio securities during the most recent 12-month period ended June 30 is available by calling Calvert funds, by visiting the Calvert funds’ website at www.calvert.com or by visiting the SEC’s website at www.sec.gov.
This Page Intentionally Left Blank
This Page Intentionally Left Blank
This Page Intentionally Left Blank
Investment Adviser and Administrator
Calvert Research and Management
1825 Connecticut Avenue NW, Suite 400
Washington, DC 20009
Principal Underwriter*
Eaton Vance Distributors, Inc.
Two International Place
Boston, MA 02110
(617) 482-8260
Custodian
State Street Bank and Trust Company
State Street Financial Center, One Lincoln Street
Boston, MA 02111
Transfer Agent
DST Asset Manager Solutions, Inc.
2000 Crown Colony Drive
Quincy, MA 02169
Independent Registered Public Accounting Firm
KPMG LLP
1601 Market Street
Philadelphia, PA 19103-2499
Fund Offices
1825 Connecticut Avenue NW, Suite 400
Washington, DC 20009
* FINRA BrokerCheck. Investors may check the background of their Investment Professional by contacting the Financial Industry Regulatory Authority (FINRA). FINRA BrokerCheck is a free tool to help investors check the professional background of current and former FINRA-registered securities firms and brokers. FINRA BrokerCheck is available by calling 1-800-289-9999 and at www.FINRA.org. The FINRA BrokerCheck brochure describing this program is available to investors at www.FINRA.org.
Printed on recycled paper.
The registrant has adopted a code of ethics applicable to its Principal Executive Officer, Principal Financial Officer and Principal Accounting Officer. The registrant undertakes to provide a copy of such code of ethics to any person upon request, without charge, by calling 1-800-368-2745. The registrant has not amended the code of ethics as described in Form N-CSR during the period covered by this report. The registrant has not granted any waiver, including an implicit waiver, from a provision of the code of ethics as described in Form N-CSR during the period covered by this report.
| Item 3. | Audit Committee Financial Expert |
The registrant’s Board of Directors has determined that Miles D. Harper III, an “independent” Director serving on the registrant’s audit committee, is an “audit committee financial expert,” as defined in Item 3 of Form N-CSR. Under applicable securities laws, a person who is determined to be an audit committee financial expert will not be deemed an “expert” for any purpose, including without limitation for the purposes of Section 11 of the Securities Act of 1933, as a result of being designated or identified as an audit committee financial expert.
The designation or identification of a person as an audit committee financial expert does not impose on such person any duties, obligations, or liabilities that are greater than the duties, obligations, and liabilities imposed on such person as a member of the audit committee and Board of Directors in the absence of such designation or identification.
| Item 4. | Principal Accountant Fees and Services |
(a) –(d)
The following table presents the aggregate fees billed to the registrant for the registrant’s fiscal years ended September 30, 2019 and September 30, 2020 by KPMG for professional services rendered for the audit of the registrant’s annual financial statements and fees billed for other services rendered by KPMG during such periods.
| | | | | | | | | | | | | | | | |
Fiscal Years Ended | | 9/30/19 | | | %* | | | 9/30/20 | | | %* | |
Audit Fees | | $ | 109,691 | | | | 0 | % | | $ | 146,312 | | | | 5.9 | % |
Audit-Related Fees(1) | | $ | 0 | | | | 0 | % | | $ | 0 | | | | 0 | % |
Tax Fees(2) | | $ | 22,000 | | | | 0 | % | | $ | 44,945 | | | | 0 | % |
All Other Fees(3) | | $ | 0 | | | | 0 | % | | $ | 0 | | | | 0 | % |
| | | | | | | | | | | | | | | | |
Total | | $ | 131,691 | | | | 0 | % | | $ | 191,257 | | | | 4.5 | % |
| | | | | | | | | | | | | | | | |
| * | Percentage of fees approved by the Audit Committee pursuant to (c)(7)(i)(C) of Rule 2-01 of Reg. S-X (statutory de minimis waiver of Committee’s requirement to pre-approve). |
| (1) | Audit-related fees consist of the aggregate fees billed for assurance and related services that are reasonably related to the performance of the audit of the registrant’s financial statements and are not reported under the category of audit fees. |
| (2) | Tax fees consist of the aggregate fees billed for professional services rendered by the principal accountant relating to tax compliance, tax advice, and tax planning and specifically include fees for tax return preparation and other related tax compliance/planning matters. |
| (3) | All other fees consist of the aggregate fees billed for products and services provided by the principal accountant other than audit, audit-related, and tax services. |
(e) The Audit Committee is required to pre-approve all audit and non-audit services provided to the registrant by the auditors, and to the registrant’s investment adviser, and any entity controlling, controlled by, or under common control with the adviser that provides ongoing services to the registrant. In determining whether to pre-approve non-audit services, the Audit Committee considers whether the services are consistent with maintaining the independence of the auditors. The Committee may delegate its authority to pre-approve certain matters to one or more of its members. In this regard, the Committee has delegated authority jointly to the Audit Committee Chair together with another Committee member with respect to non-audit services not exceeding $25,000 in each instance. In addition, the Committee has pre-approved the retention of the auditors to provide tax-related services related to the tax treatment and tax accounting of newly acquired securities, upon request by the investment adviser in each instance.
(f) Not applicable.
(g) ) Aggregate non-audit fees billed by the registrant’s accountant for services rendered to the registrant, and rendered to the registrant’s investment adviser, and any entity controlling, controlled by, or under common
control with the adviser that provides ongoing services to the registrant for each of the last two fiscal years of the registrant:
| | | | | | |
| Fiscal Year ended 9/30/19 | | Fiscal Year ended 9/30/20 |
| $ | | %* | | $ | | %* |
| $22,000 | | 0% | | $44,945 | | 0% |
| * | Percentage of fees approved by the Audit Committee pursuant to (c)(7)(i)(C) of Rule 2-01 of Reg. S-X (statutory de minimis waiver of Committee’s requirement to pre-approve). |
(h) The registrant’s audit committee has considered whether the provision by the registrant’s principal accountant of non-audit services to the registrant’s investment adviser and any entity controlling, controlled by, or under common control with the adviser that provides ongoing services to the registrant that were not pre-approved pursuant to Rule 2-01(c)(7)(ii) of Regulation S-X is compatible with maintaining the principal accountant’s independence.
| Item 5. | Audit Committee of Listed Registrants |
Not applicable.
| Item 6. | Schedule of Investments |
Please see schedule of investments contained in the Report to Stockholders included under Item 1 of this Form N-CSR.
| Item 7. | Disclosure of Proxy Voting Policies and Procedures for Closed-End Management Investment Companies |
Not applicable.
| Item 8. | Portfolio Managers of Closed-End Management Investment Companies |
Not applicable.
| Item 9. | Purchases of Equity Securities by Closed-End Management Investment Company and Affiliated Purchasers |
Not applicable.
| Item 10. | Submission of Matters to a Vote of Security Holders |
No material changes.
| Item 11. | Controls and Procedures |
(a) The registrant’s principal executive and principal financial officers have concluded that the registrant’s disclosure controls and procedures (as defined in Rule 30a-3(c) under the Investment Company Act of 1940 Act, as amended (the “1940 Act”) are effective, based on the evaluation of these controls and procedures required by Rule 30a-3(b) under the 1940 Act and Rules 13a-15(b) or 15d-15(b) under the Securities Exchange Act of 1934 (“Exchange Act”), as of a date within 90 days of the filing date of this report.
(b) There was no change in the registrant’s internal control over financial reporting (as defined in Rule 30a-3(d) under the 1940 Act) that occurred during the period covered by this report that has materially affected, or is reasonably likely to materially affect, the registrant’s internal control over financial reporting.
| Item 12. | Disclosure of Securities Lending Activities for Closed-End Management Investment Companies |
Not applicable.
Signatures
Pursuant to the requirements of the Securities Exchange Act of 1934 and the Investment Company Act of 1940, the registrant has duly caused this report to be signed on its behalf by the undersigned, thereunto duly authorized.
| | |
| CALVERT WORLD VALUES FUND, INC. |
| |
| By: | | /s/ John H. Streur |
| | John H. Streur |
| | President |
| |
| Date: | | November 20, 2020 |
Pursuant to the requirements of the Securities Exchange Act of 1934 and the Investment Company Act of 1940, this report has been signed below by the following persons on behalf of the registrant and in the capacities and on the dates indicated.
| | |
| By: | | /s/ James F. Kirchner |
| | James F. Kirchner |
| | Treasurer |
| |
| Date: | | November 20, 2020 |
| |
| By: | | /s/ John H. Streur |
| | John H. Streur |
| | President |
| |
| Date: | | November 20, 2020 |