UNITED STATES SECURITIES AND EXCHANGE COMMISSION
Form N-CSR
CERTIFIED SHAREHOLDER REPORT OF REGISTERED
MANAGEMENT INVESTMENT COMPANIES
Investment Company Act File Number: 811-06563
CALVERT WORLD VALUES FUND, INC.
(Exact Name of Registrant as Specified in Charter)
1825 Connecticut Avenue NW, Suite 400, Washington, DC 20009
(Address of Principal Executive Offices)
Maureen A. Gemma
Two International Place, Boston, Massachusetts 02110
(Name and Address of Agent for Services)
(202) 238-2200
(Registrant’s Telephone Number)
September 30
Date of Fiscal Year End
September 30, 2018
Date of Reporting Period
____________________________________________________________________________________
Item 1. Reports to Stockholders
Calvert International Equity Fund
Calvert Mid-Cap Fund
Calvert International Opportunities Fund
Calvert Emerging Markets Equity Fund
|
| | |
| | |
| | | |
Calvert International Equity Fund
| | |
| | | |
| | |
|
| |
Annual Report September 30, 2018 E-Delivery Sign-Up — Details Inside | |
|
|
Commodity Futures Trading Commission Registration. Effective December 31, 2012, the Commodity Futures Trading Commission (“CFTC”) adopted certain regulatory changes that subject registered investment companies and advisers to regulation by the CFTC if a fund invests more than a prescribed level of its assets in certain CFTC-regulated instruments (including futures, certain options and swap agreements) or markets itself as providing investment exposure to such instruments. The Fund and its adviser have claimed an exclusion from the definition of the term “commodity pool operator” under the Commodity Exchange Act. Accordingly, neither the Fund nor the adviser is subject to CFTC regulation. |
Choose Planet-friendly E-delivery! Sign up now for on-line statements, prospectuses, and fund reports. In less than five minutes you can help reduce paper mail and lower fund costs. Just go to www.calvert.com. If you already have an online account with the Calvert funds, click on Login to access your Account and select the documents you would like to receive via e-mail. If you’re new to online account access, click on Login, then Register to create your user name and password. Once you’re in, click on the E-delivery sign-up on the Account Portfolio page and follow the quick, easy steps. Note: If your shares are not held directly with the Calvert funds but through a brokerage firm, you must contact your broker for electronic delivery options available through their firm. |
|
| | | | |
| | TABLE OF CONTENTS |
| | | | | |
| | | | | Management’s Discussion of Fund Performance |
| | | | | Performance |
| | | | | Fund Profile |
| | | | | Endnotes and Additional Disclosures |
| | | | | Fund Expenses |
| | | | | Financial Statements |
| | | | | Report of Independent Registered Public Accounting Firm |
| | | | | Federal Tax Information |
| | | | | Management and Organization |
| | | | | Important Notices |
MANAGEMENT’S DISCUSSION OF FUND PERFORMANCE1 Economic and Market Conditions
Led by higher U.S. stocks, most global stock indexes advanced during the 12-month period ended September 30, 2018.
U.S. stocks opened the period on the upswing as investors anticipated, and then cheered passage of the Republican tax reform package in December 2017. Sharp cuts in corporate taxes - a key element of the bill - raised corporate-profit expectations. Stocks also got a boost from positive U.S. economic data, including the unemployment rate, which fell to a 17-year low.
Early in the period, global stocks followed U.S. stocks sharply higher. European stocks got a boost from growing economies and rising corporate profits across the region. Key equity indexes in the Asia-Pacific region also rose despite tensions with North Korea. China’s stock market advanced behind an accelerating housing market, rising retail sales, and strong foreign trade.
U.S. stocks pulled back in February 2018 amid fears that rising rates would spur inflation and boost the appeal of fixed-income investments at the expense of stocks. After a brief rebound, equity markets weakened in the spring of 2018, as investors confronted the prospect of a global trade war due to President Trump’s imposition of broad new tariffs. The protectionist move drew retaliatory action from impacted countries including China, Canada, and certain countries in the European Union.
European stocks also pulled back even more substantially amid mounting trade war concerns, before a partial recovery in the final months of the period. In China, signs of a slowing economy compounded trade war concerns, sending Chinese stocks into a prolonged slump that reached bear market territory in late June 2018.
U.S. stocks bounced back strongly in the final three months of the period. Technology stocks led the advance, overcoming an earlier setback from a wave of data-privacy scandals. U.S. economic indicators remained largely positive throughout the period, prompting the U.S. Federal Reserve to raise its benchmark interest rate three times over the 12-month span.
For the 12-month period ended September 30, 2018, the MSCI World Index,2 a proxy for global equities, advanced 11.24%. The MSCI EAFE Index of developed-market international equities rose 2.74%, while the MSCI Emerging Markets Index declined fractionally. In the U.S., the blue-chip Dow Jones Industrial Average® advanced 20.76%, while the broader U.S. equity market, as represented by the S&P 500® Index, gained 17.91%.
Fund Performance
For the 12-month period ended September 30, 2018, Calvert International Equity Fund (the Fund) returned 4.02% for Class A shares at net asset value (NAV), outperforming the MSCI EAFE Index (the Index), which returned 2.74%. Stock selection was the
major contributor to outperformance during the period. Sector allocation detracted from relative performance. The Fund, rather than making strategic sector allocations, uses a bottom-up, stock selection strategy that focuses on the strengths of each prospective investment. Looking at sector attribution, however, the leading contributors during the period were largely in the information technology, health care, and consumer sectors. Over the 12 months, the Fund increased the proportion of its investments in these sectors relative to the benchmark.
Calvert’s environmental, social, and governance (ESG) mandate means the Fund is limited to what it may hold in the energy and materials sectors. During the period, when oil prices rebounded strongly, the Fund’s underweight in the energy sector was the largest detractor from relative performance.
The largest individual contributor, Don Quijote Holdings Co. Ltd. (Don Quijote), continued to be one of the best managed Japanese retail companies. The acquisition of 20% of Uny, another Japanese retailer, produced positive results that surprised the market and led to the belief that Don Quijote may increase its ownership position in the future.
Lonza Group AG (Lonza), in the health care sector, was another leading contributor. Calvert initiated a position in Lonza in early 2018 following a drop in the company’s stock price. Lonza’s long-term strategy appears very promising. Calvert believes the company’s use of capital and new investments in cell, viral, and antibody therapies may help increase value.
Kering SA, a French luxury goods company that owns Gucci, further contributed to returns during the period. The strength of the rejuvenation of the Gucci brand surprised the market and led to unexpectedly strong earnings.
ING Groep NV (ING), a Dutch bank, was a detractor during the period as European banks performed poorly in general. In addition, ING agreed to a settlement with Dutch authorities over money-laundering charges that entailed a fine and management changes, including the replacement of its chief financial officer.
Continental AG, a German automotive supplier, also detracted from Fund performance. The company surprised the market with a warning in August 2018 that its profits would be significantly lower than anticipated as a result of increasingly weak auto markets and internal operational issues.
ConvaTec Group plc (ConvaTec), a medical products and technologies company that the Fund bought in hopes of a turnaround, was a major detractor. Calvert sold its position in ConvaTec during the period because of ongoing operational and management problems. Those assets were reallocated to buy Coloplast A/S., a significantly higher-performing competitor in the past.
|
|
See Endnotes and Additional Disclosures in this report. Past performance is no guarantee of future results. Returns are historical and are calculated by determining the percentage change in net asset value (NAV) or offering price (as applicable) with all distributions reinvested. Investment return and principal value will fluctuate so that shares, when redeemed, may be worth more or less than their original cost. Performance less than or equal to one year is cumulative. Performance is for the stated time period only; due to market volatility, the Fund’s current performance may be lower or higher than quoted. Returns are before taxes unless otherwise noted. For performance as of the most recent month-end, please refer to www.calvert.com. |
2 www.calvert.com CALVERT INTERNATIONAL EQUITY FUND ANNUAL REPORT (Unaudited)
PERFORMANCE
|
| | | | | | | | | | | | | | |
Performance2,3 | | | | | | | | | |
Portfolio Managers Christopher M. Dyer, CFA and Ian Kirwan, each of Eaton Vance Advisers International Ltd. |
| | | | | | | | | | |
| % Average Annual Total Returns | Class Inception Date |
| | Performance Inception Date |
| | One Year |
| | Five Years |
| | Ten Years |
|
| Class A at NAV | 07/02/1992 |
| | 07/02/1992 |
| | 4.02 | % | | 2.57 | % | | 2.68 | % |
| Class A with 4.75% Maximum Sales Charge | — |
| | — |
| | -0.91 |
| | 1.57 |
| | 2.18 |
|
| Class C at NAV | 03/01/1994 |
| | 07/02/1992 |
| | 3.23 |
| | 1.75 |
| | 1.81 |
|
| Class C with 1% Maximum Sales Charge | — |
| | — |
| | 2.23 |
| | 1.75 |
| | 1.81 |
|
| Class I at NAV | 02/26/1999 |
| | 07/02/1992 |
| | 4.37 |
| | 3.05 |
| | 3.31 |
|
| | | | | | | | | | |
| | | | | | | | | | |
| MSCI EAFE Index | — |
| | — |
| | 2.74 | % | | 4.41 | % | | 5.38 | % |
| | | | | | | | | | |
% Total Annual Operating Expense Ratios4 | | | | | Class A |
| | Class C |
| | Class I |
|
| Gross | | | | | 1.60 | % | | 2.56 | % | | 1.08 | % |
| Net | | | | | 1.34 |
| | 2.09 |
| | 0.97 |
|
|
|
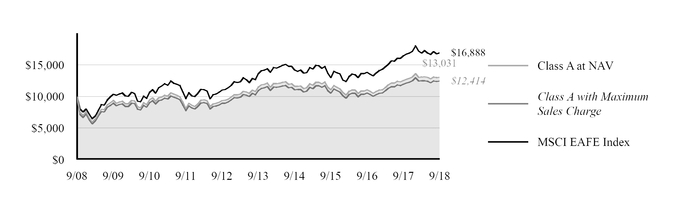
| Growth of $10,000 |
| This graph shows the change in value of a hypothetical investment of $10,000 in Class A of the Fund for the period indicated. For comparison, the same investment is shown in the indicated index. |
|
| | | | | | | | |
| Growth of Investment | Amount Invested |
| Period Beginning | At NAV |
| With Maximum Sales Charge |
| Class C |
| $10,000 |
| 09/30/2008 |
| $11,972 |
| N.A. |
| Class I |
| $250,000 |
| 09/30/2008 |
| $346,362 |
| N.A. |
See Endnotes and Additional Disclosures in this report.
Past performance is no guarantee of future results. Returns are historical and are calculated by determining the percentage change in net asset value (NAV) or offering price (as applicable) with all distributions reinvested. Investment return and principal value will fluctuate so that shares, when redeemed, may be worth more or less than their original cost. Performance less than or equal to one year is cumulative. Performance is for the stated time period only; due to market volatility, the Fund’s current performance may be lower or higher than quoted. Returns are before taxes unless otherwise noted. For performance as of the most recent month-end, please refer to www.calvert.com.
www.calvert.com CALVERT INTERNATIONAL EQUITY FUND ANNUAL REPORT (Unaudited) 3
FUND PROFILE
|
| | | | | | | |
| |
| | | | | |
| | SECTOR ALLOCATION (% of total investments)5 | | | TEN LARGEST HOLDINGS (% of net assets)6 |
| | | | | | |
| | Industrials | 19.3 | % | | Nestle SA | 3.9 | % |
| | Financials | 19.3 | % | | Unilever plc | 3.2 | % |
| | Health Care | 14.1 | % | | adidas AG | 2.8 | % |
| | Consumer Staples | 13.5 | % | | Kao Corp. | 2.7 | % |
| | Consumer Discretionary | 12.8 | % | | ASML Holding NV | 2.7 | % |
| | Information Technology | 6.9 | % | | Lonza Group AG | 2.6 | % |
| | Materials | 5.9 | % | | Prudential plc | 2.5 | % |
| | Utilities | 2.5 | % | | Iberdrola SA | 2.5 | % |
| | High Social Impact Investments | 2.5 | % | | Melrose Industries plc | 2.4 | % |
| | Communication Services | 1.4 | % | | Ecolab, Inc. | 2.4 | % |
| | Energy | 1.0 | % | | Total | 27.7 | % |
| | Venture Capital Limited Partnership Interest | 0.7 | % | | | |
| | Venture Capital | 0.1 | % | | | |
| | Total | 100.0 | % | | | |
See Endnotes and Additional Disclosures in this report.
4 www.calvert.com CALVERT INTERNATIONAL EQUITY FUND ANNUAL REPORT (Unaudited)
|
| | |
| Endnotes and Additional Disclosures | | |
1 The views expressed in this report are those of the portfolio manager(s) and are current only through the date stated on the cover. These views are subject to change at any time based upon market or other conditions, and Calvert and the Fund(s) disclaim any responsibility to update such views. These views may not be relied upon as investment advice and, because investment decisions are based on many factors, may not be relied upon as an indication of trading intent on behalf of any Calvert fund. This commentary may contain statements that are not historical facts, referred to as “forward looking statements.” The Fund’s actual future results may differ significantly from those stated in any forward looking statement, depending on factors such as changes in securities or financial markets or general economic conditions, the volume of sales and purchases of Fund shares, the continuation of investment advisory, administrative and service contracts, and other risks discussed from time to time in the Fund’s filings with the Securities and Exchange Commission.
| |
2 | MSCI World Index is an unmanaged index of equity securities in the developed markets. MSCI EAFE Index is an unmanaged index of equities in the developed markets, excluding the U.S. and Canada. MSCI Emerging Markets Index is an unmanaged index of emerging markets common stocks. MSCI indexes are net of foreign withholding taxes. Source: MSCI. MSCI data may not be reproduced or used for any other purpose. MSCI provides no warranties, has not prepared or approved this report, and has no liability hereunder. Dow Jones Industrial Average® is a price-weighted average of 30 blue-chip stocks that are generally the leaders in their industry. S&P 500® Index is an unmanaged index of large-cap stocks commonly used as a measure of U.S. stock market performance. Unless otherwise stated, index returns do not reflect the effect of any applicable sales charges, commissions, expenses, taxes or leverage, as applicable. It is not possible to invest directly in an index. |
| |
3 | Total Returns at NAV do not include applicable sales charges. If sales charges were deducted, the returns would be lower. Total Returns shown with maximum sales charge reflect the stated maximum sales charge. Unless otherwise stated, performance does not reflect the deduction of taxes on Fund distributions or redemptions of Fund shares. Performance since inception for an index, if presented, is the performance since the Fund’s or oldest share class’ inception, as applicable. |
Effective December 31, 2016, Calvert Research and Management became the investment adviser to the Fund and performance reflected prior to such date is that of the Fund’s former investment adviser, Calvert Investment Management, Inc.
4 Source: Fund prospectus. Net expense ratios reflect a contractual expense reimbursement that continues through 1/31/19. Without the reimbursement, performance would have been lower. The expense ratios for the current reporting period can be found in the Financial Highlights section of this report.
5 Does not include Short Term Investment of Cash Collateral for Securities Loaned.
6 Excludes cash and cash equivalents.
Fund profile subject to change due to active management.
www.calvert.com CALVERT INTERNATIONAL EQUITY FUND ANNUAL REPORT (Unaudited) 5
FUND EXPENSES
Example
As a Fund shareholder, you incur two types of costs: (1) transaction costs, including sales charges (loads) on purchases and redemption fees (if applicable); and (2) ongoing costs, including management fees; distribution and/or service fees; and other Fund expenses. This Example is intended to help you understand your ongoing costs (in dollars) of Fund investing and to compare these costs with the ongoing costs of investing in other mutual funds. The Example is based on an investment of $1,000 invested at the beginning of the period and held for the entire period (April 1, 2018 to September 30, 2018).
Actual Expenses
The first section of the table below provides information about actual account values and actual expenses. You may use the information in this section, together with the amount you invested, to estimate the expenses that you paid over the period. Simply divide your account value by $1,000 (for example, an $8,600 account value divided by $1,000 = 8.6), then multiply the result by the number in the first section under the heading entitled “Expenses Paid During Period” to estimate the expenses you paid on your account during this period.
Hypothetical Example for Comparison Purposes
The second section of the table below provides information about hypothetical account values and hypothetical expenses based on the actual Fund expense ratio and an assumed rate of return of 5% per year (before expenses), which is not the actual Fund return. The hypothetical account values and expenses may not be used to estimate the actual ending account balance or expenses you paid for the period. You may use this information to compare the ongoing costs of investing in the Fund and other funds. To do so, compare this 5% hypothetical example with the 5% hypothetical examples that appear in the shareholder reports of the other funds.
Please note that the expenses shown in the table are meant to highlight your ongoing costs only and do not reflect any transactional costs, such as sales charges (loads) or redemption fees (if applicable). Therefore, the second section of the table is useful in comparing ongoing costs only, and will not help you determine the relative total costs of owning different funds. In addition, if these transactional costs were included, your costs would be higher.
|
| | | | |
| | BEGINNING
ACCOUNT VALUE
(4/1/18) | ENDING
ACCOUNT VALUE
(9/30/18) | EXPENSES PAID
DURING PERIOD*
(4/1/18 - 9/30/18) | ANNUALIZED
EXPENSE RATIO |
| Actual | | | | |
| Class A | $1,000.00 | $996.60 | $6.61** | 1.32% |
| Class C | $1,000.00 | $992.70 | $10.34** | 2.07% |
| Class I | $1,000.00 | $998.40 | $4.76** | 0.95% |
| Hypothetical | | | | |
| (5% return per year before expenses) | | | | |
| Class A | $1,000.00 | $1,018.45 | $6.68** | 1.32% |
| Class C | $1,000.00 | $1,014.69 | $10.45** | 2.07% |
| Class I | $1,000.00 | $1,020.31 | $4.81** | 0.95% |
| | | | | |
| * Expenses are equal to the Fund’s annualized expense ratio for the indicated Class, multiplied by the average account value over the period, multiplied by 183/365 (to reflect the one-half year period). The Example assumes that the $1,000 was invested at the net asset value per share determined at the close of business on March 31, 2018. |
| ** Absent a waiver and/or reimbursement of expenses by affiliates, expenses would be higher. |
6 www.calvert.com CALVERT INTERNATIONAL EQUITY FUND ANNUAL REPORT (Unaudited)
CALVERT INTERNATIONAL EQUITY FUND
SCHEDULE OF INVESTMENTS
SEPTEMBER 30, 2018
|
| | |
| | SHARES | VALUE ($) |
| COMMON STOCKS - 96.2% | | |
| Australia - 3.3% | | |
| Challenger Ltd. | 379,279 | 3,068,893 |
| CSL Ltd. | 21,570 | 3,134,107 |
| | | 6,203,000 |
| | | |
| Canada - 1.9% | | |
| CAE, Inc. | 178,366 | 3,620,761 |
| | | |
| Denmark - 3.9% | | |
| Coloplast A/S, Class B | 37,223 | 3,802,531 |
| Novo Nordisk A/S, Class B | 78,885 | 3,712,727 |
| | | 7,515,258 |
| | | |
| France - 3.8% | | |
| Kering SA | 6,431 | 3,449,300 |
| Legrand SA | 53,127 | 3,873,818 |
| | | 7,323,118 |
| | | |
| Germany - 6.2% | | |
| adidas AG | 21,533 | 5,266,099 |
| Continental AG | 16,007 | 2,781,131 |
| SAP SE | 31,414 | 3,862,777 |
| | | 11,910,007 |
| | | |
| Hong Kong - 2.4% | | |
| AIA Group Ltd. | 505,537 | 4,507,830 |
| | | |
| Ireland - 1.6% | | |
| Kerry Group plc, Class A | 27,887 | 3,084,006 |
| | | |
| Japan - 20.2% | | |
| Don Quijote Holdings Co. Ltd. | 87,000 | 4,402,517 |
| FP Corp. (1) | 57,900 | 3,521,449 |
| Japan Lifeline Co. Ltd. (1) | 127,800 | 2,701,613 |
| Kao Corp. | 63,741 | 5,148,857 |
| Komatsu Ltd. | 117,702 | 3,581,778 |
| MISUMI Group, Inc. | 106,335 | 2,751,363 |
| Mitsubishi UFJ Financial Group, Inc. | 678,043 | 4,212,470 |
| ORIX Corp. (1) | 250,200 | 4,051,143 |
| Santen Pharmaceutical Co. Ltd. | 266,492 | 4,225,450 |
| Seven & I Holdings Co. Ltd. | 86,917 | 3,875,187 |
| | | 38,471,827 |
www.calvert.com CALVERT INTERNATIONAL EQUITY FUND ANNUAL REPORT 7
|
| | | |
| | SHARES | VALUE ($) |
| COMMON STOCKS - CONT’D | | |
| Netherlands - 4.7% | | |
| ASML Holding NV | 27,161 | 5,099,602 |
|
| ING Groep NV | 303,770 | 3,942,660 |
|
| | | 9,042,262 |
|
| | | |
| Singapore - 1.8% | | |
| DBS Group Holdings Ltd. | 182,428 | 3,480,205 |
|
| | | |
| South Africa - 1.4% | | |
| Naspers Ltd., Class N | 12,472 | 2,685,831 |
|
| | | |
| Spain - 4.6% | | |
| Iberdrola SA | 653,844 | 4,802,387 |
|
| Industria de Diseno Textil SA | 130,398 | 3,939,528 |
|
| | | 8,741,915 |
|
| | | |
| Sweden - 8.1% | | |
| Assa Abloy AB, Class B | 209,363 | 4,196,447 |
|
| Atlas Copco AB, Class A | 102,305 | 2,942,105 |
|
| Indutrade AB | 148,245 | 4,008,470 |
|
| Swedbank AB, Class A | 171,601 | 4,244,062 |
|
| | | 15,391,084 |
|
| | | |
| Switzerland - 8.2% | | |
| Lonza Group AG | 14,710 | 5,032,252 |
|
| Nestle SA | 88,783 | 7,389,991 |
|
| Sika AG | 22,028 | 3,205,503 |
|
| | | 15,627,746 |
|
| | | |
| Taiwan - 2.2% | | |
| Taiwan Semiconductor Manufacturing Co. Ltd., ADR | 94,362 | 4,167,026 |
|
| | | |
| United Kingdom - 16.5% | | |
| Aviva plc | 660,588 | 4,214,861 |
|
| Compass Group plc | 203,048 | 4,514,431 |
|
| GlaxoSmithKline plc | 204,665 | 4,104,497 |
|
| Melrose Industries plc | 1,736,821 | 4,520,918 |
|
| Prudential plc | 212,854 | 4,880,328 |
|
| Unilever plc | 112,206 | 6,163,936 |
|
| Weir Group plc (The) | 137,474 | 3,153,906 |
|
| | | 31,552,877 |
|
| | | |
8 www.calvert.com CALVERT INTERNATIONAL EQUITY FUND ANNUAL REPORT
|
| | | |
| United States - 5.4% | | |
| Ecolab, Inc. | 28,826 | 4,519,340 |
|
| Oceaneering International, Inc. (2) | 67,275 | 1,856,790 |
|
| Xylem, Inc. | 49,499 | 3,953,485 |
|
| | | 10,329,615 |
|
| | | |
| Total Common Stocks (Cost $162,178,795) | | 183,654,368 |
|
| | | |
| | | |
| PREFERRED STOCKS - 0.1% | | |
| Venture Capital - 0.1% | | |
| Bioceptive, Inc.: | | |
| Series A (2)(3)(4) | 582,574 | — |
|
| Series B (2)(3)(4) | 40,523 | — |
|
| FINAE, Series D (2)(3)(4) | 2,597,442 | 184,599 |
|
| | | 184,599 |
|
| | | |
| Total Preferred Stocks (Cost $491,304) | | 184,599 |
|
| | | |
| | | |
| | | VALUE ($) |
|
| VENTURE CAPITAL LIMITED PARTNERSHIP INTERESTS - 0.7% | | |
| Africa Renewable Energy Fund LP (2)(3)(4) | | 891,286 |
|
| Blackstone Clean Technology Partners LP (2)(3)(4) | | 11,560 |
|
| China Environment Fund 2004 LP (2)(3)(4) | | 3,779 |
|
| Emerald Sustainability Fund I LP (2)(3)(4) | | 85,580 |
|
| gNet Defta Development Holding LLC (2)(3)(4)(5) | | 257,618 |
|
| SEAF Central and Eastern European Growth Fund LLC (2)(3)(4)(5) | | 39,099 |
|
| SEAF India International Growth Fund LP (2)(3)(4) | | 26,763 |
|
| | | |
| Total Venture Capital Limited Partnership Interests (Cost $2,119,560) | | 1,315,685 |
|
| | | |
| | | |
| | PRINCIPAL AMOUNT ($) | VALUE ($) |
| VENTURE CAPITAL DEBT OBLIGATIONS - 0.0% | | |
| Windhorse International-Spring Health Water Ltd., 1.00%, 3/15/19 (3)(4)(6) | 70,000 | — |
|
| | | |
| Total Venture Capital Debt Obligations (Cost $70,000) | | — |
|
| | | |
| | | |
| HIGH SOCIAL IMPACT INVESTMENTS - 2.5% | | |
| Calvert Impact Capital, Inc., Community Investment Notes, 1.50%, 12/15/19 (3)(5) | 4,431,583 | 4,264,734 |
|
| ImpactAssets Inc., Global Sustainable Agriculture Notes, 2.50%, 11/3/20 (3)(4)(7) | 220,000 | 206,580 |
|
| ImpactAssets Inc., Microfinance Plus Notes, 2.40%, 11/3/20 (3)(4)(7) | 283,000 | 258,945 |
|
| | | |
| Total High Social Impact Investments (Cost $4,934,583) | | 4,730,259 |
|
www.calvert.com CALVERT INTERNATIONAL EQUITY FUND ANNUAL REPORT 9
|
| | |
| | SHARES | VALUE ($) |
| SHORT TERM INVESTMENT OF CASH COLLATERAL FOR SECURITIES LOANED - 0.9% | | |
| State Street Navigator Securities Lending Government Money Market Portfolio, 2.16% | 1,696,404 | 1,696,404 |
| | | |
| Total Short Term Investment of Cash Collateral for Securities Loaned (Cost $1,696,404) | | 1,696,404 |
| | | |
| | | |
| TOTAL INVESTMENTS (Cost $171,490,646) - 100.4% | | 191,581,315 |
| Other assets and liabilities, net - (0.4%) | | (778,525) |
NET ASSETS - 100.0% | | 190,802,790 |
|
| | |
| NOTES TO SCHEDULE OF INVESTMENTS |
| (1) All or a portion of this security was on loan at September 30, 2018. The aggregate market value of securities on loan at September 30, 2018 was $9,609,101. |
| (2) Non-income producing security. |
| (3) Restricted security. Total market value of restricted securities amounts to $6,230,543, which represents 3.3% of the net assets of the Fund as of September 30, 2018. |
| (4) For fair value measurement disclosure purposes, security is categorized as Level 3 (see Note 1A). |
| (5) Affiliated company (see Note 7). |
| (6) Security defaulted as to principal and interest in March 2013. It has been restructured at a 9% rate maturing on March 15, 2019 with 1% to be paid annually and the remaining interest due at maturity. As of September 30, 2018, security is in default with respect to its annual 1% interest payment. |
| (7) Notes carry an interest rate that varies by period and is contingent on the performance of the underlying portfolio of loans to borrowers. The coupon rate shown represents the rate in effect at September 30, 2018. |
| |
| Abbreviations: |
| ADR: | American Depositary Receipt | |
At September 30, 2018, the concentration of the Fund’s investments in the various sectors, determined as a percentage of total investments, was as follows:
|
| | |
| ECONOMIC SECTORS | (% OF TOTAL INVESTMENTS)* |
| Industrials | 19.3 | % |
| Financials | 19.3 | % |
| Health Care | 14.1 | % |
| Consumer Staples | 13.5 | % |
| Consumer Discretionary | 12.8 | % |
| Information Technology | 6.9 | % |
| Materials | 5.9 | % |
| Utilities | 2.5 | % |
| High Social Impact Investments | 2.5 | % |
| Communication Services | 1.4 | % |
| Energy | 1.0 | % |
| Venture Capital Limited Partnership Interests | 0.7 | % |
| Venture Capital | 0.1 | % |
| Total | 100.0 | % |
| * Does not include Short Term Investment of Cash Collateral for Securities Loaned. | |
10 www.calvert.com CALVERT INTERNATIONAL EQUITY FUND ANNUAL REPORT
|
| | | |
| RESTRICTED SECURITIES | ACQUISITION
DATES | COST ($) |
| Africa Renewable Energy Fund LP | 4/17/14-8/24/18 | 879,466 |
|
| Bioceptive, Inc., Series A | 10/26/12-12/18/13 | 252,445 |
|
| Bioceptive, Inc., Series B | 1/7/16 | 16,250 |
|
| Blackstone Clean Technology Partners LP | 7/29/10-6/25/15 | 78,853 |
|
| Calvert Impact Capital, Inc., Community Investment Notes, 1.50%, 12/15/19 | 12/15/16 | 4,431,583 |
|
| China Environment Fund 2004 LP | 9/15/05-4/1/09 | — |
|
| Emerald Sustainability Fund I LP | 7/19/01-5/17/11 | 395,432 |
|
| FINAE, Series D | 2/28/11-11/16/15 | 222,609 |
|
| gNet Defta Development Holding LLC | 8/30/05 | 400,000 |
|
| ImpactAssets Inc., Global Sustainable Agriculture Notes, 2.50%, 11/3/20 | 11/13/15 | 220,000 |
|
| ImpactAssets Inc., Microfinance Plus Notes, 2.40%, 11/3/20 | 11/13/15 | 283,000 |
|
| SEAF Central and Eastern European Growth Fund LLC | 8/10/00-8/26/11 | 155,418 |
|
| SEAF India International Growth Fund LP | 3/22/05-5/24/10 | 210,391 |
|
| Windhorse International-Spring Health Water Ltd., 1.00%, 3/15/19 | 2/12/14 | 70,000 |
|
| See notes to financial statements. | |
www.calvert.com CALVERT INTERNATIONAL EQUITY FUND ANNUAL REPORT 11
CALVERT INTERNATIONAL EQUITY FUND
STATEMENT OF ASSETS AND LIABILITIES
SEPTEMBER 30, 2018
|
| | | |
| ASSETS | |
Investments in securities of unaffiliated issuers, at value (identified cost $166,503,645) - including $9,609,101 of securities on loan |
| $187,019,864 |
|
| Investments in securities of affiliated issuers, at value (identified cost $4,987,001) | 4,561,451 |
|
| Cash | 652,191 |
|
| Cash denominated in foreign currency, at value (cost $30,738) | 30,595 |
|
| Receivable for capital shares sold | 185,862 |
|
| Dividends and interest receivable | 354,730 |
|
| Interest receivable - affiliated | 52,810 |
|
| Securities lending income receivable | 2,058 |
|
| Tax reclaims receivable | 366,083 |
|
| Receivable from affiliates | 28,225 |
|
| Directors’ deferred compensation plan | 104,262 |
|
| Other assets | 4,237 |
|
| Total assets | 193,362,368 |
|
| | |
| LIABILITIES | |
| Payable for capital shares redeemed | 416,395 |
|
| Deposits for securities loaned | 1,696,404 |
|
| Payable to affiliates: | |
| Investment advisory fee | 117,625 |
|
| Administrative fee | 18,820 |
|
| Distribution and service fees | 32,963 |
|
| Sub-transfer agency fee | 12,799 |
|
| Directors’ deferred compensation plan | 104,262 |
|
| Accrued expenses | 160,310 |
|
| Total liabilities | 2,559,578 |
|
| Commitments and contingent liabilities (see Note 10) | |
| NET ASSETS |
| $190,802,790 |
|
| | |
| NET ASSETS CONSIST OF: | |
| Paid-in capital applicable to common stock | |
| (75,000,000 shares per class of $0.01 par value authorized) |
| $200,931,318 |
|
| Accumulated loss | (10,128,528) |
|
| Total |
| $190,802,790 |
|
| | |
| NET ASSET VALUE PER SHARE | |
| Class A (based on net assets of $114,914,646 and 6,555,362 shares outstanding) |
| $17.53 |
|
| Class C (based on net assets of $11,148,780 and 743,225 shares outstanding) |
| $15.00 |
|
| Class I (based on net assets of $64,739,364 and 3,457,894 shares outstanding) |
| $18.72 |
|
| | |
| OFFERING PRICE PER SHARE* | |
| Class A (100/95.25 of net asset value per share) |
| $18.40 |
|
| * On sales of $50,000 or more, the offering price of Class A shares is reduced. | |
| See notes to financial statements. |
12 www.calvert.com CALVERT INTERNATIONAL EQUITY FUND ANNUAL REPORT
CALVERT INTERNATIONAL EQUITY FUND
STATEMENT OF OPERATIONS
YEAR ENDED SEPTEMBER 30, 2018
|
| | | |
| INVESTMENT INCOME | |
| Dividend income (net of foreign taxes withheld of $446,185) |
| $4,649,520 |
|
| Interest income | 129,001 |
|
| Interest income - affiliated issuers | 84,077 |
|
| Securities lending income, net | 54,210 |
|
| Total investment income | 4,916,808 |
|
| | |
| EXPENSES | |
| Investment advisory fee | 1,553,639 |
|
| Administrative fee | 248,493 |
|
| Distribution and service fees: | |
| Class A | 308,764 |
|
| Class C | 120,488 |
|
| Directors’ fees and expenses | 10,148 |
|
| Custodian fees | 77,646 |
|
| Transfer agency fees and expenses | 370,848 |
|
| Accounting fees | 54,401 |
|
| Professional fees | 74,050 |
|
| Registration fees | 77,015 |
|
| Reports to shareholders | 35,305 |
|
| Miscellaneous | 33,786 |
|
| Total expenses | 2,964,583 |
|
| Waiver and/or reimbursement of expenses by affiliates | (388,563) |
|
| Reimbursement of expenses-other | (4,237) |
|
| Net expenses | 2,571,783 |
|
| Net investment income | 2,345,025 |
|
| | |
| | |
| REALIZED AND UNREALIZED GAIN (LOSS) | |
| Net realized gain (loss) on: | |
| Investment securities - unaffiliated issuers | 7,788,657 |
|
| Foreign currency transactions | (26,658) |
|
| | 7,761,999 |
|
| | |
| Net change in unrealized appreciation (depreciation) on: | |
| Investment securities - unaffiliated issuers | (1,191,786) |
|
| Investment securities - affiliated issuers | 13,625 |
|
| Foreign currency | (9,111) |
|
| | (1,187,272) |
|
| | |
| Net realized and unrealized gain | 6,574,727 |
|
| | |
| Net increase in net assets resulting from operations |
| $8,919,752 |
|
| See notes to financial statements. |
www.calvert.com CALVERT INTERNATIONAL EQUITY FUND ANNUAL REPORT 13
CALVERT INTERNATIONAL EQUITY FUND
STATEMENTS OF CHANGES IN NET ASSETS
|
| | | | | | | |
| INCREASE (DECREASE) IN NET ASSETS | Year Ended
September 30, 2018 | | Year Ended
September 30, 2017 |
| Operations: | | | |
| Net investment income |
| $2,345,025 |
| |
| $2,944,365 |
|
| Net realized gain | 7,761,999 |
| | 14,229,386 |
|
| Net change in unrealized appreciation (depreciation) | (1,187,272) |
| | 10,933,290 |
|
| Net increase in net assets resulting from operations | 8,919,752 |
| | 28,107,041 |
|
| | | | |
Distributions to shareholders:(1) | | | |
| Class A shares | (1,876,125) |
| | (3,452,931) |
|
| Class C shares | (125,794) |
| | (255,867) |
|
| Class I shares | (1,292,207) |
| | (4,232,336) |
|
| Class Y shares | — |
| | (513,395) |
|
| Total distributions to shareholders | (3,294,126) |
| | (8,454,529) |
|
| | | | |
| Capital share transactions: | | | |
| Class A shares | (14,993,614) |
| | (41,965,309) |
|
| Class C shares | (1,124,533) |
| | (2,798,431) |
|
| Class I shares | (9,224,705) |
| | (72,272,764) |
|
Class Y shares (2) | (25,569,482) |
| | (558,951) |
|
| Net decrease in net assets from capital share transactions | (50,912,334) |
| | (117,595,455) |
|
| | | | |
| TOTAL DECREASE IN NET ASSETS | (45,286,708) |
| | (97,942,943) |
|
| | | | |
| | | | |
| NET ASSETS | | | |
| Beginning of year | 236,089,498 |
| | 334,032,441 |
|
| End of year |
| $190,802,790 |
| | $236,089,498 (3) |
|
| | | | |
| | | | |
(1) For the year ended September 30, 2017, the source of distributions was from net investment income. |
(2) Effective December 8, 2017, Class Y shares of the Fund converted to Class I shares at net asset value. Thereafter, Class Y shares were terminated. |
(3) Includes accumulated undistributed net investment income of $3,010,704 at September 30, 2017. The requirement to disclose the corresponding amount as of September 30, 2018 was eliminated. |
| See notes to financial statements. | | |
14 www.calvert.com CALVERT INTERNATIONAL EQUITY FUND ANNUAL REPORT
CALVERT INTERNATIONAL EQUITY FUND
FINANCIAL HIGHLIGHTS
|
| | | | | | | | | | | | | | | |
| | Year Ended September 30, |
| CLASS A SHARES | 2018 | | 2017 | | 2016 | | 2015 | | 2014 | |
| Net asset value, beginning | $17.10 | | $15.49 | | $15.62 | | $16.51 | | $16.44 | |
| Income from investment operations: | | | | | | | | | | |
Net investment income (1) | 0.19 |
| | 0.17 |
| | 0.34 |
| (2) | 0.18 |
| | 0.15 |
| |
| Net realized and unrealized gain (loss) | 0.50 |
| | 1.84 |
| | (0.33) |
| | (0.97) |
| | 0.02 |
| |
| Total from investment operations | 0.69 |
| | 2.01 |
| | 0.01 |
| | (0.79) |
| | 0.17 |
| |
| Distributions from: | | | | | | | | | | |
| Net investment income | (0.26) |
| | (0.40) |
| | (0.14) |
| | (0.10) |
| | (0.10) |
| |
| Total distributions | (0.26) |
| | (0.40) |
| | (0.14) |
| | (0.10) |
| | (0.10) |
| |
| Total increase (decrease) in net asset value | 0.43 |
| | 1.61 |
| | (0.13) |
| | (0.89) |
| | 0.07 |
| |
| Net asset value, ending | $17.53 | | $17.10 | | $15.49 | | $15.62 | | $16.51 | |
Total return (3) | 4.02 | % | | 13.43 | % | | 0.04 | % | | (4.78 | %) | | 0.99 | % | |
Ratios to average net assets: (4) | | | | | | | | | | |
| Total expenses | 1.47 | % | | 1.58 | % | | 1.62 | % | | 1.67 | % | | 1.66 | % | |
| Net expenses | 1.32 | % | | 1.35 | % | | 1.38 | % | | 1.54 | % | | 1.66 | % | |
| Net investment income | 1.09 | % | | 1.08 | % | | 2.20 | % | (2) | 1.08 | % | | 0.88 | % | |
| Portfolio turnover | 48 | % | | 138 | % | | 94 | % | | 97 | % | | 82 | % | |
| Net assets, ending (in thousands) | $114,915 | | $126,669 | | $156,757 | | $167,225 | | $263,718 | |
| | | | | | | | | | | |
(1) Computed using average shares outstanding. |
(2) Amount includes a non-recurring refund for overbilling of prior years’ custody out-of-pocket fees. This amounted to $0.013 per share and 0.08% of average net assets. |
(3) Returns are historical and are calculated by determining the percentage change in net asset value with all distributions reinvested and do not reflect the effect of sales charges, if any. |
(4) Total expenses do not reflect amounts reimbursed and/or waived by the adviser and certain of its affiliates, if applicable. Net expenses are net of all reductions and represent the net expenses paid by the Fund. |
| See notes to financial statements. |
www.calvert.com CALVERT INTERNATIONAL EQUITY FUND ANNUAL REPORT 15
CALVERT INTERNATIONAL EQUITY FUND
FINANCIAL HIGHLIGHTS
|
| | | | | | | | | | | | | | | |
| | Year Ended September 30, |
| CLASS C SHARES | 2018 | | 2017 | | 2016 | | 2015 | | 2014 | |
| Net asset value, beginning | $14.68 | | $13.31 | | $13.47 | | $14.27 | | $14.26 | |
| Income from investment operations: | | | | | | | | | | |
Net investment income (loss) (1) | 0.06 |
| | 0.05 |
| | 0.19 |
| (2) | 0.04 |
| | (0.01) |
| |
| Net realized and unrealized gain (loss) | 0.42 |
| | 1.59 |
| | (0.28) |
| | (0.84) |
| | 0.02 |
| |
| Total from investment operations | 0.48 |
| | 1.64 |
| | (0.09) |
| | (0.80) |
| | 0.01 |
| |
| Distributions from: | | | | | | | | | | |
| Net investment income | (0.16) |
| | (0.27) |
| | (0.07) |
| | — |
| | — |
| |
| Total distributions | (0.16) |
| | (0.27) |
| | (0.07) |
| | — |
| | — |
| |
| Total increase (decrease) in net asset value | 0.32 |
| | 1.37 |
| | (0.16) |
| | (0.80) |
| | 0.01 |
| |
| Net asset value, ending | $15.00 | | $14.68 | | $13.31 | | $13.47 | | $14.27 | |
Total return (3) | 3.23 | % | | 12.60 | % | | (0.68 | %) | | (5.61 | %) | | 0.07 | % | |
Ratios to average net assets: (4) | | | | | | | | | | |
| Total expenses | 2.22 | % | | 2.54 | % | | 2.55 | % | | 2.58 | % | | 2.57 | % | |
| Net expenses | 2.07 | % | | 2.10 | % | | 2.14 | % | | 2.37 | % | | 2.57 | % | |
| Net investment income (loss) | 0.39 | % | | 0.35 | % | | 1.42 | % | (2) | 0.31 | % | | (0.06 | %) | |
| Portfolio turnover | 48 | % | | 138 | % | | 94 | % | | 97 | % | | 82 | % | |
| Net assets, ending (in thousands) | $11,149 | | $12,013 | | $13,613 | | $15,997 | | $17,173 | |
| | | | | | | | | | | |
(1) Computed using average shares outstanding. |
(2) Amount includes a non-recurring refund for overbilling of prior years’ custody out-of-pocket fees. This amounted to $0.011 per share and 0.08% of average net assets. |
(3) Returns are historical and are calculated by determining the percentage change in net asset value with all distributions reinvested and do not reflect the effect of sales charges, if any. |
(4) Total expenses do not reflect amounts reimbursed and/or waived by the adviser and certain of its affiliates, if applicable. Net expenses are net of all reductions and represent the net expenses paid by the Fund. |
| See notes to financial statements. |
16 www.calvert.com CALVERT INTERNATIONAL EQUITY FUND ANNUAL REPORT
CALVERT INTERNATIONAL EQUITY FUND
FINANCIAL HIGHLIGHTS
|
| | | | | | | | | | | | | | | |
| | Year Ended September 30, |
| CLASS I SHARES | 2018 | | 2017 | | 2016 | | 2015 | | 2014 | |
| Net asset value, beginning | $18.24 | | $16.53 | | $16.73 | | $17.68 | | $17.69 | |
| Income from investment operations: | | | | | | | | | | |
Net investment income (1) | 0.27 |
| | 0.21 |
| | 0.44 |
| (2) | 0.30 |
| | 0.28 |
| |
| Net realized and unrealized gain (loss) | 0.53 |
| | 2.01 |
| | (0.36) |
| | (1.05) |
| | 0.02 |
| |
| Total from investment operations | 0.80 |
| | 2.22 |
| | 0.08 |
| | (0.75) |
| | 0.30 |
| |
| Distributions from: | | | | | | | | | | |
| Net investment income | (0.32) |
| | (0.51) |
| | (0.28) |
| | (0.20) |
| | (0.31) |
| |
| Total distributions | (0.32) |
| | (0.51) |
| | (0.28) |
| | (0.20) |
| | (0.31) |
| |
| Total increase (decrease) in net asset value | 0.48 |
| | 1.71 |
| | (0.20) |
| | (0.95) |
| | (0.01) |
| |
| Net asset value, ending | $18.72 | | $18.24 | | $16.53 | | $16.73 | | $17.68 | |
Total return (3) | 4.37 | % | | 13.89 | % | | 0.41 | % | | (4.27 | %) | | 1.64 | % | |
Ratios to average net assets: (4) | | | | | | | | | | |
| Total expenses | 1.22 | % | | 1.06 | % | | 1.04 | % | | 1.03 | % | | 1.02 | % | |
| Net expenses | 0.95 | % | | 0.96 | % | | 0.95 | % | | 0.98 | % | | 1.02 | % | |
| Net investment income | 1.44 | % | | 1.28 | % | | 2.67 | % | (2) | 1.68 | % | | 1.53 | % | |
| Portfolio turnover | 48 | % | | 138 | % | | 94 | % | | 97 | % | | 82 | % | |
| Net assets, ending (in thousands) | $64,739 | | $72,503 | | $140,129 | | $147,614 | | $92,318 | |
| | | | | | | | | | | |
(1) Computed using average shares outstanding. |
(2) Amount includes a non-recurring refund for overbilling of prior years’ custody out-of-pocket fees. This amounted to $0.014 per share and 0.09% of average net assets. |
(3) Returns are historical and are calculated by determining the percentage change in net asset value with all distributions reinvested and do not reflect the effect of sales charges, if any. |
(4) Total expenses do not reflect amounts reimbursed and/or waived by the adviser and certain of its affiliates, if applicable. Net expenses are net of all reductions and represent the net expenses paid by the Fund. |
| See notes to financial statements. |
www.calvert.com CALVERT INTERNATIONAL EQUITY FUND ANNUAL REPORT 17
NOTES TO FINANCIAL STATEMENTS
NOTE 1 — SIGNIFICANT ACCOUNTING POLICIES
Calvert International Equity Fund (the Fund) is a diversified series of Calvert World Values Fund, Inc. (the Corporation). The Corporation is a Maryland corporation registered under the Investment Company Act of 1940, as amended (the 1940 Act), as an open-end management investment company. The investment objective of the Fund is to seek to provide a high total return consistent with reasonable risk by investing primarily in a diversified portfolio of stocks. The Fund invests primarily in equity securities of foreign companies.
The Fund offers three classes of shares. Class A shares are generally sold subject to a sales charge imposed at time of purchase. A contingent deferred sales charge of 0.80% may apply to certain redemptions of Class A shares for accounts for which no sales charge was paid, if redeemed within one year of purchase. Class C shares are sold without a front-end sales charge, and with certain exceptions, are charged a contingent deferred sales charge of 1% on shares redeemed within one year of purchase. Class C shares are only available for purchase through a financial intermediary. Class I shares are sold at net asset value, are not subject to a sales charge and are sold only to certain eligible investors. The Fund previously offered Class Y shares. At the close of business on December 8, 2017, Class Y shares were converted to Class I shares. Each class represents a pro rata interest in the Fund, but votes separately on class-specific matters and is subject to different expenses.
The Fund applies the accounting and reporting guidance in the Financial Accounting Standards Board (FASB) Accounting Standards Codification Topic 946, Financial Services – Investment Companies (ASC 946). Subsequent events, if any, through the date that the financial statements were issued have been evaluated in the preparation of the financial statements.
A. Investment Valuation: Net asset value per share is determined every business day as of the close of the regular session of the New York Stock Exchange (generally 4:00 p.m. Eastern time). The Fund uses independent pricing services approved by the Board of Directors (the Board) to value its investments wherever possible. Investments for which market quotations are not available or deemed not reliable are fair valued in good faith under the direction of the Board.
U.S. generally accepted accounting principles (U.S. GAAP) establishes a disclosure hierarchy that categorizes the inputs to valuation techniques used to value assets and liabilities at measurement date. These inputs are summarized in the three broad levels listed below:
Level 1 - quoted prices in active markets for identical securities
Level 2 - other significant observable inputs (including quoted prices for similar securities, interest rates, prepayment speeds, credit risk, etc.)
Level 3 - significant unobservable inputs (including the Fund’s own assumptions in determining the fair value of investments)
The inputs or methodologies used for valuing securities are not necessarily an indication of the risk associated with investing in those securities.
Valuation techniques used to value the Fund’s investments by major category are as follows:
Equity Securities. Equity securities (including warrants and rights) listed on a U.S. securities exchange generally are valued at the last sale or closing price as reported by an independent pricing service on the primary market or exchange on which they are traded and are categorized as Level 1 in the hierarchy. Equity securities listed on the NASDAQ Global or Global Select Market are valued at the NASDAQ official closing price and are categorized as Level 1 in the hierarchy. Unlisted or listed securities for which closing sales prices or closing quotations are not available are valued at the mean between the latest available bid and asked prices and are categorized as Level 2 in the hierarchy. The daily valuation of exchange-traded foreign securities generally is determined as of the close of trading on the principal exchange on which such securities trade. Events occurring after the close of trading on foreign exchanges may result in adjustments to the valuation of foreign securities to more accurately reflect their fair value as of the close of regular trading on the New York Stock Exchange. When valuing foreign equity securities that meet certain criteria, the Fund’s Board has approved the use of a fair value service that values such securities to reflect market trading that occurs after the close of the applicable foreign markets of comparable securities or other instruments that have a strong correlation to the fair-valued securities. Such securities are categorized as Level 2 in the hierarchy.
Debt Securities. Debt securities are generally valued on the basis of valuations provided by third party pricing services, as derived from such services’ pricing models. Inputs to the models may include, but are not limited to, reported trades, executable bid and asked prices, broker/dealer quotations, prices or yields of securities with similar characteristics, interest rates, anticipated prepayments, benchmark curves or information pertaining to the issuer, as well as industry and economic events. Accordingly, debt securities are generally categorized as Level 2 in the hierarchy. Short-term debt securities of sufficient credit quality purchased with remaining maturities of sixty days or less for which a valuation from a third party pricing service is not readily available may be valued at amortized cost, which approximates fair value, and are categorized as Level 2 in the hierarchy.
18 www.calvert.com CALVERT INTERNATIONAL EQUITY FUND ANNUAL REPORT
Venture Capital Securities. Venture capital securities for which market quotations are not readily available are generally categorized as Level 3 in the hierarchy. Venture capital equity securities are generally valued using the most appropriate and applicable method to measure fair value in light of each company’s situation. Methods may include market, income, options-pricing or cost approaches with discounts as appropriate based on assumptions of liquidation or exit risk. Examples of the market approach are subsequent rounds of financing, comparable transactions, and revenue times an industry multiple. An example of the income approach is the discounted cash flow model. Examples of the cost approach are replacement cost, salvage value, or net asset value. The options-pricing method treats common stock and preferred stock as call options on the enterprise value with strike price based on the preferred stock liquidation preference. Venture capital limited partnership interests are valued at the fair value reported by the general partner of the partnership, adjusted as necessary to reflect subsequent capital calls and distributions and any other available information. In some cases, adjustments may be made to account for daily pricing of material public holdings within the partnership.
Other Securities. Investments in registered investment companies (including money market funds) that do not trade on an exchange are valued at the net asset value per share on the valuation day and are categorized as Level 1 in the hierarchy.
Fair Valuation. If a market value cannot be determined for a security using the methodologies described above, or if, in the good faith opinion of the Fund’s adviser, the market value does not constitute a readily available market quotation, or if a significant event has occurred that would materially affect the value of the security, the security will be fair valued as determined in good faith by or at the direction of the Board in a manner that fairly reflects the security’s value, or the amount that the Fund might reasonably expect to receive for the security upon its current sale in the ordinary course. Each such determination is based on a consideration of relevant factors, which are likely to vary from one pricing context to another. These factors may include, but are not limited to, the type of security, the existence of any contractual restrictions on the security’s disposition, the price and extent of public trading in similar securities of the issuer or of comparable companies or entities, quotations or relevant information obtained from broker/dealers or other market participants, information obtained from the issuer, analysts, and/or the appropriate stock exchange (for exchange-traded securities), an analysis of the company’s or entity’s financial condition, and an evaluation of the forces that influence the issuer and the market(s) in which the security is purchased and sold.
The values assigned to fair value investments are based on available information and do not necessarily represent amounts that might ultimately be realized. Further, due to the inherent uncertainty of valuations of such investments, the fair values may differ significantly from the values that would have been used had an active market existed, and the differences could be material.
The following table summarizes the market value of the Fund’s holdings as of September 30, 2018, based on the inputs used to value them:
|
| | | | | | | | | | | | | |
| Assets | Level 1 | Level 2 | | Level 3(1) | Total |
| Common Stocks | | | | | |
| Canada | $ | 3,620,761 |
| $ | — |
| | $ | — |
| $ | 3,620,761 |
|
| Taiwan | 4,167,026 |
| — |
| | — |
| 4,167,026 |
|
| United States | 10,329,615 |
| — |
| | — |
| 10,329,615 |
|
Other Countries(2) | — |
| 165,536,966 |
| | — |
| 165,536,966 |
|
| Total Common Stocks | $ | 18,117,402 |
| $ | 165,536,966 |
| (3) | $ | — |
| $ | 183,654,368 |
|
| Preferred Stocks - Venture Capital | — |
| — |
| | 184,599 |
| 184,599 |
|
| Venture Capital Limited Partnership Interests | — |
| — |
| | 1,315,685 |
| 1,315,685 |
|
| Venture Capital Debt Obligations | — |
| — |
| | — |
| — |
|
| High Social Impact Investments | — |
| 4,264,734 |
| | 465,525 |
| 4,730,259 |
|
| Short Term Investment of Cash Collateral for Securities Loaned | 1,696,404 |
| — |
| | — |
| 1,696,404 |
|
| Total | $ | 19,813,806 |
| $ | 169,801,700 |
| | $ | 1,965,809 |
| $ | 191,581,315 |
|
| | | | | | |
(1) None of the unobservable inputs for Level 3 assets, individually or collectively, had a material impact on the Fund. |
(2) For further breakdown of equity securities by country, please refer to the Schedule of Investments. |
(3) Includes foreign equity securities whose values were adjusted to reflect market trading of comparable securities or other correlated instruments that occurred after the close of trading in their applicable foreign markets. |
Level 3 investments at the beginning and/or end of the period in relation to net assets were not significant and accordingly, a reconciliation of Level 3 assets for the year ended September 30, 2018 is not presented.
www.calvert.com CALVERT INTERNATIONAL EQUITY FUND ANNUAL REPORT 19
B. Investment Transactions and Income: Investment transactions for financial statement purposes are accounted for on trade date. Realized gains and losses are recorded on an identified cost basis and may include proceeds from litigation. Dividend income is recorded on the ex-dividend date for dividends received in cash and/or securities or, in the case of dividends on certain foreign securities, as soon as the Fund is informed of the ex-dividend date. Non-cash dividends are recorded at the fair value of the securities received. Withholding taxes on foreign dividends, if any, have been provided for in accordance with the Fund’s understanding of the applicable country’s tax rules and rates. In consideration of recent decisions rendered by European courts, the Fund has filed additional tax reclaims for previously withheld taxes on dividends earned in certain European Union countries. These filings are subject to various administrative and judicial proceedings within these countries. Due to the uncertainty as to the ultimate resolution of these proceedings, the likelihood of receipt of these reclaims, and the potential timing of payment, no amounts are reflected in the financial statements for such outstanding reclaims. Distributions received that represent a return of capital are recorded as a reduction of cost of investments. Distributions received that represent a capital gain are recorded as a realized gain. Interest income, which includes amortization of premium and accretion of discount on debt securities, is accrued as earned.
C. Share Class Accounting: Realized and unrealized gains and losses and net investment income and losses, other than class-specific expenses, are allocated daily to each class of shares based upon the relative net assets of each class to the total net assets of the Fund. Expenses arising in connection with a specific class are charged directly to that class.
D. Foreign Currency Transactions: The Fund’s accounting records are maintained in U.S. dollars. For valuation of assets and liabilities on each date of net asset value determination, foreign denominations are converted into U.S. dollars using the current exchange rate. Security transactions, income, and expenses are translated at the prevailing rate of exchange on the date of the event. Recognized gains or losses on investment transactions attributable to changes in foreign currency exchange rates are recorded for financial statement purposes as net realized gains and losses on investments. That portion of unrealized gains and losses on investments that results from fluctuations in foreign currency exchange rates is not separately disclosed.
E. Restricted Securities: The Fund may invest in securities that are subject to legal or contractual restrictions on resale. Generally, these securities may only be sold publicly upon registration under the Securities Act of 1933 or in transactions exempt from such registration. Information regarding restricted securities (excluding Rule 144A securities) is included at the end of the Schedule of Investments.
F. Distributions to Shareholders: Distributions to shareholders are recorded by the Fund on ex-dividend date. Dividends from net investment income and distributions from net realized capital gains, if any, are paid at least annually. Distributions are determined in accordance with income tax regulations which may differ from U.S. GAAP; accordingly, periodic reclassifications are made within the Fund’s capital accounts to reflect income and gains available for distribution under income tax regulations.
G. Estimates: The preparation of financial statements in conformity with U.S. GAAP requires management to make estimates and assumptions that affect the reported amounts of assets and liabilities and disclosure of contingent assets and liabilities at the date of the financial statements and the reported amounts of increases and decreases in net assets from operations during the reporting period. Actual results could differ from those estimates.
H. Indemnifications: The Corporation’s By-Laws provide for indemnification for Directors or officers of the Corporation and certain other parties, to the fullest extent permitted by Maryland law and the 1940 Act, provided certain conditions are met. Additionally, in the normal course of business, the Fund enters into agreements with service providers that may contain indemnification clauses. The Fund’s maximum exposure under these arrangements is unknown as this would involve future claims that may be made against the Fund that have not yet occurred.
I. Federal Income Taxes: No provision for federal income or excise tax is required since the Fund intends to continue to qualify as a regulated investment company under the Internal Revenue Code and to distribute substantially all of its taxable earnings.
Management has analyzed the Fund’s tax positions taken for all open federal income tax years and has concluded that no provision for federal income tax is required in the Fund’s financial statements. A Fund’s federal tax return is subject to examination by the Internal Revenue Service for a period of three years from the date of filing.
NOTE 2 — RELATED PARTY TRANSACTIONS
The investment advisory fee is earned by Calvert Research and Management (CRM), a subsidiary of Eaton Vance Management (EVM), as compensation for investment advisory services rendered to the Fund. Pursuant to the investment advisory agreement, CRM receives a fee, payable monthly, at the following annual rates of the Fund’s average daily net assets: 0.75% on the first $250 million, 0.725% on the next $250 million and 0.675% on the excess of $500 million. For the year ended September 30, 2018, the investment advisory fee amounted to $1,553,639 or 0.75% of the Fund’s average daily net assets.
Eaton Vance Advisers International Ltd. (EVAIL), an indirect, wholly-owned subsidiary of Eaton Vance Corp., provides sub-advisory services to the Fund pursuant to a sub-advisory agreement with CRM. Sub-advisory fees are paid by CRM from its
20 www.calvert.com CALVERT INTERNATIONAL EQUITY FUND ANNUAL REPORT
investment advisory fee. Prior to November 1, 2017, Eaton Vance Management (International) Limited (EVMI), an indirect, wholly-owned subsidiary of Eaton Vance Corp., served as sub-adviser to the Fund.
CRM and EVAIL (EVMI prior to November 1, 2017) have agreed to reimburse the Fund’s operating expenses to the extent that total annual operating expenses (relating to ordinary operating expenses only and excluding expenses such as brokerage commissions, acquired fund fees and expenses of unaffiliated funds, interest expense, taxes or litigation expenses) exceed 1.32%, 2.07% and 0.95% for Class A, Class C and Class I, respectively, and prior to the close of business on December 8, 2017, 1.08% for Class Y, of such class’ average daily net assets. The expense reimbursement agreement may be changed or terminated after January 31, 2019. For the year ended September 30, 2018, CRM, EVAIL and EVMI waived or reimbursed expenses of $388,563.
The administrative fee is earned by CRM as compensation for administrative services rendered to the Fund. The fee is computed at an annual rate of 0.12% of the Fund’s average daily net assets attributable to Class A, Class C and Class I (and Class Y prior to the close of business on December 8, 2017) and is payable monthly. For the year ended September 30, 2018, CRM was paid administrative fees of $248,493.
The Fund has in effect a distribution plan for Class A shares (Class A Plan) pursuant to Rule 12b-1 under the 1940 Act. Pursuant to the Class A Plan, the Fund pays Eaton Vance Distributors, Inc. (EVD), an affiliate of CRM and the Fund’s principal underwriter, a distribution and service fee of 0.25% per annum of its average daily net assets attributable to Class A for distribution services and facilities provided to the Fund by EVD, as well as for personal services and/or the maintenance of shareholder accounts. The Fund also has in effect a distribution plan for Class C shares (Class C Plan) pursuant to Rule 12b-1 under the 1940 Act. Pursuant to the Class C Plan, the Fund pays EVD amounts equal to 0.75% per annum of its average daily net assets attributable to Class C shares for providing ongoing distribution services and facilities to the Fund. In addition, pursuant to the Class C Plan, the Fund also makes payments of service fees to EVD, financial intermediaries and other persons in amounts equal to 0.25% per annum of its average daily net assets attributable to that class. Service fees paid or accrued are for personal services and/or the maintenance of shareholder accounts. Distribution and service fees paid or accrued for the year ended September 30, 2018 amounted to $308,764 and $120,488 for Class A shares and Class C shares, respectively.
The Fund was informed that EVD received $18,902 as its portion of the sales charge on sales of Class A shares and $758 of contingent deferred sales charges paid by Fund shareholders for the year ended September 30, 2018.
EVM provides sub-transfer agency and related services to the Fund pursuant to a Sub-Transfer Agency Support Services Agreement. For the year ended September 30, 2018, sub-transfer agency fees and expenses incurred to EVM amounted to $71,269 and are included in transfer agency fees and expenses on the Statement of Operations.
Each Director of the Fund who is not an employee of CRM or its affiliates receives a fee of $3,000 for each Board meeting attended in person and $2,000 for each Board meeting attended by phone plus an annual fee of $52,000, and $1,500 for each Committee meeting attended in person and $1,000 for each Committee meeting attended by phone plus an annual Committee fee of $2,500. The Board chair receives an additional $10,000 annual retainer and Committee chairs receive an additional $6,000 annual retainer. Eligible Directors may participate in a Deferred Compensation Plan (the Plan). Amounts deferred under the Plan are treated as though equal dollar amounts had been invested in shares of the Fund or other Calvert funds selected by the Directors. The Fund purchases shares of the funds selected equal to the dollar amounts deferred under the Plan, resulting in an asset equal to the deferred compensation liability. Obligations of the Plan are paid solely from the Fund’s assets. Directors’ fees are allocated to each of the Calvert funds served. Salaries and fees of officers and Directors of the Fund who are employees of CRM or its affiliates are paid by CRM. In addition, an advisory council was established to aid the Board and CRM in advancing the cause of responsible investing through original scholarship and thought leadership. The advisory council consists of CRM’s Chief Executive Officer and four additional members. Each member (other than CRM’s Chief Executive Officer) receives annual compensation of $75,000, which is being reimbursed by Calvert Investment Management, Inc. (CIM), the Calvert funds’ former investment adviser and Ameritas Holding Company, CIM’s parent company, through the end of 2019. For the year ended September 30, 2018, the Fund’s allocated portion of such expense and reimbursement was $4,237, which are included in miscellaneous expense and reimbursement of expenses-other, respectively, on the Statement of Operations.
NOTE 3 — INVESTMENT ACTIVITY
During the year ended September 30, 2018, the cost of purchases and proceeds from sales of investments, other than short-term securities, were $98,538,556 and $147,564,483, respectively.
www.calvert.com CALVERT INTERNATIONAL EQUITY FUND ANNUAL REPORT 21
NOTE 4 — DISTRIBUTIONS TO SHAREHOLDERS AND INCOME TAX INFORMATION
The tax character of distributions declared for the years ended September 30, 2018 and September 30, 2017 was as follows:
|
| | | | | | |
| | Year Ended
September 30, |
| | 2018 | 2017 |
| Ordinary income |
| $3,294,126 |
|
| $8,454,529 |
|
During the year ended September 30, 2018, accumulated loss was decreased by $105,942,269 and paid-in capital was decreased by $105,942,269 due to expired capital loss carryforwards. These reclassifications had no effect on the net assets or net asset value per share of the Fund.
As of September 30, 2018, the components of distributable earnings (accumulated loss) on a tax basis were as follows:
|
| | | |
| Undistributed ordinary income |
| $2,103,841 |
|
| Capital loss carryforwards and deferred capital losses |
| ($32,019,365 | ) |
| Net unrealized appreciation (depreciation) |
| $19,786,996 |
|
At September 30, 2018, the Fund, for federal income tax purposes, had capital loss carryforwards of $10,386,632 and deferred capital losses of $21,632,733 which would reduce the Fund’s taxable income arising from future net realized gains on investment transactions, if any, to the extent permitted by the Internal Revenue Code, and thus would reduce the amount of distributions to shareholders, which would otherwise be necessary to relieve the Fund of any liability for federal income or excise tax. The capital loss carryforwards will expire on September 30, 2019 ($10,386,632) and their character is short-term. The deferred capital losses are treated as arising on the first day of the Fund’s next taxable year and retain the same short-term or long-term character as when originally deferred. Of the deferred capital losses at September 30, 2018, $9,129,251 are short-term and $12,503,482 are long term.
Under tax regulations, capital losses incurred in taxable years beginning after December 2010 can be carried forward to offset future capital gains for an unlimited period. These losses are required to be used prior to capital loss carryforwards, which carry an expiration date. As a result of this ordering rule, capital loss carryforwards may be more likely to expire unused.
The cost and unrealized appreciation (depreciation) of investments of the Fund at September 30, 2018, as determined on a federal income tax basis, were as follows:
|
| | | |
| Aggregate cost |
| $171,792,488 |
|
| Gross unrealized appreciation |
| $25,081,971 |
|
| Gross unrealized depreciation | (5,293,144) |
|
| Net unrealized appreciation (depreciation) |
| $19,788,827 |
|
NOTE 5 — SECURITIES LENDING
To generate additional income, the Fund may lend its securities pursuant to a securities lending agency agreement with State Street Bank and Trust Company (SSB), the securities lending agent. Security loans are subject to termination by the Fund at any time and, therefore, are not considered illiquid investments. The Fund requires that the loan be continuously collateralized by either cash or securities as collateral equal at all times to at least 102% of the market value of the domestic securities loaned and 105% of the market value of the international securities loaned (if applicable). The market value of securities loaned is determined daily and any additional required collateral is delivered to the Fund on the next business day. Cash collateral is generally invested in a money market fund registered under the 1940 Act that is managed by an affiliate of SSB. Any gain or loss in the market price of the loaned securities that might occur and any interest earned or dividends declared during the term of the loan would accrue to the account of the Fund. Income earned on the investment of collateral, net of broker rebates and other expenses incurred by the securities lending agent, is split between the Fund and the securities lending agent on the basis of agreed upon contractual terms. Non-cash collateral, if any, is held by the lending agent on behalf of the Fund and cannot be sold or re-pledged by the Fund; accordingly, such collateral is not reflected in the Statement of Assets and Liabilities.
The risks associated with lending portfolio securities include, but are not limited to, possible delays in receiving additional collateral or in the recovery of the loaned securities, possible loss of rights to the collateral should the borrower fail financially, as well as risk of loss in the value of the collateral or the value of the investments made with the collateral. The securities lending agent shall indemnify the Fund in the case of default of any securities borrower.
22 www.calvert.com CALVERT INTERNATIONAL EQUITY FUND ANNUAL REPORT
At September 30, 2018, the total value of securities on loan was $9,609,101 and the total value of collateral received was $10,069,359, comprised of cash of $1,696,404 and U.S. Government and/or agencies securities of $8,372,955.
The following table provides a breakdown of securities lending transactions accounted for as secured borrowings, the obligations by class of collateral pledged, and the remaining contractual maturity of those transactions as of September 30, 2018.
|
| | | | | | | | | | | | | | | |
| | Remaining Contractual Maturity of the Transactions |
| | Overnight and
Continuous | <30 days | 30 to 90 days | >90 days | Total |
| Securities Lending Transactions |
| Common Stocks |
| $10,069,359 |
|
| $— |
|
| $— |
|
| $— |
|
| $10,069,359 |
|
The carrying amount of the liability for deposits for securities loaned at September 30, 2018 approximated its fair value. If measured at fair value, such liability would have been considered as Level 2 in the fair value hierarchy (see Note 1A) at September 30, 2018.
NOTE 6 — LINE OF CREDIT
The Fund participates with other funds managed by CRM in a $62.5 million committed ($25 million committed and $25 million uncommitted prior to August 7, 2018) unsecured line of credit agreement with SSB, which is in effect through August 6, 2019. Borrowings may be made for temporary or emergency purposes only. Borrowings bear interest at the higher of the One-Month London Interbank Offered Rate (LIBOR) in effect that day or the overnight Federal Funds Rate, plus 1.00% (1.25% prior to August 7, 2018) per annum. A commitment fee of 0.20% (0.25% prior to August 7, 2018) per annum is incurred on the unused portion of the committed facility. An administrative fee of $37,500 was incurred in connection with the renewal of the facility in August 2018. These fees are allocated to all participating funds. Because the line of credit is not available exclusively to the Fund, it may be unable to borrow some or all of its requested amounts at any particular time. The Fund had no borrowings outstanding pursuant to this line of credit at September 30, 2018. The Fund did not have any significant borrowings or allocated fees during the year ended September 30, 2018.
NOTE 7 — AFFILIATED COMPANIES
The Fund has invested a portion of its assets designated for high social impact investments in notes (the “Notes”) issued by Calvert Impact Capital, Inc. (CIC), formerly the Calvert Social Investment Foundation, pursuant to an exemptive order granted by the U.S. Securities and Exchange Commission (the SEC) in 1998 (the Exemptive Order). The Fund obtained the Exemptive Order because at that time there was a significant overlap of Fund Board members and CIC Board members as well as certain other affiliations between CIC and affiliates of the Fund’s investment adviser. CIC may be considered an affiliated person of the Fund based on the overlap between CIC’s Board of Directors and the Calvert funds’ Directors/Trustees and other potential affiliations. CIC has licensed use of the Calvert name from CRM, and currently two Fund Board members (one of whom is CRM’s President and Chief Executive Officer), two members of the Advisory Council to the Calvert Fund Board of Directors/Trustees, and an additional CRM officer serve on CIC’s Board. CIC is not owned or otherwise controlled by CRM or its affiliates. The Fund intends to request a new exemptive order from the SEC to permit additional investment in the Notes.
www.calvert.com CALVERT INTERNATIONAL EQUITY FUND ANNUAL REPORT 23
In addition to the Notes, a Fund may also invest in companies that are considered affiliated companies because the Fund has direct or indirect ownership of, control of, or voting power of 5 percent or more of the outstanding voting shares of the company, or the company is under common ownership or control with the Fund. At September 30, 2018, the value of the Fund’s investment in the Notes and affiliated companies was $4,561,451, which represents 2.39% of the Fund’s net assets. Transactions in the Notes and affiliated companies by the Fund for the year ended September 30, 2018 were as follows:
|
| | | | | | | | | | | | | | | | | | | | | | | | | | | |
| Name of Issuer | Principal Amount, beginning of period | Gross Additions | Gross Reductions | Principal Amount, end of period | Value, end of period | Interest Income | Net Realized Gain (Loss) | Capital Gain Distributions Received | Change in Unrealized Appreciation (Depreciation) |
| High Social Impact Investments | | | | | | | | | |
Calvert Impact Capital, Inc., Community
Investment Notes,
1.50%, 12/15/19 (1) |
| $4,431,583 |
|
| $— |
|
| $— |
|
| $4,431,583 |
|
| $4,264,734 |
|
| $84,077 |
|
| $— |
|
| $— |
|
| $41,081 |
|
| Venture Capital Limited Partnership Interests | | | | | | | | | |
SEAF Central and Eastern European Growth Fund LLC (1)(2)(3) | — |
| — |
| — |
| — |
| 39,099 |
| — |
| — |
| — |
| (4,563 | ) |
gNet Defta Development Holding LLC (1)(2)(3) | — |
| — |
| — |
| — |
| 257,618 |
| — |
| — |
| — |
| (22,893 | ) |
| TOTALS | | | | |
| $4,561,451 |
|
| $84,077 |
|
| $— |
|
| $— |
|
| $13,625 |
|
(1) Restricted security.
(2) Non-income producing security.
(3) For fair value measurement disclosure purposes, security is categorized as Level 3 (see Note 1A).
24 www.calvert.com CALVERT INTERNATIONAL EQUITY FUND ANNUAL REPORT
NOTE 8 — CAPITAL SHARES
Transactions in capital shares for the years ended September 30, 2018 and September 30, 2017 were as follows:
|
| | | | | | | | | | | |
| | Year Ended
September 30, 2018 | | Year Ended
September 30, 2017 |
| | Shares | Amount | | Shares | Amount |
| Class A | | | | | |
| Shares sold | 720,208 |
|
| $12,677,952 |
| | 1,029,743 |
|
| $16,222,534 |
|
| Reinvestment of distributions | 98,915 |
| 1,738,925 |
| | 201,970 |
| 2,962,903 |
|
| Shares redeemed | (1,670,878 | ) | (29,410,491 | ) | | (3,947,550 | ) | (61,150,746 | ) |
| Net decrease | (851,755 | ) |
| ($14,993,614 | ) | | (2,715,837 | ) |
| ($41,965,309 | ) |
| | | | | | |
| Class C | | | | | |
| Shares sold | 87,750 |
|
| $1,330,294 |
| | 96,471 |
|
| $1,308,982 |
|
| Reinvestment of distributions | 7,788 |
| 117,825 |
| | 17,336 |
| 219,647 |
|
| Shares redeemed | (170,651 | ) | (2,572,652 | ) | | (318,474 | ) | (4,327,060 | ) |
| Net decrease | (75,113 | ) |
| ($1,124,533 | ) | | (204,667 | ) |
| ($2,798,431 | ) |
| | | | | | |
| Class I | | | | | |
| Shares sold | 1,107,355 |
|
| $20,830,133 |
| | 1,883,414 |
|
| $30,617,396 |
|
| Reinvestment of distributions | 66,383 |
| 1,242,701 |
| | 139,987 |
| 2,183,790 |
|
| Shares redeemed | (3,142,001 | ) | (58,433,954 | ) | | (6,522,307 | ) | (105,073,950 | ) |
| Conversion from Class Y | 1,450,354 |
| 27,136,415 |
| | — |
| — |
|
| Net decrease | (517,909 | ) |
| ($9,224,705 | ) | | (4,498,906 | ) |
| ($72,272,764 | ) |
| | | | | | |
Class Y (1) | | | | | |
| Shares sold | 138,696 |
|
| $2,537,558 |
| | 755,439 |
|
| $12,598,704 |
|
| Reinvestment of distributions | — |
| — |
| | 24,315 |
| 375,908 |
|
| Shares redeemed | (52,997 | ) | (970,625 | ) | | (840,197 | ) | (13,533,563 | ) |
| Conversion to Class I | (1,464,783 | ) | (27,136,415 | ) | | — |
| — |
|
| Net decrease | (1,379,084 | ) |
| ($25,569,482 | ) | | (60,443 | ) |
| ($558,951 | ) |
| | | | | | |
(1) Effective December 8, 2017, Class Y shares of the Fund converted to Class I shares at net asset value. Thereafter, Class Y shares were terminated. |
NOTE 9 — RISKS ASSOCIATED WITH FOREIGN INVESTMENTS
Investing in foreign securities involves additional risks relating to political, social, and economic developments abroad. Other risks result from differences between regulations that apply to U.S. and foreign issuers and markets, and the potential for foreign markets to be less liquid and more volatile than U.S. markets. Securities that trade or are denominated in currencies other than the U.S. dollar may be adversely affected by fluctuations in currency exchange rates.
www.calvert.com CALVERT INTERNATIONAL EQUITY FUND ANNUAL REPORT 25
NOTE 10 — CAPITAL COMMITMENTS
In connection with certain venture capital and/or limited partnership investments, the Fund is committed to future capital calls, which will increase the Fund’s investment in these securities. The aggregate amount of the future capital commitments totaled $176,306 at September 30, 2018. The Fund had sufficient cash and/or securities to cover these commitments.
The Fund’s unfunded capital commitments by investment at September 30, 2018 were as follows:
|
| | | |
| Name of Investment | Unfunded Commitment at 9/30/18 |
| Africa Renewable Energy Fund LP |
| $120,534 |
|
| Blackstone Clean Technology Partners LP | 508 |
|
| China Environment Fund 2004 LP | 37,764 |
|
| SEAF India International Growth Fund LP | 17,500 |
|
| Total |
| $176,306 |
|
26 www.calvert.com CALVERT INTERNATIONAL EQUITY FUND ANNUAL REPORT
REPORT OF INDEPENDENT REGISTERED PUBLIC ACCOUNTING FIRM
To the Shareholders and Board of Directors
Calvert World Values Fund, Inc.:
Opinion on the Financial Statements
We have audited the accompanying statement of assets and liabilities of Calvert International Equity Fund (the Fund), a series of Calvert World Values Fund, Inc., including the schedule of investments, as of September 30, 2018, the related statement of operations for the year then ended, the statements of changes in net assets for each of the years in the two‑year period then ended, and the related notes (collectively, the financial statements) and the financial highlights for each of the years in the five‑year period then ended. In our opinion, the financial statements and financial highlights present fairly, in all material respects, the financial position of the Fund as of September 30, 2018, the results of its operations for the year then ended, the changes in its net assets for each of the years in the two‑year period then ended, and the financial highlights for each of the years in the five‑year period then ended, in conformity with U.S. generally accepted accounting principles.
Basis for Opinion
These financial statements and financial highlights are the responsibility of the Fund’s management. Our responsibility is to express an opinion on these financial statements and financial highlights based on our audits. We are a public accounting firm registered with the Public Company Accounting Oversight Board (United States) (PCAOB) and are required to be independent with respect to the Fund in accordance with the U.S. federal securities laws and the applicable rules and regulations of the Securities and Exchange Commission and the PCAOB.
We conducted our audits in accordance with the standards of the PCAOB. Those standards require that we plan and perform the audit to obtain reasonable assurance about whether the financial statements and financial highlights are free of material misstatement, whether due to error or fraud. Our audits included performing procedures to assess the risks of material misstatement of the financial statements and financial highlights, whether due to error or fraud, and performing procedures that respond to those risks. Such procedures included examining, on a test basis, evidence regarding the amounts and disclosures in the financial statements and financial highlights. Such procedures also included confirmation of securities owned as of September 30, 2018, by correspondence with custodians. Our audits also included evaluating the accounting principles used and significant estimates made by management, as well as evaluating the overall presentation of the financial statements and financial highlights. We believe that our audits provide a reasonable basis for our opinion.
We have served as the auditor of one or more of the Calvert Funds since 2002.
Philadelphia, Pennsylvania
November 21, 2018
www.calvert.com CALVERT INTERNATIONAL EQUITY FUND ANNUAL REPORT 27
FEDERAL TAX INFORMATION
The Form 1099-DIV you receive in February 2019 will show the tax status of all distributions paid to your account in calendar year 2018. Shareholders are advised to consult their own tax adviser with respect to the tax consequences of their investment in the Fund. As required by the Internal Revenue Code and/or regulations, shareholders must be notified regarding the status of qualified dividend income for individuals and the foreign tax credit.
Qualified Dividend Income. For the fiscal year ended September 30, 2018, the Fund designates approximately $3,873,328, or up to the maximum amount of such dividends allowable pursuant to the Internal Revenue Code, as qualified dividend income eligible for the reduced tax rate of 15%.
Foreign Tax Credit. For the fiscal year ended September 30, 2018, the Fund paid foreign taxes of $320,847 and recognized foreign source income of $4,904,662.
28 www.calvert.com CALVERT INTERNATIONAL EQUITY FUND ANNUAL REPORT (Unaudited)
MANAGEMENT AND ORGANIZATION
Fund Management. The Directors of Calvert World Values Fund, Inc. (the Corporation) are responsible for the overall management and supervision of the Corporation’s affairs. The Directors and officers of the Corporation are listed below. Except as indicated, each individual has held the office shown or other offices in the same company for the last five years. Directors and officers of the Corporation hold indefinite terms of office. The “Independent Directors” consist of those Directors who are not “interested persons” of the Corporation, as that term is defined under the 1940 Act. The business address of each Director and officer, with the exception of Ms. Gemma and Mr. Kirchner, is 1825 Connecticut Avenue NW, Suite 400, Washington, DC 20009. As used below, “CRM” refers to Calvert Research and Management. Each Director oversees 39 funds in the Calvert fund complex. Each officer serves as an officer of certain other Calvert funds.
|
| | | |
| Name and Year of Birth | Position
with Corporation | Position
Start Date | Principal Occupation(s) and Directorships
During Past Five Years and Other Relevant Experience |
| | | | |
| Interested Director | | | |
John H. Streur(1)
1960 | Director & President | 2015 | President and Chief Executive Officer of Calvert Research and Management (since December 31, 2016). President and Chief Executive Officer of Calvert Investments, Inc. (January 2015 - December 2016); Chief Executive Officer of Calvert Investment Distributors, Inc. (August 2015 - December 2016); Chief Compliance Officer of Calvert Investment Management, Inc. (August 2015 - April 2016); President and Director, Portfolio 21 Investments, Inc. (through October 2014); President, Chief Executive Officer and Director, Managers Investment Group LLC (through January 2012); President and Director, The Managers Funds and Managers AMG Funds (through January 2012).
Directorships in the Last Five Years. Portfolio 21 Investments, Inc. (asset management) (through October 2014); Managers Investment Group LLC (asset management) (through January 2012); The Managers Funds (asset management) (through January 2012); Managers AMG Funds (asset management) (through January 2012); Calvert Impact Capital, Inc. |
| Independent Directors | | | |
Richard L. Baird, Jr
1948 | Director | 2005 | Former President and CEO of Adagio Health Inc. (retired in 2014) in Pittsburgh, PA, a non-profit corporation which provides family planning services, nutrition, maternal/child health care, and various health screening services and community preventive health programs.
Directorships in the Last Five Years. None. |
Alice Gresham Bullock
1950 | Chair & Director | 2016 | Professor at Howard University School of Law (retired June 2016). She is former Dean of Howard University School of Law (1996-2002) and Deputy Director of the Association of American Law Schools (1992-1994).
Directorships in the Last Five Years. None. |
Cari M. Dominguez
1949 | Director | 2016 | Former Chair of the U.S. Equal Employment Opportunity Commission.
Directorships in the Last Five Years. Manpower, Inc. (employment agency); Triple S Management Corporation (managed care); National Association of Corporate Directors. |
John G. Guffey, Jr.
1948 | Director | 1992 | President of Aurora Press Inc., a privately held publisher of trade paperbacks (since January 1997).
Directorships in the Last Five Years. Calvert Impact Capital, Inc.; Calvert Ventures, LLC. |
Miles D. Harper, III
1962 | Director | 2005 | Partner, Carr Riggs & Ingram (public accounting firm) since October 2014. Partner, Gainer Donnelly & Desroches (public accounting firm) (now Carr Riggs & Ingram), November 1999 - September 2014).
Directorships in the Last Five Years. Bridgeway Funds (10) (asset management). |
www.calvert.com CALVERT INTERNATIONAL EQUITY FUND ANNUAL REPORT (Unaudited) 29
|
| | | |
| Name and Year of Birth | Position
with Corporation | Position
Start Date | Principal Occupation(s) and Directorships
During Past Five Years and Other Relevant Experience |
| | | | |
Joy V. Jones
1950 | Director | 2005 | Attorney.
Directorships in the Last Five Years. Conduit Street Restaurants SUD 2 Limited; Palm Management Restaurant Corporation. |
Anthony A. Williams
1951 | Director | 2016 | CEO and Executive Director of the Federal City Council (July 2012 to present); Senior Adviser and Independent Consultant for McKenna Long & Aldridge LLP (September 2011 to present); Executive Director of Global Government Practice at the Corporate Executive Board (January 2010 to January 2012).
Directorships in the Last Five Years. Freddie Mac; Evoq Properties/ Meruelo Maddux Properties, Inc. (real estate management); Weston Solutions, Inc. (environmental services); Bipartisan Policy Center’s Debt Reduction Task Force; Chesapeake Bay Foundation; Catholic University of America; Urban Institute (research organization). |
|
| | | |
| Principal Officers who are not Directors | |
Name and
Year of Birth | Position with
Corporation | Position Start Date | Principal Occupation
During Past Five Years |
| | | | |
Hope L. Brown
1973 | Chief Compliance Officer | 2014 | Chief Compliance Officer of 39 registered investment companies advised by CRM (since 2014). Vice President and Chief Compliance Officer, Wilmington Funds (2012-2014). Vice President and Senior Compliance Officer, Wilmington Trust Investment Advisors, Inc. (2010-2012). |
Maureen A. Gemma(2)
1960 | Secretary, Vice President and Chief Legal Officer | 2016 | Vice President of CRM and officer of 39 registered investment companies advised by CRM (since 2016). Also Vice President of Eaton Vance Management (“EVM”) and certain of its affiliates and officer of 174 registered investment companies advised or administered by EVM. |
James F. Kirchner(2)
1967 | Treasurer | 2016 | Vice President of CRM and officer of 39 registered investment companies advised by CRM (since 2016). Also Vice President of EVM and certain of its affiliates and officer of 174 registered investment companies advised or administered by EVM. |
| | | | |
| |
(1) | Mr. Streur is an interested person of the Fund because of his positions with the Fund’s Adviser and certain affiliates. |
| |
(2) | The business address for Ms. Gemma and Mr. Kirchner is Two International Place, Boston, MA 02110. |
The SAI for the Fund includes additional information about the Directors and officers of the Fund and can be obtained without charge on Calvert’s website at www.calvert.com or by calling 1-800-368-2745.
30 www.calvert.com CALVERT INTERNATIONAL EQUITY FUND ANNUAL REPORT (Unaudited)
IMPORTANT NOTICES
Privacy. The Calvert Funds and Calvert Research and Management are committed to ensuring your financial privacy. Each of the financial institutions identified below has in effect the following policy (“Privacy Policy”) with respect to nonpublic personal information about its customers:
| |
| • | Only such information received from you, through application forms or otherwise, and information about your Calvert fund transactions will be collected. This may include information such as name, address, social security number, tax status, account balances and transactions. |
| |
| • | None of such information about you (or former customers) will be disclosed to anyone, except as permitted by law (which includes disclosure to employees necessary to service your account). In the normal course of servicing a customer’s account, Calvert Research and Management may share information with unaffiliated third parties that perform various required services such as transfer agents, custodians and broker-dealers. |
| |
| • | Policies and procedures (including physical, electronic and procedural safeguards) are in place that are designed to protect the confidentiality of such information. |
| |
| • | The Funds reserve the right to change this Privacy Policy at any time upon proper notification to you. Customers may want to review the Funds’ Privacy Policy periodically for changes by accessing the link on our homepage: www.calvert.com. |
Our pledge of privacy applies to the following entities: the Calvert Family of Funds, Calvert Research and Management and their affiliated service providers, Eaton Vance Management and Eaton Vance Distributors, Inc. In addition, our Privacy Policy applies only to those Calvert customers who are individuals and who have a direct relationship with us. If a customer’s account (i.e., fund shares) is held in the name of a third-party financial advisor/broker-dealer, it is likely that only such advisor’s privacy policies apply to the customer. This notice supersedes all previously issued privacy disclosures. For more information about Calvert’s Privacy Policy, please call 1-800-368-2745.
Delivery of Shareholder Documents. The Securities and Exchange Commission (SEC) permits funds to deliver only one copy of shareholder documents, including prospectuses, proxy statements and shareholder reports, to fund investors with multiple accounts at the same residential or post office box address. This practice is often called “householding” and it helps eliminate duplicate mailings to shareholders. Calvert funds, or your financial advisor, may household the mailing of your documents indefinitely unless you instruct Calvert funds, or your financial advisor, otherwise. If you would prefer that your Calvert fund documents not be householded, please contact Calvert funds at 1-800-368-2745, or contact your financial advisor. Your instructions that householding not apply to delivery of your Calvert fund documents will typically be effective within 30 days of receipt by Calvert funds or your financial advisor. Separate statements will be generated for each separate account and will be householded as described above.
Portfolio Holdings. Each Calvert fund will file a schedule of portfolio holdings on Form N-Q with the SEC for the first and third quarters of each fiscal year. The Form N-Q will be available on the Calvert funds’ website at www.calvert.com, by calling Calvert funds at 1-800-368-2745 or in the EDGAR database on the SEC’s website at www.sec.gov. Form N-Q may also be reviewed and copied at the SEC’s public reference room in Washington, D.C. (call 1-800-732-0330 for information on the operation of the public reference room).
Proxy Voting. The Proxy Voting Guidelines that each Calvert fund uses to determine how to vote proxies relating to portfolio securities is provided as an Appendix to the fund’s Statement of Additional Information. The Statement of Additional Information can be obtained free of charge by calling the Calvert funds at 1-800-368-2745, by visiting the Calvert funds’ website at www.calvert.com or visiting the SEC’s website at www.sec.gov. Information regarding how a Calvert fund voted proxies relating to portfolio securities during the most recent 12-month period ended June 30 is available by calling Calvert funds, by visiting the Calvert funds’ website at www.calvert.com or by visiting the SEC’s website at www.sec.gov.
www.calvert.com CALVERT INTERNATIONAL EQUITY FUND ANNUAL REPORT (Unaudited) 31
|
|
| This page intentionally left blank. |
|
| |
| CALVERT INTERNATIONAL EQUITY FUND | |
Investment Adviser and Administrator Calvert Research and Management 1825 Connecticut Avenue NW, Suite 400 Washington, DC 20009 | Transfer Agent DST Asset Manager Solutions, Inc. 2000 Crown Colony Drive Quincy, MA 02169 |
Sub-Adviser Eaton Vance Advisers International Ltd. 125 Old Broad Street London, EC2N 1AR | Independent Registered Public Accounting Firm KPMG LLP 1601 Market Street Philadelphia, PA 19103-2499 |
Principal Underwriter* Eaton Vance Distributors, Inc. Two International Place Boston, MA 02110 (617) 482-8260 | Fund Offices 1825 Connecticut Avenue NW, Suite 400 Washington, DC 20009 |
Custodian State Street Bank and Trust Company State Street Financial Center, One Lincoln Street Boston, MA 02111 | |
* FINRA BrokerCheck. Investors may check the background of their Investment Professional by contacting the Financial Industry Regulatory Authority (FINRA). FINRA BrokerCheck is a free tool to help investors check the professional background of current and former FINRA-registered securities firms and brokers. FINRA BrokerCheck is available by calling 1-800-289-9999 and at www.FINRA.org. The FINRA BrokerCheck brochure describing this program is available to investors at www.FINRA.org.
|
| |
| | |
Fund shares are not insured by the FDIC and are not deposits or other obligations of, or guaranteed by, any depository institution. Shares are subject to investment risks, including possible loss of principal invested. This report is intended to provide fund information to shareholders. It is not authorized for distribution to prospective investors unless preceded or accompanied by a prospectus. Note: The information on our website is not incorporated by reference into this report; our website address is included as an inactive textual reference only. Investors should carefully consider the investment objectives, risks, charges and expenses of the Calvert funds. This and other important information is contained in the fund’s summary prospectus and prospectus, which can be obtained from your financial professional and should be read carefully before investing. You may also call the Calvert funds at 800-368-2745. Printed on recycled paper. |
| 24207 9.30.18 | |
|
| |
Annual Report September 30, 2018 E-Delivery Sign-Up — Details Inside | |
|
|
Commodity Futures Trading Commission Registration. Effective December 31, 2012, the Commodity Futures Trading Commission (“CFTC”) adopted certain regulatory changes that subject registered investment companies and advisers to regulation by the CFTC if a fund invests more than a prescribed level of its assets in certain CFTC-regulated instruments (including futures, certain options and swap agreements) or markets itself as providing investment exposure to such instruments. The Fund and its adviser have claimed an exclusion from the definition of the term “commodity pool operator” under the Commodity Exchange Act. Accordingly, neither the Fund nor the adviser is subject to CFTC regulation. |
Choose Planet-friendly E-delivery! Sign up now for on-line statements, prospectuses, and fund reports. In less than five minutes you can help reduce paper mail and lower fund costs. Just go to www.calvert.com. If you already have an online account with the Calvert funds, click on Login to access your Account and select the documents you would like to receive via e-mail. If you’re new to online account access, click on Login, then Register to create your user name and password. Once you’re in, click on the E-delivery sign-up on the Account Portfolio page and follow the quick, easy steps. Note: If your shares are not held directly with the Calvert funds but through a brokerage firm, you must contact your broker for electronic delivery options available through their firm. |
|
| | | | |
| | TABLE OF CONTENTS |
| | | | | |
| | | | | Management’s Discussion of Fund Performance |
| | | | | Performance |
| | | | | Fund Profile |
| | | | | Endnotes and Additional Disclosures |
| | | | | Fund Expenses |
| | | | | Financial Statements |
| | | | | Report of Independent Registered Public Accounting Firm |
| | | | | Federal Tax Information |
| | | | | Management and Organization |
| | | | | Important Notices |
MANAGEMENT’S DISCUSSION OF FUND PERFORMANCE1
Economic and Market Conditions
U.S. stocks led the way with double-digit gains in the 12-month period ended September 30, 2018, while global stocks delivered mixed results.
U.S. stocks opened the period on the upswing, as investors anticipated and then cheered passage of the Republican tax reform package in December 2017. Sharp cuts in corporate taxes, a key element of the bill, raised corporate-profit expectations. Stocks also got a boost from positive U.S. economic data, including the unemployment rate which fell to a 17-year low.
Stocks pulled back in February 2018 amid fears that rising rates would spur inflation and boost the appeal of fixed-income investments at the expense of stocks. After a brief rebound, equity markets weakened in the spring of 2018, as investors confronted the prospect of a global trade war due to President Trump’s imposition of broad new tariffs. The tariffs drew retaliatory action from impacted countries including China, Canada, and certain countries in the European Union.
Stocks bounced back in the final three months of the period. Technology stocks led the advance, overcoming an earlier setback from a wave of data-privacy scandals. U.S. economic indicators remained largely positive throughout the period, prompting the U.S. Federal Reserve to raise its benchmark interest rate three times over the 12-month span.
Overseas equity markets delivered mixed results in the period. After early strength aided by rising corporate profits, European stocks subsequently pulled back amid mounting trade war concerns, before a partial recovery in the final months of the period. Similarly, after early gains, China entered a prolonged stock slump that reached bear market territory in late June 2018. Besides trade war fears, signs of slowing economic growth also weighed on Chinese stocks.
For the 12-month period ended September 30, 2018, all major U.S. stock indexes recorded double-digit gains. The blue-chip Dow Jones Industrial Average®2 advanced 20.76%, while the broader U.S. equity market, as represented by the S&P 500® Index, rose 17.91%. The technology-laden NASDAQ Composite Index surged 25.17% in the period. Large-cap U.S. stocks as measured by the S&P 500® Index generally outperformed their small-cap counterparts as measured by the Russell 2000® Index during the period. Growth stocks as a group outpaced value stocks in both the large- and small-cap categories, as measured by the Russell growth and value indexes.
Fund Performance
For the 12-month period ended September 30, 2018, Calvert Mid-Cap Fund (the Fund) had a total return of 15.04% for Class A shares at net asset value (NAV), outperforming the Russell Midcap® Index (the Index), which returned 13.98%.
Stock selection in the materials, health care, and financials sectors contributed to the Fund’s outperformance relative to the Index. Stock selection in the industrials and energy sectors and an underweight to the energy sector detracted.
GoDaddy, Inc., an Internet domain registrar and web-hosting company in the information technology sector, was the largest individual contributor during the period. Business momentum was strong as the company successfully executed its margin growth and international expansion plans. Small business trends supported the company’s strategy to bring more customers into the digital age by helping them build their own websites.
Advanced Micro Devices, Inc. (Advanced Micro Devices)7, a semiconductor manufacturer in the information technology sector, was also a leading contributor. One of the company’s main competitors reported operational issues, including capacity constraints, which provided Advanced Micro Devices an opportunity to gain market share. The company’s strong product lineup in central processing unit cards also positioned it well for the holiday season.
lululemon athletica, inc. (lululemon),7 in the consumer discretionary sector, further contributed to the Fund’s outperformance relative to the Index. New management reinvigorated the brand and expanded the athletic apparel company’s direct-to-consumer product offerings. The company’s underlying growth trends were strong in athleisure attire, and lululemon performed well in other high-growth segments, such as menswear and Asian markets during the period.
Newell Brands, Inc.,7 in the consumer discretionary sector, was the largest detractor during the period. The company posted disappointing organic revenue growth and fell short of market expectations. Investors grew frustrated with management’s inability to increase earnings after it overpaid for and failed to extract value from a recent acquisition.
Multi-Color Corp., a global label maker for consumer products in the industrials sector, was also a leading detractor. The company was under pressure as the market had grown frustrated with management’s missteps in recent acquisitions. Investors also questioned management’s ability to execute its strategy of consolidating the print labeling industry.
Deluxe Corp. (Deluxe),7 a marketing company specializing in small businesses and financial institutions, was also a notable detractor. Although we believed that the secular decline in Deluxe’s paper check business could be contained and that cash flow and margin goals were achievable, the company was unable to meet expectations. With its core business in decline during the period, management does not appear to have a sound plan for
vertical growth.
|
|
See Endnotes and Additional Disclosures in this report. Past performance is no guarantee of future results. Returns are historical and are calculated by determining the percentage change in net asset value (NAV) or offering price (as applicable) with all distributions reinvested. Investment return and principal value will fluctuate so that shares, when redeemed, may be worth more or less than their original cost. Performance less than or equal to one year is cumulative. Performance is for the stated time period only; due to market volatility, the Fund’s current performance may be lower or higher than quoted. Returns are before taxes unless otherwise noted. For performance as of the most recent month-end, please refer to www.calvert.com. |
2 www.calvert.com CALVERT MID-CAP FUND ANNUAL REPORT (Unaudited)
PERFORMANCE
|
| | | | | | | | | | | | | | |
Performance2,3 | | | | | | | | | |
Portfolio Manager Charles B. Gaffney of Calvert Research and Management |
| | | | | | | | | | |
| % Average Annual Total Returns | Class Inception Date |
| | Performance Inception Date |
| | One Year |
| | Five Years |
| | Ten Years |
|
| Class A at NAV | 10/31/1994 |
| | 10/31/1994 |
| | 15.04 | % | | 7.59 | % | | 10.13 | % |
| Class A with 4.75% Maximum Sales Charge | — |
| | — |
| | 9.56 |
| | 6.55 |
| | 9.60 |
|
| Class C at NAV | 10/31/1994 |
| | 10/31/1994 |
| | 14.20 |
| | 6.77 |
| | 9.28 |
|
| Class C with 1% Maximum Sales Charge | — |
| | — |
| | 13.20 |
| | 6.77 |
| | 9.28 |
|
| Class I at NAV | 06/03/2003 |
| | 10/31/1994 |
| | 15.48 |
| | 8.10 |
| | 10.83 |
|
| | | | | | | | | | |
| | | | | | | | | | |
Russell Midcap® Index | — |
| | — |
| | 13.98 | % | | 11.65 | % | | 12.30 | % |
| | | | | | | | | | |
% Total Annual Operating Expense Ratios4 | | | | | Class A |
| | Class C |
| | Class I |
|
| Gross | | | | | 1.34 | % | | 2.18 | % | | 0.88 | % |
| Net | | | | | 1.21 |
| | 1.96 |
| | 0.86 |
|
|
|
| Growth of $10,000 |
| This graph shows the change in value of a hypothetical investment of $10,000 in Class A of the Fund for the period indicated. For comparison, the same investment is shown in the indicated index. |
|
| | | | | | | | |
| Growth of Investment | Amount Invested |
| Period Beginning | At NAV |
| With Maximum Sales Charge |
| Class C |
| $10,000 |
| 09/30/2008 |
| $24,294 |
| N.A. |
| Class I |
| $250,000 |
| 09/30/2008 |
| $699,747 |
| N.A. |
See Endnotes and Additional Disclosures in this report.
Past performance is no guarantee of future results. Returns are historical and are calculated by determining the percentage change in net asset value (NAV) or offering price (as applicable) with all distributions reinvested. Investment return and principal value will fluctuate so that shares, when redeemed, may be worth more or less than their original cost. Performance less than or equal to one year is cumulative. Performance is for the stated time period only; due to market volatility, the Fund’s current performance may be lower or higher than quoted. Returns are before taxes unless otherwise noted. For performance as of the most recent month-end, please refer to www.calvert.com.
www.calvert.com CALVERT MID-CAP FUND ANNUAL REPORT (Unaudited) 3
FUND PROFILE
|
| | | | | | | |
| |
| | | | | |
| | SECTOR ALLOCATION (% of total investments)5 | | | TEN LARGEST HOLDINGS (% of net assets)6 |
| | | | | | |
| | Information Technology | 16.7 | % | | Ball Corp. | 2.6 | % |
| | Consumer Discretionary | 13.4 | % | | Fiserv, Inc. | 1.9 | % |
| | Industrials | 13.2 | % | | National Retail Properties, Inc. | 1.9 | % |
| | Financials | 13.0 | % | | AvalonBay Communities, Inc. | 1.8 | % |
| | Health Care | 11.2 | % | | Gildan Activewear, Inc. | 1.7 | % |
| | Real Estate | 8.9 | % | | Extra Space Storage, Inc. | 1.7 | % |
| | Utilities | 6.0 | % | | Parker-Hannifin Corp. | 1.7 | % |
| | Materials | 5.8 | % | | CMS Energy Corp. | 1.7 | % |
| | Consumer Staples | 5.1 | % | | Ulta Beauty, Inc. | 1.6 | % |
| | Energy | 3.5 | % | | Aptiv plc | 1.5 | % |
| | Communication Services | 2.0 | % | | Total | 18.1 | % |
| | High Social Impact Investments | 1.2 | % | | | |
| | Total | 100.0 | % | | | |
See Endnotes and Additional Disclosures in this report.
4 www.calvert.com CALVERT MID-CAP FUND ANNUAL REPORT (Unaudited)
|
| | |
| Endnotes and Additional Disclosures | | |
| |
1 | The views expressed in this report are those of the portfolio manager(s) and are current only through the date stated on the cover. These views are subject to change at any time based upon market or other conditions, and Calvert and the Fund(s) disclaim any responsibility to update such views. These views may not be relied upon as investment advice and, because investment decisions are based on many factors, may not be relied upon as an indication of trading intent on behalf of any Calvert fund. This commentary may contain statements that are not historical facts, referred to as “forward looking statements.” The Fund’s actual future results may differ significantly from those stated in any forward looking statement, depending on factors such as changes in securities or financial markets or general economic conditions, the volume of sales and purchases of Fund shares, the continuation of investment advisory, administrative and service contracts, and other risks discussed from time to time in the Fund’s filings with the Securities and Exchange Commission. |
| |
2 | Dow Jones Industrial Average® is a price-weighted average of 30 blue-chip stocks that are generally the leaders in their industry. S&P 500® Index is an unmanaged index of large-cap stocks commonly used as a measure of U.S. stock market performance. NASDAQ Composite Index is a market capitalization-weighted index of all domestic and international securities listed on NASDAQ. Source: Nasdaq, Inc. The information is provided by Nasdaq (with its affiliates, are referred to as “Corporations”) and Nasdaq’s third party licensors on an “as is” basis and the Corporations make no guarantees and bear no liability of any kind with respect to the information or the Fund. Russell 2000® Index is an unmanaged index of 2,000 U.S. small-cap stocks. Russell Midcap® Index is an unmanaged index of U.S. mid-cap stocks. Unless otherwise stated, index returns do not reflect the effect of any applicable sales charges, commissions, expenses, taxes or leverage, as applicable. It is not possible to invest directly in an index. |
| |
3 | Total Returns at NAV do not include applicable sales charges. If sales charges were deducted, the returns would be lower. Total Returns shown with maximum sales charge reflect the stated maximum sales charge. Unless otherwise stated, performance does not reflect the deduction of taxes on Fund distributions or redemptions of Fund shares. Performance since inception for an index, if presented, is the performance since the Fund’s or oldest share class’ inception, as applicable. |
Effective December 31, 2016, Calvert Research and Management became the investment adviser to the Fund and performance reflected prior to such date is that of the Fund’s former investment adviser, Calvert Investment Management, Inc.
| |
4 | Source: Fund prospectus. Net expense ratios reflect a contractual expense reimbursement that continues through 1/31/19. Without the reimbursement, performance would have been lower. The expense ratios for the current reporting period can be found in the Financial Highlights section of this report. |
| |
5 | Does not include Short Term Investment of Cash Collateral for Securities Loaned. |
| |
6 | Excludes cash and cash equivalents. |
| |
7 | The security was sold during the period. |
Fund profile subject to change due to active management.
www.calvert.com CALVERT MID-CAP FUND ANNUAL REPORT (Unaudited) 5
FUND EXPENSES
Example
As a Fund shareholder, you incur two types of costs: (1) transaction costs, including sales charges (loads) on purchases and redemption fees (if applicable); and (2) ongoing costs, including management fees; distribution and/or service fees; and other Fund expenses. This Example is intended to help you understand your ongoing costs (in dollars) of Fund investing and to compare these costs with the ongoing costs of investing in other mutual funds. The Example is based on an investment of $1,000 invested at the beginning of the period and held for the entire period (April 1, 2018 to September 30, 2018).
Actual Expenses
The first section of the table below provides information about actual account values and actual expenses. You may use the information in this section, together with the amount you invested, to estimate the expenses that you paid over the period. Simply divide your account value by $1,000 (for example, an $8,600 account value divided by $1,000 = 8.6), then multiply the result by the number in the first section under the heading entitled “Expenses Paid During Period” to estimate the expenses you paid on your account during this period.
Hypothetical Example for Comparison Purposes
The second section of the table below provides information about hypothetical account values and hypothetical expenses based on the actual Fund expense ratio and an assumed rate of return of 5% per year (before expenses), which is not the actual Fund return. The hypothetical account values and expenses may not be used to estimate the actual ending account balance or expenses you paid for the period. You may use this information to compare the ongoing costs of investing in the Fund and other funds. To do so, compare this 5% hypothetical example with the 5% hypothetical examples that appear in the shareholder reports of the other funds.
Please note that the expenses shown in the table are meant to highlight your ongoing costs only and do not reflect any transactional costs, such as sales charges (loads) or redemption fees (if applicable). Therefore, the second section of the table is useful in comparing ongoing costs only, and will not help you determine the relative total costs of owning different funds. In addition, if these transactional costs were included, your costs would be higher.
|
| | | | |
| | BEGINNING
ACCOUNT VALUE
(4/1/18) | ENDING
ACCOUNT VALUE
(9/30/18) | EXPENSES PAID
DURING PERIOD*
(4/1/18 - 9/30/18) | ANNUALIZED
EXPENSE RATIO |
| Actual | | | | |
| Class A | $1,000.00 | $1,102.50 | $6.38** | 1.21% |
| Class C | $1,000.00 | $1,098.50 | $10.31** | 1.96% |
| Class I | $1,000.00 | $1,104.60 | $4.54** | 0.86% |
| Hypothetical | | | | |
| (5% return per year before expenses) | | | | |
| Class A | $1,000.00 | $1,019.00 | $6.12** | 1.21% |
| Class C | $1,000.00 | $1,015.24 | $9.90** | 1.96% |
| Class I | $1,000.00 | $1,020.76 | $4.36** | 0.86% |
| | | | | |
| * Expenses are equal to the Fund’s annualized expense ratio for the indicated Class, multiplied by the average account value over the period, multiplied by 183/365 (to reflect the one-half year period). The Example assumes that the $1,000 was invested at the net asset value per share determined at the close of business on March 31, 2018. |
| ** Absent a waiver and/or reimbursement of expenses by affiliates, expenses would be higher. |
6 www.calvert.com CALVERT MID-CAP FUND ANNUAL REPORT (Unaudited)
CALVERT MID-CAP FUND
SCHEDULE OF INVESTMENTS
SEPTEMBER 30, 2018
|
| | |
| | SHARES | VALUE ($) |
| COMMON STOCKS - 98.1% | | |
| Aerospace & Defense - 2.0% | | |
| CAE, Inc. | 129,800 | 2,634,890 |
| Hexcel Corp. | 41,153 | 2,759,309 |
| | | 5,394,199 |
| | | |
| Auto Components - 1.5% | | |
| Aptiv plc | 49,009 | 4,111,855 |
| | | |
| Banks - 2.7% | | |
| First Republic Bank | 18,925 | 1,816,800 |
| KeyCorp | 162,154 | 3,225,243 |
| Sterling Bancorp | 95,700 | 2,105,400 |
| | | 7,147,443 |
| | | |
| Biotechnology - 1.8% | | |
| Incyte Corp. (1) | 24,200 | 1,671,736 |
| Ligand Pharmaceuticals, Inc. (1)(2) | 7,400 | 2,031,226 |
| Vertex Pharmaceuticals, Inc. (1) | 6,400 | 1,233,536 |
| | | 4,936,498 |
| | | |
| Capital Markets - 2.9% | | |
| E*Trade Financial Corp. (1) | 42,488 | 2,225,946 |
| Raymond James Financial, Inc. | 27,700 | 2,549,785 |
| SEI Investments Co. | 47,000 | 2,871,700 |
| | | 7,647,431 |
| | | |
| Chemicals - 2.2% | | |
| Ecolab, Inc. | 17,900 | 2,806,362 |
| Sherwin-Williams Co. (The) | 6,500 | 2,958,865 |
| | | 5,765,227 |
| | | |
| Commercial Services & Supplies - 2.2% | | |
| Multi-Color Corp. | 43,600 | 2,714,100 |
| Republic Services, Inc. | 44,700 | 3,247,902 |
| | | 5,962,002 |
| | | |
| Consumer Finance - 2.1% | | |
| Ally Financial, Inc. | 106,100 | 2,806,345 |
| OneMain Holdings, Inc. (1) | 81,100 | 2,725,771 |
| | | 5,532,116 |
| | | |
www.calvert.com CALVERT MID-CAP FUND ANNUAL REPORT 7
|
| | |
| | SHARES | VALUE ($) |
| COMMON STOCKS - CONT’D | | |
| Containers & Packaging - 3.6% | | |
| Ball Corp. (2) | 156,722 | 6,894,201 |
| WestRock Co. | 50,127 | 2,678,787 |
| | | 9,572,988 |
| | | |
| Diversified Consumer Services - 4.3% | | |
| Bright Horizons Family Solutions, Inc. (1) | 27,828 | 3,279,252 |
| Grand Canyon Education, Inc. (1) | 35,400 | 3,993,120 |
| ServiceMaster Global Holdings, Inc. (1) | 66,249 | 4,109,425 |
| | | 11,381,797 |
| | | |
| Electric Utilities - 1.5% | | |
| Xcel Energy, Inc. | 83,700 | 3,951,477 |
| | | |
| Electrical Equipment - 1.3% | | |
| AMETEK, Inc. | 45,632 | 3,610,404 |
| | | |
| Electronic Equipment, Instruments & Components - 3.7% | | |
| CDW Corp. | 35,700 | 3,174,444 |
| Dolby Laboratories, Inc., Class A | 40,925 | 2,863,522 |
| FLIR Systems, Inc. | 62,300 | 3,829,581 |
| | | 9,867,547 |
| | | |
| Energy Equipment & Services - 3.5% | | |
| Core Laboratories NV (2) | 28,400 | 3,289,572 |
| Oceaneering International, Inc. (1) | 112,781 | 3,112,756 |
| TechnipFMC plc | 62,002 | 1,937,562 |
| US Silica Holdings, Inc. (2) | 51,700 | 973,511 |
| | | 9,313,401 |
| | | |
| Equity Real Estate Investment Trusts (REITs) - 8.8% | | |
| AvalonBay Communities, Inc. | 27,032 | 4,896,847 |
| Equity Residential | 52,600 | 3,485,276 |
| Extra Space Storage, Inc. | 51,782 | 4,486,393 |
| Invitation Homes, Inc. | 124,100 | 2,843,131 |
| Mid-America Apartment Communities, Inc. | 29,300 | 2,935,274 |
| National Retail Properties, Inc. | 111,392 | 4,992,589 |
| | | 23,639,510 |
| | | |
| Food & Staples Retailing - 0.9% | | |
| Performance Food Group Co. (1) | 75,300 | 2,507,490 |
| | | |
| Food Products - 2.5% | | |
| Conagra Brands, Inc. | 85,500 | 2,904,435 |
| McCormick & Co., Inc. (2) | 28,275 | 3,725,231 |
| | | 6,629,666 |
| | | |
8 www.calvert.com CALVERT MID-CAP FUND ANNUAL REPORT
|
| | |
| | SHARES | VALUE ($) |
| COMMON STOCKS - CONT’D | | |
| Health Care Equipment & Supplies - 3.7% | | |
| Cooper Cos., Inc. (The) | 11,700 | 3,242,655 |
| ICU Medical, Inc. (1) | 12,500 | 3,534,375 |
| Teleflex, Inc. (2) | 12,025 | 3,199,732 |
| | | 9,976,762 |
| | | |
| Health Care Providers & Services - 1.5% | | |
| Amedisys, Inc. (1) | 11,100 | 1,387,056 |
| Humana, Inc. | 7,741 | 2,620,483 |
| | | 4,007,539 |
| | | |
| Hotels, Restaurants & Leisure - 1.0% | | |
| Texas Roadhouse, Inc. | 37,300 | 2,584,517 |
| | | |
| Household Products - 1.7% | | |
| Central Garden & Pet Co., Class A (1) | 74,500 | 2,468,930 |
| Clorox Co. (The) | 13,300 | 2,000,453 |
| | | 4,469,383 |
| | | |
| Independent Power and Renewable Electricity Producers - 1.4% | | |
| NextEra Energy Partners LP | 75,600 | 3,666,600 |
| | | |
| Insurance - 4.3% | | |
| Alleghany Corp. | 4,738 | 3,091,687 |
| American Financial Group, Inc. | 26,083 | 2,894,431 |
| First American Financial Corp. | 53,771 | 2,774,046 |
| RLI Corp. | 34,600 | 2,718,868 |
| | | 11,479,032 |
| | | |
| Interactive Media & Services - 2.0% | | |
| Eventbrite, Inc., Class A (1) | 35,101 | 1,332,785 |
| IAC/InterActiveCorp (1) | 18,400 | 3,987,648 |
| | | 5,320,433 |
| | | |
| IT Services - 5.6% | | |
| Amdocs Ltd. | 45,289 | 2,988,168 |
| First Data Corp., Class A (1) | 151,200 | 3,699,864 |
| Fiserv, Inc. (1) | 60,900 | 5,016,942 |
| GoDaddy, Inc., Class A (1) | 39,500 | 3,293,905 |
| | | 14,998,879 |
| | | |
| Life Sciences Tools & Services - 1.3% | | |
| Agilent Technologies, Inc. | 49,400 | 3,484,676 |
| | | |
| Machinery - 6.4% | | |
| Dover Corp. | 25,100 | 2,222,103 |
| Fortive Corp. (2) | 44,617 | 3,756,752 |
www.calvert.com CALVERT MID-CAP FUND ANNUAL REPORT 9
|
| | |
| | SHARES | VALUE ($) |
| COMMON STOCKS - CONT’D | | |
| Gardner Denver Holdings, Inc. (1) | 113,900 | 3,227,926 |
| ITT, Inc. | 55,900 | 3,424,434 |
| Parker-Hannifin Corp. | 24,300 | 4,469,499 |
| | | 17,100,714 |
| | | |
| Multi-Utilities - 3.1% | | |
| CMS Energy Corp. | 90,871 | 4,452,679 |
| Sempra Energy | 34,147 | 3,884,221 |
| | | 8,336,900 |
| | | |
| Pharmaceuticals - 2.7% | | |
| Elanco Animal Health, Inc. (1) | 54,171 | 1,890,026 |
| Jazz Pharmaceuticals plc (1) | 15,000 | 2,521,950 |
| Zoetis, Inc. | 30,255 | 2,770,148 |
| | | 7,182,124 |
| | | |
| Road & Rail - 1.1% | | |
| Kansas City Southern | 26,500 | 3,001,920 |
| | | |
| Semiconductors & Semiconductor Equipment - 3.3% | | |
| Analog Devices, Inc. | 28,800 | 2,662,848 |
| Lam Research Corp. | 7,500 | 1,137,750 |
| NXP Semiconductors NV | 29,000 | 2,479,500 |
| Skyworks Solutions, Inc. | 29,500 | 2,675,945 |
| | | 8,956,043 |
| | | |
| Software - 2.7% | | |
| Blackbaud, Inc. | 27,580 | 2,798,819 |
| RealPage, Inc. (1)(2) | 46,600 | 3,070,940 |
| SailPoint Technologies Holding, Inc. (1) | 39,200 | 1,333,584 |
| | | 7,203,343 |
| | | |
| Specialty Retail - 1.6% | | |
| Ulta Beauty, Inc. (1) | 15,100 | 4,260,012 |
| | | |
| Technology Hardware, Storage & Peripherals - 1.3% | | |
| HP, Inc. | 132,400 | 3,411,948 |
| | | |
| Textiles, Apparel & Luxury Goods - 4.9% | | |
| Columbia Sportswear Co. | 15,900 | 1,479,813 |
| Gildan Activewear, Inc. | 153,400 | 4,667,962 |
| Tapestry, Inc. | 63,000 | 3,167,010 |
| VF Corp. | 40,900 | 3,822,105 |
| | | 13,136,890 |
| | | |
10 www.calvert.com CALVERT MID-CAP FUND ANNUAL REPORT
|
| | |
| | SHARES | VALUE ($) |
| COMMON STOCKS - CONT’D | | |
| Thrifts & Mortgage Finance - 1.0% | | |
| MGIC Investment Corp. (1) | 207,900 | 2,767,149 |
| | | |
| Total Common Stocks (Cost $228,459,907) | | 262,315,915 |
| | | |
| | | |
| | PRINCIPAL AMOUNT ($) | VALUE ($) |
| HIGH SOCIAL IMPACT INVESTMENTS - 1.2% | | |
| Calvert Impact Capital, Inc., Community Investment Notes, 1.50%, 12/15/19 (3)(4) | 2,619,488 | 2,520,864 |
| ImpactAssets, Inc., Global Sustainable Agriculture Notes, 2.50%, 11/3/20 (4)(5)(6) | 309,000 | 290,151 |
| ImpactAssets, Inc., Microfinance Plus Notes, 2.40%, 11/3/20 (4)(5)(6) | 398,000 | 364,170 |
| | | |
| Total High Social Impact Investments (Cost $3,326,488) | | 3,175,185 |
| | | |
| | | |
| | SHARES | VALUE ($) |
| SHORT TERM INVESTMENT OF CASH COLLATERAL FOR SECURITIES LOANED - 1.2% | | |
| State Street Navigator Securities Lending Government Money Market Portfolio, 2.16% | 3,172,750 | 3,172,750 |
| | | |
| Total Short Term Investment of Cash Collateral for Securities Loaned (Cost $3,172,750) | | 3,172,750 |
| | | |
| | | |
| TOTAL INVESTMENTS (Cost $234,959,145) - 100.5% | | 268,663,850 |
| Other assets and liabilities, net - (0.5%) | | (1,376,780) |
NET ASSETS - 100.0% | | 267,287,070 |
|
|
| NOTES TO SCHEDULE OF INVESTMENTS |
| (1) Non-income producing security. |
| (2) All or a portion of this security was on loan at September 30, 2018. The aggregate market value of securities on loan at September 30, 2018 was $23,077,292. |
| (3) Affiliated company (see Note 7). |
| (4) Restricted security. Total market value of restricted securities amounts to $3,175,185, which represents 1.2% of the net assets of the Fund as of September 30, 2018. |
| (5) For fair value measurement disclosure purposes, security is categorized as Level 3 (see Note 1A). |
| (6) Notes carry an interest rate that varies by period and is contingent on the performance of the underlying portfolio of loans to borrowers. The coupon rate shown represents the rate in effect at September 30, 2018. |
|
| | |
| RESTRICTED SECURITIES | ACQUISITION
DATES | COST ($) |
| Calvert Impact Capital, Inc., Community Investment Notes, 1.50%, 12/15/19 | 12/15/16 | 2,619,488 |
| ImpactAssets Inc., Global Sustainable Agriculture Notes, 2.50%, 11/3/20 | 11/13/15 | 309,000 |
| ImpactAssets Inc., Microfinance Plus Notes, 2.40%, 11/3/20 | 11/13/15 | 398,000 |
| See notes to financial statements. |
www.calvert.com CALVERT MID-CAP FUND ANNUAL REPORT 11
CALVERT MID-CAP FUND
STATEMENT OF ASSETS AND LIABILITIES
SEPTEMBER 30, 2018
|
| | | |
| ASSETS | |
Investments in securities of unaffiliated issuers, at value (identified cost $232,339,657) - including $23,077,292 of securities on loan |
| $266,142,986 |
|
| Investments in securities of affiliated issuers, at value (identified cost $2,619,488) | 2,520,864 |
|
| Cash | 1,878,035 |
|
| Cash denominated in foreign currency, at value (cost $8,526) | 8,542 |
|
| Receivable for investments sold | 2,157,464 |
|
| Receivable for capital shares sold | 561,548 |
|
| Dividends and interest receivable | 247,931 |
|
| Interest receivable - affiliated | 31,652 |
|
| Securities lending income receivable | 2,353 |
|
| Receivable from affiliates | 20,744 |
|
| Directors’ deferred compensation plan | 133,274 |
|
| Other assets | 5,317 |
|
| Total assets | 273,710,710 |
|
| | |
| LIABILITIES | |
| Payable for investments purchased | 2,761,663 |
|
| Deposits for securities loaned | 3,172,750 |
|
| Payable to affiliates: | |
| Investment advisory fee | 142,805 |
|
| Administrative fee | 26,364 |
|
| Distribution and service fees | 46,466 |
|
| Sub-transfer agency fee | 12,025 |
|
| Directors’ deferred compensation plan | 133,274 |
|
| Accrued expenses | 128,293 |
|
| Total liabilities | 6,423,640 |
|
| NET ASSETS |
| $267,287,070 |
|
| | |
| NET ASSETS CONSIST OF: | |
| Paid-in capital applicable to common stock | |
| (75,000,000 shares per class of $0.01 par value authorized) |
| $219,447,754 |
|
| Distributable earnings | 47,839,316 |
|
| Total |
| $267,287,070 |
|
| | |
| NET ASSET VALUE PER SHARE | |
| Class A (based on net assets of $157,046,394 and 4,507,718 shares outstanding) |
| $34.84 |
|
| Class C (based on net assets of $17,043,026 and 691,480 shares outstanding) |
| $24.65 |
|
| Class I (based on net assets of $93,197,650 and 2,274,962 shares outstanding) |
| $40.97 |
|
| | |
| OFFERING PRICE PER SHARE* | |
| Class A (100/95.25 of net asset value per share) |
| $36.58 |
|
| * On sales of $50,000 or more, the offering price of Class A shares is reduced. | |
| See notes to financial statements. |
12 www.calvert.com CALVERT MID-CAP FUND ANNUAL REPORT
CALVERT MID-CAP FUND
STATEMENT OF OPERATIONS
YEAR ENDED SEPTEMBER 30, 2018
|
| | | |
| INVESTMENT INCOME | |
| Dividend income (net of foreign taxes withheld of $19,600) |
| $3,591,273 |
|
| Interest income | 20,282 |
|
| Interest income - affiliated issuers | 39,292 |
|
| Securities lending income, net | 25,249 |
|
| Total investment income | 3,676,096 |
|
| | |
| EXPENSES | |
| Investment advisory fee | 1,661,954 |
|
| Administrative fee | 306,786 |
|
| Distribution and service fees: | |
| Class A | 391,739 |
|
| Class C | 172,632 |
|
| Directors’ fees and expenses | 12,952 |
|
| Custodian fees | 32,417 |
|
| Transfer agency fees and expenses | 379,126 |
|
| Accounting fees | 55,502 |
|
| Professional fees | 43,055 |
|
| Registration fees | 73,948 |
|
| Reports to shareholders | 33,500 |
|
| Miscellaneous | 28,018 |
|
| Total expenses | 3,191,629 |
|
| Waiver and/or reimbursement of expenses by affiliates | (241,336) |
|
| Reimbursement of expenses-other | (5,317) |
|
| Net expenses | 2,944,976 |
|
| Net investment income | 731,120 |
|
| | |
| | |
| REALIZED AND UNREALIZED GAIN (LOSS) | |
| Net realized gain (loss) on: | |
| Investment securities - unaffiliated issuers | 15,314,615 |
|
| Foreign currency transactions | 1,044 |
|
| | 15,315,659 |
|
| | |
| Net change in unrealized appreciation (depreciation) on: | |
| Investment securities - unaffiliated issuers | 20,005,014 |
|
| Investment securities - affiliated issuers | 24,283 |
|
| Foreign currency | 7 |
|
| | 20,029,304 |
|
| | |
| Net realized and unrealized gain | 35,344,963 |
|
| | |
| Net increase in net assets resulting from operations |
| $36,076,083 |
|
| See notes to financial statements. |
www.calvert.com CALVERT MID-CAP FUND ANNUAL REPORT 13
CALVERT MID-CAP FUND
STATEMENTS OF CHANGES IN NET ASSETS
|
| | | | | | | |
| INCREASE (DECREASE) IN NET ASSETS | Year Ended
September 30, 2018 | | Year Ended
September 30, 2017 |
| Operations: | | | |
| Net investment income |
| $731,120 |
| |
| $2,394,655 |
|
| Net realized gain | 15,315,659 |
| | 34,590,028 |
|
| Net change in unrealized appreciation (depreciation) | 20,029,304 |
| | 5,294,700 |
|
| Net increase in net assets resulting from operations | 36,076,083 |
| | 42,279,383 |
|
| | | | |
Distributions to shareholders:(1) | | | |
| Class A shares | (14,823,284) |
| | (966,039) |
|
| Class C shares | (2,174,802) |
| | (7,085) |
|
| Class I shares | (6,706,763) |
| | (1,345,674) |
|
| Class Y shares | — |
| | (59,222) |
|
| Total distributions to shareholders | (23,704,849) |
| | (2,378,020) |
|
| | | | |
| Capital share transactions: | | | |
| Class A shares | (10,019,150) |
| | (53,531,833) |
|
| Class C shares | (1,216,780) |
| | (7,175,069) |
|
| Class I shares | 19,681,532 |
| | (113,050,738) |
|
Class Y shares(2) | (12,283,707) |
| | (2,973,415) |
|
| Net decrease in net assets from capital share transactions | (3,838,105) |
| | (176,731,055) |
|
| | | | |
| TOTAL INCREASE (DECREASE) IN NET ASSETS | 8,533,129 |
| | (136,829,692) |
|
| | | | |
| | | | |
| NET ASSETS | | | |
| Beginning of year | 258,753,941 |
| | 395,583,633 |
|
| End of year |
| $267,287,070 |
| | $258,753,941(3) |
|
| | | | |
| | | | |
(1) For the year ended September 30, 2017, the source of distributions was as follows: Net investment income - Class A ($920,858), Class I ($1,312,875), and Class Y ($56,984) Net realized gain - Class A ($45,181), Class C ($7,085), Class I ($32,799), and Class Y ($2,238) |
(2) Effective December 8, 2017, Class Y shares of the Fund converted to Class I shares at net asset value. Thereafter, Class Y shares were terminated. |
(3) Includes accumulated undistributed net investment income of $176,483 at September 30, 2017. The requirement to disclose the corresponding amount as of September 30, 2018 was eliminated. |
| See notes to financial statements. |
14 www.calvert.com CALVERT MID-CAP FUND ANNUAL REPORT
CALVERT MID-CAP FUND
FINANCIAL HIGHLIGHTS
|
| | | | | | | | | | | | | | |
| | Year Ended September 30, |
| CLASS A SHARES | 2018 | | 2017 | | 2016 | | 2015 | | 2014 |
| Net asset value, beginning | $33.40 | | $29.68 | | $33.41 | | $36.99 | | $36.83 |
| Income from investment operations: | | | | | | | | | |
Net investment income (loss) (1) | 0.07 |
| | 0.20 |
| | 0.02 |
| (2) | (0.16) |
| | (0.14) |
|
| Net realized and unrealized gain (loss) | 4.59 |
| | 3.68 |
| | (0.67) |
| | 1.91 |
| | 2.94 |
|
| Total from investment operations | 4.66 |
| | 3.88 |
| | (0.65) |
| | 1.75 |
| | 2.80 |
|
| Distributions from: | | | | | | | | | |
| Net investment income | (0.04) |
| | (0.15) |
| | — |
| | — |
| | — |
|
| Net realized gain | (3.18) |
| | (0.01) |
| | (3.08) |
| | (5.33) |
| | (2.64) |
|
| Total distributions | (3.22) |
| | (0.16) |
| | (3.08) |
| | (5.33) |
| | (2.64) |
|
| Total increase (decrease) in net asset value | 1.44 |
| | 3.72 |
| | (3.73) |
| | (3.58) |
| | 0.16 |
|
| Net asset value, ending | $34.84 | | $33.40 | | $29.68 | | $33.41 | | $36.99 |
Total return (3) | 15.04 | % | | 13.11 | % | | (2.08 | %) | | 4.90 | % | | 7.90 | % |
Ratios to average net assets: (4) | | | | | | | | | |
| Total expenses | 1.28 | % | | 1.34 | % | | 1.37 | % | | 1.41 | % | | 1.43 | % |
| Net expenses | 1.21 | % | | 1.21 | % | | 1.31 | % | | 1.41 | % | | 1.43 | % |
| Net investment income (loss) | 0.22 | % | | 0.64 | % | | 0.07 | % | (2) | (0.43 | %) | | (0.36 | %) |
| Portfolio turnover | 62 | % | | 162 | % | | 199 | % | | 74 | % | | 81 | % |
| Net assets, ending (in thousands) | $157,046 | | $159,951 | | $192,402 | | $223,328 | | $215,683 |
| | | | | | | | | | |
(1) Computed using average shares outstanding. |
(2) Amount includes a non-recurring refund for overbilling of prior years’ custody out-of-pocket fees. This amounted to $0.001 per share and 0% of average net assets. |
(3) Returns are historical and are calculated by determining the percentage change in net asset value with all distributions reinvested and do not reflect the effect of sales charges, if any. |
(4) Total expenses do not reflect amounts reimbursed and/or waived by the adviser and certain of its affiliates, if applicable. Net expenses are net of all reductions and represent the net expenses paid by the Fund. |
| See notes to financial statements. |
www.calvert.com CALVERT MID-CAP FUND ANNUAL REPORT 15
CALVERT MID-CAP FUND
FINANCIAL HIGHLIGHTS
|
| | | | | | | | | | | | | | |
| | Year Ended September 30, |
| CLASS C SHARES | 2018 | | 2017 | | 2016 | | 2015 | | 2014 |
| Net asset value, beginning | $24.55 | | $21.87 | | $25.62 | | $29.76 | | $30.35 |
| Income from investment operations: | | | | | | | | | |
Net investment loss (1) | (0.12) |
| | (0.03) |
| | (0.16) |
| (2) | (0.34) |
| | (0.34) |
|
| Net realized and unrealized gain (loss) | 3.27 |
| | 2.72 |
| | (0.51) |
| | 1.53 |
| | 2.39 |
|
| Total from investment operations | 3.15 |
| | 2.69 |
| | (0.67) |
| | 1.19 |
| | 2.05 |
|
| Distributions from: | | | | | | | | | |
| Net realized gain | (3.05) |
| | (0.01) |
| | (3.08) |
| | (5.33) |
| | (2.64) |
|
| Total distributions | (3.05) |
| | (0.01) |
| | (3.08) |
| | (5.33) |
| | (2.64) |
|
| Total increase (decrease) in net asset value | 0.10 |
| | 2.68 |
| | (3.75) |
| | (4.14) |
| | (0.59) |
|
| Net asset value, ending | $24.65 | | $24.55 | | $21.87 | | $25.62 | | $29.76 |
Total return (3) | 14.20 | % | | 12.29 | % | | (2.87 | %) | | 4.09 | % | | 7.06 | % |
Ratios to average net assets: (4) | | | | | | | | | |
| Total expenses | 2.03 | % | | 2.18 | % | | 2.16 | % | | 2.21 | % | | 2.19 | % |
| Net expenses | 1.96 | % | | 1.96 | % | | 2.09 | % | | 2.21 | % | | 2.19 | % |
| Net investment loss | (0.53 | %) | | (0.12 | %) | | (0.72 | %) | (2) | (1.23 | %) | | (1.12 | %) |
| Portfolio turnover | 62 | % | | 162 | % | | 199 | % | | 74 | % | | 81 | % |
| Net assets, ending (in thousands) | $17,043 | | $18,146 | | $22,885 | | $29,837 | | $27,588 |
| | | | | | | | | | |
(1) Computed using average shares outstanding. |
(2) Amount includes a non-recurring refund for overbilling of prior years’ custody out-of-pocket fees. This amounted to $0.001 per share and 0% of average net assets. |
(3) Returns are historical and are calculated by determining the percentage change in net asset value with all distributions reinvested and do not reflect the effect of sales charges, if any. |
(4) Total expenses do not reflect amounts reimbursed and/or waived by the adviser and certain of its affiliates, if applicable. Net expenses are net of all reductions and represent the net expenses paid by the Fund. |
| See notes to financial statements. |
16 www.calvert.com CALVERT MID-CAP FUND ANNUAL REPORT
CALVERT MID-CAP FUND
FINANCIAL HIGHLIGHTS
|
| | | | | | | | | | | | | | |
| | Year Ended September 30, |
| CLASS I SHARES | 2018 | | 2017 | | 2016 | | 2015 | | 2014 |
| Net asset value, beginning | $38.70 | | $34.38 | | $38.05 | | $41.19 | | $40.50 |
| Income from investment operations: | | | | | | | | | |
Net investment income (1) | 0.23 |
| | 0.41 |
| | 0.19 |
| (2) | 0.06 |
| | 0.10 |
|
| Net realized and unrealized gain (loss) | 5.37 |
| | 4.22 |
| | (0.78) |
| | 2.13 |
| | 3.23 |
|
| Total from investment operations | 5.60 |
| | 4.63 |
| | (0.59) |
| | 2.19 |
| | 3.33 |
|
| Distributions from: | | | | | | | | | |
| Net investment income | (0.15) |
| | (0.30) |
| | — |
| | — |
| | — |
|
| Net realized gain | (3.18) |
| | (0.01) |
| | (3.08) |
| | (5.33) |
| | (2.64) |
|
| Total distributions | (3.33) |
| | (0.31) |
| | (3.08) |
| | (5.33) |
| | (2.64) |
|
| Total increase (decrease) in net asset value | 2.27 |
| | 4.32 |
| | (3.67) |
| | (3.14) |
| | 0.69 |
|
| Net asset value, ending | $40.97 | | $38.70 | | $34.38 | | $38.05 | | $41.19 |
Total return (3) | 15.48 | % | | 13.53 | % | | (1.64 | %) | | 5.53 | % | | 8.53 | % |
Ratios to average net assets: (4) | | | | | | | | | |
| Total expenses | 1.03 | % | | 0.88 | % | | 0.86 | % | | 0.83 | % | | 0.82 | % |
| Net expenses | 0.86 | % | | 0.86 | % | | 0.84 | % | | 0.83 | % | | 0.82 | % |
| Net investment income | 0.59 | % | | 1.14 | % | | 0.55 | % | (2) | 0.14 | % | | 0.24 | % |
| Portfolio turnover | 62 | % | | 162 | % | | 199 | % | | 74 | % | | 81 | % |
| Net assets, ending (in thousands) | $93,198 | | $68,748 | | $166,759 | | $236,228 | | $156,677 |
| | | | | | | | | | |
(1) Computed using average shares outstanding. |
(2) Amount includes a non-recurring refund for overbilling of prior years’ custody out-of-pocket fees. This amounted to $0.001 per share and 0% of average net assets. |
(3) Returns are historical and are calculated by determining the percentage change in net asset value with all distributions reinvested and do not reflect the effect of sales charges, if any. |
(4) Total expenses do not reflect amounts reimbursed and/or waived by the adviser and certain of its affiliates, if applicable. Net expenses are net of all reductions and represent the net expenses paid by the Fund. |
| See notes to financial statements. |
www.calvert.com CALVERT MID-CAP FUND ANNUAL REPORT 17
NOTES TO FINANCIAL STATEMENTS
NOTE 1 — SIGNIFICANT ACCOUNTING POLICIES
Calvert Mid-Cap Fund (the Fund) is a diversified series of Calvert World Values Fund, Inc. (the Corporation). The Corporation is a Maryland corporation registered under the Investment Company Act of 1940, as amended (the 1940 Act), as an open-end management investment company. The investment objective of the Fund is to seek to provide long-term capital appreciation by investing primarily in mid-cap stocks.
The Fund offers three classes of shares. Class A shares are generally sold subject to a sales charge imposed at time of purchase. A contingent deferred sales charge of 0.80% may apply to certain redemptions of Class A shares for accounts for which no sales charge was paid, if redeemed within one year of purchase. Class C shares are sold without a front-end sales charge, and with certain exceptions, are charged a contingent deferred sales charge of 1% on shares redeemed within one year of purchase. Class C shares are only available for purchase through a financial intermediary. Class I shares are sold at net asset value, are not subject to a sales charge and are sold only to certain eligible investors. The Fund previously offered Class Y shares. At the close of business on December 8, 2017, Class Y shares were converted to Class I shares. Each class represents a pro rata interest in the Fund, but votes separately on class-specific matters and is subject to different expenses.
The Fund applies the accounting and reporting guidance in the Financial Accounting Standards Board (FASB) Accounting Standards Codification Topic 946, Financial Services – Investment Companies (ASC 946). Subsequent events, if any, through the date that the financial statements were issued have been evaluated in the preparation of the financial statements.
A. Investment Valuation: Net asset value per share is determined every business day as of the close of the regular session of the New York Stock Exchange (generally 4:00 p.m. Eastern time). The Fund uses independent pricing services approved by the Board of Directors (the Board) to value its investments wherever possible. Investments for which market quotations are not available or deemed not reliable are fair valued in good faith under the direction of the Board.
U.S. generally accepted accounting principles (U.S. GAAP) establishes a disclosure hierarchy that categorizes the inputs to valuation techniques used to value assets and liabilities at measurement date. These inputs are summarized in the three broad levels listed below:
Level 1 - quoted prices in active markets for identical securities
Level 2 - other significant observable inputs (including quoted prices for similar securities, interest rates, prepayment speeds, credit risk, etc.)
Level 3 - significant unobservable inputs (including the Fund’s own assumptions in determining the fair value of investments)
The inputs or methodologies used for valuing securities are not necessarily an indication of the risk associated with investing in those securities.
Valuation techniques used to value the Fund’s investments by major category are as follows:
Equity Securities. Equity securities (including warrants and rights) listed on a U.S. securities exchange generally are valued at the last sale or closing price as reported by an independent pricing service on the primary market or exchange on which they are traded and are categorized as Level 1 in the hierarchy. Equity securities listed on the NASDAQ Global or Global Select Market are valued at the NASDAQ official closing price and are categorized as Level 1 in the hierarchy. Unlisted or listed securities for which closing sales prices or closing quotations are not available are valued at the mean between the latest available bid and asked prices and are categorized as Level 2 in the hierarchy.
Short-Term Debt Securities. Short-term debt securities with a remaining maturity at time of purchase of more than sixty days are valued on the basis of valuations provided by a third party pricing service. Such securities are generally categorized as Level 2 in the hierarchy. Short-term debt securities of sufficient credit quality purchased with remaining maturities of sixty days or less are valued at amortized cost, which approximates fair value, and are categorized as Level 2 in the hierarchy.
Other Securities. Investments in registered investment companies (including money market funds) that do not trade on an exchange are valued at the net asset value per share on the valuation day and are categorized as Level 1 in the hierarchy.
Fair Valuation. If a market value cannot be determined for a security using the methodologies described above, or if, in the good faith opinion of the Fund’s adviser, the market value does not constitute a readily available market quotation, or if a significant event has occurred that would materially affect the value of the security, the security will be fair valued as determined in good faith by or at the direction of the Board in a manner that fairly reflects the security’s value, or the amount that the Fund might reasonably expect to receive for the security upon its current sale in the ordinary course. Each such determination is based on a consideration of relevant factors, which are likely to vary from one pricing context to another. These factors may include, but are not limited to, the type of security, the existence of any contractual restrictions on the security’s disposition, the price and extent
18 www.calvert.com CALVERT MID-CAP FUND ANNUAL REPORT
of public trading in similar securities of the issuer or of comparable companies or entities, quotations or relevant information obtained from broker/dealers or other market participants, information obtained from the issuer, analysts, and/or the appropriate stock exchange (for exchange-traded securities), an analysis of the company’s or entity’s financial condition, and an evaluation of the forces that influence the issuer and the market(s) in which the security is purchased and sold.
The values assigned to fair value investments are based on available information and do not necessarily represent amounts that might ultimately be realized. Further, due to the inherent uncertainty of valuations of such investments, the fair values may differ significantly from the values that would have been used had an active market existed, and the differences could be material.
The following table summarizes the market value of the Fund’s holdings as of September 30, 2018, based on the inputs used to value them:
|
| | | | | | | | | | | | | |
| Assets | Level 1 | | Level 2 | Level 3(1) | Total |
| Common Stocks | $ | 262,315,915 |
| (2) | $ | — |
| $ | — |
| $ | 262,315,915 |
|
| High Social Impact Investments | — |
| | 2,520,864 |
| 654,321 |
| 3,175,185 |
|
| Short Term Investment of Cash Collateral for Securities Loaned | 3,172,750 |
| | — |
| — |
| 3,172,750 |
|
| Total Investments | $ | 265,488,665 |
| | $ | 2,520,864 |
| $ | 654,321 |
| $ | 268,663,850 |
|
| | | | | | |
(1) None of the unobservable inputs for Level 3 assets, individually or collectively, had a material impact on the Fund. |
(2) The level classification by major category of investments is the same as the category presentation in the Schedule of Investments. |
Level 3 investments at the beginning and/or end of the period in relation to net assets were not significant and accordingly, a reconciliation of Level 3 assets for the year ended September 30, 2018 is not presented.
B. Investment Transactions and Income: Investment transactions for financial statement purposes are accounted for on trade date. Realized gains and losses are recorded on an identified cost basis and may include proceeds from litigation. Dividend income is recorded on the ex-dividend date for dividends received in cash and/or securities or, in the case of dividends on certain foreign securities, as soon as the Fund is informed of the ex-dividend date. Non-cash dividends are recorded at the fair value of the securities received. Withholding taxes on foreign dividends, if any, have been provided for in accordance with the Fund’s understanding of the applicable country’s tax rules and rates. Distributions received that represent a return of capital are recorded as a reduction of cost of investments. Distributions received that represent a capital gain are recorded as a realized gain. Interest income, which includes amortization of premium and accretion of discount on debt securities, is accrued as earned.
C. Share Class Accounting: Realized and unrealized gains and losses and net investment income and losses, other than class-specific expenses, are allocated daily to each class of shares based upon the relative net assets of each class to the total net assets of the Fund. Expenses arising in connection with a specific class are charged directly to that class.
D. Foreign Currency Transactions: The Fund’s accounting records are maintained in U.S. dollars. For valuation of assets and liabilities on each date of net asset value determination, foreign denominations are converted into U.S. dollars using the current exchange rate. Security transactions, income, and expenses are translated at the prevailing rate of exchange on the date of the event. Recognized gains or losses on investment transactions attributable to changes in foreign currency exchange rates are recorded for financial statement purposes as net realized gains and losses on investments. That portion of unrealized gains and losses on investments that results from fluctuations in foreign currency exchange rates is not separately disclosed.
E. Restricted Securities: The Fund may invest in securities that are subject to legal or contractual restrictions on resale. Generally, these securities may only be sold publicly upon registration under the Securities Act of 1933 or in transactions exempt from such registration. Information regarding restricted securities is included at the end of the Schedule of Investments.
F. Distributions to Shareholders: Distributions to shareholders are recorded by the Fund on ex-dividend date. Dividends from net investment income and distributions from net realized capital gains, if any, are paid at least annually. Distributions are determined in accordance with income tax regulations which may differ from U.S. GAAP; accordingly, periodic reclassifications are made within the Fund’s capital accounts to reflect income and gains available for distribution under income tax regulations.
G. Estimates: The preparation of financial statements in conformity with U.S. GAAP requires management to make estimates and assumptions that affect the reported amounts of assets and liabilities and disclosure of contingent assets and liabilities at the date of the financial statements and the reported amounts of increases and decreases in net assets from operations during the reporting period. Actual results could differ from those estimates.
H. Indemnifications: The Corporation’s By-Laws provide for indemnification for Directors or officers of the Corporation and certain other parties, to the fullest extent permitted by Maryland law and the 1940 Act, provided certain conditions are met.
www.calvert.com CALVERT MID-CAP FUND ANNUAL REPORT 19
Additionally, in the normal course of business, the Fund enters into agreements with service providers that may contain indemnification clauses. The Fund’s maximum exposure under these arrangements is unknown as this would involve future claims that may be made against the Fund that have not yet occurred.
I. Federal Income Taxes: No provision for federal income or excise tax is required since the Fund intends to continue to qualify as a regulated investment company under the Internal Revenue Code and to distribute substantially all of its taxable earnings.
Management has analyzed the Fund’s tax positions taken for all open federal income tax years and has concluded that no provision for federal income tax is required in the Fund’s financial statements. A Fund’s federal tax return is subject to examination by the Internal Revenue Service for a period of three years from the date of filing.
NOTE 2 — RELATED PARTY TRANSACTIONS
The investment advisory fee is earned by Calvert Research and Management (CRM), a subsidiary of Eaton Vance Management (EVM), as compensation for investment advisory services rendered to the Fund. Pursuant to the investment advisory agreement, CRM receives a fee, payable monthly, at the annual rate of 0.65% of the Fund’s average daily net assets. For the year ended September 30, 2018, the investment advisory fee amounted to $1,661,954 of the Fund’s average daily net assets.
CRM has agreed to reimburse the Fund’s operating expenses to the extent that total annual operating expenses (relating to ordinary operating expenses only and excluding expenses such as brokerage commissions, acquired fund fees and expenses of unaffiliated funds, interest expense, taxes or litigation expenses) exceed 1.21%, 1.96% and 0.86% for Class A, Class C and Class I, respectively, and prior to the close of business on December 8, 2017, 0.96% for Class Y, of such class’ average daily net assets. The expense reimbursement agreement with CRM may be changed or terminated after January 31, 2019. For the year ended September 30, 2018, CRM waived or reimbursed expenses of $236,426.
The administrative fee is earned by CRM as compensation for administrative services rendered to the Fund. The fee is computed at an annual rate of 0.12% of the Fund’s average daily net assets attributable to Class A, Class C and Class I (and Class Y prior to the close of business on December 8, 2017), and is payable monthly. CRM contractually waived 0.02% of the administrative fee through January 31, 2018 for Class I. For the year ended September 30, 2018, CRM was paid administrative fees of $306,786, of which $4,910 were waived.
The Fund has in effect a distribution plan for Class A shares (Class A Plan) pursuant to Rule 12b-1 under the 1940 Act. Pursuant to the Class A Plan, the Fund pays Eaton Vance Distributors, Inc. (EVD), an affiliate of CRM and the Fund’s principal underwriter, a distribution and service fee of 0.25% per annum of its average daily net assets attributable to Class A for distribution services and facilities provided to the Fund by EVD, as well as for personal services and/or the maintenance of shareholder accounts. The Fund also has in effect a distribution plan for Class C shares (Class C Plan) pursuant to Rule 12b-1 under the 1940 Act. Pursuant to the Class C Plan, the Fund pays EVD amounts equal to 0.75% per annum of its average daily net assets attributable to Class C shares for providing ongoing distribution services and facilities to the Fund. In addition, pursuant to the Class C Plan, the Fund also makes payments of service fees to EVD, financial intermediaries and other persons in amounts equal to 0.25% per annum of its average daily net assets attributable to that class. Service fees paid or accrued were for personal services and/or the maintenance of shareholder accounts. Distribution and service fees paid or accrued for the year ended September 30, 2018 amounted to $391,739 and $172,632 for Class A shares and Class C shares, respectively.
The Fund was informed that EVD received $17,439 and its portion of the sales charge on sales of Class A shares and $1,297 of contingent deferred sales charges paid by the Fund shareholders for the year ended September 30, 2018.
EVM provides sub-transfer agency and related services to the Fund pursuant to a Sub-Transfer Agency Support Services Agreement. For the year ended September 30, 2018, sub-transfer agency fees and expenses incurred to EVM amounted to $65,764 and are included in transfer agency fees and expenses on the Statement of Operations.
Each Director of the Fund who is not an employee of CRM or its affiliates receives a fee of $3,000 for each Board meeting attended in person and $2,000 for each Board meeting attended by phone plus an annual fee of $52,000, and $1,500 for each Committee meeting attended in person and $1,000 for each Committee meeting attended by phone plus an annual Committee fee of $2,500. The Board chair receives an additional $10,000 annual retainer and Committee chairs receive an additional $6,000 annual retainer. Eligible Directors may participate in a Deferred Compensation Plan (the Plan). Amounts deferred under the Plan are treated as though equal dollar amounts had been invested in shares of the Fund or other Calvert funds selected by the Directors. The Fund purchases shares of the funds selected equal to the dollar amounts deferred under the Plan, resulting in an asset equal to the deferred compensation liability. Obligations of the Plan are paid solely from the Fund’s assets. Directors’ fees are allocated to each of the Calvert funds served. Salaries and fees of officers and Directors of the Fund who are employees of CRM or its affiliates are paid by CRM. In addition, an advisory council was established to aid the Board and CRM in advancing the cause of responsible investing through original scholarship and thought leadership. The advisory council consists of CRM’s Chief Executive Officer and four additional members. Each member (other than CRM’s Chief Executive Officer) receives annual
20 www.calvert.com CALVERT MID-CAP FUND ANNUAL REPORT
compensation of $75,000, which is being reimbursed by Calvert Investment Management, Inc. (CIM), the Calvert funds’ former investment adviser, and Ameritas Holding Company CIM’s parent company, through the end of 2019. For the year ended September 30, 2018, the Fund’s allocated portion of such expense and reimbursement was $5,317, which are included in miscellaneous expense and reimbursement of expenses-other, respectively, on the Statement of Operations.
NOTE 3 — INVESTMENT ACTIVITY
During the year ended September 30, 2018, the cost of purchases and proceeds from sales of investments, other than short-term securities, were $158,499,710 and $187,005,211, respectively.
NOTE 4 — DISTRIBUTIONS TO SHAREHOLDERS AND INCOME TAX INFORMATION
The tax character of distributions declared for the years ended September 30, 2018 and September 30, 2017 was as follows:
|
| | | | | | |
| | Year Ended
September 30, |
| | 2018 | 2017 |
| Ordinary income |
| $10,271,655 |
|
| $2,378,020 |
|
| Long-term capital gains |
| $13,433,194 |
| $— |
|
During the year ended September 30, 2018, distributable earnings was decreased by $1,658,262 and paid-in capital was increased by $1,658,262 due to the Fund’s use of equalization accounting. Tax equalization accounting allows the Fund to treat as a distribution that portion of redemption proceeds representing a redeeming shareholder’s portion of undistributed taxable income and net capital gains. These reclassifications had no effect on the net assets or net asset value per share of the Fund.
As of September 30, 2018, the components of distributable earnings (accumulated loss) on a tax basis were as follows:
|
| | | |
| Undistributed ordinary income |
| $7,213,067 |
|
| Undistributed long-term capital gains |
| $7,018,355 |
|
| Net unrealized appreciation (depreciation) |
| $33,607,894 |
|
The cost and unrealized appreciation (depreciation) of investments of the Fund at September 30, 2018, as determined on a federal income tax basis, were as follows:
|
| | | |
| Aggregate cost |
| $235,055,956 |
|
| Gross unrealized appreciation |
| $38,144,096 |
|
| Gross unrealized depreciation | (4,536,202 | ) |
| Net unrealized appreciation (depreciation) |
| $33,607,894 |
|
NOTE 5 — SECURITIES LENDING
To generate additional income, the Fund may lend its securities pursuant to a securities lending agency agreement with State Street Bank and Trust Company (SSB), the securities lending agent. Security loans are subject to termination by the Fund at any time and, therefore, are not considered illiquid investments. The Fund requires that the loan be continuously collateralized by either cash or securities as collateral equal at all times to at least 102% of the market value of the domestic securities loaned and 105% of the market value of the international securities loaned (if applicable). The market value of securities loaned is determined daily and any additional required collateral is delivered to the Fund on the next business day. Cash collateral is generally invested in a money market fund registered under the 1940 Act that is managed by an affiliate of SSB. Any gain or loss in the market price of the loaned securities that might occur and any interest earned or dividends declared during the term of the loan would accrue to the account of the Fund. Income earned on the investment of collateral, net of broker rebates and other expenses incurred by the securities lending agent, is split between the Fund and the securities lending agent on the basis of agreed upon contractual terms. Non-cash collateral, if any, is held by the lending agent on behalf of the Fund and cannot be sold or re-pledged by the Fund; accordingly, such collateral is not reflected in the Statement of Assets and Liabilities.
The risks associated with lending portfolio securities include, but are not limited to, possible delays in receiving additional collateral or in the recovery of the loaned securities, possible loss of rights to the collateral should the borrower fail financially, as well as risk of loss in the value of the collateral or the value of the investments made with the collateral. The securities lending agent shall indemnify the Fund in the case of default of any securities borrower.
www.calvert.com CALVERT MID-CAP FUND ANNUAL REPORT 21
At September 30, 2018, the total value of securities on loan was $23,077,292 and the total value of collateral received was $23,467,914, comprised of cash of $3,172,750 and U.S. Government and/or agencies securities of $20,295,164.
The following table provides a breakdown of securities lending transactions accounted for as secured borrowings, the obligations by class of collateral pledged, and the remaining contractual maturity of those transactions as of September 30, 2018.
|
| | | | | | | | | | | | | | | |
| | Remaining Contractual Maturity of the Transactions |
| | Overnight and Continuous | <30 days | 30 to 90 days | >90 days | Total |
| Securities Lending Transactions | | | | | |
| Common Stocks |
| $23,467,914 |
|
| $— |
|
| $— |
|
| $— |
|
| $23,467,914 |
|
The carrying amount of the liability for deposits for securities loaned at September 30, 2018 approximated its fair value. If measured at fair value, such liability would have been considered as Level 2 in the fair value hierarchy (see Note 1A) at September 30, 2018.
NOTE 6 — LINE OF CREDIT
The Fund participates with other funds managed by CRM in a $62.5 million committed ($25 million committed and $25 million uncommitted prior to August 7, 2018) unsecured line of credit agreement with SSB, which is in effect through August 6, 2019. Borrowings may be made for temporary or emergency purposes only. Borrowings bear interest at the higher of the One-Month London Interbank Offered Rate (LIBOR) in effect that day or the overnight Federal Funds Rate, plus 1.00% (1.25% prior to August 7, 2018) per annum. A commitment fee of 0.20% (0.25% prior to August 7, 2018) per annum is incurred on the unused portion of the committed facility. An administrative fee of $37,500 was incurred in connection with the renewal of the facility in August 2018. These fees are allocated to all participating funds. Because the line of credit is not available exclusively to the Fund, it may be unable to borrow some or all of its requested amounts at any particular time. The Fund had no borrowings outstanding pursuant to this line of credit at September 30, 2018. The Fund did not have any significant borrowings or allocated fees during the year ended September 30, 2018.
NOTE 7 — AFFILIATED COMPANIES
The Fund has invested a portion of its assets designated for high social impact investments in notes (the Notes) issued by Calvert Impact Capital, Inc. (CIC), formerly the Calvert Social Investment Foundation, pursuant to an exemptive order granted by the U.S. Securities and Exchange Commission (the SEC) in 1998 (the Exemptive Order). The Fund obtained the Exemptive Order because at that time there was a significant overlap of Fund Board members and CIC Board members as well as certain other affiliations between CIC and affiliates of the Fund’s investment adviser. CIC may be considered an affiliated person of the Fund based on the overlap between CIC’s Board of Directors and the Calvert funds’ Directors/Trustees and other potential affiliations. CIC has licensed use of the Calvert name from CRM, and currently two Fund Board members (one of whom is CRM’s President and Chief Executive Officer), two members of the Advisory Council to the Calvert Fund Board of Directors/Trustees, and an additional CRM officer serve on CIC’s Board. CIC is not owned or otherwise controlled by CRM or its affiliates. The Fund intends to request a new exemptive order from the SEC to permit additional investment in CIC notes.
At September 30, 2018, the value of the Fund’s investment in the Notes was $2,520,864, which represents 0.9% of the Fund’s net assets. Transactions in the Notes by the Fund for the year ended September 30, 2018 were as follows:
|
| | | | | | | | | | | | | | | | | | | | | | | | | | | |
| Name of Issuer | Principal Amount,
beginning of year | Gross Additions | Gross Reductions | Principal Amount,
end of
year | Value,
end of year | Interest
Income | Net Realized
Gain (Loss) | Capital Gain
Distributions Received | Change in
Unrealized
Appreciation
(Depreciation) |
High Social Impact Investments Calvert Impact Capital, Inc., Community Investment Notes, 1.50%, 12/15/19 (1) |
| $2,619,488 |
|
| $— |
|
| $— |
|
| $2,619,488 |
|
| $2,520,864 |
|
| $39,292 |
|
| $— |
|
| $— |
|
| $24,283 |
|
(1) Restricted security
22 www.calvert.com CALVERT MID-CAP FUND ANNUAL REPORT
NOTE 8 — CAPITAL SHARES
Transactions in capital shares for the years ended September 30, 2018 and September 30, 2017 were as follows:
|
| | | | | | | | | | | |
| | Year Ended
September 30, 2018 | | Year Ended
September 30, 2017 |
| | Shares | Amount | | Shares | Amount |
| Class A | | | | | |
| Shares sold | 315,515 |
|
| $10,423,803 |
| | 461,089 |
|
| $14,551,836 |
|
| Reinvestment of distributions | 453,988 |
| 14,182,592 |
| | 29,416 |
| 924,908 |
|
| Shares redeemed | (1,050,776 | ) | (34,625,545 | ) | | (2,184,626 | ) | (69,008,577 | ) |
| Net decrease | (281,273 | ) |
| ($10,019,150 | ) | | (1,694,121 | ) |
| ($53,531,833 | ) |
| | | | | | |
| Class C | | | | | |
| Shares sold | 40,672 |
|
| $962,636 |
| | 53,038 |
|
| $1,235,476 |
|
| Reinvestment of distributions | 91,560 |
| 2,035,380 |
| | 259 |
| 6,012 |
|
| Shares redeemed | (179,909 | ) | (4,214,796 | ) | | (360,391 | ) | (8,416,557 | ) |
| Net decrease | (47,677 | ) |
| ($1,216,780 | ) | | (307,094 | ) |
| ($7,175,069 | ) |
| | | | | | |
| Class I | | | | | |
| Shares sold | 659,284 |
|
| $25,567,736 |
| | 926,505 |
|
| $33,800,648 |
|
| Reinvestment of distributions | 178,045 |
| 6,520,017 |
| | 36,631 |
| 1,330,971 |
|
| Shares redeemed | (615,028 | ) | (23,450,985 | ) | | (4,036,797 | ) | (148,182,357 | ) |
| Conversion from Class Y | 276,006 |
| 11,044,764 |
| | — |
| — |
|
| Net increase (decrease) | 498,307 |
|
| $19,681,532 |
| | (3,073,661 | ) |
| ($113,050,738 | ) |
| | | | | | |
| Class Y (1) | | | | | |
| Shares sold | 26,967 |
|
| $926,227 |
| | 329,364 |
|
| $10,605,042 |
|
| Reinvestment of distributions | — |
| — |
| | 1,469 |
| 46,876 |
|
| Shares redeemed | (63,076 | ) | (2,165,170 | ) | | (429,505 | ) | (13,625,333 | ) |
| Conversion to Class I | (314,651 | ) | (11,044,764 | ) | | — |
| — |
|
| Net decrease | (350,760 | ) |
| ($12,283,707 | ) | | (98,672 | ) |
| ($2,973,415 | ) |
| | | | | | |
| (1) Effective December 8, 2017, Class Y shares of the Fund converted to Class I shares at net asset value. Thereafter, Class Y shares were terminated. |
www.calvert.com CALVERT MID-CAP FUND ANNUAL REPORT 23
REPORT OF INDEPENDENT REGISTERED PUBLIC ACCOUNTING FIRM
To the Shareholders and Board of Directors
Calvert World Values Fund, Inc.:
Opinion on the Financial Statements
We have audited the accompanying statement of assets and liabilities of Calvert Mid-Cap Fund (the Fund), a series of Calvert World Values Fund, Inc., including the schedule of investments, as of September 30, 2018, the related statement of operations for the year then ended, the statements of changes in net assets for each of the years in the two‑year period then ended, and the related notes (collectively, the financial statements) and the financial highlights for each of the years in the five‑year period then ended. In our opinion, the financial statements and financial highlights present fairly, in all material respects, the financial position of the Fund as of September 30, 2018, the results of its operations for the year then ended, the changes in its net assets for each of the years in the two‑year period then ended, and the financial highlights for each of the years in the five‑year period then ended, in conformity with U.S. generally accepted accounting principles.
Basis for Opinion
These financial statements and financial highlights are the responsibility of the Fund’s management. Our responsibility is to express an opinion on these financial statements and financial highlights based on our audits. We are a public accounting firm registered with the Public Company Accounting Oversight Board (United States) (PCAOB) and are required to be independent with respect to the Fund in accordance with the U.S. federal securities laws and the applicable rules and regulations of the Securities and Exchange Commission and the PCAOB.
We conducted our audits in accordance with the standards of the PCAOB. Those standards require that we plan and perform the audit to obtain reasonable assurance about whether the financial statements and financial highlights are free of material misstatement, whether due to error or fraud. Our audits included performing procedures to assess the risks of material misstatement of the financial statements and financial highlights, whether due to error or fraud, and performing procedures that respond to those risks. Such procedures included examining, on a test basis, evidence regarding the amounts and disclosures in the financial statements and financial highlights. Such procedures also included confirmation of securities owned as of September 30, 2018, by correspondence with custodians and brokers. Our audits also included evaluating the accounting principles used and significant estimates made by management, as well as evaluating the overall presentation of the financial statements and financial highlights. We believe that our audits provide a reasonable basis for our opinion.
We have served as the auditor of one or more of the Calvert Funds since 2002.
Philadelphia, Pennsylvania
November 21, 2018
24 www.calvert.com CALVERT MID-CAP FUND ANNUAL REPORT
FEDERAL TAX INFORMATION
The Form 1099-DIV you receive in February 2019 will show the tax status of all distributions paid to your account in calendar year 2018. Shareholders are advised to consult their own tax adviser with respect to the tax consequences of their investment in the Fund. As required by the Internal Revenue Code and/or regulations, shareholders must be notified regarding the status of qualified dividend income for individuals, the dividends received deduction for corporations and capital gains dividends.
Qualified Dividend Income. For the fiscal year ended September 30, 2018, the Fund designates approximately $2,628,119, or up to the maximum amount of such dividends allowable pursuant to the Internal Revenue Code, as qualified dividend income eligible for the reduced tax rate of 15%.
Dividends Received Deduction. Corporate shareholders are generally entitled to take the dividends received deduction on the portion of the Fund’s dividend distribution that qualifies under tax law. For the Fund’s fiscal 2018 ordinary income dividends, 24.08% qualifies for the corporate dividends received deduction.
Capital Gains Dividends. The Fund hereby designates as a capital gain dividend with respect to the taxable year ended September 30, 2018, $7,836,692 or, if subsequently determined to be different, the net capital gain of such year.
www.calvert.com CALVERT MID-CAP FUND ANNUAL REPORT (Unaudited) 25
MANAGEMENT AND ORGANIZATION
Fund Management. The Directors of Calvert World Values Fund, Inc. (the Corporation) are responsible for the overall management and supervision of the Corporation’s affairs. The Directors and officers of the Corporation are listed below. Except as indicated, each individual has held the office shown or other offices in the same company for the last five years. Directors and officers of the Corporation hold indefinite terms of office. The “Independent Directors” consist of those Directors who are not “interested persons” of the Corporation, as that term is defined under the 1940 Act. The business address of each Director and officer, with the exception of Ms. Gemma and Mr. Kirchner, is 1825 Connecticut Avenue NW, Suite 400, Washington, DC 20009. As used below, “CRM” refers to Calvert Research and Management. Each Director oversees 39 funds in the Calvert fund complex. Each officer serves as an officer of certain other Calvert funds.
|
| | | |
| Name and Year of Birth | Position
with Corporation | Position
Start Date | Principal Occupation(s) and Directorships
During Past Five Years and Other Relevant Experience |
| | | | |
| Interested Director | | | |
John H. Streur(1)
1960 | Director & President | 2015 | President and Chief Executive Officer of Calvert Research and Management (since December 31, 2016). President and Chief Executive Officer of Calvert Investments, Inc. (January 2015 - December 2016); Chief Executive Officer of Calvert Investment Distributors, Inc. (August 2015 - December 2016); Chief Compliance Officer of Calvert Investment Management, Inc. (August 2015 - April 2016); President and Director, Portfolio 21 Investments, Inc. (through October 2014); President, Chief Executive Officer and Director, Managers Investment Group LLC (through January 2012); President and Director, The Managers Funds and Managers AMG Funds (through January 2012).
Directorships in the Last Five Years. Portfolio 21 Investments, Inc. (asset management) (through October 2014); Managers Investment Group LLC (asset management) (through January 2012); The Managers Funds (asset management) (through January 2012); Managers AMG Funds (asset management) (through January 2012); Calvert Impact Capital, Inc. |
| Independent Directors | | | |
Richard L. Baird, Jr
1948 | Director | 2005 | Former President and CEO of Adagio Health Inc. (retired in 2014) in Pittsburgh, PA, a non-profit corporation which provides family planning services, nutrition, maternal/child health care, and various health screening services and community preventive health programs.
Directorships in the Last Five Years. None. |
Alice Gresham Bullock
1950 | Chair & Director | 2016 | Professor at Howard University School of Law (retired June 2016). She is former Dean of Howard University School of Law (1996-2002) and Deputy Director of the Association of American Law Schools (1992-1994).
Directorships in the Last Five Years. None. |
Cari M. Dominguez
1949 | Director | 2016 | Former Chair of the U.S. Equal Employment Opportunity Commission.
Directorships in the Last Five Years. Manpower, Inc. (employment agency); Triple S Management Corporation (managed care); National Association of Corporate Directors. |
John G. Guffey, Jr.
1948 | Director | 1992 | President of Aurora Press Inc., a privately held publisher of trade paperbacks (since January 1997).
Directorships in the Last Five Years. Calvert Impact Capital, Inc.; Calvert Ventures, LLC. |
26 www.calvert.com CALVERT MID-CAP FUND ANNUAL REPORT (Unaudited)
|
| | | |
| Name and Year of Birth | Position
with Corporation | Position
Start Date | Principal Occupation(s) and Directorships
During Past Five Years and Other Relevant Experience |
| | | | |
Miles D. Harper, III
1962 | Director | 2005 | Partner, Carr Riggs & Ingram (public accounting firm) since October 2014. Partner, Gainer Donnelly & Desroches (public accounting firm) (now Carr Riggs & Ingram), November 1999 - September 2014).
Directorships in the Last Five Years. Bridgeway Funds (10) (asset management). |
Joy V. Jones
1950 | Director | 2005 | Attorney.
Directorships in the Last Five Years. Conduit Street Restaurants SUD 2 Limited; Palm Management Restaurant Corporation. |
Anthony A. Williams
1951 | Director | 2016 | CEO and Executive Director of the Federal City Council (July 2012 to present); Senior Adviser and Independent Consultant for McKenna Long & Aldridge LLP (September 2011 to present); Executive Director of Global Government Practice at the Corporate Executive Board (January 2010 to January 2012).
Directorships in the Last Five Years. Freddie Mac; Evoq Properties/ Meruelo Maddux Properties, Inc. (real estate management); Weston Solutions, Inc. (environmental services); Bipartisan Policy Center’s Debt Reduction Task Force; Chesapeake Bay Foundation; Catholic University of America; Urban Institute (research organization). |
|
| | | |
| Principal Officers who are not Directors | |
Name and
Year of Birth | Position with
Corporation | Position Start Date | Principal Occupation
During Past Five Years |
| | | | |
Hope L. Brown
1973 | Chief Compliance Officer | 2014 | Chief Compliance Officer of 39 registered investment companies advised by CRM (since 2014). Vice President and Chief Compliance Officer, Wilmington Funds (2012-2014). Vice President and Senior Compliance Officer, Wilmington Trust Investment Advisors, Inc. (2010-2012). |
Maureen A. Gemma(2)
1960 | Secretary, Vice President and Chief Legal Officer | 2016 | Vice President of CRM and officer of 39 registered investment companies advised by CRM (since 2016). Also Vice President of Eaton Vance Management (“EVM”) and certain of its affiliates and officer of 174 registered investment companies advised or administered by EVM. |
James F. Kirchner(2)
1967 | Treasurer | 2016 | Vice President of CRM and officer of 39 registered investment companies advised by CRM (since 2016). Also Vice President of EVM and certain of its affiliates and officer of 174 registered investment companies advised or administered by EVM. |
| | | | |
| |
(1) | Mr. Streur is an interested person of the Fund because of his positions with the Fund’s adviser and certain affiliates. |
| |
(2) | The business address for Ms. Gemma and Mr. Kirchner is Two International Place, Boston, MA 02110. |
The SAI for the Fund includes additional information about the Directors and officers of the Fund and can be obtained without charge on Calvert’s website at www.calvert.com or by calling 1-800-368-2745.
www.calvert.com CALVERT MID-CAP FUND ANNUAL REPORT (Unaudited) 27
IMPORTANT NOTICES
Privacy. The Calvert Funds and Calvert Research and Management are committed to ensuring your financial privacy. Each of the financial institutions identified below has in effect the following policy (“Privacy Policy”) with respect to nonpublic personal information about its customers:
| |
| • | Only such information received from you, through application forms or otherwise, and information about your Calvert fund transactions will be collected. This may include information such as name, address, social security number, tax status, account balances and transactions. |
| |
| • | None of such information about you (or former customers) will be disclosed to anyone, except as permitted by law (which includes disclosure to employees necessary to service your account). In the normal course of servicing a customer’s account, Calvert Research and Management may share information with unaffiliated third parties that perform various required services such as transfer agents, custodians and broker-dealers. |
| |
| • | Policies and procedures (including physical, electronic and procedural safeguards) are in place that are designed to protect the confidentiality of such information. |
| |
| • | The Funds reserve the right to change this Privacy Policy at any time upon proper notification to you. Customers may want to review the Funds’ Privacy Policy periodically for changes by accessing the link on our homepage: www.calvert.com. |
Our pledge of privacy applies to the following entities: the Calvert Family of Funds, Calvert Research and Management and their affiliated service providers, Eaton Vance Management and Eaton Vance Distributors, Inc. In addition, our Privacy Policy applies only to those Calvert customers who are individuals and who have a direct relationship with us. If a customer’s account (i.e., fund shares) is held in the name of a third-party financial advisor/broker-dealer, it is likely that only such advisor’s privacy policies apply to the customer. This notice supersedes all previously issued privacy disclosures. For more information about Calvert’s Privacy Policy, please call 1-800-368-2745.
Delivery of Shareholder Documents. The Securities and Exchange Commission (SEC) permits funds to deliver only one copy of shareholder documents, including prospectuses, proxy statements and shareholder reports, to fund investors with multiple accounts at the same residential or post office box address. This practice is often called “householding” and it helps eliminate duplicate mailings to shareholders. Calvert funds, or your financial advisor, may household the mailing of your documents indefinitely unless you instruct Calvert funds, or your financial advisor, otherwise. If you would prefer that your Calvert fund documents not be householded, please contact Calvert funds at 1-800-368-2745, or contact your financial advisor. Your instructions that householding not apply to delivery of your Calvert fund documents will typically be effective within 30 days of receipt by Calvert funds or your financial advisor. Separate statements will be generated for each separate account and will be householded as described above.
Portfolio Holdings. Each Calvert fund will file a schedule of portfolio holdings on Form N-Q with the SEC for the first and third quarters of each fiscal year. The Form N-Q will be available on the Calvert funds’ website at www.calvert.com, by calling Calvert funds at 1-800-368-2745 or in the EDGAR database on the SEC’s website at www.sec.gov. Form N-Q may also be reviewed and copied at the SEC’s public reference room in Washington, D.C. (call 1-800-732-0330 for information on the operation of the public reference room).
Proxy Voting. The Proxy Voting Guidelines that each Calvert fund uses to determine how to vote proxies relating to portfolio securities is provided as an Appendix to the fund’s Statement of Additional Information. The Statement of Additional Information can be obtained free of charge by calling the Calvert funds at 1-800-368-2745, by visiting the Calvert funds’ website at www.calvert.com or visiting the SEC’s website at www.sec.gov. Information regarding how a Calvert fund voted proxies relating to portfolio securities during the most recent 12-month period ended June 30 is available by calling Calvert funds, by visiting the Calvert funds’ website at www.calvert.com or by visiting the SEC’s website at www.sec.gov.
28 www.calvert.com CALVERT MID-CAP FUND ANNUAL REPORT (Unaudited)
|
| |
| CALVERT MID-CAP FUND | |
Investment Adviser and Administrator Calvert Research and Management 1825 Connecticut Avenue NW, Suite 400 Washington, DC 20009 | Transfer Agent DST Asset Manager Solutions, Inc. 2000 Crown Colony Drive Quincy, MA 02169 |
Principal Underwriter* Eaton Vance Distributors, Inc. Two International Place Boston, MA 02110 (617) 482-8260 | Independent Registered Public Accounting Firm KPMG LLP 1601 Market Street Philadelphia, PA 19103-2499 |
Custodian State Street Bank and Trust Company State Street Financial Center, One Lincoln Street Boston, MA 02111 | Fund Offices 1825 Connecticut Avenue NW, Suite 400 Washington, DC 20009 |
| | |
* FINRA BrokerCheck. Investors may check the background of their Investment Professional by contacting the Financial Industry Regulatory Authority (FINRA). FINRA BrokerCheck is a free tool to help investors check the professional background of current and former FINRA-registered securities firms and brokers. FINRA BrokerCheck is available by calling 1-800-289-9999 and at www.FINRA.org. The FINRA BrokerCheck brochure describing this program is available to investors at www.FINRA.org.
|
| |
| | |
Fund shares are not insured by the FDIC and are not deposits or other obligations of, or guaranteed by, any depository institution. Shares are subject to investment risks, including possible loss of principal invested. This report is intended to provide fund information to shareholders. It is not authorized for distribution to prospective investors unless preceded or accompanied by a prospectus. Note: The information on our website is not incorporated by reference into this report; our website address is included as an inactive textual reference only. Investors should carefully consider the investment objectives, risks, charges and expenses of the Calvert funds. This and other important information is contained in the fund’s summary prospectus and prospectus, which can be obtained from your financial professional and should be read carefully before investing. You may also call the Calvert funds at 800-368-2745. Printed on recycled paper. |
| 24209 9.30.18 | |
|
| | |
| | |
| | | |
Calvert International Opportunities Fund
| | |
| | | |
| | |
|
| |
Annual Report September 30, 2018 E-Delivery Sign-Up — Details Inside | |
|
|
Commodity Futures Trading Commission Registration. Effective December 31, 2012, the Commodity Futures Trading Commission (“CFTC”) adopted certain regulatory changes that subject registered investment companies and advisers to regulation by the CFTC if a fund invests more than a prescribed level of its assets in certain CFTC-regulated instruments (including futures, certain options and swap agreements) or markets itself as providing investment exposure to such instruments. The Fund and its adviser have claimed an exclusion from the definition of the term “commodity pool operator” under the Commodity Exchange Act. Accordingly, neither the Fund nor the adviser is subject to CFTC regulation. |
Choose Planet-friendly E-delivery! Sign up now for on-line statements, prospectuses, and fund reports. In less than five minutes you can help reduce paper mail and lower fund costs. Just go to www.calvert.com. If you already have an online account with the Calvert funds, click on Login to access your Account and select the documents you would like to receive via e-mail. If you’re new to online account access, click on Login, then Register to create your user name and password. Once you’re in, click on the E-delivery sign-up on the Account Portfolio page and follow the quick, easy steps. Note: If your shares are not held directly with the Calvert funds but through a brokerage firm, you must contact your broker for electronic delivery options available through their firm. |
|
| | | | |
| | TABLE OF CONTENTS |
| | | | | |
| | | | | Management’s Discussion of Fund Performance |
| | | | | Performance |
| | | | | Fund Profile |
| | | | | Endnotes and Additional Disclosures |
| | | | | Fund Expenses |
| | | | | Financial Statements |
| | | | | Report of Independent Registered Public Accounting Firm |
| | | | | Federal Tax Information |
| | | | | Management and Organization |
| | | | | Important Notices |
MANAGEMENT’S DISCUSSION OF FUND PERFORMANCE1
Economic and Market Conditions
Led by higher U.S. stocks, most global stock indexes advanced during the 12-month period ended September 30, 2018.
U.S. stocks opened the period on the upswing as investors anticipated, and then cheered passage of the Republican tax reform package in December 2017. Sharp cuts in corporate taxes - a key element of the bill - raised corporate-profit expectations. Stocks also got a boost from positive U.S. economic data, including the unemployment rate, which fell to a 17-year low.
Early in the period, global stocks followed U.S. stocks sharply higher. European stocks got a boost from growing economies and rising corporate profits across the region. Key equity indexes in the Asia-Pacific region also rose despite tensions with North Korea. China’s stock market advanced behind an accelerating housing market, rising retail sales, and strong foreign trade.
U.S. stocks pulled back in February 2018 amid fears that rising rates would spur inflation and boost the appeal of fixed-income investments at the expense of stocks. After a brief rebound, equity markets weakened in the spring of 2018, as investors confronted the prospect of a global trade war due to President Trump’s imposition of broad new tariffs. The protectionist move drew retaliatory action from impacted countries including China, Canada, and certain countries in the European Union.
European stocks also pulled back even more substantially amid mounting trade war concerns, before a partial recovery in the final months of the period. In China, signs of a slowing economy compounded trade war concerns, sending Chinese stocks into a prolonged slump that reached bear market territory in late June 2018.
U.S. stocks bounced back strongly in the final three months of the period. Technology stocks led the advance, overcoming an earlier setback from a wave of data-privacy scandals. U.S. economic indicators remained largely positive throughout the period, prompting the U.S. Federal Reserve to raise its benchmark interest rate three times over the 12-month span.
For the 12-month period ended September 30, 2018, the MSCI World Index,2 a proxy for global equities, advanced 11.24%. The MSCI EAFE Index of developed-market international equities rose 2.74%, while the MSCI Emerging Markets Index declined fractionally. In the U.S., the blue-chip Dow Jones Industrial Average® advanced 20.76%, while the broader U.S. equity market, as represented by the S&P 500® Index, gained 17.91%.
Fund Performance
For the 12-month period ended September 30, 2018, Calvert International Opportunities Fund (the Fund) had a total return of 7.62% for Class A shares at net asset value (NAV), outperforming its benchmark, the MSCI EAFE SMID Cap Index (the Index), which returned 3.80%.
Strong stock selection accounted for most of the Fund’s outperformance during the period. Although the Fund does not seek
to outperform by favoring or avoiding specific regions or sectors, strong stock selection in Europe and Japan enhanced performance during the period. On a sector basis, holdings in the financials, health care, and information technology sectors contributed positively while an underweight and stock selection in the energy sector detracted slightly.
At the stock level, the top contributor to performance was the sporting goods manufacturer Amer Sports Oyj (Finland). The company owns several strong brands in the sporting goods industry, including Salomon, Arc’teryx, Wilson, and Suunto. While the stock price performed well for much of the period as the strategic direction and operating environment for the company continued to improve, it was a takeover bid from ANTA Sports Products, Ltd. (Hong Kong) in September that led to a sharp increase in Amer Sports’ share price. The position was then sold when the valuation no longer looked attractive.
Asahi Intecc Co. Ltd. (Japan), a medical device company specializing in guide wires for angioplasty, was also a notable contributor. Investors responded favorably after the company reported strong sales and profit growth for its 2017 fiscal year. Sales were particularly strong outside of Japan and margins were ample despite an increase in research and development spending. The market also welcomed the company’s promotion to the first section of the Tokyo Stock Exchange at the end of the reporting period, a move that could lead to an expansion of the investor base.
Moncler SpA (Italy), a luxury‑apparel maker well‑known for high‑end down jackets, was another positive contributor. The company increased its retail presence and extended its global footprint while maintaining high margins and investor returns. The company also began to selectively expand its business beyond winter apparel to areas such as knitwear, in which it can capitalize on its desirable brand recognition.
IWG plc (Switzerland), a global provider of rented office space and related services, was the largest detractor during the period. Shares dropped sharply because of a profit warning attributed to disruption in the London market and elsewhere. Calvert’s lack of confidence that the company’s mature business would recover was among several factors that led to the sale of IWG plc during the period.
The share price of Inchcape plc (U.K.), the largest independent automobile distributor and retailer in the world, was also under pressure during the period. Fears of cyclical headwinds across the auto sector and, in particular, some of Inchcape’s key trading regions ─ the U.K., Singapore, and Australia ─ made investors cautious and resulted in a relatively weak share price.
Confectionary company Morinaga & Co. Ltd. (Japan) was another detractor from performance. With its share price having performed well for more than two years, the maker of the popular Hi-Chew fruit candy saw its earnings clipped as it faced higher costs from raw materials, advertising, and logistics. Shares were also weakened by investor skepticism about the company’s future investment plans.
|
|
See Endnotes and Additional Disclosures in this report. Past performance is no guarantee of future results. Returns are historical and are calculated by determining the percentage change in net asset value (NAV) or offering price (as applicable) with all distributions reinvested. Investment return and principal value will fluctuate so that shares, when redeemed, may be worth more or less than their original cost. Performance less than or equal to one year is cumulative. Performance is for the stated time period only; due to market volatility, the Fund’s current performance may be lower or higher than quoted. Returns are before taxes unless otherwise noted. For performance as of the most recent month-end, please refer to www.calvert.com. |
2 www.calvert.com CALVERT INTERNATIONAL OPPORTUNITIES FUND ANNUAL REPORT (Unaudited)
PERFORMANCE
|
| | | | | | | | | | | | | | | |
Performance2,3 | | | | | | | | | | |
Portfolio Manager Aidan M. Farrell of Eaton Vance Advisers International Ltd. |
| | | | | | | | | | | |
| % Average Annual Total Returns | | Class Inception Date |
| | Performance Inception Date |
| | One Year |
| | Five Years |
| | Ten Years |
|
| Class A at NAV | | 05/31/2007 |
| | 05/31/2007 |
| | 7.62 | % | | 7.87 | % | | 7.54 | % |
| Class A with 4.75% Maximum Sales Charge | | — |
| | — |
| | 2.52 |
| | 6.82 |
| | 7.02 |
|
| Class C at NAV | | 07/31/2007 |
| | 05/31/2007 |
| | 6.92 |
| | 6.97 |
| | 6.65 |
|
| Class C with 1% Maximum Sales Charge | | — |
| | — |
| | 5.92 |
| | 6.97 |
| | 6.65 |
|
| Class I at NAV | | 05/31/2007 |
| | 05/31/2007 |
| | 7.95 |
| | 8.29 |
| | 7.99 |
|
| | | | | | | | | | | |
| | | | | | | | | | | |
| MSCI EAFE SMID Cap Index | | — |
| | — |
| | 3.80 | % | | 7.16 | % | | 8.22 | % |
| | | | | | | | | | | |
% Total Annual Operating Expense Ratios4 | | | | | | Class A |
| | Class C |
| | Class I |
|
| Gross | | | | | | 1.48 | % | | 2.61 | % | | 1.07 | % |
| Net | | | | | | 1.43 |
| | 2.26 |
| | 1.07 |
|
|
|
| Growth of $10,000 |
| This graph shows the change in value of a hypothetical investment of $10,000 in Class A of the Fund for the period indicated. For comparison, the same investment is shown in the indicated index. |
|
| | | | | | | | |
| Growth of Investment | Amount Invested |
| Period Beginning | At NAV |
| With Maximum Sales Charge |
| Class C |
| $10,000 |
| 09/30/2008 |
| $19,047 |
| N.A. |
| Class I |
| $250,000 |
| 09/30/2008 |
| $539,284 |
| N.A. |
See Endnotes and Additional Disclosures in this report.
Past performance is no guarantee of future results. Returns are historical and are calculated by determining the percentage change in net asset value (NAV) or offering price (as applicable) with all distributions reinvested. Investment return and principal value will fluctuate so that shares, when redeemed, may be worth more or less than their original cost. Performance less than or equal to one year is cumulative. Performance is for the stated time period only; due to market volatility, the Fund’s current performance may be lower or higher than quoted. Returns are before taxes unless otherwise noted. For performance as of the most recent month-end, please refer to www.calvert.com.
www.calvert.com CALVERT INTERNATIONAL OPPORTUNITIES FUND ANNUAL REPORT (Unaudited) 3
FUND PROFILE
|
| | | | | | | |
| |
| | | | | |
| | SECTOR ALLOCATION (% of total investments)5 | | | TEN LARGEST HOLDINGS (% of net assets)6 |
| | | | | | |
| | Industrials | 22.3 | % | | Brenntag AG | 1.8 | % |
| | Financials | 13.9 | % | | Sika AG | 1.7 | % |
| | Consumer Discretionary | 13.5 | % | | Melrose Industries plc | 1.6 | % |
| | Health Care | 10.7 | % | | IMCD Group NV | 1.6 | % |
| | Real Estate | 10.5 | % | | SpareBank 1 SR-Bank ASA | 1.6 | % |
| | Materials | 8.3 | % | | Hiscox Ltd. | 1.6 | % |
| | Information Technology | 8.2 | % | | Indutrade AB | 1.4 | % |
| | Communication Services | 4.7 | % | | DS Smith plc | 1.4 | % |
| | Consumer Staples | 4.4 | % | | Asahi Intecc Co. Ltd. | 1.4 | % |
| | Utilities | 1.7 | % | | Lonza Group AG | 1.4 | % |
| | Energy | 1.4 | % | | Total | 15.5 | % |
| | High Social Impact Investments | 0.4 | % | | | |
| | Total | 100.0 | % | | | |
See Endnotes and Additional Disclosures in this report.
4 www.calvert.com CALVERT INTERNATIONAL OPPORTUNITIES FUND ANNUAL REPORT (Unaudited)
|
| | |
| Endnotes and Additional Disclosures | | |
1 The views expressed in this report are those of the portfolio manager(s) and are current only through the date stated on the cover. These views are subject to change at any time based upon market or other conditions, and Calvert and the Fund(s) disclaim any responsibility to update such views. These views may not be relied upon as investment advice and, because investment decisions are based on many factors, may not be relied upon as an indication of trading intent on behalf of any Calvert fund. This commentary may contain statements that are not historical facts, referred to as “forward looking statements.” The Fund’s actual future results may differ significantly from those stated in any forward looking statement, depending on factors such as changes in securities or financial markets or general economic conditions, the volume of sales and purchases of Fund shares, the continuation of investment advisory, administrative and service contracts, and other risks discussed from time to time in the Fund’s filings with the Securities and Exchange Commission.
| |
2 | MSCI World Index is an unmanaged index of equity securities in the developed markets. MSCI EAFE Index is an unmanaged index of equities in the developed markets, excluding the U.S. and Canada. MSCI Emerging Markets Index is an unmanaged index of emerging markets common stocks. MSCI EAFE SMID Cap Index is an unmanaged index of small & mid-capitalization equities in the developed markets, excluding the U.S. and Canada. MSCI indexes are net of foreign withholding taxes. Source: MSCI. MSCI data may not be reproduced or used for any other purpose. MSCI provides no warranties, has not prepared or approved this report, and has no liability hereunder. Dow Jones Industrial Average® is a price-weighted average of 30 blue-chip stocks that are generally the leaders in their industry. S&P 500® Index is an unmanaged index of large-cap stocks commonly used as a measure of U.S. stock market performance. Unless otherwise stated, index returns do not reflect the effect of any applicable sales charges, commissions, expenses, taxes or leverage, as applicable. It is not possible to invest directly in an index. |
| |
3 | Total Returns at NAV do not include applicable sales charges. If sales charges were deducted, the returns would be lower. Total Returns shown with maximum sales charge reflect the stated maximum sales charge. Unless otherwise stated, performance does not reflect the deduction of taxes on Fund distributions or redemptions of Fund shares. Performance since inception for an index, if presented, is the performance since the Fund’s or oldest share class’ inception, as applicable. |
Effective December 31, 2016, Calvert Research and Management became the investment adviser to the Fund and performance reflected prior to such date is that of the Fund’s former investment adviser, Calvert Investment Management, Inc.
4 Source: Fund prospectus. Net expense ratios reflect a contractual expense reimbursement that continues through 1/31/19. Without the reimbursement, performance would have been lower. The expense ratios for the current reporting period can be found in the Financial Highlights section of this report.
5 Does not include Short Term Investment of Cash Collateral for Securities Loaned.
6 Excludes cash and cash equivalents.
Fund profile subject to change due to active management.
www.calvert.com CALVERT INTERNATIONAL OPPORTUNITIES FUND ANNUAL REPORT (Unaudited) 5
FUND EXPENSES
Example
As a Fund shareholder, you incur two types of costs: (1) transaction costs, including sales charges (loads) on purchases and redemption fees (if applicable); and (2) ongoing costs, including management fees; distribution and/or service fees; and other Fund expenses. This Example is intended to help you understand your ongoing costs (in dollars) of Fund investing and to compare these costs with the ongoing costs of investing in other mutual funds. The Example is based on an investment of $1,000 invested at the beginning of the period and held for the entire period (April 1, 2018 to September 30, 2018).
Actual Expenses
The first section of the table below provides information about actual account values and actual expenses. You may use the information in this section, together with the amount you invested, to estimate the expenses that you paid over the period. Simply divide your account value by $1,000 (for example, an $8,600 account value divided by $1,000 = 8.6), then multiply the result by the number in the first section under the heading entitled “Expenses Paid During Period” to estimate the expenses you paid on your account during this period.
Hypothetical Example for Comparison Purposes
The second section of the table below provides information about hypothetical account values and hypothetical expenses based on the actual Fund expense ratio and an assumed rate of return of 5% per year (before expenses), which is not the actual Fund return. The hypothetical account values and expenses may not be used to estimate the actual ending account balance or expenses you paid for the period. You may use this information to compare the ongoing costs of investing in the Fund and other funds. To do so, compare this 5% hypothetical example with the 5% hypothetical examples that appear in the shareholder reports of the other funds.
Please note that the expenses shown in the table are meant to highlight your ongoing costs only and do not reflect any transactional costs, such as sales charges (loads) or redemption fees (if applicable). Therefore, the second section of the table is useful in comparing ongoing costs only, and will not help you determine the relative total costs of owning different funds. In addition, if these transactional costs were included, your costs would be higher.
|
| | | | |
| | BEGINNING
ACCOUNT VALUE
(4/1/18) | ENDING
ACCOUNT VALUE
(9/30/18) | EXPENSES PAID
DURING PERIOD*
(4/1/18 - 9/30/18) | ANNUALIZED
EXPENSE RATIO |
| Actual | | | | |
| Class A | $1,000.00 | $996.80 | $6.81 | 1.36% |
| Class C | $1,000.00 | $994.00 | $10.55 | 2.11% |
| Class I | $1,000.00 | $998.40 | $5.56 | 1.11% |
| Hypothetical | | | | |
| (5% return per year before expenses) | | | | |
| Class A | $1,000.00 | $1,018.25 | $6.88 | 1.36% |
| Class C | $1,000.00 | $1,014.49 | $10.66 | 2.11% |
| Class I | $1,000.00 | $1,019.50 | $5.62 | 1.11% |
| | | | | |
| * Expenses are equal to the Fund’s annualized expense ratio for the indicated Class, multiplied by the average account value over the period, multiplied by 183/365 (to reflect the one-half year period). The Example assumes that the $1,000 was invested at the net asset value per share determined at the close of business on March 31, 2018. |
6 www.calvert.com CALVERT INTERNATIONAL OPPORTUNITIES FUND ANNUAL REPORT (Unaudited)
CALVERT INTERNATIONAL OPPORTUNITIES FUND
SCHEDULE OF INVESTMENTS
SEPTEMBER 30, 2018
|
| | |
| | SHARES | VALUE ($) |
| COMMON STOCKS - 96.7% | | |
| Australia - 4.6% | | |
| Bapcor Ltd. | 354,597 | 1,961,901 |
| BlueScope Steel Ltd. | 72,979 | 895,068 |
| Bravura Solutions Ltd. | 229,774 | 732,466 |
| Challenger Ltd. | 383,088 | 3,099,713 |
| GDI Property Group | 2,281,831 | 2,177,810 |
| IOOF Holdings Ltd. (1) | 294,709 | 1,733,093 |
| National Storage REIT | 1,221,067 | 1,474,777 |
| Super Retail Group Ltd. | 285,756 | 1,831,285 |
| | | 13,906,113 |
| | | |
| Austria - 0.9% | | |
| ams AG (1) | 16,627 | 935,846 |
| CA Immobilien Anlagen AG | 47,011 | 1,677,921 |
| | | 2,613,767 |
| | | |
| Belgium - 0.9% | | |
| Kinepolis Group NV | 27,819 | 1,663,472 |
| Melexis NV | 15,555 | 1,204,106 |
| | | 2,867,578 |
| | | |
| Canada - 1.9% | | |
| CAE, Inc. | 176,570 | 3,584,303 |
| Kinaxis, Inc. (2) | 30,212 | 2,271,894 |
| | | 5,856,197 |
| | | |
| Denmark - 1.7% | | |
| SimCorp AS | 39,614 | 3,426,833 |
| Topdanmark AS | 35,144 | 1,606,222 |
| | | 5,033,055 |
| | | |
| France - 2.5% | | |
| Metropole Television S.A. | 148,753 | 2,998,334 |
| Nexity S.A. | 30,107 | 1,663,994 |
| Rubis SCA | 57,242 | 3,100,261 |
| | | 7,762,589 |
| | | |
| Germany - 6.7% | | |
| Axel Springer SE | 27,917 | 1,876,830 |
| Basler AG | 6,079 | 1,154,786 |
| Bechtle AG | 17,433 | 1,769,679 |
| Brenntag AG | 90,099 | 5,556,536 |
| | | |
www.calvert.com CALVERT INTERNATIONAL OPPORTUNITIES FUND ANNUAL REPORT 7
|
| | |
| | SHARES | VALUE ($) |
| COMMON STOCKS - CONT’D | | |
| Carl Zeiss Meditec AG | 18,948 | 1,592,722 |
| Freenet AG | 32,968 | 791,479 |
| Norma Group SE | 57,887 | 3,697,531 |
| Rational AG | 2,162 | 1,565,075 |
| Salzgitter AG | 13,541 | 675,602 |
| Sirius Real Estate Ltd. | 2,016,747 | 1,622,056 |
| | | 20,302,296 |
| | | |
| Hong Kong - 2.5% | | |
| CITIC Telecom International Holdings Ltd. | 8,446,760 | 2,877,715 |
| Hysan Development Co. Ltd. | 466,698 | 2,356,855 |
| Johnson Electric Holdings Ltd. | 801,345 | 2,262,725 |
| | | 7,497,295 |
| | | |
| Ireland - 1.8% | | |
| Green REIT plc | 908,040 | 1,591,225 |
| Kingspan Group plc | 29,921 | 1,393,097 |
| UDG Healthcare plc | 290,329 | 2,570,828 |
| | | 5,555,150 |
| | | |
| Italy - 5.3% | | |
| Amplifon SpA | 101,934 | 2,259,953 |
| Banca Generali SpA | 113,575 | 2,925,142 |
| DiaSorin SpA | 19,661 | 2,066,549 |
| FinecoBank Banca Fineco SpA | 252,551 | 3,367,741 |
| MARR SpA | 129,655 | 3,796,060 |
| Moncler SpA | 41,390 | 1,780,905 |
| | | 16,196,350 |
| | | |
| Japan - 28.0% | | |
| 77 Bank Ltd. (The) | 93,197 | 2,214,802 |
| Ariake Japan Co. Ltd. | 18,477 | 1,843,113 |
| Asahi Co. Ltd. | 226,858 | 2,997,385 |
| Asahi Intecc Co. Ltd. | 95,482 | 4,163,459 |
| Asics Corp. | 99,758 | 1,487,764 |
| Daiichikosho Co. Ltd. | 75,925 | 3,660,920 |
| Dowa Holdings Co. Ltd. | 23,165 | 735,922 |
| Eiken Chemical Co. Ltd. | 158,803 | 3,690,893 |
| FP Corp. (1) | 64,689 | 3,934,352 |
| Fuji Seal International, Inc. (1) | 77,178 | 2,733,716 |
| GLP J-REIT | 1,907 | 1,853,423 |
| GMO internet, Inc. (1) | 54,410 | 948,131 |
| HIS Co. Ltd. (1) | 89,043 | 2,977,184 |
| Invesco Office J-REIT, Inc. | 13,462 | 1,921,597 |
| Japan Hotel REIT Investment Corp. | 2,760 | 2,008,559 |
| Japan Lifeline Co. Ltd. (1) | 83,575 | 1,766,724 |
| Kuraray Co. Ltd. | 125,100 | 1,880,692 |
8 www.calvert.com CALVERT INTERNATIONAL OPPORTUNITIES FUND ANNUAL REPORT
|
| | |
| | SHARES | VALUE ($) |
| COMMON STOCKS - CONT’D | | |
| Like Co. Ltd. (1) | 109,343 | 1,718,383 |
| Morinaga & Co. Ltd. | 64,184 | 2,398,293 |
| Nippon Light Metal Holdings Co. Ltd. (1) | 283,791 | 634,172 |
| Nishi-Nippon Financial Holdings, Inc. | 197,084 | 2,278,990 |
| Nohmi Bosai Ltd. (1) | 169,525 | 3,783,610 |
| Nomura Co. Ltd. | 127,364 | 2,629,318 |
| Okamura Corp. | 215,465 | 2,881,480 |
| Oyo Corp. | 154,773 | 2,082,639 |
| Penta-Ocean Construction Co. Ltd. | 524,572 | 3,494,954 |
| Press Kogyo Co., Ltd. | 529,485 | 2,795,516 |
| Relia, Inc. | 132,748 | 1,636,126 |
| Sakata Seed Corp. (1) | 77,188 | 2,778,887 |
| Sanden Holdings Corp. (1)(2) | 238,297 | 3,272,315 |
| Sumco Corp. (1) | 87,800 | 1,279,036 |
| Tokyo Century Corp. | 54,598 | 3,391,125 |
| Tosei Corp. | 194,342 | 2,010,493 |
| UACJ Corp. | 48 | 1,150 |
| Yamaha Corp. | 58,539 | 3,101,857 |
| Yokohama Reito Co. Ltd. (1) | 274,854 | 2,228,822 |
| | | 85,215,802 |
| | | |
| Luxembourg - 0.2% | | |
| APERAM S.A. | 11,748 | 537,405 |
| | | |
| Netherlands - 5.5% | | |
| Aalberts Industries NV | 93,993 | 4,002,983 |
| Core Laboratories NV (1) | 11,843 | 1,371,775 |
| GrandVision NV (3) | 139,299 | 3,432,217 |
| IMCD Group NV | 62,457 | 4,860,896 |
| NSI NV | 76,410 | 3,144,131 |
| | | 16,812,002 |
| | | |
| New Zealand - 0.7% | | |
| Fisher & Paykel Healthcare Corp. Ltd. | 212,376 | 2,117,657 |
| | | |
| Norway - 1.6% | | |
| SpareBank 1 SR-Bank ASA | 394,529 | 4,798,439 |
| | | |
| Singapore - 1.2% | | |
| Keppel REIT (1) | 2,399,200 | 2,088,012 |
| Yanlord Land Group Ltd. | 1,589,500 | 1,720,670 |
| | | 3,808,682 |
| | | |
| Spain - 0.7% | | |
| Acciona SA | 22,166 | 2,004,171 |
| | | |
www.calvert.com CALVERT INTERNATIONAL OPPORTUNITIES FUND ANNUAL REPORT 9
|
| | |
| | SHARES | VALUE ($) |
| COMMON STOCKS - CONT’D | | |
| Sweden - 5.5% | | |
| Avanza Bank Holding AB (1) | 35,446 | 1,611,745 |
| Boliden AB | 41,467 | 1,153,232 |
| Bufab AB | 175,388 | 2,042,713 |
| Husqvarna AB, Class B | 403,928 | 3,433,984 |
| Indutrade AB | 161,510 | 4,367,148 |
| Trelleborg AB, Class B | 198,969 | 4,048,705 |
| | | 16,657,527 |
| | | |
| Switzerland - 8.0% | | |
| Belimo Holding AG | 282 | 1,348,700 |
| Bossard Holding AG, Class A | 14,931 | 2,965,364 |
| Cembra Money Bank AG | 30,645 | 2,774,046 |
| Galenica AG (3) | 40,361 | 2,302,469 |
| Logitech International SA | 57,293 | 2,569,547 |
| Lonza Group AG | 12,091 | 4,136,299 |
| Sika AG | 36,551 | 5,318,883 |
| VZ Holding AG | 10,303 | 3,061,806 |
| | | 24,477,114 |
| | | |
| United Kingdom - 15.6% | | |
| Abcam plc | 102,575 | 1,914,506 |
| Bellway plc | 82,095 | 3,221,973 |
| Bodycote plc | 262,312 | 3,093,980 |
| Croda International plc | 26,694 | 1,809,418 |
| Dechra Pharmaceuticals plc | 102,839 | 2,917,624 |
| DS Smith plc | 668,510 | 4,164,075 |
| Grainger plc | 603,799 | 2,356,393 |
| Halma plc | 218,576 | 4,115,101 |
| Hansteen Holdings plc | 1,008,829 | 1,275,976 |
| Hastings Group Holdings plc (3) | 463,441 | 1,565,572 |
| Hiscox Ltd. | 220,142 | 4,718,167 |
| Inchcape plc | 440,568 | 3,836,198 |
| Melrose Industries plc | 1,923,480 | 5,006,788 |
| St James’s Place plc | 136,232 | 2,030,620 |
| Weir Group plc (The) | 78,357 | 1,797,653 |
| WH Smith plc | 139,827 | 3,754,350 |
| | | 47,578,394 |
| | | |
| United States - 0.9% | | |
| Oceaneering International, Inc. | 98,806 | 2,727,046 |
| | | |
| Total Common Stocks (Cost $270,459,522) | | 294,324,629 |
| | | |
| | | |
10 www.calvert.com CALVERT INTERNATIONAL OPPORTUNITIES FUND ANNUAL REPORT
|
| | |
| | PRINCIPAL AMOUNT ($) | VALUE ($) |
| HIGH SOCIAL IMPACT INVESTMENTS - 0.4% | | |
| Calvert Impact Capital, Inc., Community Investment Notes, 1.50%, 12/15/19 (4)(5) | 1,000,000 | 962,350 |
| ImpactAssets Inc., Global Sustainable Agriculture Notes, 2.50%, 11/3/20 (4)(6)(7) | 111,000 | 104,229 |
| ImpactAssets Inc., Microfinance Plus Notes, 2.40%, 11/3/20 (4)(6)(7) | 142,000 | 129,930 |
| | | |
| Total High Social Impact Investments (Cost $1,253,000) | | 1,196,509 |
| | | |
| | | |
| | SHARES | VALUE ($) |
| SHORT TERM INVESTMENT OF CASH COLLATERAL FOR SECURITIES LOANED - 2.4% | | |
| State Street Navigator Securities Lending Government Money Market Portfolio, 2.16% | 7,422,626 | 7,422,626 |
| | | |
| Total Short Term Investment of Cash Collateral for Securities Loaned (Cost $7,422,626) | | 7,422,626 |
| | | |
| | | |
| TOTAL INVESTMENTS (Cost $279,135,148) - 99.5% | | 302,943,764 |
| Other assets and liabilities, net - 0.5% | | 1,401,263 |
NET ASSETS - 100.0% | | 304,345,027 |
|
|
| NOTES TO SCHEDULE OF INVESTMENTS |
| (1) All or a portion of this security was on loan at September 30, 2018. The aggregate market value of securities on loan at September 30, 2018 was $15,623,280. |
| (2) Non-income producing security. |
| (3) Security is exempt from registration under Rule 144A of the Securities Act of 1933. These securities may be resold in transactions exempt from registration, normally to qualified institutional buyers. Total market value of Rule 144A securities amounts to $7,300,258, which represents 2.4% of the net assets of the Fund as of September 30, 2018. |
| (4) Restricted security. Total market value of restricted securities amounts to $1,196,509, which represents 0.4% of the net assets of the Fund as of September 30, 2018. |
| (5) Affiliated company (see Note 7). |
| (6) For fair value measurement disclosure purposes, security is categorized as Level 3 (see Note 1A). |
| (7) Notes carry an interest rate that varies by period and is contingent on the performance of the underlying portfolio of loans to borrowers. The coupon rate shown represents the rate in effect at September 30, 2018. |
www.calvert.com CALVERT INTERNATIONAL OPPORTUNITIES FUND ANNUAL REPORT 11
|
|
| At September 30, 2018, the concentration of the Fund’s investments in the various sectors, determined as a percentage of total investments, was as follows: |
|
| | |
| ECONOMIC SECTORS | % OF TOTAL INVESTMENTS* |
| Industrials | 22.3 | % |
| Financials | 13.9 | % |
| Consumer Discretionary | 13.5 | % |
| Health Care | 10.7 | % |
| Real Estate | 10.5 | % |
| Materials | 8.3 | % |
| Information Technology | 8.2 | % |
| Communication Services | 4.7 | % |
| Consumer Staples | 4.4 | % |
| Utilities | 1.7 | % |
| Energy | 1.4 | % |
| High Social Impact Investments | 0.4 | % |
| Total | 100.0 | % |
| * Does not include Short Term Investment of Cash Collateral for Securities Loaned. | |
|
| | |
| RESTRICTED SECURITIES | ACQUISITION
DATES | COST ($) |
| Calvert Impact Capital, Inc., Community Investment Notes, 1.50%, 12/15/19 | 12/15/16 | 1,000,000 |
| ImpactAssets Inc., Global Sustainable Agriculture Notes, 2.50%, 11/3/20 | 11/13/15 | 111,000 |
| ImpactAssets Inc., Microfinance Plus Notes, 2.40%, 11/3/20 | 11/13/15 | 142,000 |
| See notes to financial statements. |
12 www.calvert.com CALVERT INTERNATIONAL OPPORTUNITIES FUND ANNUAL REPORT
CALVERT INTERNATIONAL OPPORTUNITIES FUND
STATEMENT OF ASSETS AND LIABILITIES
SEPTEMBER 30, 2018
|
| | | |
| ASSETS | |
Investments in securities of unaffiliated issuers, at value (identified cost $278,135,148) - including $15,623,280 of securities on loan |
| $301,981,414 |
|
| Investments in securities of affiliated issuers, at value (identified cost $1,000,000) | 962,350 |
|
| Cash | 4,322,814 |
|
| Cash denominated in foreign currency, at value (cost $910,630) | 900,506 |
|
| Receivable for investments sold | 10,252,750 |
|
| Receivable for capital shares sold | 774,267 |
|
| Dividends and interest receivable | 463,452 |
|
| Interest receivable - affiliated | 12,083 |
|
| Securities lending income receivable | 15,069 |
|
| Tax reclaims receivable | 182,598 |
|
| Directors’ deferred compensation plan | 143,372 |
|
| Other assets | 5,247 |
|
| Total assets | 320,015,922 |
|
| | |
| LIABILITIES | |
| Payable for investments purchased | 7,476,620 |
|
| Payable for capital shares redeemed | 242,992 |
|
| Deposits for securities loaned | 7,422,626 |
|
| Payable to affiliates: | |
| Investment advisory fee | 184,038 |
|
| Administrative fee | 29,446 |
|
| Distribution and service fees | 19,779 |
|
| Sub-transfer agency fee | 4,696 |
|
| Directors’ deferred compensation plan | 143,372 |
|
| Accrued expenses | 147,326 |
|
| Total liabilities | 15,670,895 |
|
| NET ASSETS |
| $304,345,027 |
|
| | |
| NET ASSETS CONSIST OF: | |
| Paid-in capital applicable to common stock | |
| (75,000,000 shares per class of $0.01 par value authorized) |
| $260,200,256 |
|
| Distributable earnings | 44,144,771 |
|
| Total |
| $304,345,027 |
|
| | |
| NET ASSET VALUE PER SHARE | |
| Class A (based on net assets of $65,994,056 and 3,498,837 shares outstanding) |
| $18.86 |
|
| Class C (based on net assets of $7,602,826 and 413,777 shares outstanding) |
| $18.37 |
|
| Class I (based on net assets of $230,748,145 and 12,460,819 shares outstanding) |
| $18.52 |
|
| | |
| OFFERING PRICE PER SHARE* | |
| Class A (100/95.25 of net asset value per share) |
| $19.80 |
|
| * On sales of $50,000 or more, the offering price of Class A shares is reduced. | |
| See notes to financial statements. |
www.calvert.com CALVERT INTERNATIONAL OPPORTUNITIES FUND ANNUAL REPORT 13
CALVERT INTERNATIONAL OPPORTUNITIES FUND
STATEMENT OF OPERATIONS
YEAR ENDED SEPTEMBER 30, 2018
|
| | | |
| INVESTMENT INCOME | |
| Dividend income (net of foreign taxes withheld of $544,800) |
| $5,679,363 |
|
| Interest income | 12,064 |
|
| Interest income - affiliated issuers | 15,000 |
|
| Securities lending income, net | 167,515 |
|
| Total investment income | 5,873,942 |
|
| | |
| EXPENSES | |
| Investment advisory fee | 1,927,247 |
|
| Administrative fee | 308,195 |
|
| Distribution and service fees: | |
| Class A | 149,261 |
|
| Class C | 69,433 |
|
| Directors’ fees and expenses | 13,341 |
|
| Custodian fees | 140,239 |
|
| Transfer agency fees and expenses | 219,225 |
|
| Accounting fees | 73,768 |
|
| Professional fees | 51,742 |
|
| Registration fees | 84,857 |
|
| Reports to shareholders | 25,586 |
|
| Miscellaneous | 65,475 |
|
| Total expenses | 3,128,369 |
|
| Reimbursement of expenses-other | (5,247) |
|
| Net expenses | 3,123,122 |
|
| Net investment income | 2,750,820 |
|
| | |
| | |
| REALIZED AND UNREALIZED GAIN (LOSS) | |
| Net realized gain (loss) on: | |
| Investment securities - unaffiliated issuers | 24,685,775 |
|
| Foreign currency transactions | 17,963 |
|
| | 24,703,738 |
|
| | |
| Net change in unrealized appreciation (depreciation) on: | |
| Investment securities - unaffiliated issuers | (10,567,791) |
|
| Investment securities - affiliated issuers | 9,270 |
|
| Foreign currency | (24,667) |
|
| | (10,583,188) |
|
| | |
| Net realized and unrealized gain | 14,120,550 |
|
| | |
| Net increase in net assets resulting from operations |
| $16,871,370 |
|
| See notes to financial statements. |
14 www.calvert.com CALVERT INTERNATIONAL OPPORTUNITIES FUND ANNUAL REPORT
CALVERT INTERNATIONAL OPPORTUNITIES FUND
STATEMENTS OF CHANGES IN NET ASSETS
|
| | | | | | | |
| INCREASE (DECREASE) IN NET ASSETS | Year Ended
September 30, 2018 | | Year Ended
September 30, 2017 |
| Operations: | | | |
| Net investment income |
| $2,750,820 |
| |
| $1,362,574 |
|
| Net realized gain | 24,703,738 |
| | 22,027,071 |
|
| Net change in unrealized appreciation (depreciation) | (10,583,188) |
| | 25,475,363 |
|
| Net increase in net assets resulting from operations | 16,871,370 |
| | 48,865,008 |
|
| | | | |
Distributions to shareholders: (1) | | | |
| Class A shares | (3,319,247) |
| | (1,050,800) |
|
| Class C shares | (372,738) |
| | (3,184) |
|
| Class I shares | (7,972,756) |
| | (1,136,929) |
|
| Class Y shares | (3,481,600) |
| | (418,018) |
|
| Total distributions to shareholders | (15,146,341) |
| | (2,608,931) |
|
| | | | |
| Capital share transactions: | | | |
| Class A shares | 14,972,854 |
| | (70,561,791) |
|
| Class C shares | 1,724,332 |
| | (434,754) |
|
| Class I shares | 111,958,167 |
| | 23,086,963 |
|
Class Y shares (2) | (45,149,615) |
| | (6,605,540) |
|
| Net increase (decrease) in net assets from capital share transactions | 83,505,738 |
| | (54,515,122) |
|
| | | | |
| TOTAL INCREASE (DECREASE) IN NET ASSETS | 85,230,767 |
| | (8,259,045) |
|
| | | | |
| | | | |
| NET ASSETS | | | |
| Beginning of year | 219,114,260 |
| | 227,373,305 |
|
| End of year |
| $304,345,027 |
| | $219,114,260(3) |
|
| | | | |
| | | | |
(1) For the year ended September 30, 2017, the source of distributions was from net investment income. |
(2) Effective December 8, 2017, Class Y shares of the Fund converted to Class I shares at net asset value. Thereafter, Class Y shares were terminated. |
(3) Includes accumulated undistributed net investment income of $1,413,220 at September 30, 2017. The requirement to disclose the corresponding amount as of September 30, 2018 was eliminated. |
| See notes to financial statements. |
www.calvert.com CALVERT INTERNATIONAL OPPORTUNITIES FUND ANNUAL REPORT 15
CALVERT INTERNATIONAL OPPORTUNITIES FUND
FINANCIAL HIGHLIGHTS
|
| | | | | | | | | | | | | | | |
| | Year Ended September 30, |
| CLASS A SHARES | 2018 | | 2017 | | 2016 | | 2015 | | 2014 | |
| Net asset value, beginning | $18.70 | | $14.78 | | $14.58 | | $16.42 | | $15.76 | |
| Income from investment operations: | | | | | | | | | | |
Net investment income (1) | 0.17 |
| | 0.03 |
| | 0.15 |
| (2) | 0.14 |
| | 0.15 |
| |
| Net realized and unrealized gain (loss) | 1.20 |
| | 4.04 |
| | 0.63 |
| | (0.83) |
| | 0.66 |
| |
| Total from investment operations | 1.37 |
| | 4.07 |
| | 0.78 |
| | (0.69) |
| | 0.81 |
| |
| Distributions from: | | | | | | | | | | |
| Net investment income | (0.24) |
| | (0.15) |
| | (0.11) |
| | (0.18) |
| | (0.15) |
| |
| Net realized gain | (0.97) |
| | — |
| | (0.47) |
| | (0.97) |
| | — |
| |
| Total distributions | (1.21) |
| | (0.15) |
| | (0.58) |
| | (1.15) |
| | (0.15) |
| |
| Total increase (decrease) in net asset value | 0.16 |
| | 3.92 |
| | 0.20 |
| | (1.84) |
| | 0.66 |
| |
| Net asset value, ending | $18.86 | | $18.70 | | $14.78 | | $14.58 | | $16.42 | |
Total return (3) | 7.62 | % | | 27.89 | % | | 5.49 | % | | (4.32 | %) | | 5.14 | % | |
Ratios to average net assets: (4) | | | | | | | | | | |
| Total expenses | 1.38 | % | | 1.48 | % | | 1.49 | % | | 1.69 | % | | 1.85 | % | |
| Net expenses | 1.38 | % | | 1.48 | % | | 1.46 | % | | 1.66 | % | | 1.66 | % | |
| Net investment income | 0.91 | % | | 0.18 | % | | 1.07 | % | (2) | 0.88 | % | | 0.88 | % | |
| Portfolio turnover | 60 | % | | 158 | % | | 52 | % | | 51 | % | | 56 | % | |
| Net assets, ending (in thousands) | $65,994 | | $50,552 | | $107,429 | | $99,908 | | $50,540 | |
| | | | | | | | | | | |
(1) Computed using average shares outstanding. |
(2) Amount includes a non-recurring refund for overbilling of prior years’ custody out-of-pocket fees. This amounted to $0.006 per share and 0.04% of average net assets. |
(3) Returns are historical and are calculated by determining the percentage change in net asset value with all distributions reinvested and do not reflect the effect of sales charges, if any. |
(4) Total expenses do not reflect amounts reimbursed and/or waived by the adviser and certain of its affiliates, if applicable. Net expenses are net of all reductions and represent the net expenses paid by the Fund. |
| See notes to financial statements. |
16 www.calvert.com CALVERT INTERNATIONAL OPPORTUNITIES FUND ANNUAL REPORT
CALVERT INTERNATIONAL OPPORTUNITIES FUND
FINANCIAL HIGHLIGHTS
|
| | | | | | | | | | | | | | | |
| | Year Ended September 30, |
| CLASS C SHARES | 2018 | | 2017 | | 2016 | | 2015 | | 2014 | |
| Net asset value, beginning | $18.29 | | $14.43 | | $14.28 | | $16.08 | | $15.44 | |
| Income from investment operations: | | | | | | | | | | |
Net investment income (loss) (1) | 0.03 |
| | (0.04) |
| | 0.01 |
| (2) | (0.03) |
| | (0.01) |
| |
| Net realized and unrealized gain (loss) | 1.18 |
| | 3.91 |
| | 0.61 |
| | (0.76) |
| | 0.66 |
| |
| Total from investment operations | 1.21 |
| | 3.87 |
| | 0.62 |
| | (0.79) |
| | 0.65 |
| |
| Distributions from: | | | | | | | | | | |
| Net investment income | (0.16) |
| | (0.01) |
| | — |
| | (0.04) |
| | (0.01) |
| |
| Net realized gain | (0.97) |
| | — |
| | (0.47) |
| | (0.97) |
| | — |
| |
| Total distributions | (1.13) |
| | (0.01) |
| | (0.47) |
| | (1.01) |
| | (0.01) |
| |
| Total increase (decrease) in net asset value | 0.08 |
| | 3.86 |
| | 0.15 |
| | (1.80) |
| | 0.64 |
| |
| Net asset value, ending | $18.37 | | $18.29 | | $14.43 | | $14.28 | | $16.08 | |
Total return (3) | 6.92 | % | | 26.83 | % | | 4.46 | % | | (5.09 | %) | | 4.20 | % | |
Ratios to average net assets: (4) | | | | | | | | | | |
| Total expenses | 2.13 | % | | 2.61 | % | | 2.67 | % | | 2.72 | % | | 2.81 | % | |
| Net expenses | 2.13 | % | | 2.30 | % | | 2.44 | % | | 2.50 | % | | 2.50 | % | |
| Net investment income (loss) | 0.18 | % | | (0.24 | %) | | 0.04 | % | (2) | (0.18 | %) | | (0.08 | %) | |
| Portfolio turnover | 60 | % | | 158 | % | | 52 | % | | 51 | % | | 56 | % | |
| Net assets, ending (in thousands) | $7,603 | | $5,850 | | $5,037 | | $5,030 | | $4,605 | |
| | | | | | | | | | | |
(1) Computed using average shares outstanding. |
(2) Amount includes a non-recurring refund for overbilling of prior years’ custody out-of-pocket fees. This amounted to $0.006 per share and 0.04% of average net assets. |
(3) Returns are historical and are calculated by determining the percentage change in net asset value with all distributions reinvested and do not reflect the effect of sales charges, if any. |
(4) Total expenses do not reflect amounts reimbursed and/or waived by the adviser and certain of its affiliates, if applicable. Net expenses are net of all reductions and represent the net expenses paid by the Fund. |
| See notes to financial statements. |
www.calvert.com CALVERT INTERNATIONAL OPPORTUNITIES FUND ANNUAL REPORT 17
CALVERT INTERNATIONAL OPPORTUNITIES FUND
FINANCIAL HIGHLIGHTS
|
| | | | | | | | | | | | | | | |
| | Year Ended September 30, |
| CLASS I SHARES | 2018 | | 2017 | | 2016 | | 2015 | | 2014 | |
| Net asset value, beginning | $18.42 | | $14.56 | | $14.38 | | $16.19 | | $15.54 | |
| Income from investment operations: | | | | | | | | | | |
Net investment income (1) | 0.23 |
| | 0.17 |
| | 0.19 |
| (2) | 0.19 |
| | 0.20 |
| |
| Net realized and unrealized gain (loss) | 1.17 |
| | 3.90 |
| | 0.63 |
| | (0.80) |
| | 0.66 |
| |
| Total from investment operations | 1.40 |
| | 4.07 |
| | 0.82 |
| | (0.61) |
| | 0.86 |
| |
| Distributions from: | | | | | | | | | | |
| Net investment income | (0.33) |
| | (0.21) |
| | (0.17) |
| | (0.23) |
| | (0.21) |
| |
| Net realized gain | (0.97) |
| | — |
| | (0.47) |
| | (0.97) |
| | — |
| |
| Total distributions | (1.30) |
| | (0.21) |
| | (0.64) |
| | (1.20) |
| | (0.21) |
| |
| Total increase (decrease) in net asset value | 0.10 |
| | 3.86 |
| | 0.18 |
| | (1.81) |
| | 0.65 |
| |
| Net asset value, ending | $18.52 | | $18.42 | | $14.56 | | $14.38 | | $16.19 | |
Total return (3) | 7.95 | % | | 28.44 | % | | 5.84 | % | | (3.86 | %) | | 5.58 | % | |
Ratios to average net assets: (4) | | | | | | | | | | |
| Total expenses | 1.13 | % | | 1.07 | % | | 1.17 | % | | 1.15 | % | | 1.18 | % | |
| Net expenses | 1.13 | % | | 1.07 | % | | 1.16 | % | | 1.15 | % | | 1.18 | % | |
| Net investment income | 1.23 | % | | 1.06 | % | | 1.35 | % | (2) | 1.22 | % | | 1.24 | % | |
| Portfolio turnover | 60 | % | | 158 | % | | 52 | % | | 51 | % | | 56 | % | |
| Net assets, ending (in thousands) | $230,748 | | $115,698 | | $69,319 | | $40,833 | | $32,079 | |
| | | | | | | | | | | |
(1) Computed using average shares outstanding. |
(2) Amount includes a non-recurring refund for overbilling of prior years’ custody out-of-pocket fees. This amounted to $0.008 per share and 0.06% of average net assets. |
(3) Returns are historical and are calculated by determining the percentage change in net asset value with all distributions reinvested and do not reflect the effect of sales charges, if any. |
(4) Total expenses do not reflect amounts reimbursed and/or waived by the adviser and certain of its affiliates, if applicable. Net expenses are net of all reductions and represent the net expenses paid by the Fund. |
| See notes to financial statements. |
18 www.calvert.com CALVERT INTERNATIONAL OPPORTUNITIES FUND ANNUAL REPORT
NOTES TO FINANCIAL STATEMENTS
NOTE 1 — SIGNIFICANT ACCOUNTING POLICIES
Calvert International Opportunities Fund (the Fund) is a diversified series of Calvert World Values Fund, Inc. (the Corporation). The Corporation is a Maryland corporation registered under the Investment Company Act of 1940, as amended (the 1940 Act), as an open-end management investment company. The investment objective of the Fund is to seek long-term capital appreciation. The Fund invests primarily in common and preferred stocks of non-U.S. small-cap to mid-cap companies.
The Fund offers three classes of shares. Class A shares are generally sold subject to a sales charge imposed at time of purchase. A contingent deferred sales charge of 0.80% may apply to certain redemptions of Class A shares for accounts for which no sales charge was paid, if redeemed within one year of purchase. Class C shares are sold without a front-end sales charge, and with certain exceptions, are charged a contingent deferred sales charge of 1% on shares redeemed within one year of purchase. Class C shares are only available for purchase through a financial intermediary. Class I shares are sold at net asset value, are not subject to a sales charge and are sold only to certain eligible investors. The Fund previously offered Class Y shares. At the close of business on December 8, 2017, Class Y shares were converted to Class I shares. Each class represents a pro rata interest in the Fund, but votes separately on class-specific matters and is subject to different expenses.
The Fund applies the accounting and reporting guidance in the Financial Accounting Standards Board (FASB) Accounting Standards Codification Topic 946, Financial Services – Investment Companies (ASC 946). Subsequent events, if any, through the date that the financial statements were issued have been evaluated in the preparation of the financial statements.
A. Investment Valuation: Net asset value per share is determined every business day as of the close of the regular session of the New York Stock Exchange (generally 4:00 p.m. Eastern time). The Fund uses independent pricing services approved by the Board of Directors (the Board) to value its investments wherever possible. Investments for which market quotations are not available or deemed not reliable are fair valued in good faith under the direction of the Board.
U.S. generally accepted accounting principles (U.S. GAAP) establishes a disclosure hierarchy that categorizes the inputs to valuation techniques used to value assets and liabilities at measurement date. These inputs are summarized in the three broad levels listed below:
Level 1 - quoted prices in active markets for identical securities
Level 2 - other significant observable inputs (including quoted prices for similar securities, interest rates, prepayment speeds, credit risk, etc.)
Level 3 - significant unobservable inputs (including the Fund’s own assumptions in determining the fair value of investments)
The inputs or methodologies used for valuing securities are not necessarily an indication of the risk associated with investing in those securities.
Valuation techniques used to value the Fund’s investments by major category are as follows:
Equity Securities. Equity securities (including warrants and rights) listed on a U.S. securities exchange generally are valued at the last sale or closing price as reported by an independent pricing service on the primary market or exchange on which they are traded and are categorized as Level 1 in the hierarchy. Equity securities listed on the NASDAQ Global or Global Select Market are valued at the NASDAQ official closing price and are categorized as Level 1 in the hierarchy. Unlisted or listed securities for which closing sales prices or closing quotations are not available are valued at the mean between the latest available bid and asked prices and are categorized as Level 2 in the hierarchy. The daily valuation of exchange-traded foreign securities generally is determined as of the close of trading on the principal exchange on which such securities trade. Events occurring after the close of trading on foreign exchanges may result in adjustments to the valuation of foreign securities to more accurately reflect their fair value as of the close of regular trading on the New York Stock Exchange. When valuing foreign equity securities that meet certain criteria, the Fund’s Board has approved the use of a fair value service that values such securities to reflect market trading that occurs after the close of the applicable foreign markets of comparable securities or other instruments that have a strong correlation to the fair-valued securities. Such securities are categorized as Level 2 in the hierarchy.
Debt Securities. Debt securities are generally valued on the basis of valuations provided by third party pricing services, as derived from such services’ pricing models. Inputs to the models may include, but are not limited to, reported trades, executable bid and asked prices, broker/dealer quotations, prices or yields of securities with similar characteristics, interest rates, anticipated prepayments, benchmark curves or information pertaining to the issuer, as well as industry and economic events. Accordingly, debt securities are generally categorized as Level 2 in the hierarchy. Short-term debt securities of sufficient credit quality purchased with remaining maturities of sixty days or less for which a valuation from a third party pricing service is not readily available may be valued at amortized cost, which approximates fair value, and are categorized as Level 2 in the hierarchy.
www.calvert.com CALVERT INTERNATIONAL OPPORTUNITIES FUND ANNUAL REPORT 19
Other Securities. Exchange-traded funds are valued at the official closing price as reported by an independent pricing service on the primary market or exchange on which they are traded and are categorized as Level 1 in the hierarchy. Investments in registered investment companies (including money market funds) that do not trade on an exchange are valued at the net asset value per share on the valuation day and are categorized as Level 1 in the hierarchy.
Fair Valuation. If a market value cannot be determined for a security using the methodologies described above, or if, in the good faith opinion of the Fund’s adviser, the market value does not constitute a readily available market quotation, or if a significant event has occurred that would materially affect the value of the security, the security will be fair valued as determined in good faith by or at the direction of the Board in a manner that fairly reflects the security’s value, or the amount that the Fund might reasonably expect to receive for the security upon its current sale in the ordinary course. Each such determination is based on a consideration of relevant factors, which are likely to vary from one pricing context to another. These factors may include, but are not limited to, the type of security, the existence of any contractual restrictions on the security’s disposition, the price and extent of public trading in similar securities of the issuer or of comparable companies or entities, quotations or relevant information obtained from broker/dealers or other market participants, information obtained from the issuer, analysts, and/or the appropriate stock exchange (for exchange-traded securities), an analysis of the company’s or entity’s financial condition, and an evaluation of the forces that influence the issuer and the market(s) in which the security is purchased and sold.
The values assigned to fair value investments are based on available information and do not necessarily represent amounts that might ultimately be realized. Further, due to the inherent uncertainty of valuations of such investments, the fair values may differ significantly from the values that would have been used had an active market existed, and the differences could be material.
The following table summarizes the market value of the Fund’s holdings as of September 30, 2018, based on the inputs used to value them:
|
| | | | | | | | | | | | | |
| Assets | Level 1 | Level 2 | | Level 3(1) | Total |
| Common Stocks | | | | | |
| Canada | $ | 5,856,197 |
| $ | — |
| | $ | — |
| $ | 5,856,197 |
|
| Netherlands | 1,371,775 |
| 15,440,227 |
| | — |
| 16,812,002 |
|
| United States | 2,727,046 |
| — |
| | — |
| 2,727,046 |
|
Other Countries(2) | — |
| 268,929,384 |
| | — |
| 268,929,384 |
|
| Total Common Stocks | $ | 9,955,018 |
| $ | 284,369,611 |
| (3) | $ | — |
| $ | 294,324,629 |
|
| High Social Impact Investments | — |
| 962,350 |
| | 234,159 |
| 1,196,509 |
|
| Short Term Investment of Cash Collateral for Securities Loaned | 7,422,626 |
| — |
| | — |
| 7,422,626 |
|
| Total Investments | $ | 17,377,644 |
| $ | 285,331,961 |
| | $ | 234,159 |
| $ | 302,943,764 |
|
| | | | | | |
(1) None of the unobservable inputs for Level 3 assets, individually or collectively, had a material impact on the Fund. |
(2) For further breakdown of equity securities by country, please refer to the Schedule of Investments. |
(3) Includes foreign equity securities whose values were adjusted to reflect market trading of comparable securities or other correlated instruments that occurred after the close of trading in their applicable foreign markets. |
Level 3 investments at the beginning and/or end of the period in relation to net assets were not significant and accordingly, a reconciliation of Level 3 assets for the year ended September 30, 2018 is not presented.
B. Investment Transactions and Income: Investment transactions for financial statement purposes are accounted for on trade date. Realized gains and losses are recorded on an identified cost basis and may include proceeds from litigation. Dividend income is recorded on the ex-dividend date for dividends received in cash and/or securities or, in the case of dividends on certain foreign securities, as soon as the Fund is informed of the ex-dividend date. Non-cash dividends are recorded at the fair value of the securities received. Withholding taxes on foreign dividends, if any, have been provided for in accordance with the Fund’s understanding of the applicable country’s tax rules and rates. Distributions received that represent a return of capital are recorded as a reduction of cost of investments. Distributions received that represent a capital gain are recorded as a realized gain. Interest income, which includes amortization of premium and accretion of discount on debt securities, is accrued as earned.
C. Share Class Accounting: Realized and unrealized gains and losses and net investment income and losses, other than class-specific expenses, are allocated daily to each class of shares based upon the relative net assets of each class to the total net assets of the Fund. Expenses arising in connection with a specific class are charged directly to that class.
D. Foreign Currency Transactions: The Fund’s accounting records are maintained in U.S. dollars. For valuation of assets and liabilities on each date of net asset value determination, foreign denominations are converted into U.S. dollars using the current
20 www.calvert.com CALVERT INTERNATIONAL OPPORTUNITIES FUND ANNUAL REPORT
exchange rate. Security transactions, income, and expenses are translated at the prevailing rate of exchange on the date of the event. Recognized gains or losses on investment transactions attributable to changes in foreign currency exchange rates are recorded for financial statement purposes as net realized gains and losses on investments. That portion of unrealized gains and losses on investments that results from fluctuations in foreign currency exchange rates is not separately disclosed.
E. Restricted Securities: The Fund may invest in securities that are subject to legal or contractual restrictions on resale. Generally, these securities may only be sold publicly upon registration under the Securities Act of 1933 or in transactions exempt from such registration. Information regarding restricted securities (excluding Rule 144A securities) is included at the end of the Schedule of Investments.
F. Distributions to Shareholders: Distributions to shareholders are recorded by the Fund on ex-dividend date. Dividends from net investment income and distributions from net realized capital gains, if any, are paid at least annually. Distributions are determined in accordance with income tax regulations which may differ from U.S. GAAP; accordingly, periodic reclassifications are made within the Fund’s capital accounts to reflect income and gains available for distribution under income tax regulations.
G. Estimates: The preparation of financial statements in conformity with U.S. GAAP requires management to make estimates and assumptions that affect the reported amounts of assets and liabilities and disclosure of contingent assets and liabilities at the date of the financial statements and the reported amounts of increases and decreases in net assets from operations during the reporting period. Actual results could differ from those estimates.
H. Indemnifications: The Corporation’s By-Laws provide for indemnification for Directors or officers of the Corporation and certain other parties, to the fullest extent permitted by Maryland law and the 1940 Act, provided certain conditions are met. Additionally, in the normal course of business, the Fund enters into agreements with service providers that may contain indemnification clauses. The Fund’s maximum exposure under these arrangements is unknown as this would involve future claims that may be made against the Fund that have not yet occurred.
I. Federal Income Taxes: No provision for federal income or excise tax is required since the Fund intends to continue to qualify as a regulated investment company under the Internal Revenue Code and to distribute substantially all of its taxable earnings.
Management has analyzed the Fund’s tax positions taken for all open federal income tax years and has concluded that no provision for federal income tax is required in the Fund’s financial statements. A Fund’s federal tax return is subject to examination by the Internal Revenue Service for a period of three years from the date of filing.
NOTE 2 — RELATED PARTY TRANSACTIONS
The investment advisory fee is earned by Calvert Research and Management (CRM), a subsidiary of Eaton Vance Management (EVM), as compensation for investment advisory services rendered to the Fund. Pursuant to the investment advisory agreement, CRM receives a fee, payable monthly, at the annual rate of 0.75% of the Fund’s average daily net assets. For the year ended September 30, 2018, the investment advisory fee amounted to $1,927,247.
Eaton Vance Advisers International Ltd. (EVAIL), an indirect, wholly-owned subsidiary of Eaton Vance Corp., provides sub-advisory services to the Fund pursuant to a sub-advisory agreement with CRM. Sub-advisory fees are paid by CRM from its investment advisory fee. Prior to November 1, 2017, Eaton Vance Management (International) Limited (EVMI), an indirect, wholly-owned subsidiary of Eaton Vance Corp., served as sub-adviser to the Fund.
CRM and EVAIL (EVMI prior to November 1, 2017) have agreed to reimburse the Fund’s operating expenses to the extent that total annual operating expenses (relating to ordinary operating expenses only and excluding expenses such as brokerage commissions, acquired fund fees and expenses of unaffiliated funds, interest expense, taxes or litigation expenses) exceed 1.43%, 2.26% and 1.16% for Class A, Class C and Class I, respectively, and prior to the close of business on December 8, 2017, 1.41% for Class Y, of such class’ average daily net assets. The expense reimbursement agreement may be changed or terminated after January 31, 2019. For the year ended September 30, 2018, CRM, EVAIL and EVMI waived or reimbursed no expenses.
The administrative fee is earned by CRM as compensation for administrative services rendered to the Fund. The fee is computed at an annual rate of 0.12% of the Fund’s average daily net assets attributable to Class A, Class C and Class I (and Class Y prior to the close of business on December 8, 2017) and is payable monthly. For the year ended September 30, 2018, CRM was paid administrative fees of $308,195.
The Fund has in effect a distribution plan for Class A shares (Class A Plan) pursuant to Rule 12b-1 under the 1940 Act. Pursuant to the Class A Plan, the Fund pays Eaton Vance Distributors, Inc. (EVD), an affiliate of CRM and the Fund’s principal underwriter, a distribution and service fee of 0.25% per annum of its average daily net assets attributable to Class A for distribution services and facilities provided to the Fund by EVD, as well as for personal services and/or the maintenance of shareholder accounts. The Fund also has in effect a distribution plan for Class C shares (Class C Plan) pursuant to Rule 12b-1 under the 1940 Act. Pursuant to the Class C Plan, the Fund pays EVD amounts equal to 0.75% per annum of its average daily net
www.calvert.com CALVERT INTERNATIONAL OPPORTUNITIES FUND ANNUAL REPORT 21
assets attributable to Class C shares for providing ongoing distribution services and facilities to the Fund. In addition, pursuant to the Class C Plan, the Fund also makes payments of service fees to EVD, financial intermediaries and other persons in amounts equal to 0.25% per annum of its average daily net assets attributable to that class. Service fees paid or accrued are for personal services and/or the maintenance of shareholder accounts. Distribution and service fees paid or accrued for the year ended September 30, 2018 amounted to $149,261 and $69,433 for Class A shares and Class C shares, respectively.
The Fund was informed that EVD received $37,615 as its portion of the sales charge on sales of Class A shares for the year ended September 30, 2018. The Fund was also informed that EVD received $1,789 of contingent deferred sales charges (CDSC) paid by Class C shareholders and no CDSC paid by Class A shareholders for the same period.
EVM provides sub-transfer agency and related services to the Fund pursuant to a Sub-Transfer Agency Support Services Agreement. For the year ended September 30, 2018, sub-transfer agency fees and expenses incurred to EVM amounted to $22,730 and are included in transfer agency fees and expenses on the Statement of Operations.
Each Director of the Fund who is not an employee of CRM or its affiliates receives a fee of $3,000 for each Board meeting attended in person and $2,000 for each Board meeting attended by phone plus an annual fee of $52,000, and $1,500 for each Committee meeting attended in person and $1,000 for each Committee meeting attended by phone plus an annual Committee fee of $2,500. The Board chair receives an additional $10,000 annual retainer and Committee chairs receive an additional $6,000 annual retainer. Eligible Directors may participate in a Deferred Compensation Plan (the Plan). Amounts deferred under the Plan are treated as though equal dollar amounts had been invested in shares of the Fund or other Calvert funds selected by the Directors. The Fund purchases shares of the funds selected equal to the dollar amounts deferred under the Plan, resulting in an asset equal to the deferred compensation liability. Obligations of the Plan are paid solely from the Fund’s assets. Directors’ fees are allocated to each of the Calvert funds served. Salaries and fees of officers and Directors of the Fund who are employees of CRM or its affiliates are paid by CRM. In addition, an advisory council was established to aid the Board and CRM in advancing the cause of responsible investing through original scholarship and thought leadership. The advisory council consists of CRM’s Chief Executive Officer and four additional members. Each member (other than CRM’s Chief Executive Officer) receives annual compensation of $75,000, which is being reimbursed by Calvert Investment Management, Inc. (CIM), the Calvert funds’ former investment adviser and Ameritas Holding Company, CIM’s parent company, through the end of 2019. For the year ended September 30, 2018, the Fund’s allocated portion of such expense and reimbursement was $5,247, which are included in miscellaneous expense and reimbursement of expenses-other, respectively, on the Statement of Operations.
NOTE 3 — INVESTMENT ACTIVITY
During the year ended September 30, 2018, the cost of purchases and proceeds from sales of investments, other than short-term securities, were $219,128,268 and $151,175,028, respectively.
NOTE 4 — DISTRIBUTIONS TO SHAREHOLDERS AND INCOME TAX INFORMATION
The tax character of distributions declared for the years ended September 30, 2018 and September 30, 2017 was as follows:
|
| | | | | | |
| | Year Ended September 30, |
| | 2018 | 2017 |
| Ordinary income |
| $15,146,341 |
|
| $2,608,931 |
|
During the year ended September 30, 2018, distributable earnings was decreased by $1,967,819 and paid-in capital was increased by $1,967,819 due to the Fund’s use of equalization accounting. Tax equalization accounting allows the Fund to treat as a distribution that portion of redemption proceeds representing a redeeming shareholder’s portion of undistributed taxable income and net capital gains. These reclassifications had no effect on the net assets or net asset value per share of the Fund.
As of September 30, 2018, the components of distributable earnings (accumulated loss) on a tax basis were as follows:
|
| | | |
| Undistributed ordinary income |
| $11,108,212 |
|
| Undistributed long-term capital gains |
| $12,059,229 |
|
| Net unrealized appreciation (depreciation) |
| $20,977,330 |
|
22 www.calvert.com CALVERT INTERNATIONAL OPPORTUNITIES FUND ANNUAL REPORT
The cost and unrealized appreciation (depreciation) of investments of the Fund at September 30, 2018, as determined on a federal income tax basis, were as follows:
|
| | | |
| Aggregate cost |
| $281,956,961 |
|
| Gross unrealized appreciation |
| $29,594,044 |
|
| Gross unrealized depreciation | (8,607,241) |
|
| Net unrealized appreciation (depreciation) |
| $20,986,803 |
|
NOTE 5 — SECURITIES LENDING
To generate additional income, the Fund may lend its securities pursuant to a securities lending agency agreement with State Street Bank and Trust Company (SSB), the securities lending agent. Security loans are subject to termination by the Fund at any time and, therefore, are not considered illiquid investments. The Fund requires that the loan be continuously collateralized by either cash or securities as collateral equal at all times to at least 102% of the market value of the domestic securities loaned and 105% of the market value of the international securities loaned (if applicable). The market value of securities loaned is determined daily and any additional required collateral is delivered to the Fund on the next business day. Cash collateral is generally invested in a money market fund registered under the 1940 Act that is managed by an affiliate of SSB. Any gain or loss in the market price of the loaned securities that might occur and any interest earned or dividends declared during the term of the loan would accrue to the account of the Fund. Income earned on the investment of collateral, net of broker rebates and other expenses incurred by the securities lending agent, is split between the Fund and the securities lending agent on the basis of agreed upon contractual terms. Non-cash collateral, if any, is held by the lending agent on behalf of the Fund and cannot be sold or re-pledged by the Fund; accordingly, such collateral is not reflected in the Statement of Assets and Liabilities.
The risks associated with lending portfolio securities include, but are not limited to, possible delays in receiving additional collateral or in the recovery of the loaned securities, possible loss of rights to the collateral should the borrower fail financially, as well as risk of loss in the value of the collateral or the value of the investments made with the collateral. The securities lending agent shall indemnify the Fund in the case of default of any securities borrower.
At September 30, 2018, the total value of securities on loan was $15,623,280 and the total value of collateral received was $16,306,454, comprised of cash of $7,422,626 and U.S. Government and/or agencies securities of $8,883,828.
The following table provides a breakdown of securities lending transactions accounted for as secured borrowings, the obligations by class of collateral pledged, and the remaining contractual maturity of those transactions as of September 30, 2018.
|
| | | | | | | | | | | | | | | |
| | Remaining Contractual Maturity of the Transactions |
| | Overnight and
Continuous | <30 days | 30 to 90 days | >90 days | Total |
| Securities Lending Transactions | | | | | |
| Common Stocks |
| $16,306,454 |
|
| $— |
|
| $— |
|
| $— |
|
| $16,306,454 |
|
The carrying amount of the liability for deposits for securities loaned at September 30, 2018 approximated its fair value. If measured at fair value, such liability would have been considered as Level 2 in the fair value hierarchy (see Note 1A) at September 30, 2018.
NOTE 6 — LINE OF CREDIT
The Fund participates with other funds managed by CRM in a $62.5 million committed ($25 million committed and $25 million uncommitted prior to August 7, 2018) unsecured line of credit agreement with SSB, which is in effect through August 6, 2019. Borrowings may be made for temporary or emergency purposes only. Borrowings bear interest at the higher of the One-Month London Interbank Offered Rate (LIBOR) in effect that day or the overnight Federal Funds Rate, plus 1.00% (1.25% prior to August 7, 2018) per annum. A commitment fee of 0.20% (0.25% prior to August 7, 2018) per annum is incurred on the unused portion of the committed facility. An administrative fee of $37,500 was incurred in connection with the renewal of the facility in August 2018. These fees are allocated to all participating funds. Because the line of credit is not available exclusively to the Fund, it may be unable to borrow some or all of its requested amounts at any particular time. The Fund had no borrowings outstanding pursuant to this line of credit at September 30, 2018. The Fund did not have any significant borrowings or allocated fees during the year ended September 30, 2018.
www.calvert.com CALVERT INTERNATIONAL OPPORTUNITIES FUND ANNUAL REPORT 23
NOTE 7 — AFFILIATED COMPANIES
The Fund has invested a portion of its assets designated for high social impact investments in notes (the Notes) issued by Calvert Impact Capital, Inc. (CIC), formerly the Calvert Social Investment Foundation, pursuant to an exemptive order granted by the U.S. Securities and Exchange Commission (the SEC) in 1998 (the Exemptive Order). The Fund obtained the Exemptive Order because at that time there was a significant overlap of Fund Board members and CIC Board members as well as certain other affiliations between CIC and affiliates of the Fund’s investment adviser. CIC may be considered an affiliated person of the Fund based on the overlap between the CIC’s Board of Directors and the Calvert funds’ Directors/Trustees and other potential affiliations. CIC has licensed use of the Calvert name from CRM, and currently two Fund Board members (one of whom is CRM’s President and Chief Executive Officer), two members of the Advisory Council to the Calvert Fund Board of Directors/Trustees, and an additional CRM officer serve on CIC’s Board. CIC is not owned or otherwise controlled by CRM or its affiliates. The Fund intends to request a new exemptive order from the SEC to permit additional investment in CIC notes.
At September 30, 2018, the value of the Fund’s investment in the Notes was $962,350, which represents 0.32% of the Fund’s net assets. Transactions in the Notes by the Fund for the year ended September 30, 2018 were as follows:
|
| | | | | | | | | | | | | | | | | | | | | | | | | | | |
| Name of Issuer | Principal Amount,
beginning of period | Gross Additions | Gross Reductions | Principal Amount,
end of period | Value,
end of period | Interest
Income | Net Realized
Gain (Loss) | Capital Gain
Distributions Received | Change in
Unrealized
Appreciation
(Depreciation) |
| High Social Impact Investments | | | | | | | | | |
Calvert Impact Capital, Inc., Community Investment Notes, 1.50%, 12/15/19(1) |
| $1,000,000 |
|
| $— |
|
| $— |
|
| $1,000,000 |
|
| $962,350 |
|
| $15,000 |
|
| $— |
|
| $— |
|
| $9,270 |
|
| TOTALS | | | | |
| $962,350 |
|
| $15,000 |
|
| $— |
|
| $— |
|
| $9,270 |
|
(1) Restricted security.
24 www.calvert.com CALVERT INTERNATIONAL OPPORTUNITIES FUND ANNUAL REPORT
NOTE 8 — CAPITAL SHARES
Transactions in capital shares for the years ended September 30, 2018 and September 30, 2017 were as follows:
|
| | | | | | | | | | | |
| | Year Ended
September 30, 2018 | | Year Ended
September 30, 2017 |
| | Shares | Amount | | Shares | Amount |
| Class A | | | | | |
| Shares sold | 1,433,775 |
|
| $27,113,992 |
| | 1,095,896 |
|
| $17,214,378 |
|
| Reinvestment of distributions | 175,001 |
| 3,161,116 |
| | 67,243 |
| 961,581 |
|
| Shares redeemed | (813,792 | ) | (15,302,254 | ) | | (5,729,215 | ) | (88,737,750 | ) |
| Net increase (decrease) | 794,984 |
|
| $14,972,854 |
| | (4,566,076 | ) |
| ($70,561,791 | ) |
| | | | | | |
| Class C | | | | | |
| Shares sold | 146,091 |
|
| $2,698,914 |
| | 53,630 |
|
| $847,542 |
|
| Reinvestment of distributions | 18,636 |
| 329,666 |
| | 193 |
| 2,718 |
|
| Shares redeemed | (70,780 | ) | (1,304,248 | ) | | (83,136 | ) | (1,285,014 | ) |
| Net increase (decrease) | 93,947 |
|
| $1,724,332 |
| | (29,313 | ) |
| ($434,754 | ) |
| | | | | | |
| Class I | | | | | |
| Shares sold | 5,102,338 |
|
| $94,476,812 |
| | 2,647,916 |
|
| $40,716,918 |
|
| Reinvestment of distributions | 435,520 |
| 7,704,353 |
| | 80,932 |
| 1,136,295 |
|
| Shares redeemed | (2,182,140 | ) | (40,327,347 | ) | | (1,208,983 | ) | (18,766,250 | ) |
| Conversion from Class Y | 2,825,040 |
| 50,104,349 |
| | — |
| — |
|
| Net increase | 6,180,758 |
|
| $111,958,167 |
| | 1,519,865 |
|
| $23,086,963 |
|
| | | | | | |
Class Y (1) | | | | | |
| Shares sold | 268,609 |
|
| $4,778,865 |
| | 1,626,177 |
|
| $25,255,978 |
|
| Reinvestment of distributions | 176,372 |
| 3,028,308 |
| | 26,818 |
| 366,604 |
|
| Shares redeemed | (159,596 | ) | (2,852,439 | ) | | (2,248,321 | ) | (32,228,122 | ) |
| Conversion to Class I | (2,909,948 | ) | (50,104,349 | ) | | — |
| — |
|
| Net decrease | (2,624,563 | ) |
| ($45,149,615 | ) | | (595,326 | ) |
| ($6,605,540 | ) |
| | | | | | |
(1) Effective December 8, 2017, Class Y shares of the Fund converted to Class I shares at net asset value. Thereafter, Class Y shares were terminated. |
NOTE 9 — RISKS ASSOCIATED WITH FOREIGN INVESTMENTS
Investing in foreign securities involves additional risks relating to political, social, and economic developments abroad. Other risks result from differences between regulations that apply to U.S. and foreign issuers and markets, and the potential for foreign markets to be less liquid and more volatile than U.S. markets. Securities that trade or are denominated in currencies other than the U.S. dollar may be adversely affected by fluctuations in currency exchange rates.
www.calvert.com CALVERT INTERNATIONAL OPPORTUNITIES FUND ANNUAL REPORT 25
REPORT OF INDEPENDENT REGISTERED PUBLIC ACCOUNTING FIRM
To the Shareholders and Board of Directors
Calvert World Values Fund, Inc.:
Opinion on the Financial Statements
We have audited the accompanying statement of assets and liabilities of Calvert International Opportunities Fund (the Fund), a series of Calvert World Values Fund, Inc., including the schedule of investments, as of September 30, 2018, the related statement of operations for the year then ended, the statements of changes in net assets for each of the years in the two‑year period then ended, and the related notes (collectively, the financial statements) and the financial highlights for each of the years in the five‑year period then ended. In our opinion, the financial statements and financial highlights present fairly, in all material respects, the financial position of the Fund as of September 30, 2018, the results of its operations for the year then ended, the changes in its net assets for each of the years in the two‑year period then ended, and the financial highlights for each of the years in the five‑year period then ended, in conformity with U.S. generally accepted accounting principles.
Basis for Opinion
These financial statements and financial highlights are the responsibility of the Fund’s management. Our responsibility is to express an opinion on these financial statements and financial highlights based on our audits. We are a public accounting firm registered with the Public Company Accounting Oversight Board (United States) (PCAOB) and are required to be independent with respect to the Fund in accordance with the U.S. federal securities laws and the applicable rules and regulations of the Securities and Exchange Commission and the PCAOB.
We conducted our audits in accordance with the standards of the PCAOB. Those standards require that we plan and perform the audit to obtain reasonable assurance about whether the financial statements and financial highlights are free of material misstatement, whether due to error or fraud. Our audits included performing procedures to assess the risks of material misstatement of the financial statements and financial highlights, whether due to error or fraud, and performing procedures that respond to those risks. Such procedures included examining, on a test basis, evidence regarding the amounts and disclosures in the financial statements and financial highlights. Such procedures also included confirmation of securities owned as of September 30, 2018, by correspondence with custodians and brokers. Our audits also included evaluating the accounting principles used and significant estimates made by management, as well as evaluating the overall presentation of the financial statements and financial highlights. We believe that our audits provide a reasonable basis for our opinion.
We have served as the auditor of one or more of the Calvert Funds since 2002.
Philadelphia, Pennsylvania
November 21, 2018
26 www.calvert.com CALVERT INTERNATIONAL OPPORTUNITIES FUND ANNUAL REPORT
FEDERAL TAX INFORMATION
The Form 1099-DIV you receive in February 2019 will show the tax status of all distributions paid to your account in calendar year 2018. Shareholders are advised to consult their own tax adviser with respect to the tax consequences of their investment in the Fund. As required by the Internal Revenue Code and/or regulations, shareholders must be notified regarding the status of qualified dividend income for individuals, the foreign tax credit and capital gains dividends.
Qualified Dividend Income. For the fiscal year ended September 30, 2018, the Fund designates approximately $4,161,554, or up to the maximum amount of such dividends allowable pursuant to the Internal Revenue Code, as qualified dividend income eligible for the reduced tax rate of 15%.
Foreign Tax Credit. For the fiscal year ended September 30, 2018, the Fund paid foreign taxes of $420,085 and recognized foreign source income of $6,156,580.
Capital Gains Dividends. The Fund hereby designates as a capital gain dividend with respect to the taxable year ended September 30, 2018, $13,083,528 or, if subsequently determined to be different, the net capital gain of such year.
www.calvert.com CALVERT INTERNATIONAL OPPORTUNITIES FUND ANNUAL REPORT (Unaudited) 27
MANAGEMENT AND ORGANIZATION
Fund Management. The Directors of Calvert World Values Fund, Inc. (the Corporation) are responsible for the overall management and supervision of the Corporation’s affairs. The Directors and officers of the Corporation are listed below. Except as indicated, each individual has held the office shown or other offices in the same company for the last five years. Directors and officers of the Corporation hold indefinite terms of office. The “Independent Directors” consist of those Directors who are not “interested persons” of the Corporation, as that term is defined under the 1940 Act. The business address of each Director and officer, with the exception of Ms. Gemma and Mr. Kirchner, is 1825 Connecticut Avenue NW, Suite 400, Washington, DC 20009. As used below, “CRM” refers to Calvert Research and Management. Each Director oversees 39 funds in the Calvert fund complex. Each officer serves as an officer of certain other Calvert funds.
|
| | | |
| Name and Year of Birth | Position
with Corporation | Position
Start Date | Principal Occupation(s) and Directorships
During Past Five Years and Other Relevant Experience |
| | | | |
| Interested Director | | | |
John H. Streur(1)
1960 | Director & President | 2015 | President and Chief Executive Officer of Calvert Research and Management (since December 31, 2016). President and Chief Executive Officer of Calvert Investments, Inc. (January 2015 - December 2016); Chief Executive Officer of Calvert Investment Distributors, Inc. (August 2015 - December 2016); Chief Compliance Officer of Calvert Investment Management, Inc. (August 2015 - April 2016); President and Director, Portfolio 21 Investments, Inc. (through October 2014); President, Chief Executive Officer and Director, Managers Investment Group LLC (through January 2012); President and Director, The Managers Funds and Managers AMG Funds (through January 2012).
Directorships in the Last Five Years. Portfolio 21 Investments, Inc. (asset management) (through October 2014); Managers Investment Group LLC (asset management) (through January 2012); The Managers Funds (asset management) (through January 2012); Managers AMG Funds (asset management) (through January 2012); Calvert Impact Capital, Inc. |
| Independent Directors | | | |
Richard L. Baird, Jr
1948 | Director | 2005 | Former President and CEO of Adagio Health Inc. (retired in 2014) in Pittsburgh, PA, a non-profit corporation which provides family planning services, nutrition, maternal/child health care, and various health screening services and community preventive health programs.
Directorships in the Last Five Years. None. |
Alice Gresham Bullock
1950 | Chair & Director | 2016 | Professor at Howard University School of Law (retired June 2016). She is former Dean of Howard University School of Law (1996-2002) and Deputy Director of the Association of American Law Schools (1992-1994).
Directorships in the Last Five Years. None. |
Cari M. Dominguez
1949 | Director | 2016 | Former Chair of the U.S. Equal Employment Opportunity Commission.
Directorships in the Last Five Years. Manpower, Inc. (employment agency); Triple S Management Corporation (managed care); National Association of Corporate Directors. |
John G. Guffey, Jr.
1948 | Director | 1992 | President of Aurora Press Inc., a privately held publisher of trade paperbacks (since January 1997).
Directorships in the Last Five Years. Calvert Impact Capital, Inc.; Calvert Ventures, LLC. |
Miles D. Harper, III
1962 | Director | 2005 | Partner, Carr Riggs & Ingram (public accounting firm) since October 2014. Partner, Gainer Donnelly & Desroches (public accounting firm) (now Carr Riggs & Ingram), November 1999 - September 2014).
Directorships in the Last Five Years. Bridgeway Funds (10) (asset management). |
28 www.calvert.com CALVERT INTERNATIONAL OPPORTUNITIES FUND ANNUAL REPORT (Unaudited)
|
| | | |
| Name and Year of Birth | Position
with Corporation | Position
Start Date | Principal Occupation(s) and Directorships
During Past Five Years and Other Relevant Experience |
| | | | |
Joy V. Jones
1950 | Director | 2005 | Attorney.
Directorships in the Last Five Years. Conduit Street Restaurants SUD 2 Limited; Palm Management Restaurant Corporation. |
Anthony A. Williams
1951 | Director | 2016 | CEO and Executive Director of the Federal City Council (July 2012 to present); Senior Adviser and Independent Consultant for McKenna Long & Aldridge LLP (September 2011 to present); Executive Director of Global Government Practice at the Corporate Executive Board (January 2010 to January 2012).
Directorships in the Last Five Years. Freddie Mac; Evoq Properties/ Meruelo Maddux Properties, Inc. (real estate management); Weston Solutions, Inc. (environmental services); Bipartisan Policy Center’s Debt Reduction Task Force; Chesapeake Bay Foundation; Catholic University of America; Urban Institute (research organization). |
|
| | | |
| Principal Officers who are not Directors | |
Name and
Year of Birth | Position with
Corporation | Position Start Date | Principal Occupation
During Past Five Years |
| | | | |
Hope L. Brown
1973 | Chief Compliance Officer | 2014 | Chief Compliance Officer of 39 registered investment companies advised by CRM (since 2014). Vice President and Chief Compliance Officer, Wilmington Funds (2012-2014). Vice President and Senior Compliance Officer, Wilmington Trust Investment Advisors, Inc. (2010-2012). |
Maureen A. Gemma(2)
1960 | Secretary, Vice President and Chief Legal Officer | 2016 | Vice President of CRM and officer of 39 registered investment companies advised by CRM (since 2016). Also Vice President of Eaton Vance Management (“EVM”) and certain of its affiliates and officer of 174 registered investment companies advised or administered by EVM. |
James F. Kirchner(2)
1967 | Treasurer | 2016 | Vice President of CRM and officer of 39 registered investment companies advised by CRM (since 2016). Also Vice President of EVM and certain of its affiliates and officer of 174 registered investment companies advised or administered by EVM. |
| | | | |
| |
(1) | Mr. Streur is an interested person of the Fund because of his positions with the Fund’s Adviser and certain affiliates. |
| |
(2) | The business address for Ms. Gemma and Mr. Kirchner is Two International Place, Boston, MA 02110. |
The SAI for the Fund includes additional information about the Directors and officers of the Fund and can be obtained without charge on Calvert’s website at www.calvert.com or by calling 1-800-368-2745.
www.calvert.com CALVERT INTERNATIONAL OPPORTUNITIES FUND ANNUAL REPORT (Unaudited) 29
IMPORTANT NOTICES
Privacy. The Calvert Funds and Calvert Research and Management are committed to ensuring your financial privacy. Each of the financial institutions identified below has in effect the following policy (“Privacy Policy”) with respect to nonpublic personal information about its customers:
| |
| • | Only such information received from you, through application forms or otherwise, and information about your Calvert fund transactions will be collected. This may include information such as name, address, social security number, tax status, account balances and transactions. |
| |
| • | None of such information about you (or former customers) will be disclosed to anyone, except as permitted by law (which includes disclosure to employees necessary to service your account). In the normal course of servicing a customer’s account, Calvert Research and Management may share information with unaffiliated third parties that perform various required services such as transfer agents, custodians and broker-dealers. |
| |
| • | Policies and procedures (including physical, electronic and procedural safeguards) are in place that are designed to protect the confidentiality of such information. |
| |
| • | The Funds reserve the right to change this Privacy Policy at any time upon proper notification to you. Customers may want to review the Funds’ Privacy Policy periodically for changes by accessing the link on our homepage: www.calvert.com. |
Our pledge of privacy applies to the following entities: the Calvert Family of Funds, Calvert Research and Management and their affiliated service providers, Eaton Vance Management and Eaton Vance Distributors, Inc. In addition, our Privacy Policy applies only to those Calvert customers who are individuals and who have a direct relationship with us. If a customer’s account (i.e., fund shares) is held in the name of a third-party financial advisor/broker-dealer, it is likely that only such advisor’s privacy policies apply to the customer. This notice supersedes all previously issued privacy disclosures. For more information about Calvert’s Privacy Policy, please call 1-800-368-2745.
Delivery of Shareholder Documents. The Securities and Exchange Commission (SEC) permits funds to deliver only one copy of shareholder documents, including prospectuses, proxy statements and shareholder reports, to fund investors with multiple accounts at the same residential or post office box address. This practice is often called “householding” and it helps eliminate duplicate mailings to shareholders. Calvert funds, or your financial advisor, may household the mailing of your documents indefinitely unless you instruct Calvert funds, or your financial advisor, otherwise. If you would prefer that your Calvert fund documents not be householded, please contact Calvert funds at 1-800-368-2745, or contact your financial advisor. Your instructions that householding not apply to delivery of your Calvert fund documents will typically be effective within 30 days of receipt by Calvert funds or your financial advisor. Separate statements will be generated for each separate account and will be householded as described above.
Portfolio Holdings. Each Calvert fund will file a schedule of portfolio holdings on Form N-Q with the SEC for the first and third quarters of each fiscal year. The Form N-Q will be available on the Calvert funds’ website at www.calvert.com, by calling Calvert funds at 1-800-368-2745 or in the EDGAR database on the SEC’s website at www.sec.gov. Form N-Q may also be reviewed and copied at the SEC’s public reference room in Washington, D.C. (call 1-800-732-0330 for information on the operation of the public reference room).
Proxy Voting. The Proxy Voting Guidelines that each Calvert fund uses to determine how to vote proxies relating to portfolio securities is provided as an Appendix to the fund’s Statement of Additional Information. The Statement of Additional Information can be obtained free of charge by calling the Calvert funds at 1-800-368-2745, by visiting the Calvert funds’ website at www.calvert.com or visiting the SEC’s website at www.sec.gov. Information regarding how a Calvert fund voted proxies relating to portfolio securities during the most recent 12-month period ended June 30 is available by calling Calvert funds, by visiting the Calvert funds’ website at www.calvert.com or by visiting the SEC’s website at www.sec.gov.
30 www.calvert.com CALVERT INTERNATIONAL OPPORTUNITIES FUND ANNUAL REPORT (Unaudited)
|
|
| This page intentionally left blank. |
|
|
| This page intentionally left blank. |
|
| |
| CALVERT INTERNATIONAL OPPORTUNITIES FUND | |
Investment Adviser and Administrator Calvert Research and Management 1825 Connecticut Avenue NW, Suite 400 Washington, DC 20009 | Transfer Agent DST Asset Manager Solutions, Inc. 2000 Crown Colony Drive Quincy, MA 02169 |
Sub-Adviser Eaton Vance Advisers International Ltd. 125 Old Broad Street London, EC2N 1AR | Independent Registered Public Accounting Firm KPMG LLP 1601 Market Street Philadelphia, PA 19103-2499 |
Principal Underwriter* Eaton Vance Distributors, Inc. Two International Place Boston, MA 02110 (617) 482-8260 | Fund Offices 1825 Connecticut Avenue NW, Suite 400 Washington, DC 20009 |
Custodian State Street Bank and Trust Company State Street Financial Center, One Lincoln Street Boston, MA 02111 | |
* FINRA BrokerCheck. Investors may check the background of their Investment Professional by contacting the Financial Industry Regulatory Authority (FINRA). FINRA BrokerCheck is a free tool to help investors check the professional background of current and former FINRA-registered securities firms and brokers. FINRA BrokerCheck is available by calling 1-800-289-9999 and at www.FINRA.org. The FINRA BrokerCheck brochure describing this program is available to investors at www.FINRA.org.
|
| |
| | |
Fund shares are not insured by the FDIC and are not deposits or other obligations of, or guaranteed by, any depository institution. Shares are subject to investment risks, including possible loss of principal invested. This report is intended to provide fund information to shareholders. It is not authorized for distribution to prospective investors unless preceded or accompanied by a prospectus. Note: The information on our website is not incorporated by reference into this report; our website address is included as an inactive textual reference only. Investors should carefully consider the investment objectives, risks, charges and expenses of the Calvert funds. This and other important information is contained in the fund’s summary prospectus and prospectus, which can be obtained from your financial professional and should be read carefully before investing. You may also call the Calvert funds at 800-368-2745. Printed on recycled paper. |
| 24211 9.30.18 | |
|
| | |
| | |
| | | |
Calvert Emerging Markets Equity Fund
| | |
| | | |
| | |
|
| |
Annual Report September 30, 2018 E-Delivery Sign-Up — Details Inside | |
|
|
Commodity Futures Trading Commission Registration. Effective December 31, 2012, the Commodity Futures Trading Commission (“CFTC”) adopted certain regulatory changes that subject registered investment companies and advisers to regulation by the CFTC if a fund invests more than a prescribed level of its assets in certain CFTC-regulated instruments (including futures, certain options and swap agreements) or markets itself as providing investment exposure to such instruments. The Fund and its adviser have claimed an exclusion from the definition of the term “commodity pool operator” under the Commodity Exchange Act. Accordingly, neither the Fund nor the adviser is subject to CFTC regulation. |
Choose Planet-friendly E-delivery! Sign up now for on-line statements, prospectuses, and fund reports. In less than five minutes you can help reduce paper mail and lower fund costs. Just go to www.calvert.com. If you already have an online account with the Calvert funds, click on Login to access your Account and select the documents you would like to receive via e-mail. If you’re new to online account access, click on Login, then Register to create your user name and password. Once you’re in, click on the E-delivery sign-up on the Account Portfolio page and follow the quick, easy steps. Note: If your shares are not held directly with the Calvert funds but through a brokerage firm, you must contact your broker for electronic delivery options available through their firm. |
|
| | | | |
| | TABLE OF CONTENTS |
| | | | | |
| | | | | Management’s Discussion of Fund Performance |
| | | | | Performance |
| | | | | Fund Profile |
| | | | | Endnotes and Additional Disclosures |
| | | | | Fund Expenses |
| | | | | Financial Statements |
| | | | | Report of Independent Registered Public Accounting Firm |
| | | | | Federal Tax Information |
| | | | | Special Meeting of Shareholders |
| | | | | Management and Organization |
| | | | | Important Notices |
MANAGEMENT’S DISCUSSION OF FUND PERFORMANCE1
Economic and Market Conditions
Emerging market equities moved into negative territory during the 12-month period ended September 30, 2018, returning -0.81% as measured by the MSCI Emerging Markets Index (the Index)2. Emerging markets, which underperformed developed markets during the period, were weighed down by concerns over a tighter U.S. monetary policy, the strength of the U.S. dollar, elevated oil prices, the potential impact of a global trade war, a slowdown in Chinese growth, and a rising 10-year U.S. Treasury yield.
China underperformed during the period as the U.S. implemented tariffs on $250 billion worth of Chinese imports. China retaliated with measures of its own during a period when Chinese macroeconomic data disappointed. These escalating tensions contributed to weakness across a number of emerging markets.
Those markets vulnerable to tightening global liquidity came under the most pressure. Turkey had the weakest performance among emerging countries, dropping 41.66%. The Turkish lira fell more than 45% as a result of a bitter dispute with the U.S. that exacerbated investor concerns over macro imbalances, regional inflation, policy mismanagement, and a seemingly powerless central bank. The Philippines, Indonesia, and South Africa also underperformed.
Meanwhile, Thailand recorded robust returns, with companies in the financials and energy sectors among the best performers. Taiwan also stood out, supported by the strong performance of semiconductor stocks. Despite the threat of U.S. sanctions, Russian equities benefited from rising crude oil prices, helping that market finish ahead of the Index.
At the sector level, energy significantly outperformed the Index, surging 26.95% on the strength of increased oil prices. The consumer discretionary sector fell 14.75% amid fears of a potential trade war.
Fund Performance
For the 12-month period ended September 30, 2018, Calvert Emerging Markets Equity Fund (the Fund) had a total return of -4.62% for Class A shares at net asset value (NAV), underperforming the Index, which returned -0.81%. The underperformance was primarily due to country allocation, notably an overweight to China, which detracted from returns because of the substantial weakening of the renminbi during the period. This eclipsed the positive contribution from stock selection in the country. Stock selection in Taiwan, Brazil, Russia, and India also detracted.
The Fund’s position in Techtronic Industries Co. Ltd. (Techtronic), a Hong Kong-listed manufacturer of home
improvement equipment, was a leading contributor to returns relative to the Index. Techtronic rose after reporting very strong first-half 2018 results, which included better-than-projected earnings by both its divisions. The power tools division grew at its fastest pace in more than a decade while its floor-care division reported an unexpectedly strong rebound in sales. AIA Group Ltd. (AIA), a Hong Kong-listed insurer, moved higher as a result of strong growth across all regions, most notably China.
Turnarounds in Singapore and Thailand also produced strong results, as did AIA’s resilient business line in Hong Kong. Tech Mahindra Ltd., an Indian information technology services provider, rose on the strength of its quarterly revenue and operational results in the second quarter of the Fund’s fiscal year.
Magnit PJSC (Magnit), a Russian discount retailer, was a notable detractor from Fund performance during the period. Poor results were worsened by news that one of Magnit’s majority owners had sold shares in 2017. Based on disappointing returns and challenging market conditions, the Fund sold its position in the company during the period.
Ultrapar Participacoes SA (Ultrapar), a Brazilian fuel distributor, fell on weak results for the first nine months of 2018. Performance was hurt by increased competition in the fuel market from independent gas stations able to import cheaper fuel and poor management of its reseller network. Ultrapar also slowed business expansion as it worked to make its capital allocation model more sustainable. Another detractor, BB Seguridade Participacoes SA, a Brazilian insurer, announced reduced earnings largely stemming from pension contributions.
The Fund’s country allocations included an overweight to China, India, the United Arab Emirates, and Taiwan. The Fund was underweight in South Korea, South Africa, Malaysia, Thailand, and Poland. Major changes included raising the overweight to China and moving to underweight South Africa by switching out of Naspers Ltd. into Tencent Holdings Ltd. The Fund moved from an overweight to an underweight position in Brazil. It exited Turkey during the period, selling ownership in Arcelik AS, a Turkish manufacturer of white goods, because of challenging market conditions.
At the sector level, the Fund remained overweight in information technology, consumer discretionary, and financials. It was underweight in the energy, materials, and communication services sectors.
|
|
See Endnotes and Additional Disclosures in this report. Past performance is no guarantee of future results. Returns are historical and are calculated by determining the percentage change in net asset value (NAV) or offering price (as applicable) with all distributions reinvested. Investment return and principal value will fluctuate so that shares, when redeemed, may be worth more or less than their original cost. Performance less than or equal to one year is cumulative. Performance is for the stated time period only; due to market volatility, the Fund’s current performance may be lower or higher than quoted. Returns are before taxes unless otherwise noted. For performance as of the most recent month-end, please refer to www.calvert.com. |
2 www.calvert.com CALVERT EMERGING MARKETS EQUITY FUND ANNUAL REPORT (Unaudited)
PERFORMANCE
|
| | | | | | | | | | | | | | |
Performance2,3 | | | | | | | | | |
Portfolio Managers Gary Greenberg, CFA and Elena Tedesco, CFA, each of Hermes Investment Management Limited |
| | | | | | | | | | |
| % Average Annual Total Returns | Class Inception Date |
| | Performance Inception Date |
| | One Year |
| | Five Years |
| | Since Inception |
|
| Class A at NAV | 10/29/2012 |
| | 10/29/2012 |
| | -4.62 | % | | 5.32 | % | | 6.54 | % |
| Class A with 4.75% Maximum Sales Charge | — |
| | — |
| | -9.13 |
| | 4.29 |
| | 5.67 |
|
| Class C at NAV | 10/29/2012 |
| | 10/29/2012 |
| | -5.36 |
| | 4.43 |
| | 5.63 |
|
| Class C with 1% Maximum Sales Charge | — |
| | — |
| | -6.31 |
| | 4.43 |
| | 5.63 |
|
| Class I at NAV | 10/29/2012 |
| | 10/29/2012 |
| | -4.30 |
| | 5.68 |
| | 6.91 |
|
| Class R6 at NAV | 02/01/2018 |
| | 10/29/2012 |
| | -4.36 |
| | 5.66 |
| | 6.90 |
|
| | | | | | | | | | |
| | | | | | | | | | |
| MSCI Emerging Markets Index | — |
| | — |
| | -0.81 | % | | 3.61 | % | | 3.41 | % |
| | | | | | | | | | |
% Total Annual Operating Expense Ratios4 | | | Class A |
| | Class C |
| | Class I |
| | Class R6 |
|
| Gross | | | 1.79 | % | | 3.68 | % | | 1.31 | % | | 1.31 | % |
| Net | | | 1.27 |
| | 2.02 |
| | 0.92 |
| | 0.92 |
|
|
|
| Growth of $10,000 |
| This graph shows the change in value of a hypothetical investment of $10,000 in Class A of the Fund for the period indicated. For comparison, the same investment is shown in the indicated index. |
|
| | | | | | | | |
Growth of Investment3 | Amount Invested |
| Period Beginning | At NAV |
| With Maximum Sales Charge |
| Class C |
| $10,000 |
| 10/29/2012 |
| $13,834 |
| N.A. |
| Class I |
| $250,000 |
| 10/29/2012 |
| $371,464 |
| N.A. |
| Class R6 |
| $1,000,000 |
| 10/29/2012 |
| $1,484,911 |
| N.A. |
See Endnotes and Additional Disclosures in this report.
Past performance is no guarantee of future results. Returns are historical and are calculated by determining the percentage change in net asset value (NAV) or offering price (as applicable) with all distributions reinvested. Investment return and principal value will fluctuate so that shares, when redeemed, may be worth more or less than their original cost. Performance less than or equal to one year is cumulative. Performance is for the stated time period only; due to market volatility, the Fund’s current performance may be lower or higher than quoted. Returns are before taxes unless otherwise noted. For performance as of the most recent month-end, please refer to www.calvert.com.
www.calvert.com CALVERT EMERGING MARKETS EQUITY FUND ANNUAL REPORT (Unaudited) 3
FUND PROFILE
|
| | | | | | | |
| |
| | | | | |
| | SECTOR ALLOCATION (% of total investments)5 | | | TEN LARGEST HOLDINGS (% of net assets)6 |
| | | | | | |
| | Financials | 29.0 | % | | Tencent Holdings Ltd. | 7.7 | % |
| | Consumer Discretionary | 21.7 | % | | Taiwan Semiconductor Manufacturing Co. Ltd. ADR | 6.4 | % |
| | Information Technology | 21.5 | % | | Samsung Electronics Co. Ltd. | 5.4 | % |
| | Communication Services | 10.2 | % | | Alibaba Group Holding Ltd. ADR | 4.8 | % |
| | Industrials | 5.3 | % | | Techtronic Industries Co. Ltd. | 3.7 | % |
| | Consumer Staples | 4.4 | % | | AIA Group Ltd. | 3.1 | % |
| | Health Care | 3.5 | % | | KB Financial Group, Inc. | 3.1 | % |
| | Materials | 2.3 | % | | Samsonite International SA | 2.5 | % |
| | Utilities | 1.0 | % | | China Construction Bank Corp., Class H | 2.5 | % |
| | Energy | 0.9 | % | | Sberbank of Russia PJSC ADR | 2.5 | % |
| | High Social Impact Investments | 0.2 | % | | Total | 41.7 | % |
| | Total | 100.0 | % | | | |
See Endnotes and Additional Disclosures in this report.
4 www.calvert.com CALVERT EMERGING MARKETS EQUITY FUND ANNUAL REPORT (Unaudited)
|
| | |
| Endnotes and Additional Disclosures | | |
1 The views expressed in this report are those of the portfolio manager(s) and are current only through the date stated on the cover. These views are subject to change at any time based upon market or other conditions, and Calvert and the Fund(s) disclaim any responsibility to update such views. These views may not be relied upon as investment advice and, because investment decisions are based on many factors, may not be relied upon as an indication of trading intent on behalf of any Calvert fund. This commentary may contain statements that are not historical facts, referred to as “forward looking statements.” The Fund’s actual future results may differ significantly from those stated in any forward looking statement, depending on factors such as changes in securities or financial markets or general economic conditions, the volume of sales and purchases of Fund shares, the continuation of investment advisory, administrative and service contracts, and other risks discussed from time to time in the Fund’s filings with the Securities and Exchange Commission.
| |
2 | MSCI Emerging Markets Index is an unmanaged index of emerging markets common stocks. MSCI indexes are net of foreign withholding taxes. Source: MSCI. MSCI data may not be reproduced or used for any other purpose. MSCI provides no warranties, has not prepared or approved this report, and has no liability hereunder. Unless otherwise stated, index returns do not reflect the effect of any applicable sales charges, commissions, expenses, taxes or leverage, as applicable. It is not possible to invest directly in an index. |
| |
3 | Total Returns at NAV do not include applicable sales charges. If sales charges were deducted, the returns would be lower. Total Returns shown with maximum sales charge reflect the stated maximum sales charge. Unless otherwise stated, performance does not reflect the deduction of taxes on Fund distributions or redemptions of Fund shares. |
Performance prior to the inception date of a class may be linked to the performance of an older class of the Fund. This linked performance is adjusted for any applicable sales charge, but is not adjusted for class expense differences. If adjusted for such differences, the performance would be different. The performance of Class R6 is linked to Class I. Performance since inception for an index, if presented, is the performance since the Fund’s or oldest share class’ inception, as applicable. Performance presented in the Financial Highlights included in the financial statements is not linked.
Effective December 31, 2016, Calvert Research and Management became the investment adviser to the Fund and performance reflected prior to such date is that of the Fund’s former investment adviser, Calvert Investment Management, Inc.
| |
4 | Source: Fund prospectus. Net expense ratios reflect a contractual expense reimbursement that continues through 1/31/19. Without the reimbursement, performance would have been lower. The expense ratios for the current reporting period can be found in the Financial Highlights section of this report. |
| |
5 | Does not include Short Term Investment of Cash Collateral for Securities Loaned. |
| |
6 | Excludes cash and cash equivalents. |
Fund profile subject to change due to active management.
Important Notice to Shareholders
At a special meeting of shareholders held October 5, 2018, shareholders of the Fund approved (i) an investment sub-advisory agreement between Calvert Research and Management (“CRM”) and Hermes Investment Management Limited (“Hermes”) pursuant to which Hermes will continue to serve as sub-adviser to the Fund and (ii) a “manager of managers” structure, which would allow CRM and the Fund to enter into and materially amend investment sub-advisory agreements with unaffiliated sub-advisers and certain affiliated sub-advisers without obtaining additional shareholder approval, subject to certain conditions. Prior to reliance on a “manager of managers” structure, CRM and Calvert World Values Fund, Inc. would need to apply for and be granted exemptive relief from the SEC.
www.calvert.com CALVERT EMERGING MARKETS EQUITY FUND ANNUAL REPORT (Unaudited) 5
FUND EXPENSES
Example
As a Fund shareholder, you incur two types of costs: (1) transaction costs, including sales charges (loads) on purchases and redemption fees (if applicable); and (2) ongoing costs, including management fees; distribution and/or service fees; and other Fund expenses. This Example is intended to help you understand your ongoing costs (in dollars) of Fund investing and to compare these costs with the ongoing costs of investing in other mutual funds. The Example is based on an investment of $1,000 invested at the beginning of the period and held for the entire period (April 1, 2018 to September 30, 2018).
Actual Expenses
The first section of the table below provides information about actual account values and actual expenses. You may use the information in this section, together with the amount you invested, to estimate the expenses that you paid over the period. Simply divide your account value by $1,000 (for example, an $8,600 account value divided by $1,000 = 8.6), then multiply the result by the number in the first section under the heading entitled “Expenses Paid During Period” to estimate the expenses you paid on your account during this period.
Hypothetical Example for Comparison Purposes
The second section of the table below provides information about hypothetical account values and hypothetical expenses based on the actual Fund expense ratio and an assumed rate of return of 5% per year (before expenses), which is not the actual Fund return. The hypothetical account values and expenses may not be used to estimate the actual ending account balance or expenses you paid for the period. You may use this information to compare the ongoing costs of investing in the Fund and other funds. To do so, compare this 5% hypothetical example with the 5% hypothetical examples that appear in the shareholder reports of the other funds.
Please note that the expenses shown in the table are meant to highlight your ongoing costs only and do not reflect any transactional costs, such as sales charges (loads) or redemption fees (if applicable). Therefore, the second section of the table is useful in comparing ongoing costs only, and will not help you determine the relative total costs of owning different funds. In addition, if these transactional costs were included, your costs would be higher.
|
| | | | |
| | BEGINNING
ACCOUNT VALUE
(4/1/18) | ENDING
ACCOUNT VALUE
(9/30/18) | EXPENSES PAID
DURING PERIOD*
(4/1/18 - 9/30/18) | ANNUALIZED
EXPENSE RATIO |
| Actual | | | | |
| Class A | $1,000.00 | $875.60 | $5.97** | 1.27% |
| Class C | $1,000.00 | $871.90 | $9.48** | 2.02% |
| Class I | $1,000.00 | $876.80 | $4.33** | 0.92% |
| Class R6 | $1,000.00 | $876.70 | $4.33** | 0.92% |
| Hypothetical | | | | |
| (5% return per year before expenses) | | | | |
| Class A | $1,000.00 | $1,018.70 | $6.43** | 1.27% |
| Class C | $1,000.00 | $1,014.94 | $10.20** | 2.02% |
| Class I | $1,000.00 | $1,020.46 | $4.66** | 0.92% |
| Class R6 | $1,000.00 | $1,020.46 | $4.66** | 0.92% |
| | | | | |
| * Expenses are equal to the Fund’s annualized expense ratio for the indicated Class, multiplied by the average account value over the period, multiplied by 183/365 (to reflect the one-half year period). The Example assumes that the $1,000 was invested at the net asset value per share determined at the close of business on March 31, 2018. |
| ** Absent a waiver and/or reimbursement of expenses by affiliates, expenses would be higher. |
6 www.calvert.com CALVERT EMERGING MARKETS EQUITY FUND ANNUAL REPORT (Unaudited)
CALVERT EMERGING MARKETS EQUITY FUND
SCHEDULE OF INVESTMENTS
SEPTEMBER 30, 2018
|
| | |
| | SHARES | VALUE ($) |
| COMMON STOCKS - 97.3% | | |
| Brazil - 6.6% | | |
| BB Seguridade Participacoes SA | 3,265,967 | 19,489,620 |
| Duratex SA | 6,355,441 | 14,210,455 |
| Itau Unibanco Holding SA, PFC Shares | 1,934,428 | 21,137,861 |
| Klabin SA | 2,595,897 | 12,784,883 |
| Ultrapar Participacoes SA | 1,211,930 | 11,202,374 |
| | | 78,825,193 |
| | | |
| China - 25.3% | | |
| Alibaba Group Holding Ltd. ADR (1) | 346,974 | 57,167,436 |
| China Communications Services Corp. Ltd., Class H | 13,742,000 | 12,671,613 |
| China Construction Bank Corp., Class H | 34,234,000 | 29,923,949 |
| China Mengniu Dairy Company Ltd. | 6,825,310 | 22,690,113 |
| Gree Electric Appliances, Inc. of Zhuhai, Class A (1) | 2,637,798 | 15,412,527 |
| Hangzhou Hikvision Digital Technology Co. Ltd., Class A | 2,618,461 | 10,943,882 |
| Huayu Automotive Systems Co. Ltd., Class A | 4,683,254 | 15,316,193 |
| NARI Technology Co. Ltd., Class A | 9,636,394 | 24,722,775 |
| Shenzhen International Holdings Ltd. | 11,206,873 | 23,091,667 |
| Tencent Holdings Ltd. | 2,268,996 | 92,644,985 |
| | | 304,585,140 |
| | | |
| Egypt - 1.1% | | |
| Commercial International Bank Egypt SAE | 2,932,314 | 13,708,618 |
| | | |
| Hong Kong - 9.3% | | |
| AIA Group Ltd. | 4,182,200 | 37,292,319 |
| Samsonite International SA (2) | 8,261,746 | 30,559,141 |
| Techtronic Industries Co. Ltd. | 6,996,290 | 44,627,149 |
| | | 112,478,609 |
| | | |
| Hungary - 2.0% | | |
| Richter Gedeon Nyrt | 1,320,283 | 24,691,601 |
| | | |
| India - 13.3% | | |
| Bharat Forge Ltd. | 2,381,524 | 19,777,602 |
| Container Corp. of India Ltd. | 1,655,917 | 14,393,017 |
| HCL Technologies Ltd. | 925,262 | 13,861,698 |
| HDFC Bank Ltd. ADR | 236,779 | 22,280,904 |
| Hero MotoCorp Ltd. | 414,668 | 16,667,603 |
| ICICI Bank Ltd. | 6,407,257 | 27,084,937 |
| |
www.calvert.com CALVERT EMERGING MARKETS EQUITY FUND ANNUAL REPORT 7
|
| | |
| | SHARES | VALUE ($) |
| COMMON STOCKS - CONT’D | | |
| Motherson Sumi Systems Ltd. | 5,394,695 | 19,119,006 |
| Power Grid Corp. of India Ltd. | 4,476,146 | 11,636,665 |
| Tech Mahindra Ltd. | 1,453,183 | 14,976,029 |
| | | 159,797,461 |
| | | |
| Indonesia - 2.1% | | |
| Bank Rakyat Indonesia Persero Tbk PT | 117,222,160 | 24,771,219 |
| | | |
| Mexico - 3.5% | | |
| Grupo Financiero Banorte SAB de CV | 3,535,050 | 25,573,104 |
| Wal-Mart de Mexico SAB de CV | 5,300,914 | 16,080,629 |
| | | 41,653,733 |
| | | |
| Peru - 1.7% | | |
| Credicorp Ltd. | 91,927 | 20,507,075 |
| | | |
| Russia - 3.8% | | |
| Mail.Ru Group Ltd. GDR (1) | 580,234 | 15,627,690 |
| Sberbank of Russia PJSC ADR (3)(4) | 53,523 | 673,052 |
| Sberbank of Russia PJSC ADR (4) | 2,329,434 | 29,454,489 |
| | | 45,755,231 |
| | | |
| South Africa - 3.3% | | |
| Foschini Group Ltd. (The) | 2,133,011 | 26,174,696 |
| Shoprite Holdings Ltd. | 991,611 | 13,427,260 |
| | | 39,601,956 |
| | | |
| South Korea - 10.2% | | |
| KB Financial Group, Inc. | 753,917 | 36,718,752 |
| Samsung Electronics Co. Ltd. | 1,559,581 | 65,269,796 |
| Samsung Fire & Marine Insurance Co. Ltd. | 78,755 | 20,160,426 |
| | | 122,148,974 |
| | | |
| Taiwan - 12.5% | | |
| Accton Technology Corp. | 4,281,000 | 11,929,953 |
| Advantech Co. Ltd. | 2,117,983 | 15,763,715 |
| Chipbond Technology Corp. | 9,916,000 | 19,129,902 |
| LandMark Optoelectronics Corp. | 2,005,900 | 18,760,710 |
| Taiwan Semiconductor Manufacturing Co. Ltd. ADR | 1,736,786 | 76,696,470 |
| Tong Yang Industry Co. Ltd. | 5,570,448 | 7,694,952 |
| | | 149,975,702 |
| | | |
8 www.calvert.com CALVERT EMERGING MARKETS EQUITY FUND ANNUAL REPORT
|
| | |
| | SHARES | VALUE ($) |
| COMMON STOCKS - CONT’D | | |
| United Arab Emirates - 1.2% | | |
| Abu Dhabi Commercial Bank PJSC | 6,710,126 | 14,529,421 |
| | | |
| United Kingdom - 1.4% | | |
| NMC Health plc | 386,741 | 17,095,878 |
| | | |
| Total Common Stocks (Cost $1,225,148,090) | | 1,170,125,811 |
| | | |
| | | |
| PARTICIPATORY NOTES - 0.9% | | |
| China - 0.9% | | |
| Gree Electric Appliances, Inc. of Zhuhai (Morgan Stanley Asia Products Ltd.), 12/14/18 (1) | 663,957 | 3,879,178 |
| Hangzhou Hikvision Digital Technology Co. Ltd., (Merrill Lynch International & Co.), 1/3/19 (1) | 40,846 | 170,612 |
| Hangzhou Hikvision Digital Technology Co. Ltd., (Merrill Lynch International & Co.), 4/9/19 (1) | 376,480 | 1,572,542 |
| Hangzhou Hikvision Digital Technology Co. Ltd., (Morgan Stanley Asia Products Ltd.), 1/18/19 (1) | 1,219,921 | 5,095,563 |
| | | |
| Total Participatory Notes (Cost $9,205,446) | | 10,717,895 |
| | | |
| | | |
| | PRINCIPAL AMOUNT ($) | VALUE ($) |
| HIGH SOCIAL IMPACT INVESTMENTS - 0.1% | | |
| Calvert Impact Capital, Inc., Community Investment Notes, 1.50%, 12/15/19 (5)(6) | 2,000,000 | 1,924,700 |
| ImpactAssets Inc., Global Sustainable Agriculture Notes, 2.50%, 11/3/20 (5)(7)(8) | 43,000 | 40,377 |
| ImpactAssets Inc., Microfinance Plus Notes, 2.40%, 11/3/20 (5)(7)(8) | 56,000 | 51,240 |
| | | |
| Total High Social Impact Investments (Cost $2,099,000) | | 2,016,317 |
| | | |
| | | |
| | SHARES | VALUE ($) |
| SHORT TERM INVESTMENT OF CASH COLLATERAL FOR SECURITIES LOANED - 0.1% | | |
| State Street Navigator Securities Lending Government Money Market Portfolio, 2.16% | 688,831 | 688,831 |
| | | |
| Total Short Term Investment of Cash Collateral for Securities Loaned (Cost $688,831) | | 688,831 |
| | | |
| | | |
| TOTAL INVESTMENTS (Cost $1,237,141,367) - 98.4% | | 1,183,548,854 |
| Other assets and liabilities, net - 1.6% | | 19,263,237 |
NET ASSETS - 100.0% | | 1,202,812,091 |
www.calvert.com CALVERT EMERGING MARKETS EQUITY FUND ANNUAL REPORT 9
|
| | |
| NOTES TO SCHEDULE OF INVESTMENTS |
| (1) Non-income producing security. |
| (2) Security is exempt from registration under Rule 144A of the Securities Act of 1933. These securities may be resold in transactions exempt from registration, normally to qualified institutional buyers. Total market value of Rule 144A securities amounts to $30,559,141, which represents 2.5% of the net assets of the Fund as of September 30, 2018. |
| (3) All or a portion of this security was on loan at September 30, 2018. The aggregate market value of securities on loan at September 30, 2018 was $666,312. |
| (4) Securities are traded on separate exchanges for the same entity. |
| (5) Restricted security. Total market value of restricted securities amounts to $2,016,317, which represents 0.1% of the net assets of the Fund as of September 30, 2018. |
| (6) Affiliated company (see Note 7). |
| (7) For fair value measurement disclosure purposes, security is categorized as Level 3 (see Note 1A). |
| (8) Notes carry an interest rate that varies by period and is contingent on the performance of the underlying portfolio of loans to borrowers. The coupon rate shown represents the rate in effect at September 30, 2018. |
| |
| Abbreviations: |
| ADR: | American Depositary Receipt | |
| GDR: | Global Depositary Receipts | |
| PFC Shares: | Preference Shares | |
|
| | |
| At September 30, 2018, the concentration of the Fund’s investments in the various sectors, determined as a percentage of total investments, was as follows: |
| | |
| ECONOMIC SECTORS | (% OF TOTAL INVESTMENTS)* |
| Financials | 29.0 | % |
| Consumer Discretionary | 21.7 | % |
| Information Technology | 21.5 | % |
| Communication Services | 10.2 | % |
| Industrials | 5.3 | % |
| Consumer Staples | 4.4 | % |
| Health Care | 3.5 | % |
| Materials | 2.3 | % |
| Utilities | 1.0 | % |
| Energy | 0.9 | % |
| High Social Impact Investments | 0.2 | % |
| Total | 100.0 | % |
| * Does not include Short Term Investment of Cash Collateral for Securities Loaned. | |
|
| | |
| RESTRICTED SECURITIES | ACQUISITION
DATES | COST ($) |
| Calvert Impact Capital, Inc., Community Investment Notes, 1.50%, 12/15/19 | 12/15/16 | 2,000,000 |
| ImpactAssets Inc., Global Sustainable Agriculture Notes, 2.50%, 11/3/20 | 11/13/15 | 43,000 |
| ImpactAssets Inc., Microfinance Plus Notes, 2.40%, 11/3/20 | 11/13/15 | 56,000 |
| See notes to financial statements. | |
10 www.calvert.com CALVERT EMERGING MARKETS EQUITY FUND ANNUAL REPORT
CALVERT EMERGING MARKETS EQUITY FUND
STATEMENT OF ASSETS AND LIABILITIES
SEPTEMBER 30, 2018
|
| | | |
| ASSETS | |
Investments in securities of unaffiliated issuers, at value (identified cost $1,235,141,367) - including $666,312 of securities on loan |
| $1,181,624,154 |
|
| Investments in securities of affiliated issuers, at value (identified cost $2,000,000) | 1,924,700 |
|
| Cash | 15,277,646 |
|
| Cash denominated in foreign currency, at value (cost $10,908,893) | 10,928,537 |
|
| Receivable for investments sold | 6,934,658 |
|
| Receivable for capital shares sold | 11,899,398 |
|
| Dividends and interest receivable | 89,222 |
|
| Interest receivable - affiliated | 24,167 |
|
| Securities lending income receivable | 1,696 |
|
| Directors’ deferred compensation plan | 553,466 |
|
| Receivable from affiliates | 513,782 |
|
| Other assets | 15,907 |
|
| Total assets | 1,229,787,333 |
|
| | |
| LIABILITIES | |
| Payable for investments purchased | 17,877,299 |
|
| Payable for capital shares redeemed | 5,952,730 |
|
| Payable for foreign capital gains taxes | 204,319 |
|
| Deposits for securities loaned | 688,831 |
|
| Payable to affiliates: | |
| Investment advisory fee | 846,901 |
|
| Administrative fee | 115,486 |
|
| Distribution and service fees | 51,921 |
|
| Sub-transfer agency fee | 10,252 |
|
| Directors’ deferred compensation plan | 553,466 |
|
| Accrued expenses | 674,037 |
|
| Total liabilities | 26,975,242 |
|
| NET ASSETS |
| $1,202,812,091 |
|
| | |
| NET ASSETS CONSIST OF: | |
| Paid-in capital applicable to common stock | |
| (75,000,000 shares per class of $0.01 par value authorized) |
| $1,262,177,446 |
|
| Accumulated loss | (59,365,355) |
|
| Total |
| $1,202,812,091 |
|
| | |
www.calvert.com CALVERT EMERGING MARKETS EQUITY FUND ANNUAL REPORT 11
CALVERT EMERGING MARKETS EQUITY FUND
STATEMENT OF ASSETS AND LIABILITIES
SEPTEMBER 30, 2018 - CONT’D
|
| | | |
| NET ASSET VALUE PER SHARE | |
| Class A (based on net assets of $155,734,929 and 10,014,680 shares outstanding) |
| $15.55 |
|
| Class C (based on net assets of $24,285,573 and 1,599,315 shares outstanding) |
| $15.18 |
|
| Class I (based on net assets of $1,012,574,256 and 64,363,582 shares outstanding) |
| $15.73 |
|
| Class R6 (based on net assets of $10,217,333 and 650,064 shares outstanding) |
| $15.72 |
|
| | |
| OFFERING PRICE PER SHARE* | |
| Class A (100/95.25 of net asset value per share) |
| $16.33 |
|
| * On sales of $50,000 or more, the offering price of Class A shares is reduced. | |
| See notes to financial statements. |
12 www.calvert.com CALVERT EMERGING MARKETS EQUITY FUND ANNUAL REPORT
CALVERT EMERGING MARKETS EQUITY FUND
STATEMENT OF OPERATIONS
YEAR ENDED SEPTEMBER 30, 2018
|
| | | |
| INVESTMENT INCOME | |
| Dividend income (net of foreign taxes withheld of $2,292,981) |
| $21,209,152 |
|
| Interest income | 2,366 |
|
| Interest income - affiliated issuers | 30,000 |
|
| Securities lending income, net | 37,631 |
|
| Total investment income | 21,279,149 |
|
| | |
| EXPENSES | |
| Investment advisory fee | 7,383,211 |
|
| Administrative fee | 1,006,194 |
|
| Distribution and service fees: | |
| Class A | 350,932 |
|
| Class C | 169,866 |
|
| Directors’ fees and expenses | 46,292 |
|
| Custodian fees | 1,196,454 |
|
| Transfer agency fees and expenses | 766,883 |
|
| Accounting fees | 187,474 |
|
| Professional fees | 109,352 |
|
| Registration fees | 263,395 |
|
| Reports to shareholders | 94,786 |
|
| Miscellaneous | 51,448 |
|
| Total expenses | 11,626,287 |
|
| Waiver and/or reimbursement of expenses by affiliates | (3,147,628) |
|
| Reimbursement of expenses-other | (15,907) |
|
| Net expenses | 8,462,752 |
|
| Net investment income | 12,816,397 |
|
| | |
| | |
| REALIZED AND UNREALIZED GAIN (LOSS) | |
| Net realized gain (loss) on: | |
| Investment securities - unaffiliated issuers | (13,923,283) |
|
| Foreign currency transactions | (976,844) |
|
| | (14,900,127) |
|
| | |
| Net change in unrealized appreciation (depreciation) on: | |
| Investment securities - unaffiliated issuers (including net increase in payable for foreign capital gains taxes of $186,714) | (106,920,178) |
|
| Investment securities - affiliated issuers | 18,540 |
|
| Foreign currency | (16,148) |
|
| | (106,917,786) |
|
| | |
| Net realized and unrealized loss | (121,817,913) |
|
| | |
| Net decrease in net assets resulting from operations |
| ($109,001,516 | ) |
| See notes to financial statements. |
www.calvert.com CALVERT EMERGING MARKETS EQUITY FUND ANNUAL REPORT 13
CALVERT EMERGING MARKETS EQUITY FUND
STATEMENTS OF CHANGES IN NET ASSETS
|
| | | | | | | |
| INCREASE (DECREASE) IN NET ASSETS | Year Ended
September 30, 2018 | | Year Ended
September 30, 2017 |
| Operations: | | | |
| Net investment income |
| $12,816,397 |
| |
| $1,875,213 |
|
| Net realized gain (loss) | (14,900,127) |
| | 3,399,544 |
|
| Net change in unrealized appreciation (depreciation) | (106,917,786) |
| | 41,529,615 |
|
| Net increase (decrease) in net assets resulting from operations | (109,001,516) |
| | 46,804,372 |
|
| | | | |
Distributions to shareholders: (1) | | | |
| Class A shares | (169,566) |
| | (160,548) |
|
| Class C shares | — |
| | (1,582) |
|
| Class I shares | (1,069,639) |
| | (514,051) |
|
| Class Y shares | — |
| | (212,318) |
|
| Total distributions to shareholders | (1,239,205) |
| | (888,499) |
|
| | | | |
| Capital share transactions: | | | |
| Class A shares | 109,663,028 |
| | 14,094,148 |
|
| Class C shares | 22,425,876 |
| | 3,183,341 |
|
| Class I shares | 978,379,270 |
| | 45,733,960 |
|
Class R6 shares (2) | 10,515,540 |
| | — |
|
Class Y shares (3) | (110,789,228) |
| | 68,695,807 |
|
| Net increase in net assets from capital share transactions | 1,010,194,486 |
| | 131,707,256 |
|
| | | | |
| TOTAL INCREASE IN NET ASSETS | 899,953,765 |
| | 177,623,129 |
|
| | | | |
| | | | |
| NET ASSETS | | | |
| Beginning of year | 302,858,326 |
| | 125,235,197 |
|
| End of year |
| $1,202,812,091 |
| | $302,858,326(4) |
|
| | | | |
(1) For the year ended September 30, 2017, the source of distributions was from net investment income. |
(2) From February 1, 2018 inception. |
(3) Effective December 8, 2017, Class Y shares of the Fund converted to Class I shares at net asset value. Thereafter, Class Y shares were terminated |
(4) Includes accumulated undistributed net investment income of $1,450,300 at September 30, 2017. The requirement to disclose the corresponding amount as of September 30, 2018 was eliminated. |
| See notes to financial statements. |
14 www.calvert.com CALVERT EMERGING MARKETS EQUITY FUND ANNUAL REPORT
CALVERT EMERGING MARKETS EQUITY FUND
FINANCIAL HIGHLIGHTS
|
| | | | | | | | | | | | | | | |
| | Year Ended September 30, | |
| CLASS A SHARES | 2018 | | 2017 | | 2016 | | 2015 | | 2014 | |
| Net asset value, beginning | $16.33 | | $12.94 | | $10.90 | | $13.15 | | $13.34 | |
| Income from investment operations: | | | | | | | | | | |
Net investment income (1) | 0.19 |
| | 0.10 |
| | 0.08 |
| (2) | 0.11 |
| | 0.08 |
| |
| Net realized and unrealized gain (loss) | (0.94) |
| | 3.36 |
| | 2.06 |
| | (1.92) |
| | 0.46 |
| |
| Total from investment operations | (0.75) |
| | 3.46 |
| | 2.14 |
| | (1.81) |
| | 0.54 |
| |
| Distributions from: | | | | | | | | | | |
| Net investment income | (0.03) |
| | (0.07) |
| | (0.10) |
| | (0.03) |
| | (0.04) |
| |
| Net realized gain | — |
| | — |
| | — |
| | (0.41) |
| | (0.69) |
| |
| Total distributions | (0.03) |
| | (0.07) |
| | (0.10) |
| | (0.44) |
| | (0.73) |
| |
| Total increase (decrease) in net asset value | (0.78) |
| | 3.39 |
| | 2.04 |
| | (2.25) |
| | (0.19) |
| |
| Net asset value, ending | $15.55 | | $16.33 | | $12.94 | | $10.90 | | $13.15 | |
Total return (3) | (4.62 | %) | | 26.89 | % | | 19.75 | % | | (14.18 | %) | | 4.19 | % | |
Ratios to average net assets: (4) | | | | | | | | | | |
| Total expenses | 1.56 | % | | 1.80 | % | | 1.95 | % | | 2.18 | % | | 2.22 | % | |
| Net expenses | 1.27 | % | | 1.27 | % | | 1.47 | % | | 1.75 | % | | 1.78 | % | |
| Net investment income | 1.15 | % | | 0.73 | % | | 0.66 | % | (2) | 0.84 | % | | 0.57 | % | |
| Portfolio turnover | 27 | % | | 36 | % | | 32 | % | | 66 | % | | 95 | % | |
| Net assets, ending (in thousands) | $155,735 | | $62,432 | | $39,343 | | $23,569 | | $20,628 | |
| | | | | | | | | | | |
(1) Computed using average shares outstanding. |
(2) Amount includes a non-recurring refund for overbilling of prior years’ custody out-of-pocket fees. This amounted to $0.003 per share and 0.003% of average net assets. |
(3) Returns are historical and are calculated by determining the percentage change in net asset value with all distributions reinvested and do not reflect the effect of sales charges, if any. Total return is not annualized for periods of less than one year. |
(4) Total expenses do not reflect amounts reimbursed and/or waived by the adviser and certain of its affiliates, if applicable. Net expenses are net of all reductions and represent the net expenses paid by the Fund. |
| See notes to financial statements. |
www.calvert.com CALVERT EMERGING MARKETS EQUITY FUND ANNUAL REPORT 15
CALVERT EMERGING MARKETS EQUITY FUND
FINANCIAL HIGHLIGHTS
|
| | | | | | | | | | | | | | | |
| | Year Ended September 30, | |
| CLASS C SHARES | 2018 | | 2017 | | 2016 | | 2015 | | 2014 | |
| Net asset value, beginning | $16.04 | | $12.76 | | $10.74 | | $13.05 | | $13.34 | |
| Income from investment operations: | | | | | | | | | | |
Net investment income (loss) (1) | 0.10 |
| | 0.01 |
| | — |
| (2) | (0.03) |
| | (0.05) |
| |
| Net realized and unrealized gain (loss) | (0.96) |
| | 3.29 |
| | 2.03 |
| | (1.87) |
| | 0.45 |
| |
| Total from investment operations | (0.86) |
| | 3.30 |
| | 2.03 |
| | (1.90) |
| | 0.40 |
| |
| Distributions from: | | | | | | | | | | |
| Net investment income | — |
| | (0.02) |
| | (0.01) |
| | — |
| | — |
| |
| Net realized gain | — |
| | — |
| | — |
| | (0.41) |
| | (0.69) |
| |
| Total distributions | — |
| | (0.02) |
| | (0.01) |
| | (0.41) |
| | (0.69) |
| |
| Total increase (decrease) in net asset value | (0.86) |
| | 3.28 |
| | 2.02 |
| | (2.31) |
| | (0.29) |
| |
| Net asset value, ending | $15.18 | | $16.04 | | $12.76 | | $10.74 | | $13.05 | |
Total return (3) | (5.36 | %) | | 25.88 | % | | 18.94 | % | | (14.98 | %) | | 3.10 | % | |
Ratios to average net assets: (4) | | | | | | | | | | |
| Total expenses | 2.31 | % | | 3.69 | % | | 4.44 | % | | 5.00 | % | | 4.36 | % | |
| Net expenses | 2.02 | % | | 2.02 | % | | 2.21 | % | | 2.70 | % | | 2.78 | % | |
| Net investment income (loss) | 0.60 | % | | 0.08 | % | | 0.02 | % | (2) | (0.23 | %) | | (0.41 | %) | |
| Portfolio turnover | 27 | % | | 36 | % | | 32 | % | | 66 | % | | 95 | % | |
| Net assets, ending (in thousands) | $24,286 | | $4,627 | | $994 | | $566 | | $610 | |
| | | | | | | | | | | |
(1) Computed using average shares outstanding. |
(2) Amount includes a non-recurring refund for overbilling of prior years’ custody out-of-pocket fees. This amounted to $0.003 per share and 0.003% of average net assets. |
(3) Returns are historical and are calculated by determining the percentage change in net asset value with all distributions reinvested and do not reflect the effect of sales charges, if any. Total return is not annualized for periods of less than one year. |
(4) Total expenses do not reflect amounts reimbursed and/or waived by the adviser and certain of its affiliates, if applicable. Net expenses are net of all reductions and represent the net expenses paid by the Fund. |
| See notes to financial statements. |
16 www.calvert.com CALVERT EMERGING MARKETS EQUITY FUND ANNUAL REPORT
CALVERT EMERGING MARKETS EQUITY FUND
FINANCIAL HIGHLIGHTS
|
| | | | | | | | | | | | | | | |
| | Year Ended September 30, | |
| CLASS I SHARES | 2018 | | 2017 | | 2016 | | 2015 | | 2014 | |
| Net asset value, beginning | $16.48 | | $13.06 | | $10.99 | | $13.26 | | $13.49 | |
| Income from investment operations: | | | | | | | | | | |
Net investment income (1) | 0.29 |
| | 0.17 |
| | 0.12 |
| (2) | 0.14 |
| | 0.10 |
| |
| Net realized and unrealized gain (loss) | (0.99) |
| | 3.35 |
| | 2.09 |
| | (1.93) |
| | 0.48 |
| |
| Total from investment operations | (0.70) |
| | 3.52 |
| | 2.21 |
| | (1.79) |
| | 0.58 |
| |
| Distributions from: | | | | | | | | | | |
| Net investment income | (0.05) |
| | (0.10) |
| | (0.14) |
| | (0.07) |
| | (0.12) |
| |
| Net realized gain | — |
| | — |
| | — |
| | (0.41) |
| | (0.69) |
| |
| Total distributions | (0.05) |
| | (0.10) |
| | (0.14) |
| | (0.48) |
| | (0.81) |
| |
| Total increase (decrease) in net asset value | (0.75) |
| | 3.42 |
| | 2.07 |
| | (2.27) |
| | (0.23) |
| |
| Net asset value, ending | $15.73 | | $16.48 | | $13.06 | | $10.99 | | $13.26 | |
Total return (3) | (4.30 | %) | | 27.27 | % | | 20.31 | % | | (13.92 | %) | | 4.49 | % | |
Ratios to average net assets: (4) | | | | | | | | | | |
| Total expenses | 1.32 | % | | 1.32 | % | | 1.41 | % | | 1.48 | % | | 1.42 | % | |
| Net expenses | 0.92 | % | | 0.92 | % | | 1.12 | % | | 1.40 | % | | 1.42 | % | |
| Net investment income | 1.71 | % | | 1.20 | % | | 1.06 | % | (2) | 1.12 | % | | 0.78 | % | |
| Portfolio turnover | 27 | % | | 36 | % | | 32 | % | | 66 | % | | 95 | % | |
| Net assets, ending (in thousands) | $1,012,574 | | $126,398 | | $58,259 | | $39,101 | | $33,721 | |
| | | | | | | | | | | |
(1) Computed using average shares outstanding. |
(2) Amount includes a non-recurring refund for overbilling of prior years’ custody out-of-pocket fees. This amounted to $0.003 per share and 0.003% of average net assets. |
(3) Returns are historical and are calculated by determining the percentage change in net asset value with all distributions reinvested and do not reflect the effect of sales charges, if any. Total return is not annualized for periods of less than one year. |
(4) Total expenses do not reflect amounts reimbursed and/or waived by the adviser and certain of its affiliates, if applicable. Net expenses are net of all reductions and represent the net expenses paid by the Fund. |
| See notes to financial statements. |
www.calvert.com CALVERT EMERGING MARKETS EQUITY FUND ANNUAL REPORT 17
CALVERT EMERGING MARKETS EQUITY FUND
FINANCIAL HIGHLIGHTS
|
| | | | |
| | Period Ended
September 30, 2018(1) | | |
| CLASS R6 SHARES | | |
| Net asset value, beginning | $18.65 | | |
| Income from investment operations: | | | |
Net investment income (2) | 0.26 |
| | |
| Net realized and unrealized loss | (3.19) |
| | |
| Total from investment operations | (2.93) |
| | |
| Total decrease in net asset value | (2.93) |
| | |
| Net asset value, ending | $15.72 | | |
Total return (4) | (15.71 | %) | (3) | |
Ratios to average net assets: (5) | | | |
| Total expenses | 1.24 | % | (6) | |
| Net expenses | 0.92 | % | (6) | |
| Net investment income | 2.48 | % | (6) | |
| Portfolio turnover | 27 | % | (7) | |
| Net assets, ending (in thousands) | $10,217 | | |
| | | | |
(1) From February 1, 2018 inception. |
(2) Computed using average shares outstanding. |
(3) Not annualized. |
(4) Returns are historical and are calculated by determining the percentage change in net asset value with all distributions reinvested and do not reflect the effect of sales charges, if any. |
(5) Total expenses do not reflect amounts reimbursed and/or waived by the adviser and certain of its affiliates, if applicable. Net expenses are net of all reductions and represent the net expenses paid by the Fund. |
(6) Annualized. |
(7) For the Fund’s year ended September 30, 2018. |
| See notes to financial statements. |
18 www.calvert.com CALVERT EMERGING MARKETS EQUITY FUND ANNUAL REPORT
NOTES TO FINANCIAL STATEMENTS
NOTE 1 — SIGNIFICANT ACCOUNTING POLICIES
Calvert Emerging Markets Equity Fund (the Fund) is a diversified series of Calvert World Values Fund, Inc. (the Corporation). The Corporation is a Maryland corporation registered under the Investment Company Act of 1940, as amended (the 1940 Act), as an open-end management investment company. The investment objective of the Fund is to seek long-term capital appreciation by investing primarily in equity securities of companies located in emerging market countries.
The Fund offers four classes of shares. Class A shares are generally sold subject to a sales charge imposed at time of purchase. A contingent deferred sales charge of 0.80% may apply to certain redemptions of Class A shares for accounts for which no sales charge was paid, if redeemed within one year of purchase. Class C shares are sold without a front-end sales charge, and with certain exceptions, are charged a contingent deferred sales charge of 1% on shares redeemed within one year of purchase. Class C shares are only available for purchase through a financial intermediary. Class I and Class R6 shares are sold at net asset value, are not subject to a sales charge and are sold only to certain eligible investors. The Fund previously offered Class Y shares. At the close of business on December 8, 2017, Class Y shares were converted to Class I shares. Each class represents a pro rata interest in the Fund, but votes separately on class-specific matters and is subject to different expenses.
The Fund applies the accounting and reporting guidance in the Financial Accounting Standards Board (FASB) Accounting Standards Codification Topic 946, Financial Services – Investment Companies (ASC 946). Subsequent events, if any, through the date that the financial statements were issued have been evaluated in the preparation of the financial statements.
A. Investment Valuation: Net asset value per share is determined every business day as of the close of the regular session of the New York Stock Exchange (generally 4:00 p.m. Eastern time). The Fund uses independent pricing services approved by the Board of Directors (the Board) to value its investments wherever possible. Investments for which market quotations are not available or deemed not reliable are fair valued in good faith under the direction of the Board.
U.S. generally accepted accounting principles (U.S. GAAP) establishes a disclosure hierarchy that categorizes the inputs to valuation techniques used to value assets and liabilities at measurement date. These inputs are summarized in the three broad levels listed below:
Level 1 - quoted prices in active markets for identical securities
Level 2 - other significant observable inputs (including quoted prices for similar securities, interest rates, prepayment speeds, credit risk, etc.)
Level 3 - significant unobservable inputs (including the Fund’s own assumptions in determining the fair value of investments)
The inputs or methodologies used for valuing securities are not necessarily an indication of the risk associated with investing in those securities.
Valuation techniques used to value the Fund’s investments by major category are as follows:
Equity Securities. Equity securities (including warrants and rights) listed on a U.S. securities exchange generally are valued at the last sale or closing price as reported by an independent pricing service on the primary market or exchange on which they are traded and are categorized as Level 1 in the hierarchy. Equity securities listed on the NASDAQ Global or Global Select Market are valued at the NASDAQ official closing price and are categorized as Level 1 in the hierarchy. Unlisted or listed securities for which closing sales prices or closing quotations are not available are valued at the mean between the latest available bid and asked prices and are categorized as Level 2 in the hierarchy. The daily valuation of exchange-traded foreign securities generally is determined as of the close of trading on the principal exchange on which such securities trade. Events occurring after the close of trading on foreign exchanges may result in adjustments to the valuation of foreign securities to more accurately reflect their fair value as of the close of regular trading on the New York Stock Exchange. When valuing foreign equity securities that meet certain criteria, the Fund’s Board has approved the use of a fair value service that values such securities to reflect market trading that occurs after the close of the applicable foreign markets of comparable securities or other instruments that have a strong correlation to the fair-valued securities. Such securities are categorized as Level 2 in the hierarchy.
Short-Term Debt Securities. Short-term debt securities with a remaining maturity at time of purchase of more than sixty days are valued on the basis of valuations provided by a third party pricing service. Such securities are generally categorized as Level 2 in the hierarchy. Short-term debt securities of sufficient credit quality purchased with remaining maturities of sixty days or less are valued at amortized cost, which approximates fair value, and are categorized as Level 2 in the hierarchy.
Other Securities. Participatory notes are valued based on the value of the underlying equity security as determined using the valuation techniques for equity securities listed above. Participatory notes are categorized as Level 2 in the hierarchy. Investments
www.calvert.com CALVERT EMERGING MARKETS EQUITY FUND ANNUAL REPORT 19
in registered investment companies (including money market funds) that do not trade on an exchange are valued at the net asset value per share on the valuation day and are categorized as Level 1 in the hierarchy.
Fair Valuation. If a market value cannot be determined for a security using the methodologies described above, or if, in the good faith opinion of the Fund’s adviser, the market value does not constitute a readily available market quotation, or if a significant event has occurred that would materially affect the value of the security, the security will be fair valued as determined in good faith by or at the direction of the Board in a manner that fairly reflects the security’s value, or the amount that the Fund might reasonably expect to receive for the security upon its current sale in the ordinary course. Each such determination is based on a consideration of relevant factors, which are likely to vary from one pricing context to another. These factors may include, but are not limited to, the type of security, the existence of any contractual restrictions on the security’s disposition, the price and extent of public trading in similar securities of the issuer or of comparable companies or entities, quotations or relevant information obtained from broker/dealers or other market participants, information obtained from the issuer, analysts, and/or the appropriate stock exchange (for exchange-traded securities), an analysis of the company’s or entity’s financial condition, and an evaluation of the forces that influence the issuer and the market(s) in which the security is purchased and sold.
The values assigned to fair value investments are based on available information and do not necessarily represent amounts that might ultimately be realized. Further, due to the inherent uncertainty of valuations of such investments, the fair values may differ significantly from the values that would have been used had an active market existed, and the differences could be material.
The following table summarizes the market value of the Fund’s holdings as of September 30, 2018, based on the inputs used to value them:
|
| | | | | | | | | | | | | |
| Assets | Level 1 | Level 2 | | Level 3(1) | Total |
| Common Stocks | | | | | |
| Brazil | $ | 78,825,193 |
| $ | — |
| | $ | — |
| $ | 78,825,193 |
|
| China | 57,167,436 |
| 247,417,704 |
| | — |
| 304,585,140 |
|
| India | 22,280,904 |
| 137,516,557 |
| | — |
| 159,797,461 |
|
| Mexico | 41,653,733 |
| — |
| | — |
| 41,653,733 |
|
| Peru | 20,507,075 |
| — |
| | — |
| 20,507,075 |
|
| Russia | 673,052 |
| 45,082,179 |
| | — |
| 45,755,231 |
|
| Taiwan | 76,696,470 |
| 73,279,232 |
| | — |
| 149,975,702 |
|
Other Countries(2) | — |
| 369,026,276 |
| | — |
| 369,026,276 |
|
| Total Common Stocks | $ | 297,803,863 |
| $ | 872,321,948 |
| (3) | $ | — |
| $ | 1,170,125,811 |
|
| Participatory Notes | — |
| 10,717,895 |
| | — |
| 10,717,895 |
|
| High Social Impact Investments | — |
| 1,924,700 |
| | 91,617 |
| 2,016,317 |
|
| Short Term Investment of Cash Collateral for Securities Loaned | 688,831 |
| — |
| | — |
| 688,831 |
|
| Total Investments | $ | 298,492,694 |
| $ | 884,964,543 |
| | $ | 91,617 |
| $ | 1,183,548,854 |
|
| | | | | | |
(1) None of the unobservable inputs for Level 3 assets, individually or collectively, had a material impact on the Fund. |
(2) For further breakdown of equity securities by country, please refer to the Schedule of Investments. |
(3) Includes foreign equity securities whose values were adjusted to reflect market trading of comparable securities or other correlated instruments that occurred after the close of trading in their applicable foreign markets. |
B. Investment Transactions and Income: Investment transactions for financial statement purposes are accounted for on trade date. Realized gains and losses are recorded on an identified cost basis and may include proceeds from litigation. Dividend income is recorded on the ex-dividend date for dividends received in cash and/or securities or, in the case of dividends on certain foreign securities, as soon as the Fund is informed of the ex-dividend date. Non-cash dividends are recorded at the fair value of the securities received. Withholding taxes on foreign dividends and capital gains, if any, have been provided for in accordance with the Fund’s understanding of the applicable country’s tax rules and rates. Distributions received that represent a return of capital are recorded as a reduction of cost of investments. Distributions received that represent a capital gain are recorded as a realized gain. Interest income, which includes amortization of premium and accretion of discount on debt securities, is accrued as earned.
C. Share Class Accounting: Realized and unrealized gains and losses and net investment income and losses, other than class-specific expenses, are allocated daily to each class of shares based upon the relative net assets of each class to the total net assets of the Fund. Expenses arising in connection with a specific class are charged directly to that class. Sub-accounting, recordkeeping
20 www.calvert.com CALVERT EMERGING MARKETS EQUITY FUND ANNUAL REPORT
and similar administrative fees payable to financial intermediaries, which are a component of transfer and dividend disbursing agent fees on the Statement of Operations, are not allocated to Class R6 shares.
D. Foreign Currency Transactions: The Fund’s accounting records are maintained in U.S. dollars. For valuation of assets and liabilities on each date of net asset value determination, foreign denominations are converted into U.S. dollars using the current exchange rate. Security transactions, income, and expenses are translated at the prevailing rate of exchange on the date of the event. Recognized gains or losses on investment transactions attributable to changes in foreign currency exchange rates are recorded for financial statement purposes as net realized gains and losses on investments. That portion of unrealized gains and losses on investments that results from fluctuations in foreign currency exchange rates is not separately disclosed.
E. Participatory Notes: The Fund may gain exposure to securities in certain foreign markets through investments in participatory notes (P-notes), especially in markets where direct investment by the Fund is not possible. P-notes are generally issued by a bank or broker-dealer (the counterparty) and are designed to offer a return linked to a particular underlying equity security. While the holder of a P-note is entitled to receive from the counterparty any dividends paid by the underlying security, the counterparty retains legal ownership and voting rights of the underlying security. The risks associated with investing in a P-note may include the possible failure of the counterparty to perform its obligations under the terms of the agreement, an inability to liquidate or transfer the notes, and an imperfect correlation between the value of the P-note and the underlying security.
F. Restricted Securities: The Fund may invest in securities that are subject to legal or contractual restrictions on resale. Generally, these securities may only be sold publicly upon registration under the Securities Act of 1933 or in transactions exempt from such registration. Information regarding restricted securities (excluding Rule 144A securities) is included at the end of the Schedule of Investments.
G. Distributions to Shareholders: Distributions to shareholders are recorded by the Fund on ex-dividend date. Dividends from net investment income and distributions from net realized capital gains, if any, are paid at least annually. Distributions are determined in accordance with income tax regulations which may differ from U.S. GAAP; accordingly, periodic reclassifications are made within the Fund’s capital accounts to reflect income and gains available for distribution under income tax regulations.
H. Estimates: The preparation of financial statements in conformity with U.S. GAAP requires management to make estimates and assumptions that affect the reported amounts of assets and liabilities and disclosure of contingent assets and liabilities at the date of the financial statements and the reported amounts of increases and decreases in net assets from operations during the reporting period. Actual results could differ from those estimates.
I. Indemnifications: The Corporation’s By-Laws provide for indemnification for Directors or officers of the Corporation and certain other parties, to the fullest extent permitted by Maryland law and the 1940 Act, provided certain conditions are met. Additionally, in the normal course of business, the Fund enters into agreements with service providers that may contain indemnification clauses. The Fund’s maximum exposure under these arrangements is unknown as this would involve future claims that may be made against the Fund that have not yet occurred.
J. Federal Income Taxes: No provision for federal income or excise tax is required since the Fund intends to continue to qualify as a regulated investment company under the Internal Revenue Code and to distribute substantially all of its taxable earnings.
In addition to the requirements of the Internal Revenue Code, the Fund may also be subject to local taxes on the recognition of capital gains in certain countries. In determining the daily net asset value, the Fund estimates the accrual for such taxes, if any, based on the unrealized appreciation on certain portfolio securities and the related tax rates. Taxes attributable to unrealized appreciation are included in the change in unrealized appreciation (depreciation) on investments. Capital gains taxes on securities sold are included in net realized gain (loss) on investments.
Management has analyzed the Fund’s tax positions taken for all open federal income tax years and has concluded that no provision for federal income tax is required in the Fund’s financial statements. A Fund’s federal tax return is subject to examination by the Internal Revenue Service for a period of three years from the date of filing.
NOTE 2 — RELATED PARTY TRANSACTIONS
The investment advisory fee is earned by Calvert Research and Management (CRM), a subsidiary of Eaton Vance Management (EVM), as compensation for investment advisory services rendered to the Fund. Pursuant to the investment advisory agreement, CRM receives a fee, payable monthly, at the annual rate of 0.88% of the Fund’s average daily net assets. For the year ended September 30, 2018, the investment advisory fee amounted to $7,383,211.
Hermes Investment Management Limited (Hermes) provides sub-advisory services to the Fund pursuant to a sub-advisory agreement with CRM. Sub-advisory fees are paid by CRM from its investment advisory fee.
CRM has agreed to reimburse the Fund’s operating expenses to the extent that total annual operating expenses (relating to ordinary operating expenses only and excluding expenses such as brokerage commissions, acquired fund fees and expenses of
www.calvert.com CALVERT EMERGING MARKETS EQUITY FUND ANNUAL REPORT 21
unaffiliated funds, interest expense, taxes or litigation expenses) exceed 1.27%, 2.02%, 0.92% and 0.92% for Class A, Class C, Class I and Class R6, respectively, and prior to the close of business on December 8, 2017, 0.85% for Class Y, of such class’ average daily net assets. The expense reimbursement agreement may be changed or terminated after January 31, 2019. For the year ended September 30, 2018, CRM waived or reimbursed expenses of $3,129,354. A portion of the expenses waived or reimbursed was borne by Hermes.
The administrative fee is earned by CRM as compensation for administrative services rendered to the Fund. The fee is computed at an annual rate of 0.12% of the Fund’s average daily net assets attributable to Class A, Class C, Class I and Class R6 (and Class Y prior to the close of business on December 8, 2017) and is payable monthly. CRM contractually waived 0.02% of the administrative fee through January 31, 2018 for Class I. For the year ended September 30, 2018, CRM was paid administrative fees of $1,006,194, of which $18,274 were waived.
The Fund has in effect a distribution plan for Class A shares (Class A Plan) pursuant to Rule 12b-1 under the 1940 Act. Pursuant to the Class A Plan, the Fund pays Eaton Vance Distributors, Inc. (EVD), an affiliate of CRM and the Fund’s principal underwriter, a distribution and service fee of 0.25% per annum of its average daily net assets attributable to Class A for distribution services and facilities provided to the Fund by EVD, as well as for personal services and/or the maintenance of shareholder accounts. The Fund also has in effect a distribution plan for Class C shares (Class C Plan) pursuant to Rule 12b-1 under the 1940 Act. Pursuant to the Class C Plan, the Fund pays EVD amounts equal to 0.75% per annum of its average daily net assets attributable to Class C shares for providing ongoing distribution services and facilities to the Fund. In addition, pursuant to the Class C Plan, the Fund also makes payments of service fees to EVD, financial intermediaries and other persons in amounts equal to 0.25% per annum of its average daily net assets attributable to that class. Service fees paid or accrued are for personal services and/or the maintenance of shareholder accounts. Distribution and service fees paid or accrued for the year ended September 30, 2018 amounted to $350,932 and $169,866 for Class A shares and Class C shares, respectively.
The Fund was informed that EVD received $85,607 as its portion of the sales charge on sales of Class A shares. The Fund was also informed that EVD received $7,497 of contingent deferred sales charges (CDSC) paid by Class C shareholders and no CDSC paid by Class A shareholders for the year ended September 30, 2018.
EVM provides sub-transfer agency and related services to the Fund pursuant to a Sub-Transfer Agency Support Services Agreement. For the year ended September 30, 2018, sub-transfer agency fees and expenses incurred to EVM amounted to $54,031 and are included in transfer agency fees and expenses on the Statement of Operations.
Each Director of the Fund who is not an employee of CRM or its affiliates receives a fee of $3,000 for each Board meeting attended in person and $2,000 for each Board meeting attended by phone plus an annual fee of $52,000, and $1,500 for each Committee meeting attended in person and $1,000 for each Committee meeting attended by phone plus an annual Committee fee of $2,500. The Board chair receives an additional $10,000 annual retainer and Committee chairs receive an additional $6,000 annual retainer. Eligible Directors may participate in a Deferred Compensation Plan (the Plan). Amounts deferred under the Plan are treated as though equal dollar amounts had been invested in shares of the Fund or other Calvert funds selected by the Directors. The Fund purchases shares of the funds selected equal to the dollar amounts deferred under the Plan, resulting in an asset equal to the deferred compensation liability. Obligations of the Plan are paid solely from the Fund’s assets. Directors’ fees are allocated to each of the Calvert funds served. Salaries and fees of officers and Directors of the Fund who are employees of CRM or its affiliates are paid by CRM. In addition, an advisory council was established to aid the Board and CRM in advancing the cause of responsible investing through original scholarship and thought leadership. The advisory council consists of CRM’s Chief Executive Officer and four additional members. Each member (other than CRM’s Chief Executive Officer) receives annual compensation of $75,000, which is being reimbursed by Calvert Investment Management, Inc. (CIM), the Calvert funds’ former investment adviser and Ameritas Holding Company, CIM’s parent company, through the end of 2019. For the year ended September 30, 2018, the Fund’s allocated portion of such expense and reimbursement was $15,907, which are included in miscellaneous expense and reimbursement of expenses-other, respectively, on the Statement of Operations.
NOTE 3 — INVESTMENT ACTIVITY
During the year ended September 30, 2018, the cost of purchases and proceeds from sales of investments, other than short-term securities, were $1,225,626,884 and $219,089,713, respectively.
22 www.calvert.com CALVERT EMERGING MARKETS EQUITY FUND ANNUAL REPORT
NOTE 4 — DISTRIBUTIONS TO SHAREHOLDERS AND INCOME TAX INFORMATION
The tax character of distributions declared for the years ended September 30, 2018 and September 30, 2017 was as follows:
|
| | | | | | |
| | Year Ended
September 30, |
| | 2018 | 2017 |
| Ordinary income |
| $1,239,205 |
|
| $888,499 |
|
During the year ended September 30, 2018, accumulated loss was increased by $1,638,191 and paid-in capital was increased by $1,638,191 due to the Fund’s use of equalization accounting. Tax equalization accounting allows the Fund to treat as a distribution that portion of redemption proceeds representing a redeeming shareholder’s portion of undistributed taxable income and net capital gains. These reclassifications had no effect on the net assets or net asset value per share of the Fund.
As of September 30, 2018 the components of distributable earnings (accumulated loss) on tax basis were as follows:
|
| | | |
| Undistributed ordinary income |
| $10,412,457 |
|
| Deferred capital losses |
| ($7,907,354 | ) |
| Net unrealized appreciation (depreciation) |
| ($61,870,458 | ) |
At September 30, 2018, the Fund, for federal income tax purposes, had deferred capital losses of $7,907,354 which would reduce the Fund’s taxable income arising from future net realized gains on investment transactions, if any, to the extent permitted by the Internal Revenue Code, and thus would reduce the amount of distributions to shareholders, which would otherwise be necessary to relieve the Fund of any liability for federal income or excise tax. The deferred capital losses are treated as arising on the first day of the Fund’s next taxable year and retain the same short-term or long-term character as when originally deferred. Of the deferred capital losses at September 30, 2018, $7,907,354 are short-term.
The cost and unrealized appreciation (depreciation) of investments of the Fund at September 30, 2018, as determined on a federal income tax basis, were as follows:
|
| | | |
| Aggregate cost |
| $1,245,194,722 |
|
| Gross unrealized appreciation |
| $54,349,660 |
|
| Gross unrealized depreciation | (115,995,528) |
|
| Net unrealized appreciation (depreciation) |
| ($61,645,868 | ) |
NOTE 5 — SECURITIES LENDING
To generate additional income, the Fund may lend its securities pursuant to a securities lending agency agreement with State Street Bank and Trust Company (SSB), the securities lending agent. Security loans are subject to termination by the Fund at any time and, therefore, are not considered illiquid investments. The Fund requires that the loan be continuously collateralized by either cash or securities as collateral equal at all times to at least 102% of the market value of the domestic securities loaned and 105% of the market value of the international securities loaned (if applicable). The market value of securities loaned is determined daily and any additional required collateral is delivered to the Fund on the next business day. Cash collateral is generally invested in a money market fund registered under the 1940 Act that is managed by an affiliate of SSB. Any gain or loss in the market price of the loaned securities that might occur and any interest earned or dividends declared during the term of the loan would accrue to the account of the Fund. Income earned on the investment of collateral, net of broker rebates and other expenses incurred by the securities lending agent, is split between the Fund and the securities lending agent on the basis of agreed upon contractual terms. Non-cash collateral, if any, is held by the lending agent on behalf of the Fund and cannot be sold or re-pledged by the Fund; accordingly, such collateral is not reflected in the Statement of Assets and Liabilities.
The risks associated with lending portfolio securities include, but are not limited to, possible delays in receiving additional collateral or in the recovery of the loaned securities, possible loss of rights to the collateral should the borrower fail financially, as well as risk of loss in the value of the collateral or the value of the investments made with the collateral. The securities lending agent shall indemnify the Fund in the case of default of any securities borrower.
At September 30, 2018, the total value of securities on loan was $666,312 and the total value of collateral received was $688,831, comprised of cash.
The following table provides a breakdown of securities lending transactions accounted for as secured borrowings, the obligations by class of collateral pledged, and the remaining contractual maturity of those transactions as of September 30, 2018.
www.calvert.com CALVERT EMERGING MARKETS EQUITY FUND ANNUAL REPORT 23
|
| | | | | | | | | | | | | | | |
| | Remaining Contractual Maturity of the Transactions |
| | Overnight and
Continuous | <30 days | 30 to 90 days | >90 days | Total |
| Securities Lending Transactions |
| Common Stocks |
| $688,831 |
|
| $— |
|
| $— |
|
| $— |
|
| $688,831 |
|
The carrying amount of the liability for deposits for securities loaned at September 30, 2018 approximated its fair value. If measured at fair value, such liability would have been considered as Level 2 in the fair value hierarchy (see Note 1A) at September 30, 2018.
NOTE 6 — LINE OF CREDIT
The Fund participates with other funds managed by CRM in a $62.5 million committed ($25 million committed and $25 million uncommitted prior to August 7, 2018) unsecured line of credit agreement with SSB, which is in effect through August 6, 2019. Borrowings may be made for temporary or emergency purposes only. Borrowings bear interest at the higher of the One-Month London Interbank Offered Rate (LIBOR) in effect that day or the overnight Federal Funds Rate, plus 1.00% (1.25% prior to August 7, 2018) per annum. A commitment fee of 0.20% (0.25% prior to August 7, 2018) per annum is incurred on the unused portion of the committed facility. An administrative fee of $37,500 was incurred in connection with the renewal of the facility in August 2018. These fees are allocated to all participating funds. Because the line of credit is not available exclusively to the Fund, it may be unable to borrow some or all of its requested amounts at any particular time. The Fund had no borrowings outstanding pursuant to this line of credit at September 30, 2018. The Fund did not have any significant borrowings or allocated fees during the year ended September 30, 2018.
NOTE 7 — AFFILIATED COMPANIES
The Fund has invested a portion of its assets designated for high social impact investments in notes (the Notes) issued by Calvert Impact Capital, Inc. (CIC), formerly the Calvert Social Investment Foundation, pursuant to an exemptive order granted by the U.S. Securities and Exchange Commission (the SEC) in 1998 (the Exemptive Order). The Fund obtained the Exemptive Order because at that time there was a significant overlap of Fund Board members and CIC Board members as well as certain other affiliations between CIC and affiliates of the Fund’s investment adviser. CIC may be considered an affiliated person of the Fund based on the overlap between CIC’s Board of Directors and the Calvert funds’ Directors/Trustees and other potential affiliations. CIC has licensed use of the Calvert name from CRM, and currently two Fund Board members (one of whom is CRM’s President and Chief Executive Officer), two members of the Advisory Council to the Calvert Fund Board of Directors/Trustees, and an additional CRM officer serve on CIC’s Board. CIC is not owned or otherwise controlled by CRM or its affiliates. The Fund intends to request a new exemptive order from the SEC to permit additional investment in CIC notes.
At September 30, 2018, the value of the Fund’s investment in the Notes was $1,924,700, which represents 0.1% of the Fund’s net assets. Transactions in the Notes by the Fund for the year ended September 30, 2018 were as follows:
|
| | | | | | | | | | | | | | | | | | | | | | | | | | | |
| Name of Issuer | Principal Amount,
beginning of period | Gross Additions | Gross Reductions | Principal Amount,
end of period | Value,
end of period | Interest
Income | Net Realized
Gain (Loss) | Capital Gain
Distributions Received | Change in
Unrealized
Appreciation
(Depreciation) |
High Social Impact Investments Calvert Impact Capital Inc., Community Investment Notes, 1.50%, 12/15/19(1) |
| $2,000,000 |
|
| $— |
|
| $— |
|
| $2,000,000 |
|
| $1,924,700 |
|
| $30,000 |
|
| $— |
|
| $— |
|
| $18,540 |
|
| TOTALS | | | | |
| $1,924,700 |
|
| $30,000 |
|
| $— |
|
| $— |
|
| $18,540 |
|
(1) Restricted security.
24 www.calvert.com CALVERT EMERGING MARKETS EQUITY FUND ANNUAL REPORT
NOTE 8 — CAPITAL SHARES
Transactions in capital shares for the years ended September 30, 2018 and September 30, 2017 were as follows:
|
| | | | | | | | | | | |
| | Year Ended
September 30, 2018 | | Year Ended
September 30, 2017 |
| | Shares | Amount | | Shares | Amount |
| Class A | | | | | |
| Shares sold | 11,263,459 |
|
| $194,432,874 |
| | 2,714,784 |
|
| $39,910,400 |
|
| Reinvestment of distributions | 9,049 |
| 156,375 |
| | 12,454 |
| 148,081 |
|
| Shares redeemed | (5,081,081 | ) | (84,926,221 | ) | | (1,943,550 | ) | (25,964,333 | ) |
| Net increase | 6,191,427 |
|
| $109,663,028 |
| | 783,688 |
|
| $14,094,148 |
|
| | | | | | |
| Class C | | | | | |
| Shares sold | 1,473,664 |
|
| $24,993,031 |
| | 233,865 |
|
| $3,505,694 |
|
| Reinvestment of distributions | — |
| — |
| | 121 |
| 1,420 |
|
| Shares redeemed | (162,815 | ) | (2,567,155 | ) | | (23,457 | ) | (323,773 | ) |
| Net increase | 1,310,849 |
|
| $22,425,876 |
| | 210,529 |
|
| $3,183,341 |
|
| | | | | | |
| Class I | | | | | |
| Shares sold | 63,885,698 |
|
| $1,094,110,020 |
| | 4,317,449 |
|
| $61,919,177 |
|
| Reinvestment of distributions | 58,557 |
| 1,021,237 |
| | 42,446 |
| 508,083 |
|
| Shares redeemed | (18,240,642 | ) | (301,542,471 | ) | | (1,152,319 | ) | (16,693,300 | ) |
| Conversion from Class Y | 10,991,452 |
| 184,790,484 |
| | — |
| — |
|
| Net increase | 56,695,065 |
|
| $978,379,270 |
| | 3,207,576 |
|
| $45,733,960 |
|
| | | | | | |
Class R6 (1) | | | | | |
| Shares sold | 745,765 |
|
| $12,022,644 |
| | — |
|
| $— |
|
| Shares redeemed | (95,701 | ) | (1,507,104 | ) | | — |
| — |
|
| Net increase | 650,064 |
|
| $10,515,540 |
| | — |
|
| $— |
|
| | | | | | |
Class Y (2) | | | | | |
| Shares sold | 4,489,874 |
|
| $76,898,417 |
| | 5,504,746 |
|
| $81,985,672 |
|
| Reinvestment of distributions | — |
| — |
| | 16,100 |
| 194,485 |
|
| Shares redeemed | (169,118 | ) | (2,897,161 | ) | | (959,597 | ) | (13,484,350 | ) |
| Conversion to Class I | (10,904,152 | ) | (184,790,484 | ) | | — |
| — |
|
| Net increase (decrease) | (6,583,396 | ) |
| ($110,789,228 | ) | | 4,561,249 |
|
| $68,695,807 |
|
| | | | | | |
(1) From February 1, 2018 inception. | | | | | |
(2) Effective December 8, 2017, Class Y shares of the Fund converted to Class I shares at net asset value. Thereafter, Class Y shares were terminated. |
NOTE 9 — RISKS ASSOCIATED WITH FOREIGN INVESTMENTS
Investing in foreign securities involves additional risks relating to political, social, and economic developments abroad. Other risks result from differences between regulations that apply to U.S. and foreign issuers and markets, and the potential for foreign markets to be less liquid and more volatile than U.S. markets. Securities that trade or are denominated in currencies other than the U.S. dollar may be adversely affected by fluctuations in currency exchange rates.
The risks of investing in emerging market securities are greater than those of investing in securities of developed foreign countries. These risks include volatile currency exchange rates, periods of high inflation, increased risk of default, greater social, economic and political uncertainty and instability, less governmental supervision and regulation of securities markets, weaker auditing and financial reporting standards, lack of liquidity in the markets, and the significantly smaller market capitalization of emerging market issuers.
www.calvert.com CALVERT EMERGING MARKETS EQUITY FUND ANNUAL REPORT 25
REPORT OF INDEPENDENT REGISTERED PUBLIC ACCOUNTING FIRM
To the Shareholders and Board of Directors
Calvert World Values Fund, Inc:
Opinion on the Financial Statements
We have audited the accompanying statement of assets and liabilities of Calvert Emerging Markets Equity Fund (the Fund), a series of Calvert World Values Fund, Inc., including the schedule of investments, as of September 30, 2018, the related statement of operations for the year then ended, the statements of changes in net assets for each of the years in the two‑year period then ended, and the related notes (collectively, the financial statements) and the financial highlights for each of the years or periods in the five‑year period then ended. In our opinion, the financial statements and financial highlights present fairly, in all material respects, the financial position of the Fund as of September 30, 2018, the results of its operations for the year then ended, the changes in its net assets for each of the years in the two‑year period then ended, and the financial highlights for each of the years or periods in the five‑year period then ended, in conformity with U.S. generally accepted accounting principles.
Basis for Opinion
These financial statements and financial highlights are the responsibility of the Fund’s management. Our responsibility is to express an opinion on these financial statements and financial highlights based on our audits. We are a public accounting firm registered with the Public Company Accounting Oversight Board (United States) (PCAOB) and are required to be independent with respect to the Fund in accordance with the U.S. federal securities laws and the applicable rules and regulations of the Securities and Exchange Commission and the PCAOB.
We conducted our audits in accordance with the standards of the PCAOB. Those standards require that we plan and perform the audit to obtain reasonable assurance about whether the financial statements and financial highlights are free of material misstatement, whether due to error or fraud. Our audits included performing procedures to assess the risks of material misstatement of the financial statements and financial highlights, whether due to error or fraud, and performing procedures that respond to those risks. Such procedures included examining, on a test basis, evidence regarding the amounts and disclosures in the financial statements and financial highlights. Such procedures also included confirmation of securities owned as of September 30, 2018, by correspondence with custodians and brokers. Our audits also included evaluating the accounting principles used and significant estimates made by management, as well as evaluating the overall presentation of the financial statements and financial highlights. We believe that our audits provide a reasonable basis for our opinion.
We have served as the auditor of one or more of the Calvert Funds since 2002.
Philadelphia, Pennsylvania
November 21, 2018
26 www.calvert.com CALVERT EMERGING MARKETS EQUITY FUND ANNUAL REPORT
FEDERAL TAX INFORMATION
The Form 1099-DIV you receive in February 2019 will show the tax status of all distributions paid to your account in calendar year 2018. Shareholders are advised to consult their own tax adviser with respect to the tax consequences of their investment in the Fund. As required by the Internal Revenue Code and/or regulations, shareholders must be notified regarding the status of qualified dividend income for individuals and the foreign tax credit.
Qualified Dividend Income. For the fiscal year ended September 30, 2018, the Fund designates approximately $15,539,276, or up to the maximum amount of such dividends allowable pursuant to the Internal Revenue Code, as qualified dividend income eligible for the reduced tax rate of 15%.
Foreign Tax Credit. For the fiscal year ended September 30, 2018, the Fund paid foreign taxes of $2,284,105 and recognized foreign source income of $23,504,484.
www.calvert.com CALVERT EMERGING MARKETS EQUITY FUND ANNUAL REPORT (Unaudited) 27
SPECIAL MEETING OF SHAREHOLDERS
The Fund held a Special Meeting of Shareholders on Friday, October 5, 2018 for the following purposes: (1) to approve an investment sub-advisory agreement between Calvert Research and Management (“CRM”) and Hermes Investment Management Limited (“Hermes”) pursuant to which Hermes will continue to serve as sub-adviser to the Fund and (2) to approve a “manager of managers” structure, which would allow CRM and the Fund to enter into and materially amend investment sub-advisory agreements with unaffiliated sub-advisers and certain affiliated sub-advisers without obtaining additional shareholder approval, subject to certain conditions. Prior to reliance on a “manager of managers” structure, CRM and Calvert World Values Fund, Inc. would need to apply for and be granted exemptive relief from the SEC.
The shareholder meeting results are as follows:
|
| | | |
| | Number of Shares |
| | For | Against/Withhold | Abstain(1) |
| Proposal One | 36,097,731 | 647,076 | 1,124,221 |
| Proposal Two | 34,622,275 | 2,053,840 | 1,192,913 |
(1) Abstained shares (i.e., proxies from brokers or nominees indicating that such persons have not received instructions from the beneficial owner or other person entitled to vote shares on a particular matter with respect to which the brokers or nominees do not have discretionary power) were treated as shares that were present at the meeting for purposes of establishing a quorum, but had the effect of a vote against the Proposal.
28 www.calvert.com CALVERT EMERGING MARKETS EQUITY FUND ANNUAL REPORT (Unaudited)
MANAGEMENT AND ORGANIZATION
Fund Management. The Directors of Calvert World Values Fund, Inc. (the Corporation) are responsible for the overall management and supervision of the Corporation’s affairs. The Directors and officers of the Corporation are listed below. Except as indicated, each individual has held the office shown or other offices in the same company for the last five years. Directors and officers of the Corporation hold indefinite terms of office. The “Independent Directors” consist of those Directors who are not “interested persons” of the Corporation, as that term is defined under the 1940 Act. The business address of each Director and officer, with the exception of Ms. Gemma and Mr. Kirchner, is 1825 Connecticut Avenue NW, Suite 400, Washington, DC 20009. As used below, “CRM” refers to Calvert Research and Management. Each Director oversees 39 funds in the Calvert fund complex. Each officer serves as an officer of certain other Calvert funds.
|
| | | |
| Name and Year of Birth | Position
with Corporation | Position
Start Date | Principal Occupation(s) and Directorships
During Past Five Years and Other Relevant Experience |
| | | | |
| Interested Director | | | |
John H. Streur(1)
1960 | Director & President | 2015 | President and Chief Executive Officer of Calvert Research and Management (since December 31, 2016). President and Chief Executive Officer of Calvert Investments, Inc. (January 2015 - December 2016); Chief Executive Officer of Calvert Investment Distributors, Inc. (August 2015 - December 2016); Chief Compliance Officer of Calvert Investment Management, Inc. (August 2015 - April 2016); President and Director, Portfolio 21 Investments, Inc. (through October 2014); President, Chief Executive Officer and Director, Managers Investment Group LLC (through January 2012); President and Director, The Managers Funds and Managers AMG Funds (through January 2012).
Directorships in the Last Five Years. Portfolio 21 Investments, Inc. (asset management) (through October 2014); Managers Investment Group LLC (asset management) (through January 2012); The Managers Funds (asset management) (through January 2012); Managers AMG Funds (asset management) (through January 2012); Calvert Impact Capital, Inc. |
| Independent Directors | | | |
Richard L. Baird, Jr
1948 | Director | 2005 | Former President and CEO of Adagio Health Inc. (retired in 2014) in Pittsburgh, PA, a non-profit corporation which provides family planning services, nutrition, maternal/child health care, and various health screening services and community preventive health programs.
Directorships in the Last Five Years. None. |
Alice Gresham Bullock
1950 | Chair & Director | 2016 | Professor at Howard University School of Law (retired June 2016). She is former Dean of Howard University School of Law (1996-2002) and Deputy Director of the Association of American Law Schools (1992-1994).
Directorships in the Last Five Years. None. |
Cari M. Dominguez
1949 | Director | 2016 | Former Chair of the U.S. Equal Employment Opportunity Commission.
Directorships in the Last Five Years. Manpower, Inc. (employment agency); Triple S Management Corporation (managed care); National Association of Corporate Directors. |
John G. Guffey, Jr.
1948 | Director | 1992 | President of Aurora Press Inc., a privately held publisher of trade paperbacks (since January 1997).
Directorships in the Last Five Years. Calvert Impact Capital, Inc.; Calvert Ventures, LLC. |
Miles D. Harper, III
1962 | Director | 2005 | Partner, Carr Riggs & Ingram (public accounting firm) since October 2014. Partner, Gainer Donnelly & Desroches (public accounting firm) (now Carr Riggs & Ingram), November 1999 - September 2014).
Directorships in the Last Five Years. Bridgeway Funds (10) (asset management). |
www.calvert.com CALVERT EMERGING MARKETS EQUITY FUND ANNUAL REPORT (Unaudited) 29
|
| | | |
| Name and Year of Birth | Position
with Corporation | Position
Start Date | Principal Occupation(s) and Directorships
During Past Five Years and Other Relevant Experience |
| | | | |
Joy V. Jones
1950 | Director | 2005 | Attorney.
Directorships in the Last Five Years. Conduit Street Restaurants SUD 2 Limited; Palm Management Restaurant Corporation. |
Anthony A. Williams
1951 | Director | 2016 | CEO and Executive Director of the Federal City Council (July 2012 to present); Senior Adviser and Independent Consultant for McKenna Long & Aldridge LLP (September 2011 to present); Executive Director of Global Government Practice at the Corporate Executive Board (January 2010 to January 2012).
Directorships in the Last Five Years. Freddie Mac; Evoq Properties/ Meruelo Maddux Properties, Inc. (real estate management); Weston Solutions, Inc. (environmental services); Bipartisan Policy Center’s Debt Reduction Task Force; Chesapeake Bay Foundation; Catholic University of America; Urban Institute (research organization). |
|
| | | |
| Principal Officers who are not Directors | |
Name and
Year of Birth | Position with
Corporation | Position Start Date | Principal Occupation
During Past Five Years |
| | | | |
Hope L. Brown
1973 | Chief Compliance Officer | 2014 | Chief Compliance Officer of 39 registered investment companies advised by CRM (since 2014). Vice President and Chief Compliance Officer, Wilmington Funds (2012-2014). Vice President and Senior Compliance Officer, Wilmington Trust Investment Advisors, Inc. (2010-2012). |
Maureen A. Gemma(2)
1960 | Secretary, Vice President and Chief Legal Officer | 2016 | Vice President of CRM and officer of 39 registered investment companies advised by CRM (since 2016). Also Vice President of Eaton Vance Management (“EVM”) and certain of its affiliates and officer of 174 registered investment companies advised or administered by EVM. |
James F. Kirchner(2)
1967 | Treasurer | 2016 | Vice President of CRM and officer of 39 registered investment companies advised by CRM (since 2016). Also Vice President of EVM and certain of its affiliates and officer of 174 registered investment companies advised or administered by EVM. |
| | | | |
| |
(1) | Mr. Streur is an interested person of the Fund because of his positions with the Fund’s adviser and certain affiliates. |
| |
(2) | The business address for Ms. Gemma and Mr. Kirchner is Two International Place, Boston, MA 02110. |
The SAI for the Fund includes additional information about the Directors and officers of the Fund and can be obtained without charge on Calvert’s website at www.calvert.com or by calling 1-800-368-2745.
30 www.calvert.com CALVERT EMERGING MARKETS EQUITY FUND ANNUAL REPORT (Unaudited)
IMPORTANT NOTICES
Privacy. The Calvert Funds and Calvert Research and Management are committed to ensuring your financial privacy. Each of the financial institutions identified below has in effect the following policy (“Privacy Policy”) with respect to nonpublic personal information about its customers:
| |
| • | Only such information received from you, through application forms or otherwise, and information about your Calvert fund transactions will be collected. This may include information such as name, address, social security number, tax status, account balances and transactions. |
| |
| • | None of such information about you (or former customers) will be disclosed to anyone, except as permitted by law (which includes disclosure to employees necessary to service your account). In the normal course of servicing a customer’s account, Calvert Research and Management may share information with unaffiliated third parties that perform various required services such as transfer agents, custodians and broker-dealers. |
| |
| • | Policies and procedures (including physical, electronic and procedural safeguards) are in place that are designed to protect the confidentiality of such information. |
| |
| • | The Funds reserve the right to change this Privacy Policy at any time upon proper notification to you. Customers may want to review the Funds’ Privacy Policy periodically for changes by accessing the link on our homepage: www.calvert.com. |
Our pledge of privacy applies to the following entities: the Calvert Family of Funds, Calvert Research and Management and their affiliated service providers, Eaton Vance Management and Eaton Vance Distributors, Inc. In addition, our Privacy Policy applies only to those Calvert customers who are individuals and who have a direct relationship with us. If a customer’s account (i.e., fund shares) is held in the name of a third-party financial advisor/broker-dealer, it is likely that only such advisor’s privacy policies apply to the customer. This notice supersedes all previously issued privacy disclosures. For more information about Calvert’s Privacy Policy, please call 1-800-368-2745.
Delivery of Shareholder Documents. The Securities and Exchange Commission (SEC) permits funds to deliver only one copy of shareholder documents, including prospectuses, proxy statements and shareholder reports, to fund investors with multiple accounts at the same residential or post office box address. This practice is often called “householding” and it helps eliminate duplicate mailings to shareholders. Calvert funds, or your financial advisor, may household the mailing of your documents indefinitely unless you instruct Calvert funds, or your financial advisor, otherwise. If you would prefer that your Calvert fund documents not be householded, please contact Calvert funds at 1-800-368-2745, or contact your financial advisor. Your instructions that householding not apply to delivery of your Calvert fund documents will typically be effective within 30 days of receipt by Calvert funds or your financial advisor. Separate statements will be generated for each separate account and will be householded as described above.
Portfolio Holdings. Each Calvert fund will file a schedule of portfolio holdings on Form N-Q with the SEC for the first and third quarters of each fiscal year. The Form N-Q will be available on the Calvert funds’ website at www.calvert.com, by calling Calvert funds at 1-800-368-2745 or in the EDGAR database on the SEC’s website at www.sec.gov. Form N-Q may also be reviewed and copied at the SEC’s public reference room in Washington, D.C. (call 1-800-732-0330 for information on the operation of the public reference room).
Proxy Voting. The Proxy Voting Guidelines that each Calvert fund uses to determine how to vote proxies relating to portfolio securities is provided as an Appendix to the fund’s Statement of Additional Information. The Statement of Additional Information can be obtained free of charge by calling the Calvert funds at 1-800-368-2745, by visiting the Calvert funds’ website at www.calvert.com or visiting the SEC’s website at www.sec.gov. Information regarding how a Calvert fund voted proxies relating to portfolio securities during the most recent 12-month period ended June 30 is available by calling Calvert funds, by visiting the Calvert funds’ website at www.calvert.com or by visiting the SEC’s website at www.sec.gov.
www.calvert.com CALVERT EMERGING MARKETS EQUITY FUND ANNUAL REPORT (Unaudited) 31
|
|
| This page intentionally left blank. |
|
| |
| CALVERT EMERGING MARKETS EQUITY FUND | |
Investment Adviser and Administrator Calvert Research and Management 1825 Connecticut Avenue NW, Suite 400 Washington, DC 20009 | Transfer Agent DST Asset Manager Solutions, Inc. 2000 Crown Colony Drive Quincy, MA 02169 |
Sub-Adviser Hermes Investment Management Limited 150 Cheapside London EC2V 6ET
| Independent Registered Public Accounting Firm KPMG LLP 1601 Market Street Philadelphia, PA 19103-2499 |
Principal Underwriter* Eaton Vance Distributors, Inc. Two International Place Boston, MA 02110 (617) 482-8260 | Fund Offices 1825 Connecticut Avenue NW, Suite 400 Washington, DC 20009 |
Custodian State Street Bank and Trust Company State Street Financial Center, One Lincoln Street Boston, MA 02111 | |
* FINRA BrokerCheck. Investors may check the background of their Investment Professional by contacting the Financial Industry Regulatory Authority (FINRA). FINRA BrokerCheck is a free tool to help investors check the professional background of current and former FINRA-registered securities firms and brokers. FINRA BrokerCheck is available by calling 1-800-289-9999 and at www.FINRA.org. The FINRA BrokerCheck brochure describing this program is available to investors at www.FINRA.org.
|
| |
| | |
Fund shares are not insured by the FDIC and are not deposits or other obligations of, or guaranteed by, any depository institution. Shares are subject to investment risks, including possible loss of principal invested. This report is intended to provide fund information to shareholders. It is not authorized for distribution to prospective investors unless preceded or accompanied by a prospectus. Note: The information on our website is not incorporated by reference into this report; our website address is included as an inactive textual reference only. Investors should carefully consider the investment objectives, risks, charges and expenses of the Calvert funds. This and other important information is contained in the fund’s summary prospectus and prospectus, which can be obtained from your financial professional and should be read carefully before investing. You may also call the Calvert funds at 800-368-2745. Printed on recycled paper. |
| 24213 9.30.18 | |
Item 2. Code of Ethics
The registrant has adopted a code of ethics applicable to its Principal Executive Officer, Principal Financial Officer and Principal Accounting Officer. The registrant undertakes to provide a copy of such code of ethics to any person upon request, without charge, by calling 1-800-368-2745. The registrant has amended the code of ethics as described in Form N-CSR during the period covered by this report to make immaterial changes. The registrant has not granted any waiver, including an implicit waiver, from a provision of the code of ethics as described in Form N-CSR during the period covered by this report.
Item 3. Audit Committee Financial Expert
The registrant's Board of Directors has determined that Miles D. Harper III, an “independent” Director serving on the registrant’s audit committee, is an “audit committee financial expert,” as defined in Item 3 of Form N-CSR. Under applicable securities laws, a person who is determined to be an audit committee financial expert will not be deemed an "expert" for any purpose, including without limitation for the purposes of Section 11 of the Securities Act of 1933, as a result of being designated or identified as an audit committee financial expert. The designation or identification of a person as an audit committee financial expert does not impose on such person any duties, obligations, or liabilities that are greater than the duties, obligations, and liabilities imposed on such person as a member of the audit committee and Board of Directors in the absence of such designation or identification.
Item 4. Principal Accountant Fees and Services
(a) –(d)
The following table presents the aggregate fees billed to the registrant for the registrant’s fiscal years ended September 30, 2017 and September 30, 2018 by KPMG for professional services rendered for the audit of the registrant’s annual financial statements and fees billed for other services rendered by KPMG during such periods.
|
| | | | | | | | | | |
| Fiscal Years Ended | 9/30/17 |
| %* |
| 9/30/18 |
| %* |
|
| | | | | |
| Audit Fees |
| $93,825 |
| 0 | % |
| $102,641 |
| 0 | % |
| | | | | |
| Audit-Related Fees |
| $0 |
| 0 | % |
| $0 |
| 0 | % |
| | | | | |
Tax Fees(1) |
| $28,860 |
| 0 | % |
| $30,410 |
| 0 | % |
| | | | | |
| All Other Fees |
| $0 |
| 0 | % |
| $0 |
| 0 | % |
| | | | | |
| Total |
| $122,685 |
| 0 | % |
| $133,051 |
| 0 | % |
*Percentage of fees approved by the Audit Committee pursuant to (c)(7)(i)(C) of Rule 2-01 of Reg. S-X (statutory de minimis waiver of Committee’s requiremen6t to pre-approve).
| |
(1) | Tax fees consist of the aggregate fees billed for professional services rendered by the principal accountant relating to tax compliance, tax advice, and tax planning and specifically include fees for tax return preparation and other related tax compliance/planning matters. |
(e) The Audit Committee is required to pre-approve all audit and non-audit services provided to the registrant by the auditors, and to the registrant’s investment adviser, and any entity controlling, controlled by, or under common control with the adviser that provides ongoing services to the registrant. In determining whether to pre-approve non-audit services, the Audit Committee considers whether the services are consistent with maintaining the independence of the auditors. The Committee may delegate its authority to pre-approve certain matters to one or more of its members. In this regard, the Committee has delegated authority jointly to the Audit Committee Chair together with another Committee member with respect to non-audit services not exceeding $25,000 in each instance. In addition, the Committee has pre-approved the retention of the auditors to provide tax-related services related to the tax treatment and tax accounting of newly acquired securities, upon request by the investment adviser in each instance.
(f) Not applicable.
(g) ) Aggregate non-audit fees billed by the registrant’s accountant for services rendered to the registrant, and rendered to the registrant’s investment adviser, and any entity controlling, controlled by, or under common control with the adviser that provides ongoing services to the registrant for each of the last two fiscal years of the registrant:
|
| | | |
Fiscal Year ended 9/30/17
|
Fiscal Year ended 9/30/18
|
| $ | %* | $ | %* |
| | | | |
| $73,860 | 0% | $20,150 | 0% |
*Percentage of fees approved by the Audit Committee pursuant to (c)(7)(i)(C) of Rule 2-01 of Reg. S-X (statutory de minimis waiver of Committee’s requiremen6t to pre-approve)
(h) The registrant’s audit committee has considered whether the provision by the registrant’s principal accountant of non-audit services to the registrant’s investment adviser and any entity controlling, controlled by, or under common control with the adviser that provides ongoing services to the registrant that were not pre-approved pursuant to Rule 2-01(c)(7)(ii) of Regulation S-X is compatible with maintaining the principal accountant’s independence.
Item 5. Audit Committee of Listed Registrants
Not applicable.
Item 6. Schedule of Investments
Please see schedule of investments contained in the Report to Stockholders included under Item 1 of this Form N-CSR.
Item 7. Disclosure of Proxy Voting Policies and Procedures for Closed-End Management Investment Companies
Not applicable.
Item 8. Portfolio Managers of Closed-End Management Investment Companies
Not applicable.
Item 9. Purchases of Equity Securities by Closed-End Management Investment Company and Affiliated Purchasers
Not applicable.
Item 10. Submission of Matters to a Vote of Security Holders
No material changes.
Item 11. Controls and Procedures
(a) The registrant’s principal executive and principal financial officers have concluded that the registrant's disclosure controls and procedures (as defined in Rule 30a-3(c) under the Investment Company Act of 1940 Act, as amended (the “1940 Act”) are effective, based on the evaluation of these controls and procedures required by Rule 30a-3(b) under the 1940 Act and Rules 13a-15(b) or 15d-15(b) under the Securities Exchange Act of 1934 (“Exchange Act”), as of a date within 90 days of the filing date of this report.
(b) There was no change in the registrant's internal control over financial reporting (as defined in Rule 30a-3(d) under the 1940 Act) that occurred during the second fiscal quarter of the period covered by this report that has materially affected, or is reasonably likely to materially affect, the registrant's internal control over financial reporting.
Item 12. Disclosure of Securities Lending Activities for Closed-End Management Investment Companies
Not applicable.
Item 13. Exhibits
(a)(1) Registrant’s Code of Ethics – Not applicable (please see Item 2).
(a)(2)(i) Treasurer’s Section 302 certification.
(a)(2)(ii) President’s Section 302 certification.
(b) Combined Section 906 certification.
Signatures
Pursuant to the requirements of the Securities Exchange Act of 1934 and the Investment Company Act of 1940, the registrant has duly caused this report to be signed on its behalf by the undersigned, thereunto duly authorized.
CALVERT WORLD VALUES FUND, INC.
By: /s/ John H. Streur
John H. Streur
President
Date: November 26, 2018
Pursuant to the requirements of the Securities Exchange Act of 1934 and the Investment Company Act of 1940, this report has been signed below by the following persons on behalf of the registrant and in the capacities and on the dates indicated.
By: /s/ James F. Kirchner
James F. Kirchner
Treasurer
Date: November 26, 2018
By: /s/ John H. Streur
John H. Streur
President
Date: November 26, 2018