UNITED STATES
SECURITIES AND EXCHANGE COMMISSION
Washington, D.C. 20549
FORM N-CSR
CERTIFIED SHAREHOLDER REPORT OF REGISTERED
MANAGEMENT INVESTMENT COMPANIES
Investment Company Act file number: 811-06563
CALVERT WORLD VALUES FUND, INC.
(Exact name of registrant as specified in charter)
4550 Montgomery Avenue
Suite 1000N
Bethesda, Maryland 20814
(Address of Principal Executive Offices)
Ivy Wafford Duke, Esq.
4550 Montgomery Avenue
Suite 1000N
Bethesda, Maryland 20814
(Name and Address of Agent for Service)
Registrant's telephone number, including area code: (301) 951-4800
Date of fiscal year end: September 30
Date of reporting period: Twelve months ended September 30, 2015
Item 1. Report to Stockholders.
|
| | |
| | |
| | | |
Calvert International Equity Fund
| | |
| | | |
| | |
|
| |
Annual Report September 30, 2015 E-Delivery Sign-Up — Details Inside | |
|
|
| |
Choose Planet-friendly E-delivery! Sign up now for on-line statements, prospectuses, and fund reports. In less than five minutes you can help reduce paper mail and lower fund costs. Just go to calvert.com. If you already have an online account at Calvert, click on Login, to access your Account, and select the documents you would like to receive via e-mail. If you’re new to online account access, click on Login, then Register to create your user name and password. Once you’re in, click on the E-delivery sign-up on the Account Portfolio page and follow the quick, easy steps. Note: if your shares are not held directly at Calvert but through a brokerage firm, you must contact your broker for electronic delivery options available through their firm. |
|
| | | |
| | | TABLE OF CONTENTS |
| | | | |
| | | | President’s Letter |
| | | | Portfolio Management Discussion |
| | | | Understanding Your Fund’s Expenses |
| | | | Report of Independent Registered Public Accounting Firm |
| | | | Statement of Net Assets |
| | | | Restricted Securities |
| | | | Statement of Operations |
| | | | Statements of Changes in Net Assets |
| | | | Notes to Financial Statements |
| | | | Financial Highlights |
| | | | Explanation of Financial Tables |
| | | | Proxy Voting |
| | | | Availability of Quarterly Portfolio Holdings |
| | | | Director and Officer Information Tables |
|
| |
| John Streur President and Chief Executive Officer, Calvert Investments, Inc. |
Dear Shareholders,
Global economic growth is vital to the improvement of the lives of all people, especially so to those of the ultra-poor. However, how that growth is achieved is critical to the long-term health and sustainability of our collective societies. Business activity that does not show consideration for environmental and social impacts may have calamitous consequences, many of which we are witnessing now, including political and social unrest, unjust wealth distribution and diminished bio-diversity.
The returns of the markets (chart below) reflect the impact of the uncertainty created by a legacy of unsustainable development and the current lack of positive economic growth trends. The steep decline in the emerging market equities index (reflective of the flight of capital and currency weakness) is particularly impactful as these regions include some of the largest populations of individuals most in need of sustainable and inclusive economic development.
|
| | | | |
| MARKET BENCHMARKS | Total Returns for the period ended 9/30/2015 |
| 6 Months | Year-to-Date | 1 Year | 5 Year |
| S&P 500 | -6.18% | -5.29% | -0.61% | 13.34% |
| Russell 1000 | -6.72% | -5.24% | -0.61% | 13.42% |
| Russell 3000 | -7.12% | -5.45% | -0.49% | 13.28% |
| MSCI World ex USA | -9.88% | -6.32% | -9.73% | 3.92% |
| MSCI Emerging Markets | -17.11% | -15.22% | -18.98% | -3.25% |
| Barclays U.S. Aggregate Bond | -0.47% | 1.13% | 2.94% | 3.10% |
| Barclays Global Aggregate | -0.34% | -2.25% | -3.26% | 0.81% |
| Returns for periods greater than one year have been annualized. |
In an effort to mitigate this issue and foster the long term sustainability and justice of our global economic system, many of the world’s leaders participated with the United Nations (“UN”) to design and implement a 15-year plan to create the kind of economic development (http://www.calvert.com/media-relations/press-releases/calvert-ceo-participates-in-the-un-sustainable-development-summit) that should benefit the poorest people in the world, preserve opportunities for future generations, and provide stewardship to the environment. This effort, which kicked-off at the UN Summit earlier this month, involves bringing together private enterprise, governments, NGOs, development banks and people of all walks of life to achieve the “Sustainable Development Goals 2015” (SDGs). These goals include: eliminating extreme poverty, eliminating extreme hunger, fostering good health for all, promoting gender equality, and creating environmental sustainability and peace and stability throughout the world. The SDGs impact residents of every country in some manner, but no one more acutely than the denizens of the developing and emerging nations.
It was my privilege, as Calvert’s CEO, to be invited to the Summit, as one of 350 global leaders asked to participate in the development of this critical 15-year sustainability plan. During the course of this event, I announced that Calvert Investments would lead a project (http://www.calvert.com/perspective/social-impact/calvert-un-sustainable-development-goals) to map the Sustainable Development Goals to standards that companies can be measured by, and that investors may look to in order to
4 calvert.com CALVERT INTERNATIONAL EQUITY FUND ANNUAL REPORT (UNAUDITED)
understand which companies are helping to create sustainable, responsible growth. It is integral to the success and achievement of the goals, that the largest holders of capital, i.e., corporations, help drive these initiatives.
The crucial role that corporations now play in creating social and environmental outcomes was highlighted at the UN sessions by the presence of CEOs and sustainability officers from around the world, and the vital role of investors and the capital markets was reflected by our presence and contribution. In addition to representing your interests at the UN event, Calvert has contributed to the understanding of the role that corporations and investors play in driving social and environmental conditions through our most recent research, “The Role of the Corporation in Society”, available to you on our website, (see http://www.calvert.com/perspective/governance/calvert-serafeim-series-report).
Despite the fact that the past year has not brought the financial returns that you or I would have wished for as investors, I believe that when we look back on 2015 several years from now we are likely to see it as a transformative year in terms of our economic and social systems. Individuals and organizations of all types — corporate, government, NGO, religious — are coming together due to the realization that we need a more sustainable and just system to serve the needs of all stakeholders. As a shareholder of Calvert Funds, you are very much part of this mission, as together we are a leader and innovator in connecting capital to mission, with the dual purpose of driving competitive investment returns with just and sustainable economic progress.
On behalf of all of us at Calvert Investments, thank you for the confidence you have placed in our management of your funds and the ongoing privilege to serve you. We appreciate the opportunity to work with you as we strive to meet your financial needs while also helping to render the world a better place for all people.
Respectfully,
John Streur
October 2015
calvert.com CALVERT INTERNATIONAL EQUITY FUND ANNUAL REPORT (UNAUDITED) 5
|
| |
| PORTFOLIO MANAGEMENT DISCUSSION |
|
| |
| Joshua Linder, CFA Portfolio Manager |
|
| |
| Christopher Madden, CFA Portfolio Manager |
Performance
For the year ended September 30, 2015, Calvert International Equity Fund outperformed its benchmark, the MSCI EAFE Investable Market Index (IMI), by 238 basis points. The Fund declined 4.78%, while the benchmark declined 7.16%.
Investment Process
Our investment process focuses on sustainable businesses with attractive valuations and environmental, social, and governance (ESG) characteristics, generous dividend yields, reasonable growth prospects, and stable quality of earnings and cash flows. The Fund invests primarily in the stocks of large-cap, non-U.S. companies from the constituent countries of the MSCI EAFE IMI, but may also invest in other countries, including emerging market stocks. Effective October 1, 2015, the Fund (“Funds” for the Social Book) adopted The Calvert Principles for Responsible Investment. The Principles may be found at http://www.calvert.com/approach/how-we-invest/the-calvert-principles.
Market Review
Improving economic conditions in the United States compared with a stagnating or deteriorating growth outlook in much of the rest of the world helped domestic equities outperform international equity markets over the 12-month reporting period. Despite an initial positive reaction by European financial markets following the quantitative easing announcement by the European Central Bank (ECB), there are already signs the eurozone economic recovery may have a hard time accelerating. Further signs of an economic slowdown in China and concerns about the ability of the Chinese government to engineer a soft economic landing weighed on emerging market stocks throughout the period and contributed to the broader sell-off in equities at the end of the third quarter of 2015.
For the 12-month period ended September 30, 2015, the S&P 500 and Russell 1000 both declined 0.61% while the MSCI EAFE IMI and MSCI Emerging Markets Index declined 7.16% and 18.98%, respectively. The Russell 2000 Fund Class A shares (at NAV) returned 1.25%. The Barclays U.S. Credit Index returned 1.50%.
A wide range of U.S. macroeconomic data improved over the year. Most importantly, the job market was relatively healthy for most of the 12-month period, adding an average of 237,000 jobs per month. This helped push the unemployment rate down to 5.1%, though this was driven in part by a declining labor force participation rate and has not yet been accompanied by meaningful wage growth.
The price of crude oil declined by 50% during the period. With lower commodity prices, a stronger dollar, and little wage growth, inflation in the U.S. remained below the U.S. Federal Reserve’s 2% target. The Fed decided to delay interest rate hikes given the continued low inflation and slowing global growth, but is still considering raising rates before the end of the calendar year.
Slowing growth in China helped push down commodity prices and contributed to weakness in other emerging market economies that rely heavily on Chinese commodity consumption. The low level of inflation provides the Chinese government with room for additional accommodative monetary and fiscal policy, which we saw with the devaluing of the yuan.
6 calvert.com CALVERT INTERNATIONAL EQUITY FUND ANNUAL REPORT (UNAUDITED)
|
| | | | |
| | | | |
| | CALVERT INTERNATIONAL EQUITY FUND |
| | SEPTEMBER 30, 2015 | |
| | | | |
| | ECONOMIC SECTORS | % OF TOTAL INVESTMENTS | |
| | Consumer Discretionary | 7.8 | % | |
| | Consumer Staples | 10.4 | % | |
| | Energy | 2.4 | % | |
| | Financials | 26.9 | % | |
| | Health Care | 16.0 | % | |
| | High Social Impact Investment | 1.1 | % | |
| | Industrials | 8.9 | % | |
| | Information Technology | 1.3 | % | |
| | Limited Partnership Interest | 0.5 | % | |
| | Materials | 0.4 | % | |
| | Short-Term Investments | 12.3 | % | |
| | Telecommunication Services | 7.1 | % | |
| | Utilities | 4.6 | % | |
| | Venture Capital | 0.3 | % | |
| | Total | 100 | % | |
| | | | |
Portfolio Strategy
Earlier this year, we transitioned the Fund to being managed entirely by Calvert Investments. We manage this Fund as a core portfolio with a valuation bias.
Our quantitative models performed well and drove stock selection during the period. In particular, the drivers that focus on market sentiment and earnings as well as profitability positively contributed to results.
The Fund is underweight materials and industrials, given both macroeconomic concerns and ESG issues. Materials companies also tend to be poor businesses, with limited differentiation and low barriers to entry.
Over the past year, we have decreased exposure to those sectors and to the consumer discretionary sector. We exited consumer electronics and media giant Sony, after it had strong price appreciation. We believe the market already understands and properly values the positive changes occurring at the company.
The Fund’s largest geographical underweight is to the Asia-Pacific region, excluding Japan. Almost all of that underweight is due to not owning Australian companies. Many of Australia’s largest companies are materials or energy firms with large Chinese customer bases and significant exposure to the commodity supercycle, a part of the market we have been negative on for some time.
The Fund is overweighted in financial services and health care stocks, where we have focused on pharmaceutical companies. Over the last year, we have added to holdings in each group, including insurer Swiss Re. Swiss Re has significant excess capital, which should result in higher
|
| | | | | | |
| | | | | |
| | CALVERT INTERNATIONAL EQUITY FUND | |
| | SEPTEMBER 30, 2015 | |
| | | | | |
| | INVESTMENT PERFORMANCE | |
| | (TOTAL RETURN AT NAV) | |
| | | 6 MONTHS ENDED 9/30/15 | 12 MONTHS ENDED 9/30/15 | |
| | Class A | -6.24 | % | -4.78 | % | |
| | Class C | -6.65 | % | -5.67 | % | |
| | Class I | -6.06 | % | -4.27 | % | |
| | Class Y | -6.13 | % | -4.52 | % | |
| | MSCI EAFE Investable Market Index | -8.56 | % | -7.16 | % | |
| | Lipper International Multi-Cap Growth Funds Average | -8.16 | % | -5.79 | % | |
| | | | | |
| | Investment performance/return at NAV does not reflect the deduction of the Fund’s maximum 4.75% front-end sales charge or any deferred sales charge. | |
| | | | | |
| | TEN LARGEST STOCK HOLDINGS | % OF NET ASSETS | |
| | Sanofi SA (ADR) | 2.9 | % | |
| | Banco Bilbao Vizcaya Argentaria SA | 2.7 | % | |
| | Atlas Copco AB (ADR), Shares A | 2.5 | % | |
| | Nippon Telegraph & Telephone Corp. | 2.5 | % | |
| | Unilever NV (CVA) | 2.4 | % | |
| | Novartis AG (ADR) | 2.4 | % | |
| | Nissan Motor Co. Ltd. | 2.4 | % | |
| | Roche Holding AG | 2.4 | % | |
| | Toyota Motor Corp. | 2.3 | % | |
| | Allianz SE | 2.2 | % | |
| | Total | 24.7 | % | |
| | | | | |
dividends or more stock bought back near book value. Total yield, including buybacks, is expected to be 12% in 2016 and 9% in 2017. Swiss Re has improved its life insurance underwriting and has exhibited price discipline through the cycle for property and casualty insurance. It also has improved asset management, avoiding major problems during the European sovereign debt crisis. Reinsurance industry pricing is cyclically weak, allowing investors to buy a top-notch company at a bargain price.
Access to western medicines in emerging markets is one of the themes in this portfolio. We added to Novartis, which makes branded pharmaceuticals, eye care products, and generic drugs. Novartis’ broad range of pharmaceuticals has limited patent expiration over the next few years, and the company has several promising drugs in late stages of research and development, focusing on oncology and cardiology. Novartis’ management believes that Entresto, its new drug to treat heart failure, could be its biggest drug ever.
calvert.com CALVERT INTERNATIONAL EQUITY FUND ANNUAL REPORT (UNAUDITED) 7
We believe Novartis’ multiple does not reflect its relatively low patent risk or its strong pipeline. From an ESG perspective, Novartis is a leader in helping emerging markets (25% of sales) gain access to top-notch medicines through a broad suite of products that address diseases disproportionately affecting the poor, and through pricing programs based on affordability.
Sector allocation and stock selection each contributed positively to Fund performance. Our ESG approach underweights materials and energy sectors, two of the worst performing sectors during the period.
Stock selection was positive in the financial services sector. Within financial services, French insurer Axa was a positive contributor. We still consider the stock undervalued. Axa is a leader in incorporating ESG risks into its asset management business, and it has a strong structure to protect data security.
Stock selection in health care was detrimental to performance. Sanofi, a French pharmaceutical manufacturer with a promising drug pipeline, dropped 14% during the period as the market over-reacted to slower sales in one key drug, Lantus.1 The company’s valuation is lower than that of most of its peers. From an ESG perspective, Sanofi has very strong initiatives to improve access to healthcare in emerging market countries.
Outlook
Central banks around the globe have engaged in a concurrent, unprecedented effort to keep interest rates low in hopes of boosting economic activity. As a result, risky assets have appeared more attractive to investors and benefited from an expansion in earnings multiples over the last several years. Although valuations are far from extreme levels, they are well above historical long-term averages, making markets more vulnerable to shocks from some of the negative catalysts currently in the global economy. These include continued economic deceleration in China — a scenario that began to unfold in the third quarter of 2015.
We are worried that concurrent quantitative easing (QE) across multiple global economies could be less potent than that implemented in the U.S. after the financial crisis if these efforts effectively cancel each other out. Market enthusiasm for global QE may wane if robust economic recovery doesn’t follow, hindered by underlying structural economic and fiscal challenges in many economies, including Europe and Japan.
______________________________
1All returns reflect the period a holding was in the Fund.
In our view, the probability of a hard economic landing for China is increasing. If this process occurs in a disorderly fashion, it may have a significant negative impact on both market sentiment and the global economy since China is the world’s second-largest economy and has a meaningful impact on corporate earnings streams globally.
We believe the U.S. economy can continue to grow, although the tough first quarter of 2015 caused by severe weather will have a negative impact on growth numbers for the year. The positive impact of lower oil prices should provide additional support to the economy. Despite our positive outlook on the U.S. economy in the medium-to-long run, we continue to be concerned about potential market jitters in the short term given recent data indicating softness globally. Large-cap stocks with relatively high percentages of profits exposed to foreign markets will most likely be more volatile in the next 12-month period as European and Asian economies continue to work through challenging growth environments, soft demand, and the impacts of a high dollar.
Note: for information on a recent portfolio manager change in the Fund and other changes, please see the supplement to the prospectus included at the end of this report.
Joshua Linder, CFA
Christopher Madden
Calvert Investment Management, Inc.
October 2015
As of September 30, 2015, the following companies represented the following percentages of net assets: Sony 0.00%; Swiss Re 1.91%, ADR 0.26%; Novartis 1.83%, ADR 2.37%; Axa ADR 1.88%; and Sanofi 0.97%, ADR 2.94%. Holdings are subject to change.
8 calvert.com CALVERT INTERNATIONAL EQUITY FUND ANNUAL REPORT (UNAUDITED)
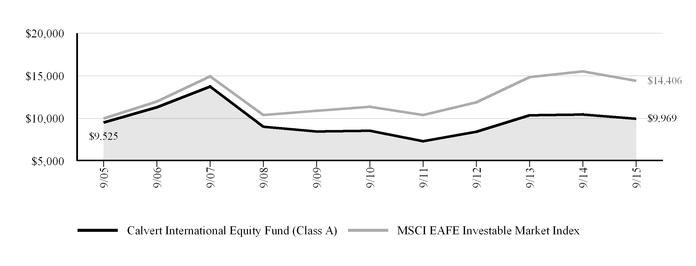
Growth of $10,000
The graph below shows the value of a hypothetical $10,000 investment in the Fund over the past 10 fiscal year periods. The results shown are for Class A shares, reflect the deduction of the maximum front-end Class A sales charge of 4.75%, and assume the reinvestment of dividends. The result is compared with a broad based market index. Market indexes are unmanaged and their results do not reflect the effect of expenses or sales charges. The value of an investment in a different share class would be different.
|
| | | | | | | |
| CALVERT INTERNATIONAL EQUITY FUND |
| SEPTEMBER 30, 2015 |
| AVERAGE ANNUAL TOTAL RETURNS | Ticker Symbol | 1 Year | 5 Year | 10 Year |
| Class A (with max. load) | CWVGX | -9.29 | % | 2.14 | % | -0.03 | % |
| Class C (with max. load) | CWVCX | -6.62 | % | 2.20 | % | -0.41 | % |
| Class I | CWVIX | -4.27 | % | 3.83 | % | 1.15 | % |
| Class Y | CWEYX | -4.52 | % | 3.51 | % | 0.73 | % |
| MSCI EAFE Investable Market Index | | -7.16 | % | 4.84 | % | 3.72 | % |
| Lipper International Multi-Cap Growth Funds Average | | -5.79 | % | 3.85 | % | 3.19 | % |
| | | | | |
| Calvert International Equity Fund first offered Class Y shares on October 31, 2008. Performance prior to that date reflects the performance of Class A shares at net asset value (NAV). Actual Class Y share performance would have been different. |
| | | | | |
All performance data shown, including the graph above and the adjacent table, represents past performance, does not guarantee future results, assumes reinvestment of dividends and distributions, and does not reflect the deduction of taxes that a shareholder would pay on the Fund’s distributions or the redemption of the Fund shares. All performance data reflects fee waivers and/or expense limitations, if any are in effect; in their absence performance would be lower. See Note B in Notes to Financial Statements. The investment return and principal value of an investment will fluctuate so that an investor’s shares, when redeemed, may be worth more or less than their original cost. Current performance may be lower or higher than the performance data quoted; for current performance data, including most recent month-end, visit www.calvert.com. The gross expense ratio from the current prospectus for Class A shares is 1.68%. This number may differ from the expense ratio shown elsewhere in this report because it is based on a different time period and, if applicable, does not include fee or expense waivers. Performance data quoted already reflects the deduction of the Fund’s operating expenses.
calvert.com CALVERT INTERNATIONAL EQUITY FUND ANNUAL REPORT (UNAUDITED) 9
UNDERSTANDING YOUR FUND'S EXPENSES
As an investor, you incur two types of costs. There are transaction costs, which generally include sales charges on purchases and may include redemption fees. There are also ongoing costs, which generally include management fees, distribution and/or service fees, and other fund expenses. The following information is intended to help you understand your ongoing costs (in dollars) of investing in this mutual fund and to help you compare these costs with the ongoing costs of investing in other mutual funds.
To illustrate these ongoing costs, we have provided examples and calculated the expenses paid by the fund's investors during the period. The actual and hypothetical information presented in the examples is based on an investment of $1,000 invested at the beginning of the period and held for the entire period (April 1, 2015 to September 30, 2015).
Actual Expenses
The first line of the table below provides information about actual account values and actual expenses. You may use the information in this line, together with the amount you invested, to estimate the expenses that you paid over the period. Simply divide your account value by $1,000 (for example, an $8,600 account value divided by $1,000 = 8.6), then multiply the result by the number in the first line under the heading entitled "Expenses Paid During Period" to estimate the expenses you paid on your account during this period.
Hypothetical Example for Comparison Purposes
The second line of the table below provides information about hypothetical account values and hypothetical expenses based on the Fund’s actual expense ratio and an assumed rate of return of 5% per year before expenses, which is not the Fund’s actual return. The hypothetical account values and expenses may not be used to estimate the actual ending account balance or expenses you paid for the period. You may use this information to compare the ongoing costs of investing in the Fund and other funds. To do so, compare the 5% hypothetical example with the 5% hypothetical examples that appear in the shareholder reports of the other funds.
Please note that the expenses shown in the table are meant to highlight your ongoing costs only and do not reflect any transactional costs, such as sales charges (loads), or redemption fees. Therefore, the second line of the table is useful in comparing ongoing costs only, and will not help you determine the relative total costs of owning different funds. In addition, if these transactional costs were included, your costs would have been higher. |
| | | | |
| | ANNUALIZED
EXPENSE RATIO | BEGINNING
ACCOUNT VALUE
4/1/15 | ENDING
ACCOUNT VALUE
9/30/15 | EXPENSES PAID
DURING PERIOD*
4/1/15 - 9/30/15 |
| Class A | | | | |
| Actual | 1.38% | $1,000.00 | $937.60 | $6.70 |
| Hypothetical (5% return per year before expenses) | 1.38% | $1,000.00 | $1,018.15 | $6.98 |
| Class C | | | | |
| Actual | 2.14% | $1,000.00 | $933.50 | $10.37 |
| Hypothetical (5% return per year before expenses) | 2.14% | $1,000.00 | $1,014.34 | $10.81 |
| Class I | | | | |
| Actual | 0.95% | $1,000.00 | $939.40 | $4.62 |
| Hypothetical (5% return per year before expenses) | 0.95% | $1,000.00 | $1,020.31 | $4.81 |
| Class Y | | | | |
| Actual | 1.13% | $1,000.00 | $938.70 | $5.49 |
| Hypothetical (5% return per year before expenses) | 1.13% | $1,000.00 | $1,019.40 | $5.72 |
| | | | | |
| * Expenses paid during the period are equal to the annualized expense ratio for each class as indicated above, multiplied by the average account value over the period, multiplied by 183/365 (to reflect the one-half year period). Expense ratios shown in the Financial Highlights represent the actual expenses incurred for the fiscal year. |
10 calvert.com CALVERT INTERNATIONAL EQUITY FUND ANNUAL REPORT (UNAUDITED)
REPORT OF INDEPENDENT REGISTERED PUBLIC ACCOUNTING FIRM
The Board of Directors of Calvert World Values Fund, Inc. and Shareholders of Calvert International Equity Fund:
We have audited the accompanying statement of net assets of the Calvert International Equity Fund (the “Fund”), a series of Calvert World Values Fund, Inc., as of September 30, 2015, and the related statement of operations for the year then ended, the statements of changes in net assets for each of the years in the two-year period then ended, and the financial highlights for each of the years in the five-year period then ended. These financial statements and financial highlights are the responsibility of the Fund’s management. Our responsibility is to express an opinion on these financial statements and financial highlights based on our audits.
We conducted our audits in accordance with the standards of the Public Company Accounting Oversight Board (United States). Those standards require that we plan and perform the audit to obtain reasonable assurance about whether the financial statements and financial highlights are free of material misstatement. An audit includes examining, on a test basis, evidence supporting the amounts and disclosures in the financial statements. Our procedures included confirmation of securities owned as of September 30, 2015 by correspondence with the custodian and brokers or by other appropriate auditing procedures. An audit also includes assessing the accounting principles used and significant estimates made by management, as well as evaluating the overall financial statement presentation. We believe that our audits provide a reasonable basis for our opinion.
In our opinion, the financial statements and financial highlights referred to above present fairly, in all material respects, the financial position of the Calvert International Equity Fund as of September 30, 2015, the results of its operations for the year then ended, the changes in its net assets for each of the years in the two-year period then ended, and the financial highlights for each of the years in the five-year period then ended, in conformity with U.S. generally accepted accounting principles.
Philadelphia, Pennsylvania
November 25, 2015
calvert.com CALVERT INTERNATIONAL EQUITY FUND ANNUAL REPORT 11
CALVERT INTERNATIONAL EQUITY FUND
STATEMENT OF NET ASSETS
SEPTEMBER 30, 2015
|
| | |
| | SHARES | VALUE ($) |
| EQUITY SECURITIES - 91.2% | | |
| | | |
| Belgium - 0.6% | | |
Ageas (ADR) | 49,904 | 2,042,072 |
| | | |
| France - 12.9% | | |
| AXA SA (ADR) | 271,355 | 6,602,067 |
| BNP Paribas SA | 47,113 | 2,771,305 |
| BNP Paribas SA (ADR) | 162,367 | 4,802,816 |
| Credit Agricole SA (ADR) | 214,378 | 1,217,667 |
| Ipsen SA (ADR) | 118,735 | 1,824,957 |
| Orange SA | 253,725 | 3,832,990 |
| Orange SA (ADR) | 217,395 | 3,287,012 |
| Sanofi SA | 35,864 | 3,412,938 |
| Sanofi SA (ADR) | 217,706 | 10,334,504 |
| Suez Environnement Co. | 298,495 | 5,363,179 |
| Suez Environnement Co. (ADR) | 37,117 | 332,940 |
| Valeo SA (ADR) | 24,671 | 1,667,019 |
| | | 45,449,394 |
| | | |
| Germany - 6.6% | | |
| Allianz SE | 48,317 | 7,564,850 |
| Allianz SE (ADR) | 390,467 | 6,102,999 |
| Deutsche Post AG | 164,873 | 4,558,220 |
| Deutsche Post AG (ADR) | 174,622 | 4,840,522 |
| | | 23,066,591 |
| | | |
| Hong Kong - 0.8% | | |
BOC Hong Kong Holdings Ltd. (ADR) | 46,638 | 2,763,768 |
| | | |
| Japan - 19.2% | | |
| Mizuho Financial Group, Inc. | 3,131,400 | 5,890,236 |
| Mizuho Financial Group, Inc. (ADR) | 1,134,770 | 4,209,997 |
| MS&AD Insurance Group Holdings, Inc. (ADR) | 155,752 | 2,088,634 |
| Nippon Telegraph & Telephone Corp. | 250,800 | 8,820,525 |
| Nippon Telegraph & Telephone Corp. (ADR) | 170,981 | 6,037,339 |
| Nissan Motor Co. Ltd. | 901,336 | 8,314,410 |
| Nissan Motor Co. Ltd. (ADR) | 266,570 | 4,950,205 |
| Nomura Holdings, Inc. | 1,281,243 | 7,444,604 |
| Nomura Holdings, Inc. (ADR) | 963,766 | 5,609,118 |
|
| | |
| | SHARES | VALUE ($) |
| Toyota Motor Corp.(t) | 135,137 | 7,959,273 |
| Toyota Motor Corp. (ADR) | 53,368 | 6,258,999 |
| | | 67,583,340 |
| | | |
| Netherlands - 8.0% | | |
| Koninklijke Ahold NV (ADR) | 249,710 | 4,866,848 |
| Koninklijke Ahold NV, Amsterdam Stock Exchange | 311,105 | 6,065,442 |
| Koninklijke Philips NV: | | |
| Common | 61,768 | 1,454,910 |
| NY Shares | 110,944 | 2,602,746 |
| Unilever NV (CVA) | 213,120 | 8,567,650 |
| Unilever NV, NY Shares | 109,014 | 4,382,363 |
| | | 27,939,959 |
| | | |
| New Zealand - 0.5% | | |
| Spark New Zealand Ltd. | 428,639 | 816,576 |
| Spark New Zealand Ltd. (ADR) | 93,967 | 894,566 |
| | | 1,711,142 |
| | | |
| Norway - 2.9% | | |
| Statoil ASA | 276,311 | 4,022,782 |
| Statoil ASA (ADR) | 330,453 | 4,811,396 |
| Yara International ASA (ADR) | 37,046 | 1,485,915 |
| | | 10,320,093 |
| | | |
| Singapore - 0.5% | | |
Singapore Telecommunications Ltd. (ADR) | 75,343 | 1,900,904 |
| | | |
| South Africa - 1.0% | | |
| Aspen Pharmacare Holdings Ltd.* | 122,151 | 2,604,193 |
| MTN Group Ltd. (ADR) | 77,381 | 990,477 |
| | | 3,594,670 |
| | | |
| Spain - 3.8% | | |
| Banco Bilbao Vizcaya Argentaria SA | 1,133,449 | 9,603,256 |
| Banco Bilbao Vizcaya Argentaria SA (ADR) | 446,445 | 3,736,745 |
| | | 13,340,001 |
| | | |
12 calvert.com CALVERT INTERNATIONAL EQUITY FUND ANNUAL REPORT
|
| | | | |
| | SHARES | VALUE ($) |
| Sweden - 3.6% | | |
| Atlas Copco AB (ADR): | | |
| A Shares | 108,608 | 2,619,625 |
|
| B Shares | 45,265 | 1,012,035 |
|
| Atlas Copco AB, A Shares | 371,126 | 8,922,426 |
|
| | | 12,554,086 |
|
| | | |
| Switzerland - 9.8% | | |
| Novartis AG | 70,135 | 6,442,949 |
|
| Novartis AG (ADR) | 90,608 | 8,328,687 |
|
| Roche Holding AG | 31,383 | 8,273,725 |
|
| Roche Holding AG (ADR) | 47,060 | 1,550,627 |
|
| Swiss Re AG | 78,186 | 6,702,593 |
|
| Swiss Re AG (ADR) | 42,500 | 913,750 |
|
Zurich Insurance Group AG (ADR)* | 94,607 | 2,323,548 |
|
| | | 34,535,879 |
|
| | | |
| United Kingdom - 17.4% | | |
| AstraZeneca plc | 55,335 | 3,508,613 |
|
| AstraZeneca plc (ADR) | 163,515 | 5,203,047 |
|
| Barclays plc | 1,963,031 | 7,250,957 |
|
| Barclays plc (ADR) | 286,993 | 4,241,757 |
|
| GlaxoSmithKline plc | 195,720 | 3,748,551 |
|
| GlaxoSmithKline plc (ADR) | 112,096 | 4,310,091 |
|
| J Sainsbury plc | 1,364,910 | 5,397,189 |
|
| J Sainsbury plc (ADR) | 300,535 | 4,748,453 |
|
| SSE plc | 231,575 | 5,247,107 |
|
| SSE plc (ADR) | 279,454 | 6,371,551 |
|
| Standard Chartered plc | 659,315 | 6,404,076 |
|
| Unilever plc | 10,526 | 428,400 |
|
| Unilever plc (ADR) | 104,800 | 4,273,744 |
|
| | | 61,133,536 |
|
| | | |
| United States - 3.4% | | |
| Apple, Inc. | 43,996 | 4,852,759 |
|
| Applied Industrial Technologies, Inc. | 186,061 | 7,098,227 |
|
| | | 11,950,986 |
|
| | | |
| Venture Capital - 0.2% | | |
Bioceptive, Inc., Series A, Preferred (a)(b)(i)* | 582,574 | 299,967 |
|
| FINAE, Series D, Preferred (b)(i)* | 2,597,442 | 203,960 |
|
| Powerspan Corp., Contingent Deferred Distribution (b)(i)* | 1 | — |
|
| | | 503,927 |
|
| | | |
|
| | | | |
| | SHARES | VALUE ($) |
Total Equity Securities (Cost $345,302,129) | | 320,390,348 |
|
| | | |
| | | |
| | ADJUSTED BASIS ($) | VALUE ($) |
|
VENTURE CAPITAL LIMITED PARTNERSHIP INTEREST - 0.5% | | |
| Africa Renewable Energy Fund LP (b)(i)* | 344,664 | 301,316 |
|
| BFSE Holding, BV LP (b)(i)* | 481,870 | 338,409 |
|
| Blackstone Clean Technology Partners LP (b)(i)* | 78,853 | 27,058 |
|
| China Environment Fund 2004 LP (b)(i)* | 462,236 | 123,854 |
|
| Emerald Sustainability Fund I LP (b)(i)* | 1,246,310 | 272,189 |
|
| gNet Defta Development Holdings LLC, LP (a)(b)(i)* | 400,000 | 313,541 |
|
| Mainstream Brazil Impact Investing Fund LP (b)(i)* | 18,422 | — |
|
| SEAF Central and Eastern European Growth Fund LLC, LP (a)(b)(i)* | 1,060,000 | 316,913 |
|
| SEAF India International Growth Fund LP (b)(i)* | 482,500 | 83,614 |
|
| Terra Capital (b)(i)* | 469,590 | 1 |
|
| | | |
Total Venture Capital Limited Partnership Interest (Cost $2,896,431) | | 1,776,895 |
|
| | | |
| | | |
| VENTURE CAPITAL DEBT OBLIGATIONS - 0.2% | PRINCIPAL
AMOUNT ($) | |
| AFIG LLC, 6.00%, 10/17/17 (b)(i) | 450,953 | 450,953 |
|
| FINAE: | | |
| Note I, 6.50%, 12/1/15 (b)(i) | 62,500 | 62,500 |
|
| Note II, 6.50%, 12/1/15 (b)(i) | 125,000 | 125,000 |
|
Windhorse International-Spring Health Water Ltd., 1.00%, 3/14/18 (b)(i)(u) | 70,000 | 52,500 |
|
| | | |
| Total Venture Capital Debt Obligations (Cost $708,452) | | 690,953 |
|
| | | |
| | | |
calvert.com CALVERT INTERNATIONAL EQUITY FUND ANNUAL REPORT 13
|
| | | | |
| HIGH SOCIAL IMPACT INVESTMENTS - 1.2% | SHARES | VALUE ($) |
Calvert Social Investment Foundation Notes, 0.25%, 7/1/17 (b)(i)(r) | 4,431,583 | 4,293,415 |
|
| | | |
| Total High Social Impact Investments (Cost $4,431,583) | | 4,293,415 |
|
| TIME DEPOSIT - 13.0% | | |
| State Street Bank Time Deposit, 0.088%, 10/1/15 | 45,772,457 | 45,772,457 |
|
| | | |
Total Time Deposit (Cost $45,772,457) | | 45,772,457 |
|
| | | |
| | | |
| TOTAL INVESTMENTS (Cost $399,111,052) - 106.1% | | 372,924,068 |
|
| Other assets and liabilities, net - (6.1%) | | (21,597,297) |
|
NET ASSETS - 100.0% | |
| $351,326,771 |
|
|
| | | |
| NET ASSETS CONSIST OF: | |
| Paid-in capital applicable to the following shares of common stock, with 250,000,000 shares of $0.01 par value shares authorized: | |
| Class A: 10,706,550 shares outstanding |
| $264,692,076 |
|
| Class C: 1,187,167 shares outstanding | 31,480,478 |
|
| Class I: 8,824,625 shares outstanding | 193,481,605 |
|
| Class Y: 1,238,872 shares outstanding | 20,255,665 |
|
| Undistributed net investment income | 4,124,476 |
|
| Accumulated net realized gain (loss) on investments and foreign currency transactions | (136,513,607) |
|
| Net unrealized appreciation (depreciation) on investments and assets and liabilities denominated in foreign currencies | (26,193,922) |
|
| | |
| NET ASSETS |
| $351,326,771 |
|
| | |
| NET ASSET VALUE PER SHARE | |
| Class A (based on net assets of $167,224,905) |
| $15.62 |
|
| Class C (based on net assets of $15,997,034) |
| $13.47 |
|
| Class I (based on net assets of $147,613,901) |
| $16.73 |
|
| Class Y (based on net assets of $20,490,931) |
| $16.54 |
|
|
| |
| NOTES TO STATEMENT OF NET ASSETS |
| (a) | Affiliated company. |
| (b) | This security was valued under the direction of the Board of Directors. See Note A. |
| (i) | Restricted securities represent 2.1% of the net assets of the Fund. |
| (r) | The coupon rate shown on floating or adjustable rate securities represents the rate in effect on September 30, 2015. |
| (t) | 90,000 shares of Toyota Motor Corp. have been soft segregated in order to cover outstanding commitments to certain limited partnerships investments within the Fund. There are no restrictions on the trading of this security. |
| (u) | Security defaulted as to principal and interest in March 2013. It has been restructured at a 9% rate maturing on March 14, 2018 with 1% to be paid annually and the remaining interest due at maturity. This security is currently accruing at 1%. |
| * | Non-income producing security. |
| Abbreviations: |
| ADR: | American Depositary Receipt |
| CVA: | Certificaten Van Aandelen |
| LLC: | Limited Liability Corporation |
| LP: | Limited Partnership |
| Ltd.: | Limited |
| plc: | Public Limited Company |
| See notes to financial statements. |
14 calvert.com CALVERT INTERNATIONAL EQUITY FUND ANNUAL REPORT
|
| | | |
| RESTRICTED SECURITIES | ACQUISITON DATES | COST ($) |
| AFIG LLC | 10/11/12-10/15/12 | 450,953 |
|
| Africa Renewable Energy Fund LP | 4/17/14 - 7/2/15 | 344,664 |
|
| BFSE Holding, BV LP | 1/12/06 - 6/11/14 | 604,246 |
|
| Bioceptive, Inc., Series A, Preferred | 10/26/12 - 12/18/13 | 252,445 |
|
| Blackstone Clean Technology Partners LP | 7/29/10 - 6/25/15 | 78,853 |
|
| Calvert Social Investment Foundation Notes, 0.25%, 7/1/17 | 7/1/14 | 4,431,583 |
|
| China Environment Fund 2004 LP | 9/15/05 - 4/1/09 | — |
|
| Emerald Sustainability Fund I LP | 7/19/01 - 5/17/11 | 425,186 |
|
| FINAE, Series D, Preferred | 2/28/11 | 252,686 |
|
| FINAE, Note I, 6.50%, 12/1/15 | 12/10/10 | 62,500 |
|
| FINAE, Note II, 6.50%, 12/1/15 | 2/24/11 | 125,000 |
|
| gNet Defta Development Holdings LLC, LP | 8/30/05 | 400,000 |
|
| Mainstream Brazil Impact Investing Fund LP | 12/12/14 - 3/25/15 | 18,422 |
|
| Powerspan Corp., Contingent Deferred Distribution | 7/11/14 | — |
|
| SEAF Central and Eastern European Growth Fund LLC, LP | 8/10/00 - 8/26/11 | 317,335 |
|
| SEAF India International Growth Fund LP | 3/22/05 - 5/24/10 | 238,135 |
|
| Terra Capital LP | 11/23/98 - 3/14/06 | 469,590 |
|
| Windhorse International-Spring Health Water Ltd., 1.00%, 3/14/18 | 2/12/14 | 70,000 |
|
| See notes to financial statements. |
calvert.com CALVERT INTERNATIONAL EQUITY FUND ANNUAL REPORT 15
CALVERT INTERNATIONAL EQUITY FUND
STATEMENT OF OPERATIONS
YEAR ENDED SEPTEMPER 30, 2015
|
| | | | | |
| NET INVESTMENT INCOME | | |
| Investment Income: | | |
| Dividend income (net of foreign taxes withheld of $944,579) | |
| $9,989,278 |
|
| Interest income | | 54,258 |
|
| Total investment income | | 10,043,536 |
|
| | | |
| Expenses: | | |
| Investment advisory fee | | 2,822,908 |
|
| Administrative fees | | 1,120,384 |
|
| Transfer agency fees and expenses | | 565,599 |
|
| Distribution Plan expenses: | | |
| Class A | | 592,604 |
|
| Class B (a) | | 9,510 |
|
| Class C | | 170,741 |
|
| Directors' fees and expenses | | 36,300 |
|
| Accounting fees | | 38,363 |
|
| Custodian fees | | 164,729 |
|
| Professional fees | | 44,689 |
|
| Registration fees | | 71,913 |
|
| Reports to shareholders | | 39,260 |
|
| Miscellaneous | | 112,648 |
|
| Total expenses | | 5,789,648 |
|
| Reimbursement from Advisor: | | |
| Class A | | (305,073) |
|
| Class B (a) | | (7,560) |
|
| Class C | | (36,507) |
|
| Class I | | (46,574) |
|
| Class Y | | (31,244) |
|
| Net expenses | | 5,362,690 |
|
| | | |
| NET INVESTMENT INCOME | | 4,680,846 |
|
| | | |
| REALIZED AND UNREALIZED GAIN (LOSS) | | |
| Net realized gain (loss) on: | | |
| Investments | | 26,700,045 |
|
| Foreign currency transactions | | (721,042) |
|
| | | 25,979,003 |
|
| | | |
| Change in unrealized appreciation (depreciation) on: | | |
| Investments in unaffiliated securities | | (46,510,373) |
|
| Investments in affiliated securities | | (54,006) |
|
| Assets and liabilities denominated in foreign currencies | | 26,209 |
|
| | | (46,538,170) |
|
| | | |
| NET REALIZED AND UNREALIZED GAIN (LOSS) | | (20,559,167) |
|
| | | |
| INCREASE (DECREASE) IN NET ASSETS RESULTING FROM OPERATIONS | |
| ($15,878,321 | ) |
| (a) | Class B shares were converted into Class A shares at the close of business on April 20, 2015. | | |
| See notes to financial statements. |
16 calvert.com CALVERT INTERNATIONAL EQUITY FUND ANNUAL REPORT
CALVERT INTERNATIONAL EQUITY FUND
STATEMENTS OF CHANGES IN NET ASSETS
|
| | | | | | | | |
| INCREASE (DECREASE) IN NET ASSETS | YEAR ENDED
SEPTEMBER 30, 2015 | | YEAR ENDED
SEPTEMBER 30, 2014 |
| Operations: | | | |
| Net investment income |
| $4,680,846 |
| |
| $3,856,887 |
|
| Net realized gain (loss) | 25,979,003 |
| | 38,182,047 |
|
| Change in unrealized appreciation (depreciation) | (46,538,170) |
| | (39,050,285) |
|
| INCREASE (DECREASE) IN NET ASSETS RESULTING FROM OPERATIONS | (15,878,321) |
| | 2,988,649 |
|
| | | | |
| Distributions to shareholders from: | | | |
| Net investment income: | | | |
| Class A shares | (1,631,419) |
| | (1,441,168) |
|
| Class I shares | (1,067,547) |
| | (1,465,772) |
|
| Class Y shares | (128,897) |
| | (125,098) |
|
| Total distributions | (2,827,863) |
| | (3,032,038) |
|
| | | | |
| Capital share transactions: | | | |
| Shares sold: | | | |
| Class A shares (b) | 66,145,855 |
| | 58,755,990 |
|
| Class B shares (a) | 16,461 |
| | 22,810 |
|
| Class C shares | 2,588,056 |
| | 2,254,459 |
|
| Class I shares | 87,412,574 |
| | 15,405,740 |
|
| Class Y shares | 8,115,882 |
| | 9,173,420 |
|
| Reinvestment of distributions: | | | |
| Class A shares | 1,180,433 |
| | 1,068,320 |
|
| Class I shares | 878,598 |
| | 1,195,493 |
|
| Class Y shares | 88,086 |
| | 72,616 |
|
| Redemption fees: | | | |
| Class A shares | 442 |
| | 3,602 |
|
| Class C shares | 22 |
| | 227 |
|
| Shares redeemed: | | | |
| Class A shares | (157,566,212) |
| | (38,938,256) |
|
| Class B shares (a)(b) | (2,086,695) |
| | (1,205,154) |
|
| Class C shares | (2,791,010) |
| | (2,857,013) |
|
| Class I shares | (22,631,854) |
| | (6,486,688) |
|
| Class Y shares | (4,015,663) |
| | (1,959,045) |
|
| Total capital share transactions | (22,665,025) |
| | 36,506,521 |
|
| | | | |
| TOTAL INCREASE (DECREASE) IN NET ASSETS | (41,371,209) |
| | 36,463,132 |
|
| See notes to financial statements. |
calvert.com CALVERT INTERNATIONAL EQUITY FUND ANNUAL REPORT 17
|
| | | | | | | | |
| NET ASSETS | YEAR ENDED
SEPTEMBER 30, 2015 | | YEAR ENDED
SEPTEMBER 30, 2014 |
| Beginning of year |
| $392,697,980 |
| |
| $356,234,848 |
|
| End of year (including undistributed net investment income of $4,124,476 and $2,266,246, respectively) |
| $351,326,771 |
| |
| $392,697,980 |
|
| | | | |
| CAPITAL SHARE ACTIVITY | | | |
| Shares sold: | | | |
| Class A shares (c) | 3,961,337 |
| | 3,451,461 |
|
| Class B shares (a) | 1,117 |
| | 1,517 |
|
| Class C shares | 178,700 |
| | 152,718 |
|
| Class I shares | 4,800,946 |
| | 846,818 |
|
| Class Y shares | 461,877 |
| | 510,073 |
|
| Reinvestment of distributions: | | | |
| Class A shares | 73,137 |
| | 62,658 |
|
| Class I shares | 51,022 |
| | 65,795 |
|
| Class Y shares | 5,163 |
| | 4,041 |
|
| Shares redeemed: | | | |
| Class A shares | (9,300,506) |
| | (2,290,221) |
|
| Class B shares (a)(c) | (140,247) |
| | (80,280) |
|
| Class C shares | (194,622) |
| | (193,947) |
|
| Class I shares | (1,248,932) |
| | (355,259) |
|
| Class Y shares | (230,027) |
| | (108,621) |
|
| Total capital share activity | (1,581,035) |
| | 2,066,753 |
|
| | | | |
| (a) | Class B shares were converted into Class A shares at the close of business on April 20, 2015. |
| (b) | Amounts include $1,452,680 of share transactions that were redeemed from Class B shares and converted into Class A shares at the close of business on April 20, 2015. |
| (c) | Amount includes 96,332 shares redeemed from Class B shares and 84,213 shares purchased into Class A shares at the close of business on April 20,2015. |
| See notes to financial statements. |
18 calvert.com CALVERT INTERNATIONAL EQUITY FUND ANNUAL REPORT
NOTES TO FINANCIAL STATEMENTS
NOTE A — SIGNIFICANT ACCOUNTING POLICIES
General: Calvert International Equity Fund (the "Fund"), a series of Calvert World Values Fund, Inc., is registered under the Investment Company Act of 1940 as a diversified, open-end management investment company. Calvert World Values Fund, Inc. is comprised of four separate series. The operations of each series are accounted for separately. The Fund applies the accounting and reporting guidance in the Financial Accounting Standards Board (FASB) Accounting Standards Codification Topic 946, Financial Services – Investment Companies (ASC 946).
The Fund offers four classes of shares of capital stock - Classes A, C, I, and Y. The Fund also offered Class B shares; however, all existing Class B shares of the Fund were automatically converted to Class A shares of the Fund at the close of business on April 20, 2015, without the imposition of the applicable Class A sales load or the Class B contingent deferred sales charge. Class B shares were closed at that time and are no longer available. Class A shares are sold with a maximum front-end sales charge of 4.75%. Class C shares are sold without a front-end sales charge and, with certain exceptions, will be charged a deferred sales charge on shares sold within one year of purchase. Class C shares have higher levels of expenses than Class A shares. Class I shares require a minimum account balance of $1,000,000. The $1 million minimum initial investment is waived for retirement plans that trade through omnibus accounts and may be waived in certain other instances where it is believed to be in the best interest of the Fund and its shareholders. Class I shares have no front-end or deferred sales charge and have lower levels of expenses than Class A shares. Class Y shares are generally only available to wrap or similar fee-based programs offered by financial intermediaries, foundations, and endowments that have entered into an agreement with the Fund’s Distributor to offer Class Y shares. Class Y shares have no front-end or deferred sales charge and have lower levels of expenses than Class A shares. Each class has different: (a) dividend rates due to differences in Distribution Plan expenses and other class specific expenses, (b) exchange privileges and (c) class specific voting rights.
Security Valuation: Net asset value per share is determined every business day as of the close of the regular session of the New York Stock Exchange (generally 4:00 p.m. Eastern time). The Fund uses independent pricing services approved by the Board of Directors (“the Board”) to value its investments wherever possible. Investments for which market quotations are not available or deemed not reliable are fair valued in good faith under the direction of the Board.
The Board has adopted Valuation Procedures (the “Procedures”) to determine the fair value of securities and other financial instruments for which market prices are not readily available or which may not be reliably priced. The Board has delegated the day-to-day responsibility for determining the fair value of assets of the Fund to Calvert Investment Management, Inc. (the “Advisor” or “Calvert”) and has provided these Procedures to govern Calvert in its valuation duties.
Calvert has chartered an internal Valuation Committee to oversee the implementation of these Procedures and to assist it in carrying out the valuation responsibilities that the Board has delegated.
The Valuation Committee meets on a regular basis to review illiquid securities and other investments which may not have readily available market prices. The Valuation Committee’s fair valuation determinations are subject to review, approval and ratification by the Board at its next regularly scheduled meeting covering the calendar quarter in which the fair valuation was determined.
The Valuation Committee utilizes various methods to measure the fair value of the Fund’s investments. U.S. generally accepted accounting principles (GAAP) establishes a disclosure hierarchy that categorizes the inputs to valuation techniques used to value assets and liabilities at measurement date. These inputs are summarized in the three broad levels listed below:
Level 1 - quoted prices in active markets for identical securities
Level 2 - other significant observable inputs (including quoted prices for similar securities, interest rates, prepayment speeds, credit risk, etc.)
Level 3 - significant unobservable inputs (including the Fund’s own assumptions in determining the fair value of investments)
The inputs or methodologies used for valuing securities are not necessarily an indication of the risk associated with investing in those securities.
Changes in valuation techniques may result in transfers in or out of an investment’s assigned level within the hierarchy during the year. Transfers in and/or out of levels are determined based on the fair value of such securities at the end of the year. Valuation techniques used to value the Fund’s investments by major category are as follows:
Equity securities, including restricted securities and venture capital securities, for which market quotations are readily available, are valued at the last reported sale price or official closing price as reported by an independent pricing service on the primary market or exchange on which they are traded and are categorized as Level 1 in the hierarchy. In the event there were no sales during the day or closing prices are not available, securities are valued at the last quoted bid price or using the last available price and are categorized as Level 2 in the hierarchy. Foreign securities are valued based on quotations from the
calvert.com CALVERT INTERNATIONAL EQUITY FUND ANNUAL REPORT 19
principal market in which such securities are normally traded. If events occur after the close of the principal market in which foreign securities are traded, and before the close of business of the Fund, that are expected to materially affect the value of those securities, then they are valued at their fair value taking these events into account and are categorized as Level 2 in the hierarchy. The Fund has retained a third party fair value pricing service to quantitatively analyze the price movement of its holdings on foreign exchanges and to automatically fair value if the variation from the prior day’s closing price exceeds specified parameters. Such securities would be categorized as Level 2 in the hierarchy in these circumstances. Utilizing this technique may result in transfers between Level 1 and Level 2. For restricted securities and private placements where observable inputs are limited, assumptions about market activity and risk are used and such securities are categorized as Level 3 in the hierarchy.
Venture capital securities for which market quotations are not readily available are generally categorized as Level 3 in the hierarchy. Venture capital direct equity securities are generally valued using the most appropriate and applicable method to measure fair value in light of each company’s situation. Methods may include market, income or cost approaches with discounts as appropriate based on assumptions of liquidation or exit risk. Examples of the market approach are subsequent rounds of financing, comparable transactions, and revenue times an industry multiple. An example of the income approach is the discounted cash flow. Examples of the cost approach are replacement cost, salvage value, or net asset percentage. Venture capital limited partnership (“LP”) securities are valued at the fair value reported by the general partner of the partnership adjusted as necessary to reflect subsequent capital calls and distributions and any other available information, as a practical expedient. In the absence of a reported LP unit value, fair value may be estimated based on the Fund’s percentage equity in the partnership and/or other balance sheet information and portfolio value for the most recently available period reported by the general partner. In some cases adjustments may be made to account for daily pricing of material public holdings within the partnership. Venture capital debt securities are valued based on assumptions of credit and market risk. For venture capital securities denominated in foreign currency, the fair value is marked to the daily exchange rate.
Debt securities, other than Venture capital debt securities, are valued based on evaluated prices received from independent pricing services or from dealers who make markets in such securities and are generally categorized as Level 2 in the hierarchy. Short-term securities of sufficient credit quality with remaining maturities of sixty days or less for which quotations are not readily available are valued at amortized cost, which approximates fair value, and are categorized as Level 2 in the hierarchy.
If a market value cannot be determined for a security using the methodologies described above, or if, in the good faith opinion of the Advisor, the market value does not constitute a readily available market quotation, or if a significant event has occurred that would materially affect the value of the security, the security will be fair valued as determined in good faith by the Valuation Committee.
The Valuation Committee considers a number of factors, including significant unobservable valuation inputs when arriving at fair value. It considers all significant facts that are reasonably available and relevant to the determination of fair value.
The Valuation Committee primarily employs a market-based approach which may use related or comparable assets or liabilities, recent transactions, market multiples, book values, and other relevant information for the investment to determine the fair value of the investment. When more appropriate, the Fund may employ an income-based or cost approach. An income-based valuation approach discounts anticipated future cash flows of the investment to calculate a present amount (discounted). The measurement is based on the value indicated by current market expectations about those future amounts. Discounts may also be applied due to the nature or duration of any restrictions on the disposition of the investments. A cost based approach is based on the amount that currently would be required to replace the service capacity of an asset (current replacement cost). From the seller’s perspective, the price that would be received for the asset is determined based on the cost to a buyer to acquire or construct a substitute asset of comparable utility, adjusted for obsolescence.
The values assigned to fair value investments are based on available information and do not necessarily represent amounts that might ultimately be realized. Further, due to the inherent uncertainty of valuations of such investments, the fair values may differ significantly from the values that would have been used had an active market existed, and the differences could be material. The Valuation Committee employs various methods for calibrating these valuation approaches including a regular review of key inputs and assumptions, transactional back-testing or disposition analysis and reviews of any related market activity.
At September 30, 2015, securities valued at $7,265,190, or 2.1% of net assets, were fair valued in good faith under the direction of the Board.
20 calvert.com CALVERT INTERNATIONAL EQUITY FUND ANNUAL REPORT
The following table summarizes the market value of the Fund's holdings as of September 30, 2015, based on the inputs used to value them:
|
| | | | | | | | | | | | | |
| VALUATION INPUTS |
| INVESTMENT IN SECURITIES | LEVEL 1 | LEVEL 2 | LEVEL 3 | TOTAL |
| Equity Securities* |
| $158,492,496 |
| $161,393,925** |
| $— |
|
| $319,886,421 |
|
| Equity Securities - Venture Capital | — |
| — |
| 503,927 |
| 503,927 |
|
| Venture Capital Limited Partnership | | | | |
| Interest | — |
| — |
| 1,776,895 |
| 1,776,895 |
|
| Venture Capital Debt Obligations | — |
| — |
| 690,953 |
| 690,953 |
|
| High Social Impact Investments | — |
| 4,293,415 |
| — |
| 4,293,415 |
|
| Time Deposit | — |
| 45,772,457 |
| — |
| 45,772,457 |
|
| TOTAL |
| $158,492,496 |
|
| $211,459,797 |
| $2,971,775*** |
|
| $372,924,068 |
|
| | | | | | |
| * | For a further breakdown of equity securities by country, please refer to the Statement of Net Assets. |
| ** | Includes certain securities trading primarily outside the U.S. whose value was adjusted as a result of significant market movements following the close of local trading. On September 30, 2015, price movements exceeded specified parameters and the third party fair value pricing service quantitatively fair valued the affected securities. |
| *** | Level 3 securities represent 0.8% of net assets. |
On September 30, 2015, price movements exceeded specified parameters and the third party fair value pricing service quantitatively fair valued the affected securities. As a result, $161,393,925 transferred out of Level 1 into Level 2. The amount of this transfer was determined based on the fair value of the securities at the end of the year.
Restricted Securities: The Fund may invest in securities that are subject to legal or contractual restrictions on resale. Generally, these securities may only be sold publicly upon registration under the Securities Act of 1933 or in transactions exempt from such registration. Information regarding restricted securities is included at the end of the Statement of Net Assets.
The Fund may invest in Community Investment Notes issued by the Calvert Social Investment Foundation (the “CSI Foundation”). The CSI Foundation is a 501(c)(3) non-profit organization that receives in-kind support from Calvert and its subsidiaries. The Fund has received an exemptive order from the Securities and Exchange Commission permitting the Fund to make investments in these notes under certain conditions.
Security Transactions and Investment Income: Security transactions are accounted for on trade date. Realized gains and losses are recorded on an identified cost basis and may include proceeds from litigation. Dividend income is recorded on the ex-dividend date or, in the case of dividends on certain foreign securities, as soon as the Fund is informed of the ex-dividend date. Withholding taxes on foreign dividends have been provided for in accordance with the Fund’s understanding of the applicable country’s tax rules and rates. Distributions received on securities that represent a return of capital or capital gain are recorded as a reduction of cost of investments and/or as a realized gain. Interest income, which includes amortization of premium and accretion of discount on debt securities, is accrued as earned. Investment income and realized and unrealized gains and losses are allocated to separate classes of shares based upon the relative net assets of each class. Expenses arising in connection with a specific class are charged directly to that class. Expenses common to the classes are allocated to each class in proportion to their relative net assets.
Foreign Currency Transactions: The Fund’s accounting records are maintained in U.S. dollars. For valuation of assets and liabilities on each date of net asset value determination, foreign denominations are converted into U.S. dollars using the current exchange rate. Security transactions, income, and expenses are translated at the prevailing rate of exchange on the date of the event. The effect of changes in foreign exchange rates on securities and foreign currencies is included in the net realized and unrealized gain or loss on investments and assets and liabilities denominated in foreign currencies.
Distributions to Shareholders: Distributions to shareholders are recorded by the Fund on ex-dividend date. Dividends from net investment income and distributions from net realized capital gains, if any, are paid at least annually. Distributions are determined in accordance with income tax regulations which may differ from U.S. generally accepted accounting principles; accordingly, periodic reclassifications are made within the Fund's capital accounts to reflect income and gains available for distribution under income tax regulations.
Estimates: The preparation of financial statements in conformity with U.S. generally accepted accounting principles requires management to make estimates and assumptions that affect the reported amounts of assets and liabilities and disclosure of contingent assets and liabilities at the date of the financial statements and the reported amounts of increases and decreases in net assets from operations during the reporting period. Actual results could differ from those estimates.
calvert.com CALVERT INTERNATIONAL EQUITY FUND ANNUAL REPORT 21
Redemption Fees: The Fund charged a 2% redemption fee on redemptions, including exchanges, made within 30 days of purchase (within seven days for Class I shares). The redemption fee was accounted for as an addition to paid-in capital. This fee was eliminated effective February 2, 2015.
Federal Income Taxes: No provision for federal income or excise tax is required since the Fund intends to continue to qualify as a regulated investment company under the Internal Revenue Code and to distribute substantially all of its taxable earnings.
Management has analyzed the Fund's tax positions taken for all open federal income tax years and has concluded that no provision for federal income tax is required in the Fund's financial statements. A Fund's federal tax return is subject to examination by the Internal Revenue Service for a period of three years.
NOTE B — RELATED PARTY TRANSACTIONS
Calvert Investment Management, Inc. (the “Advisor”) is wholly-owned by Calvert Investments, Inc., which is indirectly wholly-owned by Ameritas Mutual Holding Company. The Advisor provides investment advisory services and pays the salaries and fees of officers and Directors of the Fund who are employees of the Advisor or its affiliates. For its services, the Advisor receives an annual fee, payable monthly, on the following rates of the Fund’s average daily net assets: .75% on the first $250 million, .725% on the next $250 million, and .675% on the excess of $500 million. Under the terms of the agreement, $215,433 was payable at year end.
The Advisor has contractually agreed to limit net annual Fund operating expenses through January 31, 2017. The contractual expense caps are 1.38%, 2.14%, .95%, and 1.13% for Class A, Class C, Class I, and Class Y, respectively. Prior to April 1, 2015, the contractual expense class was 1.10% and 1.39%, for Class I and Class Y, respectively. For the purpose of this expense limit, operating expenses do not include interest expense, brokerage commissions, taxes and extraordinary expenses. This expense limitation does not limit acquired fund fees and expenses, if any. Under the terms of the agreement, $12,285 was receivable at year end. The Advisor voluntarily reimbursed Class B shares for expenses of $7,560 for the year ended September 30, 2015.
Calvert Investment Administrative Services, Inc., an affiliate of the Advisor, provides administrative services to the Fund for an annual fee, payable monthly, of .35% for Class A, C and Y shares and .15% for Class I shares, based on their average daily net assets. Under the terms of the agreement, $77,498 was payable at year end.
Calvert Investment Distributors, Inc. (“CID”), an affiliate of the Advisor, is the distributor and principal underwriter for the Fund. Pursuant to Rule 12b-1 under the Investment Company Act of 1940, the Fund has adopted a Distribution Plan that permits the Fund to pay certain expenses associated with the distribution and servicing of its shares. The expenses paid may not exceed .35% and 1.00% annually of average daily net assets of Class A and C, respectively. The amount actually paid by the Fund is an annualized fee, payable monthly, of .25% and 1.00% of the Fund’s average daily net assets of Class A and C shares, respectively. Class I and Class Y shares do not have Distribution Plan expenses. Under the terms of the agreement, $48,267 was payable at year end.
CID received $43,455 as its portion of commissions charged on sales of the Fund’s Class A shares for the year ended September 30, 2015.
Calvert Investment Services, Inc. (“CIS”), an affiliate of the Advisor, acts as shareholder servicing agent for the Fund. For its services, CIS received a fee of $94,500 for the year ended September 30, 2015. Under the terms of the agreement, $7,793 was payable at year end. Boston Financial Data Services, Inc. is the transfer and dividend disbursing agent.
Each Director of the Fund who is not an employee of the Advisor or its affiliates receives an annual retainer of $52,000 ($48,000 prior to January 1, 2015) plus a meeting fee of up to $3,000 for each Board meeting attended. Additional fees of $6,000 ($5,000 prior to January 1, 2015) annually may be paid to the Committee chairs ($10,000 for the Board Chair and the Special Equities Committee chair) and $2,500 annually may be paid to Committee members, plus a Committee meeting fee of $500 for each Committee meeting attended. Eligible Directors may participate in a Deferred Compensation Plan (the “Plan”). Obligations of the Plan will be paid solely out of the Fund’s assets. As of September 30, 2015, approximately $234,600 was deferred under the Plan. Directors’ fees are allocated to each of the funds served.
NOTE C — INVESTMENT ACTIVITY AND TAX INFORMATION
During the year, the cost of purchases and proceeds from sales of investments, other than short-term securities, were $352,845,677 and $385,921,803, respectively.
The Fund may purchase securities, typically short-term variable rate demand notes, from or sell to other funds managed by the Advisor. These interportfolio transactions are primarily used for cash management purposes and are made pursuant to Rule 17a-7 of the Investment Company Act of 1940. For the year ended September 30, 2015, such sales transactions were $201,633. The realized loss on sales transactions was $92,252.
22 calvert.com CALVERT INTERNATIONAL EQUITY FUND ANNUAL REPORT
|
| | | |
| Capital Loss Carryforward | |
| EXPIRATION DATE | |
| 2017 |
| ($19,653,860 | ) |
| 2018 |
| ($105,942,268 | ) |
| 2019 |
| ($10,386,632 | ) |
Under the Regulated Investment Company Modernization Act of 2010, capital losses incurred in taxable years beginning after December 22, 2010 can be carried forward to offset future capital gains for an unlimited period. These losses are required to be utilized prior to the losses incurred in pre-enactment taxable years and will retain their character as either long-term or short-term. Losses incurred in pre-enactment taxable years can be utilized until expiration. The Fund's use of net capital losses acquired from reorganizations may be limited under certain tax provisions.
The tax character of dividends and distributions paid during the year ended September 30, 2015 and September 30, 2014 was as follows:
|
| | | | | | | |
| DISTRIBUTIONS PAID FROM: | 2015 |
| | 2014 |
|
| Ordinary income |
| $2,827,863 |
| |
| $3,032,038 |
|
| Total |
| $2,827,863 |
| |
| $3,032,038 |
|
As of September 30, 2015, the tax basis components of distributable earnings/(accumulated losses) and the federal tax cost were as follows:
|
| | | |
| Unrealized appreciation |
| $4,073,038 |
|
| Unrealized (depreciation) | (30,790,869) |
|
| Net unrealized appreciation (depreciation) |
| ($26,717,831 | ) |
| | |
| Undistributed ordinary income |
| $4,124,476 |
|
| Capital loss carryforward |
| ($135,982,760 | ) |
| | |
| Federal income tax cost of investments |
| $399,641,899 |
|
The differences between components of distributable earnings on a tax basis and the amounts reflected in the Statement of Net Assets are primarily due to temporary book-tax differences that will reverse in a subsequent period. These differences are mainly due to wash sales and partnerships.
Reclassifications, as shown in the table below, have been made to the Fund's components of net assets to reflect income and gains available for distribution (or available capital loss carryovers, as applicable) under income tax law and regulations. These reclassifications are due to permanent book-tax differences and have no impact on net assets. The primary permanent differences causing such reclassifications for the Fund are due to foreign currency transactions, partnerships, and passive foreign investment companies.
|
| | | |
| Undistributed net investment income |
| $5,247 |
|
| Accumulated net realized gain (loss) |
| ($5,247 | ) |
NOTE D — LINE OF CREDIT
A financing agreement is in place with the Calvert Funds and State Street Corporation (“SSC”). Under the agreement, SSC provides an unsecured line of credit facility, in the aggregate amount of $50 million ($25 million committed and $25 million uncommitted), accessible by the Funds for temporary or emergency purposes only. Borrowings bear interest at the higher of the London Interbank Offered Rate (LIBOR) or the overnight Federal Funds Rate plus 1.25% per annum. A commitment fee of .20% per annum is incurred on the unused portion of the committed facility. An administrative fee of $25,000 was paid in connection with the uncommitted facility. These fees are allocated to all participating funds. The Fund had no borrowings under the agreement during the year ended September 30, 2015.
calvert.com CALVERT INTERNATIONAL EQUITY FUND ANNUAL REPORT 23
NOTE E — AFFILIATED COMPANIES
An affiliated company is a company in which the Fund has a direct or indirect ownership of, control of, or voting power of 5 percent or more of the outstanding voting shares. Affiliated companies of the Fund as of September 30, 2015 are as follows:
|
| | | | | | | | | | | | | | | | | | | | | |
| Name of Affiliated Issuer | Market Value 9/30/14 | Purchases at Cost | Proceeds from Sales | Net Realized Gain (Loss) | Net Change in Unrealized Gain (Loss) | Market Value 9/30/15 | Dividend Income |
| Bioceptive, Inc., Series A, Preferred |
| $299,967 |
|
| $— |
|
| $— |
|
| $— |
|
| $— |
|
| $299,967 |
|
| $— |
|
| gNet Defta Development Holdings LLC, LP | 319,014 |
| — |
| — |
| — |
| (5,473 | ) | 313,541 |
| — |
|
| SEAF Central and Eastern European Growth Fund LLC, LP | 379,035 |
| — |
| (13,589 | ) | — |
| (48,533 | ) | 316,913 |
| — |
|
| Total |
| $998,016 |
|
| $— |
|
| ($13,589 | ) |
| $— |
|
| ($54,006 | ) |
| $930,421 |
|
| $— |
|
NOTE F — CAPITAL COMMITMENTS
In connection with certain venture capital investments, the Fund is committed to future capital calls, which will increase the Fund’s investment in these securities. The aggregate amount of the future capital commitments totals $1,219,773 at September 30, 2015.
NOTE G — LIMITED PARTNERSHIP INVESTMENT
The Fund executed agreements to invest in the following limited partnerships:
|
| | | | | | |
| Name of Partnership | Total Capital Commitment | Unfunded Commitment at 9/30/15 |
| Africa Renewable Energy Fund, LP |
| $1,000,000 |
|
| $655,336 |
|
| BFSE Holding, BV, LP |
| $494,429 |
|
| $14,178 |
|
| Blackstone Clean Technology Partners, LP |
| $79,361 |
|
| $508 |
|
| China Environment Fund 2004, LP |
| $500,000 |
|
| $37,764 |
|
| Emerald Sustainability Fund I, LP |
| $1,246,310 |
|
| $— |
|
| Mainstream Brazil Impact Investing Fund, LP |
| $500,000 |
|
| $481,578 |
|
| SEAF Central and Eastern European Growth Fund LLC, LP |
| $1,060,000 |
|
| $— |
|
| SEAF India International Growth Fund, LP |
| $482,500 |
|
| $— |
|
| Terra Capital |
| $500,000 |
|
| $30,410 |
|
NOTE H — SUBSEQUENT EVENTS
At a special meeting of the Fund’s Board of Directors (the “Board”) held on November 24, 2015, the Board approved the recommendation made by Calvert Investment Administrative Services, Inc. (“CIAS”) to standardize and rationalize the administrative fee payable by the Calvert Funds at 12 basis points for all series and all share classes of the Calvert Funds. The change is being implemented in two phases. First, CIAS will voluntarily waive the amount of the existing administrative fee above 12 basis points for the period from December 1, 2015 through January 31, 2016. Second, CIAS and the Fund have entered into an Amended and Restated Administrative Services Agreement that will establish a 12 basis point administrative fee for all classes of the Fund commencing on February 1, 2016. In the case of any series or share class that currently pays an administrative fee to CIAS that is less than 12 basis points, CIAS has contractually agreed to waive the difference between that lower administrative fee and the 12 basis point fee until January 31, 2018.
In preparing the financial statements as of September 30, 2015, no other subsequent events or transactions occurred that would have required recognition or disclosure in these financial statements.
NOTICE TO SHAREHOLDERS (UNAUDITED)
For the fiscal year ended September 30, 2015, the Fund considers 100% of the ordinary dividends paid during the year as qualified dividend income and 0.9% as eligible for the corporate dividends received deduction in accordance with Section 854 of the Internal Revenue Code. It also considers $10,724,954 as income derived from foreign sources and $730,815 as foreign taxes paid.
24 calvert.com CALVERT INTERNATIONAL EQUITY FUND ANNUAL REPORT
CALVERT INTERNATIONAL EQUITY FUND
FINANCIAL HIGHLIGHTS
|
| | | | | | | | | | | | | | | | | | | | |
| | YEARS ENDED |
| CLASS A SHARES | September 30, 2015 (z) | | September 30, 2014 (z) | | September 30, 2013 (z) | | September 30, 2012 (z) | | September 30, 2011(z) |
| Net asset value, beginning |
| $16.51 |
| |
| $16.44 |
| |
| $13.49 |
| |
| $11.84 |
| |
| $13.88 |
|
| Income from investment operations: | | | | | | | | | |
| Net investment income | .18 |
| | .15 |
| | .08 |
| | .12 |
| | .15 |
|
| Net realized and unrealized gain (loss) | (.97 | ) | | .02 |
| | 2.98 |
| | 1.68 |
| | (2.15 | ) |
| Total from investment operations | (.79 | ) | | .17 |
| | 3.06 |
| | 1.80 |
| | (2.00 | ) |
| Distributions from: | | | | | | | | | |
| Net investment income | (.10 | ) | | (.10 | ) | | (.11 | ) | | (.15 | ) | | (.04 | ) |
| Total distributions | (.10 | ) | | (.10 | ) | | (.11 | ) | | (.15 | ) | | (.04 | ) |
| Total increase (decrease) in net asset value | (.89 | ) | | .07 |
| | 2.95 |
| | 1.65 |
| | (2.04 | ) |
| Net asset value, ending |
| $15.62 |
| |
| $16.51 |
| |
| $16.44 |
| |
| $13.49 |
| |
| $11.84 |
|
Total return* | (4.78 | %) | | .99 | % | | 22.82 | % | | 15.34 | % | | (14.47 | %) |
| Ratios to average net assets: A | | | | | | | | | |
| Net investment income | 1.08 | % | | .88 | % | | .52 | % | | .96 | % | | 1.03 | % |
| Total expenses | 1.67 | % | | 1.66 | % | | 1.76 | % | | 1.84 | % | | 1.80 | % |
| Expenses before offsets | 1.54 | % | | 1.66 | % | | 1.76 | % | | 1.80 | % | | 1.80 | % |
| Net expenses | 1.54 | % | | 1.66 | % | | 1.76 | % | | 1.80 | % | | 1.80 | % |
| Portfolio turnover | 97 | % | | 82 | % | | 40 | % | | 43 | % | | 49 | % |
| Net assets, ending (in thousands) |
| $167,225 |
| |
| $263,718 |
| |
| $242,464 |
| |
| $183,588 |
| |
| $173,936 |
|
| | |
| (z) | Per share figures are calculated using the Average Shares Method. |
| * | Total return is not annualized for periods of less than one year and does not reflect deduction of any front-end or deferred sales charge. |
| A | Total expenses do not reflect amounts reimbursed and/or waived by the Advisor or reductions from expense offset arrangements. Expenses before offsets reflect expenses after reimbursement and/or waiver by the Advisor but prior to reductions from expense offset arrangements. Net expenses are net of all reductions and represent the net expenses paid by the Fund. |
| | | | | | | | | | | |
| See notes to financial statements. |
calvert.com CALVERT INTERNATIONAL EQUITY FUND ANNUAL REPORT 25
CALVERT INTERNATIONAL EQUITY FUND
FINANCIAL HIGHLIGHTS
|
| | | | | | | | | | | | | | | | | | | | |
| | YEARS ENDED |
| CLASS C SHARES | September 30, 2015 (z) | | September 30, 2014 (z) | | September 30, 2013 (z) | | September 30, 2012 (z) | | September 30, 2011 (z) |
| Net asset value, beginning |
| $14.27 |
| |
| $14.26 |
| |
| $11.71 |
| |
| $10.26 |
| |
| $12.10 |
|
| Income from investment operations: | | | | | | | | | |
| Net investment income (loss) | .04 |
| | (.01 | ) | | (.05 | ) | | .01 |
| | .01 |
|
| Net realized and unrealized gain (loss) | (.84 | ) | | .02 |
| | 2.60 |
| | 1.45 |
| | (1.85 | ) |
| Total from investment operations | (.80 | ) | | .01 |
| | 2.55 |
| | 1.46 |
| | (1.84 | ) |
| Distributions from: | | | | | | | | | |
| Net investment income | — |
| | — |
| | — |
| | (.01 | ) | | — |
|
| Total distributions | — |
| | — |
| | — |
| | (.01 | ) | | — |
|
| Total increase (decrease) in net asset value | (.80 | ) | | .01 |
| | 2.55 |
| | 1.45 |
| | (1.84 | ) |
| Net asset value, ending |
| $13.47 |
| |
| $14.27 |
| |
| $14.26 |
| |
| $11.71 |
| |
| $10.26 |
|
Total return* | (5.61 | %) | | .07 | % | | 21.78 | % | | 14.23 | % | | (15.21 | %) |
| Ratios to average net assets: A | | | | | | | | | |
| Net investment income (loss) | .31 | % | | (.06 | %) | | (.40 | %) | | .05 | % | | .12 | % |
| Total expenses | 2.58 | % | | 2.57 | % | | 2.65 | % | | 2.72 | % | | 2.67 | % |
| Expenses before offsets | 2.37 | % | | 2.57 | % | | 2.65 | % | | 2.69 | % | | 2.67 | % |
| Net expenses | 2.37 | % | | 2.57 | % | | 2.65 | % | | 2.69 | % | | 2.67 | % |
| Portfolio turnover | 97 | % | | 82 | % | | 40 | % | | 43 | % | | 49 | % |
| Net assets, ending (in thousands) |
| $15,997 |
| |
| $17,173 |
| |
| $17,746 |
| |
| $15,922 |
| |
| $16,195 |
|
| | |
| (z) | Per share figures are calculated using the Average Shares Method. |
| * | Total return is not annualized for periods of less than one year and does not reflect deduction of any front-end or deferred sales charge. |
| A | Total expenses do not reflect amounts reimbursed and/or waived by the Advisor or reductions from expense offset arrangements. Expenses before offsets reflect expenses after reimbursement and/or waiver by the Advisor but prior to reductions from expense offset arrangements. Net expenses are net of all reductions and represent the net expenses paid by the Fund. |
| | | | | | | | | | | |
| See notes to financial statements. |
26 calvert.com CALVERT INTERNATIONAL EQUITY FUND ANNUAL REPORT
CALVERT INTERNATIONAL EQUITY FUND
FINANCIAL HIGHLIGHTS
|
| | | | | | | | | | | | | | | | | | | | |
| | YEARS ENDED |
| CLASS I SHARES | September 30, 2015 (z) | | September 30, 2014 (z) | | September 30, 2013 (z) | | September 30, 2012(z) | | September 30, 2011 (z) |
| Net asset value, beginning |
| $17.68 |
| |
| $17.69 |
| |
| $14.52 |
| |
| $12.70 |
| |
| $14.83 |
|
| Income from investment operations: | | | | | | | | | |
| Net investment income | .30 |
| | .28 |
| | .17 |
| | .24 |
| | .26 |
|
| Net realized and unrealized gain (loss) | (1.05 | ) | | .02 |
| | 3.24 |
| | 1.79 |
| | (2.30 | ) |
| Total from investment operations | (.75 | ) | | .30 |
| | 3.41 |
| | 2.03 |
| | (2.04 | ) |
| Distributions from: | | | | | | | | | |
| Net investment income | (.20 | ) | | (.31 | ) | | (.24 | ) | | (.21 | ) | | (.09 | ) |
| Total distributions | (.20 | ) | | (.31 | ) | | (.24 | ) | | (.21 | ) | | (.09 | ) |
| Total increase (decrease) in net asset value | (.95 | ) | | (.01 | ) | | 3.17 |
| | 1.82 |
| | (2.13 | ) |
| Net asset value, ending |
| $16.73 |
| |
| $17.68 |
| |
| $17.69 |
| |
| $14.52 |
| |
| $12.70 |
|
Total return* | (4.27 | %) | | 1.64 | % | | 23.74 | % | | 16.16 | % | | (13.84 | %) |
| Ratios to average net assets: A | | | | | | | | | |
| Net investment income | 1.68 | % | | 1.53 | % | | 1.07 | % | | 1.71 | % | | 1.74 | % |
| Total expenses | 1.03 | % | | 1.02 | % | | 1.06 | % | | 1.09 | % | | 1.07 | % |
| Expenses before offsets | .98 | % | | 1.02 | % | | 1.06 | % | | 1.06 | % | | 1.06 | % |
| Net expenses | .98 | % | | 1.02 | % | | 1.06 | % | | 1.06 | % | | 1.06 | % |
| Portfolio turnover | 97 | % | | 82 | % | | 40 | % | | 43 | % | | 49 | % |
| Net assets, ending (in thousands) |
| $147,614 |
| |
| $92,318 |
| |
| $82,499 |
| |
| $101,203 |
| |
| $89,142 |
|
| | |
| (z) | Per share figures are calculated using the Average Shares Method. |
| * | Total return is not annualized for periods of less than one year and does not reflect deduction of any front-end or deferred sales charge. |
| A | Total expenses do not reflect amounts reimbursed and/or waived by the Advisor or reductions from expense offset arrangements. Expenses before offsets reflect expenses after reimbursement and/or waiver by the Advisor but prior to reductions from expense offset arrangements. Net expenses are net of all reductions and represent the net expenses paid by the Fund. |
| | | | | | | | | | | |
| See notes to financial statements. |
calvert.com CALVERT INTERNATIONAL EQUITY FUND ANNUAL REPORT 27
CALVERT INTERNATIONAL EQUITY FUND
FINANCIAL HIGHLIGHTS
|
| | | | | | | | | | | | | | | | | | | | |
| | YEARS ENDED |
| CLASS Y SHARES | September 30, 2015 (z) | | September 30, 2014(z) | | September 30, 2013 (z) | | September 30, 2012 (z) | | September 30, 2011 (z) |
| Net asset value, beginning |
| $17.45 |
| |
| $17.38 |
| |
| $14.25 |
| |
| $12.45 |
| |
| $14.53 |
|
| Income from investment operations: | | | | | | | | | |
| Net investment income | .27 |
| | .23 |
| | .14 |
| | .18 |
| | .24 |
|
| Net realized and unrealized gain (loss) | (1.05 | ) | | .02 |
| | 3.15 |
| | 1.77 |
| | (2.30 | ) |
| Total from investment operations | (.78 | ) | | .25 |
| | 3.29 |
| | 1.95 |
| | (2.06 | ) |
| Distributions from: | | | | | | | | | |
| Net investment income | (.13 | ) | | (.18 | ) | | (.16 | ) | | (.15 | ) | | (.02 | ) |
| Total distributions | (.13 | ) | | (.18 | ) | | (.16 | ) | | (.15 | ) | | (.02 | ) |
| Total increase (decrease) in net asset value | (.91 | ) | | .07 |
| | 3.13 |
| | 1.80 |
| | (2.08 | ) |
| Net asset value, ending |
| $16.54 |
| |
| $17.45 |
| |
| $17.38 |
| |
| $14.25 |
| |
| $12.45 |
|
Total return* | (4.52 | %) | | 1.41 | % | | 23.27 | % | | 15.80 | % | | (14.20 | %) |
| Ratios to average net assets: A | | | | | | | | | |
| Net investment income | 1.52 | % | | 1.27 | % | | .90 | % | | 1.36 | % | | 1.56 | % |
| Total expenses | 1.37 | % | | 1.31 | % | | 1.41 | % | | 1.46 | % | | 1.51 | % |
| Expenses before offsets | 1.22 | % | | 1.31 | % | | 1.39 | % | | 1.39 | % | | 1.39 | % |
| Net expenses | 1.22 | % | | 1.31 | % | | 1.39 | % | | 1.39 | % | | 1.39 | % |
| Portfolio turnover | 97 | % | | 82 | % | | 40 | % | | 43 | % | | 49 | % |
| Net assets, ending (in thousands) |
| $20,491 |
| |
| $17,479 |
| |
| $10,367 |
| |
| $7,535 |
| |
| $7,398 |
|
| | |
| (z) | Per share figures are calculated using the Average Shares Method. |
| * | Total return is not annualized for periods of less than one year and does not reflect deduction of any front-end or deferred sales charge. |
| A | Total expenses do not reflect amounts reimbursed and/or waived by the Advisor or reductions from expense offset arrangements. Expenses before offsets reflect expenses after reimbursement and/or waiver by the Advisor but prior to reductions from expense offset arrangements. Net expenses are net of all reductions and represent the net expenses paid by the Fund. |
| | | | | | | | | | | |
| See notes to financial statements. |
28 calvert.com CALVERT INTERNATIONAL EQUITY FUND ANNUAL REPORT
EXPLANATION OF FINANCIAL TABLES
SCHEDULE OF INVESTMENTS
The Schedule of Investments is a snapshot of all securities held in the fund at their market value, on the last day of the reporting period. Securities are listed by asset type (e.g., common stock, corporate bonds, U.S. government obligations) or, for International and Global funds, by country, and may be further broken down into sub-groups and by industry classification.
STATEMENT OF ASSETS AND LIABILITIES
The Statement of Assets and Liabilities is often referred to as the fund’s balance sheet. It lists the value of what the fund owns, is due and owes on the last day of the reporting period. The fund’s assets include the market value of securities owned, cash, receivables for securities sold and shareholder subscriptions, and receivables for dividends and interest payments that have been earned, but not yet received. The fund’s liabilities include payables for securities purchased and shareholder redemptions, and expenses owed but not yet paid. The statement also reports the fund’s net asset value (NAV) per share on the last day of the reporting period. The NAV is calculated by dividing the fund’s net assets (assets minus liabilities) by the number of shares outstanding. This statement is accompanied by a Schedule of Investments. Alternatively, if certain conditions are met, a Statement of Net Assets may be presented in lieu of this statement and the Schedule of Investments.
STATEMENT OF NET ASSETS
The Statement of Net Assets provides a detailed list of the fund’s holdings, including each security’s market value on the last day of the reporting period. The Statement of Net Assets includes a Schedule of Investments. Other assets are added and other liabilities subtracted from the investments total to calculate the fund’s net assets. Finally, net assets are divided by the outstanding shares of the fund to arrive at its share price, or Net Asset Value (NAV) per share.
At the end of the Statement of Net Assets is a table displaying the composition of the fund’s net assets. Paid in Capital is the money invested by shareholders and represents the bulk of net assets. Undistributed Net Investment Income and Accumulated Net Realized Gains usually approximate the amounts the fund had available to distribute to shareholders as of the statement date. Accumulated Realized Losses will appear as negative balances. Unrealized Appreciation (Depreciation) is the difference between the market value of the fund’s investments and their cost, and reflects the gains (losses) that would be realized if the fund were to sell all of its investments at their statement-date values.
STATEMENT OF OPERATIONS
The Statement of Operations summarizes the fund’s investment income earned and expenses incurred in operating the fund. Investment income includes dividends earned from stocks and interest earned from interest-bearing securities in the fund. Expenses incurred in operating the fund include the advisory fee paid to the investment advisor, administrative services fees, distribution plan expenses (if applicable), transfer agent fees, shareholder servicing expenses, custodial, legal, and audit fees, and the printing and postage expenses related to shareholder reports. Expense offsets (fees paid indirectly) may also be shown. Credits earned from offset arrangements are used to reduce the fund’s expenses. This statement also shows net gains (losses) realized on the sale of investments and the increase or decrease in the unrealized appreciation (depreciation) on investments held during the period.
STATEMENT OF CHANGES IN NET ASSETS
The Statement of Changes in Net Assets shows how the fund’s total net assets changed during the two most recent reporting periods. Changes in the fund’s net assets are attributable to investment operations, distributions and capital share transactions.
The Operations section of the report summarizes information detailed in the Statement of Operations. The Distribution section shows the dividend and capital gain distributions made to shareholders. The amounts shown as distributions in this section may not match the net investment income and realized gains amounts shown in the Operations section because distributions are determined on a tax basis and certain investments or transactions may be treated differently for financial statement and tax purposes. The Capital Share Transactions section shows the amount shareholders invested in the fund, either by purchasing shares or by reinvesting distributions, and the amounts redeemed. The corresponding numbers of shares issued, reinvested and redeemed are shown at the end of the report.
FINANCIAL HIGHLIGHTS
The Financial Highlights table provides a per-share breakdown per class of the components that affect the fund’s net asset value for current and past reporting periods. The table provides total return, total distributions, expense ratios, portfolio turnover and net assets for the applicable period. Total return is a measure of a fund’s performance that encompasses all elements of return: dividends, capital gain distributions and changes in net asset value. Total return is the change in value of an investment over a given period, assuming reinvestment of any dividends and capital gain distributions, expressed as a percentage of the initial investment. Total distributions include distributions from net investment income and net realized gains. Long-term gains are earned on securities held in the fund more than one year. Short-term gains, on the sale of securities held less than one year, are treated as ordinary dividend income for tax purposes. The expense ratio is a fund’s cost of doing business, expressed as a
calvert.com CALVERT INTERNATIONAL EQUITY FUND ANNUAL REPORT (UNAUDITED) 29
percentage of net assets. These expenses directly reduce returns to shareholders. Portfolio turnover measures the trading activity in a fund’s investment portfolio—how often securities are bought and sold by a fund. Portfolio turnover is affected by market conditions, changes in the size of the fund, the nature of the fund’s investments and the investment style of the portfolio manager.
PROXY VOTING
The Proxy Voting Guidelines of the Calvert Funds that the Fund uses to determine how to vote proxies relating to portfolio securities are provided as an Appendix to the Fund’s Statement of Additional Information. The Statement of Additional Information can be obtained free of charge by calling the Fund at 1-800-368-2745, by visiting the Calvert website at www.calvert.com; or by visiting the SEC’s website at www.sec.gov.
Information regarding how the Fund voted proxies relating to portfolio securities during the most recent 12-month period ended June 30 is available on the Fund’s website at www.calvert.com and on the SEC’s website at www.sec.gov.
AVAILABILITY OF QUARTERLY PORTFOLIO HOLDINGS
The Fund files its complete schedule of portfolio holdings with the SEC for the first and third quarters of each fiscal year on Form N-Q. The Fund’s Form N-Q is available on the SEC’s website at www.sec.gov. The Fund’s Form N-Q may be reviewed and copied at the SEC’s Public Reference Room in Washington, DC; information on the operation of the Public Reference Room may be obtained by calling 1-800-SEC-0330.
30 calvert.com CALVERT INTERNATIONAL EQUITY FUND ANNUAL REPORT (UNAUDITED)
DIRECTOR AND OFFICER INFORMATION TABLE
|
| | | | | |
| Name & Age | Position With Fund | Position Start Date | Principal Occupation During Last 5 Years | # of Calvert Portfolios Overseen | Other Directorships During the Past Five Years |
| INDEPENDENT TRUSTEES/DIRECTORS |
REBECCA L. ADAMSON AGE: 66 | Trustee Director Director Director | 1989 CSIF 2000 IMPACT 2000 CRIS 2005 CWVF | President of the national non-profit, First People’s Worldwide, formerly First Nations Financial Project. Founded by her in 1980, First People’s Worldwide is the only American Indian alternative development institute in the country. | 18 | • Bay & Paul Foundation |
RICHARD L. BAIRD, JR. AGE: 67 | Trustee & Chair Director & Chair Director & Chair Director & Chair
| 1982 CSIF
2000 CRIS
2005 CWVF
2005 IMPACT | Former President and CEO of Adagio Health Inc. (retired in 2014) in Pittsburgh, PA, a non-profit corporation which provides family planning services, nutrition, maternal/child health care, and various health screening services and community preventive health programs. | 25 | |
JOHN G. GUFFEY, JR. AGE: 67 | Director Trustee Director Director | 1992 CWVF 1982 CSIF 2000 CRIS 2005 IMPACT | President of Aurora Press Inc., a privately held publisher of trade paperbacks. | 25 | • Ariel Funds (3) (asset management) (through 12/31/11) • Calvert Social Investment Foundation • Calvert Ventures, LLC |
MILES D. HARPER, III AGE: 52 | Director Trustee Director Director | 2000 IMPACT 2005 CSIF 2005 CRIS 2005 CWVF | Partner, Carr Riggs & Ingram (public accounting firm) since September 2013. Partner, Gainer Donnelly & Desroches (public accounting firm) (now Carr Riggs & Ingram), 1999-2013. | 18 | • Bridgeway Funds (14) (asset management) |
JOY V. JONES AGE: 65 | Director Trustee Director Director | 2000 IMPACT 1990 CSIF 2000 CRIS 2005 CWVF | Attorney. | 18 | • Director, Conduit Street Restaurants SUD 2 Limited • Director, Palm Management Corporation |
TERRENCE J. MOLLNER, Ed.D. AGE: 70 | Director Trustee Director Director | 1992 CWVF 1982 CSIF 2000 CRIS 2005 IMPACT | Founder, Chairperson and President of Trusteeship Institute, Inc., an educational organization focused on the personal skills and organizations described in Dr. Mollner’s book, The Love Skill: We Are Mastering the 7 Layers of Human Maturity, particularly businesses that freely chose to give priority to the common good. Chairperson, Stakeholders Capital, Inc., an asset management firm and financial services provider.
| 18 | • Calvert Social Investment Foundation • Ben & Jerry’s Homemade, Inc. (food products) |
SYDNEY A. MORRIS AGE: 66 | Trustee Director Director Director | 1982 CSIF 2000 CRIS 2005 CWVF 2005 IMPACT | The Rev. Dr. Morris is a Unitarian Universalist minister. | 18 | |
calvert.com CALVERT INTERNATIONAL EQUITY FUND ANNUAL REPORT (UNAUDITED) 31
|
| | | | | |
| Name & Age | Position With Fund | Position Start Date | Principal Occupation During Last 5 Years | # of Calvert Portfolios Overseen | Other Directorships During the Past Five Years |
| INTERESTED TRUSTEES/DIRECTORS |
D. WAYNE SILBY, Esq.* AGE: 67 | Director Trustee Director Director | 1992 CWVF 1982 CSIF 2000 CRIS 2000 IMPACT | Mr. Silby is the founding Chair of the Calvert Funds. He is the Chair-Elect and a principal of Syntao.com, a Beijing-based company promoting corporate social responsibility. | 25 | • Ameritas Mutual Holding Company (insurance) • Calvert Social Investment Foundation • ImpactAssets, Inc. (asset management) • Committee for the Future (charitable supporting organization) • Syntao.com China (HK) (sustainability consulting) • The ICE Organization (environmental services) |
JOHN H. STREUR* AGE: 55 | Director & President Trustee & President Director & President Director & President | 2015 CWVF
2015 CSIF
2015 CRIS
2015 IMPACT | President and Chief Executive Officer of Calvert Investments, Inc. (since January 2015) and Chief Compliance Officer for the Advisor and Calvert Investment Distributors, Inc. (since August 10, 2015) President and Director, Portfolio 21 Investments, Inc. (through October 2014) President, Chief Executive Officer and Director, Managers Investment Group LLC (through January 2012) President and Director, The Managers Funds and Managers AMG Funds (through January 2012). | 38 | • Portfolio 21 Investments, Inc. (asset management)(through October 2014) • Managers Investment Group LLC (asset management)(through January 2012) • The Managers Funds (asset management) (through January 2012) • Managers AMG Funds (asset management) (through January 2012) • Calvert Social Investment Foundation |
32 calvert.com CALVERT INTERNATIONAL EQUITY FUND ANNUAL REPORT (UNAUDITED)
|
| | | |
| Name & Age | Position With Fund | Position Start Date | Principal Occupation During Last 5 Years |
| OFFICERS |
SUSAN WALKER BENDER, Esq. AGE: 56 | Assistant Vice President & Assistant Secretary | 1988 CSIF 2000 CRIS 1992 CWVF 2000 Impact | Assistant Vice President, Assistant Secretary and Associate General Counsel of Calvert Investments, Inc. |
VICKI L. BENJAMIN AGE: 54 | Treasurer | 2015 | Executive Vice President and Chief Financial Officer of Calvert Investments, Inc. since March 2015. Prior to Calvert, Ms. Benjamin was a Senior Partner at KPMG. |
ROBERT D. BENSON, ESQ. AGE: 36 | Assistant Vice President & Assistant Secretary | 2014 | Assistant General Counsel (since 2014), Assistant Vice President & Assistant Secretary (since 2015) and Staff Attorney (prior to 2014), Calvert Investments, Inc. |
HOPE BROWN AGE: 42 | Chief Compliance Officer | 2014 | Chief Compliance Officer for the Calvert Funds (since 2014). Vice President and Chief Compliance Officer, Wilmington Funds (2012-2014). Vice President and Senior Compliance Officer, Wilmington Trust Investment Advisors, Inc. (2010-2012). Assistant Vice President, Lead Manager, Risk Management and Divisional Compliance, T. Rowe Price Associates, Inc. (2005-2010). |
THOMAS DAILEY AGE: 51 | Vice President | 2004 | Vice President of the Advisor and lead portfolio manager for Calvert’s municipal funds. |
MATTHEW DUCH Age: 40 | Vice President | 2011 | Vice President of the Advisor (since 2011) and portfolio manager for Calvert’s taxable fixed-income funds. |
IVY WAFFORD DUKE, Esq. AGE: 47 | Vice President & Secretary | 1996 CSIF 2000 CRIS 1996 CWVF 2000 Impact | Vice President, Acting Secretary and Acting General Counsel (Deputy General Counsel prior to 2015) of Calvert Investments, Inc. Prior to August 10, 2015, Ms. Duke was also Chief Compliance Officer for the Advisor and Calvert Investment Distributors, Inc. |
ROBERT J. ENDERSON, CFA AGE: 57 | Assistant Treasurer | 2014 | Acting Chief Financial Officer (September 2014-March 2015) and Vice President, Corporate Finance, of Calvert Investments, Inc. |
PATRICK FAUL AGE: 50 | Vice President | 2010 | Vice President and Head of Credit Research for the Advisor. |
TRACI L. GOLDT AGE: 42 | Assistant Secretary | 2004 | SEC Filing and Administrative Operations Manager (since 2011) and Executive Assistant to General Counsel (prior to 2011), Calvert Investments, Inc. |
VISHAL KHANDUJA, CFA AGE: 37 | Vice President | 2014 | Vice President of Calvert Investment Management, Inc. (since 2014) and portfolio manager for Calvert’s taxable fixed-income funds since 2012. Previously worked at Columbia Management as Portfolio Manager - Global Rates and Currency Team (2009-2012). |
LANCELOT A. KING, Esq. AGE: 45 | Assistant Vice President & Assistant Secretary | 2002 | Assistant Vice President, Assistant Secretary and Associate General Counsel of Calvert Investments, Inc. |
ANDREW K. NIEBLER, Esq. AGE: 48 | Assistant Vice President & Assistant Secretary | 2006 | Assistant Vice President, Assistant Secretary and Associate General Counsel of Calvert Investments, Inc. |
MARYBETH PILAT, CPA AGE: 47 | Fund Controller and Assistant Treasurer | 2015 | Director of Fund Administration, Calvert Investment Administrative Services, Inc. since August 2015. VP Expense & Budgeting, Global Fiduciary Platform, Legg Mason (May 2015 - July 2015). Vice President and Assistant Treasurer, Columbia Funds, Ameriprise, Columbia Management (2010 - April 2015). |
CATHERINE P. ROY AGE: 59 | Vice President | 2004 | Senior Vice President of the Advisor and Chief Investment Officer – Fixed Income. |
NATALIE A. TRUNOW AGE: 47 | Vice President | 2008 | Senior Vice President of the Advisor and Chief Investment Officer – Equities. |
* Mr. Streur is an interested person of the Funds since he is an Officer and Director of each Fund’s Advisor and certain affiliates. Mr. Silby is an interested person of the Funds since he is a Director of the parent company of each Fund’s Advisor. The address of Trustees/Directors and Officers is 4550 Montgomery Avenue, Suite 1000N, Bethesda, Maryland 20814, except Mr. Silby’s address is 1715 18th Street, N.W., Washington, DC 20009. Additional information about the Fund’s Trustees/Directors can be found in the Statement of Additional Information (SAI). You can get a free copy of the SAI at www.calvert.com, or by contacting your broker, or the Fund at 1-800-368-2745. |
calvert.com CALVERT INTERNATIONAL EQUITY FUND ANNUAL REPORT (UNAUDITED) 33
|
|
| This page intentionally left blank. |
|
|
| This page intentionally left blank. |
|
|
| This page intentionally left blank. |
To Open an Account
800-368-2748
Service for Existing Account
Shareholders: 800-368-2745
Brokers: 800-368-2746
Registered Mail
Calvert Investments
c/o BFDS,
P.O. Box 219544
Kansas City, MO 64121-9544
Overnight Mail
Calvert Investments
c/o BFDS,
330 West 9th Street
Kansas City, MO 64105
Web Site
calvert.com
Principal Underwriter
Calvert Investment Distributors, Inc.
4550 Montgomery Avenue
Suite 1000 North
Bethesda, Maryland 20814
|
| | | |
| CALVERT INTERNATIONAL EQUITY FUND | CALVERT’S FAMILY OF FUNDS | | |
| | Municipal Funds Tax-Free Responsible Impact Bond Fund Taxable Bond Funds Bond Portfolio Income Fund Short Duration Income Fund Long-Term Income Fund Ultra-Short Income Fund High Yield Bond Fund Green Bond Fund Unconstrained Bond Fund Balanced and Asset Allocation Funds Balanced Portfolio Conservative Allocation Fund Moderate Allocation Fund Aggressive Allocation Fund | | Equity Funds Large Cap Core Portfolio Equity Portfolio Global Value Fund U.S. Large Cap Core Responsible Index Fund U.S. Large Cap Value Responsible Index Fund U.S. Large Cap Growth Responsible Index Fund U.S. Mid Cap Core Responsible Index Fund Developed Markets EX-U.S. Responsible Index Fund Capital Accumulation Fund International Equity Fund Small Cap Fund Global Energy Solutions Fund Global Water Fund International Opportunities Fund Global Equity Income Fund Emerging Markets Equity Fund
|
This report is intended to provide fund information to shareholders. It is not authorized for distribution to prospective investors unless preceded or accompanied by a prospectus. Note: The information on our website is not incorporated by reference into this report; our website address is included as an inactive textual reference only. Investors should carefully consider the investment objectives, risks, charges and expenses of the Calvert Funds. This and other important information is contained in the fund’s summary prospectus and prospectus, which can be obtained from your financial professional and should be read carefully before investing. You may also call Calvert at 800/368-2748 or visit calvert.com. Printed on recycled paper using soy inks. |
| | | | |
|
| | |
| | |
| | | |
Calvert Capital Accumulation Fund
| | |
| | | |
| | |
|
| |
Annual Report September 30, 2015 E-Delivery Sign-Up — Details Inside | |
|
|
| |
Choose Planet-friendly E-delivery! Sign up now for on-line statements, prospectuses, and fund reports. In less than five minutes you can help reduce paper mail and lower fund costs. Just go to calvert.com. If you already have an online account at Calvert, click on Login, to access your Account, and select the documents you would like to receive via e-mail. If you’re new to online account access, click on Login, then Register to create your user name and password. Once you’re in, click on the E-delivery sign-up on the Account Portfolio page and follow the quick, easy steps. Note: if your shares are not held directly at Calvert but through a brokerage firm, you must contact your broker for electronic delivery options available through their firm. |
|
| | | |
| | | TABLE OF CONTENTS |
| | | | |
| | | | President’s Letter |
| | | | Portfolio Management Discussion |
| | | | Understanding Your Fund's Expenses |
| | | | Report of Independent Registered Public Accounting Firm |
| | | | Statement of Net Assets |
| | | | Statement of Operations |
| | | | Statements of Changes in Net Assets |
| | | | Notes to Financial Statements |
| | | | Financial Highlights |
| | | | Explanation of Financial Tables |
| | | | Proxy Voting |
| | | | Availability of Quarterly Portfolio Holdings |
| | | | Director and Officer Information Table |
|
| |
| John Streur President and Chief Executive Officer, Calvert Investments, Inc. |
Dear Shareholders,
Global economic growth is vital to the improvement of the lives of all people, especially so to those of the ultra-poor. However, how that growth is achieved is critical to the long-term health and sustainability of our collective societies. Business activity that does not show consideration for environmental and social impacts may have calamitous consequences, many of which we are witnessing now, including political and social unrest, unjust wealth distribution and diminished bio-diversity.
The returns of the markets (chart below) reflect the impact of the uncertainty created by a legacy of unsustainable development and the current lack of positive economic growth trends. The steep decline in the emerging market equities index (reflective of the flight of capital and currency weakness) is particularly impactful as these regions include some of the largest populations of individuals most in need of sustainable and inclusive economic development.
|
| | | | |
| MARKET BENCHMARKS | Total Returns for the period ended 9/30/2015 |
| 6 Months | Year-to-Date | 1 Year | 5 Year |
| S&P 500 | -6.18% | -5.29% | -0.61% | 13.34% |
| Russell 1000 | -6.72% | -5.24% | -0.61% | 13.42% |
| Russell 3000 | -7.12% | -5.45% | -0.49% | 13.28% |
| MSCI World ex USA | -9.88% | -6.32% | -9.73% | 3.92% |
| MSCI Emerging Markets | -17.11% | -15.22% | -18.98% | -3.25% |
| Barclays U.S. Aggregate Bond | -0.47% | 1.13% | 2.94% | 3.10% |
| Barclays Global Aggregate | -0.34% | -2.25% | -3.26% | 0.81% |
| Returns for periods greater than one year have been annualized. |
In an effort to mitigate this issue and foster the long term sustainability and justice of our global economic system, many of the world’s leaders participated with the United Nations (“UN”) to design and implement a 15-year plan to create the kind of economic development (http://www.calvert.com/media-relations/press-releases/calvert-ceo-participates-in-the-un-sustainable-development-summit) that should benefit the poorest people in the world, preserve opportunities for future generations, and provide stewardship to the environment. This effort, which kicked-off at the UN Summit earlier this month, involves bringing together private enterprise, governments, NGOs, development banks and people of all walks of life to achieve the “Sustainable Development Goals 2015” (SDGs). These goals include: eliminating extreme poverty, eliminating extreme hunger, fostering good health for all, promoting gender equality, and creating environmental sustainability and peace and stability throughout the world. The SDGs impact residents of every country in some manner, but no one more acutely than the denizens of the developing and emerging nations.
It was my privilege, as Calvert’s CEO, to be invited to the Summit, as one of 350 global leaders asked to participate in the development of this critical 15-year sustainability plan. During the course of this event, I announced that Calvert Investments would lead a project (http://www.calvert.com/perspective/social-impact/calvert-un-sustainable-development-goals) to map the Sustainable Development Goals to standards that companies can be measured by, and that investors may look to in order to
4 calvert.com CALVERT CAPITAL ACCUMULATION FUND ANNUAL REPORT (UNAUDITED)
understand which companies are helping to create sustainable, responsible growth. It is integral to the success and achievement of the goals, that the largest holders of capital, i.e., corporations, help drive these initiatives.
The crucial role that corporations now play in creating social and environmental outcomes was highlighted at the UN sessions by the presence of CEOs and sustainability officers from around the world, and the vital role of investors and the capital markets was reflected by our presence and contribution. In addition to representing your interests at the UN event, Calvert has contributed to the understanding of the role that corporations and investors play in driving social and environmental conditions through our most recent research, “The Role of the Corporation in Society”, available to you on our website, (see http://www.calvert.com/perspective/governance/calvert-serafeim-series-report).
Despite the fact that the past year has not brought the financial returns that you or I would have wished for as investors, I believe that when we look back on 2015 several years from now we are likely to see it as a transformative year in terms of our economic and social systems. Individuals and organizations of all types — corporate, government, NGO, religious — are coming together due to the realization that we need a more sustainable and just system to serve the needs of all stakeholders. As a shareholder of Calvert Funds, you are very much part of this mission, as together we are a leader and innovator in connecting capital to mission, with the dual purpose of driving competitive investment returns with just and sustainable economic progress.
On behalf of all of us at Calvert Investments, thank you for the confidence you have placed in our management of your funds and the ongoing privilege to serve you. We appreciate the opportunity to work with you as we strive to meet your financial needs while also helping to render the world a better place for all people.
Respectfully,
John Streur
October 2015
calvert.com CALVERT CAPITAL ACCUMULATION FUND ANNUAL REPORT (UNAUDITED) 5
|
| |
| PORTFOLIO MANAGEMENT DISCUSSION |
|
| |
| Michelle Clayman of New Amsterdam Partners, LLC |
|
| |
| Nathanial Paull of New Amsterdam Partners, LLC |
Performance
In the 12 months ended September 30, 2015, the Calvert Capital Accumulation Fund returned 4.90% (at NAV). By comparison, the Russell Midcap Growth Index returned 1.45%. Outperformance was driven by strong stock selection, particularly in the financials, materials, industrials, and information technology sectors. A focus on stocks with solid return on equity also contributed to performance.
Investment Process
New Amsterdam Partners uses a valuation model to identify companies with better-than-average forecasted growth and profitability selling at reasonable valuation multiples. New Amsterdam Partners then validates the inputs of the model with rigorous fundamental scrutiny.
Market Review
The market climbed steadily for much of the first three quarters of the 12-month period, reaching all-time highs toward the end of June. U.S. economic data continued to improve with the labor market’s slow and steady recovery and modest gross domestic product growth. Energy commodity prices dropped precipitously, but this has been a boon to U.S. consumers’ purchasing power. In August, concerns about global economic growth, particularly with respect to China and Europe, drove markets sharply lower, erasing more than 1,000 basis points from the Russell Midcap Growth’s previous high. China’s currency devaluation and concerns about the U.S. Federal Reserve’s eventual interest rate liftoff brought market volatility back to levels not seen in nearly four years. The annual Russell Index reconstitution near the end of the second quarter was also noteworthy. Most significant was the marked reduction of the Russell Midcap Growth’s energy sector, which currently has a less than 1% allocation in the benchmark, down from nearly 5%.
Over the past year, consumer staples and health care led the benchmark’s performance while utilities and energy were the worst performing sectors, and growth stocks outperformed value stocks. Benchmark stocks with stronger return on equity outperformed over the year, a factor that benefited the Fund, due to its positioning. Companies with larger portions of revenue derived internationally lagged the broader benchmark; this served as a tailwind to performance as the Fund has been relatively underexposed to foreign revenues. Heightened merger and acquisitions activity helped the Fund as three companies were either merged or taken over. The benchmark’s highest valuation companies — as measured by price-to-earnings (P/E) and price-to-book ratios — outperformed, a factor that detracted from the Fund’s relative performance as the Fund usually underrepresents the benchmark’s higher valuation companies in favor of more attractively priced holdings. Companies with high levels of debt outperformed, and this, too, worked against the Fund, which tends to favor lower debt holdings. Lastly, the Fund faced a market cap effect throughout the year, as the benchmark’s larger capitalization holdings outpaced smaller cap holdings, despite the fact that the Russell 1000 Index lagged the Russell 2000 Index. Performance was affected by our underrepresentation of these top performing larger-cap companies within the Russell Midcap Growth; our discipline calls for buying stocks with market capitalizations of between $1 billion and $9 billion to adhere closely to a true midcap mandate. But overall, the Fund’s strong stock selection produced solid relative performance.
6 calvert.com CALVERT CAPITAL ACCUMULATION FUND ANNUAL REPORT (UNAUDITED)
|
| | | | |
| | | | |
| | CALVERT CAPITAL ACCUMULATION FUND |
| | SEPTEMBER 30, 2015 | |
| | | | |
| | ECONOMIC SECTORS | % OF TOTAL INVESTMENTS | |
| | Consumer Discretionary | 23.0 | % | |
| | Consumer Staples | 4.6 | % | |
| | Energy | 1.5 | % | |
| | Financials | 10.8 | % | |
| | Health Care | 12.9 | % | |
| | High Social Impact Investments | 0.3 | % | |
| | Industrials | 17.9 | % | |
| | Information Technology | 20.6 | % | |
| | Materials | 4.6 | % | |
| | Short-Term Investments | 2.8 | % | |
| | Utilities | 1.0 | % | |
| | Total | 100 | % | |
| | | | |
Portfolio Strategy
The financials sector added the most value over the period. AmTrust Financial Services rose on continued positive earnings surprises and solid growth driven by strength in its workers’ compensation segment and stabilizing loss ratios. Waddell & Reed was sold in the fourth quarter, helping to avoid weakness in the stock. More recently, BofI Holding was nearing a price target in anticipation of the consummation of its long-awaited deal with H&R Block. We replaced it with EverBank, which has slightly higher forecasted growth, positive earnings revisions, and a more attractive valuation.
A combination of strong performance and a reduced representation within the benchmark drove our industrials position from underweight at the beginning of the period to the Fund’s largest overweight at the period’s end.
Alaska Air Group had performed well and as its price rose, its expected return declined while the airline was experiencing increased competition in its Seattle hub. We sold it in favor of JetBlue, an attractive company in the buy universe with stronger earnings revisions, more robust growth, and better potential for positive earnings surprise. We reduced the sector’s overall exposure to economic cyclicality with the sale of companies such as Wesco.
Our information technology position shifted from market neutral at the beginning of the period to one of the largest overweight positions, reflecting a combination of strong performance and the model’s preference for the sector. We sold software company SolarWinds when it reached its price target and replaced it with FactSet Research Systems, which offered a higher expected return. DST Systems contributed the most to the sector’s outperformance, trading higher with solid execution and improving operating margins. DST also benefited as noncore business asset sale proceeds funded
|
| | | | | | |
| | | | | |
| | CALVERT CAPITAL ACCUMULATION FUND | |
| | SEPTEMBER 30, 2015 | |
| | | | | |
| | INVESTMENT PERFORMANCE | |
| | (TOTAL RETURN AT NAV) | |
| | | 6 MONTHS ENDED 9/30/15 | 12 MONTHS ENDED 9/30/15 | |
| | Class A | -8.49 | % | 4.90 | % | |
| | Class C | -8.86 | % | 4.09 | % | |
| | Class I | -8.22 | % | 5.53 | % | |
| | Class Y | -8.38 | % | 5.16 | % | |
| | Russell Midcap Growth Index | -9.04 | % | 1.45 | % | |
| | Lipper Mid-Cap Growth Funds Average | -9.28 | % | 1.02 | % | |
| | | | | |
| | Investment performance/return at NAV does not reflect the deduction of the Fund’s maximum 4.75% front-end sales charge or any deferred sales charges. | |
| | | | | |
| | TEN LARGEST STOCK HOLDINGS | % OF NET ASSETS | |
| | JetBlue Airways Corp. | | 3.9 | % | |
| | Ulta Salon, Cosmetics & Fragrance, Inc. | | 3.4 | % | |
| | Synaptics, Inc. | | 3.3 | % | |
| | DST Systems, Inc. | | 3.1 | % | |
| | Amtrust Financial Services, Inc. | | 3.1 | % | |
| | Ross Stores, Inc. | | 3.0 | % | |
| | Syntel, Inc. | | 2.9 | % | |
| | American Financial Group, Inc. | | 2.8 | % | |
| | Lithia Motors, Inc., Class A | | 2.8 | % | |
| | Toro Co. (The) | | 2.8 | % | |
| | Total | 31.1 | % | |
| | | | | |
stock buybacks, although this was slightly offset by a minor earnings shortfall versus expectations in July.
At the beginning of the period, the largest overweight position was in the consumer discretionary sector, which is now one of our largest underweight positions. This is a result of poor performance within the sector, but is also consistent with our valuation model’s signals. Retailers Fossil Group and Deckers Brands lost ground due to lackluster sales and exposure to weak international end markets. Fossil was affected by disappointing department store sales trends and soft results from its partnership with Michael Kors. Deckers traded lower on weak sales of its core, classic UGG boots as well as negative foreign exchange impacts. On a positive note, auto dealer Lithia Motors traded higher on better-than-expected quarterly results due to continued same-store-sales momentum. Interval Leisure Group, a time-share travel agency, boosted performance in the sector, reaching its price target in May. We sold the stock and divided the proceeds between Scripps Networks Interactive, a broadcasting
calvert.com CALVERT CAPITAL ACCUMULATION FUND ANNUAL REPORT (UNAUDITED) 7
company, and Select Comfort, the mattress company. Both of the incoming holdings boasted higher expected returns and more attractive earnings revisions, with Scripps having the potential to expand distribution of its existing content in international and online channels and Select Comfort having the highest margins in the bedding industry.
Merger and acquisition activity also contributed positively to Fund performance throughout the year. PetSmart was acquired by a private equity consortium, RockTenn merged with MeadWestvaco, and Exelis was purchased by Harris Corporation, all at significant stock price premiums. We sold all three holdings shortly after their respective announcements.
Outlook
While second quarter U.S. gross domestic product growth came in higher than anticipated, we still expect it to be 2.0% to 2.5% over the second half of 2015. Outside the U.S., growth is sluggish; China’s growth rate may be still lower than expected. Within the U.S., the energy sector is in a slump, dragging down industrial and materials companies. Employment is stable while inflation has stayed muted and may even go lower, and interest rates are unlikely to rise in the near term. The Fed is boxed in by weak global and muted domestic growth, dropping commodity prices, and its own past policies, which leave it few tools with which to maneuver. International monetary policy still has room to ease.
The P/E of the stock market has dropped a couple of points and is in more reasonable territory. Earnings from sectors other than those affected by falling energy prices are holding up, and some sectors are benefiting from lower oil and gas prices. This will prop up these sectors’ stock prices, though multinationals are still at risk from developments in the global economy. Stock picking will become more determinant again in the coming months.
Geopolitical events continue to be a threat to market stability. Turmoil in the Middle East dominates headlines and the region’s troubles have spilled to other areas of the world as Europe deals with an immense migrant crisis. China’s growth slowdown will have ripple effects across the globe.
We believe that this backdrop strongly suggests adherence to our discipline, which entails looking for stocks with better-than-average growth and profitability and selling at relatively low multiples.
New Amsterdam Partners, LLC
October 2015
As of September 30, 2015, the following companies represented the following percentages of net assets: AmTrust Financial Services 3.08%, Waddell & Reed 0.00%, BofI Holdings 0.00%, EverBank 2.48%, Alaska Air Group 0.00%, JetBlue 3.95%, Wesco 0.00%, SolarWinds 0.00%, FactSet Research Systems 1.61%, DST Systems 3.15%, Fossil Group 1.36%, Deckers Brands 2.17%, Lithia Motors 2.79%, Interval Leisure Group 0.00%, Scripps Networks Interactive 0.99%, Select Comfort 0.97%, Pet Smart 0.00%, RockTenn 0.00%, and Excelis 0.00%. Holdings are subject to change.
8 calvert.com CALVERT CAPITAL ACCUMULATION FUND ANNUAL REPORT (UNAUDITED)
Growth of $10,000
The graph below shows the value of a hypothetical $10,000 investment in the Fund over the past 10 fiscal year periods. The results shown are for Class A shares, reflect the deduction of the maximum front-end Class A sales charge of 4.75%, and assume the reinvestment of dividends. The result is compared with a broad based market index. Market indexes are unmanaged and their results do not reflect the effect of expenses or sales charges. The value of an investment in a different share class would be different.
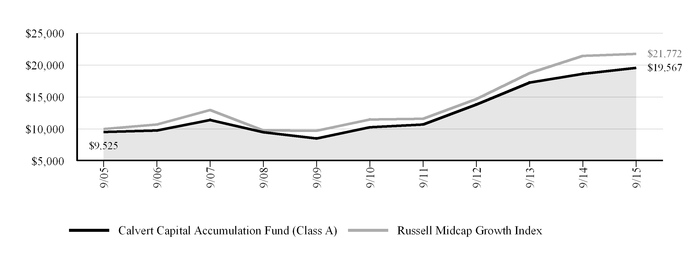
|
| | | | | | | |
| CALVERT CAPITAL ACCUMULATION FUND |
| SEPTEMBER 30, 2015 |
| AVERAGE ANNUAL TOTAL RETURNS | Ticker Symbol | 1 Year | 5 Year | 10 Year |
| Class A (with max. load) | CCAFX | -0.08 | % | 12.63 | % | 6.94 | % |
| Class C (with max. load) | CCACX | 3.09 | % | 12.82 | % | 6.62 | % |
| Class I | CCPIX | 5.53 | % | 14.45 | % | 8.29 | % |
| Class Y | CCAYX | 5.16 | % | 13.93 | % | 7.56 | % |
| Russell Midcap Growth Index | | 1.45 | % | 13.58 | % | 8.09 | % |
| Lipper Mid-Cap Growth Funds Average | | 1.02 | % | 11.97 | % | 7.18 | % |
| | | | | |
| Calvert Capital Accumulation Fund first offered Class Y shares on January 31, 2011. Performance prior to that date reflects the performance of Class A shares at net asset value (NAV). Actual Class Y share performance would have been different. |
| | | | | |
All performance data shown, including the graph above and the adjacent table, represents past performance, does not guarantee future results, assumes reinvestment of dividends and distributions, and does not reflect the deduction of taxes that a shareholder would pay on the Fund’s distributions or the redemption of the Fund shares. All performance data reflects fee waivers and/or expense limitations, if any are in effect; in their absence performance would be lower. See Note B in Notes to Financial Statements. The investment return and principal value of an investment will fluctuate so that an investor’s shares, when redeemed, may be worth more or less than their original cost. Current performance may be lower or higher than the performance data quoted; for current performance data, including most recent month-end, visit www.calvert.com. The gross expense ratio from the current prospectus for Class A shares is 1.43%. This number may differ from the expense ratio shown elsewhere in this report because it is based on a different time period and, if applicable, does not include fee or expense waivers. Performance data quoted already reflects the deduction of the Fund’s operating expenses.
calvert.com CALVERT CAPITAL ACCUMULATION FUND ANNUAL REPORT (UNAUDITED) 9
UNDERSTANDING YOUR FUND'S EXPENSES
As an investor, you incur two types of costs. There are transaction costs, which generally include sales charges on purchases and may include redemption fees. There are also ongoing costs, which generally include management fees, distribution and/or service fees, and other fund expenses. The following information is intended to help you understand your ongoing costs (in dollars) of investing in this mutual fund and to help you compare these costs with the ongoing costs of investing in other mutual funds.
To illustrate these ongoing costs, we have provided examples and calculated the expenses paid by the fund's investors during the period. The actual and hypothetical information presented in the examples is based on an investment of $1,000 invested at the beginning of the period and held for the entire period (April 1, 2015 to September 30, 2015).
Actual Expenses
The first line of the table below provides information about actual account values and actual expenses. You may use the information in this line, together with the amount you invested, to estimate the expenses that you paid over the period. Simply divide your account value by $1,000 (for example, an $8,600 account value divided by $1,000 = 8.6), then multiply the result by the number in the first line under the heading entitled "Expenses Paid During Period" to estimate the expenses you paid on your account during this period.
Hypothetical Example for Comparison Purposes
The second line of the table below provides information about hypothetical account values and hypothetical expenses based on the Fund’s actual expense ratio and an assumed rate of return of 5% per year before expenses, which is not the Fund’s actual return. The hypothetical account values and expenses may not be used to estimate the actual ending account balance or expenses you paid for the period. You may use this information to compare the ongoing costs of investing in the Fund and other funds. To do so, compare the 5% hypothetical example with the 5% hypothetical examples that appear in the shareholder reports of the other funds.
Please note that the expenses shown in the table are meant to highlight your ongoing costs only and do not reflect any transactional costs, such as sales charges (loads). Therefore, the second line of the table is useful in comparing ongoing costs only, and will not help you determine the relative total costs of owning different funds. In addition, if these transactional costs were included, your costs would have been higher.
|
| | | | |
| | ANNUALIZED
EXPENSE RATIO | BEGINNING
ACCOUNT VALUE
4/1/15 | ENDING
ACCOUNT VALUE
9/30/15 | EXPENSES PAID
DURING PERIOD*
4/1/15 - 9/30/15 |
| Class A | | | | |
| Actual | 1.40% | $1,000.00 | $915.10 | $6.72 |
| Hypothetical (5% return per year before expenses) | 1.40% | $1,000.00 | $1,018.05 | $7.08 |
| Class C | | | | |
| Actual | 2.23% | $1,000.00 | $911.40 | $10.69 |
| Hypothetical (5% return per year before expenses) | 2.23% | $1,000.00 | $1,013.89 | $11.26 |
| Class I | | | | |
| Actual | 0.83% | $1,000.00 | $917.80 | $3.99 |
| Hypothetical (5% return per year before expenses) | 0.83% | $1,000.00 | $1,020.91 | $4.20 |
| Class Y | | | | |
| Actual | 1.17% | $1,000.00 | $916.20 | $5.62 |
| Hypothetical (5% return per year before expenses) | 1.17% | $1,000.00 | $1,019.20 | $5.92 |
|
|
| * Expenses paid during the period are equal to the annualized expense ratio for each class as indicated above, multiplied by the average account value over the period, multiplied by 183/365 (to reflect the one-half year period). Expense ratios shown in the Financial Highlights represent the actual expenses incurred for the fiscal year. |
10 calvert.com CALVERT CAPITAL ACCUMULATION FUND ANNUAL REPORT (UNAUDITED)
REPORT OF INDEPENDENT REGISTERED PUBLIC ACCOUNTING FIRM
The Board of Directors of Calvert World Values Fund, Inc. and Shareholders of Calvert Capital Accumulation Fund:
We have audited the accompanying statement of net assets of the Calvert Capital Accumulation Fund (the “Fund”), a series of Calvert World Values Fund, Inc., as of September 30, 2015, and the related statement of operations for the year then ended, the statements of changes in net assets for each of the years in the two-year period then ended, and the financial highlights for each of the years or periods in the five-year period then ended. These financial statements and financial highlights are the responsibility of the Fund’s management. Our responsibility is to express an opinion on these financial statements and financial highlights based on our audits.
We conducted our audits in accordance with the standards of the Public Company Accounting Oversight Board (United States). Those standards require that we plan and perform the audit to obtain reasonable assurance about whether the financial statements and financial highlights are free of material misstatement. An audit includes examining, on a test basis, evidence supporting the amounts and disclosures in the financial statements. Our procedures included confirmation of securities owned as of September 30, 2015 by correspondence with the custodian and brokers or by other appropriate auditing procedures. An audit also includes assessing the accounting principles used and significant estimates made by management, as well as evaluating the overall financial statement presentation. We believe that our audits provide a reasonable basis for our opinion.
In our opinion, the financial statements and financial highlights referred to above present fairly, in all material respects, the financial position of the Calvert Capital Accumulation Fund as of September 30, 2015, the results of its operations for the year then ended, the changes in its net assets for each of the years in the two-year period then ended, and the financial highlights for each of the years or periods in the five-year period then ended, in conformity with U.S. generally accepted accounting principles.
Philadelphia, Pennsylvania
November 25, 2015
calvert.com CALVERT CAPITAL ACCUMULATION FUND ANNUAL REPORT 11
CALVERT CAPITAL ACCUMULATION FUND
STATEMENT OF NET ASSETS
SEPTEMBER 30, 2015
|
| | |
| | SHARES | VALUE ($) |
| EQUITY SECURITIES - 97.2% | | |
| Airlines - 4.0% | | |
JetBlue Airways Corp. * | 770,984 | 19,868,258 |
| | | |
| Auto Components - 2.3% | | |
Gentherm, Inc. * | 252,164 | 11,327,207 |
| | | |
| Biotechnology - 1.8% | | |
United Therapeutics Corp. * | 68,341 | 8,969,073 |
| | | |
| Building Products - 2.4% | | |
Lennox International, Inc. | 105,249 | 11,927,869 |
| | | |
| Commercial Services & Supplies - 3.0% | | |
| Deluxe Corp. | 212,698 | 11,855,787 |
| Essendant, Inc. | 104,245 | 3,380,665 |
| | | 15,236,452 |
| | | |
| Communications Equipment - 4.6% | | |
| F5 Networks, Inc. * | 109,949 | 12,732,094 |
| Ubiquiti Networks, Inc. | 310,947 | 10,537,994 |
| | | 23,270,088 |
| | | |
| Containers & Packaging - 2.4% | | |
Owens-Illinois, Inc. * | 570,811 | 11,827,204 |
| | | |
| Electric Utilities - 1.0% | | |
OGE Energy Corp. | 189,798 | 5,192,873 |
| | | |
| Electronic Equipment & Instruments - 2.7% | | |
Arrow Electronics, Inc. * | 248,964 | 13,762,730 |
| | | |
| Energy Equipment & Services - 1.5% | | |
Dril-Quip, Inc. * | 129,932 | 7,564,641 |
| | | |
| Food Products - 2.8% | | |
Ingredion, Inc. | 158,240 | 13,815,934 |
|
| | |
| | SHARES | VALUE ($) |
| Health Care Equipment & Supplies - 2.6% | | |
| Globus Medical, Inc., Class A * | 230,481 | 4,761,737 |
| Varian Medical Systems, Inc. * | 115,174 | 8,497,538 |
| | | 13,259,275 |
| | | |
| Health Care Providers & Services - 6.8% | | |
| AmerisourceBergen Corp. | 130,632 | 12,408,734 |
| Chemed Corp. | 68,941 | 9,201,555 |
| Laboratory Corporation of America Holdings * | 115,774 | 12,558,006 |
| | | 34,168,295 |
| | | |
| Insurance - 5.9% | | |
| American Financial Group, Inc. | 205,398 | 14,153,976 |
| Amtrust Financial Services, Inc. | 245,706 | 15,474,564 |
| | | 29,628,540 |
| | | |
| IT Services - 8.4% | | |
| DST Systems, Inc. | 150,415 | 15,814,633 |
| NeuStar, Inc., Class A * | 442,979 | 12,053,458 |
| Syntel, Inc. * | 317,880 | 14,403,143 |
| | | 42,271,234 |
| | | |
| Leisure Products - 2.5% | | |
Polaris Industries, Inc. | 105,249 | 12,616,198 |
| | | |
| Machinery - 4.1% | | |
| Graco, Inc. | 100,870 | 6,761,316 |
| Toro Co. (The) | 196,673 | 13,873,313 |
| | | 20,634,629 |
| | | |
| Media - 1.0% | | |
Scripps Networks Interactive, Inc., Class A | 100,849 | 4,960,762 |
| | | |
| Metals & Mining - 2.3% | | |
Worthington Industries, Inc. | 427,254 | 11,313,686 |
| | | |
| Personal Products - 1.9% | | |
Inter Parfums, Inc. | 377,463 | 9,364,857 |
| | | |
| Pharmaceuticals - 1.7% | | |
Lannett Co., Inc. * | 209,998 | 8,719,117 |
12 calvert.com CALVERT CAPITAL ACCUMULATION FUND ANNUAL REPORT
|
| | |
| | SHARES | VALUE ($) |
| Professional Services - 2.4% | | |
Robert Half International, Inc. | 238,431 | 12,198,130 |
| | | |
| Real Estate Management & Development - 2.4% | | |
Jones Lang LaSalle, Inc. | 85,399 | 12,277,814 |
| | | |
| Road & Rail - 2.1% | | |
Landstar System, Inc. | 164,365 | 10,432,247 |
| | | |
| Semiconductors & Semiconductor Equipment - 3.3% | | |
Synaptics, Inc. * | 202,373 | 16,687,678 |
| | | |
| Software - 1.6% | | |
FactSet Research Systems, Inc. | 50,491 | 8,068,967 |
| | | |
| Specialty Retail - 13.7% | | |
| Buckle, Inc. (The) | 248,331 | 9,180,797 |
| Lithia Motors, Inc., Class A | 129,732 | 14,025,327 |
| Rent-A-Center, Inc. | 363,263 | 8,809,128 |
| Ross Stores, Inc. | 314,447 | 15,241,246 |
| Select Comfort Corp. * | 221,956 | 4,856,397 |
| Ulta Salon, Cosmetics & Fragrance, Inc. * | 103,949 | 16,980,069 |
| | | 69,092,964 |
| | | |
| Textiles, Apparel & Luxury Goods - 3.5% | | |
| Deckers Outdoor Corp. * | 188,148 | 10,923,873 |
| Fossil Group, Inc. * | 122,232 | 6,830,324 |
| | | 17,754,197 |
| | | |
| Thrifts & Mortgage Finance - 2.5% | | |
EverBank Financial Corp. | 646,227 | 12,472,181 |
| | | |
| Total Equity Securities (Cost $457,983,278) | | 488,683,100 |
|
| | | | |
| | PRINCIPAL
AMOUNT ($) | VALUE ($) |
|
| HIGH SOCIAL IMPACT INVESTMENTS - 0.3% | | |
Calvert Social Investment Foundation Notes, 0.25%, 7/1/17 (b)(i)(r) | 1,419,488 | 1,375,231 |
|
| | | |
| Total High Social Impact Investments (Cost $1,419,488) | | 1,375,231 |
|
| | | |
| | | |
| TIME DEPOSIT- 2.8% | | |
| State Street Bank Time Deposit, 0.088%, 10/1/15 | 13,997,874 | 13,997,874 |
|
| | | |
| Total Time Deposit (Cost $13,997,874) | | 13,997,874 |
|
| | | |
| TOTAL INVESTMENTS (Cost $473,400,640) - 100.3% | | 504,056,205 |
|
| Other assets and liabilities, net - (0.3%) | | (1,532,815) |
|
NET ASSETS - 100.0% | |
| $502,523,390 |
|
|
| | | |
| NET ASSETS CONSIST OF: | |
| Paid-in capital applicable to the following shares of common stock, with 250,000,000 shares of $0.01 par value shares authorized: | |
| Class A: 6,684,600 shares outstanding |
| $179,352,823 |
|
| Class C: 1,164,619 shares outstanding | 28,166,723 |
|
| Class I: 6,208,603 shares outstanding | 224,667,580 |
|
| Class Y: 388,740 shares outstanding | 12,536,439 |
|
| Accumulated net realized gain (loss) | 27,144,260 |
|
| Net unrealized appreciation (depreciation) | 30,655,565 |
|
| | |
| NET ASSETS |
| $502,523,390 |
|
| | |
| NET ASSET VALUE PER SHARE | |
| Class A (based on net assets of $223,328,233) |
| $33.41 |
|
| Class C (based on net assets of $29,836,895) |
| $25.62 |
|
| Class I (based on net assets of $236,228,287) |
| $38.05 |
|
| Class Y (based on net assets of $13,129,975) |
| $33.78 |
|
|
| | | |
| NOTES TO STATEMENT OF NET ASSETS | | |
| * | Non-income producing security. |
| (b) | This security was valued under the direction of the Board of Directors. See Note A. |
| (i) | Restricted securities represent 0.3% of the net assets of the Fund. |
| (r) | The coupon rate shown on floating or adjustable rate securities represents the rate in effect on September 30, 2015. |
| | | | |
| RESTRICTED SECURITIES | ACQUISITON DATES | COST |
| Calvert Social Investment Foundation Notes, 0.25%, 7/1/17 | 7/1/14 | $1,419,488 |
| See notes to financial statements. |
calvert.com CALVERT CAPITAL ACCUMULATION FUND ANNUAL REPORT 13
CALVERT CAPITAL ACCUMULATION FUND
STATEMENT OF OPERATIONS
YEAR ENDED SEPTEMPER 30, 2015
|
| | | | |
| NET INVESTMENT INCOME | |
| Investment Income: | |
| Dividend income |
| $4,535,969 |
|
| Interest income | 7,768 |
|
| Total investment income | 4,543,737 |
|
| | |
| Expenses: | |
| Investment advisory fee | 3,019,915 |
|
| Administrative fees | 878,767 |
|
| Transfer agency fees and expenses | 539,676 |
|
| Distribution Plan expenses: | |
| Class A | 582,918 |
|
| Class B (a) | 7,876 |
|
| Class C | 302,555 |
|
| Directors' fees and expenses | 45,572 |
|
| Accounting fees | 45,849 |
|
| Custodian fees | 59,078 |
|
| Professional fees | 36,528 |
|
| Registration fees | 74,923 |
|
| Reports to shareholders | 40,981 |
|
| Miscellaneous | 68,089 |
|
| Total expenses | 5,702,727 |
|
| Reimbursement from Advisor: | |
| Class B (a) | (5,303) |
|
| Net expenses | 5,697,424 |
|
| | |
| NET INVESTMENT LOSS | (1,153,687) |
|
| | |
| REALIZED AND UNREALIZED GAIN (LOSS) ON INVESTMENTS | |
| Net realized gain (loss) | 30,888,315 |
|
| | |
| Change in unrealized appreciation (depreciation) | (15,807,702) |
|
| | |
| NET REALIZED AND UNREALIZED GAIN (LOSS) ON INVESTMENTS | 15,080,613 |
|
| | |
| INCREASE (DECREASE) IN NET ASSETS RESULTING FROM OPERATIONS |
| $13,926,926 |
|
| | | |
| (a) | Class B Shares were converted into Class A Shares at the close of business on April 20, 2015. | |
| See notes to financial statements. |
14 calvert.com CALVERT CAPITAL ACCUMULATION FUND ANNUAL REPORT
CALVERT CAPITAL ACCUMULATION FUND
STATEMENTS OF CHANGES IN NET ASSETS
|
| | | | | | | | |
| INCREASE (DECREASE) IN NET ASSETS | YEAR ENDED
SEPTEMBER 30, 2015 | | YEAR ENDED
SEPTEMBER 30, 2014 |
| Operations: | | | |
| Net investment loss |
| ($1,153,687 | ) | |
| ($815,075 | ) |
| Net realized gain (loss) | 30,888,315 |
| | 59,457,045 |
|
| Change in unrealized appreciation (depreciation) | (15,807,702) |
| | (28,138,344) |
|
| INCREASE (DECREASE) IN NET ASSETS RESULTING FROM OPERATIONS | 13,926,926 |
| | 30,503,626 |
|
| | | | |
| Distributions to shareholders from: | | | |
| Net realized gain: | | | |
| Class A shares | (30,865,909) |
| | (14,945,015) |
|
| Class B shares (a) | (251,625) |
| | (177,298) |
|
| Class C shares | (4,946,653) |
| | (2,189,103) |
|
| Class I shares | (20,496,886) |
| | (8,563,686) |
|
| Class Y shares | (1,536,994) |
| | (1,114,603) |
|
| Total distributions | (58,098,067) |
| | (26,989,705) |
|
| | | | |
| Capital share transactions: | | | |
| Shares sold: | | | |
| Class A shares | 40,170,404 |
| | 32,067,475 |
|
| Class B shares (a) | 4,705 |
| | 63,533 |
|
| Class C shares | 5,890,514 |
| | 4,614,839 |
|
| Class I shares | 112,345,198 |
| | 40,956,937 |
|
| Class Y shares | 5,526,066 |
| | 10,488,394 |
|
| Reinvestment of distributions: | | | |
| Class A shares | 28,980,344 |
| | 14,069,011 |
|
| Class B shares (a) | 238,368 |
| | 170,836 |
|
| Class C shares | 4,103,071 |
| | 1,820,485 |
|
| Class I shares | 11,967,403 |
| | 4,405,337 |
|
| Class Y shares | 1,529,030 |
| | 1,101,720 |
|
| Redemption fees: | | | |
| Class A shares | 210 |
| | 997 |
|
| Class C shares | 2 |
| | 43 |
|
| Class I shares | 191 |
| | 200 |
|
| Shares redeemed: | | | |
| Class A shares | (40,881,939) |
| | (39,220,043) |
|
| Class B shares (a) | (1,716,203) |
| | (793,635) |
|
| Class C shares | (3,811,253) |
| | (3,738,490) |
|
| Class I shares | (26,371,471) |
| | (22,197,082) |
|
| Class Y shares | (3,626,477) |
| | (15,100,337) |
|
| Total capital share transactions | 134,348,163 |
| | 28,710,220 |
|
| | | | |
| TOTAL INCREASE (DECREASE) IN NET ASSETS | 90,177,022 |
| | 32,224,141 |
|
| | | | |
| See notes to financial statements. |
calvert.com CALVERT CAPITAL ACCUMULATION FUND ANNUAL REPORT 15
|
| | | | | | | | |
| NET ASSETS | YEAR ENDED
SEPTEMBER 30, 2015 | | YEAR ENDED
SEPTEMBER 30, 2014 |
| Beginning of year |
| $412,346,368 |
| |
| $380,122,227 |
|
| End of year (including undistributed net investment income of $0 and $0, respectively) |
| $502,523,390 |
| |
| $412,346,368 |
|
| CAPITAL SHARE ACTIVITY | | | |
| Shares sold: | | | |
| Class A shares | 1,124,697 |
| | 870,814 |
|
| Class B shares (a) | 151 |
| | 2,073 |
|
| Class C shares | 215,070 |
| | 154,647 |
|
| Class I shares | 2,747,606 |
| | 1,005,460 |
|
| Class Y shares | 152,704 |
| | 280,613 |
|
| Reinvestment of distributions: | | | |
| Class A shares | 877,129 |
| | 395,976 |
|
| Class B shares (a) | 9,308 |
| | 5,877 |
|
| Class C shares | 160,905 |
| | 63,299 |
|
| Class I shares | 319,557 |
| | 111,896 |
|
| Class Y shares | 45,862 |
| | 30,809 |
|
| Shares redeemed: | | | |
| Class A shares | (1,148,492) |
| | (1,062,252) |
|
| Class B shares (a) | (60,520) |
| | (26,330) |
|
| Class C shares | (138,297) |
| | (124,957) |
|
| Class I shares | (662,101) |
| | (541,398) |
|
| Class Y shares | (101,580) |
| | (417,051) |
|
| Total capital share activity | 3,541,999 |
| | 749,476 |
|
| |
| (a) | Class B Shares were converted into Class A Shares at the close of business on April 20, 2015. |
| See notes to financial statements. |
16 calvert.com CALVERT CAPITAL ACCUMULATION FUND ANNUAL REPORT
NOTES TO FINANCIAL STATEMENTS
NOTE A — SIGNIFICANT ACCOUNTING POLICIES
General: Calvert Capital Accumulation Fund (the “Fund”), a series of Calvert World Values Fund, Inc., is registered under the Investment Company Act of 1940 as a non diversified, open-end management investment company. Calvert World Values Fund, Inc. is comprised of four separate series. The operations of each series are accounted for separately. The Fund applies the accounting and reporting guidance in the Financial Accounting Standards Board (FASB) Accounting Standards Codification Topic 946, Financial Services – Investment Companies (ASC 946).
The Fund offers four classes of shares of capital stock - Classes A, C, I, and Y. The Fund also offered Class B shares; however, all existing Class B shares of the Fund were automatically converted to Class A shares of the Fund at the close of business on April 20, 2015, without the imposition of the applicable Class A sales load or the Class B contingent deferred sales charge. Class B shares were closed at that time and are no longer available. Class A shares are sold with a maximum front-end sales charge of 4.75%. Class C shares are sold without a front-end sales charge and, with certain exceptions, will be charged a deferred sales charge on shares sold within one year of purchase. Class C shares have higher levels of expenses than Class A shares. Class I shares require a minimum account balance of $1,000,000. The $1 million minimum initial investment is waived for retirement plans that trade through omnibus accounts and may be waived in certain other instances where it is believed to be in the best interest of the Fund and its shareholders. Class I shares have no front-end or deferred sales charge and have lower levels of expenses than Class A Shares. Class Y shares are generally only available to wrap or similar fee-based programs offered by financial intermediaries, foundations, and endowments that have entered into an agreement with the Fund’s Distributor to offer Class Y shares. Class Y shares have no front-end or deferred sales charge and have lower levels of expenses than Class A shares. Each class has different: (a) dividend rates, due to differences in Distribution Plan expenses and other class-specific expenses, (b) exchange privileges; and (c) class-specific voting rights.
Security Valuation: Net asset value per share is determined every business day as of the close of the regular session of the New York Stock Exchange (generally 4:00 p.m. Eastern time). The Fund uses independent pricing services approved by the Board of Directors (“the Board”) to value its investments wherever possible. Investments for which market quotations are not available or deemed not reliable are fair valued in good faith under the direction of the Board.
The Board has adopted Valuation Procedures (the “Procedures”) to determine the fair value of securities and other financial instruments for which market prices are not readily available or which may not be reliably priced. The Board has delegated the day-to-day responsibility for determining the fair value of assets of the Fund to Calvert Investment Management, Inc. (the “Advisor” or “Calvert”) and has provided these Procedures to govern Calvert in its valuation duties.
Calvert has chartered an internal Valuation Committee to oversee the implementation of these Procedures and to assist it in carrying out the valuation responsibilities that the Board has delegated.
The Valuation Committee meets on a regular basis to review illiquid securities and other investments which may not have readily available market prices. The Valuation Committee’s fair valuation determinations are subject to review, approval and ratification by the Board at its next regularly scheduled meeting covering the calendar quarter in which the fair valuation was determined.
The Valuation Committee utilizes various methods to measure the fair value of the Fund’s investments. U.S. generally accepted accounting principles (GAAP) establishes a disclosure hierarchy that categorizes the inputs to valuation techniques used to value assets and liabilities at measurement date. These inputs are summarized in the three broad levels listed below:
Level 1 - quoted prices in active markets for identical securities
Level 2 - other significant observable inputs (including quoted prices for similar securities, interest rates, prepayment speeds, credit risk, etc.)
Level 3 - significant unobservable inputs (including the Fund’s own assumptions in determining the fair value of investments)
The inputs or methodologies used for valuing securities are not necessarily an indication of the risk associated with investing in those securities.
Changes in valuation techniques may result in transfers in or out of an investment’s assigned level within the hierarchy during the year. Transfers in and/or out of levels are determined based on the fair value of such securities at the end of the year. Valuation techniques used to value the Fund’s investments by major category are as follows:
Equity securities, including restricted securities, for which market quotations are readily available, are valued at the last reported sale price or official closing price as reported by an independent pricing service on the primary market or exchange on which they are traded and are categorized as Level 1 in the hierarchy. In the event there were no sales during the day or closing prices are not available, securities are valued at the last quoted bid price or the last available price and are categorized as Level 2 in the hierarchy. Foreign securities are valued based on quotations from the principal market in which such
calvert.com CALVERT CAPITAL ACCUMULATION FUND ANNUAL REPORT 17
securities are normally traded. If events occur after the close of the principal market in which foreign securities are traded, and before the close of business of the Fund, that are expected to materially affect the value of those securities, then they are valued at their fair value taking these events into account and are categorized as Level 2 in the hierarchy. For restricted securities and private placements where observable inputs are limited, assumptions about market activity and risk are used and such securities are categorized as Level 3 in the hierarchy.
Debt securities, including restricted securities, are valued based on evaluated prices received from independent pricing services or from dealers who make markets in such securities and are generally categorized as Level 2 in the hierarchy. Short-term securities of sufficient credit quality with remaining maturities of sixty days or less for which quotations are not readily available are valued at amortized cost, which approximates fair value, and are categorized as Level 2 in the hierarchy.
If a market value cannot be determined for a security using the methodologies described above, or if, in the good faith opinion of the Advisor, the market value does not constitute a readily available market quotation, or if a significant event has occurred that would materially affect the value of the security, the security will be fair valued as determined in good faith by the Valuation Committee.
The Valuation Committee considers a number of factors, including significant unobservable valuation inputs when arriving at fair value. It considers all significant facts that are reasonably available and relevant to the determination of fair value.
The Valuation Committee primarily employs a market-based approach which may use related or comparable assets or liabilities, recent transactions, market multiples, book values, and other relevant information for the investment to determine the fair value of the investment. When more appropriate, the Fund may employ an income-based or cost approach. An income-based valuation approach discounts anticipated future cash flows of the investment to calculate a present amount (discounted). The measurement is based on the value indicated by current market expectations about those future amounts. Discounts may also be applied due to the nature or duration of any restrictions on the disposition of the investments. A cost based approach is based on the amount that currently would be required to replace the service capacity of an asset (current replacement cost). From the seller’s perspective, the price that would be received for the asset is determined based on the cost to a buyer to acquire or construct a substitute asset of comparable utility, adjusted for obsolescence.
The values assigned to fair value investments are based on available information and do not necessarily represent amounts that might ultimately be realized. Further, due to the inherent uncertainty of valuations of such investments, the fair values may differ significantly from the values that would have been used had an active market existed, and the differences could be material. The Valuation Committee employs various methods for calibrating these valuation approaches including a regular review of key inputs and assumptions, transactional back-testing or disposition analysis and reviews of any related market activity.
At September 30, 2015, securities valued at $1,375,231 or 0.3% of net assets, were fair valued in good faith under the direction of the Board.
The following table summarizes the market value of the Fund's holdings as of September 30, 2015, based on the inputs used to value them:
|
| | | | | | | | | | | | | |
| VALUATION INPUTS |
| INVESTMENT IN SECURITIES | LEVEL 1 | LEVEL 2 | LEVEL 3 | TOTAL |
| Equity Securities* |
| $488,683,100 |
| $— |
| $— |
|
| $488,683,100 |
|
| High Social Impact Investments | — |
| 1,375,231 |
| — |
| 1,375,231 |
|
| Time Deposit | — |
| 13,997,874 |
| — |
| 13,997,874 |
|
| TOTAL |
| $488,683,100 |
|
| $15,373,105 |
| $— |
|
| $504,056,205 |
|
| | | | | | |
| * | For further breakdown of equity securities by industry, please refer to the Statement of Net Assets. |
There were no transfers between levels during the year.
Restricted Securities: The Fund may invest in securities that are subject to legal or contractual restrictions on resale. Generally, these securities may only be sold publicly upon registration under the Securities Act of 1933 or in transactions exempt from such registration. Information regarding restricted securities is included at the end of the Statement of Net Assets.
The Fund may invest in Community Investment Notes issued by the Calvert Social Investment Foundation (the “CSI Foundation”). The CSI Foundation is a 501(c)(3) non-profit organization that receives in-kind support from Calvert and its subsidiaries. The Fund has received an exemptive order from the Securities and Exchange Commission permitting the Fund to make investments in these notes under certain conditions.
Security Transactions and Investment Income: Security transactions are accounted for on trade date. Realized gains and losses are recorded on an identified cost basis and may include proceeds from litigation. Dividend income is recorded on the ex-dividend
18 calvert.com CALVERT CAPITAL ACCUMULATION FUND ANNUAL REPORT
date. Distributions received on securities that represent a return of capital or capital gain are recorded as a reduction of cost of investments and/or as a realized gain. Interest income, which includes amortization of premium and accretion of discount on debt securities, is accrued as earned. Investment income and realized and unrealized gains and losses are allocated to separate classes of shares based upon the relative net assets of each class. Expenses arising in connection with a specific class are charged directly to that class. Expenses common to the classes are allocated to each class in proportion to their relative net assets.
Distributions to Shareholders: Distributions to shareholders are recorded by the Fund on ex-dividend date. Dividends from net investment income and distributions from net realized capital gains, if any, are paid at least annually. Distributions are determined in accordance with income tax regulations which may differ from U.S. generally accepted accounting principles; accordingly, periodic reclassifications are made within the Fund's capital accounts to reflect income and gains available for distribution under income tax regulations.
Estimates: The preparation of financial statements in conformity with U.S. generally accepted accounting principles requires management to make estimates and assumptions that affect the reported amounts of assets and liabilities and disclosure of contingent assets and liabilities at the date of the financial statements and the reported amounts of increases and decreases in net assets from operations during the reporting period. Actual results could differ from those estimates.
Redemption Fees: The Fund charged a 2% redemption fee on redemptions, including exchanges, made within 30 days of purchase (within seven days for Class I shares). The redemption fee was accounted for as an addition to paid-in capital. This fee was eliminated effective February 2, 2015.
Federal Income Taxes: No provision for federal income or excise tax is required since the Fund intends to continue to qualify as a regulated investment company under the Internal Revenue Code and to distribute substantially all of its taxable earnings.
Management has analyzed the Fund's tax positions taken for all open federal income tax years and has concluded that no provision for federal income tax is required in the Fund's financial statements. A Fund's federal tax return is subject to examination by the Internal Revenue Service for a period of three years.
NOTE B — RELATED PARTY TRANSACTIONS
Calvert Investment Management, Inc. (the “Advisor”) is wholly-owned by Calvert Investments, Inc., which is indirectly wholly-owned by Ameritas Mutual Holding Company. The Advisor provides investment advisory services and pays the salaries and fees of officers and Directors of the Fund who are employees of the Advisor or its affiliates. For its services, the Advisor receives an annual fee, payable monthly, of .65% of the Fund’s average daily net assets. Under the terms of the agreement, $271,908 was payable at year end.
The Advisor has contractually agreed to limit net annual fund operating expenses through January 31, 2016. The contractual expense caps are 1.59%, 2.59%, .86%, and 1.44% for Class A, C, I, and Y, respectively. For the purpose of this expense limit, operating expenses do not include interest expense, brokerage commissions, taxes, or extraordinary expenses. This expense limitation does not limit acquired fund fees or expenses, if any.
During the year ended September 30, 2015, the Advisor voluntarily reimbursed expenses of $5,303 for Class B of the Fund.
Calvert Investment Administrative Services, Inc., an affiliate of the Advisor, provides administrative services to the Fund for an annual fee, payable monthly, of .25% for Classes A, C, and Y, and .10% for Class I shares based on their average daily net assets. Under the terms of the agreement, $75,413 was payable at year end.
Calvert Investment Distributors, Inc. (“CID”), an affiliate of the Advisor, is the distributor and principal underwriter for the Fund. Pursuant to Rule 12b-1 under the Investment Company Act of 1940, the Fund has adopted a Distribution Plan that permits the Fund to pay certain expenses associated with the distribution and servicing of its shares. The expenses paid may not exceed .35% and 1.00% annually of average daily net assets of Class A and C, respectively. The amount actually paid by the Fund is an annualized fee, payable monthly, of .25% and 1.00% of the Fund’s average daily net assets of Class A and C shares, respectively. Class I and Class Y shares do not have Distribution Plan expenses. Under the terms of the agreement, $71,941 was payable at year end.
CID received $80,148 as its portion of commissions charged on sales of the Fund’s Class A shares for the year ended September 30, 2015.
Calvert Investment Services, Inc. (“CIS”), an affiliate of the Advisor, acts as shareholder servicing agent for the Fund. For its services, CIS received a fee of $84,876 for the year ended September 30, 2015. Under the terms of the agreement, $7,045 was payable at year end. Boston Financial Data Services, Inc. is the transfer and dividend disbursing agent.
Each Director of the Fund who is not an employee of the Advisor or its affiliates receives an annual retainer of $52,000 ($48,000 prior to January 1, 2015) plus a meeting fee of up to $3,000 for each Board meeting attended. Additional fees of $6,000 ($5,000 prior to January 1, 2015) annually may be paid to the Committee chairs ($10,000 for the Board Chair and the Special Equities
calvert.com CALVERT CAPITAL ACCUMULATION FUND ANNUAL REPORT 19
Committee chair) and $2,500 annually may be paid to Committee members, plus a Committee meeting fee of $500 for each Committee meeting attended. Eligible Directors may participate in a Deferred Compensation Plan (the “Plan”). Obligations of the Plan will be paid solely out of the Fund’s assets. As of September 30, 2015, approximately $335,593 was deferred under the Plan. Directors’ fees are allocated to each of the funds served.
NOTE C — INVESTMENT ACTIVITY AND TAX INFORMATION
During the year, the cost of purchases and proceeds from sales of investments, other than short-term securities, were $408,619,459 and $338,092,924, respectively.
The tax character of dividends and distributions paid during the year ended September 30, 2015 and September 30, 2014 was as follows:
|
| | | | | | | |
| Distributions Paid From: | 2015 |
| | 2014 |
|
| Ordinary income |
| $11,530,872 |
| |
| $6,163,453 |
|
| Long-term capital gains | 46,567,195 |
| | 20,826,252 |
|
| Total |
| $58,098,067 |
| |
| $26,989,705 |
|
As of September 30, 2015, the tax basis components of distributable earnings/(accumulated losses) and the federal tax cost were as follows:
|
| | | |
| Unrealized appreciation |
| $65,777,529 |
|
| Unrealized (depreciation) | (35,313,679) |
|
| Net unrealized appreciation (depreciation) |
| $30,463,850 |
|
| | |
| Undistributed ordinary income |
| $8,431,325 |
|
| Undistributed long-term capital gain |
| $18,904,650 |
|
| | |
| Federal income tax cost of investments |
| $473,592,355 |
|
The differences between components of distributable earnings on a tax basis and the amounts reflected in the Statement of Net Assets are primarily due to temporary book-tax differences that will reverse in a subsequent period. These differences are mainly due to wash sales.
Reclassifications, as shown in the table below, have been made to the Fund's components of net assets to reflect income and gains available for distribution (or available capital loss carryovers, as applicable) under income tax law and regulations. These reclassifications are due to permanent book-tax differences and have no impact on net assets.
|
| | | |
| Undistributed net investment income |
| $1,153,687 |
|
| Accumulated net realized gain (loss) |
| ($1,153,687 | ) |
NOTE D — LINE OF CREDIT
A financing agreement is in place with the Calvert Funds and State Street Corporation (“SSC”). Under the agreement, SSC provides an unsecured line of credit facility, in the aggregate amount of $50 million ($25 million committed and $25 million uncommitted), accessible by the Funds for temporary or emergency purposes only. Borrowings bear interest at the higher of the London Interbank Offered Rate (LIBOR) or the overnight Federal Funds Rate plus 1.25% per annum. A commitment fee of .20% per annum is incurred on the unused portion of the committed facility. An administrative fee of $25,000 was paid in connection with the uncommitted facility. These fees are allocated to all participating funds. The Fund had no borrowings under the agreement during the year ended September 30, 2015.
NOTE E — SUBSEQUENT EVENTS
At a special meeting of the Fund’s Board of Directors (the “Board”) held on November 24, 2015, the Board approved the recommendation made by Calvert Investment Administrative Services, Inc. (“CIAS”) to standardize and rationalize the administrative fee payable by the Calvert Funds at 12 basis points for all series and all share classes of the Calvert Funds. The change is being implemented in two phases. First, CIAS will voluntarily waive the amount of the existing administrative fee above 12 basis points for the period from December 1, 2015 through January 31, 2016. Second, CIAS and the Fund have entered into an Amended and Restated Administrative Services Agreement that will establish a 12 basis point administrative fee for all classes of the Fund commencing on February 1, 2016. In the case of any series or share class that currently pays an
20 calvert.com CALVERT CAPITAL ACCUMULATION FUND ANNUAL REPORT
administrative fee to CIAS that is less than 12 basis points, CIAS has contractually agreed to waive the difference between that lower administrative fee and the 12 basis point fee until January 31, 2018.
In preparing the financial statements as of September 30, 2015, no other subsequent events or transactions occurred that would have required recognition or disclosure in these financial statements.
NOTICE TO SHAREHOLDERS (UNAUDITED)
For the fiscal year ended September 30, 2015, the Fund considers 42.3% of the ordinary dividends paid during the year as qualified dividend income and as eligible for the corporate dividends received deduction in accordance with Section 854 of the Internal Revenue Code. The Fund also considers $46,567,195 of the long-term capital gain distributions paid during the year as capital gain dividends in accordance with Section 852(b)(3)(C) of the Internal Revenue Code.
calvert.com CALVERT CAPITAL ACCUMULATION FUND ANNUAL REPORT 21
CALVERT CAPITAL ACCUMULATION FUND
FINANCIAL HIGHLIGHTS
|
| | | | | | | | | | | | | | | | | | | | |
| | YEARS ENDED |
| CLASS A SHARES | September 30, 2015 (z) | | September 30, 2014 (z) | | September 30, 2013 (z) | | September 30, 2012 (z) | | September 30, 2011 (z) |
| Net asset value, beginning |
| $36.99 |
| |
| $36.83 |
| |
| $31.45 |
| |
| $26.00 |
| |
| $24.93 |
|
| Income from investment operations: | | | | | | | | | |
| Net investment loss | (.16 | ) | | (.14 | ) | | (.18 | ) | | (.26 | ) | | (.28 | ) |
| Net realized and unrealized gain (loss) | 1.91 |
| | 2.94 |
| | 7.49 |
| | 7.64 |
| | 1.35 |
|
| Total from investment operations | 1.75 |
| | 2.80 |
| | 7.31 |
| | 7.38 |
| | 1.07 |
|
| Distributions from: | | | | | | | | | |
| Net realized gain | (5.33 | ) | | (2.64 | ) | | (1.93 | ) | | (1.93 | ) | | — |
|
| Total distributions | (5.33 | ) | | (2.64 | ) | | (1.93 | ) | | (1.93 | ) | | — |
|
| Total increase (decrease) in net asset value | (3.58 | ) | | .16 |
| | 5.38 |
| | 5.45 |
| | 1.07 |
|
| Net asset value, ending |
| $33.41 |
| |
| $36.99 |
| |
| $36.83 |
| |
| $31.45 |
| |
| $26.00 |
|
Total return* | 4.90 | % | | 7.90 | % | | 24.74 | % | | 29.16 | % | | 4.29 | % |
| Ratios to average net assets: A | | | | | | | | | |
| Net investment loss | (.43 | %) | | (.36 | %) | | (.53 | %) | | (.85 | %) | | (.93 | %) |
| Total expenses | 1.41 | % | | 1.43 | % | | 1.48 | % | | 1.53 | % | | 1.58 | % |
| Expenses before offsets | 1.41 | % | | 1.43 | % | | 1.48 | % | | 1.53 | % | | 1.58 | % |
| Net expenses | 1.41 | % | | 1.43 | % | | 1.48 | % | | 1.53 | % | | 1.58 | % |
| Portfolio turnover | 74 | % | | 81 | % | | 73 | % | | 63 | % | | 65 | % |
| Net assets, ending (in thousands) |
| $223,328 |
| |
| $215,683 |
| |
| $207,257 |
| |
| $157,016 |
| |
| $128,755 |
|
| | |
| (z) | Per share figures are calculated using the Average Shares Method. |
| * | Total return is not annualized for periods of less than one year and does not reflect deduction of any front-end or deferred sales charge. |
| A | Total expenses do not reflect amounts reimbursed and/or waived by the Advisor or reductions from expense offset arrangements. Expenses before offsets reflect expenses after reimbursement and/or waiver by the Advisor but prior to reductions from expense offset arrangements. Net expenses are net of all reductions and represent the net expenses paid by the Fund. |
| | | | | | | | | | | |
| See notes to financial statements. |
22 calvert.com CALVERT CAPITAL ACCUMULATION FUND ANNUAL REPORT
CALVERT CAPITAL ACCUMULATION FUND
FINANCIAL HIGHLIGHTS
|
| | | | | | | | | | | | | | | | | | | | |
| | YEARS ENDED |
| CLASS C SHARES | September 30, 2015 (z) | | September 30, 2014 (z) | | September 30, 2013 (z) | | September 30, 2012 (z) | | September 30, 2011 (z) |
| Net asset value, beginning |
| $29.76 |
| |
| $30.35 |
| |
| $26.44 |
| |
| $22.29 |
| |
| $21.55 |
|
| Income from investment operations: | | | | | | | | | |
| Net investment loss | (.34 | ) | | (.34 | ) | | (.36 | ) | | (.42 | ) | | (.46 | ) |
| Net realized and unrealized gain (loss) | 1.53 |
| | 2.39 |
| | 6.20 |
| | 6.50 |
| | 1.20 |
|
| Total from investment operations | 1.19 |
| | 2.05 |
| | 5.84 |
| | 6.08 |
| | .74 |
|
| Distributions from: | | | | | | | | | |
| Net realized gain | (5.33 | ) | | (2.64 | ) | | (1.93 | ) | | (1.93 | ) | | — |
|
| Total distributions | (5.33 | ) | | (2.64 | ) | | (1.93 | ) | | (1.93 | ) | | — |
|
| Total increase (decrease) in net asset value | (4.14 | ) | | (.59 | ) | | 3.91 |
| | 4.15 |
| | .74 |
|
| Net asset value, ending |
| $25.62 |
| |
| $29.76 |
| |
| $30.35 |
| |
| $26.44 |
| |
| $22.29 |
|
Total return* | 4.09 | % | | 7.06 | % | | 23.81 | % | | 28.11 | % | | 3.43 | % |
| Ratios to average net assets: A | | | | | | | | | |
| Net investment loss | (1.23 | %) | | (1.12 | %) | | (1.30 | %) | | (1.64 | %) | | (1.79 | %) |
| Total expenses | 2.21 | % | | 2.19 | % | | 2.25 | % | | 2.33 | % | | 2.44 | % |
| Expenses before offsets | 2.21 | % | | 2.19 | % | | 2.25 | % | | 2.33 | % | | 2.44 | % |
| Net expenses | 2.21 | % | | 2.19 | % | | 2.25 | % | | 2.33 | % | | 2.44 | % |
| Portfolio turnover | 74 | % | | 81 | % | | 73 | % | | 63 | % | | 65 | % |
| Net assets, ending (in thousands) |
| $29,837 |
| |
| $27,588 |
| |
| $25,311 |
| |
| $18,630 |
| |
| $12,973 |
|
| | | | | | | | | | | |
| (z) | Per share figures are calculated using the Average Shares Method. |
| * | Total return is not annualized for periods of less than one year and does not reflect deduction of any front-end or deferred sales charge. |
| A | Total expenses do not reflect amounts reimbursed and/or waived by the Advisor or reductions from expense offset arrangements. Expenses before offsets reflect expenses after reimbursement and/or waiver by the Advisor but prior to reductions from expense offset arrangements. Net expenses are net of all reductions and represent the net expenses paid by the Fund. |
| | | | | | | | | | | |
| See notes to financial statements. |
calvert.com CALVERT CAPITAL ACCUMULATION FUND ANNUAL REPORT 23
CALVERT CAPITAL ACCUMULATION FUND
FINANCIAL HIGHLIGHTS
|
| | | | | | | | | | | | | | | | | | | | |
| | YEARS ENDED |
| CLASS I SHARES | September 30, 2015 (z) | | September 30, 2014 (z) | | September 30, 2013 (z) | | September 30, 2012 (z) | | September 30, 2011 (z) |
| Net asset value, beginning |
| $41.19 |
| |
| $40.50 |
| |
| $34.18 |
| |
| $27.94 |
| |
| $26.59 |
|
| Income from investment operations: | | | | | | | | | |
| Net investment income (loss) | .06 |
| | .10 |
| | .03 |
| | (.05 | ) | | (.06 | ) |
| Net realized and unrealized gain (loss) | 2.13 |
| | 3.23 |
| | 8.22 |
| | 8.22 |
| | 1.41 |
|
| Total from investment operations | 2.19 |
| | 3.33 |
| | 8.25 |
| | 8.17 |
| | 1.35 |
|
| Distributions from: | | | | | | | | | |
| Net realized gain | (5.33 | ) | | (2.64 | ) | | (1.93 | ) | | (1.93 | ) | | — |
|
| Total distributions | (5.33 | ) | | (2.64 | ) | | (1.93 | ) | | (1.93 | ) | | — |
|
| Total increase (decrease) in net asset value | (3.14 | ) | | .69 |
| | 6.32 |
| | 6.24 |
| | 1.35 |
|
| Net asset value, ending |
| $38.05 |
| |
| $41.19 |
| |
| $40.50 |
| |
| $34.18 |
| |
| $27.94 |
|
Total return* | 5.53 | % | | 8.53 | % | | 25.55 | % | | 30.00 | % | | 5.08 | % |
| Ratios to average net assets: A | | | | | | | | | |
| Net investment income (loss) | .14 | % | | .24 | % | | .08 | % | | (.16 | %) | | (.20 | %) |
| Total expenses | .83 | % | | .82 | % | | .85 | % | | .88 | % | | .99 | % |
| Expenses before offsets | .83 | % | | .82 | % | | .85 | % | | .86 | % | | .86 | % |
| Net expenses | .83 | % | | .82 | % | | .85 | % | | .86 | % | | .86 | % |
| Portfolio turnover | 74 | % | | 81 | % | | 73 | % | | 63 | % | | 65 | % |
| Net assets, ending (in thousands) |
| $236,228 |
| |
| $156,677 |
| |
| $130,705 |
| |
| $83,181 |
| |
| $21,144 |
|
| | | | | | | | | | | |
| (z) | Per share figures are calculated using the Average Shares Method. |
| * | Total return is not annualized for periods of less than one year and does not reflect deduction of any front-end or deferred sales charge. |
| A | Total expenses do not reflect amounts reimbursed and/or waived by the Advisor or reductions from expense offset arrangements. Expenses before offsets reflect expenses after reimbursement and/or waiver by the Advisor but prior to reductions from expense offset arrangements. Net expenses are net of all reductions and represent the net expenses paid by the Fund. |
| | | | | | | | | | | |
| See notes to financial statements. |
24 calvert.com CALVERT CAPITAL ACCUMULATION FUND ANNUAL REPORT
CALVERT CAPITAL ACCUMULATION FUND
FINANCIAL HIGHLIGHTS
|
| | | | | | | | | | | | | | | | | | | | |
| | PERIODS ENDED |
| CLASS Y SHARES | September 30, 2015 (z) | | September 30, 2014 (z) | | September 30, 2013 (z) | | September 30, 2012 (z) | | September 30, 2011 (z)# |
| Net asset value, beginning |
| $37.26 |
| |
| $37.04 |
| |
| $31.56 |
| |
| $26.03 |
| |
| $29.79 |
|
| Income from investment operations: | | | | | | | | | |
| Net investment loss | (.07 | ) | | (.07 | ) | | (.12 | ) | | (.18 | ) | | (.15 | ) |
| Net realized and unrealized gain (loss) | 1.92 |
| | 2.93 |
| | 7.53 |
| | 7.64 |
| | (3.61 | ) |
| Total from investment operations | 1.85 |
| | 2.86 |
| | 7.41 |
| | 7.46 |
| | (3.76 | ) |
| Distributions from: | | | | | | | | | |
| Net realized gain | (5.33 | ) | | (2.64 | ) | | (1.93 | ) | | (1.93 | ) | | — |
|
| Total distributions | (5.33 | ) | | (2.64 | ) | | (1.93 | ) | | (1.93 | ) | | — |
|
| Total increase (decrease) in net asset value | (3.48 | ) | | .22 |
| | 5.48 |
| | 5.53 |
| | (3.76 | ) |
| Net asset value, ending |
| $33.78 |
| |
| $37.26 |
| |
| $37.04 |
| |
| $31.56 |
| |
| $26.03 |
|
Total return* | 5.16 | % | | 8.02 | % | | 24.98 | % | | 29.45 | % | | (12.62 | %) |
| Ratios to average net assets: A | | | | | | | | | |
| Net investment loss | (.20 | %) | | (.17 | %) | | (.36 | %) | | (.59 | %) | | (.74%)(a) |
|
| Total expenses | 1.18 | % | | 1.26 | % | | 1.29 | % | | 1.29 | % | | 1.49%(a) |
|
| Expenses before offsets | 1.18 | % | | 1.26 | % | | 1.29 | % | | 1.29 | % | | 1.44%(a) |
|
| Net expenses | 1.18 | % | | 1.26 | % | | 1.29 | % | | 1.29 | % | | 1.44%(a) |
|
| Portfolio turnover | 74 | % | | 81 | % | | 73 | % | | 63 | % | | 65%** |
|
| Net assets, ending (in thousands) |
| $13,130 |
| |
| $10,871 |
| |
| $14,719 |
| |
| $8,071 |
| |
| $7,968 |
|
| | |
| # | From January 31, 2011 inception. |
| (z) | Per share figures are calculated using the Average Shares Method. |
| * | Total return is not annualized for periods of less than one year and does not reflect deduction of any front-end or deferred sales charge. |
| A | Total expenses do not reflect amounts reimbursed and/or waived by the Advisor or reductions from expense offset arrangements. Expenses before offsets reflect expenses after reimbursement and/or waiver by the Advisor but prior to reductions from expense offset arrangements. Net expenses are net of all reductions and represent the net expenses paid by the Fund. |
| (a) | Annualized. |
| ** | Portfolio turnover is not annualized for periods of less than one year. |
| | | | | | | | | | | |
| See notes to financial statements. |
calvert.com CALVERT CAPITAL ACCUMULATION FUND ANNUAL REPORT 25
EXPLANATION OF FINANCIAL TABLES
SCHEDULE OF INVESTMENTS
The Schedule of Investments is a snapshot of all securities held in the fund at their market value, on the last day of the reporting period. Securities are listed by asset type (e.g., common stock, corporate bonds, U.S. government obligations) and may be further broken down into sub-groups and by industry classification.
STATEMENT OF ASSETS AND LIABILITIES
The Statement of Assets and Liabilities is often referred to as the fund’s balance sheet. It lists the value of what the fund owns, is due and owes on the last day of the reporting period. The fund’s assets include the market value of securities owned, cash, receivables for securities sold and shareholder subscriptions, and receivables for dividends and interest payments that have been earned, but not yet received. The fund’s liabilities include payables for securities purchased and shareholder redemptions, and expenses owed but not yet paid. The statement also reports the fund’s net asset value (NAV) per share on the last day of the reporting period. The NAV is calculated by dividing the fund’s net assets (assets minus liabilities) by the number of shares outstanding. This statement is accompanied by a Schedule of Investments. Alternatively, if certain conditions are met, a Statement of Net Assets may be presented in lieu of this statement and the Schedule of Investments.
STATEMENT OF NET ASSETS
The Statement of Net Assets provides a detailed list of the fund’s holdings, including each security’s market value on the last day of the reporting period. The Statement of Net Assets includes a Schedule of Investments. Other assets are added and other liabilities subtracted from the investments total to calculate the fund’s net assets. Finally, net assets are divided by the outstanding shares of the fund to arrive at its share price, or Net Asset Value (NAV) per share.
At the end of the Statement of Net Assets is a table displaying the composition of the fund’s net assets. Paid in Capital is the money invested by shareholders and represents the bulk of net assets. Undistributed Net Investment Income and Accumulated Net Realized Gains usually approximate the amounts the fund had available to distribute to shareholders as of the statement date. Accumulated Realized Losses will appear as negative balances. Unrealized Appreciation (Depreciation) is the difference between the market value of the fund’s investments and their cost, and reflects the gains (losses) that would be realized if the fund were to sell all of its investments at their statement-date -values.
STATEMENT OF OPERATIONS
The Statement of Operations summarizes the fund’s investment income earned and expenses incurred in operating the fund. Investment income includes dividends earned from stocks and interest earned from interest-bearing securities in the fund. Expenses incurred in operating the fund include the advisory fee paid to the investment advisor, administrative services fees, distribution plan expenses (if applicable), transfer agent fees, shareholder servicing expenses, custodial, legal, and audit fees, and the printing and postage expenses related to shareholder reports. Expense offsets (fees paid indirectly) may also be shown. Credits earned from offset arrangements may be used to reduce the fund’s expenses. This statement also shows net gains (losses) realized on the sale of investments and the increase or decrease in the unrealized appreciation (depreciation) on investments held during the period.
STATEMENT OF CHANGES IN NET ASSETS
The Statement of Changes in Net Assets shows how the fund’s total net assets changed during the two most recent reporting periods. Changes in the fund’s net assets are attributable to investment operations, distributions and capital share transactions.
The Operations section of the report summarizes information detailed in the Statement of Operations. The Distribution section shows the dividend and capital gain distributions made to shareholders. The amounts shown as distributions in this section may not match the net investment income and realized gains amounts shown in the Operations section because distributions are determined on a tax basis and certain investments or transactions may be treated differently for financial statement and tax purposes. The Capital Share Transactions section shows the amount shareholders invested in the fund, either by purchasing shares or by reinvesting distributions, and the amounts redeemed. The corresponding numbers of shares issued, reinvested and redeemed are shown at the end of the report.
FINANCIAL HIGHLIGHTS
The Financial Highlights table provides a per-share breakdown per class of the components that affect the fund’s net asset value for current and past reporting periods. The table provides total return, total distributions, expense ratios, portfolio turnover and net assets for the applicable period. Total return is a measure of a fund’s performance that encompasses all elements of return: dividends, capital gain distributions and changes in net asset value. Total return is the change in value of an investment over a given period, assuming reinvestment of any dividends and capital gain distributions, expressed as a percentage of the initial investment. Total distributions include distributions from net investment income and net realized gains. Long-term gains are earned on securities held in the fund more than one year. Short-term gains, on the sale of securities held less than one year, are treated as ordinary dividend income for tax purposes. The expense ratio is a fund’s cost of doing business, expressed as a
26 calvert.com CALVERT CAPITAL ACCUMULATION FUND ANNUAL REPORT (UNAUDITED)
percentage of net assets. These expenses directly reduce returns to shareholders. Portfolio turnover measures the trading activity in a fund’s investment portfolio—how often securities are bought and sold by a fund. Portfolio turnover is affected by market conditions, changes in the size of the fund, the nature of the fund’s investments and the investment style of the portfolio manager.
PROXY VOTING
The Proxy Voting Guidelines of the Calvert Funds that the Fund uses to determine how to vote proxies relating to portfolio securities are provided as an Appendix to the Fund’s Statement of Additional Information. The Statement of Additional Information can be obtained free of charge by calling the Fund at 1-800-368-2745, by visiting the Calvert website at www.calvert.com; or by visiting the SEC’s website at www.sec.gov.
Information regarding how the Fund voted proxies relating to portfolio securities during the most recent 12-month period ended June 30 is available on the Fund’s website at www.calvert.com and on the SEC’s website at www.sec.gov.
AVAILABILITY OF QUARTERLY PORTFOLIO HOLDINGS
The Fund files its complete schedule of portfolio holdings with the SEC for the first and third quarters of each fiscal year on Form N-Q. The Fund’s Form N-Q is available on the SEC’s website at www.sec.gov. The Fund’s Form N-Q may be reviewed and copied at the SEC’s Public Reference Room in Washington, DC; information on the operation of the Public Reference Room may be obtained by calling 1-800-SEC-0330.
calvert.com CALVERT CAPITAL ACCUMULATION FUND ANNUAL REPORT (UNAUDITED) 27
DIRECTOR AND OFFICER INFORMATION TABLE
|
| | | | | |
| Name & Age | Position With Fund | Position Start Date | Principal Occupation During Last 5 Years | # of Calvert Portfolios Overseen | Other Directorships During the Past Five Years |
| INDEPENDENT TRUSTEES/DIRECTORS |
REBECCA L. ADAMSON AGE: 66 | Trustee Director Director Director | 1989 CSIF 2000 IMPACT 2000 CRIS 2005 CWVF | President of the national non-profit, First People’s Worldwide, formerly First Nations Financial Project. Founded by her in 1980, First People’s Worldwide is the only American Indian alternative development institute in the country. | 18 | • Bay & Paul Foundation |
RICHARD L. BAIRD, JR. AGE: 67 | Trustee & Chair Director & Chair Director & Chair Director & Chair
| 1982 CSIF
2000 CRIS
2005 CWVF
2005 IMPACT | Former President and CEO of Adagio Health Inc. (retired in 2014) in Pittsburgh, PA, a non-profit corporation which provides family planning services, nutrition, maternal/child health care, and various health screening services and community preventive health programs. | 25 | |
JOHN G. GUFFEY, JR. AGE: 67 | Director Trustee Director Director | 1992 CWVF 1982 CSIF 2000 CRIS 2005 IMPACT | President of Aurora Press Inc., a privately held publisher of trade paperbacks. | 25 | • Ariel Funds (3) (asset management) (through 12/31/11) • Calvert Social Investment Foundation • Calvert Ventures, LLC |
MILES D. HARPER, III AGE: 52 | Director Trustee Director Director | 2000 IMPACT 2005 CSIF 2005 CRIS 2005 CWVF | Partner, Carr Riggs & Ingram (public accounting firm) since September 2013. Partner, Gainer Donnelly & Desroches (public accounting firm) (now Carr Riggs & Ingram), 1999-2013. | 18 | • Bridgeway Funds (14) (asset management) |
JOY V. JONES AGE: 65 | Director Trustee Director Director | 2000 IMPACT 1990 CSIF 2000 CRIS 2005 CWVF | Attorney. | 18 | • Director, Conduit Street Restaurants SUD 2 Limited • Director, Palm Management Corporation |
TERRENCE J. MOLLNER, Ed.D. AGE: 70 | Director Trustee Director Director | 1992 CWVF 1982 CSIF 2000 CRIS 2005 IMPACT | Founder, Chairperson and President of Trusteeship Institute, Inc., an educational organization focused on the personal skills and organizations described in Dr. Mollner’s book, The Love Skill: We Are Mastering the 7 Layers of Human Maturity, particularly businesses that freely chose to give priority to the common good. Chairperson, Stakeholders Capital, Inc., an asset management firm and financial services provider.
| 18 | • Calvert Social Investment Foundation • Ben & Jerry’s Homemade, Inc. (food products) |
SYDNEY A. MORRIS AGE: 66 | Trustee Director Director Director | 1982 CSIF 2000 CRIS 2005 CWVF 2005 IMPACT | The Rev. Dr. Morris is a Unitarian Universalist minister. | 18 | |
28 calvert.com CALVERT CAPITAL ACCUMULATION FUND ANNUAL REPORT (UNAUDITED)
|
| | | | | |
| Name & Age | Position With Fund | Position Start Date | Principal Occupation During Last 5 Years | # of Calvert Portfolios Overseen | Other Directorships During the Past Five Years |
| INTERESTED TRUSTEES/DIRECTORS |
D. WAYNE SILBY, Esq.* AGE: 67 | Director Trustee Director Director | 1992 CWVF 1982 CSIF 2000 CRIS 2000 IMPACT | Mr. Silby is the founding Chair of the Calvert Funds. He is the Chair-Elect and a principal of Syntao.com, a Beijing-based company promoting corporate social responsibility. | 25 | • Ameritas Mutual Holding Company (insurance) • Calvert Social Investment Foundation • ImpactAssets, Inc. (asset management) • Committee for the Future (charitable supporting organization) • Syntao.com China (HK) (sustainability consulting) • The ICE Organization (environmental services) |
JOHN H. STREUR* AGE: 55 | Director & President Trustee & President Director & President Director & President | 2015 CWVF
2015 CSIF
2015 CRIS
2015 IMPACT | President and Chief Executive Officer of Calvert Investments, Inc. (since January 2015) and Chief Compliance Officer for the Advisor and Calvert Investment Distributors, Inc. (since August 10, 2015) President and Director, Portfolio 21 Investments, Inc. (through October 2014) President, Chief Executive Officer and Director, Managers Investment Group LLC (through January 2012) President and Director, The Managers Funds and Managers AMG Funds (through January 2012). | 38 | • Portfolio 21 Investments, Inc. (asset management)(through October 2014) • Managers Investment Group LLC (asset management)(through January 2012) • The Managers Funds (asset management) (through January 2012) • Managers AMG Funds (asset management) (through January 2012) • Calvert Social Investment Foundation |
calvert.com CALVERT CAPITAL ACCUMULATION FUND ANNUAL REPORT (UNAUDITED) 29
|
| | | |
| Name & Age | Position With Fund | Position Start Date | Principal Occupation During Last 5 Years |
| OFFICERS |
SUSAN WALKER BENDER, Esq. AGE: 56 | Assistant Vice President & Assistant Secretary | 1988 CSIF 2000 CRIS 1992 CWVF 2000 Impact | Assistant Vice President, Assistant Secretary and Associate General Counsel of Calvert Investments, Inc. |
VICKI L. BENJAMIN AGE: 54 | Treasurer | 2015 | Executive Vice President and Chief Financial Officer of Calvert Investments, Inc. since March 2015. Prior to Calvert, Ms. Benjamin was a Senior Partner at KPMG. |
ROBERT D. BENSON, ESQ. AGE: 36 | Assistant Vice President & Assistant Secretary | 2014 | Assistant General Counsel (since 2014), Assistant Vice President & Assistant Secretary (since 2015) and Staff Attorney (prior to 2014), Calvert Investments, Inc. |
HOPE BROWN AGE: 42 | Chief Compliance Officer | 2014 | Chief Compliance Officer for the Calvert Funds (since 2014). Vice President and Chief Compliance Officer, Wilmington Funds (2012-2014). Vice President and Senior Compliance Officer, Wilmington Trust Investment Advisors, Inc. (2010-2012). Assistant Vice President, Lead Manager, Risk Management and Divisional Compliance, T. Rowe Price Associates, Inc. (2005-2010). |
THOMAS DAILEY AGE: 51 | Vice President | 2004 | Vice President of the Advisor and lead portfolio manager for Calvert’s municipal funds. |
MATTHEW DUCH Age: 40 | Vice President | 2011 | Vice President of the Advisor (since 2011) and portfolio manager for Calvert’s taxable fixed-income funds. |
IVY WAFFORD DUKE, Esq. AGE: 47 | Vice President & Secretary | 1996 CSIF 2000 CRIS 1996 CWVF 2000 Impact | Vice President, Acting Secretary and Acting General Counsel (Deputy General Counsel prior to 2015) of Calvert Investments, Inc. Prior to August 10, 2015, Ms. Duke was also Chief Compliance Officer for the Advisor and Calvert Investment Distributors, Inc. |
ROBERT J. ENDERSON, CFA AGE: 57 | Assistant Treasurer | 2014 | Acting Chief Financial Officer (September 2014-March 2015) and Vice President, Corporate Finance, of Calvert Investments, Inc. |
PATRICK FAUL AGE: 50 | Vice President | 2010 | Vice President and Head of Credit Research for the Advisor. |
TRACI L. GOLDT AGE: 42 | Assistant Secretary | 2004 | SEC Filing and Administrative Operations Manager (since 2011) and Executive Assistant to General Counsel (prior to 2011), Calvert Investments, Inc. |
VISHAL KHANDUJA, CFA AGE: 37 | Vice President | 2014 | Vice President of Calvert Investment Management, Inc. (since 2014) and portfolio manager for Calvert’s taxable fixed-income funds since 2012. Previously worked at Columbia Management as Portfolio Manager - Global Rates and Currency Team (2009-2012). |
LANCELOT A. KING, Esq. AGE: 45 | Assistant Vice President & Assistant Secretary | 2002 | Assistant Vice President, Assistant Secretary and Associate General Counsel of Calvert Investments, Inc. |
ANDREW K. NIEBLER, Esq. AGE: 48 | Assistant Vice President & Assistant Secretary | 2006 | Assistant Vice President, Assistant Secretary and Associate General Counsel of Calvert Investments, Inc. |
MARYBETH PILAT, CPA AGE: 47 | Fund Controller and Assistant Treasurer | 2015 | Director of Fund Administration, Calvert Investment Administrative Services, Inc. since August 2015. VP Expense & Budgeting, Global Fiduciary Platform, Legg Mason (May 2015 - July 2015). Vice President and Assistant Treasurer, Columbia Funds, Ameriprise, Columbia Management (2010 - April 2015). |
CATHERINE P. ROY AGE: 59 | Vice President | 2004 | Senior Vice President of the Advisor and Chief Investment Officer – Fixed Income. |
NATALIE A. TRUNOW AGE: 47 | Vice President | 2008 | Senior Vice President of the Advisor and Chief Investment Officer – Equities. |
* Mr. Streur is an interested person of the Funds since he is an Officer and Director of each Fund’s Advisor and certain affiliates. Mr. Silby is an interested person of the Funds since he is a Director of the parent company of each Fund’s Advisor. The address of Trustees/Directors and Officers is 4550 Montgomery Avenue, Suite 1000N, Bethesda, Maryland 20814, except Mr. Silby’s address is 1715 18th Street, N.W., Washington, DC 20009. Additional information about the Fund’s Trustees/Directors can be found in the Statement of Additional Information (SAI). You can get a free copy of the SAI at www.calvert.com, or by contacting your broker, or the Fund at 1-800-368-2745. |
30 calvert.com CALVERT CAPITAL ACCUMULATION FUND ANNUAL REPORT (UNAUDITED)
|
|
| This page intentionally left blank. |
|
|
| This page intentionally left blank. |
To Open an Account
800-368-2748
Service for Existing Account
Shareholders: 800-368-2745
Brokers: 800-368-2746
Registered Mail
Calvert Investments
c/o BFDS,
P.O. Box 219544
Kansas City, MO 64121-9544
Overnight Mail
Calvert Investments
c/o BFDS,
330 West 9th Street
Kansas City, MO 64105
Web Site
calvert.com
Principal Underwriter
Calvert Investment Distributors, Inc.
4550 Montgomery Avenue
Suite 1000 North
Bethesda, Maryland 20814
|
| | | |
| CALVERT CAPITAL ACCUMULATION FUND | CALVERT’S FAMILY OF FUNDS | | |
| | Municipal Funds Tax-Free Responsible Impact Bond Fund Taxable Bond Funds Bond Portfolio Income Fund Short Duration Income Fund Long-Term Income Fund Ultra-Short Income Fund High Yield Bond Fund Green Bond Fund Unconstrained Bond Fund Balanced and Asset Allocation Funds Balanced Portfolio Conservative Allocation Fund Moderate Allocation Fund Aggressive Allocation Fund | | Equity Funds Large Cap Core Portfolio Equity Portfolio Global Value Fund U.S. Large Cap Core Responsible Index Fund U.S. Large Cap Value Responsible Index Fund U.S. Large Cap Growth Responsible Index Fund U.S. Mid Cap Core Responsible Index Fund Developed Markets EX-U.S. Responsible Index Fund Capital Accumulation Fund International Equity Fund Small Cap Fund Global Energy Solutions Fund Global Water Fund International Opportunities Fund Global Equity Income Fund Emerging Markets Equity Fund
|
This report is intended to provide fund information to shareholders. It is not authorized for distribution to prospective investors unless preceded or accompanied by a prospectus. Note: The information on our website is not incorporated by reference into this report; our website address is included as an inactive textual reference only. Investors should carefully consider the investment objectives, risks, charges and expenses of the Calvert Funds. This and other important information is contained in the fund’s summary prospectus and prospectus, which can be obtained from your financial professional and should be read carefully before investing. You may also call Calvert at 800/368-2748 or visit calvert.com. Printed on recycled paper using soy inks. |
| | | | |
|
| | |
| | |
| | | |
Calvert International Opportunities Fund
| | |
| | | |
| | |
|
| |
Annual Report September 30, 2015 E-Delivery Sign-Up — Details Inside | |
|
|
| |
Choose Planet-friendly E-delivery! Sign up now for on-line statements, prospectuses, and fund reports. In less than five minutes you can help reduce paper mail and lower fund costs. Just go to calvert.com. If you already have an online account at Calvert, click on Login, to access your Account, and select the documents you would like to receive via e-mail. If you’re new to online account access, click on Login, then Register to create your user name and password. Once you’re in, click on the E-delivery sign-up on the Account Portfolio page and follow the quick, easy steps. Note: if your shares are not held directly at Calvert but through a brokerage firm, you must contact your broker for electronic delivery options available through their firm. |
|
| | | |
| | | TABLE OF CONTENTS |
| | | | |
| | | | President's Letter |
| | | | Portfolio Management Discussion |
| | | | Understanding Your Fund's Expenses |
| | | | Report of Independent Registered Public Accounting Firm |
| | | | Statement of Net Assets |
| | | | Statement of Operations |
| | | | Statements of Changes in Net Assets |
| | | | Notes to Financial Statements |
| | | | Financial Highlights |
| | | | Explanation of Financial Tables |
| | | | Proxy Voting |
| | | | Availability of Quarterly Portfolio Holdings |
| | | | Director and Officer Information Table |
|
| |
| John Streur President and Chief Executive Officer, Calvert Investments, Inc. |
Dear Shareholders,
Global economic growth is vital to the improvement of the lives of all people, especially so to those of the ultra-poor. However, how that growth is achieved is critical to the long-term health and sustainability of our collective societies. Business activity that does not show consideration for environmental and social impacts may have calamitous consequences, many of which we are witnessing now, including political and social unrest, unjust wealth distribution and diminished bio-diversity.
The returns of the markets (chart below) reflect the impact of the uncertainty created by a legacy of unsustainable development and the current lack of positive economic growth trends. The steep decline in the emerging market equities index (reflective of the flight of capital and currency weakness) is particularly impactful as these regions include some of the largest populations of individuals most in need of sustainable and inclusive economic development.
|
| | | | |
| MARKET BENCHMARKS | Total Returns for the period ended 9/30/2015 |
| 6 Months | Year-to-Date | 1 Year | 5 Year |
| S&P 500 | -6.18% | -5.29% | -0.61% | 13.34% |
| Russell 1000 | -6.72% | -5.24% | -0.61% | 13.42% |
| Russell 3000 | -7.12% | -5.45% | -0.49% | 13.28% |
| MSCI World ex USA | -9.88% | -6.32% | -9.73% | 3.92% |
| MSCI Emerging Markets | -17.11% | -15.22% | -18.98% | -3.25% |
| Barclays U.S. Aggregate Bond | -0.47% | 1.13% | 2.94% | 3.10% |
| Barclays Global Aggregate | -0.34% | -2.25% | -3.26% | 0.81% |
| Returns for periods greater than one year have been annualized. |
In an effort to mitigate this issue and foster the long term sustainability and justice of our global economic system, many of the world’s leaders participated with the United Nations (“UN”) to design and implement a 15-year plan to create the kind of economic development (http://www.calvert.com/media-relations/press-releases/calvert-ceo-participates-in-the-un-sustainable-development-summit) that should benefit the poorest people in the world, preserve opportunities for future generations, and provide stewardship to the environment. This effort, which kicked-off at the UN Summit earlier this month, involves bringing together private enterprise, governments, NGOs, development banks and people of all walks of life to achieve the “Sustainable Development Goals 2015” (SDGs). These goals include: eliminating extreme poverty, eliminating extreme hunger, fostering good health for all, promoting gender equality, and creating environmental sustainability and peace and stability throughout the world. The SDGs impact residents of every country in some manner, but no one more acutely than the denizens of the developing and emerging nations.
It was my privilege, as Calvert’s CEO, to be invited to the Summit, as one of 350 global leaders asked to participate in the development of this critical 15-year sustainability plan. During the course of this event, I announced that Calvert Investments would lead a project (http://www.calvert.com/perspective/social-impact/calvert-un-sustainable-development-goals) to map the Sustainable Development Goals to standards that companies can be measured by, and that investors may look to in order to
4 calvert.com CALVERT INTERNATIONAL OPPORTUNITIES FUND ANNUAL REPORT (UNAUDITED)
understand which companies are helping to create sustainable, responsible growth. It is integral to the success and achievement of the goals, that the largest holders of capital, i.e., corporations, help drive these initiatives.
The crucial role that corporations now play in creating social and environmental outcomes was highlighted at the UN sessions by the presence of CEOs and sustainability officers from around the world, and the vital role of investors and the capital markets was reflected by our presence and contribution. In addition to representing your interests at the UN event, Calvert has contributed to the understanding of the role that corporations and investors play in driving social and environmental conditions through our most recent research, “The Role of the Corporation in Society”, available to you on our website, (see http://www.calvert.com/perspective/governance/calvert-serafeim-series-report).
Despite the fact that the past year has not brought the financial returns that you or I would have wished for as investors, I believe that when we look back on 2015 several years from now we are likely to see it as a transformative year in terms of our economic and social systems. Individuals and organizations of all types — corporate, government, NGO, religious — are coming together due to the realization that we need a more sustainable and just system to serve the needs of all stakeholders. As a shareholder of Calvert Funds, you are very much part of this mission, as together we are a leader and innovator in connecting capital to mission, with the dual purpose of driving competitive investment returns with just and sustainable economic progress.
On behalf of all of us at Calvert Investments, thank you for the confidence you have placed in our management of your funds and the ongoing privilege to serve you. We appreciate the opportunity to work with you as we strive to meet your financial needs while also helping to render the world a better place for all people.
Respectfully,
John Streur
October 2015
calvert.com CALVERT INTERNATIONAL OPPORTUNITIES FUND ANNUAL REPORT (UNAUDITED) 5
|
| |
| PORTFOLIO MANAGEMENT DISCUSSION |
|
| |
| John P. Nichols, CFA Vice President - Equities |
Performance
For the 12-month period ended September 30, 2015, the Class A shares (at NAV) of the Calvert International Opportunities Fund declined 4.32%. Its benchmark, the MSCI EAFE Small/MidCap (Smid) Index, declined 0.49%. While the Fund was well positioned from a sector allocation perspective, the Fund’s holdings of emerging markets equities detracted from investment performance for the period.
Investment Process
Our investment process draws on two subadvisors, each of which manages its respective portfolio with high conviction investment processes. Advisory Research, a value oriented manager, and Trilogy Global Advisors, a growth oriented manager, develop a core portfolio of international small- and mid-cap companies that demonstrate positive environmental, social, and governance performance. Over the long term, we seek to allocate equally to these distinct investment processes while drawing on our views of opportunities and risks in the markets and economy to make short- to intermediate-term shifts in allocations between these two processes.
Market Review
International equity markets posted good returns relative to U.S. equity markets over the first six months of 2015, boosted by quantitative easing in Europe and further stimulus efforts in Japan. But, in the third quarter of 2015, because of fears about China’s slowdown, growing risks to corporate earnings, and uncertainty over Federal Reserve monetary policy, global equity markets posted their worst quarterly returns since 2011.
The strong U.S. dollar hurt U.S.-based investor returns in international equities for the reporting period. Because of the effects of currency translation, the MSCI EAFE Smid Index declined 0.49% in U.S. dollar terms during the reporting period while the constituent local markets returned 10.13%. Developed market equities, as measured by the MSCI EAFE Index, declined 8.27% (up 1.24% based on local market returns), while emerging market equities, as measured by the MSCI Emerging Markets Index, declined 18.98% (down 6.79% based on local market returns).
Global economic data remain a study in contrasts, with relatively solid news flow from the U.S. and Europe having been overshadowed by weak news from emerging market nations in general and China in particular. Both the U.S. and Europe have reported upward revisions to growth for the first half of 2015, which suggests that developed market nations are on track to post the sixth consecutive quarter of above-trend growth. In contrast, JP Morgan analysts estimate that gross domestic product growth in emerging market economies has recently been running below 4% on an annualized basis, which is well below its potential. Much of the weakness is centered in Asia, with China having reported a September Purchasing Managers’ Index reading of 47. That is well below the dividing line of 50 between boom and bust and is the lowest reading since the global financial crisis.
The weakness in emerging market growth was an important backdrop to the Fed’s decision not to raise interest rates in September. Upward pressure on the U.S. dollar and downward pressure on commodity prices also have kept inflation expectations subdued, with market participants now projecting that five-year inflation, five years from now, will be only 1.7%. That is well below the Fed’s target of 2% and represents lower expected inflation than levels that prevailed during the depths of the global financial crisis. This projection calls into question arguments that current low inflation is transitory. Inflation is running well below target in both the eurozone and Japan, suggesting growing pressure for those nations to engage in further quantitative easing.
The Fund is subadvised by two managers with complementary investment styles and processes. Advisory Research, a value-oriented fundamental manager, managed approximately 60% of the Fund’s net assets as of September 30, 2015, while Trilogy Global Advisors, a growth manager, managed the balance of the Fund. At the beginning of the period, assets were evenly divided between the two managers. In May, Calvert elected to increase the Fund’s allocation to Advisory Research in line with Calvert’s view that the value investing style was more likely to outperform after an extended period of strong performance for growth.
6 calvert.com CALVERT INTERNATIONAL OPPORTUNITIES FUND ANNUAL REPORT (UNAUDITED)
|
| | | | |
| | | | |
| | CALVERT INTERNATIONAL OPPORTUNITIES FUND |
| | SEPTEMBER 30, 2015 |
| | | | |
| | ECONOMIC SECTORS | % OF TOTAL INVESTMENTS | |
| | Consumer Discretionary | 19.0 | % | |
| | Consumer Staples | 8.4 | % | |
| | Energy | 2.1 | % | |
| | Financials | 27.3 | % | |
| | Health Care | 3.9 | % | |
| | Industrials | 17.8 | % | |
| | Information Technology | 9.4 | % | |
| | Materials | 7.9 | % | |
| | Short-Term Investments | 3.6 | % | |
| | Telecommunication Services | 0.6 | % | |
| | Total | 100 | % | |
| | | | |
This reallocation did not affect Fund performance materially over the balance of the period as the managers have produced similar investment returns since the reallocation.
The Fund’s underperformance of 3.83% relative to its benchmark was driven largely by its holdings in emerging markets equities.
The Fund invested in emerging market equities throughout the period, with emerging market stocks accounting for 10% to 13% of the Fund’s net assets over the course of the period. While the EAFE Smid Index was down modestly for the period, emerging market stocks, as measured by the MSCI Emerging Markets Index, were down 18.98%. Our emerging markets holdings did a bit better than the emerging markets index, but still were down substantially for the period. Our emerging markets holdings were helped by the strong performance of China Lesso Group Holdings, which was up more than 69% for the period.1 China Lesso Group is a manufacturer of plastic pipes and pipe fittings in China, with products widely used for water supply and drainage, power supply, and telecommunications.
China’s water infrastructure either is nonexistent or very old, giving Lesso a very attractive market niche and one in which it is consolidating. Lesso surprised the market during the period with stronger than expected results, and the stock price reacted favorably.
Overall, the Fund’s developed market stocks performed in line with the benchmark for the period. Strong returns from top performing stocks like Irish packaging producer Smurfit Kappa Group and Cookpad, a Japanese food and cooking-oriented website, were offset by weaker performance from
______________________________
1All returns reflect the period a holding was in the Fund.
|
| | | | | | |
| | | | | |
| | CALVERT INTERNATIONAL OPPORTUNITIES FUND | |
| | SEPTEMBER 30, 2015 | |
| | | | | |
| | INVESTMENT PERFORMANCE | |
| | (TOTAL RETURN AT NAV) | |
| | | 6 MONTHS ENDED 9/30/15 | 12 MONTHS ENDED 9/30/15 | |
| | Class A | -6.36 | % | -4.32 | % | |
| | Class C | -6.73 | % | -5.09 | % | |
| | Class I | -6.14 | % | -3.86 | % | |
| | Class Y | -6.30 | % | -4.11 | % | |
| | MSCI EAFE Small/MidCap Index | -4.66 | % | -0.49 | % | |
| | Lipper International Small/Mid Cap Core Funds Average | -5.50 | % | -4.13 | % | |
| | | | | |
| | Investment performance/return at NAV does not reflect the deduction of the Fund’s maximum 4.75% front-end sales charge or any deferred sales charge. | |
| | | | | |
| | TEN LARGEST STOCK HOLDINGS | % OF NET ASSETS | |
| | Smurfit Kappa Group plc | 2.1 | % | |
| | BUWOG AG | 1.7 | % | |
| | Austevoll Seafood ASA | 1.7 | % | |
| | China Lesso Group Holdings Ltd. | 1.5 | % | |
| | Samsung SDI Co. Ltd. | 1.4 | % | |
| | DGB Financial Group, Inc. | 1.4 | % | |
| | Kingfisher plc | 1.4 | % | |
| | Teco Electric and Machinery Co. Ltd. | 1.4 | % | |
| | WM Morrison Supermarkets plc | 1.3 | % | |
| | Cie Generale des Etablissements Michelin | 1.3 | % | |
| | Total | 15.2 | % | |
| | | | | |
other holdings, including German fashion company Tom Tailor Group and Dutch insurer Delta Lloyd Group. Smurfit Kappa is the largest packaging producer in Europe and has benefited from recovering sales volume in Europe and Latin America. In Europe, a weak euro has provided tailwinds for export sales. We expect the company to see improved financial performance through cost cutting and improved energy efficiency. Cookpad is Japan’s premier cooking website, with 60% of its revenues coming from the site’s nearly one million premium members and 40% from advertisers. The site blends learning, e-commerce, and social media as users can search for recipes, buy ingredients, learn to cook, and discuss cooking.
Tom Tailor focuses on midpriced, casual clothing for men, women, and children. Company management provided conservative guidance for same-store sales in 2015, disappointing investors. Our subadvisor continues to believe that management’s focus on profitability and sales growth will lead to improved stock performance in the future.
calvert.com CALVERT INTERNATIONAL OPPORTUNITIES FUND ANNUAL REPORT (UNAUDITED) 7
Delta Lloyd is a Netherlands-based insurance company with a good track record of cost consciousness and conservative risk management. When the company reported a lower-than-expected capital position at the end of the second quarter of 2015, investors became concerned that the company may need to raise capital. Our subadvisor believes the ensuing decline in the stock was an overreaction and that the underlying business is doing well.
Outlook
Central banks around the globe have engaged in a concurrent, unprecedented effort to keep interest rates low in hopes of boosting economic activity. As a result, risky assets have appeared more attractive to investors and benefited from an expansion in earnings multiples over the last several years. Although valuations are far from extreme levels, they are well above historical long-term averages, making markets more vulnerable to shocks from some of the negative catalysts currently in the global economy. These include continued economic deceleration in China — a scenario that began to unfold in the third quarter of 2015.
We are worried that concurrent quantitative easing (QE) across multiple global economies could be less potent than that implemented in the U.S. after the financial crisis if these efforts effectively cancel each other out. Market enthusiasm for global QE may wane if robust economic recovery doesn’t follow, hindered by underlying structural economic and fiscal challenges in many economies, including Europe and Japan.
Our view remains that the probability of a hard economic landing for China is increasing. If this process occurs in a disorderly fashion, it may have a significant negative impact on both market sentiment and the global economy since China is the world’s second-largest economy and has a meaningful impact on corporate earnings streams globally.
John P. Nichols, CFA
Calvert Investment Management, Inc.
October 2015
As of September 30, 2015, the following companies represented the following percentages of net assets: China Lesso Group Holdings 1.52%, Cookpad 0.75%, Smurfit Kappa 2.07%, Delta Lloyd 0.85%, and Tom Tailor 0.52%. Holdings are subject to change.
8 calvert.com CALVERT INTERNATIONAL OPPORTUNITIES FUND ANNUAL REPORT (UNAUDITED)
Growth of $10,000
The graph below shows the value of a hypothetical $10,000 investment in the Fund over the past 10 fiscal year periods or since inception (for funds without 10-year records). The results shown are for Class A, reflect the deduction of the maximum front-end Class A sales charge of 4.75%, and assume the reinvestment of dividends. The result is compared with a broad based market index. Market indexes are unmanaged and their results do not reflect the effect of expenses or sales charges. The value of an investment in a different share class would be different.
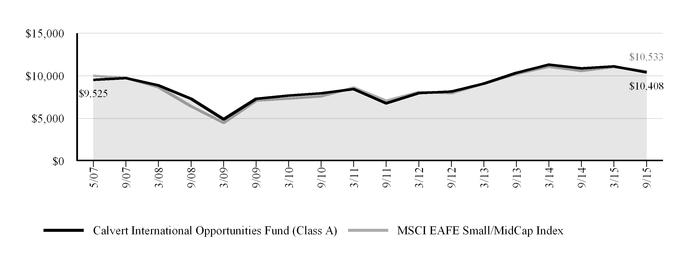
|
| | | | | | | |
| CALVERT INTERNATIONAL OPPORTUNITIES FUND |
| SEPTEMBER 30, 2015 |
| AVERAGE ANNUAL TOTAL RETURNS | Ticker Symbol | 1 Year | 5 Year | Since Inception (5/31/2007) |
| Class A (with max. load) | CIOAX | -8.87 | % | 4.51 | % | 0.48 | % |
| Class C (with max. load) | COICX | -6.04 | % | 4.64 | % | 0.25 | % |
| Class I | COIIX | -3.86 | % | 6.02 | % | 1.53 | % |
| Class Y | CWVYX | -4.11 | % | 5.79 | % | 1.25 | % |
| MSCI EAFE Small/MidCap Index | | -0.49 | % | 6.76 | % | 0.62 | % |
| Lipper International Small/Mid Cap Core Funds Average | | -4.13 | % | 4.79 | % | -0.07 | % |
| | | | | |
| Calvert International Opportunities Fund first offered Class C shares on July 31, 2007 and Class Y shares on October 31, 2008. Performance prior to those dates reflects the performance of Class A shares at net asset value (NAV). Actual Class C and Class Y share performance would have been different. |
| | | | | |
All performance data shown, including the graph above and the adjacent table, represents past performance, does not guarantee future results, assumes reinvestment of dividends and distributions, and does not reflect the deduction of taxes that a shareholder would pay on the Fund’s distributions or the redemption of the Fund shares. All performance data reflects fee waivers and/or expense limitations, if any are in effect; in their absence performance would be lower. See Note B in Notes to Financial Statements. The investment return and principal value of an investment will fluctuate so that an investor’s shares, when redeemed, may be worth more or less than their original cost. Current performance may be lower or higher than the performance data quoted; for current performance data, including most recent month-end, visit www.calvert.com. The gross expense ratio from the current prospectus for Class A shares is 1.85%. This number may differ from the expense ratio shown elsewhere in this report because it is based on a different time period and, if applicable, does not include fee or expense waivers. Performance data quoted already reflects the deduction of the Fund’s operating expenses.
calvert.com CALVERT INTERNATIONAL OPPORTUNITIES FUND ANNUAL REPORT (UNAUDITED) 9
UNDERSTANDING YOUR FUND'S EXPENSES
As an investor, you incur two types of costs. There are transaction costs, which generally include sales charges on purchases and may include redemption fees. There are also ongoing costs, which generally include management fees, distribution and/or service fees, and other fund expenses. The following information is intended to help you understand your ongoing costs (in dollars) of investing in this mutual fund and to help you compare these costs with the ongoing costs of investing in other mutual funds.
To illustrate these ongoing costs, we have provided examples and calculated the expenses paid by the fund's investors during the period. The actual and hypothetical information presented in the examples is based on an investment of $1,000 invested at the beginning of the period and held for the entire period (April 1, 2015 to September 30, 2015).
Actual Expenses
The first line of the table below provides information about actual account values and actual expenses. You may use the information in this line, together with the amount you invested, to estimate the expenses that you paid over the period. Simply divide your account value by $1,000 (for example, an $8,600 account value divided by $1,000 = 8.6), then multiply the result by the number in the first line under the heading entitled "Expenses Paid During Period" to estimate the expenses you paid on your account during this period.
Hypothetical Example for Comparison Purposes
The second line of the table below provides information about hypothetical account values and hypothetical expenses based on the Fund’s actual expense ratio and an assumed rate of return of 5% per year before expenses, which is not the Fund’s actual return. The hypothetical account values and expenses may not be used to estimate the actual ending account balance or expenses you paid for the period. You may use this information to compare the ongoing costs of investing in the Fund and other funds. To do so, compare the 5% hypothetical example with the 5% hypothetical examples that appear in the shareholder reports of the other funds.
Please note that the expenses shown in the table are meant to highlight your ongoing costs only and do not reflect any transactional costs, such as sales charges (loads), or redemption fees. Therefore, the second line of the table is useful in comparing ongoing costs only, and will not help you determine the relative total costs of owning different funds. In addition, if these transactional costs were included, your costs would have been higher.
|
| | | | | | | | |
| | ANNUALIZED
EXPENSE RATIO | BEGINNING
ACCOUNT VALUE
4/1/15 | ENDING
ACCOUNT VALUE
9/30/15 | EXPENSES PAID
DURING PERIOD*
4/1/15 - 9/30/15 |
| Class A | | | | | | |
| Actual | 1.66% | $1,000.00 | $936.40 | $8.06 |
| Hypothetical (5% return per year before expenses) | 1.66% | $1,000.00 | $1,016.75 | $8.39 |
| Class C | |
| Actual | 2.50% | $1,000.00 | $932.70 | $12.11 |
| Hypothetical (5% return per year before expenses) | 2.50% | $1,000.00 | $1,012.53 | $12.61 |
| Class I | |
| Actual | 1.15% | $1,000.00 | $938.60 | $5.59 |
| Hypothetical (5% return per year before expenses) | 1.15% | $1,000.00 | $1,019.30 | $5.82 |
| Class Y | |
| Actual | 1.44% | $1,000.00 | $937.00 | $6.99 |
| Hypothetical (5% return per year before expenses) | 1.44% | $1,000.00 | $1,017.85 | $7.28 |
| | | | | | | | | |
| * Expenses paid during the period are equal to the annualized expense ratio for each class as indicated above, multiplied by the average account value over the period, multiplied by 183/365 (to reflect the one-half year period). Expense ratios shown in the Financial Highlights represent the actual expenses incurred for the fiscal year. |
10 calvert.com CALVERT INTERNATIONAL OPPORTUNITIES FUND ANNUAL REPORT
REPORT OF INDEPENDENT REGISTERED PUBLIC ACCOUNTING FIRM
The Board of Directors of Calvert World Values Fund, Inc. and Shareholders of the Calvert International Opportunities Fund:
We have audited the accompanying statement of net assets of the Calvert International Opportunities Fund (the “Fund”), a series of Calvert World Values Fund, Inc., as of September 30, 2015, and the related statement of operations for the year then ended, the statements of changes in net assets for each of the years in the two-year period then ended, and the financial highlights for each of the years in the five-year period then ended. These financial statements and financial highlights are the responsibility of the Fund’s management. Our responsibility is to express an opinion on these financial statements and financial highlights based on our audits.
We conducted our audits in accordance with the standards of the Public Company Accounting Oversight Board (United States). Those standards require that we plan and perform the audit to obtain reasonable assurance about whether the financial statements and financial highlights are free of material misstatement. An audit includes examining, on a test basis, evidence supporting the amounts and disclosures in the financial statements. Our procedures included confirmation of securities owned as of September 30, 2015 by correspondence with the custodian and brokers or by other appropriate auditing procedures. An audit also includes assessing the accounting principles used and significant estimates made by management, as well as evaluating the overall financial statement presentation. We believe that our audits provide a reasonable basis for our opinion.
In our opinion, the financial statements and financial highlights referred to above present fairly, in all material respects, the financial position of the Calvert International Opportunities Fund as of September 30, 2015, the results of its operations for the year then ended, the changes in its net assets for each of the years in the two-year period then ended, and the financial highlights for each of the years in the five-year period then ended, in conformity with U.S. generally accepted accounting principles.
Philadelphia, Pennsylvania
November 25, 2015
calvert.com CALVERT INTERNATIONAL OPPORTUNITIES FUND ANNUAL REPORT 11
CALVERT INTERNATIONAL OPPORTUNITIES FUND
STATEMENT OF NET ASSETS
SEPTEMBER 30, 2015
|
| | |
| | SHARES | VALUE ($) |
| EQUITY SECURITIES - 96.0% | | |
| Australia - 2.4% | | |
| GrainCorp Ltd. | 249,665 | 1,589,797 |
| Orora Ltd. | 773,996 | 1,266,702 |
| Tassal Group Ltd. | 454,315 | 1,373,177 |
| | | 4,229,676 |
| | | |
| Austria - 4.2% | | |
| BUWOG AG* | 144,872 | 3,072,373 |
| Vienna Insurance Group AG Wiener Versicherung Gruppe | 57,401 | 1,688,561 |
| Wienerberger AG | 75,346 | 1,324,715 |
| Zumtobel Group AG | 67,094 | 1,475,955 |
| | | 7,561,604 |
| | | |
| Brazil - 1.2% | | |
| Banco ABC Brasil SA: | | |
| Receipts* | 14,630 | 33,258 |
| Preferred | 378,586 | 889,328 |
| MRV Engenharia e Participacoes SA | 835,703 | 1,285,535 |
| | | 2,208,121 |
| | | |
| Canada - 2.4% | | |
| Entertainment One Ltd. | 325,084 | 1,221,601 |
| Intertape Polymer Group, Inc. | 99,250 | 1,057,293 |
| Martinrea International, Inc. | 128,047 | 1,009,426 |
| Methanex Corp. | 30,494 | 1,006,640 |
| | | 4,294,960 |
| | | |
| China - 1.5% | | |
China Lesso Group Holdings Ltd. | 3,402,550 | 2,728,553 |
| | | |
| Denmark - 1.0% | | |
Matas A/S | 91,426 | 1,712,164 |
| | | |
| Finland - 3.5% | | |
| Cramo Oyj | 71,851 | 1,499,086 |
| Nokian Renkaat Oyj | 53,635 | 1,736,820 |
| Ramirent Oyj | 200,545 | 1,536,881 |
| Tieto Oyj | 57,441 | 1,451,951 |
| | | 6,224,738 |
| | | |
|
| | |
| | SHARES | VALUE ($) |
| France - 5.3% | | |
| Cie Generale des Etablissements Michelin | 25,820 | 2,353,594 |
| Eurazeo SA | 20,532 | 1,364,763 |
| Saft Groupe SA | 49,683 | 1,624,077 |
| UBISOFT Entertainment* | 99,390 | 2,013,670 |
| Wendel SA | 17,731 | 2,073,475 |
| | | 9,429,579 |
| | | |
| Georgia - 0.9% | | |
Bank of Georgia Holdings plc | 59,038 | 1,612,928 |
| | | |
| Germany - 7.7% | | |
| Aareal Bank AG | 36,751 | 1,306,348 |
| Aurelius AG | 34,659 | 1,608,587 |
| DMG MORI AG | 52,259 | 1,997,803 |
| Hella KGaA Hueck & Co. | 27,536 | 993,943 |
| Hugo Boss AG | 13,571 | 1,520,244 |
| RHOEN-KLINIKUM AG: | | |
| Right* | 32,125 | 717 |
| Common | 67,534 | 1,907,837 |
| STADA Arzneimittel AG | 42,122 | 1,504,497 |
| Talanx AG | 70,243 | 2,098,564 |
| Tom Tailor Holding AG* | 165,590 | 923,558 |
| | | 13,862,098 |
| | | |
| Greece - 0.9% | | |
Tsakos Energy Navigation Ltd. | 198,761 | 1,615,927 |
| | | |
| Hong Kong - 1.0% | | |
| Man Wah Holdings Ltd. | 934,351 | 916,522 |
| Techtronic Industries Co. Ltd. | 248,810 | 925,058 |
| | | 1,841,580 |
| | | |
| India - 0.3% | | |
Yes Bank Ltd. | 40,237 | 449,480 |
| | | |
| Ireland - 2.1% | | |
Smurfit Kappa Group plc | 137,786 | 3,700,182 |
| | | |
12 calvert.com CALVERT INTERNATIONAL OPPORTUNITIES FUND ANNUAL REPORT
|
| | | | |
| | SHARES | VALUE ($) |
| Italy - 1.8% | | |
| Banca Generali SpA | 46,885 | 1,322,965 |
|
| Buzzi Unicem SpA | 114,354 | 1,914,277 |
|
| | | 3,237,242 |
|
| | | |
| Japan - 23.0% | | |
| Aozora Bank Ltd. | 331,099 | 1,152,771 |
|
| Azbil Corp. | 54,800 | 1,387,905 |
|
| Chiyoda Corp. | 161,619 | 1,105,404 |
|
| Chugoku Marine Paints Ltd. | 216,000 | 1,375,658 |
|
| COOKPAD, Inc. | 62,793 | 1,335,139 |
|
| Daiichikosho Co. Ltd. | 30,840 | 1,096,989 |
|
| Daiseki Co. Ltd. | 98,600 | 1,689,087 |
|
| Gulliver International Co. Ltd. | 182,281 | 1,681,116 |
|
| Haseko Corp. | 121,359 | 1,382,804 |
|
| Hino Motors Ltd. | 104,803 | 1,072,055 |
|
| Hogy Medical Co. Ltd. | 33,700 | 1,546,615 |
|
| Horiba Ltd. | 51,900 | 1,901,799 |
|
| Ibiden Co. Ltd. | 116,400 | 1,533,907 |
|
| Leopalace21 Corp.* | 223,495 | 1,048,968 |
|
| Makita Corp. | 12,325 | 658,350 |
|
| Monex Group, Inc. | 522,009 | 1,295,119 |
|
| Nabtesco Corp. | 48,031 | 879,284 |
|
| Resona Holdings, Inc. | 345,500 | 1,767,740 |
|
| Ryosan Co. Ltd. | 80,100 | 1,883,564 |
|
| Secom Co. Ltd. | 28,900 | 1,743,980 |
|
| Shinsei Bank Ltd. | 752,000 | 1,555,543 |
|
| Ship Healthcare Holdings, Inc. | 95,097 | 2,057,999 |
|
| SKY Perfect JSAT Holdings, Inc. | 396,900 | 1,876,849 |
|
| Stanley Electric Co. Ltd. | 72,743 | 1,459,243 |
|
| Star Micronics Co. Ltd. | 165,900 | 2,275,647 |
|
| Tadano Ltd. | 115,854 | 1,289,583 |
|
| Toyota Industries Corp. | 36,600 | 1,747,043 |
|
| Yamaha Corp. | 58,800 | 1,307,006 |
|
| | | 41,107,167 |
|
| | | |
| Luxembourg - 1.0% | | |
Grand City Properties SA | 89,677 | 1,719,636 |
|
| | | |
| Malaysia - 1.0% | | |
PureCircle Ltd. * | 283,483 | 1,820,571 |
|
| | | |
| Netherlands - 2.5% | | |
| BinckBank NV | 148,046 | 1,220,186 |
|
| Delta Lloyd NV | 180,834 | 1,520,265 |
|
|
| | | | |
| | SHARES | VALUE ($) |
| Koninklijke DSM NV | 38,729 | 1,786,394 |
|
| | | 4,526,845 |
|
| | | |
| Norway - 3.5% | | |
| Austevoll Seafood ASA | 481,397 | 2,993,966 |
|
| Borregaard ASA | 214,697 | 1,292,160 |
|
| Opera Software ASA | 200,324 | 1,080,613 |
|
| Petroleum Geo-Services ASA | 255,169 | 980,721 |
|
| | | 6,347,460 |
|
| | | |
| Poland - 0.7% | | |
Eurocash SA | 102,483 | 1,205,487 |
|
| | | |
| Russia - 0.1% | | |
Lenta Ltd. (GDR) * | 34,588 | 259,439 |
|
| | | |
| South Korea - 5.2% | | |
| DGB Financial Group, Inc. | 286,380 | 2,546,621 |
|
| Dongbu Insurance Co. Ltd. | 11,280 | 583,531 |
|
| Hankook Tire Worldwide Co. Ltd. | 100,974 | 1,534,405 |
|
| Samsung SDI Co. Ltd. | 27,760 | 2,553,900 |
|
| SL Corp. | 130,574 | 2,055,425 |
|
| | | 9,273,882 |
|
| | | |
| Spain - 1.0% | | |
Ebro Foods SA | 93,700 | 1,840,382 |
|
| | | |
| Sweden - 1.6% | | |
| BillerudKorsnas AB | 42,319 | 608,748 |
|
| Industrivarden AB, Class C | 131,704 | 2,306,824 |
|
| | | 2,915,572 |
|
| | | |
| Switzerland - 3.1% | | |
| Baloise Holding AG | 15,103 | 1,730,347 |
|
| Bucher Industries AG | 6,674 | 1,432,325 |
|
| GAM Holding AG* | 133,544 | 2,350,121 |
|
| | | 5,512,793 |
|
| | | |
| Taiwan - 2.4% | | |
| China Life Insurance Co. Ltd. | 2,382,059 | 1,814,358 |
|
| Teco Electric and Machinery Co. Ltd. | 3,048,000 | 2,408,942 |
|
| | | 4,223,300 |
|
| | | |
calvert.com CALVERT INTERNATIONAL OPPORTUNITIES FUND ANNUAL REPORT 13
|
| | | | |
| | SHARES | VALUE ($) |
| Turkey - 0.6% | | |
Turkiye Sinai Kalkinma Bankasi AS | 2,379,841 | 1,109,118 |
|
| | | |
| United Kingdom - 14.1% | | |
| Ashtead Group plc | 89,709 | 1,265,021 |
|
| Beazley plc | 306,195 | 1,655,898 |
|
| Bovis Homes Group plc | 144,317 | 2,200,364 |
|
| Britvic plc | 141,210 | 1,450,673 |
|
| Close Brothers Group plc | 64,190 | 1,451,224 |
|
| Dialight plc | 83,660 | 802,121 |
|
| Fenner plc | 734,156 | 1,831,715 |
|
| Inmarsat plc | 77,486 | 1,152,334 |
|
| International Personal Finance plc | 225,195 | 1,321,641 |
|
| Investec plc | 182,841 | 1,400,293 |
|
| Kennedy Wilson Europe Real Estate plc | 94,356 | 1,624,473 |
|
| Kingfisher plc | 457,849 | 2,487,460 |
|
| N Brown Group plc | 426,456 | 1,976,181 |
|
| Petrofac Ltd. | 101,793 | 1,185,442 |
|
| Speedy Hire plc | 2,234,765 | 1,145,849 |
|
| WM Morrison Supermarkets plc | 948,198 | 2,386,640 |
|
| | | 25,337,329 |
|
| | | |
| Total Equity Securities (Cost $181,245,659) | | 171,907,813 |
|
| | | |
| | | |
| | PRINCIPAL
AMOUNT ($) | VALUE ($) |
|
| TIME DEPOSIT - 3.6% | | |
| State Street Bank Time Deposit, 0.088%, 10/1/15 | 6,484,271 | 6,484,271 |
|
| | | |
| Total Time Deposit (Cost $6,484,271) | | 6,484,271 |
|
| | | |
| TOTAL INVESTMENTS (Cost $187,729,930) - 99.6% | | 178,392,084 |
|
| Other assets and liabilities, net - 0.4% | | 677,952 |
|
NET ASSETS - 100.0% | |
| $179,070,036 |
|
|
| | | |
| NET ASSETS CONSIST OF: | |
| Paid-in capital applicable to the following shares of common stock, with 250,000,000 shares of $0.01 par value shares authorized: | |
| Class A: 6,853,618 shares outstanding |
| $100,724,624 |
|
| Class C: 352,326 shares outstanding | 4,901,152 |
|
| Class I: 2,838,713 shares outstanding | 40,346,726 |
|
| Class Y: 2,379,652 shares outstanding | 35,718,582 |
|
| Undistributed net investment income (loss) | 935,299 |
|
| Accumulated net realized gain (loss) on investments and foreign currency transactions | 5,801,865 |
|
| Net unrealized appreciation (depreciation) on investments, foreign currencies and assets and liabilities denominated in foreign currencies | (9,358,212) |
|
| | |
| NET ASSETS |
| $179,070,036 |
|
| | |
| NET ASSET VALUE PER SHARE | |
| Class A (based on net assets of $99,907,526) |
| $14.58 |
|
| Class C (based on net assets of $5,029,824) |
| $14.28 |
|
| Class I (based on net assets of $40,833,210) |
| $14.38 |
|
| Class Y (based on net assets of $33,299,476) |
| $13.99 |
|
|
| |
| NOTES TO STATEMENT OF NET ASSETS |
| * | Non-income producing security. |
| Abbreviations: |
| GDR: | Global Depositary Receipts |
| Ltd.: | Limited |
| plc: | Public Limited Company |
| See notes to financial statements. |
14 calvert.com CALVERT INTERNATIONAL OPPORTUNITIES FUND ANNUAL REPORT
CALVERT INTERNATIONAL OPPORTUNITIES FUND
STATEMENT OF OPERATIONS
YEAR ENDED SEPTEMBER 30, 2015
|
| | | |
| NET INVESTMENT INCOME | |
| Investment Income: | |
| Dividend income (net of foreign taxes withheld of $358,591) |
| $3,617,479 |
|
| Interest income | 5,171 |
|
| Total investment income | 3,622,650 |
|
| | |
| Expenses: | |
| Investment advisory fee | 1,105,090 |
|
| Administrative fees | 386,226 |
|
| Transfer agency fees and expenses | 178,343 |
|
| Distribution Plan expenses: | |
| Class A | 206,015 |
|
| Class C | 49,535 |
|
| Directors' fees and expenses | 15,259 |
|
| Accounting fees | 30,935 |
|
| Custodian fees | 153,756 |
|
| Professional fees | 26,051 |
|
| Registration fees | 53,105 |
|
| Reports to shareholders | 17,448 |
|
| Miscellaneous | 51,679 |
|
| Total expenses | 2,273,442 |
|
| Reimbursement from Advisor: | |
| Class A | (21,564) |
|
| Class C | (10,774) |
|
| Class Y | (1,967) |
|
| Net expenses | 2,239,137 |
|
| | |
| NET INVESTMENT INCOME | 1,383,513 |
|
| | |
| REALIZED AND UNREALIZED GAIN (LOSS) | |
| Net realized gain (loss) on: | |
| Investments | 6,631,662 |
|
| Foreign currency transactions | (265,362) |
|
| | 6,366,300 |
|
| | |
| Change in unrealized appreciation (depreciation) on: | |
| Investments | (17,027,100) |
|
| Assets and liabilities denominated in foreign currencies | (9,983) |
|
| | (17,037,083) |
|
| | |
| NET REALIZED AND UNREALIZED GAIN (LOSS) | (10,670,783) |
|
| | |
| INCREASE (DECREASE) IN NET ASSETS RESULTING FROM OPERATIONS |
| ($9,287,270 | ) |
| See notes to financial statements. |
calvert.com CALVERT INTERNATIONAL OPPORTUNITIES FUND ANNUAL REPORT (UNAUDITED) 15
CALVERT INTERNATIONAL OPPORTUNITIES FUND
STATEMENTS OF CHANGES IN NET ASSETS
|
| | | | | | | |
| INCREASE (DECREASE) IN NET ASSETS | YEAR ENDED
SEPTEMBER 30, 2015 | | YEAR ENDED
SEPTEMBER 30, 2014 |
| Operations: | | | |
| Net investment income |
| $1,383,513 |
| |
| $881,762 |
|
| Net realized gain (loss) | 6,366,300 |
| | 8,634,029 |
|
| Change in unrealized appreciation (depreciation) | (17,037,083) |
| | (5,740,450) |
|
| INCREASE (DECREASE) IN NET ASSETS RESULTING FROM OPERATIONS | (9,287,270) |
| | 3,775,341 |
|
| | | | |
| Distributions to shareholders from: | | | |
| Net investment income: | | | |
| Class A shares | (620,616) |
| | (435,450) |
|
| Class C shares | (11,490) |
| | (1,772) |
|
| Class I shares | (485,711) |
| | (373,540) |
|
| Class Y shares | (116,873) |
| | (56,631) |
|
| Net realized gain: | | | |
| Class A shares | (3,083,385) |
| | — |
|
| Class C shares | (281,879) |
| | — |
|
| Class I shares | (1,909,381) |
| | — |
|
| Class Y shares | (1,123,889) |
| | — |
|
| Total distributions | (7,633,224) |
| | (867,393) |
|
| | | | |
| Capital share transactions: | | | |
| Shares sold: | | | |
| Class A shares | 70,117,426 |
| | 20,793,142 |
|
| Class C shares | 1,517,680 |
| | 1,625,487 |
|
| Class I shares | 15,348,576 |
| | 11,596,182 |
|
| Class Y shares | 22,957,654 |
| | 12,768,845 |
|
| Reinvestment of distributions: | | | |
| Class A shares | 3,435,373 |
| | 412,387 |
|
| Class C shares | 247,069 |
| | 1,516 |
|
| Class I shares | 2,395,093 |
| | 373,539 |
|
| Class Y shares | 1,061,068 |
| | 41,090 |
|
| Redemption fees: | | | |
| Class A shares | 159 |
| | 2,151 |
|
| Class C shares | — |
| | 170 |
|
| Class Y shares | 18 |
| | 80 |
|
| Shares redeemed: | | | |
| Class A shares | (15,108,714) |
| | (18,216,987) |
|
| Class C shares | (746,545) |
| | (405,860) |
|
| Class I shares | (4,886,433) |
| | (5,011,190) |
|
| Class Y shares | (4,107,584) |
| | (1,241,457) |
|
| Total capital share transactions | 92,230,840 |
| | 22,739,095 |
|
| | | | |
| TOTAL INCREASE (DECREASE) IN NET ASSETS | 75,310,346 |
| | 25,647,043 |
|
| | | | |
| See notes to financial statements. |
16 calvert.com CALVERT INTERNATIONAL OPPORTUNITIES FUND ANNUAL REPORT
|
| | | | | | | |
| NET ASSETS | YEAR ENDED
SEPTEMBER 30, 2015 | | YEAR ENDED
SEPTEMBER 30, 2014 |
| Beginning of year |
| $103,759,690 |
| |
| $78,112,647 |
|
| End of year (including undistributed net investment income of $935,299 and $931,251, respectively) |
| $179,070,036 |
| |
| $103,759,690 |
|
| | | | |
| CAPITAL SHARE ACTIVITY | | | |
| Shares sold: | | | |
| Class A shares | 4,511,728 |
| | 1,245,394 |
|
| Class C shares | 98,097 |
| | 98,171 |
|
| Class I shares | 1,016,025 |
| | 706,798 |
|
| Class Y shares | 1,530,787 |
| | 787,986 |
|
| Reinvestment of distributions: | | | |
| Class A shares | 229,208 |
| | 25,269 |
|
| Class C shares | 16,844 |
| | 94 |
|
| Class I shares | 162,152 |
| | 23,288 |
|
| Class Y shares | 74,193 |
| | 2,641 |
|
| Shares redeemed: | | | |
| Class A shares | (966,145) |
| | (1,082,722) |
|
| Class C shares | (48,953) |
| | (24,568) |
|
| Class I shares | (320,965) |
| | (301,772) |
|
| Class Y shares | (280,073) |
| | (77,652) |
|
| Total capital share activity | 6,022,898 |
| | 1,402,927 |
|
| See notes to financial statements. |
calvert.com CALVERT INTERNATIONAL OPPORTUNITIES FUND ANNUAL REPORT 17
NOTES TO FINANCIAL STATEMENTS
NOTE A — SIGNIFICANT ACCOUNTING POLICIES
General: Calvert International Opportunities Fund (the “Fund”), a series of Calvert World Values Fund, Inc., is registered under the Investment Company Act of 1940 as a diversified, open-end management investment company. Calvert World Values Fund, Inc. is comprised of four separate series. The operations of each series are accounted for separately. The Fund applies the accounting and reporting guidance in the Financial Accounting Standards Board (FASB) Accounting Standards Codification Topic 946, Financial Services – Investment Companies (ASC 946).
The Fund offers four classes of shares of capital stock - Classes A, C, I, and Y. Class A shares are sold with a maximum front-end sales charge of 4.75%. Class C shares are sold without a front-end sales charge and, with certain exceptions, will be charged a deferred sales charge on shares sold within one year of purchase. Class C shares have higher levels of expenses than Class A shares. Class I shares require a minimum account balance of $1,000,000. The $1 million minimum initial investment is waived for retirement plans that trade through omnibus accounts and may be waived in certain other instances where it is believed to be in the best interest of the Fund and its shareholders. Class I shares have no front-end or deferred sales charge and have lower levels of expenses than Class A shares. Class Y shares are generally only available to wrap or similar fee-based programs offered by financial intermediaries, foundations, and endowments that have entered into an agreement with the Fund’s Distributor to offer Class Y shares. Class Y shares have no front-end or deferred sales charge and have lower levels of expenses than Class A shares. Each class has different: (a) dividend rates, due to differences in Distribution Plan expenses and other class-specific expenses, (b) exchange privileges, and (c) class-specific voting rights.
Security Valuation: Net asset value per share is determined every business day as of the close of the regular session of the New York Stock Exchange (generally 4:00 p.m. Eastern time). The Fund uses independent pricing services approved by the Board of Directors (“the Board”) to value its investments wherever possible. Investments for which market quotations are not available or deemed not reliable are fair valued in good faith under the direction of the Board.
The Board has adopted Valuation Procedures (the “Procedures”) to determine the fair value of securities and other financial instruments for which market prices are not readily available or which may not be reliably priced. The Board has delegated the day-to-day responsibility for determining the fair value of assets of the Fund to Calvert Investment Management, Inc. (the “Advisor” or “Calvert”) and has provided these Procedures to govern Calvert in its valuation duties.
Calvert has chartered an internal Valuation Committee to oversee the implementation of these Procedures and to assist it in carrying out the valuation responsibilities that the Board has delegated.
The Valuation Committee meets on a regular basis to review illiquid securities and other investments which may not have readily available market prices. The Valuation Committee’s fair valuation determinations are subject to review, approval and ratification by the Board at its next regularly scheduled meeting covering the calendar quarter in which the fair valuation was determined.
The Valuation Committee utilizes various methods to measure the fair value of the Fund’s investments. U.S. generally accepted accounting principles (GAAP) establishes a disclosure hierarchy that categorizes the inputs to valuation techniques used to value assets and liabilities at measurement date. These inputs are summarized in the three broad levels listed below:
Level 1 - quoted prices in active markets for identical securities
Level 2 - other significant observable inputs (including quoted prices for similar securities, interest rates, prepayment speeds, credit risk, etc.)
Level 3 - significant unobservable inputs (including the Fund’s own assumptions in determining the fair value of investments)
The inputs or methodologies used for valuing securities are not necessarily an indication of the risk associated with investing in those securities.
Changes in valuation techniques may result in transfers in or out of an investment’s assigned level within the hierarchy during the year. Transfers in and/or out of levels are determined based on the fair value of such securities at the end of the year. Valuation techniques used to value the Fund’s investments by major category are as follows:
Equity securities, including restricted securities, for which market quotations are readily available, are valued at the last reported sale price or official closing price as reported by an independent pricing service on the primary market or exchange on which they are traded and are categorized as Level 1 in the hierarchy. In the event there were no sales during the day or closing prices are not available, securities are valued at the last quoted bid price or using the last available price and are categorized as Level 2 in the hierarchy. Foreign securities are valued based on quotations from the principal market in which such securities are normally traded. If events occur after the close of the principal market in which foreign securities are traded, and before the close of business of the Fund, that are expected to materially affect the value of those securities, then they are valued at their fair value taking these events into account and are categorized as Level 2 in the hierarchy. The Fund
18 calvert.com CALVERT INTERNATIONAL OPPORTUNITIES FUND ANNUAL REPORT (UNAUDITED)
has retained a third party fair value pricing service to quantitatively analyze the price movement of its holdings on foreign exchanges and to automatically fair value if the variation from the prior day’s closing price exceeds specified parameters. Such securities would be categorized as Level 2 in the hierarchy in these circumstances. Utilizing this technique may result in transfers between Level 1 and Level 2. For restricted securities and private placements where observable inputs are limited, assumptions about market activity and risk are used and such securities are categorized as Level 3 in the hierarchy.
Short-term securities of sufficient credit quality with remaining maturities of sixty days or less for which quotations are not readily available are valued at amortized cost, which approximates fair value, and are categorized as Level 2 in the hierarchy.
If a market value cannot be determined for a security using the methodologies described above, or if, in the good faith opinion of the Advisor, the market value does not constitute a readily available market quotation, or if a significant event has occurred that would materially affect the value of the security, the security will be fair valued as determined in good faith by the Valuation Committee.
The Valuation Committee considers a number of factors, including significant unobservable valuation inputs when arriving at fair value. It considers all significant facts that are reasonably available and relevant to the determination of fair value.
The Valuation Committee primarily employs a market-based approach which may use related or comparable assets or liabilities, recent transactions, market multiples, book values, and other relevant information for the investment to determine the fair value of the investment. When more appropriate, the Fund may employ an income-based or cost approach. An income-based valuation approach discounts anticipated future cash flows of the investment to calculate a present amount (discounted). The measurement is based on the value indicated by current market expectations about those future amounts. Discounts may also be applied due to the nature or duration of any restrictions on the disposition of the investments. A cost based approach is based on the amount that currently would be required to replace the service capacity of an asset (current replacement cost). From the seller’s perspective, the price that would be received for the asset is determined based on the cost to a buyer to acquire or construct a substitute asset of comparable utility, adjusted for obsolescence.
The values assigned to fair value investments are based on available information and do not necessarily represent amounts that might ultimately be realized. Further, due to the inherent uncertainty of valuations of such investments, the fair values may differ significantly from the values that would have been used had an active market existed, and the differences could be material. The Valuation Committee employs various methods for calibrating these valuation approaches including a regular review of key inputs and assumptions, transactional back-testing or disposition analysis and reviews of any related market activity.
At September 30, 2015, no securities were fair valued in good faith under the direction of the Board.
The following table summarizes the market value of the Fund's holdings as of September 30, 2015, based on the inputs used to value them:
|
| | | | | | | | | | | | | |
| VALUATION INPUTS |
| INVESTMENT IN SECURITIES | LEVEL 1 | LEVEL 2 | LEVEL 3 | TOTAL |
| Equity Securities* |
| $6,898,124 |
| $165,009,689** |
| $— |
|
| $171,907,813 |
|
| Time Deposit | — |
| 6,484,271 |
| — |
| 6,484,271 |
|
| Total |
| $6,898,124 |
|
| $171,493,960 |
| $— |
|
| $178,392,084 |
|
| | | | | | |
| * | For further breakdown of equity securities by country, please refer to the Statement of Net Assets. |
| ** | Includes certain securities trading primarily outside the U.S. whose value was adjusted as a result of significant market movements following the close of local trading. |
On September 30, 2015, price movements exceeded specified parameters and the third party fair value pricing service quantitatively fair valued the affected securities. As a result, $165,009,689 transferred out of Level 1 into Level 2. The amount of this transfer was determined based on the fair value of securities at the end of the year.
Security Transactions and Investment Income: Security transactions are accounted for on trade date. Realized gains and losses are recorded on an identified cost basis and may include proceeds from litigation. Dividend income is recorded on the ex-dividend date or, in the case of dividends on certain foreign securities, as soon as the Fund is informed of the ex-dividend date. Withholding taxes on foreign dividends have been provided for in accordance with the Fund’s understanding of the applicable country’s tax rules and rates. Distributions received on securities that represent a return of capital or capital gain are recorded as a reduction of cost of investments and/or as a realized gain. Interest income, which includes amortization of premium and accretion of discount on debt securities, is accrued as earned. Investment income and realized and unrealized gains and losses are allocated to separate classes of shares based upon the relative net assets of each class. Expenses arising in connection with a specific class are charged directly to that class. Expenses common to the classes are allocated to each class in proportion to their relative net assets.
calvert.com CALVERT INTERNATIONAL OPPORTUNITIES FUND ANNUAL REPORT (UNAUDITED) 19
Foreign Currency Transactions: The Fund’s accounting records are maintained in U.S. dollars. For valuation of assets and liabilities on each date of net asset value determination, foreign denominations are converted into U.S. dollars using the current exchange rate. Security transactions, income, and expenses are translated at the prevailing rate of exchange on the date of the event. The effect of changes in foreign exchange rates on securities and foreign currencies is included in the net realized and unrealized gain or loss on investments and assets and liabilities denominated in foreign currencies
Distributions to Shareholders: Distributions to shareholders are recorded by the Fund on ex-dividend date. Dividends from net investment income and distributions from net realized capital gains, if any, are paid at least annually. Distributions are determined in accordance with income tax regulations which may differ from U.S. generally accepted accounting principles; accordingly, periodic reclassifications are made within the Fund's capital accounts to reflect income and gains available for distribution under income tax regulations.
Estimates: The preparation of financial statements in conformity with U.S. generally accepted accounting principles requires management to make estimates and assumptions that affect the reported amounts of assets and liabilities and disclosure of contingent assets and liabilities at the date of the financial statements and the reported amounts of increases and decreases in net assets from operations during the reporting period. Actual results could differ from those estimates.
Redemption Fees: The Fund charged a 2% redemption fee on redemptions, including exchanges, made within 30 days of purchase (within seven days for Class I shares). The redemption fee was accounted for as an addition to paid-in capital. This fee was eliminated effective February 2, 2015.
Federal Income Taxes: No provision for federal income or excise tax is required since the Fund intends to continue to qualify as a regulated investment company under the Internal Revenue Code and to distribute substantially all of its taxable earnings.
Management has analyzed the Fund's tax positions taken for all open federal income tax years and has concluded that no provision for federal income tax is required in the Fund's financial statements. A Fund's federal tax return is subject to examination by the Internal Revenue Service for a period of three years.
NOTE B — RELATED PARTY TRANSACTIONS
Calvert Investment Management, Inc. (the “Advisor”) is wholly-owned by Calvert Investments, Inc., which is indirectly wholly-owned by Ameritas Mutual Holding Company. The Advisor provides investment advisory services and pays the salaries and fees of officers and Directors of the Fund who are employees of the Advisor or its affiliates. For its services, the Advisor receives an annual fee, payable monthly, of .75%, of the Fund’s average daily net assets. For the period ended September 30, 2015, the Advisor voluntarily waived $34,305 of its fee. Under the terms of the agreement, $110,982 was payable at year end.
The Advisor has contractually agreed to limit net annual fund operating expenses through January 31, 2016. The contractual expense caps are 1.66%, 2.50%, 1.20%, and 1.41% for Class A, C, I, and Y, respectively. For the purpose of this expense limit, operating expenses do not include interest expense, brokerage commissions, taxes, and extraordinary expenses. This expense limitation does not limit acquired fund fees and expenses, if any. Under the terms of the agreement, $26,249 was receivable at year end.
Calvert Investment Administrative Services, Inc., an affiliate of the Advisor, provides administrative services to the Fund for an annual fee, payable monthly, of .30% for Class A, C and Y shares and .15% for Class I shares, based on their average daily net assets. Under the terms of the agreement, $39,341 was payable at year end.
Calvert Investment Distributors, Inc. (“CID”), an affiliate of the Advisor, is the distributor and principal underwriter for the Fund. Pursuant to Rule 12b-1 under the Investment Company Act of 1940, the Fund has adopted a Distribution Plan that permits the Fund to pay certain expenses associated with the distribution and servicing of its shares. The expenses paid may not exceed .50% and 1.00% annually of the average daily net assets of Class A and C, respectively. The amount actually paid by the Fund is an annualized fee, payable monthly, of .25% and 1.00% of the average daily net assets of Class A and C, respectively. Class I and Y shares do not have Distribution Plan expenses. Under the terms of the agreement, $24,847 was payable at year end.
CID received $23,836 as its portion of commissions charged on sales of the Fund’s Class A shares for the year ended September 30, 2015.
Calvert Investment Services, Inc. (“CIS”), an affiliate of the Advisor, acts as shareholder servicing agent for the Fund. For its services, CIS received a fee of $22,305 for the year ended September 30, 2015. Under the terms of the agreement, $2,059 was payable at year end. Boston Financial Data Services, Inc. is the transfer and dividend disbursing agent.
Each Director of the Fund who is not an employee of the Advisor or its affiliates receives an annual retainer of $52,000 ($48,000 prior to January 1, 2015) plus a meeting fee of up to $3,000 for each Board meeting attended. Additional fees of $6,000 ($5,000 prior to January 1, 2015) annually may be paid to the Committee chairs ($10,000 for the Board Chair and the Special Equities Committee chair) and $2,500 annually may be paid to Committee members, plus a Committee meeting fee of $500 for each
20 calvert.com CALVERT INTERNATIONAL OPPORTUNITIES FUND ANNUAL REPORT (UNAUDITED)
Committee meeting attended. Eligible Directors may participate in a Deferred Compensation Plan (the “Plan”). Obligations of the Plan will be paid solely out of the Fund’s assets. As of September 30, 2015, approximately $119,487 was deferred under the Plan. Directors’ fees are allocated to each of the funds served.
NOTE C — INVESTMENT ACTIVITY AND TAX INFORMATION
During the year, the cost of purchases and proceeds from sales of investments, other than short-term securities, were $159,683,064 and $71,516,991, respectively.
The Fund may purchase securities, typically short-term variable rate demand notes, from or sell to other funds managed by the Advisor. These interportfolio transactions are primarily used for cash management purposes and are made pursuant to Rule 17a-7 of the Investment Company Act of 1940. For the year ended September 30, 2015, such purchases were $201,633.
The tax character of dividends and distributions paid during the year ended September 30, 2015 and September 30, 2014 was as follows:
|
| | | | | | | |
| DISTRIBUTIONS PAID FROM: | 2015 |
| | 2014 |
|
| Ordinary income |
| $1,823,213 |
| |
| $867,393 |
|
| Long-term capital gains | 5,810,011 |
| | — |
|
| Total |
| $7,633,224 |
| |
| $867,393 |
|
As of September 30, 2015, the tax basis components of distributable earnings/(accumulated losses) and the federal tax cost were as follows:
|
| | | |
| Unrealized appreciation |
| $9,366,010 |
|
| Unrealized (depreciation) |
| ($19,665,780 | ) |
| Net unrealized appreciation (depreciation) |
| ($10,299,770 | ) |
| | |
| Undistributed ordinary income |
| $2,008,165 |
|
| Undistributed long-term capital gain |
| $5,690,923 |
|
| | |
| Federal income tax cost of investments |
| $188,691,854 |
|
The differences between the components of distributable earnings on a tax basis and the amounts reflected in the Statement of Net Assets are primarily due to temporary book-tax differences that will reverse in a subsequent period. These differences are mainly due to wash sales and passive foreign investment companies.
Reclassifications, as shown in the table below, have been made to the Fund's components of net assets to reflect income and gains available for distribution (or available capital loss carryovers, as applicable) under income tax law and regulations. These reclassifications are due to permanent book-tax differences and have no impact on net assets. The primary permanent differences causing such reclassifications for the Fund are due to foreign currency transactions and passive foreign investment companies.
|
| | | |
| Undistributed net investment income |
| ($144,775 | ) |
| Accumulated net realized gain (loss) | 144,775 |
|
NOTE D— LINE OF CREDIT
A financing agreement is in place with the Calvert Funds and State Street Corporation (“SSC”). Under the agreement, SSC provides an unsecured line of credit facility, in the aggregate amount of $50 million ($25 million committed and $25 million uncommitted), accessible by the Funds for temporary or emergency purposes only. Borrowings bear interest at the higher of the London Interbank Offered Rate (LIBOR) or the overnight Federal Funds Rate plus 1.25% per annum. A commitment fee of .20% per annum is incurred on the unused portion of the committed facility. An administrative fee of $25,000 was paid in connection with the uncommitted facility. These fees are allocated to all participating funds. The Fund had no borrowings under the agreement during the year ended September 30, 2015.
calvert.com CALVERT INTERNATIONAL OPPORTUNITIES FUND ANNUAL REPORT (UNAUDITED) 21
NOTE E — SUBSEQUENT EVENTS
At a special meeting of the Fund’s Board of Directors (the “Board”) held on November 24, 2015, the Board approved the recommendation made by Calvert Investment Administrative Services, Inc. (“CIAS”) to standardize and rationalize the administrative fee payable by the Calvert Funds at 12 basis points for all series and all share classes of the Calvert Funds. The change is being implemented in two phases. First, CIAS will voluntarily waive the amount of the existing administrative fee above 12 basis points for the period from December 1, 2015 through January 31, 2016. Second, CIAS and the Fund have entered into an Amended and Restated Administrative Services Agreement that will establish a 12 basis point administrative fee for all classes of the Fund commencing on February 1, 2016. In the case of any series or share class that currently pays an administrative fee to CIAS that is less than 12 basis points, CIAS has contractually agreed to waive the difference between that lower administrative fee and the 12 basis point fee until January 31, 2018.
In preparing the financial statements as of September 30, 2015, no other subsequent events or transactions occurred that would have required recognition or disclosure in these financial statements.
NOTICE TO SHAREHOLDERS (UNAUDITED)
For the fiscal year ended September 30, 2015, the Fund considers 1507% of the ordinary dividends paid during the year as qualified dividend income. The Fund also considers $5,810,011 of the long-term capital gain distributions paid during the year as capital gain dividends in accordance with Section 852(b)(3)(C) of the Internal Revenue Code. It also considers $3,976,078 as income derived from foreign sources and $338,469 as foreign taxes paid.
22 calvert.com CALVERT INTERNATIONAL OPPORTUNITIES FUND ANNUAL REPORT (UNAUDITED)
CALVERT INTERNATIONAL OPPORTUNITIES FUND
FINANCIAL HIGHLIGHTS
|
| | | | | | | | | | | | | | | | | | | | |
| | YEARS ENDED |
| CLASS A SHARES | September 30, 2015 (z) | | September 30, 2014 (z) | | September 30, 2013 (z) | | September 30, 2012 | | September 30, 2011 |
| Net asset value, beginning |
| $16.42 |
| |
| $15.76 |
| |
| $12.59 |
| |
| $10.57 |
| |
| $12.43 |
|
| Income from investment operations: | | | | | | | | | |
| Net investment income | .14 |
| | .15 |
| | .14 |
| | .13 |
| | .10 |
|
| Net realized and unrealized gain (loss) | (.83 | ) | | .66 |
| | 3.19 |
| | 2.01 |
| | (1.93 | ) |
| Total from investment operations | (.69 | ) | | .81 |
| | 3.33 |
| | 2.14 |
| | (1.83 | ) |
| Distributions from: | | | | | | | | | |
| Net investment income | (.18 | ) | | (.15 | ) | | (.16 | ) | | (.12 | ) | | (.03 | ) |
| Net realized gain | (.97 | ) | | — |
| | — |
| | — |
| | — |
|
| Total distributions | (1.15 | ) | | (.15 | ) | | (.16 | ) | | (.12 | ) | | (.03 | ) |
| Total increase (decrease) in net asset value | (1.84 | ) | | .66 |
| | 3.17 |
| | 2.02 |
| | (1.86 | ) |
| Net asset value, ending |
| $14.58 |
| |
| $16.42 |
| |
| $15.76 |
| |
| $12.59 |
| |
| $10.57 |
|
Total return* | (4.32 | %) | | 5.14 | % | | 26.70 | % | | 20.52 | % | | (14.78 | %) |
| Ratios to average net assets: A | | | | | | | | | |
| Net investment income | .88 | % | | .88% |
| | 1.04 | % | | 1.10 | % | | .68 | % |
| Total expenses | 1.69 | % | | 1.85 | % | | 2.13 | % | | 2.35 | % | | 2.21 | % |
| Expenses before offsets | 1.66 | % | | 1.66 | % | | 1.66 | % | | 1.66 | % | | 1.66 | % |
| Net expenses | 1.66 | % | | 1.66 | % | | 1.66 | % | | 1.66 | % | | 1.66 | % |
| Portfolio turnover | 51 | % | | 56 | % | | 42 | % | | 56 | % | | 126 | % |
| Net assets, ending (in thousands) |
| $99,908 |
| |
| $50,540 |
| |
| $45,563 |
| |
| $27,406 |
| |
| $24,874 |
|
| | | | | | | | | | | |
| (z) | Per share figures are calculated using the Average Shares Method. |
| * | Total return is not annualized for periods of less than one year and does not reflect deduction of any front-end or deferred sales charge. |
| A | Total expenses do not reflect amounts reimbursed and/or waived by the Advisor or reductions from expense offset arrangements. Expenses before offsets reflect expenses after reimbursement and/or waiver by the Advisor but prior to reductions from expense offset arrangements. Net expenses are net of all reductions and represent the net expenses paid by the Fund. |
| | | | | | | | | | | |
| See notes to financial statements. |
calvert.com CALVERT INTERNATIONAL OPPORTUNITIES FUND ANNUAL REPORT 23
CALVERT INTERNATIONAL OPPORTUNITIES FUND
FINANCIAL HIGHLIGHTS
|
| | | | | | | | | | | | | | | | | | | | |
| | YEARS ENDED |
| CLASS C SHARES | September 30, 2015 (z) | | September 30, 2014 (z) | | September 30, 2013 (z) | | September 30, 2012 | | September 30, 2011 |
| Net asset value, beginning |
| $16.08 |
| |
| $15.44 |
| |
| $12.30 |
| |
| $10.32 |
| |
| $12.20 |
|
| Income from investment operations: | | | | | | | | | |
| Net investment income (loss) | (.03 | ) | | (.01 | ) | | .02 |
| | .04 |
| | (.01 | ) |
| Net realized and unrealized gain (loss) | (.76 | ) | | .66 |
| | 3.14 |
| | 1.95 |
| | (1.87 | ) |
| Total from investment operations | (.79 | ) | | .65 |
| | 3.16 |
| | 1.99 |
| | (1.88 | ) |
| Distributions from: | | | | | | | | | |
| Net investment income | (.04 | ) | | (.01 | ) | | (.02 | ) | | (.01 | ) | | — |
|
| Net realized gain | (.97 | ) | | — |
| | — |
| | — |
| | — |
|
| Total distributions | (1.01 | ) | | (.01 | ) | | (.02 | ) | | (.01 | ) | | — |
|
| Total increase (decrease) in net asset value | (1.80 | ) | | .64 |
| | 3.14 |
| | 1.98 |
| | (1.88 | ) |
| Net asset value, ending |
| $14.28 |
| |
| $16.08 |
| |
| $15.44 |
| |
| $12.30 |
| |
| $10.32 |
|
Total return* | (5.09 | %) | | 4.20 | % | | 25.70 | % | | 19.31 | % | | (15.41 | %) |
| Ratios to average net assets: A | | | | | | | | | |
| Net investment income (loss) | (.18 | %) | | (.08)% |
| | .17% |
| | .30% |
| | (.13 | %) |
| Total expenses | 2.72 | % | | 2.81 | % | | 3.27 | % | | 3.65 | % | | 3.48 | % |
| Expenses before offsets | 2.50 | % | | 2.50 | % | | 2.50 | % | | 2.50 | % | | 2.50 | % |
| Net expenses | 2.50 | % | | 2.50 | % | | 2.50 | % | | 2.50 | % | | 2.50 | % |
| Portfolio turnover | 51 | % | | 56 | % | | 42 | % | | 56 | % | | 126 | % |
| Net assets, ending (in thousands) |
| $5,030 |
| |
| $4,605 |
| |
| $3,282 |
| |
| $2,363 |
| |
| $1,831 |
|
| | |
| (z) | Per share figures are calculated using the Average Shares Method. |
| * | Total return is not annualized for periods of less than one year and does not reflect deduction of any front-end or deferred sales charge. |
| A | Total expenses do not reflect amounts reimbursed and/or waived by the Advisor or reductions from expense offset arrangements. Expenses before offsets reflect expenses after reimbursement and/or waiver by the Advisor but prior to reductions from expense offset arrangements. Net expenses are net of all reductions and represent the net expenses paid by the Fund. |
| | | | | | | | | | | |
| See notes to financial statements. |
24 calvert.com CALVERT INTERNATIONAL OPPORTUNITIES FUND ANNUAL REPORT
CALVERT INTERNATIONAL OPPORTUNITIES FUND
FINANCIAL HIGHLIGHTS
|
| | | | | | | | | | | | | | | | | | | | |
| | YEARS ENDED |
| CLASS I SHARES | September 30, 2015 (z) | | September 30, 2014 (z) | | September 30, 2013 (z) | | September 30, 2012 | | September 30, 2011 |
| Net asset value, beginning |
| $16.19 |
| |
| $15.54 |
| |
| $12.37 |
| |
| $10.36 |
| |
| $12.17 |
|
| Income from investment operations: | | | | | | | | | |
| Net investment income | .19 |
| | .20 |
| | .25 |
| | .21 |
| | .15 |
|
| Net realized and unrealized gain (loss) | (.80 | ) | | .66 |
| | 3.10 |
| | 1.93 |
| | (1.88 | ) |
| Total from investment operations | (.61 | ) | | .86 |
| | 3.35 |
| | 2.14 |
| | (1.73 | ) |
| Distributions from: | | | | | | | | | |
| Net investment income | (.23 | ) | | (.21 | ) | | (.18 | ) | | (.13 | ) | | (.08 | ) |
| Net realized gain | (.97 | ) | | — |
| | — |
| | — |
| | — |
|
| Total distributions | (1.20 | ) | | (.21 | ) | | (.18 | ) | | (.13 | ) | | (.08 | ) |
| Total increase (decrease) in net asset value | (1.81 | ) | | .65 |
| | 3.17 |
| | 2.01 |
| | (1.81 | ) |
| Net asset value, ending |
| $14.38 |
| |
| $16.19 |
| |
| $15.54 |
| |
| $12.37 |
| |
| $10.36 |
|
Total return* | (3.86 | %) | | 5.58 | % | | 27.43 | % | | 20.89 | % | | (14.32 | %) |
| Ratios to average net assets: A | | | | | | | | | |
| Net investment income | 1.22 | % | | 1.24 | % | | 1.76 | % | | 1.76 | % | | 1.11 | % |
| Total expenses | 1.15 | % | | 1.18 | % | | 1.43 | % | | 1.70 | % | | 1.54 | % |
| Expenses before offsets | 1.15 | % | | 1.18 | % | | 1.20 | % | | 1.20 | % | | 1.20 | % |
| Net expenses | 1.15 | % | | 1.18 | % | | 1.20 | % | | 1.20 | % | | 1.20 | % |
| Portfolio turnover | 51 | % | | 56 | % | | 42 | % | | 56 | % | | 126 | % |
| Net assets, ending (in thousands) |
| $40,833 |
| |
| $32,079 |
| |
| $24,130 |
| |
| $8,771 |
| |
| $4,174 |
|
| | |
| (z) | Per share figures are calculated using the Average Shares Method. |
| * | Total return is not annualized for periods of less than one year and does not reflect deduction of any front-end or deferred sales charge. |
| A | Total expenses do not reflect amounts reimbursed and/or waived by the Advisor or reductions from expense offset arrangements. Expenses before offsets reflect expenses after reimbursement and/or waiver by the Advisor but prior to reductions from expense offset arrangements. Net expenses are net of all reductions and represent the net expenses paid by the Fund. |
| | | | | | | | | | | |
| See notes to financial statements. |
calvert.com CALVERT INTERNATIONAL OPPORTUNITIES FUND ANNUAL REPORT 25
CALVERT INTERNATIONAL OPPORTUNITIES FUND
FINANCIAL HIGHLIGHTS
|
| | | | | | | | | | | | | | | | | | | | |
| | YEARS ENDED |
| CLASS Y SHARES | September 30, 2015 (z) | | September 30, 2014 (z) | | September 30, 2013 (z) | | September 30, 2012 | | September 30, 2011 |
| Net asset value, beginning |
| $15.68 |
| |
| $15.03 |
| |
| $11.94 |
| |
| $10.00 |
| |
| $11.72 |
|
| Income from investment operations: | | | | | | | | | |
| Net investment income | .14 |
| | .11 |
| | .18 |
| | .15 |
| | .13 |
|
| Net realized and unrealized gain (loss) | (.77 | ) | | .70 |
| | 3.03 |
| | 1.90 |
| | (1.83 | ) |
| Total from investment operations | (.63 | ) | | .81 |
| | 3.21 |
| | 2.05 |
| | (1.70 | ) |
| Distributions from: | | | | | | | | | |
| Net investment income | (.09 | ) | | (.16 | ) | | (.12 | ) | | (.11 | ) | | (.02 | ) |
| Net realized gain | (.97 | ) | | — |
| | — |
| | — |
| | — |
|
| Total distributions | (1.06 | ) | | (.16 | ) | | (.12 | ) | | (.11 | ) | | (.02 | ) |
| Total increase (decrease) in net asset value | (1.69 | ) | | .65 |
| | 3.09 |
| | 1.94 |
| | (1.72 | ) |
| Net asset value, ending |
| $13.99 |
| |
| $15.68 |
| |
| $15.03 |
| |
| $11.94 |
| |
| $10.00 |
|
Total return* | (4.11 | %) | | 5.40 | % | | 27.06 | % | | 20.69 | % | | (14.52 | %) |
| Ratios to average net assets: A | | | | | | | | | |
| Net investment income | .92 | % | | .68% |
| | 1.31 | % | | 1.36 | % | | 1.04 | % |
| Total expenses | 1.42 | % | | 1.48 | % | | 1.90 | % | | 2.49 | % | | 2.68 | % |
| Expenses before offsets | 1.41 | % | | 1.41 | % | | 1.41 | % | | 1.41 | % | | 1.41 | % |
| Net expenses | 1.41 | % | | 1.41 | % | | 1.41 | % | | 1.41 | % | | 1.41 | % |
| Portfolio turnover | 51 | % | | 56 | % | | 42 | % | | 56 | % | | 126 | % |
| Net assets, ending (in thousands) |
| $33,299 |
| |
| $16,536 |
| |
| $5,138 |
| |
| $1,638 |
| |
| $1,519 |
|
| | |
| (z) | Per share figures are calculated using the Average Shares Method. |
| * | Total return is not annualized for periods of less than one year and does not reflect deduction of any front-end or deferred sales charge. |
| A | Total expenses do not reflect amounts reimbursed and/or waived by the Advisor or reductions from expense offset arrangements. Expenses before offsets reflect expenses after reimbursement and/or waiver by the Advisor but prior to reductions from expense offset arrangements. Net expenses are net of all reductions and represent the net expenses paid by the Fund. |
| | | | | | | | | | | |
| See notes to financial statements. |
26 calvert.com CALVERT INTERNATIONAL OPPORTUNITIES FUND ANNUAL REPORT
EXPLANATION OF FINANCIAL TABLES
SCHEDULE OF INVESTMENTS
The Schedule of Investments is a snapshot of all securities held in the fund at their market value, on the last day of the reporting period. Securities are listed by asset type (e.g., common stock, corporate bonds, U.S. government obligations) or, for International and Global funds, by country, and may be further broken down into sub-groups and by industry classification.
STATEMENT OF ASSETS AND LIABILITIES
The Statement of Assets and Liabilities is often referred to as the fund’s balance sheet. It lists the value of what the fund owns, is due and owes on the last day of the reporting period. The fund’s assets include the market value of securities owned, cash, receivables for securities sold and shareholder subscriptions, and receivables for dividends and interest payments that have been earned, but not yet received. The fund’s liabilities include payables for securities purchased and shareholder redemptions, and expenses owed but not yet paid. The statement also reports the fund’s net asset value (NAV) per share on the last day of the reporting period. The NAV is calculated by dividing the fund’s net assets (assets minus liabilities) by the number of shares outstanding. This statement is accompanied by a Schedule of Investments. Alternatively, if certain conditions are met, a Statement of Net Assets may be presented in lieu of this statement and the Schedule of Investments.
STATEMENT OF NET ASSETS
The Statement of Net Assets provides a detailed list of the fund’s holdings, including each security’s market value on the last day of the reporting period. The Statement of Net Assets includes a Schedule of Investments. Other assets are added and other liabilities subtracted from the investments total to calculate the fund’s net assets. Finally, net assets are divided by the outstanding shares of the fund to arrive at its share price, or Net Asset Value (NAV) per share.
At the end of the Statement of Net Assets is a table displaying the composition of the fund’s net assets. Paid in Capital is the money invested by shareholders and represents the bulk of net assets. Undistributed Net Investment Income and Accumulated Net Realized Gains usually approximate the amounts the fund had available to distribute to shareholders as of the statement date. Accumulated Realized Losses will appear as negative balances. Unrealized Appreciation (Depreciation) is the difference between the market value of the fund’s investments and their cost, and reflects the gains (losses) that would be realized if the fund were to sell all of its investments at their statement-date -values.
STATEMENT OF OPERATIONS
The Statement of Operations summarizes the fund’s investment income earned and expenses incurred in operating the fund. Investment income includes dividends earned from stocks and interest earned from interest-bearing securities in the fund. Expenses incurred in operating the fund include the advisory fee paid to the investment advisor, administrative services fees, distribution plan expenses (if applicable), transfer agent fees, shareholder servicing expenses, custodial, legal, and audit fees, and the printing and postage expenses related to shareholder reports. Expense offsets (fees paid indirectly) may also be shown. Credits earned from offset arrangements are used to reduce the fund’s expenses. This statement also shows net gains (losses) realized on the sale of investments and the increase or decrease in the unrealized appreciation (depreciation) on investments held during the period.
STATEMENT OF CHANGES IN NET ASSETS
The Statement of Changes in Net Assets shows how the fund’s total net assets changed during the two most recent reporting periods. Changes in the fund’s net assets are attributable to investment operations, distributions and capital share transactions.
The Operations section of the report summarizes information detailed in the Statement of Operations. The Distribution section shows the dividend and capital gain distributions made to shareholders. The amounts shown as distributions in this section may not match the net investment income and realized gains amounts shown in the Operations section because distributions are determined on a tax basis and certain investments or transactions may be treated differently for financial statement and tax purposes. The Capital Share Transactions section shows the amount shareholders invested in the fund, either by purchasing shares or by reinvesting distributions, and the amounts redeemed. The corresponding numbers of shares issued, reinvested and redeemed are shown at the end of the report.
FINANCIAL HIGHLIGHTS
The Financial Highlights table provides a per-share breakdown per class of the components that affect the fund’s net asset value for current and past reporting periods. The table provides total return, total distributions, expense ratios, portfolio turnover and net assets for the applicable period. Total return is a measure of a fund’s performance that encompasses all elements of return: dividends, capital gain distributions and changes in net asset value. Total return is the change in value of an investment over a given period, assuming reinvestment of any dividends and capital gain distributions, expressed as a percentage of the initial investment. Total distributions include distributions from net investment income and net realized gains. Long-term gains are earned on securities held in the fund more than one year. Short-term gains, on the sale of securities held less than one year, are treated as ordinary dividend income for tax purposes. The expense ratio is a fund’s cost of doing business, expressed as a
calvert.com CALVERT INTERNATIONAL OPPORTUNITIES FUND ANNUAL REPORT (UNAUDITED) 27
percentage of net assets. These expenses directly reduce returns to shareholders. Portfolio turnover measures the trading activity in a fund’s investment portfolio—how often securities are bought and sold by a fund. Portfolio turnover is affected by market conditions, changes in the size of the fund, the nature of the fund’s investments and the investment style of the portfolio manager.
PROXY VOTING
The Proxy Voting Guidelines of the Calvert Funds that the Fund uses to determine how to vote proxies relating to portfolio securities are provided as an Appendix to the Fund’s Statement of Additional Information. The Statement of Additional Information can be obtained free of charge by calling the Fund at 1-800-368-2745, by visiting the Calvert website at www.calvert.com; or by visiting the SEC’s website at www.sec.gov.
Information regarding how the Fund voted proxies relating to portfolio securities during the most recent 12-month period ended June 30 is available on the Fund’s website at www.calvert.com and on the SEC’s website at www.sec.gov.
AVAILABILITY OF QUARTERLY PORTFOLIO HOLDINGS
The Fund files its complete schedule of portfolio holdings with the SEC for the first and third quarters of each fiscal year on Form N-Q. The Fund’s Form N-Q is available on the SEC’s website at www.sec.gov. The Fund’s Form N-Q may be reviewed and copied at the SEC’s Public Reference Room in Washington, DC; information on the operation of the Public Reference Room may be obtained by calling 1-800-SEC-0330.
28 calvert.com CALVERT INTERNATIONAL OPPORTUNITIES FUND ANNUAL REPORT (UNAUDITED)
DIRECTOR AND OFFICER INFORMATION TABLE
|
| | | | | |
| Name & Age | Position With Fund | Position Start Date | Principal Occupation During Last 5 Years | # of Calvert Portfolios Overseen | Other Directorships During the Past Five Years |
| INDEPENDENT TRUSTEES/DIRECTORS |
REBECCA L. ADAMSON AGE: 66 | Trustee Director Director Director | 1989 CSIF 2000 IMPACT 2000 CRIS 2005 CWVF | President of the national non-profit, First People’s Worldwide, formerly First Nations Financial Project. Founded by her in 1980, First People’s Worldwide is the only American Indian alternative development institute in the country. | 18 | • Bay & Paul Foundation |
RICHARD L. BAIRD, JR. AGE: 67 | Trustee & Chair Director & Chair Director & Chair Director & Chair
| 1982 CSIF
2000 CRIS
2005 CWVF
2005 IMPACT | Former President and CEO of Adagio Health Inc. (retired in 2014) in Pittsburgh, PA, a non-profit corporation which provides family planning services, nutrition, maternal/child health care, and various health screening services and community preventive health programs. | 25 | |
JOHN G. GUFFEY, JR. AGE: 67 | Director Trustee Director Director | 1992 CWVF 1982 CSIF 2000 CRIS 2005 IMPACT | President of Aurora Press Inc., a privately held publisher of trade paperbacks. | 25 | • Ariel Funds (3) (asset management) (through 12/31/11) • Calvert Social Investment Foundation • Calvert Ventures, LLC |
MILES D. HARPER, III AGE: 52 | Director Trustee Director Director | 2000 IMPACT 2005 CSIF 2005 CRIS 2005 CWVF | Partner, Carr Riggs & Ingram (public accounting firm) since September 2013. Partner, Gainer Donnelly & Desroches (public accounting firm) (now Carr Riggs & Ingram), 1999-2013. | 18 | • Bridgeway Funds (14) (asset management) |
JOY V. JONES AGE: 65 | Director Trustee Director Director | 2000 IMPACT 1990 CSIF 2000 CRIS 2005 CWVF | Attorney. | 18 | • Director, Conduit Street Restaurants SUD 2 Limited • Director, Palm Management Corporation |
TERRENCE J. MOLLNER, Ed.D. AGE: 70 | Director Trustee Director Director | 1992 CWVF 1982 CSIF 2000 CRIS 2005 IMPACT | Founder, Chairperson and President of Trusteeship Institute, Inc., an educational organization focused on the personal skills and organizations described in Dr. Mollner’s book, The Love Skill: We Are Mastering the 7 Layers of Human Maturity, particularly businesses that freely chose to give priority to the common good. Chairperson, Stakeholders Capital, Inc., an asset management firm and financial services provider.
| 18 | • Calvert Social Investment Foundation • Ben & Jerry’s Homemade, Inc. (food products) |
SYDNEY A. MORRIS AGE: 66 | Trustee Director Director Director | 1982 CSIF 2000 CRIS 2005 CWVF 2005 IMPACT | The Rev. Dr. Morris is a Unitarian Universalist minister. | 18 | |
calvert.com CALVERT INTERNATIONAL OPPORTUNITIES FUND ANNUAL REPORT (UNAUDITED) 29
|
| | | | | |
| Name & Age | Position With Fund | Position Start Date | Principal Occupation During Last 5 Years | # of Calvert Portfolios Overseen | Other Directorships During the Past Five Years |
| INTERESTED TRUSTEES/DIRECTORS |
D. WAYNE SILBY, Esq.* AGE: 67 | Director Trustee Director Director | 1992 CWVF 1982 CSIF 2000 CRIS 2000 IMPACT | Mr. Silby is the founding Chair of the Calvert Funds. He is the Chair-Elect and a principal of Syntao.com, a Beijing-based company promoting corporate social responsibility. | 25 | • Ameritas Mutual Holding Company (insurance) • Calvert Social Investment Foundation • ImpactAssets, Inc. (asset management) • Committee for the Future (charitable supporting organization) • Syntao.com China (HK) (sustainability consulting) • The ICE Organization (environmental services) |
JOHN H. STREUR* AGE: 55 | Director & President Trustee & President Director & President Director & President | 2015 CWVF
2015 CSIF
2015 CRIS
2015 IMPACT | President and Chief Executive Officer of Calvert Investments, Inc. (since January 2015) and Chief Compliance Officer for the Advisor and Calvert Investment Distributors, Inc. (since August 10, 2015) President and Director, Portfolio 21 Investments, Inc. (through October 2014) President, Chief Executive Officer and Director, Managers Investment Group LLC (through January 2012) President and Director, The Managers Funds and Managers AMG Funds (through January 2012). | 38 | • Portfolio 21 Investments, Inc. (asset management)(through October 2014) • Managers Investment Group LLC (asset management)(through January 2012) • The Managers Funds (asset management) (through January 2012) • Managers AMG Funds (asset management) (through January 2012) • Calvert Social Investment Foundation |
30 calvert.com CALVERT INTERNATIONAL OPPORTUNITIES FUND ANNUAL REPORT (UNAUDITED)
|
| | | |
| Name & Age | Position With Fund | Position Start Date | Principal Occupation During Last 5 Years |
| OFFICERS |
SUSAN WALKER BENDER, Esq. AGE: 56 | Assistant Vice President & Assistant Secretary | 1988 CSIF 2000 CRIS 1992 CWVF 2000 Impact | Assistant Vice President, Assistant Secretary and Associate General Counsel of Calvert Investments, Inc. |
VICKI L. BENJAMIN AGE: 54 | Treasurer | 2015 | Executive Vice President and Chief Financial Officer of Calvert Investments, Inc. since March 2015. Prior to Calvert, Ms. Benjamin was a Senior Partner at KPMG. |
ROBERT D. BENSON, ESQ. AGE: 36 | Assistant Vice President & Assistant Secretary | 2014 | Assistant General Counsel (since 2014), Assistant Vice President & Assistant Secretary (since 2015) and Staff Attorney (prior to 2014), Calvert Investments, Inc. |
HOPE BROWN AGE: 42 | Chief Compliance Officer | 2014 | Chief Compliance Officer for the Calvert Funds (since 2014). Vice President and Chief Compliance Officer, Wilmington Funds (2012-2014). Vice President and Senior Compliance Officer, Wilmington Trust Investment Advisors, Inc. (2010-2012). Assistant Vice President, Lead Manager, Risk Management and Divisional Compliance, T. Rowe Price Associates, Inc. (2005-2010). |
THOMAS DAILEY AGE: 51 | Vice President | 2004 | Vice President of the Advisor and lead portfolio manager for Calvert’s municipal funds. |
MATTHEW DUCH Age: 40 | Vice President | 2011 | Vice President of the Advisor (since 2011) and portfolio manager for Calvert’s taxable fixed-income funds. |
IVY WAFFORD DUKE, Esq. AGE: 47 | Vice President & Secretary | 1996 CSIF 2000 CRIS 1996 CWVF 2000 Impact | Vice President, Acting Secretary and Acting General Counsel (Deputy General Counsel prior to 2015) of Calvert Investments, Inc. Prior to August 10, 2015, Ms. Duke was also Chief Compliance Officer for the Advisor and Calvert Investment Distributors, Inc. |
ROBERT J. ENDERSON, CFA AGE: 57 | Assistant Treasurer | 2014 | Acting Chief Financial Officer (September 2014-March 2015) and Vice President, Corporate Finance, of Calvert Investments, Inc. |
PATRICK FAUL AGE: 50 | Vice President | 2010 | Vice President and Head of Credit Research for the Advisor. |
TRACI L. GOLDT AGE: 42 | Assistant Secretary | 2004 | SEC Filing and Administrative Operations Manager (since 2011) and Executive Assistant to General Counsel (prior to 2011), Calvert Investments, Inc. |
VISHAL KHANDUJA, CFA AGE: 37 | Vice President | 2014 | Vice President of Calvert Investment Management, Inc. (since 2014) and portfolio manager for Calvert’s taxable fixed-income funds since 2012. Previously worked at Columbia Management as Portfolio Manager - Global Rates and Currency Team (2009-2012). |
LANCELOT A. KING, Esq. AGE: 45 | Assistant Vice President & Assistant Secretary | 2002 | Assistant Vice President, Assistant Secretary and Associate General Counsel of Calvert Investments, Inc. |
ANDREW K. NIEBLER, Esq. AGE: 48 | Assistant Vice President & Assistant Secretary | 2006 | Assistant Vice President, Assistant Secretary and Associate General Counsel of Calvert Investments, Inc. |
MARYBETH PILAT, CPA AGE: 47 | Fund Controller and Assistant Treasurer | 2015 | Director of Fund Administration, Calvert Investment Administrative Services, Inc. since August 2015. VP Expense & Budgeting, Global Fiduciary Platform, Legg Mason (May 2015 - July 2015). Vice President and Assistant Treasurer, Columbia Funds, Ameriprise, Columbia Management (2010 - April 2015). |
CATHERINE P. ROY AGE: 59 | Vice President | 2004 | Senior Vice President of the Advisor and Chief Investment Officer – Fixed Income. |
NATALIE A. TRUNOW AGE: 47 | Vice President | 2008 | Senior Vice President of the Advisor and Chief Investment Officer – Equities. |
* Mr. Streur is an interested person of the Funds since he is an Officer and Director of each Fund’s Advisor and certain affiliates. Mr. Silby is an interested person of the Funds since he is a Director of the parent company of each Fund’s Advisor. The address of Trustees/Directors and Officers is 4550 Montgomery Avenue, Suite 1000N, Bethesda, Maryland 20814, except Mr. Silby’s address is 1715 18th Street, N.W., Washington, DC 20009. Additional information about the Fund’s Trustees/Directors can be found in the Statement of Additional Information (SAI). You can get a free copy of the SAI at www.calvert.com, or by contacting your broker, or the Fund at 1-800-368-2745. |
calvert.com CALVERT INTERNATIONAL OPPORTUNITIES FUND ANNUAL REPORT (UNAUDITED) 31
To Open an Account
800-368-2748
Service for Existing Account
Shareholders: 800-368-2745
Brokers: 800-368-2746
Registered Mail
Calvert Investments
c/o BFDS,
P.O. Box 219544
Kansas City, MO 64121-9544
Overnight Mail
Calvert Investments
c/o BFDS,
330 West 9th Street
Kansas City, MO 64105
Web Site
calvert.com
Principal Underwriter
Calvert Investment Distributors, Inc.
4550 Montgomery Avenue
Suite 1000 North
Bethesda, Maryland 20814
|
| | | |
CALVERT INTERNATIONAL OPPORTUNITIES FUND | CALVERT’S FAMILY OF FUNDS | | |
| | Municipal Funds Tax-Free Responsible Impact Bond Fund Taxable Bond Funds Bond Portfolio Income Fund Short Duration Income Fund Long-Term Income Fund Ultra-Short Income Fund High Yield Bond Fund Green Bond Fund Unconstrained Bond Fund Balanced and Asset Allocation Funds Balanced Portfolio Conservative Allocation Fund Moderate Allocation Fund Aggressive Allocation Fund | | Equity Funds Large Cap Core Portfolio Equity Portfolio Global Value Fund U.S. Large Cap Core Responsible Index Fund U.S. Large Cap Value Responsible Index Fund U.S. Large Cap Growth Responsible Index Fund U.S. Mid Cap Core Responsible Index Fund Developed Markets EX-U.S. Responsible Index Fund Capital Accumulation Fund International Equity Fund Small Cap Fund Global Energy Solutions Fund Global Water Fund International Opportunities Fund Global Equity Income Fund Emerging Markets Equity Fund
|
This report is intended to provide fund information to shareholders. It is not authorized for distribution to prospective investors unless preceded or accompanied by a prospectus. Note: The information on our website is not incorporated by reference into this report; our website address is included as an inactive textual reference only. Investors should carefully consider the investment objectives, risks, charges and expenses of the Calvert Funds. This and other important information is contained in the fund’s summary prospectus and prospectus, which can be obtained from your financial professional and should be read carefully before investing. You may also call Calvert at 800/368-2748 or visit calvert.com. Printed on recycled paper using soy inks. |
| | | | |
|
| | |
| | |
| | | |
Calvert Emerging Markets Equity Fund
| | |
| | | |
| | |
|
| |
Annual Report September 30, 2015 E-Delivery Sign-Up — Details Inside | |
|
|
| |
Choose Planet-friendly E-delivery! Sign up now for on-line statements, prospectuses, and fund reports. In less than five minutes you can help reduce paper mail and lower fund costs. Just go to calvert.com. If you already have an online account at Calvert, click on Login, to access your Account, and select the documents you would like to receive via e-mail. If you’re new to online account access, click on Login, then Register to create your user name and password. Once you’re in, click on the E-delivery sign-up on the Account Portfolio page and follow the quick, easy steps. Note: if your shares are not held directly at Calvert but through a brokerage firm, you must contact your broker for electronic delivery options available through their firm. |
|
| | | |
| | | TABLE OF CONTENTS |
| | | | |
| | | | President's Letter |
| | | | Portfolio Management Discussion |
| | | | Understanding Your Fund's Expenses |
| | | | Report of Independent Registered Public Accounting Firm |
| | | | Statement of Net Assets |
| | | | Statement of Operations |
| | | | Statements of Changes in Net Assets |
| | | | Notes to Financial Statements |
| | | | Financial Highlights |
| | | | Explanation of Financial Tables |
| | | | Proxy Voting |
| | | | Availability of Quarterly Portfolio Holdings |
| | | | Director and Officer Information Table |
|
| |
| John Streur President and Chief Executive Officer, Calvert Investments, Inc. |
Dear Shareholders,
Global economic growth is vital to the improvement of the lives of all people, especially so to those of the ultra-poor. However, how that growth is achieved is critical to the long-term health and sustainability of our collective societies. Business activity that does not show consideration for environmental and social impacts may have calamitous consequences, many of which we are witnessing now, including political and social unrest, unjust wealth distribution and diminished bio-diversity.
The returns of the markets (chart below) reflect the impact of the uncertainty created by a legacy of unsustainable development and the current lack of positive economic growth trends. The steep decline in the emerging market equities index (reflective of the flight of capital and currency weakness) is particularly impactful as these regions include some of the largest populations of individuals most in need of sustainable and inclusive economic development.
|
| | | | |
| MARKET BENCHMARKS | Total Returns for the period ended 9/30/2015 |
| 6 Months | Year-to-Date | 1 Year | 5 Year |
| S&P 500 | -6.18% | -5.29% | -0.61% | 13.34% |
| Russell 1000 | -6.72% | -5.24% | -0.61% | 13.42% |
| Russell 3000 | -7.12% | -5.45% | -0.49% | 13.28% |
| MSCI World ex USA | -9.88% | -6.32% | -9.73% | 3.92% |
| MSCI Emerging Markets | -17.11% | -15.22% | -18.98% | -3.25% |
| Barclays U.S. Aggregate Bond | -0.47% | 1.13% | 2.94% | 3.10% |
| Barclays Global Aggregate | -0.34% | -2.25% | -3.26% | 0.81% |
| Returns for periods greater than one year have been annualized. |
In an effort to mitigate this issue and foster the long term sustainability and justice of our global economic system, many of the world’s leaders participated with the United Nations (“UN”) to design and implement a 15-year plan to create the kind of economic development (http://www.calvert.com/media-relations/press-releases/calvert-ceo-participates-in-the-un-sustainable-development-summit) that should benefit the poorest people in the world, preserve opportunities for future generations, and provide stewardship to the environment. This effort, which kicked-off at the UN Summit earlier this month, involves bringing together private enterprise, governments, NGOs, development banks and people of all walks of life to achieve the “Sustainable Development Goals 2015” (SDGs). These goals include: eliminating extreme poverty, eliminating extreme hunger, fostering good health for all, promoting gender equality, and creating environmental sustainability and peace and stability throughout the world. The SDGs impact residents of every country in some manner, but no one more acutely than the denizens of the developing and emerging nations.
It was my privilege, as Calvert’s CEO, to be invited to the Summit, as one of 350 global leaders asked to participate in the development of this critical 15-year sustainability plan. During the course of this event, I announced that Calvert Investments would lead a project (http://www.calvert.com/perspective/social-impact/calvert-un-sustainable-development-goals) to map the Sustainable Development Goals to standards that companies can be measured by, and that investors may look to in order to
4 calvert.com CALVERT EMERGING MARKETS EQUITY FUND ANNUAL REPORT (UNAUDITED)
understand which companies are helping to create sustainable, responsible growth. It is integral to the success and achievement of the goals, that the largest holders of capital, i.e., corporations, help drive these initiatives.
The crucial role that corporations now play in creating social and environmental outcomes was highlighted at the UN sessions by the presence of CEOs and sustainability officers from around the world, and the vital role of investors and the capital markets was reflected by our presence and contribution. In addition to representing your interests at the UN event, Calvert has contributed to the understanding of the role that corporations and investors play in driving social and environmental conditions through our most recent research, “The Role of the Corporation in Society”, available to you on our website, (see http://www.calvert.com/perspective/governance/calvert-serafeim-series-report).
Despite the fact that the past year has not brought the financial returns that you or I would have wished for as investors, I believe that when we look back on 2015 several years from now we are likely to see it as a transformative year in terms of our economic and social systems. Individuals and organizations of all types — corporate, government, NGO, religious — are coming together due to the realization that we need a more sustainable and just system to serve the needs of all stakeholders. As a shareholder of Calvert Funds, you are very much part of this mission, as together we are a leader and innovator in connecting capital to mission, with the dual purpose of driving competitive investment returns with just and sustainable economic progress.
On behalf of all of us at Calvert Investments, thank you for the confidence you have placed in our management of your funds and the ongoing privilege to serve you. We appreciate the opportunity to work with you as we strive to meet your financial needs while also helping to render the world a better place for all people.
Respectfully,
John Streur
October 2015
calvert.com CALVERT EMERGING MARKETS EQUITY FUND ANNUAL REPORT (UNAUDITED) 5
|
| |
| PORTFOLIO MANAGEMENT DISCUSSION |
|
| |
| Gary Greenberg of Hermes Investment Management Limited |
|
| |
| Elena Tedesco of Hermes Investment Management Limited |
Performance
In the 12-months ended September 30, 2015, the Calvert Emerging Markets Equity Fund Class A shares (at NAV) fell 14.18%, outperforming the benchmark, the MSCI Emerging Markets Index, which fell 18.98%. The Fund’s outperformance relative to the benchmark of 4.8% was driven by strong stock selection in China and Taiwan and positive country allocation (combining the currency effect), specifically overweights to China and India and an underweight to Brazil.
Investment Process
The Calvert Emerging Markets Equity Fund seeks to invest in companies whose products, services, or business practices contribute to addressing such global sustainability challenges as poverty, economic development, and health; environment and climate change; and human rights and corporate governance. The team believes that structural changes within emerging markets are creating inefficiencies and opportunities that can be exploited by experienced investors. It believes that the best way to add value is through an investment process that integrates bottom-up and top-down analysis, looking for quality companies trading at attractive valuations, in countries with conditions that support growth.
Market Review
Emerging markets fell sharply over the period, underperforming developed markets, as uncertainty surrounding U.S. Federal Reserve rate hikes, weak Chinese economic data, political risk, and commodity price weakness weighed on sentiment and contributed to risk aversion.
Within the MSCI Emerging Markets Index, emerging Asia was the leading sector, although still falling 12.75%. Although Chinese stocks declined 4.83%, they were the region’s best performers. This was despite the volatility in Chinese stock markets since June and slowing growth in the world’s second-largest economy, which led to a global sell-off. Through the second and third quarters of 2015, China’s markets saw heavy selling pressure on the deleveraging and unwinding of margin financing, a strong driver of the Chinese market rally earlier in the year. The surprise devaluation in the yuan in early August and uncertainty over future policy responses added to negative sentiment. Malaysia and Indonesia fell more than 30% as their respective currencies magnified the impact of slowing growth. The export-oriented economies of Korea and Taiwan fell on weak global demand, technology-sector weakness, and currency concerns.
Europe, the Middle East, and Africa (EMEA) fell 21.35%, led lower by Greece, which was the worst performing emerging market, dropping 65.93% amid a highly volatile trading period, which produced a series of wide swings as politics drove the local market. Latin America was the worst performing region, dropping 38.47%. Currency weakness across the region amplified losses. Brazil was also a particular source of vulnerability in the third quarter of 2015, as Standard & Poor’s downgraded the country’s debt to noninvestment grade and the Brazilian political saga continued.
At a sector level, the defensive characteristics of health care and consumer staples enabled them to be among the best performers, dropping 8.07% and 11.90% respectively. Energy was the worst performing sector, dropping 36.90% amid deteriorating commodity prices.
6 calvert.com CALVERT EMERGING MARKETS EQUITY FUND ANNUAL REPORT (UNAUDITED)
|
| | | | |
| | | | |
| | CALVERT EMERGING MARKETS EQUITY FUND |
| | SEPTEMBER 30, 2015 | |
| | | | |
| | ECONOMIC SECTORS | % OF TOTAL INVESTMENTS | |
| | Consumer Discretionary | 18.9 | % | |
| | Consumer Staples | 5.4 | % | |
| | Financials | 28.8 | % | |
| | Health Care | 5.4 | % | |
| | Industrials | 7.7 | % | |
| | Information Technology | 28.9 | % | |
| | Materials | 1.0 | % | |
| | Telecommunication Services | 2.2 | % | |
| | Utilities | 1.7 | % | |
| | Total | 100 | % | |
| | | | |
Portfolio Strategy
The Calvert Emerging Markets Equity Fund outperformed its benchmark by 4.8%. Stock selection, most notably among Chinese and Taiwanese stocks, contributed to outperformance. The Fund also benefited from positive country allocation (combining the currency effect), specifically overweights to China and India, an underweight to Brazil, and a lack of exposure to Malaysia. China contributed significantly to overall returns despite the market volatility since June.
At the sector level, allocation accounted for the majority of outperformance, led by an overweight to consumer discretionary and an underweight to materials and energy. Strong stock selection in information technology and financials was pared by weaker consumer staples, utilities, and energy stocks.
The Indian private sector bank HDFC Bank Limited was the biggest contributor, benefiting from the improved economic environment underpinning strong loan growth. Its strong capital position enables HDFC to gain market share at a time when state banks are focused on capital conservation amid deteriorating asset quality. Techtronic Industries, the Hong Kong manufacturer of branded power tools and floor care equipment, moved higher on strong U.S. sales growth of its largest customer, Home Depot, and strong reception for a new high-margin product. China Internet services provider Tencent Holdings Limited has delivered strong results, underpinned by an increasingly vibrant personal computer and mobile Internet ecosystem. With its dominant position in WeChat and Mobile QQ, Tencent is able to monetize through a diversified exposure of entertainment services that cover games, video, music, and literature.
Macau casino and hotel operator Galaxy Entertainment Group was the biggest detractor after reporting a drop in earnings on higher operational costs from its new casino resorts and a declining market in Macau’s gambling industry.
|
| | | | | | |
| | | | | |
| | CALVERT EMERGING MARKETS EQUITY FUND | |
| | SEPTEMBER 30, 2015 | |
| | | | | |
| | INVESTMENT PERFORMANCE | |
| | (TOTAL RETURN AT NAV) | |
| | | 6 MONTHS ENDED 9/30/15 | 12 MONTHS ENDED 9/30/15 | |
| | Class A | -15.77 | % | -14.18 | % | |
| | Class C | -16.16 | % | -14.98 | % | |
| | Class I | -15.72 | % | -13.92 | % | |
| | Class Y | -15.65 | % | -13.96 | % | |
| | MSCI Emerging Markets Index | -17.11 | % | -18.98 | % | |
| | Lipper Emerging Markets Funds Average | -15.46 | % | -19.25 | % | |
| | | | | |
| | Investment performance/return at NAV does not reflect the deduction of the Fund’s maximum 4.75% front-end sales charge or any deferred sales charge. | |
| | | | | |
| | TEN LARGEST STOCK HOLDINGS | % OF NET ASSETS | |
| | Tencent Holdings Ltd. | 5.1 | % | |
| | Taiwan Semiconductor Manufacturing Co. Ltd. (ADR) | 5.0 | % | |
| | HDFC Bank Ltd. (ADR) | 4.8 | % | |
| | Techtronic Industries Co. Ltd. | 4.2 | % | |
| | Shenzhen International Holdings Ltd. | 3.4 | % | |
| | Samsonite International SA | 3.3 | % | |
| | Samsung Fire & Marine Insurance Co. Ltd. | 3.3 | % | |
| | KB Financial Group, Inc. | 3.1 | % | |
| | ICICI Bank Ltd. (ADR) | 3.0 | % | |
| | Bank Rakyat Indonesia Persero Tbk PT | 2.9 | % | |
| | Total | 38.1 | % | |
| | | | | |
Cosan, a Brazilian producer of sugar and bioethanol, was affected by weak commodity prices, the re-election of President Dilma Rousseff, and investor concerns around the corporate restructuring that concluded in the first quarter of 2015. Alibaba Group Holding, the U.S.-listed Chinese e-commerce and Internet provider, lost a lot of momentum after its initial public offering last year. Over the past few months, a host of concerns ranging from counterfeit products on its platform to risks in the Chinese economy and increased competition from JD.com have further weighed on the company’s stock.
We remain overweight emerging Asia and underweight the other regions. The most significant change in the period was the reduction in the overweight to China in mid-June, from 13% to 3% as we took profits, leery of market weakness in the context of high margin levels. We are cautious on China given the overhang caused by government intervention and our expectation that earnings will contract this year. We retain
calvert.com CALVERT EMERGING MARKETS EQUITY FUND ANNUAL REPORT (UNAUDITED) 7
a small (2 to 3%) overweight, confident in the prospects of our companies, which include video surveillance companies, spirits brands, logistics players, and consumer products providers. The lifting of restrictions on access to the Indian market in the second quarter of 2015 enabled us to replace the respective Index exposure with our favorite companies. Like China, the market offers great choice in companies, and we think we have a portfolio of very reasonably valued but very healthy companies in sectors such as software, logistics, power transmission, manufacturing, and finance. More recently, we raised our exposure to Taiwan, adding to selected technology-related companies following a period of weakness in the sector. Meanwhile, we retain our underweight to Korea due to our concerns about its exposure to a slowing Chinese economy, a weakening yen, very poor corporate governance, and a slowdown in global demand.
We also retain underweights in Latin America and EMEA. Both regions are commodity intensive and more exposed than the Asia region to plummeting commodity prices and the strengthening U.S. dollar. Our approach to Latin America is to stay underweight, slowly and patiently building positions in great companies as they enter bargain territory.
Our main sector exposures continue to be overweights in consumer discretionary and information technology. We remain underweight telecommunications, energy, and materials.
Outlook
We are assuming slow growth in the Western world, continued weak oil prices, a well-supported dollar, and continued slow growth in emerging markets (EM), at least compared with their historical growth. However, it is not all gloom. The valuation of EM reflects a lower level of profitability engendered by the misallocation of capital in the form of the Chinese stimulus in 2009 and the subsequent commodity bust. We do not see commodity demand returning to 2006 levels and therefore expect prices to stay weak. State-owned enterprise reform could improve Chinese profitability and also help repair Chinese bank balance sheets, but evidence of this is not yet visible.
We expect the Chinese authorities to announce further reforms by the end of the year, Prime Minister Narendra Modi to make progress at the state level in India, and President Joko Widodo’s new cabinet in Indonesia to find its feet and make limited but useful progress in creating the legal infrastructure for sustainable growth. In Thailand, Brazil, Mexico, South Africa, and Chile, expectations are low, and Poland, Hungary, and Egypt expect moderate growth. Russia and Malaysia remain political pariahs.
Taiwan and Korea, with supportive financial conditions, should see stronger currencies than most emerging markets, although the technology cycle is peaking. India looks best at the moment, with credit growth picking up, bank reform taking place, and the price of onions (an important input into the cost of living basket and political popularity) peaking. The high corporate governance standards of Taiwan companies combined with the skittishness of the market are providing opportunities to find world-beating stocks there. As patient investors, we are biding our time, waiting for bargains to appear in Latin America.
Hermes Investment Management, Limited
October 2015
As of September 30, 2015, the following companies represented the following percentages of net assets: HDFC Bank Limited (ADR) 4.78%, Techtronic Industries 4.16%, Tencent Holdings Limited 5.13%, Galaxy Entertainment Group 1.99%, Cosan 0.00%, and Alibaba Group Holding (ADR) 2.67%. Holdings are subject to change.
8 calvert.com CALVERT EMERGING MARKETS EQUITY FUND ANNUAL REPORT (UNAUDITED)
Growth of $10,000
The graph below shows the value of a hypothetical $10,000 investment in the Fund over the past 10 fiscal year periods or since inception (for funds without 10-year records). The results shown are for Class A shares, reflect the deduction of the maximum front-end Class A sales charge of 4.75%, and assume the reinvestment of dividends. The result is compared with a broad based market index. Market indexes are unmanaged and their results do not reflect the effect of expenses or sales charges. The value of an investment in a different share class would be different.
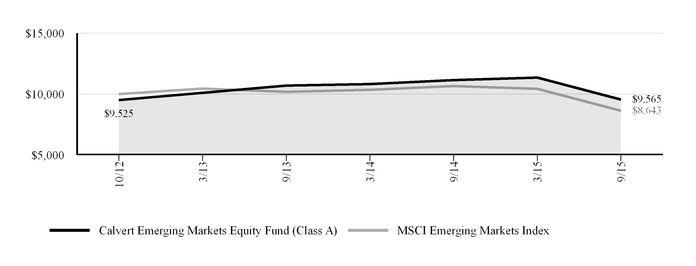
|
| | | | | |
| CALVERT EMERGING MARKETS EQUITY FUND |
| SEPTEMBER 30, 2015 |
| AVERAGE ANNUAL TOTAL RETURNS | Ticker Symbol | 1 Year | Since Inception (10/29/2012) |
| Class A (with max. load) | CVMAX | -18.28 | % | -1.52 | % |
| Class C (with max. load) | CVMCX | -15.83 | % | -0.82 | % |
| Class I | CVMIX | -13.92 | % | 0.47 | % |
| Class Y | CVMYX | -13.96 | % | 0.41 | % |
| MSCI Emerging Markets Index | | -18.98 | % | -4.72 | % |
| Lipper Emerging Markets Funds Average | | -19.25 | % | NA |
|
| | | | |
| | | | |
All performance data shown, including the graph above and the adjacent table, represents past performance, does not guarantee future results, assumes reinvestment of dividends and distributions, and does not reflect the deduction of taxes that a shareholder would pay on the Fund’s distributions or the redemption of the Fund shares. All performance data reflects fee waivers and/or expense limitations, if any are in effect; in their absence performance would be lower. See Note B in Notes to Financial Statements. The investment return and principal value of an investment will fluctuate so that an investor’s shares, when redeemed, may be worth more or less than their original cost. Current performance may be lower or higher than the performance data quoted; for current performance data, including most recent month-end, visit www.calvert.com. The gross expense ratio from the current prospectus for Class A shares is 2.22%. This number may differ from the expense ratio shown elsewhere in this report because it is based on a different time period and, if applicable, does not include fee or expense waivers. Performance data quoted already reflects the deduction of the Fund’s operating expenses.
calvert.com CALVERT EMERGING MARKETS EQUITY FUND ANNUAL REPORT (UNAUDITED) 9
UNDERSTANDING YOUR FUND'S EXPENSES
As an investor, you incur two types of costs. There are transaction costs, which generally include sales charges on purchases and may include redemption fees. There are also ongoing costs, which generally include management fees, distribution and/or service fees, and other fund expenses. The following information is intended to help you understand your ongoing costs (in dollars) of investing in this mutual fund and to help you compare these costs with the ongoing costs of investing in other mutual funds.
To illustrate these ongoing costs, we have provided examples and calculated the expenses paid by the fund's investors during the period. The actual and hypothetical information presented in the examples is based on an investment of $1,000 invested at the beginning of the period and held for the entire period (April 1, 2015 to September 30, 2015).
Actual Expenses
The first line of the table below provides information about actual account values and actual expenses. You may use the information in this line, together with the amount you invested, to estimate the expenses that you paid over the period. Simply divide your account value by $1,000 (for example, an $8,600 account value divided by $1,000 = 8.6), then multiply the result by the number in the first line under the heading entitled "Expenses Paid During Period" to estimate the expenses you paid on your account during this period.
Hypothetical Example for Comparison Purposes
The second line of the table below provides information about hypothetical account values and hypothetical expenses based on the Fund’s actual expense ratio and an assumed rate of return of 5% per year before expenses, which is not the Fund’s actual return. The hypothetical account values and expenses may not be used to estimate the actual ending account balance or expenses you paid for the period. You may use this information to compare the ongoing costs of investing in the Fund and other funds. To do so, compare the 5% hypothetical example with the 5% hypothetical examples that appear in the shareholder reports of the other funds.
Please note that the expenses shown in the table are meant to highlight your ongoing costs only and do not reflect any transactional costs, such as sales charges (loads), or redemption fees. Therefore, the second line of the table is useful in comparing ongoing costs only, and will not help you determine the relative total costs of owning different funds. In addition, if these transactional costs were included, your costs would have been higher.
|
| | | | |
| | ANNUALIZED
EXPENSE RATIO | BEGINNING
ACCOUNT VALUE
4/1/15 | ENDING
ACCOUNT VALUE
9/30/15 | EXPENSES PAID
DURING PERIOD*
4/1/15 - 9/30/15 |
| Class A | | | | |
| Actual | 1.73% | $1,000.00 | $842.30 | $7.99 |
| Hypothetical (5% return per year before expenses) | 1.73% | $1,000.00 | $1,016.40 | $8.74 |
| Class C | | | | |
| Actual | 2.61% | $1,000.00 | $838.40 | $12.03 |
| Hypothetical (5% return per year before expenses) | 2.61% | $1,000.00 | $1,011.98 | $13.16 |
| Class I | | | | |
| Actual | 1.38% | $1,000.00 | $842.80 | $6.38 |
| Hypothetical (5% return per year before expenses) | 1.38% | $1,000.00 | $1,018.15 | $6.98 |
| Class Y | | | | |
| Actual | 1.47% | $1,000.00 | $843.50 | $6.79 |
| Hypothetical (5% return per year before expenses) | 1.47% | $1,000.00 | $1,017.70 | $7.44 |
|
|
| * Expenses paid during the period are equal to the annualized expense ratio for each class as indicated above, multiplied by the average account value over the period, multiplied by 183/365 (to reflect the one-half year period). Expense ratios shown in the Financial Highlights represent the actual expenses incurred for the fiscal year. |
10 calvert.com CALVERT EMERGING MARKETS EQUITY FUND ANNUAL REPORT (UNAUDITED)
REPORT OF INDEPENDENT REGISTERED PUBLIC ACCOUNTING FIRM
The Board of Directors of Calvert World Values Fund, Inc. and Shareholders of Calvert Emerging Markets Equity Fund:
We have audited the accompanying statement of net assets of the Calvert Emerging Markets Equity Fund (the “Fund”), a series of Calvert World Values Fund, Inc., as of September 30, 2015, and the related statement of operations for the year then ended, the statements of changes in net assets for each of the years in the two-year period then ended, and the financial highlights for each of the years or periods in the three-year period then ended. These financial statements and financial highlights are the responsibility of the Fund’s management. Our responsibility is to express an opinion on these financial statements and financial highlights based on our audits.
We conducted our audits in accordance with the standards of the Public Company Accounting Oversight Board (United States). Those standards require that we plan and perform the audit to obtain reasonable assurance about whether the financial statements and financial highlights are free of material misstatement. An audit includes examining, on a test basis, evidence supporting the amounts and disclosures in the financial statements. Our procedures included confirmation of securities owned as of September 30, 2015 by correspondence with the custodian and brokers or by other appropriate auditing procedures. An audit also includes assessing the accounting principles used and significant estimates made by management, as well as evaluating the overall financial statement presentation. We believe that our audits provide a reasonable basis for our opinion.
In our opinion, the financial statements and financial highlights referred to above present fairly, in all material respects, the financial position of the Calvert Emerging Markets Equity Fund as of September 30, 2015, the results of its operations for the year then ended, the changes in its net assets for each of the years in the two-year period then ended, and the financial highlights for each of the years or periods in the three-year period then ended, in conformity with U.S. generally accepted accounting principles.
Philadelphia, Pennsylvania
November 25, 2015
calvert.com CALVERT EMERGING MARKETS EQUITY FUND ANNUAL REPORT 11
CALVERT EMERGING MARKETS EQUITY FUND
STATEMENT OF NET ASSETS
SEPTEMBER 30, 2015
|
| | |
| | SHARES | VALUE ($) |
| EQUITY SECURITIES - 93.4% | | |
| Austria - 0.9% | | |
Vienna Insurance Group AG Wiener Versicherung Gruppe | 21,339 | 627,728 |
| | | |
| Brazil - 5.2% | | |
| BB Seguridade Participacoes SA | 196,700 | 1,232,667 |
| Embraer SA (ADR) | 59,500 | 1,522,010 |
| Itau Unibanco Holding SA, Preferred | 131,455 | 880,240 |
| | | 3,634,917 |
| | | |
| China – 16.7% | | |
| Alibaba Group Holding Ltd. (ADR) * | 31,723 | 1,870,705 |
| China Dongxiang Group Co. Ltd. | 3,778,000 | 911,171 |
| China Mengniu Dairy Company Ltd. | 536,000 | 1,903,000 |
| Ping An Insurance Group Company of China Ltd. | 198,000 | 988,219 |
| Shenzhen International Holdings Ltd. | 1,748,904 | 2,412,761 |
| Tencent Holdings Ltd. | 213,700 | 3,599,611 |
| | | 11,685,467 |
| | | |
| Egypt - 1.6% | | |
Commercial International Bank Egypt SAE | 164,527 | 1,106,295 |
| | | |
| Hong Kong – 9.5% | | |
| Galaxy Entertainment Group Ltd. | 544,000 | 1,397,029 |
| Samsonite International SA | 712,759 | 2,334,792 |
| Techtronic Industries Co. Ltd. | 785,000 | 2,918,574 |
| | | 6,650,395 |
| | | |
| Hungary - 2.8% | | |
Richter Gedeon Nyrt | 124,248 | 1,975,763 |
| | | |
| India - 18.9% | | |
| Bharat Forge Ltd. | 92,785 | 1,287,253 |
| Container Corp Of India Ltd. | 58,875 | 1,322,563 |
| Greenko Group plc * | 173,802 | 191,813 |
| HCL Technologies Ltd. | 79,363 | 1,193,549 |
| HDFC Bank Ltd. (ADR) | 54,868 | 3,351,886 |
| Housing Development Finance Corp Ltd. | 48,561 | 899,118 |
| ICICI Bank Ltd. (ADR) | 250,262 | 2,097,195 |
|
| | |
| | SHARES | VALUE ($) |
| Motherson Sumi Systems Ltd. | 327,019 | 1,160,825 |
| Tech Mahindra Ltd. | 204,364 | 1,746,178 |
| | | 13,250,380 |
| | | |
| Indonesia - 4.1% | | |
Bank Rakyat Indonesia Persero Tbk PT | 3,362,300 | 1,997,164 |
Tower Bersama Infrastructure Tbk PT * | 2,006,000 | 898,832 |
| | | 2,895,996 |
| | | |
| Mexico - 2.7% | | |
Banregio Grupo Financiero SAB de CV | 357,205 | 1,904,854 |
| | | |
| Russia - 2.4% | | |
| Mail.Ru Group Ltd. (GDR) * | 60,473 | 1,054,312 |
| MMC Norilsk Nickel PJSC (ADR): | | |
| BATS Chi-X Europe | 43,404 | 623,727 |
| OTC US | 3,059 | 43,958 |
| | | 1,721,997 |
| | | |
| South Africa - 5.8% | | |
Life Healthcare Group Holdings Ltd. | 651,724 | 1,681,650 |
| MTN Group Ltd. | 45,868 | 592,050 |
| Shoprite Holdings Ltd. | 156,330 | 1,780,212 |
| | | 4,053,912 |
| | | |
| South Korea - 6.4% | | |
| KB Financial Group, Inc. | 73,932 | 2,194,632 |
| Samsung Fire & Marine Insurance Co. Ltd. | 9,702 | 2,276,685 |
| | | 4,471,317 |
| | | |
| Taiwan - 15.0% | | |
| Advantech Co. Ltd. | 156,000 | 1,071,687 |
| Chipbond Technology Corp. | 982,000 | 1,436,383 |
| Phison Electronics Corp. | 223,982 | 1,418,344 |
| Siliconware Precision Industries Co. Ltd. (ADR) | 217,267 | 1,365,523 |
| Taiwan Semiconductor Manufacturing Co. Ltd. (ADR) | 168,980 | 3,506,335 |
| Tong Yang Industry Co. Ltd. | 1,702,138 | 1,699,551 |
| Tung Thih Electronic Co. Ltd. | 1,000 | 6,920 |
| | | 10,504,743 |
12 calvert.com CALVERT EMERGING MARKETS EQUITY FUND ANNUAL REPORT
|
| | | | |
| | SHARES | VALUE ($) |
| Turkey - 1.4% | | |
Aygaz AS | 303,108 | 976,199 |
|
| | | |
Total Equity Securities (Cost $74,151,432) | | 65,459,963 |
|
| | | |
| PARTICIPATORY NOTES - 3.4% | | |
| | | |
| China - 3.4% | | |
| Gree Electric Appliances, Inc., Merrill Lynch International & Co., 8/31/18 *(b) | 173,352 | 443,313 |
|
| Gree Electric Appliances, Inc., Morgan Stanley Asia Products Ltd. 3/9/16 *(b) | 241,611 | 617,871 |
|
Hangzhou Hikvision Digital Technology Co., Ltd., Merrill Lynch International & Co., 4/9/19 *(b) | 264,451 | 1,355,305 |
|
| | | 2,416,489 |
|
| | | |
Total Participatory Notes (Cost $2,129,080) | | 2,416,489 |
|
| | | |
| | | |
| TOTAL INVESTMENTS (Cost $76,280,512) - 96.8% | | 67,876,452 |
|
| Other assets and liabilities, net - 3.2% | | 2,248,615 |
|
| | | |
NET ASSETS - 100.0% | |
| $70,125,067 |
|
|
| | | |
| NET ASSETS CONSIST OF: | |
| Paid-in capital applicable to the following shares of common stock, with 250,000,000 shares of $0.01 par value shares authorized: | |
| Class A: 2,163,207 shares outstanding |
| $27,848,999 |
|
| Class C: 52,717 shares outstanding | 670,164 |
|
| Class I: 3,556,324 shares outstanding | 44,012,722 |
|
| Class Y: 620,817 shares outstanding | 7,885,235 |
|
| Undistributed net investment income | 650,198 |
|
| Accumulated net realized gain (loss) on investments and foreign currency transactions | (2,514,915) |
|
| Net unrealized appreciation (depreciation) on investments, foreign currencies and assets and liabilities denominated in foreign currencies | (8,427,336) |
|
| | |
| NET ASSETS |
| $70,125,067 |
|
| | |
| NET ASSET VALUE PER SHARE | |
| Class A (based on net assets of $23,568,990) |
| $10.90 |
|
| Class C (based on net assets of $566,002) |
| $10.74 |
|
| Class I (based on net assets of $39,100,865) |
| $10.99 |
|
| Class Y (based on net assets of $6,889,210) |
| $11.10 |
|
|
| |
| NOTES TO STATEMENT OF NET ASSETS |
| * | Non-income producing security. |
| (b) | This security was valued under the direction of the Board of Directors. See Note A. |
| Abbreviations: |
| ADR: | American Depositary Receipts |
| GDR: | Global Depositary Receipts |
| Ltd.: | Limited |
| Plc: | Public Limited Company |
| | |
| See notes to financial statements. |
calvert.com CALVERT EMERGING MARKETS EQUITY FUND ANNUAL REPORT 13
CALVERT EMERGING MARKETS EQUITY FUND
STATEMENT OF OPERATIONS
YEAR ENDED SEPTEMBER 30, 2015
|
| | | |
| NET INVESTMENT INCOME | |
| Investment Income: | |
| Dividend income (net of foreign taxes withheld of $158,155) |
| $1,742,633 |
|
| Interest income | 216 |
|
| Total investment income | 1,742,849 |
|
| | |
| Expenses: | |
| Investment advisory fee | 650,618 |
|
| Administrative fees | 143,640 |
|
| Transfer agency fees and expenses | 63,648 |
|
| Distribution Plan expenses: | |
| Class A | 60,807 |
|
| Class C | 6,147 |
|
| Directors' fees and expenses | 6,213 |
|
| Accounting fees | 17,946 |
|
| Custodian fees | 133,956 |
|
| Professional fees | 20,081 |
|
| Registration fees | 58,220 |
|
| Reports to shareholders | 11,212 |
|
| Miscellaneous | 63,693 |
|
| Total expenses | 1,236,181 |
|
| Reimbursement from Advisor: | |
| Class A | (104,735) |
|
| Class C | (14,137) |
|
| Class I | (29,085) |
|
| Class Y | (29,104) |
|
| Net expenses | 1,059,120 |
|
| | |
| NET INVESTMENT INCOME | 683,729 |
|
| | |
| REALIZED AND UNREALIZED GAIN (LOSS) | |
| Net realized gain (loss) on: | |
| Investments | (1,747,709) |
|
| Foreign currency transactions | (118,091) |
|
| | (1,865,800) |
|
| | |
| Change in unrealized appreciation (depreciation) on: | |
| Investments | (10,088,499) |
|
| Assets and liabilities denominated in foreign currencies | (958) |
|
| | (10,089,457) |
|
| | |
| NET REALIZED AND UNREALIZED GAIN (LOSS) | (11,955,257) |
|
| | |
| INCREASE (DECREASE) IN NET ASSETS RESULTING FROM OPERATIONS |
| ($11,271,528 | ) |
| See notes to financial statements. |
14 calvert.com CALVERT EMERGING MARKETS EQUITY FUND ANNUAL REPORT
CALVERT EMERGING MARKETS EQUITY FUND
STATEMENTS OF CHANGES IN NET ASSETS
|
| | | | | | | |
| INCREASE (DECREASE) IN NET ASSETS | YEAR ENDED
SEPTEMBER 30, 2015 | | YEAR ENDED
SEPTEMBER 30, 2014 |
| Operations: | | | |
| Net investment income |
| $683,729 |
| |
| $377,036 |
|
| Net realized gain (loss) | (1,865,800) |
| | 1,692,873 |
|
| Change in unrealized appreciation (depreciation) | (10,089,457) |
| | 611,506 |
|
| INCREASE (DECREASE) IN NET ASSETS RESULTING FROM OPERATIONS | (11,271,528) |
| | 2,681,415 |
|
| | | | |
| Distributions to shareholders from: | | | |
| Net investment income: | | | |
| Class A shares | (55,632) |
| | (28,225) |
|
| Class I shares | (197,710) |
| | (317,615) |
|
| Class Y shares | (7,207) |
| | (1,227) |
|
| Net realized gain: | | | |
| Class A shares | (719,225) |
| | (430,902) |
|
| Class C shares | (19,298) |
| | (10,387) |
|
| Class I shares | (1,059,703) |
| | (1,713,041) |
|
| Class Y shares | (80,750) |
| | (42,699) |
|
| Total distributions | (2,139,525) |
| | (2,544,096) |
|
| | | | |
| Capital share transactions: | | | |
| Shares sold: | | | |
| Class A shares | 21,136,575 |
| | 16,568,829 |
|
| Class C shares | 341,215 |
| | 485,806 |
|
| Class I shares | 13,238,700 |
| | 5,236,012 |
|
| Class Y shares | 11,494,694 |
| | 1,949,648 |
|
| Reinvestment of distributions: | | | |
| Class A shares | 730,848 |
| | 433,075 |
|
| Class C shares | 15,018 |
| | 9,915 |
|
| Class I shares | 1,257,413 |
| | 2,030,657 |
|
| Class Y shares | 83,767 |
| | 42,453 |
|
| Redemption fees: | | | |
| Class A shares | 3 |
| | 89 |
|
| Class Y shares | — |
| | 150 |
|
| Shares redeemed: | | | |
| Class A shares | (14,175,053) |
| | (2,817,017) |
|
| Class C shares | (295,231) |
| | (16,467) |
|
| Class I shares | (1,547,822) |
| | (6,669,371) |
|
| Class Y shares | (6,023,221) |
| | (75,526) |
|
| Total capital share transactions | 26,256,906 |
| | 17,178,253 |
|
| | | | |
| TOTAL INCREASE (DECREASE) IN NET ASSETS | 12,845,853 |
| | 17,315,572 |
|
| | | | |
| See notes to financial statements. |
calvert.com CALVERT EMERGING MARKETS EQUITY FUND ANNUAL REPORT 15
|
| | | | | | | |
| NET ASSETS | YEAR ENDED
SEPTEMBER 30, 2015 | | YEAR ENDED
SEPTEMBER 30, 2014 |
| Beginning of year | $57,279,214 | | $39,963,642 |
| End of year (including undistributed net investment income of $650,198 and $260,557, respectively) |
| $70,125,067 |
| |
| $57,279,214 |
|
| | | | |
| | | | |
| CAPITAL SHARE ACTIVITY | | | |
| Shares sold: | | | |
| Class A shares | 1,662,220 |
| | 1,275,683 |
|
| Class C shares | 27,020 |
| | 37,216 |
|
| Class I shares | 1,043,577 |
| | 410,505 |
|
| Class Y shares | 899,948 |
| | 143,493 |
|
| Reinvestment of distributions: | | | |
| Class A shares | 58,063 |
| | 33,624 |
|
| Class C shares | 1,205 |
| | 771 |
|
| Class I shares | 99,030 |
| | 155,876 |
|
| Class Y shares | 6,546 |
| | 3,258 |
|
| Shares redeemed: | | | |
| Class A shares | (1,126,025) |
| | (215,396) |
|
| Class C shares | (22,276) |
| | (1,223) |
|
| Class I shares | (128,965) |
| | (474,511) |
|
| Class Y shares | (459,427) |
| | (5,649) |
|
| Total capital share activity | 2,060,916 |
| | 1,363,647 |
|
| | | | |
| See notes to financial statements. |
16 calvert.com CALVERT EMERGING MARKETS EQUITY FUND ANNUAL REPORT
NOTES TO FINANCIAL STATEMENTS
NOTE A — SIGNIFICANT ACCOUNTING POLICIES
General: Calvert Emerging Markets Equity Fund (the “Fund”), a series of Calvert World Values Fund, Inc., is registered under the Investment Company Act of 1940 as a non-diversified, open-end management investment company. Calvert World Values Fund, Inc. is comprised of four separate series. The operations of each series are accounted for separately. The Fund applies the accounting and reporting guidance in the Financial Accounting Standards Board (FASB) Accounting Standards Codification Topic 946, Financial Services – Investment Companies (ASC 946).
The Fund offers four classes of shares of capital stock - Classes A, C, I, and Y. Class A shares are sold with a maximum front-end sales charge of 4.75%. Class C shares are sold without a front-end sales charge and, with certain exceptions, will be charged a deferred sales charge on shares sold within one year of purchase. Class C shares have higher levels of expenses than Class A shares. Class I shares require a minimum account balance of $1,000,000. The $1 million minimum initial investment is waived for retirement plans that trade through omnibus accounts and may be waived in certain other instances where it is believed to be in the best interest of the Fund and its shareholders. Class I shares have no front-end or deferred sales charge and have lower levels of expenses than Class A shares. Class Y shares are generally only available to wrap or similar fee-based programs offered by financial intermediaries, foundations, and endowments that have entered into an agreement with the Fund’s Distributor to offer Class Y shares. Class Y shares have no front-end or deferred sales charge and have lower levels of expenses than Class A shares. Each class has different: (a) dividend rates, due to differences in Distribution Plan expenses and other class-specific expenses, (b) exchange privileges, and (c) class-specific voting rights.
Security Valuation: Net asset value per share is determined every business day as of the close of the regular session of the New York Stock Exchange (generally 4:00 p.m. Eastern time). The Fund uses independent pricing services approved by the Board of Directors (“the Board”) to value its investments wherever possible. Investments for which market quotations are not available or deemed not reliable are fair valued in good faith under the direction of the Board.
The Board has adopted Valuation Procedures (the “Procedures”) to determine the fair value of securities and other financial instruments for which market prices are not readily available or which may not be reliably priced. The Board has delegated the day-to-day responsibility for determining the fair value of assets of the Fund to Calvert Investment Management, Inc. (the “Advisor” or “Calvert”) and has provided these Procedures to govern Calvert in its valuation duties.
Calvert has chartered an internal Valuation Committee to oversee the implementation of these Procedures and to assist it in carrying out the valuation responsibilities that the Board has delegated.
The Valuation Committee meets on a regular basis to review illiquid securities and other investments which may not have readily available market prices. The Valuation Committee’s fair valuation determinations are subject to review, approval and ratification by the Board at its next regularly scheduled meeting covering the calendar quarter in which the fair valuation was determined.
The Valuation Committee utilizes various methods to measure the fair value of the Fund’s investments. U.S. generally accepted accounting principles (GAAP) establishes a disclosure hierarchy that categorizes the inputs to valuation techniques used to value assets and liabilities at measurement date. These inputs are summarized in the three broad levels listed below:
Level 1 - quoted prices in active markets for identical securities
Level 2 - other significant observable inputs (including quoted prices for similar securities, interest rates, prepayment speeds, credit risk, etc.)
Level 3 - significant unobservable inputs (including the Fund’s own assumptions in determining the fair value of investments)
The inputs or methodologies used for valuing securities are not necessarily an indication of the risk associated with investing in those securities.
Changes in valuation techniques may result in transfers in or out of an investment’s assigned level within the hierarchy during the year. Transfers in and/or out of levels are determined based on the fair value of such securities at the end of the year. Valuation techniques used to value the Fund’s investments by major category are as follows:
Equity securities, including restricted securities, for which market quotations are readily available, are valued at the last reported sale price or official closing price as reported by an independent pricing service on the primary market or exchange on which they are traded and are categorized as Level 1 in the hierarchy. In the event there were no sales during the day or closing prices are not available, securities are valued at the last quoted bid price or the last available price and are categorized as Level 2 in the hierarchy. Foreign securities are valued based on quotations from the principal market in which such securities are normally traded. If events occur after the close of the principal market in which foreign securities are traded, and before the close of business of the Fund, that are expected to materially affect the value of those securities, then they are valued at their fair value taking these events into account and are categorized as Level 2 in the hierarchy. The Fund has
calvert.com CALVERT EMERGING MARKETS EQUITY FUND ANNUAL REPORT 17
retained a third party fair value pricing service to quantitatively analyze the price movement of its holdings on foreign exchanges and to automatically fair value if the variation from the prior day’s closing price exceeds specified parameters. Such securities would be categorized as Level 2 in the hierarchy in these circumstances. Utilizing this technique may result in transfers between Level 1 and Level 2. For restricted securities and private placements where observable inputs are limited, assumptions about market activity and risk are used and such securities are categorized as Level 3 in the hierarchy.
Exchange-traded products and closed-end funds are valued at the official closing price as reported by an independent pricing service on the primary market or exchange on which they are traded and are categorized as Level 1 in the hierarchy.
Participatory notes are valued based on the value of the underlying equity security as determined using the valuation techniques for equity securities listed above. Participatory notes are categorized as Level 2 in the hierarchy.
Short-term securities of sufficient credit quality with remaining maturities of sixty days or less for which quotations are not readily available are valued at amortized cost, which approximates fair value, and are categorized as Level 2 in the hierarchy.
If a market value cannot be determined for a security using the methodologies described above, or if, in the good faith opinion of the Advisor, the market value does not constitute a readily available market quotation, or if a significant event has occurred that would materially affect the value of the security, the security will be fair valued as determined in good faith by the Valuation Committee.
The Valuation Committee considers a number of factors, including significant unobservable valuation inputs when arriving at fair value. It considers all significant facts that are reasonably available and relevant to the determination of fair value.
The Valuation Committee primarily employs a market-based approach which may use related or comparable assets or liabilities, recent transactions, market multiples, book values, and other relevant information for the investment to determine the fair value of the investment. When more appropriate, the Fund may employ an income-based or cost approach. An income-based valuation approach discounts anticipated future cash flows of the investment to calculate a present amount (discounted). The measurement is based on the value indicated by current market expectations about those future amounts. Discounts may also be applied due to the nature or duration of any restrictions on the disposition of the investments. A cost based approach is based on the amount that currently would be required to replace the service capacity of an asset (current replacement cost). From the seller’s perspective, the price that would be received for the asset is determined based on the cost to a buyer to acquire or construct a substitute asset of comparable utility, adjusted for obsolescence.
The values assigned to fair value investments are based on available information and do not necessarily represent amounts that might ultimately be realized. Further, due to the inherent uncertainty of valuations of such investments, the fair values may differ significantly from the values that would have been used had an active market existed, and the differences could be material. The Valuation Committee employs various methods for calibrating these valuation approaches including a regular review of key inputs and assumptions, transactional back-testing or disposition analysis and reviews of any related market activity.
At September 30, 2015, securities valued at $2,416,489, or 3.4% of net assets, were fair valued in good faith under the direction of the Board.
The following table summarizes the market value of the Fund's holdings as of September 30, 2015, based on the inputs used to value them:
|
| | | | | | | | | | | | | |
| VALUATION INPUTS |
| INVESTMENTS IN SECURITIES | LEVEL 1 | LEVEL 2 | LEVEL 3 | TOTAL |
| Equity Securities* |
| $17,775,373 |
| $47,684,590** |
| $— |
|
| $65,459,963 |
|
| Participatory Notes | — |
| 2,416,489 |
| — |
| 2,416,489 |
|
| TOTAL |
| $17,775,373 |
|
| $50,101,079 |
| $— |
|
| $67,876,452 |
|
| | | | | | |
| * | For further breakdown of equity securities by country, please refer to the Statement of Net Assets. |
| ** | Includes certain securities trading primarily outside the U.S. whose value was adjusted as a result of significant market movements following the close of local trading. On September 30, 2015, price movements exceeded specified parameters and the third party fair value pricing service quantitatively fair valued the affected securities. |
On September 30, 2015, price movements exceeded specified parameters and the third party fair value pricing service quantitatively fair valued the affected securities. As a result, $47,684,590 transferred out of Level 1 into Level 2. The amount of this transfer was determined based on the fair value of the securities at the end of the year.
18 calvert.com CALVERT EMERGING MARKETS EQUITY FUND ANNUAL REPORT
Participatory Notes: The Fund may gain exposure to securities in certain foreign markets through investments in participatory notes (“P-notes”), especially in markets where direct investment by the Fund is not possible. P-notes are generally issued by a bank or broker-dealer (the “counterparty”) and are designed to offer a return linked to a particular underlying equity security. While the holder of a P-note is entitled to receive from the counterparty any dividends paid by the underlying security, the counterparty retains legal ownership and voting rights of the underlying security. The risks associated with investing in a P-note may include the possible failure of the counterparty to perform its obligations under the terms of the agreement, an inability to liquidate or transfer the notes, and an imperfect correlation between the value of the P-note and the underlying security.
Security Transactions and Investment Income: Security transactions are accounted for on trade date. Realized gains and losses are recorded on an identified cost basis and may include proceeds from litigation. Dividend income is recorded on the ex-dividend date or, in the case of dividends on certain foreign securities, as soon as the Fund is informed of the ex-dividend date. Withholding taxes on foreign dividends have been provided for in accordance with the Fund’s understanding of the applicable country’s tax rules and rates. Distributions received on securities that represent a return of capital or capital gain are recorded as a reduction of cost of investments and/or as a realized gain. Interest income, which includes amortization of premium and accretion of discount on debt securities, is accrued as earned. Investment income and realized and unrealized gains and losses are allocated to separate classes of shares based upon the relative net assets of each class. Expenses arising in connection with a specific class are charged directly to that class. Expenses common to the classes are allocated to each class in proportion to their relative net assets.
Foreign Currency Transactions: The Fund’s accounting records are maintained in U.S. dollars. For valuation of assets and liabilities on each date of net asset value determination, foreign denominations are converted into U.S. dollars using the current exchange rate. Security transactions, income, and expenses are translated at the prevailing rate of exchange on the date of the event. The effect of changes in foreign exchange rates on securities and foreign currencies is included in the net realized and unrealized gain or loss on investments and assets and liabilities denominated in foreign currencies.
Distributions to Shareholders: Distributions to shareholders are recorded by the Fund on ex-dividend date. Dividends from net investment income and distributions from net realized capital gains, if any, are paid at least annually. Distributions are determined in accordance with income tax regulations which may differ from U.S. generally accepted accounting principles; accordingly, periodic reclassifications are made within the Fund's capital accounts to reflect income and gains available for distribution under income tax regulations.
Estimates: The preparation of financial statements in conformity with U.S. generally accepted accounting principles requires management to make estimates and assumptions that affect the reported amounts of assets and liabilities and disclosure of contingent assets and liabilities at the date of the financial statements and the reported amounts of increases and decreases in net assets from operations during the reporting period. Actual results could differ from those estimates.
Redemption Fees: The Fund charged a 2% redemption fee on redemptions, including exchanges, made within 30 days of purchase (within seven days for Class I shares). The redemption fee was accounted for as an addition to paid-in capital. This fee was eliminated effective February 2, 2015.
Federal Income Taxes: No provision for federal income or excise tax is required since the Fund intends to continue to qualify as a regulated investment company under the Internal Revenue Code and to distribute substantially all of its taxable earnings.
Management has analyzed the Fund's tax positions taken for all open federal income tax years and has concluded that no provision for federal income tax is required in the Fund's financial statements. A Fund's federal tax return is subject to examination by the Internal Revenue Service for a period of three years.
NOTE B — RELATED PARTY TRANSACTIONS
Calvert Investment Management, Inc. (the “Advisor”) is wholly-owned by Calvert Investments, Inc., which is indirectly wholly-owned by Ameritas Mutual Holding Company. The Advisor provides investment advisory services and pays the salaries and fees of officers and Directors of the Fund who are employees of the Advisor or its affiliates. For its services, the Advisor receives an annual fee, payable monthly, of .95% of the average daily net assets. Under the terms of the agreement, $54,620 was payable at year end.
The Advisor has contractually agreed to limit net annual fund operating expenses through January 31, 2017. The contractual expense caps are 1.68%, 2.43%, 1.33%, and 1.43% for Class A, C, I, and Y, respectively. Prior to July 1, 2015, the expense caps were 1.78%, 2.78%, 1.43%, and 1.53% for Class A, C, I, and Y, respectively. For the purpose of this expense limit, operating expenses do not include interest expense, brokerage commissions, taxes, and extraordinary expenses. This expense limitation does not limit acquired fund fees and expenses, if any. Under the terms of the agreement, $25,585 was receivable at year end.
Calvert Investment Administrative Services, Inc., an affiliate of the Advisor, provides administrative services to the Fund for an annual fee, payable monthly, of .35% for Classes A, C, and Y shares and .10% for Class I shares, based on their average daily net assets. Under the terms of the agreement, $12,114 was payable at year end.
calvert.com CALVERT EMERGING MARKETS EQUITY FUND ANNUAL REPORT 19
Calvert Investment Distributors, Inc. (“CID”), an affiliate of the Advisor, is the distributor and principal underwriter for the Fund. Pursuant to Rule 12b-1 under the Investment Company Act of 1940, the Fund has adopted a Distribution Plan that permits the Fund to pay certain expenses associated with the distribution and servicing of its shares. The expenses paid may not exceed .50% and 1.00% annually of the average daily net assets of Class A and C, respectively. The amount actually paid by the Fund is an annualized fee, payable monthly, of .25% and 1.00% of the average daily net assets of Class A and C, respectively. Class I and Y shares do not have Distribution Plan expenses. Under the terms of the agreement, $5,331 was payable at year end.
CID received $9,049 as its portion of commissions charged on sales of the Fund’s Class A shares for the year ended September 30, 2015.
Calvert Investment Services, Inc. (“CIS”), an affiliate of the Advisor, acts as shareholder servicing agent for the Fund. For its services, CIS received a fee of $8,145 for the year ended September 30, 2015. Under the terms of the agreement, $795 was payable at year end. Boston Financial Data Services, Inc. is the transfer and dividend disbursing agent.
Each Director of the Fund who is not an employee of the Advisor or its affiliates receives an annual retainer of $52,000 ($48,000 prior to January 1, 2015) plus a meeting fee of up to $3,000 for each Board meeting attended. Additional fees of $6,000 ($5,000 prior to January 1, 2015) annually may be paid to the Committee chairs ($10,000 for the Board Chair and the Special Equities Committee chair) and $2,500 annually may be paid to Committee members, plus a Committee meeting fee of $500 for each Committee meeting attended. Eligible Directors may participate in a Deferred Compensation Plan (the “Plan”). Obligations of the Plan will be paid solely out of the Fund’s assets. As of September 30, 2015, approximately $46,776 was deferred under the Plan. Directors’ fees are allocated to each of the funds served.
NOTE C — INVESTMENT ACTIVITY AND TAX INFORMATION
During the year, the cost of purchases and proceeds from sales of investments, other than short-term securities, were $66,681,942 and $43,437,816, respectively.
|
| |
| Capital Loss Carryforwards | |
| No expiration date | |
| Long-term | ($248,421) |
Under the Regulated Investment Company Modernization Act of 2010, capital losses incurred in taxable years beginning after December 22, 2010 can be carried forward to offset future capital gains for an unlimited period. These losses will retain their character as either long-term or short term.
The tax character of dividends and distributions paid during the years ended September 30, 2015 and September 30, 2014 was as follows:
|
| | | | | | |
| Distributions Paid From: | 2015 |
| 2014 |
|
| Ordinary income |
| $2,139,525 |
|
| $2,469,620 |
|
| Long-term capital gains | — |
| 74,476 |
|
| Total |
| $2,139,525 |
|
| $2,544,096 |
|
As of September 30, 2015, the tax basis components of distributable earnings/(accumulated losses) and the federal tax cost were as follows:
|
| | | |
| Unrealized appreciation | $— |
|
| Unrealized (depreciation) | (9,146,985) |
|
| Net unrealized appreciation (depreciation) |
| ($9,146,985 | ) |
| | |
| Undistributed ordinary income |
| $819,144 |
|
| Capital loss carryforward |
| ($248,421 | ) |
| Late year ordinary and post October capital loss deferrals |
| ($1,692,515 | ) |
| | |
| Federal income tax cost of investments |
| $77,023,437 |
|
The differences between components of distributable earnings on a tax basis and the amounts reflected in the Statement of Net Assets are primarily due to temporary book-tax differences that will reverse in a subsequent period. These differences are mainly due to wash sales and investments in Passive Foreign Investment Companies.
20 calvert.com CALVERT EMERGING MARKETS EQUITY FUND ANNUAL REPORT
Reclassifications, as shown in the table below, have been made to the Fund's components of net assets to reflect income and gains available for distribution (or available capital loss carryovers, as applicable) under income tax law and regulations. These reclassifications are due to permanent book-tax differences and have no impact on net assets. The primary permanent differences causing such reclassifications for the Fund are due to foreign currency transactions, investments in Passive Foreign Investment Companies, and capital gain taxes.
|
| | | |
| Undistributed net investment income |
| ($33,539 | ) |
| Accumulated net realized gain (loss) | 33,539 |
|
NOTE D — LINE OF CREDIT
A financing agreement is in place with the Calvert Funds and State Street Corporation (“SSC”). Under the agreement, SSC provides an unsecured line of credit facility, in the aggregate amount of $50 million ($25 million committed and $25 million uncommitted), accessible by the Funds for temporary or emergency purposes only. Borrowings bear interest at the higher of the London Interbank Offered Rate (LIBOR) or the overnight Federal Funds Rate plus 1.25% per annum. A commitment fee of .20% per annum is incurred on the unused portion of the committed facility. An administrative fee of $25,000 was paid in connection with the uncommitted facility. These fees are allocated to all participating funds. The Fund had no loans outstanding pursuant to this line of credit at September 30, 2015.
For the year ended September 30, 2015, borrowing information by the Fund under the agreement was as follows:
|
| | | |
| Average Daily Balance | Weighted Average Interest Rate | Maximum Amount Borrowed | Month of Maximum Amount Borrowed |
| $48,259 | 1.38% | $3,563,751 | February 2015 |
NOTE E — SUBSEQUENT EVENTS
At a special meeting of the Fund’s Board of Directors (the “Board”) held on November 24, 2015, the Board approved the recommendation made by Calvert Investment Administrative Services, Inc. (“CIAS”) to standardize and rationalize the administrative fee payable by the Calvert Funds at 12 basis points for all series and all share classes of the Calvert Funds. The change is being implemented in two phases. First, CIAS will voluntarily waive the amount of the existing administrative fee above 12 basis points for the period from December 1, 2015 through January 31, 2016. Second, CIAS and the Fund have entered into an Amended and Restated Administrative Services Agreement that will establish a 12 basis point administrative fee for all classes of the Fund commencing on February 1, 2016. In the case of any series or share class that currently pays an administrative fee to CIAS that is less than 12 basis points, CIAS has contractually agreed to waive the difference between that lower administrative fee and the 12 basis point fee until January 31, 2018.
In preparing the financial statements as of September 30, 2015, no other subsequent events or transactions occurred that would have required recognition or disclosure in these financial statements.
NOTICE TO SHAREHOLDERS (UNAUDITED)
For the fiscal year ended September 30, 2015, the Fund considers 62.1% of the ordinary dividends paid during the year as qualified dividend income in accordance with Section 854 of the Internal Revenue Code. It also considers $1,645,077 as income derived from foreign sources and $191,752 as foreign taxes paid.
calvert.com CALVERT EMERGING MARKETS EQUITY FUND ANNUAL REPORT 21
CALVERT EMERGING MARKETS EQUITY FUND
FINANCIAL HIGHLIGHTS
|
| | | | | | | | | | | | | |
| | PERIODS ENDED | |
| CLASS A SHARES | September 30, 2015 (z) | | September 30, 2014 (z) | | September 30, 2013 (z)# | |
| Net asset value, beginning |
| $13.15 |
| |
| $13.34 |
| |
| $12.00 |
| |
| Income from investment operations: | | | | | | |
| Net investment income | .11 |
| | .08 |
| | .13 |
| |
| Net realized and unrealized gain (loss) | (1.92 | ) | | .46 |
| | 1.34 |
| |
| Total from investment operations | (1.81 | ) | | .54 |
| | 1.47 |
| |
| Distributions from: | | | | | | |
| Net investment income | (.03 | ) | | (.04 | ) | | (.13 | ) | |
| Net realized gain | (.41 | ) | | (.69 | ) | | — |
| |
| Total distributions | (.44 | ) | | (.73 | ) | | (.13 | ) | |
| Total increase (decrease) in net asset value | (2.25 | ) | | (.19 | ) | | 1.34 |
| |
| Net asset value, ending |
| $10.90 |
| |
| $13.15 |
| |
| $13.34 |
| |
Total return* | (14.18 | %) | | 4.19 | % | | 12.30 | % | |
| Ratios to average net assets: A | | | | | | |
| Net investment income | .84 | % | | .57 | % | | 1.16%(a) |
| |
| Total expenses | 2.18 | % | | 2.22 | % | | 3.03%(a) |
| |
| Expenses before offsets | 1.75 | % | | 1.78 | % | | 1.78%(a) |
| |
| Net expenses | 1.75 | % | | 1.78 | % | | 1.78%(a) |
| |
| Portfolio turnover | 66 | % | | 95 | % | | 74 | % | |
| Net assets, ending (in thousands) |
| $23,569 |
| |
| $20,628 |
| |
| $6,337 |
| |
| | | |
| (z) | Per share figures are calculated using the Average Shares Method. | |
| # | From October 29, 2012 inception. | |
| * | Total return is not annualized for periods of less than one year and does not reflect deduction of any front-end or deferred sales charge. |
| A | Total expenses do not reflect amounts reimbursed and/or waived by the Advisor or reductions from expense offset arrangements. Expenses before offsets reflect expenses after reimbursement and/or waiver by the Advisor but prior to reductions from expense offset arrangements. Net expenses are net of all reductions and represent the net expenses paid by the Fund. |
| (a) | Annualized. | | | | | | |
| | | | | | | | |
| See notes to financial statements. | |
22 calvert.com CALVERT EMERGING MARKETS EQUITY FUND ANNUAL REPORT
CALVERT EMERGING MARKETS EQUITY FUND
FINANCIAL HIGHLIGHTS
|
| | | | | | | | | | | | | |
| | PERIODS ENDED | |
| CLASS C SHARES | September 30, 2015 (z) | | September 30, 2014 (z) | | September 30, 2013 (z)# | |
| Net asset value, beginning |
| $13.05 |
| |
| $13.34 |
| |
| $12.00 |
| |
| Income from investment operations: | | | | | | |
| Net investment loss | (.03 | ) | | (.05 | ) | | (.01 | ) | |
| Net realized and unrealized gain (loss) | (1.87 | ) | | .45 |
| | 1.37 |
| |
| Total from investment operations | (1.90 | ) | | .40 |
| | 1.36 |
| |
| Distributions from: | | | | | | |
| Net investment income | — |
| | — |
| | (.02 | ) | |
| Net realized gain | (.41 | ) | | (.69 | ) | | — |
| |
| Total distributions | (.41 | ) | | (.69 | ) | | (.02 | ) | |
| Total increase (decrease) in net asset value | (2.31 | ) | | (.29 | ) | | 1.34 |
| |
| Net asset value, ending |
| $10.74 |
| |
| $13.05 |
| |
| $13.34 |
| |
Total return* | (14.98 | %) | | 3.10 | % | | 11.38 | % | |
| Ratios to average net assets: A | | | | | | |
| Net investment loss | (.23 | %) | | (.41 | %) | | (.09%)(a) |
| |
| Total expenses | 5.00 | % | | 4.36 | % | | 100.72%(a) |
| |
| Expenses before offsets | 2.70 | % | | 2.78 | % | | 2.78%(a) |
| |
| Net expenses | 2.70 | % | | 2.78 | % | | 2.78%(a) |
| |
| Portfolio turnover | 66 | % | | 95 | % | | 74 | % | |
| Net assets, ending (in thousands) |
| $566 |
| |
| $610 |
| |
| $133 |
| |
| | | | | | | | |
| (z) | Per share figures are calculated using the Average Shares Method. |
| # | From October 29, 2012 inception. | | | | | | |
| * | Total return is not annualized for periods of less than one year and does not reflect deduction of any front-end or deferred sales charge. |
| A | Total expenses do not reflect amounts reimbursed and/or waived by the Advisor or reductions from expense offset arrangements. Expenses before offsets reflect expenses after reimbursement and/or waiver by the Advisor but prior to reductions from expense offset arrangements. Net expenses are net of all reductions and represent the net expenses paid by the Fund. |
| (a) | Annualized. | | | | | | |
| | | | | | | | |
| See notes to financial statements. | |
calvert.com CALVERT EMERGING MARKETS EQUITY FUND ANNUAL REPORT 23
CALVERT EMERGING MARKETS EQUITY FUND
FINANCIAL HIGHLIGHTS
|
| | | | | | | | | | | | | |
| | PERIODS ENDED | |
| CLASS I SHARES | September 30, 2015 (z) | | September 30, 2014 (z) | | September 30, 2013 (z)# | |
| Net asset value, beginning |
| $13.26 |
| |
| $13.49 |
| |
| $12.00 |
| |
| Income from investment operations: | | | | | | |
| Net investment income | .14 |
| | .10 |
| | .19 |
| |
| Net realized and unrealized gain (loss) | (1.93) |
| | .48 |
| | 1.33 |
| |
| Total from investment operations | (1.79) |
| | .58 |
| | 1.52 |
| |
| Distributions from: | | | | | | |
| Net investment income | (.07) |
| | (.12) |
| | (.03) |
| |
| Net realized gain | (.41) |
| | (.69) |
| | — |
| |
| Total distributions | (.48) |
| | (.81) |
| | (.03) |
| |
| Total increase (decrease) in net asset value | (2.27) |
| | (.23) |
| | 1.49 |
| |
| Net asset value, ending |
| $10.99 |
| |
| $13.26 |
| |
| $13.49 |
| |
Total return* | (13.92 | %) | | 4.49 | % | | 12.73 | % | |
| Ratios to average net assets: A | | | | | | |
| Net investment income | 1.12 | % | | .78 | % | | 1.61%(a) |
| |
| Total expenses | 1.48 | % | | 1.42 | % | | 1.65%(a) |
| |
| Expenses before offsets | 1.40 | % | | 1.42 | % | | 1.43%(a) |
| |
| Net expenses | 1.40 | % | | 1.42 | % | | 1.43%(a) |
| |
| Portfolio turnover | 66 | % | | 95 | % | | 74 | % | |
| Net assets, ending (in thousands) |
| $39,101 |
| |
| $33,721 |
| |
| $33,053 |
| |
| | | | | | | | |
| (z) | Per share figures are calculated using the Average Shares Method. |
| # | From October 29, 2012 inception. | | | | | | |
| * | Total return is not annualized for periods of less than one year and does not reflect deduction of any front-end or deferred sales charge. |
| A | Total expenses do not reflect amounts reimbursed and/or waived by the Advisor or reductions from expense offset arrangements. Expenses before offsets reflect expenses after reimbursement and/or waiver by the Advisor but prior to reductions from expense offset arrangements. Net expenses are net of all reductions and represent the net expenses paid by the Fund. |
| (a) | Annualized. | | | | | | |
| | | | | | | | |
| See notes to financial statements. | |
24 calvert.com CALVERT EMERGING MARKETS EQUITY FUND ANNUAL REPORT
CALVERT EMERGING MARKETS EQUITY FUND
FINANCIAL HIGHLIGHTS
|
| | | | | | | | | | | | | |
| | PERIODS ENDED | |
| CLASS Y SHARES | September 30, 2015 (z) | | September 30, 2014 (z) | | September 30, 2013 (z)# | |
| Net asset value, beginning |
| $13.35 |
| |
| $13.48 |
| |
| $12.00 |
| |
| Income from investment operations: | | | | | | |
| Net investment income | .12 |
| | .10 |
| | .14 |
| |
| Net realized and unrealized gain (loss) | (1.93) |
| | .49 |
| | 1.36 |
| |
| Total from investment operations | (1.81) |
| | .59 |
| | 1.50 |
| |
| Distributions from: | | | | | | |
| Net investment income | (.03) |
| | (.03) |
| | (.02) |
| |
| Net realized gain | (.41) |
| | (.69) |
| | — |
| |
| Total distributions | (.44) |
| | (.72) |
| | (.02) |
| |
| Total increase (decrease) in net asset value | (2.25) |
| | (.13) |
| | 1.48 |
| |
| Net asset value, ending |
| $11.10 |
| |
| $13.35 |
| |
| $13.48 |
| |
Total return* | (13.96 | %) | | 4.51 | % | | 12.55 | % | |
| Ratios to average net assets: A | | | | | | |
| Net investment income | .95 | % | | .78 | % | | 1.28%(a) |
| |
| Total expenses | 2.07 | % | | 2.24 | % | | 18.62%(a) |
| |
| Expenses before offsets | 1.50 | % | | 1.53 | % | | 1.53%(a) |
| |
| Net expenses | 1.50 | % | | 1.53 | % | | 1.53%(a) |
| |
| Portfolio turnover | 66 | % | | 95 | % | | 74 | % | |
| Net assets, ending (in thousands) |
| $6,889 |
| |
| $2,320 |
| |
| $440 |
| |
| | | | | | | | |
| (z) | Per share figures are calculated using the Average Shares Method. |
| # | From October 29, 2012 inception. | | | | | | |
| * | Total return is not annualized for periods of less than one year and does not reflect deduction of any front-end or deferred sales charge. |
| A | Total expenses do not reflect amounts reimbursed and/or waived by the Advisor or reductions from expense offset arrangements. Expenses before offsets reflect expenses after reimbursement and/or waiver by the Advisor but prior to reductions from expense offset arrangements. Net expenses are net of all reductions and represent the net expenses paid by the Fund. |
| (a) | Annualized. | | | | | | |
| | | | | | | | |
| See notes to financial statements. | |
calvert.com CALVERT EMERGING MARKETS EQUITY FUND ANNUAL REPORT 25
EXPLANATION OF FINANCIAL TABLES
SCHEDULE OF INVESTMENTS
The Schedule of Investments is a snapshot of all securities held in the fund at their market value, on the last day of the reporting period. Securities are listed by asset type (e.g., common stock, corporate bonds, U.S. government obligations) or, for International and Global funds, by country, and may be further broken down into sub-groups and by industry classification.
STATEMENT OF ASSETS AND LIABILITIES
The Statement of Assets and Liabilities is often referred to as the fund’s balance sheet. It lists the value of what the fund owns, is due and owes on the last day of the reporting period. The fund’s assets include the market value of securities owned, cash, receivables for securities sold and shareholder subscriptions, and receivables for dividends and interest payments that have been earned, but not yet received. The fund’s liabilities include payables for securities purchased and shareholder redemptions, and expenses owed but not yet paid. The statement also reports the fund’s net asset value (NAV) per share on the last day of the reporting period. The NAV is calculated by dividing the fund’s net assets (assets minus liabilities) by the number of shares outstanding. This statement is accompanied by a Schedule of Investments. Alternatively, if certain conditions are met, a Statement of Net Assets may be presented in lieu of this statement and the Schedule of Investments.
STATEMENT OF NET ASSETS
The Statement of Net Assets provides a detailed list of the fund’s holdings, including each security’s market value on the last day of the reporting period. The Statement of Net Assets includes a Schedule of Investments. Other assets are added and other liabilities subtracted from the investments total to calculate the fund’s net assets. Finally, net assets are divided by the outstanding shares of the fund to arrive at its share price, or Net Asset Value (NAV) per share.
At the end of the Statement of Net Assets is a table displaying the composition of the fund’s net assets. Paid in Capital is the money invested by shareholders and represents the bulk of net assets. Undistributed Net Investment Income and Accumulated Net Realized Gains usually approximate the amounts the fund had available to distribute to shareholders as of the statement date. Accumulated Realized Losses will appear as negative balances. Unrealized Appreciation (Depreciation) is the difference between the market value of the fund’s investments and their cost, and reflects the gains (losses) that would be realized if the fund were to sell all of its investments at their statement-date -values.
STATEMENT OF OPERATIONS
The Statement of Operations summarizes the fund’s investment income earned and expenses incurred in operating the fund. Investment income includes dividends earned from stocks and interest earned from interest-bearing securities in the fund. Expenses incurred in operating the fund include the advisory fee paid to the investment advisor, administrative services fees, distribution plan expenses (if applicable), transfer agent fees, shareholder servicing expenses, custodial, legal, and audit fees, and the printing and postage expenses related to shareholder reports. Expense offsets (fees paid indirectly) may also be shown. Credits earned from offset arrangements are used to reduce the fund’s expenses. This statement also shows net gains (losses) realized on the sale of investments and the increase or decrease in the unrealized appreciation (depreciation) on investments held during the period.
STATEMENT OF CHANGES IN NET ASSETS
The Statement of Changes in Net Assets shows how the fund’s total net assets changed during the two most recent reporting periods. Changes in the fund’s net assets are attributable to investment operations, distributions and capital share transactions.
The Operations section of the report summarizes information detailed in the Statement of Operations. The Distribution section shows the dividend and capital gain distributions made to shareholders. The amounts shown as distributions in this section may not match the net investment income and realized gains amounts shown in the Operations section because distributions are determined on a tax basis and certain investments or transactions may be treated differently for financial statement and tax purposes. The Capital Share Transactions section shows the amount shareholders invested in the fund, either by purchasing shares or by reinvesting distributions, and the amounts redeemed. The corresponding numbers of shares issued, reinvested and redeemed are shown at the end of the report.
FINANCIAL HIGHLIGHTS
The Financial Highlights table provides a per-share breakdown per class of the components that affect the fund’s net asset value for current and past reporting periods. The table provides total return, total distributions, expense ratios, portfolio turnover and net assets for the applicable period. Total return is a measure of a fund’s performance that encompasses all elements of return: dividends, capital gain distributions and changes in net asset value. Total return is the change in value of an investment over a given period, assuming reinvestment of any dividends and capital gain distributions, expressed as a percentage of the initial investment. Total distributions include distributions from net investment income and net realized gains. Long-term gains are earned on securities held in the fund more than one year. Short-term gains, on the sale of securities held less than one year, are treated as ordinary dividend income for tax purposes. The expense ratio is a fund’s cost of doing business, expressed as a
26 calvert.com CALVERT EMERGING MARKETS EQUITY FUND ANNUAL REPORT (UNAUDITED)
percentage of net assets. These expenses directly reduce returns to shareholders. Portfolio turnover measures the trading activity in a fund’s investment portfolio—how often securities are bought and sold by a fund. Portfolio turnover is affected by market conditions, changes in the size of the fund, the nature of the fund’s investments and the investment style of the portfolio manager.
PROXY VOTING
The Proxy Voting Guidelines of the Calvert Funds that the Fund uses to determine how to vote proxies relating to portfolio securities are provided as an Appendix to the Fund’s Statement of Additional Information. The Statement of Additional Information can be obtained free of charge by calling the Fund at 1-800-368-2745, by visiting the Calvert website at www.calvert.com; or by visiting the SEC’s website at www.sec.gov.
Information regarding how the Fund voted proxies relating to portfolio securities during the most recent 12-month period ended June 30 is available on the Fund’s website at www.calvert.com and on the SEC’s website at www.sec.gov.
AVAILABILITY OF QUARTERLY PORTFOLIO HOLDINGS
The Fund files its complete schedule of portfolio holdings with the SEC for the first and third quarters of each fiscal year on Form N-Q. The Fund’s Form N-Q is available on the SEC’s website at www.sec.gov. The Fund’s Form N-Q may be reviewed and copied at the SEC’s Public Reference Room in Washington, DC; information on the operation of the Public Reference Room may be obtained by calling 1-800-SEC-0330.
calvert.com CALVERT EMERGING MARKETS EQUITY FUND ANNUAL REPORT (UNAUDITED) 27
DIRECTOR AND OFFICER INFORMATION TABLE
|
| | | | | |
| Name & Age | Position With Fund | Position Start Date | Principal Occupation During Last 5 Years | # of Calvert Portfolios Overseen | Other Directorships During the Past Five Years |
| INDEPENDENT TRUSTEES/DIRECTORS |
REBECCA L. ADAMSON AGE: 66 | Trustee Director Director Director | 1989 CSIF 2000 IMPACT 2000 CRIS 2005 CWVF | President of the national non-profit, First People’s Worldwide, formerly First Nations Financial Project. Founded by her in 1980, First People’s Worldwide is the only American Indian alternative development institute in the country. | 18 | • Bay & Paul Foundation |
RICHARD L. BAIRD, JR. AGE: 67 | Trustee & Chair Director & Chair Director & Chair Director & Chair
| 1982 CSIF
2000 CRIS
2005 CWVF
2005 IMPACT | Former President and CEO of Adagio Health Inc. (retired in 2014) in Pittsburgh, PA, a non-profit corporation which provides family planning services, nutrition, maternal/child health care, and various health screening services and community preventive health programs. | 25 | |
JOHN G. GUFFEY, JR. AGE: 67 | Director Trustee Director Director | 1992 CWVF 1982 CSIF 2000 CRIS 2005 IMPACT | President of Aurora Press Inc., a privately held publisher of trade paperbacks. | 25 | • Ariel Funds (3) (asset management) (through 12/31/11) • Calvert Social Investment Foundation • Calvert Ventures, LLC |
MILES D. HARPER, III AGE: 52 | Director Trustee Director Director | 2000 IMPACT 2005 CSIF 2005 CRIS 2005 CWVF | Partner, Carr Riggs & Ingram (public accounting firm) since September 2013. Partner, Gainer Donnelly & Desroches (public accounting firm) (now Carr Riggs & Ingram), 1999-2013. | 18 | • Bridgeway Funds (14) (asset management) |
JOY V. JONES AGE: 65 | Director Trustee Director Director | 2000 IMPACT 1990 CSIF 2000 CRIS 2005 CWVF | Attorney. | 18 | • Director, Conduit Street Restaurants SUD 2 Limited • Director, Palm Management Corporation |
TERRENCE J. MOLLNER, Ed.D. AGE: 70 | Director Trustee Director Director | 1992 CWVF 1982 CSIF 2000 CRIS 2005 IMPACT | Founder, Chairperson and President of Trusteeship Institute, Inc., an educational organization focused on the personal skills and organizations described in Dr. Mollner’s book, The Love Skill: We Are Mastering the 7 Layers of Human Maturity, particularly businesses that freely chose to give priority to the common good. Chairperson, Stakeholders Capital, Inc., an asset management firm and financial services provider.
| 18 | • Calvert Social Investment Foundation • Ben & Jerry’s Homemade, Inc. (food products) |
SYDNEY A. MORRIS AGE: 66 | Trustee Director Director Director | 1982 CSIF 2000 CRIS 2005 CWVF 2005 IMPACT | The Rev. Dr. Morris is a Unitarian Universalist minister. | 18 | |
28 calvert.com CALVERT EMERGING MARKETS EQUITY FUND ANNUAL REPORT (UNAUDITED)
|
| | | | | |
| Name & Age | Position With Fund | Position Start Date | Principal Occupation During Last 5 Years | # of Calvert Portfolios Overseen | Other Directorships During the Past Five Years |
| INTERESTED TRUSTEES/DIRECTORS |
D. WAYNE SILBY, Esq.* AGE: 67 | Director Trustee Director Director | 1992 CWVF 1982 CSIF 2000 CRIS 2000 IMPACT | Mr. Silby is the founding Chair of the Calvert Funds. He is the Chair-Elect and a principal of Syntao.com, a Beijing-based company promoting corporate social responsibility. | 25 | • Ameritas Mutual Holding Company (insurance) • Calvert Social Investment Foundation • ImpactAssets, Inc. (asset management) • Committee for the Future (charitable supporting organization) • Syntao.com China (HK) (sustainability consulting) • The ICE Organization (environmental services) |
JOHN H. STREUR* AGE: 55 | Director & President Trustee & President Director & President Director & President | 2015 CWVF
2015 CSIF
2015 CRIS
2015 IMPACT | President and Chief Executive Officer of Calvert Investments, Inc. (since January 2015) and Chief Compliance Officer for the Advisor and Calvert Investment Distributors, Inc. (since August 10, 2015) President and Director, Portfolio 21 Investments, Inc. (through October 2014) President, Chief Executive Officer and Director, Managers Investment Group LLC (through January 2012) President and Director, The Managers Funds and Managers AMG Funds (through January 2012). | 38 | • Portfolio 21 Investments, Inc. (asset management)(through October 2014) • Managers Investment Group LLC (asset management)(through January 2012) • The Managers Funds (asset management) (through January 2012) • Managers AMG Funds (asset management) (through January 2012) • Calvert Social Investment Foundation |
calvert.com CALVERT EMERGING MARKETS EQUITY FUND ANNUAL REPORT (UNAUDITED) 29
|
| | | |
| Name & Age | Position With Fund | Position Start Date | Principal Occupation During Last 5 Years |
| OFFICERS |
SUSAN WALKER BENDER, Esq. AGE: 56 | Assistant Vice President & Assistant Secretary | 1988 CSIF 2000 CRIS 1992 CWVF 2000 Impact | Assistant Vice President, Assistant Secretary and Associate General Counsel of Calvert Investments, Inc. |
VICKI L. BENJAMIN AGE: 54 | Treasurer | 2015 | Executive Vice President and Chief Financial Officer of Calvert Investments, Inc. since March 2015. Prior to Calvert, Ms. Benjamin was a Senior Partner at KPMG. |
ROBERT D. BENSON, ESQ. AGE: 36 | Assistant Vice President & Assistant Secretary | 2014 | Assistant General Counsel (since 2014), Assistant Vice President & Assistant Secretary (since 2015) and Staff Attorney (prior to 2014), Calvert Investments, Inc. |
HOPE BROWN AGE: 42 | Chief Compliance Officer | 2014 | Chief Compliance Officer for the Calvert Funds (since 2014). Vice President and Chief Compliance Officer, Wilmington Funds (2012-2014). Vice President and Senior Compliance Officer, Wilmington Trust Investment Advisors, Inc. (2010-2012). Assistant Vice President, Lead Manager, Risk Management and Divisional Compliance, T. Rowe Price Associates, Inc. (2005-2010). |
THOMAS DAILEY AGE: 51 | Vice President | 2004 | Vice President of the Advisor and lead portfolio manager for Calvert’s municipal funds. |
MATTHEW DUCH Age: 40 | Vice President | 2011 | Vice President of the Advisor (since 2011) and portfolio manager for Calvert’s taxable fixed-income funds. |
IVY WAFFORD DUKE, Esq. AGE: 47 | Vice President & Secretary | 1996 CSIF 2000 CRIS 1996 CWVF 2000 Impact | Vice President, Acting Secretary and Acting General Counsel (Deputy General Counsel prior to 2015) of Calvert Investments, Inc. Prior to August 10, 2015, Ms. Duke was also Chief Compliance Officer for the Advisor and Calvert Investment Distributors, Inc. |
ROBERT J. ENDERSON, CFA AGE: 57 | Assistant Treasurer | 2014 | Acting Chief Financial Officer (September 2014-March 2015) and Vice President, Corporate Finance, of Calvert Investments, Inc. |
PATRICK FAUL AGE: 50 | Vice President | 2010 | Vice President and Head of Credit Research for the Advisor. |
TRACI L. GOLDT AGE: 42 | Assistant Secretary | 2004 | SEC Filing and Administrative Operations Manager (since 2011) and Executive Assistant to General Counsel (prior to 2011), Calvert Investments, Inc. |
VISHAL KHANDUJA, CFA AGE: 37 | Vice President | 2014 | Vice President of Calvert Investment Management, Inc. (since 2014) and portfolio manager for Calvert’s taxable fixed-income funds since 2012. Previously worked at Columbia Management as Portfolio Manager - Global Rates and Currency Team (2009-2012). |
LANCELOT A. KING, Esq. AGE: 45 | Assistant Vice President & Assistant Secretary | 2002 | Assistant Vice President, Assistant Secretary and Associate General Counsel of Calvert Investments, Inc. |
ANDREW K. NIEBLER, Esq. AGE: 48 | Assistant Vice President & Assistant Secretary | 2006 | Assistant Vice President, Assistant Secretary and Associate General Counsel of Calvert Investments, Inc. |
MARYBETH PILAT, CPA AGE: 47 | Fund Controller and Assistant Treasurer | 2015 | Director of Fund Administration, Calvert Investment Administrative Services, Inc. since August 2015. VP Expense & Budgeting, Global Fiduciary Platform, Legg Mason (May 2015 - July 2015). Vice President and Assistant Treasurer, Columbia Funds, Ameriprise, Columbia Management (2010 - April 2015). |
CATHERINE P. ROY AGE: 59 | Vice President | 2004 | Senior Vice President of the Advisor and Chief Investment Officer – Fixed Income. |
NATALIE A. TRUNOW AGE: 47 | Vice President | 2008 | Senior Vice President of the Advisor and Chief Investment Officer – Equities. |
* Mr. Streur is an interested person of the Funds since he is an Officer and Director of each Fund’s Advisor and certain affiliates. Mr. Silby is an interested person of the Funds since he is a Director of the parent company of each Fund’s Advisor. The address of Trustees/Directors and Officers is 4550 Montgomery Avenue, Suite 1000N, Bethesda, Maryland 20814, except Mr. Silby’s address is 1715 18th Street, N.W., Washington, DC 20009. Additional information about the Fund’s Trustees/Directors can be found in the Statement of Additional Information (SAI). You can get a free copy of the SAI at www.calvert.com, or by contacting your broker, or the Fund at 1-800-368-2745. |
30 calvert.com CALVERT EMERGING MARKETS EQUITY FUND ANNUAL REPORT (UNAUDITED)
|
|
| This page intentionally left blank. |
To Open an Account
800-368-2748
Service for Existing Account
Shareholders: 800-368-2745
Brokers: 800-368-2746
Registered Mail
Calvert Investments
c/o BFDS,
P.O. Box 219544
Kansas City, MO 64121-9544
Overnight Mail
Calvert Investments
c/o BFDS,
330 West 9th Street
Kansas City, MO 64105
Web Site
calvert.com
Principal Underwriter
Calvert Investment Distributors, Inc.
4550 Montgomery Avenue
Suite 1000 North
Bethesda, Maryland 20814
|
| | | |
| CALVERT EMERGING MARKETS EQUITY FUND | CALVERT’S FAMILY OF FUNDS | | |
| | Municipal Funds Tax-Free Responsible Impact Bond Fund Taxable Bond Funds Bond Portfolio Income Fund Short Duration Income Fund Long-Term Income Fund Ultra-Short Income Fund High Yield Bond Fund Green Bond Fund Unconstrained Bond Fund Balanced and Asset Allocation Funds Balanced Portfolio Conservative Allocation Fund Moderate Allocation Fund Aggressive Allocation Fund | | Equity Funds Large Cap Core Portfolio Equity Portfolio Global Value Fund U.S. Large Cap Core Responsible Index Fund U.S. Large Cap Value Responsible Index Fund U.S. Large Cap Growth Responsible Index Fund U.S. Mid Cap Core Responsible Index Fund Developed Markets EX-U.S. Responsible Index Fund Capital Accumulation Fund International Equity Fund Small Cap Fund Global Energy Solutions Fund Global Water Fund International Opportunities Fund Global Equity Income Fund Emerging Markets Equity Fund
|
This report is intended to provide fund information to shareholders. It is not authorized for distribution to prospective investors unless preceded or accompanied by a prospectus. Note: The information on our website is not incorporated by reference into this report; our website address is included as an inactive textual reference only. Investors should carefully consider the investment objectives, risks, charges and expenses of the Calvert Funds. This and other important information is contained in the fund’s summary prospectus and prospectus, which can be obtained from your financial professional and should be read carefully before investing. You may also call Calvert at 800/368-2748 or visit calvert.com. Printed on recycled paper using soy inks. |
| | | | |
Item 2. Code of Ethics.
(a) The registrant has adopted a code of ethics (the "Code of Ethics") that applies to its principal executive officer and principal financial officer (also referred to as “principal accounting officer”).
(b) No information need be disclosed under this paragraph.
(c) The registrant has not amended its Code of Ethics during the period covered by the shareholder report presented in Item 1 hereto.
(d) The registrant has not granted a waiver or implicit waiver from a provision of its Code of Ethics during the period covered by the shareholder report presented in Item 1 hereto.
(e) Not applicable.
(f) The registrant's Code of Ethics is attached as an Exhibit hereto.
Item 3. Audit Committee Financial Expert.
The registrant's Board of Directors has determined that Miles D. Harper, III, an "independent" Director serving on the registrant's audit committee, is an "audit committee financial expert," as defined in Item 3 of Form N-CSR. Under applicable securities laws, a person who is determined to be an audit committee financial expert will not be deemed an "expert" for any purpose, including without limitation for the purposes of Section 11 of the Securities Act of 1933, as a result of being designated or identified as an audit committee financial expert. The designation or identification of a person as an audit committee financial expert does not impose on such person any duties, obligations, or liabilities that are greater than the duties, obligations, and liabilities imposed on such person as a member of the audit committee and Board of Directors in the absence of such designation or identification.
Item 4. Principal Accountant Fees and Services.
Services fees paid to auditing firm:
|
| | | | |
| | Fiscal Year ended 9/30/15 | Fiscal Year ended 9/30/14 |
| | $ | % * | $ | %* |
| | | | | |
| (a) Audit Fees | $89,320 | 0% | $81,891 | 0% |
| (b) Audit-Related Fees | $0 | 0% | $0 | 0% |
| (c) Tax Fees (tax return preparation and filing for the registrant) | $13,400 | 0% | $13,120 | 0% |
| (d) All Other Fees | $0 | 0% | $0 | 0% |
| | | | | |
| Total | $102,720 | 0% | $95,011 | 0% |
* Percentage of fees approved by the Audit Committee pursuant to (c)(7)(i)(C) of Rule 2-01 of Reg. S-X (statutory de minimis waiver of Committee’s requirement to pre-approve)
(e) Audit Committee pre-approval policies and procedures:
The Audit Committee is required to pre-approve all audit and non-audit services provided to the registrant by the auditors, and to the registrant’s investment advisor, and any entity controlling, controlled by, or under common control with the advisor that provides ongoing services to the registrant. In determining whether to pre-approve non-audit services, the Audit Committee considers whether the services are consistent with maintaining the independence of the auditors. The Committee may delegate its authority to pre-approve certain matters to one or more of its members. In this regard, the Committee has delegated authority to the Audit Committee Chair with respect to non-audit services not exceeding $25,000 in each instance. In addition, the Committee has pre-approved the retention of the auditors to provide tax-related services related to the tax treatment and tax accounting of newly acquired securities, upon request by the investment advisor in each instance.
(f) Not applicable.
(g) Aggregate non-audit fees billed by the registrant’s accountant for services rendered to the registrant, and rendered to the registrant’s investment advisor, and any entity controlling, controlled by, or under common control with the advisor that provides ongoing services to the registrant for each of the last two fiscal years of the registrant:
|
| | | | |
| | Fiscal Year ended 9/30/15 | Fiscal Year ended 9/30/14 |
| | $ | %* | $ | %* |
| | $340,000 | 0%* | $28,146 | 0%* |
* Percentage of fees approved by the Audit Committee pursuant to (c)(7)(i)(C) of Rule 2-01 of Reg. S-X (statutory de minimis waiver of Committee’s requirement to pre-approve)
(h) The registrant’s Audit Committee of the Board of Directors has considered whether the provision of non-audit services that were rendered to the registrant’s investment advisor, and any entity controlling, controlled by, or under common control with the investment advisor that provides ongoing services to the registrant that were not pre-approved pursuant to paragraph (c) (7)(ii) of Rule 2-01 of Reg. S-X is compatible with maintaining the principal accountant’s independence and found that the provision of such services is compatible with maintaining the principal accountant’s independence.
Item 5. Audit Committee of Listed Registrants.
Not applicable.
Item 6. Schedule of Investments.
| |
| (a) | This Schedule is included as part of the report to shareholders filed under Item 1 of this Form. |
Item 7. Disclosure of Proxy Voting Policies and Procedures for Closed-End Management Investment Companies.
Not applicable.
Item 8. Portfolio Managers of Closed-End Management Investment Companies.
Not applicable.
Item 9. Purchases of Equity Securities by Closed-End Management Investment Company and Affiliated Purchasers.
Not applicable.
Item 10. Submission of Matters to a Vote of Security Holders.
No material changes were made to the procedures by which shareholders may recommend nominees to the registrant’s Board of Directors since registrant last provided disclosure in response to this Item.
Item 11. Controls and Procedures.
(a) The principal executive and financial officers concluded that the registrant's disclosure controls and procedures (as defined in Rule 30a-3(c) under the 1940 Act) are effective, based on the evaluation of these controls and procedures required by Rule 30a-3(b) under the 1940 Act and Rules 13a-15(b) or 15d-15(b) under the Exchange Act, as of a date within 90 days of the filing date of this report.
(b) There was no change in the registrant's internal control over financial reporting (as defined in Rule 30a-3(d) under the 1940 Act) that occurred during the registrant's second fiscal quarter of the period covered by this report that has materially affected, or is reasonably likely to materially affect, the registrant's internal control over financial reporting.
Item 12. Exhibits.
(a)(1) A copy of the Registrant’s Code of Ethics.
Attached hereto.
(a)(2) A separate certification for each principal executive officer and principal financial officer of the registrant as required by Rule 30a-2 under the Act (17 CFR 270.30a-2).
Attached hereto.
(a)(3) Not applicable.
(b) A certification for the registrant's Principal Executive Officer and Principal Financial Officer, as required by Rule 30a-2(b) under the Investment Company Act of 1940, is attached hereto. The certification furnished pursuant to this paragraph is not deemed to be "filed" for purposes of Section 18 of the Securities Exchange Act of 1934, or otherwise subject to the liability of that section. Such certification is not deemed to be incorporated by reference into any filing under the Securities Act of 1933 or the Securities Exchange Act of 1934, except to the extent that the registrant specifically incorporates it by reference.
Pursuant to the requirements of the Securities Exchange Act of 1934 and the Investment Act of 1940, the registrant has duly caused this report to be signed on its behalf by the undersigned, thereunto duly authorized.
CALVERT WORLD VALUES FUND, INC.
By: /s/ John H. Streur
John H. Streur
President -- Principal Executive Officer
Date: December 3, 2015
Pursuant to the requirements of the Securities Exchange Act of 1934 and the Investment Act of 1940, this report has been signed below by the following persons on behalf of the registrant and in the capacities and on the dates indicated.
/s/ John H. Streur
John H. Streur
President -- Principal Executive Officer
Date: December 3, 2015
/s/ Vicki L. Benjamin
Vicki L. Benjamin
Treasurer -- Principal Financial Officer
Date: December 3, 2015