UNITED STATES
SECURITIES AND EXCHANGE COMMISSION
Washington, D.C. 20549
FORM N-CSR
CERTIFIED SHAREHOLDER REPORT OF REGISTERED
MANAGEMENT INVESTMENT COMPANIES
Investment Company Act file number: 811-6563
CALVERT WORLD VALUES FUND, INC.
(Exact name of registrant as specified in charter)
4550 Montgomery Avenue
Suite 1000N
Bethesda, Maryland 20814
(Address of Principal Executive Offices)
William M. Tartikoff, Esq.
4550 Montgomery Avenue
Suite 1000N
Bethesda, Maryland 20814
(Name and Address of Agent for Service)
Registrant's telephone number, including area code: (301) 951-4800
Date of fiscal year end: September 30
Date of reporting period: Twelve months ended September 30, 2013
Item 1. Report to Stockholders.
[Calvert International Equity Fund Annual Report]
and
[Calvert Capital Accumulation Fund Annual Report]
and
[Calvert International Opportunities Fund Annual Report]
and
[Calvert Emerging Markets Equity Fund Annual Report]
Choose Planet-friendly E-delivery!
Sign up now for on-line statements, prospectuses, and fund reports. In less than five minutes you can help reduce paper mail and lower fund costs.
Just go to www.calvert.com. If you already have an online account at Calvert, click on My Account, and select the documents you would like to receive via e-mail.
If you’re new to online account access, click on Login/Register to open an online account. Once you’re in, click on the E-delivery sign-up at the bottom of the Account Portfolio page and follow the quick, easy steps. Note: if your shares are not held directly at Calvert but through a brokerage firm, you must contact your broker for electronic delivery options available through their firm.


Barbara Krumsiek
President and CEO of Calvert Investments, Inc.
Dear Calvert Shareholder,
For the 12 months ended September 30, 2013, the global equity markets generally had a strong year, while bonds saw more mixed results. Large-cap stocks, as represented by the Russell 1000 Index, posted a healthy 20.9% return, while the smaller-cap Russell 2000 Index led with a 30.1% gain. This occurred despite political turmoil and market concerns worldwide about a forced shutdown of the U.S. government and the upcoming debt ceiling deadline.
Despite these advances, it was a challenging year for the financial markets overall. At various times, issues at home and abroad led to marked volatility in the performance of both stocks and bonds. Emerging-market performance was notably low, as fears of slowing growth in China and the Eurozone, along with continuing struggles in the Eurozone periphery, stalled regional investment. As a result, the formerly high-flying MSCI Emerging Markets Index gained only 1.3% for the period. The Barclays U.S. Credit Index, a barometer for the overall U.S. bond market, returned -1.9%.
Early in the Fall, Fed Chairman Ben Bernanke’s retirement was big news. The nomination of Vice Chair Janet Yellen as his replacement means the Fed will likely stay the course with current monetary policy. Yet, this is a historic moment for the United States, as Yellen, following Senate approval, will be the first woman to lead this critical agency.
Calvert Co-Founder Honored
I’m proud to congratulate Calvert co-founder Wayne Silby, who received the prestigious Joseph Wharton Award for Social Impact from The Alumni Club of New York, honoring his lifetime of achievement in impact investing and social entrepreneurship. Besides founding Calvert with John Guffey, Wayne is a co-founder of the Social Venture Network, Co-Chairman of the board of the Calvert Foundation, Chairman of Syntao Ltd., a CSR consultancy in Beijing, and active in other ventures in social impact and entrepreneurship.
Calvert Releases New Report on Diversity
In March, we published the latest edition of Examining the Cracks in the Glass Ceiling, which measures diversity practices of the companies that constitute the S&P 100 Index. As you know, Calvert believes companies with a diverse workforce are poised for greater success in today’s increasingly global marketplace and will enjoy greater long-term value—a view supported by a growing body of research from McKinsey, Credit Suisse, and others.
Companies in the report were rated on 10 indicators: EEO policy, internal diversity initiatives, external diversity initiatives, scope of diversity initiatives, family-friendly benefits, demographic disclosure of employees (EEO-1), highest-paid executives, board diversity,
4 www.calvert.com CALVERT INTERNATIONAL EQUITY FUND ANNUAL REPORT
director selection criteria, and overall corporate commitment. The highest-rated companies were Citigroup, Merck, The Coca-Cola Company, and J.P. Morgan Chase, all scoring at least 95 points or more out of 100. We hold these companies in a number of our Calvert portfolios.
While some progress has been achieved in corporate diversity practices since our last assessment in 2010, the S&P 100 companies are largely failing to translate progressive practices into increased promotion rates for women and minority employees. For example, women are now hired as often as men. However, more than half of the S&P 100 companies lack diversity among their highest-paid senior executive positions. And women still only represent 19% of board members among these large-cap companies. Much remains to be done, which is why we continue to work with a number of international, multi-stakeholder groups on these issues, as well as conduct advocacy work with individual companies.
Stay Informed in the Months Ahead
Maintaining a well-diversified mix of U.S. and international stocks, bonds, and cash—appropriate for your goals and risk tolerance—is one of the best ways to mitigate the effects of an uneven recovery in the economy and markets. Of course, we recommend consulting your financial advisor if you have questions or concerns about your investments.
We also invite you to visit our website, www.calvert.com, for fund information, portfolio updates, and commentary from Calvert professionals. As always, we thank you for investing with Calvert.
The following companies represented the following percentages of Fund net assets: Citigroup 2.27% of Calvert Large Cap Value, 1.32% of Calvert Social Index; Merck 2.26% of Calvert Equity Income, 2.01% of Calvert Large Cap Value, and 1.25% of Calvert Social Index; Coca-Cola 1.29% of Calvert Social Index, 3.20% of Calvert Large Cap Core and 3.29% Calvert Equity Portfolio; J.P. Morgan Chase 2.54% of Calvert Equity Income, 1.74% of Calvert Social Index and 0.34% of Calvert Balanced Portfolio. Holdings are subject to change.
www.calvert.com CALVERT INTERNATIONAL EQUITY FUND ANNUAL REPORT 5

As always, Calvert continues to work hard to ensure you have a say in the responsible management of environmental, social, and governance (ESG) factors for the companies in which we invest. Below are highlights of our accomplishments during the reporting period.
Shareholder Advocacy
Over the past year, Calvert engaged with 139 companies via emails, letters, phone calls, and in-person meetings. We also filed 22 shareholder proposals during the 2013 proxy season, which led to agreements with 14 companies on the issues of board diversity and sustainability reporting, among others. We also presented at four annual meetings where the proposals came to a vote and received shareholder support that exceeded 40% at two companies.
One proposal was for diversified energy services company Cleco, which has significant assets in thermoelectricity, to report on its sustainability risks and opportunities, including an analysis of material water-related risks. The other at Pioneer Natural Resources focused on reporting the environmental and social challenges and opportunities associated with hydraulic fracturing.
Company Engagement
Research and an intensive dialogue across a range of corporate responsibility and sustainability issues led to McDonald’s and Walt Disney meeting our Signature® criteria1 for the first time. McDonald’s is improving its supply chain labor policies and practices, diversifying its menu options, and disclosing their nutritional content—although it continues to face challenges in both areas. Walt Disney now meets the criteria for workplace safety, while continuing to meet our criteria on supply chain labor and human rights practices.
We undertook more engagement with Coca-Cola and PepsiCo on labor and human rights, water, and sustainability issues. In fact, PepsiCo management credited our recommendations with influencing their decision to strengthen their human rights policy framework.
Climate Change And Energy
Calvert, the World Wildlife Fund (WWF) and Ceres published, “Power Forward: Why the World’s Largest Companies are Investing in Renewable Energy.” The report found that more than half of the largest U.S. corporations and more than two-thirds of the largest companies across the globe have set greenhouse gas (GHG) emissions reduction commitments and/or renewable energy commitments.
Calvert joined with other Investor Network on Climate Risk (INCR) members to speak at congressional staff briefings about recommendations for corporations in the report and draft an investor letter to Congress supporting the production tax credit (PTC) for wind
6 www.calvert.com CALVERT INTERNATIONAL EQUITY FUND ANNUAL REPORT
energy, which was due to expire at the end of 2012. The report, briefings and investor letter helped spur extension of the PTC to support the growth of renewable energy.
350.Org Divestment Campaign On Fossil Fuels
Calvert watched closely the 350.org campaign urging college and university endowments, as well as other institutional investors, to divest from companies producing fossil fuels. In December, Calvert posted a statement on our website expressing support for the campaign’s broad objectives while making the case for a complementary strategy of active ownership and engagement. The statement pointed to specific fossil fuel companies such as Denbury Resources and Suncor Energy that Calvert has successfully engaged on climate change, alternative energy, and revenue transparency.
Burma
After the lifting of U.S. sanctions prohibiting new investment in Burma by American companies, the Calvert Social Funds Board approved revisions to Calvert’s long-standing policy language in September. Instead of urging U.S. companies to “cease operations” in Burma, the new language instead calls for Calvert to advocate for “responsible investment.”
Garment Industry Safety
Following the Rana Plaza tragedy earlier this year, where more than 1,100 Bangladesh garment factory workers were killed, Calvert assessed the state of significant country-level sourcing disclosure by retail companies, which is essential to assessing sourcing risks more effectively. After learning that only a handful of companies disclose this necessary data, we contacted 26 retail company CEOs requesting disclosure of sourcing information for those countries representing 5% or more of global order volume.
Human Rights Report
In March, Calvert, Interfaith Center on Corporate Responsibility and the Institute for Human Rights and Business launched “Investing the Rights Way: A Guide for Business and Human Rights” in both New York and London. The guide outlines how investors can apply the UN Guiding Principles on Business and Human Rights as a due diligence and risk assessment framework to assess companies in their portfolios.
Conflict Minerals
Calvert continued to be a leader among investors on “conflict minerals” through a multi-stakeholder group supporting disclosure requirements enacted as Section 1502 of the Dodd-Frank Wall Street Reform and Consumer Protection Act of 2010. The disclosure would certify that certain minerals used in cell phones and other consumer electronic components (tin, titanium, tantalum and gold) are not illegally mined to fuel the continuing bloody conflict in the Democratic Republic of Congo (DRC).
After the SEC approved and released the final rule to implement the reporting requirements of Section 1502 in August 2012, the U.S. Chamber of Commerce filed a lawsuit against the Securities and Exchange Commission (SEC) to stop implementation. Calvert led the multi-stakeholder group’s effort to forge a common statement urging implementation of the law as outlined by the rule, regardless of the lawsuit. On July 23, the court upheld the “conflict minerals rule” in favor of the SEC and the statute requiring adoption of the rule—a major victory for Calvert and its allies.
www.calvert.com CALVERT INTERNATIONAL EQUITY FUND ANNUAL REPORT 7
Extractives Revenue Transparency
Widely credited for its leadership role among investors in supporting extractive revenue transparency as an imperative for investors interested in full disclosure of material information related to oil, gas and mining in certain countries, Calvert has remained actively engaged in the SEC rule-making process. The U.S. Chamber of Commerce and the American Petroleum Institute filed a lawsuit challenging the pro-disclosure rules, Calvert submitted a sworn statement about the problems investors would face if the rules were delayed or revoked. We also sent letters to the SEC emphasizing the materiality of disclosures required by the rules and contributed research to Oxfam America’s January 2013 brief.
On July 2, the court “vacated” the SEC’s rule, declaring it inoperative until the SEC addresses certain key issues (the necessity for exemptions for certain countries and public reporting of the disclosures). Calvert subsequently drafted a letter to SEC Chairman Mary Jo White that acknowledged the value of the Commission’s rules to implement Section 1504 and urged her respond to the API vs. SEC decision by reinstating rules consistent with those issued in August 2012, which were endorsed by investors representing more than $5.6 trillion in assets under management.
1. Calvert’s Signature® criteria examine corporate performance across seven broad areas of concern: Governance and Ethics, Environment, Workplace, Product Safety and Impact, International Operations and Human Rights, Indigenous Peoples’ Rights, and Community Relations. For a company to be eligible for inclusion in a Calvert Signature portfolio, it must meet the criteria in all seven categories.
The following companies represented the following percentages of net assets: Cleco 0.02% of Calvert Social Index; Pioneer Natural Resources 0.23% of Calvert Social Index and 1.39% of Calvert Balanced Portfolio; McDonald’s 0.86% of Calvert Social Index and 2.35% of Calvert Equity Portfolio, Walt Disney 0.96% of Calvert Social Index and 2.25% of Calvert Equity Portfolio; Coca-Cola 1.29% of Calvert Social Index, 3.20% of Calvert Large Cap Core and 3.29% Calvert Equity Portfolio; PepsiCo 1.10% of Calvert Social Index, 1.20% of Calvert Equity Portfolio and 0.54% of Calvert Balanced Portfolio; Denbury Resources 0.06% of Calvert Social Index and 2.86% of Calvert Large Cap Core; and Suncor Energy 0.71%% of Calvert International Equity Portfolio. Holdings are subject to change.
8 www.calvert.com CALVERT INTERNATIONAL EQUITY FUND ANNUAL REPORT
Investment Performance
For the one-year period ended September 30, 2013, Calvert International Equity Fund’s Class A Shares (at NAV) returned 22.82% compared to its benchmark, the MSCI EAFE IMI Index, which returned 24.94%. The Fund’s relative underperformance was due to weak stock selection, which was partially offset by strong sector selection.
Investment Climate
Equities faced a brief pullback in late 2012, but recovered and posted strong gains throughout most of 2013. The third round of quantitative easing (QE), unleashed in mid-2012, provided an impetus for equity investors to look past numerous macro head-winds from fiscal cliff debates, sequester, slow growth in China and the Eurozone, and weak corporate earnings. The macro-economic picture in the U.S. continued to show improvement in the key economic sectors—housing and employment. For the year, the S&P 500, Russell 1000, Russell 2000, MSCI EAFE, and MSCI Emerging Markets Indices returned 19.34%, 20.91%, 30.06%, 24.92%, and 1.33%, respectively.
Value stocks outperformed growth stocks by 2.18%, as measured by the MSCI EAFE IMI Value and MSCI EAFE IMI Growth Indices for the 12-month period. Within the MSCI EAFE IMI Index, Consumer Discretionary, Industrials, Information Technology and Financials were the top-performing sectors, while Utilities, and Materials lagged.
Corporate Earnings Are Weaker
Corporate earnings reports in late 2012 and throughout the first half of 2013 were largely weak on both the top- and bottom-line figures, with the sequester negatively impacting corporate results in the first half of 2013.
Sounding a cautious note, several bellwether companies that reported late in the summer of 2013, including names like Walmart and Cisco, issued reduced earnings forecasts citing everything from consumer weakness to fears of rising interest rates. We continue to believe that, going forward, the U.S. economic recovery can be sustained and able to support earnings growth for U.S. companies.
Improving Macro-Economic Picture in the U.S., But Continued Softness Abroad
Throughout the year, U.S. macro indicators continued to improve, albeit slowly. The unemployment rate ticked down to just above 7% and initial jobless claims hit post-financial crisis lows in the third quarter of 2013. New job growth remains sluggish.
www.calvert.com CALVERT INTERNATIONAL EQUITY FUND ANNUAL REPORT 9
| CALVERT |
| INTERNATIONAL |
| EQUITY FUND |
| SEPTEMBER 30, 2013 |
| |
| INVESTMENT PERFORMANCE | | | |
| (TOTAL RETURN AT NAV*) | | | |
| | 6 MONTHS | | 12 MONTHS | |
| | ENDED | | ENDED | |
| | 9/30/13 | | 9/30/13 | |
| Class A | 10.71 | % | 22.82 | % |
| Class B | 10.02 | % | 21.36 | % |
| Class C | 10.20 | % | 21.78 | % |
| Class I | 11.12 | % | 23.74 | % |
| Class Y | 10.91 | % | 23.27 | % |
| |
| MSCI EAFE | | | | |
| Investable Market | | | | |
| Index (IMI) | 11.04 | % | 24.94 | % |
| |
| Lipper | | | | |
| International | | | | |
| Multi-Cap | | | | |
| Growth Funds | | | | |
| Average | 8.24 | % | 19.03 | % |
| TEN LARGEST | % OF NET | |
| STOCK HOLDINGS | ASSETS | |
| Roche Holding AG | 2.3 | % |
| Toyota Motor Corp. | 2.3 | % |
| Novartis AG | 1.8 | % |
| Air Liquide SA | 1.7 | % |
| Assa Abloy AB | 1.6 | % |
| AIA Group Ltd. | 1.5 | % |
| Kingfisher plc | 1.4 | % |
| Novo Nordisk A/S | 1.3 | % |
| ASML Holding NV | 1.3 | % |
| FANUC Corp. | 1.2 | % |
| Total | 16.4 | % |
* Investment performance/return at NAV does not reflect the deduction of the Fund’s maximum 4.75% front-end sales charge or any deferred sales charges.
| CALVERT |
| INTERNATIONAL |
| EQUITY FUND |
| SEPTEMBER 30, 2013 |
| |
| | % OF TOTAL | |
| ECONOMIC SECTORS | INVESTMENTS | |
| Consumer Discretionary | 22.3 | % |
| Consumer Staples | 6.3 | % |
| Energy | 2.3 | % |
| Financials | 22.7 | % |
| Health Care | 9.3 | % |
| Industrials | 14.0 | % |
| Information Technology | 7.8 | % |
| Limited Partnership Interest | 0.5 | % |
| Materials | 6.3 | % |
| Short-Term Investments | 3.6 | % |
| Telecommunication Services | 3.6 | % |
| Utilities | 0.8 | % |
| Venture Capital | 0.5 | % |
| Total | 100 | % |
However, consumers continue to remain upbeat and willing to spend on bigger-ticket items, as reflected in improving vehicle and home sales. Sales of previously owned homes hit a three-year high in May of 2013 and housing prices continued to trend upward, despite the looming threat of rising interest rates.
Abroad, developed markets kept pace with the U.S., but emerging markets were rattled by developments in China and the Eurozone periphery. A transition of power in China went smoothly, but new leadership promised to curb excesses in the economy, triggering fears of an economic slowdown. The pullback reached its climax with a 14% sell-off in the Shanghai composite in June that rattled markets around the globe. Elsewhere in Asia, Japan launched an unprecedented QE program
10 www.calvert.com CALVERT INTERNATIONAL EQUITY FUND ANNUAL REPORT
in late 2012, triggering a massive rally in Japanese equities and a large sell-off in the yen. With similar (but smaller) policy measures in Europe, investors began to focus on the theme of coordinated global QE as a stabilizing force for the global economy in the near term, despite potentially negative effects in the longer term.
In Europe, economic turmoil in the so called “PIIGS” (Portugal, Italy, Ireland, Greece and Spain) continued to simmer in the background. While Italy nearly saw its government collapse, unemployment in Spain reached almost 50% among youth—reminding investors that the region, while improving, remains fragile.
Federal Reserve: QE Taper and Transition Talk
During the summer, investor consensus largely settled around the view that the Federal Reserve (Fed) would begin tapering its QE program in September of 2013 by reducing both its Treasury and mortgage-backed security purchases. This view took hold despite weakness in both employment and inflation, the two areas highlighted by Fed Chairman Ben Bernanke as needing improvement before tapering would begin. Nevertheless, the “surprise” decision not to taper in September caught market participants off guard, sending equities up and sparking a retreat in bond yields.
As markets digested the lack of a QE taper – and largely gave back the equity gains won on the news – focus also returned to the transition of the Fed Chairman role. With Larry Summers removing himself from consideration, consensus coalesced around eventual nominee Vice Chair Janet Yellen, a selection largely signaling favor for continuing current monetary policy with little change.
With Political Stalemate in Washington, It’s Déjà Vu All Over Again…
The debt ceiling drama of 2011 reared its head again in late September 2013. The government shutdown and debt ceiling impasse in Washington fueled uncertainty and created a negative feedback loop in the U.S. economy. Although U.S. labor conditions improved materially since the asset purchase program began, recent reductions in public-sector employment were felt in the July and August employment reports.
The U.S. Congress failed to approve a budget to fund the government past September 30, which culminated in the shutdown of the federal government. Equity markets appeared largely unconcerned with the event in September despite the looming U.S. debt ceiling debate. Congress was not able to raise the debt ceiling until hours before the October 17 deadline identified by the Treasury Department.
Although the markets welcomed the resolution, the turmoil took its toll. Estimates of fiscal drag from the shutdown were in the billions, while credit-rating firm Fitch put the nation’s credit rating on negative outlook as a result of the political stalemate and inability to take timely action on raising the debt ceiling.
www.calvert.com CALVERT INTERNATIONAL EQUITY FUND ANNUAL REPORT 11
GROWTH OF $10,000
The graph below shows the value of a hypothetical $10,000 investment in the Fund over the past 10 fiscal year periods. The results shown are for Class A shares and reflect the deduction of the maximum front-end sales charge of 4.75% and assume the reinvestment of dividends. The result is compared with benchmarks that include a broad based market index and a Lipper peer group average. Market indexes are unmanaged and their results do not reflect the effect of expenses or sales charges. The Lipper average reflects the deduction of the category’s average front-end sales charge. The value of an investment in a different share class would be different.
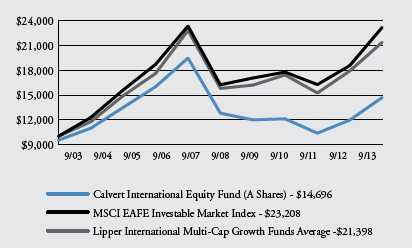
All performance data shown, including the graph above and the adjacent table, represents past performance, does not guarantee future results, assumes reinvestment of dividends and distributions and does not reflect the deduction of taxes that a shareholder would pay on the Fund’s distributions or the redemption of the Fund shares. All performance data reflects fee waivers and/or expense limitations, if any are in effect; in their absence performance would be lower. See Note B in Notes to Financial Statements. The investment return and principal value of an investment will fluctuate so that an investor’s shares, when redeemed, may be worth more or less than their original cost. Current performance may be lower or higher than the performance data quoted; for current performance data visit www.calvert.com. The gross expense ratio from the current prospectus for Class A shares is 1.86%. This number may differ from the expense ratio shown elsewhere in this report because it is based on a different time period and, if applicable, does not include fee or expense waivers. Performance data quoted already reflects the deduction of the Fund’s operating expenses.
12 www.calvert.com CALVERT INTERNATIONAL EQUITY FUND ANNUAL REPORT
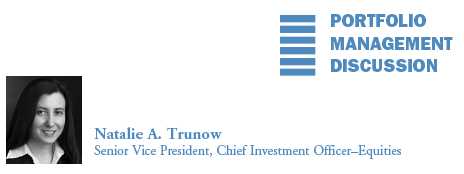
Portfolio Strategy
Developed market equities posted impressive returns for the period with the MSCI EAFE IMI Index returning 24.94%. Calvert International Equity Fund under-performed the benchmark index by 2.12%, returning 22.82% for the year. Weak stock selection drove the Fund’s under-performance but was partially offset by strong sector allocation. Stock selection particularly struggled within the Energy and Consumer Staples sectors. However, an overweight to Consumer Discretionary made a positive contribution to relative performance.
The Fund’s investment management team is comprised of three investment managers: Thornburg Investment Management, Martin Currie, and Calvert Investment Management.
Stock selection was the main driver of overall Fund’s relative underperformance for the period, particularly in the Energy and Consumer Staples sectors, both of which underperformed for the year. Top detractors included UK oil and gas company BG Group and Canadian oil company Cenovus Energy, which were down 4% and 13%, respectively, due to lower production forecasts.1 Other significant detractors included Brazilian personal products company Natura Cosmeticos and South African health and beauty products company Clicks Group Limited, which fell 15% and 20%, respectively. Both declined due to slowing sales growth estimates based on weaker consumer spending and a lack of success in innovation.
| CALVERT |
| INTERNATIONAL |
| EQUITY FUND |
| SEPTEMBER 30, 2013 |
| |
| AVERAGE ANNUAL TOTAL RETURNS | |
| |
| CLASS A SHARES | (WITH MAX. LOAD) | |
| One year | 17.01 | % |
| Five year | 1.81 | % |
| Ten year | 3.92 | % |
| |
| CLASS B SHARES | (WITH MAX. LOAD) | |
| One year | 16.36 | % |
| Five year | 1.39 | % |
| Ten year | 3.28 | % |
| |
| CLASS C SHARES | (WITH MAX. LOAD) | |
| One year | 20.78 | % |
| Five year | 1.88 | % |
| Ten year | 3.54 | % |
| |
| CLASS I SHARES | | |
| One year | 23.74 | % |
| Five year | 3.58 | % |
| Ten year | 5.20 | % |
| |
| CLASS Y SHARES* | | |
| One year | 23.27 | % |
| Five year | 3.22 | % |
| Ten year | 4.65 | % |
* Calvert International Equity Fund first offered Class Y shares on October 31, 2008. Performance prior to that date reflects the performance of Class A shares at net asset value (NAV). Actual Class Y share performance would have been different.
On the positive side, U.S.-based electric car maker Tesla Motors was the top contributor, returning 250% during the year on strong demand for its electric cars—reflecting growing consumer awareness and demand for green products. German cable company Kabel Deutschland gained 71% while receiving several takeover offers over the course of the year before the European Commission eventually approved Vodafone’s acquisition
www.calvert.com CALVERT INTERNATIONAL EQUITY FUND ANNUAL REPORT 13
offer. Shares of German media company ProsiebenSat.1 rose 86% due to private equity firm bids for several of its TV channels.
Japanese real estate companies, Mitsui Fudosan and Mitusbishi Estate Company, up 69% and 55%, respectively, contributed positively to the Fund’s relative performance. These firms benefited from the appreciation in commercial real estate, increasing rents, and the overall positive outlook for the Japanese real estate market amid Prime Minister Abe’s monetary policies.
Sector allocation was an overall positive for the Fund’s relative performance. The Fund’s overweight in Consumer Discretionary, the best-performing sector for the period, was the main driver. The Fund also benefited from an underweight to the Metals and Mining industry, which is the result of the Fund’s sustainability criteria. The Fund’s very modest cash position also hurt relative performance in a period in which developed market equity returns were so strong.
However, country allocation hurt returns, driven primarily by the Fund’s 7% allocation to emerging market countries, which underperformed developed markets during the year.
Outlook
As we have stated in the past, despite negative short-term investor sentiment, the long-term drivers of economic recovery continue to gain strength. Investors continue to look beyond the headlines and focus on the improving macro-economic climate in the U.S. and, to some degree, overseas.
The path to recovery will not necessarily be smooth, however. The Fed is largely expected to taper QE as early as December and interest rates are expected to continue climbing. In such a scenario, higher dividend stocks remain especially vulnerable. While growth stocks made an impressive recovery in the third quarter, value names may recover when the reality of Fed tapering and interest rate uptick returns to focus.
However, longer-term factors, such as historically low housing inventories and continued household formation, will provide support for improving economic growth. Likewise, manufacturing is pulling out of its seasonal slump and the broader trend of consumer balance sheet repair is well underway.
As confidence sets in at both the consumer and corporate level, we continue to expect consumers to increase spending and companies to eventually expand capital expenditures and increase inventories. The sharp rise in interest rates that many feared would continue to 3% and beyond has tempered. While consumers and companies alike must prepare for a rising-rate environment, over the medium- and longer-terms, a gradual shift up in borrowing costs may be a sign of an improving economy and not necessarily a near-term threat to growth.
Calvert Investment Management, Inc. October 2013
1. Returns reflect the period securities were held by the portfolio
As of September 30, 2013, the following companies represented the following percentages of Fund net assets: Walmart 0.0%, Cisco 0.0%, BG Group 1.14%, Cenovus Energy 0%, Natura Cosmeticos 0.37%, Clicks Group 0.51%, Tesla Motors 0%, Kabel Deutschland 0.37%, ProsiebenSat.1 Media 0%, Vodafone 0.21%. Holdings, Mitsui Fudosan 0.43%, Mitsubishi Estate 0.53% are subject to change.
14 www.calvert.com CALVERT INTERNATIONAL EQUITY FUND ANNUAL REPORT
SHAREHOLDER EXPENSE EXAMPLE
As a shareholder of the Fund, you incur two types of costs: (1) transaction costs, including sales charges (loads) and redemption fees; and (2) ongoing costs, including management fees; distribution (12b-1) fees; and other Fund expenses. This Example is intended to help you understand your ongoing costs (in dollars) of investing in the Fund and to compare these costs with the ongoing costs of investing in other mutual funds.
This Example is based on an investment of $1,000 invested at the beginning of the period and held for the entire period (April 1, 2013 to September 30, 2013).
Actual Expenses
The first line of the table below provides information about actual account values and actual expenses. You may use the information in this line, together with the amount you invested, to estimate the expenses that you paid over the period. Simply divide your account value by $1,000 (for example, an $8,600 account value divided by $1,000 = 8.6), then multiply the result by the number in the first line under the heading entitled “Expenses Paid During Period” to estimate the expenses you paid on your account during this period.
Hypothetical Example for Comparison Purposes
The second line of the table below provides information about hypothetical account values and hypothetical expenses based on the Fund’s actual expense ratio and an assumed rate of return of 5% per year before expenses, which is not the Fund’s actual return. The hypothetical account values and expenses may not be used to estimate the actual ending account balance or expenses you paid for the period. You may use this information to compare the ongoing costs of investing in the Fund and other funds. To do so, compare the 5% hypothetical example with the 5% hypothetical examples that appear in the shareholder reports of the other funds.
Please note that the expenses shown in the table are meant to highlight your ongoing costs only and do not reflect any transactional costs, such as sales charges (loads) or redemption fees. Therefore, the second line of the table is useful in comparing ongoing costs only, and will not help you determine the relative total costs of owning different funds. In addition, if these transactional costs were included, your costs would have been higher.
www.calvert.com CALVERT INTERNATIONAL EQUITY FUND ANNUAL REPORT 15
| | BEGINNING | ENDING ACCOUNT | EXPENSES PAID |
| | ACCOUNT VALUE | VALUE | DURING PERIOD* |
| | 4/1/13 | 9/30/13 | 4/1/13 - 9/30/13 |
| CLASS A | | | |
| Actual | $1,000.00 | $1,107.07 | $9.17 |
| Hypothetical | $1,000.00 | $1,016.36 | $8.78 |
| (5% return per year before expenses) | | | |
| |
| CLASS B | | | |
| Actual | $1,000.00 | $1,100.23 | $15.64 |
| Hypothetical | $1,000.00 | $1,010.18 | $14.97 |
| (5% return per year before expenses) | | | |
| |
| CLASS C | | | |
| Actual | $1,000.00 | $1,102.01 | $13.88 |
| Hypothetical | $1,000.00 | $1,011.86 | $13.29 |
| (5% return per year before expenses) | | | |
| |
| CLASS I | | | |
| Actual | $1,000.00 | $1,111.18 | $5.58 |
| Hypothetical | $1,000.00 | $1,019.79 | $5.33 |
| (5% return per year before expenses) | | | |
| |
| CLASS Y | | | |
| Actual | $1,000.00 | $1,109.13 | $7.35 |
| Hypothetical | $1,000.00 | $1,018.10 | $7.03 |
| (5% return per year before expenses) | | | |
* Expenses are equal to the Fund’s annualized expense ratio of 1.74%, 2.97%, 2.63%, 1.05%, and 1.39% for Class A, Class B, Class C, Class I, and Class Y, respectively, multiplied by the average account value over the period, multiplied by 183/365 (to reflect the one-half year period).
16 www.calvert.com CALVERT INTERNATIONAL EQUITY FUND ANNUAL REPORT
REPORT OF INDEPENDENT REGISTERED PUBLIC ACCOUNTING FIRM
The Board of Directors of Calvert World Values Fund, Inc. and Shareholders of Calvert International Equity Fund: We have audited the accompanying statement of net assets of the Calvert International Equity Fund (the “Fund”), a series of Calvert World Values Fund, Inc., as of September 30, 2013, and the related statement of operations for the year then ended, the statements of changes in net assets for each of the years in the two-year period then ended, and the financial highlights for each of the years or periods in the five-year period then ended. These financial statements and financial highlights are the responsibility of the Fund’s management. Our responsibility is to express an opinion on these financial statements and financial highlights based on our audits.
We conducted our audits in accordance with the standards of the Public Company Accounting Oversight Board (United States). Those standards require that we plan and perform the audit to obtain reasonable assurance about whether the financial statements and financial highlights are free of material misstatement. An audit includes examining, on a test basis, evidence supporting the amounts and disclosures in the financial statements. Our procedures included confirmation of securities owned as of September 30, 2013, by correspondence with the custodian and brokers or by performing other appropriate auditing procedures. An audit also includes assessing the accounting principles used and significant estimates made by management, as well as evaluating the overall financial statement presentation. We believe that our audits provide a reasonable basis for our opinion.
In our opinion, the financial statements and financial highlights referred to above present fairly, in all material respects, the financial position of the Calvert International Equity Fund as of September 30, 2013, the results of its operations for the year then ended, the changes in its net assets for each of the years in the two-year period then ended, and the financial highlights for each of the years or periods in the five-year period then ended, in conformity with U.S. generally accepted accounting principles.

www.calvert.com CALVERT INTERNATIONAL EQUITY FUND ANNUAL REPORT 17
| | | |
| STATEMENT OF NET ASSETS |
| SEPTEMBER 30, 2013 |
| |
| EQUITY SECURITIES - 94.2% | SHARES | | VALUE |
| Argentina - 0.4% | | | |
| MercadoLibre, Inc | 10,600 | $ | 1,430,046 |
| |
| Australia - 1.7% | | | |
| Amcor Ltd. (ADR) | 2,834 | | 110,781 |
| Aurizon Holdings Ltd. | 620,587 | | 2,713,096 |
| Macquarie Group Ltd. | 65,029 | | 2,910,381 |
| Sims Metal Management Ltd. (ADR) | 32,355 | | 284,400 |
| | | | 6,018,658 |
| |
| Austria - 0.0% | | | |
| Erste Group Bank AG (ADR) | 4,668 | | 74,128 |
| Telekom Austria AG (ADR) | 239 | | 3,970 |
| Verbund AG (ADR) | 449 | | 2,016 |
| | | | 80,114 |
| |
| Belgium - 0.4% | | | |
| Ageas (ADR) | 179 | | 7,258 |
| Umicore SA | 29,800 | | 1,448,350 |
| | | | 1,455,608 |
| |
| Brazil - 0.8% | | | |
| Itau Unibanco Holding SA (ADR) | 119,159 | | 1,682,525 |
| Natura Cosmeticos SA | 58,503 | | 1,303,901 |
| | | | 2,986,426 |
| |
| Canada - 3.9% | | | |
| Canadian National Railway Co.: | | | |
| New York Exchange | 15,075 | | 1,528,153 |
| Toronto Exchange | 30,288 | | 3,073,711 |
| EnCana Corp. New York Exchange | 26,303 | | 455,831 |
| Intact Financial Corp. | 60,000 | | 3,604,259 |
| Lululemon Athletica, Inc.* | 35,923 | | 2,625,612 |
| Suncor Energy, Inc.: | | | |
| New York Exchange | 5,770 | | 206,451 |
| Toronto Exchange | 63,100 | | 2,259,685 |
| | | | 13,753,702 |
| |
| China - 0.6% | | | |
| China Merchants Holdings International Co. Ltd. | 570,000 | | 2,072,647 |
| |
| Denmark - 1.4% | | | |
| Danske Bank A/S (ADR)* | 14,080 | | 151,078 |
| H Lundbeck A/S (ADR) | 3,101 | | 67,137 |
| Novo Nordisk A/S, Series B | 26,949 | | 4,577,159 |
| Novozymes A/S (ADR) | 1,642 | | 62,987 |
| | | | 4,858,361 |
18 www.calvert.com CALVERT INTERNATIONAL EQUITY FUND ANNUAL REPORT
| | | |
| EQUITY SECURITIES - CONT’D | SHARES | | VALUE |
| Finland - 0.8% | | | |
| Kone Oyj, Series B | 27,800 | $ | 2,481,427 |
| Metso Oyj (ADR) | 371 | | 14,540 |
| Nokia Oyj (ADR)* | 7,099 | | 46,214 |
| Sampo Oyj (ADR) | 6,114 | | 131,267 |
| | | | 2,673,448 |
| |
| France - 9.1% | | | |
| Air France-KLM (ADR)* | 2,283 | | 22,830 |
| Air Liquide SA | 43,840 | | 6,108,560 |
| Air Liquide SA (ADR) | 7,531 | | 209,211 |
| AXA SA (ADR) | 16,254 | | 375,630 |
| BNP Paribas SA | 39,497 | | 2,672,859 |
| BNP Paribas SA (ADR) | 7,008 | | 237,221 |
| Cap Gemini SA (ADR) | 181 | | 5,394 |
| Carrefour SA | 66,086 | | 2,269,642 |
| Carrefour SA (ADR) | 24,185 | | 164,458 |
| Cie Generale des Etablissements Michelin | 25,568 | | 2,836,571 |
| Credit Agricole SA (ADR)* | 29,751 | | 162,143 |
| Danone SA (ADR) | 24,149 | | 363,201 |
| Dassault Systemes SA | 18,176 | | 2,427,557 |
| Essilor International SA (ADR) | 1,240 | | 66,811 |
| Kering SA | 8,919 | | 1,999,630 |
| L’Oreal SA (ADR) | 3,604 | | 123,978 |
| Publicis Groupe | 40,000 | | 3,184,395 |
| Sanofi SA | 29,686 | | 3,012,182 |
| Sanofi SA (ADR) | 9,910 | | 501,743 |
| Schneider Electric SA | 37,603 | | 3,181,368 |
| Schneider Electric SA (ADR) | 10,079 | | 170,134 |
| SCOR SE | 56,838 | | 1,882,797 |
| Suez Environnement Co. (ADR) | 1,564 | | 12,606 |
| Valeo SA (ADR) | 4,907 | | 209,382 |
| Veolia Environnement SA (ADR) | 19,554 | | 334,764 |
| | | | 32,535,067 |
| |
| Germany - 5.7% | | | |
| adidas AG | 28,804 | | 3,125,797 |
| Aixtron SE (ADR)* | 21,051 | | 357,025 |
| Allianz SE (ADR) | 62,582 | | 990,047 |
| Brenntag AG | 11,594 | | 1,930,887 |
| Celesio AG (ADR) | 838 | | 3,729 |
| Commerzbank AG (ADR) | 89 | | 1,026 |
| Continental AG | 14,907 | | 2,528,036 |
| Continental AG (ADR) | 49 | | 8,344 |
| Deutsche Bank AG | 68,494 | | 3,146,345 |
| Deutsche Post AG | 84,202 | | 2,795,515 |
| Deutsche Post AG (ADR) | 6,696 | | 221,504 |
| K+S AG (ADR) | 1,500 | | 19,455 |
| Kabel Deutschland Holding AG | 11,023 | | 1,296,467 |
| Merck KGaA (ADR) | 303 | | 15,768 |
| SAP AG | 31,668 | | 2,343,212 |
| SAP AG (ADR) | 15,976 | | 1,180,946 |
| Volkswagen AG (ADR), Preferred | 8,356 | | 393,735 |
| | | | 20,357,838 |
www.calvert.com CALVERT INTERNATIONAL EQUITY FUND ANNUAL REPORT 19
| | | |
| EQUITY SECURITIES - CONT’D | SHARES | | VALUE |
| Greece - 0.0% | | | |
| National Bank of Greece SA (ADR)* | 4,508 | $ | 18,257 |
| |
| Hong Kong - 3.1% | | | |
| AIA Group Ltd | 1,155,804 | | 5,432,292 |
| Bank of East Asia Ltd. (ADR) | 3,342 | | 13,903 |
| Esprit Holdings Ltd. (ADR) | 55,409 | | 178,417 |
| Hang Lung Properties Ltd. (ADR) | 1,399 | | 23,965 |
| Hang Seng Bank Ltd. (ADR) | 985 | | 16,016 |
| Hong Kong Exchanges and Clearing Ltd | 219,197 | | 3,516,061 |
| Hong Kong Exchanges and Clearing Ltd. (ADR) | 3,017 | | 48,435 |
| Hong Kong Television Network Ltd. (ADR) | 52,133 | | 321,661 |
| Johnson Electric Holdings Ltd. (ADR) (b) | 953 | | 6,824 |
| Li & Fung Ltd. (ADR) | 19,693 | | 56,519 |
| PCCW Ltd. (ADR) | 2,187 | | 9,710 |
| SJM Holdings Ltd | 550,000 | | 1,546,040 |
| | | | 11,169,843 |
| |
| Ireland - 0.6% | | | |
| Kerry Group plc | 35,272 | | 2,146,100 |
| |
| Israel - 0.6% | | | |
| Check Point Software Technologies Ltd.* | 36,300 | | 2,053,128 |
| |
| Italy - 0.8% | | | |
| Intesa Sanpaolo SpA | 431,900 | | 891,446 |
| Intesa Sanpaolo SpA (ADR) | 9,743 | | 121,788 |
| Mediobanca SpA | 250,435 | | 1,747,293 |
| | | | 2,760,527 |
| |
| Japan - 16.0% | | | |
| Advantest Corp. (ADR) | 4,077 | | 47,497 |
| Aeon Co. Ltd. (ADR) | 2,943 | | 40,378 |
| Asahi Glass Co. Ltd. (ADR) | 21,912 | | 135,854 |
| Astellas Pharma, Inc. | 35,700 | | 1,815,593 |
| Canon, Inc. (ADR) | 27,118 | | 867,776 |
| Dai Nippon Printing Co. Ltd. (ADR) | 19,821 | | 210,103 |
| Daiwa House Industry Co. Ltd. (ADR) | 410 | | 77,297 |
| Denso Corp. (ADR) | 5,492 | | 128,677 |
| Eisai Co. Ltd. (ADR) | 222 | | 9,055 |
| FANUC Corp. | 26,043 | | 4,293,923 |
| Fujitsu Ltd. (ADR) | 10,001 | | 185,818 |
| Honda Motor Co. Ltd. (ADR) | 32,741 | | 1,248,742 |
| Japan Exchange Group, Inc. | 43,500 | | 961,455 |
| Konami Corp. (ADR) | 2,154 | | 49,930 |
| Kubota Corp. | 243,824 | | 3,514,200 |
| Kubota Corp. (ADR) | 6,210 | | 452,088 |
| Lawson, Inc | 20,300 | | 1,587,825 |
| Mitsubishi Estate Co. Ltd | 64,000 | | 1,885,206 |
| Mitsui Fudosan Co. Ltd. | 45,256 | | 1,516,742 |
| Mizuho Financial Group, Inc. (ADR) | 170,806 | | 737,882 |
| MS&AD Insurance Group Holdings (ADR) | 31,352 | $ | 408,203 |
| Nabtesco Corp. | 96,200 | | 2,340,542 |
20 www.calvert.com CALVERT INTERNATIONAL EQUITY FUND ANNUAL REPORT
| | | |
| EQUITY SECURITIES - CONT’D | SHARES | | VALUE |
| Japan - Cont’d | | | |
| Nippon Yusen KK (ADR) | 80,192 | $ | 506,012 |
| Nissan Motor Co. Ltd. | 215,100 | | 2,152,859 |
| Nissan Motor Co. Ltd. (ADR) | 46,315 | | 936,026 |
| Nitto Denko Corp. | 28,400 | | 1,845,863 |
| Nitto Denko Corp. (ADR) | 14,235 | | 461,499 |
| Nomura Holdings, Inc. (ADR) | 130,979 | | 1,022,946 |
| NSK Ltd. (ADR) | 1,431 | | 30,380 |
| ORIX Corp | 146,800 | | 2,381,590 |
| ORIX Corp. (ADR) | 6,868 | | 561,940 |
| Panasonic Corp. (ADR) | 69,539 | | 668,040 |
| Seiko Epson Corp. (ADR) | 8,660 | | 70,666 |
| Sekisui House Ltd. | 106,000 | | 1,421,024 |
| Sharp Corp. (ADR) | 24,094 | | 87,943 |
| Shin-Etsu Chemical Co. Ltd. | 27,800 | | 1,696,588 |
| Softbank Corp | 58,339 | | 4,029,109 |
| Sony Corp. (ADR) | 30,778 | | 662,343 |
| Sumitomo Mitsui Trust Holdings, Inc | 746,736 | | 3,683,741 |
| Sumitomo Mitsui Trust Holdings, Inc. (ADR) | 36,310 | | 180,098 |
| Tokyo Gas Co. Ltd | 313,118 | | 1,713,446 |
| Toyota Motor Corp. | 129,836 | | 8,280,239 |
| Toyota Motor Corp. (ADR) | 15,962 | | 2,043,615 |
| | | | 56,950,753 |
| |
| Mexico - 0.1% | | | |
| FINAE, Series D, Preferred (b)(i)* | 1,962,553 | | 383,345 |
| |
| Netherlands - 3.6% | | | |
| ASML Holding NV: | | | |
| Common | 45,505 | | 4,495,976 |
| New York Registered Shares | 1,608 | | 158,806 |
| BE Semiconductor Industries NV | 3,748 | | 45,126 |
| ING Groep NV (CVA)* | 221,520 | | 2,503,764 |
| Koninklijke DSM NV | 18,158 | | 1,370,845 |
| Koninklijke Philips NV | 42,387 | | 1,366,981 |
| PostNL NV (ADR)* | 13,467 | | 57,639 |
| TNT Express NV (ADR) | 11,797 | | 107,235 |
| Unilever NV (CVA) | 65,504 | | 2,549,313 |
| | | | 12,655,685 |
| |
| Norway - 1.7% | | | |
| DnB ASA | 150,301 | | 2,282,857 |
| Orkla ASA | 305,000 | | 2,222,389 |
| Petroleum Geo-Services ASA | 99,503 | | 1,229,904 |
| Yara International ASA (ADR) | 7,616 | | 313,398 |
| | | | 6,048,548 |
| |
| Philippines - 0.5% | | | |
| Philippine Long Distance Telephone Co. (ADR) | 25,907 | | 1,757,531 |
| Portugal - 0.0% | | | |
| Portugal Telecom SGPS SA (ADR) | 25,997 | $ | 116,207 |
www.calvert.com CALVERT INTERNATIONAL EQUITY FUND ANNUAL REPORT 21
| | | |
| EQUITY SECURITIES - CONT’D | SHARES | | VALUE |
| Russia - 1.4% | | | |
| Sberbank of Russia (ADR) | 124,300 | $ | 1,497,815 |
| Yandex NV* | 93,072 | | 3,389,682 |
| | | | 4,887,497 |
| |
| Singapore - 0.1% | | | |
| City Developments Ltd. (ADR) | 423 | | 3,418 |
| Singapore Telecommunications Ltd. (ADR) | 10,037 | | 300,708 |
| | | | 304,126 |
| |
| South Africa - 1.2% | | | |
| African Bank Investments Ltd. (ADR) | 147 | | 1,249 |
| Aspen Pharmacare Holdings Ltd.* | 79,306 | | 2,074,069 |
| Clicks Group Ltd. | 323,500 | | 1,762,921 |
| MTN Group Ltd. (ADR) | 19,570 | | 388,660 |
| Nedbank Group Ltd. (ADR) | 3,510 | | 71,639 |
| Tiger Brands Ltd. (ADR) | 1,776 | | 52,765 |
| | | | 4,351,303 |
| |
| Spain - 2.7% | | | |
| Amadeus IT Holding SA | 89,478 | | 3,172,923 |
| Banco Bilbao Vizcaya Argentaria SA: | | | |
| Common | 81,100 | | 906,657 |
| Rights | 81,100 | | 11,086 |
| Banco Bilbao Vizcaya Argentaria SA (ADR) | 39,108 | | 437,227 |
| Banco Santander SA (ADR) | 71,727 | | 586,010 |
| Inditex SA | 15,791 | | 2,434,307 |
| Telefonica SA* | 124,456 | | 1,938,800 |
| | | | 9,487,010 |
| |
| Sweden - 3.6% | | | |
| Assa Abloy AB, Series B | 120,266 | | 5,534,086 |
| Atlas Copco AB (ADR) | 2,082 | | 61,044 |
| Elekta AB, Series B | 108,300 | | 1,746,747 |
| Hennes & Mauritz AB, B Shares | 81,088 | | 3,530,185 |
| Modern Times Group AB, Series B | 38,630 | | 2,019,806 |
| SKF AB (ADR) | 576 | | 16,094 |
| Svenska Cellulosa AB SCA (ADR) | 3,031 | | 76,563 |
| | | | 12,984,525 |
| |
| Switzerland - 9.3% | | | |
| Adecco SA (ADR) | 242 | | 8,630 |
| Cie Financiere Richemont SA | 24,334 | | 2,438,379 |
| Clariant AG* | 112,036 | | 1,889,674 |
| Credit Suisse Group AG* | 81,767 | | 2,497,821 |
| Credit Suisse Group AG (ADR)* | 30,872 | | 943,139 |
| Julius Baer Group Ltd.* | 88,604 | | 4,135,474 |
| Nobel Biocare Holding AG (ADR)* | 445 | | 3,271 |
| Novartis AG | 82,859 | | 6,369,187 |
| Roche Holding AG | 30,899 | | 8,335,194 |
| Roche Holding AG (ADR) | 34,892 | $ | 2,356,257 |
| STMicroelectronics NV | 15,076 | | 138,699 |
| Swatch Group AG, Bearer Shares | 5,730 | | 3,688,392 |
22 www.calvert.com CALVERT INTERNATIONAL EQUITY FUND ANNUAL REPORT
| | | |
| EQUITY SECURITIES - CONT’D | SHARES | | VALUE |
| Switzerland - Cont’d | | | |
| Zurich Insurance Group AG (ADR)* | 16,751 | $ | 430,333 |
| | | | 33,234,450 |
| |
| Taiwan - 0.5% | | | |
| Taiwan Semiconductor Manufacturing Co. Ltd. (ADR) | 96,000 | | 1,628,160 |
| |
| Thailand - 0.3% | | | |
| Kasikornbank PCL | 189,400 | | 1,068,705 |
| |
| United Kingdom - 20.3% | | | |
| Aon plc | 40,300 | | 2,999,932 |
| ARM Holdings plc | 67,378 | | 1,074,781 |
| Aviva plc (ADR) | 15,890 | | 204,028 |
| Barclays plc, Rights (b)* | 4,515 | | 21,219 |
| Barclays plc (ADR) | 18,059 | | 307,725 |
| BG Group plc | 169,195 | | 3,231,310 |
| BG Group plc (ADR) | 37,883 | | 722,050 |
| British Land Co. plc (ADR) | 481 | | 4,507 |
| British Sky Broadcasting Group plc | 144,055 | | 2,027,555 |
| BT Group plc (ADR) | 24,444 | | 1,351,753 |
| Bunzl plc (ADR) | 533 | | 58,022 |
| Burberry Group plc | 71,290 | | 1,884,542 |
| Capita plc | 142,516 | | 2,296,403 |
| Centrica plc (ADR) | 8,313 | | 200,510 |
| Compass Group plc | 265,850 | | 3,655,785 |
| Experian plc | 133,350 | | 2,539,186 |
| Experian plc (ADR) | 10,020 | | 190,079 |
| HSBC Holdings plc: | | | |
| Hong Kong Exchange | 248,000 | | 2,697,355 |
| London Exchange | 354,798 | | 3,842,306 |
| HSBC Holdings plc (ADR) | 19,907 | | 1,080,154 |
| Inmarsat plc | 188,126 | | 2,157,845 |
| International Consolidated Airlines Group SA (ADR)* | 601 | | 16,491 |
| J Sainsbury plc (ADR) | 6,790 | | 173,281 |
| Johnson Matthey plc | 51,142 | | 2,323,280 |
| Johnson Matthey plc (ADR) | 115 | | 10,442 |
| Kingfisher plc | 793,916 | | 4,956,492 |
| Legal & General Group plc (ADR) | 526 | | 8,469 |
| Liberty Global plc* | 32,600 | | 2,586,810 |
| Man Group plc (ADR) | 35,135 | | 45,675 |
| Old Mutual plc (ADR) | 755 | | 18,350 |
| Pearson plc | 128,430 | | 2,611,722 |
| Persimmon plc* | 133,295 | | 2,341,903 |
| Prudential plc | 143,736 | | 2,676,492 |
| Prudential plc (ADR) | 51,917 | | 1,938,062 |
| Reckitt Benckiser Group plc (s) | 55,943 | | 4,090,810 |
| Reckitt Benckiser Group plc (ADR) | 16,387 | | 240,725 |
| Rexam plc | 283,661 | | 2,210,096 |
| Sage Group plc (ADR) | 6,524 | | 139,550 |
| Smith & Nephew plc (ADR) | 14,216 | $ | 887,362 |
| SSE plc (ADR) | 16,118 | | 386,026 |
| Tate & Lyle plc | 130,361 | | 1,553,265 |
www.calvert.com CALVERT INTERNATIONAL EQUITY FUND ANNUAL REPORT 23
| | | | |
| EQUITY SECURITIES - CONT’D | | SHARES | | VALUE |
| United Kingdom - Cont’d | | | | |
| Tesco plc (ADR) | | 39,950 | $ | 701,522 |
| UBM plc | | 136,824 | | 1,581,574 |
| Unilever plc | | 59,200 | | 2,336,881 |
| Unilever plc (ADR) | | 39,513 | | 1,524,412 |
| United Utilities Group plc (ADR) | | 3,834 | | 86,188 |
| Vodafone Group plc (ADR) | | 20,811 | | 732,131 |
| WPP plc | | 180,403 | | 3,706,573 |
| WPP plc (ADR) | | 591 | | 60,838 |
| | | | | 72,492,469 |
| |
| United States - 3.0% | | | | |
| Accenture plc | | 34,300 | | 2,525,852 |
| ACCO Brands Corp.* | | 13,089 | | 86,911 |
| Bioceptive, Inc. - Series A Preferred (b)(i)* | | 417,601 | | 167,500 |
| Bristol-Myers Squibb Co. | | 21,354 | | 988,263 |
| CVS Caremark Corp | | 24,500 | | 1,390,375 |
| MeadWestvaco Corp. | | 39,685 | | 1,523,110 |
| Nielsen Holdings NV | | 94,700 | | 3,451,815 |
| Powerspan Corp.: | | | | |
| Series A, Convertible Preferred (b)(i)* | | 45,455 | | — |
| Series B, Convertible Preferred (b)(i)* | | 20,000 | | — |
| Series C, Convertible Preferred (b)(i)* | | 239,764 | | — |
| Series D, Convertible Preferred (b)(i)* | | 45,928 | | — |
| Sealed Air Corp. | | 23,350 | | 634,887 |
| | | | | 10,768,713 |
| |
| |
| Total Equity Securities (Cost $275,514,005) | | | | 335,488,797 |
| |
| |
| VENTURE CAPITAL LIMITED | | ADJUSTED | | |
| PARTNERSHIP INTEREST - 0.6% | | BASIS | | |
| Balkan Financial Sector Equity Fund CV (b)(i)* | $ | 593,200 | | 575,752 |
| Blackstone Cleantech Venture Partners (b)(i)* | | 71,322 | | 39,774 |
| China Environment Fund 2004 (b)(i)* | | - | | 263,732 |
| Emerald Sustainability Fund I (b)(i)* | | 441,425 | | 284,099 |
| gNet Defta Development Holdings LLC (a)(b)(i)* | | 400,000 | | 324,686 |
| SEAF Central and Eastern European Growth Fund LLC (a)(b)(i)* | | 330,924 | | 381,498 |
| SEAF India International Growth Fund (b)(i)* | | 289,849 | | 151,927 |
| ShoreCap International LLC (b)(i)* | | - | | 126,188 |
| Terra Capital (b)(i)* | | 469,590 | | 1 |
| |
| Total Venture Capital Limited Partnership Interest (Cost $2,596,310) | | | | 2,147,657 |
| |
| |
| | | PRINCIPAL | | |
| VENTURE CAPITAL DEBT OBLIGATIONS - 0.3% | | AMOUNT | | |
| AFIG LLC, 6.00%, 10/31/17 (b)(i) | | 481,820 | | 481,820 |
| FINAE: | | | | |
| Note I, 6.50%, 12/17/15 (b)(i) | | 250,000 | | 250,000 |
| Note II, 6.50%, 2/29/16 (b)(i) | | 500,000 | | 500,000 |
24 www.calvert.com CALVERT INTERNATIONAL EQUITY FUND ANNUAL REPORT
| | | | | |
| | | PRINCIPAL | | | |
| VENTURE CAPITAL DEBT OBLIGATIONS - CONT’D | | AMOUNT | | VALUE | |
| Mayer Laboratories, Inc., 6.00%, 12/31/01 (b)(i)(w) | $ | 2,888 | $ | 722 | |
| Windhorse International-Spring Health Water Ltd., 8.00%, | | | | | |
| 3/14/13 (b)(i)(x) | | 70,000 | | 52,500 | |
| |
| |
| Total Venture Capital Debt Obligations (Cost $1,304,708) | | | | 1,285,042 | |
| |
| HIGH SOCIAL IMPACT INVESTMENTS - 1.2% | | | | | |
| Calvert Social Investment Foundation Notes, 0.65%, 7/1/14 (b)(i)(r) | | 4,431,583 | | 4,333,645 | |
| |
| Total High Social Impact Investments (Cost $4,431,583) | | | | 4,333,645 | |
| |
| |
| TIME DEPOSIT - 3.6% | | | | | |
| State Street Bank Time Deposit, 0.083%, 10/1/13 | | 12,743,035 | | 12,743,035 | |
| |
| Total Time Deposit (Cost $12,743,035) | | | | 12,743,035 | |
| |
| |
| TOTAL INVESTMENTS (Cost $296,589,641) - 99.9% | | | | 355,998,176 | |
| Other assets and liabilities, net - 0.1% | | | | 236,672 | |
| NET ASSETS - 100% | | | $ | 356,234,848 | |
| |
| |
| NET ASSETS CONSIST OF: | | | | | |
| Paid-in capital applicable to the following shares of common stock with | | | | | |
| 250,000,000 shares of $0.01 par value shares authorized: | | | | | |
| Class A: 14,748,684 shares outstanding | | | $ | 327,742,343 | |
| Class B: 217,893 shares outstanding | | | | 9,552,137 | |
| Class C: 1,244,318 shares outstanding | | | | 32,285,737 | |
| Class I: 4,664,235 shares outstanding | | | | 117,707,742 | |
| Class Y: 596,366 shares outstanding | | | | 8,780,369 | |
| Undistributed net investment income | | | | 1,765,051 | |
| Accumulated net realized gain (loss) on investments and | | | | | |
| foreign currency transactions | | | | (200,993,064 | ) |
| Net unrealized appreciation (depreciation) on investments, foreign currencies, | | | |
| and assets and liabilities denominated in foreign currencies | | | | 59,394,533 | |
| |
| NET ASSETS | | | $ | 356,234,848 | |
| |
| NET ASSET VALUE PER SHARE | | | | | |
| Class A (based on net assets of $242,464,356) | | | $ | 16.44 | |
| Class B (based on net assets of $3,158,104) | | | $ | 14.49 | |
| Class C (based on net assets of $17,746,186) | | | $ | 14.26 | |
| Class I (based on net assets of $82,499,330) | | | $ | 17.69 | |
| Class Y (based on net assets of $10,366,872) | | | $ | 17.38 | |
See notes to financial statements.
www.calvert.com CALVERT INTERNATIONAL EQUITY FUND ANNUAL REPORT 25
| | | |
| RESTRICTED SECURITIES | ACQUISITION DATES | | COST |
| AFIG LLC, 6.00%, 10/31/17 | 10/11/12 | $ | 481,820 |
| Balkan Financial Sector Equity Fund CV LP | 1/12/06 - 1/17/13 | | 593,200 |
| Bioceptive, Inc. - Series A Preferred | 10/26/12 | | 167,500 |
| Blackstone Cleantech Venture Partners LP | 7/29/10 - 7/25/13 | | 71,322 |
| Calvert Social Investment Foundation Notes, 0.65%, | | | |
| 7/1/14 | 7/1/11 | | 4,431,583 |
| China Environment Fund 2004 LP | 9/15/05 - 4/1/09 | | — |
| Emerald Sustainability Fund I LP | 7/19/01 - 5/17/11 | | 441,425 |
| FINAE: | | | |
| Series D, Preferred | 2/28/11 | | 252,686 |
| Note I, 6.50%, 12/17/15 | 12/10/10 | | 250,000 |
| Note II, 6.50%, 2/29/16 | 2/24/11 | | 500,000 |
| gNet Defta Development Holdings LLC, LP | 8/30/05 | | 400,000 |
| Mayer Laboratories, Inc., 6.00%, 12/31/01 | 12/22/06 | | 2,888 |
| Powerspan Corp.: | | | |
| Series A, Convertible Preferred | 8/20/97 | | 250,000 |
| Series B, Convertible Preferred | 10/5/99 | | 200,000 |
| Series C, Convertible Preferred | 12/21/04 - 6/12/08 | | 273,331 |
| Series D, Convertible Preferred | 6/20/08 | | 157,996 |
| SEAF Central and Eastern European Growth | | | |
| Fund LLC, LP | 8/10/00 - 8/26/11 | | 330,924 |
| SEAF India International Growth Fund LP | 3/22/05 - 5/24/10 | | 289,849 |
| ShoreCap International LLC, LP | 8/12/04 - 12/15/08 | | — |
| Terra Capital LP | 11/23/98 - 3/14/06 | | 469,590 |
| Windhorse International-Spring Health Water Ltd., | | | |
| 8.00%, 3/14/13 | 9/13/11 - 7/10/12 | | 70,000 |
(a) Affiliated company.
(b) This security was valued under the direction of the Board of Directors. See Note A. (i) Restricted securities represent 2.3% of net assets of the Fund.
(r) The coupon rate shown on floating or adjustable rate securities represents the rate at period end.
(s) 42,500 shares of Reckitt Benckiser Group plc have been soft segregated in order to cover outstanding commitments to certain limited partnerships investments within the Fund. There are no restrictions on the trading of this security.
(w) Mayer Laboratories, Inc. is in default for principal and interest. Past due accrued interest as of September 30, 2013 totaled $191.
(x) Windhorse International-Spring Health Water Ltd. is currently in default for principal.
* Non-income producing security.
Abbreviations:
ADR: American Depositary Receipts
CVA: Certificaten Van Aandelen
LLC: Limited Liability Corporation
LP: Limited Partnership
PCL: Public Company Limited
plc: Public Limited Company
See notes to financial statements.
26 www.calvert.com CALVERT INTERNATIONAL EQUITY FUND ANNUAL REPORT
| | | |
| STATEMENT OF OPERATIONS |
| YEAR ENDED SEPTEMBER 30, 2013 |
| |
| NET INVESTMENT INCOME | | | |
| Investment Income: | | | |
| Dividend income (net of foreign taxes withheld of $566,167) | $ | 7,108,606 | |
| Interest income | | 117,783 | |
| Total investment income | | 7,226,389 | |
| |
| Expenses: | | | |
| Investment advisory fee | | 2,403,601 | |
| Transfer agency fees and expenses | | 623,692 | |
| Administrative fees | | 958,670 | |
| Distribution Plan expenses: | | | |
| Class A | | 520,851 | |
| Class B | | 33,430 | |
| Class C | | 164,485 | |
| Directors’ fees and expenses | | 41,832 | |
| Custodian fees | | 186,796 | |
| Registration fees | | 65,708 | |
| Reports to shareholders | | 125,301 | |
| Professional fees | | 42,432 | |
| Miscellaneous | | 82,655 | |
| Total expenses | | 5,249,453 | |
| Reimbursement from Advisor: | | | |
| Class B | | (7,216 | ) |
| Class I | | (5,768 | ) |
| Class Y | | (1,356 | ) |
| Fees paid indirectly | | (74 | ) |
| Net expenses | | 5,235,039 | |
| |
| |
| NET INVESTMENT INCOME | | 1,991,350 | |
| |
| REALIZED AND UNREALIZED GAIN (LOSS) | | | |
| Net realized gain (loss) on: | | | |
| Investments | | 22,118,603 | |
| Foreign currency transactions | | (209,121 | ) |
| | | 21,909,482 | |
| |
| Change in unrealized appreciation (depreciation) on: | | | |
| Investments and foreign currencies | | 43,158,105 | |
| Assets and liabilities denominated in foreign currencies | | (17,737 | ) |
| | | 43,140,368 | |
| |
| |
| NET REALIZED AND UNREALIZED GAIN (LOSS) | | 65,049,850 | |
| |
| INCREASE (DECREASE) IN NET ASSETS | | | |
| RESULTING FROM OPERATIONS | $ | 67,041,200 | |
See notes to financial statements.
www.calvert.com CALVERT INTERNATIONAL EQUITY FUND ANNUAL REPORT 27
| | | | | | |
| STATEMENTS OF CHANGES IN NET ASSETS |
| |
| | | YEAR
ENDED | | | YEAR
ENDED | |
| | | SEPTEMBER
30, | | | SEPTEMBER
30, | |
| INCREASE (DECREASE) IN NET ASSETS | | 2013 | | | 2012 | |
| Operations: | | | | | | |
| Net investment income | $ | 1,991,350 | | $ | 3,457,114 | |
| Net realized gain (loss) | | 21,909,482 | | | (15,575,664 | ) |
| Change in unrealized appreciation (depreciation) | | 43,140,368 | | | 56,188,178 | |
| |
| INCREASE (DECREASE) IN NET ASSETS | | | | | | |
| RESULTING FROM OPERATIONS | | 67,041,200 | | | 44,069,628 | |
| |
| Distributions to shareholders from: | | | | | | |
| Net investment income: | | | | | | |
| Class A shares | | (1,472,525 | ) | | (2,117,749 | ) |
| Class C shares | | — | | | (14,293 | ) |
| Class I shares | | (1,480,867 | ) | | (1,414,874 | ) |
| Class Y shares | | (86,752 | ) | | (79,164 | ) |
| Total distributions | | (3,040,144 | ) | | (3,626,080 | ) |
| |
| Capital share transactions: | | | | | | |
| Shares sold: | | | | | | |
| Class A shares | | 50,683,210 | | | 25,698,704 | |
| Class B shares | | 12,163 | | | 17,463 | |
| Class C shares | | 1,438,125 | | | 994,622 | |
| Class I shares | | 11,987,612 | | | 20,757,214 | |
| Class Y shares | | 4,137,041 | | | 1,229,161 | |
| Reinvestment of distributions: | | | | | | |
| Class A shares | | 1,204,726 | | | 1,891,096 | |
| Class C shares | | — | | | 11,391 | |
| Class I shares | | 1,307,560 | | | 1,274,329 | |
| Class Y shares | | 42,132 | | | 35,166 | |
| Redemption fees: | | | | | | |
| Class A shares | | 804 | | | 6,002 | |
| Class C shares | | 52 | | | 15 | |
| Class I shares | | 1 | | | — | |
| Class Y shares | | — | | | 14 | |
| Shares redeemed: | | | | | | |
| Class A shares | | (34,384,564 | ) | | (41,319,982 | ) |
| Class B shares | | (1,104,033 | ) | | (1,476,972 | ) |
| Class C shares | | (2,851,196 | ) | | (3,469,843 | ) |
| Class I shares | | (48,952,897 | ) | | (23,295,875 | ) |
| Class Y shares | | (3,141,545 | ) | | (2,119,332 | ) |
| Total capital share transactions | | (19,620,809 | ) | | (19,766,827 | ) |
| |
| TOTAL INCREASE (DECREASE) IN NET ASSETS | | 44,380,247 | | | 20,676,721 | |
| |
| NET ASSETS | | | | | | |
| Beginning of year | | 311,854,601 | | | 291,177,880 | |
| End of year (including undistributed net investment income | | | | | | |
| of $1,765,051 and $2,995,904, respectively) | $ | 356,234,848 | | $ | 311,854,601 | |
See notes to financial statements.
28 www.calvert.com CALVERT INTERNATIONAL EQUITY FUND ANNUAL REPORT
| | | | |
| STATEMENTS OF CHANGES IN NET ASSETS |
| |
| | YEAR
ENDED | | YEAR
ENDED | |
| | SEPTEMBER
30, | | SEPTEMBER
30, | |
| CAPITAL SHARE ACTIVITY | 2013 | | 2012 | |
| Shares sold: | | | | |
| Class A shares | 3,392,867 | | 2,002,914 | |
| Class B shares | 864 | | 1,516 | |
| Class C shares | 108,793 | | 88,845 | |
| Class I shares | 739,068 | | 1,510,443 | |
| Class Y shares | 264,708 | | 90,952 | |
| Reinvestment of distributions: | | | | |
| Class A shares | 85,381 | | 156,677 | |
| Class C shares | — | | 1,079 | |
| Class I shares | 86,594 | | 98,632 | |
| Class Y shares | 2,831 | | 2,767 | |
| Shares redeemed: | | | | |
| Class A shares | (2,343,110 | ) | (3,233,923 | ) |
| Class B shares | (85,072 | ) | (129,393 | ) |
| Class C shares | (223,872 | ) | (308,966 | ) |
| Class I shares | (3,131,479 | ) | (1,656,401 | ) |
| Class Y shares | (200,003 | ) | (158,957 | ) |
| Total capital share activity | (1,302,430 | ) | (1,533,815 | ) |
See notes to financial statements.
www.calvert.com CALVERT INTERNATIONAL EQUITY FUND ANNUAL REPORT 29
NOTES TO FINANCIAL STATEMENTS
NOTE A — SIGNIFICANT ACCOUNTING POLICIES
General: Calvert International Equity Fund (the “Fund”), a series of Calvert World Values Fund, Inc., is registered under the Investment Company Act of 1940 as a diversified, open-end management investment company. Calvert World Values Fund, Inc. is comprised of four separate series. The operations of each series are accounted for separately. The Fund offers five classes of shares of capital stock - Classes A, B, C, I, and Y. Class A shares are sold with a maximum front-end sales charge of 4.75%. Class B shares are sold without a front-end sales charge and, with certain exceptions, will be charged a deferred sales charge at the time of redemption, depending on how long investors have owned the shares. Class B shares are no longer offered for purchase, except through reinvestment of dividends and/or distributions and through certain exchanges. Class C shares are sold without a front-end sales charge and, with certain exceptions, will be charged a deferred sales charge on shares sold within one year of purchase. Class B and Class C shares have higher levels of expenses than Class A shares. Class I shares require a minimum account balance of $1,000,000. The $1 million minimum initial investment is waived for retirement plans that trade through omnibus accounts and may be waived for certain other institutional accounts where it is believed to be in the best interest of the Fund and its shareholders. Class I shares have no front-end or deferred sales charge and have lower levels of expenses than Class A shares. Class Y shares are generally only available to wrap or similar fee-based programs offered by financial intermediaries that have entered into an agreement with the Fund’s Distributor to offer Class Y shares. Class Y shares have no front-end or deferred sales charge and have lower levels of expenses than Class A shares. Each class has different: (a) dividend rates, due to differences in Distribution Plan expenses and other class-specific expenses, (b) exchange privileges and (c) class-specific voting rights.
Security Valuation: Net asset value per share is determined every business day as of the close of the regular session of the New York Stock Exchange (generally 4:00 p.m. Eastern time). The Fund uses independent pricing services approved by the Board of Directors (“the Board”) to value its investments wherever possible. Investments for which market quotations are not available or deemed not reliable are fair valued in good faith under the direction of the Board.
The Board has adopted Valuation Procedures (the “Procedures”) to determine the fair value of securities and other financial instruments for which market prices are not readily available or which may not be reliably priced. The Board has delegated the day-to-day responsibility for determining the fair value of assets of the Fund, except Special Equities investments, to Calvert Investment Management, Inc. (the “Advisor” or “Calvert”) and has provided these Procedures to govern Calvert in its valuation duties. Special Equities investments, as described in the Fund’s prospectus and statement of additional information, are fair valued by the Board’s Special Equities Committee.
Calvert has chartered an internal Valuation Committee to oversee the implementation of these Procedures and to assist it in carrying out the valuation responsibilities that the Board has delegated.
30 www.calvert.com CALVERT INTERNATIONAL EQUITY FUND ANNUAL REPORT
The Valuation Committee meets on a regular basis to review illiquid securities and other investments which may not have readily available market prices. The Valuation Committee’s fair valuation determinations are subject to review, approval and ratification by the Board at its next regularly scheduled meeting covering the calendar quarter in which the fair valuation was determined.
The Valuation Committee utilizes various methods to measure the fair value of the Fund’s investments. Generally Accepted Accounting Principles (GAAP) establishes a disclosure hierarchy that categorizes the inputs to valuation techniques used to value assets and liabilities at measurement date. These inputs are summarized in the three broad levels listed below:
Level 1 – quoted prices in active markets for identical securities
Level 2 – other significant observable inputs (including quoted prices for similar securities, interest rates, prepayment speeds, credit risk, etc.)
Level 3 – significant unobservable inputs (including the Fund’s own assumptions in determining the fair value of investments) The inputs or methodologies used for valuing securities are not necessarily an indication of the risk associated with investing in those securities.
Changes in valuation techniques may result in transfers in or out of an investment’s assigned level within the hierarchy during the period. There were no such transfers during the period. Valuation techniques used to value the Funds’ investments by major category are as follows: Equity securities, including restricted securities and venture capital securities, for which market quotations are readily available, are valued at the last reported sale price or official closing price as reported by an independent pricing service on the primary market or exchange on which they are traded and are categorized as Level 1 in the hierarchy. In the event there were no sales during the day or closing prices are not available, securities are valued at the last quoted bid price or using the last available price and are categorized as Level 2 in the hierarchy. Foreign securities are valued based on quotations from the principal market in which such securities are normally traded. If events occur after the close of the principal market in which foreign securities are traded, and before the close of business of the Fund, that are expected to materially affect the value of those securities, then they are valued at their fair value taking these events into account. The Fund has retained a third party fair value pricing service to quantitatively analyze the price movement of its holdings on foreign exchanges and to automatically fair value if the variation from the prior day’s closing price exceeds specified parameters. Such securities would be categorized as Level 2 in the hierarchy in these circumstances. Utilizing this technique may result in transfers between Level 1 and Level 2. For restricted securities and private placements where observable inputs are limited, assumptions about market activity and risk are used and such securities are categorized as Level 3 in the hierarchy.
Venture capital securities for which market quotations are not readily available are fair valued by the Fund’s Board of Directors and are categorized as Level 3 in the hierarchy. Venture capital direct equity securities are generally valued using the
www.calvert.com CALVERT INTERNATIONAL EQUITY FUND ANNUAL REPORT 31
most appropriate and applicable method to measure fair value in light of each company’s situation. Methods may include market, income or cost approaches with discounts as appropriate based on assumptions of liquidation or exit risk. Examples of the market approach are subsequent rounds of financing, comparable transactions, and revenue times an industry multiple. An example of the income approach is the discounted cash flow. Examples of the cost approach are replacement cost, salvage value, or net asset percentage. Venture capital limited partnership (“LP”) securities are valued at the fair value reported by the general partner of the partnership adjusted as necessary to reflect subsequent capital calls and distributions and any other available information. In the absence of a reported LP unit value, fair value may be estimated based on the Fund’s percentage equity in the partnership and/or other balance sheet information and portfolio value for the most recently available period reported by the general partner. In some cases adjustments may be made to account for daily pricing of material public holdings within the partnership. Venture capital debt securities are valued based on assumptions of credit and market risk. For venture capital securities denominated in foreign currency, the fair value is marked to the daily exchange rate.
Debt securities, including restricted securities, are valued based on evaluated prices received from independent pricing services or from dealers who make markets in such securities and are generally categorized as Level 2 in the hierarchy. Short-term securities of sufficient credit quality with remaining maturities of sixty days or less for which quotations are not readily available are valued at amortized cost, which approximates fair value, and are categorized as Level 2 in the hierarchy.
When independent prices are unavailable or unreliable, debt securities may be valued utilizing pricing matrices which consider similar factors that would be used by independent pricing services. These are generally categorized as Level 2 in the hierarchy but may be Level 3 depending on the circumstances.
If a market value cannot be determined for a security using the methodologies described above, or if, in the good faith opinion of the Advisor, the market value does not constitute a readily available market quotation, or if a significant event has occurred that would materially affect the value of the security, the security will be fair valued as determined in good faith by the Valuation Committee or with respect to Special Equities investments, by the Special Equities Committee using the venture capital methodologies described above.
The Valuation Committee considers a number of factors, including significant unobservable valuation inputs when arriving at fair value. It considers all significant facts that are reasonably available and relevant to the determination of fair value.
The Valuation Committee primarily employs a market-based approach which may use related or comparable assets or liabilities, recent transactions, market multiples, book values, and other relevant information for the investment to determine the fair value of the investment. When more appropriate, the fund may employ an income-based or cost approach. An income-based valuation approach discounts anticipated future cash flows of the investment to calculate a present amount (discounted). The measurement is based on the value indicated by current market expectations about those future amounts. Discounts may also be applied due to the nature or duration of any restrictions on the
32 www.calvert.com CALVERT INTERNATIONAL EQUITY FUND ANNUAL REPORT
disposition of the investments. A cost based approach is based on the amount that currently would be required to replace the service capacity of an asset (current replacement cost). From the seller’s perspective, the price that would be received for the asset is determined based on the cost to a buyer to acquire or construct a substitute asset of comparable utility, adjusted for obsolescence.
The values assigned to fair value investments are based on available information and do not necessarily represent amounts that might ultimately be realized. Further, due to the inherent uncertainty of valuations of such investments, the fair values may differ significantly from the values that would have been used had an active market existed, and the differences could be material. The Valuation Committee employs various methods for calibrating these valuation approaches including a regular review of key inputs and assumptions, transactional back-testing or disposition analysis and reviews of any related market activity.
At September 30, 2013, securities valued at $8,345,232, or 2.3% of net assets, were fair valued in good faith under the direction of the Board.
The following is a summary of the inputs used to value the Fund’s net assets as of September 30, 2013:
| | | VALUATION INPUTS | | |
| INVESTMENTS IN SECURITIES | LEVEL 1 | LEVEL 2 | LEVEL 3 | TOTAL | |
| Equity securities* | $334,937,952 | — | — | $334,937,952 | ** |
| Other debt obligations | — | $17,076,680 | — | 17,076,680 | |
| Venture capital | — | — | $3,983,544 | 3,983,544 | |
| TOTAL | $334,937,952 | $17,076,680 | $3,983,544 | $355,998,176 | |
* For further breakdown of equity securities by country, please refer to the Statement of Net Assets.
** Exclusive of $550,845 venture capital equity shown in venture capital heading.
www.calvert.com CALVERT INTERNATIONAL EQUITY FUND ANNUAL REPORT 33
The following is a reconciliation of Level 3 assets for which significant unobservable inputs were used to determine fair value:
| | | | | | |
| | | VENTURE CAPITAL | | | TOTAL | |
| Balance as of 9/30/12 | $ | 3,605,572 | | $ | 3,605,572 | |
| Accrued discounts/premiums | | — | | | — | |
| Realized gain (loss) | | — | | | — | |
| Change in unrealized appreciation (depreciation) | | (201,990 | ) | | (201,990 | ) |
| Purchases | | 690,771 | | | 690,771 | |
| Sales | | (110,809 | ) | | (110,809 | ) |
| Transfers in and/or out of Level 31 | | — | | | — | |
| Balance as of 9/30/13 | $ | 3,983,544 | | $ | 3,983,544 | |
1 The Fund’s policy is to recognize transfers into and transfers out of Level 3 as of the end of the reporting period.
For the year ended September 30, 2013, total change in unrealized gain (loss) on Level 3 securities included in the change in net assets was ($201,990). Total unrealized gain (loss) for all securities (including Level 1 and Level 2) can be found on the accompanying Statement of Operations.
Restricted Securities: The Fund may invest in securities that are subject to legal or contractual restrictions on resale. Generally, these securities may only be sold publicly upon registration under the Securities Act of 1933 or in transactions exempt from such registration. Information regarding restricted securities is included at the end of the Fund’s Statement of Net Assets.
Security Transactions and Net Investment Income: Security transactions are accounted for on trade date. Realized gains and losses are recorded on an identified cost basis and may include proceeds from litigation. Dividend income is recorded on the ex-dividend date or, in the case of dividends on certain foreign securities, as soon as the Fund is informed of the ex-dividend date. Withholding taxes on foreign dividends have been provided for in accordance with the Fund’s understanding of the applicable country’s tax rules and rates. Distributions received on securities that represent a return of capital or capital gain are recorded as a reduction of cost of investments and/or as a realized gain. Interest income, which includes amortization of premium and accretion of discount on debt securities, is accrued as earned. Investment income and realized and unrealized gains and losses are allocated to separate classes of shares based upon the relative net assets of each class. Expenses arising in connection with a specific class are charged directly to that class. Expenses common to the classes are allocated to each class in proportion to their relative net assets.
Foreign Currency Transactions: The Fund’s accounting records are maintained in U.S. dollars. For valuation of assets and liabilities on each date of net asset value determination, foreign denominations are converted into U.S. dollars using the current exchange rate. Security transactions, income and expenses are translated at the prevailing rate of exchange on the date of the event. The effect of changes in foreign exchange rates on
34 www.calvert.com CALVERT INTERNATIONAL EQUITY FUND ANNUAL REPORT
securities and foreign currencies is included in the net realized and unrealized gain or loss on securities and foreign currencies.
Distributions to Shareholders: Distributions to shareholders are recorded by the Fund on ex-dividend date. Dividends from net investment income and distributions from net realized capital gains, if any, are paid at least annually. Distributions are determined in accordance with income tax regulations which may differ from generally accepted accounting principles; accordingly, periodic reclassifications are made within the Fund’s capital accounts to reflect income and gains available for distribution under income tax regulations.
Estimates: The preparation of the financial statements in conformity with accounting principles generally accepted in the United States requires management to make estimates and assumptions that affect the reported amounts of assets and liabilities and disclosure of contingent assets and liabilities at the date of the financial statements and the reported amounts of income and expenses during the reported period. Actual results could differ from those estimates.
Redemption Fees: The Fund charges a 2% redemption fee on redemptions, including exchanges, made within 30 days of purchase in the same Fund (within seven days for Class I shares). The redemption fee is accounted for as an addition to paid-in capital and is intended to discourage market-timers by ensuring that short-term trading costs are borne by the investors making the transactions and not the shareholders already in the Fund.
Expense Offset Arrangement: The Fund had an arrangement with the custodian bank whereby the custodian’s fees may have been paid indirectly by credits earned on the Fund’s cash on deposit with the bank. These credits were used to reduce the Fund’s expenses. This arrangement was suspended on January 1, 2013, until further notice, due to low interest rates. Such a deposit arrangement was an alternative to overnight investments.
Federal Income Taxes: No provision for federal income or excise tax is required since the Fund intends to continue to qualify as a regulated investment company under the Internal Revenue Code and to distribute substantially all of its taxable earnings.
Management has analyzed the Fund’s tax positions taken for all open federal income tax years and has concluded that no provision for federal income tax is required in the Fund’s financial statements. A Fund’s federal tax return is subject to examination by the Internal Revenue Service for a period of three years.
NOTE B — RELATED PARTY TRANSACTIONS
Calvert Investment Management, Inc. (the “Advisor”) is wholly-owned by Calvert Investments, Inc., which is indirectly wholly-owned by Ameritas Mutual Holding Company. The Advisor provides investment advisory services and pays the salaries and fees of officers and Directors of the Fund who are employees of the Advisor or its affiliates. For its services, the Advisor receives a monthly fee based on the following annual rates of average daily net assets: .75% on the first $250 million, .725% on the next $250 million, and .675% on the excess of $500 million. Under the terms of the agreement, $227,712 was payable at year end. In addition, $25,886 was payable at year end for operating expenses paid by the Advisor during September 2013.
www.calvert.com CALVERT INTERNATIONAL EQUITY FUND ANNUAL REPORT 35
The Advisor has contractually agreed to limit net annual fund operating expenses through January 31, 2014 for Class I and Class Y. The contractual expense cap is 1.10% and 1.39%, respectively. For the purpose of this expense limit, operating expenses do not include interest expense, brokerage commissions, taxes, and extraordinary expenses. This expense limitation does not limit any acquired fund fees and expenses. To the extent any expense offset credits were earned, the Advisor’s obligation under the contractual limitation may have been reduced and the Advisor may have benefited from the expense offset arrangement. The Advisor voluntarily reimbursed Class B and Class I shares for expenses of $7,216 and $5,768, respectively for the year ended September 30, 2013.
Calvert Investment Administrative Services, Inc., an affiliate of the Advisor, provides administrative services to the Fund for an annual fee, payable monthly, of .35% for Classes A, B, C, and Y, and .15% for Class I, based on their average daily net assets. Under the terms of the agreement, $93,085 was payable at year end.
Calvert Investment Distributors, Inc. (“CID”), an affiliate of the Advisor, is the distributor and principal underwriter for the Fund. Pursuant to Rule 12b-1 under the Investment Company Act of 1940, the Fund has adopted a Distribution Plan that permits the Fund to pay certain expenses associated with the distribution and servicing of its shares. The expenses paid may not exceed .35%, 1.00% and 1.00% annually of average daily net assets of Class A, B, and C, respectively. The amount actually paid by the Fund is an annualized fee, payable monthly, of .25%, 1.00% and 1.00% of the Fund’s average daily net assets of Class A, B, and C, respectively. Class I and Class Y shares do not have Distribution Plan expenses. Under the terms of agreement, $70,060 was payable at year end.
CID received $32,875 as its portion of commissions charged on sales of the Fund’s Class A shares for the year ended September 30, 2013.
Calvert Investment Services, Inc. (“CIS”), an affiliate of the Advisor, is the shareholder servicing agent for the Fund. For its services, CIS received a fee of $114,274 for the year ended September 30, 2013. Under the terms of the agreement, $8,441 was payable at year end. Boston Financial Data Services, Inc. is the transfer and dividend disbursing agent.
The Fund invests in Community Investment Notes issued by the Calvert Social Investment Foundation (the “CSI Foundation”). The CSI Foundation is a 501(c)(3) non-profit organization that receives in-kind support from Calvert and its subsidiaries. The Fund has received an exemptive order from the Securities and Exchange Commission permitting the Fund to make investments in these notes under certain conditions.
Each Director of the Funds who is not an employee of the Advisor or its affiliates receives an annual retainer of $48,000 plus a meeting fee of up to $3,000 for each Board meeting attended. Additional fees of up to $5,000 annually may be paid to the Board chair and Committee chairs ($10,000 for the Special Equities Committee chair) and $2,500 annually may be paid to Committee members, plus a Committee meeting fee of $500 for each Committee meeting attended. Directors’ fees are allocated to each of the Funds served.
NOTE C — INVESTMENTS ACTIVITY AND TAX INFORMATION
During the year, the cost of purchases and proceeds from sales of investments, other than short-term securities, were $125,780,255 and $149,606,862, respectively.
36 www.calvert.com CALVERT INTERNATIONAL EQUITY FUND ANNUAL REPORT
| CAPITAL LOSS CARRYFORWARDS | | |
| EXPIRATION DATE | | |
| 30-Sep-17 | ($83,864,915 | ) |
| 30-Sep-18 | (105,942,268 | ) |
| 30-Sep-19 | (10,386,632 | ) |
Under the Regulated Investment Company Modernization Act of 2010, capital losses incurred in taxable years beginning after December 22, 2010 can be carried forward for an unlimited period. These losses are required to be utilized prior to the losses incurred in pre-enactment taxable years and will retain their character as either long-term or short-term. Losses incurred in pre-enactment taxable years can be utilized until expiration.
The tax character of dividends and distributions paid during the years ended September 30, 2013 and September 30, 2012 was as follows:
| | |
| Distributions paid from: | 2013 | 2012 |
| Ordinary income | $3,040,144 | $3,626,080 |
| Total | $3,040,144 | $3,626,080 |
As of September 30, 2013, the tax basis components of distributable earnings/(accumulated losses) and the federal tax cost were as follows:
| Unrealized appreciation | $68,777,562 | |
| Unrealized (depreciation) | (11,313,599 | ) |
| Net unrealized appreciation/(depreciation) | $57,463,963 | |
| |
| Undistributed ordinary income | $2,910,374 | |
| Capital loss carryforward | ($200,193,815 | ) |
| |
| Federal income tax cost of investments | $298,534,213 | |
The differences between the components of distributable earnings on a tax basis and the amounts reflected in the statement of net assets are primarily due to temporary book-tax differences that will reverse in a subsequent period. These book-tax differences are due to wash sales, passive foreign investment companies, and partnerships.
Reclassifications, as shown in the table below, have been made to the Fund’s components of net assets to reflect income and gains available for distribution (or available capital loss carryovers, as applicable) under income tax law and regulations. These reclassifications are due to permanent book-tax differences and have no impact on net assets. The primary permanent differences causing such reclassification for the Fund are due to foreign currency transactions, partnerships, capital gain taxes, and passive foreign investment companies.
www.calvert.com CALVERT INTERNATIONAL EQUITY FUND ANNUAL REPORT 37
| Undistributed net investment income | ($182,059 | ) |
| Accumulated net realized gain (loss) | 182,038 | |
| Paid-in capital | 21 | |
NOTE D — LINE OF CREDIT
A financing agreement is in place with the Calvert Funds and State Street Corporation (“SSC”). Under the agreement, SSC provides an unsecured line of credit facility, in the aggregate amount of $50 million ($25 million committed and $25 million uncommitted), accessible by the Funds for temporary or emergency purposes only. Borrowings under the committed facility bear interest at the higher of the London Interbank Offered Rate (LIBOR) or the overnight Federal Funds Rate plus 1.25% per annum. A commitment fee of .11% per annum is incurred on the unused portion of the committed facility, which is allocated to all participating funds. The Fund had no borrowings under the agreement during the year ended September 30, 2013.
NOTE E — AFFILIATED COMPANIES
An affiliated company is a company in which the Fund has a direct or indirect ownership of, control of, or voting power of 5 percent or more of the outstanding voting shares. Affiliated companies of the Fund as of September 30, 2013 are as follows:
| AFFILIATES | COST | VALUE |
| gNet Defta Development Holdings LLC, LP | $400,000 | $324,686 |
| SEAF Central & Eastern European Growth Fund LLC, LP | 330,924 | 381,498 |
| TOTALS | $730,924 | $706,184 |
NOTE F — SUBSEQUENT EVENTS
In preparing the financial statements as of September 30, 2013, no subsequent events or transactions occurred that would have required recognition or disclosure in these financial statements.
NOTE G — OTHER
In connection with certain venture capital investments, the Fund is committed to future capital calls, which will increase the Fund’s investment in these securities. The aggregate amount of the future capital commitments totals $334,807 at September 30, 2013.
38 www.calvert.com CALVERT INTERNATIONAL EQUITY FUND ANNUAL REPORT
| | | | | | | | | |
| FINANCIAL HIGHLIGHTS |
| |
| | | | | | YEARS ENDED | | | | |
| | | SEPTEMBER
30, | | | SEPTEMBER
30, | | | SEPTEMBER
30, | |
| CLASS A SHARES | | 2013 | (z) | | 2012 | (z) | | 2011 | (z) |
| Net asset value, beginning | $ | 13.49 | | $ | 11.84 | | $ | 13.88 | |
| Income from investment operations: | | | | | | | | | |
| Net investment income | | .08 | | | .12 | | | .15 | |
| Net realized and unrealized gain (loss) | | 2.98 | | | 1.68 | | | (2.15 | ) |
| Total from investment operations | | 3.06 | | | 1.80 | | | (2.00 | ) |
| Distributions from: | | | | | | | | | |
| Net investment income | | (.11 | ) | | (.15 | ) | | (.04 | ) |
| Total distributions | | (.11 | ) | | (.15 | ) | | (.04 | ) |
| Total increase (decrease) in net asset value | | 2.95 | | | 1.65 | | | (2.04 | ) |
| Net asset value, ending | $ | 16.44 | | $ | 13.49 | | $ | 11.84 | |
| |
| Total return* | | 22.82 | % | | 15.34 | % | | (14.47 | %) |
| Ratios to average net assets: A | | | | | | | | | |
| Net investment income | | .52 | % | | .96 | % | | 1.03 | % |
| Total expenses | | 1.76 | % | | 1.84 | % | | 1.80 | % |
| Expenses before offsets | | 1.76 | % | | 1.80 | % | | 1.80 | % |
| Net expenses | | 1.76 | % | | 1.80 | % | | 1.80 | % |
| Portfolio turnover | | 40 | % | | 43 | % | | 49 | % |
| Net assets, ending (in thousands) | $ | 242,464 | | $ | 183,588 | | $ | 173,936 | |
| |
| | | | | | YEARS ENDED | |
| | | | | | SEPTEMBER
30, | | | SEPTEMBER
30, | |
| CLASS A SHARES | | | | | 2010 | (z) | | 2009 | (z) |
| Net asset value, beginning | | | | $ | 13.83 | | $ | 15.31 | |
| Income from investment operations: | | | | | | | | | |
| Net investment income | | | | | .06 | | | .11 | |
| Net realized and unrealized gain (loss) | | | | | .09 | | | (1.19 | ) |
| Total from investment operations | | | | | .15 | | | (1.08 | ) |
| Distributions from: | | | | | | | | | |
| Net investment income | | | | | (.10 | ) | | (.37 | ) |
| Net realized gain | | | | | — | | | (.03 | ) |
| Total distributions | | | | | (.10 | ) | | (.40 | ) |
| Total increase (decrease) in net asset value | | | | | 0.05 | | | (1.48 | ) |
| Net asset value, ending | | | | $ | 13.88 | | $ | 13.83 | |
| |
| Total return* | | | | | 1.08 | % | | (6.27 | %) |
| Ratios to average net assets: A | | | | | | | | | |
| Net investment income | | | | | .46 | % | | .99 | % |
| Total expenses | | | | | 1.83 | % | | 1.87 | % |
| Expenses before offsets | | | | | 1.80 | % | | 1.86 | % |
| Net expenses | | | | | 1.80 | % | | 1.86 | % |
| Portfolio turnover | | | | | 133 | % | | 135 | % |
| Net assets, ending (in thousands) | | | | $ | 245,309 | | $ | 270,900 | |
See notes to financial highlights.
www.calvert.com CALVERT INTERNATIONAL EQUITY FUND ANNUAL REPORT 39
| | | | | | | | | |
| FINANCIAL HIGHLIGHTS |
| |
| | | | | | YEARS ENDED | | | | |
| | | SEPTEMBER
30, | | | SEPTEMBER
30, | | | SEPTEMBER
30, | |
| CLASS B SHARES | | 2013 | (z) | | 2012 | (z) | | 2011 | (z) |
| Net asset value, beginning | $ | 11.94 | | $ | 10.48 | | $ | 12.40 | |
| Income from investment operations: | | | | | | | | | |
| Net investment income (loss) | | (.10 | ) | | (.03 | ) | | (.03 | ) |
| Net realized and unrealized gain (loss) | | 2.65 | | | 1.49 | | | (1.89 | ) |
| Total from investment operations | | 2.55 | | | 1.46 | | | (1.92 | ) |
| Distributions from: | | | | | | | | | |
| Net investment income | | — | | | — | | | — | |
| Net realized gain | | — | | | — | | | — | |
| Total distributions | | — | | | — | | | — | |
| Total increase (decrease) in net asset value | | 2.55 | | | 1.46 | | | (1.92 | ) |
| Net asset value, ending | $ | 14.49 | | $ | 11.94 | | $ | 10.48 | |
| |
| Total return* | | 21.36 | % | | 13.93 | % | | (15.48 | %) |
| Ratios to average net assets: A | | | | | | | | | |
| Net investment income (loss) | | (.75 | %) | | (.26 | %) | | (.21 | %) |
| Total expenses | | 3.19 | % | | 3.18 | % | | 3.02 | % |
| Expenses before offsets | | 2.97 | % | | 2.97 | % | | 2.97 | % |
| Net expenses | | 2.97 | % | | 2.97 | % | | 2.97 | % |
| Portfolio turnover | | 40 | % | | 43 | % | | 49 | % |
| Net assets, ending (in thousands) | $ | 3,158 | | $ | 3,607 | | $ | 4,506 | |
| |
| | | | | | YEARS ENDED | |
| | | | | | SEPTEMBER
30, | | | SEPTEMBER
30, | |
| CLASS B SHARES | | | | | 2010 | (z) | | 2009 | (z) |
| Net asset value, beginning | | | | $ | 12.40 | | $ | 13.69 | |
| Income from investment operations: | | | | | | | | | |
| Net investment income (loss) | | | | | (.09 | ) | | (.02 | ) |
| Net realized and unrealized gain (loss) | | | | | .09 | | | (1.06 | ) |
| Total from investment operations | | | | | — | | | (1.08 | ) |
| Distributions from: | | | | | | | | | |
| Net investment income | | | | | — | | | (.18 | ) |
| Net realized gain | | | | | — | | | (.03 | ) |
| Total distributions | | | | | — | | | (.21 | ) |
| Total increase (decrease) in net asset value | | | | | — | | | (1.29 | ) |
| Net asset value, ending | | | | $ | 12.40 | | $ | 12.40 | |
| |
| |
| Total return* | | | | | 0.00 | % | | (7.47 | %) |
| Ratios to average net assets: A | | | | | | | | | |
| Net investment income (loss) | | | | | (.74 | %) | | (.26 | %) |
| Total expenses | | | | | 3.03 | % | | 3.12 | % |
| Expenses before offsets | | | | | 2.97 | % | | 3.10 | % |
| Net expenses | | | | | 2.97 | % | | 3.10 | % |
| Portfolio turnover | | | | | 133 | % | | 135 | % |
| Net assets, ending (in thousands) | | | | $ | 6,850 | | $ | 8,993 | |
See notes to financial highlights.
40 www.calvert.com CALVERT INTERNATIONAL EQUITY FUND ANNUAL REPORT
| | | | | | | | | |
| FINANCIAL HIGHLIGHTS |
| |
| | | | | | YEARS ENDED | | | | |
| | | SEPTEMBER
30, | | | SEPTEMBER
30, | | | SEPTEMBER
30, | |
| CLASS C SHARES | | 2013 | (z) | | 2012 | (z) | | 2011 | (z) |
| Net asset value, beginning | $ | 11.71 | | $ | 10.26 | | $ | 12.10 | |
| Income from investment operations: | | | | | | | | | |
| Net investment income (loss) | | (.05 | ) | | .01 | | | .01 | |
| Net realized and unrealized gain (loss) | | 2.60 | | | 1.45 | | | (1.85 | ) |
| Total from investment operations | | 2.55 | | | 1.46 | | | (1.84 | ) |
| Distributions from: | | | | | | | | | |
| Net investment income | | — | | | (.01 | ) | | — | |
| Net realized gain | | — | | | — | | | — | |
| Total distributions | | — | | | (.01 | ) | | — | |
| Total increase (decrease) in net asset value | | 2.55 | | | 1.45 | | | (1.84 | ) |
| Net asset value, ending | $ | 14.26 | | $ | 11.71 | | $ | 10.26 | |
| |
| Total return* | | 21.78 | % | | 14.23 | % | | (15.21 | %) |
| Ratios to average net assets: A | | | | | | | | | |
| Net investment income (loss) | | (.40 | %) | | .05 | % | | .12 | % |
| Total expenses | | 2.65 | % | | 2.72 | % | | 2.67 | % |
| Expenses before offsets | | 2.65 | % | | 2.69 | % | | 2.67 | % |
| Net expenses | | 2.65 | % | | 2.69 | % | | 2.67 | % |
| Portfolio turnover | | 40 | % | | 43 | % | | 49 | % |
| Net assets, ending (in thousands) | $ | 17,746 | | $ | 15,922 | | $ | 16,195 | |
| |
| | | | | | YEARS ENDED | |
| | | | | | SEPTEMBER
30, | | | SEPTEMBER
30, | |
| CLASS C SHARES | | | | | 2010 | (z) | | 2009 | (z) |
| Net asset value, beginning | | | | $ | 12.07 | | $ | 13.31 | |
| Income from investment operations: | | | | | | | | | |
| Net investment income (loss) | | | | | (.05 | ) | | .01 | |
| Net realized and unrealized gain (loss) | | | | | .08 | | | (1.03 | ) |
| Total from investment operations | | | | | .03 | | | (1.02 | ) |
| Distributions from: | | | | | | | | | |
| Net investment income | | | | | — | | | (.19 | ) |
| Net realized gain | | | | | — | | | (.03 | ) |
| Total distributions | | | | | — | | | (.22 | ) |
| Total increase (decrease) in net asset value | | | | | 0.03 | | | (1.24 | ) |
| Net asset value, ending | | | | $ | 12.10 | | $ | 12.07 | |
| |
| Total return* | | | | | 0.25 | % | | (7.16 | %) |
| Ratios to average net assets: A | | | | | | | | | |
| Net investment income (loss) | | | | | (.41 | %) | | .07 | % |
| Total expenses | | | | | 2.72 | % | | 2.79 | % |
| Expenses before offsets | | | | | 2.69 | % | | 2.79 | % |
| Net expenses | | | | | 2.69 | % | | 2.79 | % |
| Portfolio turnover | | | | | 133 | % | | 135 | % |
| Net assets, ending (in thousands) | | | | $ | 21,942 | | $ | 24,107 | |
See notes to financial highlights.
www.calvert.com CALVERT INTERNATIONAL EQUITY FUND ANNUAL REPORT 41
| | | | | | | | | |
| FINANCIAL HIGHLIGHTS |
| |
| | | | | | YEARS ENDED | | | | |
| | | SEPTEMBER
30, | | | SEPTEMBER
30, | | | SEPTEMBER
30, | |
| CLASS I SHARES | | 2013 | (z) | | 2012 | (z) | | 2011 | (z) |
| Net asset value, beginning | $ | 14.52 | | $ | 12.70 | | $ | 14.83 | |
| Income from investment operations: | | | | | | | | | |
| Net investment income | | .17 | | | .24 | | | .26 | |
| Net realized and unrealized gain (loss) | | 3.24 | | | 1.79 | | | (2.30 | ) |
| Total from investment operations | | 3.41 | | | 2.03 | | | (2.04 | ) |
| Distributions from: | | | | | | | | | |
| Net investment income | | (.24 | ) | | (.21 | ) | | (.09 | ) |
| Net realized gain | | — | | | — | | | — | |
| Total distributions | | (.24 | ) | | (.21 | ) | | (.09 | ) |
| Total increase (decrease) in net asset value | | 3.17 | | | 1.82 | | | (2.13 | ) |
| Net asset value, ending | $ | 17.69 | | $ | 14.52 | | $ | 12.70 | |
| |
| Total return* | | 23.74 | % | | 16.16 | % | | (13.84 | %) |
| Ratios to average net assets: A | | | | | | | | | |
| Net investment income | | 1.07 | % | | 1.71 | % | | 1.74 | % |
| Total expenses | | 1.06 | % | | 1.09 | % | | 1.07 | % |
| Expenses before offsets | | 1.06 | % | | 1.06 | % | | 1.06 | % |
| Net expenses | | 1.06 | % | | 1.06 | % | | 1.06 | % |
| Portfolio turnover | | 40 | % | | 43 | % | | 49 | % |
| Net assets, ending (in thousands) | $ | 82,499 | | $ | 101,203 | | $ | 89,142 | |
| |
| | | | | | YEARS ENDED | |
| | | | | | SEPTEMBER
30, | | | SEPTEMBER
30, | |
| CLASS I SHARES | | | | | 2010 | (z) | | 2009 | (z) |
| Net asset value, beginning | | | | $ | 14.79 | | $ | 16.37 | |
| Income from investment operations: | | | | | | | | | |
| Net investment income | | | | | .17 | | | .22 | |
| Net realized and unrealized gain (loss) | | | | | .11 | | | (1.29 | ) |
| Total from investment operations | | | | | .28 | | | (1.07 | ) |
| Distributions from: | | | | | | | | | |
| Net investment income | | | | | (.24 | ) | | (.48 | ) |
| Net realized gain | | | | | — | | | (.03 | ) |
| Total distributions | | | | | (.24 | ) | | (.51 | ) |
| Total increase (decrease) in net asset value | | | | | 0.04 | | | (1.58 | ) |
| Net asset value, ending | | | | $ | 14.83 | | $ | 14.79 | |
| |
| Total return* | | | | | 1.91 | % | | (5.59 | %) |
| Ratios to average net assets: A | | | | | | | | | |
| Net investment income | | | | | 1.17 | % | | 1.80 | % |
| Total expenses | | | | | 1.08 | % | | 1.08 | % |
| Expenses before offsets | | | | | 1.06 | % | | 1.07 | % |
| Net expenses | | | | | 1.06 | % | | 1.07 | % |
| Portfolio turnover | | | | | 133 | % | | 135 | % |
| Net assets, ending (in thousands) | | | | $ | 86,475 | | $ | 107,456 | |
See notes to financial highlights.
42 www.calvert.com CALVERT INTERNATIONAL EQUITY FUND ANNUAL REPORT
| | | | | | |
| FINANCIAL HIGHLIGHTS |
| |
| | | | YEARS ENDED | | | |
| | SEPTEMBER
30, | | SEPTEMBER
30, | | SEPTEMBER
30, | |
| CLASS Y SHARES | 2013 | (z) | 2012 | (z) | 2011 | (z) |
| Net asset value, beginning | $14.25 | | $12.45 | | $14.53 | |
| Income from investment operations: | | | | | | |
| Net investment income | .14 | | .18 | | .24 | |
| Net realized and unrealized gain (loss) | 3.15 | | 1.77 | | (2.30 | ) |
| Total from investment operations | 3.29 | | 1.95 | | (2.06 | ) |
| Distributions from: | | | | | | |
| Net investment income | (.16 | ) | (.15 | ) | (.02 | ) |
| Net realized gain | — | | — | | — | |
| Total distributions | (.16 | ) | (.15 | ) | (.02 | ) |
| Total increase (decrease) in net asset value | 3.13 | | 1.80 | | (2.08 | ) |
| Net asset value, ending | $17.38 | | $14.25 | | $12.45 | |
| |
| Total return* | 23.27 | % | 15.80 | % | (14.20 | %) |
| Ratios to average net assets: A | | | | | | |
| Net investment income | .90 | % | 1.36 | % | 1.56 | % |
| Total expenses | 1.41 | % | 1.46 | % | 1.51 | % |
| Expenses before offsets | 1.39 | % | 1.39 | % | 1.39 | % |
| Net expenses | 1.39 | % | 1.39 | % | 1.39 | % |
| Portfolio turnover | 40 | % | 43 | % | 49 | % |
| Net assets, ending (in thousands) | $10,367 | | $7,535 | | $7,398 | |
| |
| | | | PERIODS ENDED | |
| | | | SEPTEMBER
30, | | SEPTEMBER
30, | |
| CLASS Y SHARES | | | 2010 | (z) | 2009 | # (z) |
| Net asset value, beginning | | | $14.34 | | $11.45 | |
| Income from investment operations: | | | | | | |
| Net investment income | | | .08 | | .17 | |
| Net realized and unrealized gain (loss) | | | .17 | | 2.76 | |
| Total from investment operations | | | .25 | | 2.93 | |
| Distributions from: | | | | | | |
| Net investment income | | | (.06 | ) | (.01 | ) |
| Net realized gain | | | — | | (.03 | ) |
| Total distributions | | | (.06 | ) | (.04 | ) |
| Total increase (decrease) in net asset value | | | 0.19 | | 2.89 | |
| Net asset value, ending | | | $14.53 | | $14.34 | |
| |
| Total return* | | | 1.73 | % | 25.75 | % |
| Ratios to average net assets: A | | | | | | |
| Net investment income | | | .61 | % | 1.52 | % (a) |
| Total expenses | | | 2.14 | % | 5.91 | % (a) |
| Expenses before offsets | | | 1.39 | % | 1.39 | % (a) |
| Net expenses | | | 1.39 | % | 1.39 | % (a) |
| Portfolio turnover | | | 133 | % | 100 | % |
| Net assets, ending (in thousands) | | | $2,790 | | $702 | |
See notes to financial highlights.
www.calvert.com CALVERT INTERNATIONAL EQUITY FUND ANNUAL REPORT 43
A Total expenses do not reflect amounts reimbursed and/or waived by the Advisor or reductions from expense offset arrangements. Expenses before offsets reflect expenses after reimbursement and/or waiver by the Advisor but prior to reductions from expense offset arrangements. Net expenses are net of all reductions and represent the net expenses paid by the Fund.
(a) Annualized.
(z) Per share figures are calculated using the Average Share Method.
* Total return is not annualized for periods less than one year and does not reflect deduction of any front-end or deferred sales charge.
# From October 31, 2008, inception.
See notes to financial statements.
44 www.calvert.com CALVERT INTERNATIONAL EQUITY FUND ANNUAL REPORT
EXPLANATION OF FINANCIAL TABLES
SCHEDULE OF INVESTMENTS
The Schedule of Investments is a snapshot of all securities held in the fund at their market value, on the last day of the reporting period. Securities are listed by asset type (e.g., common stock, corporate bonds, U.S. government obligations) or, for International Funds, by country, and may be further broken down into sub-groups and by industry classification.
STATEMENT OF ASSETS AND LIABILITIES
The Statement of Assets and Liabilities is often referred to as the fund’s balance sheet. It lists the value of what the fund owns, is due and owes on the last day of the reporting period. The fund’s assets include the market value of securities owned, cash, receivables for securities sold and shareholder subscriptions, and receivables for dividends and interest payments that have been earned, but not yet received. The fund’s liabilities include payables for securities purchased and shareholder redemptions, and expenses owed but not yet paid. The statement also reports the fund’s net asset value (NAV) per share on the last day of the reporting period. The NAV is calculated by dividing the fund’s net assets (assets minus liabilities) by the number of shares outstanding. This statement is accompanied by a Schedule of Investments. Alternatively, if certain conditions are met, a Statement of Net Assets may be presented in lieu of this statement and the Schedule of Investments.
STATEMENT OF NET ASSETS
The Statement of Net Assets provides a detailed list of the fund’s holdings, including each security’s market value on the last day of the reporting period. The Statement of Net Assets includes a Schedule of Investments. Other assets are added and other liabilities subtracted from the investments total to calculate the fund’s net assets. Finally, net assets are divided by the outstanding shares of the fund to arrive at its share price, or Net Asset Value (NAV) per share.
At the end of the Statement of Net Assets is a table displaying the composition of the fund’s net assets. Paid in Capital is the money invested by shareholders and represents the bulk of net assets. Undistributed Net Investment Income and Accumulated Net Realized Gains usually approximate the amounts the fund had available to distribute to shareholders as of the statement date. Accumulated Realized Losses will appear as negative balances. Unrealized Appreciation (Depreciation) is the difference between the market value of the fund’s investments and their cost, and reflects the gains (losses) that would be realized if the fund were to sell all of its investments at their statement-date values.
STATEMENT OF OPERATIONS
The Statement of Operations summarizes the fund’s investment income earned and expenses incurred in operating the fund. Investment income includes dividends earned from stocks and interest earned from interest-bearing securities in the fund. Expenses incurred in operating the fund include the advisory fee paid to the investment advisor, administrative services fees, distribution plan expenses (if applicable), transfer agent fees, shareholder servicing expenses, custodial, legal, and audit fees, and the printing and postage expenses related to shareholder reports. Expense offsets (fees paid indirectly) are also shown. Credits earned from offset arrangements are used to reduce the fund’s expenses.
www.calvert.com CALVERT INTERNATIONAL EQUITY FUND ANNUAL REPORT (UNAUDITED) 45
This statement also shows net gains (losses) realized on the sale of investments and the increase or decrease in the unrealized appreciation (depreciation) on investments held during the period.
STATEMENT OF CHANGES IN NET ASSETS
The Statement of Changes in Net Assets shows how the fund’s total net assets changed during the two most recent reporting periods. Changes in the fund’s net assets are attributable to investment operations, distributions and capital share transactions.
The Operations section of the report summarizes information detailed in the Statement of Operations. The Distribution section shows the dividend and capital gain distributions made to shareholders. The amounts shown as distributions in this section may not match the net investment income and realized gains amounts shown in the Operations section because distributions are determined on a tax basis and certain investments or transactions may be treated differently for financial statement and tax purposes. The Capital Share Transactions section shows the amount shareholders invested in the fund, either by purchasing shares or by reinvesting distributions, and the amounts redeemed. The corresponding numbers of shares issued, reinvested and redeemed are shown at the end of the report.
FINANCIAL HIGHLIGHTS
The Financial Highlights table provides a per-share breakdown per class of the components that affect the fund’s net asset value for current and past reporting periods. The table provides total return, total distributions, expense ratios, portfolio turnover and net assets for the applicable period. Total return is a measure of a fund’s performance that encompasses all elements of return: dividends, capital gain distributions and changes in net asset value. Total return is the change in value of an investment over a given period, assuming reinvestment of any dividends and capital gain distributions, expressed as a percentage of the initial investment. Total distributions include distributions from net investment income and net realized gains. Long-term gains are earned on securities held in the fund more than one year. Short-term gains, on the sale of securities held less than one year, are treated as ordinary dividend income for tax purposes. The expense ratio is a fund’s cost of doing business, expressed as a percentage of net assets. These expenses directly reduce returns to shareholders. Portfolio turnover measures the trading activity in a fund’s investment portfolio – how often securities are bought and sold by a fund. Portfolio turnover is affected by market conditions, changes in the size of the fund, the nature of the fund’s investments and the investment style of the portfolio manager.
PROXY VOTING
The Proxy Voting Guidelines of the Calvert Funds that the Fund uses to determine how to vote proxies relating to portfolio securities are provided as an Appendix to the Fund’s Statement of Additional Information. The Statement of Additional Information can be obtained free of charge by calling the Fund at 1-800-368-2745, by visiting the Calvert website at www.calvert.com; or by visiting the SEC’s website at www.sec.gov.
Information regarding how the Fund voted proxies relating to portfolio securities during the most recent 12-month period ended June 30 is available on the Fund’s website at www.calvert.com and on the SEC’s website at www.sec.gov.
46 www.calvert.com CALVERT INTERNATIONAL EQUITY FUND ANNUAL REPORT (UNAUDITED)
AVAILABILITY OF QUARTERLY PORTFOLIO HOLDINGS
The Fund files its complete schedule of portfolio holdings with the SEC for the first and third quarters of each fiscal year on Form N-Q. The Fund’s Form N-Q is available on the SEC’s website at www.sec.gov. The Fund’s Form N-Q may be reviewed and copied at the SEC’s Public Reference Room in Washington, DC; information on the operation of the Public Reference Room may be obtained by calling 1-800-SEC-0330.
www.calvert.com CALVERT INTERNATIONAL EQUITY FUND ANNUAL REPORT (UNAUDITED) 47
This page intentionally left blank.
To Open an Account
800-368-2748
Service for Existing Account
Shareholders: 800-368-2745
Brokers: 800-368-2746
TDD for Hearing Impaired
800-541-1524
Registered Mail
Calvert Investments
c/o BFDS,
P.O. Box 219544
Kansas City, MO 64121-9544
Overnight Mail
Calvert Investments
c/o BFDS,
330 West 9th Street
Kansas City, MO 64105
Web Site
www.calvert.com
Principal Underwriter
Calvert Investment Distributors, Inc.
4550 Montgomery Avenue
Suite 1000 North
Bethesda, Maryland 20814
This report is intended to provide fund information to shareholders. It is not authorized for distribution to prospective investors unless preceded or accompanied by a prospectus.
Note: The information on our website is not incorporated by reference into this report; our website address is included as an inactive textual reference only.
Investors should carefully consider the investment objectives, risks, charges and expenses of the Calvert Funds. This and other important information is contained in the fund’s summary prospectus and prospectus, which can be obtained from your financial professional and should be read carefully before investing. You may also call Calvert at 800/368-2748 or visit www. calvert.com.
Choose Planet-friendly E-delivery!
Sign up now for on-line statements, prospectuses, and fund reports. In less than five minutes you can help reduce paper mail and lower fund costs.
Just go to www.calvert.com. If you already have an online account at Calvert, click on My Account, and select the documents you would like to receive via e-mail.
If you’re new to online account access, click on Login/Register to open an online account. Once you’re in, click on the E-delivery sign-up at the bottom of the Account Portfolio page and follow the quick, easy steps. Note: if your shares are not held directly at Calvert but through a brokerage firm, you must contact your broker for electronic delivery options available through their firm.


Barbara Krumsiek
President and CEO of Calvert Investments, Inc.
Dear Calvert Shareholder,
For the 12 months ended September 30, 2013, the global equity markets generally had a strong year, while bonds saw more mixed results. Large-cap stocks, as represented by the Russell 1000 Index, posted a healthy 20.9% return, while the smaller-cap Russell 2000 Index led with a 30.1% gain. This occurred despite political turmoil and market concerns worldwide about a forced shutdown of the U.S. government and the upcoming debt ceiling deadline.
Despite these advances, it was a challenging year for the financial markets overall. At various times, issues at home and abroad led to marked volatility in the performance of both stocks and bonds. Emerging-market performance was notably low, as fears of slowing growth in China and the Eurozone, along with continuing struggles in the Eurozone periphery, stalled regional investment. As a result, the formerly high-flying MSCI Emerging Markets Index gained only 1.3% for the period. The Barclays U.S. Credit Index, a barometer for the overall U.S. bond market, returned -1.9%.
Early in the Fall, Fed Chairman Ben Bernanke’s retirement was big news. The nomination of Vice Chair Janet Yellen as his replacement means the Fed will likely stay the course with current monetary policy. Yet, this is a historic moment for the United States, as Yellen, following Senate approval, will be the first woman to lead this critical agency.
Calvert Co-Founder Honored
I’m proud to congratulate Calvert co-founder Wayne Silby, who received the prestigious Joseph Wharton Award for Social Impact from The Alumni Club of New York, honoring his lifetime of achievement in impact investing and social entrepreneurship. Besides founding Calvert with John Guffey, Wayne is a co-founder of the Social Venture Network, Co-Chairman of the board of the Calvert Foundation, Chairman of Syntao Ltd., a CSR consultancy in Beijing, and active in other ventures in social impact and entrepreneurship.
Calvert Releases New Report on Diversity
In March, we published the latest edition of Examining the Cracks in the Glass Ceiling, which measures diversity practices of the companies that constitute the S&P 100 Index. As you know, Calvert believes companies with a diverse workforce are poised for greater success in today’s increasingly global marketplace and will enjoy greater long-term value—a view supported by a growing body of research from McKinsey, Credit Suisse, and others.
Companies in the report were rated on 10 indicators: EEO policy, internal diversity initiatives, external diversity initiatives, scope of diversity initiatives, family-friendly benefits, demographic disclosure of employees (EEO-1), highest-paid executives, board diversity,
4 www.calvert.com CALVERT CAPITAL ACCUMULATION FUND ANNUAL REPORT
director selection criteria, and overall corporate commitment. The highest-rated companies were Citigroup, Merck, The Coca-Cola Company, and J.P. Morgan Chase, all scoring at least 95 points or more out of 100. We hold these companies in a number of our Calvert portfolios.
While some progress has been achieved in corporate diversity practices since our last assessment in 2010, the S&P 100 companies are largely failing to translate progressive practices into increased promotion rates for women and minority employees. For example, women are now hired as often as men. However, more than half of the S&P 100 companies lack diversity among their highest-paid senior executive positions. And women still only represent 19% of board members among these large-cap companies. Much remains to be done, which is why we continue to work with a number of international, multi-stakeholder groups on these issues, as well as conduct advocacy work with individual companies.
Stay Informed in the Months Ahead
Maintaining a well-diversified mix of U.S. and international stocks, bonds, and cash—appropriate for your goals and risk tolerance—is one of the best ways to mitigate the effects of an uneven recovery in the economy and markets. Of course, we recommend consulting your financial advisor if you have questions or concerns about your investments.
We also invite you to visit our website, www.calvert.com, for fund information, portfolio updates, and commentary from Calvert professionals. As always, we thank you for invest ing with Calvert.
The following companies represented the following percentages of Fund net assets: Citigroup 2.27% of Calvert Large Cap Value, 1.32% of Calvert Social Index; Merck 2.26% of Calvert Equity Income, 2.01% of Calvert Large Cap Value, and 1.25% of Calvert Social Index; Coca-Cola 1.29% of Calvert Social Index, 3.20% of Calvert Large Cap Core and 3.29% Calvert Equity Portfolio; J.P. Morgan Chase 2.54% of Calvert Equity Income, 1.74% of Calvert Social Index and 0.34% of Calvert Balanced Portfolio. Holdings are subject to change.
www.calvert.com CALVERT CAPITAL ACCUMULATION FUND ANNUAL REPORT 5

As always, Calvert continues to work hard to ensure you have a say in the responsible management of environmental, social, and governance (ESG) factors for the companies in which we invest. Below are highlights of our accomplishments during the reporting period.
Shareholder Advocacy
Over the past year, Calvert engaged with 139 companies via emails, letters, phone calls, and in-person meetings. We also filed 22 shareholder proposals during the 2013 proxy season, which led to agreements with 14 companies on the issues of board diversity and sustainability reporting, among others. We also presented at four annual meetings where the proposals came to a vote and received shareholder support that exceeded 40% at two companies.
One proposal was for diversified energy services company Cleco, which has significant assets in thermoelectricity, to report on its sustainability risks and opportunities, including an analysis of material water-related risks. The other at Pioneer Natural Resources focused on reporting the environmental and social challenges and opportunities associated with hydraulic fracturing.
Company Engagement
Research and an intensive dialogue across a range of corporate responsibility and sustainability issues led to McDonald’s and Walt Disney meeting our Signature® criteria1 for the first time. McDonald’s is improving its supply chain labor policies and practices, diversifying its menu options, and disclosing their nutritional content—although it continues to face challenges in both areas. Walt Disney now meets the criteria for workplace safety, while continuing to meet our criteria on supply chain labor and human rights practices.
We undertook more engagement with Coca-Cola and PepsiCo on labor and human rights, water, and sustainability issues. In fact, PepsiCo management credited our recommendations with influencing their decision to strengthen their human rights policy framework.
Climate Change And Energy
Calvert, the World Wildlife Fund (WWF) and Ceres published, “Power Forward: Why the World’s Largest Companies are Investing in Renewable Energy.” The report found that more than half of the largest U.S. corporations and more than two-thirds of the largest companies across the globe have set greenhouse gas (GHG) emissions reduction commitments and/or renewable energy commitments.
Calvert joined with other Investor Network on Climate Risk (INCR) members to speak at congressional staff briefings about recommendations for corporations in the report and draft an investor letter to Congress supporting the production tax credit (PTC) for wind
6 www.calvert.com CALVERT CAPITAL ACCUMULATION FUND ANNUAL REPORT
energy, which was due to expire at the end of 2012. The report, briefings and investor letter helped spur extension of the PTC to support the growth of renewable energy.
350.Org Divestment Campaign On Fossil Fuels
Calvert watched closely the 350.org campaign urging college and university endowments, as well as other institutional investors, to divest from companies producing fossil fuels. In December, Calvert posted a statement on our website expressing support for the campaign’s broad objectives while making the case for a complementary strategy of active ownership and engagement. The statement pointed to specific fossil fuel companies such as Denbury Resources and Suncor Energy that Calvert has successfully engaged on climate change, alternative energy, and revenue transparency.
Burma
After the lifting of U.S. sanctions prohibiting new investment in Burma by American companies, the Calvert Social Funds Board approved revisions to Calvert’s long-standing policy language in September. Instead of urging U.S. companies to “cease operations” in Burma, the new language instead calls for Calvert to advocate for “responsible investment.”
Garment Industry Safety
Following the Rana Plaza tragedy earlier this year, where more than 1,100 Bangladesh garment factory workers were killed, Calvert assessed the state of significant country-level sourcing disclosure by retail companies, which is essential to assessing sourcing risks more effectively. After learning that only a handful of companies disclose this necessary data, we contacted 26 retail company CEOs requesting disclosure of sourcing information for those countries representing 5% or more of global order volume.
Human Rights Report
In March, Calvert, Interfaith Center on Corporate Responsibility and the Institute for Human Rights and Business launched “Investing the Rights Way: A Guide for Business and Human Rights” in both New York and London. The guide outlines how investors can apply the UN Guiding Principles on Business and Human Rights as a due diligence and risk assessment framework to assess companies in their portfolios.
Conflict Minerals
Calvert continued to be a leader among investors on “conflict minerals” through a multi-stakeholder group supporting disclosure requirements enacted as Section 1502 of the Dodd-Frank Wall Street Reform and Consumer Protection Act of 2010. The disclosure would certify that certain minerals used in cell phones and other consumer electronic components (tin, titanium, tantalum and gold) are not illegally mined to fuel the continuing bloody conflict in the Democratic Republic of Congo (DRC).
After the SEC approved and released the final rule to implement the reporting requirements of Section 1502 in August 2012, the U.S. Chamber of Commerce filed a lawsuit against the Securities and Exchange Commission (SEC) to stop implementation. Calvert led the multi-stakeholder group’s effort to forge a common statement urging implementation of the law as outlined by the rule, regardless of the lawsuit. On July 23, the court upheld the “conflict minerals rule” in favor of the SEC and the statute requiring adoption of the rule—a major victory for Calvert and its allies.
www.calvert.com CALVERT CAPITAL ACCUMULATION FUND ANNUAL REPORT 7
Extractives Revenue Transparency
Widely credited for its leadership role among investors in supporting extractive revenue transparency as an imperative for investors interested in full disclosure of material information related to oil, gas and mining in certain countries, Calvert has remained actively engaged in the SEC rule-making process. The U.S. Chamber of Commerce and the American Petroleum Institute filed a lawsuit challenging the pro-disclosure rules, Calvert submitted a sworn statement about the problems investors would face if the rules were delayed or revoked. We also sent letters to the SEC emphasizing the materiality of disclosures required by the rules and contributed research to Oxfam America’s January 2013 brief.
On July 2, the court “vacated” the SEC’s rule, declaring it inoperative until the SEC addresses certain key issues (the necessity for exemptions for certain countries and public reporting of the disclosures). Calvert subsequently drafted a letter to SEC Chairman Mary Jo White that acknowledged the value of the Commission’s rules to implement Section 1504 and urged her respond to the API vs. SEC decision by reinstating rules consistent with those issued in August 2012, which were endorsed by investors representing more than $5.6 trillion in assets under management.
1 Calvert’s Signature® criteria examine corporate performance across seven broad areas of concern: Governance and Ethics, Environment, Workplace, Product Safety and Impact, International Operations and Human Rights, Indigenous Peoples’ Rights, and Community Relations. For a company to be eligible for inclusion in a Calvert Signature portfolio, it must meet the criteria in all seven categories.
The following companies represented the following percentages of net assets: Cleco 0.02% of Calvert Social Index; Pioneer Natural Resources 0.23% of Calvert Social Index and 1.39% of Calvert Balanced Portfolio; McDonald’s 0.86% of Calvert Social Index and 2.35% of Calvert Equity Portfolio, Walt Disney 0.96% of Calvert Social Index and 2.25% of Calvert Equity Portfolio; Coca-Cola 1.29% of Calvert Social Index, 3.20% of Calvert Large Cap Core and 3.29% Calvert Equity Portfolio; PepsiCo 1.10% of Calvert Social Index, 1.20% of Calvert Equity Portfolio and 0.54% of Calvert Balanced Portfolio; Denbury Resources 0.06% of Calvert Social Index and 2.86% of Calvert Large Cap Core; and Suncor Energy 0.71%% of Calvert International Equity Portfolio. Holdings are subject to change.
8 www.calvert.com CALVERT CAPITAL ACCUMULATION FUND ANNUAL REPORT

Investment Performance
For the one-year period ended September 30, 2013, Calvert Capital Accumulation Fund Class A shares (at NAV) returned a solid 24.74%, compared with a return of 27.54% for the Russell Midcap Growth Index. The relative underperformance was due to weak stock selection in early 2013.
Investment Climate
The U.S. stock market delivered strong returns over the past 12 months, despite some turbulence along the way. The large-cap S&P 500 Index rose 19.34%, while the Russell 1000 Index gained 20.91%, the Russell Mid Cap Index rose 27.91%, and the small-cap Russell 2500 Index increased 29.79%.
Over the reporting period, U.S. stocks climbed a “wall of worry,” rising about 20% in the face of a still-struggling U.S. economy as well as concerns about the fiscal cliff, a government shutdown, and a potential breach of the debt-ceiling. Overseas, a banking crisis in Cyprus and unrest in Syria and other parts of the Middle East threatened the fragile recovery. Despite these and other headwinds, the stock market prevailed with the help of rebounding housing and auto markets, a slowly improving employment picture, and a recovery in China and other emerging markets.
Rising valuations on top of increases in corporate earnings helped fuel the rise, as did the “great rotation” (fund flows from bonds to stocks), which is still believed to be in its early phases. Corporate profits have risen year-over-year and are forecast to rise again next year. Consumer spending has remained steady and capital spending, which has been depressed for several years, is showing signs of improvement. Fears of a looming taper of the Fed’s accommodative monetary policy have abated amid continued signs of limited inflationary pressures.
Global and political uncertainties led to a “flight to safety” in the fourth quarter of 2012 and first quarter of 2013, with defensive, low-volatility stocks outperforming. This changed during the second quarter of 2013 as some of the fears abated and more cyclical stocks recovered.
www.calvert.com CALVERT CAPITAL ACCUMULATION FUND ANNUAL REPORT 9
| | |
| CALVERT CAPITAL |
| ACCUMULATION |
| FUND |
| SEPTEMBER 30, 2013 |
| |
| | % OF TOTAL | |
| ECONOMIC SECTORS | INVESTMENTS | |
| Consumer Discretionary | 23.1 | % |
| Consumer Staples | 4.7 | % |
| Energy | 7.9 | % |
| Financials | 7.2 | % |
| Health Care | 12.0 | % |
| Industrials | 14.4 | % |
| Information Technology | 21.3 | % |
| Materials | 5.2 | % |
| Short-Term Investments | 2.7 | % |
| Utilities | 1.5 | % |
| Total | 100 | % |
Portfolio Strategy
The Fund’s relative underperformance largely occurred in the early part of 2013. Performance was solid in the final months of 2012, then strong performance returned in mid-May, once cyclical stocks began to outpace more defensive names (a reversal of the trend from earlier in 2013) and continued for the balance of the period.
Overall, our sector selection was positive but stock selection was weak. An overweight position in Energy and timely adjustments to our exposure to Industrials, along with an underweight in Telecommunication Services, added value, but a slight overweight in Utilities detracted. During the period, we sold 27 stocks and bought 29 new ones for a total of 44 holdings as of September 30, 2013.
| CALVERT CAPITAL |
| ACCUMULATION FUND |
| SEPTEMBER 30, 2013 |
| |
| INVESTMENT PERFORMANCE | | | |
| (TOTAL RETURN AT NAV*) | | | |
| | 6 MONTHS | | 12 MONTHS | |
| | ENDED | | ENDED | |
| | 9/30/13 | | 9/30/13 | |
| Class A | 10.93 | % | 24.74 | % |
| Class B | 10.20 | % | 23.05 | % |
| Class C | 10.52 | % | 23.81 | % |
| Class I | 11.29 | % | 25.55 | % |
| Class Y | 11.03 | % | 24.98 | % |
| |
| Russell Midcap | | | | |
| Growth Index | 12.48 | % | 27.54 | % |
| |
| Lipper Mid-Cap | | | | |
| Core Funds | | | | |
| Average | 10.17 | % | 27.59 | % |
| TEN LARGEST | % OF NET | |
| STOCK HOLDINGS | ASSETS | |
| Syntel, Inc. | 3.3 | % |
| Church & Dwight Co., Inc. | 3.1 | % |
| DST Systems, Inc. | 2.9 | % |
| Hornbeck Offshore Services, Inc. | 2.9 | % |
| Polaris Industries, Inc. | 2.9 | % |
| Ross Stores, Inc. | 2.9 | % |
| Sotheby’s | 2.8 | % |
| WESCO International, Inc. | 2.7 | % |
| TRW Automotive Holdings | | |
| Corp. | 2.7 | % |
| Torchmark Corp. | 2.7 | % |
| Total | 28.9 | % |
* Investment performance/return at NAV does not reflect the deduction of the Fund’s maximum 4.75% front-end sales charge or any deferred sales charges.
Three stocks were bought and sold during the period after being acquired: Lufkin in Energy and Metro PCS in Telecommunication Services and Industrials holding BMC, which is being taken private. Six more stocks were sold after reaching their price targets, including FMC Technologies (Energy), Ball Corp (Materials), retailers Ann and Buckle (Consumer Discretionary), World Acceptance (Financials), and WEX (Information Technology).
10 www.calvert.com CALVERT CAPITAL ACCUMULATION FUND ANNUAL REPORT
Stock selection was strong in Health Care, Materials and Energy. Health Care holding Questcor Pharmaceuticals (up 222.7%)1 more than tripled in value thanks to strong earnings driven by robust script growth while concerns over reimbursements abated. In Materials, Ecolab gained 54.1% on consecutive positive earnings surprises as well as a well-received acquisition announcement.
Energy holding Lufkin Industries rose 66.4% on news that it would be acquired by General Electric. In Consumer Discretionary, TRW Automotive gained 63.1% with the help of recovering automobile markets. Industrials holding Corporate Executive Board increased 68.5% due to stable, organic revenue growth in its core business.
Stock selection was weak in Information Technology, Industrials and Consumer Staples. In Information Technology, Teradata returned -26.5% on weak earnings caused by lack-luster revenue results in the Americas. Lender Processing Services returned -19.3% on concerns over weakness in its default services division, and F5 Networks returned -18.1% on worries over its security initiatives and weakening core markets.
Industrials holding Valmont Industries’s return of 6.3% underperformed due to poor visibility in its irrigation segment given volatile corn prices. Church & Dwight earned 13.3% but failed to keep pace with Consumer Staples peers amid weak consumer demand and mounting competitive pressures. Consumer Discretionary holding Expedia returned -8.4%, as increased competition forced higher marketing expenses and weak top and bottom line results.
At the end of the reporting period, we were overweight to Information Technology and Energy and underweight in Telecommunication Services, Consumer Discretionary and Consumer Staples.
Market Outlook
We expect U.S. gross domestic product (GDP) to grow at around 2% for the next couple years, picking up slightly from this year’s below 2% growth rate. On the positive side, U.S. and global economic data is improving (the Citigroup Economic Surprise Index for the G10 is firmly in positive territory). Inflation is low and interest rates are unlikely to move up in the near term given the muted economic backdrop.
Corporate profits have risen year-over-year and are forecast to increase more next year. Consumer spending has remained steady although some pockets, such as autos and housing, have done better than others. The U.S. deficit as a percent of GDP has dropped by more than half this year, although the United States and other nations have a way to go in dealing with sovereign debt.
At the time of this writing, the U.S. government is in shutdown. While the markets historically have shrugged off shutdowns, a lengthy one coupled with a bruising debt ceiling battle with its potential for a U.S. government default could rattle markets worldwide. The 2011 U.S. debt downgrade shook domestic stocks badly, although they have since recovered. Other risks include the economy remaining too sluggish, an unexpected rise in interest rates, and the recovery underway in China and the Emerging Markets stalling out. Global political uncertainty is still high. While international action in Syria is off the table for the time being, nuclear worries about Iran and the continued presence of terrorism (such as the horrifying attack in Kenya and ongoing violence in Iraq, Afghanistan and Pakistan) keeps global tensions high.
www.calvert.com CALVERT CAPITAL ACCUMULATION FUND ANNUAL REPORT 11
GROWTH OF $10,000
The graph below shows the value of a hypothetical $10,000 investment in the Fund over the past 10 fiscal year periods. The results shown are for Classes A and C shares and reflect the deduction of the maximum front-end Class A sales charge of 4.75%, and assume the reinvestment of dividends. The result is compared with benchmarks that include a broad based market index and a Lipper peer group average. Market indexes are unmanaged and their results do not reflect the effect of expenses or sales charges. The Lipper average reflects the deduction of the category’s average front-end sales charge. The value of an investment in a different share class would be different.
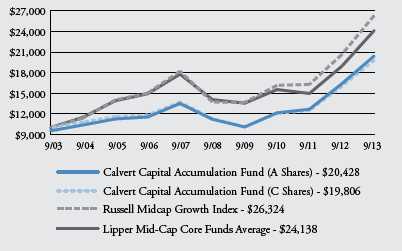
All performance data shown, including the graph above and the adjacent table, represents past performance, does not guarantee future results, assumes reinvestment of dividends and distributions and does not reflect the deduction of taxes that a shareholder would pay on the Fund’s distributions or the redemption of the Fund shares. All performance data reflects fee waivers and/or expense limitations, if any are in effect; in their absence performance would be lower. See Note B in Notes to Financial Statements. The investment return and principal value of an investment will fluctuate so that an investor’s shares, when redeemed, may be worth more or less than their original cost. Current performance may be lower or higher than the performance data quoted; for current performance data visit www.calvert.com. The gross expense ratio from the current prospectus for Class A shares is 1.53%. This number may differ from the expense ratio shown elsewhere in this report because it is based on a different time period and, if applicable, does not include fee or expense waivers. Performance data quoted already reflects the deduction of the Fund’s operating expenses.
12 www.calvert.com CALVERT CAPITAL ACCUMULATION FUND ANNUAL REPORT
Given the economic backdrop, we remain positive on the U.S. stock market. Although it is up strongly year-to-date, we believe there is still room for P/E multiple expansion as valuations are at or below historical levels.
October 2013
| CALVERT CAPITAL |
| ACCUMULATION FUND |
| SEPTEMBER 30, 2013 |
| |
| AVERAGE ANNUAL TOTAL RETURNS | |
| CLASS A SHARES | (WITH MAX. LOAD) | |
| One year | 18.81 | % |
| Five year | 11.64 | % |
| Ten year | 7.40 | % |
| CLASS B SHARES | (WITH MAX. LOAD) | |
| One year | 18.09 | % |
| Five year | 11.27 | % |
| Ten year | 6.82 | % |
| CLASS C SHARES | (WITH MAX. LOAD) | |
| One year | 22.81 | % |
| Five year | 11.85 | % |
| Ten year | 7.07 | % |
| CLASS I SHARES | | |
| One year | 25.55 | % |
| Five year | 13.64 | % |
| Ten year | 8.81 | % |
| CLASS Y SHARES* | | |
| One year | 24.98 | % |
| Five year | 12.86 | % |
| Ten year | 7.99 | % |
* Calvert Capital Accumulation Fund first offered Class Y Shares on January 31, 2011. Performance prior to that date reflects the performance of Class A Shares at net asset value (NAV). Actual Class Y Share performance would have been different.
1 Individual security returns reflect total returns for period held in portfolio.
As of September 30, 2013, the following companies represented the following percentages of Fund net assets: Lufkin 0%, Metro PCS 0%, BMC 0%, FMC Technologies 0%, Ball Corp 0%, Ann 0%, Buckle 0%, World Acceptance 0%, WEX 0%, Questcor 1.82%, Ecolab 2.23%, General Electric 0%, TRW Automotive 2.70%, Corporate Executive Board 2.54%, Teradata 1.55%, Lender Processing Services 0%, F5 Networks 1.42%, Valmont 2.41%, Church & Dwight 3.07%, Expedia 0%, CF Industries 0%, and Reliance Steel 1.51%. Holdings are subject to change.
www.calvert.com CALVERT CAPITAL ACCUMULATION FUND ANNUAL REPORT 13
SHAREHOLDER EXPENSE EXAMPLE
As a shareholder of the Fund, you incur two types of costs: (1) transaction costs, including sales charges and redemption fees; and (2) ongoing costs, including management fees; distribution (12b-1) fees; and other Fund expenses. This Example is intended to help you understand your ongoing costs (in dollars) of investing in the Fund and to compare these costs with the ongoing costs of investing in other mutual funds.
This Example is based on an investment of $1,000 invested at the beginning of the period and held for the entire period (April 1, 2013 to September 30, 2013).
Actual Expenses
The first line of the table below provides information about actual account values and actual expenses. You may use the information in this line, together with the amount you invested, to estimate the expenses that you paid over the period. Simply divide your account value by $1,000 (for example, an $8,600 account value divided by $1,000 = 8.6), then multiply the result by the number in the first line under the heading entitled “Expenses Paid During Period” to estimate the expenses you paid on your account during this period.
Hypothetical Example for Comparison Purposes
The second line of the table below provides information about hypothetical account values and hypothetical expenses based on the Fund’s actual expense ratio and an assumed rate of return of 5% per year before expenses, which is not the Fund’s actual return. The hypothetical account values and expenses may not be used to estimate the actual ending account balance or expenses you paid for the period. You may use this information to compare the ongoing costs of investing in the Fund and other funds. To do so, compare the 5% hypothetical example with the 5% hypothetical examples that appear in the shareholder reports of the other funds.
Please note that the expenses shown in the table are meant to highlight your ongoing costs only and do not reflect any transactional costs, such as sales charges (loads) or redemption fees. Therefore, the second line of the table is useful in comparing ongoing costs only, and will not help you determine the relative total costs of owning different funds. In addition, if these transactional costs were included, your costs would have been higher.
14 www.calvert.com CALVERT CAPITAL ACCUMULATION FUND ANNUAL REPORT
| | BEGINNING | ENDING ACCOUNT | EXPENSES PAID |
| | ACCOUNT VALUE | VALUE | DURING PERIOD* |
| | 4/1/13 | 9/30/13 | 4/1/13 - 9/30/13 |
| CLASS A | | | |
| Actual | $1,000.00 | $1,109.34 | $7.71 |
| Hypothetical | $1,000.00 | $1,017.76 | $7.37 |
| (5% return per year before expenses) | | | |
| |
| CLASS B | | | |
| Actual | $1,000.00 | $1,101.97 | $15.05 |
| Hypothetical | $1,000.00 | $1,010.75 | $14.39 |
| (5% return per year before expenses) | | | |
| |
| CLASS C | | | |
| Actual | $1,000.00 | $1,105.24 | $11.71 |
| Hypothetical | $1,000.00 | $1,013.94 | $11.20 |
| (5% return per year before expenses) | | | |
| |
| CLASS I | | | |
| Actual | $1,000.00 | $1,112.94 | $4.51 |
| Hypothetical | $1,000.00 | $1,020.80 | $4.31 |
| (5% return per year before expenses) | | | |
| |
| CLASS Y | | | |
| Actual | $1,000.00 | $1,110.31 | $6.76 |
| Hypothetical | $1,000.00 | $1,018.66 | $6.47 |
| (5% return per year before expenses) | | | |
* Expenses are equal to the Fund’s annualized expense ratio of 1.46%, 2.86%, 2.22%, 0.85%, and 1.28% for Class A, Class B, Class C, Class I, and Class Y, respectively, multiplied by the average account value over the period, multiplied by 183/365 (to reflect the one-half year period).
www.calvert.com CALVERT CAPITAL ACCUMULATION FUND ANNUAL REPORT 15
REPORT OF INDEPENDENT REGISTERED PUBLIC ACCOUNTING FIRM
The Board of Directors of Calvert World Values Fund, Inc. and Shareholders of Calvert Capital Accumulation Fund: We have audited the accompanying statement of net assets of the Calvert Capital Accumulation Fund (the “Fund”), a series of Calvert World Values Fund, Inc., as of September 30, 2013, and the related statement of operations for the year then ended, the statements of changes in net assets for each of the years in the two-year period then ended, and the financial highlights for each of the years or periods in the five-year period then ended. These financial statements and financial highlights are the responsibility of the Fund’s management. Our responsibility is to express an opinion on these financial statements and financial highlights based on our audits.
We conducted our audits in accordance with the standards of the Public Company Accounting Oversight Board (United States). Those standards require that we plan and perform the audit to obtain reasonable assurance about whether the financial statements and financial highlights are free of material misstatement. An audit includes examining, on a test basis, evidence supporting the amounts and disclosures in the financial statements. Our procedures included confirmation of securities owned as of September 30, 2013, by correspondence with the custodian and brokers or by performing other appropriate auditing procedures. An audit also includes assessing the accounting principles used and significant estimates made by management, as well as evaluating the overall financial statement presentation. We believe that our audits provide a reasonable basis for our opinion.
In our opinion, the financial statements and financial highlights referred to above present fairly, in all material respects, the financial position of the Calvert Capital Accumulation Fund as of September 30, 2013, the results of its operations for the year then ended, the changes in its net assets for each of the years in the two-year period then ended, and the financial highlights for each of the years or periods in the five-year period then ended, in conformity with U.S. generally accepted accounting principles.
16 www.calvert.com CALVERT CAPITAL ACCUMULATION FUND ANNUAL REPORT
| | | |
| STATEMENT OF NET ASSETS |
| SEPTEMBER 30, 2013 |
| |
| EQUITY SECURITIES - 96.0% | SHARES | | VALUE |
| Aerospace & Defense - 1.9% | | | |
| Hexcel Corp.* | 188,400 | $ | 7,309,920 |
| |
| Auto Components - 2.7% | | | |
| TRW Automotive Holdings Corp.* | 143,700 | | 10,247,247 |
| |
| Biotechnology - 4.4% | | | |
| Myriad Genetics, Inc.* | 336,675 | | 7,911,862 |
| United Therapeutics Corp.* | 111,150 | | 8,764,178 |
| | | | 16,676,040 |
| |
| Capital Markets - 1.6% | | | |
| Waddell & Reed Financial, Inc | 114,875 | | 5,913,765 |
| |
| Chemicals - 2.2% | | | |
| Ecolab, Inc. | 85,775 | | 8,471,139 |
| |
| Communications Equipment - 1.8% | | | |
| F5 Networks, Inc.* | 62,825 | | 5,387,872 |
| Ubiquiti Networks, Inc. | 49,200 | | 1,652,628 |
| | | | 7,040,500 |
| |
| Containers & Packaging - 1.4% | | | |
| Owens-Illinois, Inc.* | 181,725 | | 5,455,384 |
| |
| Diversified Consumer Services - 4.7% | | | |
| Grand Canyon Education, Inc.* | 175,090 | | 7,052,625 |
| Sotheby’s | 220,350 | | 10,825,796 |
| | | | 17,878,421 |
| |
| Electronic Equipment & Instruments - 2.5% | | | |
| Arrow Electronics, Inc.* | 198,100 | | 9,613,793 |
| |
| Energy Equipment & Services - 5.3% | | | |
| Hornbeck Offshore Services, Inc.* | 191,800 | | 11,016,992 |
| Unit Corp.* | 197,500 | | 9,181,775 |
| | | | 20,198,767 |
| |
| Food Products - 1.6% | | | |
| Ingredion, Inc. | 90,000 | | 5,955,300 |
| |
| Gas Utilities - 1.5% | | | |
| AGL Resources, Inc | 122,100 | | 5,620,263 |
| |
| Health Care Equipment & Supplies - 0.6% | | | |
| CareFusion Corp.* | 63,885 | | 2,357,356 |
www.calvert.com CALVERT CAPITAL ACCUMULATION FUND ANNUAL REPORT 17
| | | |
| EQUITY SECURITIES - CONT’D | SHARES | | VALUE |
| Health Care Providers & Services - 5.0% | | | |
| AmerisourceBergen Corp. | 149,925 | $ | 9,160,418 |
| WellCare Health Plans, Inc.* | 143,200 | | 9,986,768 |
| | | | 19,147,186 |
| |
| Household Durables - 2.2% | | | |
| The Ryland Group, Inc. | 202,575 | | 8,212,390 |
| |
| Household Products - 3.1% | | | |
| Church & Dwight Co., Inc. | 194,175 | | 11,660,209 |
| |
| Insurance - 5.2% | | | |
| American Financial Group, Inc. | 179,750 | | 9,717,285 |
| Torchmark Corp. | 139,975 | | 10,127,191 |
| | | | 19,844,476 |
| |
| Internet Software & Services - 2.4% | | | |
| AOL, Inc.* | 264,900 | | 9,160,242 |
| |
| IT Services - 10.1% | | | |
| DST Systems, Inc | 146,550 | | 11,051,336 |
| NeuStar, Inc.* | 182,875 | | 9,048,655 |
| Syntel, Inc. | 154,975 | | 12,413,497 |
| Teradata Corp.* | 105,675 | | 5,858,622 |
| | | | 38,372,110 |
| |
| Leisure Equipment & Products - 2.9% | | | |
| Polaris Industries, Inc. | 84,800 | | 10,954,464 |
| |
| Life Sciences - Tools & Services - 1.5% | | | |
| Mettler-Toledo International, Inc.* | 24,400 | | 5,858,196 |
| |
| Machinery - 5.1% | | | |
| AGCO Corp. | 166,850 | | 10,081,077 |
| Valmont Industries, Inc. | 65,750 | | 9,133,333 |
| | | | 19,214,410 |
| |
| Media - 2.5% | | | |
| Gannett Co., Inc. | 356,260 | | 9,544,205 |
| |
| Metals & Mining - 1.5% | | | |
| Reliance Steel & Aluminum Co. | 77,900 | | 5,707,733 |
| |
| Oil, Gas & Consumable Fuels - 2.6% | | | |
| EPL Oil & Gas, Inc.* | 262,100 | | 9,726,531 |
| |
| Pharmaceuticals - 1.8% | | | |
| Questcor Pharmaceuticals, Inc. | 118,950 | | 6,899,100 |
| |
| Professional Services - 2.4% | | | |
| Corporate Executive Board Co. | 124,950 | | 9,073,869 |
18 www.calvert.com CALVERT CAPITAL ACCUMULATION FUND ANNUAL REPORT
| | | | |
| EQUITY SECURITIES - CONT’D | | SHARES | | VALUE |
| Road & Rail - 2.2% | | | | |
| Old Dominion Freight Line, Inc.* | | 183,850 | $ | 8,455,262 |
| |
| Semiconductors & Semiconductor Equipment - 2.7% | | | | |
| Synaptics, Inc.* | | 228,425 | | 10,114,659 |
| |
| Specialty Retail - 7.9% | | | | |
| Express, Inc.* | | 158,670 | | 3,743,025 |
| Lithia Motors, Inc. | | 78,900 | | 5,756,544 |
| Ross Stores, Inc. | | 149,125 | | 10,856,300 |
| Ulta Salon, Cosmetics & Fragrance, Inc.* | | 82,525 | | 9,858,437 |
| | | | | 30,214,306 |
| |
| Trading Companies & Distributors - 2.7% | | | | |
| WESCO International, Inc.* | | 134,050 | | 10,258,846 |
| |
| Total Equity Securities (Cost $290,523,107) | | | | 365,156,089 |
| |
| |
| | | PRINCIPAL | | |
| HIGH SOCIAL IMPACT INVESTMENTS - 0.4% | | AMOUNT | | |
| Calvert Social Investment Foundation Notes, 0.65%, 7/1/14 (b)(i)(r) | $ | 1,419,488 | | 1,388,117 |
| |
| Total High Social Impact Investments (Cost $1,419,488) | | | | 1,388,117 |
| |
| |
| TIME DEPOSIT - 2.7% | | | | |
| State Street Bank Time Deposit, 0.083%, 10/1/13 | | 10,329,107 | | 10,329,107 |
| |
| Total Time Deposit (Cost $10,329,107) | | | | 10,329,107 |
| |
| TOTAL INVESTMENTS (Cost $302,271,702) - 99.1% | | | | 376,873,313 |
| Other assets and liabilities, net - 0.9% | | | | 3,248,914 |
| NET ASSETS - 100% | | | $ | 380,122,227 |
See notes to financial statements.
www.calvert.com CALVERT CAPITAL ACCUMULATION FUND ANNUAL REPORT 19
| | |
| NET ASSETS CONSIST OF: | | |
| Paid-in capital applicable to the following shares of common stock, | | |
| with 250,000,000 shares of $0.01 par value authorized: | | |
| Class A: 5,626,728 shares outstanding | $ | 143,333,785 |
| Class B: 69,441 shares outstanding | | 2,864,975 |
| Class C: 833,952 shares outstanding | | 19,287,512 |
| Class I: 3,227,583 shares outstanding | | 103,560,867 |
| Class Y: 397,383 shares outstanding | | 12,618,043 |
| Accumulated net realized gain (loss) | | 23,855,434 |
| Net unrealized appreciation (depreciation) | | 74,601,611 |
| |
| NETASSETS | $ | 380,122,227 |
| |
| |
| NET ASSET VALUE PER SHARE | | |
| Class A (based on net assets of $207,256,506) | $ | 36.83 |
| Class B (based on net assets of $2,130,803) | $ | 30.68 |
| Class C (based on net assets of $25,310,582) | $ | 30.35 |
| Class I (based on net assets of $130,705,316) | $ | 40.50 |
| Class Y (based on net assets of $14,719,020) | $ | 37.04 |
| | | |
| RESTRICTED SECURITIES | ACQUISITION DATES | | COST |
| Calvert Social Investment Foundation Notes, 0.65%, 7/1/14 | 7/1/11 | $ | 1,419,488 |
(b) This security was valued under the direction of the Board of Directors. See Note A.
(i) Restricted securities represent 0.4% of the net assets of the Fund.
(r) The coupon rate shown on floating or adjustable rate securities
represents the rate at period end.
* Non-income producing security.
See notes to financial statements.
20 www.calvert.com CALVERT CAPITAL ACCUMULATION FUND ANNUAL REPORT
| | | |
| STATEMENT OF OPERATIONS |
| YEAR ENDED SEPTEMBER 30, 2013 |
| |
| NET INVESTMENT INCOME | | | |
| Investment Income: | | | |
| Dividend income | $ | 2,933,732 | |
| Interest income | | 14,809 | |
| Total investment income | | 2,948,541 | |
| |
| Expenses: | | | |
| Investment advisory fee | | 2,029,599 | |
| Transfer agency fees | | 510,777 | |
| Administrative fees | | 631,238 | |
| Distribution Plan expenses: | | | |
| Class A | | 443,396 | |
| Class B | | 23,788 | |
| Class C | | 217,241 | |
| Directors’ fees and expenses | | 32,764 | |
| Custodian fees | | 39,612 | |
| Registration fees | | 59,943 | |
| Reports to shareholders | | 123,514 | |
| Professional fees | | 36,047 | |
| Miscellaneous | | 34,516 | |
| Total expenses | | 4,182,435 | |
| Reimbursement from Advisor: | | | |
| Class B | | (1,784 | ) |
| Fees paid indirectly | | (237 | ) |
| Net expenses | | 4,180,414 | |
| |
| |
| NET INVESTMENT INCOME (LOSS) | | (1,231,873 | ) |
| |
| |
| REALIZED AND UNREALIZED GAIN (LOSS) ON INVESTMENTS | | | |
| Net realized gain (loss) | | 29,954,124 | |
| Change in unrealized appreciation (depreciation) | | 42,268,831 | |
| |
| NET REALIZED AND UNREALIZED GAIN (LOSS) | | | |
| ON INVESTMENTS | | 72,222,955 | |
| |
| INCREASE (DECREASE) IN NET ASSETS | | | |
| RESULTING FROM OPERATIONS | $ | 70,991,082 | |
See notes to financial statements.
www.calvert.com CALVERT CAPITAL ACCUMULATION FUND ANNUAL REPORT 21
| | | | |
| STATEMENTS OF CHANGES IN NET ASSETS |
| |
| | YEAR
ENDED | | YEAR
ENDED | |
| | SEPTEMBER
30, | | SEPTEMBER
30, | |
| INCREASE (DECREASE) IN NET ASSETS | 2013 | | 2012 | |
| Operations: | | | | |
| Net investment income (loss) | ($1,231,873 | ) | ($1,767,417 | ) |
| Net realized gain (loss) | 29,954,124 | | 19,756,800 | |
| Change in unrealized appreciation (depreciation) | 42,268,831 | | 34,310,824 | |
| |
| |
| INCREASE (DECREASE) IN NET ASSETS | | | | |
| RESULTING FROM OPERATIONS | 70,991,082 | | 52,300,207 | |
| |
| |
| Distributions to shareholders from: | | | | |
| Net realized gain: | | | | |
| Class A shares | (9,698,123 | ) | (9,051,155 | ) |
| Class B shares | (180,146 | ) | (249,905 | ) |
| Class C shares | (1,403,614 | ) | (1,132,502 | ) |
| Class I shares | (4,715,609 | ) | (1,797,811 | ) |
| Class Y shares | (554,741 | ) | (658,920 | ) |
| Total distributions | (16,552,233 | ) | (12,890,293 | ) |
| |
| Capital share transactions: | | | | |
| Shares sold: | | | | |
| Class A shares | 42,043,987 | | 36,446,423 | |
| Class B shares | 67,672 | | 92,690 | |
| Class C shares | 4,406,372 | | 4,353,427 | |
| Class I shares | 50,292,665 | | 66,419,562 | |
| Class Y shares | 5,878,319 | | 8,156,137 | |
| Reinvestment of distributions: | | | | |
| Class A shares | 9,075,751 | | 8,386,664 | |
| Class B shares | 174,457 | | 242,281 | |
| Class C shares | 1,127,656 | | 930,598 | |
| Class I shares | 2,014,949 | | 1,269,766 | |
| Class Y shares | 179,841 | | 512,505 | |
| Redemption fees: | | | | |
| Class A shares | 2,506 | | 5,080 | |
| Class C shares | 99 | | 11 | |
| Class I shares | 108 | | 487 | |
| Shares redeemed: | | | | |
| Class A shares | (31,009,177 | ) | (42,921,921 | ) |
| Class B shares | (1,122,203 | ) | (1,309,090 | ) |
| Class C shares | (2,157,040 | ) | (2,194,144 | ) |
| Class I shares | (23,472,428 | ) | (13,311,711 | ) |
| Class Y shares | (1,424,684 | ) | (10,853,081 | ) |
| Total capital share transactions | 56,078,850 | | 56,225,684 | |
| |
| |
| |
| TOTAL INCREASE (DECREASE) IN NET ASSETS | 110,517,699 | | 95,635,598 | |
See notes to financial statements.
22 www.calvert.com CALVERT CAPITAL ACCUMULATION FUND ANNUAL REPORT
| | | | | | |
| STATEMENTS OF CHANGES IN NET ASSETS |
| |
| | | YEAR
ENDED | | | YEAR
ENDED | |
| | | SEPTEMBER
30, | | | SEPTEMBER
30, | |
| NET ASSETS | | 2013 | | | 2012 | |
| Beginning of year | $ | 269,604,528 | | $ | 173,968,930 | |
| End of year (including net investment | | | | | | |
| loss of $0 and $977,921, respectively) | $ | 380,122,227 | | $ | 269,604,528 | |
| |
| |
| CAPITAL SHARE ACTIVITY | | | | | | |
| Shares sold: | | | | | | |
| Class A shares | | 1,274,675 | | | 1,205,547 | |
| Class B shares | | 2,424 | | | 3,733 | |
| Class C shares | | 162,539 | | | 170,053 | |
| Class I shares | | 1,377,336 | | | 2,040,204 | |
| Class Y shares | | 177,940 | | | 265,544 | |
| Reinvestment of distributions: | | | | | | |
| Class A shares | | 304,868 | | | 294,165 | |
| Class B shares | | 6,951 | | | 9,845 | |
| Class C shares | | 45,660 | | | 38,566 | |
| Class I shares | | 61,883 | | | 41,199 | |
| Class Y shares | | 6,017 | | | 17,951 | |
| Shares redeemed: | | | | | | |
| Class A shares | | (945,725 | ) | | (1,458,279 | ) |
| Class B shares | | (40,687 | ) | | (50,530 | ) |
| Class C shares | | (78,882 | ) | | (85,911 | ) |
| Class I shares | | (645,434 | ) | | (404,418 | ) |
| Class Y shares | | (42,318 | ) | | (333,904 | ) |
| Total capital share activity | | 1,667,247 | | | 1,753,765 | |
See notes to financial statements.
www.calvert.com CALVERT CAPITAL ACCUMULATION FUND ANNUAL REPORT 23
NOTES TO FINANCIAL STATEMENTS
NOTE A — SIGNIFICANT ACCOUNTING POLICIES
General: Calvert Capital Accumulation Fund (the “Fund”), a series of Calvert World Values Fund, Inc., is registered under the Investment Company Act of 1940 as a non-diversified, open-end management investment company. Calvert World Values Fund, Inc. is comprised of four separate series. The operations of each series are accounted for separately. The Fund offers five classes of shares of capital stock - Classes A, B, C, I, and Y. Class A shares are sold with a maximum front-end sales charge of 4.75%. Class B shares are sold without a front-end sales charge and, with certain exceptions, will be charged a deferred sales charge at the time of redemption, depending on how long investors have owned the shares. Class B shares are no longer offered for purchase, except through reinvestment of dividends and/or distributions and through certain exchanges. Class C shares are sold without a front-end sales charge and, with certain exceptions, will be charged a deferred sales charge on shares sold within one year of purchase. Class B and Class C shares have higher levels of expenses than Class A shares. Class I shares require a minimum account balance of $1,000,000. The $1 million minimum initial investment is waived for retirement plans that trade through omnibus accounts and may be waived for certain other institutional accounts where it is believed to be in the best interest of the Fund and its shareholders. Class I shares have no front-end or deferred sales charge and have lower levels of expenses than Class A Shares. Class Y shares are generally only available to wrap or similar fee-based programs offered by financial intermediaries that have entered into an agreement with the Fund’s Distributor to offer Class Y shares. Class Y shares have no front-end or deferred sales charge and have lower levels of expenses than Class A shares. Each class has different: (a) dividend rates, due to differences in Distribution Plan expenses and other class-specific expenses, (b) exchange privileges; and (c) class-specific voting rights.
Security Valuation: Net asset value per share is determined every business day as of the close of the regular session of the New York Stock Exchange (generally 4:00 p.m. Eastern time). The Fund uses independent pricing services approved by the Board of Directors (“the Board”) to value its investments wherever possible. Investments for which market quotations are not available or deemed not reliable are fair valued in good faith under the direction of the Board.
The Board has adopted Valuation Procedures (the “Procedures”) to determine the fair value of securities and other financial instruments for which market prices are not readily available or which may not be reliably priced. The Board has delegated the day-to-day responsibility for determining the fair value of assets of the Fund to Calvert Investment Management, Inc. (the “Advisor” or “Calvert”) and has provided these Procedures to govern Calvert in its valuation duties.
Calvert has chartered an internal Valuation Committee to oversee the implementation of these Procedures and to assist it in carrying out the valuation responsibilities that the Board has delegated.
The Valuation Committee meets on a regular basis to review illiquid securities and other investments which may not have readily available market prices. The Valuation Committee’s fair valuation determinations are subject to review, approval and ratifica-
24 www.calvert.com CALVERT CAPITAL ACCUMULATION FUND ANNUAL REPORT
tion by the Board at its next regularly scheduled meeting covering the calendar quarter in which the fair valuation was determined.
The Valuation Committee utilizes various methods to measure the fair value of the Funds’ investments. Generally Accepted Accounting Principles (GAAP) establishes a disclosure hierarchy that categorizes the inputs to valuation techniques used to value assets and liabilities at measurement date. These inputs are summarized in the three broad levels listed below:
Level 1 – quoted prices in active markets for identical securities
Level 2 – other significant observable inputs (including quoted prices for similar securities, interest rates, prepayment speeds, credit risk, etc.)
Level 3 – significant unobservable inputs (including the Fund’s own assumptions in determining the fair value of investments) The inputs or methodologies used for valuing securities are not necessarily an indication of the risk associated with investing in those securities.
Changes in valuation techniques may result in transfers in or out of an investment’s assigned level within the hierarchy during the period. There were no such transfers during the period. Valuation techniques used to value the Funds’ investments by major category are as follows: Equity securities, including restricted securities, for which market quotations are readily available, are valued at the last reported sale price or official closing price as reported by an independent pricing service on the primary market or exchange on which they are traded and are categorized as Level 1 in the hierarchy. In the event there were no sales during the day or closing prices are not available, securities are valued at the last quoted bid price or using the last available price and are categorized as Level 2 in the hierarchy. Foreign securities are valued based on quotations from the principal market in which such securities are normally traded. If events occur after the close of the principal market in which foreign securities are traded, and before the close of business of the Fund, that are expected to materially affect the value of those securities, then they are valued at their fair value taking these events into account. For restricted securities and private placements where observable inputs are limited, assumptions about market activity and risk are used and such securities are categorized as Level 3 in the hierarchy.
Debt securities, including restricted securities, are valued based on evaluated prices received from independent pricing services or from dealers who make markets in such securities and are generally categorized as Level 2 in the hierarchy. Short-term securities of sufficient credit quality with remaining maturities of sixty days or less for which quotations are not readily available are valued at amortized cost, which approximates fair value, and are categorized as Level 2 in the hierarchy.
When independent prices are unavailable or unreliable, debt securities may be valued utilizing pricing matrices which consider similar factors that would be used by independent pricing services. These are generally categorized as Level 2 in the hierarchy but may be Level 3 depending on the circumstances.
www.calvert.com CALVERT CAPITAL ACCUMULATION FUND ANNUAL REPORT 25
If a market value cannot be determined for a security using the methodologies described above, or if, in the good faith opinion of the Advisor, the market value does not constitute a readily available market quotation, or if a significant event has occurred that would materially affect the value of the security, the security will be fair valued as determined in good faith by the Valuation Committee.
The Valuation Committee considers a number of factors, including significant unobservable valuation inputs when arriving at fair value. It considers all significant facts that are reasonably available and relevant to the determination of fair value.
The Valuation Committee primarily employs a market-based approach which may use related or comparable assets or liabilities, recent transactions, market multiples, book values, and other relevant information for the investment to determine the fair value of the investment. When more appropriate, the fund may employ an income-based or cost approach. An income-based valuation approach discounts anticipated future cash flows of the investment to calculate a present amount (discounted). The measurement is based on the value indicated by current market expectations about those future amounts. Discounts may also be applied due to the nature or duration of any restrictions on the disposition of the investments. A cost based approach is based on the amount that currently would be required to replace the service capacity of an asset (current replacement cost). From the seller’s perspective, the price that would be received for the asset is determined based on the cost to a buyer to acquire or construct a substitute asset of comparable utility, adjusted for obsolescence.
The values assigned to fair value investments are based on available information and do not necessarily represent amounts that might ultimately be realized. Further, due to the inherent uncertainty of valuations of such investments, the fair values may differ significantly from the values that would have been used had an active market existed, and the differences could be material. The Valuation Committee employs various methods for calibrating these valuation approaches including a regular review of key inputs and assumptions, transactional back-testing or disposition analysis and reviews of any related market activity.
At September 30, 2013, securities valued at $1,388,117, or 0.4% of net assets, were fair valued in good faith under the direction of the Board.
The following is a summary of the inputs used to value the Fund’s net assets as of September 30, 2013:
| | | VALUATION INPUTS | |
| INVESTMENTS IN SECURITIES | LEVEL 1 | LEVEL 2 | LEVEL 3 | TOTAL |
| Equity securities* | $365,156,089 | — | — | $365,156,089 |
| Other debt obligations | — | $11,717,224 | — | 11,717,224 |
| TOTAL | $365,156,089 | $11,717,224 | — | $376,873,313 |
* For further breakdown of equity securities by industry type, please refer to the Statement of Net Assets.
26 www.calvert.com CALVERT CAPITAL ACCUMULATION FUND ANNUAL REPORT
Restricted Securities: The Fund may invest in securities that are subject to legal or contractual restrictions on resale. Generally, these securities may only be sold publicly upon registration under the Securities Act of 1933 or in transactions exempt from such registration. Information regarding restricted securities is included at the end of the Statement of Net Assets.
Security Transactions and Net Investment Income: Security transactions are accounted for on trade date. Realized gains and losses are recorded on an identified cost basis and may include proceeds from litigation. Dividend income is recorded on the ex-dividend date. Distributions received on securities that represent a return of capital or capital gain are recorded as a reduction of cost investments and/or as a realized gain. Interest income, which includes amortization of premium and accretion of discount on debt securities, is accrued as earned. Investment income and realized and unrealized gains and losses are allocated to separate classes of shares based upon the relative net assets of each class. Expenses arising in connection with a specific class are charged directly to that class. Expenses common to the classes are allocated to each class in proportion to their relative net assets.
Distributions to Shareholders: Distributions to shareholders are recorded by the Fund on ex-dividend date. Dividends from net investment income and distributions from net realized capital gains, if any, are paid at least annually. Distributions are determined in accordance with income tax regulations which may differ from generally accepted accounting principles; accordingly, periodic reclassifications are made within the Fund’s capital accounts to reflect income and gains available for distribution under income tax regulations.
Estimates: The preparation of financial statements in conformity with accounting principles generally accepted in the United States requires management to make estimates and assumptions that affect the reported amounts of assets and liabilities and disclosure of contingent assets and liabilities at the date of the financial statements and the reported amounts of income and expenses during the reporting period. Actual results could differ from those estimates.
Redemption Fees: The Fund charges a 2% redemption fee on redemptions, including exchanges, made within 30 days of purchase (within seven days for Class I shares). The redemption fee is accounted for as an addition to paid-in capital and is intended to discourage market-timers by ensuring that short-term trading costs are borne by the investors making the transactions and not the shareholders already in the Fund.
Expense Offset Arrangement: The Fund had an arrangement with the custodian bank whereby the custodian’s fees may have been paid indirectly by credits earned on the Fund’s cash on deposit with the bank. These credits were used to reduce the Fund’s expenses. This arrangement was suspended on January 1, 2013, until further notice, due to low interest rates. Such a deposit arrangement was an alternative to overnight investments.
Federal Income Taxes: No provision for federal income or excise tax is required since the Fund intends to continue to qualify as a regulated investment company under the Internal Revenue Code and to distribute substantially all of its taxable earnings.
Management has analyzed the Fund’s tax positions taken for all open federal income tax years and has concluded that no provision for federal income tax is required in the Fund’s financial statements. A Fund’s federal tax return is subject to examination by the Internal Revenue Service for a period of three years.
www.calvert.com CALVERT CAPITAL ACCUMULATION FUND ANNUAL REPORT 27
NOTE B — RELATED PARTY TRANSACTIONS
Calvert Investment Management, Inc. (the “Advisor”) is wholly-owned by Calvert Investments, Inc., which is indirectly wholly-owned by Ameritas Mutual Holding Company. The Advisor provides investment advisory services and pays the salaries and fees of officers and Directors of the Fund who are employees of the Advisor or its affiliates. For its services, the Advisor receives an annual fee, payable monthly, of .65% of the Fund’s average daily net assets. Under the terms of the agreement, $206,171 was payable at year end. In addition, $25,145 was payable at year end for operating expenses paid by the Advisor during September 2013.
The Advisor has contractually agreed to limit net annual fund operating expenses through January 31, 2014. The contractual expense cap is 1.59%, 2.59%, .86%, and 1.44% for Class A, C, I, and Y, respectively. For the purpose of this expense limit, operating expenses do not include interest expense, brokerage commissions, taxes, and extraordinary expenses. This expense limitation does not limit acquired fund fees and expenses, if any. To the extent that any expense offset credits were earned, the Advisor’s obligation under the contractual limitation may have been reduced and the Advisor may have benefited from the expense offset arrangement.
During the year ended September 30, 2013, the Advisor voluntarily reimbursed expenses of $1,784 for Class B of the Fund.
Calvert Investment Administrative Services, Inc., an affiliate of the Advisor, provides administrative services to the Fund for an annual fee, payable monthly, of .25% for Classes A, B, C, and Y, and .10% for Class I shares based on their average daily net assets. Under the terms of the agreement, $62,940 was payable at year end.
Calvert Investment Distributors, Inc. (“CID”), an affiliate of the Advisor, is the distributor and principal underwriter for the Fund. Pursuant to Rule 12b-1 under the Investment Company Act of 1940, the Fund has adopted a Distribution Plan that permits the Fund to pay certain expenses associated with the distribution and servicing of its shares. The expenses paid may not exceed .35%, 1.00% and 1.00% annually of average daily net assets of Classes A, B, and C, respectively. The amount actually paid by the Fund is an annualized fee, payable monthly, of .25%, 1.00% and 1.00% of the Fund’s average daily net assets of Classes A, B, and C, respectively. Class I and Class Y shares do not have Distribution Plan expenses. Under the terms of the agreement, $66,172 was payable at year end.
CID received $81,328 as its portion of the commissions charged on sales of the Fund’s Class A shares for the year ended September 30, 2013.
Calvert Investment Services, Inc. (“CIS”), an affiliate of the Advisor, acts as shareholder servicing agent for the Fund. For its services, CIS received a fee of $101,314 for the year ended September 30, 2013. Under the terms of the agreement, $7,374 was payable at year end. Boston Financial Data Services, Inc. is the transfer and dividend disbursing agent.
The Fund may invest in Community Investment Notes issued by the Calvert Social Investment Foundation (the “CSI Foundation”). The CSI Foundation is a 501(c)(3) non-profit organization that receives in-kind support from Calvert and its subsidiaries. The Fund has received an exemptive order from the Securities and Exchange Commission permitting the Fund to make investments in these notes under certain conditions.
28 www.calvert.com CALVERT CAPITAL ACCUMULATION FUND ANNUAL REPORT
Each Director of the Fund who is not an employee of the Advisor or its affiliates receives an annual retainer of $48,000 plus a meeting fee of up to $3,000 for each Board meeting attended. Additional fees of up to $5,000 annually may be paid to the Board chairs and Committee chairs ($10,000 for Special Equities Committee chair) and $2,500 annually may be paid to Committee members, plus a Committee meeting fee of $500 for each Committee meeting attended. Directors’ fees are allocated to each of the funds served.
NOTE C — INVESTMENT ACTIVITY AND TAX INFORMATION
During the year, the cost of purchases and proceeds from sales of investments, other than short-term securities, were $254,352,719 and $224,260,435, respectively.
| CAPITAL LOSS CARRYFORWARDS | | |
| EXPIRATION DATE | | |
| 30-Sep-16 | ($1,027,669 | ) |
Under the Regulated Investment Company Modernization Act of 2010, capital losses incurred in taxable years beginning after December 22, 2010 can be carried forward for an unlimited period. These losses are required to be utilized prior to the losses incurred in pre-enactment taxable years and will retain their character as either long-term or short-term. Losses incurred in pre-enactment taxable years can be utilized until expiration. The Fund’s use of net capital losses acquired from Calvert MidCap Value Fund may be limited under certain tax provisions.
The tax character of dividends and distributions paid during the years ended September 30, 2013 and September 30, 2012 was as follows:
| | |
| Distributions paid from: | 2013 | 2012 |
| Ordinary income | $749,994 | — |
| Long-term capital gain | 15,802,239 | $12,890,293 |
| Total | $16,552,233 | $12,890,293 |
As of September 30, 2013, the tax basis components of distributable earnings/(accumulated losses) and the federal tax cost were as follows:
| Unrealized appreciation | $78,838,637 | |
| Unrealized (depreciation) | (4,457,445 | ) |
| Net unrealized appreciation/(depreciation) | $74,381,192 | |
| |
| Undistributed ordinary income | $6,163,453 | |
| Undistributed long-term capital gain | $18,940,069 | |
| Capital loss carryforward | ($1,027,669 | ) |
| |
| Federal income tax cost of investments | $302,492,121 | |
www.calvert.com CALVERT CAPITAL ACCUMULATION FUND ANNUAL REPORT 29
The differences between the components of distributable earnings on a tax basis and the amounts reflected in the statement of net assets are primarily due to temporary book-tax differences that will reverse in a subsequent period. These book-tax differences are mainly due to wash sales and capital loss limitations under Internal Revenue Code Section 382.
Reclassifications, as shown in the table below, have been made to the Fund’s components of net assets to reflect income and gains available for distribution (or available capital loss carryforwards, as applicable) under income tax law and regulations. These reclassifications are due to permanent book-tax differences and have no impact on net assets. The primary permanent differences causing such reclassification for the Fund are due to net operating losses.
| Undistributed net investment income | $2,209,794 | |
| Accumulated net realized gain (loss) | (1,231,873 | ) |
| Paid-in capital | (977,921 | ) |
NOTE D — LINE OF CREDIT
A financing agreement is in place with the Calvert Funds and State Street Corporation (“SSC”). Under the agreement, SSC provides an unsecured line of credit facility, in the aggregate amount of $50 million ($25 million committed and $25 million uncommitted), accessible by the Funds for temporary or emergency purposes only. Borrowings under the committed facility bear interest at the higher of the London Interbank Offered Rate (LIBOR) or the overnight Federal Funds Rate plus 1.25% per annum. A commitment fee of .11% per annum is incurred on the unused portion of the committed facility, which is allocated to all participating funds. The Fund had no loans outstanding pursuant to this line of credit at September 30, 2013. For the year ended September 30, 2013, borrowings by the Fund under the agreement were as follows:
| AVERAGE DAILY | WEIGHTED AVERAGE | MAXIMUM AMOUNT | MONTH OF MAXIMUM |
| BALANCE | INTEREST RATE | BORROWED | AMOUNT BORROWED |
| $14,733 | 1.46% | $1,975,027 | December 2012 |
NOTE E — SUBSEQUENT EVENTS
In preparing the financial statements as of September 30, 2013, no subsequent events or transactions occurred that would have required recognition or disclosure in these financial statements.
30 www.calvert.com CALVERT CAPITAL ACCUMULATION FUND ANNUAL REPORT
| | | | | | | | | |
| FINANCIAL HIGHLIGHTS |
| |
| | | | | | YEARS ENDED | | | | |
| | | SEPTEMBER
30, | | | SEPTEMBER
30, | | | SEPTEMBER
30, | |
| CLASS A SHARES | | 2013 | (z) | | 2012 | (z) | | 2011 | (z) |
| Net asset value, beginning | $ | 31.45 | | $ | 26.00 | | $ | 24.93 | |
| Income from investment operations: | | | | | | | | | |
| Net investment income (loss) | | (.18 | ) | | (.26 | ) | | (.28 | ) |
| Net realized and unrealized gain (loss) | | 7.49 | | | 7.64 | | | 1.35 | |
| Total from investment operations | | 7.31 | | | 7.38 | | | 1.07 | |
| Distributions from: | | | | | | | | | |
| Net realized gain | | (1.93 | ) | | (1.93 | ) | | — | |
| Total distributions | | (1.93 | ) | | (1.93 | ) | | — | |
| Total increase (decrease) in net asset value | | 5.38 | | | 5.45 | | | 1.07 | |
| Net asset value, ending | $ | 36.83 | | $ | 31.45 | | $ | 26.00 | |
| |
| Total return* | | 24.74 | % | | 29.16 | % | | 4.29 | % |
| Ratios to average net assets: A | | | | | | | | | |
| Net investment income (loss) | | (.53 | %) | | (.85 | %) | | (.93 | %) |
| Total expenses | | 1.48 | % | | 1.53 | % | | 1.58 | % |
| Expenses before offsets | | 1.48 | % | | 1.53 | % | | 1.58 | % |
| Net expenses | | 1.48 | % | | 1.53 | % | | 1.58 | % |
| Portfolio turnover | | 73 | % | | 63 | % | | 65 | % |
| Net assets, ending (in thousands) | $ | 207,257 | | $ | 157,016 | | $ | 128,755 | |
| |
| | | | | | YEARS ENDED | |
| | | | | | SEPTEMBER
30, | | | SEPTEMBER
30, | |
| CLASS A SHARES | | | | | 2010 | | | 2009 | |
| Net asset value, beginning | | | | $ | 20.71 | | $ | 23.00 | |
| Income from investment operations: | | | | | | | | | |
| Net investment income (loss) | | | | | (.25 | ) | | (.17 | ) |
| Net realized and unrealized gain (loss) | | | | | 4.47 | | | (2.12 | ) |
| Total from investment operations | | | | | 4.22 | | | (2.29 | ) |
| Total increase (decrease) in net asset value | | | | | 4.22 | | | (2.29 | ) |
| Net asset value, ending | | | | $ | 24.93 | | $ | 20.71 | |
| |
| Total return* | | | | | 20.38 | % | | (9.96 | %) |
| Ratios to average net assets: A | | | | | | | | | |
| Net investment income (loss) | | | | | (1.08 | %) | | (.92 | %) |
| Total expenses | | | | | 1.76 | % | | 1.88 | % |
| Expenses before offsets | | | | | 1.76 | % | | 1.88 | % |
| Net expenses | | | | | 1.76 | % | | 1.88 | % |
| Portfolio turnover | | | | | 87 | % | | 72 | % |
| Net assets, ending (in thousands) | | | | $ | 86,635 | | $ | 72,289 | |
See notes to financial highlights.
www.calvert.com CALVERT CAPITAL ACCUMULATION FUND ANNUAL REPORT 31
| | | | | | | | | |
| FINANCIAL HIGHLIGHTS |
| |
| | | | | | YEARS ENDED | | | | |
| | | SEPTEMBER
30, | | | SEPTEMBER
30, | | | SEPTEMBER
30, | |
| CLASS B SHARES | | 2013 | (z) | | 2012 | (z) | | 2011 | (z) |
| Net asset value, beginning | $ | 26.86 | | $ | 22.72 | | $ | 22.03 | |
| Income from investment operations: | | | | | | | | | |
| Net investment income (loss) | | (.52 | ) | | (.55 | ) | | (.55 | ) |
| Net realized and unrealized gain (loss) | | 6.27 | | | 6.62 | | | 1.24 | |
| Total from investment operations | | 5.75 | | | 6.07 | | | .69 | |
| Distributions from: | | | | | | | | | |
| Net realized gain | | (1.93 | ) | | (1.93 | ) | | — | |
| Total distributions | | (1.93 | ) | | (1.93 | ) | | — | |
| Total increase (decrease) in net asset value | | 3.82 | | | 4.14 | | | .69 | |
| Net asset value, ending | $ | 30.68 | | $ | 26.86 | | $ | 22.72 | |
| |
| Total return* | | 23.05 | % | | 27.50 | % | | 3.13 | % |
| Ratios to average net assets: A | | | | | | | | | |
| Net investment income (loss) | | (1.88 | %) | | (2.12 | %) | | (2.07 | %) |
| Total expenses | | 2.93 | % | | 2.80 | % | | 2.72 | % |
| Expenses before offsets | | 2.86 | % | | 2.80 | % | | 2.72 | % |
| Net expenses | | 2.86 | % | | 2.80 | % | | 2.71 | % |
| Portfolio turnover | | 73 | % | | 63 | % | | 65 | % |
| Net assets, ending (in thousands) | $ | 2,131 | | $ | 2,707 | | $ | 3,129 | |
| |
| | | | | | YEARS ENDED | |
| | | | | | SEPTEMBER
30, | | | SEPTEMBER
30, | |
| CLASS B SHARES | | | | | 2010 | | | 2009 | |
| Net asset value, beginning | | | | $ | 18.50 | | $ | 20.78 | |
| Income from investment operations: | | | | | | | | | |
| Net investment income (loss) | | | | | (.53 | ) | | (.39 | ) |
| Net realized and unrealized gain (loss) | | | | | 4.06 | | | (1.89 | ) |
| Total from investment operations | | | | | 3.53 | | | (2.28 | ) |
| Total increase (decrease) in net asset value | | | | | 3.53 | | | (2.28 | ) |
| Net asset value, ending | | | | $ | 22.03 | | $ | 18.50 | |
| |
| Total return* | | | | | 19.08 | % | | (10.97 | %) |
| Ratios to average net assets:A | | | | | | | | | |
| Net investment income (loss) | | | | | (2.17 | %) | | (2.04 | %) |
| Total expenses | | | | | 2.84 | % | | 2.99 | % |
| Expenses before offsets | | | | | 2.84 | % | | 2.99 | % |
| Net expenses | | | | | 2.84 | % | | 2.99 | % |
| Portfolio turnover | | | | | 87 | % | | 72 | % |
| Net assets, ending (in thousands) | | | | $ | 4,138 | | $ | 4,793 | |
See notes to financial highlights.
32 www.calvert.com CALVERT CAPITAL ACCUMULATION FUND ANNUAL REPORT
| | | | | | | | | |
| FINANCIAL HIGHLIGHTS |
| |
| | | | | | YEARS ENDED | | | | |
| | | SEPTEMBER
30, | | | SEPTEMBER
30, | | | SEPTEMBER
30, | |
| CLASS C SHARES | | 2013 | (z) | | 2012 | (z) | | 2011 | (z) |
| Net asset value, beginning | $ | 26.44 | | $ | 22.29 | | $ | 21.55 | |
| Income from investment operations: | | | | | | | | | |
| Net investment income (loss) | | (.36 | ) | | (.42 | ) | | (.46 | ) |
| Net realized and unrealized gain (loss) | | 6.20 | | | 6.50 | | | 1.20 | |
| Total from investment operations | | 5.84 | | | 6.08 | | | .74 | |
| Distributions from: | | | | | | | | | |
| Net realized gain | | (1.93 | ) | | (1.93 | ) | | — | |
| Total distributions | | (1.93 | ) | | (1.93 | ) | | — | |
| Total increase (decrease) in net asset value | | 3.91 | | | 4.15 | | | .74 | |
| Net asset value, ending | $ | 30.35 | | $ | 26.44 | | $ | 22.29 | |
| |
| Total return* | | 23.81 | % | | 28.11 | % | | 3.43 | % |
| Ratios to average net assets: A | | | | | | | | | |
| Net investment income (loss) | | (1.30 | %) | | (1.64 | %) | | (1.79 | %) |
| Total expenses | | 2.25 | % | | 2.33 | % | | 2.44 | % |
| Expenses before offsets | | 2.25 | % | | 2.33 | % | | 2.44 | % |
| Net expenses | | 2.25 | % | | 2.33 | % | | 2.44 | % |
| Portfolio turnover | | 73 | % | | 63 | % | | 65 | % |
| Net assets, ending (in thousands) | $ | 25,311 | | $ | 18,630 | | $ | 12,973 | |
| |
| | | | | | YEARS ENDED | |
| | | | | | SEPTEMBER
30, | | | SEPTEMBER
30, | |
| CLASS C SHARES | | | | | 2010 | | | 2009 | |
| Net asset value, beginning | | | | $ | 18.05 | | $ | 20.20 | |
| Income from investment operations: | | | | | | | | | |
| Net investment income (loss) | | | | | (.39 | ) | | (.28 | ) |
| Net realized and unrealized gain (loss) | | | | | 3.89 | | | (1.87 | ) |
| Total from investment operations | | | | | 3.50 | | | (2.15 | ) |
| Total increase (decrease) in net asset value | | | | | 3.50 | | | (2.15 | ) |
| Net asset value, ending | | | | $ | 21.55 | | $ | 18.05 | |
| |
| Total return* | | | | | 19.39 | % | | (10.64 | %) |
| Ratios to average net assets: A | | | | | | | | | |
| Net investment income (loss) | | | | | (1.87 | %) | | (1.75 | %) |
| Total expenses | | | | | 2.54 | % | | 2.71 | % |
| Expenses before offsets | | | | | 2.54 | % | | 2.71 | % |
| Net expenses | | | | | 2.54 | % | | 2.70 | % |
| Portfolio turnover | | | | | 87 | % | | 72 | % |
| Net assets, ending (in thousands) | | | | $ | 9,449 | | $ | 8,287 | |
See notes to financial highlights.
www.calvert.com CALVERT CAPITAL ACCUMULATION FUND ANNUAL REPORT 33
| | | | | | | | | |
| FINANCIAL HIGHLIGHTS |
| |
| | | | | | YEARS ENDED | | | | |
| | | SEPTEMBER
30, | | | SEPTEMBER
30, | | | SEPTEMBER
30, | |
| CLASS I SHARES | | 2013 | (z) | | 2012 | (z) | | 2011 | (z) |
| Net asset value, beginning | $ | 34.18 | | $ | 27.94 | | $ | 26.59 | |
| Income from investment operations: | | | | | | | | | |
| Net investment income (loss) | | .03 | | | (.05 | ) | | (.06 | ) |
| Net realized and unrealized gain (loss) | | 8.22 | | | 8.22 | | | 1.41 | |
| Total from investment operations | | 8.25 | | | 8.17 | | | 1.35 | |
| Distributions from: | | | | | | | | | |
| Net realized gain | | (1.93 | ) | | (1.93 | ) | | — | |
| Total distributions | | (1.93 | ) | | (1.93 | ) | | — | |
| Total increase (decrease) in net asset value | | 6.32 | | | 6.24 | | | 1.35 | |
| Net asset value, ending | $ | 40.50 | | $ | 34.18 | | $ | 27.94 | |
| |
| Total return* | | 25.55 | % | | 30.00 | % | | 5.08 | % |
| Ratios to average net assets:A | | | | | | | | | |
| Net investment income (loss) | | .08 | % | | (.16 | %) | | (.20 | %) |
| Total expenses | | .85 | % | | .88 | % | | .99 | % |
| Expenses before offsets | | .85 | % | | .86 | % | | .86 | % |
| Net expenses | | .85 | % | | .86 | % | | .86 | % |
| Portfolio turnover | | 73 | % | | 63 | % | | 65 | % |
| Net assets, ending (in thousands) | $ | 130,705 | | $ | 83,181 | | $ | 21,144 | |
| |
| | | | | | YEARS ENDED | |
| | | | | | SEPTEMBER
30, | | | SEPTEMBER
30, | |
| CLASS I SHARES | | | | | 2010 | | | 2009 | |
| Net asset value, beginning | | | | $ | 21.89 | | $ | 24.06 | |
| Income from investment operations: | | | | | | | | | |
| Net investment income (loss) | | | | | (.04 | ) | | .02 | |
| Net realized and unrealized gain (loss) | | | | | 4.74 | | | (2.19 | ) |
| Total from investment operations | | | | | 4.70 | | | (2.17 | ) |
| Total increase (decrease) in net asset value | | | | | 4.70 | | | (2.17 | ) |
| Net asset value, ending | | | | $ | 26.59 | | $ | 21.89 | |
| |
| Total return* | | | | | 21.47 | % | | (9.02 | %) |
| Ratios to average net assets:A | | | | | | | | | |
| Net investment income (loss) | | | | | (.19 | %) | | .10 | % |
| Total expenses | | | | | 1.12 | % | | 1.28 | % |
| Expenses before offsets | | | | | .86 | % | | .86 | % |
| Net expenses | | | | | .86 | % | | .86 | % |
| Portfolio turnover | | | | | 87 | % | | 72 | % |
| Net assets, ending (in thousands) | | | | $ | 7,138 | | $ | 3,837 | |
See notes to financial highlights.
34 www.calvert.com CALVERT CAPITAL ACCUMULATION FUND ANNUAL REPORT
| | | | | | |
| FINANCIAL HIGHLIGHTS |
| |
| | | | PERIODS ENDED | | | |
| | SEPTEMBER
30, | | SEPTEMBER
30, | | SEPTEMBER
30, | |
| CLASS Y SHARES | 2013 | (z) | 2012 | (z) | 2011 | (z) # |
| Net asset value, beginning | $31.56 | | $26.03 | | $29.79 | |
| Income from investment operations: | | | | | | |
| Net investment income (loss) | (.12 | ) | (.18 | ) | (.15 | ) |
| Net realized and unrealized gain (loss) | 7.53 | | 7.64 | | (3.61 | ) |
| Total from investment operations | 7.41 | | 7.46 | | (3.76 | ) |
| Distributions from: | | | | | | |
| Net realized gain | (1.93 | ) | (1.93 | ) | — | |
| Total distributions | (1.93 | ) | (1.93 | ) | — | |
| Total increase (decrease) in net asset value | 5.48 | | 5.53 | | (3.76 | ) |
| Net asset value, ending | $37.04 | | $31.56 | | $26.03 | |
| |
| Total return* | 24.98 | % | 29.45 | % | (12.62 | %) |
| Ratios to average net assets: A | | | | | | |
| Net investment income (loss) | (.36 | %) | (.59 | %) | (.74 | %) (a) |
| Total expenses | 1.29 | % | 1.29 | % | 1.49 | % (a) |
| Expenses before offsets | 1.29 | % | 1.29 | % | 1.44 | % (a) |
| Net expenses | 1.29 | % | 1.29 | % | 1.44 | % (a) |
| Portfolio turnover | 73 | % | 63 | % | 65 | %** |
| Net assets, ending (in thousands) | $14,719 | | $8,071 | | $7,968 | |
A Total expenses do not reflect amounts reimbursed and/or waived by the Advisor or reductions from expense offset arrangements. Expenses before offsets reflect expenses after reimbursement and/or waiver by the Advisor but prior to reductions from expense offset arrangements. Net expenses are net of all reductions and represent the net expenses paid by the Fund.
(a) Annualized.
(z) Per share figures are calculated using the Average Shares Method.
* Total return is not annualized for periods of less than one year and does not reflect deduction of any front-end or deferred sales charge.
** Portfolio turnover is not annualized for periods of less than one year.
# From January 31, 2011, inception.
See notes to financial statements.
www.calvert.com CALVERT CAPITAL ACCUMULATION FUND ANNUAL REPORT 35
EXPLANATION OF FINANCIAL TABLES
SCHEDULE OF INVESTMENTS
The Schedule of Investments is a snapshot of all securities held in the fund at their market value, on the last day of the reporting period. Securities are listed by asset type (e.g., common stock, corporate bonds, U.S. government obligations) and may be further broken down into sub-groups and by industry classification.
STATEMENT OF ASSETS AND LIABILITIES
The Statement of Assets and Liabilities is often referred to as the fund’s balance sheet. It lists the value of what the fund owns, is due and owes on the last day of the reporting period. The fund’s assets include the market value of securities owned, cash, receivables for securities sold and shareholder subscriptions, and receivables for dividends and interest payments that have been earned, but not yet received. The fund’s liabilities include payables for securities purchased and shareholder redemptions, and expenses owed but not yet paid. The statement also reports the fund’s net asset value (NAV) per share on the last day of the reporting period. The NAV is calculated by dividing the fund’s net assets (assets minus liabilities) by the number of shares outstanding. This statement is accompanied by a Schedule of Investments. Alternatively, if certain conditions are met, a Statement of Net Assets may be presented in lieu of this statement and the Schedule of Investments.
STATEMENT OF NET ASSETS
The Statement of Net Assets provides a detailed list of the fund’s holdings, including each security’s market value on the last day of the reporting period. The Statement of Net Assets includes a Schedule of Investments. Other assets are added and other liabilities subtracted from the investments total to calculate the fund’s net assets. Finally, net assets are divided by the outstanding shares of the fund to arrive at its share price, or Net Asset Value (NAV) per share.
At the end of the Statement of Net Assets is a table displaying the composition of the fund’s net assets. Paid in Capital is the money invested by shareholders and represents the bulk of net assets. Undistributed Net Investment Income and Accumulated Net Realized Gains usually approximate the amounts the fund had available to distribute to shareholders as of the statement date. Accumulated Realized Losses will appear as negative balances. Unrealized Appreciation (Depreciation) is the difference between the market value of the fund’s investments and their cost, and reflects the gains (losses) that would be realized if the fund were to sell all of its investments at their statement-date values.
STATEMENT OF OPERATIONS
The Statement of Operations summarizes the fund’s investment income earned and expenses incurred in operating the fund. Investment income includes dividends earned from stocks and interest earned from interest-bearing securities in the fund. Expenses incurred in operating the fund include the advisory fee paid to the investment advisor, administrative services fee, distribution plan expenses (if applicable), transfer agent fees, shareholder servicing expenses, custodial, legal, and audit fees, and the printing and postage expenses related to shareholder reports. Expense offsets (fees paid indirectly) are also shown. Credits earned from offset arrangements are used to reduce the fund’s expenses. This statement also shows net gains (losses) realized on the sale of investments and the
36 www.calvert.com CALVERT CAPITAL ACCUMULATION FUND ANNUAL REPORT (UNAUDITED)
increase or decrease in the unrealized appreciation (depreciation) on investments held during the period.
STATEMENT OF CHANGES IN NET ASSETS
The Statement of Changes in Net Assets shows how the fund’s total net assets changed during the two most recent reporting periods. Changes in the fund’s net assets are attributable to investment operations, distributions and capital share transactions.
The Operations section of the report summarizes information detailed in the Statement of Operations. The Distribution section shows the dividend and capital gain distributions made to shareholders. The amounts shown as distributions in this section may not match the net investment income and realized gains amounts shown in the Operations section because distributions are determined on a tax basis and certain investments or transactions may be treated differently for financial statement and tax purposes. The Capital Share Transactions section shows the amount shareholders invested in the fund, either by purchasing shares or by reinvesting distributions, and the amounts redeemed. The corresponding numbers of shares issued, reinvested and redeemed are shown at the end of the report.
FINANCIAL HIGHLIGHTS
The Financial Highlights table provides a per-share breakdown per class of the components that affect the fund’s net asset value for current and past reporting periods. The table provides total return, total distributions, expense ratios, portfolio turnover and net assets for the applicable period. Total return is a measure of a fund’s performance that encompasses all elements of return: dividends, capital gain distributions and changes in net asset value. Total return is the change in value of an investment over a given period, assuming reinvestment of any dividends and capital gain distributions, expressed as a percentage of the initial investment. Total distributions include distributions from net investment income and net realized gains. Long-term gains are earned on securities held in the fund more than one year. Short-term gains, on the sale of securities held less than one year, are treated as ordinary dividend income for tax purposes. The expense ratio is a fund’s cost of doing business, expressed as a percentage of net assets. These expenses directly reduce returns to shareholders. Portfolio turnover measures the trading activity in a fund’s investment portfolio – how often securities are bought and sold by a fund. Portfolio turnover is affected by market conditions, changes in the size of the fund, the nature of the fund’s investments and the investment style of the portfolio.
PROXY VOTING
The Proxy Voting Guidelines of the Calvert Funds that the Fund uses to determine how to vote proxies relating to portfolio securities are provided as an Appendix to the Fund’s Statement of Additional Information. The Statement of Additional Information can be obtained free of charge by calling the Fund at 1-800-368-2745, by visiting the Calvert website at www.calvert.com; or by visiting the SEC’s website at www.sec.gov.
Information regarding how the Fund voted proxies relating to portfolio securities during the most recent 12-month period ended June 30 is available on the Fund’s website at www.calvert.com and on the SEC’s website at www.sec.gov.
www.calvert.com CALVERT CAPITAL ACCUMULATION FUND ANNUAL REPORT (UNAUDITED) 37
AVAILABILITY OF QUARTERLY PORTFOLIO HOLDINGS
The Fund files its complete schedule of portfolio holdings with the SEC for the first and third quarters of each fiscal year on Form N-Q. The Fund’s Form N-Q is available on the SEC’s website at www.sec.gov. The Fund’s Form N-Q may be reviewed and copied at the SEC’s Public Reference Room in Washington, DC; information on the operation of the Public Reference Room may be obtained by calling 1-800-SEC-0330.
38 www.calvert.com CALVERT CAPITAL ACCUMULATION FUND ANNUAL REPORT (UNAUDITED)
This page intentionally left blank.
This page intentionally left blank.
To Open an Account
800-368-2748
Service for Existing Account
Shareholders: 800-368-2745
Brokers: 800-368-2746
TDD for Hearing Impaired
800-541-1524
Registered Mail
Calvert Investments
c/o BFDS,
P.O. Box 219544
Kansas City, MO 64121-9544
Overnight Mail
Calvert Investments
c/o BFDS,
330 West 9th Street
Kansas City, MO 64105
Web Site
www.calvert.com
Principal Underwriter
Calvert Investment Distributors, Inc.
4550 Montgomery Avenue
Suite 1000 North
Bethesda, Maryland 20814
This report is intended to provide fund information to shareholders. It is not authorized for distribution to prospective investors unless preceded or accompanied by a prospectus.
Note: The information on our website is not incorporated by reference into this report; our website address is included as an inactive textual reference only.
Investors should carefully consider the investment objectives, risks, charges and expenses of the Calvert Funds. This and other important information is contained in the fund’s summary prospectus and prospectus, which can be obtained from your financial professional and should be read carefully before investing. You may also call Calvert at 800/368-2748 or visit www. calvert.com.
Choose Planet-friendly E-delivery!
Sign up now for on-line statements, prospectuses, and fund reports. In less than five minutes you can help reduce paper mail and lower fund costs.
Just go to www.calvert.com. If you already have an online account at Calvert, click on My Account, and select the documents you would like to receive via e-mail.
If you’re new to online account access, click on Login/Register to open an online account. Once you’re in, click on the E-delivery sign-up at the bottom of the Account Portfolio page and follow the quick, easy steps. Note: if your shares are not held directly at Calvert but through a brokerage firm, you must contact your broker for electronic delivery options available through their firm.


Barbara Krumsiek
President and CEO of Calvert Investments, Inc.
Dear Calvert Shareholder,
For the 12 months ended September 30, 2013, the global equity markets generally had a strong year, while bonds saw more mixed results. Large-cap stocks, as represented by the Russell 1000 Index, posted a healthy 20.9% return, while the smaller-cap Russell 2000 Index led with a 30.1% gain. This occurred despite political turmoil and market concerns worldwide about a forced shutdown of the U.S. government and the upcoming debt ceiling deadline.
Despite these advances, it was a challenging year for the financial markets overall. At various times, issues at home and abroad led to marked volatility in the performance of both stocks and bonds. Emerging-market performance was notably low, as fears of slowing growth in China and the Eurozone, along with continuing struggles in the Eurozone periphery, stalled regional investment. As a result, the formerly high-flying MSCI Emerging Markets Index gained only 1.3% for the period. The Barclays U.S. Credit Index, a barometer for the overall U.S. bond market, returned -1.9%.
Early in the Fall, Fed Chairman Ben Bernanke’s retirement was big news. The nomination of Vice Chair Janet Yellen as his replacement means the Fed will likely stay the course with current monetary policy. Yet, this is a historic moment for the United States, as Yellen, following Senate approval, will be the first woman to lead this critical agency.
Calvert Co-Founder Honored
I’m proud to congratulate Calvert co-founder Wayne Silby, who received the prestigious Joseph Wharton Award for Social Impact from The Alumni Club of New York, honoring his lifetime of achievement in impact investing and social entrepreneurship. Besides founding Calvert with John Guffey, Wayne is a co-founder of the Social Venture Network, Co-Chairman of the board of the Calvert Foundation, Chairman of Syntao Ltd., a CSR consultancy in Beijing, and active in other ventures in social impact and entrepreneurship.
Calvert Releases New Report on Diversity
In March, we published the latest edition of Examining the Cracks in the Glass Ceiling, which measures diversity practices of the companies that constitute the S&P 100 Index. As you know, Calvert believes companies with a diverse workforce are poised for greater success in today’s increasingly global marketplace and will enjoy greater long-term value—a view supported by a growing body of research from McKinsey, Credit Suisse, and others.
Companies in the report were rated on 10 indicators: EEO policy, internal diversity initiatives, external diversity initiatives, scope of diversity initiatives, family-friendly benefits, demographic disclosure of employees (EEO-1), highest-paid executives, board diversity,
4 www.calvert.com CALVERT INTERNATIONAL OPPORTUNITIES FUND ANNUAL REPORT
director selection criteria, and overall corporate commitment. The highest-rated companies were Citigroup, Merck, The Coca-Cola Company, and J.P. Morgan Chase, all scoring at least 95 points or more out of 100. We hold these companies in a number of our Calvert portfolios.
While some progress has been achieved in corporate diversity practices since our last assessment in 2010, the S&P 100 companies are largely failing to translate progressive practices into increased promotion rates for women and minority employees. For example, women are now hired as often as men. However, more than half of the S&P 100 companies lack diversity among their highest-paid senior executive positions. And women still only represent 19% of board members among these large-cap companies. Much remains to be done, which is why we continue to work with a number of international, multi-stakeholder groups on these issues, as well as conduct advocacy work with individual companies.
Stay Informed in the Months Ahead
Maintaining a well-diversified mix of U.S. and international stocks, bonds, and cash—appropriate for your goals and risk tolerance—is one of the best ways to mitigate the effects of an uneven recovery in the economy and markets. Of course, we recommend consulting your financial advisor if you have questions or concerns about your investments.
We also invite you to visit our website, www.calvert.com, for fund information, portfolio updates, and commentary from Calvert professionals. As always, we thank you for investing with Calvert.

The following companies represented the following percentages of Fund net assets: Citigroup 2.27% of Calvert Large Cap Value, 1.32% of Calvert Social Index; Merck 2.26% of Calvert Equity Income, 2.01% of Calvert Large Cap Value, and 1.25% of Calvert Social Index; Coca-Cola 1.29% of Calvert Social Index, 3.20% of Calvert Large Cap Core and 3.29% Calvert Equity Portfolio; J.P. Morgan Chase 2.54% of Calvert Equity Income, 1.74% of Calvert Social Index and 0.34% of Calvert Balanced Portfolio. Holdings are subject to change.
www.calvert.com CALVERT INTERNATIONAL OPPORTUNITIES FUND ANNUAL REPORT 5

As always, Calvert continues to work hard to ensure you have a say in the responsible management of environmental, social, and governance (ESG) factors for the companies in which we invest. Below are highlights of our accomplishments during the reporting period.
Shareholder Advocacy
Over the past year, Calvert engaged with 139 companies via emails, letters, phone calls, and in-person meetings. We also filed 22 shareholder proposals during the 2013 proxy season, which led to agreements with 14 companies on the issues of board diversity and sustainability reporting, among others. We also presented at four annual meetings where the proposals came to a vote and received shareholder support that exceeded 40% at two companies.
One proposal was for diversified energy services company Cleco, which has significant assets in thermoelectricity, to report on its sustainability risks and opportunities, including an analysis of material water-related risks. The other at Pioneer Natural Resources focused on reporting the environmental and social challenges and opportunities associated with hydraulic fracturing.
Company Engagement
Research and an intensive dialogue across a range of corporate responsibility and sustainability issues led to McDonald’s and Walt Disney meeting our Signature® criteria1 for the first time. McDonald’s is improving its supply chain labor policies and practices, diversifying its menu options, and disclosing their nutritional content—although it continues to face challenges in both areas. Walt Disney now meets the criteria for workplace safety, while continuing to meet our criteria on supply chain labor and human rights practices.
We undertook more engagement with Coca-Cola and PepsiCo on labor and human rights, water, and sustainability issues. In fact, PepsiCo management credited our recommendations with influencing their decision to strengthen their human rights policy framework.
Climate Change And Energy
Calvert, the World Wildlife Fund (WWF) and Ceres published, “Power Forward: Why the World’s Largest Companies are Investing in Renewable Energy.” The report found that more than half of the largest U.S. corporations and more than two-thirds of the largest companies across the globe have set greenhouse gas (GHG) emissions reduction commitments and/or renewable energy commitments.
Calvert joined with other Investor Network on Climate Risk (INCR) members to speak at congressional staff briefings about recommendations for corporations in the report and draft an investor letter to Congress supporting the production tax credit (PTC) for wind
6 www.calvert.com CALVERT inTERnATionAL oppoRTuniTiEs FunD AnnuAL REpoRT
energy, which was due to expire at the end of 2012. The report, briefings and investor letter helped spur extension of the PTC to support the growth of renewable energy.
350.Org Divestment Campaign On Fossil Fuels
Calvert watched closely the 350.org campaign urging college and university endowments, as well as other institutional investors, to divest from companies producing fossil fuels. In December, Calvert posted a statement on our website expressing support for the campaign’s broad objectives while making the case for a complementary strategy of active ownership and engagement. The statement pointed to specific fossil fuel companies such as Denbury Resources and Suncor Energy that Calvert has successfully engaged on climate change, alternative energy, and revenue transparency.
Burma
After the lifting of U.S. sanctions prohibiting new investment in Burma by American companies, the Calvert Social Funds Board approved revisions to Calvert’s long-standing policy language in September. Instead of urging U.S. companies to “cease operations” in Burma, the new language instead calls for Calvert to advocate for “responsible investment.”
Garment Industry Safety
Following the Rana Plaza tragedy earlier this year, where more than 1,100 Bangladesh garment factory workers were killed, Calvert assessed the state of significant country-level sourcing disclosure by retail companies, which is essential to assessing sourcing risks more effectively. After learning that only a handful of companies disclose this necessary data, we contacted 26 retail company CEOs requesting disclosure of sourcing information for those countries representing 5% or more of global order volume.
Human Rights Report
In March, Calvert, Interfaith Center on Corporate Responsibility and the Institute for Human Rights and Business launched “Investing the Rights Way: A Guide for Business and Human Rights” in both New York and London. The guide outlines how investors can apply the UN Guiding Principles on Business and Human Rights as a due diligence and risk assessment framework to assess companies in their portfolios.
Conflict Minerals
Calvert continued to be a leader among investors on “conflict minerals” through a multi-stakeholder group supporting disclosure requirements enacted as Section 1502 of the Dodd-Frank Wall Street Reform and Consumer Protection Act of 2010. The disclosure would certify that certain minerals used in cell phones and other consumer electronic components (tin, titanium, tantalum and gold) are not illegally mined to fuel the continuing bloody conflict in the Democratic Republic of Congo (DRC).
After the SEC approved and released the final rule to implement the reporting requirements of Section 1502 in August 2012, the U.S. Chamber of Commerce filed a lawsuit against the Securities and Exchange Commission (SEC) to stop implementation. Calvert led the multi-stakeholder group’s effort to forge a common statement urging implementation of the law as outlined by the rule, regardless of the lawsuit. On July 23, the court upheld the “conflict minerals rule” in favor of the SEC and the statute requiring adoption of the rule—a major victory for Calvert and its allies.
www.calvert.com CALVERT INTERNATIONAL OPPORTUNITIES FUND ANNUAL REPORT 7
Extractives Revenue Transparency
Widely credited for its leadership role among investors in supporting extractive revenue transparency as an imperative for investors interested in full disclosure of material information related to oil, gas and mining in certain countries, Calvert has remained actively engaged in the SEC rule-making process. The U.S. Chamber of Commerce and the American Petroleum Institute filed a lawsuit challenging the pro-disclosure rules, Calvert submitted a sworn statement about the problems investors would face if the rules were delayed or revoked. We also sent letters to the SEC emphasizing the materiality of disclosures required by the rules and contributed research to Oxfam America’s January 2013 brief.
On July 2, the court “vacated” the SEC’s rule, declaring it inoperative until the SEC addresses certain key issues (the necessity for exemptions for certain countries and public reporting of the disclosures). Calvert subsequently drafted a letter to SEC Chairman Mary Jo White that acknowledged the value of the Commission’s rules to implement Section 1504 and urged her respond to the API vs. SEC decision by reinstating rules consistent with those issued in August 2012, which were endorsed by investors representing more than $5.6 trillion in assets under management.
1. Calvert’s Signature® criteria examine corporate performance across seven broad areas of concern: Governance and Ethics, Environment, Workplace, Product Safety and Impact, International Operations and Human Rights, Indigenous Peoples’ Rights, and Community Relations. For a company to be eligible for inclusion in a Calvert Signature portfolio, it must meet the criteria in all seven categories.
The following companies represented the following percentages of net assets: Cleco 0.02% of Calvert Social Index; Pioneer Natural Resources 0.23% of Calvert Social Index and 1.39% of Calvert Balanced Portfolio; McDonald’s 0.86% of Calvert Social Index and 2.35% of Calvert Equity Portfolio, Walt Disney 0.96% of Calvert Social Index and 2.25% of Calvert Equity Portfolio; Coca-Cola 1.29% of Calvert Social Index, 3.20% of Calvert Large Cap Core and 3.29% Calvert Equity Portfolio; PepsiCo 1.10% of Calvert Social Index, 1.20% of Calvert Equity Portfolio and 0.54% of Calvert Balanced Portfolio; Denbury Resources 0.06% of Calvert Social Index and 2.86% of Calvert Large Cap Core; and Suncor Energy 0.71%% of Calvert International Equity Portfolio. Holdings are subject to change.
8 www.calvert.com CALVERT INTERNATIONAL OPPORTUNITIES FUND ANNUAL REPORT
Investment Performance
For the one-year period ended September 30, 2013, Calvert International Opportunities Fund Class A shares (at NAV) returned a solid 26.70%, versus the MSCI EAFE SMID Index return of 28.18%. The Fund’s relative underperformance was due to weak sector selection that was partially offset by strong stock selection.
Investment Climate
Equities faced a brief pullback in late 2012, but recovered and posted strong gains throughout most of 2013. The third round of quantitative easing (QE), unleashed in mid-2012, provided an impetus for equity investors to look past numerous macro head-winds from fiscal cliff debates, sequester, slow growth in China and the Eurozone, and weak corporate earnings. The macro-economic picture in the U.S. continued to show improvement in the key economic sectors—housing and employment. For the year, the S&P 500, Russell 1000, Russell 2000, MSCI EAFE, and MSCI Emerging Markets Indices returned 19.34%, 20.91%, 30.06%, 24.92%, and 1.33%, respectively.
Value stocks outperformed growth stocks by 3.03%, as measured by the Russell 1000 Value and Russell 1000 Growth Indices for the 12-month period. Within the Russell 1000 Index, Consumer Discretionary, Industrials, and Health Care were the top-performing sectors, while Telecoms, Utilities, and Materials lagged.
Corporate Earnings Are Weaker
Corporate earnings reports in late 2012 and throughout the first half of 2013 were largely weak on both the top- and bottom-line figures, with the sequester negatively impacting corporate results in the first half of 2013.
Sounding a cautious note, several bellwether companies that reported late in the summer of 2013, including names like Walmart and Cisco, issued reduced earnings forecasts citing everything from consumer weakness to fears of rising interest rates. We continue to believe that, going forward, the U.S. economic recovery can be sustained and able to support earnings growth for U.S. companies.
Improving Macro-Economic Picture in the U.S., But Continued Softness Abroad
Throughout the year, U.S. macro indicators continued to improve, albeit slowly. The unemployment rate ticked down to just above 7% and initial jobless claims hit post-financial crisis lows in the third quarter of 2013. New job growth remains sluggish.
www.calvert.com CALVERT INTERNATIONAL OPPORTUNITIES FUND ANNUAL REPORT 9
| | |
| CALVERT |
| INTERNATIONAL |
| OPPORTUNITIES |
| FUND |
| SEPTEMBER 30, 2013 |
| |
| | % OF TOTAL | |
| ECONOMIC SECTORS | INVESTMENTS | |
| Consumer Discretionary | 18.1 | % |
| Consumer Staples | 8.4 | % |
| Energy | 1.6 | % |
| Financials | 30.7 | % |
| Health Care | 3.4 | % |
| Industrials | 22.0 | % |
| Information Technology | 6.6 | % |
| Materials | 4.6 | % |
| Short-Term Investments | 3.0 | % |
| Telecommunication Services | 1.5 | % |
| Utilities | 0.1 | % |
| Total | 100 | % |
However, consumers continue to remain upbeat and willing to spend on bigger-ticket items, as reflected in improving vehicle and home sales. Sales of previously owned homes hit a three-year high in May of 2013 and housing prices continued to trend upward, despite the looming threat of rising interest rates.
Abroad, developed markets kept pace with the U.S., but emerging markets were rattled by developments in China and the Eurozone periphery. A transition of power in China went smoothly, but new leadership promised to curb excesses in the economy, triggering fears of an economic slowdown. The pullback reached its climax with a 14% sell-off in the Shanghai composite in June that rattled markets around the globe. Elsewhere in Asia, Japan launched an unprecedented QE program in late 2012, triggering a massive rally in
| CALVERT |
| INTERNATIONAL |
| OPPORTUNITIES |
| FUND |
| SEPTEMBER 30, 2013 |
| |
| INVESTMENT PERFORMANCE | | | |
| (TOTAL RETURN AT NAV*) | | | |
| | 6 MONTHS | | 12 MONTHS | |
| | ENDED | | ENDED | |
| | 9/30/13 | | 9/30/13 | |
| Class A | 13.87 | % | 26.70 | % |
| Class C | 13.45 | % | 25.70 | % |
| Class I | 14.18 | % | 27.43 | % |
| Class Y | 13.95 | % | 27.06 | % |
| |
| MSCI EAFE | | | | |
| Small/Mid Cap | | | | |
| Index | 12.49 | % | 28.18 | % |
| |
| Lipper | | | | |
| International | | | | |
| Small/Mid Cap | | | | |
| Core Funds | | | | |
| Average | 10.62 | % | 24.88 | % |
| | |
| TEN LARGEST | % OF NET | |
| STOCK HOLDINGS | ASSETS | |
| IMMOFINANZ AG | 2.3 | % |
| GAM Holding AG | 2.1 | % |
| Gildemeister AG | 2.0 | % |
| Buzzi Unicem SpA | 1.9 | % |
| Catlin Group Ltd. | 1.7 | % |
| Delta Lloyd NV | 1.7 | % |
| D/S Norden A/S | 1.7 | % |
| Cie Generale des Etablissements | | |
| Michelin | 1.7 | % |
| Crown Ltd. | 1.6 | % |
| Koninklijke Ahold NV | 1.5 | % |
| Total | 18.2 | % |
* Investment performance/return at NAV does not reflect the deduction of the Fund’s maximum 4.75% front-end sales charge or any deferred sales charges.
10 www.calvert.com CALVERT INTERNATIONAL OPPORTUNITIES FUND ANNUAL REPORT
Japanese equities and a large sell-off in the yen. With similar (but smaller) policy measures in Europe, investors began to focus on the theme of coordinated global QE as a stabilizing force for the global economy in the near term, despite potentially negative effects in the longer term.
In Europe, economic turmoil in the so called “PIIGS” (Portugal, Italy, Ireland, Greece and Spain) continued to simmer in the background. While Italy nearly saw its government collapse, unemployment in Spain reached almost 50% among youth, reminding investors that the region, while improving, remains fragile.
Federal Reserve: QE Taper and Transition Talk
During the summer, investor consensus largely settled around the view that the Federal Reserve (Fed) would begin tapering its QE program in September of 2013 by reducing both its Treasury and mortgage-backed security purchases. This view took hold despite weakness in both employment and inflation, the two areas highlighted by Fed Chairman Ben Bernanke as needing improvement before tapering would begin. Nevertheless, the “surprise” decision not to taper in September caught market participants off guard, sending equities up and sparking a retreat in bond yields.
As markets digested the lack of a QE taper—and largely gave back the equity gains won on the news—focus also returned to the transition of the Fed Chairman role. With Larry Summers removing himself from consideration, consensus coalesced around eventual nominee Vice Chair Janet Yellen, a selection largely signaling favor for continuing current monetary policy with little change.
With Political Stalemate in Washington, It’s Déjà Vu All Over Again…
The debt ceiling drama of 2011 reared its head again in late September 2013. The government shutdown and debt ceiling impasse in Washington fueled uncertainty and created a negative feedback loop in the U.S. economy. Although U.S. labor conditions improved materially since the asset purchase program began, recent reductions in public-sector employment were felt in the July and August employment reports.
The U.S. Congress failed to approve a budget to fund the government past September 30, which culminated in the shutdown of the federal government. Equity markets appeared largely unconcerned with the event in September despite the looming U.S. debt ceiling debate. Congress was not able to raise the debt ceiling until hours before the October 17 deadline identified by the Treasury Department.
Although the markets welcomed the resolution, the turmoil took its toll. Estimates of fiscal drag from the shutdown were in the billions, while credit-rating firm Fitch put the nation’s credit rating on negative outlook as a result of the political stalemate and inability to take timely action on raising the debt ceiling.
www.calvert.com CALVERT INTERNATIONAL OPPORTUNITIES FUND ANNUAL REPORT 11
Portfolio Strategy
The Fund is subadvised by two managers with complementary investment styles and processes. Advisory Research Inc., a value-oriented fundamental manager, manages approximately 60% of the Fund, and growth manager Trilogy Global Advisors manages approximately 40%. The current manager allocation, which was maintained throughout the year, reflects Calvert’s long-term target allocation for the Fund.
Sector selection was the main driver of underperformance, primarily due to an underweight to Consumer Discretionary, the best-performing sector, and an overweight to Consumer Staples, which under-performed for the period.
Stock selection had an overall positive effect, particularly within the Industrials sector. Japanese machinery manufacturer Amada, and German truck and heavy equipment company Jungheinrich AG, were among the top contributors, up 80% and 108%, respectively on strong earnings that exceeded analysts’ estimates, strong demand, and improved outlooks for the year.1 UK-based rental equipment company Ashtead Group also added significantly to performance, rising 93% as it benefitted from a pick-up in construction activity given the housing recovery in the United States.
| CALVERT |
| INTERNATIONAL |
| OPPORTUNITIES |
| FUND |
| SEPTEMBER 30, 2013 |
| |
| AVERAGE ANNUAL TOTAL RETURNS | |
| |
| CLASS A SHARES | (WITH MAX. LOAD) | |
| One year | 20.67 | % |
| Five year | 6.18 | % |
| Since inception (5/31/2007) | 0.54 | % |
| |
| CLASS C SHARES | (WITH MAX. LOAD) | |
| One year | 24.70 | % |
| Five year | 6.34 | % |
| Since inception (7/31/2007) | 0.80 | % |
| |
| |
| CLASS I SHARES | | |
| One year | 27.43 | % |
| Five year | 7.69 | % |
| Since inception (5/31/2007) | 1.77 | % |
| |
| |
| CLASS Y SHARES* | | |
| One year | 27.06 | % |
| Five year | 7.44 | % |
| Since inception (5/31/2007) | 1.48 | % |
* Calvert International Opportunities Fund first offered Class Y shares on October 31, 2008. Performance prior to that date reflects the performance of Class A shares at net asset value (NAV). Actual Class Y share performance would have been different.On the negative side, the Fund was hurt by Japanese e-commerce company Start Today, which returned -30% before it was sold due to the company’s slower transaction development and declining margins. Hokuto Corporation, a Japanese mushroom and agricultural products producer, hurt as well, returning -12% due to a lower revenue outlook for the year. Hokuto also did not participate in the “Abenomics” induced rally as the company is not viewed as sensitive to foreign exchange rates.
Country allocation was a negative, driven primarily by the Fund’s nearly 11% allocation to emerging market countries, which underperformed developed markets during the year.
12 www.calvert.com CALVERT INTERNATIONAL OPPORTUNITIES FUND ANNUAL REPORT
GROWTH OF $10,000
The graph below shows the value of a hypothetical $10,000 investment in the Fund over the past 10 fiscal year periods or since inception (for funds without 10-year records). The results shown are for Classes A and I shares and reflect the deduction of the maximum front-end Class A sales charge of 4.75% and assume the reinvestment of dividends. The result is compared with benchmarks that include a broad based market index and a Lipper peer group average. Market indexes are unmanaged and their results do not reflect the effect of expenses or sales charges. The Lipper average reflects the deduction of the category’s average front-end sales charge. The value of an investment in a different share class would be different.
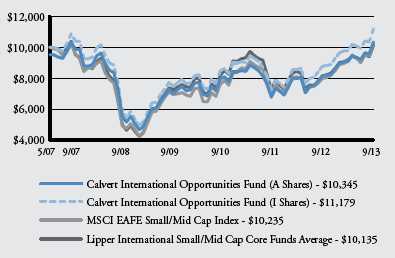
All performance data shown, including the graph above and the adjacent table, represents past performance, does not guarantee future results, assumes reinvestment of dividends and distributions and does not reflect the deduction of taxes that a shareholder would pay on the Fund’s distributions or the redemption of the Fund shares. All performance data reflects fee waivers and/or expense limitations, if any are in effect; in their absence performance would be lower. See Note B in Notes to Financial Statements. The investment return and principal value of an investment will fluctuate so that an investor’s shares, when redeemed, may be worth more or less than their original cost. Current performance may be lower or higher than the performance data quoted; for current performance data visit www.calvert.com. The gross expense ratio from the current prospectus for Class A shares is 2.35%. This number may differ from the expense ratio shown elsewhere in this report because it is based on a different time period and, if applicable, does not include fee or expense waivers. Performance data quoted already reflects the deduction of the Fund’s operating expenses.
www.calvert.com CALVERT INTERNATIONAL OPPORTUNITIES FUND ANNUAL REPORT 13
Outlook
As we have stated in the past, despite negative short-term investor sentiment, the long-term drivers of economic recovery continue to gain strength. Investors continue to look beyond the headlines and focus on the improving macro-economic climate in the U.S. and, to some degree, overseas.
The path to recovery will not necessarily be smooth, however. The Fed is largely expected to taper QE as early as December and interest rates are expected to continue climbing. In such a scenario, higher dividend stocks remain especially vulnerable. While growth stocks made an impressive recovery in the third quarter, value names may recover when the reality of Fed tapering and interest rate uptick returns to focus.
However, longer-term factors, such as historically low housing inventories and continued household formation, will provide support for improving economic growth. Likewise, manufacturing is pulling out of its seasonal slump and the broader trend of consumer balance sheet repair is well underway.
As confidence sets in at both the consumer and corporate level, we continue to expect consumers to increase spending and companies to eventually expand capital expenditures and increase inventories. The sharp rise in interest rates that many feared would continue to 3% and beyond has tempered. While consumers and companies alike must prepare for a rising-rate environment, over the medium- and longer-terms, a gradual shift up in borrowing costs may be a sign of an improving economy and not necessarily a near-term threat to growth.
Calvert Investment Management, Inc.
October 2013
1 Returns reflect the period the holding was in the portfolio.
As of September 30, 2013, the following companies represented the following percentages of Fund net assets: Walmart 0%, Cisco 0%, Amada 0.84%, Jungheinrich 1.22%, Ashtead Group 0.86%, Start Today 0%, and Hokuto 1.28%. Holdings are subject to change.
14 www.calvert.com CALVERT INTERNATIONAL OPPORTUNITIES FUND ANNUAL REPORT
SHAREHOLDER EXPENSE EXAMPLE
As a shareholder of the Fund, you incur two types of costs: (1) transaction costs, including sales charges and redemption fees; and (2) ongoing costs, including management fees; distribution (12b-1) fees; and other Fund expenses. This Example is intended to help you understand your ongoing costs (in dollars) of investing in the Fund and to compare these costs with the ongoing costs of investing in other mutual funds.
This Example is based on an investment of $1,000 invested at the beginning of the period and held for the entire period (April 1, 2013 to September 30, 2013).
Actual Expenses
The first line of the table below provides information about actual account values and actual expenses. You may use the information in this line, together with the amount you invested, to estimate the expenses that you paid over the period. Simply divide your account value by $1,000 (for example, an $8,600 account value divided by $1,000 = 8.6), then multiply the result by the number in the first line under the heading entitled “Expenses Paid During Period” to estimate the expenses you paid on your account during this period.
Hypothetical Example for Comparison Purposes
The second line of the table below provides information about hypothetical account values and hypothetical expenses based on the Fund’s actual expense ratio and an assumed rate of return of 5% per year before expenses, which is not the Fund’s actual return. The hypothetical account values and expenses may not be used to estimate the actual ending account balance or expenses you paid for the period. You may use this information to compare the ongoing costs of investing in the Fund and other funds. To do so, compare the 5% hypothetical example with the 5% hypothetical examples that appear in the shareholder reports of the other funds.
Please note that the expenses shown in the table are meant to highlight your ongoing costs only and do not reflect any transactional costs, such as sales charges (loads), or redemption fees. Therefore, the second line of the table is useful in comparing ongoing costs only, and will not help you determine the relative total costs of owning different funds. In addition, if these transactional costs were included, your costs would have been higher.
www.calvert.com CALVERT INTERNATIONAL OPPORTUNITIES FUND ANNUAL REPORT 15
| | | |
| | BEGINNING | ENDING ACCOUNT | EXPENSES PAID |
| | ACCOUNT VALUE | VALUE | DURING PERIOD* |
| | 4/1/13 | 9/30/13 | 4/1/13 - 9/30/13 |
| CLASS A | | | |
| Actual | $1,000.00 | $1,138.73 | $8.90 |
| Hypothetical | $1,000.00 | $1,016.74 | $8.39 |
| (5% return per year before expenses) | | | |
| |
| CLASS C | | | |
| Actual | $1,000.00 | $1,134.46 | $13.38 |
| Hypothetical | $1,000.00 | $1,012.53 | $12.62 |
| (5% return per year before expenses) | | | |
| |
| CLASS I | | | |
| Actual | $1,000.00 | $1,141.81 | $6.45 |
| Hypothetical | $1,000.00 | $1,019.05 | $6.08 |
| (5% return per year before expenses) | | | |
| |
| CLASS Y | | | |
| Actual | $1,000.00 | $1,139.50 | $7.56 |
| Hypothetical | $1,000.00 | $1,018.00 | $7.13 |
| (5% return per year before expenses) | | | |
* Expenses are equal to the Fund’s annualized expense ratio of 1.66%, 2.50%, 1.20%, and 1.41% for Class A, Class C, Class I, and Class Y, respectively, multiplied by the average account value over the period, multiplied by 183/365 (to reflect the one-half year period).
16 www.calvert.com CALVERT INTERNATIONAL OPPORTUNITIES FUND ANNUAL REPORT
REPORT OF INDEPENDENT REGISTERED PUBLIC ACCOUNTING FIRM
The Board of Directors of Calvert World Values Fund, Inc. and Shareholders of Calvert International Opportunities Fund: We have audited the accompanying statement of net assets of Calvert International Opportunities Fund (the “Fund”), a series of Calvert World Values Fund, Inc., as of September 30, 2013, and the related statement of operations for the year then ended, the statements of changes in net assets for each of the years in the two-year period then ended, and the financial highlights for each of the years or periods in the five-year period then ended. These financial statements and financial highlights are the responsibility of the Fund’s management. Our responsibility is to express an opinion on these financial statements and financial highlights based on our audits.
We conducted our audits in accordance with the standards of the Public Company Accounting Oversight Board (United States). Those standards require that we plan and perform the audit to obtain reasonable assurance about whether the financial statements and financial highlights are free of material misstatement. An audit includes examining, on a test basis, evidence supporting the amounts and disclosures in the financial statements. Our procedures included confirmation of securities owned as of September 30, 2013, by correspondence with the custodian and brokers or by performing other appropriate auditing procedures. An audit also includes assessing the accounting principles used and significant estimates made by management, as well as evaluating the overall financial statement presentation. We believe that our audits provide a reasonable basis for our opinion.
In our opinion, the financial statements and financial highlights referred to above present fairly, in all material respects, the financial position of the Calvert International Opportunities Fund as of September 30, 2013, the results of its operations for the year then ended, the changes in its net assets for each of the years in the two-year period then ended, and the financial highlights for each of the years or periods in the five-year period then ended, in conformity with U.S. generally accepted accounting principles.
www.calvert.com CALVERT INTERNATIONAL OPPORTUNITIES FUND ANNUAL REPORT 17
| | | |
| STATEMENT OF NET ASSETS |
| SEPTEMBER 30, 2013 |
| |
| EQUITY SECURITIES - 96.4% | SHARES | | VALUE |
| Australia - 1.6% | | | |
| Crown Ltd. | 84,033 | $ | 1,220,666 |
| |
| Austria - 3.5% | | | |
| EVN AG | 6,458 | | 98,681 |
| IMMOFINANZ AG* | 418,524 | | 1,827,937 |
| Wienerberger AG | 45,247 | | 794,889 |
| | | | 2,721,507 |
| |
| Belgium - 0.6% | | | |
| Befimmo SA | 6,306 | | 437,240 |
| |
| Brazil - 0.6% | | | |
| ALL - America Latina Logistica SA | 77,657 | | 306,299 |
| GP Investments Ltd. (BDR)* | 93,130 | | 181,987 |
| | | | 488,286 |
| |
| China - 1.2% | | | |
| Greatview Aseptic Packaging Co. Ltd. | 268,063 | | 153,123 |
| Integrated Waste Solutions Group Holdings Ltd. (b)* | 1,776,000 | | 93,917 |
| Mindray Medical International Ltd. (ADR) | 9,962 | | 387,422 |
| Prince Frog International Holdings Ltd | 446,959 | | 309,488 |
| | | | 943,950 |
| |
| Denmark - 2.8% | | | |
| D/S Norden A/S | 31,235 | | 1,317,777 |
| NKT Holding A/S | 17,874 | | 888,365 |
| | | | 2,206,142 |
| |
| Finland - 1.0% | | | |
| Ramirent Oyj | 64,204 | | 782,072 |
| |
| France - 4.8% | | | |
| Cie Generale des Etablissements Michelin | 11,858 | | 1,315,553 |
| Eutelsat Communications SA | 16,615 | | 525,534 |
| Nexans SA | 14,587 | | 885,167 |
| Vallourec SA | 16,802 | | 1,006,729 |
| | | | 3,732,983 |
| |
| Germany - 9.1% | | | |
| Gildemeister AG | 56,496 | | 1,539,994 |
| Hugo Boss AG | 5,649 | | 731,075 |
| Jungheinrich AG, Preferred | 16,317 | | 953,487 |
| KUKA AG | 9,499 | | 411,727 |
| Leoni AG | 19,521 | | 1,187,742 |
| Rational AG | 820 | | 244,717 |
| Rhoen Klinikum AG | 43,888 | | 1,128,306 |
| Wacker Neuson SE | 41,687 | | 620,634 |
| Wirecard AG | 9,339 | | 319,599 |
| | | | 7,137,281 |
18 www.calvert.com CALVERT INTERNATIONAL OPPORTUNITIES FUND ANNUAL REPORT
| | | |
| EQUITY SECURITIES - CONT’D | SHARES | | VALUE |
| Hong Kong - 0.4% | | | |
| Digital China Holdings Ltd. | 112,489 | $ | 137,796 |
| Techtronic Industries Co. | 58,189 | | 151,563 |
| | | | 289,359 |
| |
| India - 0.1% | | | |
| Yes Bank Ltd. | 23,825 | | 109,221 |
| |
| Italy - 5.3% | | | |
| Banca Generali SpA | 29,149 | | 658,843 |
| Buzzi Unicem SpA | 94,714 | | 1,476,755 |
| Indesit Co. SpA | 65,464 | | 628,633 |
| Piaggio & C SpA | 266,387 | | 704,498 |
| Prysmian SpA | 27,183 | | 665,914 |
| | | | 4,134,643 |
| |
| Japan - 23.3% | | | |
| Amada Co. Ltd | 73,000 | | 655,638 |
| Aozora Bank Ltd. | 395,326 | | 1,170,115 |
| Azbil Corp. | 40,300 | | 934,178 |
| Chugoku Marine Paints Ltd. | 112,000 | | 696,048 |
| Credit Saison Co. Ltd | 25,602 | | 692,425 |
| Daiichikosho Co. Ltd | 13,524 | | 368,517 |
| Daiseki Co. Ltd | 56,600 | | 1,040,291 |
| Doshisha Co. Ltd. | 63,900 | | 912,532 |
| FamilyMart Co. Ltd. | 12,019 | | 518,951 |
| Hogy Medical Co. Ltd. | 9,100 | | 503,524 |
| Hokuto Corp. | 55,600 | | 1,006,076 |
| Horiba Ltd. | 15,700 | | 586,864 |
| Makita Corp | 12,970 | | 751,961 |
| Namco Bandai Holdings, Inc. | 61,200 | | 1,142,267 |
| Nitori Holdings Co. Ltd. | 5,738 | | 525,271 |
| Secom Co. Ltd. | 17,400 | | 1,086,670 |
| SKY Perfect JSAT Holdings, Inc | 146,900 | | 763,524 |
| Stanley Electric Co. Ltd | 37,696 | | 799,432 |
| Star Micronics Co. Ltd | 59,100 | | 578,286 |
| Tatsuta Electric Wire and Cable Co. Ltd. | 76,496 | | 583,553 |
| The Bank of Yokohama Ltd | 167,300 | | 954,639 |
| Toyota Industries Corp | 21,700 | | 933,642 |
| Yamaha Corp. | 70,000 | | 996,796 |
| | | | 18,201,200 |
| |
| Malaysia - 0.8% | | | |
| PureCircle Ltd.* | 117,558 | | 656,140 |
| |
| Netherlands - 5.2% | | | |
| Delta Lloyd NV | 62,811 | | 1,337,231 |
| Koninklijke Ahold NV | 69,070 | | 1,197,047 |
| Koninklijke DSM NV | 7,950 | | 600,188 |
| Wereldhave NV | 12,484 | | 905,988 |
| | | | 4,040,454 |
www.calvert.com CALVERT INTERNATIONAL OPPORTUNITIES FUND ANNUAL REPORT 19
| | | |
| EQUITY SECURITIES - CONT’D | SHARES | | VALUE |
| Norway - 3.0% | | | |
| Aker ASA | 22,150 | $ | 674,327 |
| Electromagnetic GeoServices ASA* | 319,766 | | 401,097 |
| Norwegian Air Shuttle AS* | 12,509 | | 452,198 |
| Opera Software ASA | 77,176 | | 818,481 |
| | | | 2,346,103 |
| |
| Panama - 1.2% | | | |
| Banco Latinoamericano de Exportaciones SA | 36,914 | | 919,897 |
| |
| Russia - 0.5% | | | |
| Eurasia Drilling Co. Ltd. (GDR) | 9,424 | | 376,018 |
| |
| Singapore - 0.4% | | | |
| Ascendas India Trust | 657,500 | | 327,466 |
| |
| South Africa - 0.2% | | | |
| Foschini Group Ltd | 17,213 | | 178,285 |
| |
| South Korea - 4.2% | | | |
| Daum Communications Corp | 2,879 | | 248,339 |
| DGB Financial Group, Inc | 47,340 | | 713,618 |
| Dongbu Insurance Co. Ltd. | 5,210 | | 223,977 |
| Grand Korea Leisure Co. Ltd. | 7,363 | | 237,057 |
| NongShim Co. Ltd. | 3,698 | | 882,627 |
| Samsung Card Co. Ltd | 25,530 | | 950,241 |
| | | | 3,255,859 |
| |
| Sweden - 2.3% | | | |
| Industrivarden AB, C Shares | 63,431 | | 1,170,489 |
| Intrum Justitia AB | 22,423 | | 601,593 |
| | | | 1,772,082 |
| |
| Switzerland - 4.1% | | | |
| Baloise Holding AG | 8,361 | | 924,736 |
| GAM Holding AG* | 91,707 | | 1,658,364 |
| Sonova Holding AG* | 4,897 | | 608,774 |
| | | | 3,191,874 |
| |
| United Arab Emirates - 0.6% | | | |
| Polarcus Ltd.* | 712,402 | | 453,910 |
| |
| United Kingdom - 18.9% | | | |
| Ashtead Group plc | 68,031 | | 677,423 |
| Bank of Georgia Holdings plc | 7,193 | | 224,824 |
| Beazley plc | 260,195 | | 882,719 |
| Catlin Group Ltd. | 173,127 | | 1,357,292 |
| Close Brothers Group plc | 33,071 | | 625,442 |
| Colt Group SA* | 292,330 | | 550,966 |
| Debenhams plc | 452,407 | | 748,006 |
| Dialight plc | 25,597 | | 470,013 |
| Greggs plc | 129,503 | | 887,485 |
| Inmarsat plc | 54,597 | | 626,239 |
20 www.calvert.com CALVERT INTERNATIONAL OPPORTUNITIES FUND ANNUAL REPORT
| | | | |
| EQUITY SECURITIES - CONT’D | | SHARES | | VALUE |
| United Kingdom - Cont’d | | | | |
| International Personal Finance plc | | 61,503 | $ | 607,445 |
| Investec plc | | 148,926 | | 964,694 |
| Jupiter Fund Management plc | | 126,527 | | 751,233 |
| Lancashire Holdings Ltd. | | 55,645 | | 691,373 |
| Monitise plc* | | 614,393 | | 566,560 |
| NCC Group plc | | 198,105 | | 475,133 |
| Paragon Group of Co.’s plc | | 143,058 | | 722,091 |
| Provident Financial plc | | 21,018 | | 565,129 |
| Synthomer plc | | 167,068 | | 643,543 |
| Vesuvius plc | | 99,780 | | 721,243 |
| William Morrison Supermarkets plc | | 228,792 | | 1,036,392 |
| | | | | 14,795,245 |
| |
| United States - 0.7% | | | | |
| OFG Bancorp | | 36,132 | | 584,977 |
| |
| |
| Total Equity Securities (Cost $61,884,805) | | | | 75,302,860 |
| |
| | | PRINCIPAL | | |
| TIME DEPOSIT - 2.9% | | AMOUNT | | |
| State Street Bank Time Deposit, 0.083%, 10/1/13 | $ | 2,294,109 | | 2,294,109 |
| |
| Total Time Deposit (Cost $2,294,109) | | | | 2,294,109 |
| |
| |
| |
| TOTAL INVESTMENTS (Cost $64,178,914) - 99.3% | | | | 77,596,969 |
| Other assets and liabilities, net - 0.7% | | | | 515,678 |
| NET ASSETS - 100% | | | $ | 78,112,647 |
See notes to financial statements.
www.calvert.com CALVERT INTERNATIONAL OPPORTUNITIES FUND ANNUAL REPORT 21
| | | |
| NET ASSETS CONSIST OF: | | | |
| Paid-in capital applicable to the following shares of common stock with | | | |
| 250,000,000 shares of $.01 par value shares authorized: | | | |
| Class A: 2,890,886 shares outstanding | $ | 39,289,687 | |
| Class C: 212,641 shares outstanding | | 2,661,635 | |
| Class I: 1,553,187 shares outstanding | | 20,530,959 | |
| Class Y: 341,770 shares outstanding | | 4,238,868 | |
| Undistributed net investment income | | 471,179 | |
| Accumulated net realized gain (loss) on investments and | | | |
| foreign currency transactions | | (2,499,002 | ) |
| Net unrealized appreciation (depreciation) on investments, foreign currencies and | | | |
| assets and liabilities denominated in foreign currencies | | 13,419,321 | |
| |
| NET ASSETS | $ | 78,112,647 | |
| |
| |
| NET ASSET VALUE PER SHARE | | | |
| Class A (based on net assets of $45,562,519) | $ | 15.76 | |
| Class C (based on net assets of $3,282,385) | $ | 15.44 | |
| Class I (based on net assets of $24,129,826) | $ | 15.54 | |
| Class Y (based on net assets of $5,137,917) | $ | 15.03 | |
(b) This security was valued under the direction of the Board of Directors. See Note A.
* Non-income producing security.
Abbreviations:
ADR: American Depositary Receipts
BDR: Brazilian Depositary Receipts
GDR: Global Depositary Receipts
plc: Public Limited Company
See notes to financial statements.
22 www.calvert.com CALVERT INTERNATIONAL OPPORTUNITIES FUND ANNUAL REPORT
| | | |
| STATEMENT OF OPERATIONS |
| YEAR ENDED SEPTEMBER 30, 2013 |
| |
| NET INVESTMENT INCOME | | | |
| Investment Income: | | | |
| Dividend income (net of foreign taxes withheld of $134,702) | $ | 1,624,416 | |
| Interest income | | 2,397 | |
| Total investment income | | 1,626,813 | |
| |
| Expenses: | | | |
| Investment advisory fee | | 469,065 | |
| Transfer agency fees | | 121,607 | |
| Distribution Plan expenses: | | | |
| Class A | | 88,293 | |
| Class C | | 27,832 | |
| Directors’ fees and expenses | | 5,665 | |
| Administrative fees | | 171,330 | |
| Accounting fees | | 8,706 | |
| Custodian fees | | 147,738 | |
| Registration fees | | 42,365 | |
| Reports to shareholders | | 28,221 | |
| Professional fees | | 25,241 | |
| Miscellaneous | | 15,037 | |
| Total expenses | | 1,151,100 | |
| Reimbursement from Advisor: | | | |
| Class A | | (157,395 | ) |
| Class C | | (20,980 | ) |
| Class I | | (35,039 | ) |
| Class Y | | (16,552 | ) |
| Fees waived | | (11,266 | ) |
| Fees paid indirectly | | (343 | ) |
| Net expenses | | 909,525 | |
| |
| |
| NET INVESTMENT INCOME | | 717,288 | |
| |
| |
| REALIZED AND UNREALIZED GAIN (LOSS) | | | |
| Net realized gain (loss) on: | | | |
| Investments | | 3,368,263 | |
| Foreign currency transactions | | (16,899 | ) |
| | | 3,351,364 | |
| |
| Change in unrealized appreciation (depreciation) on: | | | |
| Investments and foreign currencies | | 10,113,414 | |
| Assets and liabilities denominated in foreign currencies | | 702 | |
| | | 10,114,116 | |
| |
| NET REALIZED AND UNREALIZED GAIN (LOSS) | | 13,465,480 | |
| |
| INCREASE (DECREASE) IN NET ASSETS | | | |
| RESULTING FROM OPERATIONS | $ | 14,182,768 | |
See notes to financial statements.
www.calvert.com CALVERT INTERNATIONAL OPPORTUNITIES FUND ANNUAL REPORT 23
| | | | | | |
| STATEMENTS OF CHANGES IN NET ASSETS |
| |
| |
| | | YEAR
ENDED | | | YEAR
ENDED | |
| | | SEPTEMBER
30, | | | SEPTEMBER
30, | |
| INCREASE (DECREASE) IN NET ASSETS | | 2013 | | | 2012 | |
| Operations: | | | | | | |
| Net investment income | $ | 717,288 | | $ | 405,464 | |
| Net realized gain (loss) | | 3,351,364 | | | 2,116,293 | |
| Change in unrealized appreciation (depreciation) | | 10,114,116 | | | 3,928,195 | |
| |
| |
| INCREASE (DECREASE) IN NET ASSETS | | | | | | |
| RESULTING FROM OPERATIONS | | 14,182,768 | | | 6,449,952 | |
| |
| Distributions to shareholders from: | | | | | | |
| Net investment income: | | | | | | |
| Class A shares | | (359,074 | ) | | (280,956 | ) |
| Class C shares | | (3,522 | ) | | (1,891 | ) |
| Class I shares | | (133,160 | ) | | (52,830 | ) |
| Class Y shares | | (25,865 | ) | | (15,544 | ) |
| Total distributions | | (521,621 | ) | | (351,221 | ) |
| |
| Capital share transactions: | | | | | | |
| Shares sold: | | | | | | |
| Class A shares | | 14,897,297 | | | 6,153,061 | |
| Class C shares | | 630,722 | | | 496,718 | |
| Class I shares | | 16,410,087 | | | 4,346,352 | |
| Class Y shares | | 2,960,531 | | | 426,350 | |
| Reinvestment of distributions: | | | | | | |
| Class A shares | | 322,643 | | | 245,600 | |
| Class C shares | | 2,962 | | | 1,463 | |
| Class I shares | | 133,160 | | | 52,830 | |
| Class Y shares | | 15,336 | | | 10,070 | |
| Redemption fees: | | | | | | |
| Class A shares | | 8 | | | 900 | |
| Class Y shares | | 83 | | | 20 | |
| Shares redeemed: | | | | | | |
| Class A shares | | (5,256,135 | ) | | (8,419,568 | ) |
| Class C shares | | (355,606 | ) | | (320,860 | ) |
| Class I shares | | (5,154,633 | ) | | (725,277 | ) |
| Class Y shares | | (332,615 | ) | | (586,431 | ) |
| Total capital share transactions | | 24,273,840 | | | 1,681,228 | |
| |
| |
| TOTAL INCREASE (DECREASE) IN NET ASSETS | | 37,934,987 | | | 7,779,959 | |
| |
| |
| NET ASSETS | | | | | | |
| Beginning of year | | 40,177,660 | | | 32,397,701 | |
| End of year (including undistributed net investment | | | | | | |
| income of $471,179 and $292,411, respectively) | $ | 78,112,647 | | $ | 40,177,660 | |
See notes to financial statements.
24 www.calvert.com CALVERT INTERNATIONAL OPPORTUNITIES FUND ANNUAL REPORT
| | | | |
| STATEMENTS OF CHANGES IN NET ASSETS |
| |
| |
| | YEAR
ENDED | | YEAR
ENDED | |
| | SEPTEMBER
30, | | SEPTEMBER
30, | |
| CAPITAL SHARE ACTIVITY | 2013 | | 2012 | |
| Shares sold: | | | | |
| Class A shares | 1,065,026 | | 527,829 | |
| Class C shares | 46,243 | | 42,932 | |
| Class I shares | 1,196,658 | | 364,209 | |
| Class Y shares | 227,676 | | 39,290 | |
| Reinvestment of distributions: | | | | |
| Class A shares | 24,629 | | 23,214 | |
| Class C shares | 229 | | 141 | |
| Class I shares | 10,347 | | 5,094 | |
| Class Y shares | 1,230 | | 1,005 | |
| Shares redeemed: | | | | |
| Class A shares | (376,057 | ) | (726,250 | ) |
| Class C shares | (25,959 | ) | (28,402 | ) |
| Class I shares | (362,594 | ) | (63,421 | ) |
| Class Y shares | (24,294 | ) | (54,993 | ) |
| Total capital share activity | 1,783,134 | | 130,648 | |
See notes to financial statements.
www.calvert.com CALVERT INTERNATIONAL OPPORTUNITIES FUND ANNUAL REPORT 25
NOTES TO FINANCIAL STATEMENTS
NOTE A — SIGNIFICANT ACCOUNTING POLICIES
General: Calvert International Opportunities Fund (the “Fund”), a series of Calvert World Values Fund, Inc., is registered under the Investment Company Act of 1940 as a diversified, open-end management investment company. Calvert World Values Fund, Inc. is comprised of four separate series. The operations of each series are accounted for separately. The Fund offers four classes of shares of capital stock - Classes A, C, I, and Y. Class A shares are sold with a maximum front-end sales charge of 4.75%. Class C shares are sold without a front-end sales charge and, with certain exceptions, will be charged a deferred sales charge on shares sold within one year of purchase. Class C shares have higher levels of expenses than Class A shares. Class I shares require a minimum account balance of $1,000,000. The $1 million minimum initial investment is waived for retirement plans that trade through omnibus accounts and may be waived for certain other institutional accounts where it is believed to be in the best interest of the Fund and its shareholders. Class I shares have no front-end or deferred sales charge and have lower levels of expenses than Class A shares. Class Y shares are generally only available to wrap or similar fee-based programs offered by financial intermediaries that have entered into an agreement with the Fund’s Distributor to offer Class Y shares. Class Y shares have no front-end or deferred sales charge and have lower levels of expenses than Class A shares. Each class has different: (a) dividend rates, due to differences in Distribution Plan expenses and other class-specific expenses, (b) exchange privileges, and (c) class-specific voting rights.
Security Valuation: Net asset value per share is determined every business day as of the close of the regular session of the New York Stock Exchange (generally 4:00 p.m. Eastern time). The Fund uses independent pricing services approved by the Board of Directors (“the Board”) to value its investments wherever possible. Investments for which market quotations are not available or deemed not reliable are fair valued in good faith under the direction of the Board.
The Board has adopted Valuation Procedures (the “Procedures”) to determine the fair value of securities and other financial instruments for which market prices are not readily available or which may not be reliably priced. The Board has delegated the day-to-day responsibility for determining the fair value of assets of the Fund to Calvert Investment Management, Inc. (the “Advisor” or “Calvert”) and has provided these Procedures to govern Calvert in its valuation duties.
Calvert has chartered an internal Valuation Committee to oversee the implementation of these Procedures and to assist it in carrying out the valuation responsibilities that the Board has delegated.
The Valuation Committee meets on a regular basis to review illiquid securities and other investments which may not have readily available market prices. The Valuation Committee’s fair valuation determinations are subject to review, approval and ratification by the Board at its next regularly scheduled meeting covering the calendar quarter in which the fair valuation was determined.
The Valuation Committee utilizes various methods to measure the fair value of the Fund’s investments. Generally Accepted Accounting Principles (GAAP) establishes a dis-
26 www.calvert.com CALVERT INTERNATIONAL OPPORTUNITIES FUND ANNUAL REPORT
closure hierarchy that categorizes the inputs to valuation techniques used to value assets and liabilities at measurement date. These inputs are summarized in the three broad levels listed below:
Level 1 – quoted prices in active markets for identical securities
Level 2 – other significant observable inputs (including quoted prices for similar securities, interest rates, prepayment speeds, credit risk, etc.)
Level 3 – significant unobservable inputs (including the Fund’s own assumptions in determining the fair value of investments) The inputs or methodologies used for valuing securities are not necessarily an indication of the risk associated with investing in those securities.
Changes in valuation techniques may result in transfers in or out of an investment’s assigned level within the hierarchy during the period. There were no such transfers during the period. Valuation techniques used to value the Funds’ investments by major category are as follows: Equity securities, including restricted securities, for which market quotations are readily available, are valued at the last reported sale price or official closing price as reported by an independent pricing service on the primary market or exchange on which they are traded and are categorized as Level 1 in the hierarchy. In the event there were no sales during the day or closing prices are not available, securities are valued at the last quoted bid price or using the last available price and are categorized as Level 2 in the hierarchy. Foreign securities are valued based on quotations from the principal market in which such securities are normally traded. If events occur after the close of the principal market in which foreign securities are traded, and before the close of business of the Fund, that are expected to materially affect the value of those securities, then they are valued at their fair value taking these events into account. The Fund has retained a third party fair value pricing service to quantitatively analyze the price movement of its holdings on foreign exchanges and to automatically fair value if the variation from the prior day’s closing price exceeds specified parameters. Such securities would be categorized as Level 2 in the hierarchy in these circumstances. Utilizing this technique may result in transfers between Level 1 and Level 2. For restricted securities and private placements where observable inputs are limited, assumptions about market activity and risk are used and such securities are categorized as Level 3 in the hierarchy.
Short-term securities of sufficient credit quality with remaining maturities of sixty days or less for which quotations are not readily available are valued at amortized cost, which approximates fair value, and are categorized as Level 2 in the hierarchy.
If a market value cannot be determined for a security using the methodologies described above, or if, in the good faith opinion of the Advisor, the market value does not constitute a readily available market quotation, or if a significant event has occurred that would materially affect the value of the security, the security will be fair valued as determined in good faith by the Valuation Committee.
The Valuation Committee considers a number of factors, including significant unobservable valuation inputs when arriving at fair value. It considers all significant facts that are reasonably available and relevant to the determination of fair value.
www.calvert.com CALVERT INTERNATIONAL OPPORTUNITIES FUND ANNUAL REPORT 27
The Valuation Committee primarily employs a market-based approach which may use related or comparable assets or liabilities, recent transactions, market multiples, book values, and other relevant information for the investment to determine the fair value of the investment. When more appropriate, the fund may employ an income-based or cost approach. An income-based valuation approach discounts anticipated future cash flows of the investment to calculate a present amount (discounted). The measurement is based on the value indicated by current market expectations about those future amounts. Discounts may also be applied due to the nature or duration of any restrictions on the disposition of the investments. A cost based approach is based on the amount that currently would be required to replace the service capacity of an asset (current replacement cost). From the seller’s perspective, the price that would be received for the asset is determined based on the cost to a buyer to acquire or construct a substitute asset of comparable utility, adjusted for obsolescence.
The values assigned to fair value investments are based on available information and do not necessarily represent amounts that might ultimately be realized. Further, due to the inherent uncertainty of valuations of such investments, the fair values may differ significantly from the values that would have been used had an active market existed, and the differences could be material. The Valuation Committee employs various methods for calibrating these valuation approaches including a regular review of key inputs and assumptions, transactional back-testing or disposition analysis and reviews of any related market activity.
At September 30, 2013, securities valued at $93,917, or 0.1% of net assets, were fair valued in good faith under the direction of the Board.
The following is a summary of the inputs used to value the Fund’s net assets as of September 30, 2013:
| | | VALUATION INPUTS | | |
| INVESTMENTS IN SECURITIES | LEVEL 1 | LEVEL 2 | LEVEL 3 | | TOTAL |
| Equity securities* | $75,208,943 | — | $93,917 | | $75,302,860 |
| Other debt obligations | — | $2,294,109 | — | | 2,294,109 |
| TOTAL | $75,208,943 | $2,294,109 | $93,917 | ** | $77,596,969 |
* For further breakdown of equity securities by country, please refer to the Statement of Net Assets.
** Level 3 securities represent 0.1% of net assets.
Security Transactions and Net Investment Income: Security transactions are accounted for on trade date. Realized gains and losses are recorded on an identified cost basis and may include proceeds from litigation. Dividend income is recorded on the ex-dividend date or, in the case of dividends on certain foreign securities, as soon as the Fund is informed of the ex-dividend date. Withholding taxes on foreign dividends have been provided for in accordance with the Fund’s understanding of the applicable country’s tax rules and rates. Distributions received on securities that represent a return of capital or capital gain are recorded as a reduction of cost of investments and/or as a realized gain. Interest income, which includes amortization of premium and accretion of discount on debt securities, is accrued as earned. Investment income and realized and unrealized gains
28 www.calvert.com CALVERT INTERNATIONAL OPPORTUNITIES FUND ANNUAL REPORT
and losses are allocated to separate classes of shares based upon the relative net assets of each class. Expenses arising in connection with a specific class are charged directly to that class. Expenses common to the classes are allocated to each class in proportion to their relative net assets.
Foreign Currency Transactions: The Fund’s accounting records are maintained in U.S. dollars. For valuation of assets and liabilities on each date of net asset value determination, foreign denominations are converted into U.S. dollars using the current exchange rate. Security transactions, income, and expenses are translated at the prevailing rate of exchange on the date of the event. The effect of changes in foreign exchange rates on securities and foreign currencies is included in the net realized and unrealized gain or loss on securities and foreign currencies.
Distributions to Shareholders: Distributions to shareholders are recorded by the Fund on ex-dividend date. Dividends from net investment income and distributions from net realized capital gains, if any, are paid at least annually. Distributions are determined in accordance with income tax regulations which may differ from generally accepted accounting principles; accordingly, periodic reclassifications are made within the Fund’s capital accounts to reflect income and gains available for distribution under income tax regulations.
Estimates: The preparation of financial statements in conformity with accounting principles generally accepted in the United States requires management to make estimates and assumptions that affect the reported amounts of assets and liabilities and disclosure of contingent assets and liabilities at the date of the financial statements and the reported amounts of income and expenses during the reporting period. Actual results could differ from those estimates.
Redemption Fees: The Fund charges a 2% redemption fee on redemptions, including exchanges, made within 30 days of purchase (within seven days for Class I shares). The redemption fee is accounted for as an addition to paid-in capital and is intended to discourage market-timers by ensuring that short-term trading costs are borne by the investors making the transactions and not the shareholders already in the Fund.
Expense Offset Arrangement: The Fund had an arrangement with the custodian bank whereby the custodian’s fees may have been paid indirectly by credits earned on the Fund’s cash on deposit with the bank. These credits were used to reduce the Fund’s expenses. This arrangement was suspended on January 1, 2013, until further notice, due to low interest rates. Such a deposit arrangement was an alternative to overnight investments.
Federal Income Taxes: No provision for federal income or excise tax is required since the Fund intends to continue to qualify as a regulated investment company under the Internal Revenue Code and to distribute substantially all of its taxable earnings.
Management has analyzed the Fund’s tax positions taken for all open federal income tax years and has concluded that no provision for federal income tax is required in the Fund’s financial statements. A Fund’s federal tax return is subject to examination by the Internal Revenue Service for a period of three years.
www.calvert.com CALVERT INTERNATIONAL OPPORTUNITIES FUND ANNUAL REPORT 29
NOTE B — RELATED PARTY TRANSACTIONS
Calvert Investment Management, Inc. (the “Advisor”) is wholly-owned by Calvert Investments, Inc., which is indirectly wholly-owned by Ameritas Mutual Holding Company. The Advisor provides investment advisory services and pays the salaries and fees of officers and Directors of the Fund who are employees of the Advisor or its affiliates. For its services, the Advisor receives an annual fee, payable monthly, of .80% of the average daily net assets. For the year ended September 30, 2013, the Advisor voluntarily waived $11,266 of its fee. Under the terms of the agreement, $52,411 was payable at year end. In addition, $9,709 was payable at year end for operating expenses paid by the Advisor during September 2013.
The Advisor has contractually agreed to limit net annual fund operating expenses through January 31, 2014. The contractual expense cap is 1.66%, 2.50%, 1.20%, and 1.41% for Class A, C, I, and Y, respectively. For the purpose of this expense limit, operating expenses do not include interest expense, brokerage commissions, taxes, and extraordinary expenses. This expense limitation does not limit acquired fund fees and expenses, if any. To the extent any expense offset credits were earned, the Advisor’s obligation under the contractual limitation may have been reduced and the Advisor may have benefited from the expense offset arrangement.
Calvert Investment Administrative Services, Inc., an affiliate of the Advisor, provides administrative services to the Fund for an annual fee, payable monthly, of .35% for Classes A, C, and Y shares and .15% for Class I shares, based on their average daily net assets. Under the terms of the agreement, $18,766 was payable at year end.
Calvert Investment Distributors, Inc. (“CID”), an affiliate of the Advisor, is the distributor and principal underwriter for the Fund. Pursuant to Rule 12b-1 under the Investment Company Act of 1940, the Fund has adopted a Distribution Plan that permits the Fund to pay certain expenses associated with the distribution and servicing of its shares. The expenses paid may not exceed .50% and 1.00% annually of the average daily net assets of Class A and C, respectively. The amount actually paid by the Fund is an annualized fee, payable monthly, of .25% and 1.00% of the average daily net assets of Class A and C, respectively. Class I and Y shares do not have Distribution Plan expenses. Under the terms of the agreement, $12,143 was payable at year end.
CID received $18,300 as its portion of the commissions charged on sales of the Fund’s Class A shares for the year ended September 30, 2013.
Calvert Investment Services, Inc. (“CIS”), an affiliate of the Advisor, is the shareholder servicing agent for the Fund. For its services, CIS received a fee of $20,805 for the year ended September 30, 2013. Under the terms of the agreement, $1,570 was payable at year end. Boston Financial Data Services, Inc. is the transfer and dividend disbursing agent.
Each Director of the Fund who is not an employee of the Advisor or its affiliates receives an annual retainer of $48,000 plus a meeting fee of up to $3,000 for each Board meeting attended. Additional fees of up to $5,000 annually may be paid to the Board chair and Committee chairs ($10,000 for the Special Equities Committee chair) and $2,500 annually may be paid to Committee members, plus a Committee meeting fee of $500 for each Committee meeting attended. Directors’ fees are allocated to each of the Funds served.
30 www.calvert.com CALVERT INTERNATIONAL OPPORTUNITIES FUND ANNUAL REPORT
NOTE C — INVESTMENT ACTIVITY AND TAX INFORMATION
During the year, the cost of purchases and proceeds from sales of investments, other than short-term securities, were $46,345,601 and $23,105,520, respectively.
| | |
| CAPITAL LOSS CARRYFORWARDS | | |
| EXPIRATION DATE | | |
| 30-Sep-18 | ($2,264,774 | ) |
| 30-Sep-19 | (69,673 | ) |
Under the Regulated Investment Company Modernization Act of 2010, capital losses incurred in taxable years beginning after December 22, 2010 can be carried forward for an unlimited period. These losses are required to be utilized prior to the losses incurred in pre-enactment taxable years and will retain their character as either long-term or short-term. Losses incurred in pre-enactment taxable years can be utilized until expiration.
The tax character of dividends and distributions paid during the years ended September 30, 2013 and September 30, 2012 was as follows:
| | |
| Distributions paid from: | 2013 | 2012 |
| Ordinary income | $521,621 | $351,221 |
| Total | $521,621 | $351,221 |
As of September 30, 2013, the tax basis components of distributable earnings/(accumulated losses) and the federal tax cost were as follows:
| | |
| Unrealized appreciation | $14,033,467 | |
| Unrealized (depreciation) | (1,176,180 | ) |
| Net unrealized appreciation/(depreciation) | $12,857,287 | |
| Undistributed ordinary income | $867,392 | |
| Capital loss carryforward | ($2,334,447 | ) |
| Federal income tax cost of investments | $64,739,682 | |
The differences between the components of distributable earnings on a tax basis and the amounts reflected in the statement of net assets are primarily due to temporary book-tax differences that will reverse in a subsequent period. These book-tax differences are mainly due to wash sales and passive foreign investment companies.
Reclassifications, as shown in the table below, have been made to the Fund’s components of net assets to reflect income and gains available for distribution (or available capital loss carryovers, as applicable) under income tax law and regulations. These reclassifications are due to permanent book-tax differences and have no impact on net assets. The primary permanent differences causing such reclassifications for the Fund are due to foreign currency transactions.
www.calvert.com CALVERT INTERNATIONAL OPPORTUNITIES FUND ANNUAL REPORT 31
| Undistributed net investment income | ($16,899 | ) |
| Accumulated net realized gain (loss) | 16,899 | |
NOTE D — LINE OF CREDIT
A financing agreement is in place with the Calvert Funds and State Street Corporation (“SSC”). Under the agreement, SSC provides an unsecured line of credit facility, in the aggregate amount of $50 million ($25 million committed and $25 million uncommitted), accessible by the Funds for temporary or emergency purposes only. Borrowings under the committed facility bear interest at the higher of the London Interbank Offered Rate (LIBOR) or the overnight Federal Funds Rate plus 1.25% per annum. A commitment fee of .11% per annum is incurred on the unused portion of the committed facility, which is allocated to all participating funds. The Fund had no borrowings under the agreement during the year ended September 30, 2013.
NOTE E — SUBSEQUENT EVENTS
In preparing the financial statements as of September 30, 2013, no subsequent events or transactions occurred that would have required recognition or disclosure in these financial statements.
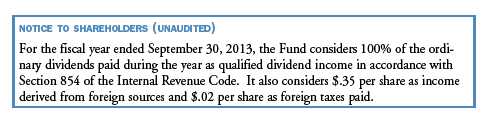
32 www .calvert.com CALVERT INTERNATIONAL OPPORTUNITIES FUND ANNUAL REPORT
| | | | | | | | | |
| FINANCIAL HIGHLIGHTS |
| |
| | | | | | YEARS ENDED | | | | |
| | | SEPTEMBER
30, | | | SEPTEMBER
30, | | | SEPTEMBER
30, | |
| CLASS A SHARES | | 2013 | (z) | | 2012 | | | 2011 | |
| Net asset value, beginning | $ | 12.59 | | $ | 10.57 | | $ | 12.43 | |
| Income from investment operations: | | | | | | | | | |
| Net investment income | | .14 | | | .13 | | | .10 | |
| Net realized and unrealized gain (loss) | | 3.19 | | | 2.01 | | | (1.93 | ) |
| Total from investment operations | | 3.33 | | | 2.14 | | | (1.83 | ) |
| Distributions from: | | | | | | | | | |
| Net investment income | | (.16 | ) | | (.12 | ) | | (.03 | ) |
| Total distributions | | (.16 | ) | | (.12 | ) | | (.03 | ) |
| Total increase (decrease) in net asset value | | 3.17 | | | 2.02 | | | (1.86 | ) |
| Net asset value, ending | $ | 15.76 | | $ | 12.59 | | $ | 10.57 | |
| |
| Total return* | | 26.70 | % | | 20.52 | % | | (14.78 | %) |
| Ratios to average net assets:A | | | | | | | | | |
| Net investment income | | 1.04 | % | | 1.10 | % | | .68 | % |
| Total expenses | | 2.13 | % | | 2.35 | % | | 2.21 | % |
| Expenses before offsets | | 1.66 | % | | 1.66 | % | | 1.66 | % |
| Net expenses | | 1.66 | % | | 1.66 | % | | 1.66 | % |
| Portfolio turnover | | 42 | % | | 56 | % | | 126 | % |
| Net assets, ending (in thousands) | $ | 45,563 | | $ | 27,406 | | $ | 24,874 | |
| |
| | | | | | YEARS ENDED | |
| | | | | | SEPTEMBER
30 | | | SEPTEMBER
30, | |
| CLASS A SHARES | | | | | 2010 | (z) | | 2009 | (z) |
| Net asset value, beginning | | | | $ | 11.40 | | $ | 11.50 | |
| Income from investment operations: | | | | | | | | | |
| Net investment income | | | | | .06 | | | .06 | |
| Net realized and unrealized gain (loss) | | | | | .97 | | | (.10 | ) |
| Total from investment operations | | | | | 1.03 | | | (.04 | ) |
| Distributions from: | | | | | | | | | |
| Net investment income | | | | | — | | | (.06 | ) |
| Net realized gain | | | | | — | | | ** | |
| Total from distributions | | | | | — | | | (.06 | ) |
| Total increase (decrease) in net asset value | | | | | 1.03 | | | (.10 | ) |
| Net asset value, ending | | | | $ | 12.43 | | $ | 11.40 | |
| |
| Total return* | | | | | 9.04 | % | | (.16 | %) |
| Ratios to average net assets:A | | | | | | | | | |
| Net investment income | | | | | .48 | % | | .63 | % |
| Total expenses | | | | | 2.27 | % | | 2.70 | % |
| Expenses before offsets | | | | | 1.66 | % | | 1.67 | % |
| Net expenses | | | | | 1.66 | % | | 1.67 | % |
| Portfolio turnover | | | | | 44 | % | | 98 | % |
| Net assets, ending (in thousands) | | | | $ | 30,062 | | $ | 21,328 | |
See notes to financial highlights.
www.calvert.com CALVERT INTERNATIONAL OPPORTUNITIES FUND ANNUAL REPORT 33
| | | | | | | | | |
| FINANCIAL HIGHLIGHTS |
| |
| | | | | | YEARS ENDED | | | | |
| | | SEPTEMBER
30, | | | SEPTEMBER
30, | | | SEPTEMBER
30, | |
| CLASS C SHARES | | 2013 | (z) | | 2012 | | | 2011 | |
| Net asset value, beginning | $ | 12.30 | | $ | 10.32 | | $ | 12.20 | |
| Income from investment operations: | | | | | | | | | |
| Net investment income (loss) | | .02 | | | .04 | | | (.01 | ) |
| Net realized and unrealized gain (loss) | | 3.14 | | | 1.95 | | | (1.87 | ) |
| Total from investment operations | | 3.16 | | | 1.99 | | | (1.88 | ) |
| Distributions from: | | | | | | | | | |
| Net investment income | | (.02 | ) | | (.01 | ) | | — | |
| Total distributions | | (.02 | ) | | (.01 | ) | | — | |
| Total increase (decrease) in net asset value | | 3.14 | | | 1.98 | | | (1.88 | ) |
| Net asset value, ending | $ | 15.44 | | $ | 12.30 | | $ | 10.32 | |
| |
| Total return* | | 25.70 | % | | 19.31 | % | | (15.41 | %) |
| Ratios to average net assets:A | | | | | | | | | |
| Net investment income (loss) | | .17 | % | | .30 | % | | (.13 | %) |
| Total expenses | | 3.27 | % | | 3.65 | % | | 3.48 | % |
| Expenses before offsets | | 2.50 | % | | 2.50 | % | | 2.50 | % |
| Net expenses | | 2.50 | % | | 2.50 | % | | 2.50 | % |
| Portfolio turnover | | 42 | % | | 56 | % | | 126 | % |
| Net assets, ending (in thousands) | $ | 3,282 | | $ | 2,363 | | $ | 1,831 | |
| |
| | | | | | YEARS ENDED | |
| | | | | | SEPTEMBER
30, | | | SEPTEMBER
30, | |
| CLASS C SHARES | | | | | 2010 | (z) | | 2009 | (z) |
| Net asset value, beginning | | | | $ | 11.29 | | $ | 11.39 | |
| Income from investment operations: | | | | | | | | | |
| Net investment income (loss) | | | | | (.03 | ) | | (.02 | ) |
| Net realized and unrealized gain (loss) | | | | | .94 | | | (.08 | ) |
| Total from investment operations | | | | | .91 | | | (.10 | ) |
| Distributions from: | | | | | | | | | |
| Net realized gain | | | | | — | | | ** | |
| Total from distributions | | | | | — | | | ** | |
| Total increase (decrease) in net asset value | | | | | .91 | | | (.10 | ) |
| Net asset value, ending | | | | $ | 12.20 | | $ | 11.29 | |
| |
| Total return* | | | | | 8.06 | % | | (.82 | %) |
| Ratios to average net assets:A | | | | | | | | | |
| Net investment income (loss) | | | | | (.25 | %) | | (.19 | %) |
| Total expenses | | | | | 3.88 | % | | 5.38 | % |
| Expenses before offsets | | | | | 2.50 | % | | 2.51 | % |
| Net expenses | | | | | 2.50 | % | | 2.51 | % |
| Portfolio turnover | | | | | 44 | % | | 98 | % |
| Net assets, ending (in thousands) | | | | $ | 1,744 | | $ | 823 | |
See notes to financial highlights.
34 www.calvert.com CALVERT INTERNATIONAL OPPORTUNITIES FUND ANNUAL REPORT
| | | | | | | | | |
| FINANCIAL HIGHLIGHTS |
| |
| | | | | | YEARS ENDED | | | | |
| | | SEPTEMBER
30, | | | SEPTEMBER
30, | | | SEPTEMBER
30, | |
| CLASS I SHARES | | 2013 | (z) | | 2012 | | | 2011 | |
| Net asset value, beginning | $ | 12.37 | | $ | 10.36 | | $ | 12.17 | |
| Income from investment operations: | | | | | | | | | |
| Net investment income | | .25 | | | .21 | | | .15 | |
| Net realized and unrealized gain (loss) | | 3.10 | | | 1.93 | | | (1.88 | ) |
| Total from investment operations | | 3.35 | | | 2.14 | | | (1.73 | ) |
| Distributions from: | | | | | | | | | |
| Net investment income | | (.18 | ) | | (.13 | ) | | (.08 | ) |
| Total distributions | | (.18 | ) | | (.13 | ) | | (.08 | ) |
| Total increase (decrease) in net asset value | | 3.17 | | | 2.01 | | | (1.81 | ) |
| Net asset value, ending | $ | 15.54 | | $ | 12.37 | | $ | 10.36 | |
| |
| Total return* | | 27.43 | % | | 20.89 | % | | (14.32 | %) |
| Ratios to average net assets:A | | | | | | | | | |
| Net investment income | | 1.76 | % | | 1.76 | % | | 1.11 | % |
| Total expenses | | 1.43 | % | | 1.70 | % | | 1.54 | % |
| Expenses before offsets | | 1.20 | % | | 1.20 | % | | 1.20 | % |
| Net expenses | | 1.20 | % | | 1.20 | % | | 1.20 | % |
| Portfolio turnover | | 42 | % | | 56 | % | | 126 | % |
| Net assets, ending (in thousands) | $ | 24,130 | | $ | 8,771 | | $ | 4,174 | |
| |
| | | | | | YEARS ENDED | |
| | | | | | SEPTEMBER
30, | | | SEPTEMBER
30, | |
| CLASS I SHARES | | | | | 2010 | (z) | | 2009 | (z) |
| Net asset value, beginning | | | | $ | 11.32 | | $ | 11.58 | |
| Income from investment operations: | | | | | | | | | |
| Net investment income | | | | | .10 | | | .09 | |
| Net realized and unrealized gain (loss) | | | | | .95 | | | (.14 | ) |
| Total from investment operations | | | | | 1.05 | | | (.05 | ) |
| Distributions from: | | | | | | | | | |
| Net investment income | | | | | (.20 | ) | | (.21 | ) |
| Net realized gain | | | | | — | | | ** | |
| Total from distributions | | | | | (.20 | ) | | (.21 | ) |
| Total increase (decrease) in net asset value | | | | | .85 | | | (.26 | ) |
| Net asset value, ending | | | | $ | 12.17 | | $ | 11.32 | |
| |
| Total return* | | | | | 9.42 | % | | .26 | % |
| Ratios to average net assets:A | | | | | | | | | |
| Net investment income | | | | | .90 | % | | 1.03 | % |
| Total expenses | | | | | 1.73 | % | | 2.11 | % |
| Expenses before offsets | | | | | 1.20 | % | | 1.21 | % |
| Net expenses | | | | | 1.20 | % | | 1.21 | % |
| Portfolio turnover | | | | | 44 | % | | 98 | % |
| Net assets, ending (in thousands) | | | | $ | 4,190 | | $ | 3,712 | |
See notes to financial highlights.
www.calvert.com CALVERT INTERNATIONAL OPPORTUNITIES FUND ANNUAL REPORT 35
| | | | | | |
| FINANCIAL HIGHLIGHTS |
| |
| | | | YEARS ENDED | | | |
| | SEPTEMBER
30, | | SEPTEMBER
30, | | SEPTEMBER
30, | |
| CLASS Y SHARES | 2013 | (z) | 2012 | | 2011 | |
| Net asset value, beginning | $11.94 | | $10.00 | | $11.72 | |
| Income from investment operations: | | | | | | |
| Net investment income | .18 | | .15 | | .13 | |
| Net realized and unrealized gain (loss) | 3.03 | | 1.90 | | (1.83 | ) |
| Total from investment operations | 3.21 | | 2.05 | | (1.70 | ) |
| Distributions from: | | | | | | |
| Net investment income | (.12 | ) | (.11 | ) | (.02 | ) |
| Total distributions | (.12 | ) | (.11 | ) | (.02 | ) |
| Total increase (decrease) in net asset value | 3.09 | | 1.94 | | (1.72 | ) |
| Net asset value, ending | $15.03 | | $11.94 | | $10.00 | |
| |
| Total return* | 27.06 | % | 20.69 | % | (14.52 | %) |
| Ratios to average net assets:A | | | | | | |
| Net investment income | 1.31 | % | 1.36 | % | 1.04 | % |
| Total expenses | 1.90 | % | 2.49 | % | 2.68 | % |
| Expenses before offsets | 1.41 | % | 1.41 | % | 1.41 | % |
| Net expenses | 1.41 | % | 1.41 | % | 1.41 | % |
| Portfolio turnover | 42 | % | 56 | % | 126 | % |
| Net assets, ending (in thousands) | $5,138 | | $1,638 | | $1,519 | |
| |
| | | | PERIODS ENDED | |
| | | | SEPTEMBER
30, | | SEPTEMBER
30, | |
| CLASS Y SHARES | | | 2010 | (z) | 2009 | #(z) |
| Net asset value, beginning | | | $11.50 | | $8.67 | |
| Income from investment operations: | | | | | | |
| Net investment income | | | .10 | | .13 | |
| Net realized and unrealized gain (loss) | | | .90 | | 2.70 | |
| Total from investment operations | | | 1.00 | | 2.83 | |
| Distributions from: | | | | | | |
| Net investment income | | | (.78 | ) | — | |
| Net realized gain | | | — | | ** | |
| Total from distributions | | | (.78 | ) | ** | |
| Total increase (decrease) in net asset value | | | .22 | | 2.83 | |
| Net asset value, ending | | | $11.72 | | $11.50 | |
| |
| Total return* | | | 9.18 | % | 32.71 | % |
| Ratios to average net assets:A | | | | | | |
| Net investment income | | | .96 | % | 1.56 | % (a) |
| Total expenses | | | 4.73 | % | 21.67 | % (a) |
| Expenses before offsets | | | 1.41 | % | 1.42 | % (a) |
| Net expenses | | | 1.41 | % | 1.41 | % (a) |
| Portfolio turnover | | | 44 | % | 90 | % |
| Net assets, ending (in thousands) | | | $944 | | $112 | |
See notes to financial highlights.
36 www.calvert.com CALVERT INTERNATIONAL OPPORTUNITIES FUND ANNUAL REPORT
A Total expenses do not reflect amounts reimbursed and/or waived by the Advisor or reductions from expense offset arrangements. Expenses before offsets reflect expenses after reimbursement and/or waiver by the Advisor but prior to reductions from expense offset arrangements. Net expenses are net of all reductions and represent the net expenses paid by the Fund.
# From October 31, 2008 inception.
* Total return is not annualized for periods of less than one year and does not reflect deduction of any front-end or deferred sales charge.
** Less than $0.01 per share.
(a) Annualized.
(z) Per share figures are calculated using the Average Shares Method.
See notes to financial statements.
www.calvert.com CALVERT INTERNATIONAL OPPORTUNITIES FUND ANNUAL REPORT 37
EXPLANATION OF FINANCIAL TABLES
SCHEDULE OF INVESTMENTS
The Schedule of Investments is a snapshot of all securities held in the fund at their market value, on the last day of the reporting period. Securities are listed by asset type (e.g., common stock, corporate bonds, U.S. government obligations) or, for International Funds, by country, and may be further broken down into sub-groups and by industry classification.
STATEMENT OF ASSETS AND LIABILITIES
The Statement of Assets and Liabilities is often referred to as the fund’s balance sheet. It lists the value of what the fund owns, is due and owes on the last day of the reporting period. The fund’s assets include the market value of securities owned, cash, receivables for securities sold and shareholder subscriptions, and receivables for dividends and interest payments that have been earned, but not yet received. The fund’s liabilities include payables for securities purchased and shareholder redemptions, and expenses owed but not yet paid. The statement also reports the fund’s net asset value (NAV) per share on the last day of the reporting period. The NAV is calculated by dividing the fund’s net assets (assets minus liabilities) by the number of shares outstanding. This statement is accompanied by a Schedule of Investments. Alternatively, if certain conditions are met, a Statement of Net Assets may be presented in lieu of this statement and the Schedule of Investments.
STATEMENT OF NET ASSETS
The Statement of Net Assets provides a detailed list of the fund’s holdings, including each security’s market value on the last day of the reporting period. The Statement of Net Assets includes a Schedule of Investments. Other assets are added and other liabilities subtracted from the investments total to calculate the fund’s net assets. Finally, net assets are divided by the outstanding shares of the fund to arrive at its share price, or Net Asset Value (NAV) per share.
At the end of the Statement of Net Assets is a table displaying the composition of the fund’s net assets. Paid in Capital is the money invested by shareholders and represents the bulk of net assets. Undistributed Net Investment Income and Accumulated Net Realized Gains usually approximate the amounts the fund had available to distribute to shareholders as of the statement date. Accumulated Realized Losses will appear as negative balances. Unrealized Appreciation (Depreciation) is the difference between the market value of the fund’s investments and their cost, and reflects the gains (losses) that would be realized if the fund were to sell all of its investments at their statement-date values.
STATEMENT OF OPERATIONS
The Statement of Operations summarizes the fund’s investment income earned and expenses incurred in operating the fund. Investment income includes dividends earned from stocks and interest earned from interest-bearing securities in the fund. Expenses incurred in operating the fund include the advisory fee paid to the investment advisor, administrative services fees, distribution plan expenses (if applicable), transfer agent fees, shareholder servicing expenses, custodial, legal, and audit fees, and the printing and post-
38 www.calvert.com CALVERT INTERNATIONAL OPPORTUNITIES FUND ANNUAL REPORT (UNAUDITED)
age expenses related to shareholder reports. Expense offsets (fees paid indirectly) are also shown. Credits earned from offset arrangements are used to reduce the fund’s expenses. This statement also shows net gains (losses) realized on the sale of investments and the increase or decrease in the unrealized appreciation (depreciation) on investments held during the period.
STATEMENT OF CHANGES IN NET ASSETS
The Statement of Changes in Net Assets shows how the fund’s total net assets changed during the two most recent reporting periods. Changes in the fund’s net assets are attributable to investment operations, distributions and capital share transactions.
The Operations section of the report summarizes information detailed in the Statement of Operations. The Distribution section shows the dividend and capital gain distributions made to shareholders. The amounts shown as distributions in this section may not match the net investment income and realized gains amounts shown in the Operations section because distributions are determined on a tax basis and certain investments or transactions may be treated differently for financial statement and tax purposes. The Capital Share Transactions section shows the amount shareholders invested in the fund, either by purchasing shares or by reinvesting distributions, and the amounts redeemed. The corresponding numbers of shares issued, reinvested and redeemed are shown at the end of the report.
FINANCIAL HIGHLIGHTS
The Financial Highlights table provides a per-share breakdown per class of the components that affect the fund’s net asset value for current and past reporting periods. The table provides total return, total distributions, expense ratios, portfolio turnover and net assets for the applicable period. Total return is a measure of a fund’s performance that encompasses all elements of return: dividends, capital gain distributions and changes in net asset value. Total return is the change in value of an investment over a given period, assuming reinvestment of any dividends and capital gain distributions, expressed as a percentage of the initial investment. Total distributions include distributions from net investment income and net realized gains. Long-term gains are earned on securities held in the fund more than one year. Short-term gains, on the sale of securities held less than one year, are treated as ordinary dividend income for tax purposes. The expense ratio is a fund’s cost of doing business, expressed as a percentage of net assets. These expenses directly reduce returns to shareholders. Portfolio turnover measures the trading activity in a fund’s investment portfolio – how often securities are bought and sold by a fund. Portfolio turnover is affected by market conditions, changes in the size of the fund, the nature of the fund’s investments and the investment style of the portfolio manager.
www.calvert.com CALVERT INTERNATIONAL OPPORTUNITIES FUND ANNUAL REPORT (UNAUDITED) 39
PROXY VOTING
The Proxy Voting Guidelines of the Calvert Funds that the Fund uses to determine how to vote proxies relating to portfolio securities are provided as an Appendix to the Fund’s Statement of Additional Information. The Statement of Additional Information can be obtained free of charge by calling the Fund at 1-800-368-2745, by visiting the Calvert website at www.calvert.com; or by visiting the SEC’s website at www.sec.gov.
Information regarding how the Fund voted proxies relating to portfolio securities during the most recent 12-month period ended June 30 is available on the Fund’s website at www.calvert.com and on the SEC’s website at www.sec.gov.
AVAILABILITY OF QUARTERLY PORTFOLIO HOLDINGS
The Fund files its complete schedule of portfolio holdings with the SEC for the first and third quarters of each fiscal year on Form N-Q. The Fund’s Form N-Q is available on the SEC’s website at www.sec.gov. The Fund’s Form N-Q may be reviewed and copied at the SEC’s Public Reference Room in Washington, DC; information on the operation of the Public Reference Room may be obtained by calling 1-800-SEC-0330.
40 www.calvert.com CALVERT INTERNATIONAL OPPORTUNITIES FUND ANNUAL REPORT (UNAUDITED)
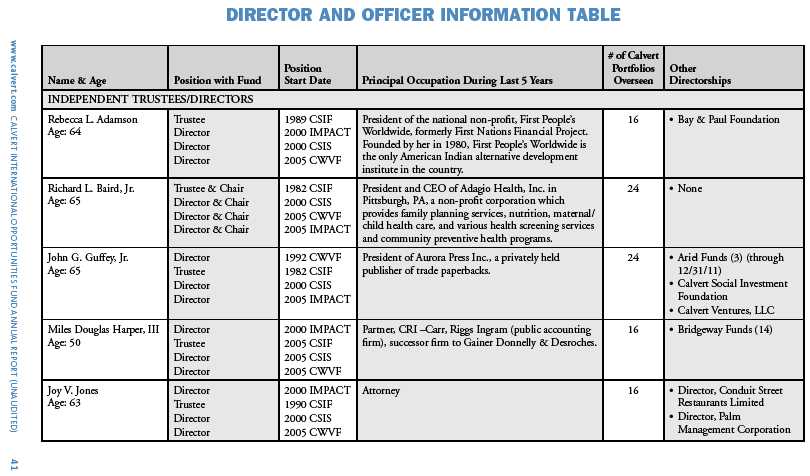
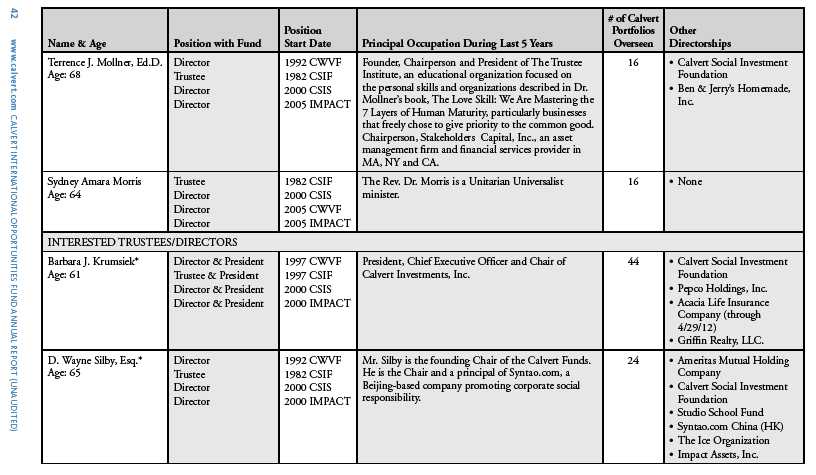
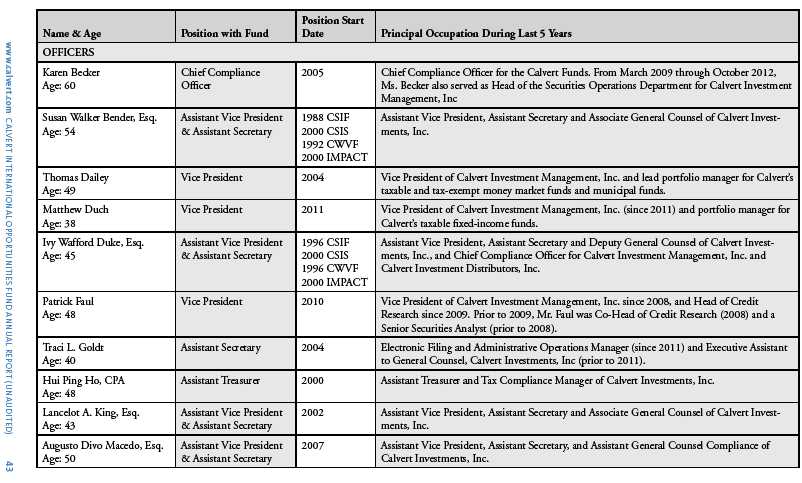
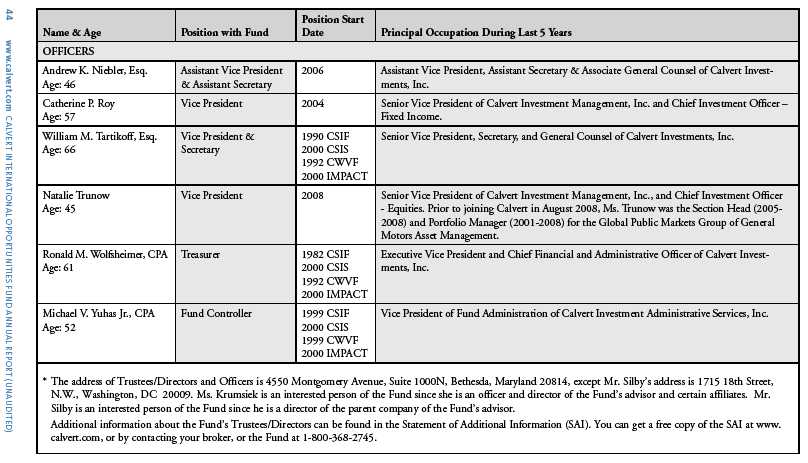
To Open an Account
800-368-2748
Service for Existing Account
Shareholders: 800-368-2745
Brokers: 800-368-2746
TDD for Hearing Impaired
800-541-1524
Registered Mail
Calvert Investments
c/o BFDS,
P.O. Box 219544
Kansas City, MO 64121-9544
Overnight Mail
Calvert Investments
c/o BFDS,
330 West 9th Street
Kansas City, MO 64105
Web Site
www.calvert.com
Principal Underwriter
Calvert Investment Distributors, Inc.
4550 Montgomery Avenue
Suite 1000 North
Bethesda, Maryland 20814
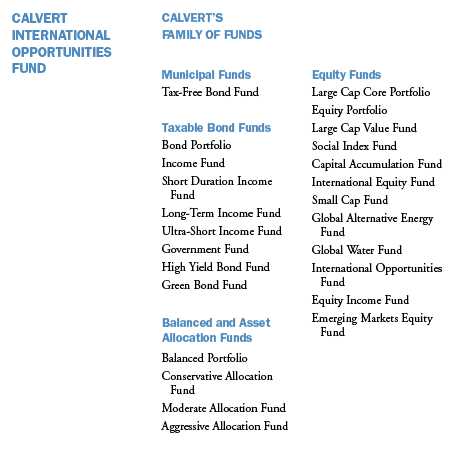
This report is intended to provide fund information to shareholders. It is not authorized for distribution to prospective investors unless preceded or accompanied by a prospectus.
Note: The information on our website is not incorporated by reference into this report; our website address is included as an inactive textual reference only.
Investors should carefully consider the investment objectives, risks, charges and expenses of the Calvert Funds. This and other important information is contained in the fund’s summary prospectus and prospectus, which can be obtained from your financial professional and should be read carefully before investing. You may also call Calvert at 800/368-2748 or visit www. calvert.com.
Choose Planet-friendly E-delivery!
Sign up now for on-line statements, prospectuses, and fund reports. In less than five minutes you can help reduce paper mail and lower fund costs.
Just go to www.calvert.com. If you already have an online account at Calvert, click on My Account, and select the documents you would like to receive via e-mail.
If you’re new to online account access, click on Login/Register to open an online account. Once you’re in, click on the E-delivery sign-up at the bottom of the Account Portfolio page and follow the quick, easy steps. Note: if your shares are not held directly at Calvert but through a brokerage firm, you must contact your broker for electronic delivery options available through their firm.
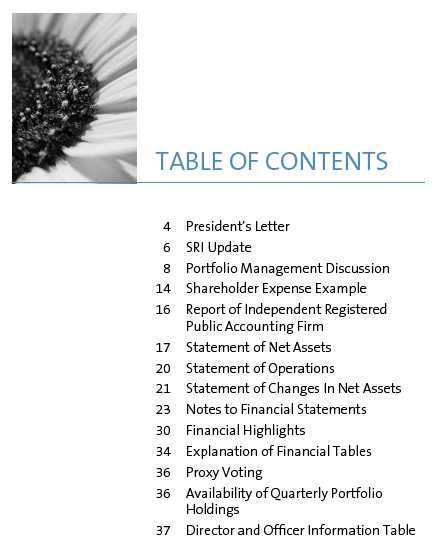

Barbara Krumsiek
President and CEO of Calvert Investments, Inc.
Dear Calvert Shareholder,
For the 12 months ended September 30, 2013, the global equity markets generally had a strong year, while bonds saw more mixed results. Large-cap stocks, as represented by the Russell 1000 Index, posted a healthy 20.9% return, while the smaller-cap Russell 2000 Index led with a 30.1% gain. This occurred despite political turmoil and market concerns worldwide about a forced shutdown of the U.S. government and the upcoming debt ceiling deadline.
Despite these advances, it was a challenging year for the financial markets overall. At various times, issues at home and abroad led to marked volatility in the performance of both stocks and bonds. Emerging-market performance was notably low, as fears of slowing growth in China and the Eurozone, along with continuing struggles in the Eurozone periphery, stalled regional investment. As a result, the formerly high-flying MSCI Emerging Markets Index gained only 1.3% for the period. The Barclays U.S. Credit Index, a barometer for the overall U.S. bond market, returned -1.9%.
Early in the Fall, Fed Chairman Ben Bernanke’s retirement was big news. The nomination of Vice Chair Janet Yellen as his replacement means the Fed will likely stay the course with current monetary policy. Yet, this is a historic moment for the United States, as Yellen, following Senate approval, will be the first woman to lead this critical agency.
Calvert Co-Founder Honored
I’m proud to congratulate Calvert co-founder Wayne Silby, who received the prestigious Joseph Wharton Award for Social Impact from The Alumni Club of New York, honoring his lifetime of achievement in impact investing and social entrepreneurship. Besides founding Calvert with John Guffey, Wayne is a co-founder of the Social Venture Network, Co-Chairman of the board of the Calvert Foundation, Chairman of Syntao Ltd., a CSR consultancy in Beijing, and active in other ventures in social impact and entrepreneurship.
Calvert Releases New Report on Diversity
In March, we published the latest edition of Examining the Cracks in the Glass Ceiling, which measures diversity practices of the companies that constitute the S&P 100 Index. As you know, Calvert believes companies with a diverse workforce are poised for greater success in today’s increasingly global marketplace and will enjoy greater long-term value—a view supported by a growing body of research from McKinsey, Credit Suisse, and others.
Companies in the report were rated on 10 indicators: EEO policy, internal diversity initiatives, external diversity initiatives, scope of diversity initiatives, family-friendly benefits, demographic disclosure of employees (EEO-1), highest-paid executives, board diversity,
4 www.calvert.com CALVERT EMERGING MARKETS EQUITY FUND ANNUAL REPORT
director selection criteria, and overall corporate commitment. The highest-rated companies were Citigroup, Merck, The Coca-Cola Company, and J.P. Morgan Chase, all scoring at least 95 points or more out of 100. We hold these companies in a number of our Calvert portfolios.
While some progress has been achieved in corporate diversity practices since our last assessment in 2010, the S&P 100 companies are largely failing to translate progressive practices into increased promotion rates for women and minority employees. For example, women are now hired as often as men. However, more than half of the S&P 100 companies lack diversity among their highest-paid senior executive positions. And women still only represent 19% of board members among these large-cap companies. Much remains to be done, which is why we continue to work with a number of international, multi-stakeholder groups on these issues, as well as conduct advocacy work with individual companies.
Stay Informed in the Months Ahead
Maintaining a well-diversified mix of U.S. and international stocks, bonds, and cash—appropriate for your goals and risk tolerance—is one of the best ways to mitigate the effects of an uneven recovery in the economy and markets. Of course, we recommend consulting your financial advisor if you have questions or concerns about your investments.
We also invite you to visit our website, www.calvert.com, for fund information, portfolio updates, and commentary from Calvert professionals. As always, we thank you for investing with Calvert.
The following companies represented the following percentages of Fund net assets: Citigroup 2.27% of Calvert Large Cap Value, 1.32% of Calvert Social Index; Merck 2.26% of Calvert Equity Income, 2.01% of Calvert Large Cap Value, and 1.25% of Calvert Social Index; Coca-Cola 1.29% of Calvert Social Index, 3.20% of Calvert Large Cap Core and 3.29% Calvert Equity Portfolio; J.P. Morgan Chase 2.54% of Calvert Equity Income, 1.74% of Calvert Social Index and 0.34% of Calvert Balanced Portfolio. Holdings are subject to change.
www.calvert.com CALVERT EMERGING MARKETS EQUITY FUND ANNUAL REPORT 5

As always, Calvert continues to work hard to ensure you have a say in the responsible management of environmental, social, and governance (ESG) factors for the companies in which we invest. Below are highlights of our accomplishments during the reporting period.
Climate Change And Energy
As an active member of the Investor Network on Climate Risk (INCR), particularly in the effort to support legislation for the Production Tax Credit (PTC) which was due to expire at the end of 2012, Calvert participated in meetings with congressional staff and drafted an investor letter to Congress supporting the PTC.
Along with the World Wildlife Fund (WWF) and Ceres, Calvert also published, “Power Forward: Why the World’s Largest Companies are Investing in Renewable Energy.” The report found more than half of the largest U.S. corporations and more than two-thirds of the largest companies across the globe have set greenhouse gas (GHG) emissions reduction commitments and/or renewable energy commitments. We also discussed the report’s recommendations with congressional staff. All of these efforts helped spur the extension of the PTC for wind energy as part of the “fiscal cliff” deal passed by Congress.
350.Org Divestment Campaign On Fossil Fuels
Calvert watched closely the 350.org campaign urging college and university endowments, as well as other institutional investors, to divest from companies producing fossil fuels. In December, Calvert posted a statement on our website expressing support for the campaign’s broad objectives while making the case for a complementary strategy of active ownership and engagement. The statement pointed to specific fossil fuel companies Calvert has successfully engaged on climate change, alternative energy, and revenue transparency.
Water Advocacy & Public Policy
Calvert remained an active leader in four policy and advocacy campaigns: the ICCR Food and Water working group, the Ceres Water working group, the CEO Water Mandate, and the Principle for Responsible Investment (PRI) work related to water.
During the period, we sent an announcement to all PRI signatories commending the draft CEO Water Mandate’s Disclosure Guidance document--a joint report from the CEO Water Mandate and PRI providing guidelines on the disclosure of water-related activities. The guidelines will be piloted for a year and we worked with the CEO Water Mandate secretariat to promote the document and encourage select holdings to pilot the
6 www.calvert.com CALVERT EMERGING MARKETS EQUITY FUND ANNUAL REPORT
Disclosure Guidance approach. We also remained active in the CEO Water Mandate’s working group on human rights.
Other Shareholder Advocacy
We filed a shareholder resolution with Fossil, an apparel maker, to evaluate and report on its supply chain risks from water scarcity and pollution, which received support from 29% of shareholders. A resolution filed with Public Storage on reducing energy use was successfully withdrawn. We also undertook more engagement with Coca-Cola and PepsiCo on water issues during the year.
None of the companies listed above—Fossil, Public Storage, Coca-Cola and PepsiCo—were held by the Fund. Holdings are subject to change.
www.calvert.com CALVERT EMERGING MARKETS EQUITY FUND ANNUAL REPORT 7

Investment Performance
Calvert’s Emerging Market Equity Fund Class A shares (at NAV) returned 12.30% since its inception on October 29, 2012, outperforming the MSCI Emerging Markets Index, which returned 2.42% for the same period. Stock selection accounted for the majority of the outperformance, particularly in China, Taiwan, and Korea. At the sector level, Consumer Discretionary (the largest relative sector overweight), Consumer Staples, and Information Technology were notable relative contributors to performance.
Investment Climate
While the MSCI Emerging Markets Index rose 2.42% since Fund inception, the MSCI EAFE Index, a benchmark for developed international markets, gained 23.36% for the same period. Concerns over Chinese economic growth and banking system liquidity, subdued emerging-markets growth, the Federal Reserve’s (Fed) tapering of the QE program in the United States, weaker global commodity prices, a stronger U.S. dollar, higher U.S. Treasury yields, and wider Emerging Markets Bond Index (EMBI) spreads all contributed to weak stock markets returns for emerging markets.
However, emerging markets helped pare earlier losses by delivering positive returns in the final quarter. The news that the QE tapering would be delayed provided the main boost to returns, alongside encouraging economic data from China and news that the eurozone had moved out of recession.
Taiwan was the top-performing Asian country, gaining 14.96% on the positive outlook for technology, followed by the Philippines at 12.52%. Indonesia was the worst performer, dropping 20.19% as QE tapering fears in the U.S. pushed investors to sell down the current account deficit currencies in emerging markets. India declined 9.02% on similar concerns and the rapid depreciation of its currency, with the rupee hitting an all-time low against the U.S. dollar in the final quarter. Yet, China rose 7.76%, reversing first-half losses amid signs of economic stabilization and reform progress.
8 www.calvert.com CALVERT EMERGING MARKETS EQUITY FUND ANNUAL REPORT
| CALVERT EMERGING |
| MARKETS EQUITY |
| FUND |
| SEPTEMBER 30, 2013 |
| |
| | % OF TOTAL | |
| ECONOMIC SECTORS | INVESTMENTS | |
| Consumer Discretionary | 24.8 | % |
| Consumer Staples | 11.1 | % |
| Energy | 6.0 | % |
| Financials | 24.2 | % |
| Health Care | 1.7 | % |
| Industrials | 6.6 | % |
| Information Technology | 12.5 | % |
| Materials | 4.4 | % |
| Mutual Funds | 0.6 | % |
| Short-Term Investments | 4.8 | % |
| Utilities | 3.3 | % |
| Total | 100 | % |
Within the Europe, Middle East and Africa (EMEA) countries, Poland was the top performer, rising 14.83% as upcoming pension reform drove Polish pension funds to aggressively buy local equities. Improvements in its domestic economy and eurozone economic data also helped. Russia was the only other country in positive territory, up 6.70% from strengthening oil prices. Egypt dropped 19.44% and Turkey declined 5.16% as increased political instability and fears of QE tapering took their toll.
Latin America posted the worst regional returns for the period. All countries were in negative territory, led by Peru and Chile, down 26.14% and 14.61%, respectively. Brazil declined 7.26% while Mexico was the best performer, down 2.43%. The region as a whole was hit hardest by weaker commodity prices and the expected QE tapering.
| CALVERT EMERGING |
| MARKETS EQUITY |
| FUND |
| SEPTEMBER 30, 2013 |
| |
| INVESTMENT PERFORMANCE | | | |
| (TOTAL RETURN AT NAV*) | | | |
| | | | SINCE | |
| | | | INCEPTION | |
| | 6 MONTHS | | 10/29/12 | |
| | ENDED | | THROUGH | |
| | 9/30/13 | | 9/30/13 | |
| Class A | 5.87 | % | 12.30 | % |
| Class C | 5.45 | % | 11.38 | % |
| Class I | 6.14 | % | 12.73 | % |
| Class Y | 6.05 | % | 12.55 | % |
| |
| MSCI Emerging | | | | |
| Markets Index | -2.53 | % | 2.42 | % |
| |
| Lipper Emerging | | | | |
| Markets Funds | | | | |
| Average | -2.60 | % | 3.27 | % |
| TEN LARGEST | % OF NET | |
| STOCK HOLDINGS | ASSETS | |
| China Merchants Holdings | | |
| International Co. Ltd. | 3.5 | % |
| Samsung Electronics Co. Ltd. | 3.3 | % |
| Sberbank of Russia (ADR) | 3.1 | % |
| Magnit OJSC | 3.0 | % |
| Franshion Properties China Ltd. | 2.9 | % |
| Taiwan Semiconductor | | |
| Manufacturing Co. Ltd. (ADR) | 2.9 | % |
| Ping An Insurance Group | | |
| Company of China Ltd. | 2.8 | % |
| Hyundai Motor Co. | 2.6 | % |
| China Mengniu Dairy | | |
| Company Ltd. | 2.6 | % |
| Galaxy Entertainment | | |
| Group Ltd. | 2.6 | % |
| Total | 29.3 | % |
* Investment performance/return at NAV does not reflect the deduction of the Fund’s maximum 4.75% front-end sales charge or any deferred sales charges.
www.calvert.com CALVERT EMERGING MARKETS EQUITY FUND ANNUAL REPORT 9
At the sector level, Information Technology was the best performer, up 16.20%, followed by Consumer Discretionary, which rose 9.47% amid a rotation to cyclical sectors. Materials and Energy were the worst performers, down 11.835% and 6.24% respectively.
Investors’ caution towards emerging markets can be seen in its relative valuation, which has become increasingly cheap versus developed nations. The Emerging Markets Index trades at 11.9 times P/E, compared with the MSCI World Index’s multiple of 17.6. Emerging markets have traded at a far greater discount in the past, but this was following the Asian Crisis, when the region was de-rated significantly. Compared to more recent history, the current valuation gap appears to be extreme.
| CALVERT EMERGING |
| MARKETS EQUITY |
| FUND |
| SEPTEMBER 30, 2013 |
| |
| AVERAGE ANNUAL TOTAL RETURNS | |
| |
| CLASS A SHARES | (WITH MAX. LOAD) | |
| Since inception (10/29/2012) | 6.96 | % |
| |
| CLASS C SHARES | (WITH MAX. LOAD) | |
| Since inception (10/29/2012) | 10.38 | % |
| |
| CLASS I SHARES | | |
| Since inception (10/29/2012) | 12.73 | % |
| |
| CLASS Y SHARES | | |
| Since inception (10/29/2012) | 12.55 | % |
Portfolio Strategy
The Fund outperformed the benchmark by nearly 10%, driven primarily by stock selection, notably, at a country level, from selected holdings in China, Taiwan and Korea and at the sector level from stocks in Consumer Discretionary, Information Technology, and Consumer Staples.
The top five contributors to total return were Galaxy Entertainment (2.50%), Hyundai Motor Preferred (2.50%), Egis Pharmaceutical (1.23%), Micron Technology (1.19%) and Tong Yang Industry (1.33%).1 Galaxy Entertainment, which operates hotels and casinos in Macau, was the top performer amid expanding market share and improving earnings momentum. It also has one of the most robust opening pipelines. South Korea-based Hyundai Motors benefited from the prospect of improving sales growth. Hyundai and Kia announced plans to increase dealer-ships in China to meet the nation’s growing demand for cars. A reduction in the discount that most Korean preferred-stock classes exhibit relative to their common stock counterparts also helped.
Hungarian generic manufacturer Egis Pharmaceuticals gained 51% thanks to improving sentiment around its pipeline and upwards earnings revisions by analysts, and ultimately, a take over offer from its parent. Macroeconomic fundamentals in Hungary have also shown signs of improvement. Micron Technology benefited from a cyclical recovery and tightening supply that improved pricing. Its primarily Asian market position also strengthened following approval to acquire a Japanese digital memory business. Taiwanese auto parts maker Tong Yang reported above consensus second-quarter earnings and higher guidance for the full year amid a strong recovery in its key end markets of the U.S. and China.
10 www.calvert.com CALVERT EMERGING MARKETS EQUITY FUND ANNUAL REPORT
GROWTH OF $10,000
The graph below shows the value of a hypothetical $10,000 investment in the Fund over the past 10 fiscal year periods or since inception (for funds without 10-year records). The results shown are for Classes A, C, Y and I shares and reflect the deduction of the maximum front-end Class A sales charge of 4.75%, or deferred sales charge, as applicable and assume the reinvestment of dividends. The result is compared with benchmarks that include a broad based market index and a Lipper peer group average. Market indexes are unmanaged and their results do not reflect the effect of expenses or sales charges. The Lipper average reflects the deduction of the category’s average front-end sales charge. The value of an investment in a different share class would be different.
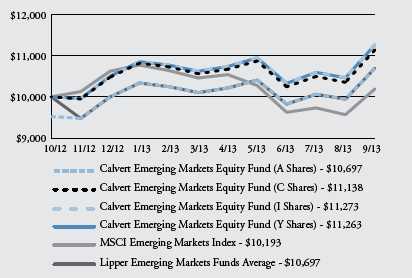
All performance data shown, including the graph above and the adjacent table, represents past performance, does not guarantee future results, assumes reinvestment of dividends and distributions and does not reflect the deduction of taxes that a shareholder would pay on the Fund’s distributions or the redemption of the Fund shares. All performance data reflects fee waivers and/or expense limitations, if any are in effect; in their absence performance would be lower. See Note B in Notes to Financial Statements. The investment return and principal value of an investment will fluctuate so that an investor’s shares, when redeemed, may be worth more or less than their original cost. Current performance may be lower or higher than the performance data quoted; for current performance data visit www.calvert.com. The gross expense ratio from the current prospectus for Class A shares is 2.95%. This number may differ from the expense ratio shown elsewhere in this report because it is based on a different time period and, if applicable, does not include fee or expense waivers. Performance data quoted already reflects the deduction of the Fund’s operating expenses.
www.calvert.com CALVERT EMERGING MARKETS EQUITY FUND ANNUAL REPORT 11
The Fund’s holdings in Materials detracted, especially in the latter part of 2012, led by Iamgold (-0.80%) and Yamana-Gold (-0.39%). Both were hurt by the weak gold complex and we closed the positions. Other top detractors were Petroleo Brasileiro SA Preferred (-0.85%), SABESP (-0.54%), Polymetal (-0.41%) and Pacific Rubiales (-0.44%).
Concerns the company would be forced to suspend a tariff increase amid growing nationwide protests over inflation and corruption caused a decline for Brazilian water utility SABESP. Polymetal, a Russian gold and silver miner, fell amid negative sentiment on precious metals and concerns about the QE tapering in the U.S. Pacific Rubiales, the Colombian E&P, fell amid flat production in the first half of 2013 and delays in new permit issues in Colombia.
Portfolio Activity
We are overweight China, Russia, and Korea, underweight Mexico, Chile, and Indonesia. India, Brazil, and South Africa are neutral. Should 2014 bring a strong U.S. recovery, we believe Korea will benefit, and has further to run than the already euphoric Mexican market.
Although the pool of liquid stocks is shallow, we are looking carefully at Eastern Europe. We recently sold Egis Pharmaceuticals after the takeout bid by its parent and Transneft, a Russian monopoly provider of pipeline oil transportation, after it reached our price target. Instead, we initiated positions in Mail.ru, Russia’s leading internet portal and social network provider, and discount supermarket operator Magnit.
We increased our exposure to the European Union (EU) recovery through a moderate exposure to Investec, a South African bank and asset manager with exposure to Europe. We bought Investec at an attractive valuation, which we feel does not reflect a potential recovery in its European banking division. We funded the purchase by selling Datatec, which reached our price target.
Sector-wise, we are reducing the weight of Consumer Discretionary, as it has performed well, and increasing Industrials and Information Technology. The benchmark has a large weighting to Financials in China and we are slightly underrepresented there. These companies have performed well but still look very cheap, assuming that non-performing loans (NPLs) stay low. We are researching this sector and believe the 3rd Party Plenum in November may bring more clarity to the outlook.
Outlook
The global markets have been obsessed with the risks to U.S. monetary policy since the spring. The prospect of Fed tapering and uncertainty about who will replace Mr. Bernanke when his term expires in January have driven a sharp rise in global bond yields and considerable volatility in emerging markets. However, the Fed postponed QE tapering due to the continued sluggish U.S. economy and considerable uncertainty about the underlying strength of the jobs market.
Even if QE tapering concerns ease in the short term, further volatility in certain emerging markets is possible. Nevertheless, the summer correction will not result in a 1990s-style crisis because these economies are now in a much stronger position, with flexible exchange rates, credible macroeconomic policies, high levels of financial reserves, and debts typically denominated in their own currencies.
12 www.calvert.com CALVERT EMERGING MARKETS EQUITY FUND ANNUAL REPORT
North Asian markets with high levels of reserves and positive current accounts such as China, Korea and Taiwan are better positioned in the short term than double-deficit countries like India, Indonesia and Turkey. Chinese, Korean and Russian valuations are still compellingly cheap.
Even the most gung-ho emerging markets manager would not deny the sector’s problems, from Indian graft to Chinese shadow banking. But macro problems produce micro opportunities and the current markets are a stock-picker’s dream. For instance, depressed valuations in China and Korea allow us to pick up quality companies with strong earnings well below their intrinsic values. Companies able to develop viable survival strategies in this unfavorable environment can reward their investors now, and be well-positioned for when the broader market turns.
October 2013
1. Individual security returns reflect total returns for period held in portfolio.
As of September 30, 2013, the following companies represented the following percentages of Fund net assets: Galaxy 2.58%, Hyundai 2.66%, Egis Pharmaceutical 0%, Micron Technology, Tong Yang 1.59%, Iamgold 0%, Yamana-Gold 0%, SABESP 0%, Petroleo Brasileiro SA Preferred 2.31%, Polymetal 0.84%, Pacific Rubiales 2.06%, Transneft 0%, Mail.ru 1.10%, Magnit 3.03%, Investec 1.88% and Datatec 0%. Holdings are subject to change.
www.calvert.com CALVERT EMERGING MARKETS EQUITY FUND ANNUAL REPORT 13
SHAREHOLDER EXPENSE EXAMPLE
As a shareholder of the Fund, you incur two types of costs: (1) transaction costs, including sales charges and redemption fees; and (2) ongoing costs, including management fees; distribution (12b-1) fees; and other Fund expenses. This Example is intended to help you understand your ongoing costs (in dollars) of investing in the Fund and to compare these costs with the ongoing costs of investing in other mutual funds.
This Example is based on an investment of $1,000 invested at the beginning of the period and held for the entire period (April 1, 2013 to September 30, 2013).
Actual Expenses
The first line of the table below provides information about actual account values and actual expenses. You may use the information in this line, together with the amount you invested, to estimate the expenses that you paid over the period. Simply divide your account value by $1,000 (for example, an $8,600 account value divided by $1,000 = 8.6), then multiply the result by the number in the first line under the heading entitled “Expenses Paid During Period” to estimate the expenses you paid on your account during this period.
Hypothetical Example for Comparison Purposes
The second line of the table below provides information about hypothetical account values and hypothetical expenses based on the Fund’s actual expense ratio and an assumed rate of return of 5% per year before expenses, which is not the Fund’s actual return. The hypothetical account values and expenses may not be used to estimate the actual ending account balance or expenses you paid for the period. You may use this information to compare the ongoing costs of investing in the Fund and other funds. To do so, compare the 5% hypothetical example with the 5% hypothetical examples that appear in the shareholder reports of the other funds.
Please note that the expenses shown in the table are meant to highlight your ongoing costs only and do not reflect any transactional costs, such as sales charges (loads), or redemption fees. Therefore, the second line of the table is useful in comparing ongoing costs only, and will not help you determine the relative total costs of owning different funds. In addition, if these transactional costs were included, your costs would have been higher.
14 www.calvert.com CALVERT EMERGING MARKETS EQUITY FUND ANNUAL REPORT
| | | |
| | BEGINNING | ENDING ACCOUNT | EXPENSES PAID |
| | ACCOUNT VALUE | VALUE | DURING PERIOD* |
| | 4/1/13 | 9/30/13 | 4/1/13 - 9/30/13 |
| CLASS A | | | |
| Actual | $1,000.00 | $1,058.73 | $8.26 |
| Hypothetical | $1,000.00 | $1,017.05 | $8.09 |
| (5% return per year before expenses) | | | |
| |
| CLASS C | | | |
| Actual | $1,000.00 | $1,054.55 | $12.85 |
| Hypothetical | $1,000.00 | $1,012.56 | $12.59 |
| (5% return per year before expenses) | | | |
| |
| CLASS I | | | |
| Actual | $1,000.00 | $1,061.37 | $6.48 |
| Hypothetical | $1,000.00 | $1,018.78 | $6.34 |
| (5% return per year before expenses) | | | |
| |
| CLASS Y | | | |
| Actual | $1,000.00 | $1,060.53 | $7.22 |
| Hypothetical | $1,000.00 | $1,018.06 | $7.07 |
| (5% return per year before expenses) | | | |
* Expenses are equal to the Fund’s annualized expense ratio of 1.60%, 2.50%, 1.25%, and 1.40% for Class A, Class C , Class I, and Class Y, respectively, multiplied by the average account value over the period, multiplied by 183/365 (to reflect the one-half year period).
www.calvert.com CALVERT EMERGING MARKETS EQUITY FUND ANNUAL REPORT 15
REPORT OF INDEPENDENT REGISTERED PUBLIC ACCOUNTING FIRM
The Board of Directors of Calvert World Values Fund, Inc. and Shareholders of Calvert Emerging Markets Equity Fund: We have audited the accompanying statement of net assets of the Calvert Emerging Markets Equity Fund (the “Fund”), a series of Calvert World Values Fund, Inc., as of September 30, 2013, and the related statement of operations, the statement of changes in net assets, and the financial highlights for the period from Inception October 29, 2012 through September 30, 2013. These financial statements and financial highlights are the responsibility of the Fund’s management. Our responsibility is to express an opinion on these financial statements and financial highlights based on our audit.
We conducted our audit in accordance with the standards of the Public Company Accounting Oversight Board (United States). Those standards require that we plan and perform the audit to obtain reasonable assurance about whether the financial statements and financial highlights are free of material misstatement. An audit includes examining, on a test basis, evidence supporting the amounts and disclosures in the financial statements. Our procedures included confirmation of securities owned as of September 30, 2013, by correspondence with the custodian and brokers or by performing other appropriate auditing procedures. An audit also includes assessing the accounting principles used and significant estimates made by management, as well as evaluating the overall financial statement presentation. We believe that our audit provides a reasonable basis for our opinion.
In our opinion, the financial statements and financial highlights referred to above present fairly, in all material respects, the financial position of the Calvert Emerging Markets Equity Fund as of September 30, 2013, the results of its operations, the changes in its net assets, and the financial highlights for the period from Inception October 29, 2012 through September 30, 2013, in conformity with U.S. generally accepted accounting principles.

16 www.calvert.com CALVERT EMERGING MARKETS EQUITY FUND ANNUAL REPORT
| | | |
| STATEMENT OF NET ASSETS |
| SEPTEMBER 30, 2013 |
| |
| EQUITY SECURITIES - 87.8% | SHARES | | VALUE |
| Brazil - 13.5% | | | |
| Banco do Brasil SA | 85,214 | $ | 991,820 |
| Cia de Saneamento Basico do Estado de Sao Paulo SA | 82,600 | | 804,820 |
| Cosan Ltd. | 53,511 | | 822,464 |
| Gerdau SA (ADR) | 72,809 | | 543,155 |
| Grendene SA | 80,600 | | 716,380 |
| M Dias Branco SA | 13,900 | | 638,375 |
| Petroleo Brasileiro SA, Preferred | 108,100 | | 893,634 |
| | | | 5,410,648 |
| |
| Cambodia - 0.5% | | | |
| NagaCorp Ltd. | 228,000 | | 192,565 |
| |
| China - 16.4% | | | |
| China Dongxiang Group Co. | 3,740,000 | | 583,523 |
| China Merchants Holdings International Co. Ltd. | 379,966 | | 1,381,641 |
| Franshion Properties China Ltd | 3,530,000 | | 1,160,690 |
| Industrial & Commercial Bank of China Ltd. | 1,165,000 | | 812,689 |
| Ping An Insurance Group Company of China Ltd. | 153,000 | | 1,137,345 |
| Prince Frog International Holdings Ltd | 895,000 | | 619,725 |
| Tencent Holdings Ltd. | 13,900 | | 729,117 |
| Travelsky Technology Ltd. | 170,000 | | 136,784 |
| | | | 6,561,514 |
| |
| Colombia - 2.1% | | | |
| Pacific Rubiales Energy Corp | 41,334 | | 817,476 |
| |
| Hong Kong - 9.9% | | | |
| Ajisen China Holdings Ltd | 289,000 | | 289,175 |
| Cathay Pacific Airways Ltd | 402,000 | | 784,790 |
| China Mengniu Dairy Company Ltd. | 233,000 | | 1,044,028 |
| Galaxy Entertainment Group Ltd.* | 146,000 | | 1,024,125 |
| Samsonite International SA* | 294,932 | | 823,344 |
| | | | 3,965,462 |
| |
| Indonesia - 1.6% | | | |
| Bank Rakyat Indonesia Persero Tbk PT | 989,000 | | 619,193 |
| |
| Nigeria - 1.2% | | | |
| Zenith Bank plc | 3,901,269 | | 482,497 |
| |
| Russia - 11.6% | | | |
| M Video OJSC | 96,360 | | 795,182 |
| Magnit OJSC | 4,733 | | 1,201,426 |
| Mail.ru Group Ltd. (GDR) | 11,442 | | 437,084 |
| Polymetal International plc | 31,457 | | 332,828 |
| Rosneft OAO (GDR) | 75,656 | | 612,814 |
| Sberbank of Russia (ADR) | 103,423 | | 1,246,247 |
| | | | 4,625,581 |
www.calvert.com CALVERT EMERGING MARKETS EQUITY FUND ANNUAL REPORT 17
| | | |
| EQUITY SECURITIES - CONT’D | SHARES | | VALUE |
| South Africa - 2.9% | | | |
| Clicks Group Ltd. | 93,220 | $ | 508,004 |
| Life Healthcare Group Holdings Ltd | 182,731 | | 650,042 |
| | | | 1,158,046 |
| |
| South Korea - 11.9% | | | |
| Hana Financial Group, Inc | 24,990 | | 856,893 |
| Hyundai Motor Co. | 4,518 | | 1,055,220 |
| Samsung Electronics Co. Ltd., Preferred | 1,639 | | 1,335,998 |
| Samsung Fire & Marine Insurance Co. Ltd. | 2,369 | | 543,381 |
| Shinsegae Food Co. Ltd | 4,458 | | 398,230 |
| Youngone Holdings Co. Ltd | 9,946 | | 572,878 |
| | | | 4,762,600 |
| |
| Taiwan - 8.0% | | | |
| China Life Insurance Co. Ltd | 387,344 | | 349,130 |
| Greatek Electronics, Inc.* | 825,000 | | 710,124 |
| Phison Electronics Corp. | 50,000 | | 360,199 |
| Taiwan Semiconductor Manufacturing Co. Ltd. (ADR) | 67,822 | | 1,150,261 |
| Tong Yang Industry Co. Ltd | 421,276 | | 631,907 |
| | | | 3,201,621 |
| |
| Thailand - 1.2% | | | |
| Bangkok Bank PCL | 77,175 | | 483,577 |
| |
| Turkey - 3.0% | | | |
| Arcelik AS | 126,819 | | 739,699 |
| Aygaz AS | 106,083 | | 476,044 |
| | | | 1,215,743 |
| |
| United Kingdom - 4.0% | | | |
| Investec plc | 115,050 | | 745,257 |
| Petra Diamonds Ltd.* | 438,938 | | 845,036 |
| | | | 1,590,293 |
| |
| Total Equity Securities (Cost $34,200,027) | | | 35,086,816 |
| |
| |
| CLOSED-END FUNDS - 0.6% | | | |
| India Fund, Inc. | 11,557 | | 221,317 |
| |
| Total Closed-End Funds (Cost $258,753) | | | 221,317 |
| |
| |
| PARTICIPATORY NOTES - 4.2% | | | |
| China - 4.2% | | | |
| Daqin Railway Co. Ltd., Merrill Lynch International & Co., | | | |
| 7/6/18 (b)* | 328,685 | | 390,857 |
| Gree Electric Appliances, Inc., Merrill Lynch International & Co., | | | |
| 8/31/18 (b)* | 128,400 | | 557,057 |
18 www.calvert.com CALVERT EMERGING MARKETS EQUITY FUND ANNUAL REPORT
| | | | |
| PARTICIPATORY NOTES - CONT’D | | SHARES | | VALUE |
| Motherson Sumi Systems Ltd., Merrill Lynch International & Co., | | | | |
| 05/31/18 (b)* | | 200,422 | $ | 736,156 |
| |
| Total Participatory Notes (Cost $1,476,291) | | | | 1,684,070 |
| |
| |
| | | PRINCIPAL | | |
| TIME DEPOSIT - 4.7% | | AMOUNT | | |
| State Street Bank Time Deposit, 0.083%, 10/1/13 | $ | 1,881,173 | | 1,881,173 |
| |
| Total Time Deposit (Cost $1,881,173) | | | | 1,881,173 |
| |
| |
| TOTAL INVESTMENTS (Cost $37,816,244) - 97.3% | | | | 38,873,376 |
| Other assets and liabilities, net - 2.7% | | | | 1,090,266 |
| NET ASSETS - 100% | | | $ | 39,963,642 |
| |
| |
| NET ASSETS CONSIST OF: | | | | |
| Paid-in capital applicable to the following shares of common stock, | | | | |
| with 250,000,000 shares of $0.01 par value shares authorized: | | | | |
| Class A: 475,038 shares outstanding | | | $ | 5,971,650 |
| Class C: 10,004 shares outstanding | | | | 129,908 |
| Class I: 2,450,812 shares outstanding | | | | 30,467,133 |
| Class Y: 32,648 shares outstanding | | | | 413,270 |
| Undistributed net investment income | | | | 314,802 |
| Accumulated net realized gain (loss) on investments and | | | | |
| foreign currency transactions | | | | 1,616,264 |
| Net unrealized appreciation (depreciation) on investments, foreign currencies | | |
| and assets and liabilities denominated in foreign currencies | | | | 1,050,615 |
| |
| NET ASSETS | | | $ | 39,963,642 |
| |
| NET ASSET VALUE PER SHARE | | | | |
| Class A (based on net assets of $6,337,244) | | | $ | 13.34 |
| Class C (based on net assets of $133,417) | | | $ | 13.34 |
| Class I (based on net assets of $33,052,760) | | | $ | 13.49 |
| Class Y (based on net assets of $440,221) | | | $ | 13.48 |
(b) This security was valued under the direction of the Board of Directors. See Note A.
* Non-income producing security.
Abbreviations:
ADR: American Depositary Receipts
GDR: Global Depositary Receipts
PCL: Public Company Limited
plc: Public Limited Company
See notes to financial statements.
www.calvert.com CALVERT EMERGING MARKETS EQUITY FUND ANNUAL REPORT 19
| | | |
| STATEMENT OF OPERATIONS |
| FROM INCEPTION OCTOBER 29, 2012 |
| THROUGH SEPTEMBER 30, 2013 |
| |
| NET INVESTMENT INCOME | | | |
| Investment Income: | | | |
| Dividend income (net of foreign taxes withheld of $72,448) | $ | 747,375 | |
| Interest income | | 610 | |
| Total investment income | | 747,985 | |
| |
| Expenses: | | | |
| Investment advisory fee | | 234,687 | |
| Transfer agency fees and expenses | | 34,141 | |
| Administrative fees | | 30,788 | |
| Distribution Plan expenses: | | | |
| Class A | | 5,730 | |
| Class C | | 208 | |
| Directors’ fees and expenses | | 2,455 | |
| Custodian fees | | 56,337 | |
| Registration fees | | 57,667 | |
| Reports to shareholders | | 4,764 | |
| Professional fees | | 40,099 | |
| Accounting fees | | 3,465 | |
| Miscellaneous | | 10,229 | |
| Total expenses | | 480,570 | |
| Reimbursement from Advisor: | | | |
| Class A | | (28,585 | ) |
| Class C | | (20,385 | ) |
| Class I | | (49,217 | ) |
| Class Y | | (20,856 | ) |
| Fees paid indirectly | | (27 | ) |
| Net expenses | | 361,500 | |
| |
| NET INVESTMENT INCOME | | 386,485 | |
| |
| |
| REALIZED AND UNREALIZED GAIN (LOSS) | | | |
| Net realized gain (loss) on: | | | |
| Investments | | 1,616,264 | |
| Foreign currency transactions | | (18,420 | ) |
| | | 1,597,844 | |
| |
| Change in unrealized appreciation (depreciation) on: | | | |
| Investments and foreign currencies | | 1,054,739 | |
| Assets and liabilities denominated in foreign currencies | | (4,124 | ) |
| | | 1,050,615 | |
| |
| NET REALIZED AND UNREALIZED GAIN (LOSS) | | 2,648,459 | |
| |
| INCREASE (DECREASE) IN NET ASSETS | | | |
| RESULTING FROM OPERATIONS | $ | 3,034,944 | |
See notes to financial statements.
20 www.calvert.com CALVERT EMERGING MARKETS EQUITY FUND ANNUAL REPORT
| | | |
| STATEMENT OF CHANGES IN NET ASSETS |
| |
| | | FROM INCEPTION | |
| | | OCTOBER 29, 2012 | |
| | | THROUGH | |
| | | SEPTEMBER 30, | |
| INCREASE (DECREASE) IN NET ASSETS | | 2013 | |
| Operations: | | | |
| Net investment income | $ | 386,485 | |
| Net realized gain (loss) | | 1,597,844 | |
| Change in unrealized appreciation (depreciation) | | 1,050,615 | |
| |
| |
| INCREASE (DECREASE) IN NET ASSETS | | | |
| RESULTING FROM OPERATIONS | | 3,034,944 | |
| |
| |
| Distributions to shareholders from: | | | |
| Net investment income: | | | |
| Class A shares | | (7,842 | ) |
| Class C shares | | (17 | ) |
| Class I shares | | (45,400 | ) |
| Class Y shares | | (4 | ) |
| Total distributions | | (53,263 | ) |
| |
| Capital share transactions: | | | |
| Shares sold: | | | |
| Class A shares | | 6,302,984 | |
| Class C shares | | 129,891 | |
| Class I shares | | 31,652,032 | |
| Class Y shares | | 421,082 | |
| Reinvestment of distributions: | | | |
| Class A shares | | 7,629 | |
| Class C shares | | 17 | |
| Class I shares | | 45,400 | |
| Class Y shares | | 4 | |
| Redemption fees: | | | |
| Class A shares | | 40 | |
| Class Y shares | | 1 | |
| Shares redeemed: | | | |
| Class A shares | | (339,003 | ) |
| Class I shares | | (1,230,299 | ) |
| Class Y shares | | (7,817 | ) |
| Total capital share transactions | | 36,981,961 | |
| |
| |
| TOTAL INCREASE (DECREASE) IN NET ASSETS | | 39,963,642 | |
| |
| |
| NET ASSETS | | | |
| Beginning of period | | — | |
| End of period (including undistributed net investment | | | |
| income of $314,802) | $ | 39,963,642 | |
See notes to financial statements.
www.calvert.com CALVERT EMERGING MARKETS EQUITY FUND ANNUAL REPORT 21
| | |
| STATEMENT OF CHANGES IN NET ASSETS |
| |
| | FROM INCEPTION | |
| | OCTOBER 29, 2012 | |
| | THROUGH | |
| | SEPTEMBER 30, | |
| CAPITAL SHARE ACTIVITY | 2013 | |
| Shares sold: | | |
| Class A shares | 500,952 | |
| Class C shares | 10,003 | |
| Class I shares | 2,541,536 | |
| Class Y shares | 33,267 | |
| Reinvestment of distributions: | | |
| Class A shares | 622 | |
| Class C shares | 1 | |
| Class I shares | 3,670 | |
| Shares redeemed: | | |
| Class A shares | (26,536 | ) |
| Class I shares | (94,394 | ) |
| Class Y shares | (619 | ) |
| Total capital share activity | 2,968,502 | |
See notes to financial statements.
22 www.calvert.com CALVERT EMERGING MARKETS EQUITY FUND ANNUAL REPORT
NOTES TO FINANCIAL STATEMENTS
NOTE A — SIGNIFICANT ACCOUNTING POLICIES
General: Calvert Emerging Markets Equity Fund (the “Fund”), a series of Calvert World Values Fund, Inc., is registered under the Investment Company Act of 1940 as a non-diversified, open-end management investment company. Calvert World Values Fund, Inc. is comprised of four separate series. The operations of each series are accounted for separately. The Fund commenced operations on October 29, 2012. The Fund offers four classes of shares of capital stock - Classes A, C, I, and Y. Class A shares are sold with a maximum front-end sales charge of 4.75%. Class C shares are sold without a front-end sales charge and, with certain exceptions, will be charged a deferred sales charge on shares sold within one year of purchase. Class C shares have higher levels of expenses than Class A shares. Class I shares require a minimum account balance of $1,000,000. The $1 million minimum initial investment is waived for retirement plans that trade through omnibus accounts and may be waived for certain other institutional accounts where it is believed to be in the best interest of the Fund and its shareholders. Class I shares have no front-end or deferred sales charge and have lower levels of expenses than Class A shares. Class Y shares are generally only available to wrap or similar fee-based programs offered by financial intermediaries that have entered into an agreement with the Fund’s Distributor to offer Class Y shares. Class Y shares have no front-end or deferred sales charge and have lower levels of expenses than Class A shares. Each class has different: (a) dividend rates, due to differences in Distribution Plan expenses and other class-specific expenses, (b) exchange privileges, and (c) class-specific voting rights.
Security Valuation: Net asset value per share is determined every business day as of the close of the regular session of the New York Stock Exchange (generally 4:00 p.m. Eastern time). The Fund uses independent pricing services approved by the Board of Directors (“the Board”) to value its investments wherever possible. Investments for which market quotations are not available or deemed not reliable are fair valued in good faith under the direction of the Board.
The Board has adopted Valuation Procedures (the “Procedures”) to determine the fair value of securities and other financial instruments for which market prices are not readily available or which may not be reliably priced. The Board has delegated the day-to-day responsibility for determining the fair value of assets of the Fund to Calvert Investment Management, Inc. (the “Advisor” or “Calvert”) and has provided these Procedures to govern Calvert in its valuation duties.
Calvert has chartered an internal Valuation Committee to oversee the implementation of these Procedures and to assist it in carrying out the valuation responsibilities that the Board has delegated.
The Valuation Committee meets on a regular basis to review illiquid securities and other investments which may not have readily available market prices. The Valuation Committee’s fair valuation determinations are subject to review, approval and ratification by the Board at its next regularly scheduled meeting covering the calendar quarter in which the fair valuation was determined.
www.calvert.com CALVERT EMERGING MARKETS EQUITY FUND ANNUAL REPORT 23
The Valuation Committee utilizes various methods to measure the fair value of the Fund’s investments. Generally Accepted Accounting Principles (GAAP) establishes a disclosure hierarchy that categorizes the inputs to valuation techniques used to value assets and liabilities at measurement date. These inputs are summarized in the three broad levels listed below:
Level 1 – quoted prices in active markets for identical securities
Level 2 – other significant observable inputs (including quoted prices for similar securities, interest rates, prepayment speeds, credit risk, etc.)
Level 3 – significant unobservable inputs (including the Fund’s own assumptions in determining the fair value of investments) The inputs or methodologies used for valuing securities are not necessarily an indication of the risk associated with investing in those securities.
Changes in valuation techniques may result in transfers in or out of an investment’s assigned level within the hierarchy during the period. There were no such changes during the period. Valuation techniques used to value the Fund’s investments by major category are as follows: Equity securities, including restricted securities, for which market quotations are readily available, are valued at the last reported sale price or official closing price as reported by an independent pricing service on the primary market or exchange on which they are traded and are categorized as Level 1 in the hierarchy. In the event there were no sales during the day or closing prices are not available, securities are valued at the last quoted bid price or using the last available price and are categorized as Level 2 in the hierarchy. Foreign securities are valued based on quotations from the principal market in which such securities are normally traded. If events occur after the close of the principal market in which foreign securities are traded, and before the close of business of the Fund, that are expected to materially affect the value of those securities, then they are valued at their fair value taking these events into account. The Fund has retained a third party fair value pricing service to quantitatively analyze the price movement of its holdings on foreign exchanges and to automatically fair value if the variation from the prior day’s closing price exceeds specified parameters. Such securities would be categorized as Level 2 in the hierarchy in these circumstances. Utilizing this technique may result in transfers between Level 1 and Level 2. For restricted securities and private placements where observable inputs are limited, assumptions about market activity and risk are used and such securities are categorized as Level 3 in the hierarchy.
Exchange traded funds and closed-end funds are valued at the official closing price as reported by an independent pricing service on the primary market or exchange on which they are traded and are categorized as Level 1 in the hierarchy.
Participatory notes are valued based on the value of the underlying equity security as determined using the valuation techniques for equity securities listed above. Participatory notes are categorized as Level 2 in the hierarchy.
Short-term securities of sufficient credit quality with remaining maturities of sixty days or less for which quotations are not readily available are valued at amortized cost, which approximates fair value, and are categorized as Level 2 in the hierarchy.
24 www.calvert.com CALVERT EMERGING MARKETS EQUITY FUND ANNUAL REPORT
If a market value cannot be determined for a security using the methodologies described above, or if, in the good faith opinion of the Advisor, the market value does not constitute a readily available market quotation, or if a significant event has occurred that would materially affect the value of the security, the security will be fair valued as determined in good faith by the Valuation Committee.
The Valuation Committee considers a number of factors, including significant unobservable valuation inputs when arriving at fair value. It considers all significant facts that are reasonably available and relevant to the determination of fair value.
The Valuation Committee primarily employs a market-based approach which may use related or comparable assets or liabilities, recent transactions, market multiples, book values, and other relevant information for the investment to determine the fair value of the investment. When more appropriate, the fund may employ an income-based or cost approach. An income-based valuation approach discounts anticipated future cash flows of the investment to calculate a present amount (discounted). The measurement is based on the value indicated by current market expectations about those future amounts. Discounts may also be applied due to the nature or duration of any restrictions on the disposition of the investments. A cost based approach is based on the amount that currently would be required to replace the service capacity of an asset (current replacement cost). From the seller’s perspective, the price that would be received for the asset is determined based on the cost to a buyer to acquire or construct a substitute asset of comparable utility, adjusted for obsolescence.
The values assigned to fair value investments are based on available information and do not necessarily represent amounts that might ultimately be realized. Further, due to the inherent uncertainty of valuations of such investments, the fair values may differ significantly from the values that would have been used had an active market existed, and the differences could be material. The Valuation Committee employs various methods for calibrating these valuation approaches including a regular review of key inputs and assumptions, transactional back-testing or disposition analysis and reviews of any related market activity.
At September 30, 2013, securities valued at $1,684,070, or 4.2% of net assets, were fair valued in good faith under the direction of the Board.
The following is a summary of the inputs used to value the Fund’s net assets as of September 30, 2013:
| | | VALUATION INPUTS | |
| INVESTMENTS IN SECURITIES | LEVEL 1 | LEVEL 2 | LEVEL 3 | TOTAL |
| Equity securities* | $35,086,816 | — | — | $35,086,816 |
| Closed-end funds | 221,317 | — | — | 221,317 |
| Participatory notes | — | $1,684,070 | — | 1,684,070 |
| Other debt obligations | — | 1,881,173 | — | 1,881,173 |
| TOTAL | $35,308,133 | $3,565,243 | — | $38,873,376 |
* For further breakdown of equity securities by country, please refer to the Statement of Net Assets.
www.calvert.com CALVERT EMERGING MARKETS EQUITY FUND ANNUAL REPORT 25
Participatory Notes: The Fund may gain exposure to securities in certain foreign markets through investments in participatory notes (“P-notes”), especially in markets where direct investment by the Fund is not possible. P-notes are generally issued by a bank or broker-dealer (the “counterparty”) and are designed to offer a return linked to a particular underlying equity security. While the holder of a P-note is entitled to receive from the counterparty any dividends paid by the underlying security, the counterparty retains legal ownership and voting rights of the underlying security. The risks associated with investing in a P-note may include the possible failure of the counterparty to perform its obligations under the terms of the agreement, an inability to liquidate or transfer the notes, and an imperfect correlation between the value of the P-note and the underlying security.
Security Transactions and Net Investment Income: Security transactions are accounted for on trade date. Realized gains and losses are recorded on an identified cost basis and may include proceeds from litigation. Dividend income is recorded on the ex-dividend date or, in the case of dividends on certain foreign securities, as soon as the Fund is informed of the ex-dividend date. Withholding taxes on foreign dividends have been provided for in accordance with the Fund’s understanding of the applicable country’s tax rules and rates. Distributions received on securities that represent a return of capital or capital gain are recorded as a reduction of cost of investments and/or as a realized gain. Interest income, which includes amortization of premium and accretion of discount on debt securities, is accrued as earned. Investment income and realized and unrealized gains and losses are allocated to separate classes of shares based upon the relative net assets of each class. Expenses arising in connection with a specific class are charged directly to that class. Expenses common to the classes are allocated to each class in proportion to their relative net assets.
Foreign Currency Transactions: The Fund’s accounting records are maintained in U.S. dollars. For valuation of assets and liabilities on each date of net asset value determination, foreign denominations are converted into U.S. dollars using the current exchange rate. Security transactions, income, and expenses are translated at the prevailing rate of exchange on the date of the event. The effect of changes in foreign exchange rates on securities and foreign currencies is included in the net realized and unrealized gain or loss on securities and foreign currencies.
Distributions to Shareholders: Distributions to shareholders are recorded by the Fund on ex-dividend date. Dividends from net investment income and distributions from net realized capital gains, if any, are paid at least annually. Distributions are determined in accordance with income tax regulations which may differ from generally accepted accounting principles; accordingly, periodic reclassifications are made within the Fund’s capital accounts to reflect income and gains available for distribution under income tax regulations.
Estimates: The preparation of financial statements in conformity with accounting principles generally accepted in the United States requires management to make estimates and assumptions that affect the reported amounts of assets and liabilities and disclosure of contingent assets and liabilities at the date of the financial statements and the reported amounts of income and expenses during the reporting period. Actual results could differ from those estimates.
26 www.calvert.com CALVERT EMERGING MARKETS EQUITY FUND ANNUAL REPORT
Redemption Fees: The Fund charges a 2% redemption fee on redemptions, including exchanges, made within 30 days of purchase (within seven days for Class I shares). The redemption fee is accounted for as an addition to paid-in capital and is intended to discourage market-timers by ensuring that short-term trading costs are borne by the investors making the transactions and not the shareholders already in the Fund.
Expense Offset Arrangement: The Fund had an arrangement with the custodian bank whereby the custodian’s fees may have been paid indirectly by credits earned on the Fund’s cash on deposit with the bank. These credits were used to reduce the Fund’s expenses. This arrangement was suspended on January 1, 2013, until further notice, due to low interest rates. Such a deposit arrangement was an alternative to overnight investments.
Federal Income Taxes: No provision for federal income or excise tax is required since the Fund intends to continue to qualify as a regulated investment company under the Internal Revenue Code and to distribute substantially all of its taxable earnings.
Management has analyzed the Fund’s tax positions taken for all open federal income tax years and has concluded that no provision for federal income tax is required in the Fund’s financial statements. A Fund’s federal tax return is subject to examination by the Internal Revenue Service for a period of three years.
NOTE B — RELATED PARTY TRANSACTIONS
Calvert Investment Management, Inc. (the “Advisor”) is wholly-owned by Calvert Investments, Inc., which is indirectly wholly-owned by Ameritas Mutual Holding Company. The Advisor provides investment advisory services and pays the salaries and fees of officers and Directors of the Fund who are employees of the Advisor or its affiliates. For its services, the Advisor receives an annual fee, payable monthly, of .95% of the average daily net assets. Under the terms of the agreement, $30,403 was payable at period end. In addition, $4,656 was payable at period end for operating expenses paid by the Advisor during September 2013.
The Advisor has contractually agreed to limit net annual fund operating expenses through January 31, 2014. The contractual expense cap is 1.78%, 2.78%, 1.43%, and 1.53% for Class A, C, I, and Y, respectively. For the purpose of this expense limit, operating expenses do not include interest expense, brokerage commissions, taxes, and extraordinary expenses. This expense limitation does not limit acquired fund fees and expenses, if any. To the extent any expense offset credits were earned, the Advisor’s obligation under the contractual limitation may have been reduced and the Advisor may have benefited from the expense offset arrangement.
Calvert Investment Administrative Services, Inc., an affiliate of the Advisor, provides administrative services to the Fund for an annual fee, payable monthly, of .35% for Classes A, C, and Y shares and .10% for Class I shares, based on their average daily net assets. Under the terms of the agreement, $4,792 was payable at period end.
Calvert Investment Distributors, Inc. (“CID”), an affiliate of the Advisor, is the distributor and principal underwriter for the Fund. Pursuant to Rule 12b-1 under the Investment Company Act of 1940, the Fund has adopted a Distribution Plan that permits the Fund to pay certain expenses associated with the distribution and servicing of its shares. The
www.calvert.com CALVERT EMERGING MARKETS EQUITY FUND ANNUAL REPORT 27
expenses paid may not exceed .50% and 1.00% annually of the average daily net assets of Class A and C, respectively. The amount actually paid by the Fund is an annualized fee, payable monthly, of .25% and 1.00% of the average daily net assets of Class A and C, respectively. Class I and Y shares do not have Distribution Plan expenses. Under the terms of the agreement, $1,237 was payable at period end.
CID received $4,728 as its portion of the commissions charged on sales of the Fund’s Class A shares for the period from the inception of the Fund through September 30, 2013.
Calvert Investment Services, Inc. (“CIS”), an affiliate of the Advisor, is the shareholder servicing agent for the Fund. For its services, CIS received a fee of $1,220 for the period from the inception of the Fund through September 30, 2013. Under the terms of the agreement, $180 was payable at period end. Boston Financial Data Services, Inc. is the transfer and dividend disbursing agent.
Each Director of the Fund who is not an employee of the Advisor or its affiliates receives an annual retainer of $48,000 plus a meeting fee of up to $3,000 for each Board meeting attended. Additional fees of up to $5,000 annually may be paid to the Board chair and Committee chairs ($10,000 for the Special Equities Committee chair) and $2,500 annually may be paid to Committee members, plus a Committee meeting fee of $500 for each Committee meeting attended. Directors’ fees are allocated to each of the Funds served.
NOTE C — INVESTMENT ACTIVITY AND TAX INFORMATION
During the period, the cost of purchases and proceeds from sales of investments, other than short-term securities, were $53,656,350 and $19,337,536, respectively.
The tax character of dividends and distributions paid during the year ended September 30, 2013 was as follows:
| Distributions paid from: | 2013 |
| Ordinary income | $53,263 |
| Total | $53,263 |
As of September 30, 2013, the tax basis components of distributable earnings/(accumulated losses) and the federal tax cost were as follows:
| Unrealized appreciation | $2,624,142 | |
| Unrealized (depreciation) | (1,683,673 | ) |
| Net unrealized appreciation/(depreciation) | $940,469 | |
| Undistributed ordinary income | $2,047,729 | |
| Federal income tax cost of investments | $37,932,907 | |
The differences between the components of distributable earnings on a tax basis and the amounts reflected in the statement of net assets are primarily due to temporary book-tax differences that will reverse in a subsequent period. These differences are due to wash sales.
28 www.calvert.com CALVERT EMERGING MARKETS EQUITY FUND ANNUAL REPORT
Reclassifications, as shown in the table below, have been made to the Fund’s components of net assets to reflect income and gains available for distribution (or available capital loss carryovers, as applicable) under income tax law and regulations. These reclassifications are due to permanent book-tax differences and have no impact on net assets. The primary permanent differences causing such reclassifications for the Fund are due to foreign currency transactions.
| Undistributed net investment income | ($18,420 | ) |
| Accumulated net realized gain (loss) | 18,420 | |
NOTE D — LINE OF CREDIT
A financing agreement is in place with the Calvert Funds and State Street Corporation (“SSC”). Under the agreement, SSC provides an unsecured line of credit facility, in the aggregate amount of $50 million ($25 million committed and $25 million uncommitted), accessible by the Funds for temporary or emergency purposes only. Borrowings under the committed facility bear interest at the higher of the London Interbank Offered Rate (LIBOR) or the overnight Federal Funds Rate plus 1.25% per annum. A commitment fee of .11% per annum is incurred on the unused portion of the committed facility, which is allocated to all participating funds. The Fund had no loans outstanding pursuant to this line of credit at September 30, 2013. For the period ended September 30, 2013, borrowings by the Fund under the agreement were as follows:
| | | | MONTH OF MAXIMUM |
| AVERAGE DAILY BALANCE | WEIGHTED AVERAGE INTEREST RATE | MAXIMUM AMOUNT BORROWED | AMOUNT
BORROWED |
| $895 | 1.38% | $196,260 | September 2013 |
NOTE E — SUBSEQUENT EVENTS
In preparing the financial statements as of September 30, 2013, no subsequent events or transactions occurred that would have required recognition or disclosure in these financial statements.
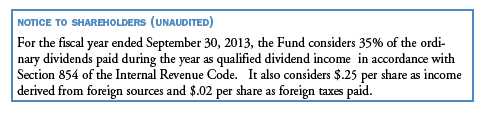
www.calvert.com CALVERT EMERGING MARKETS EQUITY FUND ANNUAL REPORT 29
| | |
| FINANCIAL HIGHLIGHTS |
| |
| | PERIOD ENDED | |
| | SEPTEMBER 30, | |
| CLASS A SHARES | 2013 | #(z) |
| Net asset value, beginning | $12.00 | |
| Income from investment operations: | | |
| Net investment income | .13 | |
| Net realized and unrealized gain (loss) | 1.34 | |
| Total from investment operations | 1.47 | |
| Distributions from: | | |
| Net investment income | (.13 | ) |
| Total distributions | (.13 | ) |
| Total increase (decrease) in net asset value | 1.34 | |
| Net asset value, ending | $13.34 | |
| |
| Total return* | 12.30 | % |
| Ratios to average net assets:A | | |
| Net investment income | 1.16 | % (a) |
| Total expenses | 3.03 | % (a) |
| Expenses before offsets | 1.78 | % (a) |
| Net expenses | 1.78 | % (a) |
| Portfolio turnover | 74 | % |
| Net assets, ending (in thousands) | $6,337 | |
See notes to financial highlights.
30 www.calvert.com CALVERT EMERGING MARKETS EQUITY FUND ANNUAL REPORT
| | |
| FINANCIAL HIGHLIGHTS |
| |
| | PERIOD ENDED | |
| | SEPTEMBER 30, | |
| CLASS C SHARES | 2013 | #(z) |
| Net asset value, beginning | $12.00 | |
| Income from investment operations: | | |
| Net investment income (loss) | (.01 | ) |
| Net realized and unrealized gain (loss) | 1.37 | |
| Total from investment operations | 1.36 | |
| Distributions from: | | |
| Net investment income | (.02 | ) |
| Total distributions | (.02 | ) |
| Total increase (decrease) in net asset value | 1.34 | |
| Net asset value, ending | $13.34 | |
| |
| Total return* | 11.38 | % |
| Ratios to average net assets:A | | |
| Net investment income (loss) | (.09 | %) (a) |
| Total expenses | 100.72 | % (a) |
| Expenses before offsets | 2.78 | % (a) |
| Net expenses | 2.78 | % (a) |
| Portfolio turnover | 74 | % |
| Net assets, ending (in thousands) | $133 | |
See notes to financial highlights.
www.calvert.com CALVERT EMERGING MARKETS EQUITY FUND ANNUAL REPORT 31
| | |
| FINANCIAL HIGHLIGHTS |
| |
| | PERIOD ENDED | |
| | SEPTEMBER 30, | |
| CLASS I SHARES | 2013 | #(z) |
| Net asset value, beginning | $12.00 | |
| Income from investment operations: | | |
| Net investment income | .19 | |
| Net realized and unrealized gain (loss) | 1.33 | |
| Total from investment operations | 1.52 | |
| Distributions from: | | |
| Net investment income | (.03 | ) |
| Total distributions | (.03 | ) |
| Total increase (decrease) in net asset value | 1.49 | |
| Net asset value, ending | $13.49 | |
| |
| Total return* | 12.73 | % |
| Ratios to average net assets:A | | |
| Net investment income | 1.61 | % (a) |
| Total expenses | 1.65 | % (a) |
| Expenses before offsets | 1.43 | % (a) |
| Net expenses | 1.43 | % (a) |
| Portfolio turnover | 74 | % |
| Net assets, ending (in thousands) | $33,053 | |
See notes to financial highlights.
32 www.calvert.com CALVERT EMERGING MARKETS EQUITY FUND ANNUAL REPORT
| | |
| FINANCIAL HIGHLIGHTS |
| |
| | PERIOD ENDED | |
| | SEPTEMBER 30, | |
| CLASS Y SHARES | 2013 | #(z) |
| Net asset value, beginning | $12.00 | |
| Income from investment operations: | | |
| Net investment income | .14 | |
| Net realized and unrealized gain (loss) | 1.36 | |
| Total from investment operations | 1.50 | |
| Distributions from: | | |
| Net investment income | (.02 | ) |
| Total distributions | (.02 | ) |
| Total increase (decrease) in net asset value | 1.48 | |
| Net asset value, ending | $13.48 | |
| |
| Total return* | 12.55 | % |
| Ratios to average net assets:A | | |
| Net investment income | 1.28 | % (a) |
| Total expenses | 18.62 | % (a) |
| Expenses before offsets | 1.53 | % (a) |
| Net expenses | 1.53 | % (a) |
| Portfolio turnover | 74 | % |
| Net assets, ending (in thousands) | $440 | |
A Total expenses do not reflect amounts reimbursed and/or waived by the Advisor or reductions from expense off-
set arrangements. Expenses before offsets reflect expenses after reimbursement and/or waiver by the Advisor but
prior to reductions from expense offset arrangements. Net expenses are net of all reductions and represent the net
expenses paid by the Fund.
(a) Annualized.
(z) Per share figures are calculated using the Average Shares Method.
# From October 29, 2012 inception.
* Total return is not annualized for periods of less than one year and does not reflect deduction of any front-end or
deferred sales charge.
See notes to financial statements.
www.calvert.com CALVERT EMERGING MARKETS EQUITY FUND ANNUAL REPORT 33
EXPLANATION OF FINANCIAL TABLES
SCHEDULE OF INVESTMENTS
The Schedule of Investments is a snapshot of all securities held in the fund at their market value, on the last day of the reporting period. Securities are listed by asset type (e.g., common stock, corporate bonds, U.S. government obligations) or, for International Funds, by country, and may be further broken down into sub-groups and by industry classification.
STATEMENT OF ASSETS AND LIABILITIES
The Statement of Assets and Liabilities is often referred to as the fund’s balance sheet. It lists the value of what the fund owns, is due and owes on the last day of the reporting period. The fund’s assets include the market value of securities owned, cash, receivables for securities sold and shareholder subscriptions, and receivables for dividends and interest payments that have been earned, but not yet received. The fund’s liabilities include payables for securities purchased and shareholder redemptions, and expenses owed but not yet paid. The statement also reports the fund’s net asset value (NAV) per share on the last day of the reporting period. The NAV is calculated by dividing the fund’s net assets (assets minus liabilities) by the number of shares outstanding. This statement is accompanied by a Schedule of Investments. Alternatively, if certain conditions are met, a Statement of Net Assets may be presented in lieu of this statement and the Schedule of Investments.
STATEMENT OF NET ASSETS
The Statement of Net Assets provides a detailed list of the fund’s holdings, including each security’s market value on the last day of the reporting period. The Statement of Net Assets includes a Schedule of Investments. Other assets are added and other liabilities subtracted from the investments total to calculate the fund’s net assets. Finally, net assets are divided by the outstanding shares of the fund to arrive at its share price, or Net Asset Value (NAV) per share.
At the end of the Statement of Net Assets is a table displaying the composition of the fund’s net assets. Paid in Capital is the money invested by shareholders and represents the bulk of net assets. Undistributed Net Investment Income and Accumulated Net Realized Gains usually approximate the amounts the fund had available to distribute to shareholders as of the statement date. Accumulated Realized Losses will appear as negative balances. Unrealized Appreciation (Depreciation) is the difference between the market value of the fund’s investments and their cost, and reflects the gains (losses) that would be realized if the fund were to sell all of its investments at their statement-date values.
STATEMENT OF OPERATIONS
The Statement of Operations summarizes the fund’s investment income earned and expenses incurred in operating the fund. Investment income includes dividends earned from stocks and interest earned from interest-bearing securities in the fund. Expenses incurred in operating the fund include the advisory fee paid to the investment advisor, administrative services fees, distribution plan expenses (if applicable), transfer agent fees, shareholder servicing expenses, custodial, legal, and audit fees, and the printing and post-
34 www.calvert.com CALVERT EMERGING MARKETS EQUITY FUND ANNUAL REPORT (UNAUDITED)
age expenses related to shareholder reports. Expense offsets (fees paid indirectly) are also shown. Credits earned from offset arrangements are used to reduce the fund’s expenses. This statement also shows net gains (losses) realized on the sale of investments and the increase or decrease in the unrealized appreciation (depreciation) on investments held during the period.
STATEMENT OF CHANGES IN NET ASSETS
The Statement of Changes in Net Assets shows how the fund’s total net assets changed during the two most recent reporting periods. Changes in the fund’s net assets are attributable to investment operations, distributions and capital share transactions.
The Operations section of the report summarizes information detailed in the Statement of Operations. The Distribution section shows the dividend and capital gain distributions made to shareholders. The amounts shown as distributions in this section may not match the net investment income and realized gains amounts shown in the Operations section because distributions are determined on a tax basis and certain investments or transactions may be treated differently for financial statement and tax purposes. The Capital Share Transactions section shows the amount shareholders invested in the fund, either by purchasing shares or by reinvesting distributions, and the amounts redeemed. The corresponding numbers of shares issued, reinvested and redeemed are shown at the end of the report.
FINANCIAL HIGHLIGHTS
The Financial Highlights table provides a per-share breakdown per class of the components that affect the fund’s net asset value for current and past reporting periods. The table provides total return, total distributions, expense ratios, portfolio turnover and net assets for the applicable period. Total return is a measure of a fund’s performance that encompasses all elements of return: dividends, capital gain distributions and changes in net asset value. Total return is the change in value of an investment over a given period, assuming reinvestment of any dividends and capital gain distributions, expressed as a percentage of the initial investment. Total distributions include distributions from net investment income and net realized gains. Long-term gains are earned on securities held in the fund more than one year. Short-term gains, on the sale of securities held less than one year, are treated as ordinary dividend income for tax purposes. The expense ratio is a fund’s cost of doing business, expressed as a percentage of net assets. These expenses directly reduce returns to shareholders. Portfolio turnover measures the trading activity in a fund’s investment portfolio – how often securities are bought and sold by a fund. Portfolio turnover is affected by market conditions, changes in the size of the fund, the nature of the fund’s investments and the investment style of the portfolio manager.
www.calvert.com CALVERT EMERGING MARKETS EQUITY FUND ANNUAL REPORT (UNAUDITED) 35
PROXY VOTING
The Proxy Voting Guidelines of the Calvert Funds that the Fund uses to determine how to vote proxies relating to portfolio securities are provided as an Appendix to the Fund’s Statement of Additional Information. The Statement of Additional Information can be obtained free of charge by calling the Fund at 1-800-368-2745, by visiting the Calvert website at www.calvert.com; or by visiting the SEC’s website at www.sec.gov.
Information regarding how the Fund voted proxies relating to portfolio securities during the most recent 12-month period ended June 30 will be available on the Fund’s website at www.calvert.com and on the SEC’s website at www.sec.gov.
AVAILABILITY OF QUARTERLY PORTFOLIO HOLDINGS
The Fund files its complete schedule of portfolio holdings with the SEC for the first and third quarters of each fiscal year on Form N-Q. The Fund’s Form N-Q is available on the SEC’s website at www.sec.gov. The Fund’s Form N-Q may be reviewed and copied at the SEC’s Public Reference Room in Washington, DC; information on the operation of the Public Reference Room may be obtained by calling 1-800-SEC-0330.
36 www.calvert.com CALVERT EMERGING MARKETS EQUITY FUND ANNUAL REPORT (UNAUDITED)
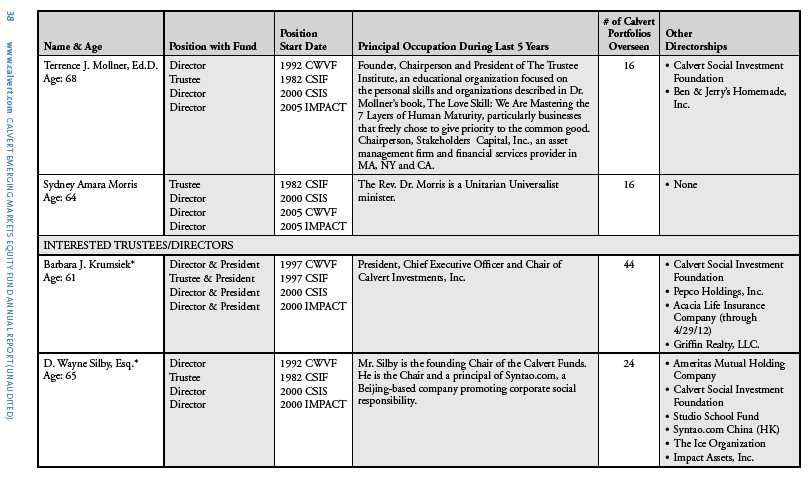
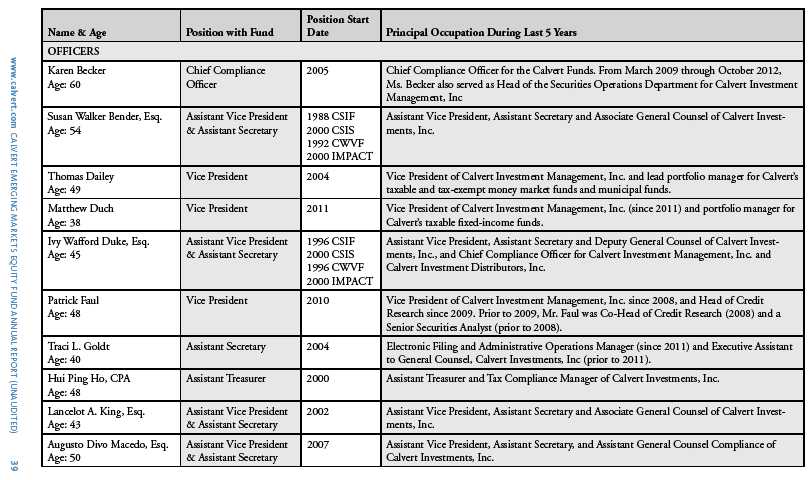
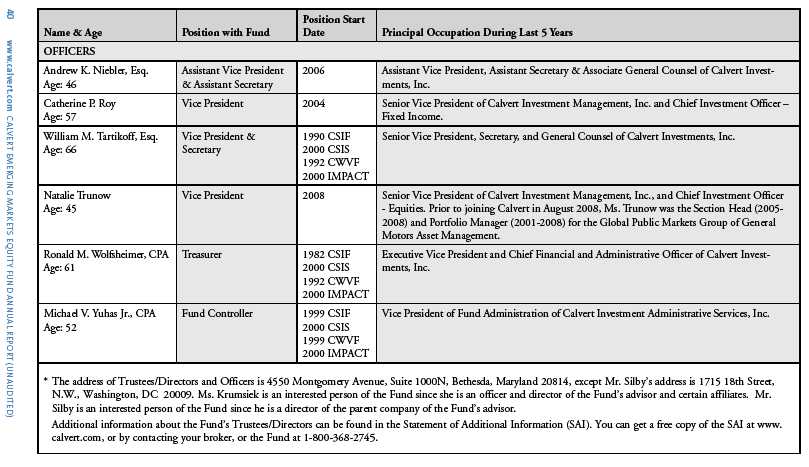
To Open an Account
800-368-2748
Service for Existing Account
Shareholders: 800-368-2745
Brokers: 800-368-2746
TDD for Hearing Impaired
800-541-1524
Registered Mail
Calvert Investments
c/o BFDS,
P.O. Box 219544
Kansas City, MO 64121-9544
Overnight Mail
Calvert Investments
c/o BFDS,
330 West 9th Street
Kansas City, MO 64105
Web Site
www.calvert.com
Principal Underwriter
Calvert Investment Distributors, Inc.
4550 Montgomery Avenue
Suite 1000 North
Bethesda, Maryland 20814
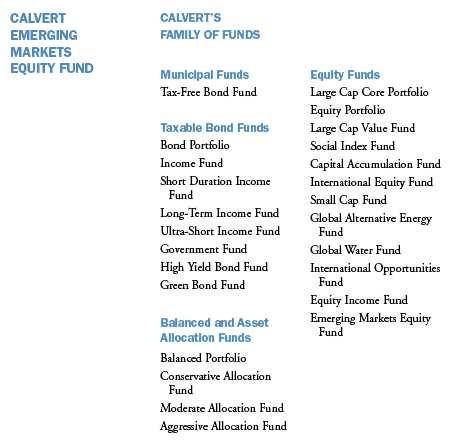
This report is intended to provide fund information to shareholders. It is not authorized for distribution to prospective investors unless preceded or accompanied by a prospectus.
Note: The information on our website is not incorporated by reference into this report; our website address is included as an inactive textual reference only.
Investors should carefully consider the investment objectives, risks, charges and expenses of the Calvert Funds. This and other important information is contained in the fund’s summary prospectus and prospectus, which can be obtained from your financial professional and should be read carefully before investing. You may also call Calvert at 800/368-2748 or visit www. calvert.com.
Item 2. Code of Ethics.
(a) The registrant has adopted a code of ethics (the "Code of Ethics") that applies to its principal executive officer and principal financial officer (also referred to as “principal accounting officer”).
(b) No information need be disclosed under this paragraph.
(c) The registrant has not amended its Code of Ethics during the period covered by the shareholder report presented in Item 1 hereto.
(d) The registrant has not granted a waiver or implicit waiver from a provision of its Code of Ethics during the period covered by the shareholder report presented in Item 1 hereto.
(e) Not applicable.
(f) The registrant's Code of Ethics is attached as an Exhibit hereto.
Item 3. Audit Committee Financial Expert.
The registrant's Board of Directors has determined that Miles D. Harper, III., an "independent" Director serving on the registrant's audit committee, is an "audit committee financial expert," as defined in Item 3 of Form N-CSR. Under applicable securities laws, a person who is determined to be an audit committee financial expert will not be deemed an "expert" for any purpose, including without limitation for the purposes of Section 11 of the Securities Act of 1933, as a result of being designated or identified as an audit committee financial expert. The designation or identification of a person as an audit committee financial expert does not impose on such person any duties, obligations, or liabilities that are greater than the duties, obligations, and liabilities imposed on such person as a member of the audit committee and Board of Directors in the absence of such designation or identification.
Item 4. Principal Accountant Fees and Services.
Services fees paid to auditing firm:
| Fiscal Year ended 9/30/12 | Fiscal Year ended 9/30/13 |
| $ | %* | $ | % * |
| | | | |
(a) Audit Fees | $58,465 | | $75,942 | |
(b) Audit-Related Fees | $0 | 0% | $0 | 0% |
(c) Tax Fees (tax return preparation and filing for the registrant) | $8,460 | 0% | $11,680 | 0% |
(d) All Other Fees | $0 | 0% | $0 | 0% |
| | | | |
Total | $66,925 | 0% | $87,622 | 0% |
* Percentage of fees approved by the Audit Committee pursuant to (c)(7)(i)(C) of Rule 2-01 of Reg. S-X (statutory de minimis waiver of Committee’s requirement to pre-approve)
(e) Audit Committee pre-approval policies and procedures:
The Audit Committee is required to pre-approve all audit and non-audit services provided to the registrant by the auditors, and to the registrant’s investment advisor, and any entity controlling, controlled by, or under common control with the advisor that provides ongoing services to the registrant. In determining whether to pre-approve non-audit services, the Audit Committee considers whether the services are consistent with maintaining the independence of the auditors. The Committee may delegate its authority to pre-approve certain matters to one or more of its members. In this regard, the Committee has delegated authority to the Audit Committee Chair with respect to non-audit services not exceeding $25,000 in each instance. In addition, the Committee has pre-approved the retention of the auditors to provide tax-related services related to the tax treatment and tax accounting of newly acquired securities, upon request by the investment advisor in each instance.
(f) Not applicable.
(g) Aggregate non-audit fees billed by the registrant’s accountant for services rendered to the registrant, and rendered to the registrant’s investment advisor, and any entity controlling, controlled by, or under common control with the advisor that provides ongoing services to the registrant for each of the last two fiscal years of the registrant:
| Fiscal Year ended 9/30/12 | Fiscal Year ended 9/30/13 |
| $ | %* | $ | % * |
| $10,000 | 0%* | $292,500 | 0%* |
* Percentage of fees approved by the Audit Committee pursuant to (c)(7)(i)(C) of Rule 2-01 of Reg. S-X (statutory de minimis waiver of Committee’s requirement to pre-approve)
(h) The registrant’s Audit Committee of the Board of Directors has considered whether the provision of non-audit services that were rendered to the registrant’s investment advisor, and any entity controlling, controlled by, or under common control with the investment advisor that provides ongoing services to the registrant that were not pre-approved pursuant to paragraph (c) (7)(ii) of Rule 2-01 of Reg. S-X is compatible with maintaining the principal accountant’s independence and found that the provision of such services is compatible with maintaining the principal accountant’s independence.
Item 5. Audit Committee of Listed Registrants.
Not applicable.
Item 6. Schedule of Investments.
(a) This Schedule is included as part of the report to shareholders filed under Item 1 of this Form.
(b) Not applicable.
Item 7. Disclosure of Proxy Voting Policies and Procedures for Closed-End Management Investment Companies.
Not applicable.
Item 8. Portfolio Managers of Closed-End Management Investment Companies.
Not applicable.
Item 9. Purchases of Equity Securities by Closed-End Management Investment Company and Affiliated Purchasers.
Not applicable.
Item 10. Submission of Matters to a Vote of Security Holders.
No material changes were made to the procedures by which shareholders may recommend nominees to the registrant’s Board of Directors since registrant last provided disclosure in response to this Item.
Item 11. Controls and Procedures.
(a) The principal executive and financial officers concluded that the registrant's disclosure controls and procedures (as defined in Rule 30a-3(c) under the 1940 Act) are effective, based on the evaluation of these controls and procedures required by Rule 30a-3(b) under the 1940 Act and Rules 13a-15(b) or 15d-15(b) under the Exchange Act, as of a date within 90 days of the filing date of this report.
(b) There was no change in the registrant's internal control over financial reporting (as defined in Rule 30a-3(d) under the 1940 Act) that occurred during the registrant's second fiscal quarter of the period covered by this report that has materially affected, or is reasonably likely to materially affect, the registrant's internal control over financial reporting.
Item 12. Exhibits.
(a)(1) A copy of the Registrant’s Code of Ethics.
Attached hereto.
(a)(2) A separate certification for each principal executive officer and principal financial officer of the registrant as required by Rule 30a-2 under the Act (17 CFR 270.30a-2).
Attached hereto.
(a)(3) Not applicable.
(b) A certification for the registrant's Principal Executive Officer and Principal Financial Officer, as required by Rule 30a-2(b) under the Investment Company Act of 1940, is attached hereto. The certification furnished pursuant to this paragraph is not deemed to be "filed" for purposes of Section 18 of the Securities Exchange Act of 1934, or otherwise subject to the liability of that section. Such certification is not deemed to be incorporated by reference into any filing under the Securities Act of 1933 or the Securities Exchange Act of 1934, except to the extent that the registrant specifically incorporates it by reference.
Pursuant to the requirements of the Securities Exchange Act of 1934 and the Investment Act of 1940, the registrant has duly caused this report to be signed on its behalf by the undersigned, thereunto duly authorized.
CALVERT WORLD VALUES FUND, INC.
By: /s/ Barbara J. Krumsiek
Barbara J. Krumsiek
President -- Principal Executive Officer
Date: December 3, 2013
Pursuant to the requirements of the Securities Exchange Act of 1934 and the Investment Act of 1940, this report has been signed below by the following persons on behalf of the registrant and in the capacities and on the dates indicated.
/s/ Barbara J. Krumsiek
Barbara J. Krumsiek
President -- Principal Executive Officer
Date: December 3, 2013
/s/ Ronald M. Wolfsheimer
Ronald M. Wolfsheimer
Treasurer -- Principal Financial Officer
Date: December 3, 2013