UNITED STATES
SECURITIES AND EXCHANGE COMMISSION
Washington, D.C. 20549
FORM N-CSR
CERTIFIED SHAREHOLDER REPORT OF REGISTERED
MANAGEMENT INVESTMENT COMPANIES
Investment Company Act file number: 811-06563
CALVERT WORLD VALUES FUND, INC.
(Exact name of registrant as specified in charter)
4550 Montgomery Avenue
Suite 1000N
Bethesda, Maryland 20814
(Address of Principal Executive Offices)
John H. Streur
4550 Montgomery Avenue
Suite 1000N
Bethesda, Maryland 20814
(Name and Address of Agent for Service)
Registrant's telephone number, including area code: (301) 951-4800
Date of fiscal year end: September 30
Date of reporting period: Twelve months ended September 30, 2016
Item 1. Report to Stockholders.
|
| | |
| | |
| | | |
Calvert International Equity Fund
| | |
| | | |
| | |
|
| |
Annual Report September 30, 2016 E-Delivery Sign-Up — Details Inside | |
|
|
| |
Choose Planet-friendly E-delivery! Sign up now for on-line statements, prospectuses, and fund reports. In less than five minutes you can help reduce paper mail and lower fund costs. Just go to calvert.com. If you already have an online account at Calvert, click on Login, to access your Account, and select the documents you would like to receive via e-mail. If you're new to online account access, click on Login, then Register to create your user name and password. Once you're in, click on the E-delivery sign-up on the Account Portfolio page and follow the quick, easy steps. Note: if your shares are not held directly at Calvert but through a brokerage firm, you must contact your broker for electronic delivery options available through their firm. |
|
| | | |
| | | TABLE OF CONTENTS |
| | | | |
| | | | President's Letter |
| | | | Portfolio Management Discussion |
| | | | Understanding Your Fund's Expenses |
| | | | Report of Independent Registered Public Accounting Firm |
| | | | Schedule of Investments |
| | | | Statement of Assets and Liabilities |
| | | | Statement of Operations |
| | | | Statements of Changes in Net Assets |
| | | | Notes to Financial Statements |
| | | | Financial Highlights |
| | | | Proxy Voting |
| | | | Availability of Quarterly Portfolio Holdings |
| | | | Director and Officer Information Tables |
|
| | |
| John Streur President and Chief Executive Officer, Calvert Investments, Inc. | |
Dear Fellow Shareowners and Friends,
Forty years ago, Calvert Investments was founded on the belief that investment capital, properly stewarded, could improve the world for its less powerful inhabitants and improve environmental sustainability, while producing reasonable investment returns. Calvert was one of the first investment advisers to introduce the responsible investment concept, and through many years of innovation and research (supported by you, our shareholders), we have developed this philosophy to now provide even greater shareholder engagement and impact.
Corporations throughout the world, big and small, have an ever increasing role in determining social and environmental outcomes for every living being, today and into the future. The power of corporations, garnered through global influence, human capital and financial strength, especially relative to our other institutions, has been steadily increasing for decades (http://www.calvert.com/perspective/research/calvert-serafeim-series-report).
Investors recognize the impact of corporations on society, and more and more are making investment decisions based on their assessments of a company's effect on environmental and social outcomes. Companies able to operate their business in a perceived sustainable manner, promoting, environmental and social justice stand to benefit; while those corporate laggards, that fail to embrace these new responsibilities, will falter.
Reliable information is critical in ensuring that shareholders are able to make informed assessments regarding a corporation's sustainability profile. Key performance metrics and data (a "sustainability information system") that indicates how a company is performing regarding environmental and social impacts, is integral to making informed responsible investment decisions. Through partnerships with world class educational institutions and forward thinking business partners, Calvert is developing valuable research methodologies and metrics to assess the quality of data inputs and results, such that we are able to assess companies' impacts. Are we completely there yet? No, but as data becomes more transparent and consistent, driven, in part by investor demands and regulatory authorities, we will get there, such that we and other market participants can make better informed investment and purchase decisions. For example, key data that measures "true" intrinsic and extrinsic product costs, including indirect environmental and social impacts could be relevant to investors when making corporate comparisons regarding risk and profitability, and also of great interest to consumers making product purchase decisions.
Calvert is participating in the Sustainability Accounting Standards Board Investment Advisory Group, which is working to move the disclosure of ESG metrics forward through corporate SEC filings (http://www.sasb.org/). Calvert is also working to map the United Nations Sustainable Development Goals to the SASB standards (http://www.calvert.com/perspective/social-impact/unsdg-faq), in order to better evaluate the progress of any public corporation on its path towards global sustainability.
Also, involved in this effort are millions of individuals and small organizations throughout the world who are adding to this mosaic of information through their local and specialized efforts and services. They often have access to pockets of information that are not publically available or disseminated, and thereby not available to the financial data service companies. Our myriad and long running engagements with NGOs and corporations provide critical insight to our analysts, driving the enhancement of our information infrastructure forward, as they research potential investments for your portfolios and design shareholder activist agendas.
ESG data about corporate behavior provides a useful baseline, but takes on additional meaning as the Calvert Principles for Responsible Investment guide our interpretation of the data, acting as our "responsibility compass" (http://www.calvert.com/approach/how-we-invest/the-calvert-principles). In addition to providing a context consistent with Calvert's mission, our Principles lead us to areas where additional, fundamental research is needed to develop a real understanding of corporate impact on society and the environment. In our complex, globalized and rapidly evolving world, the Principles allow us to contextualize information, whereas a rules based system, or an exclusive reliance on data from companies may miss valuable situational and circumstantial inference, as evidenced in the issues surrounding Standing Rock and the role of the corporation, Energy Transfer Partners. The Standing Rock Sioux Nation is striving to halt construction of the Dakota Access Pipeline crossing their sacred land and threatening water contamination (see our resolution in support of the Standing Rock Sioux Nation, (http://www.calvert.com/perspective/climate-and-environment/calvert-releases-statement-in-support-of-standing-rock-sioux-nation).
4 calvert.com CALVERT INTERNATIONAL EQUITY FUND ANNUAL REPORT (UNAUDITED)
The concerns surrounding social license and indigenous peoples' rights are complex and do not lend themselves easily to objective quantification methods employed by the traditional financial data sources. That is why the fundamental overlay performed by the Calvert research analysts is so essential to our effective responsible investing process.
While effecting change through thoughtful ESG capital allocations is important, direct impact can be made through shareholder activism, or more specifically advocacy. Calvert's shareholder advocacy process (28 resolutions last year) has been effective in influencing corporate behavior and provides another avenue for influencing valuable societal and environmental outcomes (http://www.calvert.com/perspective/social-impact/2016-proxy-season-brings-opportunity-to-accelerate-corporate-sustainability-progress).
Calvert's voice reflects and respects diversity of thought and is often used to protect the interests of those most in need, and to look out for future generations. We thank you, our shareholders, friends and partners in this mission, for a good start. We promise that our work will never be done and the next forty years will reflect the increasing imperative to work vigorously to produce competitive returns for you and to use our power to forge a better today and future for our society. Often this requires Calvert to go where other investment firms have not, and to speak out and act when others do not.
Thank you, as always, for the incredible privilege to serve your needs through the Calvert Funds.
Respectfully,
John Streur
September 2016
calvert.com CALVERT INTERNATIONAL EQUITY FUND ANNUAL REPORT (UNAUDITED) 5
|
| |
| PORTFOLIO MANAGEMENT DISCUSSION |
|
| | | |
| Joshua Linder, CFA Portfolio Manager | | Christopher Madden, CFA Portfolio Manager |
| Kurt Moeller, CFA Portfolio Manager | | Jade Huang Portfolio Manager |
Market Review
For the 12-month period ended September 30, 2016, the S&P 500 Index rose 15.43% and the Russell 1000 Index rose 14.93% while the MSCI EAFE Index and the MSCI Emerging Markets Index rose 6.52% and 16.78%, respectively.
The United States Federal Reserve Board (the “Fed”) raised interest rates only one time during the period. This was less than many observers had expected. Long-term government bond yields ended the period lower than where they began in nearly every major economy. The Japanese yen generally strengthened and the British pound weakened over the period, with the U.S. dollar remaining relatively stable vs. the Euro and the Chinese Yuan. Commodity prices fluctuated but most ended near their starting point, except for the price of gold increasing to over $1,300/oz., as of September 30, 2016.
The strong stock returns masked volatility which occurred during the twelve months. Stocks rallied to end 2015, then struggled in the first quarter of 2016, as investors became concerned about near-term economic growth. From April - September 2016, global stocks rallied as central banks kept interest rates low and economic data was generally positive.
The U.S. monthly jobs reports showed more new jobs created in June and July than in any previous month during 2016. The housing and consumer recovery continued to pick up steam. OPEC announced its first production cut in eight years in September 2016. However, market reaction was muted as any negative effects are likely to be mitigated by U.S. producers' ability to step in and fill outstanding demand. Inflation remained low, contributing to the decision by the Fed in September to maintain its steady-state interest rate policy, while indicating an increased probability of a December rate hike.
Investment Strategy and Technique
Our investment process focuses on sustainable businesses with attractive valuations and environmental, social and governance (ESG) characteristics, generous dividend yields, reasonable growth prospects, and stable quality of earnings and cash flows. The Fund invests primarily in the stocks of large-cap, non-U.S. companies from the constituent countries of the MSCI EAFE Index, but may also invest in other countries, including emerging market stocks.
We manage this Fund as a core portfolio which emphasizes quality, value and companies' ESG characteristics. The Fund often has been underweighted towards Energy and Materials companies, in part due to fewer companies in those sectors meeting our Principles for Responsible Investment. However, over the last year, we added to those sectors, reducing the Fund's underweight. We did this after prices appeared to be stabilizing for commodities, such as oil and metals.
Fund Performance Relative to the Benchmark
Effective December 10, 2015, Calvert International Equity Fund changed its benchmark from the MSCI EAFE Investable Market Index ("IMI") to the MSCI EAFE Index.
For the 12 months ending September 30, 2016, Calvert International Equity Fund Class A (at NAV) posted a return of 0.04%, underperforming the MSCI EAFE Index, which returned 6.52%, and the MSCI EAFE IMI Index, which returned 7.29%.
The Fund's underperformance was driven by sector allocation and stock selection.
6 calvert.com CALVERT INTERNATIONAL EQUITY FUND ANNUAL REPORT (UNAUDITED)
|
| | | | |
| | | | |
| | CALVERT INTERNATIONAL EQUITY FUND |
| | SEPTEMBER 30, 2016 | |
| | | | |
| | ECONOMIC SECTORS | % OF TOTAL INVESTMENTS* | |
| | Industrials | 17.2 | % | |
| | Financials | 17.0 | % | |
| | Consumer Discretionary | 12.8 | % | |
| | Health Care | 11.7 | % | |
| | Consumer Staples | 11.7 | % | |
| | Telecommunication Services | 8.0 | % | |
| | Materials | 6.6 | % | |
| | Energy | 3.5 | % | |
| | Utilities | 3.2 | % | |
| | Information Technology | 2.7 | % | |
| | Real Estate | 2.4 | % | |
| | High Social Impact Investments | 1.4 | % | |
| | Short-Term Investments | 1.1 | % | |
| | Limited Partnership Interest | 0.4 | % | |
| | Venture Capital | 0.3 | % | |
| | Total | 100 | % | |
| | | | |
| | * Does not reflect the value of securities held as cash collateral on securities loaned. | |
| | | | |
During the period, we decreased the Fund's exposure to Financials. This was driven by the persistent low interest environment, especially in Europe, and its impact on both banks and life insurance companies. We increased the Fund's exposure to Industrials, which should benefit from improvements in the global economy.
In conjunction with reducing an underweight in Materials, we reduced an underweight in Australia, where energy and materials have a large economic impact. While we added to Australian stocks, we sold British equities. This is partly due to selling some British banks, but also due to the impact that Britain's upcoming exit from the European Union might have on its economy.
During the period, the biggest detractor from performance was sector selection. The Fund was overweight in Financials, which lagged the Index during the period. The portfolio was positioned for rising interest rates, which should benefit both banks and life insurance companies. Instead, the Fed raised interest rates only one time, and long-term interest rates fell in nearly every major market.
The Fund's underweight in several industries also hurt performance. In compliance with our Principles for Responsible Investment, the Fund generally does not own companies with significant involvement in the manufacturing of tobacco products or alcoholic beverages or that are own significant fossil fuel assets. Many stocks in those industries
offer high dividend yields, and investors consider their yields
|
| | | | | | |
| | | | | |
| | CALVERT INTERNATIONAL EQUITY FUND | |
| | SEPTEMBER 30, 2016 | |
| | | | | |
| | INVESTMENT PERFORMANCE | |
| | (TOTAL RETURN AT NAV) | |
| | | 6 MONTHS ENDED 9/30/16 | 12 MONTHS ENDED 9/30/16 | |
| | Class A | 2.04 | % | 0.04 | % | |
| | Class C | 1.68 | % | -0.68 | % | |
| | Class I | 2.23 | % | 0.41 | % | |
| | Class Y | 2.19 | % | 0.28 | % | |
| | MSCI EAFE Index | 4.88 | % | 6.52 | % | |
| | MSCI EAFE Investable Market Index | 5.01 | % | 7.29 | % | |
| | Lipper International Large-Cap Core Funds Average | 5.12 | % | 5.78 | % | |
| | | | | |
| | Investment performance/return at NAV does not reflect the deduction of the Fund's maximum 4.75% front-end sales charge or any deferred sales charge. | |
| | | | | |
| | TEN LARGEST STOCK HOLDINGS | % OF NET ASSETS | |
| | Nippon Telegraph & Telephone Corp. | 3.4 | % | |
| | Unilever NV (CVA) | 2.4 | % | |
| | Roche Holding AG | 2.1 | % | |
| | Koninklijke Ahold Delhaize NV | 2.0 | % | |
| | Australia & New Zealand Banking Group Ltd. | 1.8 | % | |
| | Cie de Saint-Gobain | 1.7 | % | |
| | Novartis AG | 1.7 | % | |
| | HeidelbergCement AG | 1.7 | % | |
| | Schneider Electric SE | 1.7 | % | |
| | Atlantia SpA | 1.6 | % | |
| | Total | 20.1 | % | |
| | | | | |
safe and their business model economically defensive. Investors sought stocks like that in the last 12 months, as interest rates fell and concerns grew about near-term economic growth.
Stock selection also detracted from results, especially within the bank industry. One such stock was bank BBVA, which has a large presence in Spain, Mexico and Argentina. BBVA has been hurt by its strategy to grow, in an environment when consumers can use online tools and better compare prices. Low interest rates globally, especially in Europe, similarly are reducing BBVA's net interest margins and returns on equity. We exited BBVA over the last 12 months.
Fund returns were also hurt by stock picks among Industrial companies. International Consolidated Airlines (IAG), parent of British Airways and Iberia, fell sharply in late June, after UK voters chose to leave the European Union. Investors
calvert.com CALVERT INTERNATIONAL EQUITY FUND ANNUAL REPORT (UNAUDITED) 7
feared the long-term impact of potentially fewer international visitors to the UK, and IAG's #1 airport is London Heathrow. IAG also told investors that it had experienced weaker than expected demand in spring 2016 and reduced its expectations for 2016 profits. The post-Brexit weakness in the British pound has also hurt IAG, as it has many U.S. dollar-based costs, such as fuel and aircraft leases. The Fund also has exited IAG.
Stock selection within Telecommunications was the biggest positive contributor to Fund performance. Nippon Telephone & Telegraph posted strong returns. NTT has shifted its mobile division to focus more on retaining customers than on finding new ones at low prices. NTT has changed its fiber to the home model from retail to wholesale, reducing costs. Having increased capital spending in previous years to improve its network, NTT has decreased investment the last two years, allowing it to buy back shares and increase dividends to shareholders.
Another positive contributor was French engineering and construction firm Technip, which focuses on upstream and downstream energy projects, both onshore and offshore. Technip benefited from oil prices stabilizing in recent months, after their sharp drop from mid-2014 through early 2016. It also benefited from continued strong execution, a hallmark in recent years. During the period, Technip announced a complementary merger with FMC Technologies, which makes equipment used to transfer oil and natural gas from deep underwater or underground to the surface.
Positioning and Market Outlook
We remain constructive on the U.S. economy over the medium-to-long run and believe stocks can continue to post solid performance, although probably not as robust as what we've experienced in recent years. While valuations of U.S. equities appear stretched based on historical standards, the positive economic environment in the U.S. relative to the rest of the world should support elevated valuation levels. Many international economies continue to be hindered by underlying structural and economic fiscal challenges, including Europe and Japan.
In the near-term, equity markets face several potential headwinds. The U.S. economy is in solid shape and benefiting from improved visibility into growth, but uncertainty around the outcome of the presidential election, the Fed's anticipated December interest-rate hike, and political decisions in other parts of Europe post-Brexit could lead to increased volatility. However, accommodative monetary policy by central banks around the world should limit the downside.
Europe may experience a bit of a relief rally, benefiting from continued easing by the ECB and modest improvements in economic data, but structural problems remain. As we anticipated, the impact of Brexit on the global economy and the reaction by markets thus far has been relatively muted, but we are starting to see some implications in the UK with the
pound declining and inflation picking-up. The potential for geopolitical turmoil in a number of different European countries is also still a risk that we continue to monitor.
While we remain cautious on China's long-term growth prospects, their injection of stimulus is starting to flow through to the real economy, easing concerns about a hard economic landing and providing support for the global economy, especially emerging markets. Combined with slow, but steady growth in the U.S. and a modest pick-up in Europe, the global economy is in better shape than earlier in the year and should be able to support elevated global equity valuations, at least for now.
Although volatility in the equity markets may pick up, this should also provide greater opportunities for stock picking. We believe our stock-selection strategy, which incorporates consideration of environmental, social, and governance (ESG) factors along with quantitative analysis, is well positioned for the current environment.
|
| |
| |
| Joshua Linder, CFA | Christopher Madden, CFA |
| |
| Kurt Moeller, CFA | Jade Huang |
Calvert Investment Management, Inc.
September 2016
8 calvert.com CALVERT INTERNATIONAL EQUITY FUND ANNUAL REPORT (UNAUDITED)
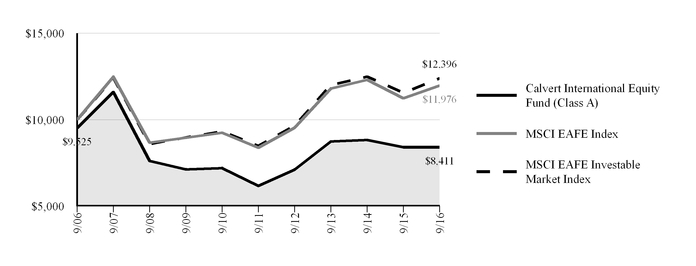
Growth of $10,000
The graph below shows the value of a hypothetical $10,000 investment in the Fund over the past 10 fiscal year periods. The results shown are for Class A shares, reflect the deduction of the maximum front-end Class A sales charge of 4.75%, and assume the reinvestment of dividends. The result is compared with a broad based market index. Market indexes are unmanaged and their results do not reflect the effect of expenses or sales charges. The value of an investment in a different share class would be different.
|
| | | | | | | |
| CALVERT INTERNATIONAL EQUITY FUND |
| SEPTEMBER 30, 2016 |
| AVERAGE ANNUAL TOTAL RETURNS | Ticker Symbol | 1 Year | 5 Year | 10 Year |
| Class A (with max. load) | CWVGX | -4.72 | % | 5.36 | % | -1.72 | % |
| Class C (with max. load) | CWVCX | -1.67 | % | 5.47 | % | -2.08 | % |
| Class I | CWVIX | 0.41 | % | 7.04 | % | -0.58 | % |
| Class Y | CWEYX | 0.28 | % | 6.75 | % | -0.94 | % |
| MSCI EAFE Index | | 6.52 | % | 7.39 | % | 1.82 | % |
| MSCI EAFE Investable Market Index | | 7.29 | % | 7.86 | % | 2.17 | % |
| Lipper International Large-Cap Core Funds Average | | 5.78 | % | 6.46 | % | 1.45 | % |
| | | | | |
| Calvert International Equity Fund first offered Class Y shares on October 31, 2008. Performance prior to that date reflects the performance of Class A shares at net asset value (NAV). Actual Class Y share performance would have been different. |
| | | | | |
All performance data shown, including the graph above and the adjacent table, represents past performance, does not guarantee future results, assumes reinvestment of dividends and distributions, and does not reflect the deduction of taxes that a shareholder would pay on the Fund's distributions or the redemption of the Fund shares. All performance data reflects fee waivers and/or expense limitations, if any are in effect; in their absence performance would be lower. See Note B in Notes to Financial Statements. The investment return and principal value of an investment will fluctuate so that an investor's shares, when redeemed, may be worth more or less than their original cost. Current performance may be lower or higher than the performance data quoted; for current performance data, including most recent month-end, visit www.calvert.com. The gross expense ratio from the current prospectus for Class A shares is 1.45%. This number may differ from the expense ratio shown elsewhere in this report because it is based on a different time period and, if applicable, does not include fee or expense waivers. Performance data quoted already reflects the deduction of the Fund's operating expenses.
calvert.com CALVERT INTERNATIONAL EQUITY FUND ANNUAL REPORT (UNAUDITED) 9
UNDERSTANDING YOUR FUND'S EXPENSES
As an investor, you incur two types of costs. There are transaction costs, which generally include sales charges on purchases and may include redemption fees. There are also ongoing costs, which generally include management fees, distribution and/or service fees, and other fund expenses. The following information is intended to help you understand your ongoing costs (in dollars) of investing in this mutual fund and to help you compare these costs with the ongoing costs of investing in other mutual funds.
To illustrate these ongoing costs, we have provided examples and calculated the expenses paid by the fund's investors during the period. The actual and hypothetical information presented in the examples is based on an investment of $1,000 invested at the beginning of the period and held for the entire period (April 1, 2016 to September 30, 2016).
Actual Expenses
The first line of the table below provides information about actual account values and actual expenses. You may use the information in this line, together with the amount you invested, to estimate the expenses that you paid over the period. Simply divide your account value by $1,000 (for example, an $8,600 account value divided by $1,000 = 8.6), then multiply the result by the number in the first line under the heading entitled "Expenses Paid During Period" to estimate the expenses you paid on your account during this period.
The fund may charge an annual low balance account fee of $15 to those shareholders whose regular account balance is less than $2,000 ($1,000 for IRA accounts). If the low balance fee applies to your account, you should subtract the fee from the ending account value in the chart below.
Hypothetical Example for Comparison Purposes
The second line of the table below provides information about hypothetical account values and hypothetical expenses based on the Fund's actual expense ratio and an assumed rate of return of 5% per year before expenses, which is not the Fund's actual return. The hypothetical account values and expenses may not be used to estimate the actual ending account balance or expenses you paid for the period. You may use this information to compare the ongoing costs of investing in the Fund and other funds. To do so, compare the 5% hypothetical example with the 5% hypothetical examples that appear in the shareholder reports of the other funds.
Please note that the expenses shown in the table are meant to highlight your ongoing costs only and do not reflect any transactional costs, such as sales charges (loads), or redemption fees. Therefore, the second line of the table is useful in comparing ongoing costs only, and will not help you determine the relative total costs of owning different funds. In addition, if these transactional costs were included, your costs would have been higher.
|
| | | | |
| | ANNUALIZED
EXPENSE RATIO | BEGINNING
ACCOUNT VALUE
4/1/16 | ENDING
ACCOUNT VALUE
9/30/16 | EXPENSES PAID
DURING PERIOD*
4/1/16 - 9/30/16 |
| Class A | | | | |
| Actual | 1.38% | $1,000.00 | $1,020.40 | $6.97 |
| Hypothetical (5% return per year before expenses) | 1.38% | $1,000.00 | $1,018.10 | $6.96 |
| Class C | | | | |
| Actual | 2.14% | $1,000.00 | $1,016.80 | $10.79 |
| Hypothetical (5% return per year before expenses) | 2.14% | $1,000.00 | $1,014.30 | $10.78 |
| Class I | | | | |
| Actual | 0.95% | $1,000.00 | $1,022.30 | $4.80 |
| Hypothetical (5% return per year before expenses) | 0.95% | $1,000.00 | $1,020.25 | $4.80 |
| Class Y | | | | |
| Actual | 1.13% | $1,000.00 | $1,021.90 | $5.71 |
| Hypothetical (5% return per year before expenses) | 1.13% | $1,000.00 | $1,019.35 | $5.70 |
| |
| * Expenses paid during the period are equal to the annualized expense ratio for each class as indicated above, multiplied by the average account value over the period, multiplied by 183/366 (to reflect the one-half year period). Expense ratios shown in the Financial Highlights represent the actual expenses incurred for the fiscal year. |
10 calvert.com CALVERT INTERNATIONAL EQUITY FUND ANNUAL REPORT (UNAUDITED)
REPORT OF INDEPENDENT REGISTERED PUBLIC ACCOUNTING FIRM
The Board of Directors of Calvert World Values Fund, Inc. and Shareholders of Calvert International Equity Fund:
We have audited the accompanying statement of assets and liabilities of the Calvert International Equity Fund (the "Fund"), a series of Calvert World Values Fund, Inc., including the schedule of investments, as of September 30, 2016, and the related statement of operations for the year then ended, the statements of changes in net assets for each of the years in the two-year period then ended, and the financial highlights for each of the years in the five-year period then ended. These financial statements and financial highlights are the responsibility of the Fund's management. Our responsibility is to express an opinion on these financial statements and financial highlights based on our audits.
We conducted our audits in accordance with the standards of the Public Company Accounting Oversight Board (United States). Those standards require that we plan and perform the audit to obtain reasonable assurance about whether the financial statements and financial highlights are free of material misstatement. An audit includes examining, on a test basis, evidence supporting the amounts and disclosures in the financial statements. Our procedures included confirmation of securities owned as of September 30, 2016 by correspondence with the custodian and brokers or by other appropriate auditing procedures. An audit also includes assessing the accounting principles used and significant estimates made by management, as well as evaluating the overall financial statement presentation. We believe that our audits provide a reasonable basis for our opinion.
In our opinion, the financial statements and financial highlights referred to above present fairly, in all material respects, the financial position of the Calvert International Equity Fund as of September 30, 2016, the results of its operations for the year then ended, the changes in its net assets for each of the years in the two-year period then ended, and the financial highlights for each of the years in the five-year period then ended, in conformity with U.S. generally accepted accounting principles.
Philadelphia, Pennsylvania
November 23, 2016
calvert.com CALVERT INTERNATIONAL EQUITY FUND ANNUAL REPORT 11
CALVERT INTERNATIONAL EQUITY FUND
SCHEDULE OF INVESTMENTS
SEPTEMBER 30, 2016
|
| | |
| | SHARES | VALUE ($) |
| COMMON STOCKS - 96.5% | | |
| | | |
| Australia - 5.2% | | |
| AMP Ltd. | 799,765 | 3,251,341 |
| Australia & New Zealand Banking Group Ltd. | 285,521 | 6,082,036 |
| Coca-Cola Amatil Ltd. | 390,727 | 3,080,938 |
| Westpac Banking Corp. | 218,615 | 4,973,962 |
| | | 17,388,277 |
| | | |
| Austria - 1.0% | | |
| Andritz AG | 63,576 | 3,459,614 |
| | | |
| Belgium - 1.3% | | |
| KBC Groep NV * | 72,807 | 4,250,169 |
| | | |
| Canada - 2.1% | | |
| Bank of Montreal | 75,378 | 4,939,400 |
| Veresen, Inc. | 191,184 | 1,952,716 |
| | | 6,892,116 |
| | | |
| Denmark - 1.0% | | |
| TDC A/S * | 554,276 | 3,264,339 |
| | | |
| France - 10.8% | | |
| Arkema SA | 38,341 | 3,549,695 |
| AXA SA (ADR) | 186,706 | 3,950,699 |
| Cie de Saint-Gobain | 133,863 | 5,792,247 |
| Sanofi SA | 38,766 | 2,952,066 |
| Sanofi SA (ADR) | 76,203 | 2,910,192 |
| Schneider Electric SE | 81,741 | 5,686,213 |
| Suez | 274,061 | 4,528,917 |
| Technip SA | 78,393 | 4,819,146 |
| Valeo SA (ADR) | 65,930 | 1,913,948 |
| | | 36,103,123 |
| | | |
| Germany - 9.0% | | |
| Allianz SE | 30,338 | 4,508,532 |
| Bayerische Motoren Werke AG | 36,920 | 3,108,486 |
| Covestro AG (a) | 34,072 | 2,016,314 |
| Daimler AG | 55,880 | 3,941,082 |
| Deutsche Post AG | 122,241 | 3,827,177 |
| HeidelbergCement AG | 60,334 | 5,705,892 |
| Metro AG | 81,438 | 2,424,062 |
| OSRAM Licht AG | 24,362 | 1,431,178 |
| TUI AG | 221,872 | 3,165,568 |
| | | 30,128,291 |
12 calvert.com CALVERT INTERNATIONAL EQUITY FUND ANNUAL REPORT
|
| | | | |
| | SHARES | VALUE ($) |
| COMMON STOCKS - CONT'D | | |
| Hong Kong - 3.0% | | |
| BOC Hong Kong Holdings Ltd. | 377,936 |
| 1,285,889 |
|
| BOC Hong Kong Holdings Ltd. (ADR) (b) | 46,638 |
| 3,183,044 |
|
| PCCW Ltd. | 3,335,000 |
| 2,054,074 |
|
| Wharf Holdings Ltd. (The) | 488,000 |
| 3,580,247 |
|
| | | 10,103,254 |
|
| | | |
| Italy - 1.6% | | |
| Atlantia SpA | 214,026 |
| 5,435,747 |
|
| | | |
| Japan - 20.7% | | |
| Alfresa Holdings Corp. | 109,333 |
| 2,315,055 |
|
| Amada Holdings Co. Ltd. | 278,600 |
| 2,898,080 |
|
| Astellas Pharma, Inc. | 230,400 |
| 3,598,631 |
|
| Fujitsu Ltd. | 786,000 |
| 4,229,955 |
|
| Kao Corp. | 49,200 |
| 2,781,671 |
|
| Komatsu Ltd. | 127,698 |
| 2,929,291 |
|
| Mitsubishi Chemical Holdings Corp. | 570,241 |
| 3,575,069 |
|
| MS&AD Insurance Group Holdings, Inc. (ADR) (b) | 155,752 |
| 2,169,625 |
|
| Nabtesco Corp. | 123,200 |
| 3,490,333 |
|
| Nippon Telegraph & Telephone Corp. (c) | 250,800 |
| 11,470,577 |
|
| Nissan Motor Co. Ltd. | 531,185 |
| 5,210,324 |
|
| NTT DoCoMo, Inc. | 102,200 |
| 2,596,186 |
|
| Oji Holdings Corp. | 807,000 |
| 3,198,573 |
|
| Panasonic Corp. | 356,457 |
| 3,565,123 |
|
| Showa Shell Sekiyu K.K. | 269,800 |
| 2,508,085 |
|
| Sumitomo Electric Industries Ltd. | 230,400 |
| 3,257,098 |
|
| Sumitomo Mitsui Financial Group, Inc. (b) | 81,000 |
| 2,736,148 |
|
| Toppan Printing Co. Ltd. | 493,000 |
| 4,450,276 |
|
| Toyo Suisan Kaisha Ltd. | 54,141 |
| 2,296,833 |
|
| | | 69,276,933 |
|
| | | |
| Kenya - 0.2% | | |
| Safaricom Ltd. | 3,369,625 |
| 661,950 |
|
| | | |
| Netherlands - 5.9% | | |
| Koninklijke Ahold Delhaize NV | 292,804 |
| 6,668,885 |
|
| Koninklijke Philips NV: | | |
| Common | 81,373 |
| 2,407,789 |
|
| NY Shares | 79,805 |
| 2,361,430 |
|
| Unilever NV (CVA) | 176,052 |
| 8,111,278 |
|
| | | 19,549,382 |
|
| | | |
| New Zealand - 1.5% | | |
| Contact Energy Ltd. | 661,792 |
| 2,428,999 |
|
| Spark New Zealand Ltd. | 444,667 |
| 1,169,876 |
|
| Spark New Zealand Ltd. (ADR) | 93,967 |
| 1,234,726 |
|
| | | 4,833,601 |
|
| |
calvert.com CALVERT INTERNATIONAL EQUITY FUND ANNUAL REPORT 13
|
| | | | |
| | SHARES | VALUE ($) |
| COMMON STOCKS - CONT'D | | |
| Norway - 1.2% | | |
| Norsk Hydro ASA | 918,788 |
| 3,972,625 |
|
| | | |
| Portugal - 1.1% | | |
| EDP - Energias de Portugal SA | 1,096,133 |
| 3,678,628 |
|
| | | |
| Singapore - 1.3% | | |
| CapitaLand Commercial Trust REIT | 3,767,100 |
| 4,405,792 |
|
| | | |
| South Africa - 0.7% | | |
| Aspen Pharmacare Holdings Ltd. | 110,178 |
| 2,488,304 |
|
| | | |
| Spain - 1.3% | | |
| Telefonica SA | 413,304 |
| 4,179,760 |
|
| | | |
| Sweden - 5.9% | | |
| Atlas Copco AB, A Shares | 150,037 |
| 4,516,793 |
|
| Electrolux AB, Series B | 155,538 |
| 3,895,727 |
|
| Husqvarna AB, Class B | 616,834 |
| 5,383,462 |
|
| Nordea Bank AB (b) | 418,279 |
| 4,153,709 |
|
| Thule Group AB (a) | 101,034 |
| 1,723,209 |
|
| | | 19,672,900 |
|
| | | |
| Switzerland - 8.9% | | |
| Nestle SA | 63,861 |
| 5,042,724 |
|
| Novartis AG | 73,314 |
| 5,785,963 |
|
| Novartis AG (ADR) | 4,280 |
| 337,949 |
|
| OC Oerlikon Corp. AG * | 313,790 |
| 3,135,680 |
|
| Roche Holding AG | 28,353 |
| 7,045,675 |
|
| Swiss Re AG | 33,586 |
| 3,033,433 |
|
| Wolseley plc | 96,569 |
| 5,431,278 |
|
| | | 29,812,702 |
|
| | | |
| Taiwan - 0.8% | | |
| Taiwan Semiconductor Manufacturing Co. Ltd. (ADR) | 87,458 |
| 2,675,340 |
|
| | | |
| United Kingdom - 10.8% | | |
| 3i Group plc | 535,745 |
| 4,517,085 |
|
| AstraZeneca plc | 57,777 |
| 3,741,167 |
|
| AstraZeneca plc (ADR) (b) | 32,388 |
| 1,064,270 |
|
| Coca-Cola European Partners plc | 73,762 |
| 2,943,104 |
|
| Direct Line Insurance Group plc | 738,952 |
| 3,490,609 |
|
| GlaxoSmithKline plc | 204,677 |
| 4,359,318 |
|
| GlaxoSmithKline plc (ADR) | 58,219 |
| 2,510,985 |
|
| ITV plc | 1,536,592 |
| 3,727,344 |
|
| J Sainsbury plc | 1,132,320 |
| 3,606,506 |
|
| Kingfisher plc | 739,794 |
| 3,609,499 |
|
| Petrofac Ltd. | 220,058 |
| 2,547,075 |
|
| | | 36,116,962 |
|
| |
14 calvert.com CALVERT INTERNATIONAL EQUITY FUND ANNUAL REPORT
|
| | | | |
| | SHARES | VALUE ($) |
| COMMON STOCKS - CONT'D | | |
| United States - 1.2% | | |
| Apple, Inc. | 17,506 |
| 1,979,053 |
|
| PepsiCo, Inc. | 19,332 |
| 2,102,742 |
|
| | | 4,081,795 |
|
| | | |
| Venture Capital - 0.0% | | |
| Powerspan Corp., Contingent Deferred Distribution *(d)(e) | 1 |
| — |
|
| | | |
| Total Common Stocks (Cost $310,338,515) | | 322,431,604 |
|
| | | |
| | | |
| PREFERRED STOCKS - 0.1% | | |
| | | |
| Venture Capital - 0.1% | | |
| Bioceptive, Inc.: | | |
| Series A *(d)(e) | 582,574 |
| 272,994 |
|
| Series B *(d)(e) | 40,523 |
| 22,162 |
|
| FINAE, Series D *(d)(e) | 2,597,442 |
| 195,581 |
|
| | | 490,737 |
|
| | | |
| Total Preferred Stocks (Cost $521,381) | | 490,737 |
|
| | | |
| | | |
| | ADJUSTED
BASIS ($) | VALUE ($) |
|
| VENTURE CAPITAL LIMITED PARTNERSHIP INTEREST - 0.4% | | |
| Africa Renewable Energy Fund LP *(d)(e) | 344,664 |
| 285,356 |
|
| BFSE Holding, BV LP *(d)(e) | 610,427 |
| 214,058 |
|
| Blackstone Clean Technology Partners LP *(d)(e) | 78,853 |
| 17,134 |
|
| China Environment Fund 2004 LP *(d)(e) | — |
| 63,767 |
|
| Emerald Sustainability Fund I LP *(d)(e) | 425,186 |
| 135,401 |
|
| gNet Defta Development Holding LLC *(d)(e)(f) | 400,000 |
| 300,016 |
|
| SEAF Central and Eastern European Growth Fund LLC *(d)(e)(f) | 285,795 |
| 264,048 |
|
| SEAF India International Growth Fund LP *(d)(e) | 219,003 |
| 35,225 |
|
| Terra Capital LP *(d)(e) | 469,590 |
| 1 |
|
| | | |
| Total Venture Capital Limited Partnership Interest (Cost $2,833,518) | | 1,315,006 |
|
| | | |
| | | |
| | PRINCIPAL AMOUNT ($) | VALUE ($) |
| VENTURE CAPITAL DEBT OBLIGATIONS - 0.2% | | |
| AFIG LLC, 6.00%, 10/17/17 (d)(e) | 450,953 |
| 448,987 |
|
| Windhorse International-Spring Health Water Ltd., 1.00%, 3/14/18 (d)(e)(g) | 70,000 |
| 52,500 |
|
| | | |
| Total Venture Capital Debt Obligations (Cost $520,953) | | 501,487 |
|
| |
calvert.com CALVERT INTERNATIONAL EQUITY FUND ANNUAL REPORT 15
|
| | | | |
| | PRINCIPAL AMOUNT ($) | VALUE ($) |
| HIGH SOCIAL IMPACT INVESTMENTS - 1.4% | | |
| Calvert Social Investment Foundation Notes, 0.25%, 7/1/17 (d)(e) | 4,431,583 | 4,306,834 |
|
| ImpactAssets Global Sustainable Agriculture Notes, 0.00%, 11/3/20 (d)(e)(h) | 220,000 | 195,800 |
|
| ImpactAssets Microfinance Plus Notes, 0.00%, 11/3/20 (d)(e)(h) | 283,000 | 266,020 |
|
| | | |
| Total High Social Impact Investments (Cost $4,934,583) | | 4,768,654 |
|
| | | |
| | | |
| TIME DEPOSIT - 1.1% | | |
| State Street Bank Time Deposit, 0.293%, 10/3/16 | 3,530,004 | 3,530,004 |
|
| | | |
| Total Time Deposit (Cost $3,530,004) | | 3,530,004 |
|
| | | |
| | SHARES | VALUE ($) |
SHORT TERM INVESTMENT OF CASH COLLATERAL FOR SECURITIES LOANED - 0.2% | | |
| State Street Institutional U.S. Government Money Market Fund - Premier Class, 0.26% | 521,361 | 521,361 |
|
| | | |
| Total Short Term Investment of Cash Collateral For Securities Loaned (Cost $521,361) | | 521,361 |
|
| | | |
| TOTAL INVESTMENTS (Cost $323,200,315) - 99.9% | | 333,558,853 |
|
| Other assets and liabilities, net - 0.1% | | 473,588 |
|
NET ASSETS - 100.0% | |
| $334,032,441 |
|
|
| | |
| NOTES TO SCHEDULE OF INVESTMENTS |
| * Non-income producing security. |
| (a) Security is exempt from registration under Rule 144A of the Securities Act of 1933. These securities may be resold in transactions exempt from registration, normally to qualified institutional buyers. Total market value of Rule 144A securities amounts to $3,739,523, which represents 1.1% of the net assets of the Fund as of September 30, 2016. |
| (b) Security, or portion of security, is on loan. Total value of securities on loan is $498,607 as of September 30, 2016. |
| (c) 75,000 shares of Nippon Telegraph & Telephone Corp. have been soft segregated in order to cover outstanding commitments to certain limit partnership investments within the Fund. There are no restrictions on the trading of this security. |
| (d) Total market value of restricted securities amounts to $7,075,884, which represents 2.1% of the net assets of the Fund as of September 30, 2016. |
| (e) This security was valued under the direction of the Board of Directors. Total market value of fair valued securities amounts to $7,075,884, which represents 2.1% of the net assets of the Fund as of September 30, 2016. |
| (f) Affiliated company. |
| (g) Security defaulted as to principal and interest in March 2013. It has been restructured at a 9% rate maturing on March 14, 2018 with 1% to be paid annually and the remaining interest due at maturity. This security is currently accruing at 1%. |
| (h) The coupon rate shown on floating or adjustable rate securities represents the rate in effect on September 30, 2016. |
| |
| Abbreviations: |
| ADR: | American Depositary Receipts | |
| CVA: | Certificaten Van Aandelen | |
| LLC: | Limited Liability Corporation | |
| LP: | Limited Partnership | |
| Ltd.: | Limited | |
| plc: | Public Limited Company | |
| REIT: | Real Estate Investment Trust | |
| See notes to financial statements. |
16 calvert.com CALVERT INTERNATIONAL EQUITY FUND ANNUAL REPORT
|
| | | |
| RESTRICTED SECURITIES | ACQUISITION DATES | COST ($) |
| AFIG LLC, 6.00%, 10/17/17 | 10/11/12 | 450,953 |
|
| Africa Renewable Energy Fund LP | 4/17/14-7/2/15 | 344,664 |
|
| BFSE Holding, BV LP | 1/12/06-8/9/16 | 610,427 |
|
| Bioceptive, Inc., Series A | 10/26/12-12/18/13 | 252,445 |
|
| Bioceptive, Inc., Series B | 1/7/16 | 16,250 |
|
| Blackstone Clean Technology Partners LP | 7/29/10-6/25/15 | 78,853 |
|
| Calvert Social Investment Foundation Notes, 0.25%, 7/1/17 | 7/1/14 | 4,431,583 |
|
| China Environment Fund 2004 LP | 9/15/05-4/1/09 | — |
|
| Emerald Sustainability Fund I LP | 7/19/01-5/17/11 | 425,186 |
|
| FINAE, Series D | 2/28/11-11/16/15 | 252,686 |
|
| gNet Defta Development Holding LLC | 8/30/05 | 400,000 |
|
| ImpactAssets Global Sustainable Agriculture Notes, 0.00%, 11/3/20 | 11/13/15 | 220,000 |
|
| ImpactAssets Microfinance Plus Notes, 0.00%, 11/3/20 | 11/13/15 | 283,000 |
|
| Powerspan Corp., Contingent Deferred Distribution | 7/11/14 | — |
|
| SEAF Central and Eastern European Growth Fund LLC | 8/10/00-8/26/11 | 285,795 |
|
| SEAF India International Growth Fund LP | 3/22/05-5/24/10 | 219,003 |
|
| Terra Capital LP | 11/23/98-3/14/06 | 469,590 |
|
| Windhorse International-Spring Health Water Ltd., 1.00%, 3/14/18 | 2/12/14 | 70,000 |
|
| See notes to financial statements. |
calvert.com CALVERT INTERNATIONAL EQUITY FUND ANNUAL REPORT 17
CALVERT INTERNATIONAL EQUITY FUND
STATEMENT OF ASSETS AND LIABILITIES
SEPTEMBER 30, 2016
|
| | | |
| ASSETS | |
| Investments in unaffiliated securities, at value (Cost $322,514,520) - see accompanying schedule |
| $332,994,789 |
|
| Investments in affiliated securities, at value (Cost $685,795) - see accompanying schedule | 564,064 |
|
| Cash | 35,681 |
|
| Cash denominated in foreign currencies (Cost $90) | 91 |
|
| Receivable for shares sold | 951,582 |
|
| Dividends and interest receivable | 1,989,297 |
|
| Securities lending income receivable | 329 |
|
| Directors' deferred compensation plan | 204,775 |
|
| Total assets | 336,740,608 |
|
| | |
| LIABILITIES | |
| Payable for securities purchased | 59,562 |
|
| Payable upon return of securities loaned | 521,361 |
|
| Payable for shares redeemed | 1,496,675 |
|
| Payable to Calvert Investment Management, Inc. | 168,480 |
|
| Payable to Calvert Investment Distributors, Inc. | 43,636 |
|
| Payable to Calvert Investment Administrative Services, Inc. | 32,830 |
|
| Payable to Calvert Investment Services, Inc. | 7,355 |
|
| Payable for Directors' fees and expenses | 7,474 |
|
| Directors' deferred compensation plan | 204,775 |
|
| Accrued expenses and other liabilities | 166,019 |
|
| Total liabilities | 2,708,167 |
|
| NET ASSETS |
| $334,032,441 |
|
| | |
| NET ASSETS CONSIST OF: | |
| Paid-in capital applicable to the following shares of common stock, | |
| with 250,000,000 shares of $0.01 par value shares authorized: | |
| Class A: 10,122,954 shares outstanding |
| $255,831,862 |
|
| Class C: 1,023,005 shares outstanding | 29,311,568 |
|
| Class I: 8,474,709 shares outstanding | 186,167,749 |
|
| Class Y: 1,439,527 shares outstanding | 23,724,027 |
|
| Undistributed net investment income | 7,087,602 |
|
| Accumulated net realized gain (loss) on investments and foreign currency transactions | (178,433,187) |
|
| Net unrealized appreciation (depreciation) on investments and assets and liabilities denominated in foreign currencies | 10,342,820 |
|
| NET ASSETS |
| $334,032,441 |
|
| | |
| NET ASSET VALUE PER SHARE | |
| Class A (based on net assets of $156,757,018) |
| $15.49 |
|
| Class C (based on net assets of $13,612,605) |
| $13.31 |
|
| Class I (based on net assets of $140,129,175) |
| $16.53 |
|
| Class Y (based on net assets of $23,533,643) |
| $16.35 |
|
| See notes to financial statements. |
18 calvert.com CALVERT INTERNATIONAL EQUITY FUND ANNUAL REPORT
CALVERT INTERNATIONAL EQUITY FUND
STATEMENT OF OPERATIONS
YEAR ENDED SEPTEMPER 30, 2016
|
| | | |
| NET INVESTMENT INCOME | |
| Investment Income: | |
| Dividend income (net of foreign taxes withheld of $1,351,002) |
| $11,886,187 |
|
| Other income (a) | 288,302 |
|
| Interest income | 63,240 |
|
| Securities lending income | 36,890 |
|
| Total investment income | 12,274,619 |
|
| | |
| Expenses: | |
| Investment advisory fee | 2,536,233 |
|
| Administrative fees | 585,035 |
|
| Transfer agency fees and expenses: | |
| Class A | 428,914 |
|
| Class C | 56,244 |
|
| Class I | 7,162 |
|
| Class Y | 22,597 |
|
| Distribution Plan expenses: | |
| Class A | 403,991 |
|
| Class C | 150,490 |
|
| Directors' fees and expenses | 40,749 |
|
| Accounting fees | 88,845 |
|
| Custodian fees | 124,083 |
|
| Professional fees | 153,416 |
|
| Registration fees | 62,412 |
|
| Reports to shareholders | 55,788 |
|
| Miscellaneous | 45,825 |
|
| Total expenses | 4,761,784 |
|
| Reimbursement from Advisor: | |
| Class A | (327,037) |
|
| Class C | (55,987) |
|
| Class I | (122,228) |
|
| Class Y | (14,166) |
|
| Administrative fees waived | (85,651) |
|
| Net expenses | 4,156,715 |
|
| NET INVESTMENT INCOME | 8,117,904 |
|
| See notes to financial statements. |
calvert.com CALVERT INTERNATIONAL EQUITY FUND ANNUAL REPORT 19
|
| | | |
CALVERT INTERNATIONAL EQUITY FUND STATEMENT OF OPERATIONS - CONT'D YEAR ENDED SEPTEMPER 30, 2016 |
| REALIZED AND UNREALIZED GAIN (LOSS) | |
| Net realized gain (loss) on: | |
| Investments | (41,642,970) |
|
| Foreign currency transactions | (1,292,833) |
|
| | (42,935,803) |
|
| | |
| Change in unrealized appreciation (depreciation) on: | |
| Investments in unaffiliated securities | 36,580,372 |
|
| Investments in affiliated securities | (34,850) |
|
| Assets and liabilities denominated in foreign currencies | (8,780) |
|
| | 36,536,742 |
|
| | |
| NET REALIZED AND UNREALIZED LOSS | (6,399,061) |
|
| | |
| INCREASE (DECREASE) IN NET ASSETS RESULTING FROM OPERATIONS |
| $1,718,843 |
|
| | |
| (a) Other income represents a non-recurring refund for overbilling of prior years' custody out-of-pocket fees. | |
| See notes to financial statements. |
20 calvert.com CALVERT INTERNATIONAL EQUITY FUND ANNUAL REPORT
CALVERT INTERNATIONAL EQUITY FUND
STATEMENTS OF CHANGES IN NET ASSETS
|
| | | | | | | |
| INCREASE (DECREASE) IN NET ASSETS | YEAR ENDED
SEPTEMBER 30, 2016 | | YEAR ENDED
SEPTEMBER 30, 2015 |
| Operations: | | | |
| Net investment income |
| $8,117,904 |
| |
| $4,680,846 |
|
| Net realized gain (loss) | (42,935,803) |
| | 25,979,003 |
|
| Net change in unrealized appreciation (depreciation) | 36,536,742 |
| | (46,538,170) |
|
| | | | |
| INCREASE (DECREASE) IN NET ASSETS RESULTING FROM OPERATIONS | 1,718,843 |
| | (15,878,321) |
|
| | | | |
| Distributions to shareholders from: | | | |
| Net investment income: | | | |
| Class A shares | (1,496,038) |
| | (1,631,419) |
|
| Class C shares | (82,845) |
| | — |
|
| Class I shares | (2,202,975) |
| | (1,067,547) |
|
| Class Y shares | (342,786) |
| | (128,897) |
|
| Total distributions | (4,124,644) |
| | (2,827,863) |
|
| | | | |
| Capital share transactions: | | | |
| Shares sold: | | | |
| Class A shares (a) | 26,167,775 |
| | 66,145,855 |
|
| Class B shares (b) | — |
| | 16,461 |
|
| Class C shares | 1,231,606 |
| | 2,588,056 |
|
| Class I shares | 50,232,783 |
| | 87,412,574 |
|
| Class Y shares | 11,645,127 |
| | 8,115,882 |
|
| Reinvestment of distributions: | | | |
| Class A shares | 1,309,720 |
| | 1,180,433 |
|
| Class C shares | 71,438 |
| | — |
|
| Class I shares | 1,301,923 |
| | 878,598 |
|
| Class Y shares | 257,139 |
| | 88,086 |
|
| Redemption fees: | | | |
| Class A shares | — |
| | 442 |
|
| Class C shares | — |
| | 22 |
|
| Shares redeemed: | | | |
| Class A shares | (36,344,297) |
| | (157,566,212) |
|
| Class B shares (a)(b) | — |
| | (2,086,695) |
|
| Class C shares | (3,472,568) |
| | (2,791,010) |
|
| Class I shares | (58,854,335) |
| | (22,631,854) |
|
| Class Y shares | (8,434,840) |
| | (4,015,663) |
|
| Total capital share transactions | (14,888,529) |
| | (22,665,025) |
|
| | | | |
| TOTAL DECREASE IN NET ASSETS | (17,294,330) |
| | (41,371,209) |
|
| | | | |
| | | | |
| NET ASSETS | | | |
| Beginning of year | 351,326,771 |
| | 392,697,980 |
|
| End of year (including undistributed net investment income of $7,087,602 and $4,124,476, respectively) |
| $334,032,441 |
| |
| $351,326,771 |
|
| See notes to financial statements. |
calvert.com CALVERT INTERNATIONAL EQUITY FUND ANNUAL REPORT 21
|
| | | | | | | |
CALVERT INTERNATIONAL EQUITY FUND STATEMENTS OF CHANGES IN NET ASSETS - CONT'D |
| CAPITAL SHARE ACTIVITY | YEAR ENDED
SEPTEMBER 30, 2016 | | YEAR ENDED
SEPTEMBER 30, 2015 |
| Shares sold: | | | |
| Class A shares (c) | 1,699,772 |
| | 3,961,337 |
|
| Class B shares (b) | — |
| | 1,117 |
|
| Class C shares | 92,905 |
| | 178,700 |
|
| Class I shares | 3,127,271 |
| | 4,800,946 |
|
| Class Y shares | 714,196 |
| | 461,877 |
|
| Reinvestment of distributions: | | | |
| Class A shares | 81,501 |
| | 73,137 |
|
| Class C shares | 5,143 |
| | — |
|
| Class I shares | 76,136 |
| | 51,022 |
|
| Class Y shares | 15,188 |
| | 5,163 |
|
| Shares redeemed: | | | |
| Class A shares | (2,364,869) |
| | (9,300,506) |
|
| Class B shares (b)(c) | — |
| | (140,247) |
|
| Class C shares | (262,210) |
| | (194,622) |
|
| Class I shares | (3,553,323) |
| | (1,248,932) |
|
| Class Y shares | (528,729) |
| | (230,027) |
|
| Total capital share activity | (897,019) |
| | (1,581,035) |
|
| |
| (a) Amounts include $1,452,680 of share transactions that were redeemed from Class B shares and converted into Class A shares at the close of business on April 20, 2015. |
| (b) Class B Shares were converted into Class A Shares at the close of business on April 20, 2015. |
| (c) Amount includes 96,332 shares redeemed from Class B shares and 84,213 shares purchased into Class A shares at the close of business on April 20,2015. |
| See notes to financial statements. |
22 calvert.com CALVERT INTERNATIONAL EQUITY FUND ANNUAL REPORT
NOTES TO FINANCIAL STATEMENTS
NOTE A — SIGNIFICANT ACCOUNTING POLICIES
General: Calvert World Values Fund, Inc. (the "Corporation") is a Maryland corporation pursuant to Articles of Incorporation filed on February 14, 1992, and is registered under the Investment Company Act of 1940, as amended (the "1940 Act") as an open-end management investment company. The Corporation operates four (4) separate series, or mutual funds, each with its own investment objective(s) and strategies. This report contains the financial statements and financial highlights for the Calvert International Equity Fund (the "Fund"). The Corporation is authorized to issue two billion (2,000,000,000) shares of stock, of which 250,000,000 shares have been allocated to the Fund, with a par value of each share at one cent ($0.01).
The Fund is diversified and invests in equity securities of foreign companies. The operations of each series of the Corporation, including the Fund, are accounted for separately. The Fund applies the accounting and reporting guidance in the Financial Accounting Standards Board (FASB) Accounting Standards Codification Topic 946, Financial Services – Investment Companies (ASC 946).
The Fund generally offers Class A, Class C, Class I, and Class Y shares. Class A shares are sold with a maximum front-end sales charge of 4.75%. However, the front-end sales charge is waived for shareholders investing in Class A shares directly with the Fund in an account maintained by Calvert Investment Distributors, Inc. ("Distributor") or without a specified broker-dealer or financial adviser ("Direct Account"). Class C shares are not available for purchase in Direct Accounts. For non-Direct Accounts, Class C shares are sold without a front-end sales charge, and with certain exceptions, will be charged a contingent deferred sales charge on shares sold within one year of purchase. Class C shares have higher levels of expenses than Class A shares. Class I shares require a minimum account balance of $1 million. The $1 million minimum initial investment is waived for retirement plans that trade through omnibus accounts and may be waived in certain other instances where it is believed to be in the best interest of the Fund and its shareholders. Class I shares have no front-end or contingent deferred sales charge and have lower levels of expenses than Class A shares. Class Y shares are generally only available to wrap or similar fee-based programs offered by financial intermediaries, and retirement plans, foundations, endowments and other consultant-driven business, that have entered into an agreement with the Fund's Distributor to offer Class Y shares to their clients. Class Y shares have no front-end or contingent deferred sales charge and have lower levels of expenses than Class A shares. Among other things, each class has different: (a) dividend rates, due to differences in Distribution Plan expenses and other class-specific expenses; (b) exchange privileges; and (c) class-specific voting rights.
Security Valuation: Net asset value per share is determined every business day as of the close of the regular session of the New York Stock Exchange (generally 4:00 p.m. Eastern time). The Fund uses independent pricing services approved by the Board of Directors ("the Board") to value its investments wherever possible. Investments for which market quotations are not available or deemed not reliable are fair valued in good faith under the direction of the Board.
The Board has adopted Valuation Procedures (the "Procedures") to determine the fair value of securities and other financial instruments for which market prices are not readily available or which may not be reliably priced. The Board has delegated the day-to-day responsibility for determining the fair value of assets of the Fund to Calvert Investment Management, Inc. (the "Advisor" or "Calvert") and has provided these Procedures to govern Calvert in its valuation duties.
Calvert has chartered an internal Valuation Committee to oversee the implementation of these Procedures and to assist it in carrying out the valuation responsibilities that the Board has delegated.
The Valuation Committee meets on a regular basis to review illiquid securities and other investments which may not have readily available market prices. The Valuation Committee's fair valuation determinations are subject to review, approval and ratification by the Board at its next regularly scheduled meeting covering the calendar quarter in which the fair valuation was determined.
The Valuation Committee utilizes various methods to measure the fair value of the Fund's investments. U.S. generally accepted accounting principles (GAAP) establishes a disclosure hierarchy that categorizes the inputs to valuation techniques used to value assets and liabilities at measurement date. These inputs are summarized in the three broad levels listed below:
Level 1 - quoted prices in active markets for identical securities
Level 2 - other significant observable inputs (including quoted prices for similar securities, interest rates, prepayment speeds, credit risk, etc.)
Level 3 - significant unobservable inputs (including the Fund's own assumptions in determining the fair value of investments)
The inputs or methodologies used for valuing securities are not necessarily an indication of the risk associated with investing in those securities.
calvert.com CALVERT INTERNATIONAL EQUITY FUND ANNUAL REPORT 23
Changes in valuation techniques may result in transfers in or out of an investment's assigned level within the hierarchy during the year. Transfers in and/or out of levels are determined based on the fair value of such securities at the end of the year. Valuation techniques used to value the Fund's investments by major category are as follows:
Common and preferred stocks, including restricted securities and venture capital securities, for which market quotations are readily available, are valued at the last reported sale price or official closing price as reported by an independent pricing service on the primary market or exchange on which they are traded and are categorized as Level 1 in the hierarchy. In the event there were no sales during the day or closing prices are not available, securities are valued at the last quoted bid price or may be valued using the last available price and are categorized as Level 2 in the hierarchy. Foreign securities are valued based on quotations from the principal market in which such securities are normally traded. The Fund has retained a third party fair value pricing service to quantitatively analyze the price movement of its holdings on foreign exchanges and to automatically fair value these securities each business day. The third party fair value pricing service takes into account many factors, including, but not limited to, movements in U.S. securities markets and changes in futures contracts and foreign exchange rates that have occurred after the close of the principal foreign market, to determine a fair value as of the close of the New York Stock Exchange. Such securities are categorized as Level 2 in the hierarchy.
For restricted securities and private placements where observable inputs are limited, assumptions about market activity and risk are used and such securities are categorized as Level 3 in the hierarchy.
Venture capital securities for which market quotations are not readily available are generally categorized as Level 3 in the hierarchy. Venture capital direct equity securities are generally valued using the most appropriate and applicable method to measure fair value in light of each company's situation. Methods may include market, income or cost approaches with discounts as appropriate based on assumptions of liquidation or exit risk. Examples of the market approach are subsequent rounds of financing, comparable transactions, and revenue times an industry multiple. An example of the income approach is the discounted cash flow. Examples of the cost approach are replacement cost, salvage value, or net asset percentage. Venture capital limited partnership ("LP") securities are valued at the fair value reported by the general partner of the partnership adjusted as necessary to reflect subsequent capital calls and distributions and any other available information, as a practical expedient. In the absence of a reported LP unit value, fair value may be estimated based on the Fund's percentage equity in the partnership and/or other balance sheet information and portfolio value for the most recently available period reported by the general partner. In some cases adjustments may be made to account for daily pricing of material public holdings within the partnership. Venture capital debt securities are valued based on assumptions of credit and market risk. For venture capital securities denominated in foreign currency, the fair value is marked to the daily exchange rate.
Debt securities, other than Venture Capital debt securities, are valued based on evaluated prices received from independent pricing services or from dealers who make markets in such securities and are generally categorized as Level 2 in the hierarchy.
Short-term securities of sufficient credit quality with remaining maturities of sixty days or less for which quotations are not readily available are valued at amortized cost, which approximates fair value, and are categorized as Level 2 in the hierarchy.
Mutual funds are valued at their closing net asset value each business day and are categorized as Level 1 in the hierarchy.
If a market value cannot be determined for a security using the methodologies described above, or if, in the good faith opinion of the Advisor, the market value does not constitute a readily available market quotation, or if a significant event has occurred that would materially affect the value of the security, the security will be fair valued as determined in good faith by the Valuation Committee. Securities which were fair valued at September 30, 2016, if any, are identified on the Schedule of Investments.
The Valuation Committee considers a number of factors, including significant unobservable valuation inputs when arriving at fair value. It considers all significant facts that are reasonably available and relevant to the determination of fair value.
The Valuation Committee primarily employs a market-based approach which may use related or comparable assets or liabilities, recent transactions, market multiples, book values, and other relevant information for the investment to determine the fair value of the investment. When more appropriate, the Fund may employ an income-based or cost approach. An income-based valuation approach discounts anticipated future cash flows of the investment to calculate a present amount (discounted). The measurement is based on the value indicated by current market expectations about those future amounts. Discounts may also be applied due to the nature or duration of any restrictions on the disposition of the investments. A cost based approach is based on the amount that currently would be required to replace the service capacity of an asset (current replacement cost). From the seller's perspective, the price that would be received for the asset is determined based on the cost to a buyer to acquire or construct a substitute asset of comparable utility, adjusted for obsolescence.
The values assigned to fair value investments are based on available information and do not necessarily represent amounts that might ultimately be realized. Further, due to the inherent uncertainty of valuations of such investments, the fair values may differ significantly from the values that would have been used had an active market existed, and the differences could be material. The
24 calvert.com CALVERT INTERNATIONAL EQUITY FUND ANNUAL REPORT
Valuation Committee employs various methods for calibrating these valuation approaches including a regular review of key inputs and assumptions, transactional back-testing or disposition analysis and reviews of any related market activity.
The following table summarizes the market value of the Fund's holdings as of September 30, 2016, based on the inputs used to value them:
|
| | | | | | | | | | | |
| | VALUATION INPUTS |
| INVESTMENTS IN SECURITIES* | LEVEL 1 | LEVEL 2 | LEVEL 3 | TOTAL |
| Common Stocks** |
| $38,891,173 |
|
| $283,540,431 | *** | $— |
|
| $322,431,604 |
|
| Common Stocks - Venture Capital | — |
| — |
| 0 |
| 0 |
|
| Preferred Stocks - Venture Capital | — |
| — |
| 490,737 |
| 490,737 |
|
| Venture Capital Limited Partnership Interest | — |
| — |
| 1,315,006 |
| 1,315,006 |
|
| Venture Capital Debt Obligations | — |
| — |
| 501,487 |
| 501,487 |
|
| High Social Impact Investments | — |
| 4,306,834 |
| 461,820 |
| 4,768,654 |
|
| Time Deposit | — |
| 3,530,004 |
| — |
| 3,530,004 |
|
| Short Term Investment of Cash Collateral For Securities Loaned | 521,361 |
| — |
| — |
| 521,361 |
|
| TOTAL |
| $39,412,534 |
|
| $291,377,269 |
| $2,769,050^ |
|
| $333,558,853 |
|
| | | | | |
| * For a complete listing of investments, please refer to the Schedule of Investments. |
| ** For further breakdown of equity securities by country, please refer to the Schedule of Investments. Venture Capital is not included in this category. |
| *** Includes certain securities trading primarily outside the U.S. where the value was adjusted as a result of significant market movements following the close of local trading. |
| ^ Level 3 securities represent 0.8% of net assets. |
There were no transfers between levels during the year.
Restricted Securities: The Fund may invest in securities that are subject to legal or contractual restrictions on resale. Generally, these securities may only be sold publicly upon registration under the Securities Act of 1933 or in transactions exempt from such registration. Information regarding restricted securities is included at the end of the Schedule of Investments.
The Fund invests in Community Investment Notes issued by the Calvert Social Investment Foundation (the "CSI Foundation"). The CSI Foundation is a 501(c)(3) non-profit organization that receives in-kind support from Calvert and its subsidiaries. The Fund has received an exemptive order from the Securities and Exchange Commission permitting the Fund to make investments in these notes under certain conditions.
Security Transactions and Investment Income: Security transactions are accounted for on trade date. Realized gains and losses are recorded on an identified cost basis and may include proceeds from litigation. Dividend income is recorded on the ex-dividend date or, in the case of dividends on certain foreign securities, as soon as the Fund is informed of the ex-dividend date.
Withholding taxes on foreign dividends have been provided for in accordance with the Fund's understanding of the applicable country's tax rules and rates. Distributions received on securities that represent a return of capital are recorded as a reduction of cost of investments. Distributions received on securities that represent a capital gain are recorded as a realized gain. Interest income, which includes amortization of premium and accretion of discount on debt securities, is accrued as earned.
Share Class Accounting: Investment income and realized and unrealized gains and losses are allocated to separate classes of shares based upon the relative net assets of each class. Expenses common to the classes are also allocated to each class in proportion to their relative net assets. Expenses arising in connection with a specific class are charged directly to that class.
Foreign Currency Transactions: The Fund's accounting records are maintained in U.S. dollars. For valuation of assets and liabilities on each date of net asset value determination, foreign denominations are converted into U.S. dollars using the current exchange rate. Security transactions, income, and expenses are translated at the prevailing rate of exchange on the date of the event. The effect of changes in foreign exchange rates on securities and foreign currencies is included in the net realized and unrealized gain or loss on investments and assets and liabilities denominated in foreign currencies.
Distributions to Shareholders: Distributions to shareholders are recorded by the Fund on ex-dividend date. Dividends from net investment income and distributions from net realized capital gains, if any, are paid at least annually. Distributions are determined in accordance with income tax regulations which may differ from U.S. generally accepted accounting principles; accordingly, periodic reclassifications are made within the Fund's capital accounts to reflect income and gains available for distribution under income tax regulations.
calvert.com CALVERT INTERNATIONAL EQUITY FUND ANNUAL REPORT 25
Estimates: The preparation of financial statements in conformity with U.S. generally accepted accounting principles requires management to make estimates and assumptions that affect the reported amounts of assets and liabilities and disclosure of contingent assets and liabilities at the date of the financial statements and the reported amounts of increases and decreases in net assets from operations during the reporting period. Actual results could differ from those estimates.
Redemption Fees: The Fund charged a 2% redemption fee on redemptions, including exchanges, made within 30 days of purchase in the same Fund. The redemption fee was accounted for as an addition to paid-in capital. This fee was eliminated effective February 2, 2015.
Federal Income Taxes: No provision for federal income or excise tax is required since the Fund intends to continue to qualify as a regulated investment company under the Internal Revenue Code and to distribute substantially all of its taxable earnings.
Management has analyzed the Fund's tax positions taken for all open federal income tax years and has concluded that no provision for federal income tax is required in the Fund's financial statements. A Fund's federal tax return is subject to examination by the Internal Revenue Service for a period of three years.
NOTE B — RELATED PARTY TRANSACTIONS
Calvert Investment Management, Inc. (the "Advisor") is wholly-owned by Calvert Investments, Inc., which is indirectly wholly-owned by Ameritas Mutual Holding Company. The Advisor provides investment advisory services and pays the salaries and fees of officers and Directors of the Fund who are employees of the Advisor or its affiliates. For its services, the Advisor receives an annual fee, payable monthly, on the following rates of the Fund's average daily net assets: 0.75% on the first $250 million, 0.725% on the next $250 million, and 0.675% on the excess of $500 million.
The Advisor has contractually agreed to limit net annual Fund operating expenses through January 31, 2017. The contractual expense caps are 1.38%, 2.14%, 0.95%, and 1.13% for Class A, Class C, Class I, and Class Y, respectively. For the purpose of this expense limit, operating expenses do not include interest expense, brokerage commissions, taxes and extraordinary expenses. This expense limitation does not limit acquired fund fees and expenses, if any.
Calvert Investment Administrative Services, Inc. ("CIAS"), an affiliate of the Advisor, provides administrative services to the Fund for an annual fee, payable monthly, based on the Fund's average daily net assets.
For the period October 1, 2015 to January 31, 2016, the administrative fee was 0.35% for Class A, C and Y and 0.15% for Class I. CIAS and the Fund entered into an Amended and Restated Administrative Services Agreement that established a 0.12% administrative fee for all classes of the Fund commencing on February 1, 2016. CIAS voluntarily waived 0.23% for Class A, C and Y shares of the Fund and 0.03% for Class I shares of the Fund (the amount of the administrative fee above 0.12%) for the period from December 1, 2015 through January 31, 2016. During the year ended September 30, 2016, CIAS voluntarily waived $85,651.
Calvert Investment Distributors, Inc. ("CID"), an affiliate of the Advisor, is the distributor and principal underwriter for the Fund. Pursuant to Rule 12b-1 under the Investment Company Act of 1940, the Fund has adopted a Distribution Plan that permits the Fund to pay certain expenses associated with the distribution and servicing of its shares. The expenses paid may not exceed 0.35% and 1.00% annually of the average daily net assets of Class A and C, respectively. The amount actually paid by the Fund is an annualized fee, payable monthly, of 0.25% and 1.00% of the Fund's average daily net assets of Class A and C shares, respectively. Class I and Class Y shares do not have Distribution Plan expenses.
CID received $29,000 as its portion of commissions charged on sales of the Fund's Class A shares for the year ended September 30, 2016.
Calvert Investment Services, Inc. ("CIS"), an affiliate of the Advisor, acts as shareholder servicing agent for the Fund. For its services, CIS received a fee of $89,033 for the year ended September 30, 2016. Boston Financial Data Services, Inc. is the transfer and dividend disbursing agent.
Each Director of the Fund who is not an employee of the Advisor or its affiliates receives an annual retainer of $52,000 plus a meeting fee of up to $3,000 for each Board meeting attended. Additional fees of $6,000 annually may be paid to the Committee chairs ($10,000 for the Board Chair and the Special Equities Committee chair) and $2,500 annually may be paid to Committee members, plus a Committee meeting fee of $500 for each Committee meeting attended. Eligible Directors may participate in a Deferred Compensation Plan (the "Plan"). Obligations of the Plan will be paid solely out of the Fund's assets. Directors' fees are allocated to each of the funds served.
26 calvert.com CALVERT INTERNATIONAL EQUITY FUND ANNUAL REPORT
NOTE C — INVESTMENT ACTIVITY AND TAX INFORMATION
During the year, the cost of purchases and proceeds from sales of investments, other than short-term securities, were $318,670,104 and $311,097,276, respectively.
Under the Regulated Investment Company Modernization Act of 2010, capital losses incurred in taxable years beginning after December 22, 2010 can be carried forward to offset future capital gains for an unlimited period. These losses are required to be utilized prior to the losses incurred in pre-enactment taxable years and will retain their character as either long-term or short-term. Losses incurred in pre-enactment taxable years can be utilized until expiration. The Fund's use of net capital losses acquired from reorganizations may be limited under certain tax provisions.
|
| | | |
| Capital Loss Carryforwards | |
| EXPIRATION DATE | |
| 2017 |
| ($19,653,830 | ) |
| 2018 | (105,942,268 | ) |
| 2019 | (10,386,632 | ) |
The tax character of dividends and distributions paid during the years ended September 30, 2016 and September 30, 2015 was as follows:
|
| | | | | | | |
| DISTRIBUTIONS PAID FROM: | 2016 |
| | 2015 |
|
| Ordinary income |
| $4,124,644 |
| |
| $2,827,863 |
|
| Total |
| $4,124,644 |
| |
| $2,827,863 |
|
As of September 30, 2016, the tax basis components of distributable earnings/(accumulated losses) and the federal tax cost were as follows:
|
| | | |
| Unrealized appreciation |
| $22,901,868 |
|
| Unrealized (depreciation) | (13,499,424) |
|
| Net unrealized appreciation (depreciation) |
| $9,402,444 |
|
| |
| Undistributed ordinary income |
| $8,212,249 |
|
| Capital loss carryforward |
| ($135,982,730 | ) |
| Late Year Ordinary and Post October Capital Loss Deferrals |
| ($42,611,536 | ) |
| Other temporary differences |
| ($7,474 | ) |
| |
| Federal income tax cost of investments |
| $324,156,409 |
|
The differences between the components of distributable earnings on a tax basis and the amounts reflected in the Statement of Assets and Liabilities are primarily due to temporary book-tax differences that will reverse in a subsequent period. These differences are mainly due to wash sales, partnerships, deferred Directors' fees and passive foreign investment companies.
Reclassifications, as shown in the table below, have been made to the Fund's components of net assets to reflect income and gains available for distribution (or available capital loss carryovers, as applicable) under income tax law and regulations. These reclassifications are due to permanent book-tax differences and have no impact on net assets. The primary permanent differences causing such reclassifications for the Fund are due to foreign currency transactions, partnerships, and passive foreign investment companies.
|
| | | |
| Undistributed net investment income |
| ($1,030,134 | ) |
| Accumulated net realized gain (loss) |
| $1,016,223 |
|
| Paid-in Capital |
| $13,911 |
|
NOTE D — SECURITIES LENDING
To generate additional income, the Fund may lend its securities pursuant to a securities lending agency agreement ("Lending Agreement") with State Street Bank, the securities lending agent. Security loans are subject to termination by the Fund at any time and, therefore, are not considered to be illiquid investments. The Fund requires that the loan be continuously collateralized
calvert.com CALVERT INTERNATIONAL EQUITY FUND ANNUAL REPORT 27
by either cash or securities as collateral equal at all times to at least 102% of the market value of the domestic securities loaned and 105% of the market value on the international securities loaned (if applicable). Cash collateral is generally invested in State Street Institutional U.S. Government Money Market Fund (the "U.S. Government Fund") that is managed by an affiliate of the custodian. The U.S. Government Fund is a registered money market fund that invests in a variety of high-quality, U.S. dollar-denominated instruments. Any gain or loss in the market price of the loaned securities that might occur and any interest earned or dividends declared during the term of the loan would accrue to the account of the Fund. Income earned on the investment of collateral, net of broker rebates and other expenses incurred by the securities lending agent, is split between the Fund and the securities lending agent on the basis of agreed upon contractual terms.
The risks associated with lending portfolio securities include, but are not limited to, possible delays in receiving additional collateral or in the recovery of the loaned securities, possible loss of rights to the collateral should the borrower fail financially, as well as risk of loss in the value of the collateral or the value of the investments made with the collateral. The securities lending agent shall indemnify the Fund in the case of default of any securities borrower.
The total value of securities on loan was $498,607 as of September 30, 2016.
The following table displays a breakdown of transactions accounted for as secured borrowings, the obligations by class of collateral pledged, and the remaining contractual maturity of those transactions as of September 30, 2016:
|
| | | | | | | | | |
| | Remaining Contractual Maturity of the Agreements as of September 30, 2016 |
| | Overnight and
Continuous | <30 days | Between
30 & 90 days | >90 days | Total |
| Securities Lending Transactions |
| Common Stocks |
| $521,361 |
| $— | $— | $— |
| $521,361 |
|
| Amount of recognized liabilities for securities lending transactions |
| $521,361 |
|
NOTE E — LINE OF CREDIT
A financing agreement is in place with the Calvert Funds and State Street Corporation ("SSC"). Under the agreement, SSC provides an unsecured line of credit facility, in the aggregate amount of $50 million ($25 million committed and $25 million uncommitted), accessible by the Calvert Funds for temporary or emergency purposes only. Borrowings bear interest at the higher of the One-Month London Interbank Offered Rate (LIBOR) in effect that day or the overnight Federal Funds Rate plus 1.25% per annum. A commitment fee of 0.25% per annum is incurred on the unused portion of the committed facility. An administrative fee of $30,000 was paid in connection with the uncommitted facility. These fees are allocated to all participating funds. The Fund had no loans outstanding pursuant to this line of credit at September 30, 2016.
For the year ended September 30, 2016, borrowing information by the Fund under the agreement was as follows:
|
| | | |
| Average Daily Balance | Weighted Average
Interest Rate | Maximum
Amount Borrowed | Month of Maximum
Amount Borrowed |
| $45,008 | 1.67% | $14,339,007 | August 2016 |
NOTE F — AFFILIATED COMPANIES
An affiliated company is a company in which the Fund has a direct or indirect ownership of, control of, or voting power of 5 percent or more of the outstanding voting shares. Affiliated companies of the Fund as of September 30, 2016 are as follows:
|
| | | | | | | | | | | | | | | | | | | | | | | | | | | | | | | |
Name of Affiliated
Company | Market Value
9/30/15 | | Purchases at
Cost | | Proceeds from
Sales | | Net Realized
Gain (Loss) | | Change in
Unrealized
Gain (Loss) | | Market Value
9/30/16 | | Dividend
Income | | Capital Gain
Distributions |
| gNet Defta Development Holding LLC |
| $313,541 |
| | $— |
| | $— |
| | $— |
| |
| ($13,525 | ) | | $ | 300,016 | | | $— | | | $— |
|
| SEAF Central and Eastern European Growth Fund LLC | 316,913 |
| | — |
| | (31,540) |
| | — |
| | (21,325) |
| | 264,048 | | | — | | | — |
|
| TOTALS |
| $630,454 |
| $— | | $ | 31,540 | ) | $— | | $ | 34,850 | ) | $ | 564,064 | | $— | | $— | |
28 calvert.com CALVERT INTERNATIONAL EQUITY FUND ANNUAL REPORT
NOTE G — CAPITAL COMMITMENTS
In connection with certain venture capital investments, the Fund is committed to future capital calls, which will increase the Fund's investment in these securities. The aggregate amount of the future capital commitments totals $731,957 at September 30, 2016.
NOTE H — LIMITED PARTNERSHIP INVESTMENTS
The Fund executed agreements to invest in the following limited partnerships:
|
| | | | | | |
| Name of Partnership | Total Capital Commitment | Unfunded Commitment at 9/30/16 |
| Africa Renewable Energy Fund LP |
| $1,000,000 |
|
| $655,336 |
|
| BFSE Holding, BV LP | 494,429 |
| 7,940 |
|
| Blackstone Clean Technology Venture Partners LP | 79,361 | 508 |
|
| China Environment Fund 2004 LP | 500,000 |
| 37,763 |
|
| Emerald Sustainability Fund I LP | 1,246,310 | — |
|
| SEAF Central and Eastern European Growth Fund LLC | 1,060,000 | — |
|
| SEAF India International Growth Fund LP | 482,500 | — |
|
| Terra Capital LP | 500,000 |
| 30,410 |
|
| Total |
| $5,362,600 |
|
| $731,957 |
|
NOTE I — OTHER MATTERS
On October 18, 2016, Calvert announced that it had determined that certain fees paid to third-party financial intermediaries were incorrectly allocated for payment by, and paid by, the Calvert Funds. Specifically, for periods prior to January 1, 2015, the Calvert Funds paid fees under certain intermediary agreements that were primarily for distribution-related services and therefore should have been paid by Calvert out of Calvert’s own assets or by the Funds under a Rule 12b-1 plan. The matter was self-reported to the SEC in 2016. Calvert is in the process of determining the economic impact of misallocated fees on the affected Funds and their shareholders, and intends to develop a plan to reimburse shareholders following that determination.
NOTE J — SUBSEQUENT EVENTS
On October 20, 2016, Calvert and Calvert's indirect parent company, Ameritas Holding Company, entered into an Asset Purchase Agreement (the "Agreement") with Eaton Vance Management ("Eaton Vance"), a newly-formed subsidiary of Eaton Vance, to operate as Calvert Research and Management ("New Calvert"), and other parties, pursuant to which New Calvert has agreed to acquire, subject to the terms and conditions set forth in the Agreement, the business assets of Calvert (the "Transaction"). Completion of the Transaction is subject to the approval by the shareholders of Calvert Funds of new investment advisory agreements with New Calvert, among other conditions, and is currently expected to occur by the end of 2016 or early 2017.
A proxy statement containing detailed information regarding several proposals was mailed to shareholders of record in November 2016. The shareholder meeting is expected to be held on or about December 16, 2016.
In preparing the financial statements as of September 30, 2016, no other subsequent events or transactions occurred that would have required recognition or disclosure in these financial statements.
NOTICE TO SHAREHOLDERS (UNAUDITED)
For the fiscal year ended September 30, 2016, the Fund considers 100% of the ordinary dividends paid during the year as qualified dividend income and 4.0% as eligible for the corporate dividends received deduction in accordance with Section 854 of the Internal Revenue Code. It also considers $12,977,877 as income derived from foreign sources and $918,176 as foreign taxes paid.
calvert.com CALVERT INTERNATIONAL EQUITY FUND ANNUAL REPORT 29
CALVERT INTERNATIONAL EQUITY FUND
FINANCIAL HIGHLIGHTS
|
| | | | | | | | | | | | | | | | | | | |
| | YEARS ENDED |
| CLASS A SHARES | September 30, 2016 (a) | | September 30, 2015 (a) | | September 30, 2014 (a) | | September 30, 2013 (a) | | September 30, 2012 (a) |
| Net asset value, beginning |
| $15.62 |
| |
| $16.51 |
| |
| $16.44 |
| |
| $13.49 |
| |
| $11.84 |
|
| Income from investment operations: | | | | | | | | | |
| Net investment income | 0.34(b) |
| | 0.18 |
| | 0.15 |
| | 0.08 |
| | 0.12 |
|
| Net realized and unrealized gain (loss) | (0.33) |
| | (0.97) |
| | 0.02 |
| | 2.98 |
| | 1.68 |
|
| Total from investment operations | 0.01 |
| | (0.79) |
| | 0.17 |
| | 3.06 |
| | 1.80 |
|
| Distributions from: | | | | | | | | | |
| Net investment income | (0.14) |
| | (0.10) |
| | (0.10) |
| | (0.11) |
| | (0.15) |
|
| Total distributions | (0.14) |
| | (0.10) |
| | (0.10) |
| | (0.11) |
| | (0.15) |
|
| Total increase (decrease) in net asset value | (0.13) |
| | (0.89) |
| | 0.07 |
| | 2.95 |
| | 1.65 |
|
| Net asset value, ending |
| $15.49 |
| |
| $15.62 |
| |
| $16.51 |
| |
| $16.44 |
| |
| $13.49 |
|
| Total return (c) | 0.04 | % | | (4.78 | %) | | 0.99 | % | | 22.82 | % | | 15.34 | % |
| Ratios to average net assets: (d) | | | | | | | | | |
| Net investment income | 2.20%(b) |
| | 1.08 | % | | 0.88 | % | | 0.52 | % | | 0.96 | % |
| Total expenses | 1.62 | % | | 1.67 | % | | 1.66 | % | | 1.76 | % | | 1.84 | % |
| Net expenses | 1.38 | % | | 1.54 | % | | 1.66 | % | | 1.76 | % | | 1.80 | % |
| Portfolio turnover | 94 | % | | 97 | % | | 82 | % | | 40 | % | | 43 | % |
| Net assets, ending (in thousands) |
| $156,757 |
| |
| $167,225 |
| |
| $263,718 |
| |
| $242,464 |
| |
| $183,588 |
|
| | | | | | | | | | |
| (a) Per share figures are calculated using the Average Shares Method. |
| (b) Amount includes a non-recurring refund for overbilling of prior years' custody out-of-pocket fees. This amounted to $0.013 per share and 0.08% of average net assets. |
| (c) Total return is not annualized for periods of less than one year and does not reflect deduction of any front-end or deferred sales charge. |
| (d) Total expenses do not reflect amounts reimbursed and/or waived by the Advisor and certain of its affiliates, if applicable. Net expenses are net of all reductions and represent the net expenses paid by the Fund. |
| See notes to financial statements. |
30 calvert.com CALVERT INTERNATIONAL EQUITY FUND ANNUAL REPORT
CALVERT INTERNATIONAL EQUITY FUND
FINANCIAL HIGHLIGHTS
|
| | | | | | | | | | | | | | | | | | | |
| | YEARS ENDED |
| CLASS C SHARES | September 30, 2016 (a) | | September 30, 2015 (a) | | September 30, 2014 (a) | | September 30, 2013 (a) | | September 30, 2012 (a) |
| Net asset value, beginning |
| $13.47 |
| |
| $14.27 |
| |
| $14.26 |
| |
| $11.71 |
| |
| $10.26 |
|
| Income from investment operations: | | | | | | | | | |
| Net investment income (loss) | 0.19(b) |
| | 0.04 |
| | (0.01) |
| | (0.05) |
| | 0.01 |
|
| Net realized and unrealized gain (loss) | (0.28) |
| | (0.84) |
| | 0.02 |
| | 2.60 |
| | 1.45 |
|
| Total from investment operations | (0.09) |
| | (0.80) |
| | 0.01 |
| | 2.55 |
| | 1.46 |
|
| Distributions from: | | | | | | | | | |
| Net investment income | (0.07) |
| | — |
| | — |
| | — |
| | (0.01) |
|
| Total distributions | (0.07) |
| | — |
| | — |
| | — |
| | (0.01) |
|
| Total increase (decrease) in net asset value | (0.16) |
| | (0.80) |
| | 0.01 |
| | 2.55 |
| | 1.45 |
|
| Net asset value, ending |
| $13.31 |
| |
| $13.47 |
| |
| $14.27 |
| |
| $14.26 |
| |
| $11.71 |
|
| Total return (c) | (0.68 | %) | | (5.61 | %) | | 0.07 | % | | 21.78 | % | | 14.23 | % |
| Ratios to average net assets: (d) | | | | | | | | | |
| Net investment income (loss) | 1.42%(b) |
| | 0.31 | % | | (0.06 | %) | | (0.40 | %) | | 0.05 | % |
| Total expenses | 2.55 | % | | 2.58 | % | | 2.57 | % | | 2.65 | % | | 2.72 | % |
| Net expenses | 2.14 | % | | 2.37 | % | | 2.57 | % | | 2.65 | % | | 2.69 | % |
| Portfolio turnover | 94 | % | | 97 | % | | 82 | % | | 40 | % | | 43 | % |
| Net assets, ending (in thousands) |
| $13,613 |
| |
| $15,997 |
| |
| $17,173 |
| |
| $17,746 |
| |
| $15,922 |
|
| | | | | | | | | | |
| (a) Per share figures are calculated using the Average Shares Method. |
| (b) Amount includes a non-recurring refund for overbilling of prior years' custody out-of-pocket fees. This amounted to $0.011 per share and 0.08% of average net assets. |
| (c) Total return is not annualized for periods of less than one year and does not reflect deduction of any front-end or deferred sales charge. |
| (d) Total expenses do not reflect amounts reimbursed and/or waived by the Advisor and certain of its affiliates, if applicable. Net expenses are net of all reductions and represent the net expenses paid by the Fund. |
| See notes to financial statements. |
calvert.com CALVERT INTERNATIONAL EQUITY FUND ANNUAL REPORT 31
CALVERT INTERNATIONAL EQUITY FUND
FINANCIAL HIGHLIGHTS
|
| | | | | | | | | | | | | | | | | | | |
| | YEARS ENDED |
| CLASS I SHARES | September 30, 2016 (a) | | September 30, 2015 (a) | | September 30, 2014 (a) | | September 30, 2013 (a) | | September 30, 2012 (a) |
| Net asset value, beginning |
| $16.73 |
| |
| $17.68 |
| |
| $17.69 |
| |
| $14.52 |
| |
| $12.70 |
|
| Income from investment operations: | | | | | | | | | |
| Net investment income | 0.44(b) |
| | 0.30 |
| | 0.28 |
| | 0.17 |
| | 0.24 |
|
| Net realized and unrealized gain (loss) | (0.36) |
| | (1.05) |
| | 0.02 |
| | 3.24 |
| | 1.79 |
|
| Total from investment operations | 0.08 |
| | (0.75) |
| | 0.30 |
| | 3.41 |
| | 2.03 |
|
| Distributions from: | | | | | | | | | |
| Net investment income | (0.28) |
| | (0.20) |
| | (0.31) |
| | (0.24) |
| | (0.21) |
|
| Total distributions | (0.28) |
| | (0.20) |
| | (0.31) |
| | (0.24) |
| | (0.21) |
|
| Total increase (decrease) in net asset value | (0.20) |
| | (0.95) |
| | (0.01) |
| | 3.17 |
| | 1.82 |
|
| Net asset value, ending |
| $16.53 |
| |
| $16.73 |
| |
| $17.68 |
| |
| $17.69 |
| |
| $14.52 |
|
| Total return (c) | 0.41 | % | | (4.27 | %) | | 1.64 | % | | 23.74 | % | | 16.16 | % |
| Ratios to average net assets: (d) | | | | | | | | | |
| Net investment income | 2.67%(b) |
| | 1.68 | % | | 1.53 | % | | 1.07 | % | | 1.71 | % |
| Total expenses | 1.04 | % | | 1.03 | % | | 1.02 | % | | 1.06 | % | | 1.09 | % |
| Net expenses | 0.95 | % | | 0.98 | % | | 1.02 | % | | 1.06 | % | | 1.06 | % |
| Portfolio turnover | 94 | % | | 97 | % | | 82 | % | | 40 | % | | 43 | % |
| Net assets, ending (in thousands) |
| $140,129 |
| |
| $147,614 |
| |
| $92,318 |
| |
| $82,499 |
| |
| $101,203 |
|
| | | | | | | | | | |
| (a) Per share figures are calculated using the Average Shares Method. |
| (b) Amount includes a non-recurring refund for overbilling of prior years' custody out-of-pocket fees. This amounted to $0.014 per share and 0.09% of average net assets. |
| (c) Total return is not annualized for periods of less than one year and does not reflect deduction of any front-end or deferred sales charge. |
| (d) Total expenses do not reflect amounts reimbursed and/or waived by the Advisor and certain of its affiliates, if applicable. Net expenses are net of all reductions and represent the net expenses paid by the Fund. |
| See notes to financial statements. |
32 calvert.com CALVERT INTERNATIONAL EQUITY FUND ANNUAL REPORT
CALVERT INTERNATIONAL EQUITY FUND
FINANCIAL HIGHLIGHTS
|
| | | | | | | | | | | | | | | | | | | |
| | YEARS ENDED |
| CLASS Y SHARES | September 30, 2016 (a) | | September 30, 2015 (a) | | September 30, 2014 (a) | | September 30, 2013 (a) | | September 30, 2012 (a) |
| Net asset value, beginning |
| $16.54 |
| |
| $17.45 |
| |
| $17.38 |
| |
| $14.25 |
| |
| $12.45 |
|
| Income from investment operations: | | | | | | | | | |
| Net investment income | 0.40(b) |
| | 0.27 |
| | 0.23 |
| | 0.14 |
| | 0.18 |
|
| Net realized and unrealized gain (loss) | (0.35) |
| | (1.05) |
| | 0.02 |
| | 3.15 |
| | 1.77 |
|
| Total from investment operations | 0.05 |
| | (0.78) |
| | 0.25 |
| | 3.29 |
| | 1.95 |
|
| Distributions from: | | | | | | | | | |
| Net investment income | (0.24) |
| | (0.13) |
| | (0.18) |
| | (0.16) |
| | (0.15) |
|
| Total distributions | (0.24) |
| | (0.13) |
| | (0.18) |
| | (0.16) |
| | (0.15) |
|
| Total increase (decrease) in net asset value | (0.19) |
| | (0.91) |
| | 0.07 |
| | 3.13 |
| | 1.80 |
|
| Net asset value, ending |
| $16.35 |
| |
| $16.54 |
| |
| $17.45 |
| |
| $17.38 |
| |
| $14.25 |
|
| Total return (c) | 0.28 | % | | (4.52 | %) | | 1.41 | % | | 23.27 | % | | 15.80 | % |
| Ratios to average net assets: (d) | | | | | | | | | |
| Net investment income | 2.50%(b) |
| | 1.52 | % | | 1.27 | % | | 0.90 | % | | 1.36 | % |
| Total expenses | 1.23 | % | | 1.37 | % | | 1.31 | % | | 1.41 | % | | 1.46 | % |
| Net expenses | 1.13 | % | | 1.22 | % | | 1.31 | % | | 1.39 | % | | 1.39 | % |
| Portfolio turnover | 94 | % | | 97 | % | | 82 | % | | 40 | % | | 43 | % |
| Net assets, ending (in thousands) |
| $23,534 |
| |
| $20,491 |
| |
| $17,479 |
| |
| $10,367 |
| |
| $7,535 |
|
| | | | | | | | | | |
| (a) Per share figures are calculated using the Average Shares Method. |
| (b) Amount includes a non-recurring refund for overbilling of prior years' custody out-of-pocket fees. This amounted to $0.014 per share and 0.09% of average net assets. |
| (c) Total return is not annualized for periods of less than one year and does not reflect deduction of any front-end or deferred sales charge. |
| (d) Total expenses do not reflect amounts reimbursed and/or waived by the Advisor and certain of its affiliates, if applicable. Net expenses are net of all reductions and represent the net expenses paid by the Fund. |
| See notes to financial statements. |
calvert.com CALVERT INTERNATIONAL EQUITY FUND ANNUAL REPORT 33
PROXY VOTING
The Proxy Voting Guidelines of the Calvert Funds that the Fund uses to determine how to vote proxies relating to portfolio securities are provided as an Appendix to the Fund's Statement of Additional Information. The Statement of Additional Information can be obtained free of charge by calling the Fund at 1-800-368-2745, by visiting the Calvert website at www.calvert.com; or by visiting the SEC's website at www.sec.gov.
Information regarding how the Fund voted proxies relating to portfolio securities during the most recent 12-month period ended June 30 is available on the Fund's website at www.calvert.com and on the SEC's website at www.sec.gov.
AVAILABILITY OF QUARTERLY PORTFOLIO HOLDINGS
The Fund files its complete schedule of portfolio holdings with the SEC for the first and third quarters of each fiscal year on Form N-Q. The Fund's Form N-Q is available on the SEC's website at www.sec.gov. The Fund's Form N-Q may be reviewed and copied at the SEC's Public Reference Room in Washington, DC; information on the operation of the Public Reference Room may be obtained by calling 1-800-SEC-0330.
34 calvert.com CALVERT INTERNATIONAL EQUITY FUND ANNUAL REPORT (UNAUDITED)
DIRECTOR AND OFFICER INFORMATION TABLE
|
| | | | | |
| Name & Age | Position With Fund | Position Start Date | Principal Occupation During Last 5 Years | # of Calvert Portfolios Overseen | Other Directorships During the Past Five Years |
| INDEPENDENT TRUSTEES/DIRECTORS |
REBECCA L. ADAMSON AGE: 67 | Trustee Director Director Director | 1989 CSIF 2000 IMPACT 2000 CRIS 2005 CWVF | President and Founder of the national non-profit, First People's Worldwide. Founded in 1980, First People's Worldwide is the only American Indian alternative development institute in the U.S. | 19 | • Bay & Paul Foundation |
RICHARD L. BAIRD, JR. AGE: 68 | Trustee & Chair Director & Chair Director & Chair Director & Chair
| 1982 CSIF
2000 CRIS
2005 CWVF
2005 IMPACT | Former President and CEO of Adagio Health Inc. (retired in 2014) in Pittsburgh, PA, a non-profit corporation which provides family planning services, nutrition, maternal/child health care, and various health screening services and community preventive health programs. | 24 | None |
JOHN G. GUFFEY, JR. AGE: 68 | Director Trustee Director Director | 1992 CWVF 1982 CSIF 2000 CRIS 2005 IMPACT | Consultant and President of Aurora Press Inc., a privately held publisher of trade paperbacks. | 24 | • Ariel Funds (3) (asset management) (through 12/31/11) • Calvert Social Investment Foundation • Calvert Ventures, LLC |
MILES D. HARPER, III AGE: 53 | Director Trustee Director Director | 2000 IMPACT 2005 CSIF 2005 CRIS 2005 CWVF | Partner, Carr Riggs & Ingram (public accounting firm) since October 2014. Partner, Gainer Donnelly & Desroches (public accounting firm) (now Carr Riggs & Ingram), 1999-2014. | 19 | • Bridgeway Funds (14) (asset management) |
JOY V. JONES AGE: 66 | Director Trustee Director Director | 2000 IMPACT 1990 CSIF 2000 CRIS 2005 CWVF | Attorney. | 19 | • Director, Conduit Street Restaurants SUD 2 Limited • Director, Palm Management Corporation |
TERRENCE J. MOLLNER, Ed.D. AGE: 71 | Director Trustee Director Director | 1992 CWVF 1982 CSIF 2000 CRIS 2005 IMPACT | Founder, Chairperson and President of Trusteeship Institute, Inc., an educational organization focused on the personal skills and organizations described in Dr. Mollner's book, The Love Skill: We Are Mastering the 7 Layers of Human Maturity, particularly businesses that freely chose to give priority to the common good. Chairperson, Stakeholders Capital, Inc., an asset management firm and financial services provider.
| 19 | • Calvert Social Investment Foundation • Ben & Jerry's Homemade, Inc. (food products) |
SYDNEY A. MORRIS AGE: 67 | Trustee Director Director Director | 1982 CSIF 2000 CRIS 2005 CWVF 2005 IMPACT | The Rev. Dr. Morris is a Unitarian Universalist minister. | 19 | None |
| |
calvert.com CALVERT INTERNATIONAL EQUITY FUND ANNUAL REPORT (UNAUDITED) 35
|
| | | | | |
| Name & Age | Position With Fund | Position Start Date | Principal Occupation During Last 5 Years | # of Calvert Portfolios Overseen | Other Directorships During the Past Five Years |
| INTERESTED TRUSTEES/DIRECTORS |
D. WAYNE SILBY, Esq.* AGE: 68 | Director Trustee Director Director | 1992 CWVF 1982 CSIF 2000 CRIS 2000 IMPACT | Mr. Silby is the founding Chair of the Calvert Funds. He is the Chair-Elect and a principal of Syntao.com, a Beijing-based company promoting corporate social responsibility. | 24 | • Ameritas Mutual Holding Company (insurance) • Calvert Social Investment Foundation • ImpactAssets, Inc. (asset management) • Committee for the Future (charitable supporting organization) • Syntao.com China (HK) (sustainability consulting) • The ICE Organization (environmental services) |
JOHN H. STREUR* AGE: 56 | Director & President Trustee & President Director & President Director & President | 2015 CWVF
2015 CSIF
2015 CRIS
2015 IMPACT | Director, Chairman, President and Chief Executive Officer of Calvert Investments, Inc., Calvert Investment Administrative Services, Inc., Calvert Investment Management, Inc., Calvert Investment Distributors, Inc. and Calvert Investment Services, Inc. (since January 2015); Chief Compliance Officer, Calvert Investment Distributors, Inc. (since August 2015); Chief Compliance Officer, Calvert Investment Management, Inc. (August 2015 - April 2016); President and Director, Portfolio 21 Investments, Inc. (through October 2014); President, Chief Executive Officer and Director, Managers Investment Group LLC (through January 2012); President and Director, The Managers Funds and Managers AMG Funds (through January 2012). | 37 | • Portfolio 21 Investments, Inc. (asset management)(through October 2014) • Managers Investment Group LLC (asset management)(through January 2012) • The Managers Funds (asset management) (through January 2012) • Managers AMG Funds (asset management) (through January 2012) • Calvert Social Investment Foundation |
* Mr. Silby is an interested person of the Funds since he is a Director of the parent company of each Fund's Advisor. Mr. Streur is an interested person of the Funds since he is an Officer and Director of each Fund's Advisor and certain affiliates. The address of the Trustees and Officers is 4550 Montgomery Avenue, Suite 1000N, Bethesda, Maryland 20814, with the exception of Mr. Silby, whose address is 1715 18th Street, N.W., Washington, DC 20009. Additional information about the Fund's Trustees/Directors can be found in the Statement of Additional Information (SAI). You can get a free copy of the SAI at www.calvert.com, or by contacting your broker, or the Fund at 1-800-368-2745. |
36 calvert.com CALVERT INTERNATIONAL EQUITY FUND ANNUAL REPORT (UNAUDITED)
|
| | | |
| Name & Age | Position with Funds | Position Start Date | Principal Occupation During Last 5 Years |
| OFFICERS |
VICKI L. BENJAMIN AGE: 54 | Treasurer | 2015 | Treasurer of the Funds (since March 2015); Director, Executive Vice President, Chief Financial Officer, Chief Operating Officer and Treasurer of Calvert Investments, Inc., Calvert Investment Administrative Services, Inc., and Calvert Investment Services, Inc. (since October 2015); Director, Executive Vice President, Chief Financial Officer - Elect, Chief Operating Officer and Treasurer of Calvert Investment Management, Inc. and Calvert Investment Distributors, Inc. (since October 2015); Director, Senior Vice President and Chief Financial Officer of Calvert Investments, Inc., Calvert Investment Administrative Services, Inc., Calvert Investment Services, Inc., Calvert Investment Management, Inc. and Calvert Investment Distributors, Inc. (March 2015 - September 2015); and Senior Partner, KPMG LLP (2005 - 2015). |
ROBERT D. BENSON, Esq. AGE: 37 | Associate General Counsel, Assistant Vice President & Assistant Secretary | 2014 | Associate General Counsel (since September 2016), Assistant General Counsel (2014 - September 2016), Assistant Vice President and Assistant Secretary of the Funds, Calvert Investments, Inc., Calvert Investment Administrative Services, Inc., Calvert Investment Services, Inc., Calvert Investment Management, Inc. and Calvert Investment Distributors, Inc. (since 2014); and Staff Attorney, Calvert Investments, Inc., Calvert Investment Administrative Services, Inc., Calvert Investment Services, Inc., Calvert Investment Management, Inc. and Calvert Investment Distributors, Inc. (2008 - 2014). |
HOPE BROWN AGE: 42 | Chief Compliance Officer | 2014 | Chief Compliance Officer of the Funds (since November 2014); Vice President and Chief Compliance Officer, Wilmington Funds (December 2012 - November 2014); and Vice President and Senior Compliance Officer, Wilmington Trust Investment Advisors, Inc. (September 2010 - December 2012). |
THOMAS DAILEY AGE:51 | Vice President | 2012 | Vice President of the Funds (since 2012); and Vice President (since January 2005) and Portfolio Manager - Tax Exempt, Calvert Investment Management, Inc. (since 1995). |
STU DALHEIM AGE: 46 | Vice President | 2015 | Vice President of the Funds (since 2015); and Vice President - Governance and Advocacy of Calvert Investment Management, Inc. (since October 2011). |
BRIAN ELLIS, CFA AGE: 32 | Vice President | 2016 | Vice President of the Funds (since February 2016); Portfolio Manager, Taxable Fixed Income, Calvert Investment Management, Inc. (since May 2012); and Business Analyst (2009 - May 2012), Calvert Investment Management, Inc. |
ROBERT J. ENDERSON, CFA AGE: 57 | Assistant Treasurer | 2014 | Assistant Treasurer of the Funds (since 2014); Vice President, Corporate Finance, and Assistant Treasurer, Calvert Investments, Inc., Calvert Investment Administrative Services, Inc., Calvert Investment Management, Inc., Calvert Investment Services, Inc. and Calvert Investment Distributors, Inc. (since 2007); Acting Chief Financial Officer of Calvert Investments, Inc., Calvert Investment Administrative Services, Inc., Calvert Investment Management, Inc., Calvert Investment Services, Inc. and Calvert Investment Distributors, Inc. (September 2014 - March 2015). |
PATRICK FAUL, CFA AGE: 51 | Vice President | 2010 | Vice President (since 2007) and Head of Credit Research, Calvert Investment Management, Inc. (since January 2010). |
TRACI L. GOLDT AGE: 42 | Assistant Secretary | 2004 | Assistant Secretary of the Funds (since 2004); Director, Strategic Projects and Fund Operations, Calvert Investment Administrative Services, Inc. (since June 2016); and SEC Filing and Operations Manager, Calvert Investment Administrative Services, Inc. (2011 – 2016). |
JADE HUANG AGE: 41 | Vice President | 2015 | Vice President of the Funds (since 2015); Portfolio Manager - Equity, Calvert Investment Management, Inc. (since November 2015); and Senior Equity Analyst, Calvert Investment Management, Inc. (2006 - November 2015). |
VISHAL KHANDUJA, CFA AGE: 38 | Vice President | 2014 | Vice President of the Funds (since 2014); Vice President and Head of Taxable Bond, Calvert Investment Management, Inc. (since May 2016); Vice President and Portfolio Manager, Taxable Fixed Income, Calvert Investment Management, Inc. (2012 - May 2016); Portfolio Manager - Global Rates and Currency Team, Columbia Management (2009 - 2012). |
ERICA LASDON AGE: 45 | Assistant Vice President, Research and Advocacy | 2015 | Assistant Vice President, Research and Advocacy of the Funds (since 2016) and Calvert Investment Management, Inc. (since August 2015); and Senior Sustainability Analyst and Manager, Calvert Investment Management, Inc. (2005 - August 2015). |
JOSHUA LINDER, CFA AGE: 30 | Vice President | 2016 | Vice President of the Funds (since 2016); Portfolio Manager, Equity, Calvert Investment Management, Inc. (since January 2016); Assistant Portfolio Manager, Calvert Investment Management, Inc. (January 2014 - October 2015); and Equity Analyst, Calvert Investment Management, Inc. (2011 - 2013). |
CHRISTOPHER MADDEN AGE: 40 | Vice President | 2015 | Vice President of the Funds (since 2015); Portfolio Manager - Equity, Calvert Investment Management, Inc. (since November 2015); and Senior Equity Analyst, Calvert Investment Management, Inc. (2010 - November 2015). |
calvert.com CALVERT INTERNATIONAL EQUITY FUND ANNUAL REPORT (UNAUDITED) 37
|
| | | |
| Name & Age | Position with Funds | Position Start Date | Principal Occupation During Last 5 Years |
| OFFICERS |
ANDREW K. NIEBLER, Esq. AGE: 48 | Deputy General Counsel, Vice President & Secretary | 2006 (TCF, CMS, CRIS, CSIF, CVS)
2008 (CVP)
2016 (CIF) | Deputy General Counsel, Vice President and Secretary of the Funds, Calvert Investments, Inc., Calvert Investment Administrative Services, Inc., Calvert Investment Management, Inc., Calvert Investment Distributors, Inc. and Calvert Investment Services, Inc. (since May 2016); Assistant Vice President, Associate General Counsel and Assistant Secretary, Calvert Investments, Inc., Calvert Investment Administrative Services, Inc., Calvert Investment Management, Inc., Calvert Investment Distributors, Inc. and Calvert Investment Services, Inc. (September 2009 - May 2016); and Assistant Vice President, Assistant General Counsel and Assistant Secretary, Calvert Investments, Inc., Calvert Investment Administrative Services, Inc., Calvert Investment Management, Inc., Calvert Investment Distributors, Inc. and Calvert Investment Services, Inc. (prior to September 2009). |
MONIQUE S. PATTILLO, Esq. AGE: 34 | Assistant General Counsel, Assistant Vice President & Assistant Secretary | 2016 | Assistant Vice President, Assistant General Counsel and Assistant Secretary of the Funds, Calvert Investments, Inc., Calvert Investment Administrative Services, Inc., Calvert Investment Management, Inc., Calvert Investment Distributors, Inc. and Calvert Investment Services, Inc. (since September 2016); Adjunct Faculty, Howard Community College (since June 2015); Adjunct Assistant Professor, University of Maryland University College (since June 2016); Legal Counsel, T. Rowe Price Associates, Inc. (March 2014 - June 2015); and Assistant U.S. Counsel, Aberdeen Asset Management, Inc. (January 2011 - March 2014). |
MARYBETH PILAT, CPA AGE: 48 | Fund Controller and Assistant Treasurer | 2015 | Fund Controller and Assistant Treasurer of the Funds (since August 2015); Director, Anti-Money Laundering Officer and Assistant Treasurer, Calvert Investments, Inc., Calvert Investment Administrative Services, Inc., Calvert Investment Management, Inc., Calvert Investment Distributors, Inc. and Calvert Investment Services, Inc. (since August 2015); Director of Fund Administration, Calvert Investment Administrative Services, Inc. (since August 2015); VP Expense & Budgeting, Global Fiduciary Platform, Legg Mason (May 2015 - July 2015); and Vice President and Assistant Treasurer, Columbia Funds, Ameriprise, Columbia Management (2010 - April 2015). |
JOHN H. STREUR AGE: 56 | President and Director (except CVS) | 2015 | Director, Chairman, President and Chief Executive Officer of Calvert Investments, Inc., Calvert Investment Administrative Services, Inc., Calvert Investment Management, Inc., Calvert Investment Distributors, Inc. and Calvert Investment Services, Inc. (since January 2015); Chief Compliance Officer, Calvert Investment Distributors, Inc. (since August 2015); Chief Compliance Officer, Calvert Investment Management, Inc. (August 2015 - April 2016); President and Director, Portfolio 21 Investments, Inc. (through October 2014); President, Chief Executive Officer and Director, Managers Investment Group LLC (through January 2012); President and Director, The Managers Funds and Managers AMG Funds (through January 2012). |
38 calvert.com CALVERT INTERNATIONAL EQUITY FUND ANNUAL REPORT (UNAUDITED)
|
|
| This page intentionally left blank. |
|
|
| This page intentionally left blank. |
|
|
| This page intentionally left blank. |
|
| | | | |
| CALVERT INTERNATIONAL EQUITY FUND | | CALVERT'S FAMILY OF FUNDS | | |
To Open an Account 800-368-2748 Service for Existing Account Shareholders: 800-368-2745 Brokers: 800-368-2746 Registered Mail Calvert Investments c/o BFDS, P.O. Box 219544 Kansas City, MO 64121-9544 Overnight Mail Calvert Investments c/o BFDS, 330 West 9th Street Kansas City, MO 64105 Web Site calvert.com Principal Underwriter Calvert Investment Distributors, Inc. 4550 Montgomery Avenue Suite 1000 North Bethesda, Maryland 20814 | | Municipal Funds Tax-Free Responsible Impact Bond Fund Taxable Bond Funds Bond Portfolio Income Fund Short Duration Income Fund Long-Term Income Fund Ultra-Short Income Fund High Yield Bond Fund Green Bond Fund Unconstrained Bond Fund Balanced and Asset Allocation Funds Balanced Portfolio Conservative Allocation Fund Moderate Allocation Fund Aggressive Allocation Fund | | Equity Funds Equity Portfolio U.S. Large Cap Core Responsible Index Fund U.S. Large Cap Value Responsible Index Fund U.S. Large Cap Growth Responsible Index Fund U.S. Mid Cap Core Responsible Index Fund Developed Markets Ex-U.S. Responsible Index Fund Capital Accumulation Fund International Equity Fund Small Cap Fund Global Energy Solutions Fund Global Water Fund International Opportunities Fund Emerging Markets Equity Fund |
|
| |
| | |
This report is intended to provide fund information to shareholders. It is not authorized for distribution to prospective investors unless preceded or accompanied by a prospectus. Note: The information on our website is not incorporated by reference into this report; our website address is included as an inactive textual reference only. Investors should carefully consider the investment objectives, risks, charges and expenses of the Calvert Funds. This and other important information is contained in the fund's summary prospectus and prospectus, which can be obtained from your financial professional and should be read carefully before investing. You may also call Calvert at 800/368-2748 or visit calvert.com. |
| Printed on recycled paper using soy inks. | |
|
| | |
| | |
| | | |
Calvert Capital Accumulation Fund
| | |
| | | |
| | |
|
| |
Annual Report September 30, 2016 E-Delivery Sign-Up — Details Inside | |
|
|
| |
Choose Planet-friendly E-delivery! Sign up now for on-line statements, prospectuses, and fund reports. In less than five minutes you can help reduce paper mail and lower fund costs. Just go to calvert.com. If you already have an online account at Calvert, click on Login, to access your Account, and select the documents you would like to receive via e-mail. If you’re new to online account access, click on Login, then Register to create your user name and password. Once you’re in, click on the E-delivery sign-up on the Account Portfolio page and follow the quick, easy steps. Note: if your shares are not held directly at Calvert but through a brokerage firm, you must contact your broker for electronic delivery options available through their firm. |
|
| | | |
| | | TABLE OF CONTENTS |
| | | | |
| | | | President’s Letter |
| | | | Portfolio Management Discussion |
| | | | Understanding Your Fund’s Expenses |
| | | | Report of Independent Registered Public Accounting Firm |
| | | | Schedule of Investments |
| | | | Statement of Assets and Liabilities |
| | | | Statement of Operations |
| | | | Statements of Changes in Net Assets |
| | | | Notes to Financial Statements |
| | | | Financial Highlights |
| | | | Proxy Voting |
| | | | Availability of Quarterly Portfolio Holdings |
| | | | Director and Officer Information Table |
|
| | |
| John Streur President and Chief Executive Officer, Calvert Investments, Inc. | |
Dear Fellow Shareowners and Friends,
Forty years ago, Calvert Investments was founded on the belief that investment capital, properly stewarded, could improve the world for its less powerful inhabitants and improve environmental sustainability, while producing reasonable investment returns. Calvert was one of the first investment advisers to introduce the responsible investment concept, and through many years of innovation and research (supported by you, our shareholders), we have developed this philosophy to now provide even greater shareholder engagement and impact.
Corporations throughout the world, big and small, have an ever increasing role in determining social and environmental outcomes for every living being, today and into the future. The power of corporations, garnered through global influence, human capital and financial strength, especially relative to our other institutions, has been steadily increasing for decades (http://www.calvert.com/perspective/research/calvert-serafeim-series-report).
Investors recognize the impact of corporations on society, and more and more are making investment decisions based on their assessments of a company’s effect on environmental and social outcomes. Companies able to operate their business in a perceived sustainable manner, promoting, environmental and social justice stand to benefit; while those corporate laggards, that fail to embrace these new responsibilities, will falter.
Reliable information is critical in ensuring that shareholders are able to make informed assessments regarding a corporation’s sustainability profile. Key performance metrics and data (a “sustainability information system”) that indicates how a company is performing regarding environmental and social impacts, is integral to making informed responsible investment decisions. Through partnerships with world class educational institutions and forward thinking business partners, Calvert is developing valuable research methodologies and metrics to assess the quality of data inputs and results, such that we are able to assess companies’ impacts. Are we completely there yet? No, but as data becomes more transparent and consistent, driven, in part by investor demands and regulatory authorities, we will get there, such that we and other market participants can make better informed investment and purchase decisions. For example, key data that measures “true” intrinsic and extrinsic product costs, including indirect environmental and social impacts could be relevant to investors when making corporate comparisons regarding risk and profitability, and also of great interest to consumers making product purchase decisions.
Calvert is participating in the Sustainability Accounting Standards Board Investment Advisory Group, which is working to move the disclosure of ESG metrics forward through corporate SEC filings (http://www.sasb.org/). Calvert is also working to map the United Nations Sustainable Development Goals to the SASB standards (http://www.calvert.com/perspective/social-impact/unsdg-faq), in order to better evaluate the progress of any public corporation on its path towards global sustainability.
Also, involved in this effort are millions of individuals and small organizations throughout the world who are adding to this mosaic of information through their local and specialized efforts and services. They often have access to pockets of information that are not publically available or disseminated, and thereby not available to the financial data service companies. Our myriad and long running engagements with NGOs and corporations provide critical insight to our analysts, driving the enhancement of our information infrastructure forward, as they research potential investments for your portfolios and design shareholder activist agendas.
ESG data about corporate behavior provides a useful baseline, but takes on additional meaning as the Calvert Principles for Responsible Investment guide our interpretation of the data, acting as our “responsibility compass” (http://www.calvert.com/approach/how-we-invest/the-calvert-principles). In addition to providing a context consistent with Calvert’s mission, our Principles lead us to areas where additional, fundamental research is needed to develop a real understanding of corporate impact on society and the environment. In our complex, globalized and rapidly evolving world, the Principles allow us to contextualize information, whereas a rules based system, or an exclusive reliance on data from companies may miss valuable situational and circumstantial inference, as evidenced in the issues surrounding Standing Rock and the role of the corporation, Energy Transfer Partners. The Standing Rock Sioux Nation is striving to halt construction of the Dakota Access Pipeline crossing their sacred land and threatening water contamination (see our resolution in support of the Standing Rock Sioux Nation, (http://www.calvert.com/perspective/climate-and-environment/calvert-releases-statement-in-support-of-standing-rock-sioux-nation).
4 calvert.com CALVERT CAPITAL ACCUMULATION FUND ANNUAL REPORT (UNAUDITED)
The concerns surrounding social license and indigenous peoples’ rights are complex and do not lend themselves easily to objective quantification methods employed by the traditional financial data sources. That is why the fundamental overlay performed by the Calvert research analysts is so essential to our effective responsible investing process.
While effecting change through thoughtful ESG capital allocations is important, direct impact can be made through shareholder activism, or more specifically advocacy. Calvert’s shareholder advocacy process (28 resolutions last year) has been effective in influencing corporate behavior and provides another avenue for influencing valuable societal and environmental outcomes (http://www.calvert.com/perspective/social-impact/2016-proxy-season-brings-opportunity-to-accelerate-corporate-sustainability-progress).
Calvert’s voice reflects and respects diversity of thought and is often used to protect the interests of those most in need, and to look out for future generations. We thank you, our shareholders, friends and partners in this mission, for a good start. We promise that our work will never be done and the next forty years will reflect the increasing imperative to work vigorously to produce competitive returns for you and to use our power to forge a better today and future for our society. Often this requires Calvert to go where other investment firms have not, and to speak out and act when others do not.
Thank you, as always, for the incredible privilege to serve your needs through the Calvert Funds.
Respectfully,
John Streur
September 2016
calvert.com CALVERT CAPITAL ACCUMULATION FUND ANNUAL REPORT (UNAUDITED) 5
|
| |
| PORTFOLIO MANAGEMENT DISCUSSION |
|
| | | |
| Joshua Linder, CFA Portfolio Manager | | Christopher Madden, CFA Portfolio Manager |
| Kurt Moeller, CFA Portfolio Manager | | Jade Huang Portfolio Manager |
Market Review
For the 12-month period ended September 30, 2016, the S&P 500 Index rose 15.43% and the Russell 1000 Index rose 14.93% while the MSCI EAFE Index and the MSCI Emerging Markets Index rose 6.52% and 16.78%, respectively. The Russell Midcap Index returned 14.25%, with the Russell Midcap Value Index rising 17.26% and the Russell Midcap Growth Index rising 11.24%.
The United States Federal Reserve Board (the “Fed”) raised interest rates only one time during the period. This was less than many observers had expected. Long-term government bond yields ended the period lower than where they began in nearly every major economy. The Japanese Yen generally strengthened and the British pound weakened over the period, with the U.S. dollar remaining relatively stable vs. the Euro and the Chinese Yuan. Commodity prices fluctuated but most ended near their starting point, except for the price of gold increasing to over $1,300/oz., as of September 30, 2016.
The strong stock returns masked volatility which occurred during the twelve months. Stocks rallied to end 2015, then struggled in the first quarter of 2016, as investors became concerned about near-term economic growth. From April through September 2016, global stocks rallied as central banks kept interest rates low and economic data was generally positive.
The U.S. monthly jobs reports showed more new jobs created in June and July than in any previous month during 2016. The housing and consumer recovery continued to pick up steam. OPEC announced its first production cut in eight years in September. However, market reaction was muted as any negative effects are likely to be mitigated by U.S. producers’ ability to step in and fill outstanding demand. Inflation remained low, contributing to the decision by the Fed in September to maintain its steady-state interest rate policy, while indicating an increased probability of a December rate hike.
Investment Strategy and Technique
The investment process for the Fund focuses on high quality companies trading at attractive valuations, with strong or improving environmental, social and governance (ESG) characteristics.
Effective June 9, 2016, the Fund’s advisor, Calvert Investment Management, Inc. (Calvert), assumed responsibility for the day-to-day portfolio management of the Fund. Prior to June 9, 2016, the Fund was sub-advised by another manager, and the Fund’s historical returns reflect those of the prior manager. Also effective June 9, 2016, the Fund changed its benchmark from the Russell Midcap Growth Index to the Russell Midcap Index.
One reason for the manager change was that Calvert hopes to achieve improved performance for Fund shareholders. The manager change also has resulted in some stylistic differences vs. the previous portfolio. Calvert expects the Fund to own more securities and have a larger average market capitalization than under the previous manager. The Fund will be managed in, and benchmarked against, the core style, as opposed to the growth style. In part due to the benchmark change, the current portfolio has higher weightings vs. the prior in the Financials, Real Estate and Energy Sectors, and lower weights in the Consumer Discretionary, Industrials and Information Technology Sectors.
Fund Performance Relative to the Benchmark
For the 12 months ending September 30, 2016, Calvert Capital Accumulation Fund Class A (at NAV) posted a return of -2.08%, underperforming the Russell Midcap Growth Index, which returned 11.24%, and the Russell Midcap Index, which returned 14.25%. The Fund’s underperformance was driven mainly by stock selection.
6 calvert.com CALVERT CAPITAL ACCUMULATION FUND ANNUAL REPORT (UNAUDITED)
|
| | | | |
| | | | |
| | CALVERT CAPITAL ACCUMULATION FUND |
| | SEPTEMBER 30, 2016 | |
| | | | |
| | ECONOMIC SECTORS | % OF TOTAL INVESTMENTS* | |
| | Financials | 18.4 | % | |
| | Information Technology | 14.4 | % | |
| | Industrials | 12.5 | % | |
| | Consumer Discretionary | 11.5 | % | |
| | Health Care | 11.2 | % | |
| | Real Estate | 7.4 | % | |
| | Utilities | 5.6 | % | |
| | Energy | 5.2 | % | |
| | Consumer Staples | 5.2 | % | |
| | Materials | 4.8 | % | |
| | Telecommunication Services | 2.4 | % | |
| | High Social Impact Investments | 0.8 | % | |
| | Short-Term Investments | 0.6 | % | |
| | Total | 100 | % | |
| | | | |
| | * Does not reflect the value of securities held as cash collateral on securities loaned. | |
| | | | |
Stock selection was the biggest detractor from performance, with Consumer Discretionary and Industrial stocks hurting the worst. Fossil, which makes watches, jewelry and other accessories, was a large detractor. Sales and profits are expected to decline in 2016, a common problem facing watchmakers globally. The Fund’s previous manager sold Fossil entirely before the Fund transitioned to its current management team.
Another detractor was JetBlue Airways (JBLU). JBLU’s stock more than doubled from late 2014 until September 2015, as all airlines benefited from falling jet fuel costs. However, the stocks of JBLU and many other airlines have fallen since late 2015. Stabilizing fuel prices, sluggish business demand and investors’ concern of a price war due to airlines expanding capacity have all contributed to this weakness. The Fund’s previous manager exited JetBlue entirely before the Fund transitioned to its current management team.
Our investment philosophy emphasizes stocks judged to be higher-quality, lower-volatility companies. This emphasis hurt performance from June to September 2016, as financial markets were in a “risk-on” mode. Within the U.S., more volatile stocks generally rose more in this time period. Smaller U.S. stocks outperformed large ones, and emerging market stocks beat international, developed markets stocks. All these results indicate investors embracing riskier assets.
On the positive front was stock selection within Energy and Health Care. Spectra Energy rose after it agreed to be
acquired by Canadian firm Enbridge. Spectra owns natural
|
| | | | | | |
| | | | | |
| | CALVERT CAPITAL ACCUMULATION FUND | |
| | SEPTEMBER 30, 2016 | |
| | | | | |
| | INVESTMENT PERFORMANCE | |
| | (TOTAL RETURN AT NAV) | |
| | | 6 MONTHS ENDED 9/30/16 | 12 MONTHS ENDED 9/30/16 | |
| | Class A | -1.62 | % | -2.08 | % | |
| | Class C | -2.02 | % | -2.87 | % | |
| | Class I | -1.43 | % | -1.64 | % | |
| | Class Y | -1.50 | % | -1.83 | % | |
| | Russell Midcap Index | 7.84 | % | 14.25 | % | |
| | Russell Midcap Growth Index | 6.23 | % | 11.24 | % | |
| | Lipper Mid-Cap Core Funds Average | 7.13 | % | 11.55 | % | |
| | | | | |
| | Investment performance/return at NAV does not reflect the deduction of the Fund’s maximum 4.75% front-end sales charge or any deferred sales charges. | |
| | | | | |
| | TEN LARGEST STOCK HOLDINGS | % OF NET ASSETS | |
| | Principal Financial Group, Inc. | | 2.4 | % | |
| | Applied Materials, Inc. | | 2.3 | % | |
| | East West Bancorp, Inc. | | 2.2 | % | |
| | Synopsys, Inc. | | 2.2 | % | |
| | Agilent Technologies, Inc. | | 2.2 | % | |
| | Umpqua Holdings Corp. | | 2.2 | % | |
| | Spectra Energy Corp. | | 2.1 | % | |
| | CA, Inc. | | 2.1 | % | |
| | Quest Diagnostics, Inc. | | 2.0 | % | |
| | Ingersoll-Rand plc | | 2.0 | % | |
| | Total | 21.7 | % | |
| | | | | |
gas and oil pipelines and storage facilities, which fits well with Enbridge’s existing oil pipeline business. The Fund has benefited in the past from buyouts, and we believe our investment philosophy of acquiring attractively-priced companies that are able to generate strong cash flows also appeals to strategic buyers. We believe that if a stock’s value is not recognized by the public markets, strategic or financial buyers may well recognize that value providing another opportunity to boost the portfolio’s returns.
Another positive contributor during the period was Applied Materials (AMAT), which makes equipment that manufactures semiconductors. Demand is stronger than expected, which resulted in analysts increasing their forecasts for AMAT’s sales and profits during the current year.
Positioning and Market Outlook
We remain constructive on the U.S. economy over the medium-to-long run and believe U.S. stocks can continue to post solid performance, although probably not as robust as
calvert.com CALVERT CAPITAL ACCUMULATION FUND ANNUAL REPORT (UNAUDITED) 7
what we’ve experienced in recent years. While valuations of U.S. equities appear stretched based on historical standards, the positive economic environment in the U.S. relative to the rest of the world should support elevated valuation levels. Many international economies continue to be hindered by underlying structural and economic fiscal challenges, including Europe and Japan.
In the near-term, equity markets face several potential headwinds. The U.S. economy is in solid shape and benefiting from improved visibility into growth, but uncertainty around the outcome of the presidential election, the Fed’s anticipated December interest-rate hike, and political decisions in other parts of Europe post-Brexit could lead to increased volatility. However, accommodative monetary policy by central banks around the world should limit the downside.
Europe may experience a bit of a relief rally, benefiting from continued easing by the ECB and modest improvements in economic data, but structural problems remain. As we anticipated, the impact of Brexit on the global economy and the reaction by markets thus far has been relatively muted, but we are starting to see some implications in the UK with the pound declining and inflation picking-up. The potential for geopolitical turmoil in a number of different European countries is also still a risk that we continue to monitor.
While we remain cautious on China’s long-term growth prospects, their injection of stimulus is starting to flow through to the real economy, easing concerns about a hard economic landing and providing support for the global economy, especially emerging markets.
Although volatility in the equity markets may pick up, we believe this should also provide greater opportunities for stock picking. We believe our stock-selection strategy, which incorporates consideration of environmental, social, and governance (ESG) factors along with quantitative analysis, is well positioned for the current environment.
|
| |
| |
| Joshua Linder, CFA | Christopher Madden, CFA |
| |
| Kurt Moeller, CFA | Jade Huang |
Calvert Investment Management, Inc.
September 2016
8 calvert.com CALVERT CAPITAL ACCUMULATION FUND ANNUAL REPORT (UNAUDITED)
Growth of $10,000
The graph below shows the value of a hypothetical $10,000 investment in the Fund over the past 10 fiscal year periods. The results shown are for Class A shares, reflect the deduction of the maximum front-end Class A sales charge of 4.75%, and assume the reinvestment of dividends. The result is compared with a broad based market index. Market indexes are unmanaged and their results do not reflect the effect of expenses or sales charges. The value of an investment in a different share class would be different.
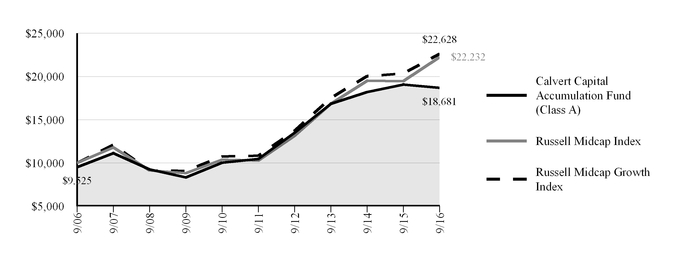
|
| | | | | | | |
| CALVERT CAPITAL ACCUMULATION FUND |
| SEPTEMBER 30, 2016 |
| AVERAGE ANNUAL TOTAL RETURNS | Ticker Symbol | 1 Year | 5 Year | 10 Year |
| Class A (with max. load) | CCAFX | -6.74 | % | 11.20 | % | 6.45 | % |
| Class C (with max. load) | CCACX | -3.84 | % | 11.42 | % | 6.13 | % |
| Class I | CCPIX | -1.64 | % | 12.95 | % | 7.74 | % |
| Class Y | CCAYX | -1.83 | % | 12.53 | % | 7.09 | % |
| Russell Midcap Index | | 14.25 | % | 16.67 | % | 8.32 | % |
| Russell Midcap Growth Index | | 11.24 | % | 15.85 | % | 8.51 | % |
| Lipper Mid-Cap Core Funds Average | | 11.55 | % | 14.69 | % | 7.05 | % |
| | | | | |
| Calvert Capital Accumulation Fund first offered Class Y shares on January 31, 2011. Performance prior to that date reflects the performance of Class A shares at net asset value (NAV). Actual Class Y share performance would have been different. |
| | | | | |
All performance data shown, including the graph above and the adjacent table, represents past performance, does not guarantee future results, assumes reinvestment of dividends and distributions, and does not reflect the deduction of taxes that a shareholder would pay on the Fund’s distributions or the redemption of the Fund shares. All performance data reflects fee waivers and/or expense limitations, if any are in effect; in their absence performance would be lower. See Note B in Notes to Financial Statements. The investment return and principal value of an investment will fluctuate so that an investor’s shares, when redeemed, may be worth more or less than their original cost. Current performance may be lower or higher than the performance data quoted; for current performance data, including most recent month-end, visit www.calvert.com. The gross expense ratio from the current prospectus for Class A shares is 1.28%. This number may differ from the expense ratio shown elsewhere in this report because it is based on a different time period and, if applicable, does not include fee or expense waivers. Performance data quoted already reflects the deduction of the Fund’s operating expenses.
calvert.com CALVERT CAPITAL ACCUMULATION FUND ANNUAL REPORT (UNAUDITED) 9
UNDERSTANDING YOUR FUND’S EXPENSES
As an investor, you incur two types of costs. There are transaction costs, which generally include sales charges on purchases and may include redemption fees. There are also ongoing costs, which generally include management fees, distribution and/or service fees, and other fund expenses. The following information is intended to help you understand your ongoing costs (in dollars) of investing in this mutual fund and to help you compare these costs with the ongoing costs of investing in other mutual funds.
To illustrate these ongoing costs, we have provided examples and calculated the expenses paid by the fund’s investors during the period. The actual and hypothetical information presented in the examples is based on an investment of $1,000 invested at the beginning of the period and held for the entire period (April 1, 2016 to September 30, 2016).
Actual Expenses
The first line of the table below provides information about actual account values and actual expenses. You may use the information in this line, together with the amount you invested, to estimate the expenses that you paid over the period. Simply divide your account value by $1,000 (for example, an $8,600 account value divided by $1,000 = 8.6), then multiply the result by the number in the first line under the heading entitled “Expenses Paid During Period” to estimate the expenses you paid on your account during this period.
The fund may charge an annual low balance account fee of $15 to those shareholders whose regular account balance is less than $2,000 ($1,000 for IRA accounts). If the low balance fee applies to your account, you should subtract the fee from the ending account value in the chart below.
Hypothetical Example for Comparison Purposes
The second line of the table below provides information about hypothetical account values and hypothetical expenses based on the Fund’s actual expense ratio and an assumed rate of return of 5% per year before expenses, which is not the Fund’s actual return. The hypothetical account values and expenses may not be used to estimate the actual ending account balance or expenses you paid for the period. You may use this information to compare the ongoing costs of investing in the Fund and other funds. To do so, compare the 5% hypothetical example with the 5% hypothetical examples that appear in the shareholder reports of the other funds.
Please note that the expenses shown in the table are meant to highlight your ongoing costs only and do not reflect any transactional costs, such as sales charges (loads), or redemption fees. Therefore, the second line of the table is useful in comparing ongoing costs only, and will not help you determine the relative total costs of owning different funds. In addition, if these transactional costs were included, your costs would have been higher.
|
| | | | |
| | ANNUALIZED
EXPENSE RATIO | BEGINNING
ACCOUNT VALUE
4/1/16 | ENDING
ACCOUNT VALUE
9/30/16 | EXPENSES PAID
DURING PERIOD*
4/1/16 - 9/30/16 |
| Class A | | | | |
| Actual | 1.26% | $1,000.00 | $983.80 | $6.25 |
| Hypothetical (5% return per year before expenses) | 1.26% | $1,000.00 | $1,018.70 | $6.36 |
| Class C | | | | |
| Actual | 2.01% | $1,000.00 | $979.80 | $9.95 |
| Hypothetical (5% return per year before expenses) | 2.01% | $1,000.00 | $1,014.95 | $10.13 |
| Class I | | | | |
| Actual | 0.86% | $1,000.00 | $985.70 | $4.27 |
| Hypothetical (5% return per year before expenses) | 0.86% | $1,000.00 | $1,020.70 | $4.34 |
| Class Y | | | | |
| Actual | 0.99% | $1,000.00 | $985.00 | $4.91 |
| Hypothetical (5% return per year before expenses) | 0.99% | $1,000.00 | $1,020.05 | $5.00 |
| |
| * Expenses paid during the period are equal to the annualized expense ratio for each class as indicated above, multiplied by the average account value over the period, multiplied by 183/366 (to reflect the one-half year period). Expense ratios shown in the Financial Highlights represent the actual expenses incurred for the fiscal year. |
10 calvert.com CALVERT CAPITAL ACCUMULATION FUND ANNUAL REPORT (UNAUDITED)
REPORT OF INDEPENDENT REGISTERED PUBLIC ACCOUNTING FIRM
The Board of Directors of Calvert World Values Fund, Inc. and Shareholders of Calvert Capital Accumulation Fund:
We have audited the accompanying statement of assets and liabilities of the Calvert Capital Accumulation Fund (the “Fund”), a series of Calvert World Values Fund, Inc., including the schedule of investments, as of September 30, 2016, and the related statement of operations for the year then ended, the statements of changes in net assets for each of the years in the two-year period then ended, and the financial highlights for each of the years in the five-year period then ended. These financial statements and financial highlights are the responsibility of the Fund’s management. Our responsibility is to express an opinion on these financial statements and financial highlights based on our audits.
We conducted our audits in accordance with the standards of the Public Company Accounting Oversight Board (United States). Those standards require that we plan and perform the audit to obtain reasonable assurance about whether the financial statements and financial highlights are free of material misstatement. An audit includes examining, on a test basis, evidence supporting the amounts and disclosures in the financial statements. Our procedures included confirmation of securities owned as of September 30, 2016 by correspondence with the custodian and brokers or by other appropriate auditing procedures. An audit also includes assessing the accounting principles used and significant estimates made by management, as well as evaluating the overall financial statement presentation. We believe that our audits provide a reasonable basis for our opinion.
In our opinion, the financial statements and financial highlights referred to above present fairly, in all material respects, the financial position of the Calvert Capital Accumulation Fund as of September 30, 2016, the results of its operations for the year then ended, the changes in its net assets for each of the years in the two-year period then ended, and the financial highlights for each of the years in the five-year period then ended, in conformity with U.S. generally accepted accounting principles.
Philadelphia, Pennsylvania
November 23, 2016
calvert.com CALVERT CAPITAL ACCUMULATION FUND ANNUAL REPORT 11
CALVERT CAPITAL ACCUMULATION FUND
SCHEDULE OF INVESTMENTS
SEPTEMBER 30, 2016
|
| | |
| | SHARES | VALUE ($) |
| COMMON STOCKS - 97.9% | | |
| | | |
| Air Freight & Logistics - 1.2% | | |
| C.H. Robinson Worldwide, Inc. | 65,433 | 4,610,409 |
| | | |
| Auto Components - 1.8% | | |
| Johnson Controls International plc | 152,220 | 7,082,797 |
| | | |
| Banks - 6.2% | | |
| East West Bancorp, Inc. | 240,707 | 8,836,354 |
| Investors Bancorp, Inc. | 604,797 | 7,263,612 |
| Umpqua Holdings Corp. | 566,515 | 8,526,051 |
| | | 24,626,017 |
| | | |
| Beverages - 1.3% | | |
| Coca-Cola European Partners plc | 133,057 | 5,308,974 |
| | | |
| Capital Markets - 4.6% | | |
| Ameriprise Financial, Inc. | 60,624 | 6,048,457 |
| Moody’s Corp. | 70,329 | 7,615,224 |
| Northern Trust Corp. | 66,110 | 4,494,819 |
| | | 18,158,500 |
| | | |
| Chemicals - 1.6% | | |
| PPG Industries, Inc. | 60,353 | 6,238,086 |
| | | |
| Containers & Packaging - 1.7% | | |
| Graphic Packaging Holding Co. | 474,552 | 6,638,982 |
| | | |
| Diversified Telecommunication Services - 2.4% | | |
| TELUS Corp. | 122,234 | 4,033,317 |
| Verizon Communications, Inc. | 103,539 | 5,381,957 |
| | | 9,415,274 |
| | | |
| Electric Utilities - 2.8% | | |
| Alliant Energy Corp. | 163,490 | 6,263,302 |
| Portland General Electric Co. | 115,474 | 4,918,038 |
| | | 11,181,340 |
| | | |
| Electrical Equipment - 1.9% | | |
| Eaton Corp. plc | 114,883 | 7,548,962 |
| | | |
| Electronic Equipment & Instruments - 1.7% | | |
| FLIR Systems, Inc. | 218,964 | 6,879,849 |
| | | |
| Energy Equipment & Services - 1.7% | | |
| FMC Technologies, Inc. * | 220,466 | 6,541,226 |
12 calvert.com CALVERT CAPITAL ACCUMULATION FUND ANNUAL REPORT
|
| | | | |
| | SHARES | VALUE ($) |
| COMMON STOCKS - CONT’D | | |
| Equity Real Estate Investment Trusts (REITs) - 7.3% | | |
| American Campus Communities, Inc. | 87,539 | 4,453,109 |
|
| DDR Corp. | 374,690 | 6,530,847 |
|
| Duke Realty Corp. | 242,342 | 6,623,207 |
|
| First Industrial Realty Trust, Inc. | 203,252 | 5,735,771 |
|
| Healthcare Trust of America, Inc., Class A | 173,107 | 5,646,750 |
|
| | | 28,989,684 |
|
| | | |
| Food & Staples Retailing - 0.6% | | |
| Kroger Co. (The) | 81,049 | 2,405,534 |
|
| | | |
| Food Products - 3.2% | | |
| Bunge Ltd. | 104,528 | 6,191,194 |
|
| ConAgra Foods, Inc. | 134,022 | 6,313,776 |
|
| | | 12,504,970 |
|
| | | |
| Gas Utilities - 2.7% | | |
| Southwest Gas Corp. | 68,384 | 4,777,306 |
|
| UGI Corp. | 132,198 | 5,980,638 |
|
| | | 10,757,944 |
|
| | | |
| Health Care Equipment & Supplies - 3.5% | | |
| ResMed, Inc. (a) | 99,915 | 6,473,493 |
|
| Varian Medical Systems, Inc. * | 75,436 | 7,508,145 |
|
| | | 13,981,638 |
|
| | | |
| Health Care Providers & Services - 3.7% | | |
| Patterson Cos., Inc. | 148,459 | 6,820,206 |
|
| Quest Diagnostics, Inc. | 94,093 | 7,963,091 |
|
| | | 14,783,297 |
|
| | | |
| Hotels, Restaurants & Leisure - 1.3% | | |
| Texas Roadhouse, Inc. | 134,762 | 5,259,761 |
|
| | | |
| Household Durables - 1.4% | | |
| Leggett & Platt, Inc. | 120,049 | 5,471,833 |
|
| | | |
| Industrial Conglomerates - 1.8% | | |
| Carlisle Cos., Inc. | 68,435 | 7,019,378 |
|
| | | |
| Insurance - 7.5% | | |
| Alleghany Corp. * | 11,047 | 5,799,896 |
|
| American Financial Group, Inc. | 65,042 | 4,878,150 |
|
| Hanover Insurance Group, Inc. (The) | 59,639 | 4,497,973 |
|
| Principal Financial Group, Inc. | 182,549 | 9,403,099 |
|
| Unum Group | 140,106 | 4,947,143 |
|
| | | 29,526,261 |
|
| |
calvert.com CALVERT CAPITAL ACCUMULATION FUND ANNUAL REPORT 13
|
| | | | |
| | SHARES | VALUE ($) |
| COMMON STOCKS - CONT’D | | |
| IT Services - 6.0% | | |
| Amdocs Ltd. | 124,661 | 7,211,639 |
|
| Automatic Data Processing, Inc. | 74,787 | 6,596,213 |
|
| Broadridge Financial Solutions, Inc. | 92,425 | 6,265,491 |
|
| Cognizant Technology Solutions Corp., Class A * | 73,366 | 3,500,292 |
|
| | | 23,573,635 |
|
| | | |
| Leisure Products - 1.2% | | |
| Hasbro, Inc. | 58,313 | 4,625,970 |
|
| | | |
| Life Sciences - Tools & Services - 3.9% | | |
| Agilent Technologies, Inc. | 182,881 | 8,611,866 |
|
| PerkinElmer, Inc. | 119,724 | 6,717,714 |
|
| | | 15,329,580 |
|
| | | |
| Machinery - 3.9% | | |
| Ingersoll-Rand plc | 114,155 | 7,755,691 |
|
| Xylem, Inc. | 143,389 | 7,520,753 |
|
| | | 15,276,444 |
|
| | | |
| Media - 1.7% | | |
| Omnicom Group, Inc. | 77,863 | 6,618,355 |
|
| | | |
| Metals & Mining - 1.5% | | |
| Reliance Steel & Aluminum Co. | 85,309 | 6,144,807 |
|
| | | |
| Oil, Gas & Consumable Fuels - 3.5% | | |
| ONEOK, Inc. | 107,435 | 5,521,085 |
|
| Spectra Energy Corp. | 198,664 | 8,492,886 |
|
| | | 14,013,971 |
|
| | | |
| Professional Services - 1.1% | | |
| Robert Half International, Inc. | 115,512 | 4,373,284 |
|
| | | |
| Semiconductors & Semiconductor Equipment - 2.2% | | |
| Applied Materials, Inc. | 295,667 | 8,914,360 |
|
| | | |
| Software - 4.3% | | |
| CA, Inc. | 251,853 | 8,331,297 |
|
| Synopsys, Inc. * | 145,425 | 8,630,974 |
|
| | | 16,962,271 |
|
| | | |
| Specialty Retail - 4.1% | | |
| Michaels Cos., Inc. (The) * | 114,879 | 2,776,625 |
|
| Ross Stores, Inc. | 116,758 | 7,507,539 |
|
| Sally Beauty Holdings, Inc. * | 184,878 | 4,747,667 |
|
| Tractor Supply Co. | 17,576 | 1,183,744 |
|
| | | 16,215,575 |
|
| |
14 calvert.com CALVERT CAPITAL ACCUMULATION FUND ANNUAL REPORT
|
| | | | |
| | SHARES | VALUE ($) |
| COMMON STOCKS - CONT’D | | |
| Trading Companies & Distributors - 2.6% | | |
| HD Supply Holdings, Inc. * | 159,627 | 5,104,872 |
|
| MSC Industrial Direct Co., Inc., Class A | 69,732 | 5,119,026 |
|
| | | 10,223,898 |
|
| | | |
| Total Common Stocks (Cost $378,703,543) | | 387,202,866 |
|
| | | |
| | | |
| | PRINCIPAL AMOUNT ($) | VALUE ($) |
| HIGH SOCIAL IMPACT INVESTMENTS - 0.8% | | |
| Calvert Social Investment Foundation Notes: | | |
| 0.50%, 3/18/17 (b)(c) | 1,200,000 | 1,179,840 |
|
| 0.25%, 7/1/17 (b)(c) | 1,419,488 | 1,379,529 |
|
| ImpactAssets Global Sustainable Agriculture Notes, 0.00%, 11/3/20 (b)(c)(d) | 309,000 | 275,010 |
|
| ImpactAssets Microfinance Plus Notes, 0.00%, 11/3/20 (b)(c)(d) | 398,000 | 374,120 |
|
| | | |
| Total High Social Impact Investments (Cost $3,326,487) | | 3,208,499 |
|
| | | |
| | | |
| TIME DEPOSIT - 0.6% | | |
| State Street Bank Time Deposit, 0.293%, 10/3/16 | 2,183,948 | 2,183,948 |
|
| | | |
| Total Time Deposit (Cost $2,183,948) | | 2,183,948 |
|
| | | |
| | | |
| | SHARES | VALUE ($) |
SHORT TERM INVESTMENT OF CASH COLLATERAL FOR SECURITIES LOANED - 0.0% | | |
| State Street Institutional U.S. Government Money Market Fund - Premier Class, 0.26% | 155,688 | 155,688 |
|
| | | |
| Total Short Term Investment of Cash Collateral For Securities Loaned (Cost $155,688) | | 155,688 |
|
| | | |
| | | |
| TOTAL INVESTMENTS (Cost $384,369,666) - 99.3% | | 392,751,001 |
|
| Other assets and liabilities, net - 0.7% | | 2,832,632 |
|
NET ASSETS - 100.0% | |
| $395,583,633 |
|
|
| | |
| NOTES TO SCHEDULE OF INVESTMENTS |
| * Non-income producing security. |
| (a) Security, or portion of security, is on loan. Total value of securities on loan is $152,257 as of September 30, 2016. |
| (b) Total market value of restricted securities amounts to $3,208,499, which represents 0.8% of the net assets of the Fund as of September 30, 2016. |
| (c) This security was valued under the direction of the Board of Directors. Total market value of fair valued securities amounts to $3,208,499, which represents 0.8% of the net assets of the Fund as of September 30, 2016. |
| (d) The coupon rate shown on floating or adjustable rate securities represents the rate in effect on September 30, 2016. |
| |
| Abbreviations: |
| Ltd.: | Limited | |
| plc: | Public Limited Company | |
| See notes to financial statements. |
calvert.com CALVERT CAPITAL ACCUMULATION FUND ANNUAL REPORT 15
|
| | |
| RESTRICTED SECURITIES | ACQUISITION DATES | COST ($) |
| Calvert Social Investment Foundation Notes, 0.50%, 3/18/17 | 3/18/16 | 1,200,000 |
| Calvert Social Investment Foundation Notes, 0.25%, 7/1/17 | 7/1/14 | 1,419,488 |
| ImpactAssets Global Sustainable Agriculture Notes, 0.00%, 11/3/20 | 11/13/15 | 309,000 |
| ImpactAssets Microfinance Plus Notes, 0.00%, 11/3/20 | 11/13/15 | 398,000 |
| See notes to financial statements. |
16 calvert.com CALVERT CAPITAL ACCUMULATION FUND ANNUAL REPORT
CALVERT CAPITAL ACCUMULATION FUND
STATEMENT OF ASSETS AND LIABILITIES
SEPTEMPER 30, 2016
|
| | | |
| ASSETS | |
| Investments in securities, at value (Cost $384,369,666) - see accompanying schedule |
| $392,751,001 |
|
| Cash | 279 |
|
| Receivable for securities sold | 3,929,471 |
|
| Receivable for shares sold | 471,741 |
|
| Dividends and interest receivable | 685,367 |
|
| Securities lending income receivable | 31 |
|
| Directors’ deferred compensation plan | 288,911 |
|
| Total assets | 398,126,801 |
|
| | |
| LIABILITIES | |
| Payable upon return of securities loaned | 155,688 |
|
| Payable for shares redeemed | 1,643,936 |
|
| Payable to Calvert Investment Management, Inc. | 195,578 |
|
| Payable to Calvert Investment Distributors, Inc. | 60,078 |
|
| Payable to Calvert Investment Administrative Services, Inc. | 37,330 |
|
| Payable to Calvert Investment Services, Inc. | 6,749 |
|
| Payable for Directors’ fees and expenses | 9,986 |
|
| Directors’ deferred compensation plan | 288,911 |
|
| Accrued expenses and other liabilities | 144,912 |
|
| Total liabilities | 2,543,168 |
|
| NET ASSETS |
| $395,583,633 |
|
| | |
| NET ASSETS CONSIST OF: | |
| Paid-in capital applicable to the following shares of common stock, | |
| with 250,000,000 shares of $0.01 par value shares authorized: | |
| Class A: 6,483,112 shares outstanding |
| $173,713,662 |
|
| Class C: 1,046,251 shares outstanding | 25,700,487 |
|
| Class I: 4,850,316 shares outstanding | 179,283,363 |
|
| Class Y: 449,432 shares outstanding | 14,511,155 |
|
| Undistributed net investment income | 1,128,301 |
|
| Accumulated net realized gain (loss) on investments and foreign currency transactions | (7,134,036) |
|
| Net unrealized appreciation (depreciation) on investments and assets and liabilities denominated in foreign currencies | 8,380,701 |
|
| NET ASSETS |
| $395,583,633 |
|
| | |
| NET ASSET VALUE PER SHARE | |
| Class A (based on net assets of $192,402,224) |
| $29.68 |
|
| Class C (based on net assets of $22,884,786) |
| $21.87 |
|
| Class I (based on net assets of $166,758,951) |
| $34.38 |
|
| Class Y (based on net assets of $13,537,672) |
| $30.12 |
|
| See notes to financial statements. |
calvert.com CALVERT CAPITAL ACCUMULATION FUND ANNUAL REPORT 17
CALVERT CAPITAL ACCUMULATION FUND
STATEMENT OF OPERATIONS
YEAR ENDED SEPTEMPER 30, 2016
|
| | | |
| NET INVESTMENT INCOME | |
| Investment Income: | |
| Dividend income (net of foreign taxes withheld of $6,541) |
| $6,391,291 |
|
| Interest income | 17,210 |
|
| Other income (a) | 15,267 |
|
| Securities lending income | 2,146 |
|
| Total investment income | 6,425,914 |
|
| | |
| Expenses: | |
| Investment advisory fee | 3,026,226 |
|
| Administrative fees | 656,599 |
|
| Transfer agency fees and expenses: | |
| Class A | 426,520 |
|
| Class C | 60,028 |
|
| Class I | 7,516 |
|
| Class Y | 19,188 |
|
| Distribution Plan expenses: | |
| Class A | 510,234 |
|
| Class C | 272,324 |
|
| Directors’ fees and expenses | 53,033 |
|
| Accounting fees | 117,397 |
|
| Custodian fees | 59,773 |
|
| Professional fees | 49,134 |
|
| Registration fees | 65,491 |
|
| Reports to shareholders | 64,540 |
|
| Miscellaneous | 31,484 |
|
| Total expenses | 5,419,487 |
|
| Reimbursement from Advisor: | |
| Class A | (75,362) |
|
| Class C | (13,838) |
|
| Class Y | (6,222) |
|
| Administrative fees waived | (82,119) |
|
| Net expenses | 5,241,946 |
|
| NET INVESTMENT INCOME (LOSS) | 1,183,968 |
|
| See notes to financial statements. |
18 calvert.com CALVERT CAPITAL ACCUMULATION FUND ANNUAL REPORT
|
| | | |
CALVERT CAPITAL ACCUMULATION FUND STATEMENT OF OPERATIONS - CONT’D YEAR ENDED SEPTEMPER 30, 2016 |
| REALIZED AND UNREALIZED GAIN (LOSS) | |
| Net realized gain (loss) on: | |
| Investments | 10,762,004 |
|
| Foreign currency transactions | (55,667) |
|
| | 10,706,337 |
|
| | |
| Change in unrealized appreciation (depreciation) on: | |
| Investments | (22,274,230) |
|
| Assets and liabilities denominated in foreign currencies | (634) |
|
| | (22,274,864) |
|
| | |
| NET REALIZED AND UNREALIZED GAIN (LOSS) | (11,568,527) |
|
| | |
| INCREASE (DECREASE) IN NET ASSETS RESULTING FROM OPERATIONS |
| ($10,384,559 | ) |
| |
| (a) Other income represents a non-recurring refund for overbilling of prior years’ custody out-of-pocket fees. |
| See notes to financial statements. |
calvert.com CALVERT CAPITAL ACCUMULATION FUND ANNUAL REPORT 19
CALVERT CAPITAL ACCUMULATION FUND
STATEMENTS OF CHANGES IN NET ASSETS
|
| | | | | | | |
| INCREASE (DECREASE) IN NET ASSETS | YEAR ENDED
SEPTEMBER 30, 2016 | | YEAR ENDED
SEPTEMBER 30, 2015 |
| Operations: | | | |
| Net investment income (loss) |
| $1,183,968 |
| |
| ($1,153,687 | ) |
| Net realized gain (loss) | 10,706,337 |
| | 30,888,315 |
|
| Net change in unrealized appreciation (depreciation) | (22,274,864) |
| | (15,807,702) |
|
| | | | |
| INCREASE (DECREASE) IN NET ASSETS RESULTING FROM OPERATIONS | (10,384,559) |
| | 13,926,926 |
|
| | | | |
| Distributions to shareholders from: | | | |
| Net realized gain: | | | |
| Class A shares | (20,254,450) |
| | (30,865,909) |
|
| Class B shares (a) | — |
| | (251,625) |
|
| Class C shares | (3,590,824) |
| | (4,946,653) |
|
| Class I shares | (19,759,432) |
| | (20,496,886) |
|
| Class Y shares | (1,435,594) |
| | (1,536,994) |
|
| Total distributions | (45,040,300) |
| | (58,098,067) |
|
| | | | |
| Capital share transactions: | | | |
| Shares sold: | | | |
| Class A shares (b) | 28,327,643 |
| | 40,170,404 |
|
| Class B shares (a) | — |
| | 4,705 |
|
| Class C shares | 3,480,475 |
| | 5,890,514 |
|
| Class I shares | 58,476,366 |
| | 112,345,198 |
|
| Class Y shares | 12,935,704 |
| | 5,526,066 |
|
| Reinvestment of distributions: | | | |
| Class A shares | 19,092,505 |
| | 28,980,344 |
|
| Class B shares (a) | — |
| | 238,368 |
|
| Class C shares | 3,032,821 |
| | 4,103,071 |
|
| Class I shares | 13,922,616 |
| | 11,967,403 |
|
| Class Y shares | 1,423,382 |
| | 1,529,030 |
|
| Redemption fees: | | | |
| Class A shares | — |
| | 210 |
|
| Class C shares | — |
| | 2 |
|
| Class I shares | — |
| | 191 |
|
| Shares redeemed: | | | |
| Class A shares | (53,059,309) |
| | (40,881,939) |
|
| Class B shares (a)(b) | — |
| | (1,716,203) |
|
| Class C shares | (8,979,532) |
| | (3,811,253) |
|
| Class I shares | (117,783,199) |
| | (26,371,471) |
|
| Class Y shares | (12,384,370) |
| | (3,626,477) |
|
| Total capital share transactions | (51,514,898) |
| | 134,348,163 |
|
| | | | |
| TOTAL INCREASE (DECREASE) IN NET ASSETS | (106,939,757) |
| | 90,177,022 |
|
| | | | |
| | | | |
| NET ASSETS | | | |
| Beginning of year | 502,523,390 |
| | 412,346,368 |
|
| End of year (including undistributed net investment income of $1,128,301 and $0, respectively) |
| $395,583,633 |
| |
| $502,523,390 |
|
| See notes to financial statements. |
20 calvert.com CALVERT CAPITAL ACCUMULATION FUND ANNUAL REPORT
|
| | | | | | | |
CALVERT CAPITAL ACCUMULATION FUND STATEMENTS OF CHANGES IN NET ASSETS - CONT’D |
| CAPITAL SHARE ACTIVITY | YEAR ENDED
SEPTEMBER 30, 2016 | | YEAR ENDED
SEPTEMBER 30, 2015 |
| Shares sold: | | | |
| Class A shares (c) | 938,319 |
| | 1,124,697 |
|
| Class B shares (a) | — |
| | 151 |
|
| Class C shares | 150,707 |
| | 215,070 |
|
| Class I shares | 1,675,673 |
| | 2,747,606 |
|
| Class Y shares | 427,806 |
| | 152,704 |
|
| Reinvestment of distributions: | | | |
| Class A shares | 633,251 |
| | 877,129 |
|
| Class B shares (a) | — |
| | 9,308 |
|
| Class C shares | 135,636 |
| | 160,905 |
|
| Class I shares | 399,960 |
| | 319,557 |
|
| Class Y shares | 46,622 |
| | 45,862 |
|
| Shares redeemed: | | | |
| Class A shares | (1,773,058) |
| | (1,148,492) |
|
| Class B shares (a)(c) | — |
| | (60,520) |
|
| Class C shares | (404,711) |
| | (138,297) |
|
| Class I shares | (3,433,920) |
| | (662,101) |
|
| Class Y shares | (413,736) |
| | (101,580) |
|
| Total capital share activity | (1,617,451) |
| | 3,541,999 |
|
| |
| (a) Class B Shares were converted into Class A Shares at the close of business on April 20, 2015. |
| (b) Amounts include $1,366,911 of share transactions that were redeemed from Class B shares and converted into Class A shares at the close of business on April 20, 2015. |
| (c) Amount includes 48,012 shares redeemed from Class B shares and 37,024 shares purchased into Class A shares at the close of business on April 20, 2015. |
| See notes to financial statements. |
calvert.com CALVERT CAPITAL ACCUMULATION FUND ANNUAL REPORT 21
NOTES TO FINANCIAL STATEMENTS
NOTE A — SIGNIFICANT ACCOUNTING POLICIES
General: Calvert World Values Fund, Inc. (the “Corporation”) is a Maryland corporation pursuant to Articles of Incorporation filed on February 14, 1992, and is registered under the Investment Company Act of 1940, as amended (the “1940 Act”) as an open-end management investment company. The Corporation operates four (4) separate series, or mutual funds, each with its own investment objective(s) and strategies. This report contains the financial statements and financial highlights for the Calvert Capital Accumulation Fund (the “Fund”). The Corporation is authorized to issue two billion (2,000,000,000) shares of stock, of which 250,000,000 shares have been allocated to the Fund, with a par value of each share at one cent ($0.01).
The Fund is non-diversified and invests primarily in the common stocks of U.S. mid-cap companies. The operations of each series of the Corporation, including the Fund, are accounted for separately. The Fund applies the accounting and reporting guidance in the Financial Accounting Standards Board (FASB) Accounting Standards Codification Topic 946, Financial Services – Investment Companies (ASC 946).
The Fund generally offers Class A, Class C, Class I, and Class Y shares. Class A shares are sold with a maximum front-end sales charge of 4.75%. However, the front-end sales charge is waived for shareholders investing in Class A shares directly with the Fund in an account maintained by Calvert Investment Distributors, Inc. (“Distributor”) or without a specified broker-dealer or financial adviser (“Direct Account”). Class C shares are not available for purchase in Direct Accounts. For non-Direct Accounts, Class C shares are sold without a front-end sales charge, and with certain exceptions, will be charged a contingent deferred sales charge on shares sold within one year of purchase. Class C shares have higher levels of expenses than Class A shares. Class I shares require a minimum account balance of $1 million. The $1 million minimum initial investment is waived for retirement plans that trade through omnibus accounts and may be waived in certain other instances where it is believed to be in the best interest of the Fund and its shareholders. Class I shares have no front-end or contingent deferred sales charge and have lower levels of expenses than Class A shares. Class Y shares are generally only available to wrap or similar fee-based programs offered by financial intermediaries, and retirement plans, foundations, endowments and other consultant-driven business, that have entered into an agreement with the Fund’s Distributor to offer Class Y shares to their clients. Class Y shares have no front-end or contingent deferred sales charge and have lower levels of expenses than Class A shares. Among other things, each class has different: (a) dividend rates, due to differences in Distribution Plan expenses and other class-specific expenses; (b) exchange privileges; and (c) class-specific voting rights.
Security Valuation: Net asset value per share is determined every business day as of the close of the regular session of the New York Stock Exchange (generally 4:00 p.m. Eastern time). The Fund uses independent pricing services approved by the Board of Directors (“the Board”) to value its investments wherever possible. Investments for which market quotations are not available or deemed not reliable are fair valued in good faith under the direction of the Board.
The Board has adopted Valuation Procedures (the “Procedures”) to determine the fair value of securities and other financial instruments for which market prices are not readily available or which may not be reliably priced. The Board has delegated the day-to-day responsibility for determining the fair value of assets of the Fund to Calvert Investment Management, Inc. (the “Advisor” or “Calvert”) and has provided these Procedures to govern Calvert in its valuation duties.
Calvert has chartered an internal Valuation Committee to oversee the implementation of these Procedures and to assist it in carrying out the valuation responsibilities that the Board has delegated.
The Valuation Committee meets on a regular basis to review illiquid securities and other investments which may not have readily available market prices. The Valuation Committee’s fair valuation determinations are subject to review, approval and ratification by the Board at its next regularly scheduled meeting covering the calendar quarter in which the fair valuation was determined.
The Valuation Committee utilizes various methods to measure the fair value of the Fund’s investments. U.S. generally accepted accounting principles (GAAP) establishes a disclosure hierarchy that categorizes the inputs to valuation techniques used to value assets and liabilities at measurement date. These inputs are summarized in the three broad levels listed below:
Level 1 - quoted prices in active markets for identical securities
Level 2 - other significant observable inputs (including quoted prices for similar securities, interest rates, prepayment speeds, credit risk, etc.)
Level 3 - significant unobservable inputs (including the Fund’s own assumptions in determining the fair value of investments)
The inputs or methodologies used for valuing securities are not necessarily an indication of the risk associated with investing in those securities.
22 calvert.com CALVERT CAPITAL ACCUMULATION FUND ANNUAL REPORT
Changes in valuation techniques may result in transfers in or out of an investment’s assigned level within the hierarchy during the year. Transfers in and/or out of levels are determined based on the fair value of such securities at the end of the year. Valuation techniques used to value the Fund’s investments by major category are as follows:
Common stock securities, for which market quotations are readily available, are valued at the last reported sale price or official closing price as reported by an independent pricing service on the primary market or exchange on which they are traded and are categorized as Level 1 in the hierarchy. In the event there were no sales during the day or closing prices are not available, securities are valued at the last quoted bid price or the last available price and are categorized as Level 2 in the hierarchy. Foreign securities are valued based on quotations from the principal market in which such securities are normally traded. The Fund has retained a third party fair value pricing service to quantitatively analyze the price movement of its holdings on foreign exchanges and to automatically fair value these securities each business day. The third party fair value pricing service takes into account many factors, including, but not limited to, movements in U.S. securities markets and changes in futures contracts and foreign exchange rates that have occurred after the close of the principal foreign market, to determine a fair value as of the close of the New York Stock Exchange. Such securities are categorized as Level 2 in the hierarchy.
Debt securities, including restricted securities, are valued based on evaluated prices received from independent pricing services or from dealers who make markets in such securities and are generally categorized as Level 2 in the hierarchy. For restricted securities and private placements where observable inputs are limited, assumptions about market activity and risk are used and such securities are categorized as Level 3 in the hierarchy. Short-term securities of sufficient credit quality with remaining maturities of sixty days or less for which quotations are not readily available are valued at amortized cost, which approximates fair value, and are categorized as Level 2 in the hierarchy.
Mutual funds are valued at their closing net asset value each business day and are categorized as Level 1 in the hierarchy.
If a market value cannot be determined for a security using the methodologies described above, or if, in the good faith opinion of the Advisor, the market value does not constitute a readily available market quotation, or if a significant event has occurred that would materially affect the value of the security, the security will be fair valued as determined in good faith by the Valuation Committee. Securities which were fair valued at September 30, 2016, if any, are identified on the Schedule of Investments.
The Valuation Committee considers a number of factors, including significant unobservable valuation inputs when arriving at fair value. It considers all significant facts that are reasonably available and relevant to the determination of fair value.
The Valuation Committee primarily employs a market-based approach which may use related or comparable assets or liabilities, recent transactions, market multiples, book values, and other relevant information for the investment to determine the fair value of the investment. When more appropriate, the Fund may employ an income-based or cost approach. An income-based valuation approach discounts anticipated future cash flows of the investment to calculate a present amount (discounted). The measurement is based on the value indicated by current market expectations about those future amounts. Discounts may also be applied due to the nature or duration of any restrictions on the disposition of the investments. A cost based approach is based on the amount that currently would be required to replace the service capacity of an asset (current replacement cost). From the seller’s perspective, the price that would be received for the asset is determined based on the cost to a buyer to acquire or construct a substitute asset of comparable utility, adjusted for obsolescence.
The values assigned to fair value investments are based on available information and do not necessarily represent amounts that might ultimately be realized. Further, due to the inherent uncertainty of valuations of such investments, the fair values may differ significantly from the values that would have been used had an active market existed, and the differences could be material. The Valuation Committee employs various methods for calibrating these valuation approaches including a regular review of key inputs and assumptions, transactional back-testing or disposition analysis and reviews of any related market activity.
calvert.com CALVERT CAPITAL ACCUMULATION FUND ANNUAL REPORT 23
The following table summarizes the market value of the Fund’s holdings as of September 30, 2016, based on the inputs used to value them:
|
| | | | | | | | | | | |
| | VALUATION INPUTS |
| INVESTMENTS IN SECURITIES* | LEVEL 1 | LEVEL 2 | LEVEL 3 | TOTAL |
| Common Stocks** |
| $387,202,866 |
| $— |
| $— |
|
| $387,202,866 |
|
| High Social Impact Investments | — |
| 2,559,369 |
| 649,130 |
| 3,208,499 |
|
| Time Deposit | — |
| 2,183,948 |
| — |
| 2,183,948 |
|
| Short Term Investment of Cash Collateral For Securities Loaned | 155,688 |
| — |
| — |
| 155,688 |
|
| TOTAL |
| $387,358,554 |
|
| $4,743,317 |
| $649,130^ |
|
| $392,751,001 |
|
| | | | | |
| * For a complete listing of investments, please refer to the Schedule of Investments. |
| ** For further breakdown of equity securities by industry, please refer to the Schedule of Investments. |
| ^ Level 3 securities represent 0.2% of net assets. |
There were no transfers between levels during the year.
Restricted Securities: The Fund may invest in securities that are subject to legal or contractual restrictions on resale. Generally, these securities may only be sold publicly upon registration under the Securities Act of 1933 or in transactions exempt from such registration. Information regarding restricted securities is included at the end of the Schedule of Investments.
The Fund invests in Community Investment Notes issued by the Calvert Social Investment Foundation (the “CSI Foundation”). The CSI Foundation is a 501(c)(3) non-profit organization that receives in-kind support from Calvert and its subsidiaries. The Fund has received an exemptive order from the Securities and Exchange Commission permitting the Fund to make investments in these notes under certain conditions.
Security Transactions and Investment Income: Security transactions are accounted for on trade date. Realized gains and losses are recorded on an identified cost basis and may include proceeds from litigation. Dividend income is recorded on the ex-dividend date or, in the case of dividends on certain foreign securities, as soon as the Fund is informed of the ex-dividend date. Withholding taxes on foreign dividends have been provided for in accordance with the Fund’s understanding of applicable country’s tax rules and rates. Distributions received on securities that represent a return of capital are recorded as a reduction of cost of investments. Distributions received on securities that represent a capital gain are recorded as a realized gain. Interest income, which includes amortization of premium and accretion of discount on debt securities, is accrued as earned.
Share Class Accounting: Investment income and realized and unrealized gains and losses are allocated to separate classes of shares based upon the relative net assets of each class. Expenses common to the classes are also allocated to each class in proportion to their relative net assets. Expenses arising in connection with a specific class are charged directly to that class.
Foreign Currency Transactions: The Fund’s accounting records are maintained in U.S. dollars. For valuation of assets and liabilities on each date of net asset value determination, foreign denominations are converted into U.S. dollars using the current exchange rate. Security transactions, income, and expenses are translated at the prevailing rate of exchange on the date of the event. The effect of changes in foreign exchange rates on securities and foreign currencies is included in the net realized and unrealized gain or loss on investments and assets and liabilities denominated in foreign currencies.
Distributions to Shareholders: Distributions to shareholders are recorded by the Fund on ex-dividend date. Dividends from net investment income and distributions from net realized capital gains, if any, are paid at least annually. Distributions are determined in accordance with income tax regulations which may differ from U.S. generally accepted accounting principles; accordingly, periodic reclassifications are made within the Fund’s capital accounts to reflect income and gains available for distribution under income tax regulations.
Estimates: The preparation of financial statements in conformity with U.S. generally accepted accounting principles requires management to make estimates and assumptions that affect the reported amounts of assets and liabilities and disclosure of contingent assets and liabilities at the date of the financial statements and the reported amounts of increases and decreases in net assets from operations during the reporting period. Actual results could differ from those estimates.
Redemption Fees: The Fund charged a 2% redemption fee on redemptions, including exchanges, made within 30 days of purchase in the same Fund. The redemption fee was accounted for as an addition to paid-in capital. This fee was eliminated effective February 2, 2015.
Federal Income Taxes: No provision for federal income or excise tax is required since the Fund intends to continue to qualify as a regulated investment company under the Internal Revenue Code and to distribute substantially all of its taxable earnings.
24 calvert.com CALVERT CAPITAL ACCUMULATION FUND ANNUAL REPORT
Management has analyzed the Fund’s tax positions taken for all open federal income tax years and has concluded that no provision for federal income tax is required in the Fund’s financial statements. A Fund’s federal tax return is subject to examination by the Internal Revenue Service for a period of three years.
NOTE B — RELATED PARTY TRANSACTIONS
Calvert Investment Management, Inc. (the “Advisor”) is wholly-owned by Calvert Investments, Inc., which is indirectly wholly-owned by Ameritas Mutual Holding Company. The Advisor provides investment advisory services and pays the salaries and fees of officers and Directors of the Fund who are employees of the Advisor or its affiliates. For its services, the Advisor receives an annual fee, payable monthly, of 0.65% of the Fund’s average daily net assets.
The Advisor has contractually agreed to limit net annual fund operating expenses through January 31, 2018 for Class A, C, and Y, and through January 31, 2017, for Class I. Effective June 9, 2016, the contractual expense caps are 1.21%, 1.96%, 0.86%, and 0.96% for Class A, C, I, and Y, respectively. For the period from February 1, 2016 through June 8, 2016, the contractual expense caps were 1.59%, 2.34%, 0.86%, and 1.44% or Class A, C, I, and Y, respectively. Prior to February 1, 2016, the contractual expense caps were 1.59%, 2.59%, 0.86%, and 1.44% for Class A, C, I, and Y, respectively. For the purpose of this expense limit, operating expenses do not include interest expense, brokerage commissions, taxes, and extraordinary expenses. This expense limitation does not limit acquired fund fees or expenses, if any.
Calvert Investment Administrative Services, Inc. (“CIAS”), an affiliate of the Advisor, provides administrative services to the Fund for an annual fee, payable monthly, based on the Fund’s average daily net assets.
For the period October 1, 2015 to January 31, 2016, the administrative fee was 0.25% for Class A, C and Y and 0.10% for Class I. CIAS and the Fund entered into an Amended and Restated Administrative Services Agreement that established a 0.12% administrative fee for all classes of the Fund commencing on February 1, 2016. CIAS voluntarily waived 0.13% (the amount of the administrative fee above 0.12%) for Class A, C and Y shares of the Fund for the period from December 1, 2015 through January 31, 2016. CIAS has also contractually agreed to waive 0.02% for Class I shares of the Fund (the difference between the previous administrative fee and the new 0.12% fee) from February 1, 2016 through January 31, 2018. During the year ended September 30, 2016, CIAS voluntarily waived $54,620.
Calvert Investment Distributors, Inc. (“CID”), an affiliate of the Advisor, is the distributor and principal underwriter for the Fund. Pursuant to Rule 12b-1 under the Investment Company Act of 1940, the Fund has adopted a Distribution Plan that permits the Fund to pay certain expenses associated with the distribution and servicing of its shares. The expenses paid may not exceed 0.35% and 1.00% annually of the average daily net assets of Class A and C, respectively. The amount actually paid by the Fund is an annualized fee, payable monthly, of 0.25% and 1.00% of the Fund’s average daily net assets of Class A and C shares, respectively. Class I and Class Y shares do not have Distribution Plan expenses.
CID received $54,925 as its portion of commissions charged on sales of the Fund’s Class A shares for the year ended September 30, 2016.
Calvert Investment Services, Inc. (“CIS”), an affiliate of the Advisor, acts as shareholder servicing agent for the Fund. For its services, CIS received a fee of $81,725 for the year ended September 30, 2016. Boston Financial Data Services, Inc. is the transfer and dividend disbursing agent.
Each Director of the Fund who is not an employee of the Advisor or its affiliates receives an annual retainer of $52,000 plus a meeting fee of up to $3,000 for each Board meeting attended. Additional fees of $6,000 annually may be paid to the Committee chairs ($10,000 for the Board Chair and the Special Equities Committee chair) and $2,500 annually may be paid to Committee members, plus a Committee meeting fee of $500 for each Committee meeting attended. Eligible Directors may participate in a Deferred Compensation Plan (the “Plan”). Obligations of the Plan will be paid solely out of the Fund’s assets. Directors’ fees are allocated to each of the funds served.
NOTE C — INVESTMENT ACTIVITY AND TAX INFORMATION
During the year, the cost of purchases and proceeds from sales of investments, other than short-term securities, were $918,536,120 and $1,002,864,112, respectively.
The tax character of dividends and distributions paid during the years ended September 30, 2016 and September 30, 2015 was as follows:
|
| | | | | | | |
| DISTRIBUTIONS PAID FROM: | 2016 |
| | 2015 |
|
| Ordinary income |
| $8,450,990 |
| |
| $11,530,872 |
|
| Long-term capital gains | 36,589,310 |
| | 46,567,195 |
|
| Total |
| $45,040,300 |
| |
| $58,098,067 |
|
calvert.com CALVERT CAPITAL ACCUMULATION FUND ANNUAL REPORT 25
As of September 30, 2016, the tax basis components of distributable earnings/(accumulated losses) and the federal tax cost were as follows:
|
| | | |
| Unrealized appreciation |
| $18,923,618 |
|
| Unrealized (depreciation) | (10,888,725) |
|
| Net unrealized appreciation (depreciation) |
| $8,034,893 |
|
| | |
| Undistributed ordinary income |
| $1,225,576 |
|
| Late year ordinary and post October capital loss deferrals |
| ($6,874,883 | ) |
| Other temporary differences |
| ($9,986 | ) |
| | |
| Federal income tax cost of investments |
| $384,716,108 |
|
The differences between components of distributable earnings on a tax basis and the amounts reflected in the Statement of Assets and Liabilities are primarily due to temporary book-tax differences that will reverse in a subsequent period. These differences are mainly due to wash sales and deferred Directors’ fees.
Reclassifications, as shown in the table below, have been made to the Fund’s components of net assets to reflect income and gains available for distribution (or available capital loss carryovers, as applicable) under income tax law and regulations. These reclassifications are due to permanent book-tax differences and have no impact on net assets. The primary permanent differences causing such reclassifications for the Fund are due to foreign currency transactions.
|
| | | |
| Undistributed net investment income |
| ($55,667 | ) |
| Accumulated net realized gain (loss) | 55,667 |
|
NOTE D — SECURITIES LENDING
To generate additional income, the Fund may lend its securities pursuant to a securities lending agency agreement (“Lending Agreement”) with State Street Bank, the securities lending agent. Security loans are subject to termination by the Fund at any time and, therefore, are not considered to be illiquid investments. The Fund requires that the loan be continuously collateralized by either cash or securities as collateral equal at all times to at least 102% of the market value of the domestic securities loaned and 105% of the market value on the international securities loaned (if applicable). Cash collateral is generally invested in State Street Institutional U.S. Government Money Market Fund (the “U.S. Government Fund”) that is managed by an affiliate of the custodian. The U.S. Government Fund is a registered money market fund that invests in a variety of high-quality, U.S. dollar-denominated instruments. Any gain or loss in the market price of the loaned securities that might occur and any interest earned or dividends declared during the term of the loan would accrue to the account of the Fund. Income earned on the investment of collateral, net of broker rebates and other expenses incurred by the securities lending agent, is split between the Fund and the securities lending agent on the basis of agreed upon contractual terms.
The risks associated with lending portfolio securities include, but are not limited to, possible delays in receiving additional collateral or in the recovery of the loaned securities, possible loss of rights to the collateral should the borrower fail financially, as well as risk of loss in the value of the collateral or the value of the investments made with the collateral. The securities lending agent shall indemnify the Fund in the case of default of any securities borrower.
The total value of securities on loan was $152,257 as of September 30, 2016.
The following table displays a breakdown of transactions accounted for as secured borrowings, the obligations by class of collateral pledged, and the remaining contractual maturity of those transactions as of September 30, 2016:
|
| | | | | | | | | |
| | Remaining Contractual Maturity of the Agreements as of September 30, 2016 |
| | Overnight and
Continuous | <30 days | Between
30 & 90 days | >90 days | Total |
| Securities Lending Transactions |
| Common Stocks |
| $155,688 |
| $— | $— | $— |
| $155,688 |
|
| Amount of recognized liabilities for securities lending transactions |
| $155,688 |
|
26 calvert.com CALVERT CAPITAL ACCUMULATION FUND ANNUAL REPORT
NOTE E — LINE OF CREDIT
A financing agreement is in place with the Calvert Funds and State Street Corporation (“SSC”). Under the agreement, SSC provides an unsecured line of credit facility, in the aggregate amount of $50 million ($25 million committed and $25 million uncommitted), accessible by the Calvert Funds for temporary or emergency purposes only. Borrowings bear interest at the higher of the One-Month London Interbank Offered Rate (LIBOR) in effect that day or the overnight Federal Funds Rate plus 1.25% per annum. A commitment fee of 0.25% per annum is incurred on the unused portion of the committed facility. An administrative fee of $30,000 was paid in connection with the uncommitted facility. These fees are allocated to all participating funds. The Fund had no loans outstanding pursuant to this line of credit at September 30, 2016.
For the year ended September 30, 2016, borrowing information by the Fund under the agreement was as follows:
|
| | | |
| Average Daily Balance | Weighted Average
Interest Rate | Maximum
Amount Borrowed | Month of Maximum
Amount Borrowed |
| $363,447 | 1.65% | $8,187,488 | March 2016 |
NOTE F — OTHER MATTERS
On October 18, 2016, Calvert announced that it had determined that certain fees paid to third-party financial intermediaries were incorrectly allocated for payment by, and paid by, the Calvert Funds. Specifically, for periods prior to January 1, 2015, the Calvert Funds paid fees under certain intermediary agreements that were primarily for distribution-related services and therefore should have been paid by Calvert out of Calvert’s own assets or by the Funds under a Rule 12b-1 plan. The matter was self-reported to the SEC in 2016. Calvert is in the process of determining the economic impact of misallocated fees on the affected Funds and their shareholders, and intends to develop a plan to reimburse shareholders following that determination.
NOTE G — SUBSEQUENT EVENTS
On October 20, 2016, Calvert and Calvert’s indirect parent company, Ameritas Holding Company, entered into an Asset Purchase Agreement (the “Agreement”) with Eaton Vance Management (“Eaton Vance”), a newly-formed subsidiary of Eaton Vance, to operate as Calvert Research and Management (“New Calvert”), and other parties, pursuant to which New Calvert has agreed to acquire, subject to the terms and conditions set forth in the Agreement, the business assets of Calvert (the “Transaction”). Completion of the Transaction is subject to the approval by the shareholders of Calvert Funds of new investment advisory agreements with New Calvert, among other conditions, and is currently expected to occur by the end of 2016 or early 2017.
A proxy statement containing detailed information regarding several proposals was mailed to shareholders of record in November 2016. The shareholder meeting is expected to be held on or about December 16, 2016.
In preparing the financial statements as of September 30, 2016, no other subsequent events or transactions occurred that would have required recognition or disclosure in these financial statements.
NOTICE TO SHAREHOLDERS (UNAUDITED)
For the fiscal year ended September 30, 2016, the Fund considers 40.8% of the ordinary dividends paid during the year as qualified dividend income and 41.9% as eligible for the corporate dividends received deduction in accordance with Section 854 of the Internal Revenue Code. The Fund also considers $36,589,310 of the long-term capital gain distributions paid during the year as capital gain dividends in accordance with Section 852(b)(3)(C) of the Internal Revenue Code.
calvert.com CALVERT CAPITAL ACCUMULATION FUND ANNUAL REPORT 27
CALVERT CAPITAL ACCUMULATION FUND
FINANCIAL HIGHLIGHTS
|
| | | | | | | | | | | | | | | | | | | |
| | YEARS ENDED |
| CLASS A SHARES | September 30, 2016 (a) | | September 30, 2015 (a) | | September 30, 2014 (a) | | September 30, 2013 (a) | | September 30, 2012 (a) |
| Net asset value, beginning |
| $33.41 |
| |
| $36.99 |
| |
| $36.83 |
| |
| $31.45 |
| |
| $26.00 |
|
| Income from investment operations: | | | | | | | | | |
| Net investment income (loss) | 0.02(b) |
| | (0.16) |
| | (0.14) |
| | (0.18) |
| | (0.26) |
|
| Net realized and unrealized gain (loss) | (0.67) |
| | 1.91 |
| | 2.94 |
| | 7.49 |
| | 7.64 |
|
| Total from investment operations | (0.65) |
| | 1.75 |
| | 2.80 |
| | 7.31 |
| | 7.38 |
|
| Distributions from: | | | | | | | | | |
| Net realized gain | (3.08) |
| | (5.33) |
| | (2.64) |
| | (1.93) |
| | (1.93) |
|
| Total distributions | (3.08) |
| | (5.33) |
| | (2.64) |
| | (1.93) |
| | (1.93) |
|
| Total increase (decrease) in net asset value | (3.73) |
| | (3.58) |
| | 0.16 |
| | 5.38 |
| | 5.45 |
|
| Net asset value, ending |
| $29.68 |
| |
| $33.41 |
| |
| $36.99 |
| |
| $36.83 |
| |
| $31.45 |
|
| Total return (c) | (2.08 | %) | | 4.90 | % | | 7.90 | % | | 24.74 | % | | 29.16 | % |
| Ratios to average net assets: (d) | | | | | | | | | |
| Net investment income (loss) | 0.07%(b) |
| | (0.43 | %) | | (0.36 | %) | | (0.53 | %) | | (0.85 | %) |
| Total expenses | 1.37 | % | | 1.41 | % | | 1.43 | % | | 1.48 | % | | 1.53 | % |
| Net expenses | 1.31 | % | | 1.41 | % | | 1.43 | % | | 1.48 | % | | 1.53 | % |
| Portfolio turnover | 199 | % | | 74 | % | | 81 | % | | 73 | % | | 63 | % |
| Net assets, ending (in thousands) |
| $192,402 |
| |
| $223,328 |
| |
| $215,683 |
| |
| $207,257 |
| |
| $157,016 |
|
| | | | | | | | | | |
| (a) Per share figures are calculated using the Average Shares Method. |
| (b) Amount includes a non-recurring refund for overbilling of prior years’ custody out-of-pocket fees. This amounted to $0.001 per share and 0.00% of average net assets. |
| (c) Total return is not annualized for periods of less than one year and does not reflect deduction of any front-end or deferred sales charge. |
| (d) Total expenses do not reflect amounts reimbursed and/or waived by the Advisor and certain of its affiliates, if applicable. Net expenses are net of all reductions and represent the net expenses paid by the Fund. |
| See notes to financial statements. |
28 calvert.com CALVERT CAPITAL ACCUMULATION FUND ANNUAL REPORT
CALVERT CAPITAL ACCUMULATION FUND
FINANCIAL HIGHLIGHTS
|
| | | | | | | | | | | | | | | | | | | |
| | YEARS ENDED |
| CLASS C SHARES | September 30, 2016 (a) | | September 30, 2015 (a) | | September 30, 2014 (a) | | September 30, 2013 (a) | | September 30, 2012 (a) |
| Net asset value, beginning |
| $25.62 |
| |
| $29.76 |
| |
| $30.35 |
| |
| $26.44 |
| |
| $22.29 |
|
| Income from investment operations: | | | | | | | | | |
| Net investment loss | (0.16)(b) |
| | (0.34) |
| | (0.34) |
| | (0.36) |
| | (0.42) |
|
| Net realized and unrealized gain (loss) | (0.51) |
| | 1.53 |
| | 2.39 |
| | 6.20 |
| | 6.50 |
|
| Total from investment operations | (0.67) |
| | 1.19 |
| | 2.05 |
| | 5.84 |
| | 6.08 |
|
| Distributions from: | | | | | | | | | |
| Net realized gain | (3.08) |
| | (5.33) |
| | (2.64) |
| | (1.93) |
| | (1.93) |
|
| Total distributions | (3.08) |
| | (5.33) |
| | (2.64) |
| | (1.93) |
| | (1.93) |
|
| Total increase (decrease) in net asset value | (3.75) |
| | (4.14) |
| | (0.59) |
| | 3.91 |
| | 4.15 |
|
| Net asset value, ending |
| $21.87 |
| |
| $25.62 |
| |
| $29.76 |
| |
| $30.35 |
| |
| $26.44 |
|
| Total return (c) | (2.87 | %) | | 4.09 | % | | 7.06 | % | | 23.81 | % | | 28.11 | % |
| Ratios to average net assets: (d) | | | | | | | | | |
| Net investment loss | (0.72%)(b) |
| | (1.23 | %) | | (1.12 | %) | | (1.30 | %) | | (1.64 | %) |
| Total expenses | 2.16 | % | | 2.21 | % | | 2.19 | % | | 2.25 | % | | 2.33 | % |
| Net expenses | 2.09 | % | | 2.21 | % | | 2.19 | % | | 2.25 | % | | 2.33 | % |
| Portfolio turnover | 199 | % | | 74 | % | | 81 | % | | 73 | % | | 63 | % |
| Net assets, ending (in thousands) |
| $22,885 |
| |
| $29,837 |
| |
| $27,588 |
| |
| $25,311 |
| |
| $18,630 |
|
| | | | | | | | | | |
| (a) Per share figures are calculated using the Average Shares Method. |
| (b) Amount includes a non-recurring refund for overbilling of prior years’ custody out-of-pocket fees. This amounted to $0.001 per share and 0.00% of average net assets. |
| (c) Total return is not annualized for periods of less than one year and does not reflect deduction of any front-end or deferred sales charge. |
| (d) Total expenses do not reflect amounts reimbursed and/or waived by the Advisor and certain of its affiliates, if applicable. Net expenses are net of all reductions and represent the net expenses paid by the Fund. |
| See notes to financial statements. |
calvert.com CALVERT CAPITAL ACCUMULATION FUND ANNUAL REPORT 29
CALVERT CAPITAL ACCUMULATION FUND
FINANCIAL HIGHLIGHTS
|
| | | | | | | | | | | | | | | | | | | |
| | YEARS ENDED |
| CLASS I SHARES | September 30, 2016 (a) | | September 30, 2015 (a) | | September 30, 2014 (a) | | September 30, 2013 (a) | | September 30, 2012 (a) |
| Net asset value, beginning |
| $38.05 |
| |
| $41.19 |
| |
| $40.50 |
| |
| $34.18 |
| |
| $27.94 |
|
| Income from investment operations: | | | | | | | | | |
| Net investment income (loss) | 0.19(b) |
| | 0.06 |
| | 0.10 |
| | 0.03 |
| | (0.05) |
|
| Net realized and unrealized gain (loss) | (0.78) |
| | 2.13 |
| | 3.23 |
| | 8.22 |
| | 8.22 |
|
| Total from investment operations | (0.59) |
| | 2.19 |
| | 3.33 |
| | 8.25 |
| | 8.17 |
|
| Distributions from: | | | | | | | | | |
| Net realized gain | (3.08) |
| | (5.33) |
| | (2.64) |
| | (1.93) |
| | (1.93) |
|
| Total distributions | (3.08) |
| | (5.33) |
| | (2.64) |
| | (1.93) |
| | (1.93) |
|
| Total increase (decrease) in net asset value | (3.67) |
| | (3.14) |
| | 0.69 |
| | 6.32 |
| | 6.24 |
|
| Net asset value, ending |
| $34.38 |
| |
| $38.05 |
| |
| $41.19 |
| |
| $40.50 |
| |
| $34.18 |
|
| Total return (c) | (1.64 | %) | | 5.53 | % | | 8.53 | % | | 25.55 | % | | 30.00 | % |
| Ratios to average net assets: (d) | | | | | | | | | |
| Net investment income (loss) | 0.55%(b) |
| | 0.14 | % | | 0.24 | % | | 0.08 | % | | (0.16 | %) |
| Total expenses | 0.86 | % | | 0.83 | % | | 0.82 | % | | 0.85 | % | | 0.88 | % |
| Net expenses | 0.84 | % | | 0.83 | % | | 0.82 | % | | 0.85 | % | | 0.86 | % |
| Portfolio turnover | 199 | % | | 74 | % | | 81 | % | | 73 | % | | 63 | % |
| Net assets, ending (in thousands) |
| $166,759 |
| |
| $236,228 |
| |
| $156,677 |
| |
| $130,705 |
| |
| $83,181 |
|
| | | | | | | | | | |
| (a) Per share figures are calculated using the Average Shares Method. |
| (b) Amount includes a non-recurring refund for overbilling of prior years’ custody out-of-pocket fees. This amounted to $0.001 per share and 0.00% of average net assets. |
| (c) Total return is not annualized for periods of less than one year and does not reflect deduction of any front-end or deferred sales charge. |
| (d) Total expenses do not reflect amounts reimbursed and/or waived by the Advisor and certain of its affiliates, if applicable. Net expenses are net of all reductions and represent the net expenses paid by the Fund. |
| See notes to financial statements. |
30 calvert.com CALVERT CAPITAL ACCUMULATION FUND ANNUAL REPORT
CALVERT CAPITAL ACCUMULATION FUND
FINANCIAL HIGHLIGHTS
|
| | | | | | | | | | | | | | | | | | | |
| | YEARS ENDED |
| CLASS Y SHARES | September 30, 2016 (a) | | September 30, 2015 (a) | | September 30, 2014 (a) | | September 30, 2013 (a) | | September 30, 2012 (a) |
| Net asset value, beginning |
| $33.78 |
| |
| $37.26 |
| |
| $37.04 |
| |
| $31.56 |
| |
| $26.03 |
|
| Income from investment operations: | | | | | | | | | |
| Net investment income (loss) | 0.08(b) |
| | (0.07) |
| | (0.07) |
| | (0.12) |
| | (0.18) |
|
| Net realized and unrealized gain (loss) | (0.66) |
| | 1.92 |
| | 2.93 |
| | 7.53 |
| | 7.64 |
|
| Total from investment operations | (0.58) |
| | 1.85 |
| | 2.86 |
| | 7.41 |
| | 7.46 |
|
| Distributions from: | | | | | | | | | |
| Net realized gain | (3.08) |
| | (5.33) |
| | (2.64) |
| | (1.93) |
| | (1.93) |
|
| Total distributions | (3.08) |
| | (5.33) |
| | (2.64) |
| | (1.93) |
| | (1.93) |
|
| Total increase (decrease) in net asset value | (3.66) |
| | (3.48) |
| | 0.22 |
| | 5.48 |
| | 5.53 |
|
| Net asset value, ending |
| $30.12 |
| |
| $33.78 |
| |
| $37.26 |
| |
| $37.04 |
| |
| $31.56 |
|
| Total return (c) | (1.83 | %) | | 5.16 | % | | 8.02 | % | | 24.98 | % | | 29.45 | % |
| Ratios to average net assets: (d) | | | | | | | | | |
| Net investment income (loss) | 0.28%(b) |
| | (0.20 | %) | | (0.17 | %) | | (0.36 | %) | | (0.59 | %) |
| Total expenses | 1.08 | % | | 1.18 | % | | 1.26 | % | | 1.29 | % | | 1.29 | % |
| Net expenses | 1.02 | % | | 1.18 | % | | 1.26 | % | | 1.29 | % | | 1.29 | % |
| Portfolio turnover | 199 | % | | 74 | % | | 81 | % | | 73 | % | | 63 | % |
| Net assets, ending (in thousands) |
| $13,538 |
| |
| $13,130 |
| |
| $10,871 |
| |
| $14,719 |
| |
| $8,071 |
|
| | | | | | | | | | |
| (a) Per share figures are calculated using the Average Shares Method. |
| (b) Amount includes a non-recurring refund for overbilling of prior years’ custody out-of-pocket fees. This amounted to $0.001 per share and 0.00% of average net assets. |
| (c) Total return is not annualized for periods of less than one year and does not reflect deduction of any front-end or deferred sales charge. |
| (d) Total expenses do not reflect amounts reimbursed and/or waived by the Advisor and certain of its affiliates, if applicable. Net expenses are net of all reductions and represent the net expenses paid by the Fund. |
| See notes to financial statements. |
calvert.com CALVERT CAPITAL ACCUMULATION FUND ANNUAL REPORT 31
PROXY VOTING
The Proxy Voting Guidelines of the Calvert Funds that the Fund uses to determine how to vote proxies relating to portfolio securities are provided as an Appendix to the Fund’s Statement of Additional Information. The Statement of Additional Information can be obtained free of charge by calling the Fund at 1-800-368-2745, by visiting the Calvert website at www.calvert.com; or by visiting the SEC’s website at www.sec.gov.
Information regarding how the Fund voted proxies relating to portfolio securities during the most recent 12-month period ended June 30 is available on the Fund’s website at www.calvert.com and on the SEC’s website at www.sec.gov.
AVAILABILITY OF QUARTERLY PORTFOLIO HOLDINGS
The Fund files its complete schedule of portfolio holdings with the SEC for the first and third quarters of each fiscal year on Form N-Q. The Fund’s Form N-Q is available on the SEC’s website at www.sec.gov. The Fund’s Form N-Q may be reviewed and copied at the SEC’s Public Reference Room in Washington, DC; information on the operation of the Public Reference Room may be obtained by calling 1-800-SEC-0330.
32 calvert.com CALVERT CAPITAL ACCUMULATION FUND ANNUAL REPORT (UNAUDITED)
DIRECTOR AND OFFICER INFORMATION TABLE
|
| | | | | |
| Name & Age | Position With Fund | Position Start Date | Principal Occupation During Last 5 Years | # of Calvert Portfolios Overseen | Other Directorships During the Past Five Years |
| INDEPENDENT TRUSTEES/DIRECTORS |
REBECCA L. ADAMSON AGE: 67 | Trustee Director Director Director | 1989 CSIF 2000 IMPACT 2000 CRIS 2005 CWVF | President and Founder of the national non-profit, First People’s Worldwide. Founded in 1980, First People’s Worldwide is the only American Indian alternative development institute in the U.S. | 19 | • Bay & Paul Foundation |
RICHARD L. BAIRD, JR. AGE: 68 | Trustee & Chair Director & Chair Director & Chair Director & Chair
| 1982 CSIF
2000 CRIS
2005 CWVF
2005 IMPACT | Former President and CEO of Adagio Health Inc. (retired in 2014) in Pittsburgh, PA, a non-profit corporation which provides family planning services, nutrition, maternal/child health care, and various health screening services and community preventive health programs. | 24 | None |
JOHN G. GUFFEY, JR. AGE: 68 | Director Trustee Director Director | 1992 CWVF 1982 CSIF 2000 CRIS 2005 IMPACT | Consultant and President of Aurora Press Inc., a privately held publisher of trade paperbacks. | 24 | • Ariel Funds (3) (asset management) (through 12/31/11) • Calvert Social Investment Foundation • Calvert Ventures, LLC |
MILES D. HARPER, III AGE: 53 | Director Trustee Director Director | 2000 IMPACT 2005 CSIF 2005 CRIS 2005 CWVF | Partner, Carr Riggs & Ingram (public accounting firm) since October 2014. Partner, Gainer Donnelly & Desroches (public accounting firm) (now Carr Riggs & Ingram), 1999-2014. | 19 | • Bridgeway Funds (14) (asset management) |
JOY V. JONES AGE: 66 | Director Trustee Director Director | 2000 IMPACT 1990 CSIF 2000 CRIS 2005 CWVF | Attorney. | 19 | • Director, Conduit Street Restaurants SUD 2 Limited • Director, Palm Management Corporation |
TERRENCE J. MOLLNER, Ed.D. AGE: 71 | Director Trustee Director Director | 1992 CWVF 1982 CSIF 2000 CRIS 2005 IMPACT | Founder, Chairperson and President of Trusteeship Institute, Inc., an educational organization focused on the personal skills and organizations described in Dr. Mollner’s book, The Love Skill: We Are Mastering the 7 Layers of Human Maturity, particularly businesses that freely chose to give priority to the common good. Chairperson, Stakeholders Capital, Inc., an asset management firm and financial services provider.
| 19 | • Calvert Social Investment Foundation • Ben & Jerry’s Homemade, Inc. (food products) |
SYDNEY A. MORRIS AGE: 67 | Trustee Director Director Director | 1982 CSIF 2000 CRIS 2005 CWVF 2005 IMPACT | The Rev. Dr. Morris is a Unitarian Universalist minister. | 19 | None |
| |
calvert.com CALVERT CAPITAL ACCUMULATION FUND ANNUAL REPORT (UNAUDITED) 33
|
| | | | | |
| Name & Age | Position With Fund | Position Start Date | Principal Occupation During Last 5 Years | # of Calvert Portfolios Overseen | Other Directorships During the Past Five Years |
| INTERESTED TRUSTEES/DIRECTORS |
D. WAYNE SILBY, Esq.* AGE: 68 | Director Trustee Director Director | 1992 CWVF 1982 CSIF 2000 CRIS 2000 IMPACT | Mr. Silby is the founding Chair of the Calvert Funds. He is the Chair-Elect and a principal of Syntao.com, a Beijing-based company promoting corporate social responsibility. | 24 | • Ameritas Mutual Holding Company (insurance) • Calvert Social Investment Foundation • ImpactAssets, Inc. (asset management) • Committee for the Future (charitable supporting organization) • Syntao.com China (HK) (sustainability consulting) • The ICE Organization (environmental services) |
JOHN H. STREUR* AGE: 56 | Director & President Trustee & President Director & President Director & President | 2015 CWVF
2015 CSIF
2015 CRIS
2015 IMPACT | Director, Chairman, President and Chief Executive Officer of Calvert Investments, Inc., Calvert Investment Administrative Services, Inc., Calvert Investment Management, Inc., Calvert Investment Distributors, Inc. and Calvert Investment Services, Inc. (since January 2015); Chief Compliance Officer, Calvert Investment Distributors, Inc. (since August 2015); Chief Compliance Officer, Calvert Investment Management, Inc. (August 2015 - April 2016); President and Director, Portfolio 21 Investments, Inc. (through October 2014); President, Chief Executive Officer and Director, Managers Investment Group LLC (through January 2012); President and Director, The Managers Funds and Managers AMG Funds (through January 2012). | 37 | • Portfolio 21 Investments, Inc. (asset management)(through October 2014) • Managers Investment Group LLC (asset management)(through January 2012) • The Managers Funds (asset management) (through January 2012) • Managers AMG Funds (asset management) (through January 2012) • Calvert Social Investment Foundation |
* Mr. Silby is an interested person of the Funds since he is a Director of the parent company of each Fund’s Advisor. Mr. Streur is an interested person of the Funds since he is an Officer and Director of each Fund’s Advisor and certain affiliates. The address of the Trustees and Officers is 4550 Montgomery Avenue, Suite 1000N, Bethesda, Maryland 20814, with the exception of Mr. Silby, whose address is 1715 18th Street, N.W., Washington, DC 20009. Additional information about the Fund’s Trustees/Directors can be found in the Statement of Additional Information (SAI). You can get a free copy of the SAI at www.calvert.com, or by contacting your broker, or the Fund at 1-800-368-2745. |
34 calvert.com CALVERT CAPITAL ACCUMULATION FUND ANNUAL REPORT (UNAUDITED)
|
| | | |
| Name & Age | Position with Funds | Position Start Date | Principal Occupation During Last 5 Years |
| OFFICERS |
VICKI L. BENJAMIN AGE: 54 | Treasurer | 2015 | Treasurer of the Funds (since March 2015); Director, Executive Vice President, Chief Financial Officer, Chief Operating Officer and Treasurer of Calvert Investments, Inc., Calvert Investment Administrative Services, Inc., and Calvert Investment Services, Inc. (since October 2015); Director, Executive Vice President, Chief Financial Officer - Elect, Chief Operating Officer and Treasurer of Calvert Investment Management, Inc. and Calvert Investment Distributors, Inc. (since October 2015); Director, Senior Vice President and Chief Financial Officer of Calvert Investments, Inc., Calvert Investment Administrative Services, Inc., Calvert Investment Services, Inc., Calvert Investment Management, Inc. and Calvert Investment Distributors, Inc. (March 2015 - September 2015); and Senior Partner, KPMG LLP (2005 - 2015). |
ROBERT D. BENSON, Esq. AGE: 37 | Associate General Counsel, Assistant Vice President & Assistant Secretary | 2014 | Associate General Counsel (since September 2016), Assistant General Counsel (2014 - September 2016), Assistant Vice President and Assistant Secretary of the Funds, Calvert Investments, Inc., Calvert Investment Administrative Services, Inc., Calvert Investment Services, Inc., Calvert Investment Management, Inc. and Calvert Investment Distributors, Inc. (since 2014); and Staff Attorney, Calvert Investments, Inc., Calvert Investment Administrative Services, Inc., Calvert Investment Services, Inc., Calvert Investment Management, Inc. and Calvert Investment Distributors, Inc. (2008 - 2014). |
HOPE BROWN AGE: 42 | Chief Compliance Officer | 2014 | Chief Compliance Officer of the Funds (since November 2014); Vice President and Chief Compliance Officer, Wilmington Funds (December 2012 - November 2014); and Vice President and Senior Compliance Officer, Wilmington Trust Investment Advisors, Inc. (September 2010 - December 2012). |
THOMAS DAILEY AGE:51 | Vice President | 2012 | Vice President of the Funds (since 2012); and Vice President (since January 2005) and Portfolio Manager - Tax Exempt, Calvert Investment Management, Inc. (since 1995). |
STU DALHEIM AGE: 46 | Vice President | 2015 | Vice President of the Funds (since 2015); and Vice President - Governance and Advocacy of Calvert Investment Management, Inc. (since October 2011). |
BRIAN ELLIS, CFA AGE: 32 | Vice President | 2016 | Vice President of the Funds (since February 2016); Portfolio Manager, Taxable Fixed Income, Calvert Investment Management, Inc. (since May 2012); and Business Analyst (2009 - May 2012), Calvert Investment Management, Inc. |
ROBERT J. ENDERSON, CFA AGE: 57 | Assistant Treasurer | 2014 | Assistant Treasurer of the Funds (since 2014); Vice President, Corporate Finance, and Assistant Treasurer, Calvert Investments, Inc., Calvert Investment Administrative Services, Inc., Calvert Investment Management, Inc., Calvert Investment Services, Inc. and Calvert Investment Distributors, Inc. (since 2007); Acting Chief Financial Officer of Calvert Investments, Inc., Calvert Investment Administrative Services, Inc., Calvert Investment Management, Inc., Calvert Investment Services, Inc. and Calvert Investment Distributors, Inc. (September 2014 - March 2015). |
PATRICK FAUL, CFA AGE: 51 | Vice President | 2010 | Vice President (since 2007) and Head of Credit Research, Calvert Investment Management, Inc. (since January 2010). |
TRACI L. GOLDT AGE: 42 | Assistant Secretary | 2004 | Assistant Secretary of the Funds (since 2004); Director, Strategic Projects and Fund Operations, Calvert Investment Administrative Services, Inc. (since June 2016); and SEC Filing and Operations Manager, Calvert Investment Administrative Services, Inc. (2011 – 2016). |
JADE HUANG AGE: 41 | Vice President | 2015 | Vice President of the Funds (since 2015); Portfolio Manager - Equity, Calvert Investment Management, Inc. (since November 2015); and Senior Equity Analyst, Calvert Investment Management, Inc. (2006 - November 2015). |
VISHAL KHANDUJA, CFA AGE: 38 | Vice President | 2014 | Vice President of the Funds (since 2014); Vice President and Head of Taxable Bond, Calvert Investment Management, Inc. (since May 2016); Vice President and Portfolio Manager, Taxable Fixed Income, Calvert Investment Management, Inc. (2012 - May 2016); Portfolio Manager - Global Rates and Currency Team, Columbia Management (2009 - 2012). |
ERICA LASDON AGE: 45 | Assistant Vice President, Research and Advocacy | 2015 | Assistant Vice President, Research and Advocacy of the Funds (since 2016) and Calvert Investment Management, Inc. (since August 2015); and Senior Sustainability Analyst and Manager, Calvert Investment Management, Inc. (2005 - August 2015). |
JOSHUA LINDER, CFA AGE: 30 | Vice President | 2016 | Vice President of the Funds (since 2016); Portfolio Manager, Equity, Calvert Investment Management, Inc. (since January 2016); Assistant Portfolio Manager, Calvert Investment Management, Inc. (January 2014 - October 2015); and Equity Analyst, Calvert Investment Management, Inc. (2011 - 2013). |
CHRISTOPHER MADDEN AGE: 40 | Vice President | 2015 | Vice President of the Funds (since 2015); Portfolio Manager - Equity, Calvert Investment Management, Inc. (since November 2015); and Senior Equity Analyst, Calvert Investment Management, Inc. (2010 - November 2015). |
calvert.com CALVERT CAPITAL ACCUMULATION FUND ANNUAL REPORT (UNAUDITED) 35
|
| | | |
| Name & Age | Position with Funds | Position Start Date | Principal Occupation During Last 5 Years |
| OFFICERS |
ANDREW K. NIEBLER, Esq. AGE: 48 | Deputy General Counsel, Vice President & Secretary | 2006 (TCF, CMS, CRIS, CSIF, CVS)
2008 (CVP)
2016 (CIF) | Deputy General Counsel, Vice President and Secretary of the Funds, Calvert Investments, Inc., Calvert Investment Administrative Services, Inc., Calvert Investment Management, Inc., Calvert Investment Distributors, Inc. and Calvert Investment Services, Inc. (since May 2016); Assistant Vice President, Associate General Counsel and Assistant Secretary, Calvert Investments, Inc., Calvert Investment Administrative Services, Inc., Calvert Investment Management, Inc., Calvert Investment Distributors, Inc. and Calvert Investment Services, Inc. (September 2009 - May 2016); and Assistant Vice President, Assistant General Counsel and Assistant Secretary, Calvert Investments, Inc., Calvert Investment Administrative Services, Inc., Calvert Investment Management, Inc., Calvert Investment Distributors, Inc. and Calvert Investment Services, Inc. (prior to September 2009). |
MONIQUE S. PATTILLO, Esq. AGE: 34 | Assistant General Counsel, Assistant Vice President & Assistant Secretary | 2016 | Assistant Vice President, Assistant General Counsel and Assistant Secretary of the Funds, Calvert Investments, Inc., Calvert Investment Administrative Services, Inc., Calvert Investment Management, Inc., Calvert Investment Distributors, Inc. and Calvert Investment Services, Inc. (since September 2016); Adjunct Faculty, Howard Community College (since June 2015); Adjunct Assistant Professor, University of Maryland University College (since June 2016); Legal Counsel, T. Rowe Price Associates, Inc. (March 2014 - June 2015); and Assistant U.S. Counsel, Aberdeen Asset Management, Inc. (January 2011 - March 2014). |
MARYBETH PILAT, CPA AGE: 48 | Fund Controller and Assistant Treasurer | 2015 | Fund Controller and Assistant Treasurer of the Funds (since August 2015); Director, Anti-Money Laundering Officer and Assistant Treasurer, Calvert Investments, Inc., Calvert Investment Administrative Services, Inc., Calvert Investment Management, Inc., Calvert Investment Distributors, Inc. and Calvert Investment Services, Inc. (since August 2015); Director of Fund Administration, Calvert Investment Administrative Services, Inc. (since August 2015); VP Expense & Budgeting, Global Fiduciary Platform, Legg Mason (May 2015 - July 2015); and Vice President and Assistant Treasurer, Columbia Funds, Ameriprise, Columbia Management (2010 - April 2015). |
JOHN H. STREUR AGE: 56 | President and Director (except CVS) | 2015 | Director, Chairman, President and Chief Executive Officer of Calvert Investments, Inc., Calvert Investment Administrative Services, Inc., Calvert Investment Management, Inc., Calvert Investment Distributors, Inc. and Calvert Investment Services, Inc. (since January 2015); Chief Compliance Officer, Calvert Investment Distributors, Inc. (since August 2015); Chief Compliance Officer, Calvert Investment Management, Inc. (August 2015 - April 2016); President and Director, Portfolio 21 Investments, Inc. (through October 2014); President, Chief Executive Officer and Director, Managers Investment Group LLC (through January 2012); President and Director, The Managers Funds and Managers AMG Funds (through January 2012). |
36 calvert.com CALVERT CAPITAL ACCUMULATION FUND ANNUAL REPORT (UNAUDITED)
|
|
| This page intentionally left blank. |
|
|
| This page intentionally left blank. |
|
| | | | |
| CALVERT CAPITAL ACCUMULATION FUND | | CALVERT’S FAMILY OF FUNDS | | |
To Open an Account 800-368-2748 Service for Existing Account Shareholders: 800-368-2745 Brokers: 800-368-2746 Registered Mail Calvert Investments c/o BFDS, P.O. Box 219544 Kansas City, MO 64121-9544 Overnight Mail Calvert Investments c/o BFDS, 330 West 9th Street Kansas City, MO 64105 Web Site calvert.com Principal Underwriter Calvert Investment Distributors, Inc. 4550 Montgomery Avenue Suite 1000 North Bethesda, Maryland 20814 | | Municipal Funds Tax-Free Responsible Impact Bond Fund Taxable Bond Funds Bond Portfolio Income Fund Short Duration Income Fund Long-Term Income Fund Ultra-Short Income Fund High Yield Bond Fund Green Bond Fund Unconstrained Bond Fund Balanced and Asset Allocation Funds Balanced Portfolio Conservative Allocation Fund Moderate Allocation Fund Aggressive Allocation Fund | | Equity Funds Equity Portfolio U.S. Large Cap Core Responsible Index Fund U.S. Large Cap Value Responsible Index Fund U.S. Large Cap Growth Responsible Index Fund U.S. Mid Cap Core Responsible Index Fund Developed Markets Ex-U.S. Responsible Index Fund Capital Accumulation Fund International Equity Fund Small Cap Fund Global Energy Solutions Fund Global Water Fund International Opportunities Fund Emerging Markets Equity Fund |
|
| |
| | |
This report is intended to provide fund information to shareholders. It is not authorized for distribution to prospective investors unless preceded or accompanied by a prospectus. Note: The information on our website is not incorporated by reference into this report; our website address is included as an inactive textual reference only. Investors should carefully consider the investment objectives, risks, charges and expenses of the Calvert Funds. This and other important information is contained in the fund’s summary prospectus and prospectus, which can be obtained from your financial professional and should be read carefully before investing. You may also call Calvert at 800/368-2748 or visit calvert.com. |
| Printed on recycled paper using soy inks. | |
|
| | |
| | |
| | | |
Calvert International Opportunities Fund
| | |
| | | |
| | |
|
| |
Annual Report September 30, 2016 E-Delivery Sign-Up — Details Inside | |
|
|
| |
Choose Planet-friendly E-delivery! Sign up now for on-line statements, prospectuses, and fund reports. In less than five minutes you can help reduce paper mail and lower fund costs. Just go to calvert.com. If you already have an online account at Calvert, click on Login, to access your Account, and select the documents you would like to receive via e-mail. If you’re new to online account access, click on Login, then Register to create your user name and password. Once you’re in, click on the E-delivery sign-up on the Account Portfolio page and follow the quick, easy steps. Note: if your shares are not held directly at Calvert but through a brokerage firm, you must contact your broker for electronic delivery options available through their firm. |
|
| | | |
| | | TABLE OF CONTENTS |
| | | | |
| | | | President’s Letter |
| | | | Portfolio Management Discussion |
| | | | Understanding Your Fund’s Expenses |
| | | | Report of Independent Registered Public Accounting Firm |
| | | | Schedule of Investments |
| | | | Statement of Assets and Liabilities |
| | | | Statement of Operations |
| | | | Statements of Changes in Net Assets |
| | | | Notes to Financial Statements |
| | | | Financial Highlights |
| | | | Proxy Voting |
| | | | Availability of Quarterly Portfolio Holdings |
| | | | Director and Officer Information Table |
|
| | |
| John Streur President and Chief Executive Officer, Calvert Investments, Inc. | |
Dear Fellow Shareowners and Friends,
Forty years ago, Calvert Investments was founded on the belief that investment capital, properly stewarded, could improve the world for its less powerful inhabitants and improve environmental sustainability, while producing reasonable investment returns. Calvert was one of the first investment advisers to introduce the responsible investment concept, and through many years of innovation and research (supported by you, our shareholders), we have developed this philosophy to now provide even greater shareholder engagement and impact.
Corporations throughout the world, big and small, have an ever increasing role in determining social and environmental outcomes for every living being, today and into the future. The power of corporations, garnered through global influence, human capital and financial strength, especially relative to our other institutions, has been steadily increasing for decades (http://www.calvert.com/perspective/research/calvert-serafeim-series-report).
Investors recognize the impact of corporations on society, and more and more are making investment decisions based on their assessments of a company’s effect on environmental and social outcomes. Companies able to operate their business in a perceived sustainable manner, promoting, environmental and social justice stand to benefit; while those corporate laggards, that fail to embrace these new responsibilities, will falter.
Reliable information is critical in ensuring that shareholders are able to make informed assessments regarding a corporation’s sustainability profile. Key performance metrics and data (a “sustainability information system”) that indicates how a company is performing regarding environmental and social impacts, is integral to making informed responsible investment decisions. Through partnerships with world class educational institutions and forward thinking business partners, Calvert is developing valuable research methodologies and metrics to assess the quality of data inputs and results, such that we are able to assess companies’ impacts. Are we completely there yet? No, but as data becomes more transparent and consistent, driven, in part by investor demands and regulatory authorities, we will get there, such that we and other market participants can make better informed investment and purchase decisions. For example, key data that measures “true” intrinsic and extrinsic product costs, including indirect environmental and social impacts could be relevant to investors when making corporate comparisons regarding risk and profitability, and also of great interest to consumers making product purchase decisions.
Calvert is participating in the Sustainability Accounting Standards Board Investment Advisory Group, which is working to move the disclosure of ESG metrics forward through corporate SEC filings (http://www.sasb.org/). Calvert is also working to map the United Nations Sustainable Development Goals to the SASB standards (http://www.calvert.com/perspective/social-impact/unsdg-faq), in order to better evaluate the progress of any public corporation on its path towards global sustainability.
Also, involved in this effort are millions of individuals and small organizations throughout the world who are adding to this mosaic of information through their local and specialized efforts and services. They often have access to pockets of information that are not publically available or disseminated, and thereby not available to the financial data service companies. Our myriad and long running engagements with NGOs and corporations provide critical insight to our analysts, driving the enhancement of our information infrastructure forward, as they research potential investments for your portfolios and design shareholder activist agendas.
ESG data about corporate behavior provides a useful baseline, but takes on additional meaning as the Calvert Principles for Responsible Investment guide our interpretation of the data, acting as our “responsibility compass” (http://www.calvert.com/approach/how-we-invest/the-calvert-principles). In addition to providing a context consistent with Calvert’s mission, our Principles lead us to areas where additional, fundamental research is needed to develop a real understanding of corporate impact on society and the environment. In our complex, globalized and rapidly evolving world, the Principles allow us to contextualize information, whereas a rules based system, or an exclusive reliance on data from companies may miss valuable situational and circumstantial inference, as evidenced in the issues surrounding Standing Rock and the role of the corporation, Energy Transfer Partners. The Standing Rock Sioux Nation is striving to halt construction of the Dakota Access Pipeline crossing their sacred land and threatening water contamination (see our resolution in support of the Standing Rock Sioux Nation, (http://www.calvert.com/perspective/climate-and-environment/calvert-releases-statement-in-support-of-standing-rock-sioux-nation).
4 calvert.com CALVERT INTERNATIONAL OPPORTUNITIES FUND ANNUAL REPORT (UNAUDITED)
The concerns surrounding social license and indigenous peoples’ rights are complex and do not lend themselves easily to objective quantification methods employed by the traditional financial data sources. That is why the fundamental overlay performed by the Calvert research analysts is so essential to our effective responsible investing process.
While effecting change through thoughtful ESG capital allocations is important, direct impact can be made through shareholder activism, or more specifically advocacy. Calvert’s shareholder advocacy process (28 resolutions last year) has been effective in influencing corporate behavior and provides another avenue for influencing valuable societal and environmental outcomes (http://www.calvert.com/perspective/social-impact/2016-proxy-season-brings-opportunity-to-accelerate-corporate-sustainability-progress).
Calvert’s voice reflects and respects diversity of thought and is often used to protect the interests of those most in need, and to look out for future generations. We thank you, our shareholders, friends and partners in this mission, for a good start. We promise that our work will never be done and the next forty years will reflect the increasing imperative to work vigorously to produce competitive returns for you and to use our power to forge a better today and future for our society. Often this requires Calvert to go where other investment firms have not, and to speak out and act when others do not.
Thank you, as always, for the incredible privilege to serve your needs through the Calvert Funds.
Respectfully,
John Streur
September 2016
calvert.com CALVERT INTERNATIONAL OPPORTUNITIES FUND ANNUAL REPORT (UNAUDITED) 5
|
| |
| PORTFOLIO MANAGEMENT DISCUSSION |
|
| | | |
| John Nichols, CFA Vice President - Equities | | |
Market Review
Developed market equities underperformed U.S. equities over the last twelve months, but the Fund’s segment of the market-small and mid-cap stocks—did substantially better than their large cap peers. The MSCI EAFE SMid Index returned 10.48% for the period, almost 4 percentage points better than the EAFE Index, but over 6 percentage points behind the MSCI Emerging Markets Index.
Significant uncertainty about global economic prospects and the ability of central banks and political leaders to spur growth while also mitigating increasing populist pressure against traditional trade and monetary solutions dominated equity markets during the twelve-month period ending September 30, 2016. The decision by UK voters to exit the EU generated considerable volatility in equity and currency markets; after sharp initial declines, a rebound in UK equities trimmed losses. Having failed to ignite growth through aggressive monetary policies, the Bank of Japan adopted a novel policy of trying to control the yield curve; the new approach was announced late in the Fund’s fiscal year and it will be some time before there is any evidence whether the change will encourage more investment by Japanese companies. A more promising development for Japanese equities was the ongoing effort of Japanese policymakers to encourage Japanese companies to enhance governance protections for minority shareholders, a campaign that began to show results during the period as some companies took steps to increase transparency and return capital to shareholders through buybacks and dividend increases. The end of the multi-year decline in basic commodities prices added to volatility in equity prices and currencies that are related to direct commodity production and commodity-related materials.
Investment Strategy and Technique
Calvert International Opportunities Fund is subadvised by two managers with complementary investment styles and processes. Advisory Research Inc, a value-oriented fundamental manager, currently manages approximately 52% of the Fund, while Trilogy Global Advisors, a growth manager, manages the balance of the Fund. We have been incrementally shifting the manager allocation to bring it into a 50/50 balance. The Fund’s focus is on developed market equities with 11.11% of the Fund invested in emerging market securities at period end.
Fund Performance Relative to the Benchmark
For the twelve-month period ending September 30, 2016, Calvert International Opportunities Fund Class A shares (at NAV) returned 5.49%, underperforming its benchmark, the MSCI EAFE SMid Index, which returned 10.48%, by 4.99%. Stock selection was the primary source of underperformance for the period. The overweight to the Financials sector—the only sector to lose value in the benchmark this year, and the lack of holdings in the environmentally problematic Metal and Mining industry—which was up over 50% in the benchmark, further contributed to the Fund’s underperformance.
Leading detractors from stock selection included IDOM, Japan’s number one used car dealer, PureCircle, the world’s leading supplier and marketer of high purity stevia products and Swiss asset manager GAM Holdings. IDOM was off 37% as the company suffered greater than expected promotional costs when they altered its original business model, exporting used cars purchased through its dealer network in Japan, to add a focus on selling in the retail used car market in Japan. After meeting with management, we elected to sell this position.
PureCircle suffered a setback in May when the U.S. Customs and Border Protection (CBP) detained shipments of PureCircle stevia into the U.S. due to allegations that these shipments contained products that were produced using forced labor. The company’s proactive approach to managing its supply chain and investing in third party audits of their historic labor practices at the highest global standards enabled the company to respond quickly to CBP’s complaints, and proved that its product was not involved with any external suppliers that used forced labor and, in fact, stands as a point of differentiation from companies without such policies. Demonstrating its leadership in the industry, the company also reiterated its commitment to human rights, fair use of labor and traceability and transparency across its supply chain. Although shipments were released in late June, this event has had a negative effect on current period earnings. We continue to believe the fundamentals and growth opportunity for the company remains attractive.
6 calvert.com CALVERT INTERNATIONAL OPPORTUNITIES FUND ANNUAL REPORT (UNAUDITED)
|
| | | | |
| | | | |
| | CALVERT INTERNATIONAL OPPORTUNITIES FUND |
| | SEPTEMBER 30, 2016 |
| | | | |
| | ECONOMIC SECTORS | % OF TOTAL INVESTMENTS* | |
| | Industrials | 20.0 | % | |
| | Consumer Discretionary | 17.1 | % | |
| | Financials | 13.6 | % | |
| | Information Technology | 10.2 | % | |
| | Consumer Staples | 9.6 | % | |
| | Materials | 9.4 | % | |
| | Real Estate | 8.7 | % | |
| | Health Care | 6.9 | % | |
| | Short-Term Investments | 2.7 | % | |
| | Telecommunication Services | 0.9 | % | |
| | High Social Impact Investments | 0.6 | % | |
| | Energy | 0.3 | % | |
| | Total | 100 | % | |
| | | | |
| | * Does not reflect the value of securities held as cash collateral on securities loaned. | |
| | | | |
GAM Holdings suffered and poor investment performance in key funds and strategies, which, in turn, contributed to a surprising level of net outflows. The adverse impact on the firm’s earnings mainly due to the depression of performance fees led us to re-evaluate our original thesis and exit the positon.
On the positive side of the ledger, our investments in Ubisoft, the French gaming software firm, Swedish beauty products maker Oriflame and Brazilian low-income home builder MRV Engenharia e Participacoes added value during the period.
Ubisoft is the third largest independent publisher of video games in the world and has a stable management team, headed up by co-founder and CEO Yves Guillemot. Ubisoft has a strong game pipeline across multiple platforms which creates a steady, predictable high level of revenue, resulting in better than expected cash flows.
Oriflame sells nature inspired beauty products in more than 60 countries through a network of more than 3 million independent consultants. While originally focused on markets in Russia and the countries of the Commonwealth of Independent States, Oriflame is becoming a more balanced global operator with strong results in Asia (notably triple digit sales growth in China) and better than expected results in Latin America. In addition to strong revenue growth, profitability has been improving on better mix of both geographical markets and products as well as pricing.
Brazilian homebuilder MRV Engenharia, builds low-income housing. The stock performed well during the first quarter of 2016 due to better-than-expected earnings results as the
|
| | | | | | |
| | | | | |
| | CALVERT INTERNATIONAL OPPORTUNITIES FUND | |
| | SEPTEMBER 30, 2016 | |
| | | | | |
| | INVESTMENT PERFORMANCE | |
| | (TOTAL RETURN AT NAV) | |
| | | 6 MONTHS ENDED 9/30/16 | 12 MONTHS ENDED 9/30/16 | |
| | Class A | 2.43 | % | 5.49 | % | |
| | Class C | 1.91 | % | 4.46 | % | |
| | Class I | 2.46 | % | 5.84 | % | |
| | Class Y | 2.53 | % | 5.82 | % | |
| | MSCI EAFE Small/Mid Cap Index | 4.80 | % | 10.48 | % | |
| | Lipper International Small/Mid Cap Core Funds Average | 5.52 | % | 8.74 | % | |
| | | | | |
| | Investment performance/return at NAV does not reflect the deduction of the Fund’s maximum 4.75% front-end sales charge or any deferred sales charge. | |
| | | | | |
| | TEN LARGEST STOCK HOLDINGS | % OF NET ASSETS | |
| | BUWOG AG | 2.5 | % | |
| | Austevoll Seafood ASA | 1.7 | % | |
| | Smurfit Kappa Group plc | 1.7 | % | |
| | Oriflame Holding AG | 1.6 | % | |
| | RHOEN-KLINIKUM AG | 1.4 | % | |
| | Aurelius Equity Opportunities SE & Co. KGaA | 1.3 | % | |
| | Cie Generale des Etablissements Michelin | 1.3 | % | |
| | Speedy Hire plc | 1.3 | % | |
| | Ebro Foods SA | 1.2 | % | |
| | Entertainment One Ltd. | 1.2 | % | |
| | Total | 15.2 | % | |
| | | | | |
company demonstrated resilient operating results and strong free cash flow despite Brazil’s political challenges, economic malaise, and high interest rates. We exited the position when the stock reached our price target.
At quarter-end, our sector weights are similar to the weightings in our benchmark. We have been trimming our over exposure to Financials throughout the course of the year and increasing our exposure to Real Estate, Information Technology and Health Care. The Fund has maintained its small cap bias relative to its benchmark and valuation measures remain attractive.
Positioning and Market Outlook
We remain constructive on the U.S. economy over the medium-to-long run and believe stocks can continue to post solid performance, although probably not as robust as what we’ve experienced in recent years. While valuations of U.S. equities appear stretched based on historical standards, the
calvert.com CALVERT INTERNATIONAL OPPORTUNITIES FUND ANNUAL REPORT (UNAUDITED) 7
positive economic environment in the U.S. relative to the rest of the world should support elevated valuation levels. Many international economies continue to be hindered by underlying structural and economic fiscal challenges, including Europe and Japan.
In the near-term, equity markets face several potential headwinds. The U.S. economy is in solid shape and benefiting from improved visibility into growth, but uncertainty around the outcome of the presidential election, the Fed’s anticipated December interest-rate hike, and political decisions in other parts of Europe post-Brexit could lead to increased volatility. However, accommodative monetary policy by central banks around the world should limit the downside.
Europe may experience a bit of a relief rally, benefiting from continued easing by the ECB and modest improvements in economic data, but structural problems remain. As we anticipated, the impact of Brexit on the global economy and the reaction by markets thus far has been relatively muted, but we are starting to see some implications in the UK with the pound declining and inflation picking-up. The potential for geopolitical turmoil in a number of different European countries is also still a risk that we continue to monitor.
While we remain cautious on China’s long-term growth prospects, their injection of stimulus is starting to flow through to the real economy, easing concerns about a hard economic landing and providing support for the global economy, especially emerging markets. Combined with slow, but steady growth in the U.S. and a modest pick-up in Europe, the global economy is in better shape than earlier in the year and should be able to support elevated global equity valuations, at least for now.
Calvert Investment Management, Inc.
September 2016
8 calvert.com CALVERT INTERNATIONAL OPPORTUNITIES FUND ANNUAL REPORT (UNAUDITED)
Growth of $10,000
The graph below shows the value of a hypothetical $10,000 investment in the Fund over the past 10 fiscal year periods or since inception (for funds without 10-year records). The results shown are for Class A, reflect the deduction of the maximum front-end Class A sales charge of 4.75%, and assume the reinvestment of dividends. The result is compared with a broad based market index. Market indexes are unmanaged and their results do not reflect the effect of expenses or sales charges. The value of an investment in a different share class would be different.
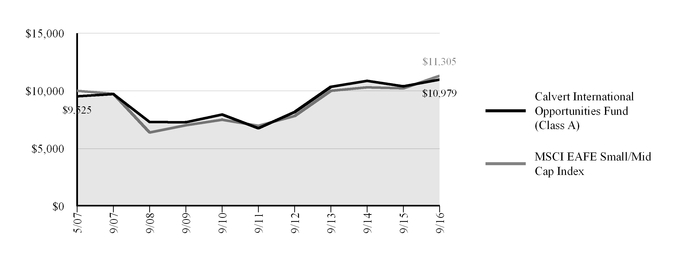
|
| | | | | | | |
| CALVERT INTERNATIONAL OPPORTUNITIES FUND |
| SEPTEMBER 30, 2016 |
| AVERAGE ANNUAL TOTAL RETURNS | Ticker Symbol | 1 Year | 5 Year | Since Inception (5/31/2007) |
| Class A (with max. load) | CIOAX | 0.46 | % | 9.06 | % | 1.00 | % |
| Class C (with max. load) | COICX | 3.46 | % | 9.17 | % | 0.69 | % |
| Class I | COIIX | 5.84 | % | 10.60 | % | 1.98 | % |
| Class Y | CWVYX | 5.82 | % | 10.40 | % | 1.73 | % |
| MSCI EAFE Small/Mid Cap Index | | 10.48 | % | 10.14 | % | 1.30 | % |
| Lipper International Small/Mid Cap Core Funds Average | | 8.74 | % | 8.63 | % | 1.00 | % |
| | | | | |
| Calvert International Opportunities Fund first offered Class C shares on July 31, 2007 and Class Y shares on October 31, 2008. Performance prior to those dates reflects the performance of Class A shares at net asset value (NAV). Actual Class C and Class Y share performance would have been different. |
| | | | | |
All performance data shown, including the graph above and the adjacent table, represents past performance, does not guarantee future results, assumes reinvestment of dividends and distributions, and does not reflect the deduction of taxes that a shareholder would pay on the Fund’s distributions or the redemption of the Fund shares. All performance data reflects fee waivers and/or expense limitations, if any are in effect; in their absence performance would be lower. See Note B in Notes to Financial Statements. The investment return and principal value of an investment will fluctuate so that an investor’s shares, when redeemed, may be worth more or less than their original cost. Current performance may be lower or higher than the performance data quoted; for current performance data, including most recent month-end, visit www.calvert.com. The gross expense ratio from the current prospectus for Class A shares is 1.51%. This number may differ from the expense ratio shown elsewhere in this report because it is based on a different time period and, if applicable, does not include fee or expense waivers. Performance data quoted already reflects the deduction of the Fund’s operating expenses.
calvert.com CALVERT INTERNATIONAL OPPORTUNITIES FUND ANNUAL REPORT (UNAUDITED) 9
UNDERSTANDING YOUR FUND’S EXPENSES
As an investor, you incur two types of costs. There are transaction costs, which generally include sales charges on purchases and may include redemption fees. There are also ongoing costs, which generally include management fees, distribution and/or service fees, and other fund expenses. The following information is intended to help you understand your ongoing costs (in dollars) of investing in this mutual fund and to help you compare these costs with the ongoing costs of investing in other mutual funds.
To illustrate these ongoing costs, we have provided examples and calculated the expenses paid by the fund’s investors during the period. The actual and hypothetical information presented in the examples is based on an investment of $1,000 invested at the beginning of the period and held for the entire period (April 1, 2016 to September 30, 2016).
Actual Expenses
The first line of the table below provides information about actual account values and actual expenses. You may use the information in this line, together with the amount you invested, to estimate the expenses that you paid over the period. Simply divide your account value by $1,000 (for example, an $8,600 account value divided by $1,000 = 8.6), then multiply the result by the number in the first line under the heading entitled “Expenses Paid During Period” to estimate the expenses you paid on your account during this period.
The fund may charge an annual low balance account fee of $15 to those shareholders whose regular account balance is less than $2,000 ($1,000 for IRA accounts). If the low balance fee applies to your account, you should subtract the fee from the ending account value in the chart below.
Hypothetical Example for Comparison Purposes
The second line of the table below provides information about hypothetical account values and hypothetical expenses based on the Fund’s actual expense ratio and an assumed rate of return of 5% per year before expenses, which is not the Fund’s actual return. The hypothetical account values and expenses may not be used to estimate the actual ending account balance or expenses you paid for the period. You may use this information to compare the ongoing costs of investing in the Fund and other funds. To do so, compare the 5% hypothetical example with the 5% hypothetical examples that appear in the shareholder reports of the other funds.
Please note that the expenses shown in the table are meant to highlight your ongoing costs only and do not reflect any transactional costs, such as sales charges (loads), or redemption fees. Therefore, the second line of the table is useful in comparing ongoing costs only, and will not help you determine the relative total costs of owning different funds. In addition, if these transactional costs were included, your costs would have been higher.
|
| | | | |
| | ANNUALIZED
EXPENSE RATIO | BEGINNING
ACCOUNT VALUE
4/1/16 | ENDING
ACCOUNT VALUE
9/30/16 | EXPENSES PAID
DURING PERIOD*
4/1/16 - 9/30/16 |
| Class A | | | | |
| Actual | 1.43% | $1,000.00 | $1,024.30 | $7.24 |
| Hypothetical (5% return per year before expenses) | 1.43% | $1,000.00 | $1,017.85 | $7.21 |
| Class C | | | | |
| Actual | 2.41% | $1,000.00 | $1,019.10 | $12.17 |
| Hypothetical (5% return per year before expenses) | 2.41% | $1,000.00 | $1,012.95 | $12.13 |
| Class I | | | | |
| Actual | 1.22% | $1,000.00 | $1,024.60 | $6.18 |
| Hypothetical (5% return per year before expenses) | 1.22% | $1,000.00 | $1,018.90 | $6.16 |
| Class Y | | | | |
| Actual | 1.17% | $1,000.00 | $1,025.30 | $5.92 |
| Hypothetical (5% return per year before expenses) | 1.17% | $1,000.00 | $1,019.15 | $5.91 |
| |
| * Expenses paid during the period are equal to the annualized expense ratio for each class as indicated above, multiplied by the average account value over the period, multiplied by 183/366 (to reflect the one-half year period). Expense ratios shown in the Financial Highlights represent the actual expenses incurred for the fiscal year. |
10 calvert.com CALVERT INTERNATIONAL OPPORTUNITIES FUND ANNUAL REPORT
REPORT OF INDEPENDENT REGISTERED PUBLIC ACCOUNTING FIRM
The Board of Directors of Calvert World Values Fund, Inc. and Shareholders of the Calvert International Opportunities Fund:
We have audited the accompanying statement of assets and liabilities of the Calvert International Opportunities Fund (the “Fund”), a series of Calvert World Values Fund, Inc., including the schedule of investments, as of September 30, 2016, and the related statement of operations for the year then ended, the statements of changes in net assets for each of the years in the two-year period then ended, and the financial highlights for each of the years in the five-year period then ended. These financial statements and financial highlights are the responsibility of the Fund’s management. Our responsibility is to express an opinion on these financial statements and financial highlights based on our audits.
We conducted our audits in accordance with the standards of the Public Company Accounting Oversight Board (United States). Those standards require that we plan and perform the audit to obtain reasonable assurance about whether the financial statements and financial highlights are free of material misstatement. An audit includes examining, on a test basis, evidence supporting the amounts and disclosures in the financial statements. Our procedures included confirmation of securities owned as of September 30, 2016 by correspondence with the custodian and brokers or by other appropriate auditing procedures. An audit also includes assessing the accounting principles used and significant estimates made by management, as well as evaluating the overall financial statement presentation. We believe that our audits provide a reasonable basis for our opinion.
In our opinion, the financial statements and financial highlights referred to above present fairly, in all material respects, the financial position of the Calvert International Opportunities Fund as of September 30, 2016, the results of its operations for the year then ended, the changes in its net assets for each of the years in the two-year period then ended, and the financial highlights for each of the years in the five-year period then ended, in conformity with U.S. generally accepted accounting principles.
Philadelphia, Pennsylvania
November 23, 2016
calvert.com CALVERT INTERNATIONAL OPPORTUNITIES FUND ANNUAL REPORT 11
CALVERT INTERNATIONAL OPPORTUNITIES FUND
SCHEDULE OF INVESTMENTS
SEPTEMBER 30, 2016
|
| | |
| | SHARES | VALUE ($) |
| COMMON STOCKS - 95.6% | | |
| | | |
| Australia - 3.0% | | |
| GrainCorp Ltd., Class A | 249,665 | 1,506,207 |
| Orora Ltd. | 564,122 | 1,368,151 |
| Qantas Airways Ltd. | 844,808 | 2,029,070 |
| Tassal Group Ltd. | 647,921 | 2,005,700 |
| | | 6,909,128 |
| | | |
| Austria - 4.6% | | |
| BUWOG AG * | 208,703 | 5,645,848 |
| Wienerberger AG | 126,053 | 2,140,153 |
| Zumtobel Group AG | 136,462 | 2,634,487 |
| | | 10,420,488 |
| | | |
| Canada - 1.2% | | |
| Entertainment One Ltd. | 940,908 | 2,761,078 |
| | | |
| China - 0.9% | | |
| China Lesso Group Holdings Ltd. | 3,138,550 | 2,143,750 |
| | | |
| Denmark - 1.1% | | |
| Matas A/S | 136,448 | 2,557,367 |
| | | |
| Finland - 1.5% | | |
| Metsa Board Oyj (a) | 397,635 | 2,354,728 |
| Tieto Oyj | 33,758 | 1,065,630 |
| | | 3,420,358 |
| | | |
| France - 4.4% | | |
| BioMerieux | 5,027 | 749,163 |
| Cie Generale des Etablissements Michelin | 25,820 | 2,859,176 |
| Eurazeo SA | 29,422 | 1,706,869 |
| Ubisoft Entertainment SA * | 52,420 | 1,980,634 |
| Wendel SA | 22,142 | 2,583,943 |
| | | 9,879,785 |
| | | |
| Germany - 8.4% | | |
| Aurelius Equity Opportunities SE & Co. KGaA | 47,286 | 2,988,091 |
| Deutsche EuroShop AG | 53,057 | 2,466,900 |
| ElringKlinger AG | 101,996 | 1,812,062 |
| Gerresheimer AG | 22,588 | 1,920,499 |
| RHOEN-KLINIKUM AG | 103,330 | 3,142,340 |
| RIB Software AG | 135,500 | 1,669,473 |
| |
12 calvert.com CALVERT INTERNATIONAL OPPORTUNITIES FUND ANNUAL REPORT
|
| | |
| | SHARES | VALUE ($) |
| COMMON STOCKS - CONT’D | | |
| Talanx AG | 70,243 | 2,143,465 |
| Wacker Neuson SE | 45,560 | 664,351 |
| XING AG | 11,275 | 2,372,292 |
| | | 19,179,473 |
| | | |
| Greece - 0.3% | | |
| Tsakos Energy Navigation Ltd. | 121,019 | 583,311 |
| | | |
| Hong Kong - 1.6% | | |
| Haier Electronics Group Co. Ltd. | 1,044,000 | 1,736,590 |
| Man Wah Holdings Ltd. | 2,828,702 | 1,819,277 |
| | | 3,555,867 |
| | | |
| India - 0.4% | | |
| Yes Bank Ltd. | 45,775 | 866,060 |
| | | |
| Ireland - 1.7% | | |
| Smurfit Kappa Group plc | 168,564 | 3,768,190 |
| | | |
| Israel - 0.7% | | |
| NiCE Ltd. ADR | 23,131 | 1,548,389 |
| | | |
| Italy - 4.2% | | |
| Banca IFIS SpA | 111,734 | 2,518,541 |
| Buzzi Unicem SpA | 64,400 | 1,320,508 |
| Cementir Holding SpA | 459,171 | 2,167,140 |
| Maire Tecnimont SpA | 565,651 | 1,400,598 |
| Piaggio & C SpA | 1,171,307 | 2,187,756 |
| | | 9,594,543 |
| | | |
| Japan - 25.3% | | |
| Alps Electric Co. Ltd. (a) | 85,486 | 2,063,441 |
| Asics Corp. (a) | 100,800 | 2,030,947 |
| Azbil Corp. | 54,800 | 1,656,097 |
| Chiyoda Corp. | 250,841 | 2,065,427 |
| Chugoku Marine Paints Ltd. | 216,000 | 1,516,307 |
| Daihen Corp. | 478,000 | 2,549,101 |
| Daiichikosho Co. Ltd. | 48,840 | 1,994,149 |
| Daiseki Co. Ltd. | 98,600 | 1,925,136 |
| Haseko Corp. | 206,459 | 1,985,873 |
| Hazama Ando Corp. | 317,000 | 1,929,749 |
| Hino Motors Ltd. | 143,803 | 1,536,417 |
| Hogy Medical Co. Ltd. | 33,700 | 2,362,882 |
| Horiba Ltd. | 52,800 | 2,601,549 |
| Japan Aviation Electronics Industry Ltd. | 170,000 | 2,667,539 |
| Leopalace21 Corp. | 347,407 | 2,295,927 |
| Makita Corp. | 29,025 | 2,068,025 |
| Nishio Rent All Co. Ltd. | 86,700 | 2,552,153 |
| Ryosan Co. Ltd. | 80,100 | 2,435,462 |
| Secom Co. Ltd. | 28,300 | 2,113,282 |
calvert.com CALVERT INTERNATIONAL OPPORTUNITIES FUND ANNUAL REPORT 13
|
| | |
| | SHARES | VALUE ($) |
| COMMON STOCKS - CONT’D | | |
| Shinmaywa Industries Ltd. | 381,000 | 2,524,540 |
| Shinsei Bank Ltd. | 1,230,000 | 1,865,203 |
| Ship Healthcare Holdings, Inc. | 85,797 | 2,636,800 |
| SKY Perfect JSAT Holdings, Inc. | 396,900 | 1,951,200 |
| Star Micronics Co. Ltd. | 165,900 | 2,076,051 |
| Sumitomo Real Estate Sales Co. Ltd. | 107,300 | 2,191,222 |
| Taiheiyo Cement Corp. (a) | 669,000 | 1,925,021 |
| Toyota Industries Corp. (a) | 40,800 | 1,893,797 |
| | | 57,413,297 |
| | | |
| Luxembourg - 1.1% | | |
| Grand City Properties SA | 127,187 | 2,490,219 |
| | | |
| Malaysia - 0.9% | | |
| PureCircle Ltd. *(a) | 569,168 | 2,036,126 |
| | | |
| Mexico - 1.5% | | |
| Alpek SAB de CV | 1,141,400 | 1,934,342 |
| Gruma SAB de CV, Class B | 113,400 | 1,487,729 |
| | | 3,422,071 |
| | | |
| Netherlands - 1.7% | | |
| Delta Lloyd NV | 294,292 | 1,349,799 |
| Koninklijke DSM NV | 37,702 | 2,546,218 |
| | | 3,896,017 |
| | | |
| Norway - 1.7% | | |
| Austevoll Seafood ASA | 455,507 | 3,839,325 |
| | | |
| Singapore - 0.8% | | |
| Global Logistic Properties Ltd. | 1,390,200 | 1,917,574 |
| | | |
| South Korea - 3.1% | | |
| BGF retail Co. Ltd. | 8,940 | 1,571,082 |
| Coway Co. Ltd. | 25,471 | 2,212,544 |
| Dongbu Insurance Co. Ltd. | 24,032 | 1,494,072 |
| Osstem Implant Co. Ltd. * | 33,458 | 1,860,320 |
| | | 7,138,018 |
| | | |
| Spain - 2.6% | | |
| Ebro Foods SA | 121,000 | 2,814,500 |
| Mediaset Espana Comunicacion SA | 152,469 | 1,807,386 |
| Telepizza Group SA *(b) | 301,804 | 1,369,686 |
| | | 5,991,572 |
| |
14 calvert.com CALVERT INTERNATIONAL OPPORTUNITIES FUND ANNUAL REPORT
|
| | |
| | SHARES | VALUE ($) |
| COMMON STOCKS - CONT’D | | |
| Sweden - 4.0% | | |
| Capio AB (b) | 297,193 | 1,657,820 |
| Cloetta AB, Class B | 748,315 | 2,712,803 |
| Hoist Finance AB (a)(b) | 201,791 | 1,940,570 |
| Industrivarden AB, Class C | 146,673 | 2,714,782 |
| | | 9,025,975 |
| | | |
| Switzerland - 4.1% | | |
| Baloise Holding AG | 15,103 | 1,828,699 |
| Bucher Industries AG | 4,993 | 1,250,285 |
| OC Oerlikon Corp. AG * | 273,790 | 2,735,963 |
| Oriflame Holding AG * | 98,402 | 3,604,093 |
| | | 9,419,040 |
| | | |
| Taiwan - 3.0% | | |
| China Life Insurance Co. Ltd. | 2,087,341 | 1,917,524 |
| Feng TAY Enterprise Co. Ltd. | 265,440 | 1,181,110 |
| PChome Online, Inc. | 122,628 | 1,451,543 |
| Teco Electric and Machinery Co. Ltd. | 2,616,000 | 2,263,005 |
| | | 6,813,182 |
| | | |
| United Kingdom - 11.8% | | |
| Arrow Global Group plc | 36,084 | 137,738 |
| Ashtead Group plc | 138,288 | 2,272,667 |
| Beazley plc | 219,359 | 1,098,761 |
| Bovis Homes Group plc | 104,862 | 1,188,938 |
| CVS Group plc | 97,720 | 1,120,939 |
| Electrocomponents plc | 338,585 | 1,489,919 |
| Fenner plc | 866,226 | 2,245,517 |
| Inchcape plc | 240,979 | 2,056,219 |
| Inmarsat plc | 232,408 | 2,118,694 |
| Investec plc | 182,841 | 1,114,554 |
| Kennedy Wilson Europe Real Estate plc | 96,907 | 1,260,536 |
| Kingfisher plc | 347,651 | 1,696,210 |
| N Brown Group plc | 532,648 | 1,311,053 |
| Northgate plc | 207,555 | 1,162,176 |
| Savills plc | 267,296 | 2,479,706 |
| Speedy Hire plc | 6,200,064 | 2,854,148 |
| Virgin Money Holdings UK plc | 300,641 | 1,212,671 |
| | | 26,820,446 |
| | | |
| Total Common Stocks (Cost $208,442,715) | | 217,410,649 |
| |
calvert.com CALVERT INTERNATIONAL OPPORTUNITIES FUND ANNUAL REPORT 15
|
| | | | |
| | PRINCIPAL AMOUNT ($) | VALUE ($) |
| HIGH SOCIAL IMPACT INVESTMENTS - 0.6% | | |
| Calvert Social Investment Foundation Notes, 0.50%, 3/18/17 (c)(d) | 1,000,000 | 983,200 |
|
| ImpactAssets Global Sustainable Agriculture Notes, 0.00%, 11/3/20 (c)(d)(e) | 111,000 | 98,790 |
|
| ImpactAssets Microfinance Plus Notes, 0.00%, 11/3/20 (c)(d)(e) | 142,000 | 133,480 |
|
| | | |
| Total High Social Impact Investments (Cost $1,253,000) | | 1,215,470 |
|
| | | |
| | | |
| TIME DEPOSIT - 2.7% | | |
| State Street Bank Time Deposit, 0.293%, 10/3/16 | 6,194,983 | 6,194,983 |
|
| | | |
| Total Time Deposit (Cost $6,194,983) | | 6,194,983 |
|
| | | |
| | | |
| | SHARES | VALUE ($) |
SHORT TERM INVESTMENT OF CASH COLLATERAL FOR SECURITIES LOANED - 1.1% | | |
| State Street Institutional U.S. Government Money Market Fund - Premier Class, 0.26% | 2,560,851 | 2,560,851 |
|
| | | |
| Total Short Term Investment of Cash Collateral For Securities Loaned (Cost $2,560,851) | | 2,560,851 |
|
| | | |
| | | |
| TOTAL INVESTMENTS (Cost $218,451,549) - 100.0% | | 227,381,953 |
|
| Other assets and liabilities, net - (0.0%) | | (8,648) |
|
NET ASSETS - 100.0% | |
| $227,373,305 |
|
|
| | | | |
| NOTES TO SCHEDULE OF INVESTMENTS |
| * Non-income producing security. |
| (a) Security, or portion of security, is on loan. Total value of securities on loan is $2,433,038 as of September 30, 2016. |
| (b) Security is exempt from registration under Rule 144A of the Securities Act of 1933. These securities may be resold in transactions exempt from registration, normally to qualified institutional buyers. Total market value of Rule 144A securities amounts to $4,968,076, which represents 2.2% of the net assets of the Fund as of September 30, 2016. |
| (c) Total market value of restricted securities amounts to $1,215,470, which represents 0.6% of the net assets of the Fund as of September 30, 2016. |
| (d) This security was valued under the direction of the Board of Directors. Total market value of fair valued securities amounts to $1,215,470, which represents 0.6% of the net assets of the Fund as of September 30, 2016. |
| (e) The coupon rate shown on floating or adjustable rate securities represents the rate in effect on September 30, 2016. |
| |
| Abbreviations: |
| ADR: | American Depositary Receipts | |
| Ltd.: | Limited | |
| plc: | Public Limited Company | |
|
| | | |
| RESTRICTED SECURITIES | ACQUISITION DATES | COST ($) |
| Calvert Social Investment Foundation Notes, 0.50%, 3/18/17 | 3/18/16 | 1,000,000 |
| ImpactAssets Global Sustainable Agriculture Notes, 0.00%, 11/3/20 | 11/13/15 | 111,000 |
| ImpactAssets Microfinance Plus Notes, 0.00%, 11/3/20 | 11/13/15 | 142,000 |
| See notes to financial statements. |
16 calvert.com CALVERT INTERNATIONAL OPPORTUNITIES FUND ANNUAL REPORT
CALVERT INTERNATIONAL OPPORTUNITIES FUND
STATEMENT OF ASSETS AND LIABILITIES
SEPTEMBER 30, 2016
|
| | | |
| ASSETS | |
| Investments in securities, at value (Cost $218,451,549) - see accompanying schedule |
| $227,381,953 |
|
| Cash denominated in foreign currencies (Cost $968,581) | 988,332 |
|
| Receivable for securities sold | 1,176,688 |
|
| Receivable for shares sold | 339,155 |
|
| Dividends and interest receivable | 842,937 |
|
| Securities lending income receivable | 1,342 |
|
| Directors’ deferred compensation plan | 112,709 |
|
| Total assets | 230,843,116 |
|
| | |
| LIABILITIES | |
| Payable for securities purchased | 299,985 |
|
| Payable upon return of securities loaned | 2,560,851 |
|
| Payable for shares redeemed | 170,912 |
|
| Payable for foreign cap gain taxes | 32,676 |
|
| Payable to Calvert Investment Management, Inc. | 139,163 |
|
| Payable to Calvert Investment Distributors, Inc. | 26,125 |
|
| Payable to Calvert Investment Administrative Services, Inc. | 22,188 |
|
| Payable to Calvert Investment Services, Inc. | 2,110 |
|
| Payable for Directors’ fees and expenses | 4,982 |
|
| Directors’ deferred compensation plan | 112,709 |
|
| Accrued expenses and other liabilities | 98,110 |
|
| Total liabilities | 3,469,811 |
|
| NET ASSETS |
| $227,373,305 |
|
| | |
| NET ASSETS CONSIST OF: | |
| Paid-in capital applicable to the following shares of common stock, | |
| with 250,000,000 shares of $0.01 par value shares authorized: | |
| Class A: 7,269,929 shares outstanding |
| $106,555,896 |
|
| Class C: 349,143 shares outstanding | 4,884,096 |
|
| Class I: 4,760,196 shares outstanding | 67,115,996 |
|
| Class Y: 3,219,889 shares outstanding | 47,468,634 |
|
| Undistributed net investment income | 1,658,886 |
|
| Accumulated net realized gain (loss) on investments and foreign currency transactions | (9,218,059) |
|
| Net unrealized appreciation (depreciation) on investments, foreign currencies and assets and liabilities denominated in foreign currencies (a) | 8,907,856 |
|
| NET ASSETS |
| $227,373,305 |
|
| | |
| NET ASSET VALUE PER SHARE | |
| Class A (based on net assets of $107,429,410) |
| $14.78 |
|
| Class C (based on net assets of $5,036,518) |
| $14.43 |
|
| Class I (based on net assets of $69,318,657) |
| $14.56 |
|
| Class Y (based on net assets of $45,588,720) |
| $14.16 |
|
| (a) Net of deferred foreign capital gains tax of $32,676. | |
| See notes to financial statements. |
calvert.com CALVERT INTERNATIONAL OPPORTUNITIES FUND ANNUAL REPORT 17
CALVERT INTERNATIONAL OPPORTUNITIES FUND
STATEMENT OF OPERATIONS
YEAR ENDED SEPTEMBER 30, 2016
|
| | | |
| NET INVESTMENT INCOME | |
| Investment Income: | |
| Dividend income (net of foreign taxes withheld of $589,577) |
| $4,839,179 |
|
| Other income (a) | 93,738 |
|
| Interest income | 21,331 |
|
| Securities lending income | 1,830 |
|
| Total investment income | 4,956,078 |
|
| | |
| Expenses: | |
| Investment advisory fee | 1,467,005 |
|
| Administrative fees | 325,072 |
|
| Transfer agency fees and expenses: | |
| Class A | 132,051 |
|
| Class C | 16,645 |
|
| Class I | 5,620 |
|
| Class Y | 32,740 |
|
| Distribution Plan expenses: | |
| Class A | 257,276 |
|
| Class C | 50,698 |
|
| Directors’ fees and expenses | 21,956 |
|
| Accounting fees | 54,745 |
|
| Custodian fees | 156,179 |
|
| Professional fees | 50,265 |
|
| Registration fees | 90,335 |
|
| Reports to shareholders | 22,675 |
|
| Miscellaneous | 23,016 |
|
| Total expenses | 2,706,278 |
|
| Reimbursement from Advisor: | |
| Class C | (9,819) |
|
| Administrative fees waived | (44,836) |
|
| Net expenses | 2,651,623 |
|
| NET INVESTMENT INCOME | 2,304,455 |
|
| | |
| REALIZED AND UNREALIZED GAIN (LOSS) | |
| Net realized gain (loss) on: | |
| Investments | (8,868,678) |
|
| Foreign currency transactions | (32,910) |
|
| | (8,901,588) |
|
| | |
| Change in unrealized appreciation (depreciation) on: | |
| Investments and foreign currencies (b) | 18,235,574 |
|
| Assets and liabilities denominated in foreign currencies | 30,494 |
|
| | 18,266,068 |
|
| | |
| NET REALIZED AND UNREALIZED GAIN | 9,364,480 |
|
| | |
| INCREASE IN NET ASSETS RESULTING FROM OPERATIONS |
| $11,668,935 |
|
| (a) Other income represents a non-recurring refund for overbilling of prior years’ custody out-of-pocket fees. | |
| (b) Net of deferred foreign capital gains tax of $32,676. | |
| See notes to financial statements. |
18 calvert.com CALVERT INTERNATIONAL OPPORTUNITIES FUND ANNUAL REPORT
CALVERT INTERNATIONAL OPPORTUNITIES FUND
STATEMENTS OF CHANGES IN NET ASSETS
|
| | | | | | | |
| INCREASE (DECREASE) IN NET ASSETS | YEAR ENDED
SEPTEMBER 30, 2016 | | YEAR ENDED
SEPTEMBER 30, 2015 |
| Operations: | | | |
| Net investment income |
| $2,304,455 |
| |
| $1,383,513 |
|
| Net realized gain (loss) | (8,901,588) |
| | 6,366,300 |
|
| Net change in unrealized appreciation (depreciation) | 18,266,068 |
| | (17,037,083) |
|
| | | | |
| INCREASE (DECREASE) IN NET ASSETS RESULTING FROM OPERATIONS | 11,668,935 |
| | (9,287,270) |
|
| | | | |
| Distributions to shareholders from: | | | |
| Net investment income: | | | |
| Class A shares | (768,140) |
| | (620,616) |
|
| Class C shares | — |
| | (11,490) |
|
| Class I shares | (496,125) |
| | (485,711) |
|
| Class Y shares | (389,709) |
| | (116,873) |
|
| Net realized gain: | | | |
| Class A shares | (3,241,863) |
| | (3,083,385) |
|
| Class C shares | (173,186) |
| | (281,879) |
|
| Class I shares | (1,423,627) |
| | (1,909,381) |
|
| Class Y shares | (1,206,553) |
| | (1,123,889) |
|
| Total distributions | (7,699,203) |
| | (7,633,224) |
|
| | | | |
| Capital share transactions: | | | |
| Shares sold: | | | |
| Class A shares | 22,584,870 |
| | 70,117,426 |
|
| Class C shares | 979,800 |
| | 1,517,680 |
|
| Class I shares | 32,818,157 |
| | 15,348,576 |
|
| Class Y shares | 21,954,857 |
| | 22,957,654 |
|
| Reinvestment of distributions: | | | |
| Class A shares | 3,890,741 |
| | 3,435,373 |
|
| Class C shares | 145,104 |
| | 247,069 |
|
| Class I shares | 1,919,524 |
| | 2,395,093 |
|
| Class Y shares | 1,463,650 |
| | 1,061,068 |
|
| Redemption fees: | | | |
| Class A shares | — |
| | 159 |
|
| Class Y shares | — |
| | 18 |
|
| Shares redeemed: | | | |
| Class A shares | (20,644,340) |
| | (15,108,714) |
|
| Class C shares | (1,141,960) |
| | (746,545) |
|
| Class I shares | (7,968,411) |
| | (4,886,433) |
|
| Class Y shares | (11,668,455) |
| | (4,107,584) |
|
| Total capital share transactions | 44,333,537 |
| | 92,230,840 |
|
| | | | |
| TOTAL INCREASE IN NET ASSETS | 48,303,269 |
| | 75,310,346 |
|
| See notes to financial statements. |
calvert.com CALVERT INTERNATIONAL OPPORTUNITIES FUND ANNUAL REPORT 19
|
| | | | | | | |
CALVERT INTERNATIONAL OPPORTUNITIES FUND STATEMENTS OF CHANGES IN NET ASSETS - CONT’D |
| NET ASSETS | YEAR ENDED
SEPTEMBER 30, 2016 | | YEAR ENDED
SEPTEMBER 30, 2015 |
| Beginning of year |
| $179,070,036 |
| |
| $103,759,690 |
|
| End of year (including undistributed net investment income of $1,658,886 and $935,299, respectively) |
| $227,373,305 |
| |
| $179,070,036 |
|
| | | | |
| CAPITAL SHARE ACTIVITY | | | |
| Shares sold: | | | |
| Class A shares | 1,580,346 |
| | 4,511,728 |
|
| Class C shares | 69,185 |
| | 98,097 |
|
| Class I shares | 2,361,433 |
| | 1,016,025 |
|
| Class Y shares | 1,595,580 |
| | 1,530,787 |
|
| Reinvestment of distributions: | | | |
| Class A shares | 269,484 |
| | 229,208 |
|
| Class C shares | 10,313 |
| | 16,844 |
|
| Class I shares | 134,648 |
| | 162,152 |
|
| Class Y shares | 105,706 |
| | 74,193 |
|
| Shares redeemed: | | | |
| Class A shares | (1,433,519) |
| | (966,145) |
|
| Class C shares | (82,681) |
| | (48,953) |
|
| Class I shares | (574,598) |
| | (320,965) |
|
| Class Y shares | (861,049) |
| | (280,073) |
|
| Total capital share activity | 3,174,848 |
| | 6,022,898 |
|
| See notes to financial statements. |
20 calvert.com CALVERT INTERNATIONAL OPPORTUNITIES FUND ANNUAL REPORT
NOTES TO FINANCIAL STATEMENTS
NOTE A — SIGNIFICANT ACCOUNTING POLICIES
General: Calvert World Values Fund, Inc. (the “Corporation”) is a Maryland corporation pursuant to Articles of Incorporation filed on February 14, 1992, and is registered under the Investment Company Act of 1940, as amended (the “1940 Act”) as an open-end management investment company. The Corporation operates four (4) separate series, or mutual funds, each with its own investment objective(s) and strategies. This report contains the financial statements and financial highlights for the Calvert International Opportunities Fund (the “Fund”). The Corporation is authorized to issue two billion (2,000,000,000) shares of stock, of which 250,000,000 shares have been allocated to the Fund, with a par value of each share at one cent ($0.01).
The Fund is diversified and invests primarily in common and preferred stocks of non-U.S. small-cap to mid-cap companies. The operations of each series of the Corporation, including the Fund, are accounted for separately. The Fund applies the accounting and reporting guidance in the Financial Accounting Standards Board (FASB) Accounting Standards Codification Topic 946, Financial Services – Investment Companies (ASC 946).
The Fund generally offers Class A, Class C, Class I, and Class Y shares. Class A shares are sold with a maximum front-end sales charge of 4.75%. However, the front-end sales charge is waived for shareholders investing in Class A shares directly with the Fund in an account maintained by Calvert Investment Distributors, Inc. (“Distributor”) or without a specified broker-dealer or financial adviser (“Direct Account”). Class C shares are not available for purchase in Direct Accounts. For non-Direct Accounts, Class C shares are sold without a front-end sales charge, and with certain exceptions, will be charged a contingent deferred sales charge on shares sold within one year of purchase. Class C shares have higher levels of expenses than Class A shares. Class I shares require a minimum account balance of $1 million. The $1 million minimum initial investment is waived for retirement plans that trade through omnibus accounts and may be waived in certain other instances where it is believed to be in the best interest of the Fund and its shareholders. Class I shares have no front-end or contingent deferred sales charge and have lower levels of expenses than Class A shares. Class Y shares are generally only available to wrap or similar fee-based programs offered by financial intermediaries, and retirement plans, foundations, endowments and other consultant-driven business, that have entered into an agreement with the Fund’s Distributor to offer Class Y shares to their clients. Class Y shares have no front-end or contingent deferred sales charge and have lower levels of expenses than Class A shares. Among other things, each class has different: (a) dividend rates, due to differences in Distribution Plan expenses and other class-specific expenses; (b) exchange privileges; and (c) class-specific voting rights.
Security Valuation: Net asset value per share is determined every business day as of the close of the regular session of the New York Stock Exchange (generally 4:00 p.m. Eastern time). The Fund uses independent pricing services approved by the Board of Directors (“the Board”) to value its investments wherever possible. Investments for which market quotations are not available or deemed not reliable are fair valued in good faith under the direction of the Board.
The Board has adopted Valuation Procedures (the “Procedures”) to determine the fair value of securities and other financial instruments for which market prices are not readily available or which may not be reliably priced. The Board has delegated the day-to-day responsibility for determining the fair value of assets of the Fund to Calvert Investment Management, Inc. (the “Advisor” or “Calvert”) and has provided these Procedures to govern Calvert in its valuation duties.
Calvert has chartered an internal Valuation Committee to oversee the implementation of these Procedures and to assist it in carrying out the valuation responsibilities that the Board has delegated.
The Valuation Committee meets on a regular basis to review illiquid securities and other investments which may not have readily available market prices. The Valuation Committee’s fair valuation determinations are subject to review, approval and ratification by the Board at its next regularly scheduled meeting covering the calendar quarter in which the fair valuation was determined.
The Valuation Committee utilizes various methods to measure the fair value of the Fund’s investments. U.S. generally accepted accounting principles (GAAP) establishes a disclosure hierarchy that categorizes the inputs to valuation techniques used to value assets and liabilities at measurement date. These inputs are summarized in the three broad levels listed below:
Level 1 - quoted prices in active markets for identical securities
Level 2 - other significant observable inputs (including quoted prices for similar securities, interest rates, prepayment speeds, credit risk, etc.)
Level 3 - significant unobservable inputs (including the Fund’s own assumptions in determining the fair value of investments)
The inputs or methodologies used for valuing securities are not necessarily an indication of the risk associated with investing in those securities.
calvert.com CALVERT INTERNATIONAL OPPORTUNITIES FUND ANNUAL REPORT 21
Changes in valuation techniques may result in transfers in or out of an investment’s assigned level within the hierarchy during the year. Transfers in and/or out of levels are determined based on the fair value of such securities at the end of the year. Valuation techniques used to value the Fund’s investments by major category are as follows:
Common stock securities, including restricted securities, for which market quotations are readily available, are valued at the last reported sale price or official closing price as reported by an independent pricing service on the primary market or exchange on which they are traded and are categorized as Level 1 in the hierarchy. In the event there were no sales during the day or closing prices are not available, securities are valued at the last quoted bid price or the last available price and are categorized as Level 2 in the hierarchy. Foreign securities are valued based on quotations from the principal market in which such securities are normally traded. The Fund has retained a third party fair value pricing service to quantitatively analyze the price movement of its holdings on foreign exchanges and to automatically fair value these securities each business day. The third party fair value pricing service takes into account many factors, including, but not limited to, movements in U.S. securities markets and changes in futures contracts and foreign exchange rates that have occurred after the close of the principal foreign market, to determine a fair value as of the close of the New York Stock Exchange. Such securities are categorized as Level 2 in the hierarchy.
Debt securities, including restricted securities, are valued based on evaluated prices received from independent pricing services or from dealers who make markets in such securities and are generally categorized as Level 2 in the hierarchy. For restricted securities and private placements where observable inputs are limited, assumptions about market activity and risk are used and such securities are categorized as Level 3 in the hierarchy.
Mutual funds are valued at their closing net asset value each business day and are categorized as Level 1 in the hierarchy.
Short-term securities of sufficient credit quality with remaining maturities of sixty days or less for which quotations are not readily available are valued at amortized cost, which approximates fair value, and are categorized as Level 2 in the hierarchy.
If a market value cannot be determined for a security using the methodologies described above, or if, in the good faith opinion of the Advisor, the market value does not constitute a readily available market quotation, or if a significant event has occurred that would materially affect the value of the security, the security will be fair valued as determined in good faith by the Valuation Committee. Securities which were fair valued at September 30, 2016, if any, are identified on the Schedule of Investments.
The Valuation Committee considers a number of factors, including significant unobservable valuation inputs when arriving at fair value. It considers all significant facts that are reasonably available and relevant to the determination of fair value.
The Valuation Committee primarily employs a market-based approach which may use related or comparable assets or liabilities, recent transactions, market multiples, book values, and other relevant information for the investment to determine the fair value of the investment. When more appropriate, the Fund may employ an income-based or cost approach. An income-based valuation approach discounts anticipated future cash flows of the investment to calculate a present amount (discounted). The measurement is based on the value indicated by current market expectations about those future amounts. Discounts may also be applied due to the nature or duration of any restrictions on the disposition of the investments. A cost based approach is based on the amount that currently would be required to replace the service capacity of an asset (current replacement cost). From the seller’s perspective, the price that would be received for the asset is determined based on the cost to a buyer to acquire or construct a substitute asset of comparable utility, adjusted for obsolescence.
The values assigned to fair value investments are based on available information and do not necessarily represent amounts that might ultimately be realized. Further, due to the inherent uncertainty of valuations of such investments, the fair values may differ significantly from the values that would have been used had an active market existed, and the differences could be material. The Valuation Committee employs various methods for calibrating these valuation approaches including a regular review of key inputs and assumptions, transactional back-testing or disposition analysis and reviews of any related market activity.
The following table summarizes the market value of the Fund’s holdings as of September 30, 2016, based on the inputs used to value them:
22 calvert.com CALVERT INTERNATIONAL OPPORTUNITIES FUND ANNUAL REPORT
|
| | | | | | | | | | | |
| | VALUATION INPUTS |
| INVESTMENTS IN SECURITIES* | LEVEL 1 | LEVEL 2 | LEVEL 3 | TOTAL |
| Common Stocks** |
| $28,822,237 |
|
| $188,588,412 | *** | $— |
|
| $217,410,649 |
|
| High Social Impact Investments | — |
| 983,200 |
| 232,270 |
| 1,215,470 |
|
| Time Deposit | — |
| 6,194,983 |
| — |
| 6,194,983 |
|
| Short Term Investment of Cash Collateral For Securities Loaned | 2,560,851 |
| — |
| — |
| 2,560,851 |
|
| | | | | |
| TOTAL |
| $31,383,088 |
|
| $195,766,595 |
| $232,270^ |
|
| $227,381,953 |
|
| | | | | |
| * For a complete listing of investments, please refer to the Schedule of Investments. |
| ** For further breakdown of equity securities by country, please refer to the Schedule of Investments. |
| *** Includes certain securities trading primarily outside the U.S. where the value was adjusted as a result of significant market movements following the close of local trading. |
| ^ Level 3 securities represent 0.1% of net assets. |
On September 30, 2016, for certain securities which trade primarily outside the U.S., adjustments to prices due to movements against a specified benchmark were not necessary. As a result, $12,121,963 transferred out of Level 2 and into Level 1. The amount of this transfer was determined based on the fair value of such securities at the end of the period.
Restricted Securities: The Fund may invest in securities that are subject to legal or contractual restrictions on resale. Generally, these securities may only be sold publicly upon registration under the Securities Act of 1933 or in transactions exempt from such registration. Information regarding restricted securities is included at the end of the Schedule of Investments.
The Fund invests in Community Investment Notes issued by the Calvert Social Investment Foundation (the “CSI Foundation”). The CSI Foundation is a 501(c)(3) non-profit organization that receives in-kind support from Calvert and its subsidiaries. The Fund has received an exemptive order from the Securities and Exchange Commission permitting the Fund to make investments in these notes under certain conditions.
Security Transactions and Investment Income: Security transactions are accounted for on trade date. Realized gains and losses are recorded on an identified cost basis and may include proceeds from litigation. Dividend income is recorded on the ex-dividend date or, in the case of dividends on certain foreign securities, as soon as the Fund is informed of the ex-dividend date.
Withholding taxes on foreign dividends have been provided for in accordance with the Fund’s understanding of the applicable country’s tax rules and rates. Distributions received on securities that represent a return of capital are recorded as a reduction of cost of investments. Distributions received on securities that represent a capital gain are recorded as a realized gain. Interest income, which includes amortization of premium and accretion of discount on debt securities, is accrued as earned.
Share Class Accounting: Investment income and realized and unrealized gains and losses are allocated to separate classes of shares based upon the relative net assets of each class. Expenses common to the classes are also allocated to each class in proportion to their relative net assets. Expenses arising in connection with a specific class are charged directly to that class.
Foreign Currency Transactions: The Fund’s accounting records are maintained in U.S. dollars. For valuation of assets and liabilities on each date of net asset value determination, foreign denominations are converted into U.S. dollars using the current exchange rate. Security transactions, income, and expenses are translated at the prevailing rate of exchange on the date of the event. The effect of changes in foreign exchange rates on securities and foreign currencies is included in the net realized and unrealized gain or loss on investments and assets and liabilities denominated in foreign currencies.
Distributions to Shareholders: Distributions to shareholders are recorded by the Fund on ex-dividend date. Dividends from net investment income and distributions from net realized capital gains, if any, are paid at least annually. Distributions are determined in accordance with income tax regulations which may differ from U.S. generally accepted accounting principles; accordingly, periodic reclassifications are made within the Fund’s capital accounts to reflect income and gains available for distribution under income tax regulations.
Estimates: The preparation of financial statements in conformity with U.S. generally accepted accounting principles requires management to make estimates and assumptions that affect the reported amounts of assets and liabilities and disclosure of contingent assets and liabilities at the date of the financial statements and the reported amounts of increases and decreases in net assets from operations during the reporting period. Actual results could differ from those estimates.
calvert.com CALVERT INTERNATIONAL OPPORTUNITIES FUND ANNUAL REPORT 23
Redemption Fees: The Fund charged a 2% redemption fee on redemptions, including exchanges, made within 30 days of purchase (within seven days for Class I shares). The redemption fee was accounted for as an addition to paid-in capital. This fee was eliminated effective February 2, 2015.
Federal Income Taxes: No provision for federal income or excise tax is required since the Fund intends to continue to qualify as a regulated investment company under the Internal Revenue Code and to distribute substantially all of its taxable earnings.
Management has analyzed the Fund’s tax positions taken for all open federal income tax years and has concluded that no provision for federal income tax is required in the Fund’s financial statements. A Fund’s federal tax return is subject to examination by the Internal Revenue Service for a period of three years.
NOTE B — RELATED PARTY TRANSACTIONS
Calvert Investment Management, Inc. (the “Advisor”) is wholly-owned by Calvert Investments, Inc., which is indirectly wholly-owned by Ameritas Mutual Holding Company. The Advisor provides investment advisory services and pays the salaries and fees of officers and Directors of the Fund who are employees of the Advisor or its affiliates. For its services, the Advisor receives an annual fee, payable monthly, of 0.75%, of the Fund’s average daily net assets.
The Advisor has contractually agreed to limit net annual fund operating expenses through January 31, 2017. The contractual expense caps are 1.66%, 2.41%, 1.20%, and 1.41% for Class A, C, I, and Y, respectively. Prior to February 1, 2016, the contractual expense caps were 1.66%, 2.50%, 1.20%, and 1.41% for Class A, C, I, and Y, respectively. For the purpose of this expense limit, operating expenses do not include interest expense, brokerage commissions, taxes, and extraordinary expenses. This expense limitation does not limit acquired fund fees and expenses, if any.
Calvert Investment Administrative Services, Inc. (“CIAS”), an affiliate of the Advisor, provides administrative services to the Fund for an annual fee, payable monthly, based on the Fund’s average daily net assets.
For the period October 1, 2015 to January 31, 2016, the administrative fee was 0.30% for Class A, C and Y and 0.15% for Class I. CIAS and the Fund entered into an Amended and Restated Administrative Services Agreement that established a 0.12% administrative fee for all classes of the Fund commencing on February 1, 2016. CIAS voluntarily waived 0.18% for Class A, C and Y shares of the Fund and 0.03% for Class I shares of the Fund (the amount of the administrative fee above 0.12%) for the period from December 1, 2015 through January 31, 2016. During the year ended September 30, 2016, CIAS voluntarily waived $44,836.
Calvert Investment Distributors, Inc. (“CID”), an affiliate of the Advisor, is the distributor and principal underwriter for the Fund. Pursuant to Rule 12b-1 under the Investment Company Act of 1940, the Fund has adopted a Distribution Plan that permits the Fund to pay certain expenses associated with the distribution and servicing of its shares. The expenses paid may not exceed 0.50% and 1.00% annually of the average daily net assets of Class A and C, respectively. The amount actually paid by the Fund is an annualized fee, payable monthly, of 0.25% and 1.00% of the average daily net assets of Class A and C, respectively. Class I and Y shares do not have Distribution Plan expenses.
CID received $13,198 as its portion of commissions charged on sales of the Fund’s Class A shares for the year ended September 30, 2016.
Calvert Investment Services, Inc. (“CIS”), an affiliate of the Advisor, acts as shareholder servicing agent for the Fund. For its services, CIS received a fee of $25,970 for the year ended September 30, 2016. Boston Financial Data Services, Inc. is the transfer and dividend disbursing agent.
Each Director of the Fund who is not an employee of the Advisor or its affiliates receives an annual retainer of $52,000 plus a meeting fee of up to $3,000 for each Board meeting attended. Additional fees of $6,000 annually may be paid to the Committee chairs ($10,000 for the Board Chair and the Special Equities Committee chair) and $2,500 annually may be paid to Committee members, plus a Committee meeting fee of $500 for each Committee meeting attended. Eligible Directors may participate in a Deferred Compensation Plan (the “Plan”). Obligations of the Plan will be paid solely out of the Fund’s assets. Director’ fees are allocated to each of the funds served.
NOTE C — INVESTMENT ACTIVITY AND TAX INFORMATION
During the year, the cost of purchases and proceeds from sales of investments, other than short-term securities, were $134,728,471 and $98,177,550, respectively.
Under the Regulated Investment Company Modernization Act of 2010, capital losses incurred in taxable years beginning after December 22, 2010 can be carried forward to offset future capital gains for an unlimited period. These losses will retain their character as either long-term or short-term.
24 calvert.com CALVERT INTERNATIONAL OPPORTUNITIES FUND ANNUAL REPORT
Capital Loss Carryforwards
|
| | | |
No expiration date Short-term |
| ($438,086 | ) |
| Long-term | (523,290) |
|
The tax character of dividends and distributions paid during the years ended September 30, 2016 and September 30, 2015 was as follows:
|
| | | | | | | |
| DISTRIBUTIONS PAID FROM: | 2016 |
| | 2015 |
|
| Ordinary income |
| $2,008,280 |
| |
| $1,823,213 |
|
| Long-term capital gains | 5,690,923 |
| | 5,810,011 |
|
| Total |
| $7,699,203 |
| |
| $7,633,224 |
|
As of September 30, 2016, the tax basis components of distributable earnings/(accumulated losses) and the federal tax cost were as follows:
|
| | | |
| Unrealized appreciation |
| $21,556,290 |
|
| Unrealized (depreciation) | (13,608,642) |
|
| Net unrealized appreciation (depreciation) |
| $7,947,648 |
|
| |
| Undistributed ordinary income |
| $2,608,931 |
|
| Capital loss carryforward |
| ($961,376 | ) |
| Late year ordinary and post October capital loss deferrals |
| ($8,218,990 | ) |
| Other temporary differences |
| ($4,982 | ) |
| |
| Federal income tax cost of investments |
| $219,434,305 |
|
The differences between the components of distributable earnings on a tax basis and the amounts reflected in the Statement of Assets and Liabilities are primarily due to temporary book-tax differences that will reverse in a subsequent period. These differences are mainly due to wash sales, deferred Directors’ fees and passive foreign investment companies.
Reclassifications, as shown in the table below, have been made to the Fund’s components of net assets to reflect income and gains available for distribution (or available capital loss carryovers, as applicable) under income tax law and regulations. These reclassifications are due to permanent book-tax differences and have no impact on net assets. The primary permanent differences causing such reclassifications for the Fund are due to foreign currency transactions, distributions redesignations and passive foreign investment companies.
|
| | | |
| Undistributed net investment income |
| $73,106 |
|
| Accumulated net realized gain (loss) | (73,107) |
|
| Paid-in Capital | 1 |
|
NOTE D — SECURITIES LENDING
To generate additional income, the Fund may lend its securities pursuant to a securities lending agency agreement (“Lending Agreement”) with State Street Bank, the securities lending agent. Security loans are subject to termination by the Fund at any time and, therefore, are not considered to be illiquid investments. The Fund requires that the loan be continuously collateralized by either cash or securities as collateral equal at all times to at least 102% of the market value of the domestic securities loaned and 105% of the market value on the international securities loaned (if applicable). Cash collateral is generally invested in State Street Institutional U.S. Government Money Market Fund (the “U.S. Government Fund”) that is managed by an affiliate of the custodian. The U.S. Government Fund is a registered money market fund that invests in a variety of high-quality, U.S. dollar-denominated instruments. Any gain or loss in the market price of the loaned securities that might occur and any interest earned or dividends declared during the term of the loan would accrue to the account of the Fund. Income earned on the investment of collateral, net of broker rebates and other expenses incurred by the securities lending agent, is split between the Fund and the securities lending agent on the basis of agreed upon contractual terms.
The risks associated with lending portfolio securities include, but are not limited to, possible delays in receiving additional collateral or in the recovery of the loaned securities, possible loss of rights to the collateral should the borrower fail financially, as
calvert.com CALVERT INTERNATIONAL OPPORTUNITIES FUND ANNUAL REPORT 25
well as risk of loss in the value of the collateral or the value of the investments made with the collateral. The securities lending agent shall indemnify the Fund in the case of default of any securities borrower.
The total value of securities on loan was $2,433,038 as of September 30, 2016.
The following table displays a breakdown of transactions accounted for as secured borrowings, the obligations by class of collateral pledged, and the remaining contractual maturity of those transactions as of September 30, 2016:
|
| | | | | | | | | |
| | Remaining Contractual Maturity of the Agreements as of September 30, 2016 |
| | Overnight and
Continuous | <30 days | Between
30 & 90 days | >90 days | Total |
| Securities Lending Transactions |
| Common Stocks |
| $2,560,851 |
| $— | $— | $— |
| $2,560,851 |
|
| Amount of recognized liabilities for securities lending transactions |
| $2,560,851 |
|
NOTE E — LINE OF CREDIT
A financing agreement is in place with the Calvert Funds and State Street Corporation (“SSC”). Under the agreement, SSC provides an unsecured line of credit facility, in the aggregate amount of $50 million ($25 million committed and $25 million uncommitted), accessible by the Calvert Funds for temporary or emergency purposes only. Borrowings bear interest at the higher of the One-Month London Interbank Offered Rate (LIBOR) in effect that day or the overnight Federal Funds Rate plus 1.25% per annum. A commitment fee of 0.25% per annum is incurred on the unused portion of the committed facility. An administrative fee of $30,000 was paid in connection with the uncommitted facility. These fees are allocated to all participating funds. The Fund had no loans outstanding pursuant to this line of credit at September 30, 2016.
For the year ended September 30, 2016, borrowing information by the Fund under the agreement was as follows:
|
| | | |
| Average Daily Balance | Weighted Average
Interest Rate | Maximum
Amount Borrowed | Month of Maximum
Amount Borrowed |
| $3,864 | 1.57% | $716,417 | December 2015 |
NOTE F — OTHER MATTERS
On October 18, 2016, Calvert announced that it had determined that certain fees paid to third-party financial intermediaries were incorrectly allocated for payment by, and paid by, the Calvert Funds. Specifically, for periods prior to January 1, 2015, the Calvert Funds paid fees under certain intermediary agreements that were primarily for distribution-related services and therefore should have been paid by Calvert out of Calvert’s own assets or by the Funds under a Rule 12b-1 plan. The matter was self-reported to the SEC in 2016. Calvert is in the process of determining the economic impact of misallocated fees on the affected Funds and their shareholders, and intends to develop a plan to reimburse shareholders following that determination.
NOTE G — SUBSEQUENT EVENTS
On October 20, 2016, Calvert and Calvert’s indirect parent company, Ameritas Holding Company, entered into an Asset Purchase Agreement (the “Agreement”) with Eaton Vance Management (“Eaton Vance”), a newly-formed subsidiary of Eaton Vance to operate as Calvert Research and Management (“New Calvert”), and other parties, pursuant to which New Calvert has agreed to acquire, subject to the terms and conditions set forth in the Agreement, the business assets of Calvert (the “Transaction”). Completion of the Transaction is subject to the approval by the shareholders of Calvert Funds of new investment advisory agreements with New Calvert, among other conditions, and is currently expected to occur by the end of 2016 or early 2017.
A proxy statement containing detailed information regarding several proposals was mailed to shareholders of record in November 2016. The shareholder meeting is expected to be held on or about December 16, 2016.
In preparing the financial statements as of September 30, 2016, no other subsequent events or transactions occurred that would have required recognition or disclosure in these financial statements.
NOTICE TO SHAREHOLDERS (UNAUDITED)
For the fiscal year ended September 30, 2016, the Fund considers 100% of the ordinary dividends paid during the year as qualified dividend income. The Fund also considers $5,690,923 of the long-term capital gain distributions paid during the year as capital gain dividends in accordance with Section 852(b)(3)(C) of the Internal Revenue Code. It also considers $5,428,756 as income derived from foreign sources and $479,029 as foreign taxes paid.
26 calvert.com CALVERT INTERNATIONAL OPPORTUNITIES FUND ANNUAL REPORT
CALVERT INTERNATIONAL OPPORTUNITIES FUND
FINANCIAL HIGHLIGHTS
|
| | | | | | | | | | | | | | | | | | | |
| | YEARS ENDED |
| CLASS A SHARES | September 30, 2016 (a) | | September 30, 2015 (a) | | September 30, 2014 (a) | | September 30, 2013 (a) | | September 30, 2012 |
| Net asset value, beginning |
| $14.58 |
| |
| $16.42 |
| |
| $15.76 |
| |
| $12.59 |
| |
| $10.57 |
|
| Income from investment operations: | | | | | | | | | |
| Net investment income | 0.15(b) |
| | 0.14 |
| | 0.15 |
| | 0.14 |
| | 0.13 |
|
| Net realized and unrealized gain (loss) | 0.63 |
| | (0.83) |
| | 0.66 |
| | 3.19 |
| | 2.01 |
|
| Total from investment operations | 0.78 |
| | (0.69) |
| | 0.81 |
| | 3.33 |
| | 2.14 |
|
| Distributions from: | | | | | | | | | |
| Net investment income | (0.11) |
| | (0.18) |
| | (0.15) |
| | (0.16) |
| | (0.12) |
|
| Net realized gain | (0.47) |
| | (0.97) |
| | — |
| | — |
| | — |
|
| Total distributions | (0.58) |
| | (1.15) |
| | (0.15) |
| | (0.16) |
| | (0.12) |
|
| Total increase (decrease) in net asset value | 0.20 |
| | (1.84) |
| | 0.66 |
| | 3.17 |
| | 2.02 |
|
| Net asset value, ending |
| $14.78 |
| |
| $14.58 |
| |
| $16.42 |
| |
| $15.76 |
| |
| $12.59 |
|
| Total return (c) | 5.49 | % | | (4.32 | %) | | 5.14 | % | | 26.70 | % | | 20.52 | % |
| Ratios to average net assets: (d) | | | | | | | | | |
| Net investment income | 1.07%(b) |
| | 0.88 | % | | 0.88 | % | | 1.04 | % | | 1.10 | % |
| Total expenses | 1.49 | % | | 1.69 | % | | 1.85 | % | | 2.13 | % | | 2.35 | % |
| Net expenses | 1.46 | % | | 1.66 | % | | 1.66 | % | | 1.66 | % | | 1.66 | % |
| Portfolio turnover | 52 | % | | 51 | % | | 56 | % | | 42 | % | | 56 | % |
| Net assets, ending (in thousands) |
| $107,429 |
| |
| $99,908 |
| |
| $50,540 |
| |
| $45,563 |
| |
| $27,406 |
|
| | | | | | | | | | |
| (a) Per share figures are calculated using the Average Shares Method. |
| (b) Amount includes a non-recurring refund for overbilling of prior years’ custody out-of-pocket fees. This amounted to $0.006 per share and 0.04% of average net assets. |
| (c) Total return is not annualized for periods of less than one year and does not reflect deduction of any front-end or deferred sales charge. |
| (d) Total expenses do not reflect amounts reimbursed and/or waived by the Advisor and certain of its affiliates, if applicable. Net expenses are net of all reductions and represent the net expenses paid by the Fund. |
| See notes to financial statements. |
calvert.com CALVERT INTERNATIONAL OPPORTUNITIES FUND ANNUAL REPORT 27
CALVERT INTERNATIONAL OPPORTUNITIES FUND
FINANCIAL HIGHLIGHTS
|
| | | | | | | | | | | | | | | | | | | |
| | YEARS ENDED |
| CLASS C SHARES | September 30, 2016 (a) | | September 30, 2015 (a) | | September 30, 2014 (a) | | September 30, 2013 (a) | | September 30, 2012 |
| Net asset value, beginning |
| $14.28 |
| |
| $16.08 |
| |
| $15.44 |
| |
| $12.30 |
| |
| $10.32 |
|
| Income from investment operations: | | | | | | | | | |
| Net investment income (loss) | 0.01(b) |
| | (0.03) |
| | (0.01) |
| | 0.02 |
| | 0.04 |
|
| Net realized and unrealized gain (loss) | 0.61 |
| | (0.76) |
| | 0.66 |
| | 3.14 |
| | 1.95 |
|
| Total from investment operations | 0.62 |
| | (0.79) |
| | 0.65 |
| | 3.16 |
| | 1.99 |
|
| Distributions from: | | | | | | | | | |
| Net investment income | — |
| | (0.04) |
| | (0.01) |
| | (0.02) |
| | (0.01) |
|
| Net realized gain | (0.47) |
| | (0.97) |
| | — |
| | — |
| | — |
|
| Total distributions | (0.47) |
| | (1.01) |
| | (0.01) |
| | (0.02) |
| | (0.01) |
|
| Total increase (decrease) in net asset value | 0.15 |
| | (1.80) |
| | 0.64 |
| | 3.14 |
| | 1.98 |
|
| Net asset value, ending |
| $14.43 |
| |
| $14.28 |
| |
| $16.08 |
| |
| $15.44 |
| |
| $12.30 |
|
| Total return (c) | 4.46 | % | | (5.09 | %) | | 4.20 | % | | 25.70 | % | | 19.31 | % |
| Ratios to average net assets: (d) | | | | | | | | | |
| Net investment income (loss) | 0.04%(b) |
| | (0.18 | %) | | (0.08 | %) | | 0.17 | % | | 0.30 | % |
| Total expenses | 2.67 | % | | 2.72 | % | | 2.81 | % | | 3.27 | % | | 3.65 | % |
| Net expenses | 2.44 | % | | 2.50 | % | | 2.50 | % | | 2.50 | % | | 2.50 | % |
| Portfolio turnover | 52 | % | | 51 | % | | 56 | % | | 42 | % | | 56 | % |
| Net assets, ending (in thousands) |
| $5,037 |
| |
| $5,030 |
| |
| $4,605 |
| |
| $3,282 |
| |
| $2,363 |
|
| | | | | | | | | | |
| (a) Per share figures are calculated using the Average Shares Method. |
| (b) Amount includes a non-recurring refund for overbilling of prior years’ custody out-of-pocket fees. This amounted to $0.006 per share and 0.04% of average net assets. |
| (c) Total return is not annualized for periods of less than one year and does not reflect deduction of any front-end or deferred sales charge. |
| (d) Total expenses do not reflect amounts reimbursed and/or waived by the Advisor and certain of its affiliates, if applicable. Net expenses are net of all reductions and represent the net expenses paid by the Fund. |
| See notes to financial statements. |
28 calvert.com CALVERT INTERNATIONAL OPPORTUNITIES FUND ANNUAL REPORT
CALVERT INTERNATIONAL OPPORTUNITIES FUND
FINANCIAL HIGHLIGHTS
|
| | | | | | | | | | | | | | | | | | | |
| | YEARS ENDED |
| CLASS I SHARES | September 30, 2016 (a) | | September 30, 2015 (a) | | September 30, 2014 (a) | | September 30, 2013 (a) | | September 30, 2012 |
| Net asset value, beginning |
| $14.38 |
| |
| $16.19 |
| |
| $15.54 |
| |
| $12.37 |
| |
| $10.36 |
|
| Income from investment operations: | | | | | | | | | |
| Net investment income | 0.19(b) |
| | 0.19 |
| | 0.20 |
| | 0.25 |
| | 0.21 |
|
| Net realized and unrealized gain (loss) | 0.63 |
| | (0.80) |
| | 0.66 |
| | 3.10 |
| | 1.93 |
|
| Total from investment operations | 0.82 |
| | (0.61) |
| | 0.86 |
| | 3.35 |
| | 2.14 |
|
| Distributions from: | | | | | | | | | |
| Net investment income | (0.17) |
| | (0.23) |
| | (0.21) |
| | (0.18) |
| | (0.13) |
|
| Net realized gain | (0.47) |
| | (0.97) |
| | — |
| | — |
| | — |
|
| Total distributions | (0.64) |
| | (1.20) |
| | (0.21) |
| | (0.18) |
| | (0.13) |
|
| Total increase (decrease) in net asset value | 0.18 |
| | (1.81) |
| | 0.65 |
| | 3.17 |
| | 2.01 |
|
| Net asset value, ending |
| $14.56 |
| |
| $14.38 |
| |
| $16.19 |
| |
| $15.54 |
| |
| $12.37 |
|
| Total return (c) | 5.84 | % | | (3.86 | %) | | 5.58 | % | | 27.43 | % | | 20.89 | % |
| Ratios to average net assets: (d) | | | | | | | | | |
| Net investment income | 1.35%(b) |
| | 1.22 | % | | 1.24 | % | | 1.76 | % | | 1.76 | % |
| Total expenses | 1.17 | % | | 1.15 | % | | 1.18 | % | | 1.43 | % | | 1.70 | % |
| Net expenses | 1.16 | % | | 1.15 | % | | 1.18 | % | | 1.20 | % | | 1.20 | % |
| Portfolio turnover | 52 | % | | 51 | % | | 56 | % | | 42 | % | | 56 | % |
| Net assets, ending (in thousands) |
| $69,319 |
| |
| $40,833 |
| |
| $32,079 |
| |
| $24,130 |
| |
| $8,771 |
|
| | | | | | | | | | |
| (a) Per share figures are calculated using the Average Shares Method. |
| (b) Amount includes a non-recurring refund for overbilling of prior years’ custody out-of-pocket fees. This amounted to $0.008 per share and 0.06% of average net assets. |
| (c) Total return is not annualized for periods of less than one year and does not reflect deduction of any front-end or deferred sales charge. |
| (d) Total expenses do not reflect amounts reimbursed and/or waived by the Advisor and certain of its affiliates, if applicable. Net expenses are net of all reductions and represent the net expenses paid by the Fund. |
| See notes to financial statements. |
calvert.com CALVERT INTERNATIONAL OPPORTUNITIES FUND ANNUAL REPORT 29
CALVERT INTERNATIONAL OPPORTUNITIES FUND
FINANCIAL HIGHLIGHTS
|
| | | | | | | | | | | | | | | | | | | |
| | YEARS ENDED |
| CLASS Y SHARES | September 30, 2016 (a) | | September 30, 2015 (a) | | September 30, 2014 (a) | | September 30, 2013 (a) | | September 30, 2012 |
| Net asset value, beginning |
| $13.99 |
| |
| $15.68 |
| |
| $15.03 |
| |
| $11.94 |
| |
| $10.00 |
|
| Income from investment operations: | | | | | | | | | |
| Net investment income | 0.19(b) |
| | 0.14 |
| | 0.11 |
| | 0.18 |
| | 0.15 |
|
| Net realized and unrealized gain (loss) | 0.60 |
| | (0.77) |
| | 0.70 |
| | 3.03 |
| | 1.90 |
|
| Total from investment operations | 0.79 |
| | (0.63) |
| | 0.81 |
| | 3.21 |
| | 2.05 |
|
| Distributions from: | | | | | | | | | |
| Net investment income | (0.15) |
| | (0.09) |
| | (0.16) |
| | (0.12) |
| | (0.11) |
|
| Net realized gain | (0.47) |
| | (0.97) |
| | — |
| | — |
| | — |
|
| Total distributions | (0.62) |
| | (1.06) |
| | (0.16) |
| | (0.12) |
| | (0.11) |
|
| Total increase (decrease) in net asset value | 0.17 |
| | (1.69) |
| | 0.65 |
| | 3.09 |
| | 1.94 |
|
| Net asset value, ending |
| $14.16 |
| |
| $13.99 |
| |
| $15.68 |
| |
| $15.03 |
| |
| $11.94 |
|
| Total return (c) | 5.82 | % | | (4.11 | %) | | 5.40 | % | | 27.06 | % | | 20.69 | % |
| Ratios to average net assets: (d) | | | | | | | | | |
| Net investment income | 1.40%(b) |
| | 0.92 | % | | 0.68 | % | | 1.31 | % | | 1.36 | % |
| Total expenses | 1.21 | % | | 1.42 | % | | 1.48 | % | | 1.90 | % | | 2.49 | % |
| Net expenses | 1.18 | % | | 1.41 | % | | 1.41 | % | | 1.41 | % | | 1.41 | % |
| Portfolio turnover | 52 | % | | 51 | % | | 56 | % | | 42 | % | | 56 | % |
| Net assets, ending (in thousands) |
| $45,589 |
| |
| $33,299 |
| |
| $16,536 |
| |
| $5,138 |
| |
| $1,638 |
|
| | | | | | | | | | |
| (a) Per share figures are calculated using the Average Shares Method. |
| (b) Amount includes a non-recurring refund for overbilling of prior years’ custody out-of-pocket fees. This amounted to $0.007 per share and 0.05% of average net assets. |
| (c) Total return is not annualized for periods of less than one year and does not reflect deduction of any front-end or deferred sales charge. |
| (d) Total expenses do not reflect amounts reimbursed and/or waived by the Advisor and certain of its affiliates, if applicable. Net expenses are net of all reductions and represent the net expenses paid by the Fund. |
| See notes to financial statements. |
PROXY VOTING
The Proxy Voting Guidelines of the Calvert Funds that the Fund uses to determine how to vote proxies relating to portfolio securities are provided as an Appendix to the Fund’s Statement of Additional Information. The Statement of Additional Information can be obtained free of charge by calling the Fund at 1-800-368-2745, by visiting the Calvert website at www.calvert.com; or by visiting the SEC’s website at www.sec.gov.
Information regarding how the Fund voted proxies relating to portfolio securities during the most recent 12-month period ended June 30 is available on the Fund’s website at www.calvert.com and on the SEC’s website at www.sec.gov.
AVAILABILITY OF QUARTERLY PORTFOLIO HOLDINGS
The Fund files its complete schedule of portfolio holdings with the SEC for the first and third quarters of each fiscal year on Form N-Q. The Fund’s Form N-Q is available on the SEC’s website at www.sec.gov. The Fund’s Form N-Q may be reviewed and copied at the SEC’s Public Reference Room in Washington, DC; information on the operation of the Public Reference Room may be obtained by calling 1-800-SEC-0330.
30 calvert.com CALVERT INTERNATIONAL OPPORTUNITIES FUND ANNUAL REPORT
DIRECTOR AND OFFICER INFORMATION TABLE
|
| | | | | |
| Name & Age | Position With Fund | Position Start Date | Principal Occupation During Last 5 Years | # of Calvert Portfolios Overseen | Other Directorships During the Past Five Years |
| INDEPENDENT TRUSTEES/DIRECTORS |
REBECCA L. ADAMSON AGE: 67 | Trustee Director Director Director | 1989 CSIF 2000 IMPACT 2000 CRIS 2005 CWVF | President and Founder of the national non-profit, First People’s Worldwide. Founded in 1980, First People’s Worldwide is the only American Indian alternative development institute in the U.S. | 19 | • Bay & Paul Foundation |
RICHARD L. BAIRD, JR. AGE: 68 | Trustee & Chair Director & Chair Director & Chair Director & Chair
| 1982 CSIF
2000 CRIS
2005 CWVF
2005 IMPACT | Former President and CEO of Adagio Health Inc. (retired in 2014) in Pittsburgh, PA, a non-profit corporation which provides family planning services, nutrition, maternal/child health care, and various health screening services and community preventive health programs. | 24 | None |
JOHN G. GUFFEY, JR. AGE: 68 | Director Trustee Director Director | 1992 CWVF 1982 CSIF 2000 CRIS 2005 IMPACT | Consultant and President of Aurora Press Inc., a privately held publisher of trade paperbacks. | 24 | • Ariel Funds (3) (asset management) (through 12/31/11) • Calvert Social Investment Foundation • Calvert Ventures, LLC |
MILES D. HARPER, III AGE: 53 | Director Trustee Director Director | 2000 IMPACT 2005 CSIF 2005 CRIS 2005 CWVF | Partner, Carr Riggs & Ingram (public accounting firm) since October 2014. Partner, Gainer Donnelly & Desroches (public accounting firm) (now Carr Riggs & Ingram), 1999-2014. | 19 | • Bridgeway Funds (14) (asset management) |
JOY V. JONES AGE: 66 | Director Trustee Director Director | 2000 IMPACT 1990 CSIF 2000 CRIS 2005 CWVF | Attorney. | 19 | • Director, Conduit Street Restaurants SUD 2 Limited • Director, Palm Management Corporation |
TERRENCE J. MOLLNER, Ed.D. AGE: 71 | Director Trustee Director Director | 1992 CWVF 1982 CSIF 2000 CRIS 2005 IMPACT | Founder, Chairperson and President of Trusteeship Institute, Inc., an educational organization focused on the personal skills and organizations described in Dr. Mollner’s book, The Love Skill: We Are Mastering the 7 Layers of Human Maturity, particularly businesses that freely chose to give priority to the common good. Chairperson, Stakeholders Capital, Inc., an asset management firm and financial services provider.
| 19 | • Calvert Social Investment Foundation • Ben & Jerry’s Homemade, Inc. (food products) |
SYDNEY A. MORRIS AGE: 67 | Trustee Director Director Director | 1982 CSIF 2000 CRIS 2005 CWVF 2005 IMPACT | The Rev. Dr. Morris is a Unitarian Universalist minister. | 19 | None |
| |
calvert.com CALVERT INTERNATIONAL OPPORTUNITIES FUND ANNUAL REPORT (UNAUDITED) 31
|
| | | | | |
| Name & Age | Position With Fund | Position Start Date | Principal Occupation During Last 5 Years | # of Calvert Portfolios Overseen | Other Directorships During the Past Five Years |
| INTERESTED TRUSTEES/DIRECTORS |
D. WAYNE SILBY, Esq.* AGE: 68 | Director Trustee Director Director | 1992 CWVF 1982 CSIF 2000 CRIS 2000 IMPACT | Mr. Silby is the founding Chair of the Calvert Funds. He is the Chair-Elect and a principal of Syntao.com, a Beijing-based company promoting corporate social responsibility. | 24 | • Ameritas Mutual Holding Company (insurance) • Calvert Social Investment Foundation • ImpactAssets, Inc. (asset management) • Committee for the Future (charitable supporting organization) • Syntao.com China (HK) (sustainability consulting) • The ICE Organization (environmental services) |
JOHN H. STREUR* AGE: 56 | Director & President Trustee & President Director & President Director & President | 2015 CWVF
2015 CSIF
2015 CRIS
2015 IMPACT | Director, Chairman, President and Chief Executive Officer of Calvert Investments, Inc., Calvert Investment Administrative Services, Inc., Calvert Investment Management, Inc., Calvert Investment Distributors, Inc. and Calvert Investment Services, Inc. (since January 2015); Chief Compliance Officer, Calvert Investment Distributors, Inc. (since August 2015); Chief Compliance Officer, Calvert Investment Management, Inc. (August 2015 - April 2016); President and Director, Portfolio 21 Investments, Inc. (through October 2014); President, Chief Executive Officer and Director, Managers Investment Group LLC (through January 2012); President and Director, The Managers Funds and Managers AMG Funds (through January 2012). | 37 | • Portfolio 21 Investments, Inc. (asset management)(through October 2014) • Managers Investment Group LLC (asset management)(through January 2012) • The Managers Funds (asset management) (through January 2012) • Managers AMG Funds (asset management) (through January 2012) • Calvert Social Investment Foundation |
* Mr. Silby is an interested person of the Funds since he is a Director of the parent company of each Fund’s Advisor. Mr. Streur is an interested person of the Funds since he is an Officer and Director of each Fund’s Advisor and certain affiliates. The address of the Trustees and Officers is 4550 Montgomery Avenue, Suite 1000N, Bethesda, Maryland 20814, with the exception of Mr. Silby, whose address is 1715 18th Street, N.W., Washington, DC 20009. Additional information about the Fund’s Trustees/Directors can be found in the Statement of Additional Information (SAI). You can get a free copy of the SAI at www.calvert.com, or by contacting your broker, or the Fund at 1-800-368-2745. |
32 calvert.com CALVERT INTERNATIONAL OPPORTUNITIES FUND ANNUAL REPORT (UNAUDITED)
|
| | | |
| Name & Age | Position with Funds | Position Start Date | Principal Occupation During Last 5 Years |
| OFFICERS |
VICKI L. BENJAMIN AGE: 54 | Treasurer | 2015 | Treasurer of the Funds (since March 2015); Director, Executive Vice President, Chief Financial Officer, Chief Operating Officer and Treasurer of Calvert Investments, Inc., Calvert Investment Administrative Services, Inc., and Calvert Investment Services, Inc. (since October 2015); Director, Executive Vice President, Chief Financial Officer - Elect, Chief Operating Officer and Treasurer of Calvert Investment Management, Inc. and Calvert Investment Distributors, Inc. (since October 2015); Director, Senior Vice President and Chief Financial Officer of Calvert Investments, Inc., Calvert Investment Administrative Services, Inc., Calvert Investment Services, Inc., Calvert Investment Management, Inc. and Calvert Investment Distributors, Inc. (March 2015 - September 2015); and Senior Partner, KPMG LLP (2005 - 2015). |
ROBERT D. BENSON, Esq. AGE: 37 | Associate General Counsel, Assistant Vice President & Assistant Secretary | 2014 | Associate General Counsel (since September 2016), Assistant General Counsel (2014 - September 2016), Assistant Vice President and Assistant Secretary of the Funds, Calvert Investments, Inc., Calvert Investment Administrative Services, Inc., Calvert Investment Services, Inc., Calvert Investment Management, Inc. and Calvert Investment Distributors, Inc. (since 2014); and Staff Attorney, Calvert Investments, Inc., Calvert Investment Administrative Services, Inc., Calvert Investment Services, Inc., Calvert Investment Management, Inc. and Calvert Investment Distributors, Inc. (2008 - 2014). |
HOPE BROWN AGE: 42 | Chief Compliance Officer | 2014 | Chief Compliance Officer of the Funds (since November 2014); Vice President and Chief Compliance Officer, Wilmington Funds (December 2012 - November 2014); and Vice President and Senior Compliance Officer, Wilmington Trust Investment Advisors, Inc. (September 2010 - December 2012). |
THOMAS DAILEY AGE:51 | Vice President | 2012 | Vice President of the Funds (since 2012); and Vice President (since January 2005) and Portfolio Manager - Tax Exempt, Calvert Investment Management, Inc. (since 1995). |
STU DALHEIM AGE: 46 | Vice President | 2015 | Vice President of the Funds (since 2015); and Vice President - Governance and Advocacy of Calvert Investment Management, Inc. (since October 2011). |
BRIAN ELLIS, CFA AGE: 32 | Vice President | 2016 | Vice President of the Funds (since February 2016); Portfolio Manager, Taxable Fixed Income, Calvert Investment Management, Inc. (since May 2012); and Business Analyst (2009 - May 2012), Calvert Investment Management, Inc. |
ROBERT J. ENDERSON, CFA AGE: 57 | Assistant Treasurer | 2014 | Assistant Treasurer of the Funds (since 2014); Vice President, Corporate Finance, and Assistant Treasurer, Calvert Investments, Inc., Calvert Investment Administrative Services, Inc., Calvert Investment Management, Inc., Calvert Investment Services, Inc. and Calvert Investment Distributors, Inc. (since 2007); Acting Chief Financial Officer of Calvert Investments, Inc., Calvert Investment Administrative Services, Inc., Calvert Investment Management, Inc., Calvert Investment Services, Inc. and Calvert Investment Distributors, Inc. (September 2014 - March 2015). |
PATRICK FAUL, CFA AGE: 51 | Vice President | 2010 | Vice President (since 2007) and Head of Credit Research, Calvert Investment Management, Inc. (since January 2010). |
TRACI L. GOLDT AGE: 42 | Assistant Secretary | 2004 | Assistant Secretary of the Funds (since 2004); Director, Strategic Projects and Fund Operations, Calvert Investment Administrative Services, Inc. (since June 2016); and SEC Filing and Operations Manager, Calvert Investment Administrative Services, Inc. (2011 – 2016). |
JADE HUANG AGE: 41 | Vice President | 2015 | Vice President of the Funds (since 2015); Portfolio Manager - Equity, Calvert Investment Management, Inc. (since November 2015); and Senior Equity Analyst, Calvert Investment Management, Inc. (2006 - November 2015). |
VISHAL KHANDUJA, CFA AGE: 38 | Vice President | 2014 | Vice President of the Funds (since 2014); Vice President and Head of Taxable Bond, Calvert Investment Management, Inc. (since May 2016); Vice President and Portfolio Manager, Taxable Fixed Income, Calvert Investment Management, Inc. (2012 - May 2016); Portfolio Manager - Global Rates and Currency Team, Columbia Management (2009 - 2012). |
ERICA LASDON AGE: 45 | Assistant Vice President, Research and Advocacy | 2015 | Assistant Vice President, Research and Advocacy of the Funds (since 2016) and Calvert Investment Management, Inc. (since August 2015); and Senior Sustainability Analyst and Manager, Calvert Investment Management, Inc. (2005 - August 2015). |
JOSHUA LINDER, CFA AGE: 30 | Vice President | 2016 | Vice President of the Funds (since 2016); Portfolio Manager, Equity, Calvert Investment Management, Inc. (since January 2016); Assistant Portfolio Manager, Calvert Investment Management, Inc. (January 2014 - October 2015); and Equity Analyst, Calvert Investment Management, Inc. (2011 - 2013). |
CHRISTOPHER MADDEN AGE: 40 | Vice President | 2015 | Vice President of the Funds (since 2015); Portfolio Manager - Equity, Calvert Investment Management, Inc. (since November 2015); and Senior Equity Analyst, Calvert Investment Management, Inc. (2010 - November 2015). |
calvert.com CALVERT INTERNATIONAL OPPORTUNITIES FUND ANNUAL REPORT (UNAUDITED) 33
|
| | | |
| Name & Age | Position with Funds | Position Start Date | Principal Occupation During Last 5 Years |
| OFFICERS |
ANDREW K. NIEBLER, Esq. AGE: 48 | Deputy General Counsel, Vice President & Secretary | 2006 (TCF, CMS, CRIS, CSIF, CVS)
2008 (CVP)
2016 (CIF) | Deputy General Counsel, Vice President and Secretary of the Funds, Calvert Investments, Inc., Calvert Investment Administrative Services, Inc., Calvert Investment Management, Inc., Calvert Investment Distributors, Inc. and Calvert Investment Services, Inc. (since May 2016); Assistant Vice President, Associate General Counsel and Assistant Secretary, Calvert Investments, Inc., Calvert Investment Administrative Services, Inc., Calvert Investment Management, Inc., Calvert Investment Distributors, Inc. and Calvert Investment Services, Inc. (September 2009 - May 2016); and Assistant Vice President, Assistant General Counsel and Assistant Secretary, Calvert Investments, Inc., Calvert Investment Administrative Services, Inc., Calvert Investment Management, Inc., Calvert Investment Distributors, Inc. and Calvert Investment Services, Inc. (prior to September 2009). |
MONIQUE S. PATTILLO, Esq. AGE: 34 | Assistant General Counsel, Assistant Vice President & Assistant Secretary | 2016 | Assistant Vice President, Assistant General Counsel and Assistant Secretary of the Funds, Calvert Investments, Inc., Calvert Investment Administrative Services, Inc., Calvert Investment Management, Inc., Calvert Investment Distributors, Inc. and Calvert Investment Services, Inc. (since September 2016); Adjunct Faculty, Howard Community College (since June 2015); Adjunct Assistant Professor, University of Maryland University College (since June 2016); Legal Counsel, T. Rowe Price Associates, Inc. (March 2014 - June 2015); and Assistant U.S. Counsel, Aberdeen Asset Management, Inc. (January 2011 - March 2014). |
MARYBETH PILAT, CPA AGE: 48 | Fund Controller and Assistant Treasurer | 2015 | Fund Controller and Assistant Treasurer of the Funds (since August 2015); Director, Anti-Money Laundering Officer and Assistant Treasurer, Calvert Investments, Inc., Calvert Investment Administrative Services, Inc., Calvert Investment Management, Inc., Calvert Investment Distributors, Inc. and Calvert Investment Services, Inc. (since August 2015); Director of Fund Administration, Calvert Investment Administrative Services, Inc. (since August 2015); VP Expense & Budgeting, Global Fiduciary Platform, Legg Mason (May 2015 - July 2015); and Vice President and Assistant Treasurer, Columbia Funds, Ameriprise, Columbia Management (2010 - April 2015). |
JOHN H. STREUR AGE: 56 | President and Director (except CVS) | 2015 | Director, Chairman, President and Chief Executive Officer of Calvert Investments, Inc., Calvert Investment Administrative Services, Inc., Calvert Investment Management, Inc., Calvert Investment Distributors, Inc. and Calvert Investment Services, Inc. (since January 2015); Chief Compliance Officer, Calvert Investment Distributors, Inc. (since August 2015); Chief Compliance Officer, Calvert Investment Management, Inc. (August 2015 - April 2016); President and Director, Portfolio 21 Investments, Inc. (through October 2014); President, Chief Executive Officer and Director, Managers Investment Group LLC (through January 2012); President and Director, The Managers Funds and Managers AMG Funds (through January 2012). |
34 calvert.com CALVERT INTERNATIONAL OPPORTUNITIES FUND ANNUAL REPORT (UNAUDITED)
|
|
| This page intentionally left blank. |
|
|
| This page intentionally left blank. |
|
| | | | |
| CALVERT INTERNATIONAL OPPORTUNITIES FUND | | CALVERT’S FAMILY OF FUNDS | | |
To Open an Account 800-368-2748 Service for Existing Account Shareholders: 800-368-2745 Brokers: 800-368-2746 Registered Mail Calvert Investments c/o BFDS, P.O. Box 219544 Kansas City, MO 64121-9544 Overnight Mail Calvert Investments c/o BFDS, 330 West 9th Street Kansas City, MO 64105 Web Site calvert.com Principal Underwriter Calvert Investment Distributors, Inc. 4550 Montgomery Avenue Suite 1000 North Bethesda, Maryland 20814 | | Municipal Funds Tax-Free Responsible Impact Bond Fund Taxable Bond Funds Bond Portfolio Income Fund Short Duration Income Fund Long-Term Income Fund Ultra-Short Income Fund High Yield Bond Fund Green Bond Fund Unconstrained Bond Fund Balanced and Asset Allocation Funds Balanced Portfolio Conservative Allocation Fund Moderate Allocation Fund Aggressive Allocation Fund | | Equity Funds Equity Portfolio U.S. Large Cap Core Responsible Index Fund U.S. Large Cap Value Responsible Index Fund U.S. Large Cap Growth Responsible Index Fund U.S. Mid Cap Core Responsible Index Fund Developed Markets Ex-U.S. Responsible Index Fund Capital Accumulation Fund International Equity Fund Small Cap Fund Global Energy Solutions Fund Global Water Fund International Opportunities Fund Emerging Markets Equity Fund |
|
| |
| | |
This report is intended to provide fund information to shareholders. It is not authorized for distribution to prospective investors unless preceded or accompanied by a prospectus. Note: The information on our website is not incorporated by reference into this report; our website address is included as an inactive textual reference only. Investors should carefully consider the investment objectives, risks, charges and expenses of the Calvert Funds. This and other important information is contained in the fund’s summary prospectus and prospectus, which can be obtained from your financial professional and should be read carefully before investing. You may also call Calvert at 800/368-2748 or visit calvert.com. |
| Printed on recycled paper using soy inks. | |
|
| | |
| | |
| | | |
Calvert Emerging Markets Equity Fund
| | |
| | | |
| | |
|
| |
Annual Report September 30, 2016 E-Delivery Sign-Up — Details Inside | |
|
|
| |
Choose Planet-friendly E-delivery! Sign up now for on-line statements, prospectuses, and fund reports. In less than five minutes you can help reduce paper mail and lower fund costs. Just go to calvert.com. If you already have an online account at Calvert, click on Login, to access your Account, and select the documents you would like to receive via e-mail. If you’re new to online account access, click on Login, then Register to create your user name and password. Once you’re in, click on the E-delivery sign-up on the Account Portfolio page and follow the quick, easy steps. Note: if your shares are not held directly at Calvert but through a brokerage firm, you must contact your broker for electronic delivery options available through their firm. |
|
| | | |
| | | TABLE OF CONTENTS |
| | | | |
| | | | President’s Letter |
| | | | Portfolio Management Discussion |
| | | | Understanding Your Fund’s Expenses |
| | | | Report of Independent Registered Public Accounting Firm |
| | | | Schedule of Investments |
| | | | Statement of Assets and Liabilities |
| | | | Statement of Operations |
| | | | Statements of Changes in Net Assets |
| | | | Notes to Financial Statements |
| | | | Financial Highlights |
| | | | Proxy Voting |
| | | | Availability of Quarterly Portfolio Holdings |
| | | | Director and Officer Information Table |
|
| | |
| John Streur President and Chief Executive Officer, Calvert Investments, Inc. | |
Dear Fellow Shareowners and Friends,
Forty years ago, Calvert Investments was founded on the belief that investment capital, properly stewarded, could improve the world for its less powerful inhabitants and improve environmental sustainability, while producing reasonable investment returns. Calvert was one of the first investment advisers to introduce the responsible investment concept, and through many years of innovation and research (supported by you, our shareholders), we have developed this philosophy to now provide even greater shareholder engagement and impact.
Corporations throughout the world, big and small, have an ever increasing role in determining social and environmental outcomes for every living being, today and into the future. The power of corporations, garnered through global influence, human capital and financial strength, especially relative to our other institutions, has been steadily increasing for decades (http://www.calvert.com/perspective/research/calvert-serafeim-series-report).
Investors recognize the impact of corporations on society, and more and more are making investment decisions based on their assessments of a company’s effect on environmental and social outcomes. Companies able to operate their business in a perceived sustainable manner, promoting, environmental and social justice stand to benefit; while those corporate laggards, that fail to embrace these new responsibilities, will falter.
Reliable information is critical in ensuring that shareholders are able to make informed assessments regarding a corporation’s sustainability profile. Key performance metrics and data (a “sustainability information system”) that indicates how a company is performing regarding environmental and social impacts, is integral to making informed responsible investment decisions. Through partnerships with world class educational institutions and forward thinking business partners, Calvert is developing valuable research methodologies and metrics to assess the quality of data inputs and results, such that we are able to assess companies’ impacts. Are we completely there yet? No, but as data becomes more transparent and consistent, driven, in part by investor demands and regulatory authorities, we will get there, such that we and other market participants can make better informed investment and purchase decisions. For example, key data that measures “true” intrinsic and extrinsic product costs, including indirect environmental and social impacts could be relevant to investors when making corporate comparisons regarding risk and profitability, and also of great interest to consumers making product purchase decisions.
Calvert is participating in the Sustainability Accounting Standards Board Investment Advisory Group, which is working to move the disclosure of ESG metrics forward through corporate SEC filings (http://www.sasb.org/). Calvert is also working to map the United Nations Sustainable Development Goals to the SASB standards (http://www.calvert.com/perspective/social-impact/unsdg-faq), in order to better evaluate the progress of any public corporation on its path towards global sustainability.
Also, involved in this effort are millions of individuals and small organizations throughout the world who are adding to this mosaic of information through their local and specialized efforts and services. They often have access to pockets of information that are not publically available or disseminated, and thereby not available to the financial data service companies. Our myriad and long running engagements with NGOs and corporations provide critical insight to our analysts, driving the enhancement of our information infrastructure forward, as they research potential investments for your portfolios and design shareholder activist agendas.
ESG data about corporate behavior provides a useful baseline, but takes on additional meaning as the Calvert Principles for Responsible Investment guide our interpretation of the data, acting as our “responsibility compass” (http://www.calvert.com/approach/how-we-invest/the-calvert-principles). In addition to providing a context consistent with Calvert’s mission, our Principles lead us to areas where additional, fundamental research is needed to develop a real understanding of corporate impact on society and the environment. In our complex, globalized and rapidly evolving world, the Principles allow us to contextualize information, whereas a rules based system, or an exclusive reliance on data from companies may miss valuable situational and circumstantial inference, as evidenced in the issues surrounding Standing Rock and the role of the corporation, Energy Transfer Partners. The Standing Rock Sioux Nation is striving to halt construction of the Dakota Access Pipeline crossing their sacred land and threatening water contamination (see our resolution in support of the Standing Rock Sioux Nation, (http://www.calvert.com/perspective/climate-and-environment/calvert-releases-statement-in-support-of-standing-rock-sioux-nation).
4 calvert.com CALVERT EMERGING MARKETS EQUITY FUND ANNUAL REPORT (UNAUDITED)
The concerns surrounding social license and indigenous peoples’ rights are complex and do not lend themselves easily to objective quantification methods employed by the traditional financial data sources. That is why the fundamental overlay performed by the Calvert research analysts is so essential to our effective responsible investing process.
While effecting change through thoughtful ESG capital allocations is important, direct impact can be made through shareholder activism, or more specifically advocacy. Calvert’s shareholder advocacy process (28 resolutions last year) has been effective in influencing corporate behavior and provides another avenue for influencing valuable societal and environmental outcomes (http://www.calvert.com/perspective/social-impact/2016-proxy-season-brings-opportunity-to-accelerate-corporate-sustainability-progress).
Calvert’s voice reflects and respects diversity of thought and is often used to protect the interests of those most in need, and to look out for future generations. We thank you, our shareholders, friends and partners in this mission, for a good start. We promise that our work will never be done and the next forty years will reflect the increasing imperative to work vigorously to produce competitive returns for you and to use our power to forge a better today and future for our society. Often this requires Calvert to go where other investment firms have not, and to speak out and act when others do not.
Thank you, as always, for the incredible privilege to serve your needs through the Calvert Funds.
Respectfully,
John Streur
September 2016
calvert.com CALVERT EMERGING MARKETS EQUITY FUND ANNUAL REPORT (UNAUDITED) 5
|
| |
| PORTFOLIO MANAGEMENT DISCUSSION |
|
| | | |
| Gary Greenberg of Hermes Investment Management Limited | | Elena Tedesco of Hermes Investment Management Limited |
Market Review
Emerging Market equities bottomed on February 12, 2016, and have since surged nearly 30% by 30 September 2016 to beat the MSCI World Index by over 10.0%. The turning point coincided with the end of Janet Yellen’s testimony to Congress in February, in which she discussed the depreciation of the Renminbi and weak commodity prices. The market took this as an incentive for risk-on trades, and large yield-seeking flows into Emerging Market Portfolios ensued. Among the equity markets to benefit most from the yield-seeking trend were Brazil, Russia and South Africa.
The benchmark MSCI Emerging Markets Index returned 16.78% and outperformed Developed Markets, as measured by the MSCI World index, by 5.42%.
The Brazilian Real duly gained 22% until reversing on 10 August, while the Russian Ruble and South African Rand both appreciated 17%. Large capital flows into these countries boosted their currencies of course, but also buoyed their stock markets, where shares of highly indebted companies that stood to benefit from lower domestic interest rates rose substantially. Latin America outperformed regionally (up 29%) and Brazil has been the strongest performing country, rallying 58%. The Brazilian Government’s decision to impeach President Dilma Rousseff gave investors fresh hope that sensible economic policies would return to spark a sustainable economic recovery.
Other supportive forces were at play, too. China’s 2015 stimulus led to a recovery in the housing market, and government spending on infrastructure drove a widespread rally in commodities and commodity-related companies from China to Brazil.
In Korea, share buybacks by Samsung Electronics led investors to bet on a sea change in corporate governance and capital discipline in the market. And a rising oil price, assisted by a weaker US Dollar, led investors to cover shorts and renew bets on Russia’s economy.
In ASEAN markets, Indonesian stocks have surged 54%, supported by monetary policy easing from the central bank. Thai stocks gained amid some encouraging macroeconomic data and expectations for further stimulus measures.
Investment Strategy and Technique
The Strategy seeks long-term capital appreciation by investing primarily in equity securities of companies located in emerging market countries.
The Strategy normally invests at least 80% of its assets in equity securities of companies located in emerging market countries, seeking those whose products/services or industrial/business practices contribute towards addressing sustainability challenges in their local and/or international markets.
Fund Performance Relative to the Benchmark
For the twelve months ended September 30, 2016, Calvert Emerging Markets Equity Fund Class A (at NAV) returned 19.75%, outperforming the MSCI Emerging Markets Index, which returned 16.78%, driven by strong stock selection in China and Taiwan. Positive country allocation, specifically the non-benchmark exposure to Argentina and the overweight in Hungary and Indonesia helped offset negative returns from the currency impact related to our overweight China and India and underweight Korea and South Africa with strongly appreciating currencies. Our underweights in Energy and Materials detracted as these were among the strongest performing sectors up 26.77% and 24.19% respectively, but the impact to the portfolio was small.
At the sector level, stock selection accounted for the majority of outperformance, led by Consumer Discretionary, Health Care, Information Technology and Financials while stock selection in the Industrials sector detracted from performance. Tong Yang, the Taiwan auto-parts manufacturer rose on solid results that show margin improvement driven by better product mix and product efficiency. Alibaba rallied after strong results showed an improving monetization rate driven by its mobile segment and its inclusion into additional MSCI indices at the end of November and in May this year. Bank Rakyat Indonesia benefited from
6 calvert.com CALVERT EMERGING MARKETS EQUITY FUND ANNUAL REPORT (UNAUDITED)
|
| | | | |
| | | | |
| | CALVERT EMERGING MARKETS EQUITY FUND |
| | SEPTEMBER 30, 2016 | |
| | | | |
| | ECONOMIC SECTORS | % OF TOTAL INVESTMENTS* | |
| | Information Technology | 29.7 | % | |
| | Financials | 28.6 | % | |
| | Consumer Discretionary | 16.9 | % | |
| | Health Care | 7.8 | % | |
| | Consumer Staples | 5.8 | % | |
| | Industrials | 4.7 | % | |
| | Materials | 2.0 | % | |
| | Energy | 1.7 | % | |
| | High Social Impact Investments | 1.7 | % | |
| | Utilities | 1.1 | % | |
| | Total | 100 | % | |
| | | | |
| | * Does not reflect the value of securities held as cash collateral on securities loaned. | |
| | | | |
expectations of improving asset quality, lower credit costs and stronger loan growth and the central bank cut in interest rates as inflation continues to trend down which should allow the economy to maintain some momentum in 2016.
Non-exposure to Samsung Electronics hurt as shares in the Korean electronics giant and large benchmark constituent rallied on better than expected results for its smartphone and memory segments. Tech Mahindra, the IT services provider lagged due to weak growth in its telecom vertical, which we and they expect to recover. The Brazilian commercial and corporate aircraft manufacturer Embraer has detracted in 2016 due to negative revisions to guidance as a result of a weaker operating environment and the strengthening Real.
Positioning and Market Outlook
We remain overweight Emerging Asia and underweight the other regions. We see Chinese growth as sufficient for quality companies to generate good returns, and this is confirmed by our bottom-up work, and therefore we remain modestly overweight. We added China Biologic Products, a leading fully integrated biopharmaceutical company specializing in blood plasma-based products used as critical therapies during medical emergencies and for the prevention of life-threatening diseases. We see the Indian market as promising as well, as there is a good chance of the rural economy turning up which should benefit new addition Hero Motorcorp, the largest manufacturer of two wheelers in India, as well as Container Corp and ICICI.
We consider the digitalization of modern life to be an inexorable trend, whether for good or ill, and thus maintain an overweight exposure in Technology, through stocks of several Taiwanese companies we believe are well managed, as well as internet companies in China and Indian software developers.
|
| | | | | | |
| | | | | |
| | CALVERT EMERGING MARKETS EQUITY FUND | |
| | SEPTEMBER 30, 2016 | |
| | | | | |
| | INVESTMENT PERFORMANCE | |
| | (TOTAL RETURN AT NAV) | |
| | | 6 MONTHS ENDED 9/30/16 | 12 MONTHS ENDED 9/30/16 | |
| | Class A | 9.20 | % | 19.75 | % | |
| | Class C | 8.87 | % | 18.94 | % | |
| | Class I | 9.47 | % | 20.31 | % | |
| | Class Y | 9.39 | % | 20.09 | % | |
| | MSCI Emerging Markets Index | 9.75 | % | 16.78 | % | |
| | Lipper Emerging Markets Funds Average | 9.78 | % | 14.91 | % | |
| | | | | |
| | Investment performance/return at NAV does not reflect the deduction of the Fund’s maximum 4.75% front-end sales charge or any deferred sales charge. | |
| | | | | |
| | TEN LARGEST STOCK HOLDINGS | % OF NET ASSETS | |
| | Tencent Holdings Ltd. | 6.8 | % | |
| | Taiwan Semiconductor Manufacturing Co. Ltd. (ADR) | 4.7 | % | |
| | Alibaba Group Holding Ltd. (ADR) | 4.1 | % | |
| | HDFC Bank Ltd. (ADR) | 3.1 | % | |
| | Bank Rakyat Indonesia Persero Tbk PT | 3.1 | % | |
| | Techtronic Industries Co. Ltd. | 3.0 | % | |
| | AIA Group Ltd. | 2.8 | % | |
| | KB Financial Group, Inc. | 2.8 | % | |
| | Samsung Fire & Marine Insurance Co. Ltd. | 2.7 | % | |
| | Shenzhen International Holdings Ltd. | 2.7 | % | |
| | Total | 35.8 | % | |
| | | | | |
We remain underweight in Korea which will have to discount a global economic recovery (which we don’t see) in order to perform strongly and economic stagnation in South Africa and Greece keeps us cautious.
We are neutral in Brazil which has discounted a return to orthodox economic policy and growth, a secular improvement in its terms of trade, and deleveraging in advance of many severe challenges which lie ahead. We trimmed our position in Embraer, the corporate and commercial aircraft manufacturer amid challenging market conditions, and added Ultrapar, a fuel distribution company in Brazil that is expected to continue gaining market share and increasing profitability by developing retail opportunities in its gas stations. We initiated a position in Klabin, the Brazilian paper and packaging producer at what we believe to be an attractive entry point based on promising growth projects and improved visibility on cashflow generation and deleveraging.
calvert.com CALVERT EMERGING MARKETS EQUITY FUND ANNUAL REPORT (UNAUDITED) 7
In EMEA, we trimmed exposure to South African names given the difficult macro environment, Rand weakness and political turmoil. Specifically, we exited our position in telecommunications business MTN following a rebound in its share price after the settlement of a fine set by the Nigerian regulator and appointment of a new CEO. We sold out of Commercial International Bank of Egypt, which had risen to our assessment of fair value. We initiated a position in NMC, a hospital group based in the United Arab Emirates that trades at a discount to peers despite its strong growth opportunities and Sberbank whose superior franchise in Russia enables the bank to attract cheaper deposits (flight to quality) and enjoy a widening of spreads even in tough scenarios.
Compared to Developed Markets, the outlook for economic growth in Emerging Markets is positive for the first time since 2010 and is likely to persist. The contraction in Latin America has continued to ease as Brazil’s worst recession since the 1930s abates; economic activity in China, India, Indonesia and Korea is increasing as well.
Economic reform in China, Russia, Turkey and Indonesia has recently been conspicuous by its absence, but India Prime Minister Narendra Modi has been successful in passing a national goods and services tax. Moves such as these, along with the swing from the political left to the centre in Brazil, Peru and Argentina should support market sentiment in those countries.
Earlier this year, we pointed to rising productivity and declining wage growth in Emerging Markets, and are pleased to see that this trend is continuing. Moreover, it is more pronounced than in Developed Markets. Profitability remains depressed but should improve as global supplies of Materials and Energy are rationalised and demand in Asia and the US continues to increase.
Such optimism is factored in to current stock valuations, so a correction would provide a good entry point to attractive companies. Even though Emerging Markets are subject to a number of political risks from within and without, including rising protectionism in the West, the oppressive nature of authoritarian leaders, demand-sapping Quantitative Easing and carry traders looking for a fast buck, improving fundamentals, if sustained, should underwrite further outperformance of Emerging Markets in the next several years.
Hermes Investment Management Limited
September 2016
8 calvert.com CALVERT EMERGING MARKETS EQUITY FUND ANNUAL REPORT (UNAUDITED)
Growth of $10,000
The graph below shows the value of a hypothetical $10,000 investment in the Fund over the past 10 fiscal year periods or since inception (for funds without 10-year records). The results shown are for Class A shares, reflect the deduction of the maximum front-end Class A sales charge of 4.75%, and assume the reinvestment of dividends. The result is compared with a broad based market index. Market indexes are unmanaged and their results do not reflect the effect of expenses or sales charges. The value of an investment in a different share class would be different.
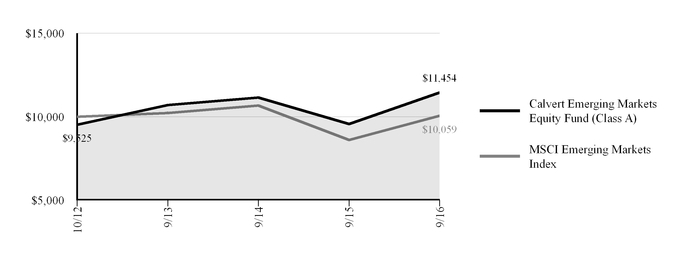
|
| | | | | |
| CALVERT EMERGING MARKETS EQUITY FUND |
| SEPTEMBER 30, 2016 |
| AVERAGE ANNUAL TOTAL RETURNS | Ticker Symbol | 1 Year | Since Inception (10/29/2012) |
| Class A (with max. load) | CVMAX | 14.10 | % | 3.52 | % |
| Class C (with max. load) | CVMCX | 17.94 | % | 3.88 | % |
| Class I | CVMIX | 20.31 | % | 5.20 | % |
| Class Y | CVMYX | 20.09 | % | 5.10 | % |
| MSCI Emerging Markets Index | | 16.78 | % | 0.09 | % |
| Lipper Emerging Markets Funds Average | | 14.91 | % | 0.32 | % |
| | | | |
| | | | |
All performance data shown, including the graph above and the adjacent table, represents past performance, does not guarantee future results, assumes reinvestment of dividends and distributions, and does not reflect the deduction of taxes that a shareholder would pay on the Fund’s distributions or the redemption of the Fund shares. All performance data reflects fee waivers and/or expense limitations, if any are in effect; in their absence performance would be lower. See Note B in Notes to Financial Statements. The investment return and principal value of an investment will fluctuate so that an investor’s shares, when redeemed, may be worth more or less than their original cost. Current performance may be lower or higher than the performance data quoted; for current performance data, including most recent month-end, visit www.calvert.com. The gross expense ratio from the current prospectus for Class A shares is 2.01%. This number may differ from the expense ratio shown elsewhere in this report because it is based on a different time period and, if applicable, does not include fee or expense waivers. Performance data quoted already reflects the deduction of the Fund’s operating expenses.
calvert.com CALVERT EMERGING MARKETS EQUITY FUND ANNUAL REPORT (UNAUDITED) 9
UNDERSTANDING YOUR FUND’S EXPENSES
As an investor, you incur two types of costs. There are transaction costs, which generally include sales charges on purchases and may include redemption fees. There are also ongoing costs, which generally include management fees, distribution and/or service fees, and other fund expenses. The following information is intended to help you understand your ongoing costs (in dollars) of investing in this mutual fund and to help you compare these costs with the ongoing costs of investing in other mutual funds.
To illustrate these ongoing costs, we have provided examples and calculated the expenses paid by the fund’s investors during the period. The actual and hypothetical information presented in the examples is based on an investment of $1,000 invested at the beginning of the period and held for the entire period (April 1, 2016 to September 30, 2016).
Actual Expenses
The first line of the table below provides information about actual account values and actual expenses. You may use the information in this line, together with the amount you invested, to estimate the expenses that you paid over the period. Simply divide your account value by $1,000 (for example, an $8,600 account value divided by $1,000 = 8.6), then multiply the result by the number in the first line under the heading entitled “Expenses Paid During Period” to estimate the expenses you paid on your account during this period.
The fund may charge an annual low balance account fee of $15 to those shareholders whose regular account balance is less than $2,000 ($1,000 for IRA accounts). If the low balance fee applies to your account, you should subtract the fee from the ending account value in the chart below.
Hypothetical Example for Comparison Purposes
The second line of the table below provides information about hypothetical account values and hypothetical expenses based on the Fund’s actual expense ratio and an assumed rate of return of 5% per year before expenses, which is not the Fund’s actual return. The hypothetical account values and expenses may not be used to estimate the actual ending account balance or expenses you paid for the period. You may use this information to compare the ongoing costs of investing in the Fund and other funds. To do so, compare the 5% hypothetical example with the 5% hypothetical examples that appear in the shareholder reports of the other funds.
Please note that the expenses shown in the table are meant to highlight your ongoing costs only and do not reflect any transactional costs, such as sales charges (loads), or redemption fees. Therefore, the second line of the table is useful in comparing ongoing costs only, and will not help you determine the relative total costs of owning different funds. In addition, if these transactional costs were included, your costs would have been higher.
|
| | | | |
| | ANNUALIZED
EXPENSE RATIO | BEGINNING
ACCOUNT VALUE
4/1/16 | ENDING
ACCOUNT VALUE
9/30/16 | EXPENSES PAID
DURING PERIOD*
4/1/16 - 9/30/16 |
| Class A | | | | |
| Actual | 1.32% | $1,000.00 | $1,092.00 | $6.90 |
| Hypothetical (5% return per year before expenses) | 1.32% | $1,000.00 | $1,018.40 | $6.66 |
| Class C | | | | |
| Actual | 2.07% | $1,000.00 | $1,088.70 | $10.81 |
| Hypothetical (5% return per year before expenses) | 2.07% | $1,000.00 | $1,014.65 | $10.43 |
| Class I | | | | |
| Actual | 0.97% | $1,000.00 | $1,094.70 | $5.08 |
| Hypothetical (5% return per year before expenses) | 0.97% | $1,000.00 | $1,020.15 | $4.90 |
| Class Y | | | | |
| Actual | 1.06% | $1,000.00 | $1,093.90 | $5.55 |
| Hypothetical (5% return per year before expenses) | 1.06% | $1,000.00 | $1,019.70 | $5.35 |
| |
| * Expenses paid during the period are equal to the annualized expense ratio for each class as indicated above, multiplied by the average account value over the period, multiplied by 183/366 (to reflect the one-half year period). Expense ratios shown in the Financial Highlights represent the actual expenses incurred for the fiscal year. |
10 calvert.com CALVERT EMERGING MARKETS EQUITY FUND ANNUAL REPORT (UNAUDITED)
REPORT OF INDEPENDENT REGISTERED PUBLIC ACCOUNTING FIRM
The Board of Directors of Calvert World Values Fund, Inc. and Shareholders of Calvert Emerging Markets Equity Fund:
We have audited the accompanying statement of assets and liabilities of the Calvert Emerging Markets Equity Fund (the “Fund”), a series of Calvert World Values Fund, Inc., including the schedule of investments, as of September 30, 2016, and the related statement of operations for the year then ended, the statements of changes in net assets for each of the years in the two-year period then ended, and the financial highlights for each of the years or periods in the four-year period then ended. These financial statements and financial highlights are the responsibility of the Fund’s management. Our responsibility is to express an opinion on these financial statements and financial highlights based on our audits.
We conducted our audits in accordance with the standards of the Public Company Accounting Oversight Board (United States). Those standards require that we plan and perform the audit to obtain reasonable assurance about whether the financial statements and financial highlights are free of material misstatement. An audit includes examining, on a test basis, evidence supporting the amounts and disclosures in the financial statements. Our procedures included confirmation of securities owned as of September 30, 2016 by correspondence with the custodian and brokers or by other appropriate auditing procedures. An audit also includes assessing the accounting principles used and significant estimates made by management, as well as evaluating the overall financial statement presentation. We believe that our audits provide a reasonable basis for our opinion.
In our opinion, the financial statements and financial highlights referred to above present fairly, in all material respects, the financial position of the Calvert Emerging Markets Equity Fund as of September 30, 2016, the results of its operations for the year then ended, the changes in its net assets for each of the years in the two-year period then ended, and the financial highlights for each of the years or periods in the four-year period then ended, in conformity with U.S. generally accepted accounting principles.
Philadelphia, Pennsylvania
November 23, 2016
calvert.com CALVERT EMERGING MARKETS EQUITY FUND ANNUAL REPORT 11
CALVERT EMERGING MARKETS EQUITY FUND
SCHEDULE OF INVESTMENTS
SEPTEMBER 30, 2016
|
| | |
| | SHARES | VALUE ($) |
| COMMON STOCKS - 89.6% | | |
| | | |
| Argentina - 1.6% | | |
| Banco Macro SA (ADR) | 24,947 | 1,952,103 |
| | | |
| Brazil - 5.4% | | |
| BB Seguridade Participacoes SA | 305,400 | 2,805,945 |
| Embraer SA (ADR) | 15,889 | 274,244 |
| Klabin SA | 199,513 | 1,045,371 |
| Lojas Renner SA | 77,900 | 586,139 |
| Ultrapar Participacoes SA | 94,800 | 2,071,395 |
| | | 6,783,094 |
| | | |
| China - 17.2% | | |
| Alibaba Group Holding Ltd. (ADR) * | 48,573 | 5,138,537 |
| China Biologic Products, Inc. * | 17,478 | 2,175,661 |
| China Mengniu Dairy Company Ltd. | 1,257,000 | 2,352,663 |
| Shenzhen International Holdings Ltd. | 2,006,404 | 3,348,691 |
| Tencent Holdings Ltd. | 305,200 | 8,485,175 |
| | | 21,500,727 |
| | | |
| Hong Kong - 9.5% | | |
| AIA Group Ltd. | 520,600 | 3,500,900 |
| Galaxy Entertainment Group Ltd. | 493,000 | 1,874,748 |
| Samsonite International SA | 853,926 | 2,736,747 |
| Techtronic Industries Co. Ltd. | 951,000 | 3,725,345 |
| | | 11,837,740 |
| | | |
| Hungary - 2.0% | | |
| Richter Gedeon Nyrt | 124,427 | 2,528,677 |
| | | |
| India - 15.1% | | |
| Bharat Forge Ltd. | 144,447 | 1,980,966 |
| Container Corp of India Ltd. | 98,682 | 2,039,686 |
| HCL Technologies Ltd. | 137,941 | 1,659,799 |
| HDFC Bank Ltd. (ADR) | 54,759 | 3,936,624 |
| Hero MotoCorp. Ltd. | 27,608 | 1,419,420 |
| ICICI Bank Ltd. (ADR) | 445,023 | 3,324,322 |
| Motherson Sumi Systems Ltd. | 498,382 | 2,391,200 |
| Tech Mahindra Ltd. | 340,546 | 2,156,938 |
| | | 18,908,955 |
| | | |
| Indonesia - 3.1% | | |
| Bank Rakyat Indonesia Persero Tbk PT | 4,133,200 | 3,878,335 |
| |
12 calvert.com CALVERT EMERGING MARKETS EQUITY FUND ANNUAL REPORT
|
| | | | |
| | SHARES | VALUE ($) |
| COMMON STOCKS - CONT’D | | |
| Mexico - 3.9% | | |
| Banregio Grupo Financiero SAB de CV | 326,308 | 1,869,017 |
|
| Grupo Financiero Banorte SAB de CV | 582,654 | 3,058,747 |
|
| | | 4,927,764 |
|
| | | |
| Russia - 5.0% | | |
| Magnit PJSC | 10,187 | 1,696,038 |
|
| Mail.Ru Group Ltd. (GDR) * | 72,685 | 1,274,895 |
|
| MMC Norilsk Nickel PJSC (ADR): | | |
| BATS Chi-X Europe | 83,359 | 1,332,336 |
|
| OTC US | 3,059 | 49,097 |
|
| Sberbank of Russia PJSC (ADR) | 208,377 | 1,956,123 |
|
| | | 6,308,489 |
|
| | | |
| South Africa - 3.2% | | |
| Life Healthcare Group Holdings Ltd. | 962,127 | 2,661,749 |
|
| Shoprite Holdings Ltd. | 94,156 | 1,315,606 |
|
| | | 3,977,355 |
|
| | | |
| South Korea - 5.5% | | |
| KB Financial Group, Inc. | 101,169 | 3,479,704 |
|
| Samsung Fire & Marine Insurance Co. Ltd. | 13,221 | 3,367,414 |
|
| | | 6,847,118 |
|
| | | |
| Taiwan - 15.4% | | |
| Advantech Co. Ltd. | 306,000 | 2,633,804 |
|
| Chipbond Technology Corp. | 1,486,000 | 2,186,179 |
|
| Hon Hai Precision Industry Co. Ltd. | 536,400 | 1,357,447 |
|
| Land Mark Optoelectronics Corp. | 133,900 | 1,485,614 |
|
| Phison Electronics Corp. | 173,982 | 1,328,725 |
|
| Taiwan Semiconductor Manufacturing Co. Ltd. (ADR) | 194,023 | 5,935,163 |
|
| Tong Yang Industry Co. Ltd. | 1,066,448 | 2,539,371 |
|
| Tung Thih Electronic Co. Ltd. | 133,000 | 1,875,734 |
|
| | | 19,342,037 |
|
| | | |
| Turkey - 1.1% | | |
| Aygaz AS | 378,258 | 1,353,515 |
|
| | | |
| United Kingdom - 1.6% | | |
| NMC Health plc (a) | 115,360 | 2,048,476 |
|
| | | |
| Total Common Stocks (Cost $101,435,825) | | 112,194,385 |
|
| | | |
| | | |
| PREFERRED STOCKS - 1.3% | | |
| | | |
| Brazil - 1.3% | | |
| Itau Unibanco Holding SA | 143,238 | 1,564,446 |
|
| | | |
| Total Preferred Stocks (Cost $1,371,689) | | 1,564,446 |
|
| |
calvert.com CALVERT EMERGING MARKETS EQUITY FUND ANNUAL REPORT 13
|
| | | | |
| | SHARES | VALUE ($) |
| PARTICIPATORY NOTES - 4.4% | | |
| China - 4.4% | | |
| Gree Electric Appliances, Inc., Merrill Lynch International & Co., 8/31/18 *(b) | 173,352 | 579,603 |
|
| Gree Electric Appliances, Inc., Morgan Stanley Asia Products Ltd., 2/16/18 *(b) | 241,611 | 807,827 |
|
Hangzhou Hikvision Digital Technology Co. Ltd., Citigroup Global Markets Holdings, Inc., 1/17/17 *(b) | 225,614 | 831,182 |
|
| Hangzhou Hikvision Digital Technology Co. Ltd., Merrill Lynch International & Co., 4/9/19 *(b) | 435,676 | 1,605,070 |
|
| Kweichow Moutai Co. Ltd., Morgan Stanley Asia Products Ltd.,11/9/17 *(b) | 38,477 | 1,721,166 |
|
| | | 5,544,848 |
|
| | | |
| Total Participatory Notes (Cost $4,879,001) | | 5,544,848 |
|
| | | |
| | | |
| HIGH SOCIAL IMPACT INVESTMENTS - 1.6% | PRINCIPAL AMOUNT ($) | |
| Calvert Social Investment Foundation Notes, 1.00%, 5/5/17 (b)(c) | 2,000,000 | 1,964,420 |
|
| ImpactAssets Global Sustainable Agriculture Notes, 0.00%, 11/3/20 (b)(c)(d) | 43,000 | 38,270 |
|
| ImpactAssets Microfinance Plus Notes, 0.00%, 11/3/20 (b)(c)(d) | 56,000 | 52,640 |
|
| | | |
| Total High Social Impact Investments (Cost $2,099,000) | | 2,055,330 |
|
| | | |
| | | |
SHORT TERM INVESTMENT OF CASH COLLATERAL FOR SECURITIES LOANED - 0.0% | SHARES | |
| State Street Institutional U.S. Government Money Market Fund - Premier Class, 0.26% | 6,788 | 6,788 |
|
| | | |
| Total Short Term Investment of Cash Collateral For Securities Loaned (Cost $6,788) | | 6,788 |
|
| | | |
| | | |
| TOTAL INVESTMENTS (Cost $109,792,303) - 96.9% | | 121,365,797 |
|
| Other assets and liabilities, net - 3.1% | | 3,869,400 |
|
NET ASSETS - 100.0% | |
| $125,235,197 |
|
|
| | |
| NOTES TO SCHEDULE OF INVESTMENTS |
| * Non-income producing security. |
| (a) Security, or portion of security, is on loan. Total value of securities on loan is $6,454 as of September 30, 2016. |
| (b) This security was valued under the direction of the Board of Directors. Total market value of fair valued securities amounts to $7,600,178, which represents 6.1% of the net assets of the Fund as of September 30, 2016. |
| (c) Total market value of restricted securities amounts to $2,055,330, which represents 1.6% of the net assets of the Fund as of September 30, 2016. |
| (d) The coupon rate shown on floating or adjustable rate securities represents the rate in effect on September 30, 2016. |
| |
| Abbreviations: |
| ADR: | American Depositary Receipts | |
| GDR: | Global Depositary Receipts | |
| Ltd.: | Limited | |
| plc: | Public Limited Company | |
|
| | |
| RESTRICTED SECURITIES | ACQUISITION DATES | COST ($) |
| Calvert Social Investment Foundation Notes, 1.00%, 5/5/17 | 5/5/16 | 2,000,000 |
| ImpactAssets Global Sustainable Agriculture Notes, 0.00%, 11/3/20 | 11/13/15 | 43,000 |
| ImpactAssets Microfinance Plus Notes, 0.00%, 11/3/20 | 11/13/15 | 56,000 |
| See notes to financial statements. |
14 calvert.com CALVERT EMERGING MARKETS EQUITY FUND ANNUAL REPORT
CALVERT EMERGING MARKETS EQUITY FUND
STATEMENT OF ASSETS AND LIABILITIES
SEPTEMBER 30, 2016
|
| | | |
| ASSETS | |
| Investments in securities, at value (Cost $109,792,303) - see accompanying schedule |
| $121,365,797 |
|
| Cash | 1,882,317 |
|
| Cash denominated in foreign currencies (Cost $1,770,603) | 1,779,868 |
|
| Receivable for securities sold | 631,713 |
|
| Receivable for shares sold | 239,590 |
|
| Dividends and interest receivable | 112,344 |
|
| Securities lending income receivable | 222 |
|
| Directors’ deferred compensation plan | 46,014 |
|
| Total assets | 126,057,865 |
|
| | |
| LIABILITIES | |
| Payable for securities purchased | 596,566 |
|
| Payable upon return of securities loaned | 6,788 |
|
| Payable for shares redeemed | 49,340 |
|
| Payable for foreign cap gain taxes | 13,262 |
|
| Payable to Calvert Investment Management, Inc. | 28,875 |
|
| Payable to Calvert Investment Distributors, Inc. | 8,706 |
|
| Payable to Calvert Investment Administrative Services, Inc. | 11,178 |
|
| Payable to Calvert Investment Services, Inc. | 990 |
|
| Payable for Directors’ fees and expenses | 2,698 |
|
| Directors’ deferred compensation plan | 46,014 |
|
| Accrued expenses and other liabilities | 58,251 |
|
| Total liabilities | 822,668 |
|
| NET ASSETS |
| $125,235,197 |
|
| | |
| NET ASSETS CONSIST OF: | |
| Paid-in capital applicable to the following shares of common stock, | |
| with 250,000,000 shares of $0.01 par value shares authorized: | |
| Class A: 3,039,565 shares outstanding |
| $38,723,745 |
|
| Class C: 77,937 shares outstanding | 957,940 |
|
| Class I: 4,460,941 shares outstanding | 54,765,033 |
|
| Class Y: 2,022,147 shares outstanding | 23,922,716 |
|
| Undistributed net investment income | 866,347 |
|
| Accumulated net realized gain (loss) on investments and foreign currency transactions | (5,571,652) |
|
| Net unrealized appreciation (depreciation) on investments, foreign currencies and assets and liabilities denominated in foreign currencies (a) | 11,571,068 |
|
| NET ASSETS |
| $125,235,197 |
|
| | |
| NET ASSET VALUE PER SHARE | |
| Class A (based on net assets of $39,342,675) |
| $12.94 |
|
| Class C (based on net assets of $994,294) |
| $12.76 |
|
| Class I (based on net assets of $58,259,253) |
| $13.06 |
|
| Class Y (based on net assets of $26,638,975) |
| $13.17 |
|
| (a) Net of deferred foreign capital gains tax of $13,262. | |
| See notes to financial statements. |
calvert.com CALVERT EMERGING MARKETS EQUITY FUND ANNUAL REPORT 15
CALVERT EMERGING MARKETS EQUITY FUND
STATEMENT OF OPERATIONS
YEAR ENDED SEPTEMBER 30, 2016
|
| | | |
| NET INVESTMENT INCOME | |
| Investment Income: | |
| Dividend income (net of foreign taxes withheld of $195,840) |
| $1,966,557 |
|
| Other income (a) | 25,472 |
|
| Interest income | 8,193 |
|
| Securities lending income | 429 |
|
| Total investment income | 2,000,651 |
|
| | |
| Expenses: | |
| Investment advisory fee | 852,053 |
|
| Administrative fees | 130,743 |
|
| Transfer agency fees and expenses: | |
| Class A | 53,788 |
|
| Class C | 5,175 |
|
| Class I | 4,832 |
|
| Class Y | 15,911 |
|
| Distribution Plan expenses: | |
| Class A | 65,371 |
|
| Class C | 7,479 |
|
| Directors’ fees and expenses | 9,887 |
|
| Accounting fees | 28,027 |
|
| Custodian fees | 178,587 |
|
| Professional fees | 40,223 |
|
| Registration fees | 42,273 |
|
| Reports to shareholders | 9,366 |
|
| Miscellaneous | 13,781 |
|
| Total expenses | 1,457,496 |
|
| Reimbursement from Advisor: | |
| Class A | (116,711) |
|
| Class C | (16,416) |
|
| Class I | (125,079) |
|
| Class Y | (66,276) |
|
| Administrative fees waived | (19,503) |
|
| Net expenses | 1,113,511 |
|
| NET INVESTMENT INCOME | 887,140 |
|
| See notes to financial statements. |
16 calvert.com CALVERT EMERGING MARKETS EQUITY FUND ANNUAL REPORT
|
| | | |
CALVERT EMERGING MARKETS EQUITY FUND STATEMENT OF OPERATIONS - CONT’D YEAR ENDED SEPTEMBER 30, 2016 |
| REALIZED AND UNREALIZED GAIN (LOSS) | |
| Net realized gain (loss) on: | |
| Investments |
| ($2,885,313 | ) |
| Foreign currency transactions | (23,201) |
|
| | (2,908,514) |
|
| | |
| Change in unrealized appreciation (depreciation) on: | |
| Investments and foreign currencies (b) | 19,964,292 |
|
| Assets and liabilities denominated in foreign currencies | 34,112 |
|
| | 19,998,404 |
|
| | |
| NET REALIZED AND UNREALIZED GAIN | 17,089,890 |
|
| | |
| INCREASE IN NET ASSETS RESULTING FROM OPERATIONS |
| $17,977,030 |
|
| (a) Other income represents a non-recurring refund for overbilling of prior years’ custody out-of-pocket fees. |
| (b) Net of deferred foreign capital gains tax of $13,262. |
| See notes to financial statements. |
calvert.com CALVERT EMERGING MARKETS EQUITY FUND ANNUAL REPORT 17
CALVERT EMERGING MARKETS EQUITY FUND
STATEMENTS OF CHANGES IN NET ASSETS
|
| | | | | | | |
| INCREASE (DECREASE) IN NET ASSETS | YEAR ENDED
SEPTEMBER 30, 2016 | | YEAR ENDED
SEPTEMBER 30, 2015 |
| Operations: | | | |
| Net investment income |
| $887,140 |
| |
| $683,729 |
|
| Net realized loss | (2,908,514) |
| | (1,865,800) |
|
| Net change in unrealized appreciation (depreciation) | 19,998,404 |
| | (10,089,457) |
|
| | | | |
| INCREASE (DECREASE) IN NET ASSETS RESULTING FROM OPERATIONS | 17,977,030 |
| | (11,271,528) |
|
| | | | |
| Distributions to shareholders from: | | | |
| Net investment income: | | | |
| Class A shares | (201,769) |
| | (55,632) |
|
| Class C shares | (739) |
| | — |
|
| Class I shares | (492,370) |
| | (197,710) |
|
| Class Y shares | (124,328) |
| | (7,207) |
|
| Net realized gain: | | | |
| Class A shares | — |
| | (719,225) |
|
| Class C shares | — |
| | (19,298) |
|
| Class I shares | — |
| | (1,059,703) |
|
| Class Y shares | — |
| | (80,750) |
|
| Total distributions | (819,206) |
| | (2,139,525) |
|
| | | | |
| Capital share transactions: | | | |
| Shares sold: | | | |
| Class A shares | 25,335,469 |
| | 21,136,575 |
|
| Class C shares | 482,880 |
| | 341,215 |
|
| Class I shares | 15,361,751 |
| | 13,238,700 |
|
| Class Y shares | 23,886,469 |
| | 11,494,694 |
|
| Reinvestment of distributions: | | | |
| Class A shares | 173,845 |
| | 730,848 |
|
| Class C shares | 668 |
| | 15,018 |
|
| Class I shares | 491,547 |
| | 1,257,413 |
|
| Class Y shares | 116,687 |
| | 83,767 |
|
| Redemption fees: | | | |
| Class A shares | — |
| | 3 |
|
| Shares redeemed: | | | |
| Class A shares | (14,634,570) |
| | (14,175,053) |
|
| Class C shares | (195,772) |
| | (295,231) |
|
| Class I shares | (5,100,991) |
| | (1,547,822) |
|
| Class Y shares | (7,965,677) |
| | (6,023,221) |
|
| Total capital share transactions | 37,952,306 |
| | 26,256,906 |
|
| | | | |
| TOTAL INCREASE IN NET ASSETS | 55,110,130 |
| | 12,845,853 |
|
| | | | |
| | | | |
| NET ASSETS | | | |
| Beginning of year | 70,125,067 |
| | 57,279,214 |
|
| End of year (including undistributed net investment income of $866,347 and $650,198, respectively) |
| $125,235,197 |
| |
| $70,125,067 |
|
| |
18 calvert.com CALVERT EMERGING MARKETS EQUITY FUND ANNUAL REPORT
|
| | | | | | | |
CALVERT EMERGING MARKETS EQUITY FUND STATEMENTS OF CHANGES IN NET ASSETS - CONT’D |
| CAPITAL SHARE ACTIVITY | YEAR ENDED
SEPTEMBER 30, 2016 | | YEAR ENDED
SEPTEMBER 30, 2015 |
| Shares sold: | | | |
| Class A shares | 2,131,863 |
| | 1,662,220 |
|
| Class C shares | 42,163 |
| | 27,020 |
|
| Class I shares | 1,296,392 |
| | 1,043,577 |
|
| Class Y shares | 2,051,842 |
| | 899,948 |
|
| Reinvestment of distributions: | | | |
| Class A shares | 15,091 |
| | 58,063 |
|
| Class C shares | 59 |
| | 1,205 |
|
| Class I shares | 42,411 |
| | 99,030 |
|
| Class Y shares | 9,973 |
| | 6,546 |
|
| Shares redeemed: | | | |
| Class A shares | (1,270,596) |
| | (1,126,025) |
|
| Class C shares | (17,002) |
| | (22,276) |
|
| Class I shares | (434,186) |
| | (128,965) |
|
| Class Y shares | (660,485) |
| | (459,427) |
|
| Total capital share activity | 3,207,525 |
| | 2,060,916 |
|
| See notes to financial statements. |
calvert.com CALVERT EMERGING MARKETS EQUITY FUND ANNUAL REPORT 19
NOTES TO FINANCIAL STATEMENTS
NOTE A — SIGNIFICANT ACCOUNTING POLICIES
General: Calvert World Values Fund, Inc. (the “Corporation”) is a Maryland corporation pursuant to Articles of Incorporation filed on February 14, 1992, and is registered under the Investment Company Act of 1940, as amended (the “1940 Act”) as an open-end management investment company. The Corporation operates four (4) separate series, or mutual funds, each with its own investment objective(s) and strategies. This report contains the financial statements and financial highlights for the Calvert Emerging Markets Equity Fund (the “Fund”). The Corporation is authorized to issue two billion (2,000,000,000) shares of stock, of which 250,000,000 shares have been allocated to the Fund, with a par value of each share at one cent ($0.01).
The Fund is non-diversified and invests primarily in equity securities of companies located in emerging market countries. The operations of each series of the Corporation, including the Fund, are accounted for separately. The Fund applies the accounting and reporting guidance in the Financial Accounting Standards Board (FASB) Accounting Standards Codification Topic 946, Financial Services – Investment Companies (ASC 946).
The Fund generally offers Class A, Class C, Class I, and Class Y shares. Class A shares are sold with a maximum front-end sales charge of 4.75%. However, the front-end sales charge is waived for shareholders investing in Class A shares directly with the Fund in an account maintained by Calvert Investment Distributors, Inc. (“Distributor”) or without a specified broker-dealer or financial adviser (“Direct Account”). Class C shares are not available for purchase in Direct Accounts. For non-Direct Accounts, Class C shares are sold without a front-end sales charge, and with certain exceptions, will be charged a contingent deferred sales charge on shares sold within one year of purchase. Class C shares have higher levels of expenses than Class A shares. Class I shares require a minimum account balance of $1 million. The $1 million minimum initial investment is waived for retirement plans that trade through omnibus accounts and may be waived in certain other instances where it is believed to be in the best interest of the Fund and its shareholders. Class I shares have no front-end or contingent deferred sales charge and have lower levels of expenses than Class A shares. Class Y shares are generally only available to wrap or similar fee-based programs offered by financial intermediaries, and retirement plans, foundations, endowments and other consultant-driven business, that have entered into an agreement with the Fund’s Distributor to offer Class Y shares to their clients. Class Y shares have no front-end or contingent deferred sales charge and have lower levels of expenses than Class A shares. Among other things, each class has different: (a) dividend rates, due to differences in Distribution Plan expenses and other class-specific expenses; (b) exchange privileges; and (c) class-specific voting rights.
Security Valuation: Net asset value per share is determined every business day as of the close of the regular session of the New York Stock Exchange (generally 4:00 p.m. Eastern time). The Fund uses independent pricing services approved by the Board of Directors (“the Board”) to value its investments wherever possible. Investments for which market quotations are not available or deemed not reliable are fair valued in good faith under the direction of the Board.
The Board has adopted Valuation Procedures (the “Procedures”) to determine the fair value of securities and other financial instruments for which market prices are not readily available or which may not be reliably priced. The Board has delegated the day-to-day responsibility for determining the fair value of assets of the Fund to Calvert Investment Management, Inc. (the “Advisor” or “Calvert”) and has provided these Procedures to govern Calvert in its valuation duties.
Calvert has chartered an internal Valuation Committee to oversee the implementation of these Procedures and to assist it in carrying out the valuation responsibilities that the Board has delegated.
The Valuation Committee meets on a regular basis to review illiquid securities and other investments which may not have readily available market prices. The Valuation Committee’s fair valuation determinations are subject to review, approval and ratification by the Board at its next regularly scheduled meeting covering the calendar quarter in which the fair valuation was determined.
The Valuation Committee utilizes various methods to measure the fair value of the Fund’s investments. U.S. generally accepted accounting principles (GAAP) establishes a disclosure hierarchy that categorizes the inputs to valuation techniques used to value assets and liabilities at measurement date. These inputs are summarized in the three broad levels listed below:
Level 1 - quoted prices in active markets for identical securities
Level 2 - other significant observable inputs (including quoted prices for similar securities, interest rates, prepayment speeds, credit risk, etc.)
Level 3 - significant unobservable inputs (including the Fund’s own assumptions in determining the fair value of investments)
The inputs or methodologies used for valuing securities are not necessarily an indication of the risk associated with investing in those securities.
20 calvert.com CALVERT EMERGING MARKETS EQUITY FUND ANNUAL REPORT
Changes in valuation techniques may result in transfers in or out of an investment’s assigned level within the hierarchy during the year. Transfers in and/or out of levels are determined based on the fair value of such securities at the end of the year. Valuation techniques used to value the Fund’s investments by major category are as follows:
Common and preferred stocks, including restricted securities, for which market quotations are readily available, are valued at the last reported sale price or official closing price as reported by an independent pricing service on the primary market or exchange on which they are traded and are categorized as Level 1 in the hierarchy. In the event there were no sales during the day or closing prices are not available, securities are valued at the last quoted bid price or the last available price and are categorized as Level 2 in the hierarchy. Foreign securities are valued based on quotations from the principal market in which such securities are normally traded. The Fund has retained a third party fair value pricing service to quantitatively analyze the price movement of its holdings on foreign exchanges and to automatically fair value these securities each business day. The third party fair value pricing service takes into account many factors, including, but not limited to, movements in U.S. securities markets and changes in futures contracts and foreign exchange rates that have occurred after the close of the principal foreign market, to determine a fair value as of the close of the New York Stock Exchange. Such securities are categorized as Level 2 in the hierarchy.
For restricted securities and private placements where observable inputs are limited, assumptions about market activity and risk are used and such securities are categorized as Level 3 in the hierarchy.
Participatory notes are valued based on the value of the underlying equity security as determined using the valuation techniques for equity securities listed above. Participatory notes are categorized as Level 2 in the hierarchy.
Mutual funds are valued at their closing net asset value each business day and are categorized as Level 1 in the hierarchy.
If a market value cannot be determined for a security using the methodologies described above, or if, in the good faith opinion of the Advisor, the market value does not constitute a readily available market quotation, or if a significant event has occurred that would materially affect the value of the security, the security will be fair valued as determined in good faith by the Valuation Committee. Securities which were fair valued at September 30, 2016, if any, are identified on the Schedule of Investments.
The Valuation Committee considers a number of factors, including significant unobservable valuation inputs when arriving at fair value. It considers all significant facts that are reasonably available and relevant to the determination of fair value.
The Valuation Committee primarily employs a market-based approach which may use related or comparable assets or liabilities, recent transactions, market multiples, book values, and other relevant information for the investment to determine the fair value of the investment. When more appropriate, the Fund may employ an income-based or cost approach. An income-based valuation approach discounts anticipated future cash flows of the investment to calculate a present amount (discounted). The measurement is based on the value indicated by current market expectations about those future amounts. Discounts may also be applied due to the nature or duration of any restrictions on the disposition of the investments. A cost based approach is based on the amount that currently would be required to replace the service capacity of an asset (current replacement cost). From the seller’s perspective, the price that would be received for the asset is determined based on the cost to a buyer to acquire or construct a substitute asset of comparable utility, adjusted for obsolescence.
The values assigned to fair value investments are based on available information and do not necessarily represent amounts that might ultimately be realized. Further, due to the inherent uncertainty of valuations of such investments, the fair values may differ significantly from the values that would have been used had an active market existed, and the differences could be material. The Valuation Committee employs various methods for calibrating these valuation approaches including a regular review of key inputs and assumptions, transactional back-testing or disposition analysis and reviews of any related market activity.
The following table summarizes the market value of the Fund’s holdings as of September 30, 2016, based on the inputs used to value them:
calvert.com CALVERT EMERGING MARKETS EQUITY FUND ANNUAL REPORT 21
|
| | | | | | | | | | | |
| | VALUATION INPUTS |
| INVESTMENTS IN SECURITIES* | LEVEL 1 | LEVEL 2 | LEVEL 3 | TOTAL |
| Common Stocks** |
| $37,545,736 |
|
| $74,648,649 | *** | $— |
|
| $112,194,385 |
|
| Preferred Stocks** | 1,564,446 |
| — |
| — |
| 1,564,446 |
|
| Participatory Notes | — |
| 5,544,848 |
| — |
| 5,544,848 |
|
| High Social Impact Investments | — |
| 1,964,420 |
| 90,910 |
| 2,055,330 |
|
| Short Term Investment of Cash Collateral For Securities Loaned | 6,788 |
| — |
| — |
| 6,788 |
|
| TOTAL |
| $39,116,970 |
|
| $82,157,917 |
| $90,910^ |
|
| $121,365,797 |
|
| | | | | |
| * For a complete listing of investments, please refer to the Schedule of Investments. |
| ** For further breakdown of equity securities by country, please refer to the Schedule of Investments. |
| *** Includes certain securities trading primarily outside the U.S. where the value was adjusted as a result of significant market movements following the close of local trading. |
| ^ Level 3 securities represent 0.1% of net assets. |
On September 30, 2016, for certain securities which trade primarily outside the U.S., adjustments to prices due to movements against a specified benchmark were not necessary. As a result, $1,274,895 transferred out of Level 2 and into Level 1. The amount of this transfer was determined based on the fair value of such securities at the end of the period.
Participatory Notes: The Fund may gain exposure to securities in certain foreign markets through investments in participatory notes (“P-notes”), especially in markets where direct investment by the Fund is not possible. P-notes are generally issued by a bank or broker-dealer (the “counterparty”) and are designed to offer a return linked to a particular underlying equity security. While the holder of a P-note is entitled to receive from the counterparty any dividends paid by the underlying security, the counterparty retains legal ownership and voting rights of the underlying security. The risks associated with investing in a P-note may include the possible failure of the counterparty to perform its obligations under the terms of the agreement, an inability to liquidate or transfer the notes, and an imperfect correlation between the value of the P-note and the underlying security.
Security Transactions and Investment Income: Security transactions are accounted for on trade date. Realized gains and losses are recorded on an identified cost basis and may include proceeds from litigation. Dividend income is recorded on the ex-dividend date or, in the case of dividends on certain foreign securities, as soon as the Fund is informed of the ex-dividend date. Withholding taxes on foreign dividends have been provided for in accordance with the Fund’s understanding of the applicable country’s tax rules and rates. Distributions received on securities that represent a return of capital are recorded as a reduction of cost of investments. Distributions received on securities that represent a capital gain are recorded as a realized gain. Interest income, which includes amortization of premium and accretion of discount on debt securities, is accrued as earned.
Share Class Accounting: Investment income and realized and unrealized gains and losses are allocated to separate classes of shares based upon the relative net assets of each class. Expenses common to the classes are also allocated to each class in proportion to their relative net assets. Expenses arising in connection with a specific class are charged directly to that class.
Foreign Currency Transactions: The Fund’s accounting records are maintained in U.S. dollars. For valuation of assets and liabilities on each date of net asset value determination, foreign denominations are converted into U.S. dollars using the current exchange rate. Security transactions, income, and expenses are translated at the prevailing rate of exchange on the date of the event. The effect of changes in foreign exchange rates on securities and foreign currencies is included in the net realized and unrealized gain or loss on investments and assets and liabilities denominated in foreign currencies.
Distributions to Shareholders: Distributions to shareholders are recorded by the Fund on ex-dividend date. Dividends from net investment income and distributions from net realized capital gains, if any, are paid at least annually. Distributions are determined in accordance with income tax regulations which may differ from U.S. generally accepted accounting principles; accordingly, periodic reclassifications are made within the Fund’s capital accounts to reflect income and gains available for distribution under income tax regulations.
Estimates: The preparation of financial statements in conformity with U.S. generally accepted accounting principles requires management to make estimates and assumptions that affect the reported amounts of assets and liabilities and disclosure of contingent assets and liabilities at the date of the financial statements and the reported amounts of increases and decreases in net assets from operations during the reporting period. Actual results could differ from those estimates.
Redemption Fees: The Fund charged a 2% redemption fee on redemptions, including exchanges, made within 30 days of purchase (within seven days for Class I shares). The redemption fee was accounted for as an addition to paid-in capital. This fee was eliminated effective February 2, 2015.
22 calvert.com CALVERT EMERGING MARKETS EQUITY FUND ANNUAL REPORT
Federal Income Taxes: No provision for federal income or excise tax is required since the Fund intends to continue to qualify as a regulated investment company under the Internal Revenue Code and to distribute substantially all of its taxable earnings.
Management has analyzed the Fund’s tax positions taken for all open federal income tax years and has concluded that no provision for federal income tax is required in the Fund’s financial statements. A Fund’s federal tax return is subject to examination by the Internal Revenue Service for a period of three years.
NOTE B — RELATED PARTY TRANSACTIONS
Calvert Investment Management, Inc. (the “Advisor”) is wholly-owned by Calvert Investments, Inc., which is indirectly wholly-owned by Ameritas Mutual Holding Company. The Advisor provides investment advisory services and pays the salaries and fees of officers and Directors of the Fund who are employees of the Advisor or its affiliates. For its services, the Advisor receives an annual fee, payable monthly, of 0.95% of the average daily net assets.
The Advisor has contractually agreed to limit net annual fund operating expenses through January 31, 2018. Effective April 29, 2016, the contractual expense caps are 1.27%, 2.02%, 0.92%, and 1.02% for Class A, C, I, and Y, respectively. For the period from February 1, 2016 through April 28, 2016, the contractual expense caps were 1.62%, 2.37%, 1.27%, and 1.37% for Class A, C, I, and Y, respectively. Prior to February 1, 2016, the expense caps were 1.68%, 2.43%, 1.33%, and 1.43% for Class A, C, I, and Y, respectively. For the purpose of this expense limit, operating expenses do not include interest expense, brokerage commissions, taxes, and extraordinary expenses. This expense limitation does not limit acquired fund fees and expenses, if any.
Calvert Investment Administrative Services, Inc. (“CIAS”), an affiliate of the Advisor, provides administrative services to the Fund for an annual fee, payable monthly, based on the Portfolio’s average daily net assets.
For the period October 1, 2015 to January 31, 2016, the administrative fee was 0.35% for Class A, C and Y and 0.10% for Class I. CIAS and the Fund entered into an Amended and Restated Administrative Services Agreement that established a 0.12% administrative fee for all classes of the Fund commencing on February 1, 2016. CIAS voluntarily waived 0.23% (the amount of the administrative fee above 0.12%) for Class A, C and Y shares of the Fund for the period from December 1, 2015 through January 31, 2016. CIAS has also contractually agreed to waive 0.02% for Class I shares of the Fund (the difference between the previous administrative fee and the new 0.12% fee) from February 1, 2016 through January 31, 2018. During the year ended September 30, 2016, CIAS voluntarily waived $13,079.
Calvert Investment Distributors, Inc. (“CID”), an affiliate of the Advisor, is the distributor and principal underwriter for the Fund. Pursuant to Rule 12b-1 under the Investment Company Act of 1940, the Fund has adopted a Distribution Plan that permits the Fund to pay certain expenses associated with the distribution and servicing of its shares. The expenses paid may not exceed 0.50% and 1.00% annually of the average daily net assets of Class A and C, respectively. The amount actually paid by the Fund is an annualized fee, payable monthly, of 0.25% and 1.00% of the average daily net assets of Class A and C, respectively. Class I and Y shares do not have Distribution Plan expenses.
CID received $10,240 as its portion of commissions charged on sales of the Fund’s Class A shares for the year ended September 30, 2016.
Calvert Investment Services, Inc. (“CIS”), an affiliate of the Advisor, acts as shareholder servicing agent for the Fund. For its services, CIS received a fee of $11,758 for the year ended September 30, 2016. Boston Financial Data Services, Inc. is the transfer and dividend disbursing agent.
Each Director of the Fund who is not an employee of the Advisor or its affiliates receives an annual retainer of $52,000 plus a meeting fee of up to $3,000 for each Board meeting attended. Additional fees of $6,000 annually may be paid to the Committee chairs ($10,000 for the Board Chair and the Special Equities Committee chair) and $2,500 annually may be paid to Committee members, plus a Committee meeting fee of $500 for each Committee meeting attended. Eligible Directors may participate in a Deferred Compensation Plan (the “Plan”). Obligations of the Plan will be paid solely out of the Fund’s assets. Directors’ fees are allocated to each of the funds served.
NOTE C — INVESTMENT ACTIVITY AND TAX INFORMATION
During the year, the cost of purchases and proceeds from sales of investments, other than short-term securities, were $61,867,447 and $27,559,685, respectively.
Under the Regulated Investment Company Modernization Act of 2010, capital losses incurred in taxable years beginning after December 22, 2010 can be carried forward to offset future capital gains for an unlimited period. These losses will retain their character as either long-term or short-term.
calvert.com CALVERT EMERGING MARKETS EQUITY FUND ANNUAL REPORT 23
|
| | | |
| Capital Loss Carryforwards | |
| NO EXPIRATION DATE | |
| Short-term |
| ($620,944 | ) |
| Long-term | (1,304,523) |
|
The tax character of dividends and distributions paid during the years ended September 30, 2016 and September 30, 2015 was as follows:
|
| | | | | | | |
| DISTRIBUTIONS PAID FROM: | 2016 |
| | 2015 |
|
| Ordinary income |
| $819,206 |
| |
| $2,139,525 |
|
| Total |
| $819,206 |
| |
| $2,139,525 |
|
As of September 30, 2016, the tax basis components of distributable earnings/(accumulated losses) and the federal tax cost were as follows:
|
| | | |
| Unrealized appreciation |
| $13,990,642 |
|
| Unrealized (depreciation) | (3,456,327) |
|
| Net unrealized appreciation (depreciation) |
| $10,534,315 |
|
| |
| Undistributed ordinary income |
| $888,498 |
|
| Capital loss carryforward |
| ($1,925,467 | ) |
| Late year ordinary and post October capital loss deferrals |
| ($2,626,459 | ) |
| Other temporary differences |
| ($2,698 | ) |
| |
| Federal income tax cost of investments |
| $110,831,482 |
|
The differences between the components of distributable earnings on a tax basis and the amounts reflected in the Statement of Assets and Liabilities are primarily due to temporary book-tax differences that will reverse in a subsequent period. These differences are mainly due to wash sales, deferred Trustees’ fees and investments in passive foreign investment companies.
Reclassifications, as shown in the table below, have been made to the Fund’s components of net assets to reflect income and gains available for distribution (or available capital loss carryovers, as applicable) under income tax law and regulations. These reclassifications are due to permanent book-tax differences and have no impact on net assets. The primary permanent differences causing such reclassifications for the Fund are due to foreign currency transactions, and investments in passive foreign investment companies.
|
| | | |
| Undistributed net investment income |
| $148,215 |
|
| Accumulated net realized gain (loss) | (148,223) |
|
| Paid-in capital | 8 |
|
NOTE D — SECURITIES LENDING
To generate additional income, the Fund may lend its securities pursuant to a securities lending agency agreement (“Lending Agreement”) with State Street Bank, the securities lending agent. Security loans are subject to termination by the Fund at any time and, therefore, are not considered to be illiquid investments. The Fund requires that the loan be continuously collateralized by either cash or securities as collateral equal at all times to at least 102% of the market value of the domestic securities loaned and 105% of the market value on the international securities loaned (if applicable). Cash collateral is generally invested in State Street Institutional U.S. Government Money Market Fund (the “U.S. Government Fund”) that is managed by an affiliate of the custodian. The U.S. Government Fund is a registered money market fund that invests in a variety of high-quality, U.S. dollar-denominated instruments. Any gain or loss in the market price of the loaned securities that might occur and any interest earned or dividends declared during the term of the loan would accrue to the account of the Fund. Income earned on the investment of collateral, net of broker rebates and other expenses incurred by the securities lending agent, is split between the Fund and the securities lending agent on the basis of agreed upon contractual terms.
The risks associated with lending portfolio securities include, but are not limited to, possible delays in receiving additional collateral or in the recovery of the loaned securities, possible loss of rights to the collateral should the borrower fail financially, as
24 calvert.com CALVERT EMERGING MARKETS EQUITY FUND ANNUAL REPORT
well as risk of loss in the value of the collateral or the value of the investments made with the collateral. The securities lending agent shall indemnify the Fund in the case of default of any securities borrower.
The total value of securities on loan was $6,454 as of September 30, 2016.
The following table displays a breakdown of transactions accounted for as secured borrowings, the obligations by class of collateral pledged, and the remaining contractual maturity of those transactions as of September 30, 2016:
|
| | | | | | | | | |
| | Remaining Contractual Maturity of the Agreements as of September 30, 2016 |
| | Overnight and
Continuous | <30 days | Between
30 & 90 days | >90 days | Total |
| Securities Lending Transactions |
| Common Stocks |
| $6,788 |
| $— | $— | $— |
| $6,788 |
|
| Amount of recognized liabilities for securities lending transactions |
| $6,788 |
|
NOTE E — LINE OF CREDIT
A financing agreement is in place with the Calvert Funds and State Street Corporation (“SSC”). Under the agreement, SSC provides an unsecured line of credit facility, in the aggregate amount of $50 million ($25 million committed and $25 million uncommitted), accessible by the Calvert Funds for temporary or emergency purposes only. Borrowings bear interest at the higher of the One-Month London Interbank Offered Rate (LIBOR) in effect that day or the overnight Federal Funds Rate plus 1.25% per annum. A commitment fee of 0.25% per annum is incurred on the unused portion of the committed facility. An administrative fee of $30,000 was paid in connection with the uncommitted facility. These fees are allocated to all participating funds. The Fund had no loans outstanding pursuant to this line of credit at September 30, 2016.
For the year ended September 30, 2016, borrowing information by the Fund under the agreement was as follows:
|
| | | |
| Average Daily Balance | Weighted Average
Interest Rate | Maximum
Amount Borrowed | Month of Maximum
Amount Borrowed |
| $51,032 | 1.39% | $1,396,711 | November 2015 |
NOTE F — SUBSEQUENT EVENTS
On October 20, 2016, Calvert and Calvert’s indirect parent company, Ameritas Holding Company, entered into an Asset Purchase Agreement (the “Agreement”) with Eaton Vance Management (“Eaton Vance”), a newly-formed subsidiary of Eaton Vance, to operate as Calvert Research and Management (“New Calvert”), and other parties, pursuant to which New Calvert has agreed to acquire, subject to the terms and conditions set forth in the Agreement, the business assets of Calvert (the “Transaction”). Completion of the Transaction is subject to the approval by the shareholders of Calvert Funds of new investment advisory agreements with New Calvert, among other conditions, and is currently expected to occur by the end of 2016 or early 2017.
A proxy statement containing detailed information regarding several proposals was mailed to shareholders of record in November 2016. The shareholder meeting is expected to be held on or about December 16, 2016.
In preparing the financial statements as of September 30, 2016, no other subsequent events or transactions occurred that would have required recognition or disclosure in these financial statements.
NOTICE TO SHAREHOLDERS (UNAUDITED)
For the fiscal year ended September 30, 2016, the Fund considers 99.2% of the ordinary dividends paid during the year as qualified dividend income and 0.1% as eligible for the corporate dividends received deduction in accordance with Section 854 of the Internal Revenue Code. It also considers $2,105,970 as income derived from foreign sources and $192,108 as foreign taxes paid.
calvert.com CALVERT EMERGING MARKETS EQUITY FUND ANNUAL REPORT 25
CALVERT EMERGING MARKETS EQUITY FUND
FINANCIAL HIGHLIGHTS
|
| | | | | | | | | | | | | | | | |
| | PERIODS ENDED | |
| CLASS A SHARES | September 30, 2016 (a) | | September 30, 2015 (a) | | September 30, 2014 (a) | | September 30, 2013 (a)(b) | |
| Net asset value, beginning |
| $10.90 |
| |
| $13.15 |
| |
| $13.34 |
| |
| $12.00 |
| |
| Income from investment operations: | | | | | | | | |
| Net investment income | 0.08(c) |
| | 0.11 |
| | 0.08 |
| | 0.13 |
| |
| Net realized and unrealized gain (loss) | 2.06 |
| | (1.92) |
| | 0.46 |
| | 1.34 |
| |
| Total from investment operations | 2.14 |
| | (1.81) |
| | 0.54 |
| | 1.47 |
| |
| Distributions from: | | | | | | | | |
| Net investment income | (0.10) |
| | (0.03) |
| | (0.04) |
| | (0.13) |
| |
| Net realized gain | — |
| | (0.41) |
| | (0.69) |
| | — |
| |
| Total distributions | (0.10) |
| | (0.44) |
| | (0.73) |
| | (0.13) |
| |
| Total increase (decrease) in net asset value | 2.04 |
| | (2.25) |
| | (0.19) |
| | 1.34 |
| |
| Net asset value, ending |
| $12.94 |
| |
| $10.90 |
| |
| $13.15 |
| |
| $13.34 |
| |
| Total return (d) | 19.75 | % | | (14.18 | %) | | 4.19 | % | | 12.30 | % | |
| Ratios to average net assets: (e) | | | | | | | | |
| Net investment income | 0.66%(c) |
| | 0.84 | % | | 0.57 | % | | 1.16%(f) |
| |
| Total expenses | 1.95 | % | | 2.18 | % | | 2.22 | % | | 3.03%(f) |
| |
| Net expenses | 1.47 | % | | 1.75 | % | | 1.78 | % | | 1.78%(f) |
| |
| Portfolio turnover | 32 | % | | 66 | % | | 95 | % | | 74 | % | |
| Net assets, ending (in thousands) |
| $39,343 |
| |
| $23,569 |
| |
| $20,628 |
| |
| $6,337 |
| |
| | | | | | | | | |
| (a) Per share figures are calculated using the Average Shares Method. |
| (b) From October 29, 2012 inception. |
| (c) Amount includes a non-recurring refund for overbilling of prior years’ custody out-of-pocket fees. This amounted to $0.003 per share and 0.03% of average net assets. |
| (d) Total return is not annualized for periods of less than one year and does not reflect deduction of any front-end or deferred sales charge. |
| (e) Total expenses do not reflect amounts reimbursed and/or waived by the Advisor and certain of its affiliates, if applicable. Net expenses are net of all reductions and represent the net expenses paid by the Fund. |
| (f) Annualized. |
| See notes to financial statements. |
26 calvert.com CALVERT EMERGING MARKETS EQUITY FUND ANNUAL REPORT
CALVERT EMERGING MARKETS EQUITY FUND
FINANCIAL HIGHLIGHTS
|
| | | | | | | | | | | | | | | | |
| | PERIODS ENDED | |
| CLASS C SHARES | September 30, 2016 (a) | | September 30, 2015 (a) | | September 30, 2014 (a) | | September 30, 2013 (a)(b) | |
| Net asset value, beginning |
| $10.74 |
| |
| $13.05 |
| |
| $13.34 |
| |
| $12.00 |
| |
| Income from investment operations: | | | | | | | | |
| Net investment income (loss) | —(c) |
| | (0.03) |
| | (0.05) |
| | (0.01) |
| |
| Net realized and unrealized gain (loss) | 2.03 |
| | (1.87) |
| | 0.45 |
| | 1.37 |
| |
| Total from investment operations | 2.03 |
| | (1.90) |
| | 0.40 |
| | 1.36 |
| |
| Distributions from: | | | | | | | | |
| Net investment income | (0.01) |
| | — |
| | — |
| | (0.02) |
| |
| Net realized gain | — |
| | (0.41) |
| | (0.69) |
| | — |
| |
| Total distributions | (0.01) |
| | (0.41) |
| | (0.69) |
| | (0.02) |
| |
| Total increase (decrease) in net asset value | 2.02 |
| | (2.31) |
| | (0.29) |
| | 1.34 |
| |
| Net asset value, ending |
| $12.76 |
| |
| $10.74 |
| |
| $13.05 |
| |
| $13.34 |
| |
| Total return (d) | 18.94 | % | | (14.98 | %) | | 3.10 | % | | 11.38 | % | |
| Ratios to average net assets: (e) | | | | | | | | |
| Net investment income (loss) | 0.02%(c) |
| | (0.23 | %) | | (0.41 | %) | | (0.09%)(f) |
| |
| Total expenses | 4.44 | % | | 5.00 | % | | 4.36 | % | | 100.72%(f) |
| |
| Net expenses | 2.21 | % | | 2.70 | % | | 2.78 | % | | 2.78%(f) |
| |
| Portfolio turnover | 32 | % | | 66 | % | | 95 | % | | 74 | % | |
| Net assets, ending (in thousands) |
| $994 |
| |
| $566 |
| |
| $610 |
| |
| $133 |
| |
| | | | | | | | | |
| (a) Per share figures are calculated using the Average Shares Method. |
| (b) From October 29, 2012 inception. |
| (c) Amount includes a non-recurring refund for overbilling of prior years’ custody out-of-pocket fees. This amounted to $0.003 per share and 0.03% of average net assets. |
| (d) Total return is not annualized for periods of less than one year and does not reflect deduction of any front-end or deferred sales charge. |
| (e) Total expenses do not reflect amounts reimbursed and/or waived by the Advisor and certain of its affiliates, if applicable. Net expenses are net of all reductions and represent the net expenses paid by the Fund. |
| (f) Annualized. |
| See notes to financial statements. |
calvert.com CALVERT EMERGING MARKETS EQUITY FUND ANNUAL REPORT 27
CALVERT EMERGING MARKETS EQUITY FUND
FINANCIAL HIGHLIGHTS
|
| | | | | | | | | | | | | | | | |
| | PERIODS ENDED | |
| CLASS I SHARES | September 30, 2016 (a) | | September 30, 2015 (a) | | September 30, 2014 (a) | | September 30, 2013 (a)(b) | |
| Net asset value, beginning |
| $10.99 |
| |
| $13.26 |
| |
| $13.49 |
| |
| $12.00 |
| |
| Income from investment operations: | | | | | | | | |
| Net investment income | 0.12(c) |
| | 0.14 |
| | 0.10 |
| | 0.19 |
| |
| Net realized and unrealized gain (loss) | 2.09 |
| | (1.93) |
| | 0.48 |
| | 1.33 |
| |
| Total from investment operations | 2.21 |
| | (1.79) |
| | 0.58 |
| | 1.52 |
| |
| Distributions from: | | | | | | | | |
| Net investment income | (0.14) |
| | (0.07) |
| | (0.12) |
| | (0.03) |
| |
| Net realized gain | — |
| | (0.41) |
| | (0.69) |
| | — |
| |
| Total distributions | (0.14) |
| | (0.48) |
| | (0.81) |
| | (0.03) |
| |
| Total increase (decrease) in net asset value | 2.07 |
| | (2.27) |
| | (0.23) |
| | 1.49 |
| |
| Net asset value, ending |
| $13.06 |
| |
| $10.99 |
| |
| $13.26 |
| |
| $13.49 |
| |
| Total return (d) | 20.31 | % | | (13.92 | %) | | 4.49 | % | | 12.73 | % | |
| Ratios to average net assets: (e) | | | | | | | | |
| Net investment income | 1.06%(c) |
| | 1.12 | % | | 0.78 | % | | 1.61%(f) |
| |
| Total expenses | 1.41 | % | | 1.48 | % | | 1.42 | % | | 1.65%(f) |
| |
| Net expenses | 1.12 | % | | 1.40 | % | | 1.42 | % | | 1.43%(f) |
| |
| Portfolio turnover | 32 | % | | 66 | % | | 95 | % | | 74 | % | |
| Net assets, ending (in thousands) |
| $58,259 |
| |
| $39,101 |
| |
| $33,721 |
| |
| $33,053 |
| |
| | | | | | | | | |
| (a) Per share figures are calculated using the Average Shares Method. |
| (b) From October 29, 2012 inception. |
| (c) Amount includes a non-recurring refund for overbilling of prior years’ custody out-of-pocket fees. This amounted to $0.003 per share and 0.03% of average net assets. |
| (d) Total return is not annualized for periods of less than one year and does not reflect deduction of any front-end or deferred sales charge. |
| (e) Total expenses do not reflect amounts reimbursed and/or waived by the Advisor and certain of its affiliates, if applicable. Net expenses are net of all reductions and represent the net expenses paid by the Fund. |
| (f) Annualized. |
| See notes to financial statements. |
28 calvert.com CALVERT EMERGING MARKETS EQUITY FUND ANNUAL REPORT
CALVERT EMERGING MARKETS EQUITY FUND
FINANCIAL HIGHLIGHTS
|
| | | | | | | | | | | | | | | | |
| | PERIODS ENDED | |
| CLASS Y SHARES | September 30, 2016 (a) | | September 30, 2015 (a) | | September 30, 2014 (a) | | September 30, 2013 (a)(b) | |
| Net asset value, beginning |
| $11.10 |
| |
| $13.35 |
| |
| $13.48 |
| |
| $12.00 |
| |
| Income from investment operations: | | | | | | | | |
| Net investment income | 0.16(c) |
| | 0.12 |
| | 0.10 |
| | 0.14 |
| |
| Net realized and unrealized gain (loss) | 2.05 |
| | (1.93) |
| | 0.49 |
| | 1.36 |
| |
| Total from investment operations | 2.21 |
| | (1.81) |
| | 0.59 |
| | 1.50 |
| |
| Distributions from: | | | | | | | | |
| Net investment income | (0.14) |
| | (0.03) |
| | (0.03) |
| | (0.02) |
| |
| Net realized gain | — |
| | (0.41) |
| | (0.69) |
| | — |
| |
| Total distributions | (0.14) |
| | (0.44) |
| | (0.72) |
| | (0.02) |
| |
| Total increase (decrease) in net asset value | 2.07 |
| | (2.25) |
| | (0.13) |
| | 1.48 |
| |
| Net asset value, ending |
| $13.17 |
| |
| $11.10 |
| |
| $13.35 |
| |
| $13.48 |
| |
| Total return (d) | 20.09 | % | | (13.96 | %) | | 4.51 | % | | 12.55 | % | |
| Ratios to average net assets: (e) | | | | | | | | |
| Net investment income | 1.34%(c) |
| | 0.95 | % | | 0.78 | % | | 1.28%(f) |
| |
| Total expenses | 1.59 | % | | 2.07 | % | | 2.24 | % | | 18.62%(f) |
| |
| Net expenses | 1.18 | % | | 1.50 | % | | 1.53 | % | | 1.53%(f) |
| |
| Portfolio turnover | 32 | % | | 66 | % | | 95 | % | | 74 | % | |
| Net assets, ending (in thousands) |
| $26,639 |
| |
| $6,889 |
| |
| $2,320 |
| |
| $440 |
| |
| | | | | | | | | |
| (a) Per share figures are calculated using the Average Shares Method. |
| (b) From October 29, 2012 inception. |
| (c) Amount includes a non-recurring refund for overbilling of prior years’ custody out-of-pocket fees. This amounted to $0.004 per share and 0.03% of average net assets. |
| (d) Total return is not annualized for periods of less than one year and does not reflect deduction of any front-end or deferred sales charge. |
| (e) Total expenses do not reflect amounts reimbursed and/or waived by the Advisor and certain of its affiliates, if applicable. Net expenses are net of all reductions and represent the net expenses paid by the Fund. |
| (f) Annualized. |
| See notes to financial statements. |
PROXY VOTING
The Proxy Voting Guidelines of the Calvert Funds that the Fund uses to determine how to vote proxies relating to portfolio securities are provided as an Appendix to the Fund’s Statement of Additional Information. The Statement of Additional Information can be obtained free of charge by calling the Fund at 1-800-368-2745, by visiting the Calvert website at www.calvert.com; or by visiting the SEC’s website at www.sec.gov.
Information regarding how the Fund voted proxies relating to portfolio securities during the most recent 12-month period ended June 30 is available on the Fund’s website at www.calvert.com and on the SEC’s website at www.sec.gov.
AVAILABILITY OF QUARTERLY PORTFOLIO HOLDINGS
The Fund files its complete schedule of portfolio holdings with the SEC for the first and third quarters of each fiscal year on Form N-Q. The Fund’s Form N-Q is available on the SEC’s website at www.sec.gov. The Fund’s Form N-Q may be reviewed and copied at the SEC’s Public Reference Room in Washington, DC; information on the operation of the Public Reference Room may be obtained by calling 1-800-SEC-0330.
calvert.com CALVERT EMERGING MARKETS EQUITY FUND ANNUAL REPORT 29
DIRECTOR AND OFFICER INFORMATION TABLE
|
| | | | | |
| Name & Age | Position With Fund | Position Start Date | Principal Occupation During Last 5 Years | # of Calvert Portfolios Overseen | Other Directorships During the Past Five Years |
| INDEPENDENT TRUSTEES/DIRECTORS |
REBECCA L. ADAMSON AGE: 67 | Trustee Director Director Director | 1989 CSIF 2000 IMPACT 2000 CRIS 2005 CWVF | President and Founder of the national non-profit, First People’s Worldwide. Founded in 1980, First People’s Worldwide is the only American Indian alternative development institute in the U.S. | 19 | • Bay & Paul Foundation |
RICHARD L. BAIRD, JR. AGE: 68 | Trustee & Chair Director & Chair Director & Chair Director & Chair
| 1982 CSIF
2000 CRIS
2005 CWVF
2005 IMPACT | Former President and CEO of Adagio Health Inc. (retired in 2014) in Pittsburgh, PA, a non-profit corporation which provides family planning services, nutrition, maternal/child health care, and various health screening services and community preventive health programs. | 24 | None |
JOHN G. GUFFEY, JR. AGE: 68 | Director Trustee Director Director | 1992 CWVF 1982 CSIF 2000 CRIS 2005 IMPACT | Consultant and President of Aurora Press Inc., a privately held publisher of trade paperbacks. | 24 | • Ariel Funds (3) (asset management) (through 12/31/11) • Calvert Social Investment Foundation • Calvert Ventures, LLC |
MILES D. HARPER, III AGE: 53 | Director Trustee Director Director | 2000 IMPACT 2005 CSIF 2005 CRIS 2005 CWVF | Partner, Carr Riggs & Ingram (public accounting firm) since October 2014. Partner, Gainer Donnelly & Desroches (public accounting firm) (now Carr Riggs & Ingram), 1999-2014. | 19 | • Bridgeway Funds (14) (asset management) |
JOY V. JONES AGE: 66 | Director Trustee Director Director | 2000 IMPACT 1990 CSIF 2000 CRIS 2005 CWVF | Attorney. | 19 | • Director, Conduit Street Restaurants SUD 2 Limited • Director, Palm Management Corporation |
TERRENCE J. MOLLNER, Ed.D. AGE: 71 | Director Trustee Director Director | 1992 CWVF 1982 CSIF 2000 CRIS 2005 IMPACT | Founder, Chairperson and President of Trusteeship Institute, Inc., an educational organization focused on the personal skills and organizations described in Dr. Mollner’s book, The Love Skill: We Are Mastering the 7 Layers of Human Maturity, particularly businesses that freely chose to give priority to the common good. Chairperson, Stakeholders Capital, Inc., an asset management firm and financial services provider.
| 19 | • Calvert Social Investment Foundation • Ben & Jerry’s Homemade, Inc. (food products) |
SYDNEY A. MORRIS AGE: 67 | Trustee Director Director Director | 1982 CSIF 2000 CRIS 2005 CWVF 2005 IMPACT | The Rev. Dr. Morris is a Unitarian Universalist minister. | 19 | None |
| |
30 calvert.com CALVERT EMERGING MARKETS EQUITY FUND ANNUAL REPORT (UNAUDITED)
|
| | | | | |
| Name & Age | Position With Fund | Position Start Date | Principal Occupation During Last 5 Years | # of Calvert Portfolios Overseen | Other Directorships During the Past Five Years |
| INTERESTED TRUSTEES/DIRECTORS |
D. WAYNE SILBY, Esq.* AGE: 68 | Director Trustee Director Director | 1992 CWVF 1982 CSIF 2000 CRIS 2000 IMPACT | Mr. Silby is the founding Chair of the Calvert Funds. He is the Chair-Elect and a principal of Syntao.com, a Beijing-based company promoting corporate social responsibility. | 24 | • Ameritas Mutual Holding Company (insurance) • Calvert Social Investment Foundation • ImpactAssets, Inc. (asset management) • Committee for the Future (charitable supporting organization) • Syntao.com China (HK) (sustainability consulting) • The ICE Organization (environmental services) |
JOHN H. STREUR* AGE: 56 | Director & President Trustee & President Director & President Director & President | 2015 CWVF
2015 CSIF
2015 CRIS
2015 IMPACT | Director, Chairman, President and Chief Executive Officer of Calvert Investments, Inc., Calvert Investment Administrative Services, Inc., Calvert Investment Management, Inc., Calvert Investment Distributors, Inc. and Calvert Investment Services, Inc. (since January 2015); Chief Compliance Officer, Calvert Investment Distributors, Inc. (since August 2015); Chief Compliance Officer, Calvert Investment Management, Inc. (August 2015 - April 2016); President and Director, Portfolio 21 Investments, Inc. (through October 2014); President, Chief Executive Officer and Director, Managers Investment Group LLC (through January 2012); President and Director, The Managers Funds and Managers AMG Funds (through January 2012). | 37 | • Portfolio 21 Investments, Inc. (asset management)(through October 2014) • Managers Investment Group LLC (asset management)(through January 2012) • The Managers Funds (asset management) (through January 2012) • Managers AMG Funds (asset management) (through January 2012) • Calvert Social Investment Foundation |
* Mr. Silby is an interested person of the Funds since he is a Director of the parent company of each Fund’s Advisor. Mr. Streur is an interested person of the Funds since he is an Officer and Director of each Fund’s Advisor and certain affiliates. The address of the Trustees and Officers is 4550 Montgomery Avenue, Suite 1000N, Bethesda, Maryland 20814, with the exception of Mr. Silby, whose address is 1715 18th Street, N.W., Washington, DC 20009. Additional information about the Fund’s Trustees/Directors can be found in the Statement of Additional Information (SAI). You can get a free copy of the SAI at www.calvert.com, or by contacting your broker, or the Fund at 1-800-368-2745. |
calvert.com CALVERT EMERGING MARKETS EQUITY FUND ANNUAL REPORT (UNAUDITED) 31
|
| | | |
| Name & Age | Position with Funds | Position Start Date | Principal Occupation During Last 5 Years |
| OFFICERS |
VICKI L. BENJAMIN AGE: 54 | Treasurer | 2015 | Treasurer of the Funds (since March 2015); Director, Executive Vice President, Chief Financial Officer, Chief Operating Officer and Treasurer of Calvert Investments, Inc., Calvert Investment Administrative Services, Inc., and Calvert Investment Services, Inc. (since October 2015); Director, Executive Vice President, Chief Financial Officer - Elect, Chief Operating Officer and Treasurer of Calvert Investment Management, Inc. and Calvert Investment Distributors, Inc. (since October 2015); Director, Senior Vice President and Chief Financial Officer of Calvert Investments, Inc., Calvert Investment Administrative Services, Inc., Calvert Investment Services, Inc., Calvert Investment Management, Inc. and Calvert Investment Distributors, Inc. (March 2015 - September 2015); and Senior Partner, KPMG LLP (2005 - 2015). |
ROBERT D. BENSON, Esq. AGE: 37 | Associate General Counsel, Assistant Vice President & Assistant Secretary | 2014 | Associate General Counsel (since September 2016), Assistant General Counsel (2014 - September 2016), Assistant Vice President and Assistant Secretary of the Funds, Calvert Investments, Inc., Calvert Investment Administrative Services, Inc., Calvert Investment Services, Inc., Calvert Investment Management, Inc. and Calvert Investment Distributors, Inc. (since 2014); and Staff Attorney, Calvert Investments, Inc., Calvert Investment Administrative Services, Inc., Calvert Investment Services, Inc., Calvert Investment Management, Inc. and Calvert Investment Distributors, Inc. (2008 - 2014). |
HOPE BROWN AGE: 42 | Chief Compliance Officer | 2014 | Chief Compliance Officer of the Funds (since November 2014); Vice President and Chief Compliance Officer, Wilmington Funds (December 2012 - November 2014); and Vice President and Senior Compliance Officer, Wilmington Trust Investment Advisors, Inc. (September 2010 - December 2012). |
THOMAS DAILEY AGE:51 | Vice President | 2012 | Vice President of the Funds (since 2012); and Vice President (since January 2005) and Portfolio Manager - Tax Exempt, Calvert Investment Management, Inc. (since 1995). |
STU DALHEIM AGE: 46 | Vice President | 2015 | Vice President of the Funds (since 2015); and Vice President - Governance and Advocacy of Calvert Investment Management, Inc. (since October 2011). |
BRIAN ELLIS, CFA AGE: 32 | Vice President | 2016 | Vice President of the Funds (since February 2016); Portfolio Manager, Taxable Fixed Income, Calvert Investment Management, Inc. (since May 2012); and Business Analyst (2009 - May 2012), Calvert Investment Management, Inc. |
ROBERT J. ENDERSON, CFA AGE: 57 | Assistant Treasurer | 2014 | Assistant Treasurer of the Funds (since 2014); Vice President, Corporate Finance, and Assistant Treasurer, Calvert Investments, Inc., Calvert Investment Administrative Services, Inc., Calvert Investment Management, Inc., Calvert Investment Services, Inc. and Calvert Investment Distributors, Inc. (since 2007); Acting Chief Financial Officer of Calvert Investments, Inc., Calvert Investment Administrative Services, Inc., Calvert Investment Management, Inc., Calvert Investment Services, Inc. and Calvert Investment Distributors, Inc. (September 2014 - March 2015). |
PATRICK FAUL, CFA AGE: 51 | Vice President | 2010 | Vice President (since 2007) and Head of Credit Research, Calvert Investment Management, Inc. (since January 2010). |
TRACI L. GOLDT AGE: 42 | Assistant Secretary | 2004 | Assistant Secretary of the Funds (since 2004); Director, Strategic Projects and Fund Operations, Calvert Investment Administrative Services, Inc. (since June 2016); and SEC Filing and Operations Manager, Calvert Investment Administrative Services, Inc. (2011 – 2016). |
JADE HUANG AGE: 41 | Vice President | 2015 | Vice President of the Funds (since 2015); Portfolio Manager - Equity, Calvert Investment Management, Inc. (since November 2015); and Senior Equity Analyst, Calvert Investment Management, Inc. (2006 - November 2015). |
VISHAL KHANDUJA, CFA AGE: 38 | Vice President | 2014 | Vice President of the Funds (since 2014); Vice President and Head of Taxable Bond, Calvert Investment Management, Inc. (since May 2016); Vice President and Portfolio Manager, Taxable Fixed Income, Calvert Investment Management, Inc. (2012 - May 2016); Portfolio Manager - Global Rates and Currency Team, Columbia Management (2009 - 2012). |
ERICA LASDON AGE: 45 | Assistant Vice President, Research and Advocacy | 2015 | Assistant Vice President, Research and Advocacy of the Funds (since 2016) and Calvert Investment Management, Inc. (since August 2015); and Senior Sustainability Analyst and Manager, Calvert Investment Management, Inc. (2005 - August 2015). |
JOSHUA LINDER, CFA AGE: 30 | Vice President | 2016 | Vice President of the Funds (since 2016); Portfolio Manager, Equity, Calvert Investment Management, Inc. (since January 2016); Assistant Portfolio Manager, Calvert Investment Management, Inc. (January 2014 - October 2015); and Equity Analyst, Calvert Investment Management, Inc. (2011 - 2013). |
CHRISTOPHER MADDEN AGE: 40 | Vice President | 2015 | Vice President of the Funds (since 2015); Portfolio Manager - Equity, Calvert Investment Management, Inc. (since November 2015); and Senior Equity Analyst, Calvert Investment Management, Inc. (2010 - November 2015). |
32 calvert.com CALVERT EMERGING MARKETS EQUITY FUND ANNUAL REPORT (UNAUDITED)
|
| | | |
| Name & Age | Position with Funds | Position Start Date | Principal Occupation During Last 5 Years |
| OFFICERS |
ANDREW K. NIEBLER, Esq. AGE: 48 | Deputy General Counsel, Vice President & Secretary | 2006 (TCF, CMS, CRIS, CSIF, CVS)
2008 (CVP)
2016 (CIF) | Deputy General Counsel, Vice President and Secretary of the Funds, Calvert Investments, Inc., Calvert Investment Administrative Services, Inc., Calvert Investment Management, Inc., Calvert Investment Distributors, Inc. and Calvert Investment Services, Inc. (since May 2016); Assistant Vice President, Associate General Counsel and Assistant Secretary, Calvert Investments, Inc., Calvert Investment Administrative Services, Inc., Calvert Investment Management, Inc., Calvert Investment Distributors, Inc. and Calvert Investment Services, Inc. (September 2009 - May 2016); and Assistant Vice President, Assistant General Counsel and Assistant Secretary, Calvert Investments, Inc., Calvert Investment Administrative Services, Inc., Calvert Investment Management, Inc., Calvert Investment Distributors, Inc. and Calvert Investment Services, Inc. (prior to September 2009). |
MONIQUE S. PATTILLO, Esq. AGE: 34 | Assistant General Counsel, Assistant Vice President & Assistant Secretary | 2016 | Assistant Vice President, Assistant General Counsel and Assistant Secretary of the Funds, Calvert Investments, Inc., Calvert Investment Administrative Services, Inc., Calvert Investment Management, Inc., Calvert Investment Distributors, Inc. and Calvert Investment Services, Inc. (since September 2016); Adjunct Faculty, Howard Community College (since June 2015); Adjunct Assistant Professor, University of Maryland University College (since June 2016); Legal Counsel, T. Rowe Price Associates, Inc. (March 2014 - June 2015); and Assistant U.S. Counsel, Aberdeen Asset Management, Inc. (January 2011 - March 2014). |
MARYBETH PILAT, CPA AGE: 48 | Fund Controller and Assistant Treasurer | 2015 | Fund Controller and Assistant Treasurer of the Funds (since August 2015); Director, Anti-Money Laundering Officer and Assistant Treasurer, Calvert Investments, Inc., Calvert Investment Administrative Services, Inc., Calvert Investment Management, Inc., Calvert Investment Distributors, Inc. and Calvert Investment Services, Inc. (since August 2015); Director of Fund Administration, Calvert Investment Administrative Services, Inc. (since August 2015); VP Expense & Budgeting, Global Fiduciary Platform, Legg Mason (May 2015 - July 2015); and Vice President and Assistant Treasurer, Columbia Funds, Ameriprise, Columbia Management (2010 - April 2015). |
JOHN H. STREUR AGE: 56 | President and Director (except CVS) | 2015 | Director, Chairman, President and Chief Executive Officer of Calvert Investments, Inc., Calvert Investment Administrative Services, Inc., Calvert Investment Management, Inc., Calvert Investment Distributors, Inc. and Calvert Investment Services, Inc. (since January 2015); Chief Compliance Officer, Calvert Investment Distributors, Inc. (since August 2015); Chief Compliance Officer, Calvert Investment Management, Inc. (August 2015 - April 2016); President and Director, Portfolio 21 Investments, Inc. (through October 2014); President, Chief Executive Officer and Director, Managers Investment Group LLC (through January 2012); President and Director, The Managers Funds and Managers AMG Funds (through January 2012). |
calvert.com CALVERT EMERGING MARKETS EQUITY FUND ANNUAL REPORT (UNAUDITED) 33
|
| | | | |
| CALVERT EMERGING MARKETS EQUITY FUND | | CALVERT’S FAMILY OF FUNDS | | |
To Open an Account 800-368-2748 Service for Existing Account Shareholders: 800-368-2745 Brokers: 800-368-2746 Registered Mail Calvert Investments c/o BFDS, P.O. Box 219544 Kansas City, MO 64121-9544 Overnight Mail Calvert Investments c/o BFDS, 330 West 9th Street Kansas City, MO 64105 Web Site calvert.com Principal Underwriter Calvert Investment Distributors, Inc. 4550 Montgomery Avenue Suite 1000 North Bethesda, Maryland 20814 | | Municipal Funds Tax-Free Responsible Impact Bond Fund Taxable Bond Funds Bond Portfolio Income Fund Short Duration Income Fund Long-Term Income Fund Ultra-Short Income Fund High Yield Bond Fund Green Bond Fund Unconstrained Bond Fund Balanced and Asset Allocation Funds Balanced Portfolio Conservative Allocation Fund Moderate Allocation Fund Aggressive Allocation Fund | | Equity Funds Equity Portfolio U.S. Large Cap Core Responsible Index Fund U.S. Large Cap Value Responsible Index Fund U.S. Large Cap Growth Responsible Index Fund U.S. Mid Cap Core Responsible Index Fund Developed Markets Ex-U.S. Responsible Index Fund Capital Accumulation Fund International Equity Fund Small Cap Fund Global Energy Solutions Fund Global Water Fund International Opportunities Fund Emerging Markets Equity Fund |
|
| |
| | |
This report is intended to provide fund information to shareholders. It is not authorized for distribution to prospective investors unless preceded or accompanied by a prospectus. Note: The information on our website is not incorporated by reference into this report; our website address is included as an inactive textual reference only. Investors should carefully consider the investment objectives, risks, charges and expenses of the Calvert Funds. This and other important information is contained in the fund’s summary prospectus and prospectus, which can be obtained from your financial professional and should be read carefully before investing. You may also call Calvert at 800/368-2748 or visit calvert.com. |
| Printed on recycled paper using soy inks. | |
Item 2. Code of Ethics.
| |
| (a) | As of September 30, 2016, the Registrant had adopted a code of ethics that applies to the Registrant’s principal executive officer, principal financial officer, principal accounting officer or controller, or persons performing similar functions, regardless of whether these individuals are employed by the Registrant or a third party (the “Code of Ethics”). |
| |
| (c) | During the period covered by the report, the Registrant adopted a revised Code of Ethics, which reflected immaterial changes to the provisions of the Code of Ethics. |
| |
| (d) | During the period covered by the report, the Registrant did not grant any waivers to the provisions of the Code of Ethics. |
| |
| (f) | The Code of Ethics is attached as an Exhibit to this Form N-CSR. |
Item 3. Audit Committee Financial Expert.
The registrant's Board of Directors has determined that Miles D. Harper, III, an "independent" Director serving on the registrant's audit committee, is an "audit committee financial expert," as defined in Item 3 of Form N-CSR. Under applicable securities laws, a person who is determined to be an audit committee financial expert will not be deemed an "expert" for any purpose, including without limitation for the purposes of Section 11 of the Securities Act of 1933, as a result of being designated or identified as an audit committee financial expert. The designation or identification of a person as an audit committee financial expert does not impose on such person any duties, obligations, or liabilities that are greater than the duties, obligations, and liabilities imposed on such person as a member of the audit committee and Board of Directors in the absence of such designation or identification.
Item 4. Principal Accountant Fees and Services.
Services fees paid to auditing firm:
|
| | | | |
| | Fiscal Year ended 9/30/16 | Fiscal Year ended 9/30/15 |
| | $ | % * | $ | %* |
| | | | | |
| (a) Audit Fees | $97,733 | —% | $89,320 | 0% |
| (b) Audit-Related Fees | $— | —% | $0 | 0% |
| (c) Tax Fees (tax return preparation and filing for the registrant) | $61,746** | —% | $13,400 | 0% |
| (d) All Other Fees | $— | —% | $0 | 0% |
| | | | | |
| Total | $159,479 | —% | $102,720 | 0% |
* Percentage of fees approved by the Audit Committee pursuant to (c)(7)(i)(C) of Rule 2-01 of Reg. S-X (statutory de minimis waiver of Committee’s requirement to pre-approve)
** Includes fees for tax consulting
(e) Audit Committee pre-approval policies and procedures:
The Audit Committee is required to pre-approve all audit and non-audit services provided to the registrant by the auditors, and to the registrant’s investment advisor, and any entity controlling, controlled by, or under common control with the advisor that provides ongoing services to the registrant. In determining whether to pre-approve non-audit services, the Audit Committee considers whether the services are consistent with maintaining the independence of the auditors. The Committee may delegate its authority to pre-approve certain matters to one or more of its members. In this regard, the Committee has delegated authority to the Audit Committee Chair with respect to non-audit services not exceeding $25,000 in each instance. In addition, the Committee has pre-approved the retention of the auditors to provide tax-related services related to the tax treatment and tax accounting of newly acquired securities, upon request by the investment advisor in each instance.
(f) Not applicable.
(g) Aggregate non-audit fees billed by the registrant’s accountant for services rendered to the registrant, and rendered to the registrant’s investment advisor, and any entity controlling, controlled by, or under common control with the advisor that provides ongoing services to the registrant for each of the last two fiscal years of the registrant:
|
| | | | |
| | Fiscal Year ended 9/30/16 | Fiscal Year ended 9/30/15 |
| | $ | %* | $ | %* |
| | $0 | 0%* | $340,000 | 0%* |
* Percentage of fees approved by the Audit Committee pursuant to (c)(7)(i)(C) of Rule 2-01 of Reg. S-X (statutory de minimis waiver of Committee’s requirement to pre-approve)
(h) The registrant’s Audit Committee of the Board of Directors has considered whether the provision of non-audit services that were rendered to the registrant’s investment advisor, and any entity controlling, controlled by, or under common control with the investment advisor that provides ongoing services to the registrant that were not pre-approved pursuant to paragraph (c) (7)(ii) of Rule 2-01 of Reg. S-X is compatible with maintaining the principal accountant’s independence and found that the provision of such services is compatible with maintaining the principal accountant’s independence.
Item 5. Audit Committee of Listed Registrants.
Not applicable.
Item 6. Schedule of Investments.
| |
| (a) | This Schedule is included as part of the report to shareholders filed under Item 1 of this Form. |
Item 7. Disclosure of Proxy Voting Policies and Procedures for Closed-End Management Investment Companies.
Not applicable.
Item 8. Portfolio Managers of Closed-End Management Investment Companies.
Not applicable.
Item 9. Purchases of Equity Securities by Closed-End Management Investment Company and Affiliated Purchasers.
Not applicable.
Item 10. Submission of Matters to a Vote of Security Holders.
No material changes were made to the procedures by which shareholders may recommend nominees to the registrant’s Board of Directors since registrant last provided disclosure in response to this Item.
Item 11. Controls and Procedures.
(a) The registrant’s principal executive and principal financial officers have concluded that the registrant's disclosure controls and procedures (as defined in Rule 30a-3(c) under the Investment Company Act of 1940 Act, as amended (the “1940 Act”) are effective, based on the evaluation of these controls and procedures required by Rule 30a-3(b) under the 1940 Act and Rules 13a-15(b) or 15d-15(b) under the Securities Exchange Act of 1934 (“Exchange Act”), as of a date within 90 days of the filing date of this report.
(b) There was no change in the registrant's internal control over financial reporting (as defined in Rule 30a-3(d) under the 1940 Act) that occurred during the second fiscal quarter of the period covered by this report that has materially affected, or is reasonably likely to materially affect, the registrant's internal control over financial reporting.
Item 12. Exhibits.
(a)(1) A copy of the Registrant’s Code of Ethics.
Attached hereto.
(a)(2) A separate certification for each principal executive officer and principal financial officer of the registrant as required by Rule 30a-2 under the Act (17 CFR 270.30a-2).
Attached hereto.
(a)(3) Not applicable.
(b) A certification for the registrant's principal executive officer and principal financial officer, as required by Rule 30a-2(b) under the 1940 Act, is attached hereto. The certification furnished pursuant to this paragraph is not deemed to be "filed" for purposes of Section 18 of the Exchange Act, or otherwise subject to the liability of that section. Such certification is not deemed to be incorporated by reference into any filing under the Securities Act of 1933 or the Exchange Act, except to the extent that the registrant specifically incorporates it by reference.
Pursuant to the requirements of the Securities Exchange Act of 1934 and the Investment Act of 1940, the registrant has duly caused this report to be signed on its behalf by the undersigned, thereunto duly authorized.
CALVERT WORLD VALUES FUND, INC.
By: /s/ John H. Streur
John H. Streur
President -- Principal Executive Officer
Date: November 23, 2016
Pursuant to the requirements of the Securities Exchange Act of 1934 and the Investment Act of 1940, this report has been signed below by the following persons on behalf of the registrant and in the capacities and on the dates indicated.
/s/ John H. Streur
John H. Streur
President -- Principal Executive Officer
Date: November 23, 2016
/s/ Vicki L. Benjamin
Vicki L. Benjamin
Treasurer -- Principal Financial Officer
Date: November 23, 2016