UNITED STATES SECURITIES AND EXCHANGE COMMISSION
Form N-CSR
CERTIFIED SHAREHOLDER REPORT OF REGISTERED
MANAGEMENT INVESTMENT COMPANIES
Investment Company Act File Number: 811-06563
CALVERT WORLD VALUES FUND, INC.
(Exact Name of Registrant as Specified in Charter)
1825 Connecticut Avenue NW, Suite 400, Washington, DC 20009
(Address of Principal Executive Offices)
Maureen A. Gemma
Two International Place, Boston, Massachusetts 02110
(Name and Address of Agent for Services)
(202) 238-2200
(Registrant’s Telephone Number)
September 30
Date of Fiscal Year End
September 30, 2017
Date of Reporting Period
Item 1. Reports to Stockholders
Calvert International Equity Fund
Calvert Mid-Cap Fund (formerly, Calvert Capital Accumulation Fund)
Calvert International Opportunities Fund
Calvert Emerging Markets Equity Fund
|
| | |
| | |
| | | |
Calvert International Equity Fund
| | |
| | | |
| | |
|
| |
Annual Report September 30, 2017 E-Delivery Sign-Up — Details Inside | |
|
|
Commodity Futures Trading Commission Registration. Effective December 31, 2012, the Commodity Futures Trading Commission (“CFTC”) adopted certain regulatory changes that subject registered investment companies and advisers to regulation by the CFTC if a fund invests more than a prescribed level of its assets in certain CFTC-regulated instruments (including futures, certain options and swap agreements) or markets itself as providing investment exposure to such instruments. The Fund and its adviser have claimed an exclusion from the definition of the term “commodity pool operator” under the Commodity Exchange Act. Accordingly, neither the Fund nor the adviser is subject to CFTC regulation. |
Choose Planet-friendly E-delivery! Sign up now for on-line statements, prospectuses, and fund reports. In less than five minutes you can help reduce paper mail and lower fund costs. Just go to www.calvert.com. If you already have an online account with the Calvert funds, click on Login to access your Account and select the documents you would like to receive via e-mail. If you’re new to online account access, click on Login, then Register to create your user name and password. Once you’re in, click on the E-delivery sign-up on the Account Portfolio page and follow the quick, easy steps. Note: If your shares are not held directly with the Calvert funds but through a brokerage firm, you must contact your broker for electronic delivery options available through their firm. |
|
| | | | |
| | TABLE OF CONTENTS |
| | | | | |
| | | | | Management’s Discussion of Fund Performance |
| | | | | Performance |
| | | | | Fund Profile |
| | | | | Endnotes and Additional Disclosures |
| | | | | Understanding Your Fund’s Expenses |
| | | | | Financial Statements |
| | | | | Report of Independent Registered Public Accounting Firm |
| | | | | Federal Tax Information |
| | | | | Management and Organization |
| | | | | Important Notices |
MANAGEMENT’S DISCUSSION OF FUND PERFORMANCE1
|
| | |
| | | |
Economic and Market Conditions
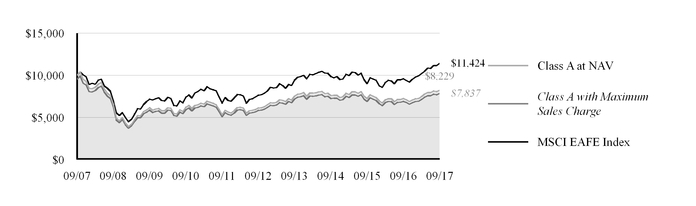
Global stocks delivered strong returns in the 12-month period ended September 30, 2017 behind an extended rally that began with Donald Trump's victory in the U.S. presidential election. After lagging early in the 12-month period, U.S. stocks moved sharply higher following President Trump's election on November 8, 2016. While its effect was broad-based, the rally particularly favored financial stocks, which received another boost in mid-December when the U.S. Federal Reserve (the Fed) raised its benchmark interest rate amid continued economic growth. After a brief pullback in the final weeks of 2016, U.S. equities resumed their advance in the new year. U.S. stocks slipped in March 2017 following the failure of President Trump's health care bill in Congress. However, stocks quickly regained their upward momentum, advancing steadily despite additional Fed rate hikes in March and June. U.S. equities retreated in August amid rising geopolitical tensions over North Korea and Hurricane Harvey's devastation in Texas. Stocks soon resumed their upward trend, with some U.S. indexes reaching record highs in the final month of the period. Energy stocks delivered notable performance in the quarter behind rising oil prices and constricted supplies due to refinery damage from Hurricane Harvey. Global stocks initially lagged the U.S. rally but rose sharply in the second half of the 12-month period, aided by positive economic indicators across a broad geographic range. National elections in France, Britain and Germany set a new political course for Europe, helping to boost stocks. Reflecting the market gains, a European Union study reported the highest level of economic confidence among businesses and households in more than a decade. Key equity indexes in the Asia-Pacific region also rose during the period despite the North Korea tensions. In the final three months of the period, China's stock market recorded its best quarterly performance in two years. For the 12-month period, the MSCI World Index,2 a proxy for global equities, returned 18.17% while reaching multiple all-time highs. The MSCI EAFE Index (the Index) of developed-market international equities rose 19.10%, while the MSCI Emerging Markets Index returned 22.46%. In the U.S., the blue-chip Dow Jones Industrial Average advanced 25.45%, while the broader U.S. equity market, as represented by the S&P 500 Index, gained 18.61%. Fund Performance For the 12 months ending September 30, 2017, Calvert International Equity Fund (the Fund) returned 13.43% for Class A shares at net asset value (NAV), underperforming the Index, which returned 19.10%. | |
Stock selection was the largest contributor to underperformance during the period. For the most part, sector allocations did not have a significant impact on the Fund’s performance relative to the Index. Overall, holdings in the health care, consumer discretionary and industrials sectors were the weakest performers. Holdings in the consumer staples and information technology sectors performed best. In the energy sector, a combination of allocation and security selection effects resulting from the portfolio’s environmental, social and governance (ESG) guidelines detracted from performance. Many energy, oil and mining companies do not meet Calvert’s ESG criteria due to environmental or other sustainability concerns. Early in the period, when the energy sector overall performed well, the Fund’s underweight to the sector weakened performance. Later in the period, the lack of exposure to major oil companies, and poor performance among some Fund holdings in the sector, detracted. An underweight to the mining sector was also detrimental. Kering, a French consumer discretionary company that owns numerous luxury brands, was the strongest individual contributor during the period. Its strength largely stemmed from a successful reinvigoration of its Gucci brand. ASML Holding NV, a Dutch information technology company, was the next largest contributor as adoption of extreme ultraviolet (EUV) technology, for which ASML is a market leader, took off considerably earlier than had been anticipated. EUV is a cutting-edge technology used in the semiconductor industry, including by industry leaders. Unilever plc, a consumer staples holding based in London, was also a leading individual contributor. It benefited from a takeover bid from 3G Capital. Although Unilever fended off the offer, the takeover attempt prompted significant cost cutting at the company. Brambles Ltd., the leading global manufacturer of wooden pallets used for shipping in fast-moving consumer goods industries, was the largest individual detractor during the period. Performance of the Australian company, in the industrials sector, was hurt by turnover in corporate leadership and challenging conditions in the North American market. WPP plc, a U.K. company in consumer discretionary, was also one of the largest detractors. The company, the largest media advertising agency worldwide, was hurt by both cyclical and secular trends during the period. Foremost among these were cost cutting by major clients, including that of Unilever in response to the takeover bid, and growing concerns about the challenges traditional advertising agencies face as Google, Inc., Facebook, Inc., and other social media disrupt the market and assume greater market share.
|
See Endnotes and Additional Disclosures in this report.
Past performance is no guarantee of future results. Returns are historical and are calculated by determining the percentage change in net asset value (NAV) or offering price (as applicable) with all distributions reinvested. Investment return and principal value will fluctuate so that shares, when redeemed, may be worth more or less than their original cost. Performance less than or equal to one year is cumulative. Performance is for the stated time period only; due to market volatility, the Fund's current performance may be lower or higher than quoted. Returns are before taxes unless otherwise noted. For performance as of the most recent month-end, please refer to www.calvert.com.
2 www.calvert.com CALVERT INTERNATIONAL EQUITY FUND ANNUAL REPORT (Unaudited)
PERFORMANCE
|
| | | | | | | | | | | | | | |
Performance2,3 | | | | | | | | | |
Portfolio Managers Christopher M. Dyer, CFA and Ian Kirwan, each of Eaton Vance Advisers International Ltd.; Christopher Madden, CFA and Jade Huang, each of Calvert Research and Management |
| | | | | | | | | | |
| % Average Annual Total Returns | Class Inception Date |
| | Performance Inception Date |
| | One Year |
| | Five Years |
| | Ten Years |
|
| Class A at NAV | 07/02/1992 |
| | 07/02/1992 |
| | 13.43 | % | | 6.03 | % | | -1.93 | % |
| Class A with 4.75% Maximum Sales Charge | — |
| | — |
| | 8.06 |
| | 5.01 |
| | -2.41 |
|
| Class C at NAV | 03/01/1994 |
| | 07/02/1992 |
| | 12.60 |
| | 5.16 |
| | -2.76 |
|
| Class C with 1% Maximum Sales Charge | — |
| | — |
| | 11.60 |
| | 5.16 |
| | -2.76 |
|
| Class I at NAV | 02/26/1999 |
| | 07/02/1992 |
| | 13.89 |
| | 6.61 |
| | -1.29 |
|
| Class Y at NAV | 10/31/2008 |
| | 07/02/1992 |
| | 13.76 |
| | 6.36 |
| | -1.61 |
|
| | | | | | | | | | |
| | | | | | | | | | |
| MSCI EAFE Index | — |
| | — |
| | 19.10 | % | | 8.37 | % | | 1.34 | % |
| | | | | | | | | | |
% Total Annual Operating Expense Ratios4 | | | Class A |
| | Class C |
| | Class I |
| | Class Y |
|
| Gross | | | 1.55 | % | | 2.48 | % | | 1.04 | % | | 1.16 | % |
| Net | | | 1.33 |
| | 2.08 |
| | 0.96 |
| | 1.09 |
|
|
|
| Growth of $10,000 |
| This graph shows the change in value of a hypothetical investment of $10,000 in Class A of the Fund for the period indicated. For comparison, the same investment is shown in the indicated index. |
|
| | | | | | | | |
Growth of Investment3 | Amount Invested |
| Period Beginning | At NAV |
| With Maximum Sales Charge |
| Class C |
| $10,000 |
| 9/30/2007 |
| $7,558 |
| N.A. |
| Class I |
| $250,000 |
| 9/30/2007 |
| $219,432 |
| N.A. |
| Class Y |
| $10,000 |
| 9/30/2007 |
| $8,502 |
| N.A. |
See Endnotes and Additional Disclosures in this report.
Past performance is no guarantee of future results. Returns are historical and are calculated by determining the percentage change in net asset value (NAV) or offering price (as applicable) with all distributions reinvested. Investment return and principal value will fluctuate so that shares, when redeemed, may be worth more or less than their original cost. Performance less than or equal to one year is cumulative. Performance is for the stated time period only; due to market volatility, the Fund's current performance may be lower or higher than quoted. Returns are before taxes unless otherwise noted. For performance as of the most recent month-end, please refer to www.calvert.com.
www.calvert.com CALVERT INTERNATIONAL EQUITY FUND ANNUAL REPORT (Unaudited) 3
FUND PROFILE
|
| | | | | | | |
| |
| | | | | |
| | SECTOR ALLOCATION (% of total investments) | | | TEN LARGEST STOCK HOLDINGS (% of net assets) |
| | | | | | |
| | Financials | 19.4 | % | | Nestle SA | 3.9 | % |
| | Industrials | 18.9 | % | | Unilever plc | 3.5 | % |
| | Consumer Discretionary | 15.8 | % | | Roche Holding AG | 3.0 | % |
| | Health Care | 11.6 | % | | ASML Holding NV | 2.7 | % |
| | Consumer Staples | 10.9 | % | | Iberdrola SA | 2.5 | % |
| | Information Technology | 7.3 | % | | Nippon Telegraph & Telephone Corp. | 2.5 | % |
| | Materials | 4.4 | % | | Prudential plc | 2.5 | % |
| | Utilities | 2.5 | % | | Komatsu Ltd. | 2.4 | % |
| | Telecommunication Services | 2.5 | % | | ORIX Corp. | 2.3 | % |
| | High Social Impact Investments | 2.0 | % | | ING Groep NV | 2.3 | % |
| | Real Estate | 1.8 | % | | Total | 27.6 | % |
| | Time Deposit | 1.1 | % | | | |
| | Energy | 0.9 | % | | | |
| | Venture Capital Limited Partnership Interest | 0.6 | % | | | |
| | Venture Capital | 0.3 | % | | | |
| | Total | 100.0 | % | | | |
See Endnotes and Additional Disclosures in this report.
4 www.calvert.com CALVERT INTERNATIONAL EQUITY FUND ANNUAL REPORT (Unaudited)
|
| | |
| Endnotes and Additional Disclosures | | |
| | | |
1 The views expressed in this report are those of the portfolio manager(s) and are current only through the date stated at the top of this page. These views are subject to change at any time based upon market or other conditions, and Eaton Vance and the Fund(s) disclaim any responsibility to update such views. These views may not be relied upon as investment advice and, because investment decisions are based on many factors, may not be relied upon as an indication of trading intent on behalf of any Calvert fund. This commentary may contain statements that are not historical facts, referred to as “forward looking statements”. The Fund’s actual future results may differ significantly from those stated in any forward looking statement, depending on factors such as changes in securities or financial markets or general economic conditions, the volume of sales and purchases of Fund shares, the continuation of investment advisory, administrative and service contracts, and other risks discussed from time to time in the Fund’s filings with the Securities and Exchange Commission.
2 MSCI World Index is an unmanaged index of equity securities in the developed markets. MSCI EAFE Index is an unmanaged index of equities in the developed markets, excluding the U.S. and Canada. MSCI Emerging Markets Index is an unmanaged index of emerging markets common stocks. Dow Jones Industrial Average is a price-weighted average of 30 blue-chip stocks that are generally the leaders in their industry. S&P 500 Index is an unmanaged index of large-cap stocks commonly used as a measure of U.S. stock market performance. MSCI indexes are net of foreign withholding taxes. Source: MSCI. MSCI data may not be reproduced or used for any other purpose. MSCI provides no warranties, has not prepared or approved this report, and has no liability hereunder. Unless otherwise stated, index returns do not reflect the effect of any applicable sales charges, commissions, expenses, taxes or leverage, as applicable. It is not possible to invest directly in an index.
3 Total Returns at NAV do not include applicable sales charges. If sales charges were deducted, the returns would be lower. Total Returns shown with maximum sales charge reflect the stated maximum sales charge. Unless otherwise stated, performance does not reflect the deduction of taxes on Fund distributions or redemptions of Fund shares.
Performance prior to the inception date of a class may be linked to the performance of an older class of the Fund. This linked performance is adjusted for any applicable sales charge, but is not adjusted for class expense differences. If adjusted for such differences, the performance would be different. The performance of Class Y is linked to Class A. Performance since inception for an index, if presented, is the performance since the Fund’s or oldest share class’ inception, as applicable. Performance presented in the Financial Highlights included in the financial statements is not linked.
Effective November 6, 2017, Class I shares have an initial investment minimum of $250,000.
| | 4 Source: Fund prospectus. Net expense ratios reflect a contractual expense reimbursement that continues through 1/31/19. Without the reimbursement, performance would have been lower. The expense ratios for the current reporting period can be found in the Financial Highlights section of this report.
Fund profile subject to change due to active management.
|
www.calvert.com CALVERT INTERNATIONAL EQUITY FUND ANNUAL REPORT (Unaudited) 5
UNDERSTANDING YOUR FUND'S EXPENSES
Example
As a Fund shareholder, you incur two types of costs: (1) transaction costs, including sales charges (loads) on purchases and redemption fees (if applicable); and (2) ongoing costs, including management fees; distribution and/or service fees; and other Fund expenses. This Example is intended to help you understand your ongoing costs (in dollars) of Fund investing and to compare these costs with the ongoing costs of investing in other mutual funds. The Example is based on an investment of $1,000 invested at the beginning of the period and held for the entire period (April 1, 2017 to September 30, 2017).
Actual Expenses
The first section of the table below provides information about actual account values and actual expenses. You may use the information in this section, together with the amount you invested, to estimate the expenses that you paid over the period. Simply divide your account value by $1,000 (for example, an $8,600 account value divided by $1,000 = 8.6), then multiply the result by the number in the first section under the heading entitled “Expenses Paid During Period” to estimate the expenses you paid on your account during this period.
Hypothetical Example for Comparison Purposes
The second section of the table below provides information about hypothetical account values and hypothetical expenses based on the actual Fund expense ratio and an assumed rate of return of 5% per year (before expenses), which is not the actual Fund return. The hypothetical account values and expenses may not be used to estimate the actual ending account balance or expenses you paid for the period. You may use this information to compare the ongoing costs of investing in the Fund and other funds. To do so, compare this 5% hypothetical example with the 5% hypothetical examples that appear in the shareholder reports of the other funds.
Please note that the expenses shown in the table are meant to highlight your ongoing costs only and do not reflect any transactional costs, such as sales charges (loads) or redemption fees (if applicable). Therefore, the second section of the table is useful in comparing ongoing costs only, and will not help you determine the relative total costs of owning different funds. In addition, if these transactional costs were included, your costs would be higher.
|
| | | | |
| | BEGINNING
ACCOUNT VALUE
(4/1/17) | ENDING
ACCOUNT VALUE
(9/30/17) | EXPENSES PAID
DURING PERIOD*
(4/1/17 - 9/30/17) | ANNUALIZED
EXPENSE RATIO |
| Actual | | | | |
| Class A | $1,000.00 | $1,096.90 | $6.99** | 1.33% |
| Class C | $1,000.00 | $1,093.10 | $10.91** | 2.08% |
| Class I | $1,000.00 | $1,099.50 | $5.00** | 0.95% |
| Class Y | $1,000.00 | $1,098.50 | $5.68** | 1.08% |
| Hypothetical | | | | |
| (5% return per year before expenses) | | | | |
| Class A | $1,000.00 | $1,018.40 | $6.73** | 1.33% |
| Class C | $1,000.00 | $1,014.64 | $10.50** | 2.08% |
| Class I | $1,000.00 | $1,020.31 | $4.81** | 0.95% |
| Class Y | $1,000.00 | $1,019.65 | $5.47** | 1.08% |
| | | | | |
| * Expenses are equal to the Fund's annualized expense ratio for the indicated Class, multiplied by the average account value over the period, multiplied by 183/365 (to reflect the one-half year period). The Example assumes that the $1,000 was invested at the net asset value per share determined at the close of business on March 31, 2017. |
| ** Absent a waiver and/or reimbursement of expenses by affiliates, expenses would be higher. |
6 www.calvert.com CALVERT INTERNATIONAL EQUITY FUND ANNUAL REPORT (Unaudited)
CALVERT INTERNATIONAL EQUITY FUND
SCHEDULE OF INVESTMENTS
SEPTEMBER 30, 2017
|
| | |
| | SHARES | VALUE ($) |
| COMMON STOCKS - 95.5% | | |
| Australia - 5.4% | | |
| Australia & New Zealand Banking Group Ltd. | 177,359 | 4,131,326 |
| Brambles Ltd. | 683,307 | 4,836,473 |
| Challenger Ltd. | 385,986 | 3,783,536 |
| | | 12,751,335 |
| | | |
| Belgium - 1.1% | | |
| UCB SA | 37,119 | 2,645,405 |
| | | |
| Canada - 1.8% | | |
| CAE, Inc. | 243,834 | 4,265,996 |
| | | |
| China - 1.3% | | |
| Zhuzhou CRRC Times Electric Co., Ltd., Class H | 540,319 | 3,032,829 |
| | | |
| Denmark - 5.2% | | |
| Novo Nordisk A/S, Class B | 110,228 | 5,299,622 |
| Novozymes A/S, Class B | 60,143 | 3,089,403 |
| Pandora A/S | 38,889 | 3,845,042 |
| | | 12,234,067 |
| | | |
| France - 5.4% | | |
| Kering | 9,719 | 3,871,734 |
| Legrand SA | 71,395 | 5,152,580 |
| Peugeot SA | 159,638 | 3,800,210 |
| | | 12,824,524 |
| | | |
| Germany - 5.5% | | |
| Brenntag AG | 56,704 | 3,161,011 |
| Continental AG | 20,469 | 5,198,495 |
| SAP SE | 41,017 | 4,497,318 |
| | | 12,856,824 |
| | | |
| Hong Kong - 3.9% | | |
| AIA Group Ltd. | 596,820 | 4,418,437 |
| Samsonite International SA | 1,131,073 | 4,857,246 |
| | | 9,275,683 |
| | | |
| Ireland - 1.7% | | |
| Shire plc | 80,062 | 4,077,857 |
| | | |
www.calvert.com CALVERT INTERNATIONAL EQUITY FUND ANNUAL REPORT 7
|
| | | | |
| | SHARES | VALUE ($) |
| COMMON STOCKS - CONT'D | | |
| Israel - 1.4% | | |
| Frutarom Industries Ltd. | 41,573 | 3,197,833 |
|
| | | |
| Japan - 20.6% | | |
| Don Quijote Holdings Co. Ltd. | 135,200 | 5,053,459 |
|
| Kao Corp. | 56,841 | 3,346,418 |
|
| Komatsu Ltd. | 203,002 | 5,748,409 |
|
| MISUMI Group, Inc. | 152,300 | 4,014,178 |
|
| Mitsubishi Estate Co. Ltd. | 236,637 | 4,112,606 |
|
| Mitsubishi UFJ Financial Group, Inc. | 747,008 | 4,856,920 |
|
| Nippon Telegraph & Telephone Corp. | 127,947 | 5,862,621 |
|
| ORIX Corp. | 342,500 | 5,529,396 |
|
| Santen Pharmaceutical Co. Ltd. | 273,192 | 4,310,399 |
|
| Seven & I Holdings Co. Ltd. | 95,817 | 3,701,838 |
|
| Sumco Corp. | 128,556 | 2,028,351 |
|
| | | 48,564,595 |
|
| | | |
| Netherlands - 5.0% | | |
| ASML Holding NV | 37,861 | 6,469,596 |
|
| ING Groep NV | 288,655 | 5,320,591 |
|
| | | 11,790,187 |
|
| | | |
| Singapore - 1.6% | | |
| DBS Group Holdings Ltd. | 246,628 | 3,796,606 |
|
| | | |
| South Africa - 1.0% | | |
| Naspers Ltd., Class N | 6,110 | 1,320,815 |
|
| Tiger Brands Ltd. | 38,368 | 1,069,715 |
|
| | | 2,390,530 |
|
| | | |
| Spain - 4.3% | | |
| Iberdrola SA | 768,379 | 5,974,629 |
|
| Industria de Diseno Textil SA | 111,757 | 4,213,265 |
|
| | | 10,187,894 |
|
| | | |
| Sweden - 4.2% | | |
| Assa Abloy AB, Class B | 220,930 | 5,058,277 |
|
| Swedbank AB, Class A | 176,981 | 4,900,871 |
|
| | | 9,959,148 |
|
| | | |
| Switzerland - 6.9% | | |
| Nestle SA | 109,945 | 9,228,920 |
|
| Roche Holding AG | 27,361 | 6,994,022 |
|
| | | 16,222,942 |
|
| | | |
8 www.calvert.com CALVERT INTERNATIONAL EQUITY FUND ANNUAL REPORT
|
| | | | |
| | SHARES | VALUE ($) |
| COMMON STOCKS - CONT'D | | |
| Taiwan - 1.7% | | |
| Taiwan Semiconductor Manufacturing Co. Ltd. (ADR) | 109,384 | 4,107,369 |
|
| | | |
| United Kingdom - 16.6% | | |
| Aviva plc | 442,705 | 3,055,521 |
|
| ConvaTec Group plc (a) | 1,084,859 | 3,986,386 |
|
| Melrose Industries plc | 1,527,686 | 4,358,393 |
|
| Prudential plc | 244,071 | 5,840,740 |
|
| RPC Group plc | 299,403 | 3,975,978 |
|
| Unilever plc | 141,209 | 8,173,081 |
|
| Weir Group plc (The) | 182,066 | 4,792,247 |
|
| WPP plc | 271,228 | 5,032,928 |
|
| | | 39,215,274 |
|
| | | |
| United States - 0.9% | | |
| Oceaneering International, Inc. | 79,062 | 2,076,959 |
|
| | | |
| Total Common Stocks (Cost $202,527,301) | | 225,473,857 |
|
| | | |
| | | |
| PREFERRED STOCKS - 0.1% | | |
| | | |
| Venture Capital - 0.1% | | |
| Bioceptive, Inc.: | | |
| Series A *(b)(c) | 582,574 | — |
|
| Series B *(b)(c) | 40,523 | — |
|
| FINAE, Series D *(b)(c) | 2,597,442 | 212,531 |
|
| | | 212,531 |
|
| | | |
| Total Preferred Stocks (Cost $521,381) | | 212,531 |
|
| | | |
| | | |
| | | VALUE ($) |
|
| VENTURE CAPITAL LIMITED PARTNERSHIP INTEREST - 0.6% | | |
| Africa Renewable Energy Fund LP *(b)(c) | | 626,484 |
|
| BFSE Holding, BV LP *(b)(c) | | 186,386 |
|
| Blackstone Clean Technology Partners LP *(b)(c) | | 12,952 |
|
| China Environment Fund 2004 LP *(b)(c) | | 3,779 |
|
| Emerald Sustainability Fund LP *(b)(c) | | 130,041 |
|
| gNet Defta Development Holding LLC *(b)(c)(d) | | 280,511 |
|
| SEAF Central and Eastern European Growth Fund LLC *(b)(c)(d) | | 43,662 |
|
| SEAF India International Growth Fund LP *(b)(c) | | 25,909 |
|
| | | |
| Total Venture Capital Limited Partnership Interest (Cost $2,520,114) | | 1,309,724 |
|
| | | |
| | | |
www.calvert.com CALVERT INTERNATIONAL EQUITY FUND ANNUAL REPORT 9
|
| | | | |
| | PRINCIPAL AMOUNT ($) | VALUE ($) |
| VENTURE CAPITAL DEBT OBLIGATIONS - 0.2% | | |
| AFIG LLC, 6.00%, 10/17/17(b)(c) | 450,953 | 543,298 |
|
| Windhorse International-Spring Health Water Ltd., 1.00%, 3/14/18(b)(c)(e) | 70,000 | 52,500 |
|
| | | |
| Total Venture Capital Debt Obligations (Cost $520,953) | | 595,798 |
|
| | | |
| | | |
| HIGH SOCIAL IMPACT INVESTMENTS - 2.0% | | |
| Calvert Social Investment Foundation, Community Investment Notes, 1.50%, 12/15/19(b)(d) | 4,431,583 | 4,223,653 |
|
| ImpactAssets Inc., Global Sustainable Agriculture Notes, 0.00%, 11/3/20(b)(c)(f) | 220,000 | 207,900 |
|
| ImpactAssets Inc., Microfinance Plus Notes, 0.00%, 11/3/20(b)(c)(f) | 283,000 | 269,699 |
|
| | | |
| Total High Social Impact Investments (Cost $4,934,583) | | 4,701,252 |
|
| | | |
| | | |
| TIME DEPOSIT - 1.1% | | |
| State Street Bank and Trust Eurodollar Time Deposit, 0.12%, 10/2/17 | 2,588,186 | 2,588,186 |
|
| | | |
| Total Time Deposit (Cost $2,588,186) | | 2,588,186 |
|
| | | |
| | | |
| TOTAL INVESTMENTS (Cost $213,612,518) - 99.5% | | 234,881,348 |
|
| Other assets and liabilities, net - 0.5% | | 1,208,150 |
|
NET ASSETS - 100.0% | |
| $236,089,498 |
|
|
|
| NOTES TO SCHEDULE OF INVESTMENTS |
| * Non-income producing security. |
| (a) Security is exempt from registration under Rule 144A of the Securities Act of 1933. These securities may be resold in transactions exempt from registration, normally to qualified institutional buyers. Total market value of Rule 144A securities amounts to $3,986,386, which represents 1.7% of the net assets of the Fund as of September 30, 2017. |
| (b) Restricted security. Total market value of restricted securities amounts to $6,819,305, which represents 2.9% of the net assets of the Fund as of September 30, 2017. |
| (c) For fair value measurement disclosure purposes, security is categorized as Level 3 (see Note A). |
| (d) Affiliated company (see Note F). |
| (e) Security defaulted as to principal and interest in March 2013. It has been restructured at a 9% rate maturing on March 14, 2018 with 1% to be paid annually and the remaining interest due at maturity. This security is currently accruing at 1%. |
| (f) Notes carry an interest rate that varies by period and is contingent on the performance of the underlying portfolio of loans to borrowers. The coupon rate shown represents the rate in effect at September 30, 2017. |
10 www.calvert.com CALVERT INTERNATIONAL EQUITY FUND ANNUAL REPORT
At September 30, 2017, the concentration of the Fund’s investments in the various sectors, determined as a percentage of total investments, was as follows: |
| | |
| ECONOMIC SECTORS | % OF TOTAL INVESTMENTS |
| Financials | 19.4 | % |
| Industrials | 18.9 | % |
| Consumer Discretionary | 15.8 | % |
| Health Care | 11.6 | % |
| Consumer Staples | 10.9 | % |
| Information Technology | 7.3 | % |
| Materials | 4.4 | % |
| Utilities | 2.5 | % |
| Telecommunication Services | 2.5 | % |
| High Social Impact Investments | 2.0 | % |
| Real Estate | 1.8 | % |
| Time Deposit | 1.1 | % |
| Energy | 0.9 | % |
| Venture Capital Limited Partnership Interest | 0.6 | % |
| Venture Capital | 0.3 | % |
| Total | 100.0 | % |
|
| | |
| Abbreviations: | |
| ADR: | American Depositary Receipt | |
|
| | | |
| RESTRICTED SECURITIES | ACQUISITION DATES | COST ($) |
| AFIG LLC, 6.00%, 10/17/17 | 10/11/12 | 450,953 |
|
| Africa Renewable Energy Fund LP | 4/17/14-3/6/17 | 635,688 |
|
| BFSE Holding, BV LP | 1/12/06-6/1/17 | 614,577 |
|
| Bioceptive, Inc., Series A | 10/26/12-12/18/13 | 252,445 |
|
| Bioceptive, Inc., Series B | 1/7/16 | 16,250 |
|
| Blackstone Clean Technology Partners LP | 7/29/10-6/25/15 | 78,853 |
|
| Calvert Social Investment Foundation, Community Investment Notes, 1.50%, 12/15/19 | 12/15/16 | 4,431,583 |
|
| China Environment Fund 2004 LP | 9/15/05-4/1/09 | — |
|
| Emerald Sustainability Fund LP | 7/19/01-5/17/11 | 425,186 |
|
| FINAE, Series D | 2/28/11-11/16/15 | 252,686 |
|
| gNet Defta Development Holding LLC | 8/30/05 | 400,000 |
|
| ImpactAssets Inc., Global Sustainable Agriculture Notes, 0.00%, 11/3/20 | 11/13/15 | 220,000 |
|
| ImpactAssets Inc., Microfinance Plus Notes, 0.00%, 11/3/20 | 11/13/15 | 283,000 |
|
| SEAF Central and Eastern European Growth Fund LLC | 8/10/00-8/26/11 | 155,418 |
|
| SEAF India International Growth Fund LP | 3/22/05-5/24/10 | 210,392 |
|
| Windhorse International-Spring Health Water Ltd., 1.00%, 3/14/18 | 2/12/14 | 70,000 |
|
| See notes to financial statements. |
www.calvert.com CALVERT INTERNATIONAL EQUITY FUND ANNUAL REPORT 11
CALVERT INTERNATIONAL EQUITY FUND
STATEMENT OF ASSETS AND LIABILITIES
SEPTEMBER 30, 2017
|
| | | |
| ASSETS | |
| Investments in securities of unaffiliated issuers, at value (identified cost $208,625,517) |
| $230,333,522 |
|
| Investments in securities of affiliated issuers, at value (identified cost $4,987,001) | 4,547,826 |
|
| Cash denominated in foreign currency, at value (cost $307,950) | 308,000 |
|
| Receivable for investments sold | 554 |
|
| Receivable for capital shares sold | 339,355 |
|
| Dividends and interest receivable | 509,761 |
|
| Interest receivable - affiliated | 35,206 |
|
| Securities lending income receivable | 378 |
|
| Tax reclaims receivable | 473,213 |
|
| Directors' deferred compensation plan | 217,075 |
|
| Total assets | 236,764,890 |
|
| | |
| LIABILITIES | |
| Payable for capital shares redeemed | 42,722 |
|
| Payable to affiliates: | |
| Investment advisory fee | 143,872 |
|
| Administrative fee | 23,019 |
|
| Distribution and service fees | 35,616 |
|
| Sub-transfer agency fee | 6,302 |
|
| Directors' deferred compensation plan | 217,075 |
|
| Other | 11,721 |
|
| Accrued expenses | 195,065 |
|
| Total liabilities | 675,392 |
|
| Commitments and contingent liabilities (see Note I) | |
| NET ASSETS |
| $236,089,498 |
|
| | |
| NET ASSETS CONSIST OF: | |
| Paid-in capital applicable to common stock | |
| (250,000,000 shares of $0.01 par value authorized) |
| $357,785,921 |
|
| Accumulated undistributed net investment income | 3,010,704 |
|
| Accumulated net realized loss | (145,983,237) |
|
| Net unrealized appreciation (depreciation) | 21,276,110 |
|
| Total |
| $236,089,498 |
|
| | |
| NET ASSET VALUE PER SHARE | |
| Class A (based on net assets of $126,668,516 and 7,407,117 shares outstanding) |
| $17.10 |
|
| Class C (based on net assets of $12,012,824 and 818,338 shares outstanding) |
| $14.68 |
|
| Class I (based on net assets of $72,503,086 and 3,975,803 shares outstanding) |
| $18.24 |
|
| Class Y (based on net assets of $24,905,072 and 1,379,084 shares outstanding) |
| $18.06 |
|
| | |
| OFFERING PRICE PER SHARE* | |
| Class A (100/95.25 of net asset value per share) |
| $17.95 |
|
| * On sales of $50,000 or more, the offering price of Class A shares is reduced. | |
| See notes to financial statements. | |
12 www.calvert.com CALVERT INTERNATIONAL EQUITY FUND ANNUAL REPORT
CALVERT INTERNATIONAL EQUITY FUND
STATEMENT OF OPERATIONS
YEAR ENDED SEPTEMBER 30, 2017
|
| | | |
| INVESTMENT INCOME | |
| Dividend income (net of foreign taxes withheld of $593,446) |
| $6,018,841 |
|
| Interest income - unaffiliated issuers | 18,186 |
|
| Interest income - affiliated issuers | 37,461 |
|
| Securities lending income, net | 28,478 |
|
| Other income | 866 |
|
| Total investment income | 6,103,832 |
|
| | |
| EXPENSES | |
| Investment advisory fee | 1,932,392 |
|
| Administrative fee | 309,925 |
|
| Distribution and service fees: | |
| Class A | 330,020 |
|
| Class C | 124,675 |
|
| Directors' fees and expenses | 19,763 |
|
| Custodian fees | 144,733 |
|
| Transfer agency fees and expenses: | |
| Class A | 371,317 |
|
| Class C | 48,648 |
|
| Class I | 8,057 |
|
| Class Y | 17,861 |
|
| Accounting fees | 74,648 |
|
| Professional fees | 78,225 |
|
| Registration fees: | |
| Class A | 17,014 |
|
| Class C | 13,701 |
|
| Class I | 16,641 |
|
| Class Y | 15,465 |
|
| Reports to shareholders | 34,660 |
|
| Miscellaneous | 81,678 |
|
| Total expenses | 3,639,423 |
|
| Waiver and/or reimbursement of expenses by affiliates | (477,227) |
|
| Reimbursement of expenses-other | (2,729) |
|
| Net expenses | 3,159,467 |
|
| Net investment income (loss) | 2,944,365 |
|
| |
www.calvert.com CALVERT INTERNATIONAL EQUITY FUND ANNUAL REPORT 13
CALVERT INTERNATIONAL EQUITY FUND
STATEMENT OF OPERATIONS
YEAR ENDED SEPTEMBER 30, 2017 - CONT'D
|
| | | |
| REALIZED AND UNREALIZED GAIN (LOSS) | |
| Net realized gain (loss) on: | |
| Investment securities - unaffiliated issuers | 14,275,732 |
|
| Foreign currency transactions | (46,346) |
|
| | 14,229,386 |
|
| | |
| Net change in unrealized appreciation (depreciation) on: | |
| Investment securities - unaffiliated issuers | 11,102,987 |
|
| Investment securities - affiliated issuers | (192,695) |
|
| Foreign currency | 22,998 |
|
| | 10,933,290 |
|
| | |
| Net realized and unrealized gain (loss) | 25,162,676 |
|
| | |
| Net increase (decrease) in net assets resulting from operations |
| $28,107,041 |
|
| | |
| See notes to financial statements. | |
14 www.calvert.com CALVERT INTERNATIONAL EQUITY FUND ANNUAL REPORT
CALVERT INTERNATIONAL EQUITY FUND
STATEMENTS OF CHANGES IN NET ASSETS
|
| | | | | | | |
| INCREASE (DECREASE) IN NET ASSETS | Year Ended
September 30, 2017 | | Year Ended
September 30, 2016 |
| Operations: | | | |
| Net investment income (loss) |
| $2,944,365 |
| |
| $8,117,904 |
|
| Net realized gain (loss) | 14,229,386 |
| | (42,935,803) |
|
| Net change in unrealized appreciation (depreciation) | 10,933,290 |
| | 36,536,742 |
|
| Net increase (decrease) in net assets resulting from operations | 28,107,041 |
| | 1,718,843 |
|
| | | | |
| Distributions to shareholders from: | | | |
| Net investment income: | | | |
| Class A shares | (3,452,931) |
| | (1,496,038) |
|
| Class C shares | (255,867) |
| | (82,845) |
|
| Class I shares | (4,232,336) |
| | (2,202,975) |
|
| Class Y shares | (513,395) |
| | (342,786) |
|
| Total distributions to shareholders | (8,454,529) |
| | (4,124,644) |
|
| | | | |
| Capital share transactions: | | | |
| Class A shares | (41,965,309) |
| | (8,866,802) |
|
| Class C shares | (2,798,431) |
| | (2,169,524) |
|
| Class I shares | (72,272,764) |
| | (7,319,629) |
|
| Class Y shares | (558,951) |
| | 3,467,426 |
|
| Net increase (decrease) in net assets from capital share transactions | (117,595,455) |
| | (14,888,529) |
|
| | | | |
| TOTAL INCREASE (DECREASE) IN NET ASSETS | (97,942,943) |
| | (17,294,330) |
|
| | | | |
| | | | |
| NET ASSETS | | | |
| Beginning of year | 334,032,441 |
| | 351,326,771 |
|
| End of year (including accumulated undistributed net investment income of $3,010,704 and $7,087,602, respectively) |
| $236,089,498 |
| |
| $334,032,441 |
|
| See notes to financial statements. | | | |
www.calvert.com CALVERT INTERNATIONAL EQUITY FUND ANNUAL REPORT 15
CALVERT INTERNATIONAL EQUITY FUND
FINANCIAL HIGHLIGHTS
|
| | | | | | | | | | | | | | |
| | Year Ended September 30, |
| CLASS A SHARES | 2017 | | 2016 | | 2015 | | 2014 | | 2013 |
| Net asset value, beginning | $15.49 | | $15.62 | | $16.51 | | $16.44 | | $13.49 |
| Income from investment operations: | | | | | | | | | |
Net investment income (a) | 0.17 |
| | 0.34 |
| (b) | 0.18 |
| | 0.15 |
| | 0.08 |
|
| Net realized and unrealized gain (loss) | 1.84 |
| | (0.33) |
| | (0.97) |
| | 0.02 |
| | 2.98 |
|
| Total from investment operations | 2.01 |
| | 0.01 |
| | (0.79) |
| | 0.17 |
| | 3.06 |
|
| Distributions from: | | | | | | | | | |
| Net investment income | (0.40) |
| | (0.14) |
| | (0.10) |
| | (0.10) |
| | (0.11) |
|
| Total distributions | (0.40) |
| | (0.14) |
| | (0.10) |
| | (0.10) |
| | (0.11) |
|
| Total increase (decrease) in net asset value | 1.61 |
| | (0.13) |
| | (0.89) |
| | 0.07 |
| | 2.95 |
|
| Net asset value, ending | $17.10 | | $15.49 | | $15.62 | | $16.51 | | $16.44 |
Total return (c) | 13.43 | % | | 0.04 | % | | (4.78 | %) | | 0.99 | % | | 22.82 | % |
Ratios to average net assets: (d) | | | | | | | | | |
| Total expenses | 1.58 | % | | 1.62 | % | | 1.67 | % | | 1.66 | % | | 1.76 | % |
| Net expenses | 1.35 | % | | 1.38 | % | | 1.54 | % | | 1.66 | % | | 1.76 | % |
| Net investment income | 1.08 | % | | 2.20 | % | (b) | 1.08 | % | | 0.88 | % | | 0.52 | % |
| Portfolio turnover | 138 | % | | 94 | % | | 97 | % | | 82 | % | | 40 | % |
| Net assets, ending (in thousands) | $126,669 | | $156,757 | | $167,225 | | $263,718 | | $242,464 |
| | | | | | | | | | |
(a) Computed using average shares outstanding. |
(b) Amount includes a non-recurring refund for overbilling of prior years' custody out-of-pocket fees. This amounted to $0.013 per share and 0.08% of average net assets. |
(c) Returns are historical and are calculated by determining the percentage change in net asset value with all distributions reinvested and do not reflect the effect of sales charges, if any. |
(d) Total expenses do not reflect amounts reimbursed and/or waived by the Adviser and certain of its affiliates, if applicable. Net expenses are net of all reductions and represent the net expenses paid by the Fund. |
| See notes to financial statements. |
16 www.calvert.com CALVERT INTERNATIONAL EQUITY FUND ANNUAL REPORT
CALVERT INTERNATIONAL EQUITY FUND
FINANCIAL HIGHLIGHTS
|
| | | | | | | | | | | | | | |
| | Year Ended September 30, |
| CLASS C SHARES | 2017 | | 2016 | | 2015 | | 2014 | | 2013 |
| Net asset value, beginning | $13.31 | | $13.47 | | $14.27 | | $14.26 | | $11.71 |
| Income from investment operations: | | | | | | | | | |
Net investment income (loss) (a) | 0.05 |
| | 0.19 |
| (b) | 0.04 |
| | (0.01) |
| | (0.05) |
|
| Net realized and unrealized gain (loss) | 1.59 |
| | (0.28) |
| | (0.84) |
| | 0.02 |
| | 2.60 |
|
| Total from investment operations | 1.64 |
| | (0.09) |
| | (0.80) |
| | 0.01 |
| | 2.55 |
|
| Distributions from: | | | | | | | | | |
| Net investment income | (0.27) |
| | (0.07) |
| | — |
| | — |
| | — |
|
| Total distributions | (0.27) |
| | (0.07) |
| | — |
| | — |
| | — |
|
| Total increase (decrease) in net asset value | 1.37 |
| | (0.16) |
| | (0.80) |
| | 0.01 |
| | 2.55 |
|
| Net asset value, ending | $14.68 | | $13.31 | | $13.47 | | $14.27 | | $14.26 |
Total return (c) | 12.60 | % | | (0.68 | %) | | (5.61 | %) | | 0.07 | % | | 21.78 | % |
Ratios to average net assets: (d) | | | | | | | | | |
| Total expenses | 2.54 | % | | 2.55 | % | | 2.58 | % | | 2.57 | % | | 2.65 | % |
| Net expenses | 2.10 | % | | 2.14 | % | | 2.37 | % | | 2.57 | % | | 2.65 | % |
| Net investment income (loss) | 0.35 | % | | 1.42 | % | (b) | 0.31 | % | | (0.06 | %) | | (0.40 | %) |
| Portfolio turnover | 138 | % | | 94 | % | | 97 | % | | 82 | % | | 40 | % |
| Net assets, ending (in thousands) | $12,013 | | $13,613 | | $15,997 | | $17,173 | | $17,746 |
| | | | | | | | | | |
(a) Computed using average shares outstanding. |
(b) Amount includes a non-recurring refund for overbilling of prior years' custody out-of-pocket fees. This amounted to $0.011 per share and 0.08% of average net assets. |
(c) Returns are historical and are calculated by determining the percentage change in net asset value with all distributions reinvested and do not reflect the effect of sales charges, if any. |
(d) Total expenses do not reflect amounts reimbursed and/or waived by the Adviser and certain of its affiliates, if applicable. Net expenses are net of all reductions and represent the net expenses paid by the Fund. |
| See notes to financial statements. |
www.calvert.com CALVERT INTERNATIONAL EQUITY FUND ANNUAL REPORT 17
CALVERT INTERNATIONAL EQUITY FUND
FINANCIAL HIGHLIGHTS
|
| | | | | | | | | | | | | | |
| | Year Ended September 30, |
| CLASS I SHARES | 2017 | | 2016 | | 2015 | | 2014 | | 2013 |
| Net asset value, beginning | $16.53 | | $16.73 | | $17.68 | | $17.69 | | $14.52 |
| Income from investment operations: | | | | | | | | | |
Net investment income (a) | 0.21 |
| | 0.44 |
| (b) | 0.30 |
| | 0.28 |
| | 0.17 |
|
| Net realized and unrealized gain (loss) | 2.01 |
| | (0.36) |
| | (1.05) |
| | 0.02 |
| | 3.24 |
|
| Total from investment operations | 2.22 |
| | 0.08 |
| | (0.75) |
| | 0.30 |
| | 3.41 |
|
| Distributions from: | | | | | | | | | |
| Net investment income | (0.51) |
| | (0.28) |
| | (0.20) |
| | (0.31) |
| | (0.24) |
|
| Total distributions | (0.51) |
| | (0.28) |
| | (0.20) |
| | (0.31) |
| | (0.24) |
|
| Total increase (decrease) in net asset value | 1.71 |
| | (0.20) |
| | (0.95) |
| | (0.01) |
| | 3.17 |
|
| Net asset value, ending | $18.24 | | $16.53 | | $16.73 | | $17.68 | | $17.69 |
Total return (c) | 13.89 | % | | 0.41 | % | | (4.27 | %) | | 1.64 | % | | 23.74 | % |
Ratios to average net assets: (d) | | | | | | | | | |
| Total expenses | 1.06 | % | | 1.04 | % | | 1.03 | % | | 1.02 | % | | 1.06 | % |
| Net expenses | 0.96 | % | | 0.95 | % | | 0.98 | % | | 1.02 | % | | 1.06 | % |
| Net investment income | 1.28 | % | | 2.67 | % | (b) | 1.68 | % | | 1.53 | % | | 1.07 | % |
| Portfolio turnover | 138 | % | | 94 | % | | 97 | % | | 82 | % | | 40 | % |
| Net assets, ending (in thousands) | $72,503 | | $140,129 | | $147,614 | | $92,318 | | $82,499 |
| | | | | | | | | | |
(a) Computed using average shares outstanding. |
(b) Amount includes a non-recurring refund for overbilling of prior years' custody out-of-pocket fees. This amounted to $0.014 per share and 0.09% of average net assets. |
(c) Returns are historical and are calculated by determining the percentage change in net asset value with all distributions reinvested and do not reflect the effect of sales charges, if any. |
(d) Total expenses do not reflect amounts reimbursed and/or waived by the Adviser and certain of its affiliates, if applicable. Net expenses are net of all reductions and represent the net expenses paid by the Fund. |
| See notes to financial statements. |
18 www.calvert.com CALVERT INTERNATIONAL EQUITY FUND ANNUAL REPORT
CALVERT INTERNATIONAL EQUITY FUND
FINANCIAL HIGHLIGHTS
|
| | | | | | | | | | | | | | |
| | Year Ended September 30, |
| CLASS Y SHARES | 2017 | | 2016 | | 2015 | | 2014 | | 2013 |
| Net asset value, beginning | $16.35 | | $16.54 | | $17.45 | | $17.38 | | $14.25 |
| Income from investment operations: | | | | | | | | | |
Net investment income (a) | 0.23 |
| | 0.40 |
| (b) | 0.27 |
| | 0.23 |
| | 0.14 |
|
| Net realized and unrealized gain (loss) | 1.94 |
| | (0.35) |
| | (1.05) |
| | 0.02 |
| | 3.15 |
|
| Total from investment operations | 2.17 |
| | 0.05 |
| | (0.78) |
| | 0.25 |
| | 3.29 |
|
| Distributions from: | | | | | | | | | |
| Net investment income | (0.46) |
| | (0.24) |
| | (0.13) |
| | (0.18) |
| | (0.16) |
|
| Total distributions | (0.46) |
| | (0.24) |
| | (0.13) |
| | (0.18) |
| | (0.16) |
|
| Total increase (decrease) in net asset value | 1.71 |
| | (0.19) |
| | (0.91) |
| | 0.07 |
| | 3.13 |
|
| Net asset value, ending | $18.06 | | $16.35 | | $16.54 | | $17.45 | | $17.38 |
Total return (c) | 13.76 | % | | 0.28 | % | | (4.52 | %) | | 1.41 | % | | 23.27 | % |
Ratios to average net assets: (d) | | | | | | | | | |
| Total expenses | 1.20 | % | | 1.23 | % | | 1.37 | % | | 1.31 | % | | 1.41 | % |
| Net expenses | 1.10 | % | | 1.13 | % | | 1.22 | % | | 1.31 | % | | 1.39 | % |
| Net investment income | 1.38 | % | | 2.50 | % | (b) | 1.52 | % | | 1.27 | % | | 0.90 | % |
| Portfolio turnover | 138 | % | | 94 | % | | 97 | % | | 82 | % | | 40 | % |
| Net assets, ending (in thousands) | $24,905 | | $23,534 | | $20,491 | | $17,479 | | $10,367 |
| | | | | | | | | | |
(a) Computed using average shares outstanding. |
(b) Amount includes a non-recurring refund for overbilling of prior years' custody out-of-pocket fees. This amounted to $0.014 per share and 0.09% of average net assets. |
(c) Returns are historical and are calculated by determining the percentage change in net asset value with all distributions reinvested and do not reflect the effect of sales charges, if any. |
(d) Total expenses do not reflect amounts reimbursed and/or waived by the Adviser and certain of its affiliates, if applicable. Net expenses are net of all reductions and represent the net expenses paid by the Fund. |
| See notes to financial statements. |
www.calvert.com CALVERT INTERNATIONAL EQUITY FUND ANNUAL REPORT 19
NOTES TO FINANCIAL STATEMENTS
NOTE A — SIGNIFICANT ACCOUNTING POLICIES
General: Calvert World Values Fund, Inc. (the “Corporation”) was organized as a Maryland corporation on February 14, 1992, and is registered under the Investment Company Act of 1940, as amended (the “1940 Act”), as an open-end management investment company. The Corporation operates four (4) separate series, each with its own investment objective(s) and strategies, which are accounted for separately. This report contains the financial statements and financial highlights of Calvert International Equity Fund (the “Fund”). The Corporation is authorized to issue 2 billion shares of common stock, $0.01 par value per share, of which 250 million shares have been allocated to the Fund.
The Fund is diversified. The investment objective of the Fund is to seek to provide a high total return consistent with reasonable risk by investing primarily in a diversified portfolio of stocks. The Fund invests primarily in equity securities of foreign companies.
The Fund offers four classes of shares. Class A shares are generally sold subject to a sales charge imposed at time of purchase. A contingent deferred sales charge of 0.80% may apply to certain redemptions of Class A shares for accounts for which no sales charge was paid, if redeemed within one year of purchase. Class C shares are sold without a front-end sales charge, and with certain exceptions, are charged a contingent deferred sales charge of 1% on shares redeemed within one year of purchase. Class C shares are only available for purchase through a financial intermediary. Class I and Class Y shares are sold at net asset value, are not subject to a sales charge and are sold only to certain eligible investors. Each class represents a pro rata interest in the Fund, but votes separately on class-specific matters and is subject to different expenses.
The Fund applies the accounting and reporting guidance in the Financial Accounting Standards Board (FASB) Accounting Standards Codification Topic 946, Financial Services – Investment Companies (ASC 946). Subsequent events, if any, through the date that the financial statements were issued have been evaluated in the preparation of the financial statements.
Investment Valuation: Net asset value per share is determined every business day as of the close of the regular session of the New York Stock Exchange (generally 4:00 p.m. Eastern time). The Fund uses independent pricing services approved by the Board of Directors (the “Board”) to value its investments wherever possible. Investments for which market quotations are not available or deemed not reliable are fair valued in good faith under the direction of the Board.
The Board has adopted Valuation Procedures (the “Procedures”) to determine the fair value of securities and financial instruments for which market prices are not readily available or which may not be reliably priced. The Board has delegated the day-to-day responsibility for determining the fair value of securities and financial instruments of the Fund to the Fund's investment adviser (the “Adviser”) and has provided these Procedures to govern the Adviser in its valuation duties.
The Adviser has chartered an internal Valuation Committee to oversee the implementation of these Procedures and to assist it in carrying out the valuation responsibilities that the Board has delegated. The Valuation Committee meets on a regular basis to review investments which may not have readily available market prices. The Valuation Committee’s fair valuation determinations are subject to review, approval and ratification by the Board at its next regularly scheduled meeting covering the calendar quarter in which the fair valuation was determined.
U.S. generally accepted accounting principles (U.S. GAAP) establishes a disclosure hierarchy that categorizes the inputs to valuation techniques used to value assets and liabilities at measurement date. These inputs are summarized in the three broad levels listed below:
Level 1 - quoted prices in active markets for identical securities
Level 2 - other significant observable inputs (including quoted prices for similar securities, interest rates, prepayment speeds, credit risk, etc.)
Level 3 - significant unobservable inputs (including the Fund’s own assumptions in determining the fair value of investments)
The inputs or methodologies used for valuing securities are not necessarily an indication of the risk associated with investing in those securities.
Changes in valuation techniques may result in transfers in or out of an investment’s assigned level within the hierarchy during the period. Transfers in and/or out of levels are determined based on the fair value of such securities at the end of the period. Valuation techniques used to value the Fund’s investments by major category are as follows:
Equity Securities. Equity securities (including warrants and rights) listed on a U.S. securities exchange generally are valued at the last sale or closing price as reported by an independent pricing service on the primary market or exchange on which they are traded and are categorized as Level 1 in the hierarchy. Equity securities listed on the NASDAQ Global or Global Select Market are valued at the NASDAQ official closing price and are categorized as Level 1 in the hierarchy. Unlisted or listed securities for
20 www.calvert.com CALVERT INTERNATIONAL EQUITY FUND ANNUAL REPORT
which closing sales prices or closing quotations are not available are valued at the mean between the latest available bid and asked prices and are categorized as Level 2 in the hierarchy. The daily valuation of exchange-traded foreign securities generally is determined as of the close of trading on the principal exchange on which such securities trade. Events occurring after the close of trading on foreign exchanges may result in adjustments to the valuation of foreign securities to more accurately reflect their fair value as of the close of regular trading on the New York Stock Exchange. When valuing foreign equity securities that meet certain criteria, the Fund’s Board has approved the use of a fair value service that values such securities to reflect market trading that occurs after the close of the applicable foreign markets of comparable securities or other instruments that have a strong correlation to the fair-valued securities. Such securities are categorized as Level 2 in the hierarchy.
Debt Securities. Debt securities are generally valued on the basis of valuations provided by third party pricing services, as derived from such services’ pricing models. Inputs to the models may include, but are not limited to, reported trades, executable bid and asked prices, broker/dealer quotations, prices or yields of securities with similar characteristics, interest rates, anticipated prepayments, benchmark curves or information pertaining to the issuer, as well as industry and economic events. Accordingly, debt securities are generally categorized as Level 2 in the hierarchy. Short-term securities of sufficient credit quality purchased with remaining maturities of sixty days or less for which a valuation from a third party pricing service is not readily available may be valued at amortized cost, which approximates fair value, and are categorized as Level 2 in the hierarchy.
Venture Capital Securities. Venture capital securities for which market quotations are not readily available are generally categorized as Level 3 in the hierarchy. Venture capital equity securities are generally valued using the most appropriate and applicable method to measure fair value in light of each company’s situation. Methods may include market, income, options-pricing or cost approaches with discounts as appropriate based on assumptions of liquidation or exit risk. Examples of the market approach are subsequent rounds of financing, comparable transactions, and revenue times an industry multiple. An example of the income approach is the discounted cash flow model. Examples of the cost approach are replacement cost, salvage value, or net asset value. The options-pricing method treats common stock and preferred stock as call options on the enterprise value with strike price based on the preferred stock liquidation preference. Venture capital limited partnership interests are valued at the fair value reported by the general partner of the partnership, adjusted as necessary to reflect subsequent capital calls and distributions and any other available information. In some cases, adjustments may be made to account for daily pricing of material public holdings within the partnership.
Other Securities. Exchange-traded funds are valued at the official closing price as reported by an independent pricing service on the primary market or exchange on which they are traded and are categorized as Level 1 in the hierarchy. Investments in registered investment companies (including money market funds) that do not trade on an exchange are valued at the net asset value per share on the valuation day and are categorized as Level 1 in the hierarchy.
Fair Valuation. If a market value cannot be determined for a security using the methodologies described above, or if, in the good faith opinion of the Adviser, the market value does not constitute a readily available market quotation, or if a significant event has occurred that would materially affect the value of the security, the security will be fair valued as determined in good faith by or at the direction of the Board in a manner that fairly reflects the security’s value, or the amount that the Fund might reasonably expect to receive for the security upon its current sale in the ordinary course. Each such determination is based on a consideration of relevant factors, which are likely to vary from one pricing context to another. These factors may include, but are not limited to, the type of security, the existence of any contractual restrictions on the security’s disposition, the price and extent of public trading in similar securities of the issuer or of comparable companies or entities, quotations or relevant information obtained from broker/dealers or other market participants, information obtained from the issuer, analysts, and/or the appropriate stock exchange (for exchange-traded securities), an analysis of the company’s or entity’s financial condition, and an evaluation of the forces that influence the issuer and the market(s) in which the security is purchased and sold.
The values assigned to fair value investments are based on available information and do not necessarily represent amounts that might ultimately be realized. Further, due to the inherent uncertainty of valuations of such investments, the fair values may differ significantly from the values that would have been used had an active market existed, and the differences could be material. The Valuation Committee employs various methods for calibrating these valuation approaches including a regular review of key inputs and assumptions, transactional back-testing or disposition analysis and reviews of any related market activity.
www.calvert.com CALVERT INTERNATIONAL EQUITY FUND ANNUAL REPORT 21
The following table summarizes the market value of the Fund's holdings as of September 30, 2017, based on the inputs used to value them:
|
| | | | | | | | | | | | | |
| INVESTMENTS IN SECURITIES - ASSETS | LEVEL 1 | LEVEL 2 | | LEVEL 3* | TOTAL |
| Common Stocks | | | | | |
| Canada |
| $4,265,996 |
|
| $— |
| |
| $— |
|
| $4,265,996 |
|
| Israel | 3,197,833 |
| — |
| | — |
| 3,197,833 |
|
| Taiwan | 4,107,369 |
| — |
| | — |
| 4,107,369 |
|
| United States | 2,076,959 |
| — |
| | — |
| 2,076,959 |
|
| Other Countries** | — |
| 211,825,700 |
| | — |
| 211,825,700 |
|
| Total Common Stocks |
| $13,648,157 |
|
| $211,825,700 |
| *** |
| $— |
|
| $225,473,857 |
|
| Preferred Stocks - Venture Capital | — |
| — |
| | 212,531 |
| 212,531 |
|
| Venture Capital Limited Partnership Interest | — |
| — |
| | 1,309,724 |
| 1,309,724 |
|
| Venture Capital Debt Obligations | — |
| — |
| | 595,798 |
| 595,798 |
|
| High Social Impact Investments | — |
| 4,223,653 |
| | 477,599 |
| 4,701,252 |
|
| Time Deposit | — |
| 2,588,186 |
| | — |
| 2,588,186 |
|
| TOTAL |
| $13,648,157 |
|
| $218,637,539 |
| |
| $2,595,652 |
|
| $234,881,348 |
|
| | | | | | |
| * None of the unobservable inputs for Level 3 assets, individually or collectively, had a material impact on the Fund. |
| ** For further breakdown of equity securities by country, please refer to the Schedule of Investments. |
| *** Includes foreign equity securities whose values were adjusted to reflect market trading of comparable securities or other correlated instruments that occurred after the close of trading in their applicable foreign markets. |
Level 3 investments at the beginning and/or end of the period in relation to net assets were not significant and accordingly, a reconciliation of Level 3 assets for the year ended September 30, 2017 is not presented. There were no transfers between Level 1 and Level 2 during the year ended September 30, 2017.
Investment Transactions and Income: Investment transactions for financial statement purposes are accounted for on trade date. Realized gains and losses are recorded on an identified cost basis and may include proceeds from litigation. Dividend income is recorded on the ex-dividend date for dividends received in cash and/or securities or, in the case of dividends on certain foreign securities, as soon as the Fund is informed of the ex-dividend date. Non-cash dividends are recorded at the fair value of the securities received. Withholding taxes on foreign dividends, if any, have been provided for in accordance with the Fund’s understanding of the applicable country’s tax rules and rates. Distributions received that represent a return of capital are recorded as a reduction of cost of investments. Distributions received that represent a capital gain are recorded as a realized gain. Interest income, which includes amortization of premium and accretion of discount on debt securities, is accrued as earned.
Share Class Accounting: Investment income and realized and unrealized gains and losses are allocated to separate classes of shares based upon the relative net assets of each class. Expenses common to the classes are also allocated to each class in proportion to their relative net assets. Expenses arising in connection with a specific class are charged directly to that class.
Foreign Currency Transactions: The Fund’s accounting records are maintained in U.S. dollars. For valuation of assets and liabilities on each date of net asset value determination, foreign denominations are converted into U.S. dollars using the current exchange rate. Security transactions, income, and expenses are translated at the prevailing rate of exchange on the date of the event. Recognized gains or losses on investment transactions attributable to changes in foreign currency exchange rates are recorded for financial statement purposes as net realized gains and losses on investments. That portion of unrealized gains and losses on investments that results from fluctuations in foreign currency exchange rates is not separately disclosed.
Restricted Securities: The Fund may invest in securities that are subject to legal or contractual restrictions on resale. Generally, these securities may only be sold publicly upon registration under the Securities Act of 1933 or in transactions exempt from such registration. Information regarding restricted securities (excluding Rule 144A securities) is included at the end of the Schedule of Investments.
Distributions to Shareholders: Distributions to shareholders are recorded by the Fund on ex-dividend date. Dividends from net investment income and distributions from net realized capital gains, if any, are paid at least annually. Distributions are determined in accordance with income tax regulations which may differ from U.S. GAAP; accordingly, periodic reclassifications are made within the Fund's capital accounts to reflect income and gains available for distribution under income tax regulations.
22 www.calvert.com CALVERT INTERNATIONAL EQUITY FUND ANNUAL REPORT
Estimates: The preparation of financial statements in conformity with U.S. GAAP requires management to make estimates and assumptions that affect the reported amounts of assets and liabilities and disclosure of contingent assets and liabilities at the date of the financial statements and the reported amounts of increases and decreases in net assets from operations during the reporting period. Actual results could differ from those estimates.
Indemnifications: The Corporation’s By-Laws provide for indemnification for Directors or officers of the Corporation and certain other parties, to the fullest extent permitted by Maryland law and the 1940 Act, provided certain conditions are met. Additionally, in the normal course of business, the Fund enters into agreements with service providers that may contain indemnification clauses. The Fund’s maximum exposure under these arrangements is unknown as this would involve future claims that may be made against the Fund that have not yet occurred.
Federal Income Taxes: No provision for federal income or excise tax is required since the Fund intends to continue to qualify as a regulated investment company under the Internal Revenue Code and to distribute substantially all of its taxable earnings.
Management has analyzed the Fund's tax positions taken for all open federal income tax years and has concluded that no provision for federal income tax is required in the Fund's financial statements. A Fund's federal tax return is subject to examination by the Internal Revenue Service for a period of three years from the date of filing.
NOTE B — RELATED PARTY TRANSACTIONS
Effective December 31, 2016, Calvert Research and Management (CRM), a subsidiary of Eaton Vance Management (EVM), became the investment adviser to the Fund following a transaction between CRM and certain of its affiliates and Calvert Investment Management, Inc. (CIM) and certain of its affiliates, pursuant to which CRM acquired substantially all of the business assets of CIM after satisfying various closing conditions, including shareholder approval of a new investment advisory agreement between the Fund and CRM (the “Transaction”).
For its services pursuant to the new investment advisory agreement, CRM receives a fee, payable monthly, at the annual rate of 0.75% of the Fund's average daily net assets up to and including $250 million and 0.725% over $250 million up to and including $500 million. On net assets over $500 million, the annual fee is reduced. Pursuant to a sub-advisory agreement effective December 31, 2016, CRM pays Eaton Vance Management (International) Limited (EVMI), an indirect, wholly-owned subsidiary of Eaton Vance Corp., a portion of its investment advisory fee for sub-advisory services provided to the Fund. Effective November 1, 2017, Eaton Vance Advisers International Ltd. (EVAIL), an affiliate of EVM, assumed the sub-advisory responsibilities for the Fund from EVMI. Prior to December 31, 2016, CIM, a direct subsidiary of Calvert Investments, Inc. and an indirect subsidiary of Ameritas Holding Company, provided investment advisory services to the Fund. For its services, CIM received a fee at the same annual rate as the Fund’s investment advisory agreement with CRM. For the year ended September 30, 2017, the investment advisory fee amounted to $1,932,392 or 0.75% of the Fund's average daily net assets, of which $1,349,183 was paid to CRM and $583,209 was paid to CIM.
CRM and EVMI have agreed to reimburse the Fund’s operating expenses to the extent that total annual operating expenses (relating to ordinary operating expenses only and excluding expenses such as brokerage commissions, acquired fund fees and expenses of unaffiliated funds, interest expense, taxes or litigation expenses) exceed 1.33%, 2.08%, 0.95% and 1.08% (1.32%, 2.07%, 0.95% and 1.08% effective October 1, 2017) for Class A, Class C, Class I and Class Y, respectively, of such class’ average daily net assets. The expense reimbursement agreement may be changed or terminated after January 31, 2019. Prior to December 31, 2016, CIM contractually agreed to limit net annual fund operating expenses to 1.38%, 2.14%, 0.95% and 1.13% for Class A, Class C, Class I and Class Y, respectively, of such class’ average daily net assets. For the year ended September 30, 2017, CRM and EVMI waived or reimbursed in total expenses of $374,772 and CIM waived or reimbursed expenses of $102,455.
The administrative fee is earned by CRM as compensation for administrative services rendered to the Fund. The fee is computed at an annual rate of 0.12% of the Fund’s average daily net assets attributable to Class A, Class C, Class I and Class Y and is payable monthly. Prior to December 31, 2016, Calvert Investment Administrative Services, Inc. (CIAS), an affiliate of CIM, provided administrative services to the Fund at an annual rate of 0.12% of the Fund's average daily net assets, payable monthly. For the year ended September 30, 2017, CRM was paid administrative fees of $215,973 and CIAS was paid administrative fees of $93,952.
The Fund adopted a new distribution plan for Class A shares (Class A Plan) and Class C shares (Class C Plan) pursuant to Rule 12b-1 under the 1940 Act, which were approved by the Board and became effective as of December 31, 2016 or shortly thereafter upon approval by the shareholders of the respective class. Pursuant to the Class A Plan and Class C Plan, the Fund pays a distribution fee of 0.25% and 0.75% per annum for Class A and Class C, respectively, and a service fee of 0.25% per annum for Class C of its average daily net assets attributable to such class for distribution services and facilities provided to the Fund, as well as for personal and/or account maintenance services provided. Pursuant to the Fund’s former distribution plans for Class A shares and Class C shares, the Fund was permitted to pay certain expenses associated with the distribution and servicing of its Class A and Class C shares not to exceed 0.35% for Class A and 1.00% for Class C of the Fund’s average daily net assets with respect to
www.calvert.com CALVERT INTERNATIONAL EQUITY FUND ANNUAL REPORT 23
such class. Effective December 31, 2016, the fees are paid to Eaton Vance Distributors, Inc. (EVD), an affiliate of CRM and the Fund’s principal underwriter. Prior to December 31, 2016, the fees were paid to Calvert Investment Distributors, Inc. (CID), an affiliate of CIM and the Fund’s former distributor and principal underwriter. Distribution and service fees paid or accrued for the year ended September 30, 2017 amounted to $330,020 or 0.25% per annum of Class A’s average daily net assets, of which $238,667 was paid to EVD and $91,353 was paid to CID, and $124,675 or 1.00% per annum of Class C’s average daily net assets, of which $92,506 was paid to EVD and $32,169 was paid to CID.
The Fund was informed that EVD and CID received $15,226 and $3,865, respectively, as their portion of the sales charge on sales of Class A shares for the year ended September 30, 2017. The Fund was also informed that EVD and CID received $2,106 and $846, respectively, of contingent deferred sales charges paid by Fund shareholders for the same period.
Effective December 31, 2016, EVM provides sub-transfer agency services to the Fund pursuant to a Sub-Transfer Agency Support Services Agreement. For its services, EVM receives an annual fee of $8 per shareholder account. Prior to December 31, 2016, Calvert Investment Services, Inc. (CIS), an affiliate of CIM, acted as the shareholder servicing agent for the Fund and received a fee at the same rate as is paid to EVM. For the year ended September 30, 2017, sub-transfer agency fees paid to EVM were $56,217 and shareholder servicing fees paid to CIS were $21,597. Such fees are included in transfer agency fees and expenses on the Statement of Operations.
Each Director of the Fund who is not an employee of CRM or its affiliates receives a fee of $3,000 for each Board meeting attended in person and $2,000 for each Board meeting attended by phone plus an annual fee of $52,000, and $1,500 for each Committee meeting attended in person and $1,000 for each Committee meeting attended by phone plus an annual Committee fee of $2,500. The Board chair receives an additional $10,000 annual retainer and Committee chairs receive an additional $6,000 annual retainer. Prior to December 31, 2016, each Director of the Fund who was not an employee of CIM or its affiliates received a fee of $3,000 for each Board meeting attended plus an annual fee of $52,000. Committee members received $500 for each Committee meeting attended plus an annual fee of $2,500. Committee chairs received an additional annual retainer ranging from $6,000 to $10,000. Eligible Directors may participate in a Deferred Compensation Plan (the “Plan”). Amounts deferred under the Plan are treated as though equal dollar amounts had been invested in shares of the Fund or other Calvert Funds selected by the Directors. The Fund purchases shares of the funds selected equal to the dollar amounts deferred under the Plan, resulting in an asset equal to the deferred compensation liability. Obligations of the Plan are paid solely from the Fund’s assets. Directors’ fees are allocated to each of the Calvert Funds served. Salaries and fees of officers and Directors of the Fund who are employees of CRM and, prior to December 31, 2016, of CIM or their affiliates are/were paid by CRM and CIM, respectively. In addition, in connection with the Transaction, an advisory council was established to aid the Board and CRM in advancing the cause of responsible investing through original scholarship and thought leadership. The advisory council consists of CRM’s Chief Executive Officer and four additional members. Each member (other than CRM’s Chief Executive Officer) receives annual compensation of $75,000, which is being reimbursed by CIM and Ameritas Holding Company for a period of up to three years through December 30, 2019. For the year ended September 30, 2017, the Fund’s allocated portion of such expense and reimbursement was $2,729, which are included in miscellaneous expense and reimbursement of expenses-other, respectively, on the Statement of Operations.
NOTE C — INVESTMENT ACTIVITY AND TAX INFORMATION
During the year ended September 30, 2017, the cost of purchases and proceeds from sales of investments, other than short-term securities, were $353,109,573 and $475,378,467, respectively.
The tax character of distributions declared for the years ended September 30, 2017 and September 30, 2016 was as follows:
|
| | | | | | | |
| | Year Ended September 30, |
| | 2017 | | 2016 |
| Distributions declared from: | | | |
| Ordinary income |
| $8,454,529 |
| |
| $4,124,644 |
|
During the year ended September 30, 2017, accumulated net realized loss was decreased by $18,220,564, accumulated undistributed net investment income was increased by $1,433,266 and paid-in capital was decreased by $19,653,830 due to expired capital loss carryforwards and differences between book and tax accounting, primarily for foreign currency gain (loss), investments in passive foreign investment companies and investments in partnerships. These reclassifications had no effect on the net assets or net asset value per share of the Fund.
24 www.calvert.com CALVERT INTERNATIONAL EQUITY FUND ANNUAL REPORT
As of September 30, 2017, the components of distributable earnings (accumulated losses) on a tax basis were as follows:
|
| | | |
| Undistributed ordinary income |
| $3,039,176 |
|
| Capital loss carryforwards and deferred capital losses |
| ($145,698,498 | ) |
| Net unrealized appreciation (depreciation) |
| $20,962,899 |
|
The differences between components of distributable earnings (accumulated losses) on a tax basis and the amounts reflected in the Statement of Assets and Liabilities are primarily due to temporary book-tax differences that will reverse in a subsequent period. These differences are primarily due to wash sales, investments in partnerships and investments in passive foreign investment companies.
At September 30, 2017, the Fund, for federal income tax purposes, had capital loss carryforwards of $116,328,900 and deferred capital losses of $29,369,598 which would reduce the Fund’s taxable income arising from future net realized gains on investment transactions, if any, to the extent permitted by the Internal Revenue Code, and thus would reduce the amount of distributions to shareholders, which would otherwise be necessary to relieve the Fund of any liability for federal income or excise tax. The capital loss carryforwards will expire on September 30, 2018 ($105,942,268) and September 30, 2019 ($10,386,632) and their character is short-term. The deferred capital losses are treated as arising on the first day of the Fund’s next taxable year and retain the same short-term or long-term character as when originally deferred. Of the deferred capital losses at September 30, 2017, $11,471,284 are short-term and $17,898,314 are long-term.
Under the Regulated Investment Company Modernization Act of 2010, capital losses incurred in taxable years beginning after December 22, 2010 can be carried forward to offset future capital gains for an unlimited period. These losses are required to be utilized prior to the losses incurred in pre-enactment taxable years. Losses incurred in pre-enactment taxable years can be utilized until expiration.
The cost and unrealized appreciation (depreciation) of investments of the Fund at September 30, 2017, as determined on a federal income tax basis, were as follows:
|
| | | |
| Federal tax cost of investments |
| $213,925,729 |
|
| Gross unrealized appreciation |
| $28,207,175 |
|
| Gross unrealized depreciation | (7,251,556 | ) |
| Net unrealized appreciation (depreciation) |
| $20,955,619 |
|
NOTE D — SECURITIES LENDING
To generate additional income, the Fund may lend its securities pursuant to a securities lending agency agreement with State Street Bank and Trust Company (SSB), the securities lending agent. Security loans are subject to termination by the Fund at any time and, therefore, are not considered to be illiquid investments. The Fund requires that the loan be continuously collateralized by either cash or securities as collateral equal at all times to at least 102% of the market value of the domestic securities loaned and 105% of the market value of the international securities loaned (if applicable). The market value of securities loaned is determined daily and any additional required collateral is delivered to the Fund on the next business day. Cash collateral is generally invested in State Street Institutional U.S. Government Money Market Fund (the “U.S. Government Fund”) that is managed by an affiliate of the custodian. The U.S. Government Fund is a registered money market fund that invests in a variety of high-quality, U.S. dollar denominated instruments. Any gain or loss in the market price of the loaned securities that might occur and any interest earned or dividends declared during the term of the loan would accrue to the account of the Fund. Income earned on the investment of collateral, net of broker rebates and other expenses incurred by the securities lending agent, is split between the Fund and the securities lending agent on the basis of agreed upon contractual terms. Non-cash collateral is held by the lending agent on behalf of the Fund and cannot be sold or re-pledged by the Fund; accordingly, such collateral is not reflected in the Statement of Assets and Liabilities.
The risks associated with lending portfolio securities include, but are not limited to, possible delays in receiving additional collateral or in the recovery of the loaned securities, possible loss of rights to the collateral should the borrower fail financially, as well as risk of loss in the value of the collateral or the value of the investments made with the collateral. The securities lending agent shall indemnify the Fund in the case of default of any securities borrower.
The Fund did not have any securities on loan at September 30, 2017.
www.calvert.com CALVERT INTERNATIONAL EQUITY FUND ANNUAL REPORT 25
NOTE E — LINE OF CREDIT
A financing agreement is in place with the Calvert Funds and SSB. Under the agreement, which expires on August 7, 2018, SSB provides an unsecured line of credit facility in the aggregate amount of $50 million ($25 million committed and $25 million uncommitted), accessible by the Calvert Funds for temporary or emergency purposes only. Borrowings bear interest at the higher of the One-Month London Interbank Offered Rate (LIBOR) in effect that day or the overnight Federal Funds Rate, plus 1.25% per annum. A commitment fee of 0.25% per annum is incurred on the unused portion of the committed facility. An administrative fee of $30,000 was paid in connection with the renewal of the uncommitted facility. These fees are allocated to all participating funds. Because the line of credit is not available exclusively to the Fund, it may be unable to borrow some or all of its requested amounts at any particular time. The Fund had no loans outstanding pursuant to this line of credit at September 30, 2017. Average borrowings and the weighted average interest rate (excluding fees) for the year ended September 30, 2017 were $697,924 and 2.10%, respectively.
NOTE F — AFFILIATED COMPANIES
The Fund invests a portion of its assets designated for high social impact investments in notes issued by the Calvert Social Investment Foundation (the “Foundation”) pursuant to an exemptive order granted by the U.S. Securities and Exchange Commission (the “SEC”). The Fund relies on exemptive relief to invest in the notes because the Fund’s investments in the notes may be considered prohibited transactions between affiliated persons under the 1940 Act. The Foundation may be considered an affiliated person of the Calvert Funds based on the overlap between the Foundation’s Board of Directors and the Calvert Funds’ Directors/Trustees and other potential affiliations. The Foundation has licensed use of the Calvert name from the Adviser, and the Adviser’s President and Chief Executive Officer serves on the Foundation Board. The Foundation is not owned or otherwise controlled by the Adviser or its affiliates.
In addition, an affiliated company is a company in which a fund has a direct or indirect ownership of, control of, or voting power of 5 percent or more of the outstanding voting shares, or a company that is under common ownership or control with a fund. At September 30, 2017, the value of the Fund’s investment in affiliated companies was $4,547,826, which represents 1.93% of the Fund’s net assets. Transactions in affiliated companies by the Fund for the year ended September 30, 2017 were as follows:
|
| | | | | | | | | | | | | | | | | | | | | | | | | | | |
Name of Affiliated
Company | Principal Amount,
beginning of year | Gross Additions | Gross Reductions | Principal Amount,
end of year | Value,
end of year | Interest
Income | Net Realized
Gain (Loss) | Capital Gain
Distributions Received | Change in
Unrealized
Appreciation
(Depreciation) |
| High Social Impact Investments | | | | | | | | | |
| Calvert Social Investment Foundation, Community Investment Notes: | | | | | | | | | |
| 0.25%, 7/1/17 |
| $4,431,583 |
|
| $— |
|
| ($4,431,583 | ) |
| $— |
|
| $— |
|
| $2,255 |
|
| $— |
|
| $— |
|
| $124,749 |
|
| 1.50%, 12/15/19 | — |
| 4,431,583 |
| — |
| 4,431,583 |
| 4,223,653 |
| 35,206 |
| — |
| — |
| (207,930 | ) |
| Venture Capital Limited Partnership Interests | | | | | | | | | |
| SEAF Central and Eastern European Growth Fund LLC | — |
| — |
| (130,377 | ) | — |
| 43,662 |
| — |
| — |
| — |
| (90,009 | ) |
| gNet Defta Development Holding LLC | — |
| — |
| — |
| — |
| 280,511 |
| — |
| — |
| — |
| (19,505 | ) |
| TOTALS | | | | |
| $4,547,826 |
|
| $37,461 |
| $— |
| $— |
|
| ($192,695 | ) |
26 www.calvert.com CALVERT INTERNATIONAL EQUITY FUND ANNUAL REPORT
NOTE G — CAPITAL SHARES
Transactions in capital shares for the years ended September 30, 2017 and September 30, 2016 were as follows:
|
| | | | | | | | | |
| | Year Ended
September 30, 2017 | | Year Ended
September 30, 2016 |
| | Shares | Amount | | Shares | Amount |
| Class A | | | | | |
| Shares sold | 1,029,743 |
| $16,222,534 |
| | 1,699,772 |
| $26,167,775 |
|
| Reinvestment of distributions | 201,970 | 2,962,903 |
| | 81,501 | 1,309,720 |
|
| Shares redeemed | (3,947,550) | (61,150,746) |
| | (2,364,869) | (36,344,297) |
|
| Net decrease | (2,715,837) | ($41,965,309) | | (583,596) | ($8,866,802) |
| | | | | | |
| Class C | | | | | |
| Shares sold | 96,471 |
| $1,308,982 |
| | 92,905 |
| $1,231,606 |
|
| Reinvestment of distributions | 17,336 | 219,647 |
| | 5,143 | 71,438 |
|
| Shares redeemed | (318,474) | (4,327,060) |
| | (262,210) | (3,472,568) |
|
| Net decrease | (204,667) | ($2,798,431) | | (164,162) | ($2,169,524) |
| | | | | | |
| Class I | | | | | |
| Shares sold | 1,883,414 |
| $30,617,396 |
| | 3,127,271 |
| $50,232,783 |
|
| Reinvestment of distributions | 139,987 | 2,183,790 |
| | 76,136 | 1,301,923 |
|
| Shares redeemed | (6,522,307) | (105,073,950) |
| | (3,553,323) | (58,854,335) |
|
| Net decrease | (4,498,906) | ($72,272,764) | | (349,916) | ($7,319,629) |
| | | | | | |
| Class Y | | | | | |
| Shares sold | 755,439 |
| $12,598,704 |
| | 714,196 |
| $11,645,127 |
|
| Reinvestment of distributions | 24,315 | 375,908 |
| | 15,188 | 257,139 |
|
| Shares redeemed | (840,197) | (13,533,563) |
| | (528,729) | (8,434,840) |
|
| Net increase (decrease) | (60,443) | ($558,951) | | 200,655 |
| $3,467,426 |
|
The Board approved the termination of the Fund’s Class Y shares. Effective December 8, 2017, Class Y shares of the Fund will convert to Class I shares at net asset value. Thereafter, Class Y shares will be terminated.
At September 30, 2017, Calvert Conservative Allocation Fund, Calvert Moderate Allocation Fund and Calvert Aggressive Allocation Fund owned in the aggregate 18.7% of the value of the outstanding shares of the Fund.
NOTE H — RISKS ASSOCIATED WITH FOREIGN INVESTMENTS
Investing in foreign securities involves additional risks relating to political, social, and economic developments abroad. Other risks result from differences between regulations that apply to U.S. and foreign issuers and markets, and the potential for foreign markets to be less liquid and more volatile than U.S. markets. Securities that trade or are denominated in currencies other than the U.S. dollar may be adversely affected by fluctuations in currency exchange rates.
NOTE I — CAPITAL COMMITMENTS
In connection with certain venture capital and/or limited partnership investments, the Fund is committed to future capital calls, which will increase the Fund’s investment in these securities. The aggregate amount of the future capital commitments totaled $402,584 at September 30, 2017. The Fund had sufficient cash and/or securities to cover these commitments.
www.calvert.com CALVERT INTERNATIONAL EQUITY FUND ANNUAL REPORT 27
The Fund's unfunded capital commitments by investment at September 30, 2017 were as follows:
|
| | | |
| Name of Investment | Unfunded Commitment at 9/30/17 |
|
| Africa Renewable Energy Fund LP |
| $364,312 |
|
| Blackstone Clean Technology Partners LP | 508 |
|
| China Environment Fund 2004 LP | 37,764 |
|
| Total |
| $402,584 |
|
NOTE J — REGULATORY MATTERS
On May 2, 2017, the SEC issued an administrative order (“Order”) relating to the improper use of Calvert Fund assets by CIM and CID, the Calvert Funds’ former adviser and principal underwriter, respectively, to pay for the distribution and marketing of fund shares outside of a Rule 12b-1 plan, as well as to pay expenses in excess of Fund expense caps. Pursuant to the Order, CIM and CID are required to pay $21,614,534 to affected shareholders of the Calvert Funds, including the Fund’s shareholders. The distributions required to be made by CIM and CID to affected shareholders are the obligations of CIM and CID and will not have an impact on the Fund’s net assets.
28 www.calvert.com CALVERT INTERNATIONAL EQUITY FUND ANNUAL REPORT
REPORT OF INDEPENDENT REGISTERED PUBLIC ACCOUNTING FIRM
The Board of Directors of Calvert World Values Fund, Inc. and Shareholders of Calvert International Equity Fund:
We have audited the accompanying statement of assets and liabilities of the Calvert International Equity Fund (the “Fund”), a series of Calvert World Values Fund, Inc., including the schedule of investments, as of September 30, 2017, and the related statement of operations for the year then ended, the statements of changes in net assets for each of the years in the two-year period then ended, and the financial highlights for each of the years in the five-year period then ended. These financial statements and financial highlights are the responsibility of the Fund’s management. Our responsibility is to express an opinion on these financial statements and financial highlights based on our audits.
We conducted our audits in accordance with the standards of the Public Company Accounting Oversight Board (United States). Those standards require that we plan and perform the audit to obtain reasonable assurance about whether the financial statements and financial highlights are free of material misstatement. An audit includes examining, on a test basis, evidence supporting the amounts and disclosures in the financial statements. Our procedures included confirmation of securities owned as of September 30, 2017, by correspondence with the custodian and brokers or by performing other appropriate auditing procedures. An audit also includes assessing the accounting principles used and significant estimates made by management, as well as evaluating the overall financial statement presentation. We believe that our audits provide a reasonable basis for our opinion.
In our opinion, the financial statements and financial highlights referred to above present fairly, in all material respects, the financial position of the Calvert International Equity Fund as of September 30, 2017, the results of its operations for the year then ended, the changes in its net assets for each of the years in the two-year period then ended, and the financial highlights for each of the years in the five-year period then ended, in conformity with U.S. generally accepted accounting principles.
/s/ KPMG LLP
Philadelphia, Pennsylvania
November 22, 2017
www.calvert.com CALVERT INTERNATIONAL EQUITY FUND ANNUAL REPORT 29
FEDERAL TAX INFORMATION
The Form 1099-DIV you receive in February 2018 will show the tax status of all distributions paid to your account in calendar year 2017. Shareholders are advised to consult their own tax adviser with respect to the tax consequences of their investment in the Fund. As required by the Internal Revenue Code and/or regulations, shareholders must be notified regarding the status of qualified dividend income for individuals, the dividends received deduction for corporations and the foreign tax credit.
Qualified Dividend Income. For the fiscal year ended September 30, 2017, the Fund designates approximately $5,497,727, or up to the maximum amount of such dividends allowable pursuant to the Internal Revenue Code, as qualified dividend income eligible for the reduced tax rate of 15%.
Dividends Received Deduction. Corporate shareholders are generally entitled to take the dividends received deduction on the portion of the Fund’s dividend distribution that qualifies under tax law. For the Fund’s fiscal 2017 ordinary income dividends, 2.60% qualifies for the corporate dividends received deduction.
Foreign Tax Credit. For the fiscal year ended September 30, 2017, the Fund paid foreign taxes of $414,132 and recognized foreign source income of $6,562,493.
30 www.calvert.com CALVERT INTERNATIONAL EQUITY FUND ANNUAL REPORT (Unaudited)
MANAGEMENT AND ORGANIZATION
Fund Management. The Directors of Calvert World Values Fund, Inc. (the Corporation) are responsible for the overall management and supervision of the Corporation’s affairs. The Directors and officers of the Corporation are listed below. Except as indicated, each individual has held the office shown or other offices in the same company for the last five years. Directors and officers of the Corporation hold indefinite terms of office. The “Independent Directors” consist of those Directors who are not “interested persons” of the Corporation, as that term is defined under the 1940 Act. The business address of each Director and officer, with the exception of Ms. Gemma and Mr. Kirchner, is 1825 Connecticut Avenue NW, Suite 400, Washington, DC 20009. As used below, “CRM” refers to Calvert Research and Management. Each Director oversees 37 funds in the Calvert fund complex. Each officer serves as an officer of certain other Calvert funds.
|
| | | |
| Name and Year of Birth | Position with Corporation | Position Start Date | Principal Occupation(s) and Directorships During Past Five Years and Other Relevant Experience |
| | | | |
| Interested Director | | | |
John H. Streur(1) 1960 | Director & President | 2015 | President and Chief Executive Officer of Calvert Research and Management (since December 31, 2016). President and Chief Executive Officer of Calvert Investments, Inc. (January 2015 - December 2016); Chief Compliance Officer of Calvert Investment Distributors, Inc. (August 2015 - December 2016); Chief Compliance Officer of Calvert Investment Management (August 2015 - April 2016); President and Director, Portfolio 21 Investments, Inc. (through October 2014); President, Chief Executive Officer and Director, Managers Investment Group LLC (through January 2012); President and Director, The Managers Funds and Managers AMG Funds (through January 2012). Directorships in the Last Five Years. Portfolio 21 Investments, Inc. (asset management) (through October 2014); Managers Investment Group LLC (asset management) (through January 2012); The Managers Funds (asset management) (through January 2012); Managers AMG Funds (asset management) (through January 2012); Calvert Social Investment Foundation. |
| Independent Directors | | | |
Richard L. Baird, Jr. 1948 | Director | 2005 | Former President and CEO of Adagio Health Inc. (retired in 2014) in Pittsburgh, PA, a non-profit corporation which provides family planning services, nutrition, maternal/child health care, and various health screening services and community preventive health programs. Directorships in the Last Five Years. None. |
Alice Gresham Bullock(2) 1950 | Chair & Director | 2016 | Professor at Howard University School of Law (retired June 2016). She is former Dean of Howard University School of Law (1996-2002) and Deputy Director of the Association of American Law Schools (1992-1994). Directorships in the Last Five Years. None. |
Cari M. Dominguez(2) 1949 | Director | 2016 | Former Chair of the U.S. Equal Employment Opportunity Commission. Directorships in the Last Five Years. Manpower, Inc. (employment agency); Triple S Management Corporation (managed care); National Association of Corporate Directors. |
John G. Guffey, Jr. 1948 | Director | 1992 | President of Aurora Press Inc., a privately held publisher of trade paperbacks (since January 1997). Directorships in the Last Five Years. Ariel Funds (3) (asset management) (through December 31, 2011); Calvert Social Investment Foundation; Calvert Ventures, LLC. |
Miles D. Harper, III 1962 | Director | 2005 | Partner, Carr Riggs & Ingram (public accounting firm) since October 2014. Partner, Gainer Donnelly & Desroches (now Carr Riggs & Ingram) (public accounting firm), November 1999 - September 2014). Directorships in the Last Five Years. Bridgeway Funds (14) (asset management). |
Joy V. Jones 1950 | Director | 2005 | Attorney. Directorships in the Last Five Years. Conduit Street Restaurants SUD 2 Limited (restaurant) (dissolved September 2016); Palm Management Restaurant Corporation. |
www.calvert.com CALVERT INTERNATIONAL EQUITY FUND ANNUAL REPORT (Unaudited) 31
|
| | | |
| Name and Year of Birth | Position with Corporation | Position Start Date | Principal Occupation(s) and Directorships During Past Five Years and Other Relevant Experience |
| | | | |
Anthony A. Williams(2) 1951 | Director | 2016 | CEO and Executive Director of the Federal City Council (July 2012 to present) (economic development non-profit organization); Senior Adviser and Independent Consultant for McKenna Long & Aldridge LLP (now Dentons) (law firm) (September 2011 to present); Executive Director of Global Government Practice at the Corporate Executive Board (now Gartner Inc.) (global research and Advisory company) (January 2010 to January 2012); William H. Bloomberg Lecturer in Public Management at the Harvard Kennedy School (since 2009). Directorships in the Last Five Years. Freddie Mac; Evoq Properties/ Meruelo Maddux Properties, Inc. (real estate management); Weston Solutions, Inc. (environmental services); Bipartisan Policy Center’s Debt Reduction Task Force (non-profit organization); Chesapeake Bay Foundation (independent conservation organization); Catholic University of America; Urban Institute (research organization). |
|
| | | |
| Principal Officers who are not Directors | |
| Name and Year of Birth | Position with Corporation | Position Start Date | Principal Occupation During Past Five Years |
| | | | |
Hope Brown 1973 | Chief Compliance Officer | 2014 | Chief Compliance Officer of 37 registered investment companies advised by CRM (since 2014). Vice President and Chief Compliance Officer, Wilmington Funds (2012-2014). Vice President and Senior Compliance Officer, Wilmington Trust Investment Advisors, Inc. (2010-2012). |
Maureen A. Gemma(3) 1960 | Secretary and Vice President | 2016 | Vice President of CRM and officer of 37 registered investment companies advised by CRM. Also Vice President of Eaton Vance Management (“EVM”) and certain of its affiliates and officer of 176 registered investment companies advised or administered by EVM. |
James F. Kirchner(3) 1967 | Treasurer | 2016 | Vice President of CRM and officer of 37 registered investment companies advised by CRM. Also Vice President of EVM and certain of its affiliates and officer of 176 registered investment companies advised or administered by EVM. |
(1) Mr. Streur is an interested person of the Funds because of his positions with each Fund’s Adviser and certain affiliates.
(2) Mmes. Bullock and Dominguez and Mr. Williams began serving as Directors effective December 23, 2016.
(3) The business address for Ms. Gemma and Mr. Kirchner is Two International Place, Boston, MA 02110. Ms. Gemma and Mr. Kirchner began serving as Officers effective December 31, 2016.
The SAI for the Fund includes additional information about the Directors and officers of the Fund and can be obtained without charge on Calvert’s website at www.calvert.com or by calling 1-800-368-2745.
32 www.calvert.com CALVERT INTERNATIONAL EQUITY FUND ANNUAL REPORT (Unaudited)
IMPORTANT NOTICES
Privacy. The Calvert organization is committed to ensuring your financial privacy. Each of the financial institutions identified below has in effect the following policy (“Privacy Policy”) with respect to nonpublic personal information about its customers:
| |
| • | Only such information received from you, through application forms or otherwise, and information about your Calvert fund transactions will be collected. This may include information such as name, address, social security number, tax status, account balances and transactions. |
| |
| • | None of such information about you (or former customers) will be disclosed to anyone, except as permitted by law (which includes disclosure to employees necessary to service your account). In the normal course of servicing a customer’s account, the Calvert organization may share information with unaffiliated third parties that perform various required services such as transfer agents, custodians and broker-dealers. |
| |
| • | Policies and procedures (including physical, electronic and procedural safeguards) are in place that are designed to protect the confidentiality of such information. |
| |
| • | We reserve the right to change our Privacy Policy at any time upon proper notification to you. Customers may want to review our Privacy Policy periodically for changes by accessing the link on our homepage: www.calvert.com. |
Our pledge of privacy applies to the following entities within the Calvert organization: the Calvert family of funds and Calvert Research and Management. In addition, our Privacy Policy applies only to those Calvert customers who are individuals and who have a direct relationship with us. If a customer’s account (i.e., fund shares) is held in the name of a third-party financial advisor/broker-dealer, it is likely that only such advisor’s privacy policies apply to the customer. This notice supersedes all previously issued privacy disclosures. For more information about Calvert’s Privacy Policy, please call 1-800-368-2745.
Delivery of Shareholder Documents. The Securities and Exchange Commission (SEC) permits funds to deliver only one copy of shareholder documents, including prospectuses, proxy statements and shareholder reports, to fund investors with multiple accounts at the same residential or post office box address. This practice is often called “householding” and it helps eliminate duplicate mailings to shareholders. Calvert funds, or your financial advisor, may household the mailing of your documents indefinitely unless you instruct Calvert funds, or your financial advisor, otherwise. If you would prefer that your Calvert fund documents not be householded, please contact Calvert funds at 1-800-368-2745, or contact your financial advisor. Your instructions that householding not apply to delivery of your Calvert fund documents will typically be effective within 30 days of receipt by Calvert funds or your financial advisor. Separate statements will be generated for each separate account and will be householded as described above.
Portfolio Holdings. Each Calvert fund will file a schedule of portfolio holdings on Form N-Q with the SEC for the first and third quarters of each fiscal year. The Form N-Q will be available on the Calvert funds’ website at www.calvert.com, by calling Calvert funds at 1-800-368-2745 or in the EDGAR database on the SEC’s website at www.sec.gov. Form N-Q may also be reviewed and copied at the SEC’s public reference room in Washington, D.C. (call 1-800-732-0330 for information on the operation of the public reference room).
Proxy Voting. The Proxy Voting Guidelines that each Calvert fund uses to determine how to vote proxies relating to portfolio securities is provided as an Appendix to the fund’s Statement of Additional Information. The Statement of Additional Information can be obtained free of charge by calling the Calvert funds at 1-800-368-2745, by visiting the Calvert funds’ website at www.calvert.com or visiting the SEC’s website at www.sec.gov. Information regarding how a Calvert fund voted proxies relating to portfolio securities during the most recent 12-month period ended June 30 is available by calling Calvert funds, by visiting the Calvert funds’ website at www.calvert.com or by visiting the SEC’s website at www.sec.gov.
www.calvert.com CALVERT INTERNATIONAL EQUITY FUND ANNUAL REPORT (Unaudited) 33
|
|
| This page intentionally left blank. |
|
|
| This page intentionally left blank. |
|
|
| This page intentionally left blank. |
|
| | | | |
| CALVERT INTERNATIONAL EQUITY FUND | | CALVERT FUNDS | | |
Service for Existing Account Shareholders: 800-368-2745 Brokers: 800-368-2746 Regular Mail Calvert Funds c/o BFDS, P.O. Box 219544 Kansas City, MO 64121-9544 Overnight Mail Calvert Funds c/o BFDS, 330 West 9th Street Kansas City, MO 64105 Web Site www.calvert.com Principal Underwriter* Eaton Vance Distributors, Inc. Two International Place Boston, MA 02110 | | Municipal Funds Responsible Municipal Income Fund Taxable Bond Funds Bond Fund Income Fund Short Duration Income Fund Long-Term Income Fund Ultra-Short Duration Income Fund High Yield Bond Fund Green Bond Fund Absolute Return Bond Fund Floating-Rate Advantage Fund Balanced and Asset Allocation Funds Balanced Fund Conservative Allocation Fund Moderate Allocation Fund Aggressive Allocation Fund
| | Equity Funds Equity Fund US Large-Cap Core Responsible Index Fund US Large-Cap Value Responsible Index Fund US Large-Cap Growth Responsible Index Fund US Mid-Cap Core Responsible Index Fund International Responsible Index Fund Mid-Cap Fund International Equity Fund Small-Cap Fund Global Energy Solutions Fund Global Water Fund International Opportunities Fund Emerging Markets Equity Fund |
* FINRA BrokerCheck. Investors may check the background of their Investment Professional by contacting the Financial Industry Regulatory Authority (FINRA). FINRA BrokerCheck is a free tool to help investors check the professional background of current and former FINRA-registered securities firms and brokers. FINRA BrokerCheck is available by calling 1-800-289-9999 and at www.FINRA.org. The FINRA BrokerCheck brochure describing this program is available to investors at www.FINRA.org.
|
| |
| | |
Fund shares are not insured by the FDIC and are not deposits or other obligations of, or guaranteed by, any depository institution. Shares are subject to investment risks, including possible loss of principal invested. This report is intended to provide fund information to shareholders. It is not authorized for distribution to prospective investors unless preceded or accompanied by a prospectus. Note: The information on our website is not incorporated by reference into this report; our website address is included as an inactive textual reference only. Investors should carefully consider the investment objectives, risks, charges and expenses of the Calvert funds. This and other important information is contained in the fund’s summary prospectus and prospectus, which can be obtained from your financial professional and should be read carefully before investing. You may also call Calvert funds at 800-368-2745. Printed on recycled paper. |
| 24207 9.30.17 | |
|
| |
Annual Report September 30, 2017 E-Delivery Sign-Up — Details Inside | |
|
|
Commodity Futures Trading Commission Registration. Effective December 31, 2012, the Commodity Futures Trading Commission (“CFTC”) adopted certain regulatory changes that subject registered investment companies and advisers to regulation by the CFTC if a fund invests more than a prescribed level of its assets in certain CFTC-regulated instruments (including futures, certain options and swap agreements) or markets itself as providing investment exposure to such instruments. The Fund and its adviser have claimed an exclusion from the definition of the term “commodity pool operator” under the Commodity Exchange Act. Accordingly, neither the Fund nor the adviser is subject to CFTC regulation. |
Choose Planet-friendly E-delivery! Sign up now for on-line statements, prospectuses, and fund reports. In less than five minutes you can help reduce paper mail and lower fund costs. Just go to www.calvert.com. If you already have an online account with the Calvert funds, click on Login to access your Account and select the documents you would like to receive via e-mail. If you’re new to online account access, click on Login, then Register to create your user name and password. Once you’re in, click on the E-delivery sign-up on the Account Portfolio page and follow the quick, easy steps. Note: If your shares are not held directly with the Calvert funds but through a brokerage firm, you must contact your broker for electronic delivery options available through their firm. |
|
| | | | |
| | TABLE OF CONTENTS |
| | | | | |
| | | | | Management’s Discussion of Fund Performance |
| | | | | Performance |
| | | | | Fund Profile |
| | | | | Endnotes and Additional Disclosures |
| | | | | Understanding Your Fund’s Expenses |
| | | | | Financial Statements |
| | | | | Report of Independent Registered Public Accounting Firm |
| | | | | Federal Tax Information |
| | | | | Management and Organization |
| | | | | Important Notices |
MANAGEMENT’S DISCUSSION OF FUND PERFORMANCE1
|
| | |
| | | |
Economic and Market Conditions U.S. stocks delivered strong returns in the 12-month period ended September 30, 2017 behind an extended rally that began with Donald Trump's victory in the U.S. presidential election. After lagging early in the period, U.S stocks moved sharply higher following President Trump's election on November 8, 2016. While its effect was broad-based, the rally particularly favored financial stocks, which received another boost in mid-December when the U.S. Federal Reserve (the Fed) raised its benchmark interest rate amid continued economic growth. After a brief pullback in the final weeks of 2016, U.S. equities resumed their advance in early 2017. U.S. stocks slipped in March 2017, as the failure of President Trump's health care bill in Congress raised concerns about prospects for the rest of his policy agenda including tax reform and infrastructure spending. However, stocks quickly regained their upward momentum, advancing steadily despite additional Fed rate hikes in March and June. Encouraged by a range of economic indicators, particularly U.S. job market gains, many investors viewed the rate hikes as a sign of a strengthening economy. U.S. equities retreated again in August amid rising geopolitical tensions over the North Korea stand-off and the devastation in Texas left by Hurricane Harvey. Stocks soon resumed their upward trend, with some U.S. indexes reaching record highs in the final month of the period. From a sector perspective, energy stocks delivered notable performance in the quarter as oil prices rose and refinery damage from Hurricane Harvey constricted supplies. The massive flood damage from the hurricane also helped boost auto sales, which rose in September after declining for much of 2017. Major stock indexes recorded double-digit gains for the period. The blue-chip Dow Jones Industrial Average2 advanced 25.45%, while the broader U.S. equity market, as represented by the S&P 500 Index, rose 18.61%. The technology-laden NASDAQ Composite Index delivered a 23.68% gain. Small-cap U.S. stocks, as measured by the Russell 2000® Index, generally outperformed their large-cap counterparts as measured by the S&P 500 Index during the period. Growth stocks, as a group, outpaced value stocks in both the large- and small-cap categories, as measured by the Russell growth and value indexes. Fund Performance
For the 12-month period ended September 30, 2017, Calvert Mid-Cap Fund (the Fund) had a total return of 13.11% for Class A shares at net asset value (NAV), underperforming the Russell Midcap® Index (the Index), which returned 15.32%.
| |
Stock selection overall detracted from Fund performance relative to the Index while asset allocation benefited. An overweight to financials, among the best-performing sectors during the period, along with strong stock selection in the sector, contributed significantly to the Fund’s performance. Stock selection in consumer staples and industrials was also beneficial. An underweight to energy, the weakest-performing sector during the period, further contributed. Stock selection in information technology was a major contributor to underperformance during the reporting period. Stock selection in consumer discretionary and materials also detracted. East West Bancorp, Inc., a regional bank specializing in personal and business checking and savings services, was the largest individual contributor during the period. Its shares rose sharply following the U.S. presidential election on expectations that the new administration would reduce regulations on financial institutions and cut corporate taxes. Anticipation of higher interest rates also raised expectations for a rise in banks’ net-interest margins. East West Bancorp was sold during the period. Teleflex, Inc., a medical device manufacturer specializing in vascular and anesthesia products, was also a leading contributor. The company’s shares benefited from strong operating results throughout the one-year period as well as positive market reaction to Teleflex’s acquisition of NeoTract, Inc., a urology device manufacturer. Umpqua Holdings Corp., a regional bank specializing in personal and business banking and retail brokerage services, was another strong contributor. Like East West, it benefited from post-election expectations for loosened financial regulations and corporate tax cuts, as well as expectations of rising interest rates resulting in higher net-interest margins for banks. Umpqua Holdings Corp. was sold during the period. Advance Auto Parts, Inc., an automotive replacement-parts retailer, was the largest individual detractor during the period. The company fell short of earnings expectations and several analysts questioned whether the company would succeed in its turnaround efforts. The Fund’s not holding Nvidia Corp., a leading semiconductor manufacturer, detracted from relative returns as the information technology company advanced more than 125% during the period. The company continued to build on its leadership position in graphics-processing units, data centers and artificial intelligence. TechnipFMC plc, an energy-services provider for petroleum and natural-gas extraction among the Fund’s energy holdings, also was a major detractor from Fund performance. Since energy equipment and services revenues are highly correlated with oil prices, the company’s shares sank as oil prices dropped during the period.
|
See Endnotes and Additional Disclosures in this report.
Past performance is no guarantee of future results. Returns are historical and are calculated by determining the percentage change in net asset value (NAV) or offering price (as applicable) with all distributions reinvested. Investment return and principal value will fluctuate so that shares, when redeemed, may be worth more or less than their original cost. Performance less than or equal to one year is cumulative. Performance is for the stated time period only; due to market volatility, the Fund's current performance may be lower or higher than quoted. Returns are before taxes unless otherwise noted. For performance as of the most recent month-end, please refer to www.calvert.com.
2 www.calvert.com CALVERT MID-CAP FUND ANNUAL REPORT (Unaudited)
PERFORMANCE
|
| | | | | | | | | | | | | | |
Performance2,3 | | | | | | | | | |
Portfolio Managers Christopher Madden, CFA, Jade Huang and Charles B. Gaffney, each of Calvert Research and Management |
| | | | | | | | | | |
| % Average Annual Total Returns | Class Inception Date |
| | Performance Inception Date |
| | One Year |
| | Five Years |
| | Ten Years |
|
| Class A at NAV | 10/31/1994 |
| | 10/31/1994 |
| | 13.11 | % | | 9.35 | % | | 6.60 | % |
| Class A with 4.75% Maximum Sales Charge | — |
| | — |
| | 7.73 |
| | 8.29 |
| | 6.08 |
|
| Class C at NAV | 10/31/1994 |
| | 10/31/1994 |
| | 12.29 |
| | 8.51 |
| | 5.77 |
|
| Class C with 1% Maximum Sales Charge | — |
| | — |
| | 11.29 |
| | 8.51 |
| | 5.77 |
|
| Class I at NAV | 06/03/2003 |
| | 10/31/1994 |
| | 13.53 |
| | 9.93 |
| | 7.32 |
|
| Class Y at NAV | 01/31/2011 |
| | 10/31/1994 |
| | 13.41 |
| | 9.59 |
| | 6.75 |
|
| | | | | | | | | | |
| | | | | | | | | | |
Russell Midcap® Index | — |
| | — |
| | 15.32 | % | | 14.25 | % | | 8.07 | % |
Russell Midcap® Growth Index | — |
| | — |
| | 17.82 |
| | 14.17 |
| | 8.19 |
|
| | | | | | | | | | |
% Total Annual Operating Expense Ratios4 | | | Class A |
| | Class C |
| | Class I |
| | Class Y |
|
| Gross | | | 1.32 | % | | 2.11 | % | | 0.87 | % | | 1.04 | % |
| Net | | | 1.21 |
| | 1.96 |
| | 0.85 |
| | 0.96 |
|
|
|
| Growth of $10,000 |
| This graph shows the change in value of a hypothetical investment of $10,000 in Class A of the Fund for the period indicated. For comparison, the same investment is shown in the indicated index. |
|
| | | | | | | | |
Growth of Investment3 | Amount Invested |
| Period Beginning | At NAV |
| With Maximum Sales Charge |
| Class C |
| $10,000 |
| 9/30/2007 |
| $17,525 |
| N.A. |
| Class I |
| $250,000 |
| 9/30/2007 |
| $507,076 |
| N.A. |
| Class Y |
| $10,000 |
| 9/30/2007 |
| $19,226 |
| N.A. |
See Endnotes and Additional Disclosures in this report.
Past performance is no guarantee of future results. Returns are historical and are calculated by determining the percentage change in net asset value (NAV) or offering price (as applicable) with all distributions reinvested. Investment return and principal value will fluctuate so that shares, when redeemed, may be worth more or less than their original cost. Performance less than or equal to one year is cumulative. Performance is for the stated time period only; due to market volatility, the Fund's current performance may be lower or higher than quoted. Returns are before taxes unless otherwise noted. For performance as of the most recent month-end, please refer to www.calvert.com.
www.calvert.com CALVERT MID-CAP FUND ANNUAL REPORT (Unaudited) 3
FUND PROFILE
|
| | | | | | | |
| |
| | | | | |
| | SECTOR ALLOCATION (% of total investments) | | | TEN LARGEST STOCK HOLDINGS (% of net assets) |
| | | | | | |
| | Information Technology | 15.6 | % | | Extra Space Storage, Inc. | 2.1 | % |
| | Financials | 14.6 | % | | Multi-Color Corp. | 2.0 | % |
| | Consumer Discretionary | 13.9 | % | | National Retail Properties, Inc. | 2.0 | % |
| | Industrials | 13.7 | % | | Equity Residential | 2.0 | % |
| | Health Care | 10.3 | % | | Fortive Corp. | 1.8 | % |
| | Real Estate | 9.7 | % | | Delphi Automotive plc | 1.8 | % |
| | Utilities | 6.2 | % | | Intuit, Inc. | 1.7 | % |
| | Materials | 5.7 | % | | Bright Horizons Family Solutions, Inc. | 1.7 | % |
| | Consumer Staples | 4.6 | % | | CMS Energy Corp. | 1.6 | % |
| | Energy | 4.4 | % | | First American Financial Corp. | 1.6 | % |
| | High Social Impact Investments | 1.2 | % | | Total | 18.3 | % |
| | Time Deposit | 0.1 | % | | | |
| | Total | 100.0 | % | | | |
See Endnotes and Additional Disclosures in this report.
4 www.calvert.com CALVERT MID-CAP FUND ANNUAL REPORT (Unaudited)
|
| | |
| Endnotes and Additional Disclosures | | |
| | | |
1 The views expressed in this report are those of the portfolio manager(s) and are current only through the date stated at the top of this page. These views are subject to change at any time based upon market or other conditions, and Eaton Vance and the Fund(s) disclaim any responsibility to update such views. These views may not be relied upon as investment advice and, because investment decisions are based on many factors, may not be relied upon as an indication of trading intent on behalf of any Calvert fund. This commentary may contain statements that are not historical facts, referred to as “forward looking statements”. The Fund’s actual future results may differ significantly from those stated in any forward looking statement, depending on factors such as changes in securities or financial markets or general economic conditions, the volume of sales and purchases of Fund shares, the continuation of investment advisory, administrative and service contracts, and other risks discussed from time to time in the Fund’s filings with the Securities and Exchange Commission.
2 Dow Jones Industrial Average is a price-weighted average of 30 blue-chip stocks that are generally the leaders in their industry. S&P 500 Index is an unmanaged index of large-cap stocks commonly used as a measure of U.S. stock market performance. NASDAQ Composite Index is a market capitalization-weighted index of all domestic and international securities listed on NASDAQ. Russell 2000® Index is an unmanaged index of 2,000 U.S. small-cap stocks. Russell Midcap® Index is an unmanaged index of U.S. mid-cap stocks. Russell Midcap® Growth Index is an unmanaged index of U.S. midcap growth stocks. Unless otherwise stated, index returns do not reflect the effect of any applicable sales charges, commissions, expenses, taxes or leverage, as applicable. It is not possible to invest directly in an index.
3 Total Returns at NAV do not include applicable sales charges. If sales charges were deducted, the returns would be lower. Total Returns shown with maximum sales charge reflect the stated maximum sales charge. Unless otherwise stated, performance does not reflect the deduction of taxes on Fund distributions or redemptions of Fund shares.
Performance prior to the inception date of a class may be linked to the performance of an older class of the Fund. This linked performance is adjusted for any applicable sales charge, but is not adjusted for class expense differences. If adjusted for such differences, the performance would be different. The performance of Class Y is linked to Class A. Performance since inception for an index, if presented, is the performance since the Fund’s or oldest share class’ inception, as applicable. Performance presented in the Financial Highlights included in the financial statements is not linked.
Effective November 6, 2017, Class I shares have an initial investment minimum of $250,000.
4 Source: Fund prospectus. Net expense ratios reflect a contractual expense reimbursement that continues through 1/31/19. Without the reimbursement, performance would have been lower. The expense ratios for the current reporting period can be found in the Financial Highlights section of this report.
| | Fund profile subject to change due to active management
Important Notice to Shareholders Effective November 6, 2017, the name of Calvert Mid-Cap Fund was changed from Calvert Capital Accumulation Fund. |
www.calvert.com CALVERT MID-CAP FUND ANNUAL REPORT (Unaudited) 5
UNDERSTANDING YOUR FUND'S EXPENSES
Example
As a Fund shareholder, you incur two types of costs: (1) transaction costs, including sales charges (loads) on purchases and redemption fees (if applicable); and (2) ongoing costs, including management fees; distribution and/or service fees; and other Fund expenses. This Example is intended to help you understand your ongoing costs (in dollars) of Fund investing and to compare these costs with the ongoing costs of investing in other mutual funds. The Example is based on an investment of $1,000 invested at the beginning of the period and held for the entire period (April 1, 2017 to September 30, 2017).
Actual Expenses
The first section of the table below provides information about actual account values and actual expenses. You may use the information in this section, together with the amount you invested, to estimate the expenses that you paid over the period. Simply divide your account value by $1,000 (for example, an $8,600 account value divided by $1,000 = 8.6), then multiply the result by the number in the first section under the heading entitled “Expenses Paid During Period” to estimate the expenses you paid on your account during this period.
Hypothetical Example for Comparison Purposes
The second section of the table below provides information about hypothetical account values and hypothetical expenses based on the actual Fund expense ratio and an assumed rate of return of 5% per year (before expenses), which is not the actual Fund return. The hypothetical account values and expenses may not be used to estimate the actual ending account balance or expenses you paid for the period. You may use this information to compare the ongoing costs of investing in the Fund and other funds. To do so, compare this 5% hypothetical example with the 5% hypothetical examples that appear in the shareholder reports of the other funds.
Please note that the expenses shown in the table are meant to highlight your ongoing costs only and do not reflect any transactional costs, such as sales charges (loads) or redemption fees (if applicable). Therefore, the second section of the table is useful in comparing ongoing costs only, and will not help you determine the relative total costs of owning different funds. In addition, if these transactional costs were included, your costs would be higher.
|
| | | | |
| | BEGINNING
ACCOUNT VALUE
(4/1/17) | ENDING
ACCOUNT VALUE
(9/30/17) | EXPENSES PAID
DURING PERIOD*
(4/1/17 - 9/30/17) | ANNUALIZED
EXPENSE RATIO |
| Actual | | | | |
| Class A | $1,000.00 | $1,043.10 | $6.20** | 1.21% |
| Class C | $1,000.00 | $1,038.90 | $10.02** | 1.96% |
| Class I | $1,000.00 | $1,045.10 | $4.41** | 0.86% |
| Class Y | $1,000.00 | $1,044.30 | $4.92** | 0.96% |
| Hypothetical | | | | |
| (5% return per year before expenses) | | | | |
| Class A | $1,000.00 | $1,019.00 | $6.12** | 1.21% |
| Class C | $1,000.00 | $1,015.24 | $9.90** | 1.96% |
| Class I | $1,000.00 | $1,020.76 | $4.36** | 0.86% |
| Class Y | $1,000.00 | $1,020.25 | $4.86** | 0.96% |
| | | | | |
| * Expenses are equal to the Fund's annualized expense ratio for the indicated Class, multiplied by the average account value over the period, multiplied by 183/365 (to reflect the one-half year period). The Example assumes that the $1,000 was invested at the net asset value per share determined at the close of business on March 31, 2017. |
| ** Absent a waiver and/or reimbursement of expenses by affiliates, expenses would be higher. |
6 www.calvert.com CALVERT MID-CAP FUND ANNUAL REPORT (Unaudited)
CALVERT MID-CAP FUND
SCHEDULE OF INVESTMENTS
SEPTEMBER 30, 2017
|
| | |
| | SHARES | VALUE ($) |
| COMMON STOCKS - 98.8% | | |
| Aerospace & Defense - 2.3% | | |
| CAE, Inc. | 169,900 | 2,972,484 |
| Hexcel Corp. | 53,053 | 3,046,303 |
| | | 6,018,787 |
| | | |
| Auto Components - 1.8% | | |
| Delphi Automotive plc | 46,209 | 4,546,966 |
| | | |
| Banks - 4.0% | | |
| Bank of the Ozarks, Inc. | 58,410 | 2,806,601 |
| First Republic Bank | 28,525 | 2,979,721 |
| Great Western Bancorp, Inc. | 46,028 | 1,900,036 |
| KeyCorp | 148,354 | 2,792,022 |
| | | 10,478,380 |
| | | |
| Biotechnology - 1.7% | | |
| Alexion Pharmaceuticals, Inc. * | 11,197 | 1,570,827 |
| Incyte Corp. * | 9,576 | 1,117,902 |
| Vertex Pharmaceuticals, Inc. * | 11,300 | 1,718,052 |
| | | 4,406,781 |
| | | |
| Capital Markets - 3.5% | | |
| CBOE Holdings, Inc. | 28,724 | 3,091,564 |
| E*Trade Financial Corp. * | 75,088 | 3,274,588 |
| S&P Global, Inc. | 16,761 | 2,619,912 |
| | | 8,986,064 |
| | | |
| Chemicals - 1.6% | | |
| Ecolab, Inc. | 31,700 | 4,076,937 |
| | | |
| Commercial Services & Supplies - 3.1% | | |
| Deluxe Corp. | 37,600 | 2,743,296 |
| Multi-Color Corp. | 64,100 | 5,252,995 |
| | | 7,996,291 |
| | | |
| Communications Equipment - 1.1% | | |
| NETGEAR, Inc. * | 60,300 | 2,870,280 |
| | | |
www.calvert.com CALVERT MID-CAP FUND ANNUAL REPORT 7
|
| | |
| | SHARES | VALUE ($) |
| COMMON STOCKS - CONT’D | | |
| Consumer Finance - 2.1% | | |
| Ally Financial, Inc. | 114,100 | 2,768,066 |
| OneMain Holdings, Inc. * | 99,600 | 2,807,724 |
| | | 5,575,790 |
| | | |
| Containers & Packaging - 3.3% | | |
| AptarGroup, Inc. | 32,600 | 2,813,706 |
| Crown Holdings, Inc. * | 51,925 | 3,100,961 |
| WestRock Co. | 44,627 | 2,531,690 |
| | | 8,446,357 |
| | | |
| Distributors - 1.5% | | |
| LKQ Corp. * | 108,251 | 3,895,953 |
| | | |
| Diversified Consumer Services - 3.0% | | |
| Bright Horizons Family Solutions, Inc. * | 51,428 | 4,433,608 |
| ServiceMaster Global Holdings, Inc. * | 71,249 | 3,329,466 |
| | | 7,763,074 |
| | | |
| Electric Utilities - 1.2% | | |
| Xcel Energy, Inc. | 66,200 | 3,132,584 |
| | | |
| Electrical Equipment - 1.5% | | |
| AMETEK, Inc. | 57,532 | 3,799,413 |
| | | |
| Electronic Equipment, Instruments & Components - 2.3% | | |
| Avnet, Inc. | 59,428 | 2,335,520 |
| Dolby Laboratories, Inc., Class A | 64,525 | 3,711,478 |
| | | 6,046,998 |
| | | |
| Energy Equipment & Services - 4.4% | | |
| Core Laboratories NV | 32,300 | 3,188,010 |
| Oceaneering International, Inc. | 114,981 | 3,020,551 |
| TechnipFMC plc * | 123,402 | 3,445,384 |
| US Silica Holdings, Inc. | 52,700 | 1,637,389 |
| | | 11,291,334 |
| | | |
| Equity Real Estate Investment Trusts (REITs) - 9.7% | | |
| AvalonBay Communities, Inc. | 19,432 | 3,467,057 |
| DCT Industrial Trust, Inc. | 46,900 | 2,716,448 |
| Equity Residential | 76,600 | 5,050,238 |
| Extra Space Storage, Inc. | 69,182 | 5,529,026 |
| Mid-America Apartment Communities, Inc. | 29,900 | 3,195,712 |
| National Retail Properties, Inc. | 125,492 | 5,227,997 |
| | | 25,186,478 |
| | | |
8 www.calvert.com CALVERT MID-CAP FUND ANNUAL REPORT
|
| | |
| | SHARES | VALUE ($) |
| COMMON STOCKS - CONT’D | | |
| Food & Staples Retailing - 1.4% | | |
| Performance Food Group Co. * | 132,400 | 3,740,300 |
| | | |
| Food Products - 2.2% | | |
| McCormick & Co., Inc. | 26,100 | 2,678,904 |
| Pinnacle Foods, Inc. | 51,592 | 2,949,515 |
| | | 5,628,419 |
| | | |
| Gas Utilities - 1.4% | | |
| UGI Corp. | 78,394 | 3,673,543 |
| | | |
| Health Care Equipment & Supplies - 3.9% | | |
| Align Technology, Inc. * | 8,200 | 1,527,414 |
| Boston Scientific Corp. * | 89,000 | 2,596,130 |
| Teleflex, Inc. | 12,725 | 3,079,068 |
| West Pharmaceutical Services, Inc. | 29,625 | 2,851,703 |
| | | 10,054,315 |
| | | |
| Health Care Providers & Services - 1.0% | | |
| Humana, Inc. | 10,241 | 2,495,015 |
| | | |
| Health Care Technology - 0.5% | | |
| Cotiviti Holdings, Inc. * | 38,800 | 1,396,024 |
| | | |
| Household Durables - 1.5% | | |
| Newell Brands, Inc. | 89,965 | 3,838,806 |
| | | |
| Independent Power and Renewable Electricity Producers - 1.0% | | |
| NextEra Energy Partners LP | 63,900 | 2,574,531 |
| | | |
| Insurance - 4.9% | | |
| Alleghany Corp. * | 6,046 | 3,349,545 |
| American Financial Group, Inc. | 30,083 | 3,112,086 |
| First American Financial Corp. | 82,371 | 4,116,079 |
| RLI Corp. | 36,000 | 2,064,960 |
| | | 12,642,670 |
| | | |
| Internet Software & Services - 1.1% | | |
| GoDaddy, Inc., Class A * | 63,900 | 2,780,289 |
| | | |
| IT Services - 3.8% | | |
| Amdocs Ltd. | 54,089 | 3,479,004 |
| Genpact Ltd. | 124,500 | 3,579,375 |
| Leidos Holdings, Inc. | 47,100 | 2,789,262 |
| | | 9,847,641 |
| | | |
www.calvert.com CALVERT MID-CAP FUND ANNUAL REPORT 9
|
| | |
| | SHARES | VALUE ($) |
| COMMON STOCKS - CONT’D | | |
| Life Sciences Tools & Services - 1.0% | | |
| Cambrex Corp. * | 47,900 | 2,634,500 |
| | | |
| Machinery - 4.3% | | |
| Dover Corp. | 37,300 | 3,408,847 |
| Fortive Corp. | 64,417 | 4,560,079 |
| ITT, Inc. | 70,900 | 3,138,743 |
| | | 11,107,669 |
| | | |
| Media - 1.1% | | |
| Interpublic Group of Cos., Inc. (The) | 141,468 | 2,941,120 |
| | | |
| Metals & Mining - 0.9% | | |
| Reliance Steel & Aluminum Co. | 30,645 | 2,334,230 |
| | | |
| Multi-Utilities - 2.6% | | |
| CMS Energy Corp. | 89,271 | 4,135,033 |
| Sempra Energy | 23,047 | 2,630,354 |
| | | 6,765,387 |
| | | |
| Personal Products - 1.0% | | |
| Estee Lauder Cos., Inc. (The), Class A | 23,180 | 2,499,731 |
| | | |
| Pharmaceuticals - 2.2% | | |
| Jazz Pharmaceuticals plc * | 21,400 | 3,129,750 |
| Zoetis, Inc. | 38,755 | 2,471,019 |
| | | 5,600,769 |
| | | |
| Professional Services - 1.2% | | |
| Dun & Bradstreet Corp. (The) | 25,900 | 3,015,019 |
| | | |
| Road & Rail - 1.4% | | |
| Kansas City Southern | 32,800 | 3,564,704 |
| | | |
| Semiconductors & Semiconductor Equipment - 2.7% | | |
| Analog Devices, Inc. | 31,900 | 2,748,823 |
| Lam Research Corp. | 5,900 | 1,091,736 |
| Microchip Technology, Inc. | 8,600 | 772,108 |
| Skyworks Solutions, Inc. | 7,000 | 713,300 |
| Veeco Instruments, Inc. * | 84,200 | 1,801,880 |
| | | 7,127,847 |
| | | |
| Software - 3.5% | | |
| Blackbaud, Inc. | 31,080 | 2,728,824 |
| Ellie Mae, Inc. * | 23,016 | 1,890,304 |
| Intuit, Inc. | 31,615 | 4,493,756 |
| | | 9,112,884 |
| | | |
10 www.calvert.com CALVERT MID-CAP FUND ANNUAL REPORT
|
| | |
| | SHARES | VALUE ($) |
| COMMON STOCKS - CONT’D | | |
| Specialty Retail - 1.8% | | |
| Advance Auto Parts, Inc. | 28,796 | 2,856,563 |
| Burlington Stores, Inc. * | 17,787 | 1,697,947 |
| | | 4,554,510 |
| | | |
| Technology Hardware, Storage & Peripherals - 1.0% | | |
| HP, Inc. | 132,900 | 2,652,684 |
| | | |
| Textiles, Apparel & Luxury Goods - 3.3% | | |
| Coach, Inc. | 64,000 | 2,577,920 |
| Gildan Activewear, Inc. | 81,200 | 2,539,936 |
| lululemon athletica, Inc. * | 53,500 | 3,330,375 |
| | | 8,448,231 |
| | | |
| Total Common Stocks (Cost $241,715,289) | | 255,549,305 |
| | | |
| | | |
| | PRINCIPAL AMOUNT ($) | VALUE ($) |
| HIGH SOCIAL IMPACT INVESTMENTS - 1.2% | | |
| Calvert Social Investment Foundation, Community Investment Notes, 1.50%, 12/15/19 (a)(b) | 2,619,488 | 2,496,581 |
| ImpactAssets Inc., Global Sustainable Agriculture Notes, 0.00%, 11/3/20 (a)(c)(d) | 309,000 | 292,005 |
| ImpactAssets Inc., Microfinance Plus Notes, 0.00%, 11/3/20 (a)(c)(d) | 398,000 | 379,294 |
| | | |
| Total High Social Impact Investments (Cost $3,326,488) | | 3,167,880 |
| | | |
| | | |
| TIME DEPOSIT - 0.1% | | |
| State Street Bank and Trust Eurodollar Time Deposit, 0.12%, 10/2/17 | 224,025 | 224,025 |
| | | |
| Total Time Deposit (Cost $224,025) | | 224,025 |
| | | |
| | | |
| TOTAL INVESTMENTS (Cost $245,265,802) - 100.1% | | 258,941,210 |
| Other assets and liabilities, net - (0.1%) | | (187,269) |
NET ASSETS - 100.0% | | 258,753,941 |
|
| | |
| NOTES TO SCHEDULE OF INVESTMENTS |
| * Non-income producing security. |
| (a) Restricted security. Total market value of restricted securities amounts to $3,167,880, which represents 1.2% of the net assets of the Fund as of September 30, 2017. |
| (b) Affiliated company (see Note F). |
| (c) For fair value measurement disclosure purposes, security is categorized as Level 3 (see Note A). |
| (d) Notes carry an interest rate that varies by period and is contingent on the performance of the underlying portfolio of loans to borrowers. The coupon rate shown represents the rate in effect at September 30, 2017. |
www.calvert.com CALVERT MID-CAP FUND ANNUAL REPORT 11
|
| | |
| RESTRICTED SECURITIES | ACQUISITION DATES | COST ($) |
| Calvert Social Investment Foundation, Community Investment Notes, 1.50%, 12/15/19 | 12/15/16 | 2,619,488 |
| ImpactAssets Inc., Global Sustainable Agriculture Notes, 0.00%, 11/3/20 | 11/13/15 | 309,000 |
| ImpactAssets Inc., Microfinance Plus Notes, 0.00%, 11/3/20 | 11/13/15 | 398,000 |
| See notes to financial statements. |
12 www.calvert.com CALVERT MID-CAP FUND ANNUAL REPORT
CALVERT MID-CAP FUND
STATEMENT OF ASSETS AND LIABILITIES
SEPTEMBER 30, 2017
|
| | | |
| ASSETS | |
| Investments in securities of unaffiliated issuers, at value (identified cost $242,646,314) |
| $256,444,629 |
|
| Investments in securities of affiliated issuers, at value (identified cost $2,619,488) | 2,496,581 |
|
| Cash denominated in foreign currency, at value (cost $10,421) | 10,417 |
|
| Receivable for capital shares sold | 105,006 |
|
| Dividends and interest receivable | 207,386 |
|
| Interest receivable - affiliated | 31,652 |
|
| Receivable from affiliates | 19,884 |
|
| Directors' deferred compensation plan | 303,852 |
|
| Total assets | 259,619,407 |
|
| | |
| LIABILITIES | |
| Payable for capital shares redeemed | 191,412 |
|
| Payable to affiliates: | |
| Investment advisory fee | 136,975 |
|
| Administrative fee | 24,174 |
|
| Distribution and service fees | 47,430 |
|
| Sub-transfer agency fee | 6,011 |
|
| Directors' deferred compensation plan | 303,852 |
|
| Accrued expenses | 155,612 |
|
| Total liabilities | 865,466 |
|
| NET ASSETS |
| $258,753,941 |
|
| | |
| NET ASSETS CONSIST OF: | |
| Paid-in capital applicable to common stock | |
| (250,000,000 shares of $0.01 par value authorized) |
| $221,627,597 |
|
| Accumulated undistributed net investment income | 176,483 |
|
| Accumulated undistributed net realized gain | 23,274,460 |
|
| Net unrealized appreciation (depreciation) | 13,675,401 |
|
| Total |
| $258,753,941 |
|
| | |
| NET ASSET VALUE PER SHARE | |
| Class A (based on net assets of $159,951,282 and 4,788,991 shares outstanding) |
| $33.40 |
|
| Class C (based on net assets of $18,146,131 and 739,157 shares outstanding) |
| $24.55 |
|
| Class I (based on net assets of $68,748,381 and 1,776,655 shares outstanding) |
| $38.70 |
|
| Class Y (based on net assets of $11,908,147 and 350,760 shares outstanding) |
| $33.95 |
|
| | |
| OFFERING PRICE PER SHARE* | |
| Class A (100/95.25 of net asset value per share) |
| $35.07 |
|
| * On sales of $50,000 or more, the offering price of Class A shares is reduced. | |
| See notes to financial statements. |
www.calvert.com CALVERT MID-CAP FUND ANNUAL REPORT 13
CALVERT MID-CAP FUND
STATEMENT OF OPERATIONS
YEAR ENDED SEPTEMBER 30, 2017
|
| | | |
| INVESTMENT INCOME | |
| Dividend income (net of foreign taxes withheld of $10,033) |
| $5,866,680 |
|
| Interest income - unaffiliated issuers | 27,705 |
|
| Interest income - affiliated issuers | 33,541 |
|
| Securities lending income, net | 13,876 |
|
| Other income | 242 |
|
| Total investment income | 5,942,044 |
|
| | |
| EXPENSES | |
| Investment advisory fee | 2,033,513 |
|
| Administrative fee | 375,418 |
|
| Distribution and service fees: | |
| Class A | 438,000 |
|
| Class C | 207,215 |
|
| Directors' fees and expenses | 23,298 |
|
| Custodian fees | 44,584 |
|
| Transfer agency fees and expenses: | |
| Class A | 385,630 |
|
| Class C | 52,334 |
|
| Class I | 6,406 |
|
| Class Y | 14,712 |
|
| Accounting fees | 83,647 |
|
| Professional fees | 37,612 |
|
| Registration fees: | |
| Class A | 17,722 |
|
| Class C | 14,128 |
|
| Class I | 16,587 |
|
| Class Y | 14,088 |
|
| Reports to shareholders | 39,490 |
|
| Miscellaneous | 41,860 |
|
| Total expenses | 3,846,244 |
|
| Waiver and/or reimbursement of expenses by affiliates | (295,804) |
|
| Reimbursement of expenses-other | (3,051) |
|
| Net expenses | 3,547,389 |
|
| Net investment income (loss) | 2,394,655 |
|
| | |
14 www.calvert.com CALVERT MID-CAP FUND ANNUAL REPORT
CALVERT MID-CAP FUND
STATEMENT OF OPERATIONS
YEAR ENDED SEPTEMBER 30, 2017 - CONT’D
|
| | | |
| REALIZED AND UNREALIZED GAIN (LOSS) | |
| Net realized gain (loss) on: | |
| Investment securities - unaffiliated issuers | 34,609,522 |
|
| Foreign currency transactions | (19,494) |
|
| | 34,590,028 |
|
| | |
| Net change in unrealized appreciation (depreciation) on: | |
| Investment securities - unaffiliated issuers | 5,356,861 |
|
| Investment securities - affiliated issuers | (62,788) |
|
| Foreign currency | 627 |
|
| | 5,294,700 |
|
| | |
| Net realized and unrealized gain (loss) | 39,884,728 |
|
| | |
| Net increase (decrease) in net assets resulting from operations |
| $42,279,383 |
|
| See notes to financial statements. |
www.calvert.com CALVERT MID-CAP FUND ANNUAL REPORT 15
CALVERT MID-CAP FUND
STATEMENTS OF CHANGES IN NET ASSETS
|
| | | | | | | |
| INCREASE (DECREASE) IN NET ASSETS | Year Ended
September 30, 2017 | | Year Ended
September 30, 2016 |
| Operations: | | | |
| Net investment income (loss) |
| $2,394,655 |
| |
| $1,183,968 |
|
| Net realized gain (loss) | 34,590,028 |
| | 10,706,337 |
|
| Net change in unrealized appreciation (depreciation) | 5,294,700 |
| | (22,274,864) |
|
| Net increase (decrease) in net assets resulting from operations | 42,279,383 |
| | (10,384,559) |
|
| | | | |
| Distributions to shareholders from: | | | |
| Net investment income: | | | |
| Class A shares | (920,858) |
| | — |
|
| Class I shares | (1,312,875) |
| | — |
|
| Class Y shares | (56,984) |
| | — |
|
| Net realized gain: | | | |
| Class A shares | (45,181) |
| | (20,254,450) |
|
| Class C shares | (7,085) |
| | (3,590,824) |
|
| Class I shares | (32,799) |
| | (19,759,432) |
|
| Class Y shares | (2,238) |
| | (1,435,594) |
|
| Total distributions to shareholders | (2,378,020) |
| | (45,040,300) |
|
| | | | |
| Capital share transactions: | | | |
| Class A shares | (53,531,833) |
| | (5,639,161) |
|
| Class C shares | (7,175,069) |
| | (2,466,236) |
|
| Class I shares | (113,050,738) |
| | (45,384,217) |
|
| Class Y shares | (2,973,415) |
| | 1,974,716 |
|
| Net increase (decrease) in net assets from capital share transactions | (176,731,055) |
| | (51,514,898) |
|
| | | | |
| TOTAL INCREASE (DECREASE) IN NET ASSETS | (136,829,692) |
| | (106,939,757) |
|
| | | | |
| | | | |
| NET ASSETS | | | |
| Beginning of year | 395,583,633 |
| | 502,523,390 |
|
| End of year (including accumulated undistributed net investment income of $176,483 and $1,128,301, respectively) |
| $258,753,941 |
| |
| $395,583,633 |
|
| See notes to financial statements. |
16 www.calvert.com CALVERT MID-CAP FUND ANNUAL REPORT
CALVERT MID-CAP FUND
FINANCIAL HIGHLIGHTS
|
| | | | | | | | | | | | | | |
| | Year Ended September 30, |
| CLASS A SHARES | 2017 | | 2016 | | 2015 | | 2014 | | 2013 |
| Net asset value, beginning | $29.68 | | $33.41 | | $36.99 | | $36.83 | | $31.45 |
| Income from investment operations: | | | | | | | | | |
Net investment income (loss) (a) | 0.20 |
| | 0.02 |
| (b) | (0.16) |
| | (0.14) |
| | (0.18) |
|
| Net realized and unrealized gain (loss) | 3.68 |
| | (0.67) |
| | 1.91 |
| | 2.94 |
| | 7.49 |
|
| Total from investment operations | 3.88 |
| | (0.65) |
| | 1.75 |
| | 2.80 |
| | 7.31 |
|
| Distributions from: | | | | | | | | | |
| Net investment income | (0.15) |
| | — |
| | — |
| | — |
| | — |
|
| Net realized gain | (0.01) |
| | (3.08) |
| | (5.33) |
| | (2.64) |
| | (1.93) |
|
| Total distributions | (0.16) |
| | (3.08) |
| | (5.33) |
| | (2.64) |
| | (1.93) |
|
| Total increase (decrease) in net asset value | 3.72 |
| | (3.73) |
| | (3.58) |
| | 0.16 |
| | 5.38 |
|
| Net asset value, ending | $33.40 | | $29.68 | | $33.41 | | $36.99 | | $36.83 |
Total return (c) | 13.11 | % | | (2.08 | %) | | 4.90 | % | | 7.90 | % | | 24.74 | % |
Ratios to average net assets: (d) | | | | | | | | | |
| Total expenses | 1.34 | % | | 1.37 | % | | 1.41 | % | | 1.43 | % | | 1.48 | % |
| Net expenses | 1.21 | % | | 1.31 | % | | 1.41 | % | | 1.43 | % | | 1.48 | % |
| Net investment income (loss) | 0.64 | % | | 0.07 | % | (b) | (0.43 | %) | | (0.36 | %) | | (0.53 | %) |
| Portfolio turnover | 162 | % | | 199 | % | | 74 | % | | 81 | % | | 73 | % |
| Net assets, ending (in thousands) | $159,951 | | $192,402 | | $223,328 | | $215,683 | | $207,257 |
| | | | | | | | | | |
(a) Computed using average shares outstanding. |
(b) Amount includes a non-recurring refund for overbilling of prior years' custody out-of-pocket fees. This amounted to $0.001 per share and 0% of average net assets. |
(c) Returns are historical and are calculated by determining the percentage change in net asset value with all distributions reinvested and do not reflect the effect of sales charges, if any. |
(d) Total expenses do not reflect amounts reimbursed and/or waived by the Adviser and certain of its affiliates, if applicable. Net expenses are net of all reductions and represent the net expenses paid by the Fund. |
| See notes to financial statements. |
www.calvert.com CALVERT MID-CAP FUND ANNUAL REPORT 17
CALVERT MID-CAP FUND
FINANCIAL HIGHLIGHTS
|
| | | | | | | | | | | | | | |
| | Year Ended September 30, |
| CLASS C SHARES | 2017 | | 2016 | | 2015 | | 2014 | | 2013 |
| Net asset value, beginning | $21.87 | | $25.62 | | $29.76 | | $30.35 | | $26.44 |
| Income from investment operations: | | | | | | | | | |
Net investment loss (a) | (0.03) |
| | (0.16) |
| (b) | (0.34) |
| | (0.34) |
| | (0.36) |
|
| Net realized and unrealized gain (loss) | 2.72 |
| | (0.51) |
| | 1.53 |
| | 2.39 |
| | 6.20 |
|
| Total from investment operations | 2.69 |
| | (0.67) |
| | 1.19 |
| | 2.05 |
| | 5.84 |
|
| Distributions from: | | | | | | | | | |
| Net realized gain | (0.01) |
| | (3.08) |
| | (5.33) |
| | (2.64) |
| | (1.93) |
|
| Total distributions | (0.01) |
| | (3.08) |
| | (5.33) |
| | (2.64) |
| | (1.93) |
|
| Total increase (decrease) in net asset value | 2.68 |
| | (3.75) |
| | (4.14) |
| | (0.59) |
| | 3.91 |
|
| Net asset value, ending | $24.55 | | $21.87 | | $25.62 | | $29.76 | | $30.35 |
Total return (c) | 12.29 | % | | (2.87 | %) | | 4.09 | % | | 7.06 | % | | 23.81 | % |
Ratios to average net assets: (d) | | | | | | | | | |
| Total expenses | 2.18 | % | | 2.16 | % | | 2.21 | % | | 2.19 | % | | 2.25 | % |
| Net expenses | 1.96 | % | | 2.09 | % | | 2.21 | % | | 2.19 | % | | 2.25 | % |
| Net investment loss | (0.12 | %) | | (0.72 | %) | (b) | (1.23 | %) | | (1.12 | %) | | (1.30 | %) |
| Portfolio turnover | 162 | % | | 199 | % | | 74 | % | | 81 | % | | 73 | % |
| Net assets, ending (in thousands) | $18,146 | | $22,885 | | $29,837 | | $27,588 | | $25,311 |
| | | | | | | | | | |
(a) Computed using average shares outstanding. |
(b) Amount includes a non-recurring refund for overbilling of prior years' custody out-of-pocket fees. This amounted to $0.001 per share and 0% of average net assets. |
(c) Returns are historical and are calculated by determining the percentage change in net asset value with all distributions reinvested and do not reflect the effect of sales charges, if any. |
(d) Total expenses do not reflect amounts reimbursed and/or waived by the Adviser and certain of its affiliates, if applicable. Net expenses are net of all reductions and represent the net expenses paid by the Fund. |
| See notes to financial statements. |
18 www.calvert.com CALVERT MID-CAP FUND ANNUAL REPORT
CALVERT MID-CAP FUND
FINANCIAL HIGHLIGHTS
|
| | | | | | | | | | | | | | |
| | Year Ended September 30, |
| CLASS I SHARES | 2017 | | 2016 | | 2015 | | 2014 | | 2013 |
| Net asset value, beginning | $34.38 | | $38.05 | | $41.19 | | $40.50 | | $34.18 |
| Income from investment operations: | | | | | | | | | |
Net investment income (a) | 0.41 |
| | 0.19 |
| (b) | 0.06 |
| | 0.10 |
| | 0.03 |
|
| Net realized and unrealized gain (loss) | 4.22 |
| | (0.78) |
| | 2.13 |
| | 3.23 |
| | 8.22 |
|
| Total from investment operations | 4.63 |
| | (0.59) |
| | 2.19 |
| | 3.33 |
| | 8.25 |
|
| Distributions from: | | | | | | | | | |
| Net investment income | (0.30) |
| | — |
| | — |
| | — |
| | — |
|
| Net realized gain | (0.01) |
| | (3.08) |
| | (5.33) |
| | (2.64) |
| | (1.93) |
|
| Total distributions | (0.31) |
| | (3.08) |
| | (5.33) |
| | (2.64) |
| | (1.93) |
|
| Total increase (decrease) in net asset value | 4.32 |
| | (3.67) |
| | (3.14) |
| | 0.69 |
| | 6.32 |
|
| Net asset value, ending | $38.70 | | $34.38 | | $38.05 | | $41.19 | | $40.50 |
Total return (c) | 13.53 | % | | (1.64 | %) | | 5.53 | % | | 8.53 | % | | 25.55 | % |
Ratios to average net assets: (d) | | | | | | | | | |
| Total expenses | 0.88 | % | | 0.86 | % | | 0.83 | % | | 0.82 | % | | 0.85 | % |
| Net expenses | 0.86 | % | | 0.84 | % | | 0.83 | % | | 0.82 | % | | 0.85 | % |
| Net investment income | 1.14 | % | | 0.55 | % | (b) | 0.14 | % | | 0.24 | % | | 0.08 | % |
| Portfolio turnover | 162 | % | | 199 | % | | 74 | % | | 81 | % | | 73 | % |
| Net assets, ending (in thousands) | $68,748 | | $166,759 | | $236,228 | | $156,677 | | $130,705 |
| | | | | | | | | | |
(a) Computed using average shares outstanding. |
(b) Amount includes a non-recurring refund for overbilling of prior years' custody out-of-pocket fees. This amounted to $0.001 per share and 0% of average net assets. |
(c) Returns are historical and are calculated by determining the percentage change in net asset value with all distributions reinvested and do not reflect the effect of sales charges, if any. |
(d) Total expenses do not reflect amounts reimbursed and/or waived by the Adviser and certain of its affiliates, if applicable. Net expenses are net of all reductions and represent the net expenses paid by the Fund. |
| See notes to financial statements. |
www.calvert.com CALVERT MID-CAP FUND ANNUAL REPORT 19
CALVERT MID-CAP FUND
FINANCIAL HIGHLIGHTS
|
| | | | | | | | | | | | | | |
| | Year Ended September 30, |
| CLASS Y SHARES | 2017 | | 2016 | | 2015 | | 2014 | | 2013 |
| Net asset value, beginning | $30.12 | | $33.78 | | $37.26 | | $37.04 | | $31.56 |
| Income from investment operations: | | | | | | | | | |
Net investment income (loss) (a) | 0.28 |
| | 0.08 |
| (b) | (0.07) |
| | (0.07) |
| | (0.12) |
|
| Net realized and unrealized gain (loss) | 3.75 |
| | (0.66) |
| | 1.92 |
| | 2.93 |
| | 7.53 |
|
| Total from investment operations | 4.03 |
| | (0.58) |
| | 1.85 |
| | 2.86 |
| | 7.41 |
|
| Distributions from: | | | | | | | | | |
| Net investment income | (0.19) |
| | — |
| | — |
| | — |
| | — |
|
| Net realized gain | (0.01) |
| | (3.08) |
| | (5.33) |
| | (2.64) |
| | (1.93) |
|
| Total distributions | (0.20) |
| | (3.08) |
| | (5.33) |
| | (2.64) |
| | (1.93) |
|
| Total increase (decrease) in net asset value | 3.83 |
| | (3.66) |
| | (3.48) |
| | 0.22 |
| | 5.48 |
|
| Net asset value, ending | $33.95 | | $30.12 | | $33.78 | | $37.26 | | $37.04 |
Total return (c) | 13.41 | % | | (1.83 | %) | | 5.16 | % | | 8.02 | % | | 24.98 | % |
Ratios to average net assets: (d) | | | | | | | | | |
| Total expenses | 1.09 | % | | 1.08 | % | | 1.18 | % | | 1.26 | % | | 1.29 | % |
| Net expenses | 0.96 | % | | 1.02 | % | | 1.18 | % | | 1.26 | % | | 1.29 | % |
| Net investment income (loss) | 0.86 | % | | 0.28 | % | (b) | (0.20 | %) | | (0.17 | %) | | (0.36 | %) |
| Portfolio turnover | 162 | % | | 199 | % | | 74 | % | | 81 | % | | 73 | % |
| Net assets, ending (in thousands) | $11,908 | | $13,538 | | $13,130 | | $10,871 | | $14,719 |
| | | | | | | | | | |
(a) Computed using average shares outstanding. |
(b) Amount includes a non-recurring refund for overbilling of prior years' custody out-of-pocket fees. This amounted to $0.001 per share and 0% of average net assets. |
(c) Returns are historical and are calculated by determining the percentage change in net asset value with all distributions reinvested and do not reflect the effect of sales charges, if any. |
(d) Total expenses do not reflect amounts reimbursed and/or waived by the Adviser and certain of its affiliates, if applicable. Net expenses are net of all reductions and represent the net expenses paid by the Fund. |
| See notes to financial statements. |
20 www.calvert.com CALVERT MID-CAP FUND ANNUAL REPORT
NOTES TO FINANCIAL STATEMENTS
NOTE A — SIGNIFICANT ACCOUNTING POLICIES
General: Calvert World Values Fund, Inc. (the “Corporation”) was organized as a Maryland corporation on February 14, 1992, and is registered under the Investment Company Act of 1940, as amended (the “1940 Act”), as an open-end management investment company. The Corporation operates four (4) separate series, each with its own investment objective(s) and strategies, which are accounted for separately. This report contains the financial statements and financial highlights of Calvert Mid-Cap Fund (formerly, Calvert Capital Accumulation Fund) (the “Fund”). The Corporation is authorized to issue two billion shares of common stock, $0.01 par value per share, of which 250 million shares have been allocated to the Fund.
The Fund is diversified. The investment objective of the Fund is to seek to provide long-term capital appreciation by investing primarily in mid-cap stocks.
The Fund offers four classes of shares. Class A shares are generally sold subject to a sales charge imposed at time of purchase. A contingent deferred sales charge of 0.80% may apply to certain redemptions of Class A shares for accounts for which no sales charge was paid, if redeemed within one year of purchase. Class C shares are sold without a front-end sales charge, and with certain exceptions, are charged a contingent deferred sales charge of 1% on shares redeemed within one year of purchase. Class C shares are only available for purchase through a financial intermediary. Class I and Class Y shares are sold at net asset value, are not subject to a sales charge and are sold only to certain eligible investors. Each class represents a pro rata interest in the Fund, but votes separately on class-specific matters and is subject to different expenses.
The Fund applies the accounting and reporting guidance in the Financial Accounting Standards Board (FASB) Accounting Standards Codification Topic 946, Financial Services – Investment Companies (ASC 946). Subsequent events, if any, through the date that the financial statements were issued have been evaluated in the preparation of the financial statements.
Investment Valuation: Net asset value per share is determined every business day as of the close of the regular session of the New York Stock Exchange (generally 4:00 p.m. Eastern time). The Fund uses independent pricing services approved by the Board of Directors (the “Board”) to value its investments wherever possible. Investments for which market quotations are not available or deemed not reliable are fair valued in good faith under the direction of the Board.
The Board has adopted Valuation Procedures (the “Procedures”) to determine the fair value of securities and financial instruments for which market prices are not readily available or which may not be reliably priced. The Board has delegated the day-to-day responsibility for determining the fair value of securities and financial instruments of the Fund to the Fund’s investment adviser (the “Adviser”) and has provided these Procedures to govern the Adviser in its valuation duties.
The Adviser has chartered an internal Valuation Committee to oversee the implementation of these Procedures and to assist it in carrying out the valuation responsibilities that the Board has delegated. The Valuation Committee meets on a regular basis to review investments which may not have readily available market prices. The Valuation Committee’s fair valuation determinations are subject to review, approval and ratification by the Board at its next regularly scheduled meeting covering the calendar quarter in which the fair valuation was determined.
U.S. generally accepted accounting principles (U.S. GAAP) establishes a disclosure hierarchy that categorizes the inputs to valuation techniques used to value assets and liabilities at measurement date. These inputs are summarized in the three broad levels listed below:
Level 1 - quoted prices in active markets for identical securities
Level 2 - other significant observable inputs (including quoted prices for similar securities, interest rates, prepayment speeds, credit risk, etc.)
Level 3 - significant unobservable inputs (including the Fund’s own assumptions in determining the fair value of investments)
The inputs or methodologies used for valuing securities are not necessarily an indication of the risk associated with investing in those securities.
Changes in valuation techniques may result in transfers in or out of an investment’s assigned level within the hierarchy during the period. Transfers in and/or out of levels are determined based on the fair value of such securities at the end of the period. Valuation techniques used to value the Fund’s investments by major category are as follows:
Equity Securities. Equity securities (including warrants and rights) listed on a U.S. securities exchange generally are valued at the last sale or closing price as reported by an independent pricing service on the primary market or exchange on which they are traded and are categorized as Level 1 in the hierarchy. Equity securities listed on the NASDAQ Global or Global Select Market are valued at the NASDAQ official closing price and are categorized as Level 1 in the hierarchy. Unlisted or listed securities for
www.calvert.com CALVERT MID-CAP FUND ANNUAL REPORT 21
which closing sales prices or closing quotations are not available are valued at the mean between the latest available bid and asked prices and are categorized as Level 2 in the hierarchy.
Debt Securities. Debt securities are generally valued on the basis of valuations provided by third party pricing services, as derived from such services’ pricing models. Inputs to the models may include, but are not limited to, reported trades, executable bid and asked prices, broker/dealer quotations, prices or yields of securities with similar characteristics, interest rates, anticipated prepayments, benchmark curves or information pertaining to the issuer, as well as industry and economic events. Accordingly, debt securities are generally categorized as Level 2 in the hierarchy. Short-term securities of sufficient credit quality purchased with remaining maturities of sixty days or less for which a valuation from a third party pricing service is not readily available may be valued at amortized cost, which approximates fair value, and are categorized as Level 2 in the hierarchy.
Fair Valuation. If a market value cannot be determined for a security using the methodologies described above, or if, in the good faith opinion of the Adviser, the market value does not constitute a readily available market quotation, or if a significant event has occurred that would materially affect the value of the security, the security will be fair valued as determined in good faith by or at the direction of the Board in a manner that fairly reflects the security’s value, or the amount that the Fund might reasonably expect to receive for the security upon its current sale in the ordinary course. Each such determination is based on a consideration of relevant factors, which are likely to vary from one pricing context to another. These factors may include, but are not limited to, the type of security, the existence of any contractual restrictions on the security’s disposition, the price and extent of public trading in similar securities of the issuer or of comparable companies or entities, quotations or relevant information obtained from broker/dealers or other market participants, information obtained from the issuer, analysts, and/or the appropriate stock exchange (for exchange-traded securities), an analysis of the company’s or entity’s financial condition, and an evaluation of the forces that influence the issuer and the market(s) in which the security is purchased and sold.
The values assigned to fair value investments are based on available information and do not necessarily represent amounts that might ultimately be realized. Further, due to the inherent uncertainty of valuations of such investments, the fair values may differ significantly from the values that would have been used had an active market existed, and the differences could be material. The Valuation Committee employs various methods for calibrating these valuation approaches including a regular review of key inputs and assumptions, transactional back-testing or disposition analysis and reviews of any related market activity.
The following table summarizes the market value of the Fund’s holdings as of September 30, 2017, based on the inputs used to value them:
|
| | | | | | | | | | | | | |
| INVESTMENTS IN SECURITIES - ASSETS | LEVEL 1 | | LEVEL 2 | LEVEL 3* | TOTAL |
| Common Stocks | $255,549,305 |
| ** | $— |
| $— |
|
| $255,549,305 |
|
| High Social Impact Investments | — |
| | 2,496,581 |
| 671,299 |
| 3,167,880 |
|
| Time Deposit | — |
| | 224,025 |
| — |
| 224,025 |
|
| TOTAL |
| $255,549,305 |
| |
| $2,720,606 |
|
| $671,299 |
|
| $258,941,210 |
|
| | | | | | |
| * None of the unobservable inputs for Level 3 assets, individually or collectively, had a material impact on the Fund. |
| ** The level classification by major category of investments is the same as the category presentation in the Schedule of Investments. |
Level 3 investments at the beginning and/or end of the period in relation to net assets were not significant and accordingly, a reconciliation of Level 3 assets for the year ended September 30, 2017 is not presented. There were no transfers between Level 1 and Level 2 during the year ended September 30, 2017.
Investment Transactions and Income: Investment transactions for financial statement purposes are accounted for on trade date. Realized gains and losses are recorded on an identified cost basis and may include proceeds from litigation. Dividend income is recorded on the ex-dividend date for dividends received in cash and/or securities or, in the case of dividends on certain foreign securities, as soon as the Fund is informed of the ex-dividend date. Non-cash dividends are recorded at the fair value of the securities received. Withholding taxes on foreign dividends, if any, have been provided for in accordance with the Fund’s understanding of the applicable country’s tax rules and rates. Distributions received that represent a return of capital are recorded as a reduction of cost of investments. Distributions received that represent a capital gain are recorded as a realized gain. Interest income, which includes amortization of premium and accretion of discount on debt securities, is accrued as earned.
Share Class Accounting: Investment income and realized and unrealized gains and losses are allocated to separate classes of shares based upon the relative net assets of each class. Expenses common to the classes are also allocated to each class in proportion to their relative net assets. Expenses arising in connection with a specific class are charged directly to that class.
22 www.calvert.com CALVERT MID-CAP FUND ANNUAL REPORT
Foreign Currency Transactions: The Fund’s accounting records are maintained in U.S. dollars. For valuation of assets and liabilities on each date of net asset value determination, foreign denominations are converted into U.S. dollars using the current exchange rate. Security transactions, income, and expenses are translated at the prevailing rate of exchange on the date of the event. Recognized gains or losses on investment transactions attributable to changes in foreign currency exchange rates are recorded for financial statement purposes as net realized gains and losses on investments. That portion of unrealized gains and losses on investments that results from fluctuations in foreign currency exchange rates is not separately disclosed.
Restricted Securities: The Fund may invest in securities that are subject to legal or contractual restrictions on resale. Generally, these securities may only be sold publicly upon registration under the Securities Act of 1933 or in transactions exempt from such registration. Information regarding restricted securities is included at the end of the Schedule of Investments.
Distributions to Shareholders: Distributions to shareholders are recorded by the Fund on ex-dividend date. Dividends from net investment income and distributions from net realized capital gains, if any, are paid at least annually. Distributions are determined in accordance with income tax regulations which may differ from U.S. GAAP; accordingly, periodic reclassifications are made within the Fund’s capital accounts to reflect income and gains available for distribution under income tax regulations.
Estimates: The preparation of financial statements in conformity with U.S. GAAP requires management to make estimates and assumptions that affect the reported amounts of assets and liabilities and disclosure of contingent assets and liabilities at the date of the financial statements and the reported amounts of increases and decreases in net assets from operations during the reporting period. Actual results could differ from those estimates.
Indemnifications: The Corporation’s By-Laws provide for indemnification for Directors or officers of the Corporation and certain other parties, to the fullest extent permitted by Maryland law and the 1940 Act, provided certain conditions are met. Additionally, in the normal course of business, the Fund enters into agreements with service providers that may contain indemnification clauses. The Fund’s maximum exposure under these arrangements is unknown as this would involve future claims that may be made against the Fund that have not yet occurred.
Federal Income Taxes: No provision for federal income or excise tax is required since the Fund intends to continue to qualify as a regulated investment company under the Internal Revenue Code and to distribute substantially all of its taxable earnings.
Management has analyzed the Fund’s tax positions taken for all open federal income tax years and has concluded that no provision for federal income tax is required in the Fund’s financial statements. A Fund’s federal tax return is subject to examination by the Internal Revenue Service for a period of three years from the date of filing.
NOTE B — RELATED PARTY TRANSACTIONS
Effective December 31, 2016, Calvert Research and Management (CRM), a subsidiary of Eaton Vance Management (EVM), became the investment adviser to the Fund following a transaction between CRM and certain of its affiliates and Calvert Investment Management, Inc. (CIM) and certain of its affiliates, pursuant to which CRM acquired substantially all of the business assets of CIM after satisfying various closing conditions, including shareholder approval of a new investment advisory agreement between the Fund and CRM (the "Transaction").
For its services pursuant to the new investment advisory agreement, CRM receives a fee, payable monthly, at the annual rate of 0.65% of the Fund’s average daily net assets. Prior to December 31, 2016, CIM, a direct subsidiary of Calvert Investments, Inc. and an indirect subsidiary of Ameritas Holding Company, provided investment advisory services to the Fund. For its services, CIM received a fee at the same annual rate as the Fund’s investment advisory agreement with CRM. For the year ended September 30, 2017, the investment advisory fee amounted to $2,033,513, of which $1,405,522 was paid to CRM and $627,991 was paid to CIM.
CRM has agreed to reimburse the Fund’s operating expenses to the extent that total annual operating expenses (relating to ordinary operating expenses only and excluding expenses such as brokerage commissions, acquired fund fees and expenses of unaffiliated funds, interest expense, taxes or litigation expenses) exceed 1.21%, 1.96%, 0.86% and 0.96% for Class A, Class C, Class I and Class Y, respectively, of such class’ average daily net assets. The expense reimbursement agreement with CRM may be changed or terminated after January 31, 2019. For the year ended September 30, 2017, CRM waived or reimbursed expenses of $202,140 and CIM waived or reimbursed expenses of $72,716.
The administrative fee is earned by CRM as compensation for administrative services rendered to the Fund. The fee is computed at an annual rate of 0.12% of the Fund’s average daily net assets attributable to Class A, Class C, Class I and Class Y and is payable monthly. CRM has agreed to contractually waive 0.02% of the administrative fee through January 31, 2018 for Class I. Prior to December 31, 2016, Calvert Investment Administrative Services, Inc. (CIAS), an affiliate of CIM, provided administrative services to the Fund at an annual rate of 0.12% of the Fund’s average daily net assets, payable monthly. In addition, CIAS contractually waived administrative fees of 0.02% for the period October 1, 2016 through December 30, 2016 for Class I.
www.calvert.com CALVERT MID-CAP FUND ANNUAL REPORT 23
For the year ended September 30, 2017, CRM was paid administrative fees of $259,481, of which $12,790 were waived and CIAS was paid administrative fees of $115,937, of which $8,158 were waived.
The Fund adopted a new distribution plan for Class A shares (Class A Plan) and Class C shares (Class C Plan) pursuant to Rule 12b-1 under the 1940 Act, which were approved by the Board and became effective as of December 31, 2016 or shortly thereafter upon approval by the shareholders of the respective class. Pursuant to the Class A Plan and Class C Plan, the Fund pays a distribution fee of 0.25% and 0.75% per annum for Class A and Class C, respectively, and a service fee of 0.25% per annum for Class C of its average daily net assets attributable to such class for distribution services and facilities provided to the Fund, as well as for personal and/or account maintenance services provided. Pursuant to the Fund’s former distribution plans for Class A shares and Class C shares, the Fund was permitted to pay certain expenses associated with the distribution and servicing of its Class A and Class C shares not to exceed 0.50% for Class A and 1.00% for Class C of the Fund’s average daily net assets with respect to such class. Effective December 31, 2016, the fees are paid to Eaton Vance Distributors, Inc. (EVD), an affiliate of CRM and the Fund’s principal underwriter. Prior to December 31, 2016, the fees were paid to Calvert Investment Distributors, Inc. (CID), an affiliate of CIM and the Fund’s former distributor and principal underwriter. Distribution and service fees paid or accrued for the year ended September 30, 2017 amounted to $438,000 or 0.25% per annum of Class A’s average daily net assets, of which $319,301 was paid to EVD and $118,699 was paid to CID, and $207,215 or 1.00% per annum of Class C’s average daily net assets, of which $151,732 was paid to EVD and $55,483 was paid to CID.
The Fund was informed that EVD and CID received $23,504 and $6,833, respectively, as their portion of the sales charge on sales of Class A shares for the year ended September 30, 2017. The Fund was also informed that EVD and CID received $1,523 and $0, respectively, of contingent deferred sales charges paid by Fund shareholders for the same period.
Effective December 31, 2016, EVM provides sub-transfer agency services to the Fund pursuant to a Sub-Transfer Agency Support Services Agreement. For its services, EVM receives an annual fee of $8 per shareholder account. Prior to December 31, 2016, Calvert Investment Services, Inc. (CIS), an affiliate of CIM, acted as the shareholder servicing agent for the Fund and received a fee at the same rate as is paid to EVM. For the year ended September 30, 2017, sub-transfer agency fees paid to EVM were $53,448 and shareholder servicing fees paid to CIS were $19,986. Such fees are included in transfer agency fees and expenses on the Statement of Operations.
Each Director of the Fund who is not an employee of CRM or its affiliates receives a fee of $3,000 for each Board meeting attended in person and $2,000 for each Board meeting attended by phone plus an annual fee of $52,000, and $1,500 for each Committee meeting attended in person and $1,000 for each Committee meeting attended by phone plus an annual Committee fee of $2,500. The Board chair receives an additional $10,000 annual retainer and Committee chairs receive an additional $6,000 annual retainer. Prior to December 31, 2016, each Director of the Fund who was not an employee of CIM or its affiliates received a fee of $3,000 for each Board meeting attended plus an annual fee of $52,000. Committee members received $500 for each Committee meeting attended plus an annual fee of $2,500. Committee chairs received an additional annual retainer ranging from $6,000 to $10,000. Eligible Directors may participate in a Deferred Compensation Plan (the “Plan”). Amounts deferred under the Plan are treated as though equal dollar amounts had been invested in shares of the Fund or other Calvert Funds selected by the Directors. The Fund purchases shares of the funds selected equal to the dollar amounts deferred under the Plan, resulting in an asset equal to the deferred compensation liability. Obligations of the Plan are paid solely from the Fund’s assets. Directors’ fees are allocated to each of the Calvert Funds served. Salaries and fees of officers and Directors of the Fund who are employees of CRM and, prior to December 31, 2016, of CIM or their affiliates are/were paid by CRM and CIM, respectively. In addition, in connection with the Transaction, an advisory council was established to aid the Board and CRM in advancing the cause of responsible investing through original scholarship and thought leadership. The advisory council consists of CRM’s Chief Executive Officer and four additional members. Each member (other than CRM’s Chief Executive Officer) receives annual compensation of $75,000, which is being reimbursed by CIM and Ameritas Holding Company for a period of up to three years through December 30, 2019. For the year ended September 30, 2017, the Fund’s allocated portion of such expense and reimbursement was $3,051, which are included in miscellaneous expense and reimbursement of expenses-other, respectively, on the Statement of Operations.
NOTE C — INVESTMENT ACTIVITY AND TAX INFORMATION
During the year ended September 30, 2017, the cost of purchases and proceeds from sales of investments, other than short-term securities, were $509,093,186 and $680,635,303, respectively.
24 www.calvert.com CALVERT MID-CAP FUND ANNUAL REPORT
The tax character of distributions declared for the years ended September 30, 2017 and September 30, 2016 was as follows:
|
| | | | | | | |
| | Year Ended September 30, |
| | 2017 | | 2016 |
| Distributions declared from: | | | |
| Ordinary income |
| $2,378,020 |
| |
| $8,450,990 |
|
| Long-term capital gains | $— |
| |
| $36,589,310 |
|
During the year ended September 30, 2017, accumulated undistributed net realized gain was decreased by $4,094,229, accumulated undistributed net investment income was decreased by $1,055,756 and paid-in capital was increased by $5,149,985 due to the Fund’s use of equalization accounting and differences between book and tax accounting, primarily due to foreign currency gain (loss) and distributions from real estate investment trusts. Tax equalization accounting allows the Fund to treat as a distribution that portion of redemption proceeds representing a redeeming shareholder’s portion of undistributed taxable income and net capital gains. These reclassifications had no effect on the net assets or net asset value per share of the Fund.
As of September 30, 2017, the components of distributable earnings (accumulated losses) on a tax basis were as follows:
|
| | | |
| Undistributed ordinary income |
| $10,067,634 |
|
| Undistributed long-term capital gains |
| $13,432,644 |
|
| Net unrealized appreciation (depreciation) |
| $13,626,066 |
|
The differences between components of distributable earnings (accumulated losses) on a tax basis and the amounts reflected in the Statement of Assets and Liabilities are primarily due to the tax treatment of short-term capital gains and temporary book-tax differences that will reverse in a subsequent period. These differences are due to wash sales.
The cost and unrealized appreciation (depreciation) of investments of the Fund at September 30, 2017, as determined on a federal income tax basis, were as follows:
|
| | | |
| Federal tax cost of investments |
| $245,315,137 |
|
| Gross unrealized appreciation |
| $21,882,693 |
|
| Gross unrealized depreciation | (8,256,620) |
|
| Net unrealized appreciation (depreciation) |
| $13,626,073 |
|
NOTE D — SECURITIES LENDING
To generate additional income, the Fund may lend its securities pursuant to a securities lending agency agreement with State Street Bank and Trust Company (SSB), the securities lending agent. Security loans are subject to termination by the Fund at any time and, therefore, are not considered to be illiquid investments. The Fund requires that the loan be continuously collateralized by either cash or securities as collateral equal at all times to at least 102% of the market value of the domestic securities loaned and 105% of the market value of the international securities loaned (if applicable). The market value of securities loaned is determined daily and any additional required collateral is delivered to the Fund on the next business day. Cash collateral is generally invested in State Street Institutional U.S. Government Money Market Fund (the “U.S. Government Fund”) that is managed by an affiliate of the custodian. The U.S. Government Fund is a registered money market fund that invests in a variety of high-quality, U.S. dollar denominated instruments. Any gain or loss in the market price of the loaned securities that might occur and any interest earned or dividends declared during the term of the loan would accrue to the account of the Fund. Income earned on the investment of collateral, net of broker rebates and other expenses incurred by the securities lending agent, is split between the Fund and the securities lending agent on the basis of agreed upon contractual terms. Non-cash collateral is held by the lending agent on behalf of the Fund and cannot be sold or re-pledged by the Fund; accordingly, such collateral is not reflected in the Statement of Assets and Liabilities.
The risks associated with lending portfolio securities include, but are not limited to, possible delays in receiving additional collateral or in the recovery of the loaned securities, possible loss of rights to the collateral should the borrower fail financially, as well as risk of loss in the value of the collateral or the value of the investments made with the collateral. The securities lending agent shall indemnify the Fund in the case of default of any securities borrower.
The Fund did not have any securities on loan at September 30, 2017.
www.calvert.com CALVERT MID-CAP FUND ANNUAL REPORT 25
NOTE E — LINE OF CREDIT
A financing agreement is in place with the Calvert Funds and SSB. Under the agreement, which expires on August 7, 2018, SSB provides an unsecured line of credit facility in the aggregate amount of $50 million ($25 million committed and $25 million uncommitted), accessible by the Calvert Funds for temporary or emergency purposes only. Borrowings bear interest at the higher of the One-Month London Interbank Offered Rate (LIBOR) in effect that day or the overnight Federal Funds Rate, plus 1.25% per annum. A commitment fee of 0.25% per annum is incurred on the unused portion of the committed facility. An administrative fee of $30,000 was paid in connection with the renewal of the uncommitted facility. These fees are allocated to all participating funds. Because the line of credit is not available exclusively to the Fund, it may be unable to borrow some or all of its requested amounts at any particular time. The Fund had no loans outstanding pursuant to this line of credit at September 30, 2017. Average borrowings and the weighted average interest rate (excluding fees) for the year ended September 30, 2017 were $387,511 and 2.10%, respectively.
NOTE F — AFFILIATED COMPANIES
The Fund invests a portion of its assets designated for high social impact investments in notes issued by the Calvert Social Investment Foundation (the “Foundation”) pursuant to an exemptive order granted by the U.S. Securities and Exchange Commission (the “SEC”). The Fund relies on exemptive relief to invest in the notes because the Fund’s investments in the notes may be considered prohibited transactions between affiliated persons under the 1940 Act. The Foundation may be considered an affiliated person of the Calvert Funds based on the overlap between the Foundation’s Board of Directors and the Calvert Funds’ Directors/Trustees and other potential affiliations. The Foundation has licensed use of the Calvert name from the Adviser, and the Adviser’s President and Chief Executive Officer serves on the Foundation Board. The Foundation is not owned or otherwise controlled by the Adviser or its affiliates.
In addition, an affiliated company is a company in which a fund has a direct or indirect ownership of, control of, or voting power of 5 percent or more of the outstanding voting shares, or a company that is under common ownership or control with a fund. At September 30, 2017, the value of the Fund’s investment in affiliated companies was $2,496,581, which represents 1.0% of the Fund’s net assets. Transactions in affiliated companies by the Fund for the year ended September 30, 2017 were as follows:
|
| | | | | | | | | | | | | | | | | | | | | | | |
Name of Affiliated
Company | Principal Amount,
beginning of year | Gross Additions | Gross Reductions | Principal Amount,
end of
year | Value,
end of year | Interest
Income | Net Realized
Gain (Loss) | Capital Gain
Distributions Received | Change in
Unrealized
Appreciation
(Depreciation) |
| High Social Impact Investments | | | | | | | | | |
Calvert Social Investment Foundation Notes: | | | | | | | | | |
| 0.25%, 7/1/17 |
| $1,419,488 |
| $— |
|
| ($1,419,488 | ) | $— |
| $— |
|
| $722 |
| $— |
| $— |
|
| $39,959 |
|
| 0.50%, 3/18/17 | 1,200,000 |
| — |
| (1,200,000) |
| — |
| — |
| 1,167 |
| — |
| — |
| 20,160 |
|
| 1.50%, 12/15/19 | — |
| 2,619,488 |
| — |
| 2,619,488 |
| 2,496,581 |
| 31,652 |
| — |
| — |
| (122,907) |
|
| TOTALS | | | | |
| $2,496,581 |
|
| $33,541 |
| $— |
| $— |
|
| ($62,788 | ) |
26 www.calvert.com CALVERT MID-CAP FUND ANNUAL REPORT
NOTE G — CAPITAL SHARES
Transactions in capital shares for the years ended September 30, 2017 and September 30, 2016 were as follows:
|
| | | | | | | | | |
| | Year Ended
September 30, 2017 | | Year Ended
September 30, 2016 |
| | Shares | Amount | | Shares | Amount |
| Class A | | | | | |
| Shares sold | 461,089 |
| $14,551,836 |
| | 938,319 |
| $28,327,643 |
|
| Reinvestment of distributions | 29,416 | 924,908 |
| | 633,251 | 19,092,505 |
|
| Shares redeemed | (2,184,626) | (69,008,577) |
| | (1,773,058) | (53,059,309) |
|
| Net decrease | (1,694,121) |
| ($53,531,833 | ) | | (201,488) |
| ($5,639,161 | ) |
| | | | | | |
| Class C | | | | | |
| Shares sold | 53,038 |
| $1,235,476 |
| | 150,707 |
| $3,480,475 |
|
| Reinvestment of distributions | 259 | 6,012 |
| | 135,636 | 3,032,821 |
|
| Shares redeemed | (360,391) | (8,416,557) |
| | (404,711) | (8,979,532) |
|
| Net decrease | (307,094) |
| ($7,175,069 | ) | | (118,368) |
| ($2,466,236 | ) |
| | | | | | |
| Class I | | | | | |
| Shares sold | 926,505 |
| $33,800,648 |
| | 1,675,673 |
| $58,476,366 |
|
| Reinvestment of distributions | 36,631 | 1,330,971 |
| | 399,960 | 13,922,616 |
|
| Shares redeemed | (4,036,797) | (148,182,357) |
| | (3,433,920) | (117,783,199) |
|
| Net decrease | (3,073,661) |
| ($113,050,738 | ) | | (1,358,287) |
| ($45,384,217 | ) |
| | | | | | |
| Class Y | | | | | |
| Shares sold | 329,364 |
| $10,605,042 |
| | 427,806 |
| $12,935,704 |
|
| Reinvestment of distributions | 1,469 | 46,876 |
| | 46,622 | 1,423,382 |
|
| Shares redeemed | (429,505) | (13,625,333) |
| | (413,736) | (12,384,370) |
|
| Net increase (decrease) | (98,672) |
| ($2,973,415 | ) | | 60,692 |
| $1,974,716 |
|
The Directors approved the termination of the Fund’s Class Y shares. Effective December 8, 2017, Class Y shares of the Fund will convert to Class I shares at net asset value. Thereafter, Class Y shares will be terminated.
NOTE H — REGULATORY MATTERS
On May 2, 2017, the Securities and Exchange Commission (SEC) issued an administrative order (“Order”) relating to the improper use of Calvert Fund assets by Calvert Investment Management, Inc. (CIM) and Calvert Investment Distributors, Inc. (CID), the Calvert Funds’ former adviser and principal underwriter, respectively, to pay for the distribution and marketing of fund shares outside of a Rule 12b-1 plan, as well as to pay expenses in excess of Fund expense caps. Pursuant to the Order, CIM and CID are required to pay $21,614,534 to affected shareholders of the Calvert Funds, including the Fund’s shareholders. The distributions required to be made by CIM and CID to affected shareholders are the obligations of CIM and CID and will not have an impact on the Fund’s net assets.
NOTE I — NAME CHANGE
Effective November 6, 2017, the name of Calvert Mid-Cap Fund was changed from Calvert Capital Accumulation Fund.
www.calvert.com CALVERT MID-CAP FUND ANNUAL REPORT 27
REPORT OF INDEPENDENT REGISTERED PUBLIC ACCOUNTING FIRM
The Board of Directors of Calvert World Values Fund, Inc. and Shareholders of Calvert Mid-Cap Fund:
We have audited the accompanying statement of assets and liabilities of the Calvert Mid-Cap Fund (formerly, Calvert Capital Accumulation Fund) (the “Fund”), a series of Calvert World Values Fund, Inc., including the schedule of investments, as of September 30, 2017, and the related statement of operations for the year then ended, the statements of changes in net assets for each of the years in the two-year period then ended, and the financial highlights for each of the years or periods in the five-year period then ended. These financial statements and financial highlights are the responsibility of the Fund’s management. Our responsibility is to express an opinion on these financial statements and financial highlights based on our audits.
We conducted our audits in accordance with the standards of the Public Company Accounting Oversight Board (United States). Those standards require that we plan and perform the audit to obtain reasonable assurance about whether the financial statements and financial highlights are free of material misstatement. An audit includes examining, on a test basis, evidence supporting the amounts and disclosures in the financial statements. Our procedures included confirmation of securities owned as of September 30, 2017, by correspondence with the custodian and brokers or by performing other appropriate auditing procedures. An audit also includes assessing the accounting principles used and significant estimates made by management, as well as evaluating the overall financial statement presentation. We believe that our audits provide a reasonable basis for our opinion.
In our opinion, the financial statements and financial highlights referred to above present fairly, in all material respects, the financial position of the Calvert Mid-Cap Fund as of September 30, 2017, the results of its operations for the year then ended, the changes in its net assets for each of the years in the two-year period then ended, and the financial highlights for each of the years or periods in the five-year period then ended, in conformity with U.S. generally accepted accounting principles.
/s/ KPMG LLP
Philadelphia, Pennsylvania
November 22, 2017
28 www.calvert.com CALVERT MID-CAP FUND ANNUAL REPORT
FEDERAL TAX INFORMATION
The Form 1099-DIV you receive in February 2018 will show the tax status of all distributions paid to your account in calendar year 2017. Shareholders are advised to consult their own tax adviser with respect to the tax consequences of their investment in the Fund. As required by the Internal Revenue Code and/or regulations, shareholders must be notified regarding the status of qualified dividend income for individuals, the dividends received deduction for corporations and capital gains dividends.
Qualified Dividend Income. For the fiscal year ended September 30, 2017, the Fund designates approximately $4,493,684, or up to the maximum amount of such dividends allowable pursuant to the Internal Revenue Code, as qualified dividend income eligible for the reduced tax rate of 15%.
Dividends Received Deduction. Corporate shareholders are generally entitled to take the dividends received deduction on the portion of the Fund’s dividend distribution that qualifies under tax law. For the Fund’s fiscal 2017 ordinary income dividends, 29.57% qualifies for the corporate dividends received deduction.
Capital Gains Dividends. The Fund hereby designates as a capital gain dividend with respect to the taxable year ended September 30, 2017, $19,320,058 or, if subsequently determined to be different, the net capital gain of such year.
www.calvert.com CALVERT MID-CAP FUND ANNUAL REPORT (Unaudited) 29
MANAGEMENT AND ORGANIZATION
Fund Management. The Directors of Calvert World Values Fund, Inc. (the Corporation) are responsible for the overall management and supervision of the Corporation’s affairs. The Directors and officers of the Corporation are listed below. Except as indicated, each individual has held the office shown or other offices in the same company for the last five years. Directors and officers of the Corporation hold indefinite terms of office. The “Independent Directors” consist of those Directors who are not “interested persons” of the Corporation, as that term is defined under the 1940 Act. The business address of each Director and officer, with the exception of Ms. Gemma and Mr. Kirchner, is 1825 Connecticut Avenue NW, Suite 400, Washington, DC 20009. As used below, “CRM” refers to Calvert Research and Management. Each Director oversees 37 funds in the Calvert fund complex. Each officer serves as an officer of certain other Calvert funds.
|
| | | |
| Name and Year of Birth | Position with Corporation | Position Start Date | Principal Occupation(s) and Directorships During Past Five Years and Other Relevant Experience |
| | | | |
| Interested Director | | | |
John H. Streur(1) 1960 | Director & President | 2015 | President and Chief Executive Officer of Calvert Research and Management (since December 31, 2016). President and Chief Executive Officer of Calvert Investments, Inc. (January 2015 - December 2016); Chief Compliance Officer of Calvert Investment Distributors, Inc. (August 2015 - December 2016); Chief Compliance Officer of Calvert Investment Management (August 2015 - April 2016); President and Director, Portfolio 21 Investments, Inc. (through October 2014); President, Chief Executive Officer and Director, Managers Investment Group LLC (through January 2012); President and Director, The Managers Funds and Managers AMG Funds (through January 2012). Directorships in the Last Five Years. Portfolio 21 Investments, Inc. (asset management) (through October 2014); Managers Investment Group LLC (asset management) (through January 2012); The Managers Funds (asset management) (through January 2012); Managers AMG Funds (asset management) (through January 2012); Calvert Social Investment Foundation. |
| Independent Directors | | | |
Richard L. Baird, Jr. 1948 | Director | 2005 | Former President and CEO of Adagio Health Inc. (retired in 2014) in Pittsburgh, PA, a non-profit corporation which provides family planning services, nutrition, maternal/child health care, and various health screening services and community preventive health programs. Directorships in the Last Five Years. None. |
Alice Gresham Bullock(2) 1950 | Chair & Director | 2016 | Professor at Howard University School of Law (retired June 2016). She is former Dean of Howard University School of Law (1996-2002) and Deputy Director of the Association of American Law Schools (1992-1994). Directorships in the Last Five Years. None. |
Cari M. Dominguez(2) 1949 | Director | 2016 | Former Chair of the U.S. Equal Employment Opportunity Commission. Directorships in the Last Five Years. Manpower, Inc. (employment agency); Triple S Management Corporation (managed care); National Association of Corporate Directors. |
John G. Guffey, Jr. 1948 | Director | 1992 | President of Aurora Press Inc., a privately held publisher of trade paperbacks (since January 1997). Directorships in the Last Five Years. Ariel Funds (3) (asset management) (through December 31, 2011); Calvert Social Investment Foundation; Calvert Ventures, LLC. |
Miles D. Harper, III 1962 | Director | 2005 | Partner, Carr Riggs & Ingram (public accounting firm) since October 2014. Partner, Gainer Donnelly & Desroches (now Carr Riggs & Ingram) (public accounting firm), November 1999 - September 2014). Directorships in the Last Five Years. Bridgeway Funds (14) (asset management). |
Joy V. Jones 1950 | Director | 2005 | Attorney. Directorships in the Last Five Years. Conduit Street Restaurants SUD 2 Limited (restaurant) (dissolved September 2016); Palm Management Restaurant Corporation. |
30 www.calvert.com CALVERT MID-CAP FUND ANNUAL REPORT (Unaudited)
|
| | | |
| Name and Year of Birth | Position with Corporation | Position Start Date | Principal Occupation(s) and Directorships During Past Five Years and Other Relevant Experience |
| | | | |
Anthony A. Williams(2) 1951 | Director | 2016 | CEO and Executive Director of the Federal City Council (July 2012 to present) (economic development non-profit organization); Senior Adviser and Independent Consultant for McKenna Long & Aldridge LLP (now Dentons) (law firm) (September 2011 to present); Executive Director of Global Government Practice at the Corporate Executive Board (now Gartner Inc.) (global research and Advisory company) (January 2010 to January 2012); William H. Bloomberg Lecturer in Public Management at the Harvard Kennedy School (since 2009). Directorships in the Last Five Years. Freddie Mac; Evoq Properties/ Meruelo Maddux Properties, Inc. (real estate management); Weston Solutions, Inc. (environmental services); Bipartisan Policy Center’s Debt Reduction Task Force (non-profit organization); Chesapeake Bay Foundation (independent conservation organization); Catholic University of America; Urban Institute (research organization). |
|
| | | |
| Principal Officers who are not Directors | |
| Name and Year of Birth | Position with Corporation | Position Start Date | Principal Occupation During Past Five Years |
| | | | |
Hope Brown 1973 | Chief Compliance Officer | 2014 | Chief Compliance Officer of 37 registered investment companies advised by CRM (since 2014). Vice President and Chief Compliance Officer, Wilmington Funds (2012-2014). Vice President and Senior Compliance Officer, Wilmington Trust Investment Advisors, Inc. (2010-2012). |
Maureen A. Gemma(3) 1960 | Secretary and Vice President | 2016 | Vice President of CRM and officer of 37 registered investment companies advised by CRM. Also Vice President of Eaton Vance Management (“EVM”) and certain of its affiliates and officer of 176 registered investment companies advised or administered by EVM. |
James F. Kirchner(3) 1967 | Treasurer | 2016 | Vice President of CRM and officer of 37 registered investment companies advised by CRM. Also Vice President of EVM and certain of its affiliates and officer of 176 registered investment companies advised or administered by EVM. |
(1) Mr. Streur is an interested person of the Funds because of his positions with each Fund’s Adviser and certain affiliates.
(2) Mmes. Bullock and Dominguez and Mr. Williams began serving as Directors effective December 23, 2016.
(3) The business address for Ms. Gemma and Mr. Kirchner is Two International Place, Boston, MA 02110. Ms. Gemma and Mr. Kirchner began serving as Officers effective December 31, 2016.
The SAI for the Fund includes additional information about the Directors and officers of the Fund and can be obtained without charge on Calvert’s website at www.calvert.com or by calling 1-800-368-2745.
www.calvert.com CALVERT MID-CAP FUND ANNUAL REPORT (Unaudited) 31
IMPORTANT NOTICES
Privacy. The Calvert organization is committed to ensuring your financial privacy. Each of the financial institutions identified below has in effect the following policy (“Privacy Policy”) with respect to nonpublic personal information about its customers:
| |
| • | Only such information received from you, through application forms or otherwise, and information about your Calvert fund transactions will be collected. This may include information such as name, address, social security number, tax status, account balances and transactions. |
| |
| • | None of such information about you (or former customers) will be disclosed to anyone, except as permitted by law (which includes disclosure to employees necessary to service your account). In the normal course of servicing a customer’s account, the Calvert organization may share information with unaffiliated third parties that perform various required services such as transfer agents, custodians and broker-dealers. |
| |
| • | Policies and procedures (including physical, electronic and procedural safeguards) are in place that are designed to protect the confidentiality of such information. |
| |
| • | We reserve the right to change our Privacy Policy at any time upon proper notification to you. Customers may want to review our Privacy Policy periodically for changes by accessing the link on our homepage: www.calvert.com. |
Our pledge of privacy applies to the following entities within the Calvert organization: the Calvert family of funds and Calvert Research and Management. In addition, our Privacy Policy applies only to those Calvert customers who are individuals and who have a direct relationship with us. If a customer’s account (i.e., fund shares) is held in the name of a third-party financial advisor/broker-dealer, it is likely that only such advisor’s privacy policies apply to the customer. This notice supersedes all previously issued privacy disclosures. For more information about Calvert’s Privacy Policy, please call 1-800-368-2745.
Delivery of Shareholder Documents. The Securities and Exchange Commission (SEC) permits funds to deliver only one copy of shareholder documents, including prospectuses, proxy statements and shareholder reports, to fund investors with multiple accounts at the same residential or post office box address. This practice is often called “householding” and it helps eliminate duplicate mailings to shareholders. Calvert funds, or your financial advisor, may household the mailing of your documents indefinitely unless you instruct Calvert funds, or your financial advisor, otherwise. If you would prefer that your Calvert fund documents not be householded, please contact Calvert funds at 1-800-368-2745, or contact your financial advisor. Your instructions that householding not apply to delivery of your Calvert fund documents will typically be effective within 30 days of receipt by Calvert funds or your financial advisor. Separate statements will be generated for each separate account and will be householded as described above.
Portfolio Holdings. Each Calvert fund will file a schedule of portfolio holdings on Form N-Q with the SEC for the first and third quarters of each fiscal year. The Form N-Q will be available on the Calvert funds’ website at www.calvert.com, by calling Calvert funds at 1-800-368-2745 or in the EDGAR database on the SEC’s website at www.sec.gov. Form N-Q may also be reviewed and copied at the SEC’s public reference room in Washington, D.C. (call 1-800-732-0330 for information on the operation of the public reference room).
Proxy Voting. The Proxy Voting Guidelines that each Calvert fund uses to determine how to vote proxies relating to portfolio securities is provided as an Appendix to the fund’s Statement of Additional Information. The Statement of Additional Information can be obtained free of charge by calling the Calvert funds at 1-800-368-2745, by visiting the Calvert funds’ website at www.calvert.com or visiting the SEC’s website at www.sec.gov. Information regarding how a Calvert fund voted proxies relating to portfolio securities during the most recent 12-month period ended June 30 is available by calling Calvert funds, by visiting the Calvert funds’ website at www.calvert.com or by visiting the SEC’s website at www.sec.gov.
32 www.calvert.com CALVERT MID-CAP FUND ANNUAL REPORT (Unaudited)
|
| | | | |
| CALVERT MID-CAP FUND | | CALVERT FUNDS | | |
Service for Existing Account Shareholders: 800-368-2745 Brokers: 800-368-2746 Regular Mail Calvert Funds c/o BFDS, P.O. Box 219544 Kansas City, MO 64121-9544 Overnight Mail Calvert Funds c/o BFDS, 330 West 9th Street Kansas City, MO 64105 Web Site www.calvert.com Principal Underwriter* Eaton Vance Distributors, Inc. Two International Place Boston, MA 02110 | | Municipal Funds Responsible Municipal Income Fund Taxable Bond Funds Bond Fund Income Fund Short Duration Income Fund Long-Term Income Fund Ultra-Short Duration Income Fund High Yield Bond Fund Green Bond Fund Absolute Return Bond Fund Floating-Rate Advantage Fund Balanced and Asset Allocation Funds Balanced Fund Conservative Allocation Fund Moderate Allocation Fund Aggressive Allocation Fund
| | Equity Funds Equity Fund US Large-Cap Core Responsible Index Fund US Large-Cap Value Responsible Index Fund US Large-Cap Growth Responsible Index Fund US Mid-Cap Core Responsible Index Fund International Responsible Index Fund Mid-Cap Fund International Equity Fund Small-Cap Fund Global Energy Solutions Fund Global Water Fund International Opportunities Fund Emerging Markets Equity Fund |
* FINRA BrokerCheck. Investors may check the background of their Investment Professional by contacting the Financial Industry Regulatory Authority (FINRA). FINRA BrokerCheck is a free tool to help investors check the professional background of current and former FINRA-registered securities firms and brokers. FINRA BrokerCheck is available by calling 1-800-289-9999 and at www.FINRA.org. The FINRA BrokerCheck brochure describing this program is available to investors at www.FINRA.org.
|
| |
| | |
Fund shares are not insured by the FDIC and are not deposits or other obligations of, or guaranteed by, any depository institution. Shares are subject to investment risks, including possible loss of principal invested. This report is intended to provide fund information to shareholders. It is not authorized for distribution to prospective investors unless preceded or accompanied by a prospectus. Note: The information on our website is not incorporated by reference into this report; our website address is included as an inactive textual reference only. Investors should carefully consider the investment objectives, risks, charges and expenses of the Calvert funds. This and other important information is contained in the fund’s summary prospectus and prospectus, which can be obtained from your financial professional and should be read carefully before investing. You may also call Calvert funds at 800-368-2745. Printed on recycled paper. |
| 24209 9.30.17 | |
|
| | |
| | |
| | | |
Calvert International Opportunities Fund
| | |
| | | |
| | |
|
| |
Annual Report September 30, 2017 E-Delivery Sign-Up — Details Inside | |
|
|
Commodity Futures Trading Commission Registration. Effective December 31, 2012, the Commodity Futures Trading Commission (“CFTC”) adopted certain regulatory changes that subject registered investment companies and advisers to regulation by the CFTC if a fund invests more than a prescribed level of its assets in certain CFTC-regulated instruments (including futures, certain options and swap agreements) or markets itself as providing investment exposure to such instruments. The Fund and its adviser have claimed an exclusion from the definition of the term “commodity pool operator” under the Commodity Exchange Act. Accordingly, neither the Fund nor the adviser is subject to CFTC regulation. |
Choose Planet-friendly E-delivery! Sign up now for on-line statements, prospectuses, and fund reports. In less than five minutes you can help reduce paper mail and lower fund costs. Just go to www.calvert.com. If you already have an online account with the Calvert funds, click on Login to access your Account and select the documents you would like to receive via e-mail. If you’re new to online account access, click on Login, then Register to create your user name and password. Once you’re in, click on the E-delivery sign-up on the Account Portfolio page and follow the quick, easy steps. Note: If your shares are not held directly with the Calvert funds but through a brokerage firm, you must contact your broker for electronic delivery options available through their firm. |
|
| | | | |
| | TABLE OF CONTENTS |
| | | | | |
| | | | | Management’s Discussion of Fund Performance |
| | | | | Performance |
| | | | | Fund Profile |
| | | | | Endnotes and Additional Disclosures |
| | | | | Understanding Your Fund’s Expenses |
| | | | | Financial Statements |
| | | | | Report of Independent Registered Public Accounting Firm |
| | | | | Federal Tax Information |
| | | | | Management and Organization |
| | | | | Important Notices |
MANAGEMENT’S DISCUSSION OF FUND PERFORMANCE1
|
| | |
| | | |
Economic and Market Conditions
Global stocks delivered strong returns in the 12-month period ended September 30, 2017 behind an extended rally that began with Donald Trump's victory in the U.S. presidential election. After lagging early in the 12-month period, U.S. stocks moved sharply higher following President Trump's election on November 8, 2016. While its effect was broad-based, the rally particularly favored financial stocks, which received another boost in mid-December when the U.S. Federal Reserve (the Fed) raised its benchmark interest rate amid continued economic growth. After a brief pullback in the final weeks of 2016, U.S. equities resumed their advance in the new year. U.S. stocks slipped in March 2017 following the failure of President Trump's health care bill in Congress. However, stocks quickly regained their upward momentum, advancing steadily despite additional Fed rate hikes in March and June. U.S. equities retreated in August amid rising geopolitical tensions over North Korea and Hurricane Harvey's devastation in Texas. Stocks soon resumed their upward trend, with some U.S. indexes reaching record highs in the final month of the period. Energy stocks delivered notable performance in the quarter behind rising oil prices and constricted supplies due to refinery damage from Hurricane Harvey. Global stocks initially lagged the U.S. rally but rose sharply in the second half of the 12-month period, aided by positive economic indicators across a broad geographic range. National elections in France, Britain and Germany set a new political course for Europe, helping to boost stocks. Reflecting the market gains, a European Union study reported the highest level of economic confidence among businesses and households in more than a decade. Key equity indexes in the Asia-Pacific region also rose during the period despite the North Korea tensions. In the final three months of the period, China's stock market recorded its best quarterly performance in two years. For the 12-month period, the MSCI World Index,2 a proxy for global equities, returned 18.17% while reaching multiple all-time highs. The MSCI EAFE Index of developed-market international equities rose 19.10%, while the MSCI Emerging Markets Index returned 22.46%. In the U.S., the blue-chip Dow Jones Industrial Average advanced 25.45%, while the broader U.S. equity market, as represented by the S&P 500 Index, gained 18.61%. Fund Performance For the 12-month period ended September 30, 2017, Calvert International Opportunities Fund (the Fund) had a total return of 27.89% for Class A shares at net asset value (NAV), outperforming its benchmark, the MSCI EAFE SMID Cap Index (the Index), which returned 20.58%. | |
Strong stock selection accounted for most of the Fund’s outperformance in the period. Although the Fund does not seek to outperform by favoring or avoiding specific regions or sectors, the Fund outpaced the Index largely from strong performance in holdings in Europe and Japan. Viewed by sector, the Fund’s returns from industrials, real estate, consumer discretionary and consumer staples stood out. Contributions lagged, however, across the technology and energy sectors. Among the largest positive contributors was Daifuku Co. Ltd., a materials-handling company based in Japan. Daifuku benefited from an increase in orders from a variety of its customers, including Japanese automakers and manufacturers across the electronics industry in Asia. At the same time, the company cut costs, producing margins that exceeded market expectations. TAL Education Group (ADR), a consumer-discretionary company that provides after-school tutoring services in China, was also a leading contributor. Structural tailwinds supporting TAL Education include the strong desire of many Chinese parents for their children to go to highly competitive schools, increasing discretionary income in China and a relaxation of the one-child policy. These tailwinds, together with TAL Education’s expansion to additional cities in China, and increasing subject offerings, have led to revenue growth rates in excess of 50% and strong share-price performance. ams AG, a semiconductor company specializing in optical sensors, was another major contributor as interest appeared strong for the new iPhone that uses the company’s 3-D sensing technology. While the company’s optical sensors have applications for other industries, it is the use of the technology by Apple, and market expectations that it will be used in Android phones as well, that are propelling the company’s strong performance. iSentia Group Ltd., an Australian technology company which sells data it collects from print, broadcast and online sources, was one of the largest detractors during the period. iSentia wrote down losses after King Content, a U.K. media company that iSentia bought, lost clients during the acquisition process. iSentia’s performance also suffered after its data costs rose, leading to its losing market share as competitors were able to undercut it. We are retaining the Fund’s investment in iSentia because we believe these were temporary setbacks and that new products it is offering will help it regain market share and pricing power. XXL ASA, a Norwegian sporting goods retailer, was also a significant detractor from Fund performance during the period. Last winter, one of the warmest in the Nordic region, hurt sales since a large portion of XXL’s product line is for winter sports. XXL’s performance also suffered from growing concerns about the impact Amazon will have on traditional retailers worldwide. XXL was sold during the period.
|
See Endnotes and Additional Disclosures in this report.
Past performance is no guarantee of future results. Returns are historical and are calculated by determining the percentage change in net asset value (NAV) or offering price (as applicable) with all distributions reinvested. Investment return and principal value will fluctuate so that shares, when redeemed, may be worth more or less than their original cost. Performance less than or equal to one year is cumulative. Performance is for the stated time period only; due to market volatility, the Fund's current performance may be lower or higher than quoted. Returns are before taxes unless otherwise noted. For performance as of the most recent month-end, please refer to www.calvert.com.
2 www.calvert.com CALVERT INTERNATIONAL OPPORTUNITIES FUND ANNUAL REPORT (Unaudited)
PERFORMANCE
|
| | | | | | | | | | | | | | | |
Performance2,3 | | | | | | | | | | |
Portfolio Managers Aidan M. Farrell of Eaton Vance Advisers International Ltd.; Christopher Madden, CFA and Jade Huang, each of Calvert Research and Management |
| | | | | | | | | | | |
| % Average Annual Total Returns | | Class Inception Date |
| | Performance Inception Date |
| | One Year |
| | Five Years |
| | Ten Years |
|
| Class A at NAV | | 05/31/2007 |
| | 05/31/2007 |
| | 27.89 | % | | 11.45 | % | | 3.73 | % |
| Class A with 4.75% Maximum Sales Charge | | — |
| | — |
| | 21.79 |
| | 10.36 |
| | 3.23 |
|
| Class C at NAV | | 07/31/2007 |
| | 05/31/2007 |
| | 26.83 |
| | 10.49 |
| | 2.86 |
|
| Class C with 1% Maximum Sales Charge | | — |
| | — |
| | 25.83 |
| | 10.49 |
| | 2.86 |
|
| Class I at NAV | | 05/31/2007 |
| | 05/31/2007 |
| | 28.44 |
| | 11.94 |
| | 4.19 |
|
| Class Y at NAV | | 10/31/2008 |
| | 05/31/2007 |
| | 28.25 |
| | 11.74 |
| | 3.95 |
|
| | | | | | | | | | | |
| | | | | | | | | | | |
| MSCI EAFE SMID Cap Index | | — |
| | — |
| | 20.58 | % | | 11.70 | % | | 3.39 | % |
| | | | | | | | | | | |
% Total Annual Operating Expense Ratios4 | | | | Class A |
| | Class C |
| | Class I |
| | Class Y |
|
| Gross | | | | 1.43 | % | | 2.61 | % | | 1.16 | % | | 1.15 | % |
| Net | | | | 1.43 |
| | 2.26 |
| | 1.16 |
| | 1.15 |
|
|
|
| Growth of $10,000 |
| This graph shows the change in value of a hypothetical investment of $10,000 in Class A of the Fund for the period indicated. For comparison, the same investment is shown in the indicated index. |
|
| | | | | | | | |
Growth of Investment3 | Amount Invested |
| Period Beginning | At NAV |
| With Maximum Sales Charge |
| Class C |
| $10,000 |
| 5/31/2007 |
| $13,261 |
| N.A. |
| Class I |
| $250,000 |
| 5/31/2007 |
| $376,859 |
| N.A. |
| Class Y |
| $10,000 |
| 5/31/2007 |
| $14,743 |
| N.A. |
See Endnotes and Additional Disclosures in this report.
Past performance is no guarantee of future results. Returns are historical and are calculated by determining the percentage change in net asset value (NAV) or offering price (as applicable) with all distributions reinvested. Investment return and principal value will fluctuate so that shares, when redeemed, may be worth more or less than their original cost. Performance less than or equal to one year is cumulative. Performance is for the stated time period only; due to market volatility, the Fund's current performance may be lower or higher than quoted. Returns are before taxes unless otherwise noted. For performance as of the most recent month-end, please refer to www.calvert.com.
www.calvert.com CALVERT INTERNATIONAL OPPORTUNITIES FUND ANNUAL REPORT (Unaudited) 3
FUND PROFILE
|
| | | | | | | |
| |
| | | | | |
| | SECTOR ALLOCATION (% of total investments)5 | | | TEN LARGEST STOCK HOLDINGS (% of net assets) |
| | | | | | |
| | Industrials | 24.4 | % | | Brenntag AG | 1.8 | % |
| | Consumer Discretionary | 17.5 | % | | IWG plc | 1.7 | % |
| | Financials | 12.9 | % | | Melrose Industries plc | 1.6 | % |
| | Real Estate | 9.3 | % | | Frutarom Industries Ltd. | 1.6 | % |
| | Materials | 8.1 | % | | IMCD Group NV | 1.6 | % |
| | Information Technology | 7.9 | % | | Sanden Holdings Corp. | 1.6 | % |
| | Health Care | 6.8 | % | | Inchcape plc | 1.5 | % |
| | Consumer Staples | 6.6 | % | | Indutrade AB | 1.5 | % |
| | Utilities | 1.9 | % | | CAE, Inc. | 1.5 | % |
| | Time Deposit | 1.7 | % | | DS Smith plc | 1.4 | % |
| | Energy | 1.4 | % | | Total | 15.8 | % |
| | Telecommunication Services | 1.0 | % | | | |
| | High Social Impact Investments | 0.5 | % | | | |
| | Total | 100.0 | % | | | |
See Endnotes and Additional Disclosures in this report.
4 www.calvert.com CALVERT INTERNATIONAL OPPORTUNITIES FUND ANNUAL REPORT (Unaudited)
|
| | |
| Endnotes and Additional Disclosures | | |
| | | |
1 The views expressed in this report are those of the portfolio manager(s) and are current only through the date stated at the top of this page. These views are subject to change at any time based upon market or other conditions, and Eaton Vance and the Fund(s) disclaim any responsibility to update such views. These views may not be relied upon as investment advice and, because investment decisions are based on many factors, may not be relied upon as an indication of trading intent on behalf of any Calvert fund. This commentary may contain statements that are not historical facts, referred to as “forward looking statements”. The Fund’s actual future results may differ significantly from those stated in any forward looking statement, depending on factors such as changes in securities or financial markets or general economic conditions, the volume of sales and purchases of Fund shares, the continuation of investment advisory, administrative and service contracts, and other risks discussed from time to time in the Fund’s filings with the Securities and Exchange Commission.
2 MSCI World Index is an unmanaged index of equity securities in the developed markets. MSCI EAFE Index is an unmanaged index of equities in the developed markets, excluding the U.S. and Canada. MSCI Emerging Markets Index is an unmanaged index of emerging markets common stocks. Dow Jones Industrial Average is a price-weighted average of 30 blue-chip stocks that are generally the leaders in their industry. S&P 500 Index is an unmanaged index of large-cap stocks commonly used as a measure of U.S. stock market performance. MSCI EAFE SMID Cap Index is an unmanaged index of small & mid-capitalization equities in the developed markets, excluding the U.S. and Canada. MSCI indexes are net of foreign withholding taxes. Source: MSCI. MSCI data may not be reproduced or used for any other purpose. MSCI provides no warranties, has not prepared or approved this report, and has no liability hereunder. Unless otherwise stated, index returns do not reflect the effect of any applicable sales charges, commissions, expenses, taxes or leverage, as applicable. It is not possible to invest directly in an index.
3 Total Returns at NAV do not include applicable sales charges. If sales charges were deducted, the returns would be lower. Total Returns shown with maximum sales charge reflect the stated maximum sales charge. Unless otherwise stated, performance does not reflect the deduction of taxes on Fund distributions or redemptions of Fund shares.
Performance prior to the inception date of a class may be linked to the performance of an older class of the Fund. This linked performance is adjusted for any applicable sales charge, but is not adjusted for class expense differences. If adjusted for such differences, the performance would be different. The performance of Class C and Class Y is linked to Class A. Performance since inception for an index, if presented, is the performance since the Fund’s or oldest share class’ inception, as applicable. Performance presented in the Financial Highlights included in the financial statements is not linked.
Effective November 6, 2017, Class I shares have an initial investment minimum of $250,000.
| | 4 Source: Fund prospectus. Net expense ratios reflect a contractual expense reimbursement that continues through 1/31/19. Without the reimbursement, performance would have been lower. The expense ratios for the current reporting period can be found in the Financial Highlights section of this report.
5 Does not include Short Term Investment of Cash Collateral for Securities Loaned. Fund profile subject to change due to active management
|
www.calvert.com CALVERT INTERNATIONAL OPPORTUNITIES FUND ANNUAL REPORT (Unaudited) 5
UNDERSTANDING YOUR FUND'S EXPENSES
Example
As a Fund shareholder, you incur two types of costs: (1) transaction costs, including sales charges (loads) on purchases and redemption fees (if applicable); and (2) ongoing costs, including management fees; distribution and/or service fees; and other Fund expenses. This Example is intended to help you understand your ongoing costs (in dollars) of Fund investing and to compare these costs with the ongoing costs of investing in other mutual funds. The Example is based on an investment of $1,000 invested at the beginning of the period and held for the entire period (April 1, 2017 to September 30, 2017).
Actual Expenses
The first section of the table below provides information about actual account values and actual expenses. You may use the information in this section, together with the amount you invested, to estimate the expenses that you paid over the period. Simply divide your account value by $1,000 (for example, an $8,600 account value divided by $1,000 = 8.6), then multiply the result by the number in the first section under the heading entitled “Expenses Paid During Period” to estimate the expenses you paid on your account during this period.
Hypothetical Example for Comparison Purposes
The second section of the table below provides information about hypothetical account values and hypothetical expenses based on the actual Fund expense ratio and an assumed rate of return of 5% per year (before expenses), which is not the actual Fund return. The hypothetical account values and expenses may not be used to estimate the actual ending account balance or expenses you paid for the period. You may use this information to compare the ongoing costs of investing in the Fund and other funds. To do so, compare this 5% hypothetical example with the 5% hypothetical examples that appear in the shareholder reports of the other funds.
Please note that the expenses shown in the table are meant to highlight your ongoing costs only and do not reflect any transactional costs, such as sales charges (loads) or redemption fees (if applicable). Therefore, the second section of the table is useful in comparing ongoing costs only, and will not help you determine the relative total costs of owning different funds. In addition, if these transactional costs were included, your costs would be higher.
|
| | | | |
| | BEGINNING
ACCOUNT VALUE
(4/1/17) | ENDING
ACCOUNT VALUE
(9/30/17) | EXPENSES PAID
DURING PERIOD*
(4/1/17 - 9/30/17) | ANNUALIZED
EXPENSE RATIO |
| Actual | | | | |
| Class A | $1,000.00 | $1,199.50 | $8.82** | 1.60% |
| Class C | $1,000.00 | $1,195.40 | $12.44** | 2.26% |
| Class I | $1,000.00 | $1,202.30 | $5.80** | 1.05% |
| Class Y | $1,000.00 | $1,201.20 | $6.40** | 1.16% |
| Hypothetical | | | | |
| (5% return per year before expenses) | | | | |
| Class A | $1,000.00 | $1,017.05 | $8.09** | 1.60% |
| Class C | $1,000.00 | $1,013.74 | $11.41** | 2.26% |
| Class I | $1,000.00 | $1,019.80 | $5.32** | 1.05% |
| Class Y | $1,000.00 | $1,019.25 | $5.87** | 1.16% |
| | | | | |
| * Expenses are equal to the Fund's annualized expense ratio for the indicated Class, multiplied by the average account value over the period, multiplied by 183/365 (to reflect the one-half year period). The Example assumes that the $1,000 was invested at the net asset value per share determined at the close of business on March 31, 2017. |
| ** Absent a waiver and/or reimbursement of expenses by affiliates, expenses would be higher. |
6 www.calvert.com CALVERT INTERNATIONAL OPPORTUNITIES FUND ANNUAL REPORT (Unaudited)
CALVERT INTERNATIONAL OPPORTUNITIES FUND
SCHEDULE OF INVESTMENTS
SEPTEMBER 30, 2017
|
| | |
| | SHARES | VALUE ($) |
| COMMON STOCKS - 96.9% | | |
| Australia - 6.1% | | |
| Amaysim Australia Ltd. (a) | 908,191 | 1,399,836 |
| BlueScope Steel Ltd. | 41,548 | 358,913 |
| BWX Ltd. (a) | 211,305 | 974,092 |
| Challenger Ltd. | 162,814 | 1,595,946 |
| GDI Property Group | 1,515,299 | 1,343,118 |
| InvoCare Ltd. | 91,253 | 1,126,305 |
| IOOF Holdings Ltd. | 150,301 | 1,317,387 |
| iSentia Group Ltd. (a) | 606,564 | 849,133 |
| Mirvac Group | 452,393 | 813,803 |
| Super Retail Group Ltd. (a) | 253,279 | 1,606,135 |
| Tox Free Solutions Ltd. (a) | 994,872 | 1,950,944 |
| | | 13,335,612 |
| | | |
| Austria - 0.7% | | |
| ams AG | 22,535 | 1,636,257 |
| | | |
| Belgium - 1.9% | | |
| Kinepolis Group NV | 29,673 | 1,970,613 |
| Melexis NV | 14,269 | 1,381,848 |
| Montea SCA | 16,495 | 880,999 |
| | | 4,233,460 |
| | | |
| Canada - 1.9% | | |
| CAE, Inc. | 181,069 | 3,167,891 |
| Kinaxis, Inc. * | 15,030 | 887,767 |
| | | 4,055,658 |
| | | |
| China - 0.9% | | |
| TAL Education Group (ADR) | 61,608 | 2,076,806 |
| | | |
| Denmark - 0.9% | | |
| Topdanmark AS * | 47,292 | 1,863,093 |
| | | |
| Finland - 2.1% | | |
| Amer Sports Oyj (a) | 100,186 | 2,659,761 |
| Technopolis Oyj | 398,245 | 1,850,863 |
| | | 4,510,624 |
| | | |
| France - 4.6% | | |
| Criteo S.A. (ADR) (a) | 30,845 | 1,280,068 |
| Ipsen S.A. | 11,914 | 1,585,197 |
| | | |
www.calvert.com CALVERT INTERNATIONAL OPPORTUNITIES FUND ANNUAL REPORT 7
|
| | |
| | SHARES | VALUE ($) |
| COMMON STOCKS - CONT’D | | |
| Metropole Television S.A. | 133,901 | 3,097,035 |
| Nexity S.A. | 28,409 | 1,736,025 |
| Rubis SCA | 36,197 | 2,307,504 |
| | | 10,005,829 |
| | | |
| Germany - 5.5% | | |
| Axel Springer SE | 20,453 | 1,315,477 |
| Brenntag AG | 70,545 | 3,932,589 |
| Carl Zeiss Meditec AG | 21,934 | 1,147,484 |
| Freenet AG | 25,082 | 839,410 |
| Nemetschek SE | 12,883 | 1,048,465 |
| Norma Group SE | 36,491 | 2,404,222 |
| Rational AG | 1,311 | 902,403 |
| Salzgitter AG (a) | 10,548 | 479,134 |
| | | 12,069,184 |
| | | |
| Hong Kong - 0.7% | | |
| Hysan Development Co. Ltd. | 318,631 | 1,503,321 |
| | | |
| Ireland - 2.3% | | |
| Irish Residential Properties REIT plc | 1,128,937 | 1,968,079 |
| UDG Healthcare plc | 271,266 | 3,091,776 |
| | | 5,059,855 |
| | | |
| Israel - 1.6% | | |
| Frutarom Industries Ltd. | 46,002 | 3,538,515 |
| | | |
| Italy - 5.2% | | |
| Amplifon SpA | 175,297 | 2,668,434 |
| Banca Generali SpA | 51,199 | 1,778,240 |
| FinecoBank Banca Fineco SpA | 224,873 | 1,996,542 |
| MARR SpA | 81,983 | 2,161,211 |
| Moncler SpA | 98,869 | 2,856,677 |
| | | 11,461,104 |
| | | |
| Japan - 28.2% | | |
| 77 Bank Ltd. (The) | 74,154 | 1,835,468 |
| Ariake Japan Co. Ltd. | 30,314 | 2,176,999 |
| Asahi Co. Ltd. | 167,997 | 1,990,104 |
| Asahi Intecc Co. Ltd. | 35,628 | 1,858,470 |
| Daifuku Co. Ltd. | 37,053 | 1,827,224 |
| Daiichikosho Co. Ltd. | 35,663 | 1,707,683 |
| Dowa Holdings Co. Ltd. | 11,213 | 411,825 |
| Eiken Chemical Co. Ltd. | 62,909 | 2,452,993 |
| FP Corp. (a) | 48,617 | 2,485,775 |
| Fuji Seal International, Inc. | 71,397 | 2,160,200 |
| GMO internet, Inc. (a) | 90,948 | 1,109,133 |
8 www.calvert.com CALVERT INTERNATIONAL OPPORTUNITIES FUND ANNUAL REPORT
|
| | |
| | SHARES | VALUE ($) |
| COMMON STOCKS - CONT’D | | |
| Heiwa Real Estate REIT, Inc. | 1,581 | 1,278,569 |
| HIS Co. Ltd. (a) | 66,106 | 2,087,352 |
| Japan Hotel REIT Investment Corp. | 1,720 | 1,087,177 |
| LaSalle Logiport REIT | 1,294 | 1,261,688 |
| Like Co. Ltd. (a) | 81,458 | 1,403,381 |
| Morinaga & Co. Ltd. | 43,964 | 2,447,895 |
| Nippon Light Metal Holdings Co. Ltd. | 208,546 | 593,980 |
| Nishi-Nippon Financial Holdings, Inc. | 145,619 | 1,595,025 |
| Nohmi Bosai Ltd. | 111,100 | 1,753,184 |
| Nomura Co. Ltd. | 55,994 | 1,241,283 |
| Okamura Corp. | 241,200 | 2,756,855 |
| Oyo Corp. | 115,203 | 1,786,702 |
| Penta-Ocean Construction Co. Ltd. | 219,279 | 1,384,476 |
| Relia, Inc. (a) | 222,480 | 2,569,452 |
| Sakata INX Corp. | 127,803 | 2,360,475 |
| Sakata Seed Corp. | 81,248 | 2,312,262 |
| Sanden Holdings Corp. * | 172,322 | 3,422,235 |
| Sumco Corp. | 125,401 | 1,978,572 |
| Tokyo Century Corp. | 54,957 | 2,475,595 |
| Tosei Corp. | 164,941 | 1,449,281 |
| UACJ Corp. (a) | 16,049 | 457,665 |
| Yamaha Corp. | 60,500 | 2,233,748 |
| Yokohama Reito Co. Ltd. (a) | 203,114 | 1,914,481 |
| | | 61,867,207 |
| | | |
| Luxembourg - 0.2% | | |
| APERAM S.A. | 9,300 | 487,370 |
| | | |
| Netherlands - 4.5% | | |
| Aalberts Industries NV | 62,936 | 3,042,194 |
| Core Laboratories NV | 9,325 | 920,377 |
| IMCD Group NV | 57,680 | 3,536,768 |
| Refresco Group NV (b) | 120,877 | 2,437,251 |
| | | 9,936,590 |
| | | |
| New Zealand - 0.7% | | |
| Fisher & Paykel Healthcare Corp. Ltd. | 166,159 | 1,534,879 |
| | | |
| Norway - 1.9% | | |
| Europris ASA (b) | 240,136 | 1,154,775 |
| SpareBank 1 SR-Bank ASA | 269,221 | 2,898,575 |
| | | 4,053,350 |
| | | |
| Singapore - 0.9% | | |
| Frasers Centrepoint Trust | 816,188 | 1,270,917 |
| SIIC Environment Holdings Ltd. | 1,533,728 | 604,920 |
| | | 1,875,837 |
www.calvert.com CALVERT INTERNATIONAL OPPORTUNITIES FUND ANNUAL REPORT 9
|
| | |
| | SHARES | VALUE ($) |
| COMMON STOCKS - CONT’D | | |
| Spain - 1.0% | | |
| Acciona SA | 14,017 | 1,128,483 |
| Hispania Activos Inmobiliarios SOCIMI SA | 54,523 | 982,722 |
| | | 2,111,205 |
| | | |
| Sweden - 3.6% | | |
| Avanza Bank Holding AB | 22,414 | 938,950 |
| Boliden AB | 31,913 | 1,082,468 |
| Indutrade AB | 125,127 | 3,305,128 |
| Trelleborg AB, Class B | 103,970 | 2,606,001 |
| | | 7,932,547 |
| | | |
| Switzerland - 3.7% | | |
| Galenica AG *(b) | 8,136 | 386,234 |
| IWG plc | 893,059 | 3,704,792 |
| Temenos Group AG | 15,259 | 1,558,542 |
| Vontobel Holding AG | 20,882 | 1,343,484 |
| VZ Holding AG | 3,173 | 1,012,503 |
| | | 8,005,555 |
| | | |
| United Kingdom - 16.9% | | |
| Aldermore Group plc * | 513,719 | 1,587,190 |
| Bellway plc | 51,911 | 2,296,297 |
| Bodycote plc | 197,316 | 2,424,485 |
| DS Smith plc | 476,207 | 3,148,151 |
| Grainger plc | 381,759 | 1,371,881 |
| Halma plc | 186,206 | 2,793,972 |
| Hansteen Holdings plc | 784,626 | 1,450,930 |
| Hastings Group Holdings plc (b) | 404,905 | 1,650,505 |
| Hiscox Ltd. | 139,197 | 2,388,489 |
| Inchcape plc | 286,672 | 3,315,754 |
| Melrose Industries plc | 1,242,092 | 3,543,611 |
| Moneysupermarket.com Group plc | 200,620 | 855,300 |
| Spirax-Sarco Engineering plc | 15,499 | 1,148,287 |
| St James's Place plc | 113,274 | 1,740,997 |
| Travis Perkins plc | 142,045 | 2,756,126 |
| Weir Group plc (The) | 57,486 | 1,513,117 |
| WH Smith plc | 113,687 | 3,078,802 |
| | | 37,063,894 |
| | | |
| United States - 0.9% | | |
| Oceaneering International, Inc. | 77,761 | 2,042,781 |
| | | |
| Total Common Stocks (Cost $177,833,697) | | 212,260,533 |
| | | |
| | | |
10 www.calvert.com CALVERT INTERNATIONAL OPPORTUNITIES FUND ANNUAL REPORT
|
| | |
| | PRINCIPAL AMOUNT ($) | VALUE ($) |
| HIGH SOCIAL IMPACT INVESTMENTS - 0.5% | | |
| Calvert Social Investment Foundation, Community Investment Notes, 1.50%, 12/15/19 (c)(d) | 1,000,000 | 953,080 |
| ImpactAssets Inc., Global Sustainable Agriculture Notes, 0.00%, 11/3/20 (c)(e)(f) | 111,000 | 104,895 |
| ImpactAssets Inc., Microfinance Plus Notes, 0.00%, 11/3/20 (c)(e)(f) | 142,000 | 135,326 |
| | | |
| Total High Social Impact Investments (Cost $1,253,000) | | 1,193,301 |
| | | |
| | | |
| TIME DEPOSIT - 1.7% | | |
| State Street Bank and Trust Eurodollar Time Deposit, 0.12%, 10/2/17 | 3,607,417 | 3,607,417 |
| | | |
| Total Time Deposit (Cost $3,607,417) | | 3,607,417 |
| | | |
| | | |
| | SHARES | VALUE ($) |
| SHORT TERM INVESTMENT OF CASH COLLATERAL FOR SECURITIES LOANED - 4.7% | |
| State Street Institutional U.S. Government Money Market Fund - Premier Class, 0.92% | 10,381,130 | 10,381,130 |
| | | |
| Total Short Term Investment of Cash Collateral for Securities Loaned (Cost $10,381,130) | | 10,381,130 |
| | | |
| | | |
| TOTAL INVESTMENTS (Cost $193,075,244) - 103.8% | | 227,442,381 |
| Other assets and liabilities, net - (3.8%) | | (8,328,121) |
NET ASSETS - 100.0% | | 219,114,260 |
|
| |
| NOTES TO SCHEDULE OF INVESTMENTS |
| * Non-income producing security. |
| (a) Security, or portion of security, is on loan. Total value of securities on loan is $9,835,248 as of September 30, 2017. |
| (b) Security is exempt from registration under Rule 144A of the Securities Act of 1933. These securities may be resold in transactions exempt from registration, normally to qualified institutional buyers. Total market value of Rule 144A securities amounts to $5,628,765, which represents 2.6% of the net assets of the Fund as of September 30, 2017. |
| (c) Restricted security. Total market value of restricted securities amounts to $1,193,301, which represents 0.5% of the net assets of the Fund as of September 30, 2017. |
| (d) Affiliated company (see Note F). |
| (e) For fair value measurement disclosure purposes, security is categorized as Level 3 (see Note A). |
| (f) Notes carry an interest rate that varies by period and is contingent on the performance of the underlying portfolio of loans to borrowers. The coupon rate shown represents the rate in effect at September 30, 2017. |
www.calvert.com CALVERT INTERNATIONAL OPPORTUNITIES FUND ANNUAL REPORT 11
At September 30, 2017, the concentration of the Fund’s investments in the various sectors, determined as a percentage of total investments, was as follows:
|
| | |
| ECONOMIC SECTORS | % OF TOTAL INVESTMENTS* |
| Industrials | 24.4 | % |
| Consumer Discretionary | 17.5 | % |
| Financials | 12.9 | % |
| Real Estate | 9.3 | % |
| Materials | 8.1 | % |
| Information Technology | 7.9 | % |
| Health Care | 6.8 | % |
| Consumer Staples | 6.6 | % |
| Utilities | 1.9 | % |
| Time Deposit | 1.7 | % |
| Energy | 1.4 | % |
| Telecommunication Services | 1.0 | % |
| High Social Impact Investments | 0.5 | % |
| Total | 100.0 | % |
| | |
| *Does not include Short Term Investment of Cash Collateral for Securities Loaned. | |
|
| |
| Abbreviations: |
| ADR: | American Depositary Receipt |
|
| | |
| RESTRICTED SECURITIES | ACQUISITION DATES | COST ($) |
| Calvert Social Investment Foundation, Community Investment Notes, 1.50%, 12/15/19 | 12/15/16 | 1,000,000 |
| ImpactAssets Inc., Global Sustainable Agriculture Notes, 0.00%, 11/3/20 | 11/13/15 | 111,000 |
| ImpactAssets Inc., Microfinance Plus Notes, 0.00%, 11/3/20 | 11/13/15 | 142,000 |
| See notes to financial statements. |
12 www.calvert.com CALVERT INTERNATIONAL OPPORTUNITIES FUND ANNUAL REPORT
CALVERT INTERNATIONAL OPPORTUNITIES FUND
STATEMENT OF ASSETS AND LIABILITIES
SEPTEMBER 30, 2017
|
| | | |
| ASSETS | |
Investments in securities of unaffiliated issuers, at value (identified cost $192,075,244) - including $9,835,248 of securities on loan |
| $226,489,301 |
|
| Investments in securities of affiliated issuers, at value (identified cost $1,000,000) | 953,080 |
|
| Cash denominated in foreign currency, at value (cost $378,924) | 393,167 |
|
| Receivable for investments sold | 1,958,701 |
|
| Receivable for capital shares sold | 343,056 |
|
| Dividends and interest receivable | 495,545 |
|
| Interest receivable - affiliated | 12,083 |
|
| Securities lending income receivable | 10,334 |
|
| Tax reclaims receivable | 172,057 |
|
| Receivable from affiliates | 4,428 |
|
| Directors' deferred compensation plan | 121,615 |
|
| Total assets | 230,953,367 |
|
| | |
| LIABILITIES | |
| Payable for investments purchased | 896,096 |
|
| Payable for capital shares redeemed | 150,849 |
|
| Deposits for securities loaned | 10,381,130 |
|
| Payable to affiliates: | |
| Investment advisory fee | 131,733 |
|
| Administrative fee | 21,077 |
|
| Distribution and service fees | 14,775 |
|
| Sub-transfer agency fee | 2,133 |
|
| Directors' deferred compensation plan | 121,615 |
|
| Accrued expenses | 119,699 |
|
| Total liabilities | 11,839,107 |
|
| NET ASSETS |
| $219,114,260 |
|
| | |
| NET ASSETS CONSIST OF: | |
| Paid-in capital applicable to common stock | |
| (250,000,000 shares of $0.01 par value authorized) |
| $174,726,699 |
|
| Accumulated undistributed net investment income | 1,413,220 |
|
| Accumulated undistributed net realized gain | 8,591,122 |
|
| Net unrealized appreciation (depreciation) | 34,383,219 |
|
| Total |
| $219,114,260 |
|
| | |
| NET ASSET VALUE PER SHARE | |
| Class A (based on net assets of $50,551,985 and 2,703,853 shares outstanding) |
| $18.70 |
|
| Class C (based on net assets of $5,849,730 and 319,830 shares outstanding) |
| $18.29 |
|
| Class I (based on net assets of $115,698,026 and 6,280,061 shares outstanding) |
| $18.42 |
|
| Class Y (based on net assets of $47,014,519 and 2,624,563 shares outstanding) |
| $17.91 |
|
| | |
| OFFERING PRICE PER SHARE* | |
| Class A (100/95.25 of net asset value per share) |
| $19.63 |
|
| * On sales of $50,000 or more, the offering price of Class A shares is reduced. | |
| See notes to financial statements. | |
www.calvert.com CALVERT INTERNATIONAL OPPORTUNITIES FUND ANNUAL REPORT 13
CALVERT INTERNATIONAL OPPORTUNITIES FUND
STATEMENT OF OPERATIONS
YEAR ENDED SEPTEMBER 30, 2017
|
| | | |
| INVESTMENT INCOME | |
| Dividend income (net of foreign taxes withheld of $337,503) |
| $3,835,949 |
|
| Interest income - unaffiliated issuers | 12,822 |
|
| Interest income - affiliated issuers | 13,055 |
|
| Securities lending income, net | 89,134 |
|
| Other income | 533 |
|
| Total investment income | 3,951,493 |
|
| | |
| EXPENSES | |
| Investment advisory fee | 1,536,752 |
|
| Administrative fee | 245,881 |
|
| Distribution and service fees: | |
| Class A | 183,900 |
|
| Class C | 51,389 |
|
| Directors' fees and expenses | 10,278 |
|
| Custodian fees | 148,102 |
|
| Transfer agency fees and expenses: | |
| Class A | 121,327 |
|
| Class C | 15,116 |
|
| Class I | 4,314 |
|
| Class Y | 34,171 |
|
| Accounting fees | 66,467 |
|
| Professional fees | 38,253 |
|
| Registration fees: | |
| Class A | 17,078 |
|
| Class C | 14,030 |
|
| Class I | 17,389 |
|
| Class Y | 16,229 |
|
| Reports to shareholders | 24,882 |
|
| Miscellaneous | 61,609 |
|
| Total expenses | 2,607,167 |
|
| Waiver and/or reimbursement of expenses by affiliates | (16,026) |
|
| Reimbursement of expenses-other | (2,222) |
|
| Net expenses | 2,588,919 |
|
| Net investment income (loss) | 1,362,574 |
|
| | |
14 www.calvert.com CALVERT INTERNATIONAL OPPORTUNITIES FUND ANNUAL REPORT
CALVERT INTERNATIONAL OPPORTUNITIES FUND
STATEMENT OF OPERATIONS
YEAR ENDED SEPTEMBER 30, 2017 - CONT’D
|
| | | |
| REALIZED AND UNREALIZED GAIN (LOSS) | |
| Net realized gain (loss) on: | |
| Investment securities - unaffiliated issuers (net of foreign capital gains taxes of $6,253) | 22,274,438 |
|
| Foreign currency transactions | (247,367) |
|
| | 22,027,071 |
|
| | |
| Net change in unrealized appreciation (depreciation) on: | |
| Investment securities - unaffiliated issuers (including net decrease in payable for foreign capital gains taxes of $32,676) | 25,499,529 |
|
| Investment securities - affiliated issuers | (30,120) |
|
| Foreign currency | 5,954 |
|
| | 25,475,363 |
|
| | |
| Net realized and unrealized gain (loss) | 47,502,434 |
|
| | |
| Net increase (decrease) in net assets resulting from operations |
| $48,865,008 |
|
| | |
| See notes to financial statements. | |
www.calvert.com CALVERT INTERNATIONAL OPPORTUNITIES FUND ANNUAL REPORT 15
CALVERT INTERNATIONAL OPPORTUNITIES FUND
STATEMENTS OF CHANGES IN NET ASSETS
|
| | | | | | | |
| INCREASE (DECREASE) IN NET ASSETS | Year Ended
September 30, 2017 | | Year Ended
September 30, 2016 |
| Operations: | | | |
| Net investment income (loss) |
| $1,362,574 |
| |
| $2,304,455 |
|
| Net realized gain (loss) | 22,027,071 |
| | (8,901,588) |
|
| Net change in unrealized appreciation (depreciation) | 25,475,363 |
| | 18,266,068 |
|
| Net increase (decrease) in net assets resulting from operations | 48,865,008 |
| | 11,668,935 |
|
| | | | |
| Distributions to shareholders from: | | | |
| Net investment income: | | | |
| Class A shares | (1,050,800) |
| | (768,140) |
|
| Class C shares | (3,184) |
| | — |
|
| Class I shares | (1,136,929) |
| | (496,125) |
|
| Class Y shares | (418,018) |
| | (389,709) |
|
| Net realized gain: | | | |
| Class A shares | — |
| | (3,241,863) |
|
| Class C shares | — |
| | (173,186) |
|
| Class I shares | — |
| | (1,423,627) |
|
| Class Y shares | — |
| | (1,206,553) |
|
| Total distributions to shareholders | (2,608,931) |
| | (7,699,203) |
|
| | | | |
| Capital share transactions: | | | |
| Class A shares | (70,561,791) |
| | 5,831,271 |
|
| Class C shares | (434,754) |
| | (17,056) |
|
| Class I shares | 23,086,963 |
| | 26,769,270 |
|
| Class Y shares | (6,605,540) |
| | 11,750,052 |
|
| Net increase (decrease) in net assets from capital share transactions | (54,515,122) |
| | 44,333,537 |
|
| | | | |
| TOTAL INCREASE (DECREASE) IN NET ASSETS | (8,259,045) |
| | 48,303,269 |
|
| | | | |
| | | | |
| NET ASSETS | | | |
| Beginning of year | 227,373,305 |
| | 179,070,036 |
|
| End of year (including accumulated undistributed net investment income of $1,413,220 and $1,658,886, respectively) |
| $219,114,260 |
| |
| $227,373,305 |
|
| See notes to financial statements. | | | |
16 www.calvert.com CALVERT INTERNATIONAL OPPORTUNITIES FUND ANNUAL REPORT
CALVERT INTERNATIONAL OPPORTUNITIES FUND
FINANCIAL HIGHLIGHTS
|
| | | | | | | | | | | | | | |
| | Year Ended September 30, |
| CLASS A SHARES | 2017 | | 2016 | | 2015 | | 2014 | | 2013 |
| Net asset value, beginning | $14.78 | | $14.58 | | $16.42 | | $15.76 | | $12.59 |
| Income from investment operations: | | | | | | | | | |
Net investment income (a) | 0.03 |
| | 0.15 |
| (b) | 0.14 |
| | 0.15 |
| | 0.14 |
|
| Net realized and unrealized gain (loss) | 4.04 |
| | 0.63 |
| | (0.83) |
| | 0.66 |
| | 3.19 |
|
| Total from investment operations | 4.07 |
| | 0.78 |
| | (0.69) |
| | 0.81 |
| | 3.33 |
|
| Distributions from: | | | | | | | | | |
| Net investment income | (0.15) |
| | (0.11) |
| | (0.18) |
| | (0.15) |
| | (0.16) |
|
| Net realized gain | — |
| | (0.47) |
| | (0.97) |
| | — |
| | — |
|
| Total distributions | (0.15) |
| | (0.58) |
| | (1.15) |
| | (0.15) |
| | (0.16) |
|
| Total increase (decrease) in net asset value | 3.92 |
| | 0.20 |
| | (1.84) |
| | 0.66 |
| | 3.17 |
|
| Net asset value, ending | $18.70 | | $14.78 | | $14.58 | | $16.42 | | $15.76 |
Total return (c) | 27.89 | % | | 5.49 | % | | (4.32 | %) | | 5.14 | % | | 26.70 | % |
Ratios to average net assets: (d) | | | | | | | | | |
| Total expenses | 1.48 | % | | 1.49 | % | | 1.69 | % | | 1.85 | % | | 2.13 | % |
| Net expenses | 1.48 | % | | 1.46 | % | | 1.66 | % | | 1.66 | % | | 1.66 | % |
| Net investment income | 0.18 | % | | 1.07 | % | (b) | 0.88 | % | | 0.88 | % | | 1.04 | % |
| Portfolio turnover | 158 | % | | 52 | % | | 51 | % | | 56 | % | | 42 | % |
| Net assets, ending (in thousands) | $50,552 | | $107,429 | | $99,908 | | $50,540 | | $45,563 |
| | | | | | | | | | |
(a) Computed using average shares outstanding. |
(b) Amount includes a non-recurring refund for overbilling of prior years' custody out-of-pocket fees. This amounted to $0.006 per share and 0.04% of average net assets. |
(c) Returns are historical and are calculated by determining the percentage change in net asset value with all distributions reinvested and do not reflect the effect of sales charges, if any. Total return is not annualized for periods of less than one year. |
(d) Total expenses do not reflect amounts reimbursed and/or waived by the Adviser and certain of its affiliates, if applicable. Net expenses are net of all reductions and represent the net expenses paid by the Fund. |
| See notes to financial statements. |
www.calvert.com CALVERT INTERNATIONAL OPPORTUNITIES FUND ANNUAL REPORT 17
CALVERT INTERNATIONAL OPPORTUNITIES FUND
FINANCIAL HIGHLIGHTS
|
| | | | | | | | | | | | | | |
| | Year Ended September 30, |
| CLASS C SHARES | 2017 | | 2016 | | 2015 | | 2014 | | 2013 |
| Net asset value, beginning | $14.43 | | $14.28 | | $16.08 | | $15.44 | | $12.30 |
| Income from investment operations: | | | | | | | | | |
Net investment income (loss) (a) | (0.04) |
| | 0.01 |
| (b) | (0.03) |
| | (0.01) |
| | 0.02 |
|
| Net realized and unrealized gain (loss) | 3.91 |
| | 0.61 |
| | (0.76) |
| | 0.66 |
| | 3.14 |
|
| Total from investment operations | 3.87 |
| | 0.62 |
| | (0.79) |
| | 0.65 |
| | 3.16 |
|
| Distributions from: | | | | | | | | | |
| Net investment income | (0.01) |
| | — |
| | (0.04) |
| | (0.01) |
| | (0.02) |
|
| Net realized gain | — |
| | (0.47) |
| | (0.97) |
| | — |
| | — |
|
| Total distributions | (0.01) |
| | (0.47) |
| | (1.01) |
| | (0.01) |
| | (0.02) |
|
| Total increase (decrease) in net asset value | 3.86 |
| | 0.15 |
| | (1.80) |
| | 0.64 |
| | 3.14 |
|
| Net asset value, ending | $18.29 | | $14.43 | | $14.28 | | $16.08 | | $15.44 |
Total return (c) | 26.83 | % | | 4.46 | % | | (5.09 | %) | | 4.20 | % | | 25.70 | % |
Ratios to average net assets: (d) | | | | | | | | | |
| Total expenses | 2.61 | % | | 2.67 | % | | 2.72 | % | | 2.81 | % | | 3.27 | % |
| Net expenses | 2.30 | % | | 2.44 | % | | 2.50 | % | | 2.50 | % | | 2.50 | % |
| Net investment income (loss) | (0.24 | %) | | 0.04 | % | (b) | (0.18 | %) | | (0.08 | %) | | 0.17 | % |
| Portfolio turnover | 158 | % | | 52 | % | | 51 | % | | 56 | % | | 42 | % |
| Net assets, ending (in thousands) | $5,850 | | $5,037 | | $5,030 | | $4,605 | | $3,282 |
| | | | | | | | | | |
(a) Computed using average shares outstanding. |
(b) Amount includes a non-recurring refund for overbilling of prior years' custody out-of-pocket fees. This amounted to $0.006 per share and 0.04% of average net assets. |
(c) Returns are historical and are calculated by determining the percentage change in net asset value with all distributions reinvested and do not reflect the effect of sales charges, if any. Total return is not annualized for periods of less than one year. |
(d) Total expenses do not reflect amounts reimbursed and/or waived by the Adviser and certain of its affiliates, if applicable. Net expenses are net of all reductions and represent the net expenses paid by the Fund. |
| See notes to financial statements. |
18 www.calvert.com CALVERT INTERNATIONAL OPPORTUNITIES FUND ANNUAL REPORT
CALVERT INTERNATIONAL OPPORTUNITIES FUND
FINANCIAL HIGHLIGHTS
|
| | | | | | | | | | | | | | |
| | Year Ended September 30, |
| CLASS I SHARES | 2017 | | 2016 | | 2015 | | 2014 | | 2013 |
| Net asset value, beginning | $14.56 | | $14.38 | | $16.19 | | $15.54 | | $12.37 |
| Income from investment operations: | | | | | | | | | |
Net investment income (a) | 0.17 |
| | 0.19 |
| (b) | 0.19 |
| | 0.20 |
| | 0.25 |
|
| Net realized and unrealized gain (loss) | 3.90 |
| | 0.63 |
| | (0.80) |
| | 0.66 |
| | 3.10 |
|
| Total from investment operations | 4.07 |
| | 0.82 |
| | (0.61) |
| | 0.86 |
| | 3.35 |
|
| Distributions from: | | | | | | | | | |
| Net investment income | (0.21) |
| | (0.17) |
| | (0.23) |
| | (0.21) |
| | (0.18) |
|
| Net realized gain | — |
| | (0.47) |
| | (0.97) |
| | — |
| | — |
|
| Total distributions | (0.21) |
| | (0.64) |
| | (1.20) |
| | (0.21) |
| | (0.18) |
|
| Total increase (decrease) in net asset value | 3.86 |
| | 0.18 |
| | (1.81) |
| | 0.65 |
| | 3.17 |
|
| Net asset value, ending | $18.42 | | $14.56 | | $14.38 | | $16.19 | | $15.54 |
Total return (c) | 28.44 | % | | 5.84 | % | | (3.86 | %) | | 5.58 | % | | 27.43 | % |
Ratios to average net assets: (d) | | | | | | | | | |
| Total expenses | 1.07 | % | | 1.17 | % | | 1.15 | % | | 1.18 | % | | 1.43 | % |
| Net expenses | 1.07 | % | | 1.16 | % | | 1.15 | % | | 1.18 | % | | 1.20 | % |
| Net investment income | 1.06 | % | | 1.35 | % | (b) | 1.22 | % | | 1.24 | % | | 1.76 | % |
| Portfolio turnover | 158 | % | | 52 | % | | 51 | % | | 56 | % | | 42 | % |
| Net assets, ending (in thousands) | $115,698 | | $69,319 | | $40,833 | | $32,079 | | $24,130 |
| | | | | | | | | | |
(a) Computed using average shares outstanding. |
(b) Amount includes a non-recurring refund for overbilling of prior years' custody out-of-pocket fees. This amounted to $0.008 per share and 0.06% of average net assets. |
(c) Returns are historical and are calculated by determining the percentage change in net asset value with all distributions reinvested and do not reflect the effect of sales charges, if any. Total return is not annualized for periods of less than one year. |
(d) Total expenses do not reflect amounts reimbursed and/or waived by the Adviser and certain of its affiliates, if applicable. Net expenses are net of all reductions and represent the net expenses paid by the Fund. |
| See notes to financial statements. |
www.calvert.com CALVERT INTERNATIONAL OPPORTUNITIES FUND ANNUAL REPORT 19
CALVERT INTERNATIONAL OPPORTUNITIES FUND
FINANCIAL HIGHLIGHTS
|
| | | | | | | | | | | | | | |
| | Year Ended September 30, |
| CLASS Y SHARES | 2017 | | 2016 | | 2015 | | 2014 | | 2013 |
| Net asset value, beginning | $14.16 | | $13.99 | | $15.68 | | $15.03 | | $11.94 |
| Income from investment operations: | | | | | | | | | |
Net investment income (a) | 0.12 |
| | 0.19 |
| (b) | 0.14 |
| | 0.11 |
| | 0.18 |
|
| Net realized and unrealized gain (loss) | 3.82 |
| | 0.60 |
| | (0.77) |
| | 0.70 |
| | 3.03 |
|
| Total from investment operations | 3.94 |
| | 0.79 |
| | (0.63) |
| | 0.81 |
| | 3.21 |
|
| Distributions from: | | | | | | | | | |
| Net investment income | (0.19) |
| | (0.15) |
| | (0.09) |
| | (0.16) |
| | (0.12) |
|
| Net realized gain | — |
| | (0.47) |
| | (0.97) |
| | — |
| | — |
|
| Total distributions | (0.19) |
| | (0.62) |
| | (1.06) |
| | (0.16) |
| | (0.12) |
|
| Total increase (decrease) in net asset value | 3.75 |
| | 0.17 |
| | (1.69) |
| | 0.65 |
| | 3.09 |
|
| Net asset value, ending | $17.91 | | $14.16 | | $13.99 | | $15.68 | | $15.03 |
Total return (c) | 28.25 | % | | 5.82 | % | | (4.11 | %) | | 5.40 | % | | 27.06 | % |
Ratios to average net assets: (d) | | | | | | | | | |
| Total expenses | 1.18 | % | | 1.21 | % | | 1.42 | % | | 1.48 | % | | 1.90 | % |
| Net expenses | 1.18 | % | | 1.18 | % | | 1.41 | % | | 1.41 | % | | 1.41 | % |
| Net investment income | 0.78 | % | | 1.40 | % | (b) | 0.92 | % | | 0.68 | % | | 1.31 | % |
| Portfolio turnover | 158 | % | | 52 | % | | 51 | % | | 56 | % | | 42 | % |
| Net assets, ending (in thousands) | $47,015 | | $45,589 | | $33,299 | | $16,536 | | $5,138 |
| | | | | | | | | | |
(a) Computed using average shares outstanding. |
(b) Amount includes a non-recurring refund for overbilling of prior years' custody out-of-pocket fees. This amounted to $0.007 per share and 0.05% of average net assets. |
(c) Returns are historical and are calculated by determining the percentage change in net asset value with all distributions reinvested and do not reflect the effect of sales charges, if any. Total return is not annualized for periods of less than one year. |
(d) Total expenses do not reflect amounts reimbursed and/or waived by the Adviser and certain of its affiliates, if applicable. Net expenses are net of all reductions and represent the net expenses paid by the Fund. |
| See notes to financial statements. |
20 www.calvert.com CALVERT INTERNATIONAL OPPORTUNITIES FUND ANNUAL REPORT
NOTES TO FINANCIAL STATEMENTS
NOTE A — SIGNIFICANT ACCOUNTING POLICIES
General: Calvert World Values Fund, Inc. (the “Corporation”) was organized as a Maryland corporation on February 14, 1992, and is registered under the Investment Company Act of 1940, as amended (the “1940 Act”), as an open-end management investment company. The Corporation operates four (4) separate series, each with its own investment objective(s) and strategies, which are accounted for separately. This report contains the financial statements and financial highlights of Calvert International Opportunities Fund (the “Fund”). The Corporation is authorized to issue 2 billion shares of common stock, $0.01 par value per share, of which 250 million shares have been allocated to the Fund.
The Fund is diversified. The investment objective of the Fund is to seek long-term capital appreciation. The Fund invests primarily in common and preferred stocks of non-U.S. small-cap to mid-cap companies.
The Fund offers four classes of shares. Class A shares are generally sold subject to a sales charge imposed at the time of purchase. A contingent deferred sales charge of 0.80% may apply to certain redemptions of Class A shares for accounts for which no sales charge was paid, if redeemed within one year of purchase. Class C shares are sold without a front-end sales charge, and with certain exceptions, are charged a contingent deferred ales charge of 1% on shares redeemed within one year of purchase. Class C shares are only available for purchase through a financial intermediary. Class I and Class Y share are sold at net asset value, are not subject to a sales charge and are sold only to certain eligible investors. Each class represents a pro rata interest in the Fund, but votes separately on class-specific matters and is subject to different expenses.
The Fund applies the accounting and reporting guidance in the Financial Accounting Standards Board (FASB) Accounting Standards Codification Topic 946, Financial Services – Investment Companies (ASC 946). Subsequent events, if any, through the date that the financial statements were issued have been evaluated in the preparation of the financial statements.
Investment Valuation: Net asset value per share is determined every business day as of the close of the regular session of the New York Stock Exchange (generally 4:00 p.m. Eastern time). The Fund uses independent pricing services approved by the Board of Directors (the “Board”) to value its investments wherever possible. Investments for which market quotations are not available or deemed not reliable are fair valued in good faith under the direction of the Board.
The Board has adopted Valuation Procedures (the “Procedures”) to determine the fair value of securities and financial instruments for which market prices are not readily available or which may not be reliably priced. The Board has delegated the day-to-day responsibility for determining the fair value of securities and financial instruments of the Fund to the Fund’s investment adviser (the “Adviser”) and has provided these Procedures to govern the Adviser in its valuation duties.
The Adviser has chartered an internal Valuation Committee to oversee the implementation of these Procedures and to assist it in carrying out the valuation responsibilities that the Board has delegated. The Valuation Committee meets on a regular basis to review investments which may not have readily available market prices. The Valuation Committee’s fair valuation determinations are subject to review, approval and ratification by the Board at its next regularly scheduled meeting covering the calendar quarter in which the fair valuation was determined.
U.S. generally accepted accounting principles (U.S. GAAP) establishes a disclosure hierarchy that categorizes the inputs to valuation techniques used to value assets and liabilities at measurement date. These inputs are summarized in the three broad levels listed below:
Level 1 - quoted prices in active markets for identical securities
Level 2 - other significant observable inputs (including quoted prices for similar securities, interest rates, prepayment speeds, credit risk, etc.)
Level 3 - significant unobservable inputs (including the Fund’s own assumptions in determining the fair value of investments)
The inputs or methodologies used for valuing securities are not necessarily an indication of the risk associated with investing in those securities.
Changes in valuation techniques may result in transfers in or out of an investment’s assigned level within the hierarchy during the period. Transfers in and/or out of levels are determined based on the fair value of such securities at the end of the period. Valuation techniques used to value the Fund’s investments by major category are as follows:
Equity Securities. Equity securities (including warrants and rights) listed on a U.S. securities exchange generally are valued at the last sale or closing price as reported by an independent pricing service on the primary market or exchange on which they are traded and are categorized as Level 1 in the hierarchy. Equity securities listed on the NASDAQ Global or Global Select Market are valued at the NASDAQ official closing price and are categorized as Level 1 in the hierarchy. Unlisted or listed securities for which closing sales prices or closing quotations are not available are valued at the mean between the latest available bid and asked
www.calvert.com CALVERT INTERNATIONAL OPPORTUNITIES FUND ANNUAL REPORT 21
prices and are categorized as Level 2 in the hierarchy. The daily valuation of exchange-traded foreign securities generally is determined as of the close of trading on the principal exchange on which such securities trade. Events occurring after the close of trading on foreign exchanges may result in adjustments to the valuation of foreign securities to more accurately reflect their fair value as of the close of regular trading on the New York Stock Exchange. When valuing foreign equity securities that meet certain criteria, the Fund’s Board has approved the use of a fair value service that values such securities to reflect market trading that occurs after the close of the applicable foreign markets of comparable securities or other instruments that have a strong correlation to the fair-valued securities. Such securities are categorized as Level 2 in the hierarchy.
Debt Securities. Debt securities are generally valued on the basis of valuations provided by third party pricing services, as derived from such services’ pricing models. Inputs to the models may include, but are not limited to, reported trades, executable bid and asked prices, broker/dealer quotations, prices or yields of securities with similar characteristics, interest rates, anticipated prepayments, benchmark curves or information pertaining to the issuer, as well as industry and economic events. Accordingly, debt securities are generally categorized as Level 2 in the hierarchy. Short-term securities of sufficient credit quality purchased with remaining maturities of sixty days or less for which a valuation from a third party pricing service is not readily available may be valued at amortized cost, which approximates fair value, and are categorized as Level 2 in the hierarchy.
Other Securities. Investments in registered investment companies (including money market funds) that do not trade on an exchange are valued at the net asset value per share on the valuation day and are categorized as Level 1 in the hierarchy.
Fair Valuation. If a market value cannot be determined for a security using the methodologies described above, or if, in the good faith opinion of the Adviser, the market value does not constitute a readily available market quotation, or if a significant event has occurred that would materially affect the value of the security, the security will be fair valued as determined in good faith by or at the direction of the Board in a manner that fairly reflects the security’s value, or the amount that the Fund might reasonably expect to receive for the security upon its current sale in the ordinary course. Each such determination is based on a consideration of relevant factors, which are likely to vary from one pricing context to another. These factors may include, but are not limited to, the type of security, the existence of any contractual restrictions on the security’s disposition, the price and extent of public trading in similar securities of the issuer or of comparable companies or entities, quotations or relevant information obtained from broker/dealers or other market participants, information obtained from the issuer, analysts, and/or the appropriate stock exchange (for exchange-traded securities), an analysis of the company’s or entity’s financial condition, and an evaluation of the forces that influence the issuer and the market(s) in which the security is purchased and sold.
The values assigned to fair value investments are based on available information and do not necessarily represent amounts that might ultimately be realized. Further, due to the inherent uncertainty of valuations of such investments, the fair values may differ significantly from the values that would have been used had an active market existed, and the differences could be material. The Valuation Committee employs various methods for calibrating these valuation approaches including a regular review of key inputs and assumptions, transactional back-testing or disposition analysis and reviews of any related market activity.
The following table summarizes the market value of the Fund’s holdings as of September 30, 2017, based on the inputs used to value them:
22 www.calvert.com CALVERT INTERNATIONAL OPPORTUNITIES FUND ANNUAL REPORT
|
| | | | | | | | | | | | | |
| INVESTMENTS IN SECURITIES - ASSETS | LEVEL 1 | LEVEL 2 | | LEVEL 3* | TOTAL |
| Common Stocks | | | | | |
| Australia |
| $4,693,898 |
|
| $8,641,714 |
| |
| $— |
|
| $13,335,612 |
|
| Belgium | 2,851,612 |
| 1,381,848 |
| | — |
| 4,233,460 |
|
| Canada | 4,055,658 |
| — |
| | — |
| 4,055,658 |
|
| China | 2,076,806 |
| — |
| | — |
| 2,076,806 |
|
| France | 1,280,068 |
| 8,725,761 |
| | — |
| 10,005,829 |
|
| Ireland | 1,968,079 |
| 3,091,776 |
| | — |
| 5,059,855 |
|
| Israel | 3,538,515 |
| — |
| | — |
| 3,538,515 |
|
| Japan | 1,278,569 |
| 60,588,638 |
| | — |
| 61,867,207 |
|
| Netherlands | 920,377 |
| 9,016,213 |
| | — |
| 9,936,590 |
|
| Norway | 4,053,350 |
| — |
| | — |
| 4,053,350 |
|
| Singapore | 604,920 |
| 1,270,917 |
| | — |
| 1,875,837 |
|
| Spain | 982,722 |
| 1,128,483 |
| | — |
| 2,111,205 |
|
| Sweden | 938,950 |
| 6,993,597 |
| | — |
| 7,932,547 |
|
| Switzerland | 1,012,503 |
| 6,993,052 |
| | — |
| 8,005,555 |
|
| United Kingdom | 8,936,363 |
| 28,127,531 |
| | — |
| 37,063,894 |
|
| United States | 2,042,781 |
| — |
| | — |
| 2,042,781 |
|
| Other Countries** | — |
| 35,065,832 |
| | — |
| 35,065,832 |
|
| Total Common Stocks |
| $41,235,171 |
|
| $171,025,362 |
| *** |
| $— |
|
| $212,260,533 |
|
| High Social Impact Investments | — |
| 953,080 |
| | 240,221 |
| 1,193,301 |
|
| Time Deposit | — |
| 3,607,417 |
| | — |
| 3,607,417 |
|
| Short Term Investment of Cash Collateral for Securities Loaned | 10,381,130 |
| — |
| | — |
| 10,381,130 |
|
| TOTAL |
| $51,616,301 |
|
| $175,585,859 |
| |
| $240,221 |
|
| $227,442,381 |
|
| | | | | | |
| * None of the unobservable inputs for Level 3 assets, individually or collectively, had a material impact on the Fund. |
| ** For further breakdown of equity securities by country, please refer to the Schedule of Investments. |
| *** Includes foreign equity securities whose values were adjusted to reflect market trading of comparable securities or other correlated instruments that occurred after the close of trading in their applicable foreign markets. |
Level 3 investments at the beginning and/or end of the period in relation to net assets were not significant and accordingly, a reconciliation of Level 3 assets for the year ended September 30, 2017 is not presented. There were no transfers between Level 1 and Level 2 during the year ended September 30, 2017.
Investment Transactions and Income: Investment transactions for financial statement purposes are accounted for on trade date. Realized gains and losses are recorded on an identified cost basis and may include proceeds from litigation. Dividend income is recorded on the ex-dividend date for dividends received in cash and/or securities or, in the case of dividends on certain foreign securities, as soon as the Fund is informed of the ex-dividend date. Non-cash dividends are recorded at the fair value of the securities received. Withholding taxes on foreign dividends, if any, have been provided for in accordance with the Fund’s understanding of the applicable country’s tax rules and rates. Distributions received that represent a return of capital are recorded as a reduction of cost of investments. Distributions received that represent a capital gain are recorded as a realized gain. Interest income, which includes amortization of premium and accretion of discount on debt securities, is accrued as earned.
Share Class Accounting: Investment income and realized and unrealized gains and losses are allocated to separate classes of shares based upon the relative net assets of each class. Expenses common to the classes are also allocated to each class in proportion to their relative net assets. Expenses arising in connection with a specific class are charged directly to that class.
Foreign Currency Transactions: The Fund’s accounting records are maintained in U.S. dollars. For valuation of assets and liabilities on each date of net asset value determination, foreign denominations are converted into U.S. dollars using the current exchange rate. Security transactions, income, and expenses are translated at the prevailing rate of exchange on the date of the event. Recognized gains or losses on investment transactions attributable to changes in foreign currency exchange rates are recorded for financial statement purposes as net realized gains and losses on investments. That portion of unrealized gains and losses on investments that results from fluctuations in foreign currency exchange rates is not separately disclosed.
www.calvert.com CALVERT INTERNATIONAL OPPORTUNITIES FUND ANNUAL REPORT 23
Restricted Securities: The Fund may invest in securities that are subject to legal or contractual restrictions on resale. Generally, these securities may only be sold publicly upon registration under the Securities Act of 1933 or in transactions exempt from such registration. Information regarding restricted securities (excluding Rule 144A securities) is included at the end of the Schedule of Investments.
Distributions to Shareholders: Distributions to shareholders are recorded by the Fund on ex-dividend date. Dividends from net investment income and distributions from net realized capital gains, if any, are paid at least annually. Distributions are determined in accordance with income tax regulations which may differ from U.S. GAAP; accordingly, periodic reclassifications are made within the Fund’s capital accounts to reflect income and gains available for distribution under income tax regulations.
Estimates: The preparation of financial statements in conformity with U.S. GAAP requires management to make estimates and assumptions that affect the reported amounts of assets and liabilities and disclosure of contingent assets and liabilities at the date of the financial statements and the reported amounts of increases and decreases in net assets from operations during the reporting period. Actual results could differ from those estimates.
Indemnifications: The Corporation’s By-Laws provide for indemnification for Directors or officers of the Corporation and certain other parties, to the fullest extent permitted by Maryland law and the 1940 Act, provided certain conditions are met. Additionally, in the normal course of business, the Fund enters into agreements with service providers that may contain indemnification clauses. The Fund’s maximum exposure under these arrangements is unknown as this would involve future claims that may be made against the Fund that have not yet occurred.
Federal Income Taxes: No provision for federal income or excise tax is required since the Fund intends to continue to qualify as a regulated investment company under the Internal Revenue Code and to distribute substantially all of its taxable earnings.
In addition to the requirements of the Internal Revenue Code, the Fund may also be subject to local taxes on the recognition of capital gains in certain countries. In determining the daily net asset value, the Fund estimates the accrual for such taxes, if any, based on the unrealized appreciation on certain portfolio securities and the related tax rates. Taxes attributable to unrealized appreciation are included in the change in unrealized appreciation (depreciation) on investments. Capital gains taxes on securities sold are included in net realized gain (loss) on investments.
Management has analyzed the Fund’s tax positions taken for all open federal income tax years and has concluded that no provision for federal income tax is required in the Fund’s financial statements. A Fund’s federal tax return is subject to examination by the Internal Revenue Service for a period of three years from the date of filing.
NOTE B — RELATED PARTY TRANSACTIONS
Effective December 31, 2016, Calvert Research and Management (CRM), a subsidiary of Eaton Vance Management (EVM), became the investment adviser to the Fund following a transaction between CRM and certain of its affiliates and Calvert Investment Management, Inc. (CIM) and certain of its affiliates, pursuant to which CRM acquired substantially all of the business assets of CIM after satisfying various closing conditions, including shareholder approval of a new investment advisory agreement between the Fund and CRM (the "Transaction").
For its services pursuant to the new investment advisory agreement, CRM receives a fee, payable monthly, at the annual rate of 0.75% of the Fund’s average daily net assets. Prior to December 31, 2016, CIM, a direct subsidiary of Calvert Investments, Inc. and an indirect subsidiary of Ameritas Holding Company, provided investment advisory services to the Fund. For its services, CIM received a fee at the same annual rate as the Fund’s investment advisory agreement with CRM. For the year ended September 30, 2017, the investment advisory fee amounted to $1,536,752, of which $1,129,335 was paid to CRM and $407,417 was paid to CIM.
Pursuant to a sub-advisory agreement effective December 31, 2016, CRM pays Eaton Vance Management (International) Limited (EVMI), an indirect, wholly-owned subsidiary of Eaton Vance Corp., a portion of its investment advisory fee for sub-advisory services provided to the Fund. Effective November 1, 2017, Eaton Vance Advisers International Ltd. (EVAIL), an affiliate of EVM, assumed the sub-advisory responsibilities for the Fund from EVMI.
CRM and EVMI have agreed to reimburse the Fund’s operating expenses to the extent that total annual operating expenses (relating to ordinary operating expenses only and excluding expenses such as brokerage commissions, acquired fund fees and expenses of unaffiliated funds, interest expense, taxes or litigation expenses) exceed 1.66%, 2.26%, 1.20% and 1.41% (1.43%, 2.26%, 1.16% and 1.41% effective October 1, 2017) for Class A, Class C, Class I and Class Y, respectively, of such class’ average daily net assets. The expense reimbursement agreement may be changed or terminated after January 31, 2019. Prior to December 31, 2016, CIM contractually agreed to limit net annual fund operating expenses to 1.66%, 2.41%, 1.20% and 1.41% for Class A, Class C, Class I and Class Y, respectively, of such class’ average daily net assets. For the year ended September 30, 2017, CRM and EVMI waived or reimbursed in total expenses of $13,673 and CIM waived or reimbursed expenses of $2,353.
24 www.calvert.com CALVERT INTERNATIONAL OPPORTUNITIES FUND ANNUAL REPORT
The administrative fee is earned by CRM as compensation for administrative services rendered to the Fund. The fee is computed at an annual rate of 0.12% of the Fund’s average daily net assets attributable to Class A, Class C, Class I and Class Y and is payable monthly. Prior to December 31, 2016, Calvert Investment Administrative Services, Inc. (CIAS), an affiliate of CIM, provided administrative services to the Fund at an annual rate of 0.12% of the Fund’s average daily net assets, payable monthly. For the year ended September 30, 2017, CRM was paid administrative fees of $180,694 and CIAS was paid administrative fees of $65,187.
The Fund adopted a new distribution plan for Class A shares (Class A Plan) and Class C shares (Class C Plan) pursuant to Rule 12b-1 under the 1940 Act, which were approved by the Board and became effective as of December 31, 2016 or shortly thereafter upon approval by the shareholders of the respective class. Pursuant to the Class A Plan and Class C Plan, the Fund pays a distribution fee of 0.25% and 0.75% per annum for Class A and Class C, respectively, and a service fee of 0.25% per annum for Class C of its average daily net assets attributable to such class for distribution services and facilities provided to the Fund, as well as for personal and/or account maintenance services provided. Pursuant to the Fund’s former distribution plans for Class A shares and Class C shares, the Fund was permitted to pay certain expenses associated with the distribution and servicing of its Class A and Class C shares not to exceed 0.50% for Class A and 1.00% for Class C of the Fund’s average daily net assets with respect to such class. Effective December 31, 2016, the fees are paid to Eaton Vance Distributors, Inc. (EVD), an affiliate of CRM and the Fund’s principal underwriter. Prior to December 31, 2016, the fees were paid to Calvert Investment Distributors, Inc. (CID), an affiliate of CIM and the Fund’s former distributor and principal underwriter. Distribution and service fees paid or accrued for the year ended September 30, 2017 amounted to $183,900 or 0.25% per annum of Class A’s average daily net assets, of which $119,146 was paid to EVD and $64,754 was paid to CID, and $51,389 or 1.00% per annum of Class C’s average daily net assets, of which $39,384 was paid to EVD and $12,005 was paid to CID.
The Fund was informed that EVD and CID received $11,785 and $2,584, respectively, as their portion of the sales charge on sales of Class A shares for the year ended September 30, 2017. The Fund was also informed that EVD and CID received $1,072 and $76, respectively, of contingent deferred sales charges paid by Fund shareholders for the same period.
Effective December 31, 2016, EVM provides sub-transfer agency services to the Fund pursuant to a Sub-Transfer Agency Support Services Agreement. For its services, EVM receives an annual fee of $8 per shareholder account. Prior to December 31, 2016, Calvert Investment Services, Inc. (CIS), an affiliate of CIM, acted as the shareholder servicing agent for the Fund and received a fee at the same rate as is paid to EVM. For the year ended September 30, 2017, sub-transfer agency fees paid to EVM were $18,628 and shareholder servicing fees paid to CIS were $6,475. Such fees are included in transfer agency fees and expenses on the Statement of Operations.
Each Director of the Fund who is not an employee of CRM or its affiliates receives a fee of $3,000 for each Board meeting attended in person and $2,000 for each Board meeting attended by phone plus an annual fee of $52,000, and $1,500 for each Committee meeting attended in person and $1,000 for each Committee meeting attended by phone plus an annual Committee fee of $2,500. The Board chair receives an additional $10,000 annual retainer and Committee chairs receive an additional $6,000 annual retainer. Prior to December 31, 2016, each Director of the Fund who was not an employee of CIM or its affiliates received a fee of $3,000 for each Board meeting attended plus an annual fee of $52,000. Committee members received $500 for each Committee meeting attended plus an annual fee of $2,500. Committee chairs received an additional annual retainer ranging from $6,000 to $10,000. Eligible Directors may participate in a Deferred Compensation Plan (the “Plan”). Amounts deferred under the Plan are treated as though equal dollar amounts had been invested in shares of the Fund or other Calvert Funds selected by the Directors. The Fund purchases shares of the funds selected equal to the dollar amounts deferred under the Plan, resulting in an asset equal to the deferred compensation liability. Obligations of the Plan are paid solely from the Fund’s assets. Directors’ fees are allocated to each of the Calvert Funds served. Salaries and fees of officers and Directors of the Fund who are employees of CRM and, prior to December 31, 2016, of CIM or their affiliates are/were paid by CRM and CIM, respectively. In addition, in connection with the Transaction, an advisory council was established to aid the Board and CRM in advancing the cause of responsible investing through original scholarship and thought leadership. The advisory council consists of CRM’s Chief Executive Officer and four additional members. Each member (other than CRM’s Chief Executive Officer) receives annual compensation of $75,000, which is being reimbursed by CIM and Ameritas Holding Company for a period of up to three years through December 30, 2019. For the year ended September 30, 2017, the Fund’s allocated portion of such expense and reimbursement was $2,222, which are included in miscellaneous expense and reimbursement of expenses-other, respectively, on the Statement of Operations.
NOTE C — INVESTMENT ACTIVITY AND TAX INFORMATION
During the year ended September 30, 2017, the cost of purchases and proceeds from sales of investments, other than short-term securities, were $314,450,792 and $367,340,373, respectively.
www.calvert.com CALVERT INTERNATIONAL OPPORTUNITIES FUND ANNUAL REPORT 25
The tax character of distributions declared for the years ended September 30, 2017 and September 30, 2016 was as follows:
|
| | | | | | | |
| | Year Ended September 30, |
| | 2017 | | 2016 |
| Distributions declared from: | | | |
| Ordinary income |
| $2,608,931 |
| |
| $2,008,280 |
|
| Long-term capital gains | $— |
| |
| $5,690,923 |
|
During the year ended September 30, 2017, accumulated undistributed net realized gain was decreased by $4,217,890, accumulated undistributed net investment income was increased by $1,000,691 and paid-in capital was increased by $3,217,199 due to the Fund’s use of equalization accounting and differences between book and tax accounting, primarily for foreign currency gain (loss), investments in passive foreign investment companies (PFICs) and foreign capital gains taxes. Tax equalization accounting allows the Fund to treat as a distribution that portion of redemption proceeds representing a redeeming shareholder’s portion of undistributed taxable income and net capital gains. These reclassifications had no effect on the net assets or net asset value per share of the Fund.
As of September 30, 2017, the components of distributable earnings (accumulated losses) on a tax basis were as follows:
|
| | | |
| Undistributed ordinary income |
| $12,406,150 |
|
| Net unrealized appreciation (depreciation) |
| $31,981,411 |
|
The differences between components of distributable earnings (accumulated losses) on a tax basis and the amounts reflected in the Statement of Assets and Liabilities are primarily due to the tax treatment of short-term capital gains and temporary book-tax differences that will reverse in a subsequent period. These differences are primarily due to wash sales and investments in PFICs.
The cost and unrealized appreciation (depreciation) of investments of the Fund at September 30, 2017, as determined on a federal income tax basis, were as follows:
|
| | | |
| Federal tax cost of investments |
| $195,477,052 |
|
| Gross unrealized appreciation |
| $33,022,370 |
|
| Gross unrealized depreciation | (1,057,041) |
| Net unrealized appreciation (depreciation) |
| $31,965,329 |
|
NOTE D — SECURITIES LENDING
To generate additional income, the Fund may lend its securities pursuant to a securities lending agency agreement with State Street Bank and Trust Company (SSB), the securities lending agent. Security loans are subject to termination by the Fund at any time and, therefore, are not considered to be illiquid investments. The Fund requires that the loan be continuously collateralized by either cash or securities as collateral equal at all times to at least 102% of the market value of the domestic securities loaned and 105% of the market value of the international securities loaned (if applicable). The market value of securities loaned is determined daily and any additional required collateral is delivered to the Fund on the next business day. Cash collateral is generally invested in State Street Institutional U.S. Government Money Market Fund (the “U.S. Government Fund”) that is managed by an affiliate of the custodian. The U.S. Government Fund is a registered money market fund that invests in a variety of high-quality, U.S. dollar denominated instruments. Any gain or loss in the market price of the loaned securities that might occur and any interest earned or dividends declared during the term of the loan would accrue to the account of the Fund. Income earned on the investment of collateral, net of broker rebates and other expenses incurred by the securities lending agent, is split between the Fund and the securities lending agent on the basis of agreed upon contractual terms. Non-cash collateral is held by the lending agent on behalf of the Fund and cannot be sold or re-pledged by the Fund; accordingly, such collateral is not reflected in the Statement of Assets and Liabilities.
The risks associated with lending portfolio securities include, but are not limited to, possible delays in receiving additional collateral or in the recovery of the loaned securities, possible loss of rights to the collateral should the borrower fail financially, as well as risk of loss in the value of the collateral or the value of the investments made with the collateral. The securities lending agent shall indemnify the Fund in the case of default of any securities borrower.
At September 30, 2017, the total value of securities on loan was $9,835,248 and the total value of collateral received was $10,381,130.
26 www.calvert.com CALVERT INTERNATIONAL OPPORTUNITIES FUND ANNUAL REPORT
The following table provides a breakdown of securities lending transactions accounted for as secured borrowings, the obligations by class of collateral pledged, and the remaining contractual maturity of those transactions as of September 30, 2017.
|
| | | | | | | | | |
| | Remaining Contractual Maturity of the Transactions |
| | Overnight and
Continuous | <30 days | 30 to 90 days | >90 days | Total |
| Securities Lending Transactions |
| Common Stocks |
| $10,381,130 |
| $— | $— | $— |
| $10,381,130 |
|
| Total |
| $10,381,130 |
|
The carrying amount of the liability for deposits for securities loaned at September 30, 2017 approximated its fair value. If measured at fair value, such liability would have been considered as Level 2 in the fair value hierarchy (see Note A) at September 30, 2017.
NOTE E — LINE OF CREDIT
A financing agreement is in place with the Calvert Funds and SSB. Under the agreement, which expires on August 7, 2018, SSB provides an unsecured line of credit facility in the aggregate amount of $50 million ($25 million committed and $25 million uncommitted), accessible by the Calvert Funds for temporary or emergency purposes only. Borrowings bear interest at the higher of the One-Month London Interbank Offered Rate (LIBOR) in effect that day or the overnight Federal Funds Rate, plus 1.25% per annum. A commitment fee of 0.25% per annum is incurred on the unused portion of the committed facility. An administrative fee of $30,000 was paid in connection with the renewal of the uncommitted facility. These fees are allocated to all participating funds. Because the line of credit is not available exclusively to the Fund, it may be unable to borrow some or all of its requested amounts at any particular time. The Fund had no loans outstanding pursuant to this line of credit at September 30, 2017. Based on the short-term nature of the borrowings under the line of credit and variable interest rate, the carrying value of the borrowings approximated its fair value at September 30, 2017. If measured at fair value, borrowings under the line of credit would have been considered as Level 2 in the fair value hierarchy (see Note A) at September 30, 2017. Average borrowings and the weighted average interest rate (excluding fees) for the year ended September 30, 2017 were $245,571 and 2.08%, respectively.
NOTE F — AFFILIATED COMPANIES
The Fund invests a portion of its assets designated for high social impact investments in notes issued by the Calvert Social Investment Foundation (the “Foundation”) pursuant to an exemptive order granted by the U.S. Securities and Exchange Commission (the “SEC”). The Fund relies on exemptive relief to invest in the notes because the Fund’s investments in the notes may be considered prohibited transactions between affiliated persons under the 1940 Act. The Foundation may be considered an affiliated person of the Calvert Funds based on the overlap between the Foundation’s Board of Directors and the Calvert Funds’ Directors/Trustees and other potential affiliations. The Foundation has licensed use of the Calvert name from the Adviser, and the Adviser’s President and Chief Executive Officer serves on the Foundation Board. The Foundation is not owned or otherwise controlled by the Adviser or its affiliates.
In addition, an affiliated company is a company in which a fund has a direct or indirect ownership of, control of, or voting power of 5 percent or more of the outstanding voting shares, or a company that is under common ownership or control with a fund. At September 30, 2017, the value of the Fund’s investment in affiliated companies was $953,080, which represents 0.43% of the Fund’s net assets. Transactions in affiliated companies by the Fund for the year ended September 30, 2017 were as follows:
|
| | | | | | | | | | | | | | | | | | | | | |
Name of Affiliated
Company | Principal Amount,
beginning of period | Gross Additions | Gross Reductions | Principal Amount,
end of period | Value,
end of period | Interest
Income | Net Realized
Gain (Loss) | Capital Gain
Distributions Received | Change in
Unrealized
Appreciation
(Depreciation) |
| High Social Impact Investments | | | | | | | | | |
| Calvert Social Investment Foundation, Community Investment Notes: | | | | | | | | | |
| 0.50%, 3/18/17 |
| $1,000,000 |
| $— |
| ($1,000,000 | ) | $— | $— |
|
| $972 |
| $— |
| $— |
|
| $16,800 |
|
| 1.50%, 12/15/19 | — |
| 1,000,000 | — |
| 1,000,000 | 953,080 |
| 12,083 |
| — |
| — |
| (46,920) |
|
| TOTALS | | | | |
| $953,080 |
|
| $13,055 |
| $— |
| $— |
|
| ($30,120 | ) |
www.calvert.com CALVERT INTERNATIONAL OPPORTUNITIES FUND ANNUAL REPORT 27
NOTE G — CAPITAL SHARES
Transactions in capital shares for the years ended September 30, 2017 and September 30, 2016 were as follows:
|
| | | | | | | | | |
| | Year Ended
September 30, 2017 | | Year Ended
September 30, 2016 |
| | Shares | Amount | | Shares | Amount |
| Class A | | | | | |
| Shares sold | 1,095,896 |
| $17,214,378 |
| | 1,580,346 |
| $22,584,870 |
|
| Reinvestment of distributions | 67,243 | 961,581 |
| | 269,484 | 3,890,741 |
|
| Shares redeemed | (5,729,215) | (88,737,750) |
| | (1,433,519) | (20,644,340) |
|
| Net increase (decrease) | (4,566,076) |
| ($70,561,791 | ) | | 416,311 |
| $5,831,271 |
|
| | | | | | |
| Class C | | | | | |
| Shares sold | 53,630 |
| $847,542 |
| | 69,185 |
| $979,800 |
|
| Reinvestment of distributions | 193 | 2,718 |
| | 10,313 | 145,104 |
|
| Shares redeemed | (83,136) | (1,285,014) |
| | (82,681) | (1,141,960) |
|
| Net decrease | (29,313) |
| ($434,754 | ) | | (3,183) |
| ($17,056 | ) |
| | | | | | |
| Class I | | | | | |
| Shares sold | 2,647,916 |
| $40,716,918 |
| | 2,361,433 |
| $32,818,157 |
|
| Reinvestment of distributions | 80,932 | 1,136,295 |
| | 134,648 | 1,919,524 |
|
| Shares redeemed | (1,208,983) | (18,766,250) |
| | (574,598) | (7,968,411) |
|
| Net increase | 1,519,865 | $23,086,963 | | 1,921,483 |
| $26,769,270 |
|
| | | | | | |
| Class Y | | | | | |
| Shares sold | 1,626,177 |
| $25,255,978 |
| | 1,595,580 |
| $21,954,857 |
|
| Reinvestment of distributions | 26,818 | 366,604 |
| | 105706 | 1,463,650 |
|
| Shares redeemed | (2,248,321) | (32,228,122) |
| | (861,049) | (11,668,455) |
|
| Net increase (decrease) | (595,326) |
| ($6,605,540 | ) | | 840,237 |
| $11,750,052 |
|
The Board approved the termination of the Fund’s Class Y shares. Effective December 8, 2017, Class Y shares of the Fund will convert to Class I shares at net asset value. Thereafter, Class Y shares will be terminated.
NOTE H — RISKS ASSOCIATED WITH FOREIGN INVESTMENTS
Investing in foreign securities involves additional risks relating to political, social, and economic developments abroad. Other risks result from differences between regulations that apply to U.S. and foreign issuers and markets, and the potential for foreign markets to be less liquid and more volatile than U.S. markets. Securities that trade or are denominated in currencies other than the U.S. dollar may be adversely affected by fluctuations in currency exchange rates.
The risks of investing in emerging market securities are greater than those of investing in securities of developed foreign countries. These risks include volatile currency exchange rates, periods of high inflation, increased risk of default, greater social, economic and political uncertainty and instability, less governmental supervision and regulation of securities markets, weaker auditing and financial reporting standards, lack of liquidity in the markets, and the significantly smaller market capitalization of emerging market issuers.
NOTE I — REGULATORY MATTERS
On May 2, 2017, the SEC issued an administrative order (“Order”) relating to the improper use of Calvert Fund assets by CIM and CID, the Calvert Funds’ former adviser and principal underwriter, respectively, to pay for the distribution and marketing of fund shares outside of a Rule 12b-1 plan, as well as to pay expenses in excess of Fund expense caps. Pursuant to the Order, CIM and CID are required to pay $21,614,534 to affected shareholders of the Calvert Funds, including the Fund’s shareholders. The distributions required to be made by CIM and CID to affected shareholders are the obligations of CIM and CID and will not have an impact on the Fund’s net assets.
28 www.calvert.com CALVERT INTERNATIONAL OPPORTUNITIES FUND ANNUAL REPORT
REPORT OF INDEPENDENT REGISTERED PUBLIC ACCOUNTING FIRM
The Board of Directors of Calvert World Values Fund, Inc. and Shareholders of Calvert International Opportunities Fund:
We have audited the accompanying statement of assets and liabilities of the Calvert International Opportunities Fund (the “Fund”), a series of Calvert World Values Fund, Inc., including the schedule of investments, as of September 30, 2017, and the related statement of operations for the year then ended, the statements of changes in net assets for each of the years in the two-year period then ended, and the financial highlights for each of the years in the five-year period then ended. These financial statements and financial highlights are the responsibility of the Fund’s management. Our responsibility is to express an opinion on these financial statements and financial highlights based on our audits.
We conducted our audits in accordance with the standards of the Public Company Accounting Oversight Board (United States). Those standards require that we plan and perform the audit to obtain reasonable assurance about whether the financial statements and financial highlights are free of material misstatement. An audit includes examining, on a test basis, evidence supporting the amounts and disclosures in the financial statements. Our procedures included confirmation of securities owned as of September 30, 2017, by correspondence with the custodian and brokers or by performing other appropriate auditing procedures. An audit also includes assessing the accounting principles used and significant estimates made by management, as well as evaluating the overall financial statement presentation. We believe that our audits provide a reasonable basis for our opinion.
In our opinion, the financial statements and financial highlights referred to above present fairly, in all material respects, the financial position of the Calvert International Opportunities Fund as of September 30, 2017, the results of its operations for the year then ended, the changes in its net assets for each of the years in the two-year period then ended, and the financial highlights for each of the years in the five-year period then ended, in conformity with U.S. generally accepted accounting principles.
/s/ KPMG LLP
Philadelphia, Pennsylvania
November 22, 2017
www.calvert.com CALVERT INTERNATIONAL OPPORTUNITIES FUND ANNUAL REPORT 29
FEDERAL TAX INFORMATION
The Form 1099-DIV you receive in February 2018 will show the tax status of all distributions paid to your account in calendar year 2017. Shareholders are advised to consult their own tax adviser with respect to the tax consequences of their investment in the Fund. As required by the Internal Revenue Code and/or regulations, shareholders must be notified regarding the status of qualified dividend income for individuals and the foreign tax credit.
Qualified Dividend Income. For the fiscal year ended September 30, 2017, the Fund designates approximately $2,789,043, or up to the maximum amount of such dividends allowable pursuant to the Internal Revenue Code, as qualified dividend income eligible for the reduced tax rate of 15%.
Foreign Tax Credit. For the fiscal year ended September 30, 2017, the Fund paid foreign taxes of $254,794 and recognized foreign source income of $4,148,659.
Information Classification: General
30 www.calvert.com CALVERT INTERNATIONAL OPPORTUNITIES FUND ANNUAL REPORT (Unaudited)
MANAGEMENT AND ORGANIZATION
Fund Management. The Directors of Calvert World Values Fund, Inc. (the Corporation) are responsible for the overall management and supervision of the Corporation’s affairs. The Directors and officers of the Corporation are listed below. Except as indicated, each individual has held the office shown or other offices in the same company for the last five years. Directors and officers of the Corporation hold indefinite terms of office. The “Independent Directors” consist of those Directors who are not “interested persons” of the Corporation, as that term is defined under the 1940 Act. The business address of each Director and officer, with the exception of Ms. Gemma and Mr. Kirchner, is 1825 Connecticut Avenue NW, Suite 400, Washington, DC 20009. As used below, “CRM” refers to Calvert Research and Management. Each Director oversees 37 funds in the Calvert fund complex. Each officer serves as an officer of certain other Calvert funds.
|
| | | |
| Name and Year of Birth | Position with Corporation | Position Start Date | Principal Occupation(s) and Directorships During Past Five Years and Other Relevant Experience |
| | | | |
| Interested Director | | | |
John H. Streur(1) 1960 | Director & President | 2015 | President and Chief Executive Officer of Calvert Research and Management (since December 31, 2016). President and Chief Executive Officer of Calvert Investments, Inc. (January 2015 - December 2016); Chief Compliance Officer of Calvert Investment Distributors, Inc. (August 2015 - December 2016); Chief Compliance Officer of Calvert Investment Management (August 2015 - April 2016); President and Director, Portfolio 21 Investments, Inc. (through October 2014); President, Chief Executive Officer and Director, Managers Investment Group LLC (through January 2012); President and Director, The Managers Funds and Managers AMG Funds (through January 2012). Directorships in the Last Five Years. Portfolio 21 Investments, Inc. (asset management) (through October 2014); Managers Investment Group LLC (asset management) (through January 2012); The Managers Funds (asset management) (through January 2012); Managers AMG Funds (asset management) (through January 2012); Calvert Social Investment Foundation. |
| Independent Directors | | | |
Richard L. Baird, Jr 1948 | Director | 2005 | Former President and CEO of Adagio Health Inc. (retired in 2014) in Pittsburgh, PA, a non-profit corporation which provides family planning services, nutrition, maternal/child health care, and various health screening services and community preventive health programs. Directorships in the Last Five Years. None. |
Alice Gresham Bullock(2) 1950 | Chair & Director | 2016 | Professor at Howard University School of Law (retired June 2016). She is former Dean of Howard University School of Law (1996-2002) and Deputy Director of the Association of American Law Schools (1992-1994). Directorships in the Last Five Years. None. |
Cari M. Dominguez(2) 1949 | Director | 2016 | Former Chair of the U.S. Equal Employment Opportunity Commission. Directorships in the Last Five Years. Manpower, Inc. (employment agency); Triple S Management Corporation (managed care); National Association of Corporate Directors. |
John G. Guffey, Jr. 1948 | Director | 1992 | President of Aurora Press Inc., a privately held publisher of trade paperbacks (since January 1997). Directorships in the Last Five Years. Ariel Funds (3) (asset management) (through December 31, 2011); Calvert Social Investment Foundation; Calvert Ventures, LLC. |
Miles D. Harper, III 1962 | Director | 2005 | Partner, Carr Riggs & Ingram (public accounting firm) since October 2014. Partner, Gainer Donnelly & Desroches (now Carr Riggs & Ingram) (public accounting firm), November 1999 - September 2014). Directorships in the Last Five Years. Bridgeway Funds (14) (asset management). |
Joy V. Jones 1950 | Director | 2005 | Attorney. Directorships in the Last Five Years. Conduit Street Restaurants SUD 2 Limited (restaurant) (dissolved September 2016); Palm Management Restaurant Corporation. |
www.calvert.com CALVERT INTERNATIONAL OPPORTUNITIES FUND ANNUAL REPORT (Unaudited) 31
|
| | | |
| Name and Year of Birth | Position with Corporation | Position Start Date | Principal Occupation(s) and Directorships During Past Five Years and Other Relevant Experience |
| | | | |
Anthony A. Williams(2) 1951 | Director | 2016 | CEO and Executive Director of the Federal City Council (July 2012 to present) (economic development non-profit organization); Senior Adviser and Independent Consultant for McKenna Long & Aldridge LLP (now Dentons) (law firm) (September 2011 to present); Executive Director of Global Government Practice at the Corporate Executive Board (now Gartner Inc.) (global research and Advisory company) (January 2010 to January 2012); William H. Bloomberg Lecturer in Public Management at the Harvard Kennedy School (since 2009). Directorships in the Last Five Years. Freddie Mac; Evoq Properties/ Meruelo Maddux Properties, Inc. (real estate management); Weston Solutions, Inc. (environmental services); Bipartisan Policy Center’s Debt Reduction Task Force (non-profit organization); Chesapeake Bay Foundation (independent conservation organization); Catholic University of America; Urban Institute (research organization). |
|
| | | |
| Principal Officers who are not Directors | |
| Name and Year of Birth | Position with Corporation | Position Start Date | Principal Occupation During Past Five Years |
| | | | |
Hope Brown 1973 | Chief Compliance Officer | 2014 | Chief Compliance Officer of 37 registered investment companies advised by CRM (since 2014). Vice President and Chief Compliance Officer, Wilmington Funds (2012-2014). Vice President and Senior Compliance Officer, Wilmington Trust Investment Advisors, Inc. (2010-2012). |
Maureen A. Gemma(3) 1960 | Secretary and Vice President | 2016 | Vice President of CRM and officer of 37 registered investment companies advised by CRM. Also Vice President of Eaton Vance Management (“EVM”) and certain of its affiliates and officer of 176 registered investment companies advised or administered by EVM. |
James F. Kirchner(3) 1967 | Treasurer | 2016 | Vice President of CRM and officer of 37 registered investment companies advised by CRM. Also Vice President of EVM and certain of its affiliates and officer of 176 registered investment companies advised or administered by EVM. |
(1) Mr. Streur is an interested person of the Funds because of his positions with each Fund’s Adviser and certain affiliates.
(2) Mmes. Bullock and Dominguez and Mr. Williams began serving as Directors effective December 23, 2016.
(3) The business address for Ms. Gemma and Mr. Kirchner is Two International Place, Boston, MA 02110. Ms. Gemma and Mr. Kirchner began serving as Officers effective December 31, 2016.
The SAI for the Fund includes additional information about the Directors and officers of the Fund and can be obtained without charge on Calvert’s website at www.calvert.com or by calling 1-800-368-2745.
32 www.calvert.com CALVERT INTERNATIONAL OPPORTUNITIES FUND ANNUAL REPORT (Unaudited)
IMPORTANT NOTICES
Privacy. The Calvert organization is committed to ensuring your financial privacy. Each of the financial institutions identified below has in effect the following policy (“Privacy Policy”) with respect to nonpublic personal information about its customers:
| |
| • | Only such information received from you, through application forms or otherwise, and information about your Calvert fund transactions will be collected. This may include information such as name, address, social security number, tax status, account balances and transactions. |
| |
| • | None of such information about you (or former customers) will be disclosed to anyone, except as permitted by law (which includes disclosure to employees necessary to service your account). In the normal course of servicing a customer’s account, the Calvert organization may share information with unaffiliated third parties that perform various required services such as transfer agents, custodians and broker-dealers. |
| |
| • | Policies and procedures (including physical, electronic and procedural safeguards) are in place that are designed to protect the confidentiality of such information. |
| |
| • | We reserve the right to change our Privacy Policy at any time upon proper notification to you. Customers may want to review our Privacy Policy periodically for changes by accessing the link on our homepage: www.calvert.com. |
Our pledge of privacy applies to the following entities within the Calvert organization: the Calvert family of funds and Calvert Research and Management. In addition, our Privacy Policy applies only to those Calvert customers who are individuals and who have a direct relationship with us. If a customer’s account (i.e., fund shares) is held in the name of a third-party financial advisor/broker-dealer, it is likely that only such advisor’s privacy policies apply to the customer. This notice supersedes all previously issued privacy disclosures. For more information about Calvert’s Privacy Policy, please call 1-800-368-2745.
Delivery of Shareholder Documents. The Securities and Exchange Commission (SEC) permits funds to deliver only one copy of shareholder documents, including prospectuses, proxy statements and shareholder reports, to fund investors with multiple accounts at the same residential or post office box address. This practice is often called “householding” and it helps eliminate duplicate mailings to shareholders. Calvert funds, or your financial advisor, may household the mailing of your documents indefinitely unless you instruct Calvert funds, or your financial advisor, otherwise. If you would prefer that your Calvert fund documents not be householded, please contact Calvert funds at 1-800-368-2745, or contact your financial advisor. Your instructions that householding not apply to delivery of your Calvert fund documents will typically be effective within 30 days of receipt by Calvert funds or your financial advisor. Separate statements will be generated for each separate account and will be householded as described above.
Portfolio Holdings. Each Calvert fund will file a schedule of portfolio holdings on Form N-Q with the SEC for the first and third quarters of each fiscal year. The Form N-Q will be available on the Calvert funds’ website at www.calvert.com, by calling Calvert funds at 1-800-368-2745 or in the EDGAR database on the SEC’s website at www.sec.gov. Form N-Q may also be reviewed and copied at the SEC’s public reference room in Washington, D.C. (call 1-800-732-0330 for information on the operation of the public reference room).
Proxy Voting. The Proxy Voting Guidelines that each Calvert fund uses to determine how to vote proxies relating to portfolio securities is provided as an Appendix to the fund’s Statement of Additional Information. The Statement of Additional Information can be obtained free of charge by calling the Calvert funds at 1-800-368-2745, by visiting the Calvert funds’ website at www.calvert.com or visiting the SEC’s website at www.sec.gov. Information regarding how a Calvert fund voted proxies relating to portfolio securities during the most recent 12-month period ended June 30 is available by calling Calvert funds, by visiting the Calvert funds’ website at www.calvert.com or by visiting the SEC’s website at www.sec.gov.
www.calvert.com CALVERT INTERNATIONAL OPPORTUNITIES FUND ANNUAL REPORT (Unaudited) 33
|
|
| This page intentionally left blank. |
|
|
| This page intentionally left blank. |
|
|
| This page intentionally left blank. |
|
| | | | |
| CALVERT INTERNATIONAL OPPORTUNITIES FUND | | CALVERT FUNDS | | |
Service for Existing Account Shareholders: 800-368-2745 Brokers: 800-368-2746 Regular Mail Calvert Funds c/o BFDS, P.O. Box 219544 Kansas City, MO 64121-9544 Overnight Mail Calvert Funds c/o BFDS, 330 West 9th Street Kansas City, MO 64105 Web Site www.calvert.com Principal Underwriter* Eaton Vance Distributors, Inc. Two International Place Boston, MA 02110 | | Municipal Funds Responsible Municipal Income Fund Taxable Bond Funds Bond Fund Income Fund Short Duration Income Fund Long-Term Income Fund Ultra-Short Duration Income Fund High Yield Bond Fund Green Bond Fund Absolute Return Bond Fund Floating-Rate Advantage Fund Balanced and Asset Allocation Funds Balanced Fund Conservative Allocation Fund Moderate Allocation Fund Aggressive Allocation Fund
| | Equity Funds Equity Fund US Large-Cap Core Responsible Index Fund US Large-Cap Value Responsible Index Fund US Large-Cap Growth Responsible Index Fund US Mid-Cap Core Responsible Index Fund International Responsible Index Fund Mid-Cap Fund International Equity Fund Small-Cap Fund Global Energy Solutions Fund Global Water Fund International Opportunities Fund Emerging Markets Equity Fund |
* FINRA BrokerCheck. Investors may check the background of their Investment Professional by contacting the Financial Industry Regulatory Authority (FINRA). FINRA BrokerCheck is a free tool to help investors check the professional background of current and former FINRA-registered securities firms and brokers. FINRA BrokerCheck is available by calling 1-800-289-9999 and at www.FINRA.org. The FINRA BrokerCheck brochure describing this program is available to investors at www.FINRA.org.
|
| |
| | |
Fund shares are not insured by the FDIC and are not deposits or other obligations of, or guaranteed by, any depository institution. Shares are subject to investment risks, including possible loss of principal invested. This report is intended to provide fund information to shareholders. It is not authorized for distribution to prospective investors unless preceded or accompanied by a prospectus. Note: The information on our website is not incorporated by reference into this report; our website address is included as an inactive textual reference only. Investors should carefully consider the investment objectives, risks, charges and expenses of the Calvert funds. This and other important information is contained in the fund’s summary prospectus and prospectus, which can be obtained from your financial professional and should be read carefully before investing. You may also call Calvert funds at 800-368-2745. Printed on recycled paper. |
| 24211 9.30.17 | |
|
| | |
| | |
| | | |
Calvert Emerging Markets Equity Fund
| | |
| | | |
| | |
|
| |
Annual Report September 30, 2017 E-Delivery Sign-Up — Details Inside | |
|
|
Commodity Futures Trading Commission Registration. Effective December 31, 2012, the Commodity Futures Trading Commission (“CFTC”) adopted certain regulatory changes that subject registered investment companies and advisers to regulation by the CFTC if a fund invests more than a prescribed level of its assets in certain CFTC-regulated instruments (including futures, certain options and swap agreements) or markets itself as providing investment exposure to such instruments. The Fund and its adviser have claimed an exclusion from the definition of the term “commodity pool operator” under the Commodity Exchange Act. Accordingly, neither the Fund nor the adviser is subject to CFTC regulation. |
Choose Planet-friendly E-delivery! Sign up now for on-line statements, prospectuses, and fund reports. In less than five minutes you can help reduce paper mail and lower fund costs. Just go to www.calvert.com. If you already have an online account with the Calvert funds, click on Login to access your Account and select the documents you would like to receive via e-mail. If you’re new to online account access, click on Login, then Register to create your user name and password. Once you’re in, click on the E-delivery sign-up on the Account Portfolio page and follow the quick, easy steps. Note: If your shares are not held directly with the Calvert funds but through a brokerage firm, you must contact your broker for electronic delivery options available through their firm. |
|
| | | | |
| | TABLE OF CONTENTS |
| | | | | |
| | | | | Management’s Discussion of Fund Performance |
| | | | | Performance |
| | | | | Fund Profile |
| | | | | Endnotes and Additional Disclosures |
| | | | | Understanding Your Fund’s Expenses |
| | | | | Financial Statements |
| | | | | Report of Independent Registered Public Accounting Firm |
| | | | | Federal Tax Information |
| | | | | Management and Organization |
| | | | | Important Notices |
MANAGEMENT’S DISCUSSION OF FUND PERFORMANCE1
|
| | |
| | | |
Economic and Market Conditions
Global stocks rose broadly for the 12-month period ended September 30, 2017, with emerging-market equities gaining nearly 23%, as measured by the MSCI Emerging Markets Index (the Index).2 Emerging markets have benefited from a plethora of positive factors - a healthy global economy, the continued improvement in growth within emerging markets, a weak U.S. dollar, positive election results in Europe, higher commodity prices, and a spate of strong earnings releases, particularly in Asia. Following a weak first few months, emerging-market equities was the best-performing asset class for most of the rest of the period. Chinese markets rose 33.04% on investor optimism, buoyed by improving economic data and a solid earnings season for their blue chip heavyweights. Sentiment was further aided in June 2016 by Morgan Stanley Capital International’s (MSCI) decision to include China ‘A’ shares in the Index as of May 2018. In addition, China showed better-than-expected gross domestic product (GDP) growth of 6.9% year-over-year in the second quarter. In response, commodity prices moved higher, helping Latin America outperform. Brazil posted the highest return, in part because of the rebound in the real. The interim government survived an impeachment effort in the summer, enabling it to continue much- needed public sector reforms. In addition, inflation fell, allowing the central bank to cut its benchmark rates. News that former President Luiz Inácio Lula da Silva could be prohibited from standing in the 2018 elections further boosted investor enthusiasm. At the sector level, information technology stood out, gaining 41% as investors sought companies with good growth prospects and benchmark constituents reported better-than-expected results. Conversely, more defensive segments underperformed, led by health care, which gained 2.82%, and consumer staples, which advanced 3.83%. Fund Performance
Calvert Emerging Markets Equity Fund (the Fund) returned 26.89% for Class A shares at net asset value (NAV), outperforming the Index, which returned 22.46% for the 12-month period ended September 30, 2017. Outperformance was driven primarily by stock selection in China, India, the United Arab Emirates and Russia. Stock selection in Taiwan and South Africa detracted from Fund performance. Being underweight South Korea, which outperformed, also detracted, though this was offset by our underweight to the South Korean won. The Fund’s position in NMC Health plc, an Abu Dhabi-based health care provider, was the largest contributor to returns relative to the Index. NMC rose on strong first-half 2017 results and increased guidance, with all segments reporting good growth and margins.
| |
Chinese global surveillance leader Hangzhou Hikvision Digital Technology Co. Ltd., was another top contributor. Hangzhou saw its share price double year-to-date following several broker upgrades of the stock. Tung Thih Electronic Co. Ltd., a Taiwanese manufacturer of automobile components, was the largest detractor from Fund performance in the period as markets anticipated a slowdown in auto sales in China, potential increases in competition, and a stronger Taiwan dollar. Not owning Samsung, a large constituent of the South Korean index, also detracted, as the stock had solid gains on strong first-half 2017 results, positive preorders for its GS8 smartphone, and robust memory prices. The Fund’s large, active weights at the country level were limited to overweights in China, India and Taiwan and underweights in South Korea, Malaysia, and Thailand. The Fund retains overweights in the consumer discretionary, information technology and health care sectors and underweights in materials, energy and industrials. We reduced the Fund’s overall exposure to India. We exited ICICI Bank Ltd. (ADR) because of our expectations for a rise in nonperforming loans, and Container Corp. of India Ltd., given weak freight volumes and our expectation that our investment thesis for the company will take longer than anticipated to play out. Both securities were sold during the period. We trimmed Fund positions that have performed strongly, notably Tencent Holdings Ltd., HDFC Bank Ltd. (ADR) and Motherson Sumi Systems Ltd., and increased holdings in existing positions that offer more value. These include Naspers Ltd., Sberbank of Russia PJSC, Itau Unibanco Holding SA, and Abu Dhabi Commercial Bank PJSC. The Fund recently invested in Industrial & Commercial Bank of China Ltd., (ICBC) one of China’s largest banks, operating in three main business segments: corporate banking, personal banking and treasury operations. ICBC has a strong capital position due to low exposure to nonstandard assets and a better-than-industry asset quality and nonperforming loan ratio. It should also benefit from improving asset yields and declining credit costs.
|
See Endnotes and Additional Disclosures in this report.
Past performance is no guarantee of future results. Returns are historical and are calculated by determining the percentage change in net asset value (NAV) or offering price (as applicable) with all distributions reinvested. Investment return and principal value will fluctuate so that shares, when redeemed, may be worth more or less than their original cost. Performance less than or equal to one year is cumulative. Performance is for the stated time period only; due to market volatility, the Fund's current performance may be lower or higher than quoted. Returns are before taxes unless otherwise noted. For performance as of the most recent month-end, please refer to www.calvert.com.
2 www.calvert.com CALVERT EMERGING MARKETS EQUITY FUND ANNUAL REPORT (Unaudited)
PERFORMANCE
|
| | | | | | | | | | | | | | |
Performance2,3 | | | | | | | | | |
Portfolio Managers Gary Greenberg, CFA and Elena Tedesco, CFA, each of Hermes Investment Management Limited |
| | | | | | | | | | |
| % Average Annual Total Returns | Class Inception Date |
| | Performance Inception Date |
| | One Year |
| | Five Years |
| | Since Inception |
|
| Class A at NAV | 10/29/2012 |
| | 10/29/2012 |
| | 26.89 | % | | — | % | | 8.96 | % |
| Class A with 4.75% Maximum Sales Charge | — |
| | — |
| | 20.83 |
| | — |
| | 7.89 |
|
| Class C at NAV | 10/29/2012 |
| | 10/29/2012 |
| | 25.88 |
| | — |
| | 8.02 |
|
| Class C with 1% Maximum Sales Charge | — |
| | — |
| | 24.88 |
| | — |
| | 8.02 |
|
| Class I at NAV | 10/29/2012 |
| | 10/29/2012 |
| | 27.27 |
| | — |
| | 9.35 |
|
| Class Y at NAV | 10/29/2012 |
| | 10/29/2012 |
| | 27.22 |
| | — |
| | 9.26 |
|
| | | | | | | | | | |
| | | | | | | | | | |
| MSCI Emerging Markets Index | — |
| | — |
| | 22.46 | % | | 3.98 | % | | 4.29 | % |
| | | | | | | | | | |
% Total Annual Operating Expense Ratios4 | | | Class A |
| | Class C |
| | Class I |
| | Class Y |
|
| Gross | | | 1.81 | % | | 4.31 | % | | 1.35 | % | | 1.48 | % |
| Net | | | 1.27 |
| | 2.02 |
| | 0.92 |
| | 1.02 |
|
|
|
| Growth of $10,000 |
| This graph shows the change in value of a hypothetical investment of $10,000 in Class A of the Fund for the period indicated. For comparison, the same investment is shown in the indicated index. |
|
| | | | | | | | |
| Growth of Investment | Amount Invested |
| Period Beginning | At NAV |
| With Maximum Sales Charge |
| Class C |
| $10,000 |
| 10/29/2012 |
| $14,618 |
| N.A. |
| Class I |
| $250,000 |
| 10/29/2012 |
| $388,137 |
| N.A. |
| Class Y |
| $10,000 |
| 10/29/2012 |
| $15,463 |
| N.A. |
See Endnotes and Additional Disclosures in this report.
Past performance is no guarantee of future results. Returns are historical and are calculated by determining the percentage change in net asset value (NAV) or offering price (as applicable) with all distributions reinvested. Investment return and principal value will fluctuate so that shares, when redeemed, may be worth more or less than their original cost. Performance less than or equal to one year is cumulative. Performance is for the stated time period only; due to market volatility, the Fund's current performance may be lower or higher than quoted. Returns are before taxes unless otherwise noted. For performance as of the most recent month-end, please refer to www.calvert.com.
www.calvert.com CALVERT EMERGING MARKETS EQUITY FUND ANNUAL REPORT (Unaudited) 3
FUND PROFILE
|
| | | | | | | |
| |
| | | | | |
| | SECTOR ALLOCATION (% of total investments) | | | TEN LARGEST STOCK HOLDINGS (% of net assets) |
| | | | | | |
| | Information Technology | 30.0 | % | | Tencent Holdings Ltd. | 5.9 | % |
| | Financials | 25.4 | % | | Alibaba Group Holdings Ltd. (ADR) | 5.6 | % |
| | Consumer Discretionary | 23.4 | % | | Taiwan Semiconductor Manufacturing Co. Ltd. (ADR) | 4.9 | % |
| | Consumer Staples | 7.4 | % | | Techtronic Industries Co. Ltd. | 4.0 | % |
| | Health Care | 5.8 | % | | Samsonite International SA | 3.1 | % |
| | Utilities | 2.1 | % | | Naspers Ltd., Class N | 2.9 | % |
| | Materials | 2.0 | % | | AIA Group Ltd. | 2.8 | % |
| | Industrials | 1.8 | % | | KB Financial Group, Inc. | 2.8 | % |
| | Energy | 1.4 | % | | Industrial & Commercial Bank of China Ltd., Class H | 2.6 | % |
| | High Social Impact Investments | 0.7 | % | | China Mengniu Dairy Company Ltd. | 2.5 | % |
| | Total | 100.0 | % | | Total | 37.1 | % |
See Endnotes and Additional Disclosures in this report.
4 www.calvert.com CALVERT EMERGING MARKETS EQUITY FUND ANNUAL REPORT (Unaudited)
|
| | |
| Endnotes and Additional Disclosures | | |
| | | |
1 The views expressed in this report are those of the portfolio manager(s) and are current only through the date stated at the top of this page. These views are subject to change at any time based upon market or other conditions, and Eaton Vance and the Fund(s) disclaim any responsibility to update such views. These views may not be relied upon as investment advice and, because investment decisions are based on many factors, may not be relied upon as an indication of trading intent on behalf of any Calvert fund. This commentary may contain statements that are not historical facts, referred to as “forward looking statements”. The Fund’s actual future results may differ significantly from those stated in any forward looking statement, depending on factors such as changes in securities or financial markets or general economic conditions, the volume of sales and purchases of Fund shares, the continuation of investment advisory, administrative and service contracts, and other risks discussed from time to time in the Fund’s filings with the Securities and Exchange Commission.
2 MSCI Emerging Markets Index is an unmanaged index of emerging markets common stocks. MSCI indexes are net of foreign withholding taxes. Source: MSCI. MSCI data may not be reproduced or used for any other purpose. MSCI provides no warranties, has not prepared or approved this report, and has no liability hereunder. Unless otherwise stated, index returns do not reflect the effect of any applicable sales charges, commissions, expenses, taxes or leverage, as applicable. It is not possible to invest directly in an index.
3 Total Returns at NAV do not include applicable sales charges. If sales charges were deducted, the returns would be lower. Total Returns shown with maximum sales charge reflect the stated maximum sales charge. Unless otherwise stated, performance does not reflect the deduction of taxes on Fund distributions or redemptions of Fund shares.
Effective November 6, 2017, Class I shares have an initial investment minimum of $250,000.
4 Source: Fund prospectus. Net expense ratios reflect a contractual expense reimbursement that continues through 1/31/19. Without the reimbursement, performance would have been lower. The expense ratios for the current reporting period can be found in the Financial Highlights section of this report.
Fund profile subject to change due to active management.
| | |
www.calvert.com CALVERT EMERGING MARKETS EQUITY FUND ANNUAL REPORT (Unaudited) 5
UNDERSTANDING YOUR FUND'S EXPENSES
Example
As a Fund shareholder, you incur two types of costs: (1) transaction costs, including sales charges (loads) on purchases and redemption fees (if applicable); and (2) ongoing costs, including management fees; distribution and/or service fees; and other Fund expenses. This Example is intended to help you understand your ongoing costs (in dollars) of Fund investing and to compare these costs with the ongoing costs of investing in other mutual funds. The Example is based on an investment of $1,000 invested at the beginning of the period and held for the entire period (April 1, 2017 to September 30, 2017).
Actual Expenses
The first section of the table below provides information about actual account values and actual expenses. You may use the information in this section, together with the amount you invested, to estimate the expenses that you paid over the period. Simply divide your account value by $1,000 (for example, an $8,600 account value divided by $1,000 = 8.6), then multiply the result by the number in the first section under the heading entitled “Expenses Paid During Period” to estimate the expenses you paid on your account during this period.
Hypothetical Example for Comparison Purposes
The second section of the table below provides information about hypothetical account values and hypothetical expenses based on the actual Fund expense ratio and an assumed rate of return of 5% per year (before expenses), which is not the actual Fund return. The hypothetical account values and expenses may not be used to estimate the actual ending account balance or expenses you paid for the period. You may use this information to compare the ongoing costs of investing in the Fund and other funds. To do so, compare this 5% hypothetical example with the 5% hypothetical examples that appear in the shareholder reports of the other funds.
Please note that the expenses shown in the table are meant to highlight your ongoing costs only and do not reflect any transactional costs, such as sales charges (loads) or redemption fees (if applicable). Therefore, the second section of the table is useful in comparing ongoing costs only, and will not help you determine the relative total costs of owning different funds. In addition, if these transactional costs were included, your costs would be higher.
|
| | | | |
| | BEGINNING
ACCOUNT VALUE
(4/1/17) | ENDING
ACCOUNT VALUE
(9/30/17) | EXPENSES PAID
DURING PERIOD*
(4/1/17 - 9/30/17) | ANNUALIZED
EXPENSE RATIO |
| Actual | | | | |
| Class A | $1,000.00 | $1,201.60 | $7.01** | 1.27% |
| Class C | $1,000.00 | $1,197.00 | $11.13** | 2.02% |
| Class I | $1,000.00 | $1,202.90 | $5.08** | 0.92% |
| Class Y | $1,000.00 | $1,203.50 | $5.63** | 1.02% |
| Hypothetical | | | | |
| (5% return per year before expenses) | | | | |
| Class A | $1,000.00 | $1,018.70 | $6.43** | 1.27% |
| Class C | $1,000.00 | $1,014.94 | $10.20** | 2.02% |
| Class I | $1,000.00 | $1,020.46 | $4.66** | 0.92% |
| Class Y | $1,000.00 | $1,019.96 | $5.17** | 1.02% |
| | | | | |
| * Expenses are equal to the Fund's annualized expense ratio for the indicated Class, multiplied by the average account value over the period, multiplied by 183/365 (to reflect the one-half year period). The Example assumes that the $1,000 was invested at the net asset value per share determined at the close of business on March 31, 2017. |
| ** Absent a waiver and/or reimbursement of expenses by affiliates, expenses would be higher. |
6 www.calvert.com CALVERT EMERGING MARKETS EQUITY FUND ANNUAL REPORT (Unaudited)
CALVERT EMERGING MARKETS EQUITY FUND
SCHEDULE OF INVESTMENTS
SEPTEMBER 30, 2017
|
| | |
| | SHARES | VALUE ($) |
| COMMON STOCKS - 93.3% | | |
| Brazil - 8.7% | | |
| BB Seguridade Participacoes SA | 658,081 | 5,948,837 |
| Itau Unibanco Holding SA, PFC Shares | 448,605 | 6,140,229 |
| Klabin SA | 1,007,155 | 5,835,308 |
| Lojas Renner SA | 367,290 | 4,181,828 |
| Ultrapar Participacoes SA | 175,738 | 4,178,782 |
| | | 26,284,984 |
| | | |
| Chile - 1.0% | | |
| S.A.C.I. Falabella | 324,232 | 3,153,416 |
| | | |
| China - 20.0% | | |
| Alibaba Group Holding Ltd. (ADR) * | 98,178 | 16,956,322 |
| China Biologic Products Holdings, Inc. * | 52,183 | 4,814,926 |
| China Mengniu Dairy Company Ltd. | 2,720,000 | 7,629,924 |
| Industrial & Commercial Bank of China Ltd., Class H | 10,572,519 | 7,903,054 |
| Shenzhen International Holdings Ltd. | 2,816,173 | 5,308,421 |
| Tencent Holdings Ltd. | 412,130 | 18,018,602 |
| | | 60,631,249 |
| | | |
| Hong Kong - 9.9% | | |
| AIA Group Ltd. | 1,155,200 | 8,552,291 |
| Samsonite International SA | 2,166,311 | 9,302,941 |
| Techtronic Industries Co. Ltd. | 2,257,661 | 12,085,444 |
| | | 29,940,676 |
| | | |
| Hungary - 2.3% | | |
| Richter Gedeon Nyrt | 275,095 | 6,835,827 |
| | | |
| India - 12.0% | | |
| Bharat Forge Ltd. | 507,172 | 4,602,204 |
| HCL Technologies Ltd. | 211,918 | 2,827,612 |
| HDFC Bank Ltd. (ADR) | 75,907 | 7,315,158 |
| Hero MotoCorp. Ltd. | 90,105 | 5,225,412 |
| Motherson Sumi Systems Ltd. | 1,142,049 | 5,893,591 |
| Power Grid Corp. of India Ltd. | 1,926,732 | 6,237,669 |
| Tech Mahindra Ltd. | 595,689 | 4,176,895 |
| | | 36,278,541 |
| | | |
| Indonesia - 1.4% | | |
| Bank Rakyat Indonesia Persero Tbk PT | 3,832,489 | 4,351,095 |
| |
www.calvert.com CALVERT EMERGING MARKETS EQUITY FUND ANNUAL REPORT 7
|
| | |
| | SHARES | VALUE ($) |
| COMMON STOCKS - CONT’D | | |
| Mexico - 2.5% | | |
| Grupo Financiero Banorte SAB de CV | 620,541 | 4,272,225 |
| Wal-Mart de Mexico SAB de CV | 1,435,867 | 3,288,065 |
| | | 7,560,290 |
| | | |
| Peru - 1.2% | | |
| Credicorp Ltd. | 17,586 | 3,605,482 |
| | | |
| Russia - 5.3% | | |
| Magnit PJSC | 33,798 | 5,923,430 |
| Mail.Ru Group Ltd. (GDR) * | 75,208 | 2,480,432 |
| Sberbank of Russia PJSC, PFC Shares | 42,385 | 114,885 |
| Sberbank of Russia PJSC (ADR) (a) | 51,268 | 731,594 |
| Sberbank of Russia PJSC (ADR) (a) | 467,696 | 6,669,110 |
| | | 15,919,451 |
| | | |
| South Africa - 6.4% | | |
| Foschini Group Ltd. (The) | 528,901 | 5,303,171 |
| Naspers Ltd., Class N | 41,302 | 8,928,363 |
| Shoprite Holdings Ltd. | 338,698 | 5,175,753 |
| | | 19,407,287 |
| | | |
| South Korea - 5.1% | | |
| KB Financial Group, Inc. | 169,328 | 8,330,788 |
| Samsung Fire & Marine Insurance Co. Ltd. | 29,260 | 7,170,465 |
| | | 15,501,253 |
| | | |
| Taiwan - 14.2% | | |
| Advantech Co. Ltd. | 695,983 | 4,968,517 |
| Chipbond Technology Corp. | 2,796,000 | 4,677,639 |
| Hon Hai Precision Industry Co. Ltd. | 1,924,942 | 6,685,141 |
| Land Mark Optoelectronics Corp. | 471,900 | 5,820,609 |
| Taiwan Semiconductor Manufacturing Co. Ltd. (ADR) | 391,299 | 14,693,277 |
| Tong Yang Industry Co. Ltd. | 2,599,448 | 5,315,024 |
| Tung Thih Electronic Co. Ltd. | 140,000 | 919,118 |
| | | 43,079,325 |
| | | |
| United Arab Emirates - 1.5% | | |
| Abu Dhabi Commercial Bank PJSC | 2,300,071 | 4,453,693 |
| | | |
| United Kingdom - 1.8% | | |
| NMC Health plc | 146,189 | 5,408,271 |
| | | |
| Total Common Stocks (Cost $232,472,415) | | 282,410,840 |
| | | |
| | | |
8 www.calvert.com CALVERT EMERGING MARKETS EQUITY FUND ANNUAL REPORT
|
| | |
| | SHARES | VALUE ($) |
| PARTICIPATORY NOTES - 4.1% | | |
| China - 4.1% | | |
| Gree Electric Appliances, Inc., (Merrill Lynch International & Co.), 8/31/18 * | 34,541 | 196,970 |
| Gree Electric Appliances, Inc., (Morgan Stanley Asia Products Ltd.), 2/16/18 * | 181,097 | 1,032,706 |
| Gree Electric Appliances, Inc., (Morgan Stanley Asia Products Ltd.), 12/14/18 * | 606,417 | 3,458,093 |
| Hangzhou Hikvision Digital Technology Co. Ltd., (Merrill Lynch International & Co.), 1/3/19 * | 102,334 | 492,708 |
| Hangzhou Hikvision Digital Technology Co. Ltd., (Merrill Lynch International & Co.), 4/9/19 * | 376,480 | 1,812,638 |
| Hangzhou Hikvision Digital Technology Co. Ltd., (Morgan Stanley Asia Products Ltd.), 1/18/19 * | 1,154,187 | 5,557,064 |
| | | 12,550,179 |
| | | |
| Total Participatory Notes (Cost $9,267,356) | | 12,550,179 |
| | | |
| | | |
| | PRINCIPAL AMOUNT ($) | VALUE ($) |
| HIGH SOCIAL IMPACT INVESTMENTS - 0.7% | | |
| Calvert Social Investment Foundation, Community Investment Notes, 1.50%, 12/15/19 (b)(c) | 2,000,000 | 1,906,160 |
| ImpactAssets Inc., Global Sustainable Agriculture Notes, 0.00%, 11/3/20 (b)(d)(e) | 43,000 | 40,635 |
| ImpactAssets Inc., Microfinance Plus Notes, 0.00%, 11/3/20 (b)(d)(e) | 56,000 | 53,368 |
| | | |
| Total High Social Impact Investments (Cost $2,099,000) | | 2,000,163 |
| | | |
| | | |
| TOTAL INVESTMENTS (Cost $243,838,771) - 98.1% | | 296,961,182 |
| Other assets and liabilities, net - 1.9% | | 5,897,144 |
NET ASSETS - 100.0% | | 302,858,326 |
|
| | |
| NOTES TO SCHEDULE OF INVESTMENTS |
| * Non-income producing security. |
| (a) Securities are traded on separate exchanges for the same entity. |
| (b) Restricted security. Total market value of restricted securities amounts to $2,000,163, which represents 0.7% of the net assets of the Fund as of September 30, 2017. |
| (c) Affiliated company (see Note F). |
| (d) For fair value measurement disclosure purposes, security is categorized as Level 3 (see Note A). |
| (e) Notes carry an interest rate that varies by period and is contingent on the performance of the underlying portfolio of loans to borrowers. The coupon rate shown represents the rate in effect at September 30, 2017. |
www.calvert.com CALVERT EMERGING MARKETS EQUITY FUND ANNUAL REPORT 9
|
| |
| At September 30, 2017, the concentration of the Fund’s investments in the various sectors, determined as a percentage of total investments, was as follows: |
| | |
| SECTOR ALLOCATION | % of Total Investments |
| Information Technology | 30.0% |
| Financials | 25.4% |
| Consumer Discretionary | 23.4% |
| Consumer Staples | 7.4% |
| Health Care | 5.8% |
| Utilities | 2.1% |
| Materials | 2.0% |
| Industrials | 1.8% |
| Energy | 1.4% |
| High Social Impact Investments | 0.7% |
| Total | 100.0% |
|
| | |
| Abbreviations: | |
| ADR: | American Depositary Receipt | |
| GDR: | Global Depositary Receipts | |
| PFC Shares: | Preference Shares | |
|
| | |
| RESTRICTED SECURITIES | ACQUISITION DATES | COST ($) |
| Calvert Social Investment Foundation, Community Investment Notes, 1.50%, 12/15/19 | 12/15/16 | 2,000,000 |
| ImpactAssets Inc., Global Sustainable Agriculture Notes, 0.00%, 11/3/20 | 11/13/15 | 43,000 |
| ImpactAssets Inc., Microfinance Plus Notes, 0.00%, 11/3/20 | 11/13/15 | 56,000 |
| See notes to financial statements. |
10 www.calvert.com CALVERT EMERGING MARKETS EQUITY FUND ANNUAL REPORT
CALVERT EMERGING MARKETS EQUITY FUND
STATEMENT OF ASSETS AND LIABILITIES
SEPTEMBER 30, 2017
|
| | | |
| ASSETS | |
| Investments in securities of unaffiliated issuers, at value (identified cost $241,838,771) |
| $295,055,022 |
|
| Investments in securities of affiliated issuers, at value (identified cost $2,000,000) | 1,906,160 |
|
| Cash | 7,072,106 |
|
| Cash denominated in foreign currency, at value (cost $312,434) | 313,065 |
|
| Receivable for investments sold | 75,490 |
|
| Receivable for capital shares sold | 2,949,869 |
|
| Dividends and interest receivable | 172,527 |
|
| Interest receivable - affiliated | 24,167 |
|
| Securities lending income receivable | 619 |
|
| Receivable from affiliates | 113,910 |
|
| Directors' deferred compensation plan | 52,272 |
|
| Total assets | 307,735,207 |
|
| | |
| LIABILITIES | |
| Payable for investments purchased | 2,901,690 |
|
| Payable for capital shares redeemed | 1,499,352 |
|
| Payable for foreign capital gains taxes | 17,605 |
|
| Payable to affiliates: | |
| Investment advisory fee | 207,015 |
|
| Administrative fee | 26,200 |
|
| Distribution and service fees | 15,158 |
|
| Sub-transfer agency fee | 2,893 |
|
| Directors' deferred compensation plan | 52,272 |
|
| Accrued expenses | 154,696 |
|
| Total liabilities | 4,876,881 |
|
| NET ASSETS |
| $302,858,326 |
|
| | |
| NET ASSETS CONSIST OF: | |
| Paid-in capital applicable to common stock | |
| (250,000,000 shares of $0.01 par value authorized) |
| $250,344,769 |
|
| Accumulated undistributed net investment income | 1,450,300 |
|
| Accumulated net realized loss | (2,037,426) |
|
| Net unrealized appreciation (depreciation) | 53,100,683 |
|
| Total |
| $302,858,326 |
|
| | |
| NET ASSET VALUE PER SHARE | |
| Class A (based on net assets of $62,431,989 and 3,823,253 shares outstanding) |
| $16.33 |
|
| Class C (based on net assets of $4,627,156 and 288,466 shares outstanding) |
| $16.04 |
|
| Class I (based on net assets of $126,398,133 and 7,668,517 shares outstanding) |
| $16.48 |
|
| Class Y (based on net assets of $109,401,048 and 6,583,396 shares outstanding) |
| $16.62 |
|
| | |
| OFFERING PRICE PER SHARE* | |
| Class A (100/95.25 of net asset value per share) |
| $17.14 |
|
| * On sales of $50,000 or more, the offering price of Class A shares is reduced. | |
| See notes to financial statements. | |
www.calvert.com CALVERT EMERGING MARKETS EQUITY FUND ANNUAL REPORT 11
CALVERT EMERGING MARKETS EQUITY FUND
STATEMENT OF OPERATIONS
YEAR ENDED SEPTEMBER 30, 2017
|
| | | |
| INVESTMENT INCOME | |
| Dividend income (net of foreign taxes withheld of $410,250) |
| $3,620,584 |
|
| Interest income - unaffiliated issuers | 5,140 |
|
| Interest income - affiliated issuers | 28,278 |
|
| Securities lending income, net | 2,826 |
|
| Other income | 107 |
|
| Total investment income | 3,656,935 |
|
| | |
| EXPENSES | |
| Investment advisory fee | 1,536,447 |
|
| Administrative fee | 206,679 |
|
| Distribution and service fees: | |
| Class A | 91,973 |
|
| Class C | 16,939 |
|
| Directors' fees and expenses | 12,231 |
|
| Custodian fees | 297,104 |
|
| Transfer agency fees and expenses: | |
| Class A | 79,022 |
|
| Class C | 6,645 |
|
| Class I | 4,308 |
|
| Class Y | 56,894 |
|
| Accounting fees | 48,375 |
|
| Professional fees | 39,370 |
|
| Registration fees: | |
| Class A | 19,907 |
|
| Class C | 17,163 |
|
| Class I | 27,899 |
|
| Class Y | 20,627 |
|
| Reports to shareholders | 18,320 |
|
| Miscellaneous | 48,831 |
|
| Total expenses | 2,548,734 |
|
| Waiver and/or reimbursement of expenses by affiliates | (764,524) |
|
| Reimbursement of expenses-other | (2,488) |
|
| Net expenses | 1,781,722 |
|
| Net investment income (loss) | 1,875,213 |
|
12 www.calvert.com CALVERT EMERGING MARKETS EQUITY FUND ANNUAL REPORT
CALVERT EMERGING MARKETS EQUITY FUND
STATEMENT OF OPERATIONS
YEAR ENDED SEPTEMBER 30, 2017 - CONT’D
|
| | | |
| REALIZED AND UNREALIZED GAIN (LOSS) | |
| Net realized gain (loss) on: | |
| Investment securities - unaffiliated issuers | 3,553,679 |
|
| Foreign currency transactions | (154,135) |
|
| | 3,399,544 |
|
| | |
| Net change in unrealized appreciation (depreciation) on: | |
| Investment securities - unaffiliated issuers (including net increase in payable for foreign capital gains taxes of $4,343) | 41,602,834 |
|
| Investment securities - affiliated issuers | (58,260) |
|
| Foreign currency | (14,959) |
|
| | 41,529,615 |
|
| | |
| Net realized and unrealized gain (loss) | 44,929,159 |
|
| | |
| Net increase (decrease) in net assets resulting from operations |
| $46,804,372 |
|
| | |
| See notes to financial statements. | |
www.calvert.com CALVERT EMERGING MARKETS EQUITY FUND ANNUAL REPORT 13
CALVERT EMERGING MARKETS EQUITY FUND
STATEMENTS OF CHANGES IN NET ASSETS
|
| | | | | | | |
| INCREASE (DECREASE) IN NET ASSETS | Year Ended
September 30, 2017 | | Year Ended
September 30, 2016 |
| Operations: | | | |
| Net investment income (loss) |
| $1,875,213 |
| |
| $887,140 |
|
| Net realized gain (loss) | 3,399,544 |
| | (2,908,514) |
|
| Net change in unrealized appreciation (depreciation) | 41,529,615 |
| | 19,998,404 |
|
| Net increase (decrease) in net assets resulting from operations | 46,804,372 |
| | 17,977,030 |
|
| | | | |
| Distributions to shareholders from: | | | |
| Net investment income: | | | |
| Class A shares | (160,548) |
| | (201,769) |
|
| Class C shares | (1,582) |
| | (739) |
|
| Class I shares | (514,051) |
| | (492,370) |
|
| Class Y shares | (212,318) |
| | (124,328) |
|
| Total distributions to shareholders | (888,499) |
| | (819,206) |
|
| | | | |
| Capital share transactions: | | | |
| Class A shares | 14,094,148 |
| | 10,874,744 |
|
| Class C shares | 3,183,341 |
| | 287,776 |
|
| Class I shares | 45,733,960 |
| | 10,752,307 |
|
| Class Y shares | 68,695,807 |
| | 16,037,479 |
|
| Net increase (decrease) in net assets from capital share transactions | 131,707,256 |
| | 37,952,306 |
|
| | | | |
| TOTAL INCREASE (DECREASE) IN NET ASSETS | 177,623,129 |
| | 55,110,130 |
|
| | | | |
| | | | |
| NET ASSETS | | | |
| Beginning of year | 125,235,197 |
| | 70,125,067 |
|
| End of year (including accumulated undistributed net investment income of $1,450,300 and $866,347, respectively) |
| $302,858,326 |
| |
| $125,235,197 |
|
| See notes to financial statements. |
14 www.calvert.com CALVERT EMERGING MARKETS EQUITY FUND ANNUAL REPORT
CALVERT EMERGING MARKETS EQUITY FUND
FINANCIAL HIGHLIGHTS
|
| | | | | | | | | | | | | | | |
| | Year Ended September 30, | | Period Ended September 30, | |
| CLASS A SHARES | 2017 | | 2016 | | 2015 | | 2014 | | 2013(a) | |
| Net asset value, beginning | $12.94 | | $10.90 | | $13.15 | | $13.34 | | $12.00 | |
| Income from investment operations: | | | | | | | | | | |
Net investment income (b) | 0.10 |
| | 0.08 |
| (c) | 0.11 |
| | 0.08 |
| | 0.13 |
| |
| Net realized and unrealized gain (loss) | 3.36 |
| | 2.06 |
| | (1.92) |
| | 0.46 |
| | 1.34 |
| |
| Total from investment operations | 3.46 |
| | 2.14 |
| | (1.81) |
| | 0.54 |
| | 1.47 |
| |
| Distributions from: | | | | | | | | | | |
| Net investment income | (0.07) |
| | (0.10) |
| | (0.03) |
| | (0.04) |
| | (0.13) |
| |
| Net realized gain | — |
| | — |
| | (0.41) |
| | (0.69) |
| | — |
| |
| Total distributions | (0.07) |
| | (0.10) |
| | (0.44) |
| | (0.73) |
| | (0.13) |
| |
| Total increase (decrease) in net asset value | 3.39 |
| | 2.04 |
| | (2.25) |
| | (0.19) |
| | 1.34 |
| |
| Net asset value, ending | $16.33 | | $12.94 | | $10.90 | | $13.15 | | $13.34 | |
Total return (d) | 26.89 | % | | 19.75 | % | | (14.18 | %) | | 4.19 | % | | 12.30 | % | |
Ratios to average net assets: (e) | | | | | | | | | | |
| Total expenses | 1.80 | % | | 1.95 | % | | 2.18 | % | | 2.22 | % | | 3.03 | % | (f) |
| Net expenses | 1.27 | % | | 1.47 | % | | 1.75 | % | | 1.78 | % | | 1.78 | % | (f) |
| Net investment income | 0.73 | % | | 0.66 | % | (c) | 0.84 | % | | 0.57 | % | | 1.16 | % | (f) |
| Portfolio turnover | 36 | % | | 32 | % | | 66 | % | | 95 | % | | 74 | % | |
| Net assets, ending (in thousands) | $62,432 | | $39,343 | | $23,569 | | $20,628 | | $6,337 | |
| | | | | | | | | | | |
(a) From October 29, 2012 inception. |
(b) Computed using average shares outstanding. |
(c) Amount includes a non-recurring refund for overbilling of prior years' custody out-of-pocket fees. This amounted to $0.003 per share and 0.03% of average net assets. |
(d) Returns are historical and are calculated by determining the percentage change in net asset value with all distributions reinvested and do not reflect the effect of sales charges, if any. Total return is not annualized for periods of less than one year. |
(e) Total expenses do not reflect amounts reimbursed and/or waived by the Adviser and certain of its affiliates, if applicable. Net expenses are net of all reductions and represent the net expenses paid by the Fund. |
(f) Annualized. |
| See notes to financial statements. |
www.calvert.com CALVERT EMERGING MARKETS EQUITY FUND ANNUAL REPORT 15
CALVERT EMERGING MARKETS EQUITY FUND
FINANCIAL HIGHLIGHTS
|
| | | | | | | | | | | | | | | |
| | Year Ended September 30, | | Period Ended September 30, | |
| CLASS C SHARES | 2017 | | 2016 | | 2015 | | 2014 | | 2013(a) | |
| Net asset value, beginning | $12.76 | | $10.74 | | $13.05 | | $13.34 | | $12.00 | |
| Income from investment operations: | | | | | | | | | | |
Net investment income (loss) (b) | 0.01 |
| | — |
| (c) | (0.03) |
| | (0.05) |
| | (0.01) |
| |
| Net realized and unrealized gain (loss) | 3.29 |
| | 2.03 |
| | (1.87) |
| | 0.45 |
| | 1.37 |
| |
| Total from investment operations | 3.30 |
| | 2.03 |
| | (1.90) |
| | 0.40 |
| | 1.36 |
| |
| Distributions from: | | | | | | | | | | |
| Net investment income | (0.02) |
| | (0.01) |
| | — |
| | — |
| | (0.02) |
| |
| Net realized gain | — |
| | — |
| | (0.41) |
| | (0.69) |
| | — |
| |
| Total distributions | (0.02) |
| | (0.01) |
| | (0.41) |
| | (0.69) |
| | (0.02) |
| |
| Total increase (decrease) in net asset value | 3.28 |
| | 2.02 |
| | (2.31) |
| | (0.29) |
| | 1.34 |
| |
| Net asset value, ending | $16.04 | | $12.76 | | $10.74 | | $13.05 | | $13.34 | |
Total return (d) | 25.88 | % | | 18.94 | % | | (14.98 | %) | | 3.10 | % | | 11.38 | % | |
Ratios to average net assets: (e) | | | | | | | | | | |
| Total expenses | 3.69 | % | | 4.44 | % | | 5.00 | % | | 4.36 | % | | 100.72 | % | (f) |
| Net expenses | 2.02 | % | | 2.21 | % | | 2.70 | % | | 2.78 | % | | 2.78 | % | (f) |
| Net investment income (loss) | 0.08 | % | | 0.02 | % | (c) | (0.23 | %) | | (0.41 | %) | | (0.09 | %) | (f) |
| Portfolio turnover | 36 | % | | 32 | % | | 66 | % | | 95 | % | | 74 | % | |
| Net assets, ending (in thousands) | $4,627 | | $994 | | $566 | | $610 | | $133 | |
| | | | | | | | | | | |
(a) From October 29, 2012 inception. |
(b) Computed using average shares outstanding. |
(c) Amount includes a non-recurring refund for overbilling of prior years' custody out-of-pocket fees. This amounted to $0.003 per share and 0.03% of average net assets. |
(d) Returns are historical and are calculated by determining the percentage change in net asset value with all distributions reinvested and do not reflect the effect of sales charges, if any. Total return is not annualized for periods of less than one year. |
(e) Total expenses do not reflect amounts reimbursed and/or waived by the Adviser and certain of its affiliates, if applicable. Net expenses are net of all reductions and represent the net expenses paid by the Fund. |
(f) Annualized. |
| See notes to financial statements. | | |
16 www.calvert.com CALVERT EMERGING MARKETS EQUITY FUND ANNUAL REPORT
CALVERT EMERGING MARKETS EQUITY FUND
FINANCIAL HIGHLIGHTS
|
| | | | | | | | | | | | | | | |
| | Year Ended September 30, | | Period Ended September 30, | |
| CLASS I SHARES | 2017 | | 2016 | | 2015 | | 2014 | | 2013(a) | |
| Net asset value, beginning | $13.06 | | $10.99 | | $13.26 | | $13.49 | | $12.00 | |
| Income from investment operations: | | | | | | | | | | |
Net investment income (b) | 0.17 |
| | 0.12 |
| (c) | 0.14 |
| | 0.10 |
| | 0.19 |
| |
| Net realized and unrealized gain (loss) | 3.35 |
| | 2.09 |
| | (1.93) |
| | 0.48 |
| | 1.33 |
| |
| Total from investment operations | 3.52 |
| | 2.21 |
| | (1.79) |
| | 0.58 |
| | 1.52 |
| |
| Distributions from: | | | | | | | | | | |
| Net investment income | (0.10) |
| | (0.14) |
| | (0.07) |
| | (0.12) |
| | (0.03) |
| |
| Net realized gain | — |
| | — |
| | (0.41) |
| | (0.69) |
| | — |
| |
| Total distributions | (0.10) |
| | (0.14) |
| | (0.48) |
| | (0.81) |
| | (0.03) |
| |
| Total increase (decrease) in net asset value | 3.42 |
| | 2.07 |
| | (2.27) |
| | (0.23) |
| | 1.49 |
| |
| Net asset value, ending | $16.48 | | $13.06 | | $10.99 | | $13.26 | | $13.49 | |
Total return (d) | 27.27 | % | | 20.31 | % | | (13.92 | %) | | 4.49 | % | | 12.73 | % | |
Ratios to average net assets: (e) | | | | | | | | | | |
| Total expenses | 1.32 | % | | 1.41 | % | | 1.48 | % | | 1.42 | % | | 1.65 | % | (f) |
| Net expenses | 0.92 | % | | 1.12 | % | | 1.40 | % | | 1.42 | % | | 1.43 | % | (f) |
| Net investment income | 1.20 | % | | 1.06 | % | (c) | 1.12 | % | | 0.78 | % | | 1.61 | % | (f) |
| Portfolio turnover | 36 | % | | 32 | % | | 66 | % | | 95 | % | | 74 | % | |
| Net assets, ending (in thousands) | $126,398 | | $58,259 | | $39,101 | | $33,721 | | $33,053 | |
| | | | | | | | | | | |
(a) From October 29, 2012 inception. |
(b) Computed using average shares outstanding. |
(c) Amount includes a non-recurring refund for overbilling of prior years' custody out-of-pocket fees. This amounted to $0.003 per share and 0.03% of average net assets. |
(d) Returns are historical and are calculated by determining the percentage change in net asset value with all distributions reinvested and do not reflect the effect of sales charges, if any. Total return is not annualized for periods of less than one year. |
(e) Total expenses do not reflect amounts reimbursed and/or waived by the Adviser and certain of its affiliates, if applicable. Net expenses are net of all reductions and represent the net expenses paid by the Fund. |
(f) Annualized. |
| See notes to financial statements. |
www.calvert.com CALVERT EMERGING MARKETS EQUITY FUND ANNUAL REPORT 17
CALVERT EMERGING MARKETS EQUITY FUND
FINANCIAL HIGHLIGHTS
|
| | | | | | | | | | | | | | | |
| | Year Ended September 30, | | Period Ended September 30, | |
| CLASS Y SHARES | 2017 | | 2016 | | 2015 | | 2014 | | 2013(a) | |
| Net asset value, beginning | $13.17 | | $11.10 | | $13.35 | | $13.48 | | $12.00 | |
| Income from investment operations: | | | | | | | | | | |
Net investment income (b) | 0.18 |
| | 0.16 |
| (c) | 0.12 |
| | 0.10 |
| | 0.14 |
| |
| Net realized and unrealized gain (loss) | 3.37 |
| | 2.05 |
| | (1.93) |
| | 0.49 |
| | 1.36 |
| |
| Total from investment operations | 3.55 |
| | 2.21 |
| | (1.81) |
| | 0.59 |
| | 1.50 |
| |
| Distributions from: | | | | | | | | | | |
| Net investment income | (0.10) |
| | (0.14) |
| | (0.03) |
| | (0.03) |
| | (0.02) |
| |
| Net realized gain | — |
| | — |
| | (0.41) |
| | (0.69) |
| | — |
| |
| Total distributions | (0.10) |
| | (0.14) |
| | (0.44) |
| | (0.72) |
| | (0.02) |
| |
| Total increase (decrease) in net asset value | 3.45 |
| | 2.07 |
| | (2.25) |
| | (0.13) |
| | 1.48 |
| |
| Net asset value, ending | $16.62 | | $13.17 | | $11.10 | | $13.35 | | $13.48 | |
Total return (d) | 27.22 | % | | 20.09 | % | | (13.96 | %) | | 4.51 | % | | 12.55 | % | |
Ratios to average net assets: (e) | | | | | | | | | | |
| Total expenses | 1.44 | % | | 1.59 | % | | 2.07 | % | | 2.24 | % | | 18.62 | % | (f) |
| Net expenses | 1.02 | % | | 1.18 | % | | 1.50 | % | | 1.53 | % | | 1.53 | % | (f) |
| Net investment income | 1.20 | % | | 1.34 | % | (c) | 0.95 | % | | 0.78 | % | | 1.28 | % | (f) |
| Portfolio turnover | 36 | % | | 32 | % | | 66 | % | | 95 | % | | 74 | % | |
| Net assets, ending (in thousands) | $109,401 | | $26,639 | | $6,889 | | $2,320 | | $440 | |
| | | | | | | | | | | |
(a) From October 29, 2012 inception. |
(b) Computed using average shares outstanding. |
(c) Amount includes a non-recurring refund for overbilling of prior years' custody out-of-pocket fees. This amounted to $0.003 per share and 0.03% of average net assets. |
(d) Returns are historical and are calculated by determining the percentage change in net asset value with all distributions reinvested and do not reflect the effect of sales charges, if any. Total return is not annualized for periods of less than one year. |
(e) Total expenses do not reflect amounts reimbursed and/or waived by the Adviser and certain of its affiliates, if applicable. Net expenses are net of all reductions and represent the net expenses paid by the Fund. |
(f) Annualized. |
| See notes to financial statements. |
18 www.calvert.com CALVERT EMERGING MARKETS EQUITY FUND ANNUAL REPORT
NOTES TO FINANCIAL STATEMENTS
NOTE A — SIGNIFICANT ACCOUNTING POLICIES
General: Calvert World Values Fund, Inc. (the “Corporation”) was organized as a Maryland corporation on February 14, 1992, and is registered under the Investment Company Act of 1940, as amended (the “1940 Act”), as an open-end management investment company. The Corporation operates four (4) separate series, each with its own investment objective(s) and strategies, that are accounted for separately. This report contains the financial statements and financial highlights of Calvert Emerging Markets Equity Fund (the “Fund”). The Corporation is authorized to issue two billion shares of common stock, $0.01 par value per share, of which 250 million shares have been allocated to the Fund.
The Fund is diversified. The investment objective of the Fund is to seek long-term capital appreciation by investing primarily in equity securities of companies located in emerging market countries.
The Fund offers four classes of shares. Class A shares are generally sold subject to a sales charge imposed at time of purchase. A contingent deferred sales charge of 0.80% may apply to certain redemptions of Class A shares for accounts for which no sales charge was paid, if redeemed within one year of purchase. Class C shares are sold without a front-end sales charge, and with certain exceptions, are charged a contingent deferred sales charge of 1% on shares redeemed within one year of purchase. Class C shares are only available for purchase through a financial intermediary. Class I and Class Y shares are sold at net asset value, are not subject to a sales charge and are sold only to certain eligible investors. Each class represents a pro rata interest in the Fund, but votes separately on class-specific matters and is subject to different expenses.
The Fund applies the accounting and reporting guidance in the Financial Accounting Standards Board (FASB) Accounting Standards Codification Topic 946, Financial Services – Investment Companies (ASC 946). Subsequent events, if any, through the date that the financial statements were issued have been evaluated in the preparation of the financial statements.
Investment Valuation: Net asset value per share is determined every business day as of the close of the regular session of the New York Stock Exchange (generally 4:00 p.m. Eastern time). The Fund uses independent pricing services approved by the Board of Directors (the “Board”) to value its investments wherever possible. Investments for which market quotations are not available or deemed not reliable are fair valued in good faith under the direction of the Board.
The Board has adopted Valuation Procedures (the “Procedures”) to determine the fair value of securities and financial instruments for which market prices are not readily available or which may not be reliably priced. The Board has delegated the day-to-day responsibility for determining the fair value of securities and financial instruments of the Fund to the Fund’s investment adviser (the “Adviser”) and has provided these Procedures to govern the Adviser in its valuation duties.
The Adviser has chartered an internal Valuation Committee to oversee the implementation of these Procedures and to assist it in carrying out the valuation responsibilities that the Board has delegated. The Valuation Committee meets on a regular basis to review investments which may not have readily available market prices. The Valuation Committee’s fair valuation determinations are subject to review, approval and ratification by the Board at its next regularly scheduled meeting covering the calendar quarter in which the fair valuation was determined.
U.S. generally accepted accounting principles (U.S. GAAP) establishes a disclosure hierarchy that categorizes the inputs to valuation techniques used to value assets and liabilities at measurement date. These inputs are summarized in the three broad levels listed below:
Level 1 - quoted prices in active markets for identical securities
Level 2 - other significant observable inputs (including quoted prices for similar securities, interest rates, prepayment speeds, credit risk, etc.)
Level 3 - significant unobservable inputs (including the Fund’s own assumptions in determining the fair value of investments)
The inputs or methodologies used for valuing securities are not necessarily an indication of the risk associated with investing in those securities.
Changes in valuation techniques may result in transfers in or out of an investment’s assigned level within the hierarchy during the period. Transfers in and/or out of levels are determined based on the fair value of such securities at the end of the period. Valuation techniques used to value the Fund’s investments by major category are as follows:
Equity Securities. Equity securities (including warrants and rights) listed on a U.S. securities exchange generally are valued at the last sale or closing price as reported by an independent pricing service on the primary market or exchange on which they are traded and are categorized as Level 1 in the hierarchy. Equity securities listed on the NASDAQ Global or Global Select Market are valued at the NASDAQ official closing price and are categorized as Level 1 in the hierarchy. Unlisted or listed securities for which closing sales prices or closing quotations are not available are valued at the mean between the latest available bid and asked
www.calvert.com CALVERT EMERGING MARKETS EQUITY FUND ANNUAL REPORT 19
prices and are categorized as Level 2 in the hierarchy. The daily valuation of exchange-traded foreign securities generally is determined as of the close of trading on the principal exchange on which such securities trade. Events occurring after the close of trading on foreign exchanges may result in adjustments to the valuation of foreign securities to more accurately reflect their fair value as of the close of regular trading on the New York Stock Exchange. When valuing foreign equity securities that meet certain criteria, the Fund’s Board has approved the use of a fair value service that values such securities to reflect market trading that occurs after the close of the applicable foreign markets of comparable securities or other instruments that have a strong correlation to the fair-valued securities. Such securities are categorized as Level 2 in the hierarchy.
Debt Securities. Debt securities are generally valued on the basis of valuations provided by third party pricing services, as derived from such services’ pricing models. Inputs to the models may include, but are not limited to, reported trades, executable bid and asked prices, broker/dealer quotations, prices or yields of securities with similar characteristics, interest rates, anticipated prepayments, benchmark curves or information pertaining to the issuer, as well as industry and economic events. Accordingly, debt securities are generally categorized as Level 2 in the hierarchy. Short-term securities of sufficient credit quality purchased with remaining maturities of sixty days or less for which a valuation from a third party pricing service is not readily available may be valued at amortized cost, which approximates fair value, and are categorized as Level 2 in the hierarchy.
Other Securities. Participatory notes are valued based on the value of the underlying equity security as determined using the valuation techniques for equity securities listed above. Participatory notes are categorized as Level 2 in the hierarchy.
Fair Valuation. If a market value cannot be determined for a security using the methodologies described above, or if, in the good faith opinion of the Adviser, the market value does not constitute a readily available market quotation, or if a significant event has occurred that would materially affect the value of the security, the security will be fair valued as determined in good faith by or at the direction of the Board in a manner that fairly reflects the security’s value, or the amount that the Fund might reasonably expect to receive for the security upon its current sale in the ordinary course. Each such determination is based on a consideration of relevant factors, which are likely to vary from one pricing context to another. These factors may include, but are not limited to, the type of security, the existence of any contractual restrictions on the security’s disposition, the price and extent of public trading in similar securities of the issuer or of comparable companies or entities, quotations or relevant information obtained from broker/dealers or other market participants, information obtained from the issuer, analysts, and/or the appropriate stock exchange (for exchange-traded securities), an analysis of the company’s or entity’s financial condition, and an evaluation of the forces that influence the issuer and the market(s) in which the security is purchased and sold.
The values assigned to fair value investments are based on available information and do not necessarily represent amounts that might ultimately be realized. Further, due to the inherent uncertainty of valuations of such investments, the fair values may differ significantly from the values that would have been used had an active market existed, and the differences could be material. The Valuation Committee employs various methods for calibrating these valuation approaches including a regular review of key inputs and assumptions, transactional back-testing or disposition analysis and reviews of any related market activity.
20 www.calvert.com CALVERT EMERGING MARKETS EQUITY FUND ANNUAL REPORT
The following table summarizes the market value of the Fund’s holdings as of September 30, 2017, based on the inputs used to value them:
|
| | | | | | | | | | | | | |
| INVESTMENTS IN SECURITIES - ASSETS | LEVEL 1 | LEVEL 2 | | LEVEL 3* | TOTAL |
| Common Stocks | | | | | |
| Brazil |
| $26,284,984 |
|
| $— |
| |
| $— |
|
| $26,284,984 |
|
| Chile | 3,153,416 |
| — |
| | — |
| 3,153,416 |
|
| China | 21,771,248 |
| 38,860,001 |
| | — |
| 60,631,249 |
|
| India | 7,315,158 |
| 28,963,383 |
| | — |
| 36,278,541 |
|
| Mexico | 7,560,290 |
| — |
| | — |
| 7,560,290 |
|
| Peru | 3,605,482 |
| — |
| | — |
| 3,605,482 |
|
| Russia | 731,594 |
| 15,187,857 |
| | — |
| 15,919,451 |
|
| South Africa | 10,478,924 |
| 8,928,363 |
| | — |
| 19,407,287 |
|
| Taiwan | 14,693,277 |
| 28,386,048 |
| | — |
| 43,079,325 |
|
| Other Countries** | — |
| 66,490,815 |
| | — |
| 66,490,815 |
|
| Total Common Stocks |
| $95,594,373 |
|
| $186,816,467 |
| *** |
| $— |
|
| $282,410,840 |
|
| Participatory Notes | — |
| 12,550,179 |
| | — |
| 12,550,179 |
|
| High Social Impact Investments | — |
| 1,906,160 |
| | 94,003 |
| 2,000,163 |
|
| TOTAL |
| $95,594,373 |
|
| $201,272,806 |
| |
| $94,003 |
|
| $296,961,182 |
|
| | | | | | |
| * None of the unobservable inputs for Level 3 assets, individually or collectively, had a material impact on the Fund. |
| ** For further breakdown of equity securities by country, please refer to the Schedule of Investments. |
| *** Includes foreign equity securities whose values were adjusted to reflect market trading of comparable securities or other correlated instruments that occurred after the close of trading in their applicable foreign markets. |
Level 3 investments at the beginning and/or end of the period in relation to net assets were not significant and accordingly, a reconciliation of Level 3 assets for the year ended September 30, 2017 is not presented. For certain securities that trade primarily outside the U.S., adjustments to prices due to movements against a specified benchmark that were necessary on September 30, 2017 were not necessary on September 30, 2016. As a result, $7,888,703 transferred out of Level 1 into Level 2. The amount of this transfer was determined based on the fair value of the securities at the end of the year.
Participatory Notes: The Fund may gain exposure to securities in certain foreign markets through investments in participatory notes (“P-notes”), especially in markets where direct investment by the Fund is not possible. P-notes are generally issued by a bank or broker-dealer (the “counterparty”) and are designed to offer a return linked to a particular underlying equity security. While the holder of a P-note is entitled to receive from the counterparty any dividends paid by the underlying security, the counterparty retains legal ownership and voting rights of the underlying security. The risks associated with investing in a P-note may include the possible failure of the counterparty to perform its obligations under the terms of the agreement, an inability to liquidate or transfer the notes, and an imperfect correlation between the value of the P-note and the underlying security.
Investment Transactions and Income: Investment transactions for financial statement purposes are accounted for on trade date. Realized gains and losses are recorded on an identified cost basis and may include proceeds from litigation. Dividend income is recorded on the ex-dividend date for dividends received in cash and/or securities or, in the case of dividends on certain foreign securities, as soon as the Fund is informed of the ex-dividend date. Non-cash dividends are recorded at the fair value of the securities received. Withholding taxes on foreign dividends and capital gains, if any, have been provided for in accordance with the Fund’s understanding of the applicable country’s tax rules and rates. Distributions received that represent a return of capital are recorded as a reduction of cost of investments. Distributions received that represent a capital gain are recorded as a realized gain. Interest income, which includes amortization of premium and accretion of discount on debt securities, is accrued as earned.
Share Class Accounting: Investment income and realized and unrealized gains and losses are allocated to separate classes of shares based upon the relative net assets of each class. Expenses common to the classes are also allocated to each class in proportion to their relative net assets. Expenses arising in connection with a specific class are charged directly to that class.
Foreign Currency Transactions: The Fund’s accounting records are maintained in U.S. dollars. For valuation of assets and liabilities on each date of net asset value determination, foreign denominations are converted into U.S. dollars using the current exchange rate. Security transactions, income, and expenses are translated at the prevailing rate of exchange on the date of the event. Recognized gains or losses on investment transactions attributable to changes in foreign currency exchange rates are
www.calvert.com CALVERT EMERGING MARKETS EQUITY FUND ANNUAL REPORT 21
recorded for financial statement purposes as net realized gains and losses on investments. That portion of unrealized gains and losses on investments that results from fluctuations in foreign currency exchange rates is not separately disclosed.
Restricted Securities: The Fund may invest in securities that are subject to legal or contractual restrictions on resale. Generally, these securities may only be sold publicly upon registration under the Securities Act of 1933 or in transactions exempt from such registration. Information regarding restricted securities (excluding Rule 144A securities) is included at the end of the Schedule of Investments.
Distributions to Shareholders: Distributions to shareholders are recorded by the Fund on ex-dividend date. Dividends from net investment income and distributions from net realized capital gains, if any, are paid at least annually. Distributions are determined in accordance with income tax regulations which may differ from U.S. GAAP; accordingly, periodic reclassifications are made within the Fund’s capital accounts to reflect income and gains available for distribution under income tax regulations.
Estimates: The preparation of financial statements in conformity with U.S. GAAP requires management to make estimates and assumptions that affect the reported amounts of assets and liabilities and disclosure of contingent assets and liabilities at the date of the financial statements and the reported amounts of increases and decreases in net assets from operations during the reporting period. Actual results could differ from those estimates.
Indemnifications: The Corporation’s By-Laws provide for indemnification for Directors or officers of the Corporation and certain other parties, to the fullest extent permitted by Maryland law and the 1940 Act, provided certain conditions are met. Additionally, in the normal course of business, the Fund enters into agreements with service providers that may contain indemnification clauses. The Fund’s maximum exposure under these arrangements is unknown as this would involve future claims that may be made against the Fund that have not yet occurred.
Federal Income Taxes: No provision for federal income or excise tax is required since the Fund intends to continue to qualify as a regulated investment company under the Internal Revenue Code and to distribute substantially all of its taxable earnings.
In addition to the requirements of the Internal Revenue Code, the Fund may also be subject to local taxes on the recognition of capital gains in certain countries. In determining the daily net asset value, the Fund estimates the accrual for such taxes, if any, based on the unrealized appreciation on certain portfolio securities and the related tax rates. Taxes attributable to unrealized appreciation are included in the change in unrealized appreciation (depreciation) on investments. Capital gains taxes on securities sold are included in net realized gain (loss) on investments.
Management has analyzed the Fund’s tax positions taken for all open federal income tax years and has concluded that no provision for federal income tax is required in the Fund’s financial statements. A Fund’s federal tax return is subject to examination by the Internal Revenue Service for a period of three years from the date of filing.
NOTE B — RELATED PARTY TRANSACTIONS
Effective December 31, 2016, Calvert Research and Management (CRM), a subsidiary of Eaton Vance Management (EVM), became the investment adviser to the Fund following a transaction between CRM and certain of its affiliates and Calvert Investment Management, Inc. (CIM) and certain of its affiliates, pursuant to which CRM acquired substantially all of the business assets of CIM after satisfying various closing conditions, including shareholder approval of a new investment advisory agreement between the Fund and CRM (the “Transaction”).
For its services pursuant to the new investment advisory agreement, CRM receives a fee, payable monthly, at the annual rate of 0.88% of the Fund’s average daily net assets. Prior to December 31, 2016, CIM, a direct subsidiary of Calvert Investments, Inc. and an indirect subsidiary of Ameritas Holding Company, provided investment advisory services to the Fund. For its services, CIM received a fee at the annual rate of 0.95% of the Fund’s average daily net assets. For the year ended September 30, 2017, the investment advisory fee amounted to $1,536,447 or 0.89% per annum of the Fund’s average daily net assets, of which $1,254,230 was paid to CRM and $282,217 was paid to CIM.
Pursuant to a sub-advisory agreement effective December 31, 2016, CRM pays Hermes Investment Management Limited (Hermes) a portion of its investment advisory fee for sub-advisory services provided to the Fund. Prior to December 31, 2016, CIM paid Hermes a portion of its investment advisory fee for sub-advisory services provided to the Fund.
CRM (CIM for the period October 1, 2016 through December 30, 2016) have agreed to reimburse the Fund’s operating expenses to the extent that total annual operating expenses (relating to ordinary operating expenses only and excluding expenses such as brokerage commissions, acquired fund fees and expenses of unaffiliated funds, interest expense, taxes or litigation expenses) exceed 1.27%, 2.02%, 0.92% and 1.02% for Class A, Class C, Class I and Class Y, respectively, of such class’ average daily net assets. The expense reimbursement agreement may be changed or terminated after January 31, 2019. For the year ended September 30, 2017, CRM waived or reimbursed expenses of $612,681 and CIM waived or reimbursed expenses of $135,039. A portion of the expenses waived or reimbursed was borne by Hermes.
22 www.calvert.com CALVERT EMERGING MARKETS EQUITY FUND ANNUAL REPORT
The administrative fee is earned by CRM as compensation for administrative services rendered to the Fund. The fee is computed at an annual rate of 0.12% of the Fund’s average daily net assets attributable to Class A, Class C, Class I and Class Y and is payable monthly. CRM has agreed to contractually waive 0.02% of the administrative fee through January 31, 2018 for Class I. Prior to December 31, 2016, Calvert Investment Administrative Services, Inc. (CIAS), an affiliate of CIM, provided administrative services to the Fund at an annual rate of 0.12% of the Fund’s average daily net assets, payable monthly. In addition, CIAS contractually waived administrative fees of 0.02% for the period October 1, 2016 through December 30, 2016 for Class I. For the year ended September 30, 2017, CRM was paid administrative fees of $171,016, of which $13,804 were waived and CIAS was paid administrative fees of $35,663, of which $3,000 were waived.
The Fund adopted a new distribution plan for Class A shares (Class A Plan) and Class C shares (Class C Plan) pursuant to Rule 12b-1 under the 1940 Act, which were approved by the Board and became effective as of December 31, 2016 or shortly thereafter upon approval by the shareholders of the respective class. Pursuant to the Class A Plan and Class C Plan, the Fund pays a distribution fee of 0.25% and 0.75% per annum for Class A and Class C, respectively, and a service fee of 0.25% per annum for Class C of its average daily net assets attributable to such class for distribution services and facilities provided to the Fund, as well as for personal and/or account maintenance services provided. Pursuant to the Fund’s former distribution plans for Class A shares and Class C shares, the Fund was permitted to pay certain expenses associated with the distribution and servicing of its Class A and Class C shares not to exceed 0.25% for Class A and 1.00% for Class C of the Fund’s average daily net assets with respect to such class. Effective December 31, 2016, the fees are paid to Eaton Vance Distributors, Inc. (EVD), an affiliate of CRM and the Fund’s principal underwriter. Prior to December 31, 2016, the fees were paid to Calvert Investment Distributors, Inc. (CID), an affiliate of CIM and the Fund’s former distributor and principal underwriter. Distribution and service fees paid or accrued for the year ended September 30, 2017 amounted to $91,973 or 0.25% per annum of Class A’s average daily net assets, of which $72,269 was paid to EVD and $19,704 was paid to CID, and $16,939 or 1.00% per annum of Class C’s average daily net assets, of which $14,499 was paid to EVD and $2,440 was paid to CID.
The Fund was informed that EVD and CID received $24,614 and $1,712, respectively, as their portion of the sales charge on sales of Class A shares for the year ended September 30, 2017. The Fund was also informed that EVD and CID received $1,448 and $981, respectively, of contingent deferred sales charges paid by Fund shareholders for the same period.
Effective December 31, 2016, EVM provides sub-transfer agency services to the Fund pursuant to a Sub-Transfer Agency Support Services Agreement. For its services, EVM receives an annual fee of $8 per shareholder account. Prior to December 31, 2016, Calvert Investment Services, Inc. (CIS), an affiliate of CIM, acted as the shareholder servicing agent for the Fund and received a fee at the same rate as is paid to EVM. For the year ended September 30, 2017, sub-transfer agency fees paid to EVM were $19,989 and shareholder servicing fees paid to CIS were $3,013. Such fees are included in transfer agency fees and expenses on the Statement of Operations.
Each Director of the Fund who is not an employee of CRM or its affiliates receives a fee of $3,000 for each Board meeting attended in person and $2,000 for each Board meeting attended by phone plus an annual fee of $52,000, and $1,500 for each Committee meeting attended in person and $1,000 for each Committee meeting attended by phone plus an annual Committee fee of $2,500. The Board chair receives an additional $10,000 annual retainer and Committee chairs receive an additional $6,000 annual retainer. Prior to December 31, 2016, each Director of the Fund who was not an employee of CIM or its affiliates received a fee of $3,000 for each Board meeting attended plus an annual fee of $52,000. Committee members received $500 for each Committee meeting attended plus an annual fee of $2,500. Committee chairs received an additional annual retainer ranging from $6,000 to $10,000. Eligible Directors may participate in a Deferred Compensation Plan (the “Plan”). Amounts deferred under the Plan are treated as though equal dollar amounts had been invested in shares of the Fund or other Calvert Funds selected by the Directors. The Fund purchases shares of the funds selected equal to the dollar amounts deferred under the Plan, resulting in an asset equal to the deferred compensation liability. Obligations of the Plan are paid solely from the Fund’s assets. Directors’ fees are allocated to each of the Calvert Funds served. Salaries and fees of officers and Directors of the Fund who are employees of CRM and, prior to December 31, 2016, of CIM or their affiliates are/were paid by CRM and CIM, respectively. In addition, in connection with the Transaction, an advisory council was established to aid the Board and CRM in advancing the cause of responsible investing through original scholarship and thought leadership. The advisory council consists of CRM’s Chief Executive Officer and four additional members. Each member (other than CRM’s Chief Executive Officer) receives annual compensation of $75,000, which is being reimbursed by CIM and Ameritas Holding Company for a period of up to three years through December 30, 2019. For the year ended September 30, 2017, the Fund’s allocated portion of such expense and reimbursement was $2,488, which are included in miscellaneous expense and reimbursement of expenses-other, respectively, on the Statement of Operations.
NOTE C — INVESTMENT ACTIVITY AND TAX INFORMATION
During the year ended September 30, 2017, the cost of purchases and proceeds from sales of investments, other than short-term securities, were $191,413,275 and $60,913,646, respectively.
www.calvert.com CALVERT EMERGING MARKETS EQUITY FUND ANNUAL REPORT 23
The tax character of distributions declared for the years ended September 30, 2017 and September 30, 2016 was as follows:
|
| | | | | | | |
| | Year Ended September 30, |
| | 2017 | | 2016 |
| Distributions declared from: | | | |
| Ordinary income |
| $888,499 |
| |
| $819,206 |
|
During the year ended September 30, 2017, accumulated net realized loss was decreased by $134,682, accumulated undistributed net investment income was decreased by $402,761 and paid-in capital was increased by $268,079 due to the Fund’s use of equalization accounting and differences between book and tax accounting, primarily for foreign currency gain (loss) and investments in passive foreign investment companies. Tax equalization accounting allows the Fund to treat as a distribution that portion of redemption proceeds representing a redeeming shareholder’s portion of undistributed taxable income and net capital gains. These reclassifications had no effect on the net assets or net asset value per share of the Fund.
As of September 30, 2017, the components of distributable earnings (accumulated losses) on a tax basis were as follows:
|
| | | |
| Undistributed ordinary income |
| $1,450,031 |
|
| Deferred capital losses |
| ($1,559,277 | ) |
| Net unrealized appreciation (depreciation) |
| $52,622,803 |
|
The differences between components of distributable earnings (accumulated losses) on a tax basis and the amounts reflected in the Statement of Assets and Liabilities are primarily due to the tax treatment of short-term capital gains and temporary book-tax differences that will reverse in a subsequent period. These differences are primarily due to wash sales and foreign currency transactions.
At September 30, 2017, the Fund, for federal income tax purposes, had deferred capital losses of $1,559,277 which would reduce the Fund’s taxable income arising from future net realized gains on investment transactions, if any, to the extent permitted by the Internal Revenue Code, and thus would reduce the amount of distributions to shareholders, which would otherwise be necessary to relieve the Fund of any liability for federal income or excise tax. The deferred capital losses are treated as arising on the first day of the Fund’s next taxable year and retain the same short-term or long-term character as when originally deferred. Of the deferred capital losses at September 30, 2017, $1,559,277 are long-term.
The cost and unrealized appreciation (depreciation) of investments of the Fund at September 30, 2017, as determined on a federal income tax basis, were as follows:
|
| |
| Federal tax cost of investments | $244,316,920 |
| Gross unrealized appreciation | $54,731,709 |
| Gross unrealized depreciation | (2,087,447) |
| Net unrealized appreciation (depreciation) | $52,644,262 |
NOTE D — SECURITIES LENDING
To generate additional income, the Fund may lend its securities pursuant to a securities lending agency agreement with State Street Bank and Trust Company (SSB), the securities lending agent. Security loans are subject to termination by the Fund at any time and, therefore, are not considered to be illiquid investments. The Fund requires that the loan be continuously collateralized by either cash or securities as collateral equal at all times to at least 102% of the market value of the domestic securities loaned and 105% of the market value of the international securities loaned (if applicable). The market value of securities loaned is determined daily and any additional required collateral is delivered to the Fund on the next business day. Cash collateral is generally invested in State Street Institutional U.S. Government Money Market Fund (the “U.S. Government Fund”) that is managed by an affiliate of the custodian. The U.S. Government Fund is a registered money market fund that invests in a variety of high-quality, U.S. dollar denominated instruments. Any gain or loss in the market price of the loaned securities that might occur and any interest earned or dividends declared during the term of the loan would accrue to the account of the Fund. Income earned on the investment of collateral, net of broker rebates and other expenses incurred by the securities lending agent, is split between the Fund and the securities lending agent on the basis of agreed upon contractual terms. Non-cash collateral is held by the lending agent on behalf of the Fund and cannot be sold or re-pledged by the Fund; accordingly, such collateral is not reflected in the Statement of Assets and Liabilities.
The risks associated with lending portfolio securities include, but are not limited to, possible delays in receiving additional collateral or in the recovery of the loaned securities, possible loss of rights to the collateral should the borrower fail financially, as
24 www.calvert.com CALVERT EMERGING MARKETS EQUITY FUND ANNUAL REPORT
well as risk of loss in the value of the collateral or the value of the investments made with the collateral. The securities lending agent shall indemnify the Fund in the case of default of any securities borrower.
The Fund did not have any securities on loan at September 30, 2017.
NOTE E — LINE OF CREDIT
A financing agreement is in place with the Calvert Funds and SSB. Under the agreement, which expires on August 7, 2018, SSB provides an unsecured line of credit facility in the aggregate amount of $50 million ($25 million committed and $25 million uncommitted), accessible by the Calvert Funds for temporary or emergency purposes only. Borrowings bear interest at the higher of the One-Month London Interbank Offered Rate (LIBOR) in effect that day or the overnight Federal Funds Rate, plus 1.25% per annum. A commitment fee of 0.25% per annum is incurred on the unused portion of the committed facility. An administrative fee of $30,000 was paid in connection with the renewal of the uncommitted facility. These fees are allocated to all participating funds. Because the line of credit is not available exclusively to the Fund, it may be unable to borrow some or all of its requested amounts at any particular time. The Fund had no loans outstanding pursuant to this line of credit at September 30, 2017. Average borrowings and the weighted average interest rate (excluding fees) for the year ended September 30, 2017 were $96,938 and 1.82%, respectively.
NOTE F — AFFILIATED COMPANIES
The Fund invests a portion of its assets designated for high social impact investments in notes issued by the Calvert Social Investment Foundation (the “Foundation”) pursuant to an exemptive order granted by the U.S. Securities and Exchange Commission (the “SEC”). The Fund relies on exemptive relief to invest in the notes because the Fund’s investments in the notes may be considered prohibited transactions between affiliated persons under the 1940 Act. The Foundation may be considered an affiliated person of the Calvert Funds based on the overlap between the Foundation’s Board of Directors and the Calvert Funds’ Directors/Trustees and other potential affiliations. The Foundation has licensed use of the Calvert name from the Adviser, and the Adviser’s President and Chief Executive Officer serves on the Foundation Board. The Foundation is not owned or otherwise controlled by the Adviser or its affiliates.
In addition, an affiliated company is a company in which a fund has a direct or indirect ownership of, control of, or voting power of 5 percent or more of the outstanding voting shares, or a company that is under common ownership or control with a fund. At September 30, 2017, the value of the Fund’s investment in affiliated companies was $1,906,160, which represents 0.6% of the Fund’s net assets. Transactions in affiliated companies by the Fund for the year ended September 30, 2017 were as follows:
|
| | | | | | | | | | | | | | | | | | | | | |
Name of Affiliated
Company | Principal Amount,
beginning of year | Gross Additions | Gross Reductions | Principal Amount,
end of
year | Value,
end of year | Interest
Income | Net Realized
Gain (Loss) | Capital Gain
Distributions Received | Change in
Unrealized
Appreciation
(Depreciation) |
| High Social Impact Investments | | | | | | | | | |
Calvert Social Investment Foundation, Community Investment Notes: | | | | | | | | | |
| 1.00%, 5/5/17 |
| $2,000,000 |
| $— |
| ($2,000,000 | ) | $— | $— |
|
| $4,111 |
| $— |
| $— |
|
| $35,580 |
|
| 1.50%, 12/15/19 | — |
| 2,000,000 | — |
| 2,000,000 | 1,906,160 |
| 24,167 |
| — |
| — |
| (93,840) |
|
| TOTALS | | | | |
| $1,906,160 |
|
| $28,278 |
| $— |
| $— |
|
| ($58,260 | ) |
www.calvert.com CALVERT EMERGING MARKETS EQUITY FUND ANNUAL REPORT 25
NOTE G — CAPITAL SHARES
Transactions in capital shares for the years ended September 30, 2017 and September 30, 2016 were as follows:
|
| | | | | | | | | |
| | Year Ended
September 30, 2017 | | Year Ended
September 30, 2016 |
| | Shares | Amount | | Shares | Amount |
| Class A | | | | | |
| Shares sold | 2,714,784 |
| $39,910,400 |
| | 2,131,863 |
| $25,335,469 |
|
| Reinvestment of distributions | 12,454 | 148,081 |
| | 15,091 | 173,845 |
|
| Shares redeemed | (1,943,550) | (25,964,333) |
| | (1,270,596) | (14,634,570) |
|
| Net increase | 783,688 |
| $14,094,148 |
| | 876,358 |
| $10,874,744 |
|
| | | | | | |
| Class C | | | | | |
| Shares sold | 233,865 |
| $3,505,694 |
| | 42,163 |
| $482,880 |
|
| Reinvestment of distributions | 121 | 1,420 |
| | 59 | 668 |
|
| Shares redeemed | (23,457) | (323,773) |
| | (17,002) | (195,772) |
|
| Net increase | 210,529 |
| $3,183,341 |
| | 25,220 |
| $287,776 |
|
| | | | | | |
| Class I | | | | | |
| Shares sold | 4,317,449 |
| $61,919,177 |
| | 1,296,392 |
| $15,361,751 |
|
| Reinvestment of distributions | 42,446 | 508,083 |
| | 42,411 | 491,547 |
|
| Shares redeemed | (1,152,319) | (16,693,300) |
| | (434,186) | (5,100,991) |
|
| Net increase | 3,207,576 | $45,733,960 | | 904,617 |
| $10,752,307 |
|
| | | | | | |
| Class Y | | | | | |
| Shares sold | 5,504,746 |
| $81,985,672 |
| | 2,051,842 |
| $23,886,469 |
|
| Reinvestment of distributions | 16,100 | 194,485 |
| | 9,973 | 116,687 |
|
| Shares redeemed | (959,597) | (13,484,350) |
| | (660,485) | (7,965,677) |
|
| Net increase | 4,561,249 |
| $68,695,807 |
| | 1,401,330 |
| $16,037,479 |
|
The Directors approved the termination of the Fund’s Class Y shares. Effective December 8, 2017, Class Y shares of the Fund will convert to Class I shares at net asset value. Thereafter, Class Y shares will be terminated.
NOTE H — RISKS ASSOCIATED WITH FOREIGN INVESTMENTS
Investing in foreign securities involves additional risks relating to political, social, and economic developments abroad. Other risks result from differences between regulations that apply to U.S. and foreign issuers and markets, and the potential for foreign markets to be less liquid and more volatile than U.S. markets. Securities that trade or are denominated in currencies other than the U.S. dollar may be adversely affected by fluctuations in currency exchange rates.
The risks of investing in emerging market securities are greater than those of investing in securities of developed foreign countries. These risks include volatile currency exchange rates, periods of high inflation, increased risk of default, greater social, economic and political uncertainty and instability, less governmental supervision and regulation of securities markets, weaker auditing and financial reporting standards, lack of liquidity in the markets, and the significantly smaller market capitalization of emerging market issuers.
26 www.calvert.com CALVERT EMERGING MARKETS EQUITY FUND ANNUAL REPORT
REPORT OF INDEPENDENT REGISTERED PUBLIC ACCOUNTING FIRM
The Board of Directors of Calvert World Values Fund, Inc. and Shareholders of Calvert Emerging Markets Equity Fund:
We have audited the accompanying statement of assets and liabilities of the Calvert Emerging Markets Equity Fund (the “Fund”), a series of Calvert World Values Fund, Inc., including the schedule of investments, as of September 30, 2017, and the related statement of operations for the year then ended, the statements of changes in net assets for each of the years in the two-year period then ended, and the financial highlights for each of the years or periods in the five-year period then ended. These financial statements and financial highlights are the responsibility of the Fund’s management. Our responsibility is to express an opinion on these financial statements and financial highlights based on our audits.
We conducted our audits in accordance with the standards of the Public Company Accounting Oversight Board (United States). Those standards require that we plan and perform the audit to obtain reasonable assurance about whether the financial statements and financial highlights are free of material misstatement. An audit includes examining, on a test basis, evidence supporting the amounts and disclosures in the financial statements. Our procedures included confirmation of securities owned as of September 30, 2017, by correspondence with the custodian and brokers or by performing other appropriate auditing procedures. An audit also includes assessing the accounting principles used and significant estimates made by management, as well as evaluating the overall financial statement presentation. We believe that our audits provide a reasonable basis for our opinion.
In our opinion, the financial statements and financial highlights referred to above present fairly, in all material respects, the financial position of the Calvert Emerging Markets Equity Fund as of September 30, 2017, the results of its operations for the year then ended, the changes in its net assets for each of the years in the two-year period then ended, and the financial highlights for each of the years or periods in the five-year period then ended, in conformity with U.S. generally accepted accounting principles.
/s/ KPMG LLP
Philadelphia, Pennsylvania
November 22, 2017
www.calvert.com CALVERT EMERGING MARKETS EQUITY FUND ANNUAL REPORT 27
FEDERAL TAX INFORMATION
The Form 1099-DIV you receive in February 2018 will show the tax status of all distributions paid to your account in calendar year 2017. Shareholders are advised to consult their own tax adviser with respect to the tax consequences of their investment in the Fund. As required by the Internal Revenue Code and/or regulations, shareholders must be notified regarding the status of qualified dividend income for individuals and the foreign tax credit.
Qualified Dividend Income. For the fiscal year ended September 30, 2017, the Fund designates approximately $2,219,086, or up to the maximum amount of such dividends allowable pursuant to the Internal Revenue Code, as qualified dividend income eligible for the reduced tax rate of 15%.
Foreign Tax Credit. For the fiscal year ended September 30, 2017, the Fund paid foreign taxes of $392,577 and recognized foreign source income of $4,030,834.
28 www.calvert.com CALVERT EMERGING MARKETS EQUITY FUND ANNUAL REPORT (Unaudited)
MANAGEMENT AND ORGANIZATION
Fund Management. The Directors of Calvert World Values Fund, Inc. (the Corporation) are responsible for the overall management and supervision of the Corporation’s affairs. The Directors and officers of the Corporation are listed below. Except as indicated, each individual has held the office shown or other offices in the same company for the last five years. Directors and officers of the Corporation hold indefinite terms of office. The “Independent Directors” consist of those Directors who are not “interested persons” of the Corporation, as that term is defined under the 1940 Act. The business address of each Director and officer, with the exception of Ms. Gemma and Mr. Kirchner, is 1825 Connecticut Avenue NW, Suite 400, Washington, DC 20009. As used below, “CRM” refers to Calvert Research and Management. Each Director oversees 37 funds in the Calvert fund complex. Each officer serves as an officer of certain other Calvert funds.
|
| | | |
| Name and Year of Birth | Position with Corporation | Position Start Date | Principal Occupation(s) and Directorships During Past Five Years and Other Relevant Experience |
| | | | |
| Interested Director | | | |
John H. Streur(1) 1960 | Director & President | 2015 | President and Chief Executive Officer of Calvert Research and Management (since December 31, 2016). President and Chief Executive Officer of Calvert Investments, Inc. (January 2015 - December 2016); Chief Compliance Officer of Calvert Investment Distributors, Inc. (August 2015 - December 2016); Chief Compliance Officer of Calvert Investment Management (August 2015 - April 2016); President and Director, Portfolio 21 Investments, Inc. (through October 2014); President, Chief Executive Officer and Director, Managers Investment Group LLC (through January 2012); President and Director, The Managers Funds and Managers AMG Funds (through January 2012). Directorships in the Last Five Years. Portfolio 21 Investments, Inc. (asset management) (through October 2014); Managers Investment Group LLC (asset management) (through January 2012); The Managers Funds (asset management) (through January 2012); Managers AMG Funds (asset management) (through January 2012); Calvert Social Investment Foundation. |
| Independent Directors | | | |
Richard L. Baird, Jr. 1948 | Director | 2005 | Former President and CEO of Adagio Health Inc. (retired in 2014) in Pittsburgh, PA, a non-profit corporation which provides family planning services, nutrition, maternal/child health care, and various health screening services and community preventive health programs. Directorships in the Last Five Years. None. |
Alice Gresham Bullock(2) 1950 | Chair & Director | 2016 | Professor at Howard University School of Law (retired June 2016). She is former Dean of Howard University School of Law (1996-2002) and Deputy Director of the Association of American Law Schools (1992-1994). Directorships in the Last Five Years. None. |
Cari M. Dominguez(2) 1949 | Director | 2016 | Former Chair of the U.S. Equal Employment Opportunity Commission. Directorships in the Last Five Years. Manpower, Inc. (employment agency); Triple S Management Corporation (managed care); National Association of Corporate Directors. |
John G. Guffey, Jr. 1948 | Director | 1992 | President of Aurora Press Inc., a privately held publisher of trade paperbacks (since January 1997). Directorships in the Last Five Years. Ariel Funds (3) (asset management) (through December 31, 2011); Calvert Social Investment Foundation; Calvert Ventures, LLC. |
Miles D. Harper, III 1962 | Director | 2005 | Partner, Carr Riggs & Ingram (public accounting firm) since October 2014. Partner, Gainer Donnelly & Desroches (now Carr Riggs & Ingram) (public accounting firm), November 1999 - September 2014). Directorships in the Last Five Years. Bridgeway Funds (14) (asset management). |
Joy V. Jones 1950 | Director | 2005 | Attorney. Directorships in the Last Five Years. Conduit Street Restaurants SUD 2 Limited (restaurant) (dissolved September 2016); Palm Management Restaurant Corporation. |
www.calvert.com CALVERT EMERGING MARKETS EQUITY FUND ANNUAL REPORT (Unaudited) 29
|
| | | |
| Name and Year of Birth | Position with Corporation | Position Start Date | Principal Occupation(s) and Directorships During Past Five Years and Other Relevant Experience |
| | | | |
Anthony A. Williams(2) 1951 | Director | 2016 | CEO and Executive Director of the Federal City Council (July 2012 to present) (economic development non-profit organization); Senior Adviser and Independent Consultant for McKenna Long & Aldridge LLP (now Dentons) (law firm) (September 2011 to present); Executive Director of Global Government Practice at the Corporate Executive Board (now Gartner Inc.) (global research and Advisory company) (January 2010 to January 2012); William H. Bloomberg Lecturer in Public Management at the Harvard Kennedy School (since 2009). Directorships in the Last Five Years. Freddie Mac; Evoq Properties/ Meruelo Maddux Properties, Inc. (real estate management); Weston Solutions, Inc. (environmental services); Bipartisan Policy Center’s Debt Reduction Task Force (non-profit organization); Chesapeake Bay Foundation (independent conservation organization); Catholic University of America; Urban Institute (research organization). |
|
| | | |
| Principal Officers who are not Directors | |
| Name and Year of Birth | Position with Corporation | Position Start Date | Principal Occupation During Past Five Years |
| | | | |
Hope Brown 1973 | Chief Compliance Officer | 2014 | Chief Compliance Officer of 37 registered investment companies advised by CRM (since 2014). Vice President and Chief Compliance Officer, Wilmington Funds (2012-2014). Vice President and Senior Compliance Officer, Wilmington Trust Investment Advisors, Inc. (2010-2012). |
Maureen A. Gemma(3) 1960 | Secretary and Vice President | 2016 | Vice President of CRM and officer of 37 registered investment companies advised by CRM. Also Vice President of Eaton Vance Management (“EVM”) and certain of its affiliates and officer of 176 registered investment companies advised or administered by EVM. |
James F. Kirchner(3) 1967 | Treasurer | 2016 | Vice President of CRM and officer of 37 registered investment companies advised by CRM. Also Vice President of EVM and certain of its affiliates and officer of 176 registered investment companies advised or administered by EVM. |
(1) Mr. Streur is an interested person of the Funds because of his positions with each Fund’s Adviser and certain affiliates.
(2) Mmes. Bullock and Dominguez and Mr. Williams began serving as Directors effective December 23, 2016.
(3) The business address for Ms. Gemma and Mr. Kirchner is Two International Place, Boston, MA 02110. Ms. Gemma and Mr. Kirchner began serving as Officers effective December 31, 2016.
The SAI for the Fund includes additional information about the Directors and officers of the Fund and can be obtained without charge on Calvert’s website at www.calvert.com or by calling 1-800-368-2745.
30 www.calvert.com CALVERT EMERGING MARKETS EQUITY FUND ANNUAL REPORT (Unaudited)
IMPORTANT NOTICES
Privacy. The Calvert organization is committed to ensuring your financial privacy. Each of the financial institutions identified below has in effect the following policy (“Privacy Policy”) with respect to nonpublic personal information about its customers:
| |
| • | Only such information received from you, through application forms or otherwise, and information about your Calvert fund transactions will be collected. This may include information such as name, address, social security number, tax status, account balances and transactions. |
| |
| • | None of such information about you (or former customers) will be disclosed to anyone, except as permitted by law (which includes disclosure to employees necessary to service your account). In the normal course of servicing a customer’s account, the Calvert organization may share information with unaffiliated third parties that perform various required services such as transfer agents, custodians and broker-dealers. |
| |
| • | Policies and procedures (including physical, electronic and procedural safeguards) are in place that are designed to protect the confidentiality of such information. |
| |
| • | We reserve the right to change our Privacy Policy at any time upon proper notification to you. Customers may want to review our Privacy Policy periodically for changes by accessing the link on our homepage: www.calvert.com. |
Our pledge of privacy applies to the following entities within the Calvert organization: the Calvert family of funds and Calvert Research and Management. In addition, our Privacy Policy applies only to those Calvert customers who are individuals and who have a direct relationship with us. If a customer’s account (i.e., fund shares) is held in the name of a third-party financial advisor/broker-dealer, it is likely that only such advisor’s privacy policies apply to the customer. This notice supersedes all previously issued privacy disclosures. For more information about Calvert’s Privacy Policy, please call 1-800-368-2745.
Delivery of Shareholder Documents. The Securities and Exchange Commission (SEC) permits funds to deliver only one copy of shareholder documents, including prospectuses, proxy statements and shareholder reports, to fund investors with multiple accounts at the same residential or post office box address. This practice is often called “householding” and it helps eliminate duplicate mailings to shareholders. Calvert funds, or your financial advisor, may household the mailing of your documents indefinitely unless you instruct Calvert funds, or your financial advisor, otherwise. If you would prefer that your Calvert fund documents not be householded, please contact Calvert funds at 1-800-368-2745, or contact your financial advisor. Your instructions that householding not apply to delivery of your Calvert fund documents will typically be effective within 30 days of receipt by Calvert funds or your financial advisor. Separate statements will be generated for each separate account and will be householded as described above.
Portfolio Holdings. Each Calvert fund will file a schedule of portfolio holdings on Form N-Q with the SEC for the first and third quarters of each fiscal year. The Form N-Q will be available on the Calvert funds’ website at www.calvert.com, by calling Calvert funds at 1-800-368-2745 or in the EDGAR database on the SEC’s website at www.sec.gov. Form N-Q may also be reviewed and copied at the SEC’s public reference room in Washington, D.C. (call 1-800-732-0330 for information on the operation of the public reference room).
Proxy Voting. The Proxy Voting Guidelines that each Calvert fund uses to determine how to vote proxies relating to portfolio securities is provided as an Appendix to the fund’s Statement of Additional Information. The Statement of Additional Information can be obtained free of charge by calling the Calvert funds at 1-800-368-2745, by visiting the Calvert funds’ website at www.calvert.com or visiting the SEC’s website at www.sec.gov. Information regarding how a Calvert fund voted proxies relating to portfolio securities during the most recent 12-month period ended June 30 is available by calling Calvert funds, by visiting the Calvert funds’ website at www.calvert.com or by visiting the SEC’s website at www.sec.gov.
www.calvert.com CALVERT EMERGING MARKETS EQUITY FUND ANNUAL REPORT (Unaudited) 31
|
|
| This page intentionally left blank. |
|
| | | | |
| CALVERT EMERGING MARKETS EQUITY FUND | | CALVERT FUNDS | | |
Service for Existing Account Shareholders: 800-368-2745 Brokers: 800-368-2746 Regular Mail Calvert Funds c/o BFDS, P.O. Box 219544 Kansas City, MO 64121-9544 Overnight Mail Calvert Funds c/o BFDS, 330 West 9th Street Kansas City, MO 64105 Web Site www.calvert.com Principal Underwriter* Eaton Vance Distributors, Inc. Two International Place Boston, MA 02110 | | Municipal Funds Responsible Municipal Income Fund Taxable Bond Funds Bond Fund Income Fund Short Duration Income Fund Long-Term Income Fund Ultra-Short Duration Income Fund High Yield Bond Fund Green Bond Fund Absolute Return Bond Fund Floating-Rate Advantage Fund Balanced and Asset Allocation Funds Balanced Fund Conservative Allocation Fund Moderate Allocation Fund Aggressive Allocation Fund
| | Equity Funds Equity Fund US Large-Cap Core Responsible Index Fund US Large-Cap Value Responsible Index Fund US Large-Cap Growth Responsible Index Fund US Mid-Cap Core Responsible Index Fund International Responsible Index Fund Mid-Cap Fund International Equity Fund Small-Cap Fund Global Energy Solutions Fund Global Water Fund International Opportunities Fund Emerging Markets Equity Fund |
* FINRA BrokerCheck. Investors may check the background of their Investment Professional by contacting the Financial Industry Regulatory Authority (FINRA). FINRA BrokerCheck is a free tool to help investors check the professional background of current and former FINRA-registered securities firms and brokers. FINRA BrokerCheck is available by calling 1-800-289-9999 and at www.FINRA.org. The FINRA BrokerCheck brochure describing this program is available to investors at www.FINRA.org.
|
| |
| | |
Fund shares are not insured by the FDIC and are not deposits or other obligations of, or guaranteed by, any depository institution. Shares are subject to investment risks, including possible loss of principal invested. This report is intended to provide fund information to shareholders. It is not authorized for distribution to prospective investors unless preceded or accompanied by a prospectus. Note: The information on our website is not incorporated by reference into this report; our website address is included as an inactive textual reference only. Investors should carefully consider the investment objectives, risks, charges and expenses of the Calvert funds. This and other important information is contained in the fund’s summary prospectus and prospectus, which can be obtained from your financial professional and should be read carefully before investing. You may also call Calvert funds at 800-368-2745. Printed on recycled paper. |
| 24213 9.30.17 | |
Item 2. Code of Ethics
The registrant has adopted a code of ethics applicable to its Principal Executive Officer, Principal Financial Officer and Principal Accounting Officer. The registrant undertakes to provide a copy of such code of ethics to any person upon request, without charge, by calling 1-800-368-2745. The registrant has amended the code of ethics as described in Form N-CSR during the period covered by this report to make immaterial changes. The registrant has not granted any waiver, including an implicit waiver, from a provision of the code of ethics as described in Form N-CSR during the period covered by this report.
Item 3. Audit Committee Financial Expert
The registrant's Board of Directors has determined that Miles D. Harper III, an “independent” Director serving on the registrant’s audit committee, is an “audit committee financial expert,” as defined in Item 3 of Form N-CSR. Under applicable securities laws, a person who is determined to be an audit committee financial expert will not be deemed an "expert" for any purpose, including without limitation for the purposes of Section 11 of the Securities Act of 1933, as a result of being designated or identified as an audit committee financial expert. The designation or identification of a person as an audit committee financial expert does not impose on such person any duties, obligations, or liabilities that are greater than the duties, obligations, and liabilities imposed on such person as a member of the audit committee and Board of Directors in the absence of such designation or identification.
Item 4. Principal Accountant Fees and Services
(a) –(d)
The following table presents the aggregate fees billed to the registrant for the registrant’s fiscal years ended September 30, 2016 and September 30, 2017 by KPMG for professional services rendered for the audit of the registrant’s annual financial statements and fees billed for other services rendered by KPMG during such periods.
|
| | | | | | | | | | |
| Fiscal Years Ended | 9/30/16 |
| %* |
| 9/30/17 |
| %* |
|
| | | | | |
| Audit Fees |
| $97,733 |
| 0 | % |
| $93,825 |
| 0 | % |
| | | | | |
| Audit-Related Fees |
| $0 |
| 0 | % |
| $0 |
| 0 | % |
| | | | | |
| Tax Fees |
| $61,746 |
| 0 | % |
| $18,600 |
| 0 | % |
| | | | | |
| All Other Fees |
| $0 |
| 0 | % |
| $0 |
| 0 | % |
| | | | | |
| Total |
| $159,479 |
| 0 | % |
| $112,425 |
| 0 | % |
*Percentage of fees approved by the Audit Committee pursuant to (c)(7)(i)(C) of Rule 2-01 of Reg. S-X (statutory de minimis waiver of Committee’s requiremen6t to pre-approve)
(e) The Audit Committee is required to pre-approve all audit and non-audit services provided to the registrant by the auditors, and to the registrant’s investment adviser, and any entity controlling, controlled by, or under common control with the adviser that provides ongoing services to the registrant. In determining whether to pre-approve non-audit services, the Audit Committee considers whether the services are consistent with maintaining the independence of the auditors. The Committee may delegate its authority to pre-approve certain matters to one or more of its members. In this regard, the Committee has delegated authority jointly to the Audit Committee Chair together with another Committee member with respect to non-audit services not exceeding $25,000 in each instance. In addition, the Committee has pre-approved the retention of the auditors to provide tax-related services related to the tax treatment and tax accounting of newly acquired securities, upon request by the investment adviser in each instance.
(f) Not applicable.
(g) ) Aggregate non-audit fees billed by the registrant’s accountant for services rendered to the registrant, and rendered to the registrant’s investment adviser, and any entity controlling, controlled by, or under common control with the adviser that provides ongoing services to the registrant for each of the last two fiscal years of the registrant:
|
| | | |
Fiscal Year ended 9/30/16
|
Fiscal Year ended 9/30/17
|
| $ | %* | $ | %* |
| | | | |
| $0 | 0% | $63,600 | 0% |
*Percentage of fees approved by the Audit Committee pursuant to (c)(7)(i)(C) of Rule 2-01 of Reg. S-X (statutory de minimis waiver of Committee’s requiremen6t to pre-approve)
(h) The registrant’s audit committee has considered whether the provision by the registrant’s principal accountant of non-audit services to the registrant’s investment adviser and any entity controlling, controlled by, or under common control with the adviser that provides ongoing services to the registrant that were not pre-approved pursuant to Rule 2-01(c)(7)(ii) of Regulation S-X is compatible with maintaining the principal accountant’s independence.
Item 5. Audit Committee of Listed Registrants
Not applicable.
Item 6. Schedule of Investments
Please see schedule of investments contained in the Report to Stockholders included under Item 1 of this Form N-CSR.
Item 7. Disclosure of Proxy Voting Policies and Procedures for Closed-End Management Investment Companies
Not applicable.
Item 8. Portfolio Managers of Closed-End Management Investment Companies
Not applicable.
Item 9. Purchases of Equity Securities by Closed-End Management Investment Company and Affiliated Purchasers
Not applicable.
Item 10. Submission of Matters to a Vote of Security Holders
No material changes.
Item 11. Controls and Procedures
(a) The registrant’s principal executive and principal financial officers have concluded that the registrant's disclosure controls and procedures (as defined in Rule 30a-3(c) under the Investment Company Act of 1940 Act, as amended (the “1940 Act”) are effective, based on the evaluation of these controls and procedures required by Rule 30a-3(b) under the 1940 Act and Rules 13a-15(b) or 15d-15(b) under the Securities Exchange Act of 1934 (“Exchange Act”), as of a date within 90 days of the filing date of this report.
(b) There was no change in the registrant's internal control over financial reporting (as defined in Rule 30a-3(d) under the 1940 Act) that occurred during the second fiscal quarter of the period covered by this report that has materially affected, or is reasonably likely to materially affect, the registrant's internal control over financial reporting.
Item 12. Exhibits
(a)(1) Registrant’s Code of Ethics – Not applicable (please see Item 2).
(a)(2)(i) Treasurer’s Section 302 certification.
(a)(2)(ii) President’s Section 302 certification.
(b) Combined Section 906 certification.
Signatures
Pursuant to the requirements of the Securities Exchange Act of 1934 and the Investment Company Act of 1940, the registrant has duly caused this report to be signed on its behalf by the undersigned, thereunto duly authorized.
CALVERT WORLD VALUES FUND, INC.
By: /s/ John H. Streur
John H. Streur
President
Date: November 22, 2017
Pursuant to the requirements of the Securities Exchange Act of 1934 and the Investment Company Act of 1940, this report has been signed below by the following persons on behalf of the registrant and in the capacities and on the dates indicated.
By: /s/ James F. Kirchner
James F. Kirchner
Treasurer
Date: November 22, 2017
By: /s/ John H. Streur
John H. Streur
President
Date: November 22, 2017