UNITED STATES
SECURITIES AND EXCHANGE COMMISSION
Washington, D.C. 20549
FORM N-CSR
CERTIFIED SHAREHOLDER REPORT OF REGISTERED
MANAGEMENT INVESTMENT COMPANIES
Investment Company Act file number: 811-6563
CALVERT WORLD VALUES FUND, INC.
(Exact name of registrant as specified in charter)
4550 Montgomery Avenue
Suite 1000N
Bethesda, Maryland 20814
(Address of Principal Executive Offices)
William M. Tartikoff, Esq.
4550 Montgomery Avenue
Suite 1000N
Bethesda, Maryland 20814
(Name and Address of Agent for Service)
Registrant's telephone number, including area code: (301) 951-4800
Date of fiscal year end: September 30
Date of reporting period: Twelve months ended September 30, 2010
Item 1. Report to Stockholders.
Calvert World Values International Equity
Fund
Annual Report
September 30, 2010
E-Delivery Sign-Up —
Details Inside
Choose Planet-friendly E-delivery!
Sign up now for on-line statements, prospectuses, and fund reports. In less than five minutes you can help reduce paper mail and lower fund costs.
Just go to www.calvert.com, click on My Account, and select the documents you would like to receive via e-mail.
If you’re new to account access, you’ll be prompted to set up a personal identification number for your account. Once you’re in, click on the E-delivery sign-up at the bottom of the Account Portfolio page and follow the quick, easy steps.
TABLE
OF CONTENTS
4 President’s Letter
7 SRI Update
9 Portfolio Management Discussion
14 Shareholder Expense Example
16 Report of Independent Registered Public Accounting Firm
17 Statement of Net Assets
28 Statement of Operations
29 Statements of Changes in Net Assets
31 Notes to Financial Statements
39 Financial Highlights
44 Explanation of Financial Tables
46 Proxy Voting and Availability of Quarterly Portfolio Holdings
48 Director and Officer Information Table
Dear Shareholder:
Over the 12-month reporting period, the U.S. financial markets and economy continued to recover, in fits and starts, from the “Great Recession.” As economic data vacillated between good and bad news on employment, housing trends, business strength, and consumer confidence, market volatility and investor sentiment also see-sawed.
During the winter, investors became less risk averse, pouring money into higher-yielding areas of the bond market as well as stocks, which reached 18-month highs in March. Later in the spring, however, investor sentiment took an abrupt turn as confidence in the global economic recovery waned and fears of a double-dip recession grew. Following a dismal August for the stock market, September saw a surge in stock prices lifted by strong corporate earnings reports and renewed investor interest in bargain-priced stocks. In the bond market, Treasury yields moved lower over the 12-month reporting period and corporate bonds generally performed well.
Economic Recovery Slow But on Track
Looking ahead, the pace of economic recovery has clearly slowed, causing Federal Reserve (Fed) Chairman Ben Bernanke to say that the Fed stands ready to use all of the tools at its disposal to reinvigorate the U.S. economy. In our view, while the country faces sobering challenges related to the unemployment rate, high levels of government debt, and the stumbling housing market, we also see encouraging signs of economic recovery. Overall, companies have strong balance sheets and cash positions, have reported stronger-than-expected corporate earnings, and are investing in their businesses. Consumers are generally “deleveraging” by saving more and paying down their debt. Financial reform is under way in the U.S. that may help reassure investors and stabilize the markets. Globally, central banks around the world are continuing to pursue extremely accommodative mone tary policies to encourage economic recovery.
In this transitional environment, we believe that both the equity and fixed-income markets are likely to continue to be somewhat volatile. In our view, investment strategies that include sustainability criteria may be better positioned to weather these uncertainties and provide long-term value.
Markets Challenged, But Gain Ground
Despite the volatility over the course of the 12-month reporting period, domestic and international stocks had moved solidly ahead by the end of the period. U.S. stock indexes reported 12-month gains across all styles, strategies, and capitalization ranges. The large-cap Russell 1000 Index and the Standard & Poor’s 500 Index returned 10.75% and 10.16%, respectively. Mid-cap stocks were the top-performing category, with the Russell Midcap Index up 17.54%, while the small-cap Russell 2000 Index rose 13.35%. In terms of style, growth stocks moderately outpaced value stocks. On the international front, the MSCI EAFE Investable Market Index (IMI), a benchmark for international stocks, edged up 4.23%, and the MSCI Emerging Markets IMI was up 21.97%.
In the fixed-income markets, the Barclays Capital U.S. Credit Index, a market barometer for investment-grade bonds, was up 11.67%. In line with the Fed’s federal funds rate target of 0% to 0.25%, money market returns remained very low.
The Gulf of Mexico Oil Spill and the Extractives Industry
In the wake of the April 20 oil spill in the Gulf of Mexico, Americans have continued to grapple with the devastation caused by the spill and its long-term environmental, societal, and economic implications. Calvert shares the concern and the frustration felt by the millions of people affected by this tragedy.
Following the spill, Calvert met with BP officials, urging BP not only to clean up the current spill, but also to implement stronger safety and process management standards for its contractors. We are also evaluating how our advocacy objectives with deepwater oil-drilling companies may help prevent such disasters in the future.
In terms of extraction methodologies, Calvert has long recognized that as readily accessible supplies of oil and gas dry up, companies may be forced to seek mineral resources in countries with poor governance, weak rule of law, and high levels of corruption. Accordingly, over the past two years, we have been a leading advocate for transparency requirements for extractive industries. In July, the U.S. Congress passed legislation requiring companies to disclose payments that they make to the U.S. or foreign governments for the purpose of commercial development of oil, natural gas, or minerals. We believe this legislation is a milestone toward helping advance environmental sustainability in this industry.
In our view, the oil spill also underlines the urgency for expanded investment—with greater federal incentives—in alternative energy sources.
Financial Reform Under Way
Looking ahead, long-awaited financial reform is under way with Congressional passage of the largest financial reform bill since the Great Depression. The Dodd-Frank Wall Street Reform and Consumer Protection Act (Dodd-Frank Act) is designed to address inadequate regulation of Wall Street firms and the type of unrestrained environment that contributed to the credit crisis of 2008 and the ensuing global market meltdown. The Dodd-Frank Act seeks to establish strong consumer protections, shield taxpayers from future corporate bailouts, shine a light on the “shadow markets” and derivatives trading, and expand the role of shareholders in corporate governance. While these goals are laudable, the impact of the Dodd-Frank Act on the financial industry—and ultimately its ability to prevent another financial crisis—must stand the test of time.
As the Obama administration and Congress work to implement key financial reforms, we believe that over time these efforts may work to redress some systemic imbalances in the financial system and provide additional stability to the economy and markets.
Review Your Portfolio Allocations
In our view, the financial markets are likely to be in transition for some time as the government tackles financial reform, the global economy continues to recover, and political elections in the U.S. impact a variety of government policies. Now may be an opportune time to review your overall investment strategy and portfolio allocations with your financial advisor. Check to ensure that your target mix of U.S. and international stocks, bonds, and cash is well-diversified and appropriate given your investment goals, stage of life, and attitude toward risk.
For up-to-date economic and market commentary from Calvert professionals, along with information on current Calvert sustainability initiatives, please visit our website,
www.calvert.com.
As always, we appreciate your investing with Calvert.
Sincerely,
Barbara J. Krumsiek
President and CEO
Calvert Group, Ltd.
October 2010
sri
Update
from the Calvert Sustainability Research Department
As the fallout from the financial crisis continues to prove, responsible management of environmental, social, and governance (ESG) factors isn’t just “nice to do”—it’s essential to keeping our companies and our economy healthy and strong. Therefore, Calvert continues to work hard to ensure that you have a say in charting new paths to a more prosperous future.
Shareholder Advocacy
For the 2010 proxy season, Calvert filed a record 45 resolutions—including 30 as the lead filer. Issues covered by the resolutions focused on climate change, board and employee diversity, executive compensation, sustainability reporting, and political contributions. Thus far, we have negotiated 31 successful withdrawals after the companies have agreed to address our objectives.
The resolutions featured two new issues this year—climate change adaptation and board chair independence. Our resolutions on the first topic asked Kroger and Dover Corporation to report on how each plans to assess and manage the business impacts of climate change. Dover management agreed, so the resolution was successfully withdrawn. At Kroger, the resolution received strong support with 40% of shareholders voting in favor of it.
The second new issue recommended that Chesapeake Energy and Eaton Corporation separate the Board of Directors Chair and CEO positions to strengthen the Board’s oversight of company management and accountability to shareholders (which is emerging as a corporate governance best practice). Both resolutions were successfully withdrawn after management agreed to appoint a Lead Independent Director.
Community Investments
Many of our Funds participate in Calvert’s High Social Impact Investing program, which is administered through the Calvert Social Investment Foundation. This community investment program may allocate a small percentage of Fund assets at below-market interest rates to investments that provide economic opportunity for struggling populations.1
The Foundation recently launched its Green Strategies to Fight Poverty™ investment initiative, which allows investors to target their Community Investment Note investments to organizations and projects that both fight poverty and protect the environment.
Special Equities
A modest but important portion of certain funds is allocated to small private companies that are developing products or services that address important sustainability or environmental issues. CSIF Equity Portfolio has invested in Marrone Bio Innovations, which uses bio-based systems to control pests and weeds and recently received emergency-use approval from the EPA to sell its new invasive mussel control system in certain areas of the western U.S. The company also submitted a second organic herbicide product, for use on both organic and industrial farms, for approval to the EPA.
Calvert Large Cap Growth Fund invested in the Berkeley Renewable Energy Asia Fund, which brings power to areas of the world without access to a central power grid. Led by a management team with a long history in the industry, Berkeley mitigates construction risk by helping communities build the plants and then selling them to a service provider once they’re up and running.2
1 As of September 30, 2010, Calvert Social Investment Foundation Community Investment Notes represented the following percentages of Fund net assets: Calvert Social Investment Fund (CSIF) Balanced Portfolio 0.94%, CSIF Bond Portfolio 0.34%, CSIF Equity Portfolio 0.52%, Calvert Capital Accumulation Fund 1.29%, Calvert World Values International Equity Fund 1.19%, Calvert New Vision Small Cap Fund 0.78%, and Calvert Large Cap Growth Fund 0.56%. The Calvert Social Investment Foundation is a 501(c)(3) nonprofit organization. The Foundation’s Community Investment Note Program is not a mutual fund and should not be confused with any Calvert Group-sponsored investment product.
2 As of September 30, 2010, Marrone Bio Innovations represented 0.05% of CSIF Equity Portfolio; Berkeley Renewable Energy Asia Fund represented 0.002% of Calvert Large Cap Growth Fund. All holdings are subject to change without notice.
As of September 30, 2010, the following companies represented the following percentages of Fund net assets:
Kroger represented 0% of all Calvert SRI funds. Dover Corporation represented 0.15% of Calvert Social Index
Fund. Chesapeake Energy represented 0.22% of CSIF Balanced Portfolio, 0.79% of CSIF Bond Portfolio,
and 0.22% of Calvert Social Index Fund. Eaton Corporation represented 0.52% of CSIF Enhanced Equity
Portfolio and 0.20% of Calvert Social Index Fund. All holdings are subject to change without notice.
Portfolio Management Discussion
Natalie A. Trunow
Senior Vice President, Chief Investment Officer - Equities
Calvert Asset Management Company
Performance
Calvert World Values International Equity Fund Class A shares (at NAV) returned 1.08% for the 12-month period ended September 30, 2010, underperforming the benchmark Morgan Stanley Capital International Europe Australasia Far East Investable Market Index (MSCI EAFE IMI), which returned 4.23%. The bulk of the Fund’s underperformance was due to stock selection in the fourth quarter of 2009.
New Subadvisor
At the end of 2009, Calvert made extensive changes to the management structure of the Fund. On December 8, 2009, the Board of Directors replaced Acadian Asset Management as the subadvisor to the Fund with a multi-manager structure consisting of Thornburg Investment Management, Martin Currie, and Calvert Asset Management Company (CAMCO) as the subadvisors. The multi-manager, investment style-balanced approach offers more upside opportunity in different market environments as well as enhanced opportunity for risk control and diversification. The three managers have
calvert world
values
international
equity fund
September 30, 2010
Investment Performance
(total return at NAV*)
| 6 Months | 12 Months |
| ended | ended |
| 9/30/10 | 9/30/10 |
Class A | 1.09% | 1.08% |
Class B | 0.49% | 0.00% |
Class C | 0.75% | 0.25% |
Class I | 1.51% | 1.91% |
Class Y | 1.40% | 1.73% |
MSCI EAFE Investable Market Index | 0.95% | 4.23% |
Lipper International Multi-Cap Core Funds Average | 2.35% | 6.50% |
Ten Largest | | |
Stock Holdings | | % of Net Assets |
Pearson plc | | 1.9% |
Canadian National Railway Co. | | 1.9% |
Novo Nordisk A/S, Series B | | 1.6% |
BNP Paribas | | 1.6% |
Potash Corporation of Saskatchewan, Inc. | | 1.5% |
Standard Chartered plc | | 1.4% |
ING Groep NV (CVA) | | 1.3% |
Tesco plc | | 1.3% |
SAP AG | | 1.3% |
Reckitt Benckiser Group plc | | 1.2% |
Total | | 15.0% |
*Investment performance/return at NAV does not reflect the deduction of the Fund’s maximum 4.75% front-end sales charge or any deferred sales charges.
complementary investment styles that we believe will help maximize returns, while enabling the CAMCO Equity Team to better control risk in the fund. Calvert managed this transition with all of the new portfolios in place by December 31, 2009.
Investment Climate
After a year of uncertainty about global economic recovery, markets worldwide ended the reporting period in positive territory. In the U.S., the Standard & Poor’s 500 Index returned 10.16% and in emerging markets, the Morgan Stanley Capital International Emerging Markets Index gained 20.54%.
Overall, markets have largely built on the rally that started in early March 2009 as investors fluctuated between optimism and uncertainty about the sustainability of an economic recovery, including fears of a double-dip recession. However, we saw some sharp sell-offs in the second quarter of 2010 as the uncertainty escalated, causing the re-pricing of risk in both equity and fixed-income assets.
Dramatic downgrades in the sovereign creditworthiness of Greece, Spain, and Dubai rattled global financial markets in the spring of 2010--leading many to question the overall strength of the euro-zone’s economic recovery. In response, several European Union countries implemented austerity programs to slash their budget deficits and slow economic growth, and a new set of rules to toughen European banks’ capital and liquidity requirements was introduced.
China had some success with its attempt to engineer a soft landing for its overheated economy, which should improve global growth prospects--especially since it is now the world’s second-largest economy, eclipsing Japan in the second quarter of 2010, according to gross domestic product (GDP) data.
In the U.S., economic news throughout the period suggested a slow and sometimes uneven recovery was underway. GDP growth in the fourth quarter of 2009 turned positive for the first time since the second quarter of 2008, largely due to government stimulus efforts designed to increase consumer spending and inventory rebuilding. However, economic recovery in the second half of 2010 has been slower than most original forecasts, with early estimates of 2.4% for the second quarter of 2010 lowered to 1.7%.
Portfolio Review
Due to the management changes, discussion of the Fund’s performance is divided into two parts: performance under Acadian’s
calvert world
values
international
equity fund
September 30, 2010
Economic Sectors | % of Total Investments |
Consumer Discretionary | 18.6% |
Consumer Staples | 6.6% |
Energy | 6.6% |
Financials | 25.4% |
Government | 2.8% |
Health Care | 11.0% |
Industrials | 9.1% |
Information Technology | 6.7% |
Limited Partnership Interest | 0.8% |
Materials | 3.4% |
Telecommunication Services | 5.7% |
Utilities | 2.6% |
Venture Capital | 0.7% |
Total | 100% |
management and transition (fourth quarter of 2009), and performance under the current multi-manager structure (January 1 through September 30, 2010).
Fourth Quarter 2009
The Fund underperformed its benchmark by 3.12 percentage points for the quarter, primarily due to stock selection in the Materials and Energy sectors. Relative returns were hurt by not owning several of the top performers--such as Rio Tinto, BHP Billiton, and BP--which do not meet Calvert’s environmental, social, and governance (ESG) criteria. Country selection helped offset some of the underperformance, although sector selection contributed a little as well. An underweight to Financials and strong stock selection within that sector were also beneficial.
2010 Year-to-Date Performance
After the change to the multi-manager structure, performance improved significantly. For 2010 through September 30, the Fund performed approximately in line with the benchmark, returning 2.29% versus 2.33%. Stock selection helped relative returns the most.
As of September 30, 2010, the allocation among the three managers was as follows: 37.9% of total Fund assets with Thornburg, 36.8% of total Fund assets with Martin Currie, and 25.3% of total Fund assets with CAMCO. These allocations are all within target ranges.
Stock selection was strongest in the Energy, Financials, and Utilities sectors. Avoiding investment in BP, Total, E.On, and RWE benefited relative performance by more than 1.20 percentage points. In Financials, Bank Mandiri, BanColombia, DnB NOR, Banco Santander-Chile, and Hang Lung Properties were all top contributors.
On the negative side, stock selection struggled in Consumer Staples and Telecommunication as a lack of exposure to Nestle, British American Tobacco, and Vodafone hurt relative performance. Mobile operator NTT DoCoMo also detracted from returns.
Overall, sector allocation had a neutral impact on the Fund. An underweight to Industrials detracted the most, but was offset by an underweight to Utilities.
Outlook
We believe that, given relative valuations and capital flows, the sharp outperformance of bonds versus equities of the past several months is bound to reverse and equities will outperform bonds over the next six to 18 months. The economy has slowed, but sustained economic recovery continues. The equity markets seem to present an attractive buying opportunity relative to other asset classes. In September, equities looked more attractive relative to bonds than they have since 1993 (except for the market bottom in March of 2009), with 10-year Treasuries yielding 2.51% versus the Dow Jones Industrial Average’s dividend yield of 2.6% and an attractive forward price/earnings multiple of 12.2.
As we have commented in the past, we don’t believe that negative GDP growth, which would constitute a double-dip recession, is likely. While we anticipate a somewhat more challenged earnings environment later this year, we believe that the strength in the corporate sector is likely to persist and continue to support the overall economic recovery. Our outlook continues to call for a slow, gradual pace to economic recovery and a generally positive environment for stock picking, barring any major geopolitical calamities.
October 2010
As of September 30, 2010, the following companies represented the following percentages of Fund net assets: Toyo Seikan Kaisha 0%, Rio Tinto 0%, BHP Billiton 0%, Santos 0.65%, BP 0%, Total 0%, Barclays 1.04%, UBS 0%, Lloyds Banking Group 0%, Nissan Motor 0.6%, Aisin Seiki 0%, E.On 0%, RWE 0%, Bank Mandiri 0.56%, BanColombia 0.84%, DnB NOR 0.97%, Banco Santander-Chile 0.51%, Hang Lung Properties 1.56%, Nestle 0%, British American Tobacco 0%, Vodafone 0.24%, and NTT DoCoMo 0%. All holdings are subject to change without notice.
calvert world
values
international
equity fund
September 30, 2010
Average Annual Total Returns
Class A Shares | (with max. load) |
One year | -3.80% |
Five year | -3.10% |
Ten year | -1.33% |
| |
| |
Class B Shares | (with max. load) |
One year | -5.15% |
Five year | -3.37% |
Ten year | -2.00% |
| |
| |
Class C Shares | (with max. load) |
One year | -0.83% |
Five year | -2.96% |
Ten year | -1.74% |
| |
Class I Shares | |
One year | 1.91% |
Five year | -1.45% |
Ten year | -0.05% |
| |
| |
| |
Class Y Shares** | |
One year | 1.73% |
Five year | -1.97% |
Ten year | -0.76% |
**Calvert World Values International Equity Fund first offered Class Y Shares on October 31, 2008. Performance prior to that date reflects the performance of Class A Shares at net asset value (NAV). Actual Class Y Share performance would have been different.
Growth of $10,000
The graph below shows the value of a hypothetical $10,000 investment in the fund over the past 10 fiscal year periods or since inception (for funds without 10-year records). The results shown are for Classes A shares and reflect the deduction of the maximum front-end sales charge of 4.75%, and assume the reinvestment of dividends. The result is compared with benchmarks that include a broad based market index and a Lipper peer group average. Market indexes are unmanaged and their results do not reflect the effect of expenses or sales charges. The Lipper average reflects the deduction of the category’s average front-end sales charge. The value of an investment in a different share class would be different.
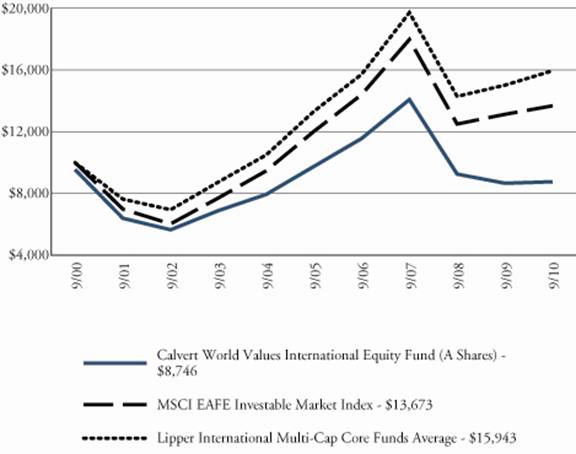
All performance data shown, including the graph above and the adjacent table, represents past performance, does not guarantee future results, assumes reinvestment of dividends and distributions and does not reflect the deduction of taxes that a shareholder would pay on the Fund’s/Portfolio’s distributions or the redemption of the Fund/Portfolio shares. The investment return and principal value of an investment will fluctuate so that an investor’s shares, when redeemed, may be worth more or less than their original cost. Current performance may be lower or higher than the performance data quoted; for current performance data visit www.calvert.com. The gross expense ratio from the current prospectus for Class A shares is 1.87%. This number may differ from the expense ratio shown elsewhere in this report because it is based on a differe nt time period and, if applicable, does not include fee or expense waivers. Performance data quoted already reflects the deduction of the Fund’s/Portfolio’s operating expenses.
Shareholder Expense Example
As a shareholder of the Fund, you incur two types of costs: (1) transaction costs, including sales charges (loads) and redemption fees; and (2) ongoing costs, including management fees; distribution (12b-1) fees; and other Fund expenses. This Example is intended to help you understand your ongoing costs (in dollars) of investing in the Fund and to compare these costs with the ongoing costs of investing in other mutual funds.
This Example is based on an investment of $1,000 invested at the beginning of the period and held for the entire period (April 1, 2010 to September 30, 2010).
Actual Expenses
The first line of the table below provides information about actual account values and actual expenses. You may use the information in this line, together with the amount you invested, to estimate the expenses that you paid over the period. Simply divide your account value by $1,000 (for example, an $8,600 account value divided by $1,000 = 8.6), then multiply the result by the number in the first line under the heading entitled “Expenses Paid During Period” to estimate the expenses you paid on your account during this period.
Hypothetical Example for Comparison Purposes
The second line of the table below provides information about hypothetical account values and hypothetical expenses based on the Fund’s actual expense ratio and an assumed rate of return of 5% per year before expenses, which is not the Fund’s actual return. The hypothetical account values and expenses may not be used to estimate the actual ending account balance or expenses you paid for the period. You may use this information to compare the ongoing costs of investing in the Fund and other funds. To do so, compare the 5% hypothetical example with the 5% hypothetical examples that appear in the shareholder reports of the other funds.
Please note that the expenses shown in the table are meant to highlight your ongoing costs only and do not reflect any transactional costs, such as sales charges (loads) or redemption fees. Therefore, the second line of the table is useful in comparing ongoing costs only, and will not help you determine the relative total costs of owning different funds. In addition, if these transactional costs were included, your costs would have been higher.
| Beginning | Ending Account | Expenses Paid |
| Account Value | Value | During Period* |
| 4/1/10 | 9/30/10 | 4/1/10 - 9/30/10 |
Class A | | | |
Actual | $1,000.00 | $1,010.90 | $9.07 |
Hypothetical | $1,000.00 | $1,016.04 | $9.10 |
(5% return per | | | |
year before expenses) | | | |
Class B | | | |
Actual | $1,000.00 | $1,004.90 | $14.93 |
Hypothetical | $1,000.00 | $1,010.18 | $14.97 |
(5% return per | | | |
year before expenses) | | | |
Class C | | | |
Actual | $1,000.00 | $1,007.50 | $13.54 |
Hypothetical | $1,000.00 | $1,011.58 | $13.56 |
(5% return per | | | |
year before expenses) | | | |
Class I | | | |
Actual | $1,000.00 | $1,015.10 | $5.35 |
Hypothetical | $1,000.00 | $1,019.75 | $5.37 |
(5% return per | | | |
year before expenses) | | | |
| | | |
Class Y | | | |
Actual | $1,000.00 | $1,014.00 | $7.02 |
Hypothetical | $1,000.00 | $1,018.10 | $7.03 |
(5% return per | | | |
year before expenses) | | | |
* Expenses are equal to the Fund’s annualized expense ratio of 1.80%, 2.97%, 2.69%, 1.06% and 1.39% for Class A, Class B, Class C, Class I and Class Y, respectively, multiplied by the average account value over the period, multiplied by 183/365 (to reflect the one-half year period).
report of independent registered public accounting firm
The Board of Directors of Calvert World Values Fund, Inc. and Shareholders of Calvert World Values International Equity Fund:
We have audited the accompanying statement of net assets of Calvert World Values International Equity Fund (the Fund), a series of the Calvert World Values Fund, Inc., as of September 30, 2010, and the related statement of operations for the year then ended, the statements of changes in net assets for each of the years in the two-year period then ended, and the financial highlights for each of the years in the five-year period then ended. These financial statements and financial highlights are the responsibility of the Fund’s management. Our responsibility is to express an opinion on these financial statements and financial highlights based on our audits.
We conducted our audits in accordance with the standards of the Public Company Accounting Oversight Board (United States). Those standards require that we plan and perform the audit to obtain reasonable assurance about whether the financial statements and financial highlights are free of material misstatement. An audit includes examining, on a test basis, evidence supporting the amounts and disclosures in the financial statements. Our procedures included confirmation of securities owned as of September 30, 2010, by correspondence with custodians and brokers or other appropriate auditing procedures. An audit also includes assessing the accounting principles used and significant estimates made by management, as well as evaluating the overall financial statement presentation. We believe that our audits provide a reasonable basis for our opinion.
In our opinion, the financial statements and financial highlights referred to above present fairly, in all material respects, the financial position of the Calvert World Values International Equity Fund as of September 30, 2010, the results of its operations for the year then ended, the changes in its net assets for each of the years in the two-year period then ended, and the financial highlights for each of the years in the five-year period then ended, in conformity with U.S. generally accepted accounting principles.
/s/KPMG LLP
Philadelphia, Pennsylvania
November 24, 2010
STATEMENT OF NET ASSETS
september 30, 2010
Equity Securities - 93.7% | | Shares | Value | |
Australia - 2.0% | | | | |
Amcor Ltd. (ADR) | | 7,398 | $185,394 | |
Australia & New Zealand Banking Group Ltd. (ADR) | | 11,353 | 260,438 | |
Computershare Ltd. (ADR) | | 936 | 8,789 | |
CSL Ltd. (ADR) | | 3,301 | 52,552 | |
Lend Lease Group (ADR) | | 1,126 | 8,220 | |
National Australia Bank Ltd. (ADR) | | 27,348 | 671,120 | |
Santos Ltd. | | 190,373 | 2,350,642 | |
Sims Metal Management Ltd. (ADR) | | 34,931 | 593,827 | |
Telstra Corp Ltd. (ADR) | | 40,833 | 518,171 | |
Westpac Banking Corp. | | 94,479 | 2,116,427 | |
Westpac Banking Corp. (ADR) | | 4,723 | 530,393 | |
Woodside Petroleum Ltd. (ADR) | | 1,536 | 64,911 | |
| | | 7,360,884 | |
| | | | |
Belgium - 0.2% | | | | |
Ageas (ADR) | | 14,865 | 41,771 | |
Delhaize Group SA (ADR) | | 9,185 | 664,627 | |
| | | 706,398 | |
| | | | |
Bermuda - 0.2% | | | | |
Signet Jewelers Ltd.* | | 26,441 | 839,238 | |
| | | | |
Brazil - 1.8% | | | | |
Banco do Brasil SA | | 111,300 | 2,107,040 | |
BM&F Bovespa SA | | 243,793 | 2,032,566 | |
Natura Cosmeticos SA | | 94,099 | 2,522,687 | |
Tractebel Energia SA (ADR) | | 794 | 11,751 | |
| | | 6,674,044 | |
| | | | |
Canada - 6.0% | | | | |
Brookfield Properties Corp. | | 49,278 | 764,795 | |
Canadian National Railway Co. | | 109,824 | 7,019,689 | |
EnCana Corp. | | 68,816 | 2,078,284 | |
Loblaw Co.’s Ltd. | | 62,500 | 2,475,230 | |
Potash Corporation of Saskatchewan, Inc. | | 36,875 | 5,311,475 | |
Suncor Energy, Inc. | | 68,000 | 2,212,832 | |
Thomson Reuters Corp. | | 53,000 | 1,991,393 | |
| | | 21,853,698 | |
| | | | |
Chile - 0.5% | | | | |
Banco Santander Chile (ADR) | | 19,079 | 1,842,077 | |
| | | | |
| | | | |
Equity Securities - Cont’d | | Shares | Value | |
China - 2.0% | | | | |
China Merchants Bank Co. Ltd. | | 446,915 | $1,151,769 | |
China Southern Airlines Co. Ltd. (ADR)* | | 7,311 | 212,165 | |
CNinsure, Inc. (ADR) | | 75,100 | 1,755,087 | |
Ctrip.com International Ltd. (ADR)* | | 55,500 | 2,650,125 | |
Mindray Medical International Ltd. (ADR) | | 55,700 | 1,647,049 | |
| | | 7,416,195 | |
| | | | |
Colombia - 0.8% | | | | |
BanColombia SA (ADR) | | 46,230 | 3,034,075 | |
| | | | |
Denmark - 2.6% | | | | |
Danske Bank A/S (ADR)* | | 4,955 | 58,717 | |
H Lundbeck A/S (ADR) | | 1,549 | 27,169 | |
Novo Nordisk A/S, Series B | | 58,893 | 5,830,671 | |
Novo Nordisk A/S (ADR) | | 9,731 | 957,920 | |
Novozymes A/S (ADR) | | 353 | 44,972 | |
Torm A/S (ADR)* | | 4,783 | 35,059 | |
Vestas Wind Systems A/S* | | 56,071 | 2,107,952 | |
Vestas Wind Systems A/S (ADR)* | | 37,928 | 472,583 | |
| | | 9,535,043 | |
| | | | |
Finland - 0.1% | | | | |
Metso Oyj (ADR) | | 827 | 37,893 | |
Stora Enso Oyj (ADR) | | 18,824 | 184,852 | |
| | | 222,745 | |
| | | | |
France - 10.0% | | | | |
Air France-KLM (ADR)* | | 4,168 | 63,937 | |
Air Liquide SA | | 21,862 | 2,660,746 | |
Air Liquide SA (ADR) | | 7,463 | 182,620 | |
AXA SA (ADR) | | 120,417 | 2,092,847 | |
BNP Paribas | | 80,560 | 5,715,830 | |
BNP Paribas (ADR) | | 14,023 | 496,975 | |
Carrefour SA (ADR) | | 42,586 | 454,818 | |
Cie Generale d’Optique Essilor International SA (ADR) | | 632 | 21,677 | |
Compagnie Generale des Etablissements Michelin (ADR) | | 609 | 9,531 | |
Credit Agricole SA (ADR) | | 6,518 | 50,710 | |
Dassault Systemes SA | | 38,521 | 2,826,887 | |
France Telecom SA (ADR) | | 52,244 | 1,124,813 | |
Gemalto NV | | 50,931 | 2,085,258 | |
Groupe Danone | | 47,866 | 2,856,165 | |
Lafarge SA | | 46,064 | 2,631,176 | |
Lafarge SA (ADR) | | 4,098 | 58,561 | |
L’Oreal SA (ADR) | | 15,703 | 353,003 | |
Publicis Groupe | | 57,100 | 2,705,535 | |
Publicis Groupe SA (ADR) | | 7,307 | 172,884 | |
Sanofi-Aventis SA (s) | | 47,723 | 3,172,148 | |
Sanofi-Aventis SA (ADR) | | 72,818 | 2,421,199 | |
Schneider Electric SA | | 26,409 | 3,340,570 | |
Schneider Electric SA (ADR) | | 3,246 | 41,386 | |
SCOR SE (ADR) | | 3,777 | 8,687 | |
Veolia Environnement (ADR) | | 36,814 | 970,417 | |
| | | 36,518,380 | |
| | | | |
Equity Securities - Cont’d | | Shares | Value | |
Germany - 3.8% | | | | |
Adidas AG | | 48,540 | $2,997,714 | |
Adidas AG (ADR) | | 2,356 | 72,848 | |
Allianz SE (ADR) | | 104,297 | 1,178,556 | |
Deutsche Bank AG | | 26,426 | 1,442,786 | |
Deutsche Post AG (ADR) | | 1,449 | 26,444 | |
Merck KGaA (ADR) | | 2,116 | 59,121 | |
SAP AG | | 92,848 | 4,581,827 | |
Volkswagen AG, Preferred | | 27,142 | 3,267,919 | |
Volkswagen AG (ADR): | | | | |
Common | | 5,591 | 123,561 | |
Preferred | | 1,001 | 24,114 | |
| | | 13,774,890 | |
| | | | |
Greece - 0.0% | | | | |
Alpha Bank AE (ADR)* | | 5,632 | 8,673 | |
National Bank of Greece SA (ADR)* | | 23,179 | 52,616 | |
| | | 61,289 | |
| | | | |
Guernsey - 0.8% | | | | |
Amdocs Ltd.* | | 103,397 | 2,963,358 | |
| | | | |
Hong Kong - 3.2% | | | | |
Bank of East Asia Ltd. (ADR) | | 19,507 | 82,710 | |
China Merchants Holdings International Co. Ltd. | | 298,000 | 1,082,868 | |
Hang Lung Properties Ltd. | | 515,989 | 2,509,965 | |
Hang Lung Properties Ltd. (ADR) | | 124,877 | 3,060,735 | |
Hang Seng Bank Ltd. (ADR) | | 3,888 | 56,843 | |
Hengdeli Holdings Ltd. | | 3,472,000 | 1,615,092 | |
Hong Kong Exchanges and Clearing Ltd. | | 155,446 | 3,060,647 | |
Hong Kong Exchanges and Clearing Ltd. (ADR) | | 2,677 | 52,496 | |
MTR Corp. (ADR) | | 276 | 10,378 | |
| | | 11,531,734 | |
| | | | |
India - 0.4% | | | | |
HDFC Bank Ltd. (ADR) | | 1,036 | 191,007 | |
Infosys Technologies Ltd. (ADR) | | 19,935 | 1,341,825 | |
Patni Computer Systems Ltd. (ADR) | | 3,285 | 60,115 | |
| | | 1,592,947 | |
| | | | |
Indonesia - 0.6% | | | | |
Bank Mandiri Tbk PT | | 2,479,000 | 1,999,866 | |
Indosat Tbk PT (ADR) | | 3,059 | 93,177 | |
| | | 2,093,043 | |
| | | | |
Ireland - 0.1% | | | | |
Allied Irish Banks plc (ADR)* | | 243,050 | 345,131 | |
Experian plc (ADR) | | 8,569 | 92,973 | |
| | | 438,104 | |
| | | | |
Israel - 0.5% | | | | |
Bezeq Israeli Telecommunication Corp Ltd. | | 769,270 | 1,921,112 | |
| | | | |
Equity Securities - Cont’d | | Shares | Value | |
Italy - 0.9% | | | | |
Intesa Sanpaolo SpA | | 696,404 | $2,256,489 | |
Luxottica Group SpA (ADR) | | 26,971 | 735,769 | |
Telecom Italia SpA (ADR) | | 15,109 | 210,468 | |
| | | 3,202,726 | |
| | | | |
Japan - 11.8% | | | | |
ACom Co. Ltd. (ADR) | | 2,655 | 9,930 | |
Aeon Co. Ltd. (ADR) | | 5,925 | 63,279 | |
Asahi Glass Co. Ltd. (ADR) | | 993 | 10,129 | |
Brother Industries Ltd. (ADR) | | 84 | 10,333 | |
Canon, Inc. | | 44,943 | 2,095,439 | |
Central Japan Railway Co. (ADR) | | 1,375 | 9,996 | |
Dai Nippon Printing Co. Ltd. (ADR) | | 48,653 | 601,351 | |
Dai-ichi Life Insurance Co. Ltd. | | 2,031 | 2,450,620 | |
Daiwa House Industry Co. Ltd. (ADR) | | 710 | 71,405 | |
Denso Corp. (ADR) | | 472 | 55,583 | |
East Japan Railway Co. (ADR) | | 5,201 | 52,218 | |
Eisai Co. Ltd. (ADR) | | 250 | 8,700 | |
Fanuc Ltd. | | 14,495 | 1,844,408 | |
Fujitsu Ltd. (ADR) | | 877 | 31,037 | |
Honda Motor Co. Ltd. (ADR) | | 61,950 | 2,204,800 | |
Kao Corp. (ADR) | | 20,767 | 505,469 | |
Kobe Steel Ltd. (ADR) | | 1,005 | 11,728 | |
Konami Corp. (ADR) | | 553 | 9,727 | |
Kubota Corp. (ADR) | | 8,451 | 389,338 | |
Minebea Co. Ltd. (ADR) | | 928 | 9,475 | |
Mitsubishi Estate Co. Ltd. (ADR) | | 871 | 141,973 | |
Mitsui Fudosan Co. Ltd. | | 102,256 | 1,723,443 | |
Mizuho Financial Group, Inc. (ADR) | | 168,689 | 484,137 | |
MS&AD Insurance Group Holdings (ADR) | | 17,351 | 199,189 | |
Nikon Corp. (ADR) | | 46 | 8,646 | |
Nintendo Co. Ltd. (ADR) | | 64,443 | 2,010,622 | |
Nippon Telegraph & Telephone Corp. (ADR) | | 115,773 | 2,537,744 | |
Nippon Yusen Kabushiki Kaisha | | 588,000 | 2,407,182 | |
Nippon Yusen KK (ADR) | | 42,425 | 345,340 | |
Nissan Motor Co. Ltd. (ADR)* | | 12,635 | 220,860 | |
Nitto Denko Corp. (ADR) | | 100 | 39,623 | |
NSK Ltd. (ADR) | | 374 | 25,275 | |
NTT DoCoMo, Inc. | | 1,607 | 2,673,845 | |
NTT DoCoMo, Inc. (ADR) | | 58,388 | 976,248 | |
ORIX Corp. (ADR) | | 6,337 | 242,453 | |
Panasonic Corp. | | 188,716 | 2,554,917 | |
Panasonic Corp. (ADR) | | 52,365 | 711,117 | |
Ricoh Co. Ltd. | | 141,000 | 1,986,557 | |
Ricoh Co. Ltd. (ADR) | | 1,197 | 83,910 | |
Secom Co. Ltd. (ADR) | | 580 | 52,925 | |
Sega Sammy Holdings, Inc. (ADR) | | 24,208 | 96,348 | |
Sekisui House Ltd. | | 193,000 | 1,732,703 | |
Sekisui House Ltd. (ADR) | | 26,991 | 244,268 | |
Sharp Corp. (ADR) | | 4,458 | 44,535 | |
Shiseido Co. Ltd. (ADR) | | 7,326 | 165,055 | |
Sony Corp. (ADR) | | 54,216 | 1,676,359 | |
Sumitomo Trust & Banking Co. Ltd. (ADR) | | 68,219 | 345,870 | |
| | | | |
Equity Securities - Cont’d | | Shares | Value | |
Japan - Cont’d | | | | |
Teijin Ltd. (ADR) | | 277 | $9,127 | |
Tokyo Gas Co. Ltd. | | 698,118 | 3,167,186 | |
Toray Industries, Inc. (ADR) | | 505 | 28,022 | |
TOTO Ltd. (ADR) | | 292 | 19,955 | |
Toyota Motor Corp. | | 92,082 | 3,304,547 | |
Toyota Motor Corp. (ADR) | | 28,402 | 2,033,015 | |
Trend Micro, Inc. (ADR) | | 483 | 14,451 | |
| | | 42,752,412 | |
| | | | |
Luxembourg - 0.7% | | | | |
SES SA (FDR) | | 109,876 | 2,635,222 | |
| | | | |
Mexico - 0.6% | | | | |
America Movil SAB de CV (ADR), Series L | | 25,043 | 1,335,543 | |
Gruma SAB de CV (ADR)* | | 6,269 | 35,545 | |
Grupo Televisa SA (ADR) | | 44,215 | 836,548 | |
| | | 2,207,636 | |
| | | | |
Netherlands - 5.0% | | | | |
AEGON NV, NY Shares* | | 71,800 | 430,082 | |
ASML Holding NV | | 50,070 | 1,491,966 | |
ING Groep NV (ADR)* | | 170,885 | 1,758,406 | |
ING Groep NV (CVA)* | | 449,654 | 4,653,740 | |
Koninklijke KPN NV | | 53,400 | 823,920 | |
Koninklijke Philips Electronics NV: | | | | |
Common | | 105,593 | 3,310,848 | |
NY Shares | | 99,709 | 3,122,886 | |
Reed Elsevier NV (ADR) | | 40,058 | 1,009,061 | |
TNT NV (ADR) | | 10,284 | 276,640 | |
Unilever NV, NY Shares | | 33,107 | 989,237 | |
Wolters Kluwer NV (ADR) | | 7,536 | 158,030 | |
| | | 18,024,816 | |
| | | | |
Norway - 2.3% | | | | |
DnB NOR ASA | | 257,967 | 3,502,270 | |
Petroleum Geo-Services ASA* | | 192,737 | 2,191,735 | |
Petroleum Geo-Services ASA (ADR)* | | 7,400 | 84,360 | |
Statoil ASA (ADR) | | 114,342 | 2,398,895 | |
Tomra Systems ASA (ADR) | | 2,030 | 11,896 | |
Yara International ASA (ADR) | | 4,589 | 207,331 | |
| | | 8,396,487 | |
| | | | |
Singapore - 0.6% | | | | |
City Developments Ltd. (ADR) | | 2,287 | 22,001 | |
Oversea-Chinese Banking Corp. Ltd. | | 310,830 | 2,089,673 | |
| | | 2,111,674 | |
| | | | |
Equity Securities - Cont’d | | Shares | Value | |
South Africa - 1.5% | | | | |
African Bank Investments Ltd. (ADR) | | 492 | $12,472 | |
Aspen Pharmacare Holdings Ltd.* | | 250,669 | 3,366,127 | |
Nedbank Group Ltd. (ADR) | | 1,165 | 49,384 | |
Telkom SA Ltd. (ADR) | | 528 | 11,484 | |
Tiger Brands Ltd. (ADR) | | 1,673 | 45,824 | |
Truworths International Ltd. | | 181,300 | 1,813,000 | |
| | | 5,298,291 | |
| | | | |
South Korea - 0.6% | | | | |
KT Corp. (ADR) | | 108,967 | 2,229,465 | |
| | | | |
Spain - 2.4% | | | | |
Banco Santander SA (ADR) | | 158,692 | 2,009,041 | |
Inditex SA | | 35,023 | 2,775,475 | |
Telefonica SA | | 155,046 | 3,830,319 | |
| | | 8,614,835 | |
| | | | |
Sweden - 2.5% | | | | |
Atlas Copco AB, Series B | | 144,543 | 2,533,013 | |
Atlas Copco AB (ADR) | | 6,427 | 124,105 | |
Hennes & Mauritz AB, B Shares | | 124,054 | 4,474,394 | |
Hennes & Mauritz AB (ADR) | | 18,528 | 134,513 | |
Husqvarna AB, Series B | | 190,600 | 1,405,333 | |
Sandvik AB (ADR) | | 2,326 | 35,844 | |
SKF AB (ADR) | | 1,101 | 25,400 | |
Telefonaktiebolaget LM Ericsson (ADR) | | 31,339 | 343,789 | |
| | | 9,076,391 | |
| | | | |
Switzerland - 6.5% | | | | |
Credit Suisse Group AG | | 44,963 | 1,925,316 | |
Credit Suisse Group AG (ADR) | | 28,037 | 1,193,255 | |
Julius Baer Group Ltd. | | 42,873 | 1,563,508 | |
Logitech International SA* | | 119,234 | 2,081,140 | |
Novartis AG | | 74,412 | 4,274,982 | |
Novartis AG (ADR) | | 53,457 | 3,082,865 | |
Roche Holding AG | | 26,495 | 3,625,049 | |
Roche Holding AG (ADR) | | 67,225 | 2,294,389 | |
Swiss Reinsurance (ADR) | | 3,510 | 153,738 | |
Zurich Financial Services AG | | 11,038 | 2,591,682 | |
Zurich Financial Services AG (ADR) | | 33,662 | 786,008 | |
| | | 23,571,932 | |
| | | | |
Taiwan - 0.3% | | | | |
Chunghwa TeleCom Co. Ltd. (ADR) | | 49,267 | 1,104,566 | |
| | | | |
Turkey - 1.1% | | | | |
Turkiye Garanti Bankasi AS | | 679,918 | 3,935,578 | |
| | | | |
Equity Securities - Cont’d | | Shares | Value | |
United Kingdom - 19.3% | | | | |
Amlin plc | | 234,585 | $1,480,712 | |
Barclays plc | | 547,117 | 2,578,240 | |
Barclays plc (ADR) | | 62,420 | 1,176,617 | |
BG Group plc | | 223,246 | 3,927,544 | |
BG Group plc (ADR) | | 31,795 | 2,810,996 | |
British Airways plc (ADR)* | | 1,226 | 23,196 | |
British Land Co. plc (ADR) | | 1,257 | 9,327 | |
Bunzl plc (ADR) | | 347 | 20,959 | |
Cairn Energy plc* | | 190,971 | 1,362,517 | |
Capita Group plc | | 216,239 | 2,673,363 | |
Centrica plc | | 665,581 | 3,386,699 | |
Centrica plc (ADR) | | 48,104 | 978,916 | |
Compass Group plc | | 322,548 | 2,691,418 | |
Compass Group plc (ADR) | | 10,209 | 86,776 | |
GlaxoSmithKline plc | | 202,324 | 3,992,265 | |
GlaxoSmithKline plc (ADR) | | 35,131 | 1,388,377 | |
HSBC Holdings plc (ADR) | | 40,183 | 2,032,858 | |
Inchcape plc* | | 441,527 | 2,165,383 | |
International Power plc (ADR) | | 1,318 | 80,398 | |
J Sainsbury plc (ADR) | | 4,951 | 121,448 | |
Johnson Matthey plc (ADR) | | 193 | 10,702 | |
Kingfisher plc | | 1,216,487 | 4,481,214 | |
Kingfisher plc (ADR) | | 21,054 | 154,115 | |
Legal & General Group plc (ADR) | | 1,518 | 12,190 | |
Man Group plc (ADR) | | 1,878 | 6,423 | |
Marks & Spencer Group plc (ADR) | | 44,751 | 541,935 | |
Old Mutual plc (ADR) | | 694 | 12,076 | |
Pearson plc | | 455,949 | 7,067,637 | |
Pearson plc (ADR) | | 22,433 | 348,160 | |
Persimmon plc* | | 212,629 | 1,335,771 | |
Prudential plc (ADR) | | 42,225 | 842,389 | |
Reckitt Benckiser Group plc | | 82,117 | 4,521,958 | |
Reckitt Benckiser Group plc (ADR) | | 15,013 | 165,743 | |
Reed Elsevier plc (ADR) | | 9,242 | 311,918 | |
Sage Group plc (ADR) | | 9,153 | 160,361 | |
Scottish & Southern Energy plc (ADR) | | 2,525 | 44,465 | |
Smith & Nephew plc | | 285,157 | 2,603,680 | |
Smith & Nephew plc (ADR) | | 13,032 | 591,653 | |
Standard Chartered plc | | 175,435 | 5,038,698 | |
Tate & Lyle plc (ADR) | | 336 | 9,828 | |
Tesco plc | | 694,278 | 4,630,209 | |
Tesco plc (ADR) | | 27,527 | 554,669 | |
Unilever plc (ADR) | | 89,541 | 2,605,643 | |
Vodafone Group plc (ADR) | | 35,009 | 868,573 | |
Wolseley plc (ADR)* | | 37,345 | 92,242 | |
| | | 70,000,261 | |
| | | | |
United States - 2.0% | | | | |
Atmos Energy Corp. | | 6,260 | 183,105 | |
Cimarex Energy Co. | | 9,599 | 635,262 | |
Distributed Energy Systems Corp.* | | 308,138 | 1,233 | |
Evergreen Solar, Inc.* | | 1,400 | 1,028 | |
Portland General Electric Co. | | 20,427 | 414,260 | |
| | | | |
Equity Securities - Cont’d | | Shares | Value | |
United States - Cont’d | | | | |
Powerspan Corp.: | | | | |
Series A, Convertible Preferred (b)(i)* | | 45,455 | $385,655 | |
Series B, Convertible Preferred (b)(i)* | | 20,000 | 203,548 | |
Series C, Convertible Preferred (b)(i)* | | 239,764 | 824,788 | |
Series D, Convertible Preferred (b)(i)* | | 45,928 | 157,992 | |
Series D, Preferred Warrants (strike price $3.44/share, | | | | |
expires 12/31/12) (b)(i)* | | 2,347 | - | |
RF Technology, Inc. Contingent Deferred Distribution (b)(i)* | | 365,374 | 3,654 | |
SEACOR Holdings, Inc.* | | 18,765 | 1,598,027 | |
SmarThinking, Inc.: | | | | |
Series 1-A, Convertible Preferred (b)(i) | | 104,297 | 318,794 | |
Series 1-B, Convertible Preferred (b)(i) | | 163,588 | 168,370 | |
Series 1-B, Preferred Warrants (strike price $0.01/share, | | | | |
expires 5/26/15) (b)(i)* | | 11,920 | 12,149 | |
Series 1-B, Preferred Warrants (strike price $1.53/share, | | | | |
expires 6/1/15) (b)(i)* | | 32,726 | - | |
Tidewater, Inc. | | 39,557 | 1,772,549 | |
Tutor Perini Corp.* | | 10,000 | 200,900 | |
| | | 6,881,314 | |
| | | | |
Total Equity Securities (Cost $325,269,963) | | | 340,422,860 | |
| | | | |
| | | | |
| | Adjusted | | |
Limited Partnership Interest - 0.8% | | Basis | | |
Blackstone Cleantech Venture Partners (b)(i)* | | $30,000 | 30,000 | |
Balkan Financial Sector Equity Fund CV (b)(i)* | | 563,779 | 450,172 | |
China Environment Fund 2004 (b)(i)* | | - | 185,968 | |
Emerald Cleantech Fund I (b)(i)* | | 954,421 | 465,393 | |
gNet Defta Development Holdings LLC (a)(b)(i)* | | 400,000 | 389,241 | |
SEAF Central and Eastern European Growth Fund LLC (a)(b)(i)* | | 347,466 | 535,931 | |
SEAF India International Growth Fund (b)(i)* | | 481,432 | 388,137 | |
ShoreCap International LLC (b)(i)* | | - | 436,472 | |
Terra Capital (b)(i)* | | 469,590 | 1 | |
| | | | |
Total Limited Partnership Interest (Cost $3,246,688) | | | 2,881,315 | |
| | | | |
| | Principal | | |
Certificates of Deposit - 0.1% | | Amount | | |
Self Help Credit Union, 1.80%, 2/23/11 (b)(k) | | 250,000 | 249,625 | |
| | | | |
Total Certificates of Deposit (Cost $250,000) | | | 249,625 | |
| | | | |
| | | | |
| | Principal | | |
Venture Capital Debt Obligations - 0.1% | | Amount | Value | |
Access Bank plc, 8.477%, 8/29/12 (b)(i) | | $500,000 | $520,442 | |
Mayer Laboratories, Inc., 6.00%, 12/31/01 (b)(i)(w) | | 47,922 | 11,980 | |
| | | | |
Total Venture Capital Debt Obligations (Cost $547,922) | | | 532,422 | |
| | | | |
High Social Impact Investments - 1.2% | | | | |
Calvert Social Investment Foundation Notes, 1.17%, 7/1/11 (b)(i)(r) | | 4,431,583 | 4,283,081 | |
| | | | |
Total High Social Impact Investments (Cost $4,431,583) | | | 4,283,081 | |
| | | | |
U.S. Government Agencies | | | | |
and Instrumentalities - 2.8% | | | | |
Federal Home Loan Bank Discount Notes, 10/1/10 | | 10,200,000 | 10,200,000 | |
| | | | |
Total U.S. Government Agencies and Instrumentalities | | | | |
(Cost $10,200,000) | | | 10,200,000 | |
| | | | |
TOTAL INVESTMENTS (Cost $343,946,156) - 98.7% | | | 358,569,303 | |
Other assets and liabilities, net - 1.3% | | | 4,796,652 | |
Net Assets - 100% | | | $363,365,955 | |
| | | | |
Net Assets Consist of: | | | | |
Paid-in capital applicable to the following shares of common stock with | | | | |
250,000,000 shares of $0.01 par value shares authorized: | | | | |
Class A: 17,669,216 shares outstanding | | | $365,500,370 | |
Class B: 552,541 shares outstanding | | | 13,654,250 | |
Class C: 1,813,107 shares outstanding | | | 39,087,341 | |
Class I: 5,829,375 shares outstanding | | | 137,024,156 | |
Class Y: 192,072 shares outstanding | | | 2,420,944 | |
Undistributed net investment income | | | 1,184,550 | |
Accumulated net realized gain (loss) on investments | | | | |
and foreign currency transactions | | | (210,102,713) | |
Net unrealized appreciation (depreciation) on investments, foreign | | | | |
currencies, and assets and liabilities denominated in foreign currencies | | | 14,597,057 | |
| | | | |
Net Assets | | | $363,365,955 | |
See notes to financial statements.
Net Asset Value Per Share | | | |
Class A (based on net assets of $245,308,866) | | $13.88 | |
Class B (based on net assets of $6,850,379) | | $12.40 | |
Class C (based on net assets of $21,941,911) | | $12.10 | |
Class I (based on net assets of $86,474,878) | | $14.83 | |
Class Y (based on net assets of $2,789,921) | | $14.53 | |
Restricted Securities | | Acquisition Dates | Cost |
Access Bank plc, 8.477%, 8/29/12 | | 8/29/07 | $500,000 |
Balkan Financial Sector Equity Fund CV LP | | 1/12/06 - 9/24/10 | 563,779 |
Blackstone Cleantech Venture Partners LP | | 7/29/10 | 30,000 |
Calvert Social Investment Foundation Notes, 1.17%, 7/1/11 | | 7/1/08 | 4,431,583 |
China Environment Fund 2004 LP | | 9/15/05 - 4/1/09 | - |
Emerald Cleantech Fund I LP | | 7/19/01 - 9/21/10 | 954,421 |
gNet Defta Development Holdings LLC, LP | | 8/30/05 | 400,000 |
Mayer Laboratories, Inc., 6.00%, 12/31/01 | | 12/31/96 | 47,922 |
Powerspan Corp.: | | | |
Series A, Convertible Preferred | | 8/20/97 | 250,000 |
Series B, Convertible Preferred | | 10/5/99 | 200,000 |
Series C, Convertible Preferred | | 12/21/04 - 6/12/08 | 273,331 |
Series D, Convertible Preferred | | 6/20/08 | 157,996 |
Series D, Preferred Warrants | | | |
(strike price $3.44/share, expires 12/31/12) | | 12/5/07 - 6/20/08 | - |
RF Technology, Inc. Contingent Deferred Distribution | | 7/17/06 | 104,368 |
SEAF Central and Eastern European Growth Fund LLC, LP | | 8/10/00 - 7/16/10 | 347,466 |
SEAF India International Growth Fund LP | | 3/22/05 - 5/24/10 | 481,432 |
ShoreCap International LLC, LP | | 8/12/04 - 12/15/08 | - |
SmarThinking, Inc.: | | | |
Series 1-A, Convertible Preferred | | 4/22/03 - 5/27/05 | 159,398 |
Series 1-B, Convertible Preferred | | 6/10/03 | 250,000 |
Series 1-B, Convertible Preferred Warrants | | | |
(strike price $0.01/share, expires 5/26/15) | | 5/27/05 | - |
Series 1-B, Convertible Preferred Warrants | | | |
(strike price $1.53/share, expires 6/1/15) | | 9/19/00 | - |
Terra Capital LP | | 11/23/98 - 3/14/06 | 469,590 |
(a) Affiliated company.
(b) This security was valued by the Board of Directors. See Note A.
(i) Restricted securities represent 2.7% of net assets of the Fund.
(k) These certificates of deposit are fully insured by agencies of the federal government.
(r) The coupon rate shown on floating or adjustable rate securities represents the rate at period end.
(s) 45,000 shares of Sanofi-Aventis SA have been soft segregated in order to cover outstanding commitments to certain limited partnership investments with the Fund. There are no restrictions on the trading of this security.
(w) Mayer Laboratories, Inc. is in default for principal and interest. Past due accrued interest as of September 30, 2010 totaled $2,310.
* Non-income producing security.
Abbreviations:
ADR: American Depositary Receipts
CVA: Certificaten Van Aandelen
FDR: Fiduciary Depositary Receipts
LLC: Limited Liability Corporation
LP: Limited Partnership
See notes to financial statements.
Statement of Operations
year ended september 30, 2010
Net Investment Income | | | |
Investment Income: | | | |
Dividend income (net of foreign taxes withheld of $854,988) | | $8,275,052 | |
Interest income | | 121,054 | |
Total investment income | | 8,396,106 | |
| | | |
Expenses: | | | |
Investment advisory fee | | 2,764,351 | |
Transfer agency fees and expenses | | 895,409 | |
Administrative fees | | 1,119,486 | |
Distribution Plan expenses: | | | |
Class A | | 621,735 | |
Class B | | 77,095 | |
Class C | | 223,571 | |
Directors’ fees and expenses | | 45,006 | |
Custodian fees | | 285,640 | |
Registration fees | | 67,400 | |
Reports to shareholders | | 209,963 | |
Professional fees | | 47,261 | |
Miscellaneous | | 63,157 | |
Total expenses | | 6,420,074 | |
Reimbursement from Advisor: | | | |
Class A | | (59,041) | |
Class B | | (4,238) | |
Class C | | (4,786) | |
Class I | | (19,110) | |
Class Y | | (11,069) | |
Fees waived | | (13,724) | |
Fees paid indirectly | | (917) | |
Net expenses | | 6,307,189 | |
| | | |
Net Investment Income | | 2,088,917 | |
| | | |
Realized and Unrealized Gain (Loss) | | | |
Net realized gain (loss) on: | | | |
Investments (net of foreign taxes of $99,594) | | 2,343,380 | |
Foreign currency transactions | | (747,721) | |
| | 1,595,659 | |
Change in unrealized appreciation (depreciation) on: | | | |
Investments and foreign currencies | | (509,221) | |
Assets and liabilities denominated in foreign currencies | | (22,841) | |
| | (532,062) | |
| | | |
Net Realized and Unrealized Gain (Loss) | | 1,063,597 | |
| | | |
Increase (Decrease) in Net Assets | | | |
Resulting From Operations | | $3,152,514 | |
See notes to financial statements.
Statements of Changes in Net Assets
| | Year Ended | Year Ended | |
| | September 30, | September 30, | |
Increase (Decrease) in Net Assets | | 2010 | 2009 | |
Operations: | | | | |
Net investment income | | $2,088,917 | $3,896,152 | |
Net realized gain (loss) | | 1,595,659 | (185,255,630) | |
Change in unrealized appreciation (depreciation) | | (532,062) | 141,828,817 | |
| | | | |
Increase (Decrease) in Net Assets | | | | |
Resulting From Operations | | 3,152,514 | (39,530,661) | |
| | | | |
Distributions to shareholders from: | | | | |
Net investment income: | | | | |
Class A shares | | (1,877,571) | (7,682,721) | |
Class B shares | | — | (148,212) | |
Class C shares | | — | (420,523) | |
Class I shares | | (1,650,864) | (3,518,021) | |
Class Y shares | | (5,626) | (1) | |
Net realized gain: | | | | |
Class A shares | | — | (634,873) | |
Class B shares | | — | (25,817) | |
Class C shares | | — | (67,464) | |
Class I shares | | — | (222,338) | |
Class Y shares | | — | (3.00) | |
Total distributions | | (3,534,061) | (12,719,973) | |
| | | | |
Capital share transactions: | | | | |
Shares sold: | | | | |
Class A shares | | 37,402,286 | 46,807,216 | |
Class B shares | | 269,456 | 518,403 | |
Class C shares | | 2,587,664 | 2,179,011 | |
Class I shares | | 13,046,519 | 22,384,629 | |
Class Y shares | | 3,391,938 | 595,466 | |
Reinvestment of distributions: | | | | |
Class A shares | | 1,712,839 | 7,616,106 | |
Class B shares | | — | 153,830 | |
Class C shares | | — | 380,058 | |
Class I shares | | 1,379,546 | 3,486,897 | |
Class Y shares | | 2,622 | 4 | |
Redemption fees: | | | | |
Class A shares | | 1,376 | 7,071 | |
Class B shares | | 6 | 47 | |
Class C shares | | 59 | 134 | |
Class I shares | | — | 59 | |
Class Y shares | | 1,837 | 3 | |
See notes to financial statements.
Statements of Changes in Net Assets
| | Year Ended | Year Ended |
| | September 30, | September 30, |
Increase (Decrease) in Net Assets - (Cont’d) | | 2010 | 2009 |
Capital share transactions (Cont’d): | | | |
Shares redeemed: | | | |
Class A shares | | ($64,598,217) | ($71,757,677) |
Class B shares | | (2,328,107) | (2,569,260) |
Class C shares | | (4,676,204) | (6,216,320) |
Class I shares | | (35,107,420) | (25,214,435) |
Class Y shares | | (1,497,086) | (73,687) |
Total capital share transactions | | (48,410,886) | (21,702,445) |
| | | |
| | | |
Total Increase (Decrease) in Net Assets | | (48,792,433) | (73,953,079) |
| | | |
| | | |
Net Assets | | | |
Beginning of year | | 412,158,388 | 486,111,467 |
End of year (including undistributed net investment | | | |
income of $1,184,550 and $3,453,338, respectively) | | $363,365,955 | $412,158,388 |
| | | |
| | | |
Capital Share Activity | | | |
Shares sold: | | | |
Class A shares | | 2,802,787 | 4,194,520 |
Class B shares | | 22,231 | 48,508 |
Class C shares | | 220,010 | 226,686 |
Class I shares | | 924,635 | 1,846,796 |
Class Y shares | | 248,819 | 54,292 |
Reinvestment of distributions: | | | |
Class A shares | | 125,851 | 715,552 |
Class B shares | | — | 16,008 |
Class C shares | | — | 40,709 |
Class I shares | | 95,470 | 307,732 |
Class Y shares | | 185 | — |
Shares redeemed: | | | |
Class A shares | | (4,854,110) | (6,481,230) |
Class B shares | | (194,930) | (253,088) |
Class C shares | | (404,192) | (634,154) |
Class I shares | | (2,456,887) | (2,100,701) |
Class Y shares | | (105,845) | (5,379) |
Total capital share activity | | (3,575,976) | (2,023,749) |
See notes to financial statements.
Notes to Financial Statements
Note A — Significant Accounting Policies
General: The Calvert World Values International Equity Fund (the “Fund”), a series of Calvert World Values Fund, Inc., is registered under the Investment Company Act of 1940 as a diversified, open-end management investment company. The operation of each series is accounted for separately. The Fund offers five classes of shares of capital stock. Class A shares are sold with a maximum front-end sales charge of 4.75%. Class B shares are sold without a front-end sales charge. With certain exceptions, the Fund will impose a deferred sales charge at the time of redemption, depending on how long investors have owned the shares. Effective March 1, 2010, Class B shares are no longer offered for purchase, except through reinvestment of dividends and/or d istributions and through certain exchanges. Class C shares are sold without a front-end sales charge. With certain exceptions, the Fund will impose a deferred sales charge on shares sold within one year of purchase. Class B and Class C shares have higher levels of expenses than Class A shares. Class I shares require a minimum account balance of $1,000,000. The $1 million minimum initial investment may be waived for certain institutional accounts, where it is believed to be in the best interest of the Fund and its shareholders. Class I shares have no front-end or deferred sales charge and have lower levels of expenses than Class A shares. Effective October 31, 2008, the Fund began to offer Class Y shares. Class Y shares are generally only available to wrap or similar fee-based programs offered by financial intermediaries that have entered into an agreement with the Fund’s Distributor to offer Class Y shares. Class Y shares have no front-end or deferred sales charge. Each class has different: (a) dividend rates, due to differences in Distribution Plan expenses and other class-specific expenses, (b) exchange privileges and (c) class-specific voting rights.
Security Valuation: Net asset value per share is determined every business day as of the close of the regular session of the New York Stock Exchange (generally 4:00 p.m. Eastern time). The Fund uses independent pricing services approved by the Board of Directors to value its investments wherever possible. Securities for which market quotations are available are valued at last sale price or official closing price on the primary market or exchange in which they trade. Foreign securities are valued based on quotations from the principal market in which such securities are normally traded. If events occur after the close of the principal market in which foreign securities are traded, and before the Fund’s net asset value is determined, that are expected to materially affect the value of those securities, then they are valued at their fair value taking these events into account. Short-term notes are stated at amortized cost, which approximates fair value. The Fund may invest in securities whose resale is subject to restrictions. Investments for which market quotations are not available or deemed not reliable are fair valued in good faith under the direction of the Board of Directors.
The Fund has retained a third party fair value pricing service to quantitatively analyze the price movement of its holdings on foreign exchanges and to automatically fair value if the variation from the prior day’s closing price exceeds specified parameters.
In determining fair value, the Board considers all relevant qualitative and quantitative information available. These factors are subject to change over time and are reviewed periodically. The values assigned to fair value investments are based on available information and do not necessarily represent amounts that might ultimately be realized. Further, because of the inherent uncertainty of valuation, those estimated values may differ significantly from the values that would have been used had a ready market for the investments existed, and the differences could be material.
At September 30, 2010, securities valued at $10,021,393 or 2.8% of net assets, were fair valued in good faith under the direction of the Board of Directors.
The Fund utilizes various methods to measure the fair value of its investments. Generally Accepted Accounting Principles (GAAP) establishes a disclosure hierarchy that categorizes the inputs to valuation techniques used to value assets and liabilities at measurement date. These inputs are summarized in the three broad levels listed below:
Level 1 – quoted prices in active markets for identical securities
Level 2 – other significant observable inputs (including quoted prices for similar securities, interest rates, prepayment speeds, credit risk, etc.)
Level 3 – significant unobservable inputs (including the Fund’s own assumptions in determining the fair value of investments)
The inputs or methodology used for valuing securities are not necessarily an indication of the risk associated with investing in those securities.
Changes in valuation techniques may result in transfers in or out of an investment’s assigned level within the hierarchy during the year. For additional information on the Fund’s policy regarding valuation of investments, please refer to the Fund’s most recent prospectus.
The following is a summary of the inputs used to value the Fund’s net assets as of September 30, 2010:
| Valuation Inputs |
Investments in Securities | Level 1 | Level 2 | Level 3 | Total |
Equity securities* | $338,347,910 | — | $2,074,950 | $340,422,860 |
Limited partnership interest | — | — | 2,881,315 | 2,881,315 |
Other debt obligations | — | $10,200,000 | 5,065,128 | 15,265,128 |
TOTAL | $338,347,910 | $10,200,000 | $10,021,393 ** | $358,569,303 |
* For further breakdown of equity securities by country, please refer to the Statement of Net Assets.
**Level 3 securities represent 2.8% of net assets.
Repurchase Agreements: The Fund may enter into repurchase agreements with recognized financial institutions or registered broker/dealers and, in all instances, holds underlying securities with a value exceeding the total repurchase price, including accrued interest. Although risk is mitigated by the collateral, the Fund could experience a delay in recovering its value and a possible loss of income or value if the counterparty fails to perform in accordance with the terms of the agreement.
Restricted Securities: The Fund may invest in securities that are subject to legal or contractual restrictions on resale. Generally, these securities may only be sold publicly upon registration under the Securities Act of 1933 or in transactions exempt from such registration. Information regarding restricted securities is included at the end of the Fund’s Statement of Net Assets.
Security Transactions and Net Investment Income: Security transactions are accounted for on trade date. Realized gains and losses are recorded on an identified cost basis and may include proceeds from litigation. Dividend income is recorded on the ex-dividend date or, in the case of dividends on certain foreign securities, as soon as the Fund is informed of the ex-dividend date. Distributions received on securities that represent a return of capital or capital gain are recorded as a reduction of cost of investments and/or as a realized gain. Interest income, which includes amortization of premium and accretion of discount on debt securities, is accrued as earned. Investment income and realized and unrealized gains and losses are allocated to separate clas ses of shares based upon the relative net assets of each class. Expenses arising in connection with a class are charged directly to that class. Expenses common to the classes are allocated to each class in proportion to their relative net assets. Withholding taxes on foreign dividends have been provided for in accordance with the Fund’s understanding of the applicable country’s tax rules and rates.
Foreign Currency Transactions: The Fund’s accounting records are maintained in U.S. dollars. For valuation of assets and liabilities on each date of net asset value determination, foreign denominations are converted into U.S. dollars using the current exchange rate. Security transactions, income and expenses are translated at the prevailing rate of exchange on the date of the event. The effect of changes in foreign exchange rates on securities and foreign currencies is included in the net realized and unrealized gain or loss on securities and foreign currencies.
Distributions to Shareholders: Distributions to shareholders are recorded by the Fund on ex-dividend date. Dividends from net investment income and distributions from net realized capital gains, if any, are paid at least annually. Distributions are determined in accordance with income tax regulations which may differ from generally accepted accounting principles; accordingly, periodic reclassifications are made within the Fund’s capital accounts to reflect income and gains available for distribution under income tax regulations.
Estimates: The preparation of the financial statements in conformity with accounting principles generally accepted in the United States requires management to make estimates and assumptions that affect the reported amounts of assets and liabilities and disclosure of contingent assets and liabilities at the date of the financial statements and the reported amounts of income and expenses during the reported period. Actual results could differ from those estimates.
Redemption Fees: The Fund charges a 2% redemption fee on redemptions, including exchanges, made within 30 days of purchase in the same Fund (within seven days for Class I shares). The redemption fee is paid to the Class of the Fund from which the redemption is made, and is accounted for as an addition to paid-in capital. The fee is intended to discourage market-timers by ensuring that short-term trading costs are borne by the investors making the transactions and not the shareholders already in the Fund.
Expense Offset Arrangement: The Fund has an arrangement with its custodian bank whereby the custodian’s fees may be paid indirectly by credits earned on the Fund’s cash on deposit with the bank. These credits are used to reduce the Fund’s expenses. Such a deposit arrangement may be an alternative to overnight investments.
Federal Income Taxes: No provision for federal income or excise tax is required since the Fund intends to continue to qualify as a regulated investment company under the Internal Revenue Code and to distribute substantially all of its taxable earnings.
Management has analyzed the Fund’s tax positions taken for all open federal income tax years and has concluded that no provision for federal income tax is required in the Fund’s financial statements. A Fund’s federal tax return is subject to examination by the Internal Revenue Service for a period of three years.
New Accounting Pronouncements: In January 2010, the Financial Accounting Standards Board (“FASB”) issued Accounting Standards Update (“ASU”) No. 2010-06 “Improving Disclosures about Fair Value Measurements”. ASU 2010-06 will require reporting entities to make new disclosures about amount and reasons for significant transfers in and out of Level 1 and Level 2 fair value measurements and input and valuation techniques used to measure fair value for both recurring and nonrecurring fair value measurements that fall in either Level 2 or Level 3, and information on purchases, sales, issuances, and settlements in the roll forward of activity in Level 3 fair value measures. The new and revised disclosures are effective for interim and annual reporting periods beginning after December 15, 2009 except for the disclosures about purchases, sales, issuances, and settlements in the roll forward of activity in Level 3 fair value measures, which are effective for fiscal years beginning after December 15, 2010. At this time, management is evaluating the implications of ASU No. 2010-06 disclosures about purchases, sales, issuances, and settlements in the roll forward of activity in Level 3 fair value measures and its impact on the financial statements has not been determined.
Note B — Related Party Transactions
Calvert Asset Management Company, Inc. (the “Advisor”) is wholly-owned by Calvert Group, Ltd. (“Calvert”), which is indirectly wholly owned by UNIFI Mutual Holding Company. The Advisor provides investment advisory services and pays the salaries and fees of officers and Directors of the Fund who are employees of the Advisor or its affiliates. For its services, the Advisor receives a monthly fee based on the following annual rates of average daily net assets: .75% on the first $250 million, .725% on the next $250 million and .675% on the excess of $500 million. Under the terms of the agreement, $217,189 was payable at year end. In addition, $104,936 was payable at year end for operating expenses paid by the Advisor during September 2010. For the year ended September 30, 2010, the Advisor waived $13,724 of its fee.
The Advisor has contractually agreed to limit net annual fund operating expenses through January 31, 2011 for Class I and Class Y. The contractual expense cap is 1.10% and 1.39%, respectively. For the purposes of this expense limit, operating expenses do not include interest expense, brokerage commissions, taxes, and extraordinary expenses. This expense limitation does not limit any acquired fund fees and expenses. To the extent any expense offset credits are earned, the Advisor’s obligation under the contractual limitation may be reduced and the Advisor may benefit from the expense offset arrangement. The Advisor voluntarily reimbursed Class Y shares for expenses of $11,069 for the year ended September 30, 2010.
Calvert Administrative Services Company, an affiliate of the Advisor, provides administrative services to the Fund for an annual fee, payable monthly, of .35% for Classes A, B, C and Y, and .15% for Class I, based on their average daily net assets. Under the terms of the agreement, $88,494 was payable at year end.
Calvert Distributors, Inc., an affiliate of the Advisor, is the distributor and principal underwriter for the Fund. Distribution Plans, adopted by Class A, Class B and Class C shares, allow the Fund to pay the Distributor for expenses and services associated with distribution of shares. The expenses paid may not exceed .35%, 1.00% and 1.00% annually of average daily net assets of each Class A, Class B and Class C, respectively. The amount actually paid by the Fund is an annualized fee, payable monthly of .25%, 1.00% and 1.00% of the Fund’s average daily net assets of Class A, Class B and Class C, respectively. Class I and Class Y shares do not have Distribution Plan expenses. Under the terms of agreement, $72,695 was payable at year end.
The Distributor received $43,053 as its portion of commissions charged on sales of the Fund’s Class A shares for the year ended September 30, 2010.
Calvert Shareholder Services, Inc. (“CSSI”), an affiliate of the Advisor, is the shareholder servicing agent for the Fund. For its services, CSSI received a fee of $191,183 for the year ended September 30, 2010. Under the terms of the agreement, $15,332 was payable at year end. Boston Financial Data Services, Inc. is the transfer and dividend disbursing agent.
The Fund invests in Community Investment Notes issued by the Calvert Social Investment Foundation (the “CSI Foundation”). The CSI Foundation is a 501(c)(3) non-profit organization that receives in-kind support from the Calvert Group, Ltd. and its subsidiaries. The Fund has received from the Securities and Exchange Commission an exemptive order permitting the Fund to make investments in these notes under certain conditions.
Each Director of the Funds who is not an employee of the Advisor or its affiliates receives an annual retainer of $44,000 plus a meeting fee of $2,000 for each Board meeting attended. Additional fees of up to $5,000 annually may be paid to the Board chair and Committee chairs ($10,000 for the Special Equities Committee chair) and $2,500 annually may be paid to committee members, plus a committee meeting fee of $500 for each committee meeting attended. Director’s fees are allocated to each of the Funds served.
Note C — Investment Activity
During the year, the cost of purchases and proceeds from sales of investments, other than short-term securities, were $478,995,400 and $539,653,412, respectively.
Capital Loss Carryforwards
Expiration Date | |
30-Sep-17 | $90,728,857 |
30-Sep-18 | 105,942,268 |
Capital losses may be utilized to offset future capital gains until expiration.
The Fund intends to elect to defer net capital losses of $13,056,491 incurred from November 1, 2009 through September 30, 2010 and treat them as arising in the fiscal year ending September 30, 2011.
The tax character of dividends and distributions paid during the years ended September 30, 2010 and September 30, 2009 were as follows:
Distributions paid from: | 2010 | | 2009 |
Ordinary income | $3,534,061 | | $12,719,973 |
Total | $3,534,061 | | $12,719,973 |
As of September 30, 2010, the tax basis components of distributable earnings/(accumulated losses) and the federal tax cost were as follows:
Unrealized appreciation | $33,019,016 |
Unrealized (depreciation) | (18,788,859) |
Net unrealized appreciation/(depreciation) | $14,230,157 |
Undistributed ordinary income | $1,202,444 |
Capital loss carryforward | ($196,671,125) |
Federal income tax cost of investments | $344,339,147 |
The differences between the components of distributable earnings on a tax basis and the amounts reflected in the statement of net assets are primarily due to temporary book-tax differences that will reverse in a subsequent period. These book-tax differences are due to wash sales, the deferral of post October losses, passive foreign investment companies, and partnerships.
Reclassifications, as shown in the table below, have been made to the Fund’s components of net assets to reflect income and gains available for distribution (or available capital loss carryovers, as applicable) under income tax law and regulations. These reclassifications are due to permanent book-tax differences and have no impact on net assets. The primary permanent differences causing such reclassification for the Fund are due to foreign currency transactions, partnerships, and passive foreign investment companies.
Undistributed net investment income | ($823,644) |
Accumulated net realized gain (loss) | 823,621 |
Paid-in capital | 23 |
Note D — Line of Credit
A financing agreement is in place with all Calvert Group Funds and State Street Corporation (“SSC”). Under the agreement, SSC provides an unsecured line of credit facility, in the aggregate amount of $50 million ($25 million committed and $25 million uncommitted), accessible by the Funds for temporary or emergency purposes only. Borrowings under this committed facility bear interest at the higher of the London Interbank Offered Rate, (LIBOR) or the overnight Federal Funds Rate plus 1.25% per annum. A commitment fee of .125% per annum is incurred on the unused portion of the committed facility, which is allocated to all participating funds. The Funds had no loans outstanding pursuant to this line of credit at September 30, 2010. For the year ended September 30, 2010, borrowings by the Fund under the Agreement were as follows:
| | Weighted | | Month of |
| Average | Average | Maximum | Maximum |
| Daily | Interest | Amount | Amount |
| Balance | Rate | Borrowed | Borrowed |
| $407,126 | 1.43% | $33,213,524 | December 2009 |
Note E — Affiliated Companies
An affiliated company is a company in which the Fund has a direct or indirect ownership of, control of, or voting power over 5 percent or more of the outstanding voting shares. Affiliated companies of the Fund are as follows:
Affiliates | Cost | Value |
gNet Defta Development Holdings LLC, LP | $400,000 | $389,241 |
SEAF Central & Eastern European Growth Fund LLC, LP | 347,466 | 535,931 |
TOTALS | $747,466 | $925,172 |
Note F — Subsequent Events
In preparing the financial statements as of September 30, 2010, no subsequent events or transactions occurred that would have materially impacted the financial statements as presented.
Note G — Other
In connection with certain venture capital investments, the Fund is committed to future capital calls, which will increase the Fund’s investment in these securities. The aggregate amount of the future capital commitments totals $516,220 at September 30, 2010.
Notice to Shareholders (Unaudited)
For the year ended September 30, 2010, in order to meet certain requirements of the Internal Revenue Code, the Fund designates 100% of the ordinary dividends paid during the year as qualified dividend income in accordance with Section 854 of the Internal Revenue Code. It also designates $.34 per share as income derived from foreign sources and $.04 per share as foreign taxes paid.
Additional information will be provided to shareholders in January 2011 for use in preparing 2010 income tax returns.
Financial Highlights
| | | Years Ended | |
| | September 30, | September 30, | September 30, |
Class A Shares | | 2010 (z) | 2009 (z) | 2008 |
Net asset value, beginning | | $13.83 | $15.31 | $25.57 |
Income from investment operations: | | | | |
Net investment income | | .06 | .11 | .37 |
Net realized and unrealized gain (loss) | | .09 | (1.19) | (8.46) |
Total from investment operations | | .15 | (1.08) | (8.09) |
Distributions from: | | | | |
Net investment income | | (.10) | (.37) | (.24) |
Net realized gain | | — | (.03) | (1.93) |
Total distributions | | (.10) | (.40) | (2.17) |
Total increase (decrease) in net asset value | | 0.05 | (1.48) | (10.26) |
Net asset value, ending | | $13.88 | $13.83 | $15.31 |
Total return* | | 1.08% | (6.27%) | (34.31%) |
Ratios to average net assets:A | | | | |
Net investment income | | .46% | .99% | 1.81% |
Total expenses | | 1.83% | 1.87% | 1.65% |
Expenses before offsets | | 1.80% | 1.86% | 1.63% |
Net expenses | | 1.80% | 1.86% | 1.63% |
Portfolio turnover | | 133% | 135% | 100% |
Net assets, ending (in thousands) | | $245,309 | $270,900 | $324,091 |
| | | | |
| | | | |
| | Years Ended | |
| | September 30, | September 30, | |
Class A Shares | | 2007 | 2006 | |
Net asset value, beginning | | $23.87 | $20.29 | |
Income from investment operations: | | | | |
Net investment income | | .22 | .24 | |
Net realized and unrealized gain (loss) | | 4.61 | 3.51 | |
Total from investment operations | | 4.83 | 3.75 | |
Distributions from: | | | | |
Net investment income | | (.20) | (.17) | |
Net realized gain | | (2.93) | — | |
Total distributions | | (3.13) | (.17) | |
Total increase (decrease) in net asset value | | 1.70 | 3.58 | |
Net asset value, ending | | $25.57 | $23.87 | |
Total return* | | 21.72% | 18.58% | |
Ratios to average net assets:A | | | | |
Net investment income | | 1.08% | 1.19% | |
Total expenses | | 1.62% | 1.73% | |
Expenses before offsets | | 1.60% | 1.72% | |
Net expenses | | 1.60% | 1.71% | |
Portfolio turnover | | 82% | 120% | |
Net assets, ending (in thousands) | | $546,564 | $401,195 | |
See notes to financial highlights.
Financial Highlights
| | | Years Ended | |
| | September 30, | September 30, | September 30, |
Class B Shares | | 2010 (z) | 2009 (z) | 2008 |
Net asset value, beginning | | $12.40 | $13.69 | $23.11 |
Income from investment operations: | | | | |
Net investment income (loss) | | (.09) | (.02) | .12 |
Net realized and unrealized gain (loss) | | .09 | (1.06) | (7.56) |
Total from investment operations | | — | (1.08) | (7.44) |
Distributions from: | | | | |
Net investment income | | — | (.18) | (.05) |
Net realized gain | | — | (.03) | (1.93) |
Total distributions | | — | (.21) | (1.98) |
Total increase (decrease) in net asset value | | — | (1.29) | (9.42) |
Net asset value, ending | | $12.40 | $12.40 | $13.69 |
Total return* | | 0.00% | (7.47%) | (34.97%) |
Ratios to average net assets:A | | | | |
Net investment income (loss) | | (.74%) | (.26%) | .78% |
Total expenses | | 3.03% | 3.12% | 2.63% |
Expenses before offsets | | 2.97% | 3.10% | 2.61% |
Net expenses | | 2.97% | 3.10% | 2.60% |
Portfolio turnover | | 133% | 135% | 100% |
Net assets, ending (in thousands) | | $6,850 | $8,993 | $12,512 |
| | | | |
| | | | |
| | Years Ended | |
| | September 30, | September 30, | |
Class B Shares | | 2007 | 2006 | |
Net asset value, beginning | | $21.85 | $18.61 | |
Income from investment operations: | | | | |
Net investment income | . | .09 | .06 | |
Net realized and unrealized gain (loss) | | 4.10 | 3.18 | |
Total from investment operations | | 4.19 | 3.24 | |
Distributions from: | | | | |
Net investment income | | — | ** | |
Net realized gain | | (2.93) | — | |
Total distributions | | (2.93) | ** | |
Total increase (decrease) in net asset value | | 1.26 | 3.24 | |
Net asset value, ending | | $23.11 | $21.85 | |
| | | | |
Total return* | | 20.60% | 17.43% | |
Ratios to average net assets:A | | | | |
Net investment income | | .13% | .18% | |
Total expenses | | 2.57% | 2.73% | |
Expenses before offsets | | 2.54% | 2.72% | |
Net expenses | | 2.54% | 2.70% | |
Portfolio turnover | | 82% | 120% | |
Net assets, ending (in thousands) | | $23,805 | $18,053 | |
See notes to financial highlights.
Financial Highlights
| | | Years Ended | |
| | September 30, | September 30, | September 30, |
Class C Shares | | 2010 (z) | 2009 (z) | 2008 |
Net asset value, beginning | | $12.07 | $13.31 | $22.51 |
Income from investment operations: | | | | |
Net investment income (loss) | | (.05) | .01 | .19 |
Net realized and unrealized gain (loss) | | .08 | (1.03) | (7.40) |
Total from investment operations | | .03 | (1.02) | (7.21) |
Distributions from: | | | | |
Net investment income | | — | (.19) | (.06) |
Net realized gain | | — | (.03) | (1.93) |
Total distributions | | — | (.22) | (1.99) |
Total increase (decrease) in net asset value | | 0.03 | (1.24) | (9.20) |
Net asset value, ending | | $12.10 | $12.07 | $13.31 |
Total return* | | 0.25% | (7.16%) | (34.86%) |
Ratios to average net assets:A | | | | |
Net investment income (loss) | | (.41%) | .07% | 1.01% |
Total expenses | | 2.72% | 2.79% | 2.47% |
Expenses before offsets | | 2.69% | 2.79% | 2.45% |
Net expenses | | 2.69% | 2.79% | 2.45% |
Portfolio turnover | | 133% | 135% | 100% |
Net assets, ending (in thousands) | | $21,942 | $24,107 | $31,475 |
| | | | |
| | | | |
| | Years Ended | |
| | September 30, | September 30, | |
Class C Shares | | 2007 | 2006 | |
Net asset value, beginning | | $21.34 | $18.18 | |
Income from investment operations: | | | | |
Net investment income | | .13 | .13 | |
Net realized and unrealized gain (loss) | | 3.99 | 3.06 | |
Total from investment operations | . | 4.12 | 3.19 | |
Distributions from: | | | | |
Net investment income | | (.02) | (.03) | |
Net realized gain | | (2.93) | — | |
�� Total distributions | | (2.95) | (.03) | |
Total increase (decrease) in net asset value | | 1.17 | 3.16 | |
Net asset value, ending | | $22.51 | $21.34 | |
| | | | |
Total return* | | 20.81% | 17.55% | |
Ratios to average net assets:A | | | | |
Net investment income | | .31% | .38% | |
Total expenses | | 2.43% | 2.57% | |
Expenses before offsets | | 2.41% | 2.56% | |
Net expenses | | 2.40% | 2.55% | |
Portfolio turnover | | 82% | 120% | |
Net assets, ending (in thousands) | | $50,790 | $32,723 | |
See notes to financial highlights.
Financial Highlights
| | | Years Ended | |
| | September 30, | September 30, | September 30, |
Class I Shares | | 2010 (z) | 2009 (z) | 2008 |
Net asset value, beginning | | $14.79 | $16.37 | $27.15 |
Income from investment operations: | | | | |
Net investment income | | .17 | .22 | .48 |
Net realized and unrealized gain (loss) | | .11 | (1.29) | (8.96) |
Total from investment operations | | .28 | (1.07) | (8.48) |
Distributions from: | | | | |
Net investment income | | (.24) | (.48) | (.37) |
Net realized gain | | — | (.03) | (1.93) |
Total distributions | | (.24) | (.51) | (2.30) |
Total increase (decrease) in net asset value | | 0.04 | (1.58) | (10.78) |
Net asset value, ending | | $14.83 | $14.79 | $16.37 |
| | | | |
Total return* | | 1.91% | (5.59%) | (33.84%) |
Ratios to average net assets:A | | | | |
Net investment income | | 1.17% | 1.80% | 2.47% |
Total expenses | | 1.08% | 1.08% | 1.00% |
Expenses before offsets | | 1.06% | 1.07% | .98% |
Net expenses | | 1.06% | 1.07% | .97% |
Portfolio turnover | | 133% | 135% | 100% |
Net assets, ending (in thousands) | | $86,475 | $107,456 | $118,033 |
| | | | |
| | | | |
| | Years Ended | |
| | September 30, | September 30, | |
Class I Shares | | 2007 | 2006 | |
Net asset value, beginning | | $25.16 | $21.32 | |
Income from investment operations: | | | | |
Net investment income | | .34 | .37 | |
Net realized and unrealized gain | | 4.93 | 3.72 | |
Total from investment operations | | 5.27 | 4.09 | |
Distributions from: | | | | |
Net investment income | | (.35) | (.25) | |
Net realized gain | | (2.93) | — | |
Total distributions | | (3.28) | (.25) | |
Total increase (decrease) in net asset value | | 1.99 | 3.84 | |
Net asset value, ending | | $27.15 | $25.16 | |
| | | | |
Total return* | | 22.49% | 19.35% | |
Ratios to average net assets:A | | | | |
Net investment income | | 1.74% | 1.84% | |
Total expenses | | .98% | 1.07% | |
Expenses before offsets | | .96% | 1.06% | |
Net expenses | | .96% | 1.05% | |
Portfolio turnover | | 82% | 120% | |
Net assets, ending (in thousands) | | $181,672 | $124,197 | |
See notes to financial highlights.
Financial Highlights
| | Periods Ended | |
| | September 30, | September 30, | |
Class Y Shares | | 2010 (z) | 2009# (z) | |
Net asset value, beginning | | $14.34 | $11.45 | |
Income from investment operations: | | | | |
Net investment income | | .08 | .17 | |
Net realized and unrealized gain (loss) | | .17 | 2.76 | |
Total from investment operations | | .25 | 2.93 | |
Distributions from: | | | | |
Net investment income | | (.06) | (.01) | |
Net realized gain | | — | (.03) | |
Total distributions | | (.06) | (.04) | |
Total increase (decrease) in net asset value | | 0.19 | 2.89 | |
Net asset value, ending | | $14.53 | $14.34 | |
| | | | |
Total return* | | 1.73% | 25.75% | |
Ratios to average net assets:A | | | | |
Net investment income | | .61% | 1.52% (a) | |
Total expenses | | 2.14% | 5.91% (a) | |
Expenses before offsets | | 1.39% | 1.39% (a) | |
Net expenses | | 1.39% | 1.39% (a) | |
Portfolio turnover | | 133% | 100% | |
Net assets, ending (in thousands) | | $2,790 | $702 | |
A Total expenses do not reflect amounts reimbursed and/or waived by the Advisor or reductions from expense offset arrangements. Expenses before offsets reflect expenses after reimbursement and/or waiver by the Advisor but prior to reductions from expense offset arrangements. Net expenses are net of all reductions and represent the net expenses paid by the Fund.
(a) Annualized.
(z) Per share figures are calculated using the Average Share Method.
* Total return is not annualized for periods less than one year and does not reflect deduction of any front-end or deferred sales charge.
** Distribution is less than $0.01 per share.
# From October 31, 2008, inception.
See notes to financial statements.
Explanation of Financial Tables
Schedule of Investments
The Schedule of Investments is a snapshot of all securities held in the fund at their market value, on the last day of the reporting period. Securities are listed by asset type (e.g., common stock, corporate bonds, U.S. government obligations) or, for International Funds, by country, and may be further broken down into sub-groups and by industry classification.
Statement of Assets and Liabilities
The Statement of Assets and Liabilities is often referred to as the fund’s balance sheet. It lists the value of what the fund owns, is due and owes on the last day of the reporting period. The fund’s assets include the market value of securities owned, cash, receivables for securities sold and shareholder subscriptions, and receivables for dividends and interest payments that have been earned, but not yet received. The fund’s liabilities include payables for securities purchased and shareholder redemptions, and expenses owed but not yet paid. The statement also reports the fund’s net asset value (NAV) per share on the last day of the reporting period. The NAV is calculated by dividing the fund’s net assets (assets minus liabilities) by the number of shares outstanding. This statement is accompanied by a Schedule of Investments. Alternatively, if certain conditions are met, a Statement of Net Assets may be presented in lieu of this statement and the Schedule of Investments.
Statement of Net Assets
The Statement of Net Assets provides a detailed list of the fund’s holdings, including each security’s market value on the last day of the reporting period. The Statement of Net Assets includes a Schedule of Investments. Other assets are added and other liabilities subtracted from the investments total to calculate the fund’s net assets. Finally, net assets are divided by the outstanding shares of the fund to arrive at its share price, or Net Asset Value (NAV) per share.
At the end of the Statement of Net Assets is a table displaying the composition of the fund’s net assets. Paid in Capital is the money invested by shareholders and represents the bulk of net assets. Undistributed Net Investment Income and Accumulated Net Realized Gains usually approximate the amounts the fund had available to distribute to shareholders as of the statement date. Accumulated Realized Losses will appear as negative balances. Unrealized Appreciation (Depreciation) is the difference between the market value of the fund’s investments and their cost, and reflects the gains (losses) that would be realized if the fund were to sell all of its investments at their statement-date -values.
Statement of Operations
The Statement of Operations summarizes the fund’s investment income earned and expenses incurred in operating the fund. Investment income includes dividends earned from stocks and interest earned from interest-bearing securities in the fund. Expenses incurred in operating the fund include the advisory fee paid to the investment advisor, administrative services fees, distribution plan expenses (if applicable), transfer agent fees, shareholder servicing expenses, custodial, legal, and audit fees, and the printing and postage expenses related to shareholder reports. Expense offsets (fees paid indirectly) are also shown. Credits earned from offset arrangements are used to reduce the fund’s expenses. This statement also shows net gains (losses) realized on the sale of investments and the increase or decrease in the unrealized appreciation (depreciation) on investments held during the period.
Statement of Changes in Net Assets
The Statement of Changes in Net Assets shows how the fund’s total net assets changed during the two most recent reporting periods. Changes in the fund’s net assets are attributable to investment operations, distributions and capital share transactions.
The Operations section of the report summarizes information detailed in the Statement of Operations. The Distribution section shows the dividend and capital gain distributions made to shareholders. The amounts shown as distributions in this section may not match the net investment income and realized gains amounts shown in the Operations section because distributions are determined on a tax basis and certain investments or transactions may be treated differently for financial statement and tax purposes. The Capital Share Transactions section shows the amount shareholders invested in the fund, either by purchasing shares or by reinvesting distributions, and the amounts redeemed. The corresponding numbers of shares issued, reinvested and redeemed are shown at the end of the report.
Financial Highlights
The Financial Highlights table provides a per-share breakdown per class of the components that affect the fund’s net asset value for current and past reporting periods. The table provides total return, total distributions, expense ratios, portfolio turnover and net assets for the applicable period. Total return is a measure of a fund’s performance that encompasses all elements of return: dividends, capital gain distributions and changes in net asset value. Total return is the change in value of an investment over a given period, assuming reinvestment of any dividends and capital gain distributions, expressed as a percentage of the initial investment. Total distributions include distributions from net investment income and net realized gains. Long-term gains are earned on securities held in the fund more than one year. Short-term gains, on the sale of securities held less than one year, are treated as ordinary dividend income for tax purposes. The expense ratio is a fund’s cost of doing business, expressed as a percentage of net assets. These expenses directly reduce returns to shareholders. Portfolio turnover measures the trading activity in a fund’s investment portfolio – how often securities are bought and sold by a fund. Portfolio turnover is affected by market conditions, changes in the size of the fund, the nature of the fund’s investments and the investment style of the portfolio manager.
Proxy Voting
The Proxy Voting Guidelines of the Calvert Funds that the Fund uses to determine how to vote proxies relating to portfolio securities are provided as an Appendix to the Fund’s Statement of Additional Information. The Statement of Additional Information can be obtained free of charge by calling the Fund at 1-800-368-2745, by visiting the Calvert website at www.calvert.com; or by visiting the SEC’s website at www.sec.gov.
Information regarding how the Fund voted proxies relating to portfolio securities during the most recent 12-month period ended June 30 is available on the Fund’s website at www.calvert.com and on the SEC’s website at www.sec.gov.
Availability of Quarterly Portfolio Holdings
The Fund files its complete schedule of portfolio holdings with the SEC for the first and third quarters of each fiscal year on Form N-Q. The Fund’s Form N-Q is available on the SEC’s website at www.sec.gov. The Fund’s Form N-Q may be reviewed and copied at the SEC’s Public Reference Room in Washington, DC; information on the operation of the Public Reference Room may be obtained by calling 1-800-SEC-0330.
This page is intentionally left blank
Director and Officer Information Table
| # of
Calvert
Portfolios
Overseen | Other
Directorships |
Name &
Age | Position
with
Fund | Position
Start
Date | Principal Occupation
During Last 5 Years |
INDEPENDENT TRUSTEES/DIRECTORS |
REBECCA L. ADAMSON
AGE: 61 | Trustee Director Director Director | 1989
CSIF 2000
IMPACT 2000
CSIS 2005
CWVF | President of the national nonprofit, First People’s Worldwide, formerly First Nations Financial Project. Founded by her in 1980, First People’s Worldwide is the only American Indian alternative development institute in the country. | 17 | • Bay & Paul Foundation |
RICHARD L. BAIRD, JR.
AGE: 62 | Trustee &
Chair Director &
Chair Director &
Chair Director &
Chair | 1982
CSIF 2000
CSIS 2005
CWVF 2005
Impact | President and CEO of Adagio Health Inc. in Pittsburgh, PA, a non-profit corporation which provides family planning services, nutrition, maternal/child health care, and various health screening services and community preventive health programs. | 29 | None |
JOHN G. GUFFEY, JR.
AGE: 62 | Director Trustee Director Director | 1992
CWVF 1982
CSIF 2000
CSIS 2005
IMPACT | Treasurer and Director of Silby, Guffey and Co., Inc., a venture capital firm (inactive as of 2003) and President of Aurora Press Inc., a privately held publisher of trade paperbacks. | 29 | • Ariel Funds (3) • Calvert Social Investment Foundation • Calvert Ventures, LLC |
MILES DOUGLAS HARPER, III
AGE: 47 | Director Trustee Director Director | 2000
Impact 2005
CSIF 2005
CSIS 2005
CWVF | Partner, Gainer Donnelly & Desroches (public accounting firm) since January 1999. | 17 | • Bridgeway Funds (14) |
JOY V. JONES AGE:60 | Director Trustee Director Director | 2000
Impact 1990
CSIF 2000
CSIS 2005
CWVF | Attorney. | 17 | • Director, Conduit Street Restaurants Limited |
TERRENCE J. MOLLNER, Ed.D. AGE: 65 | Director Trustee Director Director | 1992
CWVF 1982
CSIF 2000
CSIS 2005
IMPACT | Founder, Chairperson, and President of Trusteeship Institute, Inc., a diverse foundation known principally for its consultation to corporations converting to cooperative employee-ownership and the development of socially and spiritually responsible investment vehicles. Chairperson, Stakeholders Capital, Inc., an asset management firm and financial services provider in Amherst, MA. | 17 | • Calvert Social Investment Foundation • Ben & Jerry's Homemade, Inc. • ArtNOW, Inc. • Yourolivebranch.org |
SYDNEY AMARA MORRIS
AGE: 61 | Trustee Director Director Director | 1982
CSIF 2000
CSIS 2005
CWVF 2005
IMPACT | Rev. Morris currently serves as Parish Minister to the Keweenaw Unitarian Universalist Fellowship in Houghton, MI. Rev. Morris is a graduate of Harvard Divinity School. She currently chairs the Umbrian Universalist Committee on Socially Responsible Investing. | 17 | None |
INTERESTED TRUSTEES/DIRECTORS |
BARBARA J. KRUMSIEK
AGE: 58 | Director &
President Trustee &
Senior Vice
President Director &
Senior Vice
President Director &
President | 1997
CWVF 1997
CSIF 2000
CSIS 2000
Impact | President, Chief Executive Officer and Chair of Calvert Group, Ltd. | 51 | • Calvert Social Investment Foundation • Pepco Holdings, Inc. • Acacia Life Insurance Company (Chair) |
D. WAYNE SILBY, Esq.
AGE: 62 | Director Trustee &
President Director &
President Director | 1992
CWVF 1982
CSIF 2000
CSIS 2000
Impact | Mr. Silby is the founding Chair of the Calvert Funds. He is the Chair-Elect and a principal of Syntao.com, a Beijing-based company promoting corporate social responsibility. He was an officer and director of Silby, Guffey and Co., Inc., a venture capital firm (inactive as of 2003). | 29 | • UNIFI Mutual Holding Company • Calvert Social Investment Foundation • Giving Assets, Inc. • Studio School Fund • Syntao.com China • The Ice Organization |
OFFICERS |
KAREN BECKER
AGE: 57 | Chief Compliance Officer | 2005 | Chief Compliance Officer for the Calvert Funds. In March 2009, Ms. Becker also became Head of the Securities Operations Department for Calvert Asset Management Company, Inc. |
SUSAN WALKER BENDER, Esq.
AGE: 51 | Assistant Vice-President & Assistant Secretary | 1988
CSIF 2000
CSIS 1992
CWVF 2000
Impact | Assistant Vice President, Assistant Secretary and Associate General Counsel of Calvert Group, Ltd. |
JENNIFER BERG
AGE: 36 | Assistant Fund Controller | 2009 | Fund Administration Manager for Calvert Group, Ltd. |
THOMAS DAILEY
AGE: 46 | Vice President | 2004 | Vice President of Calvert Asset Management Company, Inc. |
| | | | | | | |
IVY WAFFORD DUKE, Esq.
AGE: 42 | Assistant Vice-President & Assistant Secretary | 1996
CSIF 2000
CSIS 1996
CWVF 2000
Impact | Assistant Vice President, Assistant Secretary and Deputy General Counsel of Calvert Group, Ltd., and Chief Compliance Officer for Calvert Asset Management Company, Inc. and Calvert Distributors, Inc. |
PATRICK FAUL
AGE: 45 | Vice President | 2010 | Vice President of Calvert Asset Management Company, Inc. (“CAMCO”) since 2008, and Head of Credit Research for CAMCO since 2009. Prior to 2009, Mr. Faul was Co-Head of Credit Research (2008) and a Senior Securities Analyst (prior to 2008) for CAMCO. |
TRACI L. GOLDT
AGE: 36 | Assistant Secretary | 2004 | Executive Assistant to General Counsel, Calvert Group, Ltd. |
GREGORY B. HABEEB
AGE: 60 | Vice President | 2004 | Senior Vice President of Calvert Asset Management Company, Inc. |
HUI PING HO, CPA
AGE: 45 | Assistant Treasurer | 2000 | Tax Compliance Manager of Calvert Group, Ltd. |
LANCELOT A. KING, Esq.
AGE: 40 | Assistant Vice President & Assistant Secretary | 2002 | Assistant Vice President, Assistant Secretary and Associate General Counsel of Calvert Group, Ltd. |
EDITH LILLIE
AGE: 53 | Assistant Secretary | 2007 | Assistant Secretary (since 2007) and Regulatory Matters Manager of Calvert Group, Ltd. |
AUGUSTO DIVO MACEDO, Esq.
AGE: 47 | Assistant Vice President & Assistant Secretary | 2007 | Assistant Vice President, Assistant Secretary, and Assistant Counsel Compliance of Calvert Group, Ltd. |
JANE B. MAXWELL Esq.
AGE: 58 | Assistant Vice President & Assistant Secretary | 2005 | Assistant Vice President, Assistant Secretary & Assistant General Counsel of Calvert Group, Ltd. |
ANDREW K. NIEBLER, Esq.
AGE: 43 | Assistant Vice President & Assistant Secretary | 2006 | Assistant Vice President, Assistant Secretary & Associate General Counsel of Calvert Group, Ltd. |
CATHERINE P. ROY
AGE: 54 | Vice President | 2004 | Senior Vice President of Calvert Asset Management Company, Inc. and Chief Investment Officer – Fixed Income. |
WILLIAM M. TARTIKOFF, Esq.
AGE: 63 | Vice President and Secretary | 1990
CSIF 2000
CSIS 1992
CWVF 2000
Impact | Senior Vice President, Secretary, and General Counsel of Calvert Group, Ltd. |
NATALIE TRUNOW
AGE: 42 | Vice resident | 2008 | Senior Vice President of Calvert Asset Management Company, Inc., and Chief Investment Officer -Equities. Prior to joining Calvert in August 2008, Ms. Trunow was the Section Head (2005-2008) and Portfolio Manager (2001-2008) for the Global Public Markets Group of General Motors Asset Management. |
RONALD M. WOLFSHEIMER CPA
AGE: 58 | Treasurer | 1982
CSIF 2000
CSIS 1992
CWVF 2000
Impact | Senior Vice President and Chief Financial and Administrative Officer of Calvert Group, Ltd. |
MICHAEL V. YUHAS JR., CPA
AGE: 49 | Fund Controller | 1999
CSIF 2000
CSIS 1999
CWVF 2000
Impact | Vice President of Calvert Administrative Services Company. |
The address of Trustees/Directors and Officers is 4550 Montgomery Avenue, Suite 1000N, Bethesda, Maryland 20814, except Mr. Silby’s address is 1715 18th Street, N.W., Washington, DC 20009. Ms. Krumsiek is an interested person of the Fund since she is an officer and director of the Fund’s advisor and certain affiliates. Mr. Silby is an interested person of the Fund since he is a director of the parent company of the Fund’s advisor.
Additional information about the Fund’s Trustees/Directors can be found in the Statement of Additional Information (SAI). You can get a free copy of the SAI at www.calvert.com, or by contacting your broker, or the Fund at 1-800-368-2745.
To Open an Account
800-368-2748
Yields and Prices
Calvert Information Network
(24 hours, 7 days a week)
800-368-2745
Service for Existing Account
Shareholders: 800-368-2745
Brokers: 800-368-2746
TDD for Hearing Impaired
800-541-1524
Branch Office
4550 Montgomery Avenue
Suite 1000 North
Bethesda, Maryland 20814
Registered, Certified
or Overnight Mail
Calvert Group
c/o BFDS,
330 West 9th Street
Kansas City, MO 64105
Web Site
www.calvert.com
Principal Underwriter
Calvert Distributors, Inc.
4550 Montgomery Avenue
Suite 1000 North
Bethesda, Maryland 20814
Calvert World Values international Equity fund
Calvert’s
Family of Funds
Tax-Exempt Money
Market Funds
CTFR Money Market Portfolio
Taxable Money Market Funds
First Government Money Market Fund
CSIF Money Market Portfolio
Municipal Funds
Calvert Tax-Free Bond Fund
Taxable Bond Funds
CSIF Bond Portfolio
Income Fund
Short Duration Income Fund
Long-Term Income Fund
Ultra-Short Income Fund
Government Fund
Short-Term Government Fund
High Yield Bond Fund
Equity Funds
CSIF Enhanced Equity Portfolio
CSIF Equity Portfolio
Calvert Large Cap Growth Fund
Calvert Large Cap Value Fund
Calvert Social Index Fund
Capital Accumulation Fund
CWV International Equity Fund
New Vision Small Cap Fund
Small Cap Value Fund
Mid Cap Value Fund
Global Alternative Energy Fund
Global Water Fund
International Opportunities Fund
Balanced and Asset
Allocation Funds
CSIF Balanced Portfolio
Calvert Conservative Allocation Fund
Calvert Moderate Allocation Fund
Calvert Aggressive Allocation Fund
This report is intended to provide fund information to shareholders. It is not authorized for distribution to prospective investors unless preceded or
accompanied by a prospectus.
Note: The information on our website is not incorporated by reference into this report; our website address is included as an inactive textual reference only.
Investors should carefully consider the investment objectives, risks, charges and expenses of the Calvert Funds. This and other important information is contained in the fund’s summary prospectus and prospectus, which can be obtained from your financial professional and should be read carefully before investing. You may also call Calvert at 800/368-2745 or visit www. calvert.com.
Calvert Capital
Accumulation Fund
Annual Report
September 30, 2010
E-Delivery Sign-Up —
Details Inside
Choose Planet-friendly E-delivery!
Sign up now for on-line statements, prospectuses, and fund reports. In less than five minutes you can help reduce paper mail and lower fund costs.
Just go to www.calvert.com, click on My Account, and select the documents you would like to receive via e-mail.
If you’re new to account access, you’ll be prompted to set up a personal identification number for your account. Once you’re in, click on the E-delivery sign-up at the bottom of the Account Portfolio page and follow the quick, easy steps.
TABLE
OF CONTENTS
4 President’s Letter
7 SRI Update
9 Portfolio Management Discussion
14 Shareholder Expense Example
16 Report of Independent Registered Public Accounting Firm
17 Statement of Net Assets
21 Statement of Operations
22 Statements of Changes in Net Assets
24 Notes to Financial Statements
30 Financial Highlights
35 Explanation of Financial Tables
37 Proxy Voting and Availability of Quarterly Portfolio Holdings
38 Director and Officer Information Table
Dear Shareholders:
Over the 12-month reporting period, the U.S. financial markets and economy continued to recover, in fits and starts, from the “Great Recession.” As economic data vacillated between good and bad news on employment, housing trends, business strength, and consumer confidence, market volatility and investor sentiment also see-sawed.
During the winter, investors became less risk averse, pouring money into higher-yielding areas of the bond market as well as stocks, which reached 18-month highs in March. Later in the spring, however, investor sentiment took an abrupt turn as confidence in the global economic recovery waned and fears of a double-dip recession grew. Following a dismal August for the stock market, September saw a surge in stock prices lifted by strong corporate earnings reports and renewed investor interest in bargain-priced stocks. In the bond market, Treasury yields moved lower over the 12-month reporting period and corporate bonds generally performed well.
Economic Recovery Slow But on Track
Looking ahead, the pace of economic recovery has clearly slowed, causing Federal Reserve (Fed) Chairman Ben Bernanke to say that the Fed stands ready to use all of the tools at its disposal to reinvigorate the U.S. economy. In our view, while the country faces sobering challenges related to the unemployment rate, high levels of government debt, and the stumbling housing market, we also see encouraging signs of economic recovery. Overall, companies have strong balance sheets and cash positions, have reported stronger-than-expected corporate earnings, and are investing in their businesses. Consumers are generally “deleveraging” by saving more and paying down their debt. Financial reform is under way in the U.S. that may help reassure investors and stabilize the markets. Globally, central banks around the world are continuing to pursue extremely accommodative mone tary policies to encourage economic recovery.
In this transitional environment, we believe that both the equity and fixed-income markets are likely to continue to be somewhat volatile. In our view, investment strategies that include sustainability criteria may be better positioned to weather these uncertainties and provide long-term value.
Markets Challenged, But Gain Ground
Despite the volatility over the course of the 12-month reporting period, domestic and international stocks had moved solidly ahead by the end of the period. U.S. stock indexes reported 12-month gains across all styles, strategies, and capitalization ranges. The large-cap Russell 1000 Index and the Standard & Poor’s 500 Index returned 10.75% and 10.16%, respectively. Mid-cap stocks were the top-performing category, with the Russell Midcap Index up 17.54%, while the small-cap Russell 2000 Index rose 13.35%. In terms of style, growth stocks moderately outpaced value stocks. On the international front, the MSCI EAFE Investable Market Index (IMI), a benchmark for international stocks, edged up 4.23%, and the MSCI Emerging Markets IMI was up 21.97%.
In the fixed-income markets, the Barclays Capital U.S. Credit Index, a market barometer for investment-grade bonds, was up 11.67%. In line with the Fed’s federal funds rate target of 0% to 0.25%, money market returns remained very low.
The Gulf of Mexico Oil Spill and the Extractives Industry
In the wake of the April 20 oil spill in the Gulf of Mexico, Americans have continued to grapple with the devastation caused by the spill and its long-term environmental, societal, and economic implications. Calvert shares the concern and the frustration felt by the millions of people affected by this tragedy.
Following the spill, Calvert met with BP officials, urging BP not only to clean up the current spill, but also to implement stronger safety and process management standards for its contractors. We are also evaluating how our advocacy objectives with deepwater oil-drilling companies may help prevent such disasters in the future.
In terms of extraction methodologies, Calvert has long recognized that as readily accessible supplies of oil and gas dry up, companies may be forced to seek mineral resources in countries with poor governance, weak rule of law, and high levels of corruption. Accordingly, over the past two years, we have been a leading advocate for transparency requirements for extractive industries. In July, the U.S. Congress passed legislation requiring companies to disclose payments that they make to the U.S. or foreign governments for the purpose of commercial development of oil, natural gas, or minerals. We believe this legislation is a milestone toward helping advance environmental sustainability in this industry.
In our view, the oil spill also underlines the urgency for expanded investment—with greater federal incentives—in alternative energy sources.
Financial Reform Under WayLooking ahead, long-awaited financial reform is under way with Congressional passage of the largest financial reform bill since the Great Depression. The Dodd-Frank Wall Street Reform and Consumer Protection Act (Dodd-Frank Act) is designed to address inadequate regulation of Wall Street firms and the type of unrestrained environment that contributed to the credit crisis of 2008 and the ensuing global market meltdown. The Dodd-Frank Act seeks to establish strong consumer protections, shield taxpayers from future corporate bailouts, shine a light on the “shadow markets” and derivatives trading, and expand the role of shareholders in corporate governance. While these goals are laudable, the impact of the Dodd-Frank Act on the financial industry—and ultimately its ability to prevent another financial crisis—must stand the test of time.
As the Obama administration and Congress work to implement key financial reforms, we believe that over time these efforts may work to redress some systemic imbalances in the financial system and provide additional stability to the economy and markets.
Review Your Portfolio Allocations
In our view, the financial markets are likely to be in transition for some time as the government tackles financial reform, the global economy continues to recover, and political elections in the U.S. impact a variety of government policies. Now may be an opportune time to review your overall investment strategy and portfolio allocations with your financial advisor. Check to ensure that your target mix of U.S. and international stocks, bonds, and cash is well-diversified and appropriate given your investment goals, stage of life, and attitude toward risk.
For up-to-date economic and market commentary from Calvert professionals, along with information on current Calvert sustainability initiatives, please visit our website,
www.calvert.com.
As always, we appreciate your investing with Calvert.
Sincerely,
Barbara J. Krumsiek
President and CEO
Calvert Group, Ltd.
October 2010
Sri
Update
from the Calvert Sustainability Research Department
As the fallout from the financial crisis continues to prove, responsible management of environmental, social, and governance (ESG) factors isn’t just “nice to do”—it’s essential to keeping our companies and our economy healthy and strong. Therefore, Calvert continues to work hard to ensure that you have a say in charting new paths to a more prosperous future.
Shareholder Advocacy
For the 2010 proxy season, Calvert filed a record 45 resolutions—including 30 as the lead filer. Issues covered by the resolutions focused on climate change, board and employee diversity, executive compensation, sustainability reporting, and political contributions. Thus far, we have negotiated 31 successful withdrawals after the companies have agreed to address our objectives.
The resolutions featured two new issues this year—climate change adaptation and board chair independence. Our resolutions on the first topic asked Kroger and Dover Corporation to report on how each plans to assess and manage the business impacts of climate change. Dover management agreed, so the resolution was successfully withdrawn. At Kroger, the resolution received strong support with 40% of shareholders voting in favor of it.
The second new issue recommended that Chesapeake Energy and Eaton Corporation separate the Board of Directors Chair and CEO positions to strengthen the Board’s oversight of company management and accountability to shareholders (which is emerging as a corporate governance best practice). Both resolutions were successfully withdrawn after management agreed to appoint a Lead Independent Director.
Community Investments
Many of our Funds participate in Calvert’s High Social Impact Investing program, which is administered through the Calvert Social Investment Foundation. This community investment program may allocate a small percentage of Fund assets at below-market interest rates to investments that provide economic opportunity for struggling populations.1
The Foundation recently launched its Green Strategies to Fight Poverty™ investment initiative, which allows investors to target their Community Investment Note investments to organizations and projects that both fight poverty and protect the environment.
Special Equities
A modest but important portion of certain funds is allocated to small private companies that are developing products or services that address important sustainability or environmental issues. CSIF Equity Portfolio has invested in Marrone Bio Innovations, which uses bio-based systems to control pests and weeds and recently received emergency-use approval from the EPA to sell its new invasive mussel control system in certain areas of the western U.S. The company also submitted a second organic herbicide product, for use on both organic and industrial farms, for approval to the EPA.
Calvert Large Cap Growth Fund invested in the Berkeley Renewable Energy Asia Fund, which brings power to areas of the world without access to a central power grid. Led by a management team with a long history in the industry, Berkeley mitigates construction risk by helping communities build the plants and then selling them to a service provider once they’re up and running.2
1 As of September 30, 2010, Calvert Social Investment Foundation Community Investment Notes represented the following percentages of Fund net assets: Calvert Social Investment Fund (CSIF) Balanced Portfolio 0.94%, CSIF Bond Portfolio 0.34%, CSIF Equity Portfolio 0.52%, Calvert Capital Accumulation Fund 1.29%, Calvert World Values International Equity Fund 1.19%, Calvert New Vision Small Cap Fund 0.78%, and Calvert Large Cap Growth Fund 0.56%. The Calvert Social Investment Foundation is a 501(c)(3) nonprofit organization. The Foundation’s Community Investment Note Program is not a mutual fund and should not be confused with any Calvert Group-sponsored investment product.
2 As of September 30, 2010, Marrone Bio Innovations represented 0.05% of CSIF Equity Portfolio; Berkeley Renewable Energy Asia Fund represented 0.002% of Calvert Large Cap Growth Fund. All holdings are subject to change without notice.
As of September 30, 2010, the following companies represented the following percentages of Fund net assets: Kroger represented 0% of all Calvert SRI funds. Dover Corporation represented 0.15% of Calvert Social Index Fund. Chesapeake Energy represented 0.22% of CSIF Balanced Portfolio, 0.79% of CSIF Bond Portfolio, and 0.22% of Calvert Social Index Fund. Eaton Corporation represented 0.52% of CSIF Enhanced Equity Portfolio and 0.20% of Calvert Social Index Fund. All holdings are subject to change without notice.
Portfolio Management Discussion
Michelle Clayman
Nathaniel Paull
of New Amsterdam Partners LLC
Performance
In the 12 months ended September 30, 2010, Calvert Capital Accumulation Fund returned 20.38%. This compares with 18.27% for the benchmark Russell Midcap Growth Index. Strong stock selection drove the Fund’s outperformance.
Investment Climate
After the financial and economic turmoil that began in 2008, the U.S. economy shrank by 2.5% in 2009. The stock market continued its fall until the beginning of March, then staged a sharp rally once signs of economic improvement appeared--bringing to a close the worst decade on record for U.S. stock performance. The “Great Recession” appeared to be ending last year and although it involved a lot of pain, it proved less dire than many had feared. Gross domestic product (GDP) growth turned positive in the second half of 2009 and that trend
calvert capital accumulation fund
September 30, 2010
Investment Performance
(total return at NAV*)
| 6 Months | 12 Months |
| ended | ended |
| 9/30/10 | 9/30/10 |
Class A | 2.01% | 20.38% |
Class B | 1.47% | 19.08% |
Class C | 1.60% | 19.39% |
Class I | 2.47% | 21.47% |
Russell Midcap Growth Index | 2.95% | 18.27% |
Lipper Mid-Cap Growth Funds Average | 3.13% | 17.14% |
| | |
Ten Largest Stock Holdings | | |
| % of Net Assets | |
Syntel, Inc. | 3.3% | |
FMC Technologies, Inc. | 3.2% | |
WABCO Holdings, Inc. | 3.0% | |
Teradata Corp. | 3.0% | |
HealthSpring, Inc. | 2.8% | |
Nalco Holding Co. | 2.8% | |
Deckers Outdoor Corp. | 2.8% | |
Wright Express Corp. | 2.7% | |
Itron, Inc. | 2.7% | |
Affiliated Managers Group, Inc. | 2.7% | |
Total | 29.0% | |
| | |
Economic Sectors | % of total investments | |
Consumer Discretionary | 21.0% | |
Consumer Staples | 4.8% | |
Energy | 5.7% | |
Financials | 7.4% | |
Government | 2.0% | |
Health Care | 12.2% | |
Industrials | 11.7% | |
Information Technology | 22.9% | |
Materials | 6.0% | |
Telecommunication Services | 4.4% | |
Utilities | 1.9% | |
Total | 100% | |
*Investment performance/return at NAV does not reflect the deduction of the Fund’s maximum 4.75% front-end sales charge or any deferred sales charge.
continued into this year as the government’s stimulus efforts worked their way through the economy.
The unemployment rate stayed at an alarmingly high 9.6% as of September but the economy did start posting modest net job gains. The employment situation and housing market continued to pressure consumer incomes, yet personal consumption expenditures have risen modestly--admittedly, from very depressed levels. Low capacity utilization rates and wage growth are keeping inflation down, although the Federal Reserve recently said its next moves are to increase inflation in the hope of increasing growth.
Despite May’s sharp sell off, which was triggered by the euro-zone’s sovereign debt crisis, the U.S. stock market rose nearly 11% over the past 12 months, with much of the gains coming from a rally in the third quarter of 2010. Valuations in U.S. equities still appear reasonable, given that corporate profits have stayed strong and balance sheets are solid. While the continued shift out of U.S. equities has dampened returns, it has also made prices and valuations more attractive to savvy buyers.
Overall, some good news on the economic front propelled the stock market higher, with returns of 17.54% for the Russell Mid Cap Index and 10.75% for large-cap stocks, as represented by the Russell 1000 Index. Among mid-caps, growth topped value, with returns of 16.93% for the Russell Mid Cap Value Index and 18.27% for the Russell Mid Cap Growth Index.
Portfolio Strategy
During the past 12 months, the stock market recovery helped many of our holdings reach their price targets. Therefore, stock selection was the primary reason for the Fund’s outperformance. Mining company Bucyrus International (40.1%),1 commercial vehicle
calvert capital accumulation fund
September 30, 2010
Average Annual Total Returns
Class A Shares | (with max. load) |
One year | 14.68% |
Five year | 0.56% |
Ten year | -2.33% |
| |
Class B Shares | (with max. load) |
One year | 14.15% |
Five year | 0.38% |
Ten year | -2.76% |
| |
| |
Class C Shares | (with max. load) |
One year | 18.46% |
Five year | 0.76% |
Ten year | -2.64% |
Class I Shares* | |
One year | 21.47% |
Five year | 2.45% |
Ten year | -0.87% |
* Note Regarding Class I Shares Total Returns: There were times during the reporting period when there were no shareholders in Class I. For purposes of reporting Average Annual Total Return, Class A performance at NAV (i.e. does not reflect deduction of the Class A front-end sales charge) is used during these periods in which there were no shareholders in Class I. For purposes of this Average Annual Total Return, the Class A performance at NAV was used during the period January 18, 2002 through June 3, 2003.
Growth of $10,000
The graph below shows the value of a hypothetical $10,000 investment in the fund over the past 10 fiscal year periods or since inception (for funds without 10-year records). The results shown are for Classes A and C shares and reflect the deduction of the maximum front-end Class A sales charge of 4.75%, or deferred sales charge, as applicable and assume the reinvestment of dividends. The result is compared with benchmarks that include a broad based market index and a Lipper peer group average. Market indexes are unmanaged and their results do not reflect the effect of expenses or sales charges. The Lipper average reflects the deduction of the category’s average front-end sales charge. The value of an investment in a different share class would be different.
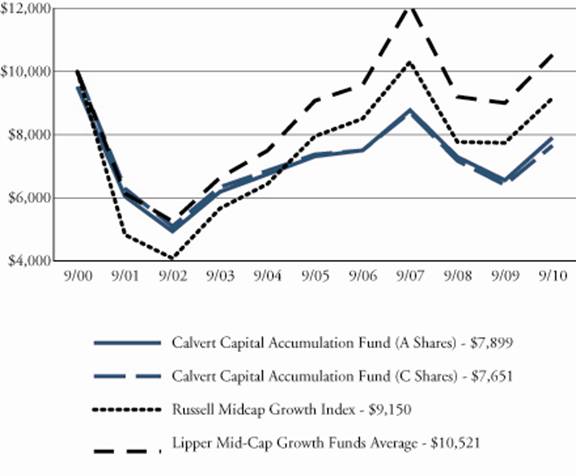
All performance data shown, including the graph above and the adjacent table, represents past performance, does not guarantee future results, assumes reinvestment of dividends and distributions and does not reflect the deduction of taxes that a shareholder would pay on the Fund’s/Portfolio’s distributions or the redemption of the Fund/Portfolio shares. The investment return and principal value of an investment will fluctuate so that an investor’s shares, when redeemed, may be worth more or less than their original cost. Current performance may be lower or higher than the performance data quoted; for current performance data visit www.calvert.com. The gross expense ratio from the current prospectus for Class A shares is 1.88%. This number may differ from the expense ratio shown elsewhere in this report because it is based on a differe nt time period and, if applicable, does not include fee or expense waivers. Performance data quoted already reflects the deduction of the Fund’s/Portfolio’s operating expenses.
parts supplier Wabco Holdings (47.5%), and TRW Automotive (38.5%) were a few of our strong performers.
Stock picks in Information Technology, Health Care, Energy, Utilities, and Industrials added value. In Information Technology, Sybase advanced 67.5% on its acquisition by SAP and the trend toward 3-D video moved Dolby Laboratories 33.4% higher. Both stocks were subsequently sold after their price run-ups. Strong earnings and takeover speculation drove new holding Teradata up 34.4%.
In Health Care, HealthSpring recovered nicely with a gain of 89.8%, driven in part by its well-received acquisition of privately held Bravo Health. In Energy and Consumer Discretionary, FMC Technologies improved 30.7%, thanks to a rebound in new orders, and Deckers Outdoors advanced 76.6% on better-than-expected sales growth.
However, our stock picking was weak in Consumer Discretionary, Consumer Staples, and Materials. Consumer Discretionary stocks GameStop lost 29.7% on weak video game sales and increasing competition, ITT Educational Services declined 22.4% due to regulatory headwinds, and Tupperware fell 15.7% due to accounting irregularities in a Russian subsidiary. All three were subsequently sold. Consumer Staples holding Del Monte Foods fell 12.3% in a more difficult promotional environment. Praxair rose 4.4% but weak earnings led it to lag its Materials sector peers before it was sold.
Overall, the Fund’s sector allocations detracted from its relative performance. Although overweights to Telecommunications and Consumer Discretionary boosted returns, this was more than offset by other sector allocations--such as an overweight to Utilities and underweight to Industrials. At period-end, the Fund had overweights to the Utilities and Telecommunications sectors and an underweight to Information Technology.
Outlook
There seems to be little appetite for further stimulus measures, and spending cuts will weigh on economic growth in the near term. As a result, we expect GDP growth of 2% to 2.5% in 2011, much lower than the estimated 3.7% rate needed to get the economy back to its pre-recession path.
In the longer term, we expect the U.S. economy to have positive but sub-par growth. Enormous budget deficits overhang the U.S. economy. These deficits will need to be paid for one way or another, and this can only be done by raising taxes, cutting spending, or monetizing the debt and “inflating our way out of it.” The latter is seen as being good for the markets (though we question its long-term efficacy). The market may also rise after the elections if the Bush era tax cuts are extended.
The largest risk on the horizon is a double-dip recession. While we think that is unlikely, the odds of it happening have increased. A resurgence of the sovereign debt crisis, increased global terrorism activity, or a marked slowdown in emerging-market growth could each trigger a drop in U.S. economic activity.
Meanwhile, with strong corporate profits and solid balance sheets, valuations of U.S. equities appear reasonable. In the near term, we expect U.S. equities to continue to rise until year end, with further modest increases in 2011.
In environments like these, we believe it’s important to continue to focus on companies with solid earnings power and cash flow generation, good quality financial statements, and reasonable valuations.
October 2010
1 All returns shown for individual holdings reflect that part of the reporting period the holdings were held.
As of September 30, 2010, the following companies represented the following percentages of Fund net assets: Bucyrus International 0%, Wabco Holding 3.06%, TRW Automotive 2.60%, Sybase 0%, Dolby Laboratories 0%, Teradata 3.05%, HealthSpring 2.84%, FMC Technologies 3.26%, Deckers Outdoors 2.79%, GameStop 0%, ITT Educational Services 0%, Tupperware 0%, Del Monte Foods 2.36%, and Praxair 0%. All holdings are subject to change without notice.
Shareholder Expense Example
As a shareholder of the Fund, you incur two types of costs: (1) transaction costs, including sales charges and redemption fees; and (2) ongoing costs, including management fees; distribution (12b-1) fees; and other Fund expenses. This Example is intended to help you understand your ongoing costs (in dollars) of investing in the Fund and to compare these costs with the ongoing costs of investing in other mutual funds.
This Example is based on an investment of $1,000 invested at the beginning of the period and held for the entire period (April 1, 2010 to September 30, 2010).
Actual Expenses
The first line of the table below provides information about actual account values and actual expenses. You may use the information in this line, together with the amount you invested, to estimate the expenses that you paid over the period. Simply divide your account value by $1,000 (for example, an $8,600 account value divided by $1,000 = 8.6), then multiply the result by the number in the first line under the heading entitled “Expenses Paid During Period” to estimate the expenses you paid on your account during this period.
Hypothetical Example for Comparison Purposes
The second line of the table below provides information about hypothetical account values and hypothetical expenses based on the Fund’s actual expense ratio and an assumed rate of return of 5% per year before expenses, which is not the Fund’s actual return. The hypothetical account values and expenses may not be used to estimate the actual ending account balance or expenses you paid for the period. You may use this information to compare the ongoing costs of investing in the Fund and other funds. To do so, compare the 5% hypothetical example with the 5% hypothetical examples that appear in the shareholder reports of the other funds.
Please note that the expenses shown in the table are meant to highlight your ongoing costs only and do not reflect any transactional costs, such as sales charges (loads) or redemption fees. Therefore, the second line of the table is useful in comparing ongoing costs only, and will not help you determine the relative total costs of owning different funds. In addition, if these transactional costs were included, your costs would have been higher.
| Beginning | Ending Account | Expenses Paid |
| Account Value | Value | During Period* |
| 4/1/10 | 9/30/10 | 4/1/10 - 9/30/10 |
Class A | | | |
Actual | $1,000.00 | $1,020.10 | $8.74 |
Hypothetical | $1,000.00 | $1,016.42 | $8.72 |
(5% return per | | | |
year before expenses) | | | |
Class B | | | |
Actual | $1,000.00 | $1,014.70 | $14.22 |
Hypothetical | $1,000.00 | $1,010.95 | $14.19 |
(5% return per | | | |
year before expenses) | | | |
Class C | | | |
Actual | $1,000.00 | $1,016.00 | $12.66 |
Hypothetical | $1,000.00 | $1,012.51 | $12.64 |
(5% return per | | | |
year before expenses) | | | |
Class I | | | |
Actual | $1,000.00 | $1,024.70 | $4.37 |
Hypothetical | $1,000.00 | $1,020.76 | $4.36 |
(5% return per | | | |
year before expenses) | | | |
* Expenses are equal to the Fund’s annualized expense ratio of 1.73%, 2.82%, 2.51% and 0.86% for Class A, Class B, Class C, and Class I respectively, multiplied by the
average account value over the period, multiplied by 183/365 (to reflect the one-half
year period).
REPORT OF INDEPENDENT PUBLIC ACCOUNTING FIRM
The Board of Directors of Calvert World Values Fund, Inc. and Shareholders of Calvert Capital Accumulation Fund:
We have audited the accompanying statement of net assets of the Calvert Capital Accumulation Fund (the Fund), a series of the Calvert World Values Fund, Inc., as of September 30, 2010, and the related statement of operations for the year then ended, the statements of changes in net assets for each of the years in the two-year period then ended, and the financial highlights for each of the years in the five-year period then ended. These financial statements and financial highlights are the responsibility of the Fund’s management. Our responsibility is to express an opinion on these financial statements and financial highlights based on our audits.
We conducted our audits in accordance with the standards of the Public Company Accounting Oversight Board (United States). Those standards require that we plan and perform the audit to obtain reasonable assurance about whether the financial statements and financial highlights are free of material misstatement. An audit includes examining, on a test basis, evidence supporting the amounts and disclosures in the financial statements. Our procedures included confirmation of securities owned as of September 30, 2010, by correspondence with custodians and brokers or other appropriate auditing procedures. An audit also includes assessing the accounting principles used and significant estimates made by management, as well as evaluating the overall financial statement presentation. We believe that our audits provide a reasonable basis for our opinion.
In our opinion, the financial statements and financial highlights referred to above present fairly, in all material respects, the financial position of the Calvert Capital Accumulation Fund as of September 30, 2010, the results of its operations for the year then ended, the changes in its net assets for each of the years in the two-year period then ended, and the financial highlights for each of the years in the five-year period then ended, in conformity with U.S. generally accepted accounting principles.
/s/KPMG LLP
Philadelphia, Pennsylvania
November 24, 2010
STATEMENT OF NET ASSETS
september 30, 2010
Equity Securities - 95.8% | | Shares | Value |
Auto Components - 2.6% | | | |
TRW Automotive Holdings Corp.* | | 66,500 | $2,763,740 |
| | | |
Building Products - 2.5% | | | |
Lennox International, Inc. | | 63,500 | 2,647,315 |
| | | |
Capital Markets - 2.6% | | | |
Affiliated Managers Group, Inc.* | | 36,600 | 2,855,166 |
| | | |
Chemicals - 4.2% | | | |
Ecolab, Inc. | | 30,900 | 1,567,866 |
Nalco Holding Co. | | 118,500 | 2,987,385 |
| | | 4,555,251 |
| | | |
Communications Equipment - 1.3% | | | |
Harris Corp. | | 30,900 | 1,368,561 |
| | | |
Diversified Financial Services - 2.2% | | | |
IntercontinentalExchange, Inc.* | | 23,000 | 2,408,560 |
| | | |
Electronic Equipment & Instruments - 4.8% | | | |
Amphenol Corp. | | 46,300 | 2,267,774 |
Itron, Inc.* | | 46,900 | 2,871,687 |
| | | 5,139,461 |
| | | |
Energy Equipment & Services - 5.6% | | | |
FMC Technologies, Inc.* | | 50,800 | 3,469,132 |
Unit Corp.* | | 69,200 | 2,580,468 |
| | | 6,049,600 |
| | | |
Food Products - 2.3% | | | |
Del Monte Foods Co. | | 191,500 | 2,510,565 |
| | | |
Gas Utilities - 1.9% | | | |
Energen Corp. | | 43,900 | 2,007,108 |
| | | |
Health Care Equipment & Supplies - 0.5% | | | |
Hospira, Inc.* | | 9,300 | 530,193 |
| | | |
| | | |
Equity Securities - Cont’d | | Shares | Value |
Health Care Providers & Services - 6.2% | | | |
AmerisourceBergen Corp. | | 61,400 | $1,882,524 |
HealthSpring, Inc.* | | 117,000 | 3,023,280 |
Lincare Holdings, Inc. | | 71,300 | 1,788,917 |
| | | 6,694,721 |
| | | |
Household Products - 2.4% | | | |
Church & Dwight Co., Inc. | | 40,100 | 2,604,094 |
| | | |
Insurance - 1.2% | | | |
Torchmark Corp. | | 23,800 | 1,264,732 |
| | | |
IT Services - 11.6% | | | |
Global Payments, Inc. | | 63,600 | 2,727,804 |
Syntel, Inc. | | 79,100 | 3,519,950 |
Teradata Corp.* | | 84,100 | 3,242,896 |
Wright Express Corp.* | | 81,800 | 2,921,078 |
| | | 12,411,728 |
| | | |
Leisure Equipment & Products - 1.8% | | | |
Polaris Industries, Inc. | | 29,500 | 1,920,450 |
| | | |
Life Sciences - Tools & Services - 4.4% | | | |
Mettler-Toledo International, Inc.* | | 16,900 | 2,103,036 |
Waters Corp.* | | 37,600 | 2,661,328 |
| | | 4,764,364 |
| | | |
Machinery - 9.5% | | | |
Flowserve Corp. | | 19,600 | 2,144,632 |
Gardner Denver, Inc. | | 50,600 | 2,716,208 |
The Toro Co. | | 37,000 | 2,080,510 |
WABCO Holdings, Inc.* | | 77,700 | 3,258,738 |
| | | 10,200,088 |
| | | |
Media - 1.8% | | | |
Gannett Co., Inc. | | 154,600 | 1,890,758 |
| | | |
Metals & Mining - 1.7% | | | |
Reliance Steel & Aluminum Co. | | 43,300 | 1,798,249 |
| | | |
Multiline Retail - 2.0% | | | |
Nordstrom, Inc. | | 57,400 | 2,135,280 |
| | | |
| | | |
Equity Securities - Cont’d | | Shares | Value |
Pharmaceuticals - 2.9% | | | |
Endo Pharmaceuticals Holdings, Inc.* | | 54,500 | $1,811,580 |
Forest Laboratories, Inc.* | | 41,000 | 1,268,130 |
| | | 3,079,710 |
| | | |
Semiconductors & Semiconductor Equipment - 3.1% | | | |
Hittite Microwave Corp.* | | 19,600 | 933,940 |
National Semiconductor Corp. | | 185,100 | 2,363,727 |
| | | 3,297,667 |
| | | |
Specialty Retail - 4.7% | | | |
Advance Auto Parts, Inc. | | 39,000 | 2,288,520 |
Ross Stores, Inc. | | 50,600 | 2,763,772 |
| | | 5,052,292 |
| | | |
Textiles, Apparel & Luxury Goods - 5.0% | | | |
Deckers Outdoor Corp.* | | 59,400 | 2,967,624 |
Hanesbrands, Inc.* | | 91,600 | 2,368,776 |
| | | 5,336,400 |
| | | |
Trading Companies & Distributors - 2.6% | | | |
WESCO International, Inc.* | | 72,100 | 2,832,809 |
| | | |
Wireless Telecommunication Services - 4.4% | | | |
NII Holdings, Inc.* | | 51,800 | 2,128,980 |
Syniverse Holdings, Inc.* | | 115,300 | 2,613,851 |
| | | 4,742,831 |
| | | |
| | | |
Total Equity Securities (Cost $89,360,931) | | | 102,861,693 |
| | | |
| | Principal | |
High Social Impact Investments - 1.3% | | Amount | |
Calvert Social Investment Foundation Notes, | | | |
1.17%, 7/1/11 (b)(i)(r) | | $1,419,488 | 1,371,921 |
| | | |
Total High Social Impact Investments (Cost $1,419,488) | | | 1,371,921 |
| | | |
U.S. Government Agencies | | Principal | |
and Instrumentalities - 1.9% | | Amount | Value |
Federal Home Loan Bank Discount Notes, 10/1/10 | | $2,100,000 | $2,100,000 |
| | | |
Total U.S. Government Agencies and Instrumentalities | | | |
(Cost $2,100,000) | | | 2,100,000 |
| | | |
| | | |
TOTAL INVESTMENTS (Cost $92,880,419) - 99.0% | | | 106,333,614 |
Other assets and liabilities, net - 1.0% | | | 1,026,242 |
Net Assets - 100% | | | $107,359,856 |
| | | |
| | | |
Net Assets Consist of: | | | |
Paid-in capital applicable to the following shares of common stock, | | | |
with 250,000,000 shares of $0.01 par value shares authorized: | | | |
Class A: 3,475,697 shares outstanding | | | $78,663,310 |
Class B: 187,826 shares outstanding | | | 5,949,071 |
Class C: 438,412 shares outstanding | | | 9,088,667 |
Class I: 268,469 shares outstanding | | | 6,209,165 |
Accumulated net realized gain (loss) on investments | | | (6,003,552) |
Net unrealized appreciation (depreciation) on investments | | | 13,453,195 |
| | | |
Net Assets | | | $107,359,856 |
| | | |
| | | |
Net Asset Value Per Share: | | | |
Class A (based on net assets of $86,634,990) | | | $24.93 |
Class B (based on net assets of $4,137,682) | | | $22.03 |
Class C (based on net assets of $9,449,351) | | | $21.55 |
Class I (based on net assets of $7,137,833) | | | $26.59 |
| | | |
| | | |
Restricted Securities | | Acquisition Dates | Cost |
Calvert Social Investment Foundation Notes, 1.17%, 7/1/11 | | 7/1/08 | $1,419,488 |
(b) This security was valued by the Board of Directors. See note A.
(i) Restricted securities represent 1.3% of the net assets of the fund.
(r) The coupon rate shown on floating or adjustable rate securities represents the rate at period end.
* Non-income producing
See notes to financial statements.
Statement of Operations
year ended september 30, 2010
Net Investment Income | | |
Investment Income: | | |
Dividend income | | $640,558 |
Interest income | | 23,803 |
Total investment income | | 664,361 |
| | |
Expenses: | | |
Investment advisory fee | | 641,942 |
Transfer agency fees and expenses | | 324,085 |
Administrative fees | | 238,010 |
Distribution Plan expenses: | | |
Class A | | 277,161 |
Class B | | 46,062 |
Class C | | 90,377 |
Directors’ fees and expenses | | 12,074 |
Custodian fees | | 31,665 |
Registration fees | | 45,113 |
Reports to shareholders | | 77,408 |
Professional fees | | 25,266 |
Miscellaneous | | 8,145 |
Total expenses | | 1,817,308 |
Reimbursement from Advisor: | | |
Class B | | (78) |
Class I | | (15,215) |
Fees paid indirectly | | (587) |
Net expenses | | 1,801,428 |
| | |
Net Investment Income (Loss) | | (1,137,067) |
| | |
Realized and Unrealized Gain (Loss) on Investments | | |
Net realized gain (loss) | | 13,500,374 |
Change in unrealized appreciation (depreciation) | | 5,739,164 |
| | |
Net Realized and Unrealized Gain | | |
(Loss) on Investments | | 19,239,538 |
| | |
Increase (Decrease) in Net Assets | | |
Resulting From Operations | | $18,102,471 |
See notes to financial statements.
Statements of Changes in Net Assets
| | Year Ended | Year Ended |
| | September 30, | September 30, |
Increase (Decrease) in Net Assets | | 2010 | 2009 |
Operations: | | | |
Net investment income (loss) | | ($1,137,067) | ($811,224) |
Net realized gain (loss) | | 13,500,374 | (13,562,431) |
Change in unrealized appreciation (depreciation) | | 5,739,164 | 2,549,748 |
| | | |
Increase (Decrease) in Net Assets | | | |
Resulting From Operations | | 18,102,471 | (11,823,907) |
| | | |
| | | |
Capital share transactions: | | | |
Shares sold: | | | |
Class A shares | | 14,410,519 | 10,271,700 |
Class B shares | | 305,711 | 340,561 |
Class C shares | | 808,515 | 582,113 |
Class I shares | | 3,104,135 | 861,998 |
Redemption fees: | | | |
Class A shares | | 351 | 11,208 |
Class B shares | | 198 | 89 |
Class C shares | | 5 | 82 |
Shares redeemed: | | | |
Class A shares | | (14,759,050) | (14,039,663) |
Class B shares | | (1,786,946) | (2,151,260) |
Class C shares | | (1,203,164) | (1,290,548) |
Class I shares | | (828,967) | (379,390) |
Total capital share transactions | | 51,307 | (5,793,110) |
| | | |
| | | |
Total Increase (Decrease) in Net Assets | | 18,153,778 | (17,617,017) |
| | | |
Net Assets | | | |
Beginning of year | | 89,206,078 | 106,823,095 |
End of year | | $107,359,856 | $89,206,078 |
See notes to financial statements.
Statements of Changes in Net Assets
| | Year Ended | Year Ended |
| | September 30, | September 30, |
Capital Share Activity | | 2010 | 2009 |
Shares sold: | | | |
Class A shares | | 623,033 | 590,092 |
Class B shares | | 14,768 | 22,798 |
Class C shares | | 39,504 | 38,543 |
Class I shares | | 126,782 | 47,056 |
Shares redeemed: | | | |
Class A shares | | (638,692) | (803,556) |
Class B shares | | (86,086) | (139,206) |
Class C shares | | (60,274) | (86,788) |
Class I shares | | (33,638) | (20,223) |
Total capital share activity | | (14,603) | (351,284) |
See notes to financial statements.
Notes to Financial Statements
Note A — Significant Accounting Policies
General: The Calvert Capital Accumulation Fund (the “Fund”), a series of Calvert World Values Fund, Inc., is registered under the Investment Company Act of 1940 as a non-diversified, open-end management investment company. The operation of each series is accounted for separately. The Fund offers four classes of shares of capital stock. Class A shares are sold with a maximum front-end sales charge of 4.75%. Class B shares are sold without a front-end sales charge. With certain exceptions, the Fund will impose a deferred sales charge at the time of redemption, depending on how long investors have owned the shares. Effective March 1, 2010, Class B shares are no longer offered for purchase, except through reinvestment of dividends and/or dist ributions and through certain exchanges. Class C shares are sold without a front-end sales charge. With certain exceptions, the Fund will impose a deferred sales charge on shares sold within one year of purchase. Class B and Class C shares have higher levels of expenses than Class A shares. Class I shares require a minimum account balance of $1,000,000. The $1 million minimum initial investment may be waived for certain institutional accounts, where it is believed to be in the best interest of the Fund and its shareholders. Class I shares have no front-end or deferred sales charge and have lower levels of expenses than Class A Shares. Each class has different: (a) dividend rates, due to differences in Distribution Plan expenses and other class-specific expenses, (b) exchange privileges; and (c) class-specific voting rights.
Security Valuation: Net asset value per share is determined every business day as of the close of the regular session of the New York Stock Exchange (generally 4:00 p.m. Eastern time). The Fund uses independent pricing services approved by the Board of Directors to value its investments wherever possible. Securities for which market quotations are available are valued at last sale price or official closing price on the primary market or exchange in which they trade. Short-term notes are stated at amortized cost, which approximates fair value. The Fund may invest in securities whose resale is subject to restrictions. Investments for which market quotations are not available or deemed not reliable are fair valued in good faith under the direction of the Board of Directors.
In determining fair value, the Board considers all relevant qualitative and quantitative information available. These factors are subject to change over time and are reviewed periodically. The values assigned to fair value investments are based on available information and do not necessarily represent amounts that might ultimately be realized. Further, because of the inherent uncertainty of valuation, those estimated values may differ significantly from the values that would have been used had a ready market for the investments existed, and the differences could be material.
At September 30, 2010 securities valued at $1,371,921, or 1.3% of net assets, were fair valued in good faith under the direction of the Board of Directors.
The Fund utilizes various methods to measure the fair value of its investments. Generally Accepted Accounting Principles (GAAP) establishes a disclosure hierarchy that categorizes the inputs to valuation techniques used to value assets and liabilities at measurement date. These inputs are summarized in the three broad levels listed below:
Level 1 – quoted prices in active markets for identical securities
Level 2 – other significant observable inputs (including quoted prices for similar securities, interest rates, prepayment speeds, credit risk, etc.)
Level 3 – significant unobservable inputs (including the Fund’s own assumptions in determining the fair value of investments)
The inputs or methodology used for valuing securities are not necessarily an indication of the risk associated with investing in those securities.
Changes in valuation techniques may result in transfers in or out of an investment’s assigned level within the hierarchy during the period. For additional information on the Fund’s policy regarding valuation of investments, please refer to the Fund’s most recent prospectus.
The following is a summary of the inputs used to value the Fund’s net assets as of September 30, 2010:
| Valuation Inputs |
Investments in Securities | Level 1 | Level 2 | Level 3 | Total |
Equity securities* | $102,861,693 | — | — | $102,861,693 |
U.S. government obligations | — | $2,100,000 | — | 2,100,000 |
Other debt obligations | — | — | $1,371,921 | 1,371,921 |
TOTAL | $102,861,693 | $2,100,000 | $1,371,921** | $106,333,614 |
* For further breakdown of equity securities by industry type, please refer to the Statement of Net Assets.
**Level 3 securities represent 1.3% of net assets.
Repurchase Agreements: The Fund may enter into repurchase agreements with recognized financial institutions or registered broker/dealers and, in all instances, holds underlying securities with a value exceeding the total repurchase price, including accrued interest. Although risk is mitigated by the collateral, the Fund could experience a delay in recovering its value and a possible loss of income or value if the counterparty fails to perform in accordance with the terms of the agreement.
Restricted Securities: The Fund may invest in securities that are subject to legal or contractual restrictions on resale. Generally, these securities may only be sold publicly upon registration under the Securities Act of 1933 or in transactions exempt from such registration. Information regarding restricted securities is included at the end of the Fund’s Statement of Net Assets.
Security Transactions and Net Investment Income: Security transactions are accounted for on trade date. Realized gains and losses are recorded on an identified cost basis and may include proceeds from litigation. Dividend income is recorded on the ex-dividend date. Distributions received on securities that represent a return of capital or capital gain are recorded as a reduction of cost investments and/or as a realized gain. Interest income, which includes amortization of premium and accretion of discount on debt securities, is accrued as earned. Investment income and realized and unrealized gains and losses are allocated to separate classes of shares based upon the relative net assets of each class. Expenses arising in connection with a class ar e charged directly to that class. Expenses common to the classes are allocated to each class in proportion to their relative net assets.
Distributions to Shareholders: Distributions to shareholders are recorded by the Fund on ex-dividend date. Dividends from net investment income and distributions from net realized capital gains, if any, are paid at least annually. Distributions are determined in accordance with income tax regulations which may differ from generally accepted accounting principles; accordingly, periodic reclassifications are made within the Fund’s capital accounts to reflect income and gains available for distribution under income tax regulations.
Estimates: The preparation of financial statements in conformity with accounting principles generally accepted in the United States requires management to make estimates and assumptions that affect the reported amounts of assets and liabilities and disclosure of contingent assets and liabilities at the date of the financial statements and the reported amounts of income and expenses during the reporting period. Actual results could differ from those estimates.
Redemption Fees: The Fund charges a 2% redemption fee on redemptions, including exchanges, made within 30 days of purchase in the same Fund (within seven days for Class I shares). The redemption fee is payable to the Class of the Fund from which the redemption is made, and is accounted for as an addition to paid-in capital. The fee is intended to discourage market-timers by ensuring that short-term trading costs are borne by the investors making the transactions and not the shareholders already in the Fund.
Expense Offset Arrangements: The Fund has an arrangement with its custodian bank whereby the custodian’s fees may be paid indirectly by credits earned on the Fund’s cash on deposit with the bank. These credits are used to reduce the Fund’s expenses. Such a deposit arrangement may be an alternative to overnight investments.
Federal Income Taxes: No provision for federal income or excise tax is required since the Fund intends to qualify as a regulated investment company under the Internal Revenue Code and to distribute substantially all of its taxable earnings.
Management has analyzed the Fund’s tax positions taken for all open federal income tax years and has concluded that no provision for federal income tax is required in the Fund’s financial statements. A Fund’s federal tax return is subject to examination by the Internal Revenue Service for a period of three years.
New Accounting Pronouncements: In January 2010, the Financial Accounting Standards Board (“FASB”) issued Accounting Standards Update (“ASU”) No. 2010-06 “Improving Disclosures about Fair Value Measurements”. ASU 2010-06 will require reporting entities to make new disclosures about amount and reasons for significant transfers in and out of Level 1 and Level 2 fair value measurements and input and valuation techniques used to measure fair value for both recurring and nonrecurring fair value measurements that fall in either Level 2 or Level 3, and information on purchases, sales, issuances, and settlements in the roll forward of activity in Level 3 fair value measures. The new and revised disclosures are effective for interim and annual reporting periods beginning after December 15, 2009 except for the disclosures about purchases, sales, issuances, and settlements in the roll forward of activity in Level 3 fair value measures, which are effective for fiscal years beginning after December 15, 2010. At this time, management is evaluating the implications of ASU No. 2010-06 disclosures about purchases, sales, issuances, and settlements in the roll forward of activity in Level 3 fair value measures and its impact on the financial statements has not been determined.
Note B — Related Party Transactions
Calvert Asset Management Company, Inc. (the “Advisor”) is wholly-owned by Calvert Group, Ltd. (“Calvert”), which is indirectly wholly owned by UNIFI Mutual Holding Company. The Advisor provides investment advisory services and pays the salaries and fees of officers and Directors of the Fund who are employees of the Advisor or its affiliates. For its services, the Advisor receives an annual fee, payable monthly, of .65% of the Fund’s average daily net assets. Under the terms of the agreement, $55,511 was payable at year end. In addition, $31,604 was payable at year end for operating expenses paid by the Advisor during September 30, 2010.
The Advisor has contractually agreed to limit net annual fund operating expenses through January 31, 2011 for Class I. The contractual expense cap is 0.86%. For the purposes of this expense limit, operating expenses do not include interest expense, brokerage commissions, taxes, and extraordinary expenses. To the extent that any expense offset credits are earned, the Advisor’s obligation under the contractual limitation may be reduced and the Advisor may benefit from the expense offset arrangement.
Calvert Administrative Services Company, an affiliate of the Advisor, provides administrative services to the Fund for an annual fee, payable monthly of .25% for Class A, Class B and Class C, and .10% for Class I shares based on their average daily net assets. Under the terms of the agreement, $20,501 was payable at year end.
Calvert Distributors, Inc., an affiliate of the Advisor, is the distributor and principal underwriter for the Fund. Distribution Plans, adopted by Class A, Class B, and Class C shares, allow the Fund to pay the Distributor for expenses and services associated with distribution of shares. The expenses paid may not exceed .35%, 1.00% and 1.00% annually of average daily net assets of Class A, Class B, and Class C, respectively. The amount actually paid by the Fund is an annualized fee, payable monthly of .35%, 1.00% and 1.00% of the Fund’s average daily net assets of Class A, Class B, and Class C, respectively. Class I shares do not have Distribution Plan expenses. Under the terms of the agreement, $34,990 was payable at year end.
The Distributor received $26,325 as its portion of the commissions charged on sales of the Fund’s Class A shares for the year ended September 30, 2010.
Calvert Shareholder Services, Inc. (“CSSI”), an affiliate of the Advisor, acts as shareholder servicing agent for the Fund. For its services, CSSI received a fee of $83,455 for the year ended September 30, 2010. Under the terms of the agreement, $6,860 was payable at year end. Boston Financial Data Services, Inc. is the transfer and dividend disbursing agent.
The Fund may invest in Community Investment Notes issued by the Calvert Social Investment Foundation (the “CSI Foundation”). The CSI Foundation is a 501(c)(3) non-profit organization that receives in-kind support from the Calvert Group, Ltd. and its subsidiaries. The Fund has received from the Securities and Exchange Commission an exemptive order permitting the Fund to make investments in these notes under certain conditions.
Each Director of the Fund who is not an employee of the Advisor or its affiliates receives an annual retainer of $44,000 plus a meeting fee of $2,000 for each Board meeting attended. Additional fees of up to $5,000 annually may be paid to the Board chairs and Committee chairs ($10,000 for Special Equities Committee chair) and $2,500 annually may be paid to Committee members, plus a Committee meeting fee of $500 for each Committee meeting attended. Director’s fees are allocated to each of the funds served.
Note C — Investment Activity
During the year, the cost of purchases and proceeds from sales of investments, other than short-term securities, were $83,800,849 and $87,035,002, respectively.
Capital Loss Carryforwards | |
Expiration Date | |
30-Sep-17 | $5,740,332 |
Capital losses may be utilized to offset future capital gains until expiration.
As of September 30, 2010, the tax basis components of distributable earnings/(accumulated losses) and the federal tax cost were as follows:
Unrealized appreciation | | $15,011,664 |
Unrealized (depreciation) | | (1,821,689) |
Net unrealized appreciation/(depreciation) | | $13,189,975 |
Capital loss carryforward | | ($5,740,332) |
Federal income tax cost of investments | | $93,143,639 |
The differences between the components of distributable earnings on a tax basis and the amounts reflected in the statement of net assets are primarily due to temporary book-tax differences that will reverse in a subsequent period. These book-tax differences are mainly due to wash sales.
Reclassifications, as shown in the table below, have been made to the Fund’s components of net assets to reflect income and gains available for distribution (or available capital loss carryovers, as applicable) under income tax law and regulations. These reclassifications are due to permanent book-tax differences and have no impact on net assets. The primary permanent difference causing such reclassification for the Fund is the tax treatment of net operating losses.
Undistributed net investment income | $1,137,067 |
Paid-in capital | (1,137,067) |
Note D — Line of Credit
A financing agreement is in place with all Calvert Group Funds and State Street Corporation (“SSC”). Under the agreement, SSC provides an unsecured line of credit facility, in the aggregate amount of $50 million ($25 million committed and $25 million uncommitted), accessible by the Funds for temporary or emergency purposes only. Borrowings under the committed facility bear interest at the higher of the London Interbank Offered Rate, (LIBOR) or the overnight Federal Funds Rate plus 1.25% per annum. A commitment fee of .125% per annum is incurred on the unused portion of the committed facility, which is allocated to all participating funds. The Fund had no loans outstanding pursuant to this line of credit at September 30, 2010. For the year ended September 30, 2010, borrowings by the Fund under the agreement were as follows:
| | Weighted | | Month of |
| Average | Average | Maximum | Maximum |
| Daily | Interest | Amount | Amount |
| Balance | Rate | Borrowed | Borrowed |
| $5,058 | 1.54% | $509,924 | July 2010 |
Note E - Subsequent Events
In preparing the financial statements as of September 30, 2010, no subsequent events or transactions occurred that would have materially impacted the financial statements as presented.
Financial Highlights
| | | Years Ended | |
| | September 30, | September 30, | September 30, |
Class A Shares | | 2010 | 2009 | 2008 |
Net asset value, beginning | | $20.71 | $23.00 | $28.11 |
Income from investment operations: | | | | |
Net investment income (loss) | | (.25) | (.17) | (.21) |
Net realized and unrealized gain (loss) | | 4.47 | (2.12) | (4.49) |
Total from investment operations | | 4.22 | (2.29) | (4.70) |
Distributions from: | | | | |
Net realized gain | | — | — | (.41) |
Total distributions | | — | — | (.41) |
Total increase (decrease) in net asset value | | 4.22 | (2.29) | (5.11) |
Net asset value, ending | | $24.93 | $20.71 | $23.00 |
Total return* | | 20.38% | (9.96%) | (16.97%) |
Ratios to average net assets:A | | | | |
Net investment income (loss) | | (1.08%) | (.92%) | (.79%) |
Total expenses | | 1.76% | 1.88% | 1.66% |
Expenses before offsets | | 1.76% | 1.88% | 1.66% |
Net expenses | | 1.76% | 1.88% | 1.65% |
Portfolio turnover | | 87% | 72% | 49% |
Net assets, ending (in thousands) | | $86,635 | $72,289 | $85,195 |
| | | | |
| | | | |
| | Years Ended | |
| | September 30, | September 30, | |
Class A Shares | | 2007(z) | 2006 | |
Net asset value, beginning | | $24.02 | $23.42 | |
Income from investment operations: | | | | |
Net investment income (loss) | | (.26) | (.27) | |
Net realized and unrealized gain | | 4.35 | .87 | |
Total from investment operations | | 4.09 | .60 | |
Total increase (decrease) in net asset value | | 4.09 | .60 | |
Net asset value, ending | | $28.11 | $24.02 | |
| | | | |
Total return* | | 17.03% | 2.56% | |
Ratios to average net assets:A | | | | |
Net investment income (loss) | | (.98%) | (1.05%) | |
Total expenses | | 1.66% | 1.71% | |
Expenses before offsets | | 1.66% | 1.71% | |
Net expenses | | 1.64% | 1.69% | |
Portfolio turnover | | 47% | 31% | |
Net assets, ending (in thousands) | | $107,976 | $103,499 | |
See notes to financial highlights.
Financial Highlights
| | | Years Ended | |
| | September 30, | September 30, | September 30, |
Class B Shares | | 2010 | 2009 | 2008 |
Net asset value, beginning | | $18.50 | $20.78 | $25.66 |
Income from investment operations: | | | | |
Net investment income (loss) | | (.53) | (.39) | (.47) |
Net realized and unrealized gain (loss) | | 4.06 | (1.89) | (4.00) |
Total from investment operations | | 3.53 | (2.28) | (4.47) |
Distributions from: | | | | |
Net realized gain | | — | — | (.41) |
Total distributions | | — | — | (.41) |
Total increase (decrease) in net asset value | | 3.53 | (2.28) | (4.88) |
Net asset value, ending | | $22.03 | $18.50 | $20.78 |
Total return* | | 19.08% | (10.97%) | (17.70%) |
Ratios to average net assets:A | | | | |
Net investment income (loss) | | (2.17%) | (2.04%) | (1.73%) |
Total expenses | | 2.84% | 2.99% | 2.57% |
Expenses before offsets | | 2.84% | 2.99% | 2.57% |
Net expenses | | 2.84% | 2.99% | 2.56 |
Portfolio turnover | | 87% | 72% | 49% |
Net assets, ending (in thousands) | | $4,138 | $4,793 | $7,803 |
| | | | |
| | | | |
| | Years Ended | |
| | September 30, | September 30, | |
Class B Shares | | 2007 (z) | 2006 | |
Net asset value, beginning | | $22.13 | $21.76 | |
Income from investment operations: | | | | |
Net investment income (loss) | | (.45) | (.49) | |
Net realized and unrealized gain (loss) | | 3.98 | .86 | |
Total from investment operations | | 3.53 | .37 | |
Total increase (decrease) in net asset value | | 3.53 | .37 | |
Net asset value, ending | | $25.66 | $22.13 | |
| | | | |
Total return* | | 15.95% | 1.70% | |
Ratios to average net assets:A | | | | |
Net investment income (loss) | | (1.86%) | (1.91%) | |
Total expenses | | 2.54% | 2.57% | |
Expenses before offsets | | 2.54% | 2.57% | |
Net expenses | | 2.52% | 2.55% | |
Portfolio turnover | | 47% | 31% | |
Net assets, ending (in thousands) | | $11,613 | $13,752 | |
See notes to financial highlights.
Financial Highlights
| | | Years Ended | |
| | September 30, | September 30, | September 30, |
Class C Shares | | 2010 | 2009 | 2008 |
Net asset value, beginning | | $18.05 | $20.20 | $24.93 |
Income from investment operations: | | | | |
Net investment income (loss) | | (.39) | (.28) | (.38) |
Net realized and unrealized gain (loss) | | 3.89 | (1.87) | (3.94) |
Total from investment operations | | 3.50 | (2.15) | (4.32) |
Distributions from: | | | | |
Net realized gain | | — | — | (.41) |
Total distributions | | — | — | (.41) |
Total increase (decrease) in net asset value | | 3.50 | (2.15) | (4.73) |
Net asset value, ending | | $21.55 | $18.05 | $20.20 |
Total return* | | 19.39% | (10.64%) | (17.62%) |
Ratios to average net assets:A | | | | |
Net investment income (loss) | | (1.87%) | (1.75%) | (1.57%) |
Total expenses | | 2.54% | 2.71% | 2.42% |
Expenses before offsets | | 2.54% | 2.71% | 2.42% |
Net expenses | | 2.54% | 2.70% | 2.42% |
Portfolio turnover | | 87% | 72% | 49% |
Net assets, ending (in thousands) | | $9,449 | $8,287 | $10,252 |
| | | | |
| | | | |
| | Years Ended | |
| | September 30, | September 30, | |
Class C Shares | | 2007 (z) | 2006 | |
Net asset value, beginning | | $21.47 | $21.10 | |
Income from investment operations: | | | | |
Net investment income (loss) | | (.41) | (.42) | |
Net realized and unrealized gain (loss) | | 3.87 | .79 | |
Total from investment operations | | 3.46 | .37 | |
Total increase (decrease) in net asset value | | 3.46 | .37 | |
Net asset value, ending | | $24.93 | $21.47 | |
| | | | |
Total return* | | 16.12% | 1.75% | |
Ratios to average net assets:A | | | | |
Net investment income (loss) | | (1.74%) | (1.84%) | |
Total expenses | | 2.42% | 2.49% | |
Expenses before offsets | | 2.42% | 2.49% | |
Net expenses | | 2.41% | 2.47% | |
Portfolio turnover | | 47% | 31% | |
Net assets, ending (in thousands) | | $13,275 | $12,831 | |
See notes to financial highlights.
Financial Highlights
| | | Years Ended | |
| | September 30, | September 30, | September 30, |
Class I Shares | | 2010 | 2009 | 2008 |
Net asset value, beginning | | $21.89 | $24.06 | $29.16 |
Income from investment operations: | | | | |
Net investment income (loss) | | (.04) | .02 | ** |
Net realized and unrealized gain (loss) | | 4.74 | (2.19) | (4.69) |
Total from investment operations | | 4.70 | (2.17) | (4.69) |
Distributions from: | | | | |
Net realized gain | | — | — | (.41) |
Total distributions | | — | — | (.41) |
Total increase (decrease) in net asset value | | 4.70 | (2.17) | (5.10) |
Net asset value, ending | | $26.59 | $21.89 | $24.06 |
Total return* | | 21.47% | (9.02%) | (16.31%) |
Ratios to average net assets:A | | | | |
Net investment income (loss) | | (.19%) | .10% | .01% |
Total expenses | | 1.12% | 1.28% | 1.18% |
Expenses before offsets | | .86% | .86% | .87% |
Net expenses | | .86% | .86% | .86% |
Portfolio turnover | | 87% | 72% | 49% |
Net assets, ending (in thousands) | | $7,138 | $3,837 | $3,573 |
| | | | |
| | | | |
| | Years Ended | |
| | September 30, | September 30, | |
Class I Shares | | 2007 (z) | 2006 | |
Net asset value, beginning | | $24.73 | $23.89 | |
Income from investment operations: | | | | |
Net investment income (loss) | | (.05) | (.02) | |
Net realized and unrealized gain (loss) | | 4.48 | .86 | |
Total from investment operations | | 4.43 | .84 | |
Total increase (decrease) in net asset value | | 4.43 | .84 | |
Net asset value, ending | | $29.16 | $24.73 | |
| | | | |
Total return* | | 17.91% | 3.52% | |
Ratios to average net assets:A | | | | |
Net investment income (loss) | | (.19%) | (.20%) | |
Total expenses | | 1.14% | 1.90% | |
Expenses before offsets | | .87% | .88% | |
Net expenses | | .86% | .86% | |
Portfolio turnover | | 47% | 31% | |
Net assets, ending (in thousands) | | $4,311 | $3,273 | |
See notes to financial highlights.
A Total expenses do not reflect amounts reimbursed and/or waived by the Advisor or reductions from expense offset arrangements. Expenses before offsets reflect expenses after reimbursement and/or waiver by the Advisor but prior to reductions from expense offset arrangements. Net expenses are net of all reductions and represent the net expenses paid by the Fund.
(z) Per share figures are calculated using the Average Shares Method.
* Total return is not annualized for periods less than one year and does not reflect deduction of any front-end or deferred sales charge.
** Less than $0.01 per share.
See notes to financial statements.
Explanation of Financial Tables
Schedule of Investments
The Schedule of Investments is a snapshot of all securities held in the fund at their market value, on the last day of the reporting period. Securities are listed by asset type (e.g., common stock, corporate bonds, U.S. government obligations) and may be further broken down into sub-groups and by industry classification.
Statement of Assets and Liabilities
The Statement of Assets and Liabilities is often referred to as the fund’s balance sheet. It lists the value of what the fund owns, is due and owes on the last day of the reporting period. The fund’s assets include the market value of securities owned, cash, receivables for securities sold and shareholder subscriptions, and receivables for dividends and interest payments that have been earned, but not yet received. The fund’s liabilities include payables for securities purchased and shareholder redemptions, and expenses owed but not yet paid. The statement also reports the fund’s net asset value (NAV) per share on the last day of the reporting period. The NAV is calculated by dividing the fund’s net assets (assets minus liabilities) by the number of shares outstanding. This statement is accompani ed by a Schedule of Investments. Alternatively, if certain conditions are met, a Statement of Net Assets may be presented in lieu of this statement and the Schedule of Investments.
Statement of Net Assets
The Statement of Net Assets provides a detailed list of the fund’s holdings, including each security’s market value on the last day of the reporting period. The Statement of Net Assets includes a Schedule of Investments. Other assets are added and other liabilities subtracted from the investments total to calculate the fund’s net assets. Finally, net assets are divided by the outstanding shares of the fund to arrive at its share price, or Net Asset Value (NAV) per share.
At the end of the Statement of Net Assets is a table displaying the composition of the fund’s net assets. Paid in Capital is the money invested by shareholders and represents the bulk of net assets. Undistributed Net Investment Income and Accumulated Net Realized Gains usually approximate the amounts the fund had available to distribute to shareholders as of the statement date. Accumulated Realized Losses will appear as negative balances. Unrealized Appreciation (Depreciation) is the difference between the market value of the fund’s investments and their cost, and reflects the gains (losses) that would be realized if the fund were to sell all of its investments at their statement-date -values.
Statement of Operations
The Statement of Operations summarizes the fund’s investment income earned and expenses incurred in operating the fund. Investment income includes dividends earned from stocks and interest earned from interest-bearing securities in the fund. Expenses incurred in operating the fund include the advisory fee paid to the investment advisor, administrative services fee, distribution plan expenses (if applicable), transfer agent fees, shareholder servicing expenses, custodial, legal, and audit fees, and the printing and postage expenses related to shareholder reports. Expense offsets (fees paid indirectly) are also shown. Credits earned from offset arrangements are used to reduce the fund’s expenses. This statement also shows net gains (losses) realized on the sale of investments and the increase or decrease in the unrealized appreciation (depreciation) on investments held during the period.
Statement of Changes in Net Assets
The Statement of Changes in Net Assets shows how the fund’s total net assets changed during the two most recent reporting periods. Changes in the fund’s net assets are attributable to investment operations, distributions and capital share transactions.
The Operations section of the report summarizes information detailed in the Statement of Operations. The Distribution section shows the dividend and capital gain distributions made to shareholders. The amounts shown as distributions in this section may not match the net investment income and realized gains amounts shown in the Operations section because distributions are determined on a tax basis and certain investments or transactions may be treated differently for financial statement and tax purposes. The Capital Share Transactions section shows the amount shareholders invested in the fund, either by purchasing shares or by reinvesting distributions, and the amounts redeemed. The corresponding numbers of shares issued, reinvested and redeemed are shown at the end of the report.
Financial Highlights
The Financial Highlights table provides a per-share breakdown per class of the components that affect the fund’s net asset value for current and past reporting periods. The table provides total return, total distributions, expense ratios, portfolio turnover and net assets for the applicable period. Total return is a measure of a fund’s performance that encompasses all elements of return: dividends, capital gain distributions and changes in net asset value. Total return is the change in value of an investment over a given period, assuming reinvestment of any dividends and capital gain distributions, expressed as a percentage of the initial investment. Total distributions include distributions from net investment income and net realized gains. Long-term gains are earned on securities held in the fund more than one year. Short-term gains, on the sale of securities held less than one year, are treated as ordinary dividend income for tax purposes. The expense ratio is a fund’s cost of doing business, expressed as a percentage of net assets. These expenses directly reduce returns to shareholders. Portfolio turnover measures the trading activity in a fund’s investment portfolio – how often securities are bought and sold by a fund. Portfolio turnover is affected by market conditions, changes in the size of the fund, the nature of the fund’s investments and the investment style of the portfolio.
Proxy Voting
The Proxy Voting Guidelines of the Calvert Funds that the Fund uses to determine how to vote proxies relating to portfolio securities are provided as an Appendix to the Fund’s Statement of Additional Information. The Statement of Additional Information can be obtained free of charge by calling the Fund at 1-800-368-2745, by visiting the Calvert website at www.calvert.com; or by visiting the SEC’s website at www.sec.gov.
Information regarding how the Fund voted proxies relating to portfolio securities during the most recent 12-month period ended June 30 is available on the Fund’s website at www.calvert.com and on the SEC’s website at www.sec.gov.
Availability of Quarterly Portfolio Holdings
The Fund files its complete schedule of portfolio holdings with the SEC for the first and third quarters of each fiscal year on Form N-Q. The Fund’s Form N-Q is available on the SEC’s website at www.sec.gov. The Fund’s Form N-Q may be reviewed and copied at the SEC’s Public Reference Room in Washington, DC; information on the operation of the Public Reference Room may be obtained by calling 1-800-SEC-0330.
Director and Officer Information Table
| # of
Calvert
Portfolios
Overseen | Other
Directorships |
Name &
Age | Position
with
Fund | Position
Start
Date | Principal Occupation
During Last 5 Years |
INDEPENDENT TRUSTEES/DIRECTORS |
REBECCA L. ADAMSON
AGE: 61 | Trustee Director Director Director | 1989
CSIF 2000
IMPACT 2000
CSIS 2005
CWVF | President of the national nonprofit, First People’s Worldwide, formerly First Nations Financial Project. Founded by her in 1980, First People’s Worldwide is the only American Indian alternative development institute in the country. | 17 | • Bay & Paul Foundation |
RICHARD L. BAIRD, JR.
AGE: 62 | Trustee &
Chair Director &
Chair Director &
Chair Director &
Chair | 1982
CSIF 2000
CSIS 2005
CWVF 2005
Impact | President and CEO of Adagio Health Inc. in Pittsburgh, PA, a non-profit corporation which provides family planning services, nutrition, maternal/child health care, and various health screening services and community preventive health programs. | 29 | None |
JOHN G. GUFFEY, JR.
AGE: 62 | Director Trustee Director Director | 1992
CWVF 1982
CSIF 2000
CSIS 2005
IMPACT | Treasurer and Director of Silby, Guffey and Co., Inc., a venture capital firm (inactive as of 2003) and President of Aurora Press Inc., a privately held publisher of trade paperbacks. | 29 | • Ariel Funds (3) • Calvert Social Investment Foundation • Calvert Ventures, LLC |
MILES DOUGLAS HARPER, III
AGE: 47 | Director Trustee Director Director | 2000
Impact 2005
CSIF 2005
CSIS 2005
CWVF | Partner, Gainer Donnelly & Desroches (public accounting firm) since January 1999. | 17 | • Bridgeway Funds (14) |
JOY V. JONES AGE:60 | Director Trustee Director Director | 2000
Impact 1990
CSIF 2000
CSIS 2005
CWVF | Attorney. | 17 | • Director, Conduit Street Restaurants Limited |
TERRENCE J. MOLLNER, Ed.D. AGE: 65 | Director Trustee Director Director | 1992
CWVF 1982
CSIF 2000
CSIS 2005
IMPACT | Founder, Chairperson, and President of Trusteeship Institute, Inc., a diverse foundation known principally for its consultation to corporations converting to cooperative employee-ownership and the development of socially and spiritually responsible investment vehicles. Chairperson, Stakeholders Capital, Inc., an asset management firm and financial services provider in Amherst, MA. | 17 | • Calvert Social Investment Foundation • Ben & Jerry's Homemade, Inc. • ArtNOW, Inc. • Yourolivebranch.org |
SYDNEY AMARA MORRIS
AGE: 61 | Trustee Director Director Director | 1982
CSIF 2000
CSIS 2005
CWVF 2005
IMPACT | Rev. Morris currently serves as Parish Minister to the Keweenaw Unitarian Universalist Fellowship in Houghton, MI. Rev. Morris is a graduate of Harvard Divinity School. She currently chairs the Umbrian Universalist Committee on Socially Responsible Investing. | 17 | None |
INTERESTED TRUSTEES/DIRECTORS |
BARBARA J. KRUMSIEK
AGE: 58 | Director &
President Trustee &
Senior Vice
President Director &
Senior Vice
President Director &
President | 1997
CWVF 1997
CSIF 2000
CSIS 2000
Impact | President, Chief Executive Officer and Chair of Calvert Group, Ltd. | 51 | • Calvert Social Investment Foundation • Pepco Holdings, Inc. • Acacia Life Insurance Company (Chair) |
D. WAYNE SILBY, Esq.
AGE: 62 | Director Trustee &
President Director &
President Director | 1992
CWVF 1982
CSIF 2000
CSIS 2000
Impact | Mr. Silby is the founding Chair of the Calvert Funds. He is the Chair-Elect and a principal of Syntao.com, a Beijing-based company promoting corporate social responsibility. He was an officer and director of Silby, Guffey and Co., Inc., a venture capital firm (inactive as of 2003). | 29 | • UNIFI Mutual Holding Company • Calvert Social Investment Foundation • Giving Assets, Inc. • Studio School Fund • Syntao.com China • The Ice Organization |
OFFICERS |
KAREN BECKER
AGE: 57 | Chief Compliance Officer | 2005 | Chief Compliance Officer for the Calvert Funds. In March 2009, Ms. Becker also became Head of the Securities Operations Department for Calvert Asset Management Company, Inc. |
SUSAN WALKER BENDER, Esq.
AGE: 51 | Assistant Vice-President & Assistant Secretary | 1988
CSIF 2000
CSIS 1992
CWVF 2000
Impact | Assistant Vice President, Assistant Secretary and Associate General Counsel of Calvert Group, Ltd. |
JENNIFER BERG
AGE: 36 | Assistant Fund Controller | 2009 | Fund Administration Manager for Calvert Group, Ltd. |
THOMAS DAILEY
AGE: 46 | Vice President | 2004 | Vice President of Calvert Asset Management Company, Inc. |
| | | | | | | |
IVY WAFFORD DUKE, Esq.
AGE: 42 | Assistant Vice-President & Assistant Secretary | 1996
CSIF 2000
CSIS 1996
CWVF 2000
Impact | Assistant Vice President, Assistant Secretary and Deputy General Counsel of Calvert Group, Ltd., and Chief Compliance Officer for Calvert Asset Management Company, Inc. and Calvert Distributors, Inc. |
PATRICK FAUL
AGE: 45 | Vice President | 2010 | Vice President of Calvert Asset Management Company, Inc. (“CAMCO”) since 2008, and Head of Credit Research for CAMCO since 2009. Prior to 2009, Mr. Faul was Co-Head of Credit Research (2008) and a Senior Securities Analyst (prior to 2008) for CAMCO. |
TRACI L. GOLDT
AGE: 36 | Assistant Secretary | 2004 | Executive Assistant to General Counsel, Calvert Group, Ltd. |
GREGORY B. HABEEB
AGE: 60 | Vice President | 2004 | Senior Vice President of Calvert Asset Management Company, Inc. |
HUI PING HO, CPA
AGE: 45 | Assistant Treasurer | 2000 | Tax Compliance Manager of Calvert Group, Ltd. |
LANCELOT A. KING, Esq.
AGE: 40 | Assistant Vice President & Assistant Secretary | 2002 | Assistant Vice President, Assistant Secretary and Associate General Counsel of Calvert Group, Ltd. |
EDITH LILLIE
AGE: 53 | Assistant Secretary | 2007 | Assistant Secretary (since 2007) and Regulatory Matters Manager of Calvert Group, Ltd. |
AUGUSTO DIVO MACEDO, Esq.
AGE: 47 | Assistant Vice President & Assistant Secretary | 2007 | Assistant Vice President, Assistant Secretary, and Assistant Counsel Compliance of Calvert Group, Ltd. |
JANE B. MAXWELL Esq.
AGE: 58 | Assistant Vice President & Assistant Secretary | 2005 | Assistant Vice President, Assistant Secretary & Assistant General Counsel of Calvert Group, Ltd. |
ANDREW K. NIEBLER, Esq.
AGE: 43 | Assistant Vice President & Assistant Secretary | 2006 | Assistant Vice President, Assistant Secretary & Associate General Counsel of Calvert Group, Ltd. |
CATHERINE P. ROY
AGE: 54 | Vice President | 2004 | Senior Vice President of Calvert Asset Management Company, Inc. and Chief Investment Officer – Fixed Income. |
WILLIAM M. TARTIKOFF, Esq.
AGE: 63 | Vice President and Secretary | 1990
CSIF 2000
CSIS 1992
CWVF 2000
Impact | Senior Vice President, Secretary, and General Counsel of Calvert Group, Ltd. |
NATALIE TRUNOW
AGE: 42 | Vice resident | 2008 | Senior Vice President of Calvert Asset Management Company, Inc., and Chief Investment Officer -Equities. Prior to joining Calvert in August 2008, Ms. Trunow was the Section Head (2005-2008) and Portfolio Manager (2001-2008) for the Global Public Markets Group of General Motors Asset Management. |
RONALD M. WOLFSHEIMER CPA
AGE: 58 | Treasurer | 1982
CSIF 2000
CSIS 1992
CWVF 2000
Impact | Senior Vice President and Chief Financial and Administrative Officer of Calvert Group, Ltd. |
MICHAEL V. YUHAS JR., CPA
AGE: 49 | Fund Controller | 1999
CSIF 2000
CSIS 1999
CWVF 2000
Impact | Vice President of Calvert Administrative Services Company. |
The address of Trustees/Directors and Officers is 4550 Montgomery Avenue, Suite 1000N, Bethesda, Maryland 20814, except Mr. Silby’s address is 1715 18th Street, N.W., Washington, DC 20009. Ms. Krumsiek is an interested person of the Fund since she is an officer and director of the Fund’s advisor and certain affiliates. Mr. Silby is an interested person of the Fund since he is a director of the parent company of the Fund’s advisor.
Additional information about the Fund’s Trustees/Directors can be found in the Statement of Additional Information (SAI). You can get a free copy of the SAI at www.calvert.com, or by contacting your broker, or the Fund at 1-800-368-2745.
To Open an Account
800-368-2748
Yields and Prices
Calvert Information Network
(24 hours, 7 days a week)
800-368-2745
Service for Existing Account
Shareholders: 800-368-2745
Brokers: 800-368-2746
TDD for Hearing Impaired
800-541-1524
Branch Office
4550 Montgomery Avenue
Suite 1000 North
Bethesda, Maryland 20814
Registered, Certified
or Overnight Mail
Calvert Group
c/o BFDS,
330 West 9th Street
Kansas City, MO 64105
Web Site
www.calvert.com
Principal Underwriter
Calvert Distributors, Inc.
4550 Montgomery Avenue
Suite 1000 North
Bethesda, Maryland 20814
Calvert capital accumulation fund
Calvert’s
Family of Funds
Tax-Exempt Money
Market Funds
CTFR Money Market Portfolio
Taxable Money Market Funds
First Government Money Market Fund
CSIF Money Market Portfolio
Municipal Funds
Calvert Tax-Free Bond Fund
Taxable Bond Funds
CSIF Bond Portfolio
Income Fund
Short Duration Income Fund
Long-Term Income Fund
Ultra-Short Income Fund
Government Fund
Short-Term Government Fund
High Yield Bond Fund
Equity Funds
CSIF Enhanced Equity Portfolio
CSIF Equity Portfolio
Calvert Large Cap Growth Fund
Calvert Large Cap Value Fund
Calvert Social Index Fund
Capital Accumulation Fund
CWV International Equity Fund
New Vision Small Cap Fund
Small Cap Value Fund
Mid Cap Value Fund
Global Alternative Energy Fund
Global Water Fund
International Opportunities Fund
Balanced and Asset
Allocation Funds
CSIF Balanced Portfolio
Calvert Conservative Allocation Fund
Calvert Moderate Allocation Fund
Calvert Aggressive Allocation Fund
This report is intended to provide fund information to shareholders. It is not authorized for distribution to prospective investors unless preceded or
accompanied by a prospectus.
Note: The information on our website is not incorporated by reference into this report; our website address is included as an inactive textual reference only.
Investors should carefully consider the investment objectives, risks, charges and expenses of the Calvert Funds. This and other important information is contained in the fund’s summary prospectus and prospectus, which can be obtained from your financial professional and should be read carefully before investing. You may also call Calvert at 800/368-2745 or visit www. calvert.com.
Calvert International Opportunities Fund
Annual Report
September 30, 2010
Choose Planet-friendly E-delivery!
Sign up now for on-line statements, prospectuses, and fund reports. In less than five minutes you can help reduce paper mail and lower fund costs.
Just go to www.calvert.com, click on My Account, and select the documents you would like to receive via e-mail.
If you’re new to account access, you’ll be prompted to set up a personal identification number for your account. Once you’re in, click on the E-delivery sign-up at the bottom of the Account Portfolio page and follow the quick, easy steps.
TABLE
OF CONTENTS
4 President’s Letter
7 SRI Update
9 Portfolio Management Discussion
14 Shareholder Expense Example
16 Report of Independent Registered Public Accounting Firm
17 Statement of Net Assets
21 Statement of Operations
22 Statements of Changes in Net Assets
24 Notes to Financial Statements
31 Financial Highlights
35 Explanation of Financial Tables
37 Proxy Voting and Availability of Quarterly Portfolio Holdings
38 Director and Officer Information Table
Dear Shareholder:
Over the 12-month reporting period, the U.S. financial markets and economy continued to recover, in fits and starts, from the “Great Recession.” As economic data vacillated between good and bad news on employment, housing trends, business strength, and consumer confidence, market volatility and investor sentiment also see-sawed.
During the winter, investors became less risk averse, pouring money into higher-yielding areas of the bond market as well as stocks, which reached 18-month highs in March. Later in the spring, however, investor sentiment took an abrupt turn as confidence in the global economic recovery waned and fears of a double-dip recession grew. Following a dismal August for the stock market, September saw a surge in stock prices lifted by strong corporate earnings reports and renewed investor interest in bargain-priced stocks. In the bond market, Treasury yields moved lower over the 12-month reporting period and corporate bonds generally performed well.
Economic Recovery Slow But on Track
Looking ahead, the pace of economic recovery has clearly slowed, causing Federal Reserve (Fed) Chairman Ben Bernanke to say that the Fed stands ready to use all of the tools at its disposal to reinvigorate the U.S. economy. In our view, while the country faces sobering challenges related to the unemployment rate, high levels of government debt, and the stumbling housing market, we also see encouraging signs of economic recovery. Overall, companies have strong balance sheets and cash positions, have reported stronger-than-expected corporate earnings, and are investing in their businesses. Consumers are generally “deleveraging” by saving more and paying down their debt. Financial reform is under way in the U.S. that may help reassure investors and stabilize the markets. Globally, central banks around the world are continuing to pursue extr emely accommodative monetary policies to encourage economic recovery.
In this transitional environment, we believe that both the equity and fixed-income markets are likely to continue to be somewhat volatile. In our view, investment strategies that include sustainability criteria may be better positioned to weather these uncertainties and provide long-term value.
Markets Challenged, But Gain Ground
Despite the volatility over the course of the 12-month reporting period, domestic and international stocks had moved solidly ahead by the end of the period. U.S. stock indexes reported 12-month gains across all styles, strategies, and capitalization ranges. The large-cap Russell 1000 Index and the Standard & Poor’s 500 Index returned 10.75% and 10.16%, respectively. Mid-cap stocks were the top-performing category, with the Russell Midcap Index up 17.54%, while the small-cap Russell 2000 Index rose 13.35%. In terms of style, growth stocks moderately outpaced value stocks. On the international front, the MSCI EAFE Investable Market Index (IMI), a benchmark for international stocks, edged up 4.23%, and the MSCI Emerging Markets IMI was up 21.97%.
In the fixed-income markets, the Barclays Capital U.S. Credit Index, a market barometer for investment-grade bonds, was up 11.67%. In line with the Fed’s federal funds rate target of 0% to 0.25%, money market returns remained very low.
The Gulf of Mexico Oil Spill and the Extractives Industry
In the wake of the April 20 oil spill in the Gulf of Mexico, Americans have continued to grapple with the devastation caused by the spill and its long-term environmental, societal, and economic implications. Calvert shares the concern and the frustration felt by the millions of people affected by this tragedy.
Following the spill, Calvert met with BP officials, urging BP not only to clean up the current spill, but also to implement stronger safety and process management standards for its contractors. We are also evaluating how our advocacy objectives with deepwater oil-drilling companies may help prevent such disasters in the future.
In terms of extraction methodologies, Calvert has long recognized that as readily accessible supplies of oil and gas dry up, companies may be forced to seek mineral resources in countries with poor governance, weak rule of law, and high levels of corruption. Accordingly, over the past two years, we have been a leading advocate for transparency requirements for extractive industries. In July, the U.S. Congress passed legislation requiring companies to disclose payments that they make to the U.S. or foreign governments for the purpose of commercial development of oil, natural gas, or minerals. We believe this legislation is a milestone toward helping advance environmental sustainability in this industry.
In our view, the oil spill also underlines the urgency for expanded investment—with greater federal incentives—in alternative energy sources.
Financial Reform Under WayLooking ahead, long-awaited financial reform is under way with Congressional passage of the largest financial reform bill since the Great Depression. The Dodd-Frank Wall Street Reform and Consumer Protection Act (Dodd-Frank Act) is designed to address inadequate regulation of Wall Street firms and the type of unrestrained environment that contributed to the credit crisis of 2008 and the ensuing global market meltdown. The Dodd-Frank Act seeks to establish strong consumer protections, shield taxpayers from future corporate bailouts, shine a light on the “shadow markets” and derivatives trading, and expand the role of shareholders in corporate governance. While these goals are laudable, the impact of the Dodd-Frank Act on the financial industry—and ultimately its ability to prevent another financial crisis—must stand the test of time.
As the Obama administration and Congress work to implement key financial reforms, we believe that over time these efforts may work to redress some systemic imbalances in the financial system and provide additional stability to the economy and markets.
Review Your Portfolio Allocations
In our view, the financial markets are likely to be in transition for some time as the government tackles financial reform, the global economy continues to recover, and political elections in the U.S. impact a variety of government policies. Now may be an opportune time to review your overall investment strategy and portfolio allocations with your financial advisor. Check to ensure that your target mix of U.S. and international stocks, bonds, and cash is well-diversified and appropriate given your investment goals, stage of life, and attitude toward risk.
For up-to-date economic and market commentary from Calvert professionals, along with information on current Calvert sustainability initiatives, please visit our website,
www.calvert.com.
As always, we appreciate your investing with Calvert.
Sincerely,
Barbara J. Krumsiek
President and CEO
Calvert Group, Ltd.
October 2010
sRI
Update
from the Calvert Sustainability Research Department
As the fallout from the financial crisis continues to prove, responsible management of environmental, social, and governance (ESG) factors isn’t just “nice to do”—it’s essential to keeping our companies and our economy healthy and strong. Therefore, Calvert continues to work hard to ensure that you have a say in charting new paths to a more prosperous future.
Shareholder Advocacy
For the 2010 proxy season, Calvert filed a record 45 resolutions—including 30 as the lead filer. Issues covered by the resolutions focused on climate change, board and employee diversity, executive compensation, sustainability reporting, and political contributions. Thus far, we have negotiated 31 successful withdrawals after the companies have agreed to address our objectives.
The resolutions featured two new issues this year—climate change adaptation and board chair independence. Our resolutions on the first topic asked Kroger and Dover Corporation to report on how each plans to assess and manage the business impacts of climate change. Dover management agreed, so the resolution was successfully withdrawn. At Kroger, the resolution received strong support with 40% of shareholders voting in favor of it.
The second new issue recommended that Chesapeake Energy and Eaton Corporation separate the Board of Directors Chair and CEO positions to strengthen the Board’s oversight of company management and accountability to shareholders (which is emerging as a corporate governance best practice). Both resolutions were successfully withdrawn after management agreed to appoint a Lead Independent Director.
Community Investments
Many of our Funds participate in Calvert’s High Social Impact Investing program, which is administered through the Calvert Social Investment Foundation. This community investment program may allocate a small percentage of Fund assets at below-market interest rates to investments that provide economic opportunity for struggling populations.1
The Foundation recently launched its Green Strategies to Fight Poverty™ investment initiative, which allows investors to target their Community Investment Note investments to organizations and projects that both fight poverty and protect the environment.
Special Equities
A modest but important portion of certain funds is allocated to small private companies that are developing products or services that address important sustainability or environmental issues. CSIF Equity Portfolio has invested in Marrone Bio Innovations, which uses bio-based systems to control pests and weeds and recently received emergency-use approval from the EPA to sell its new invasive mussel control system in certain areas of the western U.S. The company also submitted a second organic herbicide product, for use on both organic and industrial farms, for approval to the EPA.
Calvert Large Cap Growth Fund invested in the Berkeley Renewable Energy Asia Fund, which brings power to areas of the world without access to a central power grid. Led by a management team with a long history in the industry, Berkeley mitigates construction risk by helping communities build the plants and then selling them to a service provider once they’re up and running.2
1. As of September 30, 2010, Calvert Social Investment Foundation Community Investment Notes represented the following percentages of Fund net assets: Calvert Social Investment Fund (CSIF) Balanced Portfolio 0.94%, CSIF Bond Portfolio 0.34%, CSIF Equity Portfolio 0.52%, Calvert Capital Accumulation Fund 1.29%, Calvert World Values International Equity Fund 1.19%, Calvert New Vision Small Cap Fund 0.78%, and Calvert Large Cap Growth Fund 0.56%. The Calvert Social Investment Foundation is a 501(c)(3) nonprofit organization. The Foundation’s Community Investment Note Program is not a mutual fund and should not be confused with any Calvert Group-sponsored investment product.
2. As of September 30, 2010, Marrone Bio Innovations represented 0.05% of CSIF Equity Portfolio; Berkeley Renewable Energy Asia Fund represented 0.002% of Calvert Large Cap Growth Fund. All holdings are subject to change without notice.
As of September 30, 2010, the following companies represented the following percentages of Fund net assets: Kroger represented 0% of all Calvert SRI funds. Dover Corporation represented 0.15% of Calvert Social Index Fund. Chesapeake Energy represented 0.22% of CSIF Balanced Portfolio, 0.79% of CSIF Bond Portfolio, and 0.22% of Calvert Social Index Fund. Eaton Corporation represented 0.52% of CSIF Enhanced Equity Portfolio and 0.20% of Calvert Social Index Fund. All holdings are subject to change without notice.
calvert International
Opportunities fund
September 30, 2010
Investment Performance
(total return at NAV*)
| 6 Months | 12 Months |
| Ended | Ended |
| 9/30/10 | 9/30/10 |
Class A | 3.50% | 9.04% |
Class C | 3.04% | 8.06% |
Class I | 3.66% | 9.42% |
Class Y | 3.53% | 9.18% |
MSCI EAFE Small Mid Cap Index | 3.73% | 7.06% |
Lipper International Small/Mid-Cap Core Funds Average | 5.37% | 11.78% |
| % of Total | |
Economic Sectors | Investments | |
Consumer Discretionary | 25.9% | |
Consumer Staples | 8.4% | |
Energy | 2.4% | |
Financials | 7.8% | |
Government | 3.8% | |
Health Care | 7.3% | |
Industrials | 22.2% | |
Information Technology | 7.8% | |
Materials | 7.6% | |
Utilities | 6.8% | |
Total | 100% | |
* Investment performance/return at NAV does not reflect the deduction of the Fund’s maximum 4.75% front-end sales charge or any deferred sales charge.
Portfolio Management Discussion
Sophie Horsfall
of F&C Management Limited
Performance
Calvert International Opportunities Fund A shares (at NAV) rose 9.04% over the 12-month period ended September 30, 2010, while the Morgan Stanley Capital International Europe Australasia Far East Small Mid Index (MSCI EAFE SMID) returned 7.06% for the same period. Strong stock selection drove the Fund to outperform its benchmark
Investment Climate
This past year saw a return of economic growth and risk appetite that prompted a strong rally in the world’s stock markets. Despite some significant setbacks along the way--including China’s attempts to slow its economic growth and a significant sovereign debt crisis in the euro-zone--equities found support primarily on the back of company earnings, which provided the mainstay of gains.
European equities rallied in the first half of the period thanks to brighter leading economic indicators, robust company earnings, and confirmation that the euro-zone had officially exited recession. However, European markets took a knock in April and May 2010 following credit-rating downgrades for Greece and Portugal. The European Union and International Monetary Fund came to the rescue with a joint 750 billion euro bailout package and the troubled countries implemented austerity measures to restrain their spending, which triggered concerns that growth would be severely curtailed.
Among “core” European economies, Germany led the way for growth as its exporters took advantage of strong Asian demand and a weak euro. Despite the lagging economies in both Europe and the U.S., the Bank of England’s aggressive interest rate cuts and injections of rescue funds through a policy of “quantitative easing” did much to restore confidence and helped the U.K. market perform well. However, government finances were less helpful, and slowdowns in manufacturing growth and the country’s housing market underlined the fragility of its recovery.
U.S. stocks overall staged a healthy recovery as the economy emerged from its deepest recession in decades. Historically low interest rates, billions of dollars of fiscal stimulus, and imaginative efforts such as the “cash for clunkers” new car subsidy program helped revive activity. As a result, U.S. economic growth was ahead of other developed markets for most of the year. However, housing and job markets were a blight on the landscape; given their importance to the U.S. economy, this significantly undermined investor sentiment in the final months of the reporting period.
Sharp interest rate cuts and new economic stimulus packages forged a strong recovery in the Asia-Pacific region during the reporting period. Investors’ expectations that Asia would outstrip developed markets’ growth sparked a strong rally in the region’s
equities--with the exception of Japan, where a strong yen and more brittle domestic recovery reined in performance.
As the region’s primary engine of demand, China was a notable positive influence. However, later in the reporting period, China’s steps to moderate its economic expansion triggered investors’ fears of more widespread rate hikes, and regional market gains became more measured.
In the third quarter of 2010, concerns emerged that the developed economies would slip back into recession and that these governments may have to re-introduce “quantitative easing” to combat a possible stalling of growth. These fears pushed government bond yields to new lows. However, global equities were buoyant and ended the quarter at a five-month high. Encouraging growth data from emerging markets, robust corporate profits, and further moves to shore up the global financial system all boosted confidence as the period drew to a close.
Portfolio Strategy
Stock selection was the major driver of the Fund’s outperformance, although sector and region selection contributed to performance as well.
Regionally, our underweight to Japan and overweight to North America were positive. A 7% relative overweight to emerging markets was a small performance detractor, as risk averse local markets drove these premium markets to underperform in the second quarter of 2010. Yet, within emerging markets, our overweight stance in Brazil, Mexico, and the Philippines and sector selection--particularly our overweights to Health Care and Consumer Staples-- contributed to the Fund’s performance as well.
A large underweight to Financials (9%) continued to benefit the Fund, as economic and regulatory headwinds once again prevailed for this beleaguered sector. However, stock selection within Financials has been strong, and our focus on sustainable finance paid dividends. In fact, our position in microfinance company Banco Compartamos bucked sector trends and returned 78% over the period.1
Elsewhere, our slight underweight to Energy due to the Fund’s environmental social, and governance (ESG) criteria was a small negative. But stock selection was particularly strong here as well, and we focused on transitional fuels such as coal seam methane. BG and PetroChina acquired our main Energy-sector exposure, Australia’s Arrow Energy, at a 50% premium. In addition, its spin-out of international assets, Dart Energy, has returned more than 50% since July.
During the year, we sold off stocks in regions where the sovereign debt crisis posed a significant risk to company earnings. We also exited Spain’s Gamesa as the sovereign debt crisis heightened concerns about the outlook for wind power and capital spending.
After very strong performance, we increased the cyclical nature of the portfolio, increasing exposure to retail and industrial names--a shift from the more defensive positioning we had established.
Outlook
We continue to maintain a barbell strategy of owning defensive growth stocks within Health Care services and having an overweight to cyclical companies within Industrials and Information Technology. Productivity increases, low wage growth and interest rates, and a recovery in exports and capital investment all bode well for general growth prospects.
Uncertainty about euro-zone sovereign debt issues is diminishing, and we believe fears about economic growth and deflation for the region are overplayed. On the other hand, economic data in the U.S. continues to disappoint. We prefer emerging markets, which have attractive growth and less economic risk than developed markets.
Overall, we continue to target companies we feel have reasonable valuations, solid long-term growth prospects, and the ability to make the most of the economic recovery.
October 2010
1. All returns shown for individual holdings reflect that part of the reporting period the holdings were held.
As of September 30, 2010, the following companies represented the following percentages of Fund net assets: Banco Compartamos 2.21%, BG 0%, PetroChina 0%, Arrow Energy 0%, Dart Energy 1.36%, and Gamesa 0%. All holdings are subject to change without notice.
calvert International
Opportunities fund
September 30, 2010
Ten Largest | % of Net |
Stock Holdings | Assets |
Informa plc | 2.5% |
Vallourec SA | 2.5% |
Adidas AG | 2.5% |
Benesse Holdings, Inc. | 2.5% |
PPR SA | 2.3% |
Marks & Spencer Group plc | 2.3% |
FirstGroup plc | 2.2% |
Shimano, Inc. | 2.2% |
Oriflame Cosmetics SA (SDR) | 2.2% |
Banco Compartamos SA de CV | 2.2% |
Total | 23.4% |
calvert International
Opportunities fund
September 30, 2010
Average Annual Total Returns
Class A Shares | (with max. load) |
One year | 3.84% |
Since inception (5/31/2007) | -6.65% |
| |
Class C Shares | (with max. load) |
One year | 7.06% |
Since inception (7/31/2007) | -5.78% |
| |
Class I Shares | |
One year | 9.42% |
Since inception (5/31/2007) | -4.86% |
| |
Class Y Shares* | |
One year | 9.18% |
Since inception (5/31/2007) | -5.18% |
*Calvert International Opportunities Fund first offered Class Y shares on October 31, 2008. Performance prior to that date reflects the performance of Class A shares at net asset value (NAV). Actual Class Y share performance would have been different.
Growth of $10,000
The graph below shows the value of a hypothetical $10,000 investment in the fund over the past 10 fiscal year periods or since inception (for funds without 10-year records). The results shown are for Classes A and I shares and reflect the deduction of the maximum front-end Class A sales charge of 4.75%, and assume the reinvestment of dividends. The result is compared with benchmarks that include a broad based market index and a Lipper peer group average. Market indexes are unmanaged and their results do not reflect the effect of expenses or sales charges. The Lipper average reflects the deduction of the category’s average front-end sales charge. The value of an investment in a different share class would be different.
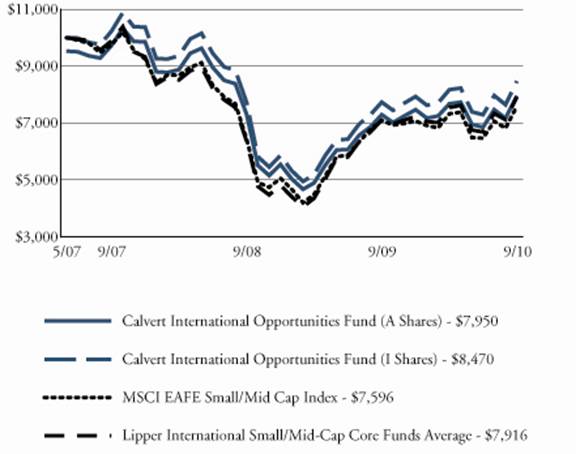
All performance data shown, including the graph above and the adjacent table, represents past performance, does not guarantee future results, assumes reinvestment of dividends and distributions and does not reflect the deduction of taxes that a shareholder would pay on the Fund’s/Portfolio’s distributions or the redemption of the Fund/Portfolio shares. The investment return and principal value of an investment will fluctuate so that an investor’s shares, when redeemed, may be worth more or less than their original cost. Current performance may be lower or higher than the performance data quoted; for current performance data visit www.calvert.com. The gross expense ratio from the current prospectus for Class A shares is 2.70%. This number may differ from the expense ratio shown elsewhere in this report because it is based on a different time peri od and, if applicable, does not include fee or expense waivers. Performance data quoted already reflects the deduction of the Fund’s/Portfolio’s operating expenses.
Shareholder Expense Example
As a shareholder of the Fund, you incur two types of costs: (1) transaction costs, including sales charges and redemption fees; and (2) ongoing costs, including management fees; distribution (12b-1) fees; and other Fund expenses. This Example is intended to help you understand your ongoing costs (in dollars) of investing in the Fund and to compare these costs with the ongoing costs of investing in other mutual funds.
This Example is based on an investment of $1,000 invested at the beginning of the period and held for the entire period (April 1, 2010 to September 30, 2010).
Actual Expenses
The first line of the table below provides information about actual account values and actual expenses. You may use the information in this line, together with the amount you invested, to estimate the expenses that you paid over the period. Simply divide your account value by $1,000 (for example, an $8,600 account value divided by $1,000 = 8.6), then multiply the result by the number in the first line under the heading entitled “Expenses Paid During Period” to estimate the expenses you paid on your account during this period.
Hypothetical Example for Comparison Purposes
The second line of the table below provides information about hypothetical account values and hypothetical expenses based on the Fund’s actual expense ratio and an assumed rate of return of 5% per year before expenses, which is not the Fund’s actual return. The hypothetical account values and expenses may not be used to estimate the actual ending account balance or expenses you paid for the period. You may use this information to compare the ongoing costs of investing in the Fund and other funds. To do so, compare the 5% hypothetical example with the 5% hypothetical examples that appear in the shareholder reports of the other funds.
Please note that the expenses shown in the table are meant to highlight your ongoing costs only and do not reflect any transactional costs, such as sales charges (loads), or redemption fees. Therefore, the second line of the table is useful in comparing ongoing costs only, and will not help you determine the relative total costs of owning different funds. In addition, if these transactional costs were included, your costs would have been higher.
| Beginning | Ending Account | Expenses Paid |
| Account Value | Value | During Period* |
| 4/1/10 | 9/30/10 | 4/1/10 - 9/30/10 |
| | | |
Class A | | | |
Actual | $1,000.00 | $1,035.00 | $8.47 |
Hypothetical | $1,000.00 | $1,016.75 | $8.39 |
(5% return per | | | |
year before expenses) | | | |
| | | |
Class C | | | |
Actual | $1,000.00 | $1,030.40 | $12.72 |
Hypothetical | $1,000.00 | $1,012.53 | $12.61 |
(5% return per | | | |
year before expenses) | | | |
| | | |
Class I | | | |
Actual | $1,000.00 | $1,036.60 | $6.13 |
Hypothetical | $1,000.00 | $1,019.05 | $6.07 |
(5% return per | | | |
year before expenses) | | | |
| | | |
Class Y | | | |
Actual | $1,000.00 | $1,035.30 | $7.19 |
Hypothetical | $1,000.00 | $1,018.00 | $7.13 |
(5% return per | | | |
year before expenses) | | | |
*Expenses are equal to the Fund’s annualized expense ratio of 1.66%, 2.50%, 1.20% and 1.41% for Class A, Class C , Class I and Class Y respectively, multiplied by the average account value over the period, multiplied by 183/365 (to reflect the one-half year period).
report of Independent registered public accounting firm
The Board of Directors of Calvert World Values Fund, Inc. and Shareholders of Calvert International Opportunities Fund:
We have audited the accompanying statement of net assets of Calvert International Opportunities Fund (the Fund), a series of the Calvert World Values Fund, Inc., as of September 30, 2010, and the related statement of operations for the year then ended, the statements of changes in net assets for each of the years in the two-year period then ended, and the financial highlights for each of the years in the three-year period then ended and for the period from May 31, 2007 (inception) through September 30, 2007. These financial statements and financial highlights are the responsibility of the Fund’s management. Our responsibility is to express an opinion on these financial statements and financial highlights based on our audits.
We conducted our audits in accordance with the standards of the Public Company Accounting Oversight Board (United States). Those standards require that we plan and perform the audit to obtain reasonable assurance about whether the financial statements and financial highlights are free of material misstatement. An audit includes examining, on a test basis, evidence supporting the amounts and disclosures in the financial statements. Our procedures included confirmation of securities owned as of September 30, 2010, by correspondence with custodians and brokers or other appropriate auditing procedures. An audit also includes assessing the accounting principles used and significant estimates made by management, as well as evaluating the overall financial statement presentation. We believe that our audits provide a reasonable basis for our opinion.
In our opinion, the financial statements and financial highlights referred to above present fairly, in all material respects, the financial position of the Calvert International Opportunities Fund as of September 30, 2010, the results of its operations for the year then ended, the changes in its net assets for each of the years in the two-year period then ended, and the financial highlights for each of the years in the three-year period then ended and for the period from May 31, 2007 (inception) through September 30, 2007, in conformity with U.S. generally accepted accounting principles.
/s/KPMG LLP
Philadelphia, Pennsylvania
November 24, 2010
STATEMENT OF NET ASSETS
september 30, 2010
Equity Securities - 94.9% | | Shares | Value | |
Australia - 8.6% | | | | |
BlueScope Steel Ltd. | | 217,229 | $460,651 | |
Computershare Ltd. | | 76,018 | 714,419 | |
Dart Energy Ltd.* | | 440,749 | 501,309 | |
QBE Insurance Group Ltd. | | 35,706 | 594,038 | |
Ramsay Health Care Ltd. | | 28,638 | 424,552 | |
Sims Metal Management Ltd. | | 27,843 | 473,420 | |
| | | 3,168,389 | |
| | | | |
Brazil - 3.7% | | | | |
Anhanguera Educacional Participacoes SA | | 25,300 | 447,356 | |
Diagnosticos da America SA | | 29,700 | 356,988 | |
Itau Unibanco Holding SA (ADR) | | 11,811 | 285,590 | |
Tractebel Energia SA | | 17,300 | 258,093 | |
| | | 1,348,027 | |
| | | | |
Canada - 1.3% | | | | |
Shoppers Drug Mart Corp. | | 12,188 | 473,455 | |
| | | | |
Finland - 1.0% | | | | |
Lassila & Tikanoja Oyj | | 19,430 | 367,041 | |
| | | | |
France - 10.4% | | | | |
Cap Gemini SA | | 13,485 | 674,897 | |
Nexans SA | | 7,845 | 569,309 | |
PPR SA | | 5,352 | 864,348 | |
Publicis Groupe | | 16,500 | 781,810 | |
Vallourec SA | | 9,418 | 933,354 | |
| | | 3,823,718 | |
| | | | |
Germany - 5.3% | | | | |
Adidas AG | | 15,098 | 932,416 | |
Rhoen Klinikum AG | | 22,546 | 496,274 | |
SMA Solar Technology AG | | 4,938 | 544,172 | |
| | | 1,972,862 | |
| | | | |
Japan - 22.0% | | | | |
Asahi Glass Co. Ltd. | | 47,000 | 478,777 | |
Benesse Holdings, Inc. | | 19,100 | 919,105 | |
Daiwa House Industry Co. Ltd. | | 20,000 | 201,101 | |
Kubota Corp. | | 63,000 | 576,155 | |
Kurita Water Industries Ltd. | | 25,600 | 710,022 | |
Nikon Corp. | | 32,900 | 609,638 | |
Ricoh Co. Ltd. | | 54,000 | 760,809 | |
Sharp Corp. | | 25,000 | 248,683 | |
Shimano, Inc. | | 15,500 | 820,086 | |
Shiseido Co. Ltd. | | 35,000 | 785,133 | |
Sumitomo Chemical Co. Ltd. | | 89,000 | 389,921 | |
| | | | |
Equity Securities - Cont’d | | Shares | Value | |
Japan - Cont’d | | | | |
USS Co. Ltd. | | 9,400 | $701,006 | |
Yamada Denki Co. Ltd. | | 8,590 | 532,633 | |
Yamatake Corp. | | 16,000 | 400,479 | |
| | | 8,133,548 | |
| | | | |
Luxembourg - 2.2% | | | | |
Oriflame Cosmetics SA (SDR) | | 12,800 | 819,132 | |
| | | | |
Mexico - 3.2% | | | | |
Banco Compartamos SA de CV | | 127,988 | 813,316 | |
Urbi Desarrollos Urbanos SA de CV* | | 176,647 | 369,139 | |
| | | 1,182,455 | |
| | | | |
Netherlands - 3.1% | | | | |
QIAGEN NV* | | 27,029 | 482,468 | |
TNT NV | | 24,489 | 656,442 | |
| | | 1,138,910 | |
| | | | |
Norway - 2.1% | | | | |
ProSafe SE | | 59,880 | 367,836 | |
Tomra Systems ASA | | 69,700 | 413,738 | |
| | | 781,574 | |
| | | | |
Philippines - 0.5% | | | | |
Manila Water Co., Inc. | | 452,000 | 195,487 | |
| | | | |
Singapore - 3.4% | | | | |
ComfortDelgro Corp. Ltd. | | 415,000 | 479,186 | |
Hyflux Ltd. | | 326,000 | 770,176 | |
| | | 1,249,362 | |
| | | | |
Spain - 1.3% | | | | |
Ebro Foods SA | | 23,909 | 477,013 | |
| | | | |
Sweden - 1.7% | | | | |
Svenska Cellulosa AB, Series B | | 42,478 | 643,345 | |
| | | | |
Switzerland - 0.4% | | | | |
Adecco SA | | 2,843 | 148,838 | |
| | | | |
United Kingdom - 15.4% | | | | |
Associated British Foods plc | | 30,564 | 504,298 | |
Eaga plc | | 230,519 | 407,906 | |
FirstGroup plc | | 143,959 | 821,500 | |
Informa plc | | 142,302 | 937,611 | |
Legal & General Group plc | | 293,261 | 477,415 | |
Marks & Spencer Group plc | | 140,162 | 855,609 | |
Severn Trent plc | | 27,486 | 566,781 | |
United Utilities Group plc | | 55,169 | 497,223 | |
Wolseley plc* | | 24,131 | 606,911 | |
| | | 5,675,254 | |
| | | | |
Equity Securities - Cont’d | | Shares | Value | |
United States - 9.3% | | | | |
AGCO Corp.* | | 12,106 | $472,255 | |
Air Products & Chemicals, Inc. | | 3,336 | 276,287 | |
Calgon Carbon Corp.* | | 22,784 | 330,368 | |
DaVita, Inc.* | | 8,981 | 619,958 | |
Informatica Corp.* | | 7,542 | 289,688 | |
IntercontinentalExchange, Inc.* | | 4,698 | 491,975 | |
Mednax, Inc.* | | 5,182 | 276,201 | |
Ormat Technologies, Inc. | | 6,341 | 184,967 | |
STR Holdings, Inc.* | | 8,737 | 188,195 | |
Towers Watson & Co. | | 6,399 | 314,703 | |
| | | 3,444,597 | |
| | | | |
| | | | |
Total Equity Securities (Cost $30,762,359) | | | 35,043,007 | |
| | | | |
| | | | |
U.S. Government Agencies | | Principal | | |
and Instrumentalities - 3.8% | | Amount | | |
Federal Home Loan Bank Discount Notes, 10/1/10 | | $1,400,000 | 1,400,000 | |
| | | | |
Total U.S. Government Agencies | | | | |
And Instrumentalities (Cost $1,400,000) | | | 1,400,000 | |
| | | | |
TOTAL INVESTMENTS (Cost $32,162,359) - 98.7% | | | 36,443,007 | |
Other assets and liabilities, net - 1.3% | | | 497,071 | |
Net Assets - 100% | | | $36,940,078 | |
| | | | |
Net Assets Consist of: | | | | |
Paid-in capital applicable to the following shares of common stock with | | | | |
250,000,000 shares of $.01 par value shares authorized: | | | | |
Class A: 2,419,325 shares outstanding | | | $31,357,747 | |
Class C: 142,955 shares outstanding | | | 1,750,008 | |
Class I: 344,207 shares outstanding | | | 4,854,503 | |
Class Y: 80,572 shares outstanding | | | 849,062 | |
Undistributed net investment income | | | 107,492 | |
Accumulated net realized gain (loss) on investments and foreign | | | | |
currency transactions | | | (6,267,739) | |
Net unrealized appreciation (depreciation) on investments, foreign currencies and | | | | |
assets and liabilities denominated in foreign currencies | | | 4,289,005 | |
Net Assets | | | $36,940,078 | |
Net Asset Value Per Share | | | | |
Class A (based on net assets of $30,061,504) | | | $12.43 | |
Class C (based on net assets of $1,743,825) | | | $12.20 | |
Class I (based on net assets of $4,190,379) | | | $12.17 | |
Class Y (based on net assets of $944,370) | | | $11.72 | |
* Non-income producing security.
Abbreviations:
ADR: American Depositary Receipts
SDR: Swedish Depositary Receipts
See notes to financial statements.
Statement of Operations
year ended september 30, 2010
Net Investment Income | | |
Investment Income: | | |
Dividend income (net of foreign taxes withheld of $48,604) | | $655,140 |
Interest income | | 567 |
Total investment income | | 655,707 |
| | |
Expenses: | | |
Investment advisory fee | | 244,345 |
Transfer agency fees and expenses | | 95,315 |
Distribution Plan expenses: | | |
Class A | | 62,700 |
Class C | | 12,906 |
Directors’ fees and expenses | | 3,836 |
Administrative fees | | 99,304 |
Accounting fees | | 4,891 |
Custodian fees | | 84,600 |
Registration fees | | 43,835 |
Reports to shareholders | | 23,435 |
Professional fees | | 22,445 |
Miscellaneous | | 4,218 |
Total expenses | | 701,830 |
Reimbursement from Advisor: | | |
Class A | | (151,594) |
Class C | | (17,739) |
Class I | | (20,176) |
Class Y | | (12,405) |
Fees paid indirectly | | (467) |
Net expenses | | 499,449 |
| | |
| | |
Net Investment Income | | 156,258 |
| | |
| | |
Realized and Unrealized Gain (Loss) | | |
Net realized gain (loss) on: | | |
Investments | | 989,983 |
Foreign currency transactions | | (48,765) |
| | 941,218 |
| | |
Change in unrealized appreciation (depreciation) on: | | |
Investments and foreign currencies | | 1,794,400 |
Assets and liabilities denominated in foreign currencies | | 1,985 |
| | 1,796,385 |
| | |
Net Realized and Unrealized Gain (Loss) | | 2,737,603 |
| | |
Increase (Decrease) in Net Assets | | |
Resulting From Operations | | $2,893,861 |
See notes to financial statements.
Statements of Changes in Net Assets
| | Year Ended | Year Ended |
| | September 30, | September 30, |
Increase (Decrease) in Net Assets | | 2010 | 2009 |
Operations: | | | |
Net investment income | | $156,258 | $123,348 |
Net realized gain (loss) | | 941,218 | (7,075,566) |
Change in unrealized appreciation or (depreciation) | | 1,796,385 | 8,121,142 |
| | | |
| | | |
Increase (Decrease) in Net Assets | | | |
Resulting from Operations | | 2,893,861 | 1,168,924 |
| | | |
Distributions to shareholders from: | | | |
Net investment income: | | | |
Class A shares | | — | (87,441) |
Class I shares | | (64,681) | (72,687) |
Class Y shares | | (8,846) | — |
Net realized gain: | | | |
Class A shares | | — | (6,794) |
Class C shares | | — | (227) |
Class I shares | | — | (1,532) |
Total distributions | | (73,527) | (168,681) |
| | | |
Capital share transactions: | | | |
Shares sold: | | | |
Class A shares | | 11,583,422 | 9,603,294 |
Class C shares | | 999,261 | 312,777 |
Class I shares | | 522,238 | 960,798 |
Class Y shares | | 968,455 | 107,900 |
Reinvestment of distributions: | | | |
Class A shares | | — | 87,637 |
Class C shares | | — | 154 |
Class I shares | | 64,681 | 74,220 |
Class Y shares | | 8,846 | — |
Redemption fees: | | | |
Class A shares | | 166 | 1,918 |
Class C shares | | 40 | 495 |
Shares redeemed: | | | |
Class A shares | | (5,203,155) | (5,951,385) |
Class C shares | | (195,764) | (143,120) |
Class I shares | | (397,915) | (912,018) |
Class Y shares | | (206,139) | (30,000) |
Total capital share transactions | | 8,144,136 | 4,112,670 |
| | | |
Total Increase (Decrease) in Net Assets | | 10,964,470 | 5,112,913 |
| | | |
Net Assets | | | |
Beginning of year | | 25,975,608 | 20,862,695 |
End of year (including undistributed net investment | | | |
income of $107,492 and $73,526, respectively) | | $36,940,078 | $25,975,608 |
See notes to financial statements.
Statements of Changes in Net Assets
| | Year Ended | Year Ended |
| | September 30, | September 30, |
Capital Share Activity | | 2010 | 2009 |
Shares sold: | | | |
Class A shares | | 998,916 | 1,083,297 |
Class C shares | | 87,604 | 34,401 |
Class I shares | | 45,909 | 108,850 |
Class Y shares | | 89,345 | 12,347 |
Reinvestment of distributions: | | | |
Class A shares | | — | 10,732 |
Class C shares | | — | 20 |
Class I shares | | 5,709 | 9,167 |
Class Y shares | | 809 | — |
Shares redeemed: | | | |
Class A shares | | (449,789) | (676,505) |
Class C shares | | (17,578) | (15,911) |
Class I shares | | (35,362) | (95,222) |
Class Y shares | | (19,331) | (2,598) |
Total capital share activity | | 706,232 | 468,578 |
See notes to financial statements.
Notes to Financial Statements
Note A — Significant Accounting Policies
General: The Calvert International Opportunities Fund (the “Fund”), a series of Calvert World Values Fund, Inc., is registered under the Investment Company Act of 1940 as a diversified, open-end management investment company. The operation of each series is accounted for separately. Class A shares are sold with a maximum front-end sales charge of 4.75%. Class C shares are sold without a front-end sales charge. With certain exceptions, the Fund will impose a deferred sales charge on shares sold within one year of purchase. Class C shares have higher levels of expenses than Class A shares. Class I shares require a minimum account balance of $1,000,000. The $1 million minimum initial investment may be waived for certain institutional accounts, where it is believed to be in the best interest of the Fund and its shareholders. Class I shares have no front-end or deferred sales charge and have lower levels of expenses than Class A shares. Effective October 31, 2008, the Fund began to offer Class Y shares. Class Y shares are generally only available to wrap or similar fee-based programs offered by financial intermediaries that have entered into an agreement with the Fund’s Distributor to offer Class Y shares. Class Y shares have no front-end or deferred sales charge and have lower levels of expenses than Class A shares. Each class has different: (a) dividen d rates, due to differences in Distribution Plan expenses and other class-specific expenses, (b) exchange privileges, and (c) class-specific voting rights.
Security Valuation: Net asset value per share is determined every business day as of the close of the regular session of the New York Stock Exchange (generally 4:00 p.m. Eastern time). The Fund uses independent pricing services approved by the Board of Directors to value its investments wherever possible. Securities for which market quotations are available are valued at last sale price or official closing price on the primary market or exchange in which they trade. Foreign securities are valued based on quotations from the principal market in which such securities are normally traded. If events occur after the close of the principal market in which foreign securities are traded, and before the Fund’s net asset value is determined, that are expected to materially affect the value of those securities, then they are valued at their fair value taking these events into account. Short-term notes are stated at amortized cost, which approximates fair value. Investments for which market quotations are not available or deemed not reliable are fair valued in good faith under the direction of the Board of Directors.
The Fund has retained a third party fair value pricing service to quantitatively analyze the price movement of its holdings on foreign exchanges and to automatically fair value if the variation from the prior day’s closing price exceeds specified parameters.
In determining fair value, the Board considers all relevant qualitative and quantitative information available. These factors are subject to change over time and are reviewed periodically. The values assigned to fair value investments are based on available information and do not necessarily represent amounts that might ultimately be realized. Further, because of the inherent uncertainty of valuation, those estimated values may differ significantly from the values that would have been used had a ready market for the investments existed, and the differences could be material.
At September 30, 2010, no securities were fair valued in good faith under the direction of the Board of Directors.
The Fund utilizes various methods to measure the fair value of its investments. Generally Accepted Accounting Principles (GAAP) establishes a disclosure hierarchy that categorizes the inputs to valuation techniques used to value assets and liabilities at measurement date. These inputs are summarized in the three broad levels listed below:
Level 1 – quoted prices in active markets for identical securities
Level 2 – other significant observable inputs (including quoted prices for similar securities, interest rates, prepayment speeds, credit risk, etc.)
Level 3 – significant unobservable inputs (including the Fund’s own assumptions in determining the fair value of investments)
The inputs or methodology used for valuing securities are not necessarily an indication of the risk associated with investing in those securities.
Changes in valuation techniques may result in transfers in or out of an investment’s assigned level within the hierarchy during the period. For additional information on the Fund’s policy regarding valuation of investments, please refer to the Fund’s most recent prospectus.
The following is a summary of the inputs used to value the Fund’s net assets as of September 30, 2010:
| Valuation Inputs |
Investments in Securities | Level 1 | Level 2 | Level 3 | Total |
Equity securities* | $35,043,007 | - | - | $35,043,007 |
U.S. government obligations | - | $1,400,000 | - | 1,400,000 |
TOTAL | $35,043,007 | $1,400,000 | - | $36,443,007 |
* For further breakdown of equity securities by country, please refer to the Statement of Net Assets.
Repurchase Agreements: The Fund may enter into repurchase agreements with recognized financial institutions or registered broker/dealers and, in all instances, holds underlying securities with a value exceeding the total repurchase price, including accrued interest. Although risk is mitigated by the collateral, the Fund could experience a delay in recovering its value and a possible loss of income or value if the counterparty fails to perform in accordance with the terms of the agreement.
Security Transactions and Net Investment Income: Security transactions are accounted for on trade date. Realized gains and losses are recorded on an identified cost basis and may include proceeds from litigation. Dividend income is recorded on the ex-dividend date or, in the case of dividends on certain foreign securities, as soon as the Fund is informed of the ex-dividend date. Distributions received on securities that represent a return of capital or capital gain are recorded as a reduction of cost of investments and/or as a realized gain. Interest income, which includes amortization of premium and accretion of discount on debt securities, is accrued as earned. Withholding taxes on foreign dividends have been provided for in accordance with the Fu nd’s understanding of the applicable country’s tax rules and rates. Investment income and realized and unrealized gains and losses are allocated to separate classes of shares based upon the relative net assets of each class. Expenses arising in connection with a class are charged directly to that class. Expenses common to the classes are allocated to each class in proportion to their relative net assets.
Foreign Currency Transactions: The Fund’s accounting records are maintained in
U.S. dollars. For valuation of assets and liabilities on each date of net asset value determination, foreign denominations are converted into U.S. dollars using the current exchange rate. Security transactions, income and expenses are translated at the prevailing rate of exchange on the date of the event. The effect of changes in foreign exchange rates on securities and foreign currencies is included in the net realized and unrealized gain or loss on securities and foreign currencies.
Distributions to Shareholders: Distributions to shareholders are recorded by the Fund on ex-dividend date. Dividends from net investment income and distributions from net realized capital gains, if any, are paid at least annually. Distributions are determined in accordance with income tax regulations which may differ from generally accepted accounting principles; accordingly, periodic reclassifications are made within the Fund’s capital accounts to reflect income and gains available for distribution under income tax regulations.
Estimates: The preparation of financial statements in conformity with accounting principles generally accepted in the United States requires management to make estimates and assumptions that affect the reported amounts of assets and liabilities and disclosure of contingent assets and liabilities at the date of the financial statements and the reported amounts of income and expenses during the reporting period. Actual results could differ from those estimates.
Redemption Fees: The Fund charges a 2% redemption fee on redemptions, including exchanges, made within 30 days of purchase in the same Fund (within seven days for Class I shares). The redemption fee is paid to the Class of the Fund from which the redemption is made, and is accounted for as an addition to paid-in capital. The fee is intended to discourage market-timers by ensuring that short-term trading costs are borne by the investors making the transactions and not the shareholders already in the Fund.
Expense Offset Arrangements: The Fund has an arrangement with its custodian bank whereby the custodian’s fees may be paid indirectly by credits earned on the Fund’s cash on deposit with the bank. These credits are used to reduce the Fund’s expenses. Such a deposit arrangement may be an alternative to overnight investments.
Federal Income Taxes: No provision for federal income or excise tax is required since the Fund intends to qualify as a regulated investment company under the Internal Revenue Code and to distribute substantially all of its taxable earnings.
Management has analyzed the Fund’s tax positions taken for all open federal income tax years and has concluded that no provision for federal income tax is required in the Fund’s financial statements. A Fund’s federal tax return is subject to examination by the Internal Revenue Service for a period of three years.
New Accounting Pronouncements: In January 2010, the Financial Accounting Standards Board (“FASB”) issued Accounting Standards Update (“ASU”) No. 2010-06 “Improving Disclosures about Fair Value Measurements”. ASU 2010-06 will require reporting entities to make new disclosures about amount and reasons for significant transfers in and out of Level 1 and Level 2 fair value measurements and input and valuation techniques used to measure fair value for both recurring and nonrecurring fair value measurements that fall in either Level 2 or Level 3, and information on purchases, sales, issuances, and settlements in the roll forward of activity in Level 3 fair value measures. The new and revised disclosures are effective fo r interim and annual reporting periods beginning after December 15, 2009 except for the disclosures about purchases, sales, issuances, and settlements in the roll forward of activity in Level 3 fair value measures, which are effective for fiscal years beginning after December 15, 2010. At this time, management is evaluating the implications of ASU No. 2010-06 disclosures about purchases, sales, issuances, and settlements in the roll forward of activity in Level 3 fair value measures and its impact on the financial statements has not been determined.
Note B — Related Party Transactions
Calvert Asset Management Company, Inc. (the “Advisor”) is wholly-owned by Calvert Group, Ltd. (“Calvert”), which is indirectly wholly owned by UNIFI Mutual Holding Company. The Advisor provides investment advisory services and pays the salaries and fees of officers and Directors of the Fund who are employees of the Advisor or its affiliates. For its services, the Advisor receives an annual fee, payable monthly, of .80% of the average daily net assets. Under the terms of the agreement, $23,141 was payable at year end. In addition, $6,970 was payable at year end for operating expenses paid by the Advisor during September 2010.
The Advisor has contractually agreed to limit net annual fund operating expenses through January 31, 2011. The contractual expense cap is 1.66% for Class A, 2.50% for Class C, 1.20% for Class I, and 1.41% for Class Y. For the purposes of this expense limit, operating expenses do not include interest expense, brokerage commissions, taxes, and extraordinary expenses. To the extent any expense offset credits are earned, the Advisor’s obligation under the contractual limitation may be reduced and the Advisor may benefit from the expense offset arrangement.
Calvert Administrative Services Company, an affiliate of the Advisor, provides administrative services to the Fund for an annual fee, payable monthly, of .35% for Class A, Class C, and Class Y shares and .15% for Class I shares, based on their average daily net assets. Under the terms of the agreement, $9,459 was payable at year end.
Calvert Distributors, Inc., an affiliate of the Advisor, is the distributor and principal underwriter for the Fund. Distribution Plans, adopted by Class A and Class C shares, allow the Fund to pay the Distributor for expenses and services associated with the distribution of shares. The expenses paid may not exceed .50% and 1.00% annually of the Fund’s average daily net assets of Class A and Class C, respectively. The amount actually paid by the Fund is an annualized fee, payable monthly of .25% and 1.00% of the Fund’s average daily net assets of Class A and Class C, respectively. Class I and Y shares do not have Distribution Plan expenses. Under the terms of the agreement, $7,220 was payable at year end.
The Distributor received $17,328 as its portion of the commissions charged on sales of the Fund’s Class A shares for the year ended September 30, 2010.
Calvert Shareholder Services, Inc. (“CSSI”), an affiliate of the Advisor, is the shareholder servicing agent for the Fund. For its services, CSSI received a fee of $14,990 for the year ended September 30, 2010. Under the terms of the agreement, $1,498 was payable at year end. Boston Financial Data Services, Inc. is the transfer and dividend disbursing agent.
Each Director of the Fund who is not an employee of the Advisor or its affiliates receives an annual retainer of $44,000 plus a meeting fee of $2,000 for each Board meeting attended. Additional fees of up to $5,000 annually may be paid to the Board chair and committee chairs ($10,000 for the Special Equities Committee chair) and $2,500 annually may be paid to committee members, plus a committee meeting fee of $500 for each committee meeting attended. Directors fees are allocated to each of the Funds served.
Note C — Investment Activity
During the year, the cost of purchases and proceeds from sales of investments, other than short-term securities, were $19,775,961 and $12,903,085, respectively.
Capital Loss Carryforwards | |
Expiration Date | |
30-Sep-17$1,330,630 | |
30-Sep-18 | 4,754,491 |
Capital losses may be utilized to offset future capital gains until expiration.
The Fund intends to elect to defer net capital losses of $12,120 incurred from November 1, 2009 though September 30, 2010 and treat them as arising in the fiscal year ending September 30, 2011.
The tax character of distributions paid during the years ended September 30, 2010 and September 30, 2009 were as follows:
Distributions paid from: | 2010 | 2009 |
Ordinary income | $73,527 | $168,681 |
Total | $73,527 | $168,681 |
As of September 30, 2010, the tax basis components of distributable earnings/(accumulated losses) and the federal tax cost were as follows:
Unrealized appreciation | $5,011,181 |
Unrealized (depreciation) | (901,030) |
Net unrealized appreciation/(depreciation) | $4,110,151 |
Undistributed ordinary income | $107,492 |
Capital loss carryforward | ($6,085,121) |
Federal income tax cost of investments | $32,332,856 |
The differences between the components of distributable earnings on a tax basis and the amounts reflected in the statement of net assets are primarily due to temporary book-tax differences that will reverse in a subsequent period. These book-tax differences are mainly due to wash sales and the deferral of post October losses.
Reclassifications, as shown in the table below, have been made to the Fund’s components of net assets to reflect income and gains available for distribution (or available capital loss carryovers, as applicable) under income tax law and regulations. These reclassifications are due to permanent book-tax differences and have no impact on net assets. The primary permanent differences causing such reclassification for the Fund are due to foreign currency transactions.
Undistributed net investment income | ($48,765) |
Accumulated net realized gain (loss) | 48,765 |
Note D — Line of Credit
A financing agreement is in place with all Calvert Group Funds and State Street Corporation (“SSC”). Under the agreement, SSC provides an unsecured line of credit facility, in the aggregate amount of $50 million ($25 million committed and $25 million uncommitted), accessible by the Funds for temporary or emergency purposes only. Borrowings under the committed facility bear interest at the higher of the London Interbank Offered Rate, (LIBOR) or the overnight Federal Funds Rate plus 1.25% per annum. A commitment fee of .125% per annum is incurred on the unused portion of the committed facility, which is allocated to all participating funds. The Fund had no borrowings under the agreement during the year ended September 30, 2010.
Note E – Subsequent Events
In preparing the financial statements as of September 30, 2010, no subsequent events or transactions occurred that would have materially impacted the financial statements as presented.
Notice to Shareholders (Unaudited)
For the year ended September 30, 2010, in order to meet certain requirements of the Internal Revenue Code, the Fund designates 100% of the ordinary dividends paid during the year as qualified dividend income in accordance with Section 854 of the Internal Revenue Code. It also designates $.23 per share as income derived from foreign sources and $.02 per share as foreign taxes.
Additional information will be provided to shareholders in January 2011 for use in preparing 2010 income tax returns.
Financial Highlights
| | | Years Ended |
| | | September 30, | September 30, |
Class A Shares | | | 2010 (z) | 2009 (z) |
Net asset value, beginning | | | $11.40 | $11.50 |
Income from investment operations: | | | | |
Net investment income | | | .06 | .06 |
Net realized and unrealized gain (loss) | | | .97 | (.10) |
Total from investment operations | | | 1.03 | (.04) |
Distributions from: | | | | |
Net investment income | | | — | (.06) |
Net realized gain | | | — | ** |
Total from distributions | | | — | (.06) |
Total increase (decrease) in net asset value | | | 1.03 | (.10) |
Net asset value, ending | | | $12.43 | $11.40 |
| | | | |
Total return* | | | 9.04% | (.16%) |
Ratios to average net assets: A | | | | |
Net investment income | | | .48% | .63% |
Total expenses | | | 2.27% | 2.70% |
Expenses before offsets | | | 1.66% | 1.67% |
Net expenses | | | 1.66% | 1.67% |
Portfolio turnover | | | 44% | 98% |
Net assets, ending (in thousands) | | | $30,062 | $21,328 |
| | | | |
| | | | |
| | | Periods Ended |
| | | September 30, | September 30, |
Class A Shares | | | 2008 (z) | 2007# (z) |
Net asset value, beginning | | | $15.32 | $15.00 |
Income from investment operations: | | | | |
Net investment income | | | .17 | .02 |
Net realized and unrealized gain (loss) | | | (3.99) | .30 |
Total from investment operations | | | (3.82) | .32 |
Total increase (decrease) in net asset value | | | (3.82) | .32 |
Net asset value, ending | | | $11.50 | $15.32 |
| | | | |
Total return* | | | (24.93%) | 2.13% |
Ratios to average net assets: A | | | | |
Net investment income | | | 1.22% | .50% (a) |
Total expenses | | | 2.81% | 7.82% (a) |
Expenses before offsets | | | 1.68% | 1.74% (a) |
Net expenses | | | 1.66% | 1.66% (a) |
Portfolio turnover | | | 29% | 2% |
Net assets, ending (in thousands) | | | $16,710 | $5,678 |
See notes to financial highlights.
Financial Highlights
| | | Years Ended |
| | | September 30, | September 30, |
Class C Shares | | | 2010 (z) | 2009 (z) |
Net asset value, beginning | | | $11.29 | $11.39 |
Income from investment operations: | | | | |
Net investment income (loss) | | | (.03) | (.02) |
Net realized and unrealized gain (loss) | | | .94 | (.08) |
Total from investment operations | | | .91 | (.10) |
Distributions from: | | | | |
Net realized gain | | | — | ** |
Total from distributions | | | — | ** |
Total increase (decrease) in net asset value | | | .91 | (.10) |
Net asset value, ending | | | $12.20 | $11.29 |
| | | | |
Total return* | | | 8.06% | (0.82%) |
Ratios to average net assets: A | | | | |
Net investment income (loss) | | | (.25%) | (.19%) |
Total expenses | | | 3.88% | 5.38% |
Expenses before offsets | | | 2.50% | 2.51% |
Net expenses | | | 2.50% | 2.51% |
Portfolio turnover | | | 44% | 98% |
Net assets, ending (in thousands) | | | $1,744 | $823 |
| | | | |
| | | | |
| | | Periods Ended |
| | | September 30, | September 30, |
Class C Shares | | | 2008 (z) | 2007 ##(z) |
Net asset value, beginning | | | $15.30 | $14.74 |
Income from investment operations | | | | |
Net investment income | | | .09 | .01 |
Net realized and unrealized gain (loss) | | | (4.00) | .55 |
Total from investment operations | | | (3.91) | .56 |
Total increase (decrease) in net asset value | | | (3.91) | .56 |
Net asset value, ending | | | $11.39 | $15.30 |
| | | | |
Total return* | | | (25.56%) | 3.80% |
Ratios to average net assets: A | | | | |
Net investment income | | | .67% | 1.14% (a) |
Total expenses | | | 7.55% | 66.65% (a) |
Expenses before offsets | | | 2.52% | 2.58% (a) |
Net expenses | | | 2.50% | 2.50% (a) |
Portfolio turnover | | | 29% | 1% |
Net assets, ending (in thousands) | | | $620 | $140 |
See notes to financial highlights.
Financial Highlights
| | | Years Ended |
| | | September 30, | September 30, |
Class I Shares | | | 2010 (z) | 2009 (z) |
Net asset value, beginning | | | $11.32 | $11.58 |
Income from investment operations: | | | | |
Net investment income | | | .10 | .09 |
Net realized and unrealized gain (loss) | | | .95 | (.14) |
Total from investment operations | | | 1.05 | (.05) |
Distributions from: | | | | |
Net investment income | | | (.20) | (.21) |
Net realized gain | | | — | ** |
Total from distributions | | | (.20) | (.21) |
Total increase (decrease) in net asset value | | | .85 | (.26) |
Net asset value, ending | | | $12.17 | $11.32 |
| | | | |
Total return* | | | 9.42% | .26% |
Ratios to average net assets: A | | | | |
Net investment income | | | .90% | 1.03% |
Total expenses | | | 1.73% | 2.11% |
Expenses before offsets | | | 1.20% | 1.21% |
Net expenses | | | 1.20% | 1.21% |
Portfolio turnover | | | 44% | 98% |
Net assets, ending (in thousands) | | | $4,190 | $3,712 |
| | | | |
| | | | |
| | | | |
| | | Periods Ended |
| | | September 30, | September 30, |
Class I Shares | | | 2008 (z) | 2007 #(z) |
Net asset value, beginning | | | $15.35 | $15.00 |
Income from investment operations: | | | | |
Net investment income | | | .25 | .04 |
Net realized and unrealized gain (loss) | | | (4.02) | .31 |
Total from investment operations | | | (3.77) | .35 |
Total increase (decrease) in net asset value | | | (3.77) | .35 |
Net asset value, ending | | | $11.58 | $15.35 |
| | | | |
Total return* | | | (24.56%) | 2.33% |
Ratios to average net assets: A | | | | |
Net investment income | | | 1.72% | .78% (a) |
Total expenses | | | 2.26% | 7.47% (a) |
Expenses before offsets | | | 1.22% | 1.28% (a) |
Net expenses | | | 1.20% | 1.20% (a) |
Portfolio turnover | | | 29% | 2% |
Net assets, ending (in thousands) | | | $3,533 | $3,075 |
See notes to financial highlights.
Financial Highlights
| | | Periods Ended |
| | | September 30, | September 30, |
Class Y Shares | | | 2010 (z) | 2009###(z) |
Net asset value, beginning | | | $11.50 | $8.67 |
Income from investment operations: | | | | |
Net investment income | | | .10 | .13 |
Net realized and unrealized gain (loss) | | | .90 | 2.70 |
Total from investment operations | | | 1.00 | 2.83 |
Distributions from: | | | | |
Net investment income | | | (.78) | — |
Net realized gain | | | — | ** |
Total from distributions | | | (.78) | ** |
Total increase (decrease) in net asset value | | | .22 | 2.83 |
Net asset value, ending | | | $11.72 | $11.50 |
| | | | |
Total return* | | | 9.18% | 32.71% |
Ratios to average net assets: A | | | | |
Net investment income | | | .96% | 1.56% (a) |
Total expenses | | | 4.73% | 21.67% (a) |
Expenses before offsets | | | 1.41% | 1.42% (a) |
Net expenses | | | 1.41% | 1.41% (a) |
Portfolio turnover | | | 44% | 90% |
Net assets, ending (in thousands) | | | $944 | $112 |
See notes to financial highlights.
A Total expenses do not reflect amounts reimbursed and/or waived by the Advisor or reductions from expense off set arrangements. Expenses before offsets reflect expenses after reimbursement and/or waiver by the Advisor but prior to reductions from expense offset arrangements. Net expenses are net of all reductions and represent the net expenses paid by the Fund.
# From May 31, 2007 inception.
## From July 31, 2007 inception.
### From October 31, 2008 inception.
* Total return is not annualized for periods less than one year and does not reflect deduction of any front-end or deferred sales charge.
** Less than $0.01 per share.
(a) Annualized.
(z) Per share figures are calculated using the Average Shares Method.
See notes to financial statements.
Explanation of Financial Tables
Schedule of Investments
The Schedule of Investments is a snapshot of all securities held in the fund at their market value, on the last day of the reporting period. Securities are listed by asset type (e.g., common stock, corporate bonds, U.S. government obligations) and may be further broken down into sub-groups and by industry classification.
Statement of Assets and Liabilities
The Statement of Assets and Liabilities is often referred to as the fund’s balance sheet. It lists the value of what the fund owns, is due and owes on the last day of the reporting period. The fund’s assets include the market value of securities owned, cash, receivables for securities sold and shareholder subscriptions, and receivables for dividends and interest payments that have been earned, but not yet received. The fund’s liabilities include payables for securities purchased and shareholder redemptions, and expenses owed but not yet paid. The statement also reports the fund’s net asset value (NAV) per share on the last day of the reporting period. The NAV is calculated by dividing the fund’s net assets (assets minus liabilities) by the number of shares outstanding. This statement is accompani ed by a Schedule of Investments. Alternatively, if certain conditions are met, a Statement of Net Assets may be presented in lieu of this statement and the Schedule of Investments.
Statement of Net Assets
The Statement of Net Assets provides a detailed list of the fund’s holdings, including each security’s market value on the last day of the reporting period. The Statement of Net Assets includes a Schedule of Investments. Other assets are added and other liabilities subtracted from the investments total to calculate the fund’s net assets. Finally, net assets are divided by the outstanding shares of the fund to arrive at its share price, or Net Asset Value (NAV) per share.
At the end of the Statement of Net Assets is a table displaying the composition of the fund’s net assets. Paid in Capital is the money invested by shareholders and represents the bulk of net assets. Undistributed Net Investment Income and Accumulated Net Realized Gains usually approximate the amounts the fund had available to distribute to shareholders as of the statement date. Accumulated Realized Losses will appear as negative balances. Unrealized Appreciation (Depreciation) is the difference between the market value of the fund’s investments and their cost, and reflects the gains (losses) that would be realized if the fund were to sell all of its investments at their statement-date -values.
Statement of Operations
The Statement of Operations summarizes the fund’s investment income earned and expenses incurred in operating the fund. Investment income includes dividends earned from stocks and interest earned from interest-bearing securities in the fund. Expenses incurred in operating the fund include the advisory fee paid to the investment advisor, administrative services fees, distribution plan expenses (if applicable), transfer agent fees, shareholder servicing expenses, custodial, legal, and audit fees, and the printing and postage expenses related to shareholder reports. Expense offsets (fees paid indirectly) are also shown. Credits earned from offset arrangements are used to reduce the fund’s expenses. This statement also shows net gains (losses) realized on the sale of investments and the increase or decrease in the unrealized a ppreciation (depreciation) on investments held during the period.
Statement of Changes in Net Assets
The Statement of Changes in Net Assets shows how the fund’s total net assets changed during the two most recent reporting periods. Changes in the fund’s net assets are attributable to investment operations, distributions and capital share transactions.
The Operations section of the report summarizes information detailed in the Statement of Operations. The Distribution section shows the dividend and capital gain distributions made to shareholders. The amounts shown as distributions in this section may not match the net investment income and realized gains amounts shown in the Operations section because distributions are determined on a tax basis and certain investments or transactions may be treated differently for financial statement and tax purposes. The Capital Share Transactions section shows the amount shareholders invested in the fund, either by purchasing shares or by reinvesting distributions, and the amounts redeemed. The corresponding numbers of shares issued, reinvested and redeemed are shown at the end of the report.
Financial Highlights
The Financial Highlights table provides a per-share breakdown per class of the components that affect the fund’s net asset value for current and past reporting periods. The table provides total return, total distributions, expense ratios, portfolio turnover and net assets for the applicable period. Total return is a measure of a fund’s performance that encompasses all elements of return: dividends, capital gain distributions and changes in net asset value. Total return is the change in value of an investment over a given period, assuming reinvestment of any dividends and capital gain distributions, expressed as a percentage of the initial investment. Total distributions include distributions from net investment income and net realized gains. Long-term gains are earned on securities held in the fund more than one year . Short-term gains, on the sale of securities held less than one year, are treated as ordinary dividend income for tax purposes. The expense ratio is a fund’s cost of doing business, expressed as a percentage of net assets. These expenses directly reduce returns to shareholders. Portfolio turnover measures the trading activity in a fund’s investment portfolio – how often securities are bought and sold by a fund. Portfolio turnover is affected by market conditions, changes in the size of the fund, the nature of the fund’s investments and the investment style of the portfolio manager.
PROXY VOTING
The Proxy Voting Guidelines of the Calvert Funds that the Fund uses to determine how to vote proxies relating to portfolio securities are provided as an Appendix to the Fund’s Statement of Additional Information. The Statement of Additional Information can be obtained free of charge by calling the Fund at 1-800-368-2745, by visiting the Calvert website at www.calvert.com; or by visiting the SEC’s website at www.sec.gov.
Information regarding how the Fund voted proxies relating to portfolio securities during the most recent 12-month period ended June 30 is available on the Fund’s website at www.calvert.com and on the SEC’s website at www.sec.gov.
Availability of Quarterly Portfolio Holdings
The Fund files its complete schedule of portfolio holdings with the SEC for the first and third quarters of each fiscal year on Form N-Q. The Fund’s Form N-Q is available on the SEC’s website at www.sec.gov. The Fund’s Form N-Q may be reviewed and copied at the SEC’s Public Reference Room in Washington, DC; information on the operation of the Public Reference Room may be obtained by calling 1-800-SEC-0330.
Director and Officer Information Table
| # of
Calvert
Portfolios
Overseen | Other
Directorships |
Name &
Age | Position
with
Fund | Position
Start
Date | Principal Occupation
During Last 5 Years |
INDEPENDENT TRUSTEES/DIRECTORS |
REBECCA L. ADAMSON
AGE: 61 | Trustee Director Director Director | 1989
CSIF 2000
IMPACT 2000
CSIS 2005
CWVF | President of the national nonprofit, First People’s Worldwide, formerly First Nations Financial Project. Founded by her in 1980, First People’s Worldwide is the only American Indian alternative development institute in the country. | 17 | • Bay & Paul Foundation |
RICHARD L. BAIRD, JR.
AGE: 62 | Trustee &
Chair Director &
Chair Director &
Chair Director &
Chair | 1982
CSIF 2000
CSIS 2005
CWVF 2005
Impact | President and CEO of Adagio Health Inc. in Pittsburgh, PA, a non-profit corporation which provides family planning services, nutrition, maternal/child health care, and various health screening services and community preventive health programs. | 29 | None |
JOHN G. GUFFEY, JR.
AGE: 62 | Director Trustee Director Director | 1992
CWVF 1982
CSIF 2000
CSIS 2005
IMPACT | Treasurer and Director of Silby, Guffey and Co., Inc., a venture capital firm (inactive as of 2003) and President of Aurora Press Inc., a privately held publisher of trade paperbacks. | 29 | • Ariel Funds (3) • Calvert Social Investment Foundation • Calvert Ventures, LLC |
MILES DOUGLAS HARPER, III
AGE: 47 | Director Trustee Director Director | 2000
Impact 2005
CSIF 2005
CSIS 2005
CWVF | Partner, Gainer Donnelly & Desroches (public accounting firm) since January 1999. | 17 | • Bridgeway Funds (14) |
JOY V. JONES AGE:60 | Director Trustee Director Director | 2000
Impact 1990
CSIF 2000
CSIS 2005
CWVF | Attorney. | 17 | • Director, Conduit Street Restaurants Limited |
TERRENCE J. MOLLNER, Ed.D. AGE: 65 | Director Trustee Director Director | 1992
CWVF 1982
CSIF 2000
CSIS 2005
IMPACT | Founder, Chairperson, and President of Trusteeship Institute, Inc., a diverse foundation known principally for its consultation to corporations converting to cooperative employee-ownership and the development of socially and spiritually responsible investment vehicles. Chairperson, Stakeholders Capital, Inc., an asset management firm and financial services provider in Amherst, MA. | 17 | • Calvert Social Investment Foundation • Ben & Jerry's Homemade, Inc. • ArtNOW, Inc. • Yourolivebranch.org |
SYDNEY AMARA MORRIS
AGE: 61 | Trustee Director Director Director | 1982
CSIF 2000
CSIS 2005
CWVF 2005
IMPACT | Rev. Morris currently serves as Parish Minister to the Keweenaw Unitarian Universalist Fellowship in Houghton, MI. Rev. Morris is a graduate of Harvard Divinity School. She currently chairs the Umbrian Universalist Committee on Socially Responsible Investing. | 17 | None |
INTERESTED TRUSTEES/DIRECTORS |
BARBARA J. KRUMSIEK
AGE: 58 | Director &
President Trustee &
Senior Vice
President Director &
Senior Vice
President Director &
President | 1997
CWVF 1997
CSIF 2000
CSIS 2000
Impact | President, Chief Executive Officer and Chair of Calvert Group, Ltd. | 51 | • Calvert Social Investment Foundation • Pepco Holdings, Inc. • Acacia Life Insurance Company (Chair) |
D. WAYNE SILBY, Esq.
AGE: 62 | Director Trustee &
President Director &
President Director | 1992
CWVF 1982
CSIF 2000
CSIS 2000
Impact | Mr. Silby is the founding Chair of the Calvert Funds. He is the Chair-Elect and a principal of Syntao.com, a Beijing-based company promoting corporate social responsibility. He was an officer and director of Silby, Guffey and Co., Inc., a venture capital firm (inactive as of 2003). | 29 | • UNIFI Mutual Holding Company • Calvert Social Investment Foundation • Giving Assets, Inc. • Studio School Fund • Syntao.com China • The Ice Organization |
OFFICERS |
KAREN BECKER
AGE: 57 | Chief Compliance Officer | 2005 | Chief Compliance Officer for the Calvert Funds. In March 2009, Ms. Becker also became Head of the Securities Operations Department for Calvert Asset Management Company, Inc. |
SUSAN WALKER BENDER, Esq.
AGE: 51 | Assistant Vice-President & Assistant Secretary | 1988
CSIF 2000
CSIS 1992
CWVF 2000
Impact | Assistant Vice President, Assistant Secretary and Associate General Counsel of Calvert Group, Ltd. |
JENNIFER BERG
AGE: 36 | Assistant Fund Controller | 2009 | Fund Administration Manager for Calvert Group, Ltd. |
THOMAS DAILEY
AGE: 46 | Vice President | 2004 | Vice President of Calvert Asset Management Company, Inc. |
| | | | | | | |
IVY WAFFORD DUKE, Esq.
AGE: 42 | Assistant Vice-President & Assistant Secretary | 1996
CSIF 2000
CSIS 1996
CWVF 2000
Impact | Assistant Vice President, Assistant Secretary and Deputy General Counsel of Calvert Group, Ltd., and Chief Compliance Officer for Calvert Asset Management Company, Inc. and Calvert Distributors, Inc. |
PATRICK FAUL
AGE: 45 | Vice President | 2010 | Vice President of Calvert Asset Management Company, Inc. (“CAMCO”) since 2008, and Head of Credit Research for CAMCO since 2009. Prior to 2009, Mr. Faul was Co-Head of Credit Research (2008) and a Senior Securities Analyst (prior to 2008) for CAMCO. |
TRACI L. GOLDT
AGE: 36 | Assistant Secretary | 2004 | Executive Assistant to General Counsel, Calvert Group, Ltd. |
GREGORY B. HABEEB
AGE: 60 | Vice President | 2004 | Senior Vice President of Calvert Asset Management Company, Inc. |
HUI PING HO, CPA
AGE: 45 | Assistant Treasurer | 2000 | Tax Compliance Manager of Calvert Group, Ltd. |
LANCELOT A. KING, Esq.
AGE: 40 | Assistant Vice President & Assistant Secretary | 2002 | Assistant Vice President, Assistant Secretary and Associate General Counsel of Calvert Group, Ltd. |
EDITH LILLIE
AGE: 53 | Assistant Secretary | 2007 | Assistant Secretary (since 2007) and Regulatory Matters Manager of Calvert Group, Ltd. |
AUGUSTO DIVO MACEDO, Esq.
AGE: 47 | Assistant Vice President & Assistant Secretary | 2007 | Assistant Vice President, Assistant Secretary, and Assistant Counsel Compliance of Calvert Group, Ltd. |
JANE B. MAXWELL Esq.
AGE: 58 | Assistant Vice President & Assistant Secretary | 2005 | Assistant Vice President, Assistant Secretary & Assistant General Counsel of Calvert Group, Ltd. |
ANDREW K. NIEBLER, Esq.
AGE: 43 | Assistant Vice President & Assistant Secretary | 2006 | Assistant Vice President, Assistant Secretary & Associate General Counsel of Calvert Group, Ltd. |
CATHERINE P. ROY
AGE: 54 | Vice President | 2004 | Senior Vice President of Calvert Asset Management Company, Inc. and Chief Investment Officer – Fixed Income. |
WILLIAM M. TARTIKOFF, Esq.
AGE: 63 | Vice President and Secretary | 1990
CSIF 2000
CSIS 1992
CWVF 2000
Impact | Senior Vice President, Secretary, and General Counsel of Calvert Group, Ltd. |
NATALIE TRUNOW
AGE: 42 | Vice resident | 2008 | Senior Vice President of Calvert Asset Management Company, Inc., and Chief Investment Officer -Equities. Prior to joining Calvert in August 2008, Ms. Trunow was the Section Head (2005-2008) and Portfolio Manager (2001-2008) for the Global Public Markets Group of General Motors Asset Management. |
RONALD M. WOLFSHEIMER CPA
AGE: 58 | Treasurer | 1982
CSIF 2000
CSIS 1992
CWVF 2000
Impact | Senior Vice President and Chief Financial and Administrative Officer of Calvert Group, Ltd. |
MICHAEL V. YUHAS JR., CPA
AGE: 49 | Fund Controller | 1999
CSIF 2000
CSIS 1999
CWVF 2000
Impact | Vice President of Calvert Administrative Services Company. |
The address of Trustees/Directors and Officers is 4550 Montgomery Avenue, Suite 1000N, Bethesda, Maryland 20814, except Mr. Silby’s address is 1715 18th Street, N.W., Washington, DC 20009. Ms. Krumsiek is an interested person of the Fund since she is an officer and director of the Fund’s advisor and certain affiliates. Mr. Silby is an interested person of the Fund since he is a director of the parent company of the Fund’s advisor.
Additional information about the Fund’s Trustees/Directors can be found in the Statement of Additional Information (SAI). You can get a free copy of the SAI at www.calvert.com, or by contacting your broker, or the Fund at 1-800-368-2745.
To Open an Account
800-368-2748
Yields and Prices
Calvert Information Network
(24 hours, 7 days a week)
800-368-2745
Service for Existing Account
Shareholders: 800-368-2745
Brokers: 800-368-2746
TDD for Hearing Impaired
800-541-1524
Branch Office
4550 Montgomery Avenue
Suite 1000 North
Bethesda, Maryland 20814
Registered, Certified
or Overnight Mail
Calvert Group
c/o BFDS,
330 West 9th Street
Kansas City, MO 64105
Web Site
www.calvert.com
Principal Underwriter
Calvert Distributors, Inc.
4550 Montgomery Avenue
Suite 1000 North
Bethesda, Maryland 20814
Calvert
International
Opportunities fund
Calvert’s Family of Funds
Tax-Exempt Money
Market Funds
CTFR Money Market Portfolio
Taxable Money Market Funds
First Government Money Market Fund
CSIF Money Market Portfolio
Municipal Funds
Calvert Tax-Free Bond Fund
Taxable Bond Funds
CSIF Bond Portfolio
Income Fund
Short Duration Income Fund
Long-Term Income Fund
Ultra-Short Income Fund
Government Fund
Short-Term Government Fund
High Yield Bond Fund
Equity Funds
CSIF Enhanced Equity Portfolio
CSIF Equity Portfolio
Calvert Large Cap Growth Fund
Calvert Large Cap Value Fund
Calvert Social Index Fund
Capital Accumulation Fund
CWV International Equity Fund
New Vision Small Cap Fund
Small Cap Value Fund
Mid Cap Value Fund
Global Alternative Energy Fund
Global Water Fund
International Opportunities Fund
Balanced and Asset
Allocation Funds
CSIF Balanced Portfolio
Calvert Conservative Allocation Fund
Calvert Moderate Allocation Fund
Calvert Aggressive Allocation Fund
This report is intended to provide fund information to shareholders. It is not authorized for distribution to prospective investors unless preceded or
accompanied by a prospectus.
Note: The information on our website is not incorporated by reference into this report; our website address is included as an inactive textual reference only.
Investors should carefully consider the investment objectives, risks, charges and expenses of the Calvert Funds. This and other important information is contained in the fund’s summary prospectus and prospectus, which can be obtained from your financial professional and should be read carefully before investing. You may also call Calvert at 800/368-2745 or visit www. calvert.com.
Item 2. Code of Ethics.
(a) The registrant has adopted a code of ethics (the "Code of Ethics") that applies to its principal executive officer and principal financial officer (also referred to as “principal accounting officer”).
(b) No information need be disclosed under this paragraph.
(c) The registrant has not amended its Code of Ethics during the period covered by the shareholder report presented in Item 1 hereto.
(d) The registrant has not granted a waiver or implicit waiver from a provision of its Code of Ethics during the period covered by the shareholder report presented in Item 1 hereto.
(e) Not applicable.
(f) The registrant's Code of Ethics is attached as an Exhibit hereto.
Item 3. Audit Committee Financial Expert.
The registrant's Board of Directors has determined that Miles D. Harper, III., an "independent" Director serving on the registrant's audit committee, is an "audit committee financial expert," as defined in Item 3 of Form N-CSR. Under applicable securities laws, a person who is determined to be an audit committee financial expert will not be deemed an "expert" for any purpose, including without limitation for the purposes of Section 11 of the Securities Act of 1933, as a result of being designated or identified as an audit committee financial expert. The designation or identification of a person as an audit committee financial expert does not impose on such person any duties, obligations, or liabilities that are greater than the duties, obligations, and liabilities imposed on such person as a member of the audit committee and Board of Directors in the absence of such designation or identification.
Item 4. Principal Accountant Fees and Services.
Services fees paid to auditing firm:
| Fiscal Year
ended 9/30/10 | Fiscal Year
ended 9/30/09 |
| $ | %* | $ | % * |
| | | | |
(a) Audit Fees | $54,285 | | $50,600 | |
(b) Audit-Related Fees | $0 | 0% | $0 | 0% |
(c) Tax Fees (tax return preparation and filing for the registrant) | $8,993 | 0% | $8,530 | 0% |
(d) All Other Fees | $0 | 0% | $0 | 0% |
| | | | |
Total | $63,278 | 0% | $59,130 | 0% |
* Percentage of fees approved by the Audit Committee pursuant to (c)(7)(i)(C) of Rule 2-01 of Reg. S-X (statutory de minimis waiver of Committee’s requirement to pre-approve)
(e) Audit Committee pre-approval policies and procedures:
The Audit Committee is required to pre-approve all audit and non-audit services provided to the registrant by the auditors, and to the registrant’s investment advisor, and any entity controlling, controlled by, or under common control with the advisor that provides ongoing services to the registrant. In determining whether to pre-approve non-audit services, the Audit Committee considers whether the services are consistent with maintaining the independence of the auditors. The Committee may delegate its authority to pre-approve certain matters to one or more of its members. In this regard, the Committee has delegated authority to the Audit Committee Chair with respect to non-audit services not exceeding $25,000 in each instance. In addition, the Committee has pre-approved the retention of the auditors to provide tax-related services related to the tax treatment and tax accounting of newly acquired securities, upon request by the investment advisor in each instance.
(f) Not applicable.
(g) Aggregate non-audit fees billed by the registrant’s accountant for services rendered to the registrant, and rendered to the registrant’s investment advisor, and any entity controlling, controlled by, or under common control with the advisor that provides ongoing services to the registrant for each of the last two fiscal years of the registrant:
| Fiscal Year
ended 9/30/10 | Fiscal Year
ended 9/30/09 |
| $ | %* | $ | % * |
| $11,000 | 0%* | $26,000 | 0%* |
* Percentage of fees approved by the Audit Committee pursuant to (c)(7)(i)(C) of Rule 2-01 of Reg. S-X (statutory de minimis waiver of Committee’s requirement to pre-approve)
(h) The registrant’s Audit Committee of the Board of Directors has considered whether the provision of non-audit services that were rendered to the registrant’s investment advisor, and any entity controlling, controlled by, or under common control with the investment advisor that provides ongoing services to the registrant that were not pre-approved pursuant to paragraph (c) (7)(ii) of Rule 2-01 of Reg. S-X is compatible with maintaining the principal accountant’s independence and found that the provision of such services is compatible with maintaining the principal accountant’s independence.
Item 5. Audit Committee of Listed Registrants.
Not applicable.
Item 6. Schedule of Investments.
(a) This Schedule is included as part of the report to shareholders filed under Item 1 of this Form.
(b) Not applicable.
Item 7. Disclosure of Proxy Voting Policies and Procedures for Closed-End Management Investment Companies.
Not applicable.
Item 8. Portfolio Managers of Closed-End Management Investment Companies.
Not applicable.
Item 9. Purchases of Equity Securities by Closed-End Management Investment Company and Affiliated Purchasers.
Not applicable.
Item 10. Submission of Matters to a Vote of Security Holders.
No material changes were made to the procedures by which shareholders may recommend nominees to the registrant’s Board of Directors since registrant last provided disclosure in response to this Item.
Item 11. Controls and Procedures.
(a) The principal executive and financial officers concluded that the registrant's disclosure controls and procedures (as defined in Rule 30a-3(c) under the 1940 Act) are effective, based on the evaluation of these controls and procedures required by Rule 30a-3(b) under the 1940 Act and Rules 13a-15(b) or 15d-15(b) under the Exchange Act, as of a date within 90 days of the filing date of this report.
(b) There was no change in the registrant's internal control over financial reporting (as defined in Rule 30a-3(d) under the 1940 Act) that occurred during the registrant's second fiscal quarter of the period covered by this report that has materially affected, or is reasonably likely to materially affect, the registrant's internal control over financial reporting.
Item 12. Exhibits.
(a)(1) A copy of the Registrant’s Code of Ethics.
Attached hereto.
(a)(2) A separate certification for each principal executive officer and principal financial officer of the registrant as required by Rule 30a-2 under the Act (17 CFR 270.30a-2).
Attached hereto.
(a)(3) Not applicable.
(b) A certification for the registrant's Principal Executive Officer and Principal Financial Officer, as required by Rule 30a-2(b) under the Investment Company Act of 1940, is attached hereto. The certification furnished pursuant to this paragraph is not deemed to be "filed" for purposes of Section 18 of the Securities Exchange Act of 1934, or otherwise subject to the liability of that section. Such certification is not deemed to be incorporated by reference into any filing under the Securities Act of 1933 or the Securities Exchange Act of 1934, except to the extent that the registrant specifically incorporates it by reference.
Pursuant to the requirements of the Securities Exchange Act of 1934 and the Investment Act of 1940, the registrant has duly caused this report to be signed on its behalf by the undersigned, thereunto duly authorized.
CALVERT WORLD VALUES FUND, INC.
By: /s/ Barbara J. Krumsiek
Barbara J. Krumsiek
President -- Principal Executive Officer
Date: December 01, 2010
Pursuant to the requirements of the Securities Exchange Act of 1934 and the Investment Act of 1940, this report has been signed below by the following persons on behalf of the registrant and in the capacities and on the dates indicated.
/s/ Barbara J. Krumsiek
Barbara J. Krumsiek
President -- Principal Executive Officer
Date: December 01, 2010
/s/ Ronald M. Wolfsheimer
Ronald M. Wolfsheimer
Treasurer -- Principal Financial Officer
Date: December 01, 2010