UNITED STATES
SECURITIES AND EXCHANGE COMMISSION
Washington, D.C. 20549
FORM N-CSR
CERTIFIED SHAREHOLDER REPORT OF REGISTERED
MANAGEMENT INVESTMENT COMPANIES
Investment Company Act file number: 811-6563
CALVERT WORLD VALUES FUND, INC.
(Exact name of registrant as specified in charter)
4550 Montgomery Avenue
Suite 1000N
Bethesda, Maryland 20814
(Address of Principal Executive Offices)
William M. Tartikoff, Esq.
4550 Montgomery Avenue
Suite 1000N
Bethesda, Maryland 20814
(Name and Address of Agent for Service)
Registrant's telephone number, including area code: (301) 951-4800
Date of fiscal year end: September 30
Date of reporting period: Twelve months ended September 30, 2012
Item 1. Report to Stockholders.
[Calvert International Equity Fund Annual Report]
and
[Calvert Capital Accumulation Fund Annual Report]
and
[Calvert International Opportunities Fund Annual Report]
Choose Planet-friendly E-delivery!
Sign up now for on-line statements, prospectuses, and fund reports. In less than five minutes you can help reduce paper mail and lower fund costs.
Just go to www.calvert.com. If you already have an online account at Calvert, click on My Account, and select the documents you would like to receive via e-mail.
If you’re new to online account access, click on Login/Register to open an online account. Once you’re in, click on the E-delivery sign-up at the bottom of the Account Portfolio page and follow the quick, easy steps. Note: if your shares are not held directly at Calvert but through a brokerage firm, you must contact your broker for electronic delivery options available through their firm.

Dear Shareholder:
Stock markets ended the 2012 annual reporting period sharply higher as the Standard & Poor’s (S&P) 500 Index returned 30.20% versus 1.14% for the 12 months through September 30, 2011. While the two periods shared many commonalities--such as a softening of economic indicators, mounting concerns about sovereign debt in the eurozone, and relatively strong corporate profits--there were some key differences.
Financial markets around the world breathed a sigh of relief after the European Central Bank committed to saving the euro this summer and offered to support the debt markets for any euro member government seeking a new financial bailout. And while the disasters in Japan and strife in the Middle East and North Africa weighed heavily on investor confidence last year, uncertainty closer to home rattled investors this year, primarily as a result of the presidential election and looming “fiscal cliff” in January 2013 that could raise taxes for many Americans. The good news is both situations should see some resolution by the end of 2012.
The U.S. economy’s relative strength was also more evident in this annual reporting period. The divergence with foreign stock market returns widened as the S&P 500 Index more than doubled the 14.33% return of the MSCI EAFE Index for the 12-month period ending September 30, 2012. In the 12 months ending September 30, 2011, the S&P 500 barely eked out a positive return compared with -8.94% for the MSCI EAFE for the same period.
A Truly Uneven Recovery
Within the United States, the economic recovery was also uneven, with some consumers and businesses feeling left behind in the midst of an “improving” economy. For example, growth in northeastern metropolitan areas lagged, while metro areas out west, particularly those in natural gas or high-tech centers, rebounded strongly.1 Also, the housing market finally turned the corner, as national home prices rose 3.6% year-over-year for the past 12 months. However, they surged 9.4% in the western U.S. while notching up only 0.9% in the northeast.2 In employment, more than 70% of jobs lost in service industries during the recession have returned, but only 15% of jobs lost in manufacturing, construction, and other goods-producing industries have come back. The differences are stark even within industries, where retail general merchandisers such as Costco recouped 92% while department stores regained just 41% of lost jobs.3 Overall, we remain cautiously optimistic about the economic recovery ahead. As both citizens and investors, we hope that government legislators return to the negotiating table after the election and give us all the gift of more certainty before the holidays.
www.calvert.com CALVERT INTERNATIONAL EQUITY FUND ANNUAL REPORT 4
Making Strides in Board Diversity
Calvert continued its advocacy efforts in many areas, including board diversity. The United Nations Gender Equality for Sustainable Business Event in March marked the two-year anniversary of the U.N.’s Women’s Empowerment Principles (WEP), which were adapted from the Calvert’s Women Principles®, and emphasized the business case for promoting gender equality and women’s empowerment in the workplace. Calvert also joined the newly formed WEP Leadership Group to expand implementation of the Principles.
On March 21, we testified before the Senate Democratic Steering and Outreach Committee about the importance of gender equity in economic empowerment and job creation, highlighting research showing the inclusion of women in corporate management correlates with higher shareholder value and better operating results.
Creating “The Future We Want” in Rio
Finally, I had the pleasure of representing Calvert by speaking at several events at the Rio + 20 Summit about board oversight of sustainability, social enterprise and impact investing, the role of business in promoting gender equality, the business case for the green economy, and establishing value for natural capital.
The first Earth Summit in Rio de Janeiro 20 years ago created climate and biodiversity conventions and set the stage for frameworks to address global environmental degradation, climate change, and poverty. However, global economic uncertainty weighed heavily on the Rio + 20 Summit. While negotiations continued to advance toward 2015, we’re disappointed by the lack of concrete commitments needed for substantial progress on critical sustainability issues.
However, side events sponsored by private-sector and non-governmental organizations sparked many innovative initiatives and positive outcomes. A number of major companies made significant commitments on water, energy, renewable materials, and deforestation. Corporate and investor disclosure of environmental, social, and governance (ESG) impacts took a real step forward as well. In fact, NASDAQ will now encourage companies on its exchange to report on ESG issues, or explain why they do not.
While these efforts can’t substitute for binding governmental commitments, we are happy to see so many companies and investors stepping up to the plate and believe the private sector will remain a key driver of progress on sustainability issues over the next few years.
Stay Informed in the Months Ahead
Maintaining a well-diversified mix of stocks, bonds, and cash appropriate for your goals and risk tolerance is one of the best ways to mitigate the effects of an uneven economic recovery. We also recommend discussing any changes in your financial situation with your investment advisor.
www.calvert.com CALVERT INTERNATIONAL EQUITY FUND ANNUAL REPORT 5
A financial services consulting firm recently named Calvert as one of the Top Social Media Leaders in 2012 for using Facebook to share valuable content with investors and advisors.4 Join the dialogue at www.facebook.com/calvert.
We also invite you to visit our website, www.calvert.com, for fund information, portfolio updates, and commentary from Calvert professionals. You can now get the same information on the go with our new iPhone® app, available free at iTunes.
As always, we thank you for investing with Calvert.

Barbara Krumsiek
President and CEO of Calvert Investments, Inc.
October 2012
1. Brookings Institution, Metro Monitor - September 2012, www.brookings.edu/research/
interactives/metromonitor#overall
2. Clear Capital, “June Home Prices Provide Further Evidence of Budding Recovery. Forecast
Indicates Further Increases Through 2012,” July 2012 Market Report, http://clearcapital.com/
company/MarketReport.cfm?month=July&year=2012
3. Paul Davison and Barbara Hansen, “Service Businesses Lead Uneven Jobs Recovery,” USA
Today, July 15, 2012, www.usatoday.com/money/economy/story/2012-07-15/jobs-recov-
ered/56242656/1
4. kasina ranked Calvert fifth of 53 asset management and insurance companies for using
Facebook to tell a compelling brand story and share valuable content with investors and advi
sors. The ranking was based on kasina’s three-tier methodology that ranked firms based on
content, branding, interactivity, and usability on each social platform. For more information,
visit www.kasina.com.
www.calvert.com CALVERT INTERNATIONAL EQUITY FUND ANNUAL REPORT 6

Landmark Rules on Conflict Minerals
After a complicated and controversial two-year rulemaking process, the Securities and Exchange Commission (SEC) released final rules under the Dodd-Frank Wall Street Reform and Consumer Protection Act (Dodd-Frank) Section 1502, which require companies to file and publish reports on their efforts to eliminate the use of “conflict minerals” that have fueled a violent 14-year conflict in the Eastern Democratic Republic of the Congo (DRC).
Calvert played a leading role among investors during the rulemaking process and is pleased with the progress. However, the two- to four-year timeline for compliance and exclusion of mining companies from reporting requirements was disappointing. We will continue to press all companies involved with conflict minerals to step up their efforts to address these issues.
New Standards Will Nearly Double Fuel Efficiency by 2025
Newly finalized corporate average fuel economy (CAFE) standards require cars and light-duty trucks to reach the equivalent of 54.5 mpg by 2025. Experts estimate the new standards will reduce oil consumption by 12 billion barrels while saving consumers $1.7 trillion. The major U.S. automakers supported the new standards and have already begun incorporating them into future vehicles.
The higher standards should boost both the competitiveness of American automakers and U.S. policy efforts to mitigate climate change, since more than 90% of a vehicle’s contribution to climate change through greenhouse gas emissions (GHGs) is related to fuel consumption.1 Calvert has long advocated for higher standards in public testimony to Environmental Protection Agency, meetings with Obama administration officials, dialogues with the auto industry, and the media and will continue to do so.
Helping Companies Combat Climate Change Risks
Economic and insured losses from natural catastrophes set new records last year, driving home the very real physical climate risks for investors. Extreme weather events accounted for 90% of the disasters and eight of the 10 most costly events, causing overall losses of more than $148 billion.
To that end, Calvert co-authored two reports to help companies evaluate their exposure to climate risks and protect shareholder value. Oxfam America and Ceres joined us to create Physical Risks from Climate Change: A guide for companies and investors on disclosure and management of climate impacts.
We also developed Value Chain Climate Resilience: A guide to managing climate impacts in companies and communities, a first-of-its-kind guide to help businesses assess and prepare for the risks and opportunities posed by climate change, with other leading companies from the Partnership for Resilience and Environmental Preparedness (PREP).
www.calvert.com CALVERT INTERNATIONAL EQUITY FUND ANNUAL REPORT 7
Exercising Our Say on Pay
Calvert fought for the new “say on pay” rule, which requires publicly traded U.S. companies to allow shareholders to vote on the compensation awarded to senior management the previous year. We built on that success this year by creating a strict set of voting guidelines on executive compensation for the proxy season. We also shared our reasons for voting against the proposals to management at key companies.
Overall, Calvert votes against compensation packages that do not align management and shareholder interests and do not incentivize the company’s long-term performance. In May, this meant voting against company compensation packages 34% of the time. This includes Gilead Sciences, Safeway, and Plains Exploration and Production, all of which rewarded CEOs with high pay in 2011 despite lackluster shareholder returns.
Even before the May announcement of a massive trading loss, we rejected the $23 million pay package for JPMorgan Chase Chairman and CEO Jamie Dimon due to its discretionary nature and inherent lack of accountability to long-term financial goals. The weaknesses in risk oversight evident by the company’s failed hedging strategy only reinforced our decision.
Other Shareholder Advocacy Efforts
This spring, Calvert filed 24 shareholder resolutions to keep the sustainability issues with a real impact on profits, people, and the planet front and center. Six were voted upon by shareholders, including resolutions on: -- Board diversity at Urban Outfitters, which received 39% support (up from 22% last year). Despite owning popular women’s retail brands Anthropologie and Free People, the company does not have any women or minorities on its board of directors.
-- Disclosure of water scarcity and pollution risks at Fossil, which received 31% support. As an apparel company, Fossil relies on water- and energy-intensive processes for producing cotton, leather, and other products. These processes can also pollute water supplies, especially in developing countries.
-- Sustainability reports at Gentex, which received 32% support. This supplier for the automotive, aerospace, and commercial fire protection industries currently provides no information on its efforts to manage resource efficiency and environmental impacts—despite increasing demands from its key clients for sustainability data.
Promoting Privacy on the Internet
In 2006, Calvert joined other investors, human rights advocacy organizations, academic experts and companies to develop the multi-stakeholder Global Network Initiative (GNI) to help information and communication technology (ICT) companies address freedom of expression and privacy issues. In early 2012, GNI’s path to becoming a fully global standard leapt forward as the first three GNI companies—Yahoo, Google, and Microsoft— completed the second phase of the assessment process.
www.calvert.com CALVERT INTERNATIONAL EQUITY FUND ANNUAL REPORT 8
In addition, Facebook became a GNI observer in May, opening the door to its participation in GNI policy and advocacy discussions for one year as it evaluates the potential commitment of implementing the GNI principles. We welcome the opportunity to work with Facebook, particularly in protecting against privacy violations that can endanger members using it as an instrument of freedom of expression and political dissent across the world.
Community Investments
Many of our Funds participate in Calvert’s High Social Impact Investing program, which is administered through the Calvert Foundation. This community investment program may allocate a small percentage of Fund assets at below-market interest rates to investments that provide economic opportunity for struggling populations.2 One such investment through the Foundation is FMM Popayan, which offers financial services to more than 400,000 clients in some of the poorest areas of Columbia. Women comprise 66% of their client base.
We also supported the Triodos Sustainable Trade Fund, which seeks to improve the economic position of farmers in emerging markets and stimulate development in the sustainable agriculture sector. It does this by providing pre-export value chain financing to farmer cooperatives—with a specific focus on fair trade and organic farming.
Special Equities
A modest but important portion of certain funds is allocated to small private companies developing products or services that address important sustainability or environmental issues facing our society.
One example of a recent investment is Ivy Capital/All Life Insurance Company of South Africa, which insures people living with HIV.3 The company uses online support systems to help clients comply with their medical requirements in order to live a longer life. This provides enormous security to their families and employers and seems to be a rather unique business model in fighting the scourge of AIDS.
www.calvert.com CALVERT INTERNATIONAL EQUITY FUND ANNUAL REPORT 9
1. ACEEE, Automobiles and the Environment, www.greenercars.org/guide_environment.
htm
2. As of September 30, 2012, Calvert Social Investment Foundation (“Calvert
Foundation” or “Foundation”) Community Investment Notes represented the follow-
ing percentages of Fund net assets: Calvert Capital Accumulation Fund 0.51%, Calvert
International Equity Fund 1.29%, and Calvert Small Cap Fund 0.48%. The Calvert
Foundation is a 501(c)(3) nonprofit organization. The Foundation’s Community
Investment Note Program is not a mutual fund and should not be confused with any
Calvert Investments-sponsored investment product.
3. As of September 30, 2012, Ivy Capital All Life Insurance represented 0.02% of
Calvert Equity Portfolio. Holdings are subject to change.
As of September 30, 2012, the following companies represented 0% of net assets in the
Fund: Gilead Sciences, Safeway, Plains Exploration and Production, JPMorgan Chase,
Urban Outfitters, Fossil, Gentex, Yahoo, Google, Microsoft and Facebook. Holdings are
subject to change.
www.calvert.com CALVERT INTERNATIONAL EQUITY FUND ANNUAL REPORT 10

Investment Performance
Calvert International Equity Fund Class A shares (at NAV) gained 15.34% for the 12-month period ended September 30, 2012, outperforming the 14.17% return of the MSCI EAFE Investable Market Index due to strong stock selection.
Investment Climate
Gradually improving U.S. economic data, healthy corporate earnings, and some policy steps toward mitigation of the sovereign debt crisis in Europe provided support for equities worldwide during the fiscal year. Global inflation remained tame, and aggressive, accommodative monetary policy by central banks around the globe helped equity markets rally hard off their lows posted last fall, albeit on low volume.
For the trailing 12-month period, the Standard and Poor’s (S&P) 500, Russell 1000, and Russell 2000 Indices returned 30.20%, 30.06%, and 31.91% respectively. Negative headwinds from the eurozone and an economic slowdown in China led to a divergence in performance by international
| CALVERT |
| INTERNATIONAL |
| EQUITY FUND |
| September 30, 2012 |
| INVESTMENT PERFORMANCE | | | |
| (total return at NAV*) | | | |
| | 6 Months | | 12 Months | |
| | ended | | ended | |
| | 9/30/12 | | 9/30/12 | |
| Class A | -1.24 | % | 15.34 | % |
| Class B | -1.89 | % | 13.93 | % |
| Class C | -1.76 | % | 14.23 | % |
| Class I | -0.89 | % | 16.16 | % |
| Class Y | -1.04 | % | 15.80 | % |
| |
| MSCI EAFE Investable | | | |
| Market Index (IMI) | -0.45 | % | 14.17 | % |
| |
| Lipper International | | | | |
| Multi-Cap Growth | | | | |
| Funds Average | -0.72 | % | 17.09 | % |
| TEN LARGEST | % of | |
| STOCK HOLDINGS | Net Assets | |
| adidas AG | 2.3 | % |
| Novartis AG | 2.1 | % |
| Check Point Software | | |
| Technologies Ltd. | 2.0 | % |
| Pearson plc | 1.9 | % |
| BG Group plc | 1.9 | % |
| Canadian National Railway Co. | 1.9 | % |
| Air Liquide SA | 1.8 | % |
| Toyota Motor Corp. | 1.8 | % |
| Kingfisher plc | 1.6 | % |
| Reckitt Benckiser Group plc | 1.6 | % |
| Total | 18.9 | % |
*Investment performance/return at NAV does not reflect the deduction of the Fund’s maximum 4.75%
front-end sales charge or any deferred sales charges.
www.calvert.com CALVERT INTERNATIONAL EQUITY FUND ANNUAL REPORT 11
stocks with the MSCI EAFE and MSCI Emerging Markets Indices returning 14.33% and 17.33%, respectively.
Value stocks slightly outperformed growth stocks during the fiscal year, and within the Russell 1000 Index, Consumer Discretionary, Telecommunication Services, and Financials were the top-performing sectors, while the Utilities, Consumer Staples, and Energy sectors lagged.
The U.S. economy continued to proceed on the path of gradual recovery. The U.S. corporate sector remained strong and provided some upside surprises for investors. The top-line numbers driven by the economic recovery were encouraging. Improvement in employment numbers were also a welcome, positive sign, though the decline in the unemployment rate was, unfortunately, primarily due to a drop in the labor force participation rate.
U.S. inflation remained low, bank lending continued to improve, and a weak U.S. dollar, thanks to the especially accommodative monetary policy in the U.S., helped U.S. exports and supported the rebuilding of the domestic manufacturing and industrial base. Vehicle sales and production also looked encouraging.
The manufacturing sector continued to provide a boost to employment and the U.S. economy, but accelerating recession in Europe and the overall slowdown in the global economy will de-emphasize the contribution of exports to U.S. GDP. Therefore, the continued recovery of the U.S. consumer will be important for a self-sustained U.S. economic recovery. More recently, the service sector has been showing signs of improvement. Consumer spending patterns remained promising and consumer confidence, helped by strength in the housing market, a falling unemploy-
| CALVERT |
| INTERNATIONAL |
| EQUITY FUND |
| September 30, 2012 |
| |
| | % of Total | |
| ECONOMIC SECTORS | Investments | |
| Consumer Discretionary | 19.5 | % |
| Consumer Staples | 8.4 | % |
| Energy | 5.0 | % |
| Financials | 18.6 | % |
| Health Care | 8.1 | % |
| Industrials | 10.3 | % |
| Information Technology | 7.8 | % |
| Limited Partnership Interest | 0.7 | % |
| Materials | 4.9 | % |
| Short-Term Investment | 9.9 | % |
| Telecommunication Services | 5.0 | % |
| Utilities | 1.4 | % |
| Venture Capital | 0.4 | % |
| Total | 100 | % |
ment rate, and improving equity markets, has also shown signs of improvement.
The U.S. housing market continued its bottoming-out process into early 2012 and showed significant improvement in the second and third quarters of 2012. With mortgage rates at record lows, housing activity picked up throughout the fiscal year. Housing can provide a positive surprise for the U.S. economy and equity markets through the powerful multiplier effect it can have on the consumer and, therefore, the economy.
The stance of the Federal Reserve (Fed) remained that it was ready to act should economic conditions in the U.S. deteriorate. This so-called “Bernanke put” provided support for U.S. equity markets throughout the fiscal year with investors believing the Fed would provide future liquidity injections in the event the economy faltered. A third round of quantitative easing (QE3)
www.calvert.com CALVERT INTERNATIONAL EQUITY FUND ANNUAL REPORT 12
materialized in September with the Federal Reserve’s Open Market Committee (FOMC) announcing an open-ended commitment to purchase $40 billion of mortgage-backed securities each month until substantial improvements in the labor market were seen. This came on top of the FOMC’s announcement earlier in the year to extend “Operation Twist” in an effort to further reduce long-term interest rates.
With global economic challenges keeping inflation in check, policymakers around the globe also continued their efforts toward easing monetary policies. On the flip side, the easing cycle has been inflating the balance sheets of the world’s six biggest central banks, which have more than doubled since 2006.
In the eurozone, the economic picture looked increasingly grim throughout the fiscal year, with peripheral economies firmly in a recessionary spiral and core economies coming under stress. Manufacturing in the region continued to fall deeper into contraction territory while consumer confidence in the eurozone reached its lowest level since early 2009 and the unemployment rate hit a record high.
As we anticipated, markets seemed to overestimate the efficacy of the policy action in Europe and underestimated the possibility of a more severe economic recession in the eurozone.
China cut its economic growth target from 8.0% to 7.5% during the first quarter of 2012, signaling the country’s need to transition from an export-driven to a more sustainable, consumer-driven, economic model. Nevertheless, the Chinese economy continued to decelerate during the fiscal year as foreign direct investment (FDI), one of the major drivers of economic growth in China, continued to decline and China’s HSBC Manufacturing Purchasing Managers Index (PMI) was in contraction territory for 11 consecutive months as exports continued to weaken.
A slower inflation trend allowed the Chinese government to reposition its economic policy from contractionary for most of 2011 to stimulative. A hard landing in China is not out of the question and could significantly impact global growth while making the overall macroeconomic backdrop riskier for the next several quarters.
Portfolio Strategy
The Fund is based upon a multi-manager approach with allocations managed by each of the two sub-advisors, Thornburg Investment Management and Martin Currie Inc., as well as the advisor, Calvert Investment Management, Inc., with the latter also overseeing the general strategy and overall allocations to the managers.
On a Fund level, stock selection drove performance, particularly in the Consumer Discretionary and Industrials sectors. Stock selection was largely positive across all sectors with the exception of Financials. Names like Canadian National Railway, Assa Abloy, Natura Cosmeticos, and adidas Group were top contributors to Fund performance for the reporting period.
Sector allocation was an overall detractor from performance. The Fund’s underweight to Financials and the beverage industry detracted most significantly, while the Fund’s
www.calvert.com CALVERT INTERNATIONAL EQUITY FUND ANNUAL REPORT 13
Growth of $10,000
The graph below shows the value of a hypothetical $10,000 investment in the Fund over the past 10 fiscal year periods. The results shown are for Classes A shares and reflect the deduction of the maximum front-end sales charge of 4.75%, and assume the reinvestment of dividends. The result is compared with benchmarks that include a broad based market index and a Lipper peer group average. Market indexes are unmanaged and their results do not reflect the effect of expenses or sales charges. The Lipper average reflects the deduction of the category’s average front-end sales charge. The value of an investment in a different share class would be different.
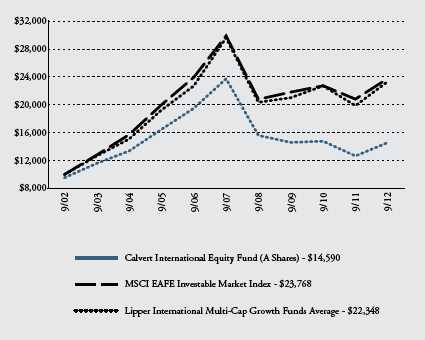
All performance data shown, including the graph above and the adjacent table, represents past performance, does not guarantee future results, assumes reinvestment of dividends and distributions and does not reflect the deduction of taxes that a shareholder would pay on the Fund’s distributions or the redemption of the Fund shares. All performance data reflects fee waivers and/or expense limitations, if any are in effect; in their absence performance would be lower. See Note B in Notes to Financial Statements. The investment return and principal value of an investment will fluctuate so that an investor’s shares, when redeemed, may be worth more or less than their original cost. Current performance may be lower or higher than the performance data quoted; for current performance data visit www.calvert.com. The gross expense ratio from the current prospectus for Class A shares is 1.82%. This number may differ from the expense ratio shown elsewhere in this report because it is based on a different time period and, if applicable, does not include fee or expense waivers. Performance data quoted already reflects the deduction of the Fund’s operating expenses.
www.calvert.com CALVERT INTERNATIONAL EQUITY FUND ANNUAL REPORT 14
underweight position in Utilities was an offsetting lift. Country allocation was also a positive contributor, driven primarily by an underweight position in Japan, which added 1.60 percentage points of relative return.
Outlook
Despite healthy corporate earnings and continued gradual economic recovery in the United States, looming developments in the political landscape could have a negative impact on U.S. GDP growth and are likely to be a source of volatility for the markets in the coming months. However, once we have more visibility into the “fiscal cliff” scenarios, market participants may feel better about investing in risky assets for the long term.
We see continued challenges in the global macro backdrop leaving equity markets vulnerable to negative news, especially given that most of the positive catalysts are out and the markets had a healthy run through September 30, 2012. Any negative news from Europe or China or a soft earnings season in the United States. will likely trigger a risk aversion trade.
October 2012
As of September 30, 2012, the following holdings accounted for the following percentages of Fund net assets: Canadian National Railway 0.92%, Assa Abloy 1.00%, Natura Cosmeticos 1.28%, and adidas Group 2.13%. Holdings are subject to change.
| CALVERT |
| INTERNATIONAL |
| EQUITY FUND |
| September 30, 2012 |
| | |
| AVERAGE ANNUAL TOTAL RETURNS | |
| |
| CLASS A SHARES | (with max. load) | |
| One year | 9.87 | % |
| Five year | -10.18 | % |
| Ten year | 3.85 | % |
| |
| CLASS B SHARES | (with max. load) | |
| One year | 8.93 | % |
| Five year | -10.51 | % |
| Ten year | 3.19 | % |
| |
| CLASS C SHARES | (with max. load) | |
| One year | 13.23 | % |
| Five year | -10.09 | % |
| Ten year | 3.45 | % |
| |
| CLASS I SHARES | | |
| One year | 16.16 | % |
| Five year | -8.62 | % |
| Ten year | 5.15 | % |
| |
| CLASS Y SHARES* | | |
| One year | 15.80 | % |
| Five year | -8.99 | % |
| Ten year | 4.53 | % |
* Calvert International Equity Fund first offered Class Y Shares on October 31, 2008.
Performance prior to that date reflects the performance of Class A Shares at net asset value (NAV). Actual Class Y Share performance would have been different.
www.calvert.com CALVERT INTERNATIONAL EQUITY FUND ANNUAL REPORT 15
SHAREHOLDER EXPENSE EXAMPLE
As a shareholder of the Fund, you incur two types of costs: (1) transaction costs, including sales charges (loads) and redemption fees; and (2) ongoing costs, including management fees; distribution (12b-1) fees; and other Fund expenses. This Example is intended to help you understand your ongoing costs (in dollars) of investing in the Fund and to compare these costs with the ongoing costs of investing in other mutual funds.
This Example is based on an investment of $1,000 invested at the beginning of the period and held for the entire period (April 1, 2012 to September 30, 2012).
Actual Expenses
The first line of the table below provides information about actual account values and actual expenses. You may use the information in this line, together with the amount you invested, to estimate the expenses that you paid over the period. Simply divide your account value by $1,000 (for example, an $8,600 account value divided by $1,000 = 8.6), then multiply the result by the number in the first line under the heading entitled “Expenses Paid During Period” to estimate the expenses you paid on your account during this period.
Hypothetical Example for Comparison Purposes
The second line of the table below provides information about hypothetical account values and hypothetical expenses based on the Fund’s actual expense ratio and an assumed rate of return of 5% per year before expenses, which is not the Fund’s actual return. The hypothetical account values and expenses may not be used to estimate the actual ending account balance or expenses you paid for the period. You may use this information to compare the ongoing costs of investing in the Fund and other funds. To do so, compare the 5% hypothetical example with the 5% hypothetical examples that appear in the shareholder reports of the other funds.
Please note that the expenses shown in the table are meant to highlight your ongoing costs only and do not reflect any transactional costs, such as sales charges (loads) or redemption fees. Therefore, the second line of the table is useful in comparing ongoing costs only, and will not help you determine the relative total costs of owning different funds. In addition, if these transactional costs were included, your costs would have been higher.
www.calvert.com CALVERT INTERNATIONAL EQUITY FUND ANNUAL REPORT 16
| | | |
| | BEGINNING | ENDING ACCOUNT | EXPENSES PAID |
| | ACCOUNT VALUE | VALUE | DURING PERIOD* |
| | 4/1/12 | 9/30/12 | 4/1/12 - 9/30/12 |
| CLASS A | | | |
| Actual | $1,000.00 | $987.60 | $8.97 |
| Hypothetical | $1,000.00 | $1,015.98 | $9.10 |
| (5% return per | | | |
| year before expenses) | | | |
| | | | |
| CLASS B | | | |
| Actual | $1,000.00 | $981.10 | $14.71 |
| Hypothetical | $1,000.00 | $1,010.15 | $14.93 |
| (5% return per | | | |
| year before expenses) | | | |
| | | | |
| CLASS C | | | |
| Actual | $1,000.00 | $982.40 | $13.39 |
| Hypothetical | $1,000.00 | $1,011.50 | $13.58 |
| (5% return per | | | |
| year before expenses) | | | |
| | | | |
| CLASS I | | | |
| Actual | $1,000.00 | $991.10 | $5.30 |
| Hypothetical | $1,000.00 | $1,019.68 | $5.38 |
| (5% return per | | | |
| year before expenses) | | | |
| |
| CLASS Y | | | |
| Actual | $1,000.00 | $989.60 | $6.93 |
| Hypothetical | $1,000.00 | $1,018.04 | $7.03 |
| (5% return per | | | |
| year before expenses) | | | |
* Expenses are equal to the Fund’s annualized expense ratio of 1.80%, 2.97%, 2.70%, 1.06%, and 1.39% for Class A, Class B, Class C, Class I, and Class Y, respectively, multiplied by the average account value over the period, multiplied by 183/366 (to reflect the one-half year period).
www.calvert.com CALVERT INTERNATIONAL EQUITY FUND ANNUAL REPORT 17
REPORT OF INDEPENDENT REGISTERED PUBLIC ACCOUNTING FIRM
The Board of Directors of Calvert World Values Fund, Inc.
and Shareholders of Calvert International Equity Fund:
We have audited the accompanying statement of net assets of Calvert International Equity Fund (the Fund), a series of the Calvert World Values Fund, Inc., as of September 30, 2012, and the related statement of operations for the year then ended, the statements of changes in net assets for each of the years in the two-year period then ended, and the financial highlights for each of the years or periods in the five-year period then ended. These financial statements and financial highlights are the responsibility of the Fund’s management. Our responsibility is to express an opinion on these financial statements and financial highlights based on our audits.
We conducted our audits in accordance with the standards of the Public Company Accounting Oversight Board (United States). Those standards require that we plan and perform the audit to obtain reasonable assurance about whether the financial statements and financial highlights are free of material misstatement. An audit includes examining, on a test basis, evidence supporting the amounts and disclosures in the financial statements. Our procedures included confirmation of securities owned as of September 30, 2012, by correspondence with the custodian and brokers or by performing other appropriate auditing procedures. An audit also includes assessing the accounting principles used and significant estimates made by management, as well as evaluating the overall financial statement presentation. We believe that our audits provide a reasonable basis for our opinion.
In our opinion, the financial statements and financial highlights referred to above present fairly, in all material respects, the financial position of the Calvert International Equity Fund as of September 30, 2012, the results of its operations for the year then ended, the changes in its net assets for each of the years in the two-year period then ended, and the financial highlights for each of the years or periods in the five-year period then ended, in conformity with U.S. generally accepted accounting principles.

Philadelphia, Pennsylvania
November 29, 2012
www.calvert.com CALVERT INTERNATIONAL EQUITY FUND ANNUAL REPORT 18
| | | |
| STATEMENT OF NET ASSETS |
| SEPTEMBER 30, 2012 |
| |
| |
| EQUITY SECURITIES - 94.4% | SHARES | | VALUE |
| Australia - 1.0% | | | |
| Amcor Ltd. (ADR) | 3,181 | $ | 101,926 |
| QR National Ltd. | 442,455 | | 1,567,236 |
| Santos Ltd. | 91,149 | | 1,075,576 |
| Sims Metal Management Ltd. (ADR) | 36,251 | | 358,885 |
| | | | 3,103,623 |
| |
| Austria - 0.0% | | | |
| Erste Group Bank AG (ADR)* | 5,237 | | 57,188 |
| Telekom Austria AG (ADR) | 271 | | 3,862 |
| Verbund AG (ADR) | 507 | | 2,119 |
| | | | 63,169 |
| |
| Belgium - 0.0% | | | |
| Ageas (ADR) | 205 | | 4,891 |
| Delhaize Group SA (ADR) | 2,364 | | 91,156 |
| | | | 96,047 |
| |
| Brazil - 2.8% | | | |
| BM&FBOVESPA SA | 122,893 | | 742,290 |
| Itau Unibanco Holding SA (ADR) | 239,200 | | 3,654,976 |
| Natura Cosmeticos SA | 157,199 | | 4,282,454 |
| | | | 8,679,720 |
| |
| Canada - 5.5% | | | |
| Canadian National Railway Co.: | | | |
| New York Exchange | 16,907 | | 1,491,704 |
| Toronto Exchange | 66,724 | | 5,900,199 |
| Cenovus Energy, Inc. | 80,300 | | 2,800,603 |
| EnCana Corp. New York Exchange | 29,499 | | 646,618 |
| Potash Corporation of Saskatchewan, Inc. | 101,544 | | 4,409,041 |
| Suncor Energy, Inc.: | | | |
| New York Exchange | 6,475 | | 212,704 |
| Toronto Exchange | 46,600 | | 1,531,938 |
| | | | 16,992,807 |
| |
| China - 0.5% | | | |
| China Merchants Bank Co. Ltd | 911,915 | | 1,533,569 |
| |
| Denmark - 1.5% | | | |
| Danske Bank A/S (ADR)* | 15,792 | | 140,075 |
| H Lundbeck A/S (ADR)* | 3,480 | | 63,858 |
| Novo Nordisk A/S, Series B | 28,742 | | 4,542,789 |
| Novozymes A/S (ADR) | 1,844 | | 51,171 |
| | | | 4,797,893 |
www.calvert.com CALVERT INTERNATIONAL EQUITY FUND ANNUAL REPORT 19
| | | |
| EQUITY SECURITIES - cont’d | SHARES | | VALUE |
| Finland - 0.1% | | | |
| Metso Oyj (ADR) | 420 | $ | 15,099 |
| Nokia Oyj (ADR) | 7,964 | | 20,468 |
| Sampo Oyj (ADR) | 6,861 | | 105,865 |
| | | | 141,432 |
| |
| France - 9.1% | | | |
| Air France-KLM (ADR)* | 2,564 | | 16,492 |
| Air Liquide SA | 46,511 | | 5,767,635 |
| Air Liquide SA (ADR) | 8,449 | | 209,704 |
| AXA SA (ADR) | 18,230 | | 271,627 |
| BNP Paribas SA (ADR) | 7,862 | | 186,408 |
| Cap Gemini SA (ADR) | 207 | | 4,368 |
| Carrefour SA (ADR) | 27,123 | | 111,475 |
| Cie Generale des Etablissements Michelin | 51,079 | | 4,003,384 |
| Cie Generale d’Optique Essilor International SA (ADR) | 1,395 | | 65,760 |
| Credit Agricole SA (ADR)* | 33,364 | | 113,137 |
| Danone SA | 70,666 | | 4,352,878 |
| Danone SA (ADR) | 27,083 | | 331,767 |
| Dassault Systemes SA | 17,521 | | 1,841,788 |
| L’Oreal SA (ADR) | 4,044 | | 99,887 |
| Publicis Groupe | 86,900 | | 4,865,728 |
| Sanofi SA | 36,379 | | 3,103,356 |
| Sanofi SA (ADR) | 11,115 | | 478,612 |
| Schneider Electric SA | 33,923 | | 2,008,681 |
| Schneider Electric SA (ADR) | 11,305 | | 133,738 |
| Suez Environnement Co. (ADR) | 1,758 | | 9,792 |
| Valeo SA (ADR) | 5,507 | | 127,102 |
| Veolia Environnement SA (ADR) | 21,929 | | 237,272 |
| | | | 28,340,591 |
| |
| Germany - 9.7% | | | |
| adidas AG | 86,947 | | 7,136,534 |
| Aixtron SE (ADR) | 23,607 | | 312,085 |
| Allianz SE | 21,736 | | 2,587,519 |
| Allianz SE (ADR) | 70,176 | | 832,989 |
| Brenntag AG | 12,313 | | 1,576,751 |
| Celesio AG (ADR) | 942 | | 3,288 |
| Commerzbank AG (ADR)* | 999 | | 1,768 |
| Continental AG | 19,166 | | 1,877,700 |
| Continental AG (ADR) | 61 | | 6,010 |
| Deutsche Bank AG | 31,100 | | 1,229,348 |
| Deutsche Post AG (ADR) | 7,514 | | 147,500 |
| Henkel AG & Co. KGaA | 24,363 | | 1,590,295 |
| K+S AG (ADR) | 1,685 | | 41,805 |
| Kabel Deutschland Holding AG* | 46,200 | | 3,297,259 |
| Merck KGaA (ADR) | 345 | | 14,141 |
| ProSiebenSat.1 Media AG, Preferred | 58,863 | | 1,483,710 |
| SAP AG | 57,535 | | 4,076,640 |
| SAP AG (ADR) | 17,919 | | 1,278,162 |
| Volkswagen AG, Preferred | 13,307 | | 2,428,597 |
| Volkswagen AG (ADR), Preferred | 9,371 | | 343,541 |
| | | | 30,265,642 |
www.calvert.com CALVERT INTERNATIONAL EQUITY FUND ANNUAL REPORT 20
| | | |
| EQUITY SECURITIES - cont’d | SHARES | | VALUE |
| Greece - 0.0% | | | |
| National Bank of Greece SA (ADR)* | 49,475 | $ | 118,740 |
| |
| Hong Kong - 3.7% | | | |
| AIA Group Ltd. | 645,700 | | 2,394,088 |
| Bank of East Asia Ltd. (ADR) | 3,753 | | 13,699 |
| China Merchants Holdings International Co. Ltd. | 914,000 | | 2,823,080 |
| City Telecom HK Ltd. (ADR) | 58,461 | | 273,013 |
| Esprit Holdings Ltd. (ADR) | 62,073 | | 190,564 |
| Hang Lung Properties Ltd. (ADR) | 67,965 | | 1,151,327 |
| Hang Seng Bank Ltd. (ADR) | 1,110 | | 16,905 |
| Hong Kong Exchanges and Clearing Ltd. | 209,546 | | 3,164,519 |
| Hong Kong Exchanges and Clearing Ltd. (ADR) | 3,389 | | 50,733 |
| Johnson Electric Holdings Ltd. (ADR) | 1,074 | | 6,884 |
| Li & Fung Ltd. (ADR) | 22,086 | | 66,258 |
| PCCW Ltd. (ADR) | 2,456 | | 10,168 |
| SJM Holdings Ltd. | 681,000 | | 1,478,974 |
| | | | 11,640,212 |
| |
| Indonesia - 0.5% | | | |
| Bank Mandiri Persero Tbk PT | 1,904,500 | | 1,631,860 |
| |
| Ireland - 2.2% | | | |
| Accenture plc | 35,200 | | 2,465,056 |
| Covidien plc | 38,400 | | 2,281,728 |
| Experian plc (ADR) | 11,240 | | 187,708 |
| Kerry Group plc | 37,457 | | 1,919,116 |
| WPP plc (ADR) | 667 | | 45,443 |
| | | | 6,899,051 |
| |
| Israel - 2.0% | | | |
| Check Point Software Technologies Ltd.* | 129,231 | | 6,223,765 |
| |
| Italy - 0.6% | | | |
| Intesa Sanpaolo SpA (ADR) | 10,926 | | 98,443 |
| Prysmian SpA | 92,657 | | 1,653,513 |
| | | | 1,751,956 |
| |
| Japan - 12.2% | | | |
| Advantest Corp. (ADR) | 4,514 | | 58,366 |
| Aeon Co. Ltd. (ADR) | 3,305 | | 37,611 |
| Asahi Glass Co. Ltd. (ADR) | 24,499 | | 161,694 |
| Astellas Pharma, Inc | 37,900 | | 1,928,561 |
| Canon, Inc | 28,100 | | 899,763 |
| Canon, Inc. (ADR) | 30,411 | | 973,456 |
| Dai Nippon Printing Co. Ltd. (ADR) | 22,230 | | 152,720 |
| Daiwa House Industry Co. Ltd. (ADR) | 489 | | 70,660 |
| Denso Corp. (ADR) | 6,160 | | 96,897 |
| Eisai Co. Ltd. (ADR) | 254 | | 11,460 |
| FANUC Corp | 21,761 | | 3,513,262 |
| Fujitsu Ltd. (ADR) | 11,218 | | 209,216 |
| Honda Motor Co. Ltd. (ADR) | 36,718 | | 1,134,586 |
| KDDI Corp. | 41,200 | | 3,204,209 |
| Konami Corp. (ADR) | 2,378 | | 53,838 |
www.calvert.com CALVERT INTERNATIONAL EQUITY FUND ANNUAL REPORT 21
| | | |
| EQUITY SECURITIES - cont’d | SHARES | | VALUE |
| Japan - Cont’d | | | |
| Kubota Corp. (ADR) | 7,329 | $ | 370,261 |
| Lawson, Inc | 21,600 | | 1,663,244 |
| Mitsubishi Estate Co. Ltd. | 101,000 | | 1,936,525 |
| Mitsui Fudosan Co. Ltd | 101,256 | | 2,031,098 |
| Mizuho Financial Group, Inc. (ADR) | 201,536 | | 650,961 |
| MS&AD Insurance Group Holdings (ADR) | 34,938 | �� | 298,021 |
| Nippon Yusen KK (ADR) | 89,927 | | 308,450 |
| Nissan Motor Co. Ltd. (ADR)* | 51,937 | | 884,357 |
| Nitto Denko Corp. (ADR) | 15,966 | | 375,680 |
| Nomura Holdings, Inc. (ADR) | 161,596 | | 575,282 |
| NSK Ltd. (ADR) | 1,607 | | 18,497 |
| NTT DoCoMo, Inc | 857 | | 1,392,405 |
| ORIX Corp | 15,890 | | 1,598,789 |
| ORIX Corp. (ADR) | 7,678 | | 384,745 |
| Panasonic Corp. (ADR) | 77,651 | | 510,167 |
| Sega Sammy Holdings, Inc. (ADR) | 6,279 | | 29,637 |
| Seiko Epson Corp. (ADR) | 9,704 | | 29,209 |
| Sekisui House Ltd. | 191,000 | | 1,899,705 |
| Sharp Corp. (ADR) | 27,019 | | 67,548 |
| Sony Corp. | 51,400 | | 606,219 |
| Sony Corp. (ADR) | 38,955 | | 455,773 |
| Sumitomo Mitsui Trust Holdings, Inc. (ADR) | 40,720 | | 118,495 |
| Tokyo Gas Co. Ltd. | 389,118 | | 2,147,340 |
| Toyota Motor Corp. | 144,882 | | 5,652,480 |
| Toyota Motor Corp. (ADR) | 17,903 | | 1,405,565 |
| | | | 37,916,752 |
| |
| Luxembourg - 1.0% | | | |
| Nielsen Holdings NV* | 105,400 | | 3,159,892 |
| |
| Mexico - 0.6% | | | |
| FINAE, Series D, Preferred (b)(i)* | 1,962,553 | | 237,661 |
| Grupo Financiero Banorte SAB de CV | 262,200 | | 1,482,732 |
| | | | 1,720,393 |
| |
| Netherlands - 2.7% | | | |
| ASML Holding NV | 2,469 | | 132,536 |
| BE Semiconductor Industries NV | 4,208 | | 28,951 |
| Gemalto NV | 15,856 | | 1,395,426 |
| ING Groep NV (CVA)* | 246,482 | | 1,948,631 |
| Koninklijke Philips Electronics NV | 45,962 | | 1,077,809 |
| PostNL NV (ADR)* | 15,105 | | 52,867 |
| TNT Express NV (ADR) | 13,119 | | 137,094 |
| Yandex NV* | 93,700 | | 2,259,107 |
| Ziggo NV | 43,049 | | 1,464,235 |
| | | | 8,496,656 |
| |
| Norway - 1.3% | | | |
| DnB ASA | 159,611 | | 1,955,966 |
| Petroleum Geo-Services ASA | 105,666 | | 1,745,571 |
| Yara International ASA (ADR) | 8,545 | | 426,823 |
| | | | 4,128,360 |
www.calvert.com CALVERT INTERNATIONAL EQUITY FUND ANNUAL REPORT 22
| | | |
| EQUITY SECURITIES - cont’d | SHARES | | VALUE |
| Philippines - 0.6% | | | |
| Philippine Long Distance Telephone Co. (ADR) | 29,053 | $ | 1,917,789 |
| |
| Portugal - 0.1% | | | |
| Portugal Telecom SGPS SA (ADR) | 29,155 | | 144,609 |
| |
| Singapore - 0.7% | | | |
| City Developments Ltd. (ADR) | 479 | | 4,608 |
| Oversea-Chinese Banking Corp. Ltd | 252,830 | | 1,925,656 |
| Singapore Telecommunications Ltd. (ADR) | 11,258 | | 292,145 |
| | | | 2,222,409 |
| |
| South Africa - 1.4% | | | |
| African Bank Investments Ltd. (ADR) | 169 | | 3,346 |
| Aspen Pharmacare Holdings Ltd.* | 118,131 | | 2,037,417 |
| Clicks Group Ltd.* | 238,800 | | 1,667,028 |
| MTN Group Ltd. (ADR) | 21,938 | | 424,500 |
| Nedbank Group Ltd. (ADR) | 3,939 | | 86,658 |
| Tiger Brands Ltd. (ADR) | 1,994 | | 65,383 |
| | | | 4,284,332 |
| |
| Spain - 0.3% | | | |
| Banco Bilbao Vizcaya Argentaria SA (ADR) | 43,088 | | 333,932 |
| Banco Santander SA (ADR) | 74,002 | | 552,055 |
| International Consolidated Airlines Group SA (ADR)* | 678 | | 8,048 |
| | | | 894,035 |
| |
| Sweden - 4.1% | | | |
| Assa Abloy AB, Series B | 103,400 | | 3,356,560 |
| Atlas Copco AB | 70,045 | | 1,634,956 |
| Atlas Copco AB (ADR) | 2,340 | | 55,130 |
| Hennes & Mauritz AB, B Shares | 116,454 | | 4,046,288 |
| SKF AB (ADR) | 650 | | 14,063 |
| Svenska Cellulosa AB (ADR) | 3,578 | | 66,329 |
| Svenska Handelsbanken AB | 99,100 | | 3,713,402 |
| | | | 12,886,728 |
| |
| Switzerland - 5.5% | | | |
| Adecco SA (ADR)* | 277 | | 6,576 |
| Compagnie Financiere Richemont SA | 33,600 | | 2,016,000 |
| Credit Suisse Group AG (ADR) | 33,797 | | 714,807 |
| Julius Baer Group Ltd.* | 72,413 | | 2,526,751 |
| Nobel Biocare Holding AG (ADR)* | 495 | | 2,445 |
| Novartis AG | 105,005 | | 6,428,764 |
| Roche Holding AG (ADR) | 39,128 | | 1,838,625 |
| STMicroelectronics NV | 16,908 | | 91,303 |
| Swatch Group AG, Bearer Shares | 7,300 | | 2,913,787 |
| Zurich Insurance Group AG (ADR)* | 18,785 | | 470,189 |
| | | | 17,009,247 |
www.calvert.com CALVERT INTERNATIONAL EQUITY FUND ANNUAL REPORT 23
| | | |
| EQUITY SECURITIES - cont’d | SHARES | | VALUE |
| Taiwan - 0.6% | | | |
| Taiwan Semiconductor Manufacturing Co. Ltd. (ADR) | 121,600 | $ | 1,923,712 |
| |
| Thailand - 0.6% | | | |
| Kasikornbank PCL | 309,700 | | 1,836,266 |
| |
| United Kingdom - 21.9% | | | |
| Aon plc | 34,600 | | 1,809,234 |
| ARM Holdings plc | 162,806 | | 1,510,172 |
| Aviva plc (ADR) | 17,740 | | 184,673 |
| Barclays plc (ADR) | 20,253 | | 280,909 |
| BG Group plc (s) | 294,893 | | 5,946,517 |
| BG Group plc (ADR) | 42,482 | | 862,385 |
| British Land Co. plc (ADR) | 543 | | 4,502 |
| British Sky Broadcasting Group plc | 152,978 | | 1,834,840 |
| BT Group plc (ADR) | 27,414 | | 1,019,801 |
| Bunzl plc (ADR) | 631 | | 56,588 |
| Capita plc | 151,344 | | 1,890,927 |
| Centrica plc | 312,006 | | 1,649,909 |
| Centrica plc (ADR) | 9,287 | | 195,863 |
| GlaxoSmithKline plc | 117,049 | | 2,695,454 |
| HSBC Holdings plc | 376,775 | | 3,484,594 |
| HSBC Holdings plc (ADR) | 22,325 | | 1,037,220 |
| Inmarsat plc | 199,779 | | 1,901,472 |
| J Sainsbury plc (ADR) | 7,617 | | 169,554 |
| Johnson Matthey plc | 46,528 | | 1,811,180 |
| Johnson Matthey plc (ADR) | 134 | | 10,496 |
| Kingfisher plc | 1,153,187 | | 4,914,968 |
| Legal & General Group plc (ADR) | 608 | | 6,408 |
| Man Group plc (ADR) | 39,306 | | 52,670 |
| Old Mutual plc (ADR) | 895 | | 19,644 |
| Pearson plc | 307,583 | | 6,003,933 |
| Persimmon plc | 161,493 | | 1,976,048 |
| Petrofac Ltd. | 71,634 | | 1,843,181 |
| Prudential plc | 166,759 | | 2,156,160 |
| Prudential plc (ADR) | 60,796 | | 1,580,696 |
| Reckitt Benckiser Group plc | 84,817 | | 4,877,874 |
| Reckitt Benckiser Group plc (ADR) | 18,380 | | 210,635 |
| Rexam plc | 165,949 | | 1,164,266 |
| Royal Bank of Scotland Group plc* | 210,550 | | 872,924 |
| Sage Group plc (ADR) | 7,701 | | 157,254 |
| Smith & Nephew plc (ADR) | 15,944 | | 878,833 |
| Spirax-Sarco Engineering plc | 22,945 | | 773,981 |
| SSE plc (ADR) | 18,076 | | 408,518 |
| Tate & Lyle plc | 138,435 | | 1,486,217 |
| Tesco plc | 415,586 | | 2,225,805 |
| Tesco plc (ADR) | 44,802 | | 724,896 |
| Unilever plc (ADR) | 44,310 | | 1,618,201 |
| United Utilities Group plc (ADR) | 4,302 | | 100,022 |
| Vodafone Group plc | 1,451,777 | | 4,116,076 |
| Vodafone Group plc (ADR) | 23,339 | | 665,045 |
| Willis Group Holdings plc | 31,900 | | 1,177,748 |
| | | | 68,368,293 |
www.calvert.com CALVERT INTERNATIONAL EQUITY FUND ANNUAL REPORT 24
| | | | |
| EQUITY SECURITIES - cont’d | | SHARES | | VALUE |
| United States - 1.6% | | | | |
| ACCO Brands Corp.* | | 14,679 | $ | 95,267 |
| Bristol-Myers Squibb Co. | | 25,205 | | 850,669 |
| H.J. Heinz Co | | 29,200 | | 1,633,740 |
| MeadWestvaco Corp | | 44,502 | | 1,361,761 |
| Powerspan Corp.: | | | | |
| Series A, Convertible Preferred (b)(i)* | | 45,455 | | — |
| Series B, Convertible Preferred (b)(i)* | | 20,000 | | — |
| Series C, Convertible Preferred (b)(i)* | | 239,764 | | — |
| Series D, Convertible Preferred (b)(i)* | | 45,928 | | — |
| Series D, Preferred Warrants (strike price $3.44/share, | | | | |
| expires 12/31/12) (b)(i)* | | 2,347 | | — |
| Pricesmart, Inc. | | 10,028 | | 759,320 |
| Sealed Air Corp | | 26,185 | | 404,820 |
| | | | | 5,105,577 |
| |
| Total Equity Securities (Cost $277,782,148) | | | | 294,295,127 |
| |
| |
| VENTURE CAPITAL LIMITED | | ADJUSTED | | |
| PARTNERSHIP INTEREST - 0.8% | | BASIS | | |
| Balkan Financial Sector Equity Fund CV (b)(i)* | $ | 587,411 | | 523,175 |
| Blackstone Cleantech Venture Partners (b)(i)* | | 64,896 | | 47,330 |
| China Environment Fund 2004 (b)(i)* | | - | | 324,950 |
| Emerald Sustainability Fund I (b)(i)* | | 441,425 | | 294,571 |
| gNet Defta Development Holdings LLC (a)(b)(i)* | | 400,000 | | 318,510 |
| SEAF Central and Eastern European Growth Fund LLC (a)(b)(i)* | | 347,969 | | 569,717 |
| SEAF India International Growth Fund (b)(i)* | | 346,209 | | 280,391 |
| ShoreCap International LLC (b)(i)* | | - | | 186,502 |
| Terra Capital (b)(i)* | | 469,590 | | 1 |
| |
| Total Venture Capital Limited Partnership Interest (Cost $2,657,500) | | 2,545,147 |
| |
| |
| VENTURE CAPITAL DEBT | | PRINCIPAL | | |
| OBLIGATIONS - 0.2% | | AMOUNT | | |
| FINAE: | | | | |
| Note I, 6.50%, 12/10/15 (b)(i) | | 250,000 | | 250,000 |
| Note II, 6.50%, 2/29/16 (b)(i) | | 500,000 | | 500,000 |
| Mayer Laboratories, Inc., 6.00%, 12/31/01 (b)(i)(w) | | 11,056 | | 2,764 |
| Windhorse International-Spring Health Water Ltd., 8.00%, 3/13/13 (b)(i) 70,000 | | 70,000 |
| |
| Total Venture Capital Debt Obligations (Cost $831,056) | | | | 822,764 |
| |
| |
| HIGH SOCIAL IMPACT INVESTMENTS - 1.4% | | | | |
| Calvert Social Investment Foundation Notes, 1.04%, 7/1/14 (b)(i)(r) | | 4,431,583 | | 4,313,969 |
| |
| Total High Social Impact Investments (Cost $4,431,583) | | | | 4,313,969 |
www.calvert.com CALVERT INTERNATIONAL EQUITY FUND ANNUAL REPORT 25
| | | | | |
| PRINCIPAL | | | |
| TIME DEPOSIT - 10.6% | | AMOUNT | | VALUE | |
| State Street Bank Time Deposit, 0.113%, 10/1/12 | $ | 33,082,395 | $ | 33,082,395 | |
| |
| Total Time Deposit (Cost $33,082,395) | | | | 33,082,395 | |
| |
| |
| |
| TOTAL INVESTMENTS (Cost $318,784,682) - 107.4% | | 335,059,402 | |
| Other assets and liabilities, net - (7.4%) | | | | (23,204,801 | ) |
| NET ASSETS - 100% | | | $ | 311,854,601 | |
| |
| |
| |
| NET ASSETS CONSIST OF: | | | | | |
| Paid-in capital applicable to the following shares of common stock with | | | | | |
| 250,000,000 shares of $0.01 par value shares authorized: | | | | | |
| Class A: 13,613,546 shares outstanding | | | $ | 310,238,153 | |
| Class B: 302,101 shares outstanding | | | | 10,644,007 | |
| Class C: 1,359,397 shares outstanding | | | | 33,698,755 | |
| Class I: 6,970,052 shares outstanding | | | | 153,365,461 | |
| Class Y: 528,830 shares outstanding | | | | 7,742,740 | |
| Undistributed net investment income | | | | 2,995,904 | |
| Accumulated net realized gain (loss) on investments and foreign currency transactions | | (223,084,584 | ) |
| Net unrealized appreciation (depreciation) on investments, foreign | | | | | |
| currencies,and assets and liabilities denominated in foreign currencies | | | | 16,254,165 | |
| |
| |
| NET ASSETS | | | $ | 311,854,601 | |
| |
| |
| NET ASSET VALUE PER SHARE | | | | | |
| Class A (based on net assets of $183,587,896) | | | $ | 13.49 | |
| Class B (based on net assets of $3,607,055) | | | $ | 11.94 | |
| Class C (based on net assets of $15,921,608) | | | $ | 11.71 | |
| Class I (based on net assets of $101,203,366) | | | $ | 14.52 | |
| Class Y (based on net assets of $7,534,676 ) | | | $ | 14.25 | |
See notes to financial statements.
www.calvert.com CALVERT INTERNATIONAL EQUITY FUND ANNUAL REPORT 26
| | | |
| RESTRICTED SECURITIES | ACQUISITION DATES | | COST |
| Balkan Financial Sector Equity Fund CV LP | 1/12/06 - 6/27/12 | $ | 587,411 |
| Blackstone Cleantech Venture Partners LP | 7/29/10 - 8/10/12 | | 64,896 |
| Calvert Social Investment Foundation Notes, 1.04%, 7/1/14 | 7/1/11 | | 4,431,583 |
| China Environment Fund 2004 LP | 9/15/05 - 4/1/09 | | - |
| Emerald Sustainability Fund I LP | 7/19/01 - 5/17/11 | | 441,425 |
| FINAE: | | | |
| Series D, Preferred | 2/28/11 | | 252,686 |
| Note I, 6.50%, 12/10/15 | 12/10/10 | | 250,000 |
| Note II, 6.50%, 2/29/16 | 2/24/11 | | 500,000 |
| gNet Defta Development Holdings LLC, LP | 8/30/05 | | 400,000 |
| Mayer Laboratories, Inc., 6.00%, 12/31/01 | 12/22/06 | | 11,056 |
| Powerspan Corp.: | | | |
| Series A, Convertible Preferred | 8/20/97 | | 250,000 |
| Series B, Convertible Preferred | 10/5/99 | | 200,000 |
| Series C, Convertible Preferred | 12/21/04 - 6/12/08 | | 273,331 |
| Series D, Convertible Preferred | 6/20/08 | | 157,996 |
| Series D, Preferred Warrants (strike price | | | |
| $3.44/share, expires 12/31/12) | 12/5/07 - 6/20/08 | | - |
| SEAF Central and Eastern European Growth Fund LLC, LP | 8/10/00 - 8/26/11 | | 347,969 |
| SEAF India International Growth Fund LP | 3/22/05 - 5/24/10 | | 346,209 |
| ShoreCap International LLC, LP | 8/12/04 - 12/15/08 | | - |
| Terra Capital LP | 11/23/98 - 3/14/06 | | 469,590 |
| Windhorse International-Spring Health Water Ltd., | | | |
| 8.00%, 3/13/13 | 9/13/11 - 7/10/12 | | 70,000 |
www.calvert.com CALVERT INTERNATIONAL EQUITY FUND ANNUAL REPORT 27
(a) Affiliated company.
(b) This security was valued by the Board of Directors. See Note A.
(i) Restricted securities represent 2.5% of net assets of the Fund.
(r) The coupon rate shown on floating or adjustable rate securities represents the rate at period end.
(s) 135,000 shares of BG Group plc have been soft segregated in order to cover outstanding commitments to
certain limited partnerships investments within the Fund. There are no restrictions on the trading of this
security.
(w) Mayer Laboratories, Inc. is in default for principal and interest. Past due accrued interest as of September
30, 2012 totaled $166.
* Non-income producing security.
Abbreviations:
ADR: American Depositary Receipts
CVA: Certificaten Van Aandelen
LLC: Limited Liability Corporation
plc: Public Limited Company
See notes to financial statements.
www.calvert.com CALVERT INTERNATIONAL EQUITY FUND ANNUAL REPORT 28
| | | |
| STATEMENT OF OPERATIONS |
| YEAR ENDED SEPTEMBER 30, 2012 |
| |
| |
| NET INVESTMENT INCOME | | | |
| Investment Income: | | | |
| Dividend income (net of foreign taxes withheld of $628,682) | $ | 8,262,769 | |
| Interest income | | 119,448 | |
| Total investment income | | 8,382,217 | |
| |
| Expenses: | | | |
| Investment advisory fee | | 2,265,331 | |
| Transfer agency fees and expenses | | 668,530 | |
| Administrative fees | | 872,048 | |
| Distribution Plan expenses: | | | |
| Class A | | 451,192 | |
| Class B | | 41,151 | |
| Class C | | 163,509 | |
| Directors’ fees and expenses | | 37,826 | |
| Custodian fees | | 207,618 | |
| Registration fees | | 67,787 | |
| Reports to shareholders | | 165,019 | |
| Professional fees | | 36,111 | |
| Miscellaneous | | 63,536 | |
| Total expenses | | 5,039,658 | |
| Reimbursement from Advisor: | | | |
| Class A | | (66,615 | ) |
| Class B | | (8,690 | ) |
| Class C | | (4,504 | ) |
| Class I | | (29,563 | ) |
| Class Y | | (5,082 | ) |
| Fees paid indirectly | | (101 | ) |
| Net expenses | | 4,925,103 | |
| |
| |
| NET INVESTMENT INCOME | | 3,457,114 | |
| |
| REALIZED AND UNREALIZED GAIN (LOSS) | | | |
| Net realized gain (loss) on: | | | |
| Investments | | (15,183,849 | ) |
| Foreign currency transactions | | (391,815 | ) |
| | | (15,575,664 | ) |
| |
| Change in unrealized appreciation (depreciation) on: | | | |
| Investments and foreign currencies | | 56,135,558 | |
| Assets and liabilities denominated in foreign currencies | | 52,620 | |
| | | 56,188,178 | |
| |
| NET REALIZED AND UNREALIZED GAIN (LOSS) | | 40,612,514 | |
| |
| INCREASE (DECREASE) IN NET ASSETS | | | |
| RESULTING FROM OPERATIONS | $ | 44,069,628 | |
See notes to financial statements.www.calvert.com CALVERT INTERNATIONAL EQUITY FUND ANNUAL REPORT 29
| | | | |
| STATEMENTS OF CHANGES IN NET ASSETS |
| |
| | Year ended | | Year ended | |
| | September 30, | | September 30, | |
| INCREASE (DECREASE) IN NET ASSETS | 2012 | | 2011 | |
| Operations: | | | | |
| Net investment income | $3,457,114 | | $4,177,788 | |
| Net realized gain (loss) | (15,575,664 | ) | 1,597,366 | |
| Change in unrealized appreciation (depreciation) | 56,188,178 | | (54,531,070 | ) |
| |
| |
| INCREASE (DECREASE) IN NET ASSETS | | | | |
| RESULTING FROM OPERATIONS | 44,069,628 | | (48,755,916 | ) |
| |
| Distributions to shareholders from: | | | | |
| Net investment income: | | | | |
| Class A shares | (2,117,749 | ) | (655,710 | ) |
| Class C shares | (14,293 | ) | — | |
| Class I shares | (1,414,874 | ) | (542,675 | ) |
| Class Y shares | (79,164 | ) | (3,993 | ) |
| Total distributions | (3,626,080 | ) | (1,202,378 | ) |
| |
| Capital share transactions: | | | | |
| Shares sold: | | | | |
| Class A shares | 25,698,704 | | 37,038,781 | |
| Class B shares | 17,463 | | 95,958 | |
| Class C shares | 994,621 | | 1,483,373 | |
| Class I shares | 20,757,214 | | 31,388,444 | |
| Class Y shares | 1,229,161 | | 8,008,040 | |
| Reinvestment of distributions: | | | | |
| Class A shares | 1,891,096 | | 608,387 | |
| Class C shares | 11,391 | | — | |
| Class I shares | 1,274,329 | | 483,830 | |
| Class Y shares | 35,166 | | 419 | |
| Redemption fees: | | | | |
| Class A shares | 6,002 | | 4,506 | |
| Class C shares | 15 | | 249 | |
| Class I shares | — | | 669 | |
| Class Y shares | 14 | | 6 | |
| Shares redeemed: | | | | |
| Class A shares | (41,319,982 | ) | (79,188,924 | ) |
| Class B shares | (1,476,972 | ) | (1,646,677 | ) |
| Class C shares | (3,469,843 | ) | (4,408,325 | ) |
| Class I shares | (23,295,875 | ) | (14,266,871 | ) |
| Class Y shares | (2,119,332 | ) | (1,831,646 | ) |
| Total capital share transactions | (19,766,827 | ) | (22,229,781 | ) |
| |
| TOTAL INCREASE (DECREASE) IN NET ASSETS | 20,676,721 | | (72,188,075 | ) |
| |
| |
| NET ASSETS | | | | |
| Beginning of year | 291,177,880 | | 363,365,955 | |
| End of year (including undistributed net investment income | | | | |
| of $2,995,904 and $3,608,275, respectively) | $311,854,601 | | $291,177,880 | |
See notes to financial statements. www.calvert.com CALVERT INTERNATIONAL EQUITY FUND ANNUAL REPORT 30
| | | | |
| STATEMENTS OF CHANGES IN NET ASSETS |
| |
| | Year ended | | Year ended | |
| | September 30, | | September 30, | |
| CAPITAL SHARE ACTIVITY | 2012 | | 2011 | |
| Shares sold: | | | | |
| Class A shares | 2,002,914 | | 2,582,076 | |
| Class B shares | 1,516 | | 7,466 | |
| Class C shares | 88,845 | | 119,086 | |
| Class I shares | 1,510,443 | | 2,086,100 | |
| Class Y shares | 90,952 | | 527,710 | |
| Reinvestment of distributions: | | | | |
| Class A shares | 156,677 | | 42,634 | |
| Class C shares | 1,079 | | — | |
| Class I shares | 98,632 | | 31,789 | |
| Class Y shares | 2,767 | | 28 | |
| Shares redeemed: | | | | |
| Class A shares | (3,233,923 | ) | (5,606,048 | ) |
| Class B shares | (129,393 | ) | (130,029 | ) |
| Class C shares | (308,966 | ) | (353,754 | ) |
| Class I shares | (1,656,401 | ) | (929,886 | ) |
| Class Y shares | (158,957 | ) | (125,742 | ) |
| Total capital share activity | (1,533,815 | ) | (1,748,570 | ) |
See notes to financial statements.
www. calvert.com CALVERT INTERNATIONAL EQUITY FUND ANNUAL REPORT 31
NOTES TO FINANCIAL STATEMENTS
NOTE A — SIGNIFICANT ACCOUNTING POLICIES
General: The Calvert International Equity Fund (the “Fund”), a series of Calvert World Values Fund, Inc., is registered under the Investment Company Act of 1940 as a diversified, open-end management investment company. The Calvert World Values Fund, Inc. is comprised of three separate series. The operations of each series are accounted for separately. The Fund offers five classes of shares of capital stock - Classes A, B, C, I, and Y. Class A shares are sold with a maximum front-end sales charge of 4.75%. Class B shares are sold without a front-end sales charge and, with certain exceptions, will be charged a deferred sales charge at the time of redemption, depending on how long investors have owned the shares. Class B shares are no longer offered for purchase, except through reinvestment of dividends and/or distributions and through certain exchanges. Class C shares are sold without a front-end sales charge and, with certain exceptions, will be charged a deferred sales charge on shares sold within one year of purchase. Class B and Class C shares have higher levels of expenses than Class A shares. Class I shares require a minimum account balance of $1,000,000. The $1 million minimum initial investment may be waived for certain institutional accounts where it is believed to be in the best interest of the Fund and its shareholders. Class I shares have no front-end or deferred sales charge and have lower levels of expenses than Class A shares. Class Y shares are generally only available to wrap or similar fee-based programs offered by financial intermediaries that have entered into an agreement with the Fund’s Distributor to offer Class Y shares. Class Y shares have no front-end or deferred sales charge and have lower levels of expenses than Class A shares. Each class has different: (a) dividend rates, due to differences in Distribution Plan expenses and other class-specific expenses, (b) exchange privileges and (c) class-specific voting rights.
Security Valuation: Net asset value per share is determined every business day as of the close of the regular session of the New York Stock Exchange (generally 4:00 p.m. Eastern time). The Fund uses independent pricing services approved by the Board of Directors (“the Board”) to value its investments wherever possible. Investments for which market quotations are not available or deemed not reliable are fair valued in good faith under the direction of the Board.
The Board has adopted Valuation Procedures (the “Procedures”) to determine the fair value of securities and other financial instruments for which market prices are not readily available or which may not be reliably priced. The Board has delegated the day-to-day responsibility for determining the fair value of assets of the Fund, except Special Equities investments, to Calvert Investment Management, Inc. (the “Advisor” or “Calvert”) and has provided these Procedures to govern Calvert in its valuation duties. Special Equities investments, as described in the Fund’s prospectus and statement of additional informa-tioin, are fair valued by the Board’s Special Equities Committee.
Calvert has chartered an internal Valuation Committee to oversee the implementation of these Procedures and to assist it in carrying out the valuation responsibilities that the Board has delegated.
The Valuation Committee meets on a regular basis to review illiquid securities and other investments which may not have readily available market prices. The Valuation Committee’s fair valuation determinations are subject to review, approval and ratification by the Board at its next regularly scheduled meeting covering the calendar quarter in
www.calvert.com CALVERT INTERNATIONAL EQUITY FUND ANNUAL REPORT 32
which the fair valuation was determined.
The Valuation Committee utilizes various methods to measure the fair value of the Fund’s investments. Generally Accepted Accounting Principles (GAAP) establishes a disclosure hierarchy that categorizes the inputs to valuation techniques used to value assets and liabilities at measurement date. These inputs are summarized in the three broad levels listed below:
Level 1 – quoted prices in active markets for identical securities
Level 2 – other significant observable inputs (including quoted prices for similar securities, interest rates, prepayment speeds, credit risk, etc.)
Level 3 – significant unobservable inputs (including the Fund’s own assumptions in determining the fair value of investments)
The inputs or methodologies used for valuing securities are not necessarily an indication of the risk associated with investing in those securities.
Changes in valuation techniques may result in transfers in or out of an investment’s assigned level within the hierarchy during the period. Valuation techniques used to value the Funds’ investments by major category are as follows: Equity securities, including restricted securities and venture capital securities, for which market quotations are readily available, are valued at the last reported sale price or official closing price as reported by an independent pricing service on the primary market or exchange on which they are traded and are categorized as Level 1 in the hierarchy. In the event there were no sales during the day or closing prices are not available, securities are valued at the last quoted bid price or using the last available price and are categorized as Level 2 in the hierarchy. Foreign securities are valued based on quotations from the principal market in which such securities are normally traded. If events occur after the close of the principal market in which foreign securities are traded, and before the close of business of the Fund, that are expected to materially affect the value of those securities, then they are valued at their fair value taking these events into account. The Fund has retained a third party fair value pricing service to quantitatively analyze the price movement of its holdings on foreign exchanges and to automatically fair value if the variation from the prior day’s closing price exceeds specified parameters. Such securities would be categorized as Level 2 in the hierarchy in these circumstances. Utilizing this technique may result in transfers between Level 1 and Level 2. For restricted securities and private placements where observable inputs are limited, assumptions about market activity and risk are used and such securities are categorized as Level 3 in the hierarchy.
Venture capital securities for which market quotations are not readily available are fair valued by the Fund’s Board of Directors and are categorized as Level 3 in the hierarchy. Venture capital direct equity securities are generally valued using the most appropriate and applicable method to measure fair value in light of each company’s situation. Methods may include market, income or cost approaches with discounts as appropriate based on assumptions of liquidation or exit risk. Examples of the market approach are subsequent rounds of financing, comparable transactions, and revenue times an industry multiple. An example of the income approach is the discounted cash flow. Examples of the cost approach are replacement cost, salvage value, or net asset percentage. Venture capital limited partnership (“LP”) securities
www.calvert.com CALVERT INTERNATIONAL EQUITY FUND ANNUAL REPORT 33
are valued at the fair value reported by the general partner of the partnership adjusted as necessary to reflect subsequent capital calls and distributions and any other available information. In the absence of a reported LP unit value, fair value may be estimated based on the Fund’s percentage equity in the partnership and/or other balance sheet information and portfolio value for the most recently available period reported by the general partner. In some cases adjustments may be made to account for daily pricing of material public holdings within the partnership. Venture capital debt securities are valued based on assumptions of credit and market risk. For venture capital securities denominated in foreign currency, the fair value is marked to the daily exchange rate.
Debt securities, including restricted securities, are valued based on evaluated prices received from independent pricing services or from dealers who make markets in such securities and are generally categorized as Level 2 in the hierarchy. Short-term securities of sufficient credit quality with remaining maturities of sixty days or less for which quotations are not readily available are valued at amortized cost, which approximates fair value, and are categorized as Level 2 in the hierarchy.
When independent prices are unavailable or unreliable, debt securities may be valued utilizing pricing matrices which consider similar factors that would be used by independent pricing services. These are generally categorized as Level 2 in the hierarchy but may be Level 3 depending on the circumstances.
If a market value cannot be determined for a security using the methodologies described above, or if, in the good faith opinion of the Advisor, the market value does not constitute a readily available market quotation, or if a significant event has occurred that would materially affect the value of the security, the security will be fair valued as determined in good faith by the Valuation Committee or with respect to Special Equities investments, by the Special Equities Committee using the venture capital methodologies described above.
The Valuation Committee considers a number of factors, including significant unobservable valuation inputs when arriving at fair value. It considers all significant facts that are reasonably available and relevant to the determination of fair value.
The Valuation Committee primarily employs a market-based approach which may use related or comparable assets or liabilities, recent transactions, market multiples, book values, and other relevant information for the investment to determine the fair value of the investment. When more appropriate, the fund may employ an income-based or cost approach. An income-based valuation approach discounts anticipated future cash flows of the investment to calculate a present amount (discounted). The measurement is based on the value indicated by current market expectations about those future amounts. Discounts may also be applied due to the nature or duration of any restrictions on the disposition of the investments. A cost based approach is based on the amount that currently would be required to replace the service capacity of an asset (current replacement cost). From the seller’s perspective, the price that would be received for the asset is determined based on the cost to a buyer to acquire or construct a substitute asset of comparable utility, adjusted for obsolescence.
The values assigned to fair value investments are based on available information and do not necessarily represent amounts that might ultimately be realized. Further, due to the inherent uncertainty of valuations of such investments, the fair values may differ sig-
www.calvert.com CALVERT INTERNATIONAL EQUITY FUND ANNUAL REPORT 34
nificantly from the values that would have been used had an active market existed, and the differences could be material. The Valuation Committee employs various methods for calibrating these valuation approaches including a regular review of key inputs and assumptions, transactional back-testing or disposition analysis and reviews of any related market activity.
At September 30, 2012, securities valued at $7,919,541, or 2.5% of net assets, were fair valued in good faith under the direction of the Board.
The following is a summary of the inputs used to value the Fund’s net assets as of September 30, 2012:
| | | VALUATION INPUTS | | |
| |
| Investments in Securities | Level 1 | Level 2 | | Level 3 | Total | |
| Equity securities* | $294,057,466 | — | | — | $294,057,466 | ** |
| Other debt obligations | — | $37,396,364 | | — | 37,396,364 | |
| Venture capital | — | — | $ | $3,605,572 | 3,605,572 | |
| |
| TOTAL | $294,057,466 | $37,396,364 | $ | $3,605,572 | $335,059,402 | |
* For further breakdown of equity securities by country, please refer to the Statement of Net Assets.
** Exclusive of $237,661 venture capital equity shown in venture capital heading.
The following is a reconciliation of Level 3 assets for which significant unobservable inputs were used to determine fair value:
| | | | |
| | VENTURE CAPITAL | | TOTAL | |
| Balance as of 9/30/11 | $8,898,945 | | $8,898,945 | |
| Accrued discounts/premiums | - | | - | |
| Realized gain (loss) | 22,504 | | 22,504 | |
| Change in unrealized appreciation (depreciation) | (49,433 | ) | (49,433 | ) |
| Purchases | 61,812 | | 61,812 | |
| Sales | (1,014,287 | ) | (1,014,287 | ) |
| Transfers in and/or out of Level 31 | (4,313,969 | )2 | (4,313,969 | ) |
| Balance as of 9/30/12 | $3,605,572 | | $3,605,572 | |
1 The Fund’s policy is to recognize transfers into and transfers out of Level 3 as of the end of the reporting period.
2 Transferred from Level 3 to Level 2 because observable inputs were obtained for the securities.
For the year ended September 30, 2012, total change in unrealized gain (loss) on Level 3 securities included in the change in net assets was ($49,433). Total unrealized gain (loss) for all securities (including Level 1 and Level 2) can be found on the accompanying Statement of Operations.
www.calvert.com CALVERT INTERNATIONAL EQUITY FUND ANNUAL REPORT 35
Restricted Securities: The Fund may invest in securities that are subject to legal or contractual restrictions on resale. Generally, these securities may only be sold publicly upon registration under the Securities Act of 1933 or in transactions exempt from such registration. Information regarding restricted securities is included at the end of the Fund’s Statement of Net Assets.
Security Transactions and Net Investment Income: Security transactions are accounted for on trade date. Realized gains and losses are recorded on an identified cost basis and may include proceeds from litigation. Dividend income is recorded on the ex-dividend date or, in the case of dividends on certain foreign securities, as soon as the Fund is informed of the ex-dividend date. Withholding taxes on foreign dividends have been provided for in accordance with the Fund’s understanding of the applicable country’s tax rules and rates. Distributions received on securities that represent a return of capital or capital gain are recorded as a reduction of cost of investments and/or as a realized gain. Interest income, which includes amortization of premium and accretion of discount on debt securities, is accrued as earned. Investment income and realized and unrealized gains and losses are allocated to separate classes of shares based upon the relative net assets of each class. Expenses arising in connection with a specific class are charged directly to that class. Expenses common to the classes are allocated to each class in proportion to their relative net assets.
Foreign Currency Transactions: The Fund’s accounting records are maintained in U.S. dollars. For valuation of assets and liabilities on each date of net asset value determination, foreign denominations are converted into U.S. dollars using the current exchange rate. Security transactions, income and expenses are translated at the prevailing rate of exchange on the date of the event. The effect of changes in foreign exchange rates on securities and foreign currencies is included in the net realized and unrealized gain or loss on securities and foreign currencies.
Distributions to Shareholders: Distributions to shareholders are recorded by the Fund on ex-dividend date. Dividends from net investment income and distributions from net realized capital gains, if any, are paid at least annually. Distributions are determined in accordance with income tax regulations which may differ from generally accepted accounting principles; accordingly, periodic reclassifications are made within the Fund’s capital accounts to reflect income and gains available for distribution under income tax regulations.
Estimates: The preparation of the financial statements in conformity with accounting principles generally accepted in the United States requires management to make estimates and assumptions that affect the reported amounts of assets and liabilities and disclosure of contingent assets and liabilities at the date of the financial statements and the reported amounts of income and expenses during the reported period. Actual results could differ from those estimates.
Redemption Fees: The Fund charges a 2% redemption fee on redemptions, including exchanges, made within 30 days of purchase in the same Fund (within seven days for Class I shares). The redemption fee is accounted for as an addition to paid-in capital and is intended to discourage market-timers by ensuring that short-term trading costs are borne by the investors making the transactions and not the shareholders already in the Fund.
Expense Offset Arrangement: The Fund has an arrangement with its custodian bank
www.calvert.com CALVERT INTERNATIONAL EQUITY FUND ANNUAL REPORT 36
whereby the custodian’s fees may be paid indirectly by credits earned on the Fund’s cash on deposit with the bank. These credits are used to reduce the Fund’s expenses. Such a deposit arrangement may be an alternative to overnight investments.
Federal Income Taxes: No provision for federal income or excise tax is required since the Fund intends to continue to qualify as a regulated investment company under the Internal Revenue Code and to distribute substantially all of its taxable earnings.
Management has analyzed the Fund’s tax positions taken for all open federal income tax years and has concluded that no provision for federal income tax is required in the Fund’s financial statements. A Fund’s federal tax return is subject to examination by the Internal Revenue Service for a period of three years.
NOTE B — RELATED PARTY TRANSACTIONS
Calvert Investment Management, Inc. (the “Advisor”) is wholly-owned by Calvert Investments, Inc., which is indirectly wholly-owned by Ameritas Mutual Holding Company (formerly known as UNIFI Mutual Holding Company). The Advisor provides investment advisory services and pays the salaries and fees of officers and Directors of the Fund who are employees of the Advisor or its affiliates. For its services, the Advisor receives a monthly fee based on the following annual rates of average daily net assets: .75% on the first $250 million, .725% on the next $250 million and .675% on the excess of $500 million. Under the terms of the agreement, $191,299 was payable at year end. In addition, $106,673 was payable at year end for operating expenses paid by the Advisor during September 2012.
The Advisor has contractually agreed to limit net annual fund operating expenses through January 31, 2013 for Class I and Class Y. The contractual expense cap is 1.10% and 1.39%, respectively. For the purpose of this expense limit, operating expenses do not include interest expense, brokerage commissions, taxes, and extraordinary expenses. This expense limitation does not limit any acquired fund fees and expenses. To the extent any expense offset credits are earned, the Advisor’s obligation under the contractual limitation may be reduced and the Advisor may benefit from the expense offset arrangement. The Advisor voluntarily reimbursed Class B shares for expenses of $8,690 for the year ended September 30, 2012.
Calvert Investment Administrative Services, Inc., an affiliate of the Advisor, provides administrative services to the Fund for an annual fee, payable monthly, of .35% for Classes A, B, C, and Y, and .15% for Class I, based on their average daily net assets. Under the terms of the agreement, $73,190 was payable at year end.
Calvert Investment Distributors, Inc. (“CID”), an affiliate of the Advisor, is the distributor and principal underwriter for the Fund. Distribution Plans, adopted by Class A, Class B, and Class C shares, allow the Fund to pay CID for expenses and services associated with distribution of shares. The expenses paid may not exceed .35%, 1.00% and 1.00% annually of average daily net assets of each Class A, B, and C, respectively. The amount actually paid by the Fund is an annualized fee, payable monthly of .25%, 1.00% and 1.00% of the Fund’s average daily net assets of Class A, B, and C, respectively. Class I and Class Y shares do not have Distribution Plan expenses. Under the terms of agree-
www.calvert.com CALVERT INTERNATIONAL EQUITY FUND ANNUAL REPORT 37
ment, $53,949 was payable at year end.
CID received $21,935 as its portion of commissions charged on sales of the Fund’s Class A shares for the year ended September 30, 2012.
Calvert Investment Services, Inc. (“CIS”), an affiliate of the Advisor, is the shareholder servicing agent for the Fund. For its services, CIS received a fee of $151,840 for the year ended September 30, 2012. Under the terms of the agreement, $9,954 was payable at year end. Boston Financial Data Services, Inc. is the transfer and dividend disbursing agent.
The Fund invests in Community Investment Notes issued by the Calvert Social Investment Foundation (the “CSI Foundation”). The CSI Foundation is a 501(c) (3) non-profit organization that receives in-kind support from Calvert and its subsidiaries. The Fund has received an exemptive order from the Securities and Exchange Commission permitting the Fund to make investments in these notes under certain conditions.
Each Director of the Funds who is not an employee of the Advisor or its affiliates receives an annual retainer of $44,000 plus a meeting fee of $2,000 for each Board meeting attended. Additional fees of up to $5,000 annually may be paid to the Board chair and Committee chairs ($10,000 for the Special Equities Committee chair) and $2,500 annually may be paid to Committee members, plus a Committee meeting fee of $500 for each Committee meeting attended. Directors’ fees are allocated to each of the Funds served.
NOTE C — INVESTMENT ACTIVITY AND TAX INFORMATION
During the year, the cost of purchases and proceeds from sales of investments, other than short-term securities, were $126,001,180 and $147,283,631, respectively.
| CAPITAL LOSS CARRYFORWARDS | | |
| EXPIRATION DATE | | |
| 30-Sep-17 | ($90,728,857 | ) |
| 30-Sep-18 | (105,942,268 | ) |
| 30-Sep-19 | (10,386,632 | ) |
| |
| NO EXPIRATION DATE | | |
| Short-term | ($8,674,523 | ) |
| Long-term | (6,652,588 | ) |
Under the Regulated Investment Company Modernization Act of 2010, capital losses incurred in taxable years beginning after December 22, 2010 can be carried forward for an unlimited period. These losses are required to be utilized prior to the losses incurred in pre-enactment taxable years. Losses incurred in pre-encactment taxable years can be utilized until expiration.
www.calvert.com CALVERT INTERNATIONAL EQUITY FUND ANNUAL REPORT 38
The tax character of dividends and distributions paid during the years ended September 30, 2012 and September 30, 2011 were as follows:
| Distributions paid from: | 2012 | 2011 |
| Ordinary income | $3,626,080 | $1,202,378 |
| Total | $3,626,080 | $1,202,378 |
As of September 30, 2012, the tax basis components of distributable earnings/(accumulated losses) and the federal tax cost were as follows:
| Unrealized appreciation | $36,568,165 | |
| Unrealized (depreciation) | (21,037,422 | ) |
| Net unrealized appreciation/(depreciation) | $15,530,743 | |
| |
| Undistributed ordinary income | $3,040,165 | |
| Capital loss carryforward | ($222,384,868 | ) |
| |
| Federal income tax cost of investments | $319,528,659 | |
The differences between the components of distributable earnings on a tax basis and the amounts reflected in the statement of net assets are primarily due to temporary book-tax differences that will reverse in a subsequent period. These book-tax differences are due to wash sales, passive foreign investment companies, and partnerships.
Reclassifications, as shown in the table below, have been made to the Fund’s components of net assets to reflect income and gains available for distribution (or available capital loss carryovers, as applicable) under income tax law and regulations. These reclassifications are due to permanent book-tax differences and have no impact on net assets. The primary permanent differences causing such reclassification for the Fund are due to foreign currency transactions, partnerships, and passive foreign investment companies.
| Undistributed net investment income | ($443,405 | ) |
| Accumulated net realized gain (loss) | 444,808 | |
| Paid-in capital | (1,403 | ) |
www.calvert.com CALVERT INTERNATIONAL EQUITY FUND ANNUAL REPORT 39
NOTE D — LINE OF CREDIT
A financing agreement is in place with the Calvert Funds and State Street Corporation (“SSC”). Under the agreement, SSC provides an unsecured line of credit facility, in the aggregate amount of $50 million ($25 million committed and $25 million uncommitted), accessible by the Funds for temporary or emergency purposes only. Borrowings under this committed facility bear interest at the higher of the London Interbank Offered Rate (LIBOR) or the overnight Federal Funds Rate plus 1.25% per annum. A commitment fee of .11% per annum is incurred on the unused portion of the committed facility, which is allocated to all participating funds. The Fund had no borrowings under the agreement during the year ended September 30, 2012.
NOTE E — AFFILIATED COMPANIES
An affiliated company is a company in which the Fund has a direct or indirect ownership of, control of, or voting power of 5 percent or more of the outstanding voting shares. Affiliated companies of the Fund are as follows:
| AFFILIATES | | COST | | VALUE |
| gNet Defta Development Holdings LLC, LP | $ | 400,000 | $ | 318,510 |
| SEAF Central & Eastern European Growth Fund LLC, LP | | 347,969 | | 569,717 |
| TOTALS | $ | 747,969 | $ | 888,227 |
NOTE F — SUBSEQUENT EVENTS
In preparing the financial statements as of September 30, 2012, no subsequent events or transactions occurred that would have required recognition or disclosure in these financial statements.
NOTE G — OTHER
In connection with certain venture capital investments, the Fund is committed to future capital calls, which will increase the Fund’s investment in these securities. The aggregate amount of the future capital commitments totals $344,309 at September 30, 2012.
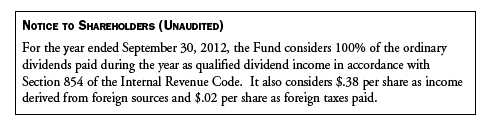
www.calvert.com CALVERT INTERNATIONAL EQUITY FUND ANNUAL REPORT 40
| | | | | | |
| FINANCIAL HIGHLIGHTS |
|
| | | | YEARS ENDED | | | |
| | September 30, | | September 30, | | September 30, | |
| CLASS A SHARES | 2012 | (z) | 2011 | (z) | 2010 | (z) |
| Net asset value, beginning | $11.84 | | $13.88 | | $13.83 | |
| Income from investment operations: | | | | | | |
| Net investment income | .12 | | .15 | | .06 | |
| Net realized and unrealized gain (loss) | 1.68 | | (2.15 | ) | .09 | |
| Total from investment operations | 1.80 | | (2.00 | ) | .15 | |
| Distributions from: | | | | | | |
| Net investment income | (.15 | ) | (.04 | ) | (.10 | ) |
| Net realized gain | — | | — | | — | |
| Total distributions | (.15 | ) | (.04 | ) | (.10 | ) |
| Total increase (decrease) in net asset value | 1.65 | | (2.04 | ) | 0.05 | |
| Net asset value, ending | $13.49 | | $11.84 | | $13.88 | |
| |
| Total return* | 15.34 | % | (14.47 | %) | 1.08 | % |
| Ratios to average net assets:A | | | | | | |
| Net investment income | .96 | % | 1.03 | % | .46 | % |
| Total expenses | 1.84 | % | 1.80 | % | 1.83 | % |
| Expenses before offsets | 1.80 | % | 1.80 | % | 1.80 | % |
| Net expenses | 1.80 | % | 1.80 | % | 1.80 | % |
| Portfolio turnover | 43 | % | 49 | % | 133 | % |
| Net assets, ending (in thousands) | $183,588 | | $173,936 | | $245,309 | |
| |
| |
| | | | YEARS ENDED | |
| | | | September 30, | | September 30, | |
| CLASS A SHARES | | | 2009 | (z) | 2008 | |
| Net asset value, beginning | | | $15.31 | | $25.57 | |
| Income from investment operations: | | | | | | |
| Net investment income | | | .11 | | .37 | |
| Net realized and unrealized gain (loss) | | | (1.19 | ) | (8.46 | ) |
| Total from investment operations | | | (1.08 | ) | (8.09 | ) |
| Distributions from: | | | | | | |
| Net investment income | | | (.37 | ) | (.24 | ) |
| Net realized gain | | | (.03 | ) | (1.93 | ) |
| Total distributions | | | (.40 | ) | (2.17 | ) |
| Total increase (decrease) in net asset value | | | (1.48 | ) | (10.26 | ) |
| Net asset value, ending | | | $13.83 | | $15.31 | |
| |
| Total return* | | | (6.27 | %) | (34.31 | %) |
| Ratios to average net assets: A | | | | | | |
| Net investment income | | | .99 | % | 1.81 | % |
| Total expenses | | | 1.87 | % | 1.65 | % |
| Expenses before offsets | | | 1.86 | % | 1.63 | % |
| Net expenses | | | 1.86 | % | 1.63 | % |
| Portfolio turnover | | | 135 | % | 100 | % |
| Net assets, ending (in thousands) | | | $270,900 | | $324,091 | |
See notes to financial highlights.
www. calvert.com CALVERT INTERNATIONAL EQUITY FUND ANNUAL REPORT 41
| | | | | | |
| FINANCIAL HIGHLIGHTS |
| |
| |
| | | | YEARS ENDED | | | |
| | September 30, | | September 30, | | September 30, | |
| CLASS B SHARES | 2012 | (z) | 2011 | (z) | 2010 | (z) |
| Net asset value, beginning | $10.48 | | $12.40 | | $12.40 | |
| Income from investment operations: | | | | | | |
| Net investment income (loss) | (.03 | ) | (.03 | ) | (.09 | ) |
| Net realized and unrealized gain (loss) | 1.49 | | (1.89 | ) | .09 | |
| Total from investment operations | 1.46 | | (1.92 | ) | — | |
| Distributions from: | | | | | | |
| Net investment income | — | | — | | — | |
| Net realized gain | — | | — | | — | |
| Total distributions | — | | — | | — | |
| Total increase (decrease) in net asset value | 1.46 | | (1.92 | ) | — | |
| Net asset value, ending | $11.94 | | $10.48 | | $12.40 | |
| |
| Total return* | 13.93 | % | (15.48 | %) | 0.00 | % |
| Ratios to average net assets: A | | | | | | |
| Net investment income (loss) | (.26 | %) | (.21 | %) | (.74 | %) |
| Total expenses | 3.18 | % | 3.02 | % | 3.03 | % |
| Expenses before offsets | 2.97 | % | 2.97 | % | 2.97 | % |
| Net expenses | 2.97 | % | 2.97 | % | 2.97 | % |
| Portfolio turnover | 43 | % | 49 | % | 133 | % |
| Net assets, ending (in thousands) | $3,607 | | $4,506 | | $6,850 | |
| |
| |
| |
| | | | YEARS ENDED | |
| | | | September 30, | | September 30, | |
| CLASS B SHARES | | | 2009 | (z) | 2008 | |
| Net asset value, beginning | | | $13.69 | | $23.11 | |
| Income from investment operations: | | | | | | |
| Net investment income (loss) | | | (.02 | ) | .12 | |
| Net realized and unrealized gain (loss) | | | (1.06 | ) | (7.56 | ) |
| Total from investment operations | | | (1.08 | ) | (7.44 | ) |
| Distributions from: | | | | | | |
| Net investment income | | | (.18 | ) | (.05 | ) |
| Net realized gain | | | (.03 | ) | (1.93 | ) |
| Total distributions | | | (.21 | ) | (1.98 | ) |
| Total increase (decrease) in net asset value | | | (1.29 | ) | (9.42 | ) |
| Net asset value, ending | | | $12.40 | | $13.69 | |
| |
| Total return* | | | (7.47 | %) | (34.97 | %) |
| Ratios to average net assets: A | | | | | | |
| Net investment income (loss) | | | (.26 | %) | .78 | % |
| Total expenses | | | 3.12 | % | 2.63 | % |
| Expenses before offsets | | | 3.10 | % | 2.61 | % |
| Net expenses | | | 3.10 | % | 2.60 | % |
| Portfolio turnover | | | 135 | % | 100 | % |
| Net assets, ending (in thousands) | | | $8,993 | | $12,512 | |
See notes to financial highlights.
www. calvert.com CALVERT INTERNATIONAL EQUITY FUND ANNUAL REPORT 42
| | | | | | |
| FINANCIAL HIGHLIGHTS |
| |
| |
| | | | YEARS ENDED | | | |
| | September 30, | | September 30, | | September 30, | |
| CLASS C SHARES | 2012 | (z) | 2011 | (z) | 2010 | (z) |
| Net asset value, beginning | $10.26 | | $12.10 | | $12.07 | |
| Income from investment operations: | | | | | | |
| Net investment income (loss) | .01 | | .01 | | (.05 | ) |
| Net realized and unrealized gain (loss) | 1.45 | | (1.85 | ) | .08 | |
| Total from investment operations | 1.46 | | (1.84 | ) | .03 | |
| Distributions from: | | | | | | |
| Net investment income | (.01 | ) | — | | — | |
| Net realized gain | — | | — | | — | |
| Total distributions | (.01 | ) | — | | — | |
| Total increase (decrease) in net asset value | 1.45 | | (1.84 | ) | 0.03 | |
| Net asset value, ending | $11.71 | | $10.26 | | $12.10 | |
| |
| Total return* | 14.23 | % | (15.21 | %) | 0.25 | % |
| Ratios to average net assets:A | | | | | | |
| Net investment income (loss) | .05 | % | .12 | % | (.41 | %) |
| Total expenses | 2.72 | % | 2.67 | % | 2.72 | % |
| Expenses before offsets | 2.69 | % | 2.67 | % | 2.69 | % |
| Net expenses | 2.69 | % | 2.67 | % | 2.69 | % |
| Portfolio turnover | 43 | % | 49 | % | 133 | % |
| Net assets, ending (in thousands) | $15,922 | | $16,195 | | $21,942 | |
| |
| |
| | | | YEARS ENDED | |
| | | | September 30, | | September 30, | |
| CLASS C SHARES | | | 2009 | (z) | 2008 | |
| Net asset value, beginning | | | $13.31 | | $22.51 | |
| Income from investment operations: | | | | | | |
| Net investment income | | | .01 | | .19 | |
| Net realized and unrealized gain (loss) | | | (1.03 | ) | (7.40 | ) |
| Total from investment operations | | | (1.02 | ) | (7.21 | ) |
| Distributions from: | | | | | | |
| Net investment income | | | (.19 | ) | (.06 | ) |
| Net realized gain | | | (.03 | ) | (1.93 | ) |
| Total distributions | | | (.22 | ) | (1.99 | ) |
| Total increase (decrease) in net asset value | | | (1.24 | ) | (9.20 | ) |
| Net asset value, ending | | | $12.07 | | $13.31 | |
| |
| Total return* | | | (7.16 | %) | (34.86 | %) |
| Ratios to average net assets: A | | | | | | |
| Net investment income | | | .07 | % | 1.01 | % |
| Total expenses | | | 2.79 | % | 2.47 | % |
| Expenses before offsets | | | 2.79 | % | 2.45 | % |
| Net expenses | | | 2.79 | % | 2.45 | % |
| Portfolio turnover | | | 135 | % | 100 | % |
| Net assets, ending (in thousands) | | | $24,107 | | $31,475 | |
See notes to financial highlights.
www. calvert.com CALVERT INTERNATIONAL EQUITY FUND ANNUAL REPORT 43
| | | | | | |
| FINANCIAL HIGHLIGHTS |
| |
| |
| | | | YEARS ENDED | | | |
| | September 30, | | September 30, | | September 30, | |
| CLASS I SHARES | 2012 | (z) | 2011 | (z) | 2010 | (z) |
| Net asset value, beginning | $12.70 | | $14.83 | | $14.79 | |
| Income from investment operations: | | | | | | |
| Net investment income | .24 | | .26 | | .17 | |
| Net realized and unrealized gain (loss) | 1.79 | | (2.30 | ) | .11 | |
| Total from investment operations | 2.03 | | (2.04 | ) | .28 | |
| Distributions from: | | | | | | |
| Net investment income | (.21 | ) | (.09 | ) | (.24 | ) |
| Net realized gain | — | | — | | — | |
| Total distributions | (.21 | ) | (.09 | ) | (.24 | ) |
| Total increase (decrease) in net asset value | 1.82 | | (2.13 | ) | 0.04 | |
| Net asset value, ending | $14.52 | | $12.70 | | $14.83 | |
| |
| Total return* | 16.16 | % | (13.84 | %) | 1.91 | % |
| Ratios to average net assets: A | | | | | | |
| Net investment income | 1.71 | % | 1.74 | % | 1.17 | % |
| Total expenses | 1.09 | % | 1.07 | % | 1.08 | % |
| Expenses before offsets | 1.06 | % | 1.06 | % | 1.06 | % |
| Net expenses | 1.06 | % | 1.06 | % | 1.06 | % |
| Portfolio turnover | 43 | % | 49 | % | 133 | % |
| Net assets, ending (in thousands) | $101,203 | | $89,142 | | $86,475 | |
| |
| |
| | | | YEARS ENDED | |
| | | | September 30, | | September 30, | |
| CLASS I SHARES | | | 2009 | (z) | 2008 | |
| Net asset value, beginning | | | $16.37 | | $27.15 | |
| Income from investment operations: | | | | | | |
| Net investment income | | | .22 | | .48 | |
| Net realized and unrealized gain (loss) | | | (1.29 | ) | (8.96 | ) |
| Total from investment operations | | | (1.07 | ) | (8.48 | ) |
| Distributions from: | | | | | | |
| Net investment income | | | (.48 | ) | (.37 | ) |
| Net realized gain | | | (.03 | ) | (1.93 | ) |
| Total distributions | | | (.51 | ) | (2.30 | ) |
| Total increase (decrease) in net asset value | | | (1.58 | ) | (10.78 | ) |
| Net asset value, ending | | | $14.79 | | $16.37 | |
| |
| Total return* | | | (5.59 | %) | (33.84 | %) |
| Ratios to average net assets: A | | | | | | |
| Net investment income | | | 1.80 | % | 2.47 | % |
| Total expenses | | | 1.08 | % | 1.00 | % |
| Expenses before offsets | | | 1.07 | % | .98 | % |
| Net expenses | | | 1.07 | % | .97 | % |
| Portfolio turnover | | | 135 | % | 100 | % |
| Net assets, ending (in thousands) | | | $107,456 | | $118,033 | |
See notes to financial highlights.
www. calvert.com CALVERT INTERNATIONAL EQUITY FUND ANNUAL REPORT 44
| | | | |
| FINANCIAL HIGHLIGHTS |
| |
| | YEARS ENDED | |
| | September 30, | | September 30, | |
| CLASS Y SHARES | 2012 | (z) | 2011 | (z) |
| Net asset value, beginning | $12.45 | | $14.53 | |
| Income from investment operations: | | | | |
| Net investment income | .18 | | .24 | |
| Net realized and unrealized gain (loss) | 1.77 | | (2.30 | ) |
| Total from investment operations | 1.95 | | (2.06 | ) |
| Distributions from: | | | | |
| Net investment income | (.15 | ) | (.02 | ) |
| Net realized gain | — | | — | |
| Total distributions | (.15 | ) | (.02 | ) |
| Total increase (decrease) in net asset value | 1.80 | | (2.08 | ) |
| Net asset value, ending | $14.25 | | $12.45 | |
| |
| Total return* | 15.80 | % | (14.20 | %) |
| Ratios to average net assets:A | | | | |
| Net investment income | 1.36 | % | 1.56 | % |
| Total expenses | 1.46 | % | 1.51 | % |
| Expenses before offsets | 1.39 | % | 1.39 | % |
| Net expenses | 1.39 | % | 1.39 | % |
| Portfolio turnover | 43 | % | 49 | % |
| Net assets, ending (in thousands) | $7,535 | | $7,398 | |
| |
| | PERIODS ENDED | |
| | September 30, | | September 30, | |
| CLASS Y SHARES | 2010 | (z) | 2009 | # (z) |
| Net asset value, beginning | $14.34 | | $11.45 | |
| Income from investment operations: | | | | |
| Net investment income | .08 | | .17 | |
| Net realized and unrealized gain (loss) | .17 | | 2.76 | |
| Total from investment operations | .25 | | 2.93 | |
| Distributions from: | | | | |
| Net investment income | (.06 | ) | (.01 | ) |
| Net realized gain | — | | (.03 | ) |
| Total distributions | (.06 | ) | (.04 | ) |
| Total increase (decrease) in net asset value | 0.19 | | 2.89 | |
| Net asset value, ending | $14.53 | | $14.34 | |
| |
| Total return* | 1.73 | % | 25.75 | % |
| Ratios to average net assets:A | | | | |
| Net investment income | .61 | % | 1.52 | % (a) |
| Total expenses | 2.14 | % | 5.91 | % (a) |
| Expenses before offsets | 1.39 | % | 1.39 | % (a) |
| Net expenses | 1.39 | % | 1.39 | % (a) |
| Portfolio turnover | 133 | % | 100 | % |
| Net assets, ending (in thousands) | $2,790 | | $702 | |
See notes to financial highlights.
www. calvert.com CALVERT INTERNATIONAL EQUITY FUND ANNUAL REPORT 45
A Total expenses do not reflect amounts reimbursed and/or waived by the Advisor or reductions from
expense offset arrangements. Expenses before offsets reflect expenses after reimbursement and/or waiver
by the Advisor but prior to reductions from expense offset arrangements. Net expenses are net of all
reductions and represent the net expenses paid by the Fund.
(a) Annualized.
(z) Per share figures are calculated using the Average Share Method.
* Total return is not annualized for periods less than one year and does not reflect deduction of any front-
end or deferred sales charge.
# From October 31, 2008, inception.
See notes to financial statements.
www.calvert.com CALVERT INTERNATIONAL EQUITY FUND ANNUAL REPORT 46
EXPLANATION OF FINANCIAL TABLES
SCHEDULE OF INVESTMENTS
The Schedule of Investments is a snapshot of all securities held in the fund at their market value, on the last day of the reporting period. Securities are listed by asset type (e.g., common stock, corporate bonds, U.S. government obligations) or, for International Funds, by country, and may be further broken down into sub-groups and by industry classification.
STATEMENT OF ASSETS AND LIABILITIES
The Statement of Assets and Liabilities is often referred to as the fund’s balance sheet. It lists the value of what the fund owns, is due and owes on the last day of the reporting period. The fund’s assets include the market value of securities owned, cash, receivables for securities sold and shareholder subscriptions, and receivables for dividends and interest payments that have been earned, but not yet received. The fund’s liabilities include payables for securities purchased and shareholder redemptions, and expenses owed but not yet paid. The statement also reports the fund’s net asset value (NAV) per share on the last day of the reporting period. The NAV is calculated by dividing the fund’s net assets (assets minus liabilities) by the number of shares outstanding. This statement is accompanied by a Schedule of Investments. Alternatively, if certain conditions are met, a Statement of Net Assets may be presented in lieu of this statement and the Schedule of Investments.
STATEMENT OF NET ASSETS
The Statement of Net Assets provides a detailed list of the fund’s holdings, including each security’s market value on the last day of the reporting period. The Statement of Net Assets includes a Schedule of Investments. Other assets are added and other liabilities subtracted from the investments total to calculate the fund’s net assets. Finally, net assets are divided by the outstanding shares of the fund to arrive at its share price, or Net Asset Value (NAV) per share.
At the end of the Statement of Net Assets is a table displaying the composition of the fund’s net assets. Paid in Capital is the money invested by shareholders and represents the bulk of net assets. Undistributed Net Investment Income and Accumulated Net Realized Gains usually approximate the amounts the fund had available to distribute to shareholders as of the statement date. Accumulated Realized Losses will appear as negative balances. Unrealized Appreciation (Depreciation) is the difference between the market value of the fund’s investments and their cost, and reflects the gains (losses) that would be realized if the fund were to sell all of its investments at their statement-date values.
STATEMENT OF OPERATIONS
The Statement of Operations summarizes the fund’s investment income earned and expenses incurred in operating the fund. Investment income includes dividends earned from stocks and interest earned from interest-bearing securities in the fund. Expenses incurred in operating the fund include the advisory fee paid to the investment advisor, administrative services fees, distribution plan expenses (if applicable), transfer agent fees, shareholder servicing expenses, custodial, legal, and audit fees, and the printing and post-
www.calvert.com CALVERT INTERNATIONAL EQUITY FUND ANNUAL REPORT (UNAUDITED) 47
age expenses related to shareholder reports. Expense offsets (fees paid indirectly) are also shown. Credits earned from offset arrangements are used to reduce the fund’s expenses. This statement also shows net gains (losses) realized on the sale of investments and the increase or decrease in the unrealized appreciation (depreciation) on investments held during the period.
STATEMENT OF CHANGES IN NET ASSETS
The Statement of Changes in Net Assets shows how the fund’s total net assets changed during the two most recent reporting periods. Changes in the fund’s net assets are attributable to investment operations, distributions and capital share transactions.
The Operations section of the report summarizes information detailed in the Statement of Operations. The Distribution section shows the dividend and capital gain distributions made to shareholders. The amounts shown as distributions in this section may not match the net investment income and realized gains amounts shown in the Operations section because distributions are determined on a tax basis and certain investments or transactions may be treated differently for financial statement and tax purposes. The Capital Share Transactions section shows the amount shareholders invested in the fund, either by purchasing shares or by reinvesting distributions, and the amounts redeemed. The corresponding numbers of shares issued, reinvested and redeemed are shown at the end of the report. fInancIaL hIghLIghtS
The Financial Highlights table provides a per-share breakdown per class of the components that affect the fund’s net asset value for current and past reporting periods. The table provides total return, total distributions, expense ratios, portfolio turnover and net assets for the applicable period. Total return is a measure of a fund’s performance that encompasses all elements of return: dividends, capital gain distributions and changes in net asset value. Total return is the change in value of an investment over a given period, assuming reinvestment of any dividends and capital gain distributions, expressed as a percentage of the initial investment. Total distributions include distributions from net investment income and net realized gains. Long-term gains are earned on securities held in the fund more than one year. Short-term gains, on the sale of securities held less than one year, are treated as ordinary dividend income for tax purposes. The expense ratio is a fund’s cost of doing business, expressed as a percentage of net assets. These expenses directly reduce returns to shareholders. Portfolio turnover measures the trading activity in a fund’s investment portfolio – how often securities are bought and sold by a fund. Portfolio turnover is affected by market conditions, changes in the size of the fund, the nature of the fund’s investments and the investment style of the portfolio manager.
www.calvert.com CALVERT INTERNATIONAL EQUITY FUND ANNUAL REPORT (UNAUDITED) 48
PROXY VOTING
The Proxy Voting Guidelines of the Calvert Funds that the Fund uses to determine how to vote proxies relating to portfolio securities are provided as an Appendix to the Fund’s Statement of Additional Information. The Statement of Additional Information can be obtained free of charge by calling the Fund at 1-800-368-2745, by visiting the Calvert website at www.calvert.com; or by visiting the SEC’s website at www.sec.gov.
Information regarding how the Fund voted proxies relating to portfolio securities during the most recent 12-month period ended June 30 is available on the Fund’s website at www.calvert.com and on the SEC’s website at www.sec.gov.
AVAILABILITY OF QUARTERLY PORTFOLIO HOLDINGS
The Fund files its complete schedule of portfolio holdings with the SEC for the first and third quarters of each fiscal year on Form N-Q. The Fund’s Form N-Q is available on the SEC’s website at www.sec.gov. The Fund’s Form N-Q may be reviewed and copied at the SEC’s Public Reference Room in Washington, DC; information on the operation of the Public Reference Room may be obtained by calling 1-800-SEC-0330.
www.calvert.com CALVERT INTERNATIONAL EQUITY FUND ANNUAL REPORT (UNAUDITED) 49
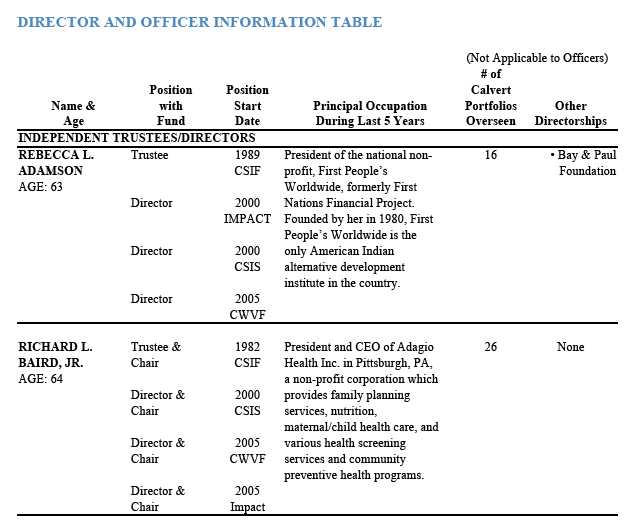 www. calvert.com CALVERT INTERNATIONAL EQUITY FUND ANNUAL REPORT (UNAUDITED) 50
www. calvert.com CALVERT INTERNATIONAL EQUITY FUND ANNUAL REPORT (UNAUDITED) 51
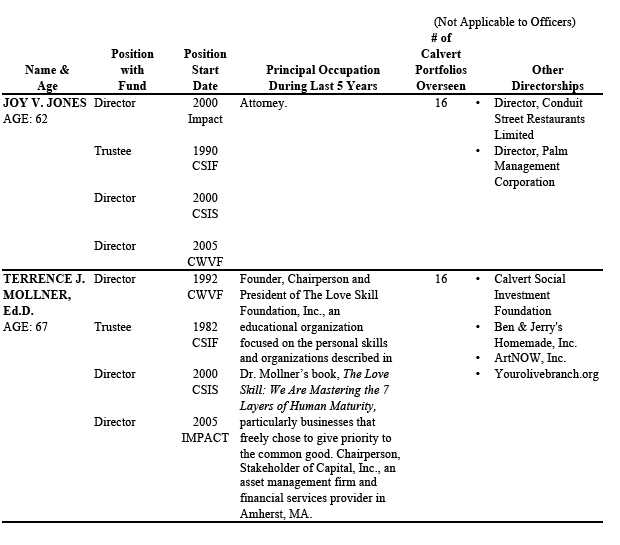 www. calvert.com CALVERT INTERNATIONAL EQUITY FUND ANNUAL REPORT (UNAUDITED) 52
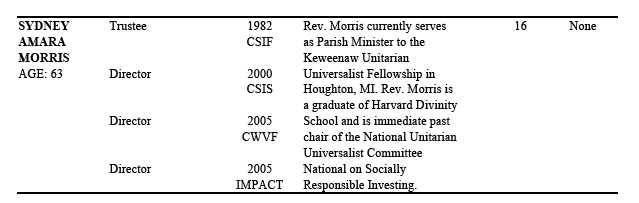 www. calvert.com CALVERT INTERNATIONAL EQUITY FUND ANNUAL REPORT (UNAUDITED) 53
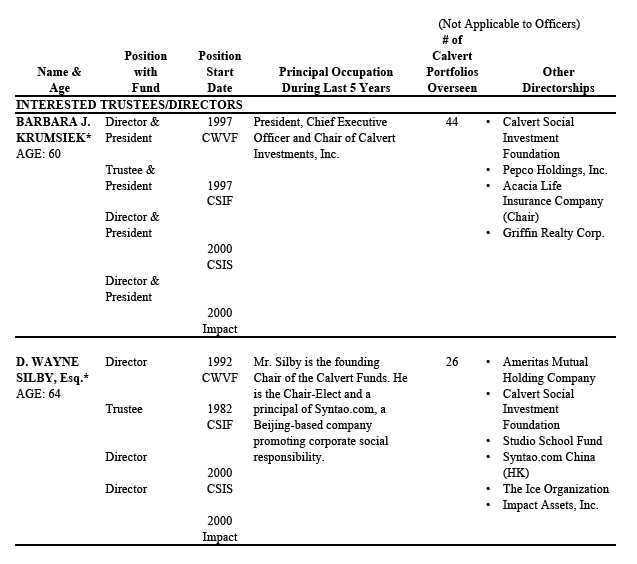 www. calvert.com CALVERT INTERNATIONAL EQUITY FUND ANNUAL REPORT (UNAUDITED) 54
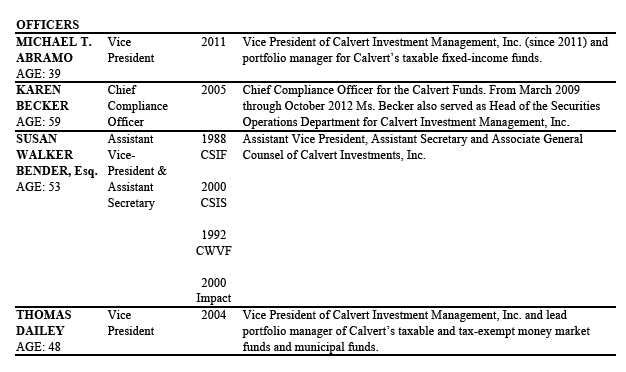 www. calvert.com CALVERT INTERNATIONAL EQUITY FUND ANNUAL REPORT (UNAUDITED) 55
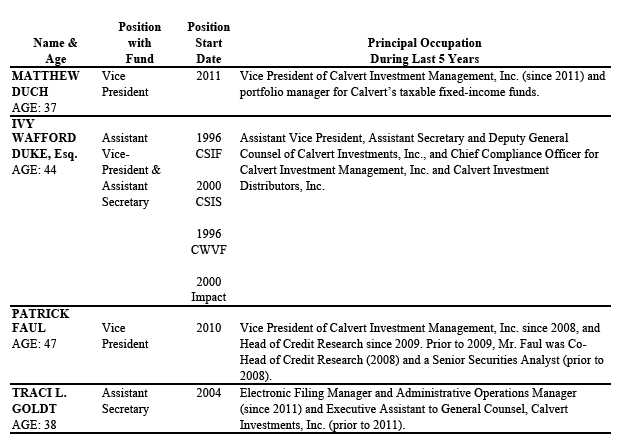 www. calvert.com CALVERT INTERNATIONAL EQUITY FUND ANNUAL REPORT (UNAUDITED) 56
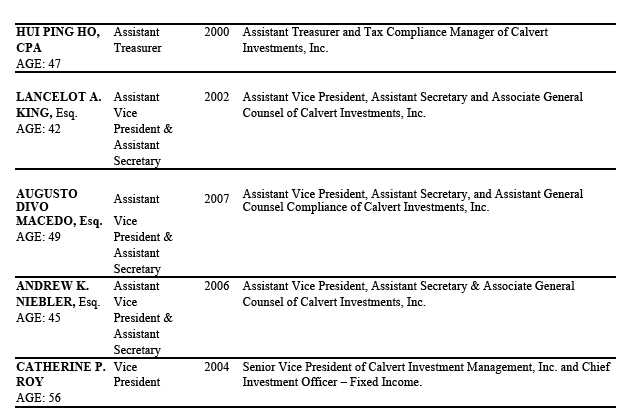 www. calvert.com CALVERT INTERNATIONAL EQUITY FUND ANNUAL REPORT (UNAUDITED) 57
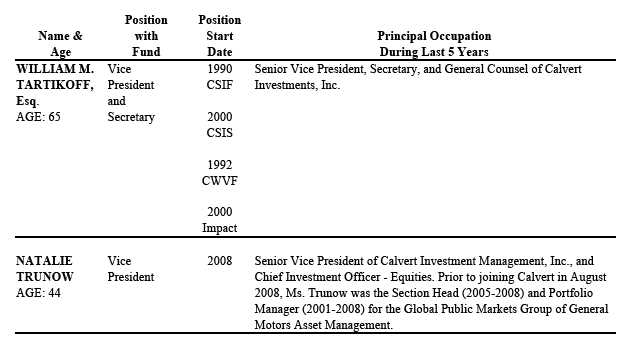 www. calvert.com CALVERT INTERNATIONAL EQUITY FUND ANNUAL REPORT (UNAUDITED) 58
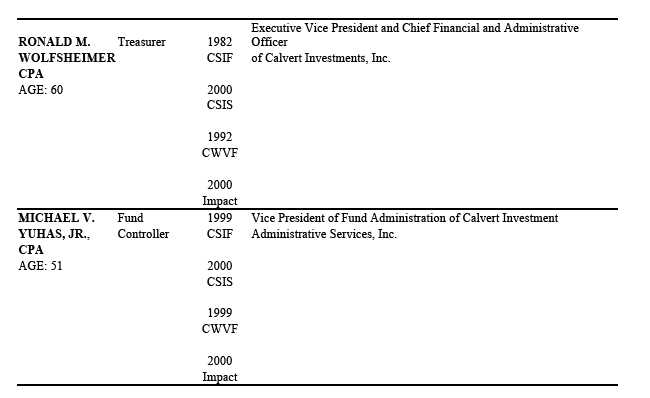 www. calvert.com CALVERT INTERNATIONAL EQUITY FUND ANNUAL REPORT (UNAUDITED) 59
*The address of Trustees/Directors and Officers is 4550 Montgomery Avenue, Suite 1000N, Bethesda, Maryland 20814, except Mr. Silby’s address is 1715 18th Street, N.W., Washington, DC 20009. Ms. Krumsiek is an interested person of the Fund since she is an officer and director of the Fund’s advisor and certain affiliates. Mr. Silby is an interested person of the Fund since he is a director of the parent company of the Fund’s advisor.
Additional information about the Fund’s Trustees/Directors can be found in the Statement of Additional Information (SAI). You can get a free copy of the SAI at www.calvert.com, or by contacting your broker, or the Fund at 1-800-368-2745.
www calvert.com CALVERT INTERNATIONAL EQUITY FUND ANNUAL REPORT (UNAUDITED) 60
To Open an Account
800-368-2748
Yields and Prices
Calvert Information Network
(24 hours, 7 days a week)
800-368-2745
Service for Existing Account
Shareholders: 800-368-2745
Brokers: 800-368-2746
TDD for Hearing Impaired
800-541-1524
Branch Office
4550 Montgomery Avenue
Suite 1000 North
Bethesda, Maryland 20814
Registered, Certified
or Overnight Mail
Calvert Investments
c/o BFDS,
330 West 9th Street
Kansas City, MO 64105
Web Site
www.calvert.com
Principal Underwriter
Calvert Investment Distributors, Inc.
4550 Montgomery Avenue
Suite 1000 North
Bethesda, Maryland 20814
This report is intended to provide fund information to shareholders. It is not authorized for distribution to prospective investors unless preceded or accompanied by a prospectus.
Note: The information on our website is not incorporated by reference into this report; our website address is included as an inactive textual reference only.
Investors should carefully consider the investment objectives, risks, charges and expenses of the Calvert Funds. This and other important information is contained in the fund’s summary prospectus and prospectus, which can be obtained from your financial professional and should be read carefully before investing. You may also call Calvert at 800/368-2745 or visit www. calvert.com.
Choose Planet-friendly E-delivery!
Sign up now for on-line statements, prospectuses, and fund reports. In less than five minutes you can help reduce paper mail and lower fund costs.
Just go to www.calvert.com. If you already have an online account at Calvert, click on My Account, and select the documents you would like to receive via e-mail.
If you’re new to online account access, click on Login/Register to open an online account. Once you’re in, click on the E-delivery sign-up at the bottom of the Account Portfolio page and follow the quick, easy steps. Note: if your shares are not held directly at Calvert but through a brokerage firm, you must contact your broker for electronic delivery options available through their firm.

Dear Shareholder:
Stock markets ended the 2012 annual reporting period sharply higher as the Standard & Poor’s (S&P) 500 Index returned 30.20% versus 1.14% for the 12 months through September 30, 2011. While the two periods shared many commonalities--such as a softening of
economic indicators, mounting concerns about sovereign debt in the eurozone, and relatively strong corporate profits--there were some key differences.
Financial markets around the world breathed a sigh of relief after the European Central Bank committed to saving the euro this summer and offered to support the debt markets for any euro member government seeking a new financial bailout. And while the disasters in Japan and strife in the Middle East and North Africa weighed heavily on investor confidence last year, uncertainty closer to home rattled investors this year, primarily as a result of the presidential election and looming “fiscal cliff” in January 2013 that could raise taxes for many Americans. The good news is both situations should see some resolution by the end of 2012.
The U.S. economy’s relative strength was also more evident in this annual reporting period. The divergence with foreign stock market returns widened as the S&P 500 Index more than doubled the 14.33% return of the MSCI EAFE Index for the 12-month period ending September 30, 2012. In the 12 months ending September 30, 2011, the S&P 500 barely eked out a positive return compared with -8.94% for the MSCI EAFE for the same period.
A Truly Uneven Recovery
Within the United States, the economic recovery was also uneven, with some consumers and businesses feeling left behind in the midst of an “improving” economy. For example, growth in northeastern metropolitan areas lagged, while metro areas out west, particularly those in natural gas or high-tech centers, rebounded strongly.1 Also, the housing market finally turned the corner, as national home prices rose 3.6% year-over-year for the past 12 months. However, they surged 9.4% in the western U.S. while notching up only 0.9% in the northeast.2 In employment, more than 70% of jobs lost in service industries during the recession have returned, but only 15% of jobs lost in manufacturing, construction, and other goods-producing industries have come back. The differences are stark even within industries, where retail general merchandisers such as Costco recouped 92% while department stores regained just 41% of lost jobs.3 Overall, we remain cautiously optimistic about the economic recovery ahead. As both citizens and investors, we hope that government legislators return to the negotiating table after the election and give us all the gift of more certainty before the holidays.
www.calvert.com CALVERT CAPITAL ACCUMULATION FUND ANNUAL REPORT 4
Making Strides in Board Diversity
Calvert continued its advocacy efforts in many areas, including board diversity. The United Nations Gender Equality for Sustainable Business Event in March marked the two-year anniversary of the U.N.’s Women’s Empowerment Principles (WEP), which were adapted from the Calvert’s Women Principles®, and emphasized the business case for promoting gender equality and women’s empowerment in the workplace. Calvert also joined the newly formed WEP Leadership Group to expand implementation of the Principles.
On March 21, we testified before the Senate Democratic Steering and Outreach Committee about the importance of gender equity in economic empowerment and job creation, highlighting research showing the inclusion of women in corporate management correlates with higher shareholder value and better operating results.
Creating “The Future We Want” in Rio
Finally, I had the pleasure of representing Calvert by speaking at several events at the Rio + 20 Summit about board oversight of sustainability, social enterprise and impact investing, the role of business in promoting gender equality, the business case for the green economy, and establishing value for natural capital.
The first Earth Summit in Rio de Janeiro 20 years ago created climate and biodiversity conventions and set the stage for frameworks to address global environmental degradation, climate change, and poverty. However, global economic uncertainty weighed heavily on the Rio + 20 Summit. While negotiations continued to advance toward 2015, we’re disappointed by the lack of concrete commitments needed for substantial progress on critical sustainability issues.
However, side events sponsored by private-sector and non-governmental organizations sparked many innovative initiatives and positive outcomes. A number of major companies made significant commitments on water, energy, renewable materials, and deforestation. Corporate and investor disclosure of environmental, social, and governance (ESG) impacts took a real step forward as well. In fact, NASDAQ will now encourage companies on its exchange to report on ESG issues, or explain why they do not.
While these efforts can’t substitute for binding governmental commitments, we are happy to see so many companies and investors stepping up to the plate and believe the private sector will remain a key driver of progress on sustainability issues over the next few years.
Stay Informed in the Months Ahead
Maintaining a well-diversified mix of stocks, bonds, and cash appropriate for your goals and risk tolerance is one of the best ways to mitigate the effects of an uneven economic recovery. We also recommend discussing any changes in your financial situation with your investment advisor.
www.calvert.com CALVERT CAPITAL ACCUMULATION FUND ANNUAL REPORT 5
A financial services consulting firm recently named Calvert as one of the Top Social Media Leaders in 2012 for using Facebook to share valuable content with investors and advisors.4 Join the dialogue at www.facebook.com/calvert.
We also invite you to visit our website, www.calvert.com, for fund information, portfolio updates, and commentary from Calvert professionals. You can now get the same information on the go with our new iPhone® app, available free at iTunes.
As always, we thank you for investing with Calvert.

Barbara Krumsiek
President and CEO of Calvert Investments, Inc.
October 2012
1. Brookings Institution, Metro Monitor - September 2012, www.brookings.edu/research/
interactives/metromonitor#overall
2. Clear Capital, “June Home Prices Provide Further Evidence of Budding Recovery. Forecast
Indicates Further Increases Through 2012,” July 2012 Market Report, http://clearcapital.com/
company/MarketReport.cfm?month=July&year=2012
3. Paul Davison and Barbara Hansen, “Service Businesses Lead Uneven Jobs Recovery,” USA
Today, July 15, 2012, www.usatoday.com/money/economy/story/2012-07-15/jobs-recov-
ered/56242656/1
4. kasina ranked Calvert fifth of 53 asset management and insurance companies for using
Facebook to tell a compelling brand story and share valuable content with investors and advi-
sors. The ranking was based on kasina’s three-tier methodology that ranked firms based on
content, branding, interactivity, and usability on each social platform. For more information,
visit www.kasina.com.
www.calvert.com CALVERT CAPITAL ACCUMULATION FUND ANNUAL REPORT 6

Landmark Rules on Conflict Minerals
After a complicated and controversial two-year rulemaking process, the Securities and Exchange Commission (SEC) released final rules under the Dodd-Frank Wall Street Reform and Consumer Protection Act (Dodd-Frank) Section 1502, which require companies to file and publish reports on their efforts to eliminate the use of “conflict minerals” that have fueled a violent 14-year conflict in the Eastern Democratic Republic of the Congo (DRC).
Calvert played a leading role among investors during the rulemaking process and is pleased with the progress. However, the two- to four-year timeline for compliance and exclusion of mining companies from reporting requirements was disappointing. We will continue to press all companies involved with conflict minerals to step up their efforts to address these issues.
New Standards Will Nearly Double Fuel Efficiency by 2025
Newly finalized corporate average fuel economy (CAFE) standards require cars and light-duty trucks to reach the equivalent of 54.5 mpg by 2025. Experts estimate the new standards will reduce oil consumption by 12 billion barrels while saving consumers $1.7 trillion. The major U.S. automakers supported the new standards and have already begun incorporating them into future vehicles.
The higher standards should boost both the competitiveness of American automakers and U.S. policy efforts to mitigate climate change, since more than 90% of a vehicle’s contribution to climate change through greenhouse gas emissions (GHGs) is related to fuel consumption.1 Calvert has long advocated for higher standards in public testimony to Environmental Protection Agency, meetings with Obama administration officials, dialogues with the auto industry, and the media and will continue to do so.
Helping Companies Combat Climate Change Risks
Economic and insured losses from natural catastrophes set new records last year, driving home the very real physical climate risks for investors. Extreme weather events accounted for 90% of the disasters and eight of the 10 most costly events, causing overall losses of more than $148 billion.
To that end, Calvert co-authored two reports to help companies evaluate their exposure to climate risks and protect shareholder value. Oxfam America and Ceres joined us to create
Physical Risks from Climate Change: A guide for companies and investors on disclosure and management of climate impacts.
www.calvert.com CALVERT CAPITAL ACCUMULATION FUND ANNUAL REPORT 7
We also developed Value Chain Climate Resilience: A guide to managing climate impacts in companies and communities, a first-of-its-kind guide to help businesses assess and prepare for the risks and opportunities posed by climate change, with other leading companies from the Partnership for Resilience and Environmental Preparedness (PREP).
Exercising Our Say on Pay
Calvert fought for the new “say on pay” rule, which requires publicly traded U.S. companies to allow shareholders to vote on the compensation awarded to senior management the previous year. We built on that success this year by creating a strict set of voting guidelines on executive compensation for the proxy season. We also shared our reasons for voting against the proposals to management at key companies.
Overall, Calvert votes against compensation packages that do not align management and shareholder interests and do not incentivize the company’s long-term performance. In May, this meant voting against company compensation packages 34% of the time. This includes Gilead Sciences, Safeway, and Plains Exploration and Production, all of which rewarded CEOs with high pay in 2011 despite lackluster shareholder returns.
Even before the May announcement of a massive trading loss, we rejected the $23 million pay package for JPMorgan Chase Chairman and CEO Jamie Dimon due to its discretionary nature and inherent lack of accountability to long-term financial goals. The weaknesses in risk oversight evident by the company’s failed hedging strategy only reinforced our decision.
Other Shareholder Advocacy Efforts
This spring, Calvert filed 24 shareholder resolutions to keep the sustainability issues with a real impact on profits, people, and the planet front and center. Six were voted upon by shareholders, including resolutions on: -- Board diversity at Urban Outfitters, which received 39% support (up from 22% last year). Despite owning popular women’s retail brands Anthropologie and Free People, the company does not have any women or minorities on its board of directors.
-- Disclosure of water scarcity and pollution risks at Fossil, which received 31% support. As an apparel company, Fossil relies on water- and energy-intensive processes for producing cotton, leather, and other products. These processes can also pollute water supplies, especially in developing countries.
-- Sustainability reports at Gentex, which received 32% support. This supplier for the automotive, aerospace, and commercial fire protection industries currently provides no information on its efforts to manage resource efficiency and environmental impacts—despite increasing demands from its key clients for sustainability data.
Promoting Privacy on the Internet
In 2006, Calvert joined other investors, human rights advocacy organizations, academic experts and companies to develop the multi-stakeholder Global Network Initiative (GNI) to help information and communication technology (ICT) companies address freedom of expression and privacy issues. In early 2012, GNI’s path to becoming a fully global standard leapt forward as the first three GNI companies—Yahoo, Google, and Microsoft— completed
www.calvert.com CALVERT CAPITAL ACCUMULATION FUND ANNUAL REPORT 8
the second phase of the assessment process.
In addition, Facebook became a GNI observer in May, opening the door to its participation in GNI policy and advocacy discussions for one year as it evaluates the potential commitment of implementing the GNI principles. We welcome the opportunity to work with Facebook, particularly in protecting against privacy violations that can endanger members using it as an instrument of freedom of expression and political dissent across the world.
Community Investments
Many of our Funds participate in Calvert’s High Social Impact Investing program, which is administered through the Calvert Foundation. This community investment program may allocate a small percentage of Fund assets at below-market interest rates to investments that provide economic opportunity for struggling populations.2 One such investment through the Foundation is FMM Popayan, which offers financial services to more than 400,000 clients in some of the poorest areas of Columbia. Women comprise 66% of their client base.
We also supported the Triodos Sustainable Trade Fund, which seeks to improve the economic position of farmers in emerging markets and stimulate development in the sustainable agriculture sector. It does this by providing pre-export value chain financing to farmer cooperatives—with a specific focus on fair trade and organic farming.
Special Equities
A modest but important portion of certain funds is allocated to small private companies developing products or services that address important sustainability or environmental issues facing our society.
One example of a recent investment is Ivy Capital/All Life Insurance Company of South Africa, which insures people living with HIV.3 The company uses online support systems to help clients comply with their medical requirements in order to live a longer life. This provides enormous security to their families and employers and seems to be a rather unique business model in fighting the scourge of AIDS.
www.calvert.com CALVERT CAPITAL ACCUMULATION FUND ANNUAL REPORT 9
1. ACEEE, Automobiles and the Environment, www.greenercars.org/guide_environment.
htm
2. As of September 30, 2012, Calvert Social Investment Foundation (“Calvert
Foundation” or “Foundation”) Community Investment Notes represented the follow-
ing percentages of Fund net assets: Calvert Capital Accumulation Fund 0.51%, Calvert
International Equity Fund 1.29%, and Calvert Small Cap Fund 0.48%. The Calvert
Foundation is a 501(c)(3) nonprofit organization. The Foundation’s Community
Investment Note Program is not a mutual fund and should not be confused with any
Calvert Investments-sponsored investment product.
3. As of September 30, 2012, Ivy Capital All Life Insurance represented 0.02% of
Calvert Equity Portfolio. Holdings are subject to change.
As of September 30, 2012, the following companies represented 0% of net assets in the
Fund: Gilead Sciences, Safeway, Plains Exploration and Production, JPMorgan Chase,
Urban Outfitters, Fossil, Gentex, Yahoo, Google, Microsoft and Facebook. Holdings are
subject to change.
www.calvert.com CALVERT CAPITAL ACCUMULATION FUND ANNUAL REPORT 10

Investment Performance
In the 12-month period ended September 30, 2012, Calvert Capital Accumulation Fund Class A shares (at NAV) returned 29.16% versus 26.69% for the Russell Midcap Growth Index. Stock selection drove the Fund’s outperformance.
Investment Climate
The U.S. markets performed strongly despite the gloomy economy. Through September 30, 2012, mid-cap stocks as measured by the Russell Mid Cap Index rose 28.03%. This is slightly under the 30.06% performance of the large-cap Russell 1000 index and 31.91% for the small-cap Russell 2000 Index for the period.
Markets staged an impressive rally in the fourth quarter of 2011, making up much of the ground lost in the third quarter. This pushed most U.S. large-cap indices into barely positive territory for the 2011, while
| CALVERT CAPITAL |
| ACCUMULATION FUND |
| September 30, 2012 |
| |
| INVESTMENT PERFORMANCE | | | |
| (total return at NAV*) | | | |
| | 6 Months | | 12 Months | |
| | ended | | ended | |
| | 9/30/12 | | 9/30/12 | |
| Class A | -0.66 | % | 29.16 | % |
| Class B | -1.32 | % | 27.50 | % |
| Class C | -1.05 | % | 28.11 | % |
| Class I | -0.35 | % | 30.00 | % |
| Class Y | -0.54 | % | 29.45 | % |
| |
| Russell Midcap Growth | | | |
| Index | -0.56 | % | 26.69 | % |
| |
| Lipper Mid-Cap Core | | | | |
| Funds Average | -0.72 | % | 26.02 | % |
| TEN LARGEST STOCK HOLDINGS | |
| % of Net Assets | |
| Expedia, Inc. | 3.6 | % |
| Church & Dwight Co., Inc. | 3.3 | % |
| Syntel, Inc. | 3.1 | % |
| Ross Stores, Inc. | 3.1 | % |
| WESCO International, Inc. | 3.1 | % |
| Polaris Industries, Inc. | 3.0 | % |
| Wright Express Corp. | 3.0 | % |
| Lender Processing Services, Inc. | 2.9 | % |
| NCR Corp. | 2.8 | % |
| Valmont Industries, Inc. | 2.8 | % |
| Total | 30.7 | % |
| |
| ECONOMIC SECTORS | |
| % of Total Investments | |
| |
| Consumer Discretionary | 21.9 | % |
| Consumer Staples | 6.1 | % |
| Energy | 7.4 | % |
| Financials | 6.9 | % |
| Health Care | 9.5 | % |
| Industrials | 15.7 | % |
| Information Technology | 21.8 | % |
| Materials | 7.3 | % |
| Telecommunication Services | 1.5 | % |
| Short-Term Investments | 1.9 | % |
| |
| Total | 100 | % |
*Investment performance/return at NAV does not reflect the deduction of the Fund’s maximum 4.75% front-end sales charge or any deferred sales charge.
www.calvert.com CALVERT CAPITAL ACCUMULATION FUND ANNUAL REPORT 11
mid- and small-cap benchmarks posted slight losses for the calendar year.
The year-end rally continued into the early months of 2012, but concerns over sluggish U.S. GDP growth, lingering eurozone difficulties and the likelihood of China’s slowing economy had erased most of the gains by early June. Thanks in large part to the Federal Reserve’s announcement of a third round of quantitative easing, markets bounced back in the third quarter, reaching multi-year highs despite little change in the relatively weak global economic backdrop.
Given the unprecedented amount of macroeconomic uncertainty--such as consumer deleveraging, unconventional policy actions, and austerity measures--markets have become much more economy-driven and much less driven by individual company fundamentals over the past 12 months. Consequently, correlations between stock prices have spiked, proving a difficult environment for a fundamental stock-picker.
Portfolio Strategy
Despite this backdrop, adherence to our discipline has helped the Fund perform well, both absolutely and relatively, due to our strong stock selection. While earnings growth is becoming more of a scarcity in this economic environment, high-quality growth names with attractive valuations like those in the Fund have been rewarded.
| CALVERT CAPITAL |
| ACCUMULATION FUND |
| September 30, 2012 |
| | |
| AVERAGE ANNUAL TOTAL RETURNS | |
| |
| CLASS A SHARES | (with max. load) | |
| One year | 23.00 | % |
| Five year | 2.92 | % |
| Ten year | 7.47 | % |
| | | |
| CLASS B SHARES | (with max. load) | |
| One year | 22.50 | % |
| Five year | 2.61 | % |
| Ten year | 6.93 | % |
| |
| CLASS C SHARES | (with max. load) | |
| One year | 27.11 | % |
| Five year | 3.10 | % |
| Ten year | 7.12 | % |
| | | |
| CLASS I SHARES* | | |
| One year | 30.00 | % |
| Five year | 4.79 | % |
| Ten year | 8.84 | % |
| |
| CLASS Y SHARES** | | |
| One year | 29.45 | % |
| Five year | 3.99 | % |
| Ten year | 8.03 | % |
Our sector selection was modestly negative. Underweight positions in Consumer Staples and Energy helped performance while an underweight to Telecommunication Services and an overweight to Information Technology detracted. During the period, we sold 22 stocks
* Note Regarding Class I Shares Total Returns: There were times during the reporting period when there were no shareholders in Class I. For purposes of reporting Average Annual Total Return, Class A performance at NAV (i.e. does not reflect deduction of the Class A front-end sales charge) is used during these periods in which there were no shareholders in Class I. For purposes of this Average Annual Total Return, the Class A performance at NAV was used during the period January 18, 2002 through June 3, 2003.
** Calvert Capital Accumulation Fund first offered Class Y Shares on January 31, 2011. Performance prior to that date reflects the performance of Class A Shares at net asset value (NAV). Actual Class Y Share performance would have been different.
www.calvert.com CALVERT CAPITAL ACCUMULATION FUND ANNUAL REPORT 12
Growth of $10,000
The graph below shows the value of a hypothetical $10,000 investment in the Fund over the past 10 fiscal year periods. The results shown are for Classes A and C shares and reflect the deduction of the maximum front-end Class A sales charge of 4.75%, or deferred sales charge, as applicable and assume the reinvestment of dividends. The result is compared with benchmarks that include a broad based market index and a Lipper peer group average. Market indexes are unmanaged and their results do not reflect the effect of expenses or sales charges. The Lipper average reflects the deduction of the category’s average front-end sales charge. The value of an investment in a different share class would be different.
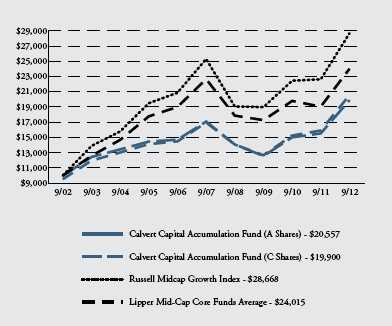
All performance data shown, including the graph above and the adjacent table, represents past performance, does not guarantee future results, assumes reinvestment of dividends and distributions and does not reflect the deduction of taxes that a shareholder would pay on the Fund’s distributions or the redemption of the Fund shares. All performance data reflects fee waivers and/or expense limitations, if any are in effect; in their absence performance would be lower. See Note B in Notes to Financial Statements. The investment return and principal value of an investment will fluctuate so that an investor’s shares, when redeemed, may be worth more or less than their original cost. Current performance may be lower or higher than the performance data quoted; for current performance data visit www.calvert.com. The gross expense ratio from the current prospectus for Class A shares is 1.58%. This number may differ from the expense ratio shown elsewhere in this report because it is based on a different time period and, if applicable, does not include fee or expense waivers. Performance data quoted already reflects the deduction of the Fund’s operating expenses.
www.calvert.com CALVERT CAPITAL ACCUMULATION FUND ANNUAL REPORT 13
and bought 23 new ones for a total of 42 holdings as of September 30, 2012.
Six stocks were sold after reaching their price target, including security service provider Brinks, fluid-handling solutions provider Colfax, and Ascena, owner of the Justice and DressBarn retail brands. All three stocks were purchased earlier in the reporting period.
Stock selection added value in Consumer stocks, Industrials, and Information Technology. In Consumer Discretionary, robust hotel bookings drove strong earnings for Expedia, a new holding that gained 96.2%.1 Another new holding, retailer Ann (formerly Ann Taylor), advanced 38.5% after adopting new merchandising and promotional strategies.
Stable volumes, pricing gains, and the integration of a recent acquisition fueled a gain of 42.2% for Ingredion in Consumer Staples. In Industrials, Wesco rose 70.5% after fears about slowing economic growth eased during the year. Information Technology holding Wright Express (83.3%) reached new highs as good transactions growth spurred consistently solid earnings.
Stock picking was weak in Health Care and Energy. A change in Aetna’s reimbursement policy for Questcor Pharmaceuticals’ main drug weighed Questcor down (-32.3%) on fears other insurers would follow suit. Energy stock Denbury Resources returned -22.1% due to the slump in crude oil prices earlier this year. Information Technology holding Lam Research (-16.3%) underperformed after softening expectations for capital expenditures prompted weak earnings and a disappointing outlook.
At the end of the reporting period, there were overweights to Information Technology, Energy, and Industrials, and underweights to the Health Care, Consumer Staples, and Consumer Discretionary sectors.
Outlook
The U.S. economy is still struggling, with low growth in gross domestic product (GDP) and high unemployment. We expect GDP growth for 2012 to barely reach 1.5%. Europe is still mired in difficulties and the rate of growth in China has ratcheted down steadily. Many deficits and other worldwide structural issues remain unaddressed.
On the other hand, continued productivity gains drove growth in U.S. corporate profits, although there are worries about the all-time highs in margins, which leaves little room to grow. Also, inflation has remained low (under 2%) and this will probably continue, thanks to weak demand and low interest rates. The U.S. housing market has stabilized, too, and is no longer such a drag on the economy.
All eyes are on the fiscal cliff--the expiration of tax cuts and implementation of mandatory budget cuts in January 2013. If a budget deal isn’t reached, we expect going over the cliff may cut 1.5% from U.S. GDP and weigh heavily on the markets, although the latter may recover as the long-term impact on the budget deficit is assessed. Even if Washington reaches a budget agreement before year-end, any deal is likely to include some tax increases and some spending cuts.
Resolution of the November elections and a return of Congress and the administration to the bargaining table would reduce the economic uncertainties. A positive budget out-
www.calvert.com CALVERT CAPITAL ACCUMULATION FUND ANNUAL REPORT 14
come with clear solutions to address structural imbalances could encourage businesses to start spending capital and hiring again.
Equity valuations are still reasonable by historical standards in our opinion and earnings are likely to continue growing in the mid-single digit percentages. Low potential returns on bonds make equities look attractive and flows from fixed income into equities could further boost the stock market. Demographics favor equities, too, as saving for retirement becomes a higher priority. The U.S. market is also still seen as a relatively safe haven in an unsettled world. As a result, we are optimistic about the coming year and expect U.S. equities to post high single-digit percentage returns.
October 2012
1. Individual security returns reflect total returns for period held in portfolio.
As of September 30, 2012, the following companies represented the following percentages of Fund net
assets: Brinks 0%, Colfax 0%, Ascena 0%, Expedia 3.57%, Ann 2.01%, Ingredion 2.71%, Wesco
3.07%, Wright Express 3.01%, Aetna 0%, Questcor Pharmaceuticals 1.10%, Denbury Resources
2.10%, and Lam Research 1.59%. Holdings are subject to change.
www.calvert.com CALVERT CAPITAL ACCUMULATION FUND ANNUAL REPORT 15
SHAREHOLDER EXPENSE EXAMPLE
As a shareholder of the Fund, you incur two types of costs: (1) transaction costs, including sales charges and redemption fees; and (2) ongoing costs, including management fees; distribution (12b-1) fees; and other Fund expenses. This Example is intended to help you understand your ongoing costs (in dollars) of investing in the Fund and to compare these costs with the ongoing costs of investing in other mutual funds.
This Example is based on an investment of $1,000 invested at the beginning of the period and held for the entire period (April 1, 2012 to September 30, 2012).
Actual Expenses
The first line of the table below provides information about actual account values and actual expenses. You may use the information in this line, together with the amount you invested, to estimate the expenses that you paid over the period. Simply divide your account value by $1,000 (for example, an $8,600 account value divided by $1,000 = 8.6), then multiply the result by the number in the first line under the heading entitled “Expenses Paid During Period” to estimate the expenses you paid on your account during this period.
Hypothetical Example for Comparison Purposes
The second line of the table below provides information about hypothetical account values and hypothetical expenses based on the Fund’s actual expense ratio and an assumed rate of return of 5% per year before expenses, which is not the Fund’s actual return. The hypothetical account values and expenses may not be used to estimate the actual ending account balance or expenses you paid for the period. You may use this information to compare the ongoing costs of investing in the Fund and other funds. To do so, compare the 5% hypothetical example with the 5% hypothetical examples that appear in the shareholder reports of the other funds.
Please note that the expenses shown in the table are meant to highlight your ongoing costs only and do not reflect any transactional costs, such as sales charges (loads) or redemption fees. Therefore, the second line of the table is useful in comparing ongoing costs only, and will not help you determine the relative total costs of owning different funds. In addition, if these transactional costs were included, your costs would have been higher.
www.calvert.com CALVERT CAPITAL ACCUMULATION FUND ANNUAL REPORT 16
| | | |
| | BEGINNING | ENDING ACCOUNT | EXPENSES PAID |
| | ACCOUNT VALUE | VALUE | DURING PERIOD* |
| | 4/1/12 | 9/30/12 | 4/1/12 - 9/30/12 |
| CLASS A | | | |
| Actual | $1,000.00 | $993.40 | $7.43 |
| Hypothetical | $1,000.00 | $1,017.55 | $7.52 |
| (5% return per | | | |
| year before expenses) | | | |
| | | | |
| CLASS B | | | |
| Actual | $1,000.00 | $986.80 | $13.94 |
| Hypothetical | $1,000.00 | $1,010.97 | $14.11 |
| (5% return per | | | |
| year before expenses) | | | |
| | | | |
| CLASS C | | | |
| Actual | $1,000.00 | $989.50 | $11.35 |
| Hypothetical | $1,000.00 | $1,013.59 | $11.49 |
| (5% return per | | | |
| year before expenses) | | | |
| | | | |
| CLASS I | | | |
| Actual | $1,000.00 | $996.50 | $4.27 |
| Hypothetical | $1,000.00 | $1,020.72 | $4.33 |
| (5% return per | | | |
| year before expenses) | | | |
| |
| CLASS Y | | | |
| Actual | $1,000.00 | $994.60 | $6.33 |
| Hypothetical | $1,000.00 | $1,018.65 | $6.40 |
| (5% return per | | | |
| year before expenses) | | | |
* Expenses are equal to the Fund’s annualized expense ratio of 1.49%, 2.81%, 2.28%, 0.86%, and 1.27% for Class A, Class B, Class C, Class I, and Class Y, respectively, multiplied by the average account value over the period, multiplied by 183/366 (to reflect the one-half year period).
www.calvert.com CALVERT CAPITAL ACCUMULATION FUND ANNUAL REPORT 17
REPORT OF INDEPENDENT REGISTERED PUBLIC ACCOUNTING FIRM
The Board of Directors of Calvert World Values Fund, Inc.
and Shareholders of Calvert Capital Accumulation Fund:
We have audited the accompanying statement of net assets of the Calvert Capital Accumulation Fund (the Fund), a series of the Calvert World Values Fund, Inc., as of September 30, 2012, and the related statement of operations for the year then ended, the statements of changes in net assets for each of the years in the two-year period then ended, and the financial highlights for each of the years or periods in the five-year period then ended. These financial statements and financial highlights are the responsibility of the Fund’s management. Our responsibility is to express an opinion on these financial statements and financial highlights based on our audits.
We conducted our audits in accordance with the standards of the Public Company Accounting Oversight Board (United States). Those standards require that we plan and perform the audit to obtain reasonable assurance about whether the financial statements and financial highlights are free of material misstatement. An audit includes examining, on a test basis, evidence supporting the amounts and disclosures in the financial statements. Our procedures included confirmation of securities owned as of September 30, 2012, by correspondence with the custodian and brokers or by performing other appropriate auditing procedures. An audit also includes assessing the accounting principles used and significant estimates made by management, as well as evaluating the overall financial statement presentation. We believe that our audits provide a reasonable basis for our opinion.
In our opinion, the financial statements and financial highlights referred to above present fairly, in all material respects, the financial position of the Calvert Capital Accumulation Fund as of September 30, 2012, the results of its operations for the year then ended, the changes in its net assets for each of the years in the two-year period then ended, and the financial highlights for each of the years or periods in the five-year period then ended, in conformity with U.S. generally accepted accounting principles.

Philadelphia, Pennsylvania
November 29, 2012
www.calvert.com CALVERT CAPITAL ACCUMULATION FUND ANNUAL REPORT 18
| | | |
| STATEMENT OF NET ASSETS |
| SEPTEMBER 30, 2012 |
| |
| |
| EQUITY SECURITIES - 97.5% | SHARES | | VALUE |
| Aerospace & Defense - 2.4% | | | |
| Cubic Corp. | 130,200 | $ | 6,517,812 |
| |
| Auto Components - 2.5% | | | |
| TRW Automotive Holdings Corp.* | 152,425 | | 6,662,497 |
| |
| Chemicals - 2.3% | | | |
| Ecolab, Inc. | 95,725 | | 6,203,937 |
| |
| Communications Equipment - 1.6% | | | |
| F5 Networks, Inc.* | 42,025 | | 4,400,018 |
| |
| Computers & Peripherals - 2.8% | | | |
| NCR Corp.* | 322,050 | | 7,506,985 |
| |
| Consumer Finance - 2.3% | | | |
| World Acceptance Corp.* | 91,400 | | 6,164,930 |
| |
| Containers & Packaging - 2.5% | | | |
| Ball Corp. | 159,900 | | 6,765,369 |
| |
| Diversified Consumer Services - 3.6% | | | |
| Coinstar, Inc.* | 104,650 | | 4,707,157 |
| Sotheby’s | 156,475 | | 4,928,963 |
| | | | 9,636,120 |
| |
| Diversified Financial Services - 1.8% | | | |
| IntercontinentalExchange, Inc.* | 36,375 | | 4,852,789 |
| |
| Electronic Equipment & Instruments - 0.9% | | | |
| IPG Photonics Corp.* | 43,700 | | 2,504,010 |
| |
| Energy Equipment & Services - 5.3% | | | |
| FMC Technologies, Inc.* | 150,975 | | 6,990,142 |
| RPC, Inc | 614,500 | | 7,306,405 |
| | | | 14,296,547 |
| |
| Food Products - 2.7% | | | |
| Ingredion, Inc. | 132,575 | | 7,312,837 |
| |
| Health Care Providers & Services - 6.1% | | | |
| AmerisourceBergen Corp. | 129,300 | | 5,005,203 |
| Chemed Corp. | 63,175 | | 4,377,396 |
| WellCare Health Plans, Inc.* | 123,650 | | 6,992,407 |
| | | | 16,375,006 |
| |
| Household Products - 3.3% | | | |
| Church & Dwight Co., Inc. | 167,775 | | 9,058,172 |
www.calvert.com CALVERT CAPITAL ACCUMULATION FUND ANNUAL REPORT 19
| | | |
| EQUITY SECURITIES - cont’d | SHARES | | VALUE |
| Insurance - 2.3% | | | |
| Torchmark Corp | 120,800 | $ | 6,203,080 |
| |
| Internet & Catalog Retail - 3.6% | | | |
| Expedia, Inc. | 166,475 | | 9,628,914 |
| |
| IT Services - 12.7% | | | |
| Lender Processing Services, Inc. | 285,450 | | 7,961,200 |
| NeuStar, Inc.* | 73,100 | | 2,926,193 |
| Syntel, Inc. | 133,175 | | 8,311,452 |
| Teradata Corp.* | 91,125 | | 6,871,736 |
| Wright Express Corp.* | 116,500 | | 8,122,380 |
| | | | 34,192,961 |
| |
| Leisure Equipment & Products - 3.0% | | | |
| Polaris Industries, Inc | 100,500 | | 8,127,435 |
| |
| Life Sciences - Tools & Services - 2.2% | | | |
| Mettler-Toledo International, Inc.* | 34,425 | | 5,877,725 |
| |
| Machinery - 7.9% | | | |
| Actuant Corp. | 242,975 | | 6,953,945 |
| AGCO Corp.* | 143,425 | | 6,809,819 |
| Valmont Industries, Inc. | 56,775 | | 7,465,912 |
| | | | 21,229,676 |
| |
| Media - 2.1% | | | |
| Gannett Co., Inc | 324,000 | | 5,751,000 |
| |
| Metals & Mining - 2.5% | | | |
| Reliance Steel & Aluminum Co | 130,101 | | 6,810,787 |
| |
| Oil, Gas & Consumable Fuels - 2.1% | | | |
| Denbury Resources, Inc.* | 350,950 | | 5,671,352 |
| |
| Pharmaceuticals - 3.4% | | | |
| Endo Health Solutions, Inc.* | 195,400 | | 6,198,088 |
| Questcor Pharmaceuticals, Inc.* | 160,700 | | 2,972,950 |
| | | | 9,171,038 |
| |
| Road & Rail - 2.3% | | | |
| Landstar System, Inc. | 130,100 | | 6,151,128 |
| |
| Semiconductors & Semiconductor Equipment - 1.6% | | | |
| Lam Research Corp.* | 134,550 | | 4,276,672 |
| |
| Specialty Retail - 7.1% | | | |
| ANN, Inc.* | 143,525 | | 5,415,198 |
| Ross Stores, Inc | 128,600 | | 8,307,560 |
| The Buckle, Inc. | 122,000 | | 5,542,460 |
| | | | 19,265,218 |
www.calvert.com CALVERT CAPITAL ACCUMULATION FUND ANNUAL REPORT 20
| | | | | | |
| EQUITY SECURITIES - cont’d | | SHARES | | VALUE | |
| Trading Companies & Distributors - 3.1% | | | | | |
| WESCO International, Inc.* | | 144,525 | $ | 8,266,830 | |
| |
| Wireless Telecommunication Services - 1.5% | | | | | |
| MetroPCS Communications, Inc.* | | 342,775 | | 4,013,895 | |
| |
| |
| Total Equity Securities (Cost $230,524,287) | | | | 262,894,740 | |
| |
| | | | PRINCIPAL | | | |
| HIGH SOCIAL IMPACT INVESTMENTS - 0.5% | | AMOUNT | | | |
| Calvert Social Investment Foundation Notes, 1.04%, 7/1/14 (b)(i)(r) | $ | 1,419,488 | | 1,381,815 | |
| |
| Total High Social Impact Investments (Cost $1,419,488) | | | | 1,381,815 | |
| |
| |
| TIME DEPOSIT - 2.0% | | | | | |
| State Street Bank Time Deposit, 0.113%, 10/1/12 | | 5,207,184 | | 5,207,184 | |
| |
| Total Time Deposit (Cost $5,207,184) | | | | 5,207,184 | |
| |
| |
| TOTAL INVESTMENTS (Cost $237,150,959) - 100.0% | | | | 269,483,739 | |
| Other assets and liabilities, net - 0.0% | | | | 120,789 | |
| NET ASSETS - 100% | | | $ | 269,604,528 | |
| |
| |
| NET ASSETS CONSIST OF: | | | | | |
| Paid-in capital applicable to the following shares of common stock, | | | | | |
| with 250,000,000 shares of $0.01 par value authorized: | | | | | |
| Class A: 4,992,910 shares outstanding | | | $ | 123,753,916 | |
| Class B: 100,753 shares outstanding | | | | 3,750,531 | |
| Class C: 704,635 shares outstanding | | | | 15,975,540 | |
| Class I: 2,433,798 shares outstanding | | | | 75,061,832 | |
| Class Y: 255,744 shares outstanding | | | | 8,022,434 | |
| Undistributed net investment income (loss) | | | | (977,921 | ) |
| Accumulated net realized gain (loss) | | | | 11,685,416 | |
| Net unrealized appreciation (depreciation) | | | | 32,332,780 | |
| |
| |
| NET ASSETS | | | $ | 269,604,528 | |
| |
| |
| NET ASSET VALUE PER SHARE | | | | | |
| Class A | (based on net assets of $157,015,941) | | | $ | 31.45 | |
| Class B | (based on net assets of $2,706,595) | | | $ | 26.86 | |
| Class C | (based on net assets of $18,630,184) | | | $ | 26.44 | |
| Class I | (based on net assets of $83,180,972) | | | $ | 34.18 | |
| Class Y (based on net assets of $8,070,836 ) | | | $ | 31.56 | |
See notes to financial statements.
www.calvert.com CALVERT CAPITAL ACCUMULATION FUND ANNUAL REPORT 21
| | |
| RESTRICTED SECURITIES | ACQUISITION DATES | COST |
| Calvert Social Investment Foundation Notes, 1.04%, 7/1/14 | 7/1/11 | $1,419,488 |
(b) This security was valued by the Board of Directors. See Note A.
(i) Restricted securities represent 0.5% of the net assets of the fund.
(r) The coupon rate shown on floating or adjustable rate securities represents the rate at period end.
* Non-income producing security.
See notes to financial statements.
www. calvert.com CALVERT CAPITAL ACCUMULATION FUND ANNUAL REPORT 22
| | | |
| STATEMENT OF OPERATIONS |
| YEAR ENDED SEPTEMBER 30, 2012 |
| |
| |
| NET INVESTMENT INCOME | | | |
| Investment Income: | | | |
| Dividend income | $ | 1,594,981 | |
| Interest income | | 19,529 | |
| Total investment income | | 1,614,510 | |
| |
| |
| Expenses: | | | |
| Investment advisory fee | | 1,532,161 | |
| Transfer agency fees | | 486,651 | |
| Administrative fees | | 507,918 | |
| Distribution Plan expenses: | | | |
| Class A | | 374,604 | |
| Class B | | 31,577 | |
| Class C | | 166,597 | |
| Directors’ fees and expenses | | 30,132 | |
| Custodian fees | | 46,147 | |
| Registration fees | | 63,836 | |
| Reports to shareholders | | 111,596 | |
| Professional fees | | 25,406 | |
| Miscellaneous | | 18,911 | |
| Total expenses | | 3,395,536 | |
| Reimbursement from Advisor: | | | |
| Class I | | (13,480 | ) |
| Fees paid indirectly | | (129 | ) |
| Net expenses | | 3,381,927 | |
| |
| |
| NET INVESTMENT INCOME (LOSS) | | (1,767,417 | ) |
| |
| |
| REALIZED AND UNREALIZED GAIN (LOSS) ON INVESTMENTS | | | |
| Net realized gain (loss) | | 19,756,800 | |
| Change in unrealized appreciation (depreciation) | | 34,310,824 | |
| |
| NET REALIZED AND UNREALIZED GAIN (LOSS) | | | |
| ON INVESTMENTS | | 54,067,624 | |
| |
| INCREASE (DECREASE) IN NET ASSETS | | | |
| RESULTING FROM OPERATIONS | $ | 52,300,207 | |
See notes to financial statements.
www. calvert.com CALVERT CAPITAL ACCUMULATION FUND ANNUAL REPORT 23
| | | | |
| STATEMENTS OF CHANGES IN NET ASSETS |
| |
| |
| | Year ended | | Year ended | |
| | September 30, | | September 30, | |
| INCREASE (DECREASE) IN NET ASSETS | 2012 | | 2011 | |
| Operations: | | | | |
| Net investment income (loss) | ($1,767,417 | ) | ($1,702,926 | ) |
| Net realized gain (loss) | 19,756,800 | | 18,650,994 | |
| Change in unrealized appreciation (depreciation) | 34,310,824 | | (19,460,051 | ) |
| |
| |
| INCREASE (DECREASE) IN NET ASSETS | | | | |
| RESULTING FROM OPERATIONS | 52,300,207 | | (2,511,983 | ) |
| |
| |
| Distributions to shareholders from: | | | | |
| Net realized gain: | | | | |
| Class A shares | (9,051,155 | ) | — | |
| Class B shares | (249,905 | ) | — | |
| Class C shares | (1,132,502 | ) | — | |
| Class I shares | (1,797,811 | ) | — | |
| Class Y shares | (658,920 | ) | — | |
| Total distributions | (12,890,293 | ) | — | |
| |
| Capital share transactions: | | | | |
| Shares sold: | | | | |
| Class A shares | 36,446,423 | | 59,940,757 | |
| Class B shares | 92,690 | | 241,968 | |
| Class C shares | 4,353,427 | | 3,176,561 | |
| Class I shares | 66,419,562 | | 10,568,924 | |
| Class Y shares | 8,156,137 | | 10,193,935 | |
| Shares issued from merger (See Note F): | | | | |
| Class A shares | — | | 32,646,286 | |
| Class C shares | — | | 2,759,872 | |
| Class I shares | — | | 8,070,394 | |
| Reinvestment of distributions: | | | | |
| Class A shares | 8,386,664 | | — | |
| Class B shares | 242,281 | | — | |
| Class C shares | 930,598 | | — | |
| Class I shares | 1,269,766 | | — | |
| Class Y shares | 512,505 | | — | |
| Redemption fees: | | | | |
| Class A shares | 5,080 | | 15,550 | |
| Class C shares | 11 | | 440 | |
| Class I shares | 487 | | — | |
| Shares redeemed: | | | | |
| Class A shares | (42,921,921 | ) | (50,165,739 | ) |
| Class B shares | (1,309,090 | ) | (1,562,363 | ) |
| Class C shares | (2,194,144 | ) | (2,443,505 | ) |
| Class I shares | (13,311,711 | ) | (4,090,555 | ) |
| Class Y shares | (10,853,081 | ) | (231,468 | ) |
| Total capital share transactions | 56,225,684 | | 69,121,057 | |
| |
| |
| TOTAL INCREASE (DECREASE) IN NET ASSETS | 95,635,598 | | 66,609,074 | |
See notes to financial statements.
www. calvert.com CALVERT CAPITAL ACCUMULATION FUND ANNUAL REPORT 24
| | | | |
| STATEMENTS OF CHANGES IN NET ASSETS |
| |
| |
| | Year ended | | Year ended | |
| | September 30, | | September 30, | |
| NET ASSETS | 2012 | | 2011 | |
| Beginning of year | $173,968,930 | | $107,359,856 | |
| End of year (including net investment loss | | | | |
| of $977,921 and $0, respectively) | $269,604,528 | | $173,968,930 | |
| |
| |
| CAPITAL SHARE ACTIVITY | | | | |
| Shares sold: | | | | |
| Class A shares | 1,205,547 | | 1,918,581 | |
| Class B shares | 3,733 | | 9,114 | |
| Class C shares | 170,053 | | 121,251 | |
| Class I shares | 2,040,204 | | 336,732 | |
| Class Y shares | 265,544 | | 313,620 | |
| Shares issued from merger (See Note F): | | | | |
| Class A shares | — | | 1,182,147 | |
| Class C shares | — | | 115,716 | |
| Class I shares | — | | 273,543 | |
| Reinvestment of distributions: | | | | |
| Class A shares | 294,165 | | — | |
| Class B shares | 9,845 | | — | |
| Class C shares | 38,566 | | — | |
| Class I shares | 41,199 | | — | |
| Class Y shares | 17,951 | | — | |
| Shares redeemed: | | | | |
| Class A shares | (1,458,279 | ) | (1,624,948 | ) |
| Class B shares | (50,530 | ) | (59,235 | ) |
| Class C shares | (85,911 | ) | (93,452 | ) |
| Class I shares | (404,418 | ) | (121,931 | ) |
| Class Y shares | (333,904 | ) | (7,467 | ) |
| Total capital share activity | 1,753,765 | | 2,363,671 | |
See notes to financial statements.
www. calvert.com CALVERT CAPITAL ACCUMULATION FUND ANNUAL REPORT 25
NOTES TO FINANCIAL STATEMENTS
NOTE A — SIGNIFICANT ACCOUNTING POLICIES
General: The Calvert Capital Accumulation Fund (the “Fund”), a series of Calvert World Values Fund, Inc., is registered under the Investment Company Act of 1940 as a non-diversified, open-end management investment company. The Calvert World Values Fund, Inc. is comprised of three separate series. The operations of each series are accounted for separately. The Fund offers five classes of shares of capital stock - Classes A, B, C, I, and Y. Class A shares are sold with a maximum front-end sales charge of 4.75%. Class B shares are sold without a front-end sales charge and, with certain exceptions, will be charged a deferred sales charge at the time of redemption, depending on how long investors have owned the shares. Class B shares are no longer offered for purchase, except through reinvestment of dividends and/or distributions and through certain exchanges. Class C shares are sold without a front-end sales charge and, with certain exceptions, will be charged a deferred sales charge on shares sold within one year of purchase. Class B and Class C shares have higher levels of expenses than Class A shares. Class I shares require a minimum account balance of $1,000,000. The $1 million minimum initial investment may be waived for certain institutional accounts where it is believed to be in the best interest of the Fund and its shareholders. Class I shares have no front-end or deferred sales charge and have lower levels of expenses than Class A Shares. Class Y shares are generally only available to wrap or similar fee-based programs offered by financial intermediaries that have entered into an agreement with the Fund’s Distributor to offer Class Y shares. Class Y shares have no front-end or deferred sales charge and have lower levels of expenses than Class A shares. Each class has different: (a) dividend rates, due to differences in Distribution Plan expenses and other class-specific expenses, (b) exchange privileges; and (c) class-specific voting rights.
Security Valuation: Net asset value per share is determined every business day as of the close of the regular session of the New York Stock Exchange (generally 4:00 p.m. Eastern time). The Fund uses independent pricing services approved by the Board of Directors (“the Board”) to value its investments wherever possible. Investments for which market quotations are not available or deemed not reliable are fair valued in good faith under the direction of the Board.
The Board has adopted Valuation Procedures (the “Procedures”) to determine the fair value of securities and other financial instruments for which market prices are not readily available or which may not be reliably priced. The Board has delegated the day-to-day responsibility for determining the fair value of assets of the Fund to Calvert Investment Management, Inc. (the “Advisor” or “Calvert”) and has provided these Procedures to govern Calvert in its valuation duties.
Calvert has chartered an internal Valuation Committee to oversee the implementation of these Procedures and to assist it in carrying out the valuation responsibilities that the Board has delegated.
The Valuation Committee meets on a regular basis to review illiquid securities and other investments which may not have readily available market prices. The Valuation Committee’s fair valuation determinations are subject to review, approval and ratifica-
www.calvert.com CALVERT CAPITAL ACCUMULATION FUND ANNUAL REPORT 26
tion by the Board at its next regularly scheduled meeting covering the calendar quarter in which the fair valuation was determined.
The Valuation Committee utilizes various methods to measure the fair value of the Funds’ investments. Generally Accepted Accounting Principles (GAAP) establishes a disclosure hierarchy that categorizes the inputs to valuation techniques used to value assets and liabilities at measurement date. These inputs are summarized in the three broad levels listed below:
Level 1 – quoted prices in active markets for identical securities
Level 2 – other significant observable inputs (including quoted prices for similar securities, interest rates, prepayment speeds, credit risk, etc.)
Level 3 – significant unobservable inputs (including the Fund’s own assumptions in determining the fair value of investments)
The inputs or methodologies used for valuing securities are not necessarily an indication of the risk associated with investing in those securities.
Changes in valuation techniques may result in transfers in or out of an investment’s assigned level within the hierarchy during the period. Valuation techniques used to value the Funds’ investments by major category are as follows: Equity securities, including restricted securities, for which market quotations are readily available, are valued at the last reported sale price or official closing price as reported by an independent pricing service on the primary market or exchange on which they are traded and are categorized as Level 1 in the hierarchy. In the event there were no sales during the day or closing prices are not available, securities are valued at the last quoted bid price or using the last available price and are categorized as Level 2 in the hierarchy. Foreign securities are valued based on quotations from the principal market in which such securities are normally traded. If events occur after the close of the principal market in which foreign securities are traded, and before the close of business of the Fund, that are expected to materially affect the value of those securities, then they are valued at their fair value taking these events into account. For restricted securities and private placements where observable inputs are limited, assumptions about market activity and risk are used and such securities are categorized as Level 3 in the hierarchy.
Debt securities, including restricted securities, are valued based on evaluated prices received from independent pricing services or from dealers who make markets in such securities and are generally categorized as Level 2 in the hierarchy. Short-term securities of sufficient credit quality with remaining maturities of sixty days or less for which quotations are not readily available are valued at amortized cost, which approximates fair value, and are categorized as Level 2 in the hierarchy.
When independent prices are unavailable or unreliable, debt securities may be valued utilizing pricing matrices which consider similar factors that would be used by independent pricing services. These are generally categorized as Level 2 in the hierarchy but may be Level 3 depending on the circumstances.
If a market value cannot be determined for a security using the methodologies described above, or if, in the good faith opinion of the Advisor, the market value does not constitute a readily available market quotation, or if a significant event has occurred that would materially affect the value of the security, the security will be fair valued as determined in
www.calvert.com CALVERT CAPITAL ACCUMULATION FUND ANNUAL REPORT 27
good faith by the Valuation Committee.
The Valuation Committee considers a number of factors, including significant unobservable valuation inputs when arriving at fair value. It considers all significant facts that are reasonably available and relevant to the determination of fair value.
The Valuation Committee primarily employs a market-based approach which may use related or comparable assets or liabilities, recent transactions, market multiples, book values, and other relevant information for the investment to determine the fair value of the investment. When more appropriate, the fund may employ an income-based or cost approach. An income-based valuation approach discounts anticipated future cash flows of the investment to calculate a present amount (discounted). The measurement is based on the value indicated by current market expectations about those future amounts. Discounts may also be applied due to the nature or duration of any restrictions on the disposition of the investments. A cost based approach is based on the amount that currently would be required to replace the service capacity of an asset (current replacement cost). From the seller’s perspective, the price that would be received for the asset is determined based on the cost to a buyer to acquire or construct a substitute asset of comparable utility, adjusted for obsolescence.
The values assigned to fair value investments are based on available information and do not necessarily represent amounts that might ultimately be realized. Further, due to the inherent uncertainty of valuations of such investments, the fair values may differ significantly from the values that would have been used had an active market existed, and the differences could be material. The Valuation Committee employs various methods for calibrating these valuation approaches including a regular review of key inputs and assumptions, transactional back-testing or disposition analysis and reviews of any related market activity.
At September 30, 2012, securities valued at $1,381,815, or 0.5% of net assets, were fair valued in good faith under the direction of the Board.
The following is a summary of the inputs used to value the Funds’ net assets as of September 30, 2012:
| | | VALUATION INPUTS | |
| |
| Investments In Securities | Level 1 | Level 2 | Level 3 | Total |
| Equity securities* | $262,894,740 | — | — | $262,894,740 |
| Other debt obligations | | $6,588,999 | — | 6,588,999 |
| TOTAL | $262,894,740 | $6,588,999 | — | $269,483,739 |
* For further breakdown of equity securities by industry type, please refer to the Statement of Net Assets.
Restricted Securities: The Fund may invest in securities that are subject to legal or contractual restrictions on resale. Generally, these securities may only be sold publicly upon registration under the Securities Act of 1933 or in transactions exempt from such registration. Information regarding restricted securities is included at the end of the Statement of Net Assets.
www.calvert.com CALVERT CAPITAL ACCUMULATION FUND ANNUAL REPORT 28
Security Transactions and Net Investment Income: Security transactions are accounted for on trade date. Realized gains and losses are recorded on an identified cost basis and may include proceeds from litigation. Dividend income is recorded on the ex-dividend date. Distributions received on securities that represent a return of capital or capital gain are recorded as a reduction of cost investments and/or as a realized gain. Interest income, which includes amortization of premium and accretion of discount on debt securities, is accrued as earned. Investment income and realized and unrealized gains and losses are allocated to separate classes of shares based upon the relative net assets of each class. Expenses arising in connection with a specific class are charged directly to that class. Expenses common to the classes are allocated to each class in proportion to their relative net assets.
Distributions to Shareholders: Distributions to shareholders are recorded by the Fund on ex-dividend date. Dividends from net investment income and distributions from net realized capital gains, if any, are paid at least annually. Distributions are determined in accordance with income tax regulations which may differ from generally accepted accounting principles; accordingly, periodic reclassifications are made within the Fund’s capital accounts to reflect income and gains available for distribution under income tax regulations.
Estimates: The preparation of financial statements in conformity with accounting principles generally accepted in the United States requires management to make estimates and assumptions that affect the reported amounts of assets and liabilities and disclosure of contingent assets and liabilities at the date of the financial statements and the reported amounts of income and expenses during the reporting period. Actual results could differ from those estimates.
Redemption Fees: The Fund charges a 2% redemption fee on redemptions, including exchanges, made within 30 days of purchase (within seven days for Class I shares). The redemption fee is accounted for as an addition to paid-in capital and is intended to discourage market-timers by ensuring that short-term trading costs are borne by the investors making the transactions and not the shareholders already in the Fund.
Expense Offset Arrangements: The Fund has an arrangement with its custodian bank whereby the custodian’s fees may be paid indirectly by credits earned on the Fund’s cash on deposit with the bank. These credits are used to reduce the Fund’s expenses. Such a deposit arrangement may be an alternative to overnight investments.
Federal Income Taxes: No provision for federal income or excise tax is required since the Fund intends to continue to qualify as a regulated investment company under the Internal Revenue Code and to distribute substantially all of its taxable earnings.
Management has analyzed the Fund’s tax positions taken for all open federal income tax years and has concluded that no provision for federal income tax is required in the Fund’s financial statements. A Fund’s federal tax return is subject to examination by the Internal Revenue Service for a period of three years.
www.calvert.com CALVERT CAPITAL ACCUMULATION FUND ANNUAL REPORT 29
NOTE B — RELATED PARTY TRANSACTIONS
Calvert Investment Management, Inc. (the “Advisor”) is wholly-owned by Calvert Investments, Inc., which is indirectly wholly-owned by Ameritas Mutual Holding Company (formerly known as UNIFI Mutual Holding Company). The Advisor provides investment advisory services and pays the salaries and fees of officers and Directors of the Fund who are employees of the Advisor or its affiliates. For its services, the Advisor receives an annual fee, payable monthly, of .65% of the Fund’s average daily net assets. Under the terms of the agreement, $149,017 was payable at year end. In addition, $58,391 was payable at year end for operating expenses paid by the Advisor during September 2012.
The Advisor has contractually agreed to limit net annual fund operating expenses through January 31, 2013. The contractual expense cap is 1.59%, 2.59%, .86%, and 1.44% for Class A, C, I, and Y, respectively. For the purpose of this expense limit, operating expenses do not include interest expense, brokerage commissions, taxes, and extraordinary expenses. To the extent that any expense offset credits are earned, the Advisor’s obligation under the contractual limitation may be reduced and the Advisor may benefit from the expense offset arrangement.
Calvert Investment Administrative Services, Inc., an affiliate of the Advisor, provides administrative services to the Fund for an annual fee, payable monthly of .25% for Classes A, B, C, and Y, and .10% for Class I shares based on their average daily net assets. Under the terms of the agreement, $46,964 was payable at year end.
Calvert Investment Distributors, Inc. (“CID”), an affiliate of the Advisor, is the distributor and principal underwriter for the Fund. Distribution Plans, adopted by Class A, Class B, and Class C shares, allow the Fund to pay CID for expenses and services associated with distribution of shares. The expenses paid may not exceed .35%, 1.00% and 1.00% annually of average daily net assets of Class A, B, and C, respectively. The amount actually paid by the Fund is an annualized fee, payable monthly of .25%, 1.00% and 1.00% of the Fund’s average daily net assets of Class A, B, and C, respectively. Class I and Class Y shares do not have Distribution Plan expenses. Under the terms of the agreement, $50,814 was payable at year end.
CID received $53,068 as its portion of the commissions charged on sales of the Fund’s Class A shares for the year ended September 30, 2012.
Calvert Investment Services, Inc. (“CIS”), an affiliate of the Advisor, acts as shareholder servicing agent for the Fund. For its services, CIS received a fee of $102,596 for the year ended September 30, 2012. Under the terms of the agreement, $8,382 was payable at year end. Boston Financial Data Services, Inc. is the transfer and dividend disbursing agent.
The Fund may invest in Community Investment Notes issued by the Calvert Social Investment Foundation (the “CSI Foundation”). The CSI Foundation is a 501(c) (3) non-profit organization that receives in-kind support from Calvert and its subsidiaries. The Fund has received an exemptive order from the Securities and Exchange Commission permitting the Fund to make investments in these notes under certain conditions.
www.calvert.com CALVERT CAPITAL ACCUMULATION FUND ANNUAL REPORT 30
Each Director of the Fund who is not an employee of the Advisor or its affiliates receives an annual retainer of $44,000 plus a meeting fee of $2,000 for each Board meeting attended. Additional fees of up to $5,000 annually may be paid to the Board chairs and Committee chairs ($10,000 for Special Equities Committee chair) and $2,500 annually may be paid to Committee members, plus a Committee meeting fee of $500 for each Committee meeting attended. Director’s fees are allocated to each of the funds served.
NOTE C — INVESTMENT ACTIVITY AND TAX INFORMATION
During the year, the cost of purchases and proceeds from sales of investments, other than short-term securities, were $187,869,525 and $143,562,733, respectively.
| CAPITAL LOSS CARRYFORWARDS | |
| EXPIRATION DATE | AMOUNT |
| 30-Sep-16 | ($2,705,864) |
Under the Regulated Investment Company Modernization Act of 2010, capital losses incurred in taxable years beginning after December 22, 2010 can be carried forward for an unlimited period. These losses are required to be utilized prior to the losses incurred in pre-enactment taxable years. Losses incurred in pre-enactment taxable years can be utilized until expiration.
The Fund intends to elect to defer net ordinary losses of $977,921 incurred from January 1, 2012 through September 30, 2012 and treat them as arising in the fiscal year ending September 30, 2013.
As of September 30, 2012, the tax basis components of distributable earnings/(accumulated losses) and the federal tax cost were as follows:
| Unrealized appreciation | $42,663,067 | |
| Unrealized (depreciation) | (10,641,351 | ) |
| Net unrealized appreciation/(depreciation) | $32,021,716 | |
| |
| Undistributed long term capital gain | $14,702,344 | |
| Capital loss carryforward | ($2,705,864 | ) |
| |
| Federal income tax cost of investments | $237,462,023 | |
www.calvert.com CALVERT CAPITAL ACCUMULATION FUND ANNUAL REPORT 31
The tax character of dividends and distributions for the years ended September 30, 2012 and September 30, 2011 was as follows:
| Distributions paid from: | 2012 | 2011 |
| Long term capital gain | $12,890,293 | — |
| Total | $12,890,293 | — |
The differences between the components of distributable earnings on a tax basis and the amounts reflected in the statement of net assets are primarily due to temporary book-tax differences that will reverse in a subsequent period. These book-tax differences are mainly due to wash sales, deferral of post December net operating losses, and capital loss carryover limitations under Internal Revenue Code Section 382.
Reclassifications, as shown in the table below, have been made to the Fund’s components of net assets to reflect income and gains available for distribution (or available capital loss carryforwards, as applicable) under income tax law and regulations. These reclassifications are due to permanent book-tax differences and have no impact on net assets. The primary permanent differences causing such reclassification for the Fund are due to net operating losses.
| Undistributed net investment income | $789,496 | |
| Accumulated net realized gain(loss) | (789,496 | ) |
NOTE D — LINE OF CREDIT
A financing agreement is in place with the Calvert Funds and State Street Corporation (“SSC”). Under the agreement, SSC provides an unsecured line of credit facility, in the aggregate amount of $50 million ($25 million committed and $25 million uncommitted), accessible by the Funds for temporary or emergency purposes only. Borrowings under the committed facility bear interest at the higher of the London Interbank Offered Rate (LIBOR) or the overnight Federal Funds Rate plus 1.25% per annum. A commitment fee of .11% per annum is incurred on the unused portion of the committed facility, which is allocated to all participating funds. The Fund had no loans outstanding pursuant to this line of credit at September 30, 2012. For the year ended September 30, 2012, borrowings by the Fund under the agreement were as follows:
| | WEIGHTED | | MONTH OF |
| AVERAGE | AVERAGE | MAXIMUM | MAXIMUM |
| DAILY | INTEREST | AMOUNT | AMOUNT |
| BALANCE | RATE | BORROWED | BORROWED |
| $23,011 | 1.41% | $2,015,058 | October 2011 |
NOTE E - SUBSEQUENT EVENTS
In preparing the financial statements as of September 30, 2012, no subsequent events or transactions occurred that would have required recognition or disclosure in these financial statements.
www.calvert.com CALVERT CAPITAL ACCUMULATION FUND ANNUAL REPORT 32
NOTE F – REORGANIZATION
On July 29, 2010, the Board of Directors approved an Agreement and Plan of Reorganization (the “Plan”) which provided for the transfer of all the assets of the Calvert Mid Cap Value Fund (“Mid Cap Value”) for shares of the acquiring portfolio, Calvert Capital Accumulation Fund (“Capital Accumulation”) and the assumption of the liabilities of Mid Cap Value. Shareholders approved the Plan at a meeting on November 15, 2010 and the reorganization took place on November 29, 2010.
The acquisition was accomplished by a tax-free exchange of the following shares:
| | | ACQUIRING | | |
| MERGED PORTFOLIO | SHARES | PORTFOLIO | SHARES | VALUE |
| Mid Cap Value, Class A | 1,893,904 | Capital Accum., Class A | 1,182,147 | $32,646,286 |
| Mid Cap Value, Class C | 168,591 | Capital Accum., Class C | 115,716 | $2,759,872 |
| Mid Cap Value, Class I | 453,854 | Capital Accum., Class I | 273,543 | $8,070,394 |
For financial reporting purposes, assets received and shares issued by Capital Accumulation were recorded at fair value; however, the cost basis of the investments received from Mid Cap Value were carried forward to align ongoing reporting of Capital Accumulation’s realized and unrealized gains and losses with amounts distributable to shareholders for tax purposes.
The net assets and net unrealized appreciation (depreciation) immediately before the acquisitions were as follows:
| | | UNREALIZED | | |
| | | APPRECIATION | ACQUIRING | |
| MERGED PORTFOLIO | NET ASSETS | (DEPRECIATION) | PORTFOLIO | NET ASSETS |
| Mid Cap Value | $43,476,552 | $4,028,812 | Capital Accum. | $117,367,809 |
Assuming the acquisition had been completed on October 1, 2010, Capital Accumulation’s results of operations for the year ended September 30, 2011 would have been as follows:
| Net investment income | ($1,710,846) | (a) |
| Net realized and change in unrealized gain (loss) on investments | $2,329,269 | (b) |
| Net increase (decrease) in assets from operations | $618,423 | |
www.calvert.com CALVERT CAPITAL ACCUMULATION FUND ANNUAL REPORT 33
Because Capital Accumulation and Mid Cap Value sold and redeemed shares throughout the period, it is not practicable to provide pro-forma information on a per-share basis.
Because the combined investment portfolios have been managed as a single integrated portfolio since the acquisition was completed, it is also not practicable to separate the amounts of revenue and earnings of Mid Cap Value that have been included in Capital Accumulation’s Statement of Operations since November 29, 2010.
(a) ($1,702,926) as reported, plus ($7,920), from Mid Cap Value pre-merger.
(b) ($809,057) as reported, plus $3,138,326 from Mid Cap Value pre-merger.

www. calvert.com CALVERT CAPITAL ACCUMULATION FUND ANNUAL REPORT 34
| | | | | | |
| FINANCIAL HIGHLIGHTS |
| |
| | | | YEARS ENDED | | | |
| | September 30, | | September 30, | | September 30, | |
| CLASS A SHARES | 2012 | (z) | 2011 | (z) | 2010 | |
| Net asset value, beginning | $26.00 | | $24.93 | | $20.71 | |
| Income from investment operations: | | | | | | |
| Net investment income (loss) | (.26 | ) | (.28 | ) | (.25 | ) |
| Net realized and unrealized gain (loss) | 7.64 | | 1.35 | | 4.47 | |
| Total from investment operations | 7.38 | | 1.07 | | 4.22 | |
| Distributions from: | | | | | | |
| Net realized gain | (1.93 | ) | — | | — | |
| Total distributions | (1.93 | ) | — | | — | |
| Total increase (decrease) in net asset value | 5.45 | | 1.07 | | 4.22 | |
| Net asset value, ending | $31.45 | | $26.00 | | $24.93 | |
| |
| Total return* | 29.16 | % | 4.29 | % | 20.38 | % |
| Ratios to average net assets: A | | | | | | |
| Net investment income (loss) | (.85 | %) | (.93 | %) | (1.08 | %) |
| Total expenses | 1.53 | % | 1.58 | % | 1.76 | % |
| Expenses before offsets | 1.53 | % | 1.58 | % | 1.76 | % |
| Net expenses | 1.53 | % | 1.58 | % | 1.76 | % |
| Portfolio turnover | 63 | % | 65 | % | 87 | % |
| Net assets, ending (in thousands) | $157,016 | | $128,755 | | $86,635 | |
| |
| |
| | | | YEARS ENDED | |
| | | | September 30, | | September 30, | |
| CLASS A SHARES | | | 2009 | | 2008 | |
| Net asset value, beginning | | | $23.00 | | $28.11 | |
| Income from investment operations: | | | | | | |
| Net investment income (loss) | | | (.17 | ) | (.21 | ) |
| Net realized and unrealized gain (loss) | | | (2.12 | ) | (4.49 | ) |
| Total from investment operations | | | (2.29 | ) | (4.70 | ) |
| Distributions from: | | | | | | |
| Net realized gain | | | — | | (.41 | ) |
| Total distributions | | | — | | (.41 | ) |
| Total increase (decrease) in net asset value | | | (2.29 | ) | (5.11 | ) |
| Net asset value, ending | | | $20.71 | | $23.00 | |
| |
| Total return* | | | (9.96 | %) | (16.97 | %) |
| Ratios to average net assets: A | | | | | | |
| Net investment income (loss) | | | (.92 | %) | (.79 | %) |
| Total expenses | | | 1.88 | % | 1.66 | % |
| Expenses before offsets | | | 1.88 | % | 1.66 | % |
| Net expenses | | | 1.88 | % | 1.65 | % |
| Portfolio turnover | | | 72 | % | 49 | % |
| Net assets, ending (in thousands) | | | $72,289 | | $85,195 | |
See notes to financial highlights.
www. calvert.com CALVERT CAPITAL ACCUMULATION FUND ANNUAL REPORT 35
| | | | | | |
| FINANCIAL HIGHLIGHTS |
| |
| | | | YEARS ENDED | | |
| | September 30, | | September 30, | | September 30, | |
| CLASS B SHARES | 2012 | (z) | 2011 | (z) | 2010 | |
| Net asset value, beginning | $22.72 | | $22.03 | | $18.50 | |
| Income from investment operations: | | | | | | |
| Net investment income (loss) | (.55 | ) | (.55 | ) | (.53 | ) |
| Net realized and unrealized gain (loss) | 6.62 | | 1.24 | | 4.06 | |
| Total from investment operations | 6.07 | | .69 | | 3.53 | |
| Distributions from: | | | | | | |
| Net realized gain | (1.93 | ) | — | | — | |
| Total distributions | (1.93 | ) | — | | — | |
| Total increase (decrease) in net asset value | 4.14 | | .69 | | 3.53 | |
| Net asset value, ending | $26.86 | | $22.72 | | $22.03 | |
| |
| Total return* | 27.50 | % | 3.13 | % | 19.08 | % |
| Ratios to average net assets:A | | | | | | |
| Net investment income (loss) | (2.12 | %) | (2.07 | %) | (2.17 | %) |
| Total expenses | 2.80 | % | 2.72 | % | 2.84 | % |
| Expenses before offsets | 2.80 | % | 2.72 | % | 2.84 | % |
| Net expenses | 2.80 | % | 2.71 | % | 2.84 | % |
| Portfolio turnover | 63 | % | 65 | % | 87 | % |
| Net assets, ending (in thousands) | $2,707 | | $3,129 | | $4,138 | |
| |
| |
| | | | YEARS ENDED | |
| | | | September 30, | | September 30, | |
| CLASS B SHARES | | | 2009 | | 2008 | |
| Net asset value, beginning | | | $20.78 | | $25.66 | |
| Income from investment operations: | | | | | | |
| Net investment income (loss) | | | (.39 | ) | (.47 | ) |
| Net realized and unrealized gain (loss) | | | (1.89 | ) | (4.00 | ) |
| Total from investment operations | | | (2.28 | ) | (4.47 | ) |
| Distributions from: | | | | | | |
| Net realized gain | | | — | | (.41 | ) |
| Total distributions | | | — | | (.41 | ) |
| Total increase (decrease) in net asset value | | | (2.28 | ) | 4.88 | |
| Net asset value, ending | | | $18.50 | | $20.78 | |
| |
| Total return* | | | (10.97 | %) | (17.70 | %) |
| Ratios to average net assets: A | | | | | | |
| Net investment income (loss) | | | (2.04 | %) | (1.73 | %) |
| Total expenses | | | 2.99 | % | 2.57 | % |
| Expenses before offsets | | | 2.99 | % | 2.57 | % |
| Net expenses | | | 2.99 | % | 2.56 | % |
| Portfolio turnover | | | 72 | % | 49 | % |
| Net assets, ending (in thousands) | | | $4,793 | | $7,803 | |
See notes to financial highlights.
www.calvert.com CALVERT CAPITAL ACCUMULATION FUND ANNUAL REPORT 36
| | | | | | |
| FINANCIAL HIGHLIGHTS |
| |
| | | | YEARS ENDED | | | |
| | September 30, | | September 30, | | September 30, | |
| CLASS C SHARES | 2012 | (z) | 2011 | (z) | 2010 | |
| Net asset value, beginning | $22.29 | | $21.55 | | $18.05 | |
| Income from investment operations: | | | | | | |
| Net investment income (loss) | (.42 | ) | (.46 | ) | (.39 | ) |
| Net realized and unrealized gain (loss) | 6.50 | | 1.20 | | 3.89 | |
| Total from investment operations | 6.08 | | .74 | | 3.50 | |
| Distributions from: | | | | | | |
| Net realized gain | (1.93 | ) | — | | — | |
| Total distributions | (1.93 | ) | — | | — | |
| Total increase (decrease) in net asset value | 4.15 | | .74 | | 3.50 | |
| Net asset value, ending | $26.44 | | $22.29 | | $21.55 | |
| |
| Total return* | 28.11 | % | 3.43 | % | 19.39 | % |
| Ratios to average net assets: A | | | | | | |
| Net investment income (loss) | (1.64 | %) | (1.79 | %) | (1.87 | %) |
| Total expenses | 2.33 | % | 2.44 | % | 2.54 | % |
| Expenses before offsets | 2.33 | % | 2.44 | % | 2.54 | % |
| Net expenses | 2.33 | % | 2.44 | % | 2.54 | % |
| Portfolio turnover | 63 | % | 65 | % | 87 | % |
| Net assets, ending (in thousands) | $18,630 | | $12,973 | | $9,449 | |
| |
| |
| | | | YEARS ENDED | |
| | | | September 30, | | September 30, | |
| CLASS C SHARES | | | 2009 | | 2008 | |
| Net asset value, beginning | | | $20.20 | | $24.93 | |
| Income from investment operations: | | | | | | |
| Net investment income (loss) | | | (.28 | ) | (.38 | ) |
| Net realized and unrealized gain (loss) | | | (1.87 | ) | (3.94 | ) |
| Total from investment operations | | | (2.15 | ) | (4.32 | ) |
| Distributions from: | | | | | | |
| Net realized gain | | | — | | (.41 | ) |
| Total distributions | | | — | | (.41 | ) |
| Total increase (decrease) in net asset value | | | (2.15 | ) | (4.73 | ) |
| Net asset value, ending | | | $18.05 | | $20.20 | |
| |
| Total return* | | | (10.64 | %) | (17.62 | %) |
| Ratios to average net assets:A | | | | | | |
| Net investment income (loss) | | | (1.75 | %) | (.157 | %) |
| Total expenses | | | 2.71 | % | 2.42 | % |
| Expenses before offsets | | | 2.71 | % | 2.42 | % |
| Net expenses | | | 2.70 | % | 2.42 | % |
| Portfolio turnover | | | 72 | % | 49 | % |
| Net assets, ending (in thousands) | | | $8,287 | | $10,252 | |
See notes to financial highlights.
www. calvert.com CALVERT CAPITAL ACCUMULATION FUND ANNUAL REPORT 37
| | | | | | |
| FINANCIAL HIGHLIGHTS |
| |
| | | | YEARS ENDED | | | |
| | September 30, | | September 30, | | September 30, | |
| CLASS I SHARES | 2012 | (z) | 2011 | (z) | 2010 | |
| Net asset value, beginning | $27.94 | | $26.59 | | $21.89 | |
| Income from investment operations: | | | | | | |
| Net investment income (loss) | (.05 | ) | (.06 | ) | (.04 | ) |
| Net realized and unrealized gain (loss) | 8.22 | | 1.41 | | 4.74 | |
| Total from investment operations | 8.17 | | 1.35 | | 4.70 | |
| Distributions from: | | | | | | |
| Net realized gain | (1.93 | ) | — | | — | |
| Total distributions | (1.93 | ) | — | | — | |
| Total increase (decrease) in net asset value | 6.24 | | 1.35 | | 4.70 | |
| Net asset value, ending | $34.18 | | $27.94 | | $26.59 | |
| |
| Total return* | 30.00 | % | 5.08 | % | 21.47 | % |
| Ratios to average net assets: A | | | | | | |
| Net investment income (loss) | (.16 | %) | (.20 | %) | (.19 | %) |
| Total expenses | .88 | % | .99 | % | 1.12 | % |
| Expenses before offsets | .86 | % | .86 | % | .86 | % |
| Net expenses | .86 | % | .86 | % | .86 | % |
| Portfolio turnover | 63 | % | 65 | % | 87 | % |
| Net assets, ending (in thousands) | $83,181 | | $21,144 | | $7,138 | |
| |
| |
| | | | YEARS ENDED | |
| | | | September 30, | | September 30, | |
| CLASS I SHARES | | | 2009 | | 2008 | |
| Net asset value, beginning | | | $24.06 | | $29.16 | |
| Income from investment operations: | | | | | | |
| Net investment income | | | .02 | | ** | |
| Net realized and unrealized gain (loss) | | | (2.19 | ) | (4.96 | ) |
| Total from investment operations | | | (2.17 | ) | (4.96 | ) |
| Distributions from: | | | | | | |
| Net realized gain | | | — | | (.41 | ) |
| Total distributions | | | — | | (.41 | ) |
| Total increase (decrease) in net asset value | | | (2.17 | ) | (5.10 | ) |
| Net asset value, ending | | | $21.89 | | $24.06 | |
| |
| Total return* | | | (9.02 | %) | (16.31 | %) |
| Ratios to average net assets:A | | | | | | |
| Net investment income | | | .10 | % | .01 | % |
| Total expenses | | | 1.28 | % | 1.18 | % |
| Expenses before offsets | | | .86 | % | .87 | % |
| Net expenses | | | .86 | % | .86 | % |
| Portfolio turnover | | | 72 | % | 49 | % |
| Net assets, ending (in thousands) | | | $3,837 | | $3,573 | |
See notes to financial highlights.
www.calvert.com CALVERT CAPITAL ACCUMULATION FUND ANNUAL REPORT 38
| | | | |
| FINANCIAL HIGHLIGHTS |
| |
| | PERIODS ENDED |
| | September 30, | | September 30, | |
| CLASS Y SHARES | 2012 | (z) | 2011 | (z) # |
| Net asset value, beginning | $26.03 | | $29.79 | |
| Income from investment operations: | | | | |
| Net investment income (loss) | (.18 | ) | (.15 | ) |
| Net realized and unrealized gain (loss) | 7.64 | | (3.61 | ) |
| Total from investment operations | 7.46 | | (3.76 | ) |
| Distributions from: | | | | |
| Net realized gain | (1.93 | ) | — | |
| Total distributions | (1.93 | ) | — | |
| Total increase (decrease) in net asset value | 5.53 | | (3.76 | ) |
| Net asset value, ending | $31.56 | | $26.03 | |
| |
| Total return* | 29.45 | % | (12.62 | %) |
| Ratios to average net assets: A | | | | |
| Net investment income (loss) | (.59 | %) | (.74 | %) (a) |
| Total expenses | 1.29 | % | 1.49 | % (a) |
| Expenses before offsets | 1.29 | % | 1.44 | % (a) |
| Net expenses | 1.29 | % | 1.44 | % (a) |
| Portfolio turnover | 63 | % | 65 | %*** |
| Net assets, ending (in thousands) | $8,071 | | $7,968 | |
A Total expenses do not reflect amounts reimbursed and/or waived by the Advisor or reductions from expense
offset arrangements. Expenses before offsets reflect expenses after reimbursement and/or waiver by the Advisor
but prior to reductions from expense offset arrangements. Net expenses are net of all reductions and represent
the net expenses paid by the Fund.
(a) Annualized.
(z) Per share figures are calculated using the Average Shares Method.
* Total return is not annualized for periods less than one year and does not reflect deduction of any front-end or
deferred sales charge.
** Less than $0.01 per share.
*** Portfolio turnover is not annualized for periods less than one year.
# From January 31, 2011, inception.
See notes to financial statements.
www.calvert.com CALVERT CAPITAL ACCUMULATION FUND ANNUAL REPORT 39
EXPLANATION OF FINANCIAL TABLES
SCHEDULE OF INVESTMENTS
The Schedule of Investments is a snapshot of all securities held in the fund at their market value, on the last day of the reporting period. Securities are listed by asset type (e.g., common stock, corporate bonds, U.S. government obligations) and may be further broken down into sub-groups and by industry classification.
STATEMENT OF ASSETS AND LIABILITIES
The Statement of Assets and Liabilities is often referred to as the fund’s balance sheet. It lists the value of what the fund owns, is due and owes on the last day of the reporting period. The fund’s assets include the market value of securities owned, cash, receivables for securities sold and shareholder subscriptions, and receivables for dividends and interest payments that have been earned, but not yet received. The fund’s liabilities include payables for securities purchased and shareholder redemptions, and expenses owed but not yet paid. The statement also reports the fund’s net asset value (NAV) per share on the last day of the reporting period. The NAV is calculated by dividing the fund’s net assets (assets minus liabilities) by the number of shares outstanding. This statement is accompanied by a Schedule of Investments. Alternatively, if certain conditions are met, a Statement of Net Assets may be presented in lieu of this statement and the Schedule of Investments.
STATEMENT OF NET ASSETS
The Statement of Net Assets provides a detailed list of the fund’s holdings, including each security’s market value on the last day of the reporting period. The Statement of Net Assets includes a Schedule of Investments. Other assets are added and other liabilities subtracted from the investments total to calculate the fund’s net assets. Finally, net assets are divided by the outstanding shares of the fund to arrive at its share price, or Net Asset Value (NAV) per share.
At the end of the Statement of Net Assets is a table displaying the composition of the fund’s net assets. Paid in Capital is the money invested by shareholders and represents the bulk of net assets. Undistributed Net Investment Income and Accumulated Net Realized Gains usually approximate the amounts the fund had available to distribute to shareholders as of the statement date. Accumulated Realized Losses will appear as negative balances. Unrealized Appreciation (Depreciation) is the difference between the market value of the fund’s investments and their cost, and reflects the gains (losses) that would be realized if the fund were to sell all of its investments at their statement-date values.
www.calvert.com CALVERT CAPITAL ACCUMULATION FUND ANNUAL REPORT (UNAUDITED) 40
STATEMENT OF OPERATIONS
The Statement of Operations summarizes the fund’s investment income earned and expenses incurred in operating the fund. Investment income includes dividends earned from stocks and interest earned from interest-bearing securities in the fund. Expenses incurred in operating the fund include the advisory fee paid to the investment advisor, administrative services fee, distribution plan expenses (if applicable), transfer agent fees, shareholder servicing expenses, custodial, legal, and audit fees, and the printing and postage expenses related to shareholder reports. Expense offsets (fees paid indirectly) are also shown. Credits earned from offset arrangements are used to reduce the fund’s expenses. This statement also shows net gains (losses) realized on the sale of investments and the increase or decrease in the unrealized appreciation (depreciation) on investments held during the period.
STATEMENT OF CHANGES IN NET ASSETS
The Statement of Changes in Net Assets shows how the fund’s total net assets changed during the two most recent reporting periods. Changes in the fund’s net assets are attributable to investment operations, distributions and capital share transactions.
The Operations section of the report summarizes information detailed in the Statement of Operations. The Distribution section shows the dividend and capital gain distributions made to shareholders. The amounts shown as distributions in this section may not match the net investment income and realized gains amounts shown in the Operations section because distributions are determined on a tax basis and certain investments or transactions may be treated differently for financial statement and tax purposes. The Capital Share Transactions section shows the amount shareholders invested in the fund, either by purchasing shares or by reinvesting distributions, and the amounts redeemed. The corresponding numbers of shares issued, reinvested and redeemed are shown at the end of the report.
FINANCIAL HIGHLIGHTS
The Financial Highlights table provides a per-share breakdown per class of the components that affect the fund’s net asset value for current and past reporting periods. The table provides total return, total distributions, expense ratios, portfolio turnover and net assets for the applicable period. Total return is a measure of a fund’s performance that encompasses all elements of return: dividends, capital gain distributions and changes in net asset value. Total return is the change in value of an investment over a given period, assuming reinvestment of any dividends and capital gain distributions, expressed as a percentage of the initial investment. Total distributions include distributions from net investment income and net realized gains. Long-term gains are earned on securities held in the fund more than one year. Short-term gains, on the sale of securities held less than one year, are treated as ordinary dividend income for tax purposes. The expense ratio is a fund’s cost of doing business, expressed as a percentage of net assets. These expenses directly reduce returns to shareholders. Portfolio turnover measures the trading activity in a fund’s investment portfolio – how often securities are bought and sold by a fund. Portfolio turnover is affected by market conditions, changes in the size of the fund, the nature of the fund’s investments and the investment style of the portfolio.
www.calvert.com CALVERT CAPITAL ACCUMULATION FUND ANNUAL REPORT (UNAUDITED) 41
PROXY VOTING
The Proxy Voting Guidelines of the Calvert Funds that the Fund uses to determine how to vote proxies relating to portfolio securities are provided as an Appendix to the Fund’s Statement of Additional Information. The Statement of Additional Information can be obtained free of charge by calling the Fund at 1-800-368-2745, by visiting the Calvert website at www.calvert.com; or by visiting the SEC’s website at www.sec.gov.
Information regarding how the Fund voted proxies relating to portfolio securities during the most recent 12-month period ended June 30 is available on the Fund’s website at www.calvert.com and on the SEC’s website at www.sec.gov.
AVAILABILITY OF QUARTERLY PORTFOLIO HOLDINGS
The Fund files its complete schedule of portfolio holdings with the SEC for the first and third quarters of each fiscal year on Form N-Q. The Fund’s Form N-Q is available on the SEC’s website at www.sec.gov. The Fund’s Form N-Q may be reviewed and copied at the SEC’s Public Reference Room in Washington, DC; information on the operation of the Public Reference Room may be obtained by calling 1-800-SEC-0330.
www.calvert.com CALVERT CAPITAL ACCUMULATION FUND ANNUAL REPORT (UNAUDITED) 42
This page intentionally left blank.
www.calvert.com CALVERT CAPITAL ACCUMULATION FUND ANNUAL REPORT (UNAUDITED) 44
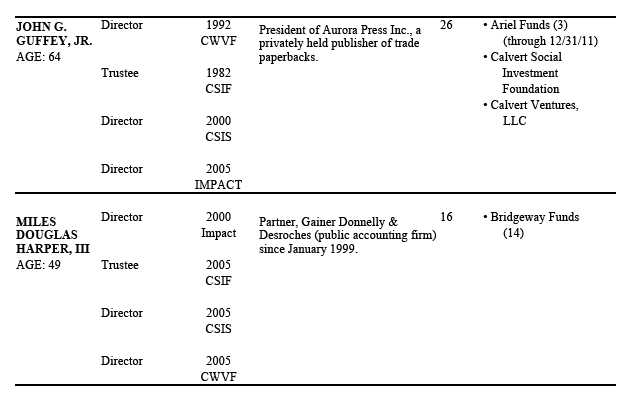
www. calvert.com CALVERT CAPITAL ACCUMULATION FUND ANNUAL REPORT (UNAUDITED) 45
www. calvert.com CALVERT CAPITAL ACCUMULATION FUND ANNUAL REPORT (UNAUDITED) 46
www. calvert.com CALVERT CAPITAL ACCUMULATION FUND ANNUAL REPORT (UNAUDITED) 47
www. calvert.com CALVERT CAPITAL ACCUMULATION FUND ANNUAL REPORT (UNAUDITED) 48
www. calvert.com CALVERT CAPITAL ACCUMULATION FUND ANNUAL REPORT (UNAUDITED) 49
www. calvert.com CALVERT CAPITAL ACCUMULATION FUND ANNUAL REPORT (UNAUDITED) 50
www. calvert.com CALVERT CAPITAL ACCUMULATION FUND ANNUAL REPORT (UNAUDITED) 51
www. calvert.com CALVERT CAPITAL ACCUMULATION FUND ANNUAL REPORT (UNAUDITED) 52
www. calvert.com CALVERT CAPITAL ACCUMULATION FUND ANNUAL REPORT (UNAUDITED) 53
*The address of Trustees/Directors and Officers is 4550 Montgomery Avenue, Suite 1000N, Bethesda, Maryland 20814, except Mr. Silby’s address is 1715 18th Street, N.W., Washington, DC 20009. Ms. Krumsiek is an interested person of the Fund since she is an officer and director of the Fund’s advisor and certain affiliates. Mr. Silby is an interested person of the Fund since he is a director of the parent company of the Fund’s advisor.
Additional information about the Fund’s Trustees/Directors can be found in the Statement of Additional Information (SAI). You can get a free copy of the SAI at www.calvert.com, or by contacting your broker, or the Fund at 1-800-368-2745.
www calvert.com CALVERT CAPITAL ACCUMULATION FUND ANNUAL REPORT (UNAUDITED) 54
To Open an Account
800-368-2748
Yields and Prices
Calvert Information Network
(24 hours, 7 days a week)
800-368-2745
Service for Existing Account
Shareholders: 800-368-2745
Brokers: 800-368-2746
TDD for Hearing Impaired
800-541-1524
Branch Office
4550 Montgomery Avenue
Suite 1000 North
Bethesda, Maryland 20814
Registered, Certified
or Overnight Mail
Calvert Investments
c/o BFDS,
330 West 9th Street
Kansas City, MO 64105
Web Site
www.calvert.com
Principal Underwriter
Calvert Investment Distributors, Inc.
4550 Montgomery Avenue
Suite 1000 North
Bethesda, Maryland 20814

This report is intended to provide fund information to shareholders. It is not authorized for distribution to prospective investors unless preceded or accompanied by a prospectus.
Note: The information on our website is not incorporated by reference into this report; our website address is included as an inactive textual reference only.
Investors should carefully consider the investment objectives, risks, charges and expenses of the Calvert Funds. This and other important information is contained in the fund’s summary prospectus and prospectus, which can be obtained from your financial professional and should be read carefully before investing. You may also call Calvert at 800/368-2745 or visit www. calvert.com.
Choose Planet-friendly E-delivery!
Sign up now for on-line statements, prospectuses, and fund reports. In less than five minutes you can help reduce paper mail and lower fund costs.
Just go to www.calvert.com. If you already have an online account at Calvert, click on My Account, and select the documents you would like to receive via e-mail.
If you’re new to online account access, click on Login/Register to open an online account. Once you’re in, click on the E-delivery sign-up at the bottom of the Account Portfolio page and follow the quick, easy steps. Note: if your shares are not held directly at Calvert but through a brokerage firm, you must contact your broker for electronic delivery options available through their firm.

Dear Shareholder:
Stock markets ended the 2012 annual reporting period sharply higher as the Standard & Poor’s (S&P) 500 Index returned 30.20% versus 1.14% for the 12 months through September 30, 2011. While the two periods shared many commonalities--such
as a softening of economic indicators, mounting concerns about sovereign debt in the eurozone, and relatively strong corporate profits--there were some key differences.
Financial markets around the world breathed a sigh of relief after the European Central Bank committed to saving the euro this summer and offered to support the debt markets for any euro member government seeking a new financial bailout. And while the disasters in Japan and strife in the Middle East and North Africa weighed heavily on investor confidence last year, uncertainty closer to home rattled investors this year, primarily as a result of the presidential election and looming “fiscal cliff” in January 2013 that could raise taxes for many Americans. The good news is both situations should see some resolution by the end of 2012.
The U.S. economy’s relative strength was also more evident in this annual reporting period. The divergence with foreign stock market returns widened as the S&P 500 Index more than doubled the 14.33% return of the MSCI EAFE Index for the 12-month period ending September 30, 2012. In the 12 months ending September 30, 2011, the S&P 500 barely eked out a positive return compared with -8.94% for the MSCI EAFE for the same period.
A Truly Uneven Recovery
Within the United States, the economic recovery was also uneven, with some consumers and businesses feeling left behind in the midst of an “improving” economy. For example, growth in northeastern metropolitan areas lagged, while metro areas out west, particularly those in natural gas or high-tech centers, rebounded strongly.1 Also, the housing market finally turned the corner, as national home prices rose 3.6% year-over-year for the past 12 months. However, they surged 9.4% in the western U.S. while notching up only 0.9% in the northeast.2 In employment, more than 70% of jobs lost in service industries during the recession have returned, but only 15% of jobs lost in manufacturing, construction, and other goods-producing industries have come back. The differences are stark even within industries, where retail general merchandisers such as Costco recouped 92% while department stores regained just 41% of lost jobs.3 Overall, we remain cautiously optimistic about the economic recovery ahead. As both citizens and investors, we hope that government legislators return to the negotiating table after the election and give us all the gift of more certainty before the holidays.
www.calvert.com CALVERT INTERNATIONAL OPPORTUNITIES FUND ANNUAL REPORT 4
Making Strides in Board Diversity
Calvert continued its advocacy efforts in many areas, including board diversity. The United Nations Gender Equality for Sustainable Business Event in March marked the two-year anniversary of the U.N.’s Women’s Empowerment Principles (WEP), which were adapted from the Calvert’s Women Principles®, and emphasized the business case for promoting gender equality and women’s empowerment in the workplace. Calvert also joined the newly formed WEP Leadership Group to expand implementation of the Principles.
On March 21, we testified before the Senate Democratic Steering and Outreach Committee about the importance of gender equity in economic empowerment and job creation, highlighting research showing the inclusion of women in corporate management correlates with higher shareholder value and better operating results.
Creating “The Future We Want” in Rio
Finally, I had the pleasure of representing Calvert by speaking at several events at the Rio + 20 Summit about board oversight of sustainability, social enterprise and impact investing, the role of business in promoting gender equality, the business case for the green economy, and establishing value for natural capital.
The first Earth Summit in Rio de Janeiro 20 years ago created climate and biodiversity conventions and set the stage for frameworks to address global environmental degradation, climate change, and poverty. However, global economic uncertainty weighed heavily on the Rio + 20 Summit. While negotiations continued to advance toward 2015, we’re disappointed by the lack of concrete commitments needed for substantial progress on critical sustainability issues.
However, side events sponsored by private-sector and non-governmental organizations sparked many innovative initiatives and positive outcomes. A number of major companies made significant commitments on water, energy, renewable materials, and deforestation. Corporate and investor disclosure of environmental, social, and governance (ESG) impacts took a real step forward as well. In fact, NASDAQ will now encourage companies on its exchange to report on ESG issues, or explain why they do not.
While these efforts can’t substitute for binding governmental commitments, we are happy to see so many companies and investors stepping up to the plate and believe the private sector will remain a key driver of progress on sustainability issues over the next few years.
Stay Informed in the Months Ahead
Maintaining a well-diversified mix of stocks, bonds, and cash appropriate for your goals and risk tolerance is one of the best ways to mitigate the effects of an uneven economic recovery. We also recommend discussing any changes in your financial situation with your investment advisor.
www.calvert.com CALVERT INTERNATIONAL OPPORTUNITIES FUND ANNUAL REPORT 5
A financial services consulting firm recently named Calvert as one of the Top Social Media Leaders in 2012 for using Facebook to share valuable content with investors and advisors.4 Join the dialogue at www.facebook.com/calvert.
We also invite you to visit our website, www.calvert.com, for fund information, portfolio updates, and commentary from Calvert professionals. You can now get the same information on the go with our new iPhone® app, available free at iTunes.
As always, we thank you for investing with Calvert.

Barbara Krumsiek
President and CEO of Calvert Investments, Inc.
October 2012
1. Brookings Institution, Metro Monitor - September 2012, www.brookings.edu/research/
interactives/metromonitor#overall
2. Clear Capital, “June Home Prices Provide Further Evidence of Budding Recovery. Forecast
Indicates Further Increases Through 2012,”July 2012 Market Report, http://clearcapital.com/
company/MarketReport.cfm?month=July&year=2012
3. Paul Davison and Barbara Hansen, “Service Businesses Lead Uneven Jobs Recovery,” USA
Today, July 15, 2012, www.usatoday.com/money/economy/story/2012-07-15/jobs-recov-
ered/56242656/1
4. kasina ranked Calvert fifth of 53 asset management and insurance companies for using
Facebook to tell a compelling brand story and share valuable content with investors and advi-
sors. The ranking was based on kasina’s three-tier methodology that ranked firms based on
content, branding, interactivity, and usability on each social platform. For more information,
visit www.kasina.com.
www.calvert.com CALVERT INTERNATIONAL OPPORTUNITIES FUND ANNUAL REPORT 6

Landmark Rules on Conflict Minerals
After a complicated and controversial two-year rulemaking process, the Securities and Exchange Commission (SEC) released final rules under the Dodd-Frank Wall Street Reform and Consumer Protection Act (Dodd-Frank) Section 1502, which require companies to file and publish reports on their efforts to eliminate the use of “conflict minerals” that have fueled a violent 14-year conflict in the Eastern Democratic Republic of the Congo (DRC).
Calvert played a leading role among investors during the rulemaking process and is pleased with the progress. However, the two- to four-year timeline for compliance and exclusion of mining companies from reporting requirements was disappointing. We will continue to press all companies involved with conflict minerals to step up their efforts to address these issues.
New Standards Will Nearly Double Fuel Efficiency by 2025
Newly finalized corporate average fuel economy (CAFE) standards require cars and light-duty trucks to reach the equivalent of 54.5 mpg by 2025. Experts estimate the new standards will reduce oil consumption by 12 billion barrels while saving consumers $1.7 trillion. The major U.S. automakers supported the new standards and have already begun incorporating them into future vehicles.
The higher standards should boost both the competitiveness of American automakers and U.S. policy efforts to mitigate climate change, since more than 90% of a vehicle’s contribution to climate change through greenhouse gas emissions (GHGs) is related to fuel consumption.1 Calvert has long advocated for higher standards in public testimony to Environmental Protection Agency, meetings with Obama administration officials, dialogues with the auto industry, and the media and will continue to do so.
Helping Companies Combat Climate Change Risks
Economic and insured losses from natural catastrophes set new records last year, driving home the very real physical climate risks for investors. Extreme weather events accounted for 90% of the disasters and eight of the 10 most costly events, causing overall losses of more than $148 billion.
To that end, Calvert co-authored two reports to help companies evaluate their exposure to climate risks and protect shareholder value. Oxfam America and Ceres joined us to create
Physical Risks from Climate Change: A guide for companies and investors on disclosure and management of climate impacts.
We also developed Value Chain Climate Resilience: A guide to managing climate impacts in companies and communities, a first-of-its-kind guide to help businesses assess and prepare for the risks and opportunities posed by climate change, with other leading companies from the Partnership for Resilience and Environmental Preparedness (PREP).
www.calvert.com CALVERT INTERNATIONAL OPPORTUNITIES FUND ANNUAL REPORT 7
Exercising Our Say on Pay
Calvert fought for the new “say on pay” rule, which requires publicly traded U.S. companies to allow shareholders to vote on the compensation awarded to senior management the previous year. We built on that success this year by creating a strict set of voting guidelines on executive compensation for the proxy season. We also shared our reasons for voting against the proposals to management at key companies.
Overall, Calvert votes against compensation packages that do not align management and shareholder interests and do not incentivize the company’s long-term performance. In May, this meant voting against company compensation packages 34% of the time. This includes Gilead Sciences, Safeway, and Plains Exploration and Production, all of which rewarded CEOs with high pay in 2011 despite lackluster shareholder returns.
Even before the May announcement of a massive trading loss, we rejected the $23 million pay package for JPMorgan Chase Chairman and CEO Jamie Dimon due to its discretionary nature and inherent lack of accountability to long-term financial goals. The weaknesses in risk oversight evident by the company’s failed hedging strategy only reinforced our decision.
Other Shareholder Advocacy Efforts
This spring, Calvert filed 24 shareholder resolutions to keep the sustainability issues with a real impact on profits, people, and the planet front and center. Six were voted upon by shareholders, including resolutions on: -- Board diversity at Urban Outfitters, which received 39% support (up from 22% last year). Despite owning popular women’s retail brands Anthropologie and Free People, the company does not have any women or minorities on its board of directors.
-- Disclosure of water scarcity and pollution risks at Fossil, which received 31% support. As an apparel company, Fossil relies on water- and energy-intensive processes for producing cotton, leather, and other products. These processes can also pollute water supplies, especially in developing countries.
-- Sustainability reports at Gentex, which received 32% support. This supplier for the automotive, aerospace, and commercial fire protection industries currently provides no information on its efforts to manage resource efficiency and environmental impacts—despite increasing demands from its key clients for sustainability data.
Promoting Privacy on the Internet
In 2006, Calvert joined other investors, human rights advocacy organizations, academic experts and companies to develop the multi-stakeholder Global Network Initiative (GNI) to help information and communication technology (ICT) companies address freedom of expression and privacy issues. In early 2012, GNI’s path to becoming a fully global standard leapt forward as the first three GNI companies—Yahoo, Google, and Microsoft— completed the second phase of the assessment process.
www.calvert.com CALVERT INTERNATIONAL OPPORTUNITIES FUND ANNUAL REPORT 8
In addition, Facebook became a GNI observer in May, opening the door to its participation in GNI policy and advocacy discussions for one year as it evaluates the potential commitment of implementing the GNI principles. We welcome the opportunity to work with Facebook, particularly in protecting against privacy violations that can endanger members using it as an instrument of freedom of expression and political dissent across the world.
Community Investments
Many of our Funds participate in Calvert’s High Social Impact Investing program, which is administered through the Calvert Foundation. This community investment program may allocate a small percentage of Fund assets at below-market interest rates to investments that provide economic opportunity for struggling populations.2 One such investment through the Foundation is FMM Popayan, which offers financial services to more than 400,000 clients in some of the poorest areas of Columbia. Women comprise 66% of their client base.
We also supported the Triodos Sustainable Trade Fund, which seeks to improve the economic position of farmers in emerging markets and stimulate development in the sustainable agriculture sector. It does this by providing pre-export value chain financing to farmer cooperatives—with a specific focus on fair trade and organic farming.
Special Equities
A modest but important portion of certain funds is allocated to small private companies developing products or services that address important sustainability or environmental issues facing our society.
One example of a recent investment is Ivy Capital/All Life Insurance Company of South Africa, which insures people living with HIV.3 The company uses online support systems to help clients comply with their medical requirements in order to live a longer life. This provides enormous security to their families and employers and seems to be a rather unique business model in fighting the scourge of AIDS.
www.calvert.com CALVERT INTERNATIONAL OPPORTUNITIES FUND ANNUAL REPORT 9
1. ACEEE, Automobiles and the Environment, www.greenercars.org/guide_environment.
htm
2. As of September 30, 2012, Calvert Social Investment Foundation (“Calvert
Foundation” or “Foundation”) Community Investment Notes represented the follow-
ing percentages of Fund net assets: Calvert Capital Accumulation Fund 0.51%, Calvert
International Equity Fund 1.29%, and Calvert Small Cap Fund 0.48%. The Calvert
Foundation is a 501(c)(3) nonprofit organization. The Foundation’s Community
Investment Note Program is not a mutual fund and should not be confused with any
Calvert Investments-sponsored investment product.
3. As of September 30, 2012, Ivy Capital All Life Insurance represented 0.02% of
Calvert Equity Portfolio. Holdings are subject to change.
As of September 30, 2012, the following companies represented 0% of net assets in the
Fund: Gilead Sciences, Safeway, Plains Exploration and Production, JPMorgan Chase,
Urban Outfitters, Fossil, Gentex, Yahoo, Google, Microsoft and Facebook. Holdings are
subject to change.
www.calvert.com CALVERT INTERNATIONAL OPPORTUNITIES FUND ANNUAL REPORT 10

Investment Performance
For the 12-month period ended September 30, 2012, Calvert International Opportunities Fund Class A Shares (at NAV) posted a return of 20.52%, outperforming the MSCI EAFE Small/Mid Cap Index’s return of 12.84% due to very strong stock selection.
Investment Climate
Gradually improving U.S. economic data, healthy corporate earnings, and some policy steps toward mitigation of the sovereign debt crisis in Europe provided support for equities worldwide during the fiscal year. Global inflation remained tame, and aggressive, accommodative monetary policy by central banks around the globe helped equity markets rally hard off their lows posted last fall, albeit on low volume.
For the trailing 12-month period, the Standard and Poor’s (S&P) 500, Russell 1000, and Russell 2000 Indices returned 30.20%, 30.06%, and 31.91% respectively. Negative headwinds from the eurozone and an economic slowdown in China led to a
| | | | |
| CALVERT INTERNATIONAL |
| OPPORTUNITIES FUND |
| September 30, 2012 |
| | | | |
| INVESTMENT PERFORMANCE | | | |
| (total return at NAV*) | | | | |
| | 6 Months | | 12 Months | |
| | ended | | ended | |
| | 9/30/12 | | 9/30/12 | |
| Class A | 2.36 | % | 20.52 | % |
| Class C | 1.82 | % | 19.31 | % |
| Class I | 2.49 | % | 20.89 | % |
| Class Y | 2.40 | % | 20.69 | % |
| |
| MSCI EAFE Small/Mid | | | |
| Cap Index | -1.34 | % | 12.84 | % |
| |
| Lipper International | | | | |
| Small/Mid-Cap Core | | | | |
| Funds Average | -2.05 | % | 13.69 | % |
| | % of Total | |
| ECONOMIC SECTORS | Investments | |
| Consumer Discretionary | 16.7 | % |
| Consumer Staples | 10.0 | % |
| Energy | 3.4 | % |
| Financials | 27.1 | % |
| Health Care | 4.5 | % |
| Industrials | 20.9 | % |
| Information Technology | 7.8 | % |
| Materials | 5.6 | % |
| Short-Term Investments | 1.4 | % |
| Telecommunication Services | 1.8 | % |
| Utilities | 0.8 | % |
| Total | 100 | % |
* Investment performance/return at NAV does not reflect the deduction of the Fund’s maximum 4.75% front-end sales charge or any deferred sales charge.
www.calvert.com CALVERT INTERNATIONAL OPPORTUNITIES FUND ANNUAL REPORT 11
divergence in performance by international stocks with the MSCI EAFE and MSCI Emerging Markets Indices returning 14.33% and 17.33%, respectively.
Value stocks slightly outperformed growth stocks during the fiscal year, and within the Russell 1000 Index, Consumer Discretionary, Telecommunication Services, and Financials were the top-performing sectors, while the Utilities, Consumer Staples, and Energy sectors lagged.
The U.S. economy continued to proceed on the path of gradual recovery. The U.S. corporate sector remained strong and provided some upside surprises for investors. The top-line numbers driven by the economic recovery were encouraging. Improvement in employment numbers were also a welcome, positive sign, though the decline in the unemployment rate was, unfortunately, primarily due to a drop in the labor force participation rate.
U.S. inflation remained low, bank lending continued to improve, and a weak U.S. dollar, thanks to the especially accommodative monetary policy in the U.S., helped U.S. exports and supported the rebuilding of the domestic manufacturing and industrial base. Vehicle sales and production also looked encouraging.
The manufacturing sector continued to provide a boost to employment and the U.S. economy, but accelerating recession in Europe and the overall slowdown in the global economy will de-emphasize the contribution of exports to U.S. GDP. Therefore, the continued recovery of the U.S. consumer will be important for a self-sustained U.S. economic recovery. More recently, the service sector has been showing signs of improvement. Consumer spending patterns remained promising and consumer confidence, helped by strength in the housing market, a falling unemployment rate, and improving equity markets, has also shown signs of improvement.
The U.S. housing market continued its bottoming-out process into early 2012 and showed significant improvement in the second and third quarters of 2012. With mortgage rates at record lows, housing activity picked up throughout the fiscal year. Housing can provide a positive surprise for the U.S. economy and equity markets through the powerful multiplier effect it can have on the consumer and, therefore, the economy.
The stance of the Federal Reserve (Fed) remained that it was ready to act should economic conditions in the U.S. deteriorate. This so-called “Bernanke put” provided support for U.S. equity markets throughout the fiscal year with investors believing the Fed would provide future liquidity injections in the event the economy faltered. A third
| CALVERT INTERNATIONAL |
| OPPORTUNITIES FUND |
| September 30, 2012 |
| TEN LARGEST | % of Net | |
| STOCK HOLDINGS | Assets | |
| Cie Generale des Etablissements | | |
| Michelin | 2.0 | % |
| Namco Bandai Holdings, Inc. | 1.8 | % |
| Catlin Group Ltd. | 1.8 | % |
| Secom Co. Ltd. | 1.6 | % |
| NV Bekaert SA | 1.6 | % |
| Buzzi Unicem SpA | 1.5 | % |
| Nexans SA | 1.4 | % |
| Rhoen Klinikum AG | 1.4 | % |
| Ashtead Group plc | 1.4 | % |
| Industrivarden AB | 1.4 | % |
| Total | 15.9 | % |
www.calvert.com CALVERT INTERNATIONAL OPPORTUNITIES FUND ANNUAL REPORT 12
round of quantitative easing (QE3) materialized in September with the Federal Reserve’s Open Market Committee (FOMC) announcing an open-ended commitment to purchase $40 billion of mortgage-backed securities each month until substantial improvements in the labor market were seen. This came on top of the FOMC’s announcement earlier in the year to extend “Operation Twist” in an effort to further reduce long-term interest rates.
With global economic challenges keeping inflation in check, policymakers around the globe also continued their efforts toward easing monetary policies. On the flip side, the easing cycle has been inflating the balance sheets of the world’s six biggest central banks, which have more than doubled since 2006.
In the eurozone, the economic picture looked increasingly grim throughout the fiscal year, with peripheral economies firmly in a recessionary spiral and core economies coming under stress. Manufacturing in the region continued to fall deeper into contraction territory while consumer confidence in the eurozone reached its lowest level since early 2009 and the unemployment rate hit a record high.
As we anticipated, markets seemed to overestimate the efficacy of the policy action in Europe and underestimated the possibility of a more severe economic recession in the eurozone.
China cut its economic growth target from 8.0% to 7.5% during the first quarter of 2012, signaling the country’s need to transition from an export-driven to a more sustainable, consumer-driven, economic model. Nevertheless, the Chinese economy continued to decelerate during the fiscal year as foreign direct investment (FDI), one of the major drivers of economic growth in China, continued to decline and China’s HSBC Manufacturing Purchasing Managers Index (PMI) was in contraction territory for 11 consecutive months as exports continued to weaken.
A slower inflation trend allowed the Chinese government to reposition its economic policy from contractionary for most of 2011 to stimulative. A hard landing in China is not out of the question and could significantly impact global growth while making the overall macroeconomic backdrop riskier for the next several quarters.
Portfolio Strategy
Strong stock selection drove the Fund’s outperformance. This positive turnaround was attributable to the manager change that took place in September 2011. The Fund’s Board of Directors approved the recommendation for a change to a multi-manager fund with Advisory Research, Inc. and Trilogy Global Investors as the two subadvisors. The two managers have both outperformed the Fund benchmark for the one-year period.
The Fund’s stock selection was positive across all sectors except Consumer Staples and Energy. Financials was the strongest sector, with holdings in commercial banks and insurance among the best performers for the year. Names like Beazley, Catlin Group, Industrivaerden, and Banco Latinoamericano do Comercio were top performers in the sector. Stock selection was also very strong in Materials, Consumer Discretionary, and Industrials, with Ashtead Group and Neo Material Technologies two top contributors to the Fund. On the negative side, Fook Woo Group Holdings was a major detractor after
www.calvert.com CALVERT INTERNATIONAL OPPORTUNITIES FUND ANNUAL REPORT 13
Growth of $10,000
The graph below shows the value of a hypothetical $10,000 investment in the Fund over the past 10 fiscal year periods or since inception (for funds without 10-year records). The results shown are for Classes A and I shares and reflect the deduction of the maximum front-end Class A sales charge of 4.75%, and assume the reinvestment of dividends. The result is compared with benchmarks that include a broad based market index and a Lipper peer group average. Market indexes are unmanaged and their results do not reflect the effect of expenses or sales charges. The Lipper average reflects the deduction of the category’s average front-end sales charge. The value of an investment in a different share class would be different.
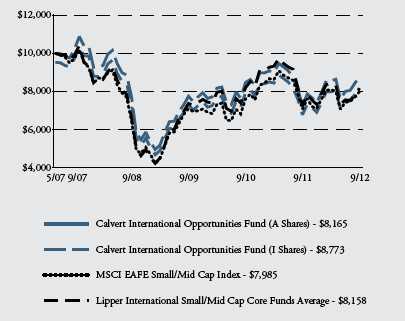
All performance data shown, including the graph above and the adjacent table, represents past performance, does not guarantee future results, assumes reinvestment of dividends and distributions and does not reflect the deduction of taxes that a shareholder would pay on the Fund’s distributions or the redemption of the Fund shares. All performance data reflects fee waivers and/or expense limitations, if any are in effect; in their absence performance would be lower. See Note B in Notes to Financial Statements. The investment return and principal value of an investment will fluctuate so that an investor’s shares, when redeemed, may be worth more or less than their original cost. Current performance may be lower or higher than the performance data quoted; for current performance data visit www.calvert.com. The gross expense ratio from the current prospectus for Class A shares is 2.21%. This number may differ from the expense ratio shown elsewhere in this report because it is based on a different time period and, if applicable, does not include fee or expense waivers. Performance data quoted already reflects the deduction of the Fund’s operating expenses.
www.calvert.com CALVERT INTERNATIONAL OPPORTUNITIES FUND ANNUAL REPORT 14
fraudulent activities at that company led to an extended halt in trading and a fair valuation adjustment.
Sector selection made a slight positive contribution with the Fund’s overweight to Financials and underweight to Materials as the top-contributing factors to performance at the sector level.
From a country allocation standpoint, stock selection was strongest in Western Europe, specifically the United Kingdom. The Fund’s underweight to Japan was also a benefit to the Fund.
| CALVERT INTERNATIONAL |
| OPPORTUNITIES FUND |
| September 30, 2012 |
| | |
| AVERAGE ANNUAL TOTAL RETURNS | |
| |
| CLASS A SHARES | (with max. load) | |
| One year | 14.76 | % |
| Five year | -4.37 | % |
| Since inception (5/31/2007) | -3.73 | % |
| |
| CLASS C SHARES | (with max. load) | |
| One year | 18.43 | % |
| Five year | -4.24 | % |
| Since inception (7/31/2007) | -3.41 | % |
| |
| CLASS I SHARES | | |
| One year | 20.89 | % |
| Five year | -3.03 | % |
| Since inception (5/31/2007) | -2.42 | % |
| |
| CLASS Y SHARES* | | |
| One year | 20.69 | % |
| Five year | -3.29 | % |
| Since inception (5/31/2007) | -2.70 | % |
*Calvert International Opportunities Fund first offered Class Y shares on October 31, 2008. Performance prior to that date reflects the performance of Class A shares at net asset value (NAV). Actual Class Y share performance would have been different.
Outlook
Despite healthy corporate earnings and continued gradual economic recovery in the United States, looming developments in the political landscape could have a negative impact on U.S. GDP growth and are likely to be a source of volatility for the markets in the coming months. However, once we have more visibility into the “fiscal cliff” scenarios, market participants may feel better about investing in risky assets for the long term.
We see continued challenges in the global macro backdrop leaving equity markets vulnerable to negative news, especially given that most of the positive catalysts are out and the markets had a healthy run through September 30, 2012. Any negative news from Europe or China or a soft earnings season in the U.S. will likely trigger a risk aversion trade.
October 2012
As of September 30, 2012, the following holdings contributed to the following percentages of Portfolio net assets: Beazley 1.34%, Catlin Group 1.78%, Industrivaerden 1.37%, Banco Latinoamericano 1.19%, Ashtead Group 1.39%, Neo Material Technologies 0%, and Fook Woo Group 0.23%. Holdings are subject to change.
www.calvert.com CALVERT INTERNATIONAL OPPORTUNITIES FUND ANNUAL REPORT 15
SHAREHOLDER EXPENSE EXAMPLE
As a shareholder of the Fund, you incur two types of costs: (1) transaction costs, including sales charges and redemption fees; and (2) ongoing costs, including management fees; distribution (12b-1) fees; and other Fund expenses. This Example is intended to help you understand your ongoing costs (in dollars) of investing in the Fund and to compare these costs with the ongoing costs of investing in other mutual funds.
This Example is based on an investment of $1,000 invested at the beginning of the period and held for the entire period (April 1, 2012 to September 30, 2012).
Actual Expenses
The first line of the table below provides information about actual account values and actual expenses. You may use the information in this line, together with the amount you invested, to estimate the expenses that you paid over the period. Simply divide your account value by $1,000 (for example, an $8,600 account value divided by $1,000 = 8.6), then multiply the result by the number in the first line under the heading entitled “Expenses Paid During Period” to estimate the expenses you paid on your account during this period.
Hypothetical Example for Comparison Purposes
The second line of the table below provides information about hypothetical account values and hypothetical expenses based on the Fund’s actual expense ratio and an assumed rate of return of 5% per year before expenses, which is not the Fund’s actual return. The hypothetical account values and expenses may not be used to estimate the actual ending account balance or expenses you paid for the period. You may use this information to compare the ongoing costs of investing in the Fund and other funds. To do so, compare the 5% hypothetical example with the 5% hypothetical examples that appear in the shareholder reports of the other funds.
Please note that the expenses shown in the table are meant to highlight your ongoing costs only and do not reflect any transactional costs, such as sales charges (loads), or redemption fees. Therefore, the second line of the table is useful in comparing ongoing costs only, and will not help you determine the relative total costs of owning different funds. In addition, if these transactional costs were included, your costs would have been higher.
www.calvert.com CALVERT INTERNATIONAL OPPORTUNITIES FUND ANNUAL REPORT 16
| | | |
| | BEGINNING | ENDING ACCOUNT | EXPENSES PAID |
| | ACCOUNT VALUE | VALUE | DURING PERIOD* |
| | 4/1/12 | 9/30/12 | 4/1/12 - 9/30/12 |
| CLASS A | | | |
| Actual | $1,000.00 | $1,023.60 | $8.40 |
| Hypothetical | $1,000.00 | $1,016.70 | $8.37 |
| (5% return per | | | |
| year before expenses) | | | |
| |
| CLASS C | | | |
| Actual | $1,000.00 | $1,018.20 | $12.61 |
| Hypothetical | $1,000.00 | $1,012.50 | $12.58 |
| (5% return per | | | |
| year before expenses) | | | |
| |
| CLASS I | | | |
| Actual | $1,000.00 | $1,024.90 | $6.07 |
| Hypothetical | $1,000.00 | $1,019.00 | $6.06 |
| (5% return per | | | |
| year before expenses) | | | |
| |
| CLASS Y | | | |
| Actual | $1,000.00 | $1,024.00 | $7.13 |
| Hypothetical | $1,000.00 | $1,017.95 | $7.11 |
| (5% return per | | | |
| year before expenses) | | | |
*Expenses are equal to the Fund’s annualized expense ratio of 1.66%, 2.50%, 1.20%, and 1.41% for Class A, Class C , Class I, and Class Y, respectively, multiplied by the average account value over the period, multiplied by 183/366 (to reflect the one-half year period).
www.calvert.com CALVERT INTERNATIONAL OPPORTUNITIES FUND ANNUAL REPORT 17
REPORT OF INDEPENDENT REGISTERED PUBLIC ACCOUNTING FIRM
The Board of Directors of Calvert World Values Fund, Inc. and Shareholders of Calvert International Opportunities Fund: We have audited the accompanying statement of net assets of Calvert International Opportunities Fund (the Fund), a series of Calvert World Values Fund, Inc., as of September 30, 2012, and the related statement of operations for the year then ended, the statements of changes in net assets for each of the years in the two-year period then ended, and the financial highlights for each of the years or periods in the five-year period then ended. These financial statements and financial highlights are the responsibility of the Fund’s management. Our responsibility is to express an opinion on these financial statements and financial highlights based on our audits.
We conducted our audits in accordance with the standards of the Public Company Accounting Oversight Board (United States). Those standards require that we plan and perform the audit to obtain reasonable assurance about whether the financial statements and financial highlights are free of material misstatement. An audit includes examining, on a test basis, evidence supporting the amounts and disclosures in the financial statements. Our procedures included confirmation of securities owned as of September 30, 2012, by correspondence with the custodian and brokers or by performing other appropriate auditing procedures. An audit also includes assessing the accounting principles used and significant estimates made by management, as well as evaluating the overall financial statement presentation. We believe that our audits provide a reasonable basis for our opinion.
In our opinion, the financial statements and financial highlights referred to above present fairly, in all material respects, the financial position of the Calvert International Opportunities Fund as of September 30, 2012, the results of its operations for the year then ended, the changes in its net assets for each of the years in the two-year period then ended, and the financial highlights for each of the years or periods in the five-year period then ended, in conformity with U.S. generally accepted accounting principles.

Philadelphia, Pennsylvania
November 29, 2012
www.calvert.com CALVERT INTERNATIONAL OPPORTUNITIES FUND ANNUAL REPORT 18
| | | |
| STATEMENT OF NET ASSETS |
| SEPTEMBER 30, 2012 |
| |
| |
| EQUITY SECURITIES - 95.5% | SHARES | | VALUE |
| Australia - 2.0% | | | |
| Crown Ltd. | 52,372 | $ | 495,053 |
| Sims Metal Management Ltd | 29,600 | | 294,556 |
| | | | 789,609 |
| |
| Austria - 2.6% | | | |
| AMAG Austria Metall AG (e) | 11,840 | | 324,244 |
| EVN AG | 22,710 | | 316,363 |
| IMMOFINANZ AG* | 115,500 | | 419,211 |
| | | | 1,059,818 |
| |
| Belgium - 2.3% | | | |
| NV Bekaert SA | 21,120 | | 608,385 |
| Umicore SA | 6,021 | | 314,874 |
| | | | 923,259 |
| |
| Brazil - 1.7% | | | |
| All America Latina Logistica SA | 37,533 | | 155,084 |
| GP Investments Ltd. (BDR)* | 70,438 | | 150,733 |
| MRV Engenharia e Participacoes SA | 28,081 | | 167,952 |
| Totvs SA | 9,994 | | 207,508 |
| | | | 681,277 |
| |
| China - 0.9% | | | |
| Mindray Medical International Ltd. (ADR) | 10,455 | | 351,393 |
| |
| Denmark - 1.4% | | | |
| D/S Norden A/S | 20,379 | | 544,035 |
| |
| Finland - 0.8% | | | |
| Ramirent Oyj | 40,474 | | 325,234 |
| |
| France - 5.8% | | | |
| Cie Generale des Etablissements Michelin, Common Series B | 9,698 | | 760,094 |
| Eutelsat Communications SA | 8,000 | | 257,294 |
| Nexans SA | 11,980 | | 562,814 |
| Societe BIC SA | 2,038 | | 246,357 |
| Vallourec SA | 12,200 | | 516,839 |
| | | | 2,343,398 |
| |
| Germany - 9.3% | | | |
| Asian Bamboo AG | 18,220 | | 142,357 |
| Deutz AG* | 58,318 | | 262,353 |
| Hugo Boss AG | 3,995 | | 351,842 |
| Jungheinrich AG, Preferred | 13,840 | | 458,821 |
| Krones AG | 9,195 | | 492,328 |
| KUKA AG* | 14,784 | | 425,775 |
www.calvert.com CALVERT INTERNATIONAL OPPORTUNITIES FUND ANNUAL REPORT 19
| | | |
| EQUITY SECURITIES - cont’d | SHARES | | VALUE |
| Germany - Cont’d | | | |
| Rational AG | 1,376 | $ | 345,068 |
| Rhoen Klinikum AG | 28,360 | | 558,605 |
| Wacker Neuson SE | 24,393 | | 344,669 |
| Wirecard AG | 15,799 | | 362,989 |
| | | | 3,744,807 |
| |
| Hong Kong - 0.7% | | | |
| Digital China Holdings Ltd. | 119,105 | | 189,854 |
| Fook Woo Group Holdings Ltd. (b)* | 1,776,000 | | 93,932 |
| | | | 283,786 |
| |
| Italy - 2.1% | | | |
| Buzzi Unicem SpA | 53,021 | | 587,277 |
| Piaggio & C SpA | 108,366 | | 246,329 |
| | | | 833,606 |
| |
| Japan - 20.5% | | | |
| Amada Co. Ltd. | 51,000 | | 223,845 |
| Autobacs Seven Co. Ltd | 3,800 | | 172,395 |
| Azbil Corp. | 23,500 | | 473,197 |
| Chugoku Marine Paints Ltd. | 79,000 | | 381,211 |
| Credit Saison Co. Ltd. | 18,902 | | 457,752 |
| Daiichikosho Co. Ltd. | 10,024 | | 241,209 |
| Doshisha Co. Ltd | 11,400 | | 331,671 |
| FamilyMart Co. Ltd | 7,029 | | 346,398 |
| Hogy Medical Co. Ltd | 4,400 | | 236,602 |
| Hokuto Corp. | 25,600 | | 542,752 |
| Makita Corp. | 10,529 | | 409,431 |
| Namco Bandai Holdings, Inc | 42,100 | | 714,274 |
| Ono Pharmaceutical Co. Ltd. | 7,200 | | 443,994 |
| Secom Co. Ltd. | 12,200 | | 637,243 |
| Stanley Electric Co. Ltd. | 27,637 | | 410,015 |
| Star Micronics Co. Ltd. | 25,500 | | 245,444 |
| Start Today Co. Ltd | 24,021 | | 345,271 |
| The Bank of Yokohama Ltd | 76,300 | | 363,287 |
| Tokyo Electron Ltd | 9,000 | | 384,048 |
| Toyota Industries Corp | 17,500 | | 490,728 |
| Yamaha Corp. | 40,100 | | 372,592 |
| | | | 8,223,359 |
| |
| Malaysia - 2.7% | | | |
| Guoco Group Ltd. | 30,000 | | 270,052 |
| New Britain Palm Oil Ltd. | 29,870 | | 299,960 |
| PureCircle Ltd.* | 151,388 | | 525,071 |
| | | | 1,095,083 |
| |
| Netherlands - 2.6% | | | |
| Koninklijke Ahold NV | 43,423 | | 544,165 |
| Wereldhave NV | 8,720 | | 485,113 |
| | | | 1,029,278 |
www.calvert.com CALVERT INTERNATIONAL OPPORTUNITIES FUND ANNUAL REPORT 20
| | | |
| EQUITY SECURITIES - cont’d | SHARES | | VALUE |
| Norway - 4.2% | | | |
| Aker ASA | 10,558 | $ | 342,568 |
| Awilco LNG AS* | 22,400 | | 77,369 |
| Electromagnetic GeoServices ASA* | 161,242 | | 395,191 |
| Golar LNG Ltd | 3,700 | | 142,783 |
| Opera Software ASA | 69,505 | | 444,973 |
| Yara International ASA | 5,391 | | 269,900 |
| | | | 1,672,784 |
| |
| Panama - 1.2% | | | |
| Banco Latinoamericano de Exportaciones SA | 21,582 | | 476,746 |
| |
| Puerto Rico - 0.6% | | | |
| Oriental Financial Group, Inc | 24,157 | | 254,132 |
| |
| Russia - 0.7% | | | |
| Eurasia Drilling Co. Ltd. (GDR) | 8,633 | | 284,889 |
| |
| Singapore - 1.0% | | | |
| Ascendas India Trust | 657,500 | | 410,167 |
| |
| South Korea - 5.2% | | | |
| Daum Communications Corp. | 2,317 | | 236,615 |
| Dongbu Insurance Co. Ltd. | 4,824 | | 210,074 |
| Mando Corp. | 1,533 | | 212,414 |
| Mirae Asset Securities Co. Ltd. | 14,860 | | 452,582 |
| NongShim Co. Ltd. | 2,046 | | 488,753 |
| Samsung Card Co. Ltd. | 13,900 | | 500,884 |
| | | | 2,101,322 |
| |
| Sweden - 2.4% | | | |
| Industrivarden AB, C Shares | 38,577 | | 552,132 |
| Intrum Justitia AB | 27,998 | | 409,247 |
| | | | 961,379 |
| |
| Switzerland - 3.9% | | | |
| GAM Holding AG* | 38,800 | | 505,638 |
| Sonova Holding AG* | 1,559 | | 157,641 |
| Swiss Life Holding AG* | 3,305 | | 393,436 |
| Valiant Holding* | 5,955 | | 517,895 |
| | | | 1,574,610 |
| |
| Taiwan - 0.8% | | | |
| Hiwin Technologies Corp | 23,795 | | 174,524 |
| Synnex Technology International Corp. | 70,143 | | 158,886 |
| | | | 333,410 |
| |
| Thailand - 0.2% | | | |
| Thanachart Capital PCL: | | | |
| Common | 74,136 | | 90,924 |
| Foreign | 3,500 | | 4,292 |
| | | | 95,216 |
www.calvert.com CALVERT INTERNATIONAL OPPORTUNITIES FUND ANNUAL REPORT 21
| | | | |
| EQUITY SECURITIES - cont’d | | SHARES | | VALUE |
| United Arab Emirates - 1.1% | | | | |
| Polarcus Ltd.* | | 396,701 | $ | 431,817 |
| |
| United Kingdom - 18.8% | | | | |
| Admiral Group plc | | 24,018 | | 407,994 |
| Ashtead Group plc | | 106,550 | | 556,568 |
| Beazley plc | | 198,077 | | 536,823 |
| Catlin Group Ltd | | 92,982 | | 713,543 |
| Close Brothers Group plc | | 31,503 | | 423,590 |
| Colt Group SA* | | 163,027 | | 313,227 |
| Debenhams plc | | 182,114 | | 300,837 |
| Dialight plc | | 8,330 | | 161,524 |
| Homeserve plc | | 95,848 | | 324,706 |
| Inmarsat plc | | 40,053 | | 381,220 |
| International Personal Finance plc | | 86,109 | | 416,316 |
| Investec plc | | 75,600 | | 466,367 |
| J Sainsbury plc | | 96,991 | | 543,719 |
| Lancashire Holdings Ltd. | | 27,379 | | 363,722 |
| N Brown Group plc | | 34,482 | | 152,806 |
| NCC Group plc | | 10,900 | | 163,090 |
| Provident Financial plc | | 16,355 | | 362,251 |
| Whitbread plc | | 13,165 | | 481,673 |
| William Morrison Supermarkets plc | | 102,880 | | 473,335 |
| | | | | 7,543,311 |
| |
| |
| Total Equity Securities (Cost $35,058,411) | | | | 38,367,725 |
| |
| |
| | | PRINCIPAL | | |
| TIME DEPOSIT - 1.3% | | AMOUNT | | |
| State Street Bank Time Deposit, 0.113%, 10/1/12 | $ | 538,844 | | 538,844 |
| |
| Total Time Deposit (Cost $538,844) | | | | 538,844 |
| |
| |
| |
| TOTAL INVESTMENTS (Cost $35,597,255) - 96.8% | | | | 38,906,569 |
| Other assets and liabilities, net - 3.2% | | | | 1,271,091 |
| NET ASSETS - 100% | | | $ | 40,177,660 |
See notes to financial statements.
www.calvert.com CALVERT INTERNATIONAL OPPORTUNITIES FUND ANNUAL REPORT 22
| | | | |
| NET ASSETS CONSIST OF: | | | |
| Paid-in capital applicable to the following shares of common stock with | | | |
| 250,000,000 shares of $.01 par value shares authorized: | | | |
| Class A: 2,177,288 shares outstanding | $ | 29,325,874 | |
| Class C: 192,128 shares outstanding | | 2,383,557 | |
| Class I: 708,776 shares outstanding | | 9,142,345 | |
| Class Y: 137,158 shares outstanding | | 1,595,533 | |
| Undistributed net investment income | | 292,411 | |
| Accumulated net realized gain (loss) on investments and foreign currency transactions | | (5,867,265 | ) |
| Net unrealized appreciation (depreciation) on investments, foreign | | | |
| currencies and assets and liabilities denominated in foreign currencies | | 3,305,205 | |
| |
| NET ASSETS | $ | 40,177,660 | |
| |
| |
| NET ASSET VALUE PER SHARE | | | |
| Class A | (based on net assets of $27,406,005) | $ | 12.59 | |
| Class C | (based on net assets of $2,362,982) | $ | 12.30 | |
| Class I | (based on net assets of $8,770,836) | $ | 12.37 | |
| Class Y | (based on net assets of $1,637,837) | $ | 11.94 | |
(b) This security was valued by the Board of Directors. See Note A.
(e) Security is exempt from registration under Rule 144A of the Securities Act of 1933. These securities may be
resold in transactions exempt from registration, normally to qualified institutional buyers.
* Non-income producing security.
Abbreviations:
ADR: American Depositary Receipts
BDR: Brazilian Depositary Receipts
GDR: Global Depositary Receipts
plc: Public Limited Company
See notes to financial statements.
www.calvert.com CALVERT INTERNATIONAL OPPORTUNITIES FUND ANNUAL REPORT 23
| | | |
| STATEMENT OF OPERATIONS |
| YEAR ENDED SEPTEMBER 30, 2012 |
| |
| |
| NET INVESTMENT INCOME | | | |
| Investment Income: | | | |
| Dividend income (net of foreign taxes withheld of $76,089) | $ | 967,361 | |
| Interest income | | 462 | |
| Total investment income | | 967,823 | |
| |
| Expenses: | | | |
| Investment advisory fee | | 277,186 | |
| Transfer agency fees and expenses | | 113,958 | |
| Distribution Plan expenses: | | | |
| Class A | | 63,821 | |
| Class C | | 19,938 | |
| Directors’ fees and expenses | | 4,308 | |
| Administrative fees | | 110,056 | |
| Accounting fees | | 5,367 | |
| Custodian fees | | 101,617 | |
| Registration fees | | 45,501 | |
| Reports to shareholders | | 33,706 | |
| Professional fees | | 20,959 | |
| Miscellaneous | | 9,151 | |
| Total expenses | | 805,568 | |
| Reimbursement from Advisor: | | | |
| Class A | | (175,316 | ) |
| Class C | | (22,921 | ) |
| Class I | | (28,084 | ) |
| Class Y | | (16,460 | ) |
| Fees paid indirectly | | (428 | ) |
| Net expenses | | 562,359 | |
| |
| |
| NET INVESTMENT INCOME | | 405,464 | |
| |
| |
| REALIZED AND UNREALIZED GAIN (LOSS) | | | |
| Net realized gain (loss) on: | | | |
| Investments | | 2,138,162 | |
| Foreign currency transactions | | (21,869 | ) |
| | | 2,116,293 | |
| |
| Change in unrealized appreciation (depreciation) on: | | | |
| Investments and foreign currencies | | 3,931,468 | |
| Assets and liabilities denominated in foreign currencies | | (3,273 | ) |
| | | 3,928,195 | |
| |
| NET REALIZED AND UNREALIZED GAIN (LOSS) | | 6,044,488 | |
| |
| INCREASE (DECREASE) IN NET ASSETS | | | |
| RESULTING FROM OPERATIONS | $ | 6,449,952 | |
See notes to financial statements.
www.calvert.com CALVERT INTERNATIONAL OPPORTUNITIES FUND ANNUAL REPORT 24
| | | | |
| STATEMENTS OF CHANGES IN NET ASSETS |
|
| | Year ended | | Year ended | |
| | September 30, | | September 30, | |
| INCREASE (DECREASE) IN NET ASSETS | 2012 | | 2011 | |
| Operations: | | | | |
| Net investment income | $405,464 | | $301,471 | |
| Net realized gain (loss) | 2,116,293 | | (1,779,213 | ) |
| Change in unrealized appreciation (depreciation) | 3,928,195 | | (4,911,995 | ) |
| |
| |
| INCREASE (DECREASE) IN NET ASSETS | | | | |
| RESULTING FROM OPERATIONS | 6,449,952 | | (6,389,737 | ) |
| |
| Distributions to shareholders from: | | | | |
| Net investment income: | | | | |
| Class A shares | (280,956 | ) | (76,759 | ) |
| Class C shares | (1,891 | ) | — | |
| Class I shares | (52,830 | ) | (28,795 | ) |
| Class Y shares | (15,544 | ) | (1,938 | ) |
| Total distributions | (351,221 | ) | (107,492 | ) |
| |
| |
| Capital share transactions: | | | | |
| Shares sold: | | | | |
| Class A shares | 6,153,061 | | 15,014,980 | |
| Class C shares | 496,718 | | 782,420 | |
| Class I shares | 4,346,352 | | 1,099,287 | |
| Class Y shares | 426,350 | | 1,087,881 | |
| Reinvestment of distributions: | | | | |
| Class A shares | 245,600 | | 69,323 | |
| Class C shares | 1,463 | | — | |
| Class I shares | 52,830 | | 28,796 | |
| Class Y shares | 10,070 | | 852 | |
| Redemption fees: | | | | |
| Class A shares | 900 | | 834 | |
| Class C shares | — | | 315 | |
| Class Y shares | 20 | | 4 | |
| Shares redeemed: | | | | |
| Class A shares | (8,419,568 | ) | (15,096,941 | ) |
| Class C shares | (320,860 | ) | (326,502 | ) |
| Class I shares | (725,277 | ) | (514,126 | ) |
| Class Y shares | (586,431 | ) | (192,271 | ) |
| Total capital share transactions | 1,681,228 | | 1,954,852 | |
| |
| |
| TOTAL INCREASE (DECREASE) IN NET ASSETS | 7,779,959 | | (4,542,377 | ) |
| |
| |
| NET ASSETS | | | | |
| Beginning of year | 32,397,701 | | 36,940,078 | |
| End of year (including undistributed net investment | | | | |
| income of $292,411 and $259,946, respectively) | $40,177,660 | | $32,397,701 | |
See notes to financial statements.
www.calvert.com CALVERT INTERNATIONAL OPPORTUNITIES FUND ANNUAL REPORT 25
| | | | |
| STATEMENTS OF CHANGES IN NET ASSETS |
| |
| |
| | Year ended | | Year ended | |
| | September 30, | | September 30, | |
| CAPITAL SHARE ACTIVITY | 2012 | | 2011 | |
| Shares sold: | | | | |
| Class A shares | 527,829 | | 1,170,709 | |
| Class C shares | 42,932 | | 61,515 | |
| Class I shares | 364,209 | | 97,690 | |
| Class Y shares | 39,290 | | 88,425 | |
| Reinvestment of distributions: | | | | |
| Class A shares | 23,214 | | 5,353 | |
| Class C shares | 141 | | — | |
| Class I shares | 5,094 | | 2,276 | |
| Class Y shares | 1,005 | | 70 | |
| Shares redeemed: | | | | |
| Class A shares | (726,250 | ) | (1,242,892 | ) |
| Class C shares | (28,402 | ) | (27,013 | ) |
| Class I shares | (63,421 | ) | (41,279 | ) |
| Class Y shares | (54,993 | ) | (17,211 | ) |
| Total capital share activity | 130,648 | | 97,643 | |
See notes to financial statements.
www.calvert.com CALVERT INTERNATIONAL OPPORTUNITIES FUND ANNUAL REPORT 26
NOTES TO FINANCIAL STATEMENTS
NOTE A — SIGNIFICANT ACCOUNTING POLICIES
General: The Calvert International Opportunities Fund (the “Fund”), a series of Calvert World Values Fund, Inc., is registered under the Investment Company Act of 1940 as a diversified, open-end management investment company. The Calvert World Values Fund, Inc. is comprised of three separate series. The operations of each series are accounted for separately. The Fund offers four classes of shares of capital stock - Classes A, C, I, and Y. Class A shares are sold with a maximum front-end sales charge of 4.75%. Class C shares are sold without a front-end sales charge and, with certain exceptions, will be charged a deferred sales charge on shares sold within one year of purchase. Class C shares have higher levels of expenses than Class A shares. Class I shares require a minimum account balance of $1,000,000. The $1 million minimum initial investment may be waived for certain institutional accounts where it is believed to be in the best interest of the Fund and its shareholders. Class I shares have no front-end or deferred sales charge and have lower levels of expenses than Class A shares. Class Y shares are generally only available to wrap or similar fee-based programs offered by financial intermediaries that have entered into an agreement with the Fund’s Distributor to offer Class Y shares. Class Y shares have no front-end or deferred sales charge and have lower levels of expenses than Class A shares. Each class has different: (a) dividend rates, due to differences in Distribution Plan expenses and other class-specific expenses, (b) exchange privileges, and (c) class-specific voting rights.
Security Valuation: Net asset value per share is determined every business day as of the close of the regular session of the New York Stock Exchange (generally 4:00 p.m. Eastern time). The Fund uses independent pricing services approved by the Board of Directors (“the Board”) to value its investments wherever possible. Investments for which market quotations are not available or deemed not reliable are fair valued in good faith under the direction of the Board.
The Board has adopted Valuation Procedures (the “Procedures”) to determine the fair value of securities and other financial instruments for which market prices are not readily available or which may not be reliably priced. The Board has delegated the day-to-day responsibility for determining the fair value of assets of the Fund to Calvert Investment Management, Inc. (the “Advisor” or “Calvert”) and has provided these Procedures to govern Calvert in its valuation duties.
Calvert has chartered an internal Valuation Committee to oversee the implementation of these Procedures and to assist it in carrying out the valuation responsibilities that the Board has delegated.
The Valuation Committee meets on a regular basis to review illiquid securities and other investments which may not have readily available market prices. The Valuation Committee’s fair valuation determinations are subject to review, approval and ratification by the Board at its next regularly scheduled meeting covering the calendar quarter in which the fair valuation was determined.
www.calvert.com CALVERT INTERNATIONAL OPPORTUNITIES FUND ANNUAL REPORT 27
The Valuation Committee utilizes various methods to measure the fair value of the Fund’s investments. Generally Accepted Accounting Principles (GAAP) establishes a disclosure hierarchy that categorizes the inputs to valuation techniques used to value assets and liabilities at measurement date. These inputs are summarized in the three broad levels listed below:
Level 1 – quoted prices in active markets for identical securities
Level 2 – other significant observable inputs (including quoted prices for similar securities, interest rates, prepayment speeds, credit risk, etc.)
Level 3 – significant unobservable inputs (including the Fund’s own assumptions in determining the fair value of investments)
The inputs or methodologies used for valuing securities are not necessarily an indication of the risk associated with investing in those securities.
Changes in valuation techniques may result in transfers in or out of an investment’s assigned level within the hierarchy during the period. Valuation techniques used to value the Funds’ investments by major category are as follows: Equity securities, including restricted securities, for which market quotations are readily available, are valued at the last reported sale price or official closing price as reported by an independent pricing service on the primary market or exchange on which they are traded and are categorized as Level 1 in the hierarchy. In the event there were no sales during the day or closing prices are not available, securities are valued at the last quoted bid price or using the last available price and are categorized as Level 2 in the hierarchy. Foreign securities are valued based on quotations from the principle market in which such securities are normally traded. If events occur after the close of the principal market in which foreign securities are traded, and before the close of business of the Fund, that are expected to materially affect the value of those securities, then they are valued at their fair value taking these events into account. The Fund has retained a third party fair value pricing service to quantitatively analyze the price movement of its holdings on foreign exchanges and to automatically fair value if the variation from the prior day’s closing price exceeds specified parameters. Such securities would be categorized as Level 2 in the hierarchy in these circumstances. Utilizing this technique may result in transfers between Level 1 and Level 2. For restricted securities and private placements where observable inputs are limited, assumptions about market activity and risk are used and such securities are categorized as Level 3 in the hierarchy.
Short-term securities of sufficient credit quality with remaining maturities of sixty days or less for which quotations are not readily available are valued at amortized cost, which approximates fair value, and are categorized as Level 2 in the hierarchy.
If a market value cannot be determined for a security using the methodologies described above, or if, in the good faith opinion of the Advisor, the market value does not constitute a readily available market quotation, or if a significant event has occurred that would materially affect the value of the security, the security will be fair valued as determined in good faith by the Valuation Committee.
www.calvert.com CALVERT INTERNATIONAL OPPORTUNITIES FUND ANNUAL REPORT 28
The Valuation Committee considers a number of factors, including significant unobservable valuation inputs when arriving at fair value. It considers all significant facts that are reasonably available and relevant to the determination of fair value.
The Valuation Committee primarily employs a market-based approach which may use related or comparable assets or liabilities, recent transactions, market multiples, book values, and other relevant information for the investment to determine the fair value of the investment. When more appropriate, the fund may employ an income-based or cost approach. An income-based valuation approach discounts anticipated future cash flows of the investment to calculate a present amount (discounted). The measurement is based on the value indicated by current market expectations about those future amounts. Discounts may also be applied due to the nature or duration of any restrictions on the disposition of the investments. A cost based approach is based on the amount that currently would be required to replace the service capacity of an asset (current replacement cost). From the seller’s perspective, the price that would be received for the asset is determined based on the cost to a buyer to acquire or construct a substitute asset of comparable utility, adjusted for obsolescence.
The values assigned to fair value investments are based on available information and do not necessarily represent amounts that might ultimately be realized. Further, due to the inherent uncertainty of valuations of such investments, the fair values may differ significantly from the values that would have been used had an active market existed, and the differences could be material. The Valuation Committee employs various methods for calibrating these valuation approaches including a regular review of key inputs and assumptions, transactional back-testing or disposition analysis and reviews of any related market activity.
At September 30, 2012, securities valued at $93,932, or 0.2% of net assets, were fair valued in good faith under the direction of the Board.
The following is a summary of the inputs used to value the Fund’s net assets as of September 30, 2012:
| | | VALUATION INPUTS | | |
| |
| Investments In Securities | Level 1 | Level 2 | Level 3 | | Total |
| Equity securities* | $38,273,793 | — | $93,932 | | $38,367,725 |
| Other debt obligations | — | $538,844 | — | | 538,844 |
| TOTAL | $38,273,793 | $538,844 | $93,932 | ** | $38,906,569 |
* For further breakdown of equity securities by country, please refer to the Statement of Net Assets.
** Level 3 securities represent 0.2% of net assets.
Security Transactions and Net Investment Income: Security transactions are accounted for on trade date. Realized gains and losses are recorded on an identified cost basis and may include proceeds from litigation. Dividend income is recorded on the ex-dividend date or, in the case of dividends on certain foreign securities, as soon as the Fund is informed of the ex-dividend date. Withholding taxes on foreign dividends have been provided for in accordance with the Fund’s understanding of the applicable country’s tax rules and rates. Distributions received on securities that represent a return of capital or capital gain are
www.calvert.com CALVERT INTERNATIONAL OPPORTUNITIES FUND ANNUAL REPORT 29
recorded as a reduction of cost of investments and/or as a realized gain. Interest income, which includes amortization of premium and accretion of discount on debt securities, is accrued as earned. Investment income and realized and unrealized gains and losses are allocated to separate classes of shares based upon the relative net assets of each class. Expenses arising in connection with a specific class are charged directly to that class. Expenses common to the classes are allocated to each class in proportion to their relative net assets.
Foreign Currency Transactions: The Fund’s accounting records are maintained in U.S. dollars. For valuation of assets and liabilities on each date of net asset value determination, foreign denominations are converted into U.S. dollars using the current exchange rate. Security transactions, income, and expenses are translated at the prevailing rate of exchange on the date of the event. The effect of changes in foreign exchange rates on securities and foreign currencies is included in the net realized and unrealized gain or loss on securities and foreign currencies.
Distributions to Shareholders: Distributions to shareholders are recorded by the Fund on ex-dividend date. Dividends from net investment income and distributions from net realized capital gains, if any, are paid at least annually. Distributions are determined in accordance with income tax regulations which may differ from generally accepted accounting principles; accordingly, periodic reclassifications are made within the Fund’s capital accounts to reflect income and gains available for distribution under income tax regulations.
Estimates: The preparation of financial statements in conformity with accounting principles generally accepted in the United States requires management to make estimates and assumptions that affect the reported amounts of assets and liabilities and disclosure of contingent assets and liabilities at the date of the financial statements and the reported amounts of income and expenses during the reporting period. Actual results could differ from those estimates.
Redemption Fees: The Fund charges a 2% redemption fee on redemptions, including exchanges, made within 30 days of purchase (within seven days for Class I shares). The redemption fee is accounted for as an addition to paid-in capital and is intended to discourage market-timers by ensuring that short-term trading costs are borne by the investors making the transactions and not the shareholders already in the Fund.
Expense Offset Arrangements: The Fund has an arrangement with its custodian bank whereby the custodian’s fees may be paid indirectly by credits earned on the Fund’s cash on deposit with the bank. These credits are used to reduce the Fund’s expenses. Such a deposit arrangement may be an alternative to overnight investments.
Federal Income Taxes: No provision for federal income or excise tax is required since the Fund intends to continue to qualify as a regulated investment company under the Internal Revenue Code and to distribute substantially all of its taxable earnings.
Management has analyzed the Fund’s tax positions taken for all open federal income tax years and has concluded that no provision for federal income tax is required in the Fund’s financial statements. A Fund’s federal tax return is subject to examination by the Internal Revenue Service for a period of three years.
www.calvert.com CALVERT INTERNATIONAL OPPORTUNITIES FUND ANNUAL REPORT 30
NOTE B — RELATED PARTY TRANSACTIONS
Calvert Investment Management, Inc. (the “Advisor”) is wholly-owned by Calvert Investments, Inc., which is indirectly wholly-owned by Ameritas Mutual Holding Company (formerly known as UNIFI Mutual Holding Company). The Advisor provides investment advisory services and pays the salaries and fees of officers and Directors of the Fund who are employees of the Advisor or its affiliates. For its services, the Advisor receives an annual fee, payable monthly, of .80% of the average daily net assets. Under the terms of the agreement, $25,630 was payable at year end. In addition, $7,815 was payable at year end for operating expenses paid by the Advisor during September 2012.
The Advisor has contractually agreed to limit net annual fund operating expenses through January 31, 2013. The contractual expense cap is 1.66%, 2.50%, 1.20%, and 1.41% for Class A, C, I, and Y, respectively. For the purpose of this expense limit, operating expenses do not include interest expense, brokerage commissions, taxes, and extraordinary expenses. To the extent any expense offset credits are earned, the Advisor’s obligation under the contractual limitation may be reduced and the Advisor may benefit from the expense offset arrangement.
Calvert Investment Administrative Services, Inc., an affiliate of the Advisor, provides administrative services to the Fund for an annual fee, payable monthly, of .35% for Classes A, C, and Y shares and .15% for Class I shares, based on their average daily net assets. Under the terms of the agreement, $9,909 was payable at year end.
Calvert Investment Distributors, Inc. (“CID”), an affiliate of the Advisor, is the distributor and principal underwriter for the Fund. Distribution Plans, adopted by Class A and Class C shares, allow the Fund to pay the Distributor for expenses and services associated with the distribution of shares. The expenses paid may not exceed .50% and 1.00% annually of the average daily net assets of Class A and C, respectively. The amount actually paid by the Fund is an annualized fee, payable monthly of .25% and 1.00% of the average daily net assets of Class A and C, respectively. Class I and Y shares do not have Distribution Plan expenses. Under the terms of the agreement, $7,450 was payable at year end.
CID received $10,134 as its portion of the commissions charged on sales of the Fund’s Class A shares for the year ended September 30, 2012.
Calvert Investment Services, Inc. (“CIS”), an affiliate of the Advisor, is the shareholder servicing agent for the Fund. For its services, CIS received a fee of $23,256 for the year ended September 30, 2012. Under the terms of the agreement, $1,583 was payable at year end. Boston Financial Data Services, Inc. is the transfer and dividend disbursing agent.
Each Director of the Fund who is not an employee of the Advisor or its affiliates receives an annual retainer of $44,000 plus a meeting fee of $2,000 for each Board meeting attended. Additional fees of up to $5,000 annually may be paid to the
www.calvert.com CALVERT INTERNATIONAL OPPORTUNITIES FUND ANNUAL REPORT 31
Board chair and Committee chairs ($10,000 for the Special Equities Committee chair) and $2,500 annually may be paid to Committee members, plus a Committee meeting fee of $500 for each Committee meeting attended. Directors’ fees are allocated to each of the Funds served.
NOTE C — INVESTMENT ACTIVITY AND TAX INFORMATION
During the year, the cost of purchases and proceeds from sales of investments, other than short-term securities, were $21,794,798 and $18,687,047, respectively.
| CAPITAL LOSS CARRYFORWARDS | | |
| EXPIRATION DATE | | |
| 30-Sep-17 | ($710,228 | ) |
| 30-Sep-18 | (4,754,491 | ) |
| 30-Sep-19 | (69,673 | ) |
Under the Regulated Investment Company Modernization Act of 2010, capital losses incurred in taxable years beginning after December 22, 2010 can be carried forward for an unlimited period. These losses are required to be utilized prior to the losses incurred in pre-enactment taxable years. Losses incurred in pre-enactment taxable years can be utilized until expiration.
The tax character of dividends and distributions paid during the years ended September 30, 2012 and September 30, 2011 was as follows:
| Distributions paid from: | 2012 | 2011 |
| Ordinary income | $351,221 | $107,492 |
| Total | $351,221 | $107,492 |
As of September 30, 2012, the tax basis components of distributable earnings/(accumulated losses) and the federal tax cost were as follows:
| Unrealized appreciation | $4,642,453 | |
| Unrealized (depreciation) | (1,881,882 | ) |
| Net unrealized appreciation/(depreciation) | $2,760,571 | |
| |
| Undistributed ordinary income | $508,281 | |
| Capital loss carryforward | ($5,534,392 | ) |
| |
| Federal income tax cost of investments | $36,145,998 | |
www.calvert.com CALVERT INTERNATIONAL OPPORTUNITIES FUND ANNUAL REPORT 32
The differences between the components of distributable earnings on a tax basis and the amounts reflected in the statement of net assets are primarily due to temporary book-tax differences that will reverse in a subsequent period. These book-tax differences are mainly due to wash sales and passive foreign investment companies.
Reclassifications, as shown in the table below, have been made to the Fund’s components of net assets to reflect income and gains available for distribution (or available capital loss carryovers, as applicable) under income tax law and regulations. These reclassifications are due to permanent book-tax differences and have no impact on net assets. The primary permanent differences causing such reclassifications for the Fund are due to foreign currency transactions.
| Undistributed net investment income | ($21,778 | ) |
| Accumulated net realized gain (loss) | 21,869 | |
| Paid-in capital | (91 | ) |
NOTE D — LINE OF CREDIT
A financing agreement is in place with the Calvert Funds and State Street Corporation (“SSC”). Under the agreement, SSC provides an unsecured line of credit facility, in the aggregate amount of $50 million ($25 million committed and $25 million uncommitted), accessible by the Funds for temporary or emergency purposes only. Borrowings under the committed facility bear interest at the higher of the London Interbank Offered Rate (LIBOR) or the overnight Federal Funds Rate plus 1.25% per annum. A commitment fee of .11% per annum is incurred on the unused portion of the committed facility, which is allocated to all participating funds. The Fund had no loans outstanding pursuant to this line of credit at September 30, 2012. For the year ended September 30, 2012, borrowings by the Fund under the agreement were as follows:
| | WEIGHTED | | MONTH OF |
| AVERAGE | AVERAGE | MAXIMUM | MAXIMUM |
| DAILY | INTEREST | AMOUNT | AMOUNT |
| BALANCE | RATE | BORROWED | BORROWED |
| $2,672 | 1.41% | $197,638 | February 2012 |
NOTE E – SUBSEQUENT EVENTS
In preparing the financial statements as of September 30, 2012, no subsequent events or transactions occurred that would have required recognition or disclosure in these financial statements.
www.calvert.com CALVERT INTERNATIONAL OPPORTUNITIES FUND ANNUAL REPORT 33
www.calvert.com CALVERT INTERNATIONAL OPPORTUNITIES FUND ANNUAL REPORT 34
| | | | | | |
| FINANCIAL HIGHLIGHTS |
| |
| | | | YEARS ENDED | | |
| | September 30, | | September 30, | | September 30, | |
| CLASS A SHARES | 2012 | | 2011 | | 2010 | (z) |
| Net asset value, beginning | $10.57 | | $12.43 | | $11.40 | |
| Income from investment operations: | | | | | | |
| Net investment income | .13 | | .10 | | .06 | |
| Net realized and unrealized gain (loss) | 2.01 | | (1.93 | ) | .97 | |
| Total from investment operations | 2.14 | | (1.83 | ) | 1.03 | |
| Distributions from: | | | | | | |
| Net investment income | (.12 | ) | (.03 | ) | — | |
| Total distributions | (.12 | ) | (.03 | ) | — | |
| Total increase (decrease) in net asset value | 2.02 | | (1.86 | ) | 1.03 | |
| Net asset value, ending | $12.59 | | $10.57 | | $12.43 | |
| |
| Total return* | 20.52 | % | (14.78 | %) | 9.04 | % |
| Ratios to average net assets:A | | | | | | |
| Net investment income | 1.10 | % | .68 | % | .48 | % |
| Total expenses | 2.35 | % | 2.21 | % | 2.27 | % |
| Expenses before offsets | 1.66 | % | 1.66 | % | 1.66 | % |
| Net expenses | 1.66 | % | 1.66 | % | 1.66 | % |
| Portfolio turnover | 56 | % | 126 | % | 44 | % |
| Net assets, ending (in thousands) | $27,406 | | $24,874 | | $30,062 | |
| |
| |
| | | | YEARS ENDED | |
| | | | September 30, | | September 30, | |
| CLASS A SHARES | | | 2009 | (z) | 2008 | (z) |
| Net asset value, beginning | | | $11.50 | | $15.32 | |
| Income from investment operations: | | | | | | |
| Net investment income | | | .06 | | .17 | |
| Net realized and unrealized gain (loss) | | | (.10 | ) | (3.99 | ) |
| Total from investment operations | | | (.04 | ) | (3.82 | ) |
| Distributions from: | | | | | | |
| Net investment income | | | (.06 | ) | — | |
| Net realized gain | | | ** | | — | |
| Total from distributions | | | (.06 | ) | — | |
| Total increase (decrease) in net asset value | | | (.10 | ) | (3.82 | ) |
| Net asset value, ending | | | $11.40 | | $11.50 | |
| |
| Total return* | | | (.16 | %) | (24.93 | %) |
| Ratios to average net assets:A | | | | | | |
| Net investment income | | | .63 | % | 1.22 | % |
| Total expenses | | | 2.70 | % | 2.81 | % |
| Expenses before offsets | | | 1.67 | % | 1.68 | % |
| Net expenses | | | 1.67 | % | 1.66 | % |
| Portfolio turnover | | | 98 | % | 29 | % |
| Net assets, ending (in thousands) | | | $21,328 | | $16,710 | |
See notes to financial highlights.
www.calvert.com CALVERT INTERNATIONAL OPPORTUNITIES FUND ANNUAL REPORT 35
| | | | | | |
| FINANCIAL HIGHLIGHTS |
| |
| | | | YEARS ENDED | | | |
| | September 30, | | September 30, | | September 30, | |
| CLASS C SHARES | 2012 | | 2011 | | 2010 | (z) |
| Net asset value, beginning | $10.32 | | $12.20 | | $11.29 | |
| Income from investment operations: | | | | | | |
| Net investment income (loss) | .04 | | (.01 | ) | (.03 | ) |
| Net realized and unrealized gain (loss) | 1.95 | | (1.87 | ) | .94 | |
| Total from investment operations | 1.99 | | (1.88 | ) | .91 | |
| Distributions from: | | | | | | |
| Net investment income | (.01 | ) | — | | — | |
| Total distributions | (.01 | ) | — | | — | |
| Total increase (decrease) in net asset value | 1.98 | | (1.88 | ) | .91 | |
| Net asset value, ending | $12.30 | | $10.32 | | $12.20 | |
| |
| Total return* | 19.31 | % | (15.41 | %) | 8.06 | % |
| Ratios to average net assets:A | | | | | | |
| Net investment income (loss) | .30 | % | (.13 | %) | (.25 | %) |
| Total expenses | 3.65 | % | 3.48 | % | 3.88 | % |
| Expenses before offsets | 2.50 | % | 2.50 | % | 2.50 | % |
| Net expenses | 2.50 | % | 2.50 | % | 2.50 | % |
| Portfolio turnover | 56 | % | 126 | % | 44 | % |
| Net assets, ending (in thousands) | $2,363 | | $1,831 | | $1,744 | |
| |
| |
| | | | YEARS ENDED | |
| | | | September 30, | | September 30, | |
| CLASS C SHARES | | | 2009 | (z) | 2008 | (z) |
| Net asset value, beginning | | | $11.39 | | $15.30 | |
| Income from investment operations | | | | | | |
| Net investment income (loss) | | | (.02 | ) | .09 | |
| Net realized and unrealized gain (loss) | | | (.08 | ) | (4.00 | ) |
| Total from investment operations | | | (.10 | ) | (3.91 | ) |
| Distributions from: | | | | | | |
| Net realized gain | | | ** | | — | |
| Total from distributions | | | ** | | — | |
| Total increase (decrease) in net asset value | | | (.10 | ) | (3.91 | ) |
| Net asset value, ending | | | $11.29 | | $11.39 | |
| |
| Total return* | | | (.82 | %) | (25.56 | %) |
| Ratios to average net assets:A | | | | | | |
| Net investment income (loss) | | | (.19 | %) | .67 | % |
| Total expenses | | | 5.38 | % | 7.55 | % |
| Expenses before offsets | | | 2.51 | % | 2.52 | % |
| Net expenses | | | 2.51 | % | 2.50 | % |
| Portfolio turnover | | | 98 | % | 29 | % |
| Net assets, ending (in thousands) | | | $823 | | $620 | |
See notes to financial highlights.
www.calvert.com CALVERT INTERNATIONAL OPPORTUNITIES FUND ANNUAL REPORT 36
| | | | | | |
| FINANCIAL HIGHLIGHTS |
| |
| | | | YEARS ENDED | | |
| | September 30, | | September 30, | | September 30, | |
| CLASS I SHARES | 2012 | | 2011 | | 2010 | (z) |
| Net asset value, beginning | $10.36 | | $12.17 | | $11.32 | |
| Income from investment operations: | | | | | | |
| Net investment income | .21 | | .15 | | .10 | |
| Net realized and unrealized gain (loss) | 1.93 | | (1.88 | ) | .95 | |
| Total from investment operations | 2.14 | | (1.73 | ) | 1.05 | |
| Distributions from: | | | | | | |
| Net investment income | (.13 | ) | (.08 | ) | (.20 | ) |
| Total distributions | (.13 | ) | (.08 | ) | (.20 | ) |
| Total increase (decrease) in net asset value | 2.01 | | (1.81 | ) | .85 | |
| Net asset value, ending | $12.37 | | $10.36 | | $12.17 | |
| |
| Total return* | 20.89 | % | (14.32 | %) | 9.42 | % |
| Ratios to average net assets:A | | | | | | |
| Net investment income | 1.76 | % | 1.11 | % | .90 | % |
| Total expenses | 1.70 | % | 1.54 | % | 1.73 | % |
| Expenses before offsets | 1.20 | % | 1.20 | % | 1.20 | % |
| Net expenses | 1.20 | % | 1.20 | % | 1.20 | % |
| Portfolio turnover | 56 | % | 126 | % | 44 | % |
| Net assets, ending (in thousands) | $8,771 | | $4,174 | | $4,190 | |
| |
| |
| | | | YEARS ENDED | |
| | | | September 30, | | September 30, | |
| CLASS I SHARES | | | 2009 | (z) | 2008 | (z) |
| Net asset value, beginning | | | $11.58 | | $15.35 | |
| Income from investment operations: | | | | | | |
| Net investment income | | | .09 | | .25 | |
| Net realized and unrealized gain (loss) | | | (.14 | ) | (4.02 | ) |
| Total from investment operations | | | (.05 | ) | (3.77 | ) |
| Distributions from: | | | | | | |
| Net investment income | | | (.21 | ) | — | |
| Net realized gain | | | ** | | — | |
| Total from distributions | | | (.21 | ) | — | |
| Total increase (decrease) in net asset value | | | (.26 | ) | (3.77 | ) |
| Net asset value, ending | | | $11.32 | | $11.58 | |
| |
| Total return* | | | .26 | % | (24.56 | %) |
| Ratios to average net assets:A | | | | | | |
| Net investment income | | | 1.03 | % | 1.72 | % |
| Total expenses | | | 2.11 | % | 2.26 | % |
| Expenses before offsets | | | 1.21 | % | 1.22 | % |
| Net expenses | | | 1.21 | % | 1.20 | % |
| Portfolio turnover | | | 98 | % | 29 | % |
| Net assets, ending (in thousands) | | | $3,712 | | $3,533 | |
See notes to financial highlights.
www.calvert.com CALVERT INTERNATIONAL OPPORTUNITIES FUND ANNUAL REPORT 37
| | | | |
FINANCIAL HIGHLIGHTS |
| |
| |
| | YEARS ENDED | |
| | September 30, | | September 30, | |
| CLASS Y SHARES | 2012 | | 2011 | |
| Net asset value, beginning | $10.00 | | $11.72 | |
| Income from investment operations: | | | | |
| Net investment income | .15 | | .13 | |
| Net realized and unrealized gain (loss) | 1.90 | | (1.83 | ) |
| Total from investment operations | 2.05 | | (1.70 | ) |
| Distributions from: | | | | |
| Net investment income | (.11 | ) | (.02 | ) |
| Total distributions | (.11 | ) | (.02 | ) |
| Total increase (decrease) in net asset value | 1.94 | | (1.72 | ) |
| Net asset value, ending | $11.94 | | $10.00 | |
| |
| Total return* | 20.69 | % | (14.52 | %) |
| Ratios to average net assets:A | | | | |
| Net investment income | 1.36 | % | 1.04 | % |
| Total expenses | 2.49 | % | 2.68 | % |
| Expenses before offsets | 1.41 | % | 1.41 | % |
| Net expenses | 1.41 | % | 1.41 | % |
| Portfolio turnover | 56 | % | 126 | % |
| Net assets, ending (in thousands) | $1,638 | | $1,519 | |
| |
| |
| | PERIODS ENDED | |
| | September 30, | | September 30, | |
| CLASS Y SHARES | 2010 | (z) | 2009 | #(z) |
| Net asset value, beginning | $11.50 | | $8.67 | |
| Income from investment operations: | | | | |
| Net investment income | .10 | | .13 | |
| Net realized and unrealized gain (loss) | .90 | | 2.70 | |
| Total from investment operations | 1.00 | | 2.83 | |
| Distributions from: | | | | |
| Net investment income | (.78 | ) | — | |
| Net realized gain | — | | ** | |
| Total from distributions | (.78 | ) | ** | |
| Total increase (decrease) in net asset value | .22 | | 2.83 | |
| Net asset value, ending | $11.72 | | $11.50 | |
| |
| Total return* | 9.18 | % | 32.71 | % |
| Ratios to average net assets:A | | | | |
| Net investment income | .96 | % | 1.56 | % (a) |
| Total expenses | 4.73 | % | 21.67 | % (a) |
| Expenses before offsets | 1.41 | % | 1.42 | % (a) |
| Net expenses | 1.41 | % | 1.41 | % (a) |
| Portfolio turnover | 44 | % | 90 | % |
| Net assets, ending (in thousands) | $944 | | $112 | |
See notes to financial highlights.
www.calvert.com CALVERT INTERNATIONAL OPPORTUNITIES FUND ANNUAL REPORT 38
A Total expenses do not reflect amounts reimbursed and/or waived by the Advisor or reductions from expense
off set arrangements. Expenses before offsets reflect expenses after reimbursement and/or waiver by the Advisor
but prior to reductions from expense offset arrangements. Net expenses are net of all reductions and represent
the net expenses paid by the Fund.
# From October 31, 2008 inception.
* Total return is not annualized for periods less than one year and does not reflect deduction of any front-
end or deferred sales charge.
** Less than $0.01 per share.
(a) Annualized.
(z) Per share figures are calculated using the Average Shares Method.
See notes to financial statements.
www.calvert.com CALVERT INTERNATIONAL OPPORTUNITIES FUND ANNUAL REPORT 39
EXPLANATION OF FINANCIAL TABLES
SCHEDULE OF INVESTMENTS
The Schedule of Investments is a snapshot of all securities held in the fund at their market value, on the last day of the reporting period. Securities are listed by asset type (e.g., common stock, corporate bonds, U.S. government obligations) or, for International Funds, by country, and may be further broken down into sub-groups and by industry classification.
STATEMENT OF ASSETS AND LIABILITIES
The Statement of Assets and Liabilities is often referred to as the fund’s balance sheet. It lists the value of what the fund owns, is due and owes on the last day of the reporting period. The fund’s assets include the market value of securities owned, cash, receivables for securities sold and shareholder subscriptions, and receivables for dividends and interest payments that have been earned, but not yet received. The fund’s liabilities include payables for securities purchased and shareholder redemptions, and expenses owed but not yet paid. The statement also reports the fund’s net asset value (NAV) per share on the last day of the reporting period. The NAV is calculated by dividing the fund’s net assets (assets minus liabilities) by the number of shares outstanding. This statement is accompanied by a Schedule of Investments. Alternatively, if certain conditions are met, a Statement of Net Assets may be presented in lieu of this statement and the Schedule of Investments.
STATEMENT OF NET ASSETS
The Statement of Net Assets provides a detailed list of the fund’s holdings, including each security’s market value on the last day of the reporting period. The Statement of Net Assets includes a Schedule of Investments. Other assets are added and other liabilities subtracted from the investments total to calculate the fund’s net assets. Finally, net assets are divided by the outstanding shares of the fund to arrive at its share price, or Net Asset Value (NAV) per share.
At the end of the Statement of Net Assets is a table displaying the composition of the fund’s net assets. Paid in Capital is the money invested by shareholders and represents the bulk of net assets. Undistributed Net Investment Income and Accumulated Net Realized Gains usually approximate the amounts the fund had available to distribute to shareholders as of the statement date. Accumulated Realized Losses will appear as negative balances. Unrealized Appreciation (Depreciation) is the difference between the market value of the fund’s investments and their cost, and reflects the gains (losses) that would be realized if the fund were to sell all of its investments at their statement-date values.
STATEMENT OF OPERATIONS
The Statement of Operations summarizes the fund’s investment income earned and expenses incurred in operating the fund. Investment income includes dividends earned from stocks and interest earned from interest-bearing securities in the fund. Expenses incurred in operating the fund include the advisory fee paid to the investment advisor, administrative services fees, distribution plan expenses (if applicable), transfer agent fees,
www.calvert.com CALVERT INTERNATIONAL OPPORTUNITIES FUND ANNUAL REPORT (UNAUDITED) 40
shareholder servicing expenses, custodial, legal, and audit fees, and the printing and postage expenses related to shareholder reports. Expense offsets (fees paid indirectly) are also shown. Credits earned from offset arrangements are used to reduce the fund’s expenses. This statement also shows net gains (losses) realized on the sale of investments and the increase or decrease in the unrealized appreciation (depreciation) on investments held during the period.
STATEMENT OF CHANGES IN NET ASSETS
The Statement of Changes in Net Assets shows how the fund’s total net assets changed during the two most recent reporting periods. Changes in the fund’s net assets are attributable to investment operations, distributions and capital share transactions.
The Operations section of the report summarizes information detailed in the Statement of Operations. The Distribution section shows the dividend and capital gain distributions made to shareholders. The amounts shown as distributions in this section may not match the net investment income and realized gains amounts shown in the Operations section because distributions are determined on a tax basis and certain investments or transactions may be treated differently for financial statement and tax purposes. The Capital Share Transactions section shows the amount shareholders invested in the fund, either by purchasing shares or by reinvesting distributions, and the amounts redeemed. The corresponding numbers of shares issued, reinvested and redeemed are shown at the end of the report.
FINANCIAL HIGHLIGHTS
The Financial Highlights table provides a per-share breakdown per class of the components that affect the fund’s net asset value for current and past reporting periods. The table provides total return, total distributions, expense ratios, portfolio turnover and net assets for the applicable period. Total return is a measure of a fund’s performance that encompasses all elements of return: dividends, capital gain distributions and changes in net asset value. Total return is the change in value of an investment over a given period, assuming reinvestment of any dividends and capital gain distributions, expressed as a percentage of the initial investment. Total distributions include distributions from net investment income and net realized gains. Long-term gains are earned on securities held in the fund more than one year. Short-term gains, on the sale of securities held less than one year, are treated as ordinary dividend income for tax purposes. The expense ratio is a fund’s cost of doing business, expressed as a percentage of net assets. These expenses directly reduce returns to shareholders. Portfolio turnover measures the trading activity in a fund’s investment portfolio – how often securities are bought and sold by a fund. Portfolio turnover is affected by market conditions, changes in the size of the fund, the nature of the fund’s investments and the investment style of the portfolio manager.
www.calvert.com CALVERT INTERNATIONAL OPPORTUNITIES FUND ANNUAL REPORT (UNAUDITED) 41
PROXY VOTING
The Proxy Voting Guidelines of the Calvert Funds that the Fund uses to determine how to vote proxies relating to portfolio securities are provided as an Appendix to the Fund’s Statement of Additional Information. The Statement of Additional Information can be obtained free of charge by calling the Fund at 1-800-368-2745, by visiting the Calvert website at www.calvert.com; or by visiting the SEC’s website at www.sec.gov.
Information regarding how the Fund voted proxies relating to portfolio securities during the most recent 12-month period ended June 30 is available on the Fund’s website at www.calvert.com and on the SEC’s website at www.sec.gov.
AVAILABILITY OF QUARTERLY PORTFOLIO HOLDINGS
The Fund files its complete schedule of portfolio holdings with the SEC for the first and third quarters of each fiscal year on Form N-Q. The Fund’s Form N-Q is available on the SEC’s website at www.sec.gov. The Fund’s Form N-Q may be reviewed and copied at the SEC’s Public Reference Room in Washington, DC; information on the operation of the Public Reference Room may be obtained by calling 1-800-SEC-0330.
www.calvert.com CALVERT INTERNATIONAL OPPORTUNITIES FUND ANNUAL REPORT (UNAUDITED) 42
This page intentionally left blank.
www.calvert.com CALVERT INTERNATIONAL OPPORTUNITIES FUND ANNUAL REPORT (UNAUDITED) 44
www. calvert.com CALVERT INTERNATIONAL OPPORTUNITIES FUND ANNUAL REPORT (UNAUDITED) 45
www.calvert.com CALVERT INTERNATIONAL OPPORTUNITIES FUND ANNUAL REPORT (UNAUDITED) 46
www.calvert.com CALVERT INTERNATIONAL OPPORTUNITIES FUND ANNUAL REPORT (UNAUDITED) 47
www.calvert.com CALVERT INTERNATIONAL OPPORTUNITIES FUND ANNUAL REPORT (UNAUDITED) 48
www.calvert.com CALVERT INTERNATIONAL OPPORTUNITIES FUND ANNUAL REPORT (UNAUDITED) 49
www.calvert.com CALVERT INTERNATIONAL OPPORTUNITIES FUND ANNUAL REPORT (UNAUDITED) 50
www.calvert.com CALVERT INTERNATIONAL OPPORTUNITIES FUND ANNUAL REPORT (UNAUDITED) 51
www.calvert.com CALVERT INTERNATIONAL OPPORTUNITIES FUND ANNUAL REPORT (UNAUDITED) 52
www.calvert.com CALVERT INTERNATIONAL OPPORTUNITIES FUND ANNUAL REPORT (UNAUDITED) 53
*The address of Trustees/Directors and Officers is 4550 Montgomery Avenue, Suite 1000N, Bethesda, Maryland 20814, except Mr. Silby’s address is 1715 18th Street, N.W., Washington, DC 20009. Ms. Krumsiek is an interested person of the Fund since she is an officer and director of the Fund’s advisor and certain affiliates. Mr. Silby is an interested person of the Fund since he is a director of the parent company of the Fund’s advisor.
Additional information about the Fund’s Trustees/Directors can be found in the Statement of Additional Information (SAI). You can get a free copy of the SAI at www.calvert.com, or by contacting your broker, or the Fund at 1-800-368-2745.
www calvert. com CALVERT INTERNATIONAL OPPORTUNITIES FUND ANNUAL REPORT (UNAUDITED) 54
To Open an Account
800-368-2748
Yields and Prices
Calvert Information Network
(24 hours, 7 days a week)
800-368-2745
Service for Existing Account
Shareholders: 800-368-2745
Brokers: 800-368-2746
TDD for Hearing Impaired
800-541-1524
Branch Office
4550 Montgomery Avenue
Suite 1000 North
Bethesda, Maryland 20814
Registered, Certified
or Overnight Mail
Calvert Investments
c/o BFDS,
330 West 9th Street
Kansas City, MO 64105
Web Site
www.calvert.com
Principal Underwriter
Calvert Investment Distributors, Inc.
4550 Montgomery Avenue
Suite 1000 North
Bethesda, Maryland 20814
This report is intended to provide fund information to shareholders. It is not authorized for distribution to prospective investors unless preceded or accompanied by a prospectus.
Note: The information on our website is not incorporated by reference into this report; our website address is included as an inactive textual reference only.
Investors should carefully consider the investment objectives, risks, charges and expenses of the Calvert Funds. This and other important information is contained in the fund’s summary prospectus and prospectus, which can be obtained from your financial professional and should be read carefully before investing. You may also call Calvert at 800/368-2745 or visit www. calvert.com.
Item 2. Code of Ethics.
(a) The registrant has adopted a code of ethics (the "Code of Ethics") that applies to its principal executive officer and principal financial officer (also referred to as “principal accounting officer”).
(b) No information need be disclosed under this paragraph.
(c) The registrant has not amended its Code of Ethics during the period covered by the shareholder report presented in Item 1 hereto.
(d) The registrant has not granted a waiver or implicit waiver from a provision of its Code of Ethics during the period covered by the shareholder report presented in Item 1 hereto.
(e) Not applicable.
(f) The registrant's Code of Ethics is attached as an Exhibit hereto.
Item 3. Audit Committee Financial Expert.
The registrant's Board of Directors has determined that Miles D. Harper, III., an "independent" Director serving on the registrant's audit committee, is an "audit committee financial expert," as defined in Item 3 of Form N-CSR. Under applicable securities laws, a person who is determined to be an audit committee financial expert will not be deemed an "expert" for any purpose, including without limitation for the purposes of Section 11 of the Securities Act of 1933, as a result of being designated or identified as an audit committee financial expert. The designation or identification of a person as an audit committee financial expert does not impose on such person any duties, obligations, or liabilities that are greater than the duties, obligations, and liabilities imposed on such person as a member of the audit committee and Board of Directors in the absence of such designation or identification.
Item 4. Principal Accountant Fees and Services.
Services fees paid to auditing firm:
| Fiscal Year
ended 9/30/12 | Fiscal Year
ended 9/30/11 |
| $ | %* | $ | % * |
| | | | |
(a) Audit Fees | $58,465 | | $58,465 | |
(b) Audit-Related Fees | $0 | 0% | $0 | 0% |
(c) Tax Fees (tax return preparation and filing for the registrant) | $8,460 | 0% | $8,460 | 0% |
(d) All Other Fees | $0 | 0% | $0 | 0% |
| | | | |
Total | $66,925 | 0% | $66,925 | 0% |
* Percentage of fees approved by the Audit Committee pursuant to (c)(7)(i)(C) of Rule 2-01 of Reg. S-X (statutory de minimis waiver of Committee’s requirement to pre-approve)
(e) Audit Committee pre-approval policies and procedures:
The Audit Committee is required to pre-approve all audit and non-audit services provided to the registrant by the auditors, and to the registrant’s investment advisor, and any entity controlling, controlled by, or under common control with the advisor that provides ongoing services to the registrant. In determining whether to pre-approve non-audit services, the Audit Committee considers whether the services are consistent with maintaining the independence of the auditors. The Committee may delegate its authority to pre-approve certain matters to one or more of its members. In this regard, the Committee has delegated authority to the Audit Committee Chair with respect to non-audit services not exceeding $25,000 in each instance. In addition, the Committee has pre-approved the retention of the auditors to provide tax-related services related to the tax treatment and tax accounting of newly acquired securities, upon request by the investment advisor in each instance.
(f) Not applicable.
(g) Aggregate non-audit fees billed by the registrant’s accountant for services rendered to the registrant, and rendered to the registrant’s investment advisor, and any entity controlling, controlled by, or under common control with the advisor that provides ongoing services to the registrant for each of the last two fiscal years of the registrant:
| Fiscal Year
ended 9/30/12 | Fiscal Year
ended 9/30/11 |
| $ | %* | $ | % * |
| $10,000 | 0%* | $42,500 | 0%* |
* Percentage of fees approved by the Audit Committee pursuant to (c)(7)(i)(C) of Rule 2-01 of Reg. S-X (statutory de minimis waiver of Committee’s requirement to pre-approve)
(h) The registrant’s Audit Committee of the Board of Directors has considered whether the provision of non-audit services that were rendered to the registrant’s investment advisor, and any entity controlling, controlled by, or under common control with the investment advisor that provides ongoing services to the registrant that were not pre-approved pursuant to paragraph (c) (7)(ii) of Rule 2-01 of Reg. S-X is compatible with maintaining the principal accountant’s independence and found that the provision of such services is compatible with maintaining the principal accountant’s independence.
Item 5. Audit Committee of Listed Registrants.
Not applicable.
Item 6. Schedule of Investments.
(a) This Schedule is included as part of the report to shareholders filed under Item 1 of this Form.
(b) Not applicable.
Item 7. Disclosure of Proxy Voting Policies and Procedures for Closed-End Management Investment Companies.
Not applicable.
Item 8. Portfolio Managers of Closed-End Management Investment Companies.
Not applicable.
Item 9. Purchases of Equity Securities by Closed-End Management Investment Company and Affiliated Purchasers.
Not applicable.
Item 10. Submission of Matters to a Vote of Security Holders.
No material changes were made to the procedures by which shareholders may recommend nominees to the registrant’s Board of Directors since registrant last provided disclosure in response to this Item.
Item 11. Controls and Procedures.
(a) The principal executive and financial officers concluded that the registrant's disclosure controls and procedures (as defined in Rule 30a-3(c) under the 1940 Act) are effective, based on the evaluation of these controls and procedures required by Rule 30a-3(b) under the 1940 Act and Rules 13a-15(b) or 15d-15(b) under the Exchange Act, as of a date within 90 days of the filing date of this report.
(b) There was no change in the registrant's internal control over financial reporting (as defined in Rule 30a-3(d) under the 1940 Act) that occurred during the registrant's second fiscal quarter of the period covered by this report that has materially affected, or is reasonably likely to materially affect, the registrant's internal control over financial reporting.
Item 12. Exhibits.
(a)(1) A copy of the Registrant’s Code of Ethics.
Attached hereto.
(a)(2) A separate certification for each principal executive officer and principal financial officer of the registrant as required by Rule 30a-2 under the Act (17 CFR 270.30a-2).
Attached hereto.
(a)(3) Not applicable.
(b) A certification for the registrant's Principal Executive Officer and Principal Financial Officer, as required by Rule 30a-2(b) under the Investment Company Act of 1940, is attached hereto. The certification furnished pursuant to this paragraph is not deemed to be "filed" for purposes of Section 18 of the Securities Exchange Act of 1934, or otherwise subject to the liability of that section. Such certification is not deemed to be incorporated by reference into any filing under the Securities Act of 1933 or the Securities Exchange Act of 1934, except to the extent that the registrant specifically incorporates it by reference.
Pursuant to the requirements of the Securities Exchange Act of 1934 and the Investment Act of 1940, the registrant has duly caused this report to be signed on its behalf by the undersigned, thereunto duly authorized.
CALVERT WORLD VALUES FUND, INC.
By: /s/ Barbara J. Krumsiek
Barbara J. Krumsiek
President -- Principal Executive Officer
Date: December 6, 2012
Pursuant to the requirements of the Securities Exchange Act of 1934 and the Investment Act of 1940, this report has been signed below by the following persons on behalf of the registrant and in the capacities and on the dates indicated.
/s/ Barbara J. Krumsiek
Barbara J. Krumsiek
President -- Principal Executive Officer
Date: December 6, 2012
/s/ Ronald M. Wolfsheimer
Ronald M. Wolfsheimer
Treasurer -- Principal Financial Officer
Date: December 6, 2012