| | OMB APPROVAL |
| | OMB Number: | 3235-0570 |
| | Expires: | August 31, 2020 |
| UNITED STATES | Estimated average burden hours per response. . . . . . . . . . . . . . .20.6 |
| SECURITIES AND EXCHANGE COMMISSION | |
| Washington, D.C. 20549 | |
FORM N-CSR
CERTIFIED SHAREHOLDER REPORT OF REGISTERED
MANAGEMENT INVESTMENT COMPANIES
Investment Company Act file number | 811-06565 |
|
Tekla Life Sciences Investors |
(Exact name of registrant as specified in charter) |
|
100 Federal Street, 19th Floor, Boston, MA | | 02110 |
(Address of principal executive offices) | | (Zip code) |
|
|
(Name and address of agent for service) |
|
Registrant’s telephone number, including area code: | 617-772-8500 | |
|
Date of fiscal year end: | September 30 | |
|
Date of reporting period: | October 1, 2018 to March 31, 2019 | |
| | | | | | | | | |
ITEM 1. REPORTS TO STOCKHOLDERS.
TEKLA LIFE SCIENCES INVESTORS


Semiannual Report
March 31, 2019
Beginning on January 1, 2021, as permitted by regulations adopted by the Securities and Exchange Commission, paper copies of the Fund's annual and semi-annual shareholder reports will no longer be sent by mail, unless you specifically request paper copies of the reports. Instead, the reports will be made available on the Fund's website, teklacap.com., and you will be notified by mail each time a report is posted and provided with a website link to access the report.
Beginning on January 1, 2019, you may elect to receive all future reports in paper free of charge. If you invest through a financial intermediary, you can contact your financial intermediary to request that you continue to receive paper copies of your shareholder reports. If you invest directly with the Fund, you can call Computershare at 1-800-426-5523 to inform the Fund that you wish to continue receiving paper copies of your shareholder reports. Your election to receive reports in paper will apply to all funds held in your account if you invest through your financial intermediary or all funds held with the fund complex if you invest directly with the Fund.
TEKLA LIFE SCIENCES INVESTORS
Distribution policy: The Fund has implemented a managed distribution policy (the Policy) that provides for quarterly distributions at a rate set by the Board of Trustees. Under the current Policy, the Fund intends to make quarterly distributions at a rate of 2% of the Fund's net assets to shareholders of record. The Policy would result in a return of capital to shareholders, if the amount of the distribution exceeds the Fund's net investment income and realized capital gains. A return of capital may occur, for example, when some or all of the money that you invested in the Fund is paid back to you. A return of capital distribution does not necessarily reflect the Fund's investment performance and should not be confused with "yield" or "income."
The amounts and sources of distributions reported in the Fund's notices pursuant to Section 19(a) of the Investment Company Act of 1940 are only estimates and are not being provided for tax reporting purposes. The actual amounts and sources of the amounts for tax reporting purposes will depend upon the Fund's investment experience during its fiscal year and may be subject to changes based on tax regulations. The Fund will send you a Form 1099-DIV for the calendar year that tells you how to report distributions for federal income tax purposes.
You should not draw any conclusions about the Fund's investment performance from the amount of distributions pursuant to the Policy or from the terms of the Policy. The Policy has been established by the Trustees and may be changed or terminated by them without shareholder approval. The Trustees regularly review the Policy and the frequency and rate of distributions considering the purpose and effect of the Policy, the financial market environment, and the Fund's income, capital gains and capital available to pay distributions. The suspension or termination of the Policy could have the effect of creating a trading discount or widening an existing trading discount. At this time there are no reasonably foreseeable circumstances that might cause the Trustees to terminate the Policy.
Consider these risks before investing: As with any investment company that invests in equity securities, the Fund is subject to market risk—the possibility that the prices of equity securities will decline over short or extended periods of time. As a result, the value of an investment in the Fund's shares will fluctuate with the market generally and market sectors in particular. You could lose money over short or long periods of time. Political and economic news can influence marketwide trends and can cause disruptions in the U.S. or world financial markets. Other factors may be ignored by the market as a whole but may cause movements in the price of one company's stock or the stock of companies in one or more industries. All of these factors may have a greater impact on initial public offerings and emerging company shares. Different types of equity securities tend to shift into and out of favor with investors, depending on market and economic conditions. The performance of funds that invest in equity securities of Healthcare Companies may at times be better or worse than the performance of funds that focus on other types of securities or that have a broader investment style.
TEKLA LIFE SCIENCES INVESTORS
Dear Shareholders,
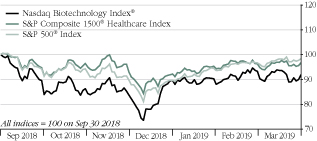
The healthcare/biotechnology sector was quite volatile during the six month period ended March 31, 2019. As can be seen in the graph below, the illustrated indices declined very significantly in the fourth quarter of 2018, particularly during December 2018. This was among the most aggressive short-term declines we have seen in recent years. Conversely, in the first quarter of 2019, we observed one of the most prolific short-term advances the healthcare/biotechnology sector has seen in many years. The result, while demonstrating quite high volatility in the report period, in aggregate left the sector and the Fund down moderately for the reporting period.
6 Month Performance Ending March 31, 2019
The question this leaves us with is: What happened and what might we expect going forward? Our sector is usually most affected by the results from individual scientific news, clinical trial results and regulatory approval/rejection as well as merger and acquisition (M&A) activity. We have observed such occurrences in recent months. During the first quarter of 2019, we saw both encouraging and disappointing events. These include a significant positive, the proposed acquisition of Celgene Corporation by Bristol-Myers Squibb Company, which is the biggest proposed acquisition in our sector in some years. Other significant and encouraging events were also seen. Conversely, the pivotal clinical trial failure of Biogen Inc.'s Aducanumab was also reported in the first quarter of 2019. The clinical trial result was probably the most highly anticipated event expected within the next year. Its failure has damaged the so-called amyloid hypothesis, a heretofore putative strategy for treating Alzheimer's Disease. We have certainly seen other positive clinical and regulatory developments in recent months but the Aducanumab trial failure was extremely disappointing.
We will continue to see, evaluate and report on positive and negative events, but we think macro related sentiment will have no less impact than events on sector performance in the short to intermediate term. As you are undoubtedly aware, in 2018 healthcare comprises nearly 18% of
1
U.S. GDP making it among the biggest sectors in the U.S. economy. Costs to provide healthcare products and services are widely considered to be too high. Opinions regarding how these costs should be controlled and paid for have been hotly debated for many years but have reached a crescendo of late. As the 2020 U.S. presidential election approaches, it is pretty clear to us that healthcare is and will be a topic that receives great attention. As prospects grow or fade for individual candidates (including the incumbent), we expect sentiment for, as well as the value of, the healthcare sector to improve or decline in tandem. We think that these macro factors will be as important to the healthcare sector as fundamentals for the next twelve to eighteen months.
In the medium to long term, headlines aside, we do not think there will be dramatic change in how healthcare is paid for or delivered. In the end, it seems likely to us that we will continue to have a system that is highly market dependent. Drugs that are differentiated and patent protected will sell well and receive premium pricing while generic drugs (which already comprise ~90% of prescriptions written) will also sell well but will be competitively priced. The Fund will continue to predominantly invest in companies that invent, develop and commercialize differentiated drugs that address unmet medical needs. We think that upon commercialization, such drugs will receive pricing that rewards the companies and their investors for risks taken in development and allow appropriate profit for the innovator. We will also continue to invest in companies that make generic drugs efficiently. We anticipate the general trend will be to increase utilization and that the "winners" in the generic drug space will be those that make (and sell) such drugs cheaply and well. Given that the quantity of generic drugs sold will continue to increase, we think there remains an opportunity to profitably invest in efficient manufacturers of such drugs.
We note that in the last ten years, the annualized return of the NASDAQ Biotechnology Index®* ("NBI") (+18.31%) and the S&P Composite 1500® Healthcare Index* ("S15HLTH") (+16.92%) has exceeded that of the S&P 500® Index* ("SPX") (+15.91%).
As always, we thank you for your consideration of the Tekla Funds. Please call our distribution partner Destra Capital or us if you have any questions.
Be well,
Daniel R. Omstead, PhD
President and Portfolio Manager
2
TEKLA LIFE SCIENCES INVESTORS
Fund Essentials
Objective of the Fund
The Fund's investment objective is to seek long-term capital appreciation by investing primarily in securities of Life Sciences companies.
Description of the Fund
Tekla Life Sciences Investors ("HQL") is a non-diversified closed-end healthcare fund traded on the New York Stock Exchange under the ticker HQL. HQL primarily invests in the life sciences industries and will emphasize the smaller, emerging companies with a maximum of 40% of the Fund's assets in restricted securities of both public and private companies.
Investment Philosophy
Tekla Capital Management LLC, the Investment Adviser to the Fund, believes that:
• Aging demographics and adoption of new medical products and services can provide long-term tailwinds for healthcare companies
• Late stage biotechnology product pipeline could lead to significant increases in biotechnology sales
• Robust M&A activity in healthcare may create additional investment opportunities
Fund Overview and Characteristics as of 3/31/19
Market Price1 | | $17.13 | |
NAV2 | | $18.68 | |
Premium/(Discount) | | -8.30% | |
Average 30 Day Volume | | 79,278 | |
Net Assets | | $425,125,816 | |
Ticker | | HQL | |
NAV Ticker | | XHQLX | |
Commencement of
Operations Date | | 5/8/92 | |
Fiscal Year to Date
Distributions
Per Share | | $0.75 | |
1 The closing price at which the Fund's shares were traded on the exchange.
2 Per-share dollar value of the Fund, calculated by dividing the total value of all the securities in its portfolio, plus any other assets and less liabilities, by the number of Fund shares outstanding.
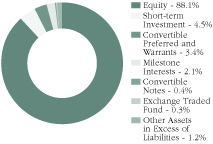
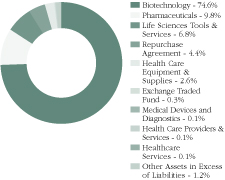
Holdings of the Fund (Data is based on net assets)
Asset Allocation as of 3/31/19
Sub-Sector Allocation as of 3/31/19
3
TEKLA LIFE SCIENCES INVESTORS
Largest Holdings by Issuer
(Excludes Short-Term Investments)
As of March 31, 2019
(Unaudited)
| Issuer – Sector | | % of Net
Assets | |
| Celgene Corporation – Biotechnology | | | 8.9 | % | |
| Amgen Inc. – Biotechnology | | | 7.8 | % | |
| Gilead Sciences, Inc. – Biotechnology | | | 6.9 | % | |
| Illumina, Inc. – Life Sciences Tools & Services | | | 5.0 | % | |
| Vertex Pharmaceuticals Incorporated – Biotechnology | | | 4.9 | % | |
| Biogen Inc. – Biotechnology | | | 4.9 | % | |
| Regeneron Pharmaceuticals, Inc. – Biotechnology | | | 4.2 | % | |
| Alexion Pharmaceuticals, Inc. – Biotechnology | | | 3.6 | % | |
| Incyte Corporation – Biotechnology | | | 3.1 | % | |
| BioMarin Pharmaceutical Inc. – Biotechnology | | | 1.8 | % | |
| Mylan N.V. – Pharmaceuticals | | | 1.8 | % | |
| Seattle Genetics, Inc. – Biotechnology | | | 1.7 | % | |
| Sarepta Therapeutics, Inc. – Biotechnology | | | 1.4 | % | |
| Neurocrine Biosciences, Inc. – Biotechnology | | | 1.3 | % | |
| bluebird bio, Inc. – Biotechnology | | | 1.2 | % | |
| Exelixis, Inc. – Biotechnology | | | 1.1 | % | |
| PRA Health Sciences, Inc. – Life Sciences Tools & Services | | | 1.0 | % | |
| Amarin Corporation plc – Biotechnology | | | 1.0 | % | |
| Alnylam Pharmaceuticals, Inc. – Biotechnology | | | 1.0 | % | |
| Sage Therapeutics, Inc. – Biotechnology | | | 0.9 | % | |
Fund Performance
HQL Investors is a closed-end fund which invests predominantly in life science companies. Subject to regular consideration, the Trustees of HQL have instituted a policy of making quarterly distributions to shareholders. The Fund seeks to make such distributions in the form of long-term capital gains.
The Fund considers investments in companies of all sizes and in all life science subsectors, including but not limited to, biotechnology, pharmaceuticals, healthcare equipment, healthcare supplies, life science tools and services, healthcare distributors, managed healthcare, healthcare technology, and healthcare facilities. The Fund emphasizes innovation, investing both in public and pre-public venture companies. The Fund considers its venture investments to be a differentiating characteristic.
4
Among the various healthcare subsectors, HQL has considered the biotechnology subsector, including both pre-public and public companies, to be a key contributor to the healthcare sector. The Fund holds biotech assets, including both public and pre-public, often representing 65-80% of net assets.
There is no commonly published index which matches the investment strategy of HQL. The S15HLTH consists of more than 160 companies representing most or all of the healthcare subsectors in which HQL typically invests; biotechnology often represents 15-20% of this index. By contrast, the NBI, which contains approximately 220 constituents, is much more narrowly constructed. The vast majority of this index is comprised of biotechnology, pharmaceutical and life science tools companies. In recent years, biotechnology has often represented 72-82% of the NBI. Neither the S15HLTH nor NBI indices contain any material amount of pre-public company assets.
Given the circumstance, we present both NAV and stock returns for the Fund in comparison to several commonly published indices. One index, the SPX, is a commonly considered broad based index; this index is comprised of companies in many areas of the economy, including, but not limited to healthcare. As described above, the NBI is a healthcare index mostly focused in three healthcare sectors with a uniquely high level of biotechnology comparison. The S15HLTH contains a wider representation of healthcare subsectors, but typically contains a much lower biotechnology composition.
HQL generally invests in a combination of large cap growth-oriented and earlier stage innovative healthcare companies with a focus on the biotechnology sector. Generally, HQL targets biotechnology exposure below that of the NBI and a higher biotechnology exposure than that of the S15HLTH. We note that in recent periods, biotechnology has been a significant contributor to returns (both positive and negative) associated with those indices. We believe this sector continues to have significant potential for growth in the future.
Fund Performance for the Period Ended March 31, 2019
Period | | HQL NAV | | HQL MKT | | NBI | | S15HLTH | | SPX | |
| 6 month | | | -7.66 | | | | -12.05 | | | | -8.18 | | | | -3.37 | | | | -1.73 | | |
| 1 year | | | 2.72 | | | | -2.72 | | | | 5.24 | | | | 14.63 | | | | 9.48 | | |
| 5 year | | | 6.47 | | | | 4.60 | | | | 7.74 | | | | 11.72 | | | | 10.90 | | |
| 10 year | | | 15.55 | | | | 17.57 | | | | 18.31 | | | | 16.92 | | | | 15.91 | | |
5
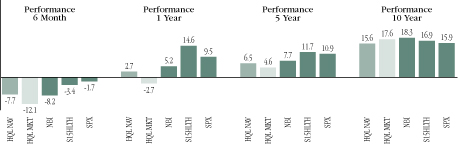
All performance over one-year has been annualized.
Performance data quoted represents past performance, which is no guarantee of future results, and current performance may be lower or higher than the figures shown. The NAV total return takes into account the Fund's total annual expenses and does not reflect transaction charges. If transaction charges were reflected, NAV total return would be reduced. All distributions are assumed to be reinvested either in accordance with the dividend reinvestment plan (DRIP) for market price returns or NAV for NAV returns. Until the dRIP price is available from the Plan Agent, the market price returns reflect the reinvestment at the closing market price on the last business day of the month. Once the DRIP is available around mid-month, the market price returns are updated to reflect reinvestment at the DRIP price.
Portfolio Highlights as of March 31, 2019
Among other investments, Tekla Life Sciences Investors' performance benefitted in the past six months by the following:
Incyte Corporation (INCY) appreciated during the recent quarter after languishing for much of 2018 following two unfavorable events around their two lead assets in development, epicadostat and baricitinib. The company has a stable and growing commercial base around the hematologic drugs Jakafi and ICLUSIG; this franchise could attract a potential acquirer and the stock overshot on the downside in 2018. This recent appreciation helped the Fund's overweight position in the stock.
TESARO, Inc. (TSRO) is a mid-cap biotech company with a Zeljula, a PARP inhibitor, approved and marketed for ovarian cancer, and several early-to-mid stage immuno-oncology antibodies. In December 2018, the company announced it was being acquired by GlaxoSmithKline plc (GSK) for $75 per share with the transaction closing in January 2019.
Ligand Pharmaceuticals Incorporated (LGND) shifted their business model from a royalty play on commercial assets centered on Promacta to a royalty shell more weighted to earlier stage candidates around novel technology platforms. This led to a rerating of the company with the shares being weak beginning in October. Our relative underweight helped the Fund's portfolio during the reporting period.
Among other examples, HQL's performance was negatively impacted by the following investments:
IDEXX Laboratories, Inc. (IDXX) continues to leverage its unique structure and stature in veterinary medicine. The central lab continues to innovate
6
successful diagnostic tests that facilitate the efforts of veterinarians to drive the shift from reactive pet care to preventative pet care. While the company's shares came under pressure in the market selloff, we believe Idexx remains in the early innings of leveraging their expanded operating platforms and remain a holder of shares.
Ionis Pharmaceuticals (IONS) is transforming into a multiple product commercial company. However, we have reservations about the wide applicability of the RNA-targeted modality of their products and have been hesitant to be overweight the stock. During 1Q19, the financial community focused much attention on its partnered late stage asset for Huntington's disease in phase II/III, a genetic disorder that has been challenging to treat. The stock's recent appreciation hurts the Fund's performance in the period under review.
Spark Therapeutics Inc. (ONCE) is a smid cap commercial gene therapy company that had a single marketed product, Luxturna, in a small indication for a rare genetic form of vision loss. It also had a pipeline of assets that, after several clinical setbacks, materially lagged its peers either in competitiveness of public data or phase of development. For this reason, we were underweight the stock heading into a key data update mid-2019. Despite these shortcomings, Roche Holding AG (ROG SW) announced it would acquire Spark Therapeutics on February 22, 2019 for a substantial premium.
*The trademarks NASDAQ Biotechnology Index®, S&P Composite 1500® Healthcare Index and S&P 500® Index referenced in this report are the property of their respective owners. These trademarks are not owned by or associated with the Fund or its service providers, including Tekla Capital Management LLC.
7
TEKLA LIFE SCIENCES INVESTORS
SCHEDULE OF INVESTMENTS
MARCH 31, 2019
(Unaudited)
SHARES | | CONVERTIBLE PREFERRED AND
WARRANTS (a) - 3.4% of Net Assets | | VALUE | |
| | | Biotechnology - 2.2% | |
| | 140,000 | | | Amphivena Therapeutics, Inc. Series B
(Restricted) (b) | | $ | 2,100,000 | | |
| | 225,416 | | | Amphivena Therapeutics, Inc. Series C,
6.00% (Restricted) (b) | | | 808,848 | | |
| | 300,429 | | | Atreca, Inc. Series C1 (Restricted) (b) | | | 700,000 | | |
| | 398,613 | | | Decipher Biosciences, Inc. Series II, 8.00%
(Restricted) (b) | | | 361,542 | | |
| | 396,284 | | | Decipher Biosciences, Inc. Series III, 8.00%
(Restricted) (b) | | | 860,730 | | |
| | 442,577 | | | Galera Therapeutics, Inc. Series C, 6.00%
(Restricted) (b) | | | 979,998 | | |
| | 105,933 | | | Oculis SA, Series B2 (Restricted) (c) | | | 885,763 | | |
| | 1,153,847 | | | Rainier Therapeutics, Inc. Series A, 6.00%
(Restricted) (b) | | | 750,001 | | |
| | 668,449 | | | Rainier Therapeutics, Inc. Series B, 6.00%
(Restricted) (b) | | | 500,000 | | |
| | 375,000 | | | Therachon Holding AG Series B, 8.00%
(Restricted) (b) | | | 1,500,000 | | |
| | 90,000 | | | Trillium Therapeutics, Inc. Series II (c) | | | 59,399 | | |
| | | | 9,506,281 | | |
| | | | | Health Care Equipment & Supplies
(Restricted) (b) - 0.4% | | | |
| | 79,330 | | | CardioKinetix, Inc. Series C, 8.00% | | | 0 | | |
| | 142,574 | | | CardioKinetix, Inc. Series D, 8.00% | | | 0 | | |
| | 439,333 | | | CardioKinetix, Inc. Series E, 8.00% | | | 0 | | |
| | 481,378 | | | CardioKinetix, Inc. Series F, 8.00% | | | 0 | | |
| | N/A (d) | | | CardioKinetix, Inc. Warrants
(expiration 12/11/19, exercise price $0.69) | | | 0 | | |
| | N/A (d) | | | CardioKinetix, Inc. Warrants
(expiration 06/03/20, exercise price $0.69) | | | 0 | | |
| | 8,822 | | | CardioKinetix, Inc. Warrants
(expiration 08/15/24, exercise price $2.85) | | | 0 | | |
| | 951,000 | | | IlluminOss Medical, Inc. Junior Preferred, 8.00% | | | 951,000 | | |
| | 895,848 | | | IlluminOss Medical, Inc. Series AA, 8.00% | | | 895,848 | | |
| | 71,324 | | | IlluminOss Medical, Inc. Warrants
(expiration 03/31/27, exercise price $1.00) | | | 0 | | |
| | 59,426 | | | IlluminOss Medical, Inc. Warrants
(expiration 09/06/27, exercise price $1.00) | | | 0 | | |
| | 23,771 | | | IlluminOss Medical, Inc. Warrants
(expiration 11/20/27, exercise price $1.00) | | | 0 | | |
The accompanying notes are an integral part of these financial statements.
8
TEKLA LIFE SCIENCES INVESTORS
SCHEDULE OF INVESTMENTS
MARCH 31, 2019
(Unaudited, continued)
SHARES | | Health Care Equipment & Supplies
(Restricted) (b) - continued | | VALUE | |
| | 47,542 | | | IlluminOss Medical, Inc. Warrants
(expiration 01/11/28, exercise price $1.00) | | $ | 0 | | |
| | 47,542 | | | IlluminOss Medical, Inc. Warrants
(expiration 02/06/28, exercise price $1.00) | | | 0 | | |
| | 46,462 | | | IlluminOss Medical, Inc. Warrants
(expiration 01/29/29, exercise price $1.00) | | | 0 | | |
| | | | 1,846,848 | | |
| | | Pharmaceuticals (Restricted) (b) - 0.8% | |
| | 1,359,927 | | | Curasen Therapeutics, Inc. Series A | | | 1,499,999 | | |
| | 659,244 | | | Milestone Pharmaceuticals, Inc. Series C,
8.00% (c) | | | 900,000 | | |
| | 461,546 | | | Milestone Pharmaceuticals, Inc. Series D1,
8.00% (c) | | | 818,183 | | |
| | | | 3,218,182 | | |
| | | | | TOTAL CONVERTIBLE PREFERRED
AND WARRANTS
(Cost $21,793,024) | | | 14,571,311 | | |
PRINCIPAL
AMOUNT | | CONVERTIBLE NOTES (Restricted) (b) - 0.4%
of Net Assets | |
| |
| | | Biotechnology - 0.1% | |
$ | 189,673 | | | Rainier Therapeutics, Inc. Promissory Note,
8.00% due 01/30/20 | | | 189,672 | | |
| | 189,673 | | | Rainier Therapeutics, Inc. Promissory Note,
8.00% due 01/30/20 | | | 189,672 | | |
| | | | 379,344 | | |
| | | Health Care Equipment & Supplies - 0.3% | |
| | 51,741 | | | CardioKinetix, Inc. Promissory Note,
5.00% due 04/30/19 | | | 0 | | |
| | 190,166 | | | IlluminOss Medical, Inc. Promissory Note,
8.00% due 06/30/19 | | | 190,166 | | |
| | 237,708 | | | IlluminOss Medical, Inc. Promissory Note,
8.00% due 06/30/19 | | | 237,708 | | |
| | 185,849 | | | IlluminOss Medical, Inc. Promissory Note,
8.00% due 06/30/19 | | | 185,850 | | |
| | 285,294 | | | IlluminOss Medical, Inc. Promissory Note,
8.00% due 06/30/19 | | | 285,294 | | |
| | 95,083 | | | IlluminOss Medical, Inc. Promissory Note,
8.00% due 06/30/19 | | | 95,083 | | |
The accompanying notes are an integral part of these financial statements.
9
TEKLA LIFE SCIENCES INVESTORS
SCHEDULE OF INVESTMENTS
MARCH 31, 2019
(Unaudited, continued)
PRINCIPAL
AMOUNT | | Health Care Equipment & Supplies - continued | | VALUE | |
$ | 190,166 | | | IlluminOss Medical, Inc. Promissory Note,
8.00% due 06/30/19 | | $ | 190,166 | | |
| | | | 1,184,267 | | |
| | | | | TOTAL CONVERTIBLE NOTES
(Cost $1,615,618) | | | 1,563,611 | | |
SHARES | | COMMON STOCKS AND WARRANTS - 88.1%
of Net Assets | |
| |
| | | Biotechnology - 72.3% | |
| | 52,739 | | | AC Immune SA (a) (c) | | | 266,332 | | |
| | 32,204 | | | ACADIA Pharmaceuticals, Inc. (a) | | | 864,677 | | |
| | 148,748 | | | Adaptimmune Therapeutics plc (a) (e) | | | 639,616 | | |
| | 254,000 | | | Affimed N.V. (a) | | | 1,066,800 | | |
| | 66,268 | | | Akebia Therapeutics, Inc. (a) | | | 542,735 | | |
| | 38,333 | | | Albireo Pharma, Inc. (a) | | | 1,234,706 | | |
| | 114,726 | | | Alexion Pharmaceuticals, Inc. (a) | | | 15,508,661 | | |
| | 60,092 | | | Alkermes plc (a) | | | 2,192,757 | | |
| | 44,853 | | | Alnylam Pharmaceuticals, Inc. (a) | | | 4,191,513 | | |
| | 203,681 | | | Amarin Corporation plc (a) (e) | | | 4,228,418 | | |
| | 174,221 | | | Amgen Inc. | | | 33,098,506 | | |
| | 112,529 | | | Amicus Therapeutics, Inc. (a) | | | 1,530,394 | | |
| | 19,983 | | | AnaptysBio, Inc. (a) | | | 1,459,758 | | |
| | 811,227 | | | ARCA biopharma, Inc. (a) | | | 303,074 | | |
| | 324,491 | | | ARCA biopharma, Inc. Warrants (expiration
06/11/22, exercise price $6.10) (a) (b) | | | 16,225 | | |
| | 320,135 | | | Ardelyx, Inc. (a) | | | 896,378 | | |
| | 21,116 | | | Arena Pharmaceuticals, Inc. (a) | | | 946,630 | | |
| | 9,862 | | | argenx SE (a) (e) | | | 1,231,172 | | |
| | 103,016 | | | Array Biopharma Inc. (a) | | | 2,511,530 | | |
| | 30,700 | | | Arrowhead Pharmaceuticals, Inc. (a) | | | 563,345 | | |
| | 23,291 | | | Ascendis Pharma A/S (a) (e) | | | 2,741,351 | | |
| | 13,850 | | | Athenex, Inc. (a) | | | 169,663 | | |
| | 25,614 | | | Audentes Therapeutics, Inc. (a) | | | 999,458 | | |
| | 23,492 | | | BeiGene, Ltd. (a) (e) | | | 3,100,944 | | |
| | 60,000 | | | Bellicum Pharmaceuticals, Inc. (a) | | | 202,200 | | |
| | 88,372 | | | Biogen Inc. (a) (f) | | | 20,889,373 | | |
| | 86,363 | | | BioMarin Pharmaceutical Inc. (a) | | | 7,671,625 | | |
| | 31,369 | | | bluebird bio, Inc. (a) | | | 4,935,285 | | |
| | 25,665 | | | Blueprint Medicines Corporation (a) | | | 2,054,483 | | |
| | 399,550 | | | Celgene Corporation (a) | | | 37,693,547 | | |
| | 74,700 | | | Cellectis S.A. (a) (e) | | | 1,369,998 | | |
The accompanying notes are an integral part of these financial statements.
10
TEKLA LIFE SCIENCES INVESTORS
SCHEDULE OF INVESTMENTS
MARCH 31, 2019
(Unaudited, continued)
SHARES | | Biotechnology - continued | | VALUE | |
| | 158,784 | | | Cidara Therapeutics, Inc. (a) | | $ | 420,778 | | |
| | 22,800 | | | Clovis Oncology, Inc. (a) | | | 565,896 | | |
| | 71,680 | | | Coherus BioSciences, Inc. (a) | | | 977,715 | | |
| | 54,956 | | | CRISPR Therapeutics AG (a) | | | 1,963,028 | | |
| | 19,372 | | | Denali Therapeutics, Inc. (a) | | | 449,818 | | |
| | 27,874 | | | Editas Medicine, Inc. (a) | | | 681,519 | | |
| | 100,871 | | | Epizyme, Inc. (a) | | | 1,249,792 | | |
| | 40,668 | | | Esperion Therapeutics, Inc. (a) | | | 1,632,820 | | |
| | 190,789 | | | Exelixis, Inc. (a) | | | 4,540,778 | | |
| | 65,464 | | | FibroGen, Inc. (a) | | | 3,557,968 | | |
| | 14,268 | | | Galapagos NV (a) (c) | | | 1,662,933 | | |
| | 454,163 | | | Gilead Sciences, Inc. | | | 29,525,137 | | |
| | 31,864 | | | Global Blood Therapeutics, Inc. (a) | | | 1,686,562 | | |
| | 154,089 | | | Incyte Corporation (a) | | | 13,253,195 | | |
| | 48,394 | | | Intellia Therapeutics, Inc. (a) | | | 826,570 | | |
| | 20,634 | | | Intercept Pharmaceuticals, Inc. (a) | | | 2,308,119 | | |
| | 44,446 | | | Ionis Pharmaceuticals, Inc. (a) | | | 3,607,682 | | |
| | 89,487 | | | Iovance Biotherapeutics, Inc. (a) | | | 851,021 | | |
| | 10,127 | | | Jounce Therapeutics, Inc. (a) | | | 62,787 | | |
| | 6,165 | | | Ligand Pharmaceuticals, Incorporated (a) | | | 775,002 | | |
| | 93,973 | | | Merus N.V. (a) (c) | | | 1,387,981 | | |
| | 62,194 | | | Molecular Templates, Inc. (a) | | | 361,347 | | |
| | 6,321 | | | Myriad Genetics, Inc. (a) | | | 209,857 | | |
| | 80,164 | | | Nektar Therapeutics (a) | | | 2,693,510 | | |
| | 62,255 | | | Neurocrine Biosciences, Inc. (a) | | | 5,484,666 | | |
| | 358,000 | | | Novavax, Inc. (a) | | | 197,222 | | |
| | 149,093 | | | Ovid Therapeutics Inc. (a) | | | 263,895 | | |
| | 563,608 | | | Pieris Pharmaceuticals, Inc. (a) | | | 1,888,087 | | |
| | 23,821 | | | Pieris Pharmaceuticals, Inc., Series A Warrants
(expiration 06/08/21, exercise price $3.00) (a) (b) | | | 23,106 | | |
| | 11,911 | | | Pieris Pharmaceuticals, Inc., Series B Warrants
(expiration 06/08/21, exercise price $2.00) (a) (b) | | | 15,603 | | |
| | 44,891 | | | Portola Pharmaceuticals, Inc. (a) | | | 1,557,718 | | |
| | 60,711 | | | Protagonist Therapeutics, Inc. (a) | | | 763,137 | | |
| | 27,391 | | | PTC Therapeutics, Inc. (a) | | | 1,030,997 | | |
| | 23,629 | | | Puma Biotechnology, Inc. (a) | | | 916,569 | | |
| | 43,469 | | | Regeneron Pharmaceuticals, Inc. (a) | | | 17,849,241 | | |
| | 23,892 | | | Sage Therapeutics, Inc. (a) | | | 3,800,023 | | |
| | 65,299 | | | Sangamo Therapeutics, Inc. (a) | | | 622,953 | | |
| | 50,980 | | | Sarepta Therapeutics, Inc. (a) | | | 6,076,306 | | |
| | 97,338 | | | Seattle Genetics, Inc. (a) | | | 7,129,035 | | |
| | 193,471 | | | Sutro Biopharma, Inc. (a) | | | 2,203,635 | | |
| | 143,438 | | | Syndax Pharmaceuticals, Inc. (a) | | | 753,050 | | |
| | 128,573 | | | Trillium Therapeutics, Inc. (a) (c) | | | 84,858 | | |
| | 23,539 | | | Ultragenyx Pharmaceutical Inc. (a) | | | 1,632,665 | | |
The accompanying notes are an integral part of these financial statements.
11
TEKLA LIFE SCIENCES INVESTORS
SCHEDULE OF INVESTMENTS
MARCH 31, 2019
(Unaudited, continued)
SHARES | | Biotechnology - continued | | VALUE | |
| | 19,751 | | | uniQure N.V. (a) | | $ | 1,178,147 | | |
| | 7,142 | | | United Therapeutics Corporation (a) | | | 838,257 | | |
| | 114,190 | | | Vertex Pharmaceuticals Incorporated (a) | | | 21,005,251 | | |
| | 34,430 | | | Viking Therapeutics, Inc. (a) | | | 342,234 | | |
| | 35,639 | | | Xencor, Inc. (a) | | | 1,106,947 | | |
| | | | 307,136,571 | | |
| | | Drug Discovery Technologies - 0.0% | |
| | 51,160 | | | ImmunoGen, Inc. (a) | | | 138,644 | | |
| | | Health Care Equipment & Supplies - 1.1% | |
| | 44,550 | | | Alliqua BioMedical, Inc. (a) | | | 130,977 | | |
| | 130,000 | | | Cercacor Laboratories, Inc. (Restricted) (a) (b) | | | 639,277 | | |
| | 10,891 | | | IDEXX Laboratories, Inc. (a) | | | 2,435,227 | | |
| | 27,160 | | | NovoCure Limited. (a) | | | 1,308,297 | | |
| | 7,157 | | | TherOx, Inc. (Restricted) (a) (b) | | | 143 | | |
| | | | 4,513,921 | | |
| | | Health Care Providers & Services (Restricted) - 0.1% | |
| | 148,148 | | | InnovaCare Health, Inc. (a) (b) (g) | | | 490,370 | | |
| | | Healthcare Services - 0.1% | |
| | 8,926 | | | Syneos Health, Inc. (a) | | | 462,010 | | |
| | | Life Sciences Tools & Services - 6.8% | |
| | 8,237 | | | Bio-Techne Corporation | | | 1,635,456 | | |
| | 67,841 | | | Illumina, Inc. (a) | | | 21,077,520 | | |
| | 40,364 | | | PRA Health Sciences, Inc. (a) | | | 4,451,746 | | |
| | 6,545 | | | Thermo Fisher Scientific Inc. | | | 1,791,498 | | |
| | | | 28,956,220 | | |
| | | Medical Devices and Diagnostics - 0.1% | |
| | 8,103 | | | Genomic Health, Inc. (a) | | | 567,615 | | |
| | | Pharmaceuticals - 7.6% | |
| | 63,696 | | | Acceleron Pharma Inc. (a) | | | 2,966,323 | | |
| | 20,932 | | | Aerie Pharmaceuticals, Inc. (a) | | | 994,270 | | |
| | 228,539 | | | Aerpio Pharmaceuticals, Inc. (a) | | | 205,936 | | |
| | 34,624 | | | Agios Pharmaceuticals, Inc. (a) | | | 2,335,043 | | |
| | 77,080 | | | ArQule, Inc. (a) | | | 369,213 | | |
| | 317,800 | | | Avadel Pharmaceuticals plc (a) (e) | | | 457,632 | | |
| | 165,330 | | | Clearside Biomedical, Inc. (a) | | | 228,155 | | |
| | 13,855 | | | Concert Pharmaceuticals, Inc. (a) | | | 167,230 | | |
| | 29,100 | | | Endo International plc (a) | | | 233,673 | | |
The accompanying notes are an integral part of these financial statements.
12
TEKLA LIFE SCIENCES INVESTORS
SCHEDULE OF INVESTMENTS
MARCH 31, 2019
(Unaudited, continued)
SHARES | | Pharmaceuticals - continued | | VALUE | |
| | 90,238 | | | Foamix Pharmaceuticals Ltd. (a) (c) | | $ | 338,392 | | |
| | 12,584 | | | GW Pharmaceuticals plc (a) (c) (e) | | | 2,121,285 | | |
| | 19,350 | | | Horizon Pharma Public Limited Company (a) | | | 511,420 | | |
| | 91,789 | | | Immunomedics, Inc. (a) | | | 1,763,267 | | |
| | 33,313 | | | Intra-Cellular Therapies, Inc. (a) | | | 405,752 | | |
| | 23,089 | | | Jazz Pharmaceuticals plc (a) | | | 3,300,573 | | |
| | 4,060 | | | Madrigal Pharmaceuticals, Inc. (a) | | | 508,556 | | |
| | 99,654 | | | Marinus Pharmaceuticals, Inc. (a) | | | 416,554 | | |
| | 75,459 | | | Medicines Company (The) (a) | | | 2,109,079 | | |
| | 4,130 | | | Mirati Therapeutics, Inc. (a) | | | 302,729 | | |
| | 265,200 | | | Mylan N.V. (a) | | | 7,515,768 | | |
| | 11,740 | | | MyoKardia, Inc. (a) | | | 610,363 | | |
| | 7,570 | | | Rhythm Pharmaceuticals, Inc. (a) | | | 207,494 | | |
| | 34,880 | | | Spectrum Pharmaceuticals, Inc. (a) | | | 372,867 | | |
| | 284,378 | | | Tetraphase Pharmaceuticals, Inc. (a) | | | 381,067 | | |
| | 929,053 | | | Verona Pharma plc (a) (c) | | | 689,725 | | |
| | 115,500 | | | Verona Pharma plc (a) (e) | | | 721,875 | | |
| | 371,622 | | | Verona Pharma plc Warrants (expiration
04/27/22, exercise price $2.07) (a) (b) (c) | | | 39,157 | | |
| | 5,750 | | | WaVe Life Sciences Ltd. (a) | | | 223,387 | | |
| | 33,078 | | | Zogenix, Inc. (a) | | | 1,819,621 | | |
| | | | 32,316,406 | | |
| | | | | TOTAL COMMON STOCKS AND WARRANTS
(Cost $282,426,103) | | | 374,581,757 | | |
| | | EXCHANGE TRADED FUND - 0.3% of Net Assets | | | |
| | 15,173 | | | SPDR S&P Biotech ETF | | | 1,373,763 | | |
| | | | | TOTAL EXCHANGE TRADED FUND
(Cost $1,042,983) | | | 1,373,763 | | |
PRINCIPAL
AMOUNT | | SHORT-TERM INVESTMENT - 4.5% of Net Assets | |
| |
$ | 18,852,000 | | | Repurchase Agreement, Fixed Income Clearing
Corp., repurchase value $18,852,000, 0.50%,
dated 03/29/19, due 04/01/19 (collateralized
by U.S. Treasury Notes 2.75%, due 08/15/21,
market value $19,231,449) | | | 18,852,000 | | |
| | | | | TOTAL SHORT-TERM INVESTMENT
(Cost $18,852,000) | | | 18,852,000 | | |
| | | | | TOTAL INVESTMENTS BEFORE MILESTONE
INTERESTS - 96.7%
(Cost $325,729,728) | | | 410,942,442 | | |
The accompanying notes are an integral part of these financial statements.
13
TEKLA LIFE SCIENCES INVESTORS
SCHEDULE OF INVESTMENTS
MARCH 31, 2019
(Unaudited, continued)
INTERESTS | | MILESTONE INTERESTS (Restricted) (a) (b) - 2.1%
of Net Assets | |
VALUE | |
| | | Health Care Equipment & Supplies - 0.8% | |
| | 1 | | | Veniti Milestone Interest | | $ | 3,191,989 | | |
| | | Pharmaceuticals - 1.4% | |
| | 1 | | | Afferent Milestone Interest | | | 335,613 | | |
| | 1 | | | Ethismos Research, Inc. Milestone Interest | | | 0 | | |
| | 1 | | | Neurovance Milestone Interest | | | 1,864,851 | | |
| | 1 | | | TargeGen Milestone Interest | | | 3,725,206 | | |
| | | | 5,925,670 | | |
| | | | | TOTAL MILESTONE INTERESTS
(Cost $6,569,382) | | | 9,117,659 | | |
NUMBER
OF
CONTRACTS
(100 SHARES
EACH)/
NOTIONAL
AMOUNT ($) | |
CALL OPTION CONTRACTS PURCHASED - 0.0% | |
| |
| | 48/1,680,000 | | | Biogen Inc. Jun20 350 Call | | | 17,160 | | |
| | | | | CALL OPTION CONTRACTS PURCHASED
(Premiums paid $247,467) | | | 17,160 | | |
| | | | | TOTAL INVESTMENTS - 98.8%
(Cost $332,546,577) | | | 420,077,261 | | |
| | | | | OTHER ASSETS IN EXCESS OF
LIABILITIES - 1.2% | | | 5,048,555 | | |
| | | | | NET ASSETS - 100% | | $ | 425,125,816 | | |
(a) Non-income producing security.
(b) Security fair valued using significant unobservable inputs. See Investment Valuation and Fair Value Measurements.
(c) Foreign security.
(d) Number of warrants to be determined at a future date.
(e) American Depository Receipt
(f) A portion of security is pledged as collateral for calll option purchased.
(g) Security exempt from registration under Rule 144A of the Securities Act of 1933, as amended. These securities may be resold in transactions exempt from registration, normally to qualified institutional buyers.
The accompanying notes are an integral part of these financial statements.
14
TEKLA LIFE SCIENCES INVESTORS
STATEMENT OF ASSETS AND LIABILITIES
MARCH 31, 2019
(Unaudited)
ASSETS: | |
Investments in unaffiliated issuers, at value
(cost $325,977,195) | | $ | 410,959,602 | | |
Milestone interests, at value (cost $6,569,382) | | | 9,117,659 | | |
Total investments | | | 420,077,261 | | |
Dividends and interest receivable | | | 110,397 | | |
Receivable for investments sold | | | 5,939,129 | | |
Prepaid expenses | | | 19,838 | | |
Other assets (see Note 1) | | | 822,881 | | |
Total assets | | | 426,969,506 | | |
LIABILITIES: | |
Due to custodian | | | 853 | | |
Payable for investments purchased | | | 1,221,302 | | |
Accrued advisory fee | | | 359,235 | | |
Accrued investor support service fees | | | 16,904 | | |
Accrued shareholder reporting fees | | | 79,363 | | |
Accrued trustee fees | | | 40,550 | | |
Accrued other | | | 125,483 | | |
Total liabilities | | | 1,843,690 | | |
Commitments and Contingencies (see Notes 1 and 5) | |
NET ASSETS | | $ | 425,125,816 | | |
SOURCES OF NET ASSETS: | |
Shares of beneficial interest, par value $.01 per share,
unlimited number of shares authorized, amount paid
in on 22,755,683 shares issued and outstanding | | $ | 339,380,742 | | |
Total distributable earnings (loss) | | | 85,745,074 | | |
Total net assets (equivalent to $18.68 per share
based on 22,755,683 shares outstanding) | | $ | 425,125,816 | | |
The accompanying notes are an integral part of these financial statements.
15
TEKLA LIFE SCIENCES INVESTORS
STATEMENT OF OPERATIONS
SIX MONTHS ENDED MARCH 31, 2019
(Unaudited)
INVESTMENT INCOME: | |
Dividend income (net of foreign tax of $0) | | $ | 1,036,572 | | |
Interest and other income | | | 89,993 | | |
Total investment income | | | 1,126,565 | | |
EXPENSES: | |
Advisory fees | | | 2,110,303 | | |
Investor support service fees | | | 102,411 | | |
Shareholder reporting | | | 78,455 | | |
Trustees' fees and expenses | | | 71,865 | | |
Legal fees | | | 68,900 | | |
Custodian fees | | | 64,226 | | |
Auditing fees | | | 51,010 | | |
Administration fees | | | 47,620 | | |
Transfer agent fees | | | 26,766 | | |
Other (see Note 2) | | | 66,898 | | |
Total expenses | | | 2,688,454 | | |
Net investment loss | | | (1,561,889 | ) | |
REALIZED AND UNREALIZED GAIN (LOSS): | |
Net realized gain (loss) on: | |
Investments in unaffiliated issuers | | | 11,542,858 | | |
Closed or expired option contracts written | | | 15,269 | | |
Foreign currency transactions | | | 702 | | |
Net realized gain | | | 11,558,829 | | |
Change in unrealized appreciation (depreciation) | |
Investments in unaffiliated issuers | | | (49,369,847 | ) | |
Investments in affiliated issuers | | | (170,682 | ) | |
Milestone interest | | | 670,461 | | |
Option contracts purchased | | | (230,307 | ) | |
Change in unrealized appreciation (depreciation) | | | (49,100,375 | ) | |
Net realized and unrealized gain (loss) | | | (37,541,546 | ) | |
Net decrease in net assets resulting from
operations | | $ | (39,103,435 | ) | |
The accompanying notes are an integral part of these financial statements.
16
TEKLA LIFE SCIENCES INVESTORS
STATEMENTS OF CHANGES IN NET ASSETS
| | | Six months ended
March 31, 2019
(Unaudited) | | Year ended
September 30,
2018 | |
NET INCREASE (DECREASE) IN NET
ASSETS RESULTING FROM OPERATIONS: | |
Net investment loss | | ($ | 1,561,889 | ) | | ($ | 3,607,111 | ) | |
Net realized gain | | | 11,558,829 | | | | 33,993,655 | | |
Change in net unrealized depreciation | | | (49,100,375 | ) | | | (1,722,315 | ) | |
Net increase (decrease) in net
assets resulting from operations | | | (39,103,435 | ) | | | 28,664,229 | | |
DISTRIBUTIONS TO SHAREHOLDERS
FROM (See Note 1): | |
Distributions (net investment
income, realized gain (loss), other) | | | (16,859,393 | ) * | | | (35,685,954 | ) | |
Total distributions | | | (16,859,393 | ) | | | (35,685,954 | ) | |
CAPITAL SHARE TRANSACTIONS: | |
Reinvestment of distributions
(456,651 and 833,649 shares,
respectively) | | | 7,153,344 | | | | 16,162,845 | | |
Fund shares repurchased
(107,109 and 0 shares, respectively)
(see Note 1) | | | (1,556,624 | ) | | | — | | |
Total capital share transactions | | | 5,596,720 | | | | 16,162,845 | | |
Net increase (decrease) in
net assets | | | (50,366,108 | ) | | | 9,141,120 | | |
NET ASSETS: | |
Beginning of period | | | 475,491,924 | | | | 466,350,804 | | |
End of period | | $ | 425,125,816 | | | $ | 475,491,924 | | |
* A portion of the distribution may be deemed a tax return of capital at year end.
The accompanying notes are an integral part of these financial statements.
17
TEKLA LIFE SCIENCES INVESTORS
| | | Six months
ended
March 31, 2019 | | Years ended September 30, | |
| | | (Unaudited) | | 2018 | | 2017 | | 2016 | | 2015 | | 2014 | |
OPERATING PERFORMANCE FOR A SHARE
OUTSTANDING THROUGHOUT EACH YEAR | |
Net asset value per share,
beginning of period | | $ | 21.22 | | | $ | 21.62 | | | $ | 20.00 | | | $ | 23.51 | | | $ | 23.37 | | | $ | 20.16 | | |
Net investment loss (1) | | | (0.07 | ) | | | (0.16 | ) | | | (0.18 | ) | | | (0.19 | ) | | | (0.25 | ) | | | (0.23 | ) | |
Net realized and unrealized
gain (loss) | | | (1.73 | ) | | | 1.39 | | | | 3.39 | | | | (0.47 | ) | | | 2.48 | | | | 5.71 | | |
Total increase (decrease)
from investment operations | | | (1.79 | ) | | | 1.23 | | | | 3.21 | | | | (0.66 | ) | | | 2.23 | | | | 5.48 | | |
Distributions to shareholders from: | |
Net realized capital gains | | | (0.75 | ) | | | (1.63 | ) | | | (1.59 | ) | | | (2.85 | ) | | | (2.09 | ) | | | (1.70 | ) | |
Total distributions | | | (0.75 | ) | | | (1.63 | ) | | | (1.59 | ) | | | (2.85 | ) | | | (2.09 | ) | | | (1.70 | ) | |
Increase resulting from
shares repurchased (1) | | | 0.01 | | | | — | | | | — | (2) | | | — | | | | — | | | | — | | |
Change due to rights offering | | | — | | | | — | | | | — | | | | — | | | | — | | | | (0.57 | )(3) | |
Net asset value per share,
end of Year | | $ | 18.68 | | | $ | 21.22 | | | $ | 21.62 | | | $ | 20.00 | | | $ | 23.51 | | | $ | 23.37 | | |
Per share market value,
end of period | | $ | 17.13 | | | $ | 20.42 | | | $ | 21.48 | | | $ | 18.73 | | | $ | 22.51 | | | $ | 22.10 | | |
Total investment return
at market value | | | (12.05 | %)* | | | 3.31 | % | | | 24.26 | % | | | (4.66 | %) | | | 9.92 | % | | | 24.20 | % | |
Total investment return
at net asset value | | | (7.66 | %)* | | | 6.61 | % | | | 17.12 | % | | | (2.52 | %) | | | 8.56 | % | | | 25.40 | % | |
RATIOS | |
Expenses to average net assets | | | 1.30 | %** | | | 1.25 | % | | | 1.32 | % | | | 1.27 | % | | | 1.21 | % | | | 1.34 | % | |
Expenses to average net assets
with waiver | | | — | | | | — | | | | — | | | | — | | | | 1.17 | % | | | 1.32 | % | |
Net investment loss to average
net assets | | | (0.75 | %)** | | | (0.81 | %) | | | (0.92 | %) | | | (0.92 | %) | | | (0.91 | %) | | | (1.07 | %) | |
SUPPLEMENTAL DATA | |
Net assets at end of period
(in millions) | | $ | 425 | | | $ | 475 | | | $ | 466 | | | $ | 415 | | | $ | 463 | | | $ | 444 | | |
Portfolio turnover rate | | | 19.23 | %* | | | 37.49 | % | | | 43.08 | % | | | 30.99 | % | | | 45.94 | % | | | 30.62 | % | |
* Not Annualized
** Annualized
(1) Computed using average shares outstanding.
(2) Rounds to less than $0.005 per share.
(3) The rights offering shares were issued at a subscription price of $19.750 which was less than the Fund's net asset value of $22.78 on June 27, 2014 thus creating a dilution effect on the net asset value per share.
The accompanying notes are an integral part of these financial statements.
18
TEKLA LIFE SCIENCES INVESTORS
NOTES TO FINANCIAL STATEMENTS
MARCH 31, 2019
(Unaudited)
(1) Organization and Significant Accounting Policies
Tekla Life Sciences Investors (the Fund) is a Massachusetts business trust formed on February 20, 1992, and registered under the Investment Company Act of 1940 as a non-diversified closed-end management investment company. The Fund commenced operations on May 8, 1992. The Fund's investment objective is long-term capital appreciation through investment in U.S. and foreign companies in the life sciences industry (including biotechnology, pharmaceutical, diagnostics, managed healthcare and medical equipment, hospitals, healthcare information technology and services, devices and supplies), agriculture and environmental management. The Fund invests primarily in securities of public and private companies that are believed by the Fund's Investment Adviser, Tekla Capital Management LLC (the Adviser), to have significant potential for above-average growth. The Fund may invest up to 20% of its net assets in securities of foreign issuers, expected to be located primarily in Western Europe, Canada and Japan, and securities of U.S. issuers that are traded primarily in foreign markets.
The preparation of these financial statements requires the use of certain estimates by management in determining the Fund's assets, liabilities, revenues and expenses. Actual results could differ from these estimates and such differences could be material. The following is a summary of significant accounting policies followed by the Fund, which are in conformity with accounting principles generally accepted in the United States of America (GAAP). The Fund is an investment company and follows accounting and reporting guidance in the Financial Accounting Standards Board Accounting Standards Codification 946. Events or transactions occurring after March 31, 2019, through the date that the financial statements were issued, have been evaluated in the preparation of these financial statements.
Investment Valuation
Shares of publicly traded companies listed on national securities exchanges or trading in the over-the-counter market are typically valued at the last sale price, as of the close of trading, generally 4 p.m., Eastern time. The Board of Trustees of the Fund (the Trustees) has established and approved fair valuation policies and procedures with respect to securities for which quoted prices may not be available or which do not reflect fair value. Convertible bonds, corporate and government bonds are valued using a third-party pricing service. Convertible bonds are valued using this pricing service only on days when there is no sale reported. Restricted securities of companies that are publicly traded are typically valued based on the closing market quote on the valuation date adjusted for the impact of the restriction as determined in good faith by the Adviser also using fair valuation policies and procedures approved by the Trustees described below. Non-exchange traded warrants of publicly traded companies are generally valued using the Black-Scholes model, which incorporates both observable and unobservable inputs. Short-term investments with a maturity of 60 days or less are generally valued at amortized cost, which approximates fair value.
Convertible preferred shares, warrants or convertible note interests in private companies, milestone interests, and other restricted securities, as well as shares of publicly traded companies for which market quotations are not readily available, such as stocks for which trading has been halted or for which there are no current day sales, or which do not reflect fair value, are typically valued in good faith, based upon the recommendations made by the Adviser pursuant to fair valuation policies and procedures approved by the Trustees.
The Adviser has a Valuation Sub-Committee comprised of senior management which reports to the Valuation Committee of the Board at least quarterly. Each fair value determination is
19
TEKLA LIFE SCIENCES INVESTORS
NOTES TO FINANCIAL STATEMENTS
MARCH 31, 2019
(continued)
based on a consideration of relevant factors, including both observable and unobservable inputs. Observable and unobservable inputs the Adviser considers may include (i) the existence of any contractual restrictions on the disposition of securities; (ii) information obtained from the company, which may include an analysis of the company's financial statements, the company's products or intended markets or the company's technologies; (iii) the price of the same or similar security negotiated at arm's length in an issuer's completed subsequent round of financing; (iv) the price and extent of public trading in similar securities of the issuer or of comparable companies; or (v) a probability and time value adjusted analysis of contractual terms. Where available and appropriate, multiple valuation methodologies are applied to confirm fair value. Significant unobservable inputs identified by the Adviser are often used in the fair value determination. A significant change in any of these inputs may result in a significant change in the fair value measurement. Due to the uncertainty inherent in the valuation process, such estimates of fair value may differ significantly from the values that would have been used had a ready market for the investments existed, and differences could be material. Additionally, changes in the market environment and other events that may occur over the life of the investments may cause the gains or losses ultimately realized on these investments to be different from the valuations used at the date of these financial statements.
Milestone Interests
The Fund holds financial instruments which reflect the current value of future milestone payments the Fund may receive as a result of contractual obligations from other parties. The value of such payments are adjusted to reflect the estimated risk based on the relative uncertainty of both the timing and the achievement of individual milestones. A risk to the Fund is that the milestones will not be achieved and no payment will be received by the Fund. The milestone interests were received as part of the proceeds from the sale of four private companies. Any payments received are treated as a reduction of the cost basis of the milestone interest with payments received in excess of the cost basis treated as a realized gain. The contractual obligations with respect to the Milestone Interest provide for payments at various stages of the development of Afferent, Neurovance, TargeGen and Veniti's principal product candidate as of the date of the sale.
The following is a summary of the impact of the milestone interests on the financial statements as of and for the six months ended March 31, 2019:
Statement of Assets and Liabilities, Milestone interests, at value | | $ | 9,117,659 | | |
Statement of Assets and Liabilities, total distributable earnings | | $ | 2,548,277 | | |
Statement of Operations, Change in unrealized appreciation (depreciation)
on milestone interests | | $ | 670,461 | | |
Options on Securities
An option contract is a contract in which the writer (seller) of the option grants the buyer of the option, upon payment of a premium, the right to purchase from (call option) or sell to (put option) the writer a designated instrument at a specified price within a specified period of time. Certain options, including options on indices, will require cash settlement by the Fund if the option is exercised. The Fund enters into option contracts in order to hedge against potential adverse price movements in the value of portfolio assets, as a temporary substitute for selling selected investments, to lock in the purchase price of a security or currency which it expects to purchase in the near future, as a temporary substitute for purchasing selected investments, or to enhance potential gain or to gain or hedge exposure to financial market risk.
20
TEKLA LIFE SCIENCES INVESTORS
NOTES TO FINANCIAL STATEMENTS
MARCH 31, 2019
(continued)
The Fund's obligation under an exchange traded written option or investment in an exchange traded purchased option is valued at the last sale price or in the absence of a sale, the mean between the closing bid and asked prices. Gain or loss is recognized when the option contract expires, is exercised or is closed.
If the Fund writes a covered call option, the Fund foregoes, in exchange for the premium, the opportunity to profit during the option period from an increase in the market value of the underlying security above the exercise price. If the Fund writes a put option it accepts the risk of a decline in the market value of the underlying security below the exercise price. Over-the-counter options have the risk of the potential inability of counterparties to meet the terms of their contracts. The Fund's maximum exposure to purchased options is limited to the premium initially paid. In addition, certain risks may arise upon entering into option contracts including the risk that an illiquid secondary market will limit the Fund's ability to close out an option contract prior to the expiration date and that a change in the value of the option contract may not correlate exactly with changes in the value of the securities or currencies hedged.
All options on securities and securities indices written by the Fund are required to be covered. When the Fund writes a call option, this means that during the life of the option the Fund may own or have the contractual right to acquire the securities subject to the option or may maintain with the Fund's custodian in a segregated account appropriate liquid securities in an amount at least equal to the market value of the securities underlying the option. When the Fund writes a put option, this means that the Fund will maintain with the Fund's custodian in a segregated account appropriate liquid securities in an amount at least equal to the exercise price of the option.
The average number of outstanding call options purchased for the six months ended March 31, 2019 were 48.
Derivatives not accounted
for as hedging instruments
under ASC 815 | | Statement of Assets and
Liabilities Location | | Statement of Operations Location | |
Equity Contracts
| | | | | | Assets, options
purchased, at value
| | $ | 17,160 | | | Net realized gain on
closed or expired option
contracts purchased | | | $— | | |
| | | | | |
| |
| | Change in unrealized
appreciation (depreciation)
on option contracts
purchased | | |
$(230,307) | | |
Other Assets
Other assets in the Statement of Assets and Liabilities consists of amounts due to the Fund at various times in the future in connection with the sale of investments in six private companies.
Investment Transactions and Income
Investment transactions are recorded on a trade date basis. Gains and losses from sales of investments are recorded using the "identified cost" method. Interest income is recorded on the accrual basis, adjusted for amortization of premiums and accretion of discounts. Dividend income is recorded on the ex-dividend date, less any foreign taxes withheld. Upon notification from issuers, some of the dividend income received may be redesignated as a reduction of cost of the related investment if it represents a return of capital.
21
TEKLA LIFE SCIENCES INVESTORS
NOTES TO FINANCIAL STATEMENTS
MARCH 31, 2019
(continued)
The aggregate cost of purchases and proceeds from sales of investment securities (other than short-term investments) for the six months ended March 31, 2019 totaled $78,098,078 and $92,096,112, respectively.
Repurchase Agreements
In managing short-term investments the Fund may from time to time enter into transactions in repurchase agreements. In a repurchase agreement, the Fund's custodian takes possession of the underlying collateral securities from the counterparty, the market value of which is at least equal to the principal, including accrued interest, of the repurchase transaction at all times. In the event of default or bankruptcy by the other party to the agreement, realization and/or retention of the collateral by the Fund may be delayed. The Fund may enter into repurchase transactions with any broker, dealer, registered clearing agency or bank. Repurchase agreement transactions are not counted for purposes of the limitations imposed on the Fund's investment in debt securities.
Distribution Policy
Pursuant to a Securities and Exchange Commission exemptive order, the Fund may make periodic distributions that include capital gains as frequently as 12 times in any one taxable year in respect of its common shares, and the Fund has implemented a managed distribution policy (the Policy) providing for quarterly distributions at a rate set by the Board of Trustees. Under the current Policy, the Fund intends to make quarterly distributions at a rate of 2% of the Fund's net assets to shareholders of record. The Fund intends to use net realized capital gains when making quarterly distributions, if available, but the Policy would result in a return of capital to shareholders if the amount of the distribution exceeds the Fund's net investment income and realized capital gains. If taxable income and net long-term realized gains exceed the amount required to be distributed under the Policy, the Fund will at a minimum make distributions necessary to comply with the requirements of the Internal Revenue Code. The Policy has been established by the Trustees and may be changed by them without shareholder approval. The Trustees regularly review the Policy and the frequency and rate of distribution considering the purpose and effect of the Policy, the financial market environment, and the Fund's income, capital gains and capital available to pay distributions.
The Fund's policy is to declare quarterly distributions in stock. The distributions are automatically paid in newly-issued full shares of the Fund unless otherwise instructed by the shareholder. Fractional shares will generally be settled in cash, except for registered shareholders with book entry accounts of the Fund's transfer agent who will have whole and fractional shares added to their accounts. The Fund's transfer agent delivers an election card and instructions to each registered shareholder in connection with each distribution. The number of shares issued will be determined by dividing the dollar amount of the distribution by the lower of net asset value or market price on the pricing date. If a shareholder elects to receive a distribution in cash, rather than in shares, the shareholder's relative ownership in the Fund will be reduced. The shares reinvested will be valued at the lower of the net asset value or market price on the pricing date. Distributions in stock will not relieve shareholders of any federal, state or local income taxes that may be payable on such distributions. Additional distributions, if any, made to satisfy requirements of the Internal Revenue Code may be paid in stock, as described above, or in cash.
22
TEKLA LIFE SCIENCES INVESTORS
NOTES TO FINANCIAL STATEMENTS
MARCH 31, 2019
(continued)
Share Repurchase Program
In March 2019, the Trustees approved the renewal of the repurchase program to allow the Fund to repurchase up to 12% of its outstanding shares in the open market for a one year period ending July 14, 2020. Prior to this renewal, in March 2018, the Trustees approved the renewal of the share repurchase program to allow the Fund to repurchase up to 12% of its outstanding shares for a one year period ending July 10, 2019. The share repurchase program is intended to enhance shareholder value and potentially reduce the discount between the market price of the Fund's shares and the Fund's net asset value.
During the six months ended March 31, 2019, the Fund repurchased 107,109 shares at a total cost of $1,556,624. The weighted average discount per share between the cost of repurchase and the net asset value applicable to such shares at the date of repurchase was 9.94%.
During the year ended September 30, 2018, the Fund did not repurchase any shares through the repurchase program.
Federal Taxes
It is the Fund's policy to comply with the requirements of the Internal Revenue Code applicable to regulated investment companies and to distribute to its shareholders substantially all of its taxable income and its net realized capital gains, if any. Therefore, no Federal income or excise tax provision is required.
As of March 31, 2019, the Fund had no uncertain tax positions that would require financial statement recognition or disclosure. The Fund's federal tax returns are subject to examination by the Internal Revenue Service for a period of three years.
Distributions
The Fund records all distributions to shareholders on the ex-dividend date. Such distributions are determined in conformity with income tax regulations, which may differ from GAAP. These differences include temporary and permanent differences from losses on wash sale transactions, installment sale adjustments and ordinary loss netting to reduce short term capital gains. Reclassifications are made to the Fund's capital accounts to reflect income and gains available for distribution under income tax regulations.
Commitments and Contingencies
Under the Fund's organizational documents, its officers and Trustees may be indemnified against certain liabilities and expenses arising out of the performance of their duties to the Fund. Additionally, in the normal course of business, the Fund enters into agreements with service providers that may contain indemnification clauses. The Fund's maximum exposure under these agreements is unknown as this would involve future claims that may be made against the Fund that have not yet occurred. However, based on experience, the Fund expects the risk of loss to be remote.
Investor Support Services
The Fund has retained Destra Capital Investment LLC (Destra) to provide investor support services in connection with the ongoing operation of the Fund. The Fund pays Destra a fee in an annual amount equal to 0.05% of the average aggregate daily value of the Fund's Managed Assets pursuant to the investor support services agreement.
23
TEKLA LIFE SCIENCES INVESTORS
NOTES TO FINANCIAL STATEMENTS
MARCH 31, 2019
(continued)
(2) Investment Advisory and Other Affiliated Fees
The Fund has entered into an Investment Advisory Agreement (the Advisory Agreement) with the Adviser. Pursuant to the terms of the Advisory Agreement, the Fund pays the Adviser a monthly fee at the rate when annualized of (i) 2.50% of the average net assets for the month of its venture capital and other restricted securities up to 25% of net assets and (ii) for all other net assets, 0.98% of the average net assets up to $250 million, 0.88% of the average net assets for the next $250 million, 0.80% of the average net assets for the next $500 million and 0.70% of the average net assets thereafter. The aggregate fee would not exceed a rate when annualized of 1.36%.
The Fund has entered into a Services Agreement (the Agreement) with the Adviser. Pursuant to the terms of the Agreement, the Fund reimburses the Adviser for certain services related to a portion of the payment of salary and provision of benefits to the Fund's Chief Compliance Officer. During the six months ended March 31, 2019, these payments amounted to $24,158 and are included in the Other category of expenses in the Statement of Operations, together with insurance and other expenses incurred to unaffiliated entities. Expenses incurred pursuant to the Agreement as well as certain expenses paid for by the Adviser are allocated to the Fund in an equitable fashion as approved by the Trustees of the Fund who are also officers of the Adviser.
The Fund pays compensation to Independent Trustees in the form of a retainer, attendance fees, and additional compensation to Board and Committee chairpersons. The Fund does not pay compensation directly to Trustees or officers of the Fund who are also officers of the Adviser.
(3) Other Transactions with Affiliates
An affiliate company is a company in which the Fund holds 5% or more of the voting securities. Transactions involving such companies during the six months ended March 31, 2019 were as follows:
Affiliated Companies | | Begining
Value as of
September 30,
2018 | | Purchases at
Cost | | Proceeds
from Sales | | Net Realized
Gain/(Loss)
on sale of
Affiliated
Companies | | Change in
Unrealized
Appreciation/
Depreciation | | Ending Value
as of
March 31,
2019 | |
ARCA Biopharma, Inc. | | $ | 489,981 | | | $ | — | | | $ | — | | | $ | — | | | $ | (170,682 | ) | | $ | 319,299 | * | |
IlluminOss Medical, Inc. | | | 2,845,265 | | | | 185,850 | | | | — | | | | — | | | | — | | | | 3,031,115 | * | |
| | | $ | 3,335,246 | | | $ | 185,850 | | | $ | — | | | $ | — | | | $ | (170,682 | ) | | $ | 3,350,414 | | |
* Not an affiliate at March 31, 2019
| | Shares/
Principal
Amount as of
March 31,
2019 | | Dividend/
Interest
Income
from
Affiliated
Companies | | Capital Gain
Distributions
from Affiliated
Companies | |
ARCA Biopharma, Inc. | | | 1,135,718 | | | $ | — | | | $ | — | | |
IlluminOss Medical, Inc. | | | 3,327,181 | | | | 42,404 | | | | — | | |
| | | | 4,462,899 | | | $ | 42,404 | | | $ | — | | |
24
TEKLA LIFE SCIENCES INVESTORS
NOTES TO FINANCIAL STATEMENTS
MARCH 31, 2019
(continued)
(4) Fair Value Measurements
The Fund uses a three-tier hierarchy to prioritize the assumptions, referred to as inputs, used in valuation techniques to measure fair value. The three-tier hierarchy of inputs is summarized in the three broad levels. Level 1 includes quoted prices in active markets for identical investments. Level 2 includes prices determined using other significant observable inputs (including quoted prices for similar investments, interest rates, credit risk, etc.). The independent pricing vendor may value bank loans and debt securities at an evaluated bid price by employing methodologies that utilize actual market transactions, broker-supplied valuations, and/or other methodologies designed to identify the market value for such securities and such securities are considered Level 2 in the fair value hierarchy. Level 3 includes prices determined using significant unobservable inputs (including the Fund's own assumptions in determining the fair value of investments). These inputs or methodology used for valuing securities are not necessarily an indication of the risk associated with investing in those securities.
The following is a summary of the levels used as of March 31, 2019 to value the Fund's net assets.
Assets at Value | | Level 1 | | Level 2 | | Level 3 | | Total | |
Convertible Preferred And Warrants | |
Biotechnology | | $ | 59,399 | | | $ | — | | | $ | 9,446,882 | | | $ | 9,506,281 | | |
Health Care Equipment & Supplies | | | — | | | | — | | | | 1,846,848 | | | | 1,846,848 | | |
Pharmaceuticals | | | — | | | | — | | | | 3,218,182 | | | | 3,218,182 | | |
Convertible Notes | |
Biotechnology | | | — | | | | — | | | | 379,344 | | | | 379,344 | | |
Health Care Equipment & Supplies | | | — | | | | — | | | | 1,184,267 | | | | 1,184,267 | | |
Common Stocks And Warrants | |
Biotechnology | | | 307,081,637 | | | | — | | | | 54,934 | | | | 307,136,571 | | |
Drug Discovery Technologies | | | 138,644 | | | | — | | | | — | | | | 138,644 | | |
Health Care Equipment & Supplies | | | 3,874,501 | | | | — | | | | 639,420 | | | | 4,513,921 | | |
Health Care Providers & Services | | | — | | | | — | | | | 490,370 | | | | 490,370 | | |
Healthcare Services | | | 462,010 | | | | — | | | | — | | | | 462,010 | | |
Life Sciences Tools & Services | | | 28,956,220 | | | | — | | | | — | | | | 28,956,220 | | |
Medical Devices And Diagnostics | | | 567,615 | | | | — | | | | — | | | | 567,615 | | |
Pharmaceuticals | | | 32,277,249 | | | | — | | | | 39,157 | | | | 32,316,406 | | |
Exchange Traded Fund | | | 1,373,763 | | | | — | | | | — | | | | 1,373,763 | | |
Short-term Investment | | | — | | | | 18,852,000 | | | | — | | | | 18,852,000 | | |
Milestone Interests | |
Health Care Equipment & Supplies | | | — | | | | — | | | | 3,191,989 | | | | 3,191,989 | | |
Pharmaceuticals | | | — | | | | — | | | | 5,925,670 | | | | 5,925,670 | | |
Other Assets | | | — | | | | — | | | | 822,881 | | | | 822,881 | | |
Total | | $ | 374,791,038 | | | $ | 18,852,000 | | | $ | 27,239,944 | | | $ | 420,882,982 | | |
Other Financial Instruments | |
Assets | |
Options Contracts Purchased | | $ | 17,160 | | | $ | — | | | $ | — | | | $ | 17,160 | | |
| | | $ | 17,160 | | | $ | — | | | $ | — | | | $ | 17,160 | | |
25
TEKLA LIFE SCIENCES INVESTORS
NOTES TO FINANCIAL STATEMENTS
MARCH 31, 2019
(continued)
The following is a reconciliation of Level 3 assets for which significant unobservable inputs were used to determine fair value.
| | | Balance as of
September 30,
2018 | | Net realized
gain (loss) and
change in
unrealized
appreciation
(depreciation) | | Cost of
purchases
and
conversions | | Cost of
sales and
conversions | | Net
transfers
in
(out of)
Level 3 | | Balance
as of
March 31,
2019 | |
Convertible Preferred and Warrants | |
Biotechnology | | $ | 7,284,914 | | | ($ | 87,693 | ) | | $ | 4,096,485 | | | $ | (1,846,824 | ) | | $ | 0 | | | $ | 9,446,882 | | |
Health Care
Equipment &
Supplies | | | 1,846,848 | | | | 0 | | | | 0 | | | | 0 | | | | 0 | | | | 1,846,848 | | |
Life Sciences
Tools & Services | | | 3,361,069 | | | | 1,655,488 | | | | 0 | | | | (5,016,557 | ) | | | 0 | | | | 0 | | |
Pharmaceuticals | | | 2,399,999 | | | | 0 | | | | 818,183 | | | | 0 | | | | 0 | | | | 3,218,182 | | |
Convertible Notes | |
Biotechnology | | | 349,198 | | | | 127 | | | | 379,217 | | | | (349,198 | ) | | | 0 | | | | 379,344 | | |
Health Care
Equipment &
Supplies | | | 998,417 | | | | 0 | | | | 185,850 | | | | 0 | | | | 0 | | | | 1,184,267 | | |
Common Stock and Warrants | |
Biotechnology | | | 131,337 | | | | (76,403 | ) | | | 0 | | | | 0 | | | | 0 | | | | 54,934 | | |
Health Care
Equipment &
Supplies | | | 550,092 | | | | 89,328 | | | | 0 | | | | 0 | | | | 0 | | | | 639,420 | | |
Health Care
Providers &
Services | | | 401,481 | | | | 88,889 | | | | 0 | | | | 0 | | | | 0 | | | | 490,370 | | |
Pharmaceuticals | | | 35,456 | | | | 3,701 | | | | 0 | | | | 0 | | | | 0 | | | | 39,157 | | |
Milestone Interests | |
Health Care
Equipment &
Supplies | | | 3,154,131 | | | | 36,986 | | | | 872 | | | | 0 | | | | 0 | | | | 3,191,989 | | |
Pharmaceuticals | | | 5,292,196 | | | | 633,474 | | | | 0 | | | | 0 | | | | 0 | | | | 5,925,670 | | |
Other Assets | | | 799,388 | | | | 0 | | | | 87,516 | | | | (64,023 | ) | | | 0 | | | | 822,881 | | |
| | | $ | 26,604,526 | | | $ | 2,343,897 | | | $ | 5,568,123 | | | ($ | 7,276,602 | ) | | $ | 0 | | | $ | 27,239,944 | | |
Net change in unrealized appreciation (depreciation) from
investments still held as of March 31, 2019 | | | | | | | | | | | | ($ | 270,936 | ) | |
26
TEKLA LIFE SCIENCES INVESTORS
NOTES TO FINANCIAL STATEMENTS
MARCH 31, 2019
(continued)
The following is a quantitative disclosure about significant unobservable inputs used in the determination of the fair value of Level 3 assets.
| | | Fair Value
at 3/31/2019 | | Valuation Technique | | Unobservable Input | | Range
(Weighted Average) | |
Private Companies
and Other
Restricted
Securities | | |
$733,368
| | |
Income approach,
Black-Scholes
| |
Discount for lack
of marketability
| |
20%-50% (25.17%)
| |
| | | | 9,287,491
| | | Probability–weighted
expected return model | | Discount rate
Price to sales multiple | | 24.24%-53.07% (36.74%)
3.65x-10.54x (5.93x) | |
| | | | 5,565,970
| | | Market approach,
recent transaction | | (a)
| | N/A
| |
| | | | 1,712,642
| | | Market Comparable
| | Discount for lack of
marketability
Earnings ratio | | 15.00%-50.00% (25.02%)
4.60x-17.00x (8.15x) | |
| | | | 9,940,473
| | | Probability adjusted
value | | Probability of events
Timing of events | | 15.00%-99.00% (44.82%)
0.25-25.00 (10.20) years | |
| | | | $27,239,944 | | | | | | | | | | |
(a) The valuation technique used as a basis to approximate fair value of these investments is based upon subsequent financing rounds. There is no quantitative information as these methods of measure are investment specific.
(5) Private Companies and Other Restricted Securities
The Fund may invest in private companies and other restricted securities if these securities would currently comprise 40% or less of net assets. The value of these securities represented 6% of the Fund's net assets at March 31, 2019.
At March 31, 2019, the Fund had a commitment of $1,649,863 relating to additional investments in three private companies.
The following table details the acquisition date, cost, carrying value per unit, and value of the Fund's private companies and other restricted securities at March 31, 2019. The Fund on its own does not have the right to demand that such securities be registered.
Security (#) | | Acquisition
Date | | Cost | | Carrying Value
per Unit | | Value | |
Afferent Milestone Interest | | 07/27/16 | | $ | 161,872 | | | $ | 335,613.00 | | | $ | 335,613 | | |
Amphivena Therapeutics, Inc. | |
Series B Cvt. Pfd | | 07/17/17 | | | 2,101,222 | | | | 15.00 | | | | 2,100,000 | | |
Series C Cvt. Pfd | | 12/10/18 | | | 808,848 | | | | 3.59 | | | | 808,848 | | |
Atreca, Inc. | |
Series C1 Cvt. Pfd | | 09/05/18 | | | 700,000 | | | | 2.33 | | | | 700,000 | | |
CardioKinetix, Inc. | |
Series C Cvt. Pfd | | 05/22/08 | | | 1,653,409 | | | | 0.00 | | | | 0 | | |
Series D Cvt. Pfd | | 12/10/10 | | | 546,109 | | | | 0.00 | | | | 0 | | |
Series E Cvt. Pfd | | 09/14/11 | | | 1,254,419 | | | | 0.00 | | | | 0 | | |
Series F Cvt. Pfd | | 12/04/14 | | | 1,645,812 | | | | 0.00 | | | | 0 | | |
Cvt. Promissory Note | | 06/20/17 | | | 51,775 | | | | 0.00 | | | | 0 | | |
Warrants (expiration 12/11/19) | | 12/10/09, 02/11/10 | | | 123 | | | | 0.00 | | | | 0 | | |
Warrants (expiration 06/03/20) | | 06/03/10, 09/01/10 | | | 123 | | | | 0.00 | | | | 0 | | |
Warrants (expiration 08/15/24) | | 8/15/14 | | | 142 | | | | 0.00 | | | | 0 | | |
Cercacor Laboratories, Inc. Common | | 03/31/98 | | | 0 | | | | 4.92 | | | | 639,277 | | |
27
TEKLA LIFE SCIENCES INVESTORS
NOTES TO FINANCIAL STATEMENTS
MARCH 31, 2019
(continued)
Security (#) | | Acquisition
Date | | Cost | | Carrying Value
per Unit | | Value | |
Curasen Therapeutics, Inc. | |
Series A Cvt. Pfd | | 09/18/18 | | $ | 1,500,000 | | | $ | 1.10 | | | $ | 1,499,999 | | |
Decipher Biosciences, Inc. | |
Series II Cvt. Pfd | | 03/29/19 | | | 1,846,823 | | | | 0.91 | | | | 361,542 | | |
Series III Cvt. Pfd | | 03/29/19 | | | 417,700 | | | | 2.17 | | | | 860,730 | | |
Ethismos Research, Inc. Milestone Interest | | 10/31/17 | | | 0 | | | | 0.00 | | | | 0 | | |
Galera Therapeutics, Inc. | |
Series C Cvt. Pfd | | 08/30/18 | | | 980,024 | | | | 2.21 | | | | 979,998 | | |
IlluminOss Medical, Inc. | |
Series AA Cvt. Pfd | | 01/21/16 | | | 960,650 | | | | 1.00 | | | | 951,000 | | |
Junior Preferred | | 01/21/16 | | | 1,566,291 | | | | 1.00 | | | | 895,848 | | |
Cvt. Promissory Note | | 02/06/18 | | | 190,166 | | | | 100.00 | | | | 190,166 | | |
Cvt. Promissory Note | | 09/05/18 | | | 237,708 | | | | 100.00 | | | | 237,708 | | |
Cvt. Promissory Note | | 01/28/19 | | | 185,849 | | | | 100.00 | | | | 185,850 | | |
Cvt. Promissory Note | | 03/28/18 | | | 285,450 | | | | 100.00 | | | | 285,294 | | |
Cvt. Promissory Note | | 12/20/18 | | | 95,139 | | | | 100.00 | | | | 95,083 | | |
Cvt. Promissory Note | | 01/11/18 | | | 190,186 | | | | 100.00 | | | | 190,166 | | |
Warrants (expiration 01/11/28) | | 01/11/18 | | | 29 | | | | 0.00 | | | | 0 | | |
Warrants (expiration 01/29/29) | | 01/28/19 | | | 0 | | | | 0.00 | | | | 0 | | |
Warrants (expiration 11/20/27) | | 11/21/17 | | | 87 | | | | 0.00 | | | | 0 | | |
Warrants (expiration 02/06/28) | | 02/06/18 | | | 0 | | | | 0.00 | | | | 0 | | |
Warrants (expiration 03/31/27) | | 03/28/17 | | | 331 | | | | 0.00 | | | | 0 | | |
Warrants (expiration 09/06/27) | | 09/05/18 | | | 0 | | | | 0.00 | | | | 0 | | |
InnovaCare Health, Inc. Common | | 12/21/12† | | | 643,527 | | | | 3.31 | | | | 490,370 | | |
Milestone Pharmaceuticals, Inc. | |
Series C Cvt. Pfd | | 07/17/17 | | | 901,252 | | | | 1.37 | | | | 900,000 | | |
Series D1 Cvt. Pfd | | 10/12/18 | | | 818,183 | | | | 1.77 | | | | 818,183 | | |
Neurovance Milestone Interest | | 03/20/17 | | | 3,417,500 | | | | 1,864,851.00 | | | | 1,864,851 | | |
Oculis SA, | |
Series B2 Cvt. Pfd | | 01/16/19 | | | 890,862 | | | | 8.36 | | | | 885,763 | | |
Rainier Therapeutics, Inc. | |
Series A Cvt. Pfd | | 01/19/16, 10/24/16 | | | 750,552 | | | | 0.65 | | | | 750,001 | | |
Series B Cvt. Pfd | | 03/03/17 | | | 500,033 | | | | 0.75 | | | | 500,000 | | |
Cvt. Promissory Note | | 01/30/19 | | | 189,672 | | | | 100.00 | | | | 189,672 | | |
Cvt. Promissory Note | | 03/28/19 | | | 189,673 | | | | 100.00 | | | | 189,672 | | |
TargeGen Milestone Interest | | 07/20/10 | | | 202,855 | | | | 3,725,206.00 | | | | 3,725,206 | | |
Therachon Holding AG | |
Series B Cvt. Pfd | | 07/17/18 | | | 1,500,000 | | | | 4.00 | | | | 1,500,000 | | |
TherOx, Inc. | | 09/11/00, 07/08/05 | | | 2,388,426 | | | | 0.02 | | | | 143 | | |
Veniti Milestone Interest | | 08/16/18 | | | 2,787,155 | | | | 3,191,989.00 | | | | 3,191,989 | | |
| | | | | $ | 32,559,977 | | | | | $ | 26,322,972 | | |
(#) See Schedule of Investments and corresponding footnotes for more information on each issuer.
† Interest received as part of a corporate action for a previously owned security.
28
TEKLA LIFE SCIENCES INVESTORS
INVESTMENT ADVISORY AGREEMENT APPROVAL
The Investment Advisory Agreement (the Advisory Agreement) between the Fund and the Adviser continues in effect so long as its continuance is approved at least annually by (i) the Trustees of the Fund and (ii) a majority of the Trustees of the Fund who are not interested persons (the Independent Trustees), by vote cast in person at a meeting called for the purpose of voting on such approval.
After considering the matter in a meeting held on March 21, 2019, the Board, and the Independent Trustees voting separately, determined that the terms of the Advisory Agreement are fair and reasonable and approved the continuance of the Advisory Agreement as being in the best interests of the Fund and its shareholders. In making its determination, the Board considered materials that were specifically prepared by the Adviser and by an independent data provider at the request of the Board and Fund counsel for purposes of the contract review process, including comparisons of (i) the Fund's performance both directly and on a risk adjusted basis to a benchmark, the NASDAQ Biotech Index® (NBI), and to a peer group of other investment companies, (ii) the Fund's expenses and expense ratios to those of a peer group of other investment companies, and (iii) the Adviser's profitability with respect to its services for the Fund to the profitability of other investment advisers. The Trustees took into account that the Adviser provides investment management services only to Tekla Life Sciences Investors, Tekla Healthcare Investors, Tekla Healthcare Opportunities Fund and Tekla World Healthcare Fund and does not derive any significant benefit from its relationship with the Fund other than receipt of advisory fees pursuant to the Advisory Agreement, market research and potential marketing exposure for the Adviser. The Board also received and reviewed information throughout the year about the portfolio performance, the investment strategy, the portfolio management team and the fees and expenses of the Fund. In their deliberations, the Independent Trustees had the opportunity to meet privately without representatives of the Adviser present and were represented throughout the process by counsel to the Independent Trustees and the Fund.
In approving the Advisory Agreement, the Board considered, among other things, the nature, extent, and quality of the services to be provided by the Adviser, the investment performance of the Fund and the Adviser, the costs of services provided and profits realized by the Adviser and its affiliates, and whether fee levels reflect any economies of scale for the benefit of Fund shareholders and the extent to which economies of scale would be realized as the Fund grows. The Board reviewed information about the foregoing factors and considered changes, if any, in such information since its previous approval. The Board also evaluated the financial strength of the Adviser and the capability of the personnel of the Adviser, specifically the strength and background of its investment analysts. Fund counsel provided the Board with the statutory and regulatory requirements for approval and disclosure of investment advisory agreements. The Board, including the Independent Trustees, evaluated all of the foregoing and, considering all factors together, determined in the exercise of its business judgment that the continuance of the Advisory Agreement is in the best interests of the Fund and its shareholders. The following provides more detail on certain factors considered by the Trustees and the Board's conclusions with respect to each such factor.
The nature, extent and quality of the services to be provided by the Adviser. On a regular basis the Board considers the roles and responsibilities of the Adviser as a whole, along with specific portfolio management, support and trading functions the Adviser provides to the Fund. The Trustees considered the nature, extent and quality of the services provided by the Adviser to the Fund. The Trustees continue to be satisfied with the quality and value of the investment advisory services provided to the Fund by the Adviser, and, in particular, the management style and discipline followed by the Adviser and the quality of the Adviser's research, trading, portfolio management, compliance and administrative personnel. The Trustees also took into
29
TEKLA LIFE SCIENCES INVESTORS
INVESTMENT ADVISORY AGREEMENT APPROVAL
(continued)
account the Adviser's significant investment in its business through the addition of portfolio management and administrative staff in recent years and the Adviser's commitment to continue to build out its infrastructure as future circumstances require.
The investment performance of the Fund and the Adviser. On a regular basis the Board reviews performance information of the Fund and discusses the Fund's investment strategy with the Adviser. The Trustees reviewed performance information for the Fund and in particular, performance information for the past one-, three-, five- and ten-year periods ending December 31, 2018, along with comparisons of the Fund's performance to its benchmark, the NBI. The Trustees also compared performance to a peer group of funds and reviewed information relating to the performance of the Fund's venture capital portfolio. The Trustees noted that the performance information reviewed reflects a view of the Fund's performance only as of a certain date, and that the results might be significantly different if a different date was selected to generate the performance information. Additionally, the Trustees recognized that longer periods of performance for the Fund may be adversely and disproportionately affected by significant underperformance in one more recent period, and that such underperformance may be caused by a small number of investment decisions or positions.
Unlike many other broader-based healthcare indices, the NBI contains high levels of biotechnology-based companies. Over time, this index has demonstrated higher returns, but has also demonstrated higher price volatility than the broad S&P 500® Index. The Adviser seeks to operate the Fund at a biotechnology exposure level that is higher than many other indices and Funds but at a level that is below that of the NBI. The Adviser also seeks to operate the Fund at lower volatility than that of the NBI. In the current reporting period, the Adviser sought to do so by limiting exposure to biotechnology relative to the NBI and also by maintaining a higher exposure to large biotechnology companies (which typically exhibit relatively lower volatility) than is present in the NBI and lower exposure to small and mid-capitalization biotechnology companies than is present in the NBI.
The Trustees noted that in calendar year 2018, the Fund outperformed the return of the NBI on a direct comparison basis and also exhibited a lower volatility than that of the NBI. Over longer-term evaluation periods (three-year, five-year and ten-year periods), the Trustees noted that the Fund had operated at a lower volatility than the NBI, but underperformed (on a net asset value basis) the NBI on a direct comparison basis for the five-year and ten-year periods while outperforming the NBI on a direct comparison basis for the three-year period. The Trustees noted that the Fund underperformed the peer group average on a direct comparison basis both for calendar year 2018 and over longer-term evaluation periods, but produced returns comparable to the returns of those funds the Adviser believes are most similar to HQL (i.e., high biotech allocation funds) where measured.
In considering the Fund's relative performance, the Trustees noted that, although an independent service provider had been engaged to help identify the appropriate benchmark and peer group for the Fund, the Fund's unique strategy presents challenges when comparing the Fund's performance to a single benchmark or peer group as no single benchmark or fund within the peer group utilizes exactly the same investment strategy. In particular, the Trustees observed that the Fund's strategy has historically included a lower allocation to biotechnology compared to the NBI and a higher biotechnology allocation compared to many other healthcare indices and to many of the peer group funds. The Trustees noted, as a result, that all other things being equal, in periods when biotechnology performs relatively well, the Fund might be expected to underperform the NBI (and/or the peer group) and vice versa. Additionally, the Trustees noted that unlike the NBI and most of the peer group, the Fund often maintains a meaningful allocation to venture and restricted securities. In light
30
TEKLA LIFE SCIENCES INVESTORS
INVESTMENT ADVISORY AGREEMENT APPROVAL
(continued)
of these differences, the Trustees recognized the more limited usefulness of these performance comparisons for the Fund.
The Trustees concluded they continue to be satisfied with the investment performance of the Fund and the Adviser.
The costs of services to be provided and profits to be realized by the Adviser from its relationship with the Fund. The Trustees considered the various services provided by the Adviser to the Fund and reviewed comparative information regarding the expenses and expense ratios of the Fund and a peer group of other investment companies. The Trustees noted that the Adviser's fees are within the range of fees presented in the comparative information and noted that a portion of the Fund's investment portfolio is invested in venture and restricted securities, a portfolio management service that can warrant higher management fees than those charged by the Adviser to the Fund. The Trustees also considered financial information provided by the Adviser, including financial statements of the Adviser and a comparison of the Adviser's profitability with respect to its services for the Fund to the profitability of other investment advisers.
The Trustees noted that the fees charged by the Adviser are within a reasonable range of fees as compared to fees charged by other investment advisers, and the services provided by the Adviser and the amounts paid under the Advisory Agreement are at least comparable to the services rendered and fees charged by others for similar services to warrant a finding that fees to be paid by the Fund are fair. Based on the information provided to and evaluated by the Trustees, the Trustees concluded that the fees charged by the Adviser are fair and reasonable in light of the quality and nature of the services provided by the Adviser and that the profitability of the Adviser's relationship with the Fund has not been excessive.
Whether fee levels reflect economies of scale and the extent to which economies of scale would be realized as the Fund grows. The Trustees considered the advisory fee schedule in the Advisory Agreement and noted that it provides for breakpoints that would reduce the effective fee to the extent the Fund's net assets should increase, allowing the Fund to share in the benefits of any economies of scale that would inure to the Adviser as the Fund's assets increase. Given the closed-end structure of the Fund, its current asset size, and the fact that any economies of scale are modest at current Fund asset levels, the Trustees determined that the Fund's advisory fee schedule is satisfactory and fair.
31
TEKLA LIFE SCIENCES INVESTORS
PRIVACY NOTICE: If you are a registered shareholder of the Fund, the Fund and Tekla Capital Management LLC, the Fund's investment adviser, may receive nonpublic personal information about you from the information collected by the transfer agent from your transactions in Fund shares. Any nonpublic personal information is not disclosed to third parties, except as permitted or required by law. In connection with servicing your account and effecting transactions, the information received may be shared with the investment adviser and non-affiliates, including transfer agents, custodians or other service companies. Access to your nonpublic personal information is restricted to employees who need to know that information to provide products or services to you. To maintain the security of your nonpublic personal information, physical, electronic, and procedural safeguards are in place that comply with federal standards. The policies and practices described above apply to both current and former shareholders.
If your Fund shares are held in "street name" at a bank or brokerage, we do not have access to your personal information and you should refer to your bank's or broker's privacy policies for a statement of the treatment of your personal information.
FOR MORE INFORMATION: A description of the Fund's proxy voting policies and procedures and information on how the Fund voted proxies relating to portfolio securities during the most recent 12-month period ended June 30 is available (i) without charge, upon request by calling 1-800-451-2597; (ii) by writing to Tekla Capital Management LLC at 100 Federal Street, 19th Floor, Boston, MA 02110; (iii) on the Fund's website at www.teklacap.com; and (iv) on the SEC's website at http://www.sec.gov.
The Fund's complete Schedule of Investments for the first and third quarters of its fiscal year will be filed quarterly with the SEC on Form N-PORT. This Schedule of Investments will also be available on the Fund's website at www.teklacap.com, or the SEC's website at http://www.sec.gov.
You can find information regarding the Fund at the Fund's website, www.teklacap.com. The Fund regularly posts information to its website, including information regarding daily share pricing and distributions and press releases, and maintains links to the Fund's SEC filings. The Fund currently publishes and distributes quarterly fact cards, including performance, portfolio and sector information for each fiscal quarter. These fact cards will be available on the Fund's website and by request from the Fund's marketing and investor support services agent, Destra Capital Advisors, at 1-877-855-3434.
DISTRIBUTION POLICY: The Fund has a managed distribution policy as described in the Notes to Financial Statements. For more information contact your financial adviser.
SHARE REPURCHASE PROGRAM: In March 2019, the Trustees reauthorized the share repurchase program to allow the Fund to repurchase up to 12% of its outstanding shares for a one year period beginning July 14, 2020.
PORTFOLIO MANAGEMENT: Daniel R. Omstead, PhD, Jason C. Akus, MD/MBA, Timothy Gasperoni, MBA, PhD, Christian M. Richard, MBA, MS, Henry Skinner, PhD, Ashton L. Wilson, Christopher Abbott, Robert Benson, CFA, CAIA, Richard Goss, Alan Kwan, MBA, PhD and Loretta Tsa, PhD are members of a team that analyzes investments on behalf of the Fund. Dr. Omstead exercises ultimate decision making authority with respect to investments.
HOUSEHOLDING: A number of banks, brokers and financial advisers have instituted "householding". Under this practice, which has been approved by the SEC, only one copy of shareholder documents may be delivered to multiple shareholders who share the same address and satisfy other conditions. Householding is intended to reduce expenses and eliminate duplicate mailings of shareholder documents. If you do not want the mailing of your shareholder documents to be combined with those of other members of your household, please contact your bank, broker or financial adviser.
32
TEKLA LIFE SCIENCES INVESTORS
New York Stock Exchange Symbol: HQL
NAV Symbol: XHQLX
100 Federal Street, 19th Floor
Boston, Massachusetts 02110
(617) 772-8500
www.teklacap.com
Officers
Daniel R. Omstead, PhD, President
Laura Woodward, CPA, Chief Compliance Officer,
Secretary and Treasurer
Trustees
Rakesh K. Jain, PhD
Thomas M. Kent, CPA
Elizabeth G.Nabel, MD
Daniel R. Omstead, PhD
Oleg M. Pohotsky, MBA, JD
William S. Reardo, MBA
Lucinda H. Stebbins, MBA, CPA
Investment Adviser
Tekla Capital Management LLC
Administrator & Custodian
State Street Bank and Trust Company
Transfer Agent
Computershare, Inc.
Legal Counsel
Dechert LLP
Shareholders with questions regarding share transfers may call
1-800-426-5523
Daily net asset value may be obtained from
our website (www.teklacap.com) or by calling
617-772-8500
ITEM 2. CODE OF ETHICS.
Not applicable to this semi-annual filing.
ITEM 3. AUDIT COMMITTEE FINANCIAL EXPERT.
Not applicable to this semi-annual filing.
ITEM 4. PRINCIPAL ACCOUNTANT FEES AND SERVICES.
Not applicable to this semi-annual filing.
ITEM 5. AUDIT COMMITTEE OF LISTED REGISTRANTS.
Not applicable to this semi-annual filing.
ITEM 6. INVESTMENTS.
The Registrant’s Schedule of Investments is included as part of the Report to Shareholders filed under Item 1 of this form.
ITEM 7. DISCLOSURE OF PROXY VOTING POLICIES AND PROCEDURES FOR CLOSED-END MANAGEMENT INVESTMENT COMPANIES.
Not applicable to this semi-annual filing.
ITEM 8. PORTFOLIO MANAGERS OF CLOSED-END MANAGEMENT INVESTMENT COMPANIES
Not applicable to this semi-annual filing.
ITEM 9. PURCHASES OF EQUITY SECURITIES BY CLOSED-END MANAGEMENT INVESTMENT COMPANY AND AFFILIATED PURCHASERS.
Period | | (a) Total No.
of Shares
Purchased (1) | | (b) Average
Price Paid per
Share | | (c) Total No.
of Shares
Purchased as
Part of
Publicly
Announced Plans
or Programs | | (d) Maximum No.
of Shares that
May Yet Be
Purchased Under
the Plans or
Programs | |
Month #1 (Oct. 1, 2018 - Oct. 31, 2018) | | — | | — | | — | | 2,665,483 | |
Month #2 (Nov. 1, 2018 — Nov. 30, 2018) | | — | | — | | — | | 2,665,483 | |
Month #3 (Dec. 1, 2018 — Dec. 31, 2018) | | 107,109 | | $ | 14.51 | | 107,109 | | 2,558,374 | |
Month #4 (Jan. 1, 2019 — Jan. 31, 2019) | | — | | — | | — | | 2,558,374 | |
Month #5 (Feb. 1, 2019 — Feb. 28, 2019) | | — | | — | | — | | 2,558,374 | |
Month #6 (Mar. 1, 2019 — Mar. 31, 2019) | | — | | — | | — | | 2,558,374 | |
Total | | 107,109 | | $ | 14.51 | | 107,109 | | | |
(1) On June 30, 2011, the share repurchase program was announced, which has been subsequently reviewed and approved by the Board of Trustees. On March 22, 2018, the share repurchase program was renewed, allowing the Registrant to repurchase up to 12% of its outstanding shares for a one year period ending July 14, 2019. On March 21, 2019, the Trustees approved the renewal of the repurchase program to allow the Registrant to repurchase up to 12% of its outstanding shares in the open market for a one year period ending July 14, 2020.
ITEM 10. SUBMISSION OF MATTERS TO A VOTE OF SECURITY HOLDERS.
There have been no material changes to the procedures by which the shareholders may recommend nominees to the Registrant’s Board of Trustees, where those changes were implemented after the Registrant last provided disclosure in response to the requirements of Item 7(d)(2)(ii)(G) of Schedule 14A, or this Item.
ITEM 11. CONTROLS AND PROCEDURES.
(a) In the opinion of the principal executive officer and principal financial officer, based on their evaluation which took place within 90 days of this filing, the Registrant’s disclosure controls and procedures are adequately designed and are operating effectively to ensure (i) that material information relating to the Registrant, including its consolidated subsidiaries, is made known to them by others within those entities, particularly during the period in which this report is being prepared; and (ii) that information required to be disclosed by the registrant on Form N-CSR is recorded, processed, summarized and reported within the time period specified in the Securities and Exchange Commission’s rules and forms.
(b) There were no changes in the Registrant’s internal control over financial reporting that occurred during the Registrant’s most recent second fiscal quarter that have materially affected or that are reasonably likely to materially affect the Registrant’s internal control over financial reporting.
ITEM 12. EXHIBITS
(a)(1) Code of Ethics - Not applicable to this semi-annual filing.
(a)(2) Separate certifications of the Principal Executive and Financial Officers as required by Rule 30a-2(a) under the 1940Act and Section 302 of the Sarbanes-Oxley Act of 2002 are attached hereto (Exhibit 1 and 2).
(a)(3) Notices to Fund’s shareholders in accordance with Investment Company Act Section 19(a) and Rule 19a-1 (Exhibit 3).
(b) Certifications pursuant to Section 906 of the Sarbanes-Oxley Act of 2002 are attached hereto (Exhibit 4).
SIGNATURES
Pursuant to the requirements of the Securities Exchange Act of 1934 and the Investment Company Act of 1940, the registrant has duly caused this report to be signed on its behalf by the undersigned, thereunto duly authorized.
(Registrant) | TEKLA LIFE SCIENCES INVESTORS | |
| |
By (Signature and Title)* | /s/ Daniel R. Omstead | |
| Daniel R. Omstead, President | |
| |
Date: | 6/5/19 | |
| | | | |
Pursuant to the requirements of the Securities Exchange Act of 1934 and the Investment Company Act of 1940, this report has been signed below by the following persons on behalf of the registrant and in the capacities and on the dates indicated.
By (Signature and Title)* | /s/ Laura Woodward | |
| Laura Woodward, Treasurer | |
| |
Date: | 6/5/19 | |
| | | |
* Print the name and title of each signing officer under his or her signature.