|
Exhibit 99.7 
|
€450 million Senior Notes due 2024
Investor Presentation
June 14 – 17, 2016
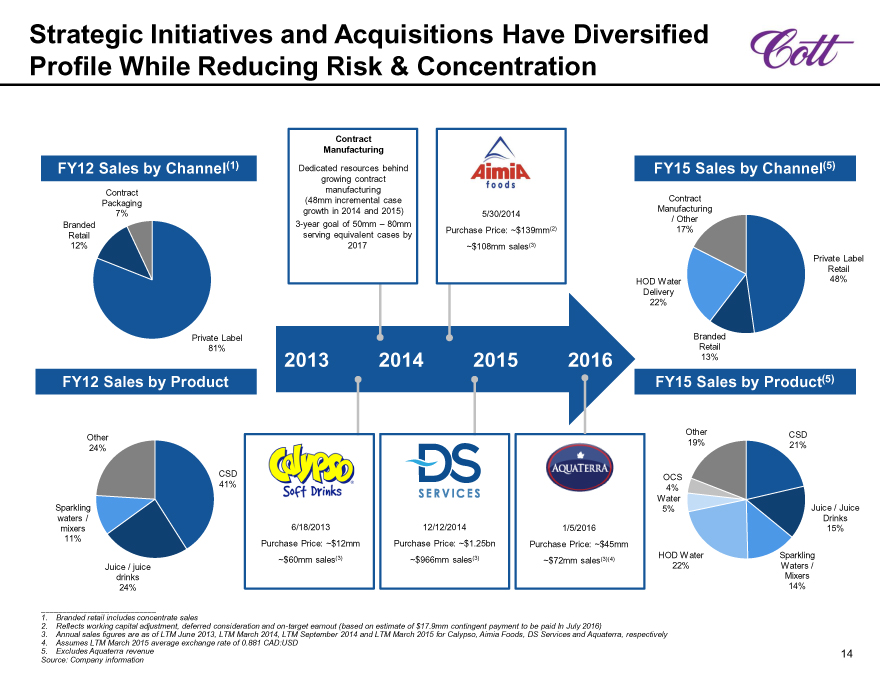
Strategic Initiatives and Acquisitions Have Diversified
Profile While Reducing Risk & Concentration
Contract
Manufacturing
FY12 Sales by Channel(1) Dedicated resources behind FY15 Sales by Channel(5)
growing contract
Contract manufacturing
Packaging (48mm incremental case Contract
7% growth in 2014 and 2015) 5/30/2014 Manufacturing
/ Other
Branded 3-year goal of 50mm – 80mm Purchase Price: ~$139mm(2) 17%
Retail serving equivalent cases by
12% 2017 ~$108mm sales(3)
Private Label
Retail
HOD Water 48%
Delivery
22%
Private Label Branded
81% Retail
2013 2014 2015 2016 13%
FY12 Sales by Product FY15 Sales by Product(5)
Other
24%
CSD
41%
Sparkling
waters /
mixers 6/18/2013
11% Purchase Price: ~$12mm
~$60mm sales(3)
Juice / juice
drinks
24%
12/12/2014
Purchase Price: ~$1.25bn
~$966mm sales(3)
1/5/2016
Purchase Price: ~$45mm
~$72mm sales(3)(4)
Other CSD
19% 21%
OCS
4%
Water
5% Juice / Juice
Drinks
15%
HOD Water Sparkling
22% Waters /
Mixers
14%
Branded retail includes concentrate sales
Reflects working capital adjustment, deferred consideration and on-target earnout (based on estimate of $17.9mm contingent payment to be paid In July 2016)
Annual sales figures are as of LTM June 2013, LTM March 2014, LTM September 2014 and LTM March 2015 for Calypso, Aimia Foods, DS Services and Aquaterra, respectively
Assumes LTM March 2015 average exchange rate of 0.881 CAD:USD
5. Excludes Aquaterra revenue 14
Source: Company information
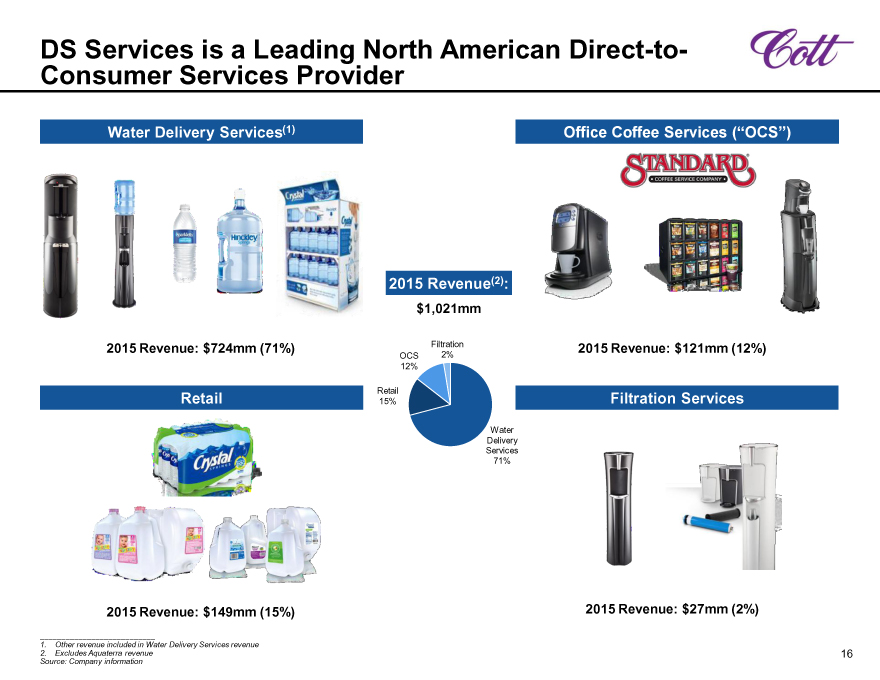
DS Services is a Leading North American Direct-to-
Consumer Services Provider
Water Delivery Services(1) Office Coffee Services (“OCS”)
2015 Revenue(2):
$1,021mm
2015 Revenue: $724mm (71%) Filtration 2015 Revenue: $121mm (12%)
OCS 2%
12%
Retail
Retail 15% Filtration Services
Water
Delivery
Services
71%
2015 Revenue: $149mm (15%) 2015 Revenue: $27mm (2%)
1. Other revenue included in Water Delivery Services revenue
2. Excludes Aquaterra revenue 16
Source: Company information
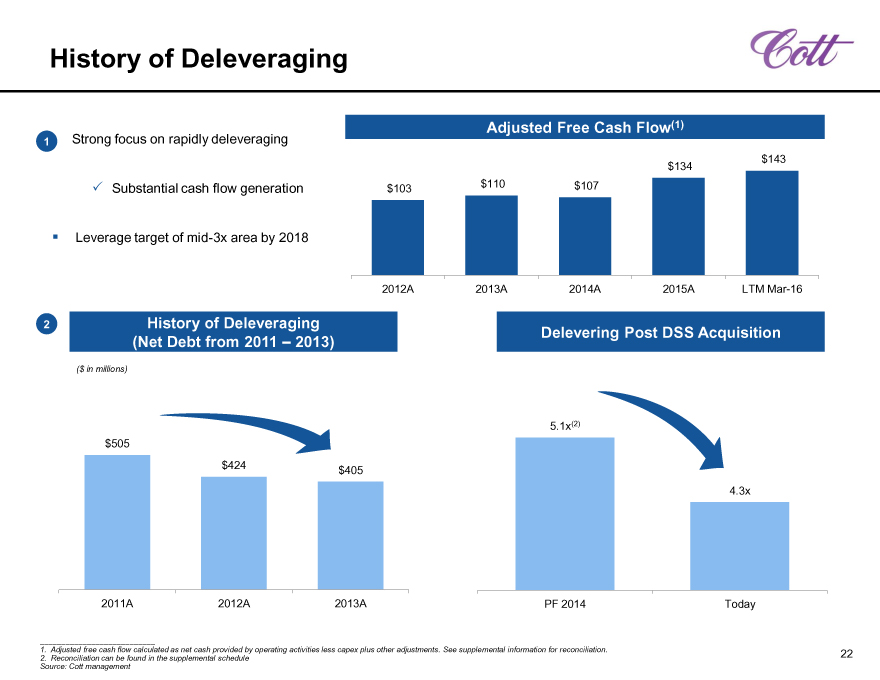
History of Deleveraging
Adjusted Free Cash Flow(1)
1 Strong focus on rapidly deleveraging
$134 $143
Substantial cash flow generation $103 $110 $107
Leverage target of mid-3x area by 2018
2012A 2013A 2014A 2015A LTM Mar-16
2 History of Deleveraging Delevering Post DSS Acquisition
(Net Debt from 2011 – 2013)
($ in millions)
5.1x(2)
$505
$424 $405
4.3x
2011A
2012A
2013A
PF 2014
Today
1. Adjusted free cash flow calculated as net cash provided by operating activities less capex plus other adjustments. See supplemental information for reconciliation. 22
2. Reconciliation can be found in the supplemental schedule
Source: Cott management
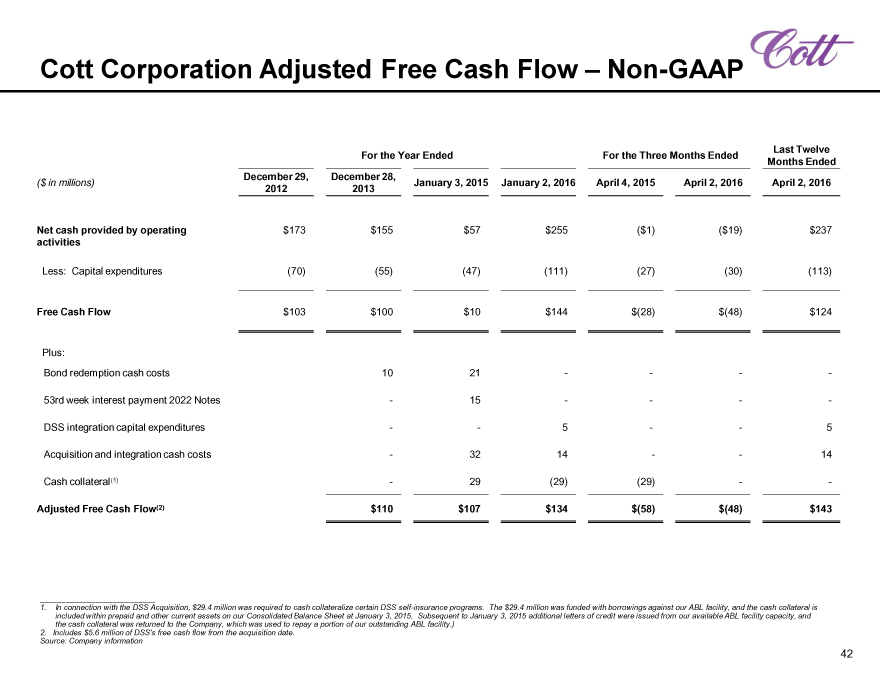
Cott Corporation Adjusted Free Cash Flow ? Non-GAAP
Last Twelve
For the Year Ended For the Three Months Ended Months Ended
December 29, December 28,
($ in millions) January 3, 2015 January 2, 2016 April 4, 2015 April 2, 2016 April 2, 2016
2012 2013
Net cash provided by operating $173 $155 $57 $255 ($1) ($19) $237
activities
Less: Capital expenditures (70) (55) (47) (111) (27) (30) (113)
Free Cash Flow $103 $100 $10 $144 $(28) $(48) $124
Plus:
Bond redemption cash costs 10 21 ——— -
53rd week interest payment 2022 Notes — 15 ——— -
DSS integration capital expenditures —— 5 —— 5
Acquisition and integration cash costs — 32 14 —— 14
Cash collateral(1) — 29 (29) (29) — -
Adjusted Free Cash Flow(2) $110 $107 $134 $(58) $(48) $143
In connection with the DSS Acquisition, $29.4 million was required to cash collateralize certain DSS self-insurance programs. The $29.4 million was funded with borrowings against our ABL facility, and the cash collateral is included within prepaid and other current assets on our Consolidated Balance Sheet at January 3, 2015. Subsequent to January 3, 2015 additional letters of credit were issued from our available ABL facility capacity, and the cash collateral was returned to the Company, which was used to repay a portion of our outstanding ABL facility.)
Includes $5.6 million of DSS’s free cash flow from the acquisition date.
Source: Company information
42
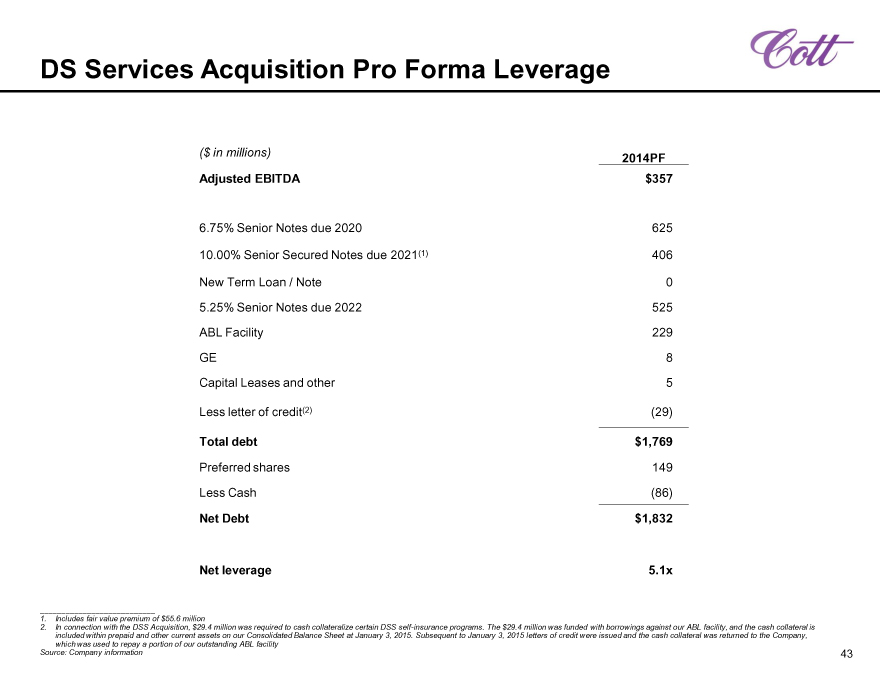
DS Services Acquisition Pro Forma Leverage
($ in millions) 2014PF
Adjusted EBITDA $357
6.75% Senior Notes due 2020 625
10.00% Senior Secured Notes due 2021(1) 406
New Term Loan / Note 0
5.25% Senior Notes due 2022 525
ABL Facility 229
GE 8
Capital Leases and other 5
Less letter of credit(2) (29)
Total debt $1,769
Preferred shares 149
Less Cash (86)
Net Debt $1,832
Net leverage 5.1x
Includes fair value premium of $55.6 million
In connection with the DSS Acquisition, $29.4 million was required to cash collateralize certain DSS self-insurance programs. The $29.4 million was funded with borrowings against our ABL facility, and the cash collateral is included within prepaid and other current assets on our Consolidated Balance Sheet at January 3, 2015. Subsequent to January 3, 2015 letters of credit were issued and the cash collateral was returned to the Company, which was used to repay a portion of our outstanding ABL facility
Source: Company information
43