UNITED STATES
SECURITIES AND EXCHANGE COMMISSION
Washington, D.C. 20549
FORM N-CSR
CERTIFIED SHAREHOLDER REPORT OF REGISTERED MANAGEMENT
INVESTMENT COMPANIES
Investment Company Act file number 811-06625
The Payden & Rygel Investment Group
(Exact name of registrant as specified in charter)
333 South Grand Avenue
Los Angeles, CA 90071
(Address of principal executive offices) (Zip code)
Edward S. Garlock, Esq.
Secretary
333 South Grand Avenue
Los Angeles, CA 90071
(Name and address of agent for service)
Registrant’s telephone number, including area code: 213-625-1900
Date of fiscal year end: October 31
Date of reporting period: October 31, 2018
Form N-CSR is to be used by management investment companies to file reports with the Commission not later than 10 days after the transmission to stockholders of any report that is required to be transmitted to stockholders under Rule 30e-1 under the Investment Company Act of 1940 (17 CFR 270.30e-1). The Commission may use the information provided on Form N-CSR in its regulatory, disclosure review, inspection, and policymaking roles.
A registrant is required to disclose the information specified by Form N-CSR, and the Commission will make this information public. A registrant is not required to respond to the collection of information contained in Form N-CSR unless the Form displays a currently valid Office of Management and Budget (“OMB”) control number. Please direct comments concerning the accuracy of the information collection burden estimate and any suggestions for reducing the burden to Secretary, Securities and Exchange Commission, 450 Fifth Street, NW, Washington, DC 20549-0609. The OMB has reviewed this collection of information under the clearance requirements of 44 U.S.C. § 3507.
Item 1. Reports to Stockholders.
The Reports to Shareholders are attached herewith.

IMPORTANT INFORMATION: The information contained in this report is intended for shareholders of the Payden Mutual Funds only. It is not authorized for distribution to prospective investors unless accompanied or preceded by a current prospectus which provides further details.
The performance numbers presented in this report are derived from historical market data. There is no guarantee of future performance nor are Fund shares guaranteed. Investment return and principal value of an investment in a Fund will fluctuate so that an investor’s shares, when redeemed, may be worth more or less than original cost. Fund shares are sold through Payden & Rygel Distributors, member FINRA.
The Fund files its complete schedule of portfolio holdings with the Securities and Exchange Commission (SEC) for the first and third quarters of each fiscal year on Form N-Q. Forms N-Q are available on the SEC’s web site at http://www.sec.gov or the Fund’s Forms N-Q may be reviewed and copied at the SEC’s Public Reference Room in Washington D.C. Information regarding the operation of the SEC’s Public Reference Room may be obtained by calling 1-800 SEC-0330.
To view the Fund’s proxy voting guidelines and proxy voting record for the period ended June 30th, visit the SEC’s web site at http://www.sec.gov. You may also call 800 572-9336 to request a free copy of the proxy voting guidelines.

Annual Report

Short Duration Bond Strategies
During the fiscal year ended October 31, 2018, the Federal Reserve Board raised the Federal Funds Rate four times, from 1.25% to 2.25%, as global growth improved, the unemployment rate fell below 4% and inflation was around the Federal Reserve Board’s 2% target.
US Treasury yields with maturities equal to or less than five years rose in concert with the central bank actions. Two-year maturity US Treasury yields rose from 1.60% to 2.87%. Three-month LIBOR continued to rise along with short term rates, increasing by 1.15% to end the fiscal year at 2.56%. Short maturity bond yields have now reached levels not seen since 2008.
As US Treasury yields increased over the year, corporate bond yields also move higher and corporate spreads widened marginally from historically low levels seen in late January. Despite higher yields and wider spreads, the investment-grade corporate sector outperformed US Treasuries on a total return basis, as the additional income earned over US Treasuries was enough to offset the negative price impact of wider spreads. Within the investment grade corporate universe financial securities outperformed industrials and lower quality securities outperformed higher quality. Investors remained optimistic over corporate earnings and global growth and have been drawn to the sector given attractive yields and low volatility profile.
The Payden Cash Reserves Money Market Fund (PBHXX) continued to provide stable daily liquidity. For the fiscal year ended October 31, 2018, the Fund returned 1.43%, compared to a return of 1.02% for the Lipper Government Money Market Average. Money market rates rose as the FOMC raised the Federal Funds Rate four times during the fiscal year.
The Payden Limited Maturity Fund (PYLMX) returned 1.92% for the fiscal year ended October 31, 2018, compared to a return of 1.68% for its benchmark, the ICE BofAML US 3-Month Treasury Bill Index. Corporate securities, securitized products and duration positioning were the largest contributors to outperformance. The Fund invests in swaps, futures and forward currency contracts for credit risk hedging and investment purposes. The use of credit default swaps to hedge credit exposure had no impact to performance.
The Payden Low Duration Fund (PYSBX) returned 0.39% for the fiscal year ended October 31, 2018, compared to a return of 0.25% for its benchmark, the ICE BofAML 1-3 Year US Treasury Index. Corporate securities and securitized products were the largest contributors to outperformance. The Fund invests in futures, swaps, options and forward currency contracts for hedging and investment purposes. The use of these derivatives impacted performance by -0.02%.
The Payden Global Low Duration Fund (PYGSX) returned 0.42% for the fiscal year ended October 31, 2018, compared to a return of 0.41% for its benchmark, the ICE BofAML 1-3 Year US Corporate & Government Index. Corporate securities, securitized products and duration positioning were the largest contributors to outperformance. The Fund invests in futures, swaps, options and forward currency contracts for hedging and investment purposes. The use of these derivatives impacted performance by 0.06%.
The Payden U.S. Government Fund, Investor Class (PYUSX) returned -0.86% for the fiscal year ended October 31, 2018, compared to its benchmark, the ICE BofAML 1-5 Year US Treasury Index, which returned -0.36%. The Fund underperformed its index due to an overweight to mortgage backed securities which generally underperformed US Treasuries over the fiscal year. Mortgages underperformed due to declining support from the Federal Reserve Board as they no longer reinvest paydowns from their portfolio and a flattening yield curve which led to faster prepayments than anticipated on adjustable rate mortgages.
The Fund is currently structured defensively. The Adviser expects the Federal Reserve Board to continue removing monetary accommodation from the marketplace due to a strong domestic economy. The Adviser anticipates maintaining an overweight to mortgage backed securities as increased US Treasury issuance and improved mortgage security valuations should lead to higher relative performance for the mortgage sector over the next fiscal year. The Fund made limited use of interest rate derivative over the course of the fiscal year. Typically, the Fund will use US Treasury futures to remove interest rate sensitivity when rates drop in a “flight to quality” US Treasury market rally. The market impact of derivatives was negligible over the past fiscal year.
Intermediate Duration Bond Strategies
The Payden GNMA Fund (PYGNX) returned -2.34%, for the fiscal year ended October 31, 2018, while its benchmark, the ICE BofAML US GNMA Mortgage Backed Securities Index, returned -1.61%. The Fund underperformed its benchmark due to an overweight to newer mortgage pools that underperformed the more seasoned mortgage vintages. Seasoned mortgage pools outperformed due to less sensitivity to rising rates and a more stable prepayment profile resulting in higher total returns. Over the
Annual Report 1

last fiscal year, yields moved higher across the yield curve, as the Federal Reserve Board raised the overnight lending rate. The Adviser expects further pressure on interest rates as the Federal Reserve Board continues to remove accommodation from the financial markets in response to a strong domestic economy. The Federal Reserve Board has also curtailed its agency MBS reinvestment program, which provides further headwinds for the asset class as money managers, banks and REITs will be tasked with absorbing forward supply. Despite the adverse supply/demand landscape, GNMA mortgages are at their cheapest valuation in years, with nominal yields on new purchases over 4%. Today’s higher mortgage rates provide the lowest refinance environment in over a decade which should lead to higher realized yields for the Fund.
The Fund employs U.S. Treasury and Euro dollar futures to manage interest rate and yield curve exposure. Over the fiscal year, the use of derivatives contributed modest positive returns to Fund performance by reducing risk exposure to the front part of the yield curve. The Fund remains positioned slightly on the defensive side, anticipating a continuation in the move toward higher interest rates.
The Payden Core Bond Fund, Investor Class (PYCBX) returned -1.88% for the fiscal year ended October 31, 2018, compared to a -2.05% return for its benchmark, the Bloomberg Barclays US Aggregate Bond Index. The Fund’s Adviser Class (PYCWX) returned -2.12% for the same period. The Fund’s, SI Class (PYCSX) began January 22, 2018. From inception through October 31, 2018, the class returned -1.75% compared to -1.74% for its benchmark over the same period. The primary driver of performance was the increase in interest rates over the period. The 10-year US Treasury bond increased 0.76% during the fiscal year. Core bond funds have price exposure to interest rates and thus would be expected to exhibit price declines in the face of higher interest rates. The full impact of the interest rate increase was moderated by the Fund’s use of non-government securities to add diversification and yield enhancement. Allocations to investment grade corporate, high yield, securitized and emerging market bonds provided a modest buffer to achieve outperformance relative to the Fund’s benchmark. The Fund uses derivatives for interest rate, currency management and credit sector management. It utilizes interest rate swaps and interest rate futures to manage overall duration and yield curve positioning. Foreign currency forwards are traded to hedge currency exposure and to take outright positions on specific currencies. Forward contracts for currency management were a modest -0.06% detractor from performance. Over the year, interest rate futures were used to hedge interest rate risk which detracted -0.06% from performance.
The Payden Corporate Bond Fund (PYACX) generated a net return of -2.61% for the fiscal year ended October 31, 2018, compared to a return of -3.02% for its benchmark, the Bloomberg Barclays US Corporate Investment Grade Index. The Fund’s largest contributor to performance was security selection within industrials, particularly energy, and consumer non-cyclical names. Energy bonds did nicely throughout the period as the price of oil rose 20% to over $65. One of the few detractors from performance was weakness in bank security selection, which came to a head in May as political tensions in Italy shook bank bonds across the globe that were low on the capital structure. Still, this was eclipsed by positive performance across most sectors and beneficial duration positioning. The Fund used futures as a means of managing duration. Ultimately this was additive to performance as the Fund was consistently short versus the benchmark.
The Payden Strategic Income Fund, Investor Class (PYSGX) returned -0.33% for the fiscal year ended October 31, 2018, compared to a -2.05% return for its benchmark, the Bloomberg Barclays US Aggregate Bond Index. The Fund’s SI Class (PYSIX) returned -0.20% for the same period. The Fund’s primary objective is to maintain an income advantage relative to the broad bond market and to exploit relative value by sector rotation and bond selection. This is achieved by investing primarily in investment grade and high yield corporate bonds, securitized debt and emerging markets. In addition, the Fund will permit a wide range of average maturity to be more opportunistic in defending against interest rate volatility. For the fiscal year, the Fund was managed with the belief that interest would trend higher and it was therefore positioned to be substantially shorter than the benchmark. This was the major reason for the fund’s outperformance. In addition, the Fund’s broad allocation to credit sectors and securitized bonds contributed strong performance relative to the index as these sectors provide substantial yield advantages and increased coupon income. The Fund uses derivatives for interest rate, currency management and credit sector management. It utilizes interest rate swaps and interest rate futures to manage overall duration and yield curve positioning, and foreign currency forwards are used to hedge currency exposure or to take outright positions on specific currencies. Over the year, interest rate futures were used to hedge interest rate risk, which enhanced performance by 0.09%. Forward contracts for currency management were a modest -0.06% detractor from performance.
For the fiscal year ended October 31, 2018, the Payden Absolute Return Bond Fund, Investor Class (PYARX) returned 1.40%, compared to a return of 1.81% for its benchmark, the ICE BofAML US Dollar 1-Month Deposit Offered Rate Constant Maturity Index. The Fund’s SI Class (PYAIX) returned 1.55% for the fiscal year. The fiscal year was a tug-of-war between robust economic
2 Payden Mutual Funds
data and persistent geopolitical risk across the globe. Emerging market sovereign debt and investment-grade corporate bonds elicited negative total returns as the US dollar strengthened and government bond yields increased. Less interest-rate sensitive sectors such as Government Sponsored Entity risk-sharing deals, collateralized loan obligations and leveraged loans offered shelter from price declines. Securitized product continued to offer structural protection and a risk premium for complexity as underwriting standards remained tight and the US Housing market remained on stable footing. Tail risk hedges contributed positively to performance as volatility increased substantially in-tandem with declines in the equity market. The Fund remains structured with low interest rate sensitivity and invested in a diversified mix of fixed income sectors, including corporate, mortgage-backed and asset-backed securities. The Fund employs futures, options, swaps and forward currency contracts to manage sensitivity to undesired risk exposures as well as efficient investment purposes.
Loan Strategy
The leveraged loan market enjoyed positive performance with little volatility over the fiscal year ended October 31, 2018. Loans continued their outperformance relative to other fixed income asset classes as they benefited from investor appetite for higher quality, floating rate product in the rising interest rate environment. As the Federal Reserve Board continues its rate hikes and LIBOR rises, loans become more attractive relative to other fixed income instruments. Loan issuers continue to report solid earnings, benefitting from a strong economy as well as the US tax cut. Robust CLO creation also remains supportive of loan prices.
For the fiscal year ended October 31, 2018, the Payden Floating Rate Fund, Investor Class (PYFRX) returned 3.15% and the SI Class (PYFIX) returned 3.25%. The Fund’s benchmark, the Credit Suisse Institutional Leverage Loan BB Index, returned 3.96% for the same period. The Fund benefitted from positions across several sectors. A position in Frontier Communications Corp. performed well (+9.2%) as the company engaged in several credit-friendly refinancing transactions early in 2018. A position in Albertsons Companies LLC also performed well (+8.4%), although the Fund elected not to participate in a refinancing transaction due to concerns about non-discount grocery stores. A position in the term loan of SFR, a French cable and telecommunications company, detracted modestly from performance during this period after returning -2.0%. Although competitive pressures on the issuer have eased, the issuer is facing macro headwinds from slower than expected economic growth in Europe.
High Yield Bond Strategy
High-yield bonds returned 0.34% during the fiscal year ended October 31, 2018 as measured by the ICE BofAML BB-B US Cash Pay High Yield Constrained Index. Returns for the asset class were negative during the first part of the period as rising rates impacted bond prices. The market rallied strongly through the summer, but it gave back most of its gains in October. Sector performance ranged from -3.1% for autos to +3.2% for healthcare. BB-rated bonds returned -0.89%, B-rated bonds returned +1.65%, and CCC-rated bonds returned +3.48%.
The Payden High Income, Investor Class (PYHRX) returned 0.16% for the fiscal year ended October 31, 2018. The Fund’s benchmark, the ICE BofAML BB-B US Cash Pay High Yield Constrained Index, returned 0.34% for the same period. One of the top performers for the period was J.C. Penney (+15.4%), which posted strong performance during the period the portfolio held the bond after it delivered better-than-expected holiday sales. A position in Bausch Health Companies (formerly known as Valeant Pharmaceutical) also generated solid performance (+14.3%) as the company’s deleveraging efforts took hold under a new management team. ARD Securities Finance was the largest detractor, as the packaging company delivered results that were softer-than-expected. The bonds were down by -6.3% during the period, but the Adviser remains comfortable with the issuer’s long-term prospects.
The Fund uses credit default swaps to gain short term market exposure when cash inflows are heavy. These positions are nominally small exposures and track the market. The Fund also holds forward currency contracts both to hedge foreign exchange exposure and for investment purposes. Active currency management detracted -0.07% from the Fund’s relative performance.
Tax Exempt Bond Strategy
For the fiscal year ended October 31, 2018, the Payden California Municipal Income Fund (PYCRX) returned -0.39%. The Fund outperformed its benchmarks, the Bloomberg Barclays California Intermediate Municipal Bond Index and the Bloomberg Barclays 7-Year Municipal Index, which returned -0.66%, and -0.94%, respectively. The outperformance was achieved primarily through the Fund’s allocation on the yield curve, and to new issue participation. While the Fund was mostly duration neutral throughout the period, our over-allocation to longer maturities and floating rate instruments was a contributing factor to performance as front-end
Annual Report 3

municipal rates increased more than long rates, flattening the yield curve. Given that the Federal Reserve Board is in the midst of its hiking cycle and front-end fixed rate municipals remain historically rich compared to US Treasuries, we expect to maintain this positioning moving forward. The Fund also continues to favor higher quality, revenue-secured sectors over general obligation debt. The Fund invests in futures contracts for hedging and investment purposes. The use of interest rate futures impacted performance by 0.01%.
Global Bond Strategy
The Payden Global Fixed Income Fund (PYGFX) posted a net return of -0.39% for the fiscal year ended October 31, 2018 compared to a return of 0.20% for its benchmark, the Bloomberg Barclays Global Aggregate Index (USD Hedged). The Fund held overweights in securitized instruments and high yield corporates which contributed positively. These positive contributions were more than offset by negative contributions coming from overweights held in investment grade corporates and hard currency emerging market debt. Overall, asset allocation slightly detracted from relative performance whilst security selection added modestly. In a government bond yield rising environment, the Fund benefited from a short duration positioning relative to the index. However, the active currency management detracted from relative performance. The Fund used currency forwards for hedging and active investment purposes throughout the period. The Fund also utilized government bond and short interest rate future contracts for duration hedging and active duration positioning.
Emerging Market Bond Strategies
For the fiscal year ended October 31, 2018, emerging markets fixed income securities experienced negative returns across hard currency and local currency bonds. Rising US Treasury yields, US dollar strength and a trade dispute between the US and China led to increased market volatility and pushed yields on emerging market bonds higher. Returns across countries showed significant dispersion, however, as those with lower external financing needs and credible monetary policy navigated the changing environment better than select countries with larger external imbalances.
For the fiscal year ended October 31, 2018, the Payden Emerging Markets Bond Fund, Investor Class (PYEMX) returned -5.64%, the Fund’s Adviser Class (PYEWX) returned -5.86%, and the Fund’s SI Class (PYEIX) returned -5.51%. The Fund’s benchmark, the J.P. Morgan EMBI Global Diversified Index, returned -4.39% for the same period. Overweight positions in Mongolia, Angola, and Oman were positive, as were underweight positions in Lebanon, Panama, and Peru. Overweight exposure in Argentina and Zambia, security selection in Indonesia and Sri Lanka, and underweight positioning in Poland all underperformed and more than offset the gains. Quasi-sovereign selection was positive, including positioning in Malaysia and Costa Rica, as well as an underweight to Chilean entities; selection within Mexican quasi-sovereigns detracted. An off-benchmark allocation to corporates added, while local currency denominated debt detracted from relative performance. The emerging markets Funds invest in swaps, futures, options and forward currency contracts for credit, currency and interest rate risk hedging and for investment purposes. During the period, the use of derivative instruments contributed 0.39% to the Fund’s total return.
The Payden Emerging Markets Local Bond, Investor Class (PYELX) returned -7.98% for the fiscal year ended October 31, 2018. The Fund’s benchmark, the J.P. Morgan GBI-EM Global Diversified Index returned -6.58% for the same period. Relative to the benchmark, the Fund benefitted from underweight rates positioning in Turkey, Czech Republic, and the Philippines, as well as targeted security selection to the intermediate part of the yield curve in Brazil. Overweight rates positioning in South Africa, Indonesia, and Russia all underperformed and more than offset the gains. Overall, currency positioning modestly detracted. Overweight positions in the Malaysian ringgit, Egyptian pound, and Nigerian naira added to returns, as did underweight exposure to the Turkish lira. An overweight stance in the South African rand, Russian ruble, Argentine peso, and Kazakhstan tenge detracted. The emerging markets Funds invest in swaps, futures, options and forward currency contracts for credit, currency and interest rate risk hedging and investment purposes. During the period, the use of derivative instruments contributed -0.03% to the Fund’s total return.
The Payden Emerging Market Corporate Bond Fund, Investor Class (PYCEX) returned -2.26%, and the Fund’s SI Class (PYCIX) returned -2.16% for the fiscal year ended October 31, 2018. The Fund’s benchmark, the J.P. Morgan CEMBI Broad Diversified Index, returned -1.86% for the period. The Fund’s selection of emerging market corporates was the primary contributor to outperformance, while off-index allocations to sovereigns and local currency bonds detracted from relative returns. Off-index allocations to quasi-sovereigns and developed market corporates outperformed the benchmark, adding to returns. Within emerging
4 Payden Mutual Funds
market corporates, selection of oil and gas credits in Chile, consumer goods in Israel, telecommunications in Jamaica, financials in Paraguay, and utilities in Peru all benefitted relative performance. Underweight positions to real estate in China and Hong Kong, financials in Turkey, and oil and gas in Thailand also added. The selection of utilities credits in Brazil, industrials in India, and financials in Mexico detracted, as did overweight positioning to Russian oil and gas corporates early in the period. The emerging markets Funds invest in swaps, futures, options and forward currency contracts for credit, currency and interest rate risk hedging and investment purposes. During the period, the use of derivative instruments contributed 0.10% to the Fund’s total return.
U.S. Equity Strategy
The U.S. equity markets posted positive returns for the fiscal year on strong corporate earnings and robust US economic growth. The fiscal year started on a positive note as US tax reform and the outlook for global synchronized growth fueled equity markets to record highs in January. However, the markets quickly reversed in February as volatility spiked up, led by technical selling with the broad market falling into correction territory. Despite the weakness in the markets, US corporate fundamentals provided support for prices as US companies reported the highest earnings growth in eight years. The equity markets grinded higher over the coming months, reaching a new record high in late September, despite continued headlines on tariffs between US and China and an economic slowdown in Europe. The gains were temporary as the Federal Reserve Board hiked interest rates for the third time this calendar year, which drove interest rates to rise across the curve and investors to reset their growth expectations. Once again volatility spiked up as technical selling wiped out a significant amount of the gains for the year. However, the broad equity market did hold on to positive territory for the fiscal year ended October 31, 2018 on strong fundamental and economic data.
The Payden Equity Income Fund, Investor Class (PYVLX), which is comprised of large-cap value stocks, returned 3.92% for the fiscal year ended October 31, 2018, while the Fund’s Adviser Class (PYVAX) returned 3.69% and the Fund’s SI Class (PYVSX) returned 4.01%. The Fund’s benchmark, the Russell 1000 Value Index, returned 3.01% for the same time period. The Fund outperformed its benchmark due to its strong individual stock selection for the year. The allocation to preferred stocks, master limited partnerships, and real estate investment trusts were negative contributors. The Fund benefited from its overweight to the information technology and utility sectors. Within individual stock selection, the strongest areas of stock selection were in the industrial and consumer discretionary sectors, while the weakest area was in the financial sector. Strong performers in the Fund were networking giant Cisco Systems and pharmaceutical company Merck & Co. The Fund uses forward currency contracts to hedge investments in foreign currencies back to US dollars. During the fiscal year the derivative added 0.21% to Fund performance.
Annual Report 5
(THIS PAGE INTENTIONALLY LEFT BLANK)

Abbreviations
AGM - Assured Guaranty Municipal Corporation
ARM - Adjustable Rate Mortgage
ARS - Argentine Peso
AUD - Australian Dollar
BAM - Build America Mutual
BRL - Brazilian Real
CAD - Canadian Dollar
CDOR - Canadian Dealer Offered Rate
CZK - Czech Koruna
EUR - Euro
EURIBOR - Euro Interbank Offered Rate
FDIC - Federal Deposit Insurance Corporation
FFCB - Federal Farm Credit Bank
FG - Freddie Mac Gold Pool
FH - Freddie Mac Non Gold Pool
FHLB - Federal Home Loan Banks
FHLMC - Federal Home Loan Mortgage Company (Freddie Mac)
FHR - Freddie Mac REMICS
FN - Fannie Mae Pool
FNMA - Federal National Mortgage Association (Fannie Mae)
FNR - Fannie Mae REMICS
G2 - Ginnie Mae II pool
GBP - British Pound
GN - Ginnie Mae I pool
GNR - Ginnie Mae REMICS
IDR - Indonesian Rupiah
JPY - Japanese Yen
LIBOR - London Interbank Offered Rate
MXN - Mexican Peso
MYR - Malaysian Ringgit
NCUA - National Credit Union Administration
NOK - Norwegian Krone
PEN - Peruvian Sol
PLN - Polish Zloty
RUB - Russian Ruble
TRY - Turkish Lira
USD - US Dollar
ZAR - South African Rand
Annual Report 7

| | | | | | | | |
| | The Fund seeks stability, liquidity and current income by generally investing in the highest quality, short term securities with an average portfolio maturity not to exceed 90 days. | | | 
Past performance does not predict future returns. The graph does not reflect the impact of taxes or transaction costs a shareholder would pay. |
| | Portfolio Composition -percent of investments | | | | |
| | U.S. Treasury | | | 45 | % |
| | Repurchase Agreement | | | 30 | % |
| | U.S. Government Agency | | | 21 | % |
| | Mortgage Backed | | | 3 | % |
| | Other | | | 1 | % |
| | | | | | |
| | | | | | |
| | | | | | |
| | | | | | |
| | | | | | |
| | | This information is not part of the audited financial statements. | |
| | | | | | |
| Schedule of Investments - October 31, 2018 | |
Principal or Shares | | Security Description | | Value
(000) | |
U.S. Government Agency (21%) | | | | |
10,000,000 | | FFCB, (1 mo. LIBOR USD + 0.070%) | | | | |
| | 2.22%, 4/18/19 (a) | | $ | 10,001 | |
5,000,000 | | FFCB Disc Note, 2.27%, 12/13/18 (b) | | | 4,990 | |
5,210,000 | | FHLB, 2.28%, 9/20/19 | | | 5,210 | |
10,000,000 | | FHLB Disc Note, 2.21%, 11/07/18 (b) | | | 9,996 | |
10,000,000 | | FHLB Disc Note, 2.21%, 11/09/18 (b) | | | 9,995 | |
8,685,000 | | FHLB Disc Note, 2.27%, 12/21/18 (b) | | | 8,659 | |
15,000,000 | | FHLMC Disc Note, 2.21%, 11/20/18 (b) | | | 14,983 | |
2,460,000 | | FNMA, (SOFR + 0.080%) 2.30%, 1/30/19 (a) | | | 2,460 | |
3,090,000 | | FNMA, (SOFR + 0.120%) 2.34%, 7/30/19 (a) | | | 3,090 | |
| | | | | | |
Total U.S. Government Agency (Cost - $69,384) | | | 69,384 | |
| | | | | | |
Mortgage Backed (3%) | | | | |
2,739,479 | | Fannie Mae-Aces, 2.17%, 9/25/19 (c) | | | 2,723 | |
1,716,913 | | Freddie Mac Multifamily Structured Pass | | | | |
| | Through Certificates, 1.73%, 7/25/19 | | | 1,707 | |
4,420,000 | | Freddie Mac Multifamily Structured | | | | |
| | Pass-Through Certificates, (1 mo. LIBOR USD | | | | |
| | + 0.220%) 2.48%, 7/25/20 (a) | | | 4,421 | |
| | | | | | |
Total Mortgage Backed (Cost - $8,851) | | | 8,851 | |
| | | | | | |
NCUA Guaranteed (0%) | | | | |
401,064 | | NCUA Guaranteed Notes Trust 2011-R1, (1 mo. | | | | |
| | LIBOR USD + 0.450%) 2.73%, 1/08/20 (a) | | | 402 | |
| | | | | | |
Total NCUA Guaranteed (Cost - $402) | | | 402 | |
| | | | | | |
U.S. Treasury (45%) | | | | |
20,000,000 | | U.S. Treasury Bill, 0.00%, 11/01/18 (b) | | | 20,000 | |
20,000,000 | | U.S. Treasury Bill, 2.12%, 11/08/18 (b) | | | 19,992 | |
10,000,000 | | U.S. Treasury Bill, 2.18%, 11/23/18 (b) | | | 9,988 | |
20,000,000 | | U.S. Treasury Bill, 2.25%, 1/03/19 (b) | | | 19,924 | |
10,000,000 | | U.S. Treasury Bill, 2.26%, 1/10/19 (b) | | | 9,959 | |
10,000,000 | | U.S. Treasury Bill, 2.33%, 1/31/19 (b) | | | 9,945 | |
10,000,000 | | U.S. Treasury Bill, 2.35%, 2/28/19 (b) | | | 9,927 | |
10,000,000 | | U.S. Treasury Bill, 2.53%, 6/20/19 (b) | | | 9,855 | |
10,000,000 | | U.S. Treasury Bill, 2.61%, 8/15/19 (b) | | | 9,807 | |
| | | | | | |
Principal
or Shares | | Security Description | | Value
(000) | |
| | |
10,000,000 | | U.S. Treasury Note, (3 mo. US Treasury Bill | | | | |
| | Yield + 0.060%) 2.38%, 7/31/19 (a) | | $ | 10,008 | |
10,000,000 | | U.S. Treasury Note, (3 mo. US Treasury Bill | | | | |
| | Yield + 0.070%) 2.39%, 4/30/19 (a) | | | 10,005 | |
10,000,000 | | U.S. Treasury Note, (3 mo. US Treasury Bill | | | | |
| | Yield + 0.140%) 2.46%, 1/31/19 (a) | | | 10,003 | |
| | | | | | |
Total U.S. Treasury (Cost - $149,413) | | | 149,413 | |
| | | | | | |
Investment Company (1%) | | | | |
2,210,085 | | Dreyfus Treasury Cash Management | | | | |
| | (Cost - $2,210) | | | 2,210 | |
| | | | | | |
Repurchase Agreement (30%) | | | | |
30,000,000 | | Bank of Montreal Tri Party, 2.19% 11/01/18 (d) | | | 30,000 | |
35,000,000 | | Citigroup Tri Party, 2.17% 11/01/18 (e) | | | 35,000 | |
35,000,000 | | Goldman Sachs Tri Party, 2.17% 11/06/18 (f) | | | 35,000 | |
| | | | | | |
Total Repurchase Agreement (Cost - $100,000) | | | 100,000 | |
| | | | | | |
Total Investments (Cost - $330,260) (100%) | | | 330,260 | |
Assets in excess of Other Liabilities (0%) | | | (264 | ) |
| | | | | | |
Net Assets (100%) | | $ | 329,996 | |
| | | | | | |
| | | | | | |
| (a) | Floating rate security. The rate shown reflects the rate in effect at October 31, 2018. See Note 2 in the Notes to Financial Statements. |
| (b) | Yield to maturity at time of purchase. |
| (c) | Variable rate security. Interest rate disclosed is as of the most recent information available. Certain variable rate securities are not based on a published reference rate and spread but are determined by the issuer or agent and are based on current market conditions. These securities do not indicate a reference rate and spread in their description above. See Note 2 in the Notes to Financial Statements. |
| (d) | The repurchase agreement dated 10/31/2018 is collateralized by the following securities: |
| | | | | | |
Bank of Montreal Tri Party | |
33,591,700 | | U.S. Treasury Note, maturity dated Feb 26, | | | | |
| | yielding 1.63% | | $ | 30,600 | |
| | | | | | |
8 Payden Mutual Funds
| (e) | The repurchase agreement dated 10/31/2018 is collateralized by the following securities: |
Citigroup Tri Party
| | | | | | |
30,660,000 | | U.S. Treasury Securities, maturity from July 20-August 40, yielding from 1.13%-3.88% | | $ | 35,700 | |
| | | | | | |
| (f) | The repurchase agreement dated 10/31/2018 is collateralized by the following securities: |
Goldman Sachs Tri Party
| | | | | | | | |
| | 33,482,400 | | | U.S. Treasury Note, maturity dated July 22, | | | | |
| | | | yielding 0.13% | | $ | 35,700 | |
| | | | | | | | |
Offsetting Assets and Liabilities
The Fund’s investments in repurchase agreements were all subject to enforceable Master Repurchase Agreements. Repurchase Agreements on a gross basis were as follows:
| | | | |
| | | Value | |
Repurchase Agreement | | (000’s) | |
| |
| Total gross amount of repurchase agreements presented on the | | $ | 100,000 | |
Statements of Assets and Liabilities | | | | |
Non-cash Collateral | | | (30,000 | ) |
| | | | |
Net Amount | | $ | 70,000 | |
| | | | |
See notes to financial statements.
Annual Report 9

| | | | |
The Fund seeks a total return greater than a money market fund along with the preservation of capital by generally investing in investment grade debt securities with a maximum average portfolio maturity not to exceed two years. | | 
Past performance does not predict future returns. The graph does not reflect the impact of taxes or transaction costs a shareholder would pay. |
| Portfolio Composition - percent of investments |
|
Corporate | | 52% |
Asset Backed | | 16% |
U.S. Treasury | | 15% |
Mortgage Backed | | 9% |
Other | | 8% |
| | |
This information is not part of the audited financial statements. |
|
| | | | |
| | | | | | |
| Schedule of Investments - October 31, 2018 | |
Principal or Shares | | Security Description | | Value
(000) | |
Asset Backed (16%) | | | | |
7,000,000 | | AmeriCredit Automobile Receivables Trust | | | | |
| | 2016-2, 2.21%, 5/10/21 | | $ | 6,971 | |
3,300,000 | | Barings CLO Ltd. 2013-I 144A, (3 mo. LIBOR | | | | |
| | USD + 0.800%) 3.27%, 1/20/28 (a)(b) | | | 3,300 | |
3,760,000 | | BSPRT 2018-FL4 Issuer Ltd. 144A, (1 mo. | | | | |
| | LIBOR USD + 1.300%) 3.58%, 9/15/35 (a)(b) | | | 3,772 | |
1,952,072 | | Capital Auto Receivables Asset Trust 2016-3, | | | | |
| | 1.54%, 8/20/20 | | | 1,946 | |
907,497 | | CarMax Auto Owner Trust 2016-1, | | | | |
| | 1.61%, 11/16/20 | | | 903 | |
75,800 | | CNH Equipment Trust 2015-B, 1.37%, 7/15/20 | | | 76 | |
1,640,000 | | CNH Equipment Trust 2018-B, | | | | |
| | 2.93%, 12/15/21 | | | 1,638 | |
3,701,914 | | Colony Starwood Homes 2016-2 Trust 144A, (1 | | | | |
| | mo. LIBOR USD + 1.250%) | | | | |
| | 3.53%, 12/17/33 (a)(b) | | | 3,705 | |
1,698,357 | | Commonbond Student Loan Trust 2017-A-GS | | | | |
| | 144A, (1 mo. LIBOR USD + 0.850%) | | | | |
| | 3.13%, 5/25/41 (a)(b) | | | 1,715 | |
60,801 | | Dell Equipment Finance Trust 2017-1 144A, | | | | |
| | 1.86%, 6/24/19 (b) | | | 61 | |
1,793,297 | | Dell Equipment Finance Trust 2017-2 144A, | | | | |
| | 1.97%, 2/24/20 (b) | | | 1,787 | |
1,800,000 | | Drive Auto Receivables Trust, 3.04%, 11/15/21 | | | 1,798 | |
5,639,374 | | Enterprise Fleet Financing LLC 144A, | | | | |
| | 1.97%, 1/20/23 (b) | | | 5,597 | |
2,300,000 | | First Investors Auto Owner Trust 2016-2 144A, | | | | |
| | 1.87%, 11/15/21 (b) | | | 2,285 | |
1,640,000 | | First Investors Auto Owner Trust 2017-1 144A, | | | | |
| | 2.20%, 3/15/22 (b) | | | 1,628 | |
3,291,239 | | First Investors Auto Owner Trust 2018-1 144A, | | | | |
| | 2.84%, 5/16/22 (b) | | | 3,284 | |
4,050,000 | | Galaxy XXIX CLO Ltd. 144A, (3 mo. LIBOR | | | | |
| | USD + 0.790%) 3.10%, 11/15/26 (a)(b) | | | 4,045 | |
| | | | | | |
Principal or Shares | | Security Description | | Value
(000) | |
| | |
3,110,000 | | GM Financial Automobile Leasing Trust 2018-3, | | | | |
| | 3.18%, 6/21/21 | | $ | 3,107 | |
3,575,000 | | LCM XX LP 144A, (3 mo. LIBOR USD | | | | |
| | + 1.040%) 3.38%, 10/20/27 (a)(b) | | | 3,575 | |
1,740,000 | | Madison Park Funding XIII Ltd. 144A, (3 mo. | | | | |
| | LIBOR USD + 0.950%) 3.40%, 4/19/30 (a)(b) | | | 1,737 | |
552,865 | | Magnetite IX Ltd. 144A, (3 mo. LIBOR USD | | | | |
| | + 1.000%) 3.49%, 7/25/26 (a)(b) | | | 553 | |
6,800,000 | | Magnetite VII Ltd. 144A, (3 mo. LIBOR USD | | | | |
| | + 0.800%) 3.24%, 1/15/28 (a)(b) | | | 6,761 | |
4,000,000 | | Marathon CRE 2018 FL1 Ltd. 144A, (1 mo. | | | | |
| | LIBOR USD + 1.150%) 3.43%, 6/15/28 (a)(b) | | | 4,006 | |
3,419,463 | | Nissan Auto Lease Trust 2017-B, | | | | |
| | 1.83%, 12/16/19 | | | 3,405 | |
4,000,000 | | Nissan Master Owner Trust Receivables, | | | | |
| | 1.54%, 6/15/21 | | | 3,964 | |
815,000 | | Octagon Investment Partners XXIII Ltd. 144A, | | | | |
| | (3 mo. LIBOR USD + 0.850%) | | | | |
| | 3.29%, 7/15/27 (a)(b) | | | 814 | |
872,327 | | OSCAR U.S. Funding Trust VII LLC 144A, | | | | |
| | 2.13%, 11/10/20 (b) | | | 869 | |
2,375,000 | | OZLM XII Ltd. 144A, (3 mo. LIBOR USD | | | | |
| | + 3.000%) 5.52%, 4/30/27 (a)(b) | | | 2,364 | |
2,600,000 | | Penarth Master Issuer PLC 144A, (1 mo. LIBOR | | | | |
| | USD + 0.380%) 2.67%, 3/18/22 (a)(b) | | | 2,597 | |
169,384 | | Santander Drive Auto Receivables Trust 2014-3, | | | | |
| | 2.65%, 8/17/20 | | | 169 | |
327,574 | | Santander Drive Auto Receivables Trust 2016-2, | | | | |
| | 2.08%, 2/16/21 | | | 327 | |
4,410,000 | | Santander Drive Auto Receivables Trust 2017-1, | | | | |
| | 2.10%, 6/15/21 | | | 4,399 | |
415,190 | | Securitized Term Auto Receivables Trust 2016-1 | | | | |
| | 144A, 1.52%, 3/25/20 (b) | | | 414 | |
10 Payden Mutual Funds
| | | | | | |
Principal or Shares | | Security Description | | Value
(000) | |
| | |
6,450,000 | | Silver Arrow Canada LP 144A, 2.28%, 2/15/20 | | | | |
| | CAD (b)(c) | | $ | 4,899 | |
1,131,415 | | Sofi Consumer Loan Program 2017-5 LLC 144A, | | | | |
| | 2.14%, 9/25/26 (b) | | | 1,126 | |
753,436 | | Sofi Consumer Loan Program 2017-6 LLC 144A, | | | | |
| | 2.20%, 11/25/26 (b) | | | 749 | |
4,313,233 | | Sofi Consumer Loan Program 2018-1 Trust | | | | |
| | 144A, 2.55%, 2/25/27 (b) | | | 4,291 | |
411,039 | | SoFi Professional Loan Program 2017-D LLC | | | | |
| | 144A, 1.72%, 9/25/40 (b) | | | 408 | |
5,227,071 | | Symphony CLO XV Ltd. 144A, (3 mo. LIBOR | | | | |
| | USD + 1.180%) 3.63%, 10/17/26 (a)(b) | | | 5,230 | |
2,462,500 | | Taco Bell Funding LLC 144A, | | | | |
| | 3.83%, 5/25/46 (b) | | | 2,465 | |
2,324,597 | | Towd Point Mortgage Trust 2017-5 144A, (1 | | | | |
| | mo. LIBOR USD + 0.600%) | | | | |
| | 2.89%, 2/25/57 (a)(b) | | | 2,328 | |
1,397,733 | | Toyota Auto Receivables 2016-B Owner Trust, | | | | |
| | 1.30%, 4/15/20 | | | 1,392 | |
3,330,000 | | Tryon Park CLO Ltd. 144A, (3 mo. LIBOR USD | | | | |
| | + 0.890%) 3.33%, 4/15/29 (a)(b) | | | 3,323 | |
5,148,432 | | Verizon Owner Trust 2016-1 144A, | | | | |
| | 1.42%, 1/20/21 (b) | | | 5,131 | |
4,330,000 | | Volkswagen Auto Loan Enhanced Trust 2018-1, | | | | |
| | 2.81%, 7/20/21 | | | 4,321 | |
2,017,786 | | Volvo Financial Equipment LLC Series 2016-1 | | | | |
| | 144A, 1.67%, 2/18/20 (b) | | | 2,013 | |
567,941 | | Westlake Automobile Receivables Trust 2018-2 | | | | |
| | 144A, 2.50%, 5/15/19 (b) | | | 568 | |
377,995 | | Wheels SPV 2 LLC 144A, 1.59%, 5/20/25 (b) | | | 377 | |
3,450,000 | | World Omni Automobile Lease Securitization | | | | |
| | Trust 2018-B, 2.96%, 6/15/21 | | | 3,445 | |
Total Asset Backed (Cost - $125,908) | | | 125,638 | |
Bank Loans(d) (0%) | | | | |
492,500 | | Zayo Group LLC Term Loan B1 1L, (LIBOR | | | | |
| | USD 1-Month + 2.000%) 4.30%, 1/31/21 | | | 493 | |
Total Bank Loans (Cost - $491) | | | 493 | |
Commercial Paper (4%) | | | | |
3,750,000 | | AT&T Inc., 0.00%, 5/28/18 (e) | | | 3,686 | |
8,000,000 | | Banco De Chile, 0.00%, 11/29/18 (e) | | | 7,985 | |
8,000,000 | | Dollar General Corp., 0.00%, 11/01/18 (e) | | | 8,000 | |
8,000,000 | | Dover Corp., 0.00%, 11/01/18 (e) | | | 7,999 | |
Total Commercial Paper (Cost - $27,670) | | | 27,670 | |
Corporate Bond (53%) | | | | |
Financial (28%) | | | | |
2,530,000 | | ABN AMRO Bank NV 144A, | | | | |
| | 2.10%, 1/18/19 (b) | | | 2,529 | |
3,580,000 | | ABN AMRO Bank NV 144A, (3 mo. LIBOR | | | | |
| | USD + 0.410%) 2.86%, 1/19/21 (a)(b) | | | 3,579 | |
1,500,000 | | African Export-Import Bank, 4.75%, 7/29/19 | | | 1,510 | |
3,500,000 | | American Express Co., (3 mo. LIBOR USD | | | | |
| | + 0.525%) 2.84%, 5/17/21 (a) | | | 3,506 | |
760,000 | | American Express Credit Corp., 1.88%, 5/03/19 | | | 756 | |
3,935,000 | | Ares Capital Corp., 4.88%, 11/30/18 | | | 3,941 | |
2,030,000 | | Assurant Inc., (3 mo. LIBOR USD + 1.250%) | | | | |
| | 3.62%, 3/26/21 (a) | | | 2,033 | |
| | | | | | |
Principal or Shares | | Security Description | | Value
(000) | |
| | |
3,330,000 | | Australia & New Zealand Banking Group Ltd. | | | | |
| | 144A, (3 mo. LIBOR USD + 0.320%) | | | | |
| | 2.66%, 11/09/20 (a)(b) | | $ | 3,334 | |
2,930,000 | | AvalonBay Communities Inc., (3 mo. LIBOR | | | | |
| | USD + 0.430%) 2.87%, 1/15/21 (a) | | | 2,930 | |
290,000 | | Banco de Credito del Peru/Panama 144A, | | | | |
| | 2.25%, 10/25/19 (b) | | | 287 | |
1,665,000 | | Banco del Estado de Chile 144A, | | | | |
| | 2.67%, 1/08/21 (b) | | | 1,623 | |
3,785,000 | | Bank of America Corp., (3 mo. LIBOR USD | | | | |
| | + 0.650%) 3.02%, 6/25/22 (a) | | | 3,787 | |
3,048,000 | | Bank of America Corp., (3 mo. LIBOR USD | | | | |
| | + 0.660%) 3.13%, 7/21/21 (a) | | | 3,062 | |
1,530,000 | | Bank of Montreal, (3 mo. LIBOR USD | | | | |
| | + 0.790%) 3.10%, 8/27/21 (a) | | | 1,550 | |
3,970,000 | | Bank of Nova Scotia, (3 mo. LIBOR USD | | | | |
| | + 0.440%) 2.91%, 4/20/21 (a) | | | 3,981 | |
5,150,000 | | Banque Federative du Credit Mutuel SA 144A, | | | | |
| | 2.00%, 4/12/19 (b) | | | 5,124 | |
1,925,000 | | Banque Federative du Credit Mutuel SA 144A, (3 | | | | |
| | mo. LIBOR USD + 0.490%) | | | | |
| | 2.96%, 7/20/20 (a)(b) | | | 1,930 | |
3,565,000 | | Barclays Bank PLC, (3 mo. LIBOR USD | | | | |
| | + 0.460%) 2.88%, 1/11/21 (a) | | | 3,559 | |
1,090,000 | | BPCE SA 144A, (3 mo. LIBOR USD + 1.220%) | | | | |
| | 3.53%, 5/22/22 (a)(b) | | | 1,100 | |
5,000,000 | | Capital One Bank USA NA, 2.30%, 6/05/19 | | | 4,981 | |
2,065,000 | | Capital One Financial Corp., (3 mo. LIBOR USD | | | | |
| | + 0.950%) 3.28%, 3/09/22 (a) | | | 2,071 | |
1,630,000 | | Citibank NA, (3 mo. LIBOR USD + 0.570%) | | | | |
| | 3.05%, 7/23/21 (a) | | | 1,636 | |
860,000 | | Citigroup Inc., (3 mo. LIBOR USD + 0.790%) | | | | |
| | 3.20%, 1/10/20 (a) | | | 865 | |
2,000,000 | | Citigroup Inc., (3 mo. LIBOR USD + 0.930%) | | | | |
| | 3.25%, 6/07/19 (a) | | | 2,009 | |
310,000 | | Citizens Bank NA/Providence RI, | | | | |
| | 2.30%, 12/03/18 | | | 310 | |
1,345,000 | | Citizens Bank NA/Providence RI, (3 mo. LIBOR | | | | |
| | USD + 0.540%) 2.86%, 3/02/20 (a) | | | 1,349 | |
4,635,000 | | Citizens Bank NA/Providence RI, (3 mo. LIBOR | | | | |
| | USD + 0.570%) 2.88%, 5/26/20 (a) | | | 4,649 | |
790,000 | | Commonwealth Bank of Australia/New York NY, | | | | |
| | 1.75%, 11/02/18 | | | 790 | |
2,822,000 | | Compass Bank, 2.75%, 9/29/19 | | | 2,810 | |
3,760,000 | | Credit Agricole Corporate & Investment Bank | | | | |
| | SA, (3 mo. LIBOR USD + 0.625%) | | | | |
| | 3.02%, 10/03/21 (a) | | | 3,763 | |
800,000 | | Credit Agricole SA/London 144A, (3 mo. LIBOR | | | | |
| | USD + 0.970%) 3.30%, 6/10/20 (a)(b) | | | 809 | |
1,965,000 | | Danske Bank A/S 144A, (3 mo. LIBOR USD | | | | |
| | + 0.510%) 2.83%, 3/02/20 (a)(b) | | | 1,963 | |
1,900,000 | | DBS Group Holdings Ltd. 144A, (3 mo. LIBOR | | | | |
| | USD + 0.490%) 2.82%, 6/08/20 (a)(b) | | | 1,905 | |
Annual Report 11

| | | | | | |
Principal or Shares | | Security Description | | Value
(000) | |
| | |
3,080,000 | | Deutsche Bank AG/New York NY, (3 mo. | | | | |
| | LIBOR USD + 0.815%) 3.28%, 1/22/21 (a) | | $ | 3,048 | |
8,000,000 | | Dexia Credit Local SA 144A, (3 mo. LIBOR USD | | | | |
| | + 0.320%) 2.64%, 9/04/20 (a)(b) | | | 8,029 | |
2,585,000 | | DNB Bank ASA 144A, (3 mo. LIBOR USD | | | | |
| | + 0.370%) 2.77%, 10/02/20 (a)(b) | | | 2,590 | |
3,800,000 | | Federation des Caisses Desjardins du Quebec | | | | |
| | 144A, (3 mo. LIBOR USD + 0.330%) | | | | |
| | 2.85%, 10/30/20 (a)(b) | | | 3,807 | |
540,000 | | Fifth Third Bank/Cincinnati OH, | | | | |
| | 2.30%, 3/15/19 | | | 539 | |
2,665,000 | | Fifth Third Bank/Cincinnati OH, (3 mo. LIBOR | | | | |
| | USD + 0.250%) 2.77%, 10/30/20 (a) | | | 2,667 | |
1,870,000 | | Fifth Third Bank/Cincinnati OH, (3 mo. LIBOR | | | | |
| | USD + 0.590%) 2.97%, 9/27/19 (a) | | | 1,874 | |
980,000 | | FS Investment Corp., 4.25%, 1/15/20 | | | 983 | |
2,035,000 | | Goldman Sachs Group Inc., (3 mo. LIBOR USD | | | | |
| | + 0.730%) 3.11%, 12/27/20 (a) | | | 2,042 | |
1,325,000 | | Goldman Sachs Group Inc., (3 mo. LIBOR USD | | | | |
| | + 1.170%) 3.48%, 11/15/21 (a) | | | 1,342 | |
1,590,000 | | Goldman Sachs Group Inc., (3 mo. LIBOR USD | | | | |
| | + 1.040%) 3.53%, 4/25/19 (a) | | | 1,597 | |
2,355,000 | | HSBC Holdings PLC, (3 mo. LIBOR USD | | | | |
| | + 0.600%) 2.92%, 5/18/21 (a) | | | 2,358 | |
1,810,000 | | HSBC Holdings PLC, (3 mo. LIBOR USD | | | | |
| | + 0.650%) 2.98%, 9/11/21 (a) | | | 1,814 | |
480,000 | | Huntington National Bank, 2.20%, 11/06/18 | | | 480 | |
1,315,000 | | Huntington National Bank, (3 mo. LIBOR USD | | | | |
| | + 0.510%) 2.84%, 3/10/20 (a) | | | 1,319 | |
770,000 | | Icahn Enterprises LP/Icahn Enterprises Finance | | | | |
| | Corp., 6.25%, 2/01/22 | | | 779 | |
1,895,000 | | Industrial & Commercial Bank of China | | | | |
| | Ltd./New York, (3 mo. LIBOR USD + 0.750%) | | | | |
| | 3.09%, 11/08/20 (a) | | | 1,896 | |
1,320,000 | | ING Bank NV 144A, 2.00%, 11/26/18 (b) | | | 1,319 | |
755,000 | | ING Groep NV, (3 mo. LIBOR USD + 1.150%) | | | | |
| | 3.54%, 3/29/22 (a) | | | 767 | |
3,185,000 | | International Lease Finance Corp., | | | | |
| | 6.25%, 5/15/19 | | | 3,236 | |
2,700,000 | | Intesa Sanpaolo SpA/New York NY, | | | | |
| | 2.39%, 1/07/19 | | | 2,698 | |
440,000 | | iStar Inc., 4.63%, 9/15/20 | | | 438 | |
3,310,000 | | Jackson National Life Global Funding 144A, (3 | | | | |
| | mo. LIBOR USD + 0.480%) | | | | |
| | 2.81%, 6/11/21 (a)(b) | | | 3,324 | |
2,100,000 | | JPMorgan Chase & Co., (3 mo. LIBOR USD | | | | |
| | + 0.550%) 2.88%, 3/09/21 (a) | | | 2,103 | |
4,485,000 | | JPMorgan Chase & Co., (3 mo. LIBOR USD | | | | |
| | + 0.610%) 2.95%, 6/18/22 (a) | | | 4,487 | |
2,505,000 | | JPMorgan Chase & Co., (3 mo. LIBOR USD | | | | |
| | + 0.680%) 3.00%, 6/01/21 (a) | | | 2,510 | |
640,000 | | KeyBank NA/Cleveland OH, 2.35%, 3/08/19 | | | 639 | |
1,250,000 | | Macquarie Group Ltd. 144A, | | | | |
| | 3.00%, 12/03/18 (b) | | | 1,250 | |
| | | | | | |
Principal or Shares | | Security Description | | Value
(000) | |
| | |
3,290,000 | | Macquarie Group Ltd. 144A, (3 mo. LIBOR | | | | |
| | USD + 1.020%) 3.33%, 11/28/23 (a)(b) | | $ | 3,284 | |
2,425,000 | | Metropolitan Life Global Funding I 144A, (3 mo. | | | | |
| | LIBOR USD + 0.230%) 2.64%, 1/08/21 (a)(b) | | | 2,423 | |
4,425,000 | | Metropolitan Life Global Funding I 144A, | | | | |
| | 2.79%, 9/07/20 (a)(b) | | | 4,430 | |
2,250,000 | | Mitsubishi UFJ Financial Group Inc., (3 mo. | | | | |
| | LIBOR USD + 0.650%) 3.16%, 7/26/21 (a) | | | 2,260 | |
520,000 | | Mitsubishi UFJ Financial Group Inc., (3 mo. | | | | |
| | LIBOR USD + 0.920%) 3.23%, 2/22/22 (a) | | | 525 | |
1,700,000 | | Mizuho Financial Group Inc., (3 mo. LIBOR | | | | |
| | USD + 0.940%) 3.25%, 2/28/22 (a) | | | 1,717 | |
2,460,000 | | Mizuho Securities USA LLC 144A, (3 mo. | | | | |
| | LIBOR USD + 0.650%) 3.04%, 6/28/19 (a)(b) | | | 2,466 | |
940,000 | | Morgan Stanley, 2.45%, 2/01/19 | | | 939 | |
1,145,000 | | Morgan Stanley, (3 mo. LIBOR USD + 0.800%) | | | | |
| | 3.12%, 2/14/20 (a) | | | 1,146 | |
1,570,000 | | Morgan Stanley, (3 mo. LIBOR USD + 0.740%) | | | | |
| | 3.22%, 7/23/19 (a) | | | 1,576 | |
2,800,000 | | MUFJ Bank Ltd. 144A, 2.35%, 9/08/19 (b) | | | 2,783 | |
750,000 | | National Australia Bank Ltd. 144A, (3 mo. | | | | |
| | LIBOR USD + 0.510%) 2.82%, 5/22/20 (a)(b) | | | 753 | |
930,000 | | New York Life Global Funding 144A, | | | | |
| | 1.55%, 11/02/18 (b) | | | 930 | |
3,755,000 | | Regions Bank/Birmingham AL, (3 mo. LIBOR | | | | |
| | USD + 0.380%) 2.78%, 4/01/21 (a) | | | 3,744 | |
1,920,000 | | Royal Bank of Canada, 1.63%, 4/15/19 | | | 1,910 | |
4,375,000 | | Royal Bank of Canada, (3 mo. LIBOR USD | | | | |
| | + 0.390%) 2.91%, 4/30/21 (a) | | | 4,383 | |
3,145,000 | | Royal Bank of Scotland Group PLC, (3 mo. | | | | |
| | LIBOR USD + 1.470%) 3.78%, 5/15/23 (a) | | | 3,163 | |
595,000 | | Santander UK PLC, 2.50%, 3/14/19 | | | 595 | |
3,350,000 | | Santander UK PLC, (3 mo. LIBOR USD | | | | |
| | + 0.300%) 2.88%, 11/03/20 (a) | | | 3,350 | |
2,500,000 | | SL Green Operating Partnership LP, (3 mo. | | | | |
| | LIBOR USD + 0.980%) 3.32%, 8/16/21 (a) | | | 2,502 | |
806,000 | | SLM Corp., 5.13%, 4/05/22 | | | 804 | |
1,120,000 | | Standard Chartered PLC 144A, (3 mo. LIBOR | | | | |
| | USD + 1.130%) 3.45%, 8/19/19 (a)(b) | | | 1,127 | |
690,000 | | Starwood Property Trust Inc. 144A, | | | | |
| | 3.63%, 2/01/21 (b) | | | 672 | |
950,000 | | Sterling Bancorp/DE, 3.50%, 6/08/20 | | | 944 | |
985,000 | | Sumitomo Mitsui Banking Corp., (3 mo. LIBOR | | | | |
| | USD + 0.350%) 2.80%, 1/17/20 (a) | | | 986 | |
4,060,000 | | Sumitomo Mitsui Banking Corp., (3 mo. LIBOR | | | | |
| | USD + 0.370%) 2.81%, 10/16/20 (a) | | | 4,061 | |
1,270,000 | | Sumitomo Mitsui Trust Bank Ltd. 144A, | | | | |
| | 2.05%, 3/06/19 (b) | | | 1,267 | |
1,675,000 | | Sumitomo Mitsui Trust Bank Ltd. 144A, (3 mo. | | | | |
| | LIBOR USD + 0.440%) 2.78%, 9/19/19 (a)(b) | | | 1,679 | |
490,000 | | Synchrony Financial, 2.60%, 1/15/19 | | | 489 | |
3,640,000 | | TD Ameritrade Holding Corp., (3 mo. LIBOR | | | | |
| | USD + 0.430%) 2.97%, 11/01/21 (a) | | | 3,641 | |
1,615,000 | | Toronto-Dominion Bank, 1.95%, 1/22/19 | | | 1,612 | |
2,110,000 | | UBS AG/London 144A, (3 mo. LIBOR USD | | | | |
| | + 0.480%) 2.80%, 12/01/20 (a)(b) | | | 2,113 | |
12 Payden Mutual Funds
| | | | | | |
Principal or Shares | | Security Description | | Value
(000) | |
| | |
2,320,000 | | UBS AG/London 144A, (3 mo. LIBOR USD | | | | |
| | + 0.580%) 2.91%, 6/08/20 (a)(b) | | $ | 2,329 | |
5,375,000 | | Wells Fargo & Co., (3 mo. LIBOR USD | | | | |
| | + 0.930%) 3.27%, 2/11/22 (a) | | | 5,421 | |
3,750,000 | | Wells Fargo Bank NA, (3 mo. LIBOR USD | | | | |
| | + 0.310%) 2.75%, 1/15/21 (a) | | | 3,745 | |
2,105,000 | | Westpac Banking Corp., (3 mo. LIBOR USD | | | | |
| | + 0.430%) 2.75%, 3/06/20 (a) | | | 2,111 | |
| | | | | 217,846 | |
Industrial (19%) | | | | |
1,570,000 | | Alimentation Couche-Tard Inc. 144A, (3 mo. | | | | |
| | LIBOR USD + 0.500%) 2.83%, 12/13/19 (a)(b) | | | 1,570 | |
2,170,000 | | America Movil SAB de CV, 5.00%, 3/30/20 | | | 2,215 | |
900,000 | | American Honda Finance Corp., 1.20%, 7/12/19 | | | 890 | |
2,000,000 | | Anthem Inc., 2.25%, 8/15/19 | | | 1,988 | |
500,000 | | APRR SA, (3 mo. EURIBOR + 0.750%) | | | | |
| | 0.43%, 3/31/19 EUR (a)(c) | | | 568 | |
3,000,000 | | ArcelorMittal, 3.00%, 3/25/19 EUR (c) | | | 3,437 | |
1,500,000 | | AT&T Inc., 2.30%, 3/11/19 | | | 1,497 | |
400,000 | | AutoZone Inc., 1.63%, 4/21/19 | | | 397 | |
1,065,000 | | Aviation Capital Group LLC 144A, (3 mo. | | | | |
| | LIBOR USD + 0.670%) 3.19%, 7/30/21 (a)(b) | | | 1,069 | |
3,080,000 | | BAT Capital Corp. 144A, (3 mo. LIBOR USD | | | | |
| | + 0.590%) 2.91%, 8/14/20 (a)(b) | | | 3,090 | |
2,035,000 | | Bayer U.S. Finance II LLC 144A, (3 mo. LIBOR | | | | |
| | USD + 0.630%) 3.00%, 6/25/21 (a)(b) | | | 2,037 | |
2,020,000 | | Becton Dickinson and Co., (3 mo. LIBOR USD | | | | |
| | + 0.875%) 3.26%, 12/29/20 (a) | | | 2,022 | |
620,000 | | BMW U.S. Capital LLC 144A, | | | | |
| | 1.50%, 4/11/19 (b) | | | 616 | |
3,410,000 | | BMW U.S. Capital LLC 144A, (3 mo. LIBOR | | | | |
| | USD + 0.500%) 2.82%, 8/13/21 (a)(b) | | | 3,414 | |
1,850,000 | | Bristol-Myers Squibb Co., 1.60%, 2/27/19 | | | 1,843 | |
2,245,000 | | Broadcom Corp./Broadcom Cayman Finance Ltd., | | | | |
| | 2.38%, 1/15/20 | | | 2,220 | |
1,145,000 | | Cardinal Health Inc., 1.95%, 6/14/19 | | | 1,138 | |
3,020,000 | | Central Nippon Expressway Co. Ltd., | | | | |
| | 2.17%, 8/05/19 | | | 3,001 | |
1,790,000 | | Comcast Corp., (3 mo. LIBOR USD + 0.330%) | | | | |
| | 2.74%, 10/01/20 (a) | | | 1,791 | |
1,980,000 | | Comcast Corp., (3 mo. LIBOR USD + 0.440%) | | | | |
| | 2.85%, 10/01/21 (a) | | | 1,982 | |
1,500,000 | | Comcast Corp., 3.30%, 10/01/20 | | | 1,500 | |
3,545,000 | | Conagra Brands Inc., (3 mo. LIBOR USD | | | | |
| | + 0.500%) 2.91%, 10/09/20 (a) | | | 3,536 | |
3,417,000 | | Corp Nacional del Cobre de Chile 144A, | | | | |
| | 7.50%, 1/15/19 (b) | | | 3,448 | |
526,000 | | CVS Health Corp., (3 mo. LIBOR USD | | | | |
| | + 0.630%) 2.96%, 3/09/20 (a) | | | 528 | |
1,275,000 | | CVS Health Corp., (3 mo. LIBOR USD | | | | |
| | + 0.720%) 3.05%, 3/09/21 (a) | | | 1,282 | |
1,330,000 | | Daimler Finance North America LLC 144A, | | | | |
| | 1.50%, 7/05/19 (b) | | | 1,316 | |
1,460,000 | | Daimler Finance North America LLC 144A, (3 | | | | |
| | mo. LIBOR USD + 0.530%) | | | | |
| | 3.11%, 5/05/20 (a)(b) | | | 1,463 | |
| | | | | | |
Principal or Shares | | Security Description | | Value
(000) | |
| | |
4,500,000 | | Daimler Finance North America LLC 144A, (3 mo. LIBOR USD + 0.620%) | | | | |
| | 3.14%, 10/30/19 (a)(b) | | $ | 4,518 | |
200,000 | | Dell International LLC/EMC Corp. 144A, | | | | |
| | 5.88%, 6/15/21 (b) | | | 203 | |
2,430,000 | | Delta Air Lines Inc., 2.60%, 12/04/20 | | | 2,377 | |
1,425,000 | | Deutsche Telekom International Finance BV | | | | |
| | 144A, (3 mo. LIBOR USD + 0.580%) | | | | |
| | 3.03%, 1/17/20 (a)(b) | | | 1,430 | |
3,500,000 | | Dollar Tree Inc., (3 mo. LIBOR USD + 0.700%) | | | | |
| | 3.15%, 4/17/20 (a) | | | 3,503 | |
846,000 | | DXC Technology Co., (3 mo. LIBOR USD | | | | |
| | + 0.950%) 3.27%, 3/01/21 (a) | | | 846 | |
3,745,000 | | Express Scripts Holding Co., (3 mo. LIBOR USD | | | | |
| | + 0.750%) 3.06%, 11/30/20 (a) | | | 3,746 | |
2,500,000 | | First Data Corp. 144A, 7.00%, 12/01/23 (b) | | | 2,594 | |
535,000 | | Ford Motor Credit Co. LLC, 2.26%, 3/28/19 | | | 533 | |
1,445,000 | | Ford Motor Credit Co. LLC, (3 mo. LIBOR USD | | | | |
| | + 0.790%) 3.12%, 6/12/20 (a) | | | 1,440 | |
1,460,000 | | Ford Motor Credit Co. LLC, (3 mo. LIBOR USD | | | | |
| | + 0.830%) 3.16%, 3/12/19 (a) | | | 1,461 | |
1,240,000 | | Ford Motor Credit Co. LLC, (3 mo. LIBOR USD | | | | |
| | + 0.830%) 3.17%, 8/12/19 (a) | | | 1,241 | |
890,000 | | Ford Motor Credit Co. LLC, (3 mo. LIBOR USD | | | | |
| | + 1.270%) 3.66%, 3/28/22 (a)(f) | | | 880 | |
1,235,000 | | General Motors Co., (3 mo. LIBOR USD | | | | |
| | + 0.800%) 3.14%, 8/07/20 (a) | | | 1,238 | |
1,700,000 | | General Motors Financial Co. Inc., (3 mo. LIBOR | | | | |
| | USD + 0.540%) 2.88%, 11/06/20 (a) | | | 1,695 | |
1,995,000 | | General Motors Financial Co. Inc., (3 mo. LIBOR | | | | |
| | USD + 0.930%) 3.37%, 4/13/20 (a) | | | 2,005 | |
2,014,000 | | General Motors Financial Co. Inc., (3 mo. LIBOR | | | | |
| | USD + 1.310%) 3.70%, 6/30/22 (a) | | | 2,030 | |
1,190,000 | | General Motors Financial Co. Inc., (3 mo. LIBOR | | | | |
| | USD + 1.450%) 3.79%, 5/09/19 (a) | | | 1,196 | |
1,275,000 | | General Motors Financial Co. Inc., (3 mo. LIBOR | | | | |
| | USD + 1.550%) 3.99%, 1/14/22 (a) | | | 1,293 | |
1,270,000 | | Glencore Funding LLC 144A, (3 mo. LIBOR | | | | |
| | USD + 1.360%) 3.80%, 1/15/19 (a)(b) | | | 1,271 | |
2,435,000 | | Halfmoon Parent Inc. 144A, (3 mo. LIBOR USD | | | | |
| | + 0.650%) 2.98%, 9/17/21 (a)(b) | | | 2,435 | |
1,940,000 | | Halfmoon Parent Inc. 144A, 3.20%, 9/17/20 (b) | | | 1,931 | |
1,050,000 | | Harley-Davidson Financial Services Inc. 144A, (3 | | | | |
| | mo. LIBOR USD + 0.350%) | | | | |
| | 2.68%, 3/08/19 (a)(b) | | | 1,050 | |
1,635,000 | | Hewlett Packard Enterprise Co. 144A, | | | | |
| | 2.10%, 10/04/19 (b) | | | 1,620 | |
1,860,000 | | Hewlett Packard Enterprise Co., (3 mo. LIBOR | | | | |
| | USD + 0.720%) 3.06%, 10/05/21 (a) | | | 1,861 | |
710,000 | | Hyundai Capital Services Inc. 144A, | | | | |
| | 1.63%, 8/30/19 (b) | | | 700 | |
700,000 | | John Deere Capital Corp., 1.95%, 1/08/19 | | | 699 | |
3,750,000 | | Keysight Technologies Inc., 3.30%, 10/30/19 | | | 3,745 | |
1,745,000 | | Lennar Corp., 2.95%, 11/29/20 | | | 1,701 | |
840,000 | | Lennar Corp., 4.13%, 1/15/22 | | | 823 | |
Annual Report 13
| | | | | | |
Principal or Shares | | Security Description | | Value
(000) | |
| | |
176,000 | | Lockheed Martin Corp., 1.85%, 11/23/18 | | $ | 176 | |
3,585,000 | | Martin Marietta Materials Inc., (3 mo. LIBOR | | | | |
| | USD + 0.500%) 2.84%, 12/20/19 (a) | | | 3,594 | |
795,000 | | Martin Marietta Materials Inc., (3 mo. LIBOR | | | | |
| | USD + 0.650%) 2.96%, 5/22/20 (a) | | | 797 | |
1,625,000 | | Microchip Technology Inc. 144A, | | | | |
| | 3.92%, 6/01/21 (b) | | | 1,614 | |
1,020,000 | | Molson Coors Brewing Co., 1.90%, 3/15/19 | | | 1,015 | |
1,178,000 | | Mylan NV, 2.50%, 6/07/19 | | | 1,173 | |
1,915,000 | | Nissan Motor Acceptance Corp. 144A, | | | | |
| | 2.00%, 3/08/19 (b) | | | 1,909 | |
1,985,000 | | Nissan Motor Acceptance Corp. 144A, (3 mo. | | | | |
| | LIBOR USD + 0.390%) 2.78%, 9/28/20 (a)(b) | | | 1,985 | |
3,500,000 | | Nissan Motor Acceptance Corp. 144A, (3 mo. | | | | |
| | LIBOR USD + 0.520%) 2.85%, 3/15/21 (a)(b) | | | 3,507 | |
3,370,000 | | Ooredoo Tamweel Ltd., 3.04%, 12/03/18 | | | 3,371 | |
330,000 | | Philip Morris International Inc., 1.38%, 2/25/19 | | | 328 | |
2,080,000 | | Philip Morris International Inc., 1.63%, 2/21/19 | | | 2,073 | |
1,086,000 | | Rockwell Collins Inc., 1.95%, 7/15/19 | | | 1,078 | |
660,000 | | Seagate HDD Cayman, 3.75%, 11/15/18 | | | 660 | |
3,315,000 | | Shire Acquisitions Investments Ireland DAC, | | | | |
| | 1.90%, 9/23/19 | | | 3,275 | |
960,000 | | Smithfield Foods Inc. 144A, 2.65%, 10/03/21 (b) | | | 914 | |
450,000 | | Smithfield Foods Inc. 144A, 2.70%, 1/31/20 (b) | | | 442 | |
3,500,000 | | Spirit AeroSystems Inc., (3 mo. LIBOR USD | | | | |
| | + 0.800%) 3.13%, 6/15/21 (a) | | | 3,505 | |
615,000 | | Sprint Spectrum Co. LLC/Sprint Spectrum Co. II LLC/Sprint Spectrum Co. III LLC 144A, | | | | |
| | 3.36%, 9/20/21 (b) | | | 610 | |
690,000 | | Stanley Black & Decker Inc., 2.45%, 11/17/18 | | | 690 | |
2,510,000 | | Suntory Holdings Ltd. 144A, 2.55%, 9/29/19 (b) | | | 2,494 | |
700,000 | | Teva Pharmaceutical Finance Netherlands III BV, 1.70%, 7/19/19 | | | 689 | |
460,000 | | Tyson Foods Inc., (3 mo. LIBOR USD + 0.450%) 2.76%, 5/30/19 (a) | | | 461 | |
2,200,000 | | Tyson Foods Inc., (3 mo. LIBOR USD + 0.450%) 2.76%, 8/21/20 (a) | | | 2,205 | |
535,000 | | Tyson Foods Inc., (3 mo. LIBOR USD + 0.550%) 2.87%, 6/02/20 (a) | | | 536 | |
1,555,000 | | United Technologies Corp., (3 mo. LIBOR USD + 0.650%) 2.97%, 8/16/21 (a) | | | 1,557 | |
1,283,000 | | Vulcan Materials Co., (3 mo. LIBOR USD + 0.600%) 2.93%, 6/15/20 (a) | | | 1,284 | |
3,500,000 | | Vulcan Materials Co., (3 mo. LIBOR USD | | | | |
| | + 0.650%) 2.97%, 3/01/21 (a) | | | 3,506 | |
| | | | | 147,371 | |
Utility (6%) | | | | |
2,010,000 | | AES Corp./VA, 4.00%, 3/15/21 | | | 1,995 | |
1,026,923 | | Cenovus Energy Inc., 5.70%, 10/15/19 | | | 1,049 | |
1,695,000 | | Cheniere Corpus Christi Holdings LLC, | | | | |
| | 5.88%, 3/31/25 | | | 1,750 | |
675,000 | | Dominion Energy Inc., 2.58%, 7/01/20 | | | 665 | |
915,000 | | Dominion Energy Inc. 144A, (3 mo. LIBOR | | | | |
| | USD + 0.550%) 2.87%, 6/01/19 (a)(b) | | | 917 | |
865,000 | | Dominion Energy Inc., 2.96%, 7/01/19 | | | 862 | |
3,565,000 | | DTE Energy Co., 1.50%, 10/01/19 | | | 3,513 | |
| | | | | | |
Principal or Shares | | Security Description | | Value
(000) | |
| | |
957,000 | | Energy Transfer Partners LP, 9.70%, 3/15/19 | | $ | 980 | |
2,730,000 | | EnLink Midstream Partners LP, 2.70%, 4/01/19 | | | 2,713 | |
2,870,000 | | EQT Corp., (3 mo. LIBOR USD + 0.770%) | | | | |
| | 3.17%, 10/01/20 (a) | | | 2,870 | |
700,000 | | Equinor ASA, (3 mo. LIBOR USD + 0.460%) | | | | |
| | 2.80%, 11/08/18 (a) | | | 700 | |
1,978,000 | | Husky Energy Inc., 6.15%, 6/15/19 | | | 2,017 | |
1,325,000 | | Kinder Morgan Inc./DE, (3 mo. LIBOR USD | | | | |
| | + 1.280%) 3.72%, 1/15/23 (a) | | | 1,348 | |
1,215,000 | | Mississippi Power Co., (3 mo. LIBOR USD | | | | |
| | + 0.650%) 3.03%, 3/27/20 (a) | | | 1,215 | |
2,595,000 | | Nabors Industries Inc., 4.63%, 9/15/21 | | | 2,510 | |
830,000 | | Oasis Petroleum Inc., 6.88%, 1/15/23 | | | 838 | |
1,035,000 | | Phillips 66, (3 mo. LIBOR USD + 0.600%) | | | | |
| | 2.91%, 2/26/21 (a) | | | 1,036 | |
1,115,000 | | Phillips 66 144A, (3 mo. LIBOR USD | | | | |
| | + 0.650%) 3.09%, 4/15/19 (a)(b) | | | 1,115 | |
3,040,000 | | Progress Energy Inc., 7.05%, 3/15/19 | | | 3,085 | |
910,000 | | QEP Resources Inc., 6.88%, 3/01/21 | | | 951 | |
3,990,000 | | Sempra Energy, (3 mo. LIBOR USD + 0.450%) 2.78%, 3/15/21 (a) | | | 3,989 | |
1,400,000 | | Sempra Energy, (3 mo. LIBOR USD + 0.500%) 2.94%, 1/15/21 (a) | | | 1,400 | |
1,420,000 | | Shell International Finance BV, 1.38%, 5/10/19 | | | 1,409 | |
3,025,000 | | Southern Co. 144A, (3 mo. LIBOR USD | | | | |
| | + 0.700%) 3.10%, 9/30/20 (a)(b) | | | 3,033 | |
3,605,000 | | WGL Holdings Inc., (3 mo. LIBOR USD | | | | |
| | + 0.400%) 2.72%, 11/29/19 (a) | | | 3,607 | |
1,745,000 | | Whiting Petroleum Corp., 5.75%, 3/15/21 | | | 1,762 | |
| | | | | 47,329 | |
Total Corporate Bond (Cost - $412,958) | | | 412,546 | |
Foreign Government (2%) | | | | |
3,685,000 | | Abu Dhabi Government International Bond | | | | |
| | 144A, 6.75%, 4/08/19 (b) | | | 3,748 | |
1,500,000 | | Argentine Republic Government International | | | | |
| | Bond, 6.25%, 4/22/19 (f) | | | 1,512 | |
950,000 | | Japan Bank for International Cooperation, (3 mo. LIBOR USD + 0.480%) 2.80%, 6/01/20 (a) | | | 955 | |
2,670,000 | | Japan Bank for International Cooperation, (3 mo. LIBOR USD + 0.570%) 2.88%, 2/24/20 (a) | | | 2,686 | |
6,700,000 | | Municipality Finance PLC 144A, (3 mo. LIBOR USD + 0.170%) 2.51%, 2/07/20 (a)(b) | | | 6,715 | |
1,600,000 | | Province of New Brunswick Canada, (3 mo. | | | | |
| | CDOR CAD + 0.130%) 2.34%, 8/01/19 | | | | |
| | CAD (a)(c) | | | 1,219 | |
371,000 | | Senegal Government International Bond 144A, 8.75%, 5/13/21 (b) | | | 397 | |
1,470,000 | | Vietnam Government International Bond 144A, 6.75%, 1/29/20 (b) | | | 1,516 | |
Total Foreign Government (Cost - $19,033) | | | 18,748 | |
Mortgage Backed (9%) | | | | |
3,710,000 | | AREIT 2018-CRE2 Trust 144A, (1 mo. LIBOR USD + 0.980%) 3.26%, 11/14/35 (a)(b) | | | 3,710 | |
14 Payden Mutual Funds
| | | | | | |
Principal or Shares | | Security Description | | Value (000) | |
| | |
3,975,000 | | BXMT 2017-FL1 Ltd. 144A, (1 mo. LIBOR | | | | |
| | USD + 0.870%) 3.16%, 6/15/35 (a)(b) | | $ | 3,981 | |
2,672,462 | | COMM 2014-CCRE15 Mortgage Trust, | | | | |
| | 2.93%, 2/10/47 | | | 2,669 | |
2,791,396 | | Fannie Mae Connecticut Avenue Securities, (1 | | | | |
| | mo. LIBOR USD + 0.550%) 2.83%, 1/25/30 (a) | | | 2,790 | |
4,980,141 | | Fannie Mae Connecticut Avenue Securities, (1 | | | | |
| | mo. LIBOR USD + 0.650%) 2.93%, 5/25/30 (a) | | | 4,981 | |
2,601,871 | | Fannie Mae Connecticut Avenue Securities, (1 | | | | |
| | mo. LIBOR USD + 0.950%) | | | | |
| | 3.23%, 10/25/29 (a) | | | 2,616 | |
1,175,526 | | Fannie Mae Connecticut Avenue Securities, (1 | | | | |
| | mo. LIBOR USD + 1.300%) 3.58%, 7/25/29 (a) | | | 1,183 | |
450,306 | | FN 906140 ARM, (12 mo. LIBOR USD | | | | |
| | + 1.676%) 3.48%, 1/01/37 (a) | | | 472 | |
6,569,897 | | Freddie Mac Structured Agency Credit Risk Debt Notes, (1 mo. LIBOR USD + 0.450%) | | | | |
| | 2.73%, 7/25/30 (a) | | | 6,552 | |
3,000,808 | | Freddie Mac Structured Agency Credit Risk Debt Notes, (1 mo. LIBOR USD + 0.750%) | | | | |
| | 3.03%, 3/25/30 (a) | | | 3,010 | |
2,450,610 | | Freddie Mac Structured Agency Credit Risk Debt Notes 144A, 4.17%, 8/25/48 (b)(g) | | | 2,455 | |
65,547 | | GNR 2002-48 FT, (1 mo. LIBOR USD | | | | |
| | + 0.200%) 2.48%, 12/16/26 (a) | | | 66 | |
473,985 | | Gosforth Funding 2016-1 PLC 144A, (3 mo. | | | | |
| | LIBOR GBP + 0.600%) 1.40%, 2/15/58 | | | | |
| | GBP (a)(b)(c) | | | 606 | |
1,969,175 | | Gosforth Funding 2017-1 PLC 144A, (3 mo. | | | | |
| | LIBOR USD + 0.470%) 2.81%, 12/19/59 (a)(b) | | | 1,975 | |
299,916 | | HarborView Mortgage Loan Trust 2004-10, | | | | |
| | 4.13%, 1/19/35 (g) | | | 299 | |
2,610,000 | | Holmes Master Issuer PLC 144A, (3 mo. LIBOR | | | | |
| | USD + 1.750%) 4.19%, 10/15/54 (a)(b) | | | 2,624 | |
1,564,269 | | JP Morgan Chase Commercial Mortgage | | | | |
| | Securities Trust 2012-CIBX, 3.14%, 6/15/45 | | | 1,563 | |
254,156 | | JP Morgan Chase Commercial Mortgage | | | | |
| | Securities Trust 2013-C16, 3.07%, 12/15/46 | | | 254 | |
1,668,266 | | JPMBB Commercial Mortgage Securities Trust | | | | |
| | 2014-C23, 3.18%, 9/15/47 | | | 1,666 | |
1,768,800 | | Lanark Master Issuer PLC 144A, (3 mo. LIBOR | | | | |
| | USD + 0.420%) 2.73%, 12/22/69 (a)(b) | | | 1,773 | |
6,059 | | MASTR Asset Securitization Trust 2004-6, | | | | |
| | 5.00%, 7/25/19 | | | 6 | |
2,978,055 | | Morgan Stanley Bank of America Merrill Lynch | | | | |
| | Trust 2014-C14, 2.92%, 2/15/47 | | | 2,975 | |
3,971,364 | | New Residential Mortgage Loan Trust 2017-5 | | | | |
| | 144A, (1 mo. LIBOR USD + 1.500%) | | | | |
| | 3.78%, 6/25/57 (a)(b) | | | 4,078 | |
4,680,000 | | Permanent Master Issuer PLC 144A, (3 mo. | | | | |
| | LIBOR USD + 0.380%) 2.82%, 7/15/58 (a)(b) | | | 4,687 | |
2,029,060 | | Ripon Mortgages PLC 144A, (3 mo. LIBOR | | | | |
| | GBP + 0.800%) 1.60%, 8/20/56 GBP (a)(b)(c) | | | 2,592 | |
44,325 | | Sequoia Mortgage Trust 2012-1, | | | | |
| | 2.87%, 1/25/42 (g) | | | 45 | |
261,721 | | Sequoia Mortgage Trust 2013-1, | | | | |
| | 1.45%, 2/25/43 (g) | | | 249 | |
| | | | | | |
Principal or Shares | | Security Description | | Value
(000) | |
| | |
464,398 | | Sequoia Mortgage Trust 2013-4, | | | | |
| | 1.55%, 4/25/43 (g) | | $ | 441 | |
1,550,169 | | Sequoia Mortgage Trust 2017-CH2 144A, | | | | |
| | 4.00%, 12/25/47 (b)(g) | | | 1,557 | |
6,970,000 | | STACR Trust 2018-DNA3 144A, (1 mo. LIBOR USD + 0.750%) 2.88%, 9/25/48 (a)(b) | | | 6,982 | |
135,221 | | Structured Adjustable Rate Mortgage Loan Trust, 4.43%, 9/25/34 (g) | | | 138 | |
2,455 | | Structured Asset Mortgage Investments Trust 2003-C1, 3.11%, 7/25/32 (g) | | | 2 | |
562,933 | | Towd Point Mortgage Funding 2016-Granite1 PLC 144A, (3 mo. LIBOR GBP + 1.180%) | | | | |
| | 1.98%, 7/20/46 GBP (a)(b)(c) | | | 722 | |
3,102,312 | | Wells Fargo Commercial Mortgage Trust | | | | |
| | 2014-LC16, 2.82%, 8/15/50 | | | 3,098 | |
Total Mortgage Backed (Cost - $72,955) | | | 72,817 | |
Municipal (1%) | | | | |
4,000,000 | | New York State Housing Finance Agency, | | | | |
| | 2.40%, 11/01/49 (g) | | | 4,000 | |
1,375,000 | | State of California, 3.09%, 4/01/47 (g) | | | 1,386 | |
Total Municipal (Cost - $5,383) | | | 5,386 | |
NCUA Guaranteed (0%) | | | | |
269,271 | | NCUA Guaranteed Notes Trust 2010-R1, (1 mo. LIBOR USD + 0.450%) 2.73%, 10/07/20 (a) | | | 270 | |
1,124,294 | | NCUA Guaranteed Notes Trust 2010-R3, (1 mo. LIBOR USD + 0.560%) 2.84%, 12/08/20 (a) | | | 1,128 | |
239,441 | | NCUA Guaranteed Notes Trust 2011-R1, (1 mo. LIBOR USD + 0.450%) 2.73%, 1/08/20 (a) | | | 240 | |
20,010 | | NCUA Guaranteed Notes Trust 2011-R2, (1 mo. LIBOR USD + 0.400%) 2.68%, 2/06/20 (a) | | | 20 | |
Total NCUA Guaranteed (Cost - $1,655) | | | 1,658 | |
U.S. Treasury (16%) | | | | |
24,000,000 | | U.S. Treasury Bill, 2.17%, 12/06/18 (e) | | | 23,950 | |
15,000,000 | | U.S. Treasury Bill, 2.52%, 9/12/19 (e) | | | 14,667 | |
8,075,000 | | U.S. Treasury Note, 1.25%, 12/31/18 | | | 8,062 | |
17,000,000 | | U.S. Treasury Note, (3 mo. US Treasury Bill | | | | |
| | Yield + 0.033%) 2.35%, 4/30/20 (a) | | | 17,006 | |
39,000,000 | | U.S. Treasury Note, (3 mo. US Treasury Bill | | | | |
| | Yield + 0.043%) 2.36%, 7/31/20 (a) | | | 39,015 | |
10,000,000 | | U.S. Treasury Note, 2.63%, 8/31/20 | | | 9,958 | |
10,000,000 | | U.S. Treasury Note, 2.75%, 9/30/20 | | | 9,978 | |
Total U.S. Treasury (Cost - $122,657) | | | 122,636 | |
Investment Company (0%) | | | | |
1,698,453 | | Payden Cash Reserves Money Market Fund * | | | | |
| | (Cost - $1,698) | | | 1,698 | |
Total Investments (Cost - $790,408) (101%) | | | 789,290 | |
Liabilities in excess of Other Assets (-1%) | | | (4,469 | ) |
Net Assets (100%) | | $ | 784,821 | |
| | | | | | |
| (a) | Floating rate security. The rate shown reflects the rate in effect at October 31, 2018. See Note 2 in the Notes to Financial Statements. |
| (b) | Security offered only to qualified institutional investors, and thus is not registered for sale to the public under rule 144A of the Securities Act of 1933.It has been deemed liquid under guidelines approved by the Board. |
| (c) | Principal in foreign currency. |
| (d) | Floating rate security. The rate shown reflects the rate in effect at October 31, 2018. The stated maturity is subject to prepayments. See Note 2 in the Notes to Financial Statements. |
Annual Report 15
| (e) | Yield to maturity at time of purchase. |
| (f) | All or a portion of these securities are on loan. At October 31, 2018, the total market value of the Fund’s securities on loan is $459 and the total market value of the collateral held by the Fund is $470. Amounts in 000s. |
| (g) | Variable rate security. Interest rate disclosed is as of the most recent information available. Certain variable rate securities are not based on a published reference rate and spread but are determined by the issuer or agent and are based on current market conditions. These securities do not indicate a reference rate and spread in their description above. See Note 2 in the Notes to Financial Statements. |
Open Forward Currency Contracts to USD
| | | | | | | | | | | | | | | | | |
Currency Purchased (000s) | | Currency
Sold (000s) | | Counterparty | | Settlement
Date | | Unrealized
Appreciation
(000s) |
Assets: | | | | | | | | | | | | | | | | | |
USD 3,608 | | | | EUR 3,093 | | | Barclays Bank PLC | | | | 03/25/2019 | | | | | $ 58 | |
USD 582 | | | | EUR 502 | | | Citibank, N.A. | | | | 11/08/2018 | | | | | 13 | |
USD 4,053 | | | | GBP 3,119 | | | HSBC Bank USA, N.A. | | | | 11/08/2018 | | | | | 65 | |
USD 6,214 | | | | CAD 8,060 | | | Royal Bank of Canada | | | | 11/08/2018 | | | | | 91 | |
| | | | | | | | | | | | | | | | | |
| Net Unrealized Appreciation | | | | | | | | | | | $ | 227 | |
| | | | | | | | | | | | | | | | | |
Offsetting Assets and Liabilities
The Fund’s loaned securities were all subject to an enforceable Securities Lending Agency Agreement. Securities lent in accordance with the Securities Lending Agency Agreement on a gross basis were as follows:
| | | | |
Total gross amount presented on the Statements | | $ | 459 | |
of Assets and Liabilities1 | | | | |
Non-cash Collateral2 | | | (459 | ) |
| | | | |
Net Amount | | $ | — | |
| | | | |
| 1 | The amount presented on the Statements of Assets and Liabilities is not offset and is shown on a gross basis. |
| 2 | At October 31, 2018, the value of the collateral received from each borrower exceeded the value of the related securities loaned. This amount is disclosed on the Schedule of Investments. |
See notes to financial statements.
16 Payden Mutual Funds

| | | | |
The Fund seeks a high level of total return that is consistent with preservation of capital by generally investing in investment grade securities with a maximum average portfolio maturity not to exceed three years. | | 
Past performance does not predict future returns. The graph does not reflect the impact of taxes or transaction costs a shareholder would pay. |
| Portfolio Composition - percent of investments |
|
Corporate | | 39% |
U.S. Treasury | | 39% |
Asset Backed | | 11% |
Mortgage Backed | | 8% |
Foreign Government | | 2% |
Other | | 1% |
|
|
|
This information is not part of the audited financial statements. |
Schedule of Investments - October 31, 2018
| | | | | | |
Principal or Shares | | Security Description | | Value
(000) | |
Asset Backed (11%) | | | | |
7,500,000 | | Allegro CLO III Ltd. 144A, (3 mo. LIBOR USD | | | | |
| | + 0.840%) 3.33%, 7/25/27 (a)(b) | | $ | 7,507 | |
9,500,000 | | Ally Auto Receivables Trust 2017-4, | | | | |
| | 1.75%, 12/15/21 | | | 9,384 | |
3,565,000 | | ALM XVI Ltd./ALM XVI LLC 144A, (3 mo. | | | | |
| | LIBOR USD + 1.500%) 3.94%, 7/15/27 (a)(b) | | | 3,562 | |
650,000 | | AmeriCredit Automobile Receivables Trust | | | | |
| | 2016-2, 2.87%, 11/08/21 | | | 648 | |
9,605,000 | | Apidos CLO XXI 144A, (3 mo. LIBOR USD | | | | |
| | + 0.930%) 3.37%, 7/18/27 (a)(b) | | | 9,584 | |
4,370,000 | | Ascentium Equipment Receivables 2018-2 Trust | | | | |
| | 144A, 3.51%, 4/10/24 (b) | | | 4,373 | |
2,000,000 | | Barings CLO Ltd. 2013-I 144A, (3 mo. LIBOR | | | | |
| | USD + 0.800%) 3.27%, 1/20/28 (a)(b) | | | 2,000 | |
1,790,000 | | BMW Vehicle Lease Trust 2018-1, | | | | |
| | 3.26%, 7/20/21 | | | 1,791 | |
1,830,000 | | BMW Vehicle Lease Trust 2018-1, | | | | |
| | 3.36%, 3/21/22 | | | 1,831 | |
5,020,000 | | BSPRT 2018-FL4 Issuer Ltd. 144A, (1 mo. | | | | |
| | LIBOR USD + 1.300%) 3.58%, 9/15/35 (a)(b) | | | 5,035 | |
450,000 | | Capital Auto Receivables Asset Trust 2016-2, | | | | |
| | 2.11%, 3/22/21 | | | 446 | |
1,870,000 | | Capital Auto Receivables Asset Trust 2017-1 | | | | |
| | 144A, 2.02%, 8/20/21 (b) | | | 1,854 | |
5,150,000 | | Carmax Auto Owner Trust 2018-4, | | | | |
| | 3.36%, 9/15/23 | | | 5,152 | |
9,732,137 | | Colony Starwood Homes 2016-2 Trust 144A, (1 | | | | |
| | mo. LIBOR USD + 1.250%) | | | | |
| | 3.53%, 12/17/33 (a)(b) | | | 9,740 | |
3,740,000 | | Dell Equipment Finance Trust 2018-2 144A, | | | | |
| | 3.37%, 10/22/23 (b) | | | 3,741 | |
2,520,000 | | Drive Auto Receivables Trust, 3.36%, 10/17/22 | | | 2,515 | |
2,798,575 | | Enterprise Fleet Financing LLC 144A, | | | | |
| | 2.13%, 5/22/23 (b) | | | 2,772 | |
| | | | | | |
Principal or Shares | | Security Description | | Value
(000) | |
| | |
2,130,000 | | GM Financial Automobile Leasing Trust 2016-1, | | | | |
| | 3.24%, 3/20/20 | | $ | 2,131 | |
2,370,000 | | GM Financial Automobile Leasing Trust 2018-2, | | | | |
| | 3.06%, 6/21/21 | | | 2,366 | |
6,890,000 | | GM Financial Consumer Automobile Receivables | | | | |
| | Trust 2018-4, 3.21%, 10/16/23 | | | 6,880 | |
1,810,000 | �� | Hyundai Auto Receivables Trust 2016-B, | | | | |
| | 2.68%, 9/15/23 | | | 1,777 | |
4,209,010 | | Invitation Homes 2018-SFR1 Trust 144A, (1 | | | | |
| | mo. LIBOR USD + 0.700%) | | | | |
| | 2.99%, 3/17/37 (a)(b) | | | 4,209 | |
354,343 | | L.A. Arena Funding LLC 144A, | | | | |
| | 7.66%, 12/15/26 (b) | | | 366 | |
4,675,000 | | LCM XX LP 144A, (3 mo. LIBOR USD | | | | |
| | + 1.040%) 3.38%, 10/20/27 (a)(b) | | | 4,675 | |
2,192,492 | | MVW Owner Trust 2017-1 144A, | | | | |
| | 2.42%, 12/20/34 (b) | | | 2,119 | |
1,600,000 | | OZLM XIII Ltd. 144A, (3 mo. LIBOR USD | | | | |
| | + 1.080%) 3.60%, 7/30/27 (a)(b) | | | 1,597 | |
6,140,000 | | PFS Financing Corp. 144A, 2.89%, 2/15/23 (b) | | | 6,073 | |
1,970,000 | | Prestige Auto Receivables Trust 2018-1 144A, | | | | |
| | 3.29%, 9/15/22 (b) | | | 1,969 | |
1,070,000 | | Santander Drive Auto Receivables Trust 2015-2, | | | | |
| | 3.02%, 4/15/21 | | | 1,069 | |
1,750,000 | | Santander Drive Auto Receivables Trust 2016-2, | | | | |
| | 2.66%, 11/15/21 | | | 1,744 | |
3,860,000 | | Santander Drive Auto Receivables Trust 2018-5, | | | | |
| | 3.19%, 3/15/22 | | | 3,860 | |
7,500,000 | | Venture XXIV CLO Ltd. 144A, (3 mo. LIBOR | | | | |
| | USD + 1.420%) 3.89%, 10/20/28 (a)(b) | | | 7,520 | |
8,600,000 | | Verizon Owner Trust 2017-3 144A, | | | | |
| | 2.06%, 4/20/22 (b) | | | 8,474 | |
3,710,000 | | Volkswagen Auto Loan Enhanced Trust 2018-1, | | | | |
| | 3.02%, 11/21/22 | | | 3,693 | |
980,000 | | Westlake Automobile Receivables Trust 2016-2 | | | | |
| | 144A, 4.10%, 6/15/21 (b) | | | 986 | |
Annual Report 17

| | | | | | |
Principal or Shares | | Security Description | | Value
(000) | |
| | |
1,940,000 | | Westlake Automobile Receivables Trust 2017-1 | | | | |
| | 144A, 2.70%, 10/17/22 (b) | | $ | 1,934 | |
Total Asset Backed (Cost - $135,887) | | | 135,377 | |
Bank Loans(c) (0%) | | | | |
1,249,688 | | Dole Food Co. Inc. Term Loan B 1L, (LIBOR | | | | |
| | USD 1-Month + 2.417%) 5.05%, 4/06/24 | | | 1,248 | |
Total Bank Loans (Cost - $1,243) | | | 1,248 | |
Corporate Bond (39%) | | | | |
Financial (20%) | | | | |
1,955,000 | | AerCap Ireland Capital DAC/AerCap Global | | | | |
| | Aviation Trust, 3.50%, 5/26/22 | | | 1,909 | |
1,200,000 | | AIA Group Ltd. 144A, 2.25%, 3/11/19 (b) | | | 1,196 | |
2,500,000 | | Air Lease Corp., 2.13%, 1/15/20 | | | 2,462 | |
1,065,000 | | American Express Credit Corp., 1.88%, 5/03/19 | | | 1,059 | |
3,920,000 | | American Express Credit Corp., 2.20%, 3/03/20 | | | 3,869 | |
1,020,000 | | ANZ New Zealand International Ltd./London | | | | |
| | 144A, 2.20%, 7/17/20 (b) | | | 1,000 | |
2,625,000 | | Ares Capital Corp., 3.63%, 1/19/22 | | | 2,573 | |
1,700,000 | | Associated Bank NA/Green Bay WI, | | | | |
| | 3.50%, 8/13/21 | | | 1,686 | |
2,275,000 | | Assurant Inc., (3 mo. LIBOR USD + 1.250%) | | | | |
| | 3.62%, 3/26/21 (a) | | | 2,278 | |
2,265,000 | | Athene Global Funding 144A, | | | | |
| | 2.75%, 4/20/20 (b) | | | 2,235 | |
830,000 | | Banco de Credito del Peru/Panama 144A, | | | | |
| | 2.25%, 10/25/19 (b)(d) | | | 822 | |
2,475,000 | | Banco del Estado de Chile 144A, | | | | |
| | 2.67%, 1/08/21 (b) | | | 2,413 | |
3,450,000 | | Banco Santander Chile 144A, | | | | |
| | 2.50%, 12/15/20 (b) | | | 3,371 | |
3,600,000 | | Banco Santander SA, 3.13%, 2/23/23 | | | 3,400 | |
795,000 | | Bank of America Corp., 2.15%, 11/09/20 | | | 776 | |
2,760,000 | | Bank of America Corp., (3 mo. LIBOR USD | | | | |
| | + 0.630%) 2.33%, 10/01/21 (a) | | | 2,695 | |
4,500,000 | | Bank of America Corp., (3 mo. LIBOR USD | | | | |
| | + 0.650%) 3.02%, 6/25/22 (a) | | | 4,503 | |
2,500,000 | | Bank of America Corp., (3 mo. LIBOR USD | | | | |
| | + 0.630%) 3.50%, 5/17/22 (a) | | | 2,489 | |
1,390,000 | | Banque Federative du Credit Mutuel SA 144A, | | | | |
| | 2.00%, 4/12/19 (b) | | | 1,383 | |
1,000,000 | | Banque Federative du Credit Mutuel SA 144A, | | | | |
| | 2.20%, 7/20/20 (b) | | | 979 | |
2,000,000 | | Banque Federative du Credit Mutuel SA 144A, | | | | |
| | 2.70%, 7/20/22 (b) | | | 1,925 | |
3,832,000 | | Barclays PLC, 2.75%, 11/08/19 | | | 3,809 | |
2,495,000 | | Barclays PLC, 3.25%, 1/12/21 | | | 2,461 | |
2,750,000 | | BNZ International Funding Ltd./London 144A, | | | | |
| | 2.40%, 2/21/20 (b) | | | 2,713 | |
1,885,000 | | BPCE SA 144A, (3 mo. LIBOR USD + 1.220%) | | | | |
| | 3.53%, 5/22/22 (a)(b) | | | 1,903 | |
5,300,000 | | Capital One Financial Corp., (3 mo. LIBOR USD | | | | |
| | + 0.950%) 3.28%, 3/09/22 (a) | | | 5,315 | |
4,455,000 | | Capital One NA, 2.35%, 1/31/20 | | | 4,400 | |
4,235,000 | | Citigroup Inc., 2.45%, 1/10/20 | | | 4,197 | |
1,020,000 | | Citizens Bank NA/Providence RI, | | | | |
| | 2.20%, 5/26/20 | | | 1,001 | |
| | | | | | | | |
Principal
or Shares | | | Security Description | | Value
(000) | |
| | |
| | 1,510,000 | | | Citizens Bank NA/Providence RI, | | | | |
| | | | 2.25%, 3/02/20 | | $ | 1,489 | |
| | 2,960,000 | | | Credit Agricole SA/London 144A, | | | | |
| | | | 3.38%, 1/10/22 (b) | | | 2,900 | |
| | 5,380,000 | | | Credit Suisse Group Funding Guernsey Ltd., | | | | |
| | | | 2.75%, 3/26/20 | | | 5,326 | |
| | 2,280,000 | | | Danske Bank A/S 144A, 1.65%, 9/06/19 (b) | | | 2,246 | |
| | 4,775,000 | | | Deutsche Bank AG/New York NY, | | | | |
| | | | 3.15%, 1/22/21 | | | 4,659 | |
| | 4,725,000 | | | Digital Realty Trust LP, 5.88%, 2/01/20 | | | 4,838 | |
| | 2,600,000 | | | Discover Bank, 2.60%, 11/13/18 | | | 2,600 | |
| | 4,660,000 | | | DNB Bank ASA 144A, 2.13%, 10/02/20 (b) | | | 4,535 | |
| | 1,470,000 | | | Enstar Group Ltd., 4.50%, 3/10/22 | | | 1,470 | |
| | 4,505,000 | | | Federation des Caisses Desjardins du Quebec | | | | |
| | | | 144A, 2.25%, 10/30/20 (b) | | | 4,406 | |
| | 870,000 | | | Fifth Third Bank/Cincinnati OH, | | | | |
| | | | 2.20%, 10/30/20 | | | 851 | |
| | 2,790,000 | | | FS Investment Corp., 4.25%, 1/15/20 | | | 2,799 | |
| | 3,980,000 | | | Goldman Sachs Group Inc., 2.60%, 12/27/20 | | | 3,907 | |
| | 5,420,000 | | | Goldman Sachs Group Inc., 3.00%, 4/26/22 | | | 5,278 | |
| | 3,250,000 | | | HSBC Holdings PLC, (3 mo. LIBOR USD | | | | |
| | | | + 0.600%) 2.92%, 5/18/21 (a) | | | 3,254 | |
| | 1,900,000 | | | HSBC Holdings PLC, (3 mo. LIBOR USD | | | | |
| | | | + 0.650%) 2.98%, 9/11/21 (a) | | | 1,904 | |
| | 1,835,000 | | | Huntington National Bank, 2.38%, 3/10/20 | | | 1,813 | |
| | 1,320,000 | | | Icahn Enterprises LP/Icahn Enterprises Finance | | | | |
| | | | Corp., 6.25%, 2/01/22 | | | 1,336 | |
| | 3,710,000 | | | ICICI Bank Ltd./Hong Kong 144A, | | | | |
| | | | 5.75%, 11/16/20 (b) | | | 3,834 | |
| | 4,445,000 | | | ING Groep NV, (3 mo. LIBOR USD + 1.150%) 3.54%, 3/29/22 (a) | | | 4,514 | |
| | 3,100,000 | | | International Lease Finance Corp., | | | | |
| | | | 4.63%, 4/15/21 | | | 3,148 | |
| | 3,000,000 | | | International Lease Finance Corp., | | | | |
| | | | 6.25%, 5/15/19 | | | 3,048 | |
| | 3,260,000 | | | Intesa Sanpaolo SpA 144A, 3.13%, 7/14/22 (b) | | | 2,965 | |
| | 745,000 | | | iStar Inc., 4.63%, 9/15/20 | | | 741 | |
| | 3,825,000 | | | JPMorgan Chase & Co., (3 mo. LIBOR USD | | | | |
| | | | + 0.680%) 3.00%, 6/01/21 (a) | | | 3,832 | |
| | 4,350,000 | | | JPMorgan Chase & Co., (3 mo. LIBOR USD | | | | |
| | | | + 0.610%) 3.51%, 6/18/22 (a) | | | 4,344 | |
| | 880,000 | | | JPMorgan Chase & Co., 6.30%, 4/23/19 | | | 894 | |
| | 5,005,000 | | | Macquarie Group Ltd. 144A, (3 mo. LIBOR | | | | |
| | | | USD + 1.020%) 3.33%, 11/28/23 (a)(b) | | | 4,996 | |
| | 1,600,000 | | | Macquarie Group Ltd. 144A, 7.63%, 8/13/19 (b) | | | 1,655 | |
| | 2,940,000 | | | Metropolitan Life Global Funding I 144A, | | | | |
| | | | 2.40%, 1/08/21 (b) | | | 2,878 | |
| | 1,320,000 | | | Mitsubishi UFJ Financial Group Inc., (3 mo. | | | | |
| | | | LIBOR USD + 0.920%) 3.23%, 2/22/22 (a) | | | 1,332 | |
| | 1,530,000 | | | Mizuho Bank Ltd. 144A, 2.40%, 3/26/20 (b) | | | 1,512 | |
| | 6,000,000 | | | Morgan Stanley, (3 mo. LIBOR USD + 0.550%) 2.89%, 2/10/21 (a) | | | 6,004 | |
| | 4,000,000 | | | Morgan Stanley, (3 mo. LIBOR USD + 1.140%) 3.65%, 1/27/20 (a) | | | 4,039 | |
| | 1,186,000 | | | Morgan Stanley, (3 mo. LIBOR USD + 1.180%) 3.65%, 1/20/22 (a) | | | 1,200 | |
| | 2,520,000 | | | Nuveen Finance LLC 144A, 2.95%, 11/01/19 (b) | | | 2,516 | |
18 Payden Mutual Funds
| | | | | | |
Principal or Shares | | Security Description | | Value
(000) | |
| | |
1,700,000 | | PNC Bank NA, 2.45%, 11/05/20 | | $ | 1,670 | |
5,420,000 | | Royal Bank of Scotland Group PLC, (3 mo. | | | | |
| | LIBOR USD + 1.470%) 3.78%, 5/15/23 (a) | | | 5,451 | |
2,050,000 | | Santander Holdings USA Inc., 3.70%, 3/28/22 | | | 2,017 | |
4,300,000 | | Santander UK PLC, 2.38%, 3/16/20 | | | 4,248 | |
3,800,000 | | Scentre Group Trust 1/Scentre Group Trust 2 | | | | |
| | 144A, 2.38%, 11/05/19 (b) | | | 3,764 | |
1,136,000 | | SLM Corp., 5.13%, 4/05/22 | | | 1,133 | |
2,400,000 | | Standard Chartered PLC 144A, | | | | |
| | 2.10%, 8/19/19 (b) | | | 2,380 | |
2,720,000 | | Standard Chartered PLC 144A, | | | | |
| | 2.40%, 9/08/19 (b) | | | 2,697 | |
1,045,000 | | Starwood Property Trust Inc. 144A, | | | | |
| | 3.63%, 2/01/21 (b) | | | 1,018 | |
1,455,000 | | Sterling Bancorp/DE, 3.50%, 6/08/20 | | | 1,446 | |
2,395,000 | | Sumitomo Mitsui Banking Corp., | | | | |
| | 2.09%, 10/18/19 | | | 2,367 | |
1,405,000 | | Sumitomo Mitsui Trust Bank Ltd. 144A, | | | | |
| | 1.95%, 9/19/19 (b) | | | 1,391 | |
1,995,000 | | Sumitomo Mitsui Trust Bank Ltd. 144A, | | | | |
| | 2.05%, 10/18/19 (b) | | | 1,973 | |
2,870,000 | | Suncorp-Metway Ltd. 144A, 2.35%, 4/27/20 (b) | | | 2,821 | |
2,245,000 | | Suncorp-Metway Ltd. 144A, | | | | |
| | 2.38%, 11/09/20 (b) | | | 2,191 | |
5,145,000 | | SunTrust Bank/Atlanta GA, (3 mo. LIBOR USD | | | | |
| | + 0.298%) 2.59%, 1/29/21 (a) | | | 5,095 | |
1,180,000 | | Synchrony Financial, 2.60%, 1/15/19 | | | 1,178 | |
1,045,000 | | Synchrony Financial, 3.00%, 8/15/19 | | | 1,041 | |
750,000 | | Synchrony Financial, (3 mo. LIBOR USD | | | | |
| | + 1.230%) 3.81%, 2/03/20 (a) | | | 755 | |
2,540,000 | | UBS AG/London 144A, 2.20%, 6/08/20 (b) | | | 2,495 | |
2,070,000 | | UBS AG/London 144A, 2.45%, 12/01/20 (b) | | | 2,028 | |
3,000,000 | | VEREIT Operating Partnership LP, | | | | |
| | 3.00%, 2/06/19 | | | 2,999 | |
700,000 | | WEA Finance LLC/Westfield UK & Europe | | | | |
| | Finance PLC 144A, 2.70%, 9/17/19 (b) | | | 698 | |
5,155,000 | | Wells Fargo Bank NA, 3.63%, 10/22/21 | | | 5,154 | |
| | | | | 237,895 | |
Industrial (13%) | | | | |
1,485,000 | | AbbVie Inc., 3.38%, 11/14/21 | | | 1,478 | |
3,755,000 | | Alimentation Couche-Tard Inc. 144A, | | | | |
| | 2.35%, 12/13/19 (b) | | | 3,718 | |
2,495,000 | | Anglo American Capital PLC 144A, | | | | |
| | 4.13%, 4/15/21 (b) | | | 2,506 | |
2,250,000 | | Bayer U.S. Finance II LLC 144A, | | | | |
| | 3.50%, 6/25/21 (b) | | | 2,237 | |
4,000,000 | | Becton Dickinson and Co., 2.13%, 6/06/19 | | | 3,975 | |
3,095,000 | | BMW U.S. Capital LLC 144A, | | | | |
| | 3.25%, 8/14/20 (b) | | | 3,091 | |
4,510,000 | | Broadcom Corp./Broadcom Cayman Finance Ltd., | | | | |
| | 2.20%, 1/15/21 | | | 4,361 | |
3,690,000 | | Broadcom Corp./Broadcom Cayman Finance Ltd., | | | | |
| | 2.38%, 1/15/20 | | | 3,648 | |
705,000 | | Centene Corp., 4.75%, 5/15/22 | | | 709 | |
2,830,000 | | CK Hutchison International 17 II Ltd. 144A, | | | | |
| | 2.25%, 9/29/20 (b) | | | 2,761 | |
3,995,000 | | Comcast Corp., 3.30%, 10/01/20 | | | 3,994 | |
| | | | | | | | |
Principal
or Shares | | | Security Description | | Value
(000) | |
| | |
| | 1,962,000 | | | Comcast Corp., 3.45%, 10/01/21 | | $ | 1,962 | |
| | 860,000 | | | Conagra Brands Inc., (3 mo. LIBOR USD | | | | |
| | | | + 0.750%) 3.22%, 10/22/20 (a) | | | 861 | |
| | 1,265,000 | | | Conagra Brands Inc., 3.80%, 10/22/21 | | | 1,267 | |
| | 1,996,000 | | | Constellation Brands Inc., 2.00%, 11/07/19 | | | 1,974 | |
| | 3,000,000 | | | CVS Health Corp., (3 mo. LIBOR USD | | | | |
| | | | + 0.720%) 3.05%, 3/09/21 (a) | | | 3,017 | |
| | 3,150,000 | | | CVS Health Corp., 3.13%, 3/09/20 | | | 3,144 | |
| | 3,070,000 | | | Daimler Finance North America LLC 144A, | | | | |
| | | | 1.50%, 7/05/19 (b) | | | 3,038 | |
| | 635,000 | | | Daimler Finance North America LLC 144A, | | | | |
| | | | 2.20%, 5/05/20 (b) | | | 624 | |
| | 1,255,000 | | | Danone SA 144A, 1.69%, 10/30/19 (b) | | | 1,237 | |
| | 4,050,000 | | | Dell International LLC/EMC Corp. 144A, | | | | |
| | | | 3.48%, 6/01/19 (b) | | | 4,056 | |
| | 3,450,000 | | | Dell International LLC/EMC Corp. 144A, | | | | |
| | | | 4.42%, 6/15/21 (b) | | | 3,481 | |
| | 400,000 | | | Dell International LLC/EMC Corp. 144A, | | | | |
| | | | 5.88%, 6/15/21 (b) | | | 407 | |
| | 2,999,000 | | | Delta Air Lines Inc., 2.60%, 12/04/20 | | | 2,934 | |
| | 1,755,000 | | | Delta Air Lines Inc., 2.88%, 3/13/20 | | | 1,739 | |
| | 1,400,000 | | | El Corte Ingles SA 144A, 3.00%, 3/15/24 | | | | |
| | | | EUR (b)(e) | | | 1,597 | |
| | 875,000 | | | Elanco Animal Health Inc. 144A, | | | | |
| | | | 3.91%, 8/27/21 (b) | | | 876 | |
| | 2,800,000 | | | Express Scripts Holding Co., 2.60%, 11/30/20 | | | 2,749 | |
| | 3,060,000 | | | Ford Motor Credit Co. LLC, 2.02%, 5/03/19 | | | 3,039 | |
| | 1,385,000 | | | Ford Motor Credit Co. LLC, 2.26%, 3/28/19 | | | 1,380 | |
| | 2,635,000 | | | Ford Motor Credit Co. LLC, 2.68%, 1/09/20 | | | 2,597 | |
| | 1,100,000 | | | Ford Motor Credit Co. LLC, (3 mo. LIBOR USD | | | | |
| | | | + 1.270%) 3.66%, 3/28/22 (a) | | | 1,087 | |
| | 65,000 | | | Fortive Corp., 1.80%, 6/15/19 | | | 64 | |
| | 1,700,000 | | | GATX Corp., 2.50%, 7/30/19 | | | 1,692 | |
| | 1,815,000 | | | General Motors Financial Co. Inc., | | | | |
| | | | 2.65%, 4/13/20 | | | 1,796 | |
| | 4,000,000 | | | General Motors Financial Co. Inc., (3 mo. LIBOR | | | | |
| | | | USD + 0.930%) 3.37%, 4/13/20 (a) | | | 4,019 | |
| | 3,285,000 | | | General Motors Financial Co. Inc., (3 mo. LIBOR | | | | |
| | | | USD + 1.310%) 3.70%, 6/30/22 (a) | | | 3,310 | |
| | 3,800,000 | | | General Motors Financial Co. Inc., (3 mo. LIBOR | | | | |
| | | | USD + 1.550%) 3.99%, 1/14/22 (a) | | | 3,853 | |
| | 1,860,000 | | | Glencore Funding LLC 144A, (3 mo. LIBOR | | | | |
| | | | USD + 1.360%) 3.80%, 1/15/19 (a)(b) | | | 1,862 | |
| | 1,825,000 | | | Halfmoon Parent Inc. 144A, (3 mo. LIBOR USD | | | | |
| | | | + 0.650%) 2.98%, 9/17/21 (a)(b) | | | 1,825 | |
| | 3,220,000 | | | Halfmoon Parent Inc. 144A, 3.20%, 9/17/20 (b) | | | 3,204 | |
| | 1,635,000 | | | Hewlett Packard Enterprise Co., | | | | |
| | | | 3.50%, 10/05/21 | | | 1,631 | |
| | 1,400,000 | | | Hyundai Capital Services Inc. 144A, | | | | |
| | | | 1.63%, 8/30/19 (b) | | | 1,381 | |
| | 2,320,000 | | | Lennar Corp., 4.13%, 1/15/22 | | | 2,274 | |
| | 1,420,000 | | | Microchip Technology Inc. 144A, | | | | |
| | | | 3.92%, 6/01/21 (b) | | | 1,411 | |
| | 1,178,000 | | | Mylan NV, 2.50%, 6/07/19 | | | 1,172 | |
| | 1,480,000 | | | Nissan Motor Acceptance Corp. 144A, | | | | |
| | | | 2.15%, 9/28/20 (b) | | | 1,444 | |
Annual Report 19
| | | | | | |
Principal
or Shares | | Security Description | | Value
(000) | |
| | |
985,000 | | Packaging Corp. of America, 2.45%, 12/15/20 | | $ | 965 | |
3,155,000 | | Pelabuhan Indonesia III Persero PT 144A, 4.50%, 5/02/23 (b) | | | 3,083 | |
2,900,000 | | Penske Truck Leasing Co. LP/PTL Finance Corp. 144A, 3.20%, 7/15/20 (b) | | | 2,882 | |
1,066,000 | | Royal Caribbean Cruises Ltd., 2.65%, 11/28/20 | | | 1,048 | |
8,487,000 | | Shire Acquisitions Investments Ireland DAC, | | | | |
| | 1.90%, 9/23/19 | | | 8,384 | |
1,550,000 | | Sirius XM Radio Inc. 144A, 3.88%, 8/01/22 (b) | | | 1,500 | |
1,050,000 | | SMBC Aviation Capital Finance DAC 144A, | | | | |
| | 2.65%, 7/15/21 (b) | | | 1,013 | |
1,595,000 | | SMBC Aviation Capital Finance DAC 144A, | | | | |
| | 3.00%, 7/15/22 (b) | | | 1,532 | |
1,415,000 | | Smithfield Foods Inc. 144A, 2.65%, 10/03/21 (b) | | | 1,347 | |
1,085,000 | | Smithfield Foods Inc. 144A, 2.70%, 1/31/20 (b) | | | 1,067 | |
1,130,000 | | Spirit AeroSystems Inc., (3 mo. LIBOR USD | | | | |
| | + 0.800%) 3.13%, 6/15/21 (a) | | | 1,132 | |
3,495,000 | | Sprint Spectrum Co. LLC/Sprint Spectrum Co. II LLC/Sprint Spectrum Co. III LLC 144A, | | | | |
| | 3.36%, 9/20/21 (b) | | | 3,469 | |
4,170,000 | | Suntory Holdings Ltd. 144A, 2.55%, 9/29/19 (b) | | | 4,143 | |
1,940,000 | | Teva Pharmaceutical Finance Netherlands III BV, 1.70%, 7/19/19 | | | 1,908 | |
930,000 | | Teva Pharmaceutical Finance Netherlands III BV, 2.20%, 7/21/21 | | | 868 | |
1,100,000 | | Teva Pharmaceutical Finance Netherlands III BV, 6.00%, 4/15/24 | | | 1,093 | |
1,300,000 | | United Technologies Corp., 3.35%, 8/16/21 | | | 1,295 | |
4,735,000 | | Verizon Communications Inc., (3 mo. LIBOR | | | | |
| | USD + 1.000%) 3.33%, 3/16/22 (a) | | | 4,813 | |
2,255,000 | | ViaSat Inc. 144A, 5.63%, 9/15/25 (b) | | | 2,100 | |
2,000,000 | | Vulcan Materials Co., (3 mo. LIBOR USD | | | | |
| | + 0.600%) 2.93%, 6/15/20 (a) | | | 2,002 | |
560,000 | | Zimmer Biomet Holdings Inc., 2.70%, 4/01/20 | | | 554 | |
| | | | | 152,680 | |
Utility (6%) | | | | |
3,030,000 | | AES Corp./VA, 4.00%, 3/15/21 | | | 3,007 | |
2,251,000 | | American Electric Power Co. Inc., | | | | |
| | 2.15%, 11/13/20 | | | 2,195 | |
1,989,615 | | Cenovus Energy Inc., 5.70%, 10/15/19 | | | 2,032 | |
1,465,000 | | CenterPoint Energy Inc., 3.60%, 11/01/21 | | | 1,466 | |
2,400,000 | | Cheniere Corpus Christi Holdings LLC, | | | | |
| | 5.88%, 3/31/25 | | | 2,478 | |
1,900,000 | | Chesapeake Energy Corp., 7.00%, 10/01/24 | | | 1,862 | |
1,030,000 | | Diamondback Energy Inc. 144A, | | | | |
| | 4.75%, 11/01/24 (b) | | | 1,004 | |
911,000 | | Dominion Energy Inc., 2.58%, 7/01/20 | | | 898 | |
4,690,000 | | Dominion Energy Inc., 2.96%, 7/01/19 | | | 4,671 | |
1,530,000 | | DTE Energy Co., 1.50%, 10/01/19 | | | 1,508 | |
2,073,000 | | Energy Transfer LP, 4.25%, 3/15/23 | | | 2,057 | |
1,385,000 | | Energy Transfer Operating LP, 9.00%, 4/15/19 | | | 1,421 | |
770,000 | | Energy Transfer Partners LP/Regency Energy | | | | |
| | Finance Corp., 5.88%, 3/01/22 | | | 811 | |
4,795,000 | | EnLink Midstream Partners LP, 2.70%, 4/01/19 | | | 4,765 | |
2,675,000 | | Enterprise Products Operating LLC, | | | | |
| | 6.50%, 1/31/19 | | | 2,697 | |
| | | | | | | | |
Principal
or Shares | | | Security Description | | Value
(000) | |
| | |
| | 1,180,000 | | | EQT Corp., 2.50%, 10/01/20 | | $ | 1,151 | |
| | 2,170,000 | | | Kinder Morgan Energy Partners LP, | | | | |
| | | | 2.65%, 2/01/19 | | | 2,166 | |
| | 1,198,000 | | | Kinder Morgan Inc./DE, 3.05%, 12/01/19 | | | 1,194 | |
| | 2,255,000 | | | Kinder Morgan Inc./DE, (3 mo. LIBOR USD | | | | |
| | | | + 1.280%) 3.72%, 1/15/23 (a) | | | 2,295 | |
| | 4,165,000 | | | Nabors Industries Inc., 4.63%, 9/15/21 | | | 4,029 | |
| | 2,930,000 | | | NextEra Energy Capital Holdings Inc., | | | | |
| | | | 3.34%, 9/01/20 | | | 2,930 | |
| | 1,485,000 | | | Nostrum Oil & Gas Finance BV 144A, | | | | |
| | | | 7.00%, 2/16/25 (b) | | | 1,203 | |
| | 1,268,000 | | | Oasis Petroleum Inc., 6.88%, 1/15/23 | | | 1,281 | |
| | 1,545,000 | | | ONEOK Inc., 4.25%, 2/01/22 | | | 1,556 | |
| | 2,035,000 | | | Phillips 66 144A, (3 mo. LIBOR USD | | | | |
| | | | + 0.750%) 3.19%, 4/15/20 (a)(b) | | | 2,035 | |
| | 4,685,000 | | | PNM Resources Inc., 3.25%, 3/09/21 | | | 4,631 | |
| | 1,303,000 | | | QEP Resources Inc., 6.88%, 3/01/21 | | | 1,362 | |
| | 4,360,000 | | | Sabine Pass Liquefaction LLC, 5.63%, 2/01/21 | | | 4,514 | |
| | 1,000,000 | | | Sempra Energy, 2.40%, 2/01/20 | | | 988 | |
| | 4,940,000 | | | Sinopec Group Overseas Development 2017 Ltd. 144A, 2.38%, 4/12/20 (b) | | | 4,862 | |
| | 2,150,000 | | | Southern California Edison Co., 1.85%, 2/01/22 | | | 2,096 | |
| | 810,000 | | | Sunoco LP/Sunoco Finance Corp. 144A, | | | | |
| | | | 4.88%, 1/15/23 (b) | | | 783 | |
| | 1,346,000 | | | TransCanada PipeLines Ltd., 2.13%, 11/15/19 | | | 1,331 | |
| | 1,665,000 | | | WEC Energy Group Inc., 3.38%, 6/15/21 | | | 1,661 | |
| | 2,525,000 | | | Whiting Petroleum Corp., 5.75%, 3/15/21 | | | 2,550 | |
| | | | | | | 77,490 | |
| | Total Corporate Bond (Cost - $473,341) | | | 468,065 | |
| | Foreign Government (2%) | | | | |
| | 1,960,000 | | | Abu Dhabi Government International Bond | | | | |
| | | | 144A, 2.50%, 10/11/22 (b) | | | 1,882 | |
| | 4,880,000 | | | Argentine Republic Government International | | | | |
| | | | Bond, 4.63%, 1/11/23 | | | 4,139 | |
| | 1,600,000 | | | Argentine Republic Government International | | | | |
| | | | Bond, 5.63%, 1/26/22 | | | 1,442 | |
| | 2,100,000 | | | Caisse d’Amortissement de la Dette Sociale | | | | |
| | | | 144A, 1.75%, 9/24/19 (b) | | | 2,079 | |
| | 2,120,000 | | | Fondo MIVIVIENDA SA 144A, | | | | |
| | | | 3.50%, 1/31/23 (b) | | | 2,040 | |
| | 3,130,000 | | | Georgia Government International Bond 144A, | | | | |
| | | | 6.88%, 4/12/21 (b) | | | 3,298 | |
| | 800,000 | | | Hellenic Republic Government Bond 144A, | | | | |
| | | | 3.38%, 2/15/25 EUR (b)(e) | | | 880 | |
| | 4,500,000 | | | Mexico Government International Bond, | | | | |
| | | | 3.63%, 3/15/22 | | | 4,453 | |
| | 3,500,000 | | | Oman Sovereign Sukuk SAOC 144A, | | | | |
| | | | 5.93%, 10/31/25 (b) | | | 3,494 | |
| | 2,730,000 | | | Perusahaan Penerbit SBSN Indonesia III 144A, | | | | |
| | | | 3.40%, 3/29/22 (b) | | | 2,664 | |
| | 646,000 | | | Senegal Government International Bond 144A, | | | | |
| | | | 8.75%, 5/13/21 (b) | | | 691 | |
| | 2,310,000 | | | Vietnam Government International Bond 144A, 6.75%, 1/29/20 (b) | | | 2,383 | |
| | Total Foreign Government (Cost - $30,950) | | | 29,445 | |
20 Payden Mutual Funds
| | | | | | |
Principal
or Shares | | Security Description | | Value
(000) | |
Mortgage Backed (8%) | | | | |
3,280,000 | | AREIT 2018-CRE2 Trust 144A, (1 mo. LIBOR | | | | |
| | USD + 1.400%) 3.68%, 11/14/35 (a)(b) | | $ | 3,280 | |
77,862,531 | | BANK 2018-BNK14, 0.53%, 9/15/60 (f) | | | 2,977 | |
130,646,000 | | BENCHMARK 2018-B6 Mortgage Trust, | | | | |
| | 0.60%, 10/10/51 (f) | | | 4,099 | |
1,547,156 | | CSMC Trust 2013-IVR2 144A, | | | | |
| | 1.55%, 4/25/43 (b)(f) | | | 1,480 | |
2,801,970 | | Fannie Mae Connecticut Avenue Securities, (1 | | | | |
| | mo. LIBOR USD + 0.550%) 2.83%, 1/25/30 (a) | | | 2,801 | |
4,400,645 | | Fannie Mae Connecticut Avenue Securities, (1 | | | | |
| | mo. LIBOR USD + 1.150%) 3.43%, 9/25/29 (a) | | | 4,424 | |
556,339 | | Fannie Mae Connecticut Avenue Securities, (1 | | | | |
| | mo. LIBOR USD + 1.950%) 4.23%, 8/25/28 (a) | | | 558 | |
2,560,000 | | Fannie Mae Connecticut Avenue Securities, (1 | | | | |
| | mo. LIBOR USD + 2.200%) 4.48%, 8/25/30 (a) | | | 2,572 | |
6,050,000 | | Fannie Mae Connecticut Avenue Securities, (1 | | | | |
| | mo. LIBOR USD + 2.250%) 4.53%, 7/25/30 (a) | | | 6,110 | |
6,034,158 | | Flagstar Mortgage Trust 2018-4 144A, | | | | |
| | 4.00%, 7/25/48 (b)(f) | | | 6,061 | |
263,426 | | FN BM4539 ARM, (12 mo. LIBOR USD | | | | |
| | + 1.620%) 3.92%, 8/01/38 (a) | | | 275 | |
1,067,152 | | FN BM4541 ARM, (12 mo. LIBOR USD | | | | |
| | + 1.500%) 4.08%, 10/01/38 (a) | | | 1,111 | |
5,385,577 | | Freddie Mac Structured Agency Credit Risk Debt | | | | |
| | Notes, (1 mo. LIBOR USD + 1.200%) | | | | |
| | 3.48%, 10/25/29 (a) | | | 5,441 | |
3,687,167 | | Freddie Mac Structured Agency Credit Risk Debt | | | | |
| | Notes, (1 mo. LIBOR USD + 2.900%) | | | | |
| | 5.19%, 7/25/28 (a) | | | 3,769 | |
1,450,000 | | Freddie Mac Structured Agency Credit Risk Debt | | | | |
| | Notes, (1 mo. LIBOR USD + 4.600%) | | | | |
| | 6.88%, 12/25/42 (a) | | | 1,547 | |
1,123,178 | | Freddie Mac Structured Agency Credit Risk Debt | | | | |
| | Notes, (1 mo. LIBOR USD + 11.250%) | | | | |
| | 13.53%, 10/25/29 (a) | | | 1,302 | |
1,150,000 | | GAHR Commercial Mortgage Trust 2015-NRF | | | | |
| | 144A, 3.38%, 12/15/34 (b)(f) | | | 1,132 | |
283,709 | | HomeBanc Mortgage Trust 2004-1, (1 mo. | | | | |
| | LIBOR USD + 0.860%) 3.14%, 8/25/29 (a) | | | 273 | |
490,385 | | JP Morgan Mortgage Trust 2013-1 144A, | | | | |
| | 2.50%, 3/25/43 (b)(f) | | | 469 | |
2,860,835 | | JP Morgan Mortgage Trust 2017-1 144A, | | | | |
| | 3.50%, 1/25/47 (b)(f) | | | 2,837 | |
6,408,850 | | JP Morgan Mortgage Trust 2017-5 144A, | | | | |
| | 3.00%, 10/26/48 (b)(f) | | | 6,351 | |
4,080,000 | | Lanark Master Issuer PLC 144A, (3 mo. LIBOR | | | | |
| | USD + 0.420%) 2.85%, 12/22/69 (a)(b) | | | 4,079 | |
298,660 | | MLCC Mortgage Investors Trust 2004-1, | | | | |
| | 4.12%, 12/25/34 (f) | | | 301 | |
554,129 | | MLCC Mortgage Investors Trust 2006-1, | | | | |
| | 4.13%, 2/25/36 (f) | | | 558 | |
89,577 | | Morgan Stanley Mortgage Loan Trust 2004-5AR, | | | | |
| | 4.06%, 7/25/34 (f) | | | 90 | |
2,533,857 | | New Residential Mortgage Loan Trust 2017-1 | | | | |
| | 144A, 4.00%, 2/25/57 (b)(f) | | | 2,545 | |
5,836,255 | | New Residential Mortgage Loan Trust 2017-3 | | | | |
| | 144A, 4.00%, 4/25/57 (b)(f) | | | 5,863 | |
| | | | | | |
Principal
or Shares | | Security Description | | Value (000) | |
| | |
5,887,904 | | New Residential Mortgage Loan Trust 2017-4 | | | | |
| | 144A, 4.00%, 5/25/57 (b)(f) | | $ | 5,907 | |
1,757,131 | | Residential Asset Securitization Trust 2006-A8, 6.00%, 8/25/36 | | | 1,477 | |
116,352 | | Sequoia Mortgage Trust 2012-1, | | | | |
| | 2.87%, 1/25/42 (f) | | | 117 | |
593,235 | | Sequoia Mortgage Trust 2013-1, | | | | |
| | 1.45%, 2/25/43 (f) | | | 565 | |
937,163 | | Sequoia Mortgage Trust 2013-4, | | | | |
| | 1.55%, 4/25/43 (f) | | | 890 | |
3,372,557 | | Sequoia Mortgage Trust 2017-CH1 144A, | | | | |
| | 3.50%, 8/25/47 (b)(f) | | | 3,357 | |
1,994,081 | | Sequoia Mortgage Trust 2017-CH2 144A, | | | | |
| | 4.00%, 12/25/47 (b)(f) | | | 2,003 | |
3,339,139 | | STACR Trust 2018-HRP1 144A, (1 mo. LIBOR USD + 1.650%) 3.93%, 4/25/43 (a)(b) | | | 3,360 | |
2,750,000 | | STACR Trust 2018-HRP1 144A, (1 mo. LIBOR USD + 3.750%) 6.03%, 4/25/43 (a)(b) | | | 2,888 | |
670,904 | | Structured Adjustable Rate Mortgage Loan Trust, 4.39%, 8/25/34 (f) | | | 664 | |
Total Mortgage Backed (Cost - $94,024) | | | 93,533 | |
U.S. Government Agency (1%) | | | | |
8,910,000 | | FNMA, 2.75%, 6/22/21 | | | | |
| | (Cost - $8,908) | | | 8,859 | |
U.S. Treasury (38%) | | | | |
25,000,000 | | U.S. Treasury Bill, 2.63%, 10/10/19 (g) | | | 24,386 | |
590,000 | | U.S. Treasury Note, 1.63%, 3/15/20 | | | 581 | |
40,055,000 | | U.S. Treasury Note, 2.00%, 1/31/20 | | | 39,676 | |
78,000,000 | | U.S. Treasury Note, 2.25%, 3/31/20 | | | 77,395 | |
23,006,000 | | U.S. Treasury Note, 2.25%, 2/15/21 | | | 22,678 | |
5,900,000 | | U.S. Treasury Note, 2.38%, 4/30/20 | | | 5,861 | |
3,125,000 | | U.S. Treasury Note, 2.38%, 4/15/21 | | | 3,086 | |
97,000,000 | | U.S. Treasury Note, 2.50%, 5/31/20 | | | 96,492 | |
109,500,000 | | U.S. Treasury Note, 2.63%, 7/31/20 | | | 109,066 | |
19,125,000 | | U.S. Treasury Note, 2.63%, 8/31/20 | | | 19,044 | |
5,000,000 | | U.S. Treasury Note, 2.63%, 5/15/21 (h) | | | 4,965 | |
30,000,000 | | U.S. Treasury Note, 2.75%, 9/30/20 | | | 29,933 | |
33,565,000 | | U.S. Treasury Note, 2.75%, 9/15/21 | | | 33,398 | |
Total U.S. Treasury (Cost - $468,240) | | | 466,561 | |
Investment Company (1%) | | | | |
6,944,879 | | Payden Cash Reserves Money Market Fund * | | | | |
| | (Cost - $6,945) | | | 6,945 | |
Total Investments (Cost - $1,219,538) (100%) | | | 1,210,033 | |
Other Assets, net of Liabilities (0%) | | | 2,275 | |
Net Assets (100%) | | $ | 1,212,308 | |
| (a) | Floating rate security. The rate shown reflects the rate in effect at October 31, 2018. See Note 2 in the Notes to Financial Statements. |
| (b) | Security offered only to qualified institutional investors, and thus is not registered for sale to the public under rule 144A of the Securities Act of 1933. It has been deemed liquid under guidelines approved by the Board. |
| (c) | Floating rate security. The rate shown reflects the rate in effect at October 31, 2018. The stated maturity is subject to prepayments. See Note 2 in the Notes to Financial Statements. |
| (d) | All or a portion of these securities are on loan. At October 31, 2018, the total market value of the Fund’s securities on loan is $248 and the total market value of the collateral held by the Fund is $253. Amounts in 000s. |
| (e) | Principal in foreign currency. |
Annual Report 21
| (f) | Variable rate security. Interest rate disclosed is as of the most recent information available. Certain variable rate securities are not based on a published reference rate and spread but are determined by the issuer or agent and are based on current market conditions. These securities do not indicate a reference rate and spread in their description above. See Note 2 in the Notes to Financial Statements. |
| (g) | Yield to maturity at time of purchase. |
| (h) | All or a portion of the security is pledged to cover futures contract margin requirements. |
Open Forward Currency Contracts to USD
| | | | | | | | | | | | | | | | |
Currency Purchased (000s) | | Currency Sold (000s) | | | Counterparty | | | Settlement Date | | | Unrealized Appreciation (000s) | |
Assets: | | | | | | | | | | | | | | | | |
USD 2,547 | | | EUR 2,198 | | | | Citibank, N.A. | | | | 11/08/2018 | | | $ | 56 | |
| | | | | | | | | | | | | | | | |
| Net Unrealized Appreciation | | | | | | | | | | | | | | $ | 56 | |
| | | | | | | | | | | | | | | | |
Open Futures Contracts
| | | | | | | | | | | | | | | | | | | | |
| Contract Type | | Number of Contracts | | | Expiration Date | | | Notional Amount (000s) | | | Current Value (000s) | | | Unrealized Appreciation (Depreciation) (000s) | |
| Long Contracts: | | | | | | | | | | | | | | | | | | | | |
U.S. Treasury
2-Year Note Future | | | 384 | | | | Dec-18 | | | $ | 80,892 | | | $ | (265 | ) | | $ | (265 | ) |
| | | | | | | | | | | | | | | | | | | | |
| | | | | | | | | | | | | | | | | | | (265 | ) |
| | | | | | | | | | | | | | | | | | | | |
| Short Contracts: | | | | | | | | | | | | | | | | | | | | |
| Euro-Bobl Future | | | 10 | | | | Dec-18 | | | | (1,489 | ) | | | 1 | | | | 1 | |
| Euro-Bund Future | | | 160 | | | | Dec-18 | | | | (29,043 | ) | | | 30 | | | | 30 | |
U.S. Treasury
5-Year Note Future | | | 321 | | | | Dec-18 | | | | (36,075 | ) | | | 315 | | | | 315 | |
| | | | | | | | | | | | | | | | | | | | |
| | | | | | | | | | | | | | | | | | | 346 | |
| | | | | | | | | | | | | | | | | | | | |
Total Futures | | | | | | | | | | | | | | | | | | $ | 81 | |
| | | | | | | | | | | | | | | | | | | | |
Offsetting Assets and Liabilities
The Fund’s loaned securities were all subject to an enforceable Securities Lending Agency Agreement. Securities lent in accordance with the Securities Lending Agency Agreement on a gross basis were as follows:
| | | | |
Total gross amount presented on the Statements | | $ | 248 | |
of Assets and Liabilities1 | | | | |
Non-cash Collateral2 | | | (248 | ) |
| | | | |
Net Amount | | $ | — | |
| | | | |
| 1 | The amount presented on the Statements of Assets and Liabilities is not offset and is shown on a gross basis. |
| 2 | At October 31, 2018, the value of the collateral received from each borrower exceeded the value of the related securities loaned. This amount is disclosed on the Schedule of Investments. |
See notes to financial statements.
22 Payden Mutual Funds

| | | | | | | | |
| | The Fund seeks a high level of total return that is consistent with preservation of capital by generally investing in U.S. government obligations with an average portfolio maturity not to exceed five years. | | | 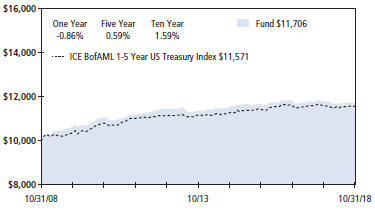
Past performance does not predict future returns. The graph does not reflect the impact of taxes or transaction costs a shareholder would pay. |
| | Portfolio Composition - percent of investments | |
| | | |
| | Mortgage Backed | | | 87 | % |
| | U.S. Treasury | | | 6 | % |
| | U.S. Government Guaranteed | | | 5 | % |
| | Cash equivalent | | | 2 | % |
| | | | | | |
| | | | | | |
| | | | | | |
| | This information is not part of the audited financial statements. | | | | | | |
| | | | | | |
| Schedule of Investments - October 31, 2018 | |
Principal or Shares | | Security Description | | Value (000) | |
FDIC Guaranteed (1%) | | | | |
379,938 | | FDIC 2010-R1 Trust 144A, 2.18%, 5/25/50 (a) | | $ | 380 | |
177,638 | | FDIC Guaranteed Notes Trust 2010-S3 144A, | | | | |
| | 2.74%, 12/03/20 (a) | | | 174 | |
Total FDIC Guaranteed (Cost - $559) | | | 554 | |
Mortgage Backed (87%) | | | | |
367,878 | | FH 1Q1363 ARM, (12 mo. LIBOR USD | | | | |
| | + 1.785%) 4.10%, 2/01/36 (b) | | | 385 | |
181,105 | | FH 2B0709 ARM, (12 mo. LIBOR USD | | | | |
| | + 1.750%) 4.50%, 8/01/42 (b) | | | 188 | |
242,478 | | FH 2B0972 ARM, (12 mo. LIBOR USD | | | | |
| | + 1.770%) 3.70%, 11/01/42 (b) | | | 253 | |
422,292 | | FH 2B1333 ARM, (12 mo. LIBOR USD | | | | |
| | + 1.650%) 3.95%, 4/01/43 (b) | | | 436 | |
1,232,569 | | FH 2B4763 ARM, (12 mo. LIBOR USD | | | | |
| | + 1.620%) 2.55%, 10/01/45 (b) | | | 1,238 | |
304,775 | | FH 849486 ARM, (12 mo. LIBOR USD | | | | |
| | + 1.863%) 4.34%, 8/01/41 (b) | | | 320 | |
1,394,929 | | FH 849506 ARM, (12 mo. LIBOR USD | | | | |
| | + 1.611%) 2.91%, 11/01/44 (b) | | | 1,393 | |
85,186 | | FN 849088 ARM, (12 mo. Federal Reserve | | | | |
| | Cumulative Average US + 1.981%) | | | | |
| | 3.81%, 11/01/35 (b) | | | 87 | |
45,217 | | FN 866093 ARM, (12 mo. LIBOR USD | | | | |
| | + 1.732%) 3.78%, 3/01/36 (b) | | | 47 | |
568,500 | | FN 890434 15YR, 3.00%, 7/01/27 | | | 561 | |
709,218 | | FN AE0193 ARM, (12 mo. LIBOR USD | | | | |
| | + 1.709%) 3.74%, 7/01/40 (b) | | | 741 | |
319,441 | | FN AI4019 ARM, (12 mo. LIBOR USD | | | | |
| | + 1.750%) 4.47%, 7/01/41 (b) | | | 334 | |
1,087,621 | | FN AJ4092 15YR, 3.50%, 10/01/26 | | | 1,088 | |
1,008,854 | | FN AL1869 15YR, 3.00%, 6/01/27 | | | 996 | |
1,408,740 | | FN AL2095 15YR, 3.00%, 6/01/27 | | | 1,391 | |
970,610 | | FN AL2221 15YR, 3.00%, 7/01/27 | | | 959 | |
515,558 | | FN AL5596 ARM, (12 mo. LIBOR USD | | | | |
| | + 1.556%) 2.49%, 2/01/44 (b) | | | 537 | |
| | | | | | |
| | | | | | |
Principal or Shares | | Security Description | | Value (000) | |
| | |
679,770 | | FN AL5790 ARM, (12 mo. LIBOR USD | | | | |
| | + 1.565%) 2.51%, 10/01/44 (b) | | $ | 696 | |
786,199 | | FN AL5967 ARM, (12 mo. LIBOR USD | | | | |
| | + 1.576%) 2.50%, 11/01/44 (b) | | | 805 | |
1,265,336 | | FN AL7648 ARM, (12 mo. LIBOR USD | | | | |
| | + 1.586%) 2.59%, 10/01/45 (b) | | | 1,253 | |
1,333,280 | | FN AM2182, 2.16%, 1/01/23 | | | 1,277 | |
695,497 | | FN AO7975 15YR, 3.00%, 6/01/27 | | | 687 | |
792,578 | | FN AP4746 15YR, 3.00%, 8/01/27 | | | 783 | |
1,517,133 | | FN AS1745 15YR, 3.00%, 2/01/29 | | | 1,495 | |
1,339,709 | | FN AS4186 15YR, 2.50%, 1/01/30 | | | 1,286 | |
591,555 | | FN AS6443 15YR, 3.00%, 12/01/30 | | | 581 | |
1,130,831 | | FN AS8013 15YR, 2.50%, 9/01/31 | | | 1,083 | |
274,632 | | FN AU6974 ARM, (12 mo. LIBOR USD | | | | |
| | + 1.580%) 2.97%, 11/01/43 (b) | | | 282 | |
707,542 | | FN AU8673 ARM, (12 mo. LIBOR USD | | | | |
| | + 1.530%) 2.69%, 2/01/44 (b) | | | 721 | |
1,551,542 | | FN AZ2886 ARM, (12 mo. LIBOR USD | | | | |
| | + 1.600%) 2.65%, 9/01/45 (b) | | | 1,539 | |
1,094,611 | | FN AZ4380 ARM, (12 mo. LIBOR USD | | | | |
| | + 1.590%) 2.51%, 8/01/45 (b) | | | 1,092 | |
1,557,980 | | FN BD2473 ARM, (12 mo. LIBOR USD | | | | |
| | + 1.620%) 2.53%, 1/01/47 (b) | | | 1,528 | |
998,547 | | FN BK8873 30yr, 4.00%, 9/01/48 | | | 1,001 | |
1,159,421 | | FN BM4540 ARM, (12 mo. LIBOR USD | | | | |
| | + 1.773%) 4.36%, 9/01/42 (b) | | | 1,216 | |
176,558 | | FN BM4541 ARM, (12 mo. LIBOR USD | | | | |
| | + 1.500%) 4.08%, 10/01/38 (b) | | | 184 | |
211,100 | | FNR 2002-10-FA, (1 mo. LIBOR USD | | | | |
| | + 0.750%) 3.03%, 2/25/32 (b) | | | 216 | |
967,876 | | G2 778200 20YR, 4.00%, 2/20/32 | | | 984 | |
470,575 | | G2 778203 20YR, 4.75%, 2/20/32 | | | 496 | |
782,304 | | G2 AY5138 Other, 3.25%, 12/20/37 | | | 764 | |
1,002,065 | | GN 728153, 5.50%, 10/15/29 | | | 1,062 | |
545,776 | | GN 737791 30YR, 4.50%, 12/15/40 | | | 565 | |
Annual Report 23

| | | | | | |
Principal or Shares | | Security Description | | Value (000) | |
| | |
8,570,088 | | GNR 2014-79 ST, 0.79%, 7/20/29 (c) | | $ | 178 | |
Total Mortgage Backed (Cost - $33,888) | | | 32,728 | |
NCUA Guaranteed (3%) | | | | |
724,439 | | NCUA Guaranteed Notes Trust 2010-R3, | | | | |
| | 2.40%, 12/08/20 | | | 721 | |
567,784 | | NCUA Guaranteed Notes Trust 2011-R2, (1 mo. LIBOR USD + 0.400%) 2.68%, 2/06/20 (b) | | | 569 | |
Total NCUA Guaranteed (Cost - $1,292) | | | 1,290 | |
U.S. Treasury (6%) | | | | |
2,200,000 | | U.S. Treasury Bill, 2.18%, 12/13/18 | | | | |
| | (Cost - $2,194) | | | 2,195 | |
| | | | | | |
Principal or Shares | | Security Description | | Value (000) | |
| |
Investment Company (2%) | | | | |
699,686 | | Payden Cash Reserves Money Market Fund * | | | | |
| | (Cost - $700) | | $ | 700 | |
Total Investments (Cost - $ 38,633) (99%) | | | 37,467 | |
Other Assets, net of Liabilities (1%) | | | 211 | |
Net Assets (100%) | | $ | 37,678 | |
| (a) | Security offered only to qualified institutional investors, and thus is not registered for sale to the public under rule 144A of the Securities Act of 1933. It has been deemed liquid under guidelines approved by the Board. |
| (b) | Floating rate security. The rate shown reflects the rate in effect at October 31, 2018. See Note 2 in the Notes to Financial Statements. |
| (c) | Variable rate security. Interest rate disclosed is as of the most recent information available. Certain variable rate securities are not based on a published reference rate and spread but are determined by the issuer or agent and are based on current market conditions. These securities do not indicate a reference rate and spread in their description above. See Note 2 in the Notes to Financial Statements. |
See notes to financial statements.
24 Payden Mutual Funds

| | | | |
The Fund seeks a high level of total return that is consistent with preservation of capital by generally investing in Government National Mortgage Association mortgage-backed securities and other U.S. government obligations with no limit on the average portfolio maturity. | | 
Past performance does not predict future returns. The graph does not reflect the impact of taxes or transaction costs a shareholder would pay. |
Portfolio Composition - percent of investments | | |
|
Mortgage Backed | | 98% |
Investment Company | | 3% |
U.S. Government Agency | | 1% |
|
|
|
This information is not part of the audited financial statements. |
| | | | | | |
| Schedule of Investments - October 31, 2018 | | | | |
Principal or Shares | | Security Description | | Value (000) | |
Mortgage Backed (145%) | | | | |
588,600 | | FH 1J1279 ARM, (12 mo. LIBOR USD | | | | |
| | + 1.520%) 3.43%, 4/01/36 (a) | | $ | 610 | |
749,288 | | FH 1Q0062 ARM, (6 mo. LIBOR USD | | | | |
| | + 1.562%) 3.94%, 11/01/35 (a) | | | 773 | |
678,477 | | FH 847228 ARM, (12 mo. LIBOR USD | | | | |
| | + 2.000%) 3.76%, 1/01/34 (a) | | | 713 | |
1,101,482 | | FHR 3174 FA, (1 mo. LIBOR USD | | | | |
| | + 0.300%) 2.58%, 4/15/36 (a) | | | 1,101 | |
419,956 | | FN 832100 ARM, (12 mo. LIBOR USD | | | | |
| | + 1.665%) 4.40%, 7/01/35 (a) | | | 439 | |
619,830 | | FN AK0419 ARM, (1 yr. US Treasury Yield | | | | |
| | Curve Rate T Note Constant Maturity | | | | |
| | + 2.274%) 4.06%, 12/01/27 (a) | | | 644 | |
977,949 | | FN AL0891 ARM, (12 mo. LIBOR USD | | | | |
| | + 1.813%) 4.54%, 9/01/41 (a) | | | 1,020 | |
417,589 | | FNR 2007-110 FA, (1 mo. LIBOR USD | | | | |
| | + 0.620%) 2.90%, 12/25/37 (a) | | | 419 | |
26,900,000 | | G2 30YR, 3.00%, 30YR TBA (b) | | | 25,720 | |
35,180,000 | | G2 30YR, 3.50%, 30YR TBA (b) | | | 34,555 | |
12,160,000 | | G2 30YR, 4.00%, 30YR TBA (b) | | | 12,239 | |
488,154 | | G2 3711 30YR, 5.50%, 5/20/35 | | | 522 | |
628,855 | | G2 3747 30YR, 5.00%, 8/20/35 | | | 667 | |
383,649 | | G2 3772 30YR, 5.00%, 10/20/35 | | | 407 | |
717,015 | | G2 3785 30YR, 5.00%, 11/20/35 | | | 761 | |
1,161,210 | | G2 3819 30YR, 5.50%, 2/20/36 | | | 1,239 | |
888,438 | | G2 4802 30YR, 5.00%, 9/20/40 | | | 942 | |
3,183,187 | | G2 4853 30YR, 4.00%, 11/20/40 | | | 3,235 | |
496,646 | | G2 4978 30YR, 4.50%, 3/20/41 | | | 517 | |
646,375 | | G2 5055 30YR, 4.50%, 5/20/41 | | | 673 | |
1,357,676 | | G2 5083 30YR, 5.00%, 6/20/41 | | | 1,440 | |
1,636,809 | | G2 5115 30YR, 4.50%, 7/20/41 | | | 1,703 | |
535,938 | | G2 5140 30YR, 4.50%, 8/20/41 | | | 558 | |
2,837,133 | | G2 5175 30YR, 4.50%, 9/20/41 | | | 2,953 | |
5,061,908 | | G2 5258 30YR, 3.50%, 12/20/41 | | | 5,007 | |
| | | | | | |
| | | | | | |
Principal or Shares | | Security Description | | Value (000) | |
| | |
784,655 | | G2 770239 30YR, 4.00%, 2/20/42 | | $ | 793 | |
247,854 | | G2 80013 ARM, (1 yr. US Treasury Yield Curve | | | | |
| | Rate T Note Constant Maturity | | | | |
| | + 1.500%) 3.13%, 11/20/26 (a) | | | 255 | |
565,298 | | G2 80029 ARM, (1 yr. US Treasury Yield Curve | | | | |
| | Rate T Note Constant Maturity | | | | |
| | + 1.500%) 3.38%, 1/20/27 (a) | | | 581 | |
612,190 | | G2 80044 ARM, (1 yr. US Treasury Yield Curve | | | | |
| | Rate T Note Constant Maturity | | | | |
| | + 1.500%) 3.38%, 2/20/27 (a) | | | 629 | |
716,343 | | G2 80052 ARM, (1 yr. US Treasury Yield Curve | | | | |
| | Rate T Note Constant Maturity | | | | |
| | + 1.500%) 3.38%, 3/20/27 (a) | | | 736 | |
603,731 | | G2 80059 ARM, (1 yr. US Treasury Yield Curve | | | | |
| | Rate T Note Constant Maturity | | | | |
| | + 1.500%) 3.63%, 4/20/27 (a) | | | 620 | |
63,192 | | G2 8006 ARM, (1 yr. US Treasury Yield Curve | | | | |
| | Rate T Note Constant Maturity | | | | |
| | + 1.500%) 2.75%, 7/20/22 (a) | | | 64 | |
1,372,137 | | G2 80074 ARM, (1 yr. US Treasury Yield Curve | | | | |
| | Rate T Note Constant Maturity | | | | |
| | + 1.500%) 3.63%, 5/20/27 (a) | | | 1,411 | |
2,657,584 | | G2 80152 ARM, (1 yr. US Treasury Yield Curve | | | | |
| | Rate T Note Constant Maturity | | | | |
| | + 1.500%) 3.38%, 1/20/28 (a) | | | 2,736 | |
660,407 | | G2 80154 ARM, (1 yr. US Treasury Yield Curve | | | | |
| | Rate T Note Constant Maturity | | | | |
| | + 1.500%) 3.38%, 1/20/28 (a) | | | 680 | |
1,166,636 | | G2 80169 ARM, (1 yr. US Treasury Yield Curve | | | | |
| | Rate T Note Constant Maturity | | | | |
| | + 1.500%) 3.38%, 2/20/28 (a) | | | 1,201 | |
1,546,638 | | G2 80184 ARM, (1 yr. US Treasury Yield Curve | | | | |
| | Rate T Note Constant Maturity | | | | |
| | + 1.500%) 3.63%, 4/20/28 (a) | | | 1,592 | |
Annual Report 25

| | | | | | |
Principal or Shares | | Security Description | | Value (000) | |
| | |
76,061 | | G2 80311 ARM, (1 yr. US Treasury Yield Curve Rate T Note Constant Maturity + 1.500%) 2.75%, 8/20/29 (a) | | $ | 79 | |
1,654,917 | | G2 80319 ARM, (1 yr. US Treasury Yield Curve Rate T Note Constant Maturity + 1.500%) 2.75%, 9/20/29 (a) | | | 1,710 | |
268,176 | | G2 8041 ARM, (1 yr. US Treasury Yield Curve Rate T Note Constant Maturity + 1.500%) 2.75%, 8/20/22 (a) | | | 270 | |
82,099 | | G2 80424 ARM, (1 yr. US Treasury Yield Curve Rate T Note Constant Maturity + 1.500%) 2.75%, 7/20/30 (a) | | | 85 | |
221,180 | | G2 80428 ARM, (1 yr. US Treasury Yield Curve Rate T Note Constant Maturity + 1.500%) 2.75%, 7/20/30 (a) | | | 229 | |
422,430 | | G2 80541 ARM, (1 yr. US Treasury Yield Curve Rate T Note Constant Maturity + 1.500%) 2.75%, 9/20/31 (a) | | | 437 | |
314,482 | | G2 80569 ARM, (1 yr. US Treasury Yield Curve Rate T Note Constant Maturity + 1.500%) 3.38%, 1/20/32 (a) | | | 325 | |
83,869 | | G2 80579 ARM, (1 yr. US Treasury Yield Curve Rate T Note Constant Maturity + 1.500%) 3.38%, 2/20/32 (a) | | | 87 | |
1,071,590 | | G2 80637 ARM, (1 yr. US Treasury Yield Curve Rate T Note Constant Maturity + 1.500%) 2.75%, 9/20/32 (a) | | | 1,110 | |
3,384,944 | | G2 80749 ARM, (1 yr. US Treasury Yield Curve Rate T Note Constant Maturity + 1.500%) 3.13%, 10/20/33 (a) | | | 3,515 | |
2,495,416 | | G2 80795 ARM, (1 yr. US Treasury Yield Curve Rate T Note Constant Maturity + 1.500%) 3.13%, 12/20/33 (a) | | | 2,591 | |
998,070 | | G2 80826 ARM, (1 yr. US Treasury Yield Curve Rate T Note Constant Maturity + 1.500%) 3.38%, 2/20/34 (a) | | | 1,034 | |
1,481,590 | | G2 80835 ARM, (1 yr. US Treasury Yield Curve Rate T Note Constant Maturity + 1.500%) 3.38%, 2/20/34 (a) | | | 1,536 | |
225,794 | | G2 80837 ARM, (1 yr. US Treasury Yield Curve Rate T Note Constant Maturity + 1.500%) 3.38%, 2/20/34 (a) | | | 234 | |
266,907 | | G2 81018 ARM, (1 yr. US Treasury Yield Curve Rate T Note Constant Maturity + 1.500%) 2.75%, 8/20/34 (a) | | | 277 | |
8,843 | | G2 81044 ARM, (1 yr. US Treasury Yield Curve Rate T Note Constant Maturity + 1.500%) 2.75%, 8/20/34 (a) | | | 9 | |
41,935 | | G2 8121 ARM, (1 yr. US Treasury Yield Curve Rate T Note Constant Maturity + 1.500%) 3.38%, 1/20/23 (a) | | | 43 | |
932,582 | | G2 81214 ARM, (1 yr. US Treasury Yield Curve Rate T Note Constant Maturity + 1.500%) 3.38%, 1/20/35 (a) | | | 966 | |
| | | | | | |
Principal or Shares | | Security Description | | Value (000) | |
| | |
353,717 | | G2 81220 ARM, (1 yr. US Treasury Yield Curve Rate T Note Constant Maturity + 1.500%) 3.38%, 1/20/35 (a) | | $ | 366 | |
324,384 | | G2 81278 ARM, (1 yr. US Treasury Yield Curve Rate T Note Constant Maturity + 1.500%) 3.38%, 3/20/35 (a) | | | 336 | |
1,343,084 | | G2 81282 ARM, (1 yr. US Treasury Yield Curve Rate T Note Constant Maturity + 1.500%) 3.38%, 3/20/35 (a) | | | 1,392 | |
132,636 | | G2 81938 ARM, (1 yr. US Treasury Yield Curve Rate T Note Constant Maturity + 1.500%) 2.75%, 7/20/37 (a) | | | 135 | |
2,259,400 | | G2 82074 ARM, (1 yr. US Treasury Yield Curve Rate T Note Constant Maturity + 1.500%) 3.63%, 5/20/38 (a) | | | 2,342 | |
1,210,088 | | G2 82107 ARM, (1 yr. US Treasury Yield Curve Rate T Note Constant Maturity + 1.500%) 2.75%, 7/20/38 (a) | | | 1,258 | |
120,116 | | G2 82151 ARM, (1 yr. US Treasury Yield Curve Rate T Note Constant Maturity + 1.500%) 2.75%, 9/20/38 (a) | | | 122 | |
63,003 | | G2 8228 ARM, (1 yr. US Treasury Yield Curve Rate T Note Constant Maturity + 1.500%) 2.75%, 7/20/23 (a) | | | 64 | |
2,394,435 | | G2 82457 ARM, (1 yr. US Treasury Yield Curve Rate T Note Constant Maturity + 1.500%) 3.38%, 1/20/40 (a) | | | 2,482 | |
1,297,539 | | G2 82463 ARM, (1 yr. US Treasury Yield Curve Rate T Note Constant Maturity + 1.500%) 3.38%, 1/20/40 (a) | | | 1,346 | |
1,119,153 | | G2 82737 ARM, (1 yr. US Treasury Yield Curve Rate T Note Constant Maturity + 1.500%) 3.38%, 2/20/41 (a) | | | 1,160 | |
332,042 | | G2 83031 ARM, (1 yr. US Treasury Yield Curve Rate T Note Constant Maturity + 1.500%) 3.50%, 1/20/42 (a) | | | 340 | |
142,556 | | G2 8358 ARM, (1 yr. US Treasury Yield Curve Rate T Note Constant Maturity + 1.500%) 3.38%, 1/20/24 (a) | | | 145 | |
590,792 | | G2 8547 ARM, (1 yr. US Treasury Yield Curve Rate T Note Constant Maturity + 1.500%) 3.13%, 11/20/24 (a) | | | 604 | |
79,498 | | G2 8595 ARM, (1 yr. US Treasury Yield Curve Rate T Note Constant Maturity + 1.500%) 3.38%, 2/20/25 (a) | | | 81 | |
25,098 | | G2 8855 ARM, (1 yr. US Treasury Yield Curve Rate T Note Constant Maturity + 1.500%) 3.13%, 10/20/21 (a) | | | 25 | |
279,904 | | G2 8968 ARM, (1 yr. US Treasury Yield Curve Rate T Note Constant Maturity + 1.500%) 2.75%, 9/20/26 (a) | | | 288 | |
945,283 | | G2 8991 ARM, (1 yr. US Treasury Yield Curve Rate T Note Constant Maturity + 1.500%) 3.13%, 10/20/26 (a) | | | 972 | |
1,565,455 | | G2 AY5138 30YR, 3.25%, 12/20/37 | | | 1,529 | |
3,967,979 | | G2 MA0698 30YR, 3.00%, 1/20/43 | | | 3,830 | |
26 Payden Mutual Funds
| | | | | | |
Principal or Shares | | Security Description | | Value (000) | |
| | |
3,769,123 | | G2 MA1012 30YR, 3.50%, 5/20/43 | | $ | 3,725 | |
3,474,326 | | G2 MA1089 30YR, 3.00%, 6/20/43 | | | 3,353 | |
3,248,315 | | G2 MA1520 30YR, 3.00%, 12/20/43 | | | 3,135 | |
2,414,029 | | G2 MA2304 30YR, 4.00%, 10/20/44 | | | 2,450 | |
3,173,726 | | G2 MA2522 30YR, 4.00%, 1/20/45 | | | 3,221 | |
4,452,914 | | G2 MA3173 30YR, 3.50%, 10/20/45 | | | 4,387 | |
767,799 | | G2 MA3454 30YR, 3.50%, 2/20/46 | | | 756 | |
4,162,455 | | G2 MA3597 30YR, 3.50%, 4/20/46 | | | 4,098 | |
3,801,249 | | G2 MA3662 30YR, 3.00%, 5/20/46 | | | 3,650 | |
4,133,863 | | G2 MA3663 30YR, 3.50%, 5/20/46 | | | 4,069 | |
3,584,505 | | G2 MA3735 30YR, 3.00%, 6/20/46 | | | 3,435 | |
2,907,235 | | G2 MA3802 30YR, 3.00%, 7/20/46 | | | 2,787 | |
4,245,162 | | G2 MA3936 30YR, 3.00%, 9/20/46 | | | 4,071 | |
1,774,418 | | G2 MA4069 30YR, 3.50%, 11/20/46 | | | 1,745 | |
470,407 | | G2 MA4127 30YR, 3.50%, 12/20/46 | | | 463 | |
1,508,694 | | G2 MA4321 30YR, 3.50%, 3/20/47 | | | 1,483 | |
625,205 | | GN 366983 30YR, 4.00%, 6/15/41 | | | 634 | |
4,360,214 | | GN 367090 30YR, 4.50%, 7/15/41 | | | 4,554 | |
2,278,730 | | GN 367092 30YR, 4.50%, 7/15/41 | | | 2,368 | |
1,569,881 | | GN 455989 15YR, 5.00%, 7/15/26 | | | 1,644 | |
229,386 | | GN 558954 20YR, 5.25%, 5/15/29 | | | 243 | |
778,578 | | GN 558956 30YR, 4.50%, 6/15/29 | | | 806 | |
335,369 | | GN 605099 30YR, 5.50%, 3/15/34 | | | 362 | |
755,425 | | GN 616826 30YR, 5.50%, 1/15/35 | | | 811 | |
1,825,064 | | GN 710868 30YR, 5.50%, 9/15/39 | | | 1,969 | |
605,626 | | GN 728153 20YR, 5.50%, 10/15/29 | | | 642 | |
273,678 | | GN 728159 20YR, 5.25%, 11/15/29 | | | 290 | |
283,921 | | GN 781636 30YR, 5.50%, 7/15/33 | | | 306 | |
331,261 | | GN 781810 30YR, 5.50%, 10/15/34 | | | 357 | |
5,554 | | GNR 2000-22 FG, (1 mo. LIBOR USD | | | | |
| | + 0.200%) 2.48%, 5/16/30 (a) | | | 6 | |
4,634 | | GNR 2001-21 FN, (1 mo. LIBOR USD | | | | |
| | + 0.200%) 2.48%, 8/16/22 (a) | | | 5 | |
835,636 | | GNR 2001-22 FG, (1 mo. LIBOR USD | | | | |
| | + 0.350%) 2.63%, 5/16/31 (a) | | | 839 | |
400,669 | | GNR 2001-35 FA, (1 mo. LIBOR USD | | | | |
| | + 0.250%) 2.53%, 8/16/31 (a) | | | 401 | |
284,098 | | GNR 2001-59 FA, (1 mo. LIBOR USD | | | | |
| | + 0.400%) 2.68%, 11/16/24 (a) | | | 285 | |
186,147 | | GNR 2001-65 FV, (1 mo. LIBOR USD | | | | |
| | + 0.400%) 2.68%, 2/20/29 (a) | | | 187 | |
204,641 | | GNR 2002-13 FA, (1 mo. LIBOR USD | | | | |
| | + 0.500%) 2.78%, 2/16/32 (a) | | | 205 | |
594,824 | | GNR 2002-48 FG, (1 mo. LIBOR USD | | | | |
| | + 0.300%) 2.58%, 12/16/30 (a) | | | 596 | |
184,959 | | GNR 2002-48 FT, (1 mo. LIBOR USD | | | | |
| | + 0.200%) 2.48%, 12/16/26 (a) | | | 185 | |
346,777 | | GNR 2002-72 FA, (1 mo. LIBOR USD | | | | |
| | + 0.400%) 2.68%, 10/20/32 (a) | | | 348 | |
159,517 | | GNR 2002-72 FB, (1 mo. LIBOR USD | | | | |
| | + 0.400%) 2.68%, 10/20/32 (a) | | | 160 | |
1,095,256 | | GNR 2002-72 FE, (1 mo. LIBOR USD | | | | |
| | + 0.400%) 2.68%, 10/20/32 (a) | | | 1,098 | |
182,096 | | GNR 2002-76 F, (1 mo. LIBOR USD | | | | |
| | + 0.200%) 2.48%, 1/16/31 (a) | | | 182 | |
74,959 | | GNR 2002-76 FY, (1 mo. LIBOR USD | | | | |
| | + 0.300%) 2.58%, 12/16/26 (a) | | | 75 | |
971,361 | | GNR 2003-71 FC, (1 mo. LIBOR USD | | | | |
| | + 0.500%) 2.78%, 7/20/33 (a) | | | 980 | |
| | | | | | |
Principal or Shares | | Security Description | | Value (000) | |
| | |
1,042,481 | | GNR 2003-94 FB, (1 mo. LIBOR USD | | | | |
| | + 0.300%) 2.58%, 12/16/30 (a) | | $ | 1,046 | |
1,832,119 | | GNR 2004-56 F, (1 mo. LIBOR USD | | | | |
| | + 0.400%) 2.68%, 6/20/33 (a) | | | 1,843 | |
1,060,196 | | GNR 2004-59 FH, (1 mo. LIBOR USD | | | | |
| | + 0.250%) 2.53%, 8/16/34 (a) | | | 1,061 | |
929,623 | | GNR 2004-86 FG, (1 mo. LIBOR USD | | | | |
| | + 0.400%) 2.68%, 7/20/34 (a) | | | 929 | |
290,393 | | GNR 2006-47 FA, (1 mo. LIBOR USD | | | | |
| | + 0.200%) 2.48%, 8/16/36 (a) | | | 289 | |
1,763,840 | | GNR 2006-60 FK, (1 mo. LIBOR USD | | | | |
| | + 0.200%) 2.48%, 11/20/36 (a) | | | 1,757 | |
1,341,048 | | GNR 2007-54 FC, (1 mo. LIBOR USD | | | | |
| | + 0.260%) 2.54%, 9/20/37 (a) | | | 1,336 | |
504,857 | | GNR 2007-76 FB, (1 mo. LIBOR USD | | | | |
| | + 0.500%) 2.78%, 11/20/37 (a) | | | 507 | |
1,574,244 | | GNR 2008-11 FB, (1 mo. LIBOR USD | | | | |
| | + 0.600%) 2.88%, 2/20/38 (a) | | | 1,591 | |
1,375,281 | | GNR 2008-15 CF, (1 mo. LIBOR USD | | | | |
| | + 0.510%) 2.79%, 2/20/38 (a) | | | 1,383 | |
369,777 | | GNR 2008-2 FH, (1 mo. LIBOR USD | | | | |
| | + 0.450%) 2.73%, 1/20/38 (a) | | | 371 | |
1,760,753 | | GNR 2008-67 UF, (1 mo. LIBOR USD | | | | |
| | + 0.450%) 2.73%, 6/20/38 (a) | | | 1,774 | |
632,602 | | GNR 2009-87 FB, (1 mo. LIBOR USD | | | | |
| | + 0.650%) 2.93%, 9/20/39 (a) | | | 639 | |
1,109,523 | | GNR 2010-57 WF, (1 mo. LIBOR USD | | | | |
| | + 0.400%) 2.68%, 3/16/38 (a) | | | 1,111 | |
655,427 | | GNR 2011-153 LF, (1 mo. LIBOR USD | | | | |
| | + 0.250%) 2.53%, 7/16/41 (a) | | | 655 | |
787,633 | | GNR 2012-18 AF, (1 mo. LIBOR USD | | | | |
| | + 0.300%) 2.58%, 2/20/38 (a) | | | 789 | |
1,732,594 | | GNR 2012-98 FM, (1 mo. LIBOR USD | | | | |
| | + 0.200%) 2.48%, 12/20/38 (a) | | | 1,735 | |
19,900,736 | | GNR 2014-79 ST, 0.79%, 7/20/29 (c) | | | 413 | |
1,144,632 | | GNR 2017-68 AF, (1 mo. LIBOR USD | | | | |
| | + 0.350%) 2.61%, 5/20/47 (a) | | | 1,146 | |
Total Mortgage Backed (Cost - $237,178) | | | 231,250 | |
Annual Report 27
| | | | | | |
Principal or Shares | | Security Description | | Value (000) | |
U.S. Treasury (1%) | | | | |
1,500,000 | | U.S. Treasury Bill, 0.00%, 11/23/18 (d) | | | | |
| | (Cost - $1,498) | | $ | 1,498 | |
Purchased Call Swaptions (0%) | | | | |
Total Purchased Call Swaptions (Cost - $79) | | | — | |
Investment Company (1%) | | | | |
1,703,086 | | Payden Cash Reserves Money Market Fund * | | | | |
| | (Cost - $1,703) | | | 1,703 | |
Total Investments (Cost - $240,458) (147%) | | | 234,451 | |
Liabilities in excess of Other Assets (-47%) | | | (75,058 | ) |
Net Assets (100%) | | $ | 159,393 | |
| | | | | | |
| (a) | Floating rate security. The rate shown reflects the rate in effect at October 31, 2018. See Note 2 in the Notes to Financial Statements. |
| (b) | Security was purchased on a delayed delivery basis. |
| (c) | Variable rate security. Interest rate disclosed is as of the most recent information available. Certain variable rate securities are not based on a published reference rate and spread but are determined by the issuer or agent and are based on current market conditions. These securities do not indicate a reference rate and spread in their description above. See Note 2 in the Notes to Financial Statements. |
| (d) | Yield to maturity at time of purchase. |
Purchased Swaptions
| | | | | | | | | | | | | | | | |
| Description | | Counterparty | | Notional
Amount
(000s) | | Expiration
date | | | Value
(000s) | | | Call/Put | |
Purchased Call Swaptions 0.0% | | | | | | | | | |
| 10-Year Interest Rate Swap, 11/13/28, Pay Fixed 2.3% Semi-Annually, Receive Pay Variable Quarterly, 3-Month USD LIBOR | | Citibank, N.A. | | $3,000 | | | 11/08/2018 | | | $ | — | | | | Call | |
| 10-Year Interest Rate Swap, 11/29/18, Pay Fixed 2.491% Semi-Annually, Receive Pay Variable Quarterly, 3-Month USD LIBOR | | Barclays Bank PLC | | 1,000 | | | 11/29/2018 | | | | — | | | | Call | |
| | | | | | | | | | | | | | | | |
Total Swaptions | | | | | | | | | | $ | — | | | | | |
| | | | | | | | | | | | | | | | |
See notes to financial statements.
28 Payden Mutual Funds

| | | | | | |
The Fund seeks a high level of total return that is consistent with preservation of capital by generally investing in investment grade securities with no limit on the average portfolio maturity. | | | | | | 
|
| Portfolio Composition - percent of investments | | | | |
Corporate | | | 36 | % |
Mortgage Backed | | | 29 | % |
U.S. Treasury | | | 20 | % |
Asset Backed | | | 6 | % |
Foreign Government | | | 3 | % |
Other | | | 6 | % |
| | | | |
| | | | |
| | | | | | |
| This information is not part of the audited financial statements. | | | | | | Past performance does not predict future returns. The graph does not reflect the impact of taxes or transaction costs a shareholder would pay. The Fund’s Adviser and SI Classes are expected to perform similarly to its Investor Class, except for class specific expenses or waivers. |
Schedule of Investments - October 31, 2018
| | | | | | |
Principal or Shares | | Security Description | | Value
(000) | |
Asset Backed (7%) | | | | |
1,500,000 | | ALM XVI Ltd./ALM XVI LLC 144A, (3 mo. LIBOR USD + 1.500%) 3.94%, 7/15/27 (a)(b) | | $ | 1,499 | |
2,000,000 | | Apidos CLO XXI 144A, (3 mo. LIBOR USD + 2.450%) 4.89%, 7/18/27 (a)(b) | | | 1,988 | |
1,565,000 | | Atrium XII 144A, (3 mo. LIBOR USD + 2.800%) 5.27%, 4/22/27 (a)(b) | | | 1,563 | |
6,020,000 | | Barings CLO Ltd. 2013-I 144A, (3 mo. LIBOR USD + 0.800%) 3.27%, 1/20/28 (a)(b) | | | 6,019 | |
2,320,000 | | Cedar Funding II CLO Ltd. 144A, (3 mo. LIBOR USD + 1.750%) 4.08%, 6/09/30 (a)(b) | | | 2,322 | |
80,236 | | Chase Funding Mortgage Loan Asset-Backed Certificates, (1 mo. LIBOR USD + 0.660%) 2.94%, 11/25/32 (a) | | | 80 | |
2,000,000 | | CIFC Funding 2017-III Ltd. 144A, (3 mo. LIBOR USD + 1.220%) 3.69%, 7/20/30 (a)(b) | | | 2,003 | |
1,700,000 | | CIFC Funding 2017-III Ltd. 144A, (3 mo. LIBOR USD + 1.800%) 4.27%, 7/20/30 (a)(b) | | | 1,702 | |
1,719,153 | | Colony American Homes 2015-1 144A, (1 mo. LIBOR USD + 1.200%) 3.49%, 7/17/32 (a)(b) | | | 1,721 | |
3,107,659 | | Colony Starwood Homes 2016-2 Trust 144A, (1 mo. LIBOR USD + 1.250%) 3.53%, 12/17/33 (a)(b) | | | 3,110 | |
2,212,000 | | Domino’s Pizza Master Issuer LLC 144A, 3.08%, 7/25/47 (b) | | | 2,146 | |
2,142,875 | | Domino’s Pizza Master Issuer LLC 144A, (3 mo. LIBOR USD + 1.250%) 3.74%, 7/25/47 (a)(b) | | | 2,151 | |
1,185,000 | | Domino’s Pizza Master Issuer LLC 144A, 4.12%, 7/25/47 (b) | | | 1,162 | |
2,600,000 | | First Investors Auto Owner Trust 2016-2 144A, 2.53%, 7/15/22 (b) | | | 2,552 | |
1,300,000 | | Greystone Commercial Real Estate Notes 2018-HC1 Ltd. 144A, (1 mo. LIBOR USD + 1.550%) 3.67%, 9/15/28 (a)(b) | | | 1,304 | |
| | | | | | |
Principal or Shares | | Security Description | | Value (000) | |
| | |
3,000,000 | | Greystone Commercial Real Estate Notes 2018-HC1 Ltd. 144A, (1 mo. LIBOR USD + 2.650%) 4.77%, 9/15/28 (a)(b) | | $ | 3,010 | |
1,600,000 | | Grippen Park CLO Ltd. 144A, (3 mo. LIBOR USD + 3.300%) 5.77%, 1/20/30 (a)(b) | | | 1,609 | |
2,700,000 | | Hunt CRE 2018-FL2 Ltd. 144A, (1 mo. LIBOR USD + 1.080%) 3.36%, 8/15/28 (a)(b) | | | 2,712 | |
1,950,000 | | Hunt CRE 2018-FL2 Ltd. 144A, (1 mo. LIBOR USD + 1.450%) 3.73%, 8/15/28 (a)(b) | | | 1,960 | |
1,980,000 | | Hyundai Auto Receivables Trust 2016-B, 2.68%, 9/15/23 | | | 1,944 | |
2,550,000 | | JFIN CLO 2014 Ltd. 144A, (3 mo. LIBOR USD + 1.450%) 3.92%, 4/21/25 (a)(b) | | | 2,553 | |
1,142,756 | | L.A. Arena Funding LLC 144A, 7.66%, 12/15/26 (b) | | | 1,181 | |
1,750,000 | | LCM XXI LP 144A, (3 mo. LIBOR USD + 2.000%) 4.47%, 4/20/28 (a)(b) | | | 1,750 | |
2,150,000 | | Magnetite IX Ltd. 144A, (3 mo. LIBOR USD + 1.500%) 3.99%, 7/25/26 (a)(b) | | | 2,153 | |
2,700,000 | | Marathon CRE 2018 FL1 Ltd. 144A, (1 mo. LIBOR USD + 1.150%) 3.43%, 6/15/28 (a)(b) | | | 2,704 | |
1,650,000 | | OZLM XII Ltd. 144A, (3 mo. LIBOR USD + 1.600%) 4.12%, 4/30/27 (a)(b) | | | 1,647 | |
3,360,000 | | Planet Fitness Master Issuer LLC 144A, 4.26%, 9/05/48 (b) | | | 3,348 | |
2,659,500 | | Taco Bell Funding LLC 144A, 3.83%, 5/25/46 (b) | | | 2,662 | |
1,250,000 | | Westlake Automobile Receivables Trust 2016-2 144A, 4.10%, 6/15/21 (b) | | | 1,258 | |
Total Asset Backed (Cost - $61,961) | | | 61,813 | |
Bank Loans(c) (3%) | | | | |
2,005,224 | | Aramark Services Inc. Term Loan B3 1L, (LIBOR USD 1-Month + 1.750%) 4.05%, 3/11/25 | | | 2,008 | |
Annual Report 29

| | | | | | |
Principal or Shares | | Security Description | | Value (000) | |
| | |
1,975,000 | | BWAY Holding Co. Term Loan B 1L, (LIBOR USD 1-Month + 3.250%) 5.58%, 4/03/24 | | $ | 1,966 | |
1,424,063 | | Dole Food Co. Inc. Term Loan B 1L, (LIBOR USD 1-Month + 2.417%) 3.41%, 4/06/24 | | | 1,422 | |
1,500,000 | | GOBP Holdings Inc. Term Loan B 1L, (LIBOR USD 1-Month + 3.750%) 6.03%, 10/22/25 | | | 1,500 | |
1,950,715 | | Golden Nugget Inc. Term Loan B 1L, (LIBOR USD 1-Month + 2.750%) 5.23%, 10/04/23 | | | 1,955 | |
1,944,994 | | Harbor Freight Tools USA Inc. Term Loan 1L, (LIBOR USD 1-Month + 2.500%) 4.80%, 8/16/23 | | | 1,917 | |
1,309,751 | | Hilton Worldwide Finance LLC Term Loan B2 1L, (LIBOR USD 1-Month + 1.750%) 4.03%, 10/25/23 | | | 1,313 | |
1,959,271 | | Infor (U.S.) Inc. Term Loan B6 1L, (LIBOR USD 1-Month + 2.750%) 5.14%, 2/01/22 | | | 1,955 | |
1,974,684 | | MGM Growth Properties Operating Partnership LP Term Loan B 1L, (LIBOR USD 1-Month + 2.000%) 4.30%, 3/25/25 | | | 1,971 | |
1,972,469 | | Numericable U.S. LLC Term Loan B11 1L, (LIBOR USD 1-Month + 2.750%) 5.05%, 7/31/25 | | | 1,908 | |
2,970,000 | | Trinseo Materials Operating SCA Term Loan B 1L, (LIBOR USD 1-Month + 2.000%) 4.30%, 9/06/24 | | | 2,953 | |
2,950,000 | | WMG Acquisition Corp. Term Loan F 1L, (LIBOR USD 1-Month + 2.125%) 4.43%, 11/01/23 | | | 2,943 | |
2,000,000 | | Wyndham Hotels & Resorts Inc. Term Loan B 1L, (LIBOR USD 1-Month + 1.750%) 4.05%, 5/30/25 | | | 2,002 | |
Total Bank Loans (Cost - $25,982) | | | 25,813 | |
Corporate Bond (39%) | | | | |
Financial (15%) | | | | |
1,945,000 | | ADCB Finance Cayman Ltd. 144A, 4.00%, 3/29/23 (b) | | | 1,918 | |
4,170,000 | | AerCap Ireland Capital DAC/AerCap Global Aviation Trust, 5.00%, 10/01/21 | | | 4,281 | |
890,000 | | Ally Financial Inc., 3.25%, 11/05/18 | | | 890 | |
1,450,000 | | Ares Capital Corp., 3.50%, 2/10/23 | | | 1,384 | |
1,650,000 | | Ares Capital Corp., 3.63%, 1/19/22 | | | 1,617 | |
2,055,000 | | ASB Bank Ltd. 144A, 3.75%, 6/14/23 (b) | | | 2,032 | |
3,145,000 | | Bank of Montreal, (5 yr. Swap Semi 30/360 USD + 1.280%) 4.34%, 10/05/28 (a) | | | 3,118 | |
3,490,000 | | Barclays PLC, 4.38%, 9/11/24 | | | 3,334 | |
2,950,000 | | Blackstone Holdings Finance Co. LLC 144A, 4.75%, 2/15/23 (b) | | | 3,056 | |
515,000 | | Block Financial LLC, 4.13%, 10/01/20 | | | 519 | |
1,225,000 | | Citigroup Inc., 4.45%, 9/29/27 | | | 1,193 | |
3,170,000 | | Citizens Financial Group Inc. 144A, 4.15%, 9/28/22 (b) | | | 3,150 | |
1,125,000 | | Compass Bank, 2.75%, 9/29/19 | | | 1,120 | |
900,000 | | Compass Bank, 3.88%, 4/10/25 | | | 856 | |
4,740,000 | | Credit Agricole Corporate & Investment Bank SA, (3 mo. LIBOR USD + 0.625%) 3.02%, 10/03/21 (a) | | | 4,743 | |
| | | | | | |
Principal or Shares | | Security Description | | Value
(000) | |
| | |
1,200,000 | | Credit Suisse Group Funding Guernsey Ltd., 2.75%, 3/26/20 | | $ | 1,188 | |
2,315,000 | | First Midwest Bancorp Inc./IL, 5.88%, 9/29/26 | | | 2,380 | |
1,600,000 | | Five Corners Funding Trust 144A, 4.42%, 11/15/23 (b) | | | 1,636 | |
2,740,000 | | Ford Motor Credit Co. LLC, 2.98%, 8/03/22 | | | 2,572 | |
2,550,000 | | Ford Motor Credit Co. LLC, (3 mo. LIBOR USD + 1.235%) 3.55%, 2/15/23 (a) | | | 2,483 | |
1,385,000 | | Ford Motor Credit Co. LLC, 3.81%, 1/09/24 | | | 1,288 | |
1,330,000 | | FS Investment Corp., 4.25%, 1/15/20 | | | 1,335 | |
2,825,000 | | General Motors Financial Co. Inc., 4.35%, 1/17/27 | | | 2,628 | |
3,400,000 | | Goldman Sachs Group Inc./The, (3 mo. LIBOR USD + 0.750%) 3.06%, 2/23/23 (a) | | | 3,399 | |
1,700,000 | | Hospitality Properties Trust, 5.25%, 2/15/26 | | | 1,701 | |
3,400,000 | | HSBC Holdings PLC, (3 mo. LIBOR USD + 1.000%) 3.32%, 5/18/24 (a) | | | 3,393 | |
2,985,000 | | ICBCIL Finance Co. Ltd. 144A, 2.38%, 5/19/19 (b) | | | 2,962 | |
4,305,000 | | JPMorgan Chase & Co., (3 mo. LIBOR USD + 0.730%) 3.56%, 4/23/24 (a) | | | 4,244 | |
2,550,000 | | JPMorgan Chase Bank NA, (3 mo. LIBOR USD + 0.280%) 2.60%, 2/01/21 (a) | | | 2,527 | |
3,450,000 | | KKR Group Finance Co. II LLC 144A, 5.50%, 2/01/43 (b) | | | 3,482 | |
2,450,000 | | Lincoln National Corp., 7.00%, 6/15/40 | | | 3,021 | |
2,350,000 | | Macquarie Group Ltd. 144A, (3 mo. LIBOR USD + 1.023%) 3.19%, 11/28/23 (a)(b) | | | 2,244 | |
2,750,000 | | Macquarie Group Ltd. 144A, (3 mo. LIBOR USD + 1.372%) 3.76%, 11/28/28 (a)(b) | | | 2,523 | |
2,455,000 | | Manulife Financial Corp., (USD Swap Rate 11:00 am NY 1 + 1.647%) 4.06%, 2/24/32 (a) | | | 2,288 | |
1,500,000 | | Massachusetts Mutual Life Insurance Co. 144A, 4.50%, 4/15/65 (b) | | | 1,356 | |
3,225,000 | | Mizuho Financial Group Inc., (3 mo. LIBOR USD + 1.000%) 3.92%, 9/11/24 (a) | | | 3,212 | |
2,200,000 | | Morgan Stanley, (3 mo. LIBOR USD + 0.847%) 3.74%, 4/24/24 (a) | | | 2,175 | |
1,500,000 | | Nationwide Building Society 144A, (USD Swap Rate 11:00 am NY 1 + 1.849%) 4.13%, 10/18/32 (a)(b) | | | 1,338 | |
1,500,000 | | Nationwide Building Society 144A, (3 mo. LIBOR USD + 1.452%) 4.30%, 3/08/29 (a)(b) | | | 1,416 | |
2,000,000 | | Nationwide Financial Services Inc. 144A, 5.30%, 11/18/44 (b) | | | 2,037 | |
1,300,000 | | Nationwide Mutual Insurance Co. 144A, 9.38%, 8/15/39 (b) | | | 1,976 | |
2,050,000 | | Nuveen Finance LLC 144A, 2.95%, 11/01/19 (b) | | | 2,047 | |
1,450,000 | | Pacific Life Insurance Co. 144A, 9.25%, 6/15/39 (b) | | | 2,169 | |
2,345,000 | | Protective Life Corp. 144A, 4.30%, 9/30/28 (b) | | | 2,284 | |
2,350,000 | | Prudential Financial Inc., (3 mo. LIBOR USD + 3.920%) 5.63%, 6/15/43 (a) | | | 2,394 | |
2,215,000 | | Regions Bank/Birmingham AL, (3 mo. LIBOR USD + 0.500%) 2.84%, 8/13/21 (a) | | | 2,217 | |
2,000,000 | | Regions Financial Corp., 3.20%, 2/08/21 | | | 1,984 | |
30 Payden Mutual Funds
| | | | | | |
Principal or Shares | | Security Description | | Value (000) | |
| | |
2,820,000 | | Royal Bank of Scotland Group PLC, (3 mo. LIBOR USD + 1.480%) 3.50%, 5/15/23 (a) | | $ | 2,715 | |
1,295,000 | | Santander Holdings USA Inc., 2.65%, 4/17/20 | | | 1,279 | |
867,000 | | Scentre Group Trust 1/Scentre Group Trust 2 144A, 2.38%, 11/05/19 (b) | | | 859 | |
835,000 | | Senior Housing Properties Trust, 4.75%, 5/01/24 | | | 827 | |
1,045,000 | | Senior Housing Properties Trust, 6.75%, 4/15/20 | | | 1,072 | |
2,740,000 | | SLM Corp., 5.13%, 4/05/22 | | | 2,733 | |
2,432,000 | | Sumitomo Mitsui Financial Group Inc., (3 mo. LIBOR USD + 0.970%) 3.39%, 1/11/22 (a) | | | 2,458 | |
1,600,000 | | Suncorp-Metway Ltd. 144A, 2.35%, 4/27/20 (b) | | | 1,573 | |
1,560,000 | | Synchrony Bank, 3.00%, 6/15/22 | | | 1,491 | |
1,650,000 | | Synchrony Financial, 2.70%, 2/03/20 | | | 1,628 | |
227,000 | | Teachers Insurance & Annuity Association of America 144A, 6.85%, 12/16/39 (b) | | | 292 | |
2,995,000 | | Transatlantic Holdings Inc., 8.00%, 11/30/39 | | | 4,005 | |
3,140,000 | | VEREIT Operating Partnership LP, 3.00%, 2/06/19 | | | 3,139 | |
2,760,000 | | WEA Finance LLC 144A, 4.63%, 9/20/48 (b) | | | 2,622 | |
3,750,000 | | Westpac Banking Corp., (USD Swap Rate 11:00 am NY 1 + 0.000%) 4.32%, 11/23/31 (a) | | | 3,576 | |
| | | | | 137,379 | |
Industrial (16%) | | | | |
1,450,000 | | 1011778 BC ULC/New Red Finance Inc. 144A, 5.00%, 10/15/25 (b) | | | 1,363 | |
2,440,000 | | AbbVie Inc., 4.25%, 11/14/28 | | | 2,357 | |
1,240,000 | | AbbVie Inc., 4.88%, 11/14/48 | | | 1,151 | |
1,700,000 | | Amgen Inc., 5.65%, 6/15/42 | | | 1,853 | |
2,400,000 | | Anheuser-Busch InBev Worldwide Inc., 4.60%, 4/15/48 | | | 2,167 | |
4,000,000 | | AstraZeneca PLC, 3.50%, 8/17/23 | | | 3,943 | |
1,450,000 | | BAT Capital Corp. 144A, 3.22%, 8/15/24 (b) | | | 1,370 | |
1,755,000 | | Bayer U.S. Finance II LLC 144A, 3.88%, 12/15/23 (b) | | | 1,730 | |
1,950,000 | | Bayer U.S. Finance II LLC 144A, 4.25%, 12/15/25 (b) | | | 1,917 | |
1,755,000 | | Bayer U.S. Finance II LLC 144A, 4.38%, 12/15/28 (b) | | | 1,699 | |
3,500,000 | | BMW U.S. Capital LLC 144A, 3.10%, 4/12/21 (b) | | | 3,465 | |
2,710,000 | | Boise Cascade Co. 144A, 5.63%, 9/01/24 (b) | | | 2,676 | |
1,755,000 | | Charter Communications Operating LLC/Charter Communications Operating Capital, 4.50%, 2/01/24 | | | 1,760 | |
2,640,000 | | Cheniere Corpus Christi Holdings LLC, 5.88%, 3/31/25 | | | 2,726 | |
2,195,000 | | Comcast Corp., 3.70%, 4/15/24 | | | 2,188 | |
3,000,000 | | Comcast Corp., 4.70%, 10/15/48 | | | 2,925 | |
4,360,000 | | Conagra Brands Inc., 5.40%, 11/01/48 | | | 4,175 | |
1,550,000 | | CVS Health Corp., 3.70%, 3/09/23 | | | 1,531 | |
1,600,000 | | CVS Health Corp., 4.78%, 3/25/38 | | | 1,544 | |
1,250,000 | | CVS Health Corp., 5.05%, 3/25/48 | | | 1,223 | |
3,270,000 | | Daimler Finance North America LLC 144A, (3 mo. LIBOR USD + 0.840%) 3.42%, 5/04/23 (a)(b) | | | 3,282 | |
| | | | | | |
Principal or Shares | | Security Description | | Value (000) | |
| | |
700,000 | | DaVita Inc., 5.13%, 7/15/24 | | $ | 670 | |
1,590,000 | | Dell International LLC/EMC Corp. 144A, 5.45%, 6/15/23 (b) | | | 1,650 | |
815,000 | | Delta Air Lines Inc., 2.88%, 3/13/20 | | | 808 | |
1,560,000 | | Diamond 1 Finance Corp./Diamond 2 Finance Corp. 144A, 6.02%, 6/15/26 (b) | | | 1,619 | |
1,695,000 | | Dignity Health, 3.13%, 11/01/22 | | | 1,673 | |
1,165,000 | | Dignity Health, 4.50%, 11/01/42 | | | 1,062 | |
2,100,000 | | Dollar Tree Inc., 3.70%, 5/15/23 | | | 2,048 | |
2,217,000 | | Dow Chemical Co., 9.40%, 5/15/39 | | | 3,228 | |
3,350,000 | | Express Scripts Holding Co., 3.05%, 11/30/22 | | | 3,245 | |
2,215,000 | | FedEx Corp., 4.95%, 10/17/48 | | | 2,161 | |
3,895,000 | | First Data Corp. 144A, 7.00%, 12/01/23 (b) | | | 4,042 | |
1,600,000 | | Ford Motor Credit Co. LLC, 3.10%, 5/04/23 | | | 1,474 | |
2,870,000 | | Halfmoon Parent Inc. 144A, (3 mo. LIBOR USD + 0.650%) 2.98%, 9/17/21 (a)(b) | | | 2,870 | |
4,335,000 | | Halfmoon Parent Inc. 144A, 4.13%, 11/15/25 (b) | | | 4,291 | |
1,205,000 | | Halfmoon Parent Inc. 144A, 4.80%, 8/15/38 (b) | | | 1,164 | |
2,040,000 | | HCA Inc., 5.00%, 3/15/24 | | | 2,069 | |
2,380,000 | | Keurig Dr Pepper Inc., 3.20%, 11/15/21 | | | 2,341 | |
1,725,000 | | Keurig Dr Pepper Inc. 144A, 4.42%, 5/25/25 (b) | | | 1,707 | |
1,497,301 | | Latam Airlines 2015-1 Pass-Through Trust A, 4.20%, 11/15/27 | | | 1,450 | |
3,000,000 | | Lennar Corp., 4.75%, 11/29/27 | | | 2,816 | |
2,260,000 | | LifePoint Health Inc., 5.50%, 12/01/21 | | | 2,297 | |
1,515,000 | | Marathon Oil Corp., 6.60%, 10/01/37 | | | 1,725 | |
2,340,000 | | Mondelez International Holdings Netherlands BV 144A, 2.00%, 10/28/21 (b) | | | 2,229 | |
2,805,000 | | Mylan NV, 3.95%, 6/15/26 | | | 2,578 | |
1,045,000 | | North Shore Long Island Jewish Health Care Inc., 6.15%, 11/01/43 | | | 1,221 | |
1,500,000 | | Northwell Healthcare Inc., 4.26%, 11/01/47 | | | 1,367 | |
3,015,000 | | Orange SA, 9.00%, 3/01/31 | | | 4,156 | |
1,001,000 | | Perrigo Finance PLC, 3.50%, 12/15/21 | | | 979 | |
346,537 | | Reynolds Group Issuer Inc./Reynolds Group Issuer LLC/Reynolds Group Issuer Lu, 6.88%, 2/15/21 | | | 350 | |
2,310,000 | | Roche Holdings Inc. 144A, 3.25%, 9/17/23 (b) | | | 2,291 | |
1,600,000 | | Sabre GLBL Inc. 144A, 5.38%, 4/15/23 (b) | | | 1,608 | |
425,000 | | Seagate HDD Cayman, 4.88%, 3/01/24 | | | 403 | |
1,485,000 | | Shire Acquisitions Investments Ireland DAC, 2.40%, 9/23/21 | | | 1,428 | |
4,060,000 | | SMBC Aviation Capital Finance DAC 144A, 2.65%, 7/15/21 (b) | | | 3,917 | |
3,120,000 | | Spirit AeroSystems Inc., 3.95%, 6/15/23 | | | 3,089 | |
5,270,000 | | Suntory Holdings Ltd. 144A, 2.55%, 9/29/19 (b) | | | 5,236 | |
1,475,000 | | Teva Pharmaceutical Finance Netherlands III BV, 2.20%, 7/21/21 | | | 1,376 | |
2,355,000 | | Teva Pharmaceutical Finance Netherlands III BV, 3.15%, 10/01/26 | | | 1,922 | |
650,000 | | Time Warner Inc., 2.95%, 7/15/26 | | | 576 | |
4,820,000 | | Toledo Hospital, 6.02%, 11/15/48 | | | 4,719 | |
2,100,000 | | Toll Brothers Finance Corp., 4.38%, 4/15/23 | | | 2,027 | |
1,195,000 | | Tribune Media Co., 5.88%, 7/15/22 | | | 1,216 | |
710,000 | | United Rentals North America Inc., 5.75%, 11/15/24 | | | 714 | |
2,110,000 | | United Technologies Corp., 4.13%, 11/16/28 | | | 2,077 | |
Annual Report 31
| | | | | | |
Principal or Shares | | Security Description | | Value (000) | |
| | |
1,375,000 | | United Technologies Corp., 4.45%, 11/16/38 | | $ | 1,335 | |
5,980,000 | | Verizon Communications Inc., 2.63%, 8/15/26 | | | 5,373 | |
1,120,000 | | Wabtec Corp., 4.15%, 3/15/24 | | | 1,095 | |
2,100,000 | | Wabtec Corp., 4.70%, 9/15/28 | | | 2,034 | |
1,010,000 | | XPO Logistics Inc. 144A, 6.13%, 9/01/23 (b) | | | 1,038 | |
1,900,000 | | Yara International ASA 144A, 4.75%, 6/01/28 (b) | | | 1,885 | |
| | | | | 151,694 | |
Utility (8%) | | | | |
400,210 | | Alliance Pipeline LP/United States 144A, 7.00%, 12/31/19 (b) | | | 404 | |
1,890,000 | | Alliant Energy Finance LLC 144A, 3.75%, 6/15/23 (b) | | | 1,880 | |
990,000 | | Boardwalk Pipelines LP, 4.45%, 7/15/27 | | | 932 | |
500,000 | | Canadian Natural Resources Ltd., 6.25%, 3/15/38 | | | 565 | |
1,100,000 | | Celeo Redes Operacion Chile SA 144A, 5.20%, 6/22/47 (b) | | | 1,079 | |
2,480,000 | | Cenovus Energy Inc., 6.75%, 11/15/39 | | | 2,656 | |
1,170,000 | | Colorado Interstate Gas Co. LLC/Colorado Interstate Issuing Corp. 144A, 4.15%, 8/15/26 (b) | | | 1,135 | |
2,000,000 | | Continental Resources Inc./OK, 4.38%, 1/15/28 | | | 1,937 | |
3,100,000 | | Edison International, 4.13%, 3/15/28 | | | 3,030 | |
1,910,000 | | Enbridge Energy Partners LP, 7.38%, 10/15/45 | | | 2,379 | |
2,055,000 | | Encana Corp., 3.90%, 11/15/21 | | | 2,054 | |
2,200,000 | | Encana Corp., 6.63%, 8/15/37 | | | 2,503 | |
2,700,000 | | Energy Transfer Operating LP, 6.50%, 2/01/42 | | | 2,805 | |
3,115,000 | | EnLink Midstream Partners LP, 5.60%, 4/01/44 | | | 2,658 | |
1,500,000 | | EnLink Midstream Partners LP, (3 mo. LIBOR USD + 4.110%) 6.00%, (a)(d) | | | 1,311 | |
2,400,000 | | Entergy Louisiana LLC, 5.00%, 7/15/44 | | | 2,371 | |
2,960,000 | | Enterprise Products Operating LLC, 4.80%, 2/01/49 | | | 2,858 | |
1,800,000 | | EQM Midstream Partners LP, 4.75%, 7/15/23 | | | 1,820 | |
1,850,000 | | EQT Corp., 3.00%, 10/01/22 | | | 1,776 | |
1,930,000 | | Exelon Generation Co. LLC, 4.25%, 6/15/22 | | | 1,953 | |
1,339,153 | | Fermaca Enterprises S de RL de CV 144A, 6.38%, 3/30/38 (b) | | | 1,372 | |
1,300,000 | | Hess Corp., 5.60%, 2/15/41 | | | 1,246 | |
2,000,000 | | Hess Corp., 7.30%, 8/15/31 | | | 2,252 | |
2,100,000 | | Kinder Morgan Inc./DE, 5.30%, 12/01/34 | | | 2,086 | |
1,750,000 | | Nabors Industries Inc., 4.63%, 9/15/21 | | | 1,693 | |
1,715,000 | | NiSource Inc. 144A, 3.65%, 6/15/23 (b) | | | 1,690 | |
2,000,000 | | ONEOK Partners LP, 6.65%, 10/01/36 | | | 2,275 | |
2,370,000 | | Pacific Gas & Electric Co., 6.25%, 3/01/39 | | | 2,558 | |
4,000,000 | | Pertamina Persero PT 144A, 4.30%, 5/20/23 (b) | | | 3,917 | |
1,360,000 | | PSEG Power LLC, 3.85%, 6/01/23 | | | 1,352 | |
2,600,000 | | Sabine Pass Liquefaction LLC, 6.25%, 3/15/22 | | | 2,772 | |
4,800,000 | | Sinopec Group Overseas Development 2016 Ltd. 144A, 2.00%, 9/29/21 (b) | | | 4,568 | |
3,635,000 | | Tampa Electric Co., 4.45%, 6/15/49 | | | 3,509 | |
1,900,000 | | Valero Energy Corp., 6.63%, 6/15/37 | | | 2,182 | |
2,245,000 | | Xcel Energy Inc., 4.00%, 6/15/28 | | | 2,234 | |
| | | | | 73,812 | |
Total Corporate Bond (Cost - $372,245) | | | 362,885 | |
| | | | | | |
Principal or Shares | | Security Description | | Value (000) | |
Foreign Government (3%) | | | | |
1,960,000 | | Colombia Government International Bond, 3.88%, 4/25/27 | | $ | 1,868 | |
1,200,000 | | Colombia Government International Bond, 4.50%, 3/15/29 | | | 1,185 | |
1,200,000 | | Colombia Government International Bond, 5.00%, 6/15/45 | | | 1,139 | |
2,000,000 | | Dominican Republic International Bond 144A, 6.00%, 7/19/28 (b) | | | 1,988 | |
1,800,000 | | Egypt Government International Bond 144A, 4.75%, 4/16/26 EUR (b)(e) | | | 1,915 | |
2,100,000 | | Honduras Government International Bond 144A, 8.75%, 12/16/20 (b) | | | 2,269 | |
1,940,000 | | Indonesia Government International Bond 144A, 3.75%, 6/14/28 EUR (b)(e) | | | 2,374 | |
2,515,000 | | Kenya Government International Bond 144A, 5.88%, 6/24/19 (b) | | | 2,535 | |
2,125,000 | | Korea Hydro & Nuclear Power Co. Ltd. 144A, 3.75%, 7/25/23 (b) | | | 2,110 | |
1,250,000 | | Oman Government International Bond 144A, 5.63%, 1/17/28 (b) | | | 1,194 | |
1,610,000 | | Perusahaan Penerbit SBSN Indonesia III 144A, 4.15%, 3/29/27 (b) | | | 1,515 | |
2,180,000 | | Provincia de Buenos Aires/Argentina 144A, 5.75%, 6/15/19 (b) | | | 2,174 | |
2,000,000 | | Republic of Armenia International Bond 144A, 6.00%, 9/30/20 (b) | | | 2,027 | |
2,800,000 | | Romanian Government International Bond 144A, 4.38%, 8/22/23 (b) | | | 2,800 | |
2,340,000 | | Saudi Government International Bond 144A, 3.25%, 10/26/26 (b) | | | 2,166 | |
854,000 | | Senegal Government International Bond 144A, 8.75%, 5/13/21 (b) | | | 913 | |
2,000,000 | | Sri Lanka Government International Bond 144A, 5.88%, 7/25/22 (b) | | | 1,850 | |
Total Foreign Government (Cost - $32,853) | | | 32,022 | |
Mortgage Backed (32%) | | | | |
3,600,000 | | AREIT 2018-CRE2 Trust 144A, (1 mo. LIBOR USD + 0.980%) 3.26%, 11/14/35 (a)(b) | | | 3,600 | |
54,503,272 | | BANK 2018-BNK14, 0.53%, 9/15/60 (f) | | | 2,084 | |
50,205,385 | | BENCHMARK 2018-B4, 0.70%, 7/15/51 (f) | | | 1,904 | |
5,000,000 | | BHMS 2018-ATLS 144A, (1 mo. LIBOR USD + 1.250%) 3.53%, 7/15/35 (a)(b) | | | 5,008 | |
912,015 | | CSMC Trust 2013-IVR3 144A, 1.55%, 5/25/43 (b)(f) | | | 877 | |
2,368,458 | | Fannie Mae Connecticut Avenue Securities, (1 mo. LIBOR USD + 0.550%) 2.83%, 1/25/30 (a) | | | 2,368 | |
4,549,793 | | Fannie Mae Connecticut Avenue Securities, (1 mo. LIBOR USD + 0.600%) 2.88%, 7/25/30 (a) | | | 4,553 | |
4,060,779 | | Fannie Mae Connecticut Avenue Securities, (1 mo. LIBOR USD + 0.720%) 3.00%, 1/25/31 (a) | | | 4,070 | |
2,105,379 | | Fannie Mae Connecticut Avenue Securities, (1 mo. LIBOR USD + 0.950%) 3.23%, 10/25/29 (a) | | | 2,117 | |
32 Payden Mutual Funds
| | | | | | |
Principal or Shares | | Security Description | | Value (000) | |
| | |
2,515,272 | | Fannie Mae Connecticut Avenue Securities, (1 mo. LIBOR USD + 1.300%) 3.58%, 4/25/29 (a) | | $ | 2,534 | |
2,130,000 | | Fannie Mae Connecticut Avenue Securities, (1 mo. LIBOR USD + 2.150%) 4.43%, 10/25/30 (a) | | | 2,129 | |
1,940,000 | | Fannie Mae Connecticut Avenue Securities, (1 mo. LIBOR USD + 2.200%) 4.48%, 8/25/30 (a) | | | 1,949 | |
1,500,000 | | Fannie Mae Connecticut Avenue Securities, (1 mo. LIBOR USD + 3.550%) 5.83%, 7/25/29 (a) | | | 1,626 | |
895,000 | | Fannie Mae Connecticut Avenue Securities, (1 mo. LIBOR USD + 4.250%) 6.53%, 1/25/29 (a) | | | 1,011 | |
1,050,000 | | Fannie Mae Connecticut Avenue Securities, (1 mo. LIBOR USD + 4.450%) 6.73%, 1/25/29 (a) | | | 1,167 | |
1,230,430 | | Fannie Mae Connecticut Avenue Securities, (1 mo. LIBOR USD + 5.700%) 7.98%, 4/25/28 (a) | | | 1,423 | |
1,500,000 | | Fannie Mae Connecticut Avenue Securities, (1 mo. LIBOR USD + 6.000%) 8.28%, 9/25/28 (a) | | | 1,754 | |
1,748,840 | | Fannie Mae Connecticut Avenue Securities, (1 mo. LIBOR USD + 10.250%) 12.53%, 1/25/29 (a) | | | 2,314 | |
498,849 | | Fannie Mae Connecticut Avenue Securities, (1 mo. LIBOR USD + 10.750%) 13.03%, 1/25/29 (a) | | | 661 | |
1,695,750 | | Fannie Mae Connecticut Avenue Securities, (1 mo. LIBOR USD + 12.250%) 14.53%, 9/25/28 (a) | | | 2,489 | |
4,375,138 | | Fannie Mae Grantor Trust 2017-T1, 2.90%, 6/25/27 | | | 4,081 | |
3,440,000 | | Fannie Mae-Aces, 3.82%, 9/25/30 (f) | | | 3,410 | |
4,831,881 | | FG Q12837 30YR, 3.00%, 11/01/42 | | | 4,617 | |
1,079,435 | | FG Q17641 30YR, 3.00%, 4/01/43 | | | 1,031 | |
3,897,764 | | FH 2B5447 ARM, (12 mo. LIBOR USD + 1.620%) 2.74%, 7/01/46 (a) | | | 3,851 | |
13,090,000 | | FHLMC Multifamily Structured Pass-Through Certificates, 3.06%, 8/25/24 (f) | | | 12,872 | |
13,200,000 | | FHLMC Multifamily Structured Pass-Through Certificates, 3.60%, 2/25/25 (f) | | | 13,290 | |
4,840,000 | | FN, 2.50%, 15YR TBA (g) | | | 4,633 | |
17,390,000 | | FN, 3.00%, 30YR TBA (g) | | | 16,450 | |
4,070,000 | | FN, 3.00%, 15YR TBA (g) | | | 3,994 | |
10,650,000 | | FN, 3.50%, 30YR TBA (g) | | | 10,367 | |
2,390,000 | | FN, 4.00%, 30YR TBA (g) | | | 2,390 | |
4,730,000 | | FN, 4.50%, 30YR TBA (g) | | | 4,843 | |
1,869,395 | | FN 254766 30YR, 5.00%, 6/01/33 | | | 1,978 | |
357,609 | | FN 725027 30YR, 5.00%, 11/01/33 | | | 380 | |
1,386,431 | | FN 725423 30YR, 5.50%, 5/01/34 | | | 1,487 | |
1,201,417 | | FN 725424 30YR, 5.50%, 4/01/34 | | | 1,289 | |
2,292,299 | | FN 995203 30YR, 5.00%, 7/01/35 | | | 2,426 | |
1,675,966 | | FN AJ7689 30YR, 4.00%, 12/01/41 | | | 1,689 | |
3,802,205 | | FN AL2221 15YR, 3.00%, 7/01/27 | | | 3,755 | |
1,587,021 | | FN AL2521 30YR, 3.50%, 9/01/42 | | | 1,559 | |
8,683,213 | | FN AL9373 15YR, 2.50%, 10/01/31 | | | 8,319 | |
5,468,937 | | FN AS4168 30YR, 4.00%, 12/01/44 | | | 5,483 | |
2,530,696 | | FN AS4885 30YR, 3.50%, 5/01/45 | | | 2,475 | |
8,502,620 | | FN AS7170 30YR, 3.50%, 5/01/46 | | | 8,310 | |
1,024,261 | | FN AS8195 15YR, 2.50%, 10/01/31 | | | 981 | |
5,585,996 | | FN AS8305 30YR, 3.00%, 11/01/46 | | | 5,286 | |
6,543,363 | | FN AS8807 30YR, 3.50%, 2/01/47 | | | 6,386 | |
2,853,670 | | FN AX3596 15YR, 3.00%, 7/01/27 | | | 2,818 | |
| | | | | | |
Principal or Shares | | Security Description | | Value
(000) | |
| | |
5,075,530 | | FN BE9567 30YR, 3.50%, 4/01/47 | | $ | 4,953 | |
4,087,321 | | FN BJ9215 30YR, 4.00%, 6/01/48 | | | 4,094 | |
6,437,055 | | FN BK8873 30YR, 4.00%, 9/01/48 | | | 6,452 | |
6,331,284 | | FN MA3155 15YR, 3.00%, 10/01/32 | | | 6,221 | |
4,465,199 | | Freddie Mac Structured Agency Credit Risk Debt Notes, (1 mo. LIBOR USD + 1.200%) 3.48%, 10/25/29 (a) | | | 4,511 | |
2,300,000 | | Freddie Mac Structured Agency Credit Risk Debt Notes, (1 mo. LIBOR USD + 1.300%) 3.59%, 4/25/29 (a) | | | 2,328 | |
1,740,000 | | Freddie Mac Structured Agency Credit Risk Debt Notes, (1 mo. LIBOR USD + 2.300%) 4.58%, 9/25/30 (a) | | | 1,742 | |
1,200,000 | | Freddie Mac Structured Agency Credit Risk Debt Notes, (1 mo. LIBOR USD + 4.600%) 6.88%, 12/25/42 (a) | | | 1,280 | |
1,248,485 | | Freddie Mac Structured Agency Credit Risk Debt Notes, (1 mo. LIBOR USD + 10.000%) 12.28%, 7/25/29 (a) | | | 1,271 | |
1,695,015 | | Freddie Mac Structured Agency Credit Risk Debt Notes, (1 mo. LIBOR USD + 11.250%) 13.53%, 12/25/28 (a) | | | 2,379 | |
4,270,000 | | G2 30YR, 3.00%, 30YR TBA (g) | | | 4,083 | |
2,710,000 | | G2 30YR, 3.50%, 30YR TBA (g) | | | 2,662 | |
4,960,000 | | G2 30YR, 4.00%, 30YR TBA (g) | | | 4,992 | |
5,569,378 | | G2 4853 30YR, 4.00%, 11/20/40 | | | 5,659 | |
2,441,378 | | G2 5115 30YR, 4.50%, 7/20/41 | | | 2,541 | |
133,120 | | G2 5140 30YR, 4.50%, 8/20/41 | | | 139 | |
1,808,402 | | G2 5175 30YR, 4.50%, 9/20/41 | | | 1,882 | |
5,456,262 | | G2 5258 30YR, 3.50%, 12/20/41 | | | 5,398 | |
5,543,671 | | G2 MA2522 30YR, 4.00%, 1/20/45 | | | 5,626 | |
5,610,386 | | G2 MA3663 30YR, 3.50%, 5/20/46 | | | 5,523 | |
9,341,404 | | G2 MA3802 30YR, 3.00%, 7/20/46 | | | 8,954 | |
2,050,000 | | GAHR Commercial Mortgage Trust 2015-NRF 144A, 3.38%, 12/15/34 (b)(f) | | | 2,017 | |
1,867,840 | | GN 784182 30YR, 4.50%, 8/15/46 | | | 1,940 | |
1,405,463 | | GN AA5452 30YR, 3.50%, 7/15/42 | | | 1,390 | |
73,616 | | HarborView Mortgage Loan Trust 2004-10, 4.13%, 1/19/35 (f) | | | 73 | |
230,472 | | JP Morgan Mortgage Trust 2006-S2, 6.00%, 7/25/36 | | | 204 | |
1,989,622 | | JP Morgan Mortgage Trust 2014-2 144A, 3.00%, 6/25/29 (b)(f) | | | 1,957 | |
5,118,492 | | JP Morgan Mortgage Trust 2018-8 144A, 4.00%, 1/25/49 (b)(f) | | | 5,155 | |
34,256 | | Landmark Mortgage Securities PLC, (3 mo. LIBOR GBP + 0.220%) 1.02%, 6/17/38 GBP (a)(e) | | | 43 | |
2,500,000 | | Madison Avenue Trust 2013-650M 144A, 4.03%, 10/12/32 (b)(f) | | | 2,462 | |
15,961,179 | | Morgan Stanley Capital I Trust 2018-H3, 1.00%, 7/15/51 (f) | | | 961 | |
24,634 | | Morgan Stanley Mortgage Loan Trust, 4.06%, 7/25/34 (f) | | | 25 | |
542,010 | | Nationstar Mortgage Loan Trust 2013-A 144A, 3.75%, 12/25/52 (b)(f) | | | 543 | |
927,732 | | New Residential Mortgage Loan Trust 2014-3 144A, 3.75%, 11/25/54 (b)(f) | | | 925 | |
Annual Report 33
| | | | | | |
Principal or Shares | | Security Description | | Value (000) | |
| | |
1,909,000 | | New Residential Mortgage Loan Trust 2017-2 | | | | |
| | 144A, 4.00%, 3/25/57 (b)(f) | | $ | 1,921 | |
228,570 | | Prime Mortgage Trust, 5.00%, 10/25/35 | | | 223 | |
1,434,392 | | Residential Asset Securitization Trust 2006-A8, | | | | |
| | 6.00%, 8/25/36 | | | 1,206 | |
2,686,663 | | STACR Trust 2018-HRP1 144A, (1 mo. LIBOR | | | | |
| | USD + 1.650%) 3.93%, 4/25/43 (a)(b) | | | 2,704 | |
619 | | Structured Asset Mortgage Investments Trust | | | | |
| | 2003-CL1, 3.11%, 7/25/32 (f) | | | — | |
509,438 | | WaMu Mortgage Pass-Through Certificates | | | | |
| | Series 2007-HY7 Trust, 3.54%, 7/25/37 (f) | | | 424 | |
3,360,000 | | Wells Fargo Commercial Mortgage Trust | | | | |
| | 2015-LC22, 3.84%, 9/15/58 | | | 3,359 | |
Total Mortgage Backed (Cost - $299,735) | | | 296,310 | |
Municipal (2%) | | | | |
2,425,000 | | California Pollution Control Financing Authority | | | | |
| | 144A, 5.00%, 11/21/45 (b) | | | 2,431 | |
2,600,000 | | City of Portland OR, 7.70%, 6/01/22 | | | 2,909 | |
770,000 | | State Board of Administration Finance Corp., | | | | |
| | 3.00%, 7/01/20 | | | 768 | |
4,000,000 | | State of California, 3.38%, 4/01/25 | | | 3,965 | |
1,495,000 | | State of California, 7.55%, 4/01/39 | | | 2,124 | |
1,000,000 | | State of Washington, 1.70%, 7/01/20 | | | 977 | |
365,000 | | University of California, 3.26%, 5/15/24 | | | 359 | |
Total Municipal (Cost - $13,080) | | | 13,533 | |
U.S. Treasury (21%) | | | | |
15,000,000 | | U.S. Treasury Bill, 2.14%, 11/15/18 (h) | | | 14,988 | |
1,800,000 | | U.S. Treasury Bond, 3.00%, 8/15/48 | | | 1,665 | |
15,540,000 | | U.S. Treasury Bond, 3.13%, 5/15/48 | | | 14,741 | |
800,000 | | U.S. Treasury Note, 1.88%, 12/31/19 | | | 792 | |
25,000,000 | | U.S. Treasury Note, 2.63%, 7/31/20 | | | 24,901 | |
22,000,000 | | U.S. Treasury Note, 2.63%, 8/31/20 | | | 21,907 | |
11,680,000 | | U.S. Treasury Note, 2.63%, 6/30/23 | | | 11,500 | |
44,400,000 | | U.S. Treasury Note, 2.75%, 6/30/25 | | | 43,550 | |
18,650,000 | | U.S. Treasury Note, 2.88%, 10/31/23 | | | 18,554 | |
13,000,000 | | U.S. Treasury Note, 2.88%, 5/15/28 | | | 12,705 | |
9,250,000 | | U.S. Treasury Note, 2.88%, 8/15/28 | | | 9,032 | |
25,760,000 | | U.S. Treasury Note, 3.00%, 5/15/47 (i)(j) | | | 23,867 | |
Total U.S. Treasury (Cost - $203,090) | | | 198,202 | |
Preferred Stock (0%) | | | | |
780 | | Wells Fargo & Co., 7.50% | | | | |
| | (Cost - $1,004) | | | 992 | |
Investment Company (1%) | | | | |
12,593,805 | | Payden Cash Reserves Money Market Fund * | | | | |
| | (Cost - $12,594) | | | 12,594 | |
Purchased Swaptions (0%) | | | | |
Total Purchased Swaptions (Cost - $1,473) | | | 1,171 | |
Total Investments, Before Options Written | | | | |
(Cost - $1,024,017) (108%) | | | 1,005,335 | |
Written Swaptions (0%) | | | | |
Total Written Swaptions (Cost - $(1,253)) | | | (848 | ) |
Total Investments (Cost - $1,022,764) (108%) | | | 1,004,487 | |
Liabilities in excess of Other Assets (-8%) | | | (74,160 | ) |
Net Assets (100%) | | $ | 930,327 | |
| | | | | | |
| (a) | Floating rate security. The rate shown reflects the rate in effect at October 31, 2018. See Note 2 in the Notes to Financial Statements. |
| (b) | Security offered only to qualified institutional investors, and thus is not registered for sale to the public under rule 144A of the Securities Act of 1933. It has been deemed liquid under guidelines approved by the Board. |
| (c) | Floating rate security. The rate shown reflects the rate in effect at October 31, 2018. The stated maturity is subject to prepayments. See Note 2 in the Notes to Financial Statements. |
| (d) | Perpetual security with no stated maturity date. |
| (e) | Principal in foreign currency. |
| (f) | Variable rate security. Interest rate disclosed is as of the most recent information available. Certain variable rate securities are not based on a published reference rate and spread but are determined by the issuer or agent and are based on current market conditions. These securities do not indicate a reference rate and spread in their description above. See Note 2 in the Notes to Financial Statements. |
| (g) | Security was purchased on a delayed delivery basis. |
| (h) | Yield to maturity at time of purchase. |
| (i) | All or a portion of security has been pledged in connection with outstanding centrally cleared swaps. |
| (j) | All or a portion of the security is pledged to cover futures contract margin requirements. |
34 Payden Mutual Funds
Purchased Swaptions
| | | | | | | | | | | | | | | | | | |
| Description | | Counterparty | | Notional
Amount
(000s) | | | Expiration
date | | | Value
(000s) | | | Call/Put | |
Purchased Swaptions 0.0% | |
| 1-Year Interest Rate Swap, 6/26/20, Pay Fixed 3.15% Semi-Annually, Receive Pay Variable Quarterly, 3-Month USD LIBOR | | Citibank, N.A. | | $ | 251,100 | | | | 06/26/2020 | | | $ | 801 | | | | Call | |
| 2-Year Interest Rate Swap, 9/27/19, Pay Fixed 2.975% Semi-Annually, Receive Pay Variable Quarterly, 3-Month USD LIBOR | | Barclays Bank PLC | | | 122,300 | | | | 09/27/2019 | | | | 370 | | | | Call | |
| | | | | | | | | | | | | | | | | | |
Total Swaptions | | | | | | | | | | | | $ | 1,171 | | | | | |
| | | | | | | | | | | | | | | | | | |
Written Swaptions
| | | | | | | | | | | | | | | | | | | | |
| Description | | Counterparty | | | Notional
Amount
(000s) | | | Expiration
date | | | Value
(000s) | | | Call/Put | |
Written Swaptions 0.0% | | | | | | | | | | | | | | | | | |
| 1-Year Interest Rate Swap, 6/26/19, Pay Fixed 3.15% Semi-Annually, Receive Pay Variable Quarterly, 3-Month USD LIBOR | | | Citibank, N.A. | | | $ | 251,100 | | | | 06/26/2019 | | | | $ (506) | | | | Call | |
| 5-Year Interest Rate Swap, 9/27/19, Pay Fixed 2.90% Semi-Annually, Receive Pay Variable Quarterly, 3-Month USD LIBOR | |
| Barclays Bank
PLC |
| | | 51,000 | | | | 09/27/2019 | | | | (342) | | | | Call | |
| | | | | | | | | | | | | | | | | | | | |
Total Swaptions | | | | | | | | | | | | | | | $ (848 | ) | | | | |
| | | | | | | | | | | | | | | | | | | | |
Open Forward Currency Contracts to USD
| | | | | | | | | | | | | | | | |
Currency Purchased (000s) | | Currency
Sold (000s) | | | Counterparty | | | Settlement
Date | | | Unrealized
Appreciation
(Depreciation)
(000s) | |
Assets: | | | | | | | | | | | | | | | | |
GBP 10,987 | | | USD 14,064 | | |
| State
Street
Bank &
Trust
Co. |
| | | 01/17/2019 | | | $ | 39 | |
USD 11,752 | | | AUD 16,450 | | |
| Barclays
Bank
PLC |
| | | 12/14/2018 | | | | 97 | |
USD 11,680 | | | CAD 15,100 | | |
| Barclays
Bank
PLC |
| | | 12/14/2018 | | | | 199 | |
USD 4,547 | | | EUR 3,923 | | |
| Citibank,
N.A. |
| | | 11/08/2018 | | | | 100 | |
USD 2,081 | | | ZAR 30,680 | | |
| HSBC
Bank
USA,
N.A. |
| | | 11/13/2018 | | | | 5 | |
USD 14,107 | | | EUR 12,338 | | |
| State
Street
Bank &
Trust
Co. |
| | | 01/17/2019 | | | | 28 | |
| | | | | | | | | | | | | | | | |
| | | | | | | | | | | | | | | 468 | |
| | | | | | | | | | | | | | | | |
Liabilities: | | | | | | | | | | | | | | | | |
AUD 16,450 | | | USD 11,678 | | |
| Barclays
Bank
PLC |
| | | 12/14/2018 | | | | (23 | ) |
CAD 15,100 | | | USD 11,550 | | |
| Barclays
Bank
PLC |
| | | 12/14/2018 | | | | (69 | ) |
ZAR 30,680 | | | USD 2,276 | | |
| HSBC
Bank
USA,
N.A. |
| | | 11/13/2018 | | | | (200 | ) |
| | | | | | | | | | | | | | | | |
| | | | | | | | | | | | | | | (292 | ) |
| | | | | | | | | | | | | | | | |
Net Unrealized Appreciation (Depreciation) | | | | | | | | | | | | | | $ | 176 | |
| | | | | | | | | | | | | | | | |
Annual Report 35
Open Futures Contracts
| | | | | | | | | | | | | | | | | | | | |
Contract
Type | | Number of
Contracts | | | Expiration
Date | | | Notional
Amount
(000s) | | | Current
Value
(000s) | | | Unrealized
Appreciation
(Depreciation)
(000s) | |
Long Contracts: | | | | | | | | | |
3 Month LIBOR | | | 1,165 | | | | Dec-19 | | | $ | 275 | | | $ | (10 | ) | | $ | (10 | ) |
U.S. Long Bond Future | | | 115 | | | | Dec-18 | | | | 15,884 | | | | (716 | ) | | | (716 | ) |
| | | | | | | | | | | | | | | | | | | | |
| | | | | | | | | | | | | | | | | | | (726 | ) |
| | | | | | | | | | | | | | | | | | | | |
Short Contracts: | | | | | | | | | |
3 Month LIBOR | | | 1,165 | | | | Dec-19 | | | | (86 | ) | | | (6 | ) | | | (6 | ) |
Euro-Bund Future | | | 60 | | | | Dec-18 | | | | (10,891 | ) | | | 11 | | | | 11 | |
U.S. 10-Year Ultra Future | | | 193 | | | | Dec-18 | | | | (24,146 | ) | | | 618 | | | | 618 | |
U.S. Treasury 10-Year Note Future | | | 57 | | | | Dec-18 | | | | (6,751 | ) | | | 102 | | | | 102 | |
U.S. Treasury 5-Year Note Future | | | 180 | | | | Dec-18 | | | | (20,229 | ) | | | 109 | | | | 109 | |
U.S. Ultra Bond Future | | | 26 | | | | Dec-18 | | | | (3,880 | ) | | | 14 | | | | 14 | |
| | | | | | | | | | | | | | | | | | | | |
| | | | | | | | | | | | | | | | | | | 848 | |
| | | | | | | | | | | | | | | | | | | | |
Total Futures | | | | | | | $ | 122 | |
| | | | | | | | | | | | | | | | | | | | |
Open Centrally Cleared Credit Default Swap Contracts
| | | | | | | | | | | | | | | | |
| Description | | Maturity Date | | Notional
Amount
(000s) | | Value
(000s) | | | Upfront
payments/
receipts
(000s) | | | Unrealized
Depreciation
(000s) | |
| Protection Bought (Relevant Credit: Markit CDX, North America High Yield Series 31 Index), Pay 5% Quarterly, Receive upon credit default | | 12/20/2023 | | $27,000 | | $ | 1,576 | | | $ | 1,600 | | | $ | (24 | ) |
| | | | | | | | | | | | | | | | |
See notes to financial statements.
36 Payden Mutual Funds

| | | | | | |
The Fund seeks a high level of total return that is consistent with the preservation of capital by generally investing 80% of its assets in investment grade corporate bonds with no limit on the average portfolio maturity. | | | | | |  |
| Portfolio Composition - percent of investments | |
| |
Financial | | | 40% | |
Energy | | | 17% | |
Consumer Non-Cyclical | | | 15% | |
Utility | | | 10% | |
Basic Industry | | | 5% | |
Other | | | 13% | | | |
| | | | | | |
| This information is not part of the audited financial statements. | | | | | | Past performance does not predict future returns. The graph does not reflect the impact of taxes or transaction costs a shareholder would pay. |
| | | | | | |
| Schedule of Investments - October 31, 2018 | | | | |
Principal or Shares | | Security Description | | Value
(000) | |
Asset Backed (0%) | | | | |
837,250 | | Taco Bell Funding LLC 144A, 3.83%, 5/25/46 (a) (Cost - $857) | | $ | 838 | |
Corporate Bond (96%) | | | | |
Basic Industry (5%) | | | | |
650,000 | | Aviation Capital Group LLC 144A, 2.88%, 1/20/22 (a) | | | 629 | |
1,120,000 | | Aviation Capital Group LLC 144A, 3.88%, 5/01/23 (a) | | | 1,108 | |
465,000 | | DAE Funding LLC 144A, 4.50%, 8/01/22 (a) | | | 455 | |
605,000 | | Dow Chemical Co., 9.40%, 5/15/39 | | | 881 | |
1,740,000 | | FedEx Corp., 4.95%, 10/17/48 | | | 1,698 | |
1,000,000 | | General Dynamics Corp., 3.00%, 5/11/21 | | | 993 | |
450,000 | | Keysight Technologies Inc., 3.30%, 10/30/19 | | | 449 | |
1,485,000 | | SMBC Aviation Capital Finance DAC 144A,
2.65%, 7/15/21 (a) | | | 1,433 | |
1,810,000 | | Spirit AeroSystems Inc., 3.95%, 6/15/23 | | | 1,792 | |
380,000 | | United Technologies Corp., 3.95%, 8/16/25 | | | 377 | |
685,000 | | United Technologies Corp., 4.13%, 11/16/28 | | | 674 | |
600,000 | | United Technologies Corp., 4.63%, 11/16/48 | | | 580 | |
585,000 | | Wabtec Corp., (3 mo. LIBOR USD + 1.050%) 3.38%, 9/15/21 (b) | | | 586 | |
1,595,000 | | Wabtec Corp., 4.70%, 9/15/28 | | | 1,545 | |
1,075,000 | | Yara International ASA 144A, 4.75%, 6/01/28 (a) | | | 1,066 | |
| | | | | 14,266 | |
Communications (5%) | | | | |
475,000 | | 21st Century Fox America Inc., 9.50%, 7/15/24 | | | 598 | |
1,600,000 | | AT&T Inc., (3 mo. LIBOR USD + 1.180%) 3.51%, 6/12/24 (b) | | | 1,606 | |
970,000 | | AT&T Inc., 3.60%, 2/17/23 | | | 957 | |
3,000,000 | | AT&T Inc., 5.45%, 3/01/47 | | | 2,856 | |
720,000 | | Charter Communications Operating LLC / Charter Communications Operating Capital, 5.38%, 5/01/47 | | | 650 | |
1,705,000 | | Comcast Corp., 3.95%, 10/15/25 | | | 1,704 | |
1,170,000 | | Comcast Corp., 4.95%, 10/15/58 | | | 1,149 | |
| | | | | | |
Principal or Shares | | Security Description | | Value (000) | |
| | |
400,000 | | Orange SA, 9.00%, 3/01/31 | | $ | 551 | |
292,500 | | Sprint Spectrum Co. LLC/Sprint Spectrum Co. II LLC/Sprint Spectrum Co. III LLC 144A, 3.36%, 9/20/21 (a) | | | 290 | |
1,100,000 | | TELUS Corp., 4.60%, 11/16/48 | | | 1,057 | |
1,000,000 | | Verizon Communications Inc., 4.40%, 11/01/34 | | | 945 | |
2,063,000 | | Verizon Communications Inc., 4.75%, 11/01/41 | | | 1,940 | |
280,000 | | Verizon Communications Inc., 4.86%, 8/21/46 | | | 267 | |
840,000 | | Verizon Communications Inc., 5.25%, 3/16/37 | | | 866 | |
| | | | | 15,436 | |
Consumer Cyclical (3%) | | | | |
542,858 | | Continental Airlines 2007-1 Class B Pass-Through Trust, 6.90%, 4/19/22 | | | 561 | |
830,000 | | Dollar Tree Inc., (3 mo. LIBOR USD + 0.700%) 3.15%, 4/17/20 (b) | | | 831 | |
730,000 | | Ford Motor Co., 7.45%, 7/16/31 | | | 770 | |
1,020,000 | | Ford Motor Credit Co. LLC, 2.98%, 8/03/22 | | | 957 | |
600,000 | | Ford Motor Credit Co. LLC, 3.10%, 5/04/23 | | | 553 | |
400,000 | | Ford Motor Credit Co. LLC, 3.81%, 1/09/24 | | | 372 | |
1,200,000 | | General Motors Co., 6.75%, 4/01/46 | | | 1,230 | |
760,000 | | General Motors Financial Co. Inc., 4.35%, 1/17/27 | | | 707 | |
1,920,000 | | Nissan Motor Acceptance Corp. 144A, (3 mo. LIBOR USD + 0.630%) 2.98%, 9/21/21 (a)(b) | | | 1,924 | |
1,171,000 | | ZF North America Capital Inc. 144A, 4.50%, 4/29/22 (a) | | | 1,174 | |
| | | | | 9,079 | |
Consumer Non-Cyclical (15%) | | | | |
685,000 | | AbbVie Inc., 3.75%, 11/14/23 | | | 679 | |
1,365,000 | | AbbVie Inc., 4.25%, 11/14/28 | | | 1,318 | |
685,000 | | AbbVie Inc., 4.88%, 11/14/48 | | | 636 | |
1,285,000 | | Advocate Health & Hospitals Corp., 3.83%, 8/15/28 | | | 1,285 | |
1,500,000 | | Amgen Inc., 4.56%, 6/15/48 | | | 1,380 | |
Annual Report 37

| | | | | | |
Principal or Shares | | Security Description | | Value
(000) | |
| | |
600,000 | | Amgen Inc., 5.65%, 6/15/42 | | $ | 654 | |
904,000 | | Anheuser-Busch InBev Worldwide Inc., 8.20%, 1/15/39 | | | 1,218 | |
1,000,000 | | AstraZeneca PLC, (3 mo. LIBOR USD + 0.665%) 2.98%, 8/17/23 (b) | | | 995 | |
1,195,000 | | AstraZeneca PLC, 3.50%, 8/17/23 | | | 1,178 | |
985,000 | | Bacardi Ltd. 144A, 5.30%, 5/15/48 (a) | | | 919 | |
700,000 | | Bayer U.S. Finance II LLC 144A, 3.88%, 12/15/23 (a) | | | 690 | |
1,000,000 | | Bayer U.S. Finance II LLC 144A, 4.38%, 12/15/28 (a) | | | 968 | |
675,000 | | Bayer U.S. Finance II LLC 144A, 4.88%, 6/25/48 (a) | | | 632 | |
135,000 | | Block Financial LLC, 4.13%, 10/01/20 | | | 136 | |
700,000 | | Blue Cross & Blue Shield of Minnesota 144A, 3.79%, 5/01/25 (a) | | | 665 | |
1,455,000 | | Conagra Brands Inc., 4.60%, 11/01/25 | | | 1,460 | |
1,445,000 | | Conagra Brands Inc., 5.40%, 11/01/48 | | | 1,384 | |
715,000 | | CVS Health Corp., 4.78%, 3/25/38 | | | 690 | |
725,000 | | CVS Health Corp., 5.05%, 3/25/48 | | | 710 | |
110,000 | | Dignity Health, 3.13%, 11/01/22 | | | 109 | |
740,000 | | Dignity Health, 4.50%, 11/01/42 | | | 675 | |
1,140,000 | | DP World Crescent Ltd. 144A, 4.85%, 9/26/28 (a) | | | 1,116 | |
550,000 | | DP World Ltd. 144A, 5.63%, 9/25/48 (a) | | | 522 | |
1,240,000 | | General Mills Inc., 3.70%, 10/17/23 | | | 1,224 | |
1,500,000 | | Halfmoon Parent Inc. 144A, (3 mo. LIBOR USD + 0.650%) 2.98%, 9/17/21 (a)(b) | | | 1,500 | |
700,000 | | Halfmoon Parent Inc. 144A, 4.13%, 11/15/25 (a) | | | 693 | |
1,100,000 | | Halfmoon Parent Inc. 144A, 4.38%, 10/15/28 (a) | | | 1,078 | |
895,000 | | Halfmoon Parent Inc. 144A, 4.90%, 12/15/48 (a) | | | 854 | |
1,670,000 | | Keurig Dr Pepper Inc., 3.13%, 12/15/23 | | | 1,587 | |
731,000 | | Keurig Dr Pepper Inc., 3.20%, 11/15/21 | | | 719 | |
2,600,000 | | Land O’ Lakes Inc. 144A, 7.00% (a)(c) | | | 2,602 | |
570,000 | | Mylan NV, 3.95%, 6/15/26 | | | 524 | |
1,050,000 | | Mylan NV, 5.25%, 6/15/46 | | | 908 | |
690,000 | | Nestle Holdings Inc. 144A, 3.35%, 9/24/23 (a) | | | 686 | |
690,000 | | Nestle Holdings Inc. 144A, 3.50%, 9/24/25 (a) | | | 680 | |
1,250,000 | | Northwell Healthcare Inc., 4.26%, 11/01/47 | | | 1,139 | |
175,000 | | Northwell Healthcare Inc., 6.15%, 11/01/43 | | | 205 | |
945,000 | | Pfizer Inc., 7.20%, 3/15/39 | | | 1,276 | |
2,250,000 | | Roche Holdings Inc. 144A, 3.63%, 9/17/28 (a) | | | 2,211 | |
640,000 | | Shire Acquisitions Investments Ireland DAC, 2.40%, 9/23/21 | | | 615 | |
2,000,000 | | Teva Pharmaceutical Finance Co. LLC, 6.15%, 2/01/36 | | | 1,901 | |
420,000 | | Teva Pharmaceutical Finance Netherlands III BV, 4.10%, 10/01/46 | | | 290 | |
850,000 | | Teva Pharmaceutical Finance Netherlands III BV, 6.00%, 4/15/24 | | | 845 | |
885,000 | | Toledo Hospital, 5.75%, 11/15/38 | | | 915 | |
2,175,000 | | Toledo Hospital, 6.02%, 11/15/48 | | | 2,129 | |
| | | | | 44,600 | |
Energy (17%) | | | | |
202,587 | | Alliance Pipeline LP/United States 144A, 7.00%, 12/31/19 (a) | | | 205 | |
2,000,000 | | Anadarko Petroleum Corp., 3.45%, 7/15/24 | | | 1,902 | |
430,000 | | Boardwalk Pipelines LP, 4.45%, 7/15/27 | | | 405 | |
| | | | | | |
Principal or Shares | | Security Description | | Value (000) | |
| | |
2,000,000 | | BP Capital Markets America Inc., 3.80%, 9/21/25 | | $ | 1,962 | |
640,000 | | Canadian Natural Resources Ltd., 6.25%, 3/15/38 | | | 723 | |
1,405,000 | | Cenovus Energy Inc., 6.75%, 11/15/39 | | | 1,505 | |
2,000,000 | | Chesapeake Energy Corp., 7.00%, 10/01/24 | | | 1,960 | |
835,000 | | Enbridge Energy Partners LP, 7.38%, 10/15/45 | | | 1,040 | |
350,000 | | Enbridge Energy Partners LP, 7.50%, 4/15/38 | | | 434 | |
985,000 | | Encana Corp., 7.38%, 11/01/31 | | | 1,179 | |
1,000,000 | | Energy Transfer Operating LP, 4.15%, 10/01/20 | | | 1,009 | |
1,550,000 | | Energy Transfer Operating LP, 6.50%, 2/01/42 | | | 1,610 | |
1,365,000 | | EnLink Midstream Partners LP, 5.60%, 4/01/44 | | | 1,165 | |
1,500,000 | | EnLink Midstream Partners LP, (3 mo. LIBOR USD + 4.110%) 6.00%, (b)(c) | | | 1,311 | |
1,000,000 | | Ensco PLC, 7.75%, 2/01/26 | | | 936 | |
1,745,000 | | Enterprise Products Operating LLC, 4.15%, 10/16/28 | | | 1,717 | |
650,000 | | Gulf South Pipeline Co. LP, 4.00%, 6/15/22 | | | 648 | |
850,000 | | Hess Corp., 5.60%, 2/15/41 | | | 815 | |
1,000,000 | | Hess Corp., 7.30%, 8/15/31 | | | 1,126 | |
750,000 | | Kinder Morgan Energy Partners LP, 6.55%, 9/15/40 | | | 822 | |
800,000 | | Kinder Morgan Inc./DE, (3 mo. LIBOR USD + 1.280%) 3.72%, 1/15/23 (b) | | | 814 | |
250,000 | | Kinder Morgan Inc./DE 144A, 5.00%, 2/15/21 (a) | | | 257 | |
1,500,000 | | Motiva Enterprises LLC 144A, 6.85%, 1/15/40 (a) | | | 1,599 | |
2,000,000 | | MPLX LP, 4.50%, 4/15/38 | | | 1,788 | |
1,200,000 | | Nabors Industries Inc., 4.63%, 9/15/21 | | | 1,161 | |
1,650,000 | | Nabors Industries Inc., 5.50%, 1/15/23 (d) | | | 1,559 | |
1,065,000 | | Oasis Petroleum Inc., 6.88%, 1/15/23 | | | 1,076 | |
275,000 | | ONEOK Inc., 4.25%, 2/01/22 | | | 277 | |
800,000 | | ONEOK Partners LP, 6.65%, 10/01/36 | | | 910 | |
1,200,000 | | Petro-Canada, 7.88%, 6/15/26 | | | 1,450 | |
441,200 | | Ras Laffan Liquefied Natural Gas Co. Ltd. II 144A, 5.30%, 9/30/20 (a) | | | 449 | |
400,000 | | Sabine Pass Liquefaction LLC, 5.63%, 2/01/21 | | | 414 | |
450,000 | | Sabine Pass Liquefaction LLC, 5.75%, 5/15/24 | | | 477 | |
895,000 | | SemGroup Corp. / Rose Rock Finance Corp., 5.63%, 11/15/23 | | | 850 | |
2,500,000 | | Sinopec Group Overseas Development 2013 Ltd. 144A, 4.38%, 10/17/23 (a) | | | 2,532 | |
900,000 | | Sunoco Logistics Partners Operations LP, 5.40%, 10/01/47 | | | 827 | |
2,000,000 | | Targa Resources Partners LP / Targa Resources Partners Finance Corp., 5.13%, 2/01/25 | | | 1,955 | |
1,990,000 | | TransCanada PipeLines Ltd., 5.10%, 3/15/49 | | | 1,991 | |
2,000,000 | | Transocean Inc., 7.50%, 4/15/31 | | | 1,860 | |
965,000 | | Western Gas Partners LP, 5.45%, 4/01/44 | | | 874 | |
700,000 | | Williams Cos. Inc., 3.70%, 1/15/23 | | | 688 | |
1,800,000 | | Williams Cos. Inc., 7.88%, 9/01/21 | | | 1,984 | |
800,000 | | WPX Energy Inc., 5.75%, 6/01/26 | | | 800 | |
| | | | | 49,066 | |
38 Payden Mutual Funds
| | | | | | |
Principal or Shares | | Security Description | | Value
(000) | |
| |
Financial (39%) | | | | |
975,000 | | ADCB Finance Cayman Ltd. 144A,
4.00%, 3/29/23 (a) | | $ | 961 | |
925,000 | | AerCap Ireland Capital DAC/AerCap Global Aviation Trust, 4.13%, 7/03/23 | | | 916 | |
830,000 | | AerCap Ireland Capital DAC/AerCap Global Aviation Trust, 4.45%, 10/01/25 | | | 812 | |
2,000,000 | | Air Lease Corp., 3.88%, 7/03/23 | | | 1,976 | |
1,000,000 | | Aircastle Ltd., 4.13%, 5/01/24 | | | 972 | |
2,000,000 | | Ally Financial Inc., 4.63%, 5/19/22 | | | 2,005 | |
1,851,000 | | American Express Co., 8.15%, 3/19/38 | | | 2,573 | |
800,000 | | American Financial Group Inc./OH, 4.50%, 6/15/47 | | | 717 | |
700,000 | | Aon Corp., 6.25%, 9/30/40 | | | 823 | |
575,000 | | Aon PLC, 4.75%, 5/15/45 | | | 556 | |
1,000,000 | | Ares Capital Corp., 3.50%, 2/10/23 | | | 954 | |
875,000 | | Ares Capital Corp., 3.63%, 1/19/22 | | | 858 | |
500,000 | | Ares Capital Corp., 4.88%, 11/30/18 | | | 501 | |
1,180,000 | | ASB Bank Ltd. 144A, 3.75%, 6/14/23 (a) | | | 1,167 | |
1,200,000 | | Australia & New Zealand Banking Group Ltd. 144A, 4.40%, 5/19/26 (a) | | | 1,168 | |
950,000 | | Bank of America Corp., (3 mo. LIBOR USD + 0.780%) 3.55%, 3/05/24 (b) | | | 933 | |
880,000 | | Bank of America Corp., (3 mo. LIBOR USD + 1.512%) 3.71%, 4/24/28 (b) | | | 836 | |
1,100,000 | | Bank of Montreal, (3 mo. LIBOR USD + 0.460%) 2.90%, 4/13/21 (b) | | | 1,104 | |
1,075,000 | | Bank of Montreal, 3.10%, 7/13/20 | | | 1,074 | |
2,275,000 | | Bank of Montreal, (5 yr. Swap Semi 30/360 USD + 1.280%) 4.34%, 10/05/28 (b) | | | 2,255 | |
1,385,000 | | Bank of New York Mellon Corp., 3.45%, 8/11/23 | | | 1,376 | |
1,020,000 | | Barclays PLC, 4.38%, 9/11/24 | | | 975 | |
1,300,000 | | Barclays PLC, 4.84%, 5/09/28 | | | 1,201 | |
850,000 | | BNZ International Funding Ltd./London 144A, 3.38%, 3/01/23 (a) | | | 830 | |
1,300,000 | | BPCE SA 144A, 5.15%, 7/21/24 (a) | | | 1,310 | |
975,000 | | Brookfield Finance Inc., 4.70%, 9/20/47 | | | 902 | |
201,000 | | Carlyle Holdings Finance LLC 144A, 3.88%, 2/01/23 (a) | | | 200 | |
2,255,000 | | CIT Group Inc., 4.75%, 2/16/24 | | | 2,224 | |
1,500,000 | | Citibank NA, 3.40%, 7/23/21 | | | 1,494 | |
425,000 | | Citigroup Inc., (3 mo. LIBOR USD + 0.950%) 2.88%, 7/24/23 (b) | | | 409 | |
1,265,000 | | Citigroup Inc., 4.45%, 9/29/27 | | | 1,232 | |
210,000 | | Citizens Financial Group Inc. 144A, 4.15%, 9/28/22 (a) | | | 209 | |
3,675,000 | | Credit Agricole Corporate & Investment Bank SA, (3 mo. LIBOR USD + 0.625%) 3.02%, 10/03/21 (b) | | | 3,678 | |
1,500,000 | | Credit Suisse AG/New York NY, 3.00%, 10/29/21 | | | 1,477 | |
630,000 | | Digital Realty Trust LP, 3.63%, 10/01/22 | | | 624 | |
1,050,000 | | Enstar Group Ltd., 4.50%, 3/10/22 | | | 1,050 | |
1,030,000 | | First Midwest Bancorp Inc./IL, 5.88%, 9/29/26 | | | 1,059 | |
1,400,000 | | Five Corners Funding Trust 144A, 4.42%, 11/15/23 (a) | | | 1,431 | |
640,000 | | FS Investment Corp., 4.25%, 1/15/20 | | | 642 | |
| | | | | | |
Principal or Shares | | Security Description | | Value
(000) | |
| | |
600,000 | | Goldman Sachs Group Inc., 2.63%, 4/25/21 | | $ | 587 | |
2,600,000 | | Goldman Sachs Group Inc., 5.75%, 1/24/22 | | | 2,749 | |
400,000 | | HCP Inc., 3.40%, 2/01/25 | | | 376 | |
1,967,000 | | Hospitality Properties Trust, 3.95%, 1/15/28 | | | 1,763 | |
2,795,000 | | HSBC Holdings PLC, (3 mo. LIBOR USD + 0.650%) 2.98%, 9/11/21 (b) | | | 2,801 | |
800,000 | | Huntington Bancshares Inc./OH, 4.00%, 5/15/25 | | | 795 | |
1,185,000 | | ICBCIL Finance Co. Ltd. 144A, 2.38%, 5/19/19 (a) | | | 1,176 | |
1,000,000 | | International Lease Finance Corp., 4.63%, 4/15/21 | | | 1,016 | |
2,800,000 | | JPMorgan Chase & Co., (3 mo. LIBOR USD + 0.935%) 2.78%, 4/25/23 (b) | | | 2,711 | |
800,000 | | JPMorgan Chase & Co., (3 mo. LIBOR USD + 0.610%) 3.51%, 6/18/22 (b) | | | 799 | |
900,000 | | Kimco Realty Corp., 4.25%, 4/01/45 | | | 782 | |
1,400,000 | | KKR Group Finance Co. III LLC 144A, 5.13%, 6/01/44 (a) | | | 1,360 | |
1,800,000 | | Lincoln National Corp., 7.00%, 6/15/40 | | | 2,220 | |
510,000 | | Macquarie Bank Ltd. 144A, 6.63%, 4/07/21 (a) | | | 540 | |
1,025,000 | | Macquarie Group Ltd. 144A, (3 mo. LIBOR USD + 1.372%) 3.76%, 11/28/28 (a)(b) | | | 940 | |
1,417,000 | | Manulife Financial Corp., (USD Swap Rate 11:00 am NY 1 + 1.647%) 4.06%, 2/24/32 (b) | | | 1,321 | |
142,000 | | Massachusetts Mutual Life Insurance Co. 144A, 8.88%, 6/01/39 (a) | | | 212 | |
950,000 | | MetLife Inc., 4.88%, 11/13/43 | | | 970 | |
2,000,000 | | Mitsubishi UFJ Trust & Banking Corp. 144A, 2.65%, 10/19/20 (a) | | | 1,970 | |
2,000,000 | | Mizuho Financial Group Inc. 144A, 2.63%, 4/12/21 (a) | | | 1,953 | |
2,245,000 | | Mizuho Financial Group Inc., (3 mo. LIBOR USD + 1.000%) 3.92%, 9/11/24 (b) | | | 2,236 | |
2,750,000 | | Morgan Stanley, (3 mo. LIBOR USD + 0.847%) 3.74%, 4/24/24 (b) | | | 2,718 | |
1,180,000 | | National Rural Utilities Cooperative Finance Corp., 4.40%, 11/01/48 | | | 1,173 | |
1,500,000 | | Nationwide Building Society 144A, (USD Swap Rate 11:00 am NY 1 + 1.849%) 4.13%, 10/18/32 (a)(b) | | | 1,338 | |
725,000 | | Nationwide Financial Services Inc. 144A, 5.30%, 11/18/44 (a) | | | 738 | |
800,000 | | Nationwide Mutual Insurance Co. 144A, 9.38%, 8/15/39 (a) | | | 1,216 | |
500,000 | | New York Life Insurance Co. 144A, 6.75%, 11/15/39 (a) | | | 645 | |
1,000,000 | | Ohio National Life Insurance Co. 144A, 6.88%, 6/15/42 (a) | | | 1,207 | |
450,000 | | Pacific Life Insurance Co. 144A, 9.25%, 6/15/39 (a) | | | 673 | |
1,000,000 | | Pershing Square Holdings Ltd. 144A, 5.50%, 7/15/22 (a) | | | 999 | |
2,000,000 | | Prudential Financial Inc., (3 mo. LIBOR USD + 2.380%) 4.50%, 9/15/47 (b) | | | 1,825 | |
2,175,000 | | Regions Financial Corp., 3.80%, 8/14/23 | | | 2,155 | |
Annual Report 39
| | | | | | |
Principal or Shares | | Security Description | | Value (000) | |
| | |
2,740,000 | | Royal Bank of Canada, 3.70%, 10/05/23 | | $ | 2,728 | |
930,000 | | Santander Holdings US.A Inc., 4.40%, 7/13/27 | | | 869 | |
450,000 | | Santander Holdings USA Inc., 3.70%, 3/28/22 | | | 443 | |
1,265,000 | | Scentre Group Trust 1/Scentre Group Trust 2 144A, 2.38%, 11/05/19 (a) | | | 1,253 | |
230,000 | | Senior Housing Properties Trust, 6.75%, 4/15/20 | | | 236 | |
1,000,000 | | Springleaf Finance Corp., 7.13%, 3/15/26 | | | 949 | |
1,135,000 | | Sumitomo Mitsui Financial Group Inc., 2.06%, 7/14/21 | | | 1,090 | |
1,527,000 | | Sumitomo Mitsui Financial Group Inc., 2.44%, 10/19/21 | | | 1,477 | |
1,415,000 | | SunTrust Bank/Atlanta GA, 4.05%, 11/03/25 | | | 1,418 | |
1,000,000 | | Synchrony Bank, 3.00%, 6/15/22 | | | 956 | |
250,000 | | Synchrony Financial, 2.70%, 2/03/20 | | | 247 | |
250,000 | | Synchrony Financial, 3.75%, 8/15/21 | | | 247 | |
550,000 | | Teachers Insurance & Annuity Association of America 144A, 4.90%, 9/15/44 (a) | | | 569 | |
2,090,000 | | Toronto-Dominion Bank, 3.25%, 6/11/21 | | | 2,084 | |
670,000 | | Transatlantic Holdings Inc., 8.00%, 11/30/39 | | | 896 | |
1,000,000 | | Travelers Cos. Inc., 4.05%, 3/07/48 | | | 935 | |
900,000 | | USAA Capital Corp. 144A, 3.00%, 7/01/20 (a) | | | 896 | |
400,000 | | Ventas Realty LP, 3.85%, 4/01/27 | | | 381 | |
800,000 | | VEREIT Operating Partnership LP, 4.60%, 2/06/24 | | | 801 | |
1,950,000 | | Voya Financial Inc. 144A, (3 mo. LIBOR USD + 2.084%) 4.70%, 1/23/48 (a)(b) | | | 1,682 | |
1,330,000 | | WEA Finance LLC 144A, 4.63%, 9/20/48 (a) | | | 1,264 | |
2,900,000 | | Wells Fargo & Co., 2.63%, 7/22/22 | | | 2,784 | |
1,350,000 | | Westpac Banking Corp., (USD Swap Rate 11:00 am NY 1 + 2.236%) 4.32%, 11/23/31 (b) | | | 1,287 | |
2,000,000 | | Westpac Banking Corp./New Zealand, (USD Swap Rate 11:00 am NY 1 + 2.888%) 5.00%, (b)(c) | | | 1,752 | |
| | | | | 116,692 | |
Technology (2%) | | | | |
835,000 | | Dell International LLC/EMC Corp. 144A, 8.35%, 7/15/46 (a) | | | 973 | |
2,660,000 | | Hewlett Packard Enterprise Co., (3 mo. LIBOR USD + 0.720%) 3.06%, 10/05/21 (b) | | | 2,661 | |
1,500,000 | | HP Inc., 6.00%, 9/15/41 | | | 1,483 | |
1,100,000 | | Microchip Technology Inc. 144A, 4.33%, 6/01/23 (a) | | | 1,077 | |
649,000 | | Seagate HDD Cayman, 4.88%, 3/01/24 | | | 615 | |
| | | | | 6,809 | |
Utility (10%) | | | | |
1,425,000 | | Abu Dhabi National Energy Co. PJSC 144A, 4.38%, 4/23/25 (a) | | | 1,410 | |
550,000 | | Abu Dhabi National Energy Co. PJSC 144A, 4.88%, 4/23/30 (a) | | | 548 | |
1,485,000 | | Alliant Energy Finance LLC 144A, 3.75%, 6/15/23 (a) | | | 1,477 | |
1,050,000 | | Basin Electric Power Cooperative 144A, 4.75%, 4/26/47 (a) | | | 1,048 | |
244,000 | | Berkshire Hathaway Energy Co., 6.13%, 4/01/36 | | | 288 | |
| | | | | | |
Principal or Shares | | Security Description | | Value (000) | |
| | |
1,660,000 | | CenterPoint Energy Inc., 3.85%, 2/01/24 | | $ | 1,661 | |
1,150,000 | | Consumers Energy Co., 4.35%, 4/15/49 | | | 1,145 | |
1,000,000 | | Dominion Energy Inc., 4.10%, 4/01/21 | | | 1,009 | |
1,185,000 | | DTE Energy Co., 3.70%, 8/01/23 | | | 1,178 | |
650,000 | | Duke Energy Corp., 3.75%, 9/01/46 | | | 557 | |
1,250,000 | | Duke Energy Florida LLC, 4.20%, 7/15/48 | | | 1,203 | |
2,000,000 | | Edison International, 4.13%, 3/15/28 | | | 1,955 | |
1,620,000 | | Entergy Louisiana LLC, 4.00%, 3/15/33 | | | 1,599 | |
500,000 | | Entergy Louisiana LLC, 5.00%, 7/15/44 | | | 494 | |
1,392,000 | | Exelon Generation Co. LLC, 4.25%, 6/15/22 | | | 1,409 | |
740,000 | | Fortis Inc./Canada, 3.06%, 10/04/26 | | | 670 | |
1,150,000 | | Indianapolis Power & Light Co. 144A, 4.05%, 5/01/46 (a) | | | 1,043 | |
1,500,000 | | KeySpan Gas East Corp. 144A, 5.82%, 4/01/41 (a) | | | 1,731 | |
1,145,000 | | NextEra Energy Capital Holdings Inc., 3.34%, 9/01/20 | | | 1,145 | |
1,000,000 | | NiSource Inc. 144A, 3.65%, 6/15/23 (a) | | | 985 | |
2,000,000 | | Pacific Gas & Electric Co., 6.25%, 3/01/39 | | | 2,158 | |
825,000 | | PSEG Power LLC, 3.85%, 6/01/23 | | | 820 | |
373,230 | | Solar Star Funding LLC 144A, 3.95%, 6/30/35 (a) | | | 354 | |
1,045,000 | | South Carolina Electric & Gas Co., 3.50%, 8/15/21 | | | 1,043 | |
2,255,000 | | Tampa Electric Co., 4.45%, 6/15/49 | | | 2,177 | |
700,000 | | WEC Energy Group Inc., 3.38%, 6/15/21 | | | 698 | |
| | | | | 29,805 | |
Total Corporate Bond (Cost - $293,125) | | | 285,753 | |
Foreign Government (0%) | | | | |
1,150,000 | | Korea Hydro & Nuclear Power Co. Ltd. 144A, 3.75%, 7/25/23 (a) | | | | |
| | (Cost - $1,143) | | | 1,142 | |
Municipal (1%) | | | | |
1,000,000 | | Rutgers The State University of New Jersey, 4.15%, 5/01/48 | | | 958 | |
1,800,000 | | State of California, 4.60%, 4/01/38 | | | 1,840 | |
Total Municipal (Cost - $2,892) | | | 2,798 | |
Investment Company (2%) | | | | |
6,342,319 | | Payden Cash Reserves Money Market Fund * | | | | |
| | (Cost - $6,342) | | | 6,342 | |
Total Investments (Cost - $304,359) (99%) | | | 296,873 | |
Other Assets, net of Liabilities (1%) | | | 1,835 | |
Net Assets (100%) | | $ | 298,708 | |
| (a) | Security offered only to qualified institutional investors, and thus is not registered for sale to the public under rule 144A of the Securities Act of 1933. It has been deemed liquid under guidelines approved by the Board. |
| (b) | Floating rate security. The rate shown reflects the rate in effect at October 31, 2018. See Note 2 in the Notes to Financial Statements. |
| (c) | Perpetual security with no stated maturity date. |
| (d) | All or a portion of these securities are on loan. At October 31, 2018, the total market value of the Fund’s securities on loan is $1,417 the total market value of the collateral held by the Fund is $1,470. Amounts in 000s. |
40 Payden Mutual Funds
Open Futures Contracts
| | | | | | | | | | | | | | | | | | | | |
| Contract Type | | Number of
Contracts | | | Expiration
Date | | | Notional
Amount
(000s) | | | Current
Value
(000s) | | | Unrealized
Appreciation
(Depreciation)
(000s) | |
Long Contracts: | | | | | | | | | | | | | | | | | | | | |
| U.S. Long Bond Future | | | 36 | | | | Dec-18 | | | $ | 4,973 | | | $ | (222 | ) | | $ | (222 | ) |
| U.S. Treasury 10-Year Note Future | | | 174 | | | | Dec-18 | | | | 20,608 | | | | (310 | ) | | | (310 | ) |
| U.S. Ultra Bond Future | | | 31 | | | | Dec-18 | | | | 4,626 | | | | (339 | ) | | | (339 | ) |
| | | | | | | | | | | | | | | | | | | | |
| | | | | | | | | | | | | | | | | | | (871 | ) |
| | | | | | | | | | | | | | | | | | | | |
| Short Contracts: | | | | | | | | | | | | | | | | | | | | |
| U.S. 10-Year Ultra Future | | | 62 | | | | Dec-18 | | | | (7,757 | ) | | | 15 | | | | 15 | |
| U.S. Treasury 5-Year Note Future | | | 193 | | | | Dec-18 | | | | (21,690 | ) | | | 60 | | | | 60 | |
| | | | | | | | | | | | | | | | | | | | |
| | | | | | | | | | | | | | | | | | | 75 | |
| | | | | | | | | | | | | | | | | | | | |
Total Futures | | | | | | | | | | | | | | | | | | $ | (796 | ) |
| | | | | | | | | | | | | | | | | | | | |
Offsetting Assets and Liabilities
The Fund’s loaned securities were all subject to an enforceable Securities Lending Agency Agreement. Securities lent in accordance with the Securities Lending Agency Agreement on a gross basis were as follows:
| | | | |
Total gross amount presented on the Statements | | $ | 1,417 | |
of Assets and Liabilities1 | | | | |
Non-cash Collateral2 | | | (1,417 | ) |
| | | | |
Net Amount | | $ | — | |
| | | | |
| 1 | The amount presented on the Statements of Assets and Liabilities is not offset and is shown on a gross basis. |
| 2 | At October 31, 2018, the value of the collateral received from each borrower exceeded the value of the related securities loaned. This amount is disclosed on the Schedule of Investments. |
See notes to financial statements.
Annual Report 41

| | | | | | |
The Fund seeks a high level of total return including income generation consistent with preservation of capital by investing in a wide variety of securities across many asset classes. | | | | | | 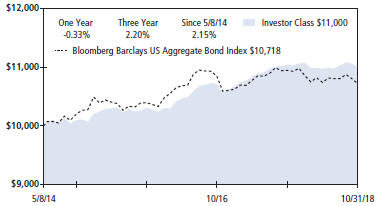
Past performance does not predict future returns. The graph does not reflect the impact of taxes or transaction costs a shareholder would pay. The Fund’s SI Class is expected to perform similarly to its Investor Class, except for class specific waivers. |
| Portfolio Composition - percent of investments | |
| |
Corporate Bond | | | 42 | % |
U.S. Treasury | | | 17 | % |
Mortgage Backed | | | 14 | % |
Bank Loans | | | 7 | % |
Asset Backed | | | 7 | % |
Other | | | 13 | % |
| | | | |
| | | | |
| | | | |
| | | | |
| | | | |
| | | | |
| This information is not part of the audited financial statements. | |
Schedule of Investments - October 31, 2018
| | | | | | |
Principal or Shares | | Security Description | | Value
(000) | |
Asset Backed (7%) | | | | |
1,170,000 | | Cedar Funding II CLO Ltd. 144A, (3 mo. LIBOR | | | | |
| | USD + 1.230%) 3.56%, 6/09/30 (a)(b) | | $ | 1,171 | |
590,000 | | Cedar Funding II CLO Ltd. 144A, (3 mo. LIBOR | | | | |
| | USD + 2.350%) 4.68%, 6/09/30 (a)(b) | | | 592 | |
914,443 | | Colony American Homes 2015-1 144A, (1 mo. | | | | |
| | LIBOR USD + 1.200%) 3.49%, 7/17/32 (a)(b) | | | 915 | |
554,849 | | Countrywide Asset-Backed Certificates, | | | | |
| | 4.71%, 10/25/46 (c) | | | 543 | |
1,629,375 | | Domino’s Pizza Master Issuer LLC 144A, (3 mo. | | | | |
| | LIBOR USD + 1.250%) 3.74%, 7/25/47 (a)(b) | | | 1,636 | |
296,250 | | Domino’s Pizza Master Issuer LLC 144A, | | | | |
| | 4.12%, 7/25/47 (b) | | | 290 | |
650,000 | | First Investors Auto Owner Trust 2016-2 144A, | | | | |
| | 2.53%, 7/15/22 (b) | | | 638 | |
876,650 | | FOCUS Brands Funding LLC 144A, | | | | |
| | 3.86%, 4/30/47 (b) | | | 870 | |
400,000 | | Grippen Park CLO Ltd. 144A, (3 mo. LIBOR | | | | |
| | USD + 3.300%) 5.77%, 1/20/30 (a)(b) | | | 402 | |
1,536,585 | | Invitation Homes 2017-SFR2 Trust 144A, (1 | | | | |
| | mo. LIBOR USD + 0.850%) | | | | |
| | 3.14%, 12/17/36 (a)(b) | | | 1,541 | |
500,000 | | LCM XXI LP 144A, (3 mo. LIBOR USD | | | | |
| | + 2.000%) 4.47%, 4/20/28 (a)(b) | | | 500 | |
800,000 | | Marathon CRE 2018 FL1 Ltd. 144A, (1 mo. | | | | |
| | LIBOR USD + 1.150%) 3.43%, 6/15/28 (a)(b) | | | 801 | |
1,500,000 | | Octagon Investment Partners 24 Ltd. 144A, (3 | | | | |
| | mo. LIBOR USD + 0.900%) | | | | |
| | 3.21%, 5/21/27 (a)(b) | | | 1,499 | |
865,000 | | Springleaf Funding Trust 2017-A 144A, | | | | |
| | 2.68%, 7/15/30 (b) | | | 847 | |
837,250 | | Taco Bell Funding LLC 144A, | | | | |
| | 3.83%, 5/25/46 (b) | | | 838 | |
1,389,500 | | Wendy’s Funding LLC 144A, 3.88%, 3/15/48 (b) | | | 1,326 | |
800,000 | | Westlake Automobile Receivables Trust 2016-2 | | | | |
| | 144A, 4.10%, 6/15/21 (b) | | | 805 | |
Total Asset Backed (Cost - $15,289) | | | 15,214 | |
| | | | | | |
Principal or Shares | | Security Description | | Value
(000) | |
Bank Loans(d) (7%) | | | | |
463,515 | | Albertson’s LLC Term Loan B4 1L, (LIBOR USD | | | | |
| | 1-Month + 2.750%) 5.05%, 8/25/21 | | $ | 463 | |
407,946 | | Allison Transmission Inc. Term Loan B3 1L, | | | | |
| | (LIBOR USD 1-Month + 1.750%) | | | | |
| | 4.04%, 9/23/22 | | | 411 | |
932,663 | | Aramark Services Inc. Term Loan B3 1L, (LIBOR | | | | |
| | USD 1-Month + 1.750%) 4.05%, 3/11/25 | | | 934 | |
995,000 | | Beacon Roofing Supply Inc. Term Loan B 1L, | | | | |
| | (LIBOR USD 1-Month + 2.250%) | | | | |
| | 4.53%, 1/02/25 | | | 987 | |
500,000 | | Berry Global Inc. Term Loan T 1L, (LIBOR USD | | | | |
| | 1-Month + 1.750%) 4.03%, 1/06/21 | | | 500 | |
562,231 | | Burlington Coat Factory Warehouse Corp. Term | | | | |
| | Loan B5 1L, (LIBOR USD 1-Month + 2.000%) | | | | |
| | 4.29%, 11/17/24 | | | 564 | |
992,500 | | Caesars Resort Collection LLC Term Loan 1L, | | | | |
| | (LIBOR USD 1-Month + 2.750%) | | | | |
| | 5.05%, 12/22/24 | | | 994 | |
481,291 | | CDW LLC Term Loan B 1L, (LIBOR USD | | | | |
| | 1-Month + 1.750%) 4.06%, 8/17/23 | | | 483 | |
995,000 | | CSC Holdings LLC Term Loan B 1L, (LIBOR | | | | |
| | USD 1-Month + 2.500%) 4.78%, 1/25/26 | | | 996 | |
478,750 | | DaVita HealthCare Partners Inc. Term Loan B | | | | |
| | 1L, (LIBOR USD 1-Month + 2.750%) | | | | |
| | 5.05%, 6/24/21 | | | 480 | |
954,959 | | Eldorado Resorts Inc. Term Loan B 1L, (LIBOR | | | | |
| | USD 1-Month + 2.250%) 4.56%, 4/17/24 | | | 957 | |
500,000 | | GOBP Holdings Inc. Term Loan B 1L, (LIBOR | | | | |
| | USD 1-Month + 3.750%) 6.03%, 10/22/25 | | | 500 | |
392,081 | | Michaels Stores Inc. Term Loan B 1L, (LIBOR | | | | |
| | USD 1-Month + 2.500%) 4.79%, 1/28/23 | | | 390 | |
986,234 | | Numericable U.S. LLC Term Loan B11 1L, | | | | |
| | (LIBOR USD 1-Month + 2.750%) | | | | |
| | 5.05%, 7/31/25 | | | 954 | |
479,132 | | Sabre GLBL Inc. Term Loan B 1L, (LIBOR USD | | | | |
| | 1-Month + 2.000%) 4.30%, 2/22/24 | | | 480 | |
42 Payden Mutual Funds
| | | | | | |
Principal or Shares | | Security Description | | Value
(000) | |
| | |
989,950 | | Sterigenics-Nordion Holdings LLC Term Loan B | | | | |
| | 1L, (LIBOR USD 1-Month + 3.000%) | | | | |
| | 5.30%, 5/15/22 | | $ | 992 | |
796,000 | | Tacala Investment Corp. Term Loan B 1L, | | | | |
| | (LIBOR USD 1-Month + 3.250%) | | | | |
| | 5.55%, 2/01/25 | | | 798 | |
1,080,045 | | Trinseo Materials Operating SCA Term Loan B | | | | |
| | 1L, (LIBOR USD 1-Month + 2.000%) | | | | |
| | 4.30%, 9/06/24 | | | 1,074 | |
545,299 | | Vantiv LLC Term Loan B3 1L, (LIBOR USD | | | | |
| | 1-Month + 1.750%) 4.03%, 10/14/23 | | | 545 | |
291,667 | | Visteon Corp. Term Loan B 1L, (LIBOR USD | | | | |
| | 1-Month + 1.750%) 4.05%, 3/24/24 | | | 290 | |
750,000 | | WMG Acquisition Corp. Term Loan F 1L, | | | | |
| | (LIBOR USD 1-Month + 2.125%) | | | | |
| | 4.43%, 11/01/23 | | | 748 | |
855,000 | | Zayo Group LLC Term Loan B2 1L, (LIBOR | | | | |
| | USD 1-Month + 2.250%) 4.55%, 1/19/24 | | | 857 | |
Total Bank Loans (Cost - $15,419) | | | 15,397 | |
Commercial Paper (1%) | | | | |
1,000,000 | | Dollar General Corp., 0.00%, 11/01/18 | | | 1,000 | |
1,000,000 | | San Diego Gas & Electric Co., 0.00%, 11/01/18 | | | 1,000 | |
Total Commercial Paper (Cost - $2,000) | | | 2,000 | |
Corporate Bond (42%) | | | | |
Financial (16%) | | | | |
440,000 | | ADCB Finance Cayman Ltd. 144A, | | | | |
| | 4.00%, 3/29/23 (b) | | | 434 | |
435,000 | | AerCap Ireland Capital DAC/AerCap Global | | | | |
| | Aviation Trust, 5.00%, 10/01/21 | | | 447 | |
400,000 | | Aircastle Ltd., 5.50%, 2/15/22 | | | 414 | |
410,000 | | Ally Financial Inc., 3.25%, 11/05/18 | | | 410 | |
660,000 | | Antares Holdings LP 144A, 6.00%, 8/15/23 (b) | | | 638 | |
770,000 | | Ares Capital Corp., 3.50%, 2/10/23 | | | 735 | |
185,000 | | Ares Capital Corp., 3.63%, 1/19/22 | | | 181 | |
430,000 | | ASB Bank Ltd. 144A, 3.75%, 6/14/23 (b) | | | 425 | |
1,045,000 | | Athene Global Funding 144A, | | | | |
| | 2.75%, 4/20/20 (b) | | | 1,031 | |
950,000 | | Bank of America Corp., (3 mo. LIBOR USD | | | | |
| | + 0.660%) 2.37%, 7/21/21 (a) | | | 932 | |
645,000 | | Bank of America Corp., (3 mo. LIBOR USD | | | | |
| | + 1.021%) 2.88%, 4/24/23 (a) | | | 624 | |
270,000 | | Barclays PLC, 3.68%, 1/10/23 | | | 262 | |
740,000 | | BMW U.S. Capital LLC 144A, | | | | |
| | 3.10%, 4/12/21 (b) | | | 733 | |
300,000 | | Capital One Bank USA NA, 2.30%, 6/05/19 | | | 299 | |
97,000 | | Carlyle Holdings Finance LLC 144A, | | | | |
| | 3.88%, 2/01/23 (b) | | | 97 | |
400,000 | | Citigroup Inc., (3 mo. LIBOR USD + 0.950%) | | | | |
| | 2.88%, 7/24/23 (a) | | | 385 | |
750,000 | | Citigroup Inc., 2.90%, 12/08/21 | | | 733 | |
485,000 | | Citigroup Inc., (3 mo. LIBOR USD + 1.023%) | | | | |
| | 3.34%, 6/01/24 (a) | | | 487 | |
130,000 | | Citigroup Inc., (3 mo. LIBOR USD + 4.478%) | | | | |
| | 6.13%, (a)(e) | | | 133 | |
510,000 | | Compass Bank, 2.88%, 6/29/22 | | | 489 | |
750,000 | | Cooperatieve Rabobank UA, 4.63%, 12/01/23 | | | 755 | |
| | | | | | |
Principal or Shares | | Security Description | | Value
(000) | |
| | |
1,045,000 | | Credit Agricole Corporate & Investment Bank | | | | |
| | SA, (3 mo. LIBOR USD + 0.625%) | | | | |
| | 3.02%, 10/03/21 (a) | | $ | 1,046 | |
425,000 | | Enstar Group Ltd., 4.50%, 3/10/22 | | | 425 | |
770,000 | | Five Corners Funding Trust 144A, | | | | |
| | 4.42%, 11/15/23 (b) | | | 787 | |
740,000 | | Ford Motor Credit Co. LLC, 2.98%, 8/03/22 | | | 695 | |
700,000 | | Ford Motor Credit Co. LLC, (3 mo. LIBOR USD | | | | |
| | + 1.235%) 3.55%, 2/15/23 (a) | | | 681 | |
250,000 | | Ford Motor Credit Co. LLC, (3 mo. LIBOR USD | | | | |
| | + 1.270%) 3.66%, 3/28/22 (a) | | | 247 | |
630,000 | | Ford Motor Credit Co. LLC, 3.81%, 1/09/24 | | | 586 | |
235,000 | | FS Investment Corp., 4.25%, 1/15/20 | | | 236 | |
705,000 | | General Motors Financial Co. Inc., (3 mo. LIBOR | | | | |
| | USD + 1.550%) 3.99%, 1/14/22 (a) | | | 715 | |
500,000 | | General Motors Financial Co. Inc., (3 mo. LIBOR | | | | |
| | USD + 3.598%) 5.75%, (a)(e) | | | 451 | |
1,135,000 | | Goldman Sachs Group Inc., (3 mo. LIBOR USD | | | | |
| | + 1.110%) 3.62%, 4/26/22 (a) | | | 1,147 | |
695,000 | | HSBC Holdings PLC, (3 mo. LIBOR USD | | | | |
| | + 1.000%) 3.32%, 5/18/24 (a) | | | 694 | |
475,000 | | International Lease Finance Corp., 4.63%, 4/15/21 | | | 482 | |
630,000 | | Lloyds Banking Group PLC, 3.00%, 1/11/22 | | | 612 | |
555,000 | | Macquarie Group Ltd. 144A, (3 mo. LIBOR | | | | |
| | USD + 1.023%) 3.19%, 11/28/23 (a)(b) | | | 530 | |
235,000 | | Mizuho Financial Group Inc. 144A, | | | | |
| | 2.63%, 4/12/21 (b) | | | 230 | |
700,000 | | Mizuho Financial Group Inc., (3 mo. LIBOR | | | | |
| | USD + 1.000%) 3.92%, 9/11/24 (a) | | | 697 | |
980,000 | | Morgan Stanley, (3 mo. LIBOR USD + 0.930%) | | | | |
| | 3.40%, 7/22/22 (a) | | | 985 | |
605,000 | | Nationwide Building Society 144A, (3 mo. | | | | |
| | LIBOR USD + 1.064%) 3.77%, 3/08/24 (a)(b) | | | 589 | |
800,000 | | Navient Corp., 5.00%, 10/26/20 | | | 806 | |
580,000 | | Realogy Group LLC/Realogy Co-Issuer Corp. | | | | |
| | 144A, 4.88%, 6/01/23 (b) | | | 528 | |
865,000 | | Regions Bank/Birmingham AL, (3 mo. LIBOR | | | | |
| | USD + 0.500%) 2.84%, 8/13/21 (a) | | | 866 | |
380,000 | | Regions Financial Corp., 3.80%, 8/14/23 | | | 376 | |
500,000 | | Royal Bank of Scotland Group PLC, (3 mo. | | | | |
| | LIBOR USD + 1.480%) 3.50%, 5/15/23 (a) | | | 481 | |
850,000 | | Santander Holdings USA Inc., 3.70%, 3/28/22 | | | 836 | |
168,000 | | Scentre Group Trust 1/Scentre Group Trust 2 | | | | |
| | 144A, 2.38%, 11/05/19 (b) | | | 166 | |
450,000 | | Senior Housing Properties Trust, | | | | |
| | 4.75%, 5/01/24 | | | 446 | |
160,000 | | Senior Housing Properties Trust, | | | | |
| | 6.75%, 4/15/20 | | | 164 | |
580,000 | | SLM Corp., 5.13%, 4/05/22 | | | 579 | |
675,000 | | Sumitomo Mitsui Financial Group Inc., | | | | |
| | 2.78%, 7/12/22 | | | 653 | |
245,000 | | Suncorp-Metway Ltd. 144A, 2.35%, 4/27/20 (b) | | | 241 | |
1,030,000 | | SunTrust Bank/Atlanta GA, (3 mo. LIBOR USD | | | | |
| | + 0.500%) 3.53%, 10/26/21 (a) | | | 1,030 | |
150,000 | | Synchrony Financial, 3.75%, 8/15/21 | | | 148 | |
935,000 | | Toronto-Dominion Bank, 3.15%, 9/17/20 | | | 934 | |
Annual Report 43

| | | | | | |
Principal or Shares | | Security Description | | Value
(000) | |
| | |
455,000 | | VEREIT Operating Partnership LP, | | | | |
| | 3.00%, 2/06/19 | | $ | 455 | |
505,000 | | VEREIT Operating Partnership LP, | | | | |
| | 4.60%, 2/06/24 | | | 506 | |
1,000,000 | | VFH Parent LLC/Orchestra Co-Issuer Inc. 144A, | | | | |
| | 6.75%, 6/15/22 (b) | | | 1,022 | |
| | | | | 32,716 | |
Industrial (19%) | | | | |
300,000 | | 1011778 BC ULC/New Red Finance Inc. 144A, | | | | |
| | 4.63%, 1/15/22 (b) | | | 298 | |
430,000 | | 1011778 BC ULC/New Red Finance Inc. 144A, | | | | |
| | 5.00%, 10/15/25 (b) | | | 404 | |
610,000 | | AbbVie Inc., 3.38%, 11/14/21 | | | 607 | |
405,000 | | AbbVie Inc., 3.75%, 11/14/23 | | | 402 | |
8,700,000 | | America Movil SAB de CV, 6.00%, 6/09/19 | | | | |
| | MXN (f) | | | 422 | |
189,466 | | American Airlines 2013-2 Class B Pass-Through | | | | |
| | Trust 144A, 5.60%, 7/15/20 (b) | | | 193 | |
400,000 | | Anglo American Capital PLC 144A, | | | | |
| | 4.13%, 4/15/21 (b) | | | 402 | |
625,000 | | Anheuser-Busch InBev Worldwide Inc., (3 mo. | | | | |
| | LIBOR USD + 0.740%) 3.17%, 1/12/24 (a) | | | 625 | |
900,000 | | AstraZeneca PLC, (3 mo. LIBOR USD | | | | |
| | + 0.665%) 2.98%, 8/17/23 (a) | | | 896 | |
1,145,000 | | AT&T Inc., (3 mo. LIBOR USD + 1.180%) | | | | |
| | 3.51%, 6/12/24 (a) | | | 1,149 | |
540,000 | | Aviation Capital Group LLC 144A, | | | | |
| | 3.88%, 5/01/23 (b) | | | 534 | |
554,000 | | Bausch Health Cos. Inc. 144A, | | | | |
| | 7.50%, 7/15/21 (b) | | | 564 | |
105,000 | | Baxalta Inc., 2.88%, 6/23/20 | | | 104 | |
715,000 | | Bayer U.S. Finance II LLC 144A, (3 mo. LIBOR | | | | |
| | USD + 0.630%) 3.00%, 6/25/21 (a)(b) | | | 716 | |
350,000 | | Bayer U.S. Finance II LLC 144A, | | | | |
| | 3.50%, 6/25/21 (b) | | | 348 | |
500,000 | | Blue Cross & Blue Shield of Minnesota 144A, | | | | |
| | 3.79%, 5/01/25 (b) | | | 475 | |
580,000 | | Boise Cascade Co. 144A, 5.63%, 9/01/24 (b) | | | 573 | |
300,000 | | BWAY Holding Co. 144A, 7.25%, 4/15/25 (b) | | | 286 | |
300,000 | | CCO Holdings LLC/CCO Holdings Capital | | | | |
| | Corp., 5.75%, 9/01/23 | | | 303 | |
200,000 | | Change Healthcare Holdings LLC/Change | | | | |
| | Healthcare Finance Inc. 144A, 5.75%, 3/01/25 (b) | | | 196 | |
385,000 | | Charter Communications Operating LLC/Charter | | | | |
| | Communications Operating Capital, | | | | |
| | 4.50%, 2/01/24 | | | 386 | |
500,000 | | Churchill Downs Inc. 144A, 4.75%, 1/15/28 (b) | | | 458 | |
600,000 | | Comcast Corp., (3 mo. LIBOR USD + 0.440%) | | | | |
| | 2.85%, 10/01/21 (a) | | | 600 | |
525,000 | | Comcast Corp., 3.45%, 10/01/21 | | | 525 | |
430,000 | | CommScope Inc. 144A, 5.00%, 6/15/21 (b) | | | 430 | |
1,200,000 | | Conagra Brands Inc., 3.80%, 10/22/21 | | | 1,202 | |
320,000 | | Continental Resources Inc./OK, 5.00%, 9/15/22 | | | 323 | |
810,000 | | CVS Health Corp., (3 mo. LIBOR USD | | | | |
| | + 0.720%) 3.05%, 3/09/21 (a) | | | 815 | |
810,000 | | CVS Health Corp., 3.70%, 3/09/23 | | | 800 | |
| | | | | | |
Principal or Shares | | Security Description | | Value
(000) | |
| | |
300,000 | | DaVita Inc., 5.13%, 7/15/24 | | $ | 287 | |
900,000 | | Dell International LLC/EMC Corp. 144A, | | | | |
| | 4.42%, 6/15/21 (b) | | | 908 | |
600,000 | | Dell International LLC/EMC Corp. 144A, | | | | |
| | 5.45%, 6/15/23 (b) | | | 622 | |
250,000 | | El Corte Ingles SA 144A, 3.00%, 3/15/24 | | | | |
| | EUR (b)(f) | | | 285 | |
470,000 | | Elanco Animal Health Inc. 144A, | | | | |
| | 3.91%, 8/27/21 (b) | | | 470 | |
900,000 | | Express Scripts Holding Co., (3 mo. LIBOR USD | | | | |
| | + 0.750%) 3.06%, 11/30/20 (a) | | | 900 | |
860,000 | | First Data Corp. 144A, 7.00%, 12/01/23 (b) | | | 892 | |
500,000 | | Halfmoon Parent Inc. 144A, (3 mo. LIBOR USD | | | | |
| | + 0.650%) 2.98%, 9/17/21 (a)(b) | | | 500 | |
800,000 | | Halfmoon Parent Inc. 144A, 3.20%, 9/17/20 (b) | | | 796 | |
400,000 | | Halfmoon Parent Inc. 144A, 3.75%, 7/15/23 (b) | | | 397 | |
500,000 | | HCA Inc., 5.00%, 3/15/24 | | | 507 | |
795,000 | | Hewlett Packard Enterprise Co., (3 mo. LIBOR | | | | |
| | USD + 0.720%) 3.06%, 10/05/21 (a) | | | 795 | |
270,000 | | Hill-Rom Holdings Inc. 144A, | | | | |
| | 5.00%, 2/15/25 (b) | | | 262 | |
225,000 | | James Hardie International Finance DAC 144A, | | | | |
| | 3.63%, 10/01/26 EUR (b)(f) | | | 255 | |
310,000 | | Keurig Dr Pepper Inc. 144A, 4.06%, 5/25/23 (b) | | | 309 | |
500,000 | | Keysight Technologies Inc., 3.30%, 10/30/19 | | | 499 | |
200,000 | | Land O’ Lakes Inc. 144A, 7.00%, (b)(e) | | | 200 | |
500,526 | | Latam Airlines 2015-1 Pass-Through Trust A, | | | | |
| | 4.20%, 11/15/27 | | | 485 | |
1,000,000 | | Lennar Corp., 4.75%, 11/29/27 | | | 939 | |
420,000 | | Level 3 Parent LLC, 5.75%, 12/01/22 | | | 420 | |
530,000 | | Meritage Homes Corp., 5.13%, 6/06/27 | | | 468 | |
225,000 | | Microchip Technology Inc. 144A, | | | | |
| | 3.92%, 6/01/21 (b) | | | 224 | |
635,000 | | Mylan NV, 3.15%, 6/15/21 | | | 620 | |
775,000 | | Nissan Motor Acceptance Corp. 144A, | | | | |
| | 2.15%, 7/13/20 (b) | | | 758 | |
1,050,000 | | Northwell Healthcare Inc., 4.26%, 11/01/47 | | | 957 | |
600,000 | | NOVA Chemicals Corp. 144A, 5.25%, 6/01/27 (b) | | | 543 | |
430,000 | | Orange SA, 1.63%, 11/03/19 | | | 423 | |
250,000 | | Orange SA, 9.00%, 3/01/31 | | | 345 | |
500,000 | | Penske Automotive Group Inc., 5.38%, 12/01/24 | | | 488 | |
85,000 | | Seagate HDD Cayman, 4.88%, 3/01/24 | | | 81 | |
555,000 | | Shire Acquisitions Investments Ireland DAC, | | | | |
| | 2.40%, 9/23/21 | | | 534 | |
450,000 | | Sirius XM Radio Inc. 144A, 5.00%, 8/01/27 (b) | | | 425 | |
885,000 | | SMBC Aviation Capital Finance DAC 144A, | | | | |
| | 2.65%, 7/15/21 (b) | | | 854 | |
400,000 | | Sonic Automotive Inc., 5.00%, 5/15/23 | | | 374 | |
290,000 | | Sprint Communications Inc, 6.00%, 11/15/22 | | | 293 | |
300,000 | | Sprint Corp., 7.88%, 9/15/23 | | | 321 | |
500,000 | | Standard Industries Inc./NJ 144A, 4.75%, 1/15/28 (b) | | | 449 | |
300,000 | | Tenet Healthcare Corp., 8.13%, 4/01/22 | | | 314 | |
500,000 | | Teva Pharmaceutical Finance Netherlands III BV, | | | | |
| | 2.20%, 7/21/21 | | | 467 | |
815,000 | | Toledo Hospital, 5.33%, 11/15/28 | | | 809 | |
44 Payden Mutual Funds
| | | | | | |
Principal or Shares | | Security Description | | Value
(000) | |
| | |
860,000 | | United Continental Holdings Inc., | | | | |
| | 5.00%, 2/01/24 (g) | | $ | 846 | |
500,000 | | United Rentals North America Inc., | | | | |
| | 4.63%, 10/15/25 | | | 464 | |
300,000 | | United Rentals North America Inc., | | | | |
| | 5.88%, 9/15/26 | | | 295 | |
805,000 | | United Technologies Corp., 3.65%, 8/16/23 | | | 798 | |
800,000 | | VeriSign Inc., 4.75%, 7/15/27 | | | 756 | |
165,000 | | WestRock MWV LLC, 7.38%, 9/01/19 | | | 170 | |
430,000 | | XPO Logistics Inc. 144A, 6.13%, 9/01/23 (b) | | | 442 | |
| | | | | 39,282 | |
Utility (7%) | | | | |
313,462 | | Cenovus Energy Inc., 5.70%, 10/15/19 | | | 320 | |
1,120,000 | | CenterPoint Energy Inc., 3.60%, 11/01/21 | | | 1,120 | |
550,000 | | Colorado Interstate Gas Co. LLC/Colorado | | | | |
| | Interstate Issuing Corp. 144A, | | | | |
| | 4.15%, 8/15/26 (b) | | | 534 | |
275,000 | | Comision Federal de Electricidad 144A, | | | | |
| | 4.88%, 5/26/21 (b) | | | 277 | |
700,000 | | Comision Federal de Electricidad 144A, | | | | |
| | 4.88%, 1/15/24 (b) | | | 692 | |
800,000 | | Dominion Energy Inc., 4.10%, 4/01/21 | | | 807 | |
380,000 | | DTE Energy Co., 3.70%, 8/01/23 | | | 378 | |
430,000 | | Emera U.S. Finance LP, 2.70%, 6/15/21 | | | 417 | |
260,000 | | Enbridge Inc., 2.90%, 7/15/22 | | | 251 | |
750,000 | | Energy Transfer LP, 4.25%, 3/15/23 | | | 744 | |
370,000 | | Energy Transfer Partners LP/Regency Energy | | | | |
| | Finance Corp., 5.00%, 10/01/22 | | | 382 | |
500,000 | | Entergy Louisiana LLC, 5.00%, 7/15/44 | | | 494 | |
500,000 | | Enviva Partners LP/Enviva Partners Finance | | | | |
| | Corp., 8.50%, 11/01/21 | | | 516 | |
355,000 | | EQM Midstream Partners LP, 4.75%, 7/15/23 | | | 359 | |
615,000 | | EQT Corp., 3.00%, 10/01/22 | | | 590 | |
420,000 | | Exelon Generation Co. LLC, 4.25%, 6/15/22 | | | 425 | |
450,000 | | Mississippi Power Co., (3 mo. LIBOR USD | | | | |
| | + 0.650%) 3.03%, 3/27/20 (a) | | | 450 | |
900,000 | | Nabors Industries Inc., 4.63%, 9/15/21 | | | 871 | |
800,000 | | Pertamina Persero PT 144A, 4.30%, 5/20/23 (b) | | | 783 | |
470,000 | | QEP Resources Inc., 5.38%, 10/01/22 | | | 465 | |
1,100,000 | | Sabine Pass Liquefaction LLC, 5.75%, 5/15/24 | | | 1,166 | |
845,000 | | Sinopec Group Overseas Development 2012 Ltd. | | | | |
| | 144A, 3.90%, 5/17/22 (b) | | | 844 | |
470,000 | | SM Energy Co., 6.13%, 11/15/22 | | | 478 | |
500,000 | | Transocean Inc. 144A, 9.00%, 7/15/23 (b) | | | 526 | |
470,000 | | Whiting Petroleum Corp., 5.75%, 3/15/21 | | | 475 | |
| | | | | 14,364 | |
Total Corporate Bond (Cost - $88,384) | | | 86,362 | |
Foreign Government (6%) | | | | |
955,000 | | Croatia Government International Bond 144A, | | | | |
| | 6.38%, 3/24/21 (b) | | | 1,004 | |
910,000 | | Dominican Republic International Bond 144A, | | | | |
| | 7.50%, 5/06/21 (b) | | | 944 | |
400,000 | | Egypt Government International Bond 144A, | | | | |
| | 4.75%, 4/16/26 EUR (b)(f) | | | 426 | |
850,000 | | Export-Import Bank of India, 3.88%, 10/02/19 | | | 852 | |
430,000 | | Georgia Government International Bond 144A, | | | | |
| | 6.88%, 4/12/21 (b) | | | 453 | |
| | | | | | |
Principal or Shares | | Security Description | | Value
(000) | |
| | |
950,000 | | Guatemala Government Bond 144A, | | | | |
| | 5.75%, 6/06/22 (b) | | $ | 975 | |
500,000 | | Honduras Government International Bond 144A, | | | | |
| | 8.75%, 12/16/20 (b) | | | 540 | |
460,000 | | Indonesia Government International Bond 144A, | | | | |
| | 5.88%, 3/13/20 (b) | | | 475 | |
355,000 | | Indonesia Government International Bond, | | | | |
| | 5.88%, 3/13/20 (h) | | | 367 | |
645,000 | | Kenya Government International Bond 144A, | | | | |
| | 5.88%, 6/24/19 (b) | | | 650 | |
500,000 | | Oman Government International Bond 144A, | | | | |
| | 5.63%, 1/17/28 (b) | | | 478 | |
560,000 | | Provincia de Buenos Aires/Argentina 144A, | | | | |
| | 5.75%, 6/15/19 (b) | | | 559 | |
450,000 | | Republic of Armenia International Bond 144A, | | | | |
| | 6.00%, 9/30/20 (b) | | | 456 | |
665,000 | | Saudi Government International Bond 144A, | | | | |
| | 3.25%, 10/26/26 (b) | | | 616 | |
750,000 | | Senegal Government International Bond 144A, | | | | |
| | 4.75%, 3/13/28 EUR (b)(f) | | | 795 | |
294,000 | | Senegal Government International Bond 144A, | | | | |
| | 8.75%, 5/13/21 (b) | | | 314 | |
1,000,000 | | Serbia International Bond 144A, | | | | |
| | 4.88%, 2/25/20 (b) | | | 1,010 | |
450,000 | | Sri Lanka Government International Bond 144A, | | | | |
| | 5.88%, 7/25/22 (b) | | | 416 | |
1,000,000 | | Vietnam Government International Bond 144A, | | | | |
| | 6.75%, 1/29/20 (b) | | | 1,031 | |
Total Foreign Government (Cost - $12,763) | | | 12,361 | |
Mortgage Backed (14%) | | | | |
138,269 | | Alternative Loan Trust 2005-47CB, | | | | |
| | 5.50%, 10/25/35 | | | 117 | |
158,763 | | Alternative Loan Trust 2005-54CB, | | | | |
| | 5.13%, 11/25/35 | | | 135 | |
819,788 | | Alternative Loan Trust 2005-54CB, | | | | |
| | 5.50%, 11/25/35 | | | 713 | |
291,668 | | Alternative Loan Trust 2007-9T1, | | | | |
| | 6.00%, 5/25/37 | | | 215 | |
420,777 | | American Home Mortgage Investment Trust | | | | |
| | 2006-3, (6 mo. LIBOR USD + 1.750%) | | | | |
| | 4.35%, 12/25/36 (a) | | | 364 | |
1,000,000 | | AREIT 2018-CRE2 Trust 144A, (1 mo. LIBOR | | | | |
| | USD + 1.900%) 4.18%, 11/14/35 (a)(b) | | | 1,000 | |
238,910 | | Banc of America Funding 2005-H Trust, | | | | |
| | 4.34%, 11/20/35 (c) | | | 213 | |
13,496,172 | | BANK 2018-BNK14, 0.53%, 9/15/60 (c) | | | 516 | |
459,123 | | BCAP LLC Trust 2007-AA2, 6.00%, 4/25/37 | | | 378 | |
217,755 | | CHL Mortgage Pass-Through Trust 2004-29, | | | | |
| | 2.61%, 2/25/35 (c) | | | 189 | |
1,230,000 | | Connecticut Avenue Securities Trust 2018-R07 | | | | |
| | 144A, (1 mo. LIBOR USD + 0.750%) | | | | |
| | 3.03%, 4/25/31 (a)(b) | | | 1,230 | |
103,191 | | CSMC Mortgage-Backed Trust 2006-7, | | | | |
| | 6.00%, 8/25/36 | | | 85 | |
207,276 | | CSMC Trust 2013-IVR3 144A, | | | | |
| | 1.55%, 5/25/43 (b)(c) | | | 199 | |
Annual Report 45
| | | | | | |
Principal or Shares | | Security Description | | Value
(000) | |
| | |
597,401 | | Fannie Mae Connecticut Avenue Securities, (1 | | | | |
| | mo. LIBOR USD + 0.550%) 2.83%, 1/25/30 (a) | | $ | 597 | |
691,318 | | Fannie Mae Connecticut Avenue Securities, (1 | | | | |
| | mo. LIBOR USD + 0.950%) | | | | |
| | 3.23%, 10/25/29 (a) | | | 695 | |
710,000 | | Fannie Mae Connecticut Avenue Securities, (1 | | | | |
| | mo. LIBOR USD + 2.100%) 4.38%, 3/25/31 (a) | | | 704 | |
550,000 | | Fannie Mae Connecticut Avenue Securities, (1 | | | | |
| | mo. LIBOR USD + 2.200%) 4.48%, 8/25/30 (a) | | | 553 | |
403,840 | | Fannie Mae Connecticut Avenue Securities, (1 | | | | |
| | mo. LIBOR USD + 2.900%) 5.18%, 7/25/24 (a) | | | 432 | |
446,795 | | Fannie Mae Connecticut Avenue Securities, (1 | | | | |
| | mo. LIBOR USD + 3.000%) 5.28%, 7/25/24 (a) | | | 476 | |
714,107 | | Fannie Mae Connecticut Avenue Securities, (1 | | | | |
| | mo. LIBOR USD + 5.000%) 7.28%, 7/25/25 (a) | | | 794 | |
328,115 | | Fannie Mae Connecticut Avenue Securities, (1 | | | | |
| | mo. LIBOR USD + 5.700%) 7.98%, 4/25/28 (a) | | | 380 | |
499,669 | | Fannie Mae Connecticut Avenue Securities, (1 | | | | |
| | mo. LIBOR USD + 10.250%) | | | | |
| | 12.53%, 1/25/29 (a) | | | 661 | |
774,640 | | Fannie Mae Connecticut Avenue Securities, (1 | | | | |
| | mo. LIBOR USD + 11.750%) | | | | |
| | 14.03%, 10/25/28 (a) | | | 1,101 | |
498,750 | | Fannie Mae Connecticut Avenue Securities, (1 | | | | |
| | mo. LIBOR USD + 12.250%) | | | | |
| | 14.53%, 9/25/28 (a) | | | 732 | |
1,825,000 | | Freddie Mac Multifamily Structured | | | | |
| | Pass-Through Certificates, 2.45%, 8/25/23 | | | 1,755 | |
1,042,000 | | Freddie Mac Multifamily Structured | | | | |
| | Pass-Through Certificates, 3.32%, 2/25/23 (c) | | | 1,042 | |
1,100,000 | | Freddie Mac Stacr Trust 2018-HQA2, (1 mo. | | | | |
| | LIBOR USD + 0.750%) 3.04%, 10/25/48 (a) | | | 1,100 | |
550,000 | | Freddie Mac Structured Agency Credit Risk Debt | | | | |
| | Notes, (1 mo. LIBOR USD + 2.300%) | | | | |
| | 4.58%, 9/25/30 (a) | | | 551 | |
1,000,000 | | Freddie Mac Structured Agency Credit Risk Debt | | | | |
| | Notes, (1 mo. LIBOR USD + 3.600%) | | | | |
| | 5.88%, 4/25/24 (a) | | | 1,103 | |
600,000 | | Freddie Mac Structured Agency Credit Risk Debt | | | | |
| | Notes, (1 mo. LIBOR USD + 4.600%) | | | | |
| | 6.88%, 12/25/42 (a) | | | 640 | |
497,865 | | Freddie Mac Structured Agency Credit Risk Debt | | | | |
| | Notes, (1 mo. LIBOR USD + 8.800%) | | | | |
| | 11.08%, 3/25/28 (a) | | | 616 | |
498,086 | | Freddie Mac Structured Agency Credit Risk Debt | | | | |
| | Notes, (1 mo. LIBOR USD + 9.350%) | | | | |
| | 11.63%, 4/25/28 (a) | | | 648 | |
332,309 | | Freddie Mac Structured Agency Credit Risk Debt | | | | |
| | Notes, (1 mo. LIBOR USD + 10.500%) | | | | |
| | 12.78%, 5/25/28 (a) | | | 449 | |
498,534 | | Freddie Mac Structured Agency Credit Risk Debt | | | | |
| | Notes, (1 mo. LIBOR USD + 11.250%) | | | | |
| | 13.53%, 12/25/28 (a) | | | 700 | |
249,595 | | Freddie Mac Structured Agency Credit Risk Debt | | | | |
| | Notes, (1 mo. LIBOR USD + 11.250%) | | | | |
| | 13.53%, 10/25/29 (a) | | | 289 | |
| | | | | | |
Principal or Shares | | Security Description | | Value
(000) | |
| | |
450,000 | | GAHR Commercial Mortgage Trust 2015-NRF | | | | |
| | 144A, 3.38%, 12/15/34 (b)(c) | | $ | 443 | |
383,885 | | GSMPS Mortgage Loan Trust 2005-RP2 144A, | | | | |
| | (1 mo. LIBOR USD + 0.350%) | | | | |
| | 2.63%, 3/25/35 (a)(b) | | | 362 | |
57,497 | | JP Morgan Mortgage Trust 2006-A4, | | | | |
| | 4.15%, 6/25/36 (c) | | | 55 | |
262,368 | | JP Morgan Mortgage Trust 2014-2 144A, | | | | |
| | 3.00%, 6/25/29 (b)(c) | | | 258 | |
110,866 | | Nationstar Mortgage Loan Trust 2013-A 144A, | | | | |
| | 3.75%, 12/25/52 (b)(c) | | | 111 | |
109,506 | | New Residential Mortgage Loan Trust 2015-1 | | | | |
| | 144A, 3.75%, 5/28/52 (b)(c) | | | 109 | |
452,805 | | New Residential Mortgage Loan Trust 2015-2 | | | | |
| | 144A, 3.75%, 8/25/55 (b)(c) | | | 451 | |
820,675 | | New Residential Mortgage Loan Trust 2017-4 | | | | |
| | 144A, 4.00%, 5/25/57 (b)(c) | | | 823 | |
1,364,730 | | New Residential Mortgage Loan Trust 2017-5 | | | | |
| | 144A, (1 mo. LIBOR USD + 1.500%) | | | | |
| | 3.78%, 6/25/57 (a)(b) | | | 1,401 | |
146,631 | | PHH Alternative Mortgage Trust Series 2007-1, | | | | |
| | 6.00%, 2/25/37 | | | 131 | |
208,459 | | RFMSI Series 2006-SA2 Trust, | | | | |
| | 4.89%, 8/25/36 (c) | | | 173 | |
1,000,000 | | Seasoned Credit Risk Transfer Trust 144A, | | | | |
| | 3.00%, 9/25/55 (b)(c) | | | 961 | |
470,396 | | Sequoia Mortgage Trust 2017-CH1 144A, | | | | |
| | 3.50%, 8/25/47 (b)(c) | | | 465 | |
248,386 | | WaMu Mortgage Pass-Through Certificates | | | | |
| | Series 2006-AR10 Trust, 3.87%, 9/25/36 (c) | | | 242 | |
629,603 | | WaMu Mortgage Pass-Through Certificates | | | | |
| | Series 2007-HY1 Trust, 3.64%, 2/25/37 (c) | | | 620 | |
Total Mortgage Backed (Cost - $26,678) | | | 27,977 | |
Municipal (2%) | | | | |
650,000 | | California Pollution Control Financing Authority | | | | |
| | 144A, 5.00%, 7/01/37 (b) | | | 677 | |
595,000 | | California Pollution Control Financing Authority | | | | |
| | 144A, 5.00%, 11/21/45 (b) | | | 596 | |
250,000 | | District of Columbia Water & Sewer Authority, | | | | |
| | 4.81%, 10/01/14 | | | 262 | |
1,500,000 | | Municipal Improvement Corp. of Los Angeles, | | | | |
| | 3.43%, 11/01/21 | | | 1,505 | |
1,000,000 | | New York Transportation Development Corp., | | | | |
| | 5.00%, 7/01/41 | | | 1,043 | |
Total Municipal (Cost - $4,163) | | | 4,083 | |
U.S. Treasury (16%) | | | | |
2,170,000 | | U.S. Treasury Bill, 2.19%, 11/29/18 (i) | | | 2,167 | |
1,800,000 | | U.S. Treasury Bond, 2.75%, 11/15/47 | | | 1,583 | |
1,000,000 | | U.S. Treasury Bond, 3.00%, 8/15/48 | | | 925 | |
850,000 | | U.S. Treasury Bond, 3.13%, 5/15/48 | | | 806 | |
370,000 | | U.S. Treasury Note, 1.25%, 11/15/18 (j) | | | 370 | |
440,000 | | U.S. Treasury Note, 2.25%, 8/15/27 | | | 410 | |
3,600,000 | | U.S. Treasury Note, 2.63%, 6/30/23 | | | 3,545 | |
12,680,000 | | U.S. Treasury Note, 2.75%, 7/31/23 (k) | | | 12,550 | |
3,610,000 | | U.S. Treasury Note, 2.75%, 6/30/25 | | | 3,541 | |
4,695,000 | | U.S. Treasury Note, 2.75%, 2/15/28 | | | 4,544 | |
1,800,000 | | U.S. Treasury Note, 2.88%, 5/15/28 | | | 1,759 | |
46 Payden Mutual Funds
| | | | | | |
Principal or Shares | | Security Description | | Value
(000) | |
| | |
1,600,000 | | U.S. Treasury Note, 2.88%, 8/15/28 | | $ | 1,562 | |
Total U.S. Treasury (Cost - $34,416) | | | 33,762 | |
Stocks (3%) | | | | |
Master Limited Partnership (1%) | | | | |
23,040 | | Antero Midstream Partners LP | | | 695 | |
23,808 | | Energy Transfer LP | | | 370 | |
23,870 | | Enterprise Products Partners LP | | | 640 | |
9,650 | | Magellan Midstream Partners LP | | | 595 | |
| | | | | 2,300 | |
Preferred Stock (1%) | | | | |
7,500 | | Bank of America Corp., 6.50% | | | 193 | |
6,650 | | BB&T Corp., 5.63% (g) | | | 167 | |
8,000 | | Charles Schwab Corp., 5.95% | | | 207 | |
3,840 | | Goldman Sachs Group Inc., 6.30% | | | 98 | |
3,550 | | US Bancorp, 6.50% | | | 96 | |
270 | | Wells Fargo & Co., 7.50% | | | 343 | |
| | | | | 1,104 | |
Real Estate Investment Trust (1%) | | | | |
2,700 | | AvalonBay Communities Inc. | | | 473 | |
4,490 | | CoreSite Realty Corp. | | | 421 | |
4,180 | | Crown Castle International Corp. | | | 455 | |
7,400 | | Prologis Inc. | | | 477 | |
| | | | | 1,826 | |
Total Stocks (Cost - $5,105) | | | 5,230 | |
Investment Company (1%) | | | | |
1,289,963 | | Payden Cash Reserves Money Market Fund * | | | | |
| | (Cost - $1,290) | | | 1,290 | |
Purchased Call Swaptions (0%) | | | | |
Total Purchased Call Swaptions (Cost - $306) | | | 245 | |
Total Investments, Before Options Written (Cost - $205,813) (99%) | | | 203,921 | |
Written Swaptions (0%) | | | | |
Total Written Call Swaptions (Cost - $(261)) | | | (178 | ) |
Total Investments (Cost - $205,552) (99%) | | | 203,743 | |
Other Assets, net of Liabilities (1%) | | | 1,151 | |
Net Assets (100%) | | $ | 204,894 | |
| (a) | Floating rate security. The rate shown reflects the rate in effect at October 31, 2018. See Note 2 in the Notes to Financial Statements. |
| (b) | Security offered only to qualified institutional investors, and thus is not registered for sale to the public under rule 144A of the Securities Act of 1933. It has been deemed liquid under guidelines approved by the Board. |
| (c) | Variable rate security. Interest rate disclosed is as of the most recent information available. Certain variable rate securities are not based on a published reference rate and spread but are determined by the issuer or agent and are based on current market conditions. These securities do not indicate a reference rate and spread in their description above. See Note 2 in the Notes to Financial Statements. |
| (d) | Floating rate security. The rate shown reflects the rate in effect at October 31, 2018. The stated maturity is subject to prepayments. See Note 2 in the Notes to Financial Statements. |
| (e) | Perpetual security with no stated maturity date. |
| (f) | Principal in foreign currency. |
| (g) | All or a portion of these securities are on loan. At October 31, 2018, the total market value of the Fund’s securities on loan is $760 and the total market value of the collateral held by the Fund is $788. Amounts in 000s. |
| (h) | Security offered and sold outside the United States, and thus is exempt from registration under Regulation S of the Securities Act of 1933. It has been deemed liquid under guidelines approved by the Board. |
| (i) | Yield to maturity at time of purchase. |
| (j) | All or a portion of the security is pledged to cover futures contract margin requirements. |
| (k) | All or a portion of security has been pledged in connection with outstanding centrally cleared swaps. |
Annual Report 47
Purchased Swaptions
| | | | | | | | | | | | | | | | | | | | |
| Description | | Counterparty | | | Notional
Amount
(000s) | | | Expiration
date | | | Value
(000s) | | | Call/Put | |
Purchased Call Swaptions 0.0% | | | | | | | | | | | | | |
1-Year Interest Rate Swap, 6/26/20, Pay Fixed 3.15% Semi- Annually, Receive Pay Variable Quarterly, 3-Month USD LIBOR | | | Citibank, N.A. | | | $ | 51,200 | | | | 06/26/2020 | | | $ | 163 | | | | Call | |
2-Year Interest Rate Swap, 9/27/19, Pay Fixed 2.975% Semi- Annually, Receive Pay Variable Quarterly, 3-Month USD LIBOR | | | Barclays Bank PLC | | | | 27,000 | | | | 09/27/2019 | | | | 82 | | | | Call | |
| | | | | | | | | | | | | | | | | | | | |
Total Swaptions | | | | | | | | | | | | | | $ | 245 | | | | | |
| | | | | | | | | | | | | | | | | | | | |
Written Swaptions
| | | | | | | | | | | | | | | | | | | | |
| Description | | Counterparty | | | Notional
Amount
(000s) | | | Expiration
date | | | Value
(000s) | | | Call/Put | |
Written Call Swaptions 0.0% | | | | | | | | | | | | | |
1-Year Interest Rate Swap, 6/26/19, Pay Fixed 3.15% Semi- Annually, Receive Pay Variable Quarterly, 3-Month USD LIBOR | | | Citibank, N.A. | | | | $51,200 | | | | 06/26/2019 | | | $ | (103 | ) | | | Call | |
5-Year Interest Rate Swap, 9/27/19, Pay Fixed 2.90% Semi- Annually, Receive Pay Variable Quarterly, 3-Month USD LIBOR | | | Barclays Bank PLC | | | | 11,200 | | | | 09/27/2019 | | | | (75 | ) | | | Call | |
| | | | | | | | | | | | | | | | | | | | |
Total Swaptions | | | | | | | | | | | | | | $ | (178 | ) | | | | |
| | | | | | | | | | | | | | | | | | | | |
Open Forward Currency Contracts to USD
| | | | | | | | | | | | |
Currency Purchased (000s) | | Currency
Sold (000s) | | Counterparty | | Settlement
Date | | | Unrealized
Appreciation
(Depreciation)
(000s) | |
Assets: | | | | | | | | | | | | |
GBP 2,391 | | USD 3,061 | | State Street Bank & Trust Co. | | | 01/17/2019 | | | $ | 9 | |
USD 2,649 | | AUD 3,708 | | Barclays Bank PLC | | | 12/14/2018 | | | | 22 | |
USD 2,633 | | CAD 3,404 | | Barclays Bank PLC | | | 12/14/2018 | | | | 45 | |
USD 451 | | MXN 8,700 | | Barclays Bank PLC | | | 12/17/2018 | | | | 26 | |
USD 1,875 | | EUR 1,618 | | Citibank, N.A. | | | 11/08/2018 | | | | 41 | |
USD 428 | | ZAR 6,310 | | HSBC Bank USA, N.A. | | | 11/13/2018 | | | | 1 | |
USD 3,070 | | EUR 2,685 | | State Street Bank & Trust Co. | | | 01/17/2019 | | | | 6 | |
| | | | | | | | | | | | |
| | | | | | | | | | | 150 | |
| | | | | | | | | | | | |
Liabilities: | | | | | | | | | | | | |
AUD 3,708 | | USD 2,632 | | Barclays Bank PLC | | | 12/14/2018 | | | | (5 | ) |
CAD 3,404 | | USD 2,604 | | Barclays Bank PLC | | | 12/14/2018 | | | | (16 | ) |
ZAR 6,310 | | USD 468 | | HSBC Bank USA, N.A. | | | 11/13/2018 | | | | (41 | ) |
| | | | | | | | | | | (62 | ) |
| | | | | | | | | | | | |
Net Unrealized Appreciation (Depreciation) | | | $ | 88 | |
| | | | | | | | | | | | |
48 Payden Mutual Funds
Open Futures Contracts
| | | | | | | | | | | | | | | | | | | | |
| Contract Type | | Number of
Contracts | | | Expiration
Date | | | Notional
Amount
(000s) | | | Current
Value
(000s) | | | Unrealized
Appreciation
(Depreciation)
(000s) | |
Long Contracts: | | | | | | | | | | | | | | | | | |
| 3 Month LIBOR | | | 252 | | | | Dec-19 | | | $ | 60 | | | $ | (2 | ) | | $ | (2 | ) |
| U.S. 10-Year Ultra Future | | | 23 | | | | Dec-18 | | | | 2,878 | | | | (74 | ) | | | (74 | ) |
| U.S. Treasury 10-Year Note Future | | | 10 | | | | Dec-18 | | | | 1,184 | | | | (18 | ) | | | (18 | ) |
| U.S. Treasury 5-Year Note Future | | | 126 | | | | Dec-18 | | | | 14,160 | | | | (117 | ) | | | (117 | ) |
| | | | | | | | | | | | | | | | | | | | |
| | | | | | | | | | | | | | | | | | | (211 | ) |
| | | | | | | | | | | | | | | | | | | | |
Short Contracts: | | | | | | | | | | | | | | | | | |
| 3 Month LIBOR | | | 252 | | | | Dec-19 | | | | (19 | ) | | | (1 | ) | | | (1 | ) |
| Euro-Bund Future | | | 18 | | | | Dec-18 | | | | (3,267 | ) | | | 3 | | | | 3 | |
| | | | | | | | | | | | | | | | | | | | |
| | | | | | | | | | | | | | | | | | | 2 | |
| | | | | | | | | | | | | | | | | | | | |
Total Futures | | | | | | | | | | | | | | | $ | (209 | ) |
| | | | | | | | | | | | | | | | | | | | |
Open Centrally Cleared Credit Default Swap Contracts
| | | | | | | | | | | | | | | | | | | | |
| Description | | Maturity
Date | | | Notional
Amount
(000s) | | | Value
(000s) | | | Upfront
payments/
receipts
(000s) | | | Unrealized
Depreciation
(000s) | |
| Protection Bought (Relevant Credit: Markit CDX, North America High Yield Series 31 Index), Pay 5% Quarterly, Receive upon credit default | | | 12/20/2023 | | | $ | 6,000 | | | $ | 350 | | | $ | 355 | | | $ | (5 | ) |
| | | | | | | | | | | | | | | | | | | | |
Offsetting Assets and Liabilities
The Fund’s loaned securities were all subject to an enforceable Securities Lending Agency Agreement. Securities lent in accordance with the Securities Lending Agency Agreement on a gross basis were as follows:
| | | | |
| Total gross amount presented on the Statements of Assets and Liabilities1 | | $ | 760 | |
Non-cash Collateral2 | | | (760 | ) |
| | | | |
Net Amount | | $ | — | |
| | | | |
| 1 | The amount presented on the Statements of Assets and Liabilities is not offset and is shown on a gross basis. |
| 2 | At October 31, 2018, the value of the collateral received from each borrower exceeded the value of the related securities loaned. This amount is disclosed on the Schedule of Investments. |
See notes to financial statements.
Annual Report 49

| | | | | | |
| | | | | |
| | | The Fund seeks a high level of total return that is consistent with preservation of capital by generally investing 80% of its assets in bonds or bond like securities. | | 
Past performance does not predict future returns. The graph does not reflect the impact of taxes or transaction costs a shareholder would pay. The Fund’s SI Class is expected to perform similarly to its Investor Class, except for class specific waivers. |
| | Portfolio Composition - percent of investments |
| | |
| | Mortgage Backed | | 34% |
| | Asset Backed | | 25% |
| | Corporate | | 21% |
| | Foregin Government | | 11% |
| | Bank Loans | | 4% |
| | | Other | | 5% |
| | | | | |
| | | | | |
| | | | | |
| | | | | |
| | | This information is not part of the audited financial statements. |
Schedule of Investments - October 31, 2018
| | | | | | |
Principal or Shares | | Security Description | | Value (000) | |
Asset Backed (26%) | | | | |
500,000 | | Allegro CLO III Ltd. 144A, (3 mo. LIBOR USD | | | | |
| | + 0.840%) 3.33%, 7/25/27 (a)(b) | | $ | 500 | |
600,000 | | ALM XVI Ltd./ALM XVI LLC 144A, (3 mo. | | | | |
| | LIBOR USD + 1.500%) 3.94%, 7/15/27 (a)(b) | | | 599 | |
1,600,000 | | Apidos CLO XXI 144A, (3 mo. LIBOR USD | | | | |
| | + 0.930%) 3.37%, 7/18/27 (a)(b) | | | 1,596 | |
650,000 | | Apidos CLO XXI 144A, (3 mo. LIBOR USD | | | | |
| | + 2.450%) 4.89%, 7/18/27 (a)(b) | | | 646 | |
450,000 | | Blackrock European CLO III DAC 144A, (3 mo. | | | | |
| | EURIBOR + 0.850%) 0.85%, 4/15/30 | | | | |
| | EUR (a)(b)(c) | | | 510 | |
800,000 | | BSPRT 2018-FL4 Issuer Ltd. 144A, (1 mo. | | | | |
| | LIBOR USD + 1.050%) 3.33%, 9/15/35 (a)(b) | | | 801 | |
600,000 | | BSPRT 2018-FL4 Issuer Ltd. 144A, (1 mo. | | | | |
| | LIBOR USD + 1.300%) 3.58%, 9/15/35 (a)(b) | | | 602 | |
450,000 | | BSPRT 2018-FL4 Issuer Ltd. 144A, (1 mo. | | | | |
| | LIBOR USD + 1.600%) 3.88%, 9/15/35 (a)(b) | | | 452 | |
400,000 | | BSPRT 2018-FL4 Issuer Ltd. 144A, (1 mo. | | | | |
| | LIBOR USD + 2.100%) 4.38%, 9/15/35 (a)(b) | | | 403 | |
350,000 | | BSPRT 2018-FL4 Issuer Ltd. 144A, (1 mo. | | | | |
| | LIBOR USD + 2.750%) 5.03%, 9/15/35 (a)(b) | | | 353 | |
600,000 | | Carlyle Global Market Strategies CLO 2015-1 | | | | |
| | Ltd. 144A, (3 mo. LIBOR USD + 1.000%) | | | | |
| | 3.47%, 4/20/27 (a)(b) | | | 600 | |
450,000 | | Carlyle Global Market Strategies Euro CLO | | | | |
| | 2015-2 DAC 144A, (3 mo. EURIBOR | | | | |
| | + 0.730%) 0.73%, 9/21/29 EUR (a)(b)(c) | | | 510 | |
860,000 | | Cedar Funding II CLO Ltd. 144A, (3 mo. LIBOR | | | | |
| | USD + 1.230%) 3.56%, 6/09/30 (a)(b) | | | 861 | |
600,000 | | Cedar Funding VI CLO Ltd. 144A, (3 mo. | | | | |
| | LIBOR USD + 1.090%) 3.56%, 10/20/28 (a)(b) | | | 600 | |
500,000 | | Cedar Funding VI CLO Ltd. 144A, (3 mo. | | | | |
| | LIBOR USD + 1.600%) 4.07%, 10/20/28 (a)(b) | | | 500 | |
| | | | | | |
Principal or Shares | | Security Description | | Value (000) | |
| | |
1,250,000 | | CIFC Funding 2015-V Ltd. 144A, (3 mo. LIBOR | | | | |
| | USD + 0.860%) 3.35%, 10/25/27 (a)(b) | | $ | 1,249 | |
450,000 | | CIFC Funding 2015-V Ltd. 144A, (3 mo. LIBOR | | | | |
| | USD + 2.950%) 5.44%, 10/25/27 (a)(b) | | | 450 | |
250,000 | | Colombia Cent CLO 27 Ltd. 144A, (3 mo. | | | | |
| | LIBOR USD + 1.600%) 4.90%, 10/25/28 (a)(b) | | | 250 | |
155,455 | | Colony American Homes 2015-1 144A, (1 mo. | | | | |
| | LIBOR USD + 1.200%) 3.49%, 7/17/32 (a)(b) | | | 156 | |
565,029 | | Colony Starwood Homes 2016-2 Trust 144A, (1 | | | | |
| | mo. LIBOR USD + 1.250%) | | | | |
| | 3.53%, 12/17/33 (a)(b) | | | 565 | |
762,918 | | Countrywide Asset-Backed Certificates, | | | | |
| | 4.71%, 10/25/46 (d) | | | 746 | |
300,000 | | CVC Cordatus Loan Fund III DAV 144A, (3 mo. | | | | |
| | EURIBOR + 2.550%) 2.55%, 8/15/32 | | | | |
| | EUR (a)(b)(c) | | | 333 | |
888,750 | | Domino’s Pizza Master Issuer LLC 144A, | | | | |
| | 3.08%, 7/25/47 (b) | | | 862 | |
670,000 | | Drive Auto Receivables Trust 2016-B 144A, | | | | |
| | 4.53%, 8/15/23 (b) | | | 681 | |
650,000 | | Dryden 39 Euro CLO 2015 BV 144A, (3 mo. | | | | |
| | EURIBOR + 0.870%) 0.87%, 10/15/31 | | | | |
| | EUR (a)(b)(c) | | | 739 | |
590,000 | | First Investors Auto Owner Trust 2016-1 144A, | | | | |
| | 4.70%, 4/18/22 (b) | | | 599 | |
443,250 | | FOCUS Brands Funding LLC 144A, | | | | |
| | 3.86%, 4/30/47 (b) | | | 440 | |
500,000 | | Greystone Commercial Real Estate Notes | | | | |
| | 2018-HC1 Ltd. 144A, (1 mo. LIBOR USD | | | | |
| | + 1.550%) 3.67%, 9/15/28 (a)(b) | | | 502 | |
250,000 | | Greystone Commercial Real Estate Notes | | | | |
| | 2018-HC1 Ltd. 144A, (1 mo. LIBOR USD | | | | |
| | + 2.150%) 4.27%, 9/15/28 (a)(b) | | | 251 | |
50 Payden Mutual Funds
| | | | | | |
Principal or Shares | | Security Description | | Value (000) | |
| | |
350,000 | | Greystone Commercial Real Estate Notes | | | | |
| | 2018-HC1 Ltd. 144A, (1 mo. LIBOR USD | | | | |
| | + 2.650%) 4.77%, 9/15/28 (a)(b) | | $ | 351 | |
200,000 | | Greystone Commercial Real Estate Notes | | | | |
| | 2018-HC1 Ltd. 144A, (1 mo. LIBOR USD | | | | |
| | + 3.350%) 5.47%, 9/15/28 (a)(b) | | | 201 | |
450,000 | | Grippen Park CLO Ltd. 144A, (3 mo. LIBOR | | | | |
| | USD + 3.300%) 5.77%, 1/20/30 (a)(b) | | | 452 | |
500,000 | | Halcyon Loan Advisors Funding 2015-2 Ltd. | | | | |
| | 144A, (3 mo. LIBOR USD + 1.650%) | | | | |
| | 4.14%, 7/25/27 (a)(b) | | | 500 | |
250,000 | | Hunt CRE 2018-FL2 Ltd. 144A, (1 mo. LIBOR | | | | |
| | USD + 1.080%) 3.36%, 8/15/28 (a)(b) | | | 251 | |
450,000 | | Hunt CRE 2018-FL2 Ltd. 144A, (1 mo. LIBOR | | | | |
| | USD + 2.350%) 4.63%, 8/15/28 (a)(b) | | | 455 | |
250,000 | | ICG US CLO 2015-2 Ltd. 144A, (3 mo. LIBOR | | | | |
| | USD + 0.850%) 3.29%, 1/16/28 (a)(b) | | | 250 | |
400,000 | | ICG US CLO 2015-2 Ltd. 144A, (3 mo. LIBOR | | | | |
| | USD + 2.450%) 4.89%, 1/16/28 (a)(b) | | | 395 | |
649,059 | | Invitation Homes 2018-SFR3 Trust 144A, (1 | | | | |
| | mo. LIBOR USD + 1.000%) | | | | |
| | 3.29%, 7/17/37 (a)(b) | | | 649 | |
470,678 | | JFIN CLO 2014 Ltd. 144A, (3 mo. LIBOR USD | | | | |
| | + 0.950%) 3.42%, 4/21/25 (a)(b) | | | 471 | |
250,000 | | JFIN CLO 2014 Ltd. 144A, (3 mo. LIBOR USD | | | | |
| | + 1.450%) 3.92%, 4/21/25 (a)(b) | | | 250 | |
750,000 | | LCM XX LP 144A, (3 mo. LIBOR USD | | | | |
| | + 1.040%) 3.38%, 10/20/27 (a)(b) | | | 750 | |
400,000 | | LoanCore 2018-CRE1 Issuer Ltd. 144A, (1 mo. | | | | |
| | LIBOR USD + 1.130%) 3.41%, 5/15/28 (a)(b) | | | 400 | |
755,000 | | Madison Park Funding XIII Ltd. 144A, (3 mo. | | | | |
| | LIBOR USD + 0.950%) 3.40%, 4/19/30 (a)(b) | | | 754 | |
400,000 | | Magnetite IX Ltd. 144A, (3 mo. LIBOR USD | | | | |
| | + 1.500%) 3.99%, 7/25/26 (a)(b) | | | 401 | |
600,000 | | Marathon CRE 2018 FL1 Ltd. 144A, (1 mo. | | | | |
| | LIBOR USD + 1.150%) 3.43%, 6/15/28 (a)(b) | | | 601 | |
150,000 | | Marathon CRE 2018 FL1 Ltd. 144A, (1 mo. | | | | |
| | LIBOR USD + 1.550%) 3.83%, 6/15/28 (a)(b) | | | 150 | |
720,000 | | Neuberger Berman CLO XVI-S Ltd. 144A, (3 | | | | |
| | mo. LIBOR USD + 0.850%) | | | | |
| | 3.29%, 1/15/28 (a)(b) | | | 718 | |
520,000 | | Octagon Investment Partners 24 Ltd. 144A, (3 | | | | |
| | mo. LIBOR USD + 0.900%) | | | | |
| | 3.21%, 5/21/27 (a)(b) | | | 520 | |
350,000 | | Octagon Investment Partners 25 Ltd. 144A, (3 | | | | |
| | mo. LIBOR USD + 0.800%) | | | | |
| | 3.27%, 10/20/26 (a)(b) | | | 348 | |
450,000 | | OZLM XII Ltd. 144A, (3 mo. LIBOR USD | | | | |
| | + 1.600%) 4.12%, 4/30/27 (a)(b) | | | 449 | |
300,000 | | OZLM XII Ltd. 144A, (3 mo. LIBOR USD | | | | |
| | + 3.000%) 5.52%, 4/30/27 (a)(b) | | | 299 | |
450,000 | | OZLM XIII Ltd. 144A, (3 mo. LIBOR USD | | | | |
| | + 3.000%) 5.52%, 7/30/27 (a)(b) | | | 448 | |
400,000 | | Planet Fitness Master Issuer LLC 144A, | | | | |
| | 4.26%, 9/05/48 (b) | | | 399 | |
| | | | | | |
Principal or Shares | | Security Description | | Value (000) | |
| | |
450,000 | | Prestige Auto Receivables Trust 2016-1 144A, | | | | |
| | 5.15%, 11/15/21 (b) | | $ | 458 | |
400,000 | | Progress Residential 2018-SFR3 Trust 144A, | | | | |
| | 4.08%, 10/17/35 (b) | | | 398 | |
380,000 | | Santander Drive Auto Receivables Trust 2017-2, | | | | |
| | 3.49%, 7/17/23 | | | 378 | |
450,000 | | Shackleton 2015-VIII CLO Ltd. 144A, (3 mo. | | | | |
| | LIBOR USD + 0.920%) 3.39%, 10/20/27 (a)(b) | | | 449 | |
594,995 | | Starwood Waypoint Homes 2017-1 Trust 144A, | | | | |
| | (1 mo. LIBOR USD + 0.950%) | | | | |
| | 3.23%, 1/17/35 (a)(b) | | | 594 | |
1,050,000 | | Symphony CLO XVII Ltd. 144A, (3 mo. LIBOR | | | | |
| | USD + 0.880%) 3.32%, 4/15/28 (a)(b) | | | 1,049 | |
450,000 | | Symphony CLO XVII Ltd. 144A, (3 mo. LIBOR | | | | |
| | USD + 2.650%) 5.09%, 4/15/28 (a)(b) | | | 442 | |
788,000 | | Taco Bell Funding LLC 144A, | | | | |
| | 3.83%, 5/25/46 (b) | | | 789 | |
720,000 | | Thacher Park CLO Ltd. 144A, (3 mo. LIBOR | | | | |
| | USD + 1.160%) 3.63%, 10/20/26 (a)(b) | | | 721 | |
250,000 | | THL Credit Wind River 2015-2 CLO Ltd. 144A, | | | | |
| | (3 mo. LIBOR USD + 0.870%) | | | | |
| | 3.31%, 10/15/27 (a)(b) | | | 250 | |
900,000 | | Tryon Park CLO Ltd. 144A, (3 mo. LIBOR USD | | | | |
| | + 0.890%) 3.33%, 4/15/29 (a)(b) | | | 898 | |
370,000 | | Venture XVII CLO Ltd. 144A, (3 mo. LIBOR | | | | |
| | USD + 0.880%) 3.32%, 4/15/27 (a)(b) | | | 369 | |
436,500 | | Wendy’s Funding LLC 144A, 4.08%, 6/15/45 (b) | | | 437 | |
160,000 | | Westlake Automobile Receivables Trust 2018-1 | | | | |
| | 144A, 3.41%, 5/15/23 (b) | | | 159 | |
200,000 | | Westlake Automobile Receivables Trust 2018-2 | | | | |
| | 144A, 4.00%, 1/16/24 (b) | | | 200 | |
550,000 | | Westlake Automobile Receivables Trust 2018-3 | | | | |
| | 144A, 4.00%, 10/16/23 (b) | | | 549 | |
Total Asset Backed (Cost - $36,072) | | | 35,958 | |
Bank Loans(e) (4%) | | | | |
664,926 | | 1011778 BCULC Term Loan B 1L, (LIBOR USD | | | | |
| | 1-Month + 2.250%) 4.55%, 2/17/24 | | | 663 | |
148,500 | | Air Canada Term Loan B 1L, (LIBOR USD | | | | |
| | 1-Month + 2.000%) 4.29%, 10/06/23 | | | 149 | |
466,331 | | Aramark Services Inc. Term Loan B3 1L, (LIBOR | | | | |
| | USD 1-Month + 1.750%) 4.05%, 3/11/25 | | | 467 | |
350,000 | | Berry Global Inc. Term Loan T 1L, (LIBOR USD | | | | |
| | 1-Month + 1.750%) 4.03%, 1/06/21 | | | 350 | |
345,370 | | Burlington Coat Factory Warehouse Corp. Term | | | | |
| | Loan B5 1L, (LIBOR USD 1-Month + 2.000%) | | | | |
| | 4.29%, 11/17/24 | | | 346 | |
421,813 | | Charter Communications Operating LLC Term | | | | |
| | Loan B 1L, (LIBOR USD 1-Month + 2.000%) | | | | |
| | 4.31%, 4/30/25 | | | 422 | |
336,809 | | DaVita HealthCare Partners Inc. Term Loan B | | | | |
| | 1L, (LIBOR USD 1-Month + 2.750%) | | | | |
| | 5.05%, 6/24/21 | | | 338 | |
409,650 | | Golden Nugget Inc. Term Loan B 1L, (LIBOR | | | | |
| | USD 1-Month + 2.750%) 5.23%, 10/04/23 | | | 411 | |
396,947 | | MGM Growth Properties Operating Partnership | | | | |
| | LP Term Loan B 1L, (LIBOR USD | | | | |
| | 1-Month + 2.000%) 4.30%, 3/25/25 | | | 396 | |
Annual Report 51

| | | | | | |
Principal or Shares | | Security Description | | Value (000) | |
| | |
225,175 | | Michaels Stores Inc. Term Loan B 1L, (LIBOR | | | | |
| | USD 1-Month + 2.500%) 4.79%, 1/28/23 | | $ | 224 | |
289,529 | | Sabre GLBL Inc. Term Loan B 1L, (LIBOR USD | | | | |
| | 1-Month + 2.000%) 4.30%, 2/22/24 | | | 290 | |
550,000 | | United Rentals North America Inc. Term Loan B | | | | |
| | 1L, (LIBOR USD 1-Month + 1.750%) | | | | |
| | 4.05%, 10/05/25 | | | 553 | |
449,793 | | Vantiv LLC Term Loan B3 1L, (LIBOR USD | | | | |
| | 1-Month + 1.750%) 4.03%, 10/14/23 | | | 449 | |
205,193 | | Visteon Corp. Term Loan B 1L, (LIBOR USD | | | | |
| | 1-Month + 1.750%) 4.05%, 3/24/24 | | | 204 | |
400,000 | | WMG Acquisition Corp. Term Loan F 1L, | | | | |
| | (LIBOR USD 1-Month + 2.125%) | | | | |
| | 4.43%, 11/01/23 | | | 399 | |
500,000 | | Wyndham Hotels & Resorts Inc. Term Loan B | | | | |
| | 1L, (LIBOR USD 1-Month + 1.750%) | | | | |
| | 4.05%, 5/30/25 | | | 501 | |
Total Bank Loans (Cost - $6,158) | | | 6,162 | |
Corporate Bond (22%) | | | | |
225,000 | | AbbVie Inc., 3.38%, 11/14/21 | | | 224 | |
400,000 | | ABN AMRO Bank NV 144A, | | | | |
| | 2.65%, 1/19/21 (b) | | | 393 | |
400,000 | | ADCB Finance Cayman Ltd. 144A, | | | | |
| | 4.00%, 3/29/23 (b) | | | 394 | |
200,000 | | Alcoa Nederland Holding BV 144A, | | | | |
| | 6.75%, 9/30/24 (b) | | | 211 | |
300,000 | | Alimentation Couche-Tard Inc. 144A, | | | | |
| | 2.70%, 7/26/22 (b) | | | 288 | |
90,000 | | Ally Financial Inc., 4.25%, 4/15/21 | | | 90 | |
350,000 | | Ares Capital Corp., 3.50%, 2/10/23 | | | 334 | |
290,000 | | AT&T Inc., 3.20%, 3/01/22 | | | 285 | |
350,000 | | AT&T Inc., (3 mo. LIBOR USD + 1.180%) | | | | |
| | 3.51%, 6/12/24 (a) | | | 351 | |
270,000 | | Athene Global Funding 144A, | | | | |
| | 4.00%, 1/25/22 (b) | | | 271 | |
200,000 | | Banco del Estado de Chile 144A, | | | | |
| | 2.67%, 1/08/21 (b) | | | 195 | |
100,000 | | Bank of America Corp., (3 mo. LIBOR USD | | | | |
| | + 0.660%) 2.37%, 7/21/21 (a) | | | 98 | |
440,000 | | Bank of America Corp., (3 mo. LIBOR USD | | | | |
| | + 1.160%) 3.12%, 1/20/23 (a) | | | 430 | |
150,000 | | Bank of Scotland PLC, 9.38%, 5/15/21 GBP (c) | | | 225 | |
300,000 | | Bayer U.S. Finance II LLC 144A, | | | | |
| | 3.88%, 12/15/23 (b) | | | 296 | |
200,000 | | BNP Paribas SA 144A, 2.95%, 5/23/22 (b) | | | 193 | |
350,000 | | BNZ International Funding Ltd./London 144A, | | | | |
| | 2.40%, 2/21/20 (b) | | | 345 | |
300,000 | | BPCE SA 144A, (3 mo. LIBOR USD + 1.220%) | | | | |
| | 3.53%, 5/22/22 (a)(b) | | | 303 | |
205,000 | | CDW LLC/CDW Finance Corp., | | | | |
| | 5.50%, 12/01/24 | | | 208 | |
185,000 | | Celgene Corp., 2.75%, 2/15/23 | | | 176 | |
76,923 | | Cenovus Energy Inc., 5.70%, 10/15/19 | | | 79 | |
80,000 | | Centene Corp., 4.75%, 5/15/22 | | | 80 | |
320,000 | | Charter Communications Operating LLC/Charter | | | | |
| | Communications Operating Capital, | | | | |
| | 4.50%, 2/01/24 | | | 321 | |
| | | | | | |
Principal or Shares | | Security Description | | Value (000) | |
| | |
70,000 | | Cheniere Corpus Christi Holdings LLC, | | | | |
| | 5.88%, 3/31/25 | | $ | 72 | |
225,000 | | Cheniere Energy Partners LP 144A, | | | | |
| | 5.63%, 10/01/26 (b) | | | 222 | |
250,000 | | CIT Group Inc., 4.75%, 2/16/24 | | | 247 | |
750,000 | | Citigroup Inc., 2.70%, 10/27/22 | | | 719 | |
350,000 | | Citigroup Inc., (3 mo. LIBOR USD + 1.100%) | | | | |
| | 3.41%, 5/17/24 (a) | | | 352 | |
200,000 | | Comcast Corp., 3.45%, 10/01/21 | | | 200 | |
350,000 | | Comcast Corp., 3.70%, 4/15/24 | | | 349 | |
200,000 | | Conagra Brands Inc., 3.80%, 10/22/21 | | | 200 | |
210,000 | | Covanta Holding Corp., 5.88%, 3/01/24 | | | 210 | |
205,000 | | Crestwood Midstream Partners LP/Crestwood | | | | |
| | Midstream Finance Corp., 6.25%, 4/01/23 | | | 210 | |
205,000 | | CSC Holdings LLC, 8.63%, 2/15/19 | | | 208 | |
490,000 | | CVS Health Corp., 3.70%, 3/09/23 | | | 484 | |
350,000 | | Dell International LLC/EMC Corp. 144A, | | | | |
| | 4.42%, 6/15/21 (b) | | | 353 | |
370,000 | | DNB Bank ASA 144A, 2.38%, 6/02/21 (b) | | | 358 | |
250,000 | | Dollar Tree Inc., 3.70%, 5/15/23 | | | 244 | |
200,000 | | El Corte Ingles SA 144A, 3.00%, 3/15/24 | | | | |
| | EUR (b)(c) | | | 228 | |
210,000 | | Encompass Health Corp., 5.75%, 11/01/24 | | | 210 | |
325,000 | | Energy Transfer LP, 4.25%, 3/15/23 | | | 323 | |
205,000 | | Energy Transfer Operating LP, 3.60%, 2/01/23 | | | 200 | |
250,000 | | Energy Transfer Operating LP, 4.20%, 9/15/23 | | | 249 | |
225,000 | | EnLink Midstream Partners LP, 4.40%, 4/01/24 | | | 217 | |
640,000 | | EQM Midstream Partners LP, 4.75%, 7/15/23 | | | 647 | |
150,000 | | Equinix Inc., 2.88%, 3/15/24 EUR (c) | | | 172 | |
110,000 | | First Data Corp. 144A, 5.00%, 1/15/24 (b) | | | 109 | |
250,000 | | First Data Corp. 144A, 5.38%, 8/15/23 (b) | | | 253 | |
250,000 | | FirstEnergy Corp., 2.85%, 7/15/22 | | | 241 | |
200,000 | | Five Corners Funding Trust 144A, | | | | |
| | 4.42%, 11/15/23 (b) | | | 204 | |
450,000 | | Ford Motor Credit Co. LLC, 2.68%, 1/09/20 | | | 444 | |
200,000 | | Ford Motor Credit Co. LLC, 2.98%, 8/03/22 | | | 188 | |
450,000 | | Ford Motor Credit Co. LLC, (3 mo. LIBOR USD | | | | |
| | + 1.235%) 3.55%, 2/15/23 (a) | | | 438 | |
300,000 | | General Motors Financial Co. Inc., (3 mo. LIBOR | | | | |
| | USD + 0.850%) 3.26%, 4/09/21 (a) | | | 300 | |
340,000 | | General Motors Financial Co. Inc., (3 mo. LIBOR | | | | |
| | USD + 1.310%) 3.70%, 6/30/22 (a) | | | 343 | |
270,000 | | Goldman Sachs Group Inc., 2.60%, 4/23/20 | | | 267 | |
200,000 | | Goldman Sachs Group Inc., (3 mo. LIBOR USD | | | | |
| | + 1.000%) 3.49%, 7/24/23 (a) | | | 201 | |
581,000 | | Goldman Sachs Group Inc., 5.75%, 1/24/22 | | | 614 | |
220,000 | | Goodyear Tire & Rubber Co., | | | | |
| | 5.13%, 11/15/23 (f) | | | 216 | |
260,000 | | Halfmoon Parent Inc. 144A, 3.40%, 9/17/21 (b) | | | 258 | |
185,000 | | Halfmoon Parent Inc. 144A, 3.75%, 7/15/23 (b) | | | 184 | |
300,000 | | HCA Healthcare Inc., 6.25%, 2/15/21 | | | 312 | |
300,000 | | Hewlett Packard Enterprise Co., | | | | |
| | 3.60%, 10/15/20 | | | 301 | |
220,000 | | Hilcorp Energy I LP/Hilcorp Finance Co. 144A, | | | | |
| | 5.00%, 12/01/24 (b) | | | 208 | |
355,000 | | HSBC Holdings PLC, (3 mo. LIBOR USD | | | | |
| | + 0.650%) 2.98%, 9/11/21 (a) | | | 356 | |
52 Payden Mutual Funds
| | | | | | |
Principal or Shares | | Security Description | | Value (000) | |
| | |
210,000 | | Icahn Enterprises LP/Icahn Enterprises Finance | | | | |
| | Corp., 5.88%, 2/01/22 | | $ | 211 | |
330,000 | | ING Groep NV, 4.10%, 10/02/23 | | | 328 | |
340,000 | | International Lease Finance Corp., | | | | |
| | 4.63%, 4/15/21 | | | 345 | |
225,000 | | Iron Mountain Inc., 5.75%, 8/15/24 | | | 221 | |
210,000 | | iStar Inc., 4.63%, 9/15/20 | | | 209 | |
135,000 | | James Hardie International Finance DAC 144A, | | | | |
| | 3.63%, 10/01/26 EUR (b)(c) | | | 153 | |
600,000 | | JPMorgan Chase & Co., (3 mo. LIBOR USD | | | | |
| | + 0.610%) 3.51%, 6/18/22 (a) | | | 599 | |
250,000 | | Keurig Dr Pepper Inc. 144A, 4.06%, 5/25/23 (b) | | | 249 | |
280,000 | | Kinder Morgan Inc./DE 144A, | | | | |
| | 5.00%, 2/15/21 (b) | | | 288 | |
315,000 | | Level 3 Financing Inc., 5.13%, 5/01/23 | | | 314 | |
300,000 | | Lloyds Banking Group PLC, (3 mo. LIBOR USD | | | | |
| | + 0.810%) 2.91%, 11/07/23 (a) | | | 285 | |
315,000 | | Macquarie Group Ltd. 144A, (3 mo. LIBOR | | | | |
| | USD + 1.023%) 3.19%, 11/28/23 (a)(b) | | | 301 | |
195,000 | | Microchip Technology Inc. 144A, | | | | |
| | 3.92%, 6/01/21 (b) | | | 194 | |
410,000 | | Mitsubishi UFJ Financial Group Inc., | | | | |
| | 3.00%, 2/22/22 | | | 402 | |
450,000 | | Morgan Stanley, 2.80%, 6/16/20 | | | 446 | |
375,000 | | Morgan Stanley, (3 mo. LIBOR USD + 0.550%) | | | | |
| | 2.89%, 2/10/21 (a) | | | 375 | |
350,000 | | Morgan Stanley, (3 mo. LIBOR USD + 0.930%) | | | | |
| | 3.40%, 7/22/22 (a) | | | 352 | |
210,000 | | MPT Operating Partnership LP/MPT Finance | | | | |
| | Corp., 5.50%, 5/01/24 | | | 213 | |
210,000 | | Nabors Industries Inc., 4.63%, 9/15/21 | | | 203 | |
300,000 | | Nordea Bank Abp 144A, 4.88%, 5/13/21 (b) | | | 306 | |
210,000 | | ONEOK Inc., 4.25%, 2/01/22 | | | 212 | |
215,000 | | Penske Automotive Group Inc., | | | | |
| | 5.38%, 12/01/24 | | | 210 | |
300,000 | | Pertamina Persero PT, 5.25%, 5/23/21 (g) | | | 309 | |
460,000 | | Sabine Pass Liquefaction LLC, 5.75%, 5/15/24 | | | 488 | |
215,000 | | SBA Communications Corp., 4.00%, 10/01/22 | | | 207 | |
310,000 | | Sinopec Group Overseas Development 2015 Ltd., | | | | |
| | 2.50%, 4/28/20 (g) | | | 305 | |
320,000 | | Sinopec Group Overseas Development 2017 Ltd. | | | | |
| | 144A, 2.25%, 9/13/20 (b) | | | 313 | |
220,000 | | SM Energy Co., 5.00%, 1/15/24 (f) | | | 211 | |
200,000 | | SMBC Aviation Capital Finance DAC 144A, | | | | |
| | 4.13%, 7/15/23 (b) | | | 199 | |
340,000 | | Smithfield Foods Inc. 144A, 3.35%, 2/01/22 (b) | | | 328 | |
300,000 | | Southern Co., 2.75%, 6/15/20 | | | 297 | |
310,000 | | Sunoco LP/Sunoco Finance Corp. 144A, | | | | |
| | 4.88%, 1/15/23 (b) | | | 300 | |
100,000 | | Teva Pharmaceutical Finance IV LLC, | | | | |
| | 2.25%, 3/18/20 | | | 97 | |
250,000 | | Teva Pharmaceutical Finance Netherlands II BV, | | | | |
| | 3.25%, 4/15/22 EUR (c) | | | 292 | |
200,000 | | Teva Pharmaceutical Finance Netherlands II BV, | | | | |
| | 4.50%, 3/01/25 EUR (c) | | | 239 | |
100,000 | | Teva Pharmaceutical Finance Netherlands III BV, | | | | |
| | 1.70%, 7/19/19 | | | 98 | |
| | | | | | |
Principal or Shares | | Security Description | | Value (000) | |
| | |
340,000 | | Teva Pharmaceutical Finance Netherlands III BV, | | | | |
| | 2.20%, 7/21/21 | | $ | 317 | |
325,000 | | Teva Pharmaceutical Finance Netherlands III BV, | | | | |
| | 2.80%, 7/21/23 | | | 287 | |
300,000 | | T-Mobile USA Inc., 6.50%, 1/15/24 | | | 311 | |
215,000 | | United Continental Holdings Inc., | | | | |
| | 4.25%, 10/01/22 (f) | | | 211 | |
150,000 | | United Technologies Corp., 3.65%, 8/16/23 | | | 149 | |
90,000 | | Universal Health Services Inc. 144A, | | | | |
| | 4.75%, 8/01/22 (b) | | | 90 | |
250,000 | | Vodafone Group PLC, 3.75%, 1/16/24 | | | 245 | |
250,000 | | Wells Fargo & Co., 2.63%, 7/22/22 | | | 240 | |
100,000 | | YPF SA 144A, 8.88%, 12/19/18 (b) | | | 100 | |
180,000 | | Zayo Group LLC/Zayo Capital Inc., | | | | |
| | 6.00%, 4/01/23 | | | 184 | |
Total Corporate Bond (Cost - $30,558) | | | 30,134 | |
Foreign Government (11%) | | | | |
600,000 | | Argentine Republic Government International | | | | |
| | Bond, 6.25%, 4/22/19 (f) | | | 605 | |
550,000 | | Dominican Republic International Bond 144A, | | | | |
| | 7.50%, 5/06/21 (b) | | | 571 | |
300,000 | | Dominican Republic International Bond, | | | | |
| | 7.50%, 5/06/21 (g) | | | 311 | |
300,000 | | Egypt Government International Bond 144A, | | | | |
| | 5.58%, 2/21/23 (b) | | | 287 | |
200,000 | | Egypt Government International Bond 144A, | | | | |
| | 5.75%, 4/29/20 (b) | | | 202 | |
350,000 | | Fondo MIVIVIENDA SA, 3.50%, 1/31/23 (g) | | | 337 | |
400,000 | | Georgia Government International Bond, | | | | |
| | 6.88%, 4/12/21 (g) | | | 421 | |
300,000 | | Ghana Government International Bond 144A, | | | | |
| | 7.88%, 8/07/23 (b) | | | 307 | |
191,000 | | Guatemala Government Bond 144A, | | | | |
| | 5.75%, 6/06/22 (b) | | | 196 | |
300,000 | | Honduras Government International Bond 144A, | | | | |
| | 8.75%, 12/16/20 (b) | | | 324 | |
250,000 | | Honduras Government International Bond, | | | | |
| | 8.75%, 12/16/20 (g) | | | 270 | |
420,000 | | Hungary Government International Bond, | | | | |
| | 6.25%, 1/29/20 | | | 435 | |
175,000,000 | | Japan Treasury Discount Bill, 0.00%, 12/03/18 | | | | |
| | JPY (c)(h) | | | 1,551 | |
450,000,000 | | Japan Treasury Discount Bill, 0.00%, 12/10/18 | | | | |
| | JPY (c)(h) | | | 3,989 | |
400,000 | | Kenya Government International Bond 144A, | | | | |
| | 5.88%, 6/24/19 (b) | | | 403 | |
200,000 | | Kenya Government International Bond, | | | | |
| | 5.88%, 6/24/19 (g) | | | 202 | |
420,000 | | Mongolia Government International Bond 144A, | | | | |
| | 10.88%, 4/06/21 (b) | | | 467 | |
220,000 | | Nigeria Government International Bond, | | | | |
| | 6.75%, 1/28/21 (g) | | | 228 | |
600,000 | | Perusahaan Penerbit SBSN Indonesia III 144A, | | | | |
| | 3.40%, 3/29/22 (b) | | | 585 | |
Annual Report 53
| | | | | | |
Principal or Shares | | Security Description | | Value (000) | |
| | |
200,000 | | Republic of Armenia International Bond 144A, | | | | |
| | 6.00%, 9/30/20 (b) | | $ | 203 | |
580,000 | | Republic of South Africa Government | | | | |
| | International Bond, 5.50%, 3/09/20 | | | 587 | |
290,000 | | Senegal Government International Bond 144A, | | | | |
| | 8.75%, 5/13/21 (b) | | | 310 | |
250,000 | | Senegal Government International Bond, | | | | |
| | 8.75%, 5/13/21 (g) | | | 267 | |
300,000 | | Serbia International Bond, 4.88%, 2/25/20 (g) | | | 303 | |
500,000 | | Serbia International Bond 144A, | | | | |
| | 5.88%, 12/03/18 (b) | | | 501 | |
350,000 | | Sri Lanka Government International Bond 144A, | | | | |
| | 5.75%, 4/18/23 (b) | | | 315 | |
300,000 | | Sri Lanka Government International Bond 144A, | | | | |
| | 6.25%, 10/04/20 (b) | | | 291 | |
200,000 | | Sri Lanka Government International Bond 144A, | | | | |
| | 6.25%, 7/27/21 (b) | | | 191 | |
500,000 | | Ukraine Government International Bond, | | | | |
| | 7.75%, 9/01/19 (g) | | | 503 | |
300,000 | | Vietnam Government International Bond 144A, | | | | |
| | 6.75%, 1/29/20 (b) | | | 309 | |
280,000 | | Vietnam Government International Bond, | | | | |
| | 6.75%, 1/29/20 (g) | | | 289 | |
Total Foreign Government (Cost - $15,953) | | | 15,760 | |
Mortgage Backed (35%) | | | | |
656,198 | | Alternative Loan Trust 2005-56, (1 mo. LIBOR | | | | |
| | USD + 0.730%) 3.01%, 11/25/35 (a) | | | 663 | |
1,843,974 | | Alternative Loan Trust 2006-25CB, | | | | |
| | 6.00%, 10/25/36 | | | 1,607 | |
309,989 | | Alternative Loan Trust 2006-2CB, | | | | |
| | 6.00%, 3/25/36 | | | 247 | |
217,995 | | Alternative Loan Trust 2006-45T1, | | | | |
| | 6.00%, 2/25/37 | | | 162 | |
492,187 | | Alternative Loan Trust 2006-HY11, (1 mo. | | | | |
| | LIBOR USD + 0.120%) 2.40%, 6/25/36 (a) | | | 463 | |
808,073 | | Alternative Loan Trust 2007-12T1, | | | | |
| | 6.00%, 6/25/37 | | | 610 | |
937,664 | | Alternative Loan Trust 2007-15CB, | | | | |
| | 5.75%, 7/25/37 | | | 825 | |
591,943 | | Alternative Loan Trust 2007-6, 5.75%, 4/25/47 | | | 511 | |
202,596 | | American Home Mortgage Investment Trust | | | | |
| | 2006-3, (6 mo. LIBOR USD + 1.750%) | | | | |
| | 4.35%, 12/25/36 (a) | | | 175 | |
750,000 | | AREIT 2018-CRE2 Trust 144A, (1 mo. LIBOR | | | | |
| | USD + 0.980%) 3.26%, 11/14/35 (a)(b) | | | 750 | |
450,000 | | AREIT 2018-CRE2 Trust 144A, (1 mo. LIBOR | | | | |
| | USD + 1.400%) 3.68%, 11/14/35 (a)(b) | | | 450 | |
300,000 | | AREIT 2018-CRE2 Trust 144A, (1 mo. LIBOR | | | | |
| | USD + 2.650%) 4.93%, 11/14/35 (a)(b) | | | 300 | |
151,470 | | Banc of America Funding 2005-H Trust, | | | | |
| | 4.34%, 11/20/35 (d) | | | 135 | |
5,153,130 | | BANK 2018-BNK13, 0.52%, 8/15/61 (d) | | | 185 | |
850,000 | | BDS 2018-FL2 144A, (1 mo. LIBOR USD | | | | |
| | + 0.950%) 3.24%, 8/15/35 (a)(b) | | | 854 | |
| | | | | | |
Principal or Shares | | Security Description | | Value (000) | |
| | |
200,000 | | BDS 2018-FL2 144A, (1 mo. LIBOR USD | | | | |
| | + 1.400%) 3.69%, 8/15/35 (a)(b) | | $ | 201 | |
194,526 | | Bear Stearns ALT-A Trust 2006-6, | | | | |
| | 4.50%, 11/25/36 (d) | | | 181 | |
131,576 | | Bear Stearns ARM Trust 2007-3, | | | | |
| | 3.95%, 5/25/47 (d) | | | 119 | |
9,991,121 | | BENCHMARK 2018-B4, 0.70%, 7/15/51 (d) | | | 379 | |
550,000 | | BXMT 2017-FL1 Ltd. 144A, (1 mo. LIBOR | | | | |
| | USD + 1.950%) 4.24%, 6/15/35 (a)(b) | | | 554 | |
610,000 | | Caesars Palace Las Vegas Trust 2017-VICI 144A, | | | | |
| | 4.35%, 10/15/34 (b)(d) | | | 598 | |
209,045 | | CHL Mortgage Pass-Through Trust 2004-29, | | | | |
| | 2.61%, 2/25/35 (d) | | | 182 | |
145,151 | | CHL Mortgage Pass-Through Trust 2006-HYB1, | | | | |
| | 3.65%, 3/20/36 (d) | | | 136 | |
225,792 | | CHL Mortgage Pass-Through Trust 2007-HYB2, | | | | |
| | 3.66%, 2/25/47 (d) | | | 203 | |
300,000 | | Connecticut Avenue Securities Trust 2018-R07 | | | | |
| | 144A, (1 mo. LIBOR USD + 0.750%) | | | | |
| | 3.03%, 4/25/31 (a)(b) | | | 300 | |
403,930 | | Deutsche Alt-B Securities Mortgage Loan Trust | | | | |
| | Series 2006-AB1, 5.60%, 2/25/36 (d) | | | 389 | |
227,825 | | Deutsche Alt-B Securities Mortgage Loan Trust | | | | |
| | Series 2006-AB4, 6.00%, 10/25/36 (d) | | | 215 | |
114,048 | | Deutsche Alt-B Securities Mortgage Loan Trust | | | | |
| | Series 2006-AB4, 6.00%, 10/25/36 | | | 108 | |
282,596 | | Fannie Mae Connecticut Avenue Securities, (1 | | | | |
| | mo. LIBOR USD + 0.600%) 2.88%, 7/25/30 (a) | | | 283 | |
286,142 | | Fannie Mae Connecticut Avenue Securities, (1 | | | | |
| | mo. LIBOR USD + 0.650%) 2.93%, 8/25/30 (a) | | | 287 | |
237,645 | | Fannie Mae Connecticut Avenue Securities, (1 | | | | |
| | mo. LIBOR USD + 0.850%) 3.13%, 11/25/29 (a) | | | 238 | |
514,094 | | Fannie Mae Connecticut Avenue Securities, (1 | | | | |
| | mo. LIBOR USD + 1.150%) 3.43%, 9/25/29 (a) | | | 517 | |
511,792 | | Fannie Mae Connecticut Avenue Securities, (1 | | | | |
| | mo. LIBOR USD + 1.300%) 3.58%, 4/25/29 (a) | | | 516 | |
274,289 | | Fannie Mae Connecticut Avenue Securities, (1 | | | | |
| | mo. LIBOR USD + 1.300%) 3.58%, 7/25/29 (a) | | | 276 | |
900,000 | | Fannie Mae Connecticut Avenue Securities, (1 | | | | |
| | mo. LIBOR USD + 2.150%) 4.43%, 10/25/30 (a) | | | 900 | |
350,000 | | Fannie Mae Connecticut Avenue Securities, (1 | | | | |
| | mo. LIBOR USD + 2.200%) 4.48%, 8/25/30 (a) | | | 352 | |
610,000 | | Fannie Mae Connecticut Avenue Securities, (1 | | | | |
| | mo. LIBOR USD + 2.250%) 4.53%, 7/25/30 (a) | | | 616 | |
270,325 | | Fannie Mae Connecticut Avenue Securities, (1 | | | | |
| | mo. LIBOR USD + 4.000%) 6.28%, 5/25/25 (a) | | | 297 | |
350,000 | | Fannie Mae Connecticut Avenue Securities, (1 | | | | |
| | mo. LIBOR USD + 4.250%) 6.53%, 1/25/29 (a) | | | 395 | |
229,228 | | Fannie Mae Connecticut Avenue Securities, (1 | | | | |
| | mo. LIBOR USD + 4.550%) 6.83%, 2/25/25 (a) | | | 247 | |
183,172 | | Fannie Mae Connecticut Avenue Securities, (1 | | | | |
| | mo. LIBOR USD + 5.000%) 7.28%, 7/25/25 (a) | | | 206 | |
54 Payden Mutual Funds
| | | | | | |
Principal or Shares | | Security Description | | Value
(000) | |
| | |
107,116 | | Fannie Mae Connecticut Avenue Securities, (1 mo. LIBOR USD + 5.000%) 7.28%, 7/25/25 (a) | | $ | 119 | |
369,129 | | Fannie Mae Connecticut Avenue Securities, (1 mo. LIBOR USD + 5.700%) 7.98%, 4/25/28 (a) | | | 427 | |
400,000 | | Fannie Mae Connecticut Avenue Securities, (1 mo. LIBOR USD + 6.000%) 8.28%, 9/25/28 (a) | | | 468 | |
228,759 | | First Horizon Alternative Mortgage Securities Trust 2006-AA5, 4.24%, 9/25/36 (d) | | | 213 | |
166,473 | | First Horizon Alternative Mortgage Securities Trust 2006-FA2, 6.00%, 5/25/36 | | | 129 | |
661,350 | | Flagstar Mortgage Trust 2018-1 144A, 3.50%, 3/25/48 (b)(d) | | | 649 | |
650,000 | | Freddie Mac Stacr Trust 2018-HQA2, (1 mo. LIBOR USD + 2.300%) 4.59%, 10/25/48 (a) | | | 646 | |
522,223 | | Freddie Mac Structured Agency Credit Risk Debt Notes, (1 mo. LIBOR USD + 0.700%) 2.98%, 9/25/30 (a) | | | 523 | |
325,165 | | Freddie Mac Structured Agency Credit Risk Debt Notes, (1 mo. LIBOR USD + 0.750%) 3.03%, 3/25/30 (a) | | | 326 | |
428,547 | | Freddie Mac Structured Agency Credit Risk Debt Notes, (1 mo. LIBOR USD + 1.200%) 3.48%, 7/25/29 (a) | | | 432 | |
278,802 | | Freddie Mac Structured Agency Credit Risk Debt Notes, (1 mo. LIBOR USD + 1.200%) 3.48%, 8/25/29 (a) | | | 281 | |
460,000 | | Freddie Mac Structured Agency Credit Risk Debt Notes, (1 mo. LIBOR USD + 1.800%) 4.08%, 7/25/30 (a) | | | 453 | |
450,000 | | Freddie Mac Structured Agency Credit Risk Debt Notes 144A, 4.17%, 8/25/48 (b)(d) | | | 415 | |
294,073 | | Freddie Mac Structured Agency Credit Risk Debt Notes 144A, 4.17%, 8/25/48 (b)(d) | | | 295 | |
600,000 | | Freddie Mac Structured Agency Credit Risk Debt Notes, (1 mo. LIBOR USD + 2.300%) 4.58%, 9/25/30 (a) | | | 601 | |
400,000 | | Freddie Mac Structured Agency Credit Risk Debt Notes, (1 mo. LIBOR USD + 2.350%) 4.63%, 4/25/30 (a) | | | 409 | |
350,000 | | Freddie Mac Structured Agency Credit Risk Debt Notes, (1 mo. LIBOR USD + 2.500%) 4.78%, 3/25/30 (a) | | | 363 | |
600,000 | | Freddie Mac Structured Agency Credit Risk Debt Notes, (1 mo. LIBOR USD + 4.600%) 6.88%, 12/25/42 (a) | | | 640 | |
1,000,000 | | GAHR Commercial Mortgage Trust 2015-NRF 144A, 3.38%, 12/15/34 (b)(d) | | | 984 | |
280,000 | | GAHR Commercial Mortgage Trust 2015-NRF 144A, 3.38%, 12/15/34 (b)(d) | | | 277 | |
318,349 | | GreenPoint MTA Trust 2005-AR1, (1 mo. LIBOR USD + 0.440%) 2.72%, 6/25/45 (a) | | | 309 | |
181,363 | | GSMPS Mortgage Loan Trust 2005-RP2 144A, (1 mo. LIBOR USD + 0.350%)
2.63%, 3/25/35 (a)(b) | | | 171 | |
| | | | | | |
Principal or Shares | | Security Description | | Value
(000) | |
| | |
250,373 | | GSMPS Mortgage Loan Trust 2005-RP3 144A, (1 mo. LIBOR USD + 0.350%) 2.63%, 9/25/35 (a)(b) | | $ | 226 | |
95,303 | | HomeBanc Mortgage Trust 2004-1, (1 mo. LIBOR USD + 0.860%) 3.14%, 8/25/29 (a) | | | 92 | |
421,762 | | IndyMac INDX Mortgage Loan Trust 2006-AR29, (1 mo. LIBOR USD + 0.250%)
2.53%, 11/25/36 (a) | | | 410 | |
2,042,216 | | IndyMac INDX Mortgage Loan Trust 2006-AR35, (1 mo. LIBOR USD + 0.180%) 2.46%, 1/25/37 (a) | | | 1,933 | |
300,000 | | InTown Hotel Portfolio Trust 2018-STAY 144A, (1 mo. LIBOR USD + 3.100%)
5.38%, 1/15/33 (a)(b) | | | 302 | |
850,000 | | JP Morgan Chase Commercial Mortgage Securities Trust 2018-BCON 144A, 3.76%, 1/05/31 (b)(d) | | | 812 | |
260,000 | | JP Morgan Chase Commercial Mortgage Securities Trust 2018-PHH 144A, (1 mo. LIBOR USD + 0.910%) 3.19%, 6/15/35 (a)(b) | | | 260 | |
260,000 | | JP Morgan Chase Commercial Mortgage Securities Trust 2018-PHH 144A, (1 mo. LIBOR USD + 1.160%) 3.44%, 6/15/35 (a)(b) | | | 260 | |
165,461 | | JP Morgan Mortgage Trust 2006-A3, 3.61%, 5/25/36 (d) | | | 161 | |
145,434 | | JP Morgan Mortgage Trust 2006-A3, 3.61%, 5/25/36 (d) | | | 141 | |
96,944 | | JP Morgan Mortgage Trust 2014-IVR3 144A, 3.00%, 9/25/44 (b)(d) | | | 96 | |
1,113,968 | | JP Morgan Mortgage Trust 2017-5 144A, 3.17%, 10/26/48 (b)(d) | | | 1,099 | |
370,000 | | Madison Avenue Trust 2013-650M 144A, 4.03%, 10/12/32 (b)(d) | | | 364 | |
354,067 | | Merrill Lynch Mortgage Backed Securities Trust Series 2007-2, (1 yr. US Treasury Yield Curve Rate T Note Constant Maturity + 2.400%) 4.98%, 8/25/36 (a) | | | 347 | |
2,397,173 | | Morgan Stanley Capital I Trust 2018-H3, 1.00%, 7/15/51 (d) | | | 144 | |
511,172 | | New Residential Mortgage Loan Trust 2014-3 144A, 5.67%, 11/25/54 (b)(d) | | | 532 | |
511,774 | | New Residential Mortgage Loan Trust 2017-5 144A, (1 mo. LIBOR USD + 1.500%) 3.78%, 6/25/57 (a)(b) | | | 525 | |
668,936 | | RALI Series 2005-QA4 Trust, 4.29%, 4/25/35 (d) | | | 620 | |
230,207 | | RALI Series 2005-QS14 Trust, 6.00%, 9/25/35 | | | 220 | |
646,780 | | RALI Series 2007-QS2 Trust, 6.25%, 1/25/37 | | | 603 | |
2,372,864 | | Residential Asset Securitization Trust 2006-A4IP, 6.62%, 5/25/36 (d) | | | 1,680 | |
552,595 | | Ripon Mortgages PLC 144A, (3 mo. LIBOR GBP + 0.800%) 1.60%, 8/20/56 GBP (a)(b)(c) | | | 706 | |
382,139 | | Sequoia Mortgage Trust 2007-1,
3.81%, 2/20/47 (d) | | | 358 | |
1,000,000 | | STACR Trust 2018-DNA3 144A, (1 mo. LIBOR USD + 0.750%) 2.88%, 9/25/48 (a)(b) | | | 1,002 | |
Annual Report 55
| | | | | | |
Principal or Shares | | Security Description | | Value (000) | |
| | |
350,000 | | STACR Trust 2018-DNA3 144A, (1 mo. LIBOR USD + 2.100%) 4.23%, 9/25/48 (a)(b) | | $ | 348 | |
1,775,117 | | STACR Trust 2018-HRP1 144A, (1 mo. LIBOR USD + 1.650%) 3.93%, 4/25/43 (a)(b) | | | 1,786 | |
500,000 | | STACR Trust 2018-HRP1 144A, (1 mo. LIBOR USD + 3.750%) 6.03%, 4/25/43 (a)(b) | | | 525 | |
449,916 | | STACR Trust 2018-HRP1 144A, (1 mo. LIBOR USD + 11.750%) 14.03%, 4/25/43 (a)(b) | | | 529 | |
1,043,341 | | Structured Asset Mortgage Investments II Trust 2006-AR7, (1 mo. LIBOR USD + 0.210%) 2.49%, 8/25/36 (a) | | | 972 | |
400,000 | | VMC Finance 2018-FL2 LLC 144A, (1 mo. LIBOR USD + 0.920%) 3.20%, 10/15/35 (a)(b) | | | 400 | |
502,992 | | WaMu Mortgage Pass-Through Certificates, (1 mo. LIBOR USD + 0.280%) 2.56%, 11/25/45 (a) | | | 487 | |
59,994 | | WaMu Mortgage Pass-Through Certificates, (1 mo. LIBOR USD + 0.290%) 2.57%, 10/25/45 (a) | | | 60 | |
122,610 | | WaMu Mortgage Pass-Through Certificates, (1 mo. LIBOR USD + 0.290%) 2.57%, 12/25/45 (a) | | | 122 | |
469,446 | | WaMu Mortgage Pass-Through Certificates, (1 mo. LIBOR USD + 0.610%) 2.89%, 8/25/45 (a) | | | 424 | |
83,997 | | WaMu Mortgage Pass-Through Certificates, 3.34%, 6/25/37 (d) | | | 81 | |
754,995 | | WaMu Mortgage Pass-Through Certificates, 3.74%, 7/25/37 (d) | | | 696 | |
163,364 | | WaMu Mortgage Pass-Through Certificates, 3.90%, 8/25/46 (d) | | | 156 | |
73,055 | | WaMu Mortgage Pass-Through Certificates Series 2006-AR10 Trust, 3.87%, 9/25/36 (d) | | | 71 | |
159,231 | | WaMu Mortgage Pass-Through Certificates Series 2006-AR19 Trust, (Cost of Funds for the 11th District of San Francisco + 1.250%) 2.27%, 1/25/47 (a) | | | 157 | |
661,083 | | WaMu Mortgage Pass-Through Certificates Series 2007-HY1 Trust, 3.64%, 2/25/37 (d) | | | 651 | |
1,452,938 | | Washington Mutual Mortgage Pass-Through Certificates WMALT Series 2005-5 Trust, (1 mo. LIBOR USD + 1.400%) 3.68%, 7/25/35 (a) | | | 1,362 | |
318,445 | | Wells Fargo Alternative Loan 2007-PA2 Trust, 6.00%, 6/25/37 | | | 322 | |
6,904,651 | | Wells Fargo Commercial Mortgage Trust 2018-C46, 0.95%, 8/15/51 (d) | | | 436 | |
Total Mortgage Backed (Cost - $47,578) | | | 48,240 | |
U.S. Treasury (1%) | | | | |
400,000 | | U.S. Treasury Note, 2.50%, 6/30/20 (i)(j) | | | 398 | |
300,000 | | U.S. Treasury Note, 2.63%, 8/31/20 | | | 298 | |
400,000 | | U.S. Treasury Note, 2.88%, 10/31/20 | | | 400 | |
Total U.S. Treasury (Cost - $1,098) | | | 1,096 | |
| | | | | | |
Principal or Shares | | Security Description | | Value (000) | |
| |
Investment Company (4%) | | | | |
5,340,123 | | Payden Cash Reserves Money Market Fund * (Cost - $5,340) | | $ | 5,340 | |
Purchased Call Swaptions (0%) | | | | |
Total Purchased Call Swaptions (Cost - $220) | | | 176 | |
Total Investments, Before Options Written | | | | |
(Cost - $142,977) (103%) | | | 142,866 | |
Written Swaptions (0%) | | | | |
Total Written Call Swaptions (Cost - $(187)) | | | (127 | ) |
Total Investments (Cost - $142,790) (103%) | | | 142,739 | |
Liabilities in excess of Other Assets (-3%) | | | (3,484 | ) |
Net Assets (100%) | | $ | 139,255 | |
| (a) | Floating rate security. The rate shown reflects the rate in effect at October 31, 2018. See Note 2 in the Notes to Financial Statements. |
| (b) | Security offered only to qualified institutional investors, and thus is not registered for sale to the public under rule 144A of the Securities Act of 1933. It has been deemed liquid under guidelines approved by the Board. |
| (c) | Principal in foreign currency. |
| (d) | Variable rate security. Interest rate disclosed is as of the most recent information available. Certain variable rate securities are not based on a published reference rate and spread but are determined by the issuer or agent and are based on current market conditions. These securities do not indicate a reference rate and spread in their description above. See Note 2 in the Notes to Financial Statements. |
| (e) | Floating rate security. The rate shown reflects the rate in effect at October 31, 2018. The stated maturity is subject to prepayments. See Note 2 in the Notes to Financial Statements. |
| (f) | All or a portion of these securities are on loan. At October 31, 2018, the total market value of the Fund’s securities on loan is $1,113 and the total market value of the collateral held by the Fund is $1,143. Amount in 000s. |
| (g) | Security offered and sold outside the United States, and thus is exempt from registration under Regulation S of the Securities Act of 1933. It has been deemed liquid under guidelines approved by the Board. |
| (h) | Yield to maturity at time of purchase. |
| (i) | All or a portion of security has been pledged in connection with outstanding centrally cleared swaps. |
| (j) | All or a portion of the security is pledged to cover futures contract margin requirements. |
56 Payden Mutual Funds
Purchased Swaptions
| | | | | | | | | | | | | | | | | | |
| Description | | Counterparty | | Notional
Amount
(000s) | | | Expiration
date | | | Value
(000s) | | | Call/Put | |
Purchased Call Swaptions 0.0% | | | | | | | | | | | | | | | | |
| 1-Year Interest Rate Swap, 6/26/20, Pay Fixed 3.15% Semi-Annually, Receive Pay Variable Quarterly, 3-Month USD LIBOR | | Barclays Bank PLC | | | $37,200 | | | | 06/26/2020 | | | $ | 119 | | | | Call | |
| 2-Year Interest Rate Swap, 9/27/19, Pay Fixed 2.975% Semi-Annually, Receive Pay Variable Quarterly, 3-Month USD LIBOR | | Barclays Bank PLC | | | 18,800 | | | | 09/27/2019 | | | | 57 | | | | Call | |
| | | | | | | | | | | | | | | | | | |
Total Swaptions | | | | | | | | | | | | $ | 176 | | | | | |
| | | | | | | | | | | | | | | | | | |
Written Swaptions
| | | | | | | | | | | | | | | | | | |
| Description | | Counterparty | | Notional
Amount
(000s) | | | Expiration
date | | | Value
(000s) | | | Call/Put | |
Written Call Swaptions 0.0% | | | | | | | | | |
| 1-Year Interest Rate Swap, 6/26/19, Pay Fixed 3.15% Semi-Annually, Receive Pay Variable Quarterly, 3-Month USD LIBOR | | Barclays Bank PLC | | $ | 37,200 | | | | 06/26/2019 | | | $ | (75 | ) | | | Call | |
| 5-Year Interest Rate Swap, 9/27/19, Pay Fixed 2.90% Semi-Annually, Receive Pay Variable Quarterly, 3-Month USD LIBOR | | Barclays Bank PLC | | | 7,800 | | | | 09/27/2019 | | | | (52 | ) | | | Call | |
| | | | | | | | | | | | | | | | | | |
Total Swaptions | | | | | | | | | | | | $ | (127 | ) | | | | |
| | | | | | | | | | | | | | | | | | |
Open Forward Currency Contracts to USD
| | | | | | | | | | | | |
Currency Purchased (000s) | | Currency
Sold (000s) | | Counterparty | | Settlement
Date | | | Unrealized
Appreciation
(Depreciation)
(000s) | |
Assets: | | | | | | | | | | | | |
GBP 1,646 | | USD2,101 | | State Street Bank & Trust Co. | | | 01/17/2019 | | | $ | 12 | |
JPY 119,500 | | USD1,055 | | BNP PARIBAS | | | 12/13/2018 | | | | 8 | |
USD 7,122 | | JPY800,200 | | Barclays Bank PLC | | | 11/08/2018 | | | | 26 | |
USD 1,066 | | JPY119,500 | | BNP PARIBAS | | | 12/13/2018 | | | | 3 | |
USD 1,055 | | EUR912 | | BNP PARIBAS | | | 12/13/2018 | | | | 18 | |
USD 3,283 | | EUR2,834 | | Citibank, N.A. | | | 11/08/2018 | | | | 71 | |
USD 981 | | GBP755 | | HSBC Bank USA, N.A. | | | 11/08/2018 | | | | 15 | |
USD 299 | | ZAR4,410 | | HSBC Bank USA, N.A. | | | 11/13/2018 | | | | 1 | |
USD 2,106 | | EUR1,843 | | State Street Bank & Trust Co. | | | 01/17/2019 | | | | 3 | |
| | | | | | | | | | | | |
| | | | | | | | | | | 157 | |
| | | | | | | | | | | | |
Liabilities: | | | | | | | | | | | | |
EUR 912 | | USD1,043 | | BNP PARIBAS | | | 12/13/2018 | | | | (6 | ) |
JPY 175,000 | | USD1,553 | | Barclays Bank PLC | | | 11/08/2018 | | | | (1 | ) |
ZAR 4,410 | | USD327 | | HSBC Bank USA, N.A. | | | 11/13/2018 | | | | (29 | ) |
| | | | | | | | | | | | |
| | | | | | | | | | | | |
| | | | | | | | | | | (36 | ) |
| | | | | | | | | | | | |
Net Unrealized Appreciation (Depreciation) | | | $ | 121 | |
| | | | | | | | | | | | |
Annual Report 57
Open Futures Contracts
| | | | | | | | | | | | | | | | | | |
| Contract Type | | Number of
Contracts | | Expiration
Date | | | Notional
Amount
(000s) | | | Current
Value
(000s) | | | Unrealized
Appreciation
(000s) | |
Long Contracts: | | | | | | | | | | | | | | | | |
| U.S. Treasury 5-Year Note Future | | 11 | | | Dec-18 | | | $ | 1,236 | | | $ | 1 | | | $ | 1 | |
| | | | | | | | | | | | | | | | | | |
| Total Futures | | | | | | | | | | | | | | $ | 1 | |
| | | | | | | | | | | | | | | | | | |
Open Centrally Cleared Credit Default Swap Contracts
| | | | | | | | | | | | | | | | | | | | |
| Description | | Maturity Date | | | Notional
Amount
(000s) | | | Value
(000s) | | | Upfront
payments/
receipts
(000s) | | | Unrealized
Depreciation
(000s) | |
| Protection Bought (Relevant Credit: Markit CDX, North America High Yield Series 31 Index), Pay 5% Quarterly, Receive upon credit default | | | 12/20/2023 | | | $ | 1,900 | | | $ | 111 | | | $ | 115 | | | $ | (4 | ) |
| | | | | | | | | | | | | | | | | | | | |
Offsetting Assets and Liabilities
The Fund’s loaned securities were all subject to an enforceable Securities Lending Agency Agreement. Securities lent in accordance with the Securities Lending Agency Agreement on a gross basis were as follows:
| | | | |
Total gross amount presented on the Statements | | $ | 1,113 | |
of Assets and Liabilities1 | | | | |
Non-cash Collateral2 | | | (1,113 | ) |
| | | | |
Net Amount | | $ | — | |
| | | | |
| 1 | The amount presented on the Statements of Assets and Liabilities is not offset and is shown on a gross basis. |
| 2 | At October 31, 2018, the value of the collateral received from each borrower exceeded the value of the related securities loaned. This amount is disclosed on the Schedule of Investments. |
See notes to financial statements.
58 Payden Mutual Funds

| | | | | | |
The Fund seeks high current income and capital appreciation by generally investing 80% of its assets in income producing senior floating rate loans and other floating rate debt instruments. | | | 
Past performance does not predict future returns. The graph does not reflect the impact of taxes or transaction costs a shareholder would pay. The Fund’s SI Class is expected to perform similarly to its Investor Class, except for class specific waivers. |
| Portfolio Composition - percent of investments | |
| |
Bank Loans | | | 79% | |
Corporate | | | 15% | |
Mortgage Backed | | | 3% | |
Investment Company | | | 2% | |
Other | | | 1% | |
| | | | |
| This information is not part of the audited financial statements. | |
Schedule of Investments - October 31, 2018
| | | | | | |
Principal or Shares | | Security Description | | Value
(000) | |
Asset Backed (1%) | | | | |
1,500,000 | | Madison Park Funding XIII Ltd. 144A, (3 mo. LIBOR USD + 2.850%) 5.30%, 4/19/30 (a)(b) | | | | |
| | (Cost - $1,500) | | $ | 1,505 | |
Bank Loans(c) (79%) | | | | |
Communications (4%) | | | | |
1,985,000 | | CenturyLink Inc. Term Loan B 1L, (LIBOR USD 1-Month + 2.750%) 5.05%, 1/31/25 | | | 1,967 | |
1,989,987 | | Charter Communications Operating LLC Term Loan B 1L, (LIBOR USD 1-Month + 2.000%) | | | | |
| | 4.31%, 4/30/25 | | | 1,992 | |
2,358,978 | | Zayo Group LLC Term Loan B2 1L, (LIBOR USD 1-Month + 2.250%) 4.55%, 1/19/24 | | | 2,365 | |
| | | | | 6,324 | |
Consumer Cyclical (34%) | | | | |
1,912,737 | | 1011778 BCULC Term Loan B 1L, (LIBOR USD 1-Month + 2.250%) 4.55%, 2/17/24 | | | 1,908 | |
1,978,759 | | Air Canada Term Loan B 1L, (LIBOR USD 1-Month + 2.000%) 4.29%, 10/06/23 | | | 1,985 | |
2,000,000 | | Altra Industrial Motion Corp. Term Loan B 1L, (LIBOR USD 1-Month + 2.000%) 4.30%, 10/01/25 | | | 2,002 | |
1,865,325 | | Aramark Services Inc. Term Loan B3 1L, (LIBOR USD 1-Month + 1.750%) 4.05%, 3/11/25 | | | 1,868 | |
1,945,225 | | Axalta Coating Systems U.S. Holdings Inc. Term Loan B3 1L, (LIBOR USD 1-Month + 1.750%) 1.75%, 6/01/24 | | | 1,943 | |
2,650,994 | | Bausch Health Cos. Inc. Term Loan B 1L, (LIBOR USD 1-Month + 3.000%) 5.27%, 5/30/25 | | | 2,656 | |
2,563,530 | | BWAY Holding Co. Term Loan B 1L, (LIBOR USD 1-Month + 3.250%) 5.58%, 4/03/24 | | | 2,552 | |
| | | | | | |
Principal or Shares | | Security Description | | Value
(000) | |
| | |
1,985,000 | | Caesars Resort Collection LLC Term Loan 1L, (LIBOR USD 1-Month + 2.750%) 5.05%, 12/22/24 | | $ | 1,988 | |
1,980,000 | | Core & Main LP Term Loan B 1L, (LIBOR USD 1-Month + 3.000%) 5.32%, 8/01/24 | | | 1,981 | |
1,431,033 | | Crown Americas LLC Term B Loan 1L, (LIBOR USD 1-Month + 2.000%) 4.28%, 4/03/25 | | | 1,435 | |
2,142,649 | | Eldorado Resorts Inc. Term Loan B 1L, (LIBOR USD 1-Month + 2.250%) 4.56%, 4/17/24 | | | 2,147 | |
1,975,000 | | Frontier Communications Corp. Term Loan B 1L, (LIBOR USD 1-Month + 3.750%) 6.06%, 6/15/24 | | | 1,918 | |
2,000,000 | | GOBP Holdings Inc. Term Loan B 1L, (LIBOR USD 1-Month + 3.750%) 6.03%, 10/22/25 | | | 2,000 | |
2,468,354 | | Jane Street Group LLC Term Loan B 1L, (LIBOR USD 1-Month + 3.000%) 5.53%, 8/25/22 | | | 2,480 | |
1,975,125 | | KFC Holding Co. Term Loan B 1L, (LIBOR USD 1-Month + 1.750%) 4.04%, 4/03/25 | | | 1,977 | |
1,789,570 | | Live Nation Entertainment Inc. Term Loan B3 1L, (LIBOR USD 1-Month + 1.750%) 4.06%, 10/27/23 | | | 1,795 | |
2,000,000 | | Marriott Ownership Resorts Inc. Term Loan B 1L, (LIBOR USD 1-Month + 2.250%) 4.55%, 8/29/25 | | | 2,010 | |
1,568,325 | | Michaels Stores Inc. Term Loan B 1L, (LIBOR USD 1-Month + 2.500%) 4.79%, 1/28/23 | | | 1,561 | |
890,616 | | NPC International Inc. Term Loan B 1L, (LIBOR USD 1-Month + 3.500%) 5.80%, 4/20/24 | | | 895 | |
2,000,000 | | Numericable U.S. LLC Term Loan B13 1L, (LIBOR USD 1-Month + 4.000%) 6.28%, 1/31/26 | | | 1,964 | |
993,259 | | Party City Holdings Inc. Term Loan, (LIBOR USD 1-Month + 2.750%) 5.06%, 8/19/22 | | | 998 | |
Annual Report 59

| | | | | | |
Principal or Shares | | Security Description | | Value (000) | |
| | |
1,537,727 | | Pearl Intermediate Parent LLC Term Loan 1L, (LIBOR USD 1-Month + 2.750%) 5.03%, 2/14/25 | | $ | 1,518 | |
346,397 | | Pearl Intermediate Parent LLC Term Loan 1L, (LIBOR USD 1-Month + 2.750%) 5.04%, 2/14/25 | | | 343 | |
1,442,688 | | PQ Corp. Term Loan B 1L, (LIBOR USD 1-Month + 2.500%) 5.03%, 2/08/25 | | | 1,443 | |
2,264,156 | | Reynolds Group Holdings Inc. Term Loan B 1L, (LIBOR USD 1-Month + 2.750%) 5.05%, 2/05/23 | | | 2,269 | |
1,492,481 | | Sabre GLBL Inc. Term Loan B 1L, (LIBOR USD 1-Month + 2.000%) 4.30%, 2/22/24 | | | 1,494 | |
1,240,641 | | Scientific Games International Inc. Term Loan B5 1L, (LIBOR USD 1-Month + 2.750%) 5.05%, 8/14/24 | | | 1,230 | |
560,000 | | Tacala Investment Corp. Term Loan 2L, (LIBOR USD 1-Month + 7.000%) 9.30%, 2/01/26 | | | 566 | |
1,691,500 | | Tacala Investment Corp. Term Loan B 1L, (LIBOR USD 1-Month + 3.250%) 5.55%, 2/01/25 | | | 1,696 | |
1,166,667 | | Visteon Corp. Term Loan B 1L, (LIBOR USD 1-Month + 1.750%) 4.05%, 3/24/24 | | | 1,160 | |
992,500 | | Wink Holdco Inc. Term Loan B 1L, (LIBOR USD 1-Month + 3.000%) 5.30%, 12/01/24 | | | 991 | |
| | | | | 52,773 | |
Consumer Non-Cyclical (18%) | | | | |
994,962 | | Ashland LLC Term Loan B 1L, (LIBOR USD 1-Month + 1.750%) 4.04%, 5/25/24 | | | 999 | |
1,990,000 | | Beacon Roofing Supply Inc. Term Loan B 1L, (LIBOR USD 1-Month + 2.250%) 4.53%, 1/02/25 | | | 1,975 | |
1,906,111 | | Berry Global Inc. Term Loan T 1L, (LIBOR USD 1-Month + 1.750%) 4.03%, 1/06/21 | | | 1,904 | |
1,791,068 | | Burlington Coat Factory Warehouse Corp. Term Loan B5 1L, (LIBOR USD 1-Month + 2.000%) 4.29%, 11/17/24 | | | 1,796 | |
1,828,125 | | Change Healthcare Holdings LLC Term Loan B 1L, (LIBOR USD 1-Month + 2.750%) 5.05%, 3/01/24 | | | 1,828 | |
520,862 | | CHS/Community Health Systems Inc. Term Loan H 1L, (LIBOR USD 1-Month + 3.250%) 5.56%, 1/27/21 | | | 511 | |
932,395 | | DaVita HealthCare Partners Inc. Term Loan B 1L, (LIBOR USD 1-Month + 2.750%) 5.05%, 6/24/21 | | | 935 | |
1,659,347 | | Dole Food Co. Inc. Term Loan B 1L, (LIBOR USD 1-Month + 2.417%) 2.75%, 4/06/24 | | | 1,657 | |
1,246,875 | | Flex Acquisition Co. Inc. Term Loan B 1L, (LIBOR USD 1-Month + 3.250%) 5.51%, 6/22/25 | | | 1,250 | |
| | | | | | |
Principal or Shares | | Security Description | | Value (000) | |
| | |
1,987,602 | | Harbor Freight Tools USA Inc. Term Loan 1L, (LIBOR USD 1-Month + 2.500%) 4.80%, 8/16/23 | | $ | 1,959 | |
548,625 | | HUB International Ltd. Term Loan B 1L, (LIBOR USD 1-Month + 3.000%) 5.49%, 4/25/25 | | | 548 | |
278,894 | | MEG Energy Corp. Term Loan B 1L, (LIBOR USD 1-Month + 3.500%) 5.81%, 12/31/23 | | | 280 | |
809,798 | | MPH Acquisition Holdings LLC Term Loan B 1L, (LIBOR USD 1-Month + 2.750%) 5.14%, 6/07/23 | | | 809 | |
2,444,155 | | Nexeo Solutions LLC Term Loan B 1L, (LIBOR USD 1-Month + 3.250%) 5.66%, 6/09/23 | | | 2,461 | |
1,190,455 | | Post Holdings Inc. Term Loan A 1L, (LIBOR USD 1-Month + 2.000%) 4.29%, 5/24/24 | | | 1,190 | |
2,028,585 | | Sterigenics-Nordion Holdings LLC Term Loan B 1L, (LIBOR USD 1-Month + 3.000%) 5.30%, 5/15/22 | | | 2,033 | |
2,443,750 | | U.S. Foods Inc. Term Loan B 1L, (LIBOR USD 1-Month + 2.000%) 4.30%, 6/27/23 | | | 2,443 | |
1,623,683 | | Western Digital Corp. Term Loan B4 1L, (LIBOR USD 1-Month + 1.750%) 4.04%, 4/29/23 | | | 1,617 | |
2,000,000 | | Wyndham Hotels & Resorts Inc. Term Loan B 1L, (LIBOR USD 1-Month + 1.750%) 4.05%, 5/30/25 | | | 2,002 | |
| | | | | 28,197 | |
Energy (2%) | | | | |
1,821,341 | | Albertson’s LLC Term Loan B4 1L, (LIBOR USD 1-Month + 2.750%) 5.05%, 8/25/21 | | | 1,821 | |
981,000 | | Talen Energy Supply LLC Term Loan B2 1L, (LIBOR USD 1-Month + 4.000%) 6.30%, 4/13/24 | | | 985 | |
| | | | | 2,806 | |
Financial Services (11%) | | | | |
500,000 | | Asurion LLC Term Loan B2 2L, (LIBOR USD 1-Month + 6.500%) 8.80%, 8/04/25 | | | 514 | |
850,704 | | Asurion LLC Term Loan B4 1L, (LIBOR USD 1-Month + 3.000%) 5.30%, 8/04/22 | | | 853 | |
1,825,000 | | Coral U.S. Co-Borrower LLC Term Loan B4 L1, (LIBOR USD 1-Month + 3.250%) 5.55%, 1/31/26 | | | 1,827 | |
1,086,250 | | Everi Payments Inc. Term Loan B 1L, (LIBOR USD 1-Month + 3.000%) 5.30%, 5/09/24 | | | 1,091 | |
1,945,777 | | Golden Nugget Inc. Term Loan B 1L, (LIBOR USD 1-Month + 2.750%) 5.23%, 10/04/23 | | | 1,950 | |
1,421,577 | | Hilton Worldwide Finance LLC Term Loan B2 1L, (LIBOR USD 1-Month + 1.750%) 1.75%, 10/25/23 | | | 1,425 | |
2,481,250 | | Ineos U.S. Finance LLC Term Loan B 1L, (LIBOR USD 1-Month + 2.000%) 4.30%, 3/31/24 | | | 2,481 | |
1,492,500 | | Iron Mountain Inc. Term Loan B 1L, (LIBOR USD 1-Month + 1.750%) 4.05%, 1/02/26 | | | 1,474 | |
895,500 | | K-Mac Holdings Corp. Term Loan B 1L, (LIBOR USD 3-Month + 3.250%) 5.53%, 3/16/25 | | | 897 | |
60 Payden Mutual Funds
| | | | | | |
Principal or Shares | | Security Description | | Value (000) | |
| | |
350,000 | | K-Mac Holdings Corp. Term Loan B 2L, (LIBOR USD 3-Month + 6.750%) 9.03%, 3/16/26 | | $ | 353 | |
2,065,237 | | MGM Growth Properties Operating Partnership LP Term Loan B 1L, (LIBOR USD 1-Month + 2.000%) 4.30%, 3/25/25 | | | 2,062 | |
1,496,250 | | Stars Group Holdings BV Term Loan B 1L, (LIBOR USD 1-Month + 3.500%) 5.89%, 7/10/25 | | | 1,505 | |
707,121 | | VFH Parent LLC Term Loan B 1L, (LIBOR USD 1-Month + 2.750%) 5.09%, 12/30/21 | | | 710 | |
| | | | | 17,142 | |
Technology (10%) | | | | |
1,931,005 | | CDW LLC Term Loan B 1L, (LIBOR USD 1-Month + 1.750%) 4.06%, 8/17/23 | | | 1,937 | |
1,985,000 | | Churchill Downs Inc. Term Loan B 1L, (LIBOR USD 1-Month + 2.000%) 4.31%, 12/27/24 | | | 1,991 | |
1,492,500 | | CSC Holdings LLC Term Loan B 1L, (LIBOR USD 1-Month + 2.500%) 4.78%, 1/25/26 | | | 1,494 | |
1,709,385 | | Dell International LLC Term Loan B 1L, (LIBOR USD 1-Month + 2.000%) 4.31%, 9/07/23 | | | 1,709 | |
1,500,000 | | First Data Corp. Term Loan 1L, (LIBOR USD 1-Month + 2.000%) 4.29%, 4/26/24 | | | 1,494 | |
1,891,912 | | Infor (U.S.) Inc. Term Loan B6 1L, (LIBOR USD 1-Month + 2.750%) 5.14%, 2/01/22 | | | 1,887 | |
1,473,750 | | RP Crown Parent LLC Term Loan B 1L, (LIBOR USD 1-Month + 2.750%) 2.75%, 10/12/23 | | | 1,473 | |
1,219,845 | | Vantiv LLC Term Loan B3 1L, (LIBOR USD 1-Month + 1.750%) 4.03%, 10/14/23 | | | 1,219 | |
1,850,000 | | WMG Acquisition Corp. Term Loan F 1L, (LIBOR USD 1-Month + 2.125%) 4.43%, 11/01/23 | | | 1,846 | |
| | | | | 15,050 | |
Total Bank Loans (Cost - $122,166) | | | 122,292 | |
Corporate Bond (14%) | | | | |
1,000,000 | | Ally Financial Inc., 3.25%, 11/05/18 | | | 1,000 | |
1,010,486 | | American Airlines 2013-2 Class B Pass-Through Trust 144A, 5.60%, 7/15/20 (b) | | | 1,027 | |
1,500,000 | | Bank of America Corp., (3 mo. LIBOR USD + 3.387%) 5.13%, 12/29/49 (a)(d) | | | 1,498 | |
1,540,000 | | California Resources Corp., 5.00%, 1/15/20 | | | 1,455 | |
307,692 | | Cenovus Energy Inc., 5.70%, 10/15/19 | | | 314 | |
1,000,000 | | CSC Holdings LLC, 6.75%, 11/15/21 | | | 1,050 | |
800,000 | | DISH DBS Corp., 6.75%, 6/01/21 | | | 810 | |
800,000 | | First Quantum Minerals Ltd. 144A, 7.00%, 2/15/21 (b) | | | 784 | |
1,000,000 | | HCA Healthcare Inc., 6.25%, 2/15/21 | | | 1,041 | |
1,000,000 | | Icahn Enterprises LP/Icahn Enterprises Finance Corp., 6.25%, 2/01/22 | | | 1,011 | |
1,000,000 | | ING Bank NV 144A, 2.50%, 10/01/19 (b) | | | 995 | |
1,000,000 | | MGM Resorts International, 6.63%, 12/15/21 | | | 1,050 | |
500,000 | | NagaCorp Ltd. 144A, 9.38%, 5/21/21 (b) | | | 517 | |
1,000,000 | | Navient Corp., 5.00%, 10/26/20 | | | 1,008 | |
1,000,000 | | Realogy Group LLC/Realogy Co-Issuer Corp. 144A, 5.25%, 12/01/21 (b) | | | 984 | |
| | | | | | |
Principal or Shares | | Security Description | | Value (000) | |
| | |
1,000,000 | | SBA Communications Corp., 4.88%, 7/15/22 | | $ | 994 | |
925,000 | | Shire Acquisitions Investments Ireland DAC, 1.90%, 9/23/19 | | | 914 | |
900,000 | | Sirius XM Radio Inc. 144A, 3.88%, 8/01/22 (b) | | | 871 | |
1,000,000 | | Springleaf Finance Corp., 6.00%, 6/01/20 | | | 1,025 | |
1,000,000 | | Sprint Corp., 7.25%, 9/15/21 | | | 1,047 | |
1,000,000 | | Tenet Healthcare Corp., 8.13%, 4/01/22 | | | 1,045 | |
1,000,000 | | Teva Pharmaceutical Finance IV LLC, 2.25%, 3/18/20 | | | 971 | |
1,000,000 | | Whiting Petroleum Corp., 5.75%, 3/15/21 | | | 1,010 | |
Total Corporate Bond (Cost - $22,683) | | | 22,421 | |
Mortgage Backed (3%) | | | | |
819,619 | | Fannie Mae Connecticut Avenue Securities, (1 mo. LIBOR USD + 11.750%) 14.03%, 10/25/28 (a) | | | 1,165 | |
798,000 | | Fannie Mae Connecticut Avenue Securities, (1 mo. LIBOR USD + 12.250%) 14.53%, 9/25/28 (a) | | | 1,171 | |
675,000 | | Freddie Mac Structured Agency Credit Risk Debt Notes, (1 mo. LIBOR USD + 3.600%) 5.88%, 4/25/24 (a) | | | 745 | |
300,000 | | Freddie Mac Structured Agency Credit Risk Debt Notes, (1 mo. LIBOR USD + 4.600%) 6.88%, 12/25/42 (a) | | | 320 | |
665,616 | | Freddie Mac Structured Agency Credit Risk Debt Notes, (1 mo. LIBOR USD + 10.500%) 12.78%, 5/25/28 (a) | | | 899 | |
699,870 | | STACR Trust 2018-HRP1 144A, (1 mo. LIBOR USD + 11.750%) 14.03%, 4/25/43 (a)(b) | | | 823 | |
Total Mortgage Backed (Cost - $4,182) | | | 5,123 | |
Preferred Stock (0%) | | | | |
390 | | Wells Fargo & Co., 7.50% | | | | |
| | (Cost - $502) | | | 496 | |
Investment Company (2%) | | | | |
3,452,214 | | Payden Cash Reserves Money Market Fund * | | | | |
| | (Cost - $3,452) | | | 3,452 | |
Total Investments (Cost - $154,485) (99%) | | | 155,289 | |
Other Assets, net of Liabilities (1%) | | | 1,015 | |
Net Assets (100%) | | $ | 156,304 | |
| | | | | | |
| (a) | Floating rate security. The rate shown reflects the rate in effect at October 31, 2018. See Note 2 in the Notes to Financial Statements. |
| (b) | Security offered only to qualified institutional investors, and thus is not registered for sale to the public under rule 144A of the Securities Act of 1933. It has been deemed liquid under guidelines approved by the Board. |
| (c) | Floating rate security. The rate shown reflects the rate in effect at October 31, 2018. The stated maturity is subject to prepayments. See Note 2 in the Notes to Financial Statements. |
| (d) | Perpetual security with no stated maturity date. |
See notes to financial statements.
Annual Report 61

| | | | | | | | | | |
The Fund seeks high current income and capital appreciation by generally investing in below investment grade debt instruments and income producing securities of U.S. and foreign issuers with no limit on the average portfolio maturity. | | | | | | |  |
| Portfolio Composition - percent of investments | | | | | |
Energy | | | 19 | % | | | | |
Communications | | | 15 | % | | | | |
Consumer Cyclical | | | 13 | % | | | | |
Financial | | | 12 | % | | | | |
Consumer Non-Cyclical | | | 12 | % | | | | |
Other | | | 29 | % | | | | |
| | |
This information is not part of the audited financial statements. | | Past performance does not predict future returns. The graph does not reflect the impact of taxes or transaction costs a shareholder would pay. |
Schedule of Investments - October 31, 2018
| | | | | | |
Principal
or Shares | | Security Description | | Value
(000) | |
Bank Loans(a) (2%) | | | | |
1,350,000 | | Asurion LLC Term Loan B2 2L, (LIBOR USD 1-Month + 6.500%) 8.80%, 8/04/25 | | $ | 1,388 | |
1,791,000 | | CSC Holdings LLC Term Loan B 1L, (LIBOR USD 1-Month + 2.500%) 4.78%, 1/25/26 | | | 1,792 | |
2,050,000 | | GOBP Holdings Inc. Term Loan 2L, 9.53%, 10/22/26 | | | 2,055 | |
1,200,000 | | K-Mac Holdings Corp. Term Loan B 2L, (LIBOR USD 3-Month + 6.750%) 9.03%, 3/16/26 | | | 1,211 | |
2,075,932 | | Pearl Intermediate Parent LLC Term Loan 1L, (LIBOR USD 1-Month + 2.750%) 5.03%, 2/14/25 | | | 2,050 | |
467,635 | | Pearl Intermediate Parent LLC Term Loan 1L, (LIBOR USD 1-Month + 2.750%) 5.04%, 2/14/25 | | | 462 | |
1,915,000 | | Tacala Investment Corp. Term Loan 2L, (LIBOR USD 1-Month + 7.000%) 9.30%, 2/01/26 | | | 1,935 | |
Total Bank Loans (Cost - $10,844) | | | 10,893 | |
Corporate Bond (90%) | | | | |
Basic Industry (5%) | | | | |
2,500,000 | | Alpha 2 BV 144A, 8.75%, 6/01/23 (b) | | | 2,503 | |
2,328,000 | | Ashland LLC, 6.88%, 5/15/43 | | | 2,369 | |
1,600,000 | | Cleveland-Cliffs Inc., 5.75%, 3/01/25 | | | 1,518 | |
1,350,000 | | Coeur Mining Inc., 5.88%, 6/01/24 | | | 1,288 | |
1,250,000 | | First Quantum Minerals Ltd. 144A, 6.88%, 3/01/26 (b) | | | 1,086 | |
1,100,000 | | First Quantum Minerals Ltd. 144A, 7.25%, 5/15/22 (b) | | | 1,055 | |
3,975,000 | | Freeport-McMoRan Inc., 3.55%, 3/01/22 | | | 3,771 | |
1,800,000 | | Hudbay Minerals Inc. 144A, 7.63%, 1/15/25 (b) | | | 1,818 | |
1,350,000 | | IAMGOLD Corp. 144A, 7.00%, 4/15/25 (b) | | | 1,345 | |
1,500,000 | | NOVA Chemicals Corp. 144A, 5.00%, 5/01/25 (b) | | | 1,376 | |
1,500,000 | | OCI NV 144A, 6.63%, 4/15/23 (b) | | | 1,543 | |
| | | | | | |
Principal
or Shares | | Security Description | | Value
(000) | |
| | |
1,400,000 | | Teck Resources Ltd., 5.20%, 3/01/42 | | $ | 1,249 | |
2,000,000 | | Trinseo Materials Operating SCA/Trinseo Materials Finance Inc. 144A, 5.38%, 9/01/25 (b) | | | 1,859 | |
| | | | | 22,780 | |
Communications (16%) | | | | |
1,150,000 | | Altice Finco SA 144A, 8.13%, 1/15/24 (b)(c) | | | 1,136 | |
1,000,000 | | Altice France SA, 5.88%, 2/01/27 EUR (d)(e) | | | 1,170 | |
1,600,000 | | Altice France SA 144A, 6.25%, 5/15/24 (b) | | | 1,540 | |
2,750,000 | | Altice France SA 144A, 7.38%, 5/01/26 (b) | | | 2,643 | |
2,200,000 | | Altice Luxembourg SA 144A, 7.63%, 2/15/25 (b)(c) | | | 1,884 | |
1,000,000 | | Altice Luxembourg SA 144A, 7.75%, 5/15/22 (b) | | | 935 | |
2,600,000 | | Anixter Inc. 144A, 6.00%, 12/01/25 (b) | | | 2,613 | |
1,825,000 | | C&W Senior Financing DAC 144A, 6.88%, 9/15/27 (b) | | | 1,747 | |
3,000,000 | | CCO Holdings LLC/CCO Holdings Capital Corp. 144A, 5.13%, 5/01/27 (b) | | | 2,831 | |
5,000,000 | | CCO Holdings LLC/CCO Holdings Capital Corp. 144A, 5.38%, 5/01/25 (b) | | | 4,906 | |
3,660,000 | | CenturyLink Inc., 5.80%, 3/15/22 | | | 3,665 | |
1,000,000 | | CenturyLink Inc., 7.50%, 4/01/24 (c) | | | 1,052 | |
3,200,000 | | CommScope Technologies LLC 144A, 6.00%, 6/15/25 (b) | | | 3,128 | |
2,200,000 | | CSC Holdings LLC 144A, 10.88%, 10/15/25 (b) | | | 2,544 | |
2,000,000 | | DISH DBS Corp., 5.88%, 7/15/22 | | | 1,898 | |
2,000,000 | | Frontier Communications Corp., 7.63%, 4/15/24 | | | 1,210 | |
750,000 | | Frontier Communications Corp. 144A, 8.50%, 4/01/26 (b) | | | 699 | |
2,050,000 | | Frontier Communications Corp., 10.50%, 9/15/22 | | | 1,717 | |
2,300,000 | | Level 3 Financing Inc., 5.63%, 2/01/23 | | | 2,314 | |
2,250,000 | | Millicom International Cellular SA 144A, 6.63%, 10/15/26 (b) | | | 2,275 | |
1,000,000 | | Netflix Inc. 144A, 4.63%, 5/15/29 EUR (b)(e) | | | 1,138 | |
62 Payden Mutual Funds
| | | | | | |
Principal or Shares | | Security Description | | Value
(000) | |
| | |
2,000,000 | | Nexstar Broadcasting Inc. 144A, 5.63%, 8/01/24 (b) | | $ | 1,915 | |
1,500,000 | | Qualitytech LP/QTS Finance Corp. 144A, 4.75%, 11/15/25 (b) | | | 1,406 | |
2,700,000 | | Sirius XM Radio Inc. 144A, 5.00%, 8/01/27 (b) | | | 2,551 | |
1,230,000 | | Sprint Capital Corp., 6.88%, 11/15/28 | | | 1,213 | |
1,000,000 | | Sprint Capital Corp., 6.90%, 5/01/19 | | | 1,016 | |
2,200,000 | | Sprint Communications Inc., 6.00%, 11/15/22 | | | 2,226 | |
3,500,000 | | Sprint Corp., 7.88%, 9/15/23 | | | 3,745 | |
2,200,000 | | Telecom Italia Capital SA, 6.38%, 11/15/33 | | | 2,024 | |
4,000,000 | | T-Mobile USA Inc., 6.50%, 1/15/26 | | | 4,220 | |
2,390,000 | | Tribune Media Co., 5.88%, 7/15/22 | | | 2,432 | |
2,400,000 | | ViaSat Inc. 144A, 5.63%, 9/15/25 (b) | | | 2,235 | |
1,000,000 | | Virgin Media Finance PLC, 4.50%, 1/15/25 EUR (d)(e) | | | 1,150 | |
2,700,000 | | Zayo Group LLC/Zayo Capital Inc. 144A, 5.75%, 1/15/27 (b) | | | 2,653 | |
| | | | | 71,831 | |
Consumer Cyclical (13%) | | | | |
1,500,000 | | 1011778 BC ULC/New Red Finance Inc. 144A, 5.00%, 10/15/25 (b) | | | 1,410 | |
1,400,000 | | Allison Transmission Inc. 144A, 4.75%, 10/01/27 (b) | | | 1,290 | |
3,433,253 | | American Airlines 2013-1 Class B Pass-Through Trust 144A, 5.63%, 1/15/21 (b) | | | 3,506 | |
800,000 | | Aramark Services Inc. 144A, 5.00%, 2/01/28 (b) | | | 761 | |
1,670,000 | | Arcos Dorados Holdings Inc. 144A, 5.88%, 4/04/27 (b) | | | 1,524 | |
3,500,000 | | Beacon Roofing Supply Inc. 144A, 4.88%, 11/01/25 (b) | | | 3,154 | |
1,500,000 | | Boyd Gaming Corp., 6.00%, 8/15/26 | | | 1,455 | |
2,900,000 | | Boyne USA Inc. 144A, 7.25%, 5/01/25 (b) | | | 3,038 | |
2,600,000 | | Carrols Restaurant Group Inc., 8.00%, 5/01/22 | | | 2,704 | |
2,000,000 | | Centene Corp., 4.75%, 1/15/25 | | | 1,980 | |
1,500,000 | | Churchill Downs Inc. 144A, 4.75%, 1/15/28 (b) | | | 1,372 | |
750,000 | | El Corte Ingles SA 144A, 3.00%, 3/15/24 EUR (b)(e) | | | 856 | |
1,000,000 | | IHO Verwaltungs GmbH, 3.75%, 9/15/26 EUR (d)(e) | | | 1,126 | |
1,000,000 | | International Game Technology PLC, 3.50%, 7/15/24 EUR (d)(e) | | | 1,137 | |
2,000,000 | | Lennar Corp., 4.75%, 11/29/27 | | | 1,878 | |
1,500,000 | | LGI Homes Inc. 144A, 6.88%, 7/15/26 (b) | | | 1,432 | |
2,900,000 | | Lithia Motors Inc. 144A, 5.25%, 8/01/25 (b) | | | 2,740 | |
2,800,000 | | Live Nation Entertainment Inc. 144A, 4.88%, 11/01/24 (b) | | | 2,688 | |
1,000,000 | | LKQ European Holdings BV, 4.13%, 4/01/28 EUR (d)(e) | | | 1,107 | |
2,200,000 | | Marriott Ownership Resorts Inc./ILG LLC 144A, 6.50%, 9/15/26 (b) | | | 2,228 | |
1,550,000 | | Melco Resorts Finance Ltd. 144A, 4.88%, 6/06/25 (b) | | | 1,425 | |
2,700,000 | | Meritage Homes Corp., 5.13%, 6/06/27 | | | 2,383 | |
1,675,000 | | Merlin Entertainments PLC 144A, 5.75%, 6/15/26 (b) | | | 1,679 | |
1,500,000 | | NagaCorp Ltd. 144A, 9.38%, 5/21/21 (b) | | | 1,553 | |
1,500,000 | | Penske Automotive Group Inc., 5.50%, 5/15/26 | | | 1,432 | |
| | | | | | |
Principal or Shares | | Security Description | | Value
(000) | |
| | |
1,600,000 | | Rite Aid Corp. 144A, 6.13%, 4/01/23 (b) | | $ | 1,367 | |
2,000,000 | | Sabre GLBL Inc. 144A, 5.25%, 11/15/23 (b) | | | 1,985 | |
1,850,000 | | Scientific Games International Inc., 6.63%, 5/15/21 | | | 1,799 | |
3,000,000 | | Taylor Morrison Communities Inc./Taylor Morrison Holdings II Inc. 144A, 5.63%, 3/01/24 (b) | | | 2,932 | |
3,025,000 | | United Continental Holdings Inc., 5.00%, 2/01/24 (c) | | | 2,976 | |
2,200,000 | | Wyndham Hotels & Resorts Inc. 144A, 5.38%, 4/15/26 (b) | | | 2,145 | |
2,000,000 | | Yum! Brands Inc., 6.88%, 11/15/37 | | | 2,020 | |
| | | | | 61,082 | |
Consumer Non-Cyclical (12%) | | | | |
2,000,000 | | Albertsons Companies LLC/Safeway Inc./New Albertsons LP/Albertson’s LLC, 5.75%, 3/15/25 | | | 1,770 | |
2,350,000 | | Ashtead Capital Inc. 144A, 5.25%, 8/01/26 (b) | | | 2,319 | |
1,750,000 | | B&G Foods Inc., 5.25%, 4/01/25 | | | 1,673 | |
2,800,000 | | Bausch Health Cos. Inc., 4.50%, 5/15/23 EUR (d)(e) | | | 3,078 | |
3,450,000 | | Bausch Health Cos. Inc. 144A, 5.50%, 3/01/23 (b) | | | 3,282 | |
1,000,000 | | Bausch Health Cos. Inc. 144A, 8.50%, 1/31/27 (b) | | | 1,020 | |
1,000,000 | | Bausch Health Cos. Inc. 144A, 9.00%, 12/15/25 (b) | | | 1,046 | |
1,350,000 | | Bausch Health Cos. Inc. 144A, 9.25%, 4/01/26 (b) | | | 1,419 | |
660,000 | | Centene Corp. 144A, 5.38%, 6/01/26 (b) | | | 672 | |
2,100,000 | | CHS/Community Health Systems Inc., 6.25%, 3/31/23 | | | 1,939 | |
1,500,000 | | Cimpress NV 144A, 7.00%, 6/15/26 (b) | | | 1,506 | |
4,600,000 | | HCA Inc., 5.00%, 3/15/24 | | | 4,666 | |
3,250,000 | | HCA Inc., 5.38%, 2/01/25 | | | 3,278 | |
1,000,000 | | HCA Inc., 5.38%, 9/01/26 | | | 995 | |
900,000 | | Hertz Corp., 5.88%, 10/15/20 | | | 885 | |
2,000,000 | | Hill-Rom Holdings Inc. 144A, 5.00%, 2/15/25 (b) | | | 1,940 | |
2,750,000 | | Land O’ Lakes Inc. 144A, 7.25%, (b)(f) | | | 2,860 | |
1,500,000 | | Mallinckrodt International Finance SA/Mallinckrodt CB LLC 144A, 5.63%, 10/15/23 (b)(c) | | | 1,294 | |
850,000 | | Refinitiv US. Holdings Inc. 144A, 6.25%, 5/15/26 (b) | | | 847 | |
850,000 | | Refinitiv US. Holdings Inc. 144A, 8.25%, 11/15/26 (b) | | | 829 | |
1,500,000 | | ServiceMaster Co. LLC 144A, 5.13%, 11/15/24 (b) | | | 1,447 | |
2,100,000 | | Tenet Healthcare Corp., 4.63%, 7/15/24 | | | 2,029 | |
3,000,000 | | Tenet Healthcare Corp., 6.75%, 6/15/23 | | | 2,993 | |
1,000,000 | | Teva Pharmaceutical Finance Netherlands II BV, 1.13%, 10/15/24 EUR (e) | | | 996 | |
2,148,000 | | Teva Pharmaceutical Finance Netherlands III BV, 2.20%, 7/21/21 | | | 2,005 | |
2,000,000 | | U.S. Foods Inc. 144A, 5.88%, 6/15/24 (b) | | | 1,990 | |
1,250,000 | | United Rentals North America Inc., 4.88%, 1/15/28 | | | 1,129 | |
Annual Report 63

| | | | | | |
Principal
or Shares | | Security Description | | Value
(000) | |
| | |
2,000,000 | | United Rentals North America Inc., 5.88%, 9/15/26 | | $ | 1,968 | |
2,225,000 | | Universal Health Services Inc. 144A, 5.00%, 6/01/26 (b) | | | 2,214 | |
1,500,000 | | WellCare Health Plans Inc. 144A, 5.38%, 8/15/26 (b) | | | 1,500 | |
| | | | | 55,589 | |
Energy (19%) | | | | |
1,800,000 | | AmeriGas Partners LP/AmeriGas Finance Corp., 5.50%, 5/20/25 | | | 1,692 | |
1,850,000 | | California Resources Corp., 5.00%, 1/15/20 | | | 1,748 | |
900,000 | | California Resources Corp., 5.50%, 9/15/21 | | | 805 | |
2,000,000 | | California Resources Corp. 144A, 8.00%, 12/15/22 (b) | | | 1,785 | |
1,150,000 | | Calpine Corp. 144A, 5.25%, 6/01/26 (b) | | | 1,061 | |
1,400,000 | | Calpine Corp., 5.50%, 2/01/24 | | | 1,276 | |
3,000,000 | | Cheniere Corpus Christi Holdings LLC, 5.88%, 3/31/25 | | | 3,098 | |
2,750,000 | | Cheniere Energy Partners LP 144A, 5.63%, 10/01/26 (b) | | | 2,716 | |
1,200,000 | | Chesapeake Energy Corp., 7.00%, 10/01/24 | | | 1,176 | |
2,400,000 | | Chesapeake Energy Corp., 8.00%, 1/15/25 (c) | | | 2,436 | |
2,800,000 | | Comstock Escrow Corp. 144A, 9.75%, 8/15/26 (b) | | | 2,709 | |
2,450,000 | | Covey Park Energy LLC/Covey Park Finance Corp. 144A, 7.50%, 5/15/25 (b) | | | 2,419 | |
3,000,000 | | Crestwood Midstream Partners LP/Crestwood Midstream Finance Corp., 5.75%, 4/01/25 | | | 3,008 | |
1,700,000 | | Diamond Offshore Drilling Inc., 7.88%, 8/15/25 | | | 1,679 | |
2,500,000 | | Diamondback Energy Inc. 144A, 4.75%, 11/01/24 (b) | | | 2,438 | |
2,850,000 | | Energy Transfer LP, 4.25%, 3/15/23 | | | 2,829 | |
2,750,000 | | Energy Transfer Operating LP, (3 mo. LIBOR USD + 4.028%) 6.25%, (f)(g) | | | 2,576 | |
3,200,000 | | EnLink Midstream Partners LP, (3 mo. LIBOR USD + 4.110%) 6.00%, (f)(g) | | | 2,797 | |
1,000,000 | | Ensco PLC, 4.50%, 10/01/24 | | | 816 | |
2,750,000 | | Enviva Partners LP/Enviva Partners Finance Corp., 8.50%, 11/01/21 | | | 2,836 | |
1,000,000 | | Extraction Oil & Gas Inc. 144A, 5.63%, 2/01/26 (b) | | | 850 | |
2,000,000 | | Geopark Ltd. 144A, 6.50%, 9/21/24 (b) | | | 1,997 | |
1,500,000 | | Gulfport Energy Corp., 6.38%, 1/15/26 | | | 1,402 | |
2,155,000 | | Hilcorp Energy I LP/Hilcorp Finance Co. 144A, 5.75%, 10/01/25 (b) | | | 2,107 | |
1,750,000 | | Hilcorp Energy I LP/Hilcorp Finance Co. 144A, 6.25%, 11/01/28 (b) | | | 1,687 | |
1,000,000 | | Murphy Oil Corp., 6.88%, 8/15/24 | | | 1,041 | |
2,600,000 | | Nabors Industries Inc., 5.75%, 2/01/25 | | | 2,406 | |
1,400,000 | | NGL Energy Partners LP/NGL Energy Finance Corp., 7.50%, 11/01/23 | | | 1,381 | |
1,500,000 | | Noble Holding International Ltd., 7.95%, 4/01/25 (c) | | | 1,371 | |
1,800,000 | | Parsley Energy LLC/Parsley Finance Corp. 144A, 5.63%, 10/15/27 (b) | | | 1,779 | |
1,550,000 | | PDC Energy Inc., 5.75%, 5/15/26 | | | 1,428 | |
| | | | | | |
Principal
or Shares | | Security Description | | Value
(000) | |
| | |
1,000,000 | | SemGroup Corp., 6.38%, 3/15/25 | | $ | 972 | |
1,000,000 | | SemGroup Corp., 7.25%, 3/15/26 | | | 981 | |
1,150,000 | | SM Energy Co., 6.63%, 1/15/27 | | | 1,161 | |
1,050,000 | | Southwestern Energy Co., 4.10%, 3/15/22 | | | 1,039 | |
2,800,000 | | Sunoco LP/Sunoco Finance Corp. 144A, 5.88%, 3/15/28 (b) | | | 2,618 | |
1,105,000 | | Talen Energy Supply LLC 144A, 9.50%, 7/15/22 (b) | | | 1,127 | |
2,400,000 | | Targa Resources Partners LP/Targa Resources Partners Finance Corp. 144A, 5.88%, 4/15/26 (b) | | | 2,424 | |
3,250,000 | | TerraForm Power Operating LLC 144A, 5.00%, 1/31/28 (b) | | | 2,917 | |
2,600,000 | | TransMontaigne Partners LP/TLP Finance Corp., 6.13%, 2/15/26 | | | 2,450 | |
1,500,000 | | Transocean Guardian Ltd. 144A, 5.88%, 1/15/24 (b) | | | 1,491 | |
1,750,000 | | Transocean Inc. 144A, 9.00%, 7/15/23 (b) | | | 1,840 | |
1,300,000 | | Vistra Energy Corp., 7.38%, 11/01/22 | | | 1,352 | |
1,450,000 | | Whiting Petroleum Corp., 6.63%, 1/15/26 | | | 1,452 | |
1,600,000 | | WildHorse Resource Development Corp., 6.88%, 2/01/25 | | | 1,600 | |
2,530,000 | | WPX Energy Inc., 5.75%, 6/01/26 | | | 2,530 | |
462,000 | | WPX Energy Inc., 6.00%, 1/15/22 | | | 475 | |
| | | | | 85,778 | |
Financial (13%) | | | | |
4,800,000 | | Ally Financial Inc., 4.13%, 2/13/22 | | | 4,740 | |
2,000,000 | | AmWINS Group Inc. 144A, 7.75%, 7/01/26 (b) | | | 2,060 | |
1,450,000 | | Assurant Inc., (3 mo. LIBOR USD + 4.135%) 7.00%, 3/27/48 (g) | | | 1,457 | |
2,750,000 | | Banco Mercantil del Norte SA/Grand Cayman 144A, (5 yr. US Treasury Yield Curve Rate T Note Constant Maturity + 4.447%) 5.75%, 10/04/31 (b)(g) | | | 2,527 | |
1,500,000 | | Bank of America Corp., (3 mo. LIBOR USD + 2.931%) 5.88%, (f)(g) | | | 1,457 | |
700,000 | | CIT Group Inc., 5.25%, 3/07/25 | | | 706 | |
3,000,000 | | Citigroup Inc., (3 mo. LIBOR USD + 4.068%) 5.95%, (f)(g) | | | 3,008 | |
3,000,000 | | Dana Financing Luxembourg Sarl 144A, 6.50%, 6/01/26 (b) | | | 2,977 | |
1,000,000 | | Equinix Inc., 2.88%, 10/01/25 EUR (e) | | | 1,113 | |
2,400,000 | | Fidelity & Guaranty Life Holdings Inc. 144A, 5.50%, 5/01/25 (b) | | | 2,391 | |
2,725,000 | | General Motors Financial Co. Inc., (3 mo. LIBOR USD + 3.598%) 5.75%, (f)(g) | | | 2,461 | |
1,500,000 | | GLP Capital LP/GLP Financing II Inc., 5.75%, 6/01/28 | | | 1,522 | |
2,500,000 | | goeasy Ltd. 144A, 7.88%, 11/01/22 (b) | | | 2,581 | |
2,050,000 | | HUB International Ltd. 144A, 7.00%, 5/01/26 (b) | | | 2,006 | |
1,200,000 | | Huntington Bancshares Inc./OH, (3 mo. LIBOR USD + 2.880%) 5.70%, (f)(g) | | | 1,178 | |
1,500,000 | | Icahn Enterprises LP/Icahn Enterprises Finance Corp., 6.75%, 2/01/24 | | | 1,513 | |
2,000,000 | | Iron Mountain Inc. 144A, 5.25%, 3/15/28 (b) | | | 1,805 | |
64 Payden Mutual Funds
| | | | | | |
Principal
or Shares | | Security Description | | Value
(000) | |
| | |
2,350,000 | | iStar Inc., 5.25%, 9/15/22 | | $ | 2,279 | |
1,500,000 | | Lloyds Banking Group PLC, (5 yr. Swap Semi 30/360 USD4.496%) 7.50%, (f)(g) | | | 1,511 | |
2,000,000 | | MPT Operating Partnership LP/MPT Finance Corp., 3.33%, 3/24/25 EUR (e) | | | 2,319 | |
4,000,000 | | Navient Corp., 5.00%, 10/26/20 | | | 4,032 | |
2,000,000 | | Pershing Square Holdings Ltd. 144A, 5.50%, 7/15/22 (b) | | | 1,999 | |
2,000,000 | | Realogy Group LLC/Realogy Co-Issuer Corp. 144A, 4.88%, 6/01/23 (b) | | | 1,820 | |
2,700,000 | | SLM Corp., 5.13%, 4/05/22 | | | 2,693 | |
2,200,000 | | Springleaf Finance Corp., 6.13%, 5/15/22 | | | 2,222 | |
1,000,000 | | Springleaf Finance Corp., 7.13%, 3/15/26 | | | 949 | |
1,500,000 | | VFH Parent LLC/Orchestra Co-Issuer Inc. 144A, 6.75%, 6/15/22 (b) | | | 1,534 | |
| | | | | 56,860 | |
Industrial (8%) | | | | |
4,137,083 | | ARD Securities Finance SARL 144A, 8.75%, 1/31/23 (b) | | | 3,992 | |
2,000,000 | | Avolon Holdings Funding Ltd. 144A, 5.50%, 1/15/23 (b) | | | 1,995 | |
2,900,000 | | Boise Cascade Co. 144A, 5.63%, 9/01/24 (b) | | | 2,864 | |
2,350,000 | | Bombardier Inc. 144A, 7.50%, 12/01/24 (b) | | | 2,394 | |
1,000,000 | | BWAY Holding Co., 4.75%, 4/15/24 EUR (d)(e) | | | 1,144 | |
3,400,000 | | BWAY Holding Co. 144A, 7.25%, 4/15/25 (b) | | | 3,238 | |
2,150,000 | | BWX Technologies Inc. 144A, 5.38%, 7/15/26 (b) | | | 2,161 | |
1,000,000 | | Covanta Holding Corp., 5.88%, 7/01/25 | | | 972 | |
2,000,000 | | Covanta Holding Corp., 6.00%, 1/01/27 | | | 1,935 | |
1,000,000 | | Crown European Holdings SA, 2.88%, 2/01/26 EUR (d)(e) | | | 1,111 | |
750,000 | | James Hardie International Finance DAC 144A, 3.63%, 10/01/26 EUR (b)(e) | | | 849 | |
1,600,000 | | James Hardie International Finance DAC 144A, 5.00%, 1/15/28 (b) | | | 1,458 | |
1,500,000 | | Mueller Water Products Inc. 144A, 5.50%, 6/15/26 (b) | | | 1,489 | |
1,200,000 | | Novelis Corp. 144A, 5.88%, 9/30/26 (b) | | | 1,134 | |
1,400,000 | | Reynolds Group Issuer Inc./Reynolds Group Issuer LLC/Reynolds Group Issuer Lu 144A, 7.00%, 7/15/24 (b) | | | 1,404 | |
2,000,000 | | Standard Industries Inc./NJ 144A, 4.75%, 1/15/28 (b) | | | 1,795 | |
2,800,000 | | TTM Technologies Inc. 144A, 5.63%, 10/01/25 (b) | | | 2,737 | |
3,100,000 | | XPO Logistics Inc. 144A, 6.13%, 9/01/23 (b) | | | 3,187 | |
| | | | | 35,859 | |
Technology (3%) | | | | |
2,500,000 | | ACI Worldwide Inc. 144A, 5.75%, 8/15/26 (b) | | | 2,509 | |
1,500,000 | | Change Healthcare Holdings LLC/Change Healthcare Finance Inc. 144A, 5.75%, 3/01/25 (b) | | | 1,472 | |
1,350,000 | | Dell International LLC/EMC Corp. 144A, 8.35%, 7/15/46 (b) | | | 1,573 | |
2,500,000 | | Everi Payments Inc. 144A, 7.50%, 12/15/25 (b) | | | 2,494 | |
2,000,000 | | First Data Corp. 144A, 5.00%, 1/15/24 (b) | | | 1,982 | |
| | | | | | |
Principal
or Shares | | Security Description | | Value (000) | |
| | |
1,800,000 | | NXP BV/NXP Funding LLC 144A, 3.88%, 9/01/22 (b) | | $ | 1,744 | |
| | | | | 11,774 | |
Utility (1%) | | | | |
1,200,000 | | AES Corp./VA, 4.50%, 3/15/23 | | | 1,185 | |
500,000 | | NextEra Energy Operating Partners LP 144A, 4.50%, 9/15/27 (b) | | | 463 | |
1,250,000 | | NRG Energy Inc., 5.75%, 1/15/28 | | | 1,249 | |
1,250,000 | | Vistra Operations Co. LLC 144A, 5.50%, 9/01/26 (b) | | | 1,233 | |
| | | | | 4,130 | |
Total Corporate Bond (Cost - $416,978) | | | 405,683 | |
Mortgage Backed (2%) | | | | |
1,998,674 | | Fannie Mae Connecticut Avenue Securities, (1 mo. LIBOR USD + 10.250%) 12.53%, 1/25/29 (g) | | | 2,645 | |
1,995,000 | | Fannie Mae Connecticut Avenue Securities, (1 mo. LIBOR USD + 12.250%) 14.53%, 9/25/28 (g) | | | 2,928 | |
900,000 | | Freddie Mac Structured Agency Credit Risk Debt Notes, (1 mo. LIBOR USD + 4.600%) 6.88%, 12/25/42 (g) | | | 960 | |
1,247,976 | | Freddie Mac Structured Agency Credit Risk Debt Notes, (1 mo. LIBOR USD + 11.250%) 13.53%, 10/25/29 (g) | | | 1,447 | |
1,899,646 | | STACR Trust 2018-HRP1 144A, (1 mo. LIBOR USD + 11.750%) 14.03%, 4/25/43 (b)(g) | | | 2,234 | |
Total Mortgage Backed (Cost - $8,041) | | | 10,214 | |
U.S. Government Agency (0%) | | | | |
2,000,000 | | Farm Credit Bank of Texas 144A, 6.20%, (b)(f)(g) (Cost - $2,000) | | | 2,005 | |
Exchange Traded Fund (1%) | | | | |
63,600 | | SPDR S&P Oil & Gas Exploration & Production ETF (c) (Cost - $2,309) | | | 2,294 | |
Stocks (1%) | | | | |
Master Limited Partnership (0%) | | | | |
35,200 | | Enterprise Products Partners LP | | | 944 | |
17,000 | | Magellan Midstream Partners LP | | | 1,049 | |
| | | | | 1,993 | |
Preferred Stock (1%) | | | | |
79,400 | | Morgan Stanley, 5.85% | | | 2,001 | |
1,170 | | Wells Fargo & Co., 7.50% | | | 1,488 | |
| | | | | 3,489 | |
Total Stocks (Cost - $5,655) | | | 5,482 | |
Investment Company (7%) | | | | |
29,111,388 | | Payden Cash Reserves Money Market Fund * (Cost - $29,111) | | | 29,111 | |
Total Investments (Cost - $474,938) (103%) | | | 465,682 | |
Liabilities in excess of Other Assets (-3%) | | | (15,743 | ) |
Net Assets (100%) | | $ | 449,939 | |
| (a) | Floating rate security. The rate shown reflects the rate in effect at October 31, 2018. The stated maturity is subject to prepayments. See Note 2 in the Notes to Financial Statements. |
Annual Report 65
| (b) | Security offered only to qualified institutional investors, and thus is not registered for sale to the public under rule 144A of the Securities Act of 1933. It has been deemed liquid under guidelines approved by the Board. |
| (c) | All or a portion of these securities are on loan. At October 31, 2018, the total market value of the Fund’s securities on loan is $11,949 and the total market value of the collateral held by the Fund is $12,248. Amounts in 000s. |
| (d) | Security offered and sold outside the United States, and thus is exempt from registration under Regulation S of the Securities Act of 1933. It has been deemed liquid under guidelines approved by the Board. |
| (e) | Principal in foreign currency. |
| (f) | Perpetual security with no stated maturity date. |
| (g) | Floating rate security. The rate shown reflects the rate in effect at October 31, 2018. See Note 2 in the Notes to Financial Statements. |
Open Forward Currency Contracts to USD
| | | | | | | | | | | | | | | | |
Currency Purchased
(000s) | | Currency Sold (000s) | | | Counterparty | | | Settlement
Date | | | Unrealized Appreciation (Depreciation) (000s) | |
Assets: | | | | | | | | | | | | | | | | |
USD 18,718 | |
| EUR
16,396 |
| | | Citibank, N.A. | | | | 11/08/2018 | | | $ | 135 | |
USD 847 | |
| ZAR
12,480 |
| | | HSBC Bank USA, N.A. | | | | 11/13/2018 | | | | 2 | |
| | | | | | | | | | | | | | | | |
| | | | | | | | | | | | | | | 137 | |
| | | | | | | | | | | | | | | | |
Liabilities: | | | | | | | | | | | | | | | | |
ZAR 12,480 | |
| USD
926 |
| | | HSBC Bank USA, N.A. | | | | 11/13/2018 | | | | (81 | ) |
| | | | | | | | | | | | | | | | |
| | | | | | | | | | | | | | | (81 | ) |
| | | | | | | | | | | | | | | | |
Net Unrealized Appreciation (Depreciation) | | | $ | 56 | |
| | | | | | | | | | | | | | | | |
Open Centrally Cleared Interest Rate Swap Contracts
| | | | | | | | | | | | | | | | |
| Description | | Maturity Date | | Notional
Amount
(000s) | | Value
(000s) | | | Upfront
payments/
receipts
(000s) | | | Unrealized
Depreciation
(000s) | |
Pay Variable Monthly, 1-Month USD LIBOR, Receive Fixed 3.013% | | 10/29/2023 | | $14,240 | | | $(13 | ) | | | $— | | | | $(13 | ) |
Semi-Annually | | | | | | | | | | | | | | | | |
Receive Variable Monthly, 1-Month EURIBOR, Pay Fixed 0.2405% | | 10/29/2023 | | 11,610 | | | (16 | ) | | | — | | | | (16 | ) |
Semi-Annually | | | | | | | | | | | | | | | | |
| | | | | | | | | | | | | | | | |
| | | | | | $ | (29 | ) | | $ | — | | | $ | (29 | ) |
| | | | | | | | | | | | | | | | |
Offsetting Assets and Liabilities
The Fund’s loaned securities were all subject to an enforceable Securities Lending Agency Agreement. Securities lent in accordance with the Securities Lending Agency Agreement on a gross basis were as follows:
| | |
| | | Value
(000’s) |
Total gross amount presented on the Statements | | $ 11,949 |
of Assets and Liabilities1 | | |
Non-cash Collateral2 | | (11,949) |
| | |
Net Amount | | $ — |
| | |
| 1 | The amount presented on the Statements of Assets and Liabilities is not offset and is shown on a gross basis. |
| 2 | At October 31, 2018, the value of the collateral received from each borrower exceeded the value of the related securities loaned. This amount is disclosed on the Schedule of Investments. |
See notes to financial statements.
66 Payden Mutual Funds

| | | | | | |
| | | |
| | The Fund seeks income that is exempt from federal and California state income tax and is consistent with preservation of capital by generally investing in investment grade California municipal securities with an average portfolio maturity of five to ten years. | |  |
| | | Portfolio Composition - percent of investments |
| | | General Obligation | | 50% |
| | Healthcare | | 14% |
| | | Industrial Development/Pollution | | |
| | | Control | | 10% |
| | | Education | | 10% |
| | | Transportation | | 7% |
| | | Other | | 9% |
| | | | | | | Past performance does not predict future returns. The graph does not reflect the impact of taxes or transaction costs a shareholder would pay. |
| | | This information is not part of the audited financial statements. | | |
Schedule of Investments - October 31, 2018
| | | | | | |
Principal
or Shares | | Security Description | | Value (000) | |
General Obligation (51%) | | | | |
645,000 | | Abag Finance Authority for Nonprofit Corps, | | | | |
| | 5.00%, 9/02/26 | | $ | 726 | |
455,000 | | Abag Finance Authority for Nonprofit Corps, | | | | |
| | 5.00%, 9/02/28 AGM (a) | | | 531 | |
100,000 | | Alameda Community Improvement Commission | | | | |
| | Successor Agency, 5.00%, 9/01/28 BAM (a) | | | 113 | |
250,000 | | Alameda Community Improvement Commission | | | | |
| | Successor Agency, 5.00%, 9/01/32 BAM (a) | | | 279 | |
300,000 | | Anaheim Public Financing Authority, | | | | |
| | 5.00%, 5/01/34 | | | 333 | |
1,000,000 | | Azusa Unified School District, 5.00%, 8/01/42 | | | 1,080 | |
800,000 | | Beaumont Public Improvement Authority, | | | | |
| | 5.00%, 9/01/43 AGM (a) | | | 896 | |
200,000 | | Brea Community Benefit Financing Authority, | | | | |
| | 5.00%, 7/01/29 | | | 225 | |
250,000 | | California Infrastructure & Economic | | | | |
| | Development Bank, 1.99%, 8/01/47 (b) | | | 250 | |
500,000 | | California Infrastructure & Economic | | | | |
| | Development Bank, 2.27%, 12/01/50 (b) | | | 504 | |
500,000 | | California State, 5.00%, 10/01/26 | | | 569 | |
480,000 | | California State, 5.25%, 10/01/21 | | | 495 | |
385,000 | | California State Public Works Board, | | | | |
| | 5.25%, 10/01/33 | | | 433 | |
100,000 | | City & County of San Francisco CA, | | | | |
| | 5.00%, 4/01/22 | | | 101 | |
260,000 | | City of Irvine CA, 5.00%, 9/02/22 | | | 283 | |
750,000 | | Compton Community College District, | | | | |
| | 4.00%, 8/01/43 BAM (a) | | | 742 | |
500,000 | | Contra Costa Transportation Authority, | | | | |
| | 1.86%, 3/01/34 (b) | | | 500 | |
250,000 | | County of Riverside CA, 4.00%, 6/28/19 | | | 254 | |
400,000 | | County of Sacramento CA, 5.75%, 2/01/30 | | | 418 | |
400,000 | | Hesperia Community Redevelopment Agency | | | | |
| | Successor Agency, 3.00%, 9/01/20 AGM (a) | | | 398 | |
285,000 | | Inglewood Public Financing Authority, | | | | |
| | 4.25%, 8/01/21 | | | 300 | |
| | | | | | |
Principal
or Shares | | Security Description | | Value (000) | |
| | |
250,000 | | Inglewood Redevelopment Agency Successor | | | | |
| | Agency, 5.00%, 5/01/31 BAM (a) | | $ | 284 | |
160,000 | | Inglewood Redevelopment Agency Successor | | | | |
| | Agency, 5.00%, 5/01/34 BAM (a) | | | 179 | |
500,000 | | Lancaster Redevelopment Agency Successor | | | | |
| | Agency, 5.00%, 8/01/30 AGM (a) | | | 567 | |
1,370,000 | | Los Angeles County Facilities Inc., | | | | |
| | 4.00%, 12/01/48 | | | 1,343 | |
250,000 | | Los Angeles County Public Works Financing | | | | |
| | Authority, 5.00%, 12/01/31 | | | 285 | |
350,000 | | Los Angeles County Redevelopment Authority, | | | | |
| | 5.25%, 12/01/26 AGM (a) | | | 408 | |
725,000 | | Midpeninsula Regional Open Space District, | | | | |
| | 4.00%, 9/01/43 | | | 743 | |
100,000 | | Municipal Improvement Corp. of Los Angeles, | | | | |
| | 5.00%, 5/01/30 | | | 113 | |
490,000 | | Municipal Improvement Corp. of Los Angeles, | | | | |
| | 5.00%, 11/01/31 | | | 562 | |
500,000 | | Napa Valley Community College District, | | | | |
| | 0.00%, 8/01/23 | | | 492 | |
310,000 | | Natomas Unified School District, | | | | |
| | 5.00%, 9/01/25 BAM (a) | | | 348 | |
1,000,000 | | Nuveen, CA Free Quality Municipal Income | | | | |
| | Fund, AMT 144A, 1.91%, 10/01/47 (b)(c) | | | 1,000 | |
250,000 | | Oakland Redevelopment Agency Successor | | | | |
| | Agency, 5.00%, 9/01/35 AGM (a) | | | 280 | |
500,000 | | Oxnard Financing Authority, 5.00%, 6/01/33 | | | | |
| | BAM (a) | | | 564 | |
250,000 | | Palm Springs Financing Authority, | | | | |
| | 5.00%, 6/01/24 | | | 276 | |
250,000 | | Pomona Redevelopment Agency Successor | | | | |
| | Agency, 3.28%, 2/01/20 | | | 250 | |
270,000 | | Rancho Mirage Redevelopment Agency Successor | | | | |
| | Agency, 5.00%, 4/01/24 BAM (a) | | | 307 | |
325,000 | | Riverside County Public Financing Authority, | | | | |
| | 5.00%, 9/01/22 AGM (a) | | | 359 | |
Annual Report 67

| | | | | | |
Principal
or Shares | | Security Description | | Value (000) | |
| | |
285,000 | | Riverside County Redevelopment Successor | | | | |
| | Agency, 5.00%, 10/01/30 AGM (a) | | $ | 317 | |
300,000 | | Riverside Unified School District Financing | | | | |
| | Authority, 5.00%, 9/01/21 BAM (a) | | | 323 | |
300,000 | | Sacramento Redevelopment Agency Successor | | | | |
| | Agency, 5.00%, 12/01/23 BAM (a) | | | 338 | |
350,000 | | San Diego Public Facilities Financing Authority, | | | | |
| | 5.00%, 10/15/30 | | | 398 | |
340,000 | | San Diego Public Facilities Financing Authority, | | | | |
| | 5.00%, 10/15/31 | | | 386 | |
550,000 | | San Diego Public Facilities Financing Authority, | | | | |
| | 5.00%, 10/15/32 | | | 622 | |
500,000 | | San Diego Regional Building Authority, | | | | |
| | 5.00%, 10/15/35 | | | 563 | |
120,000 | | San Jose Financing Authority, 5.00%, 6/01/28 | | | 134 | |
250,000 | | San Mateo Joint Powers Financing Authority, | | | | |
| | 5.00%, 6/15/30 | | | 281 | |
815,000 | | Santa Monica Public Financing Authority, | | | | |
| | 4.00%, 7/01/38 | | | 845 | |
200,000 | | Simi Valley Public Financing Authority, | | | | |
| | 5.00%, 10/01/29 | | | 227 | |
550,000 | | South Orange County Public Financing | | | | |
| | Authority, 5.00%, 4/01/34 | | | 624 | |
500,000 | | State of California, 1.99%, 12/01/27 (b) | | | 500 | |
500,000 | | State of California, 2.04%, 12/01/29 (b) | | | 501 | |
640,000 | | State of California, 2.76%, 5/01/20 (b) | | | 651 | |
250,000 | | State of California, 5.00%, 2/01/25 | | | 278 | |
390,000 | | State of California, 5.00%, 9/01/27 | | | 453 | |
100,000 | | State of California, 5.00%, 8/01/30 | | | 112 | |
550,000 | | State of California, 6.51%, 4/01/39 | | | 594 | |
1,000,000 | | State of California, 7.95%, 3/01/36 | | | 1,061 | |
800,000 | | Temecula Redevelopment Agency Successor | | | | |
| | Agency, 5.00%, 12/15/37 AGM (a) | | | 888 | |
325,000 | | Tustin Community Facilities District, | | | | |
| | 5.00%, 9/01/22 | | | 352 | |
350,000 | | Union City Community Redevelopment Agency, | | | | |
| | 5.00%, 10/01/35 | | | 390 | |
345,000 | | Watsonville Redevelopment Agency, | | | | |
| | 5.00%, 8/01/24 BAM (a) | | | 392 | |
205,000 | | West Sonoma County Union High School | | | | |
| | District, 4.00%, 8/01/46 | | | 211 | |
Total General Obligation (Cost - $29,406) | | | 29,231 | |
Revenue (51%) | | | | |
Airport/Port (4%) | | | | |
1,300,000 | | California Municipal Finance Authority, AMT, | | | | |
| | 5.00%, 12/31/43 | | | 1,390 | |
250,000 | | Norman Y Mineta San Jose International Airport | | | | |
| | SJC, 5.00%, 3/01/32 | | | 283 | |
340,000 | | San Francisco, CA City & County Airports | | | | |
| | Commission, 5.00%, 5/01/21 | | | 345 | |
| | | | | 2,018 | |
Education (9%) | | | | |
300,000 | | California Educational Facilities Authority, | | | | |
| | 5.00%, 10/01/31 | | | 334 | |
| | | | | | |
Principal
or Shares | | Security Description | | Value (000) | |
| | |
370,000 | | California Educational Facilities Authority, | | | | |
| | 5.00%, 10/01/37 | | $ | 418 | |
360,000 | | California Educational Facilities Authority, | | | | |
| | 5.00%, 10/01/38 | | | 406 | |
650,000 | | California Municipal Finance Authority, | | | | |
| | 1.96%, 10/01/45 (b) | | | 652 | |
250,000 | | California Municipal Finance Authority, | | | | |
| | 5.00%, 10/01/42 BAM (a) | | | 271 | |
120,000 | | California School Finance Authority 144A, | | | | |
| | 4.00%, 7/01/22 (c) | | | 125 | |
1,000,000 | | California School Finance Authority 144A, | | | | |
| | 5.00%, 7/01/37 (c) | | | 1,083 | |
1,000,000 | | California School Finance Authority 144A, | | | | |
| | 5.00%, 8/01/38 (c) | | | 1,072 | |
250,000 | | Oxnard School District, 2.00%, 8/01/45 | | | | |
| | BAM (a)(b) | | | 256 | |
500,000 | | Travis Unified School District, 5.00%, 9/01/31 | | | | |
| | AGM (a) | | | 562 | |
200,000 | | University of California, 1.40%, 5/15/46 (b) | | | 195 | |
| | | | | 5,374 | |
Electric & Gas (2%) | | | | |
500,000 | | City of Redding CA Electric System Revenue, | | | | |
| | 5.00%, 6/01/30 | | | 581 | |
500,000 | | Southern California Public Power Authority, | | | | |
| | 1.86%, 7/01/40 (b) | | | 500 | |
| | | | | 1,081 | |
Healthcare (14%) | | | | |
750,000 | | Abag Finance Authority for Nonprofit Corps, | | | | |
| | 5.00%, 8/01/32 | | | 827 | |
750,000 | | Augusta Development Authority, | | | | |
| | 5.00%, 7/01/36 | | | 805 | |
215,000 | | California Health Facilities Financing Authority, | | | | |
| | 4.00%, 8/15/34 | | | 219 | |
1,000,000 | | California Health Facilities Financing Authority, | | | | |
| | 4.00%, 11/15/42 | | | 989 | |
710,000 | | California Health Facilities Financing Authority, | | | | |
| | 5.00%, 11/15/27 | | | 783 | |
500,000 | | California Health Facilities Financing Authority, | | | | |
| | 5.00%, 2/01/31 | | | 565 | |
350,000 | | California Health Facilities Financing Authority, | | | | |
| | 5.00%, 8/15/32 | | | 390 | |
500,000 | | California Health Facilities Financing Authority, | | | | |
| | 5.00%, 8/15/42 | | | 545 | |
350,000 | | California Health Facilities Financing Authority, | | | | |
| | 5.00%, 7/01/43 (b) | | | 371 | |
205,000 | | California Health Facilities Financing Authority, | | | | |
| | 5.25%, 3/01/28 | | | 219 | |
325,000 | | California Municipal Finance Authority, | | | | |
| | 5.00%, 5/15/37 | | | 361 | |
750,000 | | California Statewide Communities Development | | | | |
| | Authority, 4.00%, 7/01/43 | | | 753 | |
750,000 | | California Statewide Communities Development | | | | |
| | Authority, 4.00%, 8/01/45 | | | 740 | |
500,000 | | Rib Floater Trust Various States 144A, | | | | |
| | 1.76%, 3/01/42 (b)(c) | | | 500 | |
| | | | | 8,067 | |
68 Payden Mutual Funds
| | | | | | |
Principal
or Shares | | Security Description | | Value (000) | |
| |
Industrial Development/Pollution Control (10%) | | | | |
250,000 | | California Community College Financing | | | | |
| | Authority, 5.00%, 5/01/21 | | $ | 266 | |
1,250,000 | | California Community College Financing | | | | |
| | Authority, 5.25%, 5/01/43 | | | 1,351 | |
750,000 | | California Statewide Communities Development | | | | |
| | Authority, 2.63%, 11/01/33 (b) | | | 741 | |
750,000 | | California Statewide Communities Development | | | | |
| | Authority, 5.00%, 5/15/20 | | | 776 | |
370,000 | | Emeryville Redevelopment Agency Successor | | | | |
| | Agency, 5.00%, 9/01/25 AGM (a) | | | 422 | |
300,000 | | Palm Springs Community Redevelopment | | | | |
| | Agency Successor Agency, 5.00%, 9/01/29 | | | | |
| | AGM (a) | | | 338 | |
390,000 | | Palm Springs Community Redevelopment | | | | |
| | Agency Successor Agency, 5.00%, 9/01/31 | | | | |
| | AGM (a) | | | 436 | |
160,000 | | Parish of St. Charles LA, 4.00%, 12/01/40 (b) | | | 166 | |
1,000,000 | | State of Nevada Department of Business & | | | | |
| | Industry, AMT 144A, 6.95%, 2/15/38 (c) | | | 1,004 | |
100,000 | | Successor Agency to the Upland Community | | | | |
| | Redevelopment Agency, 5.00%, 9/01/23 | | | | |
| | AGM (a) | | | 113 | |
| | | | | 5,613 | |
Resource Recovery (1%) | | | | |
500,000 | | South Bayside, CA Waste Management | | | | |
| | Authority, 5.25%, 9/01/24 | | | 513 | |
Tax Allocation (1%) | | | | |
415,000 | | Riverside County, CA Economic Development | | | | |
| | Agency, 7.25%, 12/01/40 | | | 473 | |
Transportation (7%) | | | | |
250,000 | | Bay Area Toll Authority, 2.21%, 4/01/34 (b) | | | 252 | |
660,000 | | Bay Area Toll Authority, 4.00%, 4/01/37 | | | 670 | |
1,250,000 | | Bay Area Toll Authority, 4.00%, 4/01/47 | | | 1,254 | |
| | | | | | |
Principal
or Shares | | Security Description | | Value (000) | |
| | |
600,000 | | Foothill-Eastern Transportation Corridor Agency, 5.00%, 1/15/53 (b) | | $ | 612 | |
1,000,000 | | Foothill-Eastern Transportation Corridor Agency, 5.50%, 1/15/53 (b) | | | 1,104 | |
| | | | | 3,892 | |
Water & Sewer (3%) | | | | |
490,000 | | California Pollution Control Financing Authority | | | | |
| | 144A, 5.00%, 11/21/45 (c) | | | 491 | |
250,000 | | El Dorado, CA Irrigation District / El Dorado | | | | |
| | County Water Agency, 5.00%, 3/01/29 AGM (a) | | | 280 | |
100,000 | | San Diego Public Facilities Financing Authority | | | | |
| | Water Revenue, 5.00%, 8/01/32 | | | 114 | |
500,000 | | San Francisco City & County Public Utilities | | | | |
| | Commission Wastewater Revenue, | | | | |
| | 5.00%, 10/01/33 | | | 579 | |
275,000 | | Western Riverside Water & Wastewater | | | | |
| | Financing Authority, 4.00%, 9/01/19 | | | 280 | |
| | | | | 1,744 | |
Total Revenue (Cost - $28,752) | | | 28,775 | |
Total Investments (Cost - $58,158) (102%) | | | 58,006 | |
Liabilities in excess of Other Assets (-2%) | | | (866 | ) |
Net Assets (100%) | | $ | 57,140 | |
| (a) | Payment of principal and/or interest is insured against default by a monoline insurer. |
| (b) | Variable rate security. Interest rate disclosed is as of the most recent information available. Certain variable rate securities are not based on a published reference rate and spread but are determined by the issuer or agent and are based on current market conditions. These securities do not indicate a reference rate and spread in their description above. See Note 2 in the Notes to Financial Statements. |
| (c) | Security offered only to qualified institutional investors, and thus is not registered for sale to the public under rule 144A of the Securities Act of 1933. It has been deemed liquid under guidelines approved by the Board. |
Open Futures Contracts
| | | | | | | | | | | | | | | | | | | | |
| Contract Type | | Number of
Contracts | | | Expiration
Date | | | Notional
Amount
(000s) | | | Current
Value
(000s) | | | Unrealized
Appreciation
(000s) | |
Short Contracts: | | | | | | | | | | | | | | | | | | | | |
| U.S. Ultra Bond Future | | | 18 | | | | Dec-18 | | | $ | (2,686 | ) | | $ | 6 | | | $ | 6 | |
| | | | | | | | | | | | | | | | | | | | |
| Total Futures | | | | | | | | | | | | | | | | | | $ | 6 | |
| | | | | | | | | | | | | | | | | | | | |
See notes to financial statements.
Annual Report 69

| | | | | | |
| | | The Fund seeks a high level of total return that is consistent with preservation of capital by generally investing in investment grade debt securities denominated in U.S. and foreign currencies with an average portfolio maturity not to exceed three years. | | 
Past performance does not predict future returns. The graph does not reflect the impact of taxes or transaction costs a shareholder would pay. |
| | | Portfolio Composition - percent of investments |
| | | Corporate Bond | | 61% |
| | | U.S. Treasury | | 11% |
| | | Mortgage Backed | | 10% |
| | | Asset Backed | | 9% |
| | | Foreign Government | | 7% |
| | | Other | | 2% |
| | | This information is not part of the audited financial statements. |
Schedule of Investments - October 31, 2018
| | | | | | |
Principal
or Shares | | Security Description | | Value (000) | |
Bank Loans(a) (0%) | | | | |
203,438 | | Dole Food Co. Inc. Term Loan B 1L, (LIBOR | | | | |
| | USD 1-Month + 2.417%) 5.05%, 4/06/24 | | $ | 203 | |
Total Bank Loans (Cost - $202) | | | 203 | |
Bonds (98%) | | | | |
Argentina (USD) (1%) | | | | |
545,000 | | Argentine Republic Government International | | | | |
| | Bond, 4.63%, 1/11/23 | | | 462 | |
Australia (USD) (2%) | | | | |
515,000 | | Macquarie Group Ltd. 144A, (3 mo. LIBOR | | | | |
| | USD + 1.020%) 3.33%, 11/28/23 (b)(c) | | | 514 | |
270,000 | | Scentre Group Trust 1/Scentre Group Trust 2 | | | | |
| | 144A, 2.38%, 11/05/19 (c) | | | 267 | |
242,000 | | Suncorp-Metway Ltd. 144A, 2.10%, 5/03/19 (c) | | | 241 | |
285,000 | | Suncorp-Metway Ltd. 144A, 2.38%, 11/09/20 (c) | | | 278 | |
665,000 | | Westpac Banking Corp., 2.15%, 3/06/20 | | | 656 | |
| | | | | 1,956 | |
Bermuda (USD) (0%) | | | | |
180,000 | | Enstar Group Ltd., 4.50%, 3/10/22 | | | 180 | |
Canada (USD) (2%) | | | | |
470,000 | | Alimentation Couche-Tard Inc. 144A, | | | | |
| | 2.35%, 12/13/19 (c) | | | 465 | |
165,385 | | Cenovus Energy Inc., 5.70%, 10/15/19 | | | 169 | |
570,000 | | Federation des Caisses Desjardins du Quebec | | | | |
| | 144A, 2.25%, 10/30/20 (c) | | | 557 | |
500,000 | | Husky Energy Inc., 7.25%, 12/15/19 | | | 521 | |
| | | | | 1,712 | |
Cayman Islands (USD) (6%) | | | | |
200,000 | | ADCB Finance Cayman Ltd. 144A, | | | | |
| | 4.00%, 3/29/23 (c) | | | 197 | |
400,000 | | ALM XVI Ltd./ALM XVI LLC 144A, (3 mo. | | | | |
| | LIBOR USD + 1.500%) 3.94%, 7/15/27 (b)(c) | | | 400 | |
420,000 | | Apidos CLO XXI 144A, (3 mo. LIBOR USD | | | | |
| | + 1.450%) 3.89%, 7/18/27 (b)(c) | | | 418 | |
| | | | | | |
Principal
or Shares | | Security Description | | Value (000) | |
| | |
340,000 | | Apidos CLO XXI 144A, (3 mo. LIBOR USD | | | | |
| | + 2.450%) 4.89%, 7/18/27 (b)(c) | | $ | 338 | |
500,000 | | Barings CLO Ltd. 2013-I 144A, (3 mo. LIBOR | | | | |
| | USD + 0.800%) 3.27%, 1/20/28 (b)(c) | | | 500 | |
470,000 | | BSPRT 2018-FL4 Issuer Ltd. 144A, (1 mo. | | | | |
| | LIBOR USD + 1.300%) 3.58%, 9/15/35 (b)(c) | | | 471 | |
370,000 | | CK Hutchison International 17 II Ltd. 144A, | | | | |
| | 2.25%, 9/29/20 (c) | | | 361 | |
500,000 | | Greystone Commercial Real Estate Notes | | | | |
| | 2018-HC1 Ltd. 144A, (1 mo. LIBOR USD | | | | |
| | + 2.150%) 4.27%, 9/15/28 (b)(c) | | | 502 | |
380,000 | | LCM XX LP 144A, (3 mo. LIBOR USD | | | | |
| | + 1.040%) 3.38%, 10/20/27 (b)(c) | | | 380 | |
1,050,000 | | Magnetite VII Ltd. 144A, (3 mo. LIBOR USD | | | | |
| | + 0.800%) 3.24%, 1/15/28 (b)(c) | | | 1,044 | |
250,000 | | Octagon Investment Partners XXIII Ltd. 144A, | | | | |
| | (3 mo. LIBOR USD + 0.850%) | | | | |
| | 3.29%, 7/15/27 (b)(c) | | | 250 | |
815,000 | | Tryon Park CLO Ltd. 144A, (3 mo. LIBOR USD | | | | |
| | + 0.890%) 3.33%, 4/15/29 (b)(c) | | | 813 | |
| | | | | 5,674 | |
Chile (USD) (1%) | | | | |
275,000 | | Banco del Estado de Chile 144A, | | | | |
| | 2.67%, 1/08/21 (c) | | | 268 | |
245,000 | | Banco Santander Chile 144A, | | | | |
| | 2.50%, 12/15/20 (c) | | | 239 | |
| | | | | 507 | |
Finland (USD) (1%) | | | | |
940,000 | | Finnvera OYJ 144A, 1.88%, 10/05/20 (c) | | | 919 | |
France (USD) (3%) | | | | |
220,000 | | Banque Federative du Credit Mutuel SA 144A, | | | | |
| | 2.00%, 4/12/19 (c) | | | 219 | |
See notes to financial statements.
70 Payden Mutual Funds
| | | | | | |
Principal or Shares | | Security Description | | Value (000) | |
| | |
480,000 | | Banque Federative du Credit Mutuel SA 144A, | | | | |
| | 2.20%, 7/20/20 (c) | | $ | 470 | |
250,000 | | BPCE SA 144A, (3 mo. LIBOR USD + 1.220%) | | | | |
| | 3.53%, 5/22/22 (b)(c) | | | 252 | |
560,000 | | Caisse d’Amortissement de la Dette Sociale | | | | |
| | 144A, 1.88%, 7/28/20 (c) | | | 549 | |
445,000 | | Credit Agricole SA/London 144A, | | | | |
| | 3.38%, 1/10/22 (c) | | | 436 | |
630,000 | | Dexia Credit Local SA 144A, 2.25%, 2/18/20 (c) | | | 623 | |
400,000 | | SFIL SA, 2.00%, 6/30/20 | | | 392 | |
| | | | | 2,941 | |
Georgia (USD) (1%) | | | | |
400,000 | | Georgia Government International Bond 144A, | | | | |
| | 6.88%, 4/12/21 (c) | | | 421 | |
Germany (USD) (1%) | | | | |
535,000 | | Deutsche Bank AG/New York NY, | | | | |
| | 3.15%, 1/22/21 | | | 522 | |
Greece (EUR) (0%) | | | | |
200,000 | | Hellenic Republic Government Bond 144A, | | | | |
| | 3.38%, 2/15/25 EUR (c)(d) | | | 220 | |
Guernsey (USD) (0%) | | | | |
300,000 | | Credit Suisse Group Funding Guernsey Ltd., | | | | |
| | 2.75%, 3/26/20 | | | 297 | |
Hong Kong (USD) (0%) | | | | |
200,000 | | AIA Group Ltd. 144A, 2.25%, 3/11/19 (c) | | | 199 | |
India (USD) (1%) | | | | |
345,000 | | ICICI Bank Ltd./Hong Kong 144A, | | | | |
| | 5.75%, 11/16/20 (c) | | | 357 | |
500,000 | | REC Ltd. 144A, 5.25%, 11/13/23 (c) | | | 497 | |
| | | | | 854 | |
Indonesia (USD) (1%) | | | | |
395,000 | | Pelabuhan Indonesia III Persero PT 144A, | | | | |
| | 4.50%, 5/02/23 (c) | | | 386 | |
280,000 | | Perusahaan Penerbit SBSN Indonesia III 144A, | | | | |
| | 3.75%, 3/01/23 (c) | | | 273 | |
| | | | | 659 | |
Ireland (EUR) (0%) | | | | |
100,000 | | James Hardie International Finance DAC 144A, | | | | |
| | 3.63%, 10/01/26 EUR (c)(d) | | | 113 | |
Ireland (USD) (3%) | | | | |
300,000 | | AerCap Ireland Capital DAC/AerCap Global | | | | |
| | Aviation Trust, 3.50%, 5/26/22 | | | 293 | |
825,000 | | AerCap Ireland Capital DAC/AerCap Global | | | | |
| | Aviation Trust, 3.75%, 5/15/19 | | | 827 | |
1,445,000 | | Shire Acquisitions Investments Ireland DAC, | | | | |
| | 1.90%, 9/23/19 | | | 1,427 | |
340,000 | | Shire Acquisitions Investments Ireland DAC, | | | | |
| | 2.40%, 9/23/21 | | | 327 | |
205,000 | | SMBC Aviation Capital Finance DAC 144A, | | | | |
| | 3.00%, 7/15/22 (c) | | | 197 | |
| | | | | 3,071 | |
Italy (USD) (0%) | | | | |
425,000 | | Intesa Sanpaolo SpA 144A, 3.13%, 7/14/22 (c) | | | 387 | |
| | | | | | |
Principal or Shares | | Security Description | | Value (000) | |
| |
Japan (USD) (3%) | | | | |
560,000 | | Central Nippon Expressway Co. Ltd., | | | | |
| | 2.17%, 8/05/19 | | $ | 556 | |
420,000 | | Japan Bank for International Cooperation, | | | | |
| | 2.25%, 2/24/20 | | | 416 | |
200,000 | | Japan Bank for International Cooperation, (3 mo. | | | | |
| | LIBOR USD + 0.480%) 2.80%, 6/01/20 (b) | | | 201 | |
200,000 | | Mizuho Bank Ltd. 144A, 2.40%, 3/26/20 (c) | | | 198 | |
200,000 | | Mizuho Financial Group Inc. 144A, | | | | |
| | 2.63%, 4/12/21 (c) | | | 195 | |
300,000 | | Sumitomo Mitsui Banking Corp., | | | | |
| | 2.09%, 10/18/19 | | | 297 | |
200,000 | | Sumitomo Mitsui Trust Bank Ltd. 144A, | | | | |
| | 1.95%, 9/19/19 (c) | | | 198 | |
400,000 | | Sumitomo Mitsui Trust Bank Ltd. 144A, | | | | |
| | 2.05%, 3/06/19 (c) | | | 399 | |
340,000 | | Sumitomo Mitsui Trust Bank Ltd. 144A, | | | | |
| | 2.05%, 10/18/19 (c) | | | 336 | |
330,000 | | Suntory Holdings Ltd. 144A, 2.55%, 9/29/19 (c) | | | 328 | |
| | | | | 3,124 | |
Kenya (USD) (0%) | | | | |
200,000 | | Kenya Government International Bond 144A, | | | | |
| | 5.88%, 6/24/19 (c) | | | 202 | |
Liberia (USD) (0%) | | | | |
135,000 | | Royal Caribbean Cruises Ltd., 2.65%, 11/28/20 | | | 133 | |
Mexico (USD) (1%) | | | | |
470,000 | | Mexico Government International Bond, | | | | |
| | 3.63%, 3/15/22 | | | 465 | |
Netherlands (USD) (2%) | | | | |
540,000 | | BNG Bank NV 144A, 1.75%, 10/05/20 (c) | | | 527 | |
235,000 | | ING Groep NV, (3 mo. LIBOR USD + 1.150%) | | | | |
| | 3.54%, 3/29/22 (b) | | | 239 | |
154,000 | | Mylan NV, 2.50%, 6/07/19 | | | 153 | |
200,000 | | Nostrum Oil & Gas Finance BV 144A, | | | | |
| | 7.00%, 2/16/25 (c) | | | 162 | |
270,000 | | Stars Group Holdings BV/Stars Group U.S. | | | | |
| | Co-Borrower LLC 144A, 7.00%, 7/15/26 (c) | | | 275 | |
340,000 | | Teva Pharmaceutical Finance Netherlands III BV, | | | | |
| | 1.70%, 7/19/19 | | | 334 | |
560,000 | | Teva Pharmaceutical Finance Netherlands III BV, | | | | |
| | 2.20%, 7/21/21 | | | 523 | |
| | | | | 2,213 | |
New Zealand (USD) (0%) | | | | |
200,000 | | ANZ New Zealand International Ltd./London | | | | |
| | 144A, 2.20%, 7/17/20 (c) | | | 196 | |
Nigeria (USD) (0%) | | | | |
250,000 | | Nigeria Government International Bond 144A, | | | | |
| | 6.75%, 1/28/21 (c) | | | 258 | |
Norway (USD) (0%) | | | | |
320,000 | | DNB Bank ASA 144A, 2.13%, 10/02/20 (c) | | | 311 | |
Oman (USD) (0%) | | | | |
330,000 | | Oman Sovereign Sukuk SAOC 144A, | | | | |
| | 5.93%, 10/31/25 (c) | | | 329 | |
Panama (USD) (0%) | | | | |
225,000 | | Intercorp Financial Services Inc. 144A, | | | | |
| | 4.13%, 10/19/27 (c) | | | 203 | |
See notes to financial statements.
Annual Report 71

| | | | | | |
Principal or Shares | | Security Description | | Value (000) | |
| |
Peru (USD) (1%) | | | | |
200,000 | | Banco de Credito del Peru/Panama 144A, | | | | |
| | 2.25%, 10/25/19 (c)(e) | | | $ 198 | |
320,000 | | Fondo MIVIVIENDA SA 144A, | | | | |
| | 3.50%, 1/31/23 (c) | | | 308 | |
320,000 | | Inretail Pharma SA 144A, 5.38%, 5/02/23 (c) | | | 325 | |
| | | | | 831 | |
Senegal (USD) (0%) | | | | |
210,000 | | Senegal Government International Bond 144A, | | | | |
| | 8.75%, 5/13/21 (c) | | | 225 | |
South Korea (USD) (0%) | | | | |
240,000 | | Hyundai Capital Services Inc. 144A, | | | | |
| | 1.63%, 8/30/19 (c) | | | 237 | |
Spain (EUR) (0%) | | | | |
100,000 | | El Corte Ingles SA 144A, 3.00%, 3/15/24 | | | | |
| | EUR (c)(d) | | | 114 | |
Spain (USD) (1%) | | | | |
600,000 | | Banco Santander SA, 3.13%, 2/23/23 | | | 567 | |
Supranational (USD) (2%) | | | | |
610,000 | | Africa Finance Corp., 4.38%, 4/29/20 (f) | | | 613 | |
980,000 | | European Bank for Reconstruction & | | | | |
| | Development, 1.88%, 7/15/21 | | | 950 | |
| | | | | 1,563 | |
Sweden (USD) (1%) | | | | |
490,000 | | Svensk Exportkredit AB, 1.75%, 5/18/20 | | | 481 | |
Switzerland (USD) (1%) | | | | |
270,000 | | UBS AG/London 144A, 2.45%, 12/01/20 (c) | | | 265 | |
825,000 | | UBS Group Funding Switzerland AG 144A, | | | | |
| | 3.00%, 4/15/21 (c) | | | 812 | |
| | | | | 1,077 | |
United Kingdom (USD) (3%) | | | | |
399,000 | | Anglo American Capital PLC 144A, | | | | |
| | 4.13%, 4/15/21 (c) | | | 401 | |
275,000 | | Barclays PLC, 3.25%, 1/12/21 | | | 271 | |
300,000 | | HSBC Holdings PLC, (3 mo. LIBOR USD | | | | |
| | + 0.600%) 2.92%, 5/18/21 (b) | | | 300 | |
200,000 | | HSBC Holdings PLC, (3 mo. LIBOR USD | | | | |
| | + 0.650%) 2.98%, 9/11/21 (b) | | | 200 | |
440,000 | | Lanark Master Issuer PLC 144A, (3 mo. LIBOR | | | | |
| | USD + 0.420%) 2.85%, 12/22/69 (b)(c) | | | 440 | |
660,000 | | Royal Bank of Scotland Group PLC, (3 mo. | | | | |
| | LIBOR USD + 1.470%) 3.78%, 5/15/23 (b) | | | 664 | |
400,000 | | Santander UK PLC, 2.38%, 3/16/20 | | | 395 | |
270,000 | | Standard Chartered PLC 144A, | | | | |
| | 2.10%, 8/19/19 (c) | | | 268 | |
| | | | | 2,939 | |
United States (USD) (58%) | | | | |
155,000 | | AbbVie Inc., 3.38%, 11/14/21 | | | 154 | |
300,000 | | AES Corp./VA, 4.00%, 3/15/21 | | | 298 | |
110,000 | | AmeriCredit Automobile Receivables Trust | | | | |
| | 2016-2, 2.87%, 11/08/21 | | | 110 | |
300,000 | | AREIT 2018-CRE2 Trust 144A, (1 mo. LIBOR | | | | |
| | USD + 1.400%) 3.68%, 11/14/35 (b)(c) | | | 300 | |
715,000 | | Ares Capital Corp., 3.63%, 1/19/22 | | | 701 | |
| | | | | | |
Principal or Shares | | Security Description | | Value (000) | |
| | |
250,000 | | Associated Bank NA/Green Bay WI, | | | | |
| | 3.50%, 8/13/21 | | $ | 248 | |
245,000 | | Assurant Inc., (3 mo. LIBOR USD + 1.250%) | | | | |
| | 3.62%, 3/26/21 (b) | | | 245 | |
345,000 | | Athene Global Funding 144A, | | | | |
| | 2.75%, 4/20/20 (c) | | | 341 | |
25,954,177 | | BANK 2018-BNK14, 0.53%, 9/15/60 (g) | | | 992 | |
135,000 | | Bank of America Corp., 2.15%, 11/09/20 | | | 132 | |
270,000 | | Bank of America Corp., (3 mo. LIBOR USD | | | | |
| | + 0.630%) 2.33%, 10/01/21 (b) | | | 264 | |
450,000 | | Bank of America Corp., (3 mo. LIBOR USD | | | | |
| | + 0.660%) 2.37%, 7/21/21 (b) | | | 441 | |
275,000 | | Bank of America Corp., 2.63%, 4/19/21 | | | 270 | |
220,000 | | Bayer U.S. Finance II LLC 144A, | | | | |
| | 3.50%, 6/25/21 (c) | | | 219 | |
530,000 | | Becton Dickinson and Co., 2.13%, 6/06/19 | | | 527 | |
15,741,000 | | BENCHMARK 2018-B6 Mortgage Trust, | | | | |
| | 0.60%, 10/10/51 (g) | | | 494 | |
325,000 | | BMW U.S. Capital LLC 144A, | | | | |
| | 3.25%, 8/14/20 (c) | | | 325 | |
615,000 | | Broadcom Corp./Broadcom Cayman Finance Ltd., | | | | |
| | 2.38%, 1/15/20 | | | 608 | |
80,000 | | Capital Auto Receivables Asset Trust 2016-2, | | | | |
| | 2.11%, 3/22/21 | | | 79 | |
645,000 | | Capital One Financial Corp., (3 mo. LIBOR USD | | | | |
| | + 0.950%) 3.28%, 3/09/22 (b) | | | 647 | |
690,000 | | Capital One NA, 2.35%, 1/31/20 | | | 681 | |
65,000 | | Centene Corp., 4.75%, 5/15/22 | | | 65 | |
135,000 | | CenterPoint Energy Inc., 3.60%, 11/01/21 | | | 135 | |
265,000 | | Cheniere Corpus Christi Holdings LLC, | | | | |
| | 5.88%, 3/31/25 | | | 274 | |
200,000 | | Chesapeake Energy Corp., 7.00%, 10/01/24 | | | 196 | |
550,000 | | Citigroup Inc., 2.65%, 10/26/20 | | | 542 | |
250,000 | | Citizens Bank NA/Providence RI, | | | | |
| | 2.20%, 5/26/20 | | | 245 | |
250,000 | | Citizens Bank NA/Providence RI, | | | | |
| | 2.25%, 3/02/20 | | | 247 | |
375,000 | | Comcast Corp., 3.30%, 10/01/20 | | | 375 | |
185,000 | | Comcast Corp., 3.45%, 10/01/21 | | | 185 | |
500,000 | | Compass Bank, 2.75%, 9/29/19 | | | 498 | |
90,000 | | Conagra Brands Inc., (3 mo. LIBOR USD | | | | |
| | + 0.750%) 3.22%, 10/22/20 (b) | | | 90 | |
130,000 | | Conagra Brands Inc., 3.80%, 10/22/21 | | | 130 | |
250,000 | | Constellation Brands Inc., 2.00%, 11/07/19 | | | 247 | |
202,604 | | CSMC Trust 2013-IVR2 144A, | | | | |
| | 1.55%, 4/25/43 (c)(g) | | | 194 | |
340,000 | | CVS Health Corp., (3 mo. LIBOR USD | | | | |
| | + 0.720%) 3.05%, 3/09/21 (b) | | | 342 | |
685,000 | | Dell International LLC/EMC Corp. 144A, | | | | |
| | 3.48%, 6/01/19 (c) | | | 686 | |
300,000 | | Dell International LLC/EMC Corp. 144A, | | | | |
| | 4.42%, 6/15/21 (c) | | | 303 | |
70,000 | | Dell International LLC/EMC Corp. 144A, | | | | |
| | 5.88%, 6/15/21 (c) | | | 71 | |
375,000 | | Delta Air Lines Inc., 2.60%, 12/04/20 | | | 367 | |
215,000 | | Delta Air Lines Inc., 2.88%, 3/13/20 | | | 213 | |
See notes to financial statements.
72 Payden Mutual Funds
| | | | | | |
Principal or Shares | | Security Description | | Value
(000) | |
| | |
105,000 | | Diamondback Energy Inc. 144A, | | | | |
| | 4.75%, 11/01/24 (c) | | $ | 102 | |
140,000 | | Dominion Energy Inc., 2.58%, 7/01/20 | | | 138 | |
420,000 | | Dominion Energy Inc., 2.96%, 7/01/19 | | | 418 | |
265,000 | | DTE Energy Co., 1.50%, 10/01/19 | | | 261 | |
90,000 | | Elanco Animal Health Inc. 144A, | | | | |
| | 3.91%, 8/27/21 (c) | | | 90 | |
230,000 | | Energy Transfer LP, 4.25%, 3/15/23 | | | 228 | |
146,000 | | Energy Transfer Partners LP/Regency Energy | | | | |
| | Finance Corp., 5.88%, 3/01/22 | | | 154 | |
400,000 | | EnLink Midstream Partners LP, 2.70%, 4/01/19 | | | 398 | |
145,000 | | EQT Corp., 2.50%, 10/01/20 | | | 141 | |
335,000 | | Express Scripts Holding Co., 2.60%, 11/30/20 | | | 329 | |
270,000 | | Fannie Mae Connecticut Avenue Securities, (1 mo. LIBOR USD + 2.200%) 4.48%, 8/25/30 (b) | | | 271 | |
255,000 | | Fidelity & Guaranty Life Holdings Inc. 144A, | | | | |
| | 5.50%, 5/01/25 (c) | | | 254 | |
950,000 | | FNMA, 2.75%, 6/22/21 | | | 945 | |
280,000 | | Ford Motor Credit Co. LLC, (3 mo. LIBOR USD + 1.270%) 3.66%, 3/28/22 (b)(e) | | | 277 | |
250,000 | | Freddie Mac Structured Agency Credit Risk Debt Notes, (1 mo. LIBOR USD + 4.600%) 6.88%, 12/25/42 (b) | | | 267 | |
249,595 | | Freddie Mac Structured Agency Credit Risk Debt Notes, (1 mo. LIBOR USD + 11.250%) | | | | |
| | 13.53%, 10/25/29 (b) | | | 289 | |
445,000 | | FS Investment Corp., 4.25%, 1/15/20 | | | 447 | |
240,000 | | GAHR Commercial Mortgage Trust 2015-NRF 144A, 3.38%, 12/15/34 (c)(g) | | | 236 | |
300,000 | | GATX Corp., 2.50%, 7/30/19 | | | 299 | |
370,000 | | General Motors Financial Co. Inc., | | | | |
| | 2.40%, 5/09/19 | | | 369 | |
280,000 | | General Motors Financial Co. Inc., | | | | |
| | 2.65%, 4/13/20 | | | 277 | |
615,000 | | General Motors Financial Co. Inc., (3 mo. LIBOR USD + 0.930%) 3.37%, 4/13/20 (b) | | | 618 | |
580,000 | | General Motors Financial Co. Inc., (3 mo. LIBOR USD + 1.550%) 3.99%, 1/14/22 (b) | | | 588 | |
400,000 | | Glencore Funding LLC 144A, (3 mo. LIBOR | | | | |
| | USD + 1.360%) 3.80%, 1/15/19 (b)(c) | | | 400 | |
360,000 | | GM Financial Automobile Leasing Trust 2016-1, 3.24%, 3/20/20 | | | 360 | |
250,000 | | GM Financial Automobile Leasing Trust 2018-2, 3.06%, 6/21/21 | | | 250 | |
640,000 | | Goldman Sachs Group Inc., 2.60%, 12/27/20 | | | 628 | |
675,000 | | Goldman Sachs Group Inc., 3.00%, 4/26/22 | | | 657 | |
185,000 | | Halfmoon Parent Inc. 144A, (3 mo. LIBOR USD + 0.650%) 2.98%, 9/17/21 (b)(c) | | | 185 | |
265,000 | | Halfmoon Parent Inc. 144A, 3.20%, 9/17/20 (c) | | | 264 | |
130,000 | | Hewlett Packard Enterprise Co., | | | | |
| | 3.50%, 10/05/21 | | | 130 | |
250,000 | | Huntington National Bank, 2.38%, 3/10/20 | | | 247 | |
310,000 | | Hyundai Auto Receivables Trust 2016-B, | | | | |
| | 2.68%, 9/15/23 | | | 304 | |
200,000 | | Icahn Enterprises LP/Icahn Enterprises Finance Corp., 6.25%, 2/01/22 | | | 202 | |
| | | | | | |
Principal or Shares | | Security Description | | Value
(000) | |
| | |
456,638 | | Invitation Homes 2018-SFR1 Trust 144A, (1 mo. LIBOR USD + 0.700%) 2.99%, 3/17/37 (b)(c) | | $ | 457 | |
80,000 | | iStar Inc., 4.63%, 9/15/20 | | | 80 | |
416,093 | | JP Morgan Mortgage Trust 2017-1 144A, | | | | |
| | 3.50%, 1/25/47 (c)(g) | | | 413 | |
801,106 | | JP Morgan Mortgage Trust 2017-5 144A, | | | | |
| | 3.00%, 10/26/48 (c)(g) | | | 794 | |
520,000 | | JPMorgan Chase & Co., (3 mo. LIBOR USD | | | | |
| | + 0.680%) 3.00%, 6/01/21 (b) | | | 521 | |
275,000 | | JPMorgan Chase & Co., (3 mo. LIBOR USD | | | | |
| | + 0.610%) 3.51%, 6/18/22 (b) | | | 275 | |
150,000 | | JPMorgan Chase & Co., 6.30%, 4/23/19 | | | 152 | |
275,000 | | Kinder Morgan Inc./DE, 3.05%, 12/01/19 | | | 274 | |
240,000 | | Kinder Morgan Inc./DE, (3 mo. LIBOR USD | | | | |
| | + 1.280%) 3.72%, 1/15/23 (b) | | | 244 | |
55,120 | | L.A. Arena Funding LLC 144A, | | | | |
| | 7.66%, 12/15/26 (c) | | | 57 | |
350,000 | | Lennar Corp., 4.13%, 1/15/22 | | | 343 | |
2,462 | | MASTR Asset Securitization Trust 2004-6, | | | | |
| | 5.00%, 7/25/19 | | | 2 | |
240,000 | | Metropolitan Life Global Funding I 144A, | | | | |
| | 2.40%, 1/08/21 (c) | | | 235 | |
155,000 | | Microchip Technology Inc. 144A, | | | | |
| | 3.92%, 6/01/21 (c) | | | 154 | |
300,000 | | Morgan Stanley, 2.50%, 4/21/21 | | | 292 | |
350,000 | | Morgan Stanley, (3 mo. LIBOR USD + 1.140%) 3.65%, 1/27/20 (b) | | | 353 | |
180,000 | | Morgan Stanley, (3 mo. LIBOR USD + 1.180%) 3.65%, 1/20/22 (b) | | | 182 | |
275,016 | | MVW Owner Trust 2017-1 144A, | | | | |
| | 2.42%, 12/20/34 (c) | | | 266 | |
400,000 | | Nabors Industries Inc., 4.63%, 9/15/21 | | | 387 | |
365,205 | | New Residential Mortgage Loan Trust 2017-1 | | | | |
| | 144A, 4.00%, 2/25/57 (c)(g) | | | 367 | |
775,242 | | New Residential Mortgage Loan Trust 2017-3 | | | | |
| | 144A, 4.00%, 4/25/57 (c)(g) | | | 779 | |
747,338 | | New Residential Mortgage Loan Trust 2017-4 | | | | |
| | 144A, 4.00%, 5/25/57 (c)(g) | | | 750 | |
310,000 | | NextEra Energy Capital Holdings Inc., | | | | |
| | 3.34%, 9/01/20 | | | 310 | |
290,000 | | Nuveen Finance LLC 144A, 2.95%, 11/01/19 (c) | | | 290 | |
125,000 | | Oasis Petroleum Inc., 6.88%, 1/15/23 | | | 126 | |
590,000 | | ONEOK Inc., 4.25%, 2/01/22 | | | 594 | |
400,000 | | Penske Truck Leasing Co. LP/PTL Finance Corp. 144A, 3.20%, 7/15/20 (c) | | | 398 | |
210,000 | | Phillips 66, (3 mo. LIBOR USD + 0.600%) | | | | |
| | 2.91%, 2/26/21 (b) | | | 210 | |
270,000 | | QEP Resources Inc., 5.38%, 10/01/22 | | | 267 | |
35,000 | | QEP Resources Inc., 6.88%, 3/01/21 | | | 37 | |
179,299 | | Residential Asset Securitization Trust 2006-A8, 6.00%, 8/25/36 | | | 151 | |
465,000 | | Sabine Pass Liquefaction LLC, 5.63%, 2/01/21 | | | 481 | |
180,000 | | Santander Drive Auto Receivables Trust 2015-2, 3.02%, 4/15/21 | | | 180 | |
550,000 | | Santander Holdings USA Inc., 3.70%, 3/28/22 | | | 541 | |
See notes to financial statements.
Annual Report 73

| | | | | | |
Principal or Shares | | Security Description | | Value
(000) | |
| | |
110,000 | | Sempra Energy, 2.40%, 2/01/20 | | $ | 109 | |
105,000 | | Sempra Energy, (3 mo. LIBOR USD + 0.500%) | | | | |
| | 2.94%, 1/15/21 (b) | | | 105 | |
69,792 | | Sequoia Mortgage Trust 2013-1, | | | | |
| | 1.45%, 2/25/43 (g) | | | 66 | |
121,329 | | Sequoia Mortgage Trust 2013-4, | | | | |
| | 1.55%, 4/25/43 (g) | | | 115 | |
253,664 | | Sequoia Mortgage Trust 2017-CH2 144A, | | | | |
| | 4.00%, 12/25/47 (c)(g) | | | 255 | |
180,000 | | Smithfield Foods Inc. 144A, 2.65%, 10/03/21 (c) | | | 171 | |
170,000 | | Smithfield Foods Inc. 144A, 2.70%, 1/31/20 (c) | | | 167 | |
350,000 | | Southern California Edison Co., 1.85%, 2/01/22 | | | 341 | |
125,000 | | Spirit AeroSystems Inc., (3 mo. LIBOR USD | | | | |
| | + 0.800%) 3.13%, 6/15/21 (b) | | | 125 | |
450,000 | | Springleaf Funding Trust 2017-A 144A, | | | | |
| | 2.68%, 7/15/30 (c) | | | 441 | |
360,000 | | Sprint Spectrum Co. LLC/Sprint Spectrum Co. II | | | | |
| | LLC/Sprint Spectrum Co. III LLC 144A, | | | | |
| | 3.36%, 9/20/21 (c) | | | 357 | |
1,160,000 | | STACR Trust 2018-DNA2 144A, (1 mo. LIBOR | | | | |
| | USD + 0.800%) 3.08%, 12/25/30 (b)(c) | | | 1,161 | |
364,619 | | STACR Trust 2018-HRP1 144A, (1 mo. LIBOR | | | | |
| | USD + 1.650%) 3.93%, 4/25/43 (b)(c) | | | 367 | |
250,000 | | STACR Trust 2018-HRP1 144A, (1 mo. LIBOR | | | | |
| | USD + 3.750%) 6.03%, 4/25/43 (b)(c) | | | 263 | |
100,000 | | Starwood Property Trust Inc. 144A, | | | | |
| | 3.63%, 2/01/21 (c) | | | 97 | |
195,000 | | Sterling Bancorp/DE, 3.50%, 6/08/20 | | | 194 | |
80,000 | | Sunoco LP/Sunoco Finance Corp. 144A, | | | | |
| | 4.88%, 1/15/23 (c) | | | 77 | |
555,000 | | SunTrust Bank/Atlanta GA, (3 mo. LIBOR USD | | | | |
| | + 0.298%) 2.59%, 1/29/21 (b) | | | 550 | |
130,000 | | Synchrony Financial, 2.60%, 1/15/19 | | | 130 | |
220,000 | | Synchrony Financial, 3.00%, 8/15/19 | | | 219 | |
120,000 | | Synchrony Financial, (3 mo. LIBOR USD | | | | |
| | + 1.230%) 3.81%, 2/03/20 (b) | | | 121 | |
532,000 | | U.S. Treasury Note, 1.25%, 10/31/19 (h) | | | 524 | |
2,110,000 | | U.S. Treasury Note, 2.00%, 1/31/20 | | | 2,090 | |
4,645,000 | | U.S. Treasury Note, 2.25%, 3/31/20 | | | 4,609 | |
465,000 | | U.S. Treasury Note, 2.38%, 4/15/21 | | | 459 | |
2,000,000 | | U.S. Treasury Note, 2.63%, 7/31/20 | | | 1,992 | |
295,000 | | U.S. Treasury Note, 2.75%, 9/15/21 | | | 294 | |
115,000 | | United Technologies Corp., (3 mo. LIBOR USD | | | | |
| | + 0.650%) 2.97%, 8/16/21 (b) | | | 115 | |
135,000 | | United Technologies Corp., 3.35%, 8/16/21 | | | 134 | |
560,000 | | VEREIT Operating Partnership LP, | | | | |
| | 4.13%, 6/01/21 | | | 564 | |
570,000 | | Verizon Communications Inc., (3 mo. LIBOR | | | | |
| | USD + 1.000%) 3.33%, 3/16/22 (b) | | | 579 | |
145,000 | | VFH Parent LLC/Orchestra Co-Issuer Inc. 144A, | | | | |
| | 6.75%, 6/15/22 (c) | | | 148 | |
240,000 | | ViaSat Inc. 144A, 5.63%, 9/15/25 (c) | | | 224 | |
180,000 | | WEC Energy Group Inc., 3.38%, 6/15/21 | | | 180 | |
| | | | | | |
Principal or Shares | | Security Description | | Value
(000) | |
| | |
485,000 | | Wells Fargo Bank NA, 3.63%, 10/22/21 | | $ | 485 | |
7,674,055 | | Wells Fargo Commercial Mortgage Trust | | | | |
| | 2018-C46, 0.95%, 8/15/51 (g) | | | 484 | |
160,000 | | Westlake Automobile Receivables Trust 2016-2 | | | | |
| | 144A, 4.10%, 6/15/21 (c) | | | 161 | |
330,000 | | Westlake Automobile Receivables Trust 2017-1 | | | | |
| | 144A, 2.70%, 10/17/22 (c) | | | 329 | |
255,000 | | Whiting Petroleum Corp., 5.75%, 3/15/21 | | | 258 | |
| | | | | | |
| | | | | 54,526 | |
| | | | | | |
Vietnam (USD) (1%) | | | | |
500,000 | | Vietnam Government International Bond 144A, | | | | |
| | 6.75%, 1/29/20 (c) | | | 516 | |
| | | | | | |
Virgin Islands (British) (USD) (1%) | | | | |
585,000 | | Sinopec Group Overseas Development 2017 Ltd. | | | | |
| | 144A, 2.38%, 4/12/20 (c) | | | 576 | |
| | | | | | |
Total Bonds (Cost - $93,291) | | | 92,180 | |
| | | | | | |
Investment Company (2%) | | | | |
1,600,687 | | Payden Cash Reserves Money Market Fund * | | | | |
| | (Cost - $1,601) | | | 1,601 | |
| | | | | | |
Purchased Swaptions (0%) | | | | |
Total Purchased Swaptions (Cost - $157) | | | 124 | |
| | | | | | |
Total Investments, Before Options Written | | | | |
(Cost - $95,251) (100%) | | | 94,108 | |
| | | | | | |
Written Swaptions (0%) | | | | |
Total Written Swaptions (Cost - $(133)) | | | (89 | ) |
| | | | | | |
Total Investments (Cost - $95,118) (100%) | | | 94,019 | |
Liabilities in excess of Other Assets (0%) | | | (282 | ) |
| | | | | | |
Net Assets (100%) | | $ | 93,737 | |
| (a) | Floating rate security. The rate shown reflects the rate in effect at October 31, 2018. The stated maturity is subject to prepayments. See Note 2 in the Notes to Financial Statements. |
| (b) | Floating rate security. The rate shown reflects the rate in effect at October 31, 2018. See Note 2 in the Notes to Financial Statements. |
| (c) | Security offered only to qualified institutional investors, and thus is not registered for sale to the public under rule 144A of the Securities Act of 1933. It has been deemed liquid under guidelines approved by the Board. |
| (d) | Principal in foreign currency. |
| (e) | All or a portion of these securities are on loan. At October 31, 2018, the total market value of the Fund’s securities on loan is $307 and the total market value of the collateral held by the Fund is $314. Amount in 000s. |
| (f) | Security offered and sold outside the United States, and thus is exempt from registration under Regulation S of the Securities Act of 1933. It has been deemed liquid under guidelines approved by the Board. |
| (g) | Variable rate security. Interest rate disclosed is as of the most recent information available. Certain variable rate securities are not based on a published reference rate and spread but are determined by the issuer or agent and are based on current market conditions. These securities do not indicate a reference rate and spread in their description above. See Note 2 in the Notes to Financial Statements. |
| (h) | All or a portion of the security is pledged to cover futures contract margin requirements. |
See notes to financial statements.
74 Payden Mutual Funds
Purchased Swaptions
| | | | | | | | | | | | | | | | | | |
| Description | | Counterparty | | Notional
Amount
(000s) | | | Expiration
date | | | Value
(000s) | | | Call/Put | |
| Purchased Call Swaptions 0.0% | | | | | |
| 1-Year Interest Rate Swap, 6/26/20, Pay Fixed 3.15% Semi-Annually, Receive Pay Variable Quarterly, 3-Month USD LIBOR | | Citibank, N.A. | | $ | 27,400 | | | | 06/26/2020 | | | $ | 87 | | | | Call | |
| 2-Year Interest Rate Swap, 9/27/19, Pay Fixed 2.975% Semi-Annually, Receive Pay Variable Quarterly, 3-Month USD LIBOR | | Barclays Bank PLC | | | 12,100 | | | | 09/27/2019 | | | | 37 | | | | Call | |
| | | | | | | | | | | | | | | | | | |
| Total Swaptions | | | | $ | 39,500 | | | | | | | $ | 124 | | | | | |
| | | | | | | | | | | | | | | | | | |
Written Swaptions
| | | | | | | | | | | | | | | | | | |
| Description | | Counterparty | | Notional
Amount
(000s) | | | Expiration
date | | | Value
(000s) | | | Call/Put | |
| Written Call Swaptions 0.0% | | | | | |
| 1-Year Interest Rate Swap, 6/26/19, Pay Fixed 3.15% Semi-Annually, Receive Pay Variable Quarterly, 3-Month USD LIBOR | | Citibank, N.A. | | $ | 27,400 | | | | 06/26/2019 | | | $ | (55 | ) | | | Call | |
| 5-Year Interest Rate Swap, 9/27/19, Pay Fixed 2.90% Semi-Annually, Receive Pay Variable Quarterly, 3-Month USD LIBOR | | Barclays Bank PLC | | | 5,000 | | | | 09/27/2019 | | | | (34 | ) | | | Call | |
| | | | | | | | | | | | | | | | | | |
| Total Swaptions | | | | $ | 32,400 | | | | | | | $ | (89 | ) | | | | |
| | | | | | | | | | | | | | | | | | |
Open Forward Currency Contracts to USD
| | | | | | | | | | | | | | | | |
Currency Purchased (000s) | | Currency
Sold (000s) | | | Counterparty | | | Settlement
Date | | | Unrealized
Appreciation
(Depreciation)
(000s) | |
Assets: | | | | | | | | | | | | | | | | |
GBP 734 | | | USD 940 | | |
| State Street Bank &
Trust Co. |
| | | 01/17/2019 | | | $ | 3 | |
JPY 53,200 | | | USD 470 | | | | BNP PARIBAS | | | | 12/13/2018 | | | | 3 | |
USD 800 | | | AUD 1,120 | | | | Barclays Bank PLC | | | | 12/14/2018 | | | | 7 | |
USD 795 | | | CAD 1,028 | | | | Barclays Bank PLC | | | | 12/14/2018 | | | | 14 | |
USD 475 | | | JPY 53,200 | | | | BNP PARIBAS | | | | 12/13/2018 | | | | 1 | |
USD 470 | | | EUR 406 | | | | BNP PARIBAS | | | | 12/13/2018 | | | | 8 | |
USD 464 | | | EUR 400 | | | | Citibank, N.A. | | | | 11/08/2018 | | | | 10 | |
USD 171 | | | ZAR 2,520 | | |
| HSBC Bank USA,
N.A. |
| | | 11/13/2018 | | | | 1 | |
USD 942 | | | EUR 824 | | |
| State Street Bank &
Trust Co. |
| | | 01/17/2019 | | | | 2 | |
| | | | | | | | | | | | | | | | |
| | | | | | | | | | | | | | | 49 | |
| | | | | | | | | | | | | | | | |
Liabilities: | | | | | | | | | | | | | | | | |
AUD 1,120 | | | USD 795 | | | | Barclays Bank PLC | | | | 12/14/2018 | | | | (2 | ) |
CAD 1,028 | | | USD 786 | | | | Barclays Bank PLC | | | | 12/14/2018 | | | | (5 | ) |
EUR 406 | | | USD 464 | | | | BNP PARIBAS | | | | 12/13/2018 | | | | (3 | ) |
ZAR 2,520 | | | USD 187 | | |
| HSBC Bank USA,
N.A. |
| | | 11/13/2018 | | | | (16 | ) |
| | | | | | | | | | | | | | | | |
| | | | | | | | | | | | | | | (26 | ) |
| | | | | | | | | | | | | | | | |
Net Unrealized Appreciation (Depreciation) | | | $ | 23 | |
| | | | | | | | | | | | | | | | |
See notes to financial statements.
Annual Report 75
Open Futures Contracts
| | | | | | | | | | | | | | | | | | | | |
| Contract Type | | Number of Contracts | | | Expiration Date | | | Notional
Amount
(000s) | | | Current
Value
(000s) | | | Unrealized
Appreciation
(Depreciation)
(000s) | |
| Long Contracts: | | | | | | | | | | | | | | | | | | | | |
| U.S. Treasury 2-Year Note Future | | | 71 | | | | Dec-18 | | | $ | 14,957 | | | $ | (49 | ) | | $ | (49 | ) |
| | | | | | | | | | | | | | | | | | | | |
| | | | | | | | | | | | | | | | | | | (49 | ) |
| | | | | | | | | | | | | | | | | | | | |
| Short Contracts: | | | | | | | | | | | | | | | | | | | | |
| Euro-Bobl Future | | | 3 | | | | Dec-18 | | | | (447 | ) | | | — | | | | — | |
| Euro-Bund Future | | | 16 | | | | Dec-18 | | | | (2,904 | ) | | | 3 | | | | 3 | |
| U.S. Treasury 10-Year Note Future | | | 4 | | | | Dec-18 | | | | (474 | ) | | | 7 | | | | 7 | |
| U.S. Treasury 5-Year Note Future | | | 48 | | | | Dec-18 | | | | (5,394 | ) | | | 47 | | | | 47 | |
| | | | | | | | | | | | | | | | | | | | |
| | | | | | | | | | | | | | | | | | | 57 | |
| | | | | | | | | | | | | | | | | | | | |
| Total Futures | | | | | | | | | | | | | | | | | | $ | 8 | |
| | | | | | | | | | | | | | | | | | | | |
Offsetting Asset and Liabilities
The Fund’s loaned securities were all subject to an enforceable Securities Lending Agency Agreement. Securities lent in accordance with the Securities Lending Agency Agreement on a gross basis were as follows:
| | | | |
Total gross amount presented on the Statements | | $ | 307 | |
of Assets and Liabilities1 | | | | |
Non-cash Collateral2 | | | (307 | ) |
| | | | |
Net Amount | | $ | — | |
| | | | |
| 1 | The amount presented on the Statements of Assets and Liabilities is not offset and is shown on a gross basis. |
| 2 | At October 31, 2018, the value of the collateral received from each borrower exceeded the value of the related securities loaned. This amount is disclosed on the Schedule of Investments. |
See notes to financial statements.
76 Payden Mutual Funds

| | | | | | |
| | | | | |
| | | The Fund seeks a high level of total return that is consistent with preservation of capital by generally investing in investment grade debt securities denominated in U.S. and foreign currencies with an average portfolio maturity not to exceed ten years. | | 
Past performance does not predict future returns. The graph does not reflect the impact of taxes or transaction costs a shareholder would pay. |
| | | Portfolio Composition - percent of investments |
| | | Foreign Government | | 40% |
| | | Corporate | | 33% |
| | | Mortgage Backed | | 12% |
| | | U.S. Treasury | | 5% |
| | | Asset Backed | | 5% |
| | | Other | | 5% |
| | | This information is not part of the audited financial statements. | | |
| | | | | | |
| Schedule of Investments - October 31, 2018 | |
Principal or Shares | | Security Description | | Value (000) | |
| | |
Bonds (100%) | | | | | | |
Argentina (USD) (0%) | | | | |
280,000 | | Provincia de Buenos Aires/Argentina 144A, 5.75%, 6/15/19(a) | | $ | 279 | |
Armenia (USD) (0%) | | | | |
400,000 | | Republic of Armenia International Bond 144A, 6.00%, 9/30/20(a) | | | 405 | |
Australia (AUD) (1%) | | | | |
450,000 | | Australia Government Bond, 1.75%, 11/21/20 | | | 317 | |
1,100,000 | | Australia Government Bond, 3.25%, 4/21/25 | | | 818 | |
| | | | | 1,135 | |
Australia (GBP) (0%) | | | | |
400,000 | | Westfield America Management Ltd., 2.63%, 3/30/29 | | | 500 | |
Australia (USD) (1%) | | | | |
250,000 | | Macquarie Bank Ltd. 144A, 6.63%, 4/07/21(a) | | | 265 | |
190,000 | | Macquarie Group Ltd. 144A, (3 mo. LIBOR USD + 1.372%) 3.76%, 11/28/28(a)(b) | | | 174 | |
90,000 | | Suncorp-Metway Ltd. 144A, 2.35%, 4/27/20(a) | | | 89 | |
| | | | | 528 | |
Austria (EUR) (0%) | | | | |
120,000 | | Austria Government Bond 144A, 1.65%, 10/21/24(a) | | | 149 | |
120,000 | | Austria Government Bond 144A, 2.40%, 5/23/34(a) | | | 162 | |
50,000 | | Austria Government Bond 144A, 3.15%, 6/20/44(a) | | | 80 | |
| | | | | 391 | |
Belgium (EUR) (1%) | | | | |
100,000 | | Belgium Government Bond 144A, 0.80%, 6/22/25(a) | | | 117 | |
400,000 | | Belgium Government Bond 144A, 1.00%, 6/22/31(a) | | | 451 | |
60,000 | | Belgium Government Bond 144A, 1.60%, 6/22/47(a) | | | 66 | |
250,000 | | Belgium Government Bond, 3.00%, 9/28/19 | | | 292 | |
| | | | | 926 | |
| | | | | | |
Principal or Shares | | Security Description | | Value (000) | |
| |
Brazil (USD) (0%) | | | | |
270,000 | | Brazilian Government International Bond, 4.88%, 1/22/21 | | $ | 275 | |
Canada (CAD) (2%) | | | | |
1,200,000 | | Canadian Government Bond, 2.25%, 6/01/25 | | | 900 | |
680,000 | | Canadian Government Bond, 3.50%, 12/01/45 | | | 616 | |
615,000 | | Canadian Government Bond, 3.75%, 6/01/19 | | | 472 | |
350,000 | | Canadian Government Bond, 5.00%, 6/01/37 | | | 362 | |
300,000 | | Canadian Government Bond, 5.75%, 6/01/29 | | | 296 | |
| | | | | 2,646 | |
Canada (USD) (2%) | | | | |
360,000 | | 1011778 BC ULC/New Red Finance Inc. 144A, 5.00%, 10/15/25(a) | | | 338 | |
487,000 | | Cenovus Energy Inc., 6.75%, 11/15/39 | | | 522 | |
356,000 | | Encana Corp., 3.90%, 11/15/21 | | | 356 | |
200,000 | | Encana Corp., 6.63%, 8/15/37 | | | 228 | |
405,000 | | Manulife Financial Corp., (5 yr. Swap Semi 30/360 US + 1.647%) 4.06%, 2/24/32(b) | | | 377 | |
| | | | | 1,821 | |
Cayman Islands (USD) (3%) | | | | |
700,000 | | Apidos CLO XXI 144A, (3 mo. LIBOR USD + 1.450%) 3.89%, 7/18/27(a)(b) | | | 697 | |
250,000 | | Apidos CLO XXI 144A, (3 mo. LIBOR USD + 2.450%) 4.89%, 7/18/27(a)(b) | | | 249 | |
290,000 | | Atrium XII 144A, (3 mo. LIBOR USD + 2.800%) 5.27%, 4/22/27(a)(b) | | | 290 | |
650,000 | | CIFC Funding 2017-III Ltd. 144A, (3 mo. LIBOR USD + 1.800%) 4.27%, 7/20/30(a)(b) | | | 651 | |
400,000 | | Greystone Commercial Real Estate Notes 2018-HC1 Ltd. 144A, (1 mo. LIBOR USD + 2.150%) 4.27%, 9/15/28(a)(b) | | | 401 | |
Annual Report 77

| | | | | | |
Principal or Shares | | Security Description | | Value
(000) | |
| | |
250,000 | | Grippen Park CLO Ltd. 144A, (3 mo. LIBOR | | | | |
| | USD + 3.300%) 5.77%, 1/20/30(a)(b) | | $ | 251 | |
400,000 | | Hunt CRE 2018-FL2 Ltd. 144A, (1 mo. LIBOR | | | | |
| | USD + 1.080%) 3.36%, 8/15/28(a)(b) | | | 402 | |
250,000 | | Hunt CRE 2018-FL2 Ltd. 144A, (1 mo. LIBOR | | | | |
| | USD + 1.450%) 3.73%, 8/15/28(a)(b) | | | 251 | |
400,000 | | Marathon CRE 2018 FL1 Ltd. 144A, (1 mo. | | | | |
| | LIBOR USD + 1.150%) 3.43%, 6/15/28(a)(b) | | | 401 | |
300,000 | | OZLM XII Ltd. 144A, (3 mo. LIBOR USD | | | | |
| | + 1.600%) 4.12%, 4/30/27(a)(b) | | | 299 | |
375,000 | | OZLM XII Ltd. 144A, (3 mo. LIBOR USD | | | | |
| | + 3.000%) 5.52%, 4/30/27(a)(b) | | | 373 | |
65,000 | | Seagate HDD Cayman, 4.88%, 3/01/24 | | | 62 | |
| | | | | 4,327 | |
Chile (USD) (0%) | | | | |
209,622 | | Latam Airlines 2015-1 Pass-Through Trust A, | | | | |
| | 4.20%, 11/15/27 | | | 203 | |
Colombia (USD) (1%) | | | | |
420,000 | | Colombia Government International Bond, | | | | |
| | 3.88%, 4/25/27 | | | 400 | |
200,000 | | Colombia Government International Bond, | | | | |
| | 4.50%, 3/15/29 | | | 198 | |
| | | | | 598 | |
Dominica Republic (USD) (0%) | | | | |
200,000 | | Dominican Republic International Bond 144A, | | | | |
| | 5.50%, 1/27/25(a) | | | 198 | |
Egypt (EUR) (0%) | | | | |
300,000 | | Egypt Government International Bond 144A, | | | | |
| | 4.75%, 4/16/26(a) | | | 319 | |
Finland (EUR) (0%) | | | | |
170,000 | | Finland Government Bond 144A, | | | | |
| | 2.75%, 7/04/28(a) | | | 232 | |
France (EUR) (4%) | | | | |
350,000 | | France Government Bond OAT 144A, | | | | |
| | 1.25%, 5/25/36(a) | | | 396 | |
1,120,000 | | France Government Bond OAT, 1.75%, 11/25/24 | | | 1,390 | |
1,690,000 | | France Government Bond OAT, 3.25%, 5/25/45 | | | 2,638 | |
| | | | | 4,424 | |
France (GBP) (1%) | | | | |
300,000 | | AXA SA, (3 mo. LIBOR GBP + 3.270%) | | | | |
| | 5.63%, 1/16/54(b) | | | 406 | |
150,000 | | Cie de Saint-Gobain, 4.63%, 10/09/29 | | | 221 | |
100,000 | | Cie de Saint-Gobain, 4.63%, 10/09/29 | | | 148 | |
| | | | | 775 | |
France (USD) (1%) | | | | |
585,000 | | Credit Agricole Corporate & Investment Bank | | | | |
| | SA, (3 mo. LIBOR USD + 0.625%) | | | | |
| | 3.02%, 10/03/21(b) | | | 585 | |
Germany (EUR) (4%) | | | | |
900,000 | | Bundesrepublik Deutschland Bundesanleihe, | | | | |
| | 0.00%, 8/15/26 | | | 1,008 | |
500,000 | | Bundesrepublik Deutschland Bundesanleihe, | | | | |
| | 0.50%, 2/15/26 | | | 583 | |
450,000 | | Bundesrepublik Deutschland Bundesanleihe, | | | | |
| | 1.25%, 8/15/48 | | | 540 | |
| | | | | | |
Principal or Shares | | Security Description | | Value (000) | |
| | |
1,200,000 | | Bundesrepublik Deutschland Bundesanleihe, | | | | |
| | 2.00%, 1/04/22 | | $ | 1,467 | |
360,000 | | Bundesrepublik Deutschland Bundesanleihe, | | | | |
| | 3.25%, 7/04/42 | | | 613 | |
450,000 | | Bundesrepublik Deutschland Bundesanleihe, | | | | |
| | 4.00%, 1/04/37 | | | 790 | |
80,000 | | Bundesrepublik Deutschland Bundesanleihe, | | | | |
| | 4.75%, 7/04/40 | | | 161 | |
450,000 | | Volkswagen Leasing GmbH, 1.38%, 1/20/25 | | | 496 | |
| | | | | 5,658 | |
Hong Kong (USD) (1%) | | | | |
715,000 | | ICBCIL Finance Co. Ltd. 144A, | | | | |
| | 2.38%, 5/19/19(a) | | | 710 | |
Iceland (EUR) (1%) | | | | |
502,000 | | Islandsbanki HF, 1.75%, 9/07/20 | | | 582 | |
400,000 | | Landsbankinn HF, 1.63%, 3/15/21 | | | 462 | |
| | | | | 1,044 | |
Indonesia (EUR) (0%) | | | | |
290,000 | | Indonesia Government International Bond 144A, 3.75%, 6/14/28(a) | | | 355 | |
Indonesia (USD) (0%) | | | | |
200,000 | | Indonesia Government International Bond 144A, 4.13%, 1/15/25(a) | | | 192 | |
310,000 | | Perusahaan Penerbit SBSN Indonesia III 144A, 4.15%, 3/29/27(a) | | | 292 | |
| | | | | 484 | |
Ireland (EUR) (0%) | | | | |
100,000 | | Ireland Government Bond, 3.40%, 3/18/24 | | | 132 | |
225,000 | | James Hardie International Finance DAC 144A, 3.63%, 10/01/26(a) | | | 255 | |
100,000 | | Johnson Controls International PLC, | | | | |
| | 1.00%, 9/15/23 | | | 114 | |
| | | | | 501 | |
Ireland (USD) (1%) | | | | |
510,000 | | AerCap Ireland Capital DAC/AerCap Global | | | | |
| | Aviation Trust, 4.13%, 7/03/23 | | | 505 | |
220,000 | | Shire Acquisitions Investments Ireland DAC, | | | | |
| | 2.40%, 9/23/21 | | | 211 | |
185,000 | | Shire Acquisitions Investments Ireland DAC, | | | | |
| | 2.88%, 9/23/23 | | | 175 | |
535,000 | | SMBC Aviation Capital Finance DAC 144A, | | | | |
| | 2.65%, 7/15/21(a) | | | 516 | |
| | | | | 1,407 | |
Italy (EUR) (4%) | | | | |
270,000 | | Assicurazioni Generali SpA, (3 mo. EURIBOR + 5.350%) 5.00%, 6/08/48(b) | | | 309 | |
550,000 | | Italy Buoni Poliennali Del Tesoro 144A, | | | | |
| | 2.95%, 9/01/38(a) | | | 551 | |
1,300,000 | | Italy Buoni Poliennali Del Tesoro, | | | | |
| | 3.50%, 12/01/18 | | | 1,477 | |
1,180,000 | | Italy Buoni Poliennali Del Tesoro, | | | | |
| | 4.50%, 5/01/23 | | | 1,447 | |
880,000 | | Italy Buoni Poliennali Del Tesoro, | | | | |
| | 5.25%, 11/01/29 | | | 1,158 | |
| | | | | 4,942 | |
78 Payden Mutual Funds
| | | | | | |
Principal
or Shares | | Security Description | | Value
(000) | |
| |
Japan (JPY) (16%) | | | | |
250,000,000 | | Japan Government Five Year Bond, | | | | |
| | 0.10%, 6/20/20 | | $ | 2,224 | |
317,400,000 | | Japan Government Ten Year Bond, | | | | |
| | 0.30%, 12/20/25 | | | 2,875 | |
325,000,000 | | Japan Government Ten Year Bond, | | | | |
| | 0.80%, 9/20/23 | | | 3,005 | |
375,000,000 | | Japan Government Ten Year Bond, | | | | |
| | 1.20%, 6/20/21 | | | 3,440 | |
35,000,000 | | Japan Government Thirty Year Bond, | | | | |
| | 0.80%, 3/20/48 | | | 305 | |
240,800,000 | | Japan Government Thirty Year Bond, | | | | |
| | 1.40%, 12/20/45 | | | 2,432 | |
3,000,000 | | Japan Government Thirty Year Bond, | | | | |
| | 2.00%, 9/20/40 | | | 34 | |
5,000,000 | | Japan Government Thirty Year Bond, | | | | |
| | 2.20%, 9/20/39 | | | 57 | |
100,000,000 | | Japan Government Thirty Year Bond, | | | | |
| | 2.30%, 3/20/39 | | | 1,160 | |
254,500,000 | | Japan Government Twenty Year Bond, | | | | |
| | 1.70%, 9/20/33 | | | 2,682 | |
240,000,000 | | Japan Government Twenty Year Bond, | | | | |
| | 2.10%, 6/20/28 | | | 2,533 | |
| | | | | 20,747 | |
Japan (USD) (1%) | | | | |
620,000 | | Mizuho Financial Group Inc., 2.95%, 2/28/22 | | | 604 | |
Jersey (EUR) (0%) | | | | |
400,000 | | Glencore Finance Europe Ltd., 1.88%, 9/13/23 | | | 455 | |
Jersey (GBP) (0%) | | | | |
300,000 | | Heathrow Funding Ltd., 7.13%, 2/14/24 | | | 467 | |
Kenya (USD) (1%) | | | | |
525,000 | | Kenya Government International Bond 144A, | | | | |
| | 5.88%, 6/24/19(a) | | | 529 | |
Luxembourg (EUR) (1%) | | | | |
750,000 | | Allergan Funding SCS, 1.25%, 6/01/24 | | | 828 | |
Luxembourg (USD) (0%) | | | | |
240,000 | | Allergan Funding SCS, 3.45%, 3/15/22 | | | 236 | |
Mexico (MXN) (0%) | | | | |
5,500,000 | | Mexican Bonos, 6.50%, 6/10/21 | | | 258 | |
Morocco (USD) (1%) | | | | |
550,000 | | Morocco Government International Bond 144A, 4.25%, 12/11/22(a) | | | 548 | |
Netherlands (EUR) (1%) | | | | |
300,000 | | Netherlands Government Bond 144A, | | | | |
| | 0.50%, 7/15/26(a) | | | 346 | |
130,000 | | Netherlands Government Bond 144A, | | | | |
| | 2.25%, 7/15/22(a) | | | 162 | |
130,000 | | Netherlands Government Bond 144A, | | | | |
| | 4.00%, 1/15/37(a) | | | 225 | |
400,000 | | NN Group NV, (3 mo. EURIBOR + 4.950%) | | | | |
| | 4.63%, 1/13/48(b) | | | 475 | |
220,000 | | Teva Pharmaceutical Finance Netherlands II BV, 1.13%, 10/15/24 | | | 219 | |
110,000 | | Teva Pharmaceutical Finance Netherlands II BV, 4.50%, 3/01/25 | | | 131 | |
| | | | | 1,558 | |
| | | | | | |
Principal
or Shares | | Security Description | | Value
(000) | |
| |
Netherlands (USD) (1%) | | | | |
600,000 | | Mylan NV, 3.15%, 6/15/21 | | $ | 586 | |
300,000 | | Teva Pharmaceutical Finance Netherlands III BV, | | | | |
| | 1.70%, 7/19/19 | | | 295 | |
250,000 | | Teva Pharmaceutical Finance Netherlands III BV, | | | | |
| | 2.20%, 7/21/21 | | | 233 | |
255,000 | | Teva Pharmaceutical Finance Netherlands III BV, | | | | |
| | 2.80%, 7/21/23 | | | 226 | |
| | | | | 1,340 | |
New Zealand (USD) (1%) | | | | |
750,000 | | ANZ New Zealand International Ltd./London | | | | |
| | 144A, 2.13%, 7/28/21(a) | | | 719 | |
310,000 | | ASB Bank Ltd. 144A, 3.75%, 6/14/23(a) | | | 307 | |
250,000 | | BNZ International Funding Ltd./London 144A, | | | | |
| | 2.10%, 9/14/21(a) | | | 239 | |
| | | | | 1,265 | |
Norway (USD) (0%) | | | | |
280,000 | | Yara International ASA 144A, 4.75%, 6/01/28(a) | | | 278 | |
Poland (PLN) (0%) | | | | |
500,000 | | Republic of Poland Government Bond, | | | | |
| | 5.25%, 10/25/20 | | | 140 | |
Romania (USD) (1%) | | | | |
555,000 | | Romanian Government International Bond | | | | |
| | 144A, 4.38%, 8/22/23(a) | | | 555 | |
Saudi Arabia (USD) (1%) | | | | |
450,000 | | Saudi Government International Bond 144A, | | | | |
| | 3.25%, 10/26/26(a) | | | 417 | |
600,000 | | Saudi Government International Bond 144A, | | | | |
| | 3.63%, 3/04/28(a) | | | 564 | |
| | | | | 981 | |
Senegal (EUR) (0%) | | | | |
450,000 | | Senegal Government International Bond 144A, | | | | |
| | 4.75%, 3/13/28(a) | | | 477 | |
Senegal (USD) (0%) | | | | |
295,000 | | Senegal Government International Bond 144A, | | | | |
| | 8.75%, 5/13/21(a) | | | 315 | |
South Korea (USD) (0%) | | | | |
300,000 | | Korea Hydro & Nuclear Power Co. Ltd. 144A, | | | | |
| | 3.75%, 7/25/23(a) | | | 298 | |
Spain (EUR) (2%) | | | | |
150,000 | | El Corte Ingles SA 144A, 3.00%, 3/15/24(a) | | | 171 | |
1,000,000 | | Spain Government Bond, 0.75%, 7/30/21 | | | 1,157 | |
200,000 | | Spain Government Bond 144A, | | | | |
| | 1.95%, 4/30/26(a) | | | 239 | |
600,000 | | Spain Government Bond 144A, | | | | |
| | 1.95%, 7/30/30(a) | | | 693 | |
220,000 | | Spain Government Bond 144A, | | | | |
| | 2.90%, 10/31/46(a) | | | 265 | |
500,000 | | Telefonica Emisiones SAU, 1.53%, 1/17/25 | | | 572 | |
| | | | | 3,097 | |
Sri Lanka (USD) (0%) | | | | |
300,000 | | Sri Lanka Government International Bond 144A, | | | | |
| | 5.88%, 7/25/22(a) | | | 278 | |
200,000 | | Sri Lanka Government International Bond 144A, | | | | |
| | 6.00%, 1/14/19(a) | | | 198 | |
| | | | | 476 | |
Annual Report 79
| | | | | | |
Principal
or Shares | | Security Description | | Value (000) | |
| |
United Arab Emirates (EUR) (0%) | | | | |
450,000 | | DP World Ltd. 144A, 2.38%, 9/25/26(a) | | $ | 508 | |
United Kingdom (EUR) (1%) | | | | |
250,000 | | Anglo American Capital PLC, 1.63%, 9/18/25 | | | 272 | |
500,000 | | BP Capital Markets PLC, 1.08%, 6/26/25 | | | 569 | |
500,000 | | Nationwide Building Society, (5 yr. Euro Swap | | | | |
| | + 1.500%) 2.00%, 7/25/29(b) | | | 549 | |
| | | | | 1,390 | |
United Kingdom (GBP) (4%) | | | | |
300,000 | | Anglian Water Services Financing PLC, | | | | |
| | 2.63%, 6/15/27 | | | 364 | |
350,000 | | Barclays PLC, 3.25%, 2/12/27 | | | 436 | |
450,000 | | BP Capital Markets PLC, 1.18%, 8/12/23 | | | 563 | |
310,000 | | HSBC Bank PLC, (3 mo. LIBOR GBP | | | | |
| | + 1.500%) 5.38%, 11/04/30(b) | | | 453 | |
518,058 | | Ripon Mortgages PLC 144A, (3 mo. LIBOR | | | | |
| | GBP + 0.800%) 1.60%, 8/20/56(a)(b) | | | 662 | |
100,000 | | United Kingdom Gilt, 0.50%, 7/22/22 | | | 126 | |
260,000 | | United Kingdom Gilt, 4.25%, 12/07/55 | | | 552 | |
260,000 | | United Kingdom Gilt, 4.25%, 12/07/55 | | | 552 | |
620,000 | | United Kingdom Gilt, 4.75%, 12/07/38 | | | 1,187 | |
220,000 | | United Kingdom Gilt, 5.00%, 3/07/25 | | | 348 | |
| | | | | 5,243 | |
United Kingdom (USD) (1%) | | | | |
600,000 | | AstraZeneca PLC, 3.50%, 8/17/23 | | | 592 | |
440,000 | | Barclays PLC, 3.68%, 1/10/23 | | | 426 | |
| | | | | 1,018 | |
United States (EUR) (3%) | | | | |
150,000 | | Berkshire Hathaway Inc., 1.30%, 3/15/24 | | | 175 | |
450,000 | | Blackstone Holdings Finance Co. LLC 144A, | | | | |
| | 1.00%, 10/05/26(a) | | | 484 | |
400,000 | | General Motors Financial Co. Inc., | | | | |
| | 0.96%, 9/07/23 | | | 442 | |
250,000 | | International Flavors & Fragrances Inc., | | | | |
| | 1.80%, 9/25/26 | | | 285 | |
150,000 | | McKesson Corp., 1.50%, 11/17/25 | | | 169 | |
200,000 | | McKesson Corp., 1.63%, 10/30/26 | | | 223 | |
400,000 | | Procter & Gamble Co., 1.25%, 10/25/29 | | | 452 | |
650,000 | | Southern Power Co., 1.00%, 6/20/22 | | | 746 | |
250,000 | | Verizon Communications Inc., 2.88%, 1/15/38 | | | 278 | |
| | | | | 3,254 | |
United States (GBP) (0%) | | | | |
110,000 | | Textron Inc., 6.63%, 4/07/20 | | | 150 | |
United States (USD) (35%) | | | | |
520,000 | | AbbVie Inc., 3.75%, 11/14/23 | | | 516 | |
397,111 | | American Airlines 2016-1 Class B Pass-Through | | | | |
| | Trust, 5.25%, 1/15/24 | | | 409 | |
390,000 | | American Equity Investment Life Holding Co., | | | | |
| | 5.00%, 6/15/27 | | | 377 | |
600,000 | | AREIT 2018-CRE2 Trust 144A, (1 mo. LIBOR | | | | |
| | USD + 1.900%) 4.18%, 11/14/35(a)(b) | | | 600 | |
350,000 | | Ares Capital Corp., 3.63%, 1/19/22 | | | 343 | |
8,565,128 | | BANK 2018-BNK14, 0.53%, 9/15/60(c) | | | 327 | |
200,000 | | Barrick North America Finance LLC, | | | | |
| | 7.50%, 9/15/38 | | | 240 | |
260,000 | | Bayer U.S. Finance II LLC 144A, | | | | |
| | 4.38%, 12/15/28(a) | | | 252 | |
135,000 | | Boardwalk Pipelines LP, 4.45%, 7/15/27 | | | 127 | |
| | | | | | |
Principal
or Shares | | Security Description | | Value (000) | |
| | |
500,000 | | Boise Cascade Co. 144A, 5.63%, 9/01/24(a) | | $ | 494 | |
480,000 | | Cheniere Corpus Christi Holdings LLC, | | | | |
| | 5.88%, 3/31/25 | | | 496 | |
545,545 | | Colony Starwood Homes 2016-2 Trust 144A, (1 | | | | |
| | mo. LIBOR USD + 1.250%) 3.53%, 12/17/33(a)(b) | | | 546 | |
260,000 | | Comcast Corp., 3.70%, 4/15/24 | | | 259 | |
455,000 | | Comcast Corp., 4.25%, 10/15/30 | | | 449 | |
750,000 | | Conagra Brands Inc., 4.30%, 5/01/24 | | | 753 | |
255,000 | | CVS Health Corp., 3.70%, 3/09/23 | | | 252 | |
250,000 | | CVS Health Corp., 4.78%, 3/25/38 | | | 241 | |
540,000 | | Dell International LLC/EMC Corp. 144A, | | | | |
| | 4.42%, 6/15/21(a) | | | 545 | |
325,000 | | Dell International LLC/EMC Corp. 144A, | | | | |
| | 8.35%, 7/15/46(a) | | | 379 | |
90,000 | | Dignity Health, 3.13%, 11/01/22 | | | 89 | |
543,125 | | Domino’s Pizza Master Issuer LLC 144A, | | | | |
| | 3.08%, 7/25/47(a) | | | 527 | |
385,125 | | Domino’s Pizza Master Issuer LLC 144A, (3 mo. | | | | |
| | LIBOR USD + 1.250%) 3.74%, 7/25/47(a)(b) | | | 387 | |
152,000 | | Dow Chemical Co., 9.40%, 5/15/39 | | | 221 | |
320,000 | | Energy Transfer Operating LP, 6.50%, 2/01/42 | | | 332 | |
430,000 | | EnLink Midstream Partners LP, 5.45%, 6/01/47 | | | 364 | |
230,000 | | EQM Midstream Partners LP, 4.75%, 7/15/23 | | | 233 | |
310,000 | | EQT Corp., 3.00%, 10/01/22 | | | 298 | |
338,351 | | Fannie Mae Connecticut Avenue Securities, (1 | | | | |
| | mo. LIBOR USD + 0.550%) 2.83%, 1/25/30(b) | | | 338 | |
377,083 | | Fannie Mae Connecticut Avenue Securities, (1 | | | | |
| | mo. LIBOR USD + 0.950%) 3.23%, 10/25/29(b) | | | 379 | |
350,000 | | Fannie Mae Connecticut Avenue Securities, (1 | | | | |
| | mo. LIBOR USD + 2.150%) 4.43%, 10/25/30(b) | | | 350 | |
250,000 | | Fannie Mae Connecticut Avenue Securities, (1 | | | | |
| | mo. LIBOR USD + 4.250%) 6.53%, 1/25/29(b) | | | 282 | |
330,000 | | Fannie Mae Connecticut Avenue Securities, (1 | | | | |
| | mo. LIBOR USD + 4.250%) 6.53%, 4/25/29(b) | | | 373 | |
170,000 | | Fannie Mae Connecticut Avenue Securities, (1 | | | | |
| | mo. LIBOR USD + 4.450%) 6.73%, 1/25/29(b) | | | 189 | |
499,669 | | Fannie Mae Connecticut Avenue Securities, (1 | | | | |
| | mo. LIBOR USD + 10.250%) 12.53%, 1/25/29(b) | | | 661 | |
498,849 | | Fannie Mae Connecticut Avenue Securities, (1 mo. LIBOR USD + 10.750%) 13.03%, 1/25/29(b) | | | 661 | |
460,000 | | Fannie Mae-Aces, 3.82%, 9/25/30(c) | | | 456 | |
550,000 | | First Data Corp. 144A, 7.00%, 12/01/23(a) | | | 571 | |
740,000 | | FN, 2.50%, 15YR TBA(d) | | | 708 | |
1,200,000 | | FN, 3.00%, 15YR TBA(d) | | | 1,178 | |
1,170,000 | | FN, 3.00%, 30YR TBA(d) | | | 1,107 | |
560,000 | | FN, 3.50%, 30YR TBA(d) | | | 545 | |
1,830,000 | | FN, 4.00%, 30YR TBA(d) | | | 1,830 | |
1,310,000 | | FN, 4.50%, 30YR TBA(d) | | | 1,341 | |
499,967 | | FN AS4885 30YR, 3.50%, 5/01/45 | | | 489 | |
430,000 | | Ford Motor Co., 4.35%, 12/08/26 | | | 391 | |
400,000 | | Ford Motor Co., 4.75%, 1/15/43 | | | 316 | |
470,000 | | Ford Motor Credit Co. LLC, (3 mo. LIBOR USD | | | | |
| | + 1.235%) 3.55%, 2/15/23(b) | | | 458 | |
80 Payden Mutual Funds
| | | | | | |
Principal
or Shares | | Security Description | | Value
(000) | |
| | |
346,281 | | Freddie Mac Structured Agency Credit Risk Debt Notes, (1 mo. LIBOR USD + 1.200%) 3.48%, 10/25/29(b) | | $ | 350 | |
600,000 | | Freddie Mac Structured Agency Credit Risk Debt Notes, (1 mo. LIBOR USD + 1.300%) 3.58%, 4/25/29(b) | | | 607 | |
250,000 | | Freddie Mac Structured Agency Credit Risk Debt Notes, (1 mo. LIBOR USD + 3.250%) 5.53%, 7/25/29(b) | | | 273 | |
110,000 | | FS Investment Corp., 4.25%, 1/15/20 | | | 110 | |
720,000 | | G2, 3.50%, 30YR TBA(d) | | | 707 | |
350,000 | | General Motors Co., 6.25%, 10/02/43 | | | 336 | |
310,000 | | Goldman Sachs Group Inc., 6.75%, 10/01/37 | | | 362 | |
25,058 | | GreenPoint MTA Trust 2005-AR1, (1 mo. LIBOR USD + 0.560%) 2.84%, 6/25/45(b) | | | 25 | |
400,000 | | Halfmoon Parent Inc. 144A, (3 mo. LIBOR USD + 0.650%) 2.98%, 9/17/21(a)(b) | | | 400 | |
515,000 | | Halfmoon Parent Inc. 144A, 3.20%, 9/17/20(a) | | | 513 | |
385,000 | | Halfmoon Parent Inc. 144A, 4.38%, 10/15/28(a) | | | 377 | |
500,000 | | HCA Inc., 5.38%, 2/01/25 | | | 504 | |
500,000 | | JPMorgan Chase & Co., (3 mo. LIBOR USD + 0.610%) 3.51%, 6/18/22(b) | | | 499 | |
275,000 | | Keurig Dr Pepper Inc. 144A, 4.42%, 5/25/25(a) | | | 272 | |
375,000 | | Kinder Morgan Energy Partners LP, 6.55%, 9/15/40 | | | 411 | |
525,000 | | KKR Group Finance Co. II LLC 144A, 5.50%, 2/01/43(a) | | | 530 | |
380,000 | | Madison Avenue Trust 2013-650M 144A, 4.03%, 10/12/32(a)(c) | | | 374 | |
450,000 | | Meritage Homes Corp., 5.13%, 6/06/27 | | | 397 | |
170,000 | | Nationwide Mutual Insurance Co. 144A, 9.38%, 8/15/39(a) | | | 258 | |
321,516 | | New Residential Mortgage Loan Trust 2017-2 144A, 4.00%, 3/25/57(a)(c) | | | 324 | |
485,000 | | Northwell Healthcare Inc., 4.26%, 11/01/47 | | | 442 | |
320,000 | | ONEOK Partners LP, 6.65%, 10/01/36 | | | 364 | |
63,000 | | Pacific Life Insurance Co. 144A,
9.25%, 6/15/39(a) | | | 94 | |
490,000 | | Planet Fitness Master Issuer LLC 144A, 4.26%, 9/05/48(a) | | | 488 | |
110,000 | | Prudential Financial Inc., (3 mo. LIBOR USD + 3.920%) 5.63%, 6/15/43(b) | | | 112 | |
205,000 | | PSEG Power LLC, 3.85%, 6/01/23 | | | 204 | |
240,000 | | QEP Resources Inc., 5.38%, 10/01/22 | | | 237 | |
590,000 | | Regions Bank/Birmingham AL, (3 mo. LIBOR USD + 0.500%) 2.84%, 8/13/21(b) | | | 590 | |
210,000 | | Reynolds Group Issuer Inc./Reynolds Group Issuer LLC/Reynolds Group Issuer Lu 144A, 5.13%, 7/15/23(a) | | | 206 | |
365,000 | | Sabine Pass Liquefaction LLC, 5.75%, 5/15/24 | | | 387 | |
500,000 | | SLM Corp., 5.13%, 4/05/22 | | | 499 | |
240,000 | | SM Energy Co., 6.13%, 11/15/22 | | | 244 | |
265,000 | | South Carolina Electric & Gas Co., 3.50%, 8/15/21 | | | 265 | |
470,000 | | Spirit AeroSystems Inc., 3.95%, 6/15/23 | | | 465 | |
250,000 | | Sprint Communications Inc, 6.00%, 11/15/22 | | | 253 | |
450,976 | | STACR Trust 2018-HRP1 144A, (1 mo. LIBOR USD + 1.650%) 3.93%, 4/25/43(a)(b) | | | 454 | |
| | | | | | |
Principal
or Shares | | Security Description | | Value
(000) | |
| | |
200,000 | | Synchrony Financial, 4.25%, 8/15/24 | | $ | 190 | |
492,500 | | Taco Bell Funding LLC 144A,
3.83%, 5/25/46(a) | | | 493 | |
640,000 | | Toledo Hospital, 5.33%, 11/15/28 | | | 635 | |
200,000 | | U.S. Treasury Bill, 2.18%, 12/13/18 | | | 200 | |
400,000 | | U.S. Treasury Bond, 2.25%, 8/15/46 | | | 317 | |
1,250,000 | | U.S. Treasury Bond, 3.00%, 8/15/48 | | | 1,156 | |
200,000 | | U.S. Treasury Bond, 4.50%, 5/15/38 | | | 235 | |
3,450,000 | | U.S. Treasury Bond, 5.38%, 2/15/31(e)(f) | | | 4,211 | |
624,000 | | U.S. Treasury Note, 1.25%, 4/30/19(g) | | | 620 | |
800,000 | | U.S. Treasury Note, 2.88%, 5/15/28 | | | 782 | |
295,000 | | United Technologies Corp., 4.13%, 11/16/28 | | | 290 | |
190,000 | | United Technologies Corp., 4.45%, 11/16/38 | | | 184 | |
215,000 | | Welltower, Inc., 4.95%, 1/15/21 | | | 220 | |
240,000 | | Whiting Petroleum Corp., 5.75%, 3/15/21 | | | 242 | |
| | | | | 45,387 | |
Uruguay (USD) (0%) | | | | |
325,000 | | Uruguay Government International Bond, 4.38%, 10/27/27 | | | 322 | |
117,842 | | Uruguay Government International Bond, 4.98%, 4/20/55 | | | 110 | |
| | | | | 432 | |
Virgin Islands (British) (USD) (1%) | | | | |
650,000 | | Sinopec Group Overseas Development 2016 Ltd. 144A, 2.00%, 9/29/21(a) | | | 619 | |
Total Bonds (Cost - $132,447) | | | 129,121 | |
Preferred Stock (0%) | | | | |
120 | | Wells Fargo & Co., 7.50% (Cost - $154) | | | 152 | |
Purchased Swaptions (0%) | | | | |
Total Purchased Swaptions (Cost - $49) | | | 51 | |
Investment Company (5%) | | | | |
1,195,347 | | Payden Cash Reserves Money Market Fund * | | | 1,195 | |
504,885 | | Payden Floating Rate Fund, SI Class * | | | 5,019 | |
Total Investment Company (Cost - $6,242) | | | 6,214 | |
Total Investments, Before Swaptions Written (Cost - $138,892) (105%) | | | 135,538 | |
Written Swaptions (0%) | | | | |
Total Written Swaptions (Cost - $(49)) | | | (47 | ) |
Total Investments (Cost - $138,843) (105%) | | | 135,491 | |
Liabilities in excess of Other Assets (-5%) | | | (6,488 | ) |
| |
Net Assets (100%) | | $ | 129,003 | |
| (a) | Security offered only to qualified institutional investors, and thus is not registered for sale to the public under rule 144A of the Securities Act of 1933. It has been deemed liquid under guidelines approved by the Board. |
| (b) | Floating rate security. The rate shown reflects the rate in effect at October 31, 2018. See Note 2 in the Notes to Financial Statements. |
| (c) | Variable rate security. Interest rate disclosed is as of the most recent information available. Certain variable rate securities are not based on a published reference rate and spread but are determined by the issuer or agent and are based on current market conditions. These securities do not indicate a reference rate and spread in their description above. See Note 2 in the Notes to Financial Statements. |
| (d) | Security was purchased on a delayed delivery basis. |
| (e) | All or a portion of security has been pledged in connection with outstanding centrally cleared swaps. |
| (f) | All or a portion of security has been pledged as collateral in connection with outstanding OTC derivatives. |
| (g) | All or a portion of the security is pledged to cover futures contract margin requirements. |
Annual Report 81
Purchased Swaptions
| | | | | | | | | | | | | | | | | | | | | | |
| Description | | Counterparty | | Notional
Amount
(000s) | | Expiration
date | | Value
(000s) | | Call/Put |
Purchased Call Swaptions 0.0% | | | | | | | | | | | | | | | | | | | | | | |
2-Year Interest Rate Swap, 9/27/19, Pay Fixed 2.975% Semi-Annually, Receive Pay Variable Quarterly, 3-Month USD LIBOR | | Barclays Bank PLC | | | $ | 16,800 | | | | | 09/27/2019 | | | | $ | 51 | | | | | Call | |
| | | | | | | | | | | | | | | | | | | | | | |
Written Swaptions
| | | | | | | | | | | | | | | | | | | | | | |
| Description | | Counterparty | | Notional
Amount
(000s) | | Expiration
date | | Value
(000s) | | Call/Put |
Written Call Swaptions 0.0% | | | | | | | | | | | | | | | | | | | | | | |
5-Year Interest Rate Swap, 9/27/19, Pay Fixed 2.90% Semi-Annually, Receive Pay Variable Quarterly, 3-Month USD LIBOR | | Barclays Bank PLC | | | $ | 7,000 | | | | | 09/27/2019 | | | | $ | (47 | ) | | | | Call | |
| | | | | | | | | | | | | | | | | | | | | | |
Open Forward Currency Contracts to USD
| | | | | | | | | | | | | | |
Currency Purchased
(000s) | | Currency
Sold (000s) | | Counterparty | | Settlement
Date | | Unrealized
Appreciation
(Depreciation)
(000s) |
Assets: | | | | | | | | | | | | | | |
GBP 3,047 | | USD 3,900 | | State Street Bank & Trust Co. | | | | 01/17/2019 | | | | $ | 11 | |
JPY 219,800 | | USD 1,936 | | BNP PARIBAS | | | | 12/13/2018 | | | | | 19 | |
USD 149 | | PLN 560 | | Barclays Bank PLC | | | | 11/21/2018 | | | | | 3 | |
USD 3,209 | | AUD 4,492 | | Barclays Bank PLC | | | | 12/14/2018 | | | | | 26 | |
USD 3,189 | | CAD 4,123 | | Barclays Bank PLC | | | | 12/14/2018 | | | | | 54 | |
USD 289 | | MXN 5,570 | | Barclays Bank PLC | | | | 12/17/2018 | | | | | 17 | |
USD 1,182 | | AUD 1,641 | | BNP PARIBAS | | | | 11/08/2018 | | | | | 20 | |
USD 1,961 | | JPY 219,800 | | BNP PARIBAS | | | | 12/13/2018 | | | | | 6 | |
USD 1,937 | | EUR 1,674 | | BNP PARIBAS | | | | 12/13/2018 | | | | | 34 | |
USD 19,242 | | EUR 16,603 | | Citibank, N.A. | | | | 11/08/2018 | | | | | 425 | |
USD 3,892 | | CAD 5,013 | | Citibank, N.A. | | | | 11/14/2018 | | | | | 83 | |
USD 3,826 | | AUD 5,338 | | Citibank, N.A. | | | | 11/14/2018 | | | | | 45 | |
USD 7,403 | | GBP 5,698 | | HSBC Bank USA, N.A. | | | | 11/08/2018 | | | | | 118 | |
USD 581 | | ZAR 8,560 | | HSBC Bank USA, N.A. | | | | 11/13/2018 | | | | | 1 | |
USD 2,014 | | NOK 16,345 | | HSBC Bank USA, N.A. | | | | 11/21/2018 | | | | | 73 | |
USD 1,948 | | EUR 1,663 | | HSBC Bank USA, N.A. | | | | 11/21/2018 | | | | | 61 | |
USD 977 | | NOK 7,938 | | HSBC Bank USA, N.A. | | | | 11/21/2018 | | | | | 35 | |
USD 959 | | EUR 824 | | HSBC Bank USA, N.A. | | | | 11/21/2018 | | | | | 24 | |
USD 2,765 | | CAD 3,542 | | Royal Bank of Canada | | | | 11/08/2018 | | | | | 74 | |
USD 12,204 | | EUR 10,530 | | State Street Bank & Trust Co. | | | | 11/08/2018 | | | | | 270 | |
USD 3,913 | | EUR 3,422 | | State Street Bank & Trust Co. | | | | 01/17/2019 | | | | | 8 | |
| | | | | | | | | | | | | | |
| | | | | | | | | | | | | 1,407 | |
| | | | | | | | | | | | | | |
Liabilities: | | | | | | | | | | | | | | |
AUD 4,492 | | USD 3,189 | | Barclays Bank PLC | | | | 12/14/2018 | | | | | (6 | ) |
AUD 5,338 | | USD 3,889 | | Citibank, N.A. | | | | 11/14/2018 | | | | | (108 | ) |
CAD 4,123 | | USD 3,154 | | Barclays Bank PLC | | | | 12/14/2018 | | | | | (19 | ) |
CAD 5,013 | | USD 3,908 | | Citibank, N.A. | | | | 11/14/2018 | | | | | (99 | ) |
EUR 1,674 | | USD 1,915 | | BNP PARIBAS | | | | 12/13/2018 | | | | | (11 | ) |
EUR 1,717 | | USD 2,019 | | HSBC Bank USA, N.A. | | | | 11/21/2018 | | | | | (71 | ) |
EUR 770 | | USD 898 | | HSBC Bank USA, N.A. | | | | 11/21/2018 | | | | | (25 | ) |
82 Payden Mutual Funds
| | | | | | | | | | | | |
Currency
Purchased
(000s) | | Currency
Sold (000s) | | Counterparty | | Settlement
Date | | | Unrealized
Appreciation
(Depreciation)
(000s) | |
NOK 16,293 | | USD 1,943 | | HSBC
Bank
USA,
N.A. | | | 11/21/2018 | | | | (9 | ) |
NOK 7,990 | | USD 956 | | HSBC
Bank
USA,
N.A. | | | 11/21/2018 | | | | (7 | ) |
USD 20,711 | | JPY 2,348,700 | | Barclays
Bank
PLC | | | 11/08/2018 | | | | (116 | ) |
ZAR 8,560 | | USD 635 | | HSBC
Bank
USA,
N.A. | | | 11/13/2018 | | | | (56 | ) |
| | | | | | | | | | | | |
| | | | | | | | | | | (527 | ) |
| | | | | | | | | | | | |
Net Unrealized Appreciation (Depreciation) | | | | | | $ | 880 | |
| | | | | | | | | | | | |
Open Futures Contracts
| | | | | | | | | | | | | | | | | | | | |
Contract
Type | | Number
of
Contracts | | | Expiration
Date | | | Notional
Amount
(000s) | | | Current
Value
(000s) | | | Unrealized
Appreciation
(Depreciation)
(000s) | |
Long Contracts: | | | | | | | | | | | | | | | | | | | | |
| 3-Month GBP LIBOR Option Future | | | 280 | | | | Dec-19 | | | $ | 66 | | | $ | (4 | ) | | $ | (4 | ) |
| Euro-Bobl Future | | | 6 | | | | Dec-18 | | | | 893 | | | | (1 | ) | | | (1 | ) |
| Euro-Schatz Future | | | 49 | | | | Dec-18 | | | | 6,215 | | | | 4 | | | | 4 | |
| U.S. Treasury 10-Year Note Future | | | 1 | | | | Dec-18 | | | | 118 | | | | — | | | | — | |
| U.S. Treasury 2-Year Note Future | | | 18 | | | | Dec-18 | | | | 3,792 | | | | (4 | ) | | | (4 | ) |
| U.S. Ultra Bond Future | | | 23 | | | | Dec-18 | | | | 3,432 | | | | (255 | ) | | | (255 | ) |
| | | | | | | | | | | | | | | | | | | | |
| | | | | | | | | | | | | | | | | | | (260 | ) |
| | | | | | | | | | | | | | | | | | | | |
Short Contracts: | | | | | | | | | | | | | | | | | | | | |
| 3-Month GBP LIBOR Option Future | | | 280 | | | | Dec-19 | | | | (21 | ) | | | — | | | | — | |
| Euro Buxl 30-Year Bond Future | | | 7 | | | | Dec-18 | | | | (1,403 | ) | | | (8 | ) | | | (8 | ) |
| Euro-Bund Future | | | 30 | | | | Dec-18 | | | | (5,446 | ) | | | 1 | | | | 1 | |
| Euro-Oat Future | | | 24 | | | | Dec-18 | | | | (4,131 | ) | | | 8 | | | | 8 | |
| Long Gilt Future | | | 3 | | | | Dec-18 | | | | (469 | ) | | | — | | | | — | |
| U.S. 10-Year Ultra Future | | | 33 | | | | Dec-18 | | | | (4,129 | ) | | | 50 | | | | 50 | |
| U.S. Long Bond Future | | | 10 | | | | Dec-18 | | | | (1,381 | ) | | | 50 | | | | 50 | |
| U.S. Treasury 5-Year Note Future | | | 30 | | | | Dec-18 | | | | (3,371 | ) | | | (8 | ) | | | (8 | ) |
| | | | | | | | | | | | | | | | | | | | |
| | | | | | | | | | | | | | | | | | | 93 | |
| | | | | | | | | | | | | | | | | | | | |
| Total Futures | | | | | | | | | | | | | | | | | | $ | (167 | ) |
| | | | | | | | | | | | | | | | | | | | |
Open Centrally Cleared Credit Default Swap Contracts
| | | | | | | | | | | | | | | | | | | | |
| Description | | Maturity
Date | | | Notional
Amount
(000s) | | | Value
(000s) | | | Upfront payments/
receipts (000s) | | | Unrealized
Appreciation
(000s) | |
| Protection Bought (Relevant Credit: Markit CDX, North America High Yield Series 31 Index), Pay 5% Quarterly, Receive upon credit default | | | 12/20/2023 | | | $ | 3,500 | | | $ | 204 | | | $ | 190 | | | $ | 14 | |
| | | | | | | | | | | | | | | | | | | | |
See notes to financial statements.
Annual Report 83

| | | | | | | | |
| | | | | | |
| | | The Fund seeks a high level of total return by generally investing in below investment grade debt instruments and income producing securities of emerging market countries denominated in U.S. and foreign currencies with no limit on the average portfolio maturity. | | 
Past performance does not predict future returns. The graph does not reflect the impact of taxes or transaction costs a shareholder would pay. The Fund’s Adviser and SI Classes are expected to perform similarly to its Investor Class, except for class specific expenses or waivers. |
| | | Portfolio Composition - percent of investments | | |
| | | Foreign Government | | 64% | | |
| | | Corporate | | 33% | | |
| | | Cash equivalent | | 3% | | |
| | | | | | | |
| | | | | | | |
| | | | | | | |
| | | | | | | |
| | | | | | | |
| | | | | | | |
| | | | | | | |
| | | This information is not part of the audited financial statements. |
| | | | | | |
| Schedule of Investments - October 31, 2018 | | | | |
Principal or
Shares | | Security Description | | Value (000) | |
Bonds (98%) | | | | |
Angola (USD) (3%) | | | | |
8,215,000 | | Angolan Government International Bond 144A, 8.25%, 5/09/28 (a) | | $ | 8,242 | |
13,665,000 | | Angolan Government International Bond 144A, 9.38%, 5/08/48 (a) | | | 13,775 | |
9,170,000 | | Angolan Government International Bond 144A, 9.50%, 11/12/25 (a) | | | 10,129 | |
| | | | | 32,146 | |
Argentina (ARS) (0%) | | | | |
54,000,000 | | YPF SA 144A, 16.50%, 5/09/22
ARS (a) | | | 946 | |
Argentina (USD) (7%) | | | | |
14,512,500 | | Argentine Republic Government International Bond, 2.50%, 12/31/38 | | | 8,138 | |
8,300,000 | | Argentine Republic Government International Bond, 5.63%, 1/26/22 | | | 7,480 | |
6,080,000 | | Argentine Republic Government International Bond, 6.88%, 1/11/48 | | | 4,484 | |
2,920,000 | | Argentine Republic Government International Bond, 7.13%, 6/28/17 | | | 2,181 | |
5,110,000 | | Argentine Republic Government International Bond, 7.13%, 7/06/36 | | | 3,909 | |
27,420,000 | | Argentine Republic Government International Bond, 7.50%, 4/22/26 | | | 23,992 | |
9,075,000 | | Argentine Republic Government International Bond, 7.63%, 4/22/46 | | | 7,141 | |
15,569,632 | | Argentine Republic Government International Bond, 8.28%, 12/31/33 | | | 13,429 | |
2,470,000 | | Provincia de Buenos Aires/Argentina 144A, 6.50%, 2/15/23 (a) | | | 2,127 | |
3,210,000 | | Provincia de Buenos Aires/Argentina 144A, 7.88%, 6/15/27 (a) | | | 2,525 | |
6,675,000 | | Provincia de Cordoba 144A,
7.13%, 6/10/21 (a) | | | 6,208 | |
1,870,000 | | Transportadora de Gas del Sur SA 144A, 6.75%, 5/02/25 (a) | | | 1,762 | |
| | | | | 83,376 | |
| | | | | | |
| | | | | | |
Principal or
Shares | | Security Description | | Value (000) | |
Armenia (USD) (1%) | | | | |
5,431,000 | | Republic of Armenia International Bond 144A, 6.00%, 9/30/20 (a) | | $ | 5,505 | |
9,040,000 | | Republic of Armenia International Bond 144A, 7.15%, 3/26/25 (a) | | | 9,479 | |
| | | | | 14,984 | |
Austria (USD) (0%) | | | | |
3,720,000 | | JBS Investments II GmbH 144A, 7.00%, 1/15/26 (a) | | | 3,677 | |
Azerbaijan (USD) (1%) | | | | |
4,700,000 | | Republic of Azerbaijan International Bond 144A, 4.75%, 3/18/24 (a) | | | 4,639 | |
5,210,000 | | Southern Gas Corridor CJSC 144A, 6.88%, 3/24/26 (a) | | | 5,605 | |
| | | | | 10,244 | |
Bahrain (USD) (1%) | | | | |
6,720,000 | | Bahrain Government International Bond 144A, 6.75%, 9/20/29 (a) | | | 6,440 | |
Belarus (USD) (1%) | | | | |
5,660,000 | | Republic of Belarus International Bond 144A, 6.88%, 2/28/23 (a) | | | 5,847 | |
5,755,000 | | Republic of Belarus International Bond 144A, 7.63%, 6/29/27 (a) | | | 6,102 | |
| | | | | 11,949 | |
Bolivia (USD) (1%) | | | | |
6,870,000 | | Bolivian Government International Bond 144A, 4.50%, 3/20/28 (a) | | | 6,372 | |
Brazil (BRL) (1%) | | | | |
59,500,000 | | Brazil Notas do Tesouro Nacional Serie F, 10.00%, 1/01/27 BRL | | | 16,034 | |
Brazil (USD) (1%) | | | | |
2,000,000 | | Brazilian Government International Bond, 5.00%, 1/27/45 | | | 1,676 | |
84 Payden Mutual Funds
| | | | | | |
Principal or Shares | | Security Description | | Value (000) | |
| | | | | | |
2,855,000 | | Brazilian Government International Bond, 5.63%, 1/07/41 | | $ | 2,639 | |
4,480,000 | | Brazilian Government International Bond, 5.63%, 2/21/47 | | | 4,035 | |
3,290,000 | | JBS USA LUX SA/JBS USA Finance Inc. 144A, 6.75%, 2/15/28 (a) | | | 3,175 | |
4,925,123 | | USJ Acucar e Alcool SA 144A, 9.88%, 11/09/21 (a) | | | 3,817 | |
| | | | | 15,342 | |
Canada (USD) (0%) | | | | |
200,000 | | CNOOC Nexen Finance 2014 ULC, 4.25%, 4/30/24 | | | 201 | |
2,914,941 | | Stoneway Capital Corp. 144A, 10.00%, 3/01/27 (a) | | | 2,725 | |
| | | | | 2,926 | |
Cayman Islands (USD) (1%) | | | | |
9,160,000 | | Lima Metro Line 2 Finance Ltd. 144A, 5.88%, 7/05/34 (a) | | | 9,263 | |
1,988,409 | | Odebrecht Drilling Norbe VIII/IX Ltd. 144A, 7.35%, 12/01/26 (a) | | | 1,238 | |
1,058,000 | | Odebrecht Oil & Gas Finance Ltd. 144A, 0.00%, 1/03/67 (a) | | | 23 | |
| | | | | 10,524 | |
Chile (USD) (2%) | | | | |
6,101,000 | | Celeo Redes Operacion Chile SA 144A, 5.20%, 6/22/47 (a) | | | 5,986 | |
3,080,000 | | Corp. Nacional del Cobre de Chile 144A, 3.63%, 8/01/27 (a) | | | 2,873 | |
4,950,000 | | Empresa Nacional del Petroleo 144A, 5.25%, 11/06/29 (a) | | | 4,930 | |
4,568,908 | | Latam Airlines 2015-1 Pass-Through Trust A, 4.20%, 11/15/27 | | | 4,426 | |
4,013,587 | | Latam Airlines 2015-1 Pass-Through Trust B, 4.50%, 11/15/23 | | | 3,903 | |
| | | | | 22,118 | |
Colombia (USD) (3%) | | | | |
4,350,000 | | Colombia Government International Bond, 3.88%, 4/25/27 | | | 4,146 | |
3,675,000 | | Colombia Government International Bond, 4.00%, 2/26/24 | | | 3,634 | |
2,440,000 | | Colombia Government International Bond, 4.50%, 1/28/26 | | | 2,444 | |
5,550,000 | | Colombia Government International Bond, 4.50%, 3/15/29 | | | 5,481 | |
5,160,000 | | Colombia Government International Bond, 5.00%, 6/15/45 | | | 4,897 | |
6,175,000 | | Colombia Government International Bond, 6.13%, 1/18/41 | | | 6,691 | |
8,250,000 | | Colombia Government International Bond, 7.38%, 9/18/37 | | | 9,993 | |
| | | | | 37,286 | |
Costa Rica (USD) (1%) | | | | |
4,910,000 | | Banco Nacional de Costa Rica 144A,
4.88%, 11/01/18 (a) | | | 4,910 | |
| | | | | | |
Principal or Shares | | Security Description | | Value (000) | |
| | | | | | |
2,820,000 | | Banco Nacional de Costa Rica 144A, 5.88%, 4/25/21 (a) | | $ | 2,709 | |
4,225,000 | | Costa Rica Government International Bond 144A, 7.00%, 4/04/44 (a) | | | 3,509 | |
5,340,000 | | Costa Rica Government International Bond 144A, 7.16%, 3/12/45 (a) | | | 4,480 | |
| | | | | 15,608 | |
Dominica Republic (USD) (4%) | | | | |
1,695,000 | | Dominican Republic International Bond 144A, 5.50%, 1/27/25 (a) | | | 1,676 | |
7,215,000 | | Dominican Republic International Bond 144A, 5.95%, 1/25/27 (a) | | | 7,206 | |
5,910,000 | | Dominican Republic International Bond 144A, 6.00%, 7/19/28 (a) | | | 5,873 | |
5,940,000 | | Dominican Republic International Bond 144A, 6.50%, 2/15/48 (a) | | | 5,641 | |
1,945,000 | | Dominican Republic International Bond 144A, 6.60%, 1/28/24 (a) | | | 2,038 | |
4,275,000 | | Dominican Republic International Bond 144A, 6.85%, 1/27/45 (a) | | | 4,224 | |
12,270,000 | | Dominican Republic International Bond 144A, 6.88%, 1/29/26 (a) | | | 12,914 | |
7,355,000 | | Dominican Republic International Bond 144A, 7.45%, 4/30/44 (a) | | | 7,709 | |
| | | | | 47,281 | |
Ecuador (USD) (3%) | | | | |
6,290,000 | | Ecuador Government International Bond 144A, 7.88%, 1/23/28 (a) | | | 5,280 | |
8,060,000 | | Ecuador Government International Bond 144A, 7.95%, 6/20/24 (a) | | | 7,240 | |
2,090,000 | | Ecuador Government International Bond, 7.95%, 6/20/24 (b) | | | 1,877 | |
4,760,000 | | Ecuador Government International Bond 144A, 8.75%, 6/02/23 (a) | | | 4,564 | |
6,165,000 | | Ecuador Government International Bond 144A, 8.88%, 10/23/27 (a) | | | 5,442 | |
5,135,000 | | Ecuador Government International Bond 144A, 9.65%, 12/13/26 (a) | | | 4,795 | |
5,170,000 | | Ecuador Government International Bond 144A, 10.75%, 3/28/22 (a) | | | 5,344 | |
| | | | | 34,542 | |
Egypt (USD) (2%) | | | | |
2,620,000 | | Egypt Government International Bond 144A, 5.58%, 2/21/23 (a) | | | 2,509 | |
9,855,000 | | Egypt Government International Bond 144A, 7.50%, 1/31/27 (a) | | | 9,660 | |
7,020,000 | | Egypt Government International Bond 144A, 7.90%, 2/21/48 (a) | | | 6,303 | |
4,675,000 | | Egypt Government International Bond 144A, 8.50%, 1/31/47 (a) | | | 4,427 | |
| | | | | 22,899 | |
El Salvador (USD) (1%) | | | | |
10,300,000 | | El Salvador Government International Bond 144A, 7.65%, 6/15/35 (a)(c) | | | 9,489 | |
Gabon (USD) (0%) | | | | |
5,200,000 | | Gabon Government International Bond 144A, 6.38%, 12/12/24 (a) | | | 4,748 | |
Annual Report 85

| | | | | | |
Principal or Shares | | Security Description | | Value (000) | |
| | | | | | |
Georgia (GEL) (0%) | | | | |
6,390,000 | | Bank of Georgia JSC 144A, 11.00%,
6/01/20 GEL (a) | | $ | 2,377 | |
Georgia (USD) (2%) | | | | |
4,645,000 | | Bank of Georgia JSC 144A, 6.00%, 7/26/23 (a) | | | 4,567 | |
9,205,000 | | Georgia Government International Bond 144A, 6.88%, 4/12/21 (a)(c) | | | 9,698 | |
1,575,000 | | Georgian Oil and Gas Corp. JSC 144A, 6.75%, 4/26/21 (a) | | | 1,611 | |
8,965,000 | | Georgian Railway JSC 144A, 7.75%, 7/11/22 (a) | | | 9,510 | |
| | | | | 25,386 | |
Ghana (USD) (2%) | | | | |
3,415,000 | | Ghana Government International Bond 144A, 7.63%, 5/16/29 (a) | | | 3,270 | |
3,010,000 | | Ghana Government International Bond 144A, 7.88%, 8/07/23 (a) | | | 3,079 | |
6,200,000 | | Ghana Government International Bond 144A, 8.63%, 6/16/49 (a) | | | 5,842 | |
14,350,000 | | Ghana Government International Bond 144A, 10.75%, 10/14/30 (a) | | | 17,271 | |
| | | | | 29,462 | |
Guatemala (USD) (0%) | | | | |
1,110,000 | | Guatemala Government Bond
144A, 4.50%, 5/03/26 (a) | | | 1,022 | |
Honduras (USD) (1%) | | | | |
2,070,000 | | Honduras Government International Bond 144A, 6.25%, 1/19/27 (a) | | | 2,044 | |
5,960,000 | | Honduras Government International Bond 144A, 7.50%, 3/15/24 (a) | | | 6,315 | |
5,805,000 | | Honduras Government International Bond 144A, 8.75%, 12/16/20 (a) | | | 6,273 | |
| | | | | 14,632 | |
Hungary (USD) (1%) | | | | |
8,080,000 | | Hungary Government International Bond, 5.75%, 11/22/23 | | | 8,672 | |
India (USD) (0%) | | | | |
3,840,000 | | REC Ltd. 144A, 5.25%, 11/13/23 (a) | | | 3,818 | |
Indonesia (USD) (3%) | | | | |
10,810,000 | | Indonesia Government International Bond 144A, 8.50%, 10/12/35 (a) | | | 14,188 | |
2,370,000 | | Indonesia Government International Bond, 8.50%, 10/12/35 (b) | | | 3,111 | |
2,940,000 | | Pelabuhan Indonesia III Persero PT
144A, 4.50%, 5/02/23 (a) | | | 2,873 | |
5,810,000 | | Pertamina Persero PT 144A, 6.50%, 11/07/48 (a) | | | 5,697 | |
5,870,000 | | Perusahaan Listrik Negara PT 144A, 6.15%, 5/21/48 (a) | | | 5,726 | |
4,730,000 | | Perusahaan Penerbit SBSN Indonesia III 144A, 4.15%, 3/29/27 (a) | | | 4,450 | |
3,295,000 | | Perusahaan Penerbit SBSN Indonesia III 144A, 4.40%, 3/01/28 (a) | | | 3,127 | |
| | | | | 39,172 | |
Iraq (USD) (1%) | | | | |
7,315,000 | | Iraq International Bond 144A, 5.80%, 1/15/28 (a) | | | 6,741 | |
| | | | | | |
Principal or Shares | | Security Description | | Value (000) | |
| | | | | | |
Ivory Coast (USD) (2%) | | | | |
5,735,000 | | Ivory Coast Government International Bond 144A, 5.38%, 7/23/24 (a) | | $ | 5,373 | |
7,991,075 | | Ivory Coast Government International Bond 144A, 5.75%, 12/31/32 (a) | | | 7,264 | |
8,740,000 | | Ivory Coast Government International Bond 144A, 6.13%, 6/15/33 (a) | | | 7,600 | |
| | | | | 20,237 | |
Jordan (USD) (1%) | | | | |
6,800,000 | | Jordan Government International Bond 144A, 7.38%, 10/10/47 (a) | | | 6,176 | |
Kazakhstan (KZT) (0%) | | | | |
2,550,000,000 | | Development Bank of Kazakhstan JSC 144A, 8.95%, 5/04/23 KZT (a) | | | 5,976 | |
Kazakhstan (USD) (1%) | | | | |
6,400,000 | | Kazakhstan Temir Zholy National Co. JSC 144A, 4.85%, 11/17/27 (a) | | | 6,309 | |
5,985,000 | | KazMunayGas National Co. JSC 144A, 5.75%, 4/19/47 (a) | | | 5,730 | |
4,700,000 | | KazMunayGas National Co. JSC 144A, 6.38%, 10/24/48 (a) | | | 4,785 | |
| | | | | 16,824 | |
Kenya (USD) (1%) | | | | |
6,300,000 | | Kenya Government International Bond 144A, 6.88%, 6/24/24 (a) | | | 6,149 | |
3,110,000 | | Kenya Government International Bond 144A, 7.25%, 2/28/28 (a) | | | 2,941 | |
10,675,000 | | Kenya Government International Bond 144A, 8.25%, 2/28/48 (a) | | | 9,777 | |
| | | | | 18,867 | |
Lebanon (USD) (1%) | | | | |
3,960,000 | | Lebanon Government International Bond, 6.20%, 2/26/25 | | | 3,248 | |
3,125,000 | | Lebanon Government International Bond, 6.60%, 11/27/26 | | | 2,539 | |
1,725,000 | | Lebanon Government International Bond, 6.65%, 11/03/28 | | | 1,370 | |
2,685,000 | | Lebanon Government International Bond, 6.75%, 11/29/27 | | | 2,161 | |
| | | | | 9,318 | |
Luxembourg (USD) (1%) | | | | |
8,080,000 | | Adecoagro SA 144A, 6.00%,
9/21/27 (a) | | | 7,110 | |
4,140,000 | | Millicom International Cellular SA 144A, 6.63%, 10/15/26 (a) | | | 4,187 | |
5,240,000 | | Nexa Resources SA 144A, 5.38%, 5/04/27 (a) | | | 5,109 | |
| | | | | 16,406 | |
Mexico (MXN) (1%) | | | | |
32,700,000 | | Grupo Televisa SAB, 7.25%, 5/14/43 MXN | | | 1,076 | |
206,720,000 | | Mexican Bonos, 8.00%, 12/07/23 MXN | | | 9,899 | |
| | | | | 10,975 | |
Mexico (USD) (6%) | | | | |
3,095,000 | | Cemex SAB de CV 144A, 5.70%, 1/11/25 (a) | | | 3,032 | |
680,000 | | Cemex SAB de CV 144A, 7.75%, 4/16/26 (a) | | | 719 | |
9,213,645 | | Cometa Energia SA de CV 144A, 6.38%, 4/24/35 (a) | | | 8,935 | |
86 Payden Mutual Funds
| | | | | | |
Principal or Shares | | Security Description | | Value (000) | |
| | | | | | |
5,961,712 | | Fermaca Enterprises S de RL de CV 144A, 6.38%, 3/30/38 (a) | | $ | 6,106 | |
3,905,000 | | Mexichem SAB de CV 144A, | | | | |
| | 4.00%, 10/04/27 (a) | | | 3,475 | |
5,730,000 | | Mexichem SAB de CV 144A,
5.88%, 9/17/44 (a) | | | 5,264 | |
4,660,000 | | Mexico Government International Bond, 4.15%, 3/28/27 | | | 4,440 | |
2,730,000 | | Petroleos Mexicanos, 3.50%, 1/30/23 | | | 2,516 | |
3,745,000 | | Petroleos Mexicanos, 4.88%, 1/24/22 | | | 3,702 | |
1,373,000 | | Petroleos Mexicanos 144A,
6.35%, 2/12/48 (a) | | | 1,146 | |
2,420,000 | | Petroleos Mexicanos, 6.38%, 1/23/45 | | | 2,021 | |
12,170,000 | | Petroleos Mexicanos, 6.50%, 3/13/27 | | | 11,811 | |
3,420,000 | | Petroleos Mexicanos 144A,
6.50%, 1/23/29 (a) | | | 3,279 | |
2,630,000 | | Petroleos Mexicanos, 6.50%, 6/02/41 | | | 2,259 | |
3,975,000 | | Petroleos Mexicanos, 6.63%, 6/15/35 | | | 3,657 | |
12,139,000 | | Petroleos Mexicanos, 6.75%, 9/21/47 | | | 10,449 | |
| | | | | 72,811 | |
Mongolia (USD) (2%) | | | | |
5,380,000 | | Development Bank of Mongolia LLC
144A, 7.25%, 10/23/23 (a) | | | 5,260 | |
4,585,000 | | Mongolia Government International Bond, 5.13%, 12/05/22 (b) | | | 4,354 | |
1,210,000 | | Mongolia Government International Bond 144A, 5.13%, 12/05/22 (a) | | | 1,149 | |
4,460,000 | | Mongolia Government International Bond 144A, 5.63%, 5/01/23 (a) | | | 4,262 | |
1,660,000 | | Mongolia Government International Bond 144A, 8.75%, 3/09/24 (a) | | | 1,790 | |
13,308,000 | | Mongolia Government International Bond 144A, 10.88%, 4/06/21 (a) | | | 14,809 | |
| | | | | 31,624 | |
Netherlands (USD) (3%) | | | | |
2,670,000 | | Listrindo Capital BV 144A,
4.95%, 9/14/26 (a) | | | 2,387 | |
3,370,000 | | MDC-GMTN BV 144A,
4.50%, 11/07/28 (a) | | | 3,356 | |
5,670,000 | | Minejesa Capital BV
144A, 5.63%, 8/10/37 (a) | | | 5,017 | |
2,480,000 | | Nostrum Oil & Gas Finance BV 144A, | | | | |
| | 7.00%, 2/16/25 (a) | | | 2,009 | |
13,195,000 | | Petrobras Global Finance BV, 6.00%, 1/27/28 | | | 12,548 | |
5,710,000 | | Petrobras Global Finance BV, 8.75%, 5/23/26 | | | 6,389 | |
3,505,000 | | Teva Pharmaceutical Finance Netherlands III BV, | | | | |
| | 4.10%, 10/01/46 | | | 2,424 | |
2,730,000 | | Teva Pharmaceutical Finance Netherlands III BV, | | | | |
| | 6.75%, 3/01/28 | | | 2,796 | |
| | | | | 36,926 | |
Nigeria (USD) (2%) | | | | |
7,965,000 | | Nigeria Government International Bond 144A, 6.50%, 11/28/27 (a) | | | 7,333 | |
5,480,000 | | Nigeria Government International Bond 144A, 7.14%, 2/23/30 (a) | | | 5,054 | |
4,710,000 | | Nigeria Government International Bond 144A, 7.63%, 11/28/47 (a) | | | 4,167 | |
5,120,000 | | Nigeria Government International Bond 144A, 7.70%, 2/23/38 (a) | | | 4,631 | |
6,610,000 | | Nigeria Government International Bond 144A, 7.88%, 2/16/32 (a) | | | 6,384 | |
| | | | | 27,569 | |
| | | | | | |
Principal or Shares | | Security Description | | Value (000) | |
| | | | | | |
Oman (USD) (2%) | | | | |
4,130,000 | | Oman Government International Bond 144A, 4.75%, 6/15/26 (a) | | $ | 3,813 | |
4,935,000 | | Oman Government International Bond 144A, 5.38%, 3/08/27 (a) | | | 4,659 | |
1,270,000 | | Oman Government International Bond 144A, 5.63%, 1/17/28 (a) | | | 1,213 | |
10,375,000 | | Oman Government International Bond 144A, 6.50%, 3/08/47 (a) | | | 9,299 | |
8,185,000 | | Oman Government International Bond 144A, 6.75%, 1/17/48 (a) | | | 7,492 | |
5,240,000 | | Oman Sovereign Sukuk SAOC 144A, 4.40%, 6/01/24 (a) | | | 4,949 | |
| | | | | 31,425 | |
Panama (USD) (1%) | | | | |
8,675,000 | | Panama Government International Bond, 6.70%, 1/26/36 | | | 10,432 | |
3,345,000 | | Panama Government International Bond, 9.38%, 4/01/29 | | | 4,649 | |
| | | | | 15,081 | |
Peru (PEN) (1%) | | | | |
15,320,000 | | Peru Government Bond 144A, 6.15%, 8/12/32 PEN (a) | | | 4,538 | |
8,900,000 | | Peruvian Government International Bond 144A, 6.95%, 8/12/31 PEN (a) | | | 2,824 | |
| | | | | 7,362 | |
Peru (USD) (2%) | | | | |
2,883,792 | | Abengoa Transmision Sur SA
144A, 6.88%, 4/30/43 (a) | | | 3,226 | |
5,860,000 | | Corp. Financiera de Desarrollo SA
144A, 4.75%, 7/15/25 (a) | | | 5,853 | |
5,060,000 | | Hunt Oil Co. of Peru LLC Sucursal Del Peru 144A, 6.38%, 6/01/28 (a) | | | 5,146 | |
5,440,000 | | Peru LNG Srl 144A, 5.38%, 3/22/30 (a) | | | 5,407 | |
5,990,000 | | Peruvian Government International Bond, 6.55%, 3/14/37 | | | 7,323 | |
| | | | | 26,955 | |
Qatar (USD) (0%) | | | | |
2,840,000 | | Qatar Government International Bond 144A, 5.10%, 4/23/48 (a) | | | 2,890 | |
Russian Federation (RUB) (1%) | | | | |
414,500,000 | | Russian Federal Bond - Ofz, 8.15%, 2/03/27 RUB | | | 6,185 | |
Russian Federation (USD) (1%) | | | | |
6,200,000 | | Russian Foreign Bond - Eurobond, | | | | |
| | 4.75%, 5/27/26 (b) | | | 6,129 | |
10,200,000 | | Russian Foreign Bond - Eurobond 144A, 5.25%, 6/23/47 (a) | | | 9,464 | |
| | | | | 15,593 | |
Saudi Arabia (USD) (0%) | | | | |
4,840,000 | | Saudi Government International Bond 144A, 4.50%, 4/17/30 (a) | | | 4,780 | |
Senegal (USD) (1%) | | | | |
4,145,000 | | Senegal Government International Bond 144A, 6.25%, 5/23/33 (a) | | | 3,596 | |
Annual Report 87
| | | | | | |
Principal or Shares | | Security Description | | Value (000) | |
| | | | | | |
2,630,000 | | Senegal Government International Bond 144A, 6.75%, 3/13/48 (a) | | $ | 2,177 | |
2,853,000 | | Senegal Government International Bond 144A, 8.75%, 5/13/21 (a) | | | 3,052 | |
| | | | | 8,825 | |
South Africa (USD) (3%) | | | | |
3,350,000 | | Eskom Holdings SOC Ltd. 144A, | | | | |
| | 5.75%, 1/26/21 (a) | | | 3,216 | |
4,190,000 | | Eskom Holdings SOC Ltd. 144A, | | | | |
| | 6.35%, 8/10/28 (a) | | | 4,050 | |
6,365,000 | | Eskom Holdings SOC Ltd. 144A, | | | | |
| | 6.75%, 8/06/23 (a) | | | 5,971 | |
3,080,000 | | Eskom Holdings SOC Ltd. 144A, | | | | |
| | 8.45%, 8/10/28 (a) | | | 2,983 | |
15,440,000 | | Republic of South Africa Government | | | | |
| | International Bond, 4.30%, 10/12/28 | | | 13,203 | |
3,055,000 | | Republic of South Africa Government | | | | |
| | International Bond, 5.88%, 9/16/25 | | | 3,019 | |
3,260,000 | | Republic of South Africa Government | | | | |
| | International Bond, 5.88%, 6/22/30 | | | 3,077 | |
3,460,000 | | Transnet SOC Ltd. 144A, 4.00%,
7/26/22 (a) | | | 3,238 | |
| | | | | 38,757 | |
Spain (USD) (1%) | | | | |
10,090,000 | | AI Candelaria Spain SLU 144A, | | | | |
| | 7.50%, 12/15/28 (a) | | | 9,964 | |
Sri Lanka (USD) (2%) | | | | |
1,570,000 | | Sri Lanka Government International Bond 144A, 5.75%, 4/18/23 (a) | | | 1,415 | |
3,800,000 | | Sri Lanka Government International Bond 144A, 5.88%, 7/25/22 (a) | | | 3,515 | |
9,675,000 | | Sri Lanka Government International Bond 144A, 6.20%, 5/11/27 (a) | | | 8,306 | |
3,015,000 | | Sri Lanka Government International Bond 144A, 6.25%, 7/27/21 (a) | | | 2,873 | |
1,070,000 | | Sri Lanka Government International Bond 144A, 6.75%, 4/18/28 (a) | | | 946 | |
6,308,000 | | Sri Lanka Government International Bond 144A, 6.83%, 7/18/26 (a) | | | 5,685 | |
8,695,000 | | Sri Lanka Government International Bond 144A, 6.85%, 11/03/25 (a) | | | 7,913 | |
| | | | | 30,653 | |
Turkey (USD) (3%) | | | | |
2,160,000 | | Export Credit Bank of Turkey 144A, | | | | |
| | 5.88%, 4/24/19 (a) | | | 2,154 | |
1,650,000 | | TC Ziraat Bankasi AS 144A,
5.13%, 5/03/22 (a) | | | 1,473 | |
7,715,000 | | Turkey Government International Bond, | | | | |
| | 4.25%, 4/14/26 | | | 6,374 | |
7,945,000 | | Turkey Government International Bond, | | | | |
| | 5.63%, 3/30/21 | | | 7,764 | |
8,360,000 | | Turkey Government International Bond, | | | | |
| | 6.00%, 3/25/27 | | | 7,558 | |
6,150,000 | | Turkey Government International Bond, | | | | |
| | 7.25%, 12/23/23 | | | 6,113 | |
3,825,000 | | Turkey Government International Bond, | | | | |
| | 7.38%, 2/05/25 | | | 3,803 | |
| | | | | 35,239 | |
| | | | | | |
Principal or Shares | | Security Description | | Value (000) | |
| | | | | | |
Ukraine (USD) (3%) | | | | |
3,015,000 | | Ukraine Government International Bond 144A, 0.00%, 5/31/40 (a)(d) | | $ | 1,556 | |
10,600,000 | | Ukraine Government International Bond 144A, 7.38%, 9/25/32 (a) | | | 8,863 | |
1,883,000 | | Ukraine Government International Bond 144A, 7.75%, 9/01/21 (a) | | | 1,857 | |
14,363,000 | | Ukraine Government International Bond 144A, 7.75%, 9/01/22 (a) | | | 13,995 | |
1,861,000 | | Ukraine Government International Bond 144A, 7.75%, 9/01/23 (a) | | | 1,776 | |
3,923,000 | | Ukraine Government International Bond 144A, 7.75%, 9/01/24 (a) | | | 3,689 | |
4,368,000 | | Ukraine Government International Bond 144A, 7.75%, 9/01/25 (a) | | | 4,026 | |
1,653,000 | | Ukraine Government International Bond 144A, 7.75%, 9/01/27 (a) | | | 1,483 | |
5,450,000 | | Ukraine Government International Bond 144A, 8.99%, 2/01/24 (a) | | | 5,412 | |
| | | | | 42,657 | |
United Arab Emirates (USD) (1%) | | | | |
9,695,000 | | Abu Dhabi Crude Oil Pipeline LLC 144A, 4.60%, 11/02/47 (a) | | | 9,200 | |
5,410,000 | | DP World Ltd. 144A, 5.63%,
9/25/48 (a) | | | 5,132 | |
4,030,000 | | Ruwais Power Co. PJSC 144A, | | | | |
| | 6.00%, 8/31/36 (a) | | | 4,393 | |
| | | | | 18,725 | |
United Kingdom (IDR) (1%) | | | | |
108,542,000,000 | | Standard Chartered Bank/Singapore (Indonesia Treasury Bond) 144A,
8.25%, 5/19/36 IDR (a) | | | 6,710 | |
United Kingdom (INR) (0%) | | | | |
28,000,000 | | Standard Chartered Bank/Singapore (India Government Bond) 144A, 7.59%, 1/13/26 INR (a) | | | 372 | |
195,000,000 | | Standard Chartered Bank/Singapore (India Government Bond) 144A, 7.61%, 5/13/30 INR (a) | | | 2,559 | |
43,000,000 | | Standard Chartered Bank/Singapore (India Government Bond), 9.34%, 8/27/24 INR | | | 605 | |
| | | | | 3,536 | |
United Kingdom (LKR) (0%) | | | | |
460,000,000 | | Standard Chartered Bank/Singapore (Sri Lanka Government Bonds) 144A, 10.75%, 3/03/21 LKR (a) | | | 2,600 | |
572,000,000 | | Standard Chartered Bank/Singapore (Sri Lanka Government Bonds) 144A, 11.00%, 8/05/25 LKR (a) | | | 3,158 | |
| | | | | 5,758 | |
United Kingdom (USD) (0%) | | | | |
4,480,000 | | Vedanta Resources PLC 144A, | | | | |
| | 6.13%, 8/09/24 (a) | | | 3,975 | |
United States (EGP) (2%) | | | | |
153,600,000 | | Citigroup Global Markets Holdings Inc. (Arab Republic of Egypt), 0.00%, 11/08/18 EGP | | | 8,593 | |
88 Payden Mutual Funds
| | | | | | |
Principal or Shares | | Security Description | | Value (000) | |
| | |
140,000,000 | | Citigroup Global Markets Holdings Inc. | | | | |
| | (Arab Republic of Egypt), 0.00%, | | | | |
| | 11/08/18 EGP | | $ | 7,832 | |
73,000,000 | | Citigroup Global Markets Holdings Inc.
(Arab Republic of Egypt) 144A, 0.00%,
12/13/18 EGP (a) | | | 4,022 | |
133,200,000 | | Citigroup Global Markets Holdings Inc.
(Arab Republic of Egypt) 144A, 0.00%, 1/24/19 EGP (a) | | | 7,164 | |
| | | | | 27,611 | |
United States (IDR) (1%) | | | | |
91,400,000,000 | | Indonesia Treasury Bond 144A, 5.63%, 5/17/23 IDR (a) | | | 5,408 | |
30,300,000,000 | | Indonesia Treasury Bond 144A, 8.38%, 3/17/34 IDR (a) | | | 1,911 | |
13,700,000,000 | | Indonesia Treasury Bond 144A, 11.00%, 9/17/25 IDR (a) | | | 1,015 | |
| | | | | 8,334 | |
United States (NGN) (1%) | | | | |
1,712,000,000 | | Citigroup Global Markets Holdings Inc. (Federal Republic of Nigeria), 0.00%, 12/03/18 NGN | | | 4,704 | |
1,570,000,000 | | Citigroup Global Markets Holdings Inc. (Federal Republic of Nigeria) 144A, 0.00%, 2/18/19 NGN (a) | | | 4,193 | |
| | | | | 8,897 | |
United States (USD) (0%) | | | | |
4,830,000 | | Terraform Global Operating LLC 144A, | | | | |
| | 6.13%, 3/01/26 (a) | | | 4,504 | |
Uruguay (USD) (1%) | | | | |
5,690,000 | | Uruguay Government International Bond, | | | | |
| | 4.98%, 4/20/55 | | | 5,292 | |
10,409,580 | | Uruguay Government International Bond, | | | | |
| | 5.10%, 6/18/50 | | | 9,902 | |
| | | | | 15,194 | |
Uruguay (UYU) (0%) | | | | |
37,550,000 | | Uruguay Government International Bond 144A, 8.50%, 3/15/28 UYU (a) | | | 984 | |
49,300,000 | | Uruguay Government International Bond 144A, 9.88%, 6/20/22 UYU (a) | | | 1,483 | |
| | | | | 2,467 | |
Venezuela (USD) (1%) | | | | |
6,975,000 | | Petroleos de Venezuela SA, 5.38%, 4/12/27 (e)(f) | | | 1,273 | |
6,620,000 | | Petroleos de Venezuela SA 144A, | | | | |
| | 6.00%, 11/15/26 (a)(e)(f) | | | 1,167 | |
1,225,000 | | Petroleos de Venezuela SA 144A, | | | | |
| | 8.50%, 10/27/20 (a) | | | 1,148 | |
5,540,000 | | Petroleos de Venezuela SA, | | | | |
| | 9.00%, 11/17/21 (b)(e)(f) | | | 1,190 | |
2,640,000 | | Venezuela Government International Bond, | | | | |
| | 7.00%, 3/31/38 (e)(f) | | | 655 | |
8,494,000 | | Venezuela Government International Bond, | | | | |
| | 7.65%, 4/21/25 (e)(f) | | | 2,177 | |
4,385,000 | | Venezuela Government International Bond, | | | | |
| | 7.75%, 10/13/19 (e)(f) | | | 1,103 | |
9,890,000 | | Venezuela Government International Bond, | | | | |
| | 9.25%, 9/15/27 (e)(f) | | | 2,547 | |
| | | | | 11,260 | |
| | | | | | |
Principal or Shares | | Security Description | | Value (000) | |
| |
Virgin Islands (British) (USD) (3%) | | | | |
33,300,000 | | 1MDB Global Investments Ltd., | | | | |
| | 4.40%, 3/09/23 (b) | | $ | 31,183 | |
1,850,000 | | Arcos Dorados Holdings Inc. 144A, | | | | |
| | 5.88%, 4/04/27 (a) | | | 1,688 | |
2,025,000 | | Sinopec Group Overseas Development 2016 Ltd. 144A, 3.50%, 5/03/26 (a) | | | 1,904 | |
| | | | | 34,775 | |
Zambia (USD) (1%) | | | | |
5,330,000 | | Zambia Government International Bond 144A, 5.38%, 9/20/22 (a) | | | 3,610 | |
2,115,000 | | Zambia Government International Bond 144A, 8.50%, 4/14/24 (a) | | | 1,453 | |
4,870,000 | | Zambia Government International Bond 144A, 8.97%, 7/30/27 (a) | | | 3,333 | |
| | | | | 8,396 | |
Total Bonds (Cost - $1,348,069) | | | 1,250,430 | |
Investment Company (3%) | | | | |
41,610,134 | | Payden Cash Reserves Money Market Fund * | | | | |
| | (Cost - $41,610) | | | 41,610 | |
Total Investments (Cost - $1,389,679) (101%) | | | 1,292,040 | |
Liabilities in excess of Other Assets (-1%) | | | (13,096 | ) |
| |
Net Assets (100%) | | $ | 1,278,944 | |
| (a) | Security offered only to qualified institutional investors, and thus is not registered for sale to the public under rule 144A of the Securities Act of 1933. It has been deemed liquid under guidelines approved by the Board. |
| (b) | Security offered and sold outside the United States, and thus is exempt from registration under Regulation S of the Securities Act of 1933. It has been deemed liquid under guidelines approved by the Board. |
| (c) | All or a portion of these securities are on loan. At October 31, 2018, the total market value of the Fund’s securities on loan is $2,337 and the total market value of the collateral held by the Fund is $2,403. Amounts in 000s. |
| (d) | Variable rate security. Interest rate disclosed is as of the most recent information available. Certain variable rate securities are not based on a published reference rate and spread but are determined by the issuer or agent and are based on current market conditions. These securities do not indicate a reference rate and spread in their description above. See Note 2 in the Notes to Financial Statements. |
| (e) | Issuer filed for bankruptcy and/or is in default of principal and/or interest payments. |
| (f) | Non-income producing security. |
Annual Report 89
Open Forward Currency Contracts to USD
| | | | | | | | | | | | | | | | |
Currency
Purchased (000s) | | Currency Sold
(000s) | | | Counterparty | | | Settlement
Date | | | Unrealized
Appreciation
(Depreciation)
(000s) | |
Assets: | | | | | | | | | | | | | | | | |
BRL 87,894 | | | USD 22,963 | | |
| State
Street
Bank &
Trust
Co. |
| | | 11/16/2018 | | | $ | 617 | |
KZT 2,152,800 | | | USD 5,688 | | |
| HSBC
Bank
USA,
N.A. |
| | | 01/09/2019 | | | | 49 | |
RUB 587,710 | | | USD 8,549 | | |
| Barclays
Bank
PLC |
| | | 11/19/2018 | | | | 351 | |
USD 5,448 | | | MXN 109,080 | | |
| Barclays
Bank
PLC |
| | | 12/17/2018 | | | | 120 | |
USD 3,948 | | | ZAR 58,580 | | |
| HSBC
Bank
USA,
N.A. |
| | | 01/16/2019 | | | | 16 | |
| | | | | | | | | | | | | | | | |
| | | | | | | | | | | | | | | 1,153 | |
| | | | | | | | | | | | | | | | |
Liabilities: | | | | | | | | | | | | | | | | |
USD 8,730 | | | RUB 587,710 | | |
| Barclays
Bank
PLC |
| | | 11/19/2018 | | | | (169 | ) |
USD 3,577 | | | INR 266,710 | | |
| Barclays
Bank
PLC |
| | | 12/17/2018 | | | | (10 | ) |
USD 22,137 | | | BRL 87,894 | | |
| State
Street
Bank &
Trust
Co. |
| | | 11/16/2018 | | | | (1,444 | ) |
ZAR 58,580 | | | USD 3,982 | | |
| HSBC
Bank
USA,
N.A. |
| | | 01/16/2019 | | | | (50 | ) |
| | | | | | | | | | | | | | | | |
| | | | | | | | | | | | | | | (1,673 | ) |
| | | | | | | | | | | | | | | | |
Net Unrealized Appreciation (Depreciation) | | | | | | | $ | (520 | ) |
| | | | | | | | | | | | | | | | |
Open Futures Contracts to USD
| | | | | | | | | | | | | | | | | | | | |
| Contract Type | | Number of
Contracts | | | Expiration
Date | | | Notional
Amount
(000s) | | | Current
Value
(000s) | | | Unrealized
Depreciation
(000s) | |
Short Contracts: | | | | | | | | | | | | | | | | | | | | |
U.S. Ultra Bond Future | | | 90 | | | | Dec-18 | | | $ | (13,430 | ) | | $ | (3 | ) | | $ | (3 | ) |
| | | | | | | | | | | | | | | | | | | | |
Total Futures | | | | | | | | | | | | | | | | | | $ | (3 | ) |
| | | | | | | | | | | | | | | | | | | | |
Offsetting Assets and Liabilities
The Fund’s loaned securities were all subject to an enforceable Securities Lending Agency Agreement. Securities lent in accordance with the Securities Lending Agency Agreement on a gross basis were as follows:
| | | | |
| Total gross amount presented on the Statements | | $ | 2,337 | |
| of Assets and Liabilities1 | | | | |
| Non-cash Collateral2 | | | (2,337 | ) |
| | | | |
| Net Amount | | $ | — | |
| | | | |
| 1 | The amount presented on the Statements of Assets and Liabilities is not offset and is shown on a gross basis. |
| 2 | At October 31, 2018, the value of the collateral received from each borrower exceeded the value of the related securities loaned. This amount is disclosed on the Schedule of Investments. |
See notes to financial statements.
90 Payden Mutual Funds

| | | | | | |
| | The Fund seeks a high level of total return by generally investing in below investment grade debt instruments and income producing securities of emerging market countries denominated in foreign and U.S. currencies. | | 
Past performance does not predict future returns. The graph does not reflect the impact of taxes or transaction costs a shareholder would pay. |
| | Portfolio Composition - percent of investments |
| | |
| | Foreign Government | | 81% |
| | Corporate | | 17% |
| | Cash equivalent | | 2% |
| | | | |
| | | | |
| | | | |
| | | | |
| | | | |
| | | | |
| | | | |
| | | | |
| | This information is not part of the audited financial statements. | | |
Schedule of Investments - October 31, 2018
| | | | | | |
Principal or Shares | | Security Description | | Value (000) | |
Bonds (97%) | | | | |
Argentina (ARS) (0%) | | | | |
8,765,600 | | YPF SA 144A, 16.50%, 5/09/22 ARS (a) | | $ | 154 | |
Brazil (BRL) (10%) | | | | |
955,000 | | Brazil Notas do Tesouro Nacional Serie B, 6.00%, 8/15/26 BRL | | | 872 | |
26,737,000 | | Brazil Notas do Tesouro Nacional Serie F, 10.00%, 1/01/21 BRL | | | 7,445 | |
30,446,000 | | Brazil Notas do Tesouro Nacional Serie F, 10.00%, 1/01/23 BRL | | | 8,402 | |
15,800,000 | | Brazil Notas do Tesouro Nacional Serie F, 10.00%, 1/01/27 BRL | | | 4,258 | |
| | | | | 20,977 | |
Chile (CLP) (2%) | | | | |
700,000,000 | | Bonos de la Tesoreria de la Republica en pesos 144A, 4.00%, 3/01/23 CLP (a) | | | 994 | |
1,005,000,000 | | Bonos de la Tesoreria de la Republica en pesos, 4.50%, 3/01/26 CLP | | | 1,441 | |
895,000,000 | | Bonos de la Tesoreria de la Republica en pesos, 5.00%, 3/01/35 CLP | | | 1,282 | |
79,000,000 | | Republic of Chile, 5.50%, 8/05/20 CLP | | | 117 | |
| | | | | 3,834 | |
Colombia (COP) (6%) | | | | |
540,000,000 | | Colombia Government International Bond, 7.75%, 4/14/21 COP | | | 176 | |
2,700,000,000 | | Colombian TES, 6.00%, 4/28/28 COP | | | 774 | |
7,545,000,000 | | Colombian TES, 7.00%, 5/04/22 COP | | | 2,434 | |
4,700,000,000 | | Colombian TES, 7.50%, 8/26/26 COP | | | 1,512 | |
5,870,000,000 | | Colombian TES, 7.75%, 9/18/30 COP | | | 1,887 | |
11,649,000,000 | | Colombian TES, 10.00%, 7/24/24 COP | | | 4,221 | |
900,000,000 | | Emgesa SA ESP 144A, 8.75%, 1/25/21 COP (a) | | | 293 | |
1,380,000,000 | | Empresa de Telecomunicaciones de Bogota 144A, 7.00%, 1/17/23 COP (a) | | | 369 | |
1,245,000,000 | | Empresas Publicas de Medellin ESP 144A, 7.63%, 9/10/24 COP (a) | | | 370 | |
| | | | | | |
Principal or Shares | | Security Description | | Value (000) | |
1,036,000,000 | | Empresas Publicas de Medellin ESP 144A, 8.38%, 2/01/21 COP (a) | | $ | 321 | |
1,585,000,000 | | Financiera de Desarrollo Territorial SA Findeter 144A, 7.88%, 8/12/24 COP (a) | | | 509 | |
| | | | | 12,866 | |
Czech Republic (CZK) (4%) | | | | |
16,400,000 | | Czech Republic Government Bond, | | | | |
| | 0.95%, 5/15/30 CZK | | | 623 | |
22,900,000 | | Czech Republic Government Bond, | | | | |
| | 2.40%, 9/17/25 CZK | | | 1,024 | |
44,000,000 | | Czech Republic Government Bond, | | | | |
| | 3.85%, 9/29/21 CZK | | | 2,042 | |
80,000,000 | | Czech Republic Government Bond, | | | | |
| | 4.70%, 9/12/22 CZK | | | 3,882 | |
| | | | | 7,571 | |
Dominica Republic (DOP) (1%) | | | | |
78,400,000 | | Dominican Republic International Bond 144A, 8.90%, 2/15/23 DOP (a) | | | 1,565 | |
Georgia (GEL) (0%) | | | | |
1,185,000 | | Bank of Georgia JSC 144A, 11.00%, 6/01/20 GEL (a) | | | 441 | |
Hungary (HUF) (3%) | | | | |
104,000,000 | | Hungary Government Bond, 2.50%, 10/27/21 HUF | | | 372 | |
650,000,000 | | Hungary Government Bond, 3.00%, 10/27/27 HUF | | | 2,177 | |
187,000,000 | | Hungary Government Bond, 5.50%, 6/24/25 HUF | | | 745 | |
154,000,000 | | Hungary Government Bond, 6.00%, 11/24/23 HUF | | | 628 | |
488,610,000 | | Hungary Government Bond, 7.00%, 6/24/22 HUF | | | 1,995 | |
| | | | | 5,917 | |
Indonesia (IDR) (6%) | | | | |
45,750,000,000 | | Indonesia Treasury Bond, 5.63%, 5/15/23 IDR | | | 2,707 | |
Annual Report 91

| | | | | | |
Principal or Shares | | Security Description | | Value (000) | |
24,700,000,000 | | Indonesia Treasury Bond, 8.25%, 6/15/32 IDR | | $ | 1,550 | |
12,926,000,000 | | Indonesia Treasury Bond, 8.25%, 5/15/36 IDR | | | 799 | |
16,400,000,000 | | Indonesia Treasury Bond, 8.38%, 3/15/24 IDR | | | 1,071 | |
37,700,000,000 | | Indonesia Treasury Bond, 8.38%, 9/15/26 IDR | | | 2,455 | |
4,500,000,000 | | Indonesia Treasury Bond, 8.38%, 3/15/34 IDR | | | 284 | |
22,500,000,000 | | Jasa Marga Persero Tbk PT 144A, 7.50%, 12/11/20 IDR (a) | | | 1,408 | |
21,440,000,000 | | Wijaya Karya Persero Tbk PT 144A, 7.70%, 1/31/21 IDR (a) | | | 1,329 | |
| | | | | 11,603 | |
Kazakhstan (KZT) (1%) | | | | |
620,000,000 | | Development Bank of Kazakhstan JSC 144A, 8.95%, 5/04/23 KZT (a) | | | 1,453 | |
Luxembourg (BRL) (1%) | | | | |
6,650,000 | | Swiss Insured Brazil Power Finance Sarl 144A, 9.85%, 7/16/32 BRL (a) | | | 1,752 | |
Malaysia (MYR) (4%) | | | | |
1,070,000 | | Malaysia Government Bond, 3.84%, 4/15/33 MYR | | | 236 | |
6,510,000 | | Malaysia Government Bond, 3.89%, 3/15/27 MYR | | | 1,530 | |
5,505,000 | | Malaysia Government Bond, 4.18%, 7/15/24 MYR | | | 1,328 | |
18,255,000 | | Malaysia Government Bond, 4.39%, 4/15/26 MYR | | | 4,418 | |
2,560,000 | | Malaysia Government Bond, 4.50%, 4/15/30 MYR | | | 612 | |
| | | | | 8,124 | |
Mexico (MXN) (9%) | | | | |
72,300 | | America Movil SAB de CV, 6.45%, 12/05/22 MXN | | | 320 | |
10,700,000 | | Comision Federal de Electricidad, 7.35%, 11/25/25 MXN | | | 464 | |
7,270,000 | | Grupo Televisa SAB, 7.25%, 5/14/43 MXN | | | 239 | |
16,300,000 | | Mexican Bonos, 5.75%, 3/05/26 MXN | | | 672 | |
27,400,000 | | Mexican Bonos, 7.75%, 5/29/31 MXN | | | 1,231 | |
18,220,000 | | Mexican Bonos, 7.75%, 11/23/34 MXN | | | 806 | |
59,720,000 | | Mexican Bonos, 7.75%, 11/13/42 MXN | | | 2,561 | |
102,650,000 | | Mexican Bonos, 8.00%, 6/11/20 MXN | | | 5,011 | |
48,850,000 | | Mexican Bonos, 8.00%, 12/07/23 MXN | | | 2,339 | |
48,800,000 | | Mexican Bonos, 8.50%, 5/31/29 MXN | | | 2,339 | |
16,803,100 | | Mexican Bonos, 10.00%, 12/05/24 MXN | | | 877 | |
9,200,000 | | Petroleos Mexicanos, 7.19%, 9/12/24 MXN | | | 383 | |
16,240,000 | | Petroleos Mexicanos 144A, 7.65%, 11/24/21 MXN (a) | | | 750 | |
| | | | | 17,992 | |
Peru (PEN) (4%) | | | | |
3,000,000 | | Banco de Credito del Peru 144A, 4.85%, 10/30/20 PEN (a) | | | 895 | |
7,840,000 | | Peru Government Bond 144A, 6.15%, 8/12/32 PEN (a) | | | 2,322 | |
3,990,000 | | Republic of Peru 144A, 5.70%, 8/12/24 PEN (a) | | | 1,231 | |
3,405,000 | | Republic of Peru 144A, 6.35%, 8/12/28 PEN (a) | | | 1,051 | |
500,000 | | Republic of Peru 144A, 6.90%, 8/12/37 PEN (a) | | | 155 | |
4,030,000 | | Republic of Peru 144A, 6.95%, 8/12/31 PEN (a) | | | 1,279 | |
1,026,000 | | Republic of Peru 144A, 8.20%, 8/12/26 PEN (a) | | | 355 | |
| | | | | 7,288 | |
| | | | | | |
Principal or Shares | | Security Description | | Value (000) | |
Poland (PLN) (9%) | | | | |
4,500,000 | | Poland Government Bond, 2.00%, 4/25/21 PLN | | $ | 1,181 | |
3,060,000 | | Poland Government Bond, 5.75%, 10/25/21 PLN | | | 888 | |
7,005,000 | | Republic of Poland Government Bond, 1.75%, 7/25/21 PLN | | | 1,828 | |
15,090,000 | | Republic of Poland Government Bond, 2.25%, 4/25/22 PLN | | | 3,954 | |
3,600,000 | | Republic of Poland Government Bond, 2.50%, 7/25/27 PLN | | | 894 | |
6,000,000 | | Republic of Poland Government Bond, 2.75%, 4/25/28 PLN | | | 1,507 | |
17,500,000 | | Republic of Poland Government Bond, 3.25%, 7/25/25 PLN | | | 4,663 | |
9,200,000 | | Republic of Poland Government Bond, 4.00%, 10/25/23 PLN | | | 2,569 | |
4,050,000 | | Republic of Poland Government Bond, 5.25%, 10/25/20 PLN | | | 1,132 | |
| | | | | 18,616 | |
Russian Federation (RUB) (8%) | | | | |
155,600,000 | | Russian Federal Bond - OFZ, 7.00%, 1/25/23 RUB | | | 2,274 | |
394,800,000 | | Russian Federal Bond - OFZ, 7.05%, 1/19/28 RUB | | | 5,478 | |
128,720,000 | | Russian Federal Bond - OFZ, 7.60%, 4/14/21 RUB | | | 1,940 | |
439,200,000 | | Russian Federal Bond - OFZ, 8.15%, 2/03/27 RUB | | | 6,554 | |
| | | | | 16,246 | |
South Africa (ZAR) (8%) | | | | |
32,000,000 | | Republic of South Africa, 8.88%, 2/28/35 ZAR | | | 1,956 | |
13,500,000 | | Republic of South Africa Government Bond, 7.75%, 2/28/23 ZAR | | | 886 | |
52,000,000 | | Republic of South Africa Government Bond, 8.25%, 3/31/32 ZAR | | | 3,073 | |
77,000,000 | | Republic of South Africa Government Bond, 8.50%, 1/31/37 ZAR | | | 4,504 | |
76,000,000 | | Republic of South Africa Government Bond, 8.75%, 1/31/44 ZAR | | | 4,451 | |
15,460,000 | | Republic of South Africa Government Bond, 10.50%, 12/21/26 ZAR | | | 1,112 | |
11,200,000 | | Transnet SOC Ltd. 144A, 9.50%, 5/13/21 ZAR (a) | | | 745 | |
| | | | | 16,727 | |
Thailand (THB) (5%) | | | | |
73,000,000 | | Thailand Government Bond, 3.40%, 6/17/36 THB | | | 2,249 | |
81,100,000 | | Thailand Government Bond, 3.63%, 6/16/23 THB | | | 2,580 | |
170,000 | | Thailand Government Bond, 3.65%, 12/17/21 THB | | | 5 | |
163,800,000 | | Thailand Government Bond, 4.88%, 6/22/29 THB | | | 5,800 | |
| | | | | 10,634 | |
Turkey (TRY) (5%) | | | | |
3,017,073 | | Turkey Government Bond, 3.00%, 2/23/22 TRY | | | 533 | |
7,200,000 | | Turkey Government Bond, 7.10%, 3/08/23 TRY | | | 841 | |
225,000 | | Turkey Government Bond, 7.40%, 2/05/20 TRY | | | 34 | |
92 Payden Mutual Funds
| | | | | | |
Principal or Shares | | Security Description | | Value (000) | |
| | |
2,100,000 | | Turkey Government Bond,
8.00%, 3/12/25 TRY | | $ | 237 | |
13,250,000 | | Turkey Government Bond,
8.80%, 9/27/23 TRY | | | 1,638 | |
3,070,000 | | Turkey Government Bond,
9.00%, 7/24/24 TRY | | | 387 | |
4,250,000 | | Turkey Government Bond,
9.40%, 7/08/20 TRY | | | 629 | |
2,550,000 | | Turkey Government Bond,
9.50%, 1/12/22 TRY | | | 337 | |
3,420,000 | | Turkey Government Bond,
10.40%, 3/20/24 TRY | | | 448 | |
6,470,000 | | Turkey Government Bond,
10.60%, 2/11/26 TRY | | | 826 | |
26,340,000 | | Turkey Government Bond,
11.00%, 3/02/22 TRY | | | 3,671 | |
| | | | | 9,581 | |
United Kingdom (IDR) (1%) | | | | |
17,000,000,000 | | Standard Chartered Bank (Indonesia Government Bond) 144A, 8.25%, 5/19/36 IDR (a) | | | 1,051 | |
23,400,000,000 | | Standard Chartered Bank/Singapore (Indonesia Treasury Bond) 144A, 8.38%, 3/17/34 IDR (a) | | | 1,476 | |
| | | | | 2,527 | |
United Kingdom (INR) (1%) | | | | |
55,000,000 | | Standard Chartered Bank/Singapore (India Government Bond) 144A, 7.59%, 1/13/26 INR (a) | | | 732 | |
85,000,000 | | Standard Chartered Bank/Singapore (India Government Bond) 144A, 7.61%, 5/13/30 INR (a) | | | 1,115 | |
13,000,000 | | Standard Chartered Bank/Singapore (India Government Bond), 9.34%, 8/27/24 INR | | | 183 | |
| | | | | 2,030 | |
United Kingdom (LKR) (0%) | | | | |
160,000,000 | | Standard Chartered Bank/Singapore (Sri Lanka Government Bonds) 144A, 10.75%, 3/03/21 LKR (a) | | | 905 | |
United Kingdom (NGN) (1%) | | | | |
465,000,000 | | HSBC Bank PLC (Federal Republic of Nigeria) 144A, 0.00%, 11/05/18 NGN (a) | | | 1,281 | |
United States (EGP) (3%) | | | | |
28,000,000 | | Citigroup Global Markets Holdings Inc. (Arab Republic of Egypt), 0.00%, 11/08/18 EGP | | | 1,567 | |
24,100,000 | | Citigroup Global Markets Holdings Inc. (Arab Republic of Egypt), 0.00%, 11/08/18 EGP | | | 1,348 | |
11,400,000 | | Citigroup Global Markets Holdings Inc. (Arab Republic of Egypt) 144A, 0.00%, 12/13/18 EGP (a) | | | 628 | |
34,200,000 | | Citigroup Global Markets Holdings Inc. (Arab Republic of Egypt) 144A, 0.00%, 1/24/19 EGP (a) | | | 1,839 | |
| | | | | 5,382 | |
United States (IDR) (3%) | | | | |
21,000,000,000 | | Indonesia Treasury Bond 144A, 5.63%, 5/17/23 IDR (a) | | | 1,243 | |
5,500,000,000 | | Indonesia Treasury Bond 144A, 8.38%, 3/19/24 IDR (a) | | | 359 | |
18,740,000,000 | | Indonesia Treasury Bond 144A, 8.38%, 9/17/26 IDR (a) | | | 1,221 | |
| | | | | | |
Principal or Shares | | Security Description | | Value (000) | |
| | |
10,000,000,000 | | Indonesia Treasury Bond 144A, 8.75%, 5/19/31 IDR (a) | | $ | 657 | |
49,194,000,000 | | Indonesia Treasury Bond 144A, 9.50%, 7/17/31 IDR (a) | | | 3,413 | |
4,000,000,000 | | Indonesia Treasury Bond 144A, 11.00%, 9/17/25 IDR (a) | | | 296 | |
| | | | | 7,189 | |
United States (NGN) (1%) | | | | |
368,000,000 | | Citigroup Global Markets Holdings Inc. (Federal Republic of Nigeria), 0.00%, 12/03/18 NGN | | | 1,011 | |
400,000,000 | | Citigroup Global Markets Holdings Inc. (Federal Republic of Nigeria) 144A, 0.00%, 2/18/19 NGN (a) | | | 1,068 | |
| | | | | 2,079 | |
United States (UAH) (1%) | | | | |
56,000,000 | | Citigroup Global Markets Holdings Inc. | | | | |
| | (Republic of Ukrain) 144A, 13.41%, 10/17/22 UAH (a) | | | 1,793 | |
Uruguay (UYU) (0%) | | | | |
10,970,000 | | Uruguay Government International Bond 144A, 8.50%, 3/15/28 UYU (a) | | | 288 | |
18,200,000 | | Uruguay Government International Bond 144A, 9.88%, 6/20/22 UYU (a) | | | 547 | |
| | | | | 835 | |
Total Bonds (Cost - $229,437) | | | 197,362 | |
Investment Company (2%) | | | | |
3,828,106 | | Payden Cash Reserves Money Market Fund * (Cost - $3,828) | | | 3,828 | |
Total Investments (Cost - $233,265) (99%) | | | 201,190 | |
Other Assets, net of Liabilities (1%) | | | 2,788 | |
Net Assets (100%) | | $ | 203,978 | |
| (a) | Security offered only to qualified institutional investors, and thus is not registered for sale to the public under rule 144A of the Securities Act of 1933. It has been deemed liquid under guidelines approved by the Board. |
Annual Report 93
Open Forward Currency Contracts to USD
| | | | | | | | | | | | | | | | |
Currency Purchased (000s) | | Currency
Sold
(000s) | | | Counterparty | | | Settlement
Date | | | Unrealized
Appreciation
(Depreciation)
(000s) | |
Assets: | | | | | | | | | | | | | | | | |
ARS 51,935 | | | USD 1,269 | | |
| BNP
PARIBAS |
| | | 11/01/2018 | | | $ | 176 | |
ARS 50,000 | | | USD 1,205 | | |
| BNP
PARIBAS |
| | | 02/01/2019 | | | | 32 | |
BRL 14,654 | | | USD 3,741 | | |
| State Street
Bank &
Trust Co. |
| | | 11/16/2018 | | | | 190 | |
KZT 509,100 | | | USD 1,343 | | |
| HSBC Bank
USA, N.A. |
| | | 01/09/2019 | | | | 14 | |
RUB 167,230 | | | USD 2,435 | | |
| Barclays
Bank PLC |
| | | 11/19/2018 | | | | 98 | |
USD 2,030 | | | PLN 7,769 | | |
| Barclays
Bank PLC |
| | | 11/21/2018 | | | | 4 | |
USD 1,998 | | | MXN 38,780 | | |
| Barclays
Bank PLC |
| | | 12/17/2018 | | | | 104 | |
USD 686 | | | MYR 2,856 | | |
| Barclays
Bank PLC |
| | | 01/15/2019 | | | | 4 | |
USD 7,042 | | | CZK 160,060 | | |
| BNP
PARIBAS |
| | | 11/30/2018 | | | | 48 | |
USD 830 | | | ZAR 12,320 | | |
| HSBC Bank
USA, N.A. |
| | | 01/16/2019 | | | | 3 | |
| | | | | | | | | | | | | | | | |
| | | | | | | | | | | | | | | 673 | |
| | | | | | | | | | | | | | | | |
Liabilities: | | | | | | | | | | | | | | | | |
CLP 985,300 | | | USD 1,430 | | |
| BNP
PARIBAS |
| | | 12/12/2018 | | | | (14 | ) |
COP 6,322,000 | | | USD 2,089 | | |
| HSBC Bank
USA, N.A. |
| | | 12/20/2018 | | | | (129 | ) |
CZK 193,140 | | | USD 8,911 | | |
| BNP
PARIBAS |
| | | 11/30/2018 | | | | (471 | ) |
HUF 834,000 | | | USD 3,034 | | |
| Barclays
Bank PLC |
| | | 12/21/2018 | | | | (111 | ) |
MXN 38,780 | | | USD 2,024 | | |
| Barclays
Bank PLC |
| | | 12/17/2018 | | | | (130 | ) |
MYR 7,261 | | | USD 1,745 | | |
| Barclays
Bank PLC |
| | | 01/15/2019 | | | | (11 | ) |
PLN 6,636 | | | USD 1,762 | | |
| Barclays
Bank PLC |
| | | 11/21/2018 | | | | (32 | ) |
PLN 1,133 | | | USD 310 | | |
| Barclays
Bank PLC |
| | | 11/21/2018 | | | | (15 | ) |
THB 214,490 | | | USD 6,626 | | |
| Barclays
Bank PLC |
| | | 01/25/2019 | | | | (134 | ) |
USD 2,484 | |
| RUB
167,230 |
| |
| Barclays
Bank PLC |
| | | 11/19/2018 | | | | (48 | ) |
USD 2,049 | | | INR 152,750 | | |
| Barclays
Bank PLC |
| | | 12/17/2018 | | | | (5 | ) |
USD 3,146 | | | BRL 12,387 | | |
| State Street
Bank &
Trust Co. |
| | | 11/16/2018 | | | | (177 | ) |
ZAR 12,320 | | | USD 837 | | |
| HSBC Bank
USA, N.A. |
| | | 01/16/2019 | | | | (11 | ) |
| | | | | | | | | | | | | | | | |
| | | | | | | | | | | | | | | (1,288 | ) |
| | | | | | | | | | | | | | | | |
Net Unrealized Appreciation (Depreciation) | | | | | | | | | | | | | | $ | (615 | ) |
| | | | | | | | | | | | | | | | |
Open Futures Contracts to USD
| | | | | | | | | | | | | | | | | | | | |
| Contract Type | | Number of Contracts | | | Expiration
Date | | | Notional
Amount
(000s) | | | Current
Value
(000s) | | | Unrealized
Appreciation
(000s) | |
Short Contracts: | | | | | | | | | | | | | | | | | | | | |
| U.S. Treasury 10-Year Note Future | | | 28 | | | | Dec-18 | | | $ | (3,316 | ) | | $ | 50 | | | $ | 50 | |
| U.S. Ultra Bond Future | | | 12 | | | | Dec-18 | | | | (1,791 | ) | | | — | | | | — | |
| | | | | | | | | | | | | | | | | | | | |
| Total Futures | | | | | | | | | | | | | | | | | | $ | 50 | |
| | | | | | | | | | | | | | | | | | | | |
See notes to financial statements.
94 Payden Mutual Funds

| | | | | | |
The Fund seeks a high level of total return by generally investing in below investment grade corporate debt instruments and income producing securities of emerging market countries denominated in U.S. and foreign currencies with no limit on the average portfolio maturity. | | | 
|
| Portfolio Composition - percent of investments | |
Corporate | | | 88 | % |
Foreign Government | | | 3 | % |
Cash equivalent | | | 9 | % |
| | | | |
| | | | |
| This information is not part of the audited financial statements. | | | Past performance does not predict future returns. The graph does not reflect the impact of taxes or transaction costs a shareholder would pay. The Fund’s SI Class is expected to perform similarly to its Investor Class, except for class specific waivers. |
Schedule of Investments - October 31, 2018
| | | | | | |
Principal or Shares | | Security Description | | Value (000) | |
Bonds (95%) | | | | |
Argentina (ARS) (0%) | | | | |
2,000,000 | | YPF SA 144A, 16.50%, 5/09/22 ARS (a) | | $ | 35 | |
Argentina (USD) (3%) | | | | |
445,000 | | Argentine Republic Government International Bond, 6.25%, 4/22/19 | | | 449 | |
230,000 | | Capex SA 144A, 6.88%, 5/15/24 (a) | | | 192 | |
180,000 | | Provincia de Buenos Aires/Argentina 144A,
6.50%, 2/15/23 (a) | | | 155 | |
220,000 | | Transportadora de Gas del Sur SA 144A,
6.75%, 5/02/25 (a) | | | 207 | |
425,000 | | YPF SA 144A, 8.88%, 12/19/18 (a) | | | 426 | |
| | | | | 1,429 | |
Austria (USD) (1%) | | | | |
220,000 | | JBS Investments II GmbH 144A,
7.00%, 1/15/26 (a) | | | 218 | |
Bermuda (USD) (5%) | | | | |
210,000 | | CBQ Finance Ltd., 2.88%, 6/24/19 | | | 209 | |
200,000 | | CBQ Finance Ltd. 144A,
7.50%, 11/18/19 (a) | | | 206 | |
205,000 | | Digicel Group Ltd. 144A,
8.25%, 9/30/20 (a) | | | 147 | |
710,000 | | Geopark Ltd. 144A, 6.50%, 9/21/24 (a) | | | 709 | |
295,000 | | Inkia Energy Ltd. 144A,
5.88%, 11/09/27 (a) | | | 280 | |
200,000 | | Ooredoo International Finance Ltd. 144A,
5.00%, 10/19/25 (a) | | | 205 | |
205,000 | | Ooredoo International Finance Ltd. 144A,
7.88%, 6/10/19 (a) | | | 211 | |
335,000 | | Tengizchevroil Finance Co. International Ltd. 144A, 4.00%, 8/15/26 (a) | | | 314 | |
| | | | | 2,281 | |
Brazil (BRL) (1%) | | | | |
900,000 | | Brazil Notas do Tesouro Nacional Serie F, 10.00%, 1/01/27 BRL | | | 243 | |
Brazil (USD) (3%) | | | | |
710,000 | | JBS USA LUX SA/JBS USA Finance Inc. 144A, 6.75%, 2/15/28 (a) | | | 685 | |
| | | | | | |
Principal or Shares | | Security Description | | Value (000) | |
624,612 | | USJ Acucar e Alcool SA 144A,
9.88%, 11/09/21 (a) | | $ | 484 | |
| | | | | 1,169 | |
Canada (USD) (4%) | | | | |
420,000 | | CNOOC Nexen Finance 2014 ULC,
4.25%, 4/30/24 | | | 422 | |
200,000 | | First Quantum Minerals Ltd. 144A,
6.88%, 3/01/26 (a) | | | 174 | |
460,000 | | First Quantum Minerals Ltd. 144A,
7.00%, 2/15/21 (a) | | | 450 | |
225,000 | | First Quantum Minerals Ltd. 144A,
7.25%, 5/15/22 (a) | | | 216 | |
457,718 | | Stoneway Capital Corp. 144A,
10.00%, 3/01/27 (a) | | | 428 | |
| | | | | 1,690 | |
Cayman Islands (USD) (7%) | | | | |
200,000 | | ADCB Finance Cayman Ltd. 144A,
4.00%, 3/29/23 (a) | | | 197 | |
462,000 | | Baidu Inc., 3.50%, 11/28/22 | | | 453 | |
295,000 | | Braskem Finance Ltd. 144A,
5.38%, 5/02/22 (a) | | | 300 | |
445,000 | | Dar Al-Arkan Sukuk Co., Ltd.,
6.50%, 5/28/19 | | | 447 | |
735,000 | | Gran Tierra Energy International Holdings Ltd. 144A, 6.25%, 2/15/25 (a) | | | 706 | |
200,000 | | Industrial Senior Trust 144A,
5.50%, 11/01/22 (a) | | | 196 | |
320,000 | | Lima Metro Line 2 Finance Ltd. 144A,
5.88%, 7/05/34 (a) | | | 324 | |
185,871 | | Odebrecht Drilling Norbe VIII/IX Ltd. 144A, 7.35%, 12/01/26 (a) | | | 116 | |
98,900 | | Odebrecht Oil & Gas Finance Ltd. 144A,
0.00%, 1/03/67 (a) | | | 2 | |
330,000 | | Saudi Electricity Global Sukuk Co. 2 144A,
5.06%, 4/08/43 (a) | | | 317 | |
150,000 | | Transocean Pontus Ltd. 144A,
6.13%, 8/01/25 (a) | | | 149 | |
Annual Report 95

| | | | | | |
Principal or Shares | | Security Description | | Value (000) | |
75,000 | | Vale Overseas Ltd., 6.25%, 8/10/26 | | $ | 80 | |
| | | | | 3,287 | |
Chile (USD) (1%) | | | | |
220,000 | | Celeo Redes Operacion Chile SA 144A, 5.20%, 6/22/47 (a) | | | 216 | |
410,607 | | Latam Airlines 2015-1 Pass-Through Trust B, 4.50%, 11/15/23 | | | 399 | |
| | | | | 615 | |
China (USD) (1%) | | | | |
590,000 | | Bank of China Ltd./Hong Kong,
2.88%, 6/30/20 | | | 582 | |
Colombia (USD) (2%) | | | | |
215,000 | | Banco de Bogota SA 144A,
4.38%, 8/03/27 (a) | | | 201 | |
215,000 | | Banco de Bogota SA 144A, 6.25%, 5/12/26 (a) | | | 219 | |
244,000 | | Ecopetrol SA, 5.88%, 5/28/45 | | | 233 | |
465,000 | | GrupoSura Finance SA 144A,
5.50%, 4/29/26 (a) | | | 470 | |
| | | | | 1,123 | |
Costa Rica (USD) (0%) | | | | |
200,000 | | Banco Nacional de Costa Rica 144A, 5.88%, 4/25/21 (a) | | | 192 | |
France (USD) (2%) | | | | |
420,000 | | Altice France SA/France 144A,
8.13%, 2/01/27 (a) | | | 417 | |
380,000 | | Numericable-SFR SA 144A,
7.38%, 5/01/26 (a) | | | 365 | |
| | | | | 782 | |
Georgia (USD) (0%) | | | | |
200,000 | | Georgian Oil and Gas Corp. JSC 144A, 6.75%, 4/26/21 (a) | | | 205 | |
Hong Kong (USD) (2%) | | | | |
420,000 | | ICBCIL Finance Co. Ltd. 144A,
3.20%, 11/10/20 (a) | | | 415 | |
265,000 | | Swire Properties MTN Financing Ltd., 4.38%, 6/18/22 | | | 270 | |
| | | | | 685 | |
India (USD) (2%) | | | | |
305,000 | | Adani Ports & Special Economic Zone Ltd. 144A, 4.00%, 7/30/27 (a) | | | 273 | |
240,000 | | Adani Transmission Ltd. 144A,
4.00%, 8/03/26 (a) | | | 211 | |
205,000 | | GMR Hyderabad International Airport Ltd. 144A, 4.25%, 10/27/27 (a) | | | 171 | |
200,000 | | IDBI Bank Ltd./DIFC Dubai,
4.13%, 4/23/20 | | | 197 | |
| | | | | 852 | |
Indonesia (IDR) (0%) | | | | |
2,800,000,000 | | Jasa Marga Persero Tbk PT 144A, 7.50%, 12/11/20 IDR (a) | | | 175 | |
Ireland (USD) (2%) | | | | |
490,000 | | C&W Senior Financing DAC 144A,
7.50%, 10/15/26 (a) | | | 492 | |
210,000 | | Phosagro OAO via Phosagro Bond Funding DAC 144A, 3.95%, 11/03/21 (a) | | | 204 | |
| | | | | 696 | |
Israel (USD) (1%) | | | | |
400,000 | | Israel Electric Corp. Ltd. 144A,
7.25%, 1/15/19 (a) | | | 403 | |
| | | | | | |
Principal or Shares | | Security Description | | Value (000) | |
Kazakhstan (KZT) (0%) | | | | |
70,000,000 | | Development Bank of Kazakhstan JSC 144A, 8.95%, 5/04/23 KZT (a) | | $ | 164 | |
Luxembourg (USD) (6%) | | | | |
650,000 | | Adecoagro SA 144A, 6.00%, 9/21/27 (a) | | | 572 | |
219,595 | | ARD Securities Finance SARL 144A,
8.75%, 1/31/23 (a) | | | 212 | |
260,000 | | Gazprom OAO Via Gaz Capital SA 144A, | | | | |
| | 4.95%, 3/23/27 (a) | | | 249 | |
430,000 | | Gazprom OAO Via Gaz Capital SA 144A, 4.95%, 2/06/28 (a) | | | 411 | |
455,000 | | Millicom International Cellular SA 144A, 6.63%, 10/15/26 (a) | | | 460 | |
710,000 | | Nexa Resources SA 144A,
5.38%, 5/04/27 (a) | | | 692 | |
| | | | | 2,596 | |
Mexico (USD) (8%) | | | | |
225,000 | | America Movil SAB de CV, 3.13%, 7/16/22 | | | 220 | |
415,000 | | Banco Mercantil del Norte SA/Grand Cayman 144A, (5 yr. US Treasury Yield Curve Rate T Note Constant Maturity + 4.447%) 5.75%, 10/04/31 (a)(b) | | | 381 | |
885,000 | | Cemex SAB de CV 144A,
6.13%, 5/05/25 (a) | | | 885 | |
197,400 | | Cometa Energia SA de CV 144A,
6.38%, 4/24/35 (a) | | | 192 | |
455,000 | | Cydsa SAB de CV 144A,
6.25%, 10/04/27 (a) | | | 425 | |
240,000 | | Elementia SAB de CV 144A,
5.50%, 1/15/25 (a) | | | 223 | |
243,482 | | Fermaca Enterprises S de RL de CV 144A, 6.38%, 3/30/38 (a) | | | 249 | |
225,000 | | Mexichem SAB de CV 144A,
4.88%, 9/19/22 (a) | | | 224 | |
200,000 | | Mexichem SAB de CV 144A,
5.88%, 9/17/44 (a) | | | 184 | |
246,319 | | Mexico Generadora de Energia S de rl 144A, 5.50%, 12/06/32 (a) | | | 240 | |
200,000 | | Trust F/1401 144A, 5.25%, 12/15/24 (a) | | | 200 | |
360,000 | | Unifin Financiera SAB de CV SOFOM ENR 144A, 7.00%, 1/15/25 (a) | | | 334 | |
| | | | | 3,757 | |
Morocco (USD) (1%) | | | | |
200,000 | | BMCE Bank, 6.25%, 11/27/18 | | | 200 | |
225,000 | | OCP SA 144A, 6.88%, 4/25/44 (a) | | | 236 | |
| | | | | 436 | |
Netherlands (USD) (10%) | | | | |
200,000 | | Bharti Airtel International Netherlands BV 144A, 5.13%, 3/11/23 (a) | | | 195 | |
235,000 | | Equate Petrochemical BV 144A,
3.00%, 3/03/22 (a) | | | 225 | |
200,000 | | Listrindo Capital BV 144A,
4.95%, 9/14/26 (a) | | | 179 | |
525,000 | | Lukoil International Finance BV 144A, 4.75%, 11/02/26 (a) | | | 516 | |
435,000 | | Minejesa Capital BV 144A,
5.63%, 8/10/37 (a) | | | 385 | |
200,000 | | Myriad International Holdings BV 144A, 4.85%, 7/06/27 (a) | | | 194 | |
220,000 | | Myriad International Holdings BV 144A, 5.50%, 7/21/25 (a) | | | 226 | |
200,000 | | Nostrum Oil & Gas Finance BV 144A, 7.00%, 2/16/25 (a) | | | 162 | |
165,000 | | Petrobras Global Finance BV, 6.13%, 1/17/22 | | | 171 | |
96 Payden Mutual Funds
| | | | | | |
Principal or Shares | | Security Description | | Value (000) | |
1,380,000 | | Teva Pharmaceutical Finance Netherlands III BV, 6.75%, 3/01/28 (c) | | $ | 1,413 | |
875,000 | | VTR Finance BV 144A, 6.88%, 1/15/24 (a) | | | 889 | |
| | | | | 4,555 | |
Nigeria (USD) (0%) | | | | |
216,000 | | Nigeria Government International Bond 144A, 6.50%, 11/28/27 (a) | | | 199 | |
Panama (USD) (0%) | | | | |
200,000 | | Banco General SA 144A, 4.13%, 8/07/27 (a) | | | 187 | |
Paraguay (USD) (1%) | | | | |
425,000 | | Banco Regional SAECA 144A,
8.13%, 1/24/19 (a) | | | 427 | |
Peru (PEN) (0%) | | | | |
300,000 | | Peru Government Bond 144A,
6.15%, 8/12/32 PEN (a) | | | 89 | |
Peru (USD) (4%) | | | | |
197,520 | | Abengoa Transmision Sur SA 144A,
6.88%, 4/30/43 (a) | | | 221 | |
385,000 | | Banco Internacional del Peru SAA Interbank 144A, (3 mo. LIBOR USD + 5.760%) 6.63%, 3/19/29 (a)(b) | | | 411 | |
440,000 | | Hunt Oil Co. of Peru LLC Sucursal Del Peru 144A, 6.38%, 6/01/28 (a) | | | 447 | |
220,000 | | Peru LNG Srl 144A, 5.38%, 3/22/30 (a) | | | 219 | |
200,000 | | SAN Miguel Industrias Pet SA 144A,
4.50%, 9/18/22 (a) | | | 192 | |
420,000 | | Scotiabank Peru SAA 144A, (3 mo. LIBOR USD + 3.856%) 4.50%, 12/13/27 (a)(b) | | | 418 | |
| | | | | 1,908 | |
Qatar (USD) (1%) | | | | |
300,000 | | Ras Laffan Liquefied Natural Gas Co. Ltd. 3 144A, 5.84%, 9/30/27 (a) | | | 324 | |
Singapore (USD) (1%) | | | | |
240,000 | | BOC Aviation Ltd. 144A, 2.75%, 9/18/22 (a) | | | 228 | |
200,000 | | Marble II Pte Ltd. 144A, 5.30%, 6/20/22 (a) | | | 194 | |
| | | | | 422 | |
Spain (USD) (1%) | | | | |
360,000 | | AI Candelaria Spain SLU 144A,
7.50%, 12/15/28 (a) | | | 356 | |
Thailand (USD) (0%) | | | | |
200,000 | | Krung Thai Bank PCL/Cayman Islands, (5 yr. US Treasury Yield Curve Rate T Note Constant Maturity + 3.535%)
5.20%, 12/26/24 (b) | | | 202 | |
Turkey (USD) (2%) | | | | |
265,000 | | Akbank T.A.S. 144A, 5.00%, 10/24/22 (a) | | | 243 | |
230,000 | | Turkiye Garanti Bankasi AS 144A,
4.75%, 10/17/19 (a) | | | 227 | |
200,000 | | Turkiye Garanti Bankasi AS 144A, 5.25%, 9/13/22 (a) | | | 185 | |
210,000 | | Turkiye Is Bankasi 144A, 5.50%, 4/21/22 (a) | | | 182 | |
| | | | | 837 | |
Ukraine (USD) (0%) | | | | |
215,000 | | Ukraine Government International Bond 144A, 7.75%, 9/01/21 (a) | | | 212 | |
| | | | | | |
Principal or Shares | | Security Description | | Value (000) | |
United Arab Emirates (USD) (5%) | | | | |
240,000 | | Abu Dhabi Crude Oil Pipeline LLC 144A,
4.60%, 11/02/47 (a) | | $ | 228 | |
325,000 | | Acwa Power Management And Investments One Ltd. 144A,
5.95%, 12/15/39 (a) | | | 308 | |
215,000 | | Dolphin Energy Ltd. LLC 144A,
5.50%, 12/15/21 (a) | | | 226 | |
353,420 | | Dolphin Energy Ltd. LLC 144A,
5.89%, 6/15/19 (a) | | | 357 | |
200,000 | | DP World Ltd. 144A, 5.63%, 9/25/48 (a) | | | 190 | |
300,000 | | DP World Ltd. 144A, 6.85%, 7/02/37 (a) | | | 335 | |
280,000 | | Emirates Semb Corp. Water & Power Co. PJSC 144A, 4.45%, 8/01/35 (a) | | | 265 | |
225,000 | | Oztel Holdings SPC Ltd. 144A,
5.63%, 10/24/23 (a) | | | 225 | |
200,000 | | Ruwais Power Co. PJSC 144A,
6.00%, 8/31/36 (a) | | | 218 | |
| | | | | 2,352 | |
United Kingdom (USD) (2%) | | | | |
450,000 | | MARB BondCo PLC 144A,
6.88%, 1/19/25 (a) | | | 424 | |
200,000 | | Petra Diamonds U.S. Treasury PLC 144A, 7.25%, 5/01/22 (a) | | | 193 | |
210,000 | | Vedanta Resources PLC 144A,
6.13%, 8/09/24 (a) | | | 186 | |
200,000 | | Vedanta Resources PLC 144A,
7.13%, 5/31/23 (a) | | | 189 | |
| | | | | 992 | |
United States (EGP) (1%) | | | | |
5,100,000 | | Citigroup Global Markets Holdings Inc. (Arab Republic of Egypt), 0.00%, 11/08/18 EGP | | | 285 | |
5,800,000 | | Citigroup Global Markets Holdings Inc. (Arab Republic of Egypt) 144A, 0.00%, 1/24/19 EGP (a) | | | 312 | |
| | | | | 597 | |
United States (IDR) (1%) | | | | |
4,300,000,000 | | Indonesia Treasury Bond 144A,
5.63%, 5/17/23 IDR (a) | | | 254 | |
United States (NGN) (1%) | | | | |
105,000,000 | | Citigroup Global Markets Holdings Inc. (Federal Republic of Nigeria) 144A, 0.00%, 2/18/19 NGN (a) | | | 280 | |
United States (USD) (11%) | | | | |
225,000 | | California Resources Corp.,
5.00%, 1/15/20 | | | 212 | |
245,000 | | Chesapeake Energy Corp.,
7.00%, 10/01/24 | | | 240 | |
200,000 | | Dell International LLC/EMC Corp. 144A,
4.42%, 6/15/21 (a) | | | 202 | |
220,000 | | Fannie Mae Connecticut Avenue Securities, (1 mo. LIBOR USD + 2.150%) 4.43%, 10/25/30 (b) | | | 220 | |
140,000 | | Fannie Mae Connecticut Avenue Securities, (1 mo. LIBOR USD + 2.200%) 4.48%, 8/25/30 (b) | | | 141 | |
215,000 | | Freddie Mac Structured Agency Credit Risk Debt Notes, (1 mo. LIBOR USD + 2.300%) 4.58%, 9/25/30 (b) | | | 215 | |
340,000 | | GOBP Holdings Inc. Term Loan 2L, (LIBOR USD 1-Month + 7.250%) 9.53%, 10/22/26 (d) | | | 341 | |
Annual Report 97
| | | | | | |
Principal or Shares | | Security Description | | Value (000) | |
137,591 | | Golden Nugget Inc. Term Loan B 1L, (LIBOR USD 1-Month + 2.750%) 5.23%, 10/04/23 (d) | | $ | 138 | |
140,000 | | K-Mac Holdings Corp. Term Loan B 2L, (LIBOR USD 3-Month + 6.750%) 9.03%, 3/16/26 (d) | | | 141 | |
210,000 | | Navient Corp., 5.00%, 10/26/20 | | | 212 | |
323,367 | | Nexeo Solutions LLC Term Loan B 1L, (LIBOR USD 1-Month + 3.250%) 5.66%, 6/09/23 (d) | | | 325 | |
322,000 | | Southern Copper Corp., 5.25%, 11/08/42 | | | 315 | |
285,000 | | STACR Trust 2018-HRP1 144A, (1 mo. LIBOR USD + 3.750%) 6.03%, 4/25/43 (a)(b) | | | 299 | |
160,000 | | Tacala Investment Corp. Term Loan 2L, (LIBOR USD 1-Month + 7.000%) 9.30%, 2/01/26 (d) | | | 162 | |
893,000 | | Terraform Global Operating LLC 144A, 6.13%, 3/01/26 (a) | | | 833 | |
530,000 | | Teva Pharmaceutical Finance IV LLC, 2.25%, 3/18/20 | | | 515 | |
323,346 | | U.S. Foods Inc. Term Loan B 1L, (LIBOR USD 1-Month + 2.000%) 4.30%, 6/27/23 (d) | | | 323 | |
| | | | | 4,834 | |
Virgin Islands (British) (USD) (2%) | | | | |
120,000 | | Arcos Dorados Holdings Inc. 144A, 5.88%, 4/04/27 (a) | | | 110 | |
400,000 | | Sinopec Group Overseas Development 2015 Ltd. 144A, 2.50%, 4/28/20 (a) | | | 394 | |
200,000 | | Studio City Co. Ltd. 144A, 7.25%, 11/30/21 (a) | | | 205 | |
| | | | | 709 | |
Total Bonds (Cost - $44,547) | | | 43,351 | |
| | | | | | |
Principal or Shares | | Security Description | | Value (000) | |
Investment Company (4%) | | | | |
| | 1,800,024 Payden Cash Reserves Money Market Fund * (Cost - $1,800) | | $ | 1,800 | |
Total Investments (Cost - $46,347) (99%) | | | 45,151 | |
Other Assets, net of Liabilities (1%) | | | 270 | |
Net Assets (100%) | | $ | 45,421 | |
| (a) | Security offered only to qualified institutional investors, and thus is not registered for sale to the public under rule 144A of the Securities Act of 1933. It has been deemed liquid under guidelines approved by the Board. |
| (b) | Floating rate security. The rate shown reflects the rate in effect at October 31, 2018. See Note 2 in the Notes to Financial Statements. |
| (c) | All or a portion of these securities are on loan. At October 31, 2018, the total market value of the Fund’s securities on loan is $227 and the total market value of the collateral held by the Fund is $232. Amounts in 000s. |
| (d) | Floating rate security. The rate shown reflects the rate in effect at October 31, 2018. The stated maturity is subject to prepayments. See Note 2 in the Notes to Financial Statements. |
Open Forward Currency Contracts to USD
| | | | | | | | | | | | |
Currency Purchased (000s) | | Currency
Sold
(000s) | | Counterparty | | Settlement
Date | | | Unrealized
Appreciation
(Depreciation)
(000s) | |
Assets: | | | | | | | | | | | | |
BRL 984 | | USD 262 | | State Street Bank & Trust Co. | | | 11/16/2018 | | | $ | 2 | |
KZT 56,000 | | USD 148 | | HSBC Bank USA, N.A. | | | 01/09/2019 | | | | 1 | |
RUB 8,940 | | USD 130 | | Barclays Bank PLC | | | 11/19/2018 | | | | 5 | |
USD 152 | | ZAR 2,250 | | HSBC Bank USA, N.A. | | | 01/16/2019 | | | | 1 | |
| | | | | | | | | | | | |
| | | | | | | | | | | 9 | |
| | | | | | | | | | | | |
Liabilities: | | | | | | | | | | | | |
USD 133 | | RUB 8,940 | | Barclays Bank PLC | | | 11/19/2018 | | | | (2 | ) |
USD 249 | | BRL 984 | | State Street Bank & Trust Co. | | | 11/16/2018 | | | | (15 | ) |
ZAR 2,250 | | USD 153 | | HSBC Bank USA, N.A. | | | 01/16/2019 | | | | (2 | ) |
| | | | | | | | | | | | |
| | | | | | | | | | | (19 | ) |
| | | | | | | | | | | | |
Net Unrealized Appreciation (Depreciation) | | | | | | | | | | $ | (10 | ) |
| | | | | | | | | | | | |
98 Payden Mutual Funds
Open Future Contracts
| | | | | | | | | | | | | | | | | | |
Contract Type | | Number of Contracts | | Expiration
Date | | | Notional Amount (000s) | | | Current Value (000s) | | | Unrealized Depreciation (000s) | |
Short Contracts: | | | | | | | | | | | | | | | | | | |
| U.S. Ultra Bond Future | | 4 | | | Dec-18 | | | $ | (597 | ) | | $ | (2 | ) | | $ | (2 | ) |
| | | | | | | | | | | | | | | | | | |
| Total Futures | | | | | | | | | | | | | | $ | (2 | ) |
| | | | | | | | | | | | | | | | | | |
Offsetting Assets and Liabilities
The Fund’s loaned securities were all subject to an enforceable Securities Lending Agency Agreement. Securities lent in accordance with the Securities Lending Agency Agreement on a gross basis were as follows:
| | | | |
| Total gross amount presented on the Statements | | $ | 227 | |
| of Assets and Liabilities1 | �� | | | |
| Non-cash Collateral2 | | | (227 | ) |
| | | | |
| Net Amount | | $ | — | |
| | | | |
| 1 | The amount presented on the Statements of Assets and Liabilities is not offset and is shown on a gross basis. |
| 2 | At October 31, 2018, the value of the collateral received from each borrower exceeded the value of the related securities loaned. This amount is disclosed on the Schedule of Investments. |
See notes to financial statements.
Annual Report 99

| | | | |
The Fund seeks growth of capital by investing in U.S. large capitalization value stocks and income producing equity securities with above average dividend yields with up to 30% in foreign securities. | | 
Past performance does not predict future returns. The graph does not reflect the impact of taxes or transaction costs a shareholder would pay. The Fund’s Adviser and SI Classes are expected to perform similarly to its Investor Class, except for class specific expenses or waivers. |
| Portfolio Composition - percent of investments |
|
Financial | | 25% |
Energy | | 15% |
Technology | | 13% |
Healthcare | | 12% |
Industrial | | 10% |
Other | | 25% |
| | | |
| | | |
| | | |
| | | |
| | | |
This information is not part of the audited financial statements. |
Schedule of Investments - October 31, 2018
| | | | | | |
Principal or Shares | | Security Description | | Value (000) | |
| | | | | | |
Stocks (95%) | | | | |
Common Stock (82%) | | | | |
Consumer Discretionary (6%) | | | | |
64,800 | | Home Depot Inc. | | $ | 11,397 | |
251,400 | | Las Vegas Sands Corp. | | | 12,829 | |
133,200 | | McDonald’s Corp. | | | 23,563 | |
189,800 | | Six Flags Entertainment Corp. | | | 10,223 | |
246,100 | | Starbucks Corp. | | | 14,340 | |
| | | | | 72,352 | |
Consumer Staple (8%) | | | | |
202,400 | | Altria Group Inc. | | | 13,164 | |
96,400 | | Costco Wholesale Corp. | | | 22,040 | |
417,400 | | General Mills Inc. | | | 18,282 | |
108,400 | | PepsiCo Inc. | | | 12,182 | |
325,900 | | Philip Morris International Inc. | | | 28,702 | |
| | | | | 94,370 | |
Energy (7%) | | | | |
191,100 | | Exxon Mobil Corp. | | | 15,227 | |
673,200 | | Kinder Morgan Inc./DE | | | 11,458 | |
244,200 | | ONEOK Inc. | | | 16,020 | |
172,700 | | Phillips 66 | | | 17,757 | |
220,300 | | Targa Resources Corp. | | | 11,383 | |
150,900 | | Valero Energy Corp. | | | 13,745 | |
| | | | | 85,590 | |
Financial (17%) | | | | |
103,700 | | Allianz SE | | | 21,663 | |
747,100 | | Bank of America Corp. | | | 20,545 | |
151,500 | | Bank of Montreal | | | 11,323 | |
213,900 | | BB&T Corp. | | | 10,515 | |
212,000 | | Citigroup Inc. | | | 13,878 | |
297,600 | | JPMorgan Chase & Co. | | | 32,444 | |
280,600 | | MetLife Inc. | | | 11,558 | |
535,100 | | Morgan Stanley | | | 24,433 | |
199,500 | | SunTrust Banks Inc. | | | 12,501 | |
423,200 | | Toronto-Dominion Bank | | | 23,471 | |
345,800 | | US. Bancorp | | | 18,075 | |
| | | | | 200,406 | |
Healthcare (12%) | | | | |
127,000 | | AbbVie Inc. | | | 9,887 | |
| | | | | | |
Principal or Shares | | Security Description | | Value (000) | |
| | | | | | |
127,000 | | Amgen Inc. | | $ | 24,484 | |
194,400 | | Eli Lilly & Co. | | | 21,081 | |
242,400 | | Gilead Sciences Inc. | | | 16,527 | |
85,300 | | Johnson & Johnson | | | 11,941 | |
415,700 | | Merck & Co. Inc. | | | 30,600 | |
630,900 | | Pfizer Inc. | | | 27,166 | |
| | | | | 141,686 | |
Industrial (9%) | | | | |
59,800 | | Boeing Co. | | | 21,221 | |
451,100 | | Delta Air Lines Inc. | | | 24,689 | |
165,200 | | Emerson Electric Co. | | | 11,214 | |
96,400 | | Lockheed Martin Corp. | | | 28,327 | |
107,100 | | United Parcel Service Inc. | | | 11,410 | |
179,200 | | Waste Management Inc. | | | 16,033 | |
| | | | | 112,894 | |
Material (1%) | | | | |
148,400 | | DowDuPont Inc. | | | 8,002 | |
Technology (13%) | | | | |
562,500 | | Cisco Systems Inc. | | | 25,734 | |
271,700 | | Intel Corp. | | | 12,737 | |
361,500 | | Maxim Integrated Products Inc. | | | 18,082 | |
302,800 | | Microsoft Corp. | | | 32,342 | |
278,400 | | Paychex Inc. | | | 18,233 | |
375,000 | | QUALCOMM Inc. | | | 23,584 | |
207,500 | | Texas Instruments Inc. | | | 19,262 | |
63,400 | | Tokyo Electron Ltd. | | | 8,813 | |
| | | | | 158,787 | |
Telecommunication (3%) | | | | |
516,200 | | Verizon Communications Inc. | | | 29,470 | |
Utility (6%) | | | | |
252,000 | | American Electric Power Co. Inc. | | | 18,487 | |
158,300 | | Consolidated Edison Inc. | | | 12,031 | |
113,500 | | DTE Energy Co. | | | 12,757 | |
148,900 | | Duke Energy Corp. | | | 12,303 | |
338,700 | | FirstEnergy Corp. | | | 12,627 | |
| | | | | 68,205 | |
Total Common Stock | | | 971,762 | |
100 Payden Mutual Funds
| | | | | | |
Principal or Shares | | Security Description | | Value (000) | |
Master Limited Partnership (8%) | | | | |
746,400 | | Antero Midstream Partners LP | | $ | 22,504 | |
1,287,808 | | Energy Transfer LP | | | 20,012 | |
1,130,500 | | Enterprise Products Partners LP | | | 30,320 | |
379,100 | | Magellan Midstream Partners LP | | | 23,383 | |
Total Master Limited Partnership | | | 96,219 | |
Preferred Stock (1%) | | | | |
95,700 | | Bank of America Corp., 6.625% | | | 2,470 | |
103,000 | | BB&T Corp., 5.625% | | | 2,580 | |
208,000 | | Goldman Sachs Group Inc., 5.50% | | | 5,250 | |
110,900 | | US Bancorp, 6.50% | | | 2,996 | |
Total Preferred Stock | | | 13,296 | |
Real Estate Investment Trust (5%) | | | | |
48,800 | | Alexandria Real Estate Equities Inc. | | | 5,965 | |
69,000 | | AvalonBay Communities Inc. | | | 12,101 | |
111,300 | | Crown Castle International Corp. | | | 12,103 | |
192,800 | | Digital Realty Trust Inc. | | | 19,908 | |
189,900 | | Prologis Inc. | | | 12,243 | |
Total Real Estate Investment Trust | | | 62,320 | |
Total Stocks (Cost - $994,060) | | | 1,143,597 | |
Corporate Bonds (3%) | | | | |
3,050,000 | | CenterPoint Energy Inc., (3 mo. LIBOR USD + 3.270%) 6.13%, (a)(b) | | | 3,084 | |
1,906,000 | | CIT Group Inc., (3 mo. LIBOR USD + 3.972%) 5.80%, (a)(b)(c) | | | 1,879 | |
6,000,000 | | Citigroup Inc., (3 mo. LIBOR USD + 3.423%) 6.30%, (a)(b) | | | 5,972 | |
6,100,000 | | Citizens Financial Group Inc., (3 mo. LIBOR USD + 3.003%) 6.00%, (a)(b)(c) | | | 6,054 | |
6,000,000 | | Citizens Financial Group Inc., (3 mo. LIBOR USD + 3.157%) 6.38%, (a)(b) | | | 6,014 | |
6,000,000 | | General Motors Financial Co. Inc., (3 mo. LIBOR USD + 3.436%) 6.50%, (a)(b) | | | 5,655 | |
4,414,000 | | Huntington Bancshares Inc./OH, (3 mo. LIBOR USD + 2.880%) 5.70%, (a)(b) | | | 4,334 | |
2,800,000 | | Land O’ Lakes Inc. 144A, 7.00%, (a) | | | 2,802 | |
Total Corporate Bonds (Cost - $35,861) | | | 35,794 | |
Investment Company (1%) | | | | |
14,138,505 | | Payden Cash Reserves Money Market Fund * | | | | |
| | (Cost - $14,138) | | | 14,138 | |
| |
Total Investments (Cost - $1,044,059) (100%) | | | 1,193,529 | |
Liabilities in excess of Other Assets (0%) | | | (697 | ) |
| |
Net Assets (100%) | | $ | 1,192,832 | |
| (a) | Perpetual security with no stated maturity date. |
| (b) | Floating rate security. The rate shown reflects the rate in effect at October 31, 2018. See Note 2 in the Notes to Financial Statements. |
| (c) | All or a portion of these securities are on loan. At October 31, 2018, the total market value of the Fund’s securities on loan is $440 and the total market value of the collateral held by the Fund is $460. Amounts in 000s. |
Annual Report 101

Open Forward Currency Contracts to USD
| | | | | | | | | | | | |
Currency Purchased (000s) | | Currency Sold (000s) | | Counterparty | | Settlement Date | | | Unrealized Appreciation (Depreciation) (000s) | |
Assets: | | | | | | | | | | | | |
USD 23,244 | | EUR 20,056 | | Citibank, N.A. | | | 11/08/2018 | | | $ | 513 | |
USD 36,718 | | CAD 47,492 | | Royal Bank of Canada | | | 11/08/2018 | | | | 637 | |
| | | | | | | | | | | | |
| | | | | | | | | | | 1,150 | |
| | | | | | | | | | | | |
Liabilities: | | | | | | | | | | | | |
USD 9,126 | | JPY 1,034,900 | | Barclays Bank PLC | | | 11/08/2018 | | | | (51 | ) |
| | | | | | | | | | | | |
Net Unrealized Appreciation (Depreciation) | | | | | | | | | | $ | 1,099 | |
| | | | | | | | | | | | |
Offsetting Assets and Liabilities
The Fund’s loaned securities were all subject to an enforceable Securities Lending Agency Agreement. Securities lent in accordance with the Securities Lending Agency Agreement on a gross basis were as follows:
| | | | |
| | | Value
(000’s) | |
Total gross amount presented on the Statements of Assets and Liabilities1 | | | $440 | |
| Non-cash Collateral2 | | | (440 | ) |
| | | | |
| Net Amount | | $ | — | |
| | | | |
| 1 | The amount presented on the Statements of Assets and Liabilities is not offset and is shown on a gross basis. |
| 2 | At October 31, 2018, the value of the collateral received from each borrower exceeded the value of the related securities loaned. This amount is disclosed on the Schedule of Investments. |
See notes to financial statements.
102 Payden Mutual Funds
(THIS PAGE INTENTIONALLY LEFT BLANK)

October 31, 2018
Numbers in 000s
| | | | | | | | | | | | |
| | | Payden Cash Reserves Money Market Fund | | | Payden Limited Maturity Fund | | | Payden Low Duration Fund | |
ASSETS: | | | | | | | | | | | | |
Investments, at value * | | | $230,260 | | | | $787,592 | | | | $1,203,088 | |
Affiliated investments, at value ** | | | — | | | | 1,698 | | | | 6,945 | |
Repurchase agreements, at value *** | | | 100,000 | | | | — | | | | — | |
Foreign cash **** | | | — | | | | 59 | | | | — | |
Cash | | | — | | | | 2 | | | | — | |
Cash pledged for financial futures contracts | | | — | | | | — | | | | — | |
Receivable for: | | | | | | | | | | | | |
Interest and dividends | | | 66 | | | | 2,714 | | | | 6,611 | |
Paydowns | | | — | | | | — | | | | — | |
Investments sold | | | — | | | | 1,661 | | | | 1,417 | |
Fund shares sold | | | 75 | | | | 2,480 | | | | 786 | |
Futures | | | — | | | | — | | | | 103 | |
Forward currency contracts | | | — | | | | 227 | | | | 56 | |
Variation margin on centrally cleared swaps | | | — | | | | — | | | | — | |
Receivable from Advisor (Note 3) | | | — | | | | 15 | | | | — | |
Other assets | | | 27 | | | | 58 | | | | 55 | |
| | | | |
Total Assets | | | 330,428 | | | | 796,506 | | | | 1,219,061 | |
| | | | |
LIABILITIES: | | | | | | | | | | | | |
Payable for: | | | | | | | | | | | | |
Bank overdraft | | | — | | | | — | | | | 7 | |
Forward currency contracts | | | — | | | | — | | | | — | |
Investments purchased | | | — | | | | 10,452 | | | | 3,289 | |
Fund shares redeemed | | | — | | | | 194 | | | | 2,301 | |
Futures | | | — | | | | — | | | | 48 | |
Options written ***** | | | — | | | | — | | | | — | |
Unfunded floating rate loan interests | | | — | | | | — | | | | — | |
Distributions payable | | | 318 | | | | 215 | | | | 168 | |
Liability for securities on loan (Note 2) | | | — | | | | 470 | | | | 253 | |
Accrued expenses: | | | | | | | | | | | | |
Investment advisory fees (Note 3) | | | 4 | | | | — | | | | 171 | |
Administration fees (Note 3) | | | 41 | | | | 101 | | | | 151 | |
Distribution fees (Note 3) | | | — | | | | — | | | | — | |
Trustee fees and expenses | | | 2 | | | | 5 | | | | 6 | |
Other liabilities | | | 67 | | | | 248 | | | | 359 | |
| | | | |
Total Liabilities | | | 432 | | | | 11,685 | | | | 6,753 | |
| | | | |
NET ASSETS | | | $329,996 | | | | $784,821 | | | | $1,212,308 | |
| | | | |
NET ASSETS: | | | | | | | | | | | | |
Paid in capital | | | $329,990 | | | | $785,824 | | | | $1,231,361 | |
Distributable Earnings | | | 6 | | | | (1,003) | | | | (19,053) | |
| | | | |
NET ASSETS | | | $329,996 | | | | $784,821 | | | | $1,212,308 | |
| | | | |
NET ASSET VALUE — offering and redemption price per share in whole dollars | | | | | | | | | | | | |
Adviser Class | | | | | | | | | | | | |
Net Assets | | | — | | | | — | | | | — | |
Shares Outstanding | | | — | | | | — | | | | — | |
Net Asset Value Per Share | | | — | | | | — | | | | — | |
| | | | |
Investor Class | | | | | | | | | | | | |
Net Assets | | | $329,996 | | | | $784,821 | | | | $1,212,308 | |
Shares Outstanding | | | 329,984 | | | | 82,941 | | | | 122,291 | |
Net Asset Value Per Share | | | $ 1.00 | | | | $ 9.46 | | | | $ 9.91 | |
| | | | |
SI Class | | | | | | | | | | | | |
Net Assets | | | — | | | | — | | | | — | |
Shares Outstanding | | | — | | | | — | | | | — | |
Net Asset Value Per Share | | | — | | | | — | | | | — | |
| | | | |
| | | | | | | | | | | | |
* Investments, at cost | | | $230,260 | | | | $788,710 | | | | $1,212,593 | |
** Affiliated investments, at cost | | | — | | | | 1,698 | | | | 6,945 | |
*** Repurchase agreements, at cost | | | 100,000 | | | | — | | | | — | |
**** Foreign cash, at cost | | | — | | | | 60 | | | | — | |
***** Options written, at cost | | | — | | | | — | | | | — | |
See notes to financial statements.
104 Payden Mutual Funds
| | | | | | | | | | | | | | | | | | | | | | | | | | |
Payden
U.S.
Government
Fund | | | Payden
GNMA
Fund | | | Payden
Core Bond
Fund | | | Payden
Corporate Bond
Fund | | | Payden
Strategic Income
Fund | | | Payden
Absolute Return
Bond Fund | | | Payden
Floating Rate
Fund | |
| | | | | | | | | | | | | | | | | | | | | | | | | | |
| | $36,767 | | | | $232,748 | | | | $ 992,741 | | | | $290,531 | | | | $202,631 | | | | $137,526 | | | | $151,837 | |
| | 700 | | | | 1,703 | | | | 12,594 | | | | 6,342 | | | | 1,290 | | | | 5,340 | | | | 3,452 | |
| | — | | | | — | | | | — | | | | — | | | | — | | | | — | | | | — | |
| | — | | | | — | | | | 9 | | | | — | | | | 5 | | | | 45 | | | | — | |
| | 4 | | | | — | | | | 3,412 | | | | — | | | | 54 | | | | 8 | | | | 47 | |
| | — | | | | — | | | | 558 | | | | 569 | | | | — | | | | — | | | | — | |
| | 112 | | | | 528 | | | | 6,894 | | | | 2,857 | | | | 1,521 | | | | 657 | | | | 518 | |
| | — | | | | — | | | | — | | | | — | | | | — | | | | — | | | | — | |
| | 135 | | | | 5,073 | | | | 32,564 | | | | — | | | | 1,185 | | | | 328 | | | | 1,374 | |
| | 1 | | | | 18 | | | | 310 | | | | 1,532 | | | | 2,363 | | | | 6 | | | | — | |
| | — | | | | — | | | | 234 | | | | 71 | | | | 13 | | | | — | | | | — | |
| | — | | | | — | | | | 468 | | | | — | | | | 150 | | | | 157 | | | | — | |
| | — | | | | — | | | | 63 | | | | — | | | | 14 | | | | 4 | | | | — | |
| | — | | | | — | | | | — | | | | — | | | | — | | | | — | | | | — | |
| | 9 | | | | 16 | | | | 57 | | | | 24 | | | | 16 | | | | 24 | | | | 23 | |
| | | | | | | | | | | | | | | | | | | | | | | | | | | |
| | 37,728 | | | | 240,086 | | | | 1,049,904 | | | | 301,926 | | | | 209,242 | | | | 144,095 | | | | 157,251 | |
| | | | | | | | | | | | | | | | | | | | | | | | | | | |
| | — | | | | — | | | | — | | | | — | | | | — | | | | — | | | | — | |
| | — | | | | — | | | | 292 | | | | — | | | | 62 | | | | 36 | | | | — | |
| | — | | | | 80,313 | | | | 117,564 | | | | 1,146 | | | | 3,080 | | | | 3,377 | | | | 795 | |
| | 2 | | | | 159 | | | | 208 | | | | 225 | | | | 19 | | | | 23 | | | | 2 | |
| | — | | | | — | | | | 105 | | | | 125 | | | | 45 | | | | 2 | | | | — | |
| | — | | | | — | | | | 848 | | | | — | | | | 178 | | | | 127 | | | | — | |
| | — | | | | — | | | | — | | | | — | | | | — | | | | — | | | | 1 | |
| | — | | | | 37 | | | | — | | | | — | | | | — | | | | — | | | | — | |
| | — | | | | — | | | | — | | | | 1,470 | | | | 788 | | | | 1,143 | | | | — | |
| | — | | | | 5 | | | | 202 | | | | 88 | | | | 64 | | | | 41 | | | | 52 | |
| | 5 | | | | 21 | | | | 119 | | | | 37 | | | | 26 | | | | 18 | | | | 20 | |
| | — | | | | — | | | | 12 | | | | — | | | | — | | | | — | | | | — | |
| | — | | | | 1 | | | | 5 | | | | 1 | | | | 1 | | | | 1 | | | | 1 | |
| | 43 | | | | 157 | | | | 222 | | | | 126 | | | | 85 | | | | 72 | | | | 76 | |
| | | | | | | | | | | | | | | | | | | | | | | | | | | |
| | 50 | | | | 80,693 | | | | 119,577 | | | | 3,218 | | | | 4,348 | | | | 4,840 | | | | 947 | |
| | | | | | | | | | | | | | | | | | | | | | | | | | | |
| | $37,678 | | | | $159,393 | | | | $ 930,327 | | | | $298,708 | | | | $204,894 | | | | $139,255 | | | | $156,304 | |
| | | | | | | | | | | | | | | | | | | | | | | | | | | |
| | $46,210 | | | | $202,662 | | | | $ 966,174 | | | | $308,574 | | | | $209,920 | | | | $140,403 | | | | $157,935 | |
| | (8,532) | | | | (43,269) | | | | (35,847) | | | | (9,866) | | | | (5,026) | | | | (1,148) | | | | (1,631) | |
| | | | | | | | | | | | | | | | | | | | | | | | | | | |
| | $37,678 | | | | $159,393 | | | | $ 930,327 | | | | $298,708 | | | | $204,894 | | | | $139,255 | | | | $156,304 | |
| | | | | | | | | | | | | | | | | | | | | | | | | | | |
| | — | | | | — | | | | $ 29,799 | | | | — | | | | — | | | | — | | | | — | |
| | — | | | | — | | | | 2,929 | | | | — | | | | — | | | | — | | | | — | |
| | — | | | | — | | | | $ 10.17 | | | | — | | | | — | | | | — | | | | — | |
| | | | | | | | | | | | | | | | | | | | | | | | | | | |
| | $37,678 | | | | $159,393 | | | | $ 604,289 | | | | $298,708 | | | | $146,823 | | | | $105,026 | | | | $ 51,467 | |
| | 3,725 | | | | 17,774 | | | | 59,268 | | | | 28,093 | | | | 15,026 | | | | 10,581 | | | | 5,183 | |
| | $ 10.11 | | | | $ 8.97 | | | | $ 10.20 | | | | $ 10.63 | | | | $ 9.77 | | | | $ 9.93 | | | | $ 9.93 | |
| | — | | | | — | | | | $ 296,239 | | | | — | | | | $ 58,071 | | | | $ 34,229 | | | | $104,837 | |
| | — | | | | — | | | | 29,076 | | | | — | | | | 5,944 | | | | 3,446 | | | | 10,549 | |
| | — | | | | — | | | | $ 10.19 | | | | — | | | | $ 9.77 | | | | $ 9.93 | | | | $ 9.94 | |
| | | | | | | | | | | | | | | | | | | | | | | | | | | |
| | $37,933 | | | | $238,755 | | | | $1,011,423 | | | | $298,017 | | | | $204,523 | | | | $137,637 | | | �� | $151,033 | |
| | 700 | | | | 1,703 | | | | 12,594 | | | | 6,342 | | | | 1,290 | | | | 5,340 | | | | 3,452 | |
| | — | | | | — | | | | — | | | | — | | | | — | | | | — | | | | — | |
| | — | | | | — | | | | 9 | | | | — | | | | 5 | | | | 46 | | | | — | |
| | — | | | | — | | | | (1,253) | | | | — | | | | (261) | | | | (187) | | | | — | |
See notes to financial statements.
Annual Report 105

October 31, 2018
Numbers in 000s
| | | | | | | | | | | | | | | |
| | | Payden High Income Fund | | Payden
California Municipal Income Fund | | Payden Global Low Duration Fund |
ASSETS: | | | | | | | | | | | | | | | |
Investments, at value * | | | | $436,571 | | | | | $58,006 | | | | | $92,507 | |
Affiliated investments, at value ** | | | | 29,111 | | | | | — | | | | | 1,601 | |
Foreign cash *** | | | | 1,121 | | | | | — | | | | | — | |
Cash | | | | 15 | | | | | 396 | | | | | 333 | |
Cash pledged for financial futures contracts | | | | 200 | | | | | 60 | | | | | — | |
Cash pledged for OTC derivatives | | | | — | | | | | — | | | | | — | |
Receivable for: | | | | | | | | | | | | | | | |
Interest and dividends | | | | 6,781 | | | | | 539 | | | | | 559 | |
Investments sold | | | | 3,928 | | | | | 1,222 | | | | | 2 | |
Fund shares sold | | | | 5 | | | | | 1 | | | | | — | |
Futures | | | | — | | | | | 21 | | | | | 16 | |
Forward currency contracts | | | | 137 | | | | | — | | | | | 49 | |
Variation margin on centrally cleared swaps | | | | — | | | | | — | | | | | — | |
Other assets | | | | 34 | | | | | 3 | | | | | 13 | |
| | | | | | | | | | | | | | | |
Total Assets | | | | 477,903 | | | | | 60,248 | | | | | 95,080 | |
| | | | | | | | | | | | | | | |
LIABILITIES: | | | | | | | | | | | | | | | |
Payable for: | | | | | | | | | | | | | | | |
Bank overdraft | | | | — | | | | | — | | | | | — | |
Forward currency contracts | | | | 81 | | | | | — | | | | | 26 | |
Investments purchased | | | | 14,888 | | | | | 2,978 | | | | | 799 | |
Fund shares redeemed | | | | 343 | | | | | 53 | | | | | 8 | |
Futures | | | | — | | | | | — | | | | | 9 | |
Options written **** | | | | — | | | | | — | | | | | 89 | |
Variation margin on centrally cleared swaps | | | | 29 | | | | | — | | | | | — | |
Unfunded floating rate loan interests | | | | 1 | | | | | — | | | | | — | |
Distributions payable | | | | — | | | | | 16 | | | | | — | |
Liability for securities on loan (Note 2) | | | | 12,248 | | | | | — | | | | | 314 | |
Accrued expenses: | | | | | | | | | | | | | | | |
Investment advisory fees (Note 3) | | | | 135 | | | | | 8 | | | | | 10 | |
Administration fees (Note 3) | | | | 58 | | | | | 7 | | | | | 12 | |
Distribution fees (Note 3) | | | | — | | | | | — | | | | | — | |
Trustee fees and expenses | | | | 2 | | | | | — | | | | | 1 | |
Other liabilities | | | | 179 | | | | | 46 | | | | | 75 | |
| | | | | | | | | | | | | | | |
Total Liabilities | | | | 27,964 | | | | | 3,108 | | | | | 1,343 | |
| | | | | | | | | | | | | | | |
NET ASSETS | | | | $449,939 | | | | | $57,140 | | | | | $93,737 | |
| | | | | | | | | | | | | | | |
| | | | | | | | | | | | | | | |
NET ASSETS: | | | | | | | | | | | | | | | |
Paid in capital | | | | $481,452 | | | | | $57,210 | | | | | $95,161 | |
Distributable Earnings | | | | (31,513) | | | | | (70) | | | | | (1,424) | |
| | | | | | | | | | | | | | | |
NET ASSETS | | | | $449,939 | | | | | $57,140 | | | | | $93,737 | |
| | | | | | | | | | | | | | | |
| | | | | | | | | | | | | | | |
NET ASSET VALUE — offering and redemption price per share in whole dollars | | | | | | | | | | | | | | | |
Adviser Class | | | | | | | | | | | | | | | |
Net Assets | | | | — | | | | | — | | | | | — | |
Shares Outstanding | | | | — | | | | | — | | | | | — | |
Net Asset Value Per Share | | | | — | | | | | — | | | | | — | |
| | | | | | | | | | | | | | | |
| | | | | | | | | | | | | | | |
Investor Class | | | | | | | | | | | | | | | |
Net Assets | | | | $449,939 | | | | | $57,140 | | | | | $93,737 | |
Shares Outstanding | | | | 71,958 | | | | | 5,723 | | | | | 9,496 | |
Net Asset Value Per Share | | | | $ 6.25 | | | | | $ 9.98 | | | | | $ 9.87 | |
| | | | | | | | | | | | | | | |
| | | | | | | | | | | | | | | |
SI Class | | | | | | | | | | | | | | | |
Net Assets | | | | — | | | | | — | | | | | — | |
Shares Outstanding | | | | — | | | | | — | | | | | — | |
Net Asset Value Per Share | | | | — | | | | | — | | | | | — | |
| | | | | | | | | | | | | | | |
| | | | | | | | | | | | | | | |
| | | | | | | | | | | | | | | |
* Investments, at cost | | | | $445,827 | | | | | $58,158 | | | | | $93,650 | |
** Affiliated investments, at cost | | | | 29,111 | | | | | — | | | | | 1,601 | |
*** Foreign cash, at cost | | | | 1,121 | | | | | — | | | | | — | |
**** Options written, at cost | | | | — | | | | | — | | | | | (133) | |
See notes to financial statements.
106 Payden Mutual Funds
| | | | | | | | | | | | | | | | | | |
Payden Global Fixed Income Fund | | | Payden Emerging Markets Bond Fund | | | Payden
Emerging Markets
Local Bond
Fund | | | Payden Emerging Markets Corporate Bond Fund | | | Payden Equity Income Fund | |
| | | | | | | | | | | | | | | | | | |
| $ | 129,324 | | | $ | 1,250,430 | | | $ | 197,362 | | | $ | 43,351 | | | $ | 1,179,391 | |
| | 6,214 | | | | 41,610 | | | | 3,828 | | | | 1,800 | | | | 14,138 | |
| | 240 | | | | 804 | | | | 2,109 | | | | 6 | | | | 206 | |
| | 12 | | | | — | | | | — | | | | 7 | | | | 1 | |
| | — | | | | 1,729 | | | | 894 | | | | 25 | | | | — | |
| | — | | | | — | | | | — | | | | — | | | | 3,900 | |
| | 1,047 | | | | 19,440 | | | | 3,641 | | | | 619 | | | | 3,197 | |
| | 2,499 | | | | — | | | | — | | | | 452 | | | | — | |
| | 3 | | | | 1,236 | | | | 65 | | | | — | | | | 43 | |
| | 48 | | | | 107 | | | | 24 | | | | 5 | | | | 776 | |
| | 1,407 | | | | 1,153 | | | | 673 | | | | 9 | | | | 1,150 | |
| | 8 | | | | — | | | | — | | | | — | | | | — | |
| | 16 | | | | 78 | | | | 21 | | | | 20 | | | | 67 | |
| | 140,818 | | | | 1,316,587 | | | | 208,617 | | | | 46,294 | | | | 1,202,869 | |
| | — | | | | 488 | | | | 22 | | | | — | | | | — | |
| | 527 | | | | 1,673 | | | | 1,288 | | | | 19 | | | | 51 | |
| | 10,883 | | | | 31,235 | | | | 3,072 | | | | 552 | | | | 8,357 | |
| | 138 | | | | 593 | | | | 1 | | | | — | | | | 268 | |
| | 48 | | | | — | | | | — | | | | — | | | | — | |
| | 47 | | | | — | | | | — | | | | — | | | | — | |
| | — | | | | — | | | | — | | | | — | | | | — | |
| | — | | | | — | | | | — | | | | — | | | | — | |
| | — | | | | — | | | | — | | | | — | | | | — | |
| | — | | | | 2,402 | | | | — | | | | 232 | | | | 460 | |
| | 26 | | | | 513 | | | | 103 | | | | 14 | | | | 454 | |
| | 16 | | | | 163 | | | | 26 | | | | 6 | | | | 153 | |
| | — | | | | 36 | | | | — | | | | — | | | | 6 | |
| | 1 | | | | 8 | | | | 1 | | | | — | | | | 6 | |
| | 129 | | | | 532 | | | | 126 | | | | 50 | | | | 282 | |
| | 11,815 | | | | 37,643 | | | | 4,639 | | | | 873 | | | | 10,037 | |
| $ | 129,003 | | | $ | 1,278,944 | | | $ | 203,978 | | | $ | 45,421 | | | $ | 1,192,832 | |
| | | |
| $ | 129,982 | | | $ | 1,397,924 | | | $ | 257,943 | | | $ | 46,983 | | | $ | 1,036,482 | |
| | (979) | | | | (118,980) | | | | (53,965) | | | | (1,562) | | | | 156,350 | |
| $ | 129,003 | | | $ | 1,278,944 | | | $ | 203,978 | | | $ | 45,421 | | | $ | 1,192,832 | |
| | | |
| | — | | | $ | 82,007 | | | | — | | | | — | | | $ | 13,580 | |
| | — | | | | 6,461 | | | | — | | | | — | | | | 839 | |
| | — | | | $ | 12.69 | | | | — | | | | — | | | $ | 16.19 | |
| | | |
| $ | 129,003 | | | $ | 404,580 | | | $ | 203,978 | | | $ | 4,208 | | | $ | 476,071 | |
| | 14,517 | | | | 31,896 | | | | 34,161 | | | | 439 | | | | 29,385 | |
| $ | 8.89 | | | $ | 12.68 | | | $ | 5.97 | | | $ | 9.59 | | | $ | 16.20 | |
| | | |
| | — | | | $ | 792,357 | | | | — | | | $ | 41,213 | | | $ | 703,181 | |
| | — | | | | 62,550 | | | | — | | | | 4,291 | | | | 43,382 | |
| | — | | | $ | 12.67 | | | | — | | | $ | 9.60 | | | $ | 16.21 | |
| | | |
| $ | 132,650 | | | $ | 1,348,069 | | | $ | 229,437 | | | $ | 44,547 | | | $ | 1,029,921 | |
| | 6,242 | | | | 41,610 | | | | 3,828 | | | | 1,800 | | | | 14,138 | |
| | 243 | | | | 795 | | | | 2,163 | | | | 6 | | | | 206 | |
| | (49) | | | | — | | | | — | | | | — | | | | — | |
See notes to financial statements.
Annual Report 107

Period ended October 31, 2018
Numbers in 000s
| | | | | | | | | | | | |
| | | | | | | | | | | | |
| | | Payden
Cash Reserves
Money Market
Fund | | | Payden Limited Maturity
Fund | | | Payden
Low Duration
Fund | |
INVESTMENT INCOME: | | | | | | | | | | | | |
Interest income (Note 2) | | | $ 5,768 | | | | $ 18,976 | | | | $28,541 | |
Dividend income | | | — | | | | — | | | | — | |
Dividend income from affiliated investment (Note 2) | | | — | | | | 103 | | | | 86 | |
Income from securities lending | | | — | | | | 31 | | | | 58 | |
Foreign tax withholdings | | | — | | | | (5) | | | | — | |
| | | | |
Investment Income | | | 5,768 | | | | 19,105 | | | | 28,685 | |
| | | | |
EXPENSES: | | | | | | | | | | | | |
Investment advisory fees (Note 3) | | | 527 | | | | 2,254 | | | | 3,088 | |
Administration fees (Note 3) | | | 527 | | | | 1,208 | | | | 1,654 | |
Shareholder servicing fees | | | — | | | | 382 | | | | 545 | |
Distribution fees (Note 3) | | | — | | | | — | | | | — | |
Custodian fees | | | 27 | | | | 52 | | | | 68 | |
Transfer agent fees | | | 36 | | | | 68 | | | | 103 | |
Registration and filing fees | | | 56 | | | | 102 | | | | 65 | |
Trustee fees and expenses | | | 36 | | | | 79 | | | | 102 | |
Printing and mailing costs | | | 4 | | | | 23 | | | | 22 | |
Loan commitment fees | | | — | | | | 14 | | | | 19 | |
Legal fees | | | 6 | | | | 17 | | | | 22 | |
Publication expense | | | 11 | | | | 16 | | | | 25 | |
Pricing fees | | | 4 | | | | 41 | | | | 38 | |
Fund accounting fees | | | 59 | | | | 97 | | | | 143 | |
Insurance | | | 12 | | | | 19 | | | | 32 | |
Interest expense | | | — | | | | — | | | | — | |
Audit fees | | | 33 | | | | 37 | | | | 37 | |
Other expenses | | | — | | | | 17 | | | | 12 | |
| | | | |
Gross Expenses | | | 1,338 | | | | 4,426 | | | | 5,975 | |
Expense subsidy (Note 3) | | | (459) | | | | (2,413) | | | | (1,233) | |
| | | | |
Net Expenses | | | 879 | | | | 2,013 | | | | 4,742 | |
| | | | |
Net Investment Income | | | 4,889 | | | | 17,092 | | | | 23,943 | |
| | | | |
NET REALIZED AND UNREALIZED GAINS (LOSSES): | | | | | | | | | | | | |
Net realized gains (losses) from: | | | | | | | | | | | | |
Investments | | | 3 | | | | 491 | | | | (5,659) | |
Foreign currency transactions | | | — | | | | (2) | | | | 63 | |
Forward foreign exchange contracts | | | — | | | | 445 | | | | 115 | |
Affiliated investments | | | — | | | | — | | | | — | |
Futures contracts | | | — | | | | — | | | | (842) | |
Written option contracts | | | — | | | | — | | | | (29) | |
Swap contracts | | | — | | | | (16) | | | | (44) | |
Change in net unrealized appreciation (depreciation) from: | | | | | | | | | | | | |
Investments | | | — | | | | (2,998) | | | | (12,948) | |
Translation of assets and liabilities in foreign currencies | | | — | | | | (3) | | | | (1) | |
Forward foreign exchange contracts | | | — | | | | 259 | | | | 6 | |
Affiliated investments | | | — | | | | — | | | | — | |
Futures contracts | | | — | | | | — | | | | 209 | |
Written option contracts | | | — | | | | — | | | | 9 | |
Swap contracts | | | — | | | | 38 | | | | 68 | |
Unfunded loan commitments. | | | — | | | | — | | | | — | |
| | | | |
Net Realized and Unrealized Gains (Losses) | | | 3 | | | | (1,786) | | | | (19,053) | |
| | | | |
CHANGE IN NET ASSETS RESULTING FROM OPERATIONS | | | $ 4,892 | | | | $ 15,306 | | | | $ 4,890 | |
| | | | |
| | | | |
| | | | | | | | | | | | |
See notes to financial statements.
108 Payden Mutual Funds
| | | | | | | | | | | | | | | | | | | | | | | | | | |
| | | | | | | | | | | | | | | | | | | | | | | | | | |
Payden U.S. Government
Fund | | | Payden
GNMA
Fund | | | Payden Core Bond Fund | | | Payden
Corporate
Bond Fund | | | Payden
Strategic
Income
Fund | | | Payden
Absolute
Return
Bond Fund | | | Payden
Floating Rate
Fund | |
| | | | | | | | | | | | | | | | | | | | | | | | | | |
| | $ 1,396 | | | | $ 4,693 | | | | $ 29,397 | | | �� | $ 9,132 | | | | $7,409 | | | | $4,313 | | | | $7,176 | |
| | — | | | | — | | | | — | | | | — | | | | 92 | | | | — | | | | 22 | |
| | 24 | | | | 43 | | | | 230 | | | | 122 | | | | 56 | | | | 25 | | | | 150 | |
| | — | | | | — | | | | 29 | | | | 69 | | | | 20 | | | | 7 | | | | 1 | |
| | — | | | | — | | | | — | | | | — | | | | (1) | | | | (1) | | | | (3) | |
| | | |
| | 1,420 | | | | 4,736 | | | | 29,656 | | | | 9,323 | | | | 7,576 | | | | 4,344 | | | | 7,346 | |
| | | |
| | 210 | | | | 527 | | | | 2,378 | | | | 770 | | | | 1,115 | | | | 624 | | | | 897 | |
| | 112 | | | | 293 | | | | 1,274 | | | | 330 | | | | 304 | | | | 187 | | | | 245 | |
| | 12 | | | | 302 | | | | 222 | | | | 219 | | | | 38 | | | | 10 | | | | 7 | |
| | — | | | | — | | | | 70 | | | | — | | | | — | | | | — | | | | — | |
| | 9 | | | | 13 | | | | 54 | | | | 22 | | | | 30 | | | | 36 | | | | 25 | |
| | 18 | | | | 41 | | | | 95 | | | | 31 | | | | 35 | | | | 28 | | | | 32 | |
| | 21 | | | | 23 | | | | 76 | | | | 60 | | | | 40 | | | | 39 | | | | 37 | |
| | 7 | | | | 18 | | | | 84 | | | | 21 | | | | 21 | | | | 12 | | | | 17 | |
| | 2 | | | | 7 | | | | 44 | | | | 8 | | | | 10 | | | | 7 | | | | 8 | |
| | 1 | | | | 3 | | | | 15 | | | | 4 | | | | 4 | | | | 2 | | | | 3 | |
| | 1 | | | | 4 | | | | 18 | | | | 4 | | | | 4 | | | | 3 | | | | 3 | |
| | 4 | | | | 6 | | | | 19 | | | | 5 | | | | 6 | | | | 3 | | | | 6 | |
| | 8 | | | | 22 | | | | 36 | | | | 21 | | | | 39 | | | | 37 | | | | 19 | |
| | 15 | | | | 30 | | | | 107 | | | | 27 | | | | 26 | | | | 15 | | | | 24 | |
| | 4 | | | | 7 | | | | 22 | | | | 6 | | | | 6 | | | | 3 | | | | 6 | |
| | — | | | | — | | | | 2 | | | | — | | | | 2 | | | | — | | | | — | |
| | 37 | | | | 40 | | | | 50 | | | | 40 | | | | 42 | | | | 45 | | | | 54 | |
| | — | | | | — | | | | 7 | | | | 6 | | | | 2 | | | | 2 | | | | — | |
| | | |
| | 461 | | | | 1,336 | | | | 4,573 | | | | 1,574 | | | | 1,724 | | | | 1,053 | | | | 1,383 | |
| | (157) | | | | (360) | | | | (173) | | | | (144) | | | | (356) | | | | (233) | | | | (268) | |
| | | |
| | 304 | | | | 976 | | | | 4,400 | | | | 1,430 | | | | 1,368 | | | | 820 | | | | 1,115 | |
| | | |
| | 1,116 | | | | 3,760 | | | | 25,256 | | | | 7,893 | | | | 6,208 | | | | 3,524 | | | | 6,231 | |
| | | |
| | (2,073) | | | | (1,323) | | | | (9,088) | | | | (1,593) | | | | (2,511) | | | | 370 | | | | (324) | |
| | — | | | | — | | | | 148 | | | | — | | | | 95 | | | | (48) | | | | 26 | |
| | — | | | | — | | | | 392 | | | | — | | | | 152 | | | | (272) | | | | 24 | |
| | — | | | | — | | | | 615 | | | | — | | | | — | | | | — | | | | — | |
| | (1) | | | | 300 | | | | (966) | | | | 12 | | | | (391) | | | | (259) | | | | — | |
| | — | | | | — | | | | (739) | | | | — | | | | (208) | | | | (17) | | | | — | |
| | — | | | | — | | | | 507 | | | | 101 | | | | 186 | | | | 43 | | | | — | |
| | (70) | | | | (7,957) | | | | (32,039) | | | | (12,924) | | | | (4,414) | | | | (1,675) | | | | (752) | |
| | — | | | | — | | | | (4) | | | | — | | | | (1) | | | | (8) | | | | — | |
| | — | | | | — | | | | (46) | | | | — | | | | (3) | | | | 50 | | | | — | |
| | — | | | | — | | | | (632) | | | | — | | | | — | | | | — | | | | — | |
| | 9 | | | | 19 | | | | (7) | | | | (907) | | | | (157) | | | | (4) | | | | — | |
| | — | | | | — | | | | 715 | | | | — | | | | 185 | | | | 82 | | | | — | |
| | — | | | | — | | | | (24) | | | | — | | | | (5) | | | | (8) | | | | — | |
| | — | | | | — | | | | — | | | | — | | | | — | | | | — | | | | (1) | |
| | | |
| | (2,135) | | | | (8,961) | | | | (41,168) | | | | (15,311) | | | | (7,072) | | | | (1,746) | | | | (1,027) | |
| | | |
| | $ (1,019) | | | | $ (5,201) | | | | $(15,912) | | | | $(7,418) | | | | $ (864) | | | | $1,778 | | | | $5,204 | |
| | | |
| | | |
| | | | | | | | | | | | | | | | | | | | | | | | | | |
See notes to financial statements.
Annual Report 109

Period ended October 31, 2018
Numbers in 000s
| | | | | | | | | | | | |
| | | Payden High Income Fund | | | Payden California Municipal Income Fund | | | Payden Global Low Duration Fund | |
INVESTMENT INCOME: | | | | | | | | | | | | |
Interest income (Note 2) | | $ | 28,081 | | | $ | 1,545 | | | $ | 2,822 | |
Dividend income | | | 235 | | | | — | | | | — | |
Dividend income from affiliated investment (Note 2) | | | 325 | | | | — | | | | 16 | |
Income from securities lending | | | 273 | | | | — | | | | 8 | |
Foreign tax withholdings | | | — | | | | — | | | | — | |
| | | | |
Investment Income | | | 28,914 | | | | 1,545 | | | | 2,846 | |
| | | | |
EXPENSES: | | | | | | | | | | | | |
Investment advisory fees (Note 3) | | | 1,690 | | | | 181 | | | | 305 | |
Administration fees (Note 3) | | | 724 | | | | 85 | | | | 152 | |
Shareholder servicing fees | | | 227 | | | | 27 | | | | 61 | |
Distribution fees (Note 3) | | | — | | | | — | | | | — | |
Custodian fees | | | 28 | | | | 2 | | | | 16 | |
Transfer agent fees | | | 46 | | | | 16 | | | | 25 | |
Registration and filing fees | | | 38 | | | | 2 | | | | 19 | |
Trustee fees and expenses | | | 45 | | | | 5 | | | | 10 | |
Printing and mailing costs | | | 23 | | | | 2 | | | | 1 | |
Loan commitment fees | | | 9 | | | | 1 | | | | 2 | |
Legal fees | | | 10 | | | | 1 | | | | 2 | |
Publication expense | | | 13 | | | | 2 | | | | 4 | |
Pricing fees | | | 22 | | | | 16 | | | | 28 | |
Fund accounting fees | | | 69 | | | | 7 | | | | 15 | |
Insurance | | | 15 | | | | 2 | | | | 3 | |
Audit fees | | | 45 | | | | 37 | | | | 40 | |
Interest expense | | | — | | | | — | | | | — | |
Other expenses | | | — | | | | — | | | | — | |
| | | | |
Gross Expenses | | | 3,004 | | | | 386 | | | | 683 | |
Expense subsidy (Note 3) | | | — | | | | (86) | | | | (145) | |
| | | | |
Net Expenses | | | 3,004 | | | | 300 | | | | 538 | |
| | | | |
Net Investment Income | | | 25,910 | | | | 1,245 | | | | 2,308 | |
| | | | |
NET REALIZED AND UNREALIZED GAINS (LOSSES): | | | | | | | | | | | | |
Net realized gains (losses) from: | | | | | | | | | | | | |
Investments | | | 1,836 | | | | 65 | | | | (239) | |
Foreign currency transactions | | | 14 | | | | — | | | | (3) | |
Forward foreign exchange contracts | | | (213) | | | | — | | | | (26) | |
Affiliated investments | | | 236 | | | | — | | | | — | |
Futures contracts | | | — | | | | 17 | | | | (49) | |
Written option contracts | | | — | | | | — | | | | 23 | |
Swap contracts | | | 76 | | | | — | | | | (2) | |
Change in net unrealized appreciation (depreciation) from: | | | | | | | | | | | | |
Investments | | | (26,535) | | | | (1,544) | | | | (1,718) | |
Translation of assets and liabilities in foreign currencies | | | (1) | | | | — | | | | (1) | |
Forward foreign exchange contracts | | | (37) | | | | — | | | | — | |
Affiliated investments | | | (240) | | | | — | | | | — | |
Futures contracts | | | — | | | | 6 | | | | 16 | |
Written option contracts | | | — | | | | — | | | | 45 | |
Swap contracts | | | (144) | | | | — | | | | 8 | |
Unfunded loan commitments. | | | (1) | | | | — | | | | — | |
| | | | |
Net Realized and Unrealized Gains (Losses) | | | (25,009) | | | | (1,456) | | | | (1,946) | |
| | | | |
CHANGE IN NET ASSETS RESULTING FROM OPERATIONS | | $ | 901 | | | $ | (211) | | | $ | 362 | |
| | | | |
| | | | | | | | | | | | |
See notes to financial statements.
110 Payden Mutual Funds
| | | | | | | | | | | | | | | | | | |
Payden Global Fixed Income Fund | | | Payden
Emerging Markets Bond Fund | | | Payden Emerging Markets Local Bond Fund | | | Payden Emerging Markets Corporate Bond Fund | | | Payden Equity Income Fund | |
| | | | | | | | | | | | | | | | | | |
| $ | 2,939 | | | $ | 83,400 | | | $ | 14,716 | | | $ | 2,485 | | | $ | 1,916 | |
| | — | | | | — | | | | — | | | | — | | | | 31,802 | |
| | 193 | | | | 247 | | | | 110 | | | | 27 | | | | 198 | |
| | 3 | | | | 348 | | | | — | | | | 14 | | | | 251 | |
| | — | | | | — | | | | (238) | | | | — | | | | (479) | |
| | |
| | 3,135 | | | | 83,995 | | | | 14,588 | | | | 2,526 | | | | 33,688 | |
| | |
| | | | | | | | | | | | | | | | | | |
| | 381 | | | | 5,968 | | | | 1,235 | | | | 349 | | | | 5,732 | |
| | 191 | | | | 1,989 | | | | 309 | | | | 65 | | | | 1,719 | |
| | 174 | | | | 805 | | | | 3 | | | | 1 | | | | 359 | |
| | — | | | | 275 | | | | — | | | | — | | | | 34 | |
| | 48 | | | | 159 | | | | (23) | | | | 14 | | | | 89 | |
| | 27 | | | | 265 | | | | 24 | | | | 24 | | | | 111 | |
| | 26 | | | | 123 | | | | 24 | | | | 38 | | | | 80 | |
| | 12 | | | | 127 | | | | 20 | | | | 4 | | | | 112 | |
| | 3 | | | | 51 | | | | 10 | | | | 2 | | | | 44 | |
| | 2 | | | | 24 | | | | 4 | | | | 1 | | | | 20 | |
| | 3 | | | | 27 | | | | 4 | | | | 1 | | | | 24 | |
| | 3 | | | | 31 | | | | 5 | | | | 2 | | | | 23 | |
| | 34 | | | | 29 | | | | 24 | | | | 18 | | | | 4 | |
| | 17 | | | | 183 | | | | 27 | | | | 6 | | | | 139 | |
| | 4 | | | | 40 | | | | 5 | | | | 1 | | | | 28 | |
| | 40 | | | | 46 | | | | 45 | | | | 45 | | | | 37 | |
| | 3 | | | | — | | | | 1 | | | | — | | | | 3 | |
| | — | | | | 21 | | | | 3 | | | | — | | | | 10 | |
| | |
| | 968 | | | | 10,163 | | | | 1,720 | | | | 571 | | | | 8,568 | |
| | (96) | | | | (395) | | | | 168 | | | | (194) | | | | (572) | |
| | |
| | 872 | | | | 9,768 | | | | 1,888 | | | | 377 | | | | 7,996 | |
| | |
| | 2,263 | | | | 74,227 | | | | 12,700 | | | | 2,149 | | | | 25,692 | |
| | |
| | | | | | | | | | | | | | | | | | |
| | | | | | | | | | | | | | | | | | |
| | 429 | | | | (11,223) | | | | (9,756) | | | | (474) | | | | 1,769 | |
| | (568) | | | | (1,143) | | | | (817) | | | | (10) | | | | (118) | |
| | 2,620 | | | | 1,090 | | | | (1,567) | | | | 5 | | | | 2,804 | |
| | — | | | | — | | | | 55 | | | | — | | | | — | |
| | 54 | | | | 428 | | | | 39 | | | | 60 | | | | (102) | |
| | 48 | | | | — | | | | — | | | | — | | | | — | |
| | 51 | | | | — | | | | — | | | | — | | | | — | |
| | (5,731) | | | | (141,255) | | | | (20,014) | | | | (2,661) | | | | 7,341 | |
| | (18) | | | | (50) | | | | (85) | | | | — | | | | 2 | |
| | 402 | | | | (422) | | | | (102) | | | | (11) | | | | 645 | |
| | (35) | | | | — | | | | (50) | | | | — | | | | — | |
| | (85) | | | | (3) | | | | 50 | | | | (19) | | | | — | |
| | 2 | | | | — | | | | — | | | | — | | | | — | |
| | 14 | | | | — | | | | — | | | | — | | | | — | |
| | — | | | | — | | | | — | | | | — | | | | — | |
| | |
| | (2,817) | | | | (152,578) | | | | (32,247) | | | | (3,110) | | | | 12,341 | |
| | |
| $ | (554) | | | $ | (78,351) | | | $ | (19,547) | | | $ | (961) | | | $ | 38,033 | |
| | |
| | | | | | | | | | | | | | | | | | |
See notes to financial statements.
Annual Report 111

For the periods ended October 31st
Numbers in 000s
| | | | | | | | | | | | | | | | |
| | | Payden Cash Reserves
Money Market Fund | | | Payden Limited
Maturity Fund | |
| | | 2018 | | | 2017 | | | 2018 | | | 2017 | |
INCREASE (DECREASE) IN NET ASSETS: | | | | | | | | | | | | | | | | |
| | | | |
FROM OPERATIONS: | | | | | | | | | | | | | | | | |
Net investment income | | $ | 4,889 | | | $ | 2,201 | | | $ | 17,092 | | | $ | 7,837 | |
Net realized gains (losses) | | | 3 | | | | — | | | | 918 | | | | (2,207) | |
Change in net unrealized appreciation/(depreciation) | | | — | | | | — | | | | (2,704) | | | | 3,430 | |
Change in Net Assets Resulting from Operations | | | 4,892 | | | | 2,201 | | | | 15,306 | | | | 9,060 | |
| | | | |
FROM DISTRIBUTIONS TO SHAREHOLDERS:* | | | | | | | | | | | | | | | | |
Net investment income and net realized gains from investments: | | | | | | | | | | | | | | | | |
Adviser Class | | | — | | | | — | | | | — | | | | — | |
Investor Class | | | (4,886) | | | | (2,202) | | | | (17,155) | | | | (5,239) | |
Institutional Class | | | — | | | | — | | | | — | | | | — | |
Return of capital: | | | | | | | | | | | | | | | | |
Adviser Class | | | — | | | | — | | | | — | | | | — | |
Investor Class | | | — | | | | — | | | | — | | | | (2,323) | |
Institutional Class | | | — | | | | — | | | | — | | | | — | |
Change in Net Assets from Distributions to Shareholders | | | (4,886) | | | | (2,202) | | | | (17,155) | | | | (7,562) | |
| | | | |
FROM CAPITAL TRANSACTIONS: | | | | | | | | | | | | | | | | |
Proceeds from fund shares sold: | | | | | | | | | | | | | | | | |
Adviser Class | | | — | | | | — | | | | — | | | | — | |
Investor Class | | | 31,867,454 | | | | 31,370,456 | | | | 723,903 | | | | 617,104 | |
Institutional Class | | | — | | | | — | | | | — | | | | — | |
Reinvestment of distributions: | | | | | | | | | | | | | | | | |
Adviser Class | | | — | | | | — | | | | — | | | | — | |
Investor Class | | | 1,354 | | | | 573 | | | | 15,285 | | | | 7,309 | |
Institutional Class | | | — | | | | — | | | | — | | | | — | |
Cost of fund shares redeemed: | | | | | | | | | | | | | | | | |
Adviser Class | | | — | | | | — | | | | — | | | | — | |
Investor Class | | | (31,986,381) | | | | (31,474,529) | | | | (660,448) | | | | (381,130) | |
Institutional Class | | | — | | | | — | | | | — | | | | — | |
Change in Net Assets from Capital Transactions | | | (117,573) | | | | (103,500) | | | | 78,740 | | | | 243,283 | |
Total Change in Net Assets | | | (117,567) | | | | (103,501) | | | | 76,891 | | | | 244,781 | |
| | | | |
NET ASSETS: | | | | | | | | | | | | | | | | |
Beginning of period | | | 447,563 | | | | 551,064 | | | | 707,930 | | | | 463,149 | |
End of period | | $ | 329,996 | | | $ | 447,563 | | | $ | 784,821 | | | $ | 707,930 | |
| | | | | | | | | | | | | | | | |
| | | | |
FUND SHARES OF BENEFICIAL INTEREST: | | | | | | | | | | | | | | | | |
Adviser Class: | | | | | | | | | | | | | | | | |
Outstanding shares at beginning of period | | | — | | | | — | | | | — | | | | — | |
Shares sold | | | — | | | | — | | | | — | | | | — | |
Shares issued in reinvestment of distributions | | | — | | | | — | | | | — | | | | — | |
Shares redeemed | | | — | | | | — | | | | — | | | | — | |
Change in shares outstanding | | | — | | | | — | | | | — | | | | — | |
Outstanding shares at end of period | | | — | | | | — | | | | — | | | | — | |
| | | | | | | | | | | | | | | | |
Investor Class: | | | | | | | | | | | | | | | | |
Outstanding shares at beginning of period | | | 447,557 | | | | 551,057 | | | | 74,639 | | | | 48,938 | |
Shares sold | | | 31,867,454 | | | | 31,370,456 | | | | 76,438 | | | | 65,270 | |
Shares issued in reinvestment of distributions | | | 1,354 | | | | 573 | | | | 1,614 | | | | 771 | |
Shares redeemed | | | (31,986,381) | | | | (31,474,529) | | | | (69,750) | | | | (40,340) | |
Change in shares outstanding | | | (117,573) | | | | (103,500) | | | | 8,302 | | | | 25,701 | |
Outstanding shares at end of period | | | 329,984 | | | | 447,557 | | | | 82,941 | | | | 74,639 | |
| | | | | | | | | | | | | | | | |
Institutional Class | | | | | | | | | | | | | | | | |
Shares sold | | | — | | | | — | | | | — | | | | — | |
Shares issued in reinvestment of distributions | | | — | | | | — | | | | — | | | | — | |
Shares redeemed | | | — | | | | — | | | | — | | | | — | |
Change in shares outstanding | | | — | | | | — | | | | — | | | | — | |
Outstanding shares at end of period | | | — | | | | — | | | | — | | | | — | |
| | | | | | | | | | | | | | | | |
| | | | |
LONG TERM INVESTMENT ACTIVITY: | | | | | | | | | | | | | | | | |
Purchase of investments (excluding government) | | | — | | | | — | | | | 408,382 | | | | 414,125 | |
Sale of investments (excluding government) | | | — | | | | — | | | | 354,724 | | | | 153,750 | |
Purchase of government securities | | | — | | | | — | | | | 157,141 | | | | 125,608 | |
Sale of government securities | | | — | | | | — | | | | 161,272 | | | | 92,668 | |
| * | Prior year distribution character information and undistributed net investment income had been modified or removed to conform with current year Regulation S-X presentation changes. Refer to Note 7 for this prior year information. |
See notes to financial statements.
112 Payden Mutual Funds
| | | | | | | | | | | | | | | | | | | | | | | | | | | | | | |
Payden
Low Duration Fund | | | Payden
U.S. Government Fund | | | Payden
GNMA Fund | | | Payden
Core Bond Fund | |
| 2018 | | | 2017 | | | 2018 | | | 2017 | | | 2018 | | | 2017 | | | 2018 | | | 2017 | |
| | | | | | | |
| | | | | | | | | | | | | | | | | | | | | | | | | | | | | | |
| | | | | | | |
| $ | 23,943 | | | $ | 15,012 | | | $ | 1,116 | | | $ | 1,336 | | | $ | 3,760 | | | $ | 3,810 | | | $ | 25,256 | | | $ | 20,221 | |
| | (6,396) | | | | (4,614) | | | | (2,074) | | | | (155) | | | | (1,023) | | | | 2,266 | | | | (9,131) | | | | (4,313) | |
| | (12,657) | | | | 3,318 | | | | (61) | | | | (1,503) | | | | (7,938) | | | | (7,061) | | | | (32,037) | | | | 3,402 | |
| | 4,890 | | | | 13,716 | | | | (1,019) | | | | (322) | | | | (5,201) | | | | (985) | | | | (15,912) | | | | 19,310 | |
| | | | | | | |
| | — | | | | — | | | | — | | | | (4) | | | | — | | | | (507) | | | | (821) | | | | (927) | |
| | (24,118) | | | | (11,824) | | | | (1,606) | | | | (2,192) | | | | (6,382) | | | | (7,361) | | | | (20,915) | | | | (28,006) | |
| | — | | | | — | | | | — | | | | — | | | | — | | | | — | | | | (5,408) | | | | — | |
| | — | | | | — | | | | — | | | | — | | | | — | | | | — | | | | (4) | | | | — | |
| | (28) | | | | (2,463) | | | | — | | | | — | | | | — | | | | — | | | | (102) | | | | — | |
| | — | | | | — | | | | — | | | | — | | | | — | | | | — | | | | (26) | | | | — | |
| | (24,146) | | | | (14,287) | | | | (1,606) | | | | (2,196) | | | | (6,382) | | | | (7,868) | | | | (27,276) | | | | (28,933) | |
| | | | | | | | | | | | | | | | | | | | | | | | | | | | | | |
| | | | | | | |
| | | | | | | | | | | | | | | | | | | | | | | | | | | | | | |
| | — | | | | — | | | | — | | | | 58 | | | | — | | | | 3,330 | | | | 7,044 | | | | 5,280 | |
| | 581,535 | | | | 579,552 | | | | 4,180 | | | | 28,151 | | | | 29,553 | | | | 80,044 | | | | 236,036 | | | | 95,884 | |
| | — | | | | | | | | — | | | | — | | | | — | | | | — | | | | 311,140 | | | | — | |
| | — | | | | — | | | | — | | | | 4 | | | | — | | | | 499 | | | | 824 | | | | 918 | |
| | 22,233 | | | | 12,804 | | | | 1,552 | | | | 2,108 | | | | 5,937 | | | | 6,956 | | | | 19,030 | | | | 26,852 | |
| | — | | | | — | | | | — | | | | — | | | | — | | | | — | | | | 5,434 | | | | — | |
| | — | | | | — | | | | — | | | | (420) | | | | — | | | | (25,580) | | | | (2,638) | | | | (5,682) | |
| | (433,640) | | | | (331,241) | | | | (100,883) | | | | (29,873) | | | | (99,739) | | | | (116,159) | | | | (336,293) | | | | (129,506) | |
| | — | | | | — | | | | — | | | | — | | | | — | | | | — | | | | (12,902) | | | | — | |
| | 170,128 | | | | 261,115 | | | | (95,151) | | | | 28 | | | | (64,249) | | | | (50,910) | | | | 227,675 | | | | (6,254) | |
| | 150,872 | | | | 260,544 | | | | (97,776) | | | | (2,490) | | | | (75,832) | | | | (59,763) | | | | 184,487 | | | | (15,877) | |
| | | | | | | |
| | 1,061,436 | | | | 800,892 | | | | 135,454 | | | | 137,944 | | | | 235,225 | | | | 294,988 | | | | 745,840 | | | | 761,717 | |
| $ | 1,212,308 | | | $ | 1,061,436 | | | $ | 37,678 | | | $ | 135,454 | | | $ | 159,393 | | | $ | 235,225 | | | $ | 930,327 | | | $ | 745,840 | |
| | | | | | | | | | | | | | | | | | | | | | | | | | | | | | | |
| | | | | | | |
| | — | | | | — | | | | — | | | | 34 | | | | — | | | | 2,280 | | | | 2,429 | | | | 2,382 | |
| | — | | | | — | | | | — | | | | 6 | | | | — | | | | 348 | | | | 673 | | | | 497 | |
| | — | | | | — | | | | — | | | | — | | | | — | | | | 52 | | | | 79 | | | | 87 | |
| | — | | | | | | | | — | | | | (40) | | | | — | | | | (2,680) | | | | (252) | | | | (537) | |
| | — | | | | — | | | | — | | | | (34) | | | | — | | | | (2,280) | | | | 500 | | | | 47 | |
| | — | | | | — | | | | — | | | | — | | | | — | | | | — | | | | 2,929 | | | | 2,429 | |
| | | | | | | | | | | | | | | | | | | | | | | | | | | | | | | |
| | | | | | | |
| | 105,227 | | | | 79,308 | | | | 12,996 | | | | 12,963 | | | | 24,780 | | | | 27,818 | | | | 67,115 | | | | 67,814 | |
| | 58,255 | | | | 57,538 | | | | 405 | | | | 2,686 | | | | 3,200 | | | | 8,371 | | | | 22,532 | | | | 9,005 | |
| | 2,229 | | | | 1,270 | | | | 151 | | | | 201 | | | | 644 | | | | 728 | | | | 1,818 | | | | 2,533 | |
| | (43,420) | | | | (32,889) | | | | (9,827) | | | | (2,854) | | | | (10,850) | | | | (12,137) | | | | (32,197) | | | | (12,237) | |
| | 17,064 | | | | 25,919 | | | | (9,271) | | | | 33 | | | | (7,006) | | | | (3,038) | | | | (7,847) | | | | (699) | |
| | 122,291 | | | | 105,227 | | | | 3,725 | | | | 12,996 | | | | 17,774 | | | | 24,780 | | | | 59,268 | | | | 67,115 | |
| | | | | | | | | | | | | | | | | | | | | | | | | | | | | | | |
| | | | | | | |
| | — | | | | — | | | | — | | | | — | | | | — | | | | — | | | | 29,797 | | | | — | |
| | — | | | | — | | | | — | | | | — | | | | — | | | | — | | | | 525 | | | | — | |
| | — | | | | — | | | | — | | | | — | | | | — | | | | — | | | | (1,246) | | | | — | |
| | — | | | | — | | | | — | | | | — | | | | — | | | | — | | | | 29,076 | | | | — | |
| | — | | | | — | | | | — | | | | — | | | | — | | | | — | | | | 29,076 | | | | — | |
| | | | | | | | | | | | | | | | | | | | | | | | | | | | | | | |
| | | | | | | |
| | 442,762 | | | | 501,486 | | | | 152 | | | | 271 | | | | 799 | | | | — | | | | 360,963 | | | | 314,201 | |
| | 473,914 | | | | 324,896 | | | | 4,193 | | | | 3,095 | | | | 30,073 | | | | 1,030 | | | | 285,829 | | | | 342,929 | |
| | 632,728 | | | | 910,664 | | | | 21,220 | | | | 41,192 | | | | 56,060 | | | | 64,224 | | | | 455,259 | | | | 367,481 | |
| | 459,893 | | | | 796,384 | | | | 113,044 | | | | 34,146 | | | | 114,422 | | | | 122,096 | | | | 309,989 | | | | 340,264 | |
See notes to financial statements.
Annual Report 113

For the periods ended October 31st
Numbers in 000s
| | | | | | | | | | | | | | | | | | | | |
| | | Payden Corporate
Bond Fund | | | | | | Payden Strategic
Income Fund | |
| | | 2018 | | | 2017 | | | | | | 2018 | | | 2017 | |
INCREASE (DECREASE) IN NET ASSETS: | | | | | | | | | | | | | | | | | | | | |
FROM OPERATIONS: | | | | | | | | | | | | | | | | | | | | |
Net investment income | | $ | 7,893 | | | $ | 5,415 | | | | | | | $ | 6,208 | | | $ | 4,638 | |
Net realized gains (losses) | | | (1,480) | | | | 1,357 | | | | | | | | (2,677) | | | | (17) | |
Change in net unrealized appreciation/(depreciation) | | | (13,831) | | | | 2,793 | | | | | | | | (4,395) | | | | 323 | |
Change in Net Assets Resulting from Operations | | | (7,418) | | | | 9,565 | | | | | | | | (864 | ) | | | 4,944 | |
FROM DISTRIBUTIONS TO SHAREHOLDERS:* | | | | | | | | | | | | | | | | | | | | |
Net investment income and net realized gains from investments: | | | | | | | | | | | | | | | | | | | | |
Adviser Class | | | — | | | | — | | | | | | | | — | | | | (58) | |
Investor Class | | | (9,206) | | | | (8,190) | | | | | | | | (4,027) | | | | (3,754) | |
SI Class | | | — | | | | — | | | | | | | | (2,158) | | | | (1,510) | |
Return of capital: | | | | | | | | | | | | | | | | | | | | |
Adviser Class | | | — | | | | — | | | | | | | | — | | | | — | |
Investor Class | | | — | | | | — | | | | | | | | (36) | | | | (3) | |
Sl Class | | | — | | | | — | | | | | | | | (20) | | | | (1) | |
Change in Net Assets from Distributions to Shareholders | | | (9,206) | | | | (8,190 | ) | | | | | | | (6,241 | ) | | | (5,326 | ) |
FROM CAPITAL TRANSACTIONS: | | | | | | | | | | | | | | | | | | | | |
Proceeds from fund shares sold: | | | | | | | | | | | | | | | | | | | | |
Adviser Class | | | — | | | | — | | | | | | | | — | | | | 422 | |
Investor Class | | | 172,012 | | | | 100,890 | | | | | | | | 62,163 | | | | 71,429 | |
SI Class | | | — | | | | — | | | | | | | | 21,262 | | | | 58,190 | |
Reinvestment of distributions: | | | | | | | | | | | | | | | | | | | | |
Adviser Class | | | — | | | | — | | | | | | | | — | | | | 57 | |
Investor Class | | | 8,298 | | | | 7,454 | | | | | | | | 4,000 | | | | 3,694 | |
SI Class | | | — | | | | — | | | | | | | | 2,160 | | | | 1,492 | |
Cost of fund shares redeemed: | | | | | | | | | | | | | | | | | | | | |
Adviser Class | | | — | | | | — | | | | | | | | — | | | | (6,212) | |
Investor Class | | | (72,283) | | | | (42,882) | | | | | | | | (49,725) | | | | (89,698) | |
SI Class | | | — | | | | — | | | | | | | | (53,504) | | | | — | |
Change in Net Assets from Capital Transactions | | | 108,027 | | | | 65,462 | | | | | | | | (13,644 | ) | | | 39,374 | |
Total Change in Net Assets | | | 91,403 | | | | 66,837 | | | | | | | | (20,749 | ) | | | 38,992 | |
NET ASSETS: | | | | | | | | | | | | | | | | | | | | |
Beginning of period | | | 207,305 | | | | 140,468 | | | | | | | | 225,643 | | | | 186,651 | |
End of period | | $ | 298,708 | | | $ | 207,305 | | | | | | | $ | 204,894 | | | $ | 225,643 | |
| | | | |
FUND SHARES OF BENEFICIAL INTEREST: | | | | | | | | | | | | | | | | | | | | |
Adviser Class: | | | | | | | | | | | | | | | | | | | | |
Outstanding shares at beginning of period | | | — | | | | — | | | | | | | | — | | | | 572 | |
Shares sold | | | — | | | | — | | | | | | | | — | | | | 42 | |
Shares issued in reinvestment of distributions | | | — | | | | — | | | | | | | | — | | | | 6 | |
Shares redeemed | | | — | | | | — | | | | | | | | — | | | | (620) | |
Change in shares outstanding | | | — | | | | — | | | | | | | | — | | | | (572) | |
Outstanding shares at end of period | | | — | | | | — | | | | | | | | — | | | | — | |
| | | | |
Investor Class: | | | | | | | | | | | | | | | | | | | | |
Outstanding shares at beginning of period | | | 18,213 | | | | 12,353 | | | | | | | | 13,350 | | | | 14,838 | |
Shares sold | | | 15,702 | | | | 9,037 | | | | | | | | 6,251 | | | | 7,082 | |
Shares issued in reinvestment of distributions | | | 754 | | | | 675 | | | | | | | | 403 | | | | 368 | |
Shares redeemed | | | (6,576) | | | | (3,852) | | | | | | | | (4,978) | | | | (8,938) | |
Change in shares outstanding | | | 9,880 | | | | 5,860 | | | | | | | | 1,676 | | | | (1,488) | |
Outstanding shares at end of period | | | 28,093 | | | | 18,213 | | | | | | | | 15,026 | | | | 13,350 | |
| | | | |
SI Class: | | | | | | | | | | | | | | | | | | | | |
Outstanding shares at beginning of period | | | — | | | | — | | | | | | | | 8,959 | | | | 3,040 | |
Shares sold | | | — | | | | — | | | | | | | | 2,120 | | | | 5,771 | |
Shares issued in reinvestment of distributions | | | — | | | | — | | | | | | | | 217 | | | | 148 | |
Shares redeemed | | | — | | | | — | | | | | | | | (5,352) | | | | — | |
Change in shares outstanding | | | — | | | | — | | | | | | | | (3,015) | | | | 5,919 | |
Outstanding shares at end of period | | | — | | | | — | | | | | | | | 5,944 | | | | 8,959 | |
| | | | |
LONG TERM INVESTMENT ACTIVITY: | | | | | | | | | | | | | | | | | | | | |
Purchase of investments (excluding government) | | | 282,352 | | | | 209,182 | | | | | | | | 81,050 | | | | 112,621 | |
Sale of investments (excluding government) | | | 181,235 | | | | 147,268 | | | | | | | | 95,923 | | | | 75,423 | |
Purchase of government securities | | | — | | | | — | | | | | | | | 48,014 | | | | 57,291 | |
Sale of government securities | | | — | | | | 554 | | | | | | | | 44,946 | | | | 59,943 | |
| * | Prior year distribution character information and undistributed net investment income had been modified or removed to conform with current year Regulation S-X presentation changes. Refer to Note 7 for this prior year information. |
See notes to financial statements.
114 Payden Mutual Funds
| | | | | | | | | | | | | | | | | | | | | | | | | | | | | | |
Payden Absolute Return
Bond Fund | | | Payden Floating Rate
Fund | | | Payden High Income
Fund | | | Payden California Municipal
Income Fund | |
| 2018 | | | 2017 | | | 2018 | | | 2017 | | | 2018 | | | 2017 | | | 2018 | | | 2017 | |
| | | | | | | |
| $ | 3,524 | | | $ | 2,125 | | | $ | 6,231 | | | $ | 6,198 | | | $ | 25,910 | | | $ | 28,745 | | | $ | 1,245 | | | $ | 1,034 | |
| | (183) | | | | (180) | | | | (274) | | | | (44) | | | | 1,949 | | | | 10,993 | | | | 82 | | | | 213 | |
| | (1,563) | | | | 893 | | | | (753) | | | | 323 | | | | (26,958) | | | | 726 | | | | (1,538) | | | | (15) | |
| | 1,778 | | | | 2,838 | | | | 5,204 | | | | 6,477 | | | | 901 | | | | 40,464 | | | | (211) | | | | 1,232 | |
| | | | | | | | | | | | | | | | | | | | | | | | | | | | | | |
| | | | | | | | | | | | | | | | | | | | | | | | | | | | | | |
| | — | | | | (2) | | | | — | | | | (8) | | | | — | | | | (582) | | | | — | | | | — | |
| | (2,697) | | | | (1,641) | | | | (2,054) | | | | (1,741) | | | | (26,132) | | | | (28,871) | | | | (1,458) | | | | (1,872) | |
| | (1,103) | | | | (410) | | | | (4,165) | | | | (4,473) | | | | — | | | | — | | | | — | | | | — | |
| | — | | | | — | | | | — | | | | — | | | | — | | | | (198) | | | | — | | | | — | |
| | — | | | | — | | | | — | | | | — | | | | — | | | | — | | | | — | | | | — | |
| | — | | | | — | | | | — | | | | — | | | | — | | | | — | | | | — | | | | — | |
| | (3,800) | | | | (2,053) | | | | (6,219) | | | | (6,222) | | | | (26,132) | | | | (29,651) | | | | (1,458) | | | | (1,872) | |
| | | | | | | |
| | — | | | | 585 | | | | — | | | | 381 | | | | — | | | | 7,892 | | | | — | | | | — | |
| | 30,278 | | | | 32,334 | | | | 19,480 | | | | 24,964 | | | | 114,654 | | | | 99,822 | | | | 7,959 | | | | 10,846 | |
| | 27,913 | | | | 4,307 | | | | 37,386 | | | | 26,305 | | | | — | | | | — | | | | — | | | | — | |
| | — | | | | 2 | | | | — | | | | 8 | | | | — | | | | 578 | | | | — | | | | — | |
| | 2,637 | | | | 1,601 | | | | 2,031 | | | | 1,689 | | | | 23,657 | | | | 23,467 | | | | 1,252 | | | | 1,465 | |
| | 571 | | | | 401 | | | | 3,440 | | | | 3,471 | | | | — | | | | — | | | | — | | | | — | |
| | — | | | | (634) | | | | — | | | | (671) | | | | — | | | | (32,843) | | | | — | | | | — | |
| | (13,313) | | | | (11,665) | | | | (33,489) | | | | (27,569) | | | | (196,776) | | | | (187,515) | | | | (8,047) | | | | (9,834) | |
| | (10,742) | | | | (879) | | | | (61,919) | | | | (26,183) | | | | — | | | | — | | | | — | | | | — | |
| | 37,344 | | | | 26,052 | | | | (33,071) | | | | 2,395 | | | | (58,465) | | | | (88,599) | | | | 1,164 | | | | 2,477 | |
| | 35,322 | | | | 26,837 | | | | (34,086) | | | | 2,650 | | | | (83,696) | | | | (77,786) | | | | (505) | | | | 1,837 | |
| | | | | | | |
| | 103,933 | | | | 77,096 | | | | 190,390 | | | | 187,740 | | | | 533,635 | | | | 611,421 | | | | 57,645 | | | | 55,808 | |
| $ | 139,255 | | | $ | 103,933 | | | $ | 156,304 | | | $ | 190,390 | | | $ | 449,939 | | | $ | 533,635 | | | $ | 57,140 | | | $ | 57,645 | |
| | | |
| | | | | | | |
| | — | | | | 5 | | | | — | | | | 28 | | | | — | | | | 3,729 | | | | — | | | | — | |
| | — | | | | 58 | | | | — | | | | 38 | | | | — | | | | 1,200 | | | | — | | | | — | |
| | — | | | | — | | | | — | | | | 1 | | | | — | | | | 88 | | | | — | | | | — | |
| | — | | | | (63) | | | | — | | | | (67) | | | | — | | | | (5,017) | | | | — | | | | — | |
| | — | | | | (5) | | | | — | | | | (28) | | | | — | | | | (3,729) | | | | — | | | | — | |
| | — | | | | — | | | | — | | | | — | | | | — | | | | — | | | | — | | | | — | |
| | | |
| | | | | | | |
| | 8,615 | | | | 6,403 | | | | 6,379 | | | | 6,473 | | | | 80,956 | | | | 90,842 | | | | 5,608 | | | | 5,361 | |
| | 3,029 | | | | 3,215 | | | | 1,951 | | | | 2,490 | | | | 17,761 | | | | 15,295 | | | | 783 | | | | 1,074 | |
| | 264 | | | | 160 | | | | 204 | | | | 169 | | | | 3,700 | | | | 3,596 | | | | 123 | | | | 146 | |
| | (1,327) | | | | (1,163) | | | | (3,351) | | | | (2,753) | | | | (30,459) | | | | (28,777) | | | | (791) | | | | (973) | |
| | 1,966 | | | | 2,212 | | | | (1,196) | | | | (94) | | | | (8,998) | | | | (9,886) | | | | 115 | | | | 247 | |
| | 10,581 | | | | 8,615 | | | | 5,183 | | | | 6,379 | | | | 71,958 | | | | 80,956 | | | | 5,723 | | | | 5,608 | |
| | | |
| | | | | | | |
| | 1,689 | | | | 1,306 | | | | 12,646 | | | | 12,287 | | | | — | | | | — | | | | — | | | | — | |
| | 2,775 | | | | 430 | | | | 3,740 | | | | 2,620 | | | | — | | | | — | | | | — | | | | — | |
| | 58 | | | | 40 | | | | 345 | | | | 346 | | | | — | | | | — | | | | — | | | | — | |
| | (1,076) | | | | (87) | | | | (6,182) | | | | (2,607) | | | | — | | | | — | | | | — | | | | — | |
| | 1,757 | | | | 383 | | | | (2,097) | | | | 359 | | | | — | | | | — | | | | — | | | | — | |
| | 3,446 | | | | 1,689 | | | | 10,549 | | | | 12,646 | | | | — | | | | — | | | | — | | | | — | |
| | | |
| | | | | | | |
| | 128,591 | | | | 71,469 | | | | 141,579 | | | | 184,452 | | | | 282,707 | | | | 360,897 | | | | 95,182 | | | | 84,808 | |
| | 96,158 | | | | 49,408 | | | | 168,368 | | | | 192,641 | | | | 333,707 | | | | 456,129 | | | | 89,556 | | | | 84,617 | |
| | 71,349 | | | | 48,000 | | | | 1,000 | | | | 1,438 | | | | 4,800 | | | | 2,650 | | | | — | | | | — | |
| | 71,193 | | | | 42,392 | | | | 1,626 | | | | 376 | | | | 6,973 | | | | 1,980 | | | | — | | | | — | |
See notes to financial statements.
Annual Report 115
For the periods ended October 31st
Numbers in 000s
| | | | | | | | | | | | | | | | | | | | |
| | | Payden Global Low
Duration Fund | | | | | | Payden Global Fixed
Income Fund | |
| | | 2018 | | | 2017 | | | | | | 2018 | | | 2017 | |
INCREASE (DECREASE) IN NET ASSETS: | | | | | | | | | | | | | | | | | | | | |
FROM OPERATIONS: | | | | | | | | | | | | | | | | | | | | |
Net investment income | | $ | 2,308 | | | $ | 1,954 | | | | | | | $ | 2,263 | | | $ | 1,967 | |
Net realized gains (losses) | | | (296) | | | | (714) | | | | | | | | 2,634 | | | | 1,348 | |
Change in net unrealized appreciation/(depreciation) | | | (1,650) | | | | 846 | | | | | | | | (5,451) | | | | (35) | |
Change in Net Assets Resulting from Operations | | | 362 | | | | 2,086 | | | | | | | | (554) | | | | 3,280 | |
FROM DISTRIBUTIONS TO SHAREHOLDERS:* | | | | | | | | | | | | | | | | | | | | |
Net investment income and net realized gains from investments: | | | | | | | | | | | | | | | | | | | | |
Adviser Class | | | — | | | | — | | | | | | | | — | | | | — | |
Investor Class | | | (2,306) | | | | (956) | | | | | | | | (2,617) | | | | (2,076) | |
SI Class | | | — | | | | — | | | | | | | | — | | | | — | |
Return of capital: | | | | | | | | | | | | | | | | | | | | |
Adviser Class | | | — | | | | — | | | | | | | | — | | | | — | |
Investor Class | | | (20) | | | | (892) | | | | | | | | — | | | | — | |
SI Class | | | — | | | | — | | | | | | | | — | | | | — | |
Change in Net Assets from Distributions to Shareholders | | | (2,326) | | | | (1,848) | | | | | | | | (2,617) | | | | (2,076) | |
FROM CAPITAL TRANSACTIONS: | | | | | | | | | | | | | | | | | | | | |
Proceeds from fund shares sold: | | | | | | | | | | | | | | | | | | | | |
Adviser Class | | | — | | | | — | | | | | | | | — | | | | — | |
Investor Class | | | 6,205 | | | | 23,648 | | | | | | | | 28,040 | | | | 45,623 | |
SI Class | | | — | | | | — | | | | | | | | — | | | | — | |
Reinvestment of distributions: | | | | | | | | | | | | | | | | | | | | |
Adviser Class | | | — | | | | — | | | | | | | | — | | | | — | |
Investor Class | | | 2,269 | | | | 1,789 | | | | | | | | 2,557 | | | | 2,029 | |
SI Class | | | — | | | | — | | | | | | | | — | | | | — | |
Cost of fund shares redeemed: | | | | | | | | | | | | | | | | | | | | |
Adviser Class | | | — | | | | — | | | | | | | | — | | | | — | |
Investor Class | | | (26,178) | | | | (47,487) | | | | | | | | (23,070) | | | | (35,318) | |
SI Class | | | — | | | | — | | | | | | | | — | | | | — | |
Change in Net Assets from Capital Transactions | | | (17,704) | | | | (22,050) | | | | | | | | 7,527 | | | | 12,334 | |
Total Change in Net Assets | | | (19,668) | | | | (21,812) | | | | | | | | 4,356 | | | | 13,538 | |
NET ASSETS: | | | | | | | | | | | | | | | | | | | | |
Beginning of period | | | 113,405 | | | | 135,217 | | | | | | | | 124,647 | | | | 111,109 | |
End of period | | $ | 93,737 | | | $ | 113,405 | | | | | | | $ | 129,003 | | | $ | 124,647 | |
| | | | | | | | | | | | | | | | | | | | |
FUND SHARES OF BENEFICIAL INTEREST: | | | | | | | | | | | | | | | | | | | | |
Adviser Class: | | | | | | | | | | | | | | | | | | | | |
Outstanding shares at beginning of period | | | — | | | | — | | | | | | | | — | | | | — | |
Shares sold | | | — | | | | — | | | | | | | | — | | | | — | |
Shares issued in reinvestment of distributions | | | — | | | | — | | | | | | | | — | | | | — | |
Shares redeemed | | | — | | | | — | | | | | | | | — | | | | — | |
Change in shares outstanding | | | — | | | | — | | | | | | | | — | | | | — | |
Outstanding shares at end of period | | | — | | | | — | | | | | | | | — | | | | — | |
| | | | | | | | | | | | | | | | | | | | |
Investor Class: | | | | | | | | | | | | | | | | | | | | |
Outstanding shares at beginning of period | | | 11,269 | | | | 13,461 | | | | | | | | 13,680 | | | | 12,289 | |
Shares sold | | | 623 | | | | 2,354 | | | | | | | | 3,112 | | | | 5,091 | |
Shares issued in reinvestment of distributions | | | 228 | | | | 178 | | | | | | | | 284 | | | | 225 | |
Shares redeemed | | | (2,624) | | | | (4,724) | | | | | | | | (2,559) | | | | (3,925) | |
Change in shares outstanding | | | (1,773) | | | | (2,192) | | | | | | | | 837 | | | | 1,391 | |
Outstanding shares at end of period | | | 9,496 | | | | 11,269 | | | | | | | | 14,517 | | | | 13,680 | |
| | | | | | | | | | | | | | | | | | | | |
SI Class: | | | | | | | | | | | | | | | | | | | | |
Outstanding shares at beginning of period | | | — | | | | — | | | | | | | | — | | | | — | |
Shares sold | | | — | | | | — | | | | | | | | — | | | | — | |
Shares issued in reinvestment of distributions | | | — | | | | — | | | | | | | | — | | | | — | |
Shares redeemed | | | — | | | | — | | | | | | | | — | | | | — | |
Change in shares outstanding | | | — | | | | — | | | | | | | | — | | | | — | |
Outstanding shares at end of period | | | — | | | | — | | | | | | | | — | | | | — | |
| | | | | | | | | | | | | | | | | | | | |
LONG TERM INVESTMENT ACTIVITY: | | | | | | | | | | | | | | | | | | | | |
Purchase of investments (excluding government) | | | 39,386 | | | | 72,296 | | | | | | | | 58,224 | | | | 69,396 | |
Sale of investments (excluding government) | | | 57,132 | | | | 73,268 | | | | | | | | 57,520 | | | | 55,797 | |
Purchase of government securities | | | 14,933 | | | | 56,323 | | | | | | | | 11,111 | | | | 15,586 | |
Sale of government securities | | | 16,069 | | | | 70,701 | | | | | | | | 6,258 | | | | 16,291 | |
| * | Prior year distribution character information and undistributed net investment income had been modified or removed to conform with current year Regulation S-X presentation changes. Refer to Note 7 for this prior year information. |
See notes to financial statements.
116 Payden Mutual Funds
| | | | | | | | | | | | | | | | | | | | | | | | | | | | | | | | | | |
| | | | |
Payden Emerging Markets
Bond Fund | | | Payden Emerging
Markets Local Bond Fund | | | Payden Emerging Markets
Corporate Bond Fund | | | | | | Payden Equity Income Fund | |
| 2018 | | | 2017 | | | 2018 | | | 2017 | | | 2018 | | | 2017 | | | | | | 2018 | | | 2017 | |
| | | | | | | | | | | | | | | | | | | | | | | | | | | | | | | | | | |
| | | | | | | | | | | | | | | | | | | | | | | | | | | | | | | | | | |
| $ | 74,227 | | | $ | 68,069 | | | $ | 12,700 | | | $ | 10,083 | | | $ | 2,149 | | | $ | 1,830 | | | | | | | $ | 25,692 | | | $ | 22,179 | |
| | (10,848) | | | | 11,302 | | | | (12,046) | | | | 1,151 | | | | (419) | | | | 477 | | | | | | | | 4,353 | | | | 46,314 | |
| | (141,730) | | | | 14,071 | | | | (20,201) | | | | (2,713) | | | | (2,691) | | | | 401 | | | | | | | | 7,988 | | | | 68,651 | |
| | (78,351) | | | | 93,442 | | | | (19,547) | | | | 8,521 | | | | (961) | | | | 2,708 | | | | | | | | 38,033 | | | | 137,144 | |
| | | | | | | | | | | | | | | | | | | | | | | | | | | | | | | | | | |
| | | | | | | | | | | | | | | | | | | | | | | | | | | | | | | | | | |
| | (5,272) | | | | (5,633) | | | | — | | | | (7) | | | | — | | | | (5) | | | | | | | | (950) | | | | (385) | |
| | (25,694) | | | | (25,614) | | | | (2,480) | | | | (9,432) | | | | (290) | | | | (173) | | | | | | | | (39,349) | | | | (15,362) | |
| | (37,323) | | | | (34,493) | | | | — | | | | — | | | | (1,885) | | | | (1,652) | | | | | | | | (31,695) | | | | (9,980) | |
| | | | | | | | | | | | | | | | | | | | | | | | | | | | | | | | | | |
| | (458) | | | | (264) | | | | — | | | | — | | | | — | | | | — | | | | | | | | — | | | | — | |
| | (2,232) | | | | (1,197) | | | | (10,232) | | | | (643) | | | | (14) | | | | — | | | | | | | | — | | | | — | |
| | (3,243) | | | | (1,612) | | | | — | | | | — | | | | (90) | | | | — | | | | | | | | — | | | | — | |
| | (74,222) | | | | (68,813) | | | | (12,712) | | | | (10,082) | | | | (2,279) | | | | (1,830) | | | | | | | | (71,994) | | | | (25,727) | |
| | | | | | | | | | | | | | | | | | | | | | | | | | | | | | | | | | |
| | | | | | | | | | | | | | | | | | | | | | | | | | | | | | | | | | |
| | 19,889 | | | | 83,668 | | | | — | | | | 42 | | | | — | | | | 428 | | | | | | | | 4,080 | | | | 12,290 | |
| | 266,097 | | | | 157,027 | | | | 63,440 | | | | 49,491 | | | | 5,939 | | | | 737 | | | | | | | | 104,113 | | | | 126,172 | |
| | 255,876 | | | | 127,563 | | | | — | | | | — | | | | 39,192 | | | | — | | | | | | | | 352,209 | | | | 64,027 | |
| | | | | | | | | | | | | | | | | | | | | | | | | | | | | | | | | | |
| | 5,692 | | | | 5,832 | | | | — | | | | 6 | | | | — | | | | 5 | | | | | | | | 921 | | | | 374 | |
| | 25,137 | | | | 24,996 | | | | 10,005 | | | | 5,484 | | | | 304 | | | | 173 | | | | | | | | 38,547 | | | | 15,035 | |
| | 40,171 | | | | 35,531 | | | | — | | | | — | | | | 1,519 | | | | 279 | | | | | | | | 24,550 | | | | 7,091 | |
| | | | | | | | | | | | | | | | | | | | | | | | | | | | | | | | | | |
| | (63,156) | | | | (36,872) | | | | — | | | | (175) | | | | — | | | | (2,934) | | | | | | | | (5,523) | | | | (8,058) | |
| | (366,698) | | | | (130,575) | | | | (18,150) | | | | (28,708) | | | | (5,607) | | | | (604) | | | | | | | | (218,247) | | | | (122,713) | |
| | (115,270) | | | | (87,262) | | | | — | | | | — | | | | (33,313) | | | | — | | | | | | | | (38,921) | | | | (43,244) | |
| | 67,738 | | | | 179,903 | | | | 55,295 | | | | 26,140 | | | | 8,034 | | | | (1,916) | | | | | | | | 261,729 | | | | 50,974 | |
| | (84,835) | | | | 204,537 | | | | 23,036 | | | | 24,579 | | | | 4,794 | | | | (1,038) | | | | | | | | 227,768 | | | | 162,391 | |
| | | | | | | | | | | | | | | | | | | | | | | | | | | | | | | | | | |
| | 1,363,779 | | | | 1,159,242 | | | | 180,942 | | | | 156,363 | | | | 40,627 | | | | 41,665 | | | | | | | | 965,064 | | | | 802,673 | |
| $ | 1,278,944 | | | $ | 1,363,779 | | | $ | 203,978 | | | $ | 180,942 | | | $ | 45,421 | | | $ | 40,627 | | | | | | | $ | 1,192,832 | | | $ | 965,064 | |
| | | | | | | | | | | | | | | | | | | | | | | | | | | | | | | | | | | |
| | | | | | | | | | | | | | | | | | | | | | | | | | | | | | | | | | |
| | | | | | | | | | | | | | | | | | | | | | | | | | | | | | | | | | |
| | 9,261 | | | | 5,458 | | | | — | | | | 18 | | | | — | | | | 253 | | | | | | | | 871 | | | | 566 | |
| | 1,464 | | | | 6,035 | | | | — | | | | 6 | | | | — | | | | 42 | | | | | | | | 243 | | | | 792 | |
| | 419 | | | | 419 | | | | — | | | | 1 | | | | — | | | | — | | | | | | | | 56 | | | | 24 | |
| | (4,683) | | | | (2,651) | | | | — | | | | (25) | | | | — | | | | (295) | | | | | | | | (331) | | | | (511) | |
| | (2,800) | | | | 3,803 | | | | — | | | | (18) | | | | — | | | | (253) | | | | | | | | (32) | | | | 305 | |
| | 6,461 | | | | 9,261 | | | | — | | | | — | | | | — | | | | — | | | | | | | | 839 | | | | 871 | |
| | | | | | | | | | | | | | | | | | | | | | | | | | | | | | | | | | | |
| | | | | | | | | | | | | | | | | | | | | | | | | | | | | | | | | | |
| | 37,898 | | | | 34,281 | | | | 26,240 | | | | 22,472 | | | | 392 | | | | 362 | | | | | | | | 33,828 | | | | 32,639 | |
| | 19,374 | | | | 11,274 | | | | 9,221 | | | | 7,097 | | | | 577 | | | | 72 | | | | | | | | 6,186 | | | | 8,014 | |
| | 1,851 | | | | 1,802 | | | | 1,499 | | | | 789 | | | | 30 | | | | 17 | | | | | | | | 2,318 | | | | 953 | |
| | (27,227) | | | | (9,459) | | | | (2,799) | | | | (4,118) | | | | (560) | | | | (59) | | | | | | | | (12,947) | | | | (7,778) | |
| | (6,002) | | | | 3,617 | | | | 7,921 | | | | 3,768 | | | | 47 | | | | 30 | | | | | | | | (4,443) | | | | 1,189 | |
| | 31,896 | | | | 37,898 | | | | 34,161 | | | | 26,240 | | | | 439 | | | | 392 | | | | | | | | 29,385 | | | | 33,828 | |
| | | | | | | | | | | | | | | | | | | | | | | | | | | | | | | | | | | |
| | | | | | | | | | | | | | | | | | | | | | | | | | | | | | | | | | |
| | 48,866 | | | | 43,426 | | | | — | | | | — | | | | 3,537 | | | | 3,509 | | | | | | | | 23,119 | | | | 21,431 | |
| | 19,051 | | | | 9,083 | | | | — | | | | — | | | | 3,829 | | | | — | | | | | | | | 21,091 | | | | 3,977 | |
| | 2,987 | | | | 2,564 | | | | — | | | | — | | | | 154 | | | | 28 | | | | | | | | 1,479 | | | | 449 | |
| | (8,354) | | | | (6,207) | | | | — | | | | — | | | | (3,229) | | | | — | | | | | | | | (2,307) | | | | (2,738) | |
| | 13,684 | | | | 5,440 | | | | — | | | | — | | | | 754 | | | | 28 | | | | | | | | 20,263 | | | | 1,688 | |
| | 62,550 | | | | 48,866 | | | | — | | | | — | | | | 4,291 | | | | 3,537 | | | | | | | | 43,382 | | | | 23,119 | |
| | | | | | | | | | | | | | | | | | | | | | | | | | | | | | | | | | | |
| | | | | | | | | | | | | | | | | | | | | | | | | | | | | | | | | | |
| | 850,997 | | | | 711,960 | | | | 174,090 | | | | 121,063 | | | | 35,857 | | | | 24,277 | | | | | | | | 689,875 | | | | 595,809 | |
| | 786,522 | | | | 565,645 | | | | 130,058 | | | | 95,861 | | | | 31,349 | | | | 27,594 | | | | | | | | 475,916 | | | | 526,493 | |
| | — | | | | — | | | | — | | | | — | | | | 860 | | | | — | | | | | | | | — | | | | — | |
| | — | | | | — | | | | — | | | | — | | | | — | | | | — | | | | | | | | — | | | | — | |
See notes to financial statements.
Annual Report 117

October 31, 2018
1. Organization and Related Matters
The Payden & Rygel Investment Group (the “Group” or “Paydenfunds”) is a no-load, open-end registered investment company organized as a Massachusetts business trust on January 22, 1992 and registered under the Investment Company Act of 1940 (the “1940 Act”), as amended. Each of its nineteen funds (each a “Fund,” collectively the “Funds”) is a series of the Group, and is authorized to issue unlimited shares at $0.001 par value. Each of the Funds, other than the Emerging Markets Local Bond Fund, has been classified as diversified.
2. Significant Accounting Policies
The following is a summary of significant accounting policies followed by the Funds.
The Financial Accounting Standards Board (“FASB”) Accounting Standards Codification (“ASC”) is the exclusive reference of authoritative U.S. generally accepted accounting principles (“GAAP”) recognized by the FASB to be applied by nongovernmental entities. Rules and interpretive releases of the Securities and Exchange Commission (“SEC”) under authority of federal laws are also sources of authoritative GAAP for SEC registrants. Each Fund’s financial statements are prepared in accordance with GAAP.
The Funds are considered investment companies under FASB ASC 946, Financial Services - Investment Companies.
The preparation of financial statements in conformity with GAAP requires management to make estimates and assumptions that affect the reported amounts of assets and liabilities and disclosure of contingent assets and liabilities at the date of the financial statements and the reported amounts of income and expenses during the reporting period. Actual results could differ from those estimates.
Securities Valuation
Domestic and foreign fixed income securities and other assets for which market quotations are readily available (other than obligations with original maturities of sixty days or less) are valued on the basis of quotes obtained from brokers and dealers or pricing services. Such quotations take into account appropriate factors such as institutional-sized trading in similar groups of securities, yield, quality, coupon rate, maturity, type of issue, trading characteristics and other data. Debt securities with original maturities of sixty days or less and securities in the Payden Cash Reserves Money Market Fund are valued at amortized cost, which approximates fair value. Cash Reserves Money Market Fund qualifies as a government money market fund under the Money Market Fund Reform.
Publicly traded equity securities, whether in the U.S. or outside the U.S., for which market quotations are readily available, generally will be valued at the official closing price or the last sale price on the exchange or market where they are principally traded, or if there have been no sales during the day, at the last bid price. Securities traded only on the over-the-counter (“OTC”) market are valued at the latest bid price. Investments in nonregistered investment companies are valued at their net asset values as reported by such companies.
Options, futures, swaps and other similar instruments are valued at the official closing price, in the case of exchange traded derivatives, or on the basis of information provided by pricing services, quotes obtained from brokers and dealers, and market trades in the case of other securities.
Fixed income or equity securities for which market quotations are not readily available are priced at their fair value as determined in good faith under procedures established pursuant to the Valuation and Liquidity Guidelines applicable to each of the Funds. In considering fair value of a security, one or more factors are taken into consideration depending on the circumstances at the time, including for example: the cost of the security or the last reported sales price of the security as a starting point; changes in interest rates; changes in yield spreads of similarly rated or structured securities; fundamental analytical information relating to the security; the value of other similar securities traded on other markets or among dealers; the general financial condition of the issuer; recent developments affecting the issuer; information, including price quotations, from other financial institutions or analysts; or government actions or pronouncements and other significant events affecting the economy, the markets, the fundamental value of the issuer or of the issuer’s industry.
Shares of open-end investment companies are valued at their respective net asset value.
Fair value pricing adjustments may occur when (1) developments occur (a “significant event”) that will affect the value of a Fund’s holdings, and (2) the significant event occurs after the close of the markets on which the securities trade, but before the time when the net asset value is computed for a Fund. A significant event may relate to a single issuer or an entire market.
118 Payden Mutual Funds
Risks
Unforeseen events in the markets may at times result in an unusually high degree of volatility in the markets, which could adversely affect the Funds causing a decline in value.
Investing in debt securities may include failure of an issuer to make timely interest or principal payments, or a decline or the perception of a decline in credit quality. In addition, the value of the debt security may decline due to general market conditions that are not specifically related to a particular company including industry earnings outlook, changes in interest or currency rates or perception of a specific industry.
Investing in foreign securities may include certain risks and considerations not typically associated with investing in U.S. securities, such as fluctuating currency values and changing local and regional economic, political and social conditions, which may result in greater market volatility. In addition, certain foreign securities may not be as liquid as U.S. securities.
An investment in the Payden Cash Reserves Money Market Fund is not insured or guaranteed by the Federal Deposit Insurance Corporation or any other government agency. Although the Fund seeks to preserve the value of your investment at $1.00 per share and is classified as a government money market fund under the Money Market Fund Reform, it is possible to lose money by investing in the Fund.
Investment Transactions and Related Income
Investment transactions are accounted for on the date the security is purchased or sold (trade date) for financial reporting purposes. Interest income is recognized on an accrual basis. Premiums and discounts are amortized or accreted over the
expected life of the security using the effective interest method. Dividend income is recorded on the ex-dividend date. Realized gains or losses on investment transactions are determined on the identified cost basis.
Bank Loans
Floating-Rate Loan Interests (“Bank Loans”) in which the Funds invest generally pay interest at rates which are periodically predetermined by reference to a base lending rate plus a premium. These base lending rates are generally (i) the lending rate offered by one or more major European banks, such as the London Inter-Bank Offered Rate (“LIBOR”), (ii) the prime rate offered by one or more United States banks or (iii) the certificate of deposit rate. Certain Bank Loans are subject to a LIBOR floor that establishes a minimum LIBOR rate. The interest rate shown on the Schedule of Investments reflects the rate in effect at October 31st. When a range of rates is disclosed, the Fund holds more than one position within the same tranche at varying rates.
In connection with floating rate loan interests, the Funds may also enter into unfunded loan commitments (“commitments”). In connection with these commitments, the Funds earn a commitment fee, typically set as a percentage of the commitment amount. Such fee income, which is included in interest income in the Statements of Operations, is recognized ratably over the commitment period. Unfunded floating rate loan interests are marked- to-market daily, and any unrealized appreciation or depreciation is included in the Statements of Assets and Liabilities and Statements of Operations. As of October 31, 2018, Floating Rate and High Income had the following unfunded floating rate loan interests:
| | | | | | | | | | | | | | | | | | |
| | | Borrower | | Par | | | Commitment
Amount | | | Value | | | Unrealized
Depreciation | |
Floating Rate | | Pearl Intermediate Parent LLC Delayed Draw Term Loan 1L | | $ | 107,565 | | | $ | 107,565 | | | $ | 106,486 | | | $ | (1,079 | ) |
High Income | | Pearl Intermediate Parent LLC Delayed Draw Term Loan 1L | | | 145,212 | | | | 145,212 | | | | 143,757 | | | | (1,455 | ) |
Foreign Currency Translation
The accounting records of the Funds are maintained in U.S. dollars. Each of the Funds (except Cash Reserves Money Market, U.S. Government, GNMA and California Municipal Income Funds) may purchase securities that are denominated in foreign currencies. Investment securities and other assets and liabilities denominated in a foreign currency are translated into U.S. dollars at the current exchange rates. Purchases and sales of securities, income and expenses are translated into U.S. dollars
at the exchange rates on the dates of the respective transactions. Each of these Funds does not isolate that portion of the results of operations resulting from changes in foreign exchange rates from the fluctuations arising from changes in security prices.
Reported net realized foreign exchange gains or losses arise from purchases and sales of foreign currencies, currency gains or losses realized between the trade and settlement dates of securities transactions, and the differences between the amounts of income or expenses recorded on each of these Fund’s books
Annual Report 119

and the U.S. dollar equivalents of the amounts actually received or paid. Net unrealized appreciation/depreciation from translation of assets and liabilities denominated in foreign currency arise from changes in the value of assets and liabilities resulting from changes in the foreign exchange rates.
Repurchase Agreements
The Payden Cash Reserves Money Market Fund entered into repurchase agreements (agreements to purchase U.S. Treasury notes and bills, subject to the seller’s agreement to repurchase them at a specified time and price) with well-established registered securities dealers or banks. Repurchase agreements are the equivalent of loans by the Fund. With respect to such agreements, it is the Fund’s policy to take possession of the underlying securities, except for tri-party agreements where an independent custodian takes possession. On a daily basis the Fund or the tri-party custodian mark-to-market such securities to ensure that the value, including accrued interest, is at least equal to the amount to be repaid to the Fund under the agreement. If the seller defaults, and the fair value of the collateral declines, realization of the collateral by the Fund may be delayed or limited.
Master Repurchase Agreements (“MRA”) permit the Fund, under certain circumstances, including an event of default (such as bankruptcy or insolvency), to offset payables and/or receivables under the MRA with collateral held and/or posted to the counterparty and create one single net payment due to or from the Fund. However, bankruptcy or insolvency laws of a particular jurisdiction may impose restrictions on or prohibitions against such a right of offset in the event of the MRA counterparty’s bankruptcy or insolvency. Pursuant to the terms of the MRA, the Fund receives or posts securities as collateral with a market value in excess of the repurchase price to be paid or received by the Fund upon the maturity of the transaction. Upon a bankruptcy or insolvency of the MRA counterparty, the Fund is considered an unsecured creditor with respect to excess collateral and, as such, the return of excess collateral may be delayed.
The Payden Cash Reserves Money Market Fund’s repurchase agreements by counterparty, which are subject to offset under a MRA, is included within the Fund’s Schedule of Investments. For financial statement purposes, the Fund does not offset financial assets and financial liabilities, that are subject to MRA on the Statements of Assets and Liabilities.
Forward Currency Contracts
Some Funds entered into forward currency contracts to protect against adverse currency movements or as speculative investments. The forward currency contracts are adjusted by the daily exchange rate of the underlying currency and any gains or losses are recorded for financial statement purposes as unrealized gain or loss until the contact settlement date or an offsetting forward currency contract has been executed, at which time the Fund records a realized gain or loss equal to the difference between the value of the contract at the time it was opened and the value at the time it was closed. Risk may arise upon entering into these contracts from the potential inability of counterparties to meet the terms of their contracts and from unanticipated movements in the value of a foreign currency relative to the U.S. dollar.
Futures Contracts
Some Funds entered into futures transactions to enhance potential gain in circumstances where hedging is not involved.
The purchase or sale of futures contracts and options on futures contracts provides for the future sale by one party and purchase by another party of a specified quantity of a financial instrument or foreign currency at a fixed price on a future date. Upon entering into such a contract, a Fund is required to deposit and maintain initial margin deposit of cash or securities as required by the exchange on which the contract is traded.
Pursuant to the contract, that Fund agrees to receive from or pay to the broker an amount equal to the daily fluctuations in the value of the contract. Such receipts or payments are known as variation margin and are recorded as unrealized gains or losses by that Fund. When the contract is closed, that Fund records a realized gain or loss equal to the difference between the value of the contract at the time it was opened and the value at the time it was closed. The potential risk to the Funds is that the change in value of the underlying securities may not correlate to the change in value of the contracts.
Stock index futures contracts are an agreement pursuant to which two parties agree to take or make delivery of an amount of cash equal to the difference between the value of the index at the close of the last trading day of the contract and the price at which the index contract was originally written. Variation margin accounting procedures apply to these index futures contracts. Each Fund invests in these futures contracts to permit the Fund to meet its objectives at a lower cost than investing directly in equity securities, while permitting the equivalent of an investment in a portfolio of equity securities. The potential risk to a Fund is that the change in value of the underlying index may not correlate to the change in value of the contracts.
120 Payden Mutual Funds
Swap Contracts
Some Funds may enter into swap agreements, in which a Fund and a counterparty agree either to make periodic net payments on a specified notional amount or a net payment upon termination. Swap agreements are privately negotiated in the OTC market and may be entered into as a bilateral contract (“OTC swaps”) or centrally cleared (“centrally cleared swaps”). Swaps are marked-to-market daily and changes in value are recorded as unrealized appreciation (depreciation) and realized gain/(loss) is recorded at termination of the contract.
Upon entering into a centrally cleared swap, a Fund is required to deposit and maintain initial margin deposit of cash or securities as required by the exchange on which the contract is traded. Pursuant to the centrally cleared swap, that Fund agrees to receive from or pay to the broker an amount equal to the daily fluctuations in the value of the contract. Such receipts or payments are known as variation margin and are recorded as unrealized gains or losses by that Fund. When the contract is closed, that Fund records a realized gain or loss equal to the difference between the value of the contract at the time it was opened and the value at the time it was closed.
Swap transactions involve, to varying degrees, elements of interest rate, credit and market risk in excess of the amounts recognized in the Statements of Assets and Liabilities. Such risks involve the possibility that there will be no liquid market for these agreements, that the counterparty to the agreements may default on its obligation to perform or disagree as to the meaning of the contractual terms in the agreements, and that there may be unfavorable changes in interest rates, credit spreads and/or market values associated with these transactions.
A Fund may enter into credit default swaps to manage its exposure to the market or certain sectors of the market, to reduce its risk exposure to defaults of corporate and/or sovereign issuers or to create exposure to corporate and/or sovereign issuers to which it is not otherwise exposed (credit risk). A Fund may either buy or sell (write) credit default swaps on single-name issuers (corporate or sovereign), a combination or basket of single-name issuers or traded indexes. Credit default swaps on single-name issuers are agreements in which the protection buyer pays fixed periodic payments to the seller in consideration for a guarantee from the protection seller to make a specific payment should a negative credit event take place with respect to the referenced entity (e.g., bankruptcy, failure to pay, obligation accelerators, repudiation, moratorium or
restructuring). Credit default swaps on traded indexes are agreements in which the buyer pays fixed periodic payments to the seller in consideration for a guarantee from the seller to make a specific payment should a write-down, principal or interest shortfall or default of all or individual underlying securities included in the index occur. As a buyer, if an underlying credit event occurs, the Fund will either (i) receive from the seller an amount equal to the notional amount of the swap and deliver the referenced security or underlying securities comprising the index, or (ii) receive a net settlement of cash equal to the notional amount of the swap less the recovery value of the security or underlying securities comprising the index. As a seller (writer), if an underlying credit event occurs, the Fund will either pay the buyer an amount equal to the notional amount of the swap and take delivery of the referenced security or underlying securities comprising the index or pay a net settlement of cash equal to the notional amount of the swap less the recovery value of the security or underlying securities comprising the index.
A Fund may enter into total return swaps to obtain exposure to a security or market without owning such security or investing directly in that market or to transfer the risk/return of one market (e.g., fixed income) to another market (e.g., equity) (equity risk and/or interest rate risk). Total return swaps are agreements in which there is an exchange of cash flows whereby one party commits to make payments based on the total return (coupons plus capital gains/losses) of an underlying instrument in exchange for fixed or floating rate interest payments. To the extent the total return of the instrument or index underlying the transaction exceeds or falls short of the offsetting interest rate obligation, the Fund will receive a payment from or make a payment to the counterparty.
A Fund may enter into interest rate swaps to gain or reduce exposure to interest rates or to manage duration, the yield curve or interest rate risk by economically hedging the value of the fixed rate bonds which may decrease when interest rates rise (interest rate risk). Interest rate swaps are agreements in which one party pays a stream of interest payments, either fixed or floating rate, for another party’s stream of interest payments, either fixed or floating, on the same notional amount for a specified period of time. In more complex swaps, the notional principal amount may decline (or amortize) over time.
For financial reporting purposes, swap interest and amortization are classified as realized or unrealized gain or loss on swap contracts.
Annual Report 121
Options Transactions
Option techniques may be utilized by a Fund to hedge against changes in interest rates, foreign currency exchange rates or security prices in order to establish more definitely the effective return on securities or currencies held or intended to be acquired by the Fund, to reduce the volatility of the currency exposure associated with investment in non-U.S. securities, or as an efficient means of adjusting exposure to the bond, equity and currency markets. In addition, the Fund may enter into such transactions to enhance potential gain in circumstances where hedging is not involved. When a Fund writes a covered call or put option, an amount equal to the premium received is reflected as an asset and equivalent liability. The amount of the liability is subsequently marked-to-market to reflect the current value of the option. If an option expires on its stipulated expiration date or if the Fund enters into a closing purchase transaction, a gain or loss is realized. If a written call option is exercised, a gain or loss is realized for the sale of the underlying security and the proceeds from the sale are increased by the premium originally received. If a written put option is exercised, the cost of the security acquired is decreased by the premium originally received. As writer of an option, the Fund has no control over whether the underlying securities are subsequently sold (call) or purchased (put) and, as a result, bears the market risk of an unfavorable change in the price of the security underlying the written option.
When the Fund purchases a call or put option, an amount equal to the premium paid is included in the Fund’s Statements of Assets and Liabilities as an investment, and is subsequently marked-to-market to reflect the current value of the option. If an option expires on the stipulated expiration date or if a Fund enters into a closing sale transaction, a gain or loss is realized. If the Fund exercises a call option, the cost of the security acquired is increased by the premium paid for the call. If the Fund exercises a put option, a gain or loss is realized from the sale of the underlying security, and the proceeds from such sale are decreased by the premium originally paid. Written and purchased options are non-income producing securities.
Derivative Financial Instruments
The Funds engage in various portfolio investment strategies using derivative contracts both to increase the returns of the Fund and/or to economically hedge its exposure to certain risks such as credit risk, equity risk, interest rate risk and foreign currency exchange rate risk. These contracts may be transacted on an exchange or OTC.
The following tables show the Funds’ exposure to different types of market risks as it relates to derivative investments in the Statements of Assets and Liabilities and the Statements of Operations.
Statements of Assets and Liabilities
Fair Values of Derivative Instruments as of October 31, 2018 (000s)
| | | | | | | | |
Underlying Risk | | Derivative
Assets ($) | | | Derivative
Liabilities ($) | |
Limited Maturity | | | | | | | | |
Foreign currency2 | | | 227 | | | | — | |
| | | | | | | | |
Low Duration | | | | | | | | |
Interest rate1 | | | 346 | | | | (265 | ) |
Foreign currency2 | | | 56 | | | | — | |
| | | | | | | | |
Total | | | 402 | | | | (265 | ) |
| | | | | | | | |
Core Bond | | | | | | | | |
Credit1 | | | — | | | | (24 | ) |
Interest rate1,4,5 | | | 2,025 | | | | (1,580 | ) |
Foreign currency2,3 | | | 468 | | | | (292 | ) |
| | | | | | | | |
Total | | | 2,493 | | | | (1,896 | ) |
| | | | | | | | |
Corporate Bond | | | | | | | | |
Interest rate1 | | | 75 | | | | (871 | ) |
| | | | | | | | |
Strategic Income | | | | | | | | |
Credit1 | | | — | | | | (5 | ) |
Interest rate1,4,5 | | | 248 | | | | (390 | ) |
Foreign currency2,3 | | | 150 | | | | (62 | ) |
| | | | | | | | |
Total | | | 398 | | | | (457 | ) |
| | | | | | | | |
Absolute Return Bond | | | | | | | | |
Credit1 | | | — | | | | (4 | ) |
Interest rate1,4,5 | | | 177 | | | | (127 | ) |
Foreign currency2,3 | | | 157 | | | | (36 | ) |
| | | | | | | | |
Total | | | 334 | | | | (167 | ) |
| | | | | | | | |
High Income | | | | | | | | |
Interest Rate1 | | | — | | | | (29 | ) |
Foreign currency2,3 | | | 137 | | | | (81 | ) |
| | | | | | | | |
Total | | | 137 | | | | (110 | ) |
| | | | | | | | |
California Municipal | | | | | | | | |
Interest rate1 | | | 6 | | | | — | |
| | | | | | | | |
Global Low Duration | | | | | | | | |
Interest rate1,4,5 | | | 181 | | | | (138 | ) |
Foreign currency2,3 | | | 49 | | | | (26 | ) |
| | | | | | | | |
Total | | | 230 | | | | (164 | ) |
| | | | | | | | |
Global Fixed Income | | | | | | | | |
Credit1 | | | 14 | | | | — | |
Interest rate1,4,5 | | | 164 | | | | (327 | ) |
Foreign currency2,3 | | | 1,407 | | | | (527 | ) |
| | | | | | | | |
Total | | | 1,585 | | | | (854 | ) |
| | | | | | | | |
Emerging Markets Bond | | | | | | | | |
Interest rate1 | | | — | | | | (3 | ) |
Foreign currency2,3 | | | 1,153 | | | | (1,673 | ) |
| | | | | | | | |
Total | | | 1,153 | | | | (1,676 | ) |
| | | | | | | | |
Emerging Markets Local Bond | | | | | | | | |
Interest rate1 | | | 50 | | | | — | |
Foreign currency2,3 | | | 673 | | | | (1,288 | ) |
| | | | | | | | |
Total | | | 723 | | | | (1,288 | ) |
| | | | | | | | |
122 Payden Mutual Funds
| | | | | | | | | | |
Underlying Risk | | Derivative
Assets ($) | | Derivative
Liabilities ($) |
Emerging Markets Corporate Bond | | | | | | | | | | |
Interest rate1 | | | | — | | | | | (2 | ) |
Foreign currency2,3 | | | | 9 | | | | | (19 | ) |
| | | | | | | | | | |
Total | | | | 9 | | | | | (21 | ) |
| | | | | | | | | | |
Equity Income | | | | | | | | | | |
Foreign currency2,3 | | | | 1,150 | | | | | (51 | ) |
| | | | | | | | | | |
Statement of Assets and Liabilities location:
| 1 | Includes cumulative appreciation/depreciation of futures contracts and centrally cleared swaps as reported in Schedule of Investments. Only current day’s variation margin is reported within the Statements of Assets and Liabilities as Receivable/Payable for futures and variation margin on centrally cleared swaps. |
| 2 | Receivable for forward currency contracts. |
| 3 | Payable for forward currency contracts. |
| 4 | Includes options purchased at value as reported in the Schedule of Investments. |
| 5 | Payable for options written. |
The Effect of Derivative Instruments on the Statements of Operations
For the Period Ended October 31, 2018 (000s)
| | | | | | | | | | | | | | | | | | | | | | | | | |
Amount of Realized Gain or (Loss) on Derivatives Recognized in Income |
Underlying risk | | Futures1 | | Forward
Currency
Contracts2 | | Options3 | | Swaps4 | | Total |
Limited Maturity | | | | | | | | | | | | | | | | |
Credit | | | | — | | | | | — | | | | | — | | | | $ | (16 | ) | | | $ | (16 | ) |
Foreign exchange | | | | — | | | | $ | 445 | | | | | — | | | | | — | | | | | 445 | |
| | | | | | | | | | | | | | | | | | | | | | | | | |
Total | | | | — | | | | | 445 | | | | | — | | | | | (16 | ) | | | | 429 | |
| | | | | | | | | | | | | | | | | | | | | | | | | |
Low Duration | | | | | | | | | | | | | | | | |
Credit | | | | — | | | | | — | | | | | — | | | | | (44 | ) | | | | (44 | ) |
Interest rate | | | $ | (842 | ) | | | | — | | | | $ | 253 | | | | | — | | | | | (589 | ) |
Foreign exchange | | | | — | | | | | 115 | | | | | — | | | | | — | | | | | 115 | |
| | | | | | | | | | | | | | | | | | | | | | | | | |
Total | | | | (842 | ) | | | | 115 | | | | | 253 | | | | | (44 | ) | | | | (518 | ) |
| | | | | | | | | | | | | | | | | | | | | | | | | |
U.S. Government | |
Interest rate | | | | (1 | ) | | | | — | | | | | (11 | ) | | | | — | | | | | (12 | ) |
| | | | | | | | | | | | | | | | | | | | | | | | | |
GNMA | |
Interest rate | | | | 300 | | | | | — | | | | | (40 | ) | | | | — | | | | | 260 | |
| | | | | | | | | | | | | | | | | | | | | | | | | |
Core Bond | |
Credit | | | | — | | | | | — | | | | | — | | | | | 507 | | | | | 507 | |
Interest rate | | | | (966 | ) | | | | — | | | | | (337 | ) | | | | — | | | | | (1,303 | ) |
Foreign exchange | | | | — | | | | | 392 | | | | | — | | | | | — | | | | | 392 | |
| | | | | | | | | | | | | | | | | | | | | | | | | |
Total | | | | (966 | ) | | | | 392 | | | | | (337 | ) | | | | 507 | | | | | (404 | ) |
| | | | | | | | | | | | | | | | | | | | | | | | | |
Corporate Bond | |
Credit | | | | — | | | | | — | | | | | — | | | | | 101 | | | | | 101 | |
Interest rate | | | | 12 | | | | | — | | | | | — | | | | | — | | | | | 12 | |
| | | | | | | | | | | | | | | | | | | | | | | | | |
Total | | | | 12 | | | | | — | | | | | — | | | | | 101 | | | | | 113 | |
| | | | | | | | | | | | | | | | | | | | | | | | | |
Strategic Income | |
Credit | | | | — | | | | | — | | | | | — | | | | | 186 | | | | | 186 | |
Interest rate | | | | (391 | ) | | | | — | | | | | (45 | ) | | | | — | | | | | (436 | ) |
Foreign exchange | | | | — | | | | | 152 | | | | | — | | | | | — | | | | | 152 | |
| | | | | | | | | | | | | | | | | | | | | | | | | |
Total | | | | (391 | ) | | | | 152 | | | | | (45 | ) | | | | 186 | | | | | (98 | ) |
| | | | | | | | | | | | | | | | | | | | | | | | | |
| | | | | | | | | | | | | | | | | | | | | | | | | |
Amount of Realized Gain or (Loss) on Derivatives Recognized in Income |
Underlying risk | | Futures1 | | Forward
Currency
Contracts2 | | Options3 | | Swaps4 | | Total |
Absolute Return Bond | |
Credit | | | | — | | | | | — | | | | | — | | | | $ | 48 | | | | $ | 48 | |
Equity | | | | — | | | | | — | | | | $ | 140 | | | | | — | | | | | 140 | |
Interest rate | | | $ | (259 | ) | | | | — | | | | | 141 | | | | | (5 | ) | | | | (123 | ) |
Foreign exchange | | | | — | | | | $ | (272 | ) | | | | — | | | | | — | | | | | (272 | ) |
| | | | | | | | | | | | | | | | | | | | | | | | | |
Total | | | | (259 | ) | | | | (272 | ) | | | | 281 | | | | | 43 | | | | | (207 | ) |
| | | | | | | | | | | | | | | | | | | | | | | | | |
High Income | |
Credit | | | | — | | | | | — | | | | | — | | | | | 68 | | | | | 68 | |
Interest rate | | | | — | | | | | — | | | | | — | | | | | 8 | | | | | 8 | |
Foreign exchange | | | | — | | | | | (213 | ) | | | | — | | | | | — | | | | | (213 | ) |
| | | | | | | | | | | | | | | | | | | | | | | | | |
Total | | | | — | | | | | (213 | ) | | | | — | | | | | 76 | | | | | (137 | ) |
| | | | | | | | | | | | | | | | | | | | | | | | | |
California Municipal | |
Interest rate | | | | 17 | | | | | — | | | | | — | | | | | — | | | | | 17 | |
| | | | | | | | | | | | | | | | | | | | | | | | | |
Global Low Duration | |
Credit | | | | — | | | | | — | | | | | — | | | | | (2 | ) | | | | (2 | ) |
Interest rate | | | | (49 | ) | | | | — | | | | | 38 | | | | | — | | | | | (11 | ) |
Foreign exchange | | | | — | | | | | (26 | ) | | | | — | | | | | — | | | | | (26 | ) |
| | | | | | | | | | | | | | | | | | | | | | | | | |
Total | | | | (49 | ) | | | | (26 | ) | | | | 38 | | | | | (2 | ) | | | | (39 | ) |
| | | | | | | | | | | | | | | | | | | | | | | | | |
Global Fixed Income | |
Credit | | | | — | | | | | — | | | | | — | | | | | 51 | | | | | 51 | |
Interest rate | | | | 54 | | | | | — | | | | | — | | | | | — | | | | | 54 | |
Foreign exchange | | | | — | | | | | 2,620 | | | | | — | | | | | — | | | | | 2,620 | |
| | | | | | | | | | | | | | | | | | | | | | | | | |
Total | | | | 54 | | | | | 2,620 | | | | | — | | | | | 51 | | | | | 2,725 | |
| | | | | | | | | | | | | | | | | | | | | | | | | |
Emerging Markets Bond | |
Interest rate | | | | 428 | | | | | — | | | | | — | | | | | — | | | | | 428 | |
Foreign exchange | | | | — | | | | | 1,090 | | | | | — | | | | | — | | | | | 1,090 | |
| | | | | | | | | | | | | | | | | | | | | | | | | |
Total | | | | 428 | | | | | 1,090 | | | | | — | | | | | — | | | | | 1,518 | |
| | | | | | | | | | | | | | | | | | | | | | | | | |
Emerging Markets Local Bond | |
Interest rate | | | | 39 | | | | | — | | | | | — | | | | | — | | | | | 39 | |
Foreign exchange | | | | — | | | | | (1,567 | ) | | | | — | | | | | — | | | | | (1,567 | ) |
| | | | | | | | | | | | | | | | | | | | | | | | | |
Total | | | | 39 | | | | | (1,567 | ) | | | | — | | | | | — | | | | | (1,528 | ) |
| | | | | | | | | | | | | | | | | | | | | | | | | |
Emerging Markets Corporate | |
Bond | | | | | | | | | | | | | | | | | | | | | | | | | |
Interest rate | | | | 60 | | | | | — | | | | | — | | | | | — | | | | | 60 | |
Foreign exchange | | | | — | | | | | 5 | | | | | — | | | | | — | | | | | 5 | |
| | | | | | | | | | | | | | | | | | | | | | | | | |
Total | | | | 60 | | | | | 5 | | | | | — | | | | | — | | | | | 65 | |
| | | | | | | | | | | | | | | | | | | | | | | | | |
Equity Income | |
Equity | | | | (102 | ) | | | | — | | | | | — | | | | | — | | | | | (102 | ) |
Foreign exchange | | | | — | | | | | 2,804 | | | | | — | | | | | — | | | | | 2,804 | |
| | | | | | | | | | | | | | | | | | | | | | | | | |
Total | | | | (102 | ) | | | | 2,804 | | | | | — | | | | | — | | | | | 2,702 | |
| | | | | | | | | | | | | | | | | | | | | | | | | |
| 1 | Net realized gains (losses) from futures contracts. |
| 2 | Net realized gains (losses) from forward foreign exchange contracts. |
| 3 | Net realized gains (losses) from written option contracts and purchased options which are included in net realized gain on investments. |
| 4 | Net realized gains (losses) from swap contracts. |
Annual Report 123
The Effect of Derivative Instruments on the Statements of Operations
For the Period Ended October 31, 2018 (000s)
| | | | | | | | | | | | | | | | | | | | | | | | | |
Change in Unrealized Appreciation or (Depreciation) on Derivatives Recognized in Income |
Underlying risk | | Futures5 | | Forward
Currency
Contracts6 | | Options7 | | Swaps8 | | Total |
Limited Maturity | | | | | | | | | | | | | | | | | | | | | | | | | |
Credit | | | | — | | | | | — | | | | | — | | | | $ | 38 | | | | $ | 38 | |
Foreign exchange | | | | — | | | | $ | 259 | | | | | — | | | | | — | | | | | 259 | |
| | | | | | | | | | | | | | | | | | | | | | | | | |
Total | | | | — | | | | | 259 | | | | | — | | | | | 38 | | | | | 297 | |
| | | | | | | | | | | | | | | | | | | | | | | | | |
Low Duration | | | | | | | | | | | | | | | | | | | | | | | | | |
Credit | | | | — | | | | | — | | | | | — | | | | | 68 | | | | | 68 | |
Interest rate | | | $ | 209 | | | | | — | | | | $ | 25 | | | | | — | | | | | 234 | |
Foreign exchange | | | | — | | | | | 6 | | | | | — | | | | | — | | | | | 6 | |
| | | | | | | | | | | | | | | | | | | | | | | | | |
Total | | | | 209 | | | | | 6 | | | | | 25 | | | | | 68 | | | | | 308 | |
| | | | | | | | | | | | | | | | | | | | | | | | | |
U.S. Government | | | | | | | | | | | | | | | | | | | | | | | | | |
Interest rate | | | | 9 | | | | | — | | | | | 7 | | | | | — | | | | | 16 | |
| | | | | | | | | | | | | | | | | | | | | | | | | |
GNMA | | | | | | | | | | | | | | | | | | | | | | | | | |
Interest rate | | | | 19 | | | | | — | | | | | (68 | ) | | | | — | | | | | (49 | ) |
| | | | | | | | | | | | | | | | | | | | | | | | | |
Core Bond | | | | | | | | | | | | | | | | | | | | | | | | | |
Credit | | | | — | | | | | — | | | | | — | | | | | (24 | ) | | | | (24 | ) |
Interest rate | | | | (7 | ) | | | | — | | | | | 205 | | | | | — | | | | | 198 | |
Foreign exchange | | | | — | | | | | (46 | ) | | | | — | | | | | — | | | | | (46 | ) |
| | | | | | | | | | | | | | | | | | | | | | | | | |
Total | | | | (7 | ) | | | | (46 | ) | | | | 205 | | | | | (24 | ) | | | | 128 | |
| | | | | | | | | | | | | | | | | | | | | | | | | |
Corporate Bond | | | | | | | | | | | | | | | | | | | | | | | | | |
Interest rate | | | | (907 | ) | | | | — | | | | | — | | | | | — | | | | | (907 | ) |
| | | | | | | | | | | | | | | | | | | | | | | | | |
Strategic Income | | | | | | | | | | | | | | | | | | | | | | | | | |
Credit | | | | — | | | | | — | | | | | — | | | | | (5 | ) | | | | (5 | ) |
Interest rate | | | | (157 | ) | | | | — | | | | | 43 | | | | | — | | | | | (114 | ) |
Foreign exchange | | | | — | | | | | (3 | ) | | | | — | | | | | — | | | | | (3 | ) |
| | | | | | | | | | | | | | | | | | | | | | | | | |
Total | | | | (157 | ) | | | | (3 | ) | | | | 43 | | | | | (5 | ) | | | | (122 | ) |
| | | | | | | | | | | | | | | | | | | | | | | | | |
Absolute Return Bond | | | | | | | | | | | | | | | | | | | | | | | | | |
Credit | | | | — | | | | | — | | | | | — | | | | | (4 | ) | | | | (4 | ) |
Equity | | | | — | | | | | — | | | | | 15 | | | | | — | | | | | 15 | |
Interest rate | | | | (4 | ) | | | | — | | | | | (37 | ) | | | | (4 | ) | | | | (45 | ) |
Foreign exchange | | | | — | | | | | 50 | | | | | — | | | | | — | | | | | 50 | |
| | | | | | | | | | | | | | | | | | | | | | | | | |
Total | | | | (4 | ) | | | | 50 | | | | | (22 | ) | | | | (8 | ) | | | | 16 | |
| | | | | | | | | | | | | | | | | | | | | | | | | |
High Income | | | | | | | | | | | | | | | | | | | | | | | | | |
Credit | | | | — | | | | | — | | | | | — | | | | | (113 | ) | | | | (113 | ) |
Interest rate | | | | — | | | | | — | | | | | — | | | | | (31 | ) | | | | (31 | ) |
Foreign exchange | | | | — | | | | | (37 | ) | | | | — | | | | | — | | | | | (37 | ) |
| | | | | | | | | | | | | | | | | | | | | | | | | |
Total | | | | — | | | | | (37 | ) | | | | — | | | | | (144 | ) | | | | (181 | ) |
| | | | | | | | | | | | | | | | | | | | | | | | | |
California Municipal | | | | | | | | | | | | | | | | | | | | | | | | | |
Interest rate | | | | 6 | | | | | — | | | | | — | | | | | — | | | | | 6 | |
| | | | | | | | | | | | | | | | | | | | | | | | | |
Global Low Duration | | | | | | | | | | | | | | | | | | | | | | | | | |
Credit | | | | — | | | | | — | | | | | — | | | | | 8 | | | | | 8 | |
Interest rate | | | | 16 | | | | | — | | | | | 21 | | | | | — | | | | | 37 | |
| | | | | | | | | | | | | | | | | | | | | | | | | |
Total | | | | 16 | | | | | — | | | | | 21 | | | | | 8 | | | | | 45 | |
| | | | | | | | | | | | | | | | | | | | | | | | | |
Global Fixed Income | | | | | | | | | | | | | | | | | | | | | | | | | |
Credit | | | | — | | | | | — | | | | | — | | | | | 14 | | | | | 14 | |
Interest rate | | | | (85 | ) | | | | — | | | | | 4 | | | | | — | | | | | (81 | ) |
Foreign exchange | | | | — | | | | | 402 | | | | | — | | | | | — | | | | | 402 | |
| | | | | | | | | | | | | | | | | | | | | | | | | |
Total | | | | (85 | ) | | | | 402 | | | | | 4 | | | | | 14 | | | | | 335 | |
| | | | | | | | | | | | | | | | | | | | | | | | | |
| | | | | | | | | | | | | | | | | | | | | | | | | |
Change in Unrealized Appreciation or (Depreciation) on Derivatives Recognized in Income |
Underlying risk | | Futures5 | | Forward
Currency
Contracts6 | | Options7 | | Swaps8 | | Total |
Emerging Markets Bond | | | | | | | | | | | | | | | | | | | | | | | | | |
Interest rate | | | $ | (3 | ) | | | | — | | | | | — | | | | | — | | | | $ | (3 | ) |
Foreign exchange | | | | — | | | | $ | (422 | ) | | | | — | | | | | — | | | | | (422 | ) |
| | | | | | | | | | | | | | | | | | | | | | | | | |
Total | | | | (3 | ) | | | | (422 | ) | | | | — | | | | | — | | | | | (425 | ) |
| | | | | | | | | | | | | | | | | | | | | | | | | |
Emerging Markets Local Bond | | | | | | | | | | | | | | | | | | | | | | | | | |
Interest rate | | | | 50 | | | | | — | | | | | — | | | | | — | | | | | 50 | |
Foreign exchange | | | | — | | | | | (102 | ) | | | | — | | | | | — | | | | | (102 | ) |
| | | | | | | | | | | | | | | | | | | | | | | | | |
Total | | | | 50 | | | | | (102 | ) | | | | — | | | | | — | | | | | (52 | ) |
| | | | | | | | | | | | | | | | | | | | | | | | | |
Emerging Markets Corporate | | | | | | | | | | | | | | | | | | | | | | | | | |
Bond | | | | | | | | | | | | | | | | | | | | | | | | | |
Interest rate | | | | (19 | ) | | | | — | | | | | — | | | | | — | | | | | (19 | ) |
Foreign exchange | | | | — | | | | | (11 | ) | | | | — | | | | | — | | | | | (11 | ) |
| | | | | | | | | | | | | | | | | | | | | | | | | |
Total | | | | (19 | ) | | | | (11 | ) | | | | — | | | | | — | | | | | (30 | ) |
| | | | | | | | | | | | | | | | | | | | | | | | | |
Equity Income | | | | | | | | | | | | | | | | | | | | | | | | | |
Foreign exchange | | | | — | | | | | 645 | | | | | — | | | | | — | | | | | 645 | |
| | | | | | | | | | | | | | | | | | | | | | | | | |
| 5 | Change in net unrealized appreciation (depreciation) from futures contracts. |
| 6 | Change in net unrealized appreciation (depreciation) from forward foreign exchange contracts. |
| 7 | Change in net unrealized appreciation (depreciation) from written option contracts and purchased options which are included in change in unrealized appreciation (depreciation) on investments. |
| 8 | Change in net unrealized appreciation (depreciation) from swap contracts. |
During the period ended October 31, 2018 the average notional amount of derivatives as a percent of average net assets were as follows:
| | | | | | | | | | | | | | | | | | | | |
| | | Foreign
currency | | Credit | | Interest
rate | | Equity |
Limited Maturity | | | | 1% | | | | | 0% | | | | | 0% | | | | | 0% | |
Low Duration | | | | 0% | | | | | 0% | | | | | 15% | | | | | 0% | |
U.S. Government | | | | 0% | | | | | 0% | | | | | 7% | | | | | 0% | |
GNMA | | | | 0% | | | | | 0% | | | | | 28% | | | | | 0% | |
Core Bond | | | | 10% | | | | | 0% | | | | | 7% | | | | | 0% | |
Corporate Bond | | | | 0% | | | | | 0% | | | | | 5% | | | | | 0% | |
Strategic Income | | | | 10% | | | | | 0% | | | | | 8% | | | | | 0% | |
Absolute Return Bond | | | | 18% | | | | | 0% | | | | | 6% | | | | | 0% | |
High Income | | | | 6% | | | | | 1% | | | | | 0% | | | | | 0% | |
Global Low Duration | | | | 7% | | | | | 0% | | | | | 28% | | | | | 0% | |
Global Fixed Income | | | | 65% | | | | | 0% | | | | | 31% | | | | | 0% | |
Emerging Markets Bond | | | | 5% | | | | | 0% | | | | | 0% | | | | | 0% | |
Emerging Markets Local Bond | | | | 24% | | | | | 0% | | | | | 0% | | | | | 0% | |
Emerging Markets Corporate Bond | | | | 3% | | | | | 0% | | | | | 0% | | | | | 0% | |
Equity Income | | | | 6% | | | | | 0% | | | | | 0% | | | | | 0% | |
Counterparty Credit Risk
A derivative contract may suffer a mark-to-market loss if the value of the contract decreases due to an unfavorable change in the market rates or values of the underlying instrument. Losses can also occur if the counterparty does not perform under the contract.
124 Payden Mutual Funds
A Fund’s risk of loss from counterparty credit risk on OTC derivatives is generally limited to the aggregate unrealized gain netted against any collateral held by a Fund. For OTC options purchased, a Fund bears the risk of loss of the amount of the premiums paid plus the positive change in market values net of any collateral held by such Fund should the counterparty fail to perform under the contracts. Options written by the Fund do not typically give rise to counterparty credit risk, as options written generally obligate the Fund, and not the counterparty to perform.
With exchange traded purchased options and futures and centrally cleared swaps, there is decreased counterparty credit risk to a Fund since the exchange or clearinghouse guarantees against a possible default. The clearinghouse stands between the buyer and the seller of the contract; therefore, the credit risk is limited to failure of the clearinghouse. While offset rights may exist under applicable law, a Fund does not have a contractual right of offset against a clearing broker or clearinghouse in the event of a default (including the bankruptcy or insolvency) of the clearing broker or clearinghouse. Additionally, credit risk exists in exchange traded futures and centrally cleared swaps with respect to initial and variation margin that is held in a clearing broker’s customer accounts. While clearing brokers are required to segregate customer margin from their own assets, in the event that a clearing broker becomes insolvent or goes into bankruptcy and at that time there is a shortfall in the aggregate amount of margin held by the clearing broker for all its clients, typically the shortfall would be allocated on a pro rata basis across all the clearing broker’s customers, potentially resulting in losses to a Fund.
In order to better define its contractual rights and to secure rights that will help a Fund mitigate its counterparty risk, a Fund may enter into an International Swaps and Derivatives Association, Inc. Master Agreement (“ISDA Master Agreement”) or similar agreement with its derivative contract counterparties. An ISDA Master Agreement is a bilateral agreement between a Fund and a counterparty that governs certain OTC derivatives and typically contains, among other things, collateral posting terms and netting provisions in the event of a default and/or termination event. Under an ISDA Master Agreement, the Fund may, under certain circumstances, offset with the counterparty certain derivative financial instruments’ payables and/or receivables with collateral held and/or posted and create one single net payment. The provisions of the ISDA Master Agreement typically permit a single net payment in the event of default (close-out netting), including the bankruptcy or insolvency of the counterparty. However, bankruptcy or insolvency laws of a particular jurisdiction may impose restrictions on or prohibitions against the right of offset
in bankruptcy, insolvency or other events. In addition, certain ISDA Master Agreements allow counterparties to OTC derivatives to terminate derivative contracts prior to maturity in the event the Fund’s net assets decline by a stated percentage or the Fund fails to meet the terms of its ISDA Master Agreements, which would cause the Fund to accelerate payment of any net liability owed to the counterparty.
Collateral Requirements
For derivatives traded under an ISDA Master Agreement, the collateral requirements are typically calculated by netting the mark to market amount for each transaction under such agreement and comparing that amount to the value of any collateral currently pledged by a Fund and the counterparty.
Cash collateral that has been pledged to cover obligations of a Fund and cash collateral received from the counterparty, if any, is reported separately on the Statements of Assets and Liabilities as cash pledged as collateral and cash received as collateral, respectively. Non-cash collateral pledged by the Fund, if any, is noted in the Schedule of Investments. Generally, the amount of collateral due from or to a party has to exceed a minimum transfer amount threshold (e.g. $500,000) before a transfer is required, which is determined at the close of business of a Fund and additional required collateral is delivered to/ pledged by a Fund on the next business day. Typically, a Fund and counterparties are not permitted to sell, re-pledge or use the collateral they receive. To the extent amounts due to a Fund from its counterparties are not fully collateralized, contractually or otherwise, the Fund bears the risk of loss from counterparty non-performance. A Fund attempts to mitigate counterparty risk by only entering into agreements with counterparties that it believes have the financial resources to honor their obligations and by monitoring the financial stability of those counterparties.
For financial reporting purposes, the Funds do not offset derivative assets and derivative liabilities that are subject to netting arrangements in the Statements of Assets and Liabilities.
At October 31, 2018, the Funds’ derivative assets and liabilities (by type) on a gross basis are as follows (000s):
| | | | | | | | |
| | | Assets | | | Liabilities | |
Limited Maturity | | | | | | | | |
Derivative Financial Instruments: | | | | | | | | |
Forward Currency Contracts | | $ | 227 | | | | — | |
| | | | | | | | |
Total derivative assets and liabilities in the Statements of Assets and Liabilities | | | 227 | | | | — | |
| | | | | | | | |
| Derivatives not subject to a master netting agreement or similar agreement (“MNA”) | | | (13 | ) | | | — | |
| | | | | | | | |
Total derivative assets and liabilities subject to a MNA | | $ | 214 | | | | — | |
| | | | | | | | |
Annual Report 125
| | | | | | | | |
| | | Assets | | | Liabilities | |
Low Duration | | | | | | | | |
Derivative Financial Instruments: | | | | | | | | |
Futures Contracts | | $ | 103 | | | $ | 48 | |
Forward Currency Contracts | | | 56 | | | | — | |
| | | | | | | | |
| Total derivative assets and liabilities in the Statements of Assets and Liabilities | | | 159 | | | | 48 | |
| | | | | | | | |
Derivatives not subject to a MNA | | | (159 | ) | | | (48 | ) |
| | | | | | | | |
| Total derivative assets and liabilities subject to a MNA | | | — | | | | — | |
| | | | | | | | |
| | |
Core Bond | | | | | | | | |
Derivative Financial Instruments: | | | | | | | | |
Futures Contracts | | $ | 234 | | | $ | 105 | |
Centrally Cleared Swaps | | | 63 | | | | — | |
Purchased Swaptions1 | | | 1,171 | | | | — | |
Written Swaptions | | | — | | | | 848 | |
Forward Currency Contracts | | | 468 | | | | 292 | |
| | | | | | | | |
| Total derivative assets and liabilities in the Statements of Assets and Liabilities | | | 1,936 | | | | 1,245 | |
| | | | | | | | |
Derivatives not subject to a MNA | | | (1,198 | ) | | | (611 | ) |
| | | | | | | | |
| Total derivative assets and liabilities subject to a MNA | | $ | 738 | | | $ | 634 | |
| | | | | | | | |
| | |
Corporate Bond | | | | | | | | |
Derivative Financial Instruments: | | | | | | | | |
Futures Contracts | | $ | 71 | | | $ | 125 | |
| | | | | | | | |
| Total derivative assets and liabilities in the Statements of Assets and Liabilities | | | 71 | | | | 125 | |
| | | | | | | | |
Derivatives not subject to a MNA | | | (71 | ) | | | (125 | ) |
| | | | | | | | |
| Total derivative assets and liabilities subject to a MNA | | | — | | | | — | |
| | | | | | | | |
| | |
Strategic Income | | | | | | | | |
Derivative Financial Instruments: | | | | | | | | |
Futures Contracts | | $ | 13 | | | $ | 45 | |
Centrally Cleared Swaps | | | 14 | | | | — | |
Purchased Swaptions1 | | | 245 | | | | — | |
Written Swaptions | | | — | | | | 178 | |
Forward Currency Contracts | | | 150 | | | | 62 | |
| | | | | | | | |
| Total derivative assets and liabilities in the Statements of Assets and Liabilities | | | 422 | | | | 285 | |
| | | | | | | | |
Derivatives not subject to a MNA | | | (231 | ) | | | (148 | ) |
| | | | | | | | |
| Total derivative assets and liabilities subject to a MNA | | $ | 191 | | | $ | 137 | |
| | | | | | | | |
| | |
Absolute Return Bond | | | | | | | | |
Derivative Financial Instruments: | | | | | | | | |
Futures Contracts | | | — | | | $ | 2 | |
Centrally Cleared Swaps | | $ | 4 | | | | — | |
Purchased Swaptions1 | | | 176 | | | | — | |
Written Swaptions | | | — | | | | 127 | |
Forward Currency Contracts | | | 157 | | | | 36 | |
| | | | | | | | |
| Total derivative assets and liabilities in the Statements of Assets and Liabilities | | | 337 | | | | 165 | |
| | | | | | | | |
Derivatives not subject to a MNA | | | (75 | ) | | | (2 | ) |
| | | | | | | | |
| Total derivative assets and liabilities subject to a MNA | | $ | 262 | | | $ | 163 | |
| | | | | | | | |
| | | | | | | | |
| | | Assets | | | Liabilities | |
High Income | | | | | | | | |
Derivative Financial Instruments: | | | | | | | | |
Centrally Cleared Swaps | | | — | | | $ | 29 | |
Forward Currency Contracts | | $ | 137 | | | | 81 | |
| | | | | | | | |
| Total derivative assets and liabilities in the Statements of Assets and Liabilities | | | 137 | | | | 110 | |
| | | | | | | | |
Derivatives not subject to a MNA | | | (135 | ) | | | (29 | ) |
| | | | | | | | |
| Total derivative assets and liabilities subject to a MNA | | $ | 2 | | | $ | 81 | |
| | | | | | | | |
| | |
California Municipal | | | | | | | | |
Derivative Financial Instruments: | | | | | | | | |
Futures Contracts | | $ | 21 | | | | — | |
| | | | | | | | |
| Total derivative assets and liabilities in the Statements of Assets and Liabilities | | | 21 | | | | — | |
| | | | | | | | |
Derivatives not subject to a MNA | | | (21 | ) | | | — | |
| | | | | | | | |
| Total derivative assets and liabilities subject to a MNA | | | — | | | | — | |
| | | | | | | | |
| | |
Global Low Duration | | | | | | | | |
Derivative Financial Instruments: | | | | | | | | |
Futures Contracts | | $ | 16 | | | $ | 9 | |
Purchased Swaptions1 | | | 124 | | | | — | |
Written Swaptions | | | — | | | | 89 | |
Forward Currency Contracts | | | 49 | | | | 26 | |
| | | | | | | | |
| Total derivative assets and liabilities in the Statements of Assets and Liabilities | | | 189 | | | | 124 | |
| | | | | | | | |
Derivatives not subject to a MNA | | | (113 | ) | | | (64 | ) |
| | | | | | | | |
| Total derivative assets and liabilities subject to a MNA | | $ | 76 | | | $ | 60 | |
| | | | | | | | |
| | |
Global Fixed Income | | | | | | | | |
Derivative Financial Instruments: | | | | | | | | |
Futures Contracts | | $ | 48 | | | $ | 48 | |
Centrally Cleared Swaps | | | 8 | | | | — | |
Purchased Swaptions1 | | | 51 | | | | — | |
Written Swaptions | | | — | | | | 47 | |
Forward Currency Contracts | | | 1,407 | | | | 527 | |
| | | | | | | | |
| Total derivative assets and liabilities in the Statements of Assets and Liabilities | | | 1,514 | | | | 622 | |
| | | | | | | | |
Derivatives not subject to a MNA | | | (609 | ) | | | (255 | ) |
| | | | | | | | |
| Total derivative assets and liabilities subject to a MNA | | $ | 905 | | | $ | 367 | |
| | | | | | | | |
| | |
Emerging Markets Bond | | | | | | | | |
Derivative Financial Instruments: | | | | | | | | |
Futures Contracts | | $ | 107 | | | | — | |
Forward Currency Contracts | | | 1,153 | | | $ | 1,673 | |
| | | | | | | | |
| Total derivative assets and liabilities in the Statements of Assets and Liabilities | | | 1,260 | | | | 1,673 | |
| | | | | | | | |
Derivatives not subject to a MNA | | | (107 | ) | | | — | |
| | | | | | | | |
| Total derivative assets and liabilities subject to a MNA | | $ | 1,153 | | | $ | 1,673 | |
| | | | | | | | |
126 Payden Mutual Funds
| | | | | | | | |
| | | Assets | | | Liabilities | |
Emerging Markets Local Bond | | | | | | | | |
Derivative Financial Instruments: | | | | | | | | |
Futures Contracts | | $ | 24 | | | | — | |
Forward Currency Contracts | | | 673 | | | $ | 1,288 | |
| | | | | | | | |
| Total derivative assets and liabilities in the Statements of Assets and Liabilities | | | 697 | | | | 1,288 | |
| | | | | | | | |
Derivatives not subject to a MNA | | | (24 | ) | | | — | |
| | | | | | | | |
| Total derivative assets and liabilities subject to a MNA | | $ | 673 | | | $ | 1,288 | |
| | | | | | | | |
| | | | | | | | |
| | | Assets | | | Liabilities | |
Emerging Markets Corporate Bond | | | | | | | | |
Derivative Financial Instruments: | | | | | | | | |
Futures Contracts | | $ | 5 | | | | — | |
Forward Currency Contracts | | | 9 | | | $ | 19 | |
| | | | | | | | |
| Total derivative assets and liabilities in the Statements of Assets and Liabilities | | | 14 | | | | 19 | |
| | | | | | | | |
Derivatives not subject to a MNA | | | (5 | ) | | | — | |
| | | | | | | | |
| Total derivative assets and liabilities subject to a MNA | | $ | 9 | | | $ | 19 | |
| | | | | | | | |
| | |
Equity Income | | | | | | | | |
Derivative Financial Instruments: | | | | | | | | |
Forward Currency Contracts | | $ | 1,150 | | | $ | 51 | |
| | | | | | | | |
| Total derivative assets and liabilities in the Statements of Assets and Liabilities | | | 1,150 | | | | 51 | |
| | | | | | | | |
Derivatives not subject to a MNA | | | (513 | ) | | | — | |
| | | | | | | | |
| Total derivative assets and liabilities subject to a MNA | | $ | 637 | | | $ | 51 | |
| | | | | | | | |
| 1 | Includes options purchased at value which is included in Investments at value and reported in the Schedule of Investments. |
The following tables present the Funds’ derivative assets and liabilities by counterparty net of amounts available for offset under a MNA and net of the related collateral received by the Fund as of October 31, 2018 (000s):
| | | | | | | | | | | | | | | | | | | | | | | | | |
Limited Maturity | | | | | | | | | | |
Counterparty | | Derivative Assets
Subject to MNA by
Counterparty | | Derivatives
Available
for Offset | | Non-Cash
Collateral
Received | | Cash
Collateral
Received | | Net Amount of
Derivative
Assets1 |
Barclays Bank PLC | | | $ | 58 | | | | | — | | | | | — | | | | | — | | | | $ | 58 | |
HSBC Bank USA, N.A. | | | | 65 | | | | | — | | | | | — | | | | | — | | | | | 65 | |
Royal Bank of Canada | | | | 91 | | | | | — | | | | | — | | | | | — | | | | | 91 | |
| | | | | | | | | | | | | | | | | | | | | | | | | |
Total | | | $ | 214 | | | | | — | | | | | — | | | | | — | | | | $ | 214 | |
| | | | | | | | | | | | | | | | | | | | | | | | | |
| | | | | |
Core Bond | | | | | | | | | | |
Counterparty | | Derivative Assets
Subject to MNA by
Counterparty | | Derivatives
Available
for Offset3 | | Non-Cash
Collateral
Received | | Cash
Collateral
Received | | Net Amount of
Derivative
Assets1 |
Barclays Bank PLC | | | $ | 666 | | | | $ | (434 | ) | | | | — | | | | | — | | | | $ | 232 | |
HSBC Bank USA, N.A. | | | | 5 | | | | | (5 | ) | | | | — | | | | | — | | | | | — | |
State Street Bank & Trust Co. | | | | 67 | | | | | — | | | | | — | | | | | — | | | | | 67 | |
| | | | | | | | | | | | | | | | | | | | | | | | | |
Total | | | $ | 738 | | | | $ | (439 | ) | | | | — | | | | | — | | | | $ | 299 | |
| | | | | | | | | | | | | | | | | | | | | | | | | |
| | | | | |
Counterparty | | Derivative
Liabilities
Subject to MNA by
Counterparty | | Derivatives
Available
for Offset3 | | Non-Cash
Collateral
Pledged | | Cash
Collateral
Pledged | | Net Amount of
Derivative
Liabilities2 |
Barclays Bank PLC | | | $ | 434 | | | | $ | (434 | ) | | | | — | | | | | — | | | | | — | |
HSBC Bank USA, N.A. | | | | 200 | | | | | (5 | ) | | | | — | | | | | — | | | | $ | 195 | |
| | | | | | | | | | | | | | | | | | | | | | | | | |
Total | | | $ | 634 | | | | $ | (439 | ) | | | | — | | | | | — | | | | $ | 195 | |
| | | | | | | | | | | | | | | | | | | | | | | | | |
Annual Report 127
| | | | | | | | | | | | | | | | | | | | | | | | | |
Strategic Income | | | | | | | | | | |
| | | | | |
Counterparty | | Derivative Assets
Subject to MNA by
Counterparty | | Derivatives
Available
for Offset3 | | Non-Cash
Collateral
Received | | Cash
Collateral
Received | | Net Amount of
Derivative
Assets1 |
| | | | | |
Barclays Bank PLC | | | $ | 175 | | | | $ | (96 | ) | | | | — | | | | | — | | | | $ | 79 | |
HSBC Bank USA, N.A. | | | | 1 | | | | | (1 | ) | | | | — | | | | | — | | | | | — | |
State Street Bank & Trust Co. | | | | 15 | | | | | — | | | | | — | | | | | — | | | | | 15 | |
| | | | | | | | | | | | | | | | | | | | | | | | | |
Total | | | $ | 191 | | | | $ | (97 | ) | | | | — | | | | | — | | | | $ | 94 | |
| | | | | | | | | | | | | | | | | | | | | | | | | |
| | | | | |
Counterparty | | Derivative
Liabilities
Subject to MNA by
Counterparty | | Derivatives
Available
for Offset3 | | Non-Cash
Collateral
Pledged | | Cash
Collateral
Pledged | | Net Amount of
Derivative
Liabilities2 |
| | | | | |
Barclays Bank PLC | | | $ | 96 | | | | $ | (96 | ) | | | | — | | | | | — | | | | | — | |
HSBC Bank USA, N.A. | | | | 41 | | | | | (1 | ) | | | | — | | | | | — | | | | $ | 40 | |
| | | | | | | | | | | | | | | | | | | | | | | | | |
| | | | | |
Total | | | $ | 137 | | | | $ | (97 | ) | | | | — | | | | | — | | | | $ | 40 | |
| | | | | | | | | | | | | | | | | | | | | | | | | |
| | | | | |
Absolute Return Bond | | | | | | | | | | |
| | | | | |
Counterparty | | Derivative Assets
Subject to MNA by
Counterparty | | Derivatives
Available
for Offset3 | | Non-Cash
Collateral
Received | | Cash
Collateral
Received | | Net Amount of
Derivative
Assets1 |
| | | | | |
Barclays Bank PLC | | | $ | 202 | | | | $ | (128 | ) | | | | — | | | | | — | | | | $ | 74 | |
BNP PARIBAS | | | | 29 | | | | | (6 | ) | | | | — | | | | | — | | | | | 23 | |
HSBC Bank USA, N.A. | | | | 16 | | | | | (16 | ) | | | | — | | | | | — | | | | | — | |
State Street Bank & Trust Co. | | | | 15 | | | | | — | | | | | — | | | | | — | | | | | 15 | |
| | | | | | | | | | | | | | | | | | | | | | | | | |
| | | | | |
Total | | | $ | 262 | | | | $ | (150 | ) | | | | — | | | | | — | | | | $ | 112 | |
| | | | | | | | | | | | | | | | | | | | | | | | | |
| | | | | |
Counterparty | | Derivative
Liabilities
Subject to MNA by
Counterparty | | Derivatives
Available
for Offset3 | | Non-Cash
Collateral
Pledged | | Cash
Collateral
Pledged | | Net Amount of
Derivative
Liabilities2 |
| | | | | |
Barclays Bank PLC | | | $ | 128 | | | | $ | (128 | ) | | | | — | | | | | — | | | | | — | |
BNP PARIBAS | | | | 6 | | | | | (6 | ) | | | | — | | | | | — | | | | | — | |
HSBC Bank USA, N.A. | | | | 29 | | | | | (16 | ) | | | | — | | | | | — | | | | $ | 13 | |
| | | | | | | | | | | | | | | | | | | | | | | | | |
| | | | | |
Total | | | $ | 163 | | | | $ | (150 | ) | | | | — | | | | | — | | | | $ | 13 | |
| | | | | | | | | | | | | | | | | | | | | | | | | |
| | | | | |
High Income | | | | | | | | | | |
| | | | | |
Counterparty | | Derivative Assets
Subject to MNA by
Counterparty | | Derivatives
Available
for Offset3 | | Non-Cash
Collateral
Received | | Cash
Collateral
Received | | Net Amount of
Derivative
Assets1 |
| | | | | |
HSBC Bank USA, N.A. | | | $ | 2 | | | | $ | (2 | ) | | | | — | | | | | — | | | | | — | |
| | | | | | | | | | | | | | | | | | | | | | | | | |
| | | | | |
Counterparty | | Derivative
Liabilities
Subject to MNA by
Counterparty | | Derivatives
Available
for Offset3 | | Non-Cash
Collateral
Pledged | | Cash
Collateral
Pledged | | Net Amount of
Derivative
Liabilities2 |
| | | | | |
HSBC Bank USA, N.A. | | | $ | 81 | | | | $ | (2 | ) | | | | — | | | | | — | | | | $ | 79 | |
| | | | | | | | | | | | | | | | | | | | | | | | | |
128 Payden Mutual Funds
| | | | | | | | | | | | | | | | | | | | | | | | | |
Global Low Duration | | | | | | | | | | |
| | | | | |
Counterparty | | Derivative Assets
Subject to MNA by
Counterparty | | Derivatives
Available
for Offset3 | | Non-Cash
Collateral
Received | | Cash
Collateral
Received | | Net Amount of
Derivative
Assets1 |
| | | | | |
Barclays Bank PLC | | | $ | 58 | | | | $ | (41 | ) | | | | — | | | | | — | | | | $ | 17 | |
BNP PARIBAS | | | | 12 | | | | | (3 | ) | | | | — | | | | | — | | | | | 9 | |
HSBC Bank USA, N.A. | | | | 1 | | | | | (1 | ) | | | | — | | | | | — | | | | | — | |
State Street Bank & Trust Co. | | | | 5 | | | | | — | | | | | — | | | | | — | | | | | 5 | |
| | | | | | | | | | | | | | | | | | | | | | | | | |
Total | | | $ | 76 | | | | $ | (45 | ) | | | | | | | | | — | | | | $ | 31 | |
| | | | | | | | | | | | | | | | | | | | | | | | | |
| | | | | |
Counterparty | | Derivative
Liabilities
Subject to MNA by
Counterparty | | Derivatives
Available
for Offset3 | | Non-Cash
Collateral
Pledged | | Cash
Collateral
Pledged | | Net Amount of
Derivative
Liabilities2 |
| | | | | |
Barclays Bank PLC | | | $ | 41 | | | | $ | (41 | ) | | | | — | | | | | — | | | | | — | |
BNP PARIBAS | | | | 3 | | | | | (3 | ) | | | | — | | | | | — | | | | | — | |
HSBC Bank USA, N.A. | | | | 16 | | | | | (1 | ) | | | | — | | | | | — | | | | $ | 15 | |
| | | | | | | | | | | | | | | | | | | | | | | | | |
Total | | | $ | 60 | | | | $ | (45 | ) | | | | — | | | | | — | | | | $ | 15 | |
| | | | | | | | | | | | | | | | | | | | | | | | | |
| | | | | |
Global Fixed Income | | | | | | | | | | |
| | | | | |
Counterparty | | Derivative Assets
Subject to MNA by
Counterparty | | Derivatives
Available
for Offset3 | | Non-Cash
Collateral
Received | | Cash
Collateral
Received | | Net Amount of
Derivative
Assets1 |
| | | | | |
Barclays Bank PLC | | | $ | 151 | | | | $ | (151 | ) | | | | — | | | | | — | | | | | — | |
BNP PARIBAS | | | | 79 | | | | | (11 | ) | | | | — | | | | | — | | | | $ | 68 | |
HSBC Bank USA, N.A. | | | | 312 | | | | | (168 | ) | | | | — | | | | | — | | | | | 144 | |
Royal Bank of Canada | | | | 74 | | | | | — | | | | | — | | | | | — | | | | | 74 | |
State Street Bank & Trust Co. | | | | 289 | | | | | — | | | | | — | | | | | — | | | | | 289 | |
| | | | | | | | | | | | | | | | | | | | | | | | | |
Total | | | $ | 905 | | | | $ | (330 | ) | | | | — | | | | | — | | | | $ | 575 | |
| | | | | | | | | | | | | | | | | | | | | | | | | |
| | | | | |
Counterparty | | Derivative
Liabilities
Subject to MNA by
Counterparty | | Derivatives
Available
for Offset3 | | Non-Cash
Collateral
Pledged | | Cash
Collateral
Pledged | | Net Amount of
Derivative
Liabilities2 |
| | | | | |
Barclays Bank PLC | | | $ | 188 | | | | $ | (151 | ) | | | | — | | | | | — | | | | $ | 37 | |
BNP PARIBAS | | | | 11 | | | | | (11 | ) | | | | — | | | | | — | | | | | — | |
HSBC Bank USA, N.A. | | | | 168 | | | | | (168 | ) | | | | — | | | | | — | | | | | — | |
| | | | | | | | | | | | | | | | | | | | | | | | | |
Total | | | $ | 367 | | | | $ | (330 | ) | | | | — | | | | | — | | | | $ | 37 | |
| | | | | | | | | | | | | | | | | | | | | | | | | |
| | | | | |
Emerging Markets Bond | | | | | | | | | | |
| | | | | |
Counterparty | | Derivative Assets
Subject to MNA by
Counterparty | | Derivatives
Available
for Offset3 | | Non-Cash
Collateral
Received | | Cash
Collateral
Received | | Net Amount of
Derivative
Assets1 |
| | | | | |
Barclays Bank PLC | | | $ | 471 | | | | $ | (179 | ) | | | $ | (181 | ) | | | | — | | | | $ | 111 | |
HSBC Bank USA, N.A. | | | | 65 | | | | | (50 | ) | | | | — | | | | | — | | | | | 15 | |
State Street Bank & Trust Co. | | | | 617 | | | | | (617 | ) | | | | — | | | | | — | | | | | — | |
| | | | | | | | | | | | | | | | | | | | | | | | | |
Total | | | $ | 1,153 | | | | $ | (846 | ) | | | $ | (181 | ) | | | | — | | | | $ | 126 | |
| | | | | | | | | | | | | | | | | | | | | | | | | |
Annual Report 129
| | | | | | | | | | | | | | | | | | | | | | | | | |
Counterparty | | Derivative
Liabilities
Subject to MNA by
Counterparty | | Derivatives
Available
for Offset3 | | Non-Cash
Collateral
Pledged | | Cash
Collateral
Pledged | | Net Amount of
Derivative
Liabilities2 |
| | | | | |
Barclays Bank PLC | | | $ | 179 | | | | $ | (179 | ) | | | | — | | | | | — | | | | | — | |
HSBC Bank USA, N.A. | | | | 50 | | | | | (50 | ) | | | | — | | | | | — | | | | | — | |
State Street Bank & Trust Co. | | | | 1,444 | | | | | (617 | ) | | | | — | | | | $ | (800 | ) | | | $ | 27 | |
| | | | | | | | | | | | | | | | | | | | | | | | | |
Total | | | $ | 1,673 | | | | $ | (846 | ) | | | | — | | | | $ | (800 | ) | | | $ | 27 | |
| | | | | | | | | | | | | | | | | | | | | | | | | |
| | | | | |
Emerging Markets Local Bond | | | | | | | | | | |
Counterparty | | Derivative Assets
Subject to MNA by
Counterparty | | Derivatives
Available
for Offset3 | | Non-Cash
Collateral
Received | | Cash
Collateral
Received | | Net Amount of
Derivative
Assets1 |
| | | | | |
Barclays Bank PLC | | | $ | 210 | | | | $ | (210 | ) | | | | — | | | | | — | | | | | — | |
BNP PARIBAS | | | | 256 | | | | | (256 | ) | | | | — | | | | | — | | | | | — | |
HSBC Bank USA, N.A. | | | | 17 | | | | | (17 | ) | | | | — | | | | | — | | | | | — | |
State Street Bank & Trust Co. | | | | 190 | | | | | (177 | ) | | | | — | | | | | — | | | | $ | 13 | |
| | | | | | | | | | | | | | | | | | | | | | | | | |
Total | | | $ | 673 | | | | $ | (660 | ) | | | | — | | | | | — | | | | $ | 13 | |
| | | | | | | | | | | | | | | | | | | | | | | | | |
| | | | | |
Counterparty | | Derivative
Liabilities
Subject to MNA by
Counterparty | | Derivatives
Available
for Offset3 | | Non-Cash
Collateral
Pledged | | Cash
Collateral
Pledged | | Net Amount of
Derivative
Liabilities2 |
| | | | | |
Barclays Bank PLC | | | $ | 486 | | | | $ | (210 | ) | | | | — | | | | $ | (276 | ) | | | | — | |
BNP PARIBAS | | | | 485 | | | | | (256 | ) | | | | — | | | | | (229 | ) | | | | — | |
HSBC Bank USA, N.A. | | | | 140 | | | | | (17 | ) | | | | — | | | | | (123 | ) | | | | — | |
State Street Bank & Trust Co. | | | | 177 | | | | | (177 | ) | | | | — | | | | | — | | | | | — | |
| | | | | | | | | | | | | | | | | | | | | | | | | |
Total | | | $ | 1,288 | | | | $ | (660 | ) | | | | — | | | | $ | (628 | ) | | | | — | |
| | | | | | | | | | | | | | | | | | | | | | | | | |
| | | | | |
Emerging Markets Corporate Bond | | | | | | | | | | |
Counterparty | | Derivative Assets
Subject to MNA by
Counterparty | | Derivatives
Available
for Offset3 | | Non-Cash
Collateral
Received | | Cash
Collateral
Received | | Net Amount of
Derivative
Assets1 |
| | | | | |
Barclays Bank PLC | | | $ | 5 | | | | $ | (2 | ) | | | | — | | | | | — | | | | $ | 3 | |
HSBC Bank USA, N.A. | | | | 2 | | | | | (2 | ) | | | | — | | | | | — | | | | | — | |
State Street Bank & Trust Co. | | | | 2 | | | | | (2 | ) | | | | — | | | | | — | | | | | — | |
| | | | | | | | | | | | | | | | | | | | | | | | | |
Total | | | $ | 9 | | | | $ | (6 | ) | | | | — | | | | | — | | | | $ | 3 | |
| | | | | | | | | | | | | | | | | | | | | | | | | |
| | | | | |
Counterparty | | Derivative
Liabilities
Subject to MNA by
Counterparty | | Derivatives
Available
for Offset3 | | Non-Cash
Collateral
Pledged | | Cash
Collateral
Pledged | | Net Amount of
Derivative
Liabilities2 |
| | | | | |
Barclays Bank PLC | | | $ | 2 | | | | $ | (2 | ) | | | | — | | | | | — | | | | | — | |
HSBC Bank USA, N.A. | | | | 2 | | | | | (2 | ) | | | | — | | | | | — | | | | | — | |
State Street Bank & Trust Co. | | | | 15 | | | | | (2 | ) | | | | — | | | | | — | | | | $ | 13 | |
| | | | | | | | | | | | | | | | | | | | | | | | | |
Total | | | $ | 19 | | | | $ | (6 | ) | | | | — | | | | | — | | | | $ | 13 | |
| | | | | | | | | | | | | | | | | | | | | | | | | |
130 Payden Mutual Funds
| | | | | | | | | | | | | | | | | | | | | | | | | |
Equity Income | | | | | | | | | | |
| | | | | |
Counterparty | | Derivative Assets
Subject to MNA by
Counterparty | | Derivatives
Available
for Offset | | Non-Cash
Collateral
Received | | Cash
Collateral
Received | | Net Amount of
Derivative
Assets1 |
Royal Bank of Canada | | | $ | 637 | | | | | — | | | | | — | | | | $ | (320 | ) | | | $ | 317 | |
| | | | | | | | | | | | | | | | | | | | | | | | | |
| | | | | |
Counterparty | | Derivative
Liabilities
Subject to MNA by
Counterparty | | Derivatives
Available
for Offset | | Non-Cash
Collateral
Pledged | | Cash
Collateral
Pledged | | Net Amount of
Derivative
Liabilities2 |
Barclays Bank PLC | | | $ | 51 | | | | | — | | | | | — | | | | | — | | | | $ | 51 | |
| | | | | | | | | | | | | | | | | | | | | | | | | |
| 1 | Net amount represents the net amount receivable from the counterparty in the event of default. |
| 2 | Net amount represents the net amount payable from the counterparty in the event of default. |
| 3 | The amount of derivatives for offset is limited to the amount of assets and/or liabilities that are subject to a MNA. |
Credit Enhancements
Certain obligations held in the Funds have credit enhancement or liquidity features that may, under certain circumstances, provide for repayment of principal and interest on the obligation upon demand date, interest rate reset date or final maturity. These enhancements may include: letters of credit, liquidity guarantees, security purchase agreements, and third party insurance (e.g. AGM, AMBAC and BAM).
TBA Sale Commitments
Some Funds entered into TBA sale commitments, within dollar roll agreements, to hedge their portfolio position or to sell mortgage backed securities they own under delayed delivery arrangements. Proceeds from TBA sale commitments are not received until the contractual settlement date. During the time a TBA sale commitment is outstanding, equivalent deliverable securities, or an offsetting TBA purchase commitment deliverable on or before the sale commitment date, are held as “cover” for the transaction.
Unsettled TBA sale commitments are valued at approximately the current value of the underlying securities. The contract is “marked-to-market” daily and the change in the value is recorded by the Fund as an unrealized gain or loss. If the TBA sale commitment is closed through the acquisition of an offsetting purchase commitment, the Fund realizes a gain or loss from the sale of the securities based upon the unit price established at the date the Fund entered the commitment.
Securities Lending
Pursuant to a securities lending agreement with The Bank of New York Mellon, the Funds (except Cash Reserves Money Market) may lend securities to qualified institutions. It is each Fund’s policy that at origination all loans are secured by collateral of at least 102% of the value of the U.S. securities
loaned and 105% of the value of the foreign securities loaned. Collateral equivalent to at least 100% of the market value of securities on loan is maintained at all times. The collateral is maintained by the custodian. Cash collateral is reinvested in the Payden Cash Reserves Money Market Fund. The Funds are entitled to receive all of the income on securities loaned, in addition to income earned as a result of the lending transaction. Although each security loaned is fully collateralized, each Fund bears the risk of delay in receiving additional collateral or in recovery of or loss of rights in the securities loaned should the borrower fail to return the securities in a timely manner. The Funds maintain the right to recall the securities on loan for voting purposes. The income earned by each Fund is disclosed in the Statements of Operations.
Securities lending transactions are entered into by a Fund under Master Securities Lending Agreements (“MSLA”) which provide the right, in the event of default (including bankruptcy or insolvency), for the non-defaulting party to liquidate the collateral and calculate a net exposure to the defaulting party or request additional collateral. In the event that a borrower defaults, a Fund, as lender, would offset the market value of the collateral received against the market value of the securities loaned. The value of the collateral is typically greater than that of the market value of the securities loaned, leaving the lender with a net amount payable to the defaulting party. However, bankruptcy or insolvency laws of a particular jurisdiction may impose restrictions on or prohibitions against such a right of offset in the event of a MSLA counterparty’s bankruptcy or insolvency. Under the MSLA, the borrower can resell or re-pledge the loaned securities, and a Fund can reinvest cash collateral, or, upon an event of default, resell or re-pledge the collateral.
The Fund’s securities lending agreements by counterparty, which are subject to offset under a MSLA, if applicable, is
Annual Report 131

included within each Fund’s Schedule of Investments under the heading “Offsetting Assets and Liabilities”. For financial reporting purposes, the Funds do not offset financial assets and financial liabilities that are subject to MSLA on the Statements of Assets and Liabilities.
Distributions to Shareholders
Distributions to shareholders are recorded on the ex-dividend date. Dividends from net investment income and net realized gains on foreign currency transactions are declared and paid monthly for all Funds except the Cash Reserves Money Market, Limited Maturity, Short Bond, U.S. Government, GNMA and California Municipal Income Funds, which are declared daily and paid monthly and Equity Income Fund, which is declared and paid quarterly. Net realized gains on investments, if any, are declared and distributed at least annually. All distributions are paid in the form of additional shares unless cash payment is requested.
Distributions to shareholders are determined in accordance with income tax regulations, which may differ from GAAP.
Federal Income Taxes
It is the policy of each Fund to meet the requirements for qualification as a regulated investment company as defined in Subchapter M of the Internal Revenue Code (the “Code”), and to make distributions of net investment income and net realized gains sufficient to relieve it from all Federal income or excise taxes. As of and during the period ended October 31, 2018, the Funds did not record any liability for uncertain tax positions. Accordingly, no provision for Federal income or excise tax is necessary.
Each Fund files a tax return annually using tax accounting methods required under provisions of the Code, which may differ from GAAP, the basis on which these financial statements are prepared. The differences arise primarily from the treatment of foreign currency transactions and futures contracts and the deferral of certain losses under Federal income tax regulations. Accordingly, the amounts of net investment income and net realized gains or losses reported in these financial statements may differ from those reported in each Fund’s tax return. Return of capital distributions and net investment losses for tax purposes, if any, are reclassified to paid in capital.
As of and during the period ended October 31, 2018, the Funds did not have any liabilities for any unrecognized tax positions. The Funds recognize interest and penalties, if any, related to unrecognized tax positions as income tax expense in the Statements of Operations. During the period, the Funds did not incur any interest or penalties.
Each of the tax years in the four-year period ended October 31, 2018 remains subject to examination by the Internal Revenue Service and state taxing authorities.
Affiliated Investments
Each of the Paydenfunds (except the Cash Reserves Money Market and California Municipal Income Funds) invests in other Funds of the Group (an “Affiliated Fund”). The income and both realized and the change in unrealized gains and losses earned by each Fund from the Affiliated Funds for the period is disclosed in the Statements of Operations. The table below details the transactions of each Fund in Affiliated Funds.
| | | | | | | | | | | | | | | | | | | | | | | | | | | | |
Fund | | Value
October 31, 2017 | | | Purchases | | | Sales | | | Dividends | | | Value
October 31, 2018 | | | Realized
Gain
(Loss) | | | Change in
Unrealized Appreciation
(Depreciation) | |
Investments in Cash Reserves Money Market Fund | | | | | | | | | | | | | | | | | | | | | | | | | | | | |
Limited Maturity | | $ | 9,022,262 | | | $ | 1,842,100,873 | | | $ | 1,849,424,682 | | | $ | 103,000 | | | $ | 1,698,453 | | | | — | | | | — | |
Low Duration | | | 2,020,100 | | | | 1,630,412,747 | | | | 1,625,487,968 | | | | 86,403 | | | | 6,944,879 | | | | — | | | | — | |
U.S. Government | | | 2,451,035 | | | | 411,621,017 | | | | 413,372,366 | | | | 23,613 | | | | 699,686 | | | | — | | | | — | |
GNMA | | | 8,841,198 | | | | 843,849,873 | | | | 850,987,985 | | | | 42,886 | | | | 1,703,086 | | | | — | | | | — | |
Core Bond | | | 7,782,184 | | | | 2,466,443,433 | | | | 2,461,631,812 | | | | 141,238 | | | | 12,593,805 | | | | — | | | | — | |
Corporate Bond | | | 10,209,331 | | | | 1,771,630,075 | | | | 1,775,497,087 | | | | 122,240 | | | | 6,342,319 | | | | — | | | | — | |
Strategic Income | | | 8,774,931 | | | | 991,305,993 | | | | 998,790,961 | | | | 56,272 | | | | 1,289,963 | | | | — | | | | — | |
Absolute Return Bond. | | | 2,254,466 | | | | 429,359,087 | | | | 426,273,430 | | | | 24,553 | | | | 5,340,123 | | | | — | | | | — | |
Floating Rate | | | 19,857,225 | | | | 2,977,610,570 | | | | 2,994,015,581 | | | | 149,749 | | | | 3,452,214 | | | | — | | | | — | |
High Income | | | 48,979,077 | | | | 4,052,033,775 | | | | 4,071,901,464 | | | | 217,014 | | | | 29,111,388 | | | | — | | | | — | |
Global Low Duration | | | 750,279 | | | | 260,050,509 | | | | 259,200,101 | | | | 15,605 | | | | 1,600,687 | | | | — | | | | — | |
132 Payden Mutual Funds
| | | | | | | | | | | | | | | | | | | | | | | | | | | | |
Fund | | Value
October 31, 2017 | | | Purchases | | | Sales | | | Dividends | | | Value
October 31, 2018 | | | Realized Gain
(Loss) | | | Change in
Unrealized Appreciation
(Depreciation) | |
Global Fixed Income | | | 1,242,285 | | | | 432,380,535 | | | | 432,427,473 | | | | 24,319 | | | | 1,195,347 | | | | — | | | | — | |
Emerging Markets Bond | | | 62,076,124 | | | | 4,923,575,962 | | | | 4,944,041,452 | | | | 247,005 | | | | 41,610,634 | | | | — | | | | — | |
Emerging Markets Local Bond | | | — | | | | 930,895,756 | | | | 927,067,650 | | | | 55,943 | | | | 3,828,106 | | | | — | | | | — | |
Emerging Markets Corporate Bond | | | 4,038,964 | | | | 464,072,307 | | | | 466,311,247 | | | | 26,683 | | | | 1,800,024 | | | | — | | | | — | |
Equity Income | | | 9,798,906 | | | | 3,789,931,218 | | | | 3,785,591,619 | | | | 197,739 | | | | 14,138,505 | | | | — | | | | — | |
Investments in Floating Rate Fund —SI Class | | | | | | | | | | | | | | | | | | | | | | | | | | | | |
High Income | | $ | 5,964,250 | | | | — | | | $ | 5,952,334 | | | $ | 17,458 | | | | — | | | $ | (47,666 | ) | | $ | 35,750 | |
Global Fixed Income | | | 2,773,897 | | | $ | 2,280,000 | | | | — | | | | 168,536 | | | $ | 5,018,555 | | | | — | | | | (35,342 | ) |
Investments in Emerging Markets Corporate Bond Fund — SI Class | | | | | | | | | | | | | | | | | | | | | | | | | | | | |
Core Bond | | $ | 16,919,676 | | | | — | | | $ | 16,902,777 | | | $ | 88,713 | | | | — | | | $ | 615,084 | | | $ | (631,983 | ) |
High Income | | | 8,387,342 | | | | — | | | | 8,395,454 | | | | 90,930 | | | | — | | | | 283,904 | | | | (275,792 | ) |
Emerging Markets Local Bond | | | 4,949,853 | | | | — | | | | 4,954,640 | | | | 53,663 | | | | — | | | | 54,640 | | | | (49,853 | ) |
Custodian Credits
The Funds have entered into an agreement with the custodian, whereby they earn custodian fee credits for temporary cash balances. These credits, which offset custodian fees that may be charged to the Funds, are based on 75% of the daily effective federal funds rate and are disclosed, subject to rounding, in the Statements of Operations. There were no custodian credits applicable to any fund during the period ended October 31, 2018.
Line of Credit
The Paydenfunds (except Cash Reserves Money Market) have entered into a Credit Agreement with Bank of New York Mellon under which the bank has agreed to make loans to one or more of the Funds upon request by such Fund(s) and subject to the conditions of the Credit Agreement. The interest rate for any such loan will vary depending upon the type of borrowing chosen by the Fund. The aggregate of all such loans to the Funds may not exceed $75 million. No Fund took a loan during the period, nor did any Fund have a loan outstanding at the end of the period.
Other
Income and realized and unrealized gain/loss are allocated to each class based on relative net assets. Shared expenses incurred by the Group are allocated among the Funds of the Group on the basis of relative net assets. Fund-specific expenses are charged to each Fund as incurred.
In March 2017, the FASB issued Accounting Standards Update “Premium Amortization of Purchased Callable Debt Securities” which amends the amortization period for certain purchased callable debt securities. Under the new guidance, the premium amortization of purchased callable debt securities that have explicit, non-contingent call features and are callable at fixed prices will be amortized to the earliest call date. The guidance will be applied on a modified retrospective basis and is effective for fiscal years, and their interim periods, beginning after December 15, 2018. Management is currently evaluating the impact of this guidance to the Funds.
3. Related Party Transactions
Payden & Rygel (the “Adviser”) provides investment advisory services to the Funds. Under the terms of the investment advisory agreement, the Adviser is entitled to receive fees monthly, computed on the average daily net assets of each of the Funds separately at an annualized rate. The rates for each Fund are shown in the table below.
Annual Report 133
| | | | | | | | | | | | | | | | | | | | | | | | | | | | | | | | | | | | | | | | |
| | | Adviser Fees | | | Investor Class | | | SI Class | | | 3 Year Deferred Expense Subsidy | |
| | | Between
$0–500
Million | | | Between
$0.5–1
Billion | | | Between
$1–2
Billion | | | Over $2
Billion | | | Expense
Guarantee | | | Current
Voluntary
Expense Limit | | | Current
Voluntary
Expense Limit | | | FY 2016 | | | FY 2017 | | | FY 2018 | |
Cash Reserves Money Market | | | 0.15 | % | | | 0.15 | % | | | 0.15 | % | | | 0.15 | % | | | 0.50 | % | | | 0.25 | % | | | n/a | | | $ | 548,191 | | | $ | 525,215 | | | $ | 459,206 | |
Limited Maturity | | | 0.28 | % | | | 0.28 | % | | | 0.25 | % | | | 0.25 | % | | | 0.60 | % | | | 0.25 | % | | | n/a | | | | 1,402,448 | | | | 1,754,647 | | | | 2,413,311 | |
Low Duration | | | 0.28 | % | | | 0.28 | % | | | 0.25 | % | | | 0.25 | % | | | 0.60 | % | | | 0.43 | % | | | n/a | | | | 920,321 | | | | 1,015,315 | | | | 1,233,072 | |
U.S. Government | | | 0.28 | % | | | 0.28 | % | | | 0.25 | % | | | 0.25 | % | | | 0.60 | % | | | 0.43 | % | | | n/a | | | | 181,602 | | | | 149,965 | | | | 156,901 | |
GNMA | | | 0.27 | % | | | 0.27 | % | | | 0.27 | % | | | 0.27 | % | | | 0.50 | % | | | n/a | | | | n/a | | | | 539,825 | | | | 478,155 | | | | 359,812 | |
Core Bond | | | 0.28 | % | | | 0.28 | % | | | 0.25 | % | | | 0.25 | % | | | 0.60 | % | | | 0.53 | % | | | 0.42 | % | | | — | | | | 14,626 | | | | 172,909 | |
Corporate Bond | | | 0.35 | % | | | 0.35 | % | | | 0.35 | % | | | 0.35 | % | | | 1.00 | % | | | 0.65 | % | | | n/a | | | | 88,939 | | | | 80,978 | | | | 143,962 | |
Strategic Income | | | 0.55 | % | | | 0.55 | % | | | 0.55 | % | | | 0.55 | % | | | n/a | | | | 0.70 | % | | | 0.55 | % | | | 209,400 | | | | 216,150 | | | | 356,122 | |
Absolute Return Bond | | | 0.50 | % | | | 0.50 | % | | | 0.50 | % | | | 0.50 | % | | | n/a | | | | 0.70 | % | | | 0.55 | % | | | 210,322 | | | | 190,888 | | | | 233,184 | |
Floating Rate | | | 0.55 | % | | | 0.55 | % | | | 0.55 | % | | | 0.55 | % | | | n/a | | | | 0.75 | % | | | 0.65 | % | | | 291,349 | | | | 283,851 | | | | 267,525 | |
High Income | | | 0.35 | % | | | 0.35 | % | | | 0.35 | % | | | 0.35 | % | | | 0.75 | % | | | n/a | | | | n/a | | | | — | | | | — | | | | — | |
California Municipal Income | | | 0.32 | % | | | 0.32 | % | | | 0.25 | % | | | 0.25 | % | | | 0.80 | % | | | 0.53 | % | | | n/a | | | | 81,740 | | | | 88,888 | | | | 86,089 | |
Global Low Duration | | | 0.30 | % | | | 0.30 | % | | | 0.30 | % | | | 0.25 | % | | | 0.70 | % | | | 0.53 | % | | | n/a | | | | 148,823 | | | | 147,245 | | | | 144,641 | |
Global Fixed Income | | | 0.30 | % | | | 0.30 | % | | | 0.30 | % | | | 0.25 | % | | | 0.70 | % | | | n/a | | | | n/a | | | | 143,423 | | | | 155,282 | | | | 95,623 | |
Emerging Markets Bond | | | 0.45 | % | | | 0.45 | % | | | 0.45 | % | | | 0.45 | % | | | 1.25 | % | | | n/a | | | | 0.69 | % | | | 345,690 | | | | 351,530 | | | | 395,095 | |
Emerging Markets Local Bond | | | 0.60 | % | | | 0.60 | % | | | 0.60 | % | | | 0.60 | % | | | 1.50 | % | | | 0.99 | % | | | n/a | | | | — | | | | 167,908 | | | | — | |
Emerging Markets Corporate Bond | | | 0.80 | % | | | 0.80 | % | | | 0.80 | % | | | 0.80 | % | | | n/a | | | | 0.95 | % | | | 0.85 | % | | | 189,600 | | | | 184,804 | | | | 193,589 | |
Equity Income | | | 0.50 | % | | | 0.50 | % | | | 0.50 | % | | | 0.30 | % | | | 0.80 | % | | | n/a | | | | 0.65 | % | | | 355,073 | | | | 222,256 | | | | 571,830 | |
The Adviser agreed to guarantee that, for so long as it acts as investment adviser to the Funds, the expenses of the Funds, including advisory fees (exclusive of interest, 12b-1 fees, and taxes) will not exceed the percentages indicated above (“Expense Guarantee”) of that Fund’s average daily net assets on an annualized basis. The adviser also voluntarily agreed to temporarily limit certain Funds’ total expenses (“Voluntary Expense Limit”), including advisory fees, to the percentages indicated above of that Fund’s average daily net assets on an annualized basis through February 28, 2019 (exclusive of interest and taxes).
Each Fund remains liable to the Adviser for expenses subsidized in any fiscal year up to a maximum of three years from the end of the period in which the expenses were subsidized as long as any reimbursement will not cause the annual expense ratio for the year in which it is made to exceed the amount of the expense guarantee or voluntary expense limit (whichever is in effect at the time of waiver or reimbursement).
The deferred expense subsidies represent the cumulative amount of expenses subsidized for the Funds through the end of
the period. Such amount is not considered a liability of each respective Fund, and, therefore, is not recorded as liabilities in the Statements of Assets and Liabilities, but will be recognized as net expense in the Statements of Operations as expense previously deferred in future periods, if expense limits permit.
Treasury Plus, Inc., a wholly owned subsidiary of Payden & Rygel, serves as administrator to the Funds. Under the terms of the administration agreement, Treasury Plus, Inc. receives fees monthly, computed on the average daily net assets of the Funds at an annualized rate of 0.15%.
Under a distribution agreement with the Funds, the Core Bond, Emerging Markets Bond and Equity Income Funds adopted a plan pursuant to SEC rule 12b-1 by which Payden & Rygel Distributors receives fee monthly, computed on the average net assets of the Adviser class at an annualized rate of 0.25%. Payden & Rygel Distributors is not entitled to receive any fees from the Investor or SI classes of the Funds.
Certain officers and/or trustees of the Funds are affiliated with Payden & Rygel, Payden & Rygel Distributors and/or Treasury Plus, Inc. Such officers and trustees receive no fees from the Funds for serving as officers and/or trustees of the Funds.
134 Payden Mutual Funds
The Funds may purchase securities from or sell securities to an affiliated fund or portfolio provided that the affiliation is due solely to having a common investment advisor, common officers or common trustees.
Indemnifications
Under the Group’s organizational documents, its trustees and officers are indemnified by the Funds against certain liabilities arising out of the performance of their duties to the Funds. Additionally, in the normal course of business, the Funds enter into contracts with service providers that contain general indemnification clauses. A Fund’s maximum exposure under these agreements is unknown as this would involve future claims that may be made against the Fund that have not yet occurred. Currently the Funds expect this risk of loss to be remote.
4. Fair Value Measurement
Various inputs are used in determining the value of each Fund’s investments and other financial instruments. The inputs or methodology used for valuing securities are not necessarily an indication of the risk associated with investing in those securities. These inputs are summarized in the three broad levels: Level 1 — quoted prices in active markets for identical investments, Level 2 — other significant observable inputs (including quoted prices for similar securities, interest rates, prepayment speeds, credit risk, etc.), and Level 3 — significant unobservable inputs (including fund’s own assumptions in determining the fair value of investments). See Note 2 —Securities Valuation for a summary of the inputs used in valuing the Funds’ investments and other financial instruments.
Annual Report 135
| | | | | | | | | | | | | | | | | | | | | | | | | | | | |
| | | Investments in Securities | |
| | | | | | |
| | | | | | | | | Level 2-Other | | | | | | | | | | |
| | | | | | | | | Significant | | | Level 3-Significant | | | | |
| | | Level 1-Quoted Prices | | | Observable Inputs | | | Unobservable Inputs | | | | |
| | | | | | | |
| | | Assets
(000’s) | | | Liabilities
(000’s) | | | Assets
(000’s) | | | Liabilities
(000’s) | | | Assets
(000’s) | | | Liabilities
(000’s) | | | Total
(000’s) | |
Cash Reserves Money Market | | | | | | | | | | | | | | | | | | | | | | | | | | | | |
Mortgage Backed | | | — | | | | — | | | | $ 8,851 | | | | — | | | | — | | | | — | | | | $ 8,851 | |
Repurchase Agreement. | | | — | | | | — | | | | 100,000 | | | | — | | | | — | | | | — | | | | 100,000 | |
U.S. Government | | | — | | | | — | | | | 69,786 | | | | — | | | | — | | | | — | | | | 69,786 | |
U.S. Treasury | | | — | | | | — | | | | 149,413 | | | | — | | | | — | | | | — | | | | 149,413 | |
Investment Company | | $ | 2,210 | | | | — | | | | — | | | | — | | | | — | | | | — | | | | 2,210 | |
| | | | | | | |
Limited Maturity | | | | | | | | | | | | | | | | | | | | | | | | | | | | |
Asset Backed | | | — | | | | — | | | | 125,638 | | | | — | | | | — | | | | — | | | | 125,638 | |
Bank Loans | | | — | | | | — | | | | 493 | | | | — | | | | — | | | | — | | | | 493 | |
Commercial Paper | | | — | | | | — | | | | 27,670 | | | | — | | | | — | | | | — | | | | 27,670 | |
Corporate Bond | | | — | | | | — | | | | 412,546 | | | | — | | | | — | | | | — | | | | 412,546 | |
Foreign Government | | | — | | | | — | | | | 18,748 | | | | — | | | | — | | | | — | | | | 18,748 | |
Morgage Backed | | | — | | | | — | | | | 72,817 | | | | — | | | | — | | | | — | | | | 72,817 | |
Municipal | | | — | | | | — | | | | 5,386 | | | | — | | | | | | | | | | | | 5,386 | |
U.S. Government | | | — | | | | — | | | | 124,294 | | | | — | | | | — | | | | — | | | | 124,294 | |
Investment Company | | | 1,698 | | | | — | | | | — | | | | — | | | | — | | | | — | | | | 1,698 | |
| | | | | | | |
Low Duration | | | | | | | | | | | | | | | | | | | | | | | | | | | | |
Asset Backed | | | — | | | | — | | | | 135,377 | | | | — | | | | — | | | | — | | | | 135,377 | |
Bank Loans | | | — | | | | — | | | | 1,248 | | | | — | | | | — | | | | — | | | | 1,248 | |
Corporate Bond | | | — | | | | — | | | | 468,065 | | | | — | | | | — | | | | — | | | | 468,065 | |
Foreign Government | | | | | | | — | | | | 29,445 | | | | — | | | | — | | | | — | | | | 29,445 | |
Morgage Backed | | | — | | | | — | | | | 93,533 | | | | — | | | | — | | | | — | | | | 93,533 | |
U.S. Government | | | — | | | | — | | | | 475,420 | | | | — | | | | — | | | | — | | | | 475,420 | |
Investment Company | | | 6,945 | | | | — | | | | — | | | | — | | | | — | | | | — | | | | 6,945 | |
| | | | | | | |
U.S. Government | | | | | | | | | | | | | | | | | | | | | | | | | | | | |
Mortgage Backed | | | — | | | | — | | | | 32,728 | | | | — | | | | — | | | | — | | | | 32,728 | |
U.S. Government | | | — | | | | — | | | | 4,039 | | | | — | | | | — | | | | — | | | | 4,039 | |
Investment Company | | | 700 | | | | — | | | | — | | | | — | | | | — | | | | — | | | | 700 | |
| | | | | | | |
GNMA | | | | | | | | | | | | | | | | | | | | | | | | | | | | |
Mortgage Backed | | | — | | | | — | | | | 231,250 | | | | — | | | | — | | | | — | | | | 231,250 | |
U.S. Treasury | | | — | | | | — | | | | 1,498 | | | | — | | | | — | | | | — | | | | 1,498 | |
Investment Company | | | 1,703 | | | | — | | | | — | | | | — | | | | — | | | | — | | | | 1,703 | |
136 Payden Mutual Funds
| | | | | | | | | | | | | | | | | | | | | | | | | | | | |
| | | Investments in Securities | |
| | | | | | |
| | | | | | | | | Level 2-Other | | | | | | | | | | |
| | | | | | | | | Significant | | | Level 3-Significant | | | | |
| | | Level 1-Quoted Prices | | | Observable Inputs | | | Unobservable Inputs | | | | |
| | | | | | | |
| | | Assets
(000’s) | | | Liabilities
(000’s) | | | Assets
(000’s) | | | Liabilities
(000’s) | | | Assets
(000’s) | | | Liabilities
(000’s) | | | Total
(000’s) | |
Core Bond | | | | | | | | | | | | | | | | | | | | | | | | | | | | |
Asset Backed | | | — | | | | — | | | $ | 61,813 | | | | — | | | | — | | | | — | | | $ | 61,813 | |
Bank Loans | | | — | | | | — | | | | 25,813 | | | | — | | | | — | | | | — | | | | 25,813 | |
Corporate Bond | | | — | | | | — | | | | 362,885 | | | | — | | | | — | | | | — | | | | 362,885 | |
Foreign Government | | | — | | | | — | | | | 32,022 | | | | — | | | | — | | | | — | | | | 32,022 | |
Morgage Backed | | | — | | | | — | | | | 296,310 | | | | — | | | | — | | | | — | | | | 296,310 | |
Municipal | | | — | | | | — | | | | 13,533 | | | | — | | | | — | | | | — | | | | 13,533 | |
Preferred Stock | | $ | 992 | | | | — | | | | — | | | | — | | | | — | | | | — | | | | 992 | |
Swaptions Purchased | | | — | | | | — | | | | 1,171 | | | | — | | | | — | | | | — | | | | 1,171 | |
U.S. Government | | | — | | | | — | | | | 198,202 | | | | — | | | | — | | | | — | | | | 198,202 | |
Investment Company | | | 12,594 | | | | — | | | | — | | | | — | | | | — | | | | — | | | | 12,594 | |
| | | | | | | |
Corporate Bond | | | | | | | | | | | | | | | | | | | | | | | | | | | | |
Asset Backed | | | — | | | | — | | | | 838 | | | | — | | | | — | | | | — | | | | 838 | |
Corporate Bond | | | — | | | | — | | | | 285,753 | | | | — | | | | — | | | | — | | | | 285,753 | |
Foreign Government | | | — | | | | — | | | | 1,142 | | | | — | | | | — | | | | — | | | | 1,142 | |
Municipal Bond | | | — | | | | — | | | | 2,798 | | | | — | | | | — | | | | — | | | | 2,798 | |
Investment Company | | | 6,342 | | | | — | | | | — | | | | — | | | | — | | | | — | | | | 6,342 | |
| | | | | | | |
Strategic Income | | | | | | | | | | | | | | | | | | | | | | | | | | | | |
Asset Backed | | | — | | | | — | | | | 15,214 | | | | — | | | | — | | | | — | | | | 15,214 | |
Bank Loans | | | — | | | | — | | | | 15,397 | | | | — | | | | — | | | | — | | | | 15,397 | |
Commercial Paper | | | — | | | | — | | | | 2,000 | | | | — | | | | — | | | | — | | | | 2,000 | |
Corporate Bond | | | — | | | | — | | | | 86,362 | | | | — | | | | — | | | | — | | | | 86,362 | |
Foreign Government | | | — | | | | — | | | | 12,361 | | | | — | | | | — | | | | — | | | | 12,361 | |
Mortgage Backed | | | — | | | | — | | | | 27,977 | | | | — | | | | — | | | | — | | | | 27,977 | |
Municipal | | | — | | | | — | | | | 4,083 | | | | — | | | | — | | | | — | | | | 4,083 | |
Swaptions Purchased | | | — | | | | — | | | | 245 | | | | — | | | | — | | | | — | | | | 245 | |
U.S. Government | | | — | | | | — | | | | 33,762 | | | | — | | | | — | | | | — | | | | 33,762 | |
Master Limited Partnership | | | 2,300 | | | | — | | | | — | | | | — | | | | — | | | | — | | | | 2,300 | |
Preferred Stock | | | 1,104 | | | | — | | | | — | | | | — | | | | — | | | | — | | | | 1,104 | |
Real Estate Investment Trust | | | 1,826 | | | | — | | | | — | | | | — | | | | — | | | | — | | | | 1,826 | |
Investment Company | | | 1,290 | | | | — | | | | — | | | | — | | | | — | | | | — | | | | 1,290 | |
Annual Report 137
| | | | | | | | | | | | | | | | | | | | | | | | | | | | |
| | | Investments in Securities | |
| | | | | | |
| | | | | | | | | Level 2-Other | | | | | | | | | | |
| | | | | | | | | Significant | | | Level 3-Significant | | | | |
| | | Level 1-Quoted Prices | | | Observable Inputs | | | Unobservable Inputs | | | | |
| | | | | | | |
| | | Assets
(000’s) | | | Liabilities
(000’s) | | | Assets
(000’s) | | | Liabilities
(000’s) | | | Assets
(000’s) | | | Liabilities
(000’s) | | | Total
(000’s) | |
Absolute Return Bond | | | | | | | | | | | | | | | | | | | | | | | | | | | | |
Asset Backed | | | — | | | | — | | | $ | 35,958 | | | | — | | | | — | | | | — | | | $ | 35,958 | |
Bank Loans | | | — | | | | — | | | | 6,162 | | | | — | | | | — | | | | — | | | | 6,162 | |
Corporate Bond | | | — | | | | — | | | | 30,134 | | | | — | | | | — | | | | — | | | | 30,134 | |
Foreign Government | | | — | | | | — | | | | 15,760 | | | | — | | | | — | | | | — | | | | 15,760 | |
Mortgage Backed | | | — | | | | — | | | | 48,240 | | | | — | | | | — | | | | — | | | | 48,240 | |
Swaptions Purchased | | | — | | | | — | | | | 176 | | | | — | | | | — | | | | — | | | | 176 | |
U.S. Government | | | — | | | | — | | | | 1,096 | | | | — | | | | — | | | | — | | | | 1,096 | |
Investment Company | | $ | 5,340 | | | | — | | | | — | | | | — | | | | — | | | | — | | | | 5,340 | |
| | | | | | | |
Floating Rate | | | | | | | | | | | | | | | | | | | | | | | | | | | | |
Asset Backed | | | — | | | | — | | | | 1,505 | | | | — | | | | — | | | | — | | | | 1,505 | |
Bank Loans | | | — | | | | — | | | | 122,292 | | | | — | | | | — | | | | — | | | | 122,292 | |
Corporate Bond | | | — | | | | — | | | | 22,421 | | | | — | | | | — | | | | — | | | | 22,421 | |
Mortgage Backed | | | — | | | | — | | | | 5,123 | | | | — | | | | — | | | | — | | | | 5,123 | |
Preferred Stock | | | 496 | | | | — | | | | — | | | | — | | | | — | | | | — | | | | 496 | |
Investment Company | | | 3,452 | | | | — | | | | — | | | | — | | | | — | | | | — | | | | 3,452 | |
Unfunded floating rate loan interests1 | | | — | | | | — | | | | — | | | | (1 | ) | | | — | | | | — | | | | (1 | ) |
| | | | | | | |
High Income | | | | | | | | | | | | | | | | | | | | | | | | | | | | |
Bank Loans | | | — | | | | — | | | | 10,893 | | | | — | | | | — | | | | — | | | | 10,893 | |
Corporate Bond | | | — | | | | — | | | | 405,683 | | | | — | | | | — | | | | — | | | | 405,683 | |
Exchange Traded Fund | | | 2,294 | | | | — | | | | — | | | | — | | | | — | | | | — | | | | 2,294 | |
Mortgage Backed | | | — | | | | — | | | | 10,214 | | | | — | | | | — | | | | — | | | | 10,214 | |
Master Limited Partnership | | | 1,993 | | | | — | | | | — | | | | — | | | | — | | | | — | | | | 1,993 | |
Preferred Stock | | | 3,489 | | | | — | | | | — | | | | — | | | | — | | | | — | | | | 3,489 | |
U.S. Government | | | — | | | | — | | | | 2,005 | | | | — | | | | — | | | | — | | | | 2,005 | |
Investment Company | | | 29,111 | | | | — | | | | — | | | | — | | | | — | | | | — | | | | 29,111 | |
Unfunded floating rate loan interests1 | | | — | | | | — | | | | — | | | | (1 | ) | | | — | | | | — | | | | (1 | ) |
| | | | | | | |
California Municipal Income | | | | | | | | | | | | | | | | | | | | | | | | | | | | |
Municipal | | | — | | | | — | | | | 58,006 | | | | — | | | | — | | | | — | | | | 58,006 | |
| | | | | | | |
Global Low Duration | | | | | | | | | | | | | | | | | | | | | | | | | | | | |
Asset Backed | | | — | | | | — | | | | 8,109 | | | | — | | | | — | | | | — | | | | 8,109 | |
Bank Loans | | | — | | | | — | | | | 203 | | | | — | | | | — | | | | — | | | | 203 | |
Corporate Bond | | | — | | | | — | | | | 57,552 | | | | — | | | | — | | | | — | | | | 57,552 | |
Foreign Government | | | — | | | | — | | | | 6,156 | | | | — | | | | — | | | | — | | | | 6,156 | |
Mortgage Backed | | | — | | | | — | | | | 9,450 | | | | — | | | | — | | | | — | | | | 9,450 | |
Swaptions Purchased | | | — | | | | — | | | | 124 | | | | — | | | | — | | | | — | | | | 124 | |
U.S. Government | | | — | | | | — | | | | 10,913 | | | | — | | | | — | | | | — | | | | 10,913 | |
Investment Company | | | 1,601 | | | | — | | | | — | | | | — | | | | — | | | | — | | | | 1,601 | |
138 Payden Mutual Funds
| | | | | | | | | | | | | | | | | | | | | | | | | | | | |
| | | Investments in Securities | |
| | | | |
| | | Level 1-Quoted Prices | | | Level 2-Other
Significant
Observable Inputs | | | Level 3-Significant
Unobservable Inputs | | | | |
| | | Assets
(000’s) | | | Liabilities
(000’s) | | | Assets
(000’s) | | | Liabilities
(000’s) | | | Assets
(000’s) | | | Liabilities
(000’s) | | | Total
(000’s) | |
Global Fixed Income | | | | | | | | | | | | | | | | | | | | | | | | | | | | |
Asset Backed | | | — | | | | — | | | $ | 6,706 | | | | — | | | | — | | | | — | | | $ | 6,706 | |
Corporate Bond | | | — | | | | — | | | | 45,102 | | | | — | | | | — | | | | — | | | | 45,102 | |
Foreign Government | | | — | | | | — | | | | 54,202 | | | | — | | | | — | | | | — | | | | 54,202 | |
Mortgage Backed | | | — | | | | — | | | | 15,590 | | | | — | | | | — | | | | — | | | | 15,590 | |
Preferred Stock | | $ | 152 | | | | — | | | | — | | | | — | | | | — | | | | — | | | | 152 | |
Swaptions Purchased | | | — | | | | — | | | | 51 | | | | — | | | | — | | | | — | | | | 51 | |
U.S. Government | | | — | | | | — | | | | 7,521 | | | | — | | | | — | | | | — | | | | 7,521 | |
Investment Company | | | 1,195 | | | | — | | | | — | | | | — | | | | — | | | | — | | | | 1,195 | |
Investments Valued at NAV2 | | | — | | | | — | | | | — | | | | — | | | | — | | | | — | | | | 5,019 | |
| | | | | | | |
Emerging Markets Bond | | | | | | | | | | | | | | | | | | | | | | | | | | | | |
Corporate Bond | | | — | | | | — | | | | 423,312 | | | | — | | | | — | | | | — | | | | 423,312 | |
Foreign Government | | | — | | | | — | | | | 827,118 | | | | — | | | | — | | | | — | | | | 827,118 | |
Investment Company | | | 41,610 | | | | — | | | | — | | | | — | | | | — | | | | — | | | | 41,610 | |
| | | | | | | |
Emerging Markets Local Bond | | | | | | | | | | | | | | | | | | | | | | | | | | | | |
Corporate Bond | | | — | | | | — | | | | 34,503 | | | | — | | | | — | | | | — | | | | 34,503 | |
Foreign Government | | | — | | | | — | | | | 162,859 | | | | — | | | | — | | | | — | | | | 162,859 | |
Investment Company | | | 3,828 | | | | — | | | | — | | | | — | | | | — | | | | — | | | | 3,828 | |
| | | | | | | |
Emerging Markets Corporate Bond | | | | | | | | | | | | | | | | | | | | | | | | | | | | |
Bank Loans | | | — | | | | — | | | | 1,431 | | | | — | | | | — | | | | — | | | | 1,431 | |
Corporate Bond | | | — | | | | — | | | | 39,699 | | | | — | | | | — | | | | — | | | | 39,699 | |
Foreign Government | | | — | | | | — | | | | 1,346 | | | | — | | | | — | | | | — | | | | 1,346 | |
Mortgage Backed | | | — | | | | — | | | | 875 | | | | — | | | | — | | | | — | | | | 875 | |
Investment Company | | | 1,800 | | | | — | | | | — | | | | — | | | | — | | | | — | | | | 1,800 | |
| | | | | | | |
Equity Income | | | | | | | | | | | | | | | | | | | | | | | | | | | | |
Common Stock | | | 971,762 | | | | — | | | | — | | | | — | | | | — | | | | — | | | | 971,762 | |
Corporate Bond | | | — | | | | — | | | | 35,794 | | | | — | | | | — | | | | — | | | | 35,794 | |
Master Limited Partnership | | | 96,219 | | | | — | | | | — | | | | — | | | | — | | | | — | | | | 96,219 | |
Preferred Stock | | | 13,296 | | | | — | | | | — | | | | — | | | | — | | | | — | | | | 13,296 | |
Real Estate Investment Trust | | | 62,320 | | | | — | | | | — | | | | — | | | | — | | | | — | | | | 62,320 | |
Investment Company | | | 14,138 | | | | — | | | | — | | | | — | | | | — | | | | — | | | | 14,138 | |
| 1 | Unfunded floating rate loan interests are valued at the unrealized appreciation/depreciation on the commitment. |
| 2 | As of October 31, 2018, certain investments of the Fund were fair valued using NAV per share as no quoted market value is available and therefore have been excluded from the fair value hierarchy. |
Annual Report 139
| | | | | | | | | | | | | | | | | | | | | | | | | | | | |
| | | Other Financial Instruments 1 | |
| | | Level 1-Quoted Prices | | | Level 2-Other
Significant
Observable Inputs | | | Level 3-Significant
Unobservable Inputs | | | | |
| | | | | | | |
| | | Assets
(000’s) | | | Liabilities
(000’s) | | | Assets
(000’s) | | | Liabilities
(000’s) | | | Assets
(000’s) | | | Liabilities
(000’s) | | | Total
(000’s) | |
Limited Maturity | | | | | | | | | | | | | | | | | | | | | | | | | | | | |
Forward currency contracts | | | — | | | | — | | | $ | 227 | | | | — | | | | — | | | | — | | | $ | 227 | |
| | | | | | | |
Low Duration | | | | | | | | | | | | | | | | | | | | | | | | | | | | |
Forward currency contracts | | | — | | | | — | | | | 56 | | | | — | | | | — | | | | — | | | | 56 | |
Futures | | $ | 346 | | | $ | (265 | ) | | | — | | | | — | | | | — | | | | — | | | | 81 | |
| | | | | | | |
Core Bond | | | | | | | | | | | | | | | | | | | | | | | | | | | | |
Forward currency contracts | | | — | | | | — | | | | 468 | | | $ | (292 | ) | | | — | | | | — | | | | 176 | |
Futures | | | 848 | | | | (726 | ) | | | — | | | | — | | | | — | | | | — | | | | 122 | |
Swaps | | | — | | | | — | | | | — | | | | (24 | ) | | | — | | | | — | | | | (24 | ) |
Swaptions Written | | | — | | | | — | | | | — | | | | (848 | ) | | | — | | | | — | | | | (848 | ) |
| | | | | | | |
Corporate Bond | | | | | | | | | | | | | | | | | | | | | | | | | | | | |
Futures | | | 75 | | | | (871 | ) | | | — | | | | — | | | | — | | | | — | | | | (796 | ) |
| | | | | | | |
Strategic Income | | | | | | | | | | | | | | | | | | | | | | | | | | | | |
Forward currency contracts | | | — | | | | — | | | | 150 | | | | (62 | ) | | | — | | | | — | | | | 88 | |
Futures | | | 3 | | | | (212 | ) | | | — | | | | — | | | | — | | | | — | | | | (209 | ) |
Swaps | | | — | | | | — | | | | — | | | | (5 | ) | | | — | | | | — | | | | (5 | ) |
Swaptions Written | | | — | | | | — | | | | — | | | | (178 | ) | | | — | | | | — | | | | (178 | ) |
| | | | | | | |
Absolute Return | | | | | | | | | | | | | | | | | | | | | | | | | | | | |
Forward currency contracts | | | — | | | | — | | | | 157 | | | | (36 | ) | | | — | | | | — | | | | 121 | |
Futures | | | 1 | | | | — | | | | — | | | | — | | | | — | | | | — | | | | 1 | |
Swaps | | | — | | | | — | | | | — | | | | (4 | ) | | | — | | | | — | | | | (4 | ) |
Swaptions Written | | | — | | | | — | | | | — | | | | (127 | ) | | | — | | | | — | | | | (127 | ) |
| | | | | | | |
High Income | | | | | | | | | | | | | | | | | | | | | | | | | | | | |
Forward currency contracts | | | — | | | | — | | | | 137 | | | | (81 | ) | | | — | | | | — | | | | 56 | |
Swaps | | | — | | | | — | | | | — | | | | (29 | ) | | | — | | | | — | | | | (29 | ) |
| | | | | | | |
California Municipal | | | | | | | | | | | | | | | | | | | | | | | | | | | | |
Futures | | | 6 | | | | — | | | | — | | | | — | | | | — | | | | — | | | | 6 | |
| | | | | | | |
Global Low Duration | | | | | | | | | | | | | | | | | | | | | | | | | | | | |
Forward currency contracts | | | — | | | | — | | | | 49 | | | | (26 | ) | | | — | | | | — | | | | 23 | |
Futures | | | 57 | | | | (49 | ) | | | — | | | | — | | | | — | | | | — | | | | 8 | |
Swaptions Written | | | — | | | | — | | | | — | | | | (89 | ) | | | — | | | | — | | | | (89 | ) |
140 Payden Mutual Funds
| | | | | | | | | | | | | | | | | | | | | | | | | | | | |
| | | Other Financial Instruments 1 | |
| | | Level 1-Quoted Prices | | | Level 2-Other
Significant
Observable Inputs | | | Level 3-Significant
Unobservable Inputs | | | | |
| | | | | | | |
| | | Assets
(000’s) | | | Liabilities
(000’s) | | | Assets
(000’s) | | | Liabilities
(000’s) | | | Assets
(000’s) | | | Liabilities
(000’s) | | | Total
(000’s) | |
Global Fixed Income | | | | | | | | | | | | | | | | | | | | | | | | | | | | |
Forward currency contracts | | | — | | | | — | | | $ | 1,407 | | | $ | (527 | ) | | | — | | | | — | | | $ | 880 | |
Futures | | $ | 113 | | | $ | (280 | ) | | | — | | | | — | | | | — | | | | — | | | | (167 | ) |
Swaps | | | — | | | | — | | | | 14 | | | | — | | | | — | | | | — | | | | 14 | |
Swaptions Written | | | — | | | | — | | | | — | | | | (47 | ) | | | — | | | | — | | | | (47 | ) |
| | | | | | | |
Emerging Markets Bond | | | | | | | | | | | | | | | | | | | | | | | | | | | | |
Forward currency contracts | | | — | | | | — | | | | 1,153 | | | | (1,673 | ) | | | — | | | | — | | | | (520 | ) |
Futures | | | — | | | | (3 | ) | | | — | | | | — | | | | — | | | | — | | | | (3 | ) |
| | | | | | | |
Emerging Markets Local Bond | | | | | | | | | | | | | | | | | | | | | | | | | | | | |
Forward currency contracts | | | — | | | | — | | | | 673 | | | | (1,288 | ) | | | — | | | | — | | | | (615 | ) |
Futures | | | 50 | | | | — | | | | — | | | | — | | | | — | | | | — | | | | 50 | |
| | | | | | | |
Emerging Markets Corporate Bond | | | | | | | | | | | | | | | | | | | | | | | | | | | | |
Forward currency contracts | | | — | | | | — | | | | 9 | | | | (19 | ) | | | — | | | | — | | | | (10 | ) |
Futures | | | — | | | | (2 | ) | | | — | | | | — | | | | — | | | | — | | | | (2 | ) |
| | | | | | | |
Equity Income | | | | | | | | | | | | | | | | | | | | | | | | | | | | |
Forward currency contracts | | | — | | | | — | | | | 1,150 | | | | (51 | ) | | | — | | | | — | | | | 1,099 | |
| 1 | Other financial instruments are swaps, futures contracts, forward currency contracts and options written. Swaps, futures contracts and forward currency contracts are valued at the unrealized appreciation/depreciation on the instrument and options written are shown at value. |
5. Federal Tax Information (amounts in 000s)
Distributions from net investment income and net realized capital gains are determined in accordance with U.S. federal income tax regulations, which may differ from those amounts determined under GAAP. These book/tax differences are either temporary or permanent in nature. To the extent these differences are permanent, they are charged or credited to distributable earnings and paid-in capital, as appropriate, in the period that the differences arise. Accordingly, the following permanent differences as of October 31, 2018, primarily attributable to investments in partnerships and expired capital loss carryforward were reclassified to the following
accounts. These reclassifications had no effect on net assets or net asset value per share (amounts in thousands):
| | | | | | | | |
| | | Increase/
(Decrease)
Distributable
Earnings | | | Increase/
(Decrease)
Paid
in
Capital | |
Strategic Income | | $ | (4 | ) | | $ | 4 | |
Global Low Duration | | | 914 | | | | (914 | ) |
Equity Income | | | 9 | | | | (9 | ) |
For Federal income tax purposes the following Funds had capital loss carryforwards at year end in the amount indicated below. The carryforwards are available to offset future capital gains, if any. The following Funds used capital loss carryforwards to reduce required capital gain distributions for the year ended October 31, 2018: Limited Maturity ($961), GNMA ($1,021), and High Income ($1,619). Global Low Duration had a $914 capital loss carryforward that expired at October 31, 2018.
Annual Report 141
Under the Regulated Investment Company Modernization Act of 2010, the Funds will be permitted to carry forward capital losses incurred in taxable years beginning after December 22, 2010 (“post-enactment”), for an unlimited period. However, any losses incurred during those future taxable years will be required to be utilized prior to the losses incurred in pre-enactment taxable years. Additionally, post-enactment capital losses that are carried forward will retain their character as either short or long term capital losses rather than being considered all short term.
At October 31, 2018, the following Funds had available for Federal income tax purposes unused capital losses as follows (000’s):
| | | | | | | | |
| | | Unlimited* | | | Total | |
Low Duration | | $ | 9,313 | | | $ | 9,313 | |
U.S. Government | | | 7,366 | | | | 7,366 | |
GNMA | | | 33,261 | | | | 33,261 | |
Core Bond | | | 14,930 | | | | 14,930 | |
Corporate Bond | | | 2,380 | | | | 2,380 | |
Strategic Income Fund | | | 3,221 | | | | 3,221 | |
Absolute Return Bond | | | 1,958 | | | | 1,958 | |
Floating Rate | | | 2,505 | | | | 2,505 | |
High Income | | | 22,293 | | | | 22,293 | |
Global Low Duration | | | 325 | | | | 325 | |
Global Fixed Income | | | 587 | | | | 587 | |
Emerging Markets Bond | | | 15,440 | | | | 15,440 | |
Emerging Markets Local Bond | | | 20,210 | | | | 20,210 | |
Emerging Markets Corporate Bond | | | 358 | | | | 358 | |
* Post-enactment carryforward losses.
The tax character of distributions paid during the fiscal years ended October 31st is as follows (000’s):
| | | | | | | | | | | | | | | | | | | | | | | | | | | | | | | | |
| | | 2017 | | | 2018 | |
| | | | | | | | |
| | | Tax-Exempt
Income | | | Ordinary
Income | | | Long Term
Capital Gains | | | Return of
Capital | | | Tax-Exempt
Income | | | Ordinary
Income | | | Long Term
Capital Gains | | | Return of
Capital | |
Cash Reserves Money Market | | | — | | | $ | 2,202 | | | | — | | | | — | | | | — | | | $ | 4,886 | | | | — | | | | — | |
Limited Maturity | | | — | | | | 5,239 | | | | — | | | $ | 2,323 | | | | — | | | | 17,155 | | | | — | | | | — | |
Low Duration | | | — | | | | 11,824 | | | | — | | | | 2,463 | | | | — | | | | 24,118 | | | | — | | | | 28 | |
U.S. Government | | | — | | | | 2,196 | | | | — | | | | — | | | | — | | | | 1,606 | | | | — | | | | — | |
GNMA | | | — | | | | 7,869 | | | | — | | | | — | | | | — | | | | 6,382 | | | | — | | | | — | |
Core Bond | | | — | | | | 28,933 | | | | — | | | | — | | | | — | | | | 27,144 | | | | — | | | $ | 132 | |
Corporate Bond | | | — | | | | 7,630 | | | $ | 559 | | | | — | | | | — | | | | 8,578 | | | $ | 628 | | | | — | |
Strategic Income | | | — | | | | 5,322 | | | | — | | | | 4 | | | | — | | | | 6,185 | | | | — | | | | 56 | |
Absolute Return Bond | | | — | | | | 2,053 | | | | — | | | | — | | | | — | | | | 3,800 | | | | — | | | | — | |
Floating Rate | | | — | | | | 6,222 | | | | — | | | | — | | | | — | | | | 6,219 | | | | — | | | | — | |
High Income | | | — | | | | 29,453 | | | | — | | | | 198 | | | | — | | | | 26,132 | | | | — | | | | — | |
California Municipal Income | | $ | 1,034 | | | | 82 | | | | 756 | | | | — | | | $ | 1,245 | | | | 57 | | | | 156 | | | | — | |
Global Low Duration | | | — | | | | 956 | | | | — | | | | 892 | | | | — | | | | 2,306 | | | | — | | | | 20 | |
Global Fixed Income | | | — | | | | 2,076 | | | | — | | | | — | | | | — | | | | 2,617 | | | | — | | | | — | |
Emerging Markets Bond | | | — | | | | 65,740 | | | | — | | | | 3,073 | | | | — | | | | 68,289 | | | | — | | | | 5,933 | |
Emerging Markets Local Bond | | | — | | | | 9,439 | | | | — | | | | 643 | | | | — | | | | 2,481 | | | | — | | | | 10,232 | |
Emerging Markets Corporate Bond | | | — | | | | 1,830 | | | | — | | | | — | | | | — | | | | 2,153 | | | | 23 | | | | 104 | |
Equity Income | | | — | | | | 20,987 | | | | 4,740 | | | | — | | | | — | | | | 28,495 | | | | 43,500 | | | | — | |
142 Payden Mutual Funds
At October 31, 2018, net unrealized appreciation (depreciation) on investments for Federal income tax purposes is as follows (000’s):
| | | | | | | | | | | | | | | | |
| | | Cost of Investments
Federal Income
Tax Purposes | | | Gross
Unrealized
Appreciation
on Investments | | | Gross
Unrealized
Depreciation
on Investments | | | Net
Unrealized
Appreciation
(Depreciation)
on Investments | |
Cash Reserves Money Market | | $ | 330,260 | | | $ | — | | | $ | — | | | $ | — | |
Limited Maturity | | | 790,637 | | | | 815 | | | | (1,936) | | | | (1,121 | ) |
Low Duration | | | 1,219,743 | | | | 1,149 | | | | (10,721 | ) | | | (9,572 | ) |
U.S. Government | | | 38,633 | | | | 46 | | | | (1,212 | ) | | | (1,166 | ) |
GNMA | | | 244,492 | | | | 1,096 | | | | (11,137 | ) | | | (10,041 | ) |
Core Bond | | | 1,025,678 | | | | 6,276 | | | | (27,193 | ) | | | (20,917 | ) |
Corporate Bond | | | 303,563 | | | | 1,653 | | | | (9,139 | ) | | | (7,486 | ) |
Strategic Income | | | 205,421 | | | | 2,480 | | | | (4,285 | ) | | | (1,805 | ) |
Absolute Return | | | 142,915 | | | | 1,302 | | | | (1,361 | ) | | | (59 | ) |
Floating Rate | | | 154,486 | | | | 1,348 | | | | (545 | ) | | | 803 | |
High Income | | | 474,996 | | | | 4,895 | | | | (14,183 | ) | | | (9,288 | ) |
California Municipal Income | | | 58,164 | | | | 512 | | | | (664 | ) | | | (152 | ) |
Global Low Duration | | | 95,149 | | | | 224 | | | | (1,323 | ) | | | (1,099 | ) |
Global Fixed Income | | | 140,699 | | | | 1,822 | | | | (6,304 | ) | | | (4,482 | ) |
Emerging Markets Bond | | | 1,395,057 | | | | 6,526 | | | | (110,066 | ) | | | (103,540 | ) |
Emerging Markets Local Bond | | | 234,326 | | | | 2,810 | | | | (36,565 | ) | | | (33,755 | ) |
Emerging Markets Corporate Bond | | | 46,344 | | | | 307 | | | | (1,511 | ) | | | (1,204 | ) |
Equity Income | | | 1,046,864 | | | | 160,192 | | | | (12,327 | ) | | | 147,865 | |
Annual Report 143
At October 31, 2018, the components of accumulated earnings (deficit) for Federal income tax purposes are as follows (000’s):
| | | | | | | | | | | | | | | | | | | | | | | | |
| | | Undistributed
Ordinary Income | | | Undistributed
Realized Long Term
Capital Gains | | | Capital Loss
Carryforwards | | | Distributions
Payable | | | Net Unrealized
Appreciation
(Depreciation) | | | Total Distributions
Earnings
(Deficit) | |
Cash Reserves Money Market | | $ | 324 | | | $ | — | | | $ | — | | | $ | (318 | ) | | $ | — | | | $ | 6 | |
Limited Maturity | | | 243 | | | | 90 | | | | — | | | | (215 | ) | | | (1,121 | ) | | | (1,003 | ) |
Low Duration | | | — | | | | — | | | | (9,313 | ) | | | (168 | ) | | | (9,572 | ) | | | (19,053 | ) |
U.S. Government | | | — | | | | — | | | | (7,366 | ) | | | — | | | | (1,166 | ) | | | (8,532 | ) |
GNMA | | | 70 | | | | — | | | | (33,261 | ) | | | (37 | ) | | | (10,041 | ) | | | (43,269 | ) |
Core Bond | | | — | | | | — | | | | (14,930 | ) | | | — | | | | (20,917 | ) | | | (35,847 | ) |
Corporate Bond | | | — | | | | — | | | | (2,380 | ) | | | — | | | | (7,486 | ) | | | (9,866 | ) |
Strategic Income | | | — | | | | — | | | | (3,221 | ) | | | — | | | | (1,805 | ) | | | (5,026 | ) |
Absolute Return Bond | | | 869 | | | | — | | | | (1,958 | ) | | | — | | | | (59 | ) | | | (1,148 | ) |
Floating Rate | | | 71 | | | | — | | | | (2,505 | ) | | | — | | | | 803 | | | | (1,631 | ) |
High Income | | | 68 | | | | — | | | | (22,293 | ) | | | — | | | | (9,288 | ) | | | (31,513 | ) |
California Municipal Income | | | 42 | | | | 56 | | | | — | | | | (16 | ) | | | (152 | ) | | | (70 | ) |
Global Low Duration | | | — | | | | — | | | | (325 | ) | | | — | | | | (1,099 | ) | | | (1,424 | ) |
Global Fixed Income | | | 4,090 | | | | — | | | | (587 | ) | | | — | | | | (4,482 | ) | | | (979 | ) |
Emerging Markets Bond | | | — | | | | — | | | | (15,440 | ) | | | — | | | | (103,540 | ) | | | (118,980 | ) |
Emerging Markets Local Bond | | | — | | | | — | | | | (20,210 | ) | | | — | | | | (33,755 | ) | | | (53,965 | ) |
Emerging Markets Corporate Bond | | | — | | | | — | | | | (358 | ) | | | — | | | | (1,204 | ) | | | (1,562 | ) |
Equity Income | | | — | | | | 8,485 | | | | — | | | | — | | | | 147,865 | | | | 156,350 | |
6. Exempt Interest Income Designation (unaudited)
| | | | | | | | |
| | | Exempt
Interest
Dividends
(000s) | | | Exempt
Interest
Dividends
Per Share | |
California Municipal Income | | $ | 1,245 | | | $ | 0.38 | |
7. Regulation S-X Amendments
On August 11, 2018, the SEC adopted amendments to certain disclosure requirements in Securities Act Release No 33-10532, Disclosure Update and Simplification. The Funds have adopted the amendments pertinent to Regulation S-X in this shareholder report. The amendments impacted certain disclosure presentation on the Statements of Assets and Liabilities, Statements of Changes in Net Assets and Notes to Financial Statements.
Prior year distribution information and undistributed net investment income in the Statements of Changes in Net Assets has been modified to conform to the current year presentation in accordance with the Regulation S-X changes.
144 Payden Mutual Funds
Distributions for the year ended October 31, 2017 were as follows.
| | | | | | | | | | | | | | | | | | | | | | | | | | | | | | | | | | | | |
| | | Adviser Class | | | Investor Class | | | Institutional Class | |
| | | Net
Investment
Income | | | Net
Realized
Gains | | | Total | | | Net
Investment
Income | | | Net
Realized
Gains | | | Total | | | Net
Investment
Income | | | Net
Realized
Gains | | | Total | |
Cash Reserves Money Market | | | — | | | | — | | | | — | | | $ | (2,201 | ) | | $ | (1 | ) | | $ | (2,202 | ) | | | — | | | | — | | | | — | |
Limited Maturity | | | — | | | | — | | | | — | | | | (5,239 | ) | | | — | | | | (5,239 | ) | | | — | | | | — | | | | — | |
Low Duration | | | — | | | | — | | | | — | | | | (11,824 | ) | | | — | | | | (11,824 | ) | | | — | | | | — | | | | — | |
U.S. Government | | $ | (4 | ) | | | — | | | $ | (4 | ) | | | (2,192 | ) | | | — | | | | (2,192 | ) | | | — | | | | — | | | | — | |
GNMA | | | (507 | ) | | | — | | | | (507 | ) | | | (7,361 | ) | | | — | | | | (7,361 | ) | | | — | | | | — | | | | — | |
Core Bond | | | (741 | ) | | $ | (186 | ) | | | (927 | ) | | | (22,452 | ) | | | (5,554 | ) | | | (28,006 | ) | | | — | | | | — | | | | — | |
Corporate Bond | | | — | | | | — | | | | — | | | | (5,462 | ) | | | (2,728 | ) | | | (8,190 | ) | | | — | | | | — | | | | — | |
Strategic Income | | | (53 | ) | | | (5 | ) | | | (58 | ) | | | (3,588 | ) | | | (166 | ) | | | (3,754 | ) | | $ | (1,468 | ) | | $ | (42 | ) | | $ | (1,510 | ) |
Absolute Return Bond | | | (2 | ) | | | — | | | | (2 | ) | | | (1,641 | ) | | | — | | | | (1,641 | ) | | | (410 | ) | | | — | | | | (410 | ) |
Floating Rate | | | (8 | ) | | | — | | | | (8 | ) | | | (1,741 | ) | | | — | | | | (1,741 | ) | | | (4,473 | ) | | | — | | | | (4,473 | ) |
High Income | | | (582 | ) | | | — | | | | (582 | ) | | | (28,871 | ) | | | — | | | | (28,871 | ) | | | — | | | | — | | | | — | |
California Municipal Income | | | — | | | | — | | | | — | | | | (1,034 | ) | | | (838 | ) | | | (1,872 | ) | | | — | | | | — | | | | — | |
Global Low Duration | | | — | | | | — | | | | — | | | | (956 | ) | | | — | | | | (956 | ) | | | — | | | | — | | | | — | |
Global Fixed Income | | | — | | | | — | | | | — | | | | (2,076 | ) | | | — | | | | (2,076 | ) | | | — | | | | — | | | | — | |
Emerging Markets Bond | | | (5,633 | ) | | | — | | | | (5,633 | ) | | | (25,614 | ) | | | — | | | | (25,614 | ) | | | (34,493 | ) | | | — | | | | (34,493 | ) |
Emerging Markets Local Bond | | | (7 | ) | | | — | | | | (7 | ) | | | (9,432 | ) | | | — | | | | (9,432 | ) | | | — | | | | — | | | | — | |
Emerging Markets Corporate Bond | | | (5 | ) | | | — | | | | (5 | ) | | | (173 | ) | | | — | | | | (173 | ) | | | (1,652 | ) | | | — | | | | (1,652 | ) |
Equity Income | | | (317 | ) | | | (68 | ) | | | (385 | ) | | | (12,459 | ) | | | (2,903 | ) | | | (15,362 | ) | | | (8,211 | ) | | | (1,769 | ) | | | (9,980 | ) |
8. Subsequent Events
The Funds have evaluated subsequent events through the issuance of the financial statements and have determined that no other events have occurred that require disclosure.
Annual Report 145

For the share outstanding for each of the periods ended October 31st
| | | | | | | | | | | | | | | | | | | | |
| | | Payden Cash Reserves Money Market Fund | |
| | | 2018 | | | 2017 | | | 2016 | | | 2015 | | | 2014 | |
Net asset value — beginning of period | | $ | 1.00 | | | $ | 1.00 | | | $ | 1.00 | | | $ | 1.00 | | | $ | 1.00 | |
| | | | | | | | | | | | | | | | | | | | |
Income from investment activities: | | | | | | | | | | | | | | | | | | | | |
Net investment income | | | 0.01 | | | | 0.01 | | | | 0.00 | (1) | | | 0.00 | (1) | | | 0.00 | (1) |
Net realized and unrealized gains (losses) | | | 0.00 | | | | 0.00 | | | | 0.00 | (1) | | | 0.00 | (1) | | | 0.00 | (1) |
| | | | | | | | | | | | | | | | | | | | |
Total from investment activities | | | 0.01 | | | | 0.01 | | | | 0.00 | | | | 0.00 | | | | 0.00 | |
| | | | | | | | | | | | | | | | | | | | |
Distributions to shareholders: | | | | | | | | | | | | | | | | | | | | |
From net investment income | | | (0.01 | ) | | | (0.01 | ) | | | 0.00 | (1) | | | 0.00 | (1) | | | 0.00 | (1) |
Return of capital | | | — | | | | — | | | | — | | | | — | | | | 0.00 | (1) |
| | | | | | | | | | | | | | | | | | | | |
Total distributions to shareholders | | | (0.01 | ) | | | (0.01 | ) | | | 0.00 | | | | 0.00 | | | | 0.00 | |
| | | | | | | | | | | | | | | | | | | | |
Net asset value — end of period | | $ | 1.00 | | | $ | 1.00 | | | $ | 1.00 | | | $ | 1.00 | | | $ | 1.00 | |
| | | | | | | | | | | | | | | | | | | | |
Total return | | | 1.43 | % | | | 0.53 | % | | | 0.09 | % | | | 0.01 | % | | | 0.01 | % |
| | | | | | | | | | | | | | | | | | | | |
Ratios/supplemental data: | | | | | | | | | | | | | | | | | | | | |
Net assets, end of period (000s) | | $ | 329,996 | | | $ | 447,563 | | | $ | 551,064 | | | $ | 392,391 | | | $ | 490,666 | |
Ratio of gross expense to average net assets | | | 0.38 | % | | | 0.38 | % | | | 0.37 | % | | | 0.39 | % | | | 0.37 | % |
Ratio of net expense to average net assets | | | 0.25 | % | | | 0.25 | % | | | 0.24 | % | | | 0.09 | % | | | 0.08 | % |
Ratio of investment income less gross expenses to average net assets | | | 1.26 | % | | | 0.40 | % | | | (0.04 | )% | | | (0.29 | )% | | | (0.28 | )% |
Ratio of net investment income to average net assets | | | 1.39 | % | | | 0.52 | % | | | 0.10 | % | | | 0.01 | % | | | 0.01 | % |
Portfolio turnover rate | | | n/a | | | | n/a | | | | n/a | | | | n/a | | | | n/a | |
The Fund commenced operations on December 17, 1997. | |
| | | Payden Limited Maturity Fund | |
| | | 2018 | | | 2017 | | | 2016 | | | 2015 | | | 2014 | |
Net asset value — beginning of period | | $ | 9.48 | | | $ | 9.46 | | | $ | 9.42 | | | $ | 9.47 | | | $ | 9.47 | |
| | | | | | | | | | | | | | | | | | | | |
Income (loss) from investment activities: | | | | | | | | | | | | | | | | | | | | |
Net investment income | | | 0.20 | | | | 0.12 | | | | 0.08 | | | | 0.06 | | | | 0.07 | |
Net realized and unrealized gains (losses) | | | (0.02 | ) | | | 0.02 | | | | 0.04 | | | | (0.04 | ) | | | (0.00 | )(1) |
| | | | | | | | | | | | | | | | | | | | |
Total from investment activities | | | 0.18 | | | | 0.14 | | | | 0.12 | | | | 0.02 | | | | 0.07 | |
| | | | | | | | | | | | | | | | | | | | |
Distributions to shareholders: | | | | | | | | | | | | | | | | | | | | |
From net investment income | | | (0.20 | ) | | | (0.08 | ) | | | (0.07 | ) | | | (0.04 | ) | | | (0.07 | ) |
Return of capital | | | — | | | | (0.04 | ) | | | (0.01 | ) | | | (0.03 | ) | | | — | |
| | | | | | | | | | | | | | | | | | | | |
Total distributions to shareholders | | | (0.20 | ) | | | (0.12 | ) | | | (0.08 | ) | | | (0.07 | ) | | | (0.07 | ) |
| | | | | | | | | | | | | | | | | | | | |
Net asset value — end of period | | $ | 9.46 | | | $ | 9.48 | | | $ | 9.46 | | | $ | 9.42 | | | $ | 9.47 | |
| | | | | | | | | | | | | | | | | | | | |
Total return | | | 1.92 | % | | | 1.52 | % | | | 1.31 | % | | | 0.20 | % | | | 0.78 | % |
| | | | | | | | | | | | | | | | | | | | |
Ratios/supplemental data: | | | | | | | | | | | | | | | | | | | | |
Net assets, end of period (000s) | | $ | 784,821 | | | $ | 707,930 | | | $ | 463,149 | | | $ | 422,996 | | | $ | 318,671 | |
Ratio of gross expense to average net assets | | | 0.55 | % | | | 0.56 | % | | | 0.57 | % | | | 0.57 | % | | | 0.57 | % |
Ratio of net expense to average net assets | | | 0.25 | % | | | 0.25 | % | | | 0.26 | % | | | 0.31 | % | | | 0.35 | % |
Ratio of investment income less gross expenses to average net assets | | | 1.82 | % | | | 1.06 | % | | | 0.57 | % | | | 0.31 | % | | | 0.59 | % |
Ratio of net investment income to average net assets | | | 2.12 | % | | | 1.37 | % | | | 0.88 | % | | | 0.57 | % | | | 0.81 | % |
Portfolio turnover rate | | | 72 | % | | | 51 | % | | | 39 | % | | | 39 | % | | | 59 | % |
The Fund commenced operations on April 29, 1994.
(1) Amount is less than $0.005.
146 Payden Mutual Funds
| | | | | | | | | | | | | | | | | | | | |
| | | Payden Low Duration Fund | |
| | | 2018 | | | 2017 | | | 2016 | | | 2015 | | | 2014 | |
Net asset value — beginning of period | | $ | 10.09 | | | $ | 10.10 | | | $ | 10.05 | | | $ | 10.15 | | | $ | 10.15 | |
| | | | | | | | | | | | | | | | | | | | |
Income (loss) from investment activities: | | | | | | | | | | | | | | | | | | | | |
Net investment income | | | 0.22 | | | | 0.16 | | | | 0.12 | | | | 0.11 | | | | 0.12 | |
| | | | | | | | | | | | | | | | | | | | |
Net realized and unrealized gains (losses) | | | (0.18 | ) | | | (0.02 | ) | | | 0.05 | | | | (0.06 | ) | | | (0.00 | )(1) |
| | | | | | | | | | | | | | | | | | | | |
Total from investment activities | | | 0.04 | | | | 0.14 | | | | 0.17 | | | | 0.05 | | | | 0.12 | |
Distributions to shareholders: | | | | | | | | | | | | | | | | | | | | |
From net investment income | | | (0.22 | ) | | | (0.12 | ) | | | (0.11 | ) | | | (0.11 | ) | | | (0.12 | ) |
From net realized gains | | | — | | | | — | | | | — | | | | (0.04 | ) | | | — | |
Return of capital | | | (0.00 | )(1) | | | (0.03 | ) | | | (0.01 | ) | | | (0.00 | )(1) | | | — | |
| | | | | | | | | | | | | | | | | | | | |
Total distributions to shareholders | | | (0.22 | ) | | | (0.15 | ) | | | (0.12 | ) | | | (0.15 | ) | | | (0.12 | ) |
| | | | | | | | | | | | | | | | | | | | |
Net asset value — end of period | | $ | 9.91 | | | $ | 10.09 | | | $ | 10.10 | | | $ | 10.05 | | | $ | 10.15 | |
| | | | | | | | | | | | | | | | | | | | |
Total return | | | 0.39 | % | | | 1.37 | % | | | 1.74 | % | | | 0.50 | % | | | 1.14 | % |
| | | | | | | | | | | | | | | | | | | | |
Ratios/supplemental data: | | | | | | | | | | | | | | | | | | | | |
Net assets, end of period (000s) | | $ | 1,212,308 | | | $ | 1,061,436 | | | $ | 800,892 | | | $ | 820,662 | | | $ | 833,205 | |
Ratio of gross expense to average net assets | | | 0.54 | % | | | 0.54 | % | | | 0.57 | % | | | 0.57 | % | | | 0.55 | % |
Ratio of net expense to average net assets | | | 0.43 | % | | | 0.44 | % | | | 0.45 | % | | | 0.47 | % | | | 0.48 | % |
Ratio of investment income less gross expenses to average net assets | | | 2.06 | % | | | 1.44 | % | | | 1.13 | % | | | 1.02 | % | | | 1.06 | % |
Ratio of net investment income to average net assets | | | 2.17 | % | | | 1.55 | % | | | 1.24 | % | | | 1.12 | % | | | 1.13 | % |
Portfolio turnover rate | | | 85 | % | | | 118 | % | | | 41 | % | | | 31 | % | | | 45 | % |
The Fund commenced operations on December 31, 1993. (1) Amount is less than $0.005. | |
| | | Payden U.S. Government Fund | |
| | | 2018 | | | 2017 | | | 2016 | | | 2015 | | | 2014 | |
Net asset value — beginning of period | | $ | 10.42 | | | $ | 10.61 | | | $ | 10.63 | | | $ | 10.68 | | | $ | 10.67 | |
| | | | | | | | | | | | | | | | | | | | |
Income (loss) from investment activities: | | | | | | | | | | | | | | | | | | | | |
Net investment income (1) | | | 0.15 | | | | 0.11 | | | | 0.10 | | | | 0.09 | | | | 0.08 | |
Net realized and unrealized gains (losses) | | | (0.24 | ) | | | (0.13 | ) | | | 0.05 | | | | 0.02 | | | | 0.08 | |
| | | | | | | | | | | | | | | | | | | | |
Total from investment activities | | | (0.09 | ) | | | (0.02 | ) | | | 0.15 | | | | 0.11 | | | | 0.16 | |
| | | | | | | | | | | | | | | | | | | | |
Distributions to shareholders: | | | | | | | | | | | | | | | | | | | | |
From Net investment income | | | (0.22 | ) | | | (0.17 | ) | | | (0.17 | ) | | | (0.16 | ) | | | (0.15 | ) |
| | | | | | | | | | | | | | | | | | | | |
Net asset value — end of period | | $ | 10.11 | | | $ | 10.42 | | | $ | 10.61 | | | $ | 10.63 | | | $ | 10.68 | |
| | | | | | | | | | | | | | | | | | | | |
Total return | | | (0.86 | )% | | | (0.16 | )% | | | 1.46 | % | | | 1.01 | % | | | 1.52 | % |
| | | | | | | | | | | | | | | | | | | | |
Ratios/supplemental data: | | | | | | | | | | | | | | | | | | | | |
Net assets, end of period (000s) | | $ | 37,678 | | | $ | 135,454 | | | $ | 137,581 | | | $ | 133,420 | | | $ | 130,508 | |
Ratio of gross expense to average net assets | | | 0.62 | % | | | 0.56 | % | | | 0.58 | % | | | 0.59 | % | | | 0.59 | % |
Ratio of net expense to average net assets | | | 0.41 | % | | | 0.45 | % | | | 0.45 | % | | | 0.45 | % | | | 0.45 | % |
Ratio of investment income less gross expenses to average net assets | | | 1.28 | % | | | 0.89 | % | | | 0.81 | % | | | 0.69 | % | | | 0.60 | % |
Ratio of net investment income to average net assets | | | 1.49 | % | | | 1.00 | % | | | 0.94 | % | | | 0.82 | % | | | 0.74 | % |
Portfolio turnover rate | | | 28 | % | | | 27 | % | | | 35 | % | | | 32 | % | | | 27 | % |
The Fund commenced operations on January 3, 1995.
(1) Based on average shares outstanding.
Annual Report 147

| | | | | | | | | | | | | | | | | | | | |
| | | Payden GNMA Fund | |
| | | 2018 | | | 2017 | | | 2016 | | | 2015 | | | 2014 | |
Net asset value — beginning of period | | $ | 9.49 | | | $ | 9.80 | | | $ | 9.79 | | | $ | 9.95 | | | $ | 10.00 | |
| | | | | | | | | | | | | | | | | | | | |
Income (loss) from investment activities: | | | | | | | | | | | | | | | | | | | | |
Net investment income | | | 0.16 | | | | 0.14 | | | | 0.15 | | | | 0.14 | | | | 0.15 | |
Net realized and unrealized gains (losses) | | | (0.38 | ) | | | (0.15 | ) | | | 0.17 | | | | 0.06 | | | | 0.22 | |
| | | | | | | | | | | | | | | | | | | | |
Total from investment activities | | | (0.22 | ) | | | (0.01 | ) | | | 0.32 | | | | 0.20 | | | | 0.37 | |
| | | | | | | | | | | | | | | | | | | | |
Distributions to shareholders: | | | | | | | | | | | | | | | | | | | | |
From Net investment income | | | (0.30 | ) | | | (0.30 | ) | | | (0.31 | ) | | | (0.36 | ) | | | (0.42 | ) |
| | | | | | | | | | | | | | | | | | | | |
Net asset value — end of period | | $ | 8.97 | | | $ | 9.49 | | | $ | 9.80 | | | $ | 9.79 | | | $ | 9.95 | |
| | | | | | | | | | | | | | | | | | | | |
Total return | | | (2.34 | )% | | | (0.12 | )% | | | 3.26 | % | | | 2.06 | % | | | 3.79 | % |
| | | | | | | | | | | | | | | | | | | | |
Ratios/supplemental data: | | | | | | | | | | | | | | | | | | | | |
Net assets, end of period (000s) | | $ | 159,393 | | | $ | 235,225 | | | $ | 272,657 | | | $ | 255,273 | | | $ | 281,473 | |
Ratio of gross expense to average net assets | | | 0.68 | % | | | 0.69 | % | | | 0.69 | % | | | 0.67 | % | | | 0.61 | % |
Ratio of net expense to average net assets | | | 0.50 | % | | | 0.50 | % | | | 0.50 | % | | | 0.50 | % | | | 0.50 | % |
Ratio of investment income less gross expenses to average net assets | | | 1.74 | % | | | 1.27 | % | | | 1.16 | % | | | 1.36 | % | | | 1.58 | % |
Ratio of net investment income to average net assets | | | 1.93 | % | | | 1.46 | % | | | 1.35 | % | | | 1.53 | % | | | 1.68 | % |
Portfolio turnover rate | | | 20 | % | | | 17 | % | | | 12 | % | | | 15 | % | | | 12 | % |
The Fund commenced operations on August 27, 1999. | |
| | | Payden Core Bond Fund - Adviser Class | |
| | | 2018 | | | 2017 | | | 2016 | | | 2015 | | | 2014 | |
Net asset value — beginning of period | | $ | 10.70 | | | $ | 10.83 | | | $ | 10.62 | | | $ | 10.80 | | | $ | 10.65 | |
| | | | | | | | | | | | | | | | | | | | |
Income (loss) from investment activities: | | | | | | | | | | | | | | | | | | | | |
Net investment income | | | 0.28 | (1) | | | 0.27 | (1) | | | 0.25 | (1) | | | 0.23 | (1) | | | 0.26 | (1) |
Net realized and unrealized gains (losses) | | | (0.50 | ) | | | 0.00 | (2) | | | 0.25 | | | | (0.07 | ) | | | 0.27 | |
| | | | | | | | | | | | | | | | | | | | |
Total from investment activities | | | (0.22 | ) | | | 0.27 | | | | 0.50 | | | | 0.16 | | | | 0.53 | |
| | | | | | | | | | | | | | | | | | | | |
Distributions to shareholders: | | | | | | | | | | | | | | | | | | | | |
From Net investment income | | | (0.31 | ) | | | (0.32 | ) | | | (0.28 | ) | | | (0.26 | ) | | | (0.29 | ) |
From Net realized gains | | | — | | | | (0.08 | ) | | | (0.01 | ) | | | (0.08 | ) | | | (0.09 | ) |
Return of capital. | | | (0.00 | )(2) | | | — | | | | — | | | | — | | | | — | |
| | | | | | | | | | | | | | | | | | | | |
Total distributions to shareholders | | | (0.31 | ) | | | (0.40 | ) | | | (0.29 | ) | | | (0.34 | ) | | | (0.38 | ) |
| | | | | | | | | | | | | | | | | | | | |
Net asset value — end of period | | $ | 10.17 | | | $ | 10.70 | | | $ | 10.83 | | | $ | 10.62 | | | $ | 10.80 | |
| | | | | | | | | | | | | | | | | | | | |
Total return | | | (2.12 | )% | | | 2.60 | % | | | 4.83 | % | | | 1.49 | % | | | 5.06 | % |
| | | | | | | | | | | | | | | | | | | | |
Ratios/supplemental data: | | | | | | | | | | | | | | | | | | | | |
Net assets, end of period (000s) | | $ | 29,799 | | | $ | 25,993 | | | $ | 25,801 | | | $ | 24,314 | | | $ | 5,457 | |
Ratio of gross expense to average net assets | | | 0.78 | % | | | 0.78 | % | | | 0.79 | % | | | 0.79 | % | | | 0.78 | % |
Ratio of net expense to average net assets | | | 0.78 | % | | | 0.78 | % | | | 0.79 | % | | | 0.79 | % | | | 0.78 | % |
Ratio of investment income less gross expenses to average net assets | | | 2.71 | % | | | 2.55 | % | | | 2.32 | % | | | 2.05 | % | | | 2.40 | % |
Ratio of net investment income to average net assets | | | 2.71 | % | | | 2.55 | % | | | 2.32 | % | | | 2.05 | % | | | 2.40 | % |
Portfolio turnover rate | | | 67 | % | | | 87 | % | | | 57 | % | | | 31 | % | | | 49 | % |
The Class commenced operations on November 2, 2009.
(1) Based on average shares outstanding.
(2) Amount is less than $0.005.
148 Payden Mutual Funds
| | | | | | | | | | | | | | | | | | | | |
| | | Payden Core Bond Fund - Investor Class | |
| | | 2018 | | | 2017 | | | 2016 | | | 2015 | | | 2014 | |
Net asset value — beginning of period | | $ | 10.73 | | | $ | 10.85 | | | $ | 10.64 | | | $ | 10.82 | | | $ | 10.67 | |
| | | | | | | | | | | | | | | | | | | | |
Income (loss) from investment activities: | | | | | | | | | | | | | | | | | | | | |
Net investment income | | | 0.31 | (1) | | | 0.30 | (1) | | | 0.28 | (1) | | | 0.25 | (1) | | | 0.28 | (1) |
Net realized and unrealized gains (losses) | | | (0.51 | ) | | | 0.00 | (2) | | | 0.25 | | | | (0.07 | ) | | | 0.28 | |
| | | | | | | | | | | | | | | | | | | | |
Total from investment activities | | | (0.20 | ) | | | 0.30 | | | | 0.53 | | | | 0.18 | | | | 0.56 | |
| | | | | | | | | | | | | | | | | | | | |
Distributions to shareholders: | | | | | | | | | | | | | | | | | | | | |
From Net investment income | | | (0.33 | ) | | | (0.34 | ) | | | (0.31 | ) | | | (0.28 | ) | | | (0.32 | ) |
From Net realized gains | | | — | | | | (0.08 | ) | | | (0.01 | ) | | | (0.08 | ) | | | (0.09 | ) |
Return of capital | | | (0.00 | )(2) | | | — | | | | — | | | | — | | | | — | |
| | | | | | | | | | | | | | | | | | | | |
Total distributions to shareholders | | | (0.33 | ) | | | (0.42 | ) | | | (0.32 | ) | | | (0.36 | ) | | | (0.41 | ) |
| | | | | | | | | | | | | | | | | | | | |
Net asset value — end of period | | $ | 10.20 | | | $ | 10.73 | | | $ | 10.85 | | | $ | 10.64 | | | $ | 10.82 | |
| | | | | | | | | | | | | | | | | | | | |
Total return | | | (1.88 | )% | | | 2.94 | % | | | 5.07 | % | | | 1.73 | % | | | 5.34 | % |
| | | | | | | | | | | | | | | | | | | | |
Ratios/supplemental data: | | | | | | | | | | | | | | | | | | | | |
Net assets, end of period (000s) | | $ | 604,289 | | | $ | 719,847 | | | $ | 735,916 | | | $ | 660,835 | | | $ | 593,724 | |
Ratio of gross expense to average net assets | | | 0.53 | % | | | 0.53 | % | | | 0.54 | % | | | 0.54 | % | | | 0.53 | % |
Ratio of net expense to average net assets | | | 0.53 | % | | | 0.53 | % | | | 0.54 | % | | | 0.54 | % | | | 0.53 | % |
Ratio of investment income less gross expenses to average net assets | | | 2.95 | % | | | 2.80 | % | | | 2.57 | % | | | 2.30 | % | | | 2.65 | % |
Ratio of net investment income to average net assets | | | 2.95 | % | | | 2.80 | % | | | 2.57 | % | | | 2.30 | % | | | 2.65 | % |
Portfolio turnover rate | | | 67 | % | | | 87 | % | | | 57 | % | | | 31 | % | | | 49 | % |
The Fund commenced operations on December 31, 1993. | |
| | | Payden
Core Bond
Fund -
SI Class | | | | | | | | | | | | | |
| | | 2018 | | | | | | | | | | | | | |
Net asset value — beginning of period | | $ | 10.66 | | | | | | | | | | | | | | | | | |
| | | | | | | | | | | | | | | | | | | | |
Income (loss) from investment activities: | | | | | | | | | | | | | | | | | | | | |
Net investment income | | | 0.25 | (1) | | | | | | | | | | | | | | | | |
Net realized and unrealized gains (losses) | | | (0.43 | ) | | | | | | | | | | | | | | | | |
| | | | | | | | | | | | | | | | | | | | |
Total from investment activities | | | (0.18 | ) | | | | | | | | | | | | | | | | |
| | | | | | | | | | | | | | | | | | | | |
Distributions to shareholders: | | | | | | | | | | | | | | | | | | | | |
From Net investment income | | | (0.29 | ) | | | | | | | | | | | | | | | | |
Return of capital | | | (0.00 | )(2) | | | | | | | | | | | | | | | | |
| | | | | | | | | | | | | | | | | | | | |
Total distributions to shareholders | | | (0.29 | ) | | | | | | | | | | | | | | | | |
| | | | | | | | | | | | | | | | | | | | |
Net asset value — end of period | | $ | 10.19 | | | | | | | | | | | | | | | | | |
| | | | | | | | | | | | | | | | | | | | |
Total return | | | (1.75 | )%(3) | | | | | | | | | | | | | | | | |
| | | | | | | | | | | | | | | | | | | | |
Ratios/supplemental data: | | | | | | | | | | | | | | | | | | | | |
Net assets, end of period (000s) | | $ | 296,239 | | | | | | | | | | | | | | | | | |
Ratio of gross expense to average net assets | | | 0.53 | %(4) | | | | | | | | | | | | | | | | |
Ratio of net expense to average net assets | | | 0.42 | %(4) | | | | | | | | | | | | | | | | |
Ratio of investment income less gross expenses to average net assets | | | 3.03 | %(4) | | | | | | | | | | | | | | | | |
Ratio of net investment income to average net assets | | | 3.14 | %(4) | | | | | | | | | | | | | | | | |
Portfolio turnover rate | | | 67 | % | | | | | | | | | | | | | | | | |
The Class commenced operations on January 22, 2018.
(1) Based on average shares outstanding.
(2) Amount is less than $0.005.
(3) Not annualized.
(4) Annualized.
Annual Report 149
| | | | | | | | | | | | | | | | | | | | |
| | | Payden Corporate Bond Fund | |
| | | 2018 | | | 2017 | | | 2016 | | | 2015 | | | 2014 | |
Net asset value — beginning of period | | $ | 11.38 | | | $ | 11.37 | | | $ | 10.97 | | | $ | 11.37 | | | $ | 11.05 | |
| | | | | | | | | | | | | | | | | | | | |
Income (loss) from investment activities: | | | | | | | | | | | | | | | | | | | | |
Net investment income | | | 0.39 | | | | 0.38 | | | | 0.34 | | | | 0.35 | | | | 0.39 | |
Net realized and unrealized gains (losses) | | | (0.68 | ) | | | 0.25 | | | | 0.53 | | | | (0.11 | ) | | | 0.50 | |
| | | | | | | | | | | | | | | | | | | | |
Total from investment activities | | | (0.29 | ) | | | 0.63 | | | | 0.87 | | | | 0.24 | | | | 0.89 | |
| | | | | | | | | | | | | | | | | | | | |
Distributions to shareholders: | | | | | | | | | | | | | | | | | | | | |
From net investment income | | | (0.39 | ) | | | (0.38 | ) | | | (0.34 | ) | | | (0.34 | ) | | | (0.41 | ) |
From net realized gains | | | (0.07 | ) | | | (0.24 | ) | | | (0.13 | ) | | | (0.30 | ) | | | (0.16 | ) |
| | | | | | | | | | | | | | | | | | | | |
Total distributions to shareholders | | | (0.46 | ) | | | (0.62 | ) | | | (0.47 | ) | | | (0.64 | ) | | | (0.57 | ) |
| | | | | | | | | | | | | | | | | | | | |
Net asset value — end of period | | $ | 10.63 | | | $ | 11.38 | | | $ | 11.37 | | | $ | 10.97 | | | $ | 11.37 | |
| | | | | | | | | | | | | | | | | | | | |
Total return | | | (2.61 | )% | | | 5.83 | % | | | 8.18 | % | | | 2.26 | % | | | 8.31 | % |
| | | | | | | | | | | | | | | | | | | | |
Ratios/supplemental data: | | | | | | | | | | | | | | | | | | | | |
Net assets, end of period (000s) | | $ | 298,708 | | | $ | 207,305 | | | $ | 140,468 | | | $ | 71,542 | | | $ | 69,646 | |
Ratio of gross expense to average net assets | | | 0.72 | % | | | 0.70 | % | | | 0.74 | % | | | 0.78 | % | | | 0.79 | % |
Ratio of net expense to average net assets | | | 0.65 | % | | | 0.65 | % | | | 0.65 | % | | | 0.65 | % | | | 0.65 | % |
Ratio of investment income less gross expenses to average net assets | | | 3.52 | % | | | 3.32 | % | | | 3.04 | % | | | 3.08 | % | | | 3.42 | % |
Ratio of net investment income to average net assets | | | 3.59 | % | | | 3.37 | % | | | 3.13 | % | | | 3.21 | % | | | 3.56 | % |
Portfolio turnover rate | | | 85 | % | | | 93 | % | | | 145 | % | | | 112 | % | | | 104 | % |
The Fund commenced operations on March 12, 2009.
| | | | | | | | | | | | | | | | | | | | |
| | | Payden Strategic Income Fund - Investor Class | |
| | | 2018 | | | 2017 | | | 2016 | | | 2015 | | | 2014 | |
Net asset value — beginning of period | | $ | 10.11 | | | $ | 10.12 | | | $ | 9.96 | | | $ | 10.00 | | | $ | 10.00 | |
| | | | | | | | | | | | | | | | | | | | |
Income (loss) from investment activities: | | | | | | | | | | | | | | | | | | | | |
Net investment income | | | 0.31 | | | | 0.28 | | | | 0.22 | | | | 0.22 | | | | (0.09 | ) |
Net realized and unrealized gains (losses) | | | (0.34 | ) | | | 0.02 | | | | 0.16 | | | | (0.01 | ) | | | (0.00 | )(1) |
| | | | | | | | | | | | | | | | | | | | |
Total from investment activities | | | (0.03 | ) | | | 0.30 | | | | 0.38 | | | | 0.21 | | | | (0.09 | ) |
| | | | | | | | | | | | | | | | | | | | |
Distributions to shareholders: | | | | | | | | | | | | | | | | | | | | |
From net investment income | | | (0.31 | ) | | | (0.30 | ) | | | (0.22 | ) | | | (0.22 | ) | | | (0.09 | ) |
From net realized gains | | | — | | | | (0.01 | ) | | | — | | | | (0.02 | ) | | | — | |
Return of capital | | | (0.00 | )(1) | | | (0.00 | )(1) | | | — | | | | (0.01 | ) | | | — | |
| | | | | | | | | | | | | | | | | | | | |
Total distributions to shareholders | | | (0.31 | ) | | | (0.31 | ) | | | (0.22 | ) | | | (0.25 | ) | | | (0.09 | ) |
| | | | | | | | | | | | | | | | | | | | |
Net asset value — end of period | | $ | 9.77 | | | $ | 10.11 | | | $ | 10.12 | | | $ | 9.96 | | | $ | 10.00 | |
| | | | | | | | | | | | | | | | | | | | |
Total return | | | (0.33 | )% | | | 3.09 | % | | | 3.90 | % | | | 2.08 | % | | | 0.94 | %(2) |
| | | | | | | | | | | | | | | | | | | | |
Ratios/supplemental data: | | | | | | | | | | | | | | | | | | | | |
Net assets, end of period (000s) | | $ | 146,823 | | | $ | 135,024 | | | $ | 150,106 | | | $ | 108,789 | | | $ | 55,453 | |
Ratio of gross expense to average net assets | | | 0.85 | % | | | 0.86 | % | | | 0.88 | % | | | 0.90 | % | | | 1.20 | %(3) |
Ratio of net expense to average net assets | | | 0.72 | % | | | 0.77 | % | | | 0.80 | % | | | 0.80 | % | | | 0.80 | %(3) |
Ratio of investment income less gross expenses to average net assets | | | 2.90 | % | | | 2.60 | % | | | 2.14 | % | | | 2.06 | % | | | 1.79 | %(3) |
Ratio of net investment income to average net assets | | | 3.04 | % | | | 2.70 | % | | | 2.22 | % | | | 2.17 | % | | | 2.19 | %(3) |
Portfolio turnover rate | | | 66 | % | | | 78 | % | | | 52 | % | | | 30 | % | | | 17 | %(2) |
The Fund commenced operations on May 8, 2014.
(1) Amount is less than $0.005.
(2) Not annualized.
(3) Annualized.
150 Payden Mutual Funds
| | | | | | | | | | | | | | | | | | | | |
| | | Payden Strategic Income Fund - SI Class | |
| | | 2018 | | | 2017 | | | 2016 | | | 2015 | | | 2014 | |
Net asset value — beginning of period | | $ | 10.11 | | | $ | 10.12 | | | $ | 9.96 | | | $ | 9.99 | | | $ | 10.00 | |
| | | | | | | | | | | | | | | | | | | | |
Income (loss) from investment activities: | | | | | | | | | | | | | | | | | | | | |
Net investment income | | | 0.32 | | | | 0.27 | | | | 0.25 | | | | 0.23 | | | | 0.09 | |
Net realized and unrealized gains (losses) | | | (0.34 | ) | | | 0.04 | | | | 0.15 | | | | 0.00 | | | | (0.00 | )(1) |
| | | | | | | | | | | | | | | | | | | | |
Total from investment activities | | | (0.02 | ) | | | 0.31 | | | | 0.40 | | | | 0.23 | | | | 0.09 | |
| | | | | | | | | | | | | | | | | | | | |
Distributions to shareholders: | | | | | | | | | | | | | | | | | | | | |
From net investment income | | | (0.32 | ) | | | (0.31 | ) | | | (0.24 | ) | | | (0.23 | ) | | | (0.10 | ) |
From net realized gains | | | — | | | | (0.01 | ) | | | — | | | | (0.02 | ) | | | — | |
Return of capital | | | (0.00 | )(1) | | | (0.00 | )(1) | | | — | | | | (0.01 | ) | | | — | |
| | | | | | | | | | | | | | | | | | | | |
Total distributions to shareholders | | | (0.32 | ) | | | (0.32 | ) | | | (0.24 | ) | | | (0.26 | ) | | | (0.10 | ) |
| | | | | | | | | | | | | | | | | | | | |
Net asset value — end of period | | $ | 9.77 | | | $ | 10.11 | | | $ | 10.12 | | | $ | 9.96 | | | $ | 9.99 | |
| | | | | | | | | | | | | | | | | | | | |
Total return | | | (0.20 | )% | | | 3.21 | % | | | 4.03 | % | | | 2.32 | % | | | 0.93 | %(2) |
| | | | | | | | | | | | | | | | | | | | |
Ratios/supplemental data: | | | | | | | | | | | | | | | | | | | | |
Net assets, end of period (000s) | | $ | 58,071 | | | $ | 90,619 | | | $ | 30,764 | | | $ | 37,766 | | | $ | 32,682 | |
Ratio of gross expense to average net assets | | | 0.85 | % | | | 0.85 | % | | | 0.89 | % | | | 0.90 | % | | | 1.17 | %(3) |
Ratio of net expense to average net assets | | | 0.59 | % | | | 0.65 | % | | | 0.65 | % | | | 0.65 | % | | | 0.65 | %(3) |
Ratio of investment income less gross expenses to average net assets | | | 2.86 | % | | | 2.59 | % | | | 2.15 | % | | | 2.06 | % | | | 1.87 | %(3) |
Ratio of net investment income to average net assets | | | 3.11 | % | | | 2.79 | % | | | 2.39 | % | | | 2.31 | % | | | 2.39 | %(3) |
Portfolio turnover rate | | | 66 | % | | | 78 | % | | | 52 | % | | | 30 | % | | | 17 | %(2) |
The Fund commenced operations on May 8, 2014.
| | | | | | | | | | | | | | | | | | | | |
| | | Payden Absolute Return Bond Fund - Investor Class | | | | |
| | | 2018 | | | 2017 | | | 2016 | | | 2015 | | | | |
Net asset value — beginning of period | | $ | 10.09 | | | $ | 9.99 | | | $ | 9.92 | | | $ | 10.00 | | | | | |
| | | | | | | | | | | | | | | | | | | | |
Income (loss) from investment activities: | | | | | | | | | | | | | | | | | | | | |
Net investment income | | | 0.28 | | | | 0.25 | | | | 0.27 | | | | 0.17 | (4) | | | | |
Net realized and unrealized gains(losses) | | | (0.14 | ) | | | 0.09 | | | | 0.05 | | | | (0.07 | ) | | | | |
| | | | | | | | | | | | | | | | | | | | |
Total from investment activities | | | 0.14 | | | | 0.34 | | | | 0.32 | | | | 0.10 | | | | | |
| | | | | | | | | | | | | | | | | | | | |
Distributions to shareholders: | | | | | | | | | | | | | | | | | | | | |
From net investment income | | | (0.30 | ) | | | (0.24 | ) | | | (0.25 | ) | | | (0.18 | ) | | | | |
| | | | | | | | | | | | | | | | | | | | |
Net asset value — end of period | | $ | 9.93 | | | $ | 10.09 | | | $ | 9.99 | | | $ | 9.92 | | | | | |
| | | | | | | | | | | | | | | | | | | | |
Total return | | | 1.40 | % | | | 3.42 | % | | | 3.32 | % | | | 0.97 | %(2) | | | | |
| | | | | | | | | | | | | | | | | | | | |
Ratios/supplemental data: | | | | | | | | | | | | | | | | | | | | |
Net assets, end of period (000s) | | $ | 105,026 | | | $ | 86,883 | | | $ | 63,996 | | | $ | 42,121 | | | | | |
Ratio of gross expense to average net assets | | | 0.84 | % | | | 0.89 | % | | | 0.97 | % | | | 1.17 | %(3) | | | | |
Ratio of net expense to average net assets | | | 0.70 | % | | | 0.70 | % | | | 0.70 | % | | | 0.70 | %(3) | | | | |
Ratio of investment income less gross expenses to average net assets | | | 2.63 | % | | | 2.27 | % | | | 2.45 | % | | | 1.45 | %(3) | | | | |
Ratio of net investment income to average net assets | | | 2.77 | % | | | 2.46 | % | | | 2.73 | % | | | 1.92 | %(3) | | | | |
Portfolio turnover rate | | | 145 | % | | | 112 | % | | | 47 | % | | | 64 | %(2) | | | | |
The Fund commenced operations on November 6, 2014.
(1) Amount is less than $0.005.
(2) Not annualized.
(3) Annualized.
(4) Based on average shares outstanding.
Annual Report 151
| | | | | | | | | | | | | | | | | | | | |
| | | Payden Absolute Return Bond Fund - SI Class | | | | |
| | | 2018 | | | 2017 | | | 2016 | | | 2015 | | | | |
Net asset value — beginning of period | | $ | 10.09 | | | $ | 10.00 | | | $ | 9.93 | | | $ | 10.00 | | | | | |
| | | | | | | | | | | | | | | | | | | | |
Income (loss) from investment activities: | | | | | | | | | | | | | | | | | | | | |
Net investment income | | | 0.26 | | | | 0.25 | | | | 0.33 | | | | 0.19 | (1) | | | | |
Net realized and unrealized gains (losses) | | | (0.11 | ) | | | 0.09 | | | | 0.01 | | | | (0.07 | ) | | | | |
| | | | | | | | | | | | | | | | | | | | |
Total from investment activities | | | 0.15 | | | | 0.34 | | | | 0.34 | | | | 0.12 | | | | | |
| | | | | | | | | | | | | | | | | | | | |
Distributions to shareholders: | | | | | | | | | | | | | | | | | | | | |
From net investment income | | | (0.31 | ) | | | (0.25 | ) | | | (0.27 | ) | | | (0.19 | ) | | | | |
| | | | | | | | | | | | | | | | | | | | |
Net asset value — end of period | | $ | 9.93 | | | $ | 10.09 | | | $ | 10.00 | | | $ | 9.93 | | | | | |
| | | | | | | | | | | | | | | | | | | | |
Total return | | | 1.55 | % | | | 3.47 | % | | | 3.47 | % | | | 1.20 | %(2) | | | | |
| | | | | | | | | | | | | | | | | | | | |
Ratios/supplemental data: | | | | | | | | | | | | | | | | | | | | |
Net assets, end of period (000s) | | $ | 34,229 | | | $ | 17,050 | | | $ | 13,055 | | | $ | 18,830 | | | | | |
Ratio of gross expense to average net assets | | | 0.84 | % | | | 0.90 | % | | | 0.99 | % | | | 1.17 | %(3) | | | | |
Ratio of net expense to average net assets | | | 0.55 | % | | | 0.55 | % | | | 0.55 | % | | | 0.55 | %(3) | | | | |
Ratio of investment income less gross expenses to average net assets | | | 2.67 | % | | | 2.27 | % | | | 2.43 | % | | | 1.32 | %(3) | | | | |
Ratio of net investment income to average net assets | | | 2.96 | % | | | 2.61 | % | | | 2.86 | % | | | 1.94 | %(3) | | | | |
Portfolio turnover rate | | | 145 | % | | | 112 | % | | | 47 | % | | | 64 | %(2) | | | | |
The Fund commenced operations on November 6, 2014.
| | | | | | | | | | | | | | | | | | | | |
| | | Payden Floating Rate Fund - Investor Class | |
| | | 2018 | | | 2017 | | | 2016 | | | 2015 | | | 2014 | |
Net asset value — beginning of period | | $ | 10.00 | | | $ | 9.99 | | | $ | 9.89 | | | $ | 9.97 | | | $ | 10.00 | |
| | | | | | | | | | | | | | | | | | | | |
Income from investment activities: | | | | | | | | | | | | | | | | | | | | |
Net investment income | | | 0.39 | | | | 0.34 | | | | 0.34 | | | | 0.32 | | | | 0.27 | |
Net realized and unrealized gains (losses) | | | (0.08 | ) | | | 0.01 | | | | 0.10 | | | | (0.06 | ) | | | (0.03 | ) |
| | | | | | | | | | | | | | | | | | | | |
Total from investment activities | | | 0.31 | | | | 0.35 | | | | 0.44 | | | | 0.26 | | | | 0.24 | |
| | | | | | | | | | | | | | | | | | | | |
Distributions to shareholders: | | | | | | | | | | | | | | | | | | | | |
From net investment income | | | (0.38 | ) | | | (0.34 | ) | | | (0.34 | ) | | | (0.31 | ) | | | (0.27 | ) |
From net realized gains. | | | — | | | | — | | | | — | | | | (0.03 | ) | | | — | |
| | | | | | | | | | | | | | | | | | | | |
Total distributions to shareholders | | | (0.38 | ) | | | (0.34 | ) | | | (0.34 | ) | | | (0.34 | ) | | | (0.27 | ) |
| | | | | | | | | | | | | | | | | | | | |
Net asset value — end of period | | $ | 9.93 | | | $ | 10.00 | | | $ | 9.99 | | | $ | 9.89 | | | $ | 9.97 | |
| | | | | | | | | | | | | | | | | | | | |
Total return | | | 3.15 | % | | | 3.51 | % | | | 4.59 | % | | | 2.64 | % | | | 2.39 | %(2) |
| | | | | | | | | | | | | | | | | | | | |
Ratios/supplemental data: | | | | | | | | | | | | | | | | | | | | |
Net assets, end of period (000s) | | $ | 51,467 | | | $ | 63,804 | | | $ | 64,649 | | | $ | 42,478 | | | $ | 46,586 | |
Ratio of gross expense to average net assets | | | 0.85 | % | | | 0.83 | % | | | 0.85 | % | | | 0.84 | % | | | 0.90 | %(3) |
Ratio of net expense to average net assets | | | 0.75 | % | | | 0.75 | % | | | 0.75 | % | | | 0.75 | % | | | 0.75 | %(3) |
Ratio of investment income less gross expenses to average net assets | | | 3.65 | % | | | 3.25 | % | | | 3.38 | % | | | 3.00 | % | | | 3.03 | %(3) |
Ratio of net investment income to average net assets | | | 3.75 | % | | | 3.34 | % | | | 3.47 | % | | | 3.09 | % | | | 3.17 | %(3) |
Portfolio turnover rate | | | 91 | % | | | 107 | % | | | 41 | % | | | 39 | % | | | 18 | %(2) |
The Fund commenced operations on November 11, 2013.
(1) Based on average shares outstanding.
(2) Not annualized.
(3) Annualized.
152 Payden Mutual Funds
| | | | | | | | | | | | | | | | | | | | |
| | | Payden Floating Rate Fund - SI Class | |
| | | 2018 | | | 2017 | | | 2016 | | | 2015 | | | 2014 | |
Net asset value — beginning of period | | $ | 10.01 | | | $ | 10.00 | | | $ | 9.90 | | | $ | 9.98 | | | $ | 10.00 | |
| | | | | | | | | | | | | | | | | | | | |
Income from investment activities: | | | | | | | | | | | | | | | | | | | | |
Net investment income | | | 0.39 | | | | 0.35 | | | | 0.35 | | | | 0.32 | | | | 0.28 | |
Net realized and unrealized gains (losses) | | | (0.07 | ) | | | 0.01 | | | | 0.10 | | | | (0.05 | ) | | | (0.02 | ) |
| | | | | | | | | | | | | | | | | | | | |
Total from investment activities | | | 0.32 | | | | 0.36 | | | | 0.45 | | | | 0.27 | | | | 0.26 | |
| | | | | | | | | | | | | | | | | | | | |
Distributions to shareholders: | | | | | | | | | | | | | | | | | | | | |
From net investment income | | | (0.39 | ) | | | (0.35 | ) | | | (0.35 | ) | | | (0.32 | ) | | | (0.28 | ) |
From net realized gains. | | | — | | | | — | | | | — | | | | (0.03 | ) | | | — | |
| | | | | | | | | | | | | | | | | | | | |
Total distributions to shareholders | | | (0.39 | ) | | | (0.35 | ) | | | (0.35 | ) | | | (0.35 | ) | | | (0.28 | ) |
| | | | | | | | | | | | | | | | | | | | |
Net asset value — end of period | | $ | 9.94 | | | $ | 10.01 | | | $ | 10.00 | | | $ | 9.90 | | | $ | 9.98 | |
| | | | | | | | | | | | | | | | | | | | |
Total return | | | 3.25 | % | | | 3.73 | % | | | 4.58 | % | | | 2.74 | % | | | 2.59 | %(1) |
| | | | | | | | | | | | | | | | | | | | |
Ratios/supplemental data: | | | | | | | | | | | | | | | | | | | | |
Net assets, end of period (000s) | | $ | 104,837 | | | $ | 128,586 | | | $ | 122,809 | | | $ | 124,006 | | | $ | 119,799 | |
Ratio of gross expense to average net assets | | | 0.85 | % | | | 0.83 | % | | | 0.85 | % | | | 0.84 | % | | | 0.89 | %(2) |
Ratio of net expense to average net assets | | | 0.65 | % | | | 0.65 | % | | | 0.65 | % | | | 0.65 | % | | | 0.65 | %(2) |
Ratio of investment income less gross expenses to average net assets | | | 3.66 | % | | | 3.25 | % | | | 3.38 | % | | | 3.01 | % | | | 2.93 | %(2) |
Ratio of net investment income to average net assets | | | 3.86 | % | | | 3.43 | % | | | 3.58 | % | | | 3.20 | % | | | 3.18 | %(2) |
Portfolio turnover rate | | | 91 | % | | | 107 | % | | | 41 | % | | | 39 | % | | | 18 | %(1) |
The Fund commenced operations on November 11, 2013. | | | | | |
| |
| | | Payden High Income Fund | |
| | | 2018 | | | 2017 | | | 2016 | | | 2015 | | | 2014 | |
Net asset value — beginning of period | | $ | 6.59 | | | $ | 6.46 | | | $ | 6.40 | | | $ | 7.08 | | | $ | 7.28 | |
| | | | | | | | | | | | | | | | | | | | |
Income (loss) from investment activities: | | | | | | | | | | | | | | | | | | | | |
Net investment income | | | 0.35 | | | | 0.34 | | | | 0.33 | | | | 0.36 | | | | 0.40 | |
Net realized and unrealized gains (losses) | | | (0.34 | ) | | | 0.14 | | | | 0.06 | | | | (0.42 | ) | | | (0.00 | )(3) |
| | | | | | | | | | | | | | | | | | | | |
Total from investment activities | | | 0.01 | | | | 0.48 | | | | 0.39 | | | | (0.06 | ) | | | 0.40 | |
| | | | | | | | | | | | | | | | | | | | |
Distributions to shareholders: | | | | | | | | | | | | | | | | | | | | |
From net investment income | | | (0.35 | ) | | | (0.35 | ) | | | (0.33 | ) | | | (0.36 | ) | | | (0.40 | ) |
From net realized gains. | | | — | | | | (0.00 | )(3) | | | — | | | | (0.26 | ) | | | (0.20 | ) |
| | | | | | | | | | | | | | | | | | | | |
Total distributions to shareholders | | | (0.35 | ) | | | (0.35 | ) | | | (0.33 | ) | | | (0.62 | ) | | | (0.60 | ) |
| | | | | | | | | | | | | | | | | | | | |
Net asset value — end of period | | $ | 6.25 | | | $ | 6.59 | | | $ | 6.46 | | | $ | 6.40 | | | $ | 7.08 | |
| | | | | | | | | | | | | | | | | | | | |
Total return | | | 0.16 | % | | | 7.60 | % | | | 6.33 | % | | | (0.79 | )% | | | 5.75 | % |
| | | | | | | | | | | | | | | | | | | | |
Ratios/supplemental data: | | | | | | | | | | | | | | | | | | | | |
Net assets, end of period (000s) | | $ | 449,939 | | | $ | 533,635 | | | $ | 587,215 | | | $ | 603,937 | | | $ | 734,666 | |
Ratio of gross expense to average net assets | | | 0.62 | % | | | 0.65 | % | | | 0.66 | % | | | 0.67 | % | | | 0.66 | % |
Ratio of net expense to average net assets | | | 0.62 | % | | | 0.65 | % | | | 0.66 | % | | | 0.67 | % | | | 0.66 | % |
Ratio of investment income less gross expenses to average net assets | | | 5.36 | % | | | 5.14 | % | | | 5.16 | % | | | 5.29 | % | | | 5.54 | % |
Ratio of net investment income to average net assets | | | 5.36 | % | | | 5.14 | % | | | 5.16 | % | | | 5.29 | % | | | 5.54 | % |
Portfolio turnover rate | | | 62 | % | | | 67 | % | | | 44 | % | | | 32 | % | | | 42 | % |
The Fund commenced operations on December 30, 1997.
(1) Not annualized.
(2) Annualized.
(3) Amount is less than $0.005.
Annual Report 153
| | | | | | | | | | | | | | | | | | | | |
| | | Payden California Municipal Income Fund | |
| | | 2018 | | | 2017 | | | 2016 | | | 2015 | | | 2014 | |
Net asset value — beginning of period | | $ | 10.28 | | | $ | 10.41 | | | $ | 10.39 | | | $ | 10.50 | | | $ | 10.27 | |
| | | | | | | | | | | | | | | | | | | | |
Income (loss) from investment activities: | | | | | | | | | | | | | | | | | | | | |
Net investment income | | | 0.22 | | | | 0.19 | | | | 0.19 | | | | 0.23 | | | | 0.24 | |
Net realized and unrealized gains (losses) | | | (0.26 | ) | | | 0.03 | | | | 0.14 | | | | (0.03 | ) | | | 0.29 | |
| | | | | | | | | | | | | | | | | | | | |
Total from investment activities | | | (0.04 | ) | | | 0.22 | | | | 0.33 | | | | 0.20 | | | | 0.53 | |
| | | | | | | | | | | | | | | | | | | | |
Distributions to shareholders: | | | | | | | | | | | | | | | | | | | | |
From net investment income | | | (0.22 | ) | | | (0.19 | ) | | | (0.19 | ) | | | (0.23 | ) | | | (0.24 | ) |
From net realized gains. | | | (0.04 | ) | | | (0.16 | ) | | | (0.12 | ) | | | (0.08 | ) | | | (0.06 | ) |
| | | | | | | | | | | | | | | | | | | | |
Total distributions to shareholders | | | (0.26 | ) | | | (0.35 | ) | | | (0.31 | ) | | | (0.31 | ) | | | (0.30 | ) |
| | | | | | | | | | | | | | | | | | | | |
Net asset value — end of period | | $ | 9.98 | | | $ | 10.28 | | | $ | 10.41 | | | $ | 10.39 | | | $ | 10.50 | |
| | | | | | | | | | | | | | | | | | | | |
Total return | | | (0.39 | )% | | | 2.28 | % | | | 3.22 | % | | | 1.87 | % | | | 5.27 | % |
| | | | | | | | | | | | | | | | | | | | |
Ratios/supplemental data: | | | | | | | | | | | | | | | | | | | | |
Net assets, end of period (000s) | | $ | 57,140 | | | $ | 57,645 | | | $ | 55,808 | | | $ | 45,938 | | | $ | 46,729 | |
Ratio of gross expense to average net assets | | | 0.68 | % | | | 0.70 | % | | | 0.71 | % | | | 0.70 | % | | | 0.70 | % |
Ratio of net expense to average net assets | | | 0.53 | % | | | 0.54 | % | | | 0.55 | % | | | 0.55 | % | | | 0.55 | % |
Ratio of investment income less gross expenses to average net assets | | | 2.05 | % | | | 1.72 | % | | | 1.62 | % | | | 2.03 | % | | | 2.18 | % |
Ratio of net investment income to average net assets | | | 2.20 | % | | | 1.89 | % | | | 1.78 | % | | | 2.17 | % | | | 2.33 | % |
Portfolio turnover rate | | | 161 | % | | | 157 | % | | | 57 | % | | | 45 | % | | | 48 | % |
The Fund commenced operations on December 17, 1998. | | | | | |
| |
| | | Payden Global Low Duration Fund | |
| | | 2018 | | | 2017 | | | 2016 | | | 2015 | | | 2014 | |
Net asset value — beginning of period | | $ | 10.06 | | | $ | 10.05 | | | $ | 10.01 | | | $ | 10.10 | | | $ | 10.08 | |
| | | | | | | | | | | | | | | | | | | | |
Income (loss) from investment activities: | | | | | | | | | | | | | | | | | | | | |
Net investment income | | | 0.23 | | | | 0.17 | | | | 0.11 | | | | 0.12 | | | | 0.12 | |
Net realized and unrealized gains (losses) | | | (0.19 | ) | | | 0.00 | (1) | | | 0.05 | | | | (0.09 | ) | | | 0.02 | |
| | | | | | | | | | | | | | | | | | | | |
Total from investment activities | | | 0.04 | | | | 0.17 | | | | 0.16 | | | | 0.03 | | | | 0.14 | |
| | | | | | | | | | | | | | | | | | | | |
Distributions to shareholders: | | | | | | | | | | | | | | | | | | | | |
From net investment income | | | (0.23 | ) | | | (0.08 | ) | | | (0.09 | ) | | | (0.02 | ) | | | (0.12 | ) |
Return of capital. | | | (0.00 | )(1) | | | (0.08 | ) | | | (0.03 | ) | | | (0.10 | ) | | | — | |
| | | | | | | | | | | | | | | | | | | | |
Total distributions to shareholders | | | (0.23 | ) | | | (0.16 | ) | | | (0.12 | ) | | | (0.12 | ) | | | (0.12 | ) |
| | | | | | | | | | | | | | | | | | | | |
Net asset value — end of period | | $ | 9.87 | | | $ | 10.06 | | | $ | 10.05 | | | $ | 10.01 | | | $ | 10.10 | |
| | | | | | | | | | | | | | | | | | | | |
Total return | | | 0.42 | % | | | 1.66 | % | | | 1.61 | % | | | 0.32 | % | | | 1.43 | % |
| | | | | | | | | | | | | | | | | | | | |
Ratios/supplemental data: | | | | | | | | | | | | | | | | | | | | |
Net assets, end of period (000s) | | $ | 93,737 | | | $ | 113,405 | | | $ | 135,217 | | | $ | 130,344 | | | $ | 139,965 | |
Ratio of gross expense to average net assets | | | 0.67 | % | | | 0.66 | % | | | 0.66 | % | | | 0.69 | % | | | 0.69 | % |
Ratio of net expense to average net assets | | | 0.53 | % | | | 0.54 | % | | | 0.55 | % | | | 0.55 | % | | | 0.55 | % |
Ratio of investment income less gross expenses to average net assets | | | 2.13 | % | | | 1.49 | % | | | 1.02 | % | | | 1.05 | % | | | 1.11 | % |
Ratio of net investment income to average net assets | | | 2.28 | % | | | 1.61 | % | | | 1.14 | % | | | 1.18 | % | | | 1.25 | % |
Portfolio turnover rate | | | 55 | % | | | 108 | % | | | 41 | % | | | 35 | % | | | 54 | % |
The Fund commenced operations on September 18, 1996.
(1) Amount is less than $0.005.
154 Payden Mutual Funds
| | | | | | | | | | | | | | | | | | | | |
| | | Payden Global Fixed Income Fund | |
| | | 2018 | | | 2017 | | | 2016 | | | 2015 | | | 2014 | |
Net asset value — beginning of period | | $ | 9.11 | | | $ | 9.04 | | | $ | 8.87 | | | $ | 8.84 | | | $ | 8.53 | |
| | | | | | | | | | | | | | | | | | | | |
Income (loss) from investment activities: | | | | | | | | | | | | | | | | | | | | |
Net investment income | | | 0.16 | | | | 0.14 | | | | 0.13 | | | | 0.15 | | | | 0.21 | |
Net realized and unrealized gains (losses) | | | (0.19 | ) | | | 0.08 | | | | 0.27 | | | | 0.05 | | | | 0.31 | |
| | | | | | | | | | | | | | | | | | | | |
Total from investment activities | | | (0.03 | ) | | | 0.22 | | | | 0.40 | | | | 0.20 | | | | 0.52 | |
| | | | | | | | | | | | | | | | | | | | |
Distributions to shareholders: | | | | | | | | | | | | | | | | | | | | |
From net investment income | | | (0.19 | ) | | | (0.15 | ) | | | (0.11 | ) | | | (0.17 | ) | | | (0.18 | ) |
From net realized gains | | | — | | | | — | | | | (0.10 | ) | | | — | | | | — | |
Return of capital | | | — | | | | — | | | | (0.02 | ) | | | — | | | | (0.03 | ) |
| | | | | | | | | | | | | | | | | | | | |
Total distributions to shareholders | | | (0.19 | ) | | | (0.15 | ) | | | (0.23 | ) | | | (0.17 | ) | | | (0.21 | ) |
| | | | | | | | | | | | | | | | | | | | |
Net asset value — end of period | | $ | 8.89 | | | $ | 9.11 | | | $ | 9.04 | | | $ | 8.87 | | | $ | 8.84 | |
| | | | | | | | | | | | | | | | | | | | |
Total return | | | (0.39 | )% | | | 2.48 | % | | | 4.68 | % | | | 2.27 | % | | | 6.20 | % |
| | | | | | | | | | | | | | | | | | | | |
Ratios/supplemental data: | | | | | | | | | | | | | | | | | | | | |
Net assets, end of period (000s) | | $ | 129,003 | | | $ | 124,647 | | | $ | 111,109 | | | $ | 80,293 | | | $ | 50,679 | |
Ratio of gross expense to average net assets | | | 0.76 | % | | | 0.78 | % | | | 0.80 | % | | | 0.81 | % | | | 0.90 | % |
Ratio of net expense to average net assets | | | 0.69 | % | | | 0.65 | % | | | 0.65 | % | | | 0.66 | % | | | 0.70 | % |
Ratio of investment income less gross expenses to average net assets | | | 1.70 | % | | | 1.48 | % | | | 1.39 | % | | | 1.63 | % | | | 2.30 | % |
Ratio of net investment income to average net assets | | | 1.78 | % | | | 1.60 | % | | | 1.55 | % | | | 1.78 | % | | | 2.50 | % |
Portfolio turnover rate | | | 49 | % | | | 58 | % | | | 76 | % | | | 44 | % | | | 55 | % |
The Fund commenced operations on September 1, 1992.
| | | | | | | | | | | | | | | | | | | | |
| | | Payden Emerging Markets Bond Fund - Adviser Class | |
| | | 2018 | | | 2017 | | | 2016 | | | 2015 | | | 2014 | |
Net asset value — beginning of period | | $ | 14.22 | | | $ | 13.96 | | | $ | 13.10 | | | $ | 14.14 | | | $ | 13.90 | |
| | | | | | | | | | | | | | | | | | | | |
Income (loss) from investment activities: | | | | | | | | | | | | | | | | | | | | |
Net investment income | | | 0.72 | | | | 0.75 | | | | 0.66 | | | | 0.63 | | | | 0.70 | |
Net realized and unrealized gains (losses) | | | (1.53 | ) | | | 0.26 | | | | 0.92 | | | | (1.04 | ) | | | 0.29 | |
| | | | | | | | | | | | | | | | | | | | |
Total from investment activities | | | (0.81 | ) | | | 1.01 | | | | 1.58 | | | | (0.41 | ) | | | 0.99 | |
| | | | | | | | | | | | | | | | | | | | |
Distributions to shareholders: | | | | | | | | | | | | | | | | | | | | |
From net investment income | | | (0.66 | ) | | | (0.72 | ) | | | (0.72 | ) | | | (0.63 | ) | | | (0.60 | ) |
From net realized gains | | | — | | | | — | | | | — | | | | — | | | | (0.05 | ) |
Return of capital | | | (0.06 | ) | | | (0.03 | ) | | | — | | | | — | | | | (0.10 | ) |
| | | | | | | | | | | | | | | | | | | | |
Total distributions to shareholders | | | (0.72 | ) | | | (0.75 | ) | | | (0.72 | ) | | | (0.63 | ) | | | (0.75 | ) |
| | | | | | | | | | | | | | | | | | | | |
Net asset value — end of period | | $ | 12.69 | | | $ | 14.22 | | | $ | 13.96 | | | $ | 13.10 | | | $ | 14.14 | |
| | | | | | | | | | | | | | | | | | | | |
Total return | | | (5.86 | )% | | | 7.50 | % | | | 12.46 | % | | | (2.94 | )% | | | 7.32 | % |
| | | | | | | | | | | | | | | | | | | | |
Ratios/supplemental data: | | | | | | | | | | | | | | | | | | | | |
Net assets, end of period (000s) | | $ | 82,007 | | | $ | 131,677 | | | $ | 76,182 | | | $ | 29,481 | | | $ | 21,754 | |
Ratio of gross expense to average net assets | | | 1.00 | % | | | 1.00 | % | | | 1.00 | % | | | 1.01 | % | | | 1.03 | % |
Ratio of net expense to average net assets | | | 1.00 | % | | | 1.00 | % | | | 1.00 | % | | | 1.01 | % | | | 1.03 | % |
Ratio of investment income less gross expenses to average net assets | | | 5.31 | % | | | 5.36 | % | | | 5.08 | % | | | 4.73 | % | | | 5.03 | % |
Ratio of net investment income to average net assets | | | 5.31 | % | | | 5.36 | % | | | 5.08 | % | | | 4.73 | % | | | 5.03 | % |
Portfolio turnover rate | | | 63 | % | | | 48 | % | | | 46 | % | | | 54 | % | | | 73 | % |
The Class commenced operations on November 2, 2009.
Annual Report 155
| | | | | | | | | | | | | | | | | | | | |
| | | Payden Emerging Markets Bond Fund - Investor Class | |
| | | 2018 | | | 2017 | | | 2016 | | | 2015 | | | 2014 | |
Net asset value — beginning of period | | $ | 14.21 | | | $ | 13.95 | | | $ | 13.08 | | | $ | 14.11 | | | $ | 13.88 | |
| | | | | | | | | | | | | | | | | | | | |
Income (loss) from investment activities: | | | | | | | | |
Net investment income | | | 0.77 | | | | 0.77 | | | | 0.73 | | | | 0.67 | | | | 0.75 | |
Net realized and unrealized gains (losses) | | | (1.54 | ) | | | 0.27 | | | | 0.89 | | | | (1.04 | ) | | | 0.26 | |
| | | | | | | | | | | | | | | | | | | | |
Total from investment activities | | | (0.77 | ) | | | 1.04 | | | | 1.62 | | | | (0.37 | ) | | | 1.01 | |
| | | | | | | | | | | | | | | | | | | | |
Distributions to shareholders: | | | | | | | | |
From net investment income | | | (0.70 | ) | | | (0.75 | ) | | | (0.75 | ) | | | (0.66 | ) | | | (0.63 | ) |
From net realized gains | | | — | | | | — | | | | — | | | | — | | | | (0.05 | ) |
Return of capital | | | (0.06 | ) | | | (0.03 | ) | | | — | | | | — | | | | (0.10 | ) |
| | | | | | | | | | | | | | | | | | | | |
Total distributions to shareholders | | | (0.76 | ) | | | (0.78 | ) | | | (0.75 | ) | | | (0.66 | ) | | | (0.78 | ) |
| | | | | | | | | | | | | | | | | | | | |
Net asset value — end of period | | $ | 12.68 | | | $ | 14.21 | | | $ | 13.95 | | | $ | 13.08 | | | $ | 14.11 | |
| | | | | | | | | | | | | | | | | | | | |
Total return | | | (5.64 | )% | | | 7.76 | % | | | 12.75 | % | | | (2.65 | )% | | | 7.53 | % |
| | | | | | | | | | | | | | | | | | | | |
Ratios/supplemental data: | | | | | | | | |
Net assets, end of period (000s) | | $ | 404,580 | | | $ | 538,525 | | | $ | 478,082 | | | $ | 416,408 | | | $ | 379,923 | |
Ratio of gross expense to average net assets | | | 0.75 | % | | | 0.75 | % | | | 0.75 | % | | | 0.76 | % | | | 0.78 | % |
Ratio of net expense to average net assets | | | 0.75 | % | | | 0.75 | % | | | 0.75 | % | | | 0.76 | % | | | 0.78 | % |
Ratio of investment income less gross expenses to average net assets | | | 5.56 | % | | | 5.60 | % | | | 5.45 | % | | | 4.98 | % | | | 5.29 | % |
Ratio of net investment income to average net assets | | | 5.56 | % | | | 5.60 | % | | | 5.45 | % | | | 4.98 | % | | | 5.29 | % |
Portfolio turnover rate | | | 63 | % | | | 48 | % | | | 46 | % | | | 54 | % | | | 73 | % |
The Fund commenced operations on December 17, 1998.
| | | | | | | | | | | | | | | | | | | | |
| | | Payden Emerging Markets Bond Fund - SI Class | |
| | | 2018 | | | 2017 | | | 2016 | | | 2015 | | | 2014 | |
Net asset value — beginning of period | | $ | 14.19 | | | $ | 13.93 | | | $ | 13.07 | | | $ | 14.10 | | | $ | 13.87 | |
| | | | | | | | | | | | | | | | | | | | |
Income from investment activities: | | | | | | | | | | | | | | | | | | | | |
Net investment income | | | 0.77 | | | | 0.78 | | | | 0.74 | | | | 0.68 | | | | 0.74 | |
Net realized and unrealized gains (losses) | | | (1.52 | ) | | | 0.27 | | | | 0.88 | | | | (1.04 | ) | | | 0.28 | |
| | | | | | | | | | | | | | | | | | | | |
Total from investment activities | | | (0.75 | ) | | | 1.05 | | | | 1.62 | | | | (0.36 | ) | | | 1.02 | |
| | | | | | | | | | | | | | | | | | | | |
Distributions to shareholders: | | | | | | | | | | | | | | | | | | | | |
From net investment income | | | (0.71 | ) | | | (0.75 | ) | | | (0.76 | ) | | | (0.67 | ) | | | (0.64 | ) |
From net realized gains | | | — | | | | — | | | | — | | | | — | | | | (0.05 | ) |
Return of capital | | | (0.06 | ) | | | (0.04 | ) | | | — | | | | — | | | | (0.10 | ) |
| | | | | | | | | | | | | | | | | | | | |
Total distributions to shareholders | | | (0.77 | ) | | | (0.79 | ) | | | (0.76 | ) | | | (0.67 | ) | | | (0.79 | ) |
| | | | | | | | | | | | | | | | | | | | |
Net asset value — end of period | | $ | 12.67 | | | $ | 14.19 | | | $ | 13.93 | | | $ | 13.07 | | | $ | 14.10 | |
| | | | | | | | | | | | | | | | | | | | |
Total return | | | (5.51 | )% | | | 7.83 | % | | | 12.76 | % | | | (2.58 | )% | | | 7.64 | % |
| | | | | | | | | | | | | | | | | | | | |
Ratios/supplemental data: | | | | | | | | | | | | | | | | | | | | |
Net assets, end of period (000s) | | $ | 792,357 | | | $ | 693,577 | | | $ | 604,978 | | | $ | 518,220 | | | $ | 450,550 | |
Ratio of gross expense to average net assets | | | 0.75 | % | | | 0.75 | % | | | 0.75 | % | | | 0.76 | % | | | 0.77 | % |
Ratio of net expense to average net assets | | | 0.69 | % | | | 0.69 | % | | | 0.69 | % | | | 0.69 | % | | | 0.69 | % |
Ratio of investment income less gross expenses to average net assets | | | 5.61 | % | | | 5.59 | % | | | 5.46 | % | | | 4.98 | % | | | 5.28 | % |
Ratio of net investment income to average net assets | | | 5.67 | % | | | 5.65 | % | | | 5.52 | % | | | 5.05 | % | | | 5.35 | % |
Portfolio turnover rate | | | 63 | % | | | 48 | % | | | 46 | % | | | 54 | % | | | 73 | % |
The Class commenced operations on April 9, 2012.
156 Payden Mutual Funds
| | | | | | | | | | | | | | | | | | | | |
| | | Payden Emerging Markets Local Bond Fund | |
| | | 2018 | | | 2017 | | | 2016 | | | 2015 | | | 2014 | |
Net asset value — beginning of period | | $ | 6.90 | | | $ | 6.95 | | | $ | 6.66 | | | $ | 8.48 | | | $ | 9.33 | |
| | | | | | | | | | | | | | | | | | | | |
Income from investment activities: | | | | | | | | | | | | | | | | | | | | |
Net investment income | | | 0.42 | | | | 0.43 | | | | 0.37 | | | | 0.40 | | | | 0.51 | |
Net realized and unrealized gains (losses) | | | (0.93 | ) | | | (0.05 | ) | | | 0.28 | | | | (1.83 | ) | | | (0.86 | ) |
| | | | | | | | | | | | | | | | | | | | |
Total from investment activities | | | (0.51 | ) | | | 0.38 | | | | 0.65 | | | | (1.43 | ) | | | (0.35 | ) |
| | | | | | | | | | | | | | | | | | | | |
Distributions to shareholders: | | | | | | | | | | | | | | | | | | | | |
From net investment income | | | (0.08 | ) | | | (0.40 | ) | | | — | | | | — | | | | — | |
Return of capital. | | | (0.34 | ) | | | (0.03 | ) | | | (0.36 | ) | | | (0.39 | ) | | | (0.50 | ) |
| | | | | | | | | | | | | | | | | | | | |
Total distributions to shareholders | | | (0.42 | ) | | | (0.43 | ) | | | (0.36 | ) | | | (0.39 | ) | | | (0.50 | ) |
| | | | | | | | | | | | | | | | | | | | |
Proceeds from redemption fees | | | | | | | | | | | | | | | | | | | | |
Net asset value — end of period | | $ | 5.97 | | | $ | 6.90 | | | $ | 6.95 | | | $ | 6.66 | | | $ | 8.48 | |
| | | | | | | | | | | | | | | | | | | | |
Total return | | | (7.98 | )% | | | 5.63 | % | | | 10.11 | % | | | (17.16 | )% | | | (3.84 | )% |
| | | | | | | | | | | | | | | | | | | | |
Ratios/supplemental data: | | | | | | | | | | | | | | | | | | | | |
Net assets, end of period (000s) | | $ | 203,978 | | | $ | 180,942 | | | $ | 156,240 | | | $ | 125,970 | | | $ | 174,827 | |
Ratio of gross expense to average net assets | | | 0.84 | % | | | 1.08 | % | | | 0.96 | % | | | 0.98 | % | | | 0.96 | % |
Ratio of net expense to average net assets | | | 0.92 | % | | | 0.98 | % | | | 0.98 | % | | | 0.97 | % | | | 0.96 | % |
Ratio of investment income less gross expenses to average net assets | | | 6.25 | % | | | 6.14 | % | | | 5.46 | % | | | 5.26 | % | | | 5.59 | % |
Ratio of net investment income to average net assets | | | 6.17 | % | | | 6.25 | % | | | 5.44 | % | | | 5.28 | % | | | 5.59 | % |
Portfolio turnover rate | | | 69 | % | | | 61 | % | | | 68 | % | | | 106 | % | | | 99 | % |
The Fund commenced operations on November 2, 2011.
| | | | | | | | | | | | | | | | | | | | |
| | | Payden Emerging Markets Corporate Bond
Fund - Investor Class | |
| | | 2018 | | | 2017 | | | 2016 | | | 2015 | | | 2014 | |
Net asset value — beginning of period | | $ | 10.33 | | | $ | 10.09 | | | $ | 9.62 | | | $ | 10.39 | | | $ | 10.00 | |
| | | | | | | | | | | | | | | | | | | | |
Income from investment activities: | | | | | | | | | | | | | | | | | | | | |
Net investment income | | | 0.49 | (3) | | | 0.46 | (3) | | | 0.41 | (3) | | | 0.43 | | | | 0.64 | |
Net realized and unrealized gains (losses) | | | (0.72 | ) | | | 0.24 | | | | 0.47 | | | | (0.59 | ) | | | 0.18 | |
| | | | | | | | | | | | | | | | | | | | |
Total from investment activities | | | (0.23 | ) | | | 0.70 | | | | 0.88 | | | | (0.16 | ) | | | 0.82 | |
| | | | | | | | | | | | | | | | | | | | |
Distributions to shareholders: | | | | | | | | | | | | | | | | | | | | |
From net investment income | | | (0.46 | ) | | | (0.46 | ) | | | (0.41 | ) | | | (0.43 | ) | | | (0.43 | ) |
From net realized gains | | | (0.03 | ) | | | — | | | | — | | | | (0.18 | ) | | | — | |
Return of capital | | | (0.02 | ) | | | — | | | | — | | | | — | | | | — | |
| | | | | | | | | | | | | | | | | | | | |
Total distributions to shareholders | | | (0.51 | ) | | | (0.46 | ) | | | (0.41 | ) | | | (0.61 | ) | | | (0.43 | ) |
| | | | | | | | | | | | | | | | | | | | |
Net asset value — end of period | | $ | 9.59 | | | $ | 10.33 | | | $ | 10.09 | | | $ | 9.62 | | | $ | 10.39 | |
| | | | | | | | | | | | | | | | | | | | |
Total return | | | (2.26 | )% | | | 7.12 | % | | | 9.35 | % | | | (1.55 | )% | | | 8.31 | %(1) |
| | | | | | | | | | | | | | | | | | | | |
Ratios/supplemental data: | | | | | | | | | | | | | | | | | | | | |
Net assets, end of period (000s) | | $ | 4,208 | | | $ | 4,051 | | | $ | 3,655 | | | $ | 1,401 | | | $ | 1,522 | |
Ratio of gross expense to average net assets | | | 1.30 | % | | | 1.33 | % | | | 1.33 | % | | | 1.33 | % | | | 1.42 | %(2) |
Ratio of net expense to average net assets | | | 0.95 | % | | | 0.95 | % | | | 0.95 | % | | | 0.95 | % | | | 0.94 | %(2) |
Ratio of investment income less gross expenses to average net assets | | | 4.49 | % | | | 4.14 | % | | | 3.77 | % | | | 4.00 | % | | | 3.90 | %(2) |
Ratio of net investment income to average net assets | | | 4.84 | % | | | 4.52 | % | | | 4.15 | % | | | 4.39 | % | | | 4.37 | %(2) |
Portfolio turnover rate | | | 79 | % | | | 63 | % | | | 74 | % | | | 93 | % | | | 100 | %(1) |
The Fund commenced operations on November 11, 2013.
(1) Not annualized.
(2) Annualized.
(3) Based on average shares outstanding.
Annual Report 157
| | | | | | | | | | | | | | | | | | | | |
| | | Payden Emerging Markets Corporate Bond
Fund - SI Class | |
| | | 2018 | | | 2017 | | | 2016 | | | 2015 | | | 2014 | |
Net asset value — beginning of period | | $ | 10.34 | | | $ | 10.10 | | | $ | 9.63 | | | $ | 10.40 | | | $ | 10.00 | |
| | | | | | | | | | | | | | | | | | | | |
Income from investment activities: | | | | | | | | | | | | | | | | | | | | |
Net investment income | | | 0.49 | (1) | | | 0.47 | (1) | | | 0.42 | (1) | | | 0.45 | | | | 0.44 | |
Net realized and unrealized gains (losses) | | | (0.71 | ) | | | 0.24 | | | | 0.47 | | | | (0.60 | ) | | | 0.40 | |
| | | | | | | | | | | | | | | | | | | | |
Total from investment activities | | | (0.22 | ) | | | 0.71 | | | | 0.89 | | | | (0.15 | ) | | | 0.84 | |
| | | | | | | | | | | | | | | | | | | | |
Distributions to shareholders: | | | | | | | | | | | | | | | | | | | | |
From net investment income | | | (0.47 | ) | | | (0.47 | ) | | | (0.42 | ) | | | (0.44 | ) | | | (0.44 | ) |
From net realized gains | | | (0.03 | ) | | | — | | | | — | | | | (0.18 | ) | | | — | |
Return of capital | | | (0.02 | ) | | | — | | | | — | | | | — | | | | — | |
| | | | | | | | | | | | | | | | | | | | |
Total distributions to shareholders | | | (0.52 | ) | | | (0.47 | ) | | | (0.42 | ) | | | (0.62 | ) | | | (0.44 | ) |
| | | | | | | | | | | | | | | | | | | | |
Net asset value — end of period | | $ | 9.60 | | | $ | 10.34 | | | $ | 10.10 | | | $ | 9.63 | | | $ | 10.40 | |
| | | | | | | | | | | | | | | | | | | | |
Total return | | | (2.16 | )% | | | 7.22 | % | | | 9.44 | % | | | (1.47 | )% | | | 8.52 | %(2) |
| | | | | | | | | | | | | | | | | | | | |
Ratios/supplemental data: | | | | | | | | | | | | | | | | | | | | |
Net assets, end of period (000s) | | $ | 41,213 | | | $ | 36,576 | | | $ | 35,450 | | | $ | 34,600 | | | $ | 41,662 | |
Ratio of gross expense to average net assets | | | 1.31 | % | | | 1.33 | % | | | 1.35 | % | | | 1.33 | % | | | 1.39 | %(3) |
Ratio of net expense to average net assets | | | 0.85 | % | | | 0.85 | % | | | 0.85 | % | | | 0.85 | % | | | 0.85 | %(3) |
Ratio of investment income less gross expenses to average net assets | | | 4.49 | % | | | 4.13 | % | | | 3.80 | % | | | 4.01 | % | | | 3.89 | %(3) |
Ratio of net investment income to average net assets | | | 4.95 | % | | | 4.61 | % | | | 4.29 | % | | | 4.49 | % | | | 4.43 | %(3) |
Portfolio turnover rate | | | 79 | % | | | 63 | % | | | 74 | % | | | 93 | % | | | 100 | %(2) |
The Fund commenced operations on November 11, 2013.
(1) Based on average shares outstanding.
(2) Not annualized.
(3) Annualized.
| | | | | | | | | | | | | | | | | | | | |
| | | Payden Equity Income Fund - Adviser Class | |
| | | 2018 | | | 2017 | | | 2016 | | | 2015 | | | 2014 | |
Net asset value — beginning of period | | $ | 16.68 | | | $ | 14.69 | | | $ | 13.98 | | | $ | 14.40 | | | $ | 12.64 | |
| | | | | | | | | | | | | | | | | | | | |
Income from investment activities: | | | | | | | | | | | | | | | | | | | | |
Net investment income | | | 0.33 | | | | 0.32 | | | | 0.36 | | | | 0.32 | | | | 0.36 | |
Net realized and unrealized gains | | | 0.30 | | | | 2.08 | | | | 0.76 | | | | 0.05 | | | | 1.72 | |
| | | | | | | | | | | | | | | | | | | | |
Total from investment activities | | | 0.63 | | | | 2.40 | | | | 1.12 | | | | 0.37 | | | | 2.08 | |
| | | | | | | | | | | | | | | | | | | | |
Distributions to shareholders: | | | | | | | | | | | | | | | | | | | | |
From net investment income | | | (0.30 | ) | | | (0.33 | ) | | | (0.41 | ) | | | (0.36 | ) | | | (0.21 | ) |
From net realized gains | | | (0.82 | ) | | | (0.08 | ) | | | — | | | | (0.43 | ) | | | (0.11 | ) |
| | | | | | | | | | | | | | | | | | | | |
Total distributions to shareholders | | | (1.12 | ) | | | (0.41 | ) | | | (0.41 | ) | | | (0.79 | ) | | | (0.32 | ) |
| | | | | | | | | | | | | | | | | | | | |
Net asset value — end of period | | $ | 16.19 | | | $ | 16.68 | | | $ | 14.69 | | | $ | 13.98 | | | $ | 14.40 | |
| | | | | | | | | | | | | | | | | | | | |
Total return | | | 3.69 | % | | | 16.59 | % | | | 8.06 | % | | | 2.66 | % | | | 16.66 | % |
| | | | | | | | | | | | | | | | | | | | |
Ratios/supplemental data: | | | | | | | | | | | | | | | | | | | | |
Net assets, end of period (000s) | | $ | 13,580 | | | $ | 14,529 | | | $ | 8,313 | | | $ | 4,567 | | | $ | 4,742 | |
Ratio of gross expense to average net assets | | | 0.99 | % | | | 1.05 | % | | | 1.02 | % | | | 1.05 | % | | | 1.08 | % |
Ratio of net expense to average net assets | | | 0.99 | % | | | 1.05 | % | | | 1.05 | % | | | 1.05 | % | | | 1.05 | % |
Ratio of investment income less gross expenses to average net assets | | | 1.95 | % | | | 2.18 | % | | | 2.70 | % | | | 2.29 | % | | | 2.52 | % |
Ratio of net investment income to average net assets | | | 1.95 | % | | | 2.15 | % | | | 2.67 | % | | | 2.27 | % | | | 2.55 | % |
Portfolio turnover rate | | | 42 | % | | | 60 | % | | | 25 | % | | | 48 | % | | | 51 | % |
The Class commenced operations on December 1, 2011.
158 Payden Mutual Funds
| | | | | | | | | | | | | | | | | | | | |
| | | Payden Equity Income Fund - Investor Class | |
| | | 2018 | | | 2017 | | | 2016 | | | 2015 | | | 2014 | |
Net asset value — beginning of period | | $ | 16.69 | | | $ | 14.69 | | | $ | 13.97 | | | $ | 14.39 | | | $ | 12.64 | |
| | | | | | | | | | | | | | | | | | | | |
Income from investment activities: | | | | | | | | | | | | | | | | | | | | |
Net investment income | | | 0.38 | | | | 0.39 | | | | 0.38 | | | | 0.35 | | | | 0.38 | |
Net realized and unrealized gains | | | 0.29 | | | | 2.06 | | | | 0.78 | | | | 0.05 | | | | 1.72 | |
| | | | | | | | | | | | | | | | | | | | |
Total from investment activities | | | 0.67 | | | | 2.45 | | | | 1.16 | | | | 0.40 | | | | 2.10 | |
| | | | | | | | | | | | | | | | | | | | |
Distributions to shareholders: | | | | | | | | | | | | | | | | | | | | |
From net investment income | | | (0.34 | ) | | | (0.37 | ) | | | (0.44 | ) | | | (0.39 | ) | | | (0.24 | ) |
From net realized gains. | | | (0.82 | ) | | | (0.08 | ) | | | — | | | | (0.43 | ) | | | (0.11 | ) |
| | | | | | | | | | | | | | | | | | | | |
Total distributions to shareholders | | | (1.16 | ) | | | (0.45 | ) | | | (0.44 | ) | | | (0.82 | ) | | | (0.35 | ) |
| | | | | | | | | | | | | | | | | | | | |
Net asset value — end of period | | $ | 16.20 | | | $ | 16.69 | | | $ | 14.69 | | | $ | 13.97 | | | $ | 14.39 | |
| | | | | | | | | | | | | | | | | | | | |
Total return | | | 3.92 | % | | | 16.91 | % | | | 8.37 | % | | | 2.90 | % | | | 16.88 | % |
| | | | | | | | | | | | | | | | | | | | |
Ratios/supplemental data: | | | | | | | | | | | | | | | | | | | | |
Net assets, end of period (000s) | | $ | 476,071 | | | $ | 564,547 | | | $ | 479,460 | | | $ | 281,163 | | | $ | 275,222 | |
Ratio of gross expense to average net assets | | | 0.74 | % | | | 0.80 | % | | | 0.77 | % | | | 0.80 | % | | | 0.83 | % |
Ratio of net expense to average net assets | | | 0.74 | % | | | 0.80 | % | | | 0.80 | % | | | 0.80 | % | | | 0.80 | % |
Ratio of investment income less gross expenses to average net assets | | | 2.20 | % | | | 2.48 | % | | | 2.91 | % | | | 2.54 | % | | | 2.74 | % |
Ratio of net investment income to average net assets | | | 2.20 | % | | | 2.45 | % | | | 2.88 | % | | | 2.53 | % | | | 2.77 | % |
Portfolio turnover rate | | | 42 | % | | | 60 | % | | | 25 | % | | | 48 | % | | | 51 | % |
The Fund commenced operations on November 1, 1996.
| | | | | | | | | | | | | | | | | | | | |
| | | Payden Equity Income Fund - SI Class | |
| | | 2018 | | | 2017 | | | 2016 | | | 2015 | | | 2014 | |
Net asset value — beginning of period | | $ | 16.70 | | | $ | 14.69 | | | $ | 13.97 | | | $ | 14.39 | | | $ | 13.92 | |
| | | | | | | | | | | | | | | | | | | | |
Income from investment activities: | | | | | | | | | | | | | | | | | | | | |
Net investment income | | | 0.39 | | | | 0.42 | | | | 0.42 | | | | 0.38 | | | | 0.09 | |
Net realized and unrealized gains | | | 0.29 | | | | 2.06 | | | | 0.75 | | | | 0.04 | | | | 0.46 | |
| | | | | | | | | | | | | | | | | | | | |
Total from investment activities | | | 0.68 | | | | 2.48 | | | | 1.17 | | | | 0.42 | | | | 0.55 | |
| | | | | | | | | | | | | | | | | | | | |
Distributions to shareholders: | | | | | | | | | | | | | | | | | | | | |
From net investment income | | | (0.35 | ) | | | (0.39 | ) | | | (0.45 | ) | | | (0.41 | ) | | | (0.08 | ) |
From net realized gains | | | (0.82 | ) | | | (0.08 | ) | | | — | | | | (0.43 | ) | | | — | |
| | | | | | | | | | | | | | | | | | | | |
Total distributions to shareholders | | | (1.17 | ) | | | (0.47 | ) | | | (0.45 | ) | | | (0.84 | ) | | | (0.08 | ) |
| | | | | | | | | | | | | | | | | | | | |
Net asset value — end of period | | $ | 16.21 | | | $ | 16.70 | | | $ | 14.69 | | | $ | 13.97 | | | $ | 14.39 | |
| | | | | | | | | | | | | | | | | | | | |
Total return | | | 4.01 | % | | | 17.13 | % | | | 8.50 | % | | | 3.04 | % | | | 3.94 | %(1) |
| | | | | | | | | | | | | | | | | | | | |
Ratios/supplemental data: | | | | | | | | | | | | | | | | | | | | |
Net assets, end of period (000s) | | $ | 703,181 | | | $ | 385,988 | | | $ | 314,900 | | | $ | 277,634 | | | $ | 186,735 | |
Ratio of gross expense to average net assets | | | 0.74 | % | | | 0.80 | % | | | 0.77 | % | | | 0.79 | % | | | 0.83 | %(2) |
Ratio of net expense to average net assets | | | 0.65 | % | | | 0.65 | % | | | 0.65 | % | | | 0.65 | % | | | 0.65 | %(2) |
Ratio of investment income less gross expenses to average net assets | | | 2.19 | % | | | 2.48 | % | | | 3.01 | % | | | 2.51 | % | | | 2.48 | %(2) |
Ratio of net investment income to average net assets | | | 2.29 | % | | | 2.59 | % | | | 3.13 | % | | | 2.66 | % | | | 2.64 | %(2) |
Portfolio turnover rate | | | 42 | % | | | 60 | % | | | 25 | % | | | 48 | % | | | 51 | %(1) |
The Class commenced operations on August 1, 2014.
(1) Not annualized.
(2) Annualized.
Annual Report 159

To the Shareholders and Board of Trustees of
The Payden & Rygel Investment Group
Opinion on the Financial Statements and Financial Highlights
We have audited the accompanying statements of assets and liabilities of Payden Cash Reserves Money Market Fund, Payden Limited Maturity Fund, Payden Low Duration Fund, Payden U.S. Government Fund, Payden GNMA Fund, Payden Core Bond Fund, Payden Corporate Bond Fund, Payden Strategic Income Fund, Payden Absolute Return Bond Fund, Payden Floating Rate Fund, Payden High Income Fund, Payden California Municipal Income Fund, Payden Global Low Duration Fund, Payden Global Fixed Income Fund, Payden Emerging Markets Bond Fund, Payden Emerging Markets Local Bond Fund, Payden Emerging Markets Corporate Bond Fund, and Payden Equity Income Fund, eighteen of the funds comprising The Payden & Rygel Investment Group (the “Funds”), including the schedules of investments as of October 31, 2018, the related statements of operations for the year then ended, the statements of changes in net assets for each of the two years in the period then ended, the financial highlights for each of the five years in the period then ended for the Funds, except Payden Emerging Markets Corporate Bond Fund, Payden Floating Rate Fund, Payden Absolute Return Bond Fund, and Payden Strategic Income Fund; the related statements of operations, changes in net assets, and the financial highlights for the periods indicated in the table below for Payden Emerging Markets Corporate Bond Fund, Payden Floating Rate Fund, Payden Absolute Return Bond Fund, and Payden Strategic Income Fund; and the related notes. In our opinion, the financial statements and financial highlights present fairly, in all material respects, the financial position of each of the funds listed above constituting The Payden & Rygel Investment Group as of October 31, 2018, and the results of their operations for the year then ended, the changes in their net assets for each of the two years in the period then ended and the financial highlights for each of the five years in the period then ended (or for the period listed in the table below), in conformity with accounting principles generally accepted in the United States of America.
| | | | | | |
| Fund | | Statement of Operations | | Statements of Changes in Net
Assets | | Financial Highlights |
| Payden Emerging Markets Corporate Bond Fund Payden Floating Rate Fund | | For the year ended October 31, 2018 | | For the years ended October 31, 2018 and 2017 | | For the years ended October 31, 2018, 2017, 2016, 2015, and the period from November 11, 2013 (commencement of operations) through October 31, 2014. |
| Payden Absolute Return Bond Fund | | For the year ended October 31, 2018 | | For the years ended October 31, 2018 and 2017 | | For the years ended October 31, 2018, 2017, 2016, and the period from November 6, 2014 (commencement of operations) through October 31, 2015. |
| Payden Strategic Income Fund. | | For the year ended October 31, 2018 | | For the years ended October 31, 2018 and 2017 | | For the years ended October 31, 2018, 2017, 2016, 2015, and the period from May 8, 2014 (commencement of operations) through October 31, 2014. |
Basis for Opinion
These financial statements and financial highlights are the responsibility of the Funds’ management. Our responsibility is to express an opinion on the Funds’ financial statements and financial highlights based on our audits. We are a public accounting firm registered with the Public Company Accounting Oversight Board (United States) (PCAOB) and are required to be independent with respect to the Funds in accordance with the U.S. federal securities laws and the applicable rules and regulations of the Securities and Exchange Commission and the PCAOB.
We conducted our audits in accordance with the standards of the PCAOB. Those standards require that we plan and perform the audit to obtain reasonable assurance about whether the financial statements and financial highlights are free of material misstatement, whether due to error or fraud. The Funds are not required to have, nor were we engaged to perform, an audit of their internal control over financial reporting. As part of our audits we are required to obtain an understanding of internal control over financial reporting but not for the purpose of expressing an opinion on the effectiveness of the Funds’ internal control over financial reporting. Accordingly, we express no such opinion.
160 Payden Mutual Funds
Our audits included performing procedures to assess the risks of material misstatement of the financial statements and financial highlights, whether due to error or fraud, and performing procedures that respond to those risks. Such procedures included examining, on a test basis, evidence regarding the amounts and disclosures in the financial statements and financial highlights. Our audits also included evaluating the accounting principles used and significant estimates made by management, as well as evaluating the overall presentation of the financial statements and financial highlights. Our procedures included confirmation of securities owned as of October 31, 2018, by correspondence with the custodian and brokers; when replies were not received from brokers, we performed other auditing procedures. We believe that our audits provide a reasonable basis for our opinion.
|
| /s/ DELOITTE & TOUCHE LLP |
| Los Angeles, California |
| December 21, 2018 |
We have served as the auditor of one or more of The Payden & Rygel Investment Group investment companies since 1992.
Annual Report 161

Understanding Your Fund’s Expenses
Shareholders of mutual funds, incur two types of costs: transaction costs incurred from buying or selling fund shares and ongoing costs incurred from the funds daily operations. The table below is provided to highlight ongoing cost only. If transaction costs were included your cost would have been higher.
Actual Expenses
The table below is useful in estimating actual expenses paid during the six-month period ended October 31, 2018. It uses each Fund’s actual return and expense ratio for the period (184/365 days) to calculate the ongoing expenses paid by a shareholder with an initial investment of $1,000. To estimate the actual expense that you paid over the period, divide your beginning account value by 1,000 and multiply the quotient by the number in the Expenses Paid During the Period column.
| | | | | | | | | | | | | | | | | | | | |
| | | Value
May 1, 2018 | | | Value
October 31, 2018 | | 6-Month
Return | | | Expense
Ratio | | | Expenses
Paid |
Cash Reserves Money Market | | | $1,000.00 | | | | $1,008.70 | | | | 0.87 | % | | | 0.25 | % | | $ | 1.27 | |
Limited Maturity | | | 1,000.00 | | | | 1,010.90 | | | | 1.09 | % | | | 0.25 | % | | | 1.27 | |
Low Duration | | | 1,000.00 | | | | 1,005.90 | | | | 0.59 | % | | | 0.43 | % | | | 2.17 | |
U.S. Government | | | 1,000.00 | | | | 1,003.00 | | | | 0.30 | % | | | 0.43 | % | | | 2.17 | |
GNMA | | | 1,000.00 | | | | 999.00 | | | | (0.10 | )% | | | 0.50 | % | | | 2.52 | |
Core Bond Adviser Class | | | 1,000.00 | | | | 994.30 | | | | (0.57 | )% | | | 0.78 | % | | | 3.94 | |
Core Bond Investor Class | | | 1,000.00 | | | | 995.60 | | | | (0.44 | )% | | | 0.54 | % | | | 2.69 | |
Core Bond SI Class | | | 1,000.00 | | | | 996.20 | | | | (0.38 | )% | | | 0.40 | % | | | 2.02 | |
Corporate Bond | | | 1,000.00 | | | | 993.50 | | | | (0.65 | )% | | | 0.65 | % | | | 3.27 | |
Strategic Income Investor Class | | | 1,000.00 | | | | 1,002.90 | | | | 0.29 | % | | | 0.70 | % | | | 3.54 | |
Strategic Income SI Class | | | 1,000.00 | | | | 1,003.60 | | | | 0.36 | % | | | 0.55 | % | | | 2.79 | |
Absolute Return Bond Investor Class | | | 1,000.00 | | | | 1,007.50 | | | | 0.75 | % | | | 0.70 | % | | | 3.54 | |
Absolute Return Bond SI Class | | | 1,000.00 | | | | 1,007.30 | | | | 0.73 | % | | | 0.55 | % | | | 2.78 | |
Floating Rate Bond Investor Class | | | 1,000.00 | | | | 1,015.10 | | | | 1.51 | % | | | 0.75 | % | | | 3.83 | |
Floating Rate Bond SI Class | | | 1,000.00 | | | | 1,015.60 | | | | 1.56 | % | | | 0.65 | % | | | 3.32 | |
High Income | | | 1,000.00 | | | | 1,007.50 | | | | 0.75 | % | | | 0.62 | % | | | 3.13 | |
California Municipal Income | | | 1,000.00 | | | | 1,003.30 | | | | 0.33 | % | | | 0.53 | % | | | 2.68 | |
Global Low Duration | | | 1,000.00 | | | | 1,005.70 | | | | 0.57 | % | | | 0.53 | % | | | 2.68 | |
Global Fixed Income | | | 1,000.00 | | | | 997.30 | | | | (0.27 | )% | | | 0.70 | % | | | 3.55 | |
Emerging Markets Bond Adviser Class | | | 1,000.00 | | | | 957.90 | | | | (4.21 | )% | | | 1.01 | % | | | 4.99 | |
Emerging Markets Bond Investor Class | | | 1,000.00 | | | | 959.00 | | | | (4.10 | )% | | | 0.76 | % | | | 3.75 | |
Emerging Markets Bond SI Class | | | 1,000.00 | | | | 960.10 | | | | (3.99 | )% | | | 0.69 | % | | | 3.41 | |
Emerging Markets Local Bond | | | 1,000.00 | | | | 875.90 | | | | (12.41 | )% | | | 0.97 | % | | | 4.60 | |
Emerging Markets Corporate Bond Investor Class | | | 1,000.00 | | | | 987.00 | | | | (1.30 | )% | | | 0.95 | % | | | 4.76 | |
Emerging Markets Corporate Bond SI Class | | | 1,000.00 | | | | 987.50 | | | | (1.25 | )% | | | 0.85 | % | | | 4.26 | |
Equity Income Adviser Class | | | 1,000.00 | | | | 1,002.20 | | | | 0.22 | % | | | 0.99 | % | | | 5.02 | |
Equity Income Investor Class | | | 1,000.00 | | | | 1,003.50 | | | | 0.35 | % | | | 0.74 | % | | | 3.76 | |
Equity Income SI Class | | | 1,000.00 | | | | 1,003.80 | | | | 0.38 | % | | | 0.65 | % | | | 3.29 | |
162 Payden Mutual Funds
Hypothetical Expenses
The table below is provided so that you can compare a Fund’s ongoing expenses with those of another fund. It uses a hypothetical gross annual return of 5%, which is not the Fund’s actual return, and each Fund’s actual expense ratio (184/365 days) for the six-month period ended October 31, 2018 to calculate the ongoing expenses paid by a shareholder with an initial investment of $1,000.
| | | | | | | | | | | | | | | | | | | | |
| | | Value
May 1, 2018 | | | Value
October 31, 2018 | | 6-Month
Return | | | Expense
Ratio | | | Expenses
Paid |
Cash Reserves Money Market | | | $1,000.00 | | | | $1,023.95 | | | | 2.39 | % | | | 0.25 | % | | $ | 1.28 | |
Limited Maturity | | | 1,000.00 | | | | 1,023.95 | | | | 2.39 | % | | | 0.25 | % | | | 1.28 | |
Low Duration | | | 1,000.00 | | | | 1,023.04 | | | | 2.30 | % | | | 0.43 | % | | | 2.19 | |
U.S. Government | | | 1,000.00 | | | | 1,023.04 | | | | 2.30 | % | | | 0.43 | % | | | 2.19 | |
GNMA | | | 1,000.00 | | | | 1,022.68 | | | | 2.27 | % | | | 0.50 | % | | | 2.55 | |
Core Bond Adviser Class | | | 1,000.00 | | | | 1,021.25 | | | | 2.12 | % | | | 0.78 | % | | | 4.00 | |
Core Bond Investor Class | | | 1,000.00 | | | | 1,022.50 | | | | 2.25 | % | | | 0.54 | % | | | 2.73 | |
Core Bond SI Class | | | 1,000.00 | | | | 1,023.18 | | | | 2.32 | % | | | 0.40 | % | | | 2.05 | |
Corporate Bond | | | 1,000.00 | | | | 1,021.93 | | | | 2.19 | % | | | 0.65 | % | | | 3.31 | |
Strategic Income Investor Class | | | 1,000.00 | | | | 1,021.67 | | | | 2.17 | % | | | 0.70 | % | | | 3.57 | |
Strategic Income SI Class | | | 1,000.00 | | | | 1,022.42 | | | | 2.24 | % | | | 0.55 | % | | | 2.81 | |
Absolute Return Bond Investor Class | | | 1,000.00 | | | | 1,021.68 | | | | 2.17 | % | | | 0.70 | % | | | 3.57 | |
Absolute Return Bond SI Class | | | 1,000.00 | | | | 1,022.43 | | | | 2.24 | % | | | 0.55 | % | | | 2.80 | |
Floating Rate Bond Investor Class | | | 1,000.00 | | | | 1,021.40 | | | | 2.14 | % | | | 0.75 | % | | | 3.84 | |
Floating Rate Bond SI Class | | | 1,000.00 | | | | 1,021.91 | | | | 2.19 | % | | | 0.65 | % | | | 3.33 | |
High Income | | | 1,000.00 | | | | 1,022.09 | | | | 2.21 | % | | | 0.62 | % | | | 3.15 | |
California Municipal Income | | | 1,000.00 | | | | 1,022.53 | | | | 2.25 | % | | | 0.53 | % | | | 2.70 | |
Global Low Duration | | | 1,000.00 | | | | 1,022.53 | | | | 2.25 | % | | | 0.53 | % | | | 2.70 | |
Global Fixed Income | | | 1,000.00 | | | | 1,021.66 | | | | 2.17 | % | | | 0.70 | % | | | 3.59 | |
Emerging Markets Bond Adviser Class | | | 1,000.00 | | | | 1,020.11 | | | | 2.01 | % | | | 1.01 | % | | | 5.14 | |
Emerging Markets Bond Investor Class | | | 1,000.00 | | | | 1,021.38 | | | | 2.14 | % | | | 0.76 | % | | | 3.86 | |
Emerging Markets Bond SI Class | | | 1,000.00 | | | | 1,021.73 | | | | 2.17 | % | | | 0.69 | % | | | 3.52 | |
Emerging Markets Local Bond | | | 1,000.00 | | | | 1,020.30 | | | | 2.03 | % | | | 0.97 | % | | | 4.95 | |
Emerging Markets Corporate Bond Investor Class | | | 1,000.00 | | | | 1,020.41 | | | | 2.04 | % | | | 0.95 | % | | | 4.84 | |
Emerging Markets Corporate Bond SI Class | | | 1,000.00 | | | | 1,020.92 | | | | 2.09 | % | | | 0.85 | % | | | 4.33 | |
Equity Income Adviser Class | | | 1,000.00 | | | | 1,020.19 | | | | 2.02 | % | | | 0.99 | % | | | 5.07 | |
Equity Income Investor Class | | | 1,000.00 | | | | 1,021.45 | | | | 2.15 | % | | | 0.74 | % | | | 3.79 | |
Equity Income SI Class | | | 1,000.00 | | | | 1,021.93 | | | | 2.19 | % | | | 0.65 | % | | | 3.31 | |
Annual Report 163

1. Background
Among its other duties, the Board of Trustees (the “Board” or the “Trustees”) of The Payden & Rygel Investment Group (the “P&R Trust”) is responsible for determining whether to approve initially, and subsequently annually whether to renew, the investment management agreement (the “Agreement”) between Payden & Rygel (“Adviser”) and the Trust on behalf of each of the eighteen series covered by this Report (each a “Paydenfund” and collectively, the “Paydenfunds”). Under the Agreement, the Adviser is responsible for providing investment advisory services and overseeing the everyday operations and other service providers of the Paydenfunds.
Section 15(c) of the Investment Company Act of 1940 (the “1940 Act”) requires that, after an initial period of up to two years, the Agreement for each Paydenfund will remain in effect only if the Board, including a majority of those Trustees who have no direct or indirect interest in the Agreement, and who are not “interested persons” of the Trust, as that term is defined in the 1940 Act (each an “Independent Trustee,” and collectively, the “Independent Trustees”), annually renews that Agreement. Six of the Trust’s nine Trustees are deemed to be Independent Trustees for this purpose.
On June 19, 2018, the Board of Trustees of the P&R Trust unanimously approved the Agreement between the Adviser and the P&R Trust with respect to the eighteen Paydenfunds1 for an additional year through June 30, 2019. The Board approved the Agreement following the recommendation of the Board’s Audit Committee (the “Audit Committee”), which is composed of all six of the P&R Trust’s Independent Trustees. In reaching these decisions, the Board took into account information furnished to it throughout the year at meetings of the Board and the Board’s committees, as well as extensive information prepared specifically in connection with the annual renewal process. Determinations by the Independent Trustees also took into account various factors that they believed to be relevant, in light of (1) the legal advice furnished to them by Paul Hastings LLP (“Paul Hastings”), independent legal counsel to the Independent Trustees, and (2) each Independent Trustee’s business judgment.
2. Overview of the Approval or Renewal Process
In considering the annual renewal with respect to each of the eighteen Paydenfunds, the Board followed its previously established process. As part of this process, the Board delegates the initial responsibility for the renewal process and related tasks to the Audit Committee. These tasks include working with the Adviser and Paul Hastings (1) to develop Section 15(c)-related guidelines and specific requests with respect to the types of information to be provided to the Audit Committee and the Board in connection with the proposed contract renewals, and (2) to evaluate the information provided in response to these guidelines and requests.
Consistent with its established process, the P&R Trust retained Broadridge to prepare a report on each Paydenfund to assist the Audit Committee and the Board in their respective deliberations. Broadridge is an independent provider of investment company data that is widely recognized as a leading source of independent data used by independent directors and trustees of investment companies during their advisory contract review processes.
Broadridge produced, among other information, performance and expense comparison data regarding each Paydenfund, including data relating to each Paydenfund’s advisory fee rates, total expense ratios, short-term and long-term investment performance, and portfolio turnover rates. Broadridge also compared much of this data for each Paydenfund against a universe of investment companies and against a more selective peer group of investment companies with similar investment objectives and strategies, each of which was selected by Broadridge, and, in the case of the investment performance data, against one or more appropriate broad-based benchmark indices. In each case, Broadridge summarized the methodologies it employed to provide the data contained in its reports. In addition, Broadridge represented to the Board that its reports were designed specifically to provide the Board with the fee, expense and performance information that is necessary to help the Board satisfy its duties under Section 15(c) of the 1940 Act. Broadridge also represented that it, and not the Adviser, had identified the selected comparative peer groups and universes, and that it did so in a manner that was not intended to produce biased results for its clients.
[1]The Paydenfunds covered by this approval are the Payden Cash Reserves Money Market Fund, Payden Limited Maturity Fund, Payden Low Duration Fund, Payden U.S. Government Fund, Payden GNMA Fund, Payden Core Bond Fund, Payden Strategic Income Fund, Payden Absolute Return Bond Fund, Payden Corporate Bond Fund, Payden High Income Fund, Payden Floating Rate Fund, Payden California Municipal Income Fund, Payden Global Low Duration Fund, Payden Global Fixed Income Fund, Payden Emerging Markets Bond Fund, Payden Emerging Markets Local Bond Fund, Payden Emerging Markets Corporate Bond Fund and Payden Equity Income Fund.
164 Payden Mutual Funds
In advance of the Board meeting held on June 19, 2018, Paul Hastings requested on behalf of the Audit Committee and the Board, and the Adviser provided, extensive information that was designed to assist the Audit Committee and the Board in their consideration of whether to renew the Agreement for each Paydenfund. In addition to the data provided by Broadridge as described above, this information included, but was not limited to, the following: (1) the nature, extent and quality of services provided or to be provided by the Adviser to the particular Paydenfund; (2) the Paydenfund’s investment performance; (3) the costs of the services provided to the Paydenfund and the profits realized or potential profits to be realized (if any) by the Adviser and its affiliates from their relationship with the Paydenfund; (4) fees charged by other investment advisers; (5) the extent to which economies of scale have been realized or are anticipated to be realized as the particular Paydenfund grows; (6) whether the fee schedule set forth in the Agreement reflects any such economies of scale for the benefit of Fund investors; (7) comparisons of services and fee rates with any contracts entered into by the Adviser with other clients to whom the Adviser provides comparable services; and (8) any other benefits derived or anticipated to be derived by the Adviser or its affiliates from the relationship with the Paydenfund. As a general matter, the Board viewed these factors in their totality, with no single factor being the principal factor in determining whether to approve or renew the Agreement. In reaching its decisions regarding the renewal of the Agreement for each Paydenfund, the Board took into account the information described above, other information provided to the Board in connection with this process, and relevant information provided to the Board and to its Committees on an ongoing basis in connection with the Board’s general oversight duties with respect to the Paydenfunds. In addition, the Board received and considered information from Paul Hastings as to certain relevant guidelines that relate to the approval or renewal process under Section 15(c) of the 1940 Act. While the Board considered the Agreement with respect to all Paydenfunds, the Board received and considered fund-specific information and made its approval or renewal determinations on a Paydenfund-by-Paydenfund basis. In deciding whether to renew the Agreement for each Paydenfund, each Trustee may have accorded different weight to different factors, and thus, each Trustee may have had a different basis for his or her ultimate decision to vote to renew the Agreement for each Paydenfund. At its meeting on June 19, 2018, the Board voted unanimously to renew the Agreement for each Paydenfund listed above. Set forth below are certain general factors the Board considered for each of the Paydenfunds, followed by a summary of certain specific factors the Board considered for each particular Paydenfund.
3. Nature, Extent and Quality of Services
The Board and Audit Committee considered a number of factors related to the services provided by the Adviser, including the breadth and depth of the Adviser’s investment advisory process, the experience, expertise and quality of the Adviser’s investment professionals, the experience, leadership ability and integrity of the Adviser’s senior management, the long tenure of its key personnel, and the overall financial strength, stability and viability of the Adviser. They also considered the Adviser’s ability and commitment to attract and retain qualified personnel, and its commitment to maintain and enhance its investment advisory resources and information technology systems. The Board and Audit Committee further considered the Adviser’s strong commitment to compliance with applicable laws and regulations and the nature and extent of its compliance program and records. Finally, they took into account the administrative, distribution and shareholder services that the Adviser or its affiliates provided each Paydenfund under the Agreement and other agreements. Based on the foregoing, the Board and Audit Committee concluded that the investment advisory and related services provided by the Adviser and its affiliates have benefited and should continue to benefit each Paydenfund and its shareholders.
4. Investment Results
At its regular quarterly Board meetings during the past year, the Board reviewed the investment results of each Paydenfund compared to its respective peers and benchmark indices, paying specific attention to any Paydenfund whose performance did not measure up to the Adviser’s expectations and to the Adviser’s plan to deal with that situation. In addition, as a part of the annual review of the Agreement, the Board and Audit Committee specifically reviewed a report prepared by Broadridge, which contained each Paydenfund’s performance for various time periods, i.e., 1-year, 3-years, 5-years and 10-years, as compared to the performance of (1) a group of comparable mutual funds (the “Peer Group”) selected by Broadridge, and (2) each Paydenfund’s benchmark index. The Board and Audit Committee concluded that overall the short-term and long-term results for each of the eighteen Paydenfunds have been satisfactory and that each of the eighteen Paydenfunds is performing competitively versus its Peer Group and benchmark index. Following the discussion of the performance of the eighteen Paydenfunds, the Board and Committee concluded that the Adviser’s continued management should benefit each Paydenfund and its shareholders.
Annual Report 165

5. Advisory Fees and Total Expenses
The Board and the Audit Committee reviewed each Paydenfund’s net operating expense ratio and its various fee and expense components, and then compared those fees and expenses to the fee and expense information for the Peer Group for each Paydenfund. They observed that the advisory fees and expenses for each Paydenfund continue to be competitive with the advisory fees and expenses of the particular Fund’s Peer Group. The Board and Audit Committee also reviewed information regarding the advisory fees paid by other registered investment companies, pension funds and other institutional clients of the Adviser with respect to similar investment mandates as each of the Paydenfunds. They noted that, although the fees paid by those clients generally were lower than those paid by each Paydenfund, the differences appropriately reflected the significant investment, operational and regulatory differences between advising mutual funds and advising separately managed institutional accounts. Overall, the Board and Audit Committee concluded that each Paydenfund’s cost structure was fair and reasonable in relation to the services provided, and that each Paydenfund’s shareholders received reasonable value in return for the advisory fees and other amounts paid to the Adviser or its affiliates by the Paydenfund.
6. Adviser Profitability and Indirect Benefits
The Board and Audit Committee reviewed information at the P&R Trust level regarding the Adviser’s cost of providing services to the Paydenfunds, as well as the resulting level of profits to the Adviser. They further reviewed the cost allocation methodology used to determine the Adviser’s profitability of providing services to the Paydenfunds, as well as possible economies of scale that might be achieved. Based on that review, the Board and Audit Committee each concluded that the profits earned by the Adviser were not excessive in view of the advisory, administrative and other services provided to the Paydenfunds. Finally, the Board and Audit Committee noted that the Adviser indirectly benefited from its advisory relationship with the Paydenfunds by its ability to invest more efficiently the assets of small, separately managed accounts in the Paydenfunds, and because the availability of the Paydenfunds enhanced the Adviser’s business reputation and name recognition.
7. Fund-by-Fund Factors
The Board considered the following specific factors (among others) in connection with its determination to renew the Agreement with respect to each Paydenfund. If a Paydenfund is described in the following discussions as being in the “1st” quintile, it is in the best of five groups, that is, the group has the best performance or the lowest expenses, as the case may be. References below to quintiles are based on data provided to the Board in the reports prepared by Broadridge. The specific management fee, expense and performance factors outlined below are based on the Investor Class shares of each Paydenfund. Because the Investor Class generally has lower non-management expenses than the Adviser Class of these Funds, the expenses and performance of the Adviser Class will differ from the expenses and performance shown for the Investor Class. All time periods referenced below ended as of April 30, 2018.
Cash Reserves Money Market Fund
• Adviser Fee: The Adviser’s annual contractual management fee rate for the Fund is 0.15%, placing it in the first quintile of the group of comparable funds for adviser fees. The actual management fee was in the second quintile.
• Total Expenses: The Fund’s total expenses were in the second quintile of the group of comparable funds selected by Broadridge for expense comparison purposes. The Adviser has contractually agreed to waive its investment advisory fee or reimburse Fund expenses to the extent that Total Annual Fund Operating Expenses After Fee Waiver or Expense Reimbursement (excluding Acquired Fund Fees and Expenses, interest, taxes and extraordinary expenses) exceed 0.25%. This agreement has a one-year term ending February 28, 2019. It may or may not be renewed.
• Performance: The Fund was in the first quintile of the group of comparable funds for each of the one-, three-, five- and ten-year periods.
166 Payden Mutual Funds
Limited Maturity Fund
• Adviser Fee: The Adviser’s annual contractual management fee rate for the Fund is 0.28%, placing it in the fifth quintile of the group of comparable funds for adviser fees. The actual management fee was in the first quintile.
• Total Expenses: The Fund’s total expenses were in the first quintile of the group of comparable funds. The Adviser has contractually agreed to waive its investment advisory fee or reimburse Fund expenses to the extent that Total Annual Fund Operating Expenses After Fee Waiver or Expense Reimbursement (excluding Acquired Fund Fees and Expenses, interest, taxes and extraordinary expenses) exceed 0.25%. This agreement has a one-year term ending February 28, 2019. It may or may not be renewed.
• Performance: The Fund was in the first quintile of the group of comparable funds for the one-year period, the second quintile for each of the three- and five-year periods and the third quintile for the ten-year period.
Low Duration Fund
• Adviser Fee: The Adviser’s annual contractual management fee rate for the Fund is 0.28%, placing it in the third quintile of the group of comparable funds for adviser fees. The actual management fee was also in the third quintile.
• Total Expenses: The Fund’s total expenses were in the second quintile of the group of comparable funds. The Adviser has contractually agreed to waive its investment advisory fee or reimburse Fund expenses to the extent that Total Annual Fund Operating Expenses After Fee Waiver or Expense Reimbursement (excluding Acquired Fund Fees and Expenses, interest, taxes and extraordinary expenses) exceed 0.43%. This agreement has a one-year term ending February 28, 2019. It may or may not be renewed.
• Performance: The Fund was in the third quintile of the group of comparable funds for each of the one-, three-, five- and ten-year periods.
U.S. Government Fund
• Adviser Fee: The Adviser’s annual contractual management fee rate for the Fund is 0.28%, placing it in the third quintile of the group of comparable funds for adviser fees. The actual management fee was in the second quintile.
• Total Expenses: The Fund’s total expenses were in the first quintile of the group of comparable funds. The Adviser has contractually agreed to waive its investment advisory fee or reimburse Fund expenses to the extent that Total Annual Fund Operating Expenses After Fee Waiver or Expense Reimbursement (excluding Acquired Fund Fees and Expenses, interest, taxes and extraordinary expenses) exceed 0.44%. This agreement has a one-year term ending February 28, 2019. It may or may not be renewed.
• Performance: The Fund was in the third quintile of the group of comparable funds for each of the one, three- and ten-year periods and the second quintile for the five-year period.
GNMA Fund
• Adviser Fee: The Adviser’s annual contractual management fee rate for the Fund is 0.27%, placing it in the third quintile of the group of comparable funds for adviser fees. The actual management fee was in the first quintile.
• Total Expenses: The Fund’s total expenses were in the first quintile of the group of comparable funds. The Adviser has contractually agreed that for so long as it is the investment adviser to the Fund, the Total Annual Fund Operating Expenses (excluding Acquired Fund Fees and Expenses, interest, taxes and extraordinary expenses) will not exceed 0.50%.
• Performance: The Fund was in the fourth quintile of the group of comparable funds for the one-year period and the second quintile for each of the three-, five- and ten-year periods.
Annual Report 167
Core Bond Fund
• Adviser Fee: The Adviser’s annual contractual management fee rate for the Fund is 0.28%, placing it in the third quintile of the group of comparable funds for adviser fees. The actual management fee was in the fourth quintile.
• Total Expenses: The Fund’s total expenses were in the third quintile of the group of comparable funds. The Adviser has contractually agreed to waive its investment advisory fee or reimburse Fund expenses to the extent that Total Annual Fund Operating Expenses After Fee Waiver or Expense Reimbursement (excluding Acquired Fund Fees and Expenses, interest, taxes and extraordinary expenses) exceed 0.56%. This agreement has a one-year term ending February 28, 2019. It may or may not be renewed.
• Performance: The Fund was in the first quintile of the group of comparable funds for each of the one-, three-, five and ten-year periods.
Strategic Income Fund
• Adviser Fee: The Adviser’s annual contractual management fee rate for the Fund is 0.55%, placing it in the third quintile of the group of comparable funds for adviser fees. The actual management fee was in the fifth quintile.
• Total Expenses: The Fund’s total expenses were in the fourth quintile of the group of comparable funds. The Adviser has contractually agreed to waive its investment advisory fee or reimburse Fund expenses to the extent that Total Annual Fund Operating Expenses After Fee Waiver or Expense Reimbursement (excluding Acquired Fund Fees and Expenses, interest, taxes and extraordinary expenses) exceed 0.70%. This agreement has a one-year term ending February 28, 2019. It may or may not be renewed.
• Performance: The Fund was in the fourth quintile of the group of comparable funds for the one- and three-year periods. The Fund began operations on May 8, 2014.
Absolute Return Bond Fund
• Adviser Fee: The Adviser’s annual contractual management fee rate for the Fund is 0.50%, placing it in the first quintile of the Expense Group for adviser fees. The actual management fee was in the second quintile.
• Total Expenses: The Fund’s total expenses were in the first quintile of the group of comparable funds. The Adviser has contractually agreed to waive its investment advisory fee or reimburse Fund expenses to the extent that Total Annual Fund Operating Expenses After Fee Waiver or Expense Reimbursement (excluding Acquired Fund Fees and Expenses, interest, taxes and extraordinary expenses) exceed 0.70%. This agreement has a one-year term ending February 28, 2019. It may or may not be renewed.
• Performance: The Fund was in the third quintile of the group of comparable funds for the one-year period and the second quintile for the three-year period. The Fund began operations on November 6, 2014.
Corporate Bond Fund
• Adviser Fee: The Adviser’s annual contractual management fee rate for the Fund is 0.35%, placing it in the third quintile of the Expense Group for adviser fees. The actual management fee was in the fourth quintile.
• Total Expenses: The Fund’s total expenses were in the third quintile of the Expense Group. The Adviser has contractually agreed to waive its investment advisory fee or reimburse Fund expenses to the extent that Total Annual Fund Operating Expenses After Fee Waiver or Expense Reimbursement (excluding Acquired Fund Fees and Expenses, interest, taxes and extraordinary expenses) exceed 0.65%. This agreement has a one-year term ending February 28, 2019. It may or may not be renewed.
• Performance: The Fund was in the 1st quintile of the group or comparable funds for each of the one-, three- and five-year periods. The Fund began operations on March 12, 2009.
168 Payden Mutual Funds
High Income Fund
• Adviser Fee: The Adviser’s annual contractual management fee rate for the Fund is 0.35%, placing it in the 1st quintile of the group of comparable funds for adviser fees. The actual management fee was in the second quintile.
• Total Expenses: The Fund’s total expenses were in the first quintile of the group of comparable funds.
• Performance: The Fund was in the third quintile of the group of comparable funds for the one-, three- and five-year periods and the fifth quintile for the ten-year period.
Floating Rate Fund
• Adviser Fee: The Adviser’s annual contractual management fee rate for the Fund is 0.55%, placing it in the fifth quintile of the group of comparable funds for adviser fees. The actual management fee was in the fourth quintile.
• Total Expenses: The Fund’s total expenses were in the third quintile of the group of comparable funds. The Adviser has contractually agreed to waive its investment advisory fee or reimburse Fund expenses to the extent that Total Annual Fund Operating Expenses After Fee Waiver or Expense Reimbursement (excluding Acquired Fund Fees and Expenses, interest, taxes and extraordinary expenses) exceed 0.77%. This agreement has a one-year term ending February 28, 2019. It may or may not be renewed.
• Performance: The Fund was in the fifth quintile of the group of comparable funds for the one-year period and the third quintile for the three-year period. The Fund began operations on November 11, 2013.
California Municipal Income Fund
• Adviser Fee: The Adviser’s annual contractual management fee rate for the Fund is 0.32%, placing it in the third quintile of the Expense Group for adviser fees. The actual management fee was in the second quintile.
• Total Expenses: The Fund’s total expenses were in the third quintile of the group of comparable funds. The Adviser has contractually agreed to waive its investment advisory fee or reimburse Fund expenses to the extent that Total Annual Fund Operating Expenses After Fee Waiver or Expense Reimbursement (excluding Acquired Fund Fees and Expenses, interest, taxes and extraordinary expenses) exceed 0.53%. This agreement has a one-year term ending February 28, 2019. It may or may not be renewed.
• Performance: The Fund was in the first quintile of the group of comparable funds for each of the one- and three-year periods, the second quintile for the five-year period and the third quintile for the ten-year period.
Global Low Duration Fund
• Adviser Fee: The Adviser’s annual contractual management fee rate for the Fund is 0.30%, placing it in the first quintile of the group of comparable funds for adviser fees. The actual management fee was also in the first quintile.
• Total Expenses: The Fund’s total expenses were in the first quintile of the group of comparable funds. The Adviser has contractually agreed to waive its investment advisory fee or reimburse Fund expenses to the extent that Total Annual Fund Operating Expenses After Fee Waiver or Expense Reimbursement (excluding Acquired Fund Fees and Expenses, interest, taxes and extraordinary expenses) exceed 0.53%. This agreement has a one-year term ending February 28, 2019. It may or may not be renewed.
• Performance: The Fund was in the fifth quintile of the group of comparable funds for the each of the one- and three-year periods, the third quintile for the five-year period and the fourth quintile for the ten-year period.
Global Fixed Income Fund
• Adviser Fee: The Adviser’s annual contractual management fee rate for the Fund is 0.30%, placing it in the first quintile of the group of comparable funds for adviser fees. The actual management fee was also in the first quintile.
Annual Report 169
• Total Expenses: The Fund’s total expenses were in the first quintile of the group of comparable funds. The Adviser has contractually agreed that for so long as it is the investment adviser to the Fund, the Total Annual Fund Operating Expenses (excluding Acquired Fund Fees and Expenses, interest, taxes and extraordinary expenses) will not exceed 0.70%.
• Performance: The Fund was in the fourth quintile of the group of comparable funds for the one-year period, the third quintile for the three-year period, the first quintile for the five-year period and the second quintile for the ten-year period.
Emerging Markets Bond Fund
• Adviser Fee: The Adviser’s annual contractual management fee rate for the Fund is 0.45%, placing it in the first quintile of the group of comparable funds for adviser fees. The actual management fee was in the third quintile.
• Total Expenses: The Fund’s total expenses were in the first quintile of the group of comparable funds.
• Performance: The Fund was in the third quintile of the group of comparable funds for the one-year period, the second quintile for each of the three- and five-year periods and the first quintile for the ten-year period.
Emerging Markets Local Bond Fund
• Adviser Fee: The Adviser’s annual contractual management fee rate for the Fund is 0.60%, placing it in the second quintile of the group of comparable funds for adviser fees. The actual management fee is in the fourth quintile.
• Total Expenses: The Fund’s total expenses were in the fourth quintile of the group of comparable funds.
• Performance: The Fund was in the third quintile of the group of comparable funds for the one-year period, the second quintile for the three-year period and the fourth quintile for the five-year period. The Fund began operations on November 2, 2011.
Emerging Markets Corporate Bond Fund
• Adviser Fee: The Adviser’s annual contractual management fee rate for the Fund is 0.80%, placing it in the fifth quintile of the group of comparable funds for adviser fees. The actual management fee was in the third quintile.
• Total Expenses: The Fund’s total expenses were in the fourth quintile of the group of comparable funds. The Adviser has contractually agreed to waive its investment advisory fee or reimburse Fund expenses to the extent that Total Annual Fund Operating Expenses After Fee Waiver or Expense Reimbursement (excluding Acquired Fund Fees and Expenses, interest, taxes and extraordinary expenses) exceed 0.95%. This agreement has a one-year term ending February 28, 2019. It may or may not be renewed.
• Performance: The Fund was in the second quintile of the group of comparable funds for the one-year period and the third quintile for the three-year period. The Fund began operations on November 11, 2013.
Equity Income Fund
• Adviser Fee: The Adviser’s annual contractual management fee rate for the Fund is 0.50%, placing it in the fourth quintile of the group of comparable funds for adviser fees. The actual management fee is also in the fourth quintile.
• Total Expenses: The Fund’s total expenses were in the third quintile of the group of comparable funds. The Adviser has contractually agreed that for so long as it is the investment adviser to the Fund, the Total Annual Fund Operating Expenses (excluding Acquired Fund Fees and Expenses, interest, taxes and extraordinary expenses) will not exceed 0.80%.
• Performance: The Fund was in the second quintile of the group of comparable funds for the one-year period, the first quintile for the three-year period, and the third quintile for each of the five- and ten-year periods.
170 Payden Mutual Funds

| | | | | | | | | | | | |
| Name & Address | | Age | | Position with Fund | | Year Elected | | Number of
Portfolios | | Principal
Occupation(s) | | Other
Directorships Held |
| 333 S. Grand Avenue Los Angeles, CA 90071 | | | | | | | | | | | | |
Trustees (1) | | | | | | | | | | | | |
W. D. Hilton, Jr. | | 71 | | Independent Trustee | | 1993 | | 19 | | President and CEO, Trust Service, Inc.; Executive Director, NGC Bodily Injury Trust; and Managing Trustee, Fuller-Austin Trust | | |
Thomas V. | | 74 | | Independent Trustee | | 1993 | | 19 | | Vice Chair, | | |
McKernan, Jr. | | | | | | | | | | Automobile Club of Southern California, Director, First American Financial | | |
Rosemarie T. Nassif | | 77 | | Independent Trustee | | 2008 | | 19 | | Executive Director, Center for Catholic Education, Loyola Marymount University, President Emerita, Holy Names University | | |
Andrew J. Policano | | 69 | | Independent Trustee | | 2008 | | 19 | | Former Dean, The Paul Merage School of Business, University of California, Irvine | | Director, Rockwell Collins |
Dennis C. Poulsen | | 76 | | Independent Trustee | | 1992 | | 19 | | Chairman of the Advisory Board, Rose Hills Company | | |
Stender E. Sweeney | | 79 | | Independent Trustee | | 1992 | | 19 | | Private Investor | | Director, Avis Budget Group, Inc. |
Joan A. Payden | | 87 | | Interested Trustee | | 1992 | | 19 | | President, CEO and Director, Payden & Rygel | | |
Michael E. Salvay | | 57 | | Interested Trustee | | 2009 | | 19 | | Managing Principal, Payden & Rygel | | |
James P. Sarni | | 58 | | Interested Trustee | | 2017 | | 19 | | Managing Principal and Director, Payden & Rygel | | |
Officers (2) | | | | | | | | | | | | |
Joan A. Payden | | | | Chairman and CEO | | 1992 | | | | President, CEO and Director, Payden & Rygel | | |
Brian W. Matthews | | | | Vice President and CFO | | 2003 | | | | Managing Principal, CFO and Director, Payden & Rygel | | |
Yot Chattrabhuti | | | | Vice President | | 1997 | | | | Principal, Payden & Rygel | | |
Bradley F. Hersh | | | | Vice President and Treasurer | | 1998 | | | | Principal and Treasurer, Payden & Rygel | | |
Edward S. Garlock | | | | Secretary | | 1997 | | | | Managing Principal, General Counsel and Director, Payden & Rygel | | |
Sandi Brents | | | | Vice President and CCO | | 2016 | | | | Vice President and Senior Compliance Officer, Payden & Rygel | | |
Additional information about the Trustees is included in the SAI and is available without charge, upon request at payden.com or 1800 5 PAYDEN.
(1) Trustees do not have a set term of office, but serve until their resignation, death or removal.
(2) Officers are elected by, and serve at the pleasure of, The Board of Trustees.
Annual Report 171

» U.S. BOND FUNDS
Payden Cash Reserves Money Market Fund (PBHXX) Payden Limited Maturity Fund (PYLMX) Payden Low Duration Fund (PYSBX) Payden U.S. Government Fund — Investor Class (PYUSX) Payden GNMA Fund — Investor Class (PYGNX) Payden Core Bond Fund — Adviser Class (PYCWX) Payden Core Bond Fund — Investor Class (PYCBX) Payden Core Bond Fund — SI Class (PYCSX) Payden Corporate Bond Fund (PYACX) Payden Strategic Income — Investor Class (PYSGX) Payden Strategic Income — SI Class (PYSIX) Payden Absolute Return Bond Fund — Investor Class (PYARX) Payden Absolute Return Bond Fund — SI Class (PYAIX) Payden Floating Rate Fund — Investor Class (PYFRX) Payden Floating Rate Fund — SI Class (PYFIX) Payden High Income Fund — Investor Class (PYHRX)
» TAX EXEMPT BOND FUND
Payden California Municipal Income Fund (PYCRX)
» GLOBAL BOND FUNDS
Payden Global Low Duration Fund (PYGSX) Payden Global Fixed Income Fund (PYGFX)
Payden Emerging Markets Bond Fund — Adviser Class (PYEWX) Payden Emerging Markets Bond Fund — Investor Class (PYEMX) Payden Emerging Markets Bond Fund — SI Class (PYEIX) Payden Emerging Markets Local Bond Fund — Investor Class (PYELX) Payden Emerging Markets Corporate Bond Fund — Investor Class (PYCEX) Payden Emerging Markets Corporate Bond Fund — SI Class (PYCIX)
» EQUITY FUND
Payden Equity Income Fund — Adviser Class (PYVAX) Payden Equity Income Fund — Investor Class (PYVLX) Payden Equity Income Fund — SI Class (PYVSX)
PAYDEN MUTUAL FUNDS
333 South Grand Avenue, Los Angeles, California 90071 800 5-PAYDEN 800 572-9336 payden.com payden@umb.com


Annual Report

President’s Letter Dear Shareholders, December 2018 marks the completion of the 26th year since the founding of the Payden Mutual Fund complex. During this time financial markets have experienced wide fluctuations reflecting economic, political and financial changes. But, we have all survived. I’d like first to take a minute and focus on the things we think are most important to our success: the culture, governance structure and focus of the advisor to the Payden Mutual Funds, Payden & Rygel. None of these key ingredients to our success have changed during this period. These elements are vitally important to the stability and protection of client funds and investment results. Second, the global financial markets were volatile this past year, and it is very difficult to identify trends in such an environment. Back to basics then. The U.S. economy remains healthy. We are finishing a year where the consumer has enjoyed real wage growth, near-full employment and balance sheets that are in the best shape since 2008. However, the global picture is murky. The UK and Europe are contending with Brexit as the March 2019 deadline for an agreement looms. The other big question is whether China’s economy faces a more significant slowdown. Risks remain, but we’re optimistic the global economy can withstand the varied headwinds and enjoy continued growth in the year ahead. Turning back to basics. As far as the Payden Mutual Fund complex is concerned, we continue to offer a wide array of global strategies with an emphasis on fixed income. Over the past five years, the complex has grown in assets by approximately 40%, to $8 billion. The range of strategies offered reflects the now fully global financial markets. My very best wishes to you and your family this holiday season and most importantly for health and happiness in 2019. Warm regards, Joan A. Payden President & CEO
(THIS PAGE INTENTIONALLY LEFT BLANK)

For the fiscal year ended October 31, 2018, the Payden/Kravitz Cash Balance Plan Fund, SI Class (PKBIX) returned 1.82%, the Adviser Class (PKCBX) returned 1.53%, the Retirement Class (PKCRX) returned 1.24%, and the Institutional Class (PKCIX) returned 2.06%. The Fund’s benchmark, the 30-year U.S. Treasury Bond Yield returned 2.82% for the same period. The fiscal year was a tug-of-war between robust economic data and persistent geopolitical risk across the globe. Emerging market sovereign debt and investment-grade corporates elicited negative total returns as the US dollar strengthened and government bond yields increased. Less interest-rate sensitive sectors, such as Government Sponsored Entity risk-sharing deals, collateralized loan obligations and leveraged loans offered shelter from price declines. Securitized product continued to offer structural protection and a risk premium for complexity as underwriting standards remained tight and the US Housing market remained on stable footing. In February 2018, tail risk hedges contributed positively to performance as volatility increased substantially in-tandem with declines in the equity market. The Adviser took the opportunity to leg-in to equities following the initial bout of volatility, then took profits near the end of August, and have since re-entered in early October as stock prices once again declined meaningfully. The Fund remains structured with low interest rate sensitivity and invested in a diversified mix of fixed income sectors including corporate, mortgage-backed and asset-backed securities. The Fund employs futures, options, swaps and forward currency contracts to manage sensitivity to undesired risk exposures as well as efficient investment purposes.
1 Payden Mutual Funds
(THIS PAGE INTENTIONALLY LEFT BLANK)

| | | | | | | | |
| | The Fund seeks a return equal to the yield on the 30-year U.S. Treasury Bond by primarily investing in debt instruments and income producing securities of U.S. and foreign issuers with no limit on maturity and may also invest in equity securities. | | |  Past performance does not predict future returns. The graph does not reflect the impact of taxes or transaction costs a shareholder would pay. The Fund’s Institutional, Adviser and Retirement Classes are expected to perform similarly to its SI Class, except for class specific expenses or waivers. |
| | Portfolio Composition - percent of investments | |
| | | |
| | Mortgage Backed | | | 35% | |
| | Asset Backed | | | 22% | |
| | Corporate | | | 21% | |
| | Foreign Government | | | 13% | |
| | Stocks | | | 3% | |
| | Other | | | 6% | |
| | | | | | |
| | | | | | |
| | | | | | |
| | | | | | |
| | | | | | |
| | This information is not part of the audited financial statements | | | |
| | | | | | |
| Schedule of Investments - October 31, 2018 | |
Principal or Shares | | Security Description | | Value (000) | |
Asset Backed (22%) | | | | |
1,400,000 | | Apidos CLO XXI 144A, (3 mo. LIBOR USD + 0.930%) 3.37%, 7/18/27 (a)(b) | | $ | 1,397 | |
1,050,000 | | Apidos CLO XXI 144A, (3 mo. | | | | |
| | LIBOR USD + 2.450%) 4.89%, 7/18/27 (a)(b) | | | 1,044 | |
1,050,000 | | Blackrock European CLO III DAC 144A, (3 mo. EURIBOR + 0.850%) 0.85%, 4/15/30 EUR (a)(b)(c) | | | 1,190 | |
250,000 | | Blackrock European CLO IV DAC 144A, (3 mo. EURIBOR + 1.300%) 1.30%, 7/15/30 EUR (a)(b)(c) | | | 283 | |
350,000 | | Blackrock European CLO IV DAC 144A, (3 mo. EURIBOR + 2.650%) 2.65%, 7/15/30 EUR (a)(b)(c) | | | 395 | |
850,000 | | BlueMountain Fuji US. Clo I Ltd., (3 mo. | | | | |
| | LIBOR USD + 1.700%) 4.17%, 7/20/29 (a) | | | 850 | |
1,150,000 | | BSPRT 2018-FL4 Issuer Ltd. 144A, (1 mo. | | | | |
| | LIBOR USD + 1.050%) 3.33%, 9/15/35 (a)(b) | | | 1,152 | |
850,000 | | BSPRT 2018-FL4 Issuer Ltd. 144A, (1 mo. | | | | |
| | LIBOR USD + 1.300%) 3.58%, 9/15/35 (a)(b) | | | 852 | |
700,000 | | BSPRT 2018-FL4 Issuer Ltd. 144A, (1 mo. | | | | |
| | LIBOR USD + 1.600%) 3.88%, 9/15/35 (a)(b) | | | 704 | |
550,000 | | BSPRT 2018-FL4 Issuer Ltd. 144A, (1 mo. | | | | |
| | LIBOR USD + 2.100%) 4.38%, 9/15/35 (a)(b) | | | 554 | |
500,000 | | BSPRT 2018-FL4 Issuer Ltd. 144A, (1 mo. | | | | |
| | LIBOR USD + 2.750%) 5.03%, 9/15/35 (a)(b) | | | 505 | |
1,000,000 | | Carlyle Global Market Strategies Euro CLO 2015-2 DAC 144A, (3 mo. EURIBOR + 0.730%) 0.73%, 9/21/29 EUR (a)(b)(c) | | | 1,133 | |
500,000 | | Carlyle Global Market Strategies Euro CLO 2015-2 DAC 144A, (3 mo. EURIBOR + 2.700%) 2.70%, 9/21/29 EUR (a)(b)(c) | | | 567 | |
1,560,000 | | Cedar Funding II CLO Ltd. 144A, (3 mo. | | | | |
| | LIBOR USD + 1.230%) 3.56%, 6/09/30 (a)(b) | | | 1,561 | |
1,000,000 | | Cedar Funding VI CLO Ltd. 144A, (3 mo. | | | | |
| | LIBOR USD + 1.090%) 3.56%, 10/20/28 (a)(b) | | | 1,000 | |
| | | | | | |
Principal or Shares | | Security Description | | Value (000) | |
| | | | | | |
1,000,000 | | Cedar Funding VI CLO Ltd. 144A, (3 mo. | | | | |
| | LIBOR USD + 1.600%) 4.07%, 10/20/28 (a)(b) | | $ | 1,000 | |
350,000 | | Colombia Cent CLO 27 Ltd. 144A, (3 mo. | | | | |
| | LIBOR USD + 1.600%) 4.90%, 10/25/28 (a)(b) | | | 350 | |
1,587,926 | | Colony Starwood Homes 2016-2 Trust 144A, (1 mo. | | | | |
| | LIBOR USD + 1.250%) 3.53%, 12/17/33 (a)(b) | | | 1,589 | |
1,768,582 | | Countrywide Asset-Backed Certificates, | | | | |
| | 4.71%, 10/25/46 (d) | | | 1,729 | |
2,221,875 | | Domino’s Pizza Master Issuer LLC 144A, | | | | |
| | 3.08%, 7/25/47 (b) | | | 2,156 | |
1,970,000 | | Drive Auto Receivables Trust 2016-B 144A, | | | | |
| | 4.53%, 8/15/23 (b) | | | 2,001 | |
1,300,000 | | Dryden 39 Euro CLO 2015 BV 144A, (3 mo. | | | | |
| | EURIBOR + 0.870%) 0.87%, 10/15/31 | | | | |
| | EUR (a)(b)(c) | | | 1,479 | |
689,500 | | FOCUS Brands Funding LLC 144A, | | | | |
| | 3.86%, 4/30/47 (b) | | | 684 | |
164,002 | | GE-WMC Asset-Backed Pass-Through | | | | |
| | Certificates Series 2005-2, (1 mo. LIBOR USD | | | | |
| | + 0.250%) 2.53%, 12/25/35 (a) | | | 164 | |
800,000 | | Greystone Commercial Real Estate Notes | | | | |
| | 2018-HC1 Ltd. 144A, (1 mo. LIBOR USD | | | | |
| | + 1.550%) 3.67%, 9/15/28 (a)(b) | | | 803 | |
350,000 | | Greystone Commercial Real Estate Notes | | | | |
| | 2018-HC1 Ltd. 144A, (1 mo. LIBOR USD | | | | |
| | + 2.150%) 4.27%, 9/15/28 (a)(b) | | | 351 | |
500,000 | | Greystone Commercial Real Estate Notes | | | | |
| | 2018-HC1 Ltd. 144A, (1 mo. LIBOR USD | | | | |
| | + 2.650%) 4.77%, 9/15/28 (a)(b) | | | 502 | |
250,000 | | Greystone Commercial Real Estate Notes | | | | |
| | 2018-HC1 Ltd. 144A, (1 mo. LIBOR USD | | | | |
| | + 3.350%) 5.47%, 9/15/28 (a)(b) | | | 251 | |
700,000 | | Grippen Park CLO Ltd. 144A, (3 mo. LIBOR | | | | |
| | USD + 3.300%) 5.77%, 1/20/30 (a)(b) | | | 704 | |
3 Payden Mutual Funds
| | | | | | |
Principal or Shares | | Security Description | | Value (000) | |
| | |
500,000 | | Halcyon Loan Advisors Funding 2015-2 Ltd. 144A, (3 mo. LIBOR USD + 1.650%) 4.14%, 7/25/27 (a)(b) | | $ | 500 | |
750,000 | | Hunt CRE 2018-FL2 Ltd. 144A, (1 mo. LIBOR | | | | |
| | USD + 2.350%) 4.63%, 8/15/28 (a)(b) | | | 758 | |
1,176,695 | | JFIN CLO 2014 Ltd. 144A, (3 mo. LIBOR USD | | | | |
| | + 0.950%) 3.42%, 4/21/25 (a)(b) | | | 1,178 | |
350,000 | | JFIN CLO 2014 Ltd. 144A, (3 mo. LIBOR USD | | | | |
| | + 1.450%) 3.92%, 4/21/25 (a)(b) | | | 350 | |
167,329 | | L.A. Arena Funding LLC 144A, 7.66%, 12/15/26 (b) | | | 173 | |
1,000,000 | | LCM XX LP 144A, (3 mo. LIBOR USD | | | | |
| | + 1.040%) 3.38%, 10/20/27 (a)(b) | | | 1,000 | |
1,100,000 | | Magnetite IX Ltd. 144A, (3 mo. LIBOR USD | | | | |
| | + 1.500%) 3.99%, 7/25/26 (a)(b) | | | 1,101 | |
1,000,000 | | Marathon CRE 2018 FL1 Ltd. 144A, (1 mo. | | | | |
| | LIBOR USD + 1.150%) 3.43%, 6/15/28 (a)(b) | | | 1,001 | |
250,000 | | Marathon CRE 2018 FL1 Ltd. 144A, (1 mo. | | | | |
| | LIBOR USD + 1.550%) 3.83%, 6/15/28 (a)(b) | | | 250 | |
750,000 | | Octagon Investment Partners 25 Ltd. 144A, (3 mo. LIBOR USD + 0.800%) 3.27%, 10/20/26 (a)(b) | | | 745 | |
700,000 | | OZLM XII Ltd. 144A, (3 mo. LIBOR USD | | | | |
| | + 1.600%) 4.12%, 4/30/27 (a)(b) | | | 699 | |
450,000 | | OZLM XII Ltd. 144A, (3 mo. LIBOR USD | | | | |
| | + 3.000%) 5.52%, 4/30/27 (a)(b) | | | 448 | |
700,000 | | OZLM XIII Ltd. 144A, (3 mo. LIBOR USD | | | | |
| | + 3.000%) 5.52%, 7/30/27 (a)(b) | | | 697 | |
600,000 | | Planet Fitness Master Issuer LLC 144A, | | | | |
| | 4.26%, 9/05/48 (b) | | | 598 | |
1,450,000 | | Prestige Auto Receivables Trust 2016-1 144A, | | | | |
| | 5.15%, 11/15/21 (b) | | | 1,476 | |
1,000,000 | | Shackleton 2015-VIII CLO Ltd. 144A, (3 mo. | | | | |
| | LIBOR USD + 0.920%) 3.39%, 10/20/27 (a)(b) | | | 998 | |
1,832,100 | | Taco Bell Funding LLC 144A, | | | | |
| | 3.83%, 5/25/46 (b) | | | 1,833 | |
1,070,000 | | Thacher Park CLO Ltd. 144A, (3 mo. LIBOR | | | | |
| | USD + 1.160%) 3.63%, 10/20/26 (a)(b) | | | 1,072 | |
400,000 | | THL Credit Wind River 2015-2 CLO Ltd. 144A, (3 mo. LIBOR USD + 0.870%) 3.31%, 10/15/27 (a)(b) | | | 400 | |
900,000 | | Venture XVII CLO Ltd. 144A, (3 mo. LIBOR | | | | |
| | USD + 0.880%) 3.32%, 4/15/27 (a)(b) | | | 898 | |
800,000 | | Westlake Automobile Receivables Trust 2018-3 | | | | |
| | 144A, 4.00%, 10/16/23 (b) | | | 799 | |
Total Asset Backed (Cost - $44,089) | | | 43,924 | |
Bank Loans(e) (3%) | | | | |
415,800 | | Air Canada Term Loan B 1L, (LIBOR USD | | | | |
| | 1-Month + 2.000%) 4.29%, 10/06/23 | | | 417 | |
306,515 | | Allison Transmission Inc. Term Loan B3 1L, (LIBOR USD 1-Month + 1.750%) 4.04%, 9/23/22 | | | 309 | |
932,663 | | Aramark Services Inc. Term Loan B3 1L, (LIBOR USD 1-Month + 1.750%) 4.05%, 3/11/25 | | | 934 | |
| | | | | | |
Principal or Shares | | Security Description | | Value (000) | |
| | |
724,889 | | Berry Global Inc. Term Loan T 1L, (LIBOR USD 1-Month + 1.750%) 4.03%, 1/06/21 | | $ | 724 | |
722,868 | | Burlington Coat Factory Warehouse Corp. Term Loan B5 1L, (LIBOR USD 1-Month + 2.000%) 4.29%, 11/17/24 | | | 725 | |
1,290,250 | | Charter Communications Operating LLC Term Loan B 1L, (LIBOR USD 1-Month + 2.000%) 4.31%, 4/30/25 | | | 1,292 | |
955,850 | | Golden Nugget Inc. Term Loan B 1L, (LIBOR | | | | |
| | USD 1-Month + 2.750%) 5.23%, 10/04/23 | | | 958 | |
659,230 | | Michaels Stores Inc. Term Loan B 1L, (LIBOR | | | | |
| | USD 1-Month + 2.500%) 4.79%, 1/28/23 | | | 656 | |
627,672 | | Sabre GLBL Inc. Term Loan B 1L, (LIBOR USD | | | | |
| | 1-Month + 2.000%) 4.30%, 2/22/24 | | | 628 | |
Total Bank Loans (Cost - $6,634) | | | 6,643 | |
Corporate Bond (21%) | | | | |
330,000 | | AbbVie Inc., 3.38%, 11/14/21 | | | 329 | |
750,000 | | ADCB Finance Cayman Ltd. 144A, | | | | |
| | 4.00%, 3/29/23 (b) | | | 739 | |
575,000 | | Alcoa Nederland Holding BV 144A, | | | | |
| | 6.75%, 9/30/24 (b) | | | 607 | |
750,000 | | Alimentation Couche-Tard Inc. 144A, | | | | |
| | 2.70%, 7/26/22 (b) | | | 719 | |
780,000 | | Ally Financial Inc., 4.25%, 4/15/21 | | | 782 | |
750,000 | | Ares Capital Corp., 3.50%, 2/10/23 | | | 716 | |
760,000 | | AT&T Inc., 3.20%, 3/01/22 | | | 747 | |
440,000 | | AT&T Inc., (3 mo. LIBOR USD + 1.180%) | | | | |
| | 3.51%, 6/12/24 (a) | | | 442 | |
730,000 | | Athene Global Funding 144A, | | | | |
| | 4.00%, 1/25/22 (b) | | | 733 | |
350,000 | | Banco del Estado de Chile 144A, | | | | |
| | 2.67%, 1/08/21 (b) | | | 341 | |
590,000 | | Bank of America Corp., (3 mo. LIBOR USD | | | | |
| | + 1.160%) 3.12%, 1/20/23 (a) | | | 577 | |
300,000 | | Bank of Scotland PLC, 9.38%, 5/15/21 GBP (c) | | | 449 | |
550,000 | | BNP Paribas SA 144A, 2.95%, 5/23/22 (b) | | | 531 | |
305,000 | | CDW LLC/CDW Finance Corp., | | | | |
| | 5.50%, 12/01/24 | | | 310 | |
192,308 | | Cenovus Energy Inc., 5.70%, 10/15/19 | | | 196 | |
120,000 | | Centene Corp., 4.75%, 5/15/22 | | | 121 | |
500,000 | | Charter Communications Operating LLC/Charter Communications Operating Capital, 4.50%, 2/01/24 | | | 502 | |
170,000 | | Cheniere Corpus Christi Holdings LLC, | | | | |
| | 5.88%, 3/31/25 | | | 176 | |
325,000 | | Cheniere Energy Partners LP 144A, | | | | |
| | 5.63%, 10/01/26 (b) | | | 321 | |
400,000 | | CIT Group Inc., 4.75%, 2/16/24 | | | 395 | |
1,200,000 | | Citigroup Inc., 2.90%, 12/08/21 | | | 1,173 | |
300,000 | | Comcast Corp., 3.45%, 10/01/21 | | | 300 | |
500,000 | | Comcast Corp., 3.70%, 4/15/24 | | | 498 | |
290,000 | | Conagra Brands Inc., 3.80%, 10/22/21 | | | 290 | |
310,000 | | Covanta Holding Corp., 5.88%, 3/01/24 | | | 310 | |
305,000 | | Crestwood Midstream Partners LP/Crestwood | | | | |
| | Midstream Finance Corp., 6.25%, 4/01/23 | | | 312 | |
575,000 | | CSC Holdings LLC, 8.63%, 2/15/19 | | | 582 | |
Annual Report 4

| | | | | | |
Principal or Shares | | Security Description | | Value (000) | |
| | |
850,000 | | CVS Health Corp., 3.70%, 3/09/23 | | $ | 839 | |
1,010,000 | | Dell International LLC/EMC Corp. 144A, | | | | |
| | 4.42%, 6/15/21 (b) | | | 1,019 | |
450,000 | | Dollar Tree Inc., 3.70%, 5/15/23 | | | 439 | |
250,000 | | El Corte Ingles SA 144A, 3.00%, 3/15/24 | | | | |
| | EUR (b)(c) | | | 285 | |
310,000 | | Encompass Health Corp., 5.75%, 11/01/24 | | | 310 | |
450,000 | | Energy Transfer Operating LP, 5.20%, 2/01/22 | | | 466 | |
330,000 | | EnLink Midstream Partners LP, 4.40%, 4/01/24 | | | 318 | |
670,000 | | EQM Midstream Partners LP, 4.75%, 7/15/23 | | | 677 | |
250,000 | | Equinix Inc., 2.88%, 3/15/24 EUR (c) | | | 287 | |
740,000 | | First Data Corp. 144A, 5.38%, 8/15/23 (b) | | | 748 | |
450,000 | | Five Corners Funding Trust 144A, | | | | |
| | 4.42%, 11/15/23 (b) | | | 460 | |
600,000 | | Ford Motor Credit Co. LLC, 2.98%, 8/03/22 | | | 563 | |
800,000 | | Ford Motor Credit Co. LLC, (3 mo. LIBOR USD + 1.235%) 3.55%, 2/15/23 (a) | | | 779 | |
840,000 | | General Motors Financial Co. Inc., (3 mo. LIBOR USD + 1.310%) 3.70%, 6/30/22 (a) | | | 847 | |
1,200,000 | | Goldman Sachs Group Inc., (3 mo. LIBOR USD + 1.050%) 3.37%, 6/05/23 (a) | | | 1,209 | |
315,000 | | Goodyear Tire & Rubber Co., | | | | |
| | 5.13%, 11/15/23 (f) | | | 310 | |
395,000 | | Halfmoon Parent Inc. 144A, | | | | |
| | 3.40%, 9/17/21 (b)(f) | | | 392 | |
275,000 | | Halfmoon Parent Inc. 144A, 3.75%, 7/15/23 (b) | | | 273 | |
320,000 | | Hilcorp Energy I LP/Hilcorp Finance Co. 144A, 5.00%, 12/01/24 (b) | | | 303 | |
535,000 | | HSBC Holdings PLC, (3 mo. LIBOR USD | | | | |
| | + 0.650%) 2.98%, 9/11/21 (a) | | | 536 | |
310,000 | | Icahn Enterprises LP/Icahn Enterprises Finance Corp., 5.88%, 2/01/22 | | | 311 | |
475,000 | | ING Groep NV, 4.10%, 10/02/23 | | | 472 | |
435,000 | | International Lease Finance Corp., | | | | |
| | 4.63%, 4/15/21 | | | 442 | |
335,000 | | Iron Mountain Inc., 5.75%, 8/15/24 | | | 330 | |
310,000 | | iStar Inc., 4.63%, 9/15/20 | | | 308 | |
185,000 | | James Hardie International Finance DAC 144A, 3.63%, 10/01/26 EUR (b)(c) | | | 209 | |
450,000 | | Keurig Dr Pepper Inc. 144A, 4.06%, 5/25/23 (b) | | | 448 | |
565,000 | | Kinder Morgan Inc./DE 144A, | | | | |
| | 5.00%, 2/15/21 (b) | | | 580 | |
465,000 | | Level 3 Financing Inc., 5.13%, 5/01/23 | | | 463 | |
600,000 | | Lloyds Banking Group PLC, (3 mo. LIBOR USD + 0.810%) 2.91%, 11/07/23 (a) | | | 571 | |
680,000 | | Macquarie Group Ltd. 144A, (3 mo. LIBOR | | | | |
| | USD + 1.023%) 3.19%, 11/28/23 (a)(b) | | | 649 | |
345,000 | | Microchip Technology Inc. 144A, | | | | |
| | 3.92%, 6/01/21 (b) | | | 343 | |
1,120,000 | | Mitsubishi UFJ Financial Group Inc., | | | | |
| | 3.00%, 2/22/22 | | | 1,097 | |
650,000 | | Morgan Stanley, (3 mo. LIBOR USD + 0.930%) 3.40%, 7/22/22 (a) | | | 653 | |
310,000 | | MPT Operating Partnership LP/MPT Finance Corp., 5.50%, 5/01/24 | | | 315 | |
305,000 | | Nabors Industries Inc., 4.63%, 9/15/21 | | | 295 | |
1,100,000 | | Nordea Bank Abp 144A, 4.88%, 5/13/21 (b) | | | 1,121 | |
455,000 | | ONEOK Inc., 4.25%, 2/01/22 | | | 458 | |
| | | | | | |
Principal or Shares | | Security Description | | Value (000) | |
| | |
320,000 | | Penske Automotive Group Inc., | | | | |
| | 5.38%, 12/01/24 | | $ | 312 | |
500,000 | | Pertamina Persero PT, 5.25%, 5/23/21 (g) | | | 515 | |
750,000 | | Sabine Pass Liquefaction LLC, 5.75%, 5/15/24 | | | 795 | |
320,000 | | SBA Communications Corp., 4.00%, 10/01/22 | | | 308 | |
730,000 | | Sinopec Group Overseas Development 2017 Ltd. 144A, 2.25%, 9/13/20 (b) | | | 713 | |
330,000 | | SM Energy Co., 5.00%, 1/15/24 (f) | | | 316 | |
320,000 | | SMBC Aviation Capital Finance DAC 144A, | | | | |
| | 4.13%, 7/15/23 (b) | | | 319 | |
880,000 | | Smithfield Foods Inc. 144A, 3.35%, 2/01/22 (b) | | | 849 | |
315,000 | | Sprint Spectrum Co. LLC/Sprint Spectrum Co. II LLC/Sprint Spectrum Co. III LLC 144A, 3.36%, 9/20/21 (b) | | | 313 | |
455,000 | | Sunoco LP/Sunoco Finance Corp. 144A, | | | | |
| | 4.88%, 1/15/23 (b) | | | 440 | |
150,000 | | Teva Pharmaceutical Finance IV LLC, | | | | |
| | 2.25%, 3/18/20 | | | 146 | |
350,000 | | Teva Pharmaceutical Finance Netherlands II BV, 3.25%, 4/15/22 EUR (c) | | | 409 | |
200,000 | | Teva Pharmaceutical Finance Netherlands II BV, 4.50%, 3/01/25 EUR (c) | | | 239 | |
150,000 | | Teva Pharmaceutical Finance Netherlands III BV, 1.70%, 7/19/19 | | | 148 | |
920,000 | | Teva Pharmaceutical Finance Netherlands III BV, 2.20%, 7/21/21 | | | 859 | |
470,000 | | Teva Pharmaceutical Finance Netherlands III BV, 2.80%, 7/21/23 | | | 415 | |
320,000 | | United Continental Holdings Inc., | | | | |
| | 4.25%, 10/01/22 | | | 314 | |
220,000 | | United Technologies Corp., 3.65%, 8/16/23 | | | 218 | |
260,000 | | Universal Health Services Inc. 144A, | | | | |
| | 4.75%, 8/01/22 (b) | | | 261 | |
450,000 | | Vodafone Group PLC, 3.75%, 1/16/24 | | | 440 | |
200,000 | | YPF SA 144A, 8.88%, 12/19/18 (b) | | | 201 | |
580,000 | | Zayo Group LLC/Zayo Capital Inc., | | | | |
| | 6.00%, 4/01/23 | | | 595 | |
Total Corporate Bond (Cost - $43,083) | | | 42,448 | |
Foreign Government (13%) | | | | |
1,000,000 | | Argentine Republic Government International | | | | |
| | Bond, 6.25%, 4/22/19 (f) | | | 1,008 | |
1,500,000 | | Dominican Republic International Bond 144A, | | | | |
| | 7.50%, 5/06/21 (b) | | | 1,556 | |
500,000 | | Egypt Government International Bond 144A, | | | | |
| | 5.58%, 2/21/23 (b) | | | 479 | |
250,000 | | Egypt Government International Bond 144A, | | | | |
| | 5.75%, 4/29/20 (b) | | | 252 | |
350,000 | | Egypt Government International Bond 144A, | | | | |
| | 6.13%, 1/31/22 (b) | | | 346 | |
457,000 | | Fondo MIVIVIENDA SA, 3.50%, 1/31/23 (g) | | | 440 | |
1,020,000 | | Georgia Government International Bond, | | | | |
| | 6.88%, 4/12/21 (g) | | | 1,075 | |
500,000 | | Ghana Government International Bond 144A, | | | | |
| | 7.88%, 8/07/23 (b) | | | 511 | |
381,000 | | Guatemala Government Bond 144A, | | | | |
| | 5.75%, 6/06/22 (b) | | | 391 | |
5 Payden Mutual Funds
| | | | | | |
Principal or Shares | | Security Description | | Value (000) | |
| | |
870,000 | | Honduras Government International Bond 144A, 8.75%, 12/16/20 (b) | | $ | 940 | |
550,000,000 | | Japan Treasury Discount Bill, 0.00%, 12/03/18 JPY (c) | | | 4,875 | |
650,000,000 | | Japan Treasury Discount Bill, 0.00%, 12/10/18 JPY (c) | | | 5,762 | |
1,030,000 | | Kenya Government International Bond 144A, | | | | |
| | 5.88%, 6/24/19 (b) | | | 1,038 | |
510,000 | | Mongolia Government International Bond 144A, 10.88%, 4/06/21 (b) | | | 568 | |
1,050,000 | | Perusahaan Penerbit SBSN Indonesia III 144A, 3.40%, 3/29/22 (b) | | | 1,025 | |
500,000 | | Republic of Armenia International Bond 144A, 6.00%, 9/30/20 (b) | | | 507 | |
1,100,000 | | Republic of South Africa Government | | | | |
| | International Bond, 5.50%, 3/09/20 | | | 1,113 | |
378,000 | | Saudi Government International Bond 144A, 4.00%, 4/17/25 (b) | | | 372 | |
308,000 | | Senegal Government International Bond 144A, 8.75%, 5/13/21 (b) | | | 329 | |
1,420,000 | | Serbia International Bond 144A, | | | | |
| | 5.88%, 12/03/18 (b) | | | 1,423 | |
300,000 | | Sri Lanka Government International Bond 144A, 5.75%, 4/18/23 (b) | | | 270 | |
860,000 | | Sri Lanka Government International Bond 144A, 6.25%, 10/04/20 (b) | | | 833 | |
350,000 | | Sri Lanka Government International Bond 144A, 6.25%, 7/27/21 (b) | | | 334 | |
850,000 | | Ukraine Government International Bond, | | | | |
| | 7.75%, 9/01/19 (g) | | | 855 | |
840,000 | | Vietnam Government International Bond 144A, 6.75%, 1/29/20 (b) | | | 866 | |
Total Foreign Government (Cost - $27,465) | | | 27,168 | |
Mortgage Backed (34%) | | | | |
336,702 | | Alternative Loan Trust 2006-31CB, | | | | |
| | 6.00%, 11/25/36 | | | 288 | |
175,671 | | Alternative Loan Trust 2006-31CB, | | | | |
| | 6.00%, 11/25/36 | | | 150 | |
330,030 | | Alternative Loan Trust 2006-J5, 6.50%, 9/25/36 | | | 287 | |
2,262,604 | | Alternative Loan Trust 2007-12T1, | | | | |
| | 6.00%, 6/25/37 | | | 1,707 | |
223,920 | | Alternative Loan Trust 2007-5CB, | | | | |
| | 6.00%, 4/25/37 | | | 188 | |
1,491,455 | | American Home Mortgage Assets Trust 2007-2, | | | | |
| | (1 mo. LIBOR USD + 0.125%) | | | | |
| | 2.41%, 3/25/47 (a) | | | 1,394 | |
1,050,000 | | AREIT 2018-CRE2 Trust 144A, (1 mo. LIBOR | | | | |
| | USD + 0.980%) 3.26%, 11/14/35 (a)(b) | | | 1,050 | |
650,000 | | AREIT 2018-CRE2 Trust 144A, (1 mo. LIBOR USD + 1.400%) 3.68%, 11/14/35 (a)(b) | | | 650 | |
400,000 | | AREIT 2018-CRE2 Trust 144A, (1 mo. LIBOR USD + 2.650%) 4.93%, 11/14/35 (a)(b) | | | 400 | |
413,100 | | Banc of America Funding 2005-H Trust, | | | | |
| | 4.34%, 11/20/35 (d) | | | 368 | |
8,407,475 | | BANK 2018-BNK13, 0.52%, 8/15/61 (d) | | | 301 | |
| | | | | | |
Principal or Shares | | Security Description | | Value (000) | |
| | |
1,400,000 | | BDS 2018-FL2 144A, (1 mo. LIBOR USD | | | | |
| | + 0.950%) 3.24%, 8/15/35 (a)(b) | | $ | 1,407 | |
300,000 | | BDS 2018-FL2 144A, (1 mo. LIBOR USD | | | | |
| | + 1.400%) 3.69%, 8/15/35 (a)(b) | | | 301 | |
16,355,466 | | BENCHMARK 2018-B4, 0.70%, 7/15/51 (d) | | | 620 | |
1,020,000 | | Caesars Palace Las Vegas Trust 2017-VICI 144A, 4.35%, 10/15/34 (b)(d) | | | 999 | |
499,299 | | Chase Mortgage Finance Corp., 6.00%, 5/25/37 | | | 403 | |
127,745 | | CHL Mortgage Pass-Through Trust 2005-18, | | | | |
| | 5.50%, 10/25/35 | | | 111 | |
856,391 | | CHL Mortgage Pass-Through Trust 2006-HYB1, 3.65%, 3/20/36 (d) | | | 804 | |
625,270 | | CHL Mortgage Pass-Through Trust 2007-HYB2, 3.66%, 2/25/47 (d) | | | 563 | |
500,000 | | Connecticut Avenue Securities Trust 2018-R07 | | | | |
| | 144A, (1 mo. LIBOR USD + 0.750%) | | | | |
| | 3.03%, 4/25/31 (a)(b) | | | 500 | |
1,105,417 | | Countrywide Alternative Loan Trust, | | | | |
| | 6.00%, 4/25/37 | | | 928 | |
669,936 | | Countrywide Alternative Loan Trust, | | | | |
| | 6.00%, 4/25/37 | | | 562 | |
594,111 | | Fannie Mae Connecticut Avenue Securities, (1 | | | | |
| | mo. LIBOR USD + 0.850%) | | | | |
| | 3.13%, 11/25/29 (a) | | | 596 | |
1,418,899 | | Fannie Mae Connecticut Avenue Securities, (1 | | | | |
| | mo. LIBOR USD + 1.150%) 3.43%, 9/25/29 (a) | | | 1,426 | |
464,613 | | Fannie Mae Connecticut Avenue Securities, (1 | | | | |
| | mo. LIBOR USD + 1.300%) 3.58%, 7/25/29 (a) | | | 468 | |
189,955 | | Fannie Mae Connecticut Avenue Securities, (1 | | | | |
| | mo. LIBOR USD + 1.350%) 3.63%, 1/25/29 (a) | | | 190 | |
1,060,000 | | Fannie Mae Connecticut Avenue Securities, (1 | | | | |
| | mo. LIBOR USD + 2.250%) 4.53%, 7/25/30 (a) | | | 1,071 | |
810,976 | | Fannie Mae Connecticut Avenue Securities, (1 | | | | |
| | mo. LIBOR USD + 4.000%) 6.28%, 5/25/25 (a) | | | 890 | |
1,050,000 | | Fannie Mae Connecticut Avenue Securities, (1 | | | | |
| | mo. LIBOR USD + 4.250%) 6.53%, 1/25/29 (a) | | | 1,186 | |
573,069 | | Fannie Mae Connecticut Avenue Securities, (1 | | | | |
| | mo. LIBOR USD + 4.550%) 6.83%, 2/25/25 (a) | | | 618 | |
512,883 | | Fannie Mae Connecticut Avenue Securities, (1 | | | | |
| | mo. LIBOR USD + 5.000%) 7.28%, 7/25/25 (a) | | | 577 | |
392,759 | | Fannie Mae Connecticut Avenue Securities, (1 | | | | |
| | mo. LIBOR USD + 5.000%) 7.28%, 7/25/25 (a) | | | 437 | |
1,148,402 | | Fannie Mae Connecticut Avenue Securities, (1 | | | | |
| | mo. LIBOR USD + 5.700%) 7.98%, 4/25/28 (a) | | | 1,328 | |
400,000 | | Fannie Mae Connecticut Avenue Securities, (1 | | | | |
| | mo. LIBOR USD + 6.000%) 8.28%, 9/25/28 (a) | | | 468 | |
635,441 | | First Horizon Alternative Mortgage Securities | | | | |
| | Trust 2006-AA5, 4.24%, 9/25/36 (d) | | | 591 | |
1,141,508 | | Flagstar Mortgage Trust 2018-1 144A, | | | | |
| | 3.50%, 3/25/48 (b)(d) | | | 1,120 | |
900,000 | | Freddie Mac Stacr Trust 2018-HQA2, (1 mo. | | | | |
| | LIBOR USD + 2.300%) 4.59%, 10/25/48 (a) | | | 895 | |
Annual Report 6
| | | | | | |
Principal or Shares | | Security Description | | Value (000) | |
| | |
1,142,792 | | Freddie Mac Structured Agency Credit Risk Debt | | | | |
| | Notes, (1 mo. LIBOR USD + 1.200%) | | | | |
| | 3.48%, 7/25/29 (a) | | $ | 1,153 | |
756,750 | | Freddie Mac Structured Agency Credit Risk Debt | | | | |
| | Notes, (1 mo. LIBOR USD + 1.200%) | | | | |
| | 3.48%, 8/25/29 (a) | | | 762 | |
700,000 | | Freddie Mac Structured Agency Credit Risk Debt | | | | |
| | Notes 144A, 4.17%, 8/25/48 (b)(d) | | | 645 | |
490,122 | | Freddie Mac Structured Agency Credit Risk Debt | | | | |
| | Notes 144A, 4.17%, 8/25/48 (b)(d) | | | 491 | |
1,000,000 | | Freddie Mac Structured Agency Credit Risk Debt | | | | |
| | Notes, (1 mo. LIBOR USD + 2.300%) | | | | |
| | 4.58%, 9/25/30 (a) | | | 1,001 | |
1,250,000 | | Freddie Mac Structured Agency Credit Risk Debt | | | | |
| | Notes, (1 mo. LIBOR USD + 4.600%) | | | | |
| | 6.88%, 12/25/42 (a) | | | 1,334 | |
500,000 | | Freddie Mac Structured Agency Credit Risk Debt | | | | |
| | Notes, (1 mo. LIBOR USD + 4.700%) | | | | |
| | 6.98%, 3/25/28 (a) | | | 569 | |
1,450,000 | | GAHR Commercial Mortgage Trust 2015-NRF | | | | |
| | 144A, 3.38%, 12/15/34 (b)(d) | | | 1,427 | |
400,000 | | GAHR Commercial Mortgage Trust 2015-NRF | | | | |
| | 144A, 3.38%, 12/15/34 (b)(d) | | | 396 | |
888,377 | | GSMPS Mortgage Loan Trust 2005-RP2 144A, | | | | |
| | (1 mo. LIBOR USD + 0.350%) | | | | |
| | 2.63%, 3/25/35 (a)(b) | | | 838 | |
286,283 | | HarborView Mortgage Loan Trust 2004-10, | | | | |
| | 4.13%, 1/19/35 (d) | | | 286 | |
78,442 | | HomeBanc Mortgage Trust 2004-1, (1 mo. | | | | |
| | LIBOR USD + 0.860%) 3.14%, 8/25/29 (a) | | | 76 | |
226,459 | | IndyMac Index Mortgage Loan Trust | | | | |
| | 2005-AR13, 3.92%, 8/25/35 (d) | | | 206 | |
450,000 | | InTown Hotel Portfolio Trust 2018-STAY 144A, | | | | |
| | (1 mo. LIBOR USD + 3.100%) | | | | |
| | 5.38%, 1/15/33 (a)(b) | | | 454 | |
71,883 | | JP Morgan Alternative Loan Trust, (1 mo. | | | | |
| | LIBOR USD + 0.170%) 2.45%, 8/25/36 (a) | | | 72 | |
1,400,000 | | JP Morgan Chase Commercial Mortgage | | | | |
| | Securities Trust 2018-BCON 144A, | | | | |
| | 3.76%, 1/05/31 (b)(d) | | | 1,337 | |
430,000 | | JP Morgan Chase Commercial Mortgage | | | | |
| | Securities Trust 2018-PHH 144A, (1 mo. LIBOR | | | | |
| | USD + 1.160%) 3.44%, 6/15/35 (a)(b) | | | 430 | |
114,805 | | JP Morgan Mortgage Trust, 6.00%, 7/25/36 | | | 101 | |
482,778 | | JP Morgan Mortgage Trust, 6.00%, 6/25/37 | | | 383 | |
303,169 | | JP Morgan Mortgage Trust 2014-IVR3 144A, | | | | |
| | 3.00%, 9/25/44 (b)(d) | | | 302 | |
2,399,316 | | JP Morgan Mortgage Trust 2017-5 144A, | | | | |
| | 3.17%, 10/26/48 (b)(d) | | | 2,368 | |
570,000 | | Madison Avenue Trust 2013-650M 144A, | | | | |
| | 4.03%, 10/12/32 (b)(d) | | | 561 | |
106,007 | | MLCC Mortgage Investors Inc., | | | | |
| | 4.13%, 2/25/36 (d) | | | 107 | |
3,995,289 | | Morgan Stanley Capital I Trust 2018-H3, | | | | |
| | 1.00%, 7/15/51 (d) | | | 241 | |
| | | | | | |
Principal or Shares | | Security Description | | Value (000) | |
| | |
623,436 | | Morgan Stanley Mortgage Loan Trust, | | | | |
| | 3.78%, 1/25/35 (d) | | $ | 610 | |
788,665 | | New Residential Mortgage Loan Trust 2014-3 | | | | |
| | 144A, 5.67%, 11/25/54 (b)(d) | | | 820 | |
1,228,257 | | New Residential Mortgage Loan Trust 2017-5 | | | | |
| | 144A, (1 mo. LIBOR USD + 1.500%) | | | | |
| | 3.78%, 6/25/57 (a)(b) | | | 1,261 | |
104,170 | | Prime Mortgage Trust, 5.00%, 10/25/35 | | | 102 | |
1,275,864 | | RALI Series 2005-QA7 Trust, | | | | |
| | 4.39%, 7/25/35 (d) | | | 1,190 | |
1,194,597 | | RALI Series 2005-QS14 Trust, 6.00%, 9/25/35 | | | 1,140 | |
124,596 | | RALI Series 2006-QS4 Trust, 6.00%, 4/25/36 | | | 116 | |
539,255 | | RALI Series 2007-QS1 Trust, 6.00%, 1/25/37 | | | 503 | |
1,068,592 | | RALI Series 2007-QS2 Trust, 6.25%, 1/25/37 | | | 996 | |
405,216 | | Residential Asset Securitization Trust 2006-A8, | | | | |
| | 6.00%, 8/25/36 | | | 341 | |
1,528,270 | | Ripon Mortgages PLC 144A, (3 mo. LIBOR | | | | |
| | GBP + 0.800%) 1.60%, 8/20/56 GBP (a)(b)(c) | | | 1,952 | |
500,000 | | STACR Trust 2018-DNA3 144A, (1 mo. LIBOR | | | | |
| | USD + 2.100%) 4.23%, 9/25/48 (a)(b) | | | 497 | |
2,926,544 | | STACR Trust 2018-HRP1 144A, (1 mo. LIBOR | | | | |
| | USD + 1.650%) 3.93%, 4/25/43 (a)(b) | | | 2,945 | |
800,000 | | STACR Trust 2018-HRP1 144A, (1 mo. LIBOR | | | | |
| | USD + 3.750%) 6.03%, 4/25/43 (a)(b) | | | 840 | |
999,814 | | STACR Trust 2018-HRP1 144A, (1 mo. LIBOR | | | | |
| | USD + 11.750%) 14.03%, 4/25/43 (a)(b) | | | 1,176 | |
232,181 | | Structured Adjustable Rate Mortgage Loan Trust, | | | | |
| | 4.07%, 12/25/35 (d) | | | 197 | |
24,704 | | Structured Adjustable Rate Mortgage Loan Trust, | | | | |
| | 4.12%, 8/25/34 (d) | | | 24 | |
222,327 | | Structured Adjustable Rate Mortgage Loan Trust, | | | | |
| | 4.39%, 8/25/34 (d) | | | 220 | |
2,851,575 | | Structured Asset Mortgage Investments II Trust | | | | |
| | 2006-AR7, (1 mo. LIBOR USD + 0.210%) | | | | |
| | 2.49%, 8/25/36 (a) | | | 2,657 | |
1,108,196 | | Structured Asset Mortgage Investments Inc., (1 mo. LIBOR USD + 0.310%) | | | | |
| | 2.59%, 12/25/35 (a) | | | 1,068 | |
763,387 | | Structured Asset Mortgage Investments Inc., (1 mo. LIBOR USD + 0.700%) 2.98%, 1/19/34 (a) | | | 749 | |
310,695 | | Structured Asset Mortgage Investments Inc., | | | | |
| | 3.35%, 5/25/36 (d) | | | 196 | |
1,689 | | Structured Asset Mortgage Investments Trust | | | | |
| | 2003-C1, 3.11%, 7/25/32 (d) | | | 1 | |
596,785 | | Vendee Mortgage Trust IO, 3.75%, 12/15/33 | | | 26 | |
600,000 | | VMC Finance 2018-FL2 LLC 144A, (1 mo. | | | | |
| | LIBOR USD + 0.920%) 3.20%, 10/15/35 (a)(b) | | | 600 | |
650,000 | | VMC Finance 2018-FL2 LLC 144A, (1 mo. | | | | |
| | LIBOR USD + 1.950%) 4.23%, 10/15/35 (a)(b) | | | 650 | |
132,738 | | WaMu Mortgage Pass-Through Certificates, (12 mo. Federal Reserve Cumulative Average USD | | | | |
| | + 0.940%) 2.78%, 5/25/46 (a) | | | 134 | |
436,422 | | WaMu Mortgage Pass-Through Certificates, | | | | |
| | 3.47%, 2/25/37 (d) | | | 424 | |
301,484 | | WaMu Mortgage Pass-Through Certificates, | | | | |
| | 3.49%, 10/25/36 (d) | | | 282 | |
754,723 | | WaMu Mortgage Pass-Through Certificates, | | | | |
| | 3.54%, 7/25/37 (d) | | | 628 | |
7 Payden Mutual Funds
| | | | | | |
Principal or Shares | | Security Description | | Value
(000) | |
| | |
506,807 | | WaMu Mortgage Pass-Through Certificates, | | | | |
| | 3.57%, 9/25/36 (d) | | $ | 453 | |
515,752 | | WaMu Mortgage Pass-Through Certificates, | | | | |
| | 3.88%, 10/25/36 (d) | | | 502 | |
1,353,006 | | WaMu Mortgage Pass-Through Certificates | | | | |
| | Series 2005-AR11 Trust, (1 mo. LIBOR USD | | | | |
| | + 0.320%) 2.60%, 8/25/45 (a) | | | 1,355 | |
988,429 | | WaMu Mortgage Pass-Through Certificates | | | | |
| | Series 2006-AR10 Trust, 3.87%, 9/25/36 (d) | | | 961 | |
451,156 | | WaMu Mortgage Pass-Through Certificates | | | | |
| | Series 2006-AR19 Trust, (Cost of Funds for the | | | | |
| | 11th District of San Francisco + 1.250%) | | | | |
| | 2.27%, 1/25/47 (a) | | | 445 | |
1,804,861 | | WaMu Mortgage Pass-Through Certificates | | | | |
| | Series 2007-HY1 Trust, 3.64%, 2/25/37 (d) | | | 1,779 | |
10,782,337 | | Wells Fargo Commercial Mortgage Trust | | | | |
| | 2018-C46, 0.95%, 8/15/51 (d) | | | 681 | |
Total Mortgage Backed (Cost - $68,426) | | | 69,903 | |
U.S. Treasury (3%) | | | | |
200,000 | | U.S. Treasury Note, 2.50%, 6/30/20 (h)(i) | | | 199 | |
5,300,000 | | U.S. Treasury Note, 2.63%, 8/31/20 (h) | | | 5,278 | |
Total U.S. Treasury (Cost - $5,490) | | | 5,477 | |
Stocks (3%) | | | | |
Common Stock (2%) | | | | |
19,300 | | Delta Air Lines Inc. | | | 1,056 | |
7,200 | | International Business Machines Corp. | | | 831 | |
9,700 | | JPMorgan Chase & Co. | | | 1,058 | |
3,200 | | Lockheed Martin Corp. | | | 940 | |
| | | | | 3,885 | |
Master Limited Partnership (1%) | | | | |
15,600 | | Magellan Midstream Partners LP | | | 962 | |
Preferred Stock (0%) | | | | |
220 | | Wells Fargo & Co., 7.50% | | | 280 | |
Real Estate Investment Trust (0%) | | | | |
9,300 | | Digital Realty Trust Inc. | | | 961 | |
Total Stocks (Cost - $6,435) | | | 6,088 | |
Investment Company (3%) | | | | |
5,138,674 | | Payden Cash Reserves Money Market Fund * | | | | |
| | (Cost - $5,139) | | | 5,139 | |
Purchased Swaptions (0%) | | | | |
Total Purchased Swaptions (Cost - $351) | | | 277 | |
Total Investments, Before Options Written (Cost - $207,112) (102%) | | | 207,067 | |
Written Swaptions (0%) | | | | |
Total Written Swaptions (Cost - $(298)) | | | (199 | ) |
Total Investments (Cost - $206,814) (102%) | | | 206,868 | |
Liabilities in excess of Other Assets (-2%) | | | (4,247 | ) |
Net Assets (100%) | | $ | 202,621 | |
| (a) | Floating rate security. The rate shown reflects the rate in effect at October 31, 2018. See Note 2 in the Notes to Financial Statements. |
| (b) | Security offered only to qualified institutional investors, and thus is not registered for sale to the public under rule 144A of the Securities Act of 1933. It has been deemed liquid under guidelines approved by the Board. (c) Principal in foreign currency. |
| (d) | Variable rate security. Interest rate disclosed is as of the most recent information available. Certain variable rate securities are not based on a published reference |
| | rate and spread but are determined by the issuer or agent and are based on current market conditions. These securities do not indicate a reference rate and spread in their description above. See Note 2 in the Notes to Financial Statements. |
| (e) | Floating rate security. The rate shown reflects the rate in effect at October 31, 2018. The stated maturity is subject to prepayments. See Note 2 in the Notes to Financial Statements. |
| (f) | All or a portion of these securities are on loan. At October 31, 2018, the total market value of the Fund’s securities on loan is $1,000 and the total market value of the collateral held by the Fund is $1,029. Amount in 000s. |
| (g) | Security offered and sold outside the United States, and thus is exempt from registration under Regulation S of the Securities Act of 1933. It has been deemed liquid under guidelines approved by the Board. |
| (h) | All or a portion of security has been pledged in connection with outstanding centrally cleared swaps. |
| (i) | All or a portion of the security is pledged to cover futures contract margin requirements. |
Annual Report 8
Purchased Swaptions
| | | | | | | | | | | | | | | | | | | | |
| Description | | Counterparty | | | Notional
Amount
(000s) | | | Expiration
date | | | Value
(000s) | | | Call/Put | |
Purchased Call Swaptions 0.0% | | | | | | | | | | | | | | | | | | | | |
1-Year Interest Rate Swap, 6/26/20, Pay Fixed 3.15% Semi-Annually, Receive Pay Variable Quarterly, 3-Month USD LIBOR | | | Barclays Bank PLC | | | | $61,400 | | | | 06/26/2020 | | | | $196 | | | | Call | |
2-Year Interest Rate Swap, 9/27/19, Pay Fixed 2.975% Semi-Annually, Receive Pay Variable Quarterly, 3-Month USD LIBOR | | | Barclays Bank PLC | | | | 26,800 | | | | 09/27/2019 | | | | 81 | | | | Call | |
Total Swaptions | | | | | | | | | | | | | | | $277 | | | | | |
Written Swaptions | | | | | | | | | | | | | | | | | | | | |
| Description | | Counterparty | | | Notional
Amount
(000s) | | | Expiration
date | | | Value
(000s) | | | Call/Put | |
Written Call Swaptions 0.0% | | | | | | | | | | | | | | | | | | | | |
1-Year Interest Rate Swap, 6/26/19, Pay Fixed 3.15% Semi-Annually, Receive Pay Variable Quarterly, 3-Month USD LIBOR | | | Barclays Bank PLC | | | | $61,400 | | | | 06/26/2019 | | | | $(124 | ) | | | Call | |
5-Year Interest Rate Swap, 9/27/19, Pay Fixed 2.90% Semi-Annually, Receive Pay Variable Quarterly, 3-Month USD LIBOR | | | Barclays Bank PLC | | | | 11,200 | | | | 09/27/2019 | | | | (75 | ) | | | Call | |
Total Swaptions | | | | | | | | | | | | | | | $(199 | ) | | | | |
9 Payden Mutual Funds
Open Forward Currency Contracts to USD
| | | | | | | | | | | | | | | | | | | | |
Currency Purchased (000s) | | Currency Sold (000s) | | Counterparty | | Settlement
Date | | Unrealized
Appreciation
(Depreciation)
(000s) |
Assets: | | | | | | | | | | | | | | | | | | | | |
GBP 2,401 | | | | USD 3,065 | | | | | State Street Bank & Trust Co. | | | | | 01/17/2019 | | | | | $ 17 | |
JPY 176,200 | | | | USD 1,556 | | | | | BNP PARIBAS | | | | | 12/13/2018 | | | | | 12 | |
USD 10,682 | | | | JPY 1,200,300 | | | | | Barclays Bank PLC | | | | | 11/08/2018 | | | | | 38 | |
USD 1,572 | | | | JPY 176,200 | | | | | BNP PARIBAS | | | | | 12/13/2018 | | | | | 5 | |
USD 1,556 | | | | EUR 1,345 | | | | | BNP PARIBAS | | | | | 12/13/2018 | | | | | 27 | |
USD 6,678 | | | | EUR 5,764 | | | | | Citibank, N.A. | | | | | 11/08/2018 | | | | | 145 | |
USD 2,534 | | | | GBP 1,950 | | | | | HSBC Bank USA, N.A. | | | | | 11/08/2018 | | | | | 40 | |
USD 455 | | | | ZAR 6,700 | | | | | HSBC Bank USA, N.A. | | | | | 11/13/2018 | | | | | 1 | |
USD 3,072 | | | | EUR 2,688 | | | | | State Street Bank & Trust Co. | | | | | 01/17/2019 | | | | | 5 | |
| | | | | | | | | | | | | | | | | | | 290 | |
Liabilities: | | | | | | | | | | | | | | | | | | | | |
EUR 1,345 | | | | USD 1,538 | | | | | BNP PARIBAS | | | | | 12/13/2018 | | | | | (9 | ) |
ZAR 6,700 | | | | USD 497 | | | | | HSBC Bank USA, N.A. | | | | | 11/13/2018 | | | | | (44 | ) |
| | | | | | | | | | | | | | | | | | | (53 | ) |
Net Unrealized Appreciation (Depreciation) | | | | | | | | | | | | | | | | | | | $237 | |
Open Futures Contracts
| | | | | | | | | | | | | | | | | | | | |
| Contract Type | | Number of
Contracts | | | Expiration
Date | | | Notional
Amount
(000s) | | | Current
Value
(000s) | | Unrealized
Appreciation
(000s) |
Long Contracts: | | | | | | | | | | | | | | | | | | | | |
U.S. Treasury 5-Year Note Future | | | 37 | | | | Dec-18 | | | | $4,158 | | | | $3 | | | | $3 | |
Total Futures | | | | | | | | | | | | | | | | | | | $3 | |
Open Centrally Cleared Credit Default Swap Contracts
| | | | | | | | | | | | | | | | |
| Description | | Maturity Date | | Notional
Amount
(000s) | | | Value
(000s) | | | Upfront payments/
receipts (000s) | | Unrealized
Depreciation
(000s) |
Protection Bought (Relevant Credit: Markit CDX, North America High Yield Series 31 Index), Pay 5% Quarterly, Receive upon credit default | | 12/20/2023 | | | $2,750 | | | | $161 | | | | $167 | | | $(6) |
Offsetting Assets and Liabilities
The Fund’s loaned securities were all subject to an enforceable Securities Lending Agency Agreement. Securities lent in accordance with the Securities Lending Agency Agreement on a gross basis were as follows:
| | | | |
Total gross amount presented on the Statements of Assets and Liabilities1 | | $ | 1,000 | |
Non-cash Collateral2 | | | (1,000 | ) |
| | | | |
Net Amount | | $ | — | |
| | | | |
| 1 | The amount presented on the Statements of Assets and Liabilities is not offset and is shown on a gross basis. |
| 2 | At October 31, 2018, the value of the collateral received from each borrower exceeded the value of the related securities loaned. This amount is disclosed on the Schedule of Investments. |
See notes to financial statements.
Annual Report 10

October 31, 2018
Numbers in 000s
| | | | |
ASSETS: | | | | |
Investments, at value * | | | $201,928 | |
Affiliated investments, at value ** | | | 5,139 | |
Foreign cash *** | | | 120 | |
Receivable for: | | | | |
Interest and dividends | | | 999 | |
Investments sold | | | 467 | |
Fund shares sold | | | 3 | |
Forward currency contracts | | | 290 | |
Variation margin on centrally cleared contracts | | | 6 | |
Other assets | | | 28 | |
Total Assets | | | 208,980 | |
LIABILITIES: | | | | |
Payable for: | | | | |
Bank overdraft | | | 7 | |
Forward currency contracts | | | 53 | |
Investments purchased | | | 4,716 | |
Fund shares redeemed | | | 1 | |
Futures | | | 8 | |
Options written **** | | | 199 | |
Liability for securities on loan (Note 2) | | | 1,029 | |
Accrued expenses: | | | | |
Investment advisory fees (Note 3) | | | 155 | |
Administration fees (Note 3) | | | 26 | |
Distribution fees (Note 3) | | | 47 | |
Trustee fees and expenses | | | 1 | |
Other liabilities | | | 117 | |
Total Liabilities | | | 6,359 | |
NET ASSETS | | | $202,621 | |
NET ASSETS: | | | | |
Paid in capital | | | $204,193 | |
Total distributable earnings | | | (1,572 | ) |
NET ASSETS | | | $202,621 | |
NET ASSET VALUE — offering and redemption price per share in whole dollars | | | | |
Institutional Class | | | | |
Net Assets | | | $ 6,930 | |
Shares Outstanding | | | 651 | |
Net Asset Value Per Share | | | $ 10.64 | |
SI Class | | | | |
Net Assets | | | $122,782 | |
Shares Outstanding | | | 11,610 | |
Net Asset Value Per Share | | | $ 10.58 | |
Adviser Class | | | | |
Net Assets | | | $ 33,571 | |
Shares Outstanding | | | 3,242 | |
Net Asset Value Per Share | | | $ 10.36 | |
Retirement Class | | | | |
Net Assets | | | $ 39,338 | |
Shares Outstanding | | | 3,971 | |
Net Asset Value Per Share | | | $ 9.91 | |
| |
| | | | |
* Investments, at cost | | | $201,973 | |
** Affiliated investments, at cost | | | 5,139 | |
*** Foreign cash, at cost | | | 122 | |
**** Options written, at cost | | | (298 | ) |
See notes to financial statements.
11 Payden Mutual Funds

Period ended October 31, 2018
Numbers in 000s
| | | | |
INVESTMENT INCOME: | | | | |
Interest income (Note 2) | | | $ 7,734 | |
Dividend income | | | 384 | |
Dividend income from affiliated investment (Note 2) | | | 30 | |
Income from securities lending | | | 12 | |
Foreign tax withholdings | | | (2 | ) |
Investment Income | | | 8,158 | |
EXPENSES: | | | | |
Investment advisory fees (Note 3) | | | 2,349 | |
Administration fees (Note 3) | | | 320 | |
Shareholder servicing fees | | | 38 | |
Distribution fees (Note 3) | | | 298 | |
Custodian fees | | | 36 | |
Transfer agent fees | | | 55 | |
Registration and filing fees | | | 50 | |
Trustee fees and expenses | | | 21 | |
Printing and mailing costs | | | 12 | |
Loan commitment fees | | | 4 | |
Legal fees | | | 4 | |
Publication expense | | | 7 | |
Pricing fees | | | 32 | |
Fund accounting fees | | | 55 | |
Insurance | | | 7 | |
Audit fees | | | 46 | |
Other Expenses | | | 1 | |
Gross Expenses | | | 3,335 | |
Expense subsidy (Note 3) | | | (413 | ) |
Net Expenses | | | 2,922 | |
Net Investment Income | | | 5,236 | |
NET REALIZED AND UNREALIZED GAINS (LOSSES): | | | | |
Net realized gains (losses) from: | | | | |
Investments | | | 2,119 | |
Foreign currency transactions | | | (44 | ) |
Forward foreign exchange contracts | | | 379 | |
Futures contracts | | | (294 | ) |
Written option contracts | | | (64 | ) |
Swap contracts | | | 124 | |
Change in net unrealized appreciation (depreciation) from: | | | | |
Investments | | | (4,254 | ) |
Translation of assets and liabilities in foreign currencies | | | (26 | ) |
Forward foreign exchange contracts | | | 143 | |
Futures contracts | | | (1 | ) |
Written option contracts | | | 149 | |
Swap contracts | | | (14 | ) |
Net Realized and Unrealized Losses | | | (1,783 | ) |
CHANGE IN NET ASSETS RESULTING FROM OPERATIONS | | | $ 3,453 | |
See notes to financial statements.
Annual Report 12
For the periods ended October 31st
Numbers in 000s
| | | | | | | | | | |
| | | | | |
| | | 2018 | | 2017 |
INCREASE (DECREASE) IN NET ASSETS: | | | | | | | | | | |
FROM OPERATIONS: | | | | | | | | | | |
Net investment income | | | $ | 5,236 | | | | $ | 4,609 | |
Net realized gains (losses) on investments | | | | 2,220 | | | | | (1,245 | ) |
Change in net unrealized appreciation | | | | (4,003 | ) | | | | 2,234 | |
Change in Net Assets Resulting from Operations | | | | 3,453 | | | | | 5,598 | |
FROM DISTRIBUTIONS TO SHAREHOLDERS:(1) | | | | | | | | | | |
Net investment income and net realized gains from investments: | | | | | | | | | | |
Institutional Class | | | | (440 | ) | | | | (175 | ) |
SI Class | | | | (2,824 | ) | | | | (1,853 | ) |
Adviser Class | | | | (1,171 | ) | | | | (875 | ) |
Retirement Class | | | | (901 | ) | | | | (609 | ) |
Change in Net Assets from Distributions to Shareholders | | | | (5,336 | ) | | | | (3,512 | ) |
FROM CAPITAL TRANSACTIONS: | | | | | | | | | | |
Proceeds from fund shares sold: | | | | | | | | | | |
Institutional Class | | | | — | | | | | 9,297 | |
SI Class | | | | 31,919 | | | | | 43,222 | |
Adviser Class | | | | 4,664 | | | | | 9,007 | |
Retirement Class | | | | 11,256 | | | | | 13,962 | |
Reinvestment of distributions: | | | | | | | | | | |
Institutional Class | | | | 440 | | | | | 175 | |
SI Class | | | | 2,810 | | | | | 1,852 | |
Adviser Class | | | | 1,169 | | | | | 867 | |
Retirement Class | | | | 901 | | | | | 609 | |
Cost of fund shares redeemed: | | | | | | | | | | |
Institutional Class | | | | (11,202 | ) | | | | (2,223 | ) |
SI Class | | | | (33,627 | ) | | | | (35,337 | ) |
Adviser Class | | | | (19,919 | ) | | | | (15,727 | ) |
Retirement Class | | | | (11,460 | ) | | | | (11,472 | ) |
Change in Net Assets from Capital Transactions | | | | (23,049 | ) | | | | 14,232 | |
Total Change in Net Assets | | | | (24,932 | ) | | | | 16,318 | |
NET ASSETS: | | | | | | | | | | |
Beginning of period | | | | 227,553 | | | | | 211,235 | |
End of period | | | $ | 202,621 | | | | $ | 227,553 | |
FUND SHARES OF BENEFICIAL INTEREST: | | | | | | | | | | |
Institutional Class: | | | | | | | | | | |
Outstanding shares at beginning of period | | | | 1,663 | | | | | 972 | |
Shares sold | | | | — | | | | | 883 | |
Shares issued in reinvestment of distributions | | | | 42 | | | | | 17 | |
Shares redeemed | | | | (1,054 | ) | | | | (209 | ) |
Change in shares outstanding | | | | (1,012 | ) | | | | 691 | |
Outstanding shares at end of period | | | | 651 | | | | | 1,663 | |
SI Class: | | | | | | | | | | |
Outstanding shares at beginning of period | | | | 11,500 | | | | | 10,579 | |
Shares sold | | | | 3,032 | | | | | 4,110 | |
Shares issued in reinvestment of distributions | | | | 270 | | | | | 179 | |
Shares redeemed | | | | (3,192 | ) | | | | (3,368 | ) |
Change in shares outstanding | | | | 110 | | | | | 921 | |
Outstanding shares at end of period | | | | 11,610 | | | | | 11,500 | |
Adviser Class: | | | | | | | | | | |
Outstanding shares at beginning of period | | | | 4,608 | | | | | 5,175 | |
Shares sold | | | | 453 | | | | | 871 | |
Shares issued in reinvestment of distributions | | | | 114 | | | | | 85 | |
Shares redeemed | | | | (1,933 | ) | | | | (1,523 | ) |
Change in shares outstanding | | | | (1,366 | ) | | | | (567 | ) |
Outstanding shares at end of period | | | | 3,242 | | | | | 4,608 | |
Retirement Class: | | | | | | | | | | |
Outstanding shares at beginning of period | | | | 3,894 | | | | | 3,583 | |
Shares sold | | | | 1,138 | | | | | 1,402 | |
Shares issued in reinvestment of distributions | | | | 92 | | | | | 62 | |
Shares redeemed | | | | (1,153 | ) | | | | (1,153 | ) |
Change in shares outstanding | | | | 77 | | | | | 311 | |
Outstanding shares at end of period | | | | 3,971 | | | | | 3,894 | |
LONG TERM INVESTMENT ACTIVITY: | | | | | | | | | | |
Purchase of investments (excluding government) | | | $ | 187,698 | | | | $ | 171,901 | |
Sale of investments (excluding government) | | | | 222,655 | | | | | 135,168 | |
Purchase of government securities | | | | 82,355 | | | | | 107,476 | |
Sale of government securities | | | | 86,798 | | | | | 109,326 | |
| (1) | Prior year distribution character information and undistributed net investment income had been modified or removed to conform with current year Regulation S-X presentation changes. Refer to Note 6 for this prior year information. |
See notes to financial statements.
13 Payden Mutual Funds
October 31, 2018
1. Organization and Related Matters
The Payden & Rygel Investment Group (the “Group”) is a no-load, open-end registered investment company organized as a Massachusetts business trust on January 22, 1992 and registered under the Investment Company Act of 1940 (the “1940 Act”), as amended. Each of its nineteen funds (each a “Fund,” collectively the “Funds”) is a series of the Group, and is authorized to issue unlimited shares at $0.001 par value. This report contains only the Payden/Kravitz Cash Balance Plan Fund. The other eighteen Funds are contained in a separate report.
2. Significant Accounting Policies
The following is a summary of significant accounting policies followed by the Fund.
The Financial Accounting Standards Board (“FASB”) Accounting Standards Codification (“ASC”) is the exclusive reference of authoritative U.S. generally accepted accounting principles (“GAAP”) recognized by the FASB to be applied by nongovernmental entities. Rules and interpretive releases of the Securities and Exchange Commission (“SEC”) under authority of federal laws are also sources of authoritative GAAP for SEC registrants. The Fund’s financial statements are prepared in accordance with GAAP.
The Fund is considered an investment company under FASB ASC 946, Financial Services - Investment Companies.
The preparation of financial statements in conformity with GAAP requires management to make estimates and assumptions that affect the reported amounts of assets and liabilities and disclosure of contingent assets and liabilities at the date of the financial statements and the reported amounts of income and expenses during the reporting period. Actual results could differ from those estimates.
Securities Valuation
Domestic and foreign fixed income securities and other assets for which market quotations are readily available (other than obligations with original maturities of sixty days or less) are valued on the basis of quotes obtained from brokers and dealers or pricing services. Such quotations take into account appropriate factors such as institutional-sized trading in similar groups of securities, yield, quality, coupon rate, maturity, type of issue, trading characteristics and other data. Debt securities with original maturities of sixty days or less are valued at amortized cost, which approximates fair value.
Publicly traded equity securities, whether in the U.S. or outside the U.S., for which market quotations are readily available generally will be valued at the official closing price or the last sale price on the exchange or market where they are principally traded, or if there have been no sales during the day, at the last bid price. Securities traded only on the over-the-counter (“OTC”) market are valued at the latest bid price. Investments in nonregistered investment companies are valued at their net asset values as reported by such companies.
Options, futures, swaps and other similar instruments are valued at the official closing price, in the case of exchange traded derivatives, or on the basis of information provided by pricing services, quotes obtained from brokers and dealers, and market trades in the case of other securities.
Fixed income or equity securities for which market quotations are not readily available are priced at their fair value as determined in good faith under procedures established pursuant to the Valuation and Liquidity Guidelines applicable to the Fund. In considering fair value of a security, one or more factors are taken into consideration depending on the circumstances at the time, including for example: the cost of the security or the last reported sales price of the security as a starting point; changes in interest rates; changes in yield spreads of similarly rated or structured securities; fundamental analytical information relating to the security; the value of other similar securities traded on other markets or among dealers; the general financial condition of the issuer; recent developments affecting the issuer; information, including price quotations, from other financial institutions or analysts; or government actions or pronouncements and other significant events affecting the economy, the markets, the fundamental value of the issuer or of the issuer’s industry.
Shares of open-end investment companies are valued at their respective net asset value.
Fair value pricing adjustments may occur when (1) developments occur (a “significant event”) that will affect the value of a Fund’s holdings, and (2) the significant event occurs after the close of the markets on which the securities trade, but before the time when the net asset value is computed for a Fund. A significant event may relate to a single issuer or an entire market.
Risks
Unforeseen events in the markets may at times result in an unusually high degree of volatility in the markets, which could adversely affect the fund causing a decline in value.
Annual Report 14

Investing in debt securities may include failure of an issuer to make timely interest or principal payments, or a decline or the perception of a decline in credit quality. In addition, the value of the debt security may decline due to general market conditions that are not specifically related to a particular company including industry earnings outlook, changes in interest or currency rates or perception of a specific industry.
Investing in foreign securities may include certain risks and considerations not typically associated with investing in U.S. securities, such as fluctuating currency values and changing local and regional economic, political and social conditions, which may result in greater market volatility. In addition, certain foreign securities may not be as liquid as U.S. securities.
An investment in the Payden Cash Reserves Money Market Fund is not insured or guaranteed by the Federal Deposit Insurance Corporation or any other government agency. Although the Fund seeks to preserve the value of your investment at $1.00 per share, it is possible to lose money by investing in the Fund.
Investment Transactions and Related Income
Investment transactions are accounted for on the date the security is purchased or sold (trade date) for financial reporting purposes. Interest income is recognized on an accrual basis. Premiums and discounts are amortized or accreted over the expected life of the security using the effective interest method. Dividend income is recorded on the ex-dividend date. Realized gains or losses on investment transactions are determined on the identified cost basis.
Bank Loans
Floating-Rate Loan Interests (“Bank Loans”) in which the Fund invests generally pay interest at rates which are periodically predetermined by reference to a base lending rate plus a premium. These base lending rates are generally (i) the lending rate offered by one or more major European banks, such as the London Inter-Bank Offered Rate (“LIBOR”), (ii) the prime rate offered by one or more United States banks or (iii) the certificate of deposit rate. Certain Bank Loans are subject to a LIBOR floor that establishes a minimum LIBOR rate. The interest rate shown on the Schedule of Investments reflects the rate in effect at April 30th. When a range of rates is disclosed, the Fund holds more than one position within the same tranche at varying rates.
Foreign Currency Translation
The accounting records of the Fund are maintained in U.S. dollars. The Fund may purchase securities that are denominated in foreign currencies. Investment securities and other assets and liabilities denominated in a foreign currency are translated into U.S. dollars at the current exchange rates. Purchases and sales of securities, income and expenses are translated into U.S. dollars at the exchange rates on the dates of the respective transactions. The Fund does not isolate that portion of the results of operations resulting from changes in foreign exchange rates from the fluctuations arising from changes in security prices.
Reported net realized foreign exchange gains or losses arise from purchases and sales of foreign currencies, currency gains or losses realized between the trade and settlement dates of securities transactions, and the differences between the amounts of income or expenses recorded on the Fund’s books and the U.S. dollar equivalents of the amounts actually received or paid. Net unrealized appreciation/depreciation from translation of assets and liabilities denominated in foreign currency arise from changes in the value of assets and liabilities resulting from changes in the foreign exchange rates.
Forward Currency Contracts
The Fund enters into forward currency contracts for the purchase or sale of a specific foreign currency at a fixed price on a future date. The Fund enters into forward currency contracts to protect against adverse currency movements or as speculative investments. The forward currency contracts are adjusted by the daily exchange rate of the underlying currency and any gains or losses are recorded for financial statement purposes as unrealized until the contact settlement date or an offsetting forward foreign currency contract has been executed, at which time the Fund records a realized gain or loss equal to the difference between the value of the contract at the time it was opened and the value at the time it was closed. Risk may arise upon entering into these contracts from potential inability of the counterparties to meet the terms of their contracts and from unanticipated movements in the value of a foreign currency relative to the U.S. dollar.
Futures Contracts
The Fund invests in futures contracts to hedge against anticipated future changes in interest or exchange rates or security prices. In addition, the Fund entered into such transactions to enhance potential gain in circumstances where hedging is not involved.
15 Payden Mutual Funds
The purchase or sale of futures contracts and options on futures contracts provides for the future sale by one party and purchase by another party of a specified quantity of a financial instrument or foreign currency at a fixed price on a future date. Upon entering into such a contract, the Fund is required to deposit and maintain initial margin deposit of cash or securities as required by the exchange on which the contract is traded.
Pursuant to the contract, the Fund agrees to receive from or pay to the broker an amount equal to the daily fluctuations in the value of the contract. Such receipts or payments are known as variation margin and are recorded as unrealized gains or losses by the Fund. When the contract is closed, the Fund records a realized gain or loss equal to the difference between the value of the contract at the time it was opened and the value at the time it was closed. The potential risk to the Fund is that the change in value of the underlying securities may not correlate to the change in value of the contracts.
Stock index futures contracts are an agreement pursuant to which two parties agree to take or make delivery of an amount of cash equal to the difference between the value of the index at the close of the last trading day of the contract and the price at which the index contract was originally written. Variation margin accounting procedures apply to these index futures contracts. The Fund invests in these futures contracts to permit the Fund to meet its objectives at a lower cost than investing directly in equity securities, while permitting the equivalent of an investment in a portfolio of equity securities. The potential risk to a Fund is that the change in value of the underlying index may not correlate to the change in value of the contracts.
Swap Contracts
The Fund may enter into swap agreements, in which a Fund and a counterparty agree either to make periodic net payments on a specified notional amount or a net payment upon termination. Swap agreements are privately negotiated in the OTC market and may be entered into as a bilateral contract (“OTC swaps”) or centrally cleared (“centrally cleared swaps”). Swaps are marked-to-market daily and changes in value are recorded as unrealized appreciation (depreciation) and realized gain (loss) is recorded at termination of the contract.
Upon entering into a centrally cleared swap, the Fund is required to deposit and maintain initial margin deposit of cash or securities as required by the exchange on which the contract is traded. Pursuant to a centrally cleared swap, the Fund agrees to receive from or pay to the broker an amount equal to the daily fluctuations in the value of the contract. Such receipts or payments are known as variation margin and are recorded as
unrealized gains or losses by the Fund. When the contract is closed, the Fund records a realized gain or loss equal to the difference between the value of the contract at the time it was opened and the value at the time it was closed. The potential risk to the Fund is that the change in value of the underlying securities may not correlate to the change in value of the contracts.
Swap transactions involve, to varying degrees, elements of interest rate, credit and market risk in excess of the amounts recognized in the Statement of Assets and Liabilities. Such risks involve the possibility that there will be no liquid market for these agreements, that the counterparty to the agreements may default on its obligation to perform or disagree as to the meaning of the contractual terms in the agreements, and that there may be unfavorable changes in interest rates, credit spreads and/or market values associated with these transactions.
The Fund may enter into credit default swaps to manage its exposure to the market or certain sectors of the market, to reduce its risk exposure to defaults of corporate and/or sovereign issuers or to create exposure to corporate and/or sovereign issuers to which it is not otherwise exposed (credit risk). A Fund may either buy or sell (write) credit default swaps on single-name issuers (corporate or sovereign), a combination or basket of single-name issuers or traded indexes. Credit default swaps on single-name issuers are agreements in which the protection buyer pays fixed periodic payments to the seller in consideration for a guarantee from the protection seller to make a specific payment should a negative credit event take place with respect to the referenced entity (e.g., bankruptcy, failure to pay, obligation accelerators, repudiation, moratorium or restructuring). Credit default swaps on traded indexes are agreements in which the buyer pays fixed periodic payments to the seller in consideration for a guarantee from the seller to make a specific payment should a write-down, principal or interest shortfall or default of all or individual underlying securities included in the index occur. As a buyer, if an underlying credit event occurs, the Fund will either (i) receive from the seller an amount equal to the notional amount of the swap and deliver the referenced security or underlying securities comprising the index, or (ii) receive a net settlement of cash equal to the notional amount of the swap less the recovery value of the security or underlying securities comprising the index. As a seller (writer), if an underlying credit event occurs, the Fund will either pay the buyer an amount equal to the notional amount of the swap and take delivery of the referenced security or underlying securities comprising the index or pay a net settlement of cash equal to the notional amount of the swap less the recovery value of the security or underlying securities comprising the index.
Annual Report 16
The Fund may enter into total return swaps to obtain exposure to a security or market without owning such security or investing directly in that market or to transfer the risk/return of one market (e.g., fixed income) to another market (e.g., equity) (equity risk and/or interest rate risk). Total return swaps are agreements in which there is an exchange of cash flows whereby one party commits to make payments based on the total return (coupons plus capital gains/losses) of an underlying instrument in exchange for fixed or floating rate interest payments. To the extent the total return of the instrument or index underlying the transaction exceeds or falls short of the offsetting interest rate obligation, the Fund will receive a payment from or make a payment to the counterparty.
For financial reporting purposes, swap interest and amortization is classified as realized or unrealized gain or loss on swap contracts.
Options Transactions
Option techniques may be utilized by the Fund to hedge against changes in interest rates, foreign currency exchange rates or security prices in order to establish more definitely the effective return on securities or currencies held or intended to be acquired by the Fund, to reduce the volatility of the currency exposure associated with investments in non-U.S. securities, or as an efficient means of adjusting exposure to the bond, equity and currency markets. In addition, the Fund may enter into such transactions to enhance potential gain in circumstances where hedging is not involved. When a Fund writes a covered call or put option, an amount equal to the premium received is reflected as an asset and equivalent liability. The amount of the liability is subsequently marked-to-market to reflect the current value of the option. If an option expires on its stipulated expiration date or if the Fund enters into a closing purchase transaction, a gain or loss is realized. If a written call option is exercised, a gain or loss is realized for the sale of the underlying security and the proceeds from the sale are increased by the premium originally received. If a written put option is exercised, the cost of the security acquired is decreased by the premium originally received. As writer of an option, the Fund has no control over whether the underlying securities are subsequently sold (call) or purchased (put) and, as a result, bears the market risk of an unfavorable change in the price of the security underlying the written option.
When the Fund purchases a call or put option, an amount equal to the premium paid is included in the Fund’s Statement of Assets and Liabilities as an investment, and is subsequently marked-to-market to reflect the current value of the option. If an option expires on the stipulated expiration date or if the
Fund enters into a closing sale transaction, a gain or loss is realized. If the Fund exercises a call option, the cost of the security acquired is increased by the premium paid for the call. If the Fund exercises a put option, a gain or loss is realized from the sale of the underlying security, and the proceeds from such sale are decreased by the premium originally paid. Written and purchased options are non-income producing securities.
Derivative Financial Instruments
The Fund engages in various portfolio investment strategies using derivative contracts both to increase the returns of the Fund and/or to economically hedge its exposure to certain risks such as credit risk, equity risk, interest rate risk and foreign currency exchange rate risk. These contracts may be transacted on an exchange or OTC.
The following tables show the Fund’s exposure to different types of market risk as it relates to the Statement of Assets and Liabilities and the Statement of Operations.
Statement of Assets and Liabilities
Fair Values of Derivative Instruments as of October 31, 2018 (000s)
| | | | | | | | |
Underlying Risk | | Derivative
Assets | | | Derivative
Liabilities | |
Credit1 | | | — | | | $ | (6 | ) |
Interest rate1,2,3 | | $ | 280 | | | | (199 | ) |
Foreign currency4,5 | | | 290 | | | | (53 | ) |
| | | | | | | | |
Total | | $ | 570 | | | $ | (258 | ) |
| | | | | | | | |
| 1 | Includes cumulative appreciation/depreciation of futures contracts and centrally cleared swaps as reported in Schedule of Investments. Only current day’s variation margin is reported within the Statements of Assets and Liabilities as Receivable/Payable for futures and variation margin on centrally cleared swaps. |
| 2 | Includes options purchased at value as reported in the Schedule of Investments. |
| 3 | Payable for options written. |
| 4 | Receivable for forward currency contracts. |
| 5 | Payable for forward currency contracts. |
17 Payden Mutual Funds
The Effect of Derivative Instruments on the Statement of Operations For the Period Ended October 31, 2018
| | | | | | | | | | | | | | | | | | | | |
Amount of Realized Gain (Loss) on Derivatives Recognized in Income (000s) | |
Underlying risk | | Futures1 | | | Forward
Currency
Contracts2 | | | Options3 | | | Swaps4 | | | Total | |
Credit. | | | — | | | | — | | | | — | | | | $127 | | | | $127 | |
Equity | | | — | | | | — | | | | $202 | | | | — | | | | 202 | |
Foreign exchange | | | — | | | | $379 | | | | — | | | | — | | | | 379 | |
Interest rate | | | $(294 | ) | | | — | | | | 333 | | | | (3 | ) | | | 36 | |
Total | | | $(294 | ) | | | $379 | | | | $535 | | | | $124 | | | | $744 | |
| 1 | Net realized gains (losses) from futures contracts. |
| 2 | Net realized gains (losses) from forward foreign exchange contracts. |
| 3 | Net realized gains (losses) from written option contracts and purchased options, which are included in net realized gain on investments. |
| 4 | Net realized gains (losses) from swap contracts. |
The Effect of Derivative Instruments on the Statement of Operations For the Period Ended October 31, 2018
| | | | | | | | | | | | | | | | | | | | |
Change in Unrealized Appreciation or (Depreciation) on Derivatives Recognized in Income (000s) | |
Underlying risk | | Futures5 | | | Forward
Foreign
Exchange
Contracts6 | | | Options7 | | | Swaps8 | | | Total | |
Credit | | | — | | | | — | | | | — | | | $ | (6 | ) | | $ | (6 | ) |
Equity | | | — | | | | — | | | $ | 32 | | | | — | | | | 32 | |
Foreign exchange | | | — | | | $ | 143 | | | | — | | | | — | | | | 143 | |
Interest rate | | $ | (1 | ) | | | — | | | | (98 | ) | | | (8 | ) | | | (107 | ) |
| | | | | | | | | | | | | | | | | | | | |
Total | | $ | (1 | ) | | $ | 143 | | | $ | (66 | ) | | $ | (14 | ) | | $ | 62 | |
| | | | | | | | | | | | | | | | | | | | |
| 5 | Change in net unrealized appreciation (depreciation) from futures contracts. |
| 6 | Change in net unrealized appreciation (depreciation) from forward foreign exchange contracts. |
| 7 | Change in net unrealized appreciation (depreciation) from written option contracts and purchased options, which are included in change in unrealized appreciation (depreciation) on investments. |
| 8 | Change in net unrealized appreciation (depreciation) from swap contracts. |
During the period ended October 31, 2018, the average notional amount of derivatives as a percent of average net assets were as follows:
| | | | | | |
Foreign currency | | Credit | | Interest rate | | Equity |
15% | | 0% | | 5% | | 0% |
Counterparty Credit Risk
A derivative contract may suffer a mark to market loss if the value of the contract decreases due to an unfavorable change in the market rates or values of the underlying instrument. Losses can also occur if the counterparty does not perform under the contract.
The Fund’s risk of loss from counterparty credit risk on OTC derivatives is generally limited to the aggregate unrealized gain
netted against any collateral held by the Fund. For OTC options purchased, the Fund bears the risk of loss of the amount of the premiums paid plus the positive change in market values net of any collateral held by the Fund should the counterparty fail to perform under the contracts. Options written by the Fund do not typically give rise to counterparty credit risk, as options written generally obligate the Fund, and not the counterparty to perform.
With exchange traded purchased options, futures and centrally cleared swaps, there is decreased counterparty credit risk to the Fund since the exchange or clearinghouse guarantees against a possible default. The clearinghouse stands between the buyer and the seller of the contract; therefore, the credit risk is limited to failure of the clearinghouse. While offset rights may exist under applicable law, the Fund does not have a contractual right of offset against a clearing broker or clearinghouse in the event of a default (including the bankruptcy or insolvency) of the clearing broker or clearinghouse. Additionally, credit risk exists in exchange traded futures and centrally cleared swaps with respect to initial and variation margin that is held in a clearing broker’s customer accounts. While clearing brokers are required to segregate customer margin from their own assets, in the event that a clearing broker becomes insolvent or goes into bankruptcy and at that time there is a shortfall in the aggregate amount of margin held by the clearing broker for all its clients, typically the shortfall would be allocated on a pro rata basis across all the clearing broker’s customers, potentially resulting in losses to the Fund.
In order to better define its contractual rights and to secure rights that will help the Fund mitigate its counterparty risk, the Fund may enter into an International Swaps and Derivatives Association, Inc. Master Agreement (“ISDA Master Agreement”) or similar agreement with its derivative contract counterparties. An ISDA Master Agreement is a bilateral agreement between the Fund and a counterparty that governs certain OTC derivatives and typically contains, among other things, collateral posting terms and netting provisions in the event of a default and/or termination event. Under an ISDA Master Agreement, the Fund may, under certain circumstances, offset with the counterparty certain derivative financial instruments’ payables and/or receivables with collateral held and/or posted and create one single net payment. The provisions of the ISDA Master Agreement typically permit a single net payment in the event of default (close-out netting), including the bankruptcy or insolvency of the counterparty. However, bankruptcy or insolvency laws of a particular jurisdiction may impose restrictions on or prohibitions against the right of offset in bankruptcy, insolvency or other events. In addition, certain ISDA Master Agreements allow counterparties
Annual Report 18
to OTC derivatives to terminate derivative contracts prior to maturity in the event the Fund’s net assets decline by a stated percentage or the Fund fails to meet the terms of its ISDA Master Agreements, which would cause the Fund to accelerate payment of any net liability owed to the counterparty.
Collateral Requirements
For derivatives traded under an ISDA Master Agreement, the collateral requirements are typically calculated by netting the mark to market amount for each transaction under such agreement and comparing that amount to the value of any collateral currently pledged by the Fund and the counterparty.
Cash collateral that has been pledged to cover obligations of the Fund and cash collateral received from the counterparty, if any, is reported separately on the Statement of Assets and Liabilities as cash pledged as collateral and cash received as collateral, respectively. Non-cash collateral pledged by the Fund, if any, is noted in the Schedule of Investments. Generally,
the amount of collateral due from or to a party has to exceed a minimum transfer amount threshold (e.g. $500,000) before a transfer is required, which is determined at the close of business of the Fund and additional required collateral is delivered to/ pledged by the Fund on the next business day. Typically, the Fund and counterparties are not permitted to sell, re-pledge or use the collateral they receive. To the extent amounts due to the Fund from its counterparties are not fully collateralized, contractually or otherwise, the Fund bears the risk of loss from counterparty non-performance. The Fund attempts to mitigate counterparty risk by only entering into agreements with counterparties that it believes have the financial resources to honor their obligations and by monitoring the financial stability of those counterparties.
For financial reporting purposes, the Fund does not offset derivative assets and derivative liabilities that are subject to netting arrangements in the Statement of Assets and Liabilities.
At October 31, 2018, the Fund’s derivative assets and liabilities (by type) on a gross basis are as follows (000s):
| | | | | | | | |
| | | Assets | | | Liabilities | |
Derivative Financial Instruments: | | | | | | | | |
Centrally Cleared Swaps | | $ | 6 | | | $ | — | |
Futures Contracts | | | — | | | | 8 | |
Purchased Swaptions1 | | | 277 | | | | — | |
Written Swaptions | | | — | | | | 199 | |
Forward Currency Contracts | | | 290 | | | | 53 | |
| | | | | | | | |
Total derivative assets and liabilities in the Statement of Assets and Liabilities | | | 573 | | | | 260 | |
| | | | | | | | |
Derivatives not subject to a master netting agreement or similar agreement “(MNA”) | | | (151 | ) | | | (8 | ) |
| | | | | | | | |
Total derivative assets and liabilities subject to MNA | | $ | 422 | | | $ | 252 | |
| | | | | | | | |
1 Includes options purchased at value which is included in Investments at value and reported in the Schedule of Investments.
The following tables present the Fund’s derivative assets by counterparty net of amounts available for offset under a MNA and net of the related collateral received by the Fund as of October 31, 2018 (000s):
| | | | | | | | | | | | | | | | | | | | |
Counterparty | | Derivative Assets
Subject to a MNA by Counterparty | | | Derivatives
Available
for Offset1 | | | Non-Cash
Collateral
Received | | | Cash
Collateral
Received | | | Net Amount of
Derivative Assets2 | |
Barclays Bank PLC | | | $315 | | | | $(199 | ) | | | — | | | | — | | | | $116 | |
BNP PARIBAS | | | 44 | | | | (9 | ) | | | — | | | | — | | | | 35 | |
HSBC Bank USA, N.A. | | | 41 | | | | (41 | ) | | | — | | | | — | | | | — | |
State Street Bank & Trust Co. | | | 22 | | | | — | | | | — | | | | — | | | | 22 | |
Total | | | $422 | | | | $(249) | | | | — | | | | — | | | | $173 | |
| | | | | |
Counterparty | | Derivative Liabilities
Subject to a MNA by
Counterparty | | | Derivatives
Available
for Offset1 | | | Non-Cash
Collateral
Pledged | | | Cash
Collateral
Pledged | | | Net Amount of Derivative Liabilities3 | |
Barclays Bank PLC | | | $199 | | | | $(199) | | | | — | | | | — | | | | — | |
BNP PARIBAS | | | 9 | | | | (9) | | | | — | | | | — | | | | — | |
HSBC Bank USA, N.A. | | | 44 | | | | (41) | | | | — | | | | — | | | | $ 3 | |
Total | | | $252 | | | | $(249) | | | | — | | | | — | | | | $ 3 | |
1 The amount of derivatives for offset is limited to the amount of assets and/or liabilities that are subject to a MNA.
2 Net amount represents the net amount receivable from the counterparty in the event of default.
3 Net amount represents the net amount payable due to the counterparty in the event of default.
19 Payden Mutual Funds
Securities Lending
Pursuant to a securities lending agreement with The Bank of New York Mellon, the Fund may lend securities to qualified institutions. All loans are secured by collateral of at least 102% of the value of the U.S. securities loaned and 105% of the value of the foreign securities loaned. Collateral equivalent to at least 100% of the market value of securities on loan is maintained at all times. The collateral is maintained by the custodian. Cash collateral is reinvested in the Payden Cash Reserves Money Market Fund. The Fund is entitled to receive all of the income on the securities loaned, in addition to income earned as a result of the lending transaction. Although each security is fully collateralized, the Fund bears the risk of delay in receiving additional collateral or in recovery of or loss of rights in the securities loaned should the borrower fail to return the securities in a timely manner. The Fund maintains the right to recall the securities on loan for voting purposes. The income earned is disclosed in the Statement of Operations.
Securities lending transactions are entered into by the Fund under Master Securities Lending Agreements (“MSLA”) which provide the right, in the event of default (including bankruptcy or insolvency), for the non-defaulting party to liquidate the collateral and calculate a net exposure to the defaulting party or request additional collateral. In the event that a borrower defaults, the Fund, as lender, would offset the market value of the collateral received against the market value of the securities loaned. The value of the collateral is typically greater than that of the market value of the securities loaned, leaving the lender with a net amount payable to the defaulting party. However, bankruptcy or insolvency laws of a particular jurisdiction may impose restrictions on or prohibitions against such a right of offset in the event of a MSLA counterparty’s bankruptcy or insolvency. Under the MSLA, the borrower can resell or re-pledge the loaned securities, and the Fund can reinvest cash collateral, or, upon an event of default, resell or re-pledge the collateral.
The Fund’s securities lending agreements by counterparty which are subject to offset under a MSLA, is included within the Fund’s Schedule of Investments under the heading “Offsetting Assets and Liabilities.” For financial reporting purposes, the Fund does not offset financial assets and financial liabilities that are subject to a MSLA on the Statement of Assets and Liabilities.
Distributions to Shareholders
Distributions to shareholders are recorded on the ex-dividend date. Dividends from net investment income and net realized gains on foreign currency transactions are declared and paid
annually. Net realized gains on investments, if any, are declared and distributed at least annually. All distributions are paid in the form of additional shares unless cash payment is requested.
Distributions to shareholders are determined in accordance with income tax regulations, which may differ from GAAP.
Federal Income Taxes
It is the policy of the Fund to meet the requirements for qualification as a regulated investment company as defined in Sub-chapter M of the Internal Revenue Code (the ‘Code”), and to make distributions of net investment income and net realized gains sufficient to relieve it from all Federal income or excise taxes. As of and during the period ended October 31, 2018, the Fund did not record any liability for uncertain tax positions. Accordingly, no provision for Federal income or excise tax was made.
The Fund files a tax return annually using tax accounting methods required under provisions of the Code, which may differ from GAAP, the basis on which these financial statements are prepared. The differences arise primarily from the treatment of foreign currency transactions and futures contracts and the deferral of certain losses under Federal income tax regulations. Accordingly, the amounts of net investment income and net realized gains or losses reported in these financial statements may differ from those reported in each Fund’s tax return. Return of capital distributions and net investment losses for tax purposes, if any, are reclassified to paid in capital.
As of and during the period ended October 31, 2018, the Fund did not have any liabilities for any unrecognized tax positions. The Fund recognizes interest and penalties, if any, related to unrecognized tax positions as income tax expense in the Statement of Operations. During the period, the Fund did not incur any interest or penalties.
Each of the tax years in the four-year period ended October 31, 2018 remains subject to examination by the Internal Revenue Service and state taxing authorities.
Annual Report 20
Affiliated Investment
The Fund invests in the Cash Reserves Money Market Fund, an affiliated Fund. Income earned by the Fund from affiliated funds for the period is disclosed in the Statement of Operations.
| | | | | | | | | | | | | | | | | | | | | | | | |
Value October 31, 2017 | | Purchases | | | Sales | | | Dividends | | | Value
October 31,
2018 | | | Realized
Gain
(Loss) | | | Change in
Unrealized Appreciation
(Depreciation) | |
| | | | | | |
$714,370 | | $ | 534,689,933 | | | $ | 530,265,629 | | | $ | 30,089 | | | $ | 5,138,674 | | | | — | | | | — | |
Custodian Credits
The Fund has entered into an agreement with the custodian, whereby it earns custodian fee credits for temporary cash balance. These credits, which offset custodian fees that may be charged to the Fund, are based on 75% of the daily effective federal funds rate, and are, subject to rounding, disclosed in the Statement of Operations. There were no custodian credits applicable to the Fund during the period ended October 31, 2018.
Other
Income and realized and unrealized gain/loss are allocated to each class based on relative net assets. Shared expenses incurred by the Group are allocated among the Funds of the Group on the basis of relative net assets. Fund-specific expenses are charged to each Fund as incurred.
In March 2017, the FASB issued Accounting Standards Update “Premium Amortization of Purchased Callable Debt Securities”which amends the amortization period for certain purchased callable debt securities. Under the new guidance, the premium amortization of purchased callable debt securities that have explicit, non-contingent call features and are callable at fixed prices will be amortized to the earliest call date. The guidance will be applied on a modified retrospective basis and is effective for fiscal years, and their interim periods, beginning after December 15, 2018. Management is currently evaluating the impact of this guidance to the Fund.
3. Related Party Transactions
Payden/Kravitz Advisers LLC (the “Adviser” or “Payden/ Kravitz”) provides investment advisory services to the Fund. Under the terms of the investment advisory agreement, Payden/ Kravitz is entitled to receive fees monthly, computed on the average daily net assets of the Fund at an annualized rate of 1.10%.
Payden/Kravitz agreed to guarantee that, for so long as it acts as investment adviser to the Fund, the expenses of the Fund, including advisory fees (exclusive of interest and taxes) will not
exceed 1.25% for the Institutional and SI classes, 1.50% for the Adviser class, and 1.75% for the Retirement class of average daily net assets on an annualized basis.
The adviser also voluntarily agreed to temporarily limit expenses, including advisory fees of the Institutional class to 0.95% of the average daily net assets or an annualized basis through February 28, 2019 (exclusive of interest and taxes).
The Fund remains liable to Payden/Kravitz for expenses subsidized in any fiscal year up to a maximum of three years from the end of the period in which the expenses were subsidized as long as any reimbursement will not cause the annual expense ratio for the year in which it is made to exceed the amount of the expense guarantee or expense limit (whichever is in effect at the time of waiver or reimbursement).
The deferred expense subsidies represent the cumulative amount of expenses subsidized for the Fund through the end of the year. The amount $1,181,326 ($368,864 for 2016, $399,456 for 2017 and $413,006 for 2018) is not considered a liability of the Fund, and therefore is not recorded as a liability in the Statement of Assets and Liabilities, but will be recognized as net expense in the Statement of Operations as expense previously deferred in future periods, if expense limits permit.
Treasury Plus, Inc., a wholly owned subsidiary of Payden & Rygel, serves as administrator to the Fund. Under the terms of the administration agreement, Treasury Plus, Inc. receives fees monthly, computed on the average daily net assets of the Fund at an annualized rate of 0.15%.
The Fund has adopted a plan pursuant to SEC rule 12b-1 by which Payden & Rygel Distributors receives fees monthly, computed on the average net assets of the Adviser class at an annualized rate of 0.25% and of the Retirement class at an annualized rate of 0.50%. Payden & Rygel Distributors does not receive a fee from the Institutional or SI classes.
Certain officers and/or trustees of the Group are affiliated with Payden/Kravitz, Payden & Rygel Distributors and/or Treasury Plus, Inc. Such officers and trustees receive no fees from the Fund for serving as officers and/or trustees of the Group.
21 Payden Mutual Funds
Indemnifications
Under the Group’s organizations documents, its trustees and officers are indemnified by the Fund against certain liabilities arising out of the performance of their duties to the Fund. Additionally, in the normal course of business, the Fund enters into contracts with service providers that contain general indemnification clauses. The Fund’s maximum exposure under these agreements is unknown as this would involve future claims that may be made against the Fund that have not yet occurred. Currently, the Fund expects this risk of loss to be remote.
4. Fair Value Measurement
Various inputs are used in determining the value of the Fund’s investments and other financial instruments. The inputs or methodology used for valuing securities are not necessarily an indication of the risk associated with investing in those securities. These inputs are summarized in the three broad levels: Level 1 - quoted prices in active markets for identical investments; Level 2 - other significant observable inputs (including quoted prices for similar securities, interest rates, prepayment speeds, credit risk, etc.), and Level 3 - significant unobservable inputs (including the Fund’s own assumptions in determining the fair value of investments). See Note 2 - Securities Valuation for a summary of the inputs used in valuing the Fund’s investments and other financial instruments.
| | | | | | | | | | | | | | | | | | | | | | | | | | | | |
| | | Investments in Securities | |
| | | | |
| | | Level 1-Quoted Prices | | | Level 2-Other
Significant
Observable Inputs | | | Level 3-Significant
Unobservable Inputs | | | | |
| | | Assets
(000’s) | | | Liabilities
(000’s) | | | Assets
(000’s) | | | Liabilities
(000’s) | | | Assets
(000’s) | | | Liabilities
(000’s) | | | Total
(000’s) | |
| | | | | | | |
Asset Backed | | | — | | | | — | | | $ | 43,924 | | | | — | | | | — | | | | — | | | $ | 43,924 | |
Bank Loans | | | — | | | | — | | | | 6,643 | | | | — | | | | — | | | | — | | | | 6,643 | |
Corporate Bond | | | — | | | | — | | | | 42,448 | | | | — | | | | — | | | | — | | | | 42,448 | |
Foreign Government | | | — | | | | — | | | | 27,168 | | | | — | | | | — | | | | — | | | | 27,168 | |
Mortgage Backed | | | — | | | | — | | | | 69,903 | | | | — | | | | — | | | | — | | | | 69,903 | |
U.S. Treasury | | | — | | | | — | | | | 5,477 | | | | — | | | | — | | | | — | | | | 5,477 | |
Swaptions Purchased | | | — | | | | — | | | | 277 | | | | — | | | | — | | | | — | | | | 277 | |
Common Stock | | $ | 3,885 | | | | — | | | | — | | | | — | | | | — | | | | — | | | | 3,885 | |
Master Limited Partnership | | | 962 | | | | — | | | | — | | | | — | | | | — | | | | — | | | | 962 | |
Preferred Stock | | | 280 | | | | — | | | | — | | | | — | | | | — | | | | — | | | | 280 | |
Real Estate Investment Trusts | | | 961 | | | | — | | | | — | | | | — | | | | — | | | | — | | | | 961 | |
Investment Company | | | 5,139 | | | | — | | | | — | | | | — | | | | — | | | | — | | | | 5,139 | |
| |
| | | Other Financial Instruments1 | |
| | | | |
| | | Level 1-Quoted Prices | | | Level 2-Other
Significant
Observable Inputs | | | Level 3-Significant
Unobservable Inputs | | | | |
| | | Assets
(000’s) | | | Liabilities
(000’s) | | | Assets
(000’s) | | | Liabilities
(000’s) | | | Assets
(000’s) | | | Liabilities
(000’s) | | | Total
(000’s) | |
Forward currency contracts | | | — | | | | — | | | $ | 290 | | | $ | (53 | ) | | | — | | | | — | | | $ | 237 | |
Futures | | $ | 3 | | | | — | | | | — | | | | — | | | | — | | | | — | | | | 3 | |
Swaps | | | — | | | | — | | | | — | | | | (6 | ) | | | — | | | | — | | | | (6 | ) |
Swaptions Written | | | — | | | | — | | | | — | | | | (199 | ) | | | — | | | | — | | | | (199 | ) |
| 1 | Other financial instruments are swaps, futures contracts, forward currency contracts and swaptions written. Swaps, futures contracts and forward currency contracts are valued at the unrealized appreciation/depreciation on the instrument and options written are shown at value. |
Annual Report 22
5. Federal Tax Information (amounts in 000s)
Distributions from net investment income and net realized capital gains are determined in accordance with U.S. federal income tax regulations, which may differ from those amounts determined under GAAP. These book/tax differences are either temporary or permanent in nature. To the extent these differences are permanent, they are charged or credited to distributable earnings and paid-in capital, as appropriate, in the period that the differences arise. For the year ended October 31, 2018, there were no permanent differences.
Under the Regulated Investment Company Modernization Act of 2010, the Funds will be permitted to carry forward capital losses incurred in taxable years beginning after December 22, 2010 (“post-enactment”), for an unlimited period. However, any losses incurred during those future taxable years will be required to be utilized prior to the losses incurred in pre-enactment taxable years. Additionally, post-enactment capital losses that are carried forward will retain their character as either short or long term capital losses rather than being considered all short term. As of October 31, 2018 the fund utilized $1,574 in capital loss carryforwards.
As of October 31, 2018, the Fund had available for Federal income tax purposes unused capital losses as follows (000’s):
| | | | |
| | | | |
Expires 2019 | | Unlimited* | | Total |
$492 | | $6,263 | | $6,755 |
* Post-enactment carryforward losses.
The tax character of distributions paid during the year ended October 31, is as follows (000“s).
| | | | | | | | |
2018 | | | | 2017 |
| | | | |
Ordinary
Income | | Long Term
Capital Gains | | | | Ordinary
Income | | Long Term
Capital Gains |
| | | | |
$5,336 | | — | | | | $3,512 | | — |
At October 31, 2018, net unrealized appreciation (depreciation) on investments for Federal income tax purposes is as follows (000’s):
| | | | | | |
Cost of Investments Federal Income Tax Purposes | | Gross
Unrealized
Appreciation
on Investments | | Gross
Unrealized
Depreciation
on Investments | | Net Unrealized
Appreciation
on Investments |
$207,070 | | $2,879 | | $(2,846) | | $33 |
At October 31, 2018, the components of accumulated earnings (deficit) for Federal income tax purposes are as follows (000’s):
| | | | | | | | | | | | | | | | | | | | |
Undistributed Ordinary Income | | Undistributed
Realized Long Term
Capital Gains | | | Capital Loss
Carryforwards | | | Distributions
Payable | | | Net Unrealized
Appreciation
(Depreciation) | | | Total Distributions
Earnings | |
| | | | | |
$5,150 | | | — | | | $ | (6,755 | ) | | | — | | | $ | 33 | | | $ | (1,572 | ) |
6. Regulation S-X Amendments
On August 17, 2018, the SEC adopted amendments to certain disclosure requirements in Securities Act Release No. 33-10532, Disclosure Update and Simplification. the Fund has adopted the amendments pertinent to Regulation S-X in this shareholder report. The amendments impacted certain disclosure presentation on the Statement of Assets and Liabilities, Statement of Changes in Net Assets and Notes to Financial Statements.
Prior year distribution information and undistributed net investment income in the Statement of Changes in Net Assets has been modified to conform to the current year presentation in accordance with the Regulation S-X changes.
Distributions for the year ended October 31, 2018 were classified as follows:
| | | | | | | | | | | | | | | | | | | | | | |
| Institutional Class | | SI Class | | Adviser Class | | Investor Class |
Net
Investment
Income | | Net
Realized
Gains | | Total | | Net
Investment
Income | | Net
Realized
Gains | | Total | | Net
Investment
Income | | Net
Realized
Gains | | Total | | Net
Investment
Income | | Net
Realized
Gains | | Total |
| $(175) | | — | | $(175) | | $(1,853) | | — | | $(1,853) | | $(875) | | — | | $(875) | | $(609) | | — | | $(609) |
23 Payden Mutual Funds
7. Subsequent Events
The Fund has evaluated subsequent events through the issuance of the financial statements and determined that no events have occurred that require disclosure.
Annual Report 24
For the share outstanding for each of the periods ended October 31st
| | | | | | | | | | | | |
| | | Institutional
Class | |
| | | 2018 | | | 2017 | | | 2016 | |
Net asset value — beginning of period | | $ | 10.69 | | | $ | 10.55 | | | $ | 10.33 | |
| | | | | | | | | | | | |
Income (loss) from investment activities: | | | | | | | | | | | | |
Net investment income | | | 0.30 | (1) | | | 0.25 | | | | 0.15 | |
Net realized and unrealized gains (losses) | | | (0.08 | ) | | | 0.07 | | | | 0.07 | |
| | | | | | | | | | | | |
Total from investment activities | | | 0.22 | | | | 0.32 | | | | 0.22 | |
| | | | | | | | | | | | |
Distributions to shareholders: | | | | | | | | | | | | |
From net investment income | | | (0.27 | ) | | | (0.18 | ) | | | — | |
| | | | | | | | | | | | |
Net asset value — end of period | | $ | 10.64 | | | $ | 10.69 | | | $ | 10.55 | |
| | | | | | | | | | | | |
Total return | | | 2.06 | % | | | 3.09 | % | | | 2.13 | %(2) |
| | | | | | | | | | | | |
Ratios/supplemental data: | | | | | | | | | | | | |
Net assets, end of period (000s) | | $ | 6,930 | | | $ | 17,780 | | | $ | 10,259 | |
Ratio of gross expense to average net assets | | | 1.42 | % | | | 1.41 | % | | | 1.43 | %(3) |
Ratio of net expense to average net assets | | | 0.95 | % | | | 0.95 | % | | | 0.95 | %(3) |
Ratio of investment income less gross expenses to average net assets | | | 2.37 | % | | | 2.10 | % | | | 2.90 | %(3) |
Ratio of net investment income to average net assets | | | 2.84 | % | | | 2.55 | % | | | 3.38 | %(3) |
Portfolio turnover rate | | | 130 | % | | | 116 | % | | | 55 | %(2) |
The class commenced operations on June 1, 2016.
| | | | | | | | | | | | | | | | | | | | |
| |
| | | SI Class | |
| | | 2018 | | | 2017 | | | 2016 | | | 2015 | | | 2014 | |
Net asset value — beginning of period | | $ | 10.65 | | | $ | 10.54 | | | $ | 10.48 | | | $ | 10.63 | | | $ | 10.66 | |
| | | | | | | | | | | | | | | | | | | | |
Income (loss) from investment activities: | | | | | | | | | | | | | | | | | | | | |
Net investment income | | | 0.27 | (1) | | | 0.23 | | | | 0.25 | | | | 0.19 | | | | 0.23 | |
Net realized and unrealized gains (losses) | | | (0.08 | ) | | | 0.06 | | | | 0.01 | | | | (0.16 | ) | | | 0.02 | |
| | | | | | | | | | | | | | | | | | | | |
Total from investment activities | | | 0.19 | | | | 0.29 | | | | 0.26 | | | | 0.03 | | | | 0.25 | |
| | | | | | | | | | | | | | | | | | | | |
Distributions to shareholders: | | | | | | | | | | | | | | | | | | | | |
From net investment income | | | (0.26 | ) | | | (0.18 | ) | | | (0.20 | ) | | | (0.18 | ) | | | (0.28 | ) |
| | | | | | | | | | | | | | | | | | | | |
Net asset value — end of period | | $ | 10.58 | | | $ | 10.65 | | | $ | 10.54 | | | $ | 10.48 | | | $ | 10.63 | |
| | | | | | | | | | | | | | | | | | | | |
Total return | | | 1.82 | % | | | 2.76 | % | | | 2.58 | % | | | 0.29 | % | | | 2.41 | % |
| | | | | | | | | | | | | | | | | | | | |
Ratios/supplemental data: | | | | | | | | | | | | | | | | | | | | |
Net assets, end of period (000s) | | $ | 122,782 | | | $ | 122,500 | | | $ | 111,517 | | | $ | 107,903 | | | $ | 89,025 | |
Ratio of gross expense to average net assets | | | 1.42 | % | | | 1.42 | % | | | 1.43 | % | | | 1.46 | % | | | 1.47 | % |
Ratio of net expense to average net assets | | | 1.25 | % | | | 1.25 | % | | | 1.25 | % | | | 1.25 | % | | | 1.25 | % |
Ratio of investment income less gross expenses to average net assets | | | 2.41 | % | | | 2.09 | % | | | 2.23 | % | | | 2.00 | % | | | 2.22 | % |
Ratio of net investment income to average net assets | | | 2.58 | % | | | 2.25 | % | | | 2.42 | % | | | 2.21 | % | | | 2.44 | % |
Portfolio turnover rate | | | 130 | % | | | 116 | % | | | 55 | % | | | 85 | % | | | 85 | % |
The class commenced operations on September 22, 2008.
(1) Based on average shares outstanding.
(2) Not annualized.
(3) Annualized.
25 Payden Mutual Funds
| | | | | | | | | | | | | | | | | | | | |
| | | Adviser Class | |
| | | 2018 | | | 2017 | | | 2016 | | | 2015 | | | 2014 | |
Net asset value — beginning of period | | $ | 10.46 | | | $ | 10.37 | | | $ | 10.34 | | | $ | 10.51 | | | $ | 10.54 | |
| | | | | | | | | | | | | | | | | | | | |
Income (loss) from investment activities: | | | | | | | | | | | | | | | | | | | | |
Net investment income | | | 0.24 | (1) | | | 0.22 | | | | 0.25 | | | | 0.19 | | | | 0.25 | |
Net realized and unrealized gains (losses) | | | (0.08 | ) | | | 0.04 | | | | (0.02 | ) | | | (0.19 | ) | | | (0.02 | ) |
| | | | | | | | | | | | | | | | | | | | |
Total from investment activities | | | 0.16 | | | | 0.26 | | | | 0.23 | | | | — | | | | 0.23 | |
| | | | | | | | | | | | | | | | | | | | |
Distributions to shareholders: | | | | | | | | | | | | | | | | | | | | |
From net investment income | | | (0.26 | ) | | | (0.17 | ) | | | (0.20 | ) | | | (0.17 | ) | | | (0.26 | ) |
| | | | | | | | | | | | | | | | | | | | |
Net asset value — end of period | | $ | 10.36 | | | $ | 10.46 | | | $ | 10.37 | | | $ | 10.34 | | | $ | 10.51 | |
| | | | | | | | | | | | | | | | | | | | |
Total return | | | 1.53 | % | | | 2.56 | % | | | 2.28 | % | | | 0.05 | % | | | 2.18 | % |
| | | | | | | | | | | | | | | | | | | | |
Ratios/supplemental data: | | | | | | | | | | | | | | | | | | | | |
Net assets, end of period (000s) | | $ | 33,571 | | | $ | 48,190 | | | $ | 53,687 | | | $ | 60,661 | | | $ | 57,112 | |
Ratio of gross expense to average net assets | | | 1.67 | % | | | 1.67 | % | | | 1.68 | % | | | 1.71 | % | | | 1.73 | % |
Ratio of net expense to average net assets | | | 1.50 | % | | | 1.50 | % | | | 1.50 | % | | | 1.50 | % | | | 1.50 | % |
Ratio of investment income less gross expenses to average net assets | | | 2.13 | % | | | 1.84 | % | | | 1.98 | % | | | 1.75 | % | | | 1.95 | % |
Ratio of net investment income to average net assets | | | 2.30 | % | | | 2.00 | % | | | 2.17 | % | | | 1.96 | % | | | 2.18 | % |
Portfolio turnover rate | | | 130 | % | | | 116 | % | | | 55 | % | | | 85 | % | | | 85 | % |
The class commenced operations on September 22, 2008. | |
| | | Retirement Class | |
| | | 2018 | | | 2017 | | | 2016 | | | 2015 | | | 2014 | |
Net asset value — beginning of period | | $ | 10.04 | | | $ | 9.98 | | | $ | 9.98 | | | $ | 10.17 | | | $ | 10.21 | |
| | | | | | | | | | | | | | | | | | | | |
Income (loss) from investment activities: | | | | | | | | | | | | | | | | | | | | |
Net investment income | | | 0.21 | (1) | | | 0.18 | | | | 0.20 | | | | 0.17 | | | | 0.22 | |
Net realized and unrealized gains (losses) | | | (0.09 | ) | | | 0.05 | | | | — | | | | (0.19 | ) | | | (0.03 | ) |
| | | | | | | | | | | | | | | | | | | | |
Total from investment activities | | | 0.12 | | | | 0.23 | | | | 0.20 | | | | (0.02 | ) | | | 0.19 | |
| | | | | | | | | | | | | | | | | | | | |
Distributions to shareholders: | | | | | | | | | | | | | | | | | | | | |
From net investment income | | | (0.25 | ) | | | (0.17 | ) | | | (0.20 | ) | | | (0.17 | ) | | | (0.23 | ) |
| | | | | | | | | | | | | | | | | | | | |
Net asset value — end of period | | $ | 9.91 | | | $ | 10.04 | | | $ | 9.98 | | | $ | 9.98 | | | $ | 10.17 | |
| | | | | | | | | | | | | | | | | | | | |
Total return | | | 1.24 | % | | | 2.33 | % | | | 2.03 | % | | | (0.19 | )% | | | 1.90 | % |
| | | | | | | | | | | | | | | | | | | | |
Ratios/supplemental data: | | | | | | | | | | | | | | | | | | | | |
Net assets, end of period (000s) | | $ | 39,338 | | | $ | 39,083 | | | $ | 35,772 | | | $ | 27,001 | | | $ | 28,515 | |
Ratio of gross expense to average net assets | | | 1.92 | % | | | 1.91 | % | | | 1.93 | % | | | 1.96 | % | | | 1.97 | % |
Ratio of net expense to average net assets | | | 1.75 | % | | | 1.75 | % | | | 1.75 | % | | | 1.75 | % | | | 1.75 | % |
Ratio of investment income less gross expenses to average net assets | | | 1.91 | % | | | 1.59 | % | | | 1.74 | % | | | 1.51 | % | | | 1.72 | % |
Ratio of net investment income to average net assets | | | 2.08 | % | | | 1.75 | % | | | 1.92 | % | | | 1.72 | % | | | 1.94 | % |
Portfolio turnover rate | | | 130 | % | | | 116 | % | | | 55 | % | | | 85 | % | | | 85 | % |
The class commenced operations on April 6, 2009.
(1) Based on average shares outstanding.
Annual Report 26
To the Shareholders and Board of Trustees of
The Payden & Rygel Investment Group
Opinion on the Financial Statements and Financial Highlights
We have audited the accompanying statement of assets and liabilities of Payden/Kravitz Cash Balance Plan Fund, one of the funds comprising the Payden & Rygel Investment Group (the “Fund”), including the schedule of investments, as of October 31, 2018, the related statement of operations for the year then ended, the statements of changes in net assets for each of the two years in the period then ended, the financial highlights for each of the five years in the period then ended, and the related notes. In our opinion, the financial statements and financial highlights present fairly, in all material respects, the financial position of the Fund as of October 31, 2018, and the results of its operations for the year then ended, the changes in its net assets for each of the two years in the period then ended, and the financial highlights for each of the five years in the period then ended in conformity with accounting principles generally accepted in the United States of America.
Basis for Opinion
These financial statements and financial highlights are the responsibility of the Fund’s management. Our responsibility is to express an opinion on the Fund’s financial statements and financial highlights based on our audit. We are a public accounting firm registered with the Public Company Accounting Oversight Board (United States) (PCAOB) and are required to be independent with respect to the Fund in accordance with the U.S. federal securities laws and the applicable rules and regulations of the Securities and Exchange Commission and the PCAOB.
We conducted our audit in accordance with the standards of the PCAOB. Those standards require that we plan and perform the audit to obtain reasonable assurance about whether the financial statements and financial highlights are free of material misstatement, whether due to error or fraud. The Fund is not required to have, nor were we engaged to perform, an audit of their internal control over financial reporting. As part of our audit we are required to obtain an understanding of internal control over financial reporting but not for the purpose of expressing an opinion on the effectiveness of the Fund’s internal control over financial reporting. Accordingly, we express no such opinion.
Our audit included performing procedures to assess the risks of material misstatement of the financial statements and financial highlights, whether due to error or fraud, and performing procedures that respond to those risks. Such procedures included examining, on a test basis, evidence regarding the amounts and disclosures in the financial statements and financial highlights. Our audit also included evaluating the accounting principles used and significant estimates made by management, as well as evaluating the overall presentation of the financial statements and financial highlights. Our procedures included confirmation of securities owned as of October 31, 2018, by correspondence with the custodian and brokers. We believe that our audit provides a reasonable basis for our opinion.
|
| /S/ DELOITTE & TOUCHE LLP |
| Los Angeles, California |
| December 21, 2018 |
We have served as the auditor of one or more of The Payden & Rygel Investment Group investment companies since 1992.
27 Payden Mutual Funds
Understanding Your Fund’s Expenses
Shareholders of mutual funds incur two types of costs: transaction costs incurred from buying or selling Fund shares and ongoing costs incurred from the Funds daily operations. The tables below are provided to highlight ongoing cost only. If transaction costs were included your cost would have been higher.
Actual Expenses
The table below is useful in estimating actual expenses paid during the period ended October 31, 2018. It uses the Fund’s actual return and expense ratio for the period (184/365 days) to calculate the ongoing expenses paid by a shareholder with an initial investment of $1,000. To estimate the actual expenses that you paid over the period, divide your beginning account value by 1,000 and multiply that number by the number in the Expenses Paid During the Period column.
Hypothetical Expenses
The table below is provided so that you can compare the Fund’s ongoing expense with those of another fund. It uses a hypothetical gross annual return of 5%, which is not the Fund’s actual return and the Fund’s actual expense ratio (184/365 days) for the six-month period ended October 31, 2018 to calculate the ongoing expenses paid by a shareholder with an initial investment of $1,000.
| | | | | | | | | | | | | | | | | | | | |
| | | Value
May 1, 2018 | | | Value
October 31, 2018 | | | 6-Month
Return | | | Annual
Expense
Ratio | | | Expenses
Paid During
the Period | |
Institutional Class | | | | | | | | | | | | | | | | | | | | |
Actual | | | $1,000.00 | | | | $1,014.30 | | | | 1.43 | % | | | 0.94 | % | | | $4.78 | |
Hypothetical | | | 1,000.00 | | | | 1,020.46 | | | | 2.05 | % | | | 0.94 | % | | | 4.79 | |
SI Class | | | | | | | | | | | | | | | | | | | | |
Actual | | | $1,000.00 | | | | $1,013.40 | | | | 1.34 | % | | | 1.25 | % | | | $6.35 | |
Hypothetical | | | 1,000.00 | | | | 1,018.90 | | | | 1.89 | % | | | 1.25 | % | | | 6.36 | |
Adviser Class | | | | | | | | | | | | | | | | | | | | |
Actual | | | $1,000.00 | | | | $1,011.70 | | | | 1.17 | % | | | 1.50 | % | | | $7.61 | |
Hypothetical | | | 1,000.00 | | | | 1,017.64 | | | | 1.76 | % | | | 1.50 | % | | | 7.63 | |
Retirement Class | | | | | | | | | | | | | | | | | | | | |
Actual | | | $1,000.00 | | | | $1,010.20 | | | | 1.02 | % | | | 1.75 | % | | | $8.87 | |
Hypothetical | | | 1,000.00 | | | | 1,016.38 | | | | 1.64 | % | | | 1.75 | % | | | 8.90 | |
Annual Report 28

1. Background
Among its other duties, the Board of Trustees (the “Board” or the “Trustees”) of The Payden & Rygel Investment Group (the “P&R Trust”) is responsible for determining whether to initially approve and subsequently annually renew the investment management agreement (the “Agreement”) between Payden/Kravitz Investment Advisers LLC (“Adviser”) and the Trust with respect to the Payden/Kravitz Cash Balance Plan Fund (the “Fund”). Under the Agreement, the Adviser is responsible for providing investment advisory services and overseeing the everyday operations and other service providers of the Fund.
Section 15(c) of the Investment Company Act of 1940 (the “1940 Act”) requires that, after an initial period of up to two years, the Agreement for the Fund will remain in effect only if the Board, including a majority of those Trustees who have no direct or indirect interest in the Agreement, and who are not “interested persons” of the Trust, as that term is defined in the 1940 Act (each an “Independent Trustee,” and collectively, “Independent Trustees”), annually renews that Agreement. Six of the Trust’s nine Trustees are deemed to be Independent Trustees for this purpose.
On June 19, 2018, the Board of Trustees of the P&R Trust unanimously approved the Agreement between the Adviser and the P&R Trust with respect to the Fund for an additional year through June 30, 2019. The Board approved the Agreement following the recommendation of the Board’s Audit Committee (the “Audit Committee”), which is composed of all of the P&R Trust’s Independent Trustees. In reaching these decisions, the Board took into account information furnished to it throughout the year at meetings of the Board and the Board’s committees, as well as extensive information prepared specifically in connection with the annual renewal process. Determinations by the Independent Trustees also took into account various factors that they believed to be relevant, in light of (1) the legal advice furnished to them by Paul Hastings LLP (“Paul Hastings”), independent legal counsel to the Independent Trustees, and (2) each Independent Trustee’s business judgment.
2. Overview of the Approval or Renewal Process
In considering the annual renewal with respect to the Fund, the Board followed its previously established process. As part of that process, the Board delegates the initial responsibility for this process and related tasks to the Audit Committee. These tasks include working with the Adviser and Paul Hastings (1) to develop Section 15(c)-related guidelines and specific requests with respect to the type of information to be provided to the Audit Committee and the Board in connection with the proposed contract renewal, and (2) to evaluate the information provided in response to these guidelines and requests. In advance of the Board meeting held on June 19, 2018, Paul Hastings requested on behalf of the Audit Committee and the Board, and the Adviser provided, extensive information that was designed to assist the Audit Committee and the Board in their consideration of whether to renew the Agreement for the Fund. This information included, but was not limited to, the following: (1) the nature, extent and quality of services provided or to be provided by the Adviser to the Fund; (2) the Fund’s investment performance; (3) the costs of the services provided to the Fund and the profits realized or potential profits to be realized (if any) by the Adviser and its affiliates from their relationship with the Fund; (4) fees charged by other investment advisers; (5) the extent to which economies of scale have been realized or are anticipated to be realized as the Fund grows; (6) whether the fee schedule set forth in the Agreement reflects any such economies of scale for the benefit of Fund investors; (7) comparisons of services and fee rates with any contracts entered into by the Adviser with other clients to whom the Adviser provides comparable services; and (8) any other benefits derived or anticipated to be derived by the Adviser or its affiliates from their relationship with the Fund.
As a general matter, the Board viewed these factors in their totality, with no single factor being the principal factor in determining whether to approve or renew the Agreement. In reaching its decisions regarding the renewal of the Agreement for Fund, the Board took into account the information described above, other information provided to the Board in connection with this process, and relevant information provided to the Board and to its Committees on an ongoing basis in connection with the Board’s general oversight duties with respect to the Fund. In addition, the Board received and considered information from Paul Hastings as to certain relevant guidelines that relate to the approval or renewal process under Section 15(c) of the 1940 Act. In deciding whether to renew the Agreement for the Fund, each Trustee may have accorded different weight to different factors, and thus, each Trustee may have had a different basis for his or her ultimate decision to vote to renew the Agreement for Fund. At its meeting on June 19, 2018, the Board voted unanimously to renew the Agreement for the Fund. Set forth below are the general factors the Board considered in making its decision.
29 Payden Mutual Funds
3. Nature, Extent and Quality of Services
The Board and Audit Committee considered a number of factors related to the services provided by the Adviser, including the quality of the Adviser’s investment advisory process, the experience, expertise and quality of the Adviser’s investment professionals, the experience, leadership ability and integrity of the Adviser’s senior management, the low turnover rate of its key personnel, and the overall financial strength, stability and viability of the Adviser. They also considered the Adviser’s ability and commitment to attract and retain qualified personnel, and its commitment to maintain and enhance its investment advisory resources and information technology systems. The Board and Audit Committee further considered the Adviser’s strong commitment to compliance with applicable laws and regulations and the nature and extent of its compliance program and records. Finally, they took into account the administrative, distribution and shareholder services to be provided by the Adviser or its affiliates to the Fund under the Agreement. Based on the foregoing, the Board and Audit Committee concluded that the investment advisory and related services to be provided by the Adviser and its affiliates have benefited and should continue to benefit the Fund and its prospective shareholders.
4. Investment Results
At its regular quarterly Board meetings during the past year and as a part of the annual review of the Agreement, the Board reviewed the investment results of the Fund compared to its benchmark index. In addition, as a part of the annual review of the Agreement, the Board and Audit Committee specifically reviewed a report prepared by Broadridge, which contained the Fund’s performance for various time periods, i.e., 1-year, 3-years, 5-years and 10-years, as compared to the performance of (1) a group of comparable mutual funds (the “Peer Group”) selected by Broadridge, and (2) the Fund’s benchmark index. The Board and Audit Committee concluded that the results for the Fund since its inception have been satisfactory overall, and that for the most recent calendar year, the Fund’s results continued on a satisfactory track. In sum, the Board and Audit Committee concluded that the Adviser’s continued management should benefit the Fund and its shareholders.
5. Advisory Fees and Total Expenses
The Board and the Committee reviewed the Fund’s net operating expense ratio and its various fee and expense components, and then compared those fees and expenses to the fee and expense information for a peer group for the Fund. They observed that the advisory fees and expenses for the Fund continue to be very competitive with the advisory fees and expenses of this peer group. Overall, the Board and Audit Committee concluded that the Fund’s cost structure was fair and reasonable in relation to the services provided, and that the Fund’s shareholders receive reasonable value in return for the advisory fees paid to the Adviser by the Fund.
6. Adviser Profitability and Indirect Benefits
The Board and Audit Committee reviewed information regarding the Adviser’s cost of providing services to the Fund, as well as the resulting level of profits to the Adviser. They further reviewed the cost allocation methodology used to determine the Adviser’s profitability of providing services to the Fund. Based that review, the Board and Audit Committee concluded that the profits earned by the Adviser were not excessive in view of the advisory, administrative and other services provided to the Fund. Finally, the Board and Audit Committee noted that the Adviser indirectly benefited from its advisory relationship with the Fund because the availability of the Fund enhanced the Adviser’s business reputation and name recognition.
7. Specific Fund Factors
The Board considered the following specific factors (among others) in connection with its determination to renew the Agreement with respect to the Fund. References below to quintiles are based on data provided to the Board in the report prepared by Broadridge. All time periods referenced below ended as of April 30, 2018.
• Adviser Fee: The Adviser’s annual contractual management fee rate for the Fund is 1.10%, placing it in the fifth quintile of the group of comparable funds for adviser fees. The actual management fee was also in the fifth quintile.
Annual Report 30

• Total Expenses: The Fund’s total expenses were in the third quintile of the group of comparable funds selected by Broadridge for expense comparison purposes. The Adviser has contractually agreed that, for so long as it is the investment adviser to the Fund, the total Annual Fund Operating Expenses (excluding Acquired Fund Fees and Expenses, interest, taxes and extraordinary expenses) will not exceed 1.25%.
• Performance: The Fund was in the third quintile of the group of comparable funds for each of the one- and three- year periods and in the fourth quintile for the five-year period.
31 Payden Mutual Funds

| | | | | | | | | | | | |
| Name & Address | | Age | | Position with Fund | | Year
Elected | | Number of Portfolios | | Principal Occupation(s) | | Other
Directorships
Held |
| | | | | | |
| 333 S. Grand Avenue | | | | | | | | | | | | |
| Los Angeles, CA 90071 | | | | | | | | | | | | |
| | | | | | |
| Trustees (1) | | | | | | | | | | | | |
| W. D. Hilton, Jr. | | 71 | | Independent Trustee | | 1993 | | 19 | | President and CEO, Trust Service, Inc.; Executive Director, NGC Bodily Injury Trust; and Managing Trustee, Fuller-Austin Trust | | |
| | | | | | |
| Thomas V. McKernan, Jr. | | 74 | | Independent Trustee | | 1993 | | 19 | | Vice Chair, Automobile Club of Southern California, Director, First American Financial | | |
| | | | | | |
| Rosemarie T. Nassif | | 77 | | Independent Trustee | | 2008 | | 19 | | Executive Director, Center for Catholic Education, Loyola Marymount University, President Emerita, Holy Names University | | |
| | | | | | |
| Andrew J. Policano | | 69 | | Independent Trustee | | 2008 | | 19 | | Former Dean, The Paul Merage School of Business, University of California, Irvine | | Director, Rockwell Collins |
| | | | | | |
| Dennis C. Poulsen | | 76 | | Independent Trustee | | 1992 | | 19 | | Chairman of the Advisory Board, Rose Hills Company | | |
| | | | | | |
| Stender E. Sweeney | | 79 | | Independent Trustee | | 1992 | | 19 | | Private Investor | | Director, Avis Budget Group, Inc. |
| | | | | | |
| Joan A. Payden | | 87 | | Interested Trustee | | 1992 | | 19 | | President, CEO and Director, Payden & Rygel | | |
| | | | | | |
| Michael E. Salvay | | 57 | | Interested Trustee | | 2009 | | 19 | | Managing Principal, Payden & Rygel | | |
| | | | | | |
| James P. Sarni | | 58 | | Interested Trustee | | 2017 | | 19 | | Managing Principal and Director, Payden & Rygel | | |
| | | | | | |
| Officers (2) | | | | | | | | | | | | |
| | | | | | |
| Joan A. Payden | | | | Chairman and CEO | | 1992 | | | | President, CEO and Director, Payden & Rygel | | |
| | | | | | |
| Brian W. Matthews | | | | Vice President and CFO | | 2003 | | | | Managing Principal, CFO and Director, Payden & Rygel | | |
| | | | | | |
| Yot Chattrabhuti | | | | Vice President | | 1997 | | | | Principal, Payden & Rygel | | |
| | | | | | |
| Bradley F. Hersh | | | | Vice President and Treasurer | | 1998 | | | | Principal and Treasurer, Payden & Rygel | | |
| | | | | | |
| Edward S. Garlock | | | | Secretary | | 1997 | | | | Managing Principal, General Counsel and Director, Payden & Rygel | | |
| | | | | | |
| Sandi Brents | | | | Vice President and CCO | | 2016 | | | | Vice President and Senior Compliance Officer, Payden & Rygel | | |
Additional information about the Trustees is included in the SAI and is available without charge, upon request at payden.com or 1800 5 PAYDEN.
(1) Trustees do not have a set term of office, but serve until their resignation, death or removal.
(2) Officers are elected by, and serve at the pleasure of, The Board of Trustees.
Annual Report 32
(THIS PAGE INTENTIONALLY LEFT BLANK)


Item 2. Code of Ethics.
Effective June 9, 2003, the registrant adopted “The Payden & Rygel Investment Group Supplemental Code of Ethics for Principal Officers and Senior Financial Officers” (the “Supplemental Code of Ethics”) that applies to the registrant’s principal executive officer, principal financial officer, principal accounting officer or controller. A copy of the Supplemental Code of Ethics was filed as an exhibit to the registrant’s Annual Report on Form N-CSR for the fiscal year-end and reporting period of October 31, 2003. There has been no amendment to the Supplemental Code of Ethics during the period covered by this report, and the registrant has not granted any waiver, including any implicit waiver, from any provision of the Supplemental Code of Ethics during the period covered by this report. Any person may obtain without charge a copy of the Supplemental Code of Ethics by sending his or her request in writing to: The Payden & Rygel Investment Group, Attention: General Counsel, 333 South Grand Avenue, 32nd Floor, Los Angeles, CA 90071. A copy of the Supplemental code of Ethics is also posted on the registrant’s Internet website at www.payden.com.
Item 3. Audit Committee Financial Expert.
At its meeting on December 18, 2018, the registrant’s Board of Trustees has determined that, for the fiscal year ended October 31, 2018, W.D. Hilton, Jr., Thomas V. McKernan, Andrew J. Policano and Stender E. Sweeney are qualified to serve as audit committee financial experts serving on its audit committee and that they are “independent,” as defined by Item 3 of Form N-CSR.
Item 4. Principal Accountant Fees and Services.
Audit Fees
| | (a) | The aggregate fees billed for each of the last two fiscal years for professional services rendered by the principal accountant for the audit of the registrant’s annual financial statements or services that are normally provided by the accountant in connection with statutory and regulatory filings or engagements for those fiscal years are $659,700 for 2018 and $646,000 for 2017. |
Audit-Related Fees
| | (b) | The aggregate fees billed in each of the last two fiscal years for assurance and related services by the principal accountant that are reasonably related to the performance of the audit of the registrant’s financial statements and are not reported under paragraph (a) of this Item are $0 for 2018 and $0 for 2017. |
Tax Fees
| | (c) | The aggregate fees billed in each of the last two fiscal years for professional services rendered by the principal accountant for tax compliance, tax advice, and tax planning are $120,520 for 2018 and $118,120 for 2017. These fees related to the preparation and filing of Federal and state income tax returns and Federal excise tax returns. |
All Other Fees
| | (d) | The aggregate fees billed in each of the last two fiscal years for products and services provided by the principal accountant, other than the services reported in paragraphs (a) through (c) of this Item, were $3,000 in 2018 and $7,500 in 2017, in each case related to a consent in connection with a filing with the SEC on December 7, 2017 for the registration of a new share class (the “SI Share Class”) for the Payden Core Bond Fund. |
| | (e)(1) | Disclose the audit committee’s pre-approval policies and procedures described in paragraph (c)(7) of Rule 2-01 of Regulation S-X. |
The Audit Committee of the registrant’s Board of Trustees, which is composed solely of independent Trustees, approves all services by the registrant’s principal account, and the fees for such services, prior to any engagement.
| | (e)(2) | The percentage of services described in each of paragraphs (b) through (d) of this Item that were approved by the audit committee pursuant to paragraph (c)(7)(i)(C) of Rule 2-01 of Regulation S-X are as follows: |
(b) NA
(c) 100%
(d) 100%
(f) Not applicable.
| | (g) | The aggregate non-audit fees billed by the registrant’s accountant for services rendered to the registrant for each of the last two fiscal years of the registrant was $123,000 for 2018 and $125,620 for 2017. |
| | (h) | In the fiscal years ended October 31, 2018 and October 31, 2017, respectively, the registrant’s principal accountant did not provide any non-audit services to the registrant’s investment advisers, Payden & Rygel and Payden/Kravitz Investment Advisers LLC, respectively, and any entity controlling, controlled by or under common control with either investment adviser that provides ongoing services to the registrant that required pre-approval pursuant to paragraph (c)(7)(ii) of Rule 2-01 of Regulation S-X. However, each year at the time the Audit Committee of the registrant’s Board of Trustees considers the appointment and scope of services and fees for the registrant’s principal accountant, the Audit Committee considers whether the provision of services by the registrant’s principal accountant to either of the registrant’s investment advisers, Payden & Rygel and Payden/Kravitz Investment Advisers LLC, and any entity controlling, controlled by or under common control with either investment adviser that provides ongoing services to the registrant, is compatible with maintaining the principal accountant’s independence. |
Item 5. Audit Committee of Listed Registrants.
Not applicable.
Item 6. Investments.
| (a) | Schedule of Investments in securities of unaffiliated issuers as of the close of the reporting period is included as part of the report to shareholders filed under Item 1 of this form. |
| Item 7. | Disclosure of Proxy Voting Policies and Procedures for Closed-End Management Investment Companies. |
Not applicable.
| Item 8. | Portfolio Managers of Closed-End Management Investment Companies. |
Not applicable.
| Item 9. | Purchases of Equity Securities by Closed-End Management Investment Company and Affiliated Purchasers. |
Not applicable.
| Item 10. | Submission of Matters to a Vote of Security Holders. |
Not applicable.
| Item 11. | Controls and Procedures. |
| | (a) | The registrant’s principal executive and principal financial officers have concluded that the registrant’s disclosure controls and procedures (as defined in Rule 30a-3(c) under the Investment Company Act of 1940, as amended (the “1940 Act”) (17 CFR 270.30a-3(c))) are effective, as of a date within 90 days of the filing date of the report that includes the disclosure required by this paragraph, based on their evaluation of these controls and procedures required by Rule 30a-3(b) under the 1940 Act (17 CFR 270.30a-3(b)) and Rules 13a-15(b) or 15d-15(b) under the Securities Exchange Act of 1934, as amended (17 CFR 240.13a-15(b) or 240.15d-15(b)). |
| | (b) | There were no changes in the registrant’s internal control over financial reporting (as defined in Rule 30a-3(d) under the 1940 Act (17 CFR 270.30a-3(d))) that occurred during the registrant’s last fiscal quarter that has materially affected, or is reasonably likely to materially affect, the registrant’s internal control over financial reporting. |
| Item 12. | Disclosure of Securities Lending Activities for Closed-End Management Investment Companies. |
| | (a)(2) | Certifications pursuant to Rule 30a-2(a) under the 1940 Act and Section 302 of the Sarbanes-Oxley Act of 2002 are attached hereto. |
SIGNATURES
Pursuant to the requirements of the Securities Exchange Act of 1934 and the Investment Company Act of 1940, the registrant has duly caused this report to be signed on its behalf by the undersigned, thereunto duly authorized.
| | | | |
| (Registrant) | | The Payden & Rygel Investment Group | | |
| | | | |
| | |
| By (Signature and Title)* | | /s/ Joan A. Payden | | |
| | Joan A. Payden, Chairman and CEO | | |
| | (principal executive officer) | | |
Pursuant to the requirements of the Securities Exchange Act of 1934 and the Investment Company Act of 1940, this report has been signed below by the following persons on behalf of the registrant and in the capacities and on the dates indicated.
| | | | |
| By (Signature and Title)* | | /s/ Joan A. Payden | | |
| | Joan A. Payden, Chairman and CEO | | |
| | (principal executive officer) | | |
| | | | |
| | |
| By (Signature and Title)* | | /s/ Brian W. Matthews | | |
| | Brian W. Matthews, Vice President and Chief Financial Officer |
| | (principal financial officer) | | |
* Print the name and title of each signing officer under his or her signature.