UNITED STATES
SECURITIES AND EXCHANGE COMMISSION
Washington, D.C. 20549
FORM N-CSR
CERTIFIED SHAREHOLDER REPORT OF REGISTERED MANAGEMENT
INVESTMENT COMPANIES
Investment Company Act file number 811-06625
The Payden & Rygel Investment Group
(Exact name of registrant as specified in charter)
333 South Grand Avenue
Los Angeles, CA 90071
(Address of principal executive offices) (Zip code)
Edward S. Garlock, Esq.
Secretary
333 South Grand Avenue
Los Angeles, CA 90071
(Name and address of agent for service)
Registrant’s telephone number, including area code: 213-625-1900
Date of fiscal year end: October 31
Date of reporting period: October 31, 2020
Form N-CSR is to be used by management investment companies to file reports with the Commission not later than 10 days after the transmission to stockholders of any report that is required to be transmitted to stockholders under Rule 30e-1 under the Investment Company Act of 1940 (17 CFR 270.30e-1). The Commission may use the information provided on Form N-CSR in its regulatory, disclosure review, inspection, and policymaking roles.
A registrant is required to disclose the information specified by Form N-CSR, and the Commission will make this information public. A registrant is not required to respond to the collection of information contained in Form N-CSR unless the Form displays a currently valid Office of Management and Budget (“OMB”) control number. Please direct comments concerning the accuracy of the information collection burden estimate and any suggestions for reducing the burden to Secretary, Securities and Exchange Commission, 450 Fifth Street, NW, Washington, DC 20549-0609. The OMB has reviewed this collection of information under the clearance requirements of 44 U.S.C. § 3507.
Item 1. Reports to Stockholders.
The Reports to Shareholders are attached herewith.
Annual Report

| | |
Management Discussion & Analysis | | |
Short Duration Bond Strategies
During the fiscal year ended October 31, 2020, the Federal Reserve Board deployed swift and unprecedented stimulus measures to ease financial conditions and support financial markets in the wake of the Covid-19 pandemic. Included in these measures was reducing the target range for the federal funds rate to between 0.00%-0.25%. They did so through two separate rate cuts totaling 1.50%. Short dated U.S. Treasury yields moved in sympathy, reaching all-time lows, with the 2-year and 3-year yields ending the fiscal year period at 0.15% and 0.20%, respectively. Although we have seen a rebound in economic activity following the dramatic March 2020 declines, uncertainty around the duration and impact of the Covid-19 pandemic should limit increases of overall interest rate levels. Credit premiums across all fixed income sectors spiked in March. But, they have since recovered as the Federal Reserve expanded its balance sheet and implemented numerous other purchase facilities to support markets.
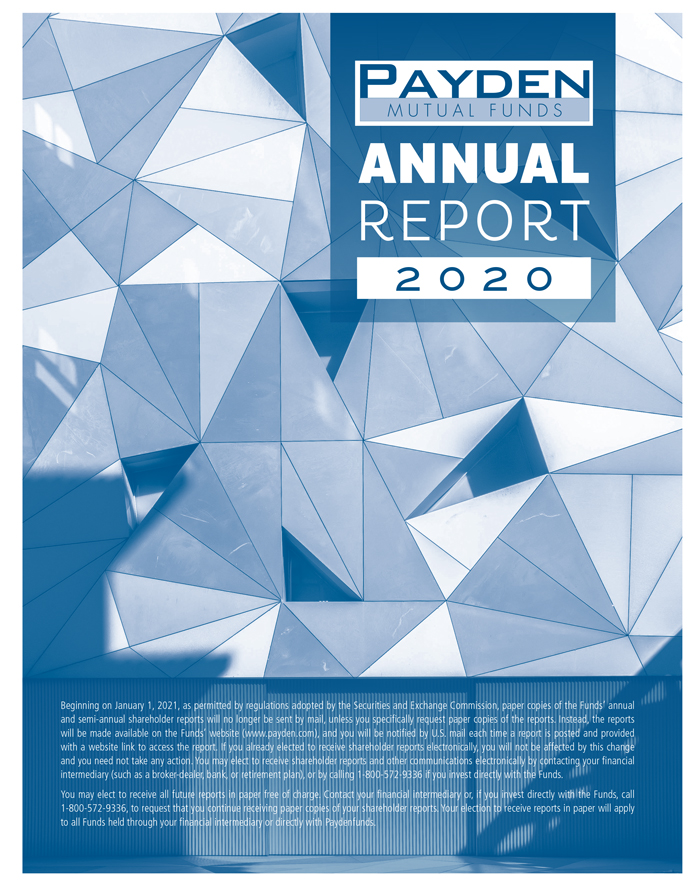
The Payden Cash Reserves Money Market Fund (PBHXX) continued to provide stable daily liquidity. For the fiscal year ended October 31, 2020, the Fund returned 0.57%, compared to a return of 0.42% for the Lipper Government Money Market Average. Money market rates decreased as the Federal Reserve Board decreased its target range, although LIBOR and front-end rates still offer attractive yields. Rates positioning contributed the most to outperformance over the year.
The Payden Limited Maturity Fund (PYLMX) returned 1.75% for the fiscal year ended October 31, 2020, compared to a return of 0.92% for its benchmark, the ICE BofA US 3-Month Treasury Bill Index. Rates positioning and income from allocations to corporate securities and securitized products were the largest contributors to outperformance. The Fund made use of futures and forward currency contracts for hedging purposes. The use of these derivatives impacted performance by 0.00%.
The Payden Low Duration Fund (PYSBX) returned 3.00% for the fiscal year ended October 31, 2020, compared to a return of 3.19% for its benchmark, the ICE BofA 1-3 Year US Treasury Index. The Fund’s allocation to asset-backed and single-A rated corporate securities contributed positively to relative performance, while the allocation to triple-B rated corporate securities and mortgage-backed securities detracted from relative performance versus the benchmark. The Fund invests in futures, swaps and forward currency contracts for hedging and investment purposes. The use of these derivatives impacted performance by 0.00%.
The Payden Global Low Duration Fund (PYGSX) returned 2.63% for the fiscal year ended October 31, 2020, compared to a return of 3.39% for its benchmark, the ICE BofA 1-3 Year US Corporate & Government Index. The Fund’s allocation to asset-backed and single-A rated corporate securities contributed positively to relative performance, while the allocation to triple-B rated corporates and mortgage-backed securities detracted relative performance versus the benchmark. The Fund invests in futures, swaps, options and forward currency contracts for hedging investment purposes. The use of these derivatives impacted performance by 0.00%.
Intermediate Duration Strategies
The Payden U.S. Government Fund (PYUSX) returned 4.26% for the fiscal year ended October 31, 2020, compared to its benchmark, the ICE BofA 1-5 Year US Treasury Index, which returned 4.14%. Over the past year, the Covid-19 global pandemic forced the U.S. to shut down the economy during the Fund’s second fiscal quarter to stem the spread of the virus. The third and fourth fiscal quarters witnessed sharp rebounds in activity, but economic activity is still significantly lower compared to pre-pandemic levels. The Federal Reserve Board responded resolutely, first moving interest rates to zero from 1.75% over a two-week period in March, then purchasing large volumes of US Treasury and agency mortgage backed securities and finally instituting a number of liquidity programs to support various sectors of the fixed income marketplace. The Fund, which invests predominantly in short average life agency mortgage backed securities (MBS), modestly outperformed its index over the year. The Fund was positioned in agency mortgage pools with low coupon mortgage loans and agency commercial mortgage backed securities, both of which have low prepayment risk and perform well in low interest rate periods. The Fund is positioned for the current low rate environment to remain in place for the foreseeable future and will remain invested in agency MBS due to their additional yield above US Treasury securities.
The Fund made limited use of interest rate derivative over the course of the fiscal year. Typically, the Fund will use US Treasury futures to manage interest rate volatility. The market impact of derivatives was negligible over the past fiscal year.
The Payden GNMA Fund (PYGNX) returned 3.52%, for the fiscal year ended October 31, 2020, while its benchmark, the ICE BofA US GNMA Mortgage Backed Securities Index, returned 3.54%. Over the past year, the Covid-19 global pandemic forced the U.S. to shut down the economy during the Fund’s second fiscal quarter to stem the spread of the virus. The third and fourth fiscal quarters witnessed sharp rebounds in activity, but economic activity is still significantly lower when compared to pre-pandemic levels. The Federal Reserve Board responded resolutely, first moving interest rates to zero from 1.75% over a two-week period in March, then
Annual Report 1
| | |
Management Discussion & Analysis continued | | |
purchasing large volumes of US Treasury and agency mortgage backed securities and finally instituting a number of liquidity programs to support various sectors of the fixed income marketplace. The Fund slightly underperformed its benchmark due to faster prepayment speeds on semi seasoned mortgage pools that responded with faster than expected prepayment due to the drop-in mortgage rates. The Fund is currently positioned for faster prepayments by overweighting lower coupon mortgage pools that have less sensitivity to prepayments and purchasing mortgage pools that will likely receive purchase demand from the Federal Reserve Board’s asset purchase program.
We expect the Federal Reserve Board to keep rates unchanged for the foreseeable future. However, we do expect a modest steepening of the yield curve as longer maturity rates respond to the potential for higher inflation. Support for GNMA securities remains robust, primarily from domestic banking institutions that have a surplus of deposits as consumers save more in response to the global pandemic.
The Fund anticipates using certain US Treasury securities and Euro dollar futures contracts to manage interest rate, yield curve and volatility exposure. The Fund’s usage of derivative contracts was negligible over the past year.
The Payden Core Bond Fund, Investor Class (PYCBX) returned 4.76% for the fiscal year ended October 31, 2020, compared to a 6.19% return for its benchmark, the Bloomberg Barclays US Aggregate Bond Index. The Fund’s Adviser Class (PYCWX) returned 4.52% and its SI Class (PYCSX) returned 4.88% for the same period.
This fiscal year was marked by the historic Covid-19 experience which led to significant market reactions and quickly changing dynamics. Government initiatives, like what was done in the global financial crisis of 2008, helped to calm markets over the ensuing months. Over the fiscal year, we have experienced some specific key themes. First, US government yields have fallen due to the Federal Reserve Board’s initiative to lower borrowing costs. The overnight Federal Funds rates fell to zero, and longer-term maturities declined in concert with little concern about future potential inflation. Credit markets reacted quite negatively at first, but even they have stabilized in part due to the Federal Reserve Board’s purchase programs of credit and mortgage related securities. The Fund lagged the return of the benchmark over the fiscal year due to our higher allocations in a couple of sectors. The hardest hit sector was the securitized sector, which includes a variety of asset backed bonds and other consumer related debt securities. These bonds were the hardest hit the first month of the crisis, and while they have largely rebounded, they are not all the way back to pre-crisis levels. Despite the underperformance, we were successful at limiting further downside by staying the course in our positions and not having any forced selling due to fund flows. The Fund ended the fiscal year comfortable in its sector positioning and ready to continue adding value in the periods ahead. The Fund uses derivatives for interest rate, currency management and credit sector management. It utilizes interest rate swaps and interest rate futures to manage overall duration and yield curve positioning. Foreign currency forwards are traded to hedge currency exposure and to take outright positions on specific currencies. The net performance impact of all derivative use was -0.16% for the fiscal year.
The Payden Corporate Bond Fund (PYACX) generated a net return of 5.65% for the fiscal year ended October 31, 2020, compared to a return of 7.05% for its benchmark, the Bloomberg Barclays U.S. Corporate Bond Index. The Fund’s biggest detractor from performance was its overweight to the Financials sector, specifically within the REIT and Insurance sub-sectors, which underperformed during the height of the pandemic. In addition, the Fund’s underweight to the Consumer Non-Cyclicals and Technology sectors that contain many higher quality credits that outperformed during the sell-off also detracted from performance. However, the Fund did hold onto its exposure to many of its higher beta positions, which then put in a strong recovery into year-end. The Fund increased its exposure throughout the year to the Automobile sector, which contributed positively to performance as these manufacturers recovered from the pandemic at a faster than expected clip, and they also benefited from implicit sovereign support. The Fund used U.S. Treasury futures as a means of hedging, as well as for active duration management. The Fund also used credit SWAP derivatives, specifically IG and HY CDX, which were used primarily to hedge underlying credit exposure or at times as a way to add credit exposure while investing inflows or while maintaining a cash buffer for liquidity purposes. While the use of CDX detracted from performance by -0.33% over the fiscal year, this was largely offset by gains in the underlying positions that it was hedging against.
The Payden Strategic Income Fund, Investor Class (PYSGX) returned 3.74% for the fiscal year ended October 31, 2020, compared to a 6.19% return for its benchmark, the Bloomberg Barclays US Aggregate Bond Index. The Fund’s SI Class (PYSIX) returned 3.90% for the same period. The Fund’s primary objective is to maintain an income advantage relative to the broad bond market and to exploit relative value by sector rotation and bond selection. This is achieved by investing primarily in investment grade and high yield corporate bonds, securitized debt and emerging markets. In addition, the Fund has been managed with a duration profile that is shorter in nature than the benchmark as a way to protect principal in the event of rising interest rates.
2 Payden Mutual Funds
This fiscal year was marked by the historic Covid-19 experience, which led to significant market reactions and quickly changing dynamics. Government initiatives, like what was done in the global financial crisis of 2008, helped to calm markets over the ensuing months. Over the fiscal year, we have experienced some specific key themes. First, US government yields have fallen due to the Federal Reserve Board’s initiative to lower borrowing costs. The overnight Federal Funds rate fell to zero, and longer-term maturities declined in concert with little concern about future potential inflation. Credit markets reacted quite negatively at first, but even they have stabilized in part due to the Federal Reserve Board’s purchase programs of credit and mortgage related securities. The Fund lagged the return of the benchmark over the fiscal year due to the Fund’s higher allocations in a couple of sectors and also due to its much shorter duration position, which meant that the Fund did not have the same price rally in light of lower interest rates. The hardest hit was the securitized sector which includes a variety of asset backed bonds and other consumer related debt securities. These bonds were the hardest hit the first month of the crisis and they have largely rebounded, but not all the way back to pre-crisis levels. Despite the underperformance, we were successful at limiting further downside by staying the course in our positions and not having any forced selling due to fund flows. Thus, we end the fiscal year comfortable in the Fund’s sector positioning and ready to continue adding value in the periods ahead. The Fund uses derivatives for interest rate, currency management and credit sector management. It utilizes interest rate swaps and interest rate futures to manage overall duration and yield curve positioning. Foreign currency forwards are traded to hedge currency exposure and to take outright positions on specific currencies. The net performance impact of all derivative use was -0.11% for the fiscal year.
For the fiscal year ended October 31, 2020, the Payden Absolute Return Bond Fund, Investor Class (PYARX) returned 1.23%. This is compared to a return of 0.47% for the Bloomberg Barclays US Treasury Bills 1-Month Index and a return of 0.93% for the ICE BofA Dollar 1-Month Deposit offered Rate Constant Maturity Index, which are the Fund’s benchmarks. The Fund’s SI Class (PYAIX) returned 1.45%. A positive tone for markets to start the fiscal year quickly changed in March as Covid-19 reared its ugly head and slowed economic activity. Global markets saw the highest level of volatility since the 2008 Global Financial Crisis. What began as a sell-off in lower quality credit turned into a liquidity crunch, with higher quality assets being sold at depressed levels in order to raise capital. This created a unique buying opportunity for the Fund to purchase higher quality, stable assets at very opportunistic levels. Almost as quickly as it started, market sentiment rebounded strongly in subsequent months driven by an unprecedented and coordinated monetary and fiscal response from central banks and governments globally. Nearly all core income sectors have recovered from the pandemic-related drawdown. The strategy prefers securitized assets relative to corporate credit, particularly given the resilience in US housing, a low interest rate backdrop, and diversification of collateral. Primary market issuance offered attractive concessions and global rates simultaneously dropped as central banks eased, leading to positive tactical credit and rates performance. The Fund generated modest positive performance from tail risk hedges. The Fund remains structured with low interest rate sensitivity and invested in a diversified mix of fixed income sectors including corporate, mortgage-backed and asset-backed securities. The Fund employs futures, options, swaps and forward currency contracts to manage sensitivity to undesired risk exposures as well as for efficient investment purposes, which detracted 0.01% from performance for the fiscal year.
Loan Strategy
The leveraged loan market finished the fiscal year ended October 31, 2020 with a return of -2.92% per the Credit Suisse Institutional Leveraged Loan BB Index. The loss was primarily due to the March return of -9.98%, which was the index’s worst monthly return since 2008. For the year ended October 31, 2020, the Payden Floating Rate Fund, Investor Class (PYFRX) returned -0.41%, and the Fund’s SI Class (PYFIX) also returned -0.41%. The Fund’s benchmark, the Credit Suisse Leveraged Institutional Loan BB Index, returned -2.92% for the same period. A top performer for the review period was a loan issued by the auto parts distributor, Dealer Tire. The loan was purchased at a discount during the market dislocation in the spring and has recovered to par since. The primary detractor to performance were positions in credit risk transfer securities that are backed by mortgages underwritten and pooled by Fannie Mae and Freddie Mac. The bonds have recovered some of their losses since March, but they lagged the overall loan market during the fiscal year. We see value in these securities on a risk-adjusted basis and continue to hold them. The Fund occasionally uses credit default swaps to gain short term market exposure when cash inflows are heavy. These positions are nominally small exposures and track the market.
Annual Report 3
| | |
Management Discussion & Analysis continued | | |
High Yield Strategy
High-yield bonds returned 3.34% during the fiscal year ended October 31, 2020, as measured by the ICE BofA BB-B US Cash Pay High Yield Constrained Index. The fiscal year was marked by extraordinary volatility, as the Covid-19 pandemic initially induced an economic recession, but then largely rallied following intervention by central banks and strong fiscal stimulus that boosted economic growth. Sector performance ranged from -7.27% for Energy to 8.06% for Telecommunications. BB-rated bonds returned 4.69%, B-rated bonds returned 0.77%, and CCC-rated bonds returned -2.92%.
The Payden High Income (PYHRX) returned 4.23% for the fiscal year ended October 31, 2020. The Fund’s benchmark, the ICE BofA BB-B US Cash Pay High Yield Constrained Index, returned 3.34% for the same period. Security selection in the Energy sector was the biggest contributor to relative outperformance as the portfolio’s bonds outperformed the benchmark’s energy bonds by 9.68%. Positioning in the Insurance sector was also beneficial thanks in part to security selection in the life insurance subsector. Positions in credit risk transfer securities detracted as mortgage forbearance increased following the March shutdowns. Positioning in the Banking sector also detracted due to exposure to consumer finance company, CIT, that underperformed during the period. The Fund uses credit default swaps to gain short term market exposure when cash inflows are heavy. These positions are nominally small exposures and track the market. The Fund also holds forward currency contracts to hedge foreign exchange exposure. Losses associated with forward euro contracts of -0.05% were offset by currency-driven outperformance by euro-denominated bonds.
Municipal Strategy
For the fiscal year ended October 31, 2020, the Payden California Municipal Social Impact Fund (PYCRX) returned 3.90%. The Fund’s benchmarks, the Bloomberg Barclays California Intermediate Municipal Index and the Bloomberg Barclays 7-Year Municipal Bond Index, returned 4.11% and 4.17%, respectively, for the same period. The Fund’s underperformance relative to its benchmarks was due primarily to its allocations across the yield curve. While the Fund was positioned neutral to headline duration for most of the year, its under-allocation to intermediate maturities and over-allocation to long maturities was a detracting factor as short and intermediate-dated interest rates fell more than long-dated interest rates. The Fund invests in futures contracts for hedging and investment purposes. The use of interest rate futures impacted performance by -0.01%.
Municipal mutual funds continued to see significant inflows in late calendar-year 2019 until an abrupt reversal in March and April 2020 on Covid-19 concerns, when almost $50 billion was pulled from mutual funds. Since then, fund flows have recovered and are now positive year-to-date. This strong demand in late 2020 has created a tailwind for municipal performance.
Looking ahead, we expect to see continued strong demand for municipals. Municipal valuations, as measured by the ratio of municipal-to-U.S. Treasury yields, are at attractive levels relative to historical medians. As a result, the Fund has selectively reduced its allocation to California taxable municipal securities and increased its allocation to fully tax-exempt municipal securities. While the Fund maintains its higher quality bias and an overweight to revenue secured sectors, it has trimmed its underweight to general obligation bonds. This was done to increase relative credit stability amidst continued uncertainty around Covid-19 related revenue disruption.
Global Bond Strategy
The Payden Global Fixed Income Fund (PYGFX) returned 3.87% for the fiscal year ended October 31, 2020 compared to a return of 4.32% for its benchmark, the Bloomberg Barclays Global Aggregate Index (USD Hedged). The Fund’s overweight positions in non-government bonds, including investment grade corporates, high yield corporates and securitized markets detracted from relative performance in the first quarter of 2020 given the economic impact of the coronavirus pandemic. As risk assets rallied in the second and third quarters of 2020, the portfolio continued to make up ground versus the benchmark. In terms of active duration management, relative country and curve trades were favoured, although overall, such trades detracted from portfolio performance. In the currency space, our weaker US dollar stance in the second and third quarter of 2020 aided performance. However, this positive contribution was offset by the negative contribution of an emerging market basket trade implemented before the pandemic. The Fund used derivatives for hedging and active investment purposes throughout the fiscal year. It utilizes interest rate swaps, bond and interest rate futures to manage overall duration and yield curve positioning. Currency forwards are traded to hedge foreign currency exposure and to take outright positions on specific currencies. The use of government bond futures and forward currency contracts for active management purposes detracted approximately 0.33% and 0.04% from the Fund’s return, respectively.
4 Payden Mutual Funds
Emerging Market Bond Strategies
For the fiscal year ended October 31, 2020, emerging markets (EM) fixed income performance was mixed, as the consequences of the novel coronavirus outbreak reverberated across all countries. Developing countries experienced sharp rates of economic contraction as a result of pandemic-associated mobility and business restrictions, predominantly in the first and second quarter of 2020, causing a sharp sell-off across EM securities. A rapid and historically large stimulus response by global central banks and fiscal authorities helped to bridge the shock, allowing EM assets to largely recover by the end of the fiscal year, posting modestly positive total returns in both sovereign and corporate debt. EM currencies broadly depreciated against the U.S. dollar, although country dispersion was pronounced. Currencies in Asia outperformed other regions, aided by China’s relative economic resilience. Similar to developed countries, EM central banks eased monetary policy extensively, bringing yields down and posting positive returns from interest rates. However, this positive performance was not enough to offset the negative performance of broad EM currency depreciation, resulting in negative total return for the period.
The Payden Emerging Markets Bond Fund, Investor Class (PYEMX) returned 0.58%, the Fund’s Adviser Class (PYEWX) returned 0.33%, and the Fund’s SI Class (PYEIX) returned 0.64% for the fiscal year ended October 31, 2020. The Fund’s benchmark, the J.P. Morgan EMBI Global Diversified Index, returned 0.98% for the same period. Within USD-pay sovereigns, underweight positioning in Lebanon and Ecuador added, as did overweight exposures in Guatemala, Nigeria, and the Dominican Republic. Against this, overweight exposures in Sri Lanka, Angola, and Ukraine detracted, as did underweight allocations to the Philippines, Peru and Saudi Arabia. Among quasi-sovereigns, overweight exposures in Malaysia and Indonesia contributed positively, while underweight positioning in China and Chile detracted. Off-benchmark allocations to corporates and local currency denominated debt benefitted relative performance. The Fund invests in swaps, futures, options and forward currency contracts for credit, currency and interest rate risk hedging and investment purposes. During the period, the use of derivative instruments contributed 0.81% to the Fund’s total return.
The Payden Emerging Markets Local Bond Investor Class (PYELX) returned -5.41% for the fiscal year ended October 31, 2020. The Fund’s benchmark, the J.P. Morgan GBI-EM Global Diversified Index returned -3.81% for the same period. Relative to the benchmark, the Fund benefitted from overweight rates positioning in Uruguay and security selection in both Romania and Brazil. Overweight rates positioning in Peru, underweight rates exposure in Thailand, and security selection in Mexico and South Africa detracted. Overall, currency positioning detracted during the period. Underweight positions in the Turkish lira, South African rand, and Thai baht added, as did overweight exposure in the Mexican peso. An overweight stance in the Brazilian real, Czech koruna, Colombian peso, Indonesian rupiah and Dominican Republic peso detracted. The Fund invests in swaps, futures, options and forward currency contracts for credit, currency and interest rate risk hedging, as well as investment purposes. During the period, the use of derivative instruments detracted -0.56% from the Fund’s total return.
The Payden Emerging Market Corporate Bond Fund, Investor Class (PYCEX) returned 4.53%, and the Fund’s SI Class (PYCIX) returned 4.52% for the fiscal year ended October 31, 2020. The Fund’s benchmark, the J.P. Morgan CEMBI Broad Diversified Index, returned 4.24% for the period. The Fund’s selection of emerging market corporates was the primary contributor, while an off-index allocation to USD-pay sovereign bonds underperformed. Off-index positions in USD-pay quasi-sovereigns and developed market corporates also benefitted relative performance. Within emerging market corporates, overweight exposure to the consumer goods sector in Israel added, as did selection of financial credits in Mexico, utilities in India, telecommunications in South Africa and utilities in Saudi Arabia. Avoiding troubled oil and gas credits in Argentina, metals and mining in Ukraine and oil and gas in Ghana also benefitted relative performance. An overweight to industrials in Brazil, transports in Colombia, and transports in Chile detracted, as did underweight exposure to financials in South Korea. The Fund invests in swaps, futures, options and forward currency contracts for credit, currency and interest rate risk hedging and investment purposes. During the period, the use of derivative instruments contributed -0.12% to the Fund’s total return.
Equity Strategy
The broad U.S. equity market, as represented by the S&P 500 Index posted a positive return of 9.70% for the fiscal year ended October 31, 2020, despite extreme pandemic-driven volatility. The fiscal year started on a positive note driven by the low interest rate environment and progress in U.S.–China trade negotiations. The upward momentum continued into the first quarter of 2020, with equity markets reaching record highs, despite growing Covid-19 concerns. However, as the global pandemic became more of a reality in February, the market reacted by falling over 30% from peak to trough, reaching a bear market at the fastest rate in history and
Annual Report 5
| | |
Management Discussion & Analysis continued | | |
abruptly ending an 11-year equity bull market. The sell-off differed from past bear markets, with the more defensive value stocks, represented by the Russell 1000 Value index returning -7.58% and significantly underperforming the tech-dominated growth stocks, represented by the Russell 1000 Growth Index returning 29.22%, which benefited from the working-from-home environment. Following the selloff, the overall equity market rebounded sharply beginning in April due to an unprecedented amount of government stimulus and central bank intervention. The recovery continued in the following months as coronavirus cases slowed, the economy re-opened and the Federal Reserve Board’s pledge to keep interest rates near zero until 2023. Given the favorable backdrop, the S&P 500 index established new all-time-highs in mid-August and continued to reach new highs until a brief tech-led selloff in the first part of September. Volatility remained elevated throughout the final two months of the fiscal year over concerns of a second wave of Covid-19 and political uncertainty surrounding the U.S. presidential election.
The Payden Equity Income Fund (PYVLX) which is comprised of large-cap value stocks, returned -7.49% for the fiscal year ended October 31, 2020, while the Fund’s Advisor Class (PYVAX) returned -7.66% and the Fund’s SI Class (PYVSX) returned -7.40%. The Fund’s benchmark, the Russell 1000 Value Index, returned -7.58% for the same time period. The Fund moderately outperformed its benchmark due to its strong security type and sector allocations. The Fund benefited from its overweight to real estate investment trusts and its underweight to the financial sector, which offset its overweight to master limited partnerships. Within individual stock selection, the strongest areas of stock selection were in the Technology and Consumer Staples sectors, while the weakest area was in the Health Care sector. Strong individual performers in the Fund were software giant Apple and food packaging company Conagra Brands.
6 Payden Mutual Funds
(THIS PAGE INTENTIONALLY LEFT BLANK)
7
| | |
Portfolio Highlights & Investments | | |
| | |
| Abbreviations | | |
| |
| AGM - Assured Guaranty Municipal Corporation | | G2 - Ginnie Mae II pool |
| AMT - Alternative Minimum Tax | | G2SF - Ginnie Mae |
| ARM - Adjustable Rate Mortgage | | GBP - British Pound |
| ARS - Argentine Peso | | GN - Ginnie Mae I pool |
| AUD - Australian Dollar | | GNR - Ginnie Mae REMICS |
| BAM - Build America Mutual | | HUF - Hungarian Forint |
| BRL - Brazilian Real | | IDR - Indonesian Rupiah |
| CAD - Canadian Dollar | | JPY - Japanese Yen |
| CDOR - Canadian Dollar offered rate | | KRW - South Korean Won |
| CHF - Swiss Franc | | KZT - Kazakhstani Tenge |
| CLO - Collateralized Loan Obligation | | LIBOR - London Interbank Offered Rate |
| CLP - Chilean Peso | | MXIBTILE - Mexican Interbank 28 day interest rate |
| CNH - Offshore China Renminbi | | MXN - Mexican Peso |
| CNY - China Renminbi | | MYR - Malaysian Ringgit |
| COP - Colombian Peso | | NCUA - National Credit Union Administration |
| CZK - Czech Koruna | | NOK - Norwegian Krone |
| DKK - Danish Krone | | PEN - Peruvian Sol |
| DOP - Dominican Peso | | PHP - Philippine Peso |
| EGP - Egyptian Pound | | PLN - Polish Zloty |
| EUR - Euro | | REMIC - Real Estate Mortgage Investment Conduit |
| EURIBOR - Euro Interbank Offered Rate | | RON - New Romanian Leu |
| FDIC - Federal Deposit Insurance Corporation | | RUB - Russian Ruble |
| FFCB - Federal Farm Credit Banks Funding Corporation | | SEK - Swedish Krona |
| FG - Freddie Mac Gold Pool | | SGD - Singapore Dollar |
| FH - Freddie Mac Non Gold Pool | | STACR - Structured Agency Credit Risk |
| FHLB - Federal Home Loan Banks | | TBA - To-Be-Announced |
| FHLMC - Federal Home Loan Mortgage Company (Freddie Mac) | | THB - Thai Baht |
| FHR - Freddie Mac REMICS | | TRY - Turkish Lira |
| FN - Fannie Mae Pool | | TWD - Taiwan Dollar |
| FNCL - Fannie Mae or Freddie Mac | | UAH - Ukrainian Hryvnia |
| FNMA - Federal National Mortgage Association (Fannie Mae) | | USD - US Dollar |
| FNR - Fannie Mae REMICS | | UYU - Uruguayan Peso |
| FR - Freddie Mac Pool | | ZAR - South African Rand |
8 Payden Mutual Funds
Payden Cash Reserves Money Market Fund
| | | | | | | | |
| | The Fund seeks stability, liquidity and current income by generally investing in the highest quality, short term securities with an average portfolio maturity not to exceed 90 days. | | | 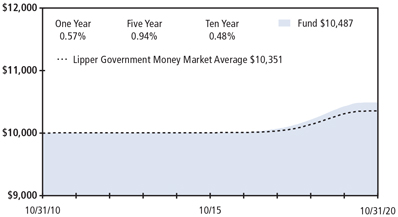
Past performance does not predict future returns. The graph does not reflect the impact of taxes or transaction costs a shareholder would pay. |
| | Portfolio Composition - percent of investments | | | | |
| | U.S. Treasury | | | 42 | % |
| | Repurchase Agreement | | | 40 | % |
| | U.S. Government Agency | | | 13 | % |
| | U.S. Government Guaranteed | | | 3 | % |
| | Other | | | 2 | % |
| | | | | | |
| | | | | | |
| | | | | | |
| | | | | | |
| | | This information is not part of the audited financial statements. | |
| | | | | | |
| Schedule of Investments - October 31, 2020 | |
Principal or Shares | | Security Description | | Value
(000) | |
U.S. Government Agency (13%) | | | | |
300,000 | | FFCB Funding Corp., (1 mo. LIBOR USD | | | | |
| | + 0.000%), 0.15%, 7/16/21 (a) | | $ | 300 | |
5,000,000 | | FFCB Funding Corp., (1 mo. LIBOR USD | | | | |
| | + 0.010%), 0.16%, 10/20/21 (a) | | | 5,000 | |
3,000,000 | | FFCB Funding Corp., (1 mo. LIBOR USD | | | | |
| | + 0.075%), 0.22%, 3/29/21 (a) | | | 3,001 | |
5,000,000 | | FHLB, (1 mo. LIBOR USD + 0.010%), | | | | |
| | 0.13%, 4/05/21 (a) | | | 5,001 | |
5,000,000 | | FHLB, (1 mo. LIBOR USD + 0.010%), | | | | |
| | 0.13%, 5/03/21 (a) | | | 5,002 | |
10,900,000 | | FHLB, (1 mo. LIBOR USD + 0.010%), | | | | |
| | 0.14%, 3/26/21 (a) | | | 10,900 | |
15,000,000 | | FHLB, (U.S. Secured Overnight Financing Rate | | | | |
| | + 0.100%), 0.20%, 12/23/20 (a) | | | 15,001 | |
| | | | | | |
Total U.S. Government Agency (Cost - $44,205) | | | 44,205 | |
| | | | | | |
NCUA Guaranteed (2%) | | | | |
2,969,393 | | NCUA Guaranteed Notes Trust 2010-R2, 2A, (1 | | | | |
| | mo. LIBOR USD + 0.470%), | | | | |
| | 0.61%, 11/05/20 (a) | | | 2,969 | |
4,233,774 | | NCUA Guaranteed Notes Trust 2011-C1, 2A, (1 | | | | |
| | mo. LIBOR USD + 0.530%), 0.67%, 3/09/21 (a) | | | 4,235 | |
| | | | | | |
Total NCUA Guaranteed (Cost - $7,204) | | | 7,204 | |
| | | | | | |
U.S. Treasury (41%) | | | | |
15,000,000 | | U.S. Cash Management Bill, 0.11%, 2/02/21 (b) | | | 14,996 | |
10,000,000 | | U.S. Cash Management Bill, 0.11%, 1/05/21 (b) | | | 9,998 | |
10,000,000 | | U.S. Treasury Bill, 0.09%, 11/05/20 (b) | | | 10,000 | |
16,000,000 | | U.S. Treasury Bill, 0.11%, 4/22/21 (b) | | | 15,992 | |
7,400,000 | | U.S. Treasury Bill, 0.11%, 4/08/21 (b) | | | 7,396 | |
5,000,000 | | U.S. Treasury Bill, 0.11%, 12/22/20 (b) | | | 4,999 | |
10,000,000 | | U.S. Treasury Bill, 0.12%, 2/04/21 (b) | | | 9,997 | |
20,000,000 | | U.S. Treasury Bill, 0.13%, 3/25/21 (b) | | | 19,991 | |
7,400,000 | | U.S. Treasury Bill, 0.13%, 10/07/21 (b) | | | 7,391 | |
6,500,000 | | U.S. Treasury Bill, 0.18%, 12/17/20 (b) | | | 6,498 | |
5,000,000 | | U.S. Treasury Note, (3 mo. U.S. Treasury Bill | | | | |
| | Yield + 0.055%), 0.15%, 7/31/22 (a)(b) | | | 5,001 | |
| | | | | | |
| | |
| | | | | | |
Principal
or Shares | | Security Description | | Value
(000) | |
10,000,000 | | U.S. Treasury Note, (3 mo. U.S. Treasury Bill | | | | |
| | Yield + 0.115%), 0.21%, 1/31/21 (a)(b) | | $ | 10,000 | |
5,000,000 | | U.S. Treasury Note, (3 mo. U.S. Treasury Bill | | | | |
| | Yield + 0.139%), 0.23%, 4/30/21 (a)(b) | | | 5,001 | |
5,000,000 | | U.S. Treasury Note, (3 mo. U.S. Treasury Bill | | | | |
| | Yield + 0.154%), 0.25%, 1/31/22 (a)(b) | | | 5,008 | |
5,000,000 | | U.S. Treasury Note, 2.00%, 1/15/21 (b) | | | 5,005 | |
7,500,000 | | U.S. Treasury Note, 2.38%, 3/15/21 (b) | | | 7,548 | |
| | | | | | |
Total U.S. Treasury (Cost - $144,821) | | | 144,821 | |
| | | | | | |
Investment Company (2%) | | | | |
8,553,313 | | Dreyfus Treasury Obligations Cash Management Fund
(Cost - $8,553) | | | 8,553 | |
| | | | | | |
Repurchase Agreement (39%) | | | | |
47,000,000 | | Bank of Montreal Tri Party, 0.06% 11/02/20 (c) | | | 47,000 | |
30,000,000 | | CIBC World Markets Tri Party, | | | | |
| | 0.06% 11/04/20 (d) | | | 30,000 | |
30,000,000 | | Citigroup Tri Party, 0.06% 11/05/20 (e) | | | 30,000 | |
30,000,000 | | Goldman Sachs Tri Party, 0.06% 11/03/20 (f) | | | 30,000 | |
| | | | | | |
Total Repurchase Agreement (Cost - $137,000) | | | 137,000 | |
| | | | | | |
Total Investments (Cost - $341,783) (97%) | | | 341,783 | |
Other Assets, net of Liabilities (3%) | | | 9,814 | |
| | | | | | |
Net Assets (100%) | | $ | 351,597 | |
| (a) | Floating rate security. The rate shown reflects the rate in effect at October 31, 2020. |
| (b) | Yield to maturity at time of purchase. |
| (c) | The repurchase agreement dated 10/30/2020 is collateralized by the following securities: |
| | | | | | |
Bank of Montreal Tri Party | | | | |
44,438,247 | | FMAC, maturity dated Oct 50, yielding 3.50% | | $ | 47,940 | |
| | | | | | |
Annual Report 9
Payden Cash Reserves Money Market Fund continued
| (d) | The repurchase agreement dated 10/28/2020 is collateralized by the following securities: |
| | | | | | |
CIBC World Markets Tri Party | | | | |
29,186,200 | | U.S. Treasury Securities, maturity dated Sep 24, yielding 1.50% | | $ | 30,600 | |
| | | | | | |
| (e) | The repurchase agreement dated 10/29/2020 is collateralized by the following securities: |
| | | | | | |
Citigroup Tri Party | | | | |
27,478,600 | | U.S. Treasury Securities, maturity from Nov 29-Jul 30, yielding from 0.13%-1.75% | | $ | 30,600 | |
| | | | | | |
| (f) | The repurchase agreement dated 10/27/2020 is collateralized by the following securities: |
| | | | | | |
Goldman Sachs Tri Party | | | | |
29,618,557 | | FMAC, maturity dated Nov 50, yielding 2.00% | | $ | 30,600 | |
| | | | | | |
Offsetting Assets and Liabilities
The Fund’s investments in repurchase agreements were all subject to enforceable Master Repurchase Agreements. Repurchase Agreements on a gross basis were as follows:
| | | | |
| | | Value | |
Repurchase Agreements | | (000’s) | |
| |
| Total gross amount of repurchase agreements presented on the | | $ | 137,000 | |
Statements of Assets and Liabilities | | | | |
Non-cash Collateral | | | (77,000 | ) |
| | | | |
Net Amount | | $ | 60,000 | |
| | | | |
See notes to financial statements.
10 Payden Mutual Funds
Payden Limited Maturity Fund
| | | | |
The Fund seeks a total return greater than a money market fund along with the preservation of capital by generally investing in investment grade debt securities with a maximum average portfolio maturity not to exceed two years. | | 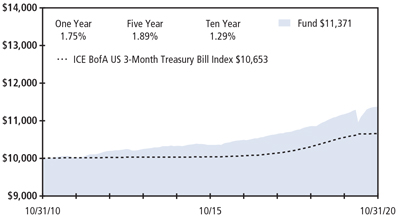
Past performance does not predict future returns. The graph does not reflect the impact of taxes or transaction costs a shareholder would pay. |
| Portfolio Composition - percent of investments |
|
Corporate | | 43% |
Asset Backed | | 33% |
U.S. Treasury | | 11% |
Mortgage Backed | | 10% |
Other | | 3% |
|
|
|
|
This information is not part of the audited financial statements. |
| | | | | | |
| Schedule of Investments - October 31, 2020 | |
Principal
or Shares | | Security Description | | Value
(000) | |
Asset Backed (33%) | | | | |
3,792,079 | | AEP Texas Restoration Funding LLC, | | | | |
| | 2.06%, 2/01/27 | | $ | 3,901 | |
3,637,017 | | Allegro CLO III Ltd. 144A, (3 mo. LIBOR USD | | | | |
| | + 0.840%), 1.05%, 7/25/27 (a)(b) | | | 3,610 | |
5,155,000 | | Ally Master Owner Trust, 2.70%, 1/17/23 | | | 5,180 | |
9,141,287 | | Americredit Automobile Receivables Trust | | | | |
| | 2018-3, 3.38%, 7/18/23 | | | 9,284 | |
5,614,434 | | AmeriCredit Automobile Receivables Trust | | | | |
| | 2020-1, 1.10%, 3/20/23 | | | 5,633 | |
2,420,000 | | AmeriCredit Automobile Receivables Trust | | | | |
| | 2020-2, 0.60%, 12/18/23 | | | 2,425 | |
6,960,000 | | AMSR 2020-SFR2 Trust 144A, | | | | |
| | 1.63%, 7/17/37 (b) | | | 7,046 | |
4,400,000 | | AMSR 2020-SFR5 Trust 144A, | | | | |
| | 1.38%, 11/17/37 (b) | | | 4,403 | |
1,000,000 | | Arbor Realty Commercial Real Estate Notes | | | | |
| | 2019-FL1 Ltd. 144A, (1 mo. LIBOR USD | | | | |
| | + 1.150%), 1.30%, 5/15/37 (a)(b) | | | 991 | |
1,910,441 | | Atrium XII 144A, (3 mo. LIBOR USD | | | | |
| | + 0.830%), 1.05%, 4/22/27 (a)(b) | | | 1,894 | |
2,240,000 | | Bank of The West Auto Trust 2019-1 144A, | | | | |
| | 2.43%, 4/15/24 (b) | | | 2,289 | |
1,800,000 | | Bank of The West Auto Trust 2019-1 144A, | | | | |
| | 2.51%, 10/15/24 (b) | | | 1,867 | |
5,132,886 | | Barings CLO Ltd. 2013-I 144A, (3 mo. LIBOR | | | | |
| | USD + 0.800%), 1.02%, 1/20/28 (a)(b) | | | 5,084 | |
1,610,000 | | BDS 2020-FL5 Ltd. 144A, (1 mo. LIBOR USD | | | | |
| | + 1.150%), 1.30%, 2/16/37 (a)(b) | | | 1,589 | |
1,316,442 | | BlueMountain CLO 2013-1 Ltd. 144A, (3 mo. | | | | |
| | LIBOR USD + 1.230%), 1.45%, 1/20/29 (a)(b) | | | 1,316 | |
1,856,132 | | BlueMountain CLO 2015-2 Ltd. 144A, (3 mo. | | | | |
| | LIBOR USD + 0.930%), 1.15%, 7/18/27 (a)(b) | | | 1,839 | |
2,850,182 | | BMW Canada Auto Trust 144A, 1.96%, 9/20/22 | | | | |
| | CAD (b)(c) | | | 2,157 | |
| | | | | | |
Principal
or Shares | | Security Description | | Value
(000) | |
| | |
731,039 | | BMW Canada Auto Trust 144A, | | | | |
| | 2.15%, 10/20/21 CAD (b)(c) | | $ | 550 | |
2,300,000 | | BMW Vehicle Owner Trust 2020-A, | | | | |
| | 0.39%, 2/27/23 | | | 2,302 | |
5,250,000 | | Bristol Park CLO Ltd. 144A, (3 mo. LIBOR USD | | | | |
| | + 0.990%), 1.23%, 4/15/29 (a)(b) | | | 5,191 | |
3,760,000 | | BSPRT 2018-FL4 Issuer Ltd. 144A, (1 mo. | | | | |
| | LIBOR USD + 1.300%), 1.45%, 9/15/35 (a)(b) | | | 3,682 | |
3,431,681 | | Canadian Pacer Auto Receivables Trust 2020-1 | | | | |
| | 144A, 1.77%, 11/21/22 (b) | | | 3,454 | |
2,820,000 | | CarMax Auto Owner Trust 2020-3, | | | | |
| | 0.49%, 6/15/23 | | | 2,824 | |
5,900,000 | | CarMax Auto Owner Trust 2020-4, | | | | |
| | 0.31%, 1/16/24 | | | 5,903 | |
5,700,000 | | CCG Receivables Trust 2020-1 144A, | | | | |
| | 0.54%, 12/14/27 (b) | | | 5,707 | |
2,340,737 | | Chesapeake Funding II LLC 144A, | | | | |
| | 0.87%, 8/16/32 (b) | | | 2,351 | |
3,000,000 | | CLNC 2019-FL1 Ltd. 144A, (1 mo. LIBOR USD | | | | |
| | + 1.250%), 1.40%, 8/20/35 (a)(b) | | | 2,951 | |
115,747 | | CNH Equipment Trust 2017-A, 2.07%, 5/16/22 | | | 116 | |
329,185 | | CNH Equipment Trust 2019-A, 2.96%, 5/16/22 | | | 330 | |
1,940,000 | | CNH Equipment Trust 2020-A, 1.08%, 7/17/23 | | | 1,949 | |
769,125 | | Commonbond Student Loan Trust 2017-A-GS | | | | |
| | 144A, (1 mo. LIBOR USD + 0.850%), | | | | |
| | 1.00%, 5/25/41 (a)(b) | | | 766 | |
666,420 | | Dell Equipment Finance Trust 2020-1 144A, | | | | |
| | 1.98%, 5/21/21 (b) | | | 668 | |
5,400,000 | | Dell Equipment Finance Trust 2020-2 144A, | | | | |
| | 0.47%, 10/24/22 (b) | | | 5,411 | |
1,287,471 | | Drive Auto Receivables Trust 2017-1, | | | | |
| | 3.84%, 3/15/23 | | | 1,306 | |
860,564 | | Drive Auto Receivables Trust 2020-1, | | | | |
| | 1.99%, 12/15/22 | | | 864 | |
Annual Report 11
Payden Limited Maturity Fund continued
| | | | | | |
Principal
or Shares | | Security Description | | Value
(000) | |
| | |
4,101,024 | �� | Drive Auto Receivables Trust 2020-2, | | | | |
| | 0.85%, 7/17/23 | | $ | 4,108 | |
3,339,052 | | Enterprise Fleet Financing 2018-2 LLC 144A, | | | | |
| | 3.14%, 2/20/24 (b) | | | 3,370 | |
2,200,000 | | Enterprise Fleet Financing 2020-1 LLC 144A, | | | | |
| | 1.78%, 12/22/25 (b) | | | 2,234 | |
5,950,000 | | Enterprise Fleet Financing 2020-2 LLC 144A, | | | | |
| | 0.61%, 7/20/26 (b) | | | 5,953 | |
5,350,000 | | FirstKey Homes 2020-SFR2 Trust 144A, | | | | |
| | 1.27%, 10/19/37 (b) | | | 5,329 | |
270,290 | | Ford Auto Securitization Trust 144A, | | | | |
| | 2.10%, 9/15/21 CAD (b)(c) | | | 203 | |
7,250,000 | | Ford Auto Securitization Trust 2020-AA 144A, | | | | |
| | 0.52%, 8/15/22 CAD (b)(c) | | | 5,442 | |
3,550,000 | | Ford Auto Securitization Trust 2020-AA 144A, | | | | |
| | 0.89%, 8/15/24 CAD (b)(c) | | | 2,665 | |
1,679,269 | | Ford Credit Auto Lease Trust 2020-A, | | | | |
| | 1.80%, 7/15/22 | | | 1,690 | |
3,140,000 | | Ford Credit Auto Lease Trust 2020-B, | | | | |
| | 0.50%, 12/15/22 | | | 3,144 | |
1,015,640 | | Ford Credit Auto Owner Trust 2017-C, | | | | |
| | 2.01%, 3/15/22 | | | 1,018 | |
481,838 | | Ford Credit Auto Owner Trust 2019-A, | | | | |
| | 2.78%, 2/15/22 | | | 483 | |
6,480,000 | | Ford Credit Floorplan Master Owner Trust A | | | | |
| | 2020-1, 0.70%, 9/15/25 | | | 6,492 | |
1,462,668 | | Foursight Capital Automobile Receivables Trust | | | | |
| | 2020-1 144A, 1.97%, 9/15/23 (b) | | | 1,476 | |
2,930,735 | | Galaxy XXIX CLO Ltd. 144A, (3 mo. LIBOR | | | | |
| | USD + 0.790%), 1.07%, 11/15/26 (a)(b) | | | 2,909 | |
53,386 | | GM Financial Automobile Leasing Trust 2018-3, | | | | |
| | 3.18%, 6/21/21 | | | 53 | |
2,040,000 | | GM Financial Automobile Leasing Trust 2020-2, | | | | |
| | 0.80%, 7/20/23 | | | 2,054 | |
6,410,000 | | GM Financial Consumer Automobile Receivables | | | | |
| | Trust 2020-3, 0.35%, 7/17/23 | | | 6,414 | |
468,311 | | GreatAmerica Leasing Receivables Funding LLC | | | | |
| | Series 2019-1 144A, 2.97%, 6/15/21 (b) | | | 469 | |
359,532 | | GreatAmerica Leasing Receivables Funding LLC | | | | |
| | Series 2020-1 144A, 1.69%, 2/15/21 (b) | | | 360 | |
4,230,000 | | Greystone CRE Notes 2019-FL2 Ltd. 144A, (1 | | | | |
| | mo. LIBOR USD + 1.180%), | | | | |
| | 1.33%, 9/15/37 (a)(b) | | | 4,153 | |
9,000,000 | | Gulf Stream Meridian 2 Ltd. 144A, (3 mo. | | | | |
| | LIBOR USD + 1.400%), | | | | |
| | 0.00%, 10/15/29 (a)(b)(d) | | | 9,000 | |
3,090,000 | | Honda Auto Receivables 2020-2 Owner Trust, | | | | |
| | 0.74%, 11/15/22 | | | 3,099 | |
1,060,814 | | HPEFS Equipment Trust 2019-1 144A, | | | | |
| | 2.19%, 9/20/29 (b) | | | 1,068 | |
5,900,000 | | Hyundai Auto Lease Securitization Trust 2020-B | | | | |
| | 144A, 0.36%, 1/17/23 (b) | | | 5,906 | |
2,197,864 | | Invitation Homes 2018-SFR1 Trust 144A, (1 | | | | |
| | mo. LIBOR USD + 0.700%), | | | | |
| | 0.85%, 3/17/37 (a)(b) | | | 2,187 | |
| | | | | | |
Principal
or Shares | | Security Description | | Value
(000) | |
| | |
1,150,000 | | John Deere Owner Trust 2020-B, | | | | |
| | 0.41%, 3/15/23 | | $ | 1,151 | |
3,410,000 | | KREF 2018-FL1 Ltd. 144A, (1 mo. LIBOR USD | | | | |
| | + 1.100%), 1.25%, 6/15/36 (a)(b) | | | 3,399 | |
4,690,000 | | Kubota Credit Owner Trust 2020-2 144A, | | | | |
| | 0.41%, 6/15/23 (b) | | | 4,694 | |
5,575,000 | | LCM XX LP 144A, (3 mo. LIBOR USD | | | | |
| | + 1.040%), 1.26%, 10/20/27 (a)(b) | | | 5,536 | |
2,240,000 | | Madison Park Funding XIII Ltd. 144A, (3 mo. | | | | |
| | LIBOR USD + 0.950%), 1.17%, 4/19/30 (a)(b) | | | 2,220 | |
6,800,000 | | Magnetite VII Ltd. 144A, (3 mo. LIBOR USD | | | | |
| | + 0.800%), 1.04%, 1/15/28 (a)(b) | | | 6,717 | |
3,349,900 | | Marathon CRE 2018 FL1 Ltd. 144A, (1 mo. | | | | |
| | LIBOR USD + 1.150%), 1.30%, 6/15/28 (a)(b) | | | 3,323 | |
3,139,780 | | Mercedes-Benz Auto Lease Trust 2020-A, | | | | |
| | 1.82%, 3/15/22 | | | 3,153 | |
3,460,000 | | Mercedes-Benz Auto Lease Trust 2020-B, | | | | |
| | 0.31%, 2/15/23 | | | 3,461 | |
1,295,569 | | MMAF Equipment Finance LLC 2019-A 144A, | | | | |
| | 2.84%, 1/10/22 (b) | | | 1,302 | |
1,900,000 | | MMAF Equipment Finance LLC 2020-A 144A, | | | | |
| | 0.74%, 4/09/24 (b) | | | 1,907 | |
2,750,000 | | MMAF Equipment Finance LLC 2020-B 144A, | | | | |
| | 0.38%, 8/14/23 (b) | | | 2,751 | |
2,206,979 | | Navient Private Education Refi Loan Trust | | | | |
| | 2020-B 144A, 1.80%, 1/15/69 (b) | | | 2,217 | |
1,410,000 | | Navient Private Education Refi Loan Trust | | | | |
| | 2020-G 144A, 1.17%, 9/16/69 (b) | | | 1,413 | |
6,456,685 | | Navient Student Loan Trust 2019-7 144A, (1 | | | | |
| | mo. LIBOR USD + 0.500%), | | | | |
| | 0.65%, 1/25/68 (a)(b) | | | 6,431 | |
2,830,000 | | Navistar Financial Dealer Note Master Trust | | | | |
| | 144A, (1 mo. LIBOR USD + 0.950%), | | | | |
| | 1.10%, 7/25/25 (a)(b) | | | 2,851 | |
4,360,000 | | Nissan Auto Lease Trust 2019-B, | | | | |
| | 2.27%, 7/15/22 | | | 4,414 | |
7,729,024 | | Nissan Auto Lease Trust 2020-A, | | | | |
| | 1.80%, 5/16/22 | | | 7,780 | |
177,807 | | Nissan Auto Receivables 2019-A Owner Trust, | | | | |
| | 2.82%, 1/18/22 | | | 178 | |
5,420,000 | | Oaktree CLO 2020-1 Ltd. 144A, (3 mo. LIBOR | | | | |
| | USD + 2.000%), 2.34%, 7/15/29 (a)(b) | | | 5,445 | |
698,938 | | Octagon Investment Partners XXIII Ltd. 144A, | | | | |
| | (3 mo. LIBOR USD + 0.850%), | | | | |
| | 1.09%, 7/15/27 (a)(b) | | | 694 | |
4,765,806 | | Palmer Square Loan Funding 2020-1 Ltd. 144A, | | | | |
| | (3 mo. LIBOR USD + 0.800%), | | | | |
| | 1.05%, 2/20/28 (a)(b) | | | 4,721 | |
2,350,000 | | PFS Financing Corp. 144A, 0.97%, 2/15/26 (b) | | | 2,361 | |
571,841 | | Prestige Auto Receivables Trust 2019-1 144A, | | | | |
| | 2.44%, 7/15/22 (b) | | | 573 | |
3,050,000 | | Santander Consumer Auto Receivables Trust | | | | |
| | 2020-B 144A, 0.38%, 2/15/23 (b) | | | 3,051 | |
750,000 | | Santander Drive Auto Receivables Trust 2017-3, | | | | |
| | 3.20%, 11/15/23 | | | 766 | |
12 Payden Mutual Funds
| | | | | | |
Principal
or Shares | | Security Description | | Value
(000) | |
| | |
4,702,768 | | Santander Drive Auto Receivables Trust 2019-2, | | | | |
| | 2.59%, 5/15/23 | | $ | 4,720 | |
3,920,000 | | Santander Drive Auto Receivables Trust 2020-2, | | | | |
| | 0.62%, 5/15/23 | | | 3,925 | |
6,260,000 | | Santander Drive Auto Receivables Trust 2020-3, | | | | |
| | 0.46%, 9/15/23 | | | 6,266 | |
2,831,361 | | Santander Retail Auto Lease Trust 2019-B 144A, | | | | |
| | 2.29%, 4/20/22 (b) | | | 2,855 | |
3,250,000 | | Santander Retail Auto Lease Trust 2020-B 144A, | | | | |
| | 0.42%, 11/20/23 (b) | | | 3,251 | |
2,621,777 | | SMB Private Education Loan Trust 2020-A | | | | |
| | 144A, (1 mo. LIBOR USD + 0.300%), | | | | |
| | 0.45%, 3/15/27 (a)(b) | | | 2,620 | |
802,352 | | SoFi Consumer Loan Program 2020-1 Trust | | | | |
| | 144A, 2.02%, 1/25/29 (b) | | | 811 | |
700,319 | | SoFi Professional Loan Program 2019-C LLC | | | | |
| | 144A, 2.13%, 11/16/48 (b) | | | 705 | |
1,348,561 | | SoFi Professional Loan Program 2020-A Trust | | | | |
| | 144A, 2.06%, 5/15/46 (b) | | | 1,362 | |
3,370,000 | | STWD 2019-FL1 Ltd. 144A, (1 mo. LIBOR | | | | |
| | USD + 1.080%), 1.23%, 7/15/38 (a)(b) | | | 3,333 | |
2,740,000 | | Synchrony Card Funding LLC, 2.34%, 6/15/25 | | | 2,829 | |
1,099,647 | | Towd Point Mortgage Trust 2017-5 144A, (1 | | | | |
| | mo. LIBOR USD + 0.600%), | | | | |
| | 0.75%, 2/25/57 (a)(b) | | | 1,098 | |
1,724,043 | | Toyota Auto Receivables 2019-B Owner Trust, | | | | |
| | 2.59%, 2/15/22 | | | 1,730 | |
2,680,000 | | Toyota Auto Receivables 2020-C Owner Trust, | | | | |
| | 0.36%, 2/15/23 | | | 2,683 | |
4,310,000 | | Trillium Credit Card Trust II 144A, (1 mo. | | | | |
| | LIBOR USD + 0.370%), 0.52%, 12/26/24 (a)(b) | | | 4,314 | |
4,040,000 | | TRTX 2019-FL3 Issuer Ltd. 144A, (1 mo. | | | | |
| | LIBOR USD + 1.450%), 1.60%, 10/15/34 (a)(b) | | | 3,976 | |
3,330,000 | | Tryon Park CLO Ltd. 144A, (3 mo. LIBOR USD | | | | |
| | + 0.890%), 1.13%, 4/15/29 (a)(b) | | | 3,305 | |
1,000,000 | | Venture XXIV CLO Ltd. 144A, (3 mo. LIBOR | | | | |
| | USD + 1.180%), 1.40%, 10/20/28 (a)(b) | | | 994 | |
10,770,000 | | Verizon Owner Trust 2020-B, 0.47%, 2/20/25 | | | 10,792 | |
11,850,000 | | Verizon Owner Trust 2020-C, 0.41%, 4/21/25 | | | 11,854 | |
528,344 | | Volvo Financial Equipment LLC Series 2019-1 | | | | |
| | 144A, 2.90%, 11/15/21 (b) | | | 529 | |
2,000,000 | | Volvo Financial Equipment LLC Series 2019-1 | | | | |
| | 144A, 3.00%, 3/15/23 (b) | | | 2,038 | |
3,422,607 | | Westlake Automobile Receivables Trust 2017-2 | | | | |
| | 144A, 3.28%, 12/15/22 (b) | | | 3,440 | |
754,739 | | Westlake Automobile Receivables Trust 2018-1 | | | | |
| | 144A, 3.41%, 5/15/23 (b) | | | 761 | |
692,672 | | Westlake Automobile Receivables Trust 2019-1 | | | | |
| | 144A, 3.06%, 5/16/22 (b) | | | 694 | |
6,090,000 | | Westlake Automobile Receivables Trust 2020-2 | | | | |
| | 144A, 0.93%, 2/15/24 (b) | | | 6,114 | |
12,000,000 | | Westlake Automobile Receivables Trust 2020-3 | | | | |
| | 144A, 0.56%, 5/15/24 (b) | | | 12,008 | |
2,180,000 | | Wheels SPV 2 LLC 144A, 0.51%, 8/20/29 (b) | | | 2,183 | |
4,379,514 | | Wheels SPV 2 LLC 144A, 2.30%, 5/22/28 (b) | | | 4,426 | |
38,878 | | World Omni Auto Receivables Trust 2019-A, | | | | |
| | 3.02%, 4/15/22 | | | 39 | |
| | | | | | |
Principal
or Shares | | Security Description | | Value
(000) | |
| | |
10,580,000 | | World Omni Auto Receivables Trust 2019-B, | | | | |
| | 2.59%, 7/15/24 | | $ | 10,796 | |
4,147,336 | | World Omni Auto Receivables Trust 2020-A, | | | | |
| | 1.02%, 6/15/23 | | | 4,164 | |
4,690,000 | | World Omni Auto Receivables Trust 2020-C, | | | | |
| | 0.35%, 12/15/23 | | | 4,694 | |
4,650,000 | | World Omni Automobile Lease Securitization | | | | |
| | Trust 2020-B, 0.32%, 9/15/23 | | | 4,651 | |
4,450,000 | | World Omni Select Auto Trust 2020-A, | | | | |
| | 0.47%, 6/17/24 | | | 4,455 | |
Total Asset Backed (Cost - $404,445) | | | 405,036 | |
Commercial Paper(d) (1%) | | | | |
10,000,000 | | BASF SE, 0.21%, 12/22/20 | | | 9,998 | |
1,750,000 | | Engie SA, 0.20%, 12/18/20 | | | 1,749 | |
Total Commercial Paper (Cost - $11,746) | | | 11,747 | |
Corporate Bond (44%) | | | | |
Financial (25%) | | | | |
3,660,000 | | AerCap Ireland Capital DAC/AerCap Global | | | | |
| | Aviation Trust, 3.95%, 2/01/22 | | | 3,723 | |
2,500,000 | | AIG Global Funding 144A, 1.90%, 10/06/21 (b) | | | 2,538 | |
870,000 | | AIG Global Funding 144A, 2.30%, 7/01/22 (b) | | | 899 | |
475,000 | | Air Lease Corp., 3.88%, 4/01/21 | | | 480 | |
2,400,000 | | Ally Financial Inc., 1.45%, 10/02/23 | | | 2,422 | |
3,000,000 | | Ameriprise Financial Inc., 3.00%, 3/22/22 | | | 3,110 | |
3,750,000 | | ANZ New Zealand Int’l Ltd. 144A, | | | | |
| | 2.88%, 1/25/22 (b) | | | 3,864 | |
383,000 | | Assurant Inc., (3 mo. LIBOR USD + 1.250%), | | | | |
| | 1.48%, 3/26/21 (a) | | | 383 | |
3,953,000 | | Athene Global Funding 144A, | | | | |
| | 4.00%, 1/25/22 (b) | | | 4,097 | |
3,330,000 | | Australia & New Zealand Banking Group Ltd. | | | | |
| | 144A, (3 mo. LIBOR USD + 0.320%), | | | | |
| | 0.56%, 11/09/20 (a)(b) | | | 3,330 | |
3,400,000 | | Banco Bilbao Vizcaya Argentaria SA, | | | | |
| | 0.88%, 9/18/23 | | | 3,399 | |
1,655,000 | | Banco Bradesco SA 144A, 2.85%, 1/27/23 (b) | | | 1,681 | |
1,665,000 | | Banco del Estado de Chile 144A, | | | | |
| | 2.67%, 1/08/21 (b) | | | 1,671 | |
6,265,000 | | Bank of America Corp., (U.S. Secured Overnight | | | | |
| | Financing Rate + 0.740%), 0.81%, 10/24/24 (a) | | | 6,274 | |
2,127,000 | | Bank of America Corp., (3 mo. LIBOR USD | | | | |
| | + 0.790%), 1.04%, 3/05/24 (a) | | | 2,141 | |
1,530,000 | | Bank of Montreal, (3 mo. LIBOR USD | | | | |
| | + 0.790%), 1.04%, 8/27/21 (a) | | | 1,540 | |
5,340,000 | | Bank of Nova Scotia, (U.S. Secured Overnight | | | | |
| | Financing Rate + 0.550%), 0.65%, 9/15/23 (a) | | | 5,355 | |
3,565,000 | | Barclays Bank PLC, (3 mo. LIBOR USD | | | | |
| | + 0.460%), 0.68%, 1/11/21 (a) | | | 3,567 | |
3,635,000 | | Barclays Bank PLC, 1.70%, 5/12/22 | | | 3,704 | |
4,000,000 | | BBVA USA, 3.50%, 6/11/21 | | | 4,065 | |
3,315,000 | | BNZ International Funding Ltd. 144A, | | | | |
| | 2.10%, 9/14/21 (b) | | | 3,368 | |
2,265,000 | | Canadian Imperial Bank of Commerce, (U.S. | | | | |
| | Secured Overnight Financing Rate + 0.800%), | | | | |
| | 0.89%, 3/17/23 (a) | | | 2,281 | |
2,065,000 | | Capital One Financial Corp., (3 mo. LIBOR USD | | | | |
| | + 0.950%), 1.19%, 3/09/22 (a) | | | 2,083 | |
Annual Report 13
Payden Limited Maturity Fund continued
| | | | | | |
Principal
or Shares | | Security Description | | Value
(000) | |
| | |
5,000,000 | | Capital One Financial Corp., 3.05%, 3/09/22 | | $ | 5,165 | |
1,965,000 | | CIT Group Inc., 5.00%, 8/15/22 | | | 2,078 | |
12,070,000 | | Citigroup Inc., (U.S. Secured Overnight | | | | |
| | Financing Rate + 0.686%), 0.78%, 10/30/24 (a) | | | 12,072 | |
2,240,000 | | Citigroup Inc., (U.S. Secured Overnight | | | | |
| | Financing Rate + 0.867%), 2.31%, 11/04/22 (a) | | | 2,281 | |
4,300,000 | | Citigroup Inc., 2.90%, 12/08/21 | | | 4,410 | |
5,005,000 | | Credit Suisse AG, (U.S. Secured Overnight | | | | |
| | Financing Rate + 0.450%), 0.55%, 2/04/22 (a) | | | 5,010 | |
3,010,000 | | Credit Suisse AG, 1.00%, 5/05/23 | | | 3,048 | |
2,765,000 | | Credit Suisse AG, 2.10%, 11/12/21 | | | 2,814 | |
1,135,000 | | Credit Suisse AG, 2.80%, 4/08/22 | | | 1,175 | |
750,000 | | Credit Suisse Group Funding Guernsey Ltd., | | | | |
| | 3.45%, 4/16/21 | | | 761 | |
3,080,000 | | Deutsche Bank AG, (3 mo. LIBOR USD | | | | |
| | + 0.815%), 1.03%, 1/22/21 (a) | | | 3,080 | |
4,310,000 | | Federation des Caisses Desjardins du Quebec | | | | |
| | 144A, 0.45%, 10/07/23 (b) | | | 4,306 | |
2,654,000 | | Goldman Sachs Group Inc., (3 mo. LIBOR USD | | | | |
| | + 0.750%), 1.01%, 2/23/23 (a) | | | 2,667 | |
1,325,000 | | Goldman Sachs Group Inc., (3 mo. LIBOR USD | | | | |
| | + 1.170%), 1.45%, 11/15/21 (a) | | | 1,326 | |
4,300,000 | | Goldman Sachs Group Inc., 5.75%, 1/24/22 | | | 4,578 | |
4,000,000 | | Huntington Bancshares Inc., 2.30%, 1/14/22 | | | 4,086 | |
770,000 | | Icahn Enterprises LP/Icahn Enterprises Finance | | | | |
| | Corp., 6.25%, 2/01/22 | | | 774 | |
1,895,000 | | Industrial & Commercial Bank of China Ltd., (3 | | | | |
| | mo. LIBOR USD + 0.750%), | | | | |
| | 0.99%, 11/08/20 (a) | | | 1,895 | |
5,000,000 | | ING Bank NV 144A, 2.63%, 12/05/22 (b) | | | 5,232 | |
965,000 | | Intercontinental Exchange Inc., 0.70%, 6/15/23 | | | 972 | |
2,050,000 | | Itau Unibanco Holding SA 144A, | | | | |
| | 2.90%, 1/24/23 (b) | | | 2,069 | |
3,710,000 | | Jackson National Life Global Funding 144A, | | | | |
| | (U.S. Secured Overnight Financing Rate | | | | |
| | + 0.600%), 0.70%, 1/06/23 (a)(b) | | | 3,719 | |
2,621,000 | | JPMorgan Chase & Co., (3 mo. LIBOR USD | | | | |
| | + 0.730%), 0.94%, 4/23/24 (a) | | | 2,636 | |
5,000,000 | | Lloyds Bank PLC, 2.13%, 7/24/22 (e) | | | 5,151 | |
3,700,000 | | Lloyds Banking Group PLC, (1 yr. US Treasury | | | | |
| | Yield Curve Rate T Note Constant Maturity | | | | |
| | + 1.100%), 1.33%, 6/15/23 (a) | | | 3,731 | |
3,290,000 | | Macquarie Group Ltd. 144A, (3 mo. LIBOR | | | | |
| | USD + 1.020%), 1.28%, 11/28/23 (a)(b) | | | 3,305 | |
5,120,000 | | Met Tower Global Funding 144A, | | | | |
| | 0.55%, 7/13/22 (b) | | | 5,144 | |
5,500,000 | | Metropolitan Life Global Funding I 144A, (U.S. | | | | |
| | Secured Overnight Financing Rate + 0.350%), | | | | |
| | 0.44%, 9/08/22 (a)(b) | | | 5,509 | |
2,320,000 | | Metropolitan Life Global Funding I 144A, | | | | |
| | 0.90%, 6/08/23 (b) | | | 2,346 | |
955,000 | | Mitsubishi UFJ Financial Group Inc., (3 mo. | | | | |
| | LIBOR USD + 0.700%), 0.95%, 3/07/22 (a) | | | 961 | |
4,000,000 | | Mitsubishi UFJ Financial Group Inc., | | | | |
| | 3.54%, 7/26/21 | | | 4,097 | |
5,500,000 | | Mitsubishi UFJ Financial Group Inc., | | | | |
| | 3.76%, 7/26/23 | | | 5,960 | |
| | | | | | |
Principal
or Shares | | Security Description | | Value
(000) | |
| | |
3,960,000 | | Mizuho Financial Group Inc., (3 mo. LIBOR | | | | |
| | USD + 0.610%), 0.86%, 9/08/24 (a) | | $ | 3,961 | |
6,700,000 | | Mizuho Financial Group Inc., (3 mo. LIBOR | | | | |
| | USD + 0.940%), 1.20%, 2/28/22 (a)(f) | | | 6,768 | |
3,910,000 | | Morgan Stanley, (U.S. Secured Overnight | | | | |
| | Financing Rate + 0.700%), 0.80%, 1/20/23 (a) | | | 3,924 | |
1,785,000 | | Morgan Stanley, (U.S. Secured Overnight | | | | |
| | Financing Rate + 0.745%), 0.86%, 10/21/25 (a) | | | 1,784 | |
2,000,000 | | Morgan Stanley, (3 mo. LIBOR USD + 1.400%), | | | | |
| | 1.61%, 10/24/23 (a) | | | 2,035 | |
4,000,000 | | Morgan Stanley, 2.63%, 11/17/21 | | | 4,096 | |
5,000,000 | | National Australia Bank Ltd. 144A, (3 mo. | | | | |
| | LIBOR USD + 0.410%), 0.66%, 12/13/22 (a)(b) | | | 5,021 | |
2,785,000 | | National Bank of Canada, (1 yr. US Treasury | | | | |
| | Yield Curve Rate T Note Constant Maturity | | | | |
| | + 0.770%), 0.90%, 8/15/23 (a) | | | 2,803 | |
3,145,000 | | Natwest Group PLC, (3 mo. LIBOR USD | | | | |
| | + 1.470%), 1.75%, 5/15/23 (a) | | | 3,166 | |
5,025,000 | | New York Life Global Funding 144A, (3 mo. | | | | |
| | LIBOR USD + 0.280%), 0.50%, 1/10/23 (a)(b) | | | 5,024 | |
985,000 | | Nordea Bank Abp 144A, 1.00%, 6/09/23 (b) | | | 999 | |
1,580,000 | | Owl Rock Capital Corp., 4.25%, 1/15/26 | | | 1,598 | |
1,700,000 | | PayPal Holdings Inc., 2.20%, 9/26/22 | | | 1,758 | |
3,780,000 | | PNC Bank NA, (3 mo. LIBOR USD + 0.325%), | | | | |
| | 0.58%, 2/24/23 (a) | | | 3,789 | |
4,080,000 | | PNC Bank NA, (3 mo. LIBOR USD + 0.430%), | | | | |
| | 0.67%, 12/09/22 (a) | | | 4,094 | |
2,805,000 | | PNC Bank NA, 1.74%, 2/24/23 (g) | | | 2,854 | |
1,105,000 | | Protective Life Global Funding 144A, | | | | |
| | 1.08%, 6/09/23 (b) | | | 1,120 | |
4,515,000 | | Reliance Standard Life Global Funding II 144A, | | | | |
| | 2.63%, 7/22/22 (b) | | | 4,644 | |
4,140,000 | | Royal Bank of Canada, 0.50%, 10/26/23 | | | 4,138 | |
2,000,000 | | Royal Bank of Canada 144A, | | | | |
| | 1.90%, 9/23/22 (b)(f) | | | 2,058 | |
2,300,000 | | Santander Holdings USA Inc., 3.70%, 3/28/22 | | | 2,384 | |
3,350,000 | | Santander UK PLC, (3 mo. LIBOR USD | | | | |
| | + 0.300%), 0.55%, 11/03/20 (a) | | | 3,350 | |
1,000,000 | | Santander UK PLC 144A, 1.63%, 2/12/23 (b) | | | 1,027 | |
2,325,000 | | Santander UK PLC, 2.10%, 1/13/23 | | | 2,401 | |
2,350,000 | | Simon Property Group LP, 2.75%, 6/01/23 | | | 2,459 | |
4,240,000 | | Skandinaviska Enskilda Banken AB 144A, | | | | |
| | 0.55%, 9/01/23 (b) | | | 4,241 | |
2,500,000 | | SL Green Operating Partnership LP, (3 mo. | | | | |
| | LIBOR USD + 0.980%), 1.26%, 8/16/21 (a) | | | 2,481 | |
241,000 | | SLM Corp., 5.13%, 4/05/22 | | | 248 | |
690,000 | | Starwood Property Trust Inc., 3.63%, 2/01/21 | | | 690 | |
690,000 | | State Street Corp. 144A, (U.S. Secured Overnight | | | | |
| | Financing Rate + 2.690%), | | | | |
| | 2.83%, 3/30/23 (a)(b) | | | 714 | |
2,330,000 | | Sumitomo Mitsui Trust Bank Ltd. 144A, | | | | |
| | 0.80%, 9/12/23 (b) | | | 2,340 | |
1,940,000 | | Synchrony Financial, 2.85%, 7/25/22 | | | 2,002 | |
2,064,000 | | Synchrony Financial, 3.75%, 8/15/21 | | | 2,102 | |
910,000 | | Synovus Bank, (U.S. Secured Overnight | | | | |
| | Financing Rate + 0.945%), 2.29%, 2/10/23 (a) | | | 922 | |
14 Payden Mutual Funds
| | | | | | |
Principal
or Shares | | Security Description | | Value
(000) | |
| | |
2,015,000 | | Toronto-Dominion Bank, (U.S. Secured | | | | |
| | Overnight Financing Rate + 0.450%), | | | | |
| | 0.54%, 9/28/23 (a) | | $ | 2,019 | |
1,575,000 | | Truist Bank, (U.S. Secured Overnight Financing Rate + 0.730%), 0.82%, 3/09/23 (a) | | | 1,588 | |
2,000,000 | | Truist Financial Corp., 3.05%, 6/20/22 | | | 2,083 | |
2,110,000 | | UBS AG 144A, (3 mo. LIBOR USD + 0.480%), 0.73%, 12/01/20 (a)(b) | | | 2,110 | |
2,725,000 | | UBS AG 144A, 1.75%, 4/21/22 (b) | | | 2,774 | |
5,000,000 | | UniCredit Bank AG, 1.88%, 7/05/22 (e) | | | 5,120 | |
5,375,000 | | Wells Fargo & Co., (3 mo. LIBOR USD | | | | |
| | + 0.930%), 1.14%, 2/11/22 (a) | | | 5,386 | |
3,750,000 | | Wells Fargo Bank NA, (3 mo. LIBOR USD | | | | |
| | + 0.510%), 0.73%, 10/22/21 (a) | | | 3,765 | |
4,000,000 | | Wells Fargo Bank NA, 3.63%, 10/22/21 | | | 4,118 | |
3,370,000 | | Westpac Banking Corp., (3 mo. LIBOR USD | | | | |
| | + 0.390%), 0.61%, 1/13/23 (a)(f) | | | 3,388 | |
2,565,000 | | Westpac Banking Corp., 2.80%, 1/11/22 | | | 2,643 | |
| | | | | 306,322 | |
Industrial (14%) | | | | |
1,810,000 | | AbbVie Inc. 144A, (3 mo. LIBOR USD | | | | |
| | + 0.460%), 0.73%, 11/19/21 (a)(b) | | | 1,814 | |
3,735,000 | | AbbVie Inc. 144A, 2.15%, 11/19/21 (b) | | | 3,803 | |
1,000,000 | | AbbVie Inc., 2.30%, 5/14/21 | | | 1,009 | |
3,340,000 | | American Honda Finance Corp., | | | | |
| | 0.40%, 10/21/22 | | | 3,341 | |
5,340,000 | | American Honda Finance Corp., 0.88%, 7/07/23 | | | 5,386 | |
1,065,000 | | Aviation Capital Group LLC 144A, (3 mo. LIBOR USD + 0.670%), 0.88%, 7/30/21 (a)(b) | | | 1,042 | |
3,620,000 | | Aviation Capital Group LLC 144A, (3 mo. LIBOR USD + 0.950%), 1.20%, 6/01/21 (a)(b) | | | 3,568 | |
1,750,000 | | BMW U.S. Capital LLC 144A, (3 mo. LIBOR | | | | |
| | USD + 0.500%), 0.75%, 8/13/21 (a)(b) | | | 1,754 | |
1,430,000 | | Caterpillar Financial Services Corp., (3 mo. | | | | |
| | LIBOR USD + 0.220%), 0.45%, 1/06/22 (a) | | | 1,432 | |
4,635,000 | | Caterpillar Financial Services Corp., (3 mo. | | | | |
| | LIBOR USD + 0.735%), 0.99%, 5/13/22 (a) | | | 4,685 | |
2,435,000 | | Cigna Corp., (3 mo. LIBOR USD + 0.650%), | | | | |
| | 0.90%, 9/17/21 (a) | | | 2,435 | |
1,255,000 | | CNH Industrial Capital LLC, 1.95%, 7/02/23 | | | 1,277 | |
2,880,000 | | Daimler Finance North America LLC 144A, (3 mo. LIBOR USD + 0.880%), 1.14%, 2/22/22 (a)(b) | | | 2,897 | |
4,500,000 | | Daimler Finance North America LLC 144A, | | | | |
| | 2.20%, 10/30/21 (b) | | | 4,575 | |
5,501,000 | | Daimler Finance North America LLC 144A, | | | | |
| | 3.35%, 2/22/23 (b) | | | 5,806 | |
132,000 | | Dell International LLC/EMC Corp. 144A, | | | | |
| | 5.88%, 6/15/21 (b) | | | 132 | |
2,430,000 | | Delta Air Lines Inc., 2.60%, 12/04/20 | | | 2,429 | |
3,745,000 | | Evernorth Health Inc., (3 mo. LIBOR USD | | | | |
| | + 0.750%), 1.01%, 11/30/20 (a) | | | 3,746 | |
1,150,000 | | Fidelity National Information Services Inc., (3 mo. EURIBOR + 0.400%), 0.04%, 5/21/21 EUR (a)(c)(d) | | | 1,340 | |
| | | | | | |
Principal
or Shares | | Security Description | | Value
(000) | |
| | |
890,000 | | Ford Motor Credit Co. LLC, (3 mo. LIBOR USD + 1.270%), 1.50%, 3/28/22 (a) | | $ | 859 | |
1,460,000 | | Ford Motor Credit Co. LLC, 3.09%, 1/09/23 | | | 1,448 | |
1,340,000 | | Ford Motor Credit Co. LLC, 5.13%, 6/16/25 | | | 1,398 | |
5,000,000 | | Fox Corp., 3.67%, 1/25/22 | | | 5,200 | |
1,700,000 | | General Motors Financial Co. Inc., (3 mo. LIBOR USD + 0.540%), 0.79%, 11/06/20 (a) | | | 1,700 | |
2,014,000 | | General Motors Financial Co. Inc., (3 mo. LIBOR USD + 1.310%), 1.53%, 6/30/22 (a) | | | 2,017 | |
1,275,000 | | General Motors Financial Co. Inc., (3 mo. LIBOR USD + 1.550%), 1.78%, 1/14/22 (a) | | | 1,281 | |
5,500,000 | | General Motors Financial Co. Inc., | | | | |
| | 4.20%, 11/06/21 | | | 5,668 | |
1,025,000 | | Gilead Sciences Inc., (3 mo. LIBOR USD | | | | |
| | + 0.520%), 0.74%, 9/29/23 (a) | | | 1,027 | |
3,020,000 | | Gilead Sciences Inc., 0.75%, 9/29/23 | | | 3,028 | |
3,180,000 | | GlaxoSmithKline Capital PLC, 0.53%, 10/01/23 | | | 3,179 | |
1,860,000 | | Hewlett Packard Enterprise Co., (3 mo. LIBOR USD + 0.720%), 0.95%, 10/05/21 (a) | | | 1,860 | |
5,605,000 | | Honeywell International Inc., 0.48%, 8/19/22 | | | 5,614 | |
1,155,000 | | Honeywell International Inc., (3 mo. LIBOR | | | | |
| | USD + 0.230%), 0.50%, 8/19/22 (a) | | | 1,157 | |
2,805,000 | | Hyundai Capital America 144A, | | | | |
| | 1.25%, 9/18/23 (b) | | | 2,814 | |
1,020,000 | | Infor Inc. 144A, 1.45%, 7/15/23 (b) | | | 1,035 | |
2,235,000 | | John Deere Capital Corp., 0.55%, 7/05/22 (f) | | | 2,246 | |
840,000 | | Lennar Corp., 4.13%, 1/15/22 | | | 862 | |
6,015,000 | | LYB International Finance III LLC, (3 mo. | | | | |
| | LIBOR USD + 1.000%), 1.23%, 10/01/23 (a) | | | 6,019 | |
1,010,000 | | Marriott International Inc., (3 mo. LIBOR USD + 0.650%), 0.90%, 3/08/21 (a) | | | 1,008 | |
3,000,000 | | McDonald’s Corp., (3 mo. LIBOR USD | | | | |
| | + 0.430%), 0.65%, 10/28/21 (a) | | | 3,011 | |
5,100,000 | | Mondelez International Inc., 0.63%, 7/01/22 | | | 5,120 | |
3,500,000 | | Nissan Motor Acceptance Corp. 144A, (3 mo. LIBOR USD + 0.520%), 0.77%, 3/15/21 (a)(b) | | | 3,488 | |
975,000 | | Nutrition & Biosciences Inc. 144A, | | | | |
| | 0.70%, 9/15/22 (b) | | | 978 | |
4,025,000 | | Otis Worldwide Corp., (3 mo. LIBOR USD | | | | |
| | + 0.450%), 0.68%, 4/05/23 (a) | | | 4,026 | |
1,505,000 | | PACCAR Financial Corp., 0.80%, 6/08/23 | | | 1,518 | |
3,400,000 | | Penske Truck Leasing Co. LP/PTL Finance Corp. 144A, 3.38%, 2/01/22 (b) | | | 3,505 | |
1,105,000 | | Roper Technologies Inc., 0.45%, 8/15/22 | | | 1,107 | |
2,910,000 | | Royalty Pharma PLC 144A, 0.75%, 9/02/23 (b) | | | 2,911 | |
1,270,000 | | Ryder System Inc., 2.80%, 3/01/22 | | | 1,306 | |
1,039,000 | | Ryder System Inc., 2.88%, 6/01/22 | | | 1,075 | |
960,000 | | Smithfield Foods Inc. 144A, 2.65%, 10/03/21 (b) | | | 965 | |
1,885,000 | | Southwest Airlines Co., 4.75%, 5/04/23 | | | 2,020 | |
3,500,000 | | Spirit AeroSystems Inc., (3 mo. LIBOR USD | | | | |
| | + 0.800%), 1.05%, 6/15/21 (a) | | | 3,362 | |
205,000 | | Sprint Spectrum Co. LLC/Sprint Spectrum Co. II LLC/Sprint Spectrum Co. III LLC 144A, 3.36%, 9/20/21 (b) | | | 207 | |
450,000 | | Starbucks Corp., 1.30%, 5/07/22 | | | 457 | |
Annual Report 15
Payden Limited Maturity Fund continued
| | | | | | |
Principal
or Shares | | Security Description | | Value (000) | |
| | |
1,700,000 | | Takeda Pharmaceutical Co. Ltd. 144A, (3 mo. | | | | |
| | EURIBOR + 0.550%), 0.06%, 11/21/20 | | | | |
| | EUR (a)(b)(c) | | $ | 1,980 | |
465,000 | | Toll Brothers Finance Corp., 4.38%, 4/15/23 | | | 488 | |
4,290,000 | | Toyota Motor Credit Corp., 0.50%, 8/14/23 | | | 4,318 | |
6,280,000 | | Upjohn Inc. 144A, 1.13%, 6/22/22 (b) | | | 6,339 | |
995,000 | | Volkswagen Group of America Finance LLC | | | | |
| | 144A, 2.50%, 9/24/21 (b) | | | 1,013 | |
4,425,000 | | Volkswagen Group of America Finance LLC | | | | |
| | 144A, 2.90%, 5/13/22 (b) | | | 4,570 | |
5,500,000 | | Volkswagen Group of America Finance LLC | | | | |
| | 144A, 3.13%, 5/12/23 (b) | | | 5,818 | |
2,065,000 | | Volkswagen Group of America Finance LLC | | | | |
| | 144A, 3.88%, 11/13/20 (b) | | | 2,067 | |
3,500,000 | | Vulcan Materials Co., (3 mo. LIBOR USD | | | | |
| | + 0.650%), 0.90%, 3/01/21 (a) | | | 3,498 | |
| | | | | 167,038 | |
Utility (5%) | | | | |
4,044,000 | | CenterPoint Energy Inc., 3.60%, 11/01/21 | | | 4,171 | |
2,675,000 | | Chevron Corp., (3 mo. LIBOR USD + 0.900%), 1.11%, 5/11/23 (a) | | | 2,726 | |
4,025,000 | | Chevron USA Inc., (3 mo. LIBOR USD | | | | |
| | + 0.110%), 0.32%, 8/12/22 (a) | | | 4,026 | |
4,115,000 | | Chevron USA Inc., (3 mo. LIBOR USD | | | | |
| | + 0.200%), 0.41%, 8/11/23 (a) | | | 4,122 | |
2,065,000 | | Dominion Energy Inc., (3 mo. LIBOR USD | | | | |
| | + 0.530%), 0.78%, 9/15/23 (a) | | | 2,071 | |
6,180,000 | | DTE Energy Co., 0.55%, 11/01/22 | | | 6,206 | |
2,670,000 | | Duke Energy Progress LLC, (3 mo. LIBOR USD + 0.180%), 0.43%, 2/18/22 (a) | | | 2,671 | |
3,000,000 | | Evergy Inc., 4.85%, 6/01/21 | | | 3,044 | |
5,355,000 | | Florida Power & Light Co., (3 mo. LIBOR USD + 0.380%), 0.60%, 7/28/23 (a) | | | 5,358 | |
1,390,000 | | Gray Oak Pipeline LLC 144A, | | | | |
| | 2.00%, 9/15/23 (b) | | | 1,395 | |
1,325,000 | | Kinder Morgan Inc., (3 mo. LIBOR USD | | | | |
| | + 1.280%), 1.52%, 1/15/23 (a) | | | 1,332 | |
408,000 | | Occidental Petroleum Corp., 2.60%, 8/13/21 | | | 400 | |
425,000 | | Occidental Petroleum Corp., 2.70%, 8/15/22 | | | 394 | |
3,580,000 | | Pacific Gas and Electric Co., 1.75%, 6/16/22 | | | 3,581 | |
1,035,000 | | Phillips 66, (3 mo. LIBOR USD + 0.600%), | | | | |
| | 0.83%, 2/26/21 (a) | | | 1,035 | |
3,990,000 | | Sempra Energy, (3 mo. LIBOR USD + 0.450%), 0.70%, 3/15/21 (a) | | | 3,995 | |
1,737,000 | | Sunoco Logistics Partners Operations LP, | | | | |
| | 4.40%, 4/01/21 | | | 1,758 | |
5,445,000 | | Valero Energy Corp., (3 mo. LIBOR USD | | | | |
| | + 1.150%), 1.40%, 9/15/23 (a) | | | 5,444 | |
4,597,000 | | Williams Cos. Inc., 4.00%, 11/15/21 | | | 4,713 | |
| | | | | 58,442 | |
Total Corporate Bond (Cost - $528,277) | | | 531,802 | |
Foreign Government (1%) | | | | |
8,100,000 | | Instituto de Credito Oficial 144A, (3 mo. LIBOR USD + 0.150%), 0.40%, 12/15/21 (a)(b) | | | 8,100 | |
| | | | | | |
Principal
or Shares | | Security Description | | Value (000) | |
| | |
3,070,000 | | Kommuninvest I Sverige AB 144A, | | | | |
| | 0.25%, 12/01/22 (b) | | $ | 3,069 | |
371,000 | | Senegal Government International Bond 144A, | | | | |
| | 8.75%, 5/13/21 (b) | | | 384 | |
Total Foreign Government (Cost - $11,546) | | | 11,553 | |
Mortgage Backed (10%) | | | | |
1,330,136 | | AREIT 2018-CRE2 Trust 144A, (1 mo. LIBOR | | | | |
| | USD + 0.980%), 1.13%, 11/14/35 (a)(b) | | | 1,328 | |
2,866,879 | | BX Commercial Mortgage Trust 2019-XL 144A, (1 mo. LIBOR USD + 0.920%), 1.07%, 10/15/36 (a)(b) | | | 2,872 | |
1,009,076 | | BX Commercial Mortgage Trust 2020-BXLP | | | | |
| | 144A, (1 mo. LIBOR USD + 1.600%), | | | | |
| | 1.75%, 12/15/36 (a)(b) | | | 977 | |
1,829,648 | | BXMT 2017-FL1 Ltd. 144A, (1 mo. LIBOR | | | | |
| | USD + 0.870%), 1.02%, 6/15/35 (a)(b) | | | 1,828 | |
5,850,000 | | BXMT 2020-FL2 Ltd. 144A, (1 mo. LIBOR | | | | |
| | USD + 0.900%), 1.05%, 2/16/37 (a)(b) | | | 5,779 | |
2,500,000 | | BXMT 2020-FL2 Ltd. 144A, (1 mo. LIBOR | | | | |
| | USD + 1.150%), 1.30%, 2/16/37 (a)(b) | | | 2,467 | |
5,376,798 | | CHC Commercial Mortgage Trust 2019-CHC | | | | |
| | 144A, (1 mo. LIBOR USD + 2.050%), | | | | |
| | 2.20%, 6/15/34 (a)(b) | | | 4,889 | |
16,420,000 | | Cold Storage Trust 2020-ICE5 144A, (1 mo. LIBOR USD + 0.900%), 1.06%, 11/15/23 (a)(b) | | | 16,358 | |
1,161,939 | | COMM 2014-CCRE15 Mortgage Trust, | | | | |
| | 2.93%, 2/10/47 | | | 1,164 | |
2,920,000 | | COMM 2019-WCM Mortgage Trust 144A, (1 mo. LIBOR USD + 0.900%), 1.05%, 10/15/34 (a)(b) | | | 2,910 | |
3,551,844 | | Connecticut Avenue Securities Trust 2019-HRP1 144A, (1 mo. LIBOR USD + 2.150%), 2.30%, 11/25/39 (a)(b) | | | 3,211 | |
614,084 | | Connecticut Avenue Securities Trust 2020-R01 | | | | |
| | 144A, (1 mo. LIBOR USD + 0.800%), | | | | |
| | 0.95%, 1/25/40 (a)(b) | | | 615 | |
1,464,122 | | Connecticut Avenue Securities Trust 2020-R02 | | | | |
| | 144A, (1 mo. LIBOR USD + 0.750%), | | | | |
| | 0.90%, 1/25/40 (a)(b) | | | 1,465 | |
3,550,000 | | Credit Suisse Mortgage Capital Certificates | | | | |
| | 2019-ICE4 144A, (1 mo. LIBOR USD | | | | |
| | + 1.230%), 1.38%, 5/15/36 (a)(b) | | | 3,543 | |
11,065,000 | | FHLMC Multifamily Structured Pass-Through | | | | |
| | Certificates, (1 mo. LIBOR USD + 0.220%), | | | | |
| | 0.38%, 3/25/25 (a) | | | 11,083 | |
246,322 | | Freddie Mac STACR REMIC Trust 2020-DNA1 144A, (1 mo. LIBOR USD + 0.700%), 0.85%, 1/25/50 (a)(b) | | | 246 | |
917,784 | | Freddie Mac STACR REMIC Trust 2020-DNA2 144A, (1 mo. LIBOR USD + 0.750%), 0.90%, 2/25/50 (a)(b) | | | 917 | |
16 Payden Mutual Funds
| | | | | | |
Principal
or Shares | | Security Description | | Value (000) | |
| | |
840,000 | | Freddie Mac STACR REMIC Trust 2020-DNA2 144A, (1 mo. LIBOR USD + 1.850%), | | | | |
| | 2.00%, 2/25/50 (a)(b) | | $ | 826 | |
1,900,000 | | Freddie Mac STACR REMIC Trust 2020-DNA4 144A, (1 mo. LIBOR USD + 1.500%), | | | | |
| | 1.65%, 8/25/50 (a)(b) | | | 1,910 | |
3,400,000 | | Freddie Mac STACR REMIC Trust 2020-DNA5 144A, (U.S. Secured Overnight Financing Rate Index 30day Average + 1.300%), 1.39%, 10/25/50 (a)(b) | | | 3,409 | |
2,006,965 | | Freddie Mac STACR REMIC Trust 2020-HQA1 144A, (1 mo. LIBOR USD + 0.750%), | | | | |
| | 0.90%, 1/25/50 (a)(b) | | | 2,005 | |
2,640,000 | | Freddie Mac STACR REMIC Trust 2020-HQA1 144A, (1 mo. LIBOR USD + 1.900%), | | | | |
| | 2.05%, 1/25/50 (a)(b) | | | 2,601 | |
4,962,225 | | Freddie Mac STACR REMIC Trust 2020-HQA2 144A, (1 mo. LIBOR USD + 1.100%), | | | | |
| | 1.25%, 3/25/50 (a)(b) | | | 4,968 | |
2,600,000 | | Freddie Mac STACR REMIC Trust 2020-HQA4 144A, (1 mo. LIBOR USD + 1.300%), | | | | |
| | 1.45%, 9/25/50 (a)(b) | | | 2,610 | |
1,570,409 | | Freddie Mac STACR Trust 2019-DNA4 144A, (1 mo. LIBOR USD + 1.950%), | | | | |
| | 2.10%, 10/25/49 (a)(b) | | | 1,564 | |
1,846,656 | | Freddie Mac STACR Trust 2019-FTR2 144A, (1 mo. LIBOR USD + 0.950%), | | | | |
| | 1.10%, 11/25/48 (a)(b) | | | 1,832 | |
6,483,552 | | Freddie Mac STACR Trust 2019-HRP1 144A, (1 mo. LIBOR USD + 1.400%), | | | | |
| | 1.55%, 2/25/49 (a)(b) | | | 6,254 | |
444,493 | | Freddie Mac Structured Agency Credit Risk Debt Notes, (1 mo. LIBOR USD + 0.750%), | | | | |
| | 0.90%, 3/25/30 (a) | | | 445 | |
469,944 | | Gosforth Funding 2017-1 PLC 144A, (3 mo. | | | | |
| | LIBOR USD + 0.470%),
0.70%, 12/19/59 (a)(b) | | | 470 | |
227,089 | | HarborView Mortgage Loan Trust 2004-10, | | | | |
| | 3.29%, 1/19/35 (g) | | | 236 | |
2,950,000 | | JP Morgan Chase Commercial Mortgage | | | | |
| | Securities Trust 2019-MFP 144A, (1 mo. LIBOR USD + 1.160%), 1.31%, 7/15/36 (a)(b) | | | 2,837 | |
2,590,000 | | MF1 2020-FL3 Ltd. 144A, (1 mo. LIBOR USD + 2.050%), 2.20%, 7/15/35 (a)(b) | | | 2,609 | |
670,095 | | Multifamily Connecticut Avenue Securities Trust 2019-01 144A, (1 mo. LIBOR USD + 1.700%), 1.85%, 10/15/49 (a)(b) | | | 644 | |
2,141,504 | | New Residential Mortgage Loan Trust 2017-5 | | | | |
| | 144A, (1 mo. LIBOR USD + 1.500%), | | | | |
| | 1.65%, 6/25/57 (a)(b) | | | 2,153 | |
1,700,000 | | PFP 2019-5 Ltd. 144A, (1 mo. LIBOR USD | | | | |
| | + 1.420%), 1.57%, 4/14/36 (a)(b) | | | 1,647 | |
2,840,000 | | PFP 2019-6 Ltd. 144A, (1 mo. LIBOR USD | | | | |
| | + 1.050%), 1.20%, 4/14/37 (a)(b) | | | 2,807 | |
1,780,000 | | PFP 2019-6 Ltd. 144A, (1 mo. LIBOR USD | | | | |
| | + 1.450%), 1.60%, 4/14/37 (a)(b) | | | 1,696 | |
| | | | | | |
Principal
or Shares | | Security Description | | Value
(000) | |
| | |
1,573,918 | | Ripon Mortgages PLC 144A, (3 mo. LIBOR | | | | |
| | GBP + 0.800%), 0.87%, 8/20/56 GBP (a)(b)(c) | | $ | 2,038 | |
16,463 | | STACR Trust 2018-DNA3 144A, (1 mo. LIBOR | | | | |
| | USD + 0.750%), 0.90%, 9/25/48 (a)(b) | | | 17 | |
2,502,245 | | STACR Trust 2018-HRP1 144A, (1 mo. LIBOR | | | | |
| | USD + 1.650%), 1.80%, 4/25/43 (a)(b) | | | 2,435 | |
4,474,951 | | STACR Trust 2018-HRP2 144A, (1 mo. LIBOR | | | | |
| | USD + 1.250%), 1.40%, 2/25/47 (a)(b) | | | 4,416 | |
5,200,000 | | STACR Trust 2018-HRP2 144A, (1 mo. LIBOR | | | | |
| | USD + 2.400%), 2.55%, 2/25/47 (a)(b) | | | 4,963 | |
112,976 | | Structured Adjustable Rate Mortgage Loan Trust, | | | | |
| | 3.04%, 9/25/34 (g) | | | 113 | |
1,601 | | Structured Asset Mortgage Investments Trust | | | | |
| | 2003-CL1, 2.30%, 7/25/32 (g) | | | 1 | |
Total Mortgage Backed (Cost - $121,202) | | | 119,158 | |
Municipal (0%) | | | | |
1,375,000 | | State of California, 0.93%, 4/01/47 (g) | | | 1,379 | |
Total Municipal (Cost - $1,378) | | | 1,379 | |
NCUA Guaranteed (0%) | | | | |
833,389 | | NCUA Guaranteed Notes Trust 2010-R3, 1A, (1 mo. LIBOR USD + 0.560%), | | | | |
| | 0.70%, 12/08/20 (a) | | | | |
| | (Cost - $833) | | | 833 | |
U.S. Government Agency (0%) | | | | |
5,200,000 | | U.S. Cash Management Bill, 0.10%, 1/12/21 (d) | | | | |
| | (Cost - $5,199) | | | 5,199 | |
U.S. Treasury (12%) | | | | |
5,000,000 | | U.S. Treasury Bill, 0.09%, 1/05/21 (d) | | | 4,999 | |
10,000,000 | | U.S. Treasury Bill, 0.10%, 1/21/21 (d) | | | 9,998 | |
15,000,000 | | U.S. Treasury Bill, 0.10%, 3/25/21 (d) | | | 14,995 | |
35,000,000 | | U.S. Treasury Bill, 0.12%, 8/12/21 (d) | | | 34,974 | |
30,000,000 | | U.S. Treasury Note, 1.13%, 2/28/21 | | | 30,102 | |
30,000,000 | | U.S. Treasury Note, 1.75%, 7/31/21 | | | 30,363 | |
10,000,000 | | U.S. Treasury Note, 2.13%, 5/31/21 | | | 10,116 | |
8,000,000 | | U.S. Treasury Note, 3.63%, 2/15/21 | | | 8,081 | |
Total U.S. Treasury (Cost - $143,027) | | | 143,628 | |
Investment Company (1%) | | | | |
9,893,718 | | Payden Cash Reserves Money Market Fund * | | | | |
| | (Cost - $9,894) | | | 9,894 | |
Total Investments (Cost - $1,237,547) (102%) | | | 1,240,229 | |
Liabilities in excess of Other Assets (-2%) | | | (20,715 | ) |
Net Assets (100%) | | $ | 1,219,514 | |
| (a) | Floating rate security. The rate shown reflects the rate in effect at October 31, 2020. |
| (b) | Security offered only to qualified institutional investors, and thus is not registered for sale to the public under rule 144A of the Securities Act of 1933. It has been deemed liquid under guidelines approved by the Board. |
| (c) | Principal in foreign currency. |
| (d) | Yield to maturity at time of purchase. |
| (e) | Security offered and sold outside the United States, and thus is exempt from registration under Regulation S of the Securities Act of 1933. It has been deemed liquid under guidelines approved by the Board. |
| (f) | All or a portion of these securities are on loan. At October 31, 2020, the total market value of the Fund’s securities on loan is $9,105 and the total market value of the collateral held by the Fund is $9,354. Amounts in 000s. |
| (g) | Variable rate security. Interest rate disclosed is as of the most recent information available. Certain variable rate securities are not based on a published reference rate and spread but are determined by the issuer or agent and are based on current market conditions. These securities do not indicate a reference rate and spread in their description above. |
Annual Report 17
Payden Limited Maturity Fund continued
Open Forward Currency Contracts to USD
| | | | | | | | | | | | | | | | | | | | |
Currency Purchased
(000s) | | Currency
Sold
(000s) | | Counterparty | | Settlement
Date | | Unrealized
Appreciation
(Depreciation)
(000s) |
Assets: | | | | | | | | | | | | | | | | | | | | |
GBP 42 | | | | USD 54 | | | |
| HSBC Bank
USA, N.A. |
| | | | 03/22/2021 | | | | $ | — | |
USD 6,996 | | | | EUR 5,872 | | | | | Citibank, N.A. | | | | | 03/22/2021 | | | | | 134 | |
USD 12,718 | | | | CAD 16,713 | | | |
| HSBC Bank
USA, N.A. |
| | | | 03/22/2021 | | | | | 167 | |
| | | | | | | | | | | | | | | | | | | | |
| | | | | | | | | | | | | | | | | | | 301 | |
| | | | | | | | | | | | | | | | | | | | |
Liabilities: | | | | | | | | | | | | | | | | | | | | |
CAD 2,039 | | | | USD 1,545 | | | |
| HSBC Bank
USA, N.A. |
| | | | 03/22/2021 | | | | | (13 | ) |
EUR 3,012 | | | | USD 3,551 | | | | | Citibank, N.A. | | | | | 03/22/2021 | | | | | (31 | ) |
USD 2,085 | | | | GBP 1,618 | | | |
| HSBC Bank
USA, N.A. |
| | | | 03/22/2021 | | | | | (14 | ) |
| | | | | | | | | | | | | | | | | | | | |
| | | | | | | | | | | | | | | | | | | (58 | ) |
| | | | | | | | | | | | | | | | | | | | |
Net Unrealized Appreciation (Depreciation) | | | | $ | 243 | |
| | | | | | | | | | | | | | | | | | | | |
Open Futures Contracts
| | | | | | | | | | | | | | | | | | | | | | | | | |
| Contract Type | | Number of
Contracts | | Expiration
Date | | Notional
Amount
(000s) | | Current
Value
(000s) | | Unrealized
Appreciation
(000s) |
| Short Contracts: | | | | | | | | | | | | | | | | | | | | | |
| U.S. Treasury 5-Year Note Future | | | | 106 | | | | | Dec-20 | | | | $ | (13,314 | ) | | | $ | 32 | | | | $ | 32 | |
| | | | | | | | | | | | | | | | | | | | | | | | | |
Offsetting Assets and Liabilities
The Fund’s loaned securities were all subject to an enforceable Securities Lending Agency Agreement. Securities lent in accordance with the Securities Lending Agency Agreement on a gross basis were as follows:
| | | | |
| Total gross amount presented on the Statements of Assets and Liabilities1 | | $ | 9,105 | |
Non-cash Collateral2 | | | (9,105 | ) |
| | | | |
Net Amount | | $ | — | |
| | | | |
| 1 | The amount presented on the Statements of Assets and Liabilities is not offset and is shown on a gross basis. |
| 2 | At October 31, 2020, the value of the collateral received from each borrower exceeded the value of the related securities loaned. This amount is disclosed on the Schedule of Investments. |
See notes to financial statements.
18 Payden Mutual Funds
| | | | | | |
| | The Fund seeks a high level of total return that is consistent with preservation of capital by generally investing in investment grade securities with a maximum average portfolio maturity not to exceed three years | | 
Past performance does not predict future returns. The graph does not reflect the impact of taxes or transaction costs a shareholder would pay. |
| | | Portfolio Composition - percent of investments |
| | Corporate | | 37% |
| | Asset Backed | | 28% |
| | U.S. Treasury | | 17% |
| | Mortgage Backed | | 16% |
| | Other | | 2% |
| | |
| | |
| | |
| | |
| | |
| | This information is not part of the audited financial statements. |
| | | | | | |
Schedule of Investments - October 31, 2020 | | | | |
| | | | | | |
Principal
or Shares | | Security Description | | Value
(000) | |
| |
Asset Backed (28%) | | | | |
3,030,847 | | Allegro CLO III Ltd. 144A, (3 mo. LIBOR USD + 0.840%), 1.05%, 7/25/27 (a)(b) | | $ | 3,008 | |
40,616 | | Ally Auto Receivables Trust 2017-4,
1.75%, 12/15/21 | | | 41 | |
7,602,464 | | Ally Auto Receivables Trust 2019-1,
2.91%, 9/15/23 | | | 7,741 | |
3,565,000 | | ALM XVI Ltd./ALM XVI LLC 144A, (3 mo. LIBOR USD + 1.500%),
1.74%, 7/15/27 (a)(b) | | | 3,542 | |
5,800,000 | | AmeriCredit Automobile Receivables Trust 2020-1, 1.11%, 8/19/24 | | | 5,862 | |
3,690,000 | | AmeriCredit Automobile Receivables Trust 2020-2, 0.66%, 12/18/24 | | | 3,710 | |
5,800,000 | | AMSR 2020-SFR5 Trust 144A,
1.38%, 11/17/37 (b) | | | 5,804 | |
9,132,830 | | Apidos CLO XXI 144A, (3 mo. LIBOR USD + 0.930%), 1.15%, 7/18/27 (a)(b) | | | 9,065 | |
10,540,000 | | Ballyrock CLO 2020-1 Ltd. 144A, (3 mo. LIBOR USD + 1.700%),
1.99%, 7/20/30 (a)(b) | | | 10,568 | |
1,849,689 | | Barings CLO Ltd. 2013-I 144A, (3 mo. LIBOR USD + 0.800%),
1.02%, 1/20/28 (a)(b) | | | 1,832 | |
3,220,000 | | BDS 2020-FL5 Ltd. 144A, (1 mo. LIBOR USD + 1.150%), 1.30%, 2/16/37 (a)(b) | | | 3,177 | |
8,936,145 | | BlueMountain CLO 2013-1 Ltd. 144A, (3 mo. LIBOR USD + 1.230%),
1.45%, 1/20/29 (a)(b) | | | 8,933 | |
650,329 | | BMW Vehicle Lease Trust 2018-1,
3.26%, 7/20/21 | | | 653 | |
1,830,000 | | BMW Vehicle Lease Trust 2018-1,
3.36%, 3/21/22 | | | 1,846 | |
3,070,000 | | BMW Vehicle Owner Trust 2020-A,
0.48%, 10/25/24 | | | 3,078 | |
10,840,000 | | Bristol Park CLO Ltd. 144A, (3 mo. LIBOR USD + 0.990%), 1.23%, 4/15/29 (a)(b) | | | 10,718 | |
5,020,000 | | BSPRT 2018-FL4 Issuer Ltd. 144A, (1 mo. LIBOR USD + 1.300%),
1.45%, 9/15/35 (a)(b) | | | 4,916 | |
| | | | | | |
Principal
or Shares | | Security Description | | Value
(000) | |
| | |
8,500,000 | | CarMax Auto Owner Trust 2019-1,
3.05%, 3/15/24 | | $ | 8,703 | |
8,470,000 | | CarMax Auto Owner Trust 2019-3,
2.18%, 8/15/24 | | | 8,665 | |
3,740,000 | | CarMax Auto Owner Trust 2020-1,
1.89%, 12/16/24 | | | 3,842 | |
1,435,199 | | CARS-DB4 LP 144A, 2.69%, 2/15/50 (b) | | | 1,479 | |
5,880,000 | | CIFC Funding 2015-II Ltd. 144A, (3 mo. LIBOR USD + 1.010%), 1.25%, 4/15/30 (a)(b) | | | 5,820 | |
11,040,000 | | CIFC Funding 2020-I Ltd. 144A, (3 mo. LIBOR USD + 1.700%), 1.94%, 7/15/32 (a)(b) | | | 11,051 | |
5,970,000 | | CLNC 2019-FL1 Ltd. 144A, (1 mo. LIBOR USD + 1.250%), 1.40%, 8/20/35 (a)(b) | | | 5,872 | |
6,180,000 | | CNH Equipment Trust 2019-A, 3.01%, 4/15/24 | | | 6,337 | |
2,601,530 | | Dell Equipment Finance Trust 2018-2 144A, 3.37%, 10/22/23 (b) | | | 2,626 | |
5,820,000 | | Dell Equipment Finance Trust 2020-2 144A, 0.57%, 10/23/23 (b) | | | 5,836 | |
1,305,000 | | Drive Auto Receivables Trust 2019-4,
2.51%, 11/17/25 | | | 1,337 | |
4,890,000 | | Drive Auto Receivables Trust 2020-1,
2.08%, 7/15/24 | | | 4,983 | |
3,620,000 | | Drive Auto Receivables Trust 2020-1,
2.36%, 3/16/26 | | | 3,713 | |
1,670,000 | | Drive Auto Receivables Trust 2020-2,
1.42%, 3/17/25 | | | 1,691 | |
3,366,437 | | Enterprise Fleet Financing 2019-2 LLC 144A, 2.29%, 2/20/25 (b) | | | 3,426 | |
11,250,000 | | FirstKey Homes 2020-SFR2 Trust 144A,
1.27%, 10/19/37 (b) | | | 11,207 | |
4,340,000 | | Ford Credit Auto Lease Trust 2020-A,
2.05%, 6/15/23 | | | 4,443 | |
9,790,000 | | Ford Credit Auto Owner Trust 2019-A,
2.78%, 9/15/23 | | | 10,002 | |
Annual Report 19
Payden Low Duration Fund continued
| | | | | | |
Principal
or Shares | | Security Description | | Value
(000) | |
| | |
8,690,000 | | Ford Credit Floorplan Master Owner Trust A 2020-1, 0.70%, 9/15/25 | | $ | 8,706 | |
3,060,000 | | GM Financial Automobile Leasing Trust 2020-2, 0.80%, 7/20/23 | | | 3,082 | |
1,660,000 | | GM Financial Consumer Automobile Receivables Trust 2020-1, 2.03%, 4/16/25 | | | 1,712 | |
1,290,000 | | GM Financial Consumer Automobile Receivables Trust 2020-1, 2.18%, 5/16/25 | | | 1,335 | |
6,120,000 | | GMF Floorplan Owner Revolving Trust 2020-1 144A, 0.68%, 8/15/25 (b) | | | 6,136 | |
6,700,000 | | GreatAmerica Leasing Receivables Funding LLC Series 2019-1 144A,
3.05%, 9/15/22 (b) | | | 6,826 | |
3,800,000 | | GreatAmerica Leasing Receivables Funding LLC Series 2020-1 144A,
1.76%, 8/15/23 (b) | | | 3,884 | |
7,810,000 | | Greystone CRE Notes 2019-FL2 Ltd. 144A, (1 mo. LIBOR USD + 1.180%),
1.33%, 9/15/37 (a)(b) | | | 7,668 | |
3,800,000 | | HPEFS Equipment Trust 144A,
0.69%, 7/22/30 (b) | | | 3,816 | |
2,720,000 | | Hyundai Auto Lease Securitization Trust 2020-A 144A, 2.00%, 12/15/23 (b) | | | 2,786 | |
1,810,000 | | Hyundai Auto Receivables Trust 2016-B, 2.68%, 9/15/23 | | | 1,822 | |
2,640,000 | | InSite Issuer 2020-1A LLC 144A,
1.50%, 9/15/50 (b) | | | 2,644 | |
3,727,577 | | Invitation Homes 2018-SFR1 Trust 144A, (1 mo. LIBOR USD + 0.700%),
0.85%, 3/17/37 (a)(b) | | | 3,709 | |
7,235,000 | | John Deere Owner Trust 2019-A,
2.91%, 7/17/23 | | | 7,385 | |
4,260,000 | | John Deere Owner Trust 2020-B,
0.51%, 11/15/24 | | | 4,274 | |
4,550,000 | | KREF 2018-FL1 Ltd. 144A, (1 mo. LIBOR USD + 1.100%), 1.25%, 6/15/36 (a)(b) | | | 4,535 | |
3,930,000 | | Kubota Credit Owner Trust 2020-1 144A, 1.96%, 3/15/24 (b) | | | 4,047 | |
194,600 | | L.A. Arena Funding LLC 144A,
7.66%, 12/15/26 (b) | | | 192 | |
4,675,000 | | LCM XX LP 144A, (3 mo. LIBOR USD + 1.040%), 1.26%, 10/20/27 (a)(b) | | | 4,642 | |
4,970,000 | | Mercedes-Benz Auto Receivables Trust 2020-1, 0.55%, 2/18/25 | | | 4,993 | |
6,290,000 | | MMAF Equipment Finance LLC 2020-A 144A, 0.97%, 4/09/27 (b) | | | 6,369 | |
3,095,000 | | Nissan Auto Lease Trust 2020-A,
1.88%, 4/15/25 | | | 3,165 | |
8,440,000 | | Oaktree CLO 2020-1 Ltd. 144A, (3 mo. LIBOR USD + 2.000%),
2.34%, 7/15/29 (a)(b) | | | 8,478 | |
1,486,306 | | OZLM XIII Ltd. 144A, (3 mo. LIBOR USD + 1.080%), 1.29%, 7/30/27 (a)(b) | | | 1,477 | |
12,600,000 | | Palmer Square CLO 2020-1 Ltd. 144A, (3 mo. LIBOR USD + 2.000%),
2.22%, 4/20/29 (a)(b) | | | 12,638 | |
10,152,408 | | Palmer Square Loan Funding 2020-1 Ltd. 144A, (3 mo. LIBOR USD + 0.800%), 1.05%, 2/20/28 (a)(b) | | | 10,056 | |
2,100,000 | | PFS Financing Corp. 144A,
0.93%, 8/15/24 (b) | | | 2,108 | |
3,050,000 | | PFS Financing Corp. 144A,
0.97%, 2/15/26 (b) | | | 3,064 | |
| | | | | | |
Principal
or Shares | | Security Description | | Value
(000) | |
| | |
6,230,000 | | PFS Financing Corp. 144A,
1.21%, 6/15/24 (b) | | $ | 6,295 | |
6,140,000 | | PFS Financing Corp. 144A,
2.89%, 2/15/23 (b) | | | 6,183 | |
485,527 | | Prestige Auto Receivables Trust 2018-1 144A, 3.29%, 9/15/22 (b) | | | 486 | |
12,070,000 | | RR 10 Ltd. 144A, (3 mo. LIBOR USD + 1.800%), 2.04%, 7/15/33 (a)(b) | | | 12,114 | |
3,000,000 | | Santander Drive Auto Receivables Trust 2020-2, 0.67%, 4/15/24 | | | 3,011 | |
4,730,000 | | Santander Retail Auto Lease Trust 2019-B 144A, 2.30%, 1/20/23 (b) | | | 4,830 | |
4,410,000 | | Stack Infrastructure Issuer 2020-1A LLC 144A, 1.89%, 8/25/45 (b) | | | 4,439 | |
5,880,000 | | STWD 2019-FL1 Ltd. 144A, (1 mo. LIBOR USD + 1.080%), 1.23%, 7/15/38 (a)(b) | | | 5,816 | |
3,841,575 | | Taco Bell Funding LLC 144A,
4.32%, 11/25/48 (b) | | | 3,922 | |
1,000,000 | | Trillium Credit Card Trust II 144A,
2.33%, 12/26/24 (b) | | | 1,013 | |
7,960,000 | | TRTX 2019-FL3 Issuer Ltd. 144A, (1 mo. LIBOR USD + 1.450%),
1.60%, 10/15/34 (a)(b) | | | 7,834 | |
6,550,000 | | Vantage Data Centers 2020-1A LLC 144A, 1.65%, 9/15/45 (b) | | | 6,530 | |
2,860,000 | | VB-S1 Issuer LLC 144A, 3.03%, 6/15/50 (b) | | | 2,978 | |
7,500,000 | | Venture XXIV CLO Ltd. 144A, (3 mo. LIBOR USD + 1.180%),
1.40%, 10/20/28 (a)(b) | | | 7,452 | |
9,960,000 | | Verizon Owner Trust 2019-A,
2.93%, 9/20/23 | | | 10,194 | |
3,370,000 | | Volkswagen Auto Lease Trust 2019-A, 1.99%, 11/21/22 | | | 3,432 | |
2,662,834 | | Volkswagen Auto Loan Enhanced Trust 2018-1, 3.02%, 11/21/22 | | | 2,699 | |
7,130,000 | | Volvo Financial Equipment LLC Series 2019-1 144A, 3.00%, 3/15/23 (b) | | | 7,265 | |
1,323,000 | | Westlake Automobile Receivables Trust 2018-3 144A, 4.00%, 10/16/23 (b) | | | 1,363 | |
3,700,000 | | Westlake Automobile Receivables Trust 2020-1 144A, 2.80%, 6/16/25 (b) | | | 3,798 | |
3,780,000 | | Westlake Automobile Receivables Trust 2020-2 144A, 1.32%, 7/15/25 (b) | | | 3,824 | |
4,500,000 | | Wingstop Funding 2020-1A LLC 144A, 2.84%, 12/05/50 (b) | | | 4,566 | |
| | | | | | |
Total Asset Backed (Cost - $424,460) | | | 427,120 | |
| | | | | | |
Commercial Paper(c) (0%) | | | | |
8,000,000 | | Consolidated Edison Company of New York Inc., 0.17%, 11/02/20 | | | | |
| | (Cost - $8,000) | | | 8,000 | |
| | | | | | |
Corporate Bond (37%) | | | | |
Financial (24%) | | | | |
2,565,000 | | AIG Global Funding 144A,
0.80%, 7/07/23 (b) | | | 2,585 | |
4,089,000 | | AIG Global Funding 144A,
2.30%, 7/01/22 (b) | | | 4,223 | |
1,100,000 | | Air Lease Corp., 2.25%, 1/15/23 | | | 1,107 | |
765,000 | | Air Lease Corp., 2.75%, 1/15/23 | | | 775 | |
4,360,000 | | Akelius Residential Property AB,
1.13%, 3/14/24 EUR (d)(e) | | | 5,207 | |
2,240,000 | | Ally Financial Inc., 1.45%, 10/02/23 | | | 2,261 | |
1,890,000 | | Ally Financial Inc., 3.88%, 5/21/24 | | | 2,034 | |
3,610,000 | | American Honda Finance Corp.,
0.88%, 7/07/23 | | | 3,641 | |
4,010,000 | | American Honda Finance Corp.,
2.05%, 1/10/23 | | | 4,148 | |
20 Payden Mutual Funds
| | | | | | |
Principal
or Shares | | Security Description | | Value
(000) | |
| | |
3,965,000 | | ANZ New Zealand Int’l Ltd. 144A,
1.90%, 2/13/23 (b) | | $ | 4,089 | |
4,095,000 | | Aon Corp., 2.20%, 11/15/22 | | | 4,242 | |
2,455,000 | | Ares Capital Corp., 3.63%, 1/19/22 | | | 2,519 | |
377,000 | | Assurant Inc., (3 mo. LIBOR USD + 1.250%), 1.48%, 3/26/21 (a) | | | 377 | |
3,070,000 | | Athene Global Funding 144A,
1.20%, 10/13/23 (b) | | | 3,076 | |
3,495,000 | | Athene Global Funding 144A,
2.80%, 5/26/23 (b) | | | 3,646 | |
4,600,000 | | Banco Bilbao Vizcaya Argentaria SA,
0.88%, 9/18/23 | | | 4,599 | |
3,000,000 | | Banco Bradesco SA 144A, 2.85%, 1/27/23 (b) | | | 3,047 | |
2,475,000 | | Banco del Estado de Chile 144A,
2.67%, 1/08/21 (b) | | | 2,484 | |
3,450,000 | | Banco Santander Chile 144A,
2.50%, 12/15/20 (b) | | | 3,459 | |
7,845,000 | | Bank of America Corp., (U.S. Secured Overnight Financing Rate + 0.740%), 0.81%, 10/24/24 (a) | | | 7,856 | |
4,600,000 | | Bank of America Corp., (3 mo. LIBOR USD + 0.930%), 2.82%, 7/21/23 (a) | | | 4,771 | |
2,500,000 | | Bank of America Corp., (3 mo. LIBOR USD + 0.630%), 3.50%, 5/17/22 (a) | | | 2,541 | |
6,885,000 | | Bank of Nova Scotia, 0.80%, 6/15/23 | | | 6,935 | |
2,751,000 | | Bank of Nova Scotia, 2.00%, 11/15/22 | | | 2,844 | |
3,115,000 | | Bank of Nova Scotia, 2.38%, 1/18/23 | | | 3,244 | |
3,265,000 | | Banque Federative du Credit Mutuel SA 144A, 2.13%, 11/21/22 (b) | | | 3,373 | |
2,000,000 | | Banque Federative du Credit Mutuel SA 144A, 2.70%, 7/20/22 (b) | | | 2,075 | |
2,930,000 | | Barclays Bank PLC, 1.70%, 5/12/22 | | | 2,986 | |
2,495,000 | | Barclays PLC, 3.25%, 1/12/21 | | | 2,509 | |
7,000,000 | | BBVA USA, 2.88%, 6/29/22 | | | 7,245 | |
5,570,000 | | BMW Finance NV 144A, 2.25%, 8/12/22 (b) | | | 5,738 | |
3,800,000 | | BNP Paribas SA 144A, 2.95%, 5/23/22 (b) | | | 3,942 | |
4,250,000 | | BNZ International Funding Ltd. 144A,
3.38%, 3/01/23 (b) | | | 4,530 | |
5,265,000 | | Canadian Imperial Bank of Commerce,
0.95%, 6/23/23 | | | 5,327 | |
2,030,000 | | CIT Bank NA, (U.S. Secured Overnight Financing Rate + 1.715%), 2.97%, 9/27/25 (a) | | | 2,100 | |
3,300,000 | | CIT Group Inc., 5.00%, 8/15/22 | | | 3,490 | |
7,835,000 | | Citigroup Inc., (U.S. Secured Overnight Financing Rate + 0.686%), 0.78%, 10/30/24 (a) | | | 7,836 | |
1,475,000 | | Citigroup Inc., (U.S. Secured Overnight Financing Rate + 1.667%), 1.68%, 5/15/24 (a) | | | 1,512 | |
2,100,000 | | Citizens Bank NA, 3.25%, 2/14/22 | | | 2,171 | |
2,005,000 | | Comerica Bank, 2.50%, 7/23/24 | | | 2,138 | |
4,610,000 | | Credit Suisse AG, 1.00%, 5/05/23 | | | 4,669 | |
1,890,000 | | Credit Suisse AG, 2.80%, 4/08/22 | | | 1,956 | |
4,750,000 | | Credit Suisse Group AG 144A,
3.57%, 1/09/23 (b) | | | 4,909 | |
2,840,000 | | DBS Group Holdings Ltd. 144A,
2.85%, 4/16/22 (b) | | | 2,934 | |
1,470,000 | | Enstar Group Ltd., 4.50%, 3/10/22 | | | 1,523 | |
| | | | | | |
Principal
or Shares | | Security Description | | Value
(000) | |
| | |
4,420,000 | | Equinix Inc., 2.63%, 11/18/24 | | $ | 4,703 | |
1,935,000 | | First Republic Bank, (U.S. Secured Overnight Financing Rate + 0.620%), 1.91%, 2/12/24 (a) | | | 1,993 | |
4,500,000 | | FS KKR Capital Corp., 4.75%, 5/15/22 | | | 4,594 | |
3,980,000 | | FS KKR Capital Corp. II 144A,
4.25%, 2/14/25 (b) | | | 3,768 | |
1,198,000 | | Goldman Sachs Group Inc., (3 mo. LIBOR USD + 0.821%), 2.88%, 10/31/22 (a) | | | 1,227 | |
5,420,000 | | Goldman Sachs Group Inc., 3.00%, 4/26/22 | | | 5,487 | |
1,645,000 | | Goldman Sachs Group Inc., 3.50%, 4/01/25 | | | 1,814 | |
2,050,000 | | Icahn Enterprises LP/Icahn Enterprises Finance Corp., 4.75%, 9/15/24 | | | 2,089 | |
1,320,000 | | Icahn Enterprises LP/Icahn Enterprises Finance Corp., 6.25%, 2/01/22 | | | 1,326 | |
3,710,000 | | ICICI Bank Ltd. 144A, 5.75%, 11/16/20 (b) | | | 3,716 | |
1,255,000 | | Intercontinental Exchange Inc., 0.70%, 6/15/23 | | | 1,264 | |
3,260,000 | | Intesa Sanpaolo SpA 144A, 3.13%, 7/14/22 (b) | | | 3,358 | |
655,000 | | iStar Inc., 4.75%, 10/01/24 | | | 627 | |
3,935,000 | | Itau Unibanco Holding SA 144A,
2.90%, 1/24/23 (b) | | | 3,970 | |
5,150,000 | | Jackson National Life Global Funding 144A, 3.30%, 2/01/22 (b) | | | 5,340 | |
4,065,000 | | JPMorgan Chase & Co., (U.S. Secured Overnight Financing Rate + 0.600%), 0.65%, 9/16/24 (a) | | | 4,069 | |
3,615,000 | | JPMorgan Chase & Co., (3 mo. LIBOR USD + 0.695%), 3.21%, 4/01/23 (a) | | | 3,757 | |
3,870,000 | | Macquarie Bank Ltd. 144A, 2.10%, 10/17/22 (b) | | | 3,991 | |
5,005,000 | | Macquarie Group Ltd. 144A, (3 mo. LIBOR USD + 1.020%), 1.28%, 11/28/23 (a)(b) | | | 5,028 | |
3,550,000 | | Metropolitan Life Global Funding I 144A,
0.90%, 6/08/23 (b) | | | 3,590 | |
7,085,000 | | Mitsubishi UFJ Financial Group Inc.,
2.62%, 7/18/22 | | | 7,350 | |
7,232,000 | | Mitsubishi UFJ Financial Group Inc.,
3.22%, 3/07/22 | | | 7,502 | |
5,200,000 | | Mizuho Financial Group Inc., (3 mo. LIBOR USD + 0.610%), 0.85%, 9/08/24 (a) | | | 5,192 | |
2,595,000 | | Mizuho Financial Group Inc., (3 mo. LIBOR USD + 0.840%), 2.72%, 7/16/23 (a) | | | 2,687 | |
2,230,000 | | Morgan Stanley, (U.S. Secured Overnight Financing Rate + 0.745%), 0.86%, 10/21/25 (a) | | | 2,229 | |
1,186,000 | | Morgan Stanley, (3 mo. LIBOR USD + 1.180%), 1.40%, 1/20/22 (a) | | | 1,189 | |
3,435,000 | | Morgan Stanley, (U.S. Secured Overnight Financing Rate + 1.152%), 2.72%, 7/22/25 (a) | | | 3,660 | |
1,875,000 | | National Bank of Canada, (1 yr. US Treasury Yield Curve Rate T Note Constant Maturity + 0.770%), 0.90%, 8/15/23 (a) | | | 1,887 | |
7,685,000 | | National Bank of Canada, 2.10%, 2/01/23 | | | 7,949 | |
2,125,000 | | National Bank of Canada 144A,
2.15%, 10/07/22 (b) | | | 2,196 | |
3,500,000 | | National Securities Clearing Corp. 144A,
1.20%, 4/23/23 (b) | | | 3,568 | |
5,420,000 | | Natwest Group PLC, (3 mo. LIBOR USD + 1.470%), 1.75%, 5/15/23 (a) | | | 5,456 | |
Annual Report 21
Payden Low Duration Fund continued
| | | | | | |
Principal
or Shares | | Security Description | | Value
(000) | |
| | |
4,455,000 | | NatWest Markets PLC 144A, 3.63%, 9/29/22 (b) | | $ | 4,692 | |
2,430,000 | | New York Life Global Funding 144A, | | | | |
| | 1.10%, 5/05/23 (b) | | | 2,469 | |
1,510,000 | | Nordea Bank Abp 144A,
1.00%, 6/09/23 (b) | | | 1,531 | |
2,160,000 | | Owl Rock Capital Corp., 4.25%, 1/15/26 | | | 2,185 | |
890,000 | | Park Aerospace Holdings Ltd. 144A, | | | | |
| | 5.25%, 8/15/22 (b) | | | 917 | |
3,045,000 | | PayPal Holdings Inc., 1.35%, 6/01/23 | | | 3,112 | |
3,225,000 | | PayPal Holdings Inc., 2.20%, 9/26/22 | | | 3,335 | |
4,485,000 | | Protective Life Global Funding 144A, | | | | |
| | 0.63%, 10/13/23 (b) | | | 4,495 | |
1,695,000 | | Protective Life Global Funding 144A, | | | | |
| | 1.08%, 6/09/23 (b) | | | 1,718 | |
1,995,000 | | Reliance Standard Life Global Funding II 144A, 2.15%, 1/21/23 (b) | | | 2,047 | |
2,600,000 | | Reliance Standard Life Global Funding II 144A, 2.63%, 7/22/22 (b) | | | 2,674 | |
5,195,000 | | Royal Bank of Canada, 0.50%, 10/26/23 | | | 5,192 | |
2,050,000 | | Santander Holdings USA Inc., 3.70%, 3/28/22 | | | 2,125 | |
1,595,000 | | Santander Holdings USA Inc., 4.45%, 12/03/21 | | | 1,657 | |
5,650,000 | | Santander UK PLC, 2.10%, 1/13/23 | | | 5,834 | |
2,850,000 | | SBA Tower Trust 144A, 1.88%, 1/15/26 (b) | | | 2,948 | |
1,195,000 | | Shriram Transport Finance Co. Ltd. 144A, | | | | |
| | 5.10%, 7/16/23 (b) | | | 1,150 | |
5,610,000 | | Skandinaviska Enskilda Banken AB 144A, | | | | |
| | 0.55%, 9/01/23 (b) | | | 5,611 | |
1,136,000 | | SLM Corp., 5.13%, 4/05/22 (f) | | | 1,171 | |
1,045,000 | | Starwood Property Trust Inc., 3.63%, 2/01/21 | | | 1,046 | |
3,630,000 | | Sumitomo Mitsui Trust Bank Ltd. 144A, | | | | |
| | 0.80%, 9/12/23 (b) | | | 3,646 | |
2,245,000 | | Suncorp-Metway Ltd. 144A, | | | | |
| | 2.38%, 11/09/20 (b) | | | 2,246 | |
5,325,000 | | Svenska Handelsbanken AB 144A, | | | | |
| | 0.63%, 6/30/23 (b) | | | 5,345 | |
515,000 | | Synchrony Financial, 2.85%, 7/25/22 | | | 531 | |
1,285,000 | | Synchrony Financial, 3.75%, 8/15/21 | | | 1,309 | |
1,505,000 | | Synovus Bank, (U.S. Secured Overnight | | | | |
| | Financing Rate + 0.945%), 2.29%, 2/10/23 (a) | | | 1,525 | |
2,940,000 | | UBS Group AG 144A, (1 yr. US Treasury Yield Curve Rate T Note Constant Maturity | | | | |
| | + 0.830%), 1.01%, 7/30/24 (a)(b) | | | 2,953 | |
2,500,000 | | UBS Group AG 144A, (3 mo. LIBOR USD | | | | |
| | + 0.954%), 2.86%, 8/15/23 (a)(b) | | | 2,591 | |
2,330,000 | | UBS Group AG 144A, 3.49%, 5/23/23 (b) | | | 2,429 | |
1,000,000 | | UniCredit SpA 144A, 6.57%, 1/14/22 (b) | | | 1,058 | |
3,075,000 | | Ventas Realty LP, 2.65%, 1/15/25 | | | 3,249 | |
7,625,000 | | Wells Fargo Bank NA, (3 mo. LIBOR USD | | | | |
| | + 0.650%), 2.08%, 9/09/22 (a) | | | 7,733 | |
| | | | | 365,773 | |
Industrial (10%) | | | | |
335,000 | | 3M Co., 2.65%, 4/15/25 | | | 363 | |
7,385,000 | | AbbVie Inc. 144A, 2.15%, 11/19/21 (b) | | | 7,519 | |
5,000,000 | | AbbVie Inc. 144A, 2.30%, 11/21/22 (b) | | | 5,183 | |
1,081,000 | | Anglo American Capital PLC 144A, | | | | |
| | 4.13%, 4/15/21 (b) | | | 1,099 | |
2,420,000 | | Aviation Capital Group LLC 144A, | | | | |
| | 3.88%, 5/01/23 (b) | | | 2,428 | |
| | | | | | |
Principal
or Shares | | Security Description | | Value
(000) | |
| | |
1,980,000 | | Aviation Capital Group LLC 144A, | | | | |
| | 4.38%, 1/30/24 (b) | | $ | 2,000 | |
3,650,000 | | Becton Dickinson Euro Finance Sarl, | | | | |
| | 0.63%, 6/04/23 EUR (e) | | | 4,314 | |
2,317,000 | | Caterpillar Financial Services Corp., | | | | |
| | 0.65%, 7/07/23 | | | 2,332 | |
1,750,000 | | Centene Corp., 4.75%, 1/15/25 | | | 1,800 | |
1,825,000 | | Cigna Corp., (3 mo. LIBOR USD + 0.650%), | | | | |
| | 0.90%, 9/17/21 (a) | | | 1,825 | |
2,455,000 | | CNH Industrial Capital LLC, 1.95%, 7/02/23 | | | 2,498 | |
2,147,000 | | Daimler Finance North America LLC 144A, | | | | |
| | 3.35%, 2/22/23 (b) | | | 2,266 | |
264,000 | | Dell International LLC/EMC Corp. 144A, | | | | |
| | 5.88%, 6/15/21 (b) | | | 265 | |
2,999,000 | | Delta Air Lines Inc., 2.60%, 12/04/20 | | | 2,997 | |
730,000 | | Elanco Animal Health Inc., 4.91%, 8/27/21 | | | 748 | |
2,800,000 | | Evernorth Health Inc., 2.60%, 11/30/20 | | | 2,805 | |
2,665,000 | | Ford Motor Credit Co. LLC, 5.13%, 6/16/25 | | | 2,781 | |
1,270,000 | | Fox Corp., 3.67%, 1/25/22 | | | 1,321 | |
1,845,000 | | General Motors Financial Co. Inc., (3 mo. LIBOR | | | | |
| | USD + 1.310%), 1.53%, 6/30/22 (a) | | | 1,848 | |
2,520,000 | | General Motors Financial Co. Inc., (3 mo. LIBOR | | | | |
| | USD + 1.550%), 1.78%, 1/14/22 (a) | | | 2,532 | |
6,045,000 | | Gilead Sciences Inc., 0.75%, 9/29/23 | | | 6,061 | |
4,175,000 | | GlaxoSmithKline Capital PLC, 0.53%, 10/01/23 | | | 4,173 | |
3,760,000 | | Hyundai Capital America 144A, | | | | |
| | 1.25%, 9/18/23 (b) | | | 3,772 | |
1,660,000 | | Infor Inc. 144A, 1.45%, 7/15/23 (b) | | | 1,685 | |
2,320,000 | | Lennar Corp., 4.13%, 1/15/22 | | | 2,380 | |
675,000 | | McDonald’s Corp., 3.30%, 7/01/25 | | | 747 | |
3,185,000 | | Microchip Technology Inc. 144A, | | | | |
| | 2.67%, 9/01/23 (b) | | | 3,307 | |
1,035,000 | | Mondelez International Inc., 2.13%, 4/13/23 | | | 1,073 | |
7,200,000 | | Mylan Inc. 144A, 3.13%, 1/15/23 (b) | | | 7,569 | |
460,000 | | NIKE Inc., 2.40%, 3/27/25 | | | 494 | |
1,315,000 | | Nutrition & Biosciences Inc. 144A, | | | | |
| | 0.70%, 9/15/22 (b) | | | 1,319 | |
1,585,000 | | Oracle Corp., 2.50%, 4/01/25 | | | 1,697 | |
3,155,000 | | Pelabuhan Indonesia III Persero PT 144A, | | | | |
| | 4.50%, 5/02/23 (b) | | | 3,338 | |
1,450,000 | | Penske Truck Leasing Co. LP/PTL Finance Corp. | | | | |
| | 144A, 3.65%, 7/29/21 (b) | | | 1,480 | |
7,450,000 | | Penske Truck Leasing Co. LP/PTL Finance Corp. | | | | |
| | 144A, 4.25%, 1/17/23 (b) | | | 8,019 | |
1,066,000 | | Royal Caribbean Cruises Ltd., 2.65%, 11/28/20 | | | 1,063 | |
3,860,000 | | Royalty Pharma PLC 144A, 0.75%, 9/02/23 (b) | | | 3,861 | |
2,400,000 | | Ryder System Inc., 2.50%, 9/01/22 | | | 2,482 | |
1,657,000 | | Ryder System Inc., 2.88%, 6/01/22 | | | 1,714 | |
5,740,000 | | Ryder System Inc., 3.40%, 3/01/23 | | | 6,071 | |
1,550,000 | | Sirius XM Radio Inc. 144A, 3.88%, 8/01/22 (b) | | | 1,564 | |
1,050,000 | | SMBC Aviation Capital Finance DAC 144A, | | | | |
| | 2.65%, 7/15/21 (b) | | | 1,058 | |
1,595,000 | | SMBC Aviation Capital Finance DAC 144A, | | | | |
| | 3.00%, 7/15/22 (b) | | | 1,632 | |
1,415,000 | | Smithfield Foods Inc. 144A, 2.65%, 10/03/21 (b) | | | 1,423 | |
2,860,000 | | Southwest Airlines Co., 4.75%, 5/04/23 | | | 3,066 | |
22 Payden Mutual Funds
| | | | | | |
Principal
or Shares | | Security Description | | Value
(000) | |
| | |
1,165,000 | | Sprint Spectrum Co. LLC/Sprint Spectrum Co. II LLC/Sprint Spectrum Co. III LLC 144A, | | | | |
| | 3.36%, 9/20/21 (b) | | $ | 1,178 | |
575,000 | | Target Corp., 2.25%, 4/15/25 | | | 614 | |
930,000 | | Teva Pharmaceutical Finance Netherlands III BV, 2.20%, 7/21/21 | | | 917 | |
1,100,000 | | Teva Pharmaceutical Finance Netherlands III BV, 6.00%, 4/15/24 | | | 1,109 | |
800,000 | | Teva Pharmaceutical Finance Netherlands III BV, 7.13%, 1/31/25 | | | 831 | |
855,000 | | Toll Brothers Finance Corp., 4.38%, 4/15/23 | | | 897 | |
5,685,000 | | Toyota Motor Credit Corp., 0.50%, 8/14/23 | | | 5,722 | |
3,000,000 | | Upjohn Inc. 144A, 1.13%, 6/22/22 (b) | | | 3,028 | |
1,885,000 | | Volkswagen Group of America Finance LLC | | | | |
| | 144A, 2.50%, 9/24/21 (b) | | | 1,919 | |
1,560,000 | | Volkswagen Group of America Finance LLC | | | | |
| | 144A, 2.70%, 9/26/22 (b) | | | 1,617 | |
7,175,000 | | Volkswagen Group of America Finance LLC | | | | |
| | 144A, 2.90%, 5/13/22 (b) | | | 7,411 | |
2,750,000 | | Volkswagen Group of America Finance LLC | | | | |
| | 144A, 3.88%, 11/13/20 (b) | | | 2,753 | |
1,340,000 | | Westinghouse Air Brake Technologies Corp., | | | | |
| | 3.20%, 6/15/25 | | | 1,429 | |
| | | 149,397 | |
Utility (3%) | | | | |
3,725,000 | | Aker BP ASA 144A, 2.88%, 1/15/26 (b) | | | 3,692 | |
8,165,000 | | DTE Energy Co., 0.55%, 11/01/22 | | | 8,200 | |
7,700,000 | | Enel Finance International NV 144A, | | | | |
| | 2.88%, 5/25/22 (b) | | | 7,944 | |
1,865,000 | | Gray Oak Pipeline LLC 144A, | | | | |
| | 2.00%, 9/15/23 (b) | | | 1,872 | |
2,255,000 | | Kinder Morgan Inc., (3 mo. LIBOR USD | | | | |
| | + 1.280%), 1.52%, 1/15/23 (a) | | | 2,266 | |
1,815,000 | | NextEra Energy Operating Partners LP 144A, | | | | |
| | 4.25%, 7/15/24 (b) | | | 1,899 | |
453,000 | | Occidental Petroleum Corp., 2.60%, 8/13/21 | | | 444 | |
695,000 | | Occidental Petroleum Corp., 2.70%, 8/15/22 | | | 644 | |
4,980,000 | | Pacific Gas and Electric Co., 1.75%, 6/16/22 | | | 4,981 | |
4,685,000 | | PNM Resources Inc., 3.25%, 3/09/21 | | | 4,726 | |
921,429 | | Southern California Edison Co., 1.85%, 2/01/22 | | | 922 | |
8,160,000 | | Southern Co. Gas Capital Corp., | | | | |
| | 2.45%, 10/01/23 | | | 8,572 | |
4,000,000 | | Valero Energy Corp., 2.70%, 4/15/23 | | | 4,118 | |
| | | 50,280 | |
Total Corporate Bond (Cost - $555,588) | | | 565,450 | |
Foreign Government (1%) | | | | |
1,960,000 | | Abu Dhabi Government International Bond | | | | |
| | 144A, 2.50%, 10/11/22 (b) | | | 2,031 | |
2,120,000 | | Fondo MIVIVIENDA SA 144A, | | | | |
| | 3.50%, 1/31/23 (b) | | | 2,223 | |
3,130,000 | | Georgia Government International Bond 144A, | | | | |
| | 6.88%, 4/12/21 (b) | | | 3,189 | |
646,000 | | Senegal Government International Bond 144A, | | | | |
| | 8.75%, 5/13/21 (b) | | | 668 | |
Total Foreign Government (Cost - $7,906) | | | 8,111 | |
| | | | | | |
Principal
or Shares | | Security Description | | Value
(000) | |
| |
Mortgage Backed (16%) | | | | |
3,274,775 | | AREIT 2018-CRE2 Trust 144A, (1 mo. LIBOR | | | | |
| | USD + 1.400%), 1.55%, 11/14/35 (a)(b) | | $ | 3,196 | |
129,710,997 | | Benchmark 2018-B6 Mortgage Trust, | | | | |
| | 0.44%, 10/10/51 (g) | | | 3,176 | |
2,847,893 | | BX Commercial Mortgage Trust 2019-XL 144A, | | | | |
| | (1 mo. LIBOR USD + 0.920%), | | | | |
| | 1.07%, 10/15/36 (a)(b) | | | 2,853 | |
2,866,879 | | BX Commercial Mortgage Trust 2019-XL 144A, | | | | |
| | (1 mo. LIBOR USD + 1.080%), | | | | |
| | 1.23%, 10/15/36 (a)(b) | | | 2,867 | |
1,628,509 | | BX Commercial Mortgage Trust 2020-BXLP | | | | |
| | 144A, (1 mo. LIBOR USD + 1.600%), | | | | |
| | 1.75%, 12/15/36 (a)(b) | | | 1,577 | |
2,150,000 | | BX Commercial Mortgage Trust 2020-VKNG | | | | |
| | 144A, (1 mo. LIBOR USD + 0.930%), | | | | |
| | 1.08%, 10/15/37 (a)(b) | | | 2,157 | |
6,480,000 | | BX Commercial Mortgage Trust 2020-VKNG | | | | |
| | 144A, (1 mo. LIBOR USD + 1.130%), | | | | |
| | 1.28%, 10/15/37 (a)(b) | | | 6,504 | |
22,486,058 | | Cantor Commercial Real Estate Lending | | | | |
| | 2019-CF1, 1.14%, 5/15/52 (g) | | | 1,653 | |
9,031,030 | | CHC Commercial Mortgage Trust 2019-CHC | | | | |
| | 144A, (1 mo. LIBOR USD + 2.050%), | | | | |
| | 2.20%, 6/15/34 (a)(b) | | | 8,212 | |
44,823,886 | | Citigroup Commercial Mortgage Trust 2018-C6, | | | | |
| | 0.78%, 11/10/51 (g) | | | 2,341 | |
20,940,000 | | Cold Storage Trust 2020-ICE5 144A, (1 mo. | | | | |
| | LIBOR USD + 0.900%), 1.06%, 11/15/23 (a)(b) | | | 20,862 | |
5,740,000 | | COMM 2019-WCM Mortgage Trust 144A, (1 | | | | |
| | mo. LIBOR USD + 0.900%), | | | | |
| | 1.05%, 10/15/34 (a)(b) | | | 5,720 | |
6,886,671 | | Connecticut Avenue Securities Trust 2019-HRP1 | | | | |
| | 144A, (1 mo. LIBOR USD + 2.150%), | | | | |
| | 2.30%, 11/25/39 (a)(b) | | | 6,225 | |
4,100,000 | | Connecticut Avenue Securities Trust 2019-HRP1 | | | | |
| | 144A, (1 mo. LIBOR USD + 9.250%), | | | | |
| | 9.40%, 11/25/39 (a)(b) | | | 3,242 | |
3,327,966 | | Connecticut Avenue Securities Trust 2019-R07 | | | | |
| | 144A, (1 mo. LIBOR USD + 2.100%), | | | | |
| | 2.25%, 10/25/39 (a)(b) | | | 3,310 | |
1,390,000 | | Connecticut Avenue Securities Trust 2020-R01 | | | | |
| | 144A, (1 mo. LIBOR USD + 2.050%), | | | | |
| | 2.20%, 1/25/40 (a)(b) | | | 1,369 | |
900,000 | | Connecticut Avenue Securities Trust 2020-SBT1 | | | | |
| | 144A, (1 mo. LIBOR USD + 3.650%), | | | | |
| | 3.80%, 2/25/40 (a)(b) | | | 862 | |
2,860,000 | | Credit Suisse Mortgage Capital Certificates | | | | |
| | 2019-ICE4 144A, (1 mo. LIBOR USD | | | | |
| | + 1.230%), 1.38%, 5/15/36 (a)(b) | | | 2,854 | |
1,679,294 | | Fannie Mae Connecticut Avenue Securities, | | | | |
| | (1 mo. LIBOR USD + 2.200%), 2.35%, 8/25/30 (a) | | | 1,637 | |
4,435,515 | | Fannie Mae Connecticut Avenue Securities, | | | | |
| | (1 mo. LIBOR USD + 2.250%), 2.40%, 7/25/30 (a) | | | 4,388 | |
8,616,027 | | FN AS7638 15YR, 2.50%, 7/01/31 | | | 8,967 | |
10,662,943 | | FN BM5108 15YR, 3.00%, 2/01/33 | | | 11,165 | |
12,864,342 | | FN FM2743 15YR, 3.00%, 2/01/34 | | | 13,493 | |
Annual Report 23
Payden Low Duration Fund continued
| | | | | | |
Principal
or Shares | | Security Description | | Value
(000) | |
| | |
4,928,280 | | FN MA3124 15YR, 2.50%, 9/01/32 | | $ | 5,131 | |
26,691,117 | | FR SB0084 15YR, 3.00%, 2/01/32 | | | 28,452 | |
5,689,796 | | FR ZS7279 15YR, 2.50%, 1/01/29 | | | 5,930 | |
13,005,957 | | FR ZS8617 15YR, 2.50%, 8/01/31 | | | 13,543 | |
3,031,942 | | Freddie Mac STACR 2019-HQA3 144A, (1 mo. | | | | |
| | LIBOR USD + 1.850%), 2.00%, 9/25/49 (a)(b) | | | 2,982 | |
3,593,967 | | Freddie Mac STACR REMIC Trust 2019-HQA4 144A, (1 mo. LIBOR USD + 2.050%), | | | | |
| | 2.20%, 11/25/49 (a)(b) | | | 3,584 | |
2,100,000 | | Freddie Mac STACR REMIC Trust 2020-DNA1 144A, (1 mo. LIBOR USD + 1.700%), | | | | |
| | 1.85%, 1/25/50 (a)(b) | | | 2,063 | |
1,020,000 | | Freddie Mac STACR REMIC Trust 2020-DNA2 144A, (1 mo. LIBOR USD + 1.850%), | | | | |
| | 2.00%, 2/25/50 (a)(b) | | | 1,004 | |
4,090,000 | | Freddie Mac STACR REMIC Trust 2020-HQA1 144A, (1 mo. LIBOR USD + 1.900%), | | | | |
| | 2.05%, 1/25/50 (a)(b) | | | 4,029 | |
1,170,000 | | Freddie Mac STACR REMIC Trust 2020-HQA2 144A, (1 mo. LIBOR USD + 3.100%), | | | | |
| | 3.25%, 3/25/50 (a)(b) | | | 1,158 | |
3,098,828 | | Freddie Mac STACR Trust 2019-DNA4 144A, (1 mo. LIBOR USD + 1.950%), | | | | |
| | 2.10%, 10/25/49 (a)(b) | | | 3,086 | |
10,533,278 | | Freddie Mac STACR Trust 2019-HRP1 144A, (1 mo. LIBOR USD + 1.400%), | | | | |
| | 1.55%, 2/25/49 (a)(b) | | | 10,161 | |
1,450,000 | | Freddie Mac Structured Agency Credit Risk Debt Notes, (1 mo. LIBOR USD + 4.600%), | | | | |
| | 4.75%, 12/25/42 (a) | | | 1,378 | |
1,115,499 | | Freddie Mac Structured Agency Credit Risk Debt Notes, (1 mo. LIBOR USD + 11.250%), | | | | |
| | 11.40%, 10/25/29 (a) | | | 1,055 | |
164,727 | | HomeBanc Mortgage Trust 2004-1, (1 mo. | | | | |
| | LIBOR USD + 0.860%), 1.01%, 8/25/29 (a) | | | 159 | |
5,000,000 | | JP Morgan Chase Commercial Mortgage Securities Trust 2019-MFP 144A, (1 mo. LIBOR USD + 1.160%), 1.31%, 7/15/36 (a)(b) | | | 4,809 | |
662,177 | | JP Morgan Mortgage Trust 2017-1 144A, | | | | |
| | 3.50%, 1/25/47 (b)(g) | | | 666 | |
2,230,300 | | JP Morgan Mortgage Trust 2017-5 144A, | | | | |
| | 3.00%, 10/26/48 (b)(g) | | | 2,247 | |
2,040,000 | | Lanark Master Issuer PLC, (3 mo. LIBOR USD | | | | |
| | + 0.420%), 0.68%, 12/22/69 (a) | | | 2,041 | |
170,681 | | Merrill Lynch Mortgage Investors Trust Series | | | | |
| | MLCC 2004-1, 2.74%, 12/25/34 (g) | | | 171 | |
1,070,000 | | MF1 2020-FL3 Ltd. 144A, (1 mo. LIBOR USD | | | | |
| | + 2.850%), 3.00%, 7/15/35 (a)(b) | | | 1,082 | |
3,400,000 | | Morgan Stanley Capital I Trust 2017-CLS 144A, (1 mo. LIBOR USD + 0.700%), | | | | |
| | 0.85%, 11/15/34 (a)(b) | | | 3,396 | |
64,073 | | Morgan Stanley Mortgage Loan Trust 2004-5AR, 2.92%, 7/25/34 (g) | | | 65 | |
1,349,369 | | Multifamily Connecticut Avenue Securities Trust 2019-01 144A, (1 mo. LIBOR USD + 1.700%), 1.85%, 10/15/49 (a)(b) | | | 1,297 | |
| | | | | | |
Principal
or Shares | | Security Description | | Value
(000) | |
| | |
1,611,594 | | New Residential Mortgage Loan Trust 2017-1 | | | | |
| | 144A, 4.00%, 2/25/57 (b)(g) | | $ | 1,751 | |
3,737,157 | | New Residential Mortgage Loan Trust 2017-3 | | | | |
| | 144A, 4.00%, 4/25/57 (b)(g) | | | 4,049 | |
3,604,344 | | New Residential Mortgage Loan Trust 2017-4 | | | | |
| | 144A, 4.00%, 5/25/57 (b)(g) | | | 3,950 | |
5,530,000 | | PFP 2019-6 Ltd. 144A, (1 mo. LIBOR USD | | | | |
| | + 1.050%), 1.20%, 4/14/37 (a)(b) | | | 5,466 | |
3,510,000 | | PFP 2019-6 Ltd. 144A, (1 mo. LIBOR USD | | | | |
| | + 1.450%), 1.60%, 4/14/37 (a)(b) | | | 3,345 | |
1,440,539 | | Residential Asset Securitization Trust 2006-A8, 6.00%, 8/25/36 | | | 1,034 | |
4,848,627 | | STACR Trust 2018-HRP1 144A, (1 mo. LIBOR USD + 1.650%), 1.80%, 4/25/43 (a)(b) | | | 4,717 | |
2,750,000 | | STACR Trust 2018-HRP1 144A, (1 mo. LIBOR USD + 3.750%), 3.90%, 4/25/43 (a)(b) | | | 2,609 | |
650,000 | | STACR Trust 2018-HRP2 144A, (1 mo. LIBOR USD + 10.500%),
10.65%, 2/25/47 (a)(b) | | | 649 | |
Total Mortgage Backed (Cost - $250,375) | | | 245,689 | |
U.S. Government Agency (1%) | | | | |
7,460,000 | | FHLMC, 0.38%, 4/20/23 | | | 7,490 | |
8,260,000 | | FNMA, 0.25%, 7/10/23 | | | 8,271 | |
Total U.S. Government Agency (Cost - $15,684) | | | 15,761 | |
U.S. Treasury (17%) | | | | |
40,237,000 | | U.S. Treasury Note, 0.13%, 8/31/22 | | | 40,216 | |
22,695,000 | | U.S. Treasury Note, 0.13%, 9/30/22 | | | 22,683 | |
97,702,000 | | U.S. Treasury Note, 0.13%, 9/15/23 | | | 97,515 | |
93,070,000 | | U.S. Treasury Note, 0.25%, 6/15/23 | | | 93,246 | |
1,191,000 | | U.S. Treasury Note, 2.75%, 5/31/23 (h)(i) | | | 1,270 | |
Total U.S. Treasury (Cost - $255,009) | | | 254,930 | |
Investment Company (0%) | | | | |
2,565,601 | | Payden Cash Reserves Money Market Fund * | | | | |
| | (Cost - $2,566) | | | 2,566 | |
Total Investments (Cost - $1,519,588) (100%) | | | 1,527,627 | |
Other Assets, net of Liabilities (0%) | | | 5,355 | |
Net Assets (100%) | | $ | 1,532,982 | |
| | | | | | |
| (a) | Floating rate security. The rate shown reflects the rate in effect at October 31, 2020. |
| (b) | Security offered only to qualified institutional investors, and thus is not registered for sale to the public under rule 144A of the Securities Act of 1933. It has been deemed liquid under guidelines approved by the Board. |
| (c) | Yield to maturity at time of purchase. |
| (d) | Security offered and sold outside the United States, and thus is exempt from registration under Regulation S of the Securities Act of 1933. It has been deemed liquid under guidelines approved by the Board. |
| (e) | Principal in foreign currency. |
| (f) | All or a portion of these securities are on loan. At October 31, 2020, the total market value of the Fund’s securities on loan is $127 and the total market value of the collateral held by the Fund is $130. Amounts in 000s. |
| (g) | Variable rate security. Interest rate disclosed is as of the most recent information available. Certain variable rate securities are not based on a published reference rate and spread but are determined by the issuer or agent and are based on current market conditions. These securities do not indicate a reference rate and spread in their description above. |
| (h) | All or a portion of security has been pledged in connection with outstanding centrally cleared swaps. |
| (i) | All or a portion of the security is pledged to cover futures contract margin requirements. |
24 Payden Mutual Funds
Open Forward Currency Contracts to USD
| | | | | | | | | | | | | | | | | | | | |
Currency Purchased
(000s) | | Currency
Sold (000s) | | Counterparty | | Settlement
Date | | Unrealized
Appreciation
(Depreciation)
(000s) |
Assets: | | | | | | | | | | | | | | | | | | | | |
| USD 13,786 | | | | EUR 11,727 | | | | | Citibank, N.A. | | | | | 03/22/2021 | | | | $ | 82 | |
Liabilities: | | | | | | | | | | | | | | | | | | | | |
| EUR 3,500 | | | | USD 4,126 | | | | | Citibank, N.A. | | | | | 03/22/2021 | | | | | (36 | ) |
| | | | | | | | | | | | | | | | | | | | |
| Net Unrealized Appreciation/(Depreciation) | | | | $ | 46 | |
| | | | | | | | | | | | | | | | | | | | |
Open Futures Contracts
| | | | | | | | | | | | | | | | | | | | | | | | | |
| Contract Type | | Number of
Contracts | | Expiration
Date | | Notional
Amount
(000s) | | Current
Value
(000s) | | Unrealized
Appreciation
(Depreciation)
(000s) |
Long Contracts: | | | | | | | | | | | | | | | | | | | | | |
| U.S. Treasury 2-Year Note Future | | | | 1,471 | | | | | Dec-20 | | | | $ | 324,861 | | | | $ | (51 | ) | | | $ | (51 | ) |
| | | | | | | | | | | | | | | | | | | | | | | | | |
Short Contracts: | | | | | | | | | | | | | | | | | | | | | | | | | |
| U.S. Treasury 10-Year Note Future | | | | 385 | | | | | Dec-20 | | | | | (53,214 | ) | | | | 247 | | | | | 247 | |
| U.S. Treasury 5-Year Note Future | | | | 125 | | | | | Dec-20 | | | | | (15,700 | ) | | | | 32 | | | | | 32 | |
| | | | | | | | | | | | | | | | | | | | | | | | | |
| | | | | | | | | | | | | | | | | | | | | | | | 279 | |
| | | | | | | | | | | | | | | | | | | | | | | | | |
Total Futures | | | | | | | | | | | | | | | | | | | | | | | $ | 228 | |
| | | | | | | | | | | | | | | | | | | | | | | | | |
Open Centrally Cleared Interest Rate Swap Contracts
| | | | | | | | | | | | | | | | | | | | | | | | | |
| Description | | Maturity
Date | | Notional
Amount
(000s) | | Value
(000s) | | Upfront
payments/
receipts
(000s) | | Unrealized
Appreciation
(Depreciation)
(000s) |
| 2-Year SOFR Swap, Receive Fixed 0.030% Annually, Pay Variable 0.08% (SOFRRATE) Annually | | | | 08/20/2022 | | | | | USD 10,000 | | | | $ | (6 | ) | | | $ | — | | | | $ | (6 | ) |
| 3-Year Interest Rate Swap, Receive Fixed 1.5535% Semi-Annually, Pay Variable 0.50625% (CDOR03 Index) Semi-Annually | | | | 08/30/2022 | | | | | CAD 17,216 | | | | | 272 | | | | | — | | | | | 272 | |
| 3-Year Interest Rate Swap, Receive Fixed 1.558% Semi-Annually, Pay Variable 0.50625% (CDOR03 Index) Semi-Annually | | | | 08/30/2022 | | | | | CAD 17,216 | | | | | 273 | | | | | — | | | | | 273 | |
| 3-Year Interest Rate Swap, Receive Fixed 1.575% Semi-Annually, Pay Variable 0.50625% (CDOR03 Index) Semi-Annually | | | | 08/30/2022 | | | | | CAD 15,118 | | | | | 243 | | | | | — | | | | | 243 | |
| | | | | | | | | | | | | | | | | | | | | | | | | |
| | | | | | | | | | | | | $ | 782 | | | | $ | ��� | | | | $ | 782 | |
| | | | | | | | | | | | | | | | | | | | | | | | | |
Offsetting Assets and Liabilities
The Fund’s loaned securities were all subject to an enforceable Securities Lending Agency Agreement. Securities lent in accordance with the Securities Lending Agency Agreement on a gross basis were as follows:
| | | | |
| Total gross amount presented on the Statements | | $ | 127 | |
of Assets and Liabilities1 | | | | |
Non-cash Collateral2 | | | (127 | ) |
| | | | |
Net Amount | | $ | — | |
| | | | |
| 1 | The amount presented on the Statements of Assets and Liabilities is not offset and is shown on a gross basis. |
| 2 | At October 31, 2020, the value of the collateral received from each borrower exceeded the value of the related securities loaned. This amount is disclosed on the Schedule of Investments. |
See notes to financial statements.
Annual Report 25
Payden U.S. Government Fund
| | | | |
The Fund seeks a high level of total return that is consistent with preservation of capital by generally investing in U.S. government obligations with an average portfolio maturity not to exceed five years. | | 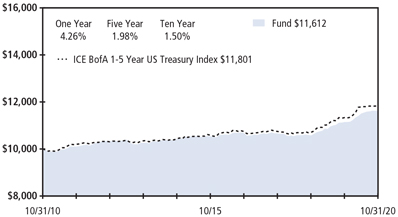
Past performance does not predict future returns. The graph does not reflect the impact of taxes or transaction costs a shareholder would pay. |
| Portfolio Composition - percent of investments |
Mortgage Backed | | 89% |
U.S. Treasury | | 4% |
Investment Company | | 3% |
Asset Backed | | 2% |
FDIC Guaranteed | | 2% |
| | |
| | |
| This information is not part of the audited financial statements. |
| | | | | | |
Schedule of Investments - October 31, 2020 | | | | |
Principal
or Shares | | Security Description | | Value
(000) | |
| |
Asset Backed (2%) | | | | |
996,905 | | Fannie Mae Grantor Trust 2017-T1, | | | | |
| | 2.90%, 6/25/27 | | | | |
| | (Cost - $1,012) | | $ | 1,096 | |
FDIC Guaranteed (2%) | | | | |
384,706 | | FDIC Guaranteed Notes Trust 2010-S1 144A, | | | | |
| | 3.25%, 4/25/38 (a) | | | 392 | |
19,995 | | FDIC Guaranteed Notes Trust 2010-S2 144A, (1 | | | | |
| | mo. LIBOR USD + 0.700%), | | | | |
| | 0.85%, 12/29/45 (a)(b) | | | 20 | |
68,996 | | FDIC Guaranteed Notes Trust 2010-S3 144A, | | | | |
| | 2.74%, 12/03/20 (a) | | | 69 | |
443,219 | | FDIC Guaranteed Notes Trust 2010-S4 144A, (1 | | | | |
| | mo. LIBOR USD + 0.720%), | | | | |
| | 0.87%, 12/04/20 (a)(b) | | | 443 | |
Total FDIC Guaranteed (Cost - $918) | | | 924 | |
Mortgage Backed (100%) | | | | |
1,191,078 | | FG C91912 20YR, 3.00%, 2/01/37 | | | 1,251 | |
76,338 | | FH 2B0709 ARM, (12 mo. LIBOR USD | | | | |
| | + 1.750%), 2.58%, 8/01/42 (b) | | | 80 | |
123,538 | | FH 2B0972 ARM, (12 mo. LIBOR USD | | | | |
| | + 1.770%), 3.02%, 11/01/42 (b) | | | 128 | |
107,130 | | FH 2B1333 ARM, (12 mo. LIBOR USD | | | | |
| | + 1.650%), 3.43%, 4/01/43 (b) | | | 112 | |
688,804 | | FH 2B4763 ARM, (12 mo. LIBOR USD | | | | |
| | + 1.620%), 2.16%, 10/01/45 (b) | | | 714 | |
122,538 | | FH 849486 ARM, (12 mo. LIBOR USD | | | | |
| | + 1.874%), 3.01%, 8/01/41 (b) | | | 129 | |
681,125 | | FH 849506 ARM, (12 mo. LIBOR USD | | | | |
| | + 1.612%), 2.92%, 11/01/44 (b) | | | 709 | |
951,328 | | FHLMC Multifamily Structured Pass-Through | | | | |
| | Certificates, (1 mo. LIBOR USD + 0.360%), | | | | |
| | 0.51%, 7/25/24 (b) | | | 953 | |
1,000,000 | | FHLMC Multifamily Structured Pass-Through | | | | |
| | Certificates, 0.70%, 4/25/29 (c) | | | 990 | |
| | | | | | |
| | | | | | |
Principal
or Shares | | Security Description | | Value
(000) | |
| | |
998,972 | | FHLMC Multifamily Structured Pass-Through | | | | |
| | Certificates, 1.16%, 5/25/50 (c) | | $ | 1,010 | |
1,250,000 | | FHLMC Multifamily Structured Pass-Through | | | | |
| | Certificates, 2.95%, 7/25/24 | | | 1,346 | |
1,000,000 | | FHLMC Multifamily Structured Pass-Through | | | | |
| | Certificates, 3.06%, 8/25/24 (c) | | | 1,083 | |
1,000,000 | | FHLMC Multifamily Structured Pass-Through | | | | |
| | Certificates, 3.32%, 2/25/23 | | | 1,062 | |
52,260 | | FHLMC Multifamily Structured Pass-Through | | | | |
| | Certificates, 3.45%, 5/25/23 | | | 53 | |
323,627 | | FN 890434 15YR, 3.00%, 7/01/27 | | | 345 | |
674,117 | | FN AH3394 30YR, 4.00%, 1/01/41 | | | 743 | |
153,950 | | FN AI4019 ARM, (12 mo. LIBOR USD | | | | |
| | + 1.750%), 2.70%, 7/01/41 (b) | | | 161 | |
1,088,897 | | FN AL2095 15YR, 3.00%, 6/01/27 | | | 1,158 | |
690,729 | | FN AL2221 15YR, 3.00%, 7/01/27 | | | 734 | |
147,924 | | FN AL5596 ARM, (12 mo. LIBOR USD | | | | |
| | + 1.553%), 3.56%, 2/01/44 (b) | | | 154 | |
167,396 | | FN AL5790 ARM, (12 mo. LIBOR USD | | | | |
| | + 1.565%), 2.07%, 10/01/44 (b) | | | 173 | |
191,832 | | FN AL5967 ARM, (12 mo. LIBOR USD | | | | |
| | + 1.576%), 2.43%, 11/01/44 (b) | | | 199 | |
680,037 | | FN AL7648 ARM, (12 mo. LIBOR USD | | | | |
| | + 1.586%), 2.57%, 10/01/45 (b) | | | 709 | |
413,092 | | FN AO7975 15YR, 3.00%, 6/01/27 | | | 439 | |
465,547 | | FN AP4746 15YR, 3.00%, 8/01/27 | | | 493 | |
960,643 | | FN AS1745 15YR, 3.00%, 2/01/29 | | | 1,027 | |
858,690 | | FN AS4186 15YR, 2.50%, 1/01/30 | | | 903 | |
420,208 | | FN AS6443 15YR, 3.00%, 12/01/30 | | | 448 | |
776,028 | | FN AS8013 15YR, 2.50%, 9/01/31 | | | 830 | |
1,142,855 | | FN AS8592 15YR, 2.50%, 1/01/32 | | | 1,219 | |
102,079 | | FN AU6974 ARM, (12 mo. LIBOR USD | | | | |
| | + 1.580%), 2.61%, 11/01/43 (b) | | | 106 | |
301,600 | | FN AU8673 ARM, (12 mo. LIBOR USD | | | | |
| | + 1.530%), 3.53%, 2/01/44 (b) | | | 313 | |
866,034 | | FN AZ2886 ARM, (12 mo. LIBOR USD | | | | |
| | + 1.600%), 2.63%, 9/01/45 (b) | | | 905 | |
26 Payden Mutual Funds
| | | | | | |
Principal
or Shares | | Security Description | | Value
(000) | |
| | |
672,978 | | FN AZ4380 ARM, (12 mo. LIBOR USD | | | | |
| | + 1.590%), 2.36%, 8/01/45 (b) | | $ | 700 | |
889,710 | | FN BD2473 ARM, (12 mo. LIBOR USD | | | | |
| | + 1.620%), 2.50%, 1/01/47 (b) | | | 925 | |
530,461 | | FN BE7522 15YR, 2.50%, 2/01/32 | | | 553 | |
1,085,379 | | FN BM3938 15YR, 3.50%, 4/01/33 | | | 1,193 | |
834,500 | | FN BM4153 15YR, 3.00%, 6/01/33 | | | 893 | |
755,289 | | FN BO3231 ARM, (12 mo. LIBOR USD | | | | |
| | + 1.620%), 2.73%, 10/01/49 (b) | | | 795 | |
965,654 | | FN BP6814 ARM, (12 mo. LIBOR USD | | | | |
| | + 1.610%), 2.29%, 5/01/50 (b) | | | 1,008 | |
845,799 | | FN CA4462 15YR, 3.00%, 11/01/34 | | | 919 | |
972,642 | | FN CA6242 15YR, 2.00%, 7/01/35 | | | 1,010 | |
866,559 | | FN MA2868 15YR, 2.50%, 1/01/32 | | | 904 | |
1,243,668 | | FN MA3124 15YR, 2.50%, 9/01/32 | | | 1,295 | |
1,194,548 | | FN MA4012 15YR, 2.00%, 5/01/35 | | | 1,239 | |
1,242,790 | | FN MA4042 15YR, 2.00%, 6/01/35 | | | 1,290 | |
2,000,000 | | FNCL, 1.50%, 30YR TBA (d) | | | 2,010 | |
4,000,000 | | FNCL, 2.00%, 15YR TBA (d) | | | 4,144 | |
147,309 | | FNR 2002-10-FA, (1 mo. LIBOR USD | | | | |
| | + 0.750%), 0.90%, 2/25/32 (b) | | | 149 | |
1,000,000 | | FR QN3917 15YR, 2.00%, 10/01/35 | | | 1,038 | |
999,214 | | FRESB 2020-SB78 Mortgage Trust, | | | | |
| | 0.82%, 6/25/40 (c) | | | 1,004 | |
1,000,000 | | FRESB 2020-SB79 Mortgage Trust, | | | | |
| | 0.80%, 7/25/40 (c) | | | 1,005 | |
648,312 | | G2 778200, 4.00%, 2/20/32 | | | 701 | |
417,741 | | G2 778203, 4.75%, 2/20/32 | | | 460 | |
1,007,137 | | G2 AD0857, 3.75%, 9/20/33 | | | 1,078 | |
339,059 | | G2 AY5132, 3.25%, 7/20/37 | | | 356 | |
700,610 | | G2 AY5138, 3.25%, 12/20/37 | | | 742 | |
703,490 | | GN 728153, 5.50%, 10/15/29 | | | 775 | |
337,690 | | GN 737791 30YR, 4.50%, 12/15/40 | | | 379 | |
4,444,846 | | GNR 2014-79 ST, 2.55%, 7/20/29 (c) | | | 64 | |
Total Mortgage Backed (Cost - $46,854) | | | 47,308 | |
U.S. Treasury (5%) | | | | |
750,000 | | U.S. Treasury Bill, 0.07%, 11/19/20 (e) | | | 750 | |
1,500,000 | | U.S. Treasury Bill, 0.08%, 11/12/20 (e) | | | 1,500 | |
Total U.S. Treasury (Cost - $2,250) | | | 2,250 | |
Investment Company (4%) | | | | |
1,857,730 | | Payden Cash Reserves Money Market Fund * | | | | |
| | (Cost - $1,858) | | | 1,858 | |
Total Investments (Cost - $52,892) (113%) | | | 53,436 | |
Liabilities in excess of Other Assets (-13%) | | | (6,076 | ) |
| |
Net Assets (100%) | | $ | 47,360 | |
| | | | | | |
| (a) | Security offered only to qualified institutional investors, and thus is not registered for sale to the public under rule 144A of the Securities Act of 1933. It has been deemed liquid under guidelines approved by the Board. |
| (b) | Floating rate security. The rate shown reflects the rate in effect at October 31, 2020. |
| (c) | Variable rate security. Interest rate disclosed is as of the most recent information available. Certain variable rate securities are not based on a published reference rate and spread but are determined by the issuer or agent and are based on current market conditions. These securities do not indicate a reference rate and spread in their description above. |
| (d) | Security was purchased on a delayed delivery basis. |
| (e) | Yield to maturity at time of purchase. |
See notes to financial statements.
Annual Report 27
| | | | | | |
The Fund seeks a high level of total return that is consistent with preservation of capital by generally investing in Government National Mortgage Association mortgage-backed securities and other U.S. government obligations with no limit on the average portfolio maturity. | | | 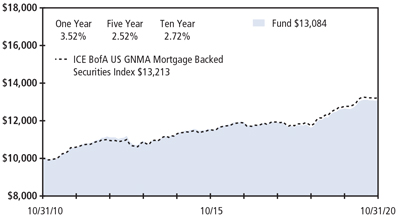
Past performance does not predict future returns. The graph does not reflect the impact of taxes or transaction costs a shareholder would pay. |
| Portfolio Composition - percent of investments | | | | |
| |
Mortgage Backed U.S. Treasury Other | |
| 97%
2% 1% |
|
| | | | |
| | | | |
| | | | |
| | | | |
| | | | |
| | | | |
| This information is not part of the audited financial statements. | |
| |
| | | | | | |
Schedule of Investments - October 31, 2020 | | | | |
Principal
or Shares | | Security Description | | Value
(000) | |
FDIC Guaranteed (0%) | | | | |
29,992 | | FDIC Guaranteed Notes Trust 2010-S2 144A, (1 mo. LIBOR USD + 0.700%), 0.85%, 12/29/45 (a)(b) | | | | |
| | (Cost - $30) | | $ | 30 | |
Mortgage Backed (135%) | | | | |
859,750 | | Fannie Mae-Aces, (1 mo. LIBOR USD + 0.590%), 0.74%, 9/25/23 (a) | | | 863 | |
585,893 | | FH 2B4763 ARM, (12 mo. LIBOR USD + 1.620%), 2.16%, 10/01/45 (a) | | | 608 | |
65,931 | | FHLMC Multifamily Structured Pass-Through Certificates, (1 mo. LIBOR USD + 0.200%), 0.35%, 2/25/23 (a) | | | 66 | |
1,000,000 | | FHLMC Multifamily Structured Pass-Through Certificates, (1 mo. LIBOR USD + 0.220%), 0.38%, 3/25/25 (a) | | | 1,002 | |
2,335,077 | | FHLMC Multifamily Structured Pass-Through Certificates, (1 mo. LIBOR USD + 0.360%), 0.51%, 7/25/24 (a) | | | 2,340 | |
974,956 | | FHR, (1 mo. LIBOR USD + 0.300%), 0.45%, 1/15/35 (a) | | | 976 | |
484,585 | | FN BM2007 30YR, 4.00%, 9/01/48 | | | 517 | |
2,260,000 | | FNCL, 1.50%, 30YR TBA (c) | | | 2,271 | |
6,160,000 | | FNCL, 3.00%, 30YR TBA (c) | | | 6,439 | |
118,329 | | FNR 2007-110 FA, (1 mo. LIBOR USD + 0.620%), 0.77%, 12/25/37 (a) | | | 120 | |
333,148 | | FNR 2019-50 MA, 3.50%, 10/25/40 | | | 334 | |
385,258 | | FNR 86 FE, (1 mo. LIBOR USD + 0.450%), 0.60%, 8/25/25 (a) | | | 385 | |
327,131 | | G2 3711 30YR, 5.50%, 5/20/35 | | | 388 | |
422,253 | | G2 3747 30YR, 5.00%, 8/20/35 | | | 481 | |
263,458 | | G2 3772 30YR, 5.00%, 10/20/35 | | | 300 | |
473,960 | | G2 3785 30YR, 5.00%, 11/20/35 | | | 540 | |
570,396 | | G2 4802 30YR, 5.00%, 9/20/40 | | | 649 | |
1,968,162 | | G2 4853 30YR, 4.00%, 11/20/40 | | | 2,181 | |
308,346 | | G2 4978 30YR, 4.50%, 3/20/41 | | | 343 | |
567,371 | | G2 5055 30YR, 4.50%, 5/20/41 | | | 632 | |
737,961 | | G2 5083 30YR, 5.00%, 6/20/41 | | | 839 | |
| | | | | | |
Principal
or Shares | | Security Description | | Value
(000) | |
| | |
1,026,676 | | G2 5115 30YR, 4.50%, 7/20/41 | | $ | 1,143 | |
338,695 | | G2 5140 30YR, 4.50%, 8/20/41 | | | 377 | |
911,423 | | G2 5233 30YR, 4.00%, 11/20/41 | | | 1,013 | |
2,025,001 | | G2 5258 30YR, 3.50%, 12/20/41 | | | 2,214 | |
504,237 | | G2 770239 30YR, 4.00%, 2/20/42 | | | 555 | |
161,810 | | G2 80013 ARM, (1 yr. US Treasury Yield Curve Rate T Note Constant Maturity + 1.500%), 3.13%, 11/20/26 (a) | | | 163 | |
351,960 | | G2 80029 ARM, (1 yr. US Treasury Yield Curve Rate T Note Constant Maturity + 1.500%), 3.00%, 1/20/27 (a) | | | 365 | |
376,209 | | G2 80044 ARM, (1 yr. US Treasury Yield Curve Rate T Note Constant Maturity + 1.500%), 3.00%, 2/20/27 (a) | | | 390 | |
520,352 | | G2 80052 ARM, (1 yr. US Treasury Yield Curve Rate T Note Constant Maturity + 1.500%), 3.00%, 3/20/27 (a) | | | 539 | |
385,355 | | G2 80059 ARM, (1 yr. US Treasury Yield Curve Rate T Note Constant Maturity + 1.500%), 2.88%, 4/20/27 (a) | | | 400 | |
21,684 | | G2 8006 ARM, (1 yr. US Treasury Yield Curve Rate T Note Constant Maturity + 1.500%), 2.25%, 7/20/22 (a) | | | 22 | |
898,530 | | G2 80074 ARM, (1 yr. US Treasury Yield Curve Rate T Note Constant Maturity + 1.500%), 2.88%, 5/20/27 (a) | | | 933 | |
1,553,119 | | G2 80152 ARM, (1 yr. US Treasury Yield Curve Rate T Note Constant Maturity + 1.500%), 3.00%, 1/20/28 (a) | | | 1,613 | |
415,837 | | G2 80154 ARM, (1 yr. US Treasury Yield Curve Rate T Note Constant Maturity + 1.500%), 3.00%, 1/20/28 (a) | | | 432 | |
28 Payden Mutual Funds
| | | | | | |
Principal
or Shares | | Security Description | | Value
(000) | |
| | |
697,084 | | G2 80169 ARM, (1 yr. US Treasury Yield Curve Rate T Note Constant Maturity + 1.500%), 3.00%, 2/20/28 (a) | | $ | 724 | |
1,000,178 | | G2 80184 ARM, (1 yr. US Treasury Yield Curve Rate T Note Constant Maturity + 1.500%), 2.88%, 4/20/28 (a) | | | 1,041 | |
53,675 | | G2 80311 ARM, (1 yr. US Treasury Yield Curve Rate T Note Constant Maturity + 1.500%), 2.25%, 8/20/29 (a) | | | 55 | |
992,468 | | G2 80319 ARM, (1 yr. US Treasury Yield Curve Rate T Note Constant Maturity + 1.500%), 2.25%, 9/20/29 (a) | | | 1,026 | |
91,592 | | G2 8041 ARM, (1 yr. US Treasury Yield Curve Rate T Note Constant Maturity + 1.500%), 2.25%, 8/20/22 (a) | | | 92 | |
55,113 | | G2 80424 ARM, (1 yr. US Treasury Yield Curve Rate T Note Constant Maturity + 1.500%), 2.25%, 7/20/30 (a) | | | 55 | |
126,237 | | G2 80428 ARM, (1 yr. US Treasury Yield Curve Rate T Note Constant Maturity + 1.500%), 2.25%, 7/20/30 (a) | | | 132 | |
288,226 | | G2 80541 ARM, (1 yr. US Treasury Yield Curve Rate T Note Constant Maturity + 1.500%), 2.25%, 9/20/31 (a) | | | 299 | |
216,184 | | G2 80569 ARM, (1 yr. US Treasury Yield Curve Rate T Note Constant Maturity + 1.500%), 3.00%, 1/20/32 (a) | | | 226 | |
50,554 | | G2 80579 ARM, (1 yr. US Treasury Yield Curve Rate T Note Constant Maturity + 1.500%), 3.00%, 2/20/32 (a) | | | 53 | |
721,793 | | G2 80637 ARM, (1 yr. US Treasury Yield Curve Rate T Note Constant Maturity + 1.500%), 2.25%, 9/20/32 (a) | | | 749 | |
1,621,151 | | G2 80795 ARM, (1 yr. US Treasury Yield Curve Rate T Note Constant Maturity + 1.500%), 3.13%, 12/20/33 (a) | | | 1,699 | |
646,411 | | G2 80826 ARM, (1 yr. US Treasury Yield Curve Rate T Note Constant Maturity + 1.500%), 3.00%, 2/20/34 (a) | | | 677 | |
974,268 | | G2 80835 ARM, (1 yr. US Treasury Yield Curve Rate T Note Constant Maturity + 1.500%), 3.00%, 2/20/34 (a) | | | 1,022 | |
145,709 | | G2 80837 ARM, (1 yr. US Treasury Yield Curve Rate T Note Constant Maturity + 1.500%), 3.00%, 2/20/34 (a) | | | 153 | |
173,025 | | G2 81018 ARM, (1 yr. US Treasury Yield Curve Rate T Note Constant Maturity + 1.500%), 2.25%, 8/20/34 (a) | | | 180 | |
8,014 | | G2 81044 ARM, (1 yr. US Treasury Yield Curve Rate T Note Constant Maturity + 1.500%), 2.25%, 8/20/34 (a) | | | 8 | |
17,294 | | G2 8121 ARM, (1 yr. US Treasury Yield Curve Rate T Note Constant Maturity + 1.500%), 3.00%, 1/20/23 (a) | | | 18 | |
| | | | | | |
Principal
or Shares | | Security Description | | Value
(000) | |
| | |
548,333 | | G2 81214 ARM, (1 yr. US Treasury Yield Curve Rate T Note Constant Maturity + 1.500%), 3.00%, 1/20/35 (a) | | $ | 575 | |
231,596 | | G2 81220 ARM, (1 yr. US Treasury Yield Curve Rate T Note Constant Maturity + 1.500%), 3.00%, 1/20/35 (a) | | | 243 | |
196,535 | | G2 81278 ARM, (1 yr. US Treasury Yield Curve Rate T Note Constant Maturity + 1.500%), 3.00%, 3/20/35 (a) | | | 206 | |
890,578 | | G2 81282 ARM, (1 yr. US Treasury Yield Curve Rate T Note Constant Maturity + 1.500%), 3.00%, 3/20/35 (a) | | | 935 | |
805,292 | | G2 82074 ARM, (1 yr. US Treasury Yield Curve Rate T Note Constant Maturity + 1.500%), 2.88%, 5/20/38 (a) | | | 843 | |
711,167 | | G2 82107 ARM, (1 yr. US Treasury Yield Curve Rate T Note Constant Maturity + 1.500%), 2.25%, 7/20/38 (a) | | | 741 | |
112,039 | | G2 82151 ARM, (1 yr. US Treasury Yield Curve Rate T Note Constant Maturity + 1.500%), 2.25%, 9/20/38 (a) | | | 112 | |
27,481 | | G2 8228 ARM, (1 yr. US Treasury Yield Curve Rate T Note Constant Maturity + 1.500%), 2.25%, 7/20/23 (a) | | | 28 | |
1,317,049 | | G2 82457 ARM, (1 yr. US Treasury Yield Curve Rate T Note Constant Maturity + 1.500%), 3.00%, 1/20/40 (a) | | | 1,382 | |
703,226 | | G2 82463 ARM, (1 yr. US Treasury Yield Curve Rate T Note Constant Maturity + 1.500%), 3.00%, 1/20/40 (a) | | | 736 | |
566,393 | | G2 82737 ARM, (1 yr. US Treasury Yield Curve Rate T Note Constant Maturity + 1.500%), 3.00%, 2/20/41 (a) | | | 593 | |
208,037 | | G2 83031 ARM, (1 yr. US Treasury Yield Curve Rate T Note Constant Maturity + 1.500%), 2.75%, 1/20/42 (a) | | | 210 | |
68,703 | | G2 8358 ARM, (1 yr. US Treasury Yield Curve Rate T Note Constant Maturity + 1.500%), 3.00%, 1/20/24 (a) | | | 70 | |
310,146 | | G2 8547 ARM, (1 yr. US Treasury Yield Curve Rate T Note Constant Maturity + 1.500%), 3.13%, 11/20/24 (a) | | | 319 | |
46,412 | | G2 8595 ARM, (1 yr. US Treasury Yield Curve Rate T Note Constant Maturity + 1.500%), 3.00%, 2/20/25 (a) | | | 48 | |
6,600 | | G2 8855 ARM, (1 yr. US Treasury Yield Curve Rate T Note Constant Maturity + 1.500%), 3.13%, 10/20/21 (a) | | | 7 | |
167,332 | | G2 8968 ARM, (1 yr. US Treasury Yield Curve Rate T Note Constant Maturity + 1.500%), 2.25%, 9/20/26 (a) | | | 172 | |
556,659 | | G2 8991 ARM, (1 yr. US Treasury Yield Curve Rate T Note Constant Maturity + 1.500%), 3.13%, 10/20/26 (a) | | | 576 | |
1,210,407 | | G2 AY5132, 3.25%, 7/20/37 | | | 1,270 | |
1,401,977 | | G2 AY5138, 3.25%, 12/20/37 | | | 1,484 | |
419,567 | | G2 MA0312, 3.50%, 8/20/42 | | | 437 | |
559,152 | | G2 MA0387, 3.50%, 9/20/42 | | | 585 | |
Annual Report 29
Payden GNMA Fund continued
| | | | | | |
Principal
or Shares | | Security Description | | Value
(000) | |
| | |
2,313,148 | | G2 MA0698 30YR, 3.00%, 1/20/43 | | $ | 2,477 | |
2,465,326 | | G2 MA1012 30YR, 3.50%, 5/20/43 | | | 2,683 | |
2,250,557 | | G2 MA1089 30YR, 3.00%, 6/20/43 | | | 2,401 | |
2,038,308 | | G2 MA1520 30YR, 3.00%, 12/20/43 | | | 2,166 | |
2,238,907 | | G2 MA2304 30YR, 4.00%, 10/20/44 | | | 2,445 | |
1,963,595 | | G2 MA2522 30YR, 4.00%, 1/20/45 | | | 2,144 | |
1,355,738 | | G2 MA2767 ARM, (1 yr. US Treasury Yield Curve Rate T Note Constant Maturity + 1.500%), 1.63%, 4/20/45 (a) | | | 1,401 | |
1,169,251 | | G2 MA3454 30YR, 3.50%, 2/20/46 | | | 1,256 | |
2,437,213 | | G2 MA3662 30YR, 3.00%, 5/20/46 | | | 2,573 | |
2,350,196 | | G2 MA3663 30YR, 3.50%, 5/20/46 | | | 2,517 | |
2,066,577 | | G2 MA3735 30YR, 3.00%, 6/20/46 | | | 2,187 | |
475,791 | | G2 MA3736 30YR, 3.50%, 6/20/46 | | | 515 | |
2,014,021 | | G2 MA3802 30YR, 3.00%, 7/20/46 | | | 2,126 | |
1,913,475 | | G2 MA3936 30YR, 3.00%, 9/20/46 | | | 2,027 | |
1,277,476 | | G2 MA4003 30YR, 3.00%, 10/20/46 | | | 1,352 | |
1,022,017 | | G2 MA4069 30YR, 3.50%, 11/20/46 | | | 1,091 | |
275,438 | | G2 MA4127 30YR, 3.50%, 12/20/46 | | | 294 | |
1,846,534 | | G2 MA4195 30YR, 3.00%, 1/20/47 | | | 1,950 | |
774,030 | | G2 MA4197 30YR, 4.00%, 1/20/47 | | | 839 | |
816,237 | | G2 MA4262 30YR, 3.50%, 2/20/47 | | | 873 | |
509,749 | | G2 MA4263 30YR, 4.00%, 2/20/47 | | | 551 | |
2,196,295 | | G2 MA4321 30YR, 3.50%, 3/20/47 | | | 2,350 | |
1,493,975 | | G2 MA4322 30YR, 4.00%, 3/20/47 | | | 1,618 | |
1,092,041 | | G2 MA4510 30YR, 3.50%, 6/20/47 | | | 1,162 | |
2,071,412 | | G2 MA4719 30YR, 3.50%, 9/20/47 | | | 2,214 | |
1,155,725 | | G2 MA4721 30YR, 4.50%, 9/20/47 | | | 1,264 | |
2,803,690 | | G2 MA4962 30YR, 3.50%, 1/20/48 | | | 2,994 | |
950,670 | | G2 MA5021 30YR, 4.50%, 2/20/48 | | | 1,033 | |
847,965 | | G2 MA5265 30YR, 4.50%, 6/20/48 | | | 917 | |
1,215,909 | | G2 MA5816 30YR, 3.50%, 3/20/49 | | | 1,284 | |
2,393,623 | | G2 MA6710 30YR, 3.00%, 6/20/50 | | | 2,515 | |
2,288,504 | | G2 MA6820 30YR, 3.00%, 8/20/50 | | | 2,409 | |
2,350,000 | | G2SF, 2.00%, 30YR TBA (c) | | | 2,436 | |
14,530,000 | | G2SF, 2.50%, 30YR TBA (c) | | | 15,185 | |
1,300,000 | | G2SF, 3.00%, 30YR TBA (c) | | | 1,357 | |
16,900,000 | | G2SF, 3.50%, 30YR TBA (c) | | | 17,818 | |
375,516 | | GN 366983 30YR, 4.00%, 6/15/41 | | | 405 | |
934,625 | | GN 455989, 5.00%, 7/15/26 | | | 1,037 | |
139,254 | | GN 558954, 5.25%, 5/15/29 | | | 155 | |
548,443 | | GN 558956, 4.50%, 6/15/29 | | | 608 | |
202,259 | | GN 605099 30YR, 5.50%, 3/15/34 | | | 237 | |
464,079 | | GN 616826 30YR, 5.50%, 1/15/35 | | | 545 | |
1,134,452 | | GN 710868 30YR, 5.50%, 9/15/39 | | | 1,305 | |
425,174 | | GN 728153, 5.50%, 10/15/29 | | | 469 | |
185,407 | | GN 728159, 5.25%, 11/15/29 | | | 206 | |
191,609 | | GN 781636 30YR, 5.50%, 7/15/33 | | | 225 | |
212,291 | | GN 781810 30YR, 5.50%, 10/15/34 | | | 247 | |
267,288 | | GN 781811 30YR, 5.00%, 10/15/34 | | | 308 | |
1,239,927 | | GN 784370 30YR, 4.00%, 7/15/45 | | | 1,393 | |
296,215 | | GNR 2001-35 FA, (1 mo. LIBOR USD + 0.250%), 0.40%, 8/16/31 (a) | | | 296 | |
124,648 | | GNR 2002-13 FA, (1 mo. LIBOR USD + 0.500%), 0.65%, 2/16/32 (a) | | | 125 | |
210,433 | | GNR 2002-72 FA, (1 mo. LIBOR USD + 0.400%), 0.55%, 10/20/32 (a) | | | 210 | |
96,799 | | GNR 2002-72 FB, (1 mo. LIBOR USD + 0.400%), 0.55%, 10/20/32 (a) | | | 97 | |
728,810 | | GNR 2002-72 FE, (1 mo. LIBOR USD + 0.400%), 0.55%, 10/20/32 (a) | | | 729 | |
| | | | | | |
Principal
or Shares | | Security Description | | Value
(000) | |
| | |
662,630 | | GNR 2003-71 FC, (1 mo. LIBOR USD + 0.500%), 0.65%, 7/20/33 (a) | | $ | 666 | |
1,264,229 | | GNR 2004-56 F, (1 mo. LIBOR USD + 0.400%), 0.55%, 6/20/33 (a) | | | 1,266 | |
904,230 | | GNR 2004-59 FH, (1 mo. LIBOR USD + 0.250%), 0.40%, 8/16/34 (a) | | | 904 | |
621,186 | | GNR 2004-86 FG, (1 mo. LIBOR USD + 0.400%), 0.55%, 7/20/34 (a) | | | 623 | |
1,292,805 | | GNR 2006-60 FK, (1 mo. LIBOR USD + 0.200%), 0.35%, 11/20/36 (a) | | | 1,291 | |
885,070 | | GNR 2007-54 FC, (1 mo. LIBOR USD + 0.260%), 0.41%, 9/20/37 (a) | | | 886 | |
360,744 | | GNR 2007-76 FB, (1 mo. LIBOR USD + 0.500%), 0.65%, 11/20/37 (a) | | | 363 | |
1,058,017 | | GNR 2008-11 FB, (1 mo. LIBOR USD + 0.600%), 0.75%, 2/20/38 (a) | | | 1,067 | |
266,701 | | GNR 2008-2 FH, (1 mo. LIBOR USD + 0.450%), 0.60%, 1/20/38 (a) | | | 268 | |
1,228,868 | | GNR 2008-67 UF, (1 mo. LIBOR USD + 0.450%), 0.60%, 6/20/38 (a) | | | 1,232 | |
548,094 | | GNR 2011-153 LF, (1 mo. LIBOR USD + 0.250%), 0.40%, 7/16/41 (a) | | | 547 | |
550,104 | | GNR 2012-18 AF, (1 mo. LIBOR USD + 0.300%), 0.45%, 2/20/38 (a) | | | 539 | |
552,167 | | GNR 2012-76 GF, (1 mo. LIBOR USD + 0.300%), 0.45%, 6/16/42 (a) | | | 552 | |
10,321,446 | | GNR 2014-79 ST, 2.55%, 7/20/29 (d) | | | 150 | |
286,344 | | GNR 2015-159 AH, 2.50%, 5/20/43 | | | 292 | |
660,523 | | GNR 2017-68 AF, (1 mo. LIBOR USD + 0.350%), 0.50%, 5/20/47 (a) | | | 662 | |
1,524,816 | | GNR 2018-91 FC, (1 mo. LIBOR USD + 0.300%), 0.45%, 7/20/48 (a) | | | 1,524 | |
Total Mortgage Backed (Cost - $163,420) | | | 166,067 | |
U.S. Treasury (3%) | | | | |
2,000,000 | | U.S. Treasury Bill, 0.05%, 11/12/20 (e) | | | 2,000 | |
1,500,000 | | U.S. Treasury Bill, 0.06%, 11/19/20 (e) | | | 1,500 | |
Total U.S. Treasury (Cost - $3,500) | | | 3,500 | |
Investment Company (2%) | | | | |
2,352,255 | | Payden Cash Reserves Money Market Fund * | | | | |
| | (Cost - $2,352) | | | 2,352 | |
Total Investments (Cost - $169,302) (140%) | | | 171,949 | |
Liabilities in excess of Other Assets (-40%) | | | (49,440 | ) |
Net Assets (100%) | | $ | 122,509 | |
| | | | | | |
| (a) | Floating rate security. The rate shown reflects the rate in effect at October 31, 2020. |
| (b) | Security offered only to qualified institutional investors, and thus is not registered for sale to the public under rule 144A of the Securities Act of 1933. It has been deemed liquid under guidelines approved by the Board. |
| (c) | Security was purchased on a delayed delivery basis. |
| (d) | Variable rate security. Interest rate disclosed is as of the most recent information available. Certain variable rate securities are not based on a published reference rate and spread but are determined by the issuer or agent and are based on current market conditions. These securities do not indicate a reference rate and spread in their description above. |
| (e) | Yield to maturity at time of purchase. |
30 Payden Mutual Funds
| | | | | | |
The Fund seeks a high level of total return that is consistent with preservation of capital by generally investing in investment grade securities with no limit on the average portfolio maturity. | | | 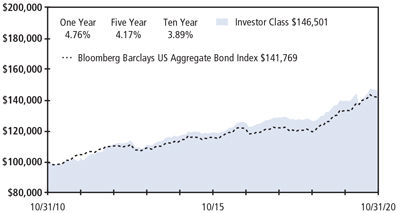 |
| Portfolio Composition - percent of investments | | | | |
Corporate Bond | | | 34 | % |
Mortgage Backed | | | 27 | % |
U.S. Treasury | | | 27 | % |
Asset Backed | | | 5 | % |
Foreign Government | | | 2 | % |
Other | | | 5 | % |
| | | | |
| | | | |
| | | | | | |
| This information is not part of the audited financial statements. | | | Past performance does not predict future returns. The graph does not reflect the impact of taxes or transaction costs a shareholder would pay. The Fund’s Adviser and SI Classes are expected to perform similarly to its Investor Class, except for class specific expenses or waivers. |
Schedule of Investments - October 31, 2020
| | | | | | |
Principal
or Shares | | Security Description | | Value
(000) | |
Asset Backed (6%) | | | | |
2,000,000 | | Apidos CLO XXI 144A, (3 mo. LIBOR USD + 2.450%), 2.67%, 7/18/27 (a)(b) | | $ | 1,887 | |
1,576,050 | | Arbys Funding LLC 144A,
3.24%, 7/30/50 (b) | | | 1,621 | |
3,065,000 | | Atrium XII 144A, (3 mo. LIBOR USD + 2.800%), 3.02%, 4/22/27 (a)(b) | | | 2,794 | |
2,850,000 | | Bain Capital Credit CLO 2020-3 Ltd. 144A, (3 mo. LIBOR USD + 1.900%), 2.16%, 10/23/32 (a)(b) | | | 2,850 | |
2,343,367 | | BlueMountain CLO 2015-2 Ltd. 144A, (3 mo. LIBOR USD + 0.930%),
1.15%, 7/18/27 (a)(b) | | | 2,321 | |
2,927,426 | | CARS-DB4 LP 144A, 3.25%, 2/15/50 (b) | | | 3,032 | |
55,330 | | Chase Funding Trust Series 2003-1, (1 mo. LIBOR USD + 0.660%),
0.81%, 11/25/32 (a) | | | 55 | |
3,650,000 | | CIFC European Funding CLO II DAC 144A, (3 mo. EURIBOR + 0.900%), 0.90%, 4/15/33 EUR (a)(b)(c) | | | 4,272 | |
2,000,000 | | CIFC Funding 2017-III Ltd. 144A, (3 mo. LIBOR USD + 1.220%),
1.44%, 7/20/30 (a)(b) | | | 1,981 | |
1,700,000 | | CIFC Funding 2017-III Ltd. 144A, (3 mo. LIBOR USD + 1.800%),
2.02%, 7/20/30 (a)(b) | | | 1,691 | |
3,950,000 | | CLNC 2019-FL1 Ltd. 144A, (1 mo. LIBOR USD + 1.550%), 1.70%, 8/20/35 (a)(b) | | | 3,867 | |
2,961,825 | | Domino’s Pizza Master Issuer LLC 144A, 4.33%, 7/25/48 (b) | | | 3,217 | |
6,064,800 | | Driven Brands Funding 2020-1A LLC 144A, 3.79%, 7/20/50 (b) | | | 6,261 | |
4,366,442 | | Fannie Mae Grantor Trust 2017-T1, 2.90%, 6/25/27 | | | 4,804 | |
958,075 | | First Investors Auto Owner Trust 2016-2 144A, 2.53%, 7/15/22 (b) | | | 960 | |
1,300,000 | | Greystone Commercial Real Estate Notes 2018-HC1 Ltd. 144A, (1 mo. LIBOR USD + 1.550%), 1.70%, 9/15/28 (a)(b) | | | 1,247 | |
3,000,000 | | Greystone Commercial Real Estate Notes 2018-HC1 Ltd. 144A, (1 mo. LIBOR USD + 2.650%), 2.80%, 9/15/28 (a)(b) | | | 2,959 | |
| | | | | | |
Principal
or Shares | | Security Description | | Value
(000) | |
| | |
3,990,000 | | Gulf Stream Meridian 2 Ltd. 144A, (3 mo. LIBOR USD + 1.400%),
0.00%, 10/15/29 (a)(b)(d) | | $ | 3,990 | |
1,950,000 | | Hunt CRE 2018-FL2 Ltd. 144A, (1 mo. LIBOR USD + 1.450%), 1.60%, 8/15/28 (a)(b) | | | 1,928 | |
2,550,000 | | JFIN CLO 2014 Ltd. 144A, (3 mo. LIBOR USD + 1.450%), 1.67%, 4/21/25 (a)(b) | | | 2,531 | |
627,585 | | L.A. Arena Funding LLC 144A, 7.66%, 12/15/26 (b) | | | 620 | |
1,750,000 | | LCM XXI LP 144A, (3 mo. LIBOR USD + 2.000%), 2.22%, 4/20/28 (a)(b) | | | 1,695 | |
2,400,000 | | Man GLG Euro CLO 144A, (3 mo. EURIBOR + 0.900%), 0.90%, 10/15/32 EUR (a)(b)(c) | | | 2,794 | |
209,369 | | Marathon CRE 2018 FL1 Ltd. 144A, (1 mo. LIBOR USD + 1.150%),
1.30%, 6/15/28 (a)(b) | | | 208 | |
1,150,000 | | Montmartre Euro CLO 2020-2 DAC 144A, (3 mo. EURIBOR + 1.590%), 1.59%, 7/15/33 EUR (a)(b)(c) | | | 1,338 | |
2,590,425 | | Planet Fitness Master Issuer LLC 144A, 3.86%, 12/05/49 (b) | | | 2,455 | |
1,900,000 | | Regatta Funding LP 2013-2A 144A, (3 mo. LIBOR USD + 2.700%),
2.94%, 1/15/29 (a)(b) | | | 1,874 | |
3,800,000 | | St Paul’s CLO XII DAC 144A, (3 mo. EURIBOR + 0.920%), 0.92%, 4/15/33 EUR (a)(b)(c) | | | 4,403 | |
2,260,000 | | STWD 2019-FL1 Ltd. 144A, (1 mo. LIBOR USD + 1.400%), 1.55%, 7/15/38 (a)(b) | | | 2,232 | |
2,446,425 | | Taco Bell Funding LLC 144A,
4.32%, 11/25/48 (b) | | | 2,498 | |
1,900,000 | | Voya Euro CLO III DAC 144A, (3 mo. EURIBOR + 0.920%), 0.92%, 4/15/33 EUR (a)(b)(c) | | | 2,203 | |
Annual Report 31
Payden Core Bond Fund continued
| | | | | | |
Principal
or Shares | | Security Description | | Value
(000) | |
| | |
2,730,000 | | Westlake Automobile Receivables Trust 2020-1 144A, 2.80%, 6/16/25 (b) | | $ | 2,802 | |
4,660,000 | | Wingstop Funding 2020-1A LLC 144A, 2.84%, 12/05/50 (b) | | | 4,728 | |
| | | | | | |
Total Asset Backed (Cost - $83,199) | | | 84,118 | |
Bank Loans(e) (2%) | | | | |
875,000 | | AI Convoy Luxembourg Sarl Term Loan B 1L, (3 mo. EURIBOR + 3.750%), 3.75%, 1/20/27 EUR (c) | | | 1,003 | |
1,932,419 | | Altice France SA Term Loan B11 1L, (LIBOR USD 1-Month + 2.750%), 2.90%, 7/31/25 | | | 1,852 | |
2,027,000 | | Ascent Resources Utica Holdings LLC Term Loan 2L, (LIBOR USD 1-Month + 9.000%), 10.00%, 11/01/25 | | | 2,150 | |
1,350,563 | | Dole Food Co. Inc. Term Loan B 1L, (LIBOR USD 1-Month + 2.750%), 3.75%, 4/06/24 | | | 1,326 | |
1,100,000 | | Froneri Lux FinCo SARL Term Loan B 1L, (1 mo. EURIBOR + 2.625%), 2.63%, 1/31/27 EUR (c) | | | 1,251 | |
952,112 | | GOBP Holdings Inc. Term Loan B 1L, (LIBOR USD 1-Month + 2.750%), 2.90%, 10/22/25 | | | 933 | |
1,923,559 | | Harbor Freight Tools USA Inc. Term Loan B 1L, (LIBOR USD 1-Month + 3.250%), 4.00%, 10/19/27 | | | 1,899 | |
1,194,837 | | Hilton Worldwide Finance LLC Term Loan B2 1L, (LIBOR USD 1-Month + 1.750%), 1.90%, 6/22/26 | | | 1,136 | |
1,964,962 | | IRB Holding Corp. Term Loan B 1L, (LIBOR USD 1-Month + 2.750%), 3.75%, 2/05/25 | | | 1,874 | |
1,935,000 | | Mauser Packaging Solutions Holding Co. Term Loan B 1L, (LIBOR USD 3-Month + 3.250%), 3.48%, 4/03/24 | | | 1,814 | |
855,000 | | Newco Financing Partnership Term Loan B1 1L, (LIBOR USD 1-Month + 3.500%), 3.50%, 1/31/29 | | | 836 | |
3,041,972 | | Tacala Investment Corp. Term Loan B 1L, (LIBOR USD 1-Month + 3.250%), 3.40%, 2/05/27 | | | 2,959 | |
855,000 | | UPC Financing Partnership Term Loan B2 1L, (LIBOR USD 1-Month + 3.500%), 3.50%, 1/31/29 | | | 836 | |
3,748,500 | | Wyndham Hotels & Resorts Inc. Term Loan B 1L, (LIBOR USD 1-Month + 1.750%), 1.90%, 5/30/25 | | | 3,578 | |
3,051,801 | | K-MAC Holdings Corp. Term Loan 1L, (LIBOR USD 1-Month + 3.000%), 3.15%, 3/14/25 | | | 2,955 | |
| | | | | | |
Total Bank Loans (Cost - $26,741) | | | 26,402 | |
Commercial Paper (0%) | | | | |
5,200,000 | | CenterPoint Energy Inc., 0.00%, 11/02/20 (d) | | | | |
| | (Cost - $5,200) | | | 5,200 | |
Corporate Bond (38%) | | | | |
Financial (14%) | | | | |
4,000,000 | | Ally Financial Inc., 1.45%, 10/02/23 | | | 4,037 | |
1,450,000 | | Ares Capital Corp., 3.50%, 2/10/23 | | | 1,495 | |
1,650,000 | | Ares Capital Corp., 3.63%, 1/19/22 | | | 1,693 | |
| | | | | | |
Principal
or Shares | | Security Description | | Value
(000) | |
| | |
660,000 | | Assurant Inc., (3 mo. LIBOR USD + 4.135%), 7.00%, 3/27/48 (a) | | $ | 720 | |
4,000,000 | | Australia & New Zealand Banking Group Ltd. 144A, 4.40%, 5/19/26 (b) | | | 4,556 | |
3,400,000 | | Banco Internacional del Peru SAA Interbank 144A, 3.25%, 10/04/26 (b) | | | 3,589 | |
3,600,000 | | Bank of America Corp., (U.S. Secured Overnight Financing Rate + 1.010%), 1.20%, 10/24/26 (a) | | | 3,606 | |
5,205,000 | | Bank of America Corp., (3 mo. LIBOR USD + 1.060%), 3.56%, 4/23/27 (a) | | | 5,806 | |
3,145,000 | | Bank of Montreal, (5 yr. Swap Semi 30/360 USD + 1.280%), 4.34%, 10/05/28 (a) | | | 3,404 | |
2,800,000 | | Bank of Nova Scotia, 1.30%, 6/11/25 | | | 2,855 | |
900,000 | | BBVA USA, 3.88%, 4/10/25 | | | 967 | |
1,800,000 | | Canadian Imperial Bank of Commerce, 3.10%, 4/02/24 | | | 1,942 | |
2,675,000 | | Charles Schwab Corp., (5 yr. US Treasury Yield Curve Rate T Note Constant Maturity + 4.971%), 5.38%, (a)(f) | | | 2,934 | |
4,675,000 | | Citigroup Inc., (U.S. Secured Overnight Financing Rate + 2.107%), 2.57%, 6/03/31 (a) | | | 4,878 | |
2,905,000 | | Citigroup Inc., (3 mo. LIBOR USD + 0.897%), 3.35%, 4/24/25 (a) | | | 3,140 | |
2,700,000 | | Credit Agricole SA 144A, (U.S. Secured Overnight Financing Rate + 1.676%), 1.91%, 6/16/26 (a)(b) | | | 2,769 | |
5,340,000 | | Credit Suisse Group AG 144A, (U.S. Secured Overnight Financing Rate + 1.560%), 2.59%, 9/11/25 (a)(b) | | | 5,600 | |
3,750,000 | | CubeSmart LP, 2.00%, 2/15/31 | | | 3,661 | |
835,000 | | Diversified Healthcare Trust, 4.75%, 5/01/24 | | | 797 | |
2,670,000 | | Equinix Inc., 1.80%, 7/15/27 | | | 2,716 | |
2,700,000 | | Federation des Caisses Desjardins du Quebec 144A, 2.05%, 2/10/25 (b) | | | 2,823 | |
2,315,000 | | First Midwest Bancorp Inc., 5.88%, 9/29/26 | | | 2,597 | |
2,550,000 | | Ford Motor Credit Co. LLC, (3 mo. LIBOR USD + 1.235%), 1.52%, 2/15/23 (a) | | | 2,403 | |
1,340,000 | | Ford Motor Credit Co. LLC, 2.98%, 8/03/22 | | | 1,333 | |
1,385,000 | | Ford Motor Credit Co. LLC, 3.81%, 1/09/24 | | | 1,385 | |
2,595,000 | | FS KKR Capital Corp., 4.75%, 5/15/22 | | | 2,649 | |
2,500,000 | | FS KKR Capital Corp. II 144A, 4.25%, 2/14/25 (b) | | | 2,367 | |
3,850,000 | | GLP Capital LP/GLP Financing II Inc., 4.00%, 1/15/31 | | | 4,033 | |
4,055,000 | | Goldman Sachs Group Inc., 2.60%, 2/07/30 | | | 4,287 | |
1,315,000 | | Goldman Sachs Group Inc., 3.50%, 4/01/25 | | | 1,450 | |
1,000,000 | | Goldman Sachs Group Inc., 3.63%, 2/20/24 | | | 1,087 | |
2,240,000 | | HSBC Holdings PLC, (U.S. Secured Overnight Financing Rate + 2.387%), 2.85%, 6/04/31 (a) | | | 2,327 | |
1,825,000 | | Intercontinental Exchange Inc., 2.10%, 6/15/30 | | | 1,876 | |
6,305,000 | | JPMorgan Chase & Co., (3 mo. LIBOR USD + 0.730%), 3.56%, 4/23/24 (a) | | | 6,755 | |
3,450,000 | | KKR Group Finance Co. II LLC 144A, 5.50%, 2/01/43 (b) | | | 4,338 | |
6,325,000 | | Life Storage LP, 2.20%, 10/15/30 | | | 6,324 | |
2,450,000 | | Lincoln National Corp., 7.00%, 6/15/40 | | | 3,522 | |
32 Payden Mutual Funds
| | | | | | |
Principal
or Shares | | Security Description | | Value
(000) | |
| | |
2,350,000 | | Macquarie Group Ltd. 144A, (3 mo. LIBOR | | | | |
| | USD + 1.023%), 3.19%, 11/28/23 (a)(b) | | $ | 2,457 | |
2,750,000 | | Macquarie Group Ltd. 144A, (3 mo. LIBOR | | | | |
| | USD + 1.372%), 3.76%, 11/28/28 (a)(b) | | | 3,004 | |
2,455,000 | | Manulife Financial Corp., (USD Swap Rate 11:00 am NY 1 + 1.647%), 4.06%, 2/24/32 (a) | | | 2,653 | |
4,000,000 | | Mitsubishi UFJ Financial Group Inc., | | | | |
| | 3.20%, 7/18/29 | | | 4,409 | |
2,200,000 | | Morgan Stanley, (3 mo. LIBOR USD + 0.847%), 3.74%, 4/24/24 (a) | | | 2,367 | |
4,000,000 | | Morgan Stanley, (3 mo. LIBOR USD + 1.628%), 4.43%, 1/23/30 (a) | | | 4,797 | |
2,040,000 | | Muthoot Finance Ltd. 144A, | | | | |
| | 6.13%, 10/31/22 (b) | | | 2,110 | |
2,300,000 | | National Securities Clearing Corp. 144A, | | | | |
| | 1.50%, 4/23/25 (b) | | | 2,365 | |
1,500,000 | | Nationwide Building Society 144A, (3 mo. | | | | |
| | LIBOR USD + 1.452%), 4.30%, 3/08/29 (a)(b) | | | 1,699 | |
2,000,000 | | Nationwide Financial Services Inc. 144A, | | | | |
| | 5.30%, 11/18/44 (b) | | | 2,261 | |
1,300,000 | | Nationwide Mutual Insurance Co. 144A, | | | | |
| | 9.38%, 8/15/39 (b) | | | 2,196 | |
1,985,000 | | Nomura Holdings Inc., 1.85%, 7/16/25 | | | 2,024 | |
2,100,000 | | Ohio National Life Insurance Co. 144A, | | | | |
| | 6.88%, 6/15/42 (b) | | | 2,119 | |
1,895,000 | | OneMain Finance Corp., 8.88%, 6/01/25 | | | 2,088 | |
2,100,000 | | Owl Rock Capital Corp., 3.75%, 7/22/25 | | | 2,095 | |
3,230,000 | | Owl Rock Capital Corp., 5.25%, 4/15/24 | | | 3,373 | |
1,450,000 | | Pacific Life Insurance Co. 144A, | | | | |
| | 9.25%, 6/15/39 (b) | | | 2,321 | |
2,850,000 | | PNC Financial Services Group Inc., | | | | |
| | 2.60%, 7/23/26 | | | 3,103 | |
2,345,000 | | Protective Life Corp. 144A, 4.30%, 9/30/28 (b) | | | 2,658 | |
2,120,000 | | SBA Tower Trust 144A, 1.88%, 1/15/26 (b) | | | 2,193 | |
1,700,000 | | Service Properties Trust, 5.25%, 2/15/26 | | | 1,483 | |
4,470,000 | | Shriram Transport Finance Co. Ltd. 144A, | | | | |
| | 5.95%, 10/24/22 (b) | | | 4,361 | |
2,740,000 | | SLM Corp., 5.13%, 4/05/22 | | | 2,824 | |
1,905,000 | | Swedbank AB 144A, 1.30%, 6/02/23 (b) | | | 1,940 | |
1,560,000 | | Synchrony Bank, 3.00%, 6/15/22 | | | 1,612 | |
227,000 | | Teachers Insurance & Annuity Association of | | | | |
| | America 144A, 6.85%, 12/16/39 (b) | | | 340 | |
1,800,000 | | U.S. Bancorp, 2.40%, 7/30/24 | | | 1,912 | |
2,035,000 | | WEA Finance LLC 144A, 4.63%, 9/20/48 (b) | | | 1,974 | |
1,900,000 | | Wells Fargo & Co., (U.S. Secured Overnight | | | | |
| | Financing Rate + 2.100%), 2.39%, 6/02/28 (a) | | | 1,976 | |
1,450,000 | | Wells Fargo & Co., (U.S. Secured Overnight | | | | |
| | Financing Rate + 2.530%), 3.07%, 4/30/41 (a) | | | 1,505 | |
3,640,000 | | Wells Fargo & Co., (3 mo. LIBOR USD + 1.170%), 3.20%, 6/17/27 (a) | | | 3,967 | |
| | | | | 188,907 | |
Industrial (16%) | | | | |
750,000 | | 1011778 BC ULC/New Red Finance Inc. 144A, | | | | |
| | 5.00%, 10/15/25 (b) | | | 769 | |
2,950,000 | | AbbVie Inc. 144A, 2.60%, 11/21/24 (b) | | | 3,139 | |
2,125,000 | | AbbVie Inc. 144A, 4.05%, 11/21/39 (b) | | | 2,440 | |
| | | | | | |
Principal
or Shares | | Security Description | | Value
(000) | |
| | |
2,460,000 | | Albertsons Cos. Inc./Safeway Inc./New Albertsons LP/Albertsons LLC 144A, 3.25%, 3/15/26 (b) | | $ | 2,416 | |
2,010,000 | | Alphabet Inc., 0.80%, 8/15/27 | | | 1,991 | |
3,252,830 | | American Airlines 2019-1 Class AA | | | | |
| | Pass-Through Trust, 3.15%, 2/15/32 | | | 2,998 | |
1,900,000 | | American Honda Finance Corp., 1.20%, 7/08/25 | | | 1,921 | |
2,655,000 | | American University, 3.67%, 4/01/49 | | | 2,846 | |
1,605,000 | | Amgen Inc., 3.38%, 2/21/50 | | | 1,714 | |
1,410,000 | | Apple Inc., 1.65%, 5/11/30 | | | 1,442 | |
1,500,000 | | Apple Inc., 2.55%, 8/20/60 | | | 1,452 | |
2,115,000 | | Applied Materials Inc., 1.75%, 6/01/30 | | | 2,167 | |
3,230,000 | | AstraZeneca PLC, 0.70%, 4/08/26 | | | 3,186 | |
650,000 | | AT&T Inc., 2.95%, 7/15/26 | | | 708 | |
2,000,000 | | AT&T Inc. 144A, 3.50%, 9/15/53 (b) | | | 1,921 | |
4,810,000 | | AT&T Inc., 4.35%, 3/01/29 | | | 5,606 | |
940,000 | | Bausch Health Cos. Inc. 144A, | | | | |
| | 6.25%, 2/15/29 (b) | | | 970 | |
1,755,000 | | Bayer U.S. Finance II LLC 144A, | | | | |
| | 3.88%, 12/15/23 (b) | | | 1,913 | |
2,290,000 | | BRF SA 144A, 5.75%, 9/21/50 (b) | | | 2,182 | |
2,760,000 | | Bristol-Myers Squibb Co., 4.13%, 6/15/39 | | | 3,415 | |
1,900,000 | | British Telecommunications PLC 144A, | | | | |
| | 4.25%, 11/08/49 (b) | | | 2,198 | |
4,748,000 | | Broadcom Inc., 4.11%, 9/15/28 | | | 5,297 | |
880,000 | | CCO Holdings LLC/CCO Holdings Capital Corp. | | | | |
| | 144A, 5.38%, 6/01/29 (b) | | | 954 | |
3,590,000 | | Centene Corp., 3.38%, 2/15/30 | | | 3,735 | |
2,640,000 | | Cheniere Corpus Christi Holdings LLC, | | | | |
| | 5.88%, 3/31/25 | | | 2,990 | |
1,725,000 | | Choice Hotels International Inc., | | | | |
| | 3.70%, 1/15/31 | | | 1,798 | |
2,870,000 | | Cigna Corp., (3 mo. LIBOR USD + 0.650%), | | | | |
| | 0.90%, 9/17/21 (a) | | | 2,871 | |
3,205,000 | | Cigna Corp., 4.80%, 8/15/38 | | | 3,990 | |
1,000,000 | | Coca-Cola Co., 2.50%, 6/01/40 | | | 1,056 | |
3,410,000 | | Comcast Corp., 1.95%, 1/15/31 | | | 3,482 | |
848,000 | | CommScope Technologies LLC 144A, | | | | |
| | 6.00%, 6/15/25 (b) | | | 842 | |
1,860,000 | | Costco Wholesale Corp., 1.60%, 4/20/30 | | | 1,882 | |
4,000,000 | | CVS Health Corp., 4.30%, 3/25/28 | | | 4,635 | |
3,270,000 | | Daimler Finance North America LLC 144A, (3 mo. LIBOR USD + 0.840%), 1.06%, 5/04/23 (a)(b) | | | 3,268 | |
4,900,000 | | DH Europe Finance II Sarl, 3.25%, 11/15/39 | | | 5,459 | |
1,695,000 | | Dignity Health, 3.13%, 11/01/22 | | | 1,754 | |
1,165,000 | | Dignity Health, 4.50%, 11/01/42 | | | 1,269 | |
2,100,000 | | Dollar Tree Inc., 3.70%, 5/15/23 | | | 2,253 | |
2,500,000 | | Ford Foundation, 2.42%, 6/01/50 | | | 2,454 | |
1,785,000 | | General Electric Co., 6.75%, 3/15/32 | | | 2,302 | |
5,000,000 | | Gilead Sciences Inc., 1.65%, 10/01/30 | | | 4,939 | |
960,000 | | HCA Inc., 3.50%, 9/01/30 | | | 983 | |
5,540,000 | | HCA Inc., 5.00%, 3/15/24 | | | 6,201 | |
950,000 | | Home Depot Inc., 2.70%, 4/15/30 | | | 1,050 | |
700,000 | | Honeywell International Inc., 1.95%, 6/01/30 | | | 731 | |
2,300,000 | | Indonesia Asahan Aluminium Persero PT 144A, | | | | |
| | 4.75%, 5/15/25 (b) | | | 2,495 | |
890,000 | | KeHE Distributors LLC/KeHE Finance Corp. 144A, 8.63%, 10/15/26 (b) | | | 959 | |
Annual Report 33
Payden Core Bond Fund continued
| | | | | | |
Principal
or Shares | | Security Description | | Value
(000) | |
| | |
2,150,000 | | Kellogg Co., 2.10%, 6/01/30 | | $ | 2,201 | |
1,725,000 | | Keurig Dr Pepper Inc., 4.42%, 5/25/25 | | | 1,982 | |
960,000 | | Kraft Heinz Foods Co., 5.00%, 6/04/42 | | | 1,056 | |
1,860,000 | | Lamar Media Corp., 4.00%, 2/15/30 | | | 1,880 | |
940,000 | | Lamar Media Corp., 4.88%, 1/15/29 | | | 980 | |
3,000,000 | | Lennar Corp., 4.75%, 11/29/27 | | | 3,439 | |
3,950,000 | | Lowe’s Cos. Inc., 3.00%, 10/15/50 | | | 4,066 | |
1,585,000 | | Merck & Co. Inc., 1.45%, 6/24/30 | | | 1,589 | |
1,425,000 | | Merck & Co. Inc., 2.35%, 6/24/40 | | | 1,436 | |
1,645,000 | | Microchip Technology Inc. 144A, | | | | |
| | 2.67%, 9/01/23 (b) | | | 1,708 | |
2,930,000 | | Moog Inc. 144A, 4.25%, 12/15/27 (b) | | | 3,011 | |
2,035,000 | | NIKE Inc., 3.38%, 3/27/50 | | | 2,347 | |
1,500,000 | | Northwell Healthcare Inc., 4.26%, 11/01/47 | | | 1,665 | |
1,045,000 | | Northwell Healthcare Inc., 6.15%, 11/01/43 | | | 1,455 | |
935,000 | | NXP BV/NXP Funding LLC/NXP USA Inc. | | | | |
| | 144A, 3.40%, 5/01/30 (b) | | | 1,029 | |
700,000 | | Open Text Corp. 144A, 3.88%, 2/15/28 (b) | | | 712 | |
5,015,000 | | Orange SA, 9.00%, 3/01/31 | | | 8,138 | |
2,340,000 | | Otis Worldwide Corp., 2.29%, 4/05/27 | | | 2,486 | |
1,250,000 | | PayPal Holdings Inc., 2.30%, 6/01/30 | | | 1,314 | |
1,500,000 | | Perrigo Finance Unlimited Co., 3.15%, 6/15/30 | | | 1,551 | |
2,360,000 | | Prosus NV 144A, 3.68%, 1/21/30 (b) | | | 2,574 | |
1,850,000 | | Prosus NV 144A, 4.03%, 8/03/50 (b) | | | 1,897 | |
960,000 | | PTC Inc. 144A, 3.63%, 2/15/25 (b) | | | 979 | |
190,000 | | PTC Inc. 144A, 4.00%, 2/15/28 (b) | | | 197 | |
920,000 | | Qorvo Inc., 4.38%, 10/15/29 | | | 988 | |
106,000 | | Science Applications International Corp. 144A, | | | | |
| | 4.88%, 4/01/28 (b) | | | 111 | |
2,450,000 | | Sirius XM Radio Inc. 144A, 3.88%, 8/01/22 (b) | | | 2,471 | |
4,060,000 | | SMBC Aviation Capital Finance DAC 144A, | | | | |
| | 2.65%, 7/15/21 (b) | | | 4,092 | |
1,935,000 | | Stryker Corp., 1.15%, 6/15/25 | | | 1,957 | |
3,000,000 | | Takeda Pharmaceutical Co. Ltd., 2.05%, 3/31/30 | | | 3,024 | |
2,910,000 | | Tencent Holdings Ltd. 144A, 2.39%, 6/03/30 (b) | | | 2,950 | |
2,000,000 | | Tencent Holdings Ltd. 144A, 3.24%, 6/03/50 (b) | | | 2,019 | |
383,000 | | Teva Pharmaceutical Finance Netherlands III BV, 2.20%, 7/21/21 | | | 378 | |
2,355,000 | | Teva Pharmaceutical Finance Netherlands III BV, 3.15%, 10/01/26 | | | 2,077 | |
720,000 | | TJX Cos. Inc., 3.50%, 4/15/25 | | | 800 | |
1,110,000 | | TJX Cos. Inc., 3.88%, 4/15/30 | | | 1,317 | |
4,820,000 | | Toledo Hospital, 6.02%, 11/15/48 | | | 5,206 | |
2,100,000 | | Toll Brothers Finance Corp., 4.38%, 4/15/23 | | | 2,204 | |
1,335,000 | | Toyota Motor Credit Corp., 1.35%, 8/25/23 | | | 1,369 | |
910,000 | | United Rentals North America Inc., | | | | |
| | 5.88%, 9/15/26 | | | 959 | |
1,995,000 | | UnitedHealth Group Inc., 3.88%, 8/15/59 | | | 2,432 | |
1,615,000 | | Upjohn Inc. 144A, 1.65%, 6/22/25 (b) | | | 1,651 | |
4,100,000 | | Vericast Corp. 144A, 9.25%, 3/01/21 (b) | | | 4,110 | |
2,400,000 | | Vodafone Group PLC, 5.25%, 5/30/48 | | | 3,113 | |
5,500,000 | | Volkswagen Group of America Finance LLC | | | | |
| | 144A, 4.25%, 11/13/23 (b) | | | 6,052 | |
2,680,000 | | Walmart Inc., 3.05%, 7/08/26 | | | 3,002 | |
1,000,000 | | Walt Disney Co., 2.75%, 9/01/49 | | | 969 | |
2,400,000 | | Weibo Corp., 3.38%, 7/08/30 | | | 2,411 | |
860,000 | | Yum! Brands Inc. 144A, 7.75%, 4/01/25 (b) | | | 946 | |
| | | | | 223,343 | |
| | | | | | |
Principal
or Shares | | Security Description | | Value
(000) | |
| |
Utility (8%) | | | | |
2,350,000 | | Acwa Power Management And Investments One | | | | |
| | Ltd. 144A, 5.95%, 12/15/39 (b) | | $ | 2,720 | |
3,590,000 | | Adani Electricity Mumbai Ltd. 144A, | | | | |
| | 3.95%, 2/12/30 (b) | | | 3,561 | |
973,000 | | Ascent Resources Utica Holdings LLC/ARU | | | | |
| | Finance Corp. 144A, 9.00%, 11/01/27 (b) | | | 949 | |
1,500,000 | | Chevron Corp., 2.24%, 5/11/30 | | | 1,574 | |
2,980,000 | | CNX Midstream Partners LP/CNX Midstream | | | | |
| | Finance Corp. 144A, 6.50%, 3/15/26 (b) | | | 3,035 | |
1,170,000 | | Colorado Interstate Gas Co. LLC/Colorado | | | | |
| | Interstate Issuing Corp. 144A, | | | | |
| | 4.15%, 8/15/26 (b) | | | 1,290 | |
1,533,869 | | Cometa Energia SA de CV 144A, | | | | |
| | 6.38%, 4/24/35 (b) | | | 1,700 | |
1,030,000 | | Consolidated Edison Co. of New York Inc., | | | | |
| | 3.95%, 4/01/50 | | | 1,220 | |
1,635,000 | | Duke Energy Corp., 4.20%, 6/15/49 | | | 2,005 | |
7,000,000 | | Entergy Texas Inc., 1.75%, 3/15/31 | | | 6,918 | |
1,850,000 | | EQT Corp., 3.00%, 10/01/22 | | | 1,851 | |
1,258,298 | | Fermaca Enterprises S de RL de CV 144A, | | | | |
| | 6.38%, 3/30/38 (b) | | | 1,384 | |
1,950,000 | | FirstEnergy Corp., 1.60%, 1/15/26 | | | 1,901 | |
4,500,000 | | Galaxy Pipeline Assets Bidco Ltd. 144A, | | | | |
| | 2.63%, 3/31/36 (b) | | | 4,511 | |
2,760,000 | | Geopark Ltd. 144A, 5.50%, 1/17/27 (b) | | | 2,436 | |
2,000,000 | | Indigo Natural Resources LLC 144A, | | | | |
| | 6.88%, 2/15/26 (b) | | | 1,970 | |
4,650,000 | | Interstate Power and Light Co., 3.50%, 9/30/49 | | | 5,137 | |
2,100,000 | | Kinder Morgan Inc., 5.30%, 12/01/34 | | | 2,435 | |
1,830,000 | | Leviathan Bond Ltd. 144A, | | | | |
| | 6.13%, 6/30/25 (b)(g) | | | 1,900 | |
1,320,000 | | Lukoil Securities BV 144A, 3.88%, 5/06/30 (b) | | | 1,403 | |
4,395,000 | | National Fuel Gas Co., 5.50%, 1/15/26 | | | 4,814 | |
4,100,000 | | National Rural Utilities Cooperative Finance | | | | |
| | Corp., 1.35%, 3/15/31 | | | 4,034 | |
7,000,000 | | NiSource Inc., 1.70%, 2/15/31 (h) | | | 6,846 | |
3,925,000 | | Northriver Midstream Finance LP 144A, | | | | |
| | 5.63%, 2/15/26 (b) | | | 3,895 | |
3,000,000 | | Oleoducto Central SA 144A, 4.00%, 7/14/27 (b) | | | 3,144 | |
2,850,000 | | Pacific Gas and Electric Co., 1.75%, 6/16/22 | | | 2,851 | |
2,400,000 | | Pattern Energy Operations LP/Pattern Energy | | | | |
| | Operations Inc. 144A, 4.50%, 8/15/28 (b) | | | 2,507 | |
2,000,000 | | Pertamina Persero PT 144A, 3.10%, 8/27/30 (b) | | | 2,082 | |
2,500,000 | | Petroleos Mexicanos, 5.95%, 1/28/31 | | | 2,096 | |
2,420,000 | | Petroleos Mexicanos, 6.49%, 1/23/27 | | | 2,258 | |
4,000,000 | | Plains All American Pipeline LP/PAA Finance | | | | |
| | Corp., 3.55%, 12/15/29 | | | 3,843 | |
2,470,000 | | Plains All American Pipeline LP/PAA Finance | | | | |
| | Corp., 5.00%, 2/01/21 | | | 2,470 | |
2,190,000 | | Range Resources Corp. 144A, | | | | |
| | 9.25%, 2/01/26 (b) | | | 2,325 | |
2,600,000 | | Sabine Pass Liquefaction LLC, 6.25%, 3/15/22 | | | 2,748 | |
2,273,000 | | Southwestern Energy Co., 8.38%, 9/15/28 | | | 2,380 | |
1,390,000 | | TerraForm Power Operating LLC 144A, | | | | |
| | 4.25%, 1/31/23 (b) | | | 1,417 | |
1,430,000 | | TerraForm Power Operating LLC 144A, | | | | |
| | 4.75%, 1/15/30 (b) | | | 1,537 | |
34 Payden Mutual Funds
| | | | | | |
Principal
or Shares | | Security Description | | Value
(000) | |
| | |
3,000,000 | | Vistra Operations Co. LLC 144A, | | | | |
| | 3.70%, 1/30/27 (b) | | $ | 3,172 | |
2,170,000 | | Vistra Operations Co. LLC 144A, | | | | |
| | 4.30%, 7/15/29 (b) | | | 2,354 | |
2,000,000 | | Williams Cos. Inc., 3.75%, 6/15/27 | | | 2,182 | |
| | | | | 108,855 | |
Total Corporate Bond (Cost - $500,129) | | | 521,105 | |
Foreign Government (2%) | | | | |
900,000 | | Bermuda Government International Bond 144A, | | | | |
| | 3.38%, 8/20/50 (b) | | | 944 | |
9,057,852 | | Brazil Notas do Tesouro Nacional Serie B, | | | | |
| | 6.00%, 8/15/28 BRL (c) | | | 1,874 | |
5,270,000 | | CPPIB Capital Inc. 144A, 1.95%, 9/30/29 | | | | |
| | CAD (b)(c) | | | 4,192 | |
2,240,000 | | Guatemala Government Bond 144A, | | | | |
| | 5.38%, 4/24/32 (b) | | | 2,650 | |
2,100,000 | | Honduras Government International Bond 144A, | | | | |
| | 8.75%, 12/16/20 (b) | | | 2,115 | |
3,820,000 | | Mongolia Government International Bond 144A, | | | | |
| | 5.13%, 4/07/26 (b) | | | 3,953 | |
3,200,000 | | Municipal Finance Authority of British | | | | |
| | Columbia, 2.55%, 10/09/29 CAD (c) | | | 2,660 | |
1,950,000 | | Panama Government International Bond, | | | | |
| | 4.50%, 4/01/56 | | | 2,408 | |
2,240,000 | | Paraguay Government International Bond 144A, | | | | |
| | 4.95%, 4/28/31 (b) | | | 2,621 | |
2,000,000 | | Ukraine Government International Bond 144A, | | | | |
| | 7.25%, 3/15/33 (b) | | | 1,887 | |
2,960,000 | | Uruguay Government International Bond, | | | | |
| | 4.98%, 4/20/55 | | | 3,918 | |
Total Foreign Government (Cost - $27,280) | | | 29,222 | |
Mortgage Backed (30%) | | | | |
2,030,000 | | BX Commercial Mortgage Trust 2018-IND | | | | |
| | 144A, (1 mo. LIBOR USD + 2.050%), | | | | |
| | 2.20%, 11/15/35 (a)(b) | | | 1,993 | |
2,987,110 | | CHC Commercial Mortgage Trust 2019-CHC | | | | |
| | 144A, (1 mo. LIBOR USD + 1.500%), | | | | |
| | 1.65%, 6/15/34 (a)(b) | | | 2,832 | |
1,866,346 | | Connecticut Avenue Securities Trust 2019-HRP1 | | | | |
| | 144A, (1 mo. LIBOR USD + 2.150%), | | | | |
| | 2.30%, 11/25/39 (a)(b) | | | 1,687 | |
4,100,000 | | Connecticut Avenue Securities Trust 2019-HRP1 | | | | |
| | 144A, (1 mo. LIBOR USD + 9.250%), | | | | |
| | 9.40%, 11/25/39 (a)(b) | | | 3,242 | |
1,739,094 | | Fannie Mae Connecticut Avenue Securities, (1 mo. LIBOR USD + 10.250%), 10.40%, 1/25/29 (a) | | | 1,964 | |
498,390 | | Fannie Mae Connecticut Avenue Securities, (1 mo. LIBOR USD + 10.750%), 10.90%, 1/25/29 (a) | | | 569 | |
1,690,363 | | Fannie Mae Connecticut Avenue Securities, (1 mo. LIBOR USD + 12.250%), 12.40%, 9/25/28 (a) | | | 2,046 | |
3,440,000 | | Fannie Mae-Aces, 3.70%, 9/25/30 (i) | | | 4,152 | |
1,124,340 | | FG G60037 30YR, 3.00%, 10/01/43 | | | 1,236 | |
| | | | | | |
Principal
or Shares | | Security Description | | Value
(000) | |
| | |
1,031,956 | | FG Q17641 30YR, 3.00%, 4/01/43 | | $ | 1,119 | |
1,642,000 | | FHLMC Multifamily Structured Pass-Through | | | | |
| | Certificates, 2.94%, 4/25/29 | | | 1,853 | |
4,410,000 | | FHLMC Multifamily Structured Pass-Through | | | | |
| | Certificates, 3.06%, 8/25/24 (i) | | | 4,775 | |
8,136,000 | | FHLMC Multifamily Structured Pass-Through | | | | |
| | Certificates, 3.60%, 2/25/25 (i) | | | 8,957 | |
1,244,791 | | FN 254766 30YR, 5.00%, 6/01/33 | | | 1,429 | |
605,427 | | FN 725027 30YR, 5.00%, 11/01/33 | | | 698 | |
1,171,658 | | FN 725423 30YR, 5.50%, 5/01/34 | | | 1,382 | |
1,120,212 | | FN 725424 30YR, 5.50%, 4/01/34 | | | 1,297 | |
1,005,166 | | FN 995023 30YR, 5.50%, 8/01/37 | | | 1,183 | |
1,552,421 | | FN 995203 30YR, 5.00%, 7/01/35 | | | 1,788 | |
3,854,889 | | FN AB9186 30YR, 3.00%, 4/01/43 | | | 4,083 | |
1,069,794 | | FN AH3394 30YR, 4.00%, 1/01/41 | | | 1,179 | |
1,083,447 | | FN AJ7689 30YR, 4.00%, 12/01/41 | | | 1,194 | |
1,049,605 | | FN AL2521 30YR, 3.50%, 9/01/42 | | | 1,137 | |
1,137,704 | | FN AL6968 30YR, 3.50%, 6/01/45 | | | 1,249 | |
5,267,784 | | FN AL9373 15YR, 2.50%, 10/01/31 | | | 5,633 | |
3,716,649 | | FN AS4168 30YR, 4.00%, 12/01/44 | | | 4,092 | |
2,179,744 | | FN AS4885 30YR, 3.50%, 5/01/45 | | | 2,327 | |
4,661,070 | | FN AS7170 30YR, 3.50%, 5/01/46 | | | 4,966 | |
4,477,637 | | FN AS8305 30YR, 3.00%, 11/01/46 | | | 4,800 | |
2,574,146 | | FN AS8592 15YR, 2.50%, 1/01/32 | | | 2,746 | |
4,303,352 | | FN AS8710 15YR, 2.50%, 2/01/32 | | | 4,602 | |
3,228,926 | | FN AS8807 30YR, 3.50%, 2/01/47 | | | 3,422 | |
3,849,101 | | FN AY4200 30YR, 3.00%, 5/01/45 | | | 4,051 | |
676,129 | | FN AZ3791 30YR, 3.00%, 3/01/46 | | | 709 | |
3,658,805 | | FN AZ7336 30YR, 3.50%, 11/01/45 | | | 3,961 | |
4,906,451 | | FN BC1520 30YR, 3.50%, 8/01/46 | | | 5,316 | |
1,784,811 | | FN BE0514 15YR, 2.50%, 11/01/31 | | | 1,859 | |
6,638,885 | | FN BJ3691 30YR, 4.00%, 3/01/48 | | | 7,148 | |
1,974,674 | | FN BJ9215 30YR, 4.00%, 6/01/48 | | | 2,112 | |
3,538,487 | | FN BK4740 30YR, 4.00%, 8/01/48 | | | 3,783 | |
889,336 | | FN BM2007 30YR, 4.00%, 9/01/48 | | | 949 | |
921,297 | | FN BM5108 15YR, 3.00%, 2/01/33 | | | 965 | |
10,152,442 | | FN BO9355 30YR, 3.00%, 3/01/50 | | | 10,623 | |
7,245,908 | | FN BP6345 30YR, 3.00%, 6/01/50 | | | 7,581 | |
1,522,386 | | FN CA0133 30YR, 4.00%, 8/01/47 | | | 1,632 | |
7,933,486 | | FN CA0858 30YR, 3.50%, 12/01/47 | | | 8,404 | |
2,924,306 | | FN CA3666 30YR, 4.00%, 6/01/49 | | | 3,221 | |
7,279,998 | | FN CA6314 30YR, 3.00%, 7/01/50 | | | 7,712 | |
3,028,518 | | FN CA6322 30YR, 2.50%, 7/01/50 | | | 3,159 | |
2,890,315 | | FN CA7112 15YR, 2.00%, 9/01/35 | | | 3,000 | |
366,457 | | FN FM1155 15YR, 2.50%, 6/01/32 | | | 382 | |
5,193,788 | | FN FM1717 30YR, 3.50%, 12/01/45 | | | 5,635 | |
5,778,152 | | FN FM2897 30YR, 3.00%, 2/01/48 | | | 6,058 | |
6,015,378 | | FN FM3936 15YR, 2.50%, 8/01/35 | | | 6,349 | |
745,639 | | FN MA2671 30YR, 3.50%, 7/01/46 | | | 795 | |
1,573,347 | | FN MA2868 15YR, 2.50%, 1/01/32 | | | 1,641 | |
4,614,624 | | FN MA3060 15YR, 3.00%, 7/01/32 | | | 4,833 | |
327,390 | | FN MA3143 30YR, 3.00%, 9/01/47 | | | 342 | |
1,468,033 | | FN MA3155 15YR, 3.00%, 10/01/32 | | | 1,538 | |
7,929,807 | | FN MA3238 30YR, 3.50%, 1/01/48 | | | 8,404 | |
6,780,000 | | FNCL, 1.50%, 30YR TBA (j) | | | 6,812 | |
6,530,000 | | FNCL, 2.00%, 15YR TBA (j) | | | 6,766 | |
26,820,000 | | FNCL, 2.00%, 30YR TBA (j) | | | 27,606 | |
24,500,000 | | FNCL, 2.50%, 30YR TBA (j) | | | 25,493 | |
25,340,000 | | FNCL, 3.00%, 30YR TBA (j) | | | 26,490 | |
Annual Report 35
Payden Core Bond Fund continued
| | | | | | |
Principal
or Shares | | Security Description | | Value
(000) | |
| | |
9,000,000 | | FNCL N.A., 3.50%, 30YR TBA (j) | | $ | 9,509 | |
4,436,555 | | FR QN1106 15YR, 3.00%, 12/01/34 | | | 4,726 | |
1,677,491 | | FR QN2947 15YR, 2.00%, 8/01/35 | | | 1,748 | |
5,100,000 | | FR QN3917 15YR, 2.00%, 10/01/35 | | | 5,294 | |
1,033,129 | | FR ZA4718 30YR, 3.00%, 10/01/46 | | | 1,107 | |
1,329,799 | | Freddie Mac STACR 2019-HQA3 144A, (1 mo. | | | | |
| | LIBOR USD + 1.850%), 2.00%, 9/25/49 (a)(b) | | | 1,308 | |
3,540,000 | | Freddie Mac STACR REMIC Trust 2020-DNA5 | | | | |
| | 144A, (U.S. Secured Overnight Financing Rate | | | | |
| | Index 30day Average + 1.300%), | | | | |
| | 1.39%, 10/25/50 (a)(b) | | | 3,550 | |
2,930,000 | | Freddie Mac STACR REMIC Trust 2020-DNA5 | | | | |
| | 144A, (U.S. Secured Overnight Financing Rate | | | | |
| | Index 30day Average + 2.800%), | | | | |
| | 2.89%, 10/25/50 (a)(b) | | | 2,928 | |
3,100,000 | | Freddie Mac STACR REMIC Trust 2020-HQA3 | | | | |
| | 144A, (1 mo. LIBOR USD + 1.550%), | | | | |
| | 1.70%, 7/25/50 (a)(b) | | | 3,107 | |
886,694 | | Freddie Mac STACR Trust 2019-DNA1 144A, (1 mo. LIBOR USD + 2.650%), 2.80%, 1/25/49 (a)(b) | | | 882 | |
647,494 | | Freddie Mac STACR Trust 2019-HQA2 144A, (1 mo. LIBOR USD + 2.050%), 2.20%, 4/25/49 (a)(b) | | | 639 | |
3,531,042 | | Freddie Mac STACR Trust 2019-HRP1 144A, (1 mo. LIBOR USD + 1.400%), 1.55%, 2/25/49 (a)(b) | | | 3,406 | |
810,143 | | Freddie Mac Structured Agency Credit Risk Debt | | | | |
| | Notes, (1 mo. LIBOR USD + 1.200%), | | | | |
| | 1.35%, 10/25/29 (a) | | | 812 | |
1,200,000 | | Freddie Mac Structured Agency Credit Risk Debt | | | | |
| | Notes, (1 mo. LIBOR USD + 4.600%), | | | | |
| | 4.75%, 12/25/42 (a) | | | 1,141 | |
1,241,226 | | Freddie Mac Structured Agency Credit Risk Debt | | | | |
| | Notes, (1 mo. LIBOR USD + 10.000%), | | | | |
| | 10.15%, 7/25/29 (a) | | | 1,139 | |
1,684,410 | | Freddie Mac Structured Agency Credit Risk Debt | | | | |
| | Notes, (1 mo. LIBOR USD + 11.250%), | | | | |
| | 11.40%, 12/25/28 (a) | | | 1,943 | |
7,140,000 | | G2, 2.50%, 30YR TBA (j) | | | 7,462 | |
3,990,000 | | G2, 3.00%, 30YR TBA (j) | | | 4,164 | |
4,490,000 | | G2, 3.50%, 30YR TBA (j) | | | 4,734 | |
3,443,541 | | G2 4853 30YR, 4.00%, 11/20/40 | | | 3,816 | |
1,531,336 | | G2 5115 30YR, 4.50%, 7/20/41 | | | 1,705 | |
84,127 | | G2 5140 30YR, 4.50%, 8/20/41 | | | 94 | |
1,163,488 | | G2 5175 30YR, 4.50%, 9/20/41 | | | 1,296 | |
413,031 | | G2 5233 30YR, 4.00%, 11/20/41 | | | 459 | |
3,712,021 | | G2 5258 30YR, 3.50%, 12/20/41 | | | 4,058 | |
2,759,704 | | G2 MA2522 30YR, 4.00%, 1/20/45 | | | 3,013 | |
3,757,471 | | G2 MA3663 30YR, 3.50%, 5/20/46 | | | 4,024 | |
7,459,525 | | G2 MA3802 30YR, 3.00%, 7/20/46 | | | 7,874 | |
1,975,257 | | G2 MA4126 30YR, 3.00%, 12/20/46 | | | 2,085 | |
3,794,864 | | G2 MA4510 30YR, 3.50%, 6/20/47 | | | 4,037 | |
323,228 | | G2 MA5021 30YR, 4.50%, 2/20/48 | | | 351 | |
1,718,957 | | G2 MA5265 30YR, 4.50%, 6/20/48 | | | 1,860 | |
9,407,038 | | G2 MA6710 30YR, 3.00%, 6/20/50 | | | 9,885 | |
6,507,313 | | G2 MA6820 30YR, 3.00%, 8/20/50 | | | 6,850 | |
| | | | | | |
Principal
or Shares | | Security Description | | Value
(000) | |
| | |
3,284,817 | | GN 783716 30YR, 3.00%, 2/15/43 | | $ | �� 3,426 | |
1,162,899 | | GN 784182 30YR, 4.50%, 8/15/46 | | | 1,288 | |
841,851 | | GN AA5452 30YR, 3.50%, 7/15/42 | | | 899 | |
55,740 | | HarborView Mortgage Loan Trust 2004-10, | | | | |
| | 3.29%, 1/19/35 (i) | | | 58 | |
160,331 | | JP Morgan Mortgage Trust 2006-S2, | | | | |
| | 6.00%, 7/25/36 | | | 124 | |
1,272,945 | | JP Morgan Mortgage Trust 2014-2 144A, | | | | |
| | 3.00%, 6/25/29 (b)(i) | | | 1,302 | |
14,918 | | Landmark Mortgage Securities No 1 PLC, (3 mo. | | | | |
| | LIBOR GBP + 0.220%), 0.27%, 6/17/38 | | | | |
| | GBP (a)(c)(g) | | | 19 | |
1,200,000 | | MF1 2020-FL3 Ltd. 144A, (1 mo. LIBOR USD + 2.850%), 3.00%, 7/15/35 (a)(b) | | | 1,213 | |
15,786,022 | | Morgan Stanley Capital I Trust 2018-H3, | | | | |
| | 0.83%, 7/15/51 (i) | | | 772 | |
17,620 | | Morgan Stanley Mortgage Loan Trust 2004-5AR, | | | | |
| | 2.92%, 7/25/34 (i) | | | 18 | |
305,209 | | Nationstar Mortgage Loan Trust 2013-A 144A, | | | | |
| | 3.75%, 12/25/52 (b)(i) | | | 315 | |
585,540 | | New Residential Mortgage Loan Trust 2014-3 | | | | |
| | 144A, 3.75%, 11/25/54 (b)(i) | | | 628 | |
1,256,737 | | New Residential Mortgage Loan Trust 2017-2 | | | | |
| | 144A, 4.00%, 3/25/57 (b)(i) | | | 1,360 | |
43,662 | | Prime Mortgage Trust 2005-4, 5.00%, 10/25/35 | | | 43 | |
1,175,950 | | Residential Asset Securitization Trust 2006-A8, | | | | |
| | 6.00%, 8/25/36 | | | 844 | |
3,196,394 | | STACR Trust 2018-HRP2 144A, (1 mo. LIBOR | | | | |
| | USD + 1.250%), 1.40%, 2/25/47 (a)(b) | | | 3,154 | |
3,325,000 | | STACR Trust 2018-HRP2 144A, (1 mo. LIBOR | | | | |
| | USD + 2.400%), 2.55%, 2/25/47 (a)(b) | | | 3,173 | |
1,300,000 | | STACR Trust 2018-HRP2 144A, (1 mo. LIBOR | | | | |
| | USD + 10.500%), 10.65%, 2/25/47 (a)(b) | | | 1,298 | |
404 | | Structured Asset Mortgage Investments Trust | | | | |
| | 2003-CL1, 2.30%, 7/25/32 (i) | | | - | |
Total Mortgage Backed (Cost - $415,673) | | | 421,901 | |
Municipal (2%) | | | | |
3,900,000 | | California Health Facilities Financing Authority, | | | | |
| | 2.86%, 6/01/31 | | | 4,091 | |
1,150,000 | | California Pollution Control Financing Authority, | | | | |
| | AMT 144A, 7.50%, 12/01/39 (b)(k) | | | 353 | |
1,835,000 | | City of Portland OR, 7.70%, 6/01/22 | | | 1,983 | |
3,700,000 | | City of San Francisco CA Public Utilities | | | | |
| | Commission Water Revenue, 2.83%, 11/01/41 | | | 3,680 | |
2,565,000 | | Compton Community College District, | | | | |
| | 3.46%, 8/01/38 | | | 2,691 | |
5,265,000 | | Los Angeles Community College District, | | | | |
| | 1.17%, 8/01/26 | | | 5,268 | |
4,000,000 | | State of California, 3.38%, 4/01/25 | | | 4,467 | |
1,495,000 | | State of California, 7.55%, 4/01/39 | | | 2,577 | |
365,000 | | University of California, 3.26%, 5/15/24 | | | 395 | |
Total Municipal (Cost - $24,385) | | | 25,505 | |
U.S. Treasury (30%) | | | | |
84,510,000 | | U.S. Cash Management Bill, 0.00%, 1/12/21 (d) | | | 84,497 | |
45,000,000 | | U.S. Treasury Bill, 0.06%, 11/03/20 (d) | | | 45,000 | |
14,295,000 | | U.S. Treasury Bond, 2.00%, 2/15/50 | | | 15,566 | |
36 Payden Mutual Funds
| | | | | | |
Principal
or Shares | | Security Description | | Value
(000) | |
| | |
22,534,000 | | U.S. Treasury Bond, 2.38%, 11/15/49 | | $ | 26,543 | |
31,250,000 | | U.S. Treasury Bond, 3.00%, 11/15/45 | | | 40,798 | |
18,630,000 | | U.S. Treasury Bond, 3.00%, 2/15/49 (l)(m) | | | 24,647 | |
10,373,837 | | U.S. Treasury Inflation Indexed Bonds, | | | | |
| | 0.13%, 10/15/24 | | | 10,942 | |
2,295,000 | | U.S. Treasury Note, 0.13%, 9/15/23 | | | 2,291 | |
1,866,000 | | U.S. Treasury Note, 0.25%, 6/15/23 | | | 1,870 | |
15,550,000 | | U.S. Treasury Note, 0.25%, 8/31/25 | | | 15,465 | |
6,497,000 | | U.S. Treasury Note, 0.50%, 8/31/27 | | | 6,447 | |
1,318,000 | | U.S. Treasury Note, 1.50%, 11/30/21 | | | 1,337 | |
1,956,000 | | U.S. Treasury Note, 1.50%, 1/15/23 | | | 2,014 | |
56,205,000 | | U.S. Treasury Note, 1.63%, 11/15/22 | | | 57,883 | |
48,145,000 | | U.S. Treasury Note, 2.50%, 1/15/22 | | | 49,515 | |
24,234,000 | | U.S. Treasury Note, 2.88%, 11/30/25 | | | 27,255 | |
Total U.S. Treasury (Cost - $413,302) | | | 412,070 | |
Investment Company (1%) | | | | |
15,715,615 | | Payden Cash Reserves Money Market Fund * | | | | |
| | (Cost - $15,716) | | | 15,716 | |
Total Investments (Cost - $1,511,625) (111%) | | | 1,541,239 | |
Liabilities in excess of Other Assets (-11%) | | | (147,438) | |
Net Assets (100%) | | $ | 1,393,801 | |
| | | | | | |
| (a) | Floating rate security. The rate shown reflects the rate in effect at October 31, 2020. |
| (b) | Security offered only to qualified institutional investors, and thus is not registered for sale to the public under rule 144A of the Securities Act of 1933. It has been deemed liquid under guidelines approved by the Board. (c) Principal in foreign currency. |
| (d) | Yield to maturity at time of purchase. |
| (e) | Floating rate security. The rate shown reflects the rate in effect at October 31, 2020. The stated maturity is subject to prepayments. See Note 2 in the Notes to Financial Statements. |
| (f) | Perpetual security with no stated maturity date. |
| (g) | Security offered and sold outside the United States, and thus is exempt from registration under Regulation S of the Securities Act of 1933. It has been deemed liquid under guidelines approved by the Board. |
| (h) | All or a portion of these securities are on loan. At October 31, 2020, the total market value of the Fund’s securities on loan is $6,846 and the total market value of the collateral held by the Fund is $7,070. Amounts in 000s. (i) Variable rate security. Interest rate disclosed is as of the most recent information available. Certain variable rate securities are not based on a published reference rate and spread but are determined by the issuer or agent and are based on current market conditions. These securities do not indicate a reference rate and spread in their description above. |
| (j) | Security was purchased on a delayed delivery basis. |
| (k) | Issuer filed for bankruptcy and/or is in default of principal and/or interest payments. |
| (l) | All or a portion of security has been pledged in connection with outstanding centrally cleared swaps. |
| (m) | All or a portion of the security is pledged to cover futures contract margin requirements. |
Open Forward Currency Contracts to USD
| | | | | | | | | | | | | | | | |
Currency
Purchased
(000s) | | Currency
Sold
(000s) | | | Counterparty | | | Settlement
Date | | | Unrealized
Appreciation
(Depreciation)
(000s) | |
Assets: | | | | | | | | | | | | | | | | |
USD 23,591 | | | EUR 19,802 | | | | Citibank, N.A. | | | | 03/22/2021 | | | $ | 451 | |
USD 7,095 | | | CAD 9,347 | | |
| HSBC Bank
USA, N.A. |
| | | 03/22/2021 | | | | 76 | |
USD 2,206 | | | BRL 11,409 | | |
| State Street
Bank & Trust Co. |
| | | 11/05/2020 | | | | 218 | |
USD 1,938 | | | BRL 11,100 | | |
| State Street
Bank & Trust Co. |
| | | 02/04/2021 | | | | 10 | |
| | | | | | | | | | | | | | | | |
| | | | | | | | | | | | | | | 755 | |
| | | | | | | | | | | | | | | | |
Liabilities: | | | | | | | | | | | | | | | | |
BRL 11,409 | | | USD 1,997 | | |
| State Street
Bank & Trust Co. |
| | | 11/05/2020 | | | | (10 | ) |
EUR 4,850 | | | USD 5,678 | | | | Citibank, N.A. | | | | 03/22/2021 | | | | (10 | ) |
| | | | | | | | | | | | | | | (20 | ) |
| | | | | | | | | | | | | | | | |
| Net Unrealized Appreciation (Depreciation) | | | $ | 735 | |
| | | | | | | | | | | | | | | | |
Annual Report 37
Payden Core Bond Fund continued
Open Futures Contracts
| | | | | | | | | | | | | | | | | | | | | | | | | |
| Contract Type | | Number of
Contracts | | Expiration
Date | | Notional
Amount
(000s) | | Current
Value
(000s) | | Unrealized
Appreciation
(Depreciation)
(000s) |
| Long Contracts: | | | | | | | | | | | | | | | | | | | | | | | | | |
| U.S. Long Bond Future | | | | 116 | | | | | Dec-20 | | | | $ | 20,006 | | | | $ | (512 | ) | | | $ | (512 | ) |
| U.S. Treasury 10-Year Note Future | | | | 190 | | | | | Dec-20 | | | | | 26,262 | | | | | (182 | ) | | | | (182 | ) |
| U.S. Treasury 5-Year Note Future | | | | 968 | | | | | Dec-20 | | | | | 121,582 | | | | | (358 | ) | | | | (358 | ) |
| U.S. Ultra Bond Future | | | | 60 | | | | | Dec-20 | | | | | 12,900 | | | | | (186 | ) | | | | (186 | ) |
| | | | | | | | | | | | | | | | | | | | | | | | | |
| | | | | | | | | | | | | | | | | | | | | | | | (1,238 | ) |
| | | | | | | | | | | | | | | | | | | | | | | | | |
| Short Contracts: | | | | | | | | | | | | | | | | | | | | | | | | | |
| U.S. 10-Year Ultra Future | | | | 562 | | | | | Dec-20 | | | | | (88,392 | ) | | | | 931 | | | | | 931 | |
| | | | | | | | | | | | | | | | | | | | | | | | | |
| Total Futures | | | | | | | | | | | | | | | | | | | | | | | $ | (307 | ) |
| | | | | | | | | | | | | | | | | | | | | | | | | |
Open Centrally Cleared Credit Default Swap Contracts
| | | | | | | | | | | | | | | | |
| Description | | Maturity
Date | | Notional
Amount
(000s) | | Value
(000s) | | | Upfront
payments/
receipts
(000s) | | | Unrealized
Appreciation
(000s) | |
| Protection Bought (Relevant Credit: Markit CDX, North America High Yield Series 35 Index), Pay 5% Quarterly, Receive upon credit default | | 12/20/2025 | | $22,400 | | $ | 904 | | | $ | 812 | | | $ | 92 | |
| | | | | | | | | | | | | | | | |
Offsetting Assets and Liabilities
The Fund’s loaned securities were all subject to an enforceable Securities Lending Agency Agreement. Securities lent in accordance with the Securities Lending Agency Agreement on a gross basis were as follows:
| | | | |
| Total gross amount presented on the Statements of Assets and Liabilities1 | | $ | 6,846 | |
Non-cash Collateral2 | | | (6,846 | ) |
| | | | |
Net Amount | | $ | — | |
| | | | |
| 1 | The amount presented on the Statements of Assets and Liabilities is not offset and is shown on a gross basis. |
| 2 | At October 31, 2020, the value of the collateral received from each borrower exceeded the value of the related securities loaned. This amount is disclosed on the Schedule of Investments. |
See notes to financial statements.
38 Payden Mutual Funds
| | |
Payden Corporate Bond Fund | | |
| | | | | | |
The Fund seeks a high level of total return that is consistent with the preservation of capital by generally investing 80% of its assets in investment grade corporate bonds with no limit on the average portfolio maturity. | | | | | | 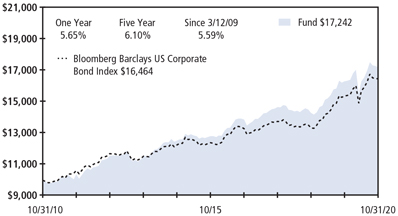
|
| Portfolio Composition - percent of investments | |
| |
Banking | | | 16% | |
Healthcare | | | 12% | |
Financial Services | | | 11% | |
Utility | | | 8% | |
Telecommunications | | | 7% | |
Other | | | 46% | |
| | | | |
| | | | |
| | | | | | |
| This information is not part of the audited financial statements. | | | Past performance does not predict future returns. The graph does not reflect the impact of taxes or transaction costs a shareholder would pay. |
Schedule of Investments - October 31, 2020
| | | | | | |
Principal
or Shares | | Security Description | | Value
(000) | |
Corporate Bond (95%) | | | | |
Automotive (6%) | | | | |
1,780,000 | | American Honda Finance Corp., 3.55%, 1/12/24 | | $ | 1,937 | |
2,700,000 | | Daimler Finance North America LLC 144A, 3.65%, 2/22/24 (a) | | | 2,931 | |
730,000 | | Ford Motor Co., 7.45%, 7/16/31 | | | 871 | |
740,000 | | Ford Motor Co., 8.50%, 4/21/23 | | | 818 | |
1,020,000 | | Ford Motor Credit Co. LLC, 2.98%, 8/03/22 | | | 1,015 | |
1,025,000 | | Ford Motor Credit Co. LLC, 3.09%, 1/09/23 | | | 1,017 | |
600,000 | | Ford Motor Credit Co. LLC, 3.10%, 5/04/23 | | | 593 | |
400,000 | | Ford Motor Credit Co. LLC, 3.81%, 1/09/24 | | | 400 | |
1,200,000 | | General Motors Co., 6.75%, 4/01/46 | | | 1,553 | |
2,450,000 | | General Motors Financial Co. Inc., 4.20%, 3/01/21 | | | 2,468 | |
1,700,000 | | Hyundai Capital America 144A, 1.80%, 10/15/25 (a) | | | 1,698 | |
1,920,000 | | Nissan Motor Acceptance Corp. 144A, (3 mo. LIBOR USD + 0.630%), 0.86%, 9/21/21 (a)(b) | | | 1,909 | |
3,275,000 | | Nissan Motor Co. Ltd. 144A, 4.35%, 9/17/27 (a) | | | 3,290 | |
2,300,000 | | Nissan Motor Co. Ltd. 144A, 4.81%, 9/17/30 (a) | | | 2,312 | |
1,705,000 | | Volkswagen Group of America Finance LLC 144A, 4.25%, 11/13/23 (a) | | | 1,876 | |
1,815,000 | | ZF North America Capital Inc. 144A, 4.75%, 4/29/25 (a) | | | 1,881 | |
| | | | | 26,569 | |
Banking (16%) | | | | |
1,180,000 | | ASB Bank Ltd. 144A, 3.75%, 6/14/23 (a) | | | 1,274 | |
2,325,000 | | Bank of America Corp., (U.S. Secured Overnight Financing Rate + 1.010%), 1.20%, 10/24/26 (b) | | | 2,329 | |
1,800,000 | | Bank of America Corp., (3 mo. LIBOR USD + 0.870%), 2.46%, 10/22/25 (b) | | | 1,902 | |
1,600,000 | | Bank of America Corp., (3 mo. LIBOR USD + 0.970%), 3.46%, 3/15/25 (b) | | | 1,732 | |
370,000 | | Bank of America Corp., (3 mo. LIBOR USD + 0.780%), 3.55%, 3/05/24 (b) | | | 394 | |
975,000 | | Bank of America Corp., (3 mo. LIBOR USD + 1.060%), 3.56%, 4/23/27 (b) | | | 1,088 | |
2,100,000 | | Bank of America Corp., 4.00%, 1/22/25 | | | 2,336 | |
| | | | | | |
Principal
or Shares | | Security Description | | Value
(000) | |
2,275,000 | | Bank of Montreal, (5 yr. Swap Semi 30/360 USD + 1.280%), 4.34%, 10/05/28 (b) | | $ | 2,462 | |
1,840,000 | | Bank of New Zealand 144A, 3.50%, 2/20/24 (a) | | | 2,003 | |
1,400,000 | | Barclays PLC, (3 mo. LIBOR USD + 2.452%), 2.85%, 5/07/26 (b) | | | 1,470 | |
1,550,000 | | BBVA Bancomer SA 144A, 1.88%, 9/18/25 (a) | | | 1,539 | |
850,000 | | BNZ International Funding Ltd. 144A, 3.38%, 3/01/23 (a) | | | 906 | |
1,830,000 | | Canadian Imperial Bank of Commerce, 3.10%, 4/02/24 | | | 1,975 | |
2,340,000 | | CIT Bank NA, (U.S. Secured Overnight Financing Rate + 1.715%), 2.97%, 9/27/25 (b) | | | 2,421 | |
850,000 | | Citibank NA, 3.65%, 1/23/24 | | | 932 | |
425,000 | | Citigroup Inc., (3 mo. LIBOR USD + 0.950%), 2.88%, 7/24/23 (b) | | | 441 | |
1,203,000 | | Citigroup Inc., (3 mo. LIBOR USD + 0.722%), 3.14%, 1/24/23 (b) | | | 1,240 | |
2,600,000 | | Comerica Inc., 4.00%, 2/01/29 | | | 2,979 | |
2,200,000 | | Discover Bank, 2.70%, 2/06/30 | | | 2,300 | |
2,745,000 | | Federation des Caisses Desjardins du Quebec 144A, 2.05%, 2/10/25 (a) | | | 2,870 | |
1,030,000 | | First Midwest Bancorp Inc., 5.88%, 9/29/26 | | | 1,155 | |
2,300,000 | | Goldman Sachs Group Inc., 2.60%, 2/07/30 | | | 2,431 | |
1,115,000 | | Goldman Sachs Group Inc., 3.50%, 4/01/25 | | | 1,230 | |
300,000 | | Goldman Sachs Group Inc., 3.63%, 2/20/24 | | | 326 | |
2,000,000 | | Goldman Sachs Group Inc., 3.85%, 7/08/24 | | | 2,193 | |
1,590,000 | | Huntington Bancshares Inc., 2.55%, 2/04/30 | | | 1,658 | |
1,500,000 | | JPMorgan Chase & Co., (3 mo. LIBOR USD + 0.935%), 2.78%, 4/25/23 (b) | | | 1,552 | |
915,000 | | JPMorgan Chase & Co., (U.S. Secured Overnight Financing Rate + 2.460%), 3.11%, 4/22/41 (b) | | | 983 | |
910,000 | | JPMorgan Chase & Co., (U.S. Secured Overnight Financing Rate + 2.440%), 3.11%, 4/22/51 (b) | | | 965 | |
1,700,000 | | JPMorgan Chase & Co., (3 mo. LIBOR USD + 1.000%), 4.02%, 12/05/24 (b) | | | 1,873 | |
510,000 | | Macquarie Bank Ltd. 144A, 6.63%, 4/07/21 (a) | | | 522 | |
Annual Report 39
| | |
Payden Corporate Bond Fund continued | | |
| | | | | | |
Principal
or Shares | | Security Description | | Value
(000) | |
| | |
1,025,000 | | Macquarie Group Ltd. 144A, (3 mo. LIBOR USD + 1.372%), 3.76%, 11/28/28 (a)(b) | | $ | 1,120 | |
910,000 | | Morgan Stanley, (U.S. Secured Overnight Financing Rate + 1.990%), 2.19%, 4/28/26 (b) | | | 954 | |
2,000,000 | | Morgan Stanley, (U.S. Secured Overnight Financing Rate + 1.152%), 2.72%, 7/22/25 (b) | | | 2,131 | |
3,000,000 | | Morgan Stanley, 4.10%, 5/22/23 | | | 3,249 | |
830,000 | | Morgan Stanley, 5.00%, 11/24/25 | | | 979 | |
2,850,000 | | National Securities Clearing Corp. 144A, 1.50%, 4/23/25 (a) | | | 2,930 | |
2,175,000 | | Regions Financial Corp., 3.80%, 8/14/23 | | | 2,366 | |
450,000 | | Santander Holdings USA Inc., 3.24%, 10/05/26 | | | 485 | |
1,600,000 | | State Street Corp., (3 mo. LIBOR USD + 0.770%), 3.78%, 12/03/24 (b) | | | 1,748 | |
735,000 | | Sumitomo Mitsui Financial Group Inc., 2.45%, 9/27/24 | | | 777 | |
1,000,000 | | Synchrony Bank, 3.00%, 6/15/22 | | | 1,033 | |
1,415,000 | | Truist Bank, 4.05%, 11/03/25 | | | 1,624 | |
2,450,000 | | UBS Group AG 144A, (3 mo. LIBOR USD + 1.468%), 3.13%, 8/13/30 (a)(b) | | | 2,693 | |
1,000,000 | | Wachovia Corp., 5.50%, 8/01/35 | | | 1,299 | |
2,000,000 | | Wells Fargo & Co., (U.S. Secured Overnight Financing Rate + 2.530%), 3.07%, 4/30/41 (b) | | | 2,075 | |
2,450,000 | | Wells Fargo & Co., 3.75%, 1/24/24 | | | 2,661 | |
| | | | | 77,605 | |
Basic Industry (6%) | | | | |
2,000,000 | | Alcoa Nederland Holding BV 144A, 6.75%, 9/30/24 (a) | | | 2,066 | |
650,000 | | Aviation Capital Group LLC 144A, 2.88%, 1/20/22 (a) | | | 649 | |
1,120,000 | | Aviation Capital Group LLC 144A, 3.88%, 5/01/23 (a) | | | 1,124 | |
1,160,000 | | Carrier Global Corp. 144A, 3.58%, 4/05/50 (a) | | | 1,257 | |
1,735,000 | | Caterpillar Financial Services Corp.,
3.65%, 12/07/23 | | | 1,905 | |
2,000,000 | | CNH Industrial Capital LLC, 3.88%, 10/15/21 | | | 2,054 | |
465,000 | | DAE Funding LLC 144A, 4.50%, 8/01/22 (a) | | | 469 | |
1,500,000 | | DuPont de Nemours Inc., 4.21%, 11/15/23 | | | 1,650 | |
1,485,000 | | GATX Corp., 4.35%, 2/15/24 | | | 1,629 | |
2,348,000 | | General Electric Co., 6.75%, 3/15/32 | | | 3,028 | |
1,825,000 | | Glencore Funding LLC 144A, 1.63%, 9/01/25 (a) | | | 1,816 | |
1,750,000 | | Honeywell International Inc., 2.80%, 6/01/50 | | | 1,861 | |
1,125,000 | | Jabil Inc., 3.60%, 1/15/30 | | | 1,194 | |
1,450,000 | | Nutrition & Biosciences Inc. 144A, 2.30%, 11/01/30 (a) | | | 1,459 | |
900,000 | | Nutrition & Biosciences Inc. 144A, 3.47%, 12/01/50 (a) | | | 923 | |
880,000 | | Penske Truck Leasing Co. LP/PTL Finance Corp. 144A, 4.45%, 1/29/26 (a) | | | 1,003 | |
685,000 | | Raytheon Technologies Corp., 4.13%, 11/16/28 | | | 804 | |
600,000 | | Raytheon Technologies Corp., 4.63%, 11/16/48 | | | 785 | |
1,500,000 | | Raytheon Technologies Corp., 6.70%, 8/01/28 | | | 2,008 | |
1,485,000 | | SMBC Aviation Capital Finance DAC 144A, 2.65%, 7/15/21 (a) | | | 1,497 | |
| | | | | 29,181 | |
Consumer Goods (4%) | | | | |
740,000 | | Anheuser-Busch InBev Worldwide Inc.,
8.00%, 11/15/39 | | | 1,202 | |
| | | | | | |
Principal
or Shares | | Security Description | | Value
(000) | |
| | |
904,000 | | Anheuser-Busch InBev Worldwide Inc.,
8.20%, 1/15/39 | | $ | 1,487 | |
445,000 | | Bacardi Ltd. 144A, 5.30%, 5/15/48 (a) | | | 569 | |
1,000,000 | | Central Garden & Pet Co., 4.13%, 10/15/30 | | | 1,014 | |
2,320,000 | | Coca-Cola Co., 2.60%, 6/01/50 | | | 2,333 | |
1,670,000 | | Keurig Dr Pepper Inc., 3.13%, 12/15/23 | | | 1,791 | |
195,000 | | Land O’ Lakes Inc. 144A, 6.00%, 11/15/22 (a) | | | 208 | |
2,600,000 | | Land O’ Lakes Inc. 144A, 7.00% (a)(c) | | | 2,346 | |
900,000 | | Mars Inc. 144A, 4.13%, 4/01/54 (a) | | | 1,129 | |
525,000 | | Mondelez International Inc., 1.50%, 5/04/25 | | | 540 | |
690,000 | | Nestle Holdings Inc. 144A, 3.35%, 9/24/23 (a) | | | 746 | |
690,000 | | Nestle Holdings Inc. 144A, 3.50%, 9/24/25 (a) | | | 776 | |
1,230,000 | | NIKE Inc., 2.75%, 3/27/27 | | | 1,356 | |
1,850,000 | | NIKE Inc., 3.38%, 3/27/50 | | | 2,133 | |
1,645,000 | | PepsiCo Inc., 2.88%, 10/15/49 | | | 1,763 | |
1,100,000 | | Procter & Gamble Co., 0.55%, 10/29/25 | | | 1,096 | |
| | | | | 20,489 | |
Energy (4%) | | | | |
1,780,000 | | Chevron Corp., 2.24%, 5/11/30 | | | 1,868 | |
1,700,000 | | CNOOC Petroleum North America ULC,
7.88%, 3/15/32 | | | 2,609 | |
3,000,000 | | EQM Midstream Partners LP, 6.50%, 7/15/48 | | | 2,855 | |
985,000 | | Gray Oak Pipeline LLC 144A,
3.45%, 10/15/27 (a) | | | 1,000 | |
1,000,000 | | Hess Corp., 7.30%, 8/15/31 | | | 1,221 | |
750,000 | | Kinder Morgan Energy Partners LP,
6.55%, 9/15/40 | | | 938 | |
400,000 | | Kinder Morgan Inc., (3 mo. LIBOR USD + 1.280%), 1.52%, 1/15/23 (b) | | | 402 | |
1,700,000 | | Williams Cos. Inc., 3.75%, 6/15/27 | | | 1,854 | |
1,800,000 | | Williams Cos. Inc., 7.88%, 9/01/21 | | | 1,908 | |
2,200,000 | | Williams Cos. Inc., 8.75%, 3/15/32 | | | 3,116 | |
| | | | | 17,771 | |
Financial Services (11%) | | | | |
925,000 | | AerCap Ireland Capital DAC/AerCap Global Aviation Trust, 4.13%, 7/03/23 | | | 951 | |
1,125,000 | | Air Lease Corp., 2.30%, 2/01/25 | | | 1,107 | |
410,000 | | Aircastle Ltd., 4.13%, 5/01/24 | | | 405 | |
1,795,000 | | Ally Financial Inc., 3.88%, 5/21/24 | | | 1,932 | |
1,851,000 | | American Express Co., 8.15%, 3/19/38 | | | 2,910 | |
1,950,000 | | Ares Capital Corp., 3.25%, 7/15/25 | | | 1,957 | |
1,000,000 | | Ares Capital Corp., 3.50%, 2/10/23 | | | 1,031 | |
875,000 | | Ares Capital Corp., 3.63%, 1/19/22 | | | 898 | |
1,670,000 | | BNP Paribas SA 144A, (U.S. Secured Overnight Financing Rate + 2.074%), 2.22%, 6/09/26 (a)(b) | | | 1,729 | |
2,100,000 | | Capital One Financial Corp., 3.30%, 10/30/24 | | | 2,279 | |
2,700,000 | | Citigroup Inc., (U.S. Secured Overnight Financing Rate + 1.667%), 1.68%, 5/15/24 (b) | | | 2,767 | |
2,300,000 | | Citigroup Inc., (U.S. Secured Overnight Financing Rate + 2.107%), 2.57%, 6/03/31 (b) | | | 2,400 | |
2,510,000 | | Credit Agricole SA 144A, (U.S. Secured Overnight Financing Rate + 1.676%), 1.91%, 6/16/26 (a)(b) | | | 2,574 | |
3,000,000 | | Credit Suisse Group AG 144A, (U.S. Secured Overnight Financing Rate + 2.044%), 2.19%, 6/05/26 (a)(b) | | | 3,104 | |
1,365,000 | | Crown Castle International Corp., 1.35%, 7/15/25 | | | 1,380 | |
40 Payden Mutual Funds
| | | | | | |
Principal
or Shares | | Security Description | | Value
(000) | |
2,180,000 | | FS KKR Capital Corp., 4.75%, 5/15/22 | | $ | 2,226 | |
3,775,000 | | FS KKR Capital Corp. II 144A, 4.25%, 2/14/25 (a) | | | 3,574 | |
1,800,000 | | GLP Capital LP/GLP Financing II Inc., 4.00%, 1/15/31 | | | 1,885 | |
1,700,000 | | Host Hotels & Resorts LP, 3.50%, 9/15/30 | | | 1,627 | |
2,800,000 | | HSBC Holdings PLC, (U.S. Secured Overnight Financing Rate + 2.387%), 2.85%, 6/04/31 (b) | | | 2,909 | |
1,400,000 | | KKR Group Finance Co. III LLC 144A, 5.13%, 6/01/44 (a) | | | 1,717 | |
1,155,000 | | Low Income Investment Fund, 3.71%, 7/01/29 | | | 1,263 | |
620,000 | | Mastercard Inc., 3.85%, 3/26/50 | | | 775 | |
1,100,000 | | Nomura Holdings Inc., 2.68%, 7/16/30 | | | 1,126 | |
2,205,000 | | Owl Rock Capital Corp., 3.75%, 7/22/25 | | | 2,200 | |
1,300,000 | | PayPal Holdings Inc., 3.25%, 6/01/50 | | | 1,408 | |
2,000,000 | | Pershing Square Holdings Ltd. 144A, 5.50%, 7/15/22 (a) | | | 2,115 | |
1,060,000 | | Royal Bank of Canada, 1.15%, 6/10/25 | | | 1,078 | |
250,000 | | Synchrony Financial, 3.75%, 8/15/21 | | | 254 | |
2,350,000 | | Wells Fargo & Co., (U.S. Secured Overnight Financing Rate + 2.100%), 2.39%, 6/02/28 (b) | | | 2,445 | |
| | | | | 54,026 | |
Healthcare (12%) | | | | |
700,000 | | AbbVie Inc. 144A, 2.30%, 11/21/22 (a) | | | 726 | |
2,160,000 | | AbbVie Inc. 144A, 2.95%, 11/21/26 (a) | | | 2,361 | |
685,000 | | AbbVie Inc., 3.75%, 11/14/23 | | | 746 | |
920,000 | | AbbVie Inc. 144A, 4.25%, 11/21/49 (a) | | | 1,078 | |
3,120,000 | | Amgen Inc., 3.15%, 2/21/40 | | | 3,293 | |
2,850,000 | | AstraZeneca PLC, 1.38%, 8/06/30 | | | 2,780 | |
700,000 | | Bayer U.S. Finance II LLC 144A, 3.88%, 12/15/23 (a) | | | 763 | |
700,000 | | Blue Cross and Blue Shield of Minnesota 144A, 3.79%, 5/01/25 (a) | | | 755 | |
1,645,000 | | Bristol-Myers Squibb Co., 2.90%, 7/26/24 | | | 1,777 | |
1,625,000 | | Bristol-Myers Squibb Co., 4.25%, 10/26/49 | | | 2,083 | |
1,500,000 | | Cigna Corp., (3 mo. LIBOR USD + 0.650%), 0.90%, 9/17/21 (b) | | | 1,500 | |
700,000 | | Cigna Corp., 4.13%, 11/15/25 | | | 801 | |
895,000 | | Cigna Corp., 4.90%, 12/15/48 | | | 1,159 | |
2,100,000 | | CVS Health Corp., 1.30%, 8/21/27 | | | 2,066 | |
2,030,000 | | CVS Health Corp., 4.10%, 3/25/25 | | | 2,290 | |
2,050,000 | | DH Europe Finance II Sarl, 3.40%, 11/15/49 | | | 2,342 | |
110,000 | | Dignity Health, 3.13%, 11/01/22 | | | 114 | |
740,000 | | Dignity Health, 4.50%, 11/01/42 | | | 806 | |
3,960,000 | | Gilead Sciences Inc., 2.60%, 10/01/40 | | | 3,854 | |
965,000 | | Gilead Sciences Inc., 2.80%, 10/01/50 | | | 945 | |
1,425,000 | | Johnson & Johnson, 0.95%, 9/01/27 | | | 1,423 | |
1,100,000 | | Merck & Co. Inc., 1.45%, 6/24/30 | | | 1,103 | |
1,300,000 | | Merck & Co. Inc., 2.35%, 6/24/40 | | | 1,310 | |
175,000 | | Northwell Healthcare Inc., 6.15%, 11/01/43 | | | 244 | |
955,000 | | PeaceHealth Obligated Group, 1.38%, 11/15/25 | | | 967 | |
1,200,000 | | Perrigo Finance Unlimited Co., 3.15%, 6/15/30 | | | 1,240 | |
880,000 | | Pfizer Inc., 2.63%, 4/01/30 | | | 969 | |
2,250,000 | | Roche Holdings Inc. 144A, 3.63%, 9/17/28 (a)(d) | | | 2,582 | |
2,620,000 | | Royalty Pharma PLC 144A, 2.20%, 9/02/30 (a) | | | 2,584 | |
174,000 | | Shire Acquisitions Investments Ireland DAC, 2.40%, 9/23/21 | | | 177 | |
2,040,000 | | Takeda Pharmaceutical Co. Ltd., 3.03%, 7/09/40 | | | 2,104 | |
| | | | | | |
Principal
or Shares | | Security Description | | Value
(000) | |
2,000,000 | | Takeda Pharmaceutical Co. Ltd., 4.40%, 11/26/23 | | $ | 2,221 | |
420,000 | | Teva Pharmaceutical Finance Netherlands III BV, 4.10%, 10/01/46 | | | 350 | |
850,000 | | Teva Pharmaceutical Finance Netherlands III BV, 6.00%, 4/15/24 | | | 857 | |
885,000 | | Toledo Hospital, 5.75%, 11/15/38 | | | 1,025 | |
2,175,000 | | Toledo Hospital, 6.02%, 11/15/48 | | | 2,349 | |
2,000,000 | | UnitedHealth Group Inc., 3.88%, 8/15/59 | | | 2,438 | |
1,820,000 | | Upjohn Inc. 144A, 4.00%, 6/22/50 (a) | | | 1,933 | |
| | | | | 58,115 | |
Insurance (7%) | | | | |
800,000 | | American Financial Group Inc., 4.50%, 6/15/47 | | | 884 | |
2,730,000 | | Athene Global Funding 144A, 2.95%, 11/12/26 (a) | | | 2,874 | |
1,050,000 | | Enstar Group Ltd., 4.50%, 3/10/22 | | | 1,088 | |
1,400,000 | | Five Corners Funding Trust 144A, 4.42%, 11/15/23 (a) | | | 1,552 | |
1,550,000 | | High Street Funding Trust I 144A, 4.11%, 2/15/28 (a) | | | 1,770 | |
2,115,000 | | Jackson National Life Global Funding 144A, 2.65%, 6/21/24 (a) | | | 2,243 | |
1,800,000 | | Lincoln National Corp., 7.00%, 6/15/40 | | | 2,588 | |
2,317,000 | | Manulife Financial Corp., (USD ICE Swap Rate 11:00 am NY 5Y + 1.647%), 4.06%, 2/24/32 (b) | | | 2,504 | |
1,030,000 | | Marsh & McLennan Cos. Inc., 3.88%, 3/15/24 | | | 1,137 | |
725,000 | | Nationwide Financial Services Inc. 144A, 5.30%, 11/18/44 (a) | | | 820 | |
1,731,000 | | Nationwide Mutual Insurance Co. 144A, 9.38%, 8/15/39 (a) | | | 2,924 | |
1,265,000 | | New York Life Insurance Co. 144A, 5.88%, 5/15/33 (a) | | | 1,734 | |
500,000 | | New York Life Insurance Co. 144A, 6.75%, 11/15/39 (a) | | | 753 | |
1,700,000 | | Ohio National Life Insurance Co. 144A, 6.88%, 6/15/42 (a) | | | 1,716 | |
450,000 | | Pacific Life Insurance Co. 144A, 9.25%, 6/15/39 (a) | | | 720 | |
1,665,000 | | Reliance Standard Life Global Funding II 144A, 2.63%, 7/22/22 (a) | | | 1,713 | |
550,000 | | Teachers Insurance & Annuity Association of America 144A, 4.90%, 9/15/44 (a) | | | 708 | |
2,000,000 | | Teachers Insurance & Annuity Association of America 144A, 6.85%, 12/16/39 (a) | | | 2,997 | |
| | | | | 30,725 | |
Media (2%) | | | | |
1,705,000 | | Comcast Corp., 3.95%, 10/15/25 | | | 1,955 | |
3,825,000 | | Comcast Corp., 6.50%, 11/15/35 | | | 5,790 | |
1,760,000 | | Fox Corp., 5.58%, 1/25/49 | | | 2,409 | |
475,000 | | Walt Disney Co., 9.50%, 7/15/24 | | | 615 | |
| | | | | 10,769 | |
Real Estate (2%) | | | | |
1,140,000 | | Healthpeak Properties Inc., 3.40%, 2/01/25 | | | 1,246 | |
555,000 | | iStar Inc., 4.75%, 10/01/24 | | | 531 | |
900,000 | | Kimco Realty Corp., 4.25%, 4/01/45 | | | 947 | |
800,000 | | National Retail Properties Inc., 3.90%, 6/15/24 | | | 864 | |
1,200,000 | | Simon Property Group LP, 6.75%, 2/01/40 | | | 1,669 | |
Annual Report 41
| | |
Payden Corporate Bond Fund continued | | |
| | | | | | |
Principal
or Shares | | Security Description | | Value
(000) | |
360,000 | | Toll Brothers Finance Corp., 4.88%, 11/15/25 | | $ | 400 | |
2,750,000 | | Ventas Realty LP, 4.88%, 4/15/49 | | | 3,069 | |
800,000 | | VEREIT Operating Partnership LP, 4.60%, 2/06/24 | | | 862 | |
770,000 | | WEA Finance LLC 144A, 4.13%, 9/20/28 (a) | | | 788 | |
980,000 | | WEA Finance LLC 144A, 4.63%, 9/20/48 (a) | | | 951 | |
| | | | | 11,327 | |
Retail (3%) | | | | |
1,550,000 | | Costco Wholesale Corp., 1.60%, 4/20/30 | | | 1,568 | |
870,000 | | Costco Wholesale Corp., 1.75%, 4/20/32 | | | 888 | |
2,000,000 | | Home Depot Inc., 4.50%, 12/06/48 | | | 2,660 | |
1,775,000 | | Lowe’s Cos. Inc., 3.00%, 10/15/50 | | | 1,827 | |
1,325,000 | | Lowe’s Cos. Inc., 5.13%, 4/15/50 | | | 1,853 | |
1,555,000 | | Walmart Inc., 3.25%, 7/08/29 | | | 1,801 | |
1,940,000 | | Yum! Brands Inc., 3.63%, 3/15/31 | | | 1,906 | |
| | | | | 12,503 | |
Service (2%) | | | | |
2,185,000 | | American University, 3.67%, 4/01/49 | | | 2,342 | |
1,850,000 | | California Institute of Technology, 3.65%, 9/01/19 | | | 1,886 | |
1,150,000 | | Ford Foundation, 2.82%, 6/01/70 | | | 1,134 | |
1,540,000 | | Georgetown University, 4.32%, 4/01/49 | | | 1,839 | |
1,180,000 | | President and Fellows of Harvard College, 2.52%, 10/15/50 | | | 1,212 | |
| | | | | 8,413 | |
Technology (4%) | | | | |
1,305,000 | | Apple Inc., 2.65%, 5/11/50 | | | 1,322 | |
2,000,000 | | Apple Inc., 4.65%, 2/23/46 | | | 2,728 | |
2,289,000 | | Broadcom Inc., 4.11%, 9/15/28 | | | 2,554 | |
1,400,000 | | Dell International LLC/EMC Corp. 144A, 4.90%, 10/01/26 (a) | | | 1,595 | |
835,000 | | Dell International LLC/EMC Corp. 144A, 8.35%, 7/15/46 (a) | | | 1,141 | |
2,300,000 | | International Business Machines Corp., 1.70%, 5/15/27 | | | 2,354 | |
1,050,000 | | Lam Research Corp., 2.88%, 6/15/50 | | | 1,083 | |
1,315,000 | | Microchip Technology Inc. 144A, 2.67%, 9/01/23 (a) | | | 1,365 | |
2,800,000 | | Microsoft Corp., 2.53%, 6/01/50 | | | 2,865 | |
1,150,000 | | ServiceNow Inc., 1.40%, 9/01/30 | | | 1,113 | |
1,050,000 | | Texas Instruments Inc., 1.75%, 5/04/30 | | | 1,074 | |
| | | | | 19,194 | |
Telecommunications (7%) | | | | |
2,575,000 | | Alphabet Inc., 2.05%, 8/15/50 | | | 2,330 | |
1,600,000 | | AT&T Inc., (3 mo. LIBOR USD + 1.180%), 1.43%, 6/12/24 (b) | | | 1,637 | |
3,359,000 | | AT&T Inc. 144A, 3.50%, 9/15/53 (a) | | | 3,227 | |
3,800,000 | | AT&T Inc. 144A, 3.65%, 9/15/59 (a) | | | 3,642 | |
1,760,000 | | British Telecommunications PLC 144A, 4.25%, 11/08/49 (a) | | | 2,036 | |
1,500,000 | | Deutsche Telekom International Finance BV, 8.75%, 6/15/30 | | | 2,331 | |
1,350,000 | | eBay Inc., 2.70%, 3/11/30 | | | 1,416 | |
735,000 | | JD.com Inc., 3.38%, 1/14/30 | | | 794 | |
1,350,000 | | JD.com Inc., 4.13%, 1/14/50 | | | 1,455 | |
| | | | | | |
Principal
or Shares | | Security Description | | Value
(000) | |
2,475,000 | | Orange SA, 9.00%, 3/01/31 | | $ | 4,016 | |
97,500 | | Sprint Spectrum Co. LLC/Sprint Spectrum Co. II LLC/Sprint Spectrum Co. III LLC 144A, 3.36%, 9/20/21 (a) | | | 99 | |
1,100,000 | | TELUS Corp., 4.60%, 11/16/48 | | | 1,371 | |
2,050,000 | | Tencent Holdings Ltd. 144A, 3.24%, 6/03/50 (a) | | | 2,070 | |
300,000 | | Tencent Holdings Ltd. 144A, 3.98%, 4/11/29 (a) | | | 338 | |
1,500,000 | | T-Mobile USA Inc. 144A, 3.88%, 4/15/30 (a) | | | 1,687 | |
1,000,000 | | Verizon Communications Inc., 4.40%, 11/01/34 | | | 1,237 | |
1,063,000 | | Verizon Communications Inc., 4.75%, 11/01/41 | | | 1,390 | |
280,000 | | Verizon Communications Inc., 4.86%, 8/21/46 | | | 373 | |
2,000,000 | | Vodafone Group PLC, 5.25%, 5/30/48 | | | 2,594 | |
| | | | | 34,043 | |
Transportation (1%) | | | | |
1,433,369 | | American Airlines 2019-1 Class A Pass-Through Trust, 3.50%, 2/15/32 | | | 1,131 | |
1,496,109 | | American Airlines 2019-1 Class AA Pass-Through Trust, 3.15%, 2/15/32 | | | 1,379 | |
172,361 | | Continental Airlines 2007-1 Class B Pass-Through Trust, 6.90%, 4/19/22 | | | 161 | |
2,100,000 | | Ryder System Inc., 3.65%, 3/18/24 | | | 2,285 | |
| | | | | 4,956 | |
Utility (8%) | | | | |
1,485,000 | | Alliant Energy Finance LLC 144A, 3.75%, 6/15/23 (a) | | | 1,594 | |
1,680,000 | | Ameren Corp., 2.50%, 9/15/24 | | | 1,786 | |
1,050,000 | | Basin Electric Power Cooperative 144A, 4.75%, 4/26/47 (a) | | | 1,215 | |
244,000 | | Berkshire Hathaway Energy Co., 6.13%, 4/01/36 | | | 350 | |
1,150,000 | | Consumers Energy Co., 4.35%, 4/15/49 | | | 1,507 | |
1,750,000 | | Dominion Energy Gas Holdings LLC, 3.00%, 11/15/29 | | | 1,907 | |
1,000,000 | | Dominion Energy Inc., 4.10%, 4/01/21 | | | 1,015 | |
1,185,000 | | DTE Energy Co., 3.70%, 8/01/23 | | | 1,284 | |
1,250,000 | | Duke Energy Florida LLC, 4.20%, 7/15/48 | | | 1,566 | |
1,620,000 | | Entergy Louisiana LLC, 4.00%, 3/15/33 | | | 2,006 | |
850,000 | | Exelon Generation Co. LLC, 3.25%, 6/01/25 | | | 926 | |
1,600,000 | | FirstEnergy Corp., 2.25%, 9/01/30 | | | 1,513 | |
545,000 | | Fortis Inc., 3.06%, 10/04/26 | | | 596 | |
1,150,000 | | Indianapolis Power & Light Co. 144A, 4.05%, 5/01/46 (a) | | | 1,397 | |
1,650,000 | | Interstate Power and Light Co., 3.50%, 9/30/49 | | | 1,823 | |
660,000 | | KeySpan Gas East Corp. 144A, 5.82%, 4/01/41 (a) | | | 915 | |
1,780,000 | | National Fuel Gas Co., 5.50%, 1/15/26 | | | 1,950 | |
1,180,000 | | National Rural Utilities Cooperative Finance Corp., 4.40%, 11/01/48 | | | 1,522 | |
1,150,000 | | NextEra Energy Capital Holdings Inc., 3.25%, 4/01/26 | | | 1,282 | |
275,000 | | Niagara Mohawk Power Corp. 144A, 1.96%, 6/27/30 (a) | | | 281 | |
2,600,000 | | Pacific Gas and Electric Co., 1.75%, 6/16/22 | | | 2,601 | |
825,000 | | PSEG Power LLC, 3.85%, 6/01/23 | | | 890 | |
345,007 | | Solar Star Funding LLC 144A, 3.95%, 6/30/35 (a) | | | 355 | |
2,255,000 | | Tampa Electric Co., 4.45%, 6/15/49 | | | 2,929 | |
2,297,000 | | Tucson Electric Power Co., 4.85%, 12/01/48 | | | 3,005 | |
42 Payden Mutual Funds
| | | | | | |
Principal
or Shares | | Security Description | | Value
(000) | |
| | |
2,605,000 | | Vistra Operations Co. LLC 144A,
4.30%, 7/15/29 (a) | | $ | 2,825 | |
| | | | | 39,040 | |
Total Corporate Bond (Cost - $423,945) | | | 454,726 | |
Foreign Government (0%) | | | | |
1,885,000 | | Corp. Financiera de Desarrollo SA 144A,
2.40%, 9/28/27 (a) | | | | |
| | (Cost - $1,883) | | | 1,919 | |
Municipal (2%) | | | | |
1,200,000 | | Bay Area Toll Authority, 3.55%, 4/01/54 | | | 1,263 | |
2,400,000 | | Chicago O’Hare International Airport,
4.47%, 1/01/49 | | | 2,836 | |
1,200,000 | | City of San Francisco CA Public Utilities Commission Water Revenue, 2.83%, 11/01/41 | | | 1,193 | |
1,050,000 | | Michigan Finance Authority, 5.02%, 11/01/43 | | | 1,270 | |
1,000,000 | | Rutgers The State University of New Jersey, 4.15%, 5/01/48 | | | 1,059 | |
2,170,000 | | University of California, 1.32%, 5/15/27 | | | 2,169 | |
Total Municipal (Cost - $9,020) | | | 9,790 | |
| | | | | | |
| | | | | | |
Principal
or Shares | | Security Description | | Value
(000) | |
| |
Investment Company (3%) | | | | |
11,713,077 | | Payden Cash Reserves Money Market Fund * | | | | |
| | (Cost - $11,713) | | $ | 11,713 | |
| |
Total Investments (Cost - $446,561) (100%) | | | 478,148 | |
Other Assets, net of Liabilities (0%) | | | 1,803 | |
Net Assets (100%) | | $ | 479,951 | |
| | | | | | |
| (a) | Security offered only to qualified institutional investors, and thus is not registered for sale to the public under rule 144A of the Securities Act of 1933. |
| | It has been deemed liquid under guidelines approved by the Board. |
| (b) | Floating rate security. The rate shown reflects the rate in effect at October 31, 2020. |
| (c) | Perpetual security with no stated maturity date. |
| (d) | All or a portion of these securities are on loan. At October 31, 2020, the total market value of the Fund’s securities on loan is $2,524 the total market value of the collateral held by the Fund is $2,596. Amounts in 000s. |
Open Futures Contracts
| | | | | | | | | | | | | | | | | | | | |
| Contract Type | | Number of
Contracts | | | Expiration
Date | | | Notional
Amount
(000s) | | | Current
Value
(000s) | | | Unrealized
Appreciation
(Depreciation)
(000s) | |
| Long Contracts: | | | | | | | | | | | | | | | | | | | | |
| U.S. Long Bond Future | | | 79 | | | | Dec-20 | | | $ | 13,625 | | | $ | (333 | ) | | $ | (333 | ) |
| U.S. Treasury 10-Year Note Future | | | 173 | | | | Dec-20 | | | | 23,912 | | | | (165 | ) | | | (165 | ) |
| U.S. Treasury 2-Year Note Future | | | 109 | | | | Dec-20 | | | | 24,072 | | | | (4 | ) | | | (4 | ) |
| | | | | | | | | | | | | | | | | | | | |
| | | | | | | | | | | | | | | | | | | (502 | ) |
| | | | | | | | | | | | | | | | | | | | |
| Short Contracts: | | | | | | | | | | | | | | | | | | | | |
| U.S. 10-Year Ultra Future | | | 97 | | | | Dec-20 | | | | (15,256 | ) | | | 139 | | | | 139 | |
| U.S. Treasury 5-Year Note Future | | | 128 | | | | Dec-20 | | | | (16,077 | ) | | | 33 | | | | 33 | |
| U.S. Ultra Bond Future | | | 36 | | | | Dec-20 | | | | (7,740 | ) | | | 124 | | | | 124 | |
| | | | | | | | | | | | | | | | | | | | |
| | | | | | | | | | | | | | | | | | | 296 | |
| | | | | | | | | | | | | | | | | | | | |
| Total Futures | | | | | | | | | | | | | | | | | | $ | (206 | ) |
| | | | | | | | | | | | | | | | | | | | |
Open Centrally Cleared Credit Default Swap Contracts
| | | | | | | | | | | | | | | | |
| Description | | Maturity
Date | | Notional
Amount
(000s) | | Value
(000s) | | | Upfront
payments/
receipts
(000s) | | | Unrealized
Depreciation
(000s) | |
| Protection Bought (Relevant Credit: Markit CDX, North America High Yield Series 34 Index), Pay 5% Quarterly, Receive upon credit default | | 06/20/2025 | | $9,200 | | $ | (449 | ) | | $ | 458 | | | $ | (907 | ) |
| | | | | | | | | | | | | | | | |
Annual Report 43
| | |
Payden Corporate Bond Fund continued | | |
Offsetting Assets and Liabilities
The Fund’s loaned securities were all subject to an enforceable Securities Lending Agency Agreement. Securities lent in accordance with the Securities Lending Agency Agreement on a gross basis were as follows:
| | | | |
| Total gross amount presented on the Statements of Assets and Liabilities1 | | $ | 2,524 | |
Non-cash Collateral2 | | | (2,524 | ) |
| | | | |
Net Amount | | $ | — | |
| | | | |
| 1 | The amount presented on the Statements of Assets and Liabilities is not offset and is shown on a gross basis. |
| 2 | At October 31, 2020, the value of the collateral received from each borrower exceeded the value of the related securities loaned. This amount is disclosed on the Schedule of Investments. |
See notes to financial statements.
44 Payden Mutual Funds
Payden Strategic Income Fund
| | | | |
The Fund seeks a high level of total return including income generation consistent with preservation of capital by investing in a wide variety of securities across many asset classes. | | 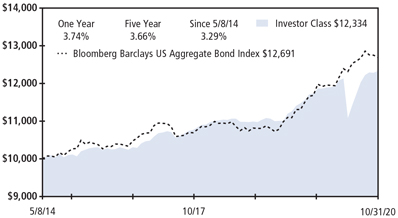
Past performance does not predict future returns. The graph does not reflect the impact of taxes or transaction costs a shareholder would pay. The Fund’s SI Class is expected to perform similarly to its Investor Class, except for class specific waivers. |
| Portfolio Composition - percent of investments |
|
Corporate Bond | | 49% |
Mortgage Backed | | 15% |
U.S. Treasury | | 12% |
Asset Backed | | 10% |
Foreign Government | | 5% |
Other | | 9% |
| | |
|
|
|
|
|
|
This information is not part of the audited financial statements. |
Schedule of Investments - October 31, 2020
| | | | | | |
Principal
or Shares | | Security Description | | Value
(000) | |
Asset Backed (10%) | | | | |
219,450 | | Arbys Funding LLC 144A, 3.24%, 7/30/50 (a) | | $ | 226 | |
500,000 | | Atrium XII 144A, (3 mo. LIBOR USD + 2.800%), 3.02%, 4/22/27 (a)(b) | | | 456 | |
700,000 | | Blackrock European CLO VII DAC 144A, (3 mo. EURIBOR + 1.700%), 1.70%, 10/15/31 EUR (a)(b)(c) | | | 803 | |
324,823 | | BlueMountain CLO 2015-2 Ltd. 144A, (3 mo. LIBOR USD + 0.930%), 1.15%, 7/18/27 (a)(b) | | | 322 | |
300,000 | | BlueMountain CLO 2015-2 Ltd. 144A, (3 mo. LIBOR USD + 2.750%), 2.97%, 7/18/27 (a)(b) | | | 266 | |
450,000 | | BlueMountain CLO 2015-3 Ltd. 144A, (3 mo. LIBOR USD + 2.600%), 2.82%, 4/20/31 (a)(b) | | | 366 | |
500,000 | | Carlyle C17 CLO Ltd. 144A, (3 mo. LIBOR USD + 2.800%), 3.01%, 4/30/31 (a)(b) | | | 452 | |
230,000 | | CARS-DB4 LP 144A, 4.17%, 2/15/50 (a) | | | 236 | |
360,000 | | CARS-DB4 LP 144A, 4.95%, 2/15/50 (a) | | | 368 | |
590,000 | | Cedar Funding II CLO Ltd. 144A, (3 mo. LIBOR USD + 2.350%), 2.59%, 6/09/30 (a)(b) | | | 574 | |
600,000 | | CIFC European Funding CLO II DAC 144A, (3 mo. EURIBOR + 0.900%), 0.90%, 4/15/33 EUR (a)(b)(c) | | | 702 | |
400,000 | | CIFC Funding 2013-III-R Ltd. 144A, (3 mo. LIBOR USD + 2.900%), 3.11%, 4/24/31 (a)(b) | | | 367 | |
620,000 | | CLNC 2019-FL1 Ltd. 144A, (1 mo. LIBOR USD + 1.550%), 1.70%, 8/20/35 (a)(b) | | | 607 | |
202,193 | | Countrywide Asset-Backed Certificates, 4.54%, 10/25/46 (d) | | | 201 | |
309,225 | | Driven Brands Funding 2020-1A LLC 144A, 3.79%, 7/20/50 (a) | | | 319 | |
400,000 | | Driven Brands Funding 2020-2A LLC 144A, 3.24%, 1/20/51 (a) | | | 400 | |
500,000 | | Dryden 33 Senior Loan Fund 144A, (3 mo. LIBOR USD + 1.750%), 1.99%, 4/15/29 (a)(b) | | | 501 | |
| | | | | | |
Principal
or Shares | | Security Description | | Value
(000) | |
| | |
400,000 | | Dryden XXVI Senior Loan Fund 144A, (3 mo. LIBOR USD + 5.540%), 5.78%, 4/15/29 (a)(b) | | $ | 347 | |
410,000 | | Gulf Stream Meridian 2 Ltd. 144A, (3 mo. LIBOR USD + 1.400%), 0.00%, 10/15/29 (a)(b)(e) | | | 410 | |
500,000 | | LCM XXI LP 144A, (3 mo. LIBOR USD + 2.000%), 2.22%, 4/20/28 (a)(b) | | | 484 | |
490,000 | | LoanCore 2019-CRE2 Issuer Ltd. 144A, (1 mo. LIBOR USD + 1.500%), 1.65%, 5/15/36 (a)(b) | | | 481 | |
400,000 | | Man GLG Euro CLO 144A, (3 mo. EURIBOR + 0.900%), 0.90%, 10/15/32 EUR (a)(b)(c) | | | 466 | |
250,000 | | Montmartre Euro CLO 2020-2 DAC 144A, (3 mo. EURIBOR + 1.590%), 1.59%, 7/15/33
EUR (a)(b)(c) | | | 291 | |
400,000 | | OCP CLO 2014-5 Ltd. 144A, (3 mo. LIBOR USD + 2.900%), 3.11%, 4/26/31 (a)(b) | | | 363 | |
600,000 | | OZLME V DAC 144A, (3 mo. EURIBOR + 1.750%), 1.75%, 1/14/32 EUR (a)(b)(c) | | | 696 | |
406,925 | | Planet Fitness Master Issuer LLC 144A, 3.86%, 12/05/49 (a) | | | 386 | |
500,000 | | Regatta Funding LP 2013-2A 144A, (3 mo. LIBOR USD + 2.700%), 2.94%, 1/15/29 (a)(b) | | | 493 | |
600,000 | | St Paul’s CLO XII DAC 144A, (3 mo. EURIBOR + 3.200%), 3.20%, 4/15/33 EUR (a)(b)(c) | | | 687 | |
370,000 | | STWD 2019-FL1 Ltd. 144A, (1 mo. LIBOR USD + 1.400%), 1.55%, 7/15/38 (a)(b) | | | 365 | |
300,000 | | Voya Euro CLO III DAC 144A, (3 mo. EURIBOR + 0.920%), 0.92%, 4/15/33
EUR (a)(b)(c) | | | 348 | |
430,000 | | Westlake Automobile Receivables Trust 2020-1 144A, 2.80%, 6/16/25 (a) | | | 441 | |
490,000 | | Wingstop Funding 2020-1A LLC 144A, 2.84%, 12/05/50 (a) | | | 497 | |
Total Asset Backed (Cost - $14,040) | | | 13,921 | |
Annual Report 45
Payden Strategic Income Fund continued
| | | | | | |
Principal
or Shares | | Security Description | | Value
(000) | |
Bank Loans(f) (3%) | | | | |
250,000 | | AI Convoy Luxembourg Sarl Term Loan B 1L, (3 mo. EURIBOR + 3.750%), 3.75%, 1/20/27 EUR (c) | | $ | 287 | |
671,553 | | Altice France SA Term Loan B11 1L, (LIBOR USD 1-Month + 2.750%), 2.90%, 7/31/25 | | | 643 | |
304,000 | | Ascent Resources Utica Holdings LLC Term Loan 2L, (LIBOR USD 1-Month + 9.000%), 10.00%, 11/01/25 | | | 322 | |
471,443 | | CDW LLC Term Loan B 1L, (LIBOR USD 1-Month + 1.750%), 1.90%, 8/17/23 | | | 470 | |
300,000 | | Froneri Lux FinCo SARL Term Loan B 1L, (1 mo. EURIBOR + 2.625%), 2.63%, 1/31/27 EUR (c) | | | 341 | |
317,371 | | GOBP Holdings Inc. Term Loan B 1L, (LIBOR USD 1-Month + 2.750%), 2.90%, 10/22/25 | | | 311 | |
408,951 | | IRB Holding Corp. Term Loan B 1L, (LIBOR USD 1-Month + 2.750%), 3.75%, 2/05/25 | | | 390 | |
408,901 | | K-MAC Holdings Corp. Term Loan 1L, (LIBOR USD 1-Month + 3.000%), 3.15%, 3/14/25 | | | 396 | |
135,000 | | Newco Financing Partnership Term Loan B1 1L, (LIBOR USD 1-Month + 3.500%), 3.50%, 1/31/29 | | | 132 | |
497,500 | | Sotera Health Holdings LLC Term Loan 1L, (LIBOR USD 3-Month + 4.500%), 5.50%, 12/13/26 | | | 497 | |
780,000 | | Tacala Investment Corp. Term Loan B 1L, (LIBOR USD 1-Month + 3.250%), 3.40%, 2/05/27 | | | 759 | |
135,000 | | UPC Financing Partnership Term Loan B2 1L, (LIBOR USD 1-Month + 3.500%), 3.50%, 1/31/29 | | | 132 | |
Total Bank Loans (Cost - $4,695) | | | 4,680 | |
Corporate Bond (50%) | | | | |
Financial (21%) | | | | |
145,000 | | Air Lease Corp., 2.30%, 2/01/25 | | | 143 | |
270,000 | | American Honda Finance Corp., 0.88%, 7/07/23 | | | 272 | |
770,000 | | Ares Capital Corp., 3.50%, 2/10/23 | | | 794 | |
185,000 | | Ares Capital Corp., 3.63%, 1/19/22 | | | 190 | |
230,000 | | ASB Bank Ltd. 144A, 3.75%, 6/14/23 (a) | | | 248 | |
180,000 | | Assurant Inc., (3 mo. LIBOR USD + 4.135%), 7.00%, 3/27/48 (b) | | | 196 | |
725,000 | | Avolon Holdings Funding Ltd. 144A, 3.63%, 5/01/22 (a) | | | 727 | |
400,000 | | Bangkok Bank PCL 144A, (5 yr. US Treasury Yield Curve Rate T Note Constant Maturity + 4.729%), 5.00%, (a)(b)(g) | | | 400 | |
445,000 | | Bank of America Corp., (3 mo. LIBOR USD + 1.021%), 2.88%, 4/24/23 (b) | | | 460 | |
385,000 | | Bank of Nova Scotia, 1.30%, 6/11/25 | | | 392 | |
255,000 | | Barclays Bank PLC, 1.70%, 5/12/22 | | | 260 | |
270,000 | | Barclays PLC, 3.68%, 1/10/23 | | | 279 | |
350,000 | | Barclays PLC, (5 yr. US Treasury Yield Curve Rate T Note Constant Maturity + 5.867%), 6.13%, (b)(g) | | | 357 | |
510,000 | | BBVA USA, 2.88%, 6/29/22 | | | 528 | |
250,000 | | BNP Paribas SA 144A, (U.S. Secured Overnight Financing Rate + 2.074%), 2.22%, 6/09/26 (a)(b) | | | 259 | |
| | | | | | |
Principal
or Shares | | Security Description | | Value
(000) | |
| | |
400,000 | | Canadian Imperial Bank of Commerce, 3.10%, 4/02/24 | | $ | 432 | |
375,000 | | Charles Schwab Corp., (5 yr. US Treasury Yield Curve Rate T Note Constant Maturity + 4.971%), 5.38%, (b)(g) | | | 411 | |
520,000 | | Citigroup Inc., (U.S. Secured Overnight Financing Rate + 2.107%), 2.57%, 6/03/31 (b) | | | 543 | |
400,000 | | Citigroup Inc., (3 mo. LIBOR USD + 0.950%), 2.88%, 7/24/23 (b) | | | 415 | |
130,000 | | Citigroup Inc., (3 mo. LIBOR USD + 4.478%), 6.13%, (b)(g) | | | 129 | |
420,000 | | Citizens Bank NA, 3.25%, 2/14/22 | | | 434 | |
390,000 | | Comerica Bank, 2.50%, 7/23/24 | | | 416 | |
375,000 | | Credit Agricole SA 144A, (U.S. Secured Overnight Financing Rate + 1.676%), 1.91%, 6/16/26 (a)(b) | | | 385 | |
335,000 | | Credit Suisse Group AG 144A, (U.S. Secured Overnight Financing Rate + 1.560%), 2.59%, 9/11/25 (a)(b) | | | 351 | |
275,000 | | Credit Suisse Group AG 144A, (5 yr. US Treasury Yield Curve Rate T Note Constant Maturity + 4.889%), 5.25%, (a)(b)(g) | | | 278 | |
830,000 | | Daimler Finance North America LLC 144A, 3.65%, 2/22/24 (a) | | | 901 | |
450,000 | | Diversified Healthcare Trust, 4.75%, 5/01/24 | | | 430 | |
425,000 | | Enstar Group Ltd., 4.50%, 3/10/22 | | | 440 | |
460,000 | | Federation des Caisses Desjardins du Quebec 144A, 2.05%, 2/10/25 (a) | | | 481 | |
470,000 | | Five Corners Funding Trust 144A, 4.42%, 11/15/23 (a) | | | 521 | |
700,000 | | Ford Motor Credit Co. LLC, (3 mo. LIBOR USD + 1.235%), 1.52%, 2/15/23 (b) | | | 660 | |
630,000 | | Ford Motor Credit Co. LLC, 3.81%, 1/09/24 | | | 630 | |
415,000 | | FS KKR Capital Corp., 4.75%, 5/15/22 | | | 424 | |
400,000 | | FS KKR Capital Corp. II 144A,
4.25%, 2/14/25 (a) | | | 379 | |
350,000 | | General Motors Financial Co. Inc., (3 mo. LIBOR USD + 1.550%), 1.78%, 1/14/22 (b) | | | 352 | |
500,000 | | General Motors Financial Co. Inc., (3 mo. LIBOR USD + 3.598%), 5.75%, (b)(g) | | | 490 | |
550,000 | | GLP Capital LP/GLP Financing II Inc., 4.00%, 1/15/31 | | | 576 | |
400,000 | | Goldman Sachs Group Inc., (3 mo. LIBOR USD + 1.110%), 1.32%, 4/26/22 (b) | | | 401 | |
365,000 | | HSBC Holdings PLC, (U.S. Secured Overnight Financing Rate + 1.929%), 2.10%, 6/04/26 (b) | | | 373 | |
245,000 | | Intercontinental Exchange Inc., 2.10%, 6/15/30 | | | 252 | |
550,000 | | JPMorgan Chase & Co., (U.S. Secured Overnight Financing Rate + 1.850%), 2.08%, 4/22/26 (b) | | | 576 | |
400,000 | | Life Storage LP, 2.20%, 10/15/30 | | | 400 | |
555,000 | | Macquarie Group Ltd. 144A, (3 mo. LIBOR USD + 1.023%), 3.19%, 11/28/23 (a)(b) | | | 580 | |
430,000 | | Mitsubishi UFJ Financial Group Inc., 3.41%, 3/07/24 | | | 466 | |
500,000 | | Mizuho Financial Group Inc., (3 mo. LIBOR USD + 1.000%), 3.92%, 9/11/24 (b) | | | 543 | |
46 Payden Mutual Funds
| | | | | | |
Principal
or Shares | | Security Description | | Value
(000) | |
| | |
580,000 | | Morgan Stanley, (3 mo. LIBOR USD + 0.930%), 1.15%, 7/22/22 (b) | | $ | 583 | |
500,000 | | MPT Operating Partnership LP/MPT Finance Corp., 5.50%, 5/01/24 | | | 507 | |
320,000 | | Muthoot Finance Ltd. 144A, 6.13%, 10/31/22 (a) | | | 331 | |
315,000 | | National Securities Clearing Corp. 144A, 1.50%, 4/23/25 (a) | | | 324 | |
270,000 | | Nomura Holdings Inc., 1.85%, 7/16/25 | | | 275 | |
255,000 | | OneMain Finance Corp., 8.88%, 6/01/25 | | | 281 | |
345,000 | | Owl Rock Capital Corp., 3.75%, 7/22/25 | | | 344 | |
235,000 | | Royal Bank of Canada, 1.60%, 4/17/23 | | | 242 | |
450,000 | | Santander Holdings USA Inc., 3.24%, 10/05/26 | | | 485 | |
500,000 | | SBA Communications Corp., 4.00%, 10/01/22 | | | 505 | |
290,000 | | SBA Tower Trust 144A, 1.88%, 1/15/26 (a) | | | 300 | |
640,000 | | Shriram Transport Finance Co. Ltd. 144A, 5.95%, 10/24/22 (a) | | | 624 | |
580,000 | | SLM Corp., 5.13%, 4/05/22 | | | 598 | |
200,000 | | State Street Corp. 144A, (U.S. Secured Overnight Financing Rate + 2.690%), 2.83%, 3/30/23 (a)(b) | | | 207 | |
260,000 | | Swedbank AB 144A, 1.30%, 6/02/23 (a) | | | 265 | |
335,000 | | Synchrony Financial, 2.85%, 7/25/22 | | | 346 | |
505,000 | | VEREIT Operating Partnership LP, 4.60%, 2/06/24 | | | 544 | |
335,000 | | WEA Finance LLC 144A, 3.15%, 4/05/22 (a) | | | 340 | |
585,000 | | Wells Fargo & Co., (U.S. Secured Overnight Financing Rate + 1.600%), 1.65%, 6/02/24 (b) | | | 598 | |
435,000 | | Wells Fargo Bank NA, (3 mo. LIBOR USD + 0.660%), 0.90%, 9/09/22 (b) | | | 437 | |
625,000 | | Zions Bancorp NA, 3.35%, 3/04/22 | | | 645 | |
| | | | | 27,955 | |
Industrial (20%) | | | | |
222,000 | | 1011778 BC ULC/New Red Finance Inc. 144A, 5.00%, 10/15/25 (a) | | | 228 | |
405,000 | | AbbVie Inc. 144A, 2.60%, 11/21/24 (a) | | | 431 | |
335,000 | | Albertsons Cos. Inc./Safeway Inc./New Albertsons LP/Albertsons LLC 144A, 3.25%, 3/15/26 (a) | | | 329 | |
280,000 | | Alphabet Inc., 0.80%, 8/15/27 | | | 277 | |
482,616 | | American Airlines 2019-1 Class A Pass-Through Trust, 3.50%, 2/15/32 | | | 381 | |
200,000 | | ams AG 144A, 6.00%, 7/31/25 EUR (a)(c) | | | 243 | |
460,000 | | AstraZeneca PLC, 0.70%, 4/08/26 | | | 454 | |
600,000 | | AT&T Inc., (3 mo. LIBOR USD + 1.180%), 1.43%, 6/12/24 (b) | | | 614 | |
540,000 | | Aviation Capital Group LLC 144A, 3.88%, 5/01/23 (a) | | | 542 | |
260,000 | | Bausch Health Cos. Inc. 144A,
6.25%, 2/15/29 (a) | | | 268 | |
715,000 | | Bayer U.S. Finance II LLC 144A, (3 mo. LIBOR USD + 0.630%), 0.86%, 6/25/21 (a)(b) | | | 717 | |
350,000 | | Bayer U.S. Finance II LLC 144A, 3.50%, 6/25/21 (a) | | | 356 | |
500,000 | | Blue Cross and Blue Shield of Minnesota 144A, 3.79%, 5/01/25 (a) | | | 539 | |
320,000 | | BRF SA 144A, 5.75%, 9/21/50 (a) | | | 305 | |
565,000 | | Bristol-Myers Squibb Co., 2.90%, 7/26/24 | | | 610 | |
| | | | | | |
Principal
or Shares | | Security Description | | Value
(000) | |
| | |
192,000 | | Broadcom Inc., 3.46%, 9/15/26 | | $ | 210 | |
300,000 | | Carrier Global Corp. 144A, 2.24%, 2/15/25 (a) | | | 313 | |
240,000 | | CCO Holdings LLC/CCO Holdings Capital Corp. 144A, 5.38%, 6/01/29 (a) | | | 260 | |
50,000 | | CDW LLC/CDW Finance Corp., 5.50%, 12/01/24 | | | 55 | |
450,000 | | Centene Corp., 4.25%, 12/15/27 | | | 475 | |
230,000 | | Choice Hotels International Inc., 3.70%, 1/15/31 | | | 240 | |
500,000 | | Churchill Downs Inc. 144A, 4.75%, 1/15/28 (a) | | | 509 | |
500,000 | | Cigna Corp., (3 mo. LIBOR USD + 0.650%), 0.90%, 9/17/21 (b) | | | 500 | |
266,000 | | Cigna Corp., 3.75%, 7/15/23 | | | 288 | |
234,000 | | CommScope Technologies LLC 144A, 6.00%, 6/15/25 (a) | | | 232 | |
255,000 | | Costco Wholesale Corp., 1.38%, 6/20/27 | | | 260 | |
500,000 | | DH Europe Finance II Sarl, 2.20%, 11/15/24 | | | 528 | |
292,000 | | Encompass Health Corp., 5.75%, 11/01/24 | | | 292 | |
140,000 | | Equifax Inc., 2.60%, 12/15/25 | | | 151 | |
385,000 | | GATX Corp., 4.35%, 2/15/24 | | | 422 | |
500,000 | | Goodyear Tire & Rubber Co., 5.13%, 11/15/23 | | | 498 | |
260,000 | | HCA Inc., 3.50%, 9/01/30 | | | 266 | |
500,000 | | HCA Inc., 5.00%, 3/15/24 | | | 560 | |
210,000 | | Home Depot Inc., 2.50%, 4/15/27 | | | 228 | |
260,000 | | Honeywell International Inc., 1.35%, 6/01/25 | | | 267 | |
240,000 | | KeHE Distributors LLC/KeHE Finance Corp. 144A, 8.63%, 10/15/26 (a) | | | 259 | |
210,000 | | Keurig Dr Pepper Inc., 4.06%, 5/25/23 | | | 228 | |
260,000 | | Kraft Heinz Foods Co., 5.00%, 6/04/42 | | | 286 | |
270,000 | | Lamar Media Corp., 4.00%, 2/15/30 | | | 273 | |
260,000 | | Lamar Media Corp., 4.88%, 1/15/29 | | | 271 | |
200,000 | | Land O’ Lakes Inc. 144A, 7.00%, (a)(g) | | | 181 | |
580,000 | | Lennar Corp., 4.75%, 11/29/27 | | | 665 | |
220,000 | | Microchip Technology Inc. 144A, 2.67%, 9/01/23 (a) | | | 228 | |
400,000 | | Moog Inc. 144A, 4.25%, 12/15/27 (a) | | | 411 | |
675,000 | | Nissan Motor Co. Ltd. 144A, 3.04%, 9/15/23 (a) | | | 685 | |
500,000 | | Northwell Healthcare Inc., 4.26%, 11/01/47 | | | 555 | |
140,000 | | Open Text Corp. 144A, 3.88%, 2/15/28 (a) | | | 142 | |
250,000 | | Pfizer Inc., 2.63%, 4/01/30 | | | 275 | |
200,000 | | Prosus NV 144A, 3.68%, 1/21/30 (a) | | | 218 | |
460,000 | | Prosus NV 144A, 4.03%, 8/03/50 (a) | | | 472 | |
260,000 | | PTC Inc. 144A, 3.63%, 2/15/25 (a) | | | 265 | |
10,000 | | PTC Inc. 144A, 4.00%, 2/15/28 (a) | | | 10 | |
250,000 | | Qorvo Inc., 4.38%, 10/15/29 | | | 268 | |
40,000 | | Reynolds Group Issuer Inc./Reynolds Group Issuer LLC 144A, 5.13%, 7/15/23 (a) | | | 41 | |
375,000 | | Ryder System Inc., 2.88%, 6/01/22 | | | 388 | |
30,000 | | Science Applications International Corp. 144A, 4.88%, 4/01/28 (a) | | | 32 | |
450,000 | | Sirius XM Radio Inc. 144A, 5.00%, 8/01/27 (a) | | | 472 | |
885,000 | | SMBC Aviation Capital Finance DAC 144A, 2.65%, 7/15/21 (a) | | | 892 | |
500,000 | | Standard Industries Inc. 144A, 4.75%, 1/15/28 (a) | | | 523 | |
390,000 | | Takeda Pharmaceutical Co. Ltd., 2.05%, 3/31/30 | | | 393 | |
260,000 | | Tencent Holdings Ltd. 144A, 3.24%, 6/03/50 (a) | | | 263 | |
Annual Report 47
Payden Strategic Income Fund continued
| | | | | | |
Principal
or Shares | | Security Description | | Value
(000) | |
| | |
535,000 | | Tencent Holdings Ltd. 144A, 3.28%, 4/11/24 (a) | | $ | 569 | |
800,000 | | Teva Pharmaceutical Finance Netherlands II BV, 6.00%, 1/31/25 EUR (c) | | | 970 | |
130,000 | | Teva Pharmaceutical Finance Netherlands III BV, 2.20%, 7/21/21 | | | 128 | |
815,000 | | Toledo Hospital, 5.33%, 11/15/28 | | | 913 | |
250,000 | | United Rentals North America Inc., 5.88%, 9/15/26 | | | 263 | |
450,000 | | Univar Solutions USA Inc. 144A, 5.13%, 12/01/27 (a) | | | 467 | |
230,000 | | Upjohn Inc. 144A, 1.65%, 6/22/25 (a) | | | 235 | |
400,000 | | Vericast Corp. 144A, 9.25%, 3/01/21 (a) | | | 401 | |
500,000 | | VTR Comunicaciones SpA 144A, 5.13%, 1/15/28 (a) | | | 530 | |
330,000 | | Weibo Corp., 3.38%, 7/08/30 | | | 332 | |
230,000 | | Yum! Brands Inc. 144A, 7.75%, 4/01/25 (a) | | | 253 | |
| | | | | 26,605 | |
Utility (9%) | | | | |
400,000 | | Acwa Power Management And Investments One Ltd. 144A, 5.95%, 12/15/39 (a) | | | 463 | |
580,000 | | Adani Electricity Mumbai Ltd. 144A, 3.95%, 2/12/30 (a) | | | 575 | |
146,000 | | Ascent Resources Utica Holdings LLC/ARU Finance Corp. 144A, 9.00%, 11/01/27 (a) | | | 142 | |
410,000 | | CNX Midstream Partners LP/CNX Midstream Finance Corp. 144A, 6.50%, 3/15/26 (a) | | | 418 | |
281,100 | | Cometa Energia SA de CV 144A, 6.38%, 4/24/35 (a) | | | 312 | |
300,000 | | Comstock Resources Inc. 144A,
7.50%, 5/15/25 (a) | | | 299 | |
200,000 | | DTE Energy Co., 3.70%, 8/01/23 | | | 217 | |
270,000 | | Energy Transfer Partners LP/Regency Energy Finance Corp., 5.00%, 10/01/22 | | | 285 | |
615,000 | | EQT Corp., 3.00%, 10/01/22 | | | 615 | |
140,000 | | Exelon Generation Co. LLC, 3.25%, 6/01/25 | | | 152 | |
560,000 | | Geopark Ltd. 144A, 5.50%, 1/17/27 (a) | | | 494 | |
420,000 | | Gray Oak Pipeline LLC 144A,
2.60%, 10/15/25 (a) | | | 420 | |
350,000 | | Indigo Natural Resources LLC 144A, 6.88%, 2/15/26 (a) | | | 345 | |
270,000 | | Kinder Morgan Inc., 2.00%, 2/15/31 | | | 257 | |
400,000 | | Leviathan Bond Ltd. 144A,
6.75%, 6/30/30 (a)(h) | | | 412 | |
755,000 | | Midwest Connector Capital Co. LLC 144A, 3.90%, 4/01/24 (a) | | | 766 | |
330,000 | | National Fuel Gas Co., 5.50%, 1/15/26 | | | 362 | |
400,000 | | Northriver Midstream Finance LP 144A, 5.63%, 2/15/26 (a) | | | 397 | |
400,000 | | Oleoducto Central SA 144A, 4.00%, 7/14/27 (a) | | | 419 | |
400,000 | | Pacific Gas and Electric Co., 1.75%, 6/16/22 | | | 400 | |
340,000 | | Pattern Energy Operations LP/Pattern Energy Operations Inc. 144A, 4.50%, 8/15/28 (a) | | | 355 | |
400,000 | | Petroleos Mexicanos, 5.95%, 1/28/31 | | | 335 | |
385,000 | | Petroleos Mexicanos, 6.49%, 1/23/27 | | | 359 | |
735,000 | | Phillips 66 Partners LP, 2.45%, 12/15/24 | | | 762 | |
380,000 | | Plains All American Pipeline LP/PAA Finance Corp., 5.00%, 2/01/21 | | | 380 | |
| | | | | | |
Principal
or Shares | | Security Description | | Value
(000) | |
| | |
300,000 | | Range Resources Corp. 144A,
9.25%, 2/01/26 (a) | | $ | 318 | |
200,000 | | Sabine Pass Liquefaction LLC, 5.75%, 5/15/24 | | | 225 | |
302,000 | | Southwestern Energy Co., 8.38%, 9/15/28 | | | 316 | |
330,000 | | TerraForm Power Operating LLC 144A, 4.75%, 1/15/30 (a) | | | 355 | |
445,000 | | Vistra Operations Co. LLC 144A, 3.55%, 7/15/24 (a) | | | 475 | |
285,000 | | Williams Cos. Inc., 3.75%, 6/15/27 | | | 311 | |
| | | | | 11,941 | |
Total Corporate Bond (Cost - $64,640) | | | 66,501 | |
Foreign Government (5%) | | | | |
200,000 | | Bermuda Government International Bond 144A, 3.38%, 8/20/50 (a) | | | 210 | |
325,000 | | Corp. Financiera de Desarrollo SA 144A, 2.40%, 9/28/27 (a) | | | 331 | |
830,000 | | CPPIB Capital Inc. 144A, 1.95%, 9/30/29 CAD (a)(c) | | | 660 | |
203,333 | | Dominican Republic International Bond 144A, 7.50%, 5/06/21 (a) | | | 209 | |
430,000 | | Georgia Government International Bond 144A, 6.88%, 4/12/21 (a) | | | 438 | |
280,000 | | Guatemala Government Bond 144A, 5.38%, 4/24/32 (a) | | | 331 | |
500,000 | | Honduras Government International Bond 144A, 8.75%, 12/16/20 (a) | | | 504 | |
390,000 | | Mongolia Government International Bond 144A, 5.13%, 4/07/26 (a) | | | 404 | |
360,000 | | Mongolia Government International Bond 144A, 8.75%, 3/09/24 (a) | | | 412 | |
500,000 | | Municipal Finance Authority of British Columbia, 2.55%, 10/09/29 CAD (c) | | | 415 | |
380,000 | | Nigeria Government International Bond 144A, 6.50%, 11/28/27 (a) | | | 370 | |
300,000 | | Paraguay Government International Bond 144A, 4.95%, 4/28/31 (a) | | | 351 | |
510,000 | | Peruvian Government International Bond, 2.78%, 1/23/31 | | | 553 | |
294,000 | | Senegal Government International Bond 144A, 8.75%, 5/13/21 (a) | | | 304 | |
410,000 | | Serbia International Bond 144A,
3.13%, 5/15/27 EUR (a)(c) | | | 520 | |
310,000 | | Ukraine Government International Bond 144A, 7.25%, 3/15/33 (a) | | | 293 | |
300,000 | | Uruguay Government International Bond, 4.98%, 4/20/55 | | | 397 | |
Total Foreign Government (Cost - $6,308) | | | 6,702 | |
Mortgage Backed (15%) | | | | |
87,859 | | Alternative Loan Trust 2005-47CB, 5.50%, 10/25/35 | | | 71 | |
111,615 | | Alternative Loan Trust 2005-54CB, 5.13%, 11/25/35 | | | 85 | |
576,297 | | Alternative Loan Trust 2005-54CB, 5.50%, 11/25/35 | | | 461 | |
48 Payden Mutual Funds
| | | | | | |
Principal
or Shares | | Security Description | | Value
(000) | |
| | |
232,160 | | Alternative Loan Trust 2007-9T1, 6.00%, 5/25/37 | | $ | 143 | |
301,686 | | American Home Mortgage Investment Trust 2006-3, (6 mo. LIBOR USD + 1.750%), 2.02%, 12/25/36 (b) | | | 273 | |
156,630 | | Banc of America Funding 2005-H Trust, 2.84%, 11/20/35 (d) | | | 139 | |
388,834 | | BCAP LLC Trust 2007-AA2, 6.00%, 4/25/37 | | | 296 | |
420,000 | | BX Commercial Mortgage Trust 2018-IND 144A, (1 mo. LIBOR USD + 2.050%), 2.20%, 11/15/35 (a)(b) | | | 412 | |
645,523 | | BX Commercial Mortgage Trust 2019-XL 144A, (1 mo. LIBOR USD + 1.080%),
1.23%, 10/15/36 (a)(b) | | | 645 | |
138,797 | | CHL Mortgage Pass-Through Trust 2004-29, 2.64%, 2/25/35 (d) | | | 120 | |
9,603,348 | | Citigroup Commercial Mortgage Trust 2018-C6, 0.78%, 11/10/51 (d) | | | 502 | |
325,525 | | Connecticut Avenue Securities Trust 2019-HRP1 144A, (1 mo. LIBOR USD + 2.150%), 2.30%, 11/25/39 (a)(b) | | | 294 | |
510,000 | | Credit Suisse Mortgage Capital Certificates 2019-ICE4 144A, (1 mo. LIBOR USD + 2.650%), 2.80%, 5/15/36 (a)(b) | | | 501 | |
76,369 | | CSMC Mortgage-Backed Trust 2006-7, 6.00%, 8/25/36 | | | 51 | |
496,884 | | Fannie Mae Connecticut Avenue Securities, (1 mo. LIBOR USD + 10.250%),
10.40%, 1/25/29 (b) | | | 561 | |
770,247 | | Fannie Mae Connecticut Avenue Securities, (1 mo. LIBOR USD + 11.750%),
11.90%, 10/25/28 (b) | | | 917 | |
497,166 | | Fannie Mae Connecticut Avenue Securities, (1 mo. LIBOR USD + 12.250%),
12.40%, 9/25/28 (b) | | | 602 | |
656,357 | | FN BP6626 30YR, 2.00%, 8/01/50 | | | 677 | |
1,329,593 | | FN CA6322 30YR, 2.50%, 7/01/50 | | | 1,387 | |
1,216,049 | | FN MA2561 15YR, 3.00%, 3/01/31 | | | 1,276 | |
972,821 | | FN MA3106 30YR, 3.00%, 8/01/47 | | | 1,018 | |
205,676 | | Freddie Mac STACR 2019-HQA3 144A, (1 mo. LIBOR USD + 1.850%), 2.00%, 9/25/49 (a)(b) | | | 202 | |
260,000 | | Freddie Mac STACR REMIC Trust 2020-DNA2 144A, (1 mo. LIBOR USD + 1.850%), 2.00%, 2/25/50 (a)(b) | | | 256 | |
78,475 | | Freddie Mac STACR Trust 2018-HQA2 144A, (1 mo. LIBOR USD + 0.750%),
0.90%, 10/25/48 (a)(b) | | | 78 | |
266,008 | | Freddie Mac STACR Trust 2019-DNA1 144A, (1 mo. LIBOR USD + 2.650%),
2.80%, 1/25/49 (a)(b) | | | 265 | |
300,000 | | Freddie Mac STACR Trust 2019-FTR3 144A, (1 mo. LIBOR USD + 4.800%),
4.95%, 9/25/47 (a)(b) | | | 228 | |
300,000 | | Freddie Mac STACR Trust 2019-FTR4 144A, (1 mo. LIBOR USD + 5.000%),
5.15%, 11/25/47 (a)(b) | | | 228 | |
| | | | | | |
Principal
or Shares | | Security Description | | Value
(000) | |
| | |
76,176 | | Freddie Mac STACR Trust 2019-HQA2 144A, (1 mo. LIBOR USD + 2.050%), 2.20%, 4/25/49 (a)(b) | | $ | 75 | |
568,558 | | Freddie Mac STACR Trust 2019-HRP1 144A, (1 mo. LIBOR USD + 1.400%), 1.55%, 2/25/49 (a)(b) | | | 548 | |
600,000 | | Freddie Mac Structured Agency Credit Risk Debt Notes, (1 mo. LIBOR USD + 4.600%), 4.75%, 12/25/42 (b) | | | 570 | |
494,733 | | Freddie Mac Structured Agency Credit Risk Debt Notes, (1 mo. LIBOR USD + 8.800%), 8.95%, 3/25/28 (b) | | | 533 | |
493,338 | | Freddie Mac Structured Agency Credit Risk Debt Notes, (1 mo. LIBOR USD + 9.350%), 9.50%, 4/25/28 (b) | | | 577 | |
331,216 | | Freddie Mac Structured Agency Credit Risk Debt Notes, (1 mo. LIBOR USD + 10.500%), 10.65%, 5/25/28 (b) | | | 370 | |
495,415 | | Freddie Mac Structured Agency Credit Risk Debt Notes, (1 mo. LIBOR USD + 11.250%), 11.40%, 12/25/28 (b) | | | 572 | |
247,889 | | Freddie Mac Structured Agency Credit Risk Debt Notes, (1 mo. LIBOR USD + 11.250%), 11.40%, 10/25/29 (b) | | | 234 | |
1,059,687 | | G2 MA3802 30YR, 3.00%, 7/20/46 | | | 1,119 | |
301,410 | | GSMPS Mortgage Loan Trust 2005-RP2 144A, (1 mo. LIBOR USD + 0.350%), 0.50%, 3/25/35 (a)(b) | | | 273 | |
34,469 | | JP Morgan Mortgage Trust 2006-A4, 3.58%, 6/25/36 (d) | | | 30 | |
167,861 | | JP Morgan Mortgage Trust 2014-2 144A, 3.00%, 6/25/29 (a)(d) | | | 172 | |
62,429 | | Nationstar Mortgage Loan Trust 2013-A 144A, 3.75%, 12/25/52 (a)(d) | | | 64 | |
66,815 | | New Residential Mortgage Loan Trust 2015-1 144A, 3.75%, 5/28/52 (a)(d) | | | 72 | |
282,102 | | New Residential Mortgage Loan Trust 2015-2 144A, 3.75%, 8/25/55 (a)(d) | | | 306 | |
502,385 | | New Residential Mortgage Loan Trust 2017-4 144A, 4.00%, 5/25/57 (a)(d) | | | 551 | |
99,190 | | PHH Alternative Mortgage Trust Series 2007-1, 6.00%, 2/25/37 | | | 93 | |
138,388 | | RFMSI Series 2006-SA2 Trust,
4.76%, 8/25/36 (d) | | | 116 | |
810,602 | | Seasoned Credit Risk Transfer Trust Series 2016-1 144A, 3.00%, 9/25/55 (a)(d) | | | 810 | |
660,000 | | STACR Trust 2018-HRP2 144A, (1 mo. LIBOR USD + 2.400%),
2.55%, 2/25/47 (a)(b) | | | 630 | |
300,000 | | STACR Trust 2018-HRP2 144A, (1 mo. LIBOR USD + 10.500%),
10.65%, 2/25/47 (a)(b) | | | 300 | |
175,559 | | WaMu Mortgage Pass-Through Certificates Series 2006-AR10 Trust, 3.04%, 9/25/36 (d) | | | 167 | |
435,523 | | WaMu Mortgage Pass-Through Certificates Series 2007-HY1 Trust, 3.49%, 2/25/37 (d) | | | 424 | |
Total Mortgage Backed (Cost - $20,205) | | | 20,294 | |
Annual Report 49
Payden Strategic Income Fund continued
| | | | | | |
Principal
or Shares | | Security Description | | Value
(000) | |
Municipal (4%) | | | | |
910,000 | | California Health Facilities Financing Authority, 2.48%, 6/01/27 | | $ | 965 | |
650,000 | | California Pollution Control Financing Authority 144A, 5.00%, 7/01/37 (a) | | | 660 | |
1,000,000 | | California Pollution Control Financing Authority, AMT 144A, 6.75%, 12/01/28 (a) | | | 975 | |
250,000 | | California Pollution Control Financing Authority, AMT 144A, 7.50%, 12/01/39 (a) | | | 77 | |
250,000 | | District of Columbia Water & Sewer Authority, 4.81%, 10/01/14 | | | 353 | |
1,500,000 | | Municipal Improvement Corp. of Los Angeles, 3.43%, 11/01/21 | | | 1,542 | |
1,000,000 | | New York Transportation Development Corp., 5.00%, 7/01/41 | | | 1,080 | |
Total Municipal (Cost - $5,621) | | | 5,652 | |
U.S. Treasury (12%) | | | | |
5,260,000 | | U.S. Cash Management Bill, 0.08%, 1/12/21 (e) | | | 5,259 | |
160,000 | | U.S. Treasury Bond, 2.00%, 2/15/50 | | | 174 | |
1,620,912 | | U.S. Treasury Inflation Indexed Bonds, 0.13%, 10/15/24 | | | 1,710 | |
700,000 | | U.S. Treasury Note, 1.38%, 8/31/26 (i) | | | 735 | |
6,660,000 | | U.S. Treasury Note, 1.50%, 2/15/30 | | | 7,071 | |
770,000 | | U.S. Treasury Note, 2.75%, 7/31/23 (i)(j) | | | 824 | |
Total U.S. Treasury (Cost - $15,750) | | | 15,773 | |
Stocks (0%) | | | | |
Preferred Stock (0%) | | | | |
3,550 | | U.S. Bancorp, 6.50% | | | | |
| | (Cost - $102) | | | 95 | |
Investment Company (2%) | | | | |
2,039,994 | | Payden Cash Reserves Money Market Fund * | | | | |
| | (Cost - $2,040) | | | 2,040 | |
Total Investments (Cost - $133,401) (101%) | | | 135,658 | |
Liabilities in excess of Other Assets (-1%) | | | (1,443 | ) |
Net Assets (100%) | | $ | 134,215 | |
| | | | | | |
| (a) | Security offered only to qualified institutional investors, and thus is not registered for sale to the public under rule 144A of the Securities Act of 1933. It has been deemed liquid under guidelines approved by the Board. |
| (b) | Floating rate security. The rate shown reflects the rate in effect at October 31, 2020. |
| (c) | Principal in foreign currency. |
| (d) | Variable rate security. Interest rate disclosed is as of the most recent information available. Certain variable rate securities are not based on a published reference rate and spread but are determined by the issuer or agent and are based on current market conditions. These securities do not indicate a reference rate and spread in their description above. |
| (e) | Yield to maturity at time of purchase. |
| (f) | Floating rate security. The rate shown reflects the rate in effect at October 31, 2020. The stated maturity is subject to prepayments. See Note 2 in the Notes to Financial Statements. |
| (g) | Perpetual security with no stated maturity date. |
| (h) | Security offered and sold outside the United States, and thus is exempt from registration under Regulation S of the Securities Act of 1933. It has been deemed liquid under guidelines approved by the Board. |
| (i) | All or a portion of security has been pledged in connection with outstanding centrally cleared swaps. |
| (j) | All or a portion of the security is pledged to cover futures contract margin requirements. |
Open Forward Currency Contracts to USD
| | | | | | | | | | | | | | | | |
Currency
Purchased
(000s) | | Currency
Sold
(000s) | | | Counterparty | | | Settlement
Date | | | Unrealized
Appreciation
(Depreciation)
(000s) | |
Assets: | | | | | | | | | | | | | | | | |
| USD 8,139 | | | EUR 6,832 | | | | Citibank, N.A. | | | | 03/22/2021 | | | $ | 155 | |
| USD 1,114 | | | CAD 1,468 | | | | HSBC Bank USA, N.A. | | | | 03/22/2021 | | | | 12 | |
| | | | | | | | | | | | | | | | |
| | | | | | | | | | | | | | | 167 | |
| | | | | | | | | | | | | | | | |
Liabilities: | | | | | | | | | | | | | | | | |
| EUR 1,354 | | | USD 1,587 | | | | Citibank, N.A. | | | | 03/22/2021 | | | | (5 | ) |
| | | | | | | | | | | | | | | | |
| Net Unrealized Appreciation (Depreciation) | | | $ | 162 | |
| | | | | | | | | | | | | | | | |
50 Payden Mutual Funds
Open Futures Contracts
| | | | | | | | | | | | | | | | | | | | |
| Contract Type | | Number
of
Contracts | | | Expiration
Date | | | Notional
Amount
(000s) | | | Current
Value
(000s) | | | Unrealized
Appreciation
(Depreciation)
(000s) | |
Long Contracts: | | | | | | | | | | | | | | | | | |
| U.S. Treasury 2-Year Note Future | | | 12 | | | | Dec-20 | | | $ | 2,650 | | | $ | (1 | ) | | $ | (1 | ) |
| U.S. Ultra Bond Future | | | 1 | | | | Dec-20 | | | | 215 | | | | (8 | ) | | | (8 | ) |
| | | | | | | | | | | | | | | | | | | | |
| | | | | | | | | | | | | | | | | | | (9 | ) |
| | | | | | | | | | | | | | | | | | | | |
Short Contracts: | | | | | | | | | | | | | | | | | | | | |
| U.S. 10-Year Ultra Future | | | 8 | | | | Dec-20 | | | | (1,258 | ) | | | 19 | | | | 19 | |
| U.S. Treasury 10-Year Note Future | | | 1 | | | | Dec-20 | | | | (138 | ) | | | 1 | | | | 1 | |
| | | | | | | | | | | | | | | | | | | | |
| | | | | | | | | | | | | | | | | | | 20 | |
| | | | | | | | | | | | | | | | | | | | |
Total Futures | | | | | | | | | | | | | | | | | | $ | 11 | |
| | | | | | | | | | | | | | | | | | | | |
Open Centrally Cleared Credit Default Swap Contracts
| | | | | | | | | | | | | | | | | | | | |
| Description | | Maturity
Date | | | Notional
Amount
(000s) | | | Value
(000s) | | | Upfront
payments/
receipts
(000s) | | | Unrealized
Appreciation
(000s) | |
| Protection Bought (Relevant Credit: Markit CDX, North America High Yield Series 35 Index), Pay 5% Quarterly, Receive upon credit default | | | 12/20/2025 | | | $ | 5,400 | | | $ | 218 | | | $ | 212 | | | $ | 6 | |
| | | | | | | | | | | | | | | | | | | | |
See notes to financial statements.
Annual Report 51
Payden Absolute Return Bond Fund
| | | | | | |
| | The Fund seeks a high level of total return that is consistent with preservation of capital by generally investing 80% of its assets in bonds or bond like securities. | | 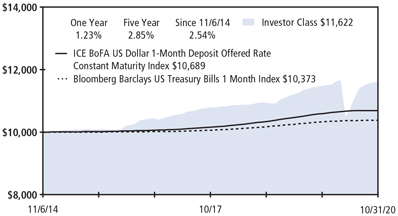
Past performance does not predict future returns. The graph does not reflect the impact of taxes or transaction costs a shareholder would pay. The Fund’s SI Class is expected to perform similarly to its Investor Class, except for class specific waivers. |
| | | Portfolio Composition - percent of investments |
| | Asset Backed | | 30% |
| | Corporate | | 29% |
| | Mortgage Backed | | 27% |
| | U.S. Treasury | | 6% |
| | Foreign Government | | 6% |
| | Other | | 2% |
| | |
| | |
| | |
| | |
| | This information is not part of the audited financial statements. |
Schedule of Investments - October 31, 2020
| | | | | | |
Principal
or Shares | | Security Description | | Value
(000) | |
Asset Backed (30%) | | | | |
202,056 | | Allegro CLO III Ltd. 144A, (3 mo. LIBOR USD + 0.840%), 1.05%, 7/25/27 (a)(b) | | $ | 201 | |
600,000 | | Allegro CLO II-S Ltd. 144A, (3 mo. LIBOR USD + 1.080%), 1.29%, 10/21/28 (a)(b) | | | 596 | |
1,600,000 | | ALM XVI Ltd./ALM XVI LLC 144A, (3 mo. LIBOR USD + 1.500%), 1.74%, 7/15/27 (a)(b) | | | 1,590 | |
4,067,266 | | ALM XVII Ltd. 144A, (3 mo. LIBOR USD + 0.930%), 1.17%, 1/15/28 (a)(b) | | | 4,044 | |
1,521,346 | | Apidos CLO XXI 144A, (3 mo. LIBOR USD + 0.930%), 1.15%, 7/18/27 (a)(b) | | | 1,510 | |
650,000 | | Apidos CLO XXI 144A, (3 mo. LIBOR USD + 2.450%), 2.67%, 7/18/27 (a)(b) | | | 613 | |
3,000,000 | | Arbor Realty Commercial Real Estate Notes 2019-FL1 Ltd. 144A, (1 mo. LIBOR USD + 1.500%),
1.65%, 5/15/37 (a)(b) | | | 2,941 | |
1,700,000 | | Arbor Realty Commercial Real Estate Notes 2019-FL1 Ltd. 144A, (1 mo. LIBOR USD + 1.700%),
1.85%, 5/15/37 (a)(b) | | | 1,666 | |
1,500,000 | | Arbor Realty Commercial Real Estate Notes 2019-FL2 Ltd. 144A, (1 mo. LIBOR USD + 1.750%),
1.90%, 9/15/34 (a)(b) | | | 1,465 | |
2,194,500 | | Arbys Funding LLC 144A, 3.24%, 7/30/50 (b) | | | 2,256 | |
1,700,000 | | Atlas Senior Loan Fund Ltd. 144A, (3 mo. LIBOR USD + 1.300%), 1.53%, 1/16/30 (a)(b) | | | 1,690 | |
2,349,453 | | Avery Point VI CLO Ltd. 144A, (3 mo. LIBOR USD + 1.050%), 1.27%, 8/05/27 (a)(b) | | | 2,348 | |
2,400,000 | | Bain Capital Credit CLO 2020-3 Ltd. 144A, (3 mo. LIBOR USD + 1.380%), 1.64%, 10/23/32 (a)(b) | | | 2,400 | |
1,600,000 | | Bain Capital Credit CLO 2020-3 Ltd. 144A, (3 mo. LIBOR USD + 1.900%), 2.16%, 10/23/32 (a)(b) | | | 1,600 | |
370,000 | | Barings CLO Ltd. 2016-II 144A, (3 mo. LIBOR USD + 3.250%), 3.47%, 7/20/28 (a)(b) | | | 358 | |
| | | | | | |
Principal
or Shares | | Security Description | | Value
(000) | |
| | |
300,000 | | BDS 2019-FL3 Ltd. 144A, (1 mo. LIBOR USD + 1.400%), 1.55%, 12/15/35 (a)(b) | | $ | 299 | |
1,450,000 | | BDS 2019-FL3 Ltd. 144A, (1 mo. LIBOR USD + 2.700%), 2.85%, 12/15/35 (a)(b) | | | 1,403 | |
2,200,000 | | BDS 2020-FL5 Ltd. 144A, (1 mo. LIBOR USD + 1.150%), 1.30%, 2/16/37 (a)(b) | | | 2,171 | |
2,350,000 | | BDS 2020-FL5 Ltd. 144A, (1 mo. LIBOR USD + 1.350%), 1.50%, 2/16/37 (a)(b) | | | 2,318 | |
2,100,000 | | BDS 2020-FL5 Ltd. 144A, (1 mo. LIBOR USD + 1.800%), 1.95%, 2/16/37 (a)(b) | | | 2,061 | |
450,000 | | Blackrock European CLO III DAC 144A, (3 mo. EURIBOR + 0.850%), 0.85%, 4/15/30 EUR (a)(b)(c) | | | 525 | |
1,300,000 | | Blackrock European CLO V DAC, (3 mo. EURIBOR + 1.100%), 1.10%, 7/16/31 EUR (a)(c)(d) | | | 1,495 | |
2,006,473 | | BlueMountain CLO 2013-1 Ltd. 144A, (3 mo. LIBOR USD + 1.230%), 1.45%, 1/20/29 (a)(b) | | | 2,006 | |
3,300,000 | | Bosphorus CLO V DAC 144A, (3 mo. EURIBOR + 1.010%), 1.01%, 12/12/32 EUR (a)(b)(c) | | | 3,838 | |
600,000 | | BSPRT 2018-FL4 Issuer Ltd. 144A, (1 mo. LIBOR USD + 1.300%), 1.45%, 9/15/35 (a)(b) | | | 588 | |
450,000 | | BSPRT 2018-FL4 Issuer Ltd. 144A, (1 mo. LIBOR USD + 1.600%), 1.75%, 9/15/35 (a)(b) | | | 430 | |
400,000 | | BSPRT 2018-FL4 Issuer Ltd. 144A, (1 mo. LIBOR USD + 2.100%), 2.25%, 9/15/35 (a)(b) | | | 378 | |
350,000 | | BSPRT 2018-FL4 Issuer Ltd. 144A, (1 mo. LIBOR USD + 2.750%), 2.90%, 9/15/35 (a)(b) | | | 326 | |
1,925,000 | | Carlyle C17 CLO Ltd. 144A, (3 mo. LIBOR USD + 2.800%), 3.01%, 4/30/31 (a)(b) | | | 1,739 | |
389,349 | | Carlyle Global Market Strategies Euro CLO 2015-2 DAC 144A, (3 mo. EURIBOR + 0.730%),
0.73%, 9/21/29 EUR (a)(b)(c) | | | 453 | |
1,672,815 | | CARS-DB4 LP 144A, 2.69%, 2/15/50 (b) | | | 1,723 | |
52 Payden Mutual Funds
| | | | | | |
Principal
or Shares | | Security Description | | Value
(000) | |
| | |
1,200,000 | | CARS-DB4 LP 144A, 3.19%, 2/15/50 (b) | | $ | 1,230 | |
2,800,000 | | CARS-DB4 LP 144A, 4.17%, 2/15/50 (b) | | | 2,877 | |
1,000,000 | | CARS-DB4 LP 144A, 4.52%, 2/15/50 (b) | | | 1,034 | |
970,000 | | CARS-DB4 LP 144A, 4.95%, 2/15/50 (b) | | | 991 | |
1,410,000 | | Cedar Funding II CLO Ltd. 144A, (3 mo. LIBOR USD + 1.230%), 1.47%, 6/09/30 (a)(b) | | | 1,402 | |
1,950,000 | | Cedar Funding VI CLO Ltd. 144A, (3 mo. LIBOR USD + 1.090%), 1.31%, 10/20/28 (a)(b) | | | 1,936 | |
500,000 | | Cedar Funding VI CLO Ltd. 144A, (3 mo. LIBOR USD + 1.600%), 1.82%, 10/20/28 (a)(b) | | | 494 | |
350,000 | | CIFC Funding 2013-III-R Ltd. 144A, (3 mo. LIBOR USD + 2.900%), 3.11%, 4/24/31 (a)(b) | | | 321 | |
5,660,000 | | CIFC Funding 2014-II-R Ltd. 144A, (3 mo. LIBOR USD + 1.050%), 1.26%, 4/24/30 (a)(b) | | | 5,607 | |
2,271,793 | | CIFC Funding 2015-V Ltd. 144A, (3 mo. LIBOR USD + 0.860%), 1.07%, 10/25/27 (a)(b) | | | 2,247 | |
700,000 | | CIFC Funding 2015-V Ltd. 144A, (3 mo. LIBOR USD + 2.950%), 3.16%, 10/25/27 (a)(b) | | | 650 | |
1,100,000 | | Clarinda Park CLO DAC 144A, (3 mo. EURIBOR + 0.900%), 0.90%, 11/15/29 EUR (a)(b)(c) | | | 1,277 | |
1,450,000 | | Clarinda Park CLO DAC 144A, (3 mo. EURIBOR + 1.600%), 1.60%, 11/15/29 EUR (a)(b)(c) | | | 1,680 | |
250,000 | | Columbia Cent CLO 27 Ltd. 144A, (3 mo. LIBOR USD + 1.600%), 1.81%, 10/25/28 (a)(b) | | | 247 | |
885,288 | | CoreVest American Finance 2018-2 Trust 144A, 4.03%, 11/15/52 (b) | | | 951 | |
278,016 | | Countrywide Asset-Backed Certificates, 4.54%, 10/25/46 (e) | | | 277 | |
300,000 | | CVC Cordatus Loan Fund III DAV 144A, (3 mo. EURIBOR + 2.550%), 2.55%, 8/15/32
EUR (a)(b)(c) | | | 335 | |
1,657,500 | | DB Master Finance LLC 144A, 3.63%, 11/20/47 (b) | | | 1,706 | |
693,000 | | DB Master Finance LLC 144A, 3.79%, 5/20/49 (b) | | | 714 | |
2,193,170 | | Domino’s Pizza Master Issuer LLC 144A, 3.08%, 7/25/47 (b) | | | 2,216 | |
1,008,873 | | Drive Auto Receivables Trust 2018-1, 3.81%, 5/15/24 | | | 1,031 | |
3,700,000 | | Drive Auto Receivables Trust 2019-2, 3.69%, 8/17/26 | | | 3,892 | |
1,000,000 | | Drive Auto Receivables Trust 2019-3, 3.18%, 10/15/26 | | | 1,040 | |
1,600,000 | | Drive Auto Receivables Trust 2020-2, 2.28%, 8/17/26 | | | 1,647 | |
883,500 | | Driven Brands Funding 2015-1A LLC 144A, 5.22%, 7/20/45 (b) | | | 920 | |
1,080,750 | | Driven Brands Funding 2019-1A LLC 144A, 4.64%, 4/20/49 (b) | | | 1,147 | |
2,044,875 | | Driven Brands Funding 2020-1A LLC 144A, 3.79%, 7/20/50 (b) | | | 2,111 | |
1,300,000 | | Driven Brands Funding 2020-2A LLC 144A, 3.24%, 1/20/51 (b) | | | 1,300 | |
| | | | | | |
Principal
or Shares | | Security Description | | Value
(000) | |
| | |
1,650,000 | | Dryden 36 Senior Loan Fund 144A, (3 mo. LIBOR USD + 1.750%), 1.99%, 4/15/29 (a)(b) | | $ | 1,649 | |
650,000 | | Dryden 39 Euro CLO 2015 BV 144A, (3 mo. EURIBOR + 0.870%), 0.87%, 10/15/31 EUR (a)(b)(c) | | | 755 | |
945,000 | | First Investors Auto Owner Trust 2019-1 144A, 3.55%, 4/15/25 (b) | | | 987 | |
2,000,000 | | First Investors Auto Owner Trust 2019-2 144A, 2.80%, 12/15/25 (b) | | | 2,057 | |
2,150,000 | | FirstKey Homes 2020-SFR2 Trust 144A,
1.27%, 10/19/37 (b) | | | 2,142 | |
1,157,821 | | Galaxy XXIX CLO Ltd. 144A, (3 mo. LIBOR USD + 0.790%), 1.07%, 11/15/26 (a)(b) | | | 1,149 | |
500,000 | | GPMT 2019-FL2 Ltd. 144A, (1 mo. LIBOR USD + 1.300%), 1.44%, 2/22/36 (a)(b) | | | 498 | |
600,000 | | GPMT 2019-FL2 Ltd. 144A, (1 mo. LIBOR USD + 1.600%), 1.74%, 2/22/36 (a)(b) | | | 595 | |
800,000 | | GPMT 2019-FL2 Ltd. 144A, (1 mo. LIBOR USD + 1.900%), 2.04%, 2/22/36 (a)(b) | | | 792 | |
1,700,000 | | Grand Avenue CRE 2019-FL1 144A, (1 mo. LIBOR USD + 1.500%), 1.65%, 6/15/37 (a)(b) | | | 1,687 | |
2,800,000 | | Greystone Commercial Real Estate Notes 2018-HC1 Ltd. 144A, (1 mo. LIBOR USD + 1.550%),
1.70%, 9/15/28 (a)(b) | | | 2,687 | |
250,000 | | Greystone Commercial Real Estate Notes 2018-HC1 Ltd. 144A, (1 mo. LIBOR USD + 2.150%),
2.30%, 9/15/28 (a)(b) | | | 235 | |
2,450,000 | | Greystone Commercial Real Estate Notes 2018-HC1 Ltd. 144A, (1 mo. LIBOR USD + 2.650%),
2.80%, 9/15/28 (a)(b) | | | 2,417 | |
2,100,000 | | Greystone CRE Notes 2019-FL2 Ltd. 144A, (1 mo. LIBOR USD + 1.180%), 1.33%, 9/15/37 (a)(b) | | | 2,062 | |
2,300,000 | | Greystone CRE Notes 2019-FL2 Ltd. 144A, (1 mo. LIBOR USD + 2.400%), 2.55%, 9/15/37 (a)(b) | | | 2,171 | |
2,000,000 | | Greystone CRE Notes 2019-FL2 Ltd. 144A, (1 mo. LIBOR USD + 2.750%), 2.90%, 9/15/37 (a)(b) | | | 1,741 | |
2,300,000 | | Greywolf CLO IV Ltd. 144A, (3 mo. LIBOR USD + 1.950%), 2.17%, 4/17/30 (a)(b) | | | 2,300 | |
1,000,000 | | Grippen Park CLO Ltd. 144A, (3 mo. LIBOR USD + 1.650%), 1.87%, 1/20/30 (a)(b) | | | 998 | |
500,000 | | Halcyon Loan Advisors Funding 2015-2 Ltd. 144A, (3 mo. LIBOR USD + 1.650%), 1.86%, 7/25/27 (a)(b) | | | 498 | |
2,300,000 | | Henley CLO I DAC 144A, (3 mo. EURIBOR + 1.140%), 1.14%, 7/15/32 EUR (a)(b)(c) | | | 2,682 | |
1,300,000 | | Henley CLO I DAC 144A, (3 mo. EURIBOR + 1.800%), 1.80%, 7/15/32 EUR (a)(b)(c) | | | 1,514 | |
817,791 | | Hunt CRE 2017-FL1 Ltd. 144A, (1 mo. LIBOR USD + 1.000%), 1.15%, 8/15/34 (a)(b) | | | 805 | |
250,000 | | Hunt CRE 2018-FL2 Ltd. 144A, (1 mo. LIBOR USD + 1.080%), 1.23%, 8/15/28 (a)(b) | | | 249 | |
450,000 | | Hunt CRE 2018-FL2 Ltd. 144A, (1 mo. LIBOR USD + 2.350%), 2.50%, 8/15/28 (a)(b) | | | 434 | |
Annual Report 53
Payden Absolute Return Bond Fund continued
| | | | | | |
Principal
or Shares | | Security Description | | Value
(000) | |
| | |
2,400,000 | | ICG U.S. CLO 2015-2R Ltd. 144A, (3 mo. LIBOR USD + 1.370%), 1.60%, 1/16/33 (a)(b) | | $ | 2,401 | |
400,000 | | ICG U.S. CLO 2017-1 Ltd. 144A, (3 mo. LIBOR USD + 1.650%), 1.87%, 4/28/29 (a)(b) | | | 393 | |
1,700,000 | | InSite Issuer 2020-1A LLC 144A, 1.50%, 9/15/50 (b) | | | 1,702 | |
595,699 | | Invitation Homes 2018-SFR3 Trust 144A, (1 mo. LIBOR USD + 1.000%), 1.15%, 7/17/37 (a)(b) | | | 598 | |
74,381 | | JFIN CLO 2014 Ltd. 144A, (3 mo. LIBOR USD + 0.950%), 1.17%, 4/21/25 (a)(b) | | | 74 | |
250,000 | | JFIN CLO 2014 Ltd. 144A, (3 mo. LIBOR USD + 1.450%), 1.67%, 4/21/25 (a)(b) | | | 248 | |
550,000 | | KREF 2018-FL1 Ltd. 144A, (1 mo. LIBOR USD + 1.100%), 1.25%, 6/15/36 (a)(b) | | | 548 | |
300,000 | | KREF 2018-FL1 Ltd. 144A, (1 mo. LIBOR USD + 1.350%), 1.50%, 6/15/36 (a)(b) | | | 298 | |
200,000 | | KREF 2018-FL1 Ltd. 144A, (1 mo. LIBOR USD + 1.600%), 1.75%, 6/15/36 (a)(b) | | | 197 | |
200,000 | | KREF 2018-FL1 Ltd. 144A, (1 mo. LIBOR USD | | | | |
| | + 2.000%), 2.15%, 6/15/36 (a)(b) | | | 195 | |
1,417,355 | | LCM XVIII LP 144A, (3 mo. LIBOR USD + 1.240%), 1.48%, 7/15/27 (a)(b) | | | 1,416 | |
950,000 | | LCM XVIII LP 144A, (3 mo. LIBOR USD + 1.750%), 1.99%, 7/15/27 (a)(b) | | | 950 | |
750,000 | | LCM XX LP 144A, (3 mo. LIBOR USD + 1.040%), 1.26%, 10/20/27 (a)(b) | | | 745 | |
800,000 | | LMREC 2019-CRE3 Inc. 144A, (1 mo. LIBOR USD + 1.400%), 1.55%, 12/22/35 (a)(b) | | | 793 | |
1,073,366 | | LoanCore 2018-CRE1 Issuer Ltd. 144A, (1 mo. LIBOR USD + 1.130%), 1.28%, 5/15/28 (a)(b) | | | 1,068 | |
1,300,000 | | LoanCore 2019-CRE2 Issuer Ltd. 144A, (1 mo. LIBOR USD + 1.500%), 1.65%, 5/15/36 (a)(b) | | | 1,276 | |
755,000 | | Madison Park Funding XIII Ltd. 144A, (3 mo. LIBOR USD + 0.950%), 1.17%, 4/19/30 (a)(b) | | | 748 | |
1,340,000 | | Madison Park Funding XIII Ltd. 144A, (3 mo. LIBOR USD + 2.850%), 3.07%, 4/19/30 (a)(b) | | | 1,252 | |
3,250,000 | | Magnetite VII Ltd. 144A, (3 mo. LIBOR USD + 0.800%), 1.04%, 1/15/28 (a)(b) | | | 3,211 | |
879,349 | | Marathon CRE 2018 FL1 Ltd. 144A, (1 mo. LIBOR USD + 1.150%), 1.30%, 6/15/28 (a)(b) | | | 872 | |
150,000 | | Marathon CRE 2018 FL1 Ltd. 144A, (1 mo. LIBOR USD + 1.550%), 1.70%, 6/15/28 (a)(b) | | | 147 | |
622,961 | | Neuberger Berman CLO XVI-S Ltd. 144A, (3 mo. LIBOR USD + 0.850%), 1.09%, 1/15/28 (a)(b) | | | 617 | |
3,500,000 | | Neuberger Berman Loan Advisers CLO 24 Ltd. 144A, (3 mo. LIBOR USD + 1.020%), 1.24%, 4/19/30 (a)(b) | | | 3,450 | |
1,000,000 | | NLY Commercial Mortgage Trust 144A, (1 mo. LIBOR USD + 1.600%), 1.75%, 2/15/36 (a)(b) | | | 993 | |
2,200,000 | | Oaktree CLO 2020-1 Ltd. 144A, (3 mo. LIBOR USD + 2.000%), 2.34%, 7/15/29 (a)(b) | | | 2,210 | |
1,600,000 | | Ocean Trails Clo X 144A, (3 mo. LIBOR USD + 1.550%), 1.74%, 10/15/31 (a)(b) | | | 1,600 | |
| | | | | | |
Principal
or Shares | | Security Description | | Value
(000) | |
| | |
2,350,000 | | OCP CLO 2013-4 Ltd. 144A, (3 mo. LIBOR USD + 1.450%), 1.66%, 4/24/29 (a)(b) | | $ | 2,301 | |
400,000 | | OCP CLO 2014-5 Ltd. 144A, (3 mo. LIBOR USD + 2.900%), 3.11%, 4/26/31 (a)(b) | | | 363 | |
222,879 | | Octagon Investment Partners 25 Ltd. 144A, (3 mo. LIBOR USD + 0.800%), 1.02%, 10/20/26 (a)(b) | | | 222 | |
630,330 | | Octagon Investment Partners XXIII Ltd. 144A, (3 mo. LIBOR USD + 0.850%), 1.09%, 7/15/27 (a)(b) | | | 626 | |
1,100,000 | | OneMain Financial Issuance Trust 2019-1 144A,
4.22%, 2/14/31 (b) | | | 1,131 | |
2,156,534 | | OZLM VII Ltd. 144A, (3 mo. LIBOR USD + 1.010%), 1.23%, 7/17/29 (a)(b) | | | 2,130 | |
450,000 | | OZLM XII Ltd. 144A, (3 mo. LIBOR USD + 1.600%), 1.81%, 4/30/27 (a)(b) | | | 445 | |
1,400,000 | | OZLME BV, (3 mo. EURIBOR + 2.350%), 2.35%, 1/18/30 EUR (a)(c)(d) | | | 1,629 | |
1,950,000 | | Palmer Square CLO 2015-1 Ltd. 144A, (3 mo. LIBOR USD + 1.650%), 1.90%, 5/21/29 (a)(b) | | | 1,928 | |
3,150,000 | | Palmer Square CLO 2015-1 Ltd. 144A, (3 mo. LIBOR USD + 3.150%), 3.40%, 5/21/29 (a)(b) | | | 2,925 | |
2,250,000 | | Palmer Square Loan Funding 2020-1 Ltd. 144A, (3 mo. LIBOR USD + 1.350%), 1.60%, 2/20/28 (a)(b) | | | 2,196 | |
2,900,000 | | Palmer Square Loan Funding 2020-1 Ltd. 144A, (3 mo. LIBOR USD + 2.500%), 2.75%, 2/20/28 (a)(b) | | | 2,679 | |
2,100,000 | | Pikes Peak CLO 6 144A, (3 mo. LIBOR USD + 4.040%), 4.44%, 8/18/30 (a)(b) | | | 2,109 | |
744,800 | | Planet Fitness Master Issuer LLC 144A,
4.26%, 9/05/48 (b) | | | 748 | |
1,960,000 | | Planet Fitness Master Issuer LLC 144A,
4.67%, 9/05/48 (b) | | | 1,962 | |
400,000 | | Progress Residential 2018-SFR3 Trust 144A,
4.08%, 10/17/35 (b) | | | 411 | |
1,250,000 | | Progress Residential 2019-SFR2 Trust 144A,
3.79%, 5/17/36 (b) | | | 1,292 | |
2,350,000 | | Progress Residential 2019-SFR4 Trust 144A,
2.94%, 10/17/36 (b) | | | 2,420 | |
1,800,000 | | Providus CLO IV DAC 144A, (3 mo. EURIBOR + 1.450%), 1.45%, 7/20/31 EUR (a)(b)(c) | | | 2,124 | |
1,850,000 | | Regatta Funding LP 2013-2A 144A, (3 mo. LIBOR USD + 1.250%), 1.49%, 1/15/29 (a)(b) | | | 1,843 | |
1,500,000 | | Regatta Funding LP 2013-2A 144A, (3 mo. LIBOR USD + 1.850%), 2.09%, 1/15/29 (a)(b) | | | 1,490 | |
850,000 | | Regatta VII Funding Ltd. 144A, (3 mo. LIBOR USD + 1.060%), 1.29%, 12/20/28 (a)(b) | | | 844 | |
300,000 | | Regatta VII Funding Ltd. 144A, (3 mo. LIBOR USD + 2.000%), 2.23%, 12/20/28 (a)(b) | | | 292 | |
2,250,000 | | RR 6 Ltd. 144A, (3 mo. LIBOR USD + 1.600%),
1.84%, 4/15/30 (a)(b) | | | 2,240 | |
1,200,000 | | Santander Drive Auto Receivables Trust 2019-2,
3.22%, 7/15/25 | | | 1,241 | |
405,579 | | Shackleton 2015-VIII CLO Ltd. 144A, (3 mo. LIBOR USD + 0.920%), 1.14%, 10/20/27 (a)(b) | | | 402 | |
54 Payden Mutual Funds
| | | | | | |
Principal
or Shares | | Security Description | | Value
(000) | |
| | |
2,950,000 | | St Paul’s CLO IX DAC, (3 mo. EURIBOR + 0.820%), 0.82%, 11/15/30 EUR (a)(c)(d) | | $ | 3,422 | |
3,450,000 | | St Paul’s CLO XII DAC 144A, (3 mo. EURIBOR + 0.920%), 0.92%, 4/15/33 EUR (a)(b)(c) | | | 3,997 | |
2,400,000 | | Stack Infrastructure Issuer 2020-1A LLC 144A, 1.89%, 8/25/45 (b) | | | 2,416 | |
543,457 | | Starwood Waypoint Homes 2017-1 Trust 144A, (1 mo. LIBOR USD + 0.950%), 1.10%, 1/17/35 (a)(b) | | | 545 | |
1,700,000 | | STWD 2019-FL1 Ltd. 144A, (1 mo. LIBOR USD + 1.080%), 1.23%, 7/15/38 (a)(b) | | | 1,682 | |
2,624,666 | | Symphony CLO XIV Ltd. 144A, (3 mo. LIBOR USD + 0.950%), 1.18%, 7/14/26 (a)(b) | | | 2,611 | |
1,945,443 | | Symphony CLO XVII Ltd. 144A, (3 mo. LIBOR USD + 0.880%), 1.12%, 4/15/28 (a)(b) | | | 1,930 | |
500,000 | | Symphony CLO XVII Ltd., (3 mo. LIBOR USD + 2.650%), 2.89%, 4/15/28 (a)(d) | | | 473 | |
450,000 | | Symphony CLO XVII Ltd. 144A, (3 mo. LIBOR USD + 2.650%), 2.89%, 4/15/28 (a)(b) | | | 426 | |
3,340,500 | | Taco Bell Funding LLC 144A, 4.32%, 11/25/48 (b) | | | 3,411 | |
119,754 | | Thacher Park CLO Ltd. 144A, (3 mo. LIBOR USD + 1.160%), 1.38%, 10/20/26 (a)(b) | | | 120 | |
1,000,000 | | TPG Real Estate Finance 2018-FL2 Issuer Ltd. 144A, (1 mo. LIBOR USD + 1.130%),
1.28%, 11/15/37 (a)(b) | | | 992 | |
250,000 | | TPG Real Estate Finance 2018-FL2 Issuer Ltd. 144A, (1 mo. LIBOR USD + 2.300%),
2.45%, 11/15/37 (a)(b) | | | 240 | |
900,000 | | Tryon Park CLO Ltd. 144A, (3 mo. LIBOR USD + 0.890%), 1.13%, 4/15/29 (a)(b) | | | 893 | |
2,400,000 | | Vantage Data Centers 2020-1A LLC 144A,
1.65%, 9/15/45 (b) | | | 2,393 | |
1,600,000 | | VB-S1 Issuer LLC 144A, 3.03%, 6/15/50 (b) | | | 1,666 | |
710,113 | | Venture XVII CLO Ltd. 144A, (3 mo. LIBOR USD + 0.880%), 1.12%, 4/15/27 (a)(b) | | | 703 | |
2,300,000 | | Venture XXIV CLO Ltd. 144A, (3 mo. LIBOR USD + 1.180%), 1.40%, 10/20/28 (a)(b) | | | 2,285 | |
2,800,000 | | Voya CLO 2019-1 Ltd. 144A, (3 mo. LIBOR USD + 1.060%), 1.30%, 4/15/31 (a)(b) | | | 2,764 | |
2,431,250 | | Wendy’s Funding LLC 144A, 3.57%, 3/15/48 (b) | | | 2,505 | |
879,750 | | Wendy’s Funding LLC 144A, 3.78%, 6/15/49 (b) | | | 932 | |
550,000 | | Westlake Automobile Receivables Trust 2018-3 144A, 4.00%, 10/16/23 (b) | | | 567 | |
4,600,000 | | Westlake Automobile Receivables Trust 2019-1 144A, 3.67%, 3/15/24 (b) | | | 4,761 | |
3,400,000 | | Westlake Automobile Receivables Trust 2019-3 144A, 2.72%, 11/15/24 (b) | | | 3,486 | |
4,800,000 | | Westlake Automobile Receivables Trust 2020-1 144A, 2.80%, 6/16/25 (b) | | | 4,927 | |
1,600,000 | | Westlake Automobile Receivables Trust 2020-2 144A, 2.76%, 1/15/26 (b) | | | 1,650 | |
3,500,000 | | Westlake Automobile Receivables Trust 2020-3 144A, 1.65%, 2/17/26 (b) | | | 3,506 | |
143,338 | | Wind River 2015-2 CLO Ltd. 144A, (3 mo. LIBOR USD + 0.870%), 1.11%, 10/15/27 (a)(b) | | | 142 | |
| | | | | | |
Principal
or Shares | | Security Description | | Value
(000) | |
| | |
2,700,000 | | Wingstop Funding 2020-1A LLC 144A,
2.84%, 12/05/50 (b) | | $ | 2,740 | |
Total Asset Backed (Cost - $245,296) | | | 245,595 | |
Bank Loans(f) (2%) | | | | |
1,687,250 | | 1011778 BC ULC Term Loan B 1L, (LIBOR USD 1-Month + 1.750%), 3.65%, 11/19/26 | | | 1,623 | |
658,983 | | Axalta Coating Systems U.S. Holdings Inc. Term Loan B3 1L, (LIBOR USD 3-Month + 1.750%),
1.97%, 6/01/24 | | | 641 | |
1,984,733 | | Beacon Roofing Supply Inc. Term Loan B 1L, (LIBOR USD 1-Month + 2.250%), 2.40%, 1/02/25 | | | 1,926 | |
1,053,439 | | Charter Communications Operating LLC Term Loan B2 1L, (LIBOR USD 1-Month + 1.750%), 1.90%, 2/01/27 | | | 1,028 | |
1,269,591 | | Elanco Animal Health Inc. Term Loan B 1L, (LIBOR USD 1-Month + 1.750%), 1.90%, 8/01/27 | | | 1,244 | |
900,000 | | Froneri Lux FinCo SARL Term Loan B 1L, (1 mo. EURIBOR + 2.625%), 2.63%, 1/31/27 EUR (c) | | | 1,024 | |
1,984,962 | | HCA Inc. Term Loan B13 1L, (LIBOR USD 1-Month + 1.750%), 1.90%, 3/18/26 | | | 1,978 | |
96,000 | | Hilton Worldwide Finance LLC Term Loan B2 1L, (LIBOR USD 1-Month + 1.750%), 1.90%, 6/22/26 | | | 91 | |
560,000 | | T-Mobile USA Inc. Term Loan B 1L, (LIBOR USD 3-Month + 3.000%), 3.15%, 4/01/27 | | | 560 | |
1,286,563 | | U.S. Foods Inc. Term Loan B 1L, (LIBOR USD 1-Month + 1.750%), 1.90%, 6/27/23 | | | 1,235 | |
1,212,089 | | WMG Acquisition Corp. Term Loan F 1L, (LIBOR USD 1-Month + 2.125%), 2.27%, 11/01/23 | | | 1,197 | |
1,723,618 | | Wyndham Hotels & Resorts Inc. Term Loan B 1L, (LIBOR USD 1-Month + 1.750%), 1.90%, 5/30/25 | | | 1,645 | |
Total Bank Loans (Cost - $14,437) | | | 14,192 | |
Corporate Bond (29%) | | | | |
800,000 | | 1011778 BC ULC/New Red Finance Inc. 144A,
3.50%, 2/15/29 (b) | | | 796 | |
2,150,000 | | AbbVie Inc. 144A, 2.60%, 11/21/24 (b) | | | 2,288 | |
978,000 | | AbbVie Inc. 144a, 4.88%, 2/15/21 (b) | | | 980 | |
1,000,000 | | AbbVie Inc. 144A, 5.00%, 12/15/21 (b) | | | 1,038 | |
850,000 | | ACI Worldwide Inc. 144A, 5.75%, 8/15/26 (b) | | | 900 | |
2,230,000 | | ADCB Finance Cayman Ltd. 144A, 4.00%, 3/29/23 (b) | | | 2,372 | |
450,000 | | ADCB Finance Cayman Ltd., 4.00%, 3/29/23 (d) | | | 479 | |
1,050,000 | | Aker BP ASA 144A, 2.88%, 1/15/26 (b) | | | 1,041 | |
1,000,000 | | Albertsons Cos. Inc./Safeway Inc./New Albertsons LP/Albertsons LLC 144A, 3.25%, 3/15/26 (b) | | | 982 | |
430,000 | | Alcoa Nederland Holding BV 144A, 6.75%, 9/30/24 (b) | | | 444 | |
1,900,000 | | Anheuser-Busch InBev Worldwide Inc., 4.15%, 1/23/25 | | | 2,156 | |
1,000,000 | | ANZ New Zealand Int’l Ltd. 144A, 3.40%, 3/19/24 (b) | | | 1,086 | |
1,150,000 | | ASB Bank Ltd. 144A, 3.75%, 6/14/23 (b) | | | 1,242 | |
Annual Report 55
Payden Absolute Return Bond Fund continued
| | | | | | |
Principal
or Shares | | Security Description | | Value
(000) | |
| | |
2,300,000 | | AstraZeneca PLC, 0.70%, 4/08/26 | | $ | 2,268 | |
3,050,000 | | AT&T Inc., 0.25%, 3/04/26 EUR (c) | | | 3,568 | |
1,500,000 | | AT&T Inc., 2.30%, 6/01/27 | | | 1,565 | |
2,000,000 | | AT&T Inc., 4.13%, 2/17/26 | | | 2,286 | |
270,000 | | Athene Global Funding 144A, 4.00%, 1/25/22 (b) | | | 280 | |
800,000 | | Aviation Capital Group LLC 144A, (3 mo. LIBOR USD + 0.950%), 1.20%, 6/01/21 (a)(b) | | | 789 | |
880,000 | | Avolon Holdings Funding Ltd. 144A,
3.63%, 5/01/22 (b) | | | 882 | |
2,200,000 | | Banco Bradesco SA 144A, 2.85%, 1/27/23 (b) | | | 2,235 | |
1,600,000 | | Banco Bradesco SA 144A, 3.20%, 1/27/25 (b) | | | 1,620 | |
690,000 | | Banco de Credito del Peru 144A, 2.70%, 1/11/25 (b) | | | 716 | |
1,060,000 | | Banco Internacional del Peru SAA Interbank 144A, 3.25%, 10/04/26 (b) | | | 1,119 | |
1,200,000 | | Banco Santander SA, 2.71%, 6/27/24 | | | 1,271 | |
2,500,000 | | Bank of America Corp., (U.S. Secured Overnight Financing Rate + 0.910%), 0.98%, 9/25/25 (a) | | | 2,499 | |
1,300,000 | | Bank of America Corp., (U.S. Secured Overnight Financing Rate + 1.010%), 1.20%, 10/24/26 (a) | | | 1,302 | |
2,900,000 | | Bank of America Corp., (U.S. Secured Overnight Financing Rate + 1.150%), 1.32%, 6/19/26 (a) | | | 2,918 | |
1,200,000 | | Bayer U.S. Finance II LLC 144A, 3.88%, 12/15/23 (b) | | | 1,308 | |
1,300,000 | | Becton Dickinson Euro Finance Sarl, 0.63%, 6/04/23 EUR (c) | | | 1,537 | |
2,550,000 | | BPCE SA 144A, 2.38%, 1/14/25 (b) | | | 2,666 | |
1,700,000 | | CaixaBank SA, 1.75%, 10/24/23 EUR (c)(d) | | | 2,062 | |
240,000 | | CCO Holdings LLC/CCO Holdings Capital Corp. 144A, 4.00%, 3/01/23 (b) | | | 243 | |
1,055,000 | | CDW LLC/CDW Finance Corp., 5.50%, 12/01/24 | | | 1,168 | |
1,000,000 | | Centene Corp., 3.38%, 2/15/30 | | | 1,040 | |
1,500,000 | | CenturyLink Inc., 5.80%, 3/15/22 | | | 1,563 | |
320,000 | | Charter Communications Operating LLC/Charter Communications Operating Capital, 4.50%, 2/01/24 | | | 354 | |
900,000 | | Chubb INA Holdings Inc., 0.30%, 12/15/24 EUR (c) | | | 1,056 | |
575,000 | | CIT Group Inc., 4.75%, 2/16/24 | | | 619 | |
2,300,000 | | Citigroup Inc., (U.S. Secured Overnight Financing Rate + 1.667%), 1.68%, 5/15/24 (a) | | | 2,357 | |
1,800,000 | | Citigroup Inc., (U.S. Secured Overnight Financing Rate + 0.867%), 2.31%, 11/04/22 (a) | | | 1,833 | |
750,000 | | Citigroup Inc., 2.70%, 10/27/22 | | | 782 | |
1,200,000 | | Citigroup Inc., 2.90%, 12/08/21 | | | 1,231 | |
1,500,000 | | CNX Midstream Partners LP/CNX Midstream Finance Corp. 144A, 6.50%, 3/15/26 (b) | | | 1,528 | |
2,150,000 | | Comcast Corp., 3.70%, 4/15/24 | | | 2,369 | |
1,952,000 | | Covanta Holding Corp., 5.88%, 7/01/25 | | | 2,025 | |
695,000 | | Credit Suisse Group AG 144A, (U.S. Secured Overnight Financing Rate + 1.560%), 2.59%, 9/11/25 (a)(b) | | | 729 | |
1,600,000 | | Credit Suisse Group Funding Guernsey Ltd.,
3.80%, 9/15/22 | | | 1,692 | |
1,900,000 | | CVS Health Corp., 1.30%, 8/21/27 | | | 1,870 | |
| | | | | | |
Principal
or Shares | | Security Description | | Value
(000) | |
| | |
1,200,000 | | Danaher Corp., 1.70%, 3/30/24 EUR (c) | | $ | 1,482 | |
750,000 | | DH Europe Finance II Sarl, 0.20%, 3/18/26 EUR (c) | | | 882 | |
650,000 | | Dollar Tree Inc., 3.70%, 5/15/23 | | | 697 | |
1,200,000 | | El Corte Ingles SA 144A, 3.63%, 3/15/24 EUR (b)(c) | | | 1,407 | |
706,000 | | Encompass Health Corp., 5.75%, 11/01/24 | | | 706 | |
1,500,000 | | Enel Finance International NV 144A, 4.63%, 9/14/25 (b) | | | 1,732 | |
205,000 | | Energy Transfer Operating LP, 3.60%, 2/01/23 | | | 211 | |
250,000 | | Energy Transfer Operating LP, 4.20%, 9/15/23 | | | 264 | |
325,000 | | Energy Transfer Operating LP, 4.25%, 3/15/23 | | | 339 | |
1,400,000 | | Energy Transfer Partners LP/Regency Energy Finance Corp., 5.00%, 10/01/22 | | | 1,476 | |
2,245,000 | | EQM Midstream Partners LP, 4.75%, 7/15/23 | | | 2,237 | |
1,100,000 | | Equinix Inc., 1.25%, 7/15/25 | | | 1,108 | |
500,000 | | Equinix Inc., 1.80%, 7/15/27 | | | 509 | |
2,050,000 | | Experian Finance PLC, 1.38%, 6/25/26 EUR (c)(d) | | | 2,549 | |
450,000 | | Fiat Chrysler Automobiles NV,
3.38%, 7/07/23 EUR (c)(d) | | | 550 | |
2,000,000 | | Fidelity National Information Services Inc.,
0.75%, 5/21/23 EUR (c) | | | 2,381 | |
1,800,000 | | Fiserv Inc., 2.75%, 7/01/24 | | | 1,924 | |
1,600,000 | | Five Corners Funding Trust 144A, 4.42%, 11/15/23 (b) | | | 1,773 | |
800,000 | | Ford Motor Co., 8.50%, 4/21/23 | | | 884 | |
1,350,000 | | Ford Motor Credit Co. LLC, 3.09%, 1/09/23 | | | 1,339 | |
1,400,000 | | Ford Motor Credit Co. LLC, 3.34%, 3/18/21 | | | 1,402 | |
700,000 | | Ford Motor Credit Co. LLC, 3.35%, 11/01/22 | | | 698 | |
1,800,000 | | Ford Motor Credit Co. LLC, 3.37%, 11/17/23 | | | 1,787 | |
1,600,000 | | FS KKR Capital Corp. II 144A, 4.25%, 2/14/25 (b) | | | 1,515 | |
900,000 | | General Motors Co., 5.40%, 10/02/23 | | | 996 | |
1,000,000 | | General Motors Co., 6.13%, 10/01/25 | | | 1,172 | |
1,950,000 | | General Motors Financial Co. Inc., 2.90%, 2/26/25 | | | 2,027 | |
1,350,000 | | General Motors Financial Co. Inc., 3.55%, 7/08/22 | | | 1,403 | |
2,485,000 | | Gilead Sciences Inc., 1.20%, 10/01/27 | | | 2,477 | |
700,000 | | Goldman Sachs Group Inc., (3 mo. LIBOR USD + 0.821%), 2.88%, 10/31/22 (a) | | | 717 | |
1,700,000 | | Goldman Sachs Group Inc., 3.50%, 4/01/25 | | | 1,875 | |
600,000 | | Goldman Sachs Group Inc., 3.63%, 2/20/24 | | | 652 | |
581,000 | | Goldman Sachs Group Inc., 5.75%, 1/24/22 | | | 619 | |
1,000,000 | | Grifols SA 144A, 1.63%, 2/15/25 EUR (b)(c) | | | 1,146 | |
550,000 | | Honeywell International Inc., 0.10%, 3/10/24 EUR (c) | | | 644 | |
900,000 | | Humana Inc., 2.90%, 12/15/22 | | | 942 | |
2,050,000 | | Icahn Enterprises LP/Icahn Enterprises Finance Corp., 6.38%, 12/15/25 | | | 2,106 | |
1,600,000 | | Indonesia Asahan Aluminium Persero PT 144A,
4.75%, 5/15/25 (b) | | | 1,736 | |
1,800,000 | | Indonesia Asahan Aluminium Persero PT 144A,
5.23%, 11/15/21 (b) | | | 1,873 | |
1,300,000 | | Indonesia Asahan Aluminium Persero PT 144A,
5.71%, 11/15/23 (b) | | | 1,432 | |
56 Payden Mutual Funds
| | | | | | |
Principal
or Shares | | Security Description | | Value
(000) | |
| | |
330,000 | | ING Groep NV, 4.10%, 10/02/23 | | $ | 363 | |
2,250,000 | | Itau Unibanco Holding SA 144A, 2.90%, 1/24/23 (b) | | | 2,270 | |
1,700,000 | | Itau Unibanco Holding SA 144A, 3.25%, 1/24/25 (b) | | | 1,725 | |
2,100,000 | | JPMorgan Chase & Co., (U.S. Secured Overnight Financing Rate + 1.850%), 2.08%, 4/22/26 (a) | | | 2,198 | |
800,000 | | JPMorgan Chase & Co., (3 mo. LIBOR USD + 1.000%),
4.02%, 12/05/24 (a) | | | 882 | |
1,200,000 | | Kraft Heinz Foods Co. 144A, 3.88%, 5/15/27 (b) | | | 1,271 | |
2,100,000 | | Logicor Financing Sarl, 1.63%, 7/15/27 EUR (c)(d) | | | 2,537 | |
1,300,000 | | Lowe’s Cos. Inc., 4.00%, 4/15/25 | | | 1,474 | |
1,250,000 | | Macquarie Bank Ltd. 144A, 2.10%, 10/17/22 (b) | | | 1,289 | |
1,715,000 | | Macquarie Group Ltd. 144A, (3 mo. LIBOR USD + 1.023%), 3.19%, 11/28/23 (a)(b) | | | 1,793 | |
1,450,000 | | Mastercard Inc., 3.30%, 3/26/27 | | | 1,644 | |
2,000,000 | | Medtronic Global Holdings SCA,
0.38%, 10/15/28 EUR (c) | | | 2,361 | |
450,000 | | Meritage Homes Corp., 7.00%, 4/01/22 | | | 480 | |
900,000 | | Microchip Technology Inc. 144A, 2.67%, 9/01/23 (b) | | | 935 | |
2,000,000 | | Mitsubishi UFJ Financial Group Inc., 2.19%, 2/25/25 | | | 2,098 | |
1,200,000 | | Mitsubishi UFJ Financial Group Inc., 2.62%, 7/18/22 | | | 1,245 | |
410,000 | | Mitsubishi UFJ Financial Group Inc., 3.00%, 2/22/22 | | | 424 | |
2,000,000 | | Morgan Stanley, (3 mo. EURIBOR + 0.867%),
0.50%, 10/26/29 EUR (a)(c) | | | 2,320 | |
700,000 | | Morgan Stanley, (3 mo. EURIBOR + 0.753%),
0.64%, 7/26/24 EUR (a)(c) | | | 827 | |
1,500,000 | | Morgan Stanley, (U.S. Secured Overnight Financing Rate + 1.990%), 2.19%, 4/28/26 (a) | | | 1,573 | |
440,000 | | MPT Operating Partnership LP/MPT Finance Corp., 5.50%, 5/01/24 | | | 446 | |
520,000 | | National Fuel Gas Co., 4.90%, 12/01/21 | | | 537 | |
1,050,000 | | National Fuel Gas Co., 5.50%, 1/15/26 | | | 1,150 | |
1,180,000 | | Nissan Motor Acceptance Corp. 144A,
3.15%, 3/15/21 (b) | | | 1,188 | |
1,550,000 | | Nissan Motor Co. Ltd. 144A, 3.04%, 9/15/23 (b) | | | 1,574 | |
1,300,000 | | Northriver Midstream Finance LP 144A,
5.63%, 2/15/26 (b) | | | 1,290 | |
2,000,000 | | Nutrition & Biosciences Inc. 144A, 1.23%, 10/01/25 (b) | | | 2,004 | |
1,455,000 | | ONEOK Partners LP, 5.00%, 9/15/23 | | | 1,568 | |
1,200,000 | | Otis Worldwide Corp., 2.06%, 4/05/25 | | | 1,262 | |
900,000 | | Park Aerospace Holdings Ltd. 144A, 5.25%, 8/15/22 (b) | | | 927 | |
1,850,000 | | PayPal Holdings Inc., 1.65%, 6/01/25 | | | 1,914 | |
1,300,000 | | Penske Automotive Group Inc., 3.50%, 9/01/25 | | | 1,305 | |
1,800,000 | | Penske Truck Leasing Co. LP/PTL Finance Corp. 144A, 1.20%, 11/15/25 (b) | | | 1,798 | |
1,000,000 | | Penske Truck Leasing Co. LP/PTL Finance Corp. 144A, 3.45%, 7/01/24 (b) | | | 1,085 | |
1,300,000 | | Petrobras Global Finance BV, 5.60%, 1/03/31 | | | 1,404 | |
1,300,000 | | Petrobras Global Finance BV, 8.38%, 5/23/21 | | | 1,349 | |
| | | | | | |
Principal
or Shares | | Security Description | | Value
(000) | |
| | |
1,100,000 | | Petroleos Mexicanos, 2.50%, 8/21/21 EUR (c)(d) | | $ | 1,270 | |
1,850,000 | | Petroleos Mexicanos, 3.75%, 2/21/24 EUR (c)(d) | | | 2,070 | |
600,000 | | Petroleos Mexicanos, 4.88%, 1/18/24 (g) | | | 590 | |
900,000 | | Petroleos Mexicanos, 5.13%, 3/15/23 EUR (c)(d) | | | 1,056 | |
1,300,000 | | Plains All American Pipeline LP/PAA Finance Corp., 4.65%, 10/15/25 | | | 1,388 | |
1,800,000 | | Plains All American Pipeline LP/PAA Finance Corp., 5.00%, 2/01/21 | | | 1,800 | |
1,300,000 | | PTC Inc. 144A, 3.63%, 2/15/25 (b) | | | 1,326 | |
1,150,000 | | Reliance Standard Life Global Funding II 144A,
2.63%, 7/22/22 (b) | | | 1,183 | |
102,000 | | Reynolds Group Issuer Inc./Reynolds Group Issuer LLC 144A, 5.13%, 7/15/23 (b) | | | 103 | |
1,500,000 | | Royalty Pharma PLC 144A, 1.75%, 9/02/27 (b) | | | 1,490 | |
1,850,000 | | Ryder System Inc., 2.50%, 9/01/24 | | | 1,954 | |
1,700,000 | | Sabine Pass Liquefaction LLC, 5.63%, 3/01/25 | | | 1,947 | |
460,000 | | Sabine Pass Liquefaction LLC, 5.75%, 5/15/24 | | | 518 | |
455,000 | | SBA Communications Corp., 4.00%, 10/01/22 | | | 460 | |
1,250,000 | | SBA Tower Trust 144A, 1.88%, 1/15/26 (b) | | | 1,293 | |
2,800,000 | | SBA Tower Trust 144A, 2.84%, 1/15/25 (b) | | | 2,974 | |
1,100,000 | | Shire Acquisitions Investments Ireland DAC,
2.88%, 9/23/23 | | | 1,167 | |
1,500,000 | | Sirius XM Radio Inc. 144A, 3.88%, 8/01/22 (b) | | | 1,513 | |
500,000 | | Sky Ltd. 144A, 3.75%, 9/16/24 (b) | | | 558 | |
200,000 | | SMBC Aviation Capital Finance DAC 144A,
4.13%, 7/15/23 (b) | | | 212 | |
525,000 | | Sprint Spectrum Co. LLC/Sprint Spectrum Co. II LLC/Sprint Spectrum Co. III LLC 144A,
3.36%, 9/20/21 (b) | | | 531 | |
1,350,000 | | Standard Industries Inc. 144A,
2.25%, 11/21/26 EUR (b)(c) | | | 1,552 | |
500,000 | | Standard Industries Inc., 2.25%, 11/21/26 EUR (c)(d) | | | 575 | |
1,520,000 | | Sumitomo Mitsui Financial Group Inc., 2.45%, 9/27/24 | | | 1,606 | |
2,100,000 | | Suncor Energy Inc., 2.80%, 5/15/23 | | | 2,196 | |
1,000,000 | | Sysco Corp., 5.65%, 4/01/25 | | | 1,180 | |
300,000 | | Takeda Pharmaceutical Co. Ltd. 144A, 1.13%, 11/21/22 EUR (b)(c) | | | 358 | |
650,000 | | Takeda Pharmaceutical Co. Ltd., 4.00%, 11/26/21 | | | 673 | |
1,470,000 | | Tenet Healthcare Corp., 4.63%, 7/15/24 | | | 1,496 | |
1,100,000 | | Terega SASU, 0.63%, 2/27/28 EUR (c)(d) | | | 1,252 | |
1,000,000 | | Teva Pharmaceutical Finance Netherlands II BV,
1.25%, 3/31/23 EUR (c)(d) | | | 1,086 | |
800,000 | | Teva Pharmaceutical Finance Netherlands II BV,
3.25%, 4/15/22 EUR (c) | | | 935 | |
1,315,000 | | Teva Pharmaceutical Finance Netherlands III BV,
2.20%, 7/21/21 | | | 1,297 | |
1,000,000 | | Teva Pharmaceutical Finance Netherlands III BV,
2.80%, 7/21/23 | | | 950 | |
775,000 | | Thermo Fisher Scientific Inc., 4.13%, 3/25/25 | | | 881 | |
1,400,000 | | T-Mobile USA Inc. 144A, 3.50%, 4/15/25 (b) | | | 1,535 | |
1,600,000 | | UBS Group AG 144A, (1 yr. US Treasury Yield Curve Rate T Note Constant Maturity + 0.830%),
1.01%, 7/30/24 (a)(b) | | | 1,607 | |
1,500,000 | | UBS Group AG 144A, 3.49%, 5/23/23 (b) | | | 1,564 | |
Annual Report 57
Payden Absolute Return Bond Fund continued
| | | | | | |
Principal
or Shares | | Security Description | | Value
(000) | |
| | |
2,050,000 | | Ventas Realty LP, 3.50%, 4/15/24 | | $ | 2,215 | |
500,000 | | VEREIT Operating Partnership LP, 3.40%, 1/15/28 | | | 525 | |
2,000,000 | | VeriSign Inc., 5.25%, 4/01/25 | | | 2,245 | |
250,000 | | Vodafone Group PLC, 3.75%, 1/16/24 | | | 273 | |
500,000 | | Volkswagen Financial Services AG,
2.50%, 4/06/23 EUR (c)(d) | | | 616 | |
1,250,000 | | Volkswagen Group of America Finance LLC 144A, 4.00%, 11/12/21 (b) | | | 1,294 | |
900,000 | | Volkswagen Group of America Finance LLC 144A, 4.25%, 11/13/23 (b) | | | 990 | |
1,800,000 | | Walt Disney Co., 1.75%, 1/13/26 | | | 1,875 | |
2,100,000 | | Wells Fargo & Co., (3 mo. LIBOR USD + 0.750%), 2.16%, 2/11/26 (a) | | | 2,183 | |
1,500,000 | | Welltower Inc., 4.00%, 6/01/25 | | | 1,689 | |
1,500,000 | | Worldline SA, 0.25%, 9/18/24 EUR (c)(d) | | | 1,763 | |
Total Corporate Bond (Cost - $228,092) | | | 235,147 | |
Foreign Government (5%) | | | | |
1,000,000 | | Corp. Financiera de Desarrollo SA 144A,
2.40%, 9/28/27 (b) | | | 1,018 | |
1,068,000 | | Dominican Republic International Bond 144A,
5.88%, 4/18/24 (b) | | | 1,129 | |
850,000 | | Dominican Republic International Bond,
6.60%, 1/28/24 (d) | | | 933 | |
950,000 | | Dominican Republic International Bond 144A,
7.50%, 5/06/21 (b) | | | 975 | |
633,333 | | Dominican Republic International Bond,
7.50%, 5/06/21 (d) | | | 650 | |
300,000 | | Egypt Government International Bond 144A,
5.75%, 5/29/24 (b) | | | 308 | |
850,000 | | Egypt Government International Bond 144A,
6.13%, 1/31/22 (b) | | | 877 | |
400,000 | | Egypt Government International Bond,
6.13%, 1/31/22 (d) | | | 413 | |
2,400,000 | | Fondo MIVIVIENDA SA, 3.50%, 1/31/23 (d) | | | 2,517 | |
2,600,000 | | Georgia Government International Bond 144A, 6.88%, 4/12/21 (b) | | | 2,649 | |
800,000 | | Georgia Government International Bond,
6.88%, 4/12/21 (d) | | | 815 | |
1,991,000 | | Guatemala Government Bond 144A, 5.75%, 6/06/22 (b) | | | 2,109 | |
1,910,000 | | Guatemala Government Bond, 5.75%, 6/06/22 (d) | | | 2,023 | |
1,700,000 | | Honduras Government International Bond 144A, 8.75%, 12/16/20 (b) | | | 1,713 | |
1,500,000 | | Indonesia Government International Bond,
0.90%, 2/14/27 EUR (c) | | | 1,729 | |
1,550,000 | | Kazakhstan Government International Bond 144A, 1.55%, 11/09/23 EUR (b)(c) | | | 1,856 | |
1,000,000 | | Mongolia Government International Bond 144A, 5.13%, 4/07/26 (b) | | | 1,035 | |
2,935,000 | | Mongolia Government International Bond 144A, 5.63%, 5/01/23 (b) | | | 3,063 | |
400,000 | | Morocco Government International Bond 144A, 1.38%, 3/30/26 EUR (b)(c) | | | 463 | |
| | | | | | |
Principal
or Shares | | Security Description | | Value
(000) | |
| | |
1,850,000 | | Morocco Government International Bond,
4.25%, 12/11/22 (d) | | $ | 1,940 | |
300,000 | | Morocco Government International Bond 144A,
4.25%, 12/11/22 (b) | | | 315 | |
1,670,000 | | Nigeria Government International Bond 144A,
6.38%, 7/12/23 (b) | | | 1,742 | |
1,520,000 | | Nigeria Government International Bond,
6.75%, 1/28/21 (d) | | | 1,533 | |
1,300,000 | | Nigeria Government International Bond 144A,
6.75%, 1/28/21 (b) | | | 1,311 | |
1,050,000 | | Panama Government International Bond, 3.75%, 3/16/25 | | | 1,151 | |
1,500,000 | | Perusahaan Penerbit SBSN Indonesia III 144A,
3.40%, 3/29/21 (b) | | | 1,516 | |
1,800,000 | | Peruvian Government International Bond, 2.39%, 1/23/26 | | | 1,895 | |
1,926,000 | | Senegal Government International Bond 144A,
6.25%, 7/30/24 (b) | | | 2,033 | |
990,000 | | Senegal Government International Bond 144A,
8.75%, 5/13/21 (b) | | | 1,024 | |
250,000 | | Senegal Government International Bond,
8.75%, 5/13/21 (d) | | | 258 | |
1,800,000 | | Serbia International Bond, 7.25%, 9/28/21 (d) | | | 1,904 | |
1,600,000 | | Ukraine Government International Bond 144A,
7.75%, 9/01/22 (b) | | | 1,671 | |
1,400,000 | | Ukraine Government International Bond,
7.75%, 9/01/23 (d) | | | 1,460 | |
Total Foreign Government (Cost - $45,528) | | | 46,028 | |
Mortgage Backed (27%) | | | | |
482,927 | | Alternative Loan Trust 2005-56, (1 mo. LIBOR USD + 0.730%), 0.88%, 11/25/35 (a) | | | 479 | |
1,433,747 | | Alternative Loan Trust 2006-25CB, 6.00%, 10/25/36 | | | 1,125 | |
240,245 | | Alternative Loan Trust 2006-2CB, 6.00%, 3/25/36 | | | 170 | |
186,451 | | Alternative Loan Trust 2006-45T1, 6.00%, 2/25/37 | | | 134 | |
338,350 | | Alternative Loan Trust 2006-HY11, (1 mo. LIBOR USD + 0.120%), 0.27%, 6/25/36 (a) | | | 325 | |
663,988 | | Alternative Loan Trust 2007-12T1, 6.00%, 6/25/37 | | | 487 | |
742,746 | | Alternative Loan Trust 2007-15CB, 5.75%, 7/25/37 | | | 637 | |
464,643 | | Alternative Loan Trust 2007-6, 5.75%, 4/25/47 | | | 373 | |
145,256 | | American Home Mortgage Investment Trust 2006-3, (6 mo. LIBOR USD + 1.750%), 2.02%, 12/25/36 (a) | | | 131 | |
449,283 | | AREIT 2018-CRE2 Trust 144A, (1 mo. LIBOR USD + 1.200%), 1.35%, 11/14/35 (a)(b) | | | 443 | |
249,602 | | AREIT 2018-CRE2 Trust 144A, (1 mo. LIBOR USD + 1.400%), 1.55%, 11/14/35 (a)(b) | | | 244 | |
1,900,000 | | BAMLL Commercial Mortgage Securities Trust 2015-200P 144A, 3.60%, 4/14/33 (b)(e) | | | 1,989 | |
99,305 | | Banc of America Funding 2005-H Trust,
2.84%, 11/20/35 (e) | | | 88 | |
58 Payden Mutual Funds
| | | | | | |
Principal
or Shares | | Security Description | | Value
(000) | |
| | |
2,307,000 | | BBCMS 2018-TALL Mortgage Trust 144A, (1 mo. LIBOR USD + 0.722%), 0.87%, 3/15/37 (a)(b) | | $ | 2,228 | |
1,808,000 | | BBCMS 2018-TALL Mortgage Trust 144A, (1 mo. LIBOR USD + 0.971%), 1.12%, 3/15/37 (a)(b) | | | 1,717 | |
114,373 | | BDS 2018-FL2 144A, (1 mo. LIBOR USD + 0.950%), 1.10%, 8/15/35 (a)(b) | | | 114 | |
200,000 | | BDS 2018-FL2 144A, (1 mo. LIBOR USD + 1.400%), 1.55%, 8/15/35 (a)(b) | | | 199 | |
135,294 | | Bear Stearns ALT-A Trust 2006-6, 3.35%, 11/25/36 (e) | | | 104 | |
87,538 | | Bear Stearns ARM Trust 2007-3, 3.87%, 5/25/47 (e) | | | 85 | |
2,200,000 | | BX Commercial Mortgage Trust 2018-BIOA 144A, (1 mo. LIBOR USD + 1.951%), 2.10%, 3/15/37 (a)(b) | | | 2,167 | |
420,000 | | BX Commercial Mortgage Trust 2018-IND 144A, (1 mo. LIBOR USD + 1.300%), 1.45%, 11/15/35 (a)(b) | | | 416 | |
350,000 | | BX Commercial Mortgage Trust 2018-IND 144A, (1 mo. LIBOR USD + 1.800%), 1.95%, 11/15/35 (a)(b) | | | 344 | |
1,995,000 | | BX Commercial Mortgage Trust 2018-IND 144A, (1 mo. LIBOR USD + 2.050%), 2.20%, 11/15/35 (a)(b) | | | 1,958 | |
1,139,157 | | BX Commercial Mortgage Trust 2019-XL 144A, (1 mo. LIBOR USD + 1.800%), 1.95%, 10/15/36 (a)(b) | | | 1,126 | |
2,658,034 | | BX Commercial Mortgage Trust 2019-XL 144A, (1 mo. LIBOR USD + 2.000%), 2.15%, 10/15/36 (a)(b) | | | 2,611 | |
3,322,542 | | BX Commercial Mortgage Trust 2019-XL 144A, (1 mo. LIBOR USD + 2.300%), 2.45%, 10/15/36 (a)(b) | | | 3,236 | |
899,177 | | BX Commercial Mortgage Trust 2020-BXLP 144A, (1 mo. LIBOR USD + 1.600%), 1.75%, 12/15/36 (a)(b) | | | 871 | |
1,198,903 | | BX Commercial Mortgage Trust 2020-BXLP 144A, (1 mo. LIBOR USD + 2.000%), 2.15%, 12/15/36 (a)(b) | | | 1,163 | |
1,700,000 | | BX Commercial Mortgage Trust 2020-VKNG 144A, (1 mo. LIBOR USD + 0.930%), 1.08%, 10/15/37 (a)(b) | | | 1,706 | |
1,700,000 | | BX Commercial Mortgage Trust 2020-VKNG 144A, (1 mo. LIBOR USD + 2.100%), 2.25%, 10/15/37 (a)(b) | | | 1,703 | |
1,800,000 | | BX Commercial Mortgage Trust 2020-VKNG 144A, (1 mo. LIBOR USD + 2.750%), 2.90%, 10/15/37 (a)(b) | | | 1,809 | |
883,984 | | BXMT 2017-FL1 Ltd. 144A, (1 mo. LIBOR USD + 0.870%), 1.02%, 6/15/35 (a)(b) | | | 883 | |
550,000 | | BXMT 2017-FL1 Ltd. 144A, (1 mo. LIBOR USD + 1.950%), 2.10%, 6/15/35 (a)(b) | | | 546 | |
| | | | | | |
Principal
or Shares | | Security Description | | Value
(000) | |
| | |
15,566,197 | | Cantor Commercial Real Estate Lending 2019-CF1, 1.14%, 5/15/52 (e) | | $ | 1,144 | |
1,096,252 | | CGDBB Commercial Mortgage Trust 2017-BIOC 144A, (1 mo. LIBOR USD + 2.150%), 2.30%, 7/15/32 (a)(b) | | | 1,088 | |
2,216,436 | | CHC Commercial Mortgage Trust 2019-CHC 144A, (1 mo. LIBOR USD + 1.120%), 1.27%, 6/15/34 (a)(b) | | | 2,121 | |
2,588,829 | | CHC Commercial Mortgage Trust 2019-CHC 144A, (1 mo. LIBOR USD + 1.500%), 1.65%, 6/15/34 (a)(b) | | | 2,455 | |
1,593,125 | | CHC Commercial Mortgage Trust 2019-CHC 144A, (1 mo. LIBOR USD + 2.350%), 2.50%, 6/15/34 (a)(b) | | | 1,379 | |
1,045,489 | | CHC Commercial Mortgage Trust 2019-CHC 144A, (1 mo. LIBOR USD + 2.608%), 2.76%, 6/15/34 (a)(b) | | | 840 | |
133,245 | | CHL Mortgage Pass-Through Trust 2004-29,
2.64%, 2/25/35 (e) | | | 115 | |
97,939 | | CHL Mortgage Pass-Through Trust 2006-HYB1,
3.26%, 3/20/36 (e) | | | 95 | |
153,192 | | CHL Mortgage Pass-Through Trust 2007-HYB2,
3.32%, 2/25/47 (e) | | | 141 | |
1,600,000 | | CHT 2017-COSMO Mortgage Trust 144A, (1 mo. LIBOR USD + 2.250%), 2.40%, 11/15/36 (a)(b) | | | 1,525 | |
1,800,000 | | Cold Storage Trust 2020-ICE5 144A, (1 mo. LIBOR USD + 0.900%), 1.06%, 11/15/23 (a)(b) | | | 1,793 | |
2,100,000 | | Cold Storage Trust 2020-ICE5 144A, (1 mo. LIBOR USD + 2.100%), 2.14%, 11/15/23 (a)(b) | | | 2,086 | |
2,000,000 | | Cold Storage Trust 2020-ICE5 144A, (1 mo. LIBOR USD + 2.766%), 2.99%, 11/15/23 (a)(b) | | | 1,980 | |
1,900,000 | | Cold Storage Trust 2020-ICE5 144A, (1 mo. LIBOR USD + 3.492%), 3.49%, 11/15/23 (a)(b) | | | 1,872 | |
1,400,000 | | COMM 2015-3BP Mortgage Trust 144A,
3.24%, 2/10/35 (b)(e) | | | 1,356 | |
6,064,177 | | Connecticut Avenue Securities Trust 2019-HRP1 144A, (1 mo. LIBOR USD + 2.150%), 2.30%, 11/25/39 (a)(b) | | | 5,481 | |
600,000 | | Connecticut Avenue Securities Trust 2019-R01 144A, (1 mo. LIBOR USD + 4.350%), 4.50%, 7/25/31 (a)(b) | | | 575 | |
1,300,000 | | Connecticut Avenue Securities Trust 2019-R02 144A, (1 mo. LIBOR USD + 4.150%), 4.30%, 8/25/31 (a)(b) | | | 1,264 | |
759,944 | | Connecticut Avenue Securities Trust 2019-R03 144A, (1 mo. LIBOR USD + 2.150%), 2.30%, 9/25/31 (a)(b) | | | 758 | |
1,050,000 | | Connecticut Avenue Securities Trust 2019-R03 144A, (1 mo. LIBOR USD + 4.100%), 4.25%, 9/25/31 (a)(b) | | | 1,020 | |
5,834,128 | | Connecticut Avenue Securities Trust 2019-R06 144A, (1 mo. LIBOR USD + 2.100%), 2.25%, 9/25/39 (a)(b) | | | 5,799 | |
1,000,000 | | Connecticut Avenue Securities Trust 2019-R07 144A, (1 mo. LIBOR USD + 3.400%), 3.55%, 10/25/39 (a)(b) | | | 878 | |
Annual Report 59
Payden Absolute Return Bond Fund continued
| | | | | | |
Principal
or Shares | | Security Description | | Value
(000) | |
| | |
1,800,000 | | Connecticut Avenue Securities Trust 2020-R01 144A, (1 mo. LIBOR USD + 2.050%), 2.20%, 1/25/40 (a)(b) | | $ | 1,773 | |
3,550,000 | | Connecticut Avenue Securities Trust 2020-R01 144A, (1 mo. LIBOR USD + 3.250%), 3.40%, 1/25/40 (a)(b) | | | 2,821 | |
750,000 | | Connecticut Avenue Securities Trust 2020-R02 144A, (1 mo. LIBOR USD + 2.000%), 2.15%, 1/25/40 (a)(b) | | | 732 | |
1,900,000 | | Connecticut Avenue Securities Trust 2020-R02 144A, (1 mo. LIBOR USD + 3.000%), 3.15%, 1/25/40 (a)(b) | | | 1,484 | |
2,350,000 | | Credit Suisse Mortgage Capital Certificates 2019-ICE4 144A, (1 mo. LIBOR USD + 0.980%),
1.13%, 5/15/36 (a)(b) | | | 2,353 | |
2,800,000 | | Credit Suisse Mortgage Capital Certificates 2019-ICE4 144A, (1 mo. LIBOR USD + 2.150%),
2.30%, 5/15/36 (a)(b) | | | 2,760 | |
2,250,000 | | Credit Suisse Mortgage Capital Certificates 2019-ICE4 144A, (1 mo. LIBOR USD + 2.650%),
2.80%, 5/15/36 (a)(b) | | | 2,208 | |
1,100,000 | | CSMC Trust 2017-MOON 144A, 3.20%, 7/10/34 (b)(e) | | | 1,052 | |
305,255 | | Deutsche Alt-B Securities Mortgage Loan Trust Series 2006-AB1, 5.60%, 2/25/36 (e) | | | 303 | |
159,566 | | Deutsche Alt-B Securities Mortgage Loan Trust Series 2006-AB4, 6.00%, 10/25/36 (e) | | | 153 | |
79,875 | | Deutsche Alt-B Securities Mortgage Loan Trust Series 2006-AB4, 6.00%, 10/25/36 | | | 76 | |
1,100,000 | | Exantas Capital Corp. 2019-RSO7 Ltd. 144A, (1 mo. LIBOR USD + 1.500%), 1.65%, 4/15/36 (a)(b) | | | 1,080 | |
2,505,820 | | Fannie Mae Connecticut Avenue Securities, (1 mo. LIBOR USD + 2.000%), 2.15%, 3/25/31 (a) | | | 2,441 | |
1,733,649 | | Fannie Mae Connecticut Avenue Securities, (1 mo. LIBOR USD + 2.100%), 2.25%, 3/25/31 (a) | | | 1,699 | |
2,900,070 | | Fannie Mae Connecticut Avenue Securities, (1 mo. LIBOR USD + 2.150%), 2.30%, 10/25/30 (a) | | | 2,843 | |
2,197,513 | | Fannie Mae Connecticut Avenue Securities, (1 mo. LIBOR USD + 2.200%), 2.35%, 8/25/30 (a) | | | 2,143 | |
1,693,560 | | Fannie Mae Connecticut Avenue Securities, (1 mo. LIBOR USD + 2.250%), 2.40%, 7/25/30 (a) | | | 1,675 | |
1,345,221 | | Fannie Mae Connecticut Avenue Securities, (1 mo. LIBOR USD + 2.350%), 2.50%, 1/25/31 (a) | | | 1,319 | |
1,325,348 | | Fannie Mae Connecticut Avenue Securities, (1 mo. LIBOR USD + 2.550%), 2.70%, 12/25/30 (a) | | | 1,306 | |
2,105,931 | | Fannie Mae Connecticut Avenue Securities, (1 mo. LIBOR USD + 3.000%), 3.15%, 10/25/29 (a) | | | 2,130 | |
1,400,000 | | Fannie Mae Connecticut Avenue Securities, (1 mo. LIBOR USD + 4.100%), 4.25%, 3/25/31 (a) | | | 1,286 | |
231,691 | | Fannie Mae Connecticut Avenue Securities, (1 mo. LIBOR USD + 4.250%), 4.40%, 1/25/29 (a) | | | 240 | |
| | | | | | |
Principal
or Shares | | Security Description | | Value
(000) | |
| | |
188,286 | | Fannie Mae Connecticut Avenue Securities, (1 mo. LIBOR USD + 6.000%), 6.15%, 9/25/28 (a) | | $ | 199 | |
138,449 | | First Horizon Alternative Mortgage Securities Trust 2006-AA5, 2.77%, 9/25/36 (e) | | | 126 | |
128,727 | | First Horizon Alternative Mortgage Securities Trust 2006-FA2, 6.00%, 5/25/36 | | | 91 | |
2,907,828 | | Freddie Mac STACR 2019-HQA3 144A, (1 mo. LIBOR USD + 1.850%), 2.00%, 9/25/49 (a)(b) | | | 2,859 | |
1,900,000 | | Freddie Mac STACR 2019-HQA3 144A, (1 mo. LIBOR USD + 3.000%), 3.15%, 9/25/49 (a)(b) | | | 1,745 | |
800,000 | | Freddie Mac STACR 2019-HQA3 144A, (1 mo. LIBOR USD + 7.500%), 7.65%, 9/25/49 (a)(b) | | | 658 | |
650,000 | | Freddie Mac STACR REMIC Trust 2020-DNA1 144A, (1 mo. LIBOR USD + 5.250%), 5.40%, 1/25/50 (a)(b) | | | 419 | |
958,879 | | Freddie Mac STACR REMIC Trust 2020-DNA2 144A, (1 mo. LIBOR USD + 0.750%), 0.90%, 2/25/50 (a)(b) | | | 959 | |
900,000 | | Freddie Mac STACR REMIC Trust 2020-DNA2 144A, (1 mo. LIBOR USD + 1.850%), 2.00%, 2/25/50 (a)(b) | | | 886 | |
1,700,000 | | Freddie Mac STACR REMIC Trust 2020-DNA2 144A, (1 mo. LIBOR USD + 2.500%), 2.65%, 2/25/50 (a)(b) | | | 1,494 | |
700,000 | | Freddie Mac STACR REMIC Trust 2020-DNA2 144A, (1 mo. LIBOR USD + 4.800%), 4.95%, 2/25/50 (a)(b) | | | 451 | |
1,700,479 | | Freddie Mac STACR REMIC Trust 2020-DNA3 144A, (1 mo. LIBOR USD + 1.500%), 1.65%, 6/25/50 (a)(b) | | | 1,706 | |
3,300,000 | | Freddie Mac STACR REMIC Trust 2020-DNA4 144A, (1 mo. LIBOR USD + 1.500%), 1.65%, 8/25/50 (a)(b) | | | 3,318 | |
2,000,000 | | Freddie Mac STACR REMIC Trust 2020-DNA5 144A, (U.S. Secured Overnight Financing Rate Index 30day Average + 1.300%), 1.39%, 10/25/50 (a)(b) | | | 2,005 | |
2,000,000 | | Freddie Mac STACR REMIC Trust 2020-DNA5 144A, (U.S. Secured Overnight Financing Rate Index 30day Average + 2.800%), 2.89%, 10/25/50 (a)(b) | | | 1,999 | |
1,100,000 | | Freddie Mac STACR REMIC Trust 2020-DNA5 144A, (U.S. Secured Overnight Financing Rate Index 30day Average + 4.800%), 4.89%, 10/25/50 (a)(b) | | | 1,106 | |
1,650,000 | | Freddie Mac STACR REMIC Trust 2020-HQA1 144A, (1 mo. LIBOR USD + 1.900%), 2.05%, 1/25/50 (a)(b) | | | 1,625 | |
700,000 | | Freddie Mac STACR REMIC Trust 2020-HQA1 144A, (1 mo. LIBOR USD + 5.100%), 5.25%, 1/25/50 (a)(b) | | | 431 | |
1,210,299 | | Freddie Mac STACR REMIC Trust 2020-HQA2 144A, (1 mo. LIBOR USD + 1.100%), 1.25%, 3/25/50 (a)(b) | | | 1,212 | |
1,000,000 | | Freddie Mac STACR REMIC Trust 2020-HQA2 144A, (1 mo. LIBOR USD + 4.100%), 4.25%, 3/25/50 (a)(b) | | | 921 | |
60 Payden Mutual Funds
| | | | | | |
Principal
or Shares | | Security Description | | Value
(000) | |
| | |
1,300,000 | | Freddie Mac STACR REMIC Trust 2020-HQA2 144A, (1 mo. LIBOR USD + 7.600%), 7.75%, 3/25/50 (a)(b) | | $ | 854 | |
3,800,000 | | Freddie Mac STACR REMIC Trust 2020-HQA3 144A, (1 mo. LIBOR USD + 1.550%), 1.70%, 7/25/50 (a)(b) | | | 3,809 | |
2,000,000 | | Freddie Mac STACR REMIC Trust 2020-HQA4 144A, (1 mo. LIBOR USD + 1.300%), 1.45%, 9/25/50 (a)(b) | | | 2,008 | |
1,600,000 | | Freddie Mac STACR REMIC Trust 2020-HQA4 144A, (1 mo. LIBOR USD + 3.150%), 3.30%, 9/25/50 (a)(b) | | | 1,619 | |
374,539 | | Freddie Mac STACR Trust 2018-HQA2 144A, (1 mo. LIBOR USD + 0.750%), 0.90%, 10/25/48 (a)(b) | | | 374 | |
4,150,000 | | Freddie Mac STACR Trust 2018-HQA2 144A, (1 mo. LIBOR USD + 2.300%), 2.45%, 10/25/48 (a)(b) | | | 4,052 | |
2,482,743 | | Freddie Mac STACR Trust 2019-DNA1 144A, (1 mo. LIBOR USD + 2.650%), 2.80%, 1/25/49 (a)(b) | | | 2,470 | |
1,644,201 | | Freddie Mac STACR Trust 2019-DNA2 144A, (1 mo. LIBOR USD + 2.450%), 2.60%, 3/25/49 (a)(b) | | | 1,625 | |
550,000 | | Freddie Mac STACR Trust 2019-DNA2 144A, (1 mo. LIBOR USD + 4.350%), 4.50%, 3/25/49 (a)(b) | | | 536 | |
1,222,373 | | Freddie Mac STACR Trust 2019-FTR2 144A, (1 mo. LIBOR USD + 0.950%), 1.10%, 11/25/48 (a)(b) | | | 1,213 | |
550,000 | | Freddie Mac STACR Trust 2019-FTR3 144A, (1 mo. LIBOR USD + 4.800%), 4.95%, 9/25/47 (a)(b) | | | 418 | |
600,000 | | Freddie Mac STACR Trust 2019-FTR4 144A, (1 mo. LIBOR USD + 5.000%), 5.15%, 11/25/47 (a)(b) | | | 457 | |
3,057,838 | | Freddie Mac STACR Trust 2019-HQA1 144A, (1 mo. LIBOR USD + 2.350%), 2.50%, 2/25/49 (a)(b) | | | 3,016 | |
1,294,988 | | Freddie Mac STACR Trust 2019-HQA2 144A, (1 mo. LIBOR USD + 2.050%), 2.20%, 4/25/49 (a)(b) | | | 1,278 | |
1,550,000 | | Freddie Mac STACR Trust 2019-HQA2 144A, (1 mo. LIBOR USD + 4.100%), 4.25%, 4/25/49 (a)(b) | | | 1,486 | |
254,586 | | Freddie Mac Structured Agency Credit Risk Debt Notes, (1 mo. LIBOR USD + 0.750%), 0.90%, 3/25/30 (a) | | | 255 | |
2,704,907 | | Freddie Mac Structured Agency Credit Risk Debt Notes, (1 mo. LIBOR USD + 1.800%), 1.95%, 7/25/30 (a) | | | 2,652 | |
2,955,404 | | Freddie Mac Structured Agency Credit Risk Debt Notes, (1 mo. LIBOR USD + 2.300%), 2.45%, 9/25/30 (a) | | | 2,904 | |
| | | | | | |
Principal
or Shares | | Security Description | | Value
(000) | |
| | |
1,227,493 | | Freddie Mac Structured Agency Credit Risk Debt Notes, (1 mo. LIBOR USD + 2.450%), 2.60%, 12/25/42 (a) | | $ | 1,172 | |
197,439 | | Freddie Mac Structured Agency Credit Risk Debt Notes 144A, 4.14%, 8/25/48 (b)(e) | | | 196 | |
1,950,000 | | Freddie Mac Structured Agency Credit Risk Debt Notes, (1 mo. LIBOR USD + 4.600%), 4.75%, 12/25/42 (a) | | | 1,853 | |
1,249,359 | | Freddie Mac Structured Agency Credit Risk Debt Notes, (1 mo. LIBOR USD + 11.250%), 11.40%, 10/25/29 (a) | | | 1,182 | |
226,575 | | GreenPoint MTA Trust 2005-AR1, (1 mo. LIBOR USD + 0.440%), 0.59%, 6/25/45 (a) | | | 201 | |
1,557,000 | | GS Mortgage Securities Corp. Trust 2017-500K 144A, (1 mo. LIBOR USD + 1.500%), 1.75%, 7/15/32 (a)(b) | | | 1,526 | |
750,000 | | GS Mortgage Securities Corp. Trust 2017-500K 144A, (1 mo. LIBOR USD + 1.800%), 2.15%, 7/15/32 (a)(b) | | | 732 | |
1,150,000 | | GS Mortgage Securities Corp. Trust 2017-500K 144A, (1 mo. LIBOR USD + 2.500%), 2.85%, 7/15/32 (a)(b) | | | 1,133 | |
142,399 | | GSMPS Mortgage Loan Trust 2005-RP2 144A, (1 mo. LIBOR USD + 0.350%), 0.50%, 3/25/35 (a)(b) | | | 129 | |
205,086 | | GSMPS Mortgage Loan Trust 2005-RP3 144A, (1 mo. LIBOR USD + 0.350%), 0.50%, 9/25/35 (a)(b) | | | 171 | |
55,335 | | HomeBanc Mortgage Trust 2004-1, (1 mo. LIBOR USD + 0.860%), 1.01%, 8/25/29 (a) | | | 54 | |
301,933 | | IndyMac INDX Mortgage Loan Trust 2006-AR29, (1 mo. LIBOR USD + 0.250%), 0.40%, 11/25/36 (a) | | | 288 | |
1,471,769 | | IndyMac INDX Mortgage Loan Trust 2006-AR35, (1 mo. LIBOR USD + 0.180%), 0.33%, 1/25/37 (a) | | | 1,401 | |
2,200,000 | | InTown Hotel Portfolio Trust 2018-STAY 144A, (1 mo. LIBOR USD + 0.700%), 0.85%, 1/15/33 (a)(b) | | | 2,160 | |
300,000 | | InTown Hotel Portfolio Trust 2018-STAY 144A, (1 mo. LIBOR USD + 3.100%), 3.25%, 1/15/33 (a)(b) | | | 296 | |
6,922,423 | | JP Morgan Alternative Loan Trust, 6.00%, 12/25/35 | | | 4,195 | |
1,351,751 | | JP Morgan Chase Commercial Mortgage Securities Trust 2018-LAQ 144A, (1 mo. LIBOR USD + 1.000%),
1.15%, 6/15/32 (a)(b) | | | 1,292 | |
92,549 | | JP Morgan Mortgage Trust 2006-A3, 3.59%, 5/25/36 (e) | | | 83 | |
80,497 | | JP Morgan Mortgage Trust 2006-A3, 3.59%, 5/25/36 (e) | | | 73 | |
24,474 | | JP Morgan Mortgage Trust 2014-IVR3 144A,
3.00%, 9/25/44 (b)(e) | | | 25 | |
599,563 | | JP Morgan Mortgage Trust 2017-5 144A,
3.13%, 10/26/48 (b)(e) | | | 612 | |
5,604,662 | | LCCM 2017-LC26 144A, 1.42%, 7/12/50 (b)(e) | | | 373 | |
Annual Report 61
Payden Absolute Return Bond Fund continued
| | | | | | |
Principal
or Shares | | Security Description | | Value
(000) | |
| | |
2,500,000 | | MBRT 2019-MBR 144A, (1 mo. LIBOR USD + 0.850%), 1.00%, 11/15/36 (a)(b) | | $ | 2,435 | |
209,968 | | Merrill Lynch Mortgage Backed Securities Trust Series 2007-2, (1 yr. US Treasury Yield Curve Rate T Note Constant Maturity + 2.400%), 2.52%, 8/25/36 (a) | | | 199 | |
3,600,000 | | MF1 2020-FL3 Ltd. 144A, (1 mo. LIBOR USD + 2.050%), 2.20%, 7/15/35 (a)(b) | | | 3,626 | |
2,000,000 | | MF1 2020-FL3 Ltd. 144A, (1 mo. LIBOR USD + 2.850%), 3.00%, 7/15/35 (a)(b) | | | 2,022 | |
2,370,867 | | Morgan Stanley Capital I Trust 2018-H3,
0.83%, 7/15/51 (e) | | | 116 | |
1,444,406 | | Motel 6 Trust 2017-MTL6 144A, (1 mo. LIBOR USD + 1.190%), 1.34%, 8/15/34 (a)(b) | | | 1,420 | |
1,444,406 | | Motel 6 Trust 2017-MTL6 144A, (1 mo. LIBOR USD + 3.250%), 3.40%, 8/15/34 (a)(b) | | | 1,429 | |
826,144 | | Multifamily Connecticut Avenue Securities Trust 2019-01 144A, (1 mo. LIBOR USD + 1.700%),
1.85%, 10/15/49 (a)(b) | | | 794 | |
2,300,000 | | Multifamily Connecticut Avenue Securities Trust 2019-01 144A, (1 mo. LIBOR USD + 3.250%),
3.40%, 10/15/49 (a)(b) | | | 2,130 | |
4,193,285 | | NACC Reperforming Loan REMIC Trust 2004-R1 144A, 6.50%, 3/25/34 (b) | | | 4,164 | |
963,420 | | NACC Reperforming Loan REMIC Trust 2004-R1 144A, 7.50%, 3/25/34 (b) | | | 986 | |
275,967 | | New Residential Mortgage Loan Trust 2017-5 144A, (1 mo. LIBOR USD + 1.500%), 1.65%, 6/25/57 (a)(b) | | | 277 | |
1,000,000 | | PFP 2019-5 Ltd. 144A, (1 mo. LIBOR USD + 1.420%), 1.57%, 4/14/36 (a)(b) | | | 969 | |
425,393 | | RALI Series 2005-QA4 Trust, 3.68%, 4/25/35 (e) | | | 368 | |
155,109 | | RALI Series 2005-QS14 Trust, 6.00%, 9/25/35 | | | 152 | |
2,783,856 | | RALI Series 2007-QS10 Trust, 6.50%, 9/25/37 | | | 2,753 | |
482,644 | | RALI Series 2007-QS2 Trust, 6.25%, 1/25/37 | | | 464 | |
2,163,088 | | Residential Asset Securitization Trust 2006-A4IP,
6.62%, 5/25/36 (e) | | | 1,265 | |
428,642 | | Ripon Mortgages PLC 144A, (3 mo. LIBOR GBP + 0.800%), 0.87%, 8/20/56 GBP (a)(b)(c) | | | 555 | |
1,699,129 | | Sequoia Mortgage Trust 2007-1, 2.97%, 2/20/47 (e) | | | 1,520 | |
2,362 | | STACR Trust 2018-DNA3 144A, (1 mo. LIBOR USD + 0.750%), 0.90%, 9/25/48 (a)(b) | | | 2 | |
350,000 | | STACR Trust 2018-DNA3 144A, (1 mo. LIBOR USD + 2.100%), 2.25%, 9/25/48 (a)(b) | | | 343 | |
3,538,529 | | STACR Trust 2018-HRP1 144A, (1 mo. LIBOR USD + 1.650%), 1.80%, 4/25/43 (a)(b) | | | 3,443 | |
2,500,000 | | STACR Trust 2018-HRP1 144A, (1 mo. LIBOR USD + 3.750%), 3.90%, 4/25/43 (a)(b) | | | 2,372 | |
925,181 | | STACR Trust 2018-HRP1 144A, (1 mo. LIBOR USD + 11.750%), 11.90%, 4/25/43 (a)(b) | | | 934 | |
1,837,926 | | STACR Trust 2018-HRP2 144A, (1 mo. LIBOR USD + 1.250%), 1.40%, 2/25/47 (a)(b) | | | 1,814 | |
3,300,000 | | STACR Trust 2018-HRP2 144A, (1 mo. LIBOR USD + 2.400%), 2.55%, 2/25/47 (a)(b) | | | 3,149 | |
1,900,000 | | STACR Trust 2018-HRP2 144A, (1 mo. LIBOR USD + 10.500%), 10.65%, 2/25/47 (a)(b) | | | 1,898 | |
| | | | | | |
Principal
or Shares | | Security Description | | Value
(000) | |
| | |
788,734 | | Structured Asset Mortgage Investments II Trust 2006-AR7, (1 mo. LIBOR USD + 0.210%),
0.36%, 8/25/36 (a) | | $ | 756 | |
2,704,311 | | Structured Asset Securities Corp. Mortgage Loan Trust Series 2006-RF4 144A, 6.00%, 10/25/36 (b) | | | 2,036 | |
195,353 | | VMC Finance 2018-FL2 LLC 144A, (1 mo. LIBOR USD + 0.920%), 1.07%, 10/15/35 (a)(b) | | | 192 | |
450,804 | | WaMu Mortgage Pass-Through Certificates Series 2005-AR11 Trust, (1 mo. LIBOR USD + 0.610%),
0.76%, 8/25/45 (a) | | | 374 | |
331,643 | | WaMu Mortgage Pass-Through Certificates Series 2005-AR15 Trust, (1 mo. LIBOR USD + 0.280%),
0.43%, 11/25/45 (a) | | | 322 | |
82,422 | | WaMu Mortgage Pass-Through Certificates Series 2005-AR17 Trust, (1 mo. LIBOR USD + 0.290%),
0.44%, 12/25/45 (a) | | | 78 | |
100,172 | | WaMu Mortgage Pass-Through Certificates Series 2006-AR10 Trust, 3.04%, 9/25/36 (e) | | | 96 | |
123,254 | | WaMu Mortgage Pass-Through Certificates Series 2006-AR19 Trust, (Cost of Funds for the 11th District of San Francisco + 1.250%), 1.78%, 1/25/47 (a) | | | 118 | |
102,218 | | WaMu Mortgage Pass-Through Certificates Series 2006-AR8 Trust, 3.11%, 8/25/46 (e) | | | 98 | |
457,299 | | WaMu Mortgage Pass-Through Certificates Series 2007-HY1 Trust, 3.49%, 2/25/37 (e) | | | 445 | |
56,743 | | WaMu Mortgage Pass-Through Certificates Series 2007-HY6 Trust, 3.15%, 6/25/37 (e) | | | 54 | |
533,351 | | WaMu Mortgage Pass-Through Certificates Series 2007-HY7 Trust, 3.17%, 7/25/37 (e) | | | 513 | |
972,306 | | Washington Mutual Mortgage Pass-Through Certificates WMALT Series 2005-5 Trust, (1 mo. LIBOR USD + 1.400%), 1.55%, 7/25/35 (a) | | | 861 | |
194,236 | | Wells Fargo Alternative Loan 2007-PA2 Trust,
6.00%, 6/25/37 | | | 197 | |
1,200,000 | | Wells Fargo Commercial Mortgage Trust 2017-SMP 144A, (1 mo. LIBOR USD + 0.750%),
0.90%, 12/15/34 (a)(b) | | | 1,169 | |
450,000 | | Wells Fargo Commercial Mortgage Trust 2017-SMP 144A, (1 mo. LIBOR USD + 1.650%),
1.80%, 12/15/34 (a)(b) | | | 376 | |
6,833,375 | | Wells Fargo Commercial Mortgage Trust 2018-C46, 0.94%, 8/15/51 (e) | | | 342 | |
Total Mortgage Backed (Cost - $233,842) | | | 225,262 | |
U.S. Treasury (6%) | | | | |
10,000,000 | | U.S. Cash Management Bill, 0.13%, 2/09/21 (h) | | | 9,997 | |
1,000,000 | | U.S. Treasury Bill, 0.10%, 11/27/20 (h) | | | 1,000 | |
25,000,000 | | U.S. Treasury Bill, 0.11%, 4/22/21 (h) | | | 24,989 | |
9,500,000 | | U.S. Treasury Bill, 0.11%, 2/11/21 (h)(i) | | | 9,498 | |
600,000 | | U.S. Treasury Note, 2.75%, 11/30/20 (j) | | | 601 | |
Total U.S. Treasury (Cost - $46,079) | | | 46,085 | |
Investment Company (1%) | | | | |
5,913,275 | | Payden Cash Reserves Money Market Fund * | | | | |
| | (Cost - $5,913) | | | 5,913 | |
62 Payden Mutual Funds
| | | | | | |
Principal
or Shares | | Security Description | | Value
(000) | |
| |
Total Investments (Cost - $819,187) (100%) | | $ | 818,222 | |
Other Assets, net of Liabilities (0%) | | | 474 | |
Net Assets (100%) | | $ | 818,696 | |
| (a) | Floating rate security. The rate shown reflects the rate in effect at October 31, 2020. |
| (b) | Security offered only to qualified institutional investors, and thus is not registered for sale to the public under rule 144A of the Securities Act of 1933. It has been deemed liquid under guidelines approved by the Board. |
| (c) | Principal in foreign currency. |
| (d) | Security offered and sold outside the United States, and thus is exempt from registration under Regulation S of the Securities Act of 1933. It has been deemed liquid under guidelines approved by the Board. |
| (e) | Variable rate security. Interest rate disclosed is as of the most recent information available. Certain variable rate securities are not based on a published reference rate and spread but are determined by the issuer or agent and are based on current market conditions. These securities do not indicate a reference rate and spread in their description above. |
| (f) | Floating rate security. The rate shown reflects the rate in effect at October 31, 2020. The stated maturity is subject to prepayments. See Note 2 in the Notes to Financial Statements. |
| (g) | All or a portion of these securities are on loan. At October 31, 2020, the total market value of the Fund’s securities on loan is $590 and the total market value of the collateral held by the Fund is $612. Amount in 000s. |
| (h) | Yield to maturity at time of purchase. |
| (i) | All or a portion of security has been pledged in connection with outstanding centrally cleared swaps. |
| (j) | All or a portion of the security is pledged to cover futures contract margin requirements. |
Open Forward Currency Contracts to USD
| | | | | | | | | | | | | | | | | | | | |
Currency
Purchased
(000s) | | Currency
Sold
(000s) | | Counterparty | | Settlement
Date | | Unrealized
Appreciation
(Depreciation)
(000s) |
Assets: | | | | | | | | | | | | | | | | |
USD 63,506 | | | | EUR 53,334 | | | |
| Citibank,
N.A. |
| | | | 03/22/2021 | | | | $ | 1,182 | |
USD 8,695 | | | | EUR 7,372 | | | |
| Citibank,
N.A. |
| | | | 03/22/2021 | | | | | 81 | |
| | | | | | | | | | | | | | | | | | | | |
| | | | | | | | | | | | | | | | | | | 1,263 | |
| | | | | | | | | | | | | | | | | | | | |
Liabilities: | | | | | | | | | | | | | | | | | | | | |
USD 1,152 | | | | GBP 894 | | | |
| HSBC Bank
USA, N.A. |
| | | | 03/22/2021 | | | | | (8 | ) |
| | | | | | | | | | | | | | | | | | | | |
| Net Unrealized Appreciation (Depreciation) | | | | | | | | | | | | | | | | | | $ | 1,255 | |
| | | | | | | | | | | | | | | | | | | | |
Open Futures Contracts
| | | | | | | | | | | | | | | | | | | | | | | | | |
| Contract Type | | Number of
Contracts | | Expiration
Date | | Notional
Amount
(000s) | | Current
Value
(000s) | | Unrealized
Appreciation
(Depreciation)
(000s) |
| Long Contracts: | | | | | | | | | | | | | | | | | | | | | |
| AUD 3-Year Bond Future | | | | 945 | | | | | Dec-20 | | | | $ | 78,018 | | | | $ | 307 | | | | $ | 307 | |
| U.S. Treasury 5-Year Note Future | | | | 96 | | | | | Dec-20 | | | | | 12,058 | | | | | (27 | ) | | | | (27 | ) |
| | | | | | | | | | | | | | | | | | | | | | | | | |
| | | | | | | | | | | | | | | | | | | | | | | | 280 | |
| | | | | | | | | | | | | | | | | | | | | | | | | |
| Short Contracts: | | | | | | | | | | | | | | | | | | | | | |
| Euro-Bobl Future | | | | 157 | | | | | Dec-20 | | | | | (24,844 | ) | | | | (142 | ) | | | | (142 | ) |
| Euro-Bund Future | | | | 5 | | | | | Dec-20 | | | | | (1,026 | ) | | | | (14 | ) | | | | (14 | ) |
| U.S. 10-Year Ultra Future | | | | 32 | | | | | Dec-20 | | | | | (5,033 | ) | | | | 72 | | | | | 72 | |
| U.S. Treasury 10-Year Note Future | | | | 51 | | | | | Dec-20 | | | | | (7,049 | ) | | | | 57 | | | | | 57 | |
| U.S. Treasury 2-Year Note Future | | | | 277 | | | | | Dec-20 | | | | | (61,174 | ) | | | | 11 | | | | | 11 | |
| | | | | | | | | | | | | | | | | | | | | | | | | |
| | | | | | | | | | | | | | | | | | | | | | | | (16 | ) |
| | | | | | | | | | | | | | | | | | | | | | | | | |
| Total Futures | | | | | | | | | | | | | | | | | | | | | | | $ | 264 | |
| | | | | | | | | | | | | | | | | | | | | | | | | |
Annual Report 63
Payden Absolute Return Bond Fund continued
Open Centrally Cleared Interest Rate Swap Contracts
| | | | | | | | | | | | | | | | | | | | | | | | | | | | | | |
| Description | | Maturity
Date | | Notional
Amount
(000s) | | Value
(000s) | | Upfront
payments/
receipts
(000s) | | Unrealized
Appreciation
(000s) |
| 3-Year Interest Rate Swap, Receive Fixed 0.598% Semi-Annually, Pay Variable 0.505% (CDOR03 Index) Semi-Annually | | 09/10/2023 | | CAD | | | | 20,780 | | | | $ | 8 | | | | $ | — | | | | $ | 8 | |
| 3-Year Interest Rate Swap, Receive Fixed 1.5535% Semi-Annually, Pay Variable 0.50625% (CDOR03 Index) Semi-Annually | | 08/30/2022 | | CAD | | | | 10,817 | | | | | 171 | | | | | — | | | | | 171 | |
| 3-Year Interest Rate Swap, Receive Fixed 1.558% Semi-Annually, Pay Variable 0.50625% (CDOR03 Index) Semi-Annually | | 08/30/2022 | | CAD | | | | 10,817 | | | | | 171 | | | | | — | | | | | 171 | |
| 3-Year Interest Rate Swap, Receive Fixed 1.575% Semi-Annually, Pay Variable 0.50625% (CDOR03 Index) Semi-Annually | | 08/30/2022 | | CAD | | | | 9,499 | | | | | 153 | | | | | — | | | | | 153 | |
| 3-Year Interest Rate Swap, Receive Fixed 1.8905% Semi-Annually, Pay Variable 0.50625% (CDOR03 Index) Semi-Annually | | 12/02/2022 | | CAD | | | | 7,838 | | | | | 204 | | | | | — | | | | | 204 | |
| | | | | | | | | | | | | | | | | | | | | | | | |
| | | | | | | | | | | | $ | 707 | | | | $ | — | | | | $ | 707 | |
| | | | | | | | | | | | | | | | | | | | | | | | |
Open Centrally Cleared Credit Default Swap Contracts
| | | | | | | | | | | | | | | | | | | | | | | | | |
| Description | | Maturity
Date | | Notional
Amount
(000s) | | Value
(000s) | | Upfront
payments/
receipts
(000s) | | Unrealized
Appreciation
(000s) |
| Protection Bought (Relevant Credit: Markit CDX, North America High Yield Series 35 Index), Pay 5% Quarterly, Receive upon credit default | | 12/20/2025 | | $9,500 | | | $ | 383 | | | | $ | 369 | | | | $ | 14 | |
| | | | | | | | | | | | | | | | | | | |
Offsetting Assets and Liabilities
The Fund’s loaned securities were all subject to an enforceable Securities Lending Agency Agreement. Securities lent in accordance with the Securities Lending Agency Agreement on a gross basis were as follows:
| | | | |
| Total gross amount presented on the Statements of Assets and Liabilities1 | | $ | 590 | |
| Non-cash Collateral2 | | | (590 | ) |
| | | | |
| Net Amount | | $ | — | |
| | | | |
| 1 | The amount presented on the Statements of Assets and Liabilities is not offset and is shown on a gross basis. |
| 2 | At October 31, 2020, the value of the collateral received from each borrower exceeded the value of the related securities loaned. This amount is disclosed on the Schedule of Investments. |
See notes to financial statements.
64 Payden Mutual Funds
Payden Floating Rate Fund
| | | | | | |
| | The Fund seeks high current income and capital appreciation by generally investing 80% of its assets in income producing senior floating rate loans and other floating rate debt instruments. | | 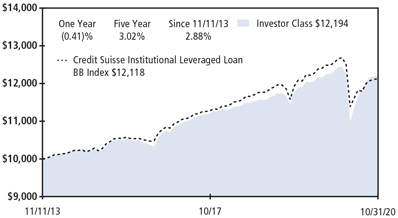
Past performance does not predict future returns. The graph does not reflect the impact of taxes or transaction costs a shareholder would pay. The Fund’s SI Class is expected to perform similarly to its Investor Class, except for class specific waivers. |
| | | Portfolio Composition - percent of investments |
| | Bank Loans | | 80% |
| | Investment Company | | 7% |
| | Mortgage Backed | | 6% |
| | Corporate | | 5% |
| | Asset Backed | | 2% |
| | | | |
| | |
| | |
| | |
| | |
| | This information is not part of the audited financial statements. |
Schedule of Investments - October 31, 2020
| | | | | | |
Principal
or Shares | | Security Description | | Value
(000) | |
Asset Backed (2%) | | | | |
1,200,000 | | Madison Park Funding XIII Ltd. 144A, (3 mo.
LIBOR USD + 2.850%), 3.07%, 4/19/30 (a)(b)
(Cost - $1,185) | | $ | 1,121 | |
Bank Loans(c) (80%) | | | | |
Communications (9%) | | | | |
1,173,538 | | Altice France SA Term Loan B13 1L, (LIBOR USD 3-Month + 4.000%), 4.24%, 8/14/26 | | | 1,144 | |
500,000 | | Banijay Group U.S. Holding Inc. Term Loan B 1L, (LIBOR USD 1-Month + 3.750%), 3.89%, 3/01/25 | | | 486 | |
595,500 | | CenturyLink Inc. Term Loan B 1L, (LIBOR USD 1-Month + 2.250%), 2.40%, 3/15/27 | | | 574 | |
926,515 | | Charter Communications Operating LLC Term Loan B2 1L, (LIBOR USD 1-Month + 1.750%), 1.90%, 2/01/27 | | | 905 | |
1,000,000 | | Coral U.S. Co-Borrower LLC Term Loan B5 1L, (LIBOR USD 1-Month + 2.250%), 2.40%, 1/31/28 | | | 968 | |
990,000 | | Diamond Sports Group LLC Term Loan B 1L, (LIBOR USD 1-Month + 3.250%), 3.40%, 8/24/26 | | | 621 | |
497,500 | | Iridium Satellite LLC Term Loan B 1L, (LIBOR USD 1-Month + 3.750%), 4.75%, 11/04/26 | | | 497 | |
1,000,000 | | Lamar Media Corp. Term Loan B 1L, (LIBOR USD 1-Month + 1.500%), 1.64%, 2/06/27 | | | 964 | |
| | | | | 6,159 | |
Consumer Cyclical (27%) | | | | |
1,002,999 | | 1011778 BC ULC Term Loan B 1L, (LIBOR USD 1-Month + 1.750%), 3.65%, 11/19/26 | | | 965 | |
465,325 | | Aramark Services Inc. Term Loan B3 1L, (LIBOR USD 1-Month + 1.750%), 1.90%, 3/11/25 | | | 447 | |
970,100 | | Beacon Roofing Supply Inc. Term Loan B 1L, (LIBOR USD 1-Month + 2.250%), 2.40%, 1/02/25 | | | 941 | |
| | | | | | |
Principal
or Shares | | Security Description | | Value
(000) | |
| | |
626,572 | | BJ’s Wholesale Club Inc. Term Loan B 1L, (LIBOR USD 1-Month + 2.000%), 2.15%, 2/03/24 | | $ | 618 | |
1,191,068 | | Burlington Coat Factory Warehouse Corp. Term Loan B 1L, (LIBOR USD 1-Month + 1.750%), 1.90%, 11/17/24 | | | 1,161 | |
982,323 | | Caesars Resort Collection LLC Term Loan B 1L, (LIBOR USD 1-Month + 2.750%), 2.90%, 12/22/24 | | | 924 | |
464,077 | | Core & Main LP Term Loan B 1L, (LIBOR USD 3-Month + 2.750%), 3.75%, 8/01/24 | | | 451 | |
992,500 | | Dealer Tire LLC Term Loan B 1L, (LIBOR USD 1-Month + 4.250%), 4.40%, 2/05/27 | | | 971 | |
457,221 | | Flynn Restaurant Group LP Term Loan 2L, (LIBOR USD 1-Month + 7.000%), 7.14%, 6/29/26 | | | 396 | |
1,269,483 | | GOBP Holdings Inc. Term Loan B 1L, (LIBOR USD 1-Month + 2.750%), 2.90%, 10/22/25 | | | 1,244 | |
926,393 | | Harbor Freight Tools USA Inc. Term Loan B 1L, (LIBOR USD 1-Month + 3.250%), 4.00%, 10/19/27 | | | 915 | |
496,852 | | Hilton Worldwide Finance LLC Term Loan B2 1L, (LIBOR USD 1-Month + 1.750%), 1.90%, 6/22/26 | | | 473 | |
1,239,403 | | Jane Street Group LLC Term Loan B 1L, (LIBOR USD 1-Month + 3.001%), 3.15%, 1/31/25 | | | 1,225 | |
458,132 | | KFC Holding Co. Term Loan B 1L, (LIBOR USD 1-Month + 1.750%), 1.90%, 4/03/25 | | | 450 | |
837,500 | | K-MAC Holdings Corp. Term Loan 1L, (LIBOR USD 1-Month + 3.000%), 3.15%, 3/14/25 | | | 811 | |
344,167 | | K-MAC Holdings Corp. Term Loan 2L, (LIBOR USD 1-Month + 6.750%), 6.90%, 3/16/26 | | | 330 | |
472,235 | | Live Nation Entertainment Inc. Term Loan B 1L, (LIBOR USD 1-Month + 1.750%), 1.94%, 10/16/26 | | | 441 | |
Annual Report 65
Payden Floating Rate Fund continued
| | | | | | |
Principal
or Shares | | Security Description | | Value
(000) | |
| | |
1,180,582 | | Marriott Ownership Resorts Inc. Term Loan B 1L, (LIBOR USD 1-Month + 1.750%), 1.90%, 8/29/25 | | $ | 1,128 | |
588,841 | | Sabre GLBL Inc. Term Loan B 1L, (LIBOR USD 1-Month + 2.000%), 2.15%, 2/22/24 | | | 557 | |
1,215,703 | | Scientific Games International Inc. Term Loan B5 1L, (LIBOR USD 3-Month + 2.750%), 2.98%, 8/14/24 | | | 1,134 | |
1,167,550 | | Tacala Investment Corp. Term Loan B 1L, (LIBOR USD 1-Month + 3.250%), 3.40%, 2/05/27 | | | 1,136 | |
560,000 | | Tacala Investment Corp. Term Loan B 2L, (LIBOR USD 1-Month + 7.500%), 7.65%, 2/07/28 | | | 535 | |
711,175 | | WMG Acquisition Corp. Term Loan F 1L, (LIBOR USD 1-Month + 2.125%), 2.27%, 11/01/23 | | | 702 | |
489,557 | | Wyndham Hotels & Resorts Inc. Term Loan B
1L, (LIBOR USD 1-Month + 1.750%), 1.90%, 5/30/25 | | | 467 | |
| | | | | 18,422 | |
Consumer Non-Cyclical (8%) | | | | |
618,678 | | Change Healthcare Holdings LLC Term Loan B 1L, (LIBOR USD 3-Month + 2.500%), 3.50%, 3/01/24 | | | 605 | |
902,345 | | Dole Food Co. Inc. Term Loan B 1L, (LIBOR USD 1-Month + 2.750%), 3.75%, 4/06/24 | | | 886 | |
498,750 | | Froneri U.S. Inc. Term Loan B 1L, (LIBOR USD 1-Month + 2.250%), 2.40%, 1/29/27 | | | 482 | |
985,000 | | JBS USA LUX SA Term Loan B 1L, (LIBOR USD 1-Month + 2.000%), 2.15%, 5/01/26 | | | 963 | |
458,680 | | MPH Acquisition Holdings LLC Term Loan B 1L, (LIBOR USD 3-Month + 2.750%), 3.75%, 6/07/23 | | | 454 | |
917,443 | | U.S. Foods Inc. Term Loan B 1L, (LIBOR USD 1-Month + 1.750%), 1.90%, 6/27/23 | | | 880 | |
972,500 | | Versant Health Holdco Inc. Term Loan B 1L, (LIBOR USD 1-Month + 3.000%), 4.00%, 12/02/24 | | | 970 | |
| | | | | 5,240 | |
Energy (3%) | | | | |
989,556 | | Calpine Corp. Term Loan B5 1L, (LIBOR USD 1-Month + 2.250%), 2.40%, 1/15/24 | | | 968 | |
997,500 | | PG&E Corp. Term Loan B 1L, (LIBOR USD 3-Month + 4.500%), 5.50%, 6/23/25 | | | 989 | |
| | | | | 1,957 | |
Financial Services (7%) | | | | |
496,144 | | Altice Financing SA Term Loan B 1L, (LIBOR USD 1-Month + 2.750%), 2.90%, 7/15/25 | | | 474 | |
494,849 | | AmWINS Group Inc. Term Loan B 1L, (LIBOR USD 1-Month + 2.750%), 3.75%, 1/25/24 | | | 489 | |
469,697 | | Asurion LLC Term Loan B2 2L, (LIBOR USD 1-Month + 6.500%), 6.64%, 8/04/25 | | | 471 | |
| | | | | | |
Principal
or Shares | | Security Description | | Value
(000) | |
| | |
691,560 | | Asurion LLC Term Loan B4 1L, (LIBOR USD 1-Month + 3.000%), 3.15%, 8/04/22 | | $ | 682 | |
537,625 | | HUB International Ltd. Term Loan B 1L, (LIBOR USD 3-Month + 3.000%), 3.22%, 4/25/25 | | | 518 | |
1,166,297 | | Iron Mountain Inc. Term Loan B 1L, (LIBOR USD 1-Month + 1.750%), 1.90%, 1/02/26 | | | 1,126 | |
375,000 | | Newco Financing Partnership Term Loan B1 1L, (LIBOR USD 1-Month + 3.500%), 3.50%, 1/31/29 | | | 367 | |
496,250 | | Nexus Buyer LLC Term Loan B 1L, (LIBOR USD 1-Month + 3.750%), 3.90%, 11/09/26 | | | 488 | |
375,000 | | UPC Financing Partnership Term Loan B2 1L, (LIBOR USD 1-Month + 3.500%), 3.50%, 1/31/29 | | | 367 | |
| | | | | 4,982 | |
Healthcare (3%) | | | | |
992,500 | | Grifols Worldwide Operations USA Inc. Term Loan B 1L, (LIBOR USD 1-Month + 2.000%), 2.10%, 11/15/27 | | | 970 | |
482,008 | | Radiology Partners Inc. Term Loan B 1L, (LIBOR USD 1-Month + 4.250%), 4.81%, 7/09/25 | | | 456 | |
497,500 | | Sotera Health Holdings LLC Term Loan 1L, (LIBOR USD 3-Month + 4.500%), 5.50%, 12/13/26 | | | 497 | |
| | | | | 1,923 | |
Industrial (15%) | | | | |
497,500 | | AI Convoy Luxembourg Sarl Term Loan B 1L, (LIBOR USD 1-Month + 3.500%), 4.50%, 1/18/27 | | | 490 | |
953,837 | | Altra Industrial Motion Corp. Term Loan B 1L, (LIBOR USD 1-Month + 2.000%), 2.15%, 10/01/25 | | | 937 | |
371,000 | | Ascent Resources Utica Holdings LLC Term Loan 2L, (LIBOR USD 1-Month + 9.000%), 10.00%, 11/01/25 | | | 393 | |
978,159 | | Axalta Coating Systems U.S. Holdings Inc. Term Loan B3 1L, (LIBOR USD 3-Month + 1.750%), 1.97%, 6/01/24 | | | 952 | |
1,185,000 | | Berry Global Inc. Term Loan Y 1L, (LIBOR USD 1-Month + 2.000%), 2.15%, 7/01/26 | | | 1,149 | |
498,750 | | Delta Air Lines Inc. Term Loan B 1L, (LIBOR USD 3-Month + 4.750%), 4.96%, 4/29/23 | | | 497 | |
292,982 | | Elanco Animal Health Inc. Term Loan B 1L, (LIBOR USD 1-Month + 1.750%), 1.90%, 8/01/27 | | | 287 | |
500,000 | | Graham Packaging Co. Inc. Term Loan 1L, (LIBOR USD 1-Month + 3.750%), 4.50%, 7/28/27 | | | 497 | |
561,132 | | H.B. Fuller Co. Term Loan B 1L, (LIBOR USD 1-Month + 2.000%), 2.15%, 10/21/24 | | | 553 | |
498,721 | | IRB Holding Corp. Term Loan B 1L, (LIBOR USD 1-Month + 2.750%), 3.75%, 2/05/25 | | | 476 | |
736,781 | | Mauser Packaging Solutions Holding Co. Term Loan B 1L, (LIBOR USD 3-Month + 3.250%), 3.48%, 4/03/24 | | | 691 | |
66 Payden Mutual Funds
| | | | | | |
Principal
or Shares | | Security Description | | Value
(000) | |
| | |
963,663 | | PQ Corp. Term Loan B1 1L, (LIBOR USD 3-Month + 2.250%), 2.51%, 2/08/27 | | $ | 939 | |
400,000 | | Reynolds Group Holdings Inc. Term Loan 1L, (LIBOR USD 1-Month + 3.250%), 3.40%, 2/05/26 | | | 391 | |
468,689 | | Reynolds Group Holdings Inc. Term Loan B 1L, (LIBOR USD 1-Month + 2.750%), 2.90%, 2/06/23 | | | 461 | |
500,000 | | SkyMiles IP Ltd. Term Loan B 1L, (LIBOR USD 3-Month + 3.750%), 4.75%, 10/20/27 | | | 499 | |
489,743 | | United Rentals N.A. Inc. Term Loan B 1L, (LIBOR USD 1-Month + 1.750%), 1.90%, 10/31/25 | | | 488 | |
| | | | | 9,700 | |
Technology (8%) | | | | |
496,241 | | Blackboard Inc. Term Loan B5 1L, (LIBOR USD 3-Month + 6.000%), 7.00%, 6/30/24 | | | 481 | |
477,585 | | BY Crown Parent LLC Term Loan B 1L, (LIBOR USD 1-Month + 3.000%), 4.00%, 2/02/26 | | | 470 | |
388,906 | | CDW LLC Term Loan B 1L, (LIBOR USD 1-Month + 1.750%), 1.90%, 8/17/23 | | | 388 | |
975,144 | | CSC Holdings LLC Term Loan B5 1L, (LIBOR USD 1-Month + 2.500%), 2.65%, 4/15/27 | | | 947 | |
1,146,014 | | Dell International LLC Term Loan B1 1L, (LIBOR USD 1-Month + 2.000%), 2.75%, 9/19/25 | | | 1,136 | |
493,750 | | GlobalFoundries Inc. Term Loan B 1L, (LIBOR USD 3-Month + 4.750%), 5.00%, 6/05/26 | | | 491 | |
498,750 | | Presidio Holdings Inc. Term Loan B 1L, (LIBOR USD 3-Month + 3.500%), 3.72%, 1/22/27 | | | 489 | |
491,117 | | Rackspace Technology Global Inc. Term Loan B 1L, (LIBOR USD 3-Month + 3.000%), 4.00%, 11/03/23 | | | 481 | |
707,514 | | Western Digital Corp. Term Loan B4 1L, (LIBOR USD 1-Month + 1.750%), 1.90%, 4/29/23 | | | 704 | |
| | | | | 5,587 | |
Total Bank Loans (Cost - $55,499) | | | 53,970 | |
Corporate Bond (5%) | | | | |
179,000 | | Ascent Resources Utica Holdings LLC/ARU Finance Corp. 144A, 9.00%, 11/01/27 (b) | | | 174 | |
500,000 | | CenturyLink Inc. 144A, 4.00%, 2/15/27 (b) | | | 512 | |
500,000 | | Covanta Holding Corp., 5.88%, 7/01/25 | | | 519 | |
400,000 | | FS KKR Capital Corp. II 144A, 4.25%, 2/14/25 (b) | | | 379 | |
250,000 | | GPC Merger Sub Inc. 144A, 7.13%, 8/15/28 (b) | | | 262 | |
| | | | | | |
Principal
or Shares | | Security Description | | Value
(000) | |
| | |
500,000 | | Lithia Motors Inc. 144A, 5.25%, 8/01/25 (b) | | $ | 519 | |
400,000 | | Northriver Midstream Finance LP 144A, 5.63%, 2/15/26 (b) | | | 397 | |
300,000 | | QEP Resources Inc., 5.38%, 10/01/22 | | | 264 | |
200,000 | | Range Resources Corp., 5.75%, 6/01/21 | | | 201 | |
Total Corporate Bond (Cost - $3,211) | | | 3,227 | |
Mortgage Backed (7%) | | | | |
814,971 | | Fannie Mae Connecticut Avenue Securities, (1 mo. LIBOR USD + 11.750%), 11.90%, 10/25/28 (a) | | | 970 | |
795,465 | | Fannie Mae Connecticut Avenue Securities, (1 mo. LIBOR USD + 12.250%), 12.40%, 9/25/28 (a) | | | 963 | |
300,000 | | Freddie Mac STACR REMIC Trust 2020-DNA2 144A, (1 mo. LIBOR USD + 4.800%), 4.95%, 2/25/50 (a)(b) | | | 193 | |
300,000 | | Freddie Mac Structured Agency Credit Risk Debt Notes, (1 mo. LIBOR USD + 4.600%), 4.75%, 12/25/42 (a) | | | 285 | |
663,427 | | Freddie Mac Structured Agency Credit Risk Debt Notes, (1 mo. LIBOR USD + 10.500%), 10.65%, 5/25/28 (a) | | | 741 | |
494,685 | | Freddie Mac Structured Agency Credit Risk Debt Notes, (1 mo. LIBOR USD + 12.750%), 12.90%, 8/25/29 (a) | | | 489 | |
681,712 | | STACR Trust 2018-HRP1 144A, (1 mo. LIBOR USD + 11.750%), 11.90%, 4/25/43 (a)(b) | | | 688 | |
Total Mortgage Backed (Cost - $4,286) | | | 4,329 | |
Investment Company (7%) | | | | |
4,906,720 | | Payden Cash Reserves Money Market Fund * | | | | |
| | (Cost - $4,907) | | | 4,907 | |
Total Investments (Cost - $69,088) (101%) | | | 67,554 | |
Liabilities in excess of Other Assets (-1%) | | | (379 | ) |
Net Assets (100%) | | $ | 67,175 | |
| | | | | | |
| (a) | Floating rate security. The rate shown reflects the rate in effect at October 31, 2020. |
| (b) | Security offered only to qualified institutional investors, and thus is not registered for sale to the public under rule 144A of the Securities Act of 1933. It has been deemed liquid under guidelines approved by the Board. |
| (c) | Floating rate security. The rate shown reflects the rate in effect at October 31, 2020. The stated maturity is subject to prepayments. See Note 2 in the Notes to Financial Statements. |
See notes to financial statements.
Annual Report 67
| | | | | | |
The Fund seeks high current income and capital appreciation by generally investing in below investment grade debt instruments and income producing securities of U.S. and foreign issuers with no limit on the average portfolio maturity. | | | 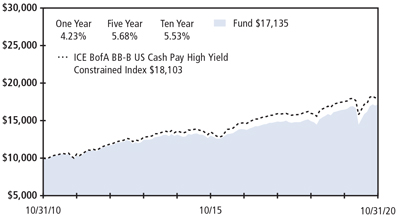
Past performance does not predict future returns. The graph does not reflect the impact of taxes or transaction costs a shareholder would pay. |
| Portfolio Composition - percent of investments | |
Energy | | | 15% | |
Basic Industry | | | 12% | |
Telecommunications | | | 7% | |
Healthcare | | | 7% | |
Investment Company | | | 6% | |
Financial Services | | | 6% | |
Media | | | 6% | |
Other | | | 41% | |
| | | | |
| This information is not part of the audited financial statements. SAR | |
| | | | | | |
| Schedule of Investments - October 31, 2020 | |
Principal
or Shares | | Security Description | | Value
(000) | |
Asset Backed (1%) | | | | |
1,650,000 | | ALM XVI Ltd./ALM XVI LLC 144A, (3 mo. LIBOR USD + 2.700%), 2.94%, 7/15/27 (a)(b) | | $ | 1,596 | |
2,500,000 | | Madison Park Funding XIII Ltd. 144A, (3 mo. LIBOR USD + 2.850%), 3.07%, 4/19/30 (a)(b) | | | 2,336 | |
Total Asset Backed (Cost - $4,050) | | | 3,932 | |
Bank Loans(c) (4%) | | | | |
1,492,500 | | AI Convoy Luxembourg Sarl Term Loan B 1L, (LIBOR USD 1-Month + 3.500%), 4.50%, 1/18/27 | | | 1,470 | |
2,703,000 | | Ascent Resources Utica Holdings LLC Term Loan 2L, (LIBOR USD 1-Month + 9.000%), 10.00%, 11/01/25 | | | 2,867 | |
1,268,182 | | Asurion LLC Term Loan B2 2L, (LIBOR USD 1-Month + 6.500%), 6.65%, 8/04/25 | | | 1,272 | |
2,100,000 | | Flynn Restaurant Group LP Term Loan 2L, (LIBOR USD 1-Month + 7.000%), 7.15%, 6/29/26 | | | 1,817 | |
2,468,750 | | GlobalFoundries Inc. Term Loan B 1L, (LIBOR USD 3-Month + 4.750%), 5.00%, 6/05/26 | | | 2,456 | |
1,284,931 | | GOBP Holdings Inc. Term Loan B 1L, (LIBOR USD 1-Month + 2.750%), 2.90%, 10/22/25 | | | 1,259 | |
1,250,000 | | Informatica LLC Term Loan 2L, (LIBOR USD 3-Month + 7.125%), 7.13%, 2/25/25 | | | 1,272 | |
2,680,000 | | K-MAC Holdings Corp. Term Loan 2L, (LIBOR USD 1-Month + 6.750%), 6.90%, 3/16/26 | | | 2,572 | |
982,234 | | Rackspace Technology Global Inc. Term Loan B 1L, (LIBOR USD 3-Month + 3.000%), 4.00%, 11/03/23 | | | 963 | |
1,990,000 | | Sotera Health Holdings LLC Term Loan 1L, (LIBOR USD 3-Month + 4.500%), 5.50%, 12/13/26 | | | 1,986 | |
2,505,000 | | Tacala Investment Corp. Term Loan B 2L, (LIBOR USD 1-Month + 7.500%), 7.65%, 2/07/28 | | | 2,394 | |
| | | | | | |
Principal
or Shares | | Security Description | | Value
(000) | |
| | |
1,250,000 | | TIBCO Software Inc. Term Loan 2L, (LIBOR USD 1-Month + 7.250%), 7.40%, 3/04/28 | | $ | 1,228 | |
Total Bank Loans (Cost - $21,407) | | | 21,556 | |
Corporate Bond (86%) | | | | |
Automotive (5%) | | | | |
1,500,000 | | Allison Transmission Inc. 144A, 4.75%, 10/01/27 (b) | | | 1,549 | |
1,000,000 | | American Axle & Manufacturing Inc., 6.25%, 3/15/26 | | | 1,003 | |
450,000 | | Clarios Global LP/Clarios U.S. Finance Co. 144A, 6.25%, 5/15/26 (b) | | | 472 | |
2,000,000 | | Dana Financing Luxembourg Sarl 144A, 6.50%, 6/01/26 (b) | | | 2,082 | |
500,000 | | Dana Inc., 5.38%, 11/15/27 | | | 517 | |
1,000,000 | | Dealer Tire LLC/DT Issuer LLC 144A, 8.00%, 2/01/28 (b) | | | 1,025 | |
1,000,000 | | Ford Motor Co., 4.75%, 1/15/43 | | | 926 | |
700,000 | | Ford Motor Co., 8.50%, 4/21/23 | | | 774 | |
1,500,000 | | Ford Motor Co., 9.00%, 4/22/25 | | | 1,770 | |
400,000 | | Ford Motor Co., 9.63%, 4/22/30 | | | 538 | |
2,000,000 | | Ford Motor Credit Co. LLC, 3.82%, 11/02/27 | | | 1,949 | |
2,050,000 | | Ford Motor Credit Co. LLC, 4.06%, 11/01/24 | | | 2,058 | |
1,000,000 | | Ford Motor Credit Co. LLC, 5.88%, 8/02/21 | | | 1,022 | |
2,000,000 | | Goodyear Tire & Rubber Co., 5.00%, 5/31/26 (d) | | | 1,974 | |
1,000,000 | | Howmet Aerospace Inc., 5.13%, 10/01/24 | | | 1,054 | |
1,000,000 | | IHO Verwaltungs GmbH, 3.75%, 9/15/26 EUR (e)(f) | | | 1,165 | |
1,000,000 | | IHO Verwaltungs GmbH 144A, 6.38%, 5/15/29 (b) | | | 1,061 | |
2,523,000 | | Moog Inc. 144A, 4.25%, 12/15/27 (b) | | | 2,592 | |
500,000 | | Spirit AeroSystems Inc., 4.60%, 6/15/28 | | | 417 | |
1,000,000 | | Spirit AeroSystems Inc. 144A, 7.50%, 4/15/25 (b) | | | 1,009 | |
900,000 | | TransDigm Inc., 6.50%, 5/15/25 | | | 902 | |
68 Payden Mutual Funds
| | | | | | |
Principal
or Shares | | Security Description | | Value
(000) | |
| | |
250,000 | | TransDigm Inc. 144A, 8.00%, 12/15/25 (b) | | $ | 271 | |
1,500,000 | | TransDigm UK Holdings PLC, 6.88%, 5/15/26 | | | 1,497 | |
| | | | | 27,627 | |
Banking (2%) | | | | |
1,500,000 | | Bank of America Corp., (3 mo. LIBOR USD + 2.931%), 5.88%, (a)(g) | | | 1,618 | |
500,000 | | CIT Group Inc., 4.13%, 3/09/21 | | | 504 | |
2,000,000 | | CIT Group Inc., (5 yr. US Treasury Yield Curve Rate T Note Constant Maturity + 2.372%), 4.13%, 11/13/29 (a) | | | 2,020 | |
1,500,000 | | Citigroup Inc., (3 mo. LIBOR USD + 4.068%), 5.95%, (a)(g) | | | 1,557 | |
1,000,000 | | Deutsche Bank AG, (USD Swap Rate 11:00 am NY 1 + 2.553%), 4.88%, 12/01/32 (a) | | | 969 | |
1,500,000 | | Lloyds Bank PLC 144A, (3 mo. LIBOR USD + 11.756%), 12.00%, (a)(b)(g) | | | 1,682 | |
| | | | | 8,350 | |
Basic Industry (12%) | | | | |
1,000,000 | | Alcoa Nederland Holding BV 144A, 5.50%, 12/15/27 (b) | | | 1,054 | |
1,500,000 | | ArcelorMittal SA, 4.55%, 3/11/26 | | | 1,616 | |
2,750,000 | | ARD Finance SA 144A, 6.50%, 6/30/27 (b) | | | 2,798 | |
1,828,000 | | Ashland LLC, 6.88%, 5/15/43 | | | 2,350 | |
1,000,000 | | Avient Corp. 144A, 5.75%, 5/15/25 (b) | | | 1,054 | |
2,000,000 | | Big River Steel LLC/BRS Finance Corp. 144A, 6.63%, 1/31/29 (b) | | | 2,064 | |
500,000 | | BWX Technologies Inc. 144A, 4.13%, 6/30/28 (b) | | | 507 | |
2,000,000 | | BWX Technologies Inc. 144A, 5.38%, 7/15/26 (b) | | | 2,080 | |
2,000,000 | | Cascades Inc./Cascades USA Inc. 144A, 5.38%, 1/15/28 (b) | | | 2,089 | |
1,300,000 | | CF Industries Inc., 5.15%, 3/15/34 | | | 1,526 | |
1,500,000 | | Cleveland-Cliffs Inc., 5.88%, 6/01/27 | | | 1,460 | |
800,000 | | Cleveland-Cliffs Inc. 144A, 6.75%, 3/15/26 (b) | | | 841 | |
1,500,000 | | Crown Cork & Seal Co. Inc., 7.38%, 12/15/26 | | | 1,802 | |
1,500,000 | | Energizer Holdings Inc. 144A, 4.38%, 3/31/29 (b) | | | 1,516 | |
1,000,000 | | FMG Resources August 2006 Pty Ltd. 144A, 4.50%, 9/15/27 (b) | | | 1,073 | |
2,600,000 | | Freeport-McMoRan Inc., 5.00%, 9/01/27 | | | 2,714 | |
500,000 | | Freeport-McMoRan Inc., 5.40%, 11/14/34 | | | 573 | |
960,000 | | Freeport-McMoRan Inc., 5.45%, 3/15/43 | | | 1,094 | |
1,000,000 | | Graphic Packaging International LLC 144A, 4.75%, 7/15/27 (b) | | | 1,088 | |
1,200,000 | | HB Fuller Co., 4.00%, 2/15/27 | | | 1,228 | |
1,000,000 | | HB Fuller Co., 4.25%, 10/15/28 | | | 1,016 | |
1,000,000 | | Hudbay Minerals Inc. 144A, 6.13%, 4/01/29 (b) | | | 1,025 | |
1,000,000 | | Hudbay Minerals Inc. 144A, 7.63%, 1/15/25 (b) | | | 1,038 | |
1,750,000 | | IAMGOLD Corp. 144A, 5.75%, 10/15/28 (b) | | | 1,754 | |
1,250,000 | | James Hardie International Finance DAC 144A, 5.00%, 1/15/28 (b) | | | 1,329 | |
1,500,000 | | KBR Inc. 144A, 4.75%, 9/30/28 (b) | | | 1,521 | |
1,750,000 | | Lennar Corp., 4.75%, 11/29/27 | | | 2,006 | |
1,500,000 | | MasTec Inc. 144A, 4.50%, 8/15/28 (b) | | | 1,543 | |
1,000,000 | | Meritage Homes Corp., 5.13%, 6/06/27 | | | 1,108 | |
| | | | | | |
Principal
or Shares | | Security Description | | Value
(000) | |
| | |
1,500,000 | | Mueller Water Products Inc. 144A, 5.50%, 6/15/26 (b) | | $ | 1,555 | |
1,850,000 | | Novelis Corp. 144A, 4.75%, 1/30/30 (b) | | | 1,880 | |
2,000,000 | | OCI NV 144A, 4.63%, 10/15/25 (b) | | | 2,029 | |
1,500,000 | | Reynolds Group Issuer Inc./Reynolds Group Issuer LLC/Reynolds Group Issuer Lu 144A, 4.00%, 10/15/27 (b) | | | 1,521 | |
1,000,000 | | Standard Industries Inc. 144A, 4.75%, 1/15/28 (b) | | | 1,046 | |
500,000 | | Standard Industries Inc. 144A, 5.00%, 2/15/27 (b) | | | 517 | |
2,000,000 | | Stevens Holding Co. Inc. 144A, 6.13%, 10/01/26 (b) | | | 2,145 | |
1,500,000 | | Taylor Morrison Communities Inc./Taylor Morrison Holdings II Inc. 144A, 5.63%, 3/01/24 (b) | | | 1,590 | |
1,500,000 | | TRI Pointe Group Inc., 5.25%, 6/01/27 | | | 1,618 | |
2,000,000 | | Trivium Packaging Finance BV 144A, 8.50%, 8/15/27 (b) | | | 2,144 | |
2,000,000 | | Tronox Inc. 144A, 6.50%, 4/15/26 (b) | | | 2,031 | |
2,000,000 | | Univar Solutions USA Inc. 144A, 5.13%, 12/01/27 (b) | | | 2,076 | |
1,000,000 | | Winnebago Industries Inc. 144A, 6.25%, 7/15/28 (b) | | | 1,059 | |
| | | | | 64,078 | |
Consumer Goods (4%) | | | | |
1,000,000 | | Albertsons Cos. Inc./Safeway Inc./New Albertsons LP/Albertsons LLC 144A, 3.50%, 3/15/29 (b) | | | 972 | |
1,400,000 | | Albertsons Cos. Inc./Safeway Inc./New Albertsons LP/Albertsons LLC 144A, 4.88%, 2/15/30 (b) | | | 1,488 | |
2,500,000 | | Dole Food Co. Inc. 144A, 7.25%, 6/15/25 (b) | | | 2,509 | |
2,750,000 | | KeHE Distributors LLC/KeHE Finance Corp. 144A, 8.63%, 10/15/26 (b) | | | 2,963 | |
910,000 | | Kraft Heinz Foods Co. 144A, 3.88%, 5/15/27 (b) | | | 964 | |
2,850,000 | | Kraft Heinz Foods Co., 5.00%, 7/15/35 | | | 3,288 | |
3,250,000 | | Kraft Heinz Foods Co., 5.00%, 6/04/42 | | | 3,577 | |
900,000 | | Post Holdings Inc. 144A, 4.63%, 4/15/30 (b) | | | 926 | |
1,750,000 | | Post Holdings Inc. 144A, 5.50%, 12/15/29 (b) | | | 1,894 | |
2,500,000 | | United Natural Foods Inc. 144A, 6.75%, 10/15/28 (b) | | | 2,534 | |
| | | | | 21,115 | |
Energy (14%) | | | | |
1,000,000 | | Aker BP ASA 144A, 4.00%, 1/15/31 (b) | | | 981 | |
500,000 | | Antero Resources Corp. 144A, 4.25%, 9/01/26 (b) | | | 492 | |
2,000,000 | | Antero Resources Corp., 5.63%, 6/01/23 (d) | | | 1,682 | |
1,000,000 | | Apache Corp., 5.10%, 9/01/40 | | | 920 | |
1,297,000 | | Ascent Resources Utica Holdings LLC/ARU Finance Corp. 144A, 9.00%, 11/01/27 (b) | | | 1,265 | |
2,000,000 | | Cenovus Energy Inc., 3.80%, 9/15/23 | | | 2,033 | |
500,000 | | Cenovus Energy Inc., 5.25%, 6/15/37 | | | 490 | |
500,000 | | Cenovus Energy Inc., 5.38%, 7/15/25 | | | 528 | |
2,000,000 | | CNX Midstream Partners LP/CNX Midstream Finance Corp. 144A, 6.50%, 3/15/26 (b) | | | 2,037 | |
1,000,000 | | CNX Resources Corp. 144A, 2.25%, 5/01/26 (b) | | | 1,060 | |
1,000,000 | | CNX Resources Corp. 144A, 7.25%, 3/14/27 (b) | | | 1,056 | |
Annual Report 69
Payden High Income Fund continued
| | | | | | |
Principal
or Shares | | Security Description | | Value
(000) | |
| | |
1,500,000 | | Comstock Resources Inc. 144A, 7.50%, 5/15/25 (b) | | $ | 1,493 | |
1,000,000 | | Comstock Resources Inc., 9.75%, 8/15/26 | | | 1,055 | |
1,000,000 | | Comstock Resources Inc., 9.75%, 8/15/26 | | | 1,055 | |
1,000,000 | | Continental Resources Inc., 4.38%, 1/15/28 | | | 902 | |
1,000,000 | | DCP Midstream Operating LP 144A, 6.75%, 9/15/37 (b) | | | 954 | |
2,000,000 | | Diamond Offshore Drilling Inc., 3.45%, 11/01/23 (h) | | | 137 | |
500,000 | | EnLink Midstream Partners LP, 4.40%, 4/01/24 | | | 455 | |
1,500,000 | | EQM Midstream Partners LP, 4.13%, 12/01/26 | | | 1,417 | |
500,000 | | EQM Midstream Partners LP 144A, 6.50%, 7/01/27 (b) | | | 525 | |
1,000,000 | | EQT Corp. 144A, 1.75%, 5/01/26 (b) | | | 1,282 | |
1,000,000 | | EQT Corp., 3.90%, 10/01/27 | | | 962 | |
1,000,000 | | EQT Midstream Partners LP, 6.50%, 7/15/48 | | | 952 | |
2,000,000 | | Geopark Ltd. 144A, 5.50%, 1/17/27 (b) | | | 1,765 | |
1,000,000 | | Geopark Ltd. 144A, 6.50%, 9/21/24 (b) | | | 943 | |
1,400,000 | | HighPoint Operating Corp., 7.00%, 10/15/22 | | | 319 | |
1,500,000 | | Holly Energy Partners LP/Holly Energy Finance Corp. 144A, 5.00%, 2/01/28 (b) | | | 1,424 | |
2,000,000 | | Husky Energy Inc., 6.80%, 9/15/37 | | | 2,250 | |
1,000,000 | | Indigo Natural Resources LLC 144A, 6.88%, 2/15/26 (b) | | | 985 | |
1,500,000 | | Leviathan Bond Ltd. 144A, 5.75%, 6/30/23 (b)(e) | | | 1,538 | |
1,000,000 | | Leviathan Bond Ltd. 144A, 6.75%, 6/30/30 (b)(e) | | | 1,029 | |
1,000,000 | | Marathon Oil Corp., 6.60%, 10/01/37 | | | 1,033 | |
1,000,000 | | MEG Energy Corp. 144A, 7.13%, 2/01/27 (b) | | | 902 | |
3,100,000 | | Northriver Midstream Finance LP 144A, 5.63%, 2/15/26 (b) | | | 3,076 | |
947,000 | | Occidental Petroleum Corp., 2.60%, 8/13/21 | | | 927 | |
1,371,000 | | Occidental Petroleum Corp., 2.70%, 8/15/22 | | | 1,270 | |
1,000,000 | | Occidental Petroleum Corp., 4.20%, 3/15/48 | | | 651 | |
500,000 | | Occidental Petroleum Corp., 4.40%, 4/15/46 | | | 337 | |
1,500,000 | | Occidental Petroleum Corp., 4.63%, 6/15/45 | | | 1,016 | |
1,000,000 | | Occidental Petroleum Corp., 5.88%, 9/01/25 | | | 882 | |
1,000,000 | | Ovintiv Inc., 8.13%, 9/15/30 | | | 1,039 | |
1,500,000 | | Parkland Corp. 144A, 5.88%, 7/15/27 (b) | | | 1,551 | |
1,000,000 | | Parsley Energy LLC/Parsley Finance Corp. 144A, 5.63%, 10/15/27 (b) | | | 1,065 | |
2,000,000 | | Petrobras Global Finance BV, 6.75%, 6/03/50 | | | 2,197 | |
500,000 | | QEP Resources Inc., 5.25%, 5/01/23 | | | 398 | |
700,000 | | QEP Resources Inc., 5.38%, 10/01/22 | | | 617 | |
1,300,000 | | Range Resources Corp., 5.75%, 6/01/21 | | | 1,306 | |
3,500,000 | | Range Resources Corp. 144A, 9.25%, 2/01/26 (b) | | | 3,715 | |
600,000 | | SM Energy Co. 144A, 10.00%, 1/15/25 (b) | | | 572 | |
1,000,000 | | Southwestern Energy Co., 6.45%, 1/23/25 | | | 1,004 | |
500,000 | | Southwestern Energy Co., 7.75%, 10/01/27 | | | 518 | |
2,000,000 | | Southwestern Energy Co., 8.38%, 9/15/28 | | | 2,094 | |
1,000,000 | | Sunoco LP/Sunoco Finance Corp., 5.88%, 3/15/28 | | | 1,041 | |
2,000,000 | | Targa Resources Partners LP/Targa Resources Partners Finance Corp. 144A, 4.88%, 2/01/31 (b) | | | 1,955 | |
2,000,000 | | Targa Resources Partners LP/Targa Resources Partners Finance Corp., 5.88%, 4/15/26 | | | 2,044 | |
| | | | | | |
Principal
or Shares | | Security Description | | Value
(000) | |
| | |
1,500,000 | | TerraForm Power Operating LLC 144A, 4.75%, 1/15/30 (b) | | $ | 1,613 | |
1,250,000 | | TerraForm Power Operating LLC 144A, 5.00%, 1/31/28 (b) | | | 1,375 | |
1,600,000 | | TransMontaigne Partners LP/TLP Finance Corp., 6.13%, 2/15/26 | | | 1,641 | |
1,000,000 | | Western Midstream Operating LP, 4.00%, 7/01/22 | | | 1,002 | |
1,000,000 | | Western Midstream Operating LP, 4.65%, 7/01/26 | | | 963 | |
2,500,000 | | WPX Energy Inc., 4.50%, 1/15/30 | | | 2,404 | |
500,000 | | WPX Energy Inc., 5.75%, 6/01/26 | | | 514 | |
| | | | | 74,708 | |
Financial Services (6%) | | | | |
1,000,000 | | Compass Group Diversified Holdings LLC 144A, 8.00%, 5/01/26 (b) | | | 1,055 | |
2,600,000 | | FS KKR Capital Corp. II 144A, 4.25%, 2/14/25 (b) | | | 2,462 | |
1,500,000 | | Genworth Mortgage Holdings Inc. 144A, 6.50%, 8/15/25 (b) | | | 1,566 | |
2,500,000 | | goeasy Ltd. 144A, 5.38%, 12/01/24 (b) | | | 2,530 | |
1,700,000 | | Icahn Enterprises LP/Icahn Enterprises Finance Corp., 4.75%, 9/15/24 | | | 1,732 | |
850,000 | | Icahn Enterprises LP/Icahn Enterprises Finance Corp., 6.25%, 5/15/26 | | | 884 | |
2,000,000 | | Icahn Enterprises LP/Icahn Enterprises Finance Corp., 6.75%, 2/01/24 | | | 2,046 | |
1,000,000 | | Nationstar Mortgage Holdings Inc. 144A, 5.50%, 8/15/28 (b) | | | 999 | |
2,500,000 | | Navient Corp., 5.50%, 1/25/23 | | | 2,502 | |
500,000 | | Navient Corp., 6.63%, 7/26/21 | | | 511 | |
1,172,000 | | Navient Corp., 7.25%, 9/25/23 | | | 1,231 | |
1,000,000 | | OneMain Finance Corp., 5.38%, 11/15/29 | | | 1,030 | |
350,000 | | OneMain Finance Corp., 6.63%, 1/15/28 | | | 383 | |
2,000,000 | | OneMain Finance Corp., 6.88%, 3/15/25 | | | 2,204 | |
450,000 | | OneMain Finance Corp., 8.88%, 6/01/25 | | | 496 | |
2,000,000 | | Owl Rock Technology Finance Corp. 144A, 4.75%, 12/15/25 (b) | | | 1,986 | |
1,000,000 | | PennyMac Financial Services Inc. 144A, 5.38%, 10/15/25 (b) | | | 1,021 | |
1,500,000 | | PRA Group Inc. 144A, 7.38%, 9/01/25 (b) | | | 1,576 | |
570,000 | | Quicken Loans LLC/Quicken Loans Co-Issuer Inc. 144A, 3.88%, 3/01/31 (b) | | | 562 | |
2,700,000 | | SLM Corp., 5.13%, 4/05/22 | | | 2,783 | |
| | | | | 29,559 | |
Healthcare (7%) | | | | |
1,350,000 | | Bausch Health Americas Inc. 144A, 9.25%, 4/01/26 (b) | | | 1,490 | |
1,500,000 | | Bausch Health Cos. Inc., 4.50%, 5/15/23 EUR (e)(f) | | | 1,732 | |
1,000,000 | | Bausch Health Cos. Inc. 144A, 5.00%, 1/30/28 (b) | | | 990 | |
1,000,000 | | Bausch Health Cos. Inc. 144A, 7.00%, 1/15/28 (b) | | | 1,059 | |
1,000,000 | | Bausch Health Cos. Inc. 144A, 9.00%, 12/15/25 (b) | | | 1,095 | |
70 Payden Mutual Funds
| | | | | | |
Principal
or Shares | | Security Description | | Value
(000) | |
| | |
950,000 | | Catalent Pharma Solutions Inc. 144A, 5.00%, 7/15/27 (b) | | $ | 992 | |
1,500,000 | | Centene Corp., 4.25%, 12/15/27 | | | 1,583 | |
2,000,000 | | Centene Corp., 4.75%, 1/15/25 | | | 2,058 | |
660,000 | | Centene Corp. 144A, 5.38%, 6/01/26 (b) | | | 695 | |
1,500,000 | | Centene Corp. 144A, 5.38%, 8/15/26 (b) | | | 1,590 | |
2,100,000 | | CHS/Community Health Systems Inc., 6.25%, 3/31/23 | | | 2,084 | |
950,000 | | CHS/Community Health Systems Inc. 144A, 6.63%, 2/15/25 (b) | | | 929 | |
500,000 | | CHS/Community Health Systems Inc. 144A, 8.00%, 12/15/27 (b) | | | 494 | |
2,500,000 | | DaVita Inc. 144A, 3.75%, 2/15/31 (b) | | | 2,408 | |
1,500,000 | | Encompass Health Corp., 4.75%, 2/01/30 | | | 1,565 | |
1,100,000 | | HCA Inc., 3.50%, 9/01/30 | | | 1,126 | |
860,000 | | HCA Inc., 5.88%, 2/01/29 | | | 1,013 | |
1,500,000 | | HCA Inc., 7.69%, 6/15/25 | | | 1,794 | |
1,900,000 | | Radiology Partners Inc. 144A, 9.25%, 2/01/28 (b) | | | 2,030 | |
1,700,000 | | Select Medical Corp. 144A, 6.25%, 8/15/26 (b) | | | 1,796 | |
750,000 | | Tenet Healthcare Corp. 144A, 4.63%, 6/15/28 (b) | | | 762 | |
1,800,000 | | Tenet Healthcare Corp. 144A, 4.88%, 1/01/26 (b) | | | 1,828 | |
2,000,000 | | Tenet Healthcare Corp., 6.75%, 6/15/23 | | | 2,111 | |
2,000,000 | | Tenet Healthcare Corp., 7.00%, 8/01/25 (d) | | | 2,049 | |
500,000 | | Tenet Healthcare Corp. 144A, 7.50%, 4/01/25 (b) | | | 539 | |
1,000,000 | | Teva Pharmaceutical Finance Netherlands II BV, 1.13%, 10/15/24 EUR (e)(f) | | | 1,023 | |
1,500,000 | | Teva Pharmaceutical Finance Netherlands III BV, 3.15%, 10/01/26 | | | 1,323 | |
| | | | | 38,158 | |
Insurance (2%) | | | | |
1,750,000 | | Alliant Holdings Intermediate LLC/Alliant Holdings Co-Issuer 144A, 6.75%, 10/15/27 (b) | | | 1,840 | |
1,450,000 | | Assurant Inc., (3 mo. LIBOR USD + 4.135%), 7.00%, 3/27/48 (a) | | | 1,581 | |
2,050,000 | | HUB International Ltd. 144A, 7.00%, 5/01/26 (b) | | | 2,103 | |
2,000,000 | | NMI Holdings Inc. 144A, 7.38%, 6/01/25 (b) | | | 2,183 | |
| | | | | 7,707 | |
Leisure (4%) | | | | |
2,000,000 | | Caesers Entertainment Inc. 144A, 6.25%, 7/01/25 (b) | | | 2,051 | |
250,000 | | Caesers Resort Collection LLC/CRC Finco Inc. 144A, 5.75%, 7/01/25 (b) | | | 257 | |
1,400,000 | | Carnival Corp. 144A, 11.50%, 4/01/23 (b) | | | 1,540 | |
1,500,000 | | Churchill Downs Inc. 144A, 4.75%, 1/15/28 (b) | | | 1,526 | |
1,800,000 | | Hilton Domestic Operating Co. Inc. 144A, 5.75%, 5/01/28 (b) | | | 1,890 | |
1,000,000 | | MGM Resorts International, 4.75%, 10/15/28 | | | 979 | |
985,000 | | MGM Resorts International, 5.75%, 6/15/25 | | | 1,025 | |
550,000 | | MGM Resorts International, 6.75%, 5/01/25 | | | 580 | |
750,000 | | Newell Brands Inc., 4.70%, 4/01/26 | | | 800 | |
500,000 | | Newell Brands Inc., 5.88%, 4/01/36 | | | 588 | |
500,000 | | Royal Caribbean Cruises Ltd., 5.25%, 11/15/22 | | | 448 | |
| | | | | | |
Principal
or Shares | | Security Description | | Value
(000) | |
| | |
1,000,000 | | Royal Caribbean Cruises Ltd. 144A, 11.50%, 6/01/25 (b) | | $ | 1,146 | |
2,000,000 | | WMG Acquisition Corp. 144A, 3.00%, 2/15/31 (b) | | | 1,905 | |
500,000 | | WMG Acquisition Corp. 144A, 3.00%, 2/15/31 (b) | | | 476 | |
1,000,000 | | Wyndham Destinations Inc., 6.00%, 4/01/27 | | | 1,033 | |
1,000,000 | | Wyndham Destinations Inc. 144A, 6.63%, 7/31/26 (b) | | | 1,065 | |
1,000,000 | | Wyndham Hotels & Resorts Inc. 144A, 5.38%, 4/15/26 (b) | | | 1,014 | |
1,000,000 | | Wynn Las Vegas LLC/Wynn Las Vegas Capital Corp. 144A, 5.50%, 3/01/25 (b) | | | 959 | |
| | | | | 19,282 | |
Media (6%) | | | | |
1,000,000 | | Altice Financing SA 144A, 5.00%, 1/15/28 (b) | | | 971 | |
750,000 | | CCO Holdings LLC/CCO Holdings Capital Corp. 144A, 4.00%, 3/01/23 (b) | | | 759 | |
500,000 | | CCO Holdings LLC/CCO Holdings Capital Corp. 144A, 4.25%, 2/01/31 (b) | | | 513 | |
1,500,000 | | CCO Holdings LLC/CCO Holdings Capital Corp. 144A, 4.50%, 8/15/30 (b) | | | 1,561 | |
1,000,000 | | CCO Holdings LLC/CCO Holdings Capital Corp. 144A, 4.50%, 5/01/32 (b) | | | 1,035 | |
1,600,000 | | CCO Holdings LLC/CCO Holdings Capital Corp. 144A, 4.75%, 3/01/30 (b) | | | 1,685 | |
2,550,000 | | CCO Holdings LLC/CCO Holdings Capital Corp. 144A, 5.38%, 6/01/29 (b) | | | 2,763 | |
2,000,000 | | CSC Holdings LLC 144A, 4.13%, 12/01/30 (b) | | | 2,036 | |
500,000 | | CSC Holdings LLC 144A, 6.50%, 2/01/29 (b) | | | 556 | |
1,300,000 | | Diamond Sports Group LLC/Diamond Sports Finance Co. 144A, 5.38%, 8/15/26 (b) | | | 762 | |
1,080,000 | | Diamond Sports Group LLC/Diamond Sports Finance Co. 144A, 6.63%, 8/15/27 (b)(d) | | | 432 | |
1,000,000 | | DISH DBS Corp., 7.38%, 7/01/28 | | | 1,009 | |
1,700,000 | | EW Scripps Co. 144A, 5.13%, 5/15/25 (b) | | | 1,625 | |
2,500,000 | | Gray Television Inc. 144A, 4.75%, 10/15/30 (b) | | | 2,469 | |
1,500,000 | | Match Group Holdings II LLC 144A, 4.63%, 6/01/28 (b) | | | 1,556 | |
750,000 | | Netflix Inc. 144A, 4.88%, 6/15/30 (b) | | | 857 | |
1,000,000 | | Netflix Inc. 144A, 5.38%, 11/15/29 (b) | | | 1,172 | |
2,000,000 | | Nexstar Broadcasting Inc. 144A, 4.75%, 11/01/28 (b) | | | 2,026 | |
1,000,000 | | Scripps Escrow Inc. 144A, 5.88%, 7/15/27 (b) | | | 974 | |
2,000,000 | | Sinclair Television Group Inc. 144A, 5.50%, 3/01/30 (b) | | | 1,884 | |
2,500,000 | | Sirius XM Radio Inc. 144A, 5.00%, 8/01/27 (b) | | | 2,622 | |
| | | | | 29,267 | |
Real Estate (3%) | | | | |
1,500,000 | | Diversified Healthcare Trust, 9.75%, 6/15/25 | | | 1,652 | |
1,450,000 | | Iron Mountain Inc. 144A, 4.88%, 9/15/29 (b) | | | 1,467 | |
1,500,000 | | Iron Mountain Inc. 144A, 5.25%, 3/15/28 (b) | | | 1,540 | |
1,000,000 | | iStar Inc., 4.75%, 10/01/24 | | | 957 | |
1,000,000 | | MGM Growth Properties Operating Partnership LP/MGP Finance Co-Issuer Inc., 5.75%, 2/01/27 | | | 1,081 | |
Annual Report 71
Payden High Income Fund continued
| | | | | | |
Principal
or Shares | | Security Description | | Value
(000) | |
| | |
1,500,000 | | MPT Operating Partnership LP/MPT Finance Corp., 4.63%, 8/01/29 | | $ | 1,573 | |
2,000,000 | | SBA Communications Corp. 144A, 3.88%, 2/15/27 (b) | | | 2,035 | |
1,000,000 | | Service Properties Trust, 7.50%, 9/15/25 | | | 1,049 | |
1,500,000 | | Toll Brothers Finance Corp., 3.80%, 11/01/29 | | | 1,597 | |
1,200,000 | | VICI Properties LP/VICI Note Co. Inc. 144A, 4.13%, 8/15/30 (b) | | | 1,217 | |
| | | | | 14,168 | |
Retail (4%) | | | | |
2,500,000 | | 1011778 BC ULC/New Red Finance Inc. 144A, 4.00%, 10/15/30 (b) | | | 2,487 | |
2,000,000 | | FirstCash Inc. 144A, 4.63%, 9/01/28 (b) | | | 2,034 | |
1,500,000 | | Group 1 Automotive Inc. 144A, 4.00%, 8/15/28 (b) | | | 1,504 | |
2,500,000 | | IRB Holding Corp. 144A, 6.75%, 2/15/26 (b) | | | 2,509 | |
1,000,000 | | L Brands Inc. 144A, 6.63%, 10/01/30 (b) | | | 1,052 | |
500,000 | | L Brands Inc., 6.88%, 11/01/35 | | | 508 | |
650,000 | | L Brands Inc., 7.50%, 6/15/29 | | | 697 | |
700,000 | | Lithia Motors Inc. 144A, 4.63%, 12/15/27 (b) | | | 738 | |
1,500,000 | | Lithia Motors Inc. 144A, 5.25%, 8/01/25 (b) | | | 1,558 | |
1,000,000 | | Nordstrom Inc., 4.38%, 4/01/30 | | | 773 | |
1,000,000 | | Penske Automotive Group Inc., 5.50%, 5/15/26 | | | 1,034 | |
1,000,000 | | QVC Inc., 4.38%, 9/01/28 | | | 1,003 | |
1,650,000 | | Sonic Automotive Inc., 6.13%, 3/15/27 | | | 1,706 | |
1,200,000 | | Yum! Brands Inc., 3.63%, 3/15/31 | | | 1,179 | |
2,000,000 | | Yum! Brands Inc., 6.88%, 11/15/37 | | | 2,444 | |
875,000 | | Yum! Brands Inc. 144A, 7.75%, 4/01/25 (b) | | | 962 | |
| | | | | 22,188 | |
Service (3%) | | | | |
500,000 | | Aramark Services Inc., 4.75%, 6/01/26 | | | 498 | |
800,000 | | Aramark Services Inc. 144A, 5.00%, 2/01/28 (b) | | | 808 | |
1,000,000 | | Avis Budget Car Rental LLC/Avis Budget Finance Inc. 144A, 5.75%, 7/15/27 (b) | | | 941 | |
1,250,000 | | Cimpress PLC 144A, 7.00%, 6/15/26 (b) | | | 1,248 | |
1,000,000 | | Covanta Holding Corp., 5.00%, 9/01/30 | | | 1,019 | |
1,000,000 | | Covanta Holding Corp., 5.88%, 7/01/25 | | | 1,038 | |
1,000,000 | | Covanta Holding Corp., 6.00%, 1/01/27 | | | 1,045 | |
1,000,000 | | Gartner Inc. 144A, 3.75%, 10/01/30 (b) | | | 1,024 | |
1,000,000 | | Gartner Inc. 144A, 4.50%, 7/01/28 (b) | | | 1,045 | |
1,000,000 | | Jaguar Holding Co. II/PPD Development LP 144A, 5.00%, 6/15/28 (b) | | | 1,044 | |
2,000,000 | | Nielsen Finance LLC/Nielsen Finance Co. 144A, 5.63%, 10/01/28 (b) | | | 2,066 | |
2,000,000 | | Prime Security Services Borrower LLC/Prime Finance Inc. 144A, 3.38%, 8/31/27 (b) | | | 1,932 | |
850,000 | | Refinitiv U.S. Holdings Inc. 144A, 8.25%, 11/15/26 (b) | | | 927 | |
1,250,000 | | United Rentals North America Inc., 4.88%, 1/15/28 | | | 1,314 | |
2,000,000 | | United Rentals North America Inc., 5.88%, 9/15/26 | | | 2,107 | |
| | | | | 18,056 | |
Technology (4%) | | | | |
1,500,000 | | ACI Worldwide Inc. 144A, 5.75%, 8/15/26 (b) | | | 1,588 | |
2,000,000 | | ams AG 144A, 7.00%, 7/31/25 (b) | | | 2,121 | |
1,000,000 | | Booz Allen Hamilton Inc. 144A, 3.88%, 9/01/28 (b) | | | 1,017 | |
| | | | | | |
Principal
or Shares | | Security Description | | Value
(000) | |
| | |
950,000 | | Castle U.S. Holding Corp. 144A, 9.50%, 2/15/28 (b) | | $ | 905 | |
1,500,000 | | CDK Global Inc. 144A, 5.25%, 5/15/29 (b) | | | 1,610 | |
1,000,000 | | CDW LLC/CDW Finance Corp., 3.25%, 2/15/29 | | | 1,000 | |
500,000 | | Dell International LLC/EMC Corp. 144A, 8.35%, 7/15/46 (b) | | | 683 | |
1,500,000 | | NCR Corp. 144A, 5.25%, 10/01/30 (b) | | | 1,488 | |
1,500,000 | | Presidio Holdings Inc. 144A, 8.25%, 2/01/28 (b) | | | 1,595 | |
960,000 | | PTC Inc. 144A, 3.63%, 2/15/25 (b) | | | 979 | |
500,000 | | PTC Inc. 144A, 4.00%, 2/15/28 (b) | | | 518 | |
1,800,000 | | Science Applications International Corp. 144A, 4.88%, 4/01/28 (b) | | | 1,889 | |
2,500,000 | | TTM Technologies Inc. 144A, 5.63%, 10/01/25 (b) | | | 2,578 | |
2,000,000 | | WESCO Distribution Inc. 144A, 7.13%, 6/15/25 (b) | | | 2,157 | |
1,000,000 | | Xerox Holdings Corp. 144A, 5.50%, 8/15/28 (b) | | | 989 | |
| | | | | 21,117 | |
Telecommunications (7%) | | | | |
2,000,000 | | Advantage Sales & Marketing Inc. 144A, 6.50%, 11/15/28 (b) | | | 1,958 | |
1,000,000 | | Altice France SA, 5.88%, 2/01/27 EUR (e)(f) | | | 1,219 | |
2,500,000 | | Altice France SA 144A, 7.38%, 5/01/26 (b) | | | 2,612 | |
2,000,000 | | Avaya Inc. 144A, 6.13%, 9/15/28 (b) | | | 2,059 | |
1,000,000 | | CenturyLink Inc., 5.63%, 4/01/25 | | | 1,052 | |
2,160,000 | | CenturyLink Inc., 5.80%, 3/15/22 | | | 2,250 | |
1,000,000 | | CenturyLink Inc., 6.88%, 1/15/28 | | | 1,114 | |
1,500,000 | | CommScope Inc. 144A, 8.25%, 3/01/27 (b) | | | 1,554 | |
866,000 | | CommScope Technologies LLC 144A, 6.00%, 6/15/25 (b) | | | 860 | |
1,000,000 | | Frontier Communications Corp. 144A, 5.88%, 10/15/27 (b) | | | 1,027 | |
2,500,000 | | Lamar Media Corp., 4.88%, 1/15/29 | | | 2,606 | |
2,000,000 | | Level 3 Financing Inc. 144A, 4.25%, 7/01/28 (b) | | | 2,012 | |
1,000,000 | | QualityTech LP/QTS Finance Corp. 144A, 4.75%, 11/15/25 (b) | | | 1,040 | |
1,230,000 | | Sprint Capital Corp., 6.88%, 11/15/28 | | | 1,558 | |
2,200,000 | | Sprint Communications Inc., 6.00%, 11/15/22 | | | 2,358 | |
1,000,000 | | Sprint Corp., 7.13%, 6/15/24 | | | 1,151 | |
3,500,000 | | Sprint Corp., 7.63%, 3/01/26 | | | 4,265 | |
2,200,000 | | Telecom Italia Capital SA, 6.38%, 11/15/33 | | | 2,607 | |
3,000,000 | | T-Mobile USA Inc., 6.50%, 1/15/26 | | | 3,130 | |
1,000,000 | | Vmed O2 UK Financing I PLC 144A, 4.25%, 1/31/31 (b) | | | 1,002 | |
950,000 | | Zayo Group Holdings Inc. 144A, 6.13%, 3/01/28 (b) | | | 960 | |
| | | | | 38,394 | |
Transportation (1%) | | | | |
2,000,000 | | Delta Air Lines Inc./SkyMiles IP Ltd. 144A, 4.75%, 10/20/28 (b) | | | 2,047 | |
1,000,000 | | Fortress Transportation and Infrastructure Investors LLC 144A, 9.75%, 8/01/27 (b) | | | 1,066 | |
975,140 | | MV24 Capital BV 144A, 6.75%, 6/01/34 (b) | | | 983 | |
1,025,000 | | United Airlines Holdings Inc., 5.00%, 2/01/24 (d) | | | 899 | |
| | | | | 4,995 | |
| | | | | | |
72 Payden Mutual Funds
| | | | | | |
Principal
or Shares | | Security Description | | Value
(000) | |
| |
Utility (2%) | | | | |
500,000 | | Calpine Corp. 144A, 4.50%, 2/15/28 (b) | | $ | 509 | |
1,000,000 | | Calpine Corp. 144A, 5.13%, 3/15/28 (b) | | | 1,033 | |
1,150,000 | | Calpine Corp. 144A, 5.25%, 6/01/26 (b) | | | 1,183 | |
2,000,000 | | DPL Inc., 4.35%, 4/15/29 | | | 2,172 | |
1,500,000 | | NextEra Energy Operating Partners LP 144A, 3.88%, 10/15/26 (b) | | | 1,556 | |
1,000,000 | | Pattern Energy Operations LP/Pattern Energy Operations Inc. 144A, 4.50%, 8/15/28 (b) | | | 1,045 | |
1,000,000 | | PG&E Corp., 5.00%, 7/01/28 | | | 1,004 | |
1,000,000 | | Talen Energy Supply LLC 144A, 6.63%, 1/15/28 (b) | | | 958 | |
1,000,000 | | Vistra Operations Co. LLC 144A, 5.00%, 7/31/27 (b) | | | 1,046 | |
1,250,000 | | Vistra Operations Co. LLC 144A, 5.50%, 9/01/26 (b) | | | 1,295 | |
| | | | | | |
| | | | | 11,801 | |
| | | | | | |
Total Corporate Bond (Cost - $438,922) | | | 450,570 | |
| | | | | | |
Mortgage Backed (3%) | | | | |
4,100,000 | | Connecticut Avenue Securities Trust 2019-HRP1 144A, (1 mo. LIBOR USD + 9.250%), 9.40%, 11/25/39 (a)(b) | | | 3,242 | |
1,987,535 | | Fannie Mae Connecticut Avenue Securities, (1 mo. LIBOR USD + 10.250%), 10.40%, 1/25/29 (a) | | | 2,245 | |
1,988,662 | | Fannie Mae Connecticut Avenue Securities, (1 mo. LIBOR USD + 12.250%), 12.40%, 9/25/28 (a) | | | 2,407 | |
1,700,000 | | Freddie Mac STACR REMIC Trust 2020-DNA2 144A, (1 mo. LIBOR USD + 4.800%), 4.95%, 2/25/50 (a)(b) | | | 1,095 | |
1,200,000 | | Freddie Mac STACR Trust 2019-HRP1 144A, (1 mo. LIBOR USD + 9.500%), 9.65%, 2/25/49 (a)(b) | | | 944 | |
900,000 | | Freddie Mac Structured Agency Credit Risk Debt Notes, (1 mo. LIBOR USD + 4.600%), 4.75%, 12/25/42 (a) | | | 856 | |
1,735,221 | | Freddie Mac Structured Agency Credit Risk Debt Notes, (1 mo. LIBOR USD + 11.250%), 11.40%, 10/25/29 (a) | | | 1,641 | |
1,850,362 | | STACR Trust 2018-HRP1 144A, (1 mo. LIBOR USD + 11.750%), 11.90%, 4/25/43 (a)(b) | | | 1,867 | |
1,550,000 | | STACR Trust 2018-HRP2 144A, (1 mo. LIBOR USD + 10.500%), 10.65%, 2/25/47 (a)(b) | | | 1,548 | |
| | | | | | |
Total Mortgage Backed (Cost - $17,080) | | | 15,845 | |
| | | | | | |
Investment Company (6%) | | | | |
33,021,275 | | Payden Cash Reserves Money Market Fund * | | | | |
| | (Cost - $33,021) | | | 33,021 | |
| | | | | | |
Total Investments (Cost - $514,480) (100%) | | | 524,924 | |
Other Assets, net of Liabilities (0%) | | | 272 | |
| | | | | | |
Net Assets (100%) | | $ | 525,196 | |
| | | | | | |
| | | | | | |
| (a) | Floating rate security. The rate shown reflects the rate in effect at October 31, 2020. |
| (b) | Security offered only to qualified institutional investors, and thus is not registered for sale to the public under rule 144A of the Securities Act of 1933. It has been deemed liquid under guidelines approved by the Board. |
| (c) | Floating rate security. The rate shown reflects the rate in effect at October 31, 2020. The stated maturity is subject to prepayments. See Note 2 in the Notes to Financial Statements. |
| (d) | All or a portion of these securities are on loan. At October 31, 2020, the total market value of the Fund’s securities on loan is $3,200 and the total market value of the collateral held by the Fund is $3,311. Amounts in 000s. |
| (e) | Security offered and sold outside the United States, and thus is exempt from registration under Regulation S of the Securities Act of 1933. It has been deemed liquid under guidelines approved by the Board. |
| (f) | Principal in foreign currency. |
| (g) | Perpetual security with no stated maturity date. |
| (h) | Issuer filed for bankruptcy and/or is in default of principal and/or interest payments. |
Annual Report 73
Payden High Income Fund continued
Open Forward Currency Contracts to USD
| | | | | | | | | | | | | | | | | | | | |
Currency Purchased (000s) | | Currency
Sold
(000s) | | Counterparty | | Settlement
Date | | Unrealized
Appreciation
(Depreciation)
(000s) |
Assets: | | | | | | | | | | | | | | | | | | | | |
USD 6,994 | | | | EUR 5,871 | | | |
| Citibank,
N.A. |
| | | | 03/22/2021 | | | | $ | 134 | |
Liabilities: | | | | | | | | | | | | | | | | | | | | |
EUR 1,340 | | | | USD 1,572 | | | |
| Citibank,
N.A. |
| | | | 03/22/2021 | | | | | (6 | ) |
| | | | | | | | | | | | | | | | | | | | |
Net Unrealized Appreciation (Depreciation) | | | | | | | | | | | | | | | | | | $ | 128 | |
| | | | | | | | | | | | | | | | | | | | |
Open Centrally Cleared Interest Rate Swap Contracts
| | | | | | | | | | | | | | | | | | | | | | | | | |
| Description | | Maturity
Date | | Notional
Amount
(000s) | | Value
(000s) | | Upfront
payments/
receipts
(000s) | | Unrealized
Appreciation
(Depreciation)
(000s) |
| 4-Year Interest Rate Swap, Pay Fixed 0.2405% Annually, Receive Variable 0.2405% (1-Month EURIBOR) Monthly | | 10/29/2023 | | | | EUR 2,343 | | | | $ | (70 | ) | | | $ | — | | | | $ | (70 | ) |
| 4-Year Interest Rate Swap, Receive Fixed 3.013% Semi-Annually, Pay Variable 0.14463% (1-Month USD LIBOR) Monthly | | 10/29/2023 | | | | USD 14,240 | | | | | 1,211 | | | | | — | | | | | 1,211 | |
| | | | | | | | | | | | | | | | | | | | | | |
| | | | | | | | | | $ | 1,141 | | | | $ | — | | | | $ | 1,141 | |
| | | | | | | | | | | | | | | | | | | | | | |
Offsetting Assets and Liabilities
The Fund’s loaned securities were all subject to an enforceable Securities Lending Agency Agreement. Securities lent in accordance with the Securities Lending Agency Agreement on a gross basis were as follows:
| | | | | |
| | | Value
(000’s) |
| Total gross amount presented on the Statements of Assets and Liabilities1 | | | $ | 3,200 | |
Non-cash Collateral2 | | | | (3,200 | ) |
| | | | | |
Net Amount | | | $ | — | |
| | | | | |
| 1 | The amount presented on the Statements of Assets and Liabilities is not offset and is shown on a gross basis. |
| 2 | At October 31, 2020, the value of the collateral received from each borrower exceeded the value of the related securities loaned. This amount is disclosed on the Schedule of Investments. |
See notes to financial statements.
74 Payden Mutual Funds
Payden California Municipal Social Impact Fund
| | | | | | |
The Fund seeks income that is exempt from federal and California state income tax and is consistent with preservation of capital by generally investing in investment grade California municipal securities with an average portfolio maturity of five to ten years. | |
| 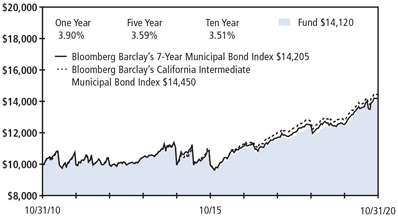
Past performance does not predict future returns. The graph does not reflect
the impact of taxes or transaction costs a shareholder would pay. |
|
| Portfolio Composition - percent of investments |
General Obligation | | 46% |
Healthcare | | 14% |
Transportation | | 10% |
Education | | 8% |
Other | | 22% |
| | |
| | |
| | |
| | |
| | |
| | |
This information is not part of the audited financial statements. |
| | | | | | |
| Schedule of Investments - October 31, 2020 | |
Principal
or Shares | | Security Description | | Value
(000) | |
Corporate Bond (2%) | | | | |
500,000 | | Century Housing Corp., 4.00%, 11/01/21 | | $ | 505 | |
500,000 | | Conservation Fund A Nonprofit Corp., 3.47%, 12/15/29 | | | 520 | |
500,000 | | Low Income Investment Fund, 3.71%, 7/01/29 | | | 547 | |
| | | | | | |
Total Corporate Bond (Cost - $1,500) | | | 1,572 | |
| | | | | | |
General Obligation (51%) | | | | |
645,000 | | Abag Finance Authority for Nonprofit Corps, 5.00%, 9/02/26 | | | 744 | |
455,000 | | Abag Finance Authority for Nonprofit Corps, 5.00%, 9/02/28 AGM (a) | | | 573 | |
100,000 | | Alameda Community Improvement Commission Successor Agency, 5.00%, 9/01/28 BAM (a) | | | 116 | |
250,000 | | Alameda Community Improvement Commission Successor Agency, 5.00%, 9/01/32 BAM (a) | | | 289 | |
300,000 | | Anaheim Public Financing Authority, 5.00%, 5/01/34 | | | 338 | |
1,000,000 | | Apple Valley Public Financing Authority, 4.00%, 6/01/35 BAM (a) | | | 1,180 | |
500,000 | | Beverly Hills Public Financing Authority, 1.15%, 6/01/26 | | | 497 | |
200,000 | | Brea Community Benefit Financing Authority, 5.00%, 7/01/29 | | | 233 | |
500,000 | | Brea Redevelopment Agency, 5.00%, 8/01/31 | | | 616 | |
300,000 | | Brentwood Infrastructure Financing Authority, 4.00%, 10/01/36 | | | 342 | |
500,000 | | Burbank Unified School District, 1.81%, 8/01/28 | | | 499 | |
250,000 | | California Infrastructure & Economic Development Bank, 0.48%, 8/01/47 (b) | | | 250 | |
500,000 | | California Infrastructure & Economic Development Bank, 0.75%, 12/01/50 (b) | | | 499 | |
| | | | | | |
| | |
| | | | | | |
Principal
or Shares | | Security Description | | Value
(000) | |
| | |
410,000 | | California Infrastructure & Economic Development Bank, 5.00%, 8/01/34 | | | 521 | |
500,000 | | California Infrastructure & Economic Development Bank, 5.00%, 8/01/44 | | | 614 | |
1,000,000 | | California Pollution Control Financing Authority 144A, 5.00%, 7/01/39 (c) | | $ | 1,158 | |
385,000 | | California State Public Works Board, 5.25%, 10/01/33 | | | 451 | |
300,000 | | City & County of San Francisco CA Community Facilities District No 2014-1, 3.11%, 9/01/24 | | | 322 | |
670,000 | | City of Irvine CA, 4.00%, 9/02/38 | | | 765 | |
260,000 | | City of Irvine CA, 5.00%, 9/02/22 | | | 279 | |
280,000 | | Coronado Community Development Agency Successor Agency, 5.00%, 9/01/33 | | | 326 | |
400,000 | | County of Sacramento CA, 5.75%, 2/01/30 | | | 401 | |
1,000,000 | | County of Santa Barbara CA, AMT, 5.00%, 12/01/36 | | | 1,211 | |
500,000 | | Fresno Unified School District, 2.85%, 8/01/27 | | | 450 | |
400,000 | | Inglewood Joint Powers Authority, 2.75%, 8/01/21 BAM (a) | | | 406 | |
460,000 | | Kern Community College District, 2.65%, 11/01/27 | | | 492 | |
500,000 | | Lancaster Redevelopment Agency Successor Agency, 5.00%, 8/01/30 AGM (a) | | | 609 | |
500,000 | | Los Angeles County Metropolitan Transportation Authority, 5.00%, 6/01/32 | | | 698 | |
350,000 | | Los Angeles County Redevelopment Authority, 5.25%, 12/01/26 AGM (a) | | | 414 | |
300,000 | | Miracosta Community College District, 4.00%, 8/01/34 | | | 372 | |
250,000 | | Municipal Improvement Corp. of Los Angeles, 1.34%, 11/01/26 | | | 247 | |
100,000 | | Municipal Improvement Corp. of Los Angeles, 5.00%, 5/01/30 | | | 115 | |
500,000 | | Municipal Improvement Corp. of Los Angeles, 5.00%, 11/01/31 | | | 613 | |
500,000 | | Municipal Improvement Corp. of Los Angeles, 5.00%, 11/01/38 | | | 568 | |
500,000 | | Napa Valley Community College District, 2.12%, 8/01/23 | | | 546 | |
Annual Report 75
Payden California Municipal Social Impact Fund continued
| | | | | | |
Principal
or Shares | | Security Description | | Value (000) | |
| | |
1,000,000 | | Nuveen, CA Free Quality Municipal Income Fund, AMT 144A, 0.58%, 10/01/47 (b)(c) | | $ | 1,000 | |
100,000 | | Peralta Community College District, 5.00%, 8/01/22 | | | 108 | |
250,000 | | Peralta Community College District, 5.00%, 8/01/26 | | | 312 | |
500,000 | | San Bernardino City Unified School District, 1.98%, 8/01/28 AGM (a) | | | 501 | |
900,000 | | San Diego Association of Governments, 5.00%, 11/15/26 | | | 1,067 | |
350,000 | | San Diego Public Facilities Financing Authority, 5.00%, 10/15/30 | | | 418 | |
340,000 | | San Diego Public Facilities Financing Authority, 5.00%, 10/15/31 | | | 404 | |
550,000 | | San Diego Public Facilities Financing Authority, 5.00%, 10/15/32 | | | 649 | |
500,000 | | San Francisco Unified School District, 4.00%, 6/15/35 | | | 590 | |
750,000 | | San Marcos Redevelopment Agency Successor Agency, 3.25%, 10/01/29 | | | 815 | |
250,000 | | San Mateo Joint Powers Financing Authority, 5.00%, 6/15/30 | | | 290 | |
815,000 | | Santa Monica Public Financing Authority, 4.00%, 7/01/38 | | | 922 | |
200,000 | | Simi Valley Public Financing Authority, 5.00%, 10/01/29 | | | 235 | |
550,000 | | South Orange County Public Financing Authority, 5.00%, 4/01/34 | | | 657 | |
1,000,000 | | State of California, 4.00%, 11/01/35 | | | 1,215 | |
500,000 | | State of California, 5.00%, 11/01/29 | | | 670 | |
1,000,000 | | State of California, 5.00%, 4/01/30 | | | 1,351 | |
550,000 | | State of California, 6.51%, 4/01/39 | | | 582 | |
105 | | State of California, 7.95%, 3/01/36 | | | — | |
300,000 | | Stockton Public Financing Authority, 1.40%, 6/01/22 | | | 301 | |
1,000,000 | | Sunnyvale Financing Authority, 4.00%, 4/01/34 | | | 1,207 | |
800,000 | | Temecula Redevelopment Agency Successor Agency, 5.00%, 12/15/37 AGM (a) | | | 968 | |
350,000 | | Union City Community Redevelopment Agency, 5.00%, 10/01/35 | | | 409 | |
225,000 | | West Hollywood Public Financing Authority, 4.00%, 4/01/34 | | | 274 | |
| | | | | | |
Total General Obligation (Cost - $31,403) | | | 32,699 | |
| | | | | | |
Revenue (43%) | | | | |
Airport/Port (4%) | | | | |
500,000 | | City of Los Angeles Department of Airports, AMT, 5.00%, 5/15/24 | | | 573 | |
250,000 | | City of Los Angeles Department of Airports, AMT, 5.00%, 5/15/26 | | | 303 | |
500,000 | | City of Los Angeles Department of Airports, AMT, 5.00%, 5/15/36 | | | 609 | |
400,000 | | City of Palm Springs CA Airport Revenue, AMT, 5.00%, 6/01/26 BAM (a) | | | 466 | |
| | |
750,000 | | San Diego County Regional Airport Authority, AMT, 5.00%, 7/01/39 | | | 906 | |
| | | | | | |
| | | | | 2,857 | |
| | | | | | |
| | | | | | |
Principal
or Shares | | Security Description | | Value (000) | |
| |
Education (5%) | | | | |
500,000 | | California Educational Facilities Authority, 3.18%, 4/01/27 | | $ | 535 | |
370,000 | | California Educational Facilities Authority, 5.00%, 10/01/37 | | | 449 | |
360,000 | | California Educational Facilities Authority, 5.00%, 10/01/38 | | | 435 | |
120,000 | | California School Finance Authority 144A, 4.00%, 7/01/22 (c) | | | 125 | |
1,000,000 | | California School Finance Authority 144A, 5.00%, 8/01/38 (c) | | | 1,153 | |
250,000 | | Oxnard School District,
2.00%, 8/01/45 BAM (a)(b) | | | 275 | |
| | | | | | |
| | | | | 2,972 | |
| | | | | | |
Healthcare (14%) | | | | |
750,000 | | California Health Facilities Financing Authority, 3.57%, 11/01/36 | | | 796 | |
200,000 | | California Health Facilities Financing Authority, 4.00%, 8/15/34 | | | 220 | |
750,000 | | California Health Facilities Financing Authority, 4.00%, 4/01/36 | | | 855 | |
710,000 | | California Health Facilities Financing Authority, 5.00%, 11/15/27 | | | 768 | |
500,000 | | California Health Facilities Financing Authority, 5.00%, 2/01/31 | | | 617 | |
350,000 | | California Health Facilities Financing Authority, 5.00%, 8/15/32 | | | 416 | |
800,000 | | California Health Facilities Financing Authority, 5.00%, 11/01/34 | | | 1,026 | |
1,000,000 | | California Health Facilities Financing Authority, 5.00%, 11/15/49 | | | 1,165 | |
205,000 | | California Health Facilities Financing Authority, 5.25%, 3/01/28 | | | 208 | |
650,000 | | California Municipal Finance Authority, 5.00%, 1/01/33 | | | 796 | |
325,000 | | California Municipal Finance Authority, 5.00%, 5/15/37 | | | 381 | |
500,000 | | California Municipal Finance Authority, 5.00%, 7/01/39 | | | 615 | |
750,000 | | California Statewide Communities Development Authority, 4.00%, 8/01/45 | | | 778 | |
| | | | | | |
| | | | | 8,641 | |
| | | | | | |
Housing (2%) | | | | |
1,400,000 | | City & County of San Francisco CA, 0.11%, 7/01/57 (b) | | | 1,400 | |
| | | | | | |
Industrial Development/Pollution Control (4%) | | | | |
230,000 | | California Infrastructure & Economic Development Bank, 3.25%, 7/01/26 | | | 251 | |
1,000,000 | | California Pollution Control Financing Authority, AMT 144A, 6.75%, 12/01/28 (c) | | | 975 | |
370,000 | | Emeryville Redevelopment Agency Successor Agency, 5.00%, 9/01/25 AGM (a) | | | 432 | |
76 Payden Mutual Funds
| | | | | | |
Principal
or Shares | | Security Description | | Value
(000) | |
| | |
300,000 | | Palm Springs Community Redevelopment Agency Successor Agency, 5.00%, 9/01/29 AGM (a) | | $ | 348 | |
390,000 | | Palm Springs Community Redevelopment Agency Successor Agency, 5.00%, 9/01/31 AGM (a) | | | 452 | |
| | | | | | |
| | | | | 2,458 | |
| | | | | | |
Resource Recovery (2%) | | | | |
600,000 | | California Pollution Control Financing Authority, AMT 144A, 7.50%, 12/01/39 (c) | | | 184 | |
1,000,000 | | South Bayside Waste Management Authority, AMT, 5.00%, 9/01/23 | | | 1,125 | |
| | | | | | |
| | | | | 1,309 | |
| | | | | | |
Transportation (10%) | | | | |
660,000 | | Bay Area Toll Authority, 4.00%, 4/01/37 | | | 753 | |
750,000 | | City of Long Beach CA Harbor Revenue, AMT, 5.00%, 5/15/28 | | | 932 | |
1,000,000 | | Foothill-Eastern Transportation Corridor Agency, 5.50%, 1/15/53 (b) | | | 1,071 | |
620,000 | | Port of Los Angeles, AMT, 5.00%, 8/01/24 | | | 719 | |
1,000,000 | | Port of Los Angeles, AMT, 5.00%, 8/01/25 | | | 1,195 | |
835,000 | | Port of Los Angeles, AMT, 5.00%, 8/01/29 | | | 960 | |
750,000 | | Port of Oakland, AMT, 5.00%, 5/01/24 | | | 800 | |
| | | | | | |
| | | | | 6,430 | |
| | | | | | |
| | | | | | |
Principal
or Shares | | Security Description | | Value
(000) | |
| |
Water & Sewer (2%) | | | | |
500,000 | | City of San Francisco CA Public Utilities Commission Water Revenue, 3.45%, 11/01/30 | | $ | 549 | |
100,000 | | Orange County Water District, 5.00%, 8/15/33 | | | 133 | |
500,000 | | San Diego County Water Authority, 5.00%, 5/01/31 | | | 687 | |
100,000 | | San Diego Public Facilities Financing Authority Water Revenue, 5.00%, 8/01/32 | | | 123 | |
| | | | | | |
| | | | | 1,492 | |
| | | | | | |
Total Revenue (Cost - $26,779) | | | 27,559 | |
| | | | | | |
Total Investments (Cost - $59,682) (96%) | | | 61,830 | |
Other Assets, net of Liabilities (4%) | | | 2,258 | |
| | | | | | |
Net Assets (100%) | | $ | 64,088 | |
| | | | | | |
| (a) | Payment of principal and/or interest is insured against default by a monoline insurer. |
| (b) | Variable rate security. Interest rate disclosed is as of the most recent information available. Certain variable rate securities are not based on a published reference rate and spread but are determined by the issuer or agent and are based on current market conditions. These securities do not indicate a reference rate and spread in their description above. |
| (c) | Security offered only to qualified institutional investors, and thus is not registered for sale to the public under rule 144A of the Securities Act of 1933. It has been deemed liquid under guidelines approved by the Board. |
See notes to financial statements.
Annual Report 77
Payden Global Low Duration Fund
| | | | | | |
| | The Fund seeks a high level of total return that is consistent with preservation of capital by generally investing in investment grade debt securities denominated in U.S. and foreign currencies with an average portfolio maturity not to exceed three years. | | 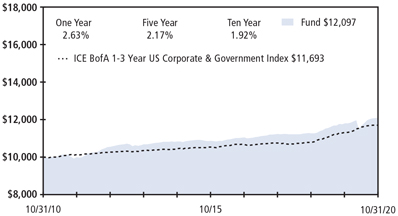
Past performance does not predict future returns. The graph does not reflect the impact of taxes or transaction costs a shareholder would pay. |
| | | Portfolio Composition - percent of investments |
| | Corporate Bond | | 41% |
| | Asset Backed | | 30% |
| | U.S. Treasury | | 13% |
| | Mortgage Backed | | 12% |
| | Foreign Government | | 3% |
| | Investment Company | | 1% |
| | |
| | |
| | |
| | |
| | This information is not part of the audited financial statements. |
| | | | | | |
| Schedule of Investments - October 31, 2020 | |
Principal
or Shares | | Security Description | | Value
(000) | |
Bonds (99%) | | | | |
Australia (EUR) (1%) | | | | |
500,000 | | Telstra Corp. Ltd., 3.50%, 9/21/22 EUR (a)(b) | | $ | 623 | |
Australia (USD) (1%) | | | | |
80,000 | | APT Pipelines Ltd. 144A, 3.88%, 10/11/22 (c) | | | 84 | |
515,000 | | Macquarie Group Ltd. 144A, (3 mo. LIBOR USD + 1.020%), 1.28%, 11/28/23 (c)(d) | | | 517 | |
| | | | | 601 | |
Bermuda (USD) (0%) | | | | |
180,000 | | Enstar Group Ltd., 4.50%, 3/10/22 | | | 187 | |
Brazil (USD) (1%) | | | | |
200,000 | | Banco Bradesco SA 144A, 2.85%, 1/27/23 (c) | | | 203 | |
260,000 | | Itau Unibanco Holding SA 144A, 2.90%, 1/24/23 (c) | | | 262 | |
| | | | | 465 | |
Canada (CAD) (0%) | | | | |
250,000 | | Ford Auto Securitization Trust 2020-AA 144A, 0.89%, 8/15/24 CAD (b)(c) | | | 188 | |
Canada (USD) (4%) | | | | |
525,000 | | Bank of Nova Scotia, 0.80%, 6/15/23 | | | 529 | |
405,000 | | Canadian Imperial Bank of Commerce, 0.95%, 6/23/23 | | | 410 | |
128,587 | | Canadian Pacer Auto Receivables Trust 2019-1 144A, 2.78%, 3/21/22 (c) | | | 129 | |
720,000 | | Canadian Pacer Auto Receivables Trust 2019-1 144A, 2.80%, 10/19/23 (c) | | | 737 | |
250,000 | | National Bank of Canada, (1 yr. US Treasury Yield Curve Rate T Note Constant Maturity + 0.770%), 0.90%, 8/15/23 (d) | | | 252 | |
505,000 | | National Bank of Canada, 2.10%, 2/01/23 | | | 522 | |
250,000 | | National Bank of Canada 144A, 2.15%, 10/07/22 (c) | | | 258 | |
750,000 | | Ontario Teachers’ Finance Trust 144A, 2.75%, 4/16/21 (c)(e) | | | 759 | |
330,000 | | Royal Bank of Canada, 0.50%, 10/26/23 | | | 330 | |
| | | | | 3,926 | |
| | | | | | |
| | | | | | |
| | |
| | | | | | |
Principal
or Shares | | Security Description | | Value (000) | |
Cayman Islands (USD) (12%) | | | | |
200,000 | | ADCB Finance Cayman Ltd. 144A, 4.00%, 3/29/23 (c) | | $ | 213 | |
400,000 | | Alibaba Group Holding Ltd., 3.13%, 11/28/21 | | | 410 | |
400,000 | | ALM XVI Ltd./ALM XVI LLC 144A, (3 mo. LIBOR USD + 1.500%), 1.74%, 7/15/27 (c)(d) | | | 397 | |
420,000 | | Apidos CLO XXI 144A, (3 mo. LIBOR USD + 1.450%), 1.67%, 7/18/27 (c)(d) | | | 418 | |
340,000 | | Apidos CLO XXI 144A, (3 mo. LIBOR USD + 2.450%), 2.67%, 7/18/27 (c)(d) | | | 321 | |
670,000 | | Bain Capital Credit CLO 2020-3 Ltd. 144A, (3 mo. LIBOR USD + 1.380%), 1.64%, 10/23/32 (c)(d) | | | 670 | |
810,000 | | Ballyrock CLO 2020-1 Ltd. 144A, (3 mo. LIBOR USD + 1.700%), 1.99%, 7/20/30 (c)(d) | | | 812 | |
462,422 | | Barings CLO Ltd. 2013-I 144A, (3 mo. LIBOR USD + 0.800%), 1.02%, 1/20/28 (c)(d) | | | 458 | |
210,000 | | BDS 2020-FL5 Ltd. 144A, (1 mo. LIBOR USD + 1.150%), 1.30%, 2/16/37 (c)(d) | | | 207 | |
670,000 | | Bristol Park CLO Ltd. 144A, (3 mo. LIBOR USD + 0.990%), 1.23%, 4/15/29 (c)(d) | | | 663 | |
470,000 | | BSPRT 2018-FL4 Issuer Ltd. 144A, (1 mo. LIBOR USD + 1.300%), 1.45%, 9/15/35 (c)(d) | | | 460 | |
360,000 | | CIFC Funding 2015-II Ltd. 144A, (3 mo. LIBOR USD + 1.010%), 1.25%, 4/15/30 (c)(d) | | | 356 | |
840,000 | | CIFC Funding 2020-I Ltd. 144A, (3 mo. LIBOR USD + 1.700%), 1.94%, 7/15/32 (c)(d) | | | 841 | |
500,000 | | Greystone Commercial Real Estate Notes 2018-HC1 Ltd. 144A, (1 mo. LIBOR USD + 2.150%), 2.30%, 9/15/28 (c)(d) | | | 471 | |
430,000 | | KREF 2018-FL1 Ltd. 144A, (1 mo. LIBOR USD + 1.100%), 1.25%, 6/15/36 (c)(d) | | | 429 | |
380,000 | | LCM XX LP 144A, (3 mo. LIBOR USD + 1.040%), 1.26%, 10/20/27 (c)(d) | | | 377 | |
1,050,000 | | Magnetite VII Ltd. 144A, (3 mo. LIBOR USD + 0.800%), 1.04%, 1/15/28 (c)(d) | | | 1,037 | |
78 Payden Mutual Funds
| | | | | | |
Principal
or Shares | | Security Description | | Value (000) | |
| | |
100,000 | | MF1 2020-FL3 Ltd. 144A, (1 mo. LIBOR USD + 2.850%), 3.00%, 7/15/35 (c)(d) | | $ | 101 | |
214,398 | | Octagon Investment Partners XXIII Ltd. 144A, (3 mo. LIBOR USD + 0.850%),
1.09%, 7/15/27 (c)(d) | | | 213 | |
668,550 | | Palmer Square Loan Funding 2020-1 Ltd. 144A, (3 mo. LIBOR USD + 0.800%), 1.05%, 2/20/28 (c)(d) | | | 662 | |
55,000 | | Park Aerospace Holdings Ltd. 144A, 5.25%, 8/15/22 (c) | | | 57 | |
330,000 | | PFP 2019-6 Ltd. 144A, (1 mo. LIBOR USD + 1.050%), 1.20%, 4/14/37 (c)(d) | | | 326 | |
210,000 | | PFP 2019-6 Ltd. 144A, (1 mo. LIBOR USD + 1.450%), 1.60%, 4/14/37 (c)(d) | | | 200 | |
370,000 | | STWD 2019-FL1 Ltd. 144A, (1 mo. LIBOR USD + 1.080%), 1.23%, 7/15/38 (c)(d) | | | 366 | |
470,000 | | TRTX 2019-FL3 Issuer Ltd. 144A, (1 mo. LIBOR USD + 1.450%), 1.60%, 10/15/34 (c)(d) | | | 463 | |
815,000 | | Tryon Park CLO Ltd. 144A, (3 mo. LIBOR USD + 0.890%), 1.13%, 4/15/29 (c)(d) | | | 809 | |
| | | | | 11,737 | |
Chile (CLP) (0%) | | | | |
180,000,000 | | Bonos de la Tesoreria de la Republica en pesos, 4.50%, 3/01/26 CLP (b) | | | 269 | |
Chile (USD) (1%) | | | | |
275,000 | | Banco del Estado de Chile 144A, 2.67%, 1/08/21 (c) | | | 276 | |
245,000 | | Banco Santander Chile 144A, 2.50%, 12/15/20 (c) | | | 246 | |
| | | | | 522 | |
France (EUR) (2%) | | | | |
500,000 | | Engie SA, 0.38%, 2/28/23 EUR (a)(b) | | | 590 | |
500,000 | | Orange SA, 2.50%, 3/01/23 EUR (a)(b) | | | 620 | |
500,000 | | Worldline SA, 0.25%, 9/18/24 EUR (a)(b) | | | 588 | |
| | | | | 1,798 | |
France (USD) (1%) | | | | |
450,000 | | Credit Agricole SA 144A, 3.38%, 1/10/22 (c) | | | 465 | |
250,000 | | Dexia Credit Local SA 144A, 0.75%, 5/07/23 (c) | | | 251 | |
| | | | | 716 | |
Georgia (USD) (0%) | | | | |
400,000 | | Georgia Government International Bond 144A, 6.88%, 4/12/21 (c) | | | 408 | |
Germany (EUR) (1%) | | | | |
500,000 | | E.ON SE, 0.39%, 10/24/22 EUR (a)(b)(f) | | | 585 | |
Guernsey (USD) (1%) | | | | |
550,000 | | Credit Suisse Group Funding Guernsey Ltd., 3.80%, 9/15/22 | | | 582 | |
India (USD) (1%) | | | | |
345,000 | | ICICI Bank Ltd. 144A, 5.75%, 11/16/20 (c) | | | 346 | |
500,000 | | REC Ltd. 144A, 5.25%, 11/13/23 (c) | | | 542 | |
200,000 | | Shriram Transport Finance Co. Ltd. 144A, 5.10%, 7/16/23 (c) | | | 192 | |
| | | | | 1,080 | |
Indonesia (USD) (1%) | | | | |
395,000 | | Pelabuhan Indonesia III Persero PT 144A, 4.50%, 5/02/23 (c) | | | 418 | |
| | | | | | |
| | | | | | |
Principal
or Shares | | Security Description | | Value (000) | |
| | |
280,000 | | Perusahaan Penerbit SBSN Indonesia III 144A, 3.75%, 3/01/23 (c) | | $ | 298 | |
| | | | | 716 | |
Ireland (USD) (0%) | | | | |
355,000 | | SMBC Aviation Capital Finance DAC 144A, 3.00%, 7/15/22 (c) | | | 363 | |
Italy (USD) (1%) | | | | |
425,000 | | Intesa Sanpaolo SpA 144A, 3.13%, 7/14/22 (c) | | | 438 | |
350,000 | | UniCredit SpA 144A, 6.57%, 1/14/22 (c) | | | 370 808 | |
Japan (USD) (2%) | | | | |
545,000 | | Mitsubishi UFJ Financial Group Inc., 1.41%, 7/17/25 | | | 554 | |
330,000 | | Mizuho Financial Group Inc., (3 mo. LIBOR USD + 0.840%), 2.72%, 7/16/23 (d) | | | 342 | |
250,000 | | Sumitomo Mitsui Financial Group Inc., 1.47%, 7/08/25 | | | 255 | |
450,000 | | Sumitomo Mitsui Financial Group Inc., 3.10%, 1/17/23 | | | 475 | |
210,000 | | Sumitomo Mitsui Trust Bank Ltd. 144A, 0.80%, 9/12/23 (c) | | | 211 | |
| | | | | 1,837 | |
Liberia (USD) (0%) | | | | |
135,000 | | Royal Caribbean Cruises Ltd., 2.65%, 11/28/20 | | | 135 | |
Luxembourg (EUR) (1%) | | | | |
250,000 | | Becton Dickinson Euro Finance Sarl, 0.63%, 6/04/23 EUR (b) | | | 295 | |
440,000 | | John Deere Cash Management SA, 1.38%, 4/02/24 EUR (a)(b) | | | 542 | |
| | | | | 837 | |
Netherlands (USD) (1%) | | | | |
345,000 | | BMW Finance NV 144A, 2.25%, 8/12/22 (c) | | | 355 | |
460,000 | | Enel Finance International NV 144A, 2.88%, 5/25/22 (c) | | | 475 | |
560,000 | | Teva Pharmaceutical Finance Netherlands III BV, 2.20%, 7/21/21 | | | 552 | |
| | | | | 1,382 | |
New Zealand (USD) (1%) | | | | |
350,000 | | ANZ New Zealand Int’l Ltd. 144A, 1.90%, 2/13/23 (c) | | | 361 | |
500,000 | | BNZ International Funding Ltd. 144A, 2.65%, 11/03/22 (c) | | | 522 | |
| | | | | 883 | |
Nigeria (USD) (0%) | | | | |
250,000 | | Nigeria Government International Bond 144A, 6.75%, 1/28/21 (c) | | | 252 | |
Norway (USD) (0%) | | | | |
250,000 | | Aker BP ASA 144A, 2.88%, 1/15/26 (c) | | | 248 | |
Panama (USD) (0%) | | | | |
225,000 | | Intercorp Financial Services Inc. 144A, 4.13%, 10/19/27 (c) | | | 233 | |
Peru (USD) (1%) | | | | |
320,000 | | Fondo MIVIVIENDA SA 144A, 3.50%, 1/31/23 (c) | | | 336 | |
320,000 | | Inretail Pharma SA 144A, 5.38%, 5/02/23 (c) | | | 334 | |
| | | | | 670 | |
| | | | | | |
Annual Report 79
Payden Global Low Duration Fund continued
| | | | | | |
Principal
or Shares | | Security Description | | Value (000) | |
| |
Senegal (USD) (0%) | | | | |
210,000 | | Senegal Government International Bond 144A, 8.75%, 5/13/21 (c) | | $ | 217 | |
Spain (USD) (0%) | | | | |
400,000 | | Banco Bilbao Vizcaya Argentaria SA, 0.88%, 9/18/23 | | | 400 | |
Sweden (EUR) (0%) | | | | |
300,000 | | Akelius Residential Property AB, 1.13%, 3/14/24 EUR (a)(b) | | | 358 | |
Switzerland (USD) (1%) | | | | |
200,000 | | UBS Group AG 144A, (1 yr. US Treasury Yield Curve Rate T Note Constant Maturity + 0.830%), 1.01%, 7/30/24 (c)(d) | | | 201 | |
500,000 | | UBS Group AG 144A, 3.49%, 5/23/23 (c) | | | 521 | |
| | | | | 722 | |
United Kingdom (EUR) (1%) | | | | |
500,000 | | Vodafone Group PLC,
1.75%, 8/25/23 EUR (a)(b) | | | 613 | |
United Kingdom (GBP) (0%) | | | | |
150,000 | | Sage AR Funding No 1 PLC 144A, (Sterling Overnight Index Average 3mo. + 1.250%),
0.00%, 11/17/30 GBP (b)(c)(d)(f) | | | 195 | |
United Kingdom (USD) (3%) | | | | |
200,000 | | Anglo American Capital PLC 144A, 4.13%, 4/15/21 (c) | | | 203 | |
420,000 | | British Telecommunications PLC, 4.50%, 12/04/23 | | | 464 | |
220,000 | | Lanark Master Issuer PLC, (3 mo. LIBOR USD + 0.420%), 0.68%, 12/22/69 (d) | | | 220 | |
460,000 | | Lloyds Banking Group PLC, 3.00%, 1/11/22 | | | 473 | |
660,000 | | Natwest Group PLC, (3 mo. LIBOR USD + 1.470%), 1.75%, 5/15/23 (d) | | | 665 | |
285,000 | | NatWest Markets PLC 144A, 3.63%, 9/29/22 (c) | | | 300 | |
420,000 | | Reckitt Benckiser Treasury Services PLC 144A, 2.38%, 6/24/22 (c) | | | 432 | |
255,000 | | Royalty Pharma PLC 144A, 0.75%, 9/02/23 (c) | | | 255 | |
295,000 | | Santander UK PLC, 2.10%, 1/13/23 | | | 305 | |
| | | | | 3,317 | |
United States (USD) (60%) | | | | |
70,000 | | Air Lease Corp., 2.25%, 1/15/23 | | | 70 | |
50,000 | | Air Lease Corp., 2.75%, 1/15/23 | | | 51 | |
150,000 | | Ally Financial Inc., 1.45%, 10/02/23 | | | 151 | |
120,000 | | Ally Financial Inc., 3.88%, 5/21/24 | | | 129 | |
140,000 | | Ally Financial Inc., 4.13%, 2/13/22 | | | 146 | |
165,000 | | Ameren Corp., 2.50%, 9/15/24 | | | 175 | |
360,000 | | AmeriCredit Automobile Receivables Trust 2020-1, 1.11%, 8/19/24 | | | 364 | |
230,000 | | AmeriCredit Automobile Receivables Trust 2020-2, 0.66%, 12/18/24 | | | 231 | |
350,000 | | AMSR 2020-SFR5 Trust 144A, 1.38%, 11/17/37 (c) | | | 350 | |
120,000 | | Anthem Inc., 2.38%, 1/15/25 | | | 127 | |
299,522 | | AREIT 2018-CRE2 Trust 144A, (1 mo. LIBOR USD + 1.400%), 1.55%, 11/14/35 (c)(d) | | | 292 | |
375,000 | | Ares Capital Corp., 3.63%, 1/19/22 | | | 385 | |
245,000 | | Assurant Inc., (3 mo. LIBOR USD + 1.250%), 1.48%, 3/26/21 (d) | | | 245 | |
| | | | | | |
Principal
or Shares | | Security Description | | Value (000) | |
| | |
195,000 | | Athene Global Funding 144A, 1.20%, 10/13/23 (c) | | $ | 195 | |
245,000 | | Athene Global Funding 144A, 2.80%, 5/26/23 (c) | | | 256 | |
500,000 | | Bank of America Corp., (U.S. Secured Overnight Financing Rate + 0.740%), 0.81%, 10/24/24 (d) | | | 501 | |
425,000 | | Bank of America Corp., (U.S. Secured Overnight Financing Rate + 1.460%), 1.49%, 5/19/24 (d) | | | 434 | |
240,000 | | Bank of The West Auto Trust 2019-1 144A, 2.43%, 4/15/24 (c) | | | 245 | |
190,000 | | Bank of The West Auto Trust 2019-1 144A, 2.51%, 10/15/24 (c) | | | 197 | |
15,628,345 | | Benchmark 2018-B6 Mortgage Trust, 0.44%, 10/10/51 (g) | | | 383 | |
250,000 | | BMW U.S. Capital LLC 144A, 3.80%, 4/06/23 (c) | | | 269 | |
190,000 | | BMW Vehicle Owner Trust 2020-A, 0.48%, 10/25/24 | | | 190 | |
170,874 | | BX Commercial Mortgage Trust 2019-XL 144A, (1 mo. LIBOR USD + 0.920%), 1.07%, 10/15/36 (c)(d) | | | 171 | |
170,874 | | BX Commercial Mortgage Trust 2019-XL 144A, (1 mo. LIBOR USD + 1.080%), 1.23%, 10/15/36 (c)(d) | | | 171 | |
99,909 | | BX Commercial Mortgage Trust 2020-BXLP 144A, (1 mo. LIBOR USD + 1.600%), 1.75%, 12/15/36 (c)(d) | | | 97 | |
400,000 | | BX Commercial Mortgage Trust 2020-VKNG 144A, (1 mo. LIBOR USD + 1.130%), 1.28%, 10/15/37 (c)(d) | | | 402 | |
2,882,777 | | Cantor Commercial Real Estate Lending 2019-CF1, 1.14%, 5/15/52 (g) | | | 212 | |
520,000 | | CarMax Auto Owner Trust 2020-3, 0.62%, 3/17/25 | | | 522 | |
95,046 | | CARS-DB4 LP 144A, 2.69%, 2/15/50 (c) | | | 98 | |
510,000 | | CCG Receivables Trust 2020-1 144A, 0.54%, 12/14/27 (c) | | | 511 | |
105,000 | | Centene Corp., 4.75%, 1/15/25 | | | 108 | |
149,356 | | CHC Commercial Mortgage Trust 2019-CHC 144A, (1 mo. LIBOR USD + 2.050%), 2.20%, 6/15/34 (c)(d) | | | 136 | |
348,496 | | CHC Commercial Mortgage Trust 2019-CHC 144A, (1 mo. LIBOR USD + 2.350%), 2.50%, 6/15/34 (c)(d) | | | 302 | |
265,000 | | Cheniere Corpus Christi Holdings LLC, 5.88%, 3/31/25 | | | 300 | |
250,000 | | CIT Bank NA, (U.S. Secured Overnight Financing Rate + 1.715%), 2.97%, 9/27/25 (d) | | | 259 | |
210,000 | | CIT Group Inc., 5.00%, 8/15/22 | | | 222 | |
480,000 | | Citigroup Inc., (U.S. Secured Overnight Financing Rate + 0.686%), 0.78%, 10/30/24 (d) | | | 480 | |
420,000 | | Citigroup Inc., (U.S. Secured Overnight Financing Rate + 1.667%), 1.68%, 5/15/24 (d) | | | 430 | |
190,000 | | CNH Industrial Capital LLC, 1.95%, 7/02/23 | | | 193 | |
80 Payden Mutual Funds
| | | | | | |
Principal
or Shares | | Security Description | | Value (000) | |
| | |
1,340,000 | | Cold Storage Trust 2020-ICE5 144A, (1 mo. LIBOR USD + 0.900%),
1.06%, 11/15/23 (c)(d) | | $ | 1,335 | |
340,000 | | COMM 2019-WCM Mortgage Trust 144A, (1 mo. LIBOR USD + 0.900%), 1.05%, 10/15/34 (c)(d) | | | 339 | |
506,373 | | Connecticut Avenue Securities Trust 2019-HRP1 144A, (1 mo. LIBOR USD + 2.150%), 2.30%, 11/25/39 (c)(d) | | | 458 | |
207,998 | | Connecticut Avenue Securities Trust 2019-R07 144A, (1 mo. LIBOR USD + 2.100%), 2.25%, 10/25/39 (c)(d) | | | 207 | |
90,000 | | Connecticut Avenue Securities Trust 2020-R01 144A, (1 mo. LIBOR USD + 2.050%), 2.20%, 1/25/40 (c)(d) | | | 89 | |
100,000 | | Connecticut Avenue Securities Trust 2020-SBT1 144A, (1 mo. LIBOR USD + 3.650%), 3.80%, 2/25/40 (c)(d) | | | 96 | |
400,000 | | Daimler Finance North America LLC 144A, 3.35%, 2/22/23 (c) | | | 422 | |
380,000 | | Dell Equipment Finance Trust 2020-2 144A, 0.57%, 10/23/23 (c) | | | 381 | |
46,000 | | Dell International LLC/EMC Corp. 144A, 5.88%, 6/15/21 (c) | | | 46 | |
375,000 | | Delta Air Lines Inc., 2.60%, 12/04/20 | | | 375 | |
240,000 | | Drive Auto Receivables Trust 2019-4, 2.51%, 11/17/25 | | | 246 | |
230,000 | | Drive Auto Receivables Trust 2020-1, 2.36%, 3/16/26 | | | 236 | |
130,000 | | Drive Auto Receivables Trust 2020-2, 1.42%, 3/17/25 | | | 132 | |
75,000 | | Elanco Animal Health Inc., 4.91%, 8/27/21 | | | 77 | |
221,789 | | Enterprise Fleet Financing 2019-2 LLC 144A, 2.29%, 2/20/25 (c) | | | 226 | |
290,000 | | Evergy Inc., 2.45%, 9/15/24 | | | 308 | |
177,113 | | Fannie Mae Connecticut Avenue Securities, (1 mo. LIBOR USD + 2.200%), 2.35%, 8/25/30 (d) | | | 173 | |
700,000 | | FirstKey Homes 2020-SFR2 Trust 144A, 1.27%, 10/19/37 (c) | | | 697 | |
637,183 | | FN, 2.50%, 7/01/31 | | | 663 | |
813,283 | | FN, 3.00%, 2/01/33 | | | 852 | |
280,000 | | Ford Credit Auto Lease Trust 2020-A, 2.05%, 6/15/23 | | | 287 | |
580,000 | | Ford Credit Floorplan Master Owner Trust A 2020-1, 0.70%, 9/15/25 | | | 581 | |
200,000 | | Ford Motor Credit Co. LLC, 5.13%, 6/16/25 | | | 209 | |
363,406 | | FR, 2.50%, 1/01/29 | | | 379 | |
202,129 | | Freddie Mac STACR 2019-HQA3 144A, (1 mo. LIBOR USD + 1.850%), 2.00%, 9/25/49 (c)(d) | | | 199 | |
140,000 | | Freddie Mac STACR REMIC Trust 2020-DNA1 144A, (1 mo. LIBOR USD + 1.700%), 1.85%, 1/25/50 (c)(d) | | | 138 | |
100,000 | | Freddie Mac STACR REMIC Trust 2020-DNA2 144A, (1 mo. LIBOR USD + 1.850%), 2.00%, 2/25/50 (c)(d) | | | 98 | |
260,000 | | Freddie Mac STACR REMIC Trust 2020-HQA1 144A, (1 mo. LIBOR USD + 1.900%), 2.05%, 1/25/50 (c)(d) | | | 256 | |
| | | | | | |
Principal
or Shares | | Security Description | | Value (000) | |
| | |
477,000 | | Freddie Mac STACR REMIC Trust 2020-HQA2 144A, (1 mo. LIBOR USD + 1.100%), 1.25%, 3/25/50 (c)(d) | | $ | 478 | |
250,000 | | Freddie Mac Structured Agency Credit Risk Debt Notes, (1 mo. LIBOR USD + 4.600%), 4.75%, 12/25/42 (d) | | | 238 | |
247,889 | | Freddie Mac Structured Agency Credit Risk Debt Notes, (1 mo. LIBOR USD + 11.250%), 11.40%, 10/25/29 (d) | | | 234 | |
300,000 | | FS KKR Capital Corp., 4.75%, 5/15/22 | | | 306 | |
245,000 | | FS KKR Capital Corp. II 144A, 4.25%, 2/14/25 (c) | | | 232 | |
385,000 | | General Motors Financial Co. Inc., (3 mo. LIBOR USD + 1.550%), 1.78%, 1/14/22 (d) | | | 387 | |
230,000 | | GM Financial Automobile Leasing Trust 2020-2, 0.80%, 7/20/23 | | | 232 | |
110,000 | | GM Financial Consumer Automobile Receivables Trust 2020-1, 2.03%, 4/16/25 | | | 113 | |
80,000 | | GM Financial Consumer Automobile Receivables Trust 2020-1, 2.18%, 5/16/25 | | | 83 | |
540,000 | | GM Financial Consumer Automobile Receivables Trust 2020-3, 0.45%, 4/16/25 | | | 541 | |
400,000 | | GMF Floorplan Owner Revolving Trust 2020-1 144A, 0.68%, 8/15/25 (c) | | | 401 | |
105,000 | | Goldman Sachs Group Inc., 3.50%, 4/01/25 | | | 116 | |
125,000 | | Gray Oak Pipeline LLC 144A, 2.00%, 9/15/23 (c) | | | 125 | |
240,000 | | GreatAmerica Leasing Receivables Funding LLC Series 2020-1 144A, 1.76%, 8/15/23 (c) | | | 245 | |
300,000 | | HPEFS Equipment Trust 144A, 0.69%, 7/22/30 (c) | | | 301 | |
180,000 | | Hyundai Auto Lease Securitization Trust 2020-A 144A, 2.00%, 12/15/23 (c) | | | 184 | |
250,000 | | Hyundai Capital America 144A, 1.25%, 9/18/23 (c) | | | 251 | |
130,000 | | Icahn Enterprises LP/Icahn Enterprises Finance Corp., 4.75%, 9/15/24 | | | 132 | |
200,000 | | Icahn Enterprises LP/Icahn Enterprises Finance Corp., 6.25%, 2/01/22 | | | 201 | |
115,000 | | Infor Inc. 144A, 1.45%, 7/15/23 (c) | | | 117 | |
180,000 | | InSite Issuer 2020-1A LLC 144A, 1.50%, 9/15/50 (c) | | | 180 | |
404,407 | | Invitation Homes 2018-SFR1 Trust 144A, (1 mo. LIBOR USD + 0.700%), 0.85%, 3/17/37 (c)(d) | | | 402 | |
40,000 | | iStar Inc., 4.75%, 10/01/24 | | | 38 | |
270,000 | | John Deere Owner Trust 2020-B, 0.51%, 11/15/24 | | | 271 | |
96,310 | | JP Morgan Mortgage Trust 2017-1 144A, 3.50%, 1/25/47 (c)(g) | | | 97 | |
278,787 | | JP Morgan Mortgage Trust 2017-5 144A, 3.00%, 10/26/48 (c)(g) | | | 281 | |
240,000 | | Kinder Morgan Inc., (3 mo. LIBOR USD + 1.280%), 1.52%, 1/15/23 (d) | | | 241 | |
410,000 | | Kubota Credit Owner Trust 2020-2 144A, 0.59%, 10/15/24 (c) | | | 411 | |
Annual Report 81
Payden Global Low Duration Fund continued
| | | | | | |
Principal
or Shares | | Security Description | | Value (000) | |
| | |
30,271 | | L.A. Arena Funding LLC 144A, 7.66%, 12/15/26 (c) | | $ | 30 | |
350,000 | | Lennar Corp., 4.13%, 1/15/22 | | | 359 | |
45,000 | | McDonald’s Corp., 3.30%, 7/01/25 | | | 50 | |
990,000 | | Mercedes-Benz Auto Lease Trust 2020-B, 0.40%, 11/15/23 | | | 991 | |
380,000 | | Mercedes-Benz Auto Receivables Trust 2020-1, 0.55%, 2/18/25 | | | 382 | |
235,000 | | Microchip Technology Inc. 144A, 2.67%, 9/01/23 (c) | | | 244 | |
470,000 | | MMAF Equipment Finance LLC 2020-A 144A, 0.97%, 4/09/27 (c) | | | 476 | |
380,000 | | MMAF Equipment Finance LLC 2020-B 144A, 0.49%, 8/14/25 (c) | | | 380 | |
145,000 | | Morgan Stanley, (U.S. Secured Overnight Financing Rate + 0.745%), 0.86%, 10/21/25 (d) | | | 145 | |
220,000 | | Morgan Stanley, (U.S. Secured Overnight Financing Rate + 1.152%), 2.72%, 7/22/25 (d) | | | 234 | |
91,794 | | Multifamily Connecticut Avenue Securities Trust 2019-01 144A, (1 mo. LIBOR USD + 1.700%), 1.85%, 10/15/49 (c)(d) | | | 88 | |
450,000 | | Mylan Inc. 144A, 3.13%, 1/15/23 (c) | | | 473 | |
232,279 | | New Residential Mortgage Loan Trust 2017-1 144A, 4.00%, 2/25/57 (c)(g) | | | 252 | |
457,491 | | New Residential Mortgage Loan Trust 2017-4 144A, 4.00%, 5/25/57 (c)(g) | | | 501 | |
110,000 | | NextEra Energy Operating Partners LP 144A, 4.25%, 7/15/24 (c) | | | 115 | |
200,000 | | Nissan Auto Lease Trust 2020-A, 1.88%, 4/15/25 | | | 205 | |
18,000 | | Occidental Petroleum Corp., 2.60%, 8/13/21 | | | 18 | |
42,000 | | Occidental Petroleum Corp., 2.70%, 8/15/22 | | | 39 | |
130,000 | | Owl Rock Capital Corp., 4.25%, 1/15/26 | | | 132 | |
380,000 | | Pacific Gas and Electric Co., 1.75%, 6/16/22 | | | 380 | |
295,000 | | Penske Truck Leasing Co. LP/PTL Finance Corp. 144A, 2.70%, 11/01/24 (c) | | | 314 | |
140,000 | | PFS Financing Corp. 144A, 0.93%, 8/15/24 (c) | | | 141 | |
200,000 | | PFS Financing Corp. 144A, 0.97%, 2/15/26 (c) | | | 201 | |
480,000 | | PFS Financing Corp. 144A, 1.21%, 6/15/24 (c) | | | 485 | |
130,000 | | Reliance Standard Life Global Funding II 144A, 2.15%, 1/21/23 (c) | | | 133 | |
465,000 | | Reliance Standard Life Global Funding II 144A, 2.63%, 7/22/22 (c) | | | 478 | |
600,000 | | RELX Capital Inc., 3.50%, 3/16/23 | | | 639 | |
146,994 | | Residential Asset Securitization Trust 2006-A8, 6.00%, 8/25/36 | | | 106 | |
110,000 | | Ryder System Inc., 2.88%, 6/01/22 | | | 114 | |
500,000 | | Ryder System Inc., 3.40%, 3/01/23 | | | 529 | |
190,000 | | Santander Drive Auto Receivables Trust 2020-2, 0.67%, 4/15/24 | | | 191 | |
580,000 | | Santander Drive Auto Receivables Trust 2020-3, 0.52%, 7/15/24 | | | 581 | |
550,000 | | Santander Holdings USA Inc., 3.70%, 3/28/22 | | | 570 | |
150,000 | | Santander Holdings USA Inc., 4.45%, 12/03/21 | | | 156 | |
180,000 | | SBA Tower Trust 144A, 1.88%, 1/15/26 (c) | | | 186 | |
290,000 | | Sirius XM Radio Inc. 144A, 4.63%, 7/15/24 (c) | | | 299 | |
180,000 | | Smithfield Foods Inc. 144A, 2.65%, 10/03/21 (c) | | | 181 | |
150,000 | | Southern California Edison Co., 1.85%, 2/01/22 | | | 150 | |
| | | | | | |
Principal
or Shares | | Security Description | | Value (000) | |
| | |
500,000 | | Southern Co. Gas Capital Corp., 2.45%, 10/01/23 | | $ | 525 | |
215,000 | | Southwest Airlines Co., 4.75%, 5/04/23 | | | 230 | |
120,000 | | Sprint Spectrum Co. LLC/Sprint Spectrum Co. II LLC/Sprint Spectrum Co. III LLC 144A, 3.36%, 9/20/21 (c) | | | 121 | |
300,000 | | Stack Infrastructure Issuer 2020-1A LLC 144A, 1.89%, 8/25/45 (c) | | | 302 | |
128,865 | | STACR Trust 2018-DNA2 144A, (1 mo. LIBOR USD + 0.800%), 0.95%, 12/25/30 (c)(d) | | | 129 | |
286,452 | | STACR Trust 2018-HRP1 144A, (1 mo. LIBOR USD + 1.650%), 1.80%, 4/25/43 (c)(d) | | | 279 | |
250,000 | | STACR Trust 2018-HRP1 144A, (1 mo. LIBOR USD + 3.750%), 3.90%, 4/25/43 (c)(d) | | | 237 | |
150,000 | | STACR Trust 2018-HRP2 144A, (1 mo. LIBOR USD + 10.500%), 10.65%, 2/25/47 (c)(d) | | | 150 | |
100,000 | | Starwood Property Trust Inc., 3.63%, 2/01/21 | | | 100 | |
290,000 | | Synchrony Card Funding LLC, 2.34%, 6/15/25 | | | 299 | |
40,000 | | Synchrony Financial, 2.85%, 7/25/22 | | | 41 | |
275,100 | | Taco Bell Funding LLC 144A, 4.32%, 11/25/48 (c) | | | 281 | |
55,000 | | Toll Brothers Finance Corp., 4.38%, 4/15/23 | | | 58 | |
6,409,000 | | U.S. Treasury Note, 0.13%, 9/15/23 | | | 6,397 | |
2,030,000 | | U.S. Treasury Note, 0.13%, 10/15/23 | | | 2,026 | |
3,511,000 | | U.S. Treasury Note, 0.25%, 6/15/23 | | | 3,518 | |
268,000 | | U.S. Treasury Note, 1.50%, 8/15/22 (h)(i) | | | 274 | |
225,000 | | Upjohn Inc. 144A, 1.13%, 6/22/22 (c) | | | 227 | |
300,000 | | Valero Energy Corp., 2.70%, 4/15/23 | | | 309 | |
450,000 | | Vantage Data Centers 2020-1A LLC 144A, 1.65%, 9/15/45 (c) | | | 449 | |
170,000 | | VB-S1 Issuer LLC 144A, 3.03%, 6/15/50 (c) | | | 177 | |
195,000 | | Ventas Realty LP, 2.65%, 1/15/25 | | | 206 | |
480,000 | | Verizon Owner Trust 2020-B, 0.47%, 2/20/25 | | | 481 | |
425,000 | | Volkswagen Group of America Finance LLC 144A, 2.90%, 5/13/22 (c) | | | 439 | |
7,594,837 | | Wells Fargo Commercial Mortgage Trust 2018-C46, 0.94%, 8/15/51 (g) | | | 380 | |
100,000 | | Westinghouse Air Brake Technologies Corp., 3.20%, 6/15/25 | | | 107 | |
80,000 | | Westlake Automobile Receivables Trust 2018-3 144A, 4.00%, 10/16/23 (c) | | | 82 | |
510,000 | | Westlake Automobile Receivables Trust 2019-3 144A, 2.49%, 10/15/24 (c) | | | 521 | |
240,000 | | Westlake Automobile Receivables Trust 2020-1 144A, 2.80%, 6/16/25 (c) | | | 246 | |
290,000 | | Westlake Automobile Receivables Trust 2020-2 144A, 1.32%, 7/15/25 (c) | | | 293 | |
200,000 | | Wheels SPV 2 2020-1A LLC 144A, 0.51%, 8/20/29 (c) | | | 200 | |
300,000 | | Wingstop Funding 2020-1A LLC 144A, 2.84%, 12/05/50 (c) | | | 304 | |
400,000 | | World Omni Auto Receivables Trust 2020-C, 0.48%, 11/17/25 | | | 401 | |
220,000 | | World Omni Select Auto Trust 2020-A, 0.55%, 7/15/25 | | | 220 | |
160,000 | | WPX Energy Inc., 5.88%, 6/15/28 | | | 164 | |
| | | | | | |
| | | | | 57,464 | |
| | | | | | |
Total Bonds (Cost - $94,598) | | | 95,337 | |
| | | | | | |
82 Payden Mutual Funds
| | | | | | |
Principal
or Shares | | Security Description | | Value (000) | |
Investment Company (1%) | | | | |
756,144 | | Payden Cash Reserves Money Market Fund * | | | | |
| | (Cost - $ 756) | | $ | 756 | |
| | | | | | |
Total Investments (Cost - $95,354) (100%) | | | 96,093 | |
Other Assets, net of Liabilities (0%) | | | 218 | |
Net Assets (100%) | | $ | 96,311 | |
| (a) | Security offered and sold outside the United States, and thus is exempt from registration under Regulation S of the Securities Act of 1933. It has been deemed liquid under guidelines approved by the Board. |
| (b) | Principal in foreign currency. |
| (c) | Security offered only to qualified institutional investors, and thus is not registered for sale to the public under rule 144A of the Securities Act of 1933. It has been deemed liquid under guidelines approved by the Board. |
| (d) | Floating rate security. The rate shown reflects the rate in effect at October 31, 2020. |
| (e) | All or a portion of these securities are on loan. At October 31, 2020, the total market value of the Fund’s securities on loan is $124 and the total market value of the collateral held by the Fund is $128. Amount in 000s. |
| (f) | Yield to maturity at time of purchase. |
| (g) | Variable rate security. Interest rate disclosed is as of the most recent information available. Certain variable rate securities are not based on a published reference rate and spread but are determined by the issuer or agent and are based on current market conditions. These securities do not indicate a reference rate and spread in their description above. |
| (h) | All or a portion of security has been pledged in connection with outstanding centrally cleared swaps. |
| (i) | All or a portion of the security is pledged to cover futures contract margin requirements. |
Open Forward Currency Contracts to USD
| | | | | | | | | | | | |
Currency Purchased
(000s) | | Currency
Sold (000s) | | Counterparty | | Settlement
Date | | | Unrealized
Appreciation
(Depreciation)
(000s) | |
Assets: | | | | | | | | | | | | |
USD 4,298 | | EUR 3,608 | | Citibank, N.A. | | | 03/22/2021 | | | $ | 82 | |
USD 887 | | EUR 753 | | Citibank, N.A. | | | 03/22/2021 | | | | 7 | |
USD 197 | | GBP 150 | | HSBC Bank USA, N.A. | | | 03/22/2021 | | | | 2 | |
USD 191 | | CAD 250 | | HSBC Bank USA, N.A. | | | 03/22/2021 | | | | 2 | |
| | | | | | | | | | | | |
| | | | | | | | | | | 93 | |
| | | | | | | | | | | | |
Liabilities: | | | | | |
EUR 209 | | USD 246 | | Citibank, N.A. | | | 03/22/2021 | | | | (2 | ) |
USD 262 | | CLP 208,300 | | HSBC Bank USA, N.A. | | | 01/20/2021 | | | | (7 | ) |
| | | | | | | | | | | | |
| | | | | | | | | | | (9 | ) |
| | | | | | | | | | | | |
Net Unrealized Appreciation (Depreciation) | | | | 84 | |
| | | | | | | | | | | | |
Open Futures Contracts
| | | | | | | | | | | | | | | | | | | | |
| Contract Type | | Number of
Contracts | | | Expiration
Date | | | Notional
Amount
(000s) | | | Current
Value
(000s) | | | Unrealized
Appreciation
(Depreciation)
(000s) | |
Long Contracts: | | | | | | | | | |
| U.S. Treasury 2-Year Note Future | | | 129 | | | | Dec-20 | | | $ | 28,489 | | | $ | (5 | ) | | $ | (5 | ) |
| | |
Short Contracts: | | | | | | | | | |
| U.S. Treasury 10-Year Note Future | | | 31 | | | | Dec-20 | | | | (4,285 | ) | | | 20 | | | | 20 | |
| U.S. Treasury 5-Year Note Future | | | 46 | | | | Dec-20 | | | | (5,778 | ) | | | 12 | | | | 12 | |
| | | | | | | | | | | | | | | | | | | | |
| | | | | | | | | | | | | | | | | | | 32 | |
| | | | | | | | | | | | | | | | | | | | |
Total Futures | | | | | | | | | | | | | | | | | | $ | 27 | |
| | | | | | | | | | | | | | | | | | | | |
Annual Report 83
Payden Global Low Duration Fund continued
Open Centrally Cleared Interest Rate Swap Contracts
| | | | | | | | | | | | | | | | | | | | | | | | | |
| Description | | Maturity
Date | | Notional
Amount
(000s) | | Value
(000s) | | Upfront
payments/
receipts
(000s) | | Unrealized
Appreciation
(000s) |
| 3-Year Interest Rate Swap, Receive Fixed 1.5535% Semi-Annually, Pay Variable 0.50625% (CDOR03 Index) Semi-Annually | | | | 08/30/2022 | | | | | CAD 1,060 | | | | $ | 16 | | | | | — | | | | $ | 16 | |
| 3-Year Interest Rate Swap, Receive Fixed 1.558% Semi-Annually, Pay Variable 0.50625% (CDOR03 Index) Semi-Annually | | | | 08/30/2022 | | | | | CAD 1,060 | | | | | 17 | | | | | — | | | | | 17 | |
| 3-Year Interest Rate Swap, Receive Fixed 1.575% Semi-Annually, Pay Variable 0.50625% (CDOR03 Index) Semi-Annually | | | | 08/30/2022 | | | | | CAD 930 | | | | | 15 | | | | | — | | | | | 15 | |
| | | | | | | | | | | | | | | | | | | | | | | | | |
| | | | | | | | | | | | | $ | 48 | | | | | | | | | $ | 48 | |
| | | | | | | | | | | | | | | | | | | | | | | | | |
Offsetting Asset and Liabilities
The Fund’s loaned securities were all subject to an enforceable Securities Lending Agency Agreement. Securities lent in accordance with the Securities Lending Agency Agreement on a gross basis were as follows:
| | | | |
| Total gross amount presented on the Statements of Assets and Liabilities1 | | $ | 124 | |
| Non-cash Collateral2 | | | (124 | ) |
| | | | |
| Net Amount | | $ | — | |
| | | | |
| 1 | The amount presented on the Statements of Assets and Liabilities is not offset and is shown on a gross basis. |
| 2 | At October 31, 2020, the value of the collateral received from each borrower exceeded the value of the related securities loaned. This amount is disclosed on the Schedule of Investments. |
See notes to financial statements.
84 Payden Mutual Funds
Payden Global Fixed Income Fund
| | | | | | | | |
| | | | | | |
| | | The Fund seeks a high level of total return that is consistent with preservation of capital by generally investing in investment grade debt securities denominated in U.S. and foreign currencies with an average portfolio maturity not to exceed ten years. | | | 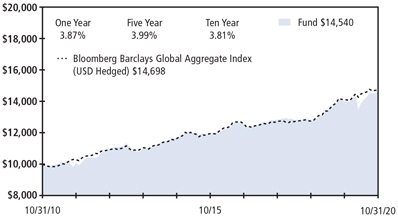
|
| | Portfolio Composition - percent of investments | |
| | | |
| | Foreign Government | | | 35 | % |
| | Corporate | | | 27 | % |
| | Mortgage Backed | | | 14 | % |
| | Asset Backed | | | 10 | % |
| | U.S. Treasury | | | 7 | % |
| | | Other | | | 7 | % |
| | | This information is not part of the audited financial statements. | | | Past performance does not predict future returns. The graph does not reflect the impact of taxes or transaction costs a shareholder would pay. |
| | | | | | |
Schedule of Investments - October 31, 2020 | | | | |
Principal
or Shares | | Security Description | | Value
(000) | |
Bonds (98%) | | | | | | |
Australia (AUD) (2%) | | | | |
550,000 | | Australia Government Bond,
2.75%, 6/21/35 (a)(b) | | $ | 471 | |
2,700,000 | | Australia Government Bond,
3.25%, 4/21/25 (a)(b) | | | 2,154 | |
| | | | | 2,625 | |
Australia (USD) (0%) | | | | |
520,000 | | APT Pipelines Ltd. 144A, 4.20%, 3/23/25 (c) | | | 571 | |
Austria (EUR) (1%) | | | | |
200,000 | | ams AG 144A, 6.00%, 7/31/25 (b)(c) | | | 243 | |
120,000 | | Republic of Austria Government Bond 144A, 1.65%, 10/21/24 (a)(b)(c) | | | 153 | |
120,000 | | Republic of Austria Government Bond 144A, 2.40%, 5/23/34 (a)(b)(c) | | | 191 | |
190,000 | | Republic of Austria Government Bond 144A, 3.15%, 6/20/44 (a)(b)(c) | | | 391 | |
| | | | | 978 | |
Belgium (EUR) (1%) | | | | |
100,000 | | Kingdom of Belgium Government Bond 144A, 0.80%, 6/22/25 (a)(b)(c) | | | 125 | |
300,000 | | Kingdom of Belgium Government Bond 144A, 1.00%, 6/22/31 (a)(b)(c) | | | 399 | |
210,000 | | Kingdom of Belgium Government Bond 144A, 1.60%, 6/22/47 (a)(b)(c) | | | 327 | |
| | | | | 851 | |
Bermuda (USD) (0%) | | | | |
200,000 | | Bermuda Government International Bond 144A, 3.38%, 8/20/50 (c) | | | 210 | |
Canada (CAD) (2%) | | | | |
880,000 | | Canadian Government Bond, 3.50%, 12/01/45 (b) | | | 997 | |
400,000 | | Canadian Government Bond, 5.00%, 6/01/37 (b) | | | 489 | |
900,000 | | CPPIB Capital Inc. 144A, 1.95%, 9/30/29 (b)(c) | | | 716 | |
400,000 | | Municipal Finance Authority of British Columbia, 2.55%, 10/09/29 (b) | | | 332 | |
500,000 | | OMERS Finance Trust 144A,
2.60%, 5/14/29 (b)(c) | | | 410 | |
| | | | | | |
Principal
or Shares | | Security Description | | Value
(000) | |
| | |
950,000 | | Ontario Teachers’ Finance Trust 144A, 1.10%, 10/19/27 (b)(c) | | $ | 710 | |
| | | | | 3,654 | |
Canada (EUR) (0%) | | | | |
400,000 | | Canadian Imperial Bank of Commerce, 0.38%, 5/03/24 (a)(b) | | | 470 | |
Canada (USD) (1%) | | | | |
186,000 | | 1011778 BC ULC/New Red Finance Inc. 144A, 5.00%, 10/15/25 (c) | | | 191 | |
300,000 | | Magna International Inc., 2.45%, 6/15/30 | | | 315 | |
405,000 | | Manulife Financial Corp., (USD ICE Swap Rate 11:00 am NY 5Y + 1.647%), 4.06%, 2/24/32 (d) | | | 438 | |
525,000 | | Northriver Midstream Finance LP 144A, 5.63%, 2/15/26 (c) | | | 521 | |
| | | | | 1,465 | |
Cayman Islands (USD) (5%) | | | | |
250,000 | | Apidos CLO XXI 144A, (3 mo. LIBOR USD + 2.450%), 2.67%, 7/18/27 (c)(d) | | | 236 | |
350,000 | | Arbor Realty Commercial Real Estate Notes 2019-FL1 Ltd. 144A, (1 mo. LIBOR USD + 1.500%), 1.65%, 5/15/37 (c)(d) | | | 343 | |
540,000 | | Atrium XII 144A, (3 mo. LIBOR USD + 2.800%), 3.02%, 4/22/27 (c)(d) | | | 492 | |
500,000 | | Bain Capital Credit CLO 2020-3 Ltd. 144A, (3 mo. LIBOR USD + 1.380%),
1.64%, 10/23/32 (c)(d) | | | 500 | |
702,882 | | Barings CLO Ltd. 2013-I 144A, (3 mo. LIBOR USD + 0.800%), 1.02%, 1/20/28 (c)(d) | | | 696 | |
525,000 | | BDS 2019-FL4 Ltd. 144A, (1 mo. LIBOR USD + 1.100%), 1.25%, 8/15/36 (c)(d) | | | 522 | |
371,226 | | BlueMountain CLO 2015-2 Ltd. 144A, (3 mo. LIBOR USD + 0.930%), 1.15%, 7/18/27 (c)(d) | | | 368 | |
Annual Report 85
Payden Global Fixed Income Fund continued
| | | | | | |
Principal
or Shares | | Security Description | | Value
(000) | |
| | |
400,000 | | CLNC 2019-FL1 Ltd. 144A, (1 mo. LIBOR USD + 1.250%), 1.40%, 8/20/35 (c)(d) | | $ | 393 | |
500,000 | | GPMT 2019-FL2 Ltd. 144A, (1 mo. LIBOR USD + 1.300%), 1.44%, 2/22/36 (c)(d) | | | 498 | |
678,000 | | Greystone Commercial Real Estate Notes 2018-HC1 Ltd. 144A, (1 mo. LIBOR USD + 2.150%), 2.30%, 9/15/28 (c)(d) | | | 638 | |
530,000 | | Gulf Stream Meridian 2 Ltd. 144A, (3 mo. LIBOR USD + 1.400%),
0.00%, 10/15/29 (c)(d)(e) | | | 530 | |
400,000 | | Hunt CRE 2018-FL2 Ltd. 144A, (1 mo. LIBOR USD + 1.080%), 1.23%, 8/15/28 (c)(d) | | | 399 | |
250,000 | | Hunt CRE 2018-FL2 Ltd. 144A, (1 mo. LIBOR USD + 1.450%), 1.60%, 8/15/28 (c)(d) | | | 247 | |
300,000 | | KREF 2018-FL1 Ltd. 144A, (1 mo. LIBOR USD + 1.100%), 1.25%, 6/15/36 (c)(d) | | | 299 | |
400,000 | | LoanCore 2019-CRE2 Issuer Ltd. 144A, (1 mo. LIBOR USD + 1.500%), 1.65%, 5/15/36 (c)(d) | | | 393 | |
350,000 | | OCP CLO 2014-5 Ltd. 144A, (3 mo. LIBOR USD + 2.900%), 3.11%, 4/26/31 (c)(d) | | | 318 | |
300,000 | | OZLM XII Ltd. 144A, (3 mo. LIBOR USD + 1.600%), 1.81%, 4/30/27 (c)(d) | | | 296 | |
668,550 | | Palmer Square Loan Funding 2020-1 Ltd. 144A, (3 mo. LIBOR USD + 0.800%), 1.05%, 2/20/28 (c)(d) | | | 662 | |
300,000 | | PFP 2019-5 Ltd. 144A, (1 mo. LIBOR USD + 1.420%), 1.57%, 4/14/36 (c)(d) | | | 291 | |
300,000 | | Tencent Holdings Ltd. 144A, 3.24%, 6/03/50 (c) | | | 303 | |
200,000 | | Tencent Holdings Ltd. 144A, 3.29%, 6/03/60 (c) | | | 201 | |
300,000 | | Voya CLO 2015-1 Ltd. 144A, (3 mo. LIBOR USD + 2.350%), 2.57%, 1/18/29 (c)(d) | | | 258 | |
525,000 | | Weibo Corp., 3.38%, 7/08/30 | | | 527 | |
| | | | | 9,410 | |
Colombia (USD) (1%) | | | | |
650,000 | | Oleoducto Central SA 144A, 4.00%, 7/14/27 (c) | | | 681 | |
Denmark (DKK) (0%) | | | | |
650,000 | | Denmark Government Bond, 4.50%, 11/15/39(b) | | | 196 | |
Dominica Republic (USD) (1%) | | | | |
200,000 | | Dominican Republic International Bond 144A, 5.50%, 1/27/25 (c) | | | 214 | |
500,000 | | Dominican Republic International Bond, 7.50%, 5/06/21(a) | | | 513 | |
| | | | | 727 | |
Finland (EUR) (1%) | | | | |
170,000 | | Finland Government Bond 144A,
2.75%, 7/04/28 (a)(b)(c) | | | 250 | |
400,000 | | Sampo Oyj, (3 mo. EURIBOR + 4.050%), 3.38%, 5/23/49 (a)(b)(d) | | | 516 | |
| | | | | 766 | |
France (EUR) (4%) | | | | |
275,000 | | Altice France SA 144A, 2.13%, 2/15/25 (b)(c) | | | 299 | |
500,000 | | Credit Mutuel Arkea SA, 1.63%, 4/15/26 (a)(b) | | | 621 | |
1,100,000 | | French Republic Government Bond OAT, 0.75%, 11/25/28 (a)(b) | | | 1,412 | |
| | | | | | |
Principal
or Shares | | Security Description | | Value
(000) | |
| | |
550,000 | | French Republic Government Bond OAT 144A, 1.25%, 5/25/36 (a)(b)(c) | | $ | 775 | |
1,420,000 | | French Republic Government Bond OAT, 1.75%, 11/25/24 (a)(b) | | | 1,822 | |
150,000 | | French Republic Government Bond OAT 144A, 2.00%, 5/25/48 (a)(b)(c) | | | 256 | |
390,000 | | French Republic Government Bond OAT, 3.25%, 5/25/45 (a)(b) | | | 789 | |
500,000 | | Terega SASU, 0.63%, 2/27/28 (a)(b) | | | 569 | |
| | | | | 6,543 | |
France (USD) (1%) | | | | |
400,000 | | BNP Paribas SA 144A, (U.S. Secured Overnight Financing Rate + 2.074%), 2.22%, 6/09/26 (c)(d) | | | 414 | |
400,000 | | BPCE SA 144A, 2.38%, 1/14/25 (c) | | | 418 | |
400,000 | | Credit Agricole SA 144A, (U.S. Secured Overnight Financing Rate + 1.676%), 1.91%, 6/16/26 (c)(d) | | | 411 | |
| | | | | 1,243 | |
Germany (EUR) (3%) | | | | |
1,410,000 | | Bundesrepublik Deutschland Bundesanleihe, 0.00%, 8/15/30 (a)(b)(e) | | | 1,746 | |
370,000 | | Bundesrepublik Deutschland Bundesanleihe, 0.25%, 8/15/26 (a)(b)(e) | | | 452 | |
950,000 | | Bundesrepublik Deutschland Bundesanleihe, 1.25%, 8/15/48 (a)(b) | | | 1,582 | |
60,000 | | Bundesrepublik Deutschland Bundesanleihe, 3.25%, 7/04/42 (a)(b) | | | 127 | |
650,000 | | Bundesrepublik Deutschland Bundesanleihe, 4.00%, 1/04/37 (a)(b) | | | 1,327 | |
450,000 | | Volkswagen Leasing GmbH,
1.50%, 6/19/26 (a)(b) | | | 552 | |
| | | | | 5,786 | |
Guatemala (USD) (0%) | | | | |
300,000 | | Guatemala Government Bond 144A, 5.38%, 4/24/32 (c) | | | 355 | |
Iceland (EUR) (0%) | | | | |
100,000 | | Landsbankinn HF, 1.63%, 3/15/21 (a)(b) | | | 117 | |
India (USD) (0%) | | | | |
665,000 | | Shriram Transport Finance Co. Ltd. 144A, 5.95%, 10/24/22 (c) | | | 649 | |
Indonesia (EUR) (0%) | | | | |
290,000 | | Indonesia Government International Bond 144A, 3.75%, 6/14/28 (b)(c) | | | 398 | |
Indonesia (USD) (1%) | | | | |
400,000 | | Indonesia Asahan Aluminium Persero PT 144A, 5.45%, 5/15/30 (c) | | | 457 | |
200,000 | | Indonesia Government International Bond 144A, 4.13%, 1/15/25 (c) | | | 223 | |
300,000 | | Pertamina Persero PT 144A, 3.10%, 8/27/30 (c) | | | 312 | |
310,000 | | Perusahaan Penerbit SBSN Indonesia III 144A, 4.15%, 3/29/27 (c) | | | 348 | |
| | | | | 1,340 | |
Ireland (EUR) (3%) | | | | |
500,000 | | Bastille Euro CLO 2020-3 DAC 144A, (3 mo. EURIBOR + 1.150%), 1.15%, 1/15/34 (b)(c)(d) | | | 582 | |
86 Payden Mutual Funds
| | | | | | |
Principal
or Shares | | Security Description | | Value
(000) | |
| | |
650,000 | | Blackrock European CLO VII DAC 144A, (3 mo. EURIBOR + 1.700%),
1.70%, 10/15/31 (b)(c)(d) | | $ | 745 | |
500,000 | | CIFC European Funding CLO II DAC 144A, (3 mo. EURIBOR + 0.900%),
0.90%, 4/15/33 (b)(c)(d) | | | 585 | |
500,000 | | Henley CLO I DAC 144A, (3 mo. EURIBOR + 1.140%), 1.14%, 7/15/32 (b)(c)(d) | | | 583 | |
250,000 | | Ireland Government Bond,
1.10%, 5/15/29 (a)(b) | | | 328 | |
100,000 | | Ireland Government Bond,
3.40%, 3/18/24 (a)(b) | | | 133 | |
400,000 | | Man GLG Euro CLO 144A, (3 mo. EURIBOR + 0.900%), 0.90%, 10/15/32 (b)(c)(d) | | | 466 | |
250,000 | | Montmartre Euro CLO 2020-2 DAC 144A, (3 mo. EURIBOR + 1.590%),
1.59%, 7/15/33 (b)(c)(d) | | | 291 | |
750,000 | | OZLME V DAC 144A, (3 mo. EURIBOR + 1.750%), 1.75%, 1/14/32 (b)(c)(d) | | | 870 | |
350,000 | | Providus CLO IV DAC 144A, (3 mo. EURIBOR + 1.450%), 1.45%, 7/20/31 (b)(c)(d) | | | 413 | |
550,000 | | St Paul’s CLO XII DAC 144A, (3 mo. EURIBOR + 3.200%), 3.20%, 4/15/33 (b)(c)(d) | | | 630 | |
300,000 | | Voya Euro CLO III DAC 144A, (3 mo. EURIBOR + 0.920%), 0.92%, 4/15/33 (b)(c)(d) | | | 348 | |
| | | | | 5,974 | |
Ireland (USD) (0%) | | | | |
535,000 | | SMBC Aviation Capital Finance DAC 144A, 2.65%, 7/15/21 (c) | | | 539 | |
Israel (USD) (0%) | | | | |
320,000 | | Leviathan Bond Ltd. 144A,
6.13%, 6/30/25 (a)(c) | | | 332 | |
Italy (EUR) (4%) | | | | |
2,300,000 | | Italy Buoni Ordinari Del Tesoro BOT, 0.00%, 9/14/21 (a)(b)(e) | | | 2,689 | |
1,090,000 | | Italy Buoni Poliennali Del Tesoro 144A, 1.65%, 12/01/30 (a)(b)(c) | | | 1,385 | |
1,010,000 | | Italy Buoni Poliennali Del Tesoro 144A, 1.80%, 3/01/41 (a)(b)(c) | | | 1,264 | |
1,500,000 | | Italy Buoni Poliennali Del Tesoro 144A, 1.85%, 7/01/25 (a)(b)(c) | | | 1,891 | |
| | | | | 7,229 | |
Italy (USD) (0%) | | | | |
350,000 | | UniCredit SpA 144A, 6.57%, 1/14/22 (c) | | | 370 | |
Japan (EUR) (0%) | | | | |
300,000 | | Takeda Pharmaceutical Co. Ltd., 2.00%, 7/09/40 (b) | | | 381 | |
Japan (JPY) (14%) | | | | |
337,400,000 | | Japan Government Ten Year Bond, 0.30%, 12/20/25 (b) | | | 3,289 | |
570,000,000 | | Japan Government Ten Year Bond, 0.80%, 9/20/23 (b) | | | 5,591 | |
85,000,000 | | Japan Government Thirty Year Bond, 0.80%, 3/20/48 (b) | | | 856 | |
222,800,000 | | Japan Government Thirty Year Bond, 1.40%, 12/20/45 (b) | | | 2,562 | |
48,000,000 | | Japan Government Thirty Year Bond, 2.00%, 9/20/40 (b) | | | 597 | |
| | | | | | |
Principal
or Shares | | Security Description | | Value
(000) | |
| | |
40,000,000 | | Japan Government Thirty Year Bond, 2.20%, 9/20/39 (b) | | $ | 508 | |
140,000,000 | | Japan Government Thirty Year Bond, 2.30%, 3/20/39 (b) | | | 1,791 | |
424,500,000 | | Japan Government Twenty Year Bond, 1.70%, 9/20/33 (b) | | | 4,841 | |
395,000,000 | | Japan Government Twenty Year Bond, 2.10%, 6/20/28 (b) | | | 4,399 | |
| | | | | 24,434 | |
Kazakhstan (EUR) (0%) | | | | |
300,000 | | Kazakhstan Government International Bond, 1.55%, 11/09/23 (a)(b) | | | 359 | |
Luxembourg (EUR) (0%) | | | | |
450,000 | | Logicor Financing Sarl, 1.63%, 7/15/27 (a)(b) | | | 544 | |
Malaysia (MYR) (0%) | | | | |
1,700,000 | | Malaysia Government Bond, 3.50%, 5/31/27 (b) | | | 438 | |
Mexico (MXN) (1%) | | | | |
11,660,000 | | Mexican Bonos, 5.75%, 3/05/26 (b) | | | 560 | |
5,500,000 | | Mexican Bonos, 6.50%, 6/10/21 (b) | | | 262 | |
| | | | | 822 | |
Mexico (USD) (1%) | | | | |
400,000 | | Fomento Economico Mexicano SAB de CV, 3.50%, 1/16/50 | | | 418 | |
400,000 | | Petroleos Mexicanos, 5.95%, 1/28/31 | | | 335 | |
| | | | | 753 | |
Mongolia (USD) (0%) | | | | |
450,000 | | Mongolia Government International Bond 144A, 5.13%, 4/07/26 (c) | | | 466 | |
Morocco (EUR) (0%) | | | | |
500,000 | | Morocco Government International Bond 144A, 2.00%, 9/30/30 (b)(c) | | | 568 | |
Netherlands (EUR) (1%) | | | | |
300,000 | | Netherlands Government Bond 144A, 0.50%, 7/15/26 (a)(b)(c) | | | 374 | |
130,000 | | Netherlands Government Bond 144A, 2.25%, 7/15/22 (a)(b)(c) | | | 159 | |
230,000 | | Netherlands Government Bond 144A, 4.00%, 1/15/37 (a)(b)(c) | | | 462 | |
100,000 | | Prosus NV 144A, 1.54%, 8/03/28 (b)(c) | | | 118 | |
100,000 | | Prosus NV 144A, 2.03%, 8/03/32 (b)(c) | | | 118 | |
400,000 | | Q-Park Holding I BV 144A, 2.00%, 3/01/27 (b)(c) | | | 400 | |
220,000 | | Teva Pharmaceutical Finance Netherlands II BV, 1.13%, 10/15/24 (a)(b) | | | 225 | |
110,000 | | Teva Pharmaceutical Finance Netherlands II BV, 4.50%, 3/01/25 (b) | | | 127 | |
| | | | | 1,983 | |
Netherlands (USD) (1%) | | | | |
700,000 | | Enel Finance International NV 144A, 4.63%, 9/14/25 (c) | | | 808 | |
200,000 | | Lukoil Securities BV 144A, 3.88%, 5/06/30 (c) | | | 212 | |
200,000 | | Prosus NV 144A, 3.68%, 1/21/30 (c) | | | 218 | |
250,000 | | Teva Pharmaceutical Finance Netherlands III BV, 2.20%, 7/21/21 | | | 247 | |
| | | | | 1,485 | |
Annual Report 87
Payden Global Fixed Income Fund continued
| | | | | | | | |
Principal
or Shares | | | Security Description | | Value (000) | |
| |
| | Nigeria (USD) (0%) | | | | |
| | 400,000 | | | Nigeria Government International Bond, 6.75%, 1/28/21 (a) | | $ | 403 | |
| | Paraguay (USD) (0%) | | | | |
| | 300,000 | | | Paraguay Government International Bond 144A, 4.95%, 4/28/31 (c) | | | 351 | |
| | Peru (USD) (0%) | | | | |
| | 387,000 | | | Banco Internacional del Peru SAA Interbank 144A, 3.25%, 10/04/26 (c) | | | 409 | |
| | Poland (EUR) (0%) | | | | |
| | 450,000 | | | CANPACK SA/Eastern PA Land Investment Holding LLC 144A, 2.38%, 11/01/27 (b)(c) | | | 527 | |
| | Poland (PLN) (0%) | | | | |
| | 410,000 | | | Republic of Poland Government Bond, 2.75%, 10/25/29 (b) | | | 118 | |
| | Qatar (USD) (0%) | | | | |
| | 400,000 | | | Qatar Government International Bond 144A, 4.00%, 3/14/29 (c) | | | 470 | |
| |
| | Russian Federation (RUB) (0%) | | | | |
| | 14,880,000 | | | Russian Federal Bond - OFZ, 8.15%, 2/03/27 (b) | | | 212 | |
| | Russian Federation (USD) (0%) | | | | |
| | 400,000 | | | Russian Foreign Bond - Eurobond, 5.63%, 4/04/42 (a) | | | 527 | |
| | Senegal (USD) (0%) | | | | |
| | 295,000 | | | Senegal Government International Bond 144A, 8.75%, 5/13/21 (c) | | | 305 | |
| |
| | Singapore (SGD) (0%) | | | | |
| | 280,000 | | | Singapore Government Bond, 3.50%, 3/01/27 (b) | | | 242 | |
| | Spain (EUR) (1%) | | | | |
| | 250,000 | | | El Corte Ingles SA 144A,
3.63%, 3/15/24 (b)(c) | | | 293 | |
| | 320,000 | | | Spain Government Bond 144A, 2.90%, 10/31/46 (a)(b)(c) | | | 552 | |
| | | | | | | 845 | |
| | Sri Lanka (USD) (0%) | | | | |
| | 300,000 | | | Sri Lanka Government International Bond 144A, 5.88%, 7/25/22 (c) | | | 194 | |
| | Sweden (SEK) (0%) | | | | |
| | 2,900,000 | | | Sweden Government Bond, 1.00%, 11/12/26 (a)(b) | | | 352 | |
| | Switzerland (CHF) (1%) | | | | |
| | 550,000 | | | Swiss Confederation Government Bond, 0.50%, 5/27/30 (a)(b) | | | 662 | |
| | Switzerland (USD) (0%) | | | | |
| | 395,000 | | | Credit Suisse Group AG 144A, (U.S. Secured Overnight Financing Rate + 1.560%), 2.59%, 9/11/25 (c)(d) | | | 414 | |
| |
| | Thailand (THB) (0%) | | | | |
| | 15,100,000 | | | Thailand Government Bond, 1.60%, 12/17/29 (b) | | | 495 | |
| | Ukraine (USD) (0%) | | | | |
| | 320,000 | | | Ukraine Government International Bond 144A, 7.25%, 3/15/33 (c) | | | 302 | |
| | United Arab Emirates (USD) (0%) | | | | |
| | 300,000 | | | Acwa Power Management And Investments One Ltd. 144A, 5.95%, 12/15/39 (c) | | | 347 | |
| | | | | | | | |
Principal
or Shares | | | Security Description | | Value (000) | |
| |
| | United Kingdom (EUR) (1%) | | | | |
| | 400,000 | | | Experian Finance PLC, 1.38%, 6/25/26 (a)(b) | | $ | 497 | |
| | 500,000 | | | Nationwide Building Society, (5 yr. Euro Swap + 1.500%), 2.00%, 7/25/29 (a)(b)(d) | | | 601 | |
| | | | | | | 1,098 | |
| | United Kingdom (GBP) (4%) | | | | |
| | 350,000 | | | Barclays PLC, 3.00%, 5/08/26 (a)(b) | | | 481 | |
| | 350,000 | | | Lloyds Banking Group PLC, (5 yr. UK Government Bonds Note Generic Bid Yield + 4.607%), 5.13%, (b)(d)(f) | | | 448 | |
| | 300,000 | | | Natwest Group PLC, (1 yr. GBP interest rate swap + 1.490%), 2.88%, 9/19/26 (a)(b)(d) | | | 412 | |
| | 401,851 | | | Ripon Mortgages PLC 144A, (3 mo. LIBOR GBP + 0.800%), 0.87%, 8/20/56 (b)(c)(d) | | | 520 | |
| | 130,000 | | | Sage AR Funding No 1 PLC 144A, (Sterling Overnight Index Average 3mo. + 3.000%), 0.00%, 11/17/30 (b)(c)(d)(e) | | | 169 | |
| | 440,000 | | | United Kingdom Gilt, 4.25%, 12/07/55 (a)(b) | | | 1,174 | |
| | 260,000 | | | United Kingdom Gilt, 4.25%, 12/07/55 (a)(b) | | | 694 | |
| | 1,210,000 | | | United Kingdom Gilt, 4.75%, 12/07/38 (a)(b) | | | 2,664 | |
| | 420,000 | | | United Kingdom Gilt, 5.00%, 3/07/25 (a)(b) | | | 664 | |
| | | | | | | 7,226 | |
| | United States (EUR) (3%) | | | | |
| | 750,000 | | | AbbVie Inc. 144A, 1.25%, 6/01/24 (b)(c) | | | 909 | |
| | 350,000 | | | AT&T Inc., 1.80%, 9/14/39 (b) | | | 418 | |
| | 450,000 | | | Blackstone Holdings Finance Co. LLC 144A, 1.00%, 10/05/26 (b)(c) | | | 548 | |
| | 500,000 | | | Chubb INA Holdings Inc., 0.88%, 12/15/29 (b) | | | 595 | |
| | 450,000 | | | Comcast Corp., 0.25%, 5/20/27 (b) | | | 530 | |
| | 200,000 | | | Comcast Corp., 0.75%, 2/20/32 (b) | | | 238 | |
| | 200,000 | | | Comcast Corp., 1.25%, 2/20/40 (b) | | | 242 | |
| | 100,000 | | | Fidelity National Information Services Inc., 0.75%, 5/21/23 (b) | | | 119 | |
| | 400,000 | | | General Motors Financial Co. Inc., 0.96%, 9/07/23 (a)(b) | | | 468 | |
| | 250,000 | | | International Flavors & Fragrances Inc., 1.80%, 9/25/26 (b) | | | 311 | |
| | 500,000 | | | Morgan Stanley, (3 mo. EURIBOR + 0.867%), 0.50%, 10/26/29 (b)(d) | | | 580 | |
| | 200,000 | | | Standard Industries Inc. 144A, 2.25%, 11/21/26 (b)(c) | | | 230 | |
| | | | | | | 5,188 | |
| | United States (USD) (39%) | | | | |
| | 250,000 | | | AbbVie Inc. 144A, 4.25%, 11/21/49 (c) | | | 293 | |
| | 400,000 | | | Air Products and Chemicals Inc., 2.05%, 5/15/30 | | | 418 | |
| | 400,000 | | | Allison Transmission Inc. 144A,
5.88%, 6/01/29 (c) | | | 438 | |
| | 390,000 | | | American Equity Investment Life Holding Co., 5.00%, 6/15/27 | | | 436 | |
| | 450,000 | | | American Water Capital Corp., 2.80%, 5/01/30 | | | 492 | |
| | 259,350 | | | Arbys Funding LLC 144A, 3.24%, 7/30/50 (c) | | | 267 | |
| | 350,000 | | | Ares Capital Corp., 3.63%, 1/19/22 | | | 359 | |
| | 163,000 | | | Ascent Resources Utica Holdings LLC/ARU Finance Corp. 144A, 9.00%, 11/01/27 (c) | | | 159 | |
| | 500,000 | | | AT&T Inc., 3.30%, 2/01/52 | | | 460 | |
| | 400,000 | | | AT&T Inc., 4.35%, 3/01/29 | | | 466 | |
| | 875,000 | | | Bank of America Corp., (U.S. Secured Overnight Financing Rate + 1.010%), 1.20%, 10/24/26 (d) | | | 876 | |
88 Payden Mutual Funds
| | | | | | | | |
Principal
or Shares | | | Security Description | | Value (000) | |
| | |
| | 350,000 | | | Bank of America Corp., (3 mo. LIBOR USD + 1.210%), 3.97%, 2/07/30 (d) | | $ | 404 | |
| | 400,000 | | | Boston Properties LP, 2.90%, 3/15/30 | | | 416 | |
| | 252,000 | | | BX Commercial Mortgage Trust 2018-IND 144A, (1 mo. LIBOR USD + 1.700%), 1.85%, 11/15/35 (c)(d) | | | 249 | |
| | 280,000 | | | BX Commercial Mortgage Trust 2018-IND 144A, (1 mo. LIBOR USD + 1.800%), 1.95%, 11/15/35 (c)(d) | | | 275 | |
| | 711,973 | | | BX Commercial Mortgage Trust 2019-XL 144A, (1 mo. LIBOR USD + 2.300%), 2.45%, 10/15/36 (c)(d) | | | 694 | |
| | 199,817 | | | BX Commercial Mortgage Trust 2020-BXLP 144A, (1 mo. LIBOR USD + 2.000%), 2.15%, 12/15/36 (c)(d) | | | 194 | |
| | 2,306,620 | | | Cantor Commercial Real Estate Lending 2019-CF1, 1.14%, 5/15/52 (g) | | | 170 | |
| | 479,942 | | | CarMax Auto Owner Trust 2020-2, 1.75%, 1/17/23 | | | 483 | |
| | 285,139 | | | CARS-DB4 LP 144A, 3.25%, 2/15/50 (c) | | | 295 | |
| | 350,000 | | | CARS-DB4 LP 144A, 4.17%, 2/15/50 (c) | | | 360 | |
| | 220,000 | | | Centene Corp., 4.25%, 12/15/27 | | | 232 | |
| | 300,000 | | | CenterPoint Energy Inc., 3.70%, 9/01/49 | | | 334 | |
| | 298,711 | | | CHC Commercial Mortgage Trust 2019-CHC 144A, (1 mo. LIBOR USD + 2.050%), 2.20%, 6/15/34 (c)(d) | | | 272 | |
| | 150,000 | | | Cheniere Energy Partners LP, 4.50%, 10/01/29 | | | 153 | |
| | 225,000 | | | Choice Hotels International Inc., 3.70%, 1/15/31 | | | 235 | |
| | 385,000 | | | Cigna Corp., 4.38%, 10/15/28 | | | 457 | |
| | 300,000 | | | CIT Bank NA, (U.S. Secured Overnight Financing Rate + 1.715%), 2.97%, 9/27/25 (d) | | | 310 | |
| | 480,000 | | | CNX Midstream Partners LP/CNX Midstream Finance Corp. 144A, 6.50%, 3/15/26 (c) | | | 489 | |
| | 550,000 | | | Comstock Resources Inc. 144A, 7.50%, 5/15/25 (c) | | | 547 | |
| | 651,051 | | | Connecticut Avenue Securities Trust 2019-HRP1 144A, (1 mo. LIBOR USD + 2.150%), 2.30%, 11/25/39 (c)(d) | | | 588 | |
| | 200,000 | | | Connecticut Avenue Securities Trust 2020-R01 144A, (1 mo. LIBOR USD + 2.050%), 2.20%, 1/25/40 (c)(d) | | | 197 | |
| | 150,000 | | | Connecticut Avenue Securities Trust 2020-R02 144A, (1 mo. LIBOR USD + 3.000%), 3.15%, 1/25/40 (c)(d) | | | 117 | |
| | 400,000 | | | CVS Health Corp., 4.30%, 3/25/28 | | | 463 | |
| | 485,550 | | | DB Master Finance LLC 144A, 4.03%, 11/20/47 (c) | | | 514 | |
| | 400,000 | | | Dell International LLC/EMC Corp. 144A, 6.10%, 7/15/27 (c) | | | 476 | |
| | 175,000 | | | Diamond Sports Group LLC/Diamond Sports Finance Co. 144A, 5.38%, 8/15/26 (c) | | | 103 | |
| | 90,000 | | | Dignity Health, 3.13%, 11/01/22 | | | 93 | |
| | 850,425 | | | Domino’s Pizza Master Issuer LLC 144A, 4.33%, 7/25/48 (c) | | | 924 | |
| | 349,125 | | | Driven Brands Funding 2020-1A LLC 144A, 3.79%, 7/20/50 (c) | | | 360 | |
| | 450,000 | | | Driven Brands Funding 2020-2A LLC 144A, 3.24%, 1/20/51 (c) | | | 450 | |
| | | | | | | | |
Principal
or Shares | | | Security Description | | Value (000) | |
| | |
| | 350,000 | | | Enterprise Products Operating LLC, 3.20%, 2/15/52 | | $ | 325 | |
| | 310,000 | | | EQT Corp., 3.00%, 10/01/22 | | | 310 | |
| | 235,000 | | | Evergy Inc., 2.90%, 9/15/29 | | | 251 | |
| | 300,000 | | | Exelon Generation Co. LLC, 3.25%, 6/01/25 | | | 327 | |
| | 260,263 | | | Fannie Mae Connecticut Avenue Securities, (1 mo. LIBOR USD + 2.150%), 2.30%, 10/25/30 (d) | | | 255 | |
| | 199,691 | | | Fannie Mae Connecticut Avenue Securities, (1 mo. LIBOR USD + 9.500%), 9.65%, 5/25/29 (d) | | | 215 | |
| | 496,884 | | | Fannie Mae Connecticut Avenue Securities, (1 mo. LIBOR USD + 10.250%), 10.40%, 1/25/29 (d) | | | 561 | |
| | 498,390 | | | Fannie Mae Connecticut Avenue Securities, (1 mo. LIBOR USD + 10.750%), 10.90%, 1/25/29 (d) | | | 569 | |
| | 460,000 | | | Fannie Mae-Aces, 3.70%, 9/25/30 (g) | | | 555 | |
| | 794,955 | | | FN BK2717 15YR, 2.00%, 7/01/35 | | | 825 | |
| | 815,474 | | | FN BP6626 30YR, 2.00%, 8/01/50 | | | 842 | |
| | 1,585,663 | | | FN CA6322 30YR, 2.50%, 7/01/50 | | | 1,654 | |
| | 836,235 | | | FN BP6749 30YR, 2.50%, 9/01/50 | | | 872 | |
| | 1,023,781 | | | FN MA3247 15YR, 3.00%, 1/01/33 | | | 1,072 | |
| | 653,371 | | | FN AB9186 30YR, 3.00%, 4/01/43 | | | 692 | |
| | 433,310 | | | FN MA3143 30YR, 3.00%, 9/01/47 | | | 453 | |
| | 652,329 | | | FN BO9355 30YR, 3.00%, 3/01/50 | | | 683 | |
| | 1,386,090 | | | FN BP6345 30YR, 3.00%, 6/01/50 | | | 1,450 | |
| | 693,799 | | | FN CA6314 30YR, 3.00%, 7/01/50 | | | 735 | |
| | 284,773 | | | FN AS4885 30YR, 3.50%, 5/01/45 | | | 304 | |
| | 1,029,606 | | | FN FM1717 30YR, 3.50%, 12/01/45 | | | 1,117 | |
| | 478,016 | | | FN MA3238 30YR, 3.50%, 1/01/48 | | | 507 | |
| | 402,211 | | | FN CA0133 30YR, 4.00%, 8/01/47 | | | 431 | |
| | 1,540,000 | | | FNCL, 2.00%, 15YR TBA (h) | | | 1,596 | |
| | 870,000 | | | FNCL, 2.00%, 30YR TBA (h) | | | 895 | |
| | 720,000 | | | FNCL, 2.50%, 30YR TBA (h) | | | 749 | |
| | 450,000 | | | Ford Motor Credit Co. LLC, 4.13%, 8/17/27 | | | 444 | |
| | 400,000 | | | Freddie Mac STACR REMIC Trust 2020-DNA2 144A, (1 mo. LIBOR USD + 2.500%), 2.65%, 2/25/50 (c)(d) | | | 352 | |
| | 300,000 | | | Freddie Mac STACR REMIC Trust 2020-DNA4 144A, (1 mo. LIBOR USD + 1.500%), 1.65%, 8/25/50 (c)(d) | | | 302 | |
| | 500,000 | | | Freddie Mac STACR REMIC Trust 2020-HQA3 144A, (1 mo. LIBOR USD + 1.550%), 1.70%, 7/25/50 (c)(d) | | | 501 | |
| | 600,000 | | | Freddie Mac STACR Trust 2018-HQA2 144A, (1 mo. LIBOR USD + 2.300%), 2.45%, 10/25/48 (c)(d) | | | 586 | |
| | 266,008 | | | Freddie Mac STACR Trust 2019-DNA1 144A, (1 mo. LIBOR USD + 2.650%), 2.80%, 1/25/49 (c)(d) | | | 265 | |
| | 178,924 | | | Freddie Mac STACR Trust 2019-DNA3 144A, (1 mo. LIBOR USD + 2.050%), 2.20%, 7/25/49 (c)(d) | | | 176 | |
| | 200,000 | | | Freddie Mac STACR Trust 2019-DNA4 144A, (1 mo. LIBOR USD + 2.700%), 2.85%, 10/25/49 (c)(d) | | | 184 | |
Annual Report 89
Payden Global Fixed Income Fund continued
| | | | | | |
Principal
or Shares | | Security Description | | Value
(000) | |
| | |
114,264 | | Freddie Mac STACR Trust 2019-HQA2 144A, (1 mo. LIBOR USD + 2.050%), 2.20%, 4/25/49 (c)(d) | | $ | 113 | |
325,000 | | FS KKR Capital Corp., 4.75%, 5/15/22 | | | 332 | |
350,000 | | FS KKR Capital Corp. II 144A, 4.25%, 2/14/25 (c) | | | 331 | |
761,604 | | G2 MA4126 30YR, 3.00%, 12/20/46 | | | 804 | |
295,670 | | G2 MA3663 30YR, 3.50%, 5/20/46 | | | 317 | |
425,900 | | G2 MA5021 30YR, 4.50%, 2/20/48 | | | 463 | |
350,000 | | General Motors Co., 6.25%, 10/02/43 | | | 431 | |
575,000 | | GLP Capital LP/GLP Financing II Inc., 4.00%, 1/15/31 | | | 602 | |
500,000 | | Goldman Sachs Group Inc., 2.60%, 2/07/30 | | | 529 | |
17,116 | | GreenPoint MTA Trust 2005-AR1, (1 mo. LIBOR USD + 0.560%), 0.71%, 6/25/45 (d) | | | 15 | |
150,000 | | HCA Inc., 4.13%, 6/15/29 | | | 170 | |
300,000 | | Indigo Natural Resources LLC 144A, 6.88%, 2/15/26 (c) | | | 295 | |
350,000 | | ITC Holdings Corp. 144A, 2.95%, 5/14/30 (c) | | | 376 | |
350,000 | | JPMorgan Chase & Co., (U.S. Secured Overnight Financing Rate + 1.510%), 2.74%, 10/15/30 (d) | | | 375 | |
375,000 | | Kinder Morgan Energy Partners LP, 6.55%, 9/15/40 | | | 469 | |
300,000 | | Kinder Morgan Inc., 3.25%, 8/01/50 | | | 272 | |
250,000 | | KKR Group Finance Co. II LLC 144A, 5.50%, 2/01/43 (c) | | | 314 | |
720,000 | | Kubota Credit Owner Trust 2020-1 144A, 1.92%, 12/15/22 (c) | | | 728 | |
470,000 | | Lamar Media Corp., 4.00%, 2/15/30 | | | 475 | |
680,000 | | Life Storage LP, 2.20%, 10/15/30 | | | 680 | |
550,000 | | MF1 2020-FL3 Ltd. 144A, (1 mo. LIBOR USD + 2.050%), 2.20%, 7/15/35 (c)(d) | | | 554 | |
470,000 | | Moog Inc. 144A, 4.25%, 12/15/27 (c) | | | 483 | |
65,000 | | National Fuel Gas Co., 4.90%, 12/01/21 | | | 67 | |
290,000 | | National Fuel Gas Co., 5.50%, 1/15/26 | | | 318 | |
170,000 | | Nationwide Mutual Insurance Co. 144A, 9.38%, 8/15/39 (c) | | | 287 | |
211,661 | | New Residential Mortgage Loan Trust 2017-2 144A, 4.00%, 3/25/57 (c)(g) | | | 229 | |
400,000 | | NextEra Energy Capital Holdings Inc., 2.25%, 6/01/30 | | | 415 | |
420,000 | | NiSource Inc., 3.60%, 5/01/30 | | | 478 | |
367,247 | | Nissan Auto Receivables 2020-A Owner Trust, 1.45%, 12/15/22 | | | 369 | |
485,000 | | Northwell Healthcare Inc., 4.26%, 11/01/47 | | | 538 | |
197,000 | | Occidental Petroleum Corp., 2.70%, 8/15/22 | | | 182 | |
63,000 | | Pacific Life Insurance Co. 144A, 9.25%, 6/15/39 (c) | | | 101 | |
300,000 | | PacifiCorp., 2.70%, 9/15/30 | | | 328 | |
650,000 | | Plains All American Pipeline LP/PAA Finance Corp., 3.80%, 9/15/30 | | | 630 | |
400,000 | | Plains All American Pipeline LP/PAA Finance Corp., 5.00%, 2/01/21 | | | 400 | |
297,750 | | Planet Fitness Master Issuer LLC 144A, 3.86%, 12/05/49 (c) | | | 282 | |
700,000 | | Progress Residential 2019-SFR4 Trust 144A, 2.69%, 10/17/36 (c) | | | 721 | |
45,000 | | PTC Inc. 144A, 4.00%, 2/15/28 (c) | | | 47 | |
| | | | | | |
Principal
or Shares | | Security Description | | Value (000) | |
| | |
700,000 | | Public Service Co. of Colorado, 2.70%, 1/15/51 | | $ | 710 | |
355,000 | | Range Resources Corp. 144A, 9.25%, 2/01/26 (c) | | | 377 | |
200,000 | | RELX Capital Inc., 3.00%, 5/22/30 | | | 216 | |
400,000 | | Sabine Pass Liquefaction LLC, 5.63%, 3/01/25 | | | 458 | |
500,000 | | SBA Tower Trust 144A, 2.84%, 1/15/25 (c) | | | 531 | |
400,000 | | Sirius XM Radio Inc. 144A, 3.88%, 8/01/22 (c) | | | 403 | |
500,000 | | SLM Corp., 5.13%, 4/05/22 | | | 515 | |
357,000 | | Southwestern Energy Co., 8.38%, 9/15/28 | | | 374 | |
282,240 | | STACR Trust 2018-HRP1 144A, (1 mo. LIBOR USD + 1.650%), 1.80%, 4/25/43 (c)(d) | | | 275 | |
200,000 | | Teachers Insurance & Annuity Association of America 144A, 4.90%, 9/15/44 (c) | | | 257 | |
450,000 | | TerraForm Power Operating LLC 144A, 4.25%, 1/31/23 (c) | | | 459 | |
640,000 | | Toledo Hospital, 5.33%, 11/15/28 | | | 717 | |
8,300,000 | | U.S. Treasury Bill, 0.12%, 9/09/21 (e) | | | 8,292 | |
2,135,000 | | U.S. Treasury Bond, 2.25%, 8/15/46 (i)(j)(k) | | | 2,445 | |
550,000 | | U.S. Treasury Bond, 2.88%, 5/15/49 | | | 712 | |
830,000 | | U.S. Treasury Bond, 4.50%, 5/15/38 | | | 1,265 | |
300,000 | | Ventas Realty LP, 3.00%, 1/15/30 | | | 309 | |
325,000 | | Ventas Realty LP, 3.50%, 2/01/25 | | | 354 | |
200,000 | | VICI Properties LP/VICI Note Co. Inc. 144A, 4.25%, 12/01/26 (c) | | | 204 | |
400,000 | | Wisconsin Power and Light Co., 3.65%, 4/01/50 | | | 460 | |
| | | | | 70,426 | |
| |
Total Bonds (Cost - $170,655) | | | 176,825 | |
| |
Bank Loans(l) (2%) | | | | |
150,000 | | AI Convoy Luxembourg Sarl Term Loan B 1L, (3 mo. EURIBOR + 3.750%) 3.75%, 1/20/27 EUR (b) | | | 172 | |
337,000 | | Ascent Resources Utica Holdings LLC Term Loan 2L, (LIBOR USD 1-Month + 9.000%) 10.00%, 11/01/25 | | | 358 | |
150,000 | | Froneri Lux FinCo SARL Term Loan B 1L, (1 mo. EURIBOR + 2.630%) 2.63%, 1/31/27 EUR (b) | | | 171 | |
297,750 | | Grifols SA Term Loan B 1L, (3 mo. EURIBOR + 2.250%) 2.25%, 11/15/27 EUR (b) | | | 343 | |
319,182 | | IRB Holdings Corp. Term Loan 1L, (LIBOR USD 1-Month + 2.750%) 3.75%, 2/05/25 | | | 304 | |
488,687 | | K-MAC Holdings Corp. Term Loan 1L, (LIBOR USD 1-Month + 3.000%) 3.15%, 3/16/25 | | | 473 | |
488,747 | | Tacala Investment Corp. Term Loan B 1L, (LIBOR USD 1-Month + 3.250%) 3.40%, 2/05/27 | | | 475 | |
| |
Total Bank Loans (Cost - $2,255) | | | 2,296 | |
Investment Company (6%) | | | | |
9,848,803 | | Payden Cash Reserves Money Market Fund * | | | 9,849 | |
146,702 | | Payden Floating Rate Fund, SI Class * | | | 1,395 | |
| |
Total Investment Company (Cost - $11,317) | | | 11,244 | |
Total Investments (Cost - $184,227) (106%) | | | 190,365 | |
Liabilities in excess of Other Assets (-6%) | | | (10,291 | ) |
| |
Net Assets (100%) | | $ | 180,074 | |
| (a) | Security offered and sold outside the United States, and thus is exempt from registration under Regulation S of the Securities Act of 1933. It has been deemed liquid under guidelines approved by the Board. |
| (b) | Principal in foreign currency. |
| (c) | Security offered only to qualified institutional investors, and thus is not registered for sale to the public under rule 144A of the Securities Act of 1933. It has been deemed liquid under guidelines approved by the Board. |
90 Payden Mutual Funds
| (d) | Floating rate security. The rate shown reflects the rate in effect at October 31, 2020. |
| (e) | Yield to maturity at time of purchase. |
| (f) | Perpetual security with no stated maturity date. |
| (g) | Variable rate security. Interest rate disclosed is as of the most recent information available. Certain variable rate securities are not based on a published reference rate and spread but are determined by the issuer or agent and are based on current market conditions. These securities do not indicate a reference rate and spread in their description above. |
| (h) | Security was purchased on a delayed delivery basis. |
| (i) | All or a portion of security has been pledged in connection with outstanding centrally cleared swaps. |
| (j) | All or a portion of the security is pledged to cover futures contract margin requirements. |
| (k) | All or a portion of security has been pledged as collateral in connection with outstanding OTC derivatives. |
| (l) | Floating rate security. The rate shown reflects the rate in effect at October 31, 2020. The stated maturity is subject to prepayments. See Note 2 in the Notes to Financial Statements. |
Open Forward Currency Contracts to USD
| | | | | | | | | | | | | | | | |
Currency
Purchased
(000s) | | Currency
Sold (000s) | | | Counterparty | | | Settlement
Date | | | Unrealized
Appreciation
(Depreciation)
(000s) | |
Assets: | | | | | | | | | | | | | | | | |
AUD 199 | | | USD 140 | | |
| BNP
PARIBAS |
| | | 12/16/2020 | | | $ | — | |
JPY 283,700 | | | USD 2,694 | | |
| HSBC Bank
USA, N.A. |
| | | 12/15/2020 | | | | 17 | |
MYR 1,867 | | | USD 446 | | |
| Barclays
Bank PLC |
| | | 11/05/2020 | | | | 3 | |
NOK 1,468 | | | USD 154 | | |
| Barclays
Bank PLC |
| | | 12/14/2020 | | | | — | |
THB 15,630 | | | USD 500 | | |
| HSBC Bank
USA, N.A. |
| | | 11/05/2020 | | | | 2 | |
USD 1,717 | | | AUD 2,380 | | |
| Barclays
Bank PLC |
| | | 12/14/2020 | | | | 44 | |
USD 879 | | | AUD 1,239 | | |
| BNP
PARIBAS |
| | | 12/16/2020 | | | | 7 | |
USD 681 | | | CHF 616 | | |
| Citibank,
N.A. |
| | | 01/20/2021 | | | | 7 | |
USD 265 | | | PLN 1,025 | | |
| Citibank,
N.A. |
| | | 01/20/2021 | | | | 6 | |
USD 251 | | | RUB 18,410 | | |
| HSBC Bank
USA, N.A. |
| | | 11/05/2020 | | | | 19 | |
USD 2,722 | | | AUD 3,869 | | |
| HSBC Bank
USA, N.A. |
| | | 12/15/2020 | | | | 2 | |
USD 900 | | | MXN 19,090 | | |
| HSBC Bank
USA, N.A. |
| | | 01/20/2021 | | | | 8 | |
USD 366 | | | SEK 3,214 | | |
| HSBC Bank
USA, N.A. |
| | | 01/20/2021 | | | | 5 | |
USD 251 | | | SGD 341 | | |
| HSBC Bank
USA, N.A. |
| | | 01/20/2021 | | | | 2 | |
USD 208 | | | DKK 1,307 | | |
| HSBC Bank
USA, N.A. |
| | | 01/20/2021 | | | | 3 | |
USD 232 | | | RUB 18,450 | | |
| HSBC Bank
USA, N.A. |
| | | 02/04/2021 | | | | 2 | |
USD 39,483 | | | EUR 33,630 | | |
| State Street
Bank &
Trust Co. |
| | | 11/09/2020 | | | | 308 | |
USD 3,772 | | | CAD 4,953 | | |
| State Street
Bank &
Trust Co. |
| | | 01/20/2021 | | | | 53 | |
USD 2,713 | | | AUD 3,814 | | |
| State Street
Bank &
Trust Co. |
| | | 01/20/2021 | | | | 31 | |
| | | | | | | | | | | | | | | | |
| | | | | | | | | | | | | | | 519 | |
| | | | | | | | | | | | | | | | |
| | | | | | | | | | | | | | | | |
Currency
Purchased
(000s) | | Currency Sold
(000s) | | | Counterparty | | | Settlement
Date | | | Unrealized
Appreciation
(Depreciation)
(000s) | |
Liabilities: | | | | | | | | | | | | | | | | |
AUD 3,619 | | | USD 2,597 | | |
| BNP
PARIBAS |
| | | 12/16/2020 | | | | (53 | ) |
EUR 1,455 | | | USD 1,713 | | |
| Barclays
Bank PLC |
| | | 12/14/2020 | | | | (16 | ) |
EUR 95 | | | USD 111 | | |
| Barclays
Bank PLC |
| | | 12/14/2020 | | | | — | |
NOK 15,853 | | | USD 1,698 | | |
| Barclays
Bank PLC |
| | | 12/14/2020 | | | | (37 | ) |
RUB 18,410 | | | USD 234 | | |
| HSBC Bank
USA, N.A. |
| | | 11/05/2020 | | | | (2 | ) |
USD 439 | | | MYR 1,867 | | |
| Barclays
Bank PLC |
| | | 11/05/2020 | | | | (10 | ) |
USD 1,694 | | | SEK 15,071 | | |
| Barclays
Bank PLC |
| | | 12/14/2020 | | | | (1 | ) |
USD 140 | | | AUD 199 | | |
| Barclays
Bank PLC |
| | | 12/14/2020 | | | | — | |
USD 122 | | | SEK 1,089 | | |
| Barclays
Bank PLC |
| | | 12/14/2020 | | | | — | |
USD 445 | | | MYR 1,868 | | |
| Barclays
Bank PLC |
| | | 02/04/2021 | | | | (4 | ) |
USD 23,552 | | | JPY 2,486,000 | | |
| Citibank,
N.A. |
| | | 11/09/2020 | | | | (196 | ) |
USD 498 | | | THB 15,630 | | |
| HSBC Bank
USA, N.A. |
| | | 11/05/2020 | | | | (4 | ) |
USD 6,978 | | | GBP 5,401 | | |
| HSBC Bank
USA, N.A. |
| | | 11/09/2020 | | | | (19 | ) |
USD 496 | | | THB 15,540 | | |
| HSBC Bank
USA, N.A. |
| | | 02/04/2021 | | | | (3 | ) |
| | | | | | | | | | | | | | | | |
| | | | | | | | | | | | | | | (345 | ) |
| | | | | | | | | | | | | | | | |
Net Unrealized Appreciation (Depreciation) | | | | | | | $ | 174 | |
| | | | | | | | | | | | | | | | |
Annual Report 91
Payden Global Fixed Income Fund continued
Open Futures Contracts
| | | | | | | | | | | | | | | | | | | | |
Contract
Type | | Number of
Contracts | | | Expiration
Date | | | Notional
Amount
(000s) | | | Current
Value
(000s) | | | Unrealized Appreciation (Depreciation) (000s) | |
| Long Contracts: | | | | | | | | | | | | | | | | | |
| Euro-Bund Future | | | 27 | | | | Dec-20 | | | $ | 5,539 | | | $ | 67 | | | $ | 67 | |
| Euro-Schatz Future | | | 30 | | | | Dec-20 | | | | 3,929 | | | | 7 | | | | 7 | |
| Long Gilt Future | | | 10 | | | | Dec-20 | | | | 1,758 | | | | (5 | ) | | | (5 | ) |
| U.S. Long Bond Future | | | 15 | | | | Dec-20 | | | | 2,587 | | | | (61 | ) | | | (61 | ) |
| U.S. Treasury 10-Year Note Future | | | 3 | | | | Dec-20 | | | | 415 | | | | — | | | | — | |
| U.S. Treasury 2-Year Note Future | | | 12 | | | | Dec-20 | | | | 2,650 | | | | — | | | | — | |
| U.S. Treasury 5-Year Note Future | | | 21 | | | | Dec-20 | | | | 2,638 | | | | (4 | ) | | | (4 | ) |
| | | | | | | | | | | | | | | | | | | | |
| | | | | | | | | | | | | | | | | | | 4 | |
| | | | | | | | | | | | | | | | | | | | |
| Short Contracts: | | | | | | | | | | | | | | | | | |
| Euro Buxl 30-Year Bond Future | | | 2 | | | | Dec-20 | | | | (533 | ) | | | (12 | ) | | | (12 | ) |
| Euro-Bobl Future | | | 14 | | | | Dec-20 | | | | (2,215 | ) | | | (11 | ) | | | (11 | ) |
| Euro-Oat Future | | | 23 | | | | Dec-20 | | | | (4,557 | ) | | | (77 | ) | | | (77 | ) |
| U.S. 10-Year Ultra Future | | | 41 | | | | Dec-20 | | | | (6,449 | ) | | | 58 | | | | 58 | |
| | | | | | | | | | | | | | | | | | | | |
| | | | | | | | | | | | | | | | | | | (42 | ) |
| | | | | | | | | | | | | | | | | | | | |
| Total Futures | | | | | | | | | | | | | | | | | | $ | (38 | ) |
| | | | | | | | | | | | | | | | | | | | |
| | | | | | | | | | | | | | | | | | | | |
Open Centrally Cleared Interest Rate Swap Contracts
| | | | | | | | | | | | | | | | | | |
| Description | | Maturity
Date | | Notional
Amount
(000s) | | | Value
(000s) | | | Upfront
payments/
receipts
(000s) | | | Unrealized
Appreciation/
(Depreciation)
(000s) | |
| 10-Year Interest Rate Swap, Receive Fixed 1.125% Quarterly, Pay Variable 0.63% (3M KWCDC) Quarterly | | 10/07/2029 | | | KRW 1,584,200 | | | $ | 5 | | | $ | — | | | $ | 5 | |
| 5-Year Interest Rate Swap, Receive Fixed 1.850% Quarterly, Pay Variable 3.15% (CNRR007) Quarterly | | 05/08/2025 | | | CNY 16,000 | | | | (83 | ) | | | — | | | | (83 | ) |
| 5-Year Interest Rate Swap, Receive Fixed 2.350% Quarterly, Pay Variable 3.15% (CNRR007) Quarterly | | 07/03/2025 | | | CNY 11,800 | | | | (19 | ) | | | — | | | | (19 | ) |
| 5-Year Interest Rate Swap, Receive Fixed 2.580% Quarterly, Pay Variable 3.00% (CNRR007) Quarterly | | 02/05/2025 | | | CNY 2,350 | | | | — | | | | — | | | | — | |
| 5-Year Interest Rate Swap, Receive Fixed 2.715% Quarterly, Pay Variable 3.00% (CNRR007) Quarterly | | 09/16/2025 | | | CNY 12,200 | | | | 9 | | | | — | | | | 9 | |
| 5-Year Interest Rate Swap, Receive Fixed 2.720% Quarterly, Pay Variable 3.00% (CNRR007) Quarterly | | 10/14/2025 | | | CNY 10,000 | | | | 9 | | | | — | | | | 9 | |
| 5-Year Interest Rate Swap, Receive Fixed 2.920% Quarterly, Pay Variable 3.15% (CNRR007) Quarterly | | 01/17/2025 | | | CNY 11,580 | | | | 24 | | | | — | | | | 24 | |
| 5-Year Interest Rate Swap, Receive Fixed 2.960% Quarterly, Pay Variable 2.50% (CNRR007) Quarterly | | 12/09/2024 | | | CNY 28,890 | | | | 70 | | | | — | | | | 70 | |
| | | | | | | | | | | | | | | | | | |
| | | | | | | | $ | 15 | | | $ | — | | | $ | 15 | |
| | | | | | | | | | | | | | | | | | |
See notes to financial statements.
92 Payden Mutual Funds
Payden Emerging Markets Bond Fund
| | | | | | | | |
| | | The Fund seeks a high level of total return by generally investing in below investment grade debt instruments and income producing securities of emerging market countries denominated in U.S. and foreign currencies with no limit on the average portfolio maturity. | | | 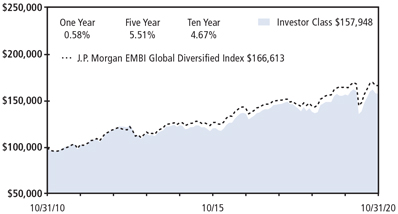
Past performance does not predict future returns. The graph does not reflect the impact of taxes or transaction costs a shareholder would pay. The Fund’s Adviser and SI Classes are expected to perform similarly to its Investor Class, except for class specific expenses or waivers. |
| | Portfolio Composition - percent of investments | |
| | Foreign Government Corporate Other | |
| 66%
32% 2% |
|
| | | | | | |
| | This information is not part of the audited financial statements. | |
| | | | | | |
| | | | | | |
| | | | | | |
| | | | | | |
| | | | | | |
| | | | | | |
| | | | | | |
| Schedule of Investments - October 31, 2020 | |
Principal
or Shares | | Security Description | | Value
(000) | |
Bonds (99%) | | | | |
Angola (USD) (2%) | | | | |
4,980,000 | | Angolan Government International Bond 144A, 8.00%, 11/26/29 (a) | | $ | 3,865 | |
8,475,000 | | Angolan Government International Bond 144A, 8.25%, 5/09/28 (a) | | | 6,691 | |
6,785,000 | | Angolan Government International Bond 144A, 9.38%, 5/08/48 (a) | | | 5,219 | |
3,340,000 | | Angolan Government International Bond 144A, 9.50%, 11/12/25 (a) | | | 2,880 | |
| | | | | 18,655 | |
Argentina (ARS) (0%) | | | | |
44,420,000 | | YPF SA 144A, 16.50%, 5/09/22 ARS (a) | | | 371 | |
Argentina (USD) (2%) | | | | |
8,151,273 | | Argentine Republic Government International Bond, 0.13%, 7/09/30 | | | 3,008 | |
13,227,476 | | Argentine Republic Government International Bond, 0.13%, 7/09/35 | | | 4,352 | |
11,689,090 | | Argentine Republic Government International Bond, 0.13%, 1/09/38 | | | 4,384 | |
4,692,500 | | Argentine Republic Government International Bond, 0.13%, 7/09/41 | | | 1,595 | |
1,798,995 | | Argentine Republic Government International Bond, 1.00%, 7/09/29 | | | 741 | |
2,050,000 | | Provincia de Buenos Aires 144A, 6.50%, 2/15/23 (a) | | | 682 | |
1,625,000 | | Provincia de Buenos Aires/Argentina 144A, 7.88%, 6/15/27 (a) | | | 540 | |
5,180,000 | | Provincia de Cordoba 144A, 7.13%, 6/10/21 (a) | | | 2,771 | |
| | | | | 18,073 | |
Armenia (USD) (1%) | | | | |
7,795,000 | | Republic of Armenia International Bond 144A, 7.15%, 3/26/25 (a) | | | 8,413 | |
Azerbaijan (USD) (0%) | | | | |
3,420,000 | | Southern Gas Corridor CJSC 144A, 6.88%, 3/24/26 (a) | | | 3,907 | |
| | | | | | |
| | |
| | | | | | |
Principal
or Shares | | Security Description | | Value
(000) | |
Bahrain (USD) (0%) | | | | |
1,835,000 | | Bahrain Government International Bond 144A, 5.63%, 9/30/31 (a) | | $ | 1,822 | |
2,140,000 | | Bahrain Government International Bond 144A, 6.75%, 9/20/29 (a) | | | 2,321 | |
| | | | | 4,143 | |
Belarus (USD) (1%) | | | | |
1,730,000 | | Republic of Belarus International Bond 144A, 6.20%, 2/28/30 (a) | | | 1,640 | |
1,610,000 | | Republic of Belarus International Bond 144A, 6.88%, 2/28/23 (a) | | | 1,596 | |
1,020,000 | | Republic of Belarus International Bond 144A, 7.63%, 6/29/27 (a) | | | 1,015 | |
2,200,000 | | Republic of Belarus Ministry of Finance 144A, 5.88%, 2/24/26 (a) | | | 2,099 | |
3,710,000 | | Republic of Belarus Ministry of Finance 144A, 6.38%, 2/24/31 (a) | | | 3,515 | |
| | | | | 9,865 | |
Bermuda (USD) (1%) | | | | |
900,000 | | Bermuda Government International Bond 144A, 2.38%, 8/20/30 (a) | | | 926 | |
2,620,000 | | Bermuda Government International Bond 144A, 3.38%, 8/20/50 (a) | | | 2,748 | |
1,740,000 | | Geopark Ltd. 144A, 6.50%, 9/21/24 (a) | | | 1,640 | |
4,430,000 | | Star Energy Geothermal Darajat II/Star Energy Geothermal Salak 144A, 4.85%, 10/14/38 (a) | | | 4,559 | |
| | | | | 9,873 | |
Brazil (BRL) (1%) | | | | |
30,863,792 | | Brazil Notas do Tesouro Nacional Serie B, 6.00%, 8/15/28 BRL | | | 6,386 | |
21,700,000 | | Brazil Notas do Tesouro Nacional Serie F, 10.00%, 1/01/27 BRL | | | 4,274 | |
| | | | | 10,660 | |
Brazil (USD) (2%) | | | | |
4,755,000 | | Brazilian Government International Bond, 4.75%, 1/14/50 | | | 4,675 | |
Annual Report 93
Payden Emerging Markets Bond Fund continued
| | | | | | |
Principal
or Shares | | Security Description | | Value
(000) | |
| | |
4,380,000 | | Brazilian Government International Bond, 5.00%, 1/27/45 | | $ | 4,486 | |
2,360,000 | | BRF SA 144A, 5.75%, 9/21/50 (a) | | | 2,249 | |
3,880,000 | | Itau Unibanco Holding SA 144A, (5 yr. US Treasury Yield Curve Rate T Note Constant Maturity + 2.822%) 4.50%, 11/21/29 (a)(b) | | | 3,823 | |
4,492,010 | | USJ-Acucar e Alcool S/A 144A, 9.88%, 11/09/23 (a)(c) | | | 1,348 | |
| | | | | 16,581 | |
Cayman Islands (USD) (1%) | | | | |
2,135,000 | | DP World Salaam, (5 yr. US Treasury Yield Curve Rate T Note Constant Maturity + 5.750%) 6.00%, (b)(d)(e) | | | 2,243 | |
868,000 | | Odebrecht Oil & Gas Finance Ltd. 144A, 7.41%, (a)(d)(f) | | | 2 | |
920,000 | | Tencent Holdings Ltd. 144A, 3.24%, 6/03/50 (a) | | | 929 | |
1,640,000 | | Tencent Holdings Ltd. 144A, 3.29%, 6/03/60 (a) | | | 1,647 | |
| | | | | 4,821 | |
Chile (USD) (0%) | | | | |
2,494,454 | | Latam Airlines 2015-1 Pass-Through Trust A, 4.20%, 11/15/27 | | | 2,170 | |
Colombia (USD) (3%) | | | | |
4,725,000 | | Colombia Government International Bond, 3.88%, 4/25/27 | | | 5,127 | |
3,595,000 | | Colombia Government International Bond, 4.50%, 3/15/29 | | | 4,047 | |
3,980,000 | | Colombia Government International Bond, 5.00%, 6/15/45 | | | 4,664 | |
4,594,000 | | Colombia Government International Bond, 6.13%, 1/18/41 | | | 5,951 | |
4,735,000 | | Colombia Government International Bond, 7.38%, 9/18/37 | | | 6,682 | |
| | | | | 26,471 | |
Costa Rica (USD) (0%) | | | | |
2,050,000 | | Costa Rica Government International Bond 144A, 6.13%, 2/19/31 (a) | | | 1,714 | |
2,270,000 | | Costa Rica Government International Bond 144A, 7.00%, 4/04/44 (a) | | | 1,791 | |
1,275,000 | | Costa Rica Government International Bond 144A, 7.16%, 3/12/45 (a) | | | 1,018 | |
| | | | | 4,523 | |
Dominica Republic (DOP) (0%) | | | | |
213,300,000 | | Dominican Republic International Bond 144A, 9.75%, 6/05/26 DOP (a) | | | 3,773 | |
Dominica Republic (USD) (4%) | | | | |
940,000 | | Dominican Republic International Bond 144A, 5.50%, 1/27/25 (a) | | | 1,007 | |
5,385,000 | | Dominican Republic International Bond 144A, 5.88%, 1/30/60 (a) | | | 5,170 | |
6,165,000 | | Dominican Republic International Bond 144A, 5.95%, 1/25/27 (a) | | | 6,735 | |
9,195,000 | | Dominican Republic International Bond 144A, 6.00%, 7/19/28 (a) | | | 10,147 | |
1,990,000 | | Dominican Republic International Bond 144A, 6.40%, 6/05/49 (a) | | | 2,030 | |
| | | | | | |
Principal
or Shares | | Security Description | | Value
(000) | |
| | |
2,200,000 | | Dominican Republic International Bond 144A, 6.50%, 2/15/48 (a) | | $ | 2,272 | |
2,520,000 | | Dominican Republic International Bond 144A, 6.85%, 1/27/45 (a) | | | 2,712 | |
4,740,000 | | Dominican Republic International Bond 144A, 6.88%, 1/29/26 (a) | | | 5,362 | |
| | | | | 35,435 | |
Ecuador (USD) (1%) | | | | |
5,530,590 | | Ecuador Government International Bond 144A, 0.50%, 7/31/30 (a) | | | 3,706 | |
13,139,458 | | Ecuador Government International Bond 144A, 0.50%, 7/31/35 (a) | | | 7,243 | |
5,497,250 | | Ecuador Government International Bond 144A, 0.50%, 7/31/40 (a) | | | 2,749 | |
1,261,899 | | Ecuador Government International Bond 144A, 6.68%, 7/31/30 (a)(f) | | | 580 | |
| | | | | 14,278 | |
Egypt (USD) (3%) | | | | |
6,185,000 | | Egypt Government International Bond 144A, 7.50%, 1/31/27 (a) | | | 6,581 | |
5,070,000 | | Egypt Government International Bond 144A, 7.63%, 5/29/32 (a) | | | 5,148 | |
4,170,000 | | Egypt Government International Bond 144A, 7.90%, 2/21/48 (a) | | | 3,967 | |
3,315,000 | | Egypt Government International Bond 144A, 8.50%, 1/31/47 (a) | | | 3,305 | |
5,680,000 | | Egypt Government International Bond 144A, 8.70%, 3/01/49 (a) | | | 5,739 | |
| | | | | 24,740 | |
El Salvador (USD) (1%) | | | | |
3,800,000 | | El Salvador Government International Bond 144A, 6.38%, 1/18/27 (a) | | | 3,112 | |
2,560,000 | | El Salvador Government International Bond 144A, 7.63%, 2/01/41 (a) | | | 1,974 | |
1,055,000 | | El Salvador Government International Bond 144A, 7.65%, 6/15/35 (a) | | | 843 | |
2,285,000 | | El Salvador Government International Bond 144A, 8.63%, 2/28/29 (a) | | | 1,997 | |
| | | | | 7,926 | |
Gabon (USD) (1%) | | | | |
755,097 | | Gabon Government International Bond 144A, 6.38%, 12/12/24 (a) | | | 722 | |
3,030,000 | | Gabon Government International Bond 144A, 6.63%, 2/06/31 (a) | | | 2,714 | |
1,290,000 | | Gabon Government International Bond 144A, 6.95%, 6/16/25 (a) | | | 1,221 | |
| | | | | 4,657 | |
Georgia (USD) (1%) | | | | |
915,000 | | Georgian Oil & Gas Corp. JSC 144A, 6.75%, 4/26/21 (a) | | | 927 | |
6,535,000 | | Georgian Railway JSC 144A, 7.75%, 7/11/22 (a) | | | 6,837 | |
2,430,000 | | TBC Bank JSC 144A, 5.75%, 6/19/24 (a) | | | 2,463 | |
| | | | | 10,227 | |
Ghana (USD) (2%) | | | | |
3,485,000 | | Ghana Government International Bond 144A, 6.38%, 2/11/27 (a) | | | 3,253 | |
94 Payden Mutual Funds
| | | | | | |
Principal
or Shares | | Security Description | | Value
(000) | |
| | |
2,090,000 | | Ghana Government International Bond 144A, 7.88%, 3/26/27 (a) | | $ | 2,037 | |
1,595,000 | | Ghana Government International Bond 144A, 8.63%, 6/16/49 (a) | | | 1,407 | |
10,110,000 | | Ghana Government International Bond 144A, 10.75%, 10/14/30 (a) | | | 12,420 | |
| | | | | 19,117 | |
Guatemala (USD) (2%) | | | | |
2,335,000 | | Guatemala Government Bond 144A, 4.38%, 6/05/27 (a) | | | 2,553 | |
4,295,000 | | Guatemala Government Bond 144A, 4.50%, 5/03/26 (a) | | | 4,694 | |
4,566,000 | | Guatemala Government Bond 144A, 4.88%, 2/13/28 (a)(g) | | | 5,148 | |
1,780,000 | | Guatemala Government Bond 144A, 4.90%, 6/01/30 (a) | | | 2,022 | |
2,060,000 | | Guatemala Government Bond 144A, 5.38%, 4/24/32 (a) | | | 2,437 | |
5,995,000 | | Guatemala Government Bond 144A, 6.13%, 6/01/50 (a) | | | 7,431 | |
| | | | | 24,285 | |
Honduras (USD) (1%) | | | | |
3,790,000 | | Honduras Government International Bond 144A, 5.63%, 6/24/30 (a) | | | 4,198 | |
2,286,000 | | Honduras Government International Bond 144A, 6.25%, 1/19/27 (a) | | | 2,575 | |
| | | | | 6,773 | |
India (USD) (2%) | | | | |
1,752,000 | | Adani Electricity Mumbai Ltd. 144A, 3.95%, 2/12/30 (a) | | | 1,738 | |
1,405,000 | | Adani Green Energy UP Ltd./Prayatna Developers Pvt. Ltd./Parampujya Solar Energy 144A, 6.25%, 12/10/24 (a) | | | 1,522 | |
4,238,700 | | Adani Transmission Ltd. 144A, 4.25%, 5/21/36 (a) | | | 4,303 | |
3,320,000 | | Muthoot Finance Ltd. 144A, 6.13%, 10/31/22 (a) | | | 3,433 | |
775,000 | | ReNew Power Ltd. 144A, 6.45%, 9/27/22 (a) | | | 797 | |
3,965,000 | | ReNew Power Pvt. Ltd. 144A, 5.88%, 3/05/27 (a) | | | 4,070 | |
4,605,000 | | Shriram Transport Finance Co. Ltd. 144A, 5.95%, 10/24/22 (a) | | | 4,493 | |
| | | | | 20,356 | |
Indonesia (EUR) (0%) | | | | |
380,000 | | Indonesia Government International Bond, 1.40%, 10/30/31 EUR | | | 439 | |
Indonesia (USD) (5%) | | | | |
2,050,000 | | Cikarang Listrindo Tbk PT 144A, 4.95%, 9/14/26 (a) | | | 2,112 | |
5,680,000 | | Hutama Karya Persero PT 144A, 3.75%, 5/11/30 (a) | | | 6,148 | |
1,460,000 | | Indonesia Asahan Aluminium Persero PT 144A, 4.75%, 5/15/25 (a) | | | 1,584 | |
2,690,000 | | Indonesia Asahan Aluminium Persero PT 144A, 5.45%, 5/15/30 (a) | | | 3,069 | |
1,530,000 | | Indonesia Asahan Aluminium Persero PT 144A, 6.53%, 11/15/28 (a) | | | 1,868 | |
| | | | | | |
Principal
or Shares | | Security Description | | Value
(000) | |
| | |
1,775,000 | | Indonesia Government International Bond 144A, 6.63%, 2/17/37 (a) | | $ | 2,482 | |
4,115,000 | | Indonesia Government International Bond 144A, 7.75%, 1/17/38 (a) | | | 6,359 | |
2,985,000 | | Indonesia Government International Bond 144A, 8.50%, 10/12/35 (a) | | | 4,788 | |
2,060,000 | | Indonesia Government International Bond, 8.50%, 10/12/35 (e) | | | 3,304 | |
2,260,000 | | Pelabuhan Indonesia III Persero PT 144A, 4.50%, 5/02/23 (a) | | | 2,391 | |
2,870,000 | | Pertamina Persero PT 144A, 3.10%, 8/27/30 (a) | | | 2,988 | |
1,780,000 | | Pertamina Persero PT 144A, 5.63%, 5/20/43 (a) | | | 2,100 | |
3,670,000 | | Pertamina Persero PT 144A, 6.50%, 11/07/48 (a) | | | 4,954 | |
241,000 | | Perusahaan Listrik Negara PT 144A, 5.25%, 5/15/47 (a) | | | 276 | |
4,110,000 | | Perusahaan Listrik Negara PT 144A, 6.15%, 5/21/48 (a) | | | 5,248 | |
1,765,000 | | Perusahaan Penerbit SBSN Indonesia III 144A, 4.40%, 3/01/28 (a) | | | 2,016 | |
| | | | | 51,687 | |
Israel (USD) (1%) | | | | |
3,895,000 | | Bank Leumi Le-Israel BM 144A, (5 yr. US Treasury Yield Curve Rate T Note Constant Maturity + 1.631%) 3.28%, 1/29/31 (a)(b)(e) | | | 3,937 | |
3,045,000 | | Leviathan Bond Ltd. 144A,
6.75%, 6/30/30 (a)(e) | | | 3,135 | |
| | | | | 7,072 | |
Ivory Coast (EUR) (1%) | | | | |
2,426,000 | | Ivory Coast Government International Bond 144A, 5.25%, 3/22/30 EUR (a) | | | 2,735 | |
2,110,000 | | Ivory Coast Government International Bond 144A, 6.63%, 3/22/48 EUR (a) | | | 2,319 | |
| | | | | 5,054 | |
Jersey (USD) (1%) | | | | |
4,850,000 | | Galaxy Pipeline Assets Bidco Ltd. 144A, 2.63%, 3/31/36 (a) | | | 4,862 | |
Jordan (USD) (0%) | | | | |
1,005,000 | | Jordan Government International Bond 144A, | | | | |
| | 7.38%, 10/10/47 (a) | | | 1,042 | |
Kazakhstan (KZT) (1%) | | | | |
2,098,000,000 | | Development Bank of Kazakhstan JSC 144A, 8.95%, 5/04/23 KZT (a) | | | 4,747 | |
Kazakhstan (USD) (2%) | | | | |
2,960,000 | | Kazakhstan Government International Bond 144A, 6.50%, 7/21/45 (a) | | | 4,682 | |
5,680,000 | | KazMunayGas National Co. JSC 144A, 3.50%, 4/14/33 (a)(g) | | | 5,868 | |
9,930,000 | | KazMunayGas National Co. JSC 144A, 5.75%, 4/19/47 (a) | | | 12,355 | |
| | | | | 22,905 | |
Kenya (USD) (1%) | | | | |
3,880,000 | | Kenya Government International Bond 144A, 6.88%, 6/24/24 (a) | | | 4,119 | |
2,625,000 | | Kenya Government International Bond 144A, 7.00%, 5/22/27 (a) | | | 2,736 | |
1,690,000 | | Kenya Government International Bond 144A, 8.25%, 2/28/48 (a) | | | 1,732 | |
| | | | | 8,587 | |
Annual Report 95
Payden Emerging Markets Bond Fund continued
| | | | | | |
Principal
or Shares | | Security Description | | Value
(000) | |
Lebanon (USD) (0%) | | | | |
3,560,000 | | Lebanon Government International Bond, 6.00%, 1/27/23 (c)(e) | | $ | 538 | |
3,420,000 | | Lebanon Government International Bond, 6.20%, 2/26/25 (c)(e) | | | 513 | |
2,045,000 | | Lebanon Government International Bond, 6.60%, 11/27/26 (c)(e) | | | 311 | |
1,246,000 | | Lebanon Government International Bond, 6.65%, 2/26/30 (c)(e) | | | 184 | |
1,930,000 | | Lebanon Government International Bond, 6.75%, 11/29/27 (c)(e) | | | 287 | |
1,390,000 | | Lebanon Government International Bond, 6.85%, 5/25/29 (c) | | | 207 | |
2,950,000 | | Lebanon Government International Bond, 7.00%, 3/23/32 (c)(e)(g) | | | 437 | |
| | | | | 2,477 | |
Malaysia (USD) (2%) | | | | |
9,700,000 | | 1MDB Energy Ltd., 5.99%, 5/11/22 (e) | | | 10,200 | |
2,990,000 | | Petronas Capital Ltd. 144A, 3.50%, 4/21/30 (a) | | | 3,338 | |
3,320,000 | | Petronas Capital Ltd. 144A, 4.55%, 4/21/50 (a) | | | 4,193 | |
| | | | | 17,731 | |
Mauritius (USD) (0%) | | | | |
1,085,000 | | Azure Power Solar Energy Pvt. Ltd. 144A, 5.65%, 12/24/24 (a) | | | 1,145 | |
Mexico (MXN) (1%) | | | | |
26,900,000 | | Grupo Televisa SAB, 7.25%, 5/14/43 MXN | | | 959 | |
83,600,000 | | Mexican Bonos, 8.50%, 5/31/29 MXN | | | 4,602 | |
56,000,000 | | Mexican Bonos, 8.50%, 11/18/38 MXN | | | 3,067 | |
| | | | | 8,628 | |
Mexico (USD) (5%) | | | | |
6,783,880 | | Cometa Energia SA de CV 144A, 6.38%, 4/24/35 (a) | | | 7,519 | |
4,411,244 | | Fermaca Enterprises S de RL de CV 144A, 6.38%, 3/30/38 (a) | | | 4,852 | |
330,000 | | Grupo Bimbo SAB de CV 144A, 4.00%, 9/06/49 (a) | | | 353 | |
1,170,000 | | Grupo Bimbo SAB de CV 144A, (5 yr. US Treasury Yield Curve Rate T Note Constant Maturity + 3.280%) 5.95%, (a)(b)(d) | | | 1,249 | |
4,140,000 | | Mexico City Airport Trust 144A, 3.88%, 4/30/28 (a) | | | 3,711 | |
3,095,000 | | Mexico City Airport Trust 144A, 5.50%, 7/31/47 (a) | | | 2,676 | |
1,720,000 | | Mexico Government International Bond, 6.05%, 1/11/40 | | | 2,168 | |
5,490,000 | | Petroleos Mexicanos, 5.95%, 1/28/31 | | | 4,602 | |
5,433,000 | | Petroleos Mexicanos, 6.49%, 1/23/27 | | | 5,069 | |
7,425,000 | | Petroleos Mexicanos, 6.50%, 3/13/27 | | | 6,906 | |
2,770,000 | | Petroleos Mexicanos, 6.63%, 6/15/35 | | | 2,286 | |
3,629,000 | | Petroleos Mexicanos, 6.75%, 9/21/47 | | | 2,823 | |
1,106,000 | | Petroleos Mexicanos, 6.84%, 1/23/30 | | | 992 | |
5,180,000 | | Petroleos Mexicanos, 6.95%, 1/28/60 | | | 4,057 | |
| | | | | 49,263 | |
Mongolia (USD) (3%) | | | | |
5,575,000 | | Development Bank of Mongolia LLC 144A, | | | | |
| | 7.25%, 10/23/23 (a) | | | 5,832 | |
| | | | | | |
Principal
or Shares | | Security Description | | Value
(000) | |
| | |
1,995,000 | | Mongolia Government International Bond, 5.13%, 12/05/22 (e) | | $ | 2,055 | |
1,103,000 | | Mongolia Government International Bond 144A, 5.13%, 12/05/22 (a) | | | 1,136 | |
10,900,000 | | Mongolia Government International Bond 144A, 5.13%, 4/07/26 (a) | | | 11,280 | |
2,650,000 | | Mongolia Government International Bond 144A, 5.63%, 5/01/23 (a) | | | 2,766 | |
7,275,000 | | Mongolia Government International Bond 144A, 8.75%, 3/09/24 (a) | | | 8,329 | |
| | | | | 31,398 | |
Morocco (EUR) (1%) | | | | |
4,220,000 | | Morocco Government International Bond 144A, 2.00%, 9/30/30 EUR (a) | | | 4,796 | |
Netherlands (USD) (2%) | | | | |
2,030,000 | | Minejesa Capital BV 144A, 5.63%, 8/10/37 (a) | | | 2,110 | |
3,656,775 | | MV24 Capital BV 144A, 6.75%, 6/01/34 (a) | | | 3,684 | |
3,010,000 | | Petrobras Global Finance BV, 5.60%, 1/03/31 | | | 3,251 | |
2,375,000 | | Petrobras Global Finance BV, 6.75%, 6/03/50 | | | 2,609 | |
4,405,000 | | Petrobras Global Finance BV, 6.90%, 3/19/49 | | | 4,992 | |
2,360,000 | | Prosus NV 144A, 3.68%, 1/21/30 (a) | | | 2,574 | |
2,870,000 | | Prosus NV 144A, 4.03%, 8/03/50 (a) | | | 2,943 | |
2,160,000 | | VTR Finance NV 144A, 6.38%, 7/15/28 (a) | | | 2,309 | |
| | | | | 24,472 | |
Nigeria (USD) (2%) | | | | |
4,015,000 | | Nigeria Government International Bond 144A, 6.50%, 11/28/27 (a) | | | 3,909 | |
2,285,000 | | Nigeria Government International Bond 144A, 7.14%, 2/23/30 (a) | | | 2,213 | |
4,555,000 | | Nigeria Government International Bond 144A, 7.63%, 11/21/25 (a) | | | 4,800 | |
1,315,000 | | Nigeria Government International Bond 144A, 7.63%, 11/28/47 (a) | | | 1,203 | |
3,285,000 | | Nigeria Government International Bond 144A, 7.70%, 2/23/38 (a) | | | 3,028 | |
3,720,000 | | Nigeria Government International Bond 144A, 7.88%, 2/16/32 (a) | | | 3,622 | |
3,805,000 | | Nigeria Government International Bond 144A, 8.75%, 1/21/31 (a) | | | 3,966 | |
| | | | | 22,741 | |
Oman (USD) (2%) | | | | |
1,310,000 | | Oman Government International Bond 144A, 4.75%, 6/15/26 (a) | | | 1,202 | |
5,065,000 | | Oman Government International Bond 144A, 5.38%, 3/08/27 (a) | | | 4,657 | |
6,995,000 | | Oman Government International Bond 144A, 6.50%, 3/08/47 (a) | | | 5,680 | |
5,490,000 | | Oman Government International Bond 144A, 6.75%, 1/17/48 (a) | | | 4,512 | |
| | | | | 16,051 | |
Panama (USD) (3%) | | | | |
1,891,601 | | Aeropuerto Internacional de Tocumen SA 144A, 6.00%, 11/18/48 (a) | | | 2,115 | |
4,048,000 | | Empresa de Transmision Electrica SA 144A, 5.13%, 5/02/49 (a) | | | 4,731 | |
2,660,000 | | Panama Government International Bond, 2.25%, 9/29/32 | | | 2,715 | |
96 Payden Mutual Funds
| | | | | | |
Principal
or Shares | | Security Description | | Value
(000) | |
| | |
1,010,000 | | Panama Government International Bond, 4.30%, 4/29/53 | | $ | 1,227 | |
3,835,000 | | Panama Government International Bond, 4.50%, 4/01/56 | | | 4,736 | |
6,075,000 | | Panama Government International Bond, 6.70%, 1/26/36 | | | 8,805 | |
2,380,000 | | Panama Government International Bond, 9.38%, 4/01/29 | | | 3,668 | |
| | | | | 27,997 | |
Paraguay (USD) (2%) | | | | |
6,160,000 | | Paraguay Government International Bond 144A, 4.95%, 4/28/31 (a) | | | 7,207 | |
2,990,000 | | Paraguay Government International Bond 144A, 5.40%, 3/30/50 (a) | | | 3,655 | |
3,310,000 | | Paraguay Government International Bond 144A, 5.60%, 3/13/48 (a) | | | 4,099 | |
2,220,000 | | Paraguay Government International Bond 144A, 6.10%, 8/11/44 (a) | | | 2,885 | |
1,850,000 | | Telefonica Celular del Paraguay SA 144A, 5.88%, 4/15/27 (a) | | | 1,973 | |
| | | | | 19,819 | |
Peru (PEN) (2%) | | | | |
6,210,000 | | Fondo MIVIVIENDA SA 144A, 7.00%, 2/14/24 PEN (a) | | | 1,934 | |
55,860,000 | | Peruvian Government International Bond 144A, 6.95%, 8/12/31 PEN (a) | | | 19,078 | |
| | | | | 21,012 | |
Peru (USD) (1%) | | | | |
2,325,840 | | ABY Transmision Sur SA 144A, | | | | |
| | 6.88%, 4/30/43 (a) | | | 3,134 | |
2,123,000 | | Corp. Financiera de Desarrollo SA 144A, | | | | |
| | 4.75%, 7/15/25 (a) | | | 2,391 | |
| | | | | 5,525 | |
Philippines (USD) (0%) | | | | |
1,695,000 | | Philippine Government International Bond, 3.70%, 3/01/41 | | | 1,945 | |
Qatar (USD) (2%) | | | | |
3,260,000 | | Qatar Government International Bond 144A, 4.40%, 4/16/50 (a) | | | 4,161 | |
7,130,000 | | Qatar Government International Bond 144A, 4.82%, 3/14/49 (a) | | | 9,524 | |
480,000 | | Qatar Government International Bond, 4.82%, 3/14/49 (e) | | | 641 | |
3,425,000 | | Qatar Government International Bond 144A, 5.10%, 4/23/48 (a) | | | 4,732 | |
| | | | | 19,058 | |
Romania (EUR) (1%) | | | | |
4,720,000 | | Romanian Government International Bond 144A, 3.38%, 1/28/50 EUR (a) | | | 5,736 | |
2,756,000 | | Romanian Government International Bond 144A, 4.63%, 4/03/49 EUR (a) | | | 3,987 | |
| | | | | 9,723 | |
Romania (USD) (0%) | | | | |
1,574,000 | | Romanian Government International Bond 144A, 5.13%, 6/15/48 (a) | | | 1,904 | |
| | | | | | |
Principal
or Shares | | Security Description | | Value
(000) | |
Russian Federation (RUB) (1%) | | | | |
974,500,000 | | Russian Federal Bond - OFZ, 6.90%, 5/23/29 RUB | | $ | 13,043 | |
Russian Federation (USD) (1%) | | | | |
3,600,000 | | Russian Foreign Bond - Eurobond 144A, 5.10%, 3/28/35 (a) | | | 4,385 | |
400,000 | | Russian Foreign Bond - Eurobond, 5.10%, 3/28/35 (e) | | | 487 | |
3,000,000 | | Russian Foreign Bond - Eurobond 144A, 5.25%, 6/23/47 (a) | | | 3,945 | |
4,000,000 | | Russian Foreign Bond - Eurobond, 5.63%, 4/04/42 (e) | | | 5,272 | |
| | | | | 14,089 | |
Saudi Arabia (USD) (1%) | | | | |
8,150,000 | | Saudi Arabian Oil Co. 144A, 4.25%, 4/16/39 (a) | | | 9,327 | |
4,560,000 | | Saudi Government International Bond 144A, 3.75%, 1/21/55 (a) | | | 4,885 | |
| | | | | 14,212 | |
Senegal (USD) (1%) | | | | |
2,280,000 | | Senegal Government International Bond 144A, 6.25%, 7/30/24 (a) | | | 2,407 | |
4,795,000 | | Senegal Government International Bond 144A, 6.25%, 5/23/33 (a) | | | 4,896 | |
1,543,000 | | Senegal Government International Bond 144A, 8.75%, 5/13/21 (a) | | | 1,595 | |
| | | | | 8,898 | |
South Africa (USD) (2%) | | | | |
2,020,000 | | Eskom Holdings SOC Ltd. 144A, 6.35%, 8/10/28 (a) | | | 2,093 | |
3,730,000 | | Eskom Holdings SOC Ltd. 144A, 6.75%, 8/06/23 (a) | | | 3,549 | |
6,805,000 | | Republic of South Africa Government International Bond, 4.30%, 10/12/28 | | | 6,626 | |
2,850,000 | | Republic of South Africa Government International Bond, 5.65%, 9/27/47 | | | 2,584 | |
3,590,000 | | Republic of South Africa Government International Bond, 5.75%, 9/30/49 | | | 3,247 | |
2,070,000 | | Republic of South Africa Government International Bond, 5.88%, 6/22/30 | | | 2,193 | |
2,415,000 | | Transnet SOC Ltd. 144A, 4.00%, 7/26/22 (a) | | | 2,406 | |
| | | | | 22,698 | |
South Africa (ZAR) (1%) | | | | |
101,800,000 | | Republic of South Africa Government Bond, 8.00%, 1/31/30 ZAR | | | 5,760 | |
Sri Lanka (USD) (2%) | | | | |
9,085,000 | | Sri Lanka Government International Bond 144A, 6.20%, 5/11/27 (a) | | | 4,906 | |
11,160,000 | | Sri Lanka Government International Bond 144A, 6.83%, 7/18/26 (a) | | | 6,081 | |
6,480,000 | | Sri Lanka Government International Bond 144A, 6.85%, 11/03/25 (a) | | | 3,628 | |
1,885,000 | | Sri Lanka Government International Bond 144A, 7.55%, 3/28/30 (a) | | | 1,018 | |
6,025,000 | | Sri Lanka Government International Bond 144A, 7.85%, 3/14/29 (a) | | | 3,314 | |
| | | | | 18,947 | |
Annual Report 97
Payden Emerging Markets Bond Fund continued
| | | | | | |
Principal
or Shares | | Security Description | | Value
(000) | |
Thailand (USD) (0%) | | | | |
3,110,000 | | Bangkok Bank PCL 144A, (5 yr. US Treasury Yield Curve Rate T Note Constant Maturity + 4.729%) 5.00%, (a)(b)(d) | | $ | 3,114 | |
Tunisia (EUR) (0%) | | | | |
2,135,000 | | Banque Centrale de Tunisie International Bond 144A, 6.38%, 7/15/26 EUR (a) | | | 2,129 | |
Tunisia (USD) (1%) | | | | |
12,820,000 | | Banque Centrale de Tunisie International Bond 144A, 5.75%, 1/30/25 (a) | | | 10,876 | |
Turkey (USD) (2%) | | | | |
970,000 | | TC Ziraat Bankasi AS 144A, 5.13%, 5/03/22 (a) | | | 943 | |
4,735,000 | | Turkey Government International Bond, 4.25%, 4/14/26 | | | 4,221 | |
4,645,000 | | Turkey Government International Bond, 6.13%, 10/24/28 | | | 4,349 | |
4,035,000 | | Turkey Government International Bond, 7.25%, 12/23/23 | | | 4,129 | |
3,375,000 | | Turkey Government International Bond, 7.38%, 2/05/25 | | | 3,456 | |
| | | | | 17,098 | |
Ukraine (EUR) (0%) | | | | |
1,285,000 | | Ukraine Government International Bond 144A, 4.38%, 1/27/30 EUR (a) | | | 1,252 | |
2,790,000 | | Ukraine Government International Bond 144A, 6.75%, 6/20/26 EUR (a) | | | 3,200 | |
| | | | | 4,452 | |
Ukraine (UAH) (0%) | | | | |
103,920,000 | | Ukraine Government International Bond 144A, 11.67%, 11/22/23 UAH (a) | | | 3,699 | |
Ukraine (USD) (3%) | | | | |
2,895,000 | | Ukraine Government International Bond 144A, 0.32%, 5/31/40 (a)(f)(h) | | | 2,517 | |
9,435,000 | | Ukraine Government International Bond 144A, 7.25%, 3/15/33 (a) | | | 8,904 | |
980,000 | | Ukraine Government International Bond 144A, | | | | |
| | 7.38%, 9/25/32 (a) | | | 943 | |
1,286,000 | | Ukraine Government International Bond 144A, 7.75%, 9/01/23 (a) | | | 1,341 | |
2,635,000 | | Ukraine Government International Bond 144A, 7.75%, 9/01/24 (a) | | | 2,734 | |
5,765,000 | | Ukraine Government International Bond 144A, 7.75%, 9/01/25 (a) | | | 5,920 | |
7,418,000 | | Ukraine Government International Bond 144A, 7.75%, 9/01/27 (a) | | | 7,491 | |
3,380,000 | | Ukraine Government International Bond 144A, 8.99%, 2/01/24 (a) | | | 3,611 | |
| | | | | 33,461 | |
United Arab Emirates (USD) (2%) | | | | |
7,183,000 | | Abu Dhabi Crude Oil Pipeline LLC 144A, 4.60%, 11/02/47 (a) | | | 8,588 | |
3,560,000 | | Abu Dhabi Government International Bond 144A, 3.13%, 9/30/49 (a) | | | 3,761 | |
2,599,000 | | Acwa Power Management And Investments One Ltd. 144A, 5.95%, 12/15/39 (a) | | | 3,008 | |
825,000 | | DP World PLC 144A, 5.63%, 9/25/48 (a) | | | 945 | |
2,160,000 | | DP World PLC 144A, 6.85%, 7/02/37 (a) | | | 2,719 | |
| | | | | | |
Principal
or Shares | | Security Description | | Value
(000) | |
| | |
3,005,000 | | Ruwais Power Co. PJSC 144A, 6.00%, 8/31/36 (a) | | $ | 3,991 | |
| | | | | 23,012 | |
United Kingdom (EGP) (1%) | | | | |
31,299,000 | | HSBC Bank PLC 144A, 14.35%, 7/16/25 EGP (a)(e) | | | 2,000 | |
43,500,000 | | HSBC Bank PLC 144A, 14.56%, 10/18/27 EGP (a)(e) | | | 2,784 | |
47,370,000 | | HSBC Bank PLC 144A, 14.61%, 9/10/25 EGP (a)(e) | | | 3,054 | |
| | | | | 7,838 | |
United Kingdom (IDR) (1%) | | | | |
89,288,000,000 | | Standard Chartered Bank 144A, 8.25%, 5/19/36 IDR (a) | | | 6,564 | |
United States (EGP) (1%) | | | | |
179,300,000 | | Citigroup Global Markets Holdings Inc. 144A, 12.47%, 9/02/21 EGP (a)(f) | | | 10,329 | |
United States (IDR) (1%) | | | | |
75,400,000,000 | | JPMorgan Chase Bank N.A. (Indonesia Treasury Bond) 144A, 5.63%, 5/17/23 IDR (a) | | | 5,272 | |
36,100,000,000 | | JPMorgan Chase Bank N.A. (Indonesia Treasury Bond) 144A, 8.25%, 5/17/36 IDR (a) | | | 2,654 | |
24,925,000,000 | | JPMorgan Chase Bank N.A. (Indonesia Treasury Bond) 144A, 8.38%, 3/17/34 IDR (a) | | | 1,855 | |
11,270,000,000 | | JPMorgan Chase Bank N.A. (Indonesia Treasury Bond) 144A, 11.00%, 9/17/25 IDR (a) | | | 937 | |
| | | | | 10,718 | |
United States (UAH) (1%) | | | | |
134,000,000 | | Citigroup Global Markets Holdings Inc. 144A, 15.92%, 11/19/21 UAH (a) | | | 5,324 | |
United States (USD) (0%) | | | | |
2,010,000 | | NBM U.S. Holdings Inc. 144A, 7.00%, 5/14/26 (a) | | | 2,136 | |
Uruguay (USD) (2%) | | | | |
5,770,000 | | Uruguay Government International Bond, 4.98%, 4/20/55 | | | 7,638 | |
6,244,580 | | Uruguay Government International Bond, 5.10%, 6/18/50 | | | 8,370 | |
| | | | | 16,008 | |
Uruguay (UYU) (1%) | | | | |
160,994,076 | | Uruguay Government International Bond, 3.88%, 7/02/40 UYU | | | 4,312 | |
176,307,224 | | Uruguay Government International Bond, 4.38%, 12/15/28 UYU | | | 4,630 | |
| | | | | 8,942 | |
Venezuela (USD) (0%) | | | | |
6,400,000 | | Petroleos de Venezuela SA, 5.38%, 4/12/27 (c)(i) | | | 250 | |
6,055,000 | | Petroleos de Venezuela SA, 6.00%, 11/15/26 (c)(i) | | | 236 | |
1,122,500 | | Petroleos de Venezuela SA, 8.50%, 10/27/20 (c)(i) | | | 320 | |
5,085,000 | | Petroleos de Venezuela SA, 9.00%, 11/17/21 (c)(i) | | | 198 | |
2,420,000 | | Venezuela Government International Bond, 7.00%, 3/31/38 (c)(i) | | | 233 | |
98 Payden Mutual Funds
| | | | | | |
Principal
or Shares | | Security Description | | Value
(000) | |
| | |
7,789,000 | | Venezuela Government International Bond, 7.65%, 4/21/25 (c)(i) | | $ | 752 | |
4,020,000 | | Venezuela Government International Bond, 7.75%, 10/13/19 (c)(i) | | | 388 | |
9,060,000 | | Venezuela Government International Bond, 9.25%, 9/15/27 (c)(i) | | | 874 | |
| | | | | 3,251 | |
Virgin Islands (British) (USD) (1%) | | | | |
13,400,000 | | 1MDB Global Investments Ltd., 4.40%, 3/09/23 (e) | | | 13,316 | |
Total Bonds (Cost - $1,018,838) | | | 982,087 | |
Purchase Options (0%) | | | | |
Total Purchased Options (Cost - $257) | | | 351 | |
Investment Company (2%) | | | | |
23,105,311 | | Payden Cash Reserves Money Market Fund * | | | | |
| | (Cost - $23,105) | | | 23,105 | |
Total Investments (Cost - $1,042,200) (101%) | | | 1,005,543 | |
Liabilities in excess of Other Assets (-1%) | | | (10,101 | ) |
Net Assets (100%) | | $ | 995,442 | |
| | | | | | |
| (a) | Security offered only to qualified institutional investors, and thus is not registered for sale to the public under rule 144A of the Securities Act of 1933. It has been deemed liquid under guidelines approved by the Board. |
| (b) | Floating rate security. The rate shown reflects the rate in effect at October 31, 2020. |
| (c) | Issuer filed for bankruptcy and/or is in default of principal and/or interest payments. |
| (d) | Perpetual security with no stated maturity date. |
| (e) | Security offered and sold outside the United States, and thus is exempt from registration under Regulation S of the Securities Act of 1933. It has been deemed liquid under guidelines approved by the Board. |
| (f) | Yield to maturity at time of purchase. |
| (g) | All or a portion of these securities are on loan. At October 31, 2020, the total market value of the Fund’s securities on loan is $4,327 and the total market value of the collateral held by the Fund is $4,462. Amounts in 000s. |
| (h) | Variable rate security. Interest rate disclosed is as of the most recent information available. Certain variable rate securities are not based on a published reference rate and spread but are determined by the issuer or agent and are based on current market conditions. These securities do not indicate a reference rate and spread in their description above. |
| (i) | Non-income producing security. |
Purchased Options
| | | | | | | | | | | | | | | | | | | | | | | | | | | |
| Description | | Number of
Contracts | | Notional
Amount
(000s) | | Exercise
Price | | Maturity
Date | | Value
(000s) | | Call/Put |
Exchange Traded Options Purchase — 0.0% | | | | | | | | |
| CBOE Volatility Index | | | | 450 | | | | $ | 4 | | | | | 30.00 | | | | | 12/16/2020 | | | | $ | 351 | | | Call |
| | | | | | | | | | | | | | | | | | | | | | | | | | | |
Open Forward Currency Contracts to USD
| | | | | | | | | | | | | | | | | | | | |
Currency
Purchased
(000s) | | Currency
Sold
(000s) | | Counterparty | | Settlement
Date | | Unrealized
Appreciation
(Depreciation)
(000s) |
Assets: | | | | | | | | | | | | | | | | | | | | |
MXN 31,280 | | | | USD 1,453 | | | |
| HSBC Bank
USA, N.A. |
| | | | 01/25/2021 | | | | $ | 8 | |
PHP 504,070 | | | | USD 10,332 | | | |
| HSBC Bank
USA, N.A. |
| | | | 01/19/2021 | | | | | 81 | |
USD 15,718 | | | | RUB 1,167,500 | | | |
| Barclays
Bank PLC |
| | | | 11/10/2020 | | | | | 1,037 | |
USD 9,944 | | | | PEN 35,118 | | | |
| Barclays
Bank PLC |
| | | | 12/23/2020 | | | | | 230 | |
USD 10,566 | | | | TWD 298,010 | | | |
| Barclays
Bank PLC |
| | | | 01/19/2021 | | | | | 144 | |
USD 29,393 | | | | EUR 24,845 | | | |
| HSBC Bank
USA, N.A. |
| | | | 03/22/2021 | | | | | 360 | |
USD 11,975 | | | | BRL 63,633 | | | |
| HSBC Bank
USA, N.A. |
| | | | 12/17/2020 | | | | | 906 | |
ZAR 128,460 | | | | USD 7,751 | | | |
| Barclays
Bank PLC |
| | | | 12/22/2020 | | | | | 93 | |
| | | | | | | | | | | | | | | | | | | | |
| | | | | | | | | | | | | | | | | | | 2,859 | |
| | | | | | | | | | | | | | | | | | | | |
Annual Report 99
Payden Emerging Markets Bond Fund continued
| | | | | | | | | | | | | | | | | |
Currency
Purchased
(000s) | | Currency
Sold
(000s) | | Counterparty | | Settlement
Date | | Unrealized
Appreciation
(Depreciation)
(000s) |
Liabilities: | | | | | | | | | | | | | | | | | |
| EUR 1,816 | | | | USD 2,154 | | | HSBC Bank USA, N.A. | | | | 03/22/2021 | | | | $ | (32 | ) |
| MYR 44,492 | | | | USD 10,743 | | | Barclays Bank PLC | | | | 11/24/2020 | | | | | (46 | ) |
| PLN 20,139 | | | | USD 5,189 | | | HSBC Bank USA, N.A. | | | | 01/28/2021 | | | | | (100 | ) |
| RUB 721,560 | | | | USD 9,349 | | | HSBC Bank USA, N.A. | | | | 11/10/2020 | | | | | (276 | ) |
| USD 10,033 | | | | THB 315,980 | | | Barclays Bank PLC | | | | 11/19/2020 | | | | | (104 | ) |
| USD 10,597 | | | | MYR 44,492 | | | Barclays Bank PLC | | | | 11/24/2020 | | | | | (100 | ) |
| USD 12,486 | | | | IDR 186,843,000 | | | Barclays Bank PLC | | | | 12/14/2020 | | | | | (236 | ) |
| USD 5,233 | | | | ZAR 88,320 | | | Barclays Bank PLC | | | | 12/22/2020 | | | | | (160 | ) |
| USD 13,062 | | | | ZAR 221,820 | | | HSBC Bank USA, N.A. | | | | 12/22/2020 | | | | | (484 | ) |
| USD 4,702 | | | | IDR 70,435,000 | | | HSBC Bank USA, N.A. | | | | 12/14/2020 | | | | | (94 | ) |
| ZAR 85,900 | | | | USD 5,261 | | | HSBC Bank USA, N.A. | | | | 12/22/2020 | | | | | (15 | ) |
| | | | | | | | | | | | | | | | | |
| | | | | | | | | | | | | | | | (1,647 | ) |
| | | | | | | | | | | | | | | | | |
| Net Unrealized Appreciation (Depreciation) | | | | | | | | | | | | | | | $ | 1,212 | |
| | | | | | | | | | | | | | | | | |
Open Centrally Cleared Credit Default Swap Contracts
| | | | | | | | | | | | | | | | | | | | | | | | | |
| Description | | Maturity
Date | | Notional
Amount
(000s) | | Value
(000s) | | Upfront
payments/
receipts
(000s) | | Unrealized
Appreciation
(Depreciation)
(000s) |
| Protection Bought (Relevant Credit: Federative Republic of Brazil), Pay 1% Quarterly, Receive upon credit default | | | | 12/20/2025 | | | | $ | 5,475 | | | | $ | 304 | | | | $ | 360 | | | | $ | (56 | ) |
| Protection Bought (Relevant Credit: Markit CDX, North America High Yield Series 35 Index), Pay 5% Quarterly, Receive upon credit default | | | | 12/20/2025 | | | | | 24,045 | | | | | (971 | ) | | | | (950 | ) | | | | (21 | ) |
| Protection Bought (Relevant Credit: Republic of Chile), Pay 1% Quarterly, Receive upon credit default | | | | 12/20/2025 | | | | | 9,520 | | | | | (217 | ) | | | | (132 | ) | | | | (85 | ) |
| Protection Bought (Relevant Credit: Republic of Colombia), Pay 1% Quarterly, Receive upon credit default | | | | 12/20/2025 | | | | | 15,040 | | | | | 176 | | | | | 392 | | | | | (216 | ) |
| Protection Bought (Relevant Credit: Republic of South Africa), Pay 1% Quarterly, Receive upon credit default | | | | 12/20/2025 | | | | | 10,140 | | | | | 850 | | | | | 948 | | | | | (98 | ) |
| Protection Bought (Relevant Credit: United Mexican States), Pay 1% Quarterly, Receive upon credit default | | | | 12/20/2025 | | | | | 4,900 | | | | | 61 | | | | | 120 | | | | | (59 | ) |
| | | | | | | | | | | | | | | | | | | | | | | | | |
| | | | | | | | | | | | | $ | 203 | | | | $ | 738 | | | | $ | (535 | ) |
| | | | | | | | | | | | | | | | | | | | | | | | | |
Offsetting Assets and Liabilities
The Fund’s loaned securities were all subject to an enforceable Securities Lending Agency Agreement. Securities lent in accordance with the Securities Lending Agency Agreement on a gross basis were as follows:
| | | | |
| Total gross amount presented on the Statements of Assets and Liabilities1 | | $ | 4,327 | |
Non-cash Collateral2 | | | (4,327 | ) |
| | | | |
Net Amount | | $ | — | |
| | | | |
| 1 | The amount presented on the Statements of Assets and Liabilities is not offset and is shown on a gross basis. |
| 2 | At October 31, 2020, the value of the collateral received from each borrower exceeded the value of the related securities loaned. This amount is disclosed on the Schedule of Investments. |
See notes to financial statements.
100 Payden Mutual Funds
Payden Emerging Markets Local Bond Fund
| | | | | | |
| | | | | |
| | | The Fund seeks a high level of total return by generally investing in below investment grade debt instruments and income producing securities of emerging market countries denominated in foreign and U.S. currencies. | | 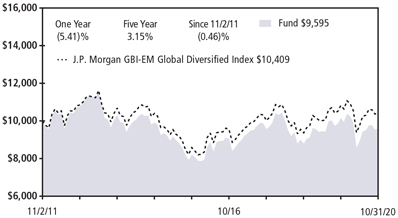
Past performance does not predict future returns. The graph does not reflect the impact of taxes or transaction costs a shareholder would pay. |
| | Portfolio Composition - percent of investments |
| | |
| | Foreign Government | | 79% |
| | Corporate | | 20% |
| | Cash equivalent | | 1% |
| | | | |
| | | | |
| | | | | |
| | | | | |
| | | | | |
| | | | | |
| | | This information is not part of the audited financial statements. | | |
| | | |
| | | | | | |
| Schedule of Investments - October 31, 2020 | |
Principal
or Shares | | Security Description | | Value
(000) | |
Bonds (98%) | | | | |
Argentina (ARS) (0%) | | | | |
8,765,600 | | YPF SA 144A, 16.50%, 5/09/22 ARS (a) | | $ | 73 | |
Brazil (BRL) (4%) | | | | |
955,000 | | Brazil Notas do Tesouro Nacional Serie B, 6.00%, 8/15/26 BRL | | | 649 | |
6,038,568 | | Brazil Notas do Tesouro Nacional Serie B, 6.00%, 8/15/28 BRL | | | 1,249 | |
6,000,000 | | Brazil Notas do Tesouro Nacional Serie F, 10.00%, 1/01/25 BRL | | | 1,173 | |
9,330,000 | | Brazil Notas do Tesouro Nacional Serie F, 10.00%, 1/01/27 BRL | | | 1,838 | |
| | | | | 4,909 | |
Chile (CLP) (3%) | | | | |
1,090,000,000 | | Bonos de la Tesoreria de la Republica en pesos, 4.50%, 3/01/26 CLP | | | 1,630 | |
695,000,000 | | Bonos de la Tesoreria de la Republica en pesos, 5.00%, 3/01/35 CLP | | | 1,093 | |
410,000,000 | | Bonos de la Tesoreria de la Republica en pesos, 6.00%, 1/01/43 CLP | | | 742 | |
| | | | | 3,465 | |
China (CNY) (6%) | | | | |
17,800,000 | | China Government Bond, 1.99%, 4/09/25 CNY | | | 2,543 | |
21,900,000 | | China Government Bond, 2.85%, 6/04/27 CNY | | | 3,192 | |
1,000,000 | | China Government Bond, 3.12%, 12/05/26 CNY | | | 149 | |
8,500,000 | | China Government Bond, 3.29%, 5/23/29 CNY | | | 1,276 | |
| | | | | 7,160 | |
Colombia (COP) (7%) | | | | |
540,000,000 | | Colombia Government International Bond, 7.75%, 4/14/21 COP | | | 142 | |
2,887,962,000 | | Colombian TES, 3.30%, 3/17/27 COP | | | 820 | |
2,700,000,000 | | Colombian TES, 6.00%, 4/28/28 COP | | | 729 | |
5,154,000,000 | | Colombian TES, 6.25%, 11/26/25 COP | | | 1,450 | |
3,600,000,000 | | Colombian TES, 7.50%, 8/26/26 COP | | | 1,065 | |
2,220,000,000 | | Colombian TES, 7.75%, 9/18/30 COP | | | 657 | |
7,329,000,000 | | Colombian TES, 10.00%, 7/24/24 COP | | | 2,307 | |
| | | | | | |
| | | | | | |
Principal
or Shares | | Security Description | | Value
(000) | |
| | |
900,000,000 | | Emgesa SA ESP 144A, 8.75%, 1/25/21 COP (a) | | $ | 235 | |
1,245,000,000 | | Empresas Publicas de Medellin ESP 144A, 7.63%, 9/10/24 COP (a) | | | 338 | |
2,003,000,000 | | Empresas Publicas de Medellin ESP 144A, 8.38%, 11/08/27 COP (a) | | | 538 | |
1,585,000,000 | | Financiera de Desarrollo Territorial SA Findeter 144A, 7.88%, 8/12/24 COP (a) | | | 448 | |
| | | | | 8,729 | |
Czech Republic (CZK) (3%) | | | | |
11,400,000 | | Czech Republic Government Bond, 0.95%, 5/15/30 CZK (b) | | | 486 | |
13,400,000 | | Czech Republic Government Bond, 2.00%, 10/13/33 CZK | | | 637 | |
26,200,000 | | Czech Republic Government Bond, 2.40%, 9/17/25 CZK (b) | | | 1,220 | |
30,000,000 | | Czech Republic Government Bond, 2.75%, 7/23/29 CZK | | | 1,483 | |
| | | | | 3,826 | |
Dominica Republic (DOP) (1%) | | | | |
78,400,000 | | Dominican Republic International Bond 144A, 8.90%, 2/15/23 DOP (a) | | | 1,355 | |
13,900,000 | | Dominican Republic International Bond 144A, 9.75%, 6/05/26 DOP (a) | | | 246 | |
| | | | | 1,601 | |
Hungary (HUF) (4%) | | | | |
190,000,000 | | Hungary Government Bond, 2.50%, 10/24/24 HUF | | | 630 | |
140,000,000 | | Hungary Government Bond, 3.00%, 6/26/24 HUF | | | 472 | |
707,000,000 | | Hungary Government Bond, 3.00%, 8/21/30 HUF | | | 2,408 | |
271,000,000 | | Hungary Government Bond, 3.25%, 10/22/31 HUF | | | 943 | |
187,000,000 | | Hungary Government Bond, 5.50%, 6/24/25 HUF | | | 703 | |
| | | | | 5,156 | |
Annual Report 101
Payden Emerging Markets Local Bond Fund continued
| | | | | | |
Principal
or Shares | | Security Description | | Value
(000) | |
Indonesia (IDR) (3%) | | | | |
16,400,000,000 | | Indonesia Treasury Bond, 8.38%, 3/15/24 IDR | | $ | 1,233 | |
8,900,000,000 | | Indonesia Treasury Bond, 8.38%, 9/15/26 IDR | | | 679 | |
4,500,000,000 | | Indonesia Treasury Bond, 8.38%, 3/15/34 IDR | | | 335 | |
21,440,000,000 | | Wijaya Karya Persero Tbk PT 144A, 7.70%, 1/31/21 IDR (a) | | | 1,411 | |
| | | | | 3,658 | |
Kazakhstan (KZT) (1%) | | | | |
620,000,000 | | Development Bank of Kazakhstan JSC 144A, 8.95%, 5/04/23 KZT (a) | | | 1,403 | |
Luxembourg (BRL) (1%) | | | | |
6,626,488 | | Swiss Insured Brazil Power Finance Sarl 144A, 9.85%, 7/16/32 BRL (a) | | | 1,322 | |
Malaysia (MYR) (5%) | | | | |
7,585,000 | | Malaysia Government Bond, 3.89%, 3/15/27 MYR | | | 1,995 | |
8,500,000 | | Malaysia Government Bond, 3.89%, 8/15/29 MYR | | | 2,244 | |
3,950,000 | | Malaysia Government Bond, 3.90%, 11/16/27 MYR | | | 1,040 | |
1,805,000 | | Malaysia Government Bond, 4.39%, 4/15/26 MYR | | | 483 | |
1,700,000 | | Malaysia Government Bond, 4.76%, 4/07/37 MYR | | | 478 | |
| | | | | 6,240 | |
Mexico (MXN) (9%) | | | | |
72,300 | | America Movil SAB de CV, 6.45%, 12/05/22 MXN | | | 347 | |
10,700,000 | | Comision Federal de Electricidad, 7.35%, 11/25/25 MXN | | | 489 | |
7,270,000 | | Grupo Televisa SAB, 7.25%, 5/14/43 MXN | | | 259 | |
7,570,000 | | Mexican Bonos, 7.75%, 11/23/34 MXN | | | 394 | |
24,620,000 | | Mexican Bonos, 7.75%, 11/13/42 MXN | | | 1,245 | |
25,100,000 | | Mexican Bonos, 8.00%, 12/07/23 MXN | | | 1,294 | |
47,300,000 | | Mexican Bonos, 8.00%, 11/07/47 MXN | | | 2,429 | |
73,200,000 | | Mexican Bonos, 8.50%, 5/31/29 MXN | | | 4,029 | |
10,600,000 | | Mexican Bonos, 8.50%, 11/18/38 MXN | | | 580 | |
9,200,000 | | Petroleos Mexicanos, 7.19%, 9/12/24 MXN | | | 378 | |
16,240,000 | | Petroleos Mexicanos 144A, 7.65%, 11/24/21 MXN (a) | | | 762 | |
| | | | | 12,206 | |
Peru (PEN) (6%) | | | | |
3,100,000 | | Banco de Credito del Peru 144A, 4.65%, 9/17/24 PEN (a) | | | 907 | |
3,075,000 | | Fondo MIVIVIENDA SA 144A, 7.00%, 2/14/24 PEN (a) | | | 958 | |
4,930,000 | | Peru Government Bond, 5.40%, 8/12/34 PEN | | | 1,437 | |
1,610,000 | | Peru Government Bond, 5.94%, 2/12/29 PEN | | | 532 | |
3,810,000 | | Peru Government Bond, 6.15%, 8/12/32 PEN | | | 1,215 | |
1,655,000 | | Peruvian Government International Bond 144A, 6.35%, 8/12/28 PEN (a) | | | 560 | |
6,325,000 | | Peruvian Government International Bond 144A, 6.95%, 8/12/31 PEN (a) | | | 2,160 | |
| | | | | 7,769 | |
Philippines (PHP) (0%) | | | | |
17,000,000 | | Philippine Government International Bond, 6.25%, 1/14/36 PHP | | | 453 | |
| | | | | | |
Principal
or Shares | | Security Description | | Value
(000) | |
Poland (PLN) (4%) | | | | |
7,120,000 | | Republic of Poland Government Bond, 2.50%, 4/25/24 PLN | | $ | 1,947 | |
5,320,000 | | Republic of Poland Government Bond, 2.50%, 7/25/26 PLN | | | 1,487 | |
4,215,000 | | Republic of Poland Government Bond, 4.00%, 10/25/23 PLN | | | 1,190 | |
| | | | | 4,624 | |
Romania (RON) (3%) | | | | |
5,800,000 | | Romania Government Bond, 3.65%, 9/24/31 RON | | | 1,413 | |
5,200,000 | | Romania Government Bond, 5.00%, 2/12/29 RON | | | 1,407 | |
2,050,000 | | Romania Government Bond, 5.80%, 7/26/27 RON | | | 568 | |
| | | | | 3,388 | |
Russian Federation (RUB) (8%) | | | | |
45,150,000 | | Russian Federal Bond - OFZ, 6.90%, 5/23/29 RUB | | | 604 | |
198,775,000 | | Russian Federal Bond - OFZ, 7.05%, 1/19/28 RUB | | | 2,689 | |
149,000,000 | | Russian Federal Bond - OFZ, 7.70%, 3/23/33 RUB | | | 2,092 | |
38,000,000 | | Russian Federal Bond - OFZ, 7.70%, 3/16/39 RUB | | | 545 | |
327,770,000 | | Russian Federal Bond - OFZ, 8.15%, 2/03/27 RUB | | | 4,675 | |
| | | | | 10,605 | |
South Africa (ZAR) (8%) | | | | |
8,700,000 | | Republic of South Africa Government Bond, 6.50%, 2/28/41 ZAR | | | 328 | |
8,380,000 | | Republic of South Africa Government Bond, 7.00%, 2/28/31 ZAR | | | 422 | |
23,000,000 | | Republic of South Africa Government Bond, 8.25%, 3/31/32 ZAR | | | 1,215 | |
56,230,000 | | Republic of South Africa Government Bond, 8.50%, 1/31/37 ZAR | | | 2,711 | |
60,500,000 | | Republic of South Africa Government Bond, 8.75%, 2/28/48 ZAR | | | 2,827 | |
32,000,000 | | Republic of South Africa Government Bond, 8.88%, 2/28/35 ZAR | | | 1,645 | |
10,460,000 | | Republic of South Africa Government Bond, 10.50%, 12/21/26 ZAR | | | 748 | |
11,200,000 | | Transnet SOC Ltd. 144A, 9.50%, 5/13/21 ZAR (a) | | | 699 | |
| | | | | 10,595 | |
South Korea (MXN) (0%) | | | | |
12,000,000 | | Export-Import Bank of Korea, 7.93%, 7/30/26 MXN | | | 623 | |
Thailand (THB) (7%) | | | | |
8,400,000 | | Thailand Government Bond, 2.88%, 6/17/46 THB | | | 312 | |
31,500,000 | | Thailand Government Bond, 3.30%, 6/17/38 THB | | | 1,227 | |
48,500,000 | | Thailand Government Bond, 3.40%, 6/17/36 THB | | | 1,928 | |
102 Payden Mutual Funds
| | | | | | |
Principal
or Shares | | Security Description | | Value
(000) | |
| | |
170,000 | | Thailand Government Bond, 3.65%, 12/17/21 THB | | $ | 6 | |
50,500,000 | | Thailand Government Bond, 3.65%, 6/20/31 THB | | | 1,974 | |
72,800,000 | | Thailand Government Bond, 4.88%, 6/22/29 THB | | | 2,998 | |
| | | | | 8,445 | |
Turkey (TRY) (1%) | | | | |
7,200,000 | | Turkey Government Bond, 7.10%, 3/08/23 TRY | | | 736 | |
3,070,000 | | Turkey Government Bond, 11.00%, 3/02/22 TRY | | | 353 | |
| | | | | 1,089 | |
Ukraine (UAH) (0%) | | | | |
11,570,000 | | Ukraine Government International Bond 144A, 11.67%, 11/22/23 UAH (a) | | | 412 | |
United Kingdom (EGP) (1%) | | | | |
6,510,000 | | HSBC Bank PLC 144A, 14.35%, 7/16/25 EGP (a)(b) | | | 416 | |
7,900,000 | | HSBC Bank PLC 144A, 14.56%, 10/18/27 EGP (a)(b) | | | 506 | |
9,840,000 | | HSBC Bank PLC 144A, 14.61%, 9/10/25 EGP (a)(b) | | | 634 | |
| | | | | 1,556 | |
United Kingdom (IDR) (4%) | | | | |
45,500,000,000 | | Standard Chartered Bank 144A, 8.25%, 5/19/36 IDR (a) | | | 3,345 | |
17,200,000,000 | | Standard Chartered Bank 144A, 8.38%, 3/17/34 IDR (a) | | | 1,281 | |
| | | | | 4,626 | |
United States (EGP) (1%) | | | | |
28,800,000 | | Citigroup Global Markets Holdings Inc. 144A, 12.47%, 9/02/21 EGP (a)(c) | | | 1,659 | |
United States (IDR) (4%) | | | | |
32,200,000,000 | | JPMorgan Chase Bank N.A. (Indonesia Treasury Bond) 144A, 8.38%, 3/17/34 IDR (a) | | | 2,397 | |
10,000,000,000 | | JPMorgan Chase Bank N.A. (Indonesia Treasury Bond) 144A, 8.75%, 5/19/31 IDR (a) | | | 770 | |
31,994,000,000 | | JPMorgan Chase Bank N.A. (Indonesia Treasury Bond) 144A, 9.50%, 7/17/31 IDR (a) | | | 2,582 | |
| | | | | 5,749 | |
United States (UAH) (2%) | | | | |
31,500,000 | | Citigroup Global Markets Holdings Inc. 144A, 13.41%, 10/17/22 UAH (a) | | | 1,186 | |
19,500,000 | | Citigroup Global Markets Holdings Inc. 144A, 15.92%, 11/19/21 UAH (a) | | | 775 | |
| | | | | 1,961 | |
Uruguay (UYU) (2%) | | | | |
44,310,178 | | Uruguay Government International Bond, 3.88%, 7/02/40 UYU | | | 1,187 | |
22,140,907 | | Uruguay Government International Bond, 4.38%, 12/15/28 UYU | | | 581 | |
10,970,000 | | Uruguay Government International Bond 144A, 8.50%, 3/15/28 UYU (a) | | | 269 | |
| | | | | 2,037 | |
Total Bonds (Cost - $134,927) | | | 125,339 | |
| | | | | | |
Principal
or Shares | | Security Description | | Value
(000) | |
Purchase Options (0%) | | | | |
Total Purchased Options (Cost - $33) | | $ | 44 | |
Investment Company (1%) | | | | |
1,595,347 | | Payden Cash Reserves Money Market Fund * | | | | |
| | (Cost - $1,595) | | | 1,595 | |
Total Investments (Cost - $136,555) (99%) | | | 126,978 | |
Other Assets, net of Liabilities (1%) | | | 1,234 | |
Net Assets (100%) | | $ | 128,212 | |
| (a) | Security offered only to qualified institutional investors, and thus is not registered for sale to the public under rule 144A of the Securities Act of 1933. It has been deemed liquid under guidelines approved by the Board. |
| (b) | Security offered and sold outside the United States, and thus is exempt from registration under Regulation S of the Securities Act of 1933. It has been deemed liquid under guidelines approved by the Board. |
| (c) | Yield to maturity at time of purchase. |
Annual Report 103
Payden Emerging Markets Local Bond Fund continued
Purchased Options
| | | | | | | | | | | | | | | | | | | | | | | | | | | | | | |
| Description | | Number of
Contracts | | Notional
Amount
(000s) | | Exercise
Price | | Maturity
Date | | Value
(000s) | | Call/Put |
Exchange Traded Options Purchase — 0.0% | | | | | | | | | | | |
| CBOE Volatility Index | | | | 57 | | | | $ | — | | | | | 30.00 | | | | | 12/16/2020 | | | | $ | 44 | | | | | Call | |
| | | | | | | | | | | | | | | | | | | | | | | | | | | | | | |
Open Forward Currency Contracts to USD
| | | | | | | | | | | | | | | | | | | | |
Currency
Purchased
(000s) | | Currency
Sold
(000s) | | Counterparty | | Settlement
Date | | Unrealized
Appreciation
(Depreciation)
(000s) |
Assets: | | | | | | | | | | | | | | | | | | | | |
CLP 56,300 | | | | USD 71 | | | |
| HSBC Bank
USA, N.A. |
| | | | 01/20/2021 | | | | $ | 2 | |
CNH 19,976 | | | | USD 2,962 | | | |
| HSBC Bank
USA, N.A. |
| | | | 01/28/2021 | | | | | 1 | |
EGP 32,550 | | | | USD 2,026 | | | |
| HSBC Bank
USA, N.A. |
| | | | 11/09/2020 | | | | | 40 | |
IDR 14,700,000 | | | | USD 984 | | | |
| HSBC Bank
USA, N.A. |
| | | | 12/14/2020 | | | | | 17 | |
MXN 44,810 | | | | USD 2,081 | | | |
| HSBC Bank
USA, N.A. |
| | | | 01/25/2021 | | | | | 11 | |
MYR 2,106 | | | | USD 501 | | | |
| Barclays
Bank PLC |
| | | | 11/24/2020 | | | | | 5 | |
PHP 124,770 | | | | USD 2,558 | | | |
| HSBC Bank
USA, N.A. |
| | | | 01/19/2021 | | | | | 20 | |
THB 86,555 | | | | USD 2,773 | | | |
| Barclays
Bank PLC |
| | | | 11/19/2020 | | | | | 4 | |
USD 2,721 | | | | RUB 202,080 | | | |
| Barclays
Bank PLC |
| | | | 11/10/2020 | | | | | 180 | |
USD 3,606 | | | | COP 13,663,000 | | | |
| Barclays
Bank PLC |
| | | | 11/17/2020 | | | | | 79 | |
USD 1,031 | | | | MYR 4,282 | | | |
| Barclays
Bank PLC |
| | | | 11/24/2020 | | | | | 1 | |
USD 2,284 | | | | PEN 8,069 | | | |
| Barclays
Bank PLC |
| | | | 12/23/2020 | | | | | 52 | |
USD 2,619 | | | | TWD 73,870 | | | |
| Barclays
Bank PLC |
| | | | 01/19/2021 | | | | | 36 | |
USD 530 | | | | CZK 11,990 | | | |
| HSBC Bank
USA, N.A. |
| | | | 12/15/2020 | | | | | 17 | |
USD 939 | | | | BRL 4,949 | | | |
| HSBC Bank
USA, N.A. |
| | | | 12/17/2020 | | | | | 78 | |
USD 682 | | | | RON 2,862 | | | |
| HSBC Bank
USA, N.A. |
| | | | 01/28/2021 | | | | | — | |
USD 2,584 | | | | EUR 2,197 | | | |
| HSBC Bank
USA, N.A. |
| | | | 03/22/2021 | | | | | 16 | |
ZAR 15,670 | | | | USD 946 | | | |
| Barclays
Bank PLC |
| | | | 12/22/2020 | | | | | 11 | |
ZAR 39,210 | | | | USD 2,392 | | | |
| HSBC Bank
USA, N.A. |
| | | | 12/22/2020 | | | | | 3 | |
| �� | | | | | | | | | | | | | | | | | | | |
| | | | | | | | | | | | | | | | | | | 573 | |
| | | | | | | | | | | | | | | | | | | | |
| | | | | | | | | | | | | | | | | | | | |
Currency
Purchased
(000s) | | Currency
Sold
(000s) | | Counterparty | | Settlement
Date | | Unrealized
Appreciation
(Depreciation)
(000s) |
Liabilities: | | | | | | | | | | | | | | | | | | | | |
BRL 30,345 | | | | USD 5,576 | | | |
| HSBC Bank
USA, N.A. |
| | | | 12/17/2020 | | | | | (297 | ) |
COP 3,909,000 | | | | USD 1,052 | | | |
| Barclays
Bank PLC |
| | | | 11/17/2020 | | | | | (43 | ) |
CZK 100,950 | | | | USD 4,455 | | | |
| HSBC Bank
USA, N.A. |
| | | | 12/15/2020 | | | | | (137 | ) |
HUF 20,800 | | | | USD 67 | | | |
| HSBC Bank
USA, N.A. |
| | | | 01/27/2021 | | | | | (1 | ) |
MYR 15,163 | | | | USD 3,664 | | | |
| Barclays
Bank PLC |
| | | | 11/24/2020 | | | | | (18 | ) |
PEN 1,540 | | | | USD 437 | | | |
| Barclays
Bank PLC |
| | | | 12/23/2020 | | | | | (11 | ) |
PLN 31,137 | | | | USD 8,024 | | | |
| HSBC Bank
USA, N.A. |
| | | | 01/28/2021 | | | | | (157 | ) |
RON 212 | | | | USD 51 | | | |
| HSBC Bank
USA, N.A. |
| | | | 01/28/2021 | | | | | (1 | ) |
RUB 239,850 | | | | USD 3,210 | | | |
| HSBC Bank
USA, N.A. |
| | | | 11/10/2020 | | | | | (194 | ) |
USD 3,042 | | | | THB 95,640 | | | |
| Barclays
Bank PLC |
| | | | 11/19/2020 | | | | | (26 | ) |
USD 1,602 | | | | IDR 23,978,000 | | | |
| Barclays
Bank PLC |
| | | | 12/14/2020 | | | | | (30 | ) |
USD 569 | | | | ZAR 9,600 | | | |
| Barclays
Bank PLC |
| | | | 12/22/2020 | | | | | (17 | ) |
USD 219 | | | | PHP 10,650 | | | |
| Barclays
Bank PLC |
| | | | 01/19/2021 | | | | | (1 | ) |
USD 1,920 | | | | EGP 32,550 | | | |
| HSBC Bank
USA, N.A. |
| | | | 11/09/2020 | | | | | (145 | ) |
USD 1,325 | | | | IDR 19,845,000 | | | |
| HSBC Bank
USA, N.A. |
| | | | 12/14/2020 | | | | | (26 | ) |
USD 4,026 | | | | ZAR 67,780 | | | |
| HSBC Bank
USA, N.A. |
| | | | 12/22/2020 | | | | | (113 | ) |
USD 385 | | | | HUF 121,700 | | | |
| HSBC Bank
USA, N.A. |
| | | | 01/27/2021 | | | | | (1 | ) |
| | | | | | | | | | | | | | | | | | | | |
| | | | | | | | | | | | | | | | | | | (1,218 | ) |
| | | | | | | | | | | | | | | | | | | | |
| Net Unrealized Appreciation (Depreciation) | | | | $ | (645 | ) |
| | | | | | | | | | | | | | | | | | | | |
104 Payden Mutual Funds
Open Centrally Cleared Interest Rate Swap Contracts
| | | | | | | | | | | | | | | | | | | | | | | | | |
| Description | | Maturity
Date | | Notional
Amount
(000s) | | Value
(000s) | | Upfront
payments/
receipts
(000s) | | Unrealized
Depreciation
(000s) |
| 5-Year Interest Rate Swap, Receive Fixed 2.50% Quarterly, Pay Variable 2.50% (CNRR007) Quarterly | | 07/28/2025 | | | | CNY 21,710 | | | | $ | (13 | ) | | | $ | — | | | | $ | (13 | ) |
| | | | | | | | | | | | | | | | | | | | | | |
See notes to financial statements.
Annual Report 105
Payden Emerging Markets Corporate Bond Fund
| | | | | | |
| | The Fund seeks a high level of total return by generally investing in below investment grade corporate debt instruments and income producing securities of emerging market countries denominated in U.S. and foreign currencies with no limit on the average portfolio maturity. | | 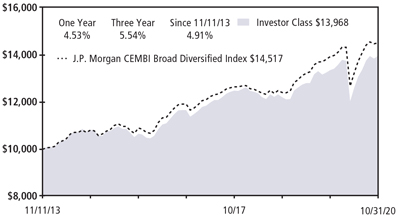
Past performance does not predict future returns. The graph does not reflect the impact of taxes or transaction costs a shareholder would pay. The Fund’s SI Class is expected to perform similarly to its Investor Class, except for class specific waivers. |
| | | Portfolio Composition - percent of investments |
| | Corporate Bond | | 86% |
| | Foreign Government | | 4% |
| | Mortgage Backed | | 3% |
| | Bank Loans | | 3% |
| | Cash equivalent | | 4% |
| | | | |
| | |
| | |
| | |
| | |
| | This information is not part of the audited financial statements. |
| | | | | | |
Schedule of Investments - October 31, 2020 | | | | |
Principal
or Shares | | Security Description | | Value
(000) | |
Bonds (96%) | | | | |
Argentina (ARS) (0%) | | | | |
2,000,000 | | YPF SA 144A, 16.50%, 5/09/22 ARS (a) | | $ | 17 | |
Argentina (USD) (1%) | | | | |
230,000 | | Capex SA 144A, 6.88%, 5/15/24 (a) | | | 182 | |
225,000 | | Pampa Energia SA 144A, 7.38%, 7/21/23 (a) | | | 189 | |
255,000 | | Provincia de Buenos Aires 144A, 6.50%, 2/15/23 (a) | | | 85 | |
70,000 | | Tecpetrol SA 144A, 4.88%, 12/12/22 (a) | | | 66 | |
| | | | | 522 | |
Austria (USD) (1%) | | | | |
200,000 | | Klabin Austria GmbH 144A, 5.75%, 4/03/29 (a) | | | 221 | |
200,000 | | Klabin Austria GmbH 144A, 7.00%, 4/03/49 (a) | | | 229 | |
| | | | | 450 | |
Bahamas (USD) (1%) | | | | |
405,000 | | Intercorp Peru Ltd. 144A, 3.88%, 8/15/29 (a) | | | 412 | |
Bermuda (USD) (4%) | | | | |
5,400 | | Digicel Group 0.5 Ltd. 144A, 7.00%, (a)(b) | | | 1 | |
32,696 | | Digicel Group 0.5 Ltd. 144A, 8.00%, 4/01/25 (a) | | | 11 | |
103,772 | | Digicel Group 0.5 Ltd., 10.00%, 4/01/24 | | | 79 | |
440,000 | | Geopark Ltd. 144A, 5.50%, 1/17/27 (a) | | | 388 | |
210,000 | | Geopark Ltd. 144A, 6.50%, 9/21/24 (a) | | | 198 | |
200,000 | | Ooredoo International Finance Ltd. 144A, 5.00%, 10/19/25 (a) | | | 233 | |
320,000 | | Star Energy Geothermal Darajat II/Star Energy | | | | |
| | Geothermal Salak 144A, 4.85%, 10/14/38 (a) | | | 330 | |
285,000 | | Tengizchevroil Finance Co. International Ltd. 144A, 4.00%, 8/15/26 (a) | | | 304 | |
| | | | | 1,544 | |
Brazil (USD) (3%) | | | | |
430,000 | | BRF SA 144A, 5.75%, 9/21/50 (a) | | | 410 | |
200,000 | | Itau Unibanco Holding SA 144A, (5 yr. US Treasury Yield Curve Rate T Note Constant Maturity + 2.822%), 4.50%, 11/21/29 (a)(c) | | | 197 | |
357,549 | | Prumo Participacoes e Investimentos S/A 144A, 7.50%, 12/31/31 (a) | | | 382 | |
| | | | | | |
| | |
| | | | | | |
Principal
or Shares | | Security Description | | Value
(000) | |
| | |
691,905 | | USJ-Acucar e Alcool S/A 144A, 9.88%, 11/09/23 (a)(d) | | $ | 208 | |
| | | | | 1,197 | |
Canada (USD) (1%) | | | | |
200,000 | | First Quantum Minerals Ltd. 144A, 6.88%, 10/15/27 (a) | | | 200 | |
200,000 | | First Quantum Minerals Ltd. 144A, 7.25%, 4/01/23 (a) | | | 201 | |
240,000 | | IAMGOLD Corp. 144A, 5.75%, 10/15/28 (a) | | | 241 | |
| | | | | 642 | |
Cayman Islands (USD) (9%) | | | | |
200,000 | | Alpha Star Holding V Ltd., 6.63%, 4/18/23 (e) | | | 188 | |
198,730 | | Bioceanico Sovereign Certificate Ltd. 144A, 3.03%, 6/05/34 (a)(f) | | | 146 | |
200,000 | | Comunicaciones Celulares SA Via Comcel Trust 144A, 6.88%, 2/06/24 (a) | | | 205 | |
610,000 | | Dar Al-Arkan Sukuk Co. Ltd., 6.88%, 4/10/22 (e) | | | 609 | |
200,000 | | DP World Salaam, (5 yr. US Treasury Yield Curve Rate T Note Constant Maturity + 5.750%), 6.00%, (b)(c)(e) | | | 210 | |
200,000 | | Energuate Trust 144A, 5.88%, 5/03/27 (a) | | | 206 | |
200,000 | | Industrial Senior Trust 144A, 5.50%, 11/01/22 (a) | | | 209 | |
450,000 | | JD.com Inc., 3.38%, 1/14/30 | | | 486 | |
200,000 | | Kaisa Group Holdings Ltd., 7.88%, 6/30/21 (e) | | | 201 | |
220,000 | | Meituan 144A, 3.05%, 10/28/30 (a) | | | 221 | |
310,000 | | Melco Resorts Finance Ltd. 144A, 5.75%, 7/21/28 (a) | | | 310 | |
98,900 | | Odebrecht Oil & Gas Finance Ltd. 144A, 7.41%, (a)(b)(f) | | | — | |
220,000 | | Saudi Electricity Global Sukuk Co. 4, 4.72%, 9/27/28 (e) | | | 260 | |
220,000 | | Three Gorges Finance I Cayman Islands Ltd. 144A, 2.15%, 9/22/30 (a) | | | 219 | |
200,000 | | Weibo Corp., 3.50%, 7/05/24 | | | 209 | |
106 Payden Mutual Funds
| | | | | | |
Principal
or Shares | | Security Description | | Value
(000) | |
| | |
230,000 | | Wynn Macau Ltd. 144A, 5.63%, 8/26/28 (a) | | $ | 221 | |
| | | | | 3,900 | |
Chile (USD) (2%) | | | | |
194,672 | | Celeo Redes Operacion Chile SA 144A, 5.20%, 6/22/47 (a) | | | 226 | |
240,000 | | Empresa Electrica Guacolda SA 144A, 4.56%, 4/30/25 (a) | | | 193 | |
210,000 | | Engie Energia Chile SA 144A, 3.40%, 1/28/30 (a) | | | 223 | |
| | | | | 642 | |
Colombia (USD) (3%) | | | | |
215,000 | | Banco de Bogota SA 144A, 4.38%, 8/03/27 (a) | | | 228 | |
215,000 | | Banco de Bogota SA 144A, 6.25%, 5/12/26 (a) | | | 236 | |
210,000 | | Colombia Telecomunicaciones SA ESP 144A, 4.95%, 7/17/30 (a) | | | 224 | |
200,000 | | Grupo de Inversiones Suramericana SA 144A, 5.50%, 4/29/26 (a) | | | 226 | |
420,000 | | Oleoducto Central SA 144A, 4.00%, 7/14/27 (a) | | | 440 | |
| | | | | 1,354 | |
Cyprus (USD) (0%) | | | | |
200,000 | | MHP SE 144A, 7.75%, 5/10/24 (a) | | | 209 | |
Egypt (USD) (0%) | | | | |
200,000 | | Egypt Government International Bond 144A, 7.63%, 5/29/32 (a) | | | 203 | |
Georgia (USD) (1%) | | | | |
210,000 | | Georgia Global Utilities JSC 144A, 7.75%, 7/30/25 (a) | | | 213 | |
200,000 | | Silknet JSC, 11.00%, 4/02/24 (e) | | | 213 | |
| | | | | 426 | |
Guatemala (USD) (1%) | | | | |
200,000 | | Guatemala Government Bond 144A, 5.38%, 4/24/32 (a) | | | 237 | |
India (USD) (5%) | | | | |
440,000 | | Adani Electricity Mumbai Ltd. 144A, 3.95%, 2/12/30 (a) | | | 436 | |
305,000 | | Adani Green Energy UP Ltd./Prayatna Developers Pvt. Ltd./Parampujya Solar Energy 144A, 6.25%, 12/10/24 (a) | | | 330 | |
201,338 | | Adani Renewable Energy RJ Ltd./Kodangal Solar Parks Pvt. Ltd./Wardha Solar Maharash 144A, 4.63%, 10/15/39 (a) | | | 198 | |
248,750 | | Adani Transmission Ltd. 144A, 4.25%, 5/21/36 (a) | | | 253 | |
220,000 | | Muthoot Finance Ltd. 144A, 6.13%, 10/31/22 (a) | | | 228 | |
210,000 | | ReNew Power Ltd. 144A, 6.45%, 9/27/22 (a) | | | 216 | |
210,000 | | ReNew Power Pvt. Ltd. 144A, 5.88%, 3/05/27 (a) | | | 216 | |
420,000 | | Shriram Transport Finance Co. Ltd. 144A, 5.95%, 10/24/22 (a) | | | 410 | |
| | | | | 2,287 | |
Indonesia (USD) (1%) | | | | |
200,000 | | Cikarang Listrindo Tbk PT, 4.95%, 9/14/26 (e) | | | 206 | |
200,000 | | Indonesia Asahan Aluminium Persero PT 144A, 6.53%, 11/15/28 (a) | | | 244 | |
| | | | | 450 | |
| | | | | | |
Principal
or Shares | | Security Description | | Value
(000) | |
Ireland (USD) (1%) | | | | |
400,000 | | C&W Senior Financing DAC 144A, 7.50%, 10/15/26 (a) | | $ | 422 | |
Isle of Man (USD) (1%) | | | | |
200,000 | | AngloGold Ashanti Holdings PLC, 3.75%, 10/01/30 | | | 213 | |
70,000 | | AngloGold Ashanti Holdings PLC, 6.50%, 4/15/40 | | | 86 | |
| | | | | 299 | |
Israel (USD) (2%) | | | | |
410,000 | | Bank Leumi Le-Israel BM 144A, (5 yr. US Treasury Yield Curve Rate T Note Constant Maturity + 1.631%), 3.28%, 1/29/31 (a)(c)(e) | | | 415 | |
265,000 | | Israel Electric Corp. Ltd. 144A, 6.88%, 6/21/23 (a) | | | 303 | |
210,000 | | Leviathan Bond Ltd. 144A, 6.75%, 6/30/30 (a)(e) | | | 216 | |
| | | | | 934 | |
Jersey (USD) (1%) | | | | |
210,000 | | Galaxy Pipeline Assets Bidco Ltd. 144A, | | | | |
| | 2.63%, 3/31/36 (a) | | | 211 | |
Kazakhstan (KZT) (0%) | | | | |
70,000,000 | | Development Bank of Kazakhstan JSC 144A, | | | | |
| | 8.95%, 5/04/23 KZT (a) | | | 158 | |
Luxembourg (USD) (4%) | | | | |
306,115 | | JBS USA LUX SA Term Loan B 1L, (LIBOR USD 1-Month + 2.000%), 2.15%, 5/01/26 (g) | | | 300 | |
210,000 | | MHP Lux SA 144A, 6.25%, 9/19/29 (a) | | | 202 | |
200,000 | | Millicom International Cellular SA 144A, 4.50%, 4/27/31 (a) | | | 203 | |
200,000 | | Millicom International Cellular SA 144A, 5.13%, 1/15/28 (a) | | | 210 | |
220,000 | | Minerva Luxembourg SA 144A, 6.50%, 9/20/26 (a) | | | 229 | |
210,000 | | Nexa Resources SA 144A, 6.50%, 1/18/28 (a) | | | 234 | |
210,000 | | Rumo Luxembourg Sarl 144A, 5.25%, 1/10/28 (a) | | | 220 | |
| | | | | 1,598 | |
Marshall Islands (USD) (1%) | | | | |
250,000 | | Nakilat Inc. 144A, 6.07%, 12/31/33 (a) | | | 318 | |
Mauritius (USD) (1%) | | | | |
200,000 | | Azure Power Energy Ltd. 144A, 5.50%, 11/03/22 (a) | | | 205 | |
200,000 | | Azure Power Solar Energy Pvt. Ltd. 144A, 5.65%, 12/24/24 (a) | | | 211 | |
210,000 | | Network i2i Ltd. 144A, (5 yr. US Treasury Yield Curve Rate T Note Constant Maturity + 4.277%), 5.65%, (a)(b)(c) | | | 211 | |
| | | | | 627 | |
Mexico (MXN) (0%) | | | | |
2,200,000 | | Mexican Bonos, 8.50%, 5/31/29 MXN | | | 121 | |
1,600,000 | | Mexican Bonos, 8.50%, 11/18/38 MXN | | | 88 | |
| | | | | 209 | |
Mexico (USD) (9%) | | | | |
215,000 | | Banco Mercantil del Norte SA 144A, (5 yr. US Treasury Yield Curve Rate T Note Constant Maturity + 5.035%), 6.88%, (a)(b)(c) | | | 215 | |
Annual Report 107
Payden Emerging Markets Corporate Bond Fund continued
| | | | | | |
Principal
or Shares | | Security Description | | Value
(000) | |
200,000 | | Banco Mercantil del Norte SA 144A, (10 yr. US Treasury Yield Curve Rate T Note Constant Maturity + 5.470%), 7.50%, (a)(b)(c) | | $ | 199 | |
200,000 | | Banco Santander Mexico SA Institucion de Banca Multiple Grupo Financiero Santand 144A, (5 yr. US Treasury Yield Curve Rate T Note Constant Maturity + 2.995%), 5.95%, 10/01/28 (a)(c)(h) | | | 213 | |
230,000 | | BBVA Bancomer SA 144A, 1.88%, 9/18/25 (a) | | | 228 | |
205,000 | | BBVA Bancomer SA 144A, 6.75%, 9/30/22 (a) | | | 221 | |
220,000 | | Cemex SAB de CV 144A, 5.20%, 9/17/30 (a) | | | 233 | |
200,000 | | Cemex SAB de CV 144A, 7.38%, 6/05/27 (a) | | | 221 | |
400,000 | | Cibanco SA Ibm/PLA Administradora Industrial S de RL de CV 144A, 4.96%, 7/18/29 (a) | | | 424 | |
374,800 | | Cometa Energia SA de CV 144A, 6.38%, 4/24/35 (a) | | | 415 | |
440,616 | | Fermaca Enterprises S de RL de CV 144A, 6.38%, 3/30/38 (a) | | | 485 | |
200,000 | | Grupo Bimbo SAB de CV 144A, (5 yr. US Treasury Yield Curve Rate T Note Constant Maturity + 3.280%), 5.95%, (a)(b)(c) | | | 213 | |
205,000 | | Mexico City Airport Trust 144A, 3.88%, 4/30/28 (a) | | | 184 | |
223,684 | | Mexico Generadora de Energia S de rl 144A, 5.50%, 12/06/32 (a) | | | 255 | |
60,000 | | Petroleos Mexicanos, 6.49%, 1/23/27 | | | 56 | |
210,000 | | Trust Fibra Uno 144A, 6.39%, 1/15/50 (a) | | | 219 | |
| | | | | 3,781 | |
Morocco (EUR) (0%) | | | | |
180,000 | | Morocco Government International Bond 144A, 2.00%, 9/30/30 EUR (a) | | | 205 | |
Netherlands (USD) (8%) | | | | |
200,000 | | Lukoil Securities BV 144A, 3.88%, 5/06/30 (a) | | | 213 | |
435,000 | | Minejesa Capital BV 144A, 5.63%, 8/10/37 (a) | | | 452 | |
195,028 | | MV24 Capital BV 144A, 6.75%, 6/01/34 (a) | | | 197 | |
130,000 | | Petrobras Global Finance BV, 5.60%, 1/03/31 | | | 140 | |
180,000 | | Petrobras Global Finance BV, 6.00%, 1/27/28 | | | 202 | |
95,000 | | Petrobras Global Finance BV, 6.75%, 6/03/50 | | | 104 | |
40,000 | | Petrobras Global Finance BV, 6.90%, 3/19/49 | | | 45 | |
90,000 | | Petrobras Global Finance BV, 8.75%, 5/23/26 | | | 115 | |
640,000 | | Prosus NV 144A, 4.03%, 8/03/50 (a) | | | 656 | |
690,000 | | Teva Pharmaceutical Finance Netherlands III BV, 6.75%, 3/01/28 | | | 726 | |
290,000 | | VEON Holdings BV 144A, 4.95%, 6/16/24 (a) | | | 313 | |
360,000 | | VTR Finance NV 144A, 6.38%, 7/15/28 (a) | | | 385 | |
| | | | | 3,548 | |
Nigeria (USD) (1%) | | | | |
216,000 | | Nigeria Government International Bond 144A, 6.50%, 11/28/27 (a) | | | 210 | |
Panama (USD) (1%) | | | | |
220,000 | | AES Panama Generation Holdings SRL 144A, 4.38%, 5/31/30 (a) | | | 233 | |
210,000 | | Avianca Holdings SA/Avianca Leasing LLC/Grupo Taca Holdings Ltd. 144A, 8.38%, 5/10/20 (a)(d) | | | 32 | |
| | | | | 265 | |
| | | | | | |
Principal
or Shares | | Security Description | | Value
(000) | |
Paraguay (USD) (1%) | | | | |
200,000 | | Telefonica Celular del Paraguay SA 144A, 5.88%, 4/15/27 (a) | | $ | 213 | |
Peru (PEN) (0%) | | | | |
590,000 | | Peruvian Government International Bond 144A, 6.35%, 8/12/28 PEN (a) | | | 200 | |
Peru (USD) (4%) | | | | |
193,820 | | ABY Transmision Sur SA 144A, 6.88%, 4/30/43 (a) | | | 261 | |
325,000 | | Banco Internacional del Peru SAA Interbank 144A, (3 mo. LIBOR USD + 5.760%), 6.63%, 3/19/29 (a)(c) | | | 360 | |
200,000 | | Consorcio Transmantaro SA 144A, 4.70%, 4/16/34 (a) | | | 238 | |
200,000 | | Kallpa Generacion SA 144A, 4.88%, 5/24/26 (a) | | | 216 | |
200,000 | | SAN Miguel Industrias Pet SA 144A, 4.50%, 9/18/22 (a) | | | 203 | |
360,000 | | Scotiabank Peru SAA 144A, (3 mo. LIBOR USD + 3.856%), 4.50%, 12/13/27 (a)(c) | | | 380 | |
| | | | | 1,658 | |
Qatar (USD) (1%) | | | | |
300,000 | | Ras Laffan Liquefied Natural Gas Co. Ltd. 3 144A, 5.84%, 9/30/27 (a) | | | 350 | |
Russian Federation (RUB) (0%) | | | | |
9,150,000 | | Russian Federal Bond - OFZ, 6.90%, 5/23/29 RUB | | | 123 | |
Saudi Arabia (USD) (1%) | | | | |
200,000 | | Saudi Arabian Oil Co. 144A, 4.25%, 4/16/39 (a) | | | 229 | |
Singapore (USD) (0%) | | | | |
200,000 | | Marble II Pte Ltd. 144A, 5.30%, 6/20/22 (a)(h) | | | 201 | |
South Korea (USD) (1%) | | | | |
220,000 | | Kookmin Bank 144A, 2.50%, 11/04/30 (a) | | | 221 | |
Spain (USD) (1%) | | | | |
250,000 | | AI Candelaria Spain SLU 144A, 7.50%, 12/15/28 (a) | | | 270 | |
Sri Lanka (USD) (0%) | | | | |
230,000 | | Sri Lanka Government International Bond 144A, 5.88%, 7/25/22 (a) | | | 148 | |
Supranational (USD) (1%) | | | | |
200,000 | | Ardagh Packaging Finance PLC/Ardagh Holdings USA Inc. 144A, 5.25%, 8/15/27 (a) | | | 205 | |
200,000 | | JBS USA LUX SA/JBS USA Food Co./JBS USA Finance Inc. 144A, 5.50%, 1/15/30 (a) | | | 218 | |
| | | | | 423 | |
Thailand (USD) (1%) | | | | |
400,000 | | Bangkok Bank PCL 144A, (5 yr. US Treasury Yield Curve Rate T Note Constant Maturity + 1.900%), 3.73%, 9/25/34 (a)(c) | | | 393 | |
220,000 | | Bangkok Bank PCL 144A, (5 yr. US Treasury Yield Curve Rate T Note Constant Maturity + 4.729%), 5.00%, (a)(b)(c) | | | 220 | |
| | | | | 613 | |
Turkey (USD) (1%) | | | | |
200,000 | | Turkcell Iletisim Hizmetleri AS 144A, 5.80%, 4/11/28 (a) | | | 194 | |
108 Payden Mutual Funds
| | | | | | |
Principal
or Shares | | Security Description | | Value
(000) | |
| | |
420,000 | | Turkiye Sise ve Cam Fabrikalari AS 144A, 6.95%, 3/14/26 (a) | | $ | 426 | |
| | | | | 620 | |
Ukraine (USD) (1%) | | | | |
225,000 | | Ukraine Government International Bond 144A, 7.25%, 3/15/33 (a) | | | 212 | |
United Arab Emirates (USD) (4%) | | | | |
530,000 | | Acwa Power Management And Investments One Ltd. 144A, 5.95%, 12/15/39 (a) | | | 613 | |
200,000 | | DP World PLC 144A, 6.85%, 7/02/37 (a) | | | 252 | |
280,000 | | Emirates Semb Corp. Water & Power Co. PJSC 144A, 4.45%, 8/01/35 (a)(h) | | | 327 | |
215,000 | | NBK Tier 1 Financing 2 Ltd., (6 yr. Swap Semi 30/360 US + 2.832%), 4.50%, (b)(c)(e) | | | 214 | |
200,000 | | Ruwais Power Co. PJSC 144A, 6.00%, 8/31/36 (a) | | | 266 | |
200,000 | | Tabreed Sukuk Spc Ltd., 5.50%, 10/31/25 (e) | | | 232 | |
| | | | | 1,904 | |
United Kingdom (USD) (1%) | | | | |
200,000 | | Fresnillo PLC 144A, 4.25%, 10/02/50 (a) | | | 204 | |
275,000 | | MARB BondCo PLC 144A, 6.88%, 1/19/25 (a) | | | 285 | |
| | | | | 489 | |
United States (EGP) (1%) | | | | |
4,000,000 | | Citigroup Global Markets Holdings Inc. 144A, 12.47%, 9/02/21 EGP (a)(f) | | | 230 | |
United States (IDR) (1%) | | | | |
6,700,000,000 | | JPMorgan Chase Bank N.A. (Indonesia Treasury Bond) 144A, 8.25%, 5/17/36 IDR (a) | | | 493 | |
United States (USD) (11%) | | | | |
256,000 | | Ascent Resources Utica Holdings LLC Term Loan 2L, (LIBOR USD 1-Month + 9.000%), 10.00%, 11/01/25 (g) | | | 272 | |
124,000 | | Ascent Resources Utica Holdings LLC/ARU Finance Corp. 144A, 9.00%, 11/01/27 (a) | | | 121 | |
205,000 | | Cleveland-Cliffs Inc. 144A, 6.75%, 3/15/26 (a) | | | 215 | |
104,731 | | Connecticut Avenue Securities Trust 2018-R07 144A, (1 mo. LIBOR USD + 2.400%), 2.55%, 4/25/31 (a)(c) | | | 105 | |
163,594 | | Fannie Mae Connecticut Avenue Securities, (1 mo. LIBOR USD + 2.150%), 2.30%, 10/25/30 (c) | | | 160 | |
91,836 | | Fannie Mae Connecticut Avenue Securities, (1 mo. LIBOR USD + 2.200%), 2.35%, 8/25/30 (c) | | | 90 | |
147,261 | | Fannie Mae Connecticut Avenue Securities, (1 mo. LIBOR USD + 2.550%), 2.70%, 12/25/30 (c) | | | 145 | |
195,000 | | Ford Motor Co., 9.00%, 4/22/25 | | | 230 | |
200,000 | | Ford Motor Credit Co. LLC, 5.13%, 6/16/25 | | | 209 | |
190,639 | | Freddie Mac STACR Trust 2019-DNA1 144A, (1 mo. LIBOR USD + 2.650%), 2.80%, 1/25/49 (a)(c) | | | 190 | |
72,392 | | Freddie Mac STACR Trust 2019-HQA1 144A, (1 mo. LIBOR USD + 2.350%), 2.50%, 2/25/49 (a)(c) | | | 71 | |
| | | | | | |
Principal
or Shares | | Security Description | | Value
(000) | |
| | |
76,176 | | Freddie Mac STACR Trust 2019-HQA2 144A, (1 mo. LIBOR USD + 2.050%), 2.20%, 4/25/49 (a)(c) | | $ | 75 | |
170,580 | | Freddie Mac Structured Agency Credit Risk Debt Notes, (1 mo. LIBOR USD + 2.300%), 2.45%, 9/25/30 (c) | | | 168 | |
235,000 | | General Motors Financial Co. Inc., (5 yr. US Treasury Yield Curve Rate T Note Constant Maturity + 4.997%), 5.70%, (b)(c) | | | 244 | |
230,000 | | IRB Holding Corp. 144A, 6.75%, 2/15/26 (a) | | | 231 | |
235,000 | | K-MAC Holdings Corp. Term Loan 2L, (LIBOR USD 1-Month + 6.750%), 6.90%, 3/16/26 (g) | | | 226 | |
215,000 | | Kraft Heinz Foods Co. 144A, 5.50%, 6/01/50 (a) | | | 246 | |
200,000 | | NBM U.S. Holdings Inc. 144A, 7.00%, 5/14/26 (a) | | | 212 | |
200,000 | | Range Resources Corp. 144A, 9.25%, 2/01/26 (a) | | | 212 | |
285,000 | | STACR Trust 2018-HRP1 144A, (1 mo. LIBOR USD + 3.750%), 3.90%, 4/25/43 (a)(c) | | | 270 | |
200,000 | | Stillwater Mining Co. 144A, 6.13%, 6/27/22 (a) | | | 203 | |
510,000 | | Tacala Investment Corp. Term Loan B 2L, (LIBOR USD 1-Month + 7.500%), 7.65%, 2/07/28 (g) | | | 487 | |
200,000 | | Terraform Global Operating LLC 144A, 6.13%, 3/01/26 (a) | | | 203 | |
195,000 | | U.S. Foods Inc. 144A, 6.25%, 4/15/25 (a) | | | 204 | |
| | | | | 4,789 | |
Virgin Islands (British) (USD) (2%) | | | | |
100,000 | | Arcos Dorados Holdings Inc. 144A, 6.63%, 9/27/23 (a) | | | 106 | |
200,000 | | Gold Fields Orogen Holdings BVI Ltd. 144A, 6.13%, 5/15/29 (a) | | | 239 | |
200,000 | | Gold Fields Orogen Holdings BVI Ltd., 6.13%, 5/15/29 (e) | | | 239 | |
205,000 | | Huarong Finance 2019 Co. Ltd., 3.88%, 11/13/29 (e) | | | 213 | |
200,000 | | Sino-Ocean Land Treasure Finance II Ltd., 5.95%, 2/04/27 (e) | | | 221 | |
| | | | | 1,018 | |
| |
Total Bonds (Cost - $41,270) | | | 41,681 | |
Purchase Options (0%) | | | | |
Total Purchased Options (Cost - $11) | | | 15 | |
Investment Company (4%) | | | | |
1,575,389 | | Payden Cash Reserves Money Market Fund * (Cost - $1,575) | | | 1,575 | |
| |
Total Investments (Cost - $42,856) (100%) | | | 43,271 | |
Liabilities in excess of Other Assets (0%) | | | (82 | ) |
| |
Net Assets (100%) | | $ | 43,189 | |
| (a) | Security offered only to qualified institutional investors, and thus is not registered for sale to the public under rule 144A of the Securities Act of 1933. It has been deemed liquid under guidelines approved by the Board. |
| (b) | Perpetual security with no stated maturity date. |
| (c) | Floating rate security. The rate shown reflects the rate in effect at October 31, 2020. |
| (d) | Issuer filed for bankruptcy and/or is in default of principal and/or interest payments. |
| (e) | Security offered and sold outside the United States, and thus is exempt from registration under Regulation S of the Securities Act of 1933. It has been deemed liquid under guidelines approved by the Board. |
Annual Report 109
Payden Emerging Markets Corporate Bond Fund continued
| (f) | Yield to maturity at time of purchase. |
| (g) | Floating rate security. The rate shown reflects the rate in effect at October 31, 2020. The stated maturity is subject to prepayments. See Note 2 in the Notes to Financial Statements. |
| (h) | All or a portion of these securities are on loan. At October 31, 2020, the total market value of the Fund’s securities on loan is $436 and the total market value of the collateral held by the Fund is $449. Amounts in 000s. |
Purchased Options
| | | | | | | | | | | | | | | | | | | | | | | | | | | | | | |
| Description | | Number of
Contracts | | Notional
Amount
(000s) | | Exercise
Price | | Maturity
Date | | Value
(000s) | | Call/Put |
Exchange Traded Options Purchase — 0.0% | | | | | | | | | | | |
| CBOE Volatility Index | | | | 19 | | | | $ | — | | | | | 30.00 | | | | | 12/16/2020 | | | | $ | 15 | | | | | Call | |
| | | | | | | | | | | | | | | | | | | | | | | | | | | | | | |
Open Forward Currency Contracts to USD
| | | | | | | | | | | | | | | | | | | | |
Currency
Purchased
(000s) | | Currency
Sold
(000s) | | Counterparty | | Settlement
Date | | Unrealized
Appreciation
(Depreciation)
(000s) |
Assets: | | | | | | | | | | | | | | | | | | | | |
MXN 30 | | | | USD 1 | | | |
| HSBC Bank
USA, N.A. |
| | | | 01/25/2021 | | | | $ | — | |
PHP 10,550 | | | | USD 216 | | | |
| HSBC Bank
USA, N.A. |
| | | | 01/19/2021 | | | | | 2 | |
USD 134 | | | | RUB 9,960 | | | |
| Barclays
Bank PLC |
| | | | 11/10/2020 | | | | | 9 | |
USD 221 | | | | TWD 6,240 | | | |
| Barclays
Bank PLC |
| | | | 01/19/2021 | | | | | 3 | |
ZAR 3,500 | | | | USD 211 | | | |
| Barclays
Bank PLC |
| | | | 12/22/2020 | | | | | 2 | |
| | | | | | | | | | | | | | | | | | | | |
| | | | | | | | | | | | | | | | | | | 16 | |
| | | | | | | | | | | | | | | | | | | | |
Liabilities: | | | | | | | | | | | | | | | | | | | | |
MYR 1,360 | | | | USD 328 | | | |
| Barclays
Bank PLC |
| | | | 11/24/2020 | | | | | (2 | ) |
PEN 35 | | | | USD 10 | | | |
| Barclays
Bank PLC |
| | | | 12/23/2020 | | | | | — | |
PLN 591 | | | | USD 152 | | | |
| HSBC Bank
USA, N.A. |
| | | | 01/28/2021 | | | | | (3 | ) |
RUB 10,090 | | | | USD 130 | | | |
| HSBC Bank
USA, N.A. |
| | | | 11/10/2020 | | | | | (3 | ) |
USD 323 | | | | THB 10,180 | | | |
| Barclays
Bank PLC |
| | | | 11/19/2020 | | | | | (3 | ) |
USD 324 | | | | MYR 1,360 | | | |
| Barclays
Bank PLC |
| | | | 11/24/2020 | | | | | (3 | ) |
USD 318 | | | | IDR 4,761,000 | | | |
| Barclays
Bank PLC |
| | | | 12/14/2020 | | | | | (6 | ) |
USD 143 | | | | ZAR 2,420 | | | |
| Barclays
Bank PLC |
| | | | 12/22/2020 | | | | | (4 | ) |
USD 170 | | | | IDR 2,541,000 | | | |
| HSBC Bank
USA, N.A. |
| | | | 12/14/2020 | | | | | (4 | ) |
USD 272 | | | | ZAR 4,660 | | | |
| HSBC Bank
USA, N.A. |
| | | | 12/22/2020 | | | | | (13 | ) |
USD 207 | | | | EUR 177 | | | |
| HSBC Bank
USA, N.A. |
| | | | 03/22/2021 | | | | | — | |
ZAR 3,580 | | | | USD 219 | | | |
| HSBC Bank
USA, N.A. |
| | | | 12/22/2020 | | | | | (1 | ) |
| | | | | | | | | | | | | | | | | | | | |
| | | | | | | | | | | | | | | | | | | (42 | ) |
| | | | | | | | | | | | | | | | | | | | |
Net Unrealized Appreciation (Depreciation) | | | | $ | (26 | ) |
| | | | | | | | | | | | | | | | | | | | |
Open Futures Contracts
| | | | | | | | | | | | | | | | | | | | | | | | | |
Contract
Type | | Number of
Contracts | | Expiration
Date | | Notional
Amount
(000s) | | Current
Value
(000s) | | Unrealized
Appreciation
(000s) |
Short Contracts: | | | | | | | | | | | | | | | |
U.S. Treasury 10-Year Note Future | | 7 | | Dec-20 | | | $ | (968 | ) | | | $ | 4 | | | | $ | 4 | |
| | | | | | | | | | | | | | | | | | | |
110 Payden Mutual Funds
Open Centrally Cleared Credit Default Swap Contracts
| | | | | | | | | | | | | | | | | | | | | | | | | |
| Description | | Maturity
Date | | Notional
Amount
(000s) | | Value
(000s) | | Upfront
payments/
receipts
(000s) | | Unrealized
Depreciation
(000s) |
| Bought (Relevant Credit: Federative Republic of Brazil), Pay 1% Quarterly, Receive upon credit default | | | | 12/20/2025 | | | | | $1,230 | | | | $ | 68 | | | | $ | 81 | | | | $ | (13 | ) |
| Protection Bought (Relevant Credit: Markit CDX, North America High Yield Series 35 Index), Pay 5% Quarterly, Receive upon credit default | | | | 12/20/2025 | | | | | 810 | | | | | (33 | ) | | | | (32 | ) | | | | (1 | ) |
| Protection Bought (Relevant Credit: United Mexican States), Pay 1% Quarterly, Receive upon credit default | | | | 12/20/2025 | | | | | 200 | | | | | 3 | | | | | 5 | | | | | (2 | ) |
| | | | | | | | | | | | | | | | | | | | | | | | | |
| | | | | | | | | | | | | $ | 38 | | | | $ | 54 | | | | $ | (16 | ) |
| | | | | | | | | | | | | | | | | | | | | | | | | |
Offsetting Assets and Liabilities
The Fund’s loaned securities were all subject to an enforceable Securities Lending Agency Agreement. Securities lent in accordance with the Securities Lending Agency Agreement on a gross basis were as follows:
| | | | | |
| Total gross amount presented on the Statements of Assets and Liabilities1 | | | $ | 436 | |
| Non-cash Collateral2 | | | | (436 | ) |
| | | | | |
Net Amount | | | $ | — | |
| | | | | |
| 1 | The amount presented on the Statements of Assets and Liabilities is not offset and is shown on a gross basis. |
| 2 | At October 31, 2020, the value of the collateral received from each borrower exceeded the value of the related securities loaned. This amount is disclosed on the Schedule of Investments. |
See notes to financial statements.
Annual Report 111
Payden Equity Income Fund
| | | | | | |
| | | | | | | |
| | | The Fund seeks growth of capital by investing in U.S. large capitalization value stocks and income producing equity securities with above average dividend yields with up to 30% in foreign securities. | | 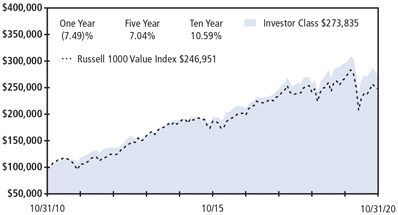
Past performance does not predict future returns. The graph does not reflect the impact of taxes or transaction costs a shareholder would pay. The Fund’s Adviser and SI Classes are expected to perform similarly to its Investor Class, except for class specific expenses or waivers. |
| | | Portfolio Composition - percent of investments |
| | | |
| | | Financials | | 20% |
| | | Industrials | | 13% |
| | | Healthcare | | 13% |
| | | Technology | | 13% |
| | | Consumer Staples | | 9% |
| | | Other | | 32% |
| | | | | |
| | | |
| | | |
| | | |
| | | |
| | | |
| | | |
| | | This information is not part of the audited financial statements. | | |
| | | | | |
| | | | | | |
| Schedule of Investments - October 31, 2020 | |
Principal
or Shares | | Security Description | | Value
(000) | |
Stocks (95%) | | | | |
Common Stock (85%) | | | | |
Communication Services (5%) | | | | |
90,000 | | Activision Blizzard Inc. | | $ | 6,816 | |
706,900 | | Comcast Corp., Class A | | | 29,859 | |
536,700 | | Verizon Communications Inc. | | | 30,587 | |
| | | | | 67,262 | |
Consumer Discretionary (7%) | | | | |
106,400 | | Home Depot Inc. | | | 28,378 | |
99,100 | | Lennar Corp., Class A | | | 6,960 | |
141,200 | | McDonald’s Corp. | | | 30,075 | |
158,000 | | Starbucks Corp. | | | 13,740 | |
156,200 | | Yum! Brands Inc. | | | 14,578 | |
| | | | | 93,731 | |
Consumer Staples (9%) | | | | |
416,200 | | Conagra Brands Inc. | | | 14,605 | |
72,700 | | Costco Wholesale Corp. | | | 25,999 | |
252,300 | | General Mills Inc. | | | 14,916 | |
125,200 | | Kimberly-Clark Corp. | | | 16,600 | |
432,500 | | Kroger Co. | | | 13,931 | |
166,900 | | PepsiCo Inc. | | | 22,246 | |
157,300 | | Walmart Inc. | | | 21,825 | |
| | | | | 130,122 | |
Energy (4%) | | | | |
820,100 | | Cabot Oil & Gas Corp. | | | 14,590 | |
178,200 | | Chevron Corp. | | | 12,385 | |
1,204,800 | | Tourmaline Oil Corp. | | | 15,608 | |
655,700 | | Williams Cos. Inc. | | | 12,583 | |
| | | | | 55,166 | |
Financials (12%) | | | | |
112,900 | | Ameriprise Financial Inc. | | | 18,158 | |
909,700 | | Bank of America Corp. | | | 21,560 | |
11,700 | | BlackRock Inc. | | | 7,011 | |
615,500 | | Fifth Third Bancorp | | | 14,292 | |
131,100 | | Goldman Sachs Group Inc. | | | 24,783 | |
319,100 | | JPMorgan Chase & Co. | | | 31,284 | |
546,600 | | Morgan Stanley | | | 26,319 | |
651,700 | | Truist Financial Corp. | | | 27,449 | |
| | | | | 170,856 | |
| | | | | | |
| | |
| | | | | | |
Principal
or Shares | | Security Description | | Value
(000) | |
Healthcare (13%) | | | | |
140,200 | | Abbott Laboratories | | $ | 14,736 | |
177,900 | | AbbVie Inc. | | | 15,139 | |
117,100 | | Amgen Inc. | | | 25,404 | |
368,700 | | Bristol-Myers Squibb Co. | | | 21,551 | |
212,900 | | CVS Health Corp. | | | 11,942 | |
198,000 | | Eli Lilly and Co. | | | 25,831 | |
147,800 | | Johnson & Johnson | | | 20,265 | |
175,900 | | Medtronic PLC | | | 17,690 | |
235,200 | | Merck & Co. Inc. | | | 17,689 | |
424,900 | | Pfizer Inc. | | | 15,075 | |
| | | | | 185,322 | |
Industrials (13%) | | | | |
230,300 | | Dover Corp. | | | 25,496 | |
137,100 | | Honeywell International Inc. | | | 22,615 | |
81,200 | | Lockheed Martin Corp. | | | 28,430 | |
163,500 | | PACCAR Inc. | | | 13,960 | |
161,400 | | Republic Services Inc. | | | 14,231 | |
147,400 | | Stanley Black & Decker Inc. | | | 24,498 | |
161,700 | | Union Pacific Corp. | | | 28,652 | |
253,900 | | Waste Management Inc. | | | 27,398 | |
| | | | | 185,280 | |
Materials (4%) | | | | |
223,800 | | Albemarle Corp. | | | 20,861 | |
573,600 | | DuPont de Nemours Inc. | | | 32,626 | |
32,300 | | Linde PLC | | | 7,117 | |
| | | | | 60,604 | |
Technology (12%) | | | | |
189,800 | �� | Apple Inc. | | | 20,662 | |
79,700 | | Broadcom Inc. | | | 27,866 | |
109,900 | | International Business Machines Corp. | | | 12,271 | |
104,200 | | Microsoft Corp. | | | 21,097 | |
291,800 | | Paychex Inc. | | | 24,001 | |
229,000 | | QUALCOMM Inc. | | | 28,249 | |
153,400 | | Texas Instruments Inc. | | | 22,180 | |
115,200 | | Visa Inc., Class A | | | 20,933 | |
| | | | | 177,259 | |
Utilities (6%) | | | | |
214,300 | | American Electric Power Co. Inc. | | | 19,272 | |
112 Payden Mutual Funds
| | | | | | |
Principal or Shares | | Security Description | | Value
(000) | |
| | |
188,700 | | Consolidated Edison Inc. | | $ | 14,811 | |
136,800 | | DTE Energy Co. | | | 16,884 | |
208,600 | | Duke Energy Corp. | | | 19,214 | |
236,100 | | Public Service Enterprise Group Inc. | | | 13,729 | |
| | | | | 83,910 | |
Total Common Stock | | | 1,209,512 | |
Preferred Stock (1%) | | | | |
279,800 | | Allstate Corp., 5.10% | | | 7,493 | |
150,400 | | Spire Inc., 5.90% | | | 4,115 | |
110,900 | | US Bancorp, 6.50% | | | 2,958 | |
Total Preferred Stock | | | 14,566 | |
Real Estate Investment Trust (7%) | | | | |
145,100 | | Alexandria Real Estate Equities Inc. | | | 21,985 | |
60,400 | | American Tower Corp. | | | 13,871 | |
156,400 | | Crown Castle International Corp. | | | 24,430 | |
127,100 | | Digital Realty Trust Inc. | | | 18,340 | |
182,800 | | Prologis Inc. | | | 18,134 | |
Total Real Estate Investment Trust | | | 96,760 | |
Total Stocks (Cost - $1,186,009) | | | 1,320,838 | |
Corporate Bond (2%) | | | | |
6,050,000 | | CenterPoint Energy Inc., (3 mo. LIBOR USD + 3.270%) 6.13% (a)(b) | | | 6,124 | |
6,000,000 | | Citigroup Inc., (3 mo. LIBOR USD + 3.423%) 6.30% (a)(b) | | | 6,233 | |
6,100,000 | | Citizens Financial Group Inc., (3 mo. LIBOR USD + 3.003%) 6.00% (a)(b) | | | 5,912 | |
| | | | | | |
Principal or Shares | | Security Description | | Value
(000) | |
| | |
6,000,000 | | General Motors Financial Co. Inc., (3 mo. LIBOR USD + 3.436%) 6.50% (a)(b) | | $ | 5,980 | |
3,400,000 | | Huntington Bancshares Inc., (3 mo. LIBOR USD + 2.880%) 5.70% (a)(b) | | | 3,264 | |
2,800,000 | | Land O’ Lakes Inc. 144A, 7.00% (a)(c) | | | 2,527 | |
Total Corporate Bond (Cost - $29,884) | | | 30,040 | |
Investment Company (5%) | | | | |
67,522,347 | | Payden Cash Reserves Money Market Fund * (Cost - $67,522) | | | 67,522 | |
Total Investments (Cost - $1,283,415) (100%) | | | 1,418,400 | |
Liabilities in excess of Other Assets (0%) | | | (4,950 | ) |
Net Assets (100%) | | $ | 1,413,450 | |
| (a) | Perpetual security with no stated maturity date. |
| (b) | Floating rate security. The rate shown reflects the rate in effect at October 31, 2020. |
| (c) | Security offered only to qualified institutional investors, and thus is not registered for sale to the public under rule 144A of the Securities Act of 1933. It has been deemed liquid under guidelines approved by the Board. |
Open Forward Currency Contracts to USD
| | | | | | | | | | | | | | | | | | | | |
Currency Purchased
(000s) | | Currency
Sold
(000s) | | Counterparty | | Settlement
Date | | Unrealized
Appreciation
(Depreciation)
(000s) |
Assets: | | | | | | | | | | | | | | | | | |
| GBP 9,508 | | | | USD 12,286 | | | HSBC Bank
USA, N.A. | | | | 03/22/2021 | | | | $ | 44 | |
| USD 23,436 | | | | EUR 19,672 | | | Citibank, N.A. | | | | 03/22/2021 | | | | | 448 | |
| USD 15,123 | | | | CAD 19,951 | | | HSBC Bank
USA, N.A. | | | | 03/22/2021 | | | | | 141 | |
| | | | | | | | | | | | | | | | | |
| | | | | | | | | | | | | | | | 633 | |
| | | | | | | | | | | | | | | | | |
Liabilities: | | | | | | | | | | | | | | | | | |
| EUR 16,913 | | | | USD 19,821 | | | Citibank, N.A. | | | | 03/22/2021 | | | | | (57 | ) |
| EUR 2,759 | | | | USD 3,252 | | | Citibank, N.A. | | | | 03/22/2021 | | | | | (28 | ) |
| USD 12,398 | | | | GBP 9,623 | | | HSBC Bank
USA, N.A. | | | | 03/22/2021 | | | | | (80 | ) |
| | | | | | | | | | | | | | | | | |
| | | | | | | | | | | | | | | | (165 | ) |
| | | | | | | | | | | | | | | | | |
| Net Unrealized Appreciation (Depreciation) | | | | | | | | | | | | | | | $ | 468 | |
| | | | | | | | | | | | | | | | | |
See notes to financial statements.
Annual Report 113
| | |
Statements of Assets & Liabilities | | |
October 31, 2020
Numbers in 000s
| | | | | | | | | | | | |
| | | Payden
Cash Reserves
Money Market
Fund | | | Payden
Limited
Maturity
Fund | | | Payden
Low Duration
Fund | |
ASSETS: | | | | | | | | | | | | |
Investments, at value * | | $ | 204,783 | | | $ | 1,230,335 | | | $ | 1,525,061 | |
Affiliated investments, at value ** | | | — | | | | 9,894 | | | | 2,566 | |
Repurchase agreements, at value *** | | | 137,000 | | | | — | | | | — | |
Foreign cash **** | | | — | | | | 11 | | | | 74 | |
Cash | | | 9,779 | | | | — | | | | — | |
Cash pledged for financial futures contracts | | | — | | | | 91 | | | | — | |
Cash pledged for centrally cleared swaps | | | — | | | | — | | | | — | |
Receivable for: | | | | | | | | | | | | |
Interest and dividends | | | 62 | | | | 2,964 | | | | 4,561 | |
Investments sold | | | — | | | | 7 | | | | 15 | |
Fund shares sold | | | 4 | | | | 293 | | | | 2,387 | |
Futures | | | — | | | | 5 | | | | 78 | |
Forward currency contracts | | | — | | | | 301 | | | | 82 | |
Variation margin on centrally cleared swaps | | | — | | | | — | | | | — | |
Other assets | | | 79 | | | | 15 | | | | 25 | |
| | | | |
Total Assets | | | 351,707 | | | | 1,243,916 | | | | 1,534,849 | |
| | | | |
LIABILITIES: | | | | | | | | | | | | |
Payable for: | | | | | | | | | | | | |
Bank overdraft | | | — | | | | 10 | | | | 144 | |
Forward currency contracts | | | — | | | | 58 | | | | 36 | |
Investments purchased | | | — | | | | 11,853 | | | | 9 | |
Fund shares redeemed | | | — | | | | 2,678 | | | | 701 | |
Futures | | | — | | | | — | | | | — | |
Variation margin on centrally cleared swaps | | | — | | | | — | | | | — | |
Distributions payable | | | 6 | | | | 14 | | | | 74 | |
Liability for securities on loan (Note 2) | | | — | | | | 9,354 | | | | 130 | |
Accrued expenses: | | | | | | | | | | | | |
Investment advisory fees (Note 3) | | | 8 | | | | 12 | | | | 234 | |
Administration fees (Note 3) | | | 43 | | | | 152 | | | | 192 | |
Distribution fees (Note 3) | | | — | | | | — | | | | — | |
Trustee fees and expenses | | | 3 | | | | 13 | | | | 18 | |
Other liabilities | | | 50 | | | | 258 | | | | 329 | |
| | | | |
Total Liabilities | | | 110 | | | | 24,402 | | | | 1,867 | |
| | | | |
NET ASSETS | | $ | 351,597 | | | $ | 1,219,514 | | | $ | 1,532,982 | |
| | | | |
| | | | |
NET ASSETS: | | | | | | | | | | | | |
Paid in capital | | $ | 351,583 | | | $ | 1,216,751 | | | $ | 1,510,307 | |
Distributable earnings (loss) | | | 14 | | | | 2,763 | | | | 22,675 | |
| | | | |
NET ASSETS | | $ | 351,597 | | | $ | 1,219,514 | | | $ | 1,532,982 | |
| | | | |
| | | | |
NET ASSET VALUE — offering and redemption price per share in whole dollars | | | | | | | | | | | | |
Adviser Class | | | | | | | | | | | | |
Net Assets | | | — | | | | — | | | | — | |
Shares Outstanding | | | — | | | | — | | | | — | |
Net Asset Value Per Share | | | — | | | | — | | | | — | |
| | | | |
| | | | |
Investor Class | | | | | | | | | | | | |
Net Assets | | $ | 351,597 | | | $ | 1,219,514 | | | $ | 1,532,982 | |
Shares Outstanding | | | 351,577 | | | | 128,347 | | | | 150,001 | |
Net Asset Value Per Share | | $ | 1.00 | | | $ | 9.50 | | | $ | 10.22 | |
| | | | |
| | | | |
SI Class | | | | | | | | | | | | |
Net Assets | | | — | | | | — | | | | — | |
Shares Outstanding | | | — | | | | — | | | | — | |
Net Asset Value Per Share | | | — | | | | — | | | | — | |
| | | | |
| | | | |
| | | | | | | | | | | | |
* Investments, at cost | | | $204,783 | | | | $1,227,653 | | | | $1,517,022 | |
** Affiliated investments, at cost | | | — | | | | 9,894 | | | | 2,566 | |
*** Repurchase agreements, at cost | | | 137,000 | | | | — | | | | — | |
**** Foreign cash, at cost | | | — | | | | 11 | | | | 74 | |
See notes to financial statements.
114 Payden Mutual Funds
| | | | | | | | | | | | | | | | | | | | | | | | | | |
Payden
U.S.
Government
Fund | | | Payden
GNMA
Fund | | Payden
Core Bond
Fund | | Payden
Corporate Bond
Fund | | Payden
Strategic Income
Fund | | | Payden
Absolute Return
Bond Fund | | Payden
Floating Rate
Fund | |
| | $51,578 | | | | $169,597 | | | | $1,525,523 | | | | $466,435 | | | | $133,618 | | | | $812,309 | | | | $62,647 | |
| | 1,858 | | | | 2,352 | | | | 15,716 | | | | 11,713 | | | | 2,040 | | | | 5,913 | | | | 4,907 | |
| | — | | | | — | | | | — | | | | — | | | | — | | | | — | | | | — | |
| | — | | | | — | | | | 1,788 | | | | — | | | | 380 | | | | 645 | | | | — | |
| | 5 | | | | — | | | | — | | | | 11 | | | | — | | | | — | | | | 296 | |
| | — | | | | — | | | | — | | | | 331 | | | | — | | | | 452 | | | | — | |
| | — | | | | — | | | | — | | | | 665 | | | | — | | | | 409 | | | | — | |
| | | | | | | | | | | | | | | | | | | | | | | | | | |
| | 105 | | | | 345 | | | | 7,720 | | | | 4,122 | | | | 914 | | | | 3,244 | | | | 101 | |
| | 5,205 | | | | 52,098 | | | | 131,611 | | | | — | | | | — | | | | — | | | | — | |
| | 1 | | | | 19 | | | | 3,201 | | | | 342 | | | | — | | | | 204 | | | | — | |
| | — | | | | — | | | | 193 | | | | 58 | | | | 3 | | | | 36 | | | | — | |
| | — | | | | — | | | | 755 | | | | — | | | | 167 | | | | 1,263 | | | | — | |
| | — | | | | — | | | | — | | | | — | | | | 3 | | | | — | | | | — | |
| | 8 | | | | 7 | | | | 59 | | | | 19 | | | | 8 | | | | 50 | | | | 44 | |
| | |
| | 58,760 | | | | 224,418 | | | | 1,686,566 | | | | 483,696 | | | | 137,133 | | | | 824,525 | | | | 67,995 | |
| | |
| | | | | | | | | | | | | | | | | | | | | | | | | | |
| | — | | | | 1,053 | | | | 2,204 | | | | — | | | | 268 | | | | 468 | | | | — | |
| | — | | | | — | | | | 20 | | | | — | | | | 5 | | | | 8 | | | | — | |
| | 11,354 | | | | 100,581 | | | | 282,590 | | | | — | | | | 2,535 | | | | 4,204 | | | | 743 | |
| | 3 | | | | 126 | | | | 15 | | | | 652 | | | | — | | | | 114 | | | | — | |
| | — | | | | — | | | | 163 | | | | 62 | | | | 1 | | | | 4 | | | | — | |
| | — | | | | — | | | | 1 | | | | 47 | | | | — | | | | 22 | | | | — | |
| | 3 | | | | 24 | | | | — | | | | — | | | | — | | | | — | | | | — | |
| | — | | | | — | | | | 7,070 | | | | 2,596 | | | | — | | | | 612 | | | | — | |
| | | | | | | | | | | | | | | | | | | | | | | | | | |
| | 1 | | | | 8 | | | | 268 | | | | 141 | | | | 36 | | | | 189 | | | | 14 | |
| | 6 | | | | 16 | | | | 168 | | | | 61 | | | | 17 | | | | 103 | | | | 9 | |
| | — | | | | — | | | | 19 | | | | — | | | | — | | | | — | | | | — | |
| | 1 | | | | 2 | | | | 12 | | | | 6 | | | | 2 | | | | 9 | | | | 1 | |
| | 32 | | | | 99 | | | | 235 | | | | 180 | | | | 54 | | | | 96 | | | | 53 | |
| | |
| | 11,400 | | | | 101,909 | | | | 292,765 | | | | 3,745 | | | | 2,918 | | | | 5,829 | | | | 820 | |
| | |
| | $47,360 | | | | $122,509 | | | | $1,393,801 | | | | $479,951 | | | | $134,215 | | | | $818,696 | | | | $67,175 | |
| | |
| | | | | | | | | | | | | | | | | | | | | | | | | | |
| | $54,267 | | | | $157,902 | | | | $1,343,477 | | | | $441,843 | | | | $131,935 | | | | $824,447 | | | | $73,169 | |
| | (6,907) | | | | (35,393) | | | | 50,324 | | | | 38,108 | | | | 2,280 | | | | (5,751) | | | | (5,994) | |
| | |
| | $47,360 | | | | $122,509 | | | | $1,393,801 | | | | $479,951 | | | | $134,215 | | | | $818,696 | | | | $67,175 | |
| | |
| | | | | | | | | | | | | | | | | | | | | | | | | | |
| | — | | | | — | | | | $ 45,755 | | | | — | | | | — | | | | — | | | | — | |
| | — | | | | — | | | | 4,122 | | | | — | | | | — | | | | — | | | | — | |
| | — | | | | — | | | | 11.10 | | | | — | | | | — | | | | — | | | | — | |
| | |
| | | | | | | | | | | | | | | | | | | | | | | | | | |
| | $47,360 | | | | $122,509 | | | | $ 589,061 | | | | $479,951 | | | | $ 84,881 | | | | $132,299 | | | | $19,569 | |
| | 4,491 | | | | 12,940 | | | | 52,925 | | | | 39,873 | | | | 8,260 | | | | 13,340 | | | | 2,058 | |
| | $ 10.54 | | | | $ 9.47 | | | | $ 11.13 | | | | $ 12.04 | | | | $ 10.28 | | | | $ 9.92 | | | | $ 9.51 | |
| | |
| | | | | | | | | | | | | | | | | | | | | | | | | | |
| | — | | | | — | | | | $ 758,985 | | | | — | | | | $ 49,334 | | | | $686,397 | | | | $47,606 | |
| | — | | | | — | | | | 68,256 | | | | — | | | | 4,802 | | | | 69,145 | | | | 5,003 | |
| | — | | | | — | | | | $ 11.12 | | | | — | | | | $ 10.27 | | | | $ 9.93 | | | | $ 9.51 | |
| | |
| | | | | | | | | | | | | | | | | | | | | | | | | | |
| | $51,034 | | | | $166,950 | | | | $1,495,909 | | | | $434,848 | | | | $131,361 | | | | $813,274 | | | | $64,181 | |
| | 1,858 | | | | 2,352 | | | | 15,716 | | | | 11,713 | | | | 2,040 | | | | 5,913 | | | | 4,907 | |
| | — | | | | — | | | | — | | | | — | | | | — | | | | — | | | | — | |
| | — | | | | — | | | | 1,815 | | | | — | | | | 386 | | | | 634 | | | | — | |
See notes to financial statements.
Annual Report 115
| | |
Statements of Assets & Liabilities continued | | |
October 31, 2020
Numbers in 000s
| | | | | | | | | | | | |
| | | Payden
High Income
Fund | | Payden
California Municipal
Social Impact
Fund | | Payden
Global Low
Duration Fund |
ASSETS: | | | | | | | | | | | | |
Investments, at value * | | $ | 491,903 | | | $ | 61,830 | | | $ | 95,337 | |
Affiliated investments, at value ** | | | 33,021 | | | | — | | | | 756 | |
Foreign cash *** | | | 13 | | | | — | | | | 13 | |
Cash | | | 60 | | | | 1,869 | | | | 80 | |
Cash pledged for financial futures contracts | | | — | | | | 90 | | | | 3 | |
Cash pledged as collateral for OTC derivatives | | | — | | | | — | | | | — | |
Cash pledged for centrally cleared swaps | | | 238 | | | | — | | | | — | |
Receivable for: | | | | | | | | | | | | |
Interest and dividends | | | 6,271 | | | | 625 | | | | 373 | |
Investments sold | | | 1,534 | | | | 2,089 | | | | 2 | |
Fund shares sold | | | 165 | | | | 251 | | | | 1 | |
Futures | | | — | | | | — | | | | 8 | |
Forward currency contracts | | | 134 | | | | — | | | | 93 | |
Variation margin on centrally cleared swaps | | | — | | | | — | | | | — | |
Unrealized gain on OTC swaps | | | — | | | | — | | | | — | |
Other assets | | | 33 | | | | 4 | | | | 9 | |
Total Assets | | | 533,372 | | | | 66,758 | | | | 96,675 | |
LIABILITIES: | | | | | | | | | | | | |
Payable for: | | | | | | | | | | | | |
Bank overdraft | | | — | | | | — | | | | — | |
Forward currency contracts | | | 6 | | | | — | | | | 9 | |
Investments purchased | | | 4,498 | | | | 2,561 | | | | 2 | |
Fund shares redeemed | | | 15 | | | | 40 | | | | 132 | |
Futures | | | — | | | | — | | | | — | |
Variation margin on centrally cleared swaps | | | 2 | | | | — | | | | — | |
Distributions payable | | | — | | | | 17 | | | | — | |
Liability for securities on loan (Note 2) | | | 3,311 | | | | — | | | | 128 | |
Accrued expenses: | | | | | | | | | | | | |
Investment advisory fees (Note 3) | | | 149 | | | | 9 | | | | 9 | |
Administration fees (Note 3) | | | 64 | | | | 8 | | | | 12 | |
Distribution fees (Note 3) | | | — | | | | — | | | | — | |
Trustee fees and expenses | | | 6 | | | | 1 | | | | 1 | |
Other liabilities | | | 125 | | | | 34 | | | | 71 | |
Total Liabilities | | | 8,176 | | | | 2,670 | | | | 364 | |
NET ASSETS | | $ | 525,196 | | | $ | 64,088 | | | $ | 96,311 | |
| | | | | | | | | | | | |
NET ASSETS: | | | | | | | | | | | | |
Paid in capital | | $ | 543,472 | | | $ | 60,841 | | | $ | 95,595 | |
Distributable earnings (loss) | | | (18,276 | ) | | | 3,247 | | | | 716 | |
NET ASSETS | | $ | 525,196 | | | $ | 64,088 | | | $ | 96,311 | |
| | | | | | | | | | | | |
NET ASSET VALUE — offering and redemption price per share in whole dollars | | | | | | | | | | | | |
Adviser Class | | | | | | | | | | | | |
Net Assets | | | — | | | | — | | | | — | |
Shares Outstanding | | | — | | | | — | | | | — | |
Net Asset Value Per Share | | | — | | | | — | | | | — | |
| | | | | | | | | | | | |
Investor Class | | | | | | | | | | | | |
Net Assets | | $ | 525,196 | | | $ | 64,088 | | | $ | 96,311 | |
Shares Outstanding | | | 81,419 | | | | 6,056 | | | | 9,534 | |
Net Asset Value Per Share | | $ | 6.45 | | | $ | 10.58 | | | $ | 10.10 | |
| | | | | | | | | | | | |
SI Class | | | | | | | | | | | | |
Net Assets | | | — | | | | — | | | | — | |
Shares Outstanding | | | — | | | | — | | | | — | |
Net Asset Value Per Share | | | — | | | | — | | | | — | |
| | | | | | | | | | | | |
| | | | | | | | | | | | |
* Investments,at cost | | $ | 481,459 | | | $ | 59,682 | | | $ | 94,598 | |
** Affiliatedinvestments, at cost | | | 33,021 | | | | — | | | | 756 | |
*** Foreign cash, at cost | | | 13 | | | | — | | | | 13 | |
See notes to financial statements.
116 Payden Mutual Funds
| | | | | | | | | | | | | | | | | | |
Payden
Global Fixed
Income
Fund | | | Payden
Emerging Markets
Bond Fund | | | Payden
Emerging Markets
Local Bond
Fund | | | Payden
Emerging Markets
Corporate
Bond Fund | | | Payden
Equity Income
Fund | |
| $ | 179,121 | | | $ | 982,438 | | | $ | 125,383 | | | $ | 41,696 | | | $ | 1,350,878 | |
| | 11,244 | | | | 23,105 | | | | 1,595 | | | | 1,575 | | | | 67,522 | |
| | 1,080 | | | | 17 | | | | 182 | | | | — | | | | 149 | |
| | — | | | | — | | | | — | | | | 10 | | | | 326 | |
| | 43 | | | | — | | | | — | | | | 13 | | | | — | |
| | 260 | | | | — | | | | 890 | | | | — | | | | — | |
| | — | | | | 3,774 | | | | 87 | | | | 124 | | | | — | |
| | 938 | | | | 15,301 | | | | 2,069 | | | | 533 | | | | 2,890 | |
| | 5,527 | | | | — | | | | — | | | | 183 | | | | 18,689 | |
| | 29 | | | | 118 | | | | — | | | | — | | | | 381 | |
| | 23 | | | | — | | | | — | | | | 1 | | | | — | |
| | 519 | | | | 2,859 | | | | 573 | | | | 16 | | | | 633 | |
| | — | | | | — | | | | — | | | | 1 | | | | — | |
| | — | | | | — | | | | — | | | | — | | | | — | |
| | 20 | | | | 56 | | | | 50 | | | | 19 | | | | 22 | |
| | 198,804 | | | | 1,027,668 | | | | 130,829 | | | | 44,171 | | | | 1,441,490 | |
| | | | | | | | | | | | | | | | | | |
| | | | | | | | | | | | | | | | | | |
| | 301 | | | | 175 | | | | 858 | | | | — | | | | — | |
| | 345 | | | | 1,647 | | | | 1,218 | | | | 42 | | | | 165 | |
| | 17,805 | | | | 4,850 | | | | 386 | | | | 430 | | | | 26,732 | |
| | 55 | | | | 20,198 | | | | — | | | | — | | | | 131 | |
| | 17 | | | | — | | | | — | | | | — | | | | — | |
| | 7 | | | | 15 | | | | 1 | | | | — | | | | — | |
| | — | | | | — | | | | — | | | | — | | | | — | |
| | — | | | | 4,462 | | | | — | | | | 449 | | | | — | |
| | 36 | | | | 443 | | | | 66 | | | | 12 | | | | 562 | |
| | 22 | | | | 131 | | | | 16 | | | | 5 | | | | 188 | |
| | — | | | | 23 | | | | — | | | | — | | | | 6 | |
| | 2 | | | | 13 | | | | 2 | | | | 1 | | | | 17 | |
| | 140 | | | | 269 | | | | 70 | | | | 43 | | | | 239 | |
| | 18,730 | | | | 32,226 | | | | 2,617 | | | | 982 | | | | 28,040 | |
| $ | 180,074 | | | $ | 995,442 | | | $ | 128,212 | | | $ | 43,189 | | | $ | 1,413,450 | |
| | | |
| | | | | | | | | | | | | | | | | | |
| $ | 174,678 | | | $ | 1,069,622 | | | $ | 161,041 | | | $ | 42,863 | | | $ | 1,278,513 | |
| | 5,396 | | | | (74,180 | ) | | | (32,829 | ) | | | 326 | | | | 134,937 | |
| $ | 180,074 | | | $ | 995,442 | | | $ | 128,212 | | | $ | 43,189 | | | $ | 1,413,450 | |
| | | |
| | | | | | | | | | | | | | | | | | |
| | | | | | | | | | | | | | | | | | |
| | — | | | $ | 52,306 | | | | — | | | | — | | | $ | 13,486 | |
| | — | | | | 4,023 | | | | — | | | | — | | | | 845 | |
| | — | | | $ | 13.00 | | | | — | | | | — | | | $ | 15.96 | |
| | | |
| | | | | | | | | | | | | | | | | | |
| $ | 180,074 | | | $ | 282,521 | | | $ | 128,212 | | | $ | 3,845 | | | $ | 483,678 | |
| | 19,306 | | | | 21,749 | | | | 21,947 | | | | 385 | | | | 30,281 | |
| $ | 9.33 | | | $ | 12.99 | | | $ | 5.84 | | | $ | 9.99 | | | $ | 15.97 | |
| | | |
| | | | | | | | | | | | | | | | | | |
| | — | | | $ | 660,615 | | | | — | | | $ | 39,344 | | | $ | 916,286 | |
| | — | | | | 50,931 | | | | — | | | | 3,929 | | | | 57,334 | |
| | — | | | $ | 12.97 | | | | — | | | $ | 10.01 | | | $ | 15.98 | |
| | | |
| | | | | | | | | | | | | | | | | | |
| $ | 172,910 | | | $ | 1,019,095 | | | $ | 134,960 | | | $ | 41,281 | | | $ | 1,215,893 | |
| | 11,317 | | | | 23,105 | | | | 1,595 | | | | 1,575 | | | | 67,522 | |
| | 1,097 | | | | 17 | | | | 184 | | | | — | | | | 149 | |
See notes to financial statements.
Annual Report 117
Period ended October 31, 2020
Numbers in 000s
| | | | | | | | | | | | |
| | | | | | | |
| | | Payden
Cash Reserves
Money Market
�� Fund | | Payden
Limited
Maturity
Fund | | Payden
Low Duration
Fund |
| | | |
INVESTMENT INCOME: | | | | | | | | | | | | |
Interest income (Note 2) | | $ | 2,298 | | | $ | 16,990 | | | $ | 31,765 | |
Dividend income | | | — | | | | — | | | | — | |
Dividend income from affiliated investment (Note 2) | | | — | | | | 75 | | | | 62 | |
Income from securities lending | | | — | | | | 5 | | | | 4 | |
Foreign tax withholdings | | | — | | | | — | | | | — | |
| | | | |
Investment Income | | | 2,298 | | | | 17,070 | | | | 31,831 | |
| | | | |
EXPENSES: | | | | | | | | | | | | |
Investment advisory fees (Note 3) | | | 466 | | | | 2,679 | | | | 4,112 | |
Administration fees (Note 3) | | | 466 | | | | 1,435 | | | | 2,203 | |
Shareholder servicing fees | | | — | | | | 389 | | | | 512 | |
Distribution fees (Note 3) | | | — | | | | — | | | | — | |
Custodian fees | | | 31 | | | | 64 | | | | 87 | |
Transfer agent fees | | | 26 | | | | 53 | | | | 134 | |
Registration and filing fees | | | 45 | | | | 57 | | | | 69 | |
Trustee fees and expenses | | | 38 | | | | 124 | | | | 198 | |
Printing and mailing costs | | | 16 | | | | 48 | | | | 72 | |
Loan commitment fees | | | — | | | | 14 | | | | 22 | |
Legal fees | | | 6 | | | | 22 | | | | 34 | |
Publication expense | | | 7 | | | | 19 | | | | 31 | |
Pricing fees | | | 4 | | | | 45 | | | | 46 | |
Fund accounting fees | | | 53 | | | | 116 | | | | 175 | |
Insurance | | | 6 | | | | 34 | | | | 4 | |
Interest expense | | | — | | | | 7 | | | | — | |
Audit fees | | | 33 | | | | 38 | | | | 38 | |
Other expenses | | | 6 | | | | 35 | | | | — | |
| | | | |
Gross Expenses | | | 1,203 | | | | 5,179 | | | | 7,737 | |
Expense subsidy (Note 3) | | | (484 | ) | | | (2,780 | ) | | | (1,422 | ) |
| | | | |
Net Expenses | | | 719 | | | | 2,399 | | | | 6,315 | |
| | | | |
Net Investment Income | | | 1,579 | | | | 14,671 | | | | 25,516 | |
| | | | |
NET REALIZED AND UNREALIZED GAINS (LOSSES): | | | | | | | | | | | | |
Net realized gains (losses) from: | | | | | | | | | | | | |
Investments | | | 16 | | | | (1,004 | ) | | | 15,224 | |
Foreign currency transactions | | | — | | | | (80 | ) | | | (13 | ) |
Forward foreign exchange contracts | | | — | | | | 912 | | | | — | |
Futures contracts | | | — | | | | (57 | ) | | | 2,223 | |
Written option contracts | | | — | | | | — | | | | — | |
Swap contracts | | | — | | | | — | | | | (8 | ) |
Change in net unrealized appreciation (depreciation) from: | | | | | | | | | | | | |
Investments | | | — | | | | 447 | | | | (3,352 | ) |
Translation of assets and liabilities in foreign currencies | | | — | | | | 7 | | | | (1 | ) |
Forward foreign exchange contracts | | | — | | | | 747 | | | | 46 | |
Futures contracts | | | — | | | | 32 | | | | 404 | |
Written option contracts | | | — | | | | — | | | | — | |
Swap contracts | | | — | | | | — | | | | 1,043 | |
| | | | |
Net Realized and Unrealized Gains (Losses) | | | 16 | | | | 1,004 | | | | 15,566 | |
| | | | |
CHANGE IN NET ASSETS RESULTING FROM OPERATIONS | | | $ 1,595 | | | | $ 15,675 | | | | $ 41,082 | |
| | | | |
See notes to financial statements.
118 Payden Mutual Funds
| | | | | | | | | | | | | | | | | | | | | | | | | | |
| | | | | | | | | | | | | | | | | | | | | | | | | | |
Payden
U.S. Government
Fund | | Payden
GNMA
Fund | | Payden
Core
Bond Fund | | Payden
Corporate
Bond Fund | | Payden
Strategic Income
Fund | | Payden
Absolute
Return Bond
Fund | | | Payden
Floating Rate
Fund | |
| | | | | | |
| | | | | | | | | | | | | | | | | | | | | | | | | | |
| $ | 947 | | | $ | 3,288 | | | $ | 29,851 | | | $ | 16,442 | | | $ | 5,123 | | | $ | 22,973 | | | $ | 2,894 | |
| | — | | | | — | | | | — | | | | — | | | | 15 | | | | — | | | | — | |
| | 9 | | | | 14 | | | | 45 | | | | 46 | | | | 12 | | | | 52 | | | | 50 | |
| | — | | | | — | | | | 10 | | | | 11 | | | | 2 | | | | 4 | | | | 1 | |
| | — | | | | — | | | | (10 | ) | | | — | | | | (2 | ) | | | — | | | | — | |
| | |
| | 956 | | | | 3,302 | | | | 29,896 | | | | 16,499 | | | | 5,150 | | | | 23,029 | | | | 2,945 | |
| | |
| | | | | | | | | | | | | | | | | | | | | | | | | | |
| | 120 | | | | 339 | | | | 2,866 | | | | 1,659 | | | | 797 | | | | 3,621 | | | | 386 | |
| | 64 | | | | 189 | | | | 1,535 | | | | 711 | | | | 217 | | | | 1,086 | | | | 105 | |
| | 7 | | | | 179 | | | | 357 | | | | 342 | | | | 22 | | | | 10 | | | | 1 | |
| | — | | | | — | | | | 108 | | | | — | | | | — | | | | — | | | | — | |
| | 7 | | | | 13 | | | | 81 | | | | 48 | | | | 23 | | | | 82 | | | | 21 | |
| | 15 | | | | 23 | | | | 79 | | | | 44 | | | | 27 | | | | 55 | | | | 24 | |
| | 21 | | | | 34 | | | | 80 | | | | 69 | | | | 39 | | | | 59 | | | | 29 | |
| | 5 | | | | 16 | | | | 134 | | | | 64 | | | | 20 | | | | 96 | | | | 10 | |
| | 3 | | | | 6 | | | | 54 | | | | 24 | | | | 9 | | | | 44 | | | | 5 | |
| | — | | | | 2 | | | | 15 | | | | 8 | | | | 2 | | | | 12 | | | | 1 | |
| | 1 | | | | 3 | | | | 23 | | | | 11 | | | | 3 | | | | 17 | | | | 1 | |
| | 2 | | | | 4 | | | | 24 | | | | 9 | | | | 5 | | | | 10 | | | | 4 | |
| | 7 | | | | 16 | | | | 46 | | | | 32 | | | | 41 | | | | 124 | | | | 17 | |
| | 16 | | | | 25 | | | | 120 | | | | 64 | | | | 27 | | | | 92 | | | | 19 | |
| | 4 | | | | 3 | | | | 23 | | | | 10 | | | | 1 | | | | 14 | | | | 2 | |
| | — | | | | — | | | | 3 | | | | — | | | | — | | | | 2 | | | | — | |
| | 38 | | | | 40 | | | | 41 | | | | 40 | | | | 43 | | | | 45 | | | | 56 | |
| | — | | | | — | | | | 1 | | | | 3 | | | | — | | | | 18 | | | | — | |
| | |
| | 310 | | | | 892 | | | | 5,590 | | | | 3,138 | | | | 1,276 | | | | 5,387 | | | | 681 | |
| | (127 | ) | | | (264 | ) | | | (492 | ) | | | (56 | ) | | | (334 | ) | | | (1,704 | ) | | | (205 | ) |
| | |
| | 183 | | | | 628 | | | | 5,098 | | | | 3,082 | | | | 942 | | | | 3,683 | | | | 476 | |
| | |
| | 773 | | | | 2,674 | | | | 24,798 | | | | 13,417 | | | | 4,208 | | | | 19,346 | | | | 2,469 | |
| | |
| | | | | | | | | | | | | | | | | | | | | | | | | | |
| | | | | | | | | | | | | | | | | | | | | | | | | | |
| | 354 | | | | 1,505 | | | | 29,910 | | | | 7,985 | | | | 1,117 | | | | (3,169 | ) | | | (984 | ) |
| | — | | | | — | | | | (63 | ) | | | — | | | | (7 | ) | | | 10 | | | | — | |
| | — | | | | — | | | | (1,783 | ) | | | — | | | | (599 | ) | | | (2,488 | ) | | | — | |
| | (10 | ) | | | (35 | ) | | | (939 | ) | | | (1,867 | ) | | | 73 | | | | 1,887 | | | | — | |
| | — | | | | — | | | | 987 | | | | — | | | | 157 | | | | 255 | | | | — | |
| | — | | | | — | | | | (2,932 | ) | | | 1,306 | | | | (240 | ) | | | (3,013 | ) | | | — | |
| | | | | | | | | | | | | | | | | | | | | | | | | | |
| | 654 | | | | 198 | | | | (6,289 | ) | | | 1,855 | | | | (1,398 | ) | | | (6,643 | ) | | | (2,255 | ) |
| | — | | | | — | | | | (31 | ) | | | — | | | | (5 | ) | | | 11 | | | | — | |
| | — | | | | — | | | | 1,388 | | | | — | | | | 296 | | | | 1,583 | | | | — | |
| | 6 | | | | — | | | | 2 | | | | (293 | ) | | | 95 | | | | 209 | | | | — | |
| | — | | | | — | | | | (689 | ) | | | — | | | | (110 | ) | | | (161 | ) | | | — | |
| | — | | | | — | | | | 92 | | | | (936 | ) | | | 6 | | | | 1,071 | | | | — | |
| | |
| | 1,004 | | | | 1,668 | | | | 19,653 | | | | 8,050 | | | | (615 | ) | | | (10,448 | ) | | | (3,239 | ) |
| | |
| $ | 1,777 | | | $ | 4,342 | | | $ | 44,451 | | | $ | 21,467 | | | $ | 3,593 | | | $ | 8,898 | | | $ | (770 | ) |
| | | |
See notes to financial statements.
Annual Report 119
| | |
Statements of Operations continued | | |
Period ended October 31, 2020
Numbers in 000s
| | | | | | | | | | | | |
| | | | | | | |
| | | Payden
High Income
Fund | | Payden
California Municipal
Social Impact
Fund | | Payden
Global Low
Duration Fund |
INVESTMENT INCOME: | | | | | | | | | | | | |
Interest income (Note 2) | | | $ 25,670 | | | | $ 1,601 | | | | $ 2,306 | |
Dividend income | | | 7 | | | | — | | | | 30 | |
Dividend income from affiliated investment (Note 2) | | | 97 | | | | — | | | | 9 | |
Income from securities lending | | | 49 | | | | — | | | | 2 | |
Foreign tax withholdings | | | (1 | ) | | | — | | | | — | |
| | | | |
Investment Income | | | 25,822 | | | | 1,601 | | | | 2,347 | |
| | | | |
EXPENSES: | | | | | | | | | | | | |
Investment advisory fees (Note 3) | | | 1,532 | | | | 196 | | | | 284 | |
Administration fees (Note 3) | | | 657 | | | | 92 | | | | 142 | |
Shareholder servicing fees | | | 152 | | | | 28 | | | | 64 | |
Distribution fees (Note 3) | | | — | | | | — | | | | — | |
Custodian fees | | | 38 | | | | 8 | | | | 23 | |
Transfer agent fees | | | 34 | | | | 15 | | | | 17 | |
Registration and filing fees | | | 31 | | | | 2 | | | | 28 | |
Trustee fees and expenses | | | 59 | | | | 8 | | | | 12 | |
Printing and mailing costs | | | 18 | | | | 26 | | | | 5 | |
Loan commitment fees | | | 7 | | | | 1 | | | | 1 | |
Legal fees | | | 10 | | | | 41 | | | | 2 | |
Publication expense | | | 11 | | | | 2 | | | | 3 | |
Pricing fees | | | 32 | | | | 15 | | | | 36 | |
Fund accounting fees | | | 60 | | | | 19 | | | | 22 | |
Insurance | | | 10 | | | | 1 | | | | 2 | |
Audit fees | | | 45 | | | | 46 | | | | 40 | |
Interest expense | | | — | | | | — | | | | — | |
Other expenses | | | 4 | | | | — | | | | — | |
| | | | |
Gross Expenses | | | 2,700 | | | | 500 | | | | 681 | |
Expense subsidy (Note 3) | | | — | | | | (175 | ) | | | (179 | ) |
| | | | |
Net Expenses | | | 2,700 | | | | 325 | | | | 502 | |
| | | | |
Net Investment Income | | | 23,122 | | | | 1,276 | | | | 1,845 | |
| | | | |
NET REALIZED AND UNREALIZED GAINS (LOSSES): | | | | | | | | | | | | |
Net realized gains (losses) from: | | | | | | | | | | | | |
Investments | | | (3,198 | ) | | | 1,109 | | | | 611 | |
Foreign currency transactions | | | 28 | | | | — | | | | (1 | ) |
Forward foreign exchange contracts | | | (442 | ) | | | — | | | | (390 | ) |
Affiliated investments | | | 4 | | | | — | | | | — | |
Futures contracts | | | — | | | | (6 | ) | | | (3 | ) |
Written option contracts | | | — | | | | — | | | | — | |
Swap contracts | | | (34) | | | | — | | | | — | |
Change in net unrealized appreciation (depreciation) from: | | | | | | | | | | | | |
Investments | | | (2,824 | ) | | | (145 | ) | | | 158 | |
Translation of assets and liabilities in foreign currencies | | | (1 | ) | | | — | | | | — | |
Forward foreign exchange contracts | | | 247 | | | | — | | | | 110 | |
Affiliated investments | | | 4 | | | | — | | | | — | |
Futures contracts | | | — | | | | — | | | | 49 | |
Written option contracts | | | — | | | | — | | | | (24 | ) |
Swap contracts | | | 300 | | | | — | | | | 64 | |
| | | | |
Net Realized and Unrealized Gains (Losses) | | | (5,916 | ) | | | 958 | | | | 574 | |
| | | | |
CHANGE IN NET ASSETS RESULTING FROM OPERATIONS | | | $ 17,206 | | | | $ 2,234 | | | | $ 2,419 | |
| | | | |
See notes to financial statements.
120 Payden Mutual Funds
| | | | | | | | | | | | | | | | | | |
| | | | | | | | | |
Payden Global Fixed Income Fund | | Payden Emerging Markets Bond Fund | | Payden Emerging Markets Local Bond Fund | | Payden Emerging Markets Corporate Bond Fund | | Payden Equity Income Fund |
| | | | | | | | | | | | | | | | | | |
| | $3,323 | | | | $59,429 | | | | $10,301 | | | | $2,149 | | | | $2,245 | |
| | 52 | | | | — | | | | — | | | | — | | | | 37,346 | |
| | 66 | | | | 114 | | | | 35 | | | | 10 | | | | 101 | |
| | 3 | | | | 38 | | | | — | | | | 15 | | | | 41 | |
| | (28 | ) | | | — | | | | (191 | ) | | | — | | | | (161 | ) |
| | | |
| | 3,416 | | | | 59,581 | | | | 10,145 | | | | 2,174 | | | | 39,572 | |
| | | |
| | | | | | | | | | | | | | | | | | |
| | 463 | | | | 4,597 | | | | 1,013 | | | | 330 | | | | 6,820 | |
| | 232 | | | | 1,532 | | | | 253 | | | | 62 | | | | 2,046 | |
| | 238 | | | | 458 | | | | 16 | | | | — | | | | 346 | |
| | — | | | | 151 | | | | — | | | | — | | | | 38 | |
| | 49 | | | | 123 | | | | 99 | | | | 27 | | | | 93 | |
| | 25 | | | | 183 | | | | 19 | | | | 24 | | | | 94 | |
| | 33 | | | | 103 | | | | 31 | | | | 29 | | | | 78 | |
| | 20 | | | | 140 | | | | 24 | | | | 6 | | | | 186 | |
| | 8 | | | | 54 | | | | 5 | | | | 4 | | | | 70 | |
| | 2 | | | | 16 | | | | 3 | | | | 1 | | | | 21 | |
| | 4 | | | | 25 | | | | 4 | | | | 1 | | | | 32 | |
| | 4 | | | | 27 | | | | 5 | | | | 2 | | | | 30 | |
| | 52 | | | | 29 | | | | 20 | | | | 17 | | | | 4 | |
| | 29 | | | | 128 | | | | 30 | | | | 16 | | | | 162 | |
| | 3 | | | | 23 | | | | 5 | | | | 1 | | | | 31 | |
| | 40 | | | | 46 | | | | 45 | | | | 45 | | | | 38 | |
| | 1 | | | | 29 | | | | — | | | | — | | | | 3 | |
| | 2 | | | | — | | | | — | | | | 3 | | | | 6 | |
| | | |
| | 1,205 | | | | 7,664 | | | | 1,572 | | | | 568 | | | | 10,098 | |
| | (123 | ) | | | (277 | ) | | | — | | | | (214 | ) | | | (733 | ) |
| | | |
| | 1,082 | | | | 7,387 | | | | 1,572 | | | | 354 | | | | 9,365 | |
| | | |
| | 2,334 | | | | 52,194 | | | | 8,573 | | | | 1,820 | | | | 30,207 | |
| | | |
| | | | | | | | | | | | | | | | | | |
| | | | | | | | | | | | | | | | | | |
| | 3,106 | | | | (19,276 | ) | | | (20,085 | ) | | | 97 | | | | (2,759 | ) |
| | (1,704 | ) | | | (581 | ) | | | (779 | ) | | | (17 | ) | | | 97 | |
| | (384 | ) | | | 2,077 | | | | (1,012 | ) | | | 67 | | | | (2,165 | ) |
| | — | | | | — | | | | — | | | | — | | | | — | |
| | (38 | ) | | | — | | | | — | | | | (37 | ) | | | — | |
| | 126 | | | | — | | | | — | | | | — | | | | — | |
| | (221 | ) | | | 7,522 | | | | 181 | | | | (19 | ) | | | — | |
| | 1,297 | | | | (41,318 | ) | | | (3,904 | ) | | | 1 | | | | (130,603 | ) |
| | (14 | ) | | | (59 | ) | | | 75 | | | | 1 | | | | (7 | ) |
| | 1,210 | | | | 2,842 | | | | (607 | ) | | | (1 | ) | | | 1,601 | |
| | (57 | ) | | | — | | | | — | | | | — | | | | — | |
| | (165 | ) | | | — | | | | — | | | | 4 | | | | — | |
| | (88 | ) | | | — | | | | — | | | | — | | | | — | |
| | 66 | | | | (1,820 | ) | | | (295 | ) | | | (80 | ) | | | — | |
| | | |
| | 3,134 | | | | (50,613 | ) | | | (26,426 | ) | | | 16 | | | | (133,836 | ) |
| | | |
| | $5,468 | | | | $1,581 | | | | $(17,853 | ) | | | $1,836 | | | | $(103,629 | ) |
| | | |
See notes to financial statements.
Annual Report 121
| | |
Statements of Changes in Net Assets | | |
For the periods ended October 31st
Numbers in 000s
| | | | | | | | | | | | | | | | |
| | |
| | | Payden Cash Reserves
Money Market Fund | | Payden Limited
Maturity Fund |
| | | 2020 | | 2019 | | 2020 | | 2019 |
INCREASE (DECREASE) IN NET ASSETS: | | | | | | | | | | | | | | | | |
FROM OPERATIONS: | | | | | | | | | | | | | | | | |
Net investment income | | $ | 1,579 | | | $ | 5,701 | | | $ | 14,671 | | | $ | 21,097 | |
Net realized gains (losses) | | | 16 | | | | 3 | | | | (229 | ) | | | 824 | |
Change in net unrealized appreciation/(depreciation) | | | — | | | | — | | | | 1,233 | | | | 2,618 | |
Change in Net Assets Resulting from Operations | | | 1,595 | | | | 5,704 | | | | 15,675 | | | | 24,539 | |
| | | | |
FROM DISTRIBUTIONS TO SHAREHOLDERS: | | | | | | | | | | | | | | | | |
Net investment income and net realized gains from investments: | | | | | | | | | | | | | | | | |
Adviser Class | | | — | | | | — | | | | — | | | | — | |
Investor Class | | | (1,606 | ) | | | (5,685 | ) | | | (15,044 | ) | | | (21,404 | ) |
Institutional Class | | | — | | | | — | | | | — | | | | — | |
Return of capital: | | | | | | | | | | | | | | | | |
Adviser Class | | | — | | | | — | | | | — | | | | — | |
Investor Class | | | — | | | | — | | | | — | | | | — | |
Institutional Class | | | — | | | | — | | | | — | | | | — | |
Change in Net Assets from Distributions to Shareholders | | | (1,606 | ) | | | (5,685 | ) | | | (15,044 | ) | | | (21,404 | ) |
| | | | |
FROM CAPITAL TRANSACTIONS: | | | | | | | | | | | | | | | | |
Proceeds from fund shares sold: | | | | | | | | | | | | | | | | |
Adviser Class | | | — | | | | — | | | | — | | | | — | |
Investor Class | | | 34,344,324 | | | | 30,628,042 | | | | 1,178,243 | | | | 578,559 | |
Institutional Class | | | — | | | | — | | | | — | | | | — | |
Reinvestment of distributions: | | | | | | | | | | | | | | | | |
Adviser Class | | | — | | | | — | | | | — | | | | — | |
Investor Class | | | 367 | | | | 1,306 | | | | 14,818 | | | | 20,949 | |
Institutional Class | | | — | | | | — | | | | — | | | | — | |
Cost of fund shares redeemed: | | | | | | | | | | | | | | | | |
Adviser Class | | | — | | | | — | | | | — | | | | — | |
Investor Class | | | (34,268,040 | ) | | | (30,684,406 | ) | | | (757,823 | ) | | | (603,819 | ) |
Institutional Class | | | — | | | | — | | | | — | | | | — | |
Change in Net Assets from Capital Transactions | | | 76,651 | | | | (55,058 | ) | | | 435,238 | | | | (4,311 | ) |
Total Change in Net Assets | | | 76,640 | | | | (55,039 | ) | | | 435,869 | | | | (1,176 | ) |
| | | | |
NET ASSETS: | | | | | | | | | | | | | | | | |
Beginning of period | | | 274,957 | | | | 329,996 | | | | 783,645 | | | | 784,821 | |
End of period | | $ | 351,597 | | | $ | 274,957 | | | $ | 1,219,514 | | | $ | 783,645 | |
| | | | | | | | | | | | | | | | |
| | | | |
FUND SHARES OF BENEFICIAL INTEREST: | | | | | | | | | | | | | | | | |
Adviser Class: | | | | | | | | | | | | | | | | |
Outstanding shares at beginning of period | | | — | | | | — | | | | — | | | | — | |
Shares sold | | | — | | | | — | | | | — | | | | — | |
Shares issued in reinvestment of distributions | | | — | | | | — | | | | — | | | | — | |
Shares redeemed | | | — | | | | — | | | | — | | | | — | |
Change in shares outstanding | | | — | | | | — | | | | — | | | | — | |
Outstanding shares at end of period | | | — | | | | — | | | | — | | | | — | |
| | | | | | | | | | | | | | | | |
Investor Class: | | | | | | | | | | | | | | | | |
Outstanding shares at beginning of period | | | 274,926 | | | | 329,984 | | | | 82,556 | | | | 82,941 | |
Shares sold | | | 34,344,324 | | | | 30,628,042 | | | | 124,443 | | | | 61,169 | |
Shares issued in reinvestment of distributions | | | 367 | | | | 1,306 | | | | 1,569 | | | | 2,212 | |
Shares redeemed | | | (34,268,040 | ) | | | (30,684,406 | ) | | | (80,221 | ) | | | (63,766 | ) |
Change in shares outstanding | | | 76,651 | | | | (55,058 | ) | | | 45,791 | | | | (385 | ) |
Outstanding shares at end of period | | | 351,577 | | | | 274,926 | | | | 128,347 | | | | 82,556 | |
| | | | | | | | | | | | | | | | |
Institutional Class | | | | | | | | | | | | | | | | |
Outstanding shares at beginning of period | | | — | | | | — | | | | — | | | | — | |
Shares sold | | | — | | | | — | | | | — | | | | — | |
Shares issued in reinvestment of distributions | | | — | | | | — | | | | — | | | | — | |
Shares redeemed | | | — | | | | — | | | | — | | | | — | |
Change in shares outstanding | | | — | | | | — | | | | — | | | | — | |
Outstanding shares at end of period | | | — | | | | — | | | | — | | | | — | |
| | | | | | | | | | | | | | | | |
| | | | |
LONG TERM INVESTMENT ACTIVITY: | | | | | | | | | | | | | | | | |
Purchase of investments (excluding government) | | | — | | | | — | | | | 797,979 | | | | 401,043 | |
Sale of investments (excluding government) | | | — | | | | — | | | | 379,249 | | | | 384,994 | |
Purchase of government securities | | | — | | | | — | | | | 182,067 | | | | 149,584 | |
Sale of government securities | | | — | | | | — | | | | 162,500 | | | | 150,383 | |
See notes to financial statements.
122 Payden Mutual Funds
| | | | | | | | | | | | | | | | | | | | | | | | | | | | | | |
| | | |
Payden
Low Duration Fund | | Payden
U.S. Government Fund | | Payden
GNMA Fund | | Payden
Core Bond Fund |
| 2020 | | 2019 | | 2020 | | 2019 | | 2020 | | 2019 | | 2020 | | 2019 |
| | | | | | | |
| | | | | | | | | | | | | | | | | | | | | | | | | | | | | | |
| | | | | | | | | | | | | | | | | | | | | | | | | | | | | | |
| $ | 25,516 | | | $ | 33,581 | | | $ | 773 | | | $ | 866 | | | $ | 2,674 | | | $ | 3,844 | | | $ | 24,798 | | | $ | 31,337 | |
| | 17,426 | | | | 6,428 | | | | 344 | | | | 16 | | | | 1,470 | | | | (215 | ) | | | 25,180 | | | | 14,277 | |
| | (1,860 | ) | | | 20,323 | | | | 660 | | | | 1,050 | | | | 198 | | | | 8,456 | | | | (5,527 | ) | | | 53,641 | |
| | 41,082 | | | | 60,332 | | | | 1,777 | | | | 1,932 | | | | 4,342 | | | | 12,085 | | | | 44,451 | | | | 99,255 | |
| | | | | | | |
| | — | | | | — | | | | — | | | | — | | | | — | | | | — | | | | (1,005 | ) | | | (896 | ) |
| | (26,184 | ) | | | (33,502 | ) | | | (1,001 | ) | | | (1,083 | ) | | | (3,703 | ) | | | (4,848 | ) | | | (14,865 | ) | | | (20,170 | ) |
| | — | | | | — | | | | — | | | | — | | | | — | | | | — | | | | (10,915 | ) | | | (9,684 | ) |
| | | | | | | | | | | | | | | | | | | | | | | | | | | | | | |
| | — | | | | — | | | | — | | | | — | | | | — | | | | — | | | | — | | | | (55 | ) |
| | — | | | | (300 | ) | | | — | | | | — | | | | — | | | | — | | | | — | | | | (1,228 | ) |
| | — | | | | | | | | — | | | | — | | | | — | | | | — | | | | — | | | | (590 | ) |
| | (26,184 | ) | | | (33,802 | ) | | | (1,001 | ) | | | (1,083 | ) | | | (3,703 | ) | | | (4,848 | ) | | | (26,785 | ) | | | (32,623 | ) |
| | | | | | | | | | | | | | | | | | | | | | | | | | | | | | |
| | | | | | | |
| | | | | | | | | | | | | | | | | | | | | | | | | | | | | | |
| | — | | | | — | | | | — | | | | — | | | | — | | | | — | | | | 11,434 | | | | 14,905 | |
| | 631,230 | | | | 928,404 | | | | 11,759 | | | | 4,871 | | | | 26,570 | | | | 22,301 | | | | 114,687 | | | | 141,231 | |
| | — | | | | — | | | | — | | | | — | | | | — | | | | — | | | | 492,322 | | | | 21,714 | |
| | | | | | | | | | | | | | | | | | | | | | | | | | | | | | |
| | — | | | | — | | | | — | | | | — | | | | — | | | | — | | | | 1,001 | | | | 949 | |
| | 25,016 | | | | 31,948 | | | | 980 | | | | 1,079 | | | | 3,344 | | | | 4,407 | | | | 13,050 | | | | 19,155 | |
| | — | | | | — | | | | — | | | | — | | | | — | | | | — | | | | 10,914 | | | | 10,274 | |
| | | | | | | | | | | | | | | | | | | | | | | | | | | | | | |
| | — | | | | — | | | | — | | | | — | | | | — | | | | — | | | | (6,521 | ) | | | (8,710 | ) |
| | (661,199 | ) | | | (676,153 | ) | | | (5,456 | ) | | | (5,176 | ) | | | (40,499 | ) | | | (60,883 | ) | | | (244,767 | ) | | | (113,019 | ) |
| | — | | | | — | | | | — | | | | — | | | | — | | | | — | | | | (74,582 | ) | | | (24,861 | ) |
| | (4,953 | ) | | | 284,199 | | | | 7,283 | | | | 774 | | | | (10,585 | ) | | | (34,175 | ) | | | 317,538 | | | | 61,638 | |
| | 9,945 | | | | 310,729 | | | | 8,059 | | | | 1,623 | | | | (9,946 | ) | | | (26,938 | ) | | | 335,204 | | | | 128,270 | |
| | | | | | | |
| | 1,523,037 | | | | 1,212,308 | | | | 39,301 | | | | 37,678 | | | | 132,455 | | | | 159,393 | | | | 1,058,597 | | | | 930,327 | |
| $ | 1,532,982 | | | $ | 1,523,037 | | | $ | 47,360 | | | $ | 39,301 | | | $ | 122,509 | | | $ | 132,455 | | | $ | 1,393,801 | | | $ | 1,058,597 | |
| | | | | | | | | | | | | | | | | | | | | | | | | | | | | | | |
| | | | | | | |
| | — | | | | — | | | | — | | | | — | | | | — | | | | — | | | | 3,585 | | | | 2,929 | |
| | — | | | | — | | | | — | | | | — | | | | — | | | | — | | | | 1,046 | | | | 1,404 | |
| | — | | | | — | | | | — | | | | — | | | | — | | | | — | | | | 92 | | | | 90 | |
| | — | | | | — | | | | — | | | | — | | | | — | | | | — | | | | (601 | ) | | | (838 | ) |
| | — | | | | — | | | | — | | | | — | | | | — | | | | — | | | | 537 | | | | 656 | |
| | — | | | | — | | | | — | | | | — | | | | — | | | | — | | | | 4,122 | | | | 3,585 | |
| | | | | | | | | | | | | | | | | | | | | | | | | | | | | | | |
| | | | | | | |
| | 150,787 | | | | 122,291 | | | | 3,798 | | | | 3,725 | | | | 14,058 | | | | 17,774 | | | | 63,832 | | | | 59,268 | |
| | 62,314 | | | | 92,867 | | | | 1,120 | | | | 472 | | | | 2,806 | | | | 2,412 | | | | 10,462 | | | | 13,533 | |
| | 2,475 | | | | 3,188 | | | | 93 | | | | 105 | | | | 353 | | | | 476 | | | | 1,189 | | | | 1,813 | |
| | (65,575 | ) | | | (67,559 | ) | | | (520 | ) | | | (504 | ) | | | (4,277 | ) | | | (6,604 | ) | | | (22,558 | ) | | | (10,782 | ) |
| | (786 | ) | | | 28,496 | | | | 693 | | | | 73 | | | | (1,118 | ) | | | (3,716 | ) | | | (10,907 | ) | | | 4,564 | |
| | 150,001 | | | | 150,787 | | | | 4,491 | | | | 3,798 | | | | 12,940 | | | | 14,058 | | | | 52,925 | | | | 63,832 | |
| | | | | | | | | | | | | | | | | | | | | | | | | | | | | | | |
| | | | | | | |
| | — | | | | — | | | | — | | | | — | | | | — | | | | — | | | | 29,745 | | | | 29,076 | |
| | — | | | | — | | | | — | | | | — | | | | — | | | | — | | | | 44,255 | | | | 2,060 | |
| | — | | | | — | | | | — | | | | — | | | | — | | | | — | | | | 994 | | | | 974 | |
| | — | | | | — | | | | — | | | | — | | | | — | | | | — | | | | (6,738 | ) | | | (2,365 | ) |
| | — | | | | — | | | | — | | | | — | | | | — | | | | — | | | | 38,511 | | | | 669 | |
| | — | | | | — | | | | — | | | | — | | | | — | | | | — | | | | 68,256 | | | | 29,745 | |
| | | | | | | | | | | | | | | | | | | | | | | | | | | | | | | |
| | | | | | | |
| | 733,040 | | | | 583,346 | | | | — | | | | 1,874 | | | | — | | | | 518 | | | | 525,058 | | | | 263,243 | |
| | 603,129 | | | | 314,877 | | | | 785 | | | | 738 | | | | 446 | | | | 42 | | | | 382,458 | | | | 289,966 | |
| | 2,304,470 | | | | 2,013,561 | | | | 26,809 | | | | 17,118 | | | | 43,215 | | | | 35,449 | | | | 1,039,794 | | | | 646,699 | |
| | 2,422,965 | | | | 1,987,024 | | | | 19,455 | | | | 17,620 | | | | 53,812 | | | | 67,024 | | | | 951,342 | | | | 598,239 | |
See notes to financial statements.
Annual Report 123
| | |
Statements of Changes in Net Assets continued | | |
For the periods ended October 31st
Numbers in 000s
| | | | | | | | | | | | | | | | | | |
| | | |
| | | Payden Corporate
Bond Fund | | | | Payden Strategic
Income Fund |
| | | 2020 | | 2019 | | | | 2020 | | 2019 |
INCREASE (DECREASE) IN NET ASSETS: | | | | | | | | | | | | | | | | | | |
FROM OPERATIONS: | | | | | | | | | | | | | | | | | | |
Net investment income | | $ | 13,417 | | | $ | 13,637 | | | | | $ | 4,208 | | | $ | 5,990 | |
Net realized gains (losses) | | | 7,424 | | | | 2,162 | | | | | | 501 | | | | 2,293 | |
Change in net unrealized appreciation/(depreciation) | | | 626 | | | | 38,130 | | | | | | (1,116 | ) | | | 5,484 | |
Change in Net Assets Resulting from Operations | | | 21,467 | | | | 53,929 | | | | | | 3,593 | | | | 13,767 | |
FROM DISTRIBUTIONS TO SHAREHOLDERS: | | | | | | | | | | | | | | | | | | |
Net investment income and net realized gains from investments: | | | | | | | | | | | | | | | | | | |
Adviser Class | | | — | | | | — | | | | | | — | | | | — | |
Investor Class | | | (13,669 | ) | | | (13,755 | ) | | | | | (2,863 | ) | | | (4,006 | ) |
SI Class | | | — | | | | — | | | | | | (1,518 | ) | | | (1,671 | ) |
Return of capital: | | | | | | | | | | | | | | | | | | |
Adviser Class | | | — | | | | — | | | | | | — | | | | — | |
Investor Class | | | — | | | | — | | | | | | — | | | | (297 | ) |
Sl Class | | | — | | | | — | | | | | | — | | | | (124 | ) |
Change in Net Assets from Distributions to Shareholders | | | (13,669 | ) | | | (13,755 | ) | | | | | (4,381 | ) | | | (6,098 | ) |
FROM CAPITAL TRANSACTIONS: | | | | | | | | | | | | | | | | | | |
Proceeds from fund shares sold: | | | | | | | | | | | | | | | | | | |
Investor Class | | | 177,669 | | | | 229,384 | | | | | | 7,047 | | | | 14,037 | |
SI Class | | | — | | | | — | | | | | | — | | | | 97 | |
Reinvestment of distributions: | | | | | | | | | | | | | | | | | | |
Investor Class | | | 12,767 | | | | 12,830 | | | | | | 2,782 | | | | 4,218 | |
SI Class | | | — | | | | — | | | | | | 1,500 | | | | 1,775 | |
Cost of fund shares redeemed: | | | | | | | | | | | | | | | | | | |
Investor Class | | | (181,486 | ) | | | (117,893 | ) | | | | | (39,424 | ) | | | (55,012 | ) |
SI Class | | | — | | | | — | | | | | | (1,535 | ) | | | (13,045 | ) |
Change in Net Assets from Capital Transactions | | | 8,950 | | | | 124,321 | | | | | | (29,630 | ) | | | (47,930 | ) |
Total Change in Net Assets | | | 16,748 | | | | 164,495 | | | | | | (30,418 | ) | | | (40,261 | ) |
NET ASSETS: | | | | | | | | | | | | | | | | | | |
Beginning of period | | | 463,203 | | | | 298,708 | | | | | | 164,633 | | | | 204,894 | |
End of period | | $ | 479,951 | | | $ | 463,203 | | | | | $ | 134,215 | | | $ | 164,633 | |
| | | | | | | | | | | | | | | | | | |
FUND SHARES OF BENEFICIAL INTEREST: | | | | | | | | | | | | | | | | | | |
Investor Class: | | | | | | | | | | | | | | | | | | |
Outstanding shares at beginning of period | | | 39,474 | | | | 28,093 | | | | | | 11,322 | | | | 15,026 | |
Shares sold | | | 14,980 | | | | 20,757 | | | | | | 697 | | | | 1,413 | |
Shares issued in reinvestment of distributions | | | 1,081 | | | | 1,147 | | | | | | 276 | | | | 423 | |
Shares redeemed | | | (15,662 | ) | | | (10,523 | ) | | | | | (4,035 | ) | | | (5,540 | ) |
Change in shares outstanding | | | 399 | | | | 11,381 | | | | | | (3,062 | ) | | | (3,704 | ) |
Outstanding shares at end of period | | | 39,873 | | | | 39,474 | | | | | | 8,260 | | | | 11,322 | |
| | | | | | | | | | | | | | | | | | |
SI Class: | | | | | | | | | | | | | | | | | | |
Outstanding shares at beginning of period | | | — | | | | — | | | | | | 4,811 | | | | 5,944 | |
Shares sold | | | — | | | | — | | | | | | — | | | | 10 | |
Shares issued in reinvestment of distributions | | | — | | | | — | | | | | | 149 | | | | 178 | |
Shares redeemed | | | — | | | | — | | | | | | (158 | ) | | | (1,321 | ) |
Change in shares outstanding | | | — | | | | — | | | | | | (9 | ) | | | (1,133 | ) |
Outstanding shares at end of period | | | — | | | | — | | | | | | 4,802 | | | | 4,811 | |
| | | | | | | | | | | | | | | | | | |
LONG TERM INVESTMENT ACTIVITY: | | | | | | | | | | | | | | | | | | |
Purchase of investments (excluding government) | | | 272,593 | | | | 312,422 | | | | | | 64,071 | | | | 70,602 | |
Sale of investments (excluding government) | | | 268,141 | | | | 190,827 | | | | | | 75,981 | | | | 107,737 | |
Purchase of government securities | | | — | | | | — | | | | | | 25,921 | | | | 56,173 | |
Sale of government securities | | | — | | | | — | | | | | | 40,736 | | | | 69,589 | |
See notes to financial statements.
124 Payden Mutual Funds
| | | | | | | | | | | | | | | | | | | | | | | | | | | | | | |
| | | |
Payden Absolute Return
Bond Fund | | Payden Floating Rate
Fund | | Payden High Income
Fund | | Payden California Municipal
Social Impact Fund |
| 2020 | | 2019 | | 2020 | | 2019 | | 2020 | | 2019 | | 2020 | | 2019 |
| | | | | | | | | | | | | | | | | | | | | | | | | | | | | | |
| | | | | | | | | | | | | | | | | | | | | | | | | | | | | | |
| $ | 19,346 | | | $ | 14,225 | | | $ | 2,469 | | | $ | 4,788 | | | $ | 23,122 | | | $ | 24,244 | | | $ | 1,276 | | | $ | 1,459 | |
| | (6,518 | ) | | | 2,229 | | | | (984 | ) | | | (855 | ) | | | (3,642 | ) | | | (3,560 | ) | | | 1,103 | | | | 1,289 | |
| | (3,930 | ) | | | 5,151 | | | | (2,255 | ) | | | (82 | ) | | | (2,274 | ) | | | 23,218 | | | | (145 | ) | | | 2,439 | |
| | 8,898 | | | | 21,605 | | | | (770 | ) | | | 3,851 | | | | 17,206 | | | | 43,902 | | | | 2,234 | | | | 5,187 | |
| | | | | | | | | | | | | | | | | | | | | | | | | | | | | | |
| | | | | | | | | | | | | | | | | | | | | | | | | | | | | | |
| | — | | | | — | | | | — | | | | — | | | | — | | | | — | | | | — | | | | — | |
| | (3,152 | ) | | | (3,909 | ) | | | (699 | ) | | | (1,188 | ) | | | (23,451 | ) | | | (24,421 | ) | | | (2,559 | ) | | | (1,545 | ) |
| | (16,949 | ) | | | (11,096 | ) | | | (1,799 | ) | | | (3,758 | ) | | | — | | | | — | | | | — | | | | — | |
| | | | | | | | | | | | | | | | | | | | | | | | | | | | | | |
| | — | | | | — | | | | — | | | | — | | | | — | | | | — | | | | — | | | | — | |
| | — | | | | — | | | | — | | | | — | | | | — | | | | — | | | | — | | | | — | |
| | — | | | | — | | | | — | | | | (1 | ) | | | — | | | | — | | | | — | | | | — | |
| | (20,101 | ) | | | (15,005 | ) | | | (2,498 | ) | | | (4,947 | ) | | | (23,451 | ) | | | (24,421 | ) | | | (2,559 | ) | | | (1,545 | ) |
| | | | | | | | | | | | | | | | | | | | | | | | | | | | | | |
| | | | | | | | | | | | | | | | | | | | | | | | | | | | | | |
| | 84,527 | | | | 30,773 | | | | 2,932 | | | | 5,870 | | | | 203,007 | | | | 83,758 | | | | 9,466 | | | | 4,444 | |
| | 257,326 | | | | 491,559 | | | | 1,730 | | | | 14,800 | | | | — | | | | — | | | | — | | | | — | |
| | | | | | | | | | | | | | | | | | | | | | | | | | | | | | |
| | 3,123 | | | | 3,852 | | | | 679 | | | | 1,155 | | | | 21,599 | | | | 22,354 | | | | 2,179 | | | | 1,351 | |
| | 16,307 | | | | 10,431 | | | | 1,448 | | | | 3,065 | | | | — | | | | — | | | | — | | | | — | |
| | | | | | | | | | | | | | | | | | | | | | | | | | | | | | |
| | (82,938 | ) | | | (16,803 | ) | | | (5,012 | ) | | | (35,823 | ) | | | (133,571 | ) | | | (135,126 | ) | | | (9,098 | ) | | | (4,711 | ) |
| | (87,072 | ) | | | (27,041 | ) | | | (8,220 | ) | | | (67,389 | ) | | | — | | | | — | | | | — | | | | — | |
| | 191,273 | | | | 492,771 | | | | (6,443 | ) | | | (78,322 | ) | | | 91,035 | | | | (29,014 | ) | | | 2,547 | | | | 1,084 | |
| | 180,070 | | | | 499,371 | | | | (9,711 | ) | | | (79,418 | ) | | | 84,790 | | | | (9,533 | ) | | | 2,222 | | | | 4,726 | |
| | | | | | | | | | | | | | | | | | | | | | | | | | | | | | |
| | 638,626 | | | | 139,255 | | | | 76,886 | | | | 156,304 | | | | 440,406 | | | | 449,939 | | | | 61,866 | | | | 57,140 | |
| $ | 818,696 | | | $ | 638,626 | | | $ | 67,175 | | | $ | 76,886 | | | $ | 525,196 | | | $ | 440,406 | | | $ | 64,088 | | | $ | 61,866 | |
| | | | | | | | | | | | | | | | | | | | | | | | | | | | | | | |
| | | | | | | | | | | | | | | | | | | | | | | | | | | | | | |
| | | | | | | | | | | | | | | | | | | | | | | | | | | | | | |
| | 12,360 | | | | 10,581 | | | | 2,220 | | | | 5,183 | | | | 67,422 | | | | 71,958 | | | | 5,824 | | | | 5,723 | |
| | 9,072 | | | | 3,084 | | | | 315 | | | | 592 | | | | 31,897 | | | | 13,100 | | | | 898 | | | | 426 | |
| | 319 | | | | 387 | | | | 71 | | | | 117 | | | | 3,423 | | | | 3,506 | | | | 209 | | | | 131 | |
| | (8,411 | ) | | | (1,692 | ) | | | (548 | ) | | | (3,672 | ) | | | (21,323 | ) | | | (21,142 | ) | | | (875 | ) | | | (456 | ) |
| | 980 | | | | 1,779 | | | | (162 | ) | | | (2,963 | ) | | | 13,997 | | | | (4,536 | ) | | | 232 | | | | 101 | |
| | 13,340 | | | | 12,360 | | | | 2,058 | | | | 2,220 | | | | 81,419 | | | | 67,422 | | | | 6,056 | | | | 5,824 | |
| | | | | | | | | | | | | | | | | | | | | | | | | | | | | | | |
| | | | | | | | | | | | | | | | | | | | | | | | | | | | | | |
| | 51,092 | | | | 3,446 | | | | 5,547 | | | | 10,549 | | | | — | | | | — | | | | — | | | | — | |
| | 25,730 | | | | 49,299 | | | | 179 | | | | 1,493 | | | | — | | | | — | | | | — | | | | — | |
| | 1,667 | | | | 1,042 | | | | 153 | | | | 311 | | | | — | | | | — | | | | — | | | | — | |
| | (9,344 | ) | | | (2,695 | ) | | | (876 | ) | | | (6,806 | ) | | | — | | | | — | | | | — | | | | — | |
| | 18,053 | | | | 47,646 | | | | (544 | ) | | | (5,002 | ) | | | — | | | | — | | | | — | | | | — | |
| | 69,145 | | | | 51,092 | | | | 5,003 | | | | 5,547 | | | | — | | | | — | | | | — | | | | — | |
| | | | | | | | | | | | | | | | | | | | | | | | | | | | | | | |
| | | | | | | | | | | | | | | | | | | | | | | | | | | | | | |
| | 523,552 | | | | 509,432 | | | | 35,328 | | | | 28,934 | | | | 594,617 | | | | 311,486 | | | | 123,452 | | | | 74,409 | |
| | 327,428 | | | | 175,166 | | | | 43,419 | | | | 106,023 | | | | 522,438 | | | | 349,198 | | | | 122,703 | | | | 74,781 | |
| | 107,573 | | | | 246,113 | | | | 300 | | | | 605 | | | | 5,800 | | | | 3,336 | | | | 987 | | | | 3,421 | |
| | 114,591 | | | | 137,854 | | | | — | | | | 717 | | | | — | | | | 2,021 | | | | 1,036 | | | | 3,565 | |
See notes to financial statements.
Annual Report 125
| | |
Statements of Changes in Net Assets continued | | |
For the periods ended October 31st
Numbers in 000s
| | | | | | | | | | | | | | | | |
| | | Payden Global Low Duration Fund | | Payden Global Fixed Income Fund |
| | | 2020 | | 2019 | | 2020 | | 2019 |
INCREASE (DECREASE) IN NET ASSETS: | | | | | | | | | | | | | | | | |
FROM OPERATIONS: | | | | | | | | | | | | | | | | |
Net investment income | | $ | 1,845 | | | $ | 2,558 | | | $ | 2,334 | | | $ | 2,439 | |
Net realized gains (losses) | | | 217 | | | | (73 | ) | | | 885 | | | | 2,643 | |
Change in net unrealized appreciation/(depreciation) | | | 357 | | | | 1,610 | | | | 2,249 | | | | 6,679 | |
Change in Net Assets Resulting from Operations | | | 2,419 | | | | 4,095 | | | | 5,468 | | | | 11,761 | |
FROM DISTRIBUTIONS TO SHAREHOLDERS: | | | | | | | | | | | | | | | | |
Net investment income and net realized gains from investments: | | | | | | | | | | | | | | | | |
Adviser Class | | | — | | | | — | | | | — | | | | — | |
Investor Class | | | (1,832 | ) | | | (2,542 | ) | | | (4,236 | ) | | | (6,618 | ) |
SI Class | | | — | | | | — | | | | — | | | | — | |
Return of capital: | | | | | | | | | | | | | | | | |
Adviser Class | | | — | | | | — | | | | — | | | | — | |
Investor Class | | | (59 | ) | | | (24 | ) | | | — | | | | — | |
SI Class | | | — | | | | — | | | | — | | | | — | |
Change in Net Assets from Distributions to Shareholders | | | (1,891 | ) | | | (2,566 | ) | | | (4,236 | ) | | | (6,618 | ) |
FROM CAPITAL TRANSACTIONS: | | | | | | | | | | | | | | | | |
Proceeds from fund shares sold: | | | | | | | | | | | | | | | | |
Adviser Class | | | — | | | | — | | | | — | | | | — | |
Investor Class | | | 45,171 | | | | 11,634 | | | | 68,961 | | | | 23,553 | |
SI Class | | | — | | | | — | | | | — | | | | — | |
Reinvestment of distributions: | | | | | | | | | | | | | | | | |
Adviser Class | | | — | | | | — | | | | — | | | | — | |
Investor Class | | | 1,880 | | | | 2,521 | | | | 4,189 | | | | 6,520 | |
SI Class | | | — | | | | — | | | | — | | | | — | |
Cost of fund shares redeemed: | | | | | | | | | | | | | | | | |
Adviser Class | | | — | | | | — | | | | — | | | | — | |
Investor Class | | | (42,296 | ) | | | (18,393 | ) | | | (32,695 | ) | | | (25,832 | ) |
SI Class | | | — | | | | — | | | | — | | | | — | |
Change in Net Assets from Capital Transactions | | | 4,755 | | | | (4,238 | ) | | | 40,455 | | | | 4,241 | |
Total Change in Net Assets | | | 5,283 | | | | (2,709 | ) | | | 41,687 | | | | 9,384 | |
NET ASSETS: | | | | | | | | | | | | | | | | |
Beginning of period | | | 91,028 | | | | 93,737 | | | | 138,387 | | | | 129,003 | |
End of period | | $ | 96,311 | | | $ | 91,028 | | | $ | 180,074 | | | $ | 138,387 | |
| | | | | | | | | | | | | | | | |
FUND SHARES OF BENEFICIAL INTEREST: | | | | | | | | | | | | | | | | |
Adviser Class: | | | | | | | | | | | | | | | | |
Outstanding shares at beginning of period | | | — | | | | — | | | | — | | | | — | |
Shares sold | | | — | | | | — | | | | — | | | | — | |
Shares issued in reinvestment of distributions | | | — | | | | — | | | | — | | | | — | |
Shares redeemed | | | — | | | | — | | | | — | | | | — | |
Change in shares outstanding | | | — | | | | — | | | | — | | | | — | |
Outstanding shares at end of period | | | — | | | | — | | | | — | | | | — | |
| | | | | | | | | | | | | | | | |
Investor Class: | | | | | | | | | | | | | | | | |
Outstanding shares at beginning of period | | | 9,069 | | | | 9,496 | | | | 14,973 | | | | 14,517 | |
Shares sold | | | 4,529 | | | | 1,166 | | | | 7,475 | | | | 2,607 | |
Shares issued in reinvestment of distributions | | | 188 | | | | 253 | | | | 458 | | | | 745 | |
Shares redeemed | | | (4,252 | ) | | | (1,846 | ) | | | (3,600 | ) | | | (2,896 | ) |
Change in shares outstanding | | | 465 | | | | (427 | ) | | | 4,333 | | | | 456 | |
Outstanding shares at end of period | | | 9,534 | | | | 9,069 | | | | 19,306 | | | | 14,973 | |
| | | | | | | | | | | | | | | | |
SI Class: | | | | | | | | | | | | | | | | |
Outstanding shares at beginning of period | | | — | | | | — | | | | — | | | | — | |
Shares sold | | | — | | | | — | | | | — | | | | — | |
Shares issued in reinvestment of distributions | | | — | | | | — | | | | — | | | | — | |
Shares redeemed | | | — | | | | — | | | | — | | | | — | |
Change in shares outstanding | | | — | | | | — | | | | — | | | | — | |
Outstanding shares at end of period | | | — | | | | — | | | | — | | | | — | |
| | | | | | | | | | | | | | | | |
LONG TERM INVESTMENT ACTIVITY: | | | | | | | | | | | | | | | | |
Purchase of investments (excluding government) | | | 65,144 | | | | 35,415 | | | | 120,482 | | | | 79,017 | |
Sale of investments (excluding government) | | | 63,540 | | | | 39,366 | | | | 96,146 | | | | 83,594 | |
Purchase of government securities | | | 127,621 | | | | 59,955 | | | | 40,215 | | | | 15,888 | |
Sale of government securities | | | 118,182 | | | | 65,851 | | | | 40,478 | | | | 7,299 | |
See notes to financial statements.
126 Payden Mutual Funds
| | | | | | | | | | | | | | | | | | | | | | | | | | | | | | |
| | | |
Payden Emerging Markets
Bond Fund | | Payden Emerging Markets
Local Bond Fund | | Payden Emerging Markets
Corporate Bond Fund | | Payden Equity
Income Fund |
| 2020 | | 2019 | | 2020 | | 2019 | | 2020 | | 2019 | | 2020 | | 2019 |
| | | | | | | |
| | | | | | | | | | | | | | | | | | | | | | | | | | | | | | |
| | | | | | | | | | | | | | | | | | | | | | | | | | | | | | |
| $ | 52,194 | | | $ | 61,806 | | | $ | 8,573 | | | $ | 12,256 | | | $ | 1,820 | | | $ | 2,141 | | | $ | 30,207 | | | $ | 30,980 | |
| | (10,258 | ) | | | (27,198 | ) | | | (21,695 | ) | | | (9,099 | ) | | | 91 | | | | 96 | | | | (4,827 | ) | | | 42,383 | |
| | (40,355 | ) | | | 102,589 | | | | (4,731 | ) | | | 27,242 | | | | (75 | ) | | | 1,662 | | | | (129,009 | ) | | | 113,907 | |
| | 1,581 | | | | 137,197 | | | | (17,853 | ) | | | 30,399 | | | | 1,836 | | | | 3,899 | | | | (103,629 | ) | | | 187,270 | |
| | | | | | | |
| | (2,835 | ) | | | (3,619 | ) | | | — | | | | — | | | | — | | | | — | | | | (737 | ) | | | (388 | ) |
| | (16,160 | ) | | | (23,428 | ) | | | — | | | | (5,008 | ) | | | (152 | ) | | | (201 | ) | | | (25,072 | ) | | | (14,582 | ) |
| | (31,855 | ) | | | (34,617 | ) | | | — | | | | — | | | | (1,575 | ) | | | (1,936 | ) | | | (42,324 | ) | | | (21,989 | ) |
| | | | | | | | | | | | | | | | | | | | | | | | | | | | | | |
| | — | | | | — | | | | — | | | | — | | | | — | | | | — | | | | (26 | ) | | | — | |
| | — | | | | — | | | | (8,579 | ) | | | (7,295 | ) | | | (8 | ) | | | — | | | | (884 | ) | | | — | |
| | — | | | | — | | | | — | | | | — | | | | (79 | ) | | | — | | | | (1,492 | ) | | | — | |
| | (50,850 | ) | | | (61,664 | ) | | | (8,579 | ) | | | (12,303 | ) | | | (1,814 | ) | | | (2,137 | ) | | | (70,535 | ) | | | (36,959 | ) |
| | | | | | | | | | | | | | | | | | | | | | | | | | | | | | |
| | | | | | | |
| | | | | | | | | | | | | | | | | | | | | | | | | | | | | | |
| | 14,201 | | | | 10,268 | | | | — | | | | — | | | | — | | | | — | | | | 6,231 | | | | 7,320 | |
| | 129,084 | | | | 173,155 | | | | 8,840 | | | | 43,549 | | | | 75 | | | | 526 | | | | 108,313 | | | | 78,714 | |
| | 238,366 | | | | 306,044 | | | | — | | | | — | | | | 15,287 | | | | 900 | | | | 252,772 | | | | 74,819 | |
| | | | | | | | | | | | | | | | | | | | | | | | | | | | | | |
| | 2,778 | | | | 3,574 | | | | — | | | | — | | | | — | | | | — | | | | 748 | | | | 381 | |
| | 13,754 | | | | 20,123 | | | | 7,525 | | | | 9,838 | | | | 160 | | | | 201 | | | | 24,305 | | | | 13,592 | |
| | 29,860 | | | | 34,514 | | | | — | | | | — | | | | 1,534 | | | | 1,758 | | | | 38,047 | | | | 18,966 | |
| | | | | | | | | | | | | | | | | | | | | | | | | | | | | | |
| | (28,311 | ) | | | (33,102 | ) | | | — | | | | — | | | | — | | | | — | | | | (7,393 | ) | | | (6,998 | ) |
| | (239,834 | ) | | | (215,052 | ) | | | (78,089 | ) | | | (59,093 | ) | | | (77 | ) | | | (1,428 | ) | | | (157,248 | ) | | | (57,584 | ) |
| | (173,797 | ) | | | (595,391 | ) | | | — | | | | — | | | | (14,318 | ) | | | (8,634 | ) | | | (74,071 | ) | | | (76,443 | ) |
| | (13,899 | ) | | | (295,867 | ) | | | (61,724 | ) | | | (5,706 | ) | | | 2,661 | | | | (6,677 | ) | | | 191,704 | | | | 52,767 | |
| | (63,168 | ) | | | (220,334 | ) | | | (88,156 | ) | | | 12,390 | | | | 2,683 | | | | (4,915 | ) | | | 17,540 | | | | 203,078 | |
| | | | | | | |
| | 1,058,610 | | | | 1,278,944 | | | | 216,368 | | | | 203,978 | | | | 40,506 | | | | 45,421 | | | | 1,395,910 | | | | 1,192,832 | |
| $ | 995,442 | | | $ | 1,058,610 | | | $ | 128,212 | | | $ | 216,368 | | | $ | 43,189 | | | $ | 40,506 | | | $ | 1,413,450 | | | $ | 1,395,910 | |
| | | | | | | | | | | | | | | | | | | | | | | | | | | | | | | |
| | | | | | | |
| | 4,937 | | | | 6,461 | | | | — | | | | — | | | | — | | | | — | | | | 885 | | | | 839 | |
| | 1,071 | | | | 761 | | | | — | | | | — | | | | — | | | | — | | | | 373 | | | | 429 | |
| | 214 | | | | 271 | | | | — | | | | — | | | | — | | | | — | | | | 43 | | | | 24 | |
| | (2,199 | ) | | | (2,556 | ) | | | — | | | | — | | | | — | | | | — | | | | (456 | ) | | | (407 | ) |
| | (914 | ) | | | (1,524 | ) | | | — | | | | — | | | | — | | | | — | | | | (40 | ) | | | 46 | |
| | 4,023 | | | | 4,937 | | | | — | | | | — | | | | — | | | | — | | | | 845 | | | | 885 | |
| | | | | | | | | | | | | | | | | | | | | | | | | | | | | | | |
| | | | | | | |
| | 30,158 | | | | 31,896 | | | | 33,265 | | | | 34,161 | | | | 368 | | | | 439 | | | | 31,449 | | | | 29,385 | |
| | 9,756 | | | | 13,131 | | | | 1,436 | | | | 6,944 | | | | 8 | | | | 55 | | | | 6,797 | | | | 4,667 | |
| | 1,053 | | | | 1,523 | | | | 1,252 | | | | 1,560 | | | | 17 | | | | 20 | | | | 1,399 | | | | 835 | |
| | (19,218 | ) | | | (16,392 | ) | | | (14,006 | ) | | | (9,400 | ) | | | (8 | ) | | | (146 | ) | | | (9,364 | ) | | | (3,438 | ) |
| | (8,409 | ) | | | (1,738 | ) | | | (11,318 | ) | | | (896 | ) | | | 17 | | | | (71 | ) | | | (1,168 | ) | | | 2,064 | |
| | 21,749 | | | | 30,158 | | | | 21,947 | | | | 33,265 | | | | 385 | | | | 368 | | | | 30,281 | | | | 31,449 | |
| | | | | | | | | | | | | | | | | | | | | | | | | | | | | | | |
| | | | | | | |
| | 42,924 | | | | 62,550 | | | | — | | | | — | | | | 3,680 | | | | 4,291 | | | | 44,568 | | | | 43,382 | |
| | 19,072 | | | | 23,988 | | | | — | | | | — | | | | 1,519 | | | | 92 | | | | 15,025 | | | | 4,450 | |
| | 2,308 | | | | 2,628 | | | | — | | | | — | | | | 156 | | | | 180 | | | | 2,203 | | | | 1,163 | |
| | (13,373 | ) | | | (46,242 | ) | | | — | | | | — | | | | (1,426 | ) | | | (883 | ) | | | (4,462 | ) | | | (4,427 | ) |
| | 8,007 | | | | (19,626 | ) | | | — | | | | — | | | | 249 | | | | (611 | ) | | | 12,766 | | | | 1,186 | |
| | 50,931 | | | | 42,924 | | | | — | | | | — | | | | 3,929 | | | | 3,680 | | | | 57,334 | | | | 44,568 | |
| | | | | | | | | | | | | | | | | | | | | | | | | | | | | | | |
| | | | | | | |
| | 799,264 | | | | 768,598 | | | | 87,107 | | | | 126,685 | | | | 43,421 | | | | 37,503 | | | | 961,458 | | | | 662,247 | |
| | 783,937 | | | | 802,994 | | | | 145,584 | | | | 127,466 | | | | 41,313 | | | | 41,833 | | | | 842,974 | | | | 620,968 | |
| | — | | | | — | | | | — | | | | — | | | | 528 | | | | 215 | | | | — | | | | — | |
| | — | | | | — | | | | — | | | | — | | | | 332 | | | | — | | | | — | | | | — | |
See notes to financial statements.
Annual Report 127
| | |
Notes to Financial Statements | | |
October 31, 2020
1. Organization and Related Matters
The Payden & Rygel Investment Group (the “Group” or “Paydenfunds”) is a no-load, open-end registered investment company organized as a Massachusetts business trust on January 22, 1992 and registered under the Investment Company Act of 1940 (the “1940 Act”), as amended. Each of its nineteen funds (each a “Fund,” collectively the “Funds”) is a series of the Group, and is authorized to issue unlimited shares at $0.001 par value. The California Municipal Income Fund changed its name to the California Municipal Social Impact Fund. Each of the Funds, other than the Emerging Markets Local Bond Fund, has been classified as diversified.
2. Significant Accounting Policies
The following is a summary of significant accounting policies followed by the Funds.
The Financial Accounting Standards Board (“FASB”) Accounting Standards Codification (“ASC”) is the exclusive reference of authoritative U.S. generally accepted accounting principles (“GAAP”) recognized by the FASB to be applied by nongovernmental entities. Rules and interpretive releases of the Securities and Exchange Commission (“SEC”) under authority of federal laws are also sources of authoritative GAAP for SEC registrants. Each Fund’s financial statements are prepared in accordance with GAAP.
The Funds are considered investment companies under FASB ASC 946, Financial Services - Investment Companies.
The preparation of financial statements in conformity with GAAP requires management to make estimates and assumptions that affect the reported amounts of assets and liabilities and disclosure of contingent assets and liabilities at the date of the financial statements and the reported amounts of income and expenses during the reporting period. Actual results could differ from those estimates.
Securities Valuation
Domestic and foreign fixed income securities and other assets for which market quotations are readily available (other than obligations with original maturities of sixty days or less) are valued on the basis of quotes obtained from brokers and dealers or pricing services. Such quotations take into account appropriate factors such as institutional-sized trading in similar groups of securities, yield, quality, coupon rate, maturity, type of issue, trading characteristics and other data. Debt securities with original maturities of sixty days or less and securities in the Payden Cash Reserves Money Market Fund are valued at
amortized cost, which approximates fair value. Cash Reserves Money Market Fund qualifies as a government money market fund under the Money Market Fund Reform.
Publicly traded equity securities, whether in the U.S. or outside the U.S., for which market quotations are readily available, generally will be valued at the official closing price or the last sale price on the exchange or market where they are principally traded, or if there have been no sales during the day, at the last bid price. Securities traded only on the over-the-counter (“OTC”) market are valued at the latest bid price. Investments in nonregistered investment companies are valued at their net asset values as reported by such companies.
Options, futures, swaps and other similar instruments are valued at the official closing price, in the case of exchange traded derivatives, or on the basis of information provided by pricing services, quotes obtained from brokers and dealers, and market trades in the case of other securities.
Fixed income or equity securities for which market quotations are not readily available are priced at their fair value as determined in good faith under procedures established pursuant to the Valuation and Liquidity Guidelines applicable to each of the Funds. In considering fair value of a security, one or more factors are taken into consideration depending on the circumstances at the time, including for example: the cost of the security or the last reported sales price of the security as a starting point; changes in interest rates; changes in yield spreads of similarly rated or structured securities; fundamental analytical information relating to the security; the value of other similar securities traded on other markets or among dealers; the general financial condition of the issuer; recent developments affecting the issuer; information, including price quotations, from other financial institutions or analysts; or government actions or pronouncements and other significant events affecting the economy, the markets, the fundamental value of the issuer or of the issuer’s industry.
Shares of open-end investment companies are valued at their respective net asset value.
Fair value pricing adjustments may occur when (1) developments occur (a “significant event”) that will affect the value of a Fund’s holdings, and (2) the significant event occurs after the close of the markets on which the securities trade, but before the time when the net asset value is computed for a Fund. A significant event may relate to a single issuer or an entire market.
128 Payden Mutual Funds
Risks
Unforeseen events in the markets may at times result in an unusually high degree of volatility in the markets, which could adversely affect the Funds causing a decline in value.
Investing in debt securities may include failure of an issuer to make timely interest or principal payments, or a decline or the perception of a decline in credit quality. In addition, the value of the debt security may decline due to general market conditions that are not specifically related to a particular company including industry earnings outlook, changes in interest or currency rates or perception of a specific industry.
Investing in foreign securities may include certain risks and considerations not typically associated with investing in U.S. securities, such as fluctuating currency values and changing local and regional economic, political and social conditions, which may result in greater market volatility. In addition, certain foreign securities may not be as liquid as U.S. securities.
An investment in the Cash Reserves Money Market Fund is not insured or guaranteed by the Federal Deposit Insurance Corporation or any other government agency. Although the Fund seeks to preserve the value of your investment at $1.00 per share and is classified as a government money market fund under the Money Market Fund Reform, it is possible to lose money by investing in the Fund.
Investment Transactions and Related Income
Investment transactions are accounted for on the date the security is purchased or sold (trade date) for financial reporting purposes. Interest income is recognized on an accrual basis. Premiums and discounts are amortized or accreted over the expected life of the security using the effective interest method. Dividend income is recorded on the ex-dividend date. Realized gains or losses on investment transactions are determined on the identified cost basis.
Bank Loans
Floating-Rate Loan Interests (“Bank Loans”) in which the Funds invest generally pay interest at rates which are periodically predetermined by reference to a base lending rate plus a premium. These base lending rates are generally (i) the lending rate offered by one or more major European banks, such as the London Inter-Bank Offered Rate (“LIBOR”), (ii) the prime rate offered by one or more United States banks or (iii) the certificate of deposit rate. Certain Bank Loans are subject to a LIBOR floor that establishes a minimum LIBOR rate. The interest rate shown on the Schedule of Investments reflects the rate in effect at October 31st. When a range of rates is disclosed, the Fund holds more than one position within the same tranche at varying rates.
Bank loans are subject to various restrictive covenants that protect the lender or investor. Loans with fewer or no restrictive covenants, “covenant light” loans, provide the issuer more flexibility and reduce investor protections in the event of a breach, and may cause the fund to experience more difficulty or delay in enforcing its rights. A significant portion of bank loans are “covenant light.”
In connection with floating rate loan interests, the Funds may also enter into unfunded loan commitments (“commitments”). In connection with these commitments, the Funds earn a commitment fee, typically set as a percentage of the commitment amount. Such fee income, which is included in interest income in the Statements of Operations, is recognized ratably over the commitment period. Unfunded floating rate loan interests are marked- to-market daily, and any unrealized appreciation or depreciation is included in the Statements of Assets and Liabilities and Statements of Operations.
Foreign Currency Translation
The accounting records of the Funds are maintained in U.S. dollars. Each of the Funds (except Cash Reserves Money Market, U.S. Government, GNMA and California Municipal Social Impact Funds) may purchase securities that are denominated in foreign currencies. Investment securities and other assets and liabilities denominated in a foreign currency are translated into U.S. dollars at the current exchange rates. Purchases and sales of securities, income and expenses are translated into U.S. dollars at the exchange rates on the dates of the respective transactions. Each of these Funds does not isolate that portion of the results of operations resulting from changes in foreign exchange rates from the fluctuations arising from changes in security prices.
Reported net realized foreign exchange gains or losses arise from purchases and sales of foreign currencies, currency gains or losses realized between the trade and settlement dates of securities transactions, and the differences between the amounts of income or expenses recorded on each of these Fund’s books and the U.S. dollar equivalents of the amounts actually received or paid. Net unrealized appreciation/depreciation from translation of assets and liabilities denominated in foreign currency arise from changes in the value of assets and liabilities resulting from changes in the foreign exchange rates.
Annual Report 129
| | |
Notes to Financial Statements continued | | |
Repurchase Agreements
The Cash Reserves Money Market Fund entered into repurchase agreements (agreements to purchase U.S. Treasury notes and bills, subject to the seller’s agreement to repurchase them at a specified time and price) with well-established registered securities dealers or banks. Repurchase agreements are the equivalent of loans by the Fund. With respect to such agreements, it is the Fund’s policy to take possession of the underlying securities, except for tri-party agreements where an independent custodian takes possession. On a daily basis the Fund or the tri-party custodian mark-to-market such securities to ensure that the value, including accrued interest, is at least equal to the amount to be repaid to the Fund under the agreement. If the seller defaults, and the fair value of the collateral declines, realization of the collateral by the Fund may be delayed or limited.
Master Repurchase Agreements (“MRA”) permit the Fund, under certain circumstances, including an event of default (such as bankruptcy or insolvency), to offset payables and/or receivables under the MRA with collateral held and/or posted to the counterparty and create one single net payment due to or from the Fund. However, bankruptcy or insolvency laws of a particular jurisdiction may impose restrictions on or prohibitions against such a right of offset in the event of the MRA counterparty’s bankruptcy or insolvency. Pursuant to the terms of the MRA, the Fund receives or posts securities as collateral with a market value in excess of the repurchase price to be paid or received by the Fund upon the maturity of the transaction. Upon a bankruptcy or insolvency of the MRA counterparty, the Fund is considered an unsecured creditor with respect to excess collateral and, as such, the return of excess collateral may be delayed.
The Cash Reserves Money Market Fund’s repurchase agreements by counterparty, which are subject to offset under a MRA, is included within the Fund’s Schedule of Investments. For financial statement purposes, the Fund does not offset financial assets and financial liabilities, that are subject to MRA on the Statements of Assets and Liabilities.
Forward Currency Contracts
Some Funds entered into forward currency contracts to protect against adverse currency movements or as speculative investments. The forward currency contracts are adjusted by the daily exchange rate of the underlying currency and any gains or losses are recorded for financial statement purposes as unrealized gain or loss until the contact settlement date or an offsetting forward currency contract has been executed, at which time the Fund records a realized gain or loss equal to the difference
between the value of the contract at the time it was opened and the value at the time it was closed. Risk may arise upon entering into these contracts from the potential inability of counterparties to meet the terms of their contracts and from unanticipated movements in the value of a foreign currency relative to the U.S. dollar.
Futures Contracts
Some Funds entered into futures transactions to enhance potential gain in circumstances where hedging is not involved.
The purchase or sale of futures contracts and options on futures contracts provides for the future sale by one party and purchase by another party of a specified quantity of a financial instrument or foreign currency at a fixed price on a future date. Upon entering into such a contract, a Fund is required to deposit and maintain initial margin deposit of cash or securities as required by the exchange on which the contract is traded.
Pursuant to the contract, that Fund agrees to receive from or pay to the broker an amount equal to the daily fluctuations in the value of the contract. Such receipts or payments are known as variation margin and are recorded as unrealized gains or losses by that Fund. When the contract is closed, that Fund records a realized gain or loss equal to the difference between the value of the contract at the time it was opened and the value at the time it was closed. The potential risk to the Funds is that the change in value of the underlying securities may not correlate to the change in value of the contracts.
Stock index futures contracts are an agreement pursuant to which two parties agree to take or make delivery of an amount of cash equal to the difference between the value of the index at the close of the last trading day of the contract and the price at which the index contract was originally written. Variation margin accounting procedures apply to these index futures contracts. Each Fund invests in these futures contracts to permit the Fund to meet its objectives at a lower cost than investing directly in equity securities, while permitting the equivalent of an investment in a portfolio of equity securities. The potential risk to a Fund is that the change in value of the underlying index may not correlate to the change in value of the contracts.
Swap Contracts
Some Funds may enter into swap agreements, in which a Fund and a counterparty agree either to make periodic net payments on a specified notional amount or a net payment upon termination. Swap agreements are privately negotiated in the OTC market and may be entered into as a bilateral contract
130 Payden Mutual Funds
(“OTC swaps”) or centrally cleared (“centrally cleared swaps”). Swaps are marked-to-market daily and changes in value are recorded as unrealized appreciation (depreciation) and realized gain/(loss) is recorded at termination of the contract.
Upon entering into a centrally cleared swap, a Fund is required to deposit and maintain initial margin deposit of cash or securities as required by the exchange on which the contract is traded. Pursuant to the centrally cleared swap, that Fund agrees to receive from or pay to the broker an amount equal to the daily fluctuations in the value of the contract. Such receipts or payments are known as variation margin and are recorded as unrealized gains or losses by that Fund. When the contract is closed, that Fund records a realized gain or loss equal to the difference between the value of the contract at the time it was opened and the value at the time it was closed.
Swap transactions involve, to varying degrees, elements of interest rate, credit and market risk in excess of the amounts recognized in the Statements of Assets and Liabilities. Such risks involve the possibility that there will be no liquid market for these agreements, that the counterparty to the agreements may default on its obligation to perform or disagree as to the meaning of the contractual terms in the agreements, and that there may be unfavorable changes in interest rates, credit spreads and/or market values associated with these transactions.
A Fund may enter into credit default swaps to manage its exposure to the market or certain sectors of the market, to reduce its risk exposure to defaults of corporate and/or sovereign issuers or to create exposure to corporate and/or sovereign issuers to which it is not otherwise exposed (credit risk). A Fund may either buy or sell (write) credit default swaps on single-name issuers (corporate or sovereign), a combination or basket of single-name issuers or traded indexes. Credit default swaps on single-name issuers are agreements in which the protection buyer pays fixed periodic payments to the seller in consideration for a guarantee from the protection seller to make a specific payment should a negative credit event take place with respect to the referenced entity (e.g., bankruptcy, failure to pay, obligation accelerators, repudiation, moratorium or restructuring). Credit default swaps on traded indexes are agreements in which the buyer pays fixed periodic payments to the seller in consideration for a guarantee from the seller to make a specific payment should a write-down, principal or interest shortfall or default of all or individual underlying securities included in the index occur. As a buyer, if an underlying credit event occurs, the Fund will either (i) receive from the seller an amount equal to the notional amount of the swap and deliver the referenced security or underlying securities comprising the index, or (ii) receive a net settlement of cash
equal to the notional amount of the swap less the recovery value of the security or underlying securities comprising the index. As a seller (writer), if an underlying credit event occurs, the Fund will either pay the buyer an amount equal to the notional amount of the swap and take delivery of the referenced security or underlying securities comprising the index or pay a net settlement of cash equal to the notional amount of the swap less the recovery value of the security or underlying securities comprising the index.
A Fund may enter into total return swaps to obtain exposure to a security or market without owning such security or investing directly in that market or to transfer the risk/return of one market (e.g., fixed income) to another market (e.g., equity) (equity risk and/or interest rate risk). Total return swaps are agreements in which there is an exchange of cash flows whereby one party commits to make payments based on the total return (coupons plus capital gains/losses) of an underlying instrument in exchange for fixed or floating rate interest payments. To the extent the total return of the instrument or index underlying the transaction exceeds or falls short of the offsetting interest rate obligation, the Fund will receive a payment from or make a payment to the counterparty.
A Fund may enter into interest rate swaps to gain or reduce exposure to interest rates or to manage duration, the yield curve or interest rate risk by economically hedging the value of the fixed rate bonds which may decrease when interest rates rise (interest rate risk). Interest rate swaps are agreements in which one party pays a stream of interest payments, either fixed or floating rate, for another party’s stream of interest payments, either fixed or floating, on the same notional amount for a specified period of time. In more complex swaps, the notional principal amount may decline (or amortize) over time.
For financial reporting purposes, swap interest and amortization are classified as realized or unrealized gain or loss on swap contracts.
Options Transactions
Option techniques may be utilized by a Fund to hedge against changes in interest rates, foreign currency exchange rates or security prices in order to establish more definitely the effective return on securities or currencies held or intended to be acquired by the Fund, to reduce the volatility of the currency exposure associated with investment in non-U.S. securities, or as an efficient means of adjusting exposure to the bond, equity and currency markets. In addition, the Fund may enter into such transactions to enhance potential gain in circumstances where hedging is not involved. When a Fund writes a covered
Annual Report 131
| | |
Notes to Financial Statements continued | | |
call or put option, an amount equal to the premium received is reflected as an asset and equivalent liability. The amount of the liability is subsequently marked-to-market to reflect the current value of the option. If an option expires on its stipulated expiration date or if the Fund enters into a closing purchase transaction, a gain or loss is realized. If a written call option is exercised, a gain or loss is realized for the sale of the underlying security and the proceeds from the sale are increased by the premium originally received. If a written put option is exercised, the cost of the security acquired is decreased by the premium originally received. As writer of an option, the Fund has no control over whether the underlying securities are subsequently sold (call) or purchased (put) and, as a result, bears the market risk of an unfavorable change in the price of the security underlying the written option.
When the Fund purchases a call or put option, an amount equal to the premium paid is included in the Fund’s Statements of Assets and Liabilities as an investment, and is subsequently marked-to-market to reflect the current value of the option. If an option expires on the stipulated expiration date or if a Fund enters into a closing sale transaction, a gain or loss is realized. If the Fund exercises a call option, the cost of the security acquired is increased by the premium paid for the call. If the Fund exercises a put option, a gain or loss is realized from the sale of the underlying security, and the proceeds from such sale are decreased by the premium originally paid. Written and purchased options are non-income producing securities.
Derivative Financial Instruments
The Funds engage in various portfolio investment strategies using derivative contracts both to increase the returns of the Fund and/or to economically hedge its exposure to certain risks such as credit risk, equity risk, interest rate risk and foreign currency exchange rate risk. These contracts may be transacted on an exchange or OTC.
The following tables show the Funds’ exposure to different types of market risks as it relates to derivative investments in the Statements of Assets and Liabilities and the Statements of Operations.
Statements of Assets and Liabilities
Fair Values of Derivative Instruments as of October 31, 2020 (000s)
| | | | | | | | |
Underlying Risk | | Derivative
Assets ($) | | | Derivative
Liabilities ($) | |
Limited Maturity | | | | | | | | |
Interest rate1 | | | 32 | | | | — | |
Foreign currency2,3 | | | 301 | | | | (58 | ) |
| | | | | | | | |
Total | | | 333 | | | | (58 | ) |
| | | | | | | | |
Low Duration | | | | | | | | |
Interest rate1 | | | 1,067 | | | | (57 | ) |
Foreign currency2,3 | | | 82 | | | | (36 | ) |
| | | | | | | | |
Total | | | 1,149 | | | | (93 | ) |
| | | | | | | | |
Core Bond | | | | | | | | |
Credit1 | | | 92 | | | | — | |
Interest rate1 | | | 931 | | | | (1,238 | ) |
Foreign currency2,3 | | | 755 | | | | (20 | ) |
| | | | | | | | |
Total | | | 1,778 | | | | (1,258 | ) |
| | | | | | | | |
Corporate Bond | | | | | | | | |
Credit1 | | | — | | | | (907 | ) |
Interest rate1 | | | 296 | | | | (502 | ) |
| | | | | | | | |
Total | | | 296 | | | | (1,409 | ) |
| | | | | | | | |
Strategic Income | | | | | | | | |
Credit1 | | | 6 | | | | — | |
Interest rate1 | | | 20 | | | | (9 | ) |
Foreign currency2,3 | | | 167 | | | | (5 | ) |
| | | | | | | | |
Total | | | 193 | | | | (14 | ) |
| | | | | | | | |
Absolute Return Bond | | | | | | | | |
Credit1 | | | 14 | | | | — | |
Interest rate1 | | | 1,154 | | | | (183 | ) |
Foreign currency2,3 | | | 1,263 | | | | (8 | ) |
| | | | | | | | |
Total | | | 2,431 | | | | (191 | ) |
| | | | | | | | |
High Income | | | | | | | | |
Interest rate1 | | | 1,211 | | | | (70 | ) |
Foreign currency2,3 | | | 134 | | | | (6 | ) |
| | | | | | | | |
Total | | | 1,345 | | | | (76 | ) |
| | | | | | | | |
Global Low Duration | | | | | | | | |
Interest rate1 | | | 80 | | | | (5 | ) |
Foreign currency2,3 | | | 93 | | | | (9 | ) |
| | | | | | | | |
Total | | | 173 | | | | (14 | ) |
| | | | | | | | |
Global Fixed Income | | | | | | | | |
Interest rate1 | | | 249 | | | | (272 | ) |
Foreign currency2,3 | | | 519 | | | | (345 | ) |
| | | | | | | | |
Total | | | 768 | | | | (617 | ) |
| | | | | | | | |
Emerging Markets Bond | | | | | | | | |
Credit1 | | | — | | | | (535 | ) |
Equity4 | | | 351 | | | | — | |
Foreign currency2,3 | | | 2,859 | | | | (1,647 | ) |
| | | | | | | | |
Total | | | 3,210 | | | | (2,182 | ) |
| | | | | | | | |
Emerging Markets Local Bond | | | | | | | | |
Equity4 | | | 44 | | | | — | |
Interest rate1 | | | — | | | | (13 | ) |
Foreign currency2,3 | | | 573 | | | | (1,218 | ) |
| | | | | | | | |
Total | | | 617 | | | | (1,231 | ) |
| | | | | | | | |
132 Payden Mutual Funds
| | | | | | | | |
Underlying Risk | | Derivative
Assets ($) | | | Derivative
Liabilities ($) | |
Emerging Markets Corporate Bond | | | | | | | | |
Credit1 | | | — | | | | (16 | ) |
Equity4 | | | 15 | | | | — | |
Interest rate1 | | | 4 | | | | — | |
Foreign currency2,3 | | | 16 | | | | (42 | ) |
| | | | | | | | |
Total | | | 35 | | | | (58 | ) |
| | | | | | | | |
Equity Income | | | | | | | | |
Foreign currency2,3 | | | 633 | | | | (165 | ) |
| | | | | | | | |
Statement of Assets and Liabilities location:
| 1 | Includes cumulative appreciation/depreciation of futures contracts and centrally cleared swaps as reported in Schedule of Investments. Only current day’s variation margin is reported within the Statements of Assets and Liabilities as Receivable/Payable for futures and variation margin on centrally cleared swaps. |
| 2 | Receivable for forward currency contracts. |
| 3 | Payable for forward currency contracts. |
| 4 | Includes options purchased at fair value as reported in the Schedule of Investments. |
The Effect of Derivative Instruments on the Statements of Operations
For the Period Ended October 31, 2020 (000s)
| | | | | | | | | | | | | | | | | | | | |
Amount of Net Realized Gain or (Loss) on Derivatives Recognized in Income | |
Underlying risk | | Futures1 | | | Forward
Currency
Contracts2 | | | Options3 | | | Swaps4 | | | Total | |
Limited Maturity | | | | | | | | | | | | | |
Interest rate | | $ | (57 | ) | | | — | | | | — | | | | — | | | $ | (57 | ) |
Foreign exchange | | | — | | | $ | 912 | | | | — | | | | — | | | | 912 | |
| | | | | | | | | | | | | | | | | | | | |
Total | | | (57 | ) | | | 912 | | | | — | | | | — | | | | 855 | |
| | | | | | | | | | | | | | | | | | | | |
Low Duration | | | | | | | | | | | | | |
Interest rate | | | 2,223 | | | | — | | | | — | | | $ | (8 | ) | | | 2,215 | |
| | | | | | | | | | | | | | | | | | | | |
U.S. Government | | | | | | | | | | | | | |
Interest rate | | | (10 | ) | | | — | | | | — | | | | — | | | | (10 | ) |
| | | | | | | | | | | | | | | | | | | | |
GNMA | | | | | | | | | | | | | |
Interest rate | | | (35 | ) | | | — | | | | — | | | | — | | | | (35 | ) |
| | | | | | | | | | | | | | | | | | | | |
Core Bond | | | | | | | | | | | | | |
Credit | | | — | | | | — | | | | — | | | | (2,932 | ) | | | (2,932 | ) |
Interest rate | | | (939 | ) | | | — | | | $ | (284 | ) | | | — | | | | (1,223 | ) |
Foreign exchange | | | — | | | | (1,783 | ) | | | — | | | | — | | | | (1,783 | ) |
| | | | | | | | | | | | | | | | | | | | |
Total | | | (939 | ) | | | (1,783 | ) | | | (284 | ) | | | (2,932 | ) | | | (5,938 | ) |
| | | | | | | | | | | | | | | | | | | | |
Corporate Bond | | | | | | | | | | | | | |
Credit | | | — | | | | — | | | | — | | | | 1,306 | | | | 1,306 | |
Interest rate | | | (1,867 | ) | | | — | | | | — | | | | — | | | | (1,867 | ) |
| | | | | | | | | | | | | | | | | | | | |
Total | | | (1,867 | ) | | | — | | | | — | | | | 1,306 | | | | (561 | ) |
| | | | | | | | | | | | | | | | | | | | |
Strategic Income | | | | | | | | | | | | | |
Credit | | | — | | | | — | | | | — | | | | (240 | ) | | | (240 | ) |
Interest rate | | | 73 | | | | — | | | | (45 | ) | | | — | | | | 28 | |
Foreign exchange | | | — | | | | (599 | ) | | | — | | | | — | | | | (599 | ) |
| | | | | | | | | | | | | | | | | | | | |
Total | | | 73 | | | | (599 | ) | | | (45 | ) | | | (240 | ) | | | (811 | ) |
| | | | | | | | | | | | | | | | | | | | |
| | | | | | | | | | | | | | | | | | | | |
Amount of Net Realized Gain or (Loss) on Derivatives Recognized in Income | |
Underlying risk | | Futures1 | | | Forward
Currency
Contracts2 | | | Options3 | | | Swaps4 | | | Total | |
Absolute Return Bond | | | | | | | | | | | | | |
Credit | | | — | | | | — | | | | — | | | $ | (3,050 | ) | | $ | (3,050 | ) |
Equity | | | — | | | | — | | | $ | 168 | | | | — | | | | 168 | |
Interest rate | | $ | 1,887 | | | | — | | | | — | | | | 37 | | | | 1,924 | |
Foreign exchange | | | — | | | $ | (2,488 | ) | | | — | | | | — | | | | (2,488 | ) |
| | | | | | | | | | | | | | | | | | | | |
Total | | | 1,887 | | | | (2,488 | ) | | | 168 | | | | (3,013 | ) | | | (3,446 | ) |
| | | | | | | | | | | | | | | | | | | | |
High Income | | | | | | | | | | | | | |
Credit | | | — | | | | — | | | �� | — | | | | 5 | | | | 5 | |
Interest rate | | | — | | | | — | | | | — | | | | (39 | ) | | | (39 | ) |
Foreign exchange | | | — | | | | (442 | ) | | | — | | | | — | | | | (442 | ) |
| | | | | | | | | | | | | | | | | | | | |
Total | | | — | | | | (442 | ) | | | — | | | | (34 | ) | | | (476 | ) |
| | | | | | | | | | | | | | | | | | | | |
California Municipal Social Impact | | | | | | | | | | | | | |
Interest rate | | | (6 | ) | | | — | | | | — | | | | — | | | | (6 | ) |
| | | | | | | | | | | | | | | | | | | | |
Global Low Duration | | | | | | | | | | | | | |
Interest rate | | | (3 | ) | | | — | | | | (26 | ) | | | — | | | | (29 | ) |
Foreign exchange | | | — | | | | (390 | ) | | | — | | | | — | | | | (390 | ) |
| | | | | | | | | | | | | | | | | | | | |
Total | | | (3 | ) | | | (390 | ) | | | (26 | ) | | | — | | | | (419 | ) |
| | | | | | | | | | | | | | | | | | | | |
Global Fixed Income | | | | | | | | | | | | | |
Credit | | | — | | | | — | | | | — | | | | (242 | ) | | | (242 | ) |
Interest rate | | | (38 | ) | | | — | | | | (36 | ) | | | 21 | | | | (53 | ) |
Foreign exchange | | | — | | | | (384 | ) | | | — | | | | — | | | | (384 | ) |
| | | | | | | | | | | | | | | | | | | | |
Total | | | (38 | ) | | | (384 | ) | | | (36 | ) | | | (221 | ) | | | (679 | ) |
| | | | | | | | | | | | | | | | | | | | |
Emerging Markets Bond | | | | | | | | | | | | | |
Credit | | | — | | | | — | | | | — | | | | 6,499 | | | | 6,499 | |
Interest rate | | | — | | | | — | | | | — | | | | 1,023 | | | | 1,023 | |
Foreign exchange | | | — | | | | 2,077 | | | | — | | | | — | | | | 2,077 | |
| | | | | | | | | | | | | | | | | | | | |
Total | | | — | | | | 2,077 | | | | — | | | | 7,522 | | | | 9,599 | |
| | | | | | | | | | | | | | | | | | | | |
Emerging Markets Local Bond | | | | | | | | | | | | | |
Interest rate | | | — | | | | — | | | | — | | | | 181 | | | | 181 | |
Foreign exchange | | | — | | | | (1,012 | ) | | | — | | | | — | | | | (1,012 | ) |
| | | | | | | | | | | | | | | | | | | | |
Total | | | — | | | | (1,012 | ) | | | — | | | | 181 | | | | (831 | ) |
| | | | | | | | | | | | | | | | | | | | |
Emerging Markets Corporate Bond | | | | | | | | | | | | | |
Credit | | | — | | | | — | | | | — | | | | (82 | ) | | | (82 | ) |
Interest rate | | | (37 | ) | | | — | | | | — | | | | 63 | | | | 26 | |
Foreign exchange | | | — | | | | 67 | | | | — | | | | — | | | | 67 | |
| | | | | | | | | | | | | | | | | | | | |
Total | | | (37 | ) | | | 67 | | | | — | | | | (19 | ) | | | 11 | |
| | | | | | | | | | | | | | | | | | | | |
Equity Income | | | | | | | | | | | | | |
Foreign exchange | | | — | | | | (2,165 | ) | | | — | | | | — | | | | (2,165 | ) |
| | | | | | | | | | | | | | | | | | | | |
| 1 | Net realized gains (losses) from futures contracts. |
| 2 | Net realized gains (losses) from forward foreign exchange contracts. |
| 3 | Net realized gains (losses) from written option contracts and purchased options which are included in net realized gain on investments. |
| 4 | Net realized gains (losses) from swap contracts. |
Annual Report 133
| | |
Notes to Financial Statements continued | | |
The Effect of Derivative Instruments on the Statements of Operations
For the Period Ended October 31, 2020 (000s)
| | | | | | | | | | | | | | | | | | | | |
Net Change in Unrealized Appreciation or (Depreciation)
on Derivatives Recognized in Income | |
Underlying risk | | Futures5 | | | Forward
Currency
Contracts6 | | | Options7 | | | Swaps8 | | | Total | |
Limited Maturity | |
Interest rate | | $ | 32 | | | | — | | | | — | | | | — | | | $ | 32 | |
Foreign exchange | | | — | | | $ | 747 | | | | — | | | | — | | | | 747 | |
| | | | | | | | | | | | | | | | | | | | |
Total | | | 32 | | | | 747 | | | | — | | | | — | | | | 779 | |
| | | | | | | | | | | | | | | | | | | | |
Low Duration | | | | | | | | | | | | | | | | | | | | |
Interest rate | | | 404 | | | | — | | | | — | | | $ | 1,043 | | | | 1,447 | |
Foreign exchange | | | — | | | | 46 | | | | — | | | | — | | | | 46 | |
| | | | | | | | | | | | | | | | | | | | |
Total | | | 404 | | | | 46 | | | | — | | | | 1,043 | | | | 1,493 | |
| | | | | | | | | | | | | | | | | | | | |
U.S. Government | | | | | | | | | | | | | | | | | | | | |
Interest rate | | | 6 | | | | — | | | | — | | | | — | | | | 6 | |
| | | | | | | | | | | | | | | | | | | | |
Core Bond | | | | | | | | | | | | | | | | | | | | |
Credit | | | — | | | | — | | | | — | | | | 92 | | | | 92 | |
Interest rate | | | 2 | | | | — | | | $ | 211 | | | | — | | | | 213 | |
Foreign exchange | | | — | | | | 1,388 | | | | — | | | | — | | | | 1,388 | |
| | | | | | | | | | | | | | | | | | | | |
Total | | | 2 | | | | 1,388 | | | | 211 | | | | 92 | | | | 1,693 | |
| | | | | | | | | | | | | | | | | | | | |
Corporate Bond | | | | | | | | | | | | | | | | | | | | |
Credit | | | — | | | | — | | | | — | | | | (936 | ) | | | (936 | ) |
Interest rate | | | (293 | ) | | | — | | | | — | | | | — | | | | (293 | ) |
| | | | | | | | | | | | | | | | | | | | |
Total | | | (293 | ) | | | — | | | | — | | | | (936 | ) | | | (1,229 | ) |
| | | | | | | | | | | | | | | | | | | | |
Strategic Income | | | | | | | | | | | | | | | | | | | | |
Credit | | | — | | | | — | | | | — | | | | 6 | | | | 6 | |
Interest rate | | | 95 | | | | — | | | | 34 | | | | — | | | | 129 | |
Foreign exchange | | | — | | | | 296 | | | | — | | | | — | | | | 296 | |
| | | | | | | | | | | | | | | | | | | | |
Total | | | 95 | | | | 296 | | | | 34 | | | | 6 | | | | 431 | |
| | | | | | | | | | | | | | | | | | | | |
Absolute Return Bond | |
Credit | | | — | | | | — | | | | — | | | | 200 | | | | 200 | |
Equity | | | — | | | | — | | | | 49 | | | | — | | | | 49 | |
Interest rate | | | 209 | | | | — | | | | 18 | | | | 871 | | | | 1,098 | |
Foreign exchange | | | — | | | | 1,583 | | | | — | | | | — | | | | 1,583 | |
| | | | | | | | | | | | | | | | | | | | |
Total | | | 209 | | | | 1,583 | | | | 67 | | | | 1,071 | | | | 2,930 | |
| | | | | | | | | | | | | | | | | | | | |
High Income | | | | | | | | | | | | | | | | | | | | |
Interest rate | | | — | | | | — | | | | — | | | | 300 | | | | 300 | |
Foreign exchange | | | — | | | | 247 | | | | — | | | | — | | | | 247 | |
| | | | | | | | | | | | | | | | | | | | |
Total | | | — | | | | 247 | | | | — | | | | 300 | | | | 547 | |
| | | | | | | | | | | | | | | | | | | | |
Global Low Duration | |
Interest rate | | | 49 | | | | — | | | | 29 | | | | 64 | | | | 142 | |
Foreign exchange | | | — | | | | 110 | | | | — | | | | — | | | | 110 | |
| | | | | | | | | | | | | | | | | | | | |
Total | | | 49 | | | | 110 | | | | 29 | | | | 64 | | | | 252 | |
| | | | | | | | | | | | | | | | | | | | |
Global Fixed Income | |
Credit | | | — | | | | — | | | | — | | | | 16 | | | | 16 | |
Interest rate | | | (165 | ) | | | — | | | | 26 | | | | 50 | | | | (89 | ) |
Foreign exchange | | | — | | | | 1,210 | | | | — | | | | — | | | | 1,210 | |
| | | | | | | | | | | | | | | | | | | | |
Total | | | (165 | ) | | | 1,210 | | | | 26 | | | | 66 | | | | 1,137 | |
| | | | | | | | | | | | | | | | | | | | |
| | | | | | | | | | | | | | | | | | | | |
Net Change in Unrealized Appreciation or (Depreciation)
on Derivatives Recognized in Income | |
Underlying risk | | Futures5 | | | Forward
Currency
Contracts6 | | | Options7 | | | Swaps8 | | | Total | |
Emerging Markets Bond | |
Credit | | | — | | | | — | | | | — | | | $ | (535 | ) | | $ | (535 | ) |
Equity | | | — | | | | — | | | $ | 94 | | | | — | | | | 94 | |
Interest rate | | | — | | | | — | | | | — | | | | (1,285 | ) | | | (1,285 | ) |
Foreign exchange | | | — | | | $ | 2,842 | | | | — | | | | — | | | | 2,842 | |
| | | | | | | | | | | | | | | | | | | | |
Total | | | — | | | | 2,842 | | | | 94 | | | | (1,820 | ) | | | 1,116 | |
| | | | | | | | | | | | | | | | | | | | |
Emerging Markets Local Bond | |
Equity | | | — | | | | — | | | | 11 | | | | — | | | | 11 | |
Interest rate | | | — | | | | — | | | | — | | | | (295 | ) | | | (295 | ) |
Foreign exchange | | | — | | | | (607 | ) | | | — | | | | — | | | | (607 | ) |
| | | | | | | | | | | | | | | | | | | | |
Total | | | — | | | | (607 | ) | | | 11 | | | | (295 | ) | | | (891 | ) |
| | | | | | | | | | | | | | | | | | | | |
Emerging Markets Corporate Bond | |
Credit | | | — | | | | — | | | | — | | | | (16 | ) | | | (16 | ) |
Equity | | | — | | | | — | | | | 4 | | | | — | | | | 4 | |
Interest rate | | $ | 4 | | | | — | | | | — | | | | (64 | ) | | | (60 | ) |
Foreign exchange | | | — | | | | (1 | ) | | | — | | | | — | | | | (1 | ) |
| | | | | | | | | | | | | | | | | | | | |
Total | | | 4 | | | | (1 | ) | | | 4 | | | | (80 | ) | | | (73 | ) |
| | | | | | | | | | | | | | | | | | | | |
Equity Income | | | | | | | | | | | | | | | | | | | | |
Foreign exchange | | | — | | | | 1,601 | | | | — | | | | — | | | | 1,601 | |
| | | | | | | | | | | | | | | | | | | | |
| 5 | Change in net unrealized appreciation (depreciation) from futures contracts. |
| 6 | Change in net unrealized appreciation (depreciation) from forward foreign exchange contracts. |
| 7 | Change in net unrealized appreciation (depreciation) from written option contracts and purchased options which are included in change in unrealized appreciation (depreciation) on investments. |
| 8 | Change in net unrealized appreciation (depreciation) from swap contracts. |
During the period ended October 31, 2020 the average notional amount of derivatives as a percent of average net assets were as follows:
| | | | | | | | | | | | | | | | |
| | | Foreign
currency | | Credit | | Interest
rate | | Equity |
Limited Maturity | | | 4 | % | | | 0 | % | | | 0 | % | | | 0 | % |
Low Duration | | | 0 | % | | | 0 | % | | | 3 | % | | | 0 | % |
Core Bond | | | 4 | % | | | 0 | % | | | 0 | % | | | 0 | % |
Corporate Bond | | | 0 | % | | | 1 | % | | | 0 | % | | | 0 | % |
Strategic Income | | | 7 | % | | | 2 | % | | | 0 | % | | | 0 | % |
Absolute Return Bond | | | 9 | % | | | 0 | % | | | 6 | % | | | 0 | % |
High Income | | | 2 | % | | | 0 | % | | | 1 | % | | | 0 | % |
Global Low Duration | | | 4 | % | | | 0 | % | | | 3 | % | | | 0 | % |
Global Fixed Income | | | 67 | % | | | 0 | % | | | 1060 | % | | | 0 | % |
Emerging Markets Bond | | | 15 | % | | | 2 | % | | | 0 | % | | | 0 | % |
Emerging Markets Local Bond | | | 33 | % | | | 0 | % | | | 14 | % | | | 0 | % |
Emerging Markets Corporate Bond | | | 5 | % | | | 1 | % | | | 13 | % | | | 0 | % |
Equity Income | | | 3 | % | | | 0 | % | | | 0 | % | | | 0 | % |
Counterparty Credit Risk
A derivative contract may suffer a mark-to-market loss if the value of the contract decreases due to an unfavorable change in
134 Payden Mutual Funds
the market rates or values of the underlying instrument. Losses can also occur if the counterparty does not perform under the contract.
A Fund’s risk of loss from counterparty credit risk on OTC derivatives is generally limited to the aggregate unrealized gain netted against any collateral held by a Fund. For OTC options purchased, a Fund bears the risk of loss of the amount of the premiums paid plus the positive change in market values net of any collateral held by such Fund should the counterparty fail to perform under the contracts. Options written by the Fund do not typically give rise to counterparty credit risk, as options written generally obligate the Fund, and not the counterparty to perform.
With exchange traded purchased options and futures and centrally cleared swaps, there is decreased counterparty credit risk to a Fund since the exchange or clearinghouse guarantees against a possible default. The clearinghouse stands between the buyer and the seller of the contract; therefore, the credit risk is limited to failure of the clearinghouse. While offset rights may exist under applicable law, a Fund does not have a contractual right of offset against a clearing broker or clearinghouse in the event of a default (including the bankruptcy or insolvency) of the clearing broker or clearinghouse. Additionally, credit risk exists in exchange traded futures and centrally cleared swaps with respect to initial and variation margin that is held in a clearing broker’s customer accounts. While clearing brokers are required to segregate customer margin from their own assets, in the event that a clearing broker becomes insolvent or goes into bankruptcy and at that time there is a shortfall in the aggregate amount of margin held by the clearing broker for all its clients, typically the shortfall would be allocated on a pro rata basis across all the clearing broker’s customers, potentially resulting in losses to a Fund.
In order to better define its contractual rights and to secure rights that will help a Fund mitigate its counterparty risk, a Fund may enter into an International Swaps and Derivatives Association, Inc. Master Agreement (“ISDA Master Agreement”) or similar agreement with its derivative contract counterparties. An ISDA Master Agreement is a bilateral agreement between a Fund and a counterparty that governs certain OTC derivatives and typically contains, among other things, collateral posting terms and netting provisions in the event of a default and/or termination event. Under an ISDA Master Agreement, the Fund may, under certain circumstances, offset with the counterparty certain derivative financial instruments’ payables and/or receivables with collateral held and/or posted and create one single net payment. The provisions of the ISDA Master Agreement typically permit a single net
payment in the event of default (close-out netting), including the bankruptcy or insolvency of the counterparty. However, bankruptcy or insolvency laws of a particular jurisdiction may impose restrictions on or prohibitions against the right of offset in bankruptcy, insolvency or other events. In addition, certain ISDA Master Agreements allow counterparties to OTC derivatives to terminate derivative contracts prior to maturity in the event the Fund’s net assets decline by a stated percentage or the Fund fails to meet the terms of its ISDA Master Agreements, which would cause the Fund to accelerate payment of any net liability owed to the counterparty.
Collateral Requirements
For derivatives traded under an ISDA Master Agreement, the collateral requirements are typically calculated by netting the mark to market amount for each transaction under such agreement and comparing that amount to the value of any collateral currently pledged by a Fund and the counterparty.
Cash collateral that has been pledged to cover obligations of a Fund and cash collateral received from the counterparty, if any, is reported separately on the Statements of Assets and Liabilities as cash pledged as collateral and cash received as collateral, respectively. Non-cash collateral pledged by the Fund, if any, is noted in the Schedule of Investments. Generally, the amount of collateral due from or to a party has to exceed a minimum transfer amount threshold (e.g. $500,000) before a transfer is required, which is determined at the close of business of a Fund and additional required collateral is delivered to/ pledged by a Fund on the next business day. Typically, a Fund and counterparties are not permitted to sell, re-pledge or use the collateral they receive. To the extent amounts due to a Fund from its counterparties are not fully collateralized, contractually or otherwise, the Fund bears the risk of loss from counterparty non-performance. A Fund attempts to mitigate counterparty risk by only entering into agreements with counterparties that it believes have the financial resources to honor their obligations and by monitoring the financial stability of those counterparties.
For financial reporting purposes, the Funds do not offset derivative assets and derivative liabilities that are subject to netting arrangements in the Statements of Assets and Liabilities.
Annual Report 135
| | |
Notes to Financial Statements continued | | |
At October 31, 2020, the Funds’ derivative assets and liabilities (by type) on a gross basis are as follows (000s):
| | | | | | | | |
| | | Assets | | | Liabilities | |
Emerging Markets Local Bond | | | | | | | | |
Derivative Financial Instruments: | | | | | | | | |
Centrally Cleared Swaps | | | — | | | $ | 1 | |
Forward Currency Contracts | | $ | 573 | | | | 1,218 | |
Options Purchased1 | | | 44 | | | | — | |
| | | | | | | | |
| Total derivative assets and liabilities in the Statements of Assets and Liabilities | | | 617 | | | | 1,219 | |
| | | | | | | | |
Derivatives not subject to a MNA | | | (44 | ) | | | (1 | ) |
| | | | | | | | |
Total derivative assets and liabilities subject to a MNA | | $ | 573 | | | $ | 1,218 | |
| | | | | | | | |
| 1 | Includes options purchased at value which is included in Investments at value and reported in the Schedule of Investments. |
The following tables present the Funds’ derivative assets and liabilities by counterparty net of amounts available for offset under a MNA and net of the related collateral received by the Fund as of October 31, 2020 (000s):
Emerging Markets Local Bond
| | | | | | | | | | | | | | | | | | | | |
| | | | | |
Counterparty | | Derivative
Assets
Subject to MNA by
Counterparty | | | Derivatives
Available
for Offset1 | | | Non-Cash
Collateral
Received | | | Cash
Collateral
Received | | | Net Amount of
Derivative
Assets2 | |
Barclays Bank PLC | | $ | 368 | | | $ | (146 | ) | | | — | | | | — | | | $ | 222 | |
HSBC Bank USA, N.A. | | | 205 | | | | (205 | ) | | | — | | | | — | | | | — | |
| | | | | | | | | | | | | | | | | | | | |
Total | | $ | 573 | | | $ | (351 | ) | | | — | | | | — | | | $ | 222 | |
| | | | | | | | | | | | | | | | | | | | |
| | | | | |
Counterparty | | Derivative
Liabilities
Subject to MNA by
Counterparty | | | Derivatives
Available
for Offset1 | | | Non-Cash
Collateral
Pledged | | | Cash
Collateral
Pledged3 | | | Net Amount of
Derivative
Liabilities | |
Barclays Bank PLC | | $ | 146 | | | $ | (146 | ) | | | — | | | | — | | | | — | |
HSBC Bank USA, N.A. | | | 1,072 | | | | (205 | ) | | | — | | | $ | (867 | ) | | | — | |
| | | | | | | | | | | | | | | | | | | | |
Total | | $ | 1,218 | | | $ | (351 | ) | | | — | | | $ | (867 | ) | | | — | |
| | | | | | | | | | | | | | | | | | | | |
| 1 | The amount of derivatives for offset is limited to the amount of assets and/or liabilities that are subject to a MNA. |
| 2 | Net amount represents the net amount receivable from the counterparty in the event of default. |
| 3 | Excess of collateral pledged from an individual counterparty may not be shown for financial reporting purposes. |
Credit Enhancements
Certain obligations held in the Funds have credit enhancement or liquidity features that may, under certain circumstances, provide for repayment of principal and interest on the obligation upon demand date, interest rate reset date or final maturity. These enhancements may include: letters of credit, liquidity guarantees, security purchase agreements, and third party insurance (e.g. AGM, AMBAC and BAM).
TBA Sale Commitments
Some Funds entered into TBA sale commitments, within dollar roll agreements, to hedge their portfolio position or to sell mortgage backed securities they own under delayed delivery arrangements. Proceeds from TBA sale commitments are not
received until the contractual settlement date. During the time a TBA sale commitment is outstanding, equivalent deliverable securities, or an offsetting TBA purchase commitment deliverable on or before the sale commitment date, are held as “cover” for the transaction.
Unsettled TBA sale commitments are valued at approximately the current value of the underlying securities. The contract is “marked-to-market” daily and the change in the value is recorded by the Fund as an unrealized gain or loss. If the TBA sale commitment is closed through the acquisition of an offsetting purchase commitment, the Fund realizes a gain or loss from the sale of the securities based upon the unit price established at the date the Fund entered the commitment.
136 Payden Mutual Funds
Securities Lending
Pursuant to a securities lending agreement with The Bank of New York Mellon, the Funds (except Cash Reserves Money Market) may lend securities to qualified institutions. It is each Fund’s policy that at origination all loans are secured by collateral of at least 102% of the value of the U.S. securities loaned and 105% of the value of the foreign securities loaned. Collateral equivalent to at least 100% of the market value of securities on loan is maintained at all times. The collateral is maintained by the custodian. Cash collateral is reinvested in the Cash Reserves Money Market Fund. The Funds are entitled to receive all of the income on securities loaned, in addition to income earned as a result of the lending transaction. Although each security loaned is fully collateralized, each Fund bears the risk of delay in receiving additional collateral or in recovery of or loss of rights in the securities loaned should the borrower fail to return the securities in a timely manner. The Funds maintain the right to recall the securities on loan for voting purposes. The income earned by each Fund is disclosed in the Statements of Operations.
Securities lending transactions are entered into by a Fund under Master Securities Lending Agreements (“MSLA”) which provide the right, in the event of default (including bankruptcy or insolvency), for the non-defaulting party to liquidate the collateral and calculate a net exposure to the defaulting party or request additional collateral. In the event that a borrower defaults, a Fund, as lender, would offset the market value of the collateral received against the market value of the securities loaned. The value of the collateral is typically greater than that of the market value of the securities loaned, leaving the lender with a net amount payable to the defaulting party. However, bankruptcy or insolvency laws of a particular jurisdiction may impose restrictions on or prohibitions against such a right of offset in the event of a MSLA counterparty’s bankruptcy or insolvency. Under the MSLA, the borrower can resell or re-pledge the loaned securities, and a Fund can reinvest cash collateral, or, upon an event of default, resell or re-pledge the collateral.
The Fund’s securities lending agreements by counterparty, which are subject to offset under a MSLA, if applicable, is included within each Fund’s Schedule of Investments under the heading “Offsetting Assets and Liabilities”. For financial reporting purposes, the Funds do not offset financial assets and financial liabilities that are subject to MSLA on the Statements of Assets and Liabilities.
Distributions to Shareholders
Distributions to shareholders are recorded on the ex-dividend date. Dividends from net investment income and net realized gains on foreign currency transactions are declared and paid monthly for all Funds except the Cash Reserves Money Market, Limited Maturity, Short Bond, U.S. Government, GNMA and California Municipal Social Impact Funds, which are declared daily and paid monthly and Equity Income Fund, which is declared and paid quarterly. Net realized gains on investments, if any, are declared and distributed at least annually. All distributions are paid in the form of additional shares unless cash payment is requested.
Distributions to shareholders are determined in accordance with income tax regulations, which may differ from GAAP.
Federal Income Taxes
It is the policy of each Fund to meet the requirements for qualification as a regulated investment company as defined in Subchapter M of the Internal Revenue Code (the “Code”), and to make distributions of net investment income and net realized gains sufficient to relieve it from all Federal income or excise taxes. As of and during the period ended October 31, 2020, the Funds did not record any liability for uncertain tax positions. Accordingly, no provision for Federal income or excise tax is necessary.
Each Fund files a tax return annually using tax accounting methods required under provisions of the Code, which may differ from GAAP, the basis on which these financial statements are prepared. The differences arise primarily from the treatment of foreign currency transactions and futures contracts and the deferral of certain losses under Federal income tax regulations. Accordingly, the amounts of net investment income and net realized gains or losses reported in these financial statements may differ from those reported in each Fund’s tax return. Return of capital distributions and net investment losses for tax purposes, if any, are reclassified to paid in capital.
As of and during the period ended October 31, 2020, the Funds did not have any liabilities for any unrecognized tax positions. The Funds recognize interest and penalties, if any, related to unrecognized tax positions as income tax expense in the Statements of Operations. During the period, the Funds did not incur any interest or penalties.
Each of the tax years in the four-year period ended October 31, 2020 remains subject to examination by the Internal Revenue Service and state taxing authorities.
Annual Report 137
| | |
Notes to Financial Statements continued | | |
Affiliated Investments
Each of the Paydenfunds (except the Cash Reserves Money Market and California Municipal Social Impact Funds) invests in other Funds of the Group (an “Affiliated Fund”). The income and both realized and the change in unrealized gains and losses
earned by each Fund from the Affiliated Funds for the period is disclosed in the Statements of Operations.
The table below details the transactions of each Fund in Affiliated Funds.
| | | | | | | | | | | | | | | | | | | | | | | | | | | | |
Fund | | Value
October 31, 2019 | | | Purchases | | | Sales | | | Dividends | | | Value
October 31, 2020 | | | Net Realized
Gain | | | Net Change in
Unrealized Appreciation
(Depreciation) | |
| | | | | | | |
Investments in Cash Reserves Money Market Fund | | | | | | | | | | | | | | | | | | | | | | | | | | | | |
Limited Maturity | | $ | 5,223,343 | | | $ | 611,962,674 | | | $ | 607,292,299 | | | $ | 75,089 | | | $ | 9,893,718 | | | | — | | | | — | |
Low Duration | | | 6,475,496 | | | | 716,750,817 | | | | 720,660,712 | | | | 61,704 | | | | 2,565,601 | | | | — | | | | — | |
U.S. Government | | | 203,634 | | | | 43,448,603 | | | | 41,794,507 | | | | 9,248 | | | | 1,857,730 | | | | — | | | | — | |
GNMA | | | 673,188 | | | | 90,754,362 | | | | 89,075,295 | | | | 14,263 | | | | 2,352,255 | | | | — | | | | — | |
Core Bond | | | 6,282,790 | | | | 521,410,958 | | | | 511,978,133 | | | | 44,701 | | | | 15,715,615 | | | | — | | | | — | |
Corporate Bond | | | 11,130,485 | | | | 218,031,528 | | | | 217,448,936 | | | | 46,040 | | | | 11,713,077 | | | | — | | | | — | |
Strategic Income | | | 1,548,218 | | | | 69,346,948 | | | | 68,855,172 | | | | 12,352 | | | | 2,039,994 | | | | — | | | | — | |
Absolute Return Bond | | | 9,825,615 | | | | 418,711,430 | | | | 422,623,770 | | | | 51,665 | | | | 5,913,275 | | | | — | | | | — | |
Floating Rate | | | 4,471,402 | | | | 29,599,646 | | | | 29,164,328 | | | | 49,631 | | | | 4,906,720 | | | | — | | | | — | |
High Income | | | 28,403,427 | | | | 357,804,843 | | | | 353,186,995 | | | | 96,780 | | | | 33,021,275 | | | | — | | | | — | |
Global Low Duration | | | 1,405,366 | | | | 94,586,946 | | | | 95,236,168 | | | | 8,639 | | | | 756,144 | | | | — | | | | — | |
Global Fixed Income | | | 878,062 | | | | 100,346,298 | | | | 91,375,557 | | | | 15,881 | | | | 9,848,803 | | | | — | | | | — | |
Emerging Markets | | | | | | | | | | | | | | | | | | | | | | | | | | | | |
Bond | | | 22,852,478 | | | | 519,294,062 | | | | 519,041,229 | | | | 114,121 | | | | 23,105,311 | | | | — | | | | — | |
Emerging Markets | | | | | | | | | | | | | | | | | | | | | | | | | | | | |
Local Bond | | | 3,703,188 | | | | 64,260,385 | | | | 66,368,226 | | | | 35,324 | | | | 1,595,347 | | | | — | | | | — | |
Emerging Markets | | | | | | | | | | | | | | | | | | | | | | | | | | | | |
Corporate Bond | | | 3,603,691 | | | | 21,052,831 | | | | 23,081,133 | | | | 10,484 | | | | 1,575,389 | | | | — | | | | — | |
Equity Income | | | 26,643,174 | | | | 562,840,863 | | | | 521,961,690 | | | | 101,086 | | | | 67,522,347 | | | | — | | | | — | |
Investments in Floating Rate Fund — SI Class | | | | | | | | | | | | | | | | | | | | | | | | | | | | |
High Income | | | 2,043,871 | | | | — | | | | 2,052,129 | | | | — | | | | — | | | $ | 4,129 | | | $ | 4,129 | |
Global Fixed Income | | | 1,452,352 | | | | — | | | | — | | | | 50,201 | | | | 1,395,138 | | | | — | | | | (57,214 | ) |
Custodian Credits
The Funds have entered into an agreement with the custodian, whereby they earn custodian fee credits for temporary cash balances. These credits, which offset custodian fees that may be charged to the Funds, are based on 75% of the daily effective federal funds rate and are disclosed, subject to rounding, in the Statements of Operations. The following Funds had custodian credits during the period ended October 31, 2020 (000s):
| | | | |
Cash Reserves Money Market | | $ | 1 | |
Limited Maturity | | | 3 | |
Corporate Bond | | | 2 | |
High Income | | | 1 | |
| | | | |
Emerging Markets Bond | | | 2 | |
Emerging Markets Local Bond | | | 1 | |
Equity Income | | | 2 | |
Line of Credit
The Paydenfunds (except Cash Reserves Money Market) have entered into a Credit Agreement with Bank of New York Mellon under which the bank has agreed to make loans to one or more of the Funds upon request by such Fund(s) and subject to the conditions of the Credit Agreement. The interest rate for any such loan will vary depending upon the type of borrowing chosen by the Fund. The aggregate of all such loans to the Funds may not exceed $75 million. No Fund took a loan during the period, nor did any Fund have a loan outstanding at the end of the period.
138 Payden Mutual Funds
Other
Income and realized and unrealized gain/loss are allocated to each class based on relative net assets. Shared expenses incurred by the Group are allocated among the Funds of the Group on the basis of relative net assets. Fund-specific expenses are charged to each Fund as incurred.
Accounting Standards
The Funds adopted FASB Accounting Standards Update (“ASU”) 2017-08, Receivables – Nonrefundable Fees and Other Costs (Subtopic 310-20): Premium Amortization on Purchased Callable Debt Securities to amend the amortization period for certain callable debt securities purchased at a premium. Under the new standard, the Funds changed the amortization period for the premium on certain purchased callable debt securities with non-contingent call features to the earliest call date. In accordance with the transition provisions of the standard, the Funds applied the amendments on a modified retrospective basis beginning after the fiscal year ended October 31, 2019. This change in accounting policy has been made to comply
with the newly issued accounting standard and had no impact on total accumulated earnings (deficit) or the net asset value of the Funds.
In March 2020, the FASB issued ASU 2020-04, Reference Rate Reform (Topic 848) — Facilitation of the Effects of Reference Rate Reform on Financial Reporting, which provides optional, temporary relief with respect to the financial reporting of contracts subject to certain types of modifications due to the planned discontinuation of the London Interbank Offered Rate (LIBOR) and other interbank-offered based reference rates as of the end of 2021. The guidance is effective for certain reference rate-related contract modifications that occur during the period March 12, 2020 through December 31, 2022. Management is currently evaluating the impact, if any, of the ASU on the Funds’ financial statements.
3. Related Party Transactions
Payden & Rygel (the “Adviser”) provides investment advisory services to the Funds. Under the terms of the investment advisory agreement, the Adviser is entitled to receive fees monthly, computed on the average daily net assets of each of the Funds separately at an annualized rate. The rates for each Fund are shown in the table below.
| | | | | | | | | | | | | | | | | | | | | | | | | | | | | | | | | | | | | | | | |
| | | Adviser Fees | | | Investor Class | | | SI Class | | | | | | | | | | |
| | | Between
$0–500
Million | | | Between
$0.5–1
Billion | | | Between
$1–2
Billion | | | Over $2
Billion | | | Expense
Guarantee | | | Current
Voluntary
Expense Limit | | | Current
Voluntary
Expense Limit | | | 3 Year Deferred Expense Subsidy | |
| | | FY 2018 | | | FY 2019 | | | FY 2020 | |
Cash Reserves Money | | | | | | | | | | | | | | | | | | | | | | | | | | | | | | | | | | | | | | | | |
Market | | | 0.15 | % | | | 0.15 | % | | | 0.15 | % | | | 0.15 | % | | | 0.50 | % | | | 0.25 | % | | | n/a | | | $ | 459,206 | | | $ | 356,789 | | | $ | 425,137 | |
Limited Maturity | | | 0.28 | % | | | 0.28 | % | | | 0.25 | % | | | 0.25 | % | | | 0.60 | % | | | 0.25 | % | | | n/a | | | | 2,413,311 | | | | 2,419,489 | | | | 2,779,713 | |
Low Duration | | | 0.28 | % | | | 0.28 | % | | | 0.25 | % | | | 0.25 | % | | | 0.60 | % | | | 0.43 | % | | | n/a | | | | 1,233,072 | | | | 1,537,992 | | | | 1,421,862 | |
U.S. Government | | | 0.28 | % | | | 0.28 | % | | | 0.25 | % | | | 0.25 | % | | | 0.60 | % | | | 0.43 | % | | | n/a | | | | 156,901 | | | | 113,838 | | | | 127,100 | |
GNMA | | | 0.27 | % | | | 0.27 | % | | | 0.27 | % | | | 0.27 | % | | | 0.50 | % | | | n/a | | | | n/a | | | | 359,812 | | | | 267,982 | | | | 264,362 | |
Core Bond | | | 0.28 | % | | | 0.28 | % | | | 0.25 | % | | | 0.25 | % | | | 0.60 | % | | | 0.53 | % | | | 0.42 | % | | | 172,909 | | | | 377,482 | | | | 492,210 | |
Corporate Bond | | | 0.35 | % | | | 0.35 | % | | | 0.35 | % | | | 0.35 | % | | | 1.00 | % | | | 0.65 | % | | | n/a | | | | 143,962 | | | | — | | | | 56,398 | |
Strategic Income | | | 0.55 | % | | | 0.55 | % | | | 0.55 | % | | | 0.55 | % | | | n/a | | | | 0.70 | % | | | 0.55 | % | | | 356,122 | | | | 372,006 | | | | 334,464 | |
Absolute Return Bond | | | 0.50 | % | | | 0.50 | % | | | 0.50 | % | | | 0.50 | % | | | n/a | | | | 0.70 | % | | | 0.47 | % | | | 233,184 | | | | 906,573 | | | | 1,703,932 | |
Floating Rate | | | 0.55 | % | | | 0.55 | % | | | 0.55 | % | | | 0.55 | % | | | n/a | | | | 0.75 | % | | | 0.65 | % | | | 267,525 | | | | 235,705 | | | | 204,662 | |
High Income | | | 0.35 | % | | | 0.35 | % | | | 0.35 | % | | | 0.35 | % | | | 0.75 | % | | | n/a | | | | n/a | | | | — | | | | — | | | | — | |
California Municipal Social Impact | | | 0.32 | % | | | 0.32 | % | | | 0.25 | % | | | 0.25 | % | | | 0.80 | % | | | 0.53 | % | | | n/a | | | | 86,089 | | | | 101,892 | | | | 174,738 | |
Global Low Duration | | | 0.30 | % | | | 0.30 | % | | | 0.30 | % | | | 0.25 | % | | | 0.70 | % | | | 0.53 | % | | | n/a | | | | 144,641 | | | | 144,077 | | | | 178,826 | |
Global Fixed Income | | | 0.30 | % | | | 0.30 | % | | | 0.30 | % | | | 0.25 | % | | | 0.70 | % | | | n/a | | | | n/a | | | | 95,623 | | | | 95,259 | | | | 123,205 | |
Emerging Markets Bond | | | 0.45 | % | | | 0.45 | % | | | 0.45 | % | | | 0.45 | % | | | 1.25 | % | | | n/a | | | | 0.69 | % | | | 395,095 | | | | 219,014 | | | | 276,554 | |
Emerging Markets Local Bond | | | 0.60 | % | | | 0.60 | % | | | 0.60 | % | | | 0.60 | % | | | 1.50 | % | | | 0.99 | % | | | n/a | | | | — | | | | — | | | | — | |
Emerging Markets Corporate Bond | | | 0.80 | % | | | 0.80 | % | | | 0.80 | % | | | 0.80 | % | | | n/a | | | | 0.95 | % | | | 0.85 | % | | | 193,589 | | | | 196,502 | | | | 213,678 | |
Equity Income | | | 0.50 | % | | | 0.50 | % | | | 0.50 | % | | | 0.30 | % | | | 0.80 | % | | | n/a | | | | 0.65 | % | | | 571,830 | | | | 680,157 | | | | 732,844 | |
Annual Report 139
| | |
Notes to Financial Statements continued | | |
The Adviser agreed to guarantee that, for so long as it acts as investment adviser to the Funds, the expenses of the Funds, including advisory fees (exclusive of interest, 12b-1 fees, and taxes) will not exceed the percentages indicated above (“Expense Guarantee”) of that Fund’s average daily net assets on an annualized basis. The adviser also voluntarily agreed to temporarily limit certain Funds’ total expenses (“Voluntary Expense Limit”), including advisory fees, to the percentages indicated above of that Fund’s average daily net assets on an annualized basis through February 28, 2021 (exclusive of interest and taxes).
Each Fund remains liable to the Adviser for expenses subsidized in any fiscal year up to a maximum of three years from the end of the period in which the expenses were subsidized as long as any reimbursement will not cause the annual expense ratio for the year in which it is made to exceed the amount of the expense guarantee or voluntary expense limit (whichever is in effect at the time of waiver or reimbursement).
The deferred expense subsidies represent the cumulative amount of expenses subsidized for the Funds through the end of the period. Such amount is not considered a liability of each respective Fund, and, therefore, is not recorded as liabilities in the Statements of Assets and Liabilities, but will be recognized as net expense in the Statements of Operations as expense previously deferred in future periods, if expense limits permit.
Treasury Plus, Inc., a wholly owned subsidiary of Payden & Rygel, serves as administrator to the Funds. Under the terms of the administration agreement, Treasury Plus, Inc. receives fees monthly, computed on the average daily net assets of the Funds at an annualized rate of 0.15%.
Under a distribution agreement with the Funds, the Core Bond, Emerging Markets Bond and Equity Income Funds adopted a plan pursuant to SEC rule 12b-1 by which Payden & Rygel Distributors receives fee monthly, computed on the average net assets of the Adviser class at an annualized rate of 0.25%. Payden & Rygel Distributors is not entitled to receive any fees from the Investor or SI classes of the Funds.
Certain officers and/or trustees of the Funds are affiliated with Payden & Rygel, Payden & Rygel Distributors and/or Treasury Plus, Inc. Such officers and trustees receive no fees from the Funds for serving as officers and/or trustees of the Funds.
The Funds may purchase securities from or sell securities to an affiliated fund or portfolio provided that the affiliation is due solely to having a common investment advisor, common officers or common trustees.
Indemnifications
Under the Group’s organizational documents, its trustees and officers are indemnified by the Funds against certain liabilities arising out of the performance of their duties to the Funds.
Additionally, in the normal course of business, the Funds enter into contracts with service providers that contain general indemnification clauses. A Fund’s maximum exposure under these agreements is unknown as this would involve future claims that may be made against the Fund that have not yet occurred. Currently the Funds expect this risk of loss to be remote.
4. Fair Value Measurement
Various inputs are used in determining the value of each Fund’s investments and other financial instruments. The inputs or methodology used for valuing securities are not necessarily an indication of the risk associated with investing in those securities. These inputs are summarized in the three broad levels: Level 1 — quoted prices in active markets for identical investments, Level 2 — other significant observable inputs (including quoted prices for similar securities, interest rates, prepayment speeds, credit risk, etc.), and Level 3 — significant unobservable inputs (including fund’s own assumptions in determining the fair value of investments). See Note 2 — Securities Valuation for a summary of the inputs used in valuing the Funds’ investments and other financial instruments.
| | | | | | | | | | | | | | | | | | | | | | | | | | | | |
| | | Investments in Securities | |
| | | | | | |
| | | | | | | | | Level 2-Other | | | | | | | | | | |
| | | | | | | | | Significant | | | Level 3-Significant | | | | |
| | | Level 1-Quoted Prices | | | Observable Inputs | | | Unobservable Inputs | | | | |
| | | | | | | |
| | | Assets
(000’s) | | | Liabilities
(000’s) | | | Assets
(000’s) | | | Liabilities
(000’s) | | | Assets
(000’s) | | | Liabilities
(000’s) | | | Total
(000’s) | |
Cash Reserves Money Market | | | | | | | | | | | | | | | | | | | | | | | | | | | | |
Repurchase Agreement | | | — | | | | — | | | $ | 137,000 | | | | — | | | | — | | | | — | | | $ | 137,000 | |
U.S. Government | | | — | | | | — | | | | 51,409 | | | | — | | | | — | | | | — | | | | 51,409 | |
U.S. Treasury | | | — | | | | — | | | | 144,821 | | | | — | | | | — | | | | — | | | | 144,821 | |
Investment Company | | $ | 8,553 | | | | — | | | | — | | | | — | | | | — | | | | — | | | | 8,553 | |
140 Payden Mutual Funds
| | | | | | | | | | | | | | | | | | | | | | | | | | | | |
| | | Investments in Securities | |
| | | | | | |
| | | | | | | | | Level 2-Other | | | | | | | | | | |
| | | | | | | | | Significant | | | Level 3-Significant | | | | |
| | | Level 1-Quoted Prices | | | Observable Inputs | | | Unobservable Inputs | | | | |
| | | | | | | |
| | | Assets
(000’s) | | | Liabilities
(000’s) | | | Assets
(000’s) | | | Liabilities
(000’s) | | | Assets
(000’s) | | | Liabilities
(000’s) | | | Total
(000’s) | |
Limited Maturity | | | | | | | | | | | | | | | | | | | | | | | | | | | | |
Asset Backed | | | — | | | | — | | | $ | 405,036 | | | | — | | | | — | | | | — | | | $ | 405,036 | |
Commercial Paper | | | — | | | | — | | | | 11,747 | | | | — | | | | — | | | | — | | | | 11,747 | |
Corporate Bond | | | — | | | | — | | | | 531,802 | | | | — | | | | — | | | | — | | | | 531,802 | |
Foreign Government | | | — | | | | — | | | | 11,553 | | | | — | | | | — | | | | — | | | | 11,553 | |
Mortgage Backed | | | — | | | | — | | | | 119,158 | | | | — | | | | — | | | | — | | | | 119,158 | |
Municipal | | | — | | | | — | | | | 1,379 | | | | — | | | | — | | | | — | | | | 1,379 | |
U.S. Government | | | — | | | | — | | | | 149,660 | | | | — | | | | — | | | | — | | | | 149,660 | |
Investment Company | | $ | 9,894 | | | | — | | | | — | | | | — | | | | — | | | | — | | | | 9,894 | |
| | | | | | | |
Low Duration | | | | | | | | | | | | | | | | | | | | | | | | | | | | |
Asset Backed | | | — | | | | — | | | | 427,120 | | | | — | | | | — | | | | — | | | | 427,120 | |
Commercial Paper | | | — | | | | — | | | | 8,000 | | | | — | | | | — | | | | — | | | | 8,000 | |
Corporate Bond | | | — | | | | — | | | | 565,450 | | | | — | | | | — | | | | — | | | | 565,450 | |
Foreign Government | | | — | | | | — | | | | 8,111 | | | | — | | | | — | | | | — | | | | 8,111 | |
Mortgage Backed | | | — | | | | — | | | | 245,689 | | | | — | | | | — | | | | — | | | | 245,689 | |
U.S. Government | | | — | | | | — | | | | 270,691 | | | | — | | | | — | | | | — | | | | 270,691 | |
Investment Company | | | 2,566 | | | | — | | | | — | | | | — | | | | — | | | | — | | | | 2,566 | |
| | | | | | | |
U.S. Government | | | | | | | | | | | | | | | | | | | | | | | | | | | | |
Asset Backed | | | — | | | | — | | | | 1,096 | | | | — | | | | — | | | | — | | | | 1,096 | |
Mortgage Backed | | | — | | | | — | | | | 47,308 | | | | — | | | | — | | | | — | | | | 47,308 | |
U.S. Government | | | — | | | | — | | | | 3,174 | | | | — | | | | — | | | | — | | | | 3,174 | |
Investment Company | | | 1,858 | | | | — | | | | — | | | | — | | | | — | | | | — | | | | 1,858 | |
| | | | | | | |
GNMA | | | | | | | | | | | | | | | | | | | | | | | | | | | | |
Mortgage Backed | | | — | | | | — | | | | 166,067 | | | | — | | | | — | | | | — | | | | 166,067 | |
U.S. Government | | | — | | | | — | | | | 3,530 | | | | — | | | | — | | | | — | | | | 3,530 | |
Investment Company | | | 2,352 | | | | — | | | | — | | | | — | | | | — | | | | — | | | | 2,352 | |
| | | | | | | |
Core Bond | | | | | | | | | | | | | | | | | | | | | | | | | | | | |
Asset Backed | | | — | | | | — | | | | 84,118 | | | | — | | | | — | | | | — | | | | 84,118 | |
Bank Loans | | | — | | | | — | | | | 26,402 | | | | — | | | | — | | | | — | | | | 26,402 | |
Commercial Paper | | | — | | | | — | | | | 5,200 | | | | — | | | | — | | | | — | | | | 5,200 | |
Corporate Bond | | | — | | | | — | | | | 521,105 | | | | — | | | | — | | | | — | | | | 521,105 | |
Foreign Government | | | — | | | | — | | | | 29,222 | | | | — | | | | — | | | | — | | | | 29,222 | |
Mortgage Backed | | | — | | | | — | | | | 421,901 | | | | — | | | | — | | | | — | | | | 421,901 | |
Municipal | | | — | | | | — | | | | 25,505 | | | | — | | | | — | | | | — | | | | 25,505 | |
U.S. Government | | | — | | | | — | | | | 412,070 | | | | — | | | | — | | | | — | | | | 412,070 | |
Investment Company | | | 15,716 | | | | — | | | | — | | | | — | | | | — | | | | — | | | | 15,716 | |
Annual Report 141
| | |
Notes to Financial Statements continued | | |
| | | | | | | | | | | | | | | | | | | | | | | | | | | | |
| | | Investments in Securities | |
| | | | | | |
| | | | | | | | | Level 2-Other | | | | | | | | | | |
| | | | | | | | | Significant | | | Level 3-Significant | | | | |
| | | Level 1-Quoted Prices | | | Observable Inputs | | | Unobservable Inputs | | | | |
| | | | | | | |
| | | Assets
(000’s) | | | Liabilities
(000’s) | | | Assets
(000’s) | | | Liabilities
(000’s) | | | Assets
(000’s) | | | Liabilities
(000’s) | | | Total
(000’s) | |
Corporate Bond | | | | | | | | | | | | | | | | | | | | | | | | | | | | |
Corporate Bond | | | — | | | | — | | | $ | 454,726 | | | | — | | | | — | | | | — | | | $ | 454,726 | |
Foreign Government | | | — | | | | — | | | | 1,919 | | | | — | | | | — | | | | — | | | | 1,919 | |
Municipal | | | — | | | | — | | | | 9,790 | | | | — | | | | — | | | | — | | | | 9,790 | |
Investment Company | | $ | 11,713 | | | | — | | | | — | | | | — | | | | — | | | | — | | | | 11,713 | |
| | | | | | | |
Strategic Income | | | | | | | | | | | | | | | | | | | | | | | | | | | | |
Asset Backed | | | — | | | | — | | | | 13,921 | | | | — | | | | — | | | | — | | | | 13,921 | |
Bank Loans | | | — | | | | — | | | | 4,680 | | | | — | | | | — | | | | — | | | | 4,680 | |
Corporate Bond | | | — | | | | — | | | | 66,501 | | | | — | | | | — | | | | — | | | | 66,501 | |
Foreign Government | | | — | | | | — | | | | 6,702 | | | | — | | | | — | | | | — | | | | 6,702 | |
Mortgage Backed | | | — | | | | — | | | | 20,294 | | | | — | | | | — | | | | — | | | | 20,294 | |
Municipal | | | — | | | | — | | | | 5,652 | | | | — | | | | — | | | | — | | | | 5,652 | |
U.S. Government | | | — | | | | — | | | | 15,773 | | | | — | | | | — | | | | — | | | | 15,773 | |
Preferred Stock | | | 95 | | | | — | | | | — | | | | — | | | | — | | | | — | | | | 95 | |
Investment Company | | | 2,040 | | | | — | | | | — | | | | — | | | | — | | | | — | | | | 2,040 | |
| | | | | | | |
Absolute Return Bond | | | | | | | | | | | | | | | | | | | | | | | | | | | | |
Asset Backed | | | — | | | | — | | | | 245,595 | | | | — | | | | — | | | | — | | | | 245,595 | |
Bank Loans | | | — | | | | — | | | | 14,192 | | | | — | | | | — | | | | — | | | | 14,192 | |
Corporate Bond | | | — | | | | — | | | | 235,147 | | | | — | | | | — | | | | — | | | | 235,147 | |
Foreign Government | | | — | | | | — | | | | 46,028 | | | | — | | | | ��� | | | | — | | | | 46,028 | |
Mortgage Backed | | | — | | | | — | | | | 225,262 | | | | — | | | | — | | | | — | | | | 225,262 | |
U.S. Government | | | — | | | | — | | | | 46,085 | | | | — | | | | — | | | | — | | | | 46,085 | |
Investment Company | | | 5,913 | | | | — | | | | — | | | | — | | | | — | | | | — | | | | 5,913 | |
| | | | | | | |
Floating Rate | | | | | | | | | | | | | | | | | | | | | | | | | | | | |
Asset Backed | | | — | | | | — | | | | 1,121 | | | | — | | | | — | | | | — | | | | 1,121 | |
Bank Loans | | | — | | | | — | | | | 53,970 | | | | — | | | | — | | | | — | | | | 53,970 | |
Corporate Bond | | | — | | | | — | | | | 3,227 | | | | — | | | | — | | | | — | | | | 3,227 | |
Mortgage Backed | | | — | | | | — | | | | 4,329 | | | | — | | | | — | | | | — | | | | 4,329 | |
Investment Company | | | 4,907 | | | | — | | | | — | | | | — | | | | — | | | | — | | | | 4,907 | |
| | | | | | | |
High Income | | | | | | | | | | | | | | | | | | | | | | | | | | | | |
Asset Backed | | | — | | | | — | | | | 3,932 | | | | — | | | | — | | | | — | | | | 3,932 | |
Bank Loans | | | — | | | | — | | | | 21,556 | | | | — | | | | — | | | | — | | | | 21,556 | |
Corporate Bond | | | — | | | | — | | | | 450,570 | | | | — | | | | — | | | | — | | | | 450,570 | |
Mortgage Backed | | | — | | | | — | | | | 15,845 | | | | — | | | | — | | | | — | | | | 15,845 | |
Investment Company | | | 33,021 | | | | — | | | | — | | | | — | | | | — | | | | — | | | | 33,021 | |
142 Payden Mutual Funds
| | | | | | | | | | | | | | | | | | | | | | | | | | | | |
| | | Investments in Securities | |
| | | | | | |
| | | | | | | | | Level 2-Other | | | | | | | | | | |
| | | | | | | | | Significant | | | Level 3-Significant | | | | |
| | | Level 1-Quoted Prices | | | Observable Inputs | | | Unobservable Inputs | | | | |
| | | | | | | |
| | | Assets
(000’s) | | | Liabilities
(000’s) | | | Assets
(000’s) | | | Liabilities
(000’s) | | | Assets
(000’s) | | | Liabilities
(000’s) | | | Total
(000’s) | |
California Municipal Social Impact | | | | | | | | | | | | | | | | | | | | | | | | | | | | |
Corporate Bond | | | — | | | | — | | | $ | 1,572 | | | | — | | | | — | | | | — | | | $ | 1,572 | |
Municipal | | | — | | | | — | | | | 60,258 | | | | — | | | | — | | | | — | | | | 60,258 | |
| | | | | | | |
Global Low Duration | | | | | | | | | | | | | | | | | | | | | | | | | | | | |
Asset Backed | | | — | | | | — | | | | 28,663 | | | | — | | | | — | | | | — | | | | 28,663 | |
Corporate Bond | | | — | | | | — | | | | 39,985 | | | | — | | | | — | | | | — | | | | 39,985 | |
Foreign Government | | | — | | | | — | | | | 2,538 | | | | — | | | | — | | | | — | | | | 2,538 | |
Mortgage Backed | | | — | | | | — | | | | 11,936 | | | | — | | | | — | | | | — | | | | 11,936 | |
U.S. Government | | | — | | | | — | | | | 12,215 | | | | — | | | | — | | | | — | | | | 12,215 | |
Investment Company | | $ | 756 | | | | — | | | | — | | | | — | | | | — | | | | — | | | | 756 | |
| | | | | | | |
Global Fixed Income | | | | | | | | | | | | | | | | | | | | | | | | | | | | |
Asset Backed | | | — | | | | — | | | | 19,355 | | | | — | | | | — | | | | — | | | | 19,355 | |
Bank Loans | | | — | | | | — | | | | 2,296 | | | | — | | | | — | | | | — | | | | 2,296 | |
Corporate Bond | | | — | | | | — | | | | 51,841 | | | | — | | | | — | | | | — | | | | 51,841 | |
Foreign Government | | | — | | | | — | | | | 67,012 | | | | — | | | | — | | | | — | | | | 67,012 | |
Mortgage Backed | | | — | | | | — | | | | 25,903 | | | | — | | | | — | | | | — | | | | 25,903 | |
U.S. Government | | | — | | | | — | | | | 12,714 | | | | — | | | | — | | | | — | | | | 12,714 | |
Investment Company | | | 11,244 | | | | — | | | | — | | | | — | | | | — | | | | — | | | | 11,244 | |
| | | | | | | |
Emerging Markets Bond | | | | | | | | | | | | | | | | | | | | | | | | | | | | |
Corporate Bond | | | — | | | | — | | | | 324,379 | | | | — | | | | — | | | | — | | | | 324,379 | |
Foreign Government | | | — | | | | — | | | | 657,708 | | | | — | | | | — | | | | — | | | | 657,708 | |
Purchased Options | | | 351 | | | | — | | | | — | | | | — | | | | — | | | | — | | | | 351 | |
Investment Company | | | 23,105 | | | | — | | | | — | | | | — | | | | — | | | | — | | | | 23,105 | |
| | | | | | | |
Emerging Markets Local Bond | | | | | | | | | | | | | | | | | | | | | | | | | | | | |
Corporate Bond | | | — | | | | — | | | | 24,711 | | | | — | | | | — | | | | — | | | | 24,711 | |
Foreign Government | | | — | | | | — | | | | 100,628 | | | | — | | | | — | | | | — | | | | 100,628 | |
Options Purchased | | | 44 | | | | — | | | | — | | | | — | | | | — | | | | — | | | | 44 | |
Investment Company | | | 1,595 | | | | — | | | | — | | | | — | | | | — | | | | — | | | | 1,595 | |
| | | | | | | |
Emerging Markets Corporate Bond | | | | | | | | | | | | | | | | | | | | | | | | | | | | |
Bank Loans | | | — | | | | — | | | | 1,284 | | | | — | | | | — | | | | — | | | | 1,284 | |
Corporate Bond | | | — | | | | — | | | | 37,292 | | | | — | | | | — | | | | — | | | | 37,292 | |
Foreign Government | | | — | | | | — | | | | 1,831 | | | | — | | | | — | | | | — | | | | 1,831 | |
Mortgage Backed | | | — | | | | — | | | | 1,274 | | | | — | | | | — | | | | — | | | | 1,274 | |
Options Purchased | | | 15 | | | | — | | | | — | | | | — | | | | — | | | | — | | | | 15 | |
Investment Company | | | 1,575 | | | | — | | | | — | | | | — | | | | — | | | | — | | | | 1,575 | |
Annual Report 143
| | |
Notes to Financial Statements continued | | |
| | | | | | | | | | | | | | | | | | | | | | | | | | | | |
| | | Investments in Securities | |
| | | | | | |
| | | | | | | | | Level 2-Other | | | | | | | | | | |
| | | | | | | | | Significant | | | Level 3-Significant | | | | |
| | | Level 1-Quoted Prices | | | Observable Inputs | | | Unobservable Inputs | | | | |
| | | | | | | |
| | | Assets
(000’s) | | | Liabilities
(000’s) | | | Assets
(000’s) | | | Liabilities
(000’s) | | | Assets
(000’s) | | | Liabilities
(000’s) | | | Total
(000’s) | |
Equity Income | | | | | | | | | | | | | | | | | | | | | | | | | | | | |
Corporate Bond | | | — | | | | — | | | $ | 30,040 | | | | — | | | | — | | | | — | | | $ | 30,040 | |
Common Stock | | $ | 1,209,512 | | | | — | | | | — | | | | — | | | | — | | | | — | | | | 1,209,512 | |
Preferred Stock | | | 14,566 | | | | — | | | | — | | | | — | | | | — | | | | — | | | | 14,566 | |
Real Estate Investment Trust | | | 96,760 | | | | — | | | | — | | | | — | | | | — | | | | — | | | | 96,760 | |
Investment Company | | | 67,522 | | | | — | | | | — | | | | — | | | | — | | | | — | | | | 67,522 | |
| | | | | | | | | | | | | | | | | | | | | | | | | | | | |
| | | Other Financial Instruments 1 | |
| | | | | | |
| | | | | | | | | Level 2-Other | | | | | | | | | | |
| | | | | | | | | Significant | | | Level 3-Significant | | | | |
| | | Level 1-Quoted Prices | | | Observable Inputs | | | Unobservable Inputs | | | | |
| | | | | | | |
| | | Assets
(000’s) | | | Liabilities
(000’s) | | | Assets
(000’s) | | | Liabilities
(000’s) | | | Assets
(000’s) | | | Liabilities
(000’s) | | | Total
(000’s) | |
Limited Maturity | | | | | | | | | | | | | | | | | | | | | | | | | | | | |
Forward currency contracts | | | — | | | | — | | | $ | 301 | | | $ | (58 | ) | | | — | | | | — | | | $ | 243 | |
Futures | | $ | 32 | | | | — | | | | — | | | | — | | | | — | | | | — | | | | 32 | |
| | | | | | | |
Low Duration | | | | | | | | | | | | | | | | | | | | | | | | | | | | |
Forward currency contracts | | | — | | | | — | | | | 82 | | | | (36 | ) | | | — | | | | — | | | | 46 | |
Futures | | | 279 | | | $ | (51 | ) | | | — | | | | — | | | | — | | | | — | | | | 228 | |
Swaps | | | — | | | | — | | | | 788 | | | | (6 | ) | | | — | | | | — | | | | 782 | |
| | | | | | | |
Core Bond | | | | | | | | | | | | | | | | | | | | | | | | | | | | |
Forward currency contracts | | | — | | | | — | | | | 755 | | | | (20 | ) | | | — | | | | — | | | | 735 | |
Futures | | | 931 | | | | (1,238 | ) | | | — | | | | — | | | | — | | | | — | | | | (307 | ) |
Swaps | | | — | | | | — | �� | | | 92 | | | | — | | | | — | | | | — | | | | 92 | |
| | | | | | | |
Corporate Bond | | | | | | | | | | | | | | | | | | | | | | | | | | | | |
Futures | | | 296 | | | | (502 | ) | | | — | | | | — | | | | — | | | | — | | | | (206 | ) |
Swaps | | | — | | | | — | | | | — | | | | (907 | ) | | | — | | | | — | | | | (907 | ) |
| | | | | | | |
Strategic Income | | | | | | | | | | | | | | | | | | | | | | | | | | | | |
Forward currency contracts | | | — | | | | — | | | | 167 | | | | (5 | ) | | | — | | | | — | | | | 162 | |
Futures | | | 20 | | | | (9 | ) | | | — | | | | — | | | | — | | | | — | | | | 11 | |
Swaps | | | — | | | | — | | | | 6 | | | | — | | | | — | | | | — | | | | 6 | |
| | | | | | | |
Absolute Return | | | | | | | | | | | | | | | | | | | | | | | | | | | | |
Forward currency contracts | | | — | | | | — | | | | 1,263 | | | | (8 | ) | | | — | | | | — | | | | 1,255 | |
Futures | | | 447 | | | | (183 | ) | | | — | | | | — | | | | — | | | | — | | | | 264 | |
Swaps | | | — | | | | — | | | | 721 | | | | — | | | | — | | | | — | | | | 721 | |
144 Payden Mutual Funds
| | | | | | | | | | | | | | | | | | | | | | | | | | | | |
| | | Other Financial Instruments 1 | |
| | | | | | |
| | | | | | | | | Level 2-Other | | | | | | | | | | |
| | | | | | | | | Significant | | | Level 3-Significant | | | | |
| | | Level 1-Quoted Prices | | | Observable Inputs | | | Unobservable Inputs | | | | |
| | | | | | | |
| | | Assets
(000’s) | | | Liabilities
(000’s) | | | Assets
(000’s) | | | Liabilities
(000’s) | | | Assets
(000’s) | | | Liabilities
(000’s) | | | Total
(000’s) | |
High Income | | | | | | | | | | | | | | | | | | | | | | | | | | | | |
Forward currency contracts | | | — | | | | — | | | $ | 134 | | | $ | (6 | ) | | | — | | | | — | | | $ | 128 | |
Swaps | | | — | | | | — | | | | 1,211 | | | | (70 | ) | | | — | | | | — | | | | 1,141 | |
| | | | | | | |
Global Low Duration | | | | | | | | | | | | | | | | | | | | | | | | | | | | |
Forward currency contracts | | | — | | | | — | | | | 93 | | | | (9 | ) | | | — | | | | — | | | | 84 | |
Futures | | $ | 32 | | | $ | (5 | ) | | | — | | | | — | | | | — | | | | — | | | | 27 | |
Swaps | | | — | | | | — | | | | 48 | | | | — | | | | — | | | | — | | | | 48 | |
| | | | | | | |
Global Fixed Income | | | | | | | | | | | | | | | | | | | | | | | | | | | | |
Forward currency contracts | | | — | | | | — | | | | 519 | | | | (345 | ) | | | — | | | | — | | | | 174 | |
Futures | | | 132 | | | | (170 | ) | | | — | | | | — | | | | — | | | | — | | | | (38 | ) |
Swaps | | | — | | | | — | | | | 117 | | | | (102 | ) | | | — | | | | — | | | | 15 | |
| | | | | | | |
Emerging Markets Bond | | | | | | | | | | | | | | | | | | | | | | | | | | | | |
Forward currency contracts | | | — | | | | — | | | | 2,859 | | | | (1,647 | ) | | | — | | | | — | | | | 1,212 | |
Swaps | | | — | | | | — | | | | — | | | | (535 | ) | | | — | | | | — | | | | (535 | ) |
| | | | | | | |
Emerging Markets Local Bond | | | | | | | | | | | | | | | | | | | | | | | | | | | | |
Forward currency contracts | | | — | | | | — | | | | 573 | | | | (1,218 | ) | | | — | | | | — | | | | (645 | ) |
Swaps | | | — | | | | — | | | | — | | | | (13 | ) | | | — | | | | — | | | | (13 | ) |
| | | | | | | |
Emerging Markets Corporate Bond | | | | | | | | | | | | | | | | | | | | | | | | | | | | |
Forward currency contracts | | | — | | | | — | | | | 16 | | | | (42 | ) | | | — | | | | — | | | | (26 | ) |
Futures | | | 4 | | | | — | | | | — | | | | — | | | | — | | | | — | | | | 4 | |
Swaps | | | — | | | | — | | | | — | | | | (16 | ) | | | — | | | | — | | | | (16 | ) |
| | | | | | | |
Equity Income | | | | | | | | | | | | | | | | | | | | | | | | | | | | |
Forward currency contracts | | | — | | | | — | | | | 633 | | | | (165 | ) | | | — | | | | — | | | | 468 | |
| 1 | Other financial instruments are swaps, futures contracts and forward currency contracts. Swaps, futures contracts and forward currency contracts are valued at the unrealized appreciation/depreciation on the instrument. |
Annual Report 145
| | |
Notes to Financial Statements continued | | |
5. Federal Tax Information (amounts in 000s)
Distributions from net investment income and net realized capital gains are determined in accordance with U.S. federal income tax regulations, which may differ from those amounts determined under GAAP. These book/tax differences are either temporary or permanent in nature. To the extent these differences are permanent, they are charged or credited to distributable earnings and paid-in capital, as appropriate, in the period that the differences arise. Accordingly, the following permanent differences as of October 31, 2020, primarily attributable to investments in partnerships and foreign currency gains/losses were reclassified to the following accounts. These reclassifications had no effect on net assets or net asset value per share (amounts in thousands):
| | | | | | | | |
| | | Increase/
(Decrease)
Distributable
Earnings | | | Increase/
(Decrease)
Paid in
Capital | |
Emerging Markets Local Bond | | $ | 13,611 | | | $ | (13,611 | ) |
Equity Income | | | 15 | | | | (15 | ) |
For Federal income tax purposes the following Funds had capital loss carryforwards at year end in the amount indicated below. The carryforwards are available to offset future capital gains, if any. The following Funds used capital loss carryforwards to reduce required capital gain distributions for the year ended October 31, 2020: Low Duration ($3,452), U.S. Government ($122), GNMA ($529), Core Bond ($5,809), Strategic Income ($675), Global Low Duration ($476), Global Fixed Income ($621), Emerging Markets Local Bond ($43), and Emerging Markets Corporate Bond ($155).
At October 31, 2020, the following Funds had available for Federal income tax purposes unused capital losses as follows (000’s):
| | | | |
| | | Total | |
Limited Maturity | | $ | 313 | |
U.S. Government | | | 7,452 | |
GNMA | | | 38,123 | |
Absolute Return | | | 7,381 | |
Floating Rate | | | 4,463 | |
High Income | | | 29,204 | |
Emerging Markets Bond | | | 24,098 | |
Emerging Markets Local Bond | | | 20,624 | |
Emerging Markets Corporate Bond | | | 47 | |
146 Payden Mutual Funds
The tax character of distributions paid during the fiscal years ended October 31st is as follows (000’s):
| | | | | | | | | | | | | | | | | | | | | | | | | | | | | | | | |
| | | 2019 | | | 2020 | |
| | | | | | | | |
| | | Tax-Exempt
Income | | | Ordinary
Income | | | Long Term
Capital Gains | | | Return of
Capital | | | Tax-Exempt
Income | | | Ordinary
Income | | | Long Term
Capital Gains | | | Return of
Capital | |
Cash Reserves Money Market | | | — | | | $ | 5,685 | | | | — | | | | — | | | | — | | | $ | 1,606 | | | | — | | | | — | |
Limited Maturity | | | — | | | | 21,314 | | | $ | 90 | | | | — | | | | — | | | | 15,044 | | | | — | | | | — | |
Low Duration | | | — | | | | 33,502 | | | | — | | | $ | 300 | | | | — | | | | 26,184 | | | | — | | | | — | |
U.S. Government | | | — | | | | 1,083 | | | | — | | | | — | | | | — | | | | 1,001 | | | | — | | | | — | |
GNMA | | | — | | | | 4,848 | | | | — | | | | — | | | | — | | | | 3,703 | | | | — | | | | — | |
Core Bond | | | — | | | | 30,750 | | | | — | | | | 1,873 | | | | — | | | | 26,785 | | | | — | | | | — | |
Corporate Bond | | | — | | | | 13,755 | | | | — | | | | — | | | | — | | | | 13,669 | | | | — | | | | — | |
Strategic Income | | | — | | | | 5,677 | | | | — | | | | 421 | | | | — | | | | 4,381 | | | | — | | | | — | |
Absolute Return Bond | | | — | | | | 15,005 | | | | — | | | | — | | | | — | | | | 20,101 | | | | — | | | | — | |
Floating Rate | | | — | | | | 4,946 | | | | — | | | | 1 | | | | — | | | | 2,498 | | | | — | | | | — | |
High Income | | | — | | | | 24,421 | | | | — | | | | — | | | | — | | | | 23,451 | | | | — | | | | — | |
California Municipal Social Impact | | $ | 1,459 | | | | 30 | | | | 56 | | | | — | | | $ | 1,276 | | | | 668 | | | $ | 615 | | | | — | |
Global Low Duration | | | — | | | | 2,542 | | | | — | | | | 24 | | | | — | | | | 1,832 | | | | — | | | $ | 59 | |
Global Fixed Income | | | — | | | | 6,618 | | | | — | | | | — | | | | — | | | | 4,236 | | | | — | | | | — | |
Emerging Markets Bond | | | — | | | | 61,664 | | | | — | | | | — | | | | — | | | | 50,850 | | | | — | | | | — | |
Emerging Markets Local Bond | | | — | | | | 5,008 | | | | — | | | | 7,295 | | | | — | | | | — | | | | — | | | | 8,579 | |
Emerging Markets Corporate Bond | | | — | | | | 2,137 | | | | — | | | | — | | | | — | | | | 1,727 | | | | — | | | | 87 | |
Equity Income | | | — | | | | 28,471 | | | | 8,488 | | | | — | | | | — | | | | 27,420 | | | | 40,713 | | | | 2,402 | |
At October 31, 2020, net unrealized appreciation (depreciation) on investments for Federal income tax purposes is as follows (000’s):
| | | | | | | | | | | | | | | | |
| | | Cost of Investments
Federal Income
Tax Purposes | | | Gross
Unrealized
Appreciation
on Investments | | | Gross
Unrealized
Depreciation
on Investments | | | Net Unrealized
Appreciation
(Depreciation)
on Investments | |
Cash Reserves Money Market | | $ | 341,783 | | | | — | | | | — | | | | — | |
Limited Maturity | | | 1,237,903 | | | $ | 6,123 | | | $ | (3,522 | ) | | $ | 2,601 | |
Low Duration | | | 1,520,665 | | | | 15,321 | | | | (7,304 | ) | | | 8,017 | |
U.S. Government | | | 52,893 | | | | 1,159 | | | | (615 | ) | | | 544 | |
GNMA | | | 169,303 | | | | 4,074 | | | | (1,428 | ) | | | 2,646 | |
Core Bond | | | 1,512,382 | | | | 40,679 | | | | (11,328 | ) | | | 29,351 | |
Corporate Bond | | | 445,448 | | | | 34,984 | | | | (3,397 | ) | | | 31,587 | |
Strategic Income | | | 133,610 | | | | 4,090 | | | | (1,868 | ) | | | 2,222 | |
Absolute Return Bond | | | 821,120 | | | | 13,361 | | | | (14,007 | ) | | | (646 | ) |
Floating Rate | | | 69,088 | | | | 367 | | | | (1,900 | ) | | | (1,533 | ) |
High Income | | | 516,427 | | | | 18,673 | | | | (8,908 | ) | | | 9,765 | |
California Municipal Income | | | 59,694 | | | | 2,613 | | | | (476 | ) | | | 2,137 | |
Global Low Duration | | | 95,537 | | | | 1,394 | | | | (678 | ) | | | 716 | |
Global Fixed Income | | | 188,117 | | | | 6,395 | | | | (4,000 | ) | | | 2,395 | |
Emerging Markets Bond | | | 1,057,431 | | | | 52,013 | | | | (103,292 | ) | | | (51,279 | ) |
Emerging Markets Local Bond | | | 138,421 | | | | 7,482 | | | | (19,687 | ) | | | (12,205 | ) |
Emerging Markets Corporate Bond | | | 42,860 | | | | 1,838 | | | | (1,465 | ) | | | 373 | |
Equity Income | | | 1,283,945 | | | | 167,571 | | | | (32,634 | ) | | | 134,937 | |
Annual Report 147
| | |
Notes to Financial Statements continued | | |
At October 31, 2020, the components of accumulated earnings (deficit) for Federal income tax purposes are as follows (000’s):
| | | | | | | | | | | | | | | | | | | | | | | | |
| | | Undistributed
Ordinary Income | | | Undistributed
Realized Long Term
Capital Gains | | | Capital Loss
Carryforwards | | | Distributions
Payable | | | Net Unrealized
Appreciation
(Depreciation) | | | Total Distributions
Earnings (Deficit) | |
Cash Reserves Money Market | | $ | 20 | | | | — | | | | — | | | $ | (6 | ) | | | — | | | $ | 14 | |
Limited Maturity | | | 489 | | | | — | | | $ | (313 | ) | | | (14 | ) | | $ | 2,601 | | | | 2,763 | |
Low Duration | | | 11,942 | | | $ | 2,790 | | | | — | | | | (74 | ) | | | 8,017 | | | | 22,675 | |
U.S. Government | | | 4 | | | | — | | | | (7,452 | ) | | | (3 | ) | | | 544 | | | | (6,907 | ) |
GNMA | | | 107 | | | | — | | | | (38,122 | ) | | | (24 | ) | | | 2,646 | | | | (35,393 | ) |
Core Bond | | | 10,649 | | | | 10,324 | | | | — | | | | — | | | | 29,351 | | | | 50,324 | |
Corporate Bond | | | 2,543 | | | | 3,978 | | | | — | | | | — | | | | 31,587 | | | | 38,108 | |
Strategic Income | | | 58 | | | | — | | | | — | | | | — | | | | 2,222 | | | | 2,280 | |
Absolute Return Bond | | | 2,285 | | | | — | | | | (7,390 | ) | | | — | | | | (646 | ) | | | (5,751 | ) |
Floating Rate | | | 1 | | | | — | | | | (4,462 | ) | | | — | | | | (1,533 | ) | | | (5,994 | ) |
High Income | | | 1,163 | | | | — | | | | (29,204 | ) | | | — | | | | 9,765 | | | | (18,276 | ) |
California Municipal Social Impact | | | 1,021 | | | | 106 | | | | — | | | | (17 | ) | | | 2,137 | | | | 3,247 | |
Global Low Duration | | | — | | | | — | | | | — | | | | — | | | | 716 | | | | 716 | |
Global Fixed Income | | | 2,489 | | | | 512 | | | | — | | | | — | | | | 2,395 | | | | 5,396 | |
Emerging Markets Bond | | | 1,197 | | | | — | | | | (24,098 | ) | | | — | | | | (51,279 | ) | | | (74,180 | ) |
Emerging Markets Local Bond | | | — | | | | — | | | | (20,624 | ) | | | — | | | | (12,205 | ) | | | (32,829 | ) |
Emerging Markets Corporate Bond | | | — | | | | — | | | | (47 | ) | | | — | | | | 373 | | | | 326 | |
Equity Income | | | — | | | | — | | | | — | | | | — | | | | 134,937 | | | | 134,937 | |
6. Exempt Interest Income Designation (unaudited)
| | | | | | | | |
| | | Exempt
Interest
Dividends
(000s) | | | Exempt
Interest
Dividends
Per Share | |
California Municipal Income | | $ | 1,276 | | | $ | 0.22 | |
7. Subsequent Events
The Funds have evaluated subsequent events through the issuance of the financial statements and have determined that no other events have occurred that require disclosure.
148 Payden Mutual Funds
For the share outstanding for each of the periods ended October 31st
| | | | | | | | | | | | | | | | | | | | |
| | | Payden Cash Reserves Money Market Fund | |
| | | 2020 | | | 2019 | | | 2018 | | | 2017 | | | 2016 | |
Net asset value — beginning of period | | $ | 1.00 | | | $ | 1.00 | | | $ | 1.00 | | | $ | 1.00 | | | $ | 1.00 | |
| | | | | | | | | | | | | | | | | | | | |
Income from investment activities: | | | | | | | | | | | | | | | | | | | | |
Net investment income | | | 0.01 | | | | 0.02 | | | | 0.01 | | | | 0.01 | | | | 0.00 | (1) |
Net realized and unrealized gains (losses) | | | 0.00 | (1) | | | 0.00 | | | | 0.00 | | | | 0.00 | | | | 0.00 | (1) |
| | | | | | | | | | | | | | | | | | | | |
Total from investment activities | | | 0.01 | | | | 0.02 | | | | 0.01 | | | | 0.01 | | | | 0.00 | |
| | | | | | | | | | | | | | | | | | | | |
Distributions to shareholders: | | | | | | | | | | | | | | | | | | | | |
From net investment income | | | (0.01 | ) | | | (0.02 | ) | | | (0.01 | ) | | | (0.01 | ) | | | 0.00 | (1) |
From net realized gains | | | (0.00 | )(1) | | | (0.00 | )(1) | | | — | | | | — | | | | — | |
| | | | | | | | | | | | | | | | | | | | |
Total distributions to shareholders | | | (0.01 | ) | | | (0.02 | ) | | | (0.01 | ) | | | (0.01 | ) | | | 0.00 | |
| | | | | | | | | | | | | | | | | | | | |
Net asset value — end of period | | $ | 1.00 | | | $ | 1.00 | | | $ | 1.00 | | | $ | 1.00 | | | $ | 1.00 | |
| | | | | | | | | | | | | | | | | | | | |
Total return | | | 0.57 | % | | | 2.10 | % | | | 1.43 | % | | | 0.53 | % | | | 0.09 | % |
| | | | | | | | | | | | | | | | | | | | |
Ratios/supplemental data: | | | | | | | | | | | | | | | | | | | | |
Net assets, end of period (000s) | | $ | 351,597 | | | $ | 274,957 | | | $ | 329,996 | | | $ | 447,563 | | | $ | 551,064 | |
Ratio of gross expense to average net assets | | | 0.39 | % | | | 0.38 | % | | | 0.38 | % | | | 0.38 | % | | | 0.37 | % |
Ratio of net expense to average net assets | | | 0.23 | % | | | 0.25 | % | | | 0.25 | % | | | 0.25 | % | | | 0.24 | % |
Ratio of investment income less gross expenses to average net assets | | | 0.35 | % | | | 1.94 | % | | | 1.26 | % | | | 0.40 | % | | | (0.04 | )% |
Ratio of net investment income to average net assets | | | 0.51 | % | | | 2.07 | % | | | 1.39 | % | | | 0.52 | % | | | 0.10 | % |
Portfolio turnover rate | | | n/a | | | | n/a | | | | n/a | | | | n/a | | | | n/a | |
The Fund commenced operations on December 17, 1997. | |
| | | Payden Limited Maturity Fund | |
| | | 2020 | | | 2019 | | | 2018 | | | 2017 | | | 2016 | |
Net asset value — beginning of period | | $ | 9.49 | | | $ | 9.46 | | | $ | 9.48 | | | $ | 9.46 | | | $ | 9.42 | |
| | | | | | | | | | | | | | | | | | | | |
Income (loss) from investment activities: | | | | | | | | | | | | | | | | | | | | |
Net investment income | | | 0.15 | | | | 0.25 | | | | 0.20 | | | | 0.12 | | | | 0.08 | |
Net realized and unrealized gains (losses) | | | 0.01 | | | | 0.03 | | | | (0.02 | ) | | | 0.02 | | | | 0.04 | |
| | | | | | | | | | | | | | | | | | | | |
Total from investment activities | | | 0.16 | | | | 0.28 | | | | 0.18 | | | | 0.14 | | | | 0.12 | |
| | | | | | | | | | | | | | | | | | | | |
Distributions to shareholders: | | | | | | | | | | | | | | | | | | | | |
From net investment income | | | (0.15 | ) | | | (0.25 | ) | | | (0.20 | ) | | | (0.08 | ) | | | (0.07 | ) |
From net realized gains | | | (0.00 | )(1) | | | (0.00 | )(1) | | | — | | | | — | | | | — | |
Return of capital | | | — | | | | — | | | | — | | | | (0.04 | ) | | | (0.01 | ) |
| | | | | | | | | | | | | | | | | | | | |
Total distributions to shareholders | | | (0.15 | ) | | | (0.25 | ) | | | (0.20 | ) | | | (0.12 | ) | | | (0.08 | ) |
| | | | | | | | | | | | | | | | | | | | |
Net asset value — end of period | | $ | 9.50 | | | $ | 9.49 | | | $ | 9.46 | | | $ | 9.48 | | | $ | 9.46 | |
| | | | | | | | | | | | | | | | | | | | |
Total return | | | 1.75 | % | | | 2.99 | % | | | 1.92 | % | | | 1.52 | % | | | 1.31 | % |
| | | | | | | | | | | | | | | | | | | | |
Ratios/supplemental data: | | | | | | | | | | | | | | | | | | | | |
Net assets, end of period (000s) | | $ | 1,219,514 | | | $ | 783,645 | | | $ | 784,821 | | | $ | 707,930 | | | $ | 463,149 | |
Ratio of gross expense to average net assets | | | 0.54 | % | | | 0.55 | % | | | 0.55 | % | | | 0.56 | % | | | 0.57 | % |
Ratio of net expense to average net assets | | | 0.25 | % | | | 0.25 | % | | | 0.25 | % | | | 0.25 | % | | | 0.26 | % |
Ratio of investment income less gross expenses to average net assets | | | 1.24 | % | | | 2.29 | % | | | 1.82 | % | | | 1.06 | % | | | 0.57 | % |
Ratio of net investment income to average net assets | | | 1.53 | % | | | 2.59 | % | | | 2.12 | % | | | 1.37 | % | | | 0.88 | % |
Portfolio turnover rate | | | 63 | % | | | 74 | % | | | 72 | % | | | 51 | % | | | 39 | % |
The Fund commenced operations on April 29, 1994.
(1) Amount is less than $0.005.
See notes to financial statements.
Annual Report 149
| | |
Financial Highlights continued | | |
| | | | | | | | | | | | | | | | | | | | |
| | | Payden Low Duration Fund | |
| | | 2020 | | | 2019 | | | 2018 | | | 2017 | | | 2016 | |
Net asset value — beginning of period | | $ | 10.10 | | | $ | 9.91 | | | $ | 10.09 | | | $ | 10.10 | | | $ | 10.05 | |
| | | | | | | | | | | | | | | | | | | | |
Income (loss) from investment activities: | | | | | | | | | | | | | | | | | | | | |
Net investment income | | | 0.18 | | | | 0.24 | | | | 0.22 | | | | 0.16 | | | | 0.12 | |
Net realized and unrealized gains (losses) | | | 0.12 | | | | 0.19 | | | | (0.18 | ) | | | (0.02 | ) | | | 0.05 | |
| | | | | | | | | | | | | | | | | | | | |
Total from investment activities | | | 0.30 | | | | 0.43 | | | | 0.04 | | | | 0.14 | | | | 0.17 | |
| | | | | | | | | | | | | | | | | | | | |
Distributions to shareholders: | | | | | | | | | | | | | | | | | | | | |
From net investment income | | | (0.18 | ) | | | (0.24 | ) | | | (0.22 | ) | | | (0.12 | ) | | | (0.11 | ) |
Return of capital | | | — | | | | (0.00 | )(1) | | | (0.00 | )(1) | | | (0.03 | ) | | | (0.01 | ) |
| | | | | | | | | | | | | | | | | | | | |
Total distributions to shareholders | | | (0.18 | ) | | | (0.24 | ) | | | (0.22 | ) | | | (0.15 | ) | | | (0.12 | ) |
| | | | | | | | | | | | | | | | | | | | |
Net asset value — end of period | | $ | 10.22 | | | $ | 10.10 | | | $ | 9.91 | | | $ | 10.09 | | | $ | 10.10 | |
| | | | | | | | | | | | | | | | | | | | |
Total return | | | 3.00 | % | | | 4.39 | % | | | 0.39 | % | | | 1.37 | % | | | 1.74 | % |
| | | | | | | | | | | | | | | | | | | | |
Ratios/supplemental data: | | | | | | | | | | | | | | | | | | | | |
Net assets, end of period (000s) | | $ | 1,532,982 | | | $ | 1,523,037 | | | $ | 1,212,308 | | | $ | 1,061,436 | | | $ | 800,892 | |
Ratio of gross expense to average net assets | | | 0.53 | % | | | 0.54 | % | | | 0.54 | % | | | 0.54 | % | | | 0.57 | % |
Ratio of net expense to average net assets | | | 0.43 | % | | | 0.43 | % | | | 0.43 | % | | | 0.44 | % | | | 0.45 | % |
Ratio of investment income less gross expenses to average net assets | | | 1.64 | % | | | 2.27 | % | | | 2.06 | % | | | 1.44 | % | | | 1.13 | % |
Ratio of net investment income to average net assets | | | 1.74 | % | | | 2.38 | % | | | 2.17 | % | | | 1.55 | % | | | 1.24 | % |
Portfolio turnover rate | | | 211 | % | | | 166 | % | | | 85 | % | | | 118 | % | | | 41 | % |
The Fund commenced operations on December 31, 1993. (1) Amount is less than $0.005. | |
| | | Payden U.S. Government Fund | |
| | | 2020 | | | 2019 | | | 2018 | | | 2017 | | | 2016 | |
Net asset value — beginning of period | | $ | 10.35 | | | $ | 10.11 | | | $ | 10.42 | | | $ | 10.61 | | | $ | 10.63 | |
| | | | | | | | | | | | | | | | | | | | |
Income (loss) from investment activities: | | | | | | | | | | | | | | | | | | | | |
Net investment income (1) | | | 0.19 | | | | 0.24 | | | | 0.15 | | | | 0.11 | | | | 0.10 | |
Net realized and unrealized gains (losses) | | | 0.25 | | | | 0.30 | | | | (0.24 | ) | | | (0.13 | ) | | | 0.05 | |
| | | | | | | | | | | | | | | | | | | | |
Total from investment activities | | | 0.44 | | | | 0.54 | | | | (0.09 | ) | | | (0.02 | ) | | | 0.15 | |
| | | | | | | | | | | | | | | | | | | | |
Distributions to shareholders: | | | | | | | | | | | | | | | | | | | | |
From net investment income | | | (0.25 | ) | | | (0.30 | ) | | | (0.22 | ) | | | (0.17 | ) | | | (0.17 | ) |
| | | | | | | | | | | | | | | | | | | | |
Total distributions to shareholders | | | (0.25 | ) | | | (0.30 | ) | | | (0.22 | ) | | | (0.17 | ) | | | (0.17 | ) |
| | | | | | | | | | | | | | | | | | | | |
Net asset value — end of period | | $ | 10.54 | | | $ | 10.35 | | | $ | 10.11 | | | $ | 10.42 | | | $ | 10.61 | |
| | | | | | | | | | | | | | | | | | | | |
Total return | | | 4.26 | % | | | 5.36 | % | | | (0.86 | )% | | | (0.16 | )% | | | 1.46 | % |
| | | | | | | | | | | | | | | | | | | | |
Ratios/supplemental data: | | | | | | | | | | | | | | | | | | | | |
Net assets, end of period (000s) | | $ | 47,360 | | | $ | 39,301 | | | $ | 37,678 | | | $ | 135,454 | | | $ | 137,581 | |
Ratio of gross expense to average net assets | | | 0.73 | % | | | 0.73 | % | | | 0.62 | % | | | 0.56 | % | | | 0.58 | % |
Ratio of net expense to average net assets | | | 0.43 | % | | | 0.43 | % | | | 0.41 | % | | | 0.45 | % | | | 0.45 | % |
Ratio of investment income less gross expenses to average net assets | | | 1.51 | % | | | 2.00 | % | | | 1.28 | % | | | 0.89 | % | | | 0.81 | % |
Ratio of net investment income to average net assets | | | 1.81 | % | | | 2.30 | % | | | 1.49 | % | | | 1.00 | % | | | 0.94 | % |
Portfolio turnover rate | | | 48 | % | | | 49 | % | | | 28 | % | | | 27 | % | | | 35 | % |
The Fund commenced operations on January 3, 1995.
(1) Based on average shares outstanding.
See notes to financial statements.
150 Payden Mutual Funds
| | | | | | | | | | | | | | | | | | | | |
| | | Payden GNMA Fund | |
| | | 2020 | | | 2019 | | | 2018 | | | 2017 | | | 2016 | |
Net asset value — beginning of period | | $ | 9.42 | | | $ | 8.97 | | | $ | 9.49 | | | $ | 9.80 | | | $ | 9.79 | |
| | | | | | | | | | | | | | | | | | | | |
Income (loss) from investment activities: | | | | | | | | | | | | | | | | | | | | |
Net investment income | | | 0.18 | | | | 0.20 | | | | 0.16 | | | | 0.14 | | | | 0.15 | |
Net realized and unrealized gains (losses) | | | 0.15 | | | | 0.56 | | | | (0.38 | ) | | | (0.15 | ) | | | 0.17 | |
| | | | | | | | | | | | | | | | | | | | |
Total from investment activities | | | 0.33 | | | | 0.76 | | | | (0.22 | ) | | | (0.01 | ) | | | 0.32 | |
| | | | | | | | | | | | | | | | | | | | |
Distributions to shareholders: | | | | | | | | | | | | | | | | | | | | |
From net investment income | | | (0.28 | ) | | | (0.31 | ) | | | (0.30 | ) | | | (0.30 | ) | | | (0.31 | ) |
| | | | | | | | | | | | | | | | | | | | |
Net asset value — end of period | | $ | 9.47 | | | $ | 9.42 | | | $ | 8.97 | | | $ | 9.49 | | | $ | 9.80 | |
| | | | | | | | | | | | | | | | | | | | |
Total return | | | 3.52 | % | | | 8.63 | % | | | (2.34 | )% | | | (0.12 | )% | | | 3.26 | % |
| | | | | | | | | | | | | | | | | | | | |
Ratios/supplemental data: | | | | | | | | | | | | | | | | | | | | |
Net assets, end of period (000s) | | $ | 122,509 | | | $ | 132,455 | | | $ | 159,393 | | | $ | 235,225 | | | $ | 272,657 | |
Ratio of gross expense to average net assets | | | 0.71 | % | | | 0.69 | % | | | 0.68 | % | | | 0.69 | % | | | 0.69 | % |
Ratio of net expense to average net assets | | | 0.50 | % | | | 0.50 | % | | | 0.50 | % | | | 0.50 | % | | | 0.50 | % |
Ratio of investment income less gross expenses to average net assets | | | 1.92 | % | | | 2.51 | % | | | 1.74 | % | | | 1.27 | % | | | 1.16 | % |
Ratio of net investment income to average net assets | | | 2.13 | % | | | 2.70 | % | | | 1.93 | % | | | 1.46 | % | | | 1.35 | % |
Portfolio turnover rate | | | 25 | % | | | 18 | % | | | 20 | % | | | 17 | % | | | 12 | % |
The Fund commenced operations on August 27, 1999. | |
| | | Payden Core Bond Fund - Adviser Class | |
| | | 2020 | | | 2019 | | | 2018 | | | 2017 | | | 2016 | |
Net asset value — beginning of period | | $ | 10.87 | | | $ | 10.17 | | | $ | 10.70 | | | $ | 10.83 | | | $ | 10.62 | |
| | | | | | | | | | | | | | | | | | | | |
Income (loss) from investment activities: | | | | | | | | | | | | | | | | | | | | |
Net investment income | | | 0.24 | (1) | | | 0.30 | (1) | | | 0.28 | (1) | | | 0.27 | (1) | | | 0.25 | (1) |
Net realized and unrealized gains (losses) | | | 0.25 | | | | 0.72 | | | | (0.50 | ) | | | 0.00 | (2) | | | 0.25 | |
| | | | | | | | | | | | | | | | | | | | |
Total from investment activities | | | 0.49 | | | | 1.02 | | | | (0.22 | ) | | | 0.27 | | | | 0.50 | |
| | | | | | | | | | | | | | | | | | | | |
Distributions to shareholders: | | | | | | | | | | | | | | | | | | | | |
From net investment income | | | (0.26 | ) | | | (0.30 | ) | | | (0.31 | ) | | | (0.32 | ) | | | (0.28 | ) |
From net realized gains | | | — | | | | — | | | | — | | | | (0.08 | ) | | | (0.01 | ) |
Return of capital | | | — | | | | (0.02 | ) | | | (0.00 | )(2) | | | — | | | | — | |
| | | | | | | | | | | | | | | | | | | | |
Total distributions to shareholders | | | (0.26 | ) | | | (0.32 | ) | | | (0.31 | ) | | | (0.40 | ) | | | (0.29 | ) |
| | | | | | | | | | | | | | | | | | | | |
Net asset value — end of period | | $ | 11.10 | | | $ | 10.87 | | | $ | 10.17 | | | $ | 10.70 | | | $ | 10.83 | |
| | | | | | | | | | | | | | | | | | | | |
Total return | | | 4.52 | % | | | 10.13 | % | | | (2.12 | )% | | | 2.60 | % | | | 4.83 | % |
| | | | | | | | | | | | | | | | | | | | |
Ratios/supplemental data: | | | | | | | | | | | | | | | | | | | | |
Net assets, end of period (000s) | | $ | 45,755 | | | $ | 38,979 | | | $ | 29,799 | | | $ | 25,993 | | | $ | 25,801 | |
Ratio of gross expense to average net assets | | | 0.79 | % | | | 0.78 | % | | | 0.78 | % | | | 0.78 | % | | | 0.79 | % |
Ratio of net expense to average net assets | | | 0.78 | % | | | 0.78 | % | | | 0.78 | % | | | 0.78 | % | | | 0.79 | % |
Ratio of investment income less gross expenses to average net assets | | | 2.14 | % | | | 2.83 | % | | | 2.71 | % | | | 2.55 | % | | | 2.32 | % |
Ratio of net investment income to average net assets | | | 2.15 | % | | | 2.83 | % | | | 2.71 | % | | | 2.55 | % | | | 2.32 | % |
Portfolio turnover rate | | | 125 | % | | | 86 | % | | | 67 | % | | | 87 | % | | | 57 | % |
The Class commenced operations on November 2, 2009.
(1) Based on average shares outstanding.
(2) Amount is less than $0.005.
See notes to financial statements.
Annual Report 151
| | |
Financial Highlights continued | | |
| | | | | | | | | | | | | | | | | | | | |
| | | Payden Core Bond Fund - Investor Class | |
| | | 2020 | | | 2019 | | | 2018 | | | 2017 | | | 2016 | |
Net asset value — beginning of period | | $ | 10.90 | | | $ | 10.20 | | | $ | 10.73 | | | $ | 10.85 | | | $ | 10.64 | |
| | | | | | | | | | | | | | | | | | | | |
Income (loss) from investment activities: | | | | | | | | | | | | | | | | | | | | |
Net investment income | | | 0.26 | (1) | | | 0.33 | (1) | | | 0.31 | (1) | | | 0.30 | (1) | | | 0.28 | (1) |
Net realized and unrealized gains (losses) | | | 0.25 | | | | 0.71 | | | | (0.51 | ) | | | 0.00 | (2) | | | 0.25 | |
| | | | | | | | | | | | | | | | | | | | |
Total from investment activities | | | 0.51 | | | | 1.04 | | | | (0.20 | ) | | | 0.30 | | | | 0.53 | |
| | | | | | | | | | | | | | | | | | | | |
Distributions to shareholders: | | | | | | | | | | | | | | | | | | | | |
From net investment income | | | (0.28 | ) | | | (0.32 | ) | | | (0.33 | ) | | | (0.34 | ) | | | (0.31 | ) |
From net realized gains | | | — | | | | — | | | | — | | | | (0.08 | ) | | | (0.01 | ) |
Return of capital | | | — | | | | (0.02 | ) | | | (0.00 | )(2) | | | — | | | | — | |
| | | | | | | | | | | | | | | | | | | | |
Total distributions to shareholders | | | (0.28 | ) | | | (0.34 | ) | | | (0.33 | ) | | | (0.42 | ) | | | (0.32 | ) |
| | | | | | | | | | | | | | | | | | | | |
Net asset value — end of period | | $ | 11.13 | | | $ | 10.90 | | | $ | 10.20 | | | $ | 10.73 | | | $ | 10.85 | |
| | | | | | | | | | | | | | | | | | | | |
Total return | | | 4.76 | % | | | 10.36 | % | | | (1.88 | )% | | | 2.94 | % | | | 5.07 | % |
| | | | | | | | | | | | | | | | | | | | |
Ratios/supplemental data: | | | | | | | | | | | | | | | | | | | | |
Net assets, end of period (000s) | | $ | 589,061 | | | $ | 695,683 | | | $ | 604,289 | | | $ | 719,847 | | | $ | 735,916 | |
Ratio of gross expense to average net assets | | | 0.54 | % | | | 0.53 | % | | | 0.53 | % | | | 0.53 | % | | | 0.54 | % |
Ratio of net expense to average net assets | | | 0.53 | % | | | 0.53 | % | | | 0.53 | % | | | 0.53 | % | | | 0.54 | % |
Ratio of investment income less gross expenses to average net assets | | | 2.40 | % | | | 3.10 | % | | | 2.95 | % | | | 2.80 | % | | | 2.57 | % |
Ratio of net investment income to average net assets | | | 2.40 | % | | | 3.10 | % | | | 2.95 | % | | | 2.80 | % | | | 2.57 | % |
Portfolio turnover rate | | | 125 | % | | | 86 | % | | | 67 | % | | | 87 | % | | | 57 | % |
The Fund commenced operations on December 31, 1993.
| | | | | | | | | | | | | | | | | | | | |
| | | Payden Core Bond Fund - SI Class | | | | | | | |
| | | 2020 | | | 2019 | | | 2018 | | | | | | | |
Net asset value — beginning of period | | $ | 10.89 | | | $ | 10.19 | | | $ | 10.66 | | | | | | | | | |
| | | | | | | | | | | | | | | | | | | | |
Income (loss) from investment activities: | | | | | | | | | | | | | | | | | | | | |
Net investment income | | | 0.27 | (1) | | | 0.34 | (1) | | | 0.25 | (1) | | | | | | | | |
Net realized and unrealized gains (losses) | | | 0.25 | | | | 0.71 | | | | (0.43 | ) | | | | | | | | |
| | | | | | | | | | | | | | | | | | | | |
Total from investment activities | | | 0.52 | | | | 1.05 | | | | (0.18 | ) | | | | | | | | |
| | | | | | | | | | | | | | | | | | | | |
Distributions to shareholders: | | | | | | | | | | | | | | | | | | | | |
From net investment income | | | (0.29 | ) | | | (0.33 | ) | | | (0.29 | ) | | | | | | | | |
Return of capital | | | — | | | | (0.02 | ) | | | (0.00 | )(2) | | | | | | | | |
| | | | | | | | | | | | | | | | | | | | |
Total distributions to shareholders | | | (0.29 | ) | | | (0.35 | ) | | | (0.29 | ) | | | | | | | | |
| | | | | | | | | | | | | | | | | | | | |
Net asset value — end of period | | $ | 11.12 | | | $ | 10.89 | | | $ | 10.19 | | | | | | | | | |
| | | | | | | | | | | | | | | | | | | | |
Total return | | | 4.88 | % | | | 10.49 | % | | | (1.75 | )%(3) | | | | | | | | |
| | | | | | | | | | | | | | | | | | | | |
Ratios/supplemental data: | | | | | | | | | | | | | | | | | | | | |
Net assets, end of period (000s) | | $ | 758,985 | | | $ | 323,935 | | | $ | 296,239 | | | | | | | | | |
Ratio of gross expense to average net assets | | | 0.54 | % | | | 0.54 | % | | | 0.53 | %(4) | | | | | | | | |
Ratio of net expense to average net assets | | | 0.42 | % | | | 0.54 | % | | | 0.42 | %(4) | | | | | | | | |
Ratio of investment income less gross expenses to average net assets | | | 2.37 | % | | | 3.10 | % | | | 3.03 | %(4) | | | | | | | | |
Ratio of net investment income to average net assets | | | 2.48 | % | | | 3.21 | % | | | 3.14 | %(4) | | | | | | | | |
Portfolio turnover rate | | | 125 | % | | | 86 | % | | | 67 | % | | | | | | | | |
The Class commenced operations on January 22, 2018.
(1) Based on average shares outstanding.
(2) Amount is less than $0.005.
(3) Not annualized.
(4) Annualized.
See notes to financial statements.
152 Payden Mutual Funds
| | | | | | | | | | | | | | | | | | | | |
| | | Payden Corporate Bond Fund | |
| | | 2020 | | | 2019 | | | 2018 | | | 2017 | | | 2016 | |
Net asset value — beginning of period | | $ | 11.73 | | | $ | 10.63 | | | $ | 11.38 | | | $ | 11.37 | | | $ | 10.97 | |
| | | | | | | | | | | | | | | | | | | | |
Income (loss) from investment activities: | | | | | | | | | | | | | | | | | | | | |
Net investment income | | | 0.34 | | | | 0.38 | | | | 0.39 | | | | 0.38 | | | | 0.34 | |
Net realized and unrealized gains (losses) | | | 0.31 | | | | 1.10 | | | | (0.68 | ) | | | 0.25 | | | | 0.53 | |
| | | | | | | | | | | | | | | | | | | | |
Total from investment activities | | | 0.65 | | | | 1.48 | | | | (0.29 | ) | | | 0.63 | | | | 0.87 | |
| | | | | | | | | | | | | | | | | | | | |
Distributions to shareholders: | | | | | | | | | | | | | | | | | | | | |
From net investment income | | | (0.33 | ) | | | (0.38 | ) | | | (0.39 | ) | | | (0.38 | ) | | | (0.34 | ) |
From net realized gains | | | (0.01 | ) | | | — | | | | (0.07 | ) | | | (0.24 | ) | | | (0.13 | ) |
| | | | | | | | | | | | | | | | | | | | |
Total distributions to shareholders | | | (0.34 | ) | | | (0.38 | ) | | | (0.46 | ) | | | (0.62 | ) | | | (0.47 | ) |
| | | | | | | | | | | | | | | | | | | | |
Net asset value — end of period | | $ | 12.04 | | | $ | 11.73 | | | $ | 10.63 | | | $ | 11.38 | | | $ | 11.37 | |
| | | | | | | | | | | | | | | | | | | | |
Total return | | | 5.65 | % | | | 14.20 | % | | | (2.61 | )% | | | 5.83 | % | | | 8.18 | % |
| | | | | | | | | | | | | | | | | | | | |
Ratios/supplemental data: | | | | | | | | | | | | | | | | | | | | |
Net assets, end of period (000s) | | $ | 479,951 | | | $ | 463,203 | | | $ | 298,708 | | | $ | 207,305 | | | $ | 140,468 | |
Ratio of gross expense to average net assets | | | 0.66 | % | | | 0.66 | % | | | 0.72 | % | | | 0.70 | % | | | 0.74 | % |
Ratio of net expense to average net assets | | | 0.65 | % | | | 0.65 | % | | | 0.65 | % | | | 0.65 | % | | | 0.65 | % |
Ratio of investment income less gross expenses to average net assets | | | 2.82 | % | | | 3.43 | % | | | 3.52 | % | | | 3.32 | % | | | 3.04 | % |
Ratio of net investment income to average net assets | | | 2.83 | % | | | 3.43 | % | | | 3.59 | % | | | 3.37 | % | | | 3.13 | % |
Portfolio turnover rate | | | 58 | % | | | 49 | % | | | 85 | % | | | 93 | % | | | 145 | % |
The Fund commenced operations on March 12, 2009. | |
| | | Payden Strategic Income Fund - Investor Class | |
| | | 2020 | | | 2019 | | | 2018 | | | 2017 | | | 2016 | |
Net asset value — beginning of period | | $ | 10.21 | | | $ | 9.77 | | | $ | 10.11 | | | $ | 10.12 | | | $ | 9.96 | |
| | | | | | | | | | | | | | | | | | | | |
Income (loss) from investment activities: | | | | | | | | | | | | | | | | | | | | |
Net investment income | | | 0.29 | | | | 0.33 | | | | 0.31 | | | | 0.28 | | | | 0.22 | |
Net realized and unrealized gains (losses) | | | 0.08 | | | | 0.45 | | | | (0.34 | ) | | | 0.02 | | | | 0.16 | |
| | | | | | | | | | | | | | | | | | | | |
Total from investment activities | | | 0.37 | | | | 0.78 | | | | (0.03 | ) | | | 0.30 | | | | 0.38 | |
| | | | | | | | | | | | | | | | | | | | |
Distributions to shareholders: | | | | | | | | | | | | | | | | | | | | |
From net investment income | | | (0.30 | ) | | | (0.32 | ) | | | (0.31 | ) | | | (0.30 | ) | | | (0.22 | ) |
From net realized gains. | | | — | | | | — | | | | — | | | | (0.01 | ) | | | — | |
Return of capital | | | — | | | | (0.02 | ) | | | (0.00 | )(1) | | | (0.00 | )(1) | | | — | |
| | | | | | | | | | | | | | | | | | | | |
Total distributions to shareholders | | | (0.30 | ) | | | (0.34 | ) | | | (0.31 | ) | | | (0.31 | ) | | | (0.22 | ) |
| | | | | | | | | | | | | | | | | | | | |
Net asset value — end of period | | $ | 10.28 | | | $ | 10.21 | | | $ | 9.77 | | | $ | 10.11 | | | $ | 10.12 | |
| | | | | | | | | | | | | | | | | | | | |
Total return | | | 3.74 | % | | | 8.09 | % | | | (0.33 | )% | | | 3.09 | % | | | 3.90 | % |
| | | | | | | | | | | | | | | | | | | | |
Ratios/supplemental data: | | | | | | | | | | | | | | | | | | | | |
Net assets, end of period (000s) | | $ | 84,881 | | | $ | 115,545 | | | $ | 146,823 | | | $ | 135,024 | | | $ | 150,106 | |
Ratio of gross expense to average net assets | | | 0.88 | % | | | 0.87 | % | | | 0.85 | % | | | 0.86 | % | | | 0.88 | % |
Ratio of net expense to average net assets | | | 0.70 | % | | | 0.70 | % | | | 0.72 | % | | | 0.77 | % | | | 0.80 | % |
Ratio of investment income less gross expenses to average net assets | | | 2.68 | % | | | 3.14 | % | | | 2.90 | % | | | 2.60 | % | | | 2.14 | % |
Ratio of net investment income to average net assets | | | 2.86 | % | | | 3.30 | % | | | 3.04 | % | | | 2.70 | % | | | 2.22 | % |
Portfolio turnover rate | | | 65 | % | | | 72 | % | | | 66 | % | | | 78 | % | | | 52 | % |
The Fund commenced operations on May 8, 2014.
(1) Amount is less than $0.005.
See notes to financial statements.
Annual Report 153
| | |
Financial Highlights continued | | |
| | | | | | | | | | | | | | | | | | | | |
| | | Payden Strategic Income Fund - SI Class | |
| | | 2020 | | | 2019 | | | 2018 | | | 2017 | | | 2016 | |
Net asset value — beginning of period | | $ | 10.20 | | | $ | 9.77 | | | $ | 10.11 | | | $ | 10.12 | | | $ | 9.96 | |
| | | | | | | | | | | | | | | | | | | | |
Income (loss) from investment activities: | | | | | | | | | | | | | | | | | | | | |
Net investment income | | | 0.31 | | | | 0.35 | | | | 0.32 | | | | 0.27 | | | | 0.25 | |
Net realized and unrealized gains (losses) | | | 0.08 | | | | 0.43 | | | | (0.34 | ) | | | 0.04 | | | | 0.15 | |
| | | | | | | | | | | | | | | | | | | | |
Total from investment activities | | | 0.39 | | | | 0.78 | | | | (0.02 | ) | | | 0.31 | | | | 0.40 | |
| | | | | | | | | | | | | | | | | | | | |
Distributions to shareholders: | | | | | | | | | | | | | | | | | | | | |
From net investment income | | | (0.32 | ) | | | (0.33 | ) | | | (0.32 | ) | | | (0.31 | ) | | | (0.24 | ) |
From net realized gains | | | — | | | | — | | | | — | | | | (0.01 | ) | | | — | |
Return of capital | | | — | | | | (0.02 | ) | | | (0.00 | )(1) | | | (0.00 | )(1) | | | — | |
| | | | | | | | | | | | | | | | | | | | |
Total distributions to shareholders | | | (0.32 | ) | | | (0.35 | ) | | | (0.32 | ) | | | (0.32 | ) | | | (0.24 | ) |
| | | | | | | | | | | | | | | | | | | | |
Net asset value — end of period | | $ | 10.27 | | | $ | 10.20 | | | $ | 9.77 | | | $ | 10.11 | | | $ | 10.12 | |
| | | | | | | | | | | | | | | | | | | | |
Total return | | | 3.90 | % | | | 8.14 | % | | | (0.20 | )% | | | 3.21 | % | | | 4.03 | % |
| | | | | | | | | | | | | | | | | | | | |
Ratios/supplemental data: | | | | | | | | | | | | | | | | | | | | |
Net assets, end of period (000s) | | $ | 49,334 | | | $ | 49,088 | | | $ | 58,071 | | | $ | 90,619 | | | $ | 30,764 | |
Ratio of gross expense to average net assets | | | 0.88 | % | | | 0.87 | % | | | 0.85 | % | | | 0.85 | % | | | 0.89 | % |
Ratio of net expense to average net assets | | | 0.55 | % | | | 0.55 | % | | | 0.59 | % | | | 0.65 | % | | | 0.65 | % |
Ratio of investment income less gross expenses to average net assets | | | 2.67 | % | | | 3.13 | % | | | 2.86 | % | | | 2.59 | % | | | 2.15 | % |
Ratio of net investment income to average net assets | | | 3.00 | % | | | 3.45 | % | | | 3.11 | % | | | 2.79 | % | | | 2.39 | % |
Portfolio turnover rate | | | 65 | % | | | 72 | % | | | 66 | % | | | 78 | % | | | 52 | % |
The Fund commenced operations on May 8, 2014. | |
| | | Payden Absolute Return Bond Fund - Investor Class | |
| | | 2020 | | | 2019 | | | 2018 | | | 2017 | | | 2016 | |
Net asset value — beginning of period | | $ | 10.06 | | | $ | 9.93 | | | $ | 10.09 | | | $ | 9.99 | | | $ | 9.92 | |
| | | | | | | | | | | | | | | | | | | | |
Income (loss) from investment activities: | | | | | | | | | | | | | | | | | | | | |
Net investment income | | | 0.25 | | | | 0.32 | | | | 0.28 | | | | 0.25 | | | | 0.27 | |
Net realized and unrealized gains (losses) | | | (0.13 | ) | | | 0.16 | | | | (0.14 | ) | | | 0.09 | | | | 0.05 | |
| | | | | | | | | | | | | | | | | | | | |
Total from investment activities | | | 0.12 | | | | 0.48 | | | | 0.14 | | | | 0.34 | | | | 0.32 | |
| | | | | | | | | | | | | | | | | | | | |
Distributions to shareholders: | | | | | | | | | | | | | | | | | | | | |
From net investment income | | | (0.26 | ) | | | (0.35 | ) | | | (0.30 | ) | | | (0.24 | ) | | | (0.25 | ) |
| | | | | | | | | | | | | | | | | | | | |
Net asset value — end of period | | $ | 9.92 | | | $ | 10.06 | | | $ | 9.93 | | | $ | 10.09 | | | $ | 9.99 | |
| | | | | | | | | | | | | | | | | | | | |
Total return | | | 1.23 | % | | | 4.93 | % | | | 1.40 | % | | | 3.42 | % | | | 3.32 | % |
| | | | | | | | | | | | | | | | | | | | |
Ratios/supplemental data: | | | | | | | | | | | | | | | | | | | | |
Net assets, end of period (000s) | | $ | 132,299 | | | $ | 124,347 | | | $ | 105,026 | | | $ | 86,883 | | | $ | 63,996 | |
Ratio of gross expense to average net assets | | | 0.74 | % | | | 0.75 | % | | | 0.84 | % | | | 0.89 | % | | | 0.97 | % |
Ratio of net expense to average net assets | | | 0.70 | % | | | 0.70 | % | | | 0.70 | % | | | 0.70 | % | | | 0.70 | % |
Ratio of investment income less gross expenses to average net assets | | | 2.44 | % | | | 3.21 | % | | | 2.63 | % | | | 2.27 | % | | | 2.45 | % |
Ratio of net investment income to average net assets | | | 2.48 | % | | | 3.26 | % | | | 2.77 | % | | | 2.46 | % | | | 2.73 | % |
Portfolio turnover rate | | | 67 | % | | | 82 | % | | | 145 | % | | | 112 | % | | | 47 | % |
The Fund commenced operations on November 6, 2014.
(1) Amount is less than $0.005.
See notes to financial statements.
154 Payden Mutual Funds
| | | | | | | | | | | | | | | | | | | | |
| | | Payden Absolute Return Bond Fund - SI Class | |
| | | 2020 | | | 2019 | | | 2018 | | | 2017 | | | 2016 | |
Net asset value — beginning of period | | $ | 10.07 | | | $ | 9.93 | | | $ | 10.09 | | | $ | 10.00 | | | $ | 9.93 | |
| | | | | | | | | | | | | | | | | | | | |
Income (loss) from investment activities: | | | | | | | | | | | | | | | | | | | | |
Net investment income | | | 0.27 | | | | 0.37 | | | | 0.26 | | | | 0.25 | | | | 0.33 | |
Net realized and unrealized gains (losses) | | | (0.13 | ) | | | 0.15 | | | | (0.11 | ) | | | 0.09 | | | | 0.01 | |
| | | | | | | | | | | | | | | | | | | | |
Total from investment activities | | | 0.14 | | | | 0.52 | | | | 0.15 | | | | 0.34 | | | | 0.34 | |
| | | | | | | | | | | | | | | | | | | | |
Distributions to shareholders: | | | | | | | | | | | | | | | | | | | | |
From net investment income | | | (0.28 | ) | | | (0.38 | ) | | | (0.31 | ) | | | (0.25 | ) | | | (0.27 | ) |
| | | | | | | | | | | | | | | | | | | | |
Net asset value — end of period | | $ | 9.93 | | | $ | 10.07 | | | $ | 9.93 | | | $ | 10.09 | | | $ | 10.00 | |
| | | | | | | | | | | | | | | | | | | | |
Total return | | | 1.45 | % | | | 5.30 | % | | | 1.55 | % | | | 3.47 | % | | | 3.47 | % |
| | | | | | | | | | | | | | | | | | | | |
Ratios/supplemental data: | | | | | | | | | | | | | | | | | | | | |
Net assets, end of period (000s) | | $ | 686,397 | | | $ | 514,279 | | | $ | 34,229 | | | $ | 17,050 | | | $ | 13,055 | |
Ratio of gross expense to average net assets | | | 0.74 | % | | | 0.74 | % | | | 0.84 | % | | | 0.90 | % | | | 0.99 | % |
Ratio of net expense to average net assets | | | 0.47 | % | | | 0.47 | % | | | 0.55 | % | | | 0.55 | % | | | 0.55 | % |
Ratio of investment income less gross expenses to average net assets | | | 2.44 | % | | | 3.13 | % | | | 2.67 | % | | | 2.27 | % | | | 2.43 | % |
Ratio of net investment income to average net assets | | | 2.71 | % | | | 3.40 | % | | | 2.96 | % | | | 2.61 | % | | | 2.86 | % |
Portfolio turnover rate | | | 67 | % | | | 82 | % | | | 145 | % | | | 112 | % | | | 47 | % |
The Fund commenced operations on November 6, 2014.
| | | | | | | | | | | | | | | | | | | | |
| | | Payden Floating Rate Fund - Investor Class | |
| | | 2020 | | | 2019 | | | 2018 | | | 2017 | | | 2016 | |
Net asset value — beginning of period | | $ | 9.89 | | | $ | 9.93 | | | $ | 10.00 | | | $ | 9.99 | | | $ | 9.89 | |
| | | | | | | | | | | | | | | | | | | | |
Income from investment activities: | | | | | | | | | | | | | | | | | | | | |
Net investment income | | | 0.33 | | | | 0.48 | | | | 0.39 | | | | 0.34 | | | | 0.34 | |
Net realized and unrealized gains (losses) | | | (0.38 | ) | | | (0.06 | ) | | | (0.08 | ) | | | 0.01 | | | | 0.10 | |
| | | | | | | | | | | | | | | | | | | | |
Total from investment activities | | | (0.05 | ) | | | 0.42 | | | | 0.31 | | | | 0.35 | | | | 0.44 | |
| | | | | | | | | | | | | | | | | | | | |
Distributions to shareholders: | | | | | | | | | | | | | | | | | | | | |
From net investment income | | | (0.33 | ) | | | (0.46 | ) | | | (0.38 | ) | | | (0.34 | ) | | | (0.34 | ) |
Return of capital | | | — | | | | (0.00 | )(1) | | | — | | | | — | | | | — | |
| | | | | | | | | | | | | | | | | | | | |
Total distributions to shareholders | | | (0.33 | ) | | | (0.46 | ) | | | (0.38 | ) | | | (0.34 | ) | | | (0.34 | ) |
| | | | | | | | | | | | | | | | | | | | |
Net asset value — end of period | | $ | 9.51 | | | $ | 9.89 | | | $ | 9.93 | | | $ | 10.00 | | | $ | 9.99 | |
| | | | | | | | | | | | | | | | | | | | |
Total return | | | (0.41 | )% | | | 4.33 | % | | | 3.15 | % | | | 3.51 | % | | | 4.59 | % |
| | | | | | | | | | | | | | | | | | | | |
Ratios/supplemental data: | | | | | | | | | | | | | | | | | | | | |
Net assets, end of period (000s) | | $ | 19,569 | | | $ | 21,962 | | | $ | 51,467 | | | $ | 63,804 | | | $ | 64,649 | |
Ratio of gross expense to average net assets | | | 0.97 | % | | | 0.89 | % | | | 0.85 | % | | | 0.83 | % | | | 0.85 | % |
Ratio of net expense to average net assets | | | 0.75 | % | | | 0.75 | % | | | 0.75 | % | | | 0.75 | % | | | 0.75 | % |
Ratio of investment income less gross expenses to average net assets | | | 3.22 | % | | | 4.22 | % | | | 3.65 | % | | | 3.25 | % | | | 3.38 | % |
Ratio of net investment income to average net assets | | | 3.44 | % | | | 4.36 | % | | | 3.75 | % | | | 3.34 | % | | | 3.47 | % |
Portfolio turnover rate | | | 53 | % | | | 29 | % | | | 91 | % | | | 107 | % | | | 41 | % |
The Fund commenced operations on November 11, 2013.
(1) Amount is less than $0.005.
See notes to financial statements.
Annual Report 155
| | |
Financial Highlights continued | | |
| | | | | | | | | | | | | | | | | | | | |
| | | Payden Floating Rate Fund - SI Class | |
| | | 2020 | | | 2019 | | | 2018 | | | 2017 | | | 2016 | |
Net asset value — beginning of period | | $ | 9.90 | | | $ | 9.94 | | | $ | 10.01 | | | $ | 10.00 | | | $ | 9.90 | |
| | | | | | | | | | | | | | | | | | | | |
Income from investment activities: | | | | | | | | | | | | | | | | | | | | |
Net investment income | | | 0.33 | | | | 0.44 | | | | 0.39 | | | | 0.35 | | | | 0.35 | |
Net realized and unrealized gains (losses) | | | (0.38 | ) | | | (0.01 | ) | | | (0.07 | ) | | | 0.01 | | | | 0.10 | |
| | | | | | | | | | | | | | | | | | | | |
Total from investment activities | | | (0.05 | ) | | | 0.43 | | | | 0.32 | | | | 0.36 | | | | 0.45 | |
| | | | | | | | | | | | | | | | | | | | |
Distributions to shareholders: | | | | | | | | | | | | | | | | | | | | |
From net investment income | | | (0.34 | ) | | | (0.47 | ) | | | (0.39 | ) | | | (0.35 | ) | | | (0.35 | ) |
Return of capital | | | — | | | | (0.00 | )(1) | | | — | | | | — | | | | — | |
| | | | | | | | | | | | | | | | | | | | |
Total distributions to shareholders | | | (0.34 | ) | | | (0.47 | ) | | | (0.39 | ) | | | (0.35 | ) | | | (0.35 | ) |
| | | | | | | | | | | | | | | | | | | | |
Net asset value — end of period | | $ | 9.51 | | | $ | 9.90 | | | $ | 9.94 | | | $ | 10.01 | | | $ | 10.00 | |
| | | | | | | | | | | | | | | | | | | | |
Total return | | | (0.41 | )% | | | 4.48 | % | | | 3.25 | % | | | 3.73 | % | | | 4.58 | % |
| | | | | | | | | | | | | | | | | | | | |
Ratios/supplemental data: | | | | | | | | | | | | | | | | | | | | |
Net assets, end of period (000s) | | $ | 47,606 | | | $ | 54,924 | | | $ | 104,837 | | | $ | 128,586 | | | $ | 122,809 | |
Ratio of gross expense to average net assets | | | 0.97 | % | | | 0.89 | % | | | 0.85 | % | | | 0.83 | % | | | 0.85 | % |
Ratio of net expense to average net assets | | | 0.65 | % | | | 0.65 | % | | | 0.65 | % | | | 0.65 | % | | | 0.65 | % |
Ratio of investment income less gross expenses to average net assets | | | 3.23 | % | | | 4.23 | % | | | 3.66 | % | | | 3.25 | % | | | 3.38 | % |
Ratio of net investment income to average net assets | | | 3.55 | % | | | 4.48 | % | | | 3.86 | % | | | 3.43 | % | | | 3.58 | % |
Portfolio turnover rate | | | 53 | % | | | 29 | % | | | 91 | % | | | 107 | % | | | 41 | % |
The Fund commenced operations on November 11, 2013. | |
| | | Payden High Income Fund | |
| | | 2020 | | | 2019 | | | 2018 | | | 2017 | | | 2016 | |
Net asset value — beginning of period | | $ | 6.53 | | | $ | 6.25 | | | $ | 6.59 | | | $ | 6.46 | | | $ | 6.40 | |
| | | | | | | | | | | | | | | | | | | | |
Income (loss) from investment activities: | | | | | | | | | | | | | | | | | | | | |
Net investment income | | | 0.34 | | | | 0.35 | | | | 0.35 | | | | 0.34 | | | | 0.33 | |
Net realized and unrealized gains (losses) | | | (0.08 | ) | | | 0.28 | | | | (0.34 | ) | | | 0.14 | | | | 0.06 | |
| | | | | | | | | | | | | | | | | | | | |
Total from investment activities | | | 0.26 | | | | 0.63 | | | | 0.01 | | | | 0.48 | | | | 0.39 | |
| | | | | | | | | | | | | | | | | | | | |
Distributions to shareholders: | | | | | | | | | | | | | | | | | | | | |
From net investment income | | | (0.34 | ) | | | (0.35 | ) | | | (0.35 | ) | | | (0.35 | ) | | | (0.33 | ) |
From net realized gains | | | — | | | | — | | | | — | | | | (0.00 | )(1) | | | — | |
| | | | | | | | | | | | | | | | | | | | |
Total distributions to shareholders | | | (0.34 | ) | | | (0.35 | ) | | | (0.35 | ) | | | (0.35 | ) | | | (0.33 | ) |
| | | | | | | | | | | | | | | | | | | | |
Net asset value — end of period | | $ | 6.45 | | | $ | 6.53 | | | $ | 6.25 | | | $ | 6.59 | | | $ | 6.46 | |
| | | | | | | | | | | | | | | | | | | | |
Total return | | | 4.23 | % | | | 10.37 | % | | | 0.16 | % | | | 7.60 | % | | | 6.33 | % |
| | | | | | | | | | | | | | | | | | | | |
Ratios/supplemental data: | | | | | | | | | | | | | | | | | | | | |
Net assets, end of period (000s) | | $ | 525,196 | | | $ | 440,406 | | | $ | 449,939 | | | $ | 533,635 | | | $ | 587,215 | |
Ratio of gross expense to average net assets | | | 0.62 | % | | | 0.62 | % | | | 0.62 | % | | | 0.65 | % | | | 0.66 | % |
Ratio of net expense to average net assets | | | 0.62 | % | | | 0.62 | % | | | 0.62 | % | | | 0.65 | % | | | 0.66 | % |
Ratio of investment income less gross expenses to average net assets | | | 5.28 | % | | | 5.41 | % | | | 5.36 | % | | | 5.14 | % | | | 5.16 | % |
Ratio of net investment income to average net assets | | | 5.28 | % | | | 5.41 | % | | | 5.36 | % | | | 5.14 | % | | | 5.16 | % |
Portfolio turnover rate | | | 124 | % | | | 74 | % | | | 62 | % | | | 67 | % | | | 44 | % |
The Fund commenced operations on December 30, 1997.
(1) Amount is less than $0.005.
See notes to financial statements.
156 Payden Mutual Funds
| | | | | | | | | | | | | | | | | | | | |
| | | Payden California Municipal Social Impact Fund | |
| | | 2020 | | | 2019 | | | 2018 | | | 2017 | | | 2016 | |
Net asset value — beginning of period | | $ | 10.62 | | | $ | 9.98 | | | $ | 10.28 | | | $ | 10.41 | | | $ | 10.39 | |
| | | | | | | | | | | | | | | | | | | | |
Income (loss) from investment activities: | | | | | | | | | | | | | | | | | | | | |
Net investment income | | | 0.22 | | | | 0.26 | | | | 0.22 | | | | 0.19 | | | | 0.19 | |
Net realized and unrealized gains (losses) | | | 0.18 | | | | 0.65 | | | | (0.26 | ) | | | 0.03 | | | | 0.14 | |
| | | | | | | | | | | | | | | | | | | | |
Total from investment activities | | | 0.40 | | | | 0.91 | | | | (0.04 | ) | | | 0.22 | | | | 0.33 | |
| | | | | | | | | | | | | | | | | | | | |
Distributions to shareholders: | | | | | | | | | | | | | | | | | | | | |
From net investment income | | | (0.22 | ) | | | (0.26 | ) | | | (0.22 | ) | | | (0.19 | ) | | | (0.19 | ) |
From net realized gains | | | (0.22 | ) | | | (0.01 | ) | | | (0.04 | ) | | | (0.16 | ) | | | (0.12 | ) |
| | | | | | | | | | | | | | | | | | | | |
Total distributions to shareholders | | | (0.44 | ) | | | (0.27 | ) | | | (0.26 | ) | | | (0.35 | ) | | | (0.31 | ) |
| | | | | | | | | | | | | | | | | | | | |
Net asset value — end of period | | $ | 10.58 | | | $ | 10.62 | | | $ | 9.98 | | | $ | 10.28 | | | $ | 10.41 | |
| | | | | | | | | | | | | | | | | | | | |
Total return | | | 3.90 | % | | | 9.22 | % | | | (0.39 | )% | | | 2.28 | % | | | 3.22 | % |
| | | | | | | | | | | | | | | | | | | | |
Ratios/supplemental data: | | | | | | | | | | | | | | | | | | | | |
Net assets, end of period (000s) | | $ | 64,088 | | | $ | 61,866 | | | $ | 57,140 | | | $ | 57,645 | | | $ | 55,808 | |
Ratio of gross expense to average net assets | | | 0.81 | % | | | 0.70 | % | | | 0.68 | % | | | 0.70 | % | | | 0.71 | % |
Ratio of net expense to average net assets | | | 0.53 | % | | | 0.53 | % | | | 0.53 | % | | | 0.54 | % | | | 0.55 | % |
Ratio of investment income less gross expenses to average net assets | | | 1.80 | % | | | 2.29 | % | | | 2.05 | % | | | 1.72 | % | | | 1.62 | % |
Ratio of net investment income to average net assets | | | 2.08 | % | | | 2.46 | % | | | 2.20 | % | | | 1.89 | % | | | 1.78 | % |
Portfolio turnover rate | | | 209 | % | | | 132 | % | | | 161 | % | | | 157 | % | | | 57 | % |
The Fund commenced operations on December 17, 1998. | |
| | | Payden Global Low Duration Fund | |
| | | 2020 | | | 2019 | | | 2018 | | | 2017 | | | 2016 | |
Net asset value — beginning of period | | $ | 10.04 | | | $ | 9.87 | | | $ | 10.06 | | | $ | 10.05 | | | $ | 10.01 | |
| | | | | | | | | | | | | | | | | | | | |
Income (loss) from investment activities: | | | | | | | | | | | | | | | | | | | | |
Net investment income | | | 0.19 | | | | 0.28 | | | | 0.23 | | | | 0.17 | | | | 0.11 | |
Net realized and unrealized gains (losses) | | | 0.07 | | | | 0.17 | | | | (0.19 | ) | | | (0.00 | )(1) | | | 0.05 | |
| | | | | | | | | | | | | | | | | | | | |
Total from investment activities | | | 0.26 | | | | 0.45 | | | | 0.04 | | | | 0.17 | | | | 0.16 | |
| | | | | | | | | | | | | | | | | | | | |
Distributions to shareholders: | | | | | | | | | | | | | | | | | | | | |
From net investment income | | | (0.20 | ) | | | (0.28 | ) | | | (0.23 | ) | | | (0.08 | ) | | | (0.09 | ) |
Return of capital | | | (0.00 | )(1) | | | (0.00 | )(1) | | | (0.00 | )(1) | | | (0.08 | ) | | | (0.03 | ) |
| | | | | | | | | | | | | | | | | | | | |
Total distributions to shareholders | | | (0.20 | ) | | | (0.28 | ) | | | (0.23 | ) | | | (0.16 | ) | | | (0.12 | ) |
| | | | | | | | | | | | | | | | | | | | |
Net asset value — end of period | | $ | 10.10 | | | $ | 10.04 | | | $ | 9.87 | | | $ | 10.06 | | | $ | 10.05 | |
| | | | | | | | | | | | | | | | | | | | |
Total return | | | 2.63 | % | | | 4.61 | % | | | 0.42 | % | | | 1.66 | % | | | 1.61 | % |
| | | | | | | | | | | | | | | | | | | | |
Ratios/supplemental data: | | | | | | | | | | | | | | | | | | | | |
Net assets, end of period (000s) | | $ | 96,311 | | | $ | 91,028 | | | $ | 93,737 | | | $ | 113,405 | | | $ | 135,217 | |
Ratio of gross expense to average net assets | | | 0.72 | % | | | 0.69 | % | | | 0.67 | % | | | 0.66 | % | | | 0.66 | % |
Ratio of net expense to average net assets | | | 0.53 | % | | | 0.53 | % | | | 0.53 | % | | | 0.54 | % | | | 0.55 | % |
Ratio of investment income less gross expenses to average net assets | | | 1.76 | % | | | 2.63 | % | | | 2.13 | % | | | 1.49 | % | | | 1.02 | % |
Ratio of net investment income to average net assets | | | 1.95 | % | | | 2.78 | % | | | 2.28 | % | | | 1.61 | % | | | 1.14 | % |
Portfolio turnover rate | | | 197 | % | | | 107 | % | | | 55 | % | | | 108 | % | | | 41 | % |
The Fund commenced operations on September 18, 1996.
(1) Amount is less than $0.005.
See notes to financial statements.
Annual Report 157
| | |
Financial Highlights continued | | |
| | | | | | | | | | | | | | | | | | | | |
| | | Payden Global Fixed Income Fund | |
| | | 2020 | | | 2019 | | | 2018 | | | 2017 | | | 2016 | |
Net asset value — beginning of period | | $ | 9.24 | | | $ | 8.89 | | | $ | 9.11 | | | $ | 9.04 | | | $ | 8.87 | |
| | | | | | | | | | | | | | | | | | | | |
Income (loss) from investment activities: | | | | | | | | | | | | | | | | | | | | |
Net investment income | | | 0.23 | | | | 0.19 | | | | 0.16 | | | | 0.14 | | | | 0.13 | |
Net realized and unrealized gains (losses) | | | 0.12 | | | | 0.63 | | | | (0.19 | ) | | | 0.08 | | | | 0.27 | |
| | | | | | | | | | | | | | | | | | | | |
Total from investment activities | | | 0.35 | | | | 0.82 | | | | (0.03 | ) | | | 0.22 | | | | 0.40 | |
| | | | | | | | | | | | | | | | | | | | |
Distributions to shareholders: | | | | | | | | | | | | | | | | | | | | |
From net investment income | | | (0.26 | ) | | | (0.47 | ) | | | (0.19 | ) | | | (0.15 | ) | | | (0.11 | ) |
From net realized gains | | | — | | | | — | | | | — | | | | — | | | | (0.10 | ) |
Return of capital | | | — | | | | — | | | | — | | | | — | | | | (0.02 | ) |
| | | | | | | | | | | | | | | | | | | | |
Total distributions to shareholders | | | (0.26 | ) | | | (0.47 | ) | | | (0.19 | ) | | | (0.15 | ) | | | (0.23 | ) |
| | | | | | | | | | | | | | | | | | | | |
Net asset value — end of period | | $ | 9.33 | | | $ | 9.24 | | | $ | 8.89 | | | $ | 9.11 | | | $ | 9.04 | |
| | | | | | | | | | | | | | | | | | | | |
Total return | | | 3.87 | % | | | 9.56 | % | | | (0.39 | )% | | | 2.48 | % | | | 4.68 | % |
| | | | | | | | | | | | | | | | | | | | |
Ratios/supplemental data: | | | | | | | | | | | | | | | | | | | | |
Net assets, end of period (000s) | | $ | 180,074 | | | $ | 138,387 | | | $ | 129,003 | | | $ | 124,647 | | | $ | 111,109 | |
Ratio of gross expense to average net assets | | | 0.78 | % | | | 0.78 | % | | | 0.76 | % | | | 0.78 | % | | | 0.80 | % |
Ratio of net expense to average net assets | | | 0.70 | % | | | 0.70 | % | | | 0.69 | % | | | 0.65 | % | | | 0.65 | % |
Ratio of investment income less gross expenses to average net assets | | | 1.43 | % | | | 1.81 | % | | | 1.70 | % | | | 1.48 | % | | | 1.39 | % |
Ratio of net investment income to average net assets | | | 1.51 | % | | | 1.88 | % | | | 1.78 | % | | | 1.60 | % | | | 1.55 | % |
Portfolio turnover rate | | | 88 | % | | | 67 | % | | | 49 | % | | | 58 | % | | | 76 | % |
The Fund commenced operations on September 1, 1992. | |
| | | Payden Emerging Markets Bond Fund - Adviser Class | |
| | | 2020 | | | 2019 | | | 2018 | | | 2017 | | | 2016 | |
Net asset value — beginning of period | | $ | 13.59 | | | $ | 12.69 | | | $ | 14.22 | | | $ | 13.96 | | | $ | 13.10 | |
| | | | | | | | | | | | | | | | | | | | |
Income (loss) from investment activities: | | | | | | | | | | | | | | | | | | | | |
Net investment income | | | 0.64 | (1) | | | 0.73 | | | | 0.72 | | | | 0.75 | | | | 0.66 | |
Net realized and unrealized gains (losses) | | | (0.61 | ) | | | 0.90 | | | | (1.53 | ) | | | 0.26 | | | | 0.92 | |
| | | | | | | | | | | | | | | | | | | | |
Total from investment activities | | | 0.03 | | | | 1.63 | | | | (0.81 | ) | | | 1.01 | | | | 1.58 | |
| | | | | | | | | | | | | | | | | | | | |
Distributions to shareholders: | | | | | | | | | | | | | | | | | | | | |
From net investment income | | | (0.62 | ) | | | (0.73 | ) | | | (0.66 | ) | | | (0.72 | ) | | | (0.72 | ) |
Return of capital | | | — | | | | — | | | | (0.06 | ) | | | (0.03 | ) | | | — | |
| | | | | | | | | | | | | | | | | | | | |
Total distributions to shareholders | | | (0.62 | ) | | | (0.73 | ) | | | (0.72 | ) | | | (0.75 | ) | | | (0.72 | ) |
| | | | | | | | | | | | | | | | | | | | |
Net asset value — end of period | | $ | 13.00 | | | $ | 13.59 | | | $ | 12.69 | | | $ | 14.22 | | | $ | 13.96 | |
| | | | | | | | | | | | | | | | | | | | |
Total return | | | 0.33 | % | | | 13.14 | % | | | (5.86 | )% | | | 7.50 | % | | | 12.46 | % |
| | | | | | | | | | | | | | | | | | | | |
Ratios/supplemental data: | | | | | | | | | | | | | | | | | | | | |
Net assets, end of period (000s) | | $ | 52,306 | | | $ | 67,090 | | | $ | 82,007 | | | $ | 131,677 | | | $ | 76,182 | |
Ratio of gross expense to average net assets | | | 0.98 | % | | | 0.97 | % | | | 1.00 | % | | | 1.00 | % | | | 1.00 | % |
Ratio of net expense to average net assets | | | 0.98 | % | | | 0.97 | % | | | 1.00 | % | | | 1.00 | % | | | 1.00 | % |
Ratio of investment income less gross expenses to average net assets | | | 4.86 | % | | | 5.40 | % | | | 5.31 | % | | | 5.36 | % | | | 5.08 | % |
Ratio of net investment income to average net assets | | | 4.86 | % | | | 5.40 | % | | | 5.31 | % | | | 5.36 | % | | | 5.08 | % |
Portfolio turnover rate | | | 79 | % | | | 73 | % | | | 63 | % | | | 48 | % | | | 46 | % |
The Class commenced operations on November 2, 2009.
(1) Based on average shares outstanding.
See notes to financial statements.
158 Payden Mutual Funds
| | | | | | | | | | | | | | | | | | | | |
| | | Payden Emerging Markets Bond Fund - Investor Class | |
| | | 2020 | | | 2019 | | | 2018 | | | 2017 | | | 2016 | |
Net asset value — beginning of period | | $ | 13.58 | | | $ | 12.68 | | | $ | 14.21 | | | $ | 13.95 | | | $ | 13.08 | |
| | | | | | | | | | | | | | | | | | | | |
Income (loss) from investment activities: | | | | | | | | | | | | | | | | | | | | |
Net investment income | | | 0.68 | (1) | | | 0.75 | | | | 0.77 | | | | 0.77 | | | | 0.73 | |
Net realized and unrealized gains (losses) | | | (0.62 | ) | | | 0.91 | | | | (1.54 | ) | | | 0.27 | | | | 0.89 | |
| | | | | | | | | | | | | | | | | | | | |
Total from investment activities | | | 0.06 | | | | 1.66 | | | | (0.77 | ) | | | 1.04 | | | | 1.62 | |
| | | | | | | | | | | | | | | | | | | | |
Distributions to shareholders: | | | | | | | | | | | | | | | | | | | | |
From net investment income | | | (0.65 | ) | | | (0.76 | ) | | | (0.70 | ) | | | (0.75 | ) | | | (0.75 | ) |
Return of capital | | | — | | | | — | | | | (0.06 | ) | | | (0.03 | ) | | | — | |
| | | | | | | | | | | | | | | | | | | | |
Total distributions to shareholders | | | (0.65 | ) | | | (0.76 | ) | | | (0.76 | ) | | | (0.78 | ) | | | (0.75 | ) |
| | | | | | | | | | | | | | | | | | | | |
Net asset value — end of period | | $ | 12.99 | | | $ | 13.58 | | | $ | 12.68 | | | $ | 14.21 | | | $ | 13.95 | |
| | | | | | | | | | | | | | | | | | | | |
Total return | | | 0.58 | % | | | 13.45 | % | | | (5.64 | )% | | | 7.76 | % | | | 12.75 | % |
| | | | | | | | | | | | | | | | | | | | |
Ratios/supplemental data: | | | | | | | | | | | | | | | | | | | | |
Net assets, end of period (000s) | | $ | 282,521 | | | $ | 409,458 | | | $ | 404,580 | | | $ | 538,525 | | | $ | 478,082 | |
Ratio of gross expense to average net assets | | | 0.73 | % | | | 0.72 | % | | | 0.75 | % | | | 0.75 | % | | | 0.75 | % |
Ratio of net expense to average net assets | | | 0.73 | % | | | 0.72 | % | | | 0.75 | % | | | 0.75 | % | | | 0.75 | % |
Ratio of investment income less gross expenses to average net assets | | | 5.16 | % | | | 5.65 | % | | | 5.56 | % | | | 5.60 | % | | | 5.45 | % |
Ratio of net investment income to average net assets | | | 5.16 | % | | | 5.65 | % | | | 5.56 | % | | | 5.60 | % | | | 5.45 | % |
Portfolio turnover rate | | | 79 | % | | | 73 | % | | | 63 | % | | | 48 | % | | | 46 | % |
The Fund commenced operations on December 17, 1998. | |
| | | Payden Emerging Markets Bond Fund - SI Class | |
| | | 2020 | | | 2019 | | | 2018 | | | 2017 | | | 2016 | |
Net asset value — beginning of period | | $ | 13.56 | | | $ | 12.67 | | | $ | 14.19 | | | $ | 13.93 | | | $ | 13.07 | |
| | | | | | | | | | | | | | | | | | | | |
Income from investment activities: | | | | | | | | | | | | | | | | | | | | |
Net investment income | | | 0.67 | (1) | | | 0.81 | | | | 0.77 | | | | 0.78 | | | | 0.74 | |
Net realized and unrealized gains (losses) | | | (0.60 | ) | | | 0.85 | | | | (1.52 | ) | | | 0.27 | | | | 0.88 | |
| | | | | | | | | | | | | | | | | | | | |
Total from investment activities | | | 0.07 | | | | 1.66 | | | | (0.75 | ) | | | 1.05 | | | | 1.62 | |
| | | | | | | | | | | | | | | | | | | | |
Distributions to shareholders: | | | | | | | | | | | | | | | | | | | | |
From net investment income | | | (0.66 | ) | | | (0.77 | ) | | | (0.71 | ) | | | (0.75 | ) | | | (0.76 | ) |
Return of capital | | | — | | | | — | | | | (0.06 | ) | | | (0.04 | ) | | | — | |
| | | | | | | | | | | | | | | | | | | | |
Total distributions to shareholders | | | (0.66 | ) | | | (0.77 | ) | | | (0.77 | ) | | | (0.79 | ) | | | (0.76 | ) |
| | | | | | | | | | | | | | | | | | | | |
Net asset value — end of period | | $ | 12.97 | | | $ | 13.56 | | | $ | 12.67 | | | $ | 14.19 | | | $ | 13.93 | |
| | | | | | | | | | | | | | | | | | | | |
Total return | | | 0.64 | % | | | 13.41 | % | | | (5.51 | )% | | | 7.83 | % | | | 12.76 | % |
| | | | | | | | | | | | | | | | | | | | |
Ratios/supplemental data: | | | | | | | | | | | | | | | | | | | | |
Net assets, end of period (000s) | | $ | 660,615 | | | $ | 582,062 | | | $ | 792,357 | | | $ | 693,577 | | | $ | 604,978 | |
Ratio of gross expense to average net assets | | | 0.74 | % | | | 0.73 | % | | | 0.75 | % | | | 0.75 | % | | | 0.75 | % |
Ratio of net expense to average net assets | | | 0.69 | % | | | 0.69 | % | | | 0.69 | % | | | 0.69 | % | | | 0.69 | % |
Ratio of investment income less gross expenses to average net assets | | | 5.06 | % | | | 5.68 | % | | | 5.61 | % | | | 5.59 | % | | | 5.46 | % |
Ratio of net investment income to average net assets | | | 5.11 | % | | | 5.72 | % | | | 5.67 | % | | | 5.65 | % | | | 5.52 | % |
Portfolio turnover rate | | | 79 | % | | | 73 | % | | | 63 | % | | | 48 | % | | | 46 | % |
The Class commenced operations on April 9, 2012.
(1) Based on average shares outstanding.
See notes to financial statements.
Annual Report 159
| | |
Financial Highlights continued | | |
| | | | | | | | | | | | | | | | | | | | |
| | | Payden Emerging Markets Local Bond Fund | |
| | | 2020 | | | 2019 | | | 2018 | | | 2017 | | | 2016 | |
Net asset value — beginning of period | | $ | 6.50 | | | $ | 5.97 | | | $ | 6.90 | | | $ | 6.95 | | | $ | 6.66 | |
| | | | | | | | | | | | | | | | | | | | |
Income from investment activities: | | | | | | | | | | | | | | | | | | | | |
Net investment income | | | 0.58 | | | | 0.37 | | | | 0.42 | | | | 0.43 | | | | 0.37 | |
Net realized and unrealized gains (losses) | | | (0.93 | ) | | | 0.52 | | | | (0.93 | ) | | | (0.05 | ) | | | 0.28 | |
| | | | | | | | | | | | | | | | | | | | |
Total from investment activities | | | (0.35 | ) | | | 0.89 | | | | (0.51 | ) | | | 0.38 | | | | 0.65 | |
| | | | | | | | | | | | | | | | | | | | |
Distributions to shareholders: | | | | | | | | | | | | | | | | | | | | |
From net investment income | | | — | | | | (0.15 | ) | | | (0.08 | ) | | | (0.40 | ) | | | — | |
Return of capital | | | (0.31 | ) | | | (0.21 | ) | | | (0.34 | ) | | | (0.03 | ) | | | (0.36 | ) |
| | | | | | | | | | | | | | | | | | | | |
Total distributions to shareholders | | | (0.31 | ) | | | (0.36 | ) | | | (0.42 | ) | | | (0.43 | ) | | | (0.36 | ) |
| | | | | | | | | | | | | | | | | | | | |
Proceeds from redemption fees | | | | | | | | | | | | | | | | | | | | |
Net asset value — end of period | | $ | 5.84 | | | $ | 6.50 | | | $ | 5.97 | | | $ | 6.90 | | | $ | 6.95 | |
| | | | | | | | | | | | | | | | | | | | |
Total return | | | (5.41 | )% | | | 15.34 | % | | | (7.98 | )% | | | 5.63 | % | | | 10.11 | % |
| | | | | | | | | | | | | | | | | | | | |
Ratios/supplemental data: | | | | | | | | | | | | | | | | | | | | |
Net assets, end of period (000s) | | $ | 128,212 | | | $ | 216,368 | | | $ | 203,978 | | | $ | 180,942 | | | $ | 156,240 | |
Ratio of gross expense to average net assets | | | 0.93 | % | | | 0.91 | % | | | 0.84 | % | | | 1.08 | % | | | 0.96 | % |
Ratio of net expense to average net assets | | | 0.93 | % | | | 0.91 | % | | | 0.92 | % | | | 0.98 | % | | | 0.98 | % |
Ratio of investment income less gross expenses to average net assets | | | 5.08 | % | | | 5.71 | % | | | 6.25 | % | | | 6.14 | % | | | 5.46 | % |
Ratio of net investment income to average net assets | | | 5.08 | % | | | 5.71 | % | | | 6.17 | % | | | 6.25 | % | | | 5.44 | % |
Portfolio turnover rate . | | | 54 | % | | | 62 | % | | | 69 | % | | | 61 | % | | | 68 | % |
The Fund commenced operations on November 2, 2011. | |
| | | Payden Emerging Markets Corporate Bond Fund - Investor Class | |
| | | 2020 | | | 2019 | | | 2018 | | | 2017 | | | 2016 | |
Net asset value — beginning of period | | $ | 9.99 | | | $ | 9.59 | | | $ | 10.33 | | | $ | 10.09 | | | $ | 9.62 | |
| | | | | | | | | | | | | | | | | | | | |
Income from investment activities: | | | | | | | | | | | | | | | | | | | | |
Net investment income | | | 0.42 | (1) | | | 0.48 | (1) | | | 0.49 | (1) | | | 0.46 | (1) | | | 0.41 | (1) |
Net realized and unrealized gains (losses) | | | 0.00 | (2) | | | 0.41 | | | | (0.72 | ) | | | 0.24 | | | | 0.47 | |
| | | | | | | | | | | | | | | | | | | | |
Total from investment activities | | | 0.42 | | | | 0.89 | | | | (0.23 | ) | | | 0.70 | | | | 0.88 | |
| | | | | | | | | | | | | | | | | | | | |
Distributions to shareholders: | | | | | | | | | | | | | | | | | | | | |
From net investment income | | | (0.40 | ) | | | (0.49 | ) | | | (0.46 | ) | | | (0.46 | ) | | | (0.41 | ) |
From net realized gains | | | — | | | | — | | | | (0.03 | ) | | | — | | | | — | |
Return of capital | | | (0.02 | ) | | | — | | | | (0.02 | ) | | | — | | | | — | |
| | | | | | | | | | | | | | | | | | | | |
Total distributions to shareholders | | | (0.42 | ) | | | (0.49 | ) | | | (0.51 | ) | | | (0.46 | ) | | | (0.41 | ) |
| | | | | | | | | | | | | | | | | | | | |
Net asset value — end of period | | $ | 9.99 | | | $ | 9.99 | | | $ | 9.59 | | | $ | 10.33 | | | $ | 10.09 | |
| | | | | | | | | | | | | | | | | | | | |
Total return | | | 4.53 | % | | | 9.46 | % | | | (2.26 | )% | | | 7.12 | % | | | 9.35 | % |
| | | | | | | | | | | | | | | | | | | | |
Ratios/supplemental data: | | | | | | | | | | | | | | | | | | | | |
Net assets, end of period (000s) | | $ | 3,845 | | | $ | 3,681 | | | $ | 4,208 | | | $ | 4,051 | | | $ | 3,655 | |
Ratio of gross expense to average net assets | | | 1.38 | % | | | 1.32 | % | | | 1.30 | % | | | 1.33 | % | | | 1.33 | % |
Ratio of net expense to average net assets | | | 0.95 | % | | | 0.95 | % | | | 0.95 | % | | | 0.95 | % | | | 0.95 | % |
Ratio of investment income less gross expenses to average net assets | | | 3.89 | % | | | 4.55 | % | | | 4.49 | % | | | 4.14 | % | | | 3.77 | % |
Ratio of net investment income to average net assets | | | 4.31 | % | | | 4.92 | % | | | 4.84 | % | | | 4.52 | % | | | 4.15 | % |
Portfolio turnover rate | | | 105 | % | | | 94 | % | | | 79 | % | | | 63 | % | | | 74 | % |
The Fund commenced operations on November 11, 2013.
(1) Based on average shares outstanding.
(2) Amount is less than $0.005.
See notes to financial statements.
160 Payden Mutual Funds
| | | | | | | | | | | | | | | | | | | | |
| | | Payden Emerging Markets Corporate Bond Fund - SI Class | |
| | | 2020 | | | 2019 | | | 2018 | | | 2017 | | | 2016 | |
Net asset value — beginning of period | | $ | 10.01 | | | $ | 9.60 | | | | 10.34 | | | $ | 10.10 | | | $ | 9.63 | |
| | | | | | | | | | | | | | | | | | | | |
Income from investment activities: | | | | | | | | | | | | | | | | | | | | |
Net investment income | | | 0.43 | (1) | | | 0.49 | (1) | | | 0.49 | (1) | | | 0.47 | (1) | | | 0.42 | (1) |
Net realized and unrealized gains (losses) | | | 0.00 | (2) | | | 0.42 | | | | (0.71 | ) | | | 0.24 | | | | 0.47 | |
| | | | | | | | | | | | | | | | | | | | |
Total from investment activities | | | 0.43 | | | | 0.91 | | | | (0.22 | ) | | | 0.71 | | | | 0.89 | |
| | | | | | | | | | | | | | | | | | | | |
Distributions to shareholders: | | | | | | | | | | | | | | | | | | | | |
From net investment income | | | (0.41 | ) | | | (0.50 | ) | | | (0.47 | ) | | | (0.47 | ) | | | (0.42 | ) |
From net realized gains | | | — | | | | — | | | | (0.03 | ) | | | — | | | | — | |
Return of capital | | | (0.02 | ) | | | — | | | | (0.02 | ) | | | — | | | | — | |
| | | | | | | | | | | | | | | | | | | | |
Total distributions to shareholders | | | (0.43 | ) | | | (0.50 | ) | | | (0.52 | ) | | | (0.47 | ) | | | (0.42 | ) |
| | | | | | | | | | | | | | | | | | | | |
Net asset value — end of period | | $ | 10.01 | | | $ | 10.01 | | | | 9.60 | | | $ | 10.34 | | | $ | 10.10 | |
| | | | | | | | | | | | | | | | | | | | |
Total return | | | 4.52 | % | | | 9.67 | % | | | (2.16 | )% | | | 7.22 | % | | | 9.44 | % |
| | | | | | | | | | | | | | | | | | | | |
Ratios/supplemental data: | | | | | | | | | | | | | | | | | | | | |
Net assets, end of period (000s) | | $ | 39,344 | | | $ | 36,825 | | | $ | 41,213 | | | $ | 36,576 | | | $ | 35,450 | |
Ratio of gross expense to average net assets | | | 1.38 | % | | | 1.32 | % | | | 1.31 | % | | | 1.33 | % | | | 1.35 | % |
Ratio of net expense to average net assets | | | 0.85 | % | | | 0.85 | % | | | 0.85 | % | | | 0.85 | % | | | 0.85 | % |
Ratio of investment income less gross expenses to average net assets | | | 3.89 | % | | | 4.54 | % | | | 4.49 | % | | | 4.13 | % | | | 3.80 | % |
Ratio of net investment income to average net assets | | | 4.41 | % | | | 5.01 | % | | | 4.95 | % | | | 4.61 | % | | | 4.29 | % |
Portfolio turnover rate | | | 105 | % | | | 94 | % | | | 79 | % | | | 63 | % | | | 74 | % |
The Fund commenced operations on November 11, 2013. (1) Based on average shares outstanding. (2) Amount is less than $0.005. | |
| | | Payden Equity Income Fund - Adviser Class | |
| | | 2020 | | | 2019 | | | 2018 | | | 2017 | | | 2016 | |
Net asset value — beginning of period | | $ | 18.13 | | | $ | 16.19 | | | $ | 16.68 | | | $ | 14.69 | | | $ | 13.98 | |
| | | | | | | | | | | | | | | | | | | | |
Income from investment activities: | | | | | | | | | | | | | | | | | | | | |
Net investment income | | | 0.32 | | | | 0.36 | | | | 0.33 | | | | 0.32 | | | | 0.36 | |
Net .realized and unrealized gains (losses) | | | (1.65 | ) | | | 2.02 | | | | 0.30 | | | | 2.08 | | | | 0.76 | |
| | | | | | | | | | | | | | | | | | | | |
Total from investment activities | | | (1.33 | ) | | | 2.38 | | | | 0.63 | | | | 2.40 | | | | 1.12 | |
| | | | | | | | | | | | | | | | | | | | |
Distributions to shareholders: | | | | | | | | | | | | | | | | | | | | |
From net investment income | | | (0.29 | ) | | | (0.33 | ) | | | (0.30 | ) | | | (0.33 | ) | | | (0.41 | ) |
From net realized gains | | | (0.52 | ) | | | (0.11 | ) | | | (0.82 | ) | | | (0.08 | ) | | | — | |
Return of capital | | | (0.03 | ) | | | — | | | | — | | | | — | | | | — | |
| | | | | | | | | | | | | | | | | | | | |
Total distributions to shareholders | | | (0.84 | ) | | | (0.44 | ) | | | (1.12 | ) | | | (0.41 | ) | | | (0.41 | ) |
| | | | | | | | | | | | | | | | | | | | |
Net asset value — end of period | | $ | 15.96 | | | $ | 18.13 | | | $ | 16.19 | | | $ | 16.68 | | | $ | 14.69 | |
| | | | | | | | | | | | | | | | | | | | |
Total return | | | (7.66 | )% | | | 15.05 | % | | | 3.69 | % | | | 16.59 | % | | | 8.06 | % |
| | | | | | | | | | | | | | | | | | | | |
Ratios/supplemental data: | | | | | | | | | | | | | | | | | | | | |
Net assets, end of period (000s) | | $ | 13,486 | | | $ | 16,039 | | | $ | 13,580 | | | $ | 14,529 | | | $ | 8,313 | |
Ratio of gross expense to average net assets | | | 0.99 | % | | | 0.99 | % | | | 0.99 | % | | | 1.05 | % | | | 1.02 | % |
Ratio of net expense to average net assets | | | 0.99 | % | | | 0.99 | % | | | 0.99 | % | | | 1.05 | % | | | 1.05 | % |
Ratio of investment income less gross expenses to average net assets | | | 1.91 | % | | | 2.11 | % | | | 1.95 | % | | | 2.18 | % | | | 2.70 | % |
Ratio of net investment income to average net assets | | | 1.91 | % | | | 2.11 | % | | | 1.95 | % | | | 2.15 | % | | | 2.67 | % |
Portfolio turnover rate | | | 63 | % | | | 49 | % | | | 42 | % | | | 60 | % | | | 25 | % |
The Class commenced operations on December 1, 2011.
See notes to financial statements.
Annual Report 161
| | |
Financial Highlights continued | | |
| | | | | | | | | | | | | | | | | | | | |
| | | Payden Equity Income Fund - Investor Class | |
| | | 2020 | | | 2019 | | | 2018 | | | 2017 | | | 2016 | |
Net asset value — beginning of period | | $ | 18.15 | | | $ | 16.20 | | | $ | 16.69 | | | $ | 14.69 | | | $ | 13.97 | |
| | | | | | | | | | | | | | | | | | | | |
Income from investment activities: | | | | | | | | | | | | | | | | | | | | |
Net investment income | | | 0.36 | | | | 0.40 | | | | 0.38 | | | | 0.39 | | | | 0.38 | |
Net realized and unrealized gains (losses) | | | (1.66 | ) | | | 2.03 | | | | 0.29 | | | | 2.06 | | | | 0.78 | |
| | | | | | | | | | | | | | | | | | | | |
Total from investment activities | | | (1.30 | ) | | | 2.43 | | | | 0.67 | | | | 2.45 | | | | 1.16 | |
| | | | | | | | | | | | | | | | | | | | |
Distributions to shareholders: | | | | | | | | | | | | | | | | | | | | |
From net investment income | | | (0.33 | ) | | | (0.37 | ) | | | (0.34 | ) | | | (0.37 | ) | | | (0.44 | ) |
From net realized gains | | | (0.52 | ) | | | (0.11 | ) | | | (0.82 | ) | | | (0.08 | ) | | | — | |
Return of capital | | | (0.03 | ) | | | — | | | | — | | | | — | | | | — | |
| | | | | | | | | | | | | | | | | | | | |
Total distributions to shareholders | | | (0.88 | ) | | | (0.48 | ) | | | (1.16 | ) | | | (0.45 | ) | | | (0.44 | ) |
| | | | | | | | | | | | | | | | | | | | |
Net asset value — end of period | | $ | 15.97 | | | $ | 18.15 | | | $ | 16.20 | | | $ | 16.69 | | | $ | 14.69 | |
| | | | | | | | | | | | | | | | | | | | |
Total return | | | (7.49 | )% | | | 15.39 | % | | | 3.92 | % | | | 16.91 | % | | | 8.37 | % |
| | | | | | | | | | | | | | | | | | | | |
Ratios/supplemental data: | | | | | | | | | | | | | | | | | | | | |
Net assets, end of period (000s) | | $ | 483,678 | | | $ | 570,662 | | | $ | 476,071 | | | $ | 564,547 | | | $ | 479,460 | |
Ratio of gross expense to average net assets | | | 0.74 | % | | | 0.74 | % | | | 0.74 | % | | | 0.80 | % | | | 0.77 | % |
Ratio of net expense to average net assets | | | 0.74 | % | | | 0.74 | % | | | 0.74 | % | | | 0.80 | % | | | 0.80 | % |
Ratio of investment income less gross expenses to average net assets | | | 2.17 | % | | | 2.36 | % | | | 2.20 | % | | | 2.48 | % | | | 2.91 | % |
Ratio of net investment income to average net assets | | | 2.17 | % | | | 2.36 | % | | | 2.20 | % | | | 2.45 | % | | | 2.88 | % |
Portfolio turnover rate | | | 63 | % | | | 49 | % | | | 42 | % | | | 60 | % | | | 25 | % |
The Fund commenced operations on November 1, 1996. | |
| | | Payden Equity Income Fund - SI Class | |
| | | 2020 | | | 2019 | | | 2018 | | | 2017 | | | 2016 | |
Net asset value — beginning of period | | $ | 18.16 | | | $ | 16.21 | | | $ | 16.70 | | | $ | 14.69 | | | $ | 13.97 | |
| | | | | | | | | | | | | | | | | | | | |
Income from investment activities: | | | | | | | | | | | | | | | | | | | | |
Net investment income | | | 0.36 | | | | 0.41 | | | | 0.39 | | | | 0.42 | | | | 0.42 | |
Net realized and unrealized gains (losses) | | | (1.64 | ) | | | 2.03 | | | | 0.29 | | | | 2.06 | | | | 0.75 | |
| | | | | | | | | | | | | | | | | | | | |
Total from investment activities | | | (1.28 | ) | | | 2.44 | | | | 0.68 | | | | 2.48 | | | | 1.17 | |
| | | | | | | | | | | | | | | | | | | | |
Distributions to shareholders: | | | | | | | | | | | | | | | | | | | | |
From net investment income | | | (0.35 | ) | | | (0.38 | ) | | | (0.35 | ) | | | (0.39 | ) | | | (0.45 | ) |
From net realized gains | | | (0.52 | ) | | | (0.11 | ) | | | (0.82 | ) | | | (0.08 | ) | | | — | |
Return of capital | | | (0.03 | ) | | | — | | | | — | | | | — | | | | — | |
| | | | | | | | | | | | | | | | | | | | |
Total distributions to shareholders | | | (0.90 | ) | | | (0.49 | ) | | | (1.17 | ) | | | (0.47 | ) | | | (0.45 | ) |
| | | | | | | | | | | | | | | | | | | | |
Net asset value — end of period | | $ | 15.98 | | | $ | 18.16 | | | $ | 16.21 | | | $ | 16.70 | | | $ | 14.69 | |
| | | | | | | | | | | | | | | | | | | | |
Total return | | | (7.40 | )% | | | 15.47 | % | | | 4.01 | % | | | 17.13 | % | | | 8.50 | % |
| | | | | | | | | | | | | | | | | | | | |
Ratios/supplemental data: | | | | | | | | | | | | | | | | | | | | |
Net assets, end of period (000s) | | $ | 916,286 | | | $ | 809,209 | | | $ | 703,181 | | | $ | 385,988 | | | $ | 314,900 | |
Ratio of gross expense to average net assets | | | 0.74 | % | | | 0.74 | % | | | 0.74 | % | | | 0.80 | % | | | 0.77 | % |
Ratio of net expense to average net assets | | | 0.65 | % | | | 0.65 | % | | | 0.65 | % | | | 0.65 | % | | | 0.65 | % |
Ratio of investment income less gross expenses to average net assets | | | 2.16 | % | | | 2.36 | % | | | 2.19 | % | | | 2.48 | % | | | 3.01 | % |
Ratio of net investment income to average net assets | | | 2.24 | % | | | 2.45 | % | | | 2.29 | % | | | 2.59 | % | | | 3.13 | % |
Portfolio turnover rate | | | 63 | % | | | 49 | % | | | 42 | % | | | 60 | % | | | 25 | % |
The Class commenced operations on August 1, 2014.
See notes to financial statements.
162 Payden Mutual Funds
| | |
REPORT OF INDEPENDENT REGISTERED PUBLIC ACCOUNTING FIRM | | |
To the shareholders and Board of Trustees of
The Payden & Rygel Investment Group
Opinion on the Financial Statements and Financial Highlights
We have audited the accompanying statements of assets and liabilities of Payden Cash Reserves Money Market Fund, Payden Limited Maturity Fund, Payden Low Duration Fund, Payden U.S. Government Fund, Payden GNMA Fund, Payden Core Bond Fund, Payden Corporate Bond Fund, Payden Strategic Income Fund, Payden Absolute Return Bond Fund, Payden Floating Rate Fund, Payden High Income Fund, Payden California Municipal Social Impact Fund, Payden Global Low Duration Fund, Payden Global Fixed Income Fund, Payden Emerging Markets Bond Fund, Payden Emerging Markets Local Bond Fund, Payden Emerging Markets Corporate Bond Fund, and Payden Equity Income Fund, eighteen of the funds comprising The Payden & Rygel Investment Group (the “Funds”), including the schedules of investments as of October 31, 2020, the related statements of operations for the year then ended, the statements of changes in net assets for each of the two years in the period then ended, the financial highlights for each of the five years in the period then ended for the Funds, and the related notes. In our opinion, the financial statements and financial highlights present fairly, in all material respects, the financial position of each of the funds listed above constituting The Payden & Rygel Investment Group as of October 31, 2020, and the results of their operations for the year then ended, the changes in their net assets for each of the two years in the period then ended and the financial highlights for each of the five years in the period then ended in conformity with accounting principles generally accepted in the United States of America.
Basis for Opinion
These financial statements and financial highlights are the responsibility of the Funds’ management. Our responsibility is to express an opinion on the Funds’ financial statements and financial highlights based on our audits. We are a public accounting firm registered with the Public Company Accounting Oversight Board (United States) (PCAOB) and are required to be independent with respect to the Funds in accordance with the U.S. federal securities laws and the applicable rules and regulations of the Securities and Exchange Commission and the PCAOB.
We conducted our audits in accordance with the standards of the PCAOB. Those standards require that we plan and perform the audit to obtain reasonable assurance about whether the financial statements and financial highlights are free of material misstatement, whether due to error or fraud. The Funds are not required to have, nor were we engaged to perform, an audit of their internal control over financial reporting. As part of our audits we are required to obtain an understanding of internal control over financial reporting but not for the purpose of expressing an opinion on the effectiveness of the Funds’ internal control over financial reporting. Accordingly, we express no such opinion.
Our audits included performing procedures to assess the risks of material misstatement of the financial statements and financial highlights, whether due to error or fraud, and performing procedures that respond to those risks. Such procedures included examining, on a test basis, evidence regarding the amounts and disclosures in the financial statements and financial highlights. Our audits also included evaluating the accounting principles used and significant estimates made by management, as well as evaluating the overall presentation of the financial statements and financial highlights. Our procedures included confirmation of securities owned as of October 31, 2020, by correspondence with the custodian and brokers; when replies were not received from brokers, we performed other auditing procedures. We believe that our audits provide a reasonable basis for our opinion.
|
| /s/ DELOITTE & TOUCHE LLP |
| Los Angeles, California |
| December 23, 2020 |
We have served as the auditor of one or more of The Payden & Rygel Investment Group investment companies since 1992.
Annual Report 163
| | |
Fund Expenses (unaudited) | | |
Understanding Your Fund’s Expenses
Shareholders of mutual funds, incur two types of costs: transaction costs incurred from buying or selling fund shares and ongoing costs incurred from the funds daily operations. The table below is provided to highlight ongoing cost only. If transaction costs were included your cost would have been higher.
Actual Expenses
The table below is useful in estimating actual expenses paid during the six-month period ended October 31, 2020. It uses each Fund’s actual return and expense ratio for the period (184/366 days) to calculate the ongoing expenses paid by a shareholder with an initial investment of $1,000. To estimate the actual expense that you paid over the period, divide your beginning account value by 1,000 and multiply the quotient by the number in the Expenses Paid During the Period column.
| | | | | | | | | | | | | | | | | | | | | | | | | |
| | | Value
May 1, 2020 | | Value
October 31, 2020 | | 6-Month
Return | | Expense
Ratio | | Expenses
Paid |
Cash Reserves Money Market | | | $ | 1,000.00 | | | | $ | 1,000.20 | | | | | 0.02 | % | | | | 0.21 | % | | | $ | 1.07 | |
Limited Maturity | | | | 1,000.00 | | | | | 1,024.20 | | | | | 2.42 | % | | | | 0.25 | % | | | | 1.28 | |
Low Duration | | | | 1,000.00 | | | | | 1,032.60 | | | | | 3.26 | % | | | | 0.43 | % | | | | 2.20 | |
U.S. Government | | | | 1,000.00 | | | | | 1,096.00 | | | | | 9.60 | % | | | | 0.43 | % | | | | 2.27 | |
GNMA | | | | 1,000.00 | | | | | 999.00 | | | | | (0.10 | )% | | | | 0.50 | % | | | | 2.51 | |
Core Bond Adviser Class | | | | 1,000.00 | | | | | 1,040.50 | | | | | 4.05 | % | | | | 0.78 | % | | | | 4.00 | |
Core Bond Investor Class | | | | 1,000.00 | | | | | 1,041.70 | | | | | 4.17 | % | | | | 0.53 | % | | | | 2.72 | |
Core Bond SI Class | | | | 1,000.00 | | | | | 1,042.30 | | | | | 4.23 | % | | | | 0.42 | % | | | | 2.16 | |
Corporate Bond | | | | 1,000.00 | | | | | 1,056.50 | | | | | 5.65 | % | | | | 0.65 | % | | | | 3.36 | |
Strategic Income Investor Class | | | | 1,000.00 | | | | | 1,080.00 | | | | | 8.00 | % | | | | 0.70 | % | | | | 3.66 | |
Strategic Income SI Class | | | | 1,000.00 | | | | | 1,079.70 | | | | | 7.97 | % | | | | 0.55 | % | | | | 2.88 | |
Absolute Return Bond Investor Class | | | | 1,000.00 | | | | | 1,079.40 | | | | | 7.94 | % | | | | 0.70 | % | | | | 3.66 | |
Absolute Return Bond SI Class | | | | 1,000.00 | | | | | 1,081.60 | | | | | 8.16 | % | | | | 0.47 | % | | | | 2.46 | |
Floating Rate Bond Investor Class | | | | 1,000.00 | | | | | 1,075.20 | | | | | 7.52 | % | | | | 0.75 | % | | | | 3.91 | |
Floating Rate Bond SI Class | | | | 1,000.00 | | | | | 1,074.50 | | | | | 7.45 | % | | | | 0.65 | % | | | | 3.39 | |
High Income | | | | 1,000.00 | | | | | 1,132.50 | | | | | 13.25 | % | | | | 0.63 | % | | | | 3.38 | |
California Municipal Social Impact | | | | 1,000.00 | | | | | 1,057.00 | | | | | 5.70 | % | | | | 0.53 | % | | | | 2.74 | |
Global Low Duration | | | | 1,000.00 | | | | | 1,035.40 | | | | | 3.54 | % | | | | 0.53 | % | | | | 2.71 | |
Global Fixed Income | | | | 1,000.00 | | | | | 1,047.00 | | | | | 4.70 | % | | | | 0.70 | % | | | | 3.60 | |
Emerging Markets Bond Adviser Class | | | | 1,000.00 | | | | | 1,135.30 | | | | | 13.53 | % | | | | 0.99 | % | | | | 5.30 | |
Emerging Markets Bond Investor Class | | | | 1,000.00 | | | | | 1,136.90 | | | | | 13.69 | % | | | | 0.73 | % | | | | 3.94 | |
Emerging Markets Bond SI Class | | | | 1,000.00 | | | | | 1,137.30 | | | | | 13.73 | % | | | | 0.70 | % | | | | 3.74 | |
Emerging Markets Local Bond | | | | 1,000.00 | | | | | 1,077.30 | | | | | 7.73 | % | | | | 0.95 | % | | | | 4.97 | |
Emerging Markets Corporate Bond Investor Class | | | | 1,000.00 | | | | | 1,111.80 | | | | | 11.18 | % | | | | 0.95 | % | | | | 5.04 | |
Emerging Markets Corporate Bond SI Class | | | | 1,000.00 | | | | | 1,110.90 | | | | | 11.09 | % | | | | 0.85 | % | | | | 4.51 | |
Equity Income Adviser Class | | | | 1,000.00 | | | | | 1,030.10 | | | | | 3.01 | % | | | | 0.99 | % | | | | 5.05 | |
Equity Income Investor Class | | | | 1,000.00 | | | | | 1,031.40 | | | | | 3.14 | % | | | | 0.74 | % | | | | 3.78 | |
Equity Income SI Class | | | | 1,000.00 | | | | | 1,031.90 | | | | | 3.19 | % | | | | 0.65 | % | | | | 3.32 | |
164 Payden Mutual Funds
Hypothetical Expenses
The table below is provided so that you can compare a Fund’s ongoing expenses with those of another fund. It uses a hypothetical gross annual return of 5%, which is not the Fund’s actual return, and each Fund’s actual expense ratio (184/366 days) for the six-month period ended October 31, 2020 to calculate the ongoing expenses paid by a shareholder with an initial investment of $1,000.
| | | | | | | | | | | | | | | | | | | | | | | | | |
| | | Value
May 1, 2020 | | Value
October 31, 2020 | | 6-Month
Return | | Expense
Ratio | | Expenses
Paid |
Cash Reserves Money Market | | | $ | 1,000.00 | | | | $ | 1,024.07 | | | | | 2.41 | % | | | | 0.21 | % | | | $ | 1.08 | |
Limited Maturity | | | | 1,000.00 | | | | | 1,023.87 | | | | | 2.39 | % | | | | 0.25 | % | | | | 1.28 | |
Low Duration | | | | 1,000.00 | | | | | 1,022.97 | | | | | 2.30 | % | | | | 0.43 | % | | | | 2.19 | |
U.S. Government | | | | 1,000.00 | | | | | 1,022.97 | | | | | 2.30 | % | | | | 0.43 | % | | | | 2.19 | |
GNMA | | | | 1,000.00 | | | | | 1,022.62 | | | | | 2.26 | % | | | | 0.50 | % | | | | 2.54 | |
Core Bond Adviser Class | | | | 1,000.00 | | | | | 1,021.21 | | | | | 2.12 | % | | | | 0.78 | % | | | | 3.97 | |
Core Bond Investor Class | | | | 1,000.00 | | | | | 1,022.47 | | | | | 2.25 | % | | | | 0.53 | % | | | | 2.70 | |
Core Bond SI Class | | | | 1,000.00 | | | | | 1,023.02 | | | | | 2.30 | % | | | | 0.42 | % | | | | 2.14 | |
Corporate Bond | | | | 1,000.00 | | | | | 1,021.87 | | | | | 2.19 | % | | | | 0.65 | % | | | | 3.30 | |
Strategic Income Investor Class | | | | 1,000.00 | | | | | 1,021.62 | | | | | 2.16 | % | | | | 0.70 | % | | | | 3.56 | |
Strategic Income SI Class | | | | 1,000.00 | | | | | 1,022.37 | | | | | 2.24 | % | | | | 0.55 | % | | | | 2.80 | |
Absolute Return Bond Investor Class | | | | 1,000.00 | | | | | 1,021.62 | | | | | 2.16 | % | | | | 0.70 | % | | | | 3.56 | |
Absolute Return Bond SI Class | | | | 1,000.00 | | | | | 1,022.77 | | | | | 2.28 | % | | | | 0.47 | % | | | | 2.39 | |
Floating Rate Bond Investor Class | | | | 1,000.00 | | | | | 1,021.37 | | | | | 2.14 | % | | | | 0.75 | % | | | | 3.81 | |
Floating Rate Bond SI Class | | | | 1,000.00 | | | | | 1,021.87 | | | | | 2.19 | % | | | | 0.65 | % | | | | 3.30 | |
High Income | | | | 1,000.00 | | | | | 1,021.97 | | | | | 2.20 | % | | | | 0.63 | % | | | | 3.20 | |
California Municipal Social Impact | | | | 1,000.00 | | | | | 1,022.47 | | | | | 2.25 | % | | | | 0.53 | % | | | | 2.69 | |
Global Low Duration | | | | 1,000.00 | | | | | 1,022.47 | | | | | 2.25 | % | | | | 0.53 | % | | | | 2.69 | |
Global Fixed Income | | | | 1,000.00 | | | | | 1,021.62 | | | | | 2.16 | % | | | | 0.70 | % | | | | 3.56 | |
Emerging Markets Bond Adviser Class | | | | 1,000.00 | | | | | 1,020.17 | | | | | 2.02 | % | | | | 0.99 | % | | | | 5.02 | |
Emerging Markets Bond Investor Class | | | | 1,000.00 | | | | | 1,021.45 | | | | | 2.15 | % | | | | 0.73 | % | | | | 3.72 | |
Emerging Markets Bond SI Class | | | | 1,000.00 | | | | | 1,021.64 | | | | | 2.16 | % | | | | 0.70 | % | | | | 3.54 | |
Emerging Markets Local Bond | | | | 1,000.00 | | | | | 1,020.35 | | | | | 2.03 | % | | | | 0.95 | % | | | | 4.84 | |
Emerging Markets Corporate Bond Investor Class | | | | 1,000.00 | | | | | 1,020.36 | | | | | 2.04 | % | | | | 0.95 | % | | | | 4.82 | |
Emerging Markets Corporate Bond SI Class | | | | 1,000.00 | | | | | 1,020.86 | | | | | 2.09 | % | | | | 0.85 | % | | | | 4.32 | |
Equity Income Adviser Class | | | | 1,000.00 | | | | | 1,020.16 | | | | | 2.02 | % | | | | 0.99 | % | | | | 5.03 | |
Equity Income Investor Class | | | | 1,000.00 | | | | | 1,021.42 | | | | | 2.14 | % | | | | 0.74 | % | | | | 3.76 | |
Equity Income SI Class | | | | 1,000.00 | | | | | 1,021.87 | | | | | 2.19 | % | | | | 0.65 | % | | | | 3.30 | |
Annual Report 165
| | |
Approval of Investment Advisory Agreement (Unaudited) | | |
1. Background
Among its other duties, the Board of Trustees (the “Board” or the “Trustees”) of The Payden & Rygel Investment Group (the “P&R Trust”) is responsible for determining whether to approve initially, and subsequently to approve annually, the investment management agreement (the “Agreement”) between Payden & Rygel (“Adviser”) and the Trust on behalf of each of the eighteen series covered by this Report (each a “Paydenfund” and collectively, the “Paydenfunds”). Under the Agreement, the Adviser is responsible for providing investment advisory services and overseeing the everyday operations and other service providers of the Paydenfunds.
Section 15(c) of the Investment Company Act of 1940 (the “1940 Act”) requires that, after an initial period of up to two years, the Agreement for each Paydenfund will remain in effect only if the Board, including a majority of those Trustees who have no direct or indirect interest in the Agreement, and who are not “interested persons” of the Trust, as that term is defined in the 1940 Act (each an “Independent Trustee,” and collectively, the “Independent Trustees”), annually renews that Agreement. Six of the Trust’s nine Trustees are deemed to be Independent Trustees for this purpose.
On June 16, 2020, the Board of Trustees of the P&R Trust unanimously approved the Agreement between the Adviser and the P&R Trust with respect to the eighteen Paydenfunds1 for an additional year through June 30, 2021. The Board approved the Agreement following the recommendation of the Board’s Audit Committee (the “Audit Committee”), which is composed of all seven of the P&R Trust’s Independent Trustees. In reaching these decisions, the Board took into account information furnished to it throughout the year at meetings of the Board and of the Board’s committees, as well as extensive information prepared specifically in connection with the annual renewal process. Determinations by the Independent Trustees also took into account various factors that they believed to be relevant, in light of (1) the legal advice furnished to them by Paul Hastings LLP (“Paul Hastings”), independent legal counsel to the Independent Trustees, and (2) each Independent Trustee’s business judgment.
2. Overview of the Approval or Renewal Process
In considering the annual renewal with respect to each of the eighteen Paydenfunds, the Board followed its previously established process. As part of this process, the Board delegates the initial responsibility for the renewal process and related tasks to the Audit Committee. These tasks include working with the Adviser and Paul Hastings (1) to develop Section 15(c)-related guidelines and specific requests with respect to the types of information to be provided to the Audit Committee and to the Board in connection with the proposed contract renewals, and (2) to evaluate the information provided in response to these guidelines and requests.
Consistent with its established process, the P&R Trust retained Broadridge to prepare a report on each Paydenfund to assist the Audit Committee and the Board in their respective deliberations. Broadridge is an independent provider of investment company data that is widely recognized as a leading source of independent data used by independent directors and trustees of investment companies during their advisory contract review processes.
Broadridge produced, among other information, performance and expense comparison data regarding each Paydenfund, including data relating to each Paydenfund’s advisory fee rates, total expense ratios, short-term and long-term investment performance, and portfolio turnover rates. Broadridge also compared much of this data for each Paydenfund against a universe of investment companies and against a more selective peer group of investment companies with similar investment objectives and strategies, each of which was selected by Broadridge, and, in the case of the investment performance data, against one or more appropriate broad-based benchmark indices. In each case, Broadridge summarized the methodologies it employed to provide the data contained in its reports. In addition, Broadridge represented to the Board that its reports were designed specifically to provide the Board with the fee, expense and performance information that is necessary to help the Board satisfy its duties under Section 15(c) of the 1940 Act. Broadridge also represented that it, and not the Adviser, had identified the selected comparative peer groups and universes, and that it did so in a manner that was not intended to produce biased results for its clients.
[1]The Paydenfunds covered by this approval are the Payden Cash Reserves Money Market Fund, Payden Limited Maturity Fund, Payden Low Duration Fund, Payden U.S. Government Fund, Payden GNMA Fund, Payden Core Bond Fund, Payden Strategic Income Fund, Payden Absolute Return Bond Fund, Payden Corporate Bond Fund, Payden High Income Fund, Payden Floating Rate Fund, Payden California Municipal Income Fund, Payden Global Low Duration Fund, Payden Global Fixed Income Fund, Payden Emerging Markets Bond Fund, Payden Emerging Markets Local Bond Fund, Payden Emerging Markets Corporate Bond Fund and Payden Equity Income Fund.
166 Payden Mutual Funds
In advance of the Board meeting held on June 16, 2020, Paul Hastings requested on behalf of the Audit Committee and the Board, and the Adviser provided, extensive information that was designed to assist the Audit Committee and the Board in their consideration of whether to renew the Agreement for each Paydenfund. In addition to the data provided by Broadridge as described above, this information included, but was not limited to, the following: (1) the nature, extent and quality of services provided, or to be provided, by the Adviser to the particular Paydenfund; (2) the Paydenfund’s investment performance; (3) the costs of the services provided to the Paydenfund and the profits realized or potential profits (if any) to be realized by the Adviser and its affiliates from their relationship with the Paydenfund; (4) fees charged by other investment advisers; (5) the extent to which economies of scale have been realized or are anticipated to be realized as the particular Paydenfund grows; (6) whether the fee schedule set forth in the Agreement reflects any such economies of scale for the benefit of Fund investors; (7) comparisons of services and fee rates with any contracts entered into by the Adviser with other clients to whom the Adviser provides comparable services; and (8) any other benefits derived or anticipated to be derived by the Adviser or its affiliates from the relationship with the Paydenfund. As a general matter, the Board viewed these factors in their totality, with no single factor being the principal factor in determining whether to approve or renew the Agreement. In reaching its decisions regarding the renewal of the Agreement for each Paydenfund, the Board took into account the information described above, other information provided to the Board in connection with this process, and relevant information provided to the Board and to its Committees on an ongoing basis in connection with the Board’s general oversight duties with respect to the Paydenfunds. In addition, the Board received and considered information from Paul Hastings as to certain relevant guidelines that relate to the approval or renewal process under Section 15(c) of the 1940 Act. While the Board considered the Agreement with respect to all Paydenfunds, the Board received and considered fund-specific information and made its approval or renewal determinations on a Paydenfund-by-Paydenfund basis. In deciding whether to renew the Agreement for each Paydenfund, each Trustee may have accorded different weight to different factors, and thus, each Trustee may have had a different basis for his or her ultimate decision to vote to renew the Agreement for each Paydenfund. At its meeting on June 16, 2020, the Board voted unanimously to renew the Agreement for each Paydenfund listed above. Set forth below are certain general factors the Board considered for each of the Paydenfunds, followed by a summary of certain specific factors the Board considered for each particular Paydenfund.
3. Nature, Extent and Quality of Services
The Board and Audit Committee considered a number of factors related to the services provided by the Adviser, including the breadth and depth of the Adviser’s investment advisory process, the experience, expertise and quality of the Adviser’s investment professionals, the experience, leadership ability and integrity of the Adviser’s senior management, the long tenure of its key personnel and the overall financial strength, stability and viability of the Adviser. They also considered the Adviser’s ability and commitment to attract and retain qualified personnel, and its commitment to maintain and enhance its investment advisory resources and information technology systems. The Board and Audit Committee further considered the Adviser’s strong commitment to compliance with applicable laws and regulations and the nature and extent of its compliance program and records. Finally, they took into account the administrative, distribution and shareholder services that the Adviser or its affiliates provided each Paydenfund under the Agreement and other agreements. Based on the foregoing, the Board and Audit Committee concluded that the investment advisory and related services provided by the Adviser and its affiliates have benefited and should continue to benefit each Paydenfund and its shareholders.
4. Investment Results
At its regular quarterly Board meetings during the past year, the Board reviewed the investment results of each Paydenfund compared to its respective peers and benchmark indices, paying specific attention to any Paydenfund whose performance did not measure up to the Adviser’s expectations and to the Adviser’s plan to deal with that situation. In addition, as a part of the annual review of the Agreement, the Board and Audit Committee specifically reviewed a report prepared by Broadridge, which contained each Paydenfund’s performance for various time periods, i.e., 1-year, 3-years, 5-years and 10-years, as compared to the performance of (1) a group of comparable mutual funds (the “Peer Group”) selected by Broadridge, and (2) each Paydenfund’s benchmark index. The Board and Audit Committee concluded that, overall, the short-term and long-term results for each of the eighteen Paydenfunds have been satisfactory and that each of the eighteen Paydenfunds is performing competitively versus its Peer Group and benchmark index. Following the discussion of the performance of the eighteen Paydenfunds, the Board and Committee concluded that the Adviser’s continued management should benefit each Paydenfund and its shareholders.
Annual Report 167
| | |
Approval of Investment Advisory Agreement (Unaudited) continued | | |
5. Advisory Fees and Total Expenses
The Board and the Audit Committee reviewed each Paydenfund’s net operating expense ratio and its various fee and expense components, and then compared those fees and expenses to the fee and expense information for the Peer Group for each Paydenfund. They observed that the advisory fees and expenses for each Paydenfund continue to be competitive with the advisory fees and expenses of the particular Fund’s Peer Group. The Board and Audit Committee also reviewed information regarding the advisory fees paid by other registered investment companies, pension funds and other institutional clients of the Adviser with respect to similar investment mandates as each of the Paydenfunds. They noted that, although the fees paid by those clients generally were lower than those paid by each Paydenfund, the differences appropriately reflected the significant investment, operational and regulatory differences between advising mutual funds and advising separately managed institutional accounts. Overall, the Board and Audit Committee concluded that each Paydenfund’s cost structure was fair and reasonable in relation to the services provided, and that each Paydenfund’s shareholders received reasonable value in return for the advisory fees and other amounts paid to the Adviser or its affiliates by the Paydenfund.
6. Adviser Profitability and Indirect Benefits
The Board and Audit Committee reviewed information at the P&R Trust level regarding the Adviser’s cost of providing services to the Paydenfunds, as well as the resulting level of profits to the Adviser. They further reviewed the cost allocation methodology used to determine the Adviser’s profitability of providing services to the Paydenfunds, as well as possible economies of scale that might be achieved. Based on that review, the Board and Audit Committee each concluded that the profits earned by the Adviser were not excessive in view of the advisory, administrative and other services provided to the Paydenfunds. Finally, the Board and Audit Committee noted that the Adviser indirectly benefited from its advisory relationship with the Paydenfunds by its ability to invest more efficiently the assets of small, separately managed accounts in the Paydenfunds, and because the availability of the Paydenfunds enhanced the Adviser’s business reputation and name recognition.
7. Fund-by-Fund Factors
The Board considered the following specific factors (among others) in connection with its determination to renew the Agreement with respect to each Paydenfund. If a Paydenfund is described in the following discussions as being in the “1st” quintile, it is in the best of five groups, that is, the group has the best performance or the lowest expenses, as the case may be. References below to quintiles are based on data provided to the Board in the reports prepared by Broadridge. The specific management fee, expense and performance factors outlined below are based on the Investor Class shares of each Paydenfund. Because the Investor Class generally has lower non-management expenses than the Adviser Class of these Funds, the expenses and performance of the Adviser Class will differ from the expenses and performance shown for the Investor Class. All time periods referenced below ended as of April 30, 2020.
Cash Reserves Money Market Fund
• Adviser Fee: The Adviser’s annual contractual management fee rate for the Fund is 0.15%, placing it in the first quintile of the group of comparable funds for adviser fees. The actual management fee was also in the first quintile.
• Total Expenses: The Fund’s total expenses were in the first quintile of the group of comparable funds selected by Broadridge for expense comparison purposes. The Adviser has contractually agreed to waive its investment advisory fee or reimburse Fund expenses to the extent that Total Annual Fund Operating Expenses After Fee Waiver or Expense Reimbursement exceed 0.25%. This agreement has a one-year term ending February 28, 2021. It may or may not be renewed.
• Performance: The Fund was in the first quintile of the group of comparable funds for each of the one-, three-, five- and ten-year periods.
Limited Maturity Fund
• Adviser Fee: The Adviser’s annual contractual management fee rate for the Fund is 0.28%, placing it in the fourth quintile of the group of comparable funds for adviser fees. The actual management fee was in the first quintile.
168 Payden Mutual Funds
• Total Expenses: The Fund’s total expenses were in the first quintile of the group of comparable funds. The Adviser has contractually agreed to waive its investment advisory fee or reimburse Fund expenses to the extent that Total Annual Fund Operating Expenses After Fee Waiver or Expense Reimbursement exceed 0.25%. This agreement has a one-year term ending February 28, 2021. It may or may not be renewed.
• Performance: The Fund was in the fourth quintile of the group of comparable funds for the one-year period and in the third quintile for each of the three- and five- and ten-year periods.
Low Duration Fund
• Adviser Fee: The Adviser’s annual contractual management fee rate for the Fund is 0.28%, placing it in the fourth quintile of the group of comparable funds for adviser fees. The actual management fee was in the second quintile.
• Total Expenses: The Fund’s total expenses were in the second quintile of the group of comparable funds. The Adviser has contractually agreed to waive its investment advisory fee or reimburse Fund expenses to the extent that Total Annual Fund Operating Expenses After Fee Waiver or Expense Reimbursement exceed 0.43%. This agreement has a one-year term ending February 28, 2020. It may or may not be renewed.
• Performance: The Fund was in the third quintile of the group of comparable funds for each of the one- and ten-year periods, and in the fourth quintile for each of the three- and five-year periods.
U.S. Government Fund
• Adviser Fee: The Adviser’s annual contractual management fee rate for the Fund is 0.28%, placing it in the second quintile of the group of comparable funds for adviser fees. The actual management fee was in the first quintile.
• Total Expenses: The Fund’s total expenses were in the first quintile of the group of comparable funds. The Adviser has contractually agreed to waive its investment advisory fee or reimburse Fund expenses to the extent that Total Annual Fund Operating Expenses After Fee Waiver or Expense Reimbursement exceed 0.43%. This agreement has a one-year term ending February 28, 2020. It may or may not be renewed.
• Performance: The Fund was in the second quintile of the group of comparable funds for each of the one-year, three-year, five-year and ten-year periods.
GNMA Fund
• Adviser Fee: The Adviser’s annual contractual management fee rate for the Fund is 0.27%, placing it in the second quintile of the group of comparable funds for adviser fees. The actual management fee was in the first quintile.
• Total Expenses: The Fund’s total expenses were in the first quintile of the group of comparable funds. The Adviser has contractually agreed that for so long as it is the investment adviser to the Fund, the Total Annual Fund Operating Expenses will not exceed 0.50%.
• Performance: The Fund was in the second quintile of the group of comparable funds for each of the one-yeae, three-year, five-year and ten-year periods.
Core Bond Fund
• Adviser Fee: The Adviser’s annual contractual management fee rate for the Fund is 0.28%, placing it in the third quintile of the group of comparable funds for adviser fees. The actual management fee was in the fourth quintile.
• Total Expenses: The Fund’s total expenses were in the fourth quintile of the group of comparable funds.
• Performance: The Fund was in the fifth quintile for the one-year period, in the fourth quintile for the three-year period, in the third quintile for the five-year period and in the second quintile for the ten-year period of the group of comparable funds.
Annual Report 169
| | |
Approval of Investment Advisory Agreement (Unaudited) continued | | |
Strategic Income Fund
• Adviser Fee: The Adviser’s annual contractual management fee rate for the Fund is 0.55%, placing it in the third quintile of the group of comparable funds for adviser fees. The actual management fee was in the third quintile, as well.
• Total Expenses: The Fund’s total expenses were in the third quintile of the group of comparable funds. The Adviser has contractually agreed to waive its investment advisory fee or reimburse Fund expenses to the extent that Total Annual Fund Operating Expenses After Fee Waiver or Expense Reimbursement exceed 0.70%. This agreement has a one-year term ending February 28, 2021. It may or may not be renewed.
• Performance: The Fund was in the third quintile of the group of comparable funds for each of the one-year, three-year and five-year periods. The Fund began operations on May 8, 2014.
Absolute Return Bond Fund
• Adviser Fee: The Adviser’s annual contractual management fee rate for the Fund is 0.50%, placing it in the second quintile of the Expense Group for adviser fees. The actual management fee was in the second quintile, as well.
• Total Expenses: The Fund’s total expenses were in the First quintile of the group of comparable funds. The Adviser has contractually agreed to waive its investment advisory fee or reimburse Fund expenses to the extent that Total Annual Fund Operating Expenses After Fee Waiver or Expense Reimbursement exceed 0.70%. This agreement has a one-year term ending February 28, 2021. It may or may not be renewed.
• Performance: The Fund was in the third quintile of the group of comparable funds for each of the one-year and three-year periods and the second quintile for the five-year period of the group of comparable funds. The Fund began operations on November 6, 2014.
Corporate Bond Fund
• Adviser Fee: The Adviser’s annual contractual management fee rate for the Fund is 0.35%, placing it in the fourth quintile of the Expense Group for adviser fees. The actual management fee was in the fifth quintile.
• Total Expenses: The Fund’s total expenses were in the fourth quintile of the Expense Group.
• Performance: The Fund was in the fourth quintile for the one-year period, the second quintile for three-year period and the 1st quintile for each of the five- and ten-year periods of the group or comparable funds . The Fund began operations on March 12, 2009.
High Income Fund
• Adviser Fee: The Adviser’s annual contractual management fee rate for the Fund is 0.35%, placing it in the first quintile of the group of comparable funds for adviser fees. The actual management fee was in the second quintile.
• Total Expenses: The Fund’s total expenses were in the first quintile of the group of comparable funds.
• Performance: The Fund was in the second quintile for each of the one-year and five-year periods, the first quintile for the three-year period and the third quintile for the ten-year period of the group of comparable funds .
Floating Rate Fund
• Adviser Fee: The Adviser’s annual contractual management fee rate for the Fund is 0.55%, placing it in the fourth quintile of the group of comparable funds for adviser fees. The actual management fee was in the third quintile.
• Total Expenses: The Fund’s total expenses were in the third quintile of the group of comparable funds. The Adviser has contractually agreed to waive its investment advisory fee or reimburse Fund expenses to the extent that Total Annual Fund Operating Expenses After Fee Waiver or Expense Reimbursement exceed 0.76%. This agreement has a one-year term ending February 28, 2021. It may or may not be renewed.
170 Payden Mutual Funds
• Performance: The Fund was in the first quintile of the group of comparable funds for each the one-year, three-year and five-year periods. The Fund began operations on November 11, 2013.
California Municipal Income Fund
• Adviser Fee: The Adviser’s annual contractual management fee rate for the Fund is 0.32%, placing it in the second quintile of the Expense Group for adviser fees. The actual management fee was in the first quintile.
• Total Expenses: The Fund’s total expenses were in the second quintile of the group of comparable funds. The Adviser has contractually agreed to waive its investment advisory fee or reimburse Fund expenses to the extent that Total Annual Fund Operating Expenses After Fee Waiver or Expense Reimbursement exceed 0.53%. This agreement has a one-year term ending February 28, 2021. It may or may not be renewed.
• Performance: The Fund was in the first quintile for each of the one- and three-year periods, the second quintile for the five-year period and the fifth quintile for the ten-year period of the group f comparable funds.
Global Low Duration Fund
• Adviser Fee: The Adviser’s annual contractual management fee rate for the Fund is 0.30%, placing it in the first quintile of the group of comparable funds for adviser fees. The actual management fee was in the first quintile, as well.
• Total Expenses: The Fund’s total expenses were in the first quintile of the group of comparable funds. The Adviser has contractually agreed to waive its investment advisory fee or reimburse Fund expenses to the extent that Total Annual Fund Operating Expenses After Fee Waiver or Expense Reimbursement exceed 0.53%. This agreement has a one-year term ending February 28, 2021. It may or may not be renewed.
• Performance: The Fund was in the fourth quintile for the one-year period and the fifth quintile for each of the three-year, five-year and ten-year periods of the group of comparable funds.
Global Fixed Income Fund
• Adviser Fee: The Adviser’s annual contractual management fee rate for the Fund is 0.30%, placing it in the first quintile of the group of comparable funds for adviser fees. The actual management fee was in the first quintile, as well.
• Total Expenses: The Fund’s total expenses were in the second quintile of the group of comparable funds. The Adviser has contractually agreed that for so long as it is the investment adviser to the Fund, the Total Annual Fund Operating Expenses will not exceed 0.70%.
• Performance: The Fund was in the third quintile for the one-year period, the second quintile for each of the three-year and five-year periods and the first quintile for the ten-year period of the group of comparable funds.
Emerging Markets Bond Fund
• Adviser Fee: The Adviser’s annual contractual management fee rate for the Fund is 0.45%, placing it in the first quintile of the group of comparable funds for adviser fees. The actual management fee was in the third quintile.
• Total Expenses: The Fund’s total expenses were in the first quintile of the group of comparable funds.
• Performance: The Fund was in the third quintile for each of the one-year and three-year periods, the second quintile for the five-year period and the first quintile for the ten-year period of the group of comparable funds.
Annual Report 171
| | |
Approval of Investment Advisory Agreement (Unaudited) continued | | |
Emerging Markets Local Bond Fund
• Adviser Fee: The Adviser’s annual contractual management fee rate for the Fund is 0.60%, placing it in the second quintile of the group of comparable funds for adviser fees. The actual management fee is in the fifth quintile.
• Total Expenses: The Fund’s total expenses were in the third quintile of the group of comparable funds.
• Performance: The Fund was in the third quintile for each of the one-year, three-year and the five-year periods. The Fund began operations on November 2, 2011.
Emerging Markets Corporate Bond Fund
• Adviser Fee: The Adviser’s annual contractual management fee rate for the Fund is 0.80%, placing it in the fifth quintile of the group of comparable funds for adviser fees. The actual management fee was in the third quintile.
• Total Expenses: The Fund’s total expenses were in the fifth quintile of the group of comparable funds. The Adviser has contractually agreed to waive its investment advisory fee or reimburse Fund expenses to the extent that Total Annual Fund Operating Expenses After Fee Waiver or Expense Reimbursement exceed 0.95%. This agreement has a one-year term ending February 28, 2021. It may or may not be renewed.
• Performance: The Fund was in the first quintile of the group of comparable funds for the one-year, three-year and five-year periods. The Fund began operations on November 11, 2013.
Equity Income Fund
• Adviser Fee: The Adviser’s annual contractual management fee rate for the Fund is 0.50%, placing it in the third quintile of the group of comparable funds for adviser fees. The actual management fee is in the fourth quintile.
• Total Expenses: The Fund’s total expenses were in the third quintile of the group of comparable funds.
• Performance: The Fund was in the first quintile for each of the one-year, five-year and ten-year periods, and the second quintile for the three-year period of the group of comparable funds.
172 Payden Mutual Funds
| | | | | | | | | | | | |
| Name & Address | | Age | | Position
with Fund | | Year
Elected | | Number of
Portfolios | | Principal
Occupation(s) | | Other
Directorships
Held |
| 333 S. Grand Avenue Los Angeles, CA 90071 | | | | | | | | | | | | |
| Trustees (1) | | | | | | | | | | | | |
| Stephanie Bell-Rose | | 63 | | Independent Trustee | | 2020 | | 19 | | Retired, Senior Managing Director, TIAA | | |
| W. D. Hilton, Jr. | | 74 | | Chariman, Independent Trustee | | 1993 | | 19 | | Trustee/Administrator, Asbestos Bankruptcy Trusts; General Partner, Mendenhall Partners Ltd.; Private Investor | | |
| Thomas V. McKernan, Jr. | | 76 | | Independent Trustee | | 1993 | | 19 | | Vice Chair, Automobile Club of Southern California; Director, Forest Lawn Memorial Parks | | |
| Rosemarie T. Nassif | | 79 | | Independent Trustee | | 2008 | | 19 | | Executive Director, Center for Catholic Education, Loyola Marymount University, President Emerita, Holy Names University | | |
| Andrew J. Policano | | 71 | | Independent Trustee | | 2008 | | 19 | | Former Dean, The Paul Merage School of Business, University of California, Irvine | | |
| Dennis C. Poulsen | | 78 | | Independent Trustee | | 1992 | | 19 | | Chairman, Clean Energy Enterprises; Private Investor | | |
| Stender E. Sweeney | | 81 | | Independent Trustee | | 1992 | | 19 | | Private Investor | | |
| Jordan H.Lopez | | 39 | | Interested Trustee | | 2020 | | 19 | | Director, Payden & Rygel | | |
| Michael E. Salvay | | 59 | | Interested Trustee | | 2009 | | 19 | | Managing Principal, Payden & Rygel | | |
| Officers (2) | | | | | | | | | | | | |
| Joan A. Payden | | | | President and CEO | | 1992 | | | | President, CEO and Director, Payden & Rygel | | |
| Brian W. Matthews | | | | Vice President and CFO | | 2003 | | | | Managing Principal, CFO and Director, Payden & Rygel | | |
| Yot Chattrabhuti | | | | Vice President | | 1997 | | | | Principal, Payden & Rygel | | |
| Bradley F. Hersh | | | | Vice President and Treasurer | | 1998 | | | | Principal and Treasurer, Payden & Rygel | | |
| Edward S. Garlock | | | | Secretary | | 1997 | | | | Managing Principal, General Counsel and Director, Payden & Rygel | | |
| Sandi Brents | | | | Vice President and CCO | | 2016 | | | | Vice President and Senior Compliance Officer, Payden & Rygel | | |
Additional information about the Trustees is included in the SAI and is available without charge, upon request at payden.com or 1800 5 PAYDEN.
(1) Trustees do not have a set term of office, but serve until their resignation, death or removal.
(2) Officers are elected by, and serve at the pleasure of, The Board of Trustees.
Annual Report 173
(THIS PAGE INTENTIONALLY LEFT BLANK)
IMPORTANT INFORMATION: The information contained in this report is intended for shareholders of the Payden Mutual Funds only. It is not authorized for distribution to prospective investors unless accompanied or preceded by a current prospectus which provides further details.
The performance numbers presented in this report are derived from historical market data. There is no guarantee of future performance nor are Fund shares guaranteed. Investment return and principal value of an investment in a Fund will fluctuate so that an investor’s shares, when redeemed, may be worth more or less than original cost. Fund shares are sold through Payden & Rygel Distributors, member FINRA.
The Fund files its complete schedule of portfolio holdings with the Securities and Exchange Commission (SEC) for the first and third quarters of each fiscal year on Form N-Q. Forms N-Q are available on the SEC’s web site at http://www.sec.gov or the Fund’s Forms N-Q may be reviewed and copied at the SEC’s Public Reference Room in Washington D.C. Information regarding the operation of the SEC’s Public Reference Room may be obtained by calling 1-800 SEC-0330.
To view the Fund’s proxy voting guidelines and proxy voting record, visit the SEC’s web site at http://www.sec.gov. You may also call 800 572-9336 to request a free copy of the proxy voting guidelines.
U.S. BOND FUNDS
Payden Cash Reserves Money Market Fund (PBHXX) Payden Limited Maturity Fund (PYLMX) Payden Low Duration Fund (PYSBX) Payden U.S. Government Fund (PYUSX) Payden GNMA Fund (PYGNX) Payden Core Bond Fund — SI Class (PYCSX) Payden Core Bond Fund — Investor Class (PYCBX) Payden Core Bond Fund — Adviser Class (PYCWX) Payden Corporate Bond Fund (PYACX) Payden Strategic Income Fund — SI Class (PYSIX) Payden Strategic Income Fund — Investor Class (PYSGX) Payden Absolute Return Bond Fund — SI Class (PYAIX) Payden Absolute Return Bond Fund — Investor Class (PYARX) Payden Floating Rate Fund — SI Class (PYFIX) Payden Floating Rate Fund — Investor Class (PYFRX) Payden High Income Fund (PYHRX)
TAX EXEMPT BOND FUND
Payden California Municipal Social Impact Fund (PYCRX)
GLOBAL BOND FUNDS
Payden Global Low Duration Fund (PYGSX) Payden Global Fixed Income Fund (PYGFX)
Payden Emerging Markets Bond Fund — SI Class (PYEIX) Payden Emerging Markets Bond Fund — Investor Class (PYEMX) Payden Emerging Markets Bond Fund — Adviser Class (PYEWX) Payden Emerging Markets Local Bond Fund (PYELX) Payden Emerging Markets Corporate Bond Fund — SI Class (PYCIX) Payden Emerging Markets Corporate Bond Fund — Investor Class (PYCEX)
EQUITY FUND
Payden Equity Income Fund — SI Class (PYVSX) Payden Equity Income Fund — Investor Class (PYVLX) Payden Equity Income Fund — Adviser Class (PYVAX)
PAYDEN MUTUAL FUNDS
333 South Grand Avenue, Los Angeles, California 90071
800 5-PAYDEN 800 572-9336 payden.com payden@UMB.com

IMPORTANT INFORMATION: The information contained in this report is intended for shareholders of the Payden Mutual Funds only. It is not authorized for distribution to prospective investors unless accompanied or preceded by a current prospectus which provides further details.
The performance numbers presented in this report are derived from historical market data. There is no guarantee of future performance nor are Fund shares guaranteed. Investment return and principal value of an investment in a Fund will fluctuate so that an investor’s shares, when redeemed, may be worth more or less than original cost. Fund shares are sold through Payden & Rygel Distributors, member FINRA.
The Fund files its complete schedule of portfolio holdings with the Securities and Exchange Commission (SEC) for the first and third quarters of each fiscal year on Form N-Q. Forms N-Q are available on the SEC’s web site at http://www. sec.gov or the Fund’s Forms N-Q may be reviewed and copied at the SEC’s Public Reference Room in Washington D.C. Information regarding the operation of the SEC’s Public Reference Room may be obtained by calling 1-800 SEC-0330.
To view the Fund’s proxy voting guidelines and proxy voting record for the period ended June 30th, visit the SEC’s web site at http://www.sec.gov. You may also call 800 572-9336 to request a free copy of the proxy voting guidelines.
Beginning on January 1, 2021, as permitted by regulations adopted by the Securities and Exchange Commission, paper copies of the Funds’ annual and semi-annual shareholder reports will no longer be sent by mail, unless you specifically request paper copies of the reports. Instead, the reports will be made available on the Funds’ website (www.payden.com), and you will be notified by U.S. mail each time a report is posted and provided with a website link to access the report. If you already elected to receive shareholder reports electronically, you will not be affected by this change and you need not take any action. You may elect to receive shareholder reports and other communications electronically by contacting your financial intermediary (such as a broker-dealer, bank, or retirement plan), or by calling 1-800-572-9336 if you invest directly with the Funds.
You may elect to receive all future reports in paper free of charge. Contact your financial intermediary or, if you invest directly with the Funds, call 1-800-572-9336, to request that you continue receiving paper copies of your shareholder reports. Your election to receive reports in paper will apply to all Funds held through your financial intermediary or directly with Paydenfunds.
Annual Report
(THIS PAGE INTENTIONALLY LEFT BLANK)
| | |
Management Discussion & Analysis | | |
For the fiscal year ended October 31, 2020, the Payden/Kravitz Cash Balance Plan Fund, SI Class (PKBIX) returned -0.42%, the Advisor Class (PKCBX) returned -0.61%, the Retirement Class (PKCRX) returned -0.93%, and the Institutional Class (PKCIX) returned -0.08%, while the Fund’s benchmark, the 30-year U.S. Treasury Bond Yield returned 2.43%. A positive tone for markets to start the fiscal year quickly changed in March as Covid-19 reared its ugly head and slowed economic activity. Global markets saw the highest level of volatility since the 2008 Global Financial Crisis. What began as a sell-off in lower quality credit turned into a liquidity crunch, with higher quality assets being sold at depressed levels in order to raise capital. This created a unique buying opportunity for the Fund to purchase higher quality, stable assets at very opportunistic levels. Almost as quickly as it started, market sentiment rebounded strongly in subsequent months driven by an unprecedented and coordinated monetary and fiscal response from central banks and governments globally. Nearly all core income sectors have recovered from the pandemic-related drawdown. The strategy prefers securitized assets relative to corporate credit, particularly given the resilience in US housing, a low interest rate backdrop, and diversification of collateral. Primary market issuance offered attractive concessions and global rates simultaneously dropped as central banks eased, leading to positive tactical credit and rates performance. The Fund generated modest positive performance from tail risk hedges. The Fund remains structured with low interest rate sensitivity and invested in a diversified mix of fixed income sectors including corporate, mortgage-backed and asset-backed securities. The Fund employs futures, options, swaps and forward currency contracts to manage sensitivity to undesired risk exposures as well as efficient investment purposes which provided an additional 0.21% to the return.
1 Payden Mutual Funds
Portfolio Highlights & Investments
| | | | |
The Fund seeks a return equal to the yield on the 30-year U.S. Treasury Bond by primarily investing in debt instruments and income producing securities of U.S. and foreign issuers with no limit on maturity and may also invest in equity securities. | | 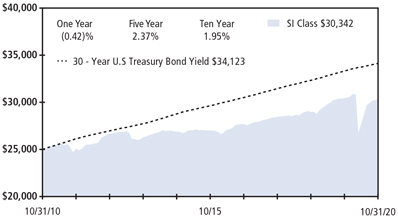
Past performance does not predict future returns. The graph does not reflect the impact of taxes or transaction costs a shareholder would pay. The Fund’s Institutional, Adviser and Retirement Classes are expected to perform similarly to its SI Class, except for class specific expenses or waivers. |
| Portfolio Composition - percent of investments |
Mortgage Backed | | 38% |
Asset Backed | | 27% |
Corporate Bond | | 22% |
Foreign Government | | 6% |
Bank Loans | | 4% |
Other | | 3% |
| | |
| | |
| | |
| | |
| | |
This information is not part of the audited financial statements |
| | | | | | |
| Schedule of Investments - October 31, 2020 | |
Principal
or Shares | | Security Description | | Value
(000) | |
Asset Backed (28%) | | | | |
399,000 | | Arbys Funding LLC 144A, 3.24%, 7/30/50 (a) | | $ | 410 | |
400,000 | | Atlas Senior Loan Fund Ltd. 144A, (3 mo. LIBOR USD + 1.300%), 1.53%, 1/16/30 (a)(b) | | | 398 | |
370,000 | | Barings CLO Ltd. 2016-II 144A, (3 mo. LIBOR USD + 3.250%), 3.47%, 7/20/28 (a)(b) | | | 358 | |
600,000 | | BDS 2020-FL5 Ltd. 144A, (1 mo. LIBOR USD + 2.750%), 2.90%, 2/16/37 (a)(b) | | | 524 | |
1,050,000 | | Blackrock European CLO III DAC 144A, (3 mo. EURIBOR + 0.850%), 0.85%, 4/15/30 EUR (a)(b)(c) | | | 1,224 | |
250,000 | | Blackrock European CLO IV DAC 144A, (3 mo. EURIBOR + 1.300%), 1.30%, 7/15/30 EUR (a)(b)(c) | | | 284 | |
350,000 | | Blackrock European CLO IV DAC 144A, (3 mo. EURIBOR + 2.650%), 2.65%, 7/15/30 EUR (a)(b)(c) | | | 390 | |
500,000 | | Blackrock European CLO V DAC, (3 mo. EURIBOR + 1.100%), 1.10%, 7/16/31 EUR (b)(c)(d) | | | 575 | |
500,000 | | BlueMountain CLO 2015-2 Ltd. 144A, (3 mo. LIBOR USD + 2.750%), 2.97%, 7/18/27 (a)(b) | | | 443 | |
850,000 | | BlueMountain Fuji U.S. CLO I Ltd., (3 mo. LIBOR USD + 1.700%), 1.92%, 7/20/29 (b)(d) | | | 842 | |
850,000 | | BSPRT 2018-FL4 Issuer Ltd. 144A, (1 mo. LIBOR USD + 1.300%), 1.45%, 9/15/35 (a)(b) | | | 832 | |
700,000 | | BSPRT 2018-FL4 Issuer Ltd. 144A, (1 mo. LIBOR USD + 1.600%), 1.75%, 9/15/35 (a)(b) | | | 670 | |
550,000 | | BSPRT 2018-FL4 Issuer Ltd. 144A, (1 mo. LIBOR USD + 2.100%), 2.25%, 9/15/35 (a)(b) | | | 520 | |
500,000 | | BSPRT 2018-FL4 Issuer Ltd. 144A, (1 mo. LIBOR USD + 2.750%), 2.90%, 9/15/35 (a)(b) | | | 465 | |
865,220 | | Carlyle Global Market Strategies Euro CLO 2015-2 DAC 144A, (3 mo. EURIBOR + 0.730%), 0.73%, 9/21/29 EUR (a)(b)(c) | | | 1,007 | |
| | | | | | |
| | |
| | | | | | |
Principal
or Shares | | Security Description | | Value
(000) | |
| | |
500,000 | | Carlyle Global Market Strategies Euro CLO 2015-2 DAC 144A, (3 mo. EURIBOR + 2.700%), 2.70%, 9/21/29 EUR (a)(b)(c) | | $ | 567 | |
800,000 | | CARS-DB4 LP 144A, 4.17%, 2/15/50 (a) | | | 822 | |
200,000 | | CARS-DB4 LP 144A, 4.52%, 2/15/50 (a) | | | 207 | |
300,000 | | CARS-DB4 LP 144A, 4.95%, 2/15/50 (a) | | | 306 | |
1,000,000 | | Cedar Funding VI CLO Ltd. 144A, (3 mo. LIBOR USD + 1.600%), 1.82%, 10/20/28 (a)(b) | | | 988 | |
300,000 | | CIFC Funding 2013-III-R Ltd. 144A, (3 mo. LIBOR USD + 2.900%), 3.11%, 4/24/31 (a)(b) | | | 275 | |
350,000 | | Columbia Cent CLO 27 Ltd. 144A, (3 mo. LIBOR USD + 1.600%), 1.81%, 10/25/28 (a)(b) | | | 346 | |
619,701 | | CoreVest American Finance 2018-2 Trust 144A, 4.03%, 11/15/52 (a) | | | 665 | |
644,491 | | Countrywide Asset-Backed Certificates, 4.54%, 10/25/46 (e) | | | 641 | |
495,000 | | Domino’s Pizza Master Issuer LLC 144A, 3.67%, 10/25/49 (a) | | | 524 | |
884,250 | | Driven Brands Funding 2019-1A LLC 144A, 4.64%, 4/20/49 (a) | | | 939 | |
150,000 | | Driven Brands Funding 2020-2A LLC 144A, 3.24%, 1/20/51 (a) | | | 150 | |
1,100,000 | | Dryden 36 Senior Loan Fund 144A, (3 mo. LIBOR USD + 1.750%), 1.99%, 4/15/29 (a)(b) | | | 1,100 | |
1,300,000 | | Dryden 39 Euro CLO 2015 BV 144A, (3 mo. EURIBOR + 0.870%), 0.87%, 10/15/31 EUR (a)(b)(c) | | | 1,510 | |
93,763 | | GE-WMC Asset-Backed Pass-Through Certificates Series 2005-2, (1 mo. LIBOR USD + 0.500%), 0.65%, 12/25/35 (b) | | | 94 | |
400,000 | | GPMT 2019-FL2 Ltd. 144A, (1 mo. LIBOR USD + 1.300%), 1.44%, 2/22/36 (a)(b) | | | 398 | |
Annual Report 2
Portfolio Highlights & Investments continued
| | | | | | |
Principal
or Shares | | Security Description | | Value
(000) | |
| | |
500,000 | | GPMT 2019-FL2 Ltd. 144A, (1 mo. LIBOR USD + 1.600%), 1.74%, 2/22/36 (a)(b) | | $ | 496 | |
800,000 | | Greystone Commercial Real Estate Notes 2018-HC1 Ltd. 144A, (1 mo. LIBOR USD + 1.550%), 1.70%, 9/15/28 (a)(b) | | | 768 | |
350,000 | | Greystone Commercial Real Estate Notes 2018-HC1 Ltd. 144A, (1 mo. LIBOR USD + 2.150%), 2.30%, 9/15/28 (a)(b) | | | 330 | |
500,000 | | Greystone Commercial Real Estate Notes 2018-HC1 Ltd. 144A, (1 mo. LIBOR USD + 2.650%), 2.80%, 9/15/28 (a)(b) | | | 493 | |
600,000 | | Greystone CRE Notes 2019-FL2 Ltd. 144A, (1 mo. LIBOR USD + 2.400%), 2.55%, 9/15/37 (a)(b) | | | 566 | |
600,000 | | Greystone CRE Notes 2019-FL2 Ltd. 144A, (1 mo. LIBOR USD + 2.750%), 2.90%, 9/15/37 (a)(b) | | | 522 | |
1,500,000 | | Greywolf CLO IV Ltd. 144A, (3 mo. LIBOR USD + 1.950%), 2.17%, 4/17/30 (a)(b) | | | 1,500 | |
500,000 | | Halcyon Loan Advisors Funding 2015-2 Ltd. 144A, (3 mo. LIBOR USD + 1.650%), 1.86%, 7/25/27 (a)(b) | | | 498 | |
750,000 | | Hunt CRE 2018-FL2 Ltd. 144A, (1 mo. LIBOR USD + 2.350%), 2.50%, 8/15/28 (a)(b) | | | 723 | |
350,000 | | InSite Issuer 2020-1A LLC 144A, 2.49%, 9/15/50 (a) | | | 353 | |
185,953 | | JFIN CLO 2014 Ltd. 144A, (3 mo. LIBOR USD + 0.950%), 1.17%, 4/21/25 (a)(b) | | | 186 | |
350,000 | | JFIN CLO 2014 Ltd. 144A, (3 mo. LIBOR USD + 1.450%), 1.67%, 4/21/25 (a)(b) | | | 347 | |
400,000 | | KREF 2018-FL1 Ltd. 144A, (1 mo. LIBOR USD + 1.350%), 1.50%, 6/15/36 (a)(b) | | | 397 | |
250,000 | | KREF 2018-FL1 Ltd. 144A, (1 mo. LIBOR USD + 1.600%), 1.75%, 6/15/36 (a)(b) | | | 246 | |
250,000 | | KREF 2018-FL1 Ltd. 144A, (1 mo. LIBOR USD + 2.000%), 2.15%, 6/15/36 (a)(b) | | | 244 | |
91,894 | | L.A. Arena Funding LLC 144A, 7.66%, 12/15/26 (a) | | | 91 | |
1,000,000 | | LCM XX LP 144A, (3 mo. LIBOR USD + 1.040%), 1.26%, 10/20/27 (a)(b) | | | 993 | |
500,000 | | LoanCore 2019-CRE2 Issuer Ltd. 144A, (1 mo. LIBOR USD + 1.500%), 1.65%, 5/15/36 (a)(b) | | | 491 | |
250,000 | | Madison Park Funding XIII Ltd. 144A, (3 mo. LIBOR USD + 2.850%), 3.07%, 4/19/30 (a)(b) | | | 234 | |
837,475 | | Marathon CRE 2018 FL1 Ltd. 144A, (1 mo. LIBOR USD + 1.150%), 1.30%, 6/15/28 (a)(b) | | | 831 | |
250,000 | | Marathon CRE 2018 FL1 Ltd. 144A, (1 mo. LIBOR USD + 1.550%), 1.70%, 6/15/28 (a)(b) | | | 245 | |
700,000 | | OZLM XII Ltd. 144A, (3 mo. LIBOR USD + 1.600%), 1.81%, 4/30/27 (a)(b) | | | 692 | |
950,000 | | Palmer Square CLO 2015-1 Ltd. 144A, (3 mo. LIBOR USD + 3.150%), 3.40%, 5/21/29 (a)(b) | | | 882 | |
272,938 | | Planet Fitness Master Issuer LLC 144A, 3.86%, 12/05/49 (a) | | | 259 | |
| | | | | | |
Principal
or Shares | | Security Description | | Value
(000) | |
| | |
323,400 | | Planet Fitness Master Issuer LLC 144A, 4.26%, 9/05/48 (a) | | $ | 325 | |
1,250,000 | | Regatta VII Funding Ltd. 144A, (3 mo. LIBOR USD + 1.060%), 1.29%, 12/20/28 (a)(b) | | | 1,241 | |
901,287 | | Shackleton 2015-VIII CLO Ltd. 144A, (3 mo. LIBOR USD + 0.920%), 1.14%, 10/20/27 (a)(b) | | | 893 | |
500,000 | | Stack Infrastructure Issuer 2020-1A LLC 144A, 1.89%, 8/25/45 (a) | | | 503 | |
1,228,125 | | Taco Bell Funding LLC 144A, 4.32%, 11/25/48 (a) | | | 1,254 | |
200,000 | | TPG Real Estate Finance 2018-FL2 Issuer Ltd. 144A, (1 mo. LIBOR USD + 2.300%), 2.45%, 11/15/37 (a)(b) | | | 192 | |
400,000 | | VB-S1 Issuer LLC 144A, 3.03%, 6/15/50 (a) | | | 416 | |
300,000 | | VB-S1 Issuer LLC 144A, 4.09%, 6/15/50 (a) | | | 311 | |
830,002 | | Venture XVII CLO Ltd. 144A, (3 mo. LIBOR USD + 0.880%), 1.12%, 4/15/27 (a)(b) | | | 822 | |
800,000 | | Westlake Automobile Receivables Trust 2018-3 144A, 4.00%, 10/16/23 (a) | | | 824 | |
1,300,000 | | Westlake Automobile Receivables Trust 2019-3 144A, 2.72%, 11/15/24 (a) | | | 1,333 | |
1,150,000 | | Westlake Automobile Receivables Trust 2020-1 144A, 2.80%, 6/16/25 (a) | | | 1,180 | |
500,000 | | Westlake Automobile Receivables Trust 2020-3 144A, 1.65%, 2/17/26 (a) | | | 501 | |
229,341 | | Wind River 2015-2 CLO Ltd. 144A, (3 mo. LIBOR USD + 0.870%), 1.11%, 10/15/27 (a)(b) | | | 227 | |
550,000 | | Wingstop Funding 2020-1A LLC 144A, 2.84%, 12/05/50 (a) | | | 558 | |
Total Asset Backed (Cost - $41,858) | | | 41,441 | |
Bank Loans(f) (4%) | | | | |
545,875 | | 1011778 BC ULC Term Loan B 1L, (LIBOR USD 1-Month + 1.750%), 3.65%, 11/19/26 | | | 525 | |
594,797 | | Axalta Coating Systems U.S. Holdings Inc. Term Loan B3 1L, (LIBOR USD 3-Month + 1.750%), 1.97%, 6/01/24 | | | 579 | |
523,880 | | Change Healthcare Holdings LLC Term Loan B 1L, (LIBOR USD 3-Month + 2.500%), 3.50%, 3/01/24 | | | 513 | |
1,264,250 | | Charter Communications Operating LLC Term Loan B2 1L, (LIBOR USD 1-Month + 1.750%), 1.90%, 2/01/27 | | | 1,234 | |
250,000 | | Froneri Lux FinCo SARL Term Loan B 1L, (1 mo. EURIBOR + 2.625%), 2.63%, 1/31/27 EUR (c) | | | 284 | |
200,000 | | Froneri U.S. Inc. Term Loan 2L, (LIBOR USD 1-Month + 5.750%), 5.90%, 1/31/28 | | | 199 | |
277,900 | | Grifols SA Term Loan B 1L, (1 mo. EURIBOR + 2.250%), 2.25%, 11/15/27 EUR (c) | | | 320 | |
671,334 | | HCA Inc. Term Loan B13 1L, (LIBOR USD 1-Month + 1.750%), 1.90%, 3/18/26 | | | 669 | |
548,593 | | IRB Holding Corp. Term Loan B 1L, (LIBOR USD 1-Month + 2.750%), 3.75%, 2/05/25 | | | 523 | |
3 Payden Mutual Funds
| | | | | | |
Principal
or Shares | | Security Description | | Value
(000) | |
| | |
493,405 | | Tacala Investment Corp. Term Loan B 1L, (LIBOR USD 1-Month + 3.250%), 3.40%, 2/05/27 | | $ | 480 | |
85,000 | | T-Mobile USA Inc. Term Loan B 1L, (LIBOR USD 1-Month + 3.000%), 3.15%, 4/01/27 | | | 85 | |
426,705 | | WMG Acquisition Corp. Term Loan F 1L, (LIBOR USD 1-Month + 2.125%), 2.27%, 11/01/23 | | | 421 | |
676,200 | | Wyndham Hotels & Resorts Inc. Term Loan B 1L, (LIBOR USD 1-Month + 1.750%), 1.90%, 5/30/25 | | | 646 | |
Total Bank Loans (Cost - $6,528) | | | 6,478 | |
Corporate Bond (23%) | | | | |
450,000 | | AbbVie Inc. 144A, 2.60%, 11/21/24 (a) | | | 479 | |
750,000 | | ADCB Finance Cayman Ltd. 144A, 4.00%, 3/29/23 (a) | | | 798 | |
200,000 | | Aker BP ASA 144A, 2.88%, 1/15/26 (a) | | | 198 | |
250,000 | | Albertsons Cos. Inc./Safeway Inc./New Albertsons LP/Albertsons LLC 144A, 3.25%, 3/15/26 (a) | | | 246 | |
575,000 | | Alcoa Nederland Holding BV 144A, 6.75%, 9/30/24 (a) | | | 594 | |
500,000 | | Ares Capital Corp., 3.50%, 2/10/23 | | | 515 | |
350,000 | | AT&T Inc., 0.25%, 3/04/26 EUR (c) | | | 409 | |
300,000 | | AT&T Inc., 2.30%, 6/01/27 | | | 313 | |
500,000 | | Banco Bradesco SA 144A, 2.85%, 1/27/23 (a) | | | 508 | |
400,000 | | Banco Bradesco SA 144A, 3.20%, 1/27/25 (a) | | | 405 | |
245,000 | | Banco de Credito del Peru 144A, 2.70%, 1/11/25 (a) | | | 254 | |
388,000 | | Banco Internacional del Peru SAA Interbank 144A, 3.25%, 10/04/26 (a) | | | 410 | |
300,000 | | Bank of America Corp., (U.S. Secured Overnight Financing Rate + 1.010%), 1.20%, 10/24/26 (b) | | | 300 | |
500,000 | | Becton Dickinson Euro Finance Sarl, 0.63%, 6/04/23 EUR (c) | | | 591 | |
500,000 | | CaixaBank SA, 1.75%, 10/24/23 EUR (c)(d) | | | 606 | |
350,000 | | CANPACK SA/Eastern PA Land Investment Holding LLC 144A, 3.13%, 11/01/25 (a) | | | 355 | |
305,000 | | CDW LLC/CDW Finance Corp., 5.50%, 12/01/24 | | | 338 | |
250,000 | | Centene Corp., 3.38%, 2/15/30 | | | 260 | |
500,000 | | Charter Communications Operating LLC/Charter Communications Operating Capital, 4.50%, 2/01/24 | | | 554 | |
115,000 | | CIT Group Inc., 4.75%, 2/16/24 | | | 124 | |
200,000 | | CNX Midstream Partners LP/CNX Midstream Finance Corp. 144A, 6.50%, 3/15/26 (a) | | | 204 | |
250,000 | | El Corte Ingles SA 144A, 3.63%, 3/15/24 EUR (a)(c) | | | 293 | |
182,000 | | Encompass Health Corp., 5.75%, 11/01/24 | | | 182 | |
500,000 | | Enel Finance International NV 144A, 4.63%, 9/14/25 (a) | | | 577 | |
465,000 | | EQM Midstream Partners LP, 4.75%, 7/15/23 | | | 463 | |
150,000 | | Fiat Chrysler Automobiles NV, 3.38%, 7/07/23
EUR (c)(d) | | | 183 | |
450,000 | | Fidelity National Information Services Inc., 0.75%, 5/21/23 EUR (c) | | | 536 | |
350,000 | | Ford Motor Credit Co. LLC, 2.98%, 8/03/22 | | | 348 | |
200,000 | | Ford Motor Credit Co. LLC, 3.09%, 1/09/23 | | | 198 | |
| | | | | | |
Principal
or Shares | | Security Description | | Value
(000) | |
| | |
350,000 | | Ford Motor Credit Co. LLC, 3.35%, 11/01/22 | | $ | 349 | |
400,000 | | Ford Motor Credit Co. LLC, 3.37%, 11/17/23 | | | 397 | |
600,000 | | FS KKR Capital Corp., 4.75%, 5/15/22 | | | 613 | |
350,000 | | FS KKR Capital Corp. II 144A, 4.25%, 2/14/25 (a) | | | 331 | |
200,000 | | General Motors Co., 5.40%, 10/02/23 | | | 221 | |
400,000 | | General Motors Co., 6.13%, 10/01/25 | | | 469 | |
500,000 | | General Motors Financial Co. Inc., 3.55%, 7/08/22 | | | 519 | |
600,000 | | Geopark Ltd. 144A, 5.50%, 1/17/27 (a) | | | 529 | |
300,000 | | Grifols SA 144A, 1.63%, 2/15/25 EUR (a)(c) | | | 344 | |
300,000 | | Honeywell International Inc., 0.00%, 3/10/24 EUR (c) | | | 351 | |
500,000 | | Icahn Enterprises LP/Icahn Enterprises Finance Corp., 4.75%, 9/15/24 | | | 509 | |
200,000 | | Icahn Enterprises LP/Icahn Enterprises Finance Corp., 5.25%, 5/15/27 | | | 208 | |
400,000 | | Indonesia Asahan Aluminium Persero PT 144A, 4.75%, 5/15/25 (a) | | | 434 | |
300,000 | | Indonesia Asahan Aluminium Persero PT 144A, 5.71%, 11/15/23 (a) | | | 330 | |
400,000 | | Itau Unibanco Holding SA 144A, 2.90%, 1/24/23 (a) | | | 404 | |
500,000 | | Itau Unibanco Holding SA 144A, 3.25%, 1/24/25 (a) | | | 507 | |
300,000 | | Kraft Heinz Foods Co. 144A, 3.88%, 5/15/27 (a) | | | 318 | |
300,000 | | Life Storage LP, 2.20%, 10/15/30 | | | 300 | |
450,000 | | Logicor Financing Sarl, 1.63%, 7/15/27 EUR (c)(d) | | | 544 | |
400,000 | | Medtronic Global Holdings SCA, 0.38%, 10/15/28 EUR (c) | | | 472 | |
200,000 | | Microchip Technology Inc. 144A, 2.67%, 9/01/23 (a) | | | 208 | |
350,000 | | Morgan Stanley, (3 mo. EURIBOR + 0.867%), 0.50%, 10/26/29 EUR (b)(c) | | | 406 | |
300,000 | | Morgan Stanley, (3 mo. EURIBOR + 0.753%), 0.64%, 7/26/24 EUR (b)(c) | | | 355 | |
200,000 | | Morgan Stanley, (U.S. Secured Overnight Financing Rate + 1.990%), 2.19%, 4/28/26 (b) | | | 210 | |
310,000 | | MPT Operating Partnership LP/MPT Finance Corp., 5.50%, 5/01/24 | | | 314 | |
115,000 | | National Fuel Gas Co., 4.90%, 12/01/21 | | | 119 | |
640,000 | | National Fuel Gas Co., 5.50%, 1/15/26 | | | 701 | |
300,000 | | Nissan Motor Co. Ltd. 144A, 3.04%, 9/15/23 (a) | | | 305 | |
300,000 | | Northriver Midstream Finance LP 144A, 5.63%, 2/15/26 (a) | | | 298 | |
700,000 | | Owl Rock Capital Corp., 4.00%, 3/30/25 | | | 702 | |
400,000 | | Penske Automotive Group Inc., 3.50%, 9/01/25 | | | 401 | |
300,000 | | Petrobras Global Finance BV, 5.60%, 1/03/31 | | | 324 | |
300,000 | | Petrobras Global Finance BV, 8.38%, 5/23/21 | | | 311 | |
200,000 | | Petroleos Mexicanos, 2.50%, 8/21/21 EUR (c)(d) | | | 231 | |
200,000 | | Petroleos Mexicanos, 3.75%, 2/21/24 EUR (c)(d) | | | 224 | |
150,000 | | Petroleos Mexicanos, 4.88%, 1/18/24 (g) | | | 147 | |
450,000 | | Petroleos Mexicanos, 5.13%, 3/15/23 EUR (c)(d) | | | 528 | |
550,000 | | Plains All American Pipeline LP/PAA Finance Corp., 3.60%, 11/01/24 | | | 566 | |
430,000 | | Plains All American Pipeline LP/PAA Finance Corp., 5.00%, 2/01/21 | | | 430 | |
500,000 | | Prosus NV 144A, 1.54%, 8/03/28 EUR (a)(c) | | | 590 | |
Annual Report 4
Portfolio Highlights & Investments continued
| | | | | | |
Principal
or Shares | | Security Description | | Value
(000) | |
| | |
450,000 | | Q-Park Holding I BV 144A, 2.00%, 3/01/27 EUR (a)(c) | | $ | 450 | |
300,000 | | Royalty Pharma PLC 144A, 1.75%, 9/02/27 (a) | | | 298 | |
750,000 | | Sabine Pass Liquefaction LLC, 5.75%, 5/15/24 | | | 845 | |
320,000 | | SBA Communications Corp., 4.00%, 10/01/22 | | | 323 | |
900,000 | | SBA Tower Trust 144A, 2.84%, 1/15/25 (a) | | | 956 | |
200,000 | | Sirius XM Radio Inc. 144A, 3.88%, 8/01/22 (a) | | | 202 | |
300,000 | | Sprint Corp., 7.88%, 9/15/23 | | | 343 | |
105,000 | | Sprint Spectrum Co. LLC/Sprint Spectrum Co. II LLC/Sprint Spectrum Co. III LLC 144A, 3.36%, 9/20/21 (a) | | | 106 | |
350,000 | | Standard Industries Inc. 144A, 2.25%, 11/21/26 EUR (a)(c) | | | 402 | |
500,000 | | Suncor Energy Inc., 2.80%, 5/15/23 | | | 523 | |
200,000 | | Terega SASU, 0.63%, 2/27/28 EUR (c)(d) | | | 228 | |
550,000 | | Teva Pharmaceutical Finance Netherlands II BV, 3.25%, 4/15/22 EUR (c) | | | 643 | |
920,000 | | Teva Pharmaceutical Finance Netherlands III BV, 2.20%, 7/21/21 | | | 907 | |
100,000 | | VEREIT Operating Partnership LP, 3.40%, 1/15/28 | | | 105 | |
300,000 | | Volkswagen Financial Services AG, 2.50%, 4/06/23 EUR (c)(d) | | | 370 | |
500,000 | | Worldline SA, 0.25%, 9/18/24 EUR (c)(d) | | | 588 | |
Total Corporate Bond (Cost - $33,311) | | | 34,049 | |
Foreign Government (7%) | | | | |
400,000 | | Corp. Financiera de Desarrollo SA 144A, 2.40%, 9/28/27 (a) | | | 407 | |
155,000 | | Dominican Republic International Bond 144A, 5.88%, 4/18/24 (a) | | | 164 | |
200,000 | | Dominican Republic International Bond, 6.60%, 1/28/24 (d) | | | 219 | |
416,667 | | Dominican Republic International Bond 144A, 7.50%, 5/06/21 (a) | | | 428 | |
200,000 | | Egypt Government International Bond 144A, 5.75%, 5/29/24 (a) | | | 205 | |
457,000 | | Fondo MIVIVIENDA SA, 3.50%, 1/31/23 (d) | | | 479 | |
1,020,000 | | Georgia Government International Bond, 6.88%, 4/12/21 (d) | | | 1,039 | |
531,000 | | Guatemala Government Bond 144A, 5.75%, 6/06/22 (a) | | | 563 | |
300,000 | | Guatemala Government Bond, 5.75%, 6/06/22 (d) | | | 318 | |
450,000 | | Honduras Government International Bond 144A, 8.75%, 12/16/20 (a) | | | 453 | |
300,000 | | Indonesia Government International Bond, 0.90%, 2/14/27 EUR (c) | | | 346 | |
500,000 | | Kazakhstan Government International Bond 144A, 1.55%, 11/09/23 EUR (a)(c) | | | 599 | |
300,000 | | Mongolia Government International Bond 144A, 5.13%, 4/07/26 (a) | | | 311 | |
390,000 | | Mongolia Government International Bond 144A, 5.63%, 5/01/23 (a) | | | 407 | |
100,000 | | Morocco Government International Bond 144A, 1.38%, 3/30/26 EUR (a)(c) | | | 116 | |
| | | | | | |
Principal
or Shares | | Security Description | | Value
(000) | |
| | |
400,000 | | Morocco Government International Bond, 4.25%, 12/11/22 (d) | | $ | 420 | |
500,000 | | Nigeria Government International Bond 144A, 6.38%, 7/12/23 (a) | | | 522 | |
600,000 | | Nigeria Government International Bond, 6.75%, 1/28/21 (d) | | | 605 | |
200,000 | | Panama Government International Bond, 3.75%, 3/16/25 | | | 219 | |
250,000 | | Perusahaan Penerbit SBSN Indonesia III 144A, 3.40%, 3/29/22 (a) | | | 259 | |
450,000 | | Senegal Government International Bond 144A, 6.25%, 7/30/24 (a) | | | 475 | |
308,000 | | Senegal Government International Bond 144A, 8.75%, 5/13/21 (a) | | | 318 | |
300,000 | | Serbia International Bond, 7.25%, 9/28/21 (d) | | | 317 | |
450,000 | | Ukraine Government International Bond 144A, 7.75%, 9/01/22 (a) | | | 470 | |
300,000 | | Ukraine Government International Bond, 7.75%, 9/01/23 (d) | | | 313 | |
Total Foreign Government (Cost - $9,839) | | | 9,972 | |
Mortgage Backed (39%) | | | | |
269,773 | | Alternative Loan Trust 2006-31CB, 6.00%, 11/25/36 | | | 224 | |
140,754 | | Alternative Loan Trust 2006-31CB, 6.00%, 11/25/36 | | | 117 | |
253,209 | | Alternative Loan Trust 2006-J5, 6.50%, 9/25/36 | | | 209 | |
1,859,166 | | Alternative Loan Trust 2007-12T1, 6.00%, 6/25/37 | | | 1,363 | |
869,603 | | Alternative Loan Trust 2007-5CB, 6.00%, 4/25/37 | | | 689 | |
527,022 | | Alternative Loan Trust 2007-5CB, 6.00%, 4/25/37 | | | 417 | |
176,156 | | Alternative Loan Trust 2007-5CB, 6.00%, 4/25/37 | | | 139 | |
1,049,271 | | American Home Mortgage Assets Trust 2007-2, (1 mo. LIBOR USD + 0.125%), 0.27%, 3/25/47 (b) | | | 992 | |
199,681 | | AREIT 2018-CRE2 Trust 144A, (1 mo. LIBOR USD + 1.400%), 1.55%, 11/14/35 (a)(b) | | | 195 | |
270,831 | | Banc of America Funding 2005-H Trust, 2.84%, 11/20/35 (e) | | | 241 | |
300,000 | | BDS 2018-FL2 144A, (1 mo. LIBOR USD + 1.400%), 1.55%, 8/15/35 (a)(b) | | | 298 | |
379,719 | | BX Commercial Mortgage Trust 2019-XL 144A, (1 mo. LIBOR USD + 1.800%), 1.95%, 10/15/36 (a)(b) | | | 375 | |
617,044 | | BX Commercial Mortgage Trust 2019-XL 144A, (1 mo. LIBOR USD + 2.000%), 2.15%, 10/15/36 (a)(b) | | | 606 | |
759,438 | | BX Commercial Mortgage Trust 2019-XL 144A, (1 mo. LIBOR USD + 2.300%), 2.45%, 10/15/36 (a)(b) | | | 740 | |
299,726 | | BX Commercial Mortgage Trust 2020-BXLP 144A, (1 mo. LIBOR USD + 2.000%), 2.15%, 12/15/36 (a)(b) | | | 291 | |
5 Payden Mutual Funds
| | | | | | |
Principal
or Shares | | Security Description | | Value
(000) | |
| | |
400,000 | | BX Commercial Mortgage Trust 2020-VKNG 144A, (1 mo. LIBOR USD + 2.100%), 2.25%, 10/15/37 (a)(b) | | $ | 401 | |
400,000 | | BX Commercial Mortgage Trust 2020-VKNG 144A, (1 mo. LIBOR USD + 2.750%), 2.90%, 10/15/37 (a)(b) | | | 402 | |
913,543 | | CGDBB Commercial Mortgage Trust 2017-BIOC 144A, (1 mo. LIBOR USD + 2.150%), 2.30%, 7/15/32 (a)(b) | | | 906 | |
420,319 | | Chase Mortgage Finance Trust Series 2007-S3, 6.00%, 5/25/37 | | | 296 | |
406,689 | | Chase Mortgage Finance Trust Series 2007-S3, 6.00%, 5/25/37 | | | 286 | |
547,637 | | CHC Commercial Mortgage Trust 2019-CHC 144A, (1 mo. LIBOR USD + 2.350%), 2.50%, 6/15/34 (a)(b) | | | 474 | |
348,496 | | CHC Commercial Mortgage Trust 2019-CHC 144A, (1 mo. LIBOR USD + 2.608%), 2.76%, 6/15/34 (a)(b) | | | 280 | |
88,326 | | CHL Mortgage Pass-Through Trust 2005-18, 5.50%, 10/25/35 | | | 71 | |
577,842 | | CHL Mortgage Pass-Through Trust 2006-HYB1, 3.26%, 3/20/36 (e) | | | 563 | |
424,224 | | CHL Mortgage Pass-Through Trust 2007-HYB2, 3.32%, 2/25/47 (e) | | | 391 | |
300,000 | | Citigroup Commercial Mortgage Trust 2019-SST2 144A, (1 mo. LIBOR USD + 1.300%), 1.45%, 12/15/36 (a)(b) | | | 290 | |
400,000 | | Citigroup Commercial Mortgage Trust 2019-SST2 144A, (1 mo. LIBOR USD + 1.600%), 1.75%, 12/15/36 (a)(b) | | | 385 | |
300,000 | | Cold Storage Trust 2020-ICE5 144A, (1 mo. LIBOR USD + 0.900%), 1.06%, 11/15/23 (a)(b) | | | 299 | |
400,000 | | Cold Storage Trust 2020-ICE5 144A, (1 mo. LIBOR USD + 2.100%), 2.14%, 11/15/23 (a)(b) | | | 397 | |
200,000 | | Cold Storage Trust 2020-ICE5 144A, (1 mo. LIBOR USD + 2.766%), 2.99%, 11/15/23 (a)(b) | | | 198 | |
600,000 | | Cold Storage Trust 2020-ICE5 144A, (1 mo. LIBOR USD + 3.492%), 3.49%, 11/15/23 (a)(b) | | | 591 | |
1,482,949 | | Connecticut Avenue Securities Trust 2019-HRP1 144A, (1 mo. LIBOR USD + 2.150%), 2.30%, 11/25/39 (a)(b) | | | 1,340 | |
187,645 | | Connecticut Avenue Securities Trust 2019-R01 144A, (1 mo. LIBOR USD + 2.450%), 2.60%, 7/25/31 (a)(b) | | | 187 | |
500,000 | | Connecticut Avenue Securities Trust 2019-R01 144A, (1 mo. LIBOR USD + 4.350%), 4.50%, 7/25/31 (a)(b) | | | 479 | |
1,000,000 | | Connecticut Avenue Securities Trust 2019-R02 144A, (1 mo. LIBOR USD + 4.150%), 4.30%, 8/25/31 (a)(b) | | | 972 | |
550,000 | | Connecticut Avenue Securities Trust 2019-R03 144A, (1 mo. LIBOR USD + 4.100%), 4.25%, 9/25/31 (a)(b) | | | 534 | |
1,210,041 | | Connecticut Avenue Securities Trust 2019-R06 144A, (1 mo. LIBOR USD + 2.100%), 2.25%, 9/25/39 (a)(b) | | | 1,203 | |
| | | | | | |
Principal
or Shares | | Security Description | | Value
(000) | |
| | |
300,000 | | Connecticut Avenue Securities Trust 2019-R07 144A, (1 mo. LIBOR USD + 3.400%), 3.55%, 10/25/39 (a)(b) | | $ | 263 | |
200,000 | | Connecticut Avenue Securities Trust 2020-R02 144A, (1 mo. LIBOR USD + 2.000%), 2.15%, 1/25/40 (a)(b) | | | 195 | |
350,000 | | Connecticut Avenue Securities Trust 2020-R02 144A, (1 mo. LIBOR USD + 3.000%), 3.15%, 1/25/40 (a)(b) | | | 273 | |
950,000 | | Credit Suisse Mortgage Capital Certificates 2019-ICE4 144A, (1 mo. LIBOR USD + 2.150%),
2.30%, 5/15/36 (a)(b) | | | 937 | |
750,000 | | Credit Suisse Mortgage Capital Certificates 2019-ICE4 144A, (1 mo. LIBOR USD + 2.650%),
2.80%, 5/15/36 (a)(b) | | | 736 | |
750,000 | | CSMC Trust 2017-MOON 144A, 3.20%, 7/10/34 (a)(e) | | | 717 | |
695,074 | | Fannie Mae Connecticut Avenue Securities, (1 mo. LIBOR USD + 4.250%), 4.40%, 1/25/29 (b) | | | 721 | |
384,580 | | First Horizon Alternative Mortgage Securities Trust 2006-AA5, 2.77%, 9/25/36 (e) | | | 350 | |
567,381 | | Freddie Mac STACR 2019-HQA3 144A, (1 mo. LIBOR USD + 1.850%), 2.00%, 9/25/49 (a)(b) | | | 558 | |
600,000 | | Freddie Mac STACR 2019-HQA3 144A, (1 mo. LIBOR USD + 3.000%), 3.15%, 9/25/49 (a)(b) | | | 551 | |
250,000 | | Freddie Mac STACR 2019-HQA3 144A, (1 mo. LIBOR USD + 7.500%), 7.65%, 9/25/49 (a)(b) | | | 206 | |
200,000 | | Freddie Mac STACR REMIC Trust 2020-DNA2 144A, (1 mo. LIBOR USD + 1.850%), 2.00%, 2/25/50 (a)(b) | | | 197 | |
400,000 | | Freddie Mac STACR REMIC Trust 2020-DNA5 144A, (U.S. Secured Overnight Financing Rate Index 30day Average + 2.800%), 2.89%, 10/25/50 (a)(b) | | | 400 | |
200,000 | | Freddie Mac STACR REMIC Trust 2020-DNA5 144A, (U.S. Secured Overnight Financing Rate Index 30day Average + 4.800%), 4.89%, 10/25/50 (a)(b) | | | 201 | |
450,000 | | Freddie Mac STACR REMIC Trust 2020-HQA1 144A, (1 mo. LIBOR USD + 1.900%), 2.05%, 1/25/50 (a)(b) | | | 443 | |
300,000 | | Freddie Mac STACR REMIC Trust 2020-HQA2 144A, (1 mo. LIBOR USD + 7.600%), 7.75%, 3/25/50 (a)(b) | | | 197 | |
800,000 | | Freddie Mac STACR REMIC Trust 2020-HQA3 144A, (1 mo. LIBOR USD + 1.550%), 1.70%, 7/25/50 (a)(b) | | | 802 | |
500,000 | | Freddie Mac STACR REMIC Trust 2020-HQA3 144A, (1 mo. LIBOR USD + 5.750%), 5.90%, 7/25/50 (a)(b) | | | 517 | |
400,000 | | Freddie Mac STACR REMIC Trust 2020-HQA4 144A, (1 mo. LIBOR USD + 1.300%), 1.45%, 9/25/50 (a)(b) | | | 402 | |
300,000 | | Freddie Mac STACR REMIC Trust 2020-HQA4 144A, (1 mo. LIBOR USD + 3.150%), 3.30%, 9/25/50 (a)(b) | | | 303 | |
Annual Report 6
Portfolio Highlights & Investments continued
| | | | | | |
Principal
or Shares | | Security Description | | Value
(000) | |
| | |
900,000 | | Freddie Mac STACR Trust 2018-HQA2 144A, (1 mo. LIBOR USD + 2.300%), 2.45%, 10/25/48 (a)(b) | | $ | 879 | |
532,016 | | Freddie Mac STACR Trust 2019-DNA1 144A, (1 mo. LIBOR USD + 2.650%), 2.80%, 1/25/49 (a)(b) | | | 529 | |
668,828 | | Freddie Mac STACR Trust 2019-DNA2 144A, (1 mo. LIBOR USD + 2.450%), 2.60%, 3/25/49 (a)(b) | | | 661 | |
260,254 | | Freddie Mac STACR Trust 2019-DNA3 144A, (1 mo. LIBOR USD + 2.050%), 2.20%, 7/25/49 (a)(b) | | | 256 | |
200,000 | | Freddie Mac STACR Trust 2019-DNA4 144A, (1 mo. LIBOR USD + 2.700%), 2.85%, 10/25/49 (a)(b) | | | 184 | |
200,000 | | Freddie Mac STACR Trust 2019-FTR3 144A, (1 mo. LIBOR USD + 4.800%), 4.95%, 9/25/47 (a)(b) | | | 152 | |
200,000 | | Freddie Mac STACR Trust 2019-FTR4 144A, (1 mo. LIBOR USD + 5.000%), 5.15%, 11/25/47 (a)(b) | | | 152 | |
361,960 | | Freddie Mac STACR Trust 2019-HQA1 144A, (1 mo. LIBOR USD + 2.350%), 2.50%, 2/25/49 (a)(b) | | | 357 | |
685,582 | | Freddie Mac STACR Trust 2019-HQA2 144A, (1 mo. LIBOR USD + 2.050%), 2.20%, 4/25/49 (a)(b) | | | 677 | |
498,735 | | Freddie Mac STACR Trust 2019-HRP1 144A, (1 mo. LIBOR USD + 1.400%), 1.55%, 2/25/49 (a)(b) | | | 481 | |
675,000 | | Freddie Mac STACR Trust 2019-HRP1 144A, (1 mo. LIBOR USD + 2.250%), 2.40%, 2/25/49 (a)(b) | | | 630 | |
450,000 | | Freddie Mac STACR Trust 2019-HRP1 144A, (1 mo. LIBOR USD + 9.500%), 9.65%, 2/25/49 (a)(b) | | | 354 | |
826,258 | | Freddie Mac Structured Agency Credit Risk Debt Notes, (1 mo. LIBOR USD + 1.800%), 1.95%, 7/25/30 (b) | | | 810 | |
793,397 | | Freddie Mac Structured Agency Credit Risk Debt Notes, (1 mo. LIBOR USD + 2.300%), 2.45%, 9/25/30 (b) | | | 780 | |
307,128 | | Freddie Mac Structured Agency Credit Risk Debt Notes 144A, 4.14%, 8/25/48 (a)(e) | | | 305 | |
1,250,000 | | Freddie Mac Structured Agency Credit Risk Debt Notes, (1 mo. LIBOR USD + 4.600%), 4.75%, 12/25/42 (b) | | | 1,188 | |
298,231 | | Freddie Mac Structured Agency Credit Risk Debt Notes, (1 mo. LIBOR USD + 9.000%), 9.15%, 3/25/29 (b) | | | 313 | |
697,516 | | GSMPS Mortgage Loan Trust 2005-RP2 144A, (1 mo. LIBOR USD + 0.350%), 0.50%, 3/25/35 (a)(b) | | | 633 | |
216,767 | | HarborView Mortgage Loan Trust 2004-10, 3.29%, 1/19/35 (e) | | | 225 | |
45,545 | | HomeBanc Mortgage Trust 2004-1, (1 mo. LIBOR USD + 0.860%), 1.01%, 8/25/29 (b) | | | 44 | |
| | | | | | |
Principal
or Shares | | Security Description | | Value
(000) | |
| | |
139,971 | | IndyMac INDX Mortgage Loan Trust 2005-AR13, 2.85%, 8/25/35 (e) | | $ | 132 | |
450,000 | | InTown Hotel Portfolio Trust 2018-STAY 144A, (1 mo. LIBOR USD + 3.100%), 3.25%, 1/15/33 (a)(b) | | | 445 | |
79,866 | | JP Morgan Mortgage Trust 2006-S2, 6.00%, 7/25/36 | | | 62 | |
391,736 | | JP Morgan Mortgage Trust 2007-S2, 6.00%, 6/25/37 | | | 253 | |
76,536 | | JP Morgan Mortgage Trust 2014-IVR3 144A, 3.00%, 9/25/44 (a)(e) | | | 77 | |
1,291,367 | | JP Morgan Mortgage Trust 2017-5 144A, 3.13%, 10/26/48 (a)(e) | | | 1,319 | |
300,000 | | MF1 2020-FL3 Ltd. 144A, (1 mo. LIBOR USD + 4.500%), 4.65%, 7/15/35 (a)(b) | | | 306 | |
3,951,445 | | Morgan Stanley Capital I Trust 2018-H3, 0.83%, 7/15/51 (e) | | | 193 | |
342,485 | | Morgan Stanley Mortgage Loan Trust 2004-11AR, 2.70%, 1/25/35 (e) | | | 333 | |
300,000 | | Multifamily Connecticut Avenue Securities Trust 2019-01 144A, (1 mo. LIBOR USD + 3.250%), 3.40%, 10/15/49 (a)(b) | | | 278 | |
900,000 | | Palisades Center Trust 2016-PLSD 144A, 3.36%, 4/13/33 (a) | | | 428 | |
450,000 | | PFP 2019-5 Ltd. 144A, (1 mo. LIBOR USD + 1.420%), 1.57%, 4/14/36 (a)(b) | | | 436 | |
19,899 | | Prime Mortgage Trust 2005-4, 5.00%, 10/25/35 | | | 20 | |
782,154 | | RALI Series 2005-QA7 Trust, 3.61%, 7/25/35 (e) | | | 753 | |
804,896 | | RALI Series 2005-QS14 Trust, 6.00%, 9/25/35 | | | 787 | |
87,954 | | RALI Series 2006-QS4 Trust, 6.00%, 4/25/36 | | | 85 | |
396,488 | | RALI Series 2007-QS1 Trust, 6.00%, 1/25/37 | | | 385 | |
797,411 | | RALI Series 2007-QS2 Trust, 6.25%, 1/25/37 | | | 766 | |
332,206 | | Residential Asset Securitization Trust 2006-A8, 6.00%, 8/25/36 | | | 239 | |
110,000 | | Sage AR Funding No 1 PLC 144A, (Sterling Overnight Index Average 3mo. + 3.000%),
0.00%, 11/17/30 GBP (a)(b)(c) | | | 143 | |
500,000 | | STACR Trust 2018-DNA3 144A, (1 mo. LIBOR USD + 2.100%), 2.25%, 9/25/48 (a)(b) | | | 490 | |
1,284,823 | | STACR Trust 2018-HRP1 144A, (1 mo. LIBOR USD + 1.650%), 1.80%, 4/25/43 (a)(b) | | | 1,250 | |
1,400,000 | | STACR Trust 2018-HRP1 144A, (1 mo. LIBOR USD + 3.750%), 3.90%, 4/25/43 (a)(b) | | | 1,328 | |
973,875 | | STACR Trust 2018-HRP1 144A, (1 mo. LIBOR USD + 11.750%), 11.90%, 4/25/43 (a)(b) | | | 983 | |
366,253 | | STACR Trust 2018-HRP2 144A, (1 mo. LIBOR USD + 1.250%), 1.40%, 2/25/47 (a)(b) | | | 361 | |
1,900,000 | | STACR Trust 2018-HRP2 144A, (1 mo. LIBOR USD + 2.400%), 2.55%, 2/25/47 (a)(b) | | | 1,813 | |
700,000 | | STACR Trust 2018-HRP2 144A, (1 mo. LIBOR USD + 10.500%), 10.65%, 2/25/47 (a)(b) | | | 699 | |
173,586 | | Structured Adjustable Rate Mortgage Loan Trust, 3.43%, 12/25/35 (e) | | | 113 | |
7 Payden Mutual Funds
| | | | | | |
Principal
or Shares | | Security Description | | Value
(000) | |
| | |
511,926 | | Structured Asset Mortgage Investments II Trust 2003-AR4, (1 mo. LIBOR USD + 0.700%), 0.85%, 1/19/34 (b) | | $ | 500 | |
663,716 | | Structured Asset Mortgage Investments II Trust 2005-AR4, (1 mo. LIBOR USD + 0.310%), 0.46%, 12/25/35 (b) | | | 625 | |
212,632 | | Structured Asset Mortgage Investments II Trust 2006-AR3, 2.93%, 5/25/36 (e) | | | 82 | |
2,155,703 | | Structured Asset Mortgage Investments II Trust 2006-AR7, (1 mo. LIBOR USD + 0.210%), 0.36%, 8/25/36 (b) | | | 2,065 | |
1,101 | | Structured Asset Mortgage Investments Trust 2003-CL1, 2.30%, 7/25/32 (e) | | | 1 | |
801,820 | | WaMu Mortgage Pass-Through Certificates Series 2005-AR11 Trust, (1 mo. LIBOR USD + 0.320%), 0.47%, 8/25/45 (b) | | | 827 | |
698,622 | | WaMu Mortgage Pass-Through Certificates Series 2006-AR10 Trust, 3.04%, 9/25/36 (e) | | | 666 | |
203,182 | | WaMu Mortgage Pass-Through Certificates Series 2006-AR12 Trust, 2.65%, 10/25/36 (e) | | | 196 | |
360,750 | | WaMu Mortgage Pass-Through Certificates Series 2006-AR12 Trust, 3.02%, 10/25/36 (e) | | | 352 | |
349,220 | | WaMu Mortgage Pass-Through Certificates Series 2006-AR19 Trust, (Cost of Funds for the 11th District of San Francisco + 1.250%), 1.78%, 1/25/47 (b) | | | 334 | |
94,537 | | WaMu Mortgage Pass-Through Certificates Series 2006-AR4 Trust, (12 mo. Federal Reserve Cumulative Average USD + 0.940%), 1.96%, 5/25/46 (b) | | | 92 | |
1,248,499 | | WaMu Mortgage Pass-Through Certificates Series 2007-HY1 Trust, 3.49%, 2/25/37 (e) | | | 1,215 | |
302,307 | | WaMu Mortgage Pass-Through Certificates Series 2007-HY1 Trust, 3.65%, 2/25/37 (e) | | | 278 | |
303,789 | | WaMu Mortgage Pass-Through Certificates Series 2007-HY2 Trust, 3.15%, 9/25/36 (e) | | | 277 | |
400,000 | | Wells Fargo Commercial Mortgage Trust 2017-SMP 144A, (1 mo. LIBOR USD + 1.650%), 1.80%, 12/15/34 (a)(b) | | | 334 | |
10,671,033 | | Wells Fargo Commercial Mortgage Trust 2018-C46, 0.94%, 8/15/51 (e) | | | 534 | |
| | | | | | |
Total Mortgage Backed (Cost - $61,367) | | | 59,275 | |
| | | | | | |
| | | | |
| | | | | | |
Principal
or Shares | | Security Description | | Value
(000) | |
| |
U.S. Treasury (0%) | | | | |
550,000 | | U.S. Treasury Bill, 0.09%, 2/11/21 (h)
(Cost - $550) | | $ | 550 | |
Stocks (2%) | | | | |
Common Stock (2%) | | | | |
2,900 | | Apple Inc. | | | 316 | |
500 | | BlackRock Inc. | | | 300 | |
5,600 | | DuPont de Nemours Inc. | | | 318 | |
1,200 | | Home Depot Inc. | | | 320 | |
3,200 | | Medtronic PLC | | | 322 | |
4,300 | | Merck & Co. Inc. | | | 323 | |
1,600 | | Microsoft Corp. | | | 324 | |
1,800 | | Union Pacific Corp. | | | 319 | |
1,700 | | Visa Inc., Class A | | | 309 | |
2,900 | | Waste Management Inc. | | | 313 | |
| | | 3,164 | |
Total Stocks (Cost - $3,134) | | | 3,164 | |
| |
Investment Company (0%) | | | | |
324,427 | | Payden Cash Reserves Money Market Fund *
(Cost - $324) | | | 324 | |
| |
Total Investments (Cost - $156,911) (103%) | | | 155,253 | |
Liabilities in excess of Other Assets (-3%) | | | (3,856 | ) |
| |
Net Assets (100%) | | $ | 151,397 | |
| | | | | | |
| (a) | Security offered only to qualified institutional investors, and thus is not registered for sale to the public under rule 144A of the Securities Act of 1933. It has been deemed liquid under guidelines approved by the Board. |
| (b) | Floating rate security. The rate shown reflects the rate in effect at October 31, 2020. |
| (c) | Principal in foreign currency. |
| (d) | Security offered and sold outside the United States, and thus is exempt from registration under Regulation S of the Securities Act of 1933. It has been deemed liquid under guidelines approved by the Board. |
| (e) | Variable rate security. Interest rate disclosed is as of the most recent information available. Certain variable rate securities are not based on a published reference rate and spread but are determined by the issuer or agent and are based on current market conditions. These securities do not indicate a reference rate and spread in their description above. |
| (f) | Floating rate security. The rate shown reflects the rate in effect at October 31, 2020. The stated maturity is subject to prepayments. See Note 2 in the Notes to Financial Statements. |
| (g) | All or a portion of these securities are on loan. At October 31, 2020, the total market value of the Fund’s securities on loan is $147 and the total market value of the collateral held by the Fund is $153. Amounts in 000s. |
| (h) | Yield to maturity at time of purchase. |
Annual Report 8
Portfolio Highlights & Investments continued
Open Forward Currency Contracts to USD
| | | | | | | | | | | | | | | | | | | | |
Currency
Purchased
(000s) | | Currency
Sold
(000s) | | Counterparty | | Settlement
Date | | Unrealized
Appreciation
(Depreciation)
(000s) |
Assets: | | | | | | | | | | | | | | | | | | | | |
USD 15,818 | | | | EUR 13,285 | | | | | Citibank, N.A. | | | | | 03/22/2021 | | | | $ | 293 | |
| USD 1,170 | | | | EUR 990 | | | | | Citibank, N.A. | | | | | 03/22/2021 | | | | | 13 | |
| | | | | | | | | | | | | | | | | | | | |
| | | | | | | | | | | | | | | | | | | 306 | |
| | | | | | | | | | | | | | | | | | | | |
Liabilities: | | | | | | | | | | | | | | | | | | | | |
| USD 144 | | | | GBP 112 | | | | | HSBC Bank USA, N.A. | | | | | 03/22/2021 | | | | | (1 | ) |
| | | | | | | | | | | | | | | | | | | | |
| Net Unrealized Appreciation | | | | | | | | | | | | | | | | | | $ | 305 | |
| | | | | | | | | | | | | | | | | | | | |
Open Futures Contracts
| | | | | | | | | | | | | | | | | | | | | | | | | |
| Contract Type | | Number of
Contracts | | Expiration
Date | | Notional
Amount
(000s) | | Current
Value
(000s) | | Unrealized
Appreciation
(Depreciation)
(000s) |
Long Contracts: | | | | | | | | | | | | | | | | | | | | | | | | | |
| AUD 3-Year Bond Future | | | | 209 | | | | | Dec-20 | | | | $ | 17,255 | | | | $ | 68 | | | | $ | 68 | |
| U.S. Treasury 2-Year Note Future | | | | 16 | | | | | Dec-20 | | | | | 3,534 | | | | | (1 | ) | | | | (1 | ) |
| U.S. Treasury 5-Year Note Future | | | | 90 | | | | | Dec-20 | | | | | 11,304 | | | | | (25 | ) | | | | (25 | ) |
| | | | | | | | | | | | | | | | | | | | | | | | | |
| | | | | | | | | | | | | | | | | | | | | | | | 42 | |
| | | | | | | | | | | | | | | | | | | | | | | | | |
Short Contracts: | | | | | | | | | | | | | | | | | | | | | | | | | |
| Euro-Bobl Future | | | | 40 | | | | | Dec-20 | | | | | (6,330 | ) | | | | (36 | ) | | | | (36 | ) |
| Euro-Bund Future | | | | 4 | | | | | Dec-20 | | | | | (821 | ) | | | | (10 | ) | | | | (10 | ) |
| U.S. 10-Year Ultra Future | | | | 11 | | | | | Dec-20 | | | | | (1,730 | ) | | | | 25 | | | | | 25 | |
| U.S. Treasury 10-Year Note Future | | | | 10 | | | | | Dec-20 | | | | | (1,382 | ) | | | | 11 | | | | | 11 | |
| | | | | | | | | | | | | | | | | | | | | | | | | |
| | | | | | | | | | | | | | | | | | | | | | | | (10 | ) |
| | | | | | | | | | | | | | | | | | | | | | | | | |
| Total Futures | | | | | | | | | | | | | | | | | | | | | | | $ | 32 | |
| | | | | | | | | | | | | | | | | | | | | | | | | |
Open Centrally Cleared Interest Rate Swap Contracts
| | | | | | | | | | | | | | | | | | | | | | | | | |
| Description | | Maturity
Date | | Notional
Amount
(000s) | | Value
(000s) | | Upfront
payments/
receipts
(000s) | | Unrealized
Appreciation
(000s) |
3-Year Interest Rate Swap, Receive Fixed 0.598% Semi-Annually,
Pay Variable 0.505% (CDOR03 Index) Semi-Annually | | 09/10/2023 | | CAD 2,170 | | | $ | 1 | | | | $ | — | | | | $ | 1 | |
3-Year Interest Rate Swap, Receive Fixed 1.5535% Semi-Annually,
Pay Variable 0.50625% (CDOR03 Index) Semi-Annually | | 08/30/2022 | | CAD 3,546 | | | | 56 | | | | | — | | | | | 56 | |
3-Year Interest Rate Swap, Receive Fixed 1.558% Semi-Annually,
Pay Variable 0.50625% (CDOR03 Index) Semi-Annually | | 08/30/2022 | | CAD 3,546 | | | | 56 | | | | | — | | | | | 56 | |
3-Year Interest Rate Swap, Receive Fixed 1.575% Semi-Annually,
Pay Variable 0.50625% (CDOR03 Index) Semi-Annually | | 08/30/2022 | | CAD 3,113 | | | | 50 | | | | | — | | | | | 50 | |
3-Year Interest Rate Swap, Receive Fixed 1.8905% Semi-Annually,
Pay Variable 0.50625% (CDOR03 Index) Semi-Annually | | 12/02/2022 | | CAD 1,715 | | | | 45 | | | | | — | | | | | 45 | |
| | | | | | | | | | | | | | | | | | | |
| | | | | | | $ | 208 | | | | $ | — | | | | $ | 208 | |
| | | | | | | | | | | | | | | | | | | |
9 Payden Mutual Funds
Open Centrally Cleared Credit Default Swap Contracts
| | | | | | | | | | | | | | | | | | | | | | | | | |
| Description | | Maturity
Date | | Notional
Amount
(000s) | | Value
(000s) | | Upfront
payments/
receipts
(000s) | | Unrealized
Appreciation
(000s) |
| Protection Bought (Relevant Credit: Markit CDX, North America High Yield Series 35 Index), Pay 5% Quarterly, Receive upon credit default | | 12/20/2025 | | 2,100 | | | $ | 85 | | | | $ | 82 | | | | $ | 3 | |
| | | | | | | | | | | | | | | | | | | |
Offsetting Assets and Liabilities
The Fund’s loaned securities were all subject to an enforceable Securities Lending Agency Agreement. Securities lent in accordance with the Securities Lending Agency Agreement on a gross basis were as follows:
| | | | | |
Total gross amount presented on the Statements of Assets and Liabilities1 | | | $ | 147 | |
Non-cash Collateral2 | | | | (147 | ) |
| | | | | |
Net Amount | | | $ | — | |
| | | | | |
| 1 | The amount presented on the Statements of Assets and Liabilities is not offset and is shown on a gross basis. |
| 2 | At October 31, 2020, the value of the collateral received from each borrower exceeded the value of the related securities loaned. This amount is disclosed on the Schedule of Investments. |
See notes to financial statements.
Annual Report 10
| | |
Statement of Assets & Liabilities | | |
| | | | |
| October 31, 2020 | | | | |
| Numbers in 000s | | | | |
| |
ASSETS: | | | | |
Investments, at value * | | $ | 154,929 | |
Affiliated investments, at value ** | | | 324 | |
Foreign cash *** | | | 18 | |
Cash pledged for financial futures contracts | | | 264 | |
Cash pledged for centrally cleared swaps | | | 334 | |
Receivable for: | | | | |
Interest and dividends | | | 640 | |
Investments sold | | | 2,929 | |
Futures | | | 10 | |
Forward currency contracts | | | 306 | |
Other assets | | | 11 | |
Total Assets | | | 159,765 | |
LIABILITIES: | | | | |
Payable for: | | | | |
Bank overdraft | | | 105 | |
Forward currency contracts | | | 1 | |
Investments purchased | | | 3,369 | |
Fund shares redeemed | | | 4,463 | |
Futures | | | 4 | |
Variation margin on centrally cleared swaps | | | 7 | |
Liability for securities on loan (Note 2) | | | 153 | |
Accrued expenses: | | | | |
Investment advisory fees (Note 3) | | | 114 | |
Administration fees (Note 3) | | | 20 | |
Distribution fees (Note 3) | | | 40 | |
Trustee fees and expenses | | | 2 | |
Other liabilities | | | 90 | |
Total Liabilities | | | 8,368 | |
NET ASSETS | | $ | 151,397 | |
NET ASSETS: | | | | |
Paid in capital | | $ | 157,988 | |
Total distributable earnings | | | (6,591 | ) |
NET ASSETS | | $ | 151,397 | |
NET ASSET VALUE — offering and redemption price per share in whole dollars | | | | |
Institutional Class | | | | |
Net Assets | | $ | 530 | |
Shares Outstanding | | | 50 | |
Net Asset Value Per Share | | $ | 10.51 | |
SI Class | | | | |
Net Assets | | $ | 98,931 | |
Shares Outstanding | | | 9,523 | |
Net Asset Value Per Share | | $ | 10.39 | |
Adviser Class | | | | |
Net Assets | | $ | 15,534 | |
Shares Outstanding | | | 1,534 | |
Net Asset Value Per Share | | $ | 10.13 | |
Retirement Class | | | | |
Net Assets | | $ | 36,402 | |
Shares Outstanding | | | 3,791 | |
Net Asset Value Per Share | | $ | 9.60 | |
| | | | |
* Investments, at cost | | $ | 156,587 | |
** Affiliated investments, at cost | | | 324 | |
*** Foreign cash, at cost | | | 18 | |
See notes to financial statements.
11 Payden Mutual Funds
| | | | |
| Period ended October 31, 2020 | | | | |
| Numbers in 000s | | | | |
| |
INVESTMENT INCOME: | | | | |
Interest income (Note 2) | | $ | 7,009 | |
Dividend income | | | 60 | |
Dividend income from affiliated investment (Note 2) | | | 20 | |
Income from securities lending | | | 1 | |
Investment Income | | | 7,090 | |
EXPENSES: | | | | |
Investment advisory fees (Note 3) | | | 1,886 | |
Administration fees (Note 3) | | | 257 | |
Shareholder servicing fees | | | 14 | |
Distribution fees (Note 3) | | | 230 | |
Custodian fees | | | 38 | |
Transfer agent fees | | | 47 | |
Registration and filing fees | | | 83 | |
Trustee fees and expenses | | | 24 | |
Printing and mailing costs | | | 20 | |
Loan commitment fees | | | 3 | |
Legal fees | | | 4 | |
Publication expense | | | 7 | |
Pricing fees | | | 63 | |
Fund accounting fees | | | 84 | |
Insurance | | | 19 | |
Audit fees | | | 45 | |
Interest expense | | | 1 | |
Gross Expenses | | | 2,825 | |
Expense subsidy (Note 3) | | | (469 | ) |
Net Expenses | | | 2,356 | |
Net Investment Income | | | 4,734 | |
NET REALIZED AND UNREALIZED GAINS (LOSSES): | | | | |
Net realized gains (losses) from: | | | | |
Investments | | | (3,895 | ) |
Foreign currency transactions | | | (16 | ) |
Forward foreign exchange contracts | | | (803 | ) |
Futures contracts | | | 941 | |
Written option contracts | | | 83 | |
Swap contracts | | | (957 | ) |
Change in net unrealized appreciation (depreciation) from: | | | | |
Investments | | | (3,762 | ) |
Translation of assets and liabilities in foreign currencies | | | (1 | ) |
Forward foreign exchange contracts | | | 552 | |
Futures contracts | | | 111 | |
Written option contracts | | | (52 | ) |
Swap contracts | | | 327 | |
Net Realized and Unrealized Losses | | | (7,472 | ) |
CHANGE IN NET ASSETS RESULTING FROM OPERATIONS | | $ | (2,738 | ) |
See notes to financial statements.
Annual Report 12
| | |
Statements of Changes in Net Assets | | |
For the periods ended October 31st
Numbers in 000s
| | | | | | | | | | |
| | | | | |
| | | 2020 | | 2019 |
INCREASE (DECREASE) IN NET ASSETS: | | | | | | | | | | |
FROM OPERATIONS: | | | | | | | | | | |
Net investment income | | | $ | 4,734 | | | | $ | 5,732 | |
Net realized gains on investments | | | | (4,647 | ) | | | | 2,372 | |
Change in net unrealized appreciation (depreciation) | | | | (2,825 | ) | | | | 1,430 | |
Change in Net Assets Resulting from Operations | | | | (2,738 | ) | | | | 9,534 | |
FROM DISTRIBUTIONS TO SHAREHOLDERS: | | | | | | | | | | |
Net investment income and net realized gains from investments: | | | | | | | | | | |
Institutional Class | | | | (220 | ) | | | | (219 | ) |
SI Class | | | | (4,067 | ) | | | | (3,904 | ) |
Adviser Class | | | | (596 | ) | | | | (793 | ) |
Retirement Class | | | | (1,248 | ) | | | | (1,260 | ) |
Change in Net Assets from Distributions to Shareholders | | | | (6,131 | ) | | | | (6,176 | ) |
FROM CAPITAL TRANSACTIONS: | | | | | | | | | | |
Proceeds from fund shares sold: | | | | | | | | | | |
Institutional Class | | | | 263 | | | | | 263 | |
SI Class | | | | 17,396 | | | | | 27,540 | |
Adviser Class | | | | 2,365 | | | | | 6,104 | |
Retirement Class | | | | 8,437 | | | | | 6,235 | |
Reinvestment of distributions: | | | | | | | | | | |
Institutional Class | | | | 220 | | | | | 220 | |
SI Class | | | | 4,055 | | | | | 3,880 | |
Adviser Class | | | | 596 | | | | | 789 | |
Retirement Class | | | | 1,248 | | | | | 1,260 | |
Cost of fund shares redeemed: | | | | | | | | | | |
Institutional Class | | | | (6,528 | ) | | | | (743 | ) |
SI Class | | | | (46,202 | ) | | | | (26,631 | ) |
Adviser Class | | | | (9,119 | ) | | | | (18,127 | ) |
Retirement Class | | | | (7,598 | ) | | | | (11,636 | ) |
Change in Net Assets from Capital Transactions | | | | (34,867 | ) | | | | (10,846 | ) |
Total Change in Net Assets | | | | (43,736 | ) | | | | (7,488 | ) |
NET ASSETS: | | | | | | | | | | |
Beginning of period | | | | 195,133 | | | | | 202,621 | |
End of period | | | $ | 151,397 | | | | $ | 195,133 | |
FUND SHARES OF BENEFICIAL INTEREST: | | | | | | | | | | |
Institutional Class: | | | | | | | | | | |
Outstanding shares at beginning of period | | | | 629 | | | | | 651 | |
Shares sold | | | | 25 | | | | | 25 | |
Shares issued in reinvestment of distributions | | | | 21 | | | | | 22 | |
Shares redeemed | | | | (625 | ) | | | | (69 | ) |
Change in shares outstanding | | | | (579 | ) | | | | (22 | ) |
Outstanding shares at end of period | | | | 50 | | | | | 629 | |
SI Class: | | | | | | | | | | |
Outstanding shares at beginning of period | | | | 12,067 | | | | | 11,610 | |
Shares sold | | | | 1,702 | | | | | 2,607 | |
Shares issued in reinvestment of distributions | | | | 388 | | | | | 381 | |
Shares redeemed | | | | (4,634 | ) | | | | (2,531 | ) |
Change in shares outstanding | | | | (2,544 | ) | | | | 457 | |
Outstanding shares at end of period | | | | 9,523 | | | | | 12,067 | |
Adviser Class: | | | | | | | | | | |
Outstanding shares at beginning of period | | | | 2,145 | | | | | 3,242 | |
Shares sold | | | | 238 | | | | | 588 | |
Shares issued in reinvestment of distributions | | | | 58 | | | | | 79 | |
Shares redeemed | | | | (907 | ) | | | | (1,764 | ) |
Change in shares outstanding | | | | (611 | ) | | | | (1,097 | ) |
Outstanding shares at end of period | | | | 1,534 | | | | | 2,145 | |
Retirement Class: | | | | | | | | | | |
Outstanding shares at beginning of period | | | | 3,558 | | | | | 3,971 | |
Shares sold | | | | 899 | | | | | 632 | |
Shares issued in reinvestment of distributions | | | | 128 | | | | | 133 | |
Shares redeemed | | | | (794 | ) | | | | (1,178 | ) |
Change in shares outstanding | | | | 233 | | | | | (413 | ) |
Outstanding shares at end of period | | | | 3,791 | | | | | 3,558 | |
LONG TERM INVESTMENT ACTIVITY: | | | | | | | | | | |
Purchase of investments (excluding government) | | | $ | 109,969 | | | | $ | 116,784 | |
Sale of investments (excluding government) | | | | 128,098 | | | | | 131,092 | |
Purchase of government securities | | | | 8,229 | | | | | 40,781 | |
Sale of government securities | | | | 13,464 | | | | | 34,893 | |
See notes to financial statements.
13 Payden Mutual Funds
| | |
Notes to Financial Statements | | |
October 31, 2020
1. Organization and Related Matters
The Payden & Rygel Investment Group (the “Group”) is a no-load, open-end registered investment company organized as a Massachusetts business trust on January 22, 1992 and registered under the Investment Company Act of 1940 (the “1940 Act”), as amended. Each of its nineteen funds (each a “Fund,” collectively the “Funds”) is a series of the Group, and is authorized to issue unlimited shares at $0.001 par value. This report contains only the Payden/Kravitz Cash Balance Plan Fund. The other eighteen Funds are contained in a separate report.
2. Significant Accounting Policies
The following is a summary of significant accounting policies followed by the Fund.
The Financial Accounting Standards Board (“FASB”) Accounting Standards Codification (“ASC”) is the exclusive reference of authoritative U.S. generally accepted accounting principles (“GAAP”) recognized by the FASB to be applied by nongovernmental entities. Rules and interpretive releases of the Securities and Exchange Commission (“SEC”) under authority of federal laws are also sources of authoritative GAAP for SEC registrants. The Fund’s financial statements are prepared in accordance with GAAP.
The Fund is considered an investment company under FASB ASC 946, Financial Services - Investment Companies.
The preparation of financial statements in conformity with GAAP requires management to make estimates and assumptions that affect the reported amounts of assets and liabilities and disclosure of contingent assets and liabilities at the date of the financial statements and the reported amounts of income and expenses during the reporting period. Actual results could differ from those estimates.
Securities Valuation
Domestic and foreign fixed income securities and other assets for which market quotations are readily available (other than obligations with original maturities of sixty days or less) are valued on the basis of quotes obtained from brokers and dealers or pricing services. Such quotations take into account appropriate factors such as institutional-sized trading in similar groups of securities, yield, quality, coupon rate, maturity, type of issue, trading characteristics and other data. Debt securities with original maturities of sixty days or less are valued at amortized cost, which approximates fair value.
Publicly traded equity securities, whether in the U.S. or outside the U.S., for which market quotations are readily available generally will be valued at the official closing price or the last sale price on the exchange or market where they are principally traded, or if there have been no sales during the day, at the last bid price. Securities traded only on the over-the-counter (“OTC”) market are valued at the latest bid price. Investments in nonregistered investment companies are valued at their net asset values as reported by such companies.
Options, futures, swaps and other similar instruments are valued at the official closing price, in the case of exchange traded derivatives, or on the basis of information provided by pricing services, quotes obtained from brokers and dealers, and market trades in the case of other securities.
Fixed income or equity securities for which market quotations are not readily available are priced at their fair value as determined in good faith under procedures established pursuant to the Valuation and Liquidity Guidelines applicable to the Fund. In considering fair value of a security, one or more factors are taken into consideration depending on the circumstances at the time, including for example: the cost of the security or the last reported sales price of the security as a starting point; changes in interest rates; changes in yield spreads of similarly rated or structured securities; fundamental analytical information relating to the security; the value of other similar securities traded on other markets or among dealers; the general financial condition of the issuer; recent developments affecting the issuer; information, including price quotations, from other financial institutions or analysts; or government actions or pronouncements and other significant events affecting the economy, the markets, the fundamental value of the issuer or of the issuer’s industry.
Shares of open-end investment companies are valued at their respective net asset value.
Fair value pricing adjustments may occur when (1) developments occur (a “significant event”) that will affect the value of a Fund’s holdings, and (2) the significant event occurs after the close of the markets on which the securities trade, but before the time when the net asset value is computed for a Fund. A significant event may relate to a single issuer or an entire market.
Risks
Unforeseen events in the markets may at times result in an unusually high degree of volatility in the markets, which could adversely affect the fund causing a decline in value.
Annual Report 14
| | |
Notes to Financial Statements continued | | |
Investing in debt securities may include failure of an issuer to make timely interest or principal payments, or a decline or the perception of a decline in credit quality. In addition, the value of the debt security may decline due to general market conditions that are not specifically related to a particular company including industry earnings outlook, changes in interest or currency rates or perception of a specific industry.
Investing in foreign securities may include certain risks and considerations not typically associated with investing in U.S. securities, such as fluctuating currency values and changing local and regional economic, political and social conditions, which may result in greater market volatility. In addition, certain foreign securities may not be as liquid as U.S. securities.
An investment in the Payden Cash Reserves Money Market Fund is not insured or guaranteed by the Federal Deposit Insurance Corporation or any other government agency. Although the Fund seeks to preserve the value of your investment at $1.00 per share, it is possible to lose money by investing in the Fund.
Investment Transactions and Related Income
Investment transactions are accounted for on the date the security is purchased or sold (trade date) for financial reporting purposes. Interest income is recognized on an accrual basis. Premiums and discounts are amortized or accreted over the expected life of the security using the effective interest method. Dividend income is recorded on the ex-dividend date. Realized gains or losses on investment transactions are determined on the identified cost basis.
Bank Loans
Floating-Rate Loan Interests (“Bank Loans”) in which the Fund invests generally pay interest at rates which are periodically predetermined by reference to a base lending rate plus a premium. These base lending rates are generally (i) the lending rate offered by one or more major European banks, such as the London Inter-Bank Offered Rate (“LIBOR”), (ii) the prime rate offered by one or more United States banks or (iii) the certificate of deposit rate. Certain Bank Loans are subject to a LIBOR floor that establishes a minimum LIBOR rate. The interest rate shown on the Schedule of Investments reflects the rate in effect at October 31st. When a range of rates is disclosed, the Fund holds more than one position within the same tranche at varying rates.
Bank loans are subject to various restrictive covenants that protect the lender or investor. Loans with fewer or no restrictive covenants, “covenant light” loans, provide the issuer more
flexibility and reduce investor protections in the event of a breach, and may cause the fund to experience more difficulty or delay in enforcing its rights. A significant portion of bank loans are “covenant light.”
Foreign Currency Translation
The accounting records of the Fund are maintained in U.S. dollars. The Fund may purchase securities that are denominated in foreign currencies. Investment securities and other assets and liabilities denominated in a foreign currency are translated into U.S. dollars at the current exchange rates. Purchases and sales of securities, income and expenses are translated into U.S. dollars at the exchange rates on the dates of the respective transactions. The Fund does not isolate that portion of the results of operations resulting from changes in foreign exchange rates from the fluctuations arising from changes in security prices.
Reported net realized foreign exchange gains or losses arise from purchases and sales of foreign currencies, currency gains or losses realized between the trade and settlement dates of securities transactions, and the differences between the amounts of income or expenses recorded on the Fund’s books and the U.S. dollar equivalents of the amounts actually received or paid. Net unrealized appreciation/depreciation from translation of assets and liabilities denominated in foreign currency arise from changes in the value of assets and liabilities resulting from changes in the foreign exchange rates.
Forward Currency Contracts
The Fund enters into forward currency contracts for the purchase or sale of a specific foreign currency at a fixed price on a future date. The Fund enters into forward currency contracts to protect against adverse currency movements or as speculative investments. The forward currency contracts are adjusted by the daily exchange rate of the underlying currency and any gains or losses are recorded for financial statement purposes as unrealized until the contact settlement date or an offsetting forward foreign currency contract has been executed, at which time the Fund records a realized gain or loss equal to the difference between the value of the contract at the time it was opened and the value at the time it was closed. Risk may arise upon entering into these contracts from potential inability of the counterparties to meet the terms of their contracts and from unanticipated movements in the value of a foreign currency relative to the U.S. dollar.
15 Payden Mutual Funds
Futures Contracts
The Fund invests in futures contracts to hedge against anticipated future changes in interest or exchange rates or security prices. In addition, the Fund entered into such transactions to enhance potential gain in circumstances where hedging is not involved.
The purchase or sale of futures contracts and options on futures contracts provides for the future sale by one party and purchase by another party of a specified quantity of a financial instrument or foreign currency at a fixed price on a future date. Upon entering into such a contract, the Fund is required to deposit and maintain initial margin deposit of cash or securities as required by the exchange on which the contract is traded.
Pursuant to the contract, the Fund agrees to receive from or pay to the broker an amount equal to the daily fluctuations in the value of the contract. Such receipts or payments are known as variation margin and are recorded as unrealized gains or losses by the Fund. When the contract is closed, the Fund records a realized gain or loss equal to the difference between the value of the contract at the time it was opened and the value at the time it was closed. The potential risk to the Fund is that the change in value of the underlying securities may not correlate to the change in value of the contracts.
Stock index futures contracts are an agreement pursuant to which two parties agree to take or make delivery of an amount of cash equal to the difference between the value of the index at the close of the last trading day of the contract and the price at which the index contract was originally written. Variation margin accounting procedures apply to these index futures contracts. The Fund invests in these futures contracts to permit the Fund to meet its objectives at a lower cost than investing directly in equity securities, while permitting the equivalent of an investment in a portfolio of equity securities. The potential risk to a Fund is that the change in value of the underlying index may not correlate to the change in value of the contracts.
Swap Contracts
The Fund may enter into swap agreements, in which a Fund and a counterparty agree either to make periodic net payments on a specified notional amount or a net payment upon termination. Swap agreements are privately negotiated in the OTC market and may be entered into as a bilateral contract (“OTC swaps”) or centrally cleared (“centrally cleared swaps”). Swaps are marked-to-market daily and changes in value are recorded as unrealized appreciation (depreciation) and realized gain (loss) is recorded at termination of the contract.
Upon entering into a centrally cleared swap, the Fund is required to deposit and maintain initial margin deposit of cash or securities as required by the exchange on which the contract is traded. Pursuant to a centrally cleared swap, the Fund agrees to receive from or pay to the broker an amount equal to the daily fluctuations in the value of the contract. Such receipts or payments are known as variation margin and are recorded as unrealized gains or losses by the Fund. When the contract is closed, the Fund records a realized gain or loss equal to the difference between the value of the contract at the time it was opened and the value at the time it was closed. The potential risk to the Fund is that the change in value of the underlying securities may not correlate to the change in value of the contracts.
Swap transactions involve, to varying degrees, elements of interest rate, credit and market risk in excess of the amounts recognized in the Statement of Assets and Liabilities. Such risks involve the possibility that there will be no liquid market for these agreements, that the counterparty to the agreements may default on its obligation to perform or disagree as to the meaning of the contractual terms in the agreements, and that there may be unfavorable changes in interest rates, credit spreads and/or market values associated with these transactions.
The Fund may enter into credit default swaps to manage its exposure to the market or certain sectors of the market, to reduce its risk exposure to defaults of corporate and/or sovereign issuers or to create exposure to corporate and/or sovereign issuers to which it is not otherwise exposed (credit risk). A Fund may either buy or sell (write) credit default swaps on single-name issuers (corporate or sovereign), a combination or basket of single-name issuers or traded indexes. Credit default swaps on single-name issuers are agreements in which the protection buyer pays fixed periodic payments to the seller in consideration for a guarantee from the protection seller to make a specific payment should a negative credit event take place with respect to the referenced entity (e.g., bankruptcy, failure to pay, obligation accelerators, repudiation, moratorium or restructuring). Credit default swaps on traded indexes are agreements in which the buyer pays fixed periodic payments to the seller in consideration for a guarantee from the seller to make a specific payment should a write-down, principal or interest shortfall or default of all or individual underlying securities included in the index occur. As a buyer, if an underlying credit event occurs, the Fund will either (i) receive from the seller an amount equal to the notional amount of the swap and deliver the referenced security or underlying securities comprising the index, or (ii) receive a net settlement of cash equal to the notional amount of the swap less the recovery value of the security or underlying securities comprising the index.
Annual Report 16
| | |
Notes to Financial Statements continued | | |
As a seller (writer), if an underlying credit event occurs, the Fund will either pay the buyer an amount equal to the notional amount of the swap and take delivery of the referenced security or underlying securities comprising the index or pay a net settlement of cash equal to the notional amount of the swap less the recovery value of the security or underlying securities comprising the index.
The Fund may enter into total return swaps to obtain exposure to a security or market without owning such security or investing directly in that market or to transfer the risk/return of one market (e.g., fixed income) to another market (e.g., equity) (equity risk and/or interest rate risk). Total return swaps are agreements in which there is an exchange of cash flows whereby one party commits to make payments based on the total return (coupons plus capital gains/losses) of an underlying instrument in exchange for fixed or floating rate interest payments. To the extent the total return of the instrument or index underlying the transaction exceeds or falls short of the offsetting interest rate obligation, the Fund will receive a payment from or make a payment to the counterparty.
For financial reporting purposes, swap interest and amortization is classified as realized or unrealized gain or loss on swap contracts.
Options Transactions
Option techniques may be utilized by the Fund to hedge against changes in interest rates, foreign currency exchange rates or security prices in order to establish more definitely the effective return on securities or currencies held or intended to be acquired by the Fund, to reduce the volatility of the currency exposure associated with investments in non-U.S. securities, or as an efficient means of adjusting exposure to the bond, equity and currency markets. In addition, the Fund may enter into such transactions to enhance potential gain in circumstances where hedging is not involved. When a Fund writes a covered call or put option, an amount equal to the premium received is reflected as an asset and equivalent liability. The amount of the liability is subsequently marked-to-market to reflect the current value of the option. If an option expires on its stipulated expiration date or if the Fund enters into a closing purchase transaction, a gain or loss is realized. If a written call option is exercised, a gain or loss is realized for the sale of the underlying security and the proceeds from the sale are increased by the premium originally received. If a written put option is exercised, the cost of the security acquired is decreased by the premium originally received. As writer of an option, the Fund has no control over whether the underlying securities are subsequently sold (call) or purchased (put) and, as a result, bears
the market risk of an unfavorable change in the price of the security underlying the written option.
When the Fund purchases a call or put option, an amount equal to the premium paid is included in the Fund’s Statement of Assets and Liabilities as an investment, and is subsequently marked-to-market to reflect the current value of the option. If an option expires on the stipulated expiration date or if the Fund enters into a closing sale transaction, a gain or loss is realized. If the Fund exercises a call option, the cost of the security acquired is increased by the premium paid for the call. If the Fund exercises a put option, a gain or loss is realized from the sale of the underlying security, and the proceeds from such sale are decreased by the premium originally paid. Written and purchased options are non-income producing securities.
Derivative Financial Instruments
The Fund engages in various portfolio investment strategies using derivative contracts both to increase the returns of the Fund and/or to economically hedge its exposure to certain risks such as credit risk, equity risk, interest rate risk and foreign currency exchange rate risk. These contracts may be transacted on an exchange or OTC.
The following tables show the Fund’s exposure to different types of market risk as it relates to the Statement of Assets and Liabilities and the Statement of Operations.
Statement of Assets and Liabilities
Fair Values of Derivative Instruments as of October 31, 2020 (000s)
| | | | | | | | |
| | | Derivative | | | Derivative | |
Underlying Risk | | Assets | | | Liabilities | |
Credit1 | | | $3 | | | | — | |
Interest rate1 | | | 312 | | | | $(72) | |
Foreign currency2,3 | | | 306 | | | | (1) | |
| | | | | | | | |
Total | | | $621 | | | | $(73) | |
| | | | | | | | |
| 1 | Includes cumulative appreciation/depreciation of futures contracts and centrally cleared swaps as reported in Schedule of Investments. Only current day’s variation margin is reported within the Statements of Assets and Liabilities as Receivable/Payable for futures and variation margin on centrally cleared swaps. |
| 2 | Receivable for forward currency contracts. |
| 3 | Payable for forward currency contracts. |
17 Payden Mutual Funds
The Effect of Derivative Instruments on the Statement of Operations For the Period Ended October 31, 2020
| | | | | | | | | | | | | | | | | | | | | | | | | |
Amount of Net Realized Gain (Loss) on Derivatives
Recognized in Income (000s) |
Underlying risk | | Futures1 | | Forward
Currency
Contracts2 | | Options3 | | Swaps4 | | Total |
Credit | | | $ | — | | | | $ | — | | | | $ | — | | | | $ | (997 | ) | | | $ | (997 | ) |
Equity | | | | — | | | | | — | | | | | 61 | | | | | — | | | | | 61 | |
Foreign exchange | | | | — | | | | | (803 | ) | | | | — | | | | | — | | | | | (803 | ) |
Interest rate | | | | 941 | | | | | — | | | | | — | | | | | 40 | | | | | 981 | |
| | | | | | | | | | | | | | | | | | | | | | | | | |
Total | | | $ | 941 | | | | $ | (803 | ) | | | $ | 61 | | | | | $(957 | ) | | | $ | (758 | ) |
| | | | | | | | | | | | | | | | | | | | | | | | | |
| 1 | Net realized gains (losses) from futures contracts. |
| 2 | Net realized gains (losses) from forward foreign exchange contracts. |
| 3 | Net realized gains (losses) from written option contracts and purchased options, which are included in net realized gain on investments. |
| 4 | Net realized gains (losses) from swap contracts. |
The Effect of Derivative Instruments on the Statement of Operations For the Period Ended October 31, 2020
| | | | | | | | | | | | | | | | | | | | | | | | | |
Change in Net Unrealized Appreciation or (Depreciation)
on Derivatives Recognized in Income (000s) |
Underlying risk | | Futures5 | | Forward
Foreign
Exchange
Contracts6 | | Options7 | | Swaps8 | | Total |
Credit | | | $ | — | | | | $ | — | | | | $ | — | | | | $ | 65 | | | | $ | 65 | |
Equity | | | | — | | | | | — | | | | | 15 | | | | | — | | | | | 15 | |
Foreign exchange | | | | — | | | | | 552 | | | | | — | | | | | — | | | | | 552 | |
Interest rate | | | | 111 | | | | | — | | | | | 6 | | | | | 262 | | | | | 379 | |
| | | | | | | | | | | | | | | | | | | | | | | | | |
Total | | | $ | 111 | | | | $ | 552 | | | | $ | 21 | | | | $ | 327 | | | | $ | 1,011 | |
| | | | | | | | | | | | | | | | | | | | | | | | | |
| 5 | Change in net unrealized appreciation (depreciation) from futures contracts. |
| 6 | Change in net unrealized appreciation (depreciation) from forward foreign exchange contracts. |
| 7 | Change in net unrealized appreciation (depreciation) from written option contracts and purchased options, which are included in change in unrealized appreciation (depreciation) on investments. |
| 8 | Change in net unrealized appreciation (depreciation) from swap contracts. |
During the period ended October 31, 2020, the average notional amount of derivatives as a percent of average net assets were as follows:
| | | | | | |
Foreign currency | | Credit | | Interest rate | | Equity |
| 11% | | 1% | | 7% | | 0% |
Counterparty Credit Risk
A derivative contract may suffer a mark to market loss if the value of the contract decreases due to an unfavorable change in the market rates or values of the underlying instrument. Losses can also occur if the counterparty does not perform under the contract.
The Fund’s risk of loss from counterparty credit risk on OTC derivatives is generally limited to the aggregate unrealized gain
netted against any collateral held by the Fund. For OTC options purchased, the Fund bears the risk of loss of the amount of the premiums paid plus the positive change in market values net of any collateral held by the Fund should the counterparty fail to perform under the contracts. Options written by the Fund do not typically give rise to counterparty credit risk, as options written generally obligate the Fund, and not the counterparty to perform.
With exchange traded purchased options, futures and centrally cleared swaps, there is decreased counterparty credit risk to the Fund since the exchange or clearinghouse guarantees against a possible default. The clearinghouse stands between the buyer and the seller of the contract; therefore, the credit risk is limited to failure of the clearinghouse. While offset rights may exist under applicable law, the Fund does not have a contractual right of offset against a clearing broker or clearinghouse in the event of a default (including the bankruptcy or insolvency) of the clearing broker or clearinghouse. Additionally, credit risk exists in exchange traded futures and centrally cleared swaps with respect to initial and variation margin that is held in a clearing broker’s customer accounts. While clearing brokers are required to segregate customer margin from their own assets, in the event that a clearing broker becomes insolvent or goes into bankruptcy and at that time there is a shortfall in the aggregate amount of margin held by the clearing broker for all its clients, typically the shortfall would be allocated on a pro rata basis across all the clearing broker’s customers, potentially resulting in losses to the Fund.
In order to better define its contractual rights and to secure rights that will help the Fund mitigate its counterparty risk, the Fund may enter into an International Swaps and Derivatives Association, Inc. Master Agreement (“ISDA Master Agreement”) or similar agreement with its derivative contract counterparties. An ISDA Master Agreement is a bilateral agreement between the Fund and a counterparty that governs certain OTC derivatives and typically contains, among other things, collateral posting terms and netting provisions in the event of a default and/or termination event. Under an ISDA Master Agreement, the Fund may, under certain circumstances, offset with the counterparty certain derivative financial instruments’ payables and/or receivables with collateral held and/or posted and create one single net payment. The provisions of the ISDA Master Agreement typically permit a single net payment in the event of default (close-out netting), including the bankruptcy or insolvency of the counterparty. However, bankruptcy or insolvency laws of a particular jurisdiction may impose restrictions on or prohibitions against the right of offset in bankruptcy, insolvency or other events. In addition, certain ISDA Master Agreements allow counterparties to OTC
Annual Report 18
| | |
Notes to Financial Statements continued | | |
derivatives to terminate derivative contracts prior to maturity in the event the Fund’s net assets decline by a stated percentage or the Fund fails to meet the terms of its ISDA Master Agreements, which would cause the Fund to accelerate payment of any net liability owed to the counterparty.
Collateral Requirements
For derivatives traded under an ISDA Master Agreement, the collateral requirements are typically calculated by netting the mark to market amount for each transaction under such agreement and comparing that amount to the value of any collateral currently pledged by the Fund and the counterparty.
Cash collateral that has been pledged to cover obligations of the Fund and cash collateral received from the counterparty, if any, is reported separately on the Statement of Assets and Liabilities as cash pledged as collateral and cash received as collateral, respectively. Non-cash collateral pledged by the Fund, if any, is noted in the Schedule of Investments. Generally, the amount of collateral due from or to a party has to exceed a minimum transfer amount threshold (e.g. $500,000) before a transfer is required, which is determined at the close of business of the Fund and additional required collateral is delivered to/ pledged by the Fund on the next business day. Typically, the Fund and counterparties are not permitted to sell, re-pledge or use the collateral they receive. To the extent amounts due to the Fund from its counterparties are not fully collateralized, contractually or otherwise, the Fund bears the risk of loss from counterparty non-performance. The Fund attempts to mitigate counterparty risk by only entering into agreements with counterparties that it believes have the financial resources to honor their obligations and by monitoring the financial stability of those counterparties.
For financial reporting purposes, the Fund does not offset derivative assets and derivative liabilities that are subject to netting arrangements in the Statement of Assets and Liabilities.
Securities Lending
Pursuant to a securities lending agreement with The Bank of New York Mellon, the Fund may lend securities to qualified institutions. All loans are secured by collateral of at least 102% of the value of the U.S. securities loaned and 105% of the value of the foreign securities loaned. Collateral equivalent to at least 100% of the market value of securities on loan is maintained at all times. The collateral is maintained by the custodian. Cash collateral is reinvested in the Payden Cash Reserves Money Market Fund. The Fund is entitled to receive all of the income
on the securities loaned, in addition to income earned as a result of the lending transaction. Although each security is fully collateralized, the Fund bears the risk of delay in receiving additional collateral or in recovery of or loss of rights in the securities loaned should the borrower fail to return the securities in a timely manner. The Fund maintains the right to recall the securities on loan for voting purposes. The income earned is disclosed in the Statement of Operations.
Securities lending transactions are entered into by the Fund under Master Securities Lending Agreements (“MSLA”) which provide the right, in the event of default (including bankruptcy or insolvency), for the non-defaulting party to liquidate the collateral and calculate a net exposure to the defaulting party or request additional collateral. In the event that a borrower defaults, the Fund, as lender, would offset the market value of the collateral received against the market value of the securities loaned. The value of the collateral is typically greater than that of the market value of the securities loaned, leaving the lender with a net amount payable to the defaulting party. However, bankruptcy or insolvency laws of a particular jurisdiction may impose restrictions on or prohibitions against such a right of offset in the event of a MSLA counterparty’s bankruptcy or insolvency. Under the MSLA, the borrower can resell or re-pledge the loaned securities, and the Fund can reinvest cash collateral, or, upon an event of default, resell or re-pledge the collateral.
The Fund’s securities lending agreements by counterparty which are subject to offset under a MSLA, is included within the Fund’s Schedule of Investments under the heading “Offsetting Assets and Liabilities.” For financial reporting purposes, the Fund does not offset financial assets and financial liabilities that are subject to a MSLA on the Statement of Assets and Liabilities.
Distributions to Shareholders
Distributions to shareholders are recorded on the ex-dividend date. Dividends from net investment income and net realized gains on foreign currency transactions are declared and paid annually. Net realized gains on investments, if any, are declared and distributed at least annually. All distributions are paid in the form of additional shares unless cash payment is requested.
Distributions to shareholders are determined in accordance with income tax regulations, which may differ from GAAP.
Federal Income Taxes
It is the policy of the Fund to meet the requirements for qualification as a regulated investment company as defined in
19 Payden Mutual Funds
Sub-chapter M of the Internal Revenue Code (the ‘Code”), and to make distributions of net investment income and net realized gains sufficient to relieve it from all Federal income or excise taxes. As of and during the period ended October 31, 2020, the Fund did not record any liability for uncertain tax positions. Accordingly, no provision for Federal income or excise tax was made.
The Fund files a tax return annually using tax accounting methods required under provisions of the Code, which may differ from GAAP, the basis on which these financial statements are prepared. The differences arise primarily from the treatment of foreign currency transactions and futures contracts and the deferral of certain losses under Federal income tax regulations. Accordingly, the amounts of net investment income and net realized gains or losses reported in these financial statements may differ from those reported in each Fund’s tax return. Return of capital distributions and net investment losses for tax purposes, if any, are reclassified to paid in capital.
As of and during the period ended October 31, 2020, the Fund did not have any liabilities for any unrecognized tax positions. The Fund recognizes interest and penalties, if any, related to unrecognized tax positions as income tax expense in the Statement of Operations. During the period, the Fund did not incur any interest or penalties.
Each of the tax years in the four-year period ended October 31, 2020 remains subject to examination by the Internal Revenue Service and state taxing authorities.
Affiliated Investment
The Fund invests in the Cash Reserves Money Market Fund, an affiliated Fund. Income earned by the Fund from affiliated funds for the period is disclosed in the Statement of Operations.
| | | | | | | | | | | | | | | | | | | | | | | |
Value
October 31,
2019 | | Purchases | | Sales | | Dividends | | Value
October 31,
2020 |
| $1,748,507 | | $100,771,284 | | $102,195,364 | | $20,391 | | $324,427 |
Custodian Credits
The Fund has entered into an agreement with the custodian, whereby it earns custodian fee credits for temporary cash balance. These credits, which offset custodian fees that may be charged to the Fund, are based on 75% of the daily effective federal funds rate, and are, subject to rounding, disclosed in the Statement of Operations. There were no custodian credits applicable to the Fund during the period ended October 31, 2020.
Other
Income and realized and unrealized gain/loss are allocated to each class based on relative net assets. Shared expenses incurred by the Group are allocated among the Funds of the Group on the basis of relative net assets. Fund-specific expenses are charged to each Fund as incurred.
Accounting Standards
The Fund adopted FASB Accounting Standards Update (“ASU”) 2017-08, Receivables - Nonrefundable Fees and Other Costs (Subtopic 310-20): Premium Amortization on Purchased Callable Debt Securities to amend the amortization period for certain callable debt securities purchased at a premium. Under the new standard, the Fund changed the amortization period for the premium on certain purchased callable debt securities with non-contingent call features to the earliest call date. In accordance with the transition provisions of the standard, the Fund applied the amendments on a modified retrospective basis beginning after the fiscal year ended October 31, 2019. This change in accounting policy has been made to comply with the newly issued accounting standard and had no impact on total accumulated earnings (deficit) or the net asset value of the Fund.
In March 2020, the FASB issued ASU 2020-04, Reference Rate Reform (Topic 848) - Facilitation of the Effects of Reference Rate Reform on Financial Reporting, which provides optional, temporary relief with respect to the financial reporting of contracts subject to certain types of modifications due to the planned discontinuation of the London Interbank Offered Rate (LIBOR) and other interbank-offered based reference rates as of the end of 2021. The guidance is effective for certain reference rate-related contract modifications that occur during the period March 12, 2020 through December 31, 2022. Management is currently evaluating the impact, if any, of the ASU on the Fund’s financial statements.
3. Related Party Transactions
Payden/Kravitz Advisers LLC (the “Adviser” or “Payden/ Kravitz”) provides investment advisory services to the Fund. Under the terms of the investment advisory agreement, Payden/ Kravitz is entitled to receive fees monthly, computed on the average daily net assets of the Fund at an annualized rate of 1.10%.
Payden/Kravitz agreed to guarantee that, for so long as it acts as investment adviser to the Fund, the expenses of the Fund, including advisory fees (exclusive of interest and taxes) will not exceed 1.25% for the Institutional and SI classes, 1.50% for the
Annual Report 20
| | |
Notes to Financial Statements continued | | |
Adviser class, and 1.75% for the Retirement class of average daily net assets on an annualized basis.
The adviser also voluntarily agreed to temporarily limit expenses, including advisory fees of the Institutional class to 0.95% of the average daily net assets or an annualized basis through February 28, 2021 (exclusive of interest and taxes).
The Fund remains liable to Payden/Kravitz for expenses subsidized in any fiscal year up to a maximum of three years from the end of the period in which the expenses were subsidized as long as any reimbursement will not cause the annual expense ratio for the year in which it is made to exceed the amount of the expense guarantee or expense limit (whichever is in effect at the time of waiver or reimbursement).
The deferred expense subsidies represent the cumulative amount of expenses subsidized for the Fund through the end of the year. The amount $1,270,877 ($413,006 for 2018, $388,987 for 2019 and $468,884 for 2020) is not considered a liability of the Fund, and therefore is not recorded as a liability in the Statement of Assets and Liabilities, but will be recognized as net expense in the Statement of Operations as expense previously deferred in future periods, if expense limits permit.
Treasury Plus, Inc., a wholly owned subsidiary of Payden & Rygel, serves as administrator to the Fund. Under the terms of the administration agreement, Treasury Plus, Inc. receives fees monthly, computed on the average daily net assets of the Fund at an annualized rate of 0.15%.
The Fund has adopted a plan pursuant to SEC rule 12b-1 by which Payden & Rygel Distributors receives fees monthly, computed on the average net assets of the Adviser class at an annualized rate of 0.25% and of the Retirement class at an annualized rate of 0.50%. Payden & Rygel Distributors does not receive a fee from the Institutional or SI classes.
Certain officers and/or trustees of the Group are affiliated with Payden/Kravitz, Payden & Rygel Distributors and/or Treasury Plus, Inc. Such officers and trustees receive no fees from the Fund for serving as officers and/or trustees of the Group.
Indemnifications
Under the Group’s organizations documents, its trustees and officers are indemnified by the Fund against certain liabilities arising out of the performance of their duties to the Fund. Additionally, in the normal course of business, the Fund enters into contracts with service providers that contain general indemnification clauses. The Fund’s maximum exposure under these agreements is unknown as this would involve future claims that may be made against the Fund that have not yet occurred. Currently, the Fund expects this risk of loss to be remote.
4. Fair Value Measurement
Various inputs are used in determining the value of the Fund’s investments and other financial instruments. The inputs or methodology used for valuing securities are not necessarily an indication of the risk associated with investing in those securities. These inputs are summarized in the three broad levels: Level 1 - quoted prices in active markets for identical investments; Level 2 - other significant observable inputs (including quoted prices for similar securities, interest rates, prepayment speeds, credit risk, etc.), and Level 3 - significant unobservable inputs (including the Fund’s own assumptions in determining the fair value of investments). See Note 2 - Securities Valuation for a summary of the inputs used in valuing the Fund’s investments and other financial instruments.
| | | | | | | | | | | | | | | | | | | | | | | | | | | | |
| | | Investments in Securities | |
| | | | |
| | | Level 1-Quoted Prices | | | Level 2-Other
Significant Observable
Inputs | | | Level 3-Significant
Unobservable Inputs | | | | |
| | | Assets
(000’s) | | | Liabilities
(000’s) | | | Assets
(000’s) | | | Liabilities
(000’s) | | | Assets
(000’s) | | | Liabilities
(000’s) | | | Total
(000’s) | |
Asset Backed | | | — | | | | — | | | $ | 41,441 | | | | — | | | | — | | | | — | | | $ | 41,441 | |
Bank Loans | | | — | | | | — | | | | 6,478 | | | | — | | | | — | | | | — | | | | 6,478 | |
Corporate Bond | | | — | | | | — | | | | 34,049 | | | | — | | | | — | | | | — | | | | 34,049 | |
Foreign Government | | | — | | | | — | | | | 9,972 | | | | — | | | | — | | | | — | | | | 9,972 | |
Mortgage Backed | | | — | | | | — | | | | 59,275 | | | | — | | | | — | | | | — | | | | 59,275 | |
U.S. Treasury | | | — | | | | — | | | | 550 | | | | — | | | | — | | | | — | | | | 550 | |
Common Stock | | $ | 3,164 | | | | — | | | | — | | | | — | | | | — | | | | — | | | | 3,164 | |
Investment Company | | | 324 | | | | — | | | | — | | | | — | | | | — | | | | — | | | | 324 | |
21 Payden Mutual Funds
| | | | | | | | | | | | | | | | | | | | | | | | | | | | |
| | | Other Financial Instruments1 | |
| | | | |
| | | Level 1-Quoted Prices | | | Level 2-Other
Significant Observable
Inputs | | | Level 3-Significant
Unobservable Inputs | | | | |
| | | Assets
(000’s) | | | Liabilities
(000’s) | | | Assets
(000’s) | | | Liabilities
(000’s) | | | Assets
(000’s) | | | Liabilities
(000’s) | | | Total
(000’s) | |
Forward currency contracts | | | — | | | | — | | | $ | 306 | | | $ | (1 | ) | | | — | | | | — | | | $ | 305 | |
Futures | | $ | 104 | | | $ | (72 | ) | | | — | | | | — | | | | — | | | | — | | | | 32 | |
Swaps | | | — | | | | — | | | | 211 | | | | — | | | | — | | | | — | | | | 211 | |
| 1 | Other financial instruments are swaps, futures contracts and forward currency contracts. Swaps, futures contracts and forward currency contracts are valued at the unrealized appreciation/depreciation on the instrument. |
5. Federal Tax Information (amounts in 000s)
Distributions from net investment income and net realized capital gains are determined in accordance with U.S. federal income tax regulations, which may differ from those amounts determined under GAAP. These book/tax differences are either temporary or permanent in nature. To the extent these differences are permanent, they are charged or credited to distributable earnings and paid-in capital, as appropriate, in the period that the differences arise. For the year ended October 31, 2020, there were no permanent differences.
For federal income tax purposes, capital loss carryforwards may be carried forward and applied against future capital gains. As of October 31, 2020, the fund did not utilize any capital loss carryforwards.
As of October 31, 2020, the Fund had available for Federal income tax purposes unused capital losses of $9,581.
The tax character of distributions paid during the year ended October 31, is as follows (000’s).
| | | | | | |
| 2020 | | 2019 |
Ordinary
Income | | Long Term
Capital Gains | | Ordinary
Income | | Long Term
Capital Gains |
| $6,131 | | — | | $6,176 | | — |
At October 31, 2020, net unrealized appreciation (depreciation) on investments for Federal income tax purposes is as follows (000’s):
| | | | | | | | | | | | | | | | | | |
Cost of Investments
Federal Income
Tax Purposes | | Gross
Unrealized
Appreciation
on Investments | | Gross
Unrealized
Depreciation
on Investments | | Net
Unrealized
Depreciation
on Investments |
| $157,392 | | $2,602 | | $(4,192) | | $(1,590) |
At October 31, 2020, the components of accumulated earnings (deficit) for Federal income tax purposes are as follows (000’s):
| | | | | | | | | | | | | | | | | | | | | | | | | | | | |
Undistributed
Ordinary
Income | | Undistributed
Realized Long Term
Capital Gains | | Capital Loss
Carryforwards | | Distributions
Payable | | Net Unrealized
Appreciation
(Depreciation) | | Total Distributions
Earnings |
| $4,580 | | $— | | $(9,581) | | $— | | $(1,590) | | $(6,591) |
6. Subsequent Events
The Fund has evaluated subsequent events through the issuance of the financial statements and determined that no events have occurred that require disclosure.
Annual Report 22
For the share outstanding for each of the periods ended October 31st
| | | | | | | | | | | | | | | | | | | | |
| | | Institutional Class | |
| | | 2020 | | | 2019 | | | 2018 | | | 2017 | | | 2016 | |
Net asset value — beginning of period | | $ | 10.87 | | | $ | 10.64 | | | $ | 10.69 | | | $ | 10.55 | | | $ | 10.33 | |
| | | | | | | | | | | | | | | | | | | | |
Income (loss) from investment activities: | | | | | | | | | | | | | | | | | | | | |
Net investment income | | | 0.34 | (1) | | | 0.36 | (1) | | | 0.30 | (1) | | | 0.25 | | | | 0.15 | |
Net realized and unrealized gains (losses) | | | (0.35 | ) | | | 0.21 | | | | (0.08 | ) | | | 0.07 | | | | 0.07 | |
| | | | | | | | | | | | | | | | | | | | |
Total from investment activities | | | (0.01 | ) | | | 0.57 | | | | 0.22 | | | | 0.32 | | | | 0.22 | |
| | | | | | | | | | | | | | | | | | | | |
Distributions to shareholders: | | | | | | | | | | | | | | | | | | | | |
From net investment income | | | (0.35 | ) | | | (0.34 | ) | | | (0.27 | ) | | | (0.18 | ) | | | — | |
| | | | | | | | | | | | | | | | | | | | |
Net asset value — end of period | | $ | 10.51 | | | $ | 10.87 | | | $ | 10.64 | | | $ | 10.69 | | | $ | 10.55 | |
| | | | | | | | | | | | | | | | | | | | |
Total return | | | (0.08 | )% | | | 5.53 | % | | | 2.06 | % | | | 3.09 | % | | | 2.13 | %(2) |
| | | | | | | | | | | | | | | | | | | | |
Ratios/supplemental data: | | | | | | | | | | | | | | | | | | | | |
Net assets, end of period (000s) | | $ | 530 | | | $ | 6,833 | | | $ | 6,930 | | | $ | 17,780 | | | $ | 10,259 | |
Ratio of gross expense to average net assets | | | 1.52 | % | | | 1.44 | % | | | 1.42 | % | | | 1.41 | % | | | 1.43 | %(3) |
Ratio of net expense to average net assets | | | 0.95 | % | | | 0.95 | % | | | 0.95 | % | | | 0.95 | % | | | 0.95 | %(3) |
Ratio of investment income less gross expenses to average net assets | | | 2.69 | % | | | 2.88 | % | | | 2.37 | % | | | 2.10 | % | | | 2.90 | %(3) |
Ratio of net investment income to average net assets | | | 3.25 | % | | | 3.36 | % | | | 2.84 | % | | | 2.55 | % | | | 3.38 | %(3) |
Portfolio turnover rate | | | 71 | % | | | 84 | % | | | 130 | % | | | 116 | % | | | 55 | %(2) |
The Class commenced operations on June 1, 2016.
| | | | | | | | | | | | | | | | | | | | |
| | | SI Class | |
| | | 2020 | | | 2019 | | | 2018 | | | 2017 | | | 2016 | |
Net asset value — beginning of period | | $ | 10.78 | | | $ | 10.58 | | | $ | 10.65 | | | $ | 10.54 | | | $ | 10.48 | |
| | | | | | | | | | | | | | | | | | | | |
Income (loss) from investment activities: | | | | | | | | | | | | | | | | | | | | |
Net investment income | | | 0.30 | (1) | | | 0.32 | (1) | | | 0.27 | (1) | | | 0.23 | | | | 0.25 | |
Net realized and unrealized gains (losses) | | | (0.34 | ) | | | 0.21 | | | | (0.08 | ) | | | 0.06 | | | | 0.01 | |
| | | | | | | | | | | | | | | | | | | | |
Total from investment activities | | | (0.04 | ) | | | 0.53 | | | | 0.19 | | | | 0.29 | | | | 0.26 | |
| | | | | | | | | | | | | | | | | | | | |
Distributions to shareholders: | | | | | | | | | | | | | | | | | | | | |
From net investment income | | | (0.35 | ) | | | (0.33 | ) | | | (0.26 | ) | | | (0.18 | ) | | | (0.20 | ) |
| | | | | | | | | | | | | | | | | | | | |
Net asset value — end of period | | $ | 10.39 | | | $ | 10.78 | | | $ | 10.58 | | | $ | 10.65 | | | $ | 10.54 | |
| | | | | | | | | | | | | | | | | | | | |
Total return | | | (0.42 | )% | | | 5.22 | % | | | 1.82 | % | | | 2.76 | % | | | 2.58 | % |
| | | | | | | | | | | | | | | | | | | | |
Ratios/supplemental data: | | | | | | | | | | | | | | | | | | | | |
Net assets, end of period (000s) | | $ | 98,931 | | | $ | 130,036 | | | $ | 122,782 | | | $ | 122,500 | | | $ | 111,517 | |
Ratio of gross expense to average net assets | | | 1.51 | % | | | 1.44 | % | | | 1.42 | % | | | 1.42 | % | | | 1.43 | % |
Ratio of net expense to average net assets | | | 1.25 | % | | | 1.25 | % | | | 1.25 | % | | | 1.25 | % | | | 1.25 | % |
Ratio of investment income less gross expenses to average net assets | | | 2.63 | % | | | 2.87 | % | | | 2.41 | % | | | 2.09 | % | | | 2.23 | % |
Ratio of net investment income to average net assets | | | 2.90 | % | | | 3.06 | % | | | 2.58 | % | | | 2.25 | % | | | 2.42 | % |
Portfolio turnover rate | | | 71 | % | | | 84 | % | | | 130 | % | | | 116 | % | | | 55 | % |
The Fund commenced operations on September 22, 2008.
(1) Based on average shares outstanding.
(2) Not annualized.
(3) Annualized.
See notes to financial statements.
23 Payden Mutual Funds
| | | | | | | | | | | | | | | | | | | | |
| | | Adviser Class | |
| | | 2020 | | | 2019 | | | 2018 | | | 2017 | | | 2016 | |
Net asset value — beginning of period | | $ | 10.53 | | | $ | 10.36 | | | $ | 10.46 | | | $ | 10.37 | | | $ | 10.34 | |
| | | | | | | | | | | | | | | | | | | | |
Income (loss) from investment activities: | | | | | | | | | | | | | | | | | | | | |
Net investment income | | | 0.26 | (1) | | | 0.29 | (1) | | | 0.24 | (1) | | | 0.22 | | | | 0.25 | |
Net realized and unrealized gains (losses) | | | (0.32 | ) | | | 0.20 | | | | (0.08 | ) | | | 0.04 | | | | (0.02 | ) |
| | | | | | | | | | | | | | | | | | | | |
Total from investment activities | | | (0.06 | ) | | | 0.49 | | | | 0.16 | | | | 0.26 | | | | 0.23 | |
| | | | | | | | | | | | | | | | | | | | |
Distributions to shareholders: | | | | | | | | | | | | | | | | | | | | |
From net investment income | | | (0.34 | ) | | | (0.32 | ) | | | (0.26 | ) | | | (0.17 | ) | | | (0.20 | ) |
| | | | | | | | | | | | | | | | | | | | |
Net asset value — end of period | | $ | 10.13 | | | $ | 10.53 | | | $ | 10.36 | | | $ | 10.46 | | | $ | 10.37 | |
| | | | | | | | | | | | | | | | | | | | |
Total return | | | (0.61 | )% | | | 4.94 | % | | | 1.53 | % | | | 2.56 | % | | | 2.28 | % |
| | | | | | | | | | | | | | | | | | | | |
Ratios/supplemental data: | | | | | | | | | | | | | | | | | | | | |
Net assets, end of period (000s) | | $ | 15,534 | | | $ | 22,587 | | | $ | 33,571 | | | $ | 48,190 | | | $ | 53,687 | |
Ratio of gross expense to average net assets | | | 1.76 | % | | | 1.69 | % | | | 1.67 | % | | | 1.67 | % | | | 1.68 | % |
Ratio of net expense to average net assets | | | 1.50 | % | | | 1.50 | % | | | 1.50 | % | | | 1.50 | % | | | 1.50 | % |
Ratio of investment income less gross expenses to average net assets | | | 2.37 | % | | | 2.63 | % | | | 2.13 | % | | | 1.84 | % | | | 1.98 | % |
Ratio of net investment income to average net assets | | | 2.64 | % | | | 2.81 | % | | | 2.30 | % | | | 2.00 | % | | | 2.17 | % |
Portfolio turnover rate | | | 71 | % | | | 84 | % | | | 130 | % | | | 116 | % | | | 55 | % |
The Fund commenced operations on September 22, 2008.
| | | | | | | | | | | | | | | | | | | | |
| | | Retirement Class | |
| | | 2020 | | | 2019 | | | 2018 | | | 2017 | | | 2016 | |
Net asset value — beginning of period | | $ | 10.03 | | | $ | 9.91 | | | $ | 10.04 | | | $ | 9.98 | | | $ | 9.98 | |
| | | | | | | | | | | | | | | | | | | | |
Income (loss) from investment activities: | | | | | | | | | | | | | | | | | | | | |
Net investment income | | | 0.22 | (1) | | | 0.25 | (1) | | | 0.21 | (1) | | | 0.18 | | | | 0.20 | |
Net realized and unrealized gains (losses) | | | (0.31 | ) | | | 0.20 | | | | (0.09 | ) | | | 0.05 | | | | — | |
| | | | | | | | | | | | | | | | | | | | |
Total from investment activities | | | (0.09 | ) | | | 0.45 | | | | 0.12 | | | | 0.23 | | | | 0.20 | |
| | | | | | | | | | | | | | | | | | | | |
Distributions to shareholders: | | | | | | | | | | | | | | | | | | | | |
From net investment income | | | (0.34 | ) | | | (0.33 | ) | | | (0.25 | ) | | | (0.17 | ) | | | (0.20 | ) |
| | | | | | | | | | | | | | | | | | | | |
Net asset value — end of period | | $ | 9.60 | | | $ | 10.03 | | | $ | 9.91 | | | $ | 10.04 | | | $ | 9.98 | |
| | | | | | | | | | | | | | | | | | | | |
Total return | | | (0.93 | )% | | | 4.68 | % | | | 1.24 | % | | | 2.33 | % | | | 2.03 | % |
| | | | | | | | | | �� | | | | | | | | | | |
Ratios/supplemental data: | | | | | | | | | | | | | | | | | | | | |
Net assets, end of period (000s) | | $ | 36,402 | | | $ | 35,677 | | | $ | 39,338 | | | $ | 39,083 | | | $ | 35,772 | |
Ratio of gross expense to average net assets | | | 2.02 | % | | | 1.94 | % | | | 1.92 | % | | | 1.91 | % | | | 1.93 | % |
Ratio of net expense to average net assets | | | 1.75 | % | | | 1.75 | % | | | 1.75 | % | | | 1.75 | % | | | 1.75 | % |
Ratio of investment income less gross expenses to average net assets | | | 2.07 | % | | | 2.38 | % | | | 1.91 | % | | | 1.59 | % | | | 1.74 | % |
Ratio of net investment income to average net assets | | | 2.34 | % | | | 2.57 | % | | | 2.08 | % | | | 1.75 | % | | | 1.92 | % |
Portfolio turnover rate | | | 71 | % | | | 84 | % | | | 130 | % | | | 116 | % | | | 55 | % |
The Class commenced operations on April 6, 2009.
(1) Based on average shares outstanding.
See notes to financial statements.
Annual Report 24
| | |
REPORT OF INDEPENDENT REGISTERED PUBLIC ACCOUNTING FIRM | | |
To the shareholders and Board of Trustees of
The Payden & Rygel Investment Group
Opinion on the Financial Statements and Financial Highlights
We have audited the accompanying statement of assets and liabilities of Payden/Kravitz Cash Balance Plan Fund, one of the funds comprising the Payden & Rygel Investment Group (the “Fund”), including the schedule of investments, as of October 31, 2020, the related statement of operations for the year then ended, the statements of changes in net assets for each of the two years in the period then ended, the financial highlights for each of the five years in the period then ended, and the related notes. In our opinion, the financial statements and financial highlights present fairly, in all material respects, the financial position of the Fund as of October 31, 2020, and the results of its operations for the year then ended, the changes in its net assets for each of the two years in the period then ended, and the financial highlights for each of the five years in the period then ended in conformity with accounting principles generally accepted in the United States of America.
Basis for Opinion
These financial statements and financial highlights are the responsibility of the Fund’s management. Our responsibility is to express an opinion on the Fund’s financial statements and financial highlights based on our audit. We are a public accounting firm registered with the Public Company Accounting Oversight Board (United States) (PCAOB) and are required to be independent with respect to the Fund in accordance with the U.S. federal securities laws and the applicable rules and regulations of the Securities and Exchange Commission and the PCAOB.
We conducted our audit in accordance with the standards of the PCAOB. Those standards require that we plan and perform the audit to obtain reasonable assurance about whether the financial statements and financial highlights are free of material misstatement, whether due to error or fraud. The Fund is not required to have, nor were we engaged to perform, an audit of their internal control over financial reporting. As part of our audit we are required to obtain an understanding of internal control over financial reporting but not for the purpose of expressing an opinion on the effectiveness of the Fund’s internal control over financial reporting. Accordingly, we express no such opinion.
Our audit included performing procedures to assess the risks of material misstatement of the financial statements and financial highlights, whether due to error or fraud, and performing procedures that respond to those risks. Such procedures included examining, on a test basis, evidence regarding the amounts and disclosures in the financial statements and financial highlights. Our audit also included evaluating the accounting principles used and significant estimates made by management, as well as evaluating the overall presentation of the financial statements and financial highlights. Our procedures included confirmation of securities owned as of October 31, 2020, by correspondence with the custodian and brokers; when replies were not received from brokers, we performed other auditing procedures. We believe that our audit provides a reasonable basis for our opinion.
|
| /s/ DELOITTE & TOUCHE LLP |
| Los Angeles, California |
| December 23, 2020 |
We have served as the auditor of one or more of The Payden & Rygel Investment Group investment companies since 1992.
25 Payden Mutual Funds
| | |
Fund Expenses (unaudited) | | |
Understanding Your Fund’s Expenses
Shareholders of mutual funds incur two types of costs: transaction costs incurred from buying or selling Fund shares and ongoing costs incurred from the Funds daily operations. The tables below are provided to highlight ongoing cost only. If transaction costs were included your cost would have been higher.
Actual Expenses
The table below is useful in estimating actual expenses paid during the period ended October 31, 2020. It uses the Fund’s actual return and expense ratio for the period (184/366 days) to calculate the ongoing expenses paid by a shareholder with an initial investment of $1,000. To estimate the actual expenses that you paid over the period, divide your beginning account value by 1,000 and multiply that number by the number in the Expenses Paid During the Period column.
Hypothetical Expenses
The table below is provided so that you can compare the Fund’s ongoing expense with those of another fund. It uses a hypothetical gross annual return of 5%, which is not the Fund’s actual return and the Fund’s actual expense ratio (184/366 days) for the six-month period ended October 31, 2020 to calculate the ongoing expenses paid by a shareholder with an initial investment of $1,000.
| | | | | | | | | | | | | | | | | | | | |
| | | Value
May 1, 2020 | | | Value
October 31, 2020 | | | 6-Month
Return | | | Annual
Expense
Ratio | | | Expenses
Paid During
the Period | |
Institutional Class | | | | | | | | | | | | | | | | | | | | |
Actual | | | $1,000.00 | | | | $1,098.20 | | | | 9.82 | % | | | 0.95 | % | | | $5.01 | |
Hypothetical | | | 1,000.00 | | | | 1,020.36 | | | | 2.04 | % | | | 0.95 | % | | | 4.83 | |
SI Class | | | | | | | | | | | | | | | | | | | | |
Actual | | | $1,000.00 | | | | $1,096.00 | | | | 9.60 | % | | | 1.25 | % | | | $6.59 | |
Hypothetical | | | 1,000.00 | | | | 1,018.85 | | | | 1.88 | % | | | 1.25 | % | | | 6.35 | |
Adviser Class | | | | | | | | | | | | | | | | | | | | |
Actual | | | $1,000.00 | | | | $1,095.10 | | | | 9.51 | % | | | 1.50 | % | | | $7.90 | |
Hypothetical | | | 1,000.00 | | | | 1,017.59 | | | | 1.76 | % | | | 1.50 | % | | | 7.61 | |
Retirement Class | | | | | | | | | | | | | | | | | | | | |
Actual | | | $1,000.00 | | | | $1,093.40 | | | | 9.34 | % | | | 1.75 | % | | | $9.21 | |
Hypothetical | | | 1,000.00 | | | | 1,016.34 | | | | 1.63 | % | | | 1.75 | % | | | 8.87 | |
Annual Report 26
| | |
Approval of Investment Advisory Agreement (Unaudited) | | |
1. Background
Among its other duties, the Board of Trustees (the “Board” or the “Trustees”) of The Payden & Rygel Investment Group (the “P&R Trust”) is responsible for determining whether to initially approve and subsequently annually renew the investment management agreement (the “Agreement”) between Payden/Kravitz Investment Advisers LLC (“Adviser”) and the Trust with respect to the Payden/Kravitz Cash Balance Plan Fund (the ”Fund”). Under the Agreement, the Adviser is responsible for providing investment advisory services and overseeing the everyday operations and other service providers of the Fund.
Section 15(c) of the Investment Company Act of 1940 (the “1940 Act”) requires that, after an initial period of up to two years, the Agreement for the Fund will remain in effect only if the Board, including a majority of those Trustees who have no direct or indirect interest in the Agreement, and who are not “interested persons” of the Trust, as that term is defined in the 1940 Act (each an “Independent Trustee,” and collectively, “Independent Trustees”), annually renews that Agreement. Seven of the Trust’s nine Trustees are deemed to be Independent Trustees for this purpose.
On June 16, 2020, the Board of Trustees of the P&R Trust unanimously approved the Agreement between the Adviser and the P&R Trust with respect to the Fund for an additional year through June 30, 2021. The Board approved the Agreement following the recommendation of the Board’s Audit Committee (the “Audit Committee”), which is composed of all of the P&R Trust’s Independent Trustees. In reaching these decisions, the Board took into account information furnished to it throughout the year at meetings of the Board and the Board’s committees, as well as extensive information prepared specifically in connection with the annual renewal process. Determinations by the Independent Trustees also took into account various factors that they believed to be relevant, in light of (1) the legal advice furnished to them by Paul Hastings LLP (“Paul Hastings”), independent legal counsel to the Independent Trustees, and (2) each Independent Trustee’s business judgment.
2. Overview of the Approval or Renewal Process
In considering the annual renewal with respect to the Fund, the Board followed its previously established process. As part of that process, the Board delegates the initial responsibility for this process and related tasks to the Audit Committee. These tasks include working with the Adviser and Paul Hastings (1) to develop Section 15(c)-related guidelines and specific requests with respect to the type of information to be provided to the Audit Committee and the Board in connection with the proposed contract renewal, and (2) to evaluate the information provided in response to these guidelines and requests.
In advance of the Board meeting held on June 16, 2020, Paul Hastings requested on behalf of the Audit Committee and the Board, and the Adviser provided, extensive information that was designed to assist the Audit Committee and the Board in their consideration of whether to renew the Agreement for the Fund. This information included, but was not limited to, the following: (1) the nature, extent and quality of services provided or to be provided by the Adviser to the Fund; (2) the Fund’s investment performance; (3) the costs of the services provided to the Fund and the profits realized or potential profits to be realized (if any) by the Adviser and its affiliates from their relationship with the Fund; (4) fees charged by other investment advisers; (5) the extent to which economies of scale have been realized or are anticipated to be realized as the Fund grows; (6) whether the fee schedule set forth in the Agreement reflects any such economies of scale for the benefit of Fund investors; (7) comparisons of services and fee rates with any contracts entered into by the Adviser with other clients to whom the Adviser provides comparable services; and (8) any other benefits derived or anticipated to be derived by the Adviser or its affiliates from their relationship with the Fund.
As a general matter, the Board viewed these factors in their totality, with no single factor being the principal factor in determining whether to approve or renew the Agreement. In reaching its decisions regarding the renewal of the Agreement for Fund, the Board took into account the information described above, other information provided to the Board in connection with this process, and relevant information provided to the Board and to its Committees on an ongoing basis in connection with the Board’s general oversight duties with respect to the Fund. In addition, the Board received and considered information from Paul Hastings as to certain relevant guidelines that relate to the approval or renewal process under Section 15(c) of the 1940 Act. In deciding whether to renew the Agreement for the Fund, each Trustee may have accorded different weight to different factors, and thus, each Trustee may have had a different basis for his or her ultimate decision to vote to renew the Agreement for Fund. At its meeting on June 16, 2020, the Board voted unanimously to renew the Agreement for the Fund. Set forth below are the general factors the Board considered in making its decision.
27 Payden Mutual Funds
3. Nature, Extent and Quality of Services
The Board and Audit Committee considered a number of factors related to the services provided by the Adviser, including the quality of the Adviser’s investment advisory process, the experience, expertise and quality of the Adviser’s investment professionals, the experience, leadership ability and integrity of the Adviser’s senior management, the low turnover rate of its key personnel, and the overall financial strength, stability and viability of the Adviser. They also considered the Adviser’s ability and commitment to attract and retain qualified personnel, and its commitment to maintain and enhance its investment advisory resources and information technology systems. The Board and Audit Committee further considered the Adviser’s strong commitment to compliance with applicable laws and regulations and the nature and extent of its compliance program and records. Finally, they took into account the administrative, distribution and shareholder services to be provided by the Adviser or its affiliates to the Fund under the Agreement. Based on the foregoing, the Board and Audit Committee concluded that the investment advisory and related services to be provided by the Adviser and its affiliates have benefited and should continue to benefit the Fund and its prospective shareholders.
4. Investment Results
At its regular quarterly Board meetings during the past year and as a part of the annual review of the Agreement, the Board reviewed the investment results of the Fund compared to its benchmark index. In addition, as a part of the annual review of the Agreement, the Board and Audit Committee specifically reviewed a report prepared by Broadridge, which contained the Fund’s performance for various time periods, i.e., 1-year, 3-years, 5-years and 10-years, as compared to the performance of (1) a group of comparable mutual funds (the “Peer Group”) selected by Broadridge, and (2) the Fund’s benchmark index. The Board and Audit Committee concluded that the results for the Fund since its inception have been satisfactory overall, and that for the most recent calendar year, the Fund’s results continued on a satisfactory track. In sum, the Board and Audit Committee concluded that the Adviser’s continued management should benefit the Fund and its shareholders.
5. Advisory Fees and Total Expenses
The Board and the Committee reviewed the Fund’s net operating expense ratio and its various fee and expense components, and then compared those fees and expenses to the fee and expense information for a peer group for the Fund. They observed that the advisory fees and expenses for the Fund continue to be very competitive with the advisory fees and expenses of this peer group. Overall, the Board and Audit Committee concluded that the Fund’s cost structure was fair and reasonable in relation to the services provided, and that the Fund’s shareholders receive reasonable value in return for the advisory fees paid to the Adviser by the Fund.
6. Adviser Profitability and Indirect Benefits
The Board and Audit Committee reviewed information regarding the Adviser’s cost of providing services to the Fund, as well as the resulting level of profits to the Adviser. They further reviewed the cost allocation methodology used to determine the Adviser’s profitability of providing services to the Fund. Based that review, the Board and Audit Committee concluded that the profits earned by the Adviser were not excessive in view of the advisory, administrative and other services provided to the Fund. Finally, the Board and Audit Committee noted that the Adviser indirectly benefited from its advisory relationship with the Fund because the availability of the Fund enhanced the Adviser’s business reputation and name recognition.
7. Specific Fund Factors
The Board considered the following specific factors (among others) in connection with its determination to renew the Agreement with respect to the Fund. References below to quintiles are based on data provided to the Board in the report prepared by Broadridge. All time periods referenced below ended as of April 30, 2020.
• Adviser Fee: The Adviser’s annual contractual management fee rate for the Fund is 1.10%, placing it in the fourth quintile of the group of comparable funds for adviser fees. The actual management fee was in the fourth quintile.
Annual Report 28
| | |
Approval of Investment Advisory Agreement (Unaudited) continued | | |
• Total Expenses: The Fund’s total expenses were in the third quintile of the group of comparable funds selected by Broadridge for expense comparison purposes. The Adviser has contractually agreed that, for so long as it is the investment adviser to the Fund, the total Annual Fund Operating Expenses will not exceed 1.25%.
• Performance: The Fund was in the fourth quintile for the one-year and ten-year periods, and in the third quintile for the three-year and five-year periods of the group of comparable funds.
29 Payden Mutual Funds
| | | | | | | | | | | | |
| Name & Address | | Age | | Position
with Fund | | Year
Elected | | Number of
Portfolios | | Principal
Occupation(s) | | Other
Directorships
Held |
| 333 S. Grand Avenue Los Angeles, CA 90071 | | | | | | | | | | | | |
| | | | | | |
| Trustees (1) | | | | | | | | | | | | |
| Stephanie Bell-Rose | | 63 | | Independent Trustee | | 2020 | | 19 | | Retired, Senior Managing Director, TIAA | | |
| W. D. Hilton, Jr. | | 74 | | Chairman, | | 1993 | | 19 | | Trustee/Administrator, | | |
| | | | Independent Trustee | | | | | | Asbestos Bankruptcy Trusts; General Partner, Mendenhall Partners Ltd.; Private Investor | | |
| Thomas V. | | 76 | | Independent Trustee | | 1993 | | 19 | | Vice Chair, | | |
| McKernan, Jr. | | | | | | | | | | Automobile Club of Southern California; Director, Forest Lawn Memorial Parks | | |
| Rosemarie T. Nassif | | 79 | | Independent Trustee | | 2008 | | 19 | | Executive Director, | | |
| | | | | | | | | | Center for Catholic Education, Loyola Marymount University, President Emerita, Holy Names University | | |
| Andrew J. Policano | | 71 | | Independent Trustee | | 2008 | | 19 | | Former Dean, The Paul Merage School of Business, University of California, Irvine | | |
| Dennis C. Poulsen | | 78 | | Independent Trustee | | 1992 | | 19 | | Chairman, Clean Energy Enterprises; Private Investor | | |
| Stender E. Sweeney | | 81 | | Independent Trustee | | 1992 | | 19 | | Private Investor | | |
| Jordan H. Lopez | | 39 | | Interested Trustee | | 2020 | | 19 | | Director, Payden & Rygel | | |
| Michael E. Salvay | | 59 | | Interested Trustee | | 2009 | | 19 | | Managing Principal, Payden & Rygel | | |
| Officers (2) | | | | | | | | | | | | |
| Joan A. Payden | | | | President and CEO | | 1992 | | | | President, CEO and Director, Payden & Rygel | | |
| Brian W. Matthews | | | | Vice President and CFO | | 2003 | | | | Managing Principal, CFO and Director, Payden & Rygel | | |
| Yot Chattrabhuti | | | | Vice President | | 1997 | | | | Principal, Payden & Rygel | | |
| Bradley F. Hersh | | | | Vice President and Treasurer | | 1998 | | | | Principal and Treasurer, Payden & Rygel | | |
| Edward S. Garlock | | | | Secretary | | 1997 | | | | Managing Principal, General Counsel and Director, Payden & Rygel | | |
| Sandi Brents | | | | Vice President and CCO | | 2016 | | | | Vice President and Senior Compliance Officer, Payden & Rygel | | |
Additional information about the Trustees is included in the SAI and is available without charge, upon request at payden.com or 1800 5 PAYDEN.
(1) Trustees do not have a set term of office, but serve until their resignation, death or removal.
| (2) | Officers are elected by, and serve at the pleasure of, The Board of Trustees. |
Annual Report 30
Item 2. Code of Ethics.
Effective June 9, 2003, the registrant adopted “The Payden & Rygel Investment Group Supplemental Code of Ethics for Principal Officers and Senior Financial Officers” (the “Supplemental Code of Ethics”) that applies to the registrant’s principal executive officer, principal financial officer, principal accounting officer or controller. A copy of the Supplemental Code of Ethics was filed as an exhibit to the registrant’s Annual Report on Form N-CSR for the fiscal year-end and reporting period of October 31, 2003. There has been no amendment to the Supplemental Code of Ethics during the period covered by this report, and the registrant has not granted any waiver, including any implicit waiver, from any provision of the Supplemental Code of Ethics during the period covered by this report. Any person may obtain without charge a copy of the Supplemental Code of Ethics by sending his or her request in writing to: The Payden & Rygel Investment Group, Attention: General Counsel, 333 South Grand Avenue, 32nd Floor, Los Angeles, CA 90071. A copy of the Supplemental code of Ethics is also posted on the registrant’s Internet website at www.payden.com.
Item 3. Audit Committee Financial Expert.
At its meeting on December 15, 2020, the registrant’s Board of Trustees has determined that, for the fiscal year ended October 31, 2020, W.D. Hilton, Jr., Thomas V. McKernan, Andrew J. Policano and Stender E. Sweeney are qualified to serve as audit committee financial experts serving on its audit committee and that they are “independent,” as defined by Item 3 of Form N-CSR.
Item 4. Principal Accountant Fees and Services.
[Registrant may incorporate the following information by reference, if this information has been disclosed in the registrant’s definitive proxy statement or definitive information statement. The proxy statement or information statement must be filed no later than 120 days after the end of the fiscal year covered by the Annual Report.]
Audit Fees
| | (a) | The aggregate fees billed for each of the last two fiscal years for professional services rendered by the principal accountant for the audit of the registrant’s annual financial statements or services that are normally provided by the accountant in connection with statutory and regulatory filings or engagements for those fiscal years are $686,400 for 2020 and $672,900 for 2019. |
Audit-Related Fees
| | (b) | The aggregate fees billed in each of the last two fiscal years for assurance and related services by the principal accountant that are reasonably related to the performance of the audit of the registrant’s financial statements and are not reported under paragraph (a) of this Item are $0 for 2020 and $0 for 2019. |
Tax Fees
| | (c) | The aggregate fees billed in each of the last two fiscal years for professional services rendered by the principal accountant for tax compliance, tax advice, and tax planning are $125,400 for 2020 and $122,900 for 2019. These fees related to the preparation and filing of Federal and state income tax returns and Federal excise tax returns. |
All Other Fees
| | (d) | The aggregate fees billed in each of the last two fiscal years for products and services provided by the principal accountant, other than the services reported in paragraphs (a) through (c) of this Item, were $8,000 in 2019 related to a consent in connection with a filing with the SEC on October 18, 2019 for the Payden California Municipal Income Fund. |
| | (e)(1) | Disclose the audit committee’s pre-approval policies and procedures described in paragraph (c)(7) of Rule 2-01 of Regulation S-X. |
The Audit Committee of the registrant’s Board of Trustees, which is composed solely of independent Trustees, approves all services by the registrant’s principal accountant, and the fees for such services, prior to any engagement.
| | (e)(2) | The percentage of services described in each of paragraphs (b) through (d) of this Item that were approved by the audit committee pursuant to paragraph (c)(7)(i)(C) of Rule 2-01 of Regulation S-X are as follows: |
(b) NA
(c) 0%
(d) 0%
(f) Not applicable.
| | (g) | The aggregate non-audit fees billed by the registrant’s accountant for services rendered to the registrant for each of the last two fiscal years of the registrant was $125,400 for 2020 and $130,900 for 2019. |
| | (h) | In the fiscal years ended October 31, 2020 and October 31, 2019 respectively, the registrant’s principal accountant did not provide any non-audit services to the registrant’s investment advisers, Payden & Rygel and Payden/Kravitz Investment Advisers LLC, respectively, and any entity controlling, controlled by or under common control with either investment adviser that provides ongoing services to the registrant that required pre-approval pursuant to paragraph (c)(7)(ii) of Rule 2-01 of Regulation S-X. However, each year at the time the Audit Committee of the registrant’s Board of Trustees considers the appointment and scope of services and fees for the registrant’s principal accountant, the Audit Committee considers whether the provision of services by the registrant’s principal accountant to either of the registrant’s investment advisers, Payden & Rygel and Payden/Kravitz Investment Advisers LLC, and any entity controlling, controlled by or under common control with either investment adviser that provides ongoing services to the registrant, is compatible with maintaining the principal accountant’s independence. |
Item 5. Audit Committee of Listed Registrants.
Not applicable.
| (a) | Schedule of Investments in securities of unaffiliated issuers as of the close of the reporting period is included as part of the report to shareholders filed under Item 1 of this form. |
| Item 7. | Disclosure of Proxy Voting Policies and Procedures for Closed-End Management Investment Companies. |
Not applicable.
| Item 8. | Portfolio Managers of Closed-End Management Investment Companies. |
Not applicable.
| Item 9. | Purchases of Equity Securities by Closed-End Management Investment Company and Affiliated Purchasers. |
Not applicable.
| Item 10. | Submission of Matters to a Vote of Security Holders. |
Not applicable.
| Item 11. | Controls and Procedures. |
| | (a) | The registrant’s principal executive and principal financial officers have concluded that the registrant’s disclosure controls and procedures (as defined in Rule 30a-3(c) under the Investment Company Act of 1940, as amended (the “1940 Act”) (17 CFR 270.30a-3(c))) are effective, as of a date within 90 days of the filing date of the report that includes the disclosure required by this paragraph, based on their evaluation of these controls and procedures required by Rule 30a-3(b) under the 1940 Act (17 CFR 270.30a-3(b)) and Rules 13a-15(b) or 15d-15(b) under the Securities Exchange Act of 1934, as amended (17 CFR 240.13a-15(b) or 240.15d-15(b)). |
| | (b) | There were no changes in the registrant’s internal control over financial reporting (as defined in Rule 30a-3(d) under the 1940 Act (17 CFR 270.30a-3(d))) that occurred during the period covered by this report that has materially affected, or is reasonably likely to materially affect, the registrant’s internal control over financial reporting. |
| Item 12. | Disclosure of Securities Lending Activities for Closed-End Management Investment Companies. |
Not applicable.
SIGNATURES
Pursuant to the requirements of the Securities Exchange Act of 1934 and the Investment Company Act of 1940, the registrant has duly caused this report to be signed on its behalf by the undersigned, thereunto duly authorized.
| | | | |
| (Registrant) | | The Payden & Rygel Investment Group | | |
| | | | |
| | |
| By (Signature and Title)* | | /s/ Joan A. Payden | | |
| | Joan A. Payden, Chairman and CEO | | |
| | (principal executive officer) | | |
Pursuant to the requirements of the Securities Exchange Act of 1934 and the Investment Company Act of 1940, this report has been signed below by the following persons on behalf of the registrant and in the capacities and on the dates indicated.
| | | | |
| By (Signature and Title)* | | /s/ Joan A. Payden | | |
| | Joan A. Payden, Chairman and CEO | | |
| | (principal executive officer) | | |
| | | | |
| | |
| By (Signature and Title)* | | /s/ Brian W. Matthews | | |
| | Brian W. Matthews, Vice President and Chief Financial Officer |
| | (principal financial officer) | | |
* Print the name and title of each signing officer under his or her signature.