UHOS Q1 2007 Earnings Teleconference May 9, 2007

Forward Looking Statements _ Safe Harbor Statement under the Private Securities Litigation Reform Act of 1995: Universal Hospital Services, Inc. believes statements in this presentation looking forward in time involve risks and uncertainties. The following factors, among others, could adversely affect our business, operations and financial condition causing our actual results to differ materially from those expressed in any forward-looking statements: our history of net losses and substantial interest expense; our need for substantial cash to operate and expand our business as planned; our substantial outstanding debt and debt service obligations; restrictions imposed by the terms of our debt; a decrease in the number of patients our customers are serving; our ability to effect change in the manner in which healthcare providers traditionally procure medical equipment; the absence of long-term commitments with customers; our ability to renew contracts with group purchasing organizations and integrated delivery networks; changes in reimbursement rates and policies by third-party payors; the impact of health care reform initiatives; the impact of significant regulation of the health care industry and the need to comply with those regulations; difficulties or delays in our continued expansion into certain of our businesses/geographic markets and developments of new businesses/geographic markets; and additional credit risks in increasing business with home care providers and nursing homes, impacts of equipment product recalls or obsolescence; increases in vendor costs that cannot be passed through to our customers; and other Risk Factors as detailed in our annual report on Form 10K for the year ended December 31, 2006, filed with the Securities and Exchange Commission. _ This presentation contains non-GAAP measures as defined by SEC rules. Reconciliations of these measures to the most directly comparable GAAP measures are contained in the appendix.

3 Financial Results ($ millions) _ Revenues _ Adjusted EBITDA Refer to appendix for reconciliation of Adjusted EBITDA to Cash Flow from Operations 2006 2007 % Chg 58.0 $ 63.5 $ 10% 22.9 $ 25.2 $ 10% 1st Qtr Another Record Quarter in Q1-2007!
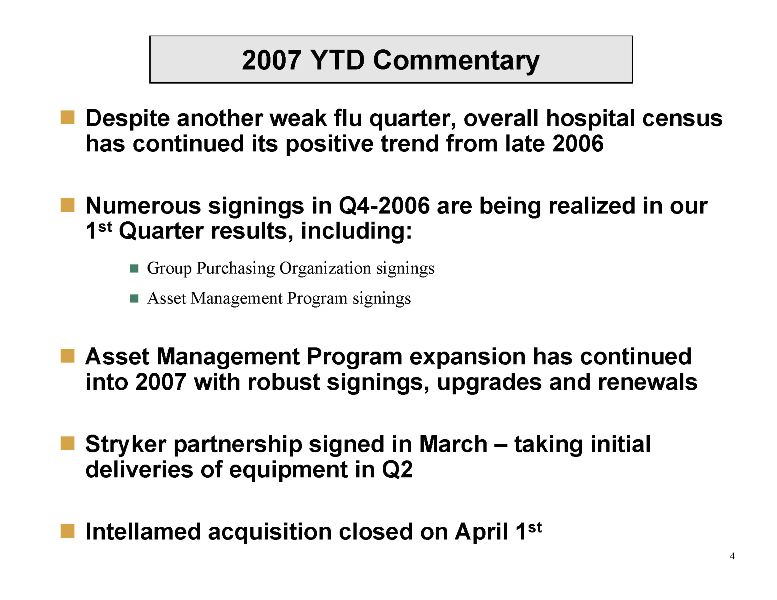
4 _ Despite another weak flu quarter, overall hospital census has continued its positive trend from late 2006 _ Numerous signings in Q4-2006 are being realized in our 1st Quarter results, including: _ Group Purchasing Organization signings _ Asset Management Program signings _ Asset Management Program expansion has continued into 2007 with robust signings, upgrades and renewals _ Stryker partnership signed in March – taking initial deliveries of equipment in Q2 _ Intellamed acquisition closed on April 1st 2007 YTD Commentary
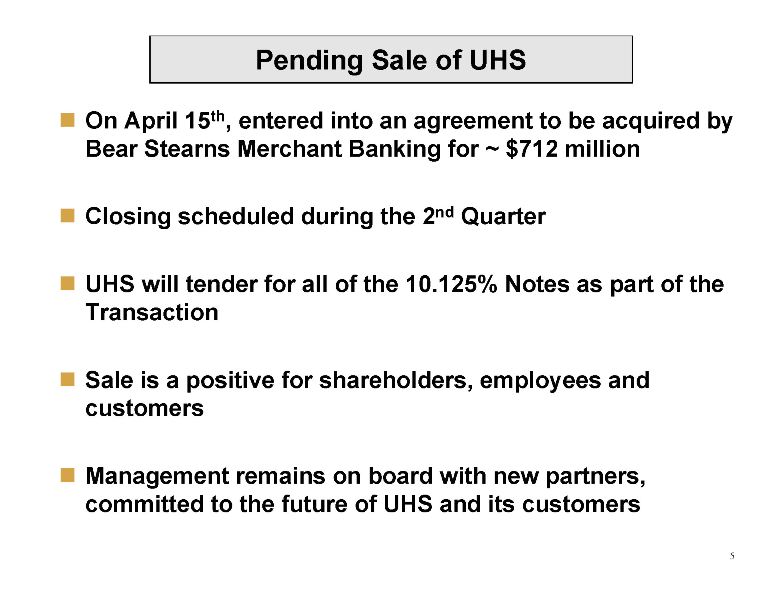
5 _ On April 15th, entered into an agreement to be acquired by Bear Stearns Merchant Banking for ~ $712 million _ Closing scheduled during the 2nd Quarter _ UHS will tender for all of the 10.125% Notes as part of the Transaction _ Sale is a positive for shareholders, employees and customers _ Management remains on board with new partners, committed to the future of UHS and its customers Pending Sale of UHS
UHS 6 Growth Opportunities
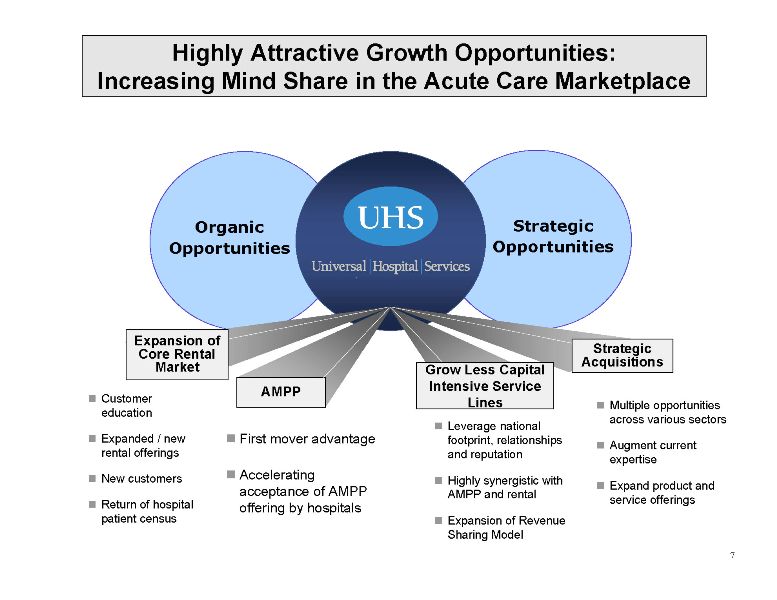
7 Strategic Opportunities Organic Opportunities Highly Attractive Growth Opportunities: Increasing Mind Share in the Acute Care Marketplace AMPP Grow Less Capital Intensive Service Lines Strategic Acquisitions _ Customer education _ Expanded / new rental offerings _ New customers _ Return of hospital patient census _ First mover advantage _ Accelerating acceptance of AMPP offering by hospitals _ Leverage national footprint, relationships and reputation _ Highly synergistic with AMPP and rental _ Expansion of Revenue Sharing Model _ Multiple opportunities across various sectors _ Augment current expertise _ Expand product and service offerings Expansion of Core Rental Market

8 Expansion of Core Rental Market: Continued Competitive Wins and Successful Customer Conversions GPO GPO Hospital System Alternate Care System $500 $750 $1,000 $1,250 $1,500 $1,750 $2,000 Mar-05 May-05 Jul-05 Sep-05 Nov-05 Jan-06 Mar-06 May-06 Jul-06 Sep-06 Nov-06 Jan-07 Mar-07 Monthly Revenue ($ in 000's) Sole-source contract signing $300 $400 $500 $600 $700 $800 $900 $1,000 $1,100 Mar-05 May-05 Jul-05 Sep-05 Nov-05 Jan-06 Mar-06 May-06 Jul-06 Sep-06 Nov-06 Jan-07 Mar-07 Monthly Revenue ($ in 000's) Dual-source contract signing $0 $20 $40 $60 $80 $100 $120 $140 $160 Mar-05 May-05 Jul-05 Sep-05 Nov-05 Ja n-06 Mar-06 May-06 Jul-06 Sep-06 Nov-06 Jan-07 Mar-07 Monthly Revenue ($ in 000's) Sole-source MME rental conversion signing $0 $50 $100 $150 $200 $250 $300 $350 $400 Mar-05 May-05 Jul-05 Sep-05 Nov-05 Jan-06 Mar-06 May-06 Jul-06 Sep-06 Nov-06 Jan-07 Mar-07 Monthly Revenue ($ in 000's) Sole-source bariatrics and PAM contract signing
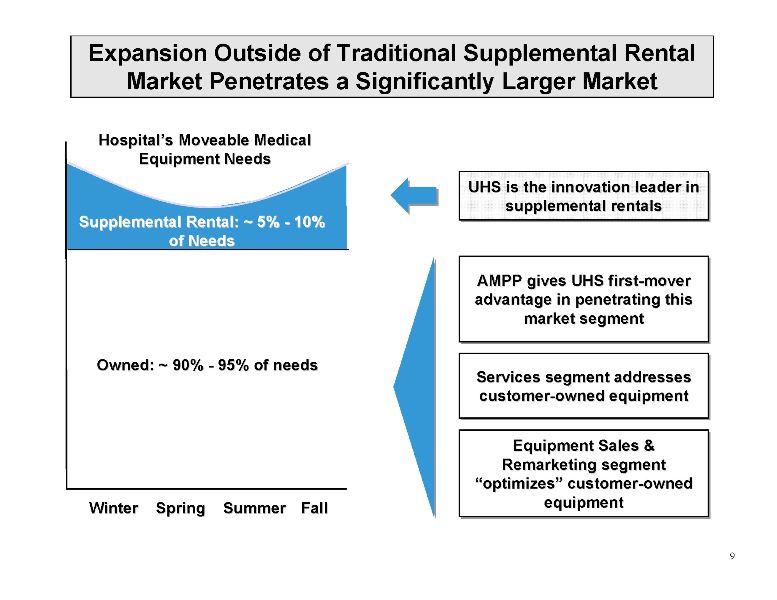
signing 9 Expansion Outside of Traditional Supplemental Rental Market Penetrates a Significantly Larger Market UHS is the innovation leader in supplemental rentals UHS is the innovation leader in UHS is the innovation leader in supplemental rentals supplemental rentals AMPP gives UHS first-mover advantage in penetrating this market segment AMPP gives UHS first AMPP gives UHS first-mover mover advantage in penetrating this advantage in penetrating this market segment market segment Services segment addresses customer-owned equipment Services segment addresses Services segment addresses customer customer-owned equipment owned equipment Equipment Sales & Remarketing segment “optimizes” customer-owned equipment Equipment Sales & Equipment Sales & Remarketing segment Remarketing segment “optimizes optimizes” customer customer-owned owned equipment equipment Supplemental Rental: ~ 5% Supplemental Rental: ~ 5% - 10% 10% of Needs of Needs Winter Spring Summer Winter Spring Summer Fall Fall Owned: ~ 90% Owned: ~ 90% - 95% of needs 95% of needs Hospital Hospital’’s Moveable Medical s Moveable Medical Equipment Needs Equipment Needs
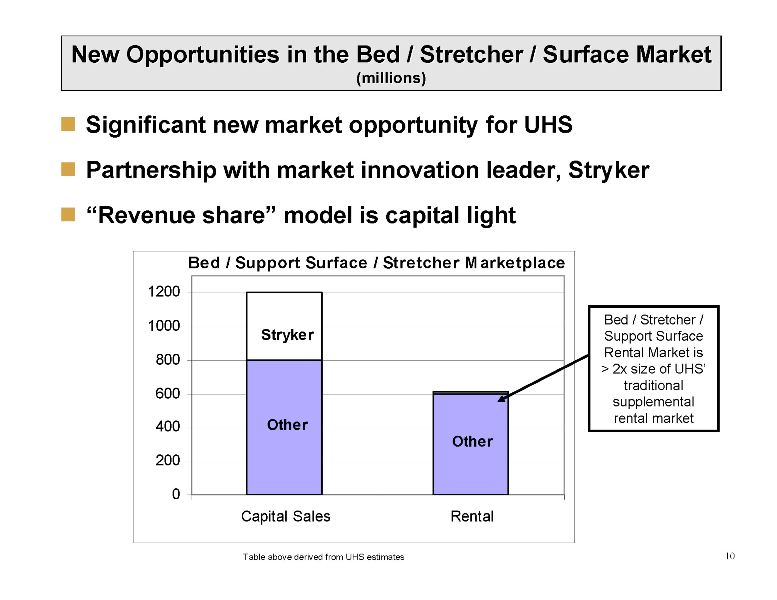
10 New Opportunities in the Bed / Stretcher / Surface Market New Opportunities in the Bed / Stretcher / Surface Market (millions) (millions) 0 200 400 600 800 1000 1200 Capital Sales Rental Bed / Support Surface / Stretcher Marketplace Other Other Stryker _ Significant new market opportunity for UHS _ Partnership with market innovation leader, Stryker _ “Revenue share” model is capital light Table above derived from UHS estimates Bed / Stretcher / Support Surface Rental Market is > 2x size of UHS’ traditional supplemental rental market
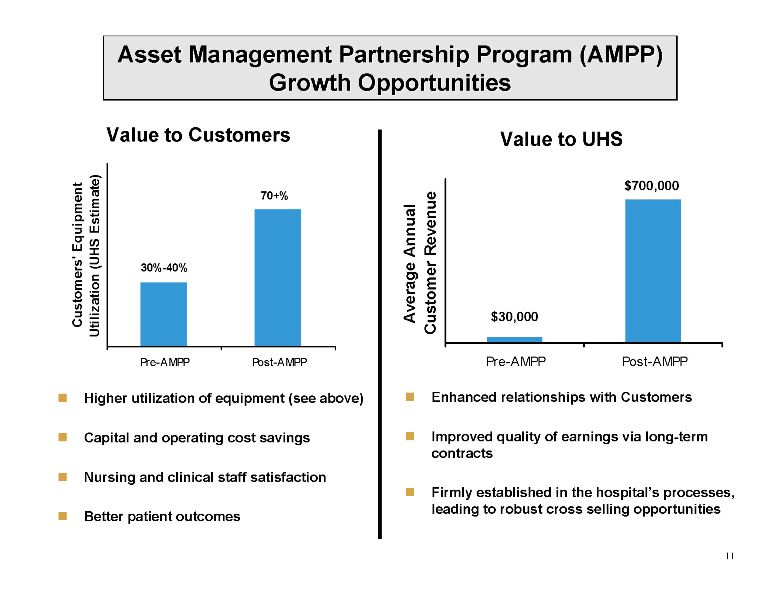
11 Asset Management Partnership Program (AMPP) Asset Management Partnership Program (AMPP) Growth Opportunities Growth Opportunities Pre-AMPP Post-AMPP Average Annual Customer Revenue $30,000 $700,000 Value to Customers Pre-AMPP Post-AMPP Customers' Equipment Utilization (UHS Estimate) 30%-40% 70+% _ Higher utilization of equipment (see above) _ Capital and operating cost savings _ Nursing and clinical staff satisfaction _ Better patient outcomes Value to UHS _ Enhanced relationships with Customers _ Improved quality of earnings via long-term contracts _ Firmly established in the hospital’s processes, leading to robust cross selling opportunities
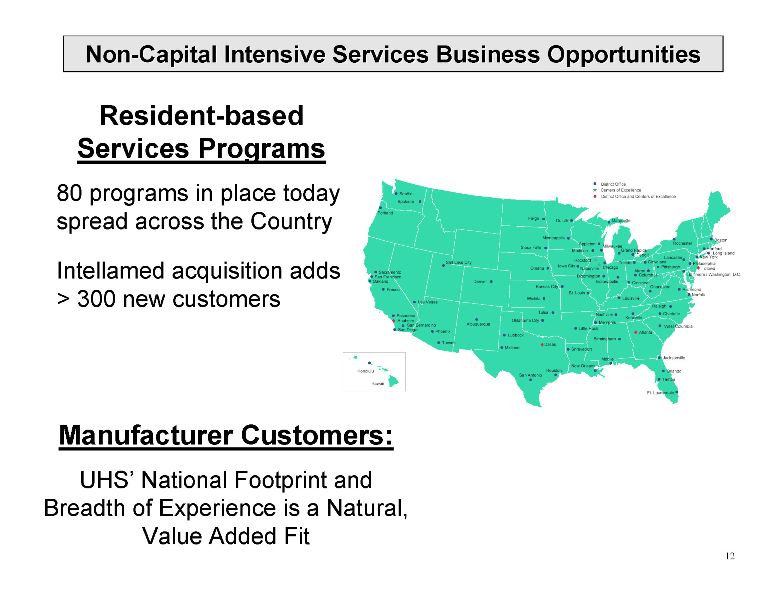
12 Non Non-Capital Intensive Services Business Opportunities Capital Intensive Services Business Opportunities Resident-based Services Programs 80 programs in place today spread across the Country Intellamed acquisition adds > 300 new customers Manufacturer Customers: UHS’ National Footprint and Breadth of Experience is a Natural, Value Added Fit
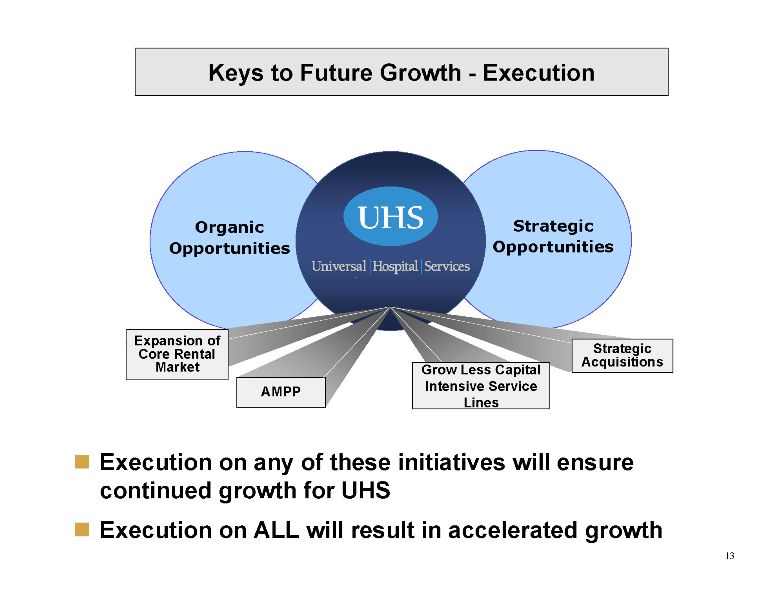
13 Strategic Opportunities Organic Opportunities Keys to Future Growth - Execution AMPP Grow Less Capital Intensive Service Lines Strategic Acquisitions Expansion of Core Rental Market _ Execution on any of these initiatives will ensure continued growth for UHS _ Execution on ALL will result in accelerated growth
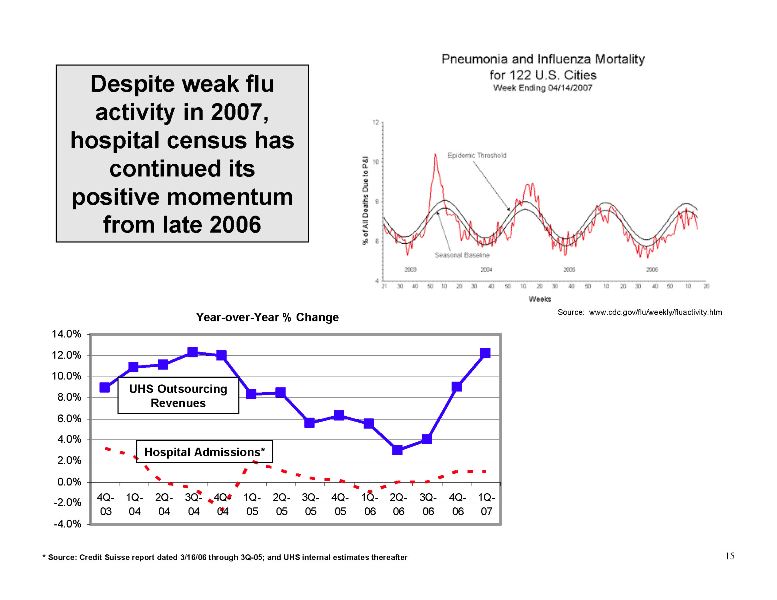
15 -4.0% -2.0% 0.0% 2.0% 4.0% 6.0% 8.0% 10.0% 12.0% 14.0% 4Q- 03 1Q- 04 2Q- 04 3Q- 04 4Q- 04 1Q- 05 2Q- 05 3Q- 05 4Q- 05 1Q- 06 2Q- 06 3Q- 06 4Q- 06 1Q- 07 Despite weak flu activity in 2007, hospital census has continued its positive momentum from late 2006 Year-over-Year % Change * Source: Credit Suisse report dated 3/16/06 through 3Q-05; and UHS internal estimates thereafter UHS Outsourcing Revenues Hospital Admissions* Source: www.cdc.gov/flu/weekly/fluactivity.htm
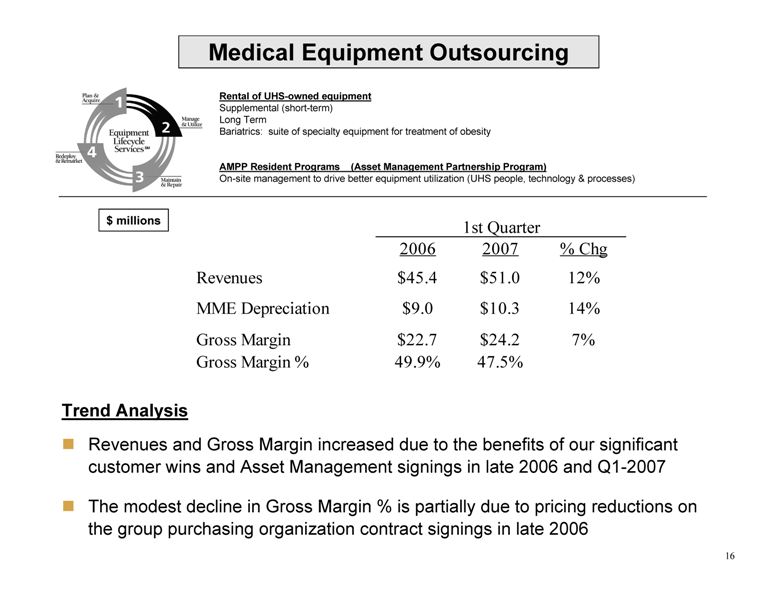
16 2006 2007 % Chg Revenues $45.4 $51.0 12% MME Depreciation $9.0 $10.3 14% Gross Margin $22.7 $24.2 7% Gross Margin % 49.9% 47.5% 1st Quarter $ millions Medical Equipment Outsourcing Trend Analysis _ Revenues and Gross Margin increased due to the benefits of our significant customer wins and Asset Management signings in late 2006 and Q1-2007 _ The modest decline in Gross Margin % is partially due to pricing reductions on the group purchasing organization contract signings in late 2006 Rental of UHS-owned equipment Supplemental (short-term) Long Term Bariatrics: suite of specialty equipment for treatment of obesity AMPP Resident Programs (Asset Management Partnership Program) On-site management to drive better equipment utilization (UHS people, technology & processes)
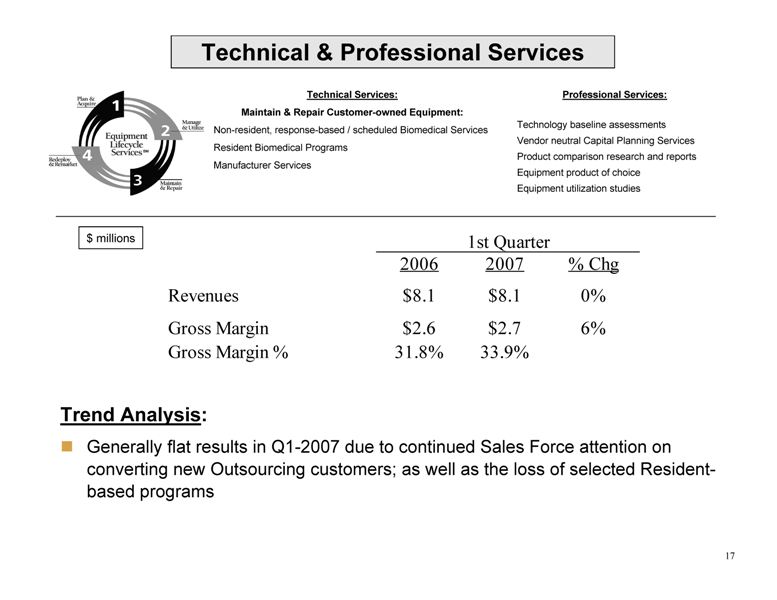
17 2006 2007 % Chg Revenues $8.1 $8.1 0% Gross Margin $2.6 $2.7 6% Gross Margin % 31.8% 33.9% 1st Quarter $ millions Technical & Professional Services Trend Analysis: _ Generally flat results in Q1-2007 due to continued Sales Force attention on converting new Outsourcing customers; as well as the loss of selected Residentbased programs Technical Services: Maintain & Repair Customer-owned Equipment: Non-resident, response-based / scheduled Biomedical Services Resident Biomedical Programs Manufacturer Services Professional Services: Technology baseline assessments Vendor neutral Capital Planning Services Product comparison research and reports Equipment product of choice Equipment utilization studies
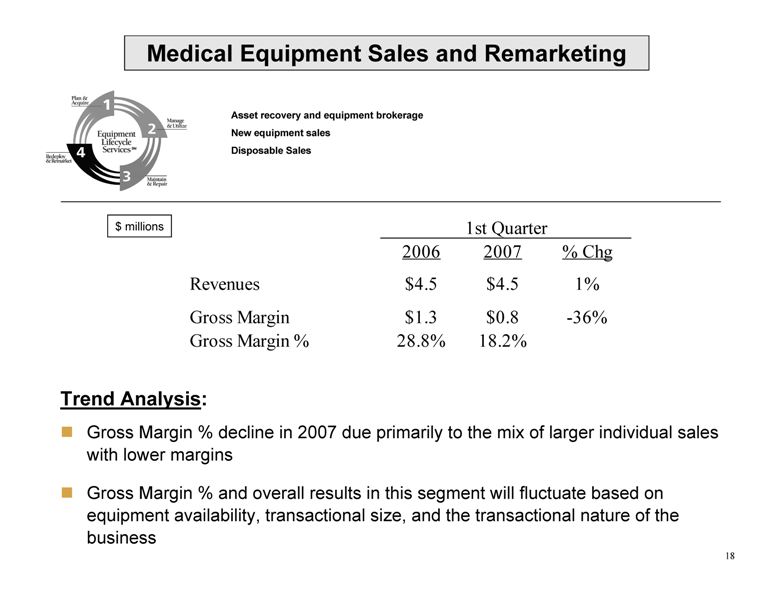
18 2006 2007 % Chg Revenues $4.5 $4.5 1% Gross Margin $1.3 $0.8 -36% Gross Margin % 28.8% 18.2% 1st Quarter $ millions Medical Equipment Sales and Remarketing Asset recovery and equipment brokerage New equipment sales Disposable Sales Trend Analysis: _ Gross Margin % decline in 2007 due primarily to the mix of larger individual sales with lower margins _ Gross Margin % and overall results in this segment will fluctuate based on equipment availability, transactional size, and the transactional nature of the business
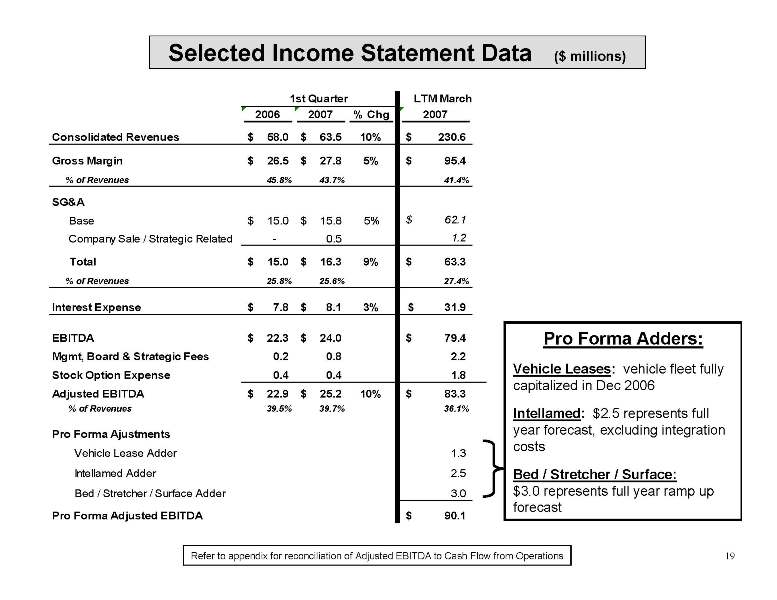
19 Selected Income Statement Data ($ millions) 2006 2007 % Chg 2007 Consolidated Revenues 58.0 $ 63.5 $ 10% 230.6 $ Gross Margin 26.5 $ 27.8 $ 5% 95.4 $ % of Revenues 45.8% 43.7% 41.4% SG&A Base 15.0 $ 15.8 $ 5% 62.1 $ Company Sale / Strategic Related - 0.5 1.2 Total 15.0 $ 16.3 $ 9% 63.3 $ % of Revenues 25.8% 25.6% 27.4% Interest Expense 7.8 $ 8.1 $ 3% 31.9 $ EBITDA 22.3 $ 24.0 $ 79.4 $ Mgmt, Board & Strategic Fees 0.2 0.8 2.2 Stock Option Expense 0.4 0.4 1.8 Adjusted EBITDA 22.9 $ 25.2 $ 10% 83.3 $ % of Revenues 39.5% 39.7% 36.1% Pro Forma Ajustments Vehicle Lease Adder 1.3 Intellamed Adder 2.5 Bed / Stretcher / Surface Adder 3.0 Pro Forma Adjusted EBITDA 90.1 $ 1st Quarter LTM March Pro Forma Adders: Vehicle Leases: vehicle fleet fully capitalized in Dec 2006 Intellamed: $2.5 represents full year forecast, excluding integration costs Bed / Stretcher / Surface: $3.0 represents full year ramp up forecast Refer to appendix for reconciliation of Adjusted EBITDA to Cash Flow from Operations
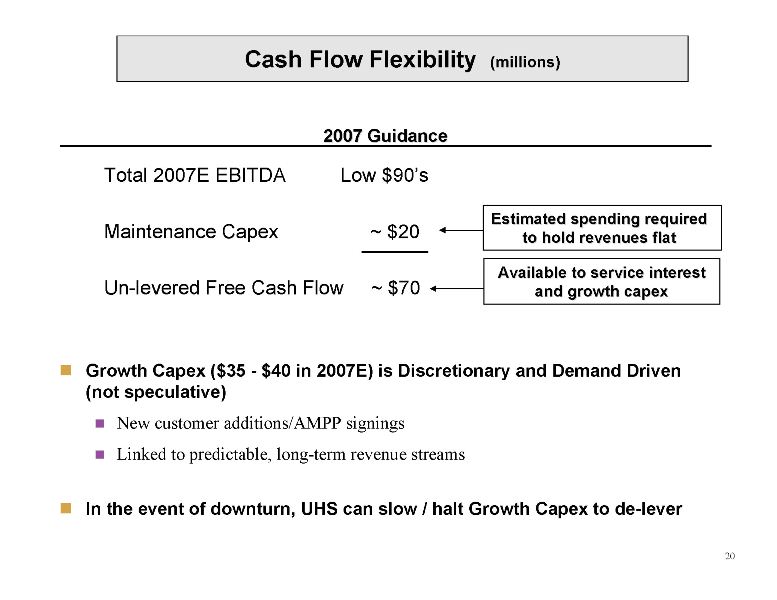
Operations 20 Cash Flow Flexibility (millions) Total 2007E EBITDA Low $90’s Maintenance Capex ~ $20 Un-levered Free Cash Flow ~ $70 2007 Guidance 2007 Guidance _ Growth Capex ($35 - $40 in 2007E) is Discretionary and Demand Driven (not speculative) _ New customer additions/AMPP signings _ Linked to predictable, long-term revenue streams _ In the event of downturn, UHS can slow / halt Growth Capex to de-lever Estimated spending required Estimated spending required to hold revenues flat to hold revenues flat Available to service interest Available to service interest and growth and growth capex capex
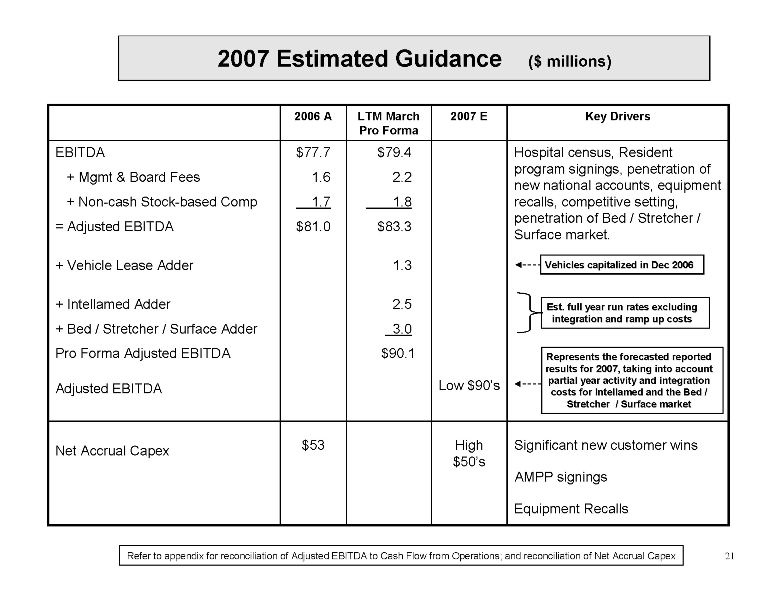
21 2007 Estimated Guidance ($ millions) $79.4 2.2 1.8 $83.3 1.3 2.5 3.0 $90.1 LTM March Pro Forma $53 $77.7 1.6 1.7 $81.0 2006 A Significant new customer wins AMPP signings Equipment Recalls High $50’s Net Accrual Capex Low $90’s 2007 E Hospital census, Resident program signings, penetration of new national accounts, equipment recalls, competitive setting, penetration of Bed / Stretcher / Surface market. EBITDA + Mgmt & Board Fees + Non-cash Stock-based Comp = Adjusted EBITDA + Vehicle Lease Adder + Intellamed Adder + Bed / Stretcher / Surface Adder Pro Forma Adjusted EBITDA Adjusted EBITDA Key Drivers Refer to appendix for reconciliation of Adjusted EBITDA to Cash Flow from Operations; and reconciliation of Net Accrual Capex Est. full year run rates excluding Est. full year run rates excluding integration and ramp up costs integration and ramp up costs Represents the forecasted reported Represents the forecasted reported results for 2007, taking into account results for 2007, taking into account partial year activity and integration partial year activity and integration costs for costs for Intellamed Intellamed and the Bed / and the Bed / Stretcher / Surface market Stretcher / Surface market Vehicles capitalized in Dec 2006 Vehicles capitalized in Dec 2006

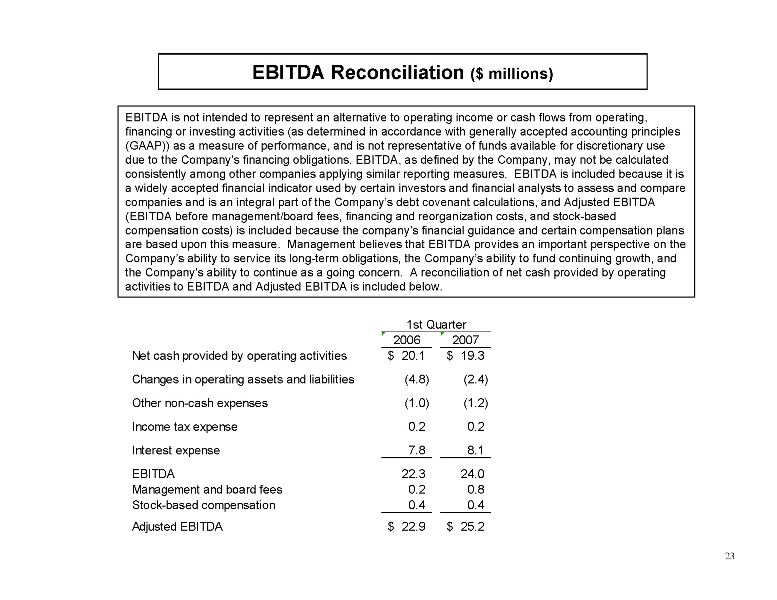
23 EBITDA Reconciliation ($ millions) EBITDA is not intended to represent an alternative to operating income or cash flows from operating, financing or investing activities (as determined in accordance with generally accepted accounting principles (GAAP)) as a measure of performance, and is not representative of funds available for discretionary use due to the Company’s financing obligations. EBITDA, as defined by the Company, may not be calculated consistently among other companies applying similar reporting measures. EBITDA is included because it is a widely accepted financial indicator used by certain investors and financial analysts to assess and compare companies and is an integral part of the Company’s debt covenant calculations, and Adjusted EBITDA (EBITDA before management/board fees, financing and reorganization costs, and stock-based compensation costs) is included because the company’s financial guidance and certain compensation plans are based upon this measure. Management believes that EBITDA provides an important perspective on the Company’s ability to service its long-term obligations, the Company’s ability to fund continuing growth, and the Company’s ability to continue as a going concern. A reconciliation of net cash provided by operating activities to EBITDA and Adjusted EBITDA is included below. 2006 2007 Net cash provided by operating activities 20.1 $ 19.3 $ Changes in operating assets and liabilities (4.8) (2.4) Other non-cash expenses (1.0) (1.2) Income tax expense 0.2 0.2 Interest expense 7.8 8.1 EBITDA 22.3 24.0 Management and board fees 0.2 0.8 Stock-based compensation 0.4 0.4 Adjusted EBITDA 22.9 $ 25.2 $ 1st Quarter
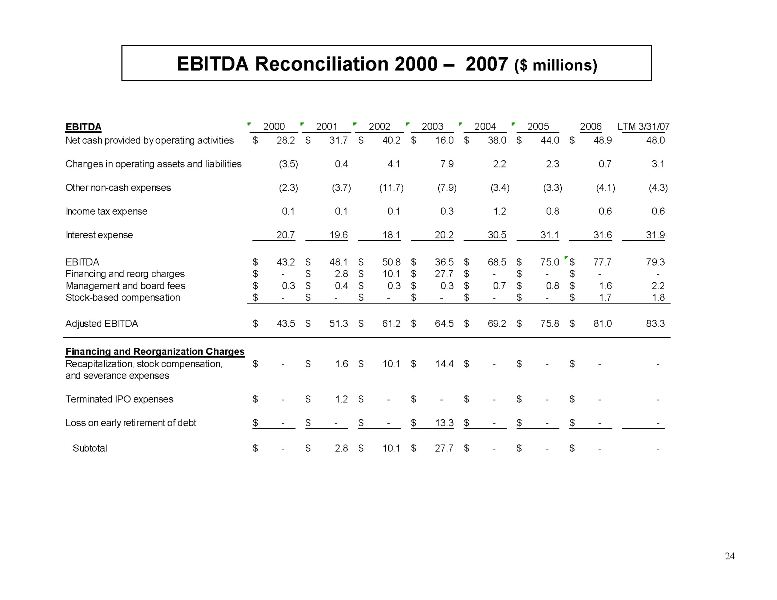
24 EBITDA Reconciliation 2000 – 2007 ($ millions) EBITDA 2000 2001 2002 2003 2004 2005 2006 LTM 3/31/07 Net cash provided by operating activities 28.2 $ 31.7 $ 40.2 $ 16.0 $ 38.0 $ 44.0 $ 48.9 $ 48.0 Changes in operating assets and liabilities (3.5) 0.4 4.1 7.9 2.2 2.3 0.7 3.1 Other non-cash expenses (2.3) (3.7) (11.7) (7.9) (3.4) (3.3) (4.1) (4.3) Income tax expense 0.1 0.1 0.1 0.3 1.2 0.8 0.6 0.6 Interest expense 20.7 19.6 18.1 20.2 30.5 31.1 31.6 31.9 EBITDA 43.2 $ 48.1 $ 50.8 $ 36.5 $ 68.5 $ 75.0 $ 77.7 $ 79.3 Financing and reorg charges - $ 2.8 $ 10.1 $ 27.7 $ - $ - $ - $ - Management and board fees 0.3 $ 0.4 $ 0.3 $ 0.3 $ 0.7 $ 0.8 $ 1.6 $ 2.2 Stock-based compensation - $ - $ - $ - $ - $ - $ 1.7 $ 1.8 Adjusted EBITDA 43.5 $ 51.3 $ 61.2 $ 64.5 $ 69.2 $ 75.8 $ 81.0 $ 83.3 Financing and Reorganization Charges Recapitalization, stock compensation, - $ 1.6 $ 10.1 $ 14.4 $ - $ - $ - $ - and severance expenses Terminated IPO expenses - $ 1.2 $ - $ - $ - $ - $ - $ - Loss on early retirement of debt - $ - $ - $ 13.3 $ - $ - $ - $ - Subtotal - $ 2.8 $ 10.1 $ 27.7 $ - $ - $ - $ -
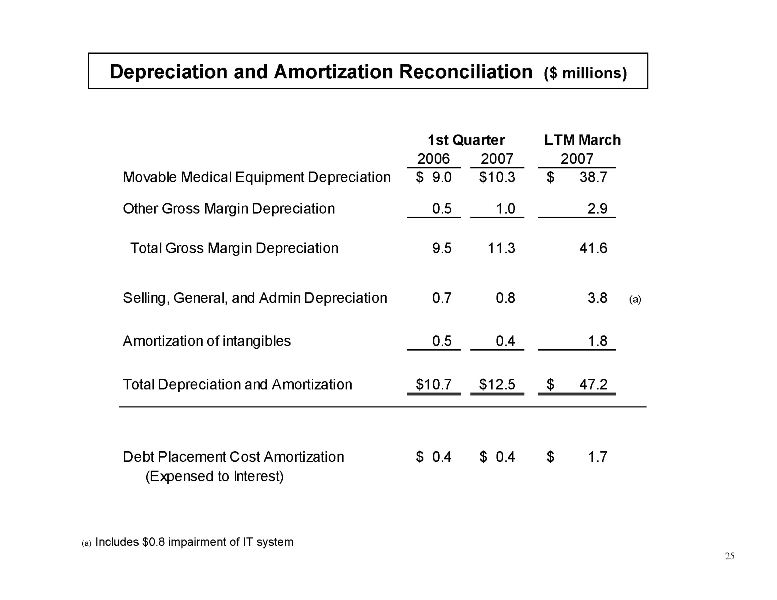
25 Depreciation and Amortization Reconciliation ($ millions) 2006 2007 2007 Movable Medical Equipment Depreciation 9.0 $ 10.3 $ 38.7 $ Other Gross Margin Depreciation 0.5 1.0 2.9 Total Gross Margin Depreciation 9.5 11.3 41.6 Selling, General, and Admin Depreciation 0.7 0.8 3.8 (a) Amortization of intangibles 0.5 0.4 1.8 Total Depreciation and Amortization 10.7 $ 12.5 $ 47.2 $ Debt Placement Cost Amortization 0.4 $ 0.4 $ 1.7 $ (Expensed to Interest) 1st Quarter LTM March (a) Includes $0.8 impairment of IT system
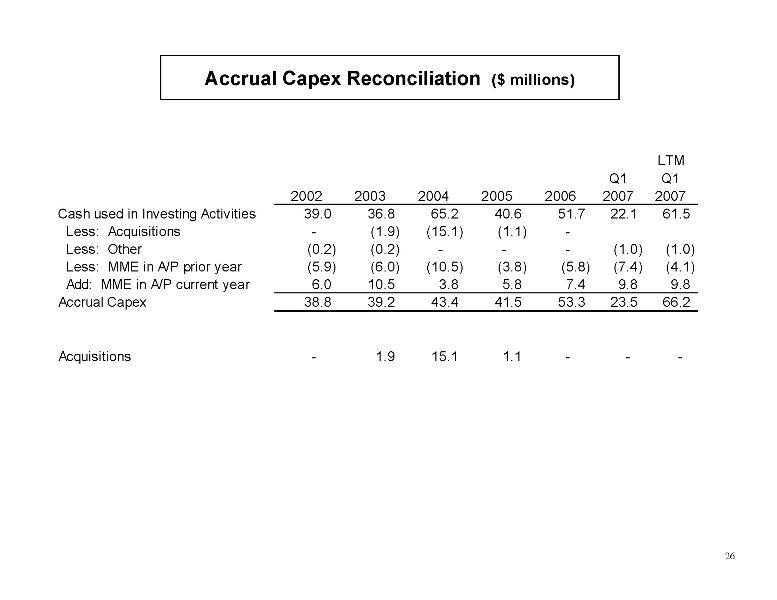
26 Accrual Capex Reconciliation ($ millions) 2002 2003 2004 2005 2006 Q1 2007 LTM Q1 2007 Cash used in Investing Activities 39.0 36.8 65.2 40.6 51.7 22.1 61.5 Less: Acquisitions - (1.9) (15.1) (1.1) - Less: Other (0.2) (0.2) - - - (1.0) (1.0) Less: MME in A/P prior year (5.9) (6.0) (10.5) (3.8) (5.8) (7.4) (4.1) Add: MME in A/P current year 6.0 10.5 3.8 5.8 7.4 9.8 9.8 Accrual Capex 38.8 39.2 43.4 41.5 53.3 23.5 66.2 Acquisitions - 1.9 15.1 1.1 - - -