UNITED STATES
SECURITIES AND EXCHANGE COMMISSION
Washington, D.C. 20549
FORM 10-Q
(Mark One)
| x | QUARTERLY REPORT PURSUANT TO SECTION 13 OR 15(d) OF THE SECURITIES EXCHANGE ACT OF 1934 |
For the quarterly period ended June 30, 2005
| ¨ | TRANSITION REPORT PURSUANT TO SECTION 13 OR 15(d) OF THE SECURITIES EXCHANGE ACT OF 1934 |
For the transition period from
Commission file number: 000-20086
UNIVERSAL HOSPITAL SERVICES, INC.
(Exact name of registrant as specified in its charter)
| | |
| Delaware | | 41-0760940 |
(State or other jurisdiction of incorporation or organization) | | (IRS Employer Identification No.) |
7700 France Avenue South, Suite 275
Edina, Minnesota 55435-5228
(Address of principal executive offices)
(Zip Code)
952-893-3200
(Registrant’s telephone number, including area code)
Not Applicable
(Former name, former address and former fiscal year, if changed since last report)
Indicate by check mark whether the registrant (1) has filed all reports required to be filed by Section 13 or 15(d) of the Securities Exchange Act of 1934 during the preceding 12 months (or for such shorter period that the registrant was required to file such reports), and (2) has been subject to such filing requirements for the past 90 days. Yes ¨ No x
Indicate by check mark whether the registrant is an accelerated filer (as defined in Rule 12b-2 of the Exchange Act). Yes ¨ No x
Number of shares of common stock outstanding as of August 12, 2005: 123,437,689.21
PART I - FINANCIAL INFORMATION
Item 1. Financial Statements - Unaudited
Universal Hospital Services, Inc.
Statements of Operations
(dollars in thousands)
(unaudited)
| | | | | | | | | | | | | | | |
| | | Three Months Ended
June 30,
| | | Six Months Ended June 30,
|
| | | 2005
| | | 2004
| | | 2005
| | | 2004
|
Medical equipment outsourcing | | $ | 41,718 | | | $ | 38,466 | | | $ | 84,899 | | | $ | 78,354 |
Technical and professional services | | | 7,362 | | | | 6,678 | | | | 14,855 | | | | 11,400 |
Medical equipment sales and remarketing | | | 4,318 | | | | 4,145 | | | | 8,915 | | | | 8,533 |
| | |
|
|
| |
|
|
| |
|
|
| |
|
|
Total revenues | | | 53,398 | | | | 49,289 | | | | 108,669 | | | | 98,287 |
| | | | |
Cost of medical equipment outsourcing | | | 13,235 | | | | 11,414 | | | | 26,472 | | | | 23,061 |
Cost of technical and professional services | | | 5,703 | | | | 4,672 | | | | 11,148 | | | | 7,887 |
Cost of medical equipment sales and remarketing | | | 3,478 | | | | 2,944 | | | | 7,114 | | | | 6,296 |
Movable medical equipment depreciation | | | 9,148 | | | | 9,013 | | | | 18,420 | | | | 17,650 |
| | |
|
|
| |
|
|
| |
|
|
| |
|
|
Total costs of medical equipment outsourcing, service and sales | | | 31,564 | | | | 28,043 | | | | 63,154 | | | | 54,894 |
| | |
|
|
| |
|
|
| |
|
|
| |
|
|
Gross margin | | | 21,834 | | | | 21,246 | | | | 45,515 | | | | 43,393 |
| | | | |
Selling, general and administrative | | | 15,368 | | | | 14,303 | | | | 30,214 | | | | 27,395 |
| | |
|
|
| |
|
|
| |
|
|
| |
|
|
Operating income | | | 6,466 | | | | 6,943 | | | | 15,301 | | | | 15,998 |
| | | | |
Interest expense | | | 7,774 | | | | 7,484 | | | | 15,421 | | | | 14,933 |
| | |
|
|
| |
|
|
| |
|
|
| |
|
|
Income before income taxes | | | (1,308 | ) | | | (541 | ) | | | (120 | ) | | | 1,065 |
| | | | |
Provision for income taxes | | | 214 | | | | 91 | | | | 421 | | | | 339 |
| | |
|
|
| |
|
|
| |
|
|
| |
|
|
Net (loss) income | | $ | (1,522 | ) | | $ | (632 | ) | | $ | (541 | ) | | $ | 726 |
The accompanying notes are an integral part of the unaudited financial statements.
2
Universal Hospital Services, Inc.
Balance Sheets
(dollars in thousands, except share and per share information)
(unaudited)
| | | | | | | | |
| | | June 30,
2005
| | | December 31,
2004
| |
Assets | | | | | | | | |
| | |
Current assets: | | | | | | | | |
Accounts receivable, less allowance for doubtful accounts of $1,500 at June 30, 2005 and December 31, 2004 | | $ | 41,071 | | | $ | 40,644 | |
Inventories | | | 5,473 | | | | 5,229 | |
Deferred income taxes | | | 2,623 | | | | 2,449 | |
Other current assets | | | 1,608 | | | | 3,458 | |
| | |
|
|
| |
|
|
|
Total current assets | | | 50,775 | | | | 51,780 | |
| | |
Property and equipment, net: | | | | | | | | |
Movable medical equipment, net | | | 125,436 | | | | 125,987 | |
Property and office equipment, net | | | 10,254 | | | | 10,042 | |
| | |
|
|
| |
|
|
|
Total property and equipment, net | | | 135,690 | | | | 136,029 | |
| | |
Intangible assets: | | | | | | | | |
Goodwill | | | 37,062 | | | | 37,062 | |
Other, primarily deferred financing costs, net | | | 10,416 | | | | 10,471 | |
Other intangibles, net | | | 10,175 | | | | 11,065 | |
| | |
|
|
| |
|
|
|
Total assets | | $ | 244,118 | | | $ | 246,407 | |
| | |
Liabilities and Shareholders’ Deficiency | | | | | | | | |
| | |
Current liabilities: | | | | | | | | |
Current portion of long-term debt | | $ | 175 | | | $ | 328 | |
Accounts payable | | | 14,883 | | | | 13,406 | |
Accrued compensation | | | 6,659 | | | | 9,276 | |
Accrued interest | | | 4,444 | | | | 4,615 | |
Other accrued expenses | | | 3,614 | | | | 2,594 | |
Book overdrafts | | | 119 | | | | 4,691 | |
| | |
|
|
| |
|
|
|
Total current liabilities | | | 29,894 | | | | 34,910 | |
| | |
Long-term debt, less current portion | | | 299,676 | | | | 296,974 | |
Deferred compensation and pension | | | 3,743 | | | | 3,644 | |
Deferred income taxes | | | 4,388 | | | | 3,937 | |
| | |
Commitments and contingencies | | | | | | | | |
| | |
Shareholders’ deficiency: | | | | | | | | |
Common stock, $0.01 par value; 500,000,000 shares authorized, 123,436,440.46 and 123,430,612.96 shares issued and outstanding at June 30, 2005 and December 31, 2004, respectively | | | 1,234 | | | | 1,234 | |
Additional paid in capital | | | 766 | | | | 760 | |
Accumulated deficit | | | (92,550 | ) | | | (92,010 | ) |
Deferred compensation | | | (53 | ) | | | (62 | ) |
Accumulated other comprehensive loss | | | (2,980 | ) | | | (2,980 | ) |
| | |
|
|
| |
|
|
|
Total shareholders’ deficiency | | | (93,583 | ) | | | (93,058 | ) |
| | |
|
|
| |
|
|
|
Total liabilities and shareholders’ deficiency | | $ | 244,118 | | | $ | 246,407 | |
The accompanying notes are an integral part of the unaudited financial statements.
3
Universal Hospital Services, Inc.
Statements of Cash Flows
(dollars in thousands)
(unaudited)
| | | | | | | | |
| | | Six Months Ended June 30,
| |
| | | 2005
| | | 2004
| |
Cash flows from operating activities: | | | | | | | | |
Net (loss) income | | $ | (541 | ) | | $ | 726 | |
Adjustments to reconcile net (loss) income to net cash provided by operating activities: | | | | | | | | |
Depreciation | | | 20,286 | | | | 19,062 | |
Amortization of intangibles and deferred financing costs | | | 1,758 | | | | 131 | |
Provision for doubtful accounts | | | 533 | | | | 618 | |
Provision for inventory obsolescence | | | 60 | | | | 110 | |
Non-cash stock-based compensation expense | | | 9 | | | | — | |
Gain on sales and disposal of equipment | | | (601 | ) | | | (272 | ) |
Deferred income taxes | | | 277 | | | | — | |
Changes in operating assets and liabilities, net of impact of acquisitions: | | | | | | | | |
Accounts receivable | | | (917 | ) | | | (5,105 | ) |
Inventories and other operating assets | | | 1,546 | | | | (1,512 | ) |
Accounts payable and accrued expenses | | | (1,625 | ) | | | 4,775 | |
| | |
|
|
| |
|
|
|
Net cash provided by operating activities | | | 20,785 | | | | 18,533 | |
| | |
|
|
| |
|
|
|
Cash flows from investing activities: | | | | | | | | |
Movable medical equipment purchases | | | (17,148 | ) | | | (27,130 | ) |
Property and office equipment purchases | | | (2,092 | ) | | | (2,405 | ) |
Proceeds from disposition of movable medical equipment | | | 1,328 | | | | 1,714 | |
Acquisitions | | | — | | | | (11,391 | ) |
Other | | | — | | | | (908 | ) |
| | |
|
|
| |
|
|
|
Net cash used in investing activities | | | (17,912 | ) | | | (40,120 | ) |
| | |
|
|
| |
|
|
|
Cash flows from financing activities: | | | | | | | | |
Proceeds under revolving credit facility agreements | | | 52,455 | | | | 61,589 | |
Payments under revolving credit facility agreements | | | (49,906 | ) | | | (37,161 | ) |
Payment of deferred financing cost | | | (856 | ) | | | — | |
Proceeds from issuance of common stock, net of issuance costs | | | 6 | | | | 700 | |
Other | | | — | | | | (43 | ) |
Change in book overdrafts | | | (4,572 | ) | | | (3,498 | ) |
| | |
|
|
| |
|
|
|
Net cash (used in) provided by financing activities | | | (2,873 | ) | | | 21,587 | |
| | |
|
|
| |
|
|
|
Net change in cash and cash equivalents | | $ | — | | | $ | — | |
| | |
Cash and cash equivalents at the beginning of period | | $ | — | | | $ | — | |
Cash and cash equivalents at the end of period | | $ | — | | | $ | — | |
| | |
Supplemental cash flow information: | | | | | | | | |
Interest paid | | $ | 14,727 | | | $ | 15,142 | |
| | |
|
|
| |
|
|
|
Movable medical equipment purchases included in accounts payable | | | 5,241 | | | | 3,231 | |
| | |
|
|
| |
|
|
|
Income taxes paid | | $ | 231 | | | $ | 29 | |
| | |
|
|
| |
|
|
|
The accompanying notes are an integral part of the unaudited financial statements.
4
Universal Hospital Services, Inc.
NOTES TO UNAUDITED QUARTERLY FINANCIAL STATEMENTS
1. Basis of Presentation
The interim financial statements included in this Form 10-Q have been prepared by the Company without audit, pursuant to the rules and regulations of the Securities and Exchange Commission. Certain information and footnote disclosures normally included in financial statements prepared in accordance with accounting principles generally accepted in the United States of America have been condensed, or omitted, pursuant to such rules and regulations. These condensed financial statements should be read in conjunction with the financial statements and related notes included in the Company’s 2004 Annual Report on Form 10-K filed with the Securities and Exchange Commission.
The interim financial statements presented herein as of June 30, 2005, and for the three and six months ended June 30, 2005, and 2004, reflect, in the opinion of management, all adjustments necessary for a fair presentation of financial position and the results of operations and cash flows for the periods presented. These adjustments are all of a normal, recurring nature. The results of operations for any interim period are not necessarily indicative of results for the full year.
The December 31, 2004, balance sheet amounts were derived from audited financial statements, but do not include all disclosures required by accounting principles generally accepted in the United States of America.
2. Recent Accounting Pronouncements
In December 2004, the Financial Accounting Standards Board (“FASB”) issued Statement of Financial Accounting Standards (“SFAS”) No. 153, “Exchanges of Nonmonetary Assets – An Amendment of APB Opinion No. 29.” This statement amends APB Opinion No. 29 and is based on the principle that exchanges of nonmonetary assets should be measured based on the fair value of the assets exchanged. SFAS No. 153 is effective for nonmonetary exchanges occurring in fiscal periods beginning after June 15, 2005. The adoption of this statement, effective July 1, 2005, will not have a material effect on the Company’s financial condition or results of operations.
On December 16, 2004, the FASB issued SFAS No. 123(R), “Share-Based Payment”, which is a revision of SFAS No.123 and supersedes APB Opinion No. 25. SFAS No. 123(R) requires all share-based payments to employees, including grants of employee stock options, to be valued at fair value on the date of grant, and to be expensed over the applicable vesting period. Pro forma disclosure of the income statement effects of share-based payments is no longer an alternative. SFAS No. 123(R) is effective for private entities (as defined) on or after January 1, 2006. In addition, companies must also recognize compensation expense related to any awards that are not fully vested as of the effective date. Compensation expense for the unvested awards will be measured based on the fair value of the awards previously calculated in developing the pro forma disclosures in accordance with the provisions of SFAS No. 123. The Company is currently assessing the impact of adopting SFAS No. 123(R) to its results of operations.
In May 2005, the FASB issued SFAS No. 154, “Accounting Changes and Error Corrections.” This new statement replaces APB Opinion No. 20, “Accounting Changes” and FASB Statement No. 3, “Reporting Accounting Changes in Interim Financial Statements.” Among other changes, Statement 154 requires that a voluntary change in accounting principle be applied retrospectively with all prior period financial statements presented on the new accounting principle, unless it is impracticable to do so. The new standard is effective for accounting changes and correction of errors made in fiscal years beginning after December 15, 2005. We believe the adoption of FASB No. 154 will not have an impact on our consolidated financial position or results of operations.
5
3. Stock Based Compensation
We measure compensation expense for our stock-based compensation plan using the intrinsic value method. Accordingly, compensation cost for stock options granted to employees is measured as the excess, if any, of the value of our stock at the date of the grant over the amount an employee must pay to acquire the stock. Had compensation cost for our stock option plans been determined based on the fair value at the grant date for awards, our net income would have changed to the pro forma amounts indicated below (dollars in thousands):
| | | | | | | | |
| | | Six Months Ended
June 30,
| |
| | | 2005
| | | 2004
| |
Net (loss) income, as reported | | $ | (541 | ) | | $ | 726 | |
Add: Stock-based employee compensation included In reported net (loss) income | | | 9 | | | | — | |
Less: Total stock-based employee compensation expense under fair value-based method | | | (245 | ) | | | (305 | ) |
| | |
|
|
| |
|
|
|
Pro forma net (loss) income | | $ | (777 | ) | | $ | 421 | |
4. Long-Term Debt
Long-term debt consists of the following (dollars in thousands):
| | | | | | | | |
| | | June 30,
2005
| | | December 31,
2004
| |
10.125% senior notes | | $ | 260,000 | | | $ | 260,000 | |
Revolving credit facility | | | 39,676 | | | | 36,974 | |
Capital lease obligations | | | 175 | | | | 328 | |
| | |
|
|
| |
|
|
|
| | | | 299,851 | | | | 297,302 | |
| | |
Less: Current portion of long-term debt | | | (175 | ) | | | (328 | ) |
| | |
|
|
| |
|
|
|
Total long-term debt | | $ | 299,676 | | | $ | 296,974 | |
The 10.125% Senior Notes (“Senior Notes”) mature on November 1, 2011. Interest on the Senior Notes accrues at the rate of 10.125% per annum and is payable semiannually on each May 1 and November 1. The Senior Notes are redeemable, at the Company’s option, in whole or in part, on or after November 1, 2007, at specified redemption prices plus accrued interest to the date of redemption. At any time upon an equity offering, as defined in the Indenture, the Company can redeem up to 35% of the Senior Notes, at a purchase price equal to 110.125% of the principal amount plus accrued interest to the dates of purchase. In addition, the Senior Notes have a change of control provision which gives each holder the right to require the Company to purchase all or a portion of such holders’ Senior Notes upon a change in control, as defined in the agreement, at a purchase price equal to 101% of the principal amount plus accrued interest to the date of purchase. The Senior Notes have covenants that restrict the incurrence of additional debt, the payment of dividends and the issuance of preferred stock. The Senior Notes are uncollateralized.
6
On May 26, 2005, the Company entered into an Amended and Restated Credit Agreement (“Amended Credit Agreement”) with a bank group led by General Electric Capital Corporation. The Amended Credit Agreement increases the aggregate amount the Company may obtain under revolving loans, reduces the applicable borrowing spreads, extends the maturity date, and modifies the financial covenants to provide more operating flexibility.
Under the terms of the Amended Credit Agreement, the aggregate amount the Company may obtain under its revolving loans increased from $100 million to $125 million. Availability under the Amended Credit Agreement as of June 30, 2005, was approximately $68 million, representing our borrowing base of approximately $110 million less borrowings of $40 million and outstanding letters of credit of $2 million at that date. Borrowings under the agreement are collateralized by substantially all the assets of the Company.
Amounts borrowed under the Amended Credit Agreement generally bear interest on a LIBOR-based formula. The interest rate currently is 2.25 percentage points over LIBOR with the interest rate margin subject to change based upon quarterly leverage ratios. Amounts previously outstanding under the prior credit agreement generally bore interest at a rate of 3.00 percentage points over LIBOR. The terms of the Amended Credit Agreement also extend the maturity from October 2008 to May 2010. Amounts borrowed under the Amended Credit Agreement are due at the end of the five year term.
The Amended Credit Agreement contains certain covenants including restrictions and limitations on dividends, liens, leases, incurrence or guarantees of debt, transactions with affiliates, investments or loans, and mergers, acquisitions, consolidations and asset sales. Furthermore, the Company is required to maintain compliance with certain financial covenants, including a maximum senior debt leverage ratio and a minimum interest coverage ratio. As of June 30, 2005, the Company was in compliance with all covenants under the Amended Credit Agreement.
5. Acquisitions
On March 24, 2004, we completed the acquisition of Affiliated Clinical Engineering Services, Inc. (“ACES”), headquartered in Boston, Massachusetts. The purchase price was approximately $4.2 million. We financed this purchase from borrowings under our revolving credit facility.
On April 15, 2004, we completed the acquisition of certain assets from Galaxy Medical Products, Inc., headquartered in Akron, Ohio. The purchase price was approximately $4.9 million. We financed this purchase from borrowings under our revolving credit facility.
On May 4, 2004, we completed the acquisition of substantially all of the assets of Advanced Therapeutics of Wisconsin, Inc., headquartered in Milwaukee, Wisconsin. The purchase price was approximately $5.1 million. We financed this purchase from borrowings under our revolving credit facility.
7
On August 31, 2004, we completed the acquisition of certain assets of Cardinal Health 200, Inc., headquartered in Naperville, Illinois. The purchase price was approximately $0.9 million. We financed this purchase from borrowings under our revolving credit facility.
The operations of the above acquired companies have been included in the Company’s results of operations since the date of the respective acquisitions.
The following summarizes pro forma results of operations, assuming the acquisitions noted above occurred at January 1, 2004. (dollars in thousands)
| | | | | | | | | | | |
| | | Three Months Ended
June 30,
| | | Six Months Ended
June 30,
|
| | | 2005
| | | 2004
| | | 2005
| | | 2004
|
Total revenues | | 53,398 | | | 50,030 | | | 108,669 | | | 102,156 |
Net (loss) income | | (1,522 | ) | | (566 | ) | | (541 | ) | | 1,201 |
6. Segment Information
Our operating segments consist of Medical Equipment Outsourcing, Technical and Professional Services, and Medical Equipment Sales & Remarketing. Certain operating information on our segments is as follows:
| | | | | | | | | | | | | | | | | | | | | | | | |
| | | Three months ended June 30,
|
| | | (dollars in thousands)
|
| | | Medical Equipment Outsourcing
| | Technical and Professional Services
| | Medical Equipment Sales & Remarketing
| | Total
|
| | | 2005
| | 2004
| | 2005
| | 2004
| | 2005
| | 2004
| | 2005
| | 2004
|
Revenues | | $ | 41,718 | | $ | 38,466 | | $ | 7,362 | | $ | 6,678 | | $ | 4,318 | | $ | 4,145 | | | 53,398 | | $ | 49,289 |
Cost of Revenue | | | 13,235 | | | 11,414 | | | 5,703 | | | 4,672 | | | 3,478 | | | 2,944 | | | 22,416 | | | 19,030 |
Movable Medical Equipment Depreciation | | | 9,148 | | | 9,013 | | | — | | | — | | | — | | | — | | | 9,148 | | | 9,013 |
| | |
|
| |
|
| |
|
| |
|
| |
|
| |
|
| |
|
| |
|
|
Gross Margin | | $ | 19,335 | | $ | 18,039 | | $ | 1,659 | | $ | 2,006 | | $ | 840 | | $ | 1,201 | | $ | 21,834 | | $ | 21,246 |
| |
| | | Six months ended June 30,
|
| | | (dollars in thousands)
|
| | | Medical Equipment Outsourcing
| | Technical and Professional Services
| | Medical Equipment Sales & Remarketing
| | Total
|
| | | 2005
| | 2004
| | 2005
| | 2004
| | 2005
| | 2004
| | 2005
| | 2004
|
Revenues | | $ | 84,899 | | $ | 78,354 | | $ | 14,855 | | $ | 11,400 | | $ | 8,915 | | $ | 8,533 | | $ | 108,669 | | $ | 98,287 |
Cost of Revenue | | | 26,472 | | | 23,061 | | | 11,148 | | | 7,887 | | | 7,114 | | | 6,296 | | | 44,734 | | | 37,244 |
Movable Medical Equipment Depreciation | | | 18,420 | | | 17,650 | | | — | | | — | | | — | | | — | | | 18,420 | | | 17,650 |
| | |
|
| |
|
| |
|
| |
|
| |
|
| |
|
| |
|
| |
|
|
Gross Margin | | $ | 40,007 | | $ | 37,643 | | $ | 3,707 | | $ | 3,513 | | $ | 1,801 | | $ | 2,237 | | $ | 45,515 | | $ | 43,393 |
8
7. Pension Plan
The components of net periodic pension costs are as follows:
| | | | | | | | | | | | | | | | |
| | | Three months ended June 30,
| | | Six months ended June 30,
| |
(dollars in thousands) | | 2005
| | | 2004
| | | 2005
| | | 2004
| |
Service cost | | $ | — | | | $ | — | | | $ | — | | | $ | — | |
Interest cost | | | 238 | | | | 219 | | | | 475 | | | | 438 | |
Expected return on plan assets | | | (247 | ) | | | (240 | ) | | | (493 | ) | | | (471 | ) |
Recognized net actuarial loss | | | 58 | | | | 14 | | | | 117 | | | | 28 | |
Amortization of prior service cost | | | — | | | | — | | | | — | | | | — | |
| | |
|
|
| |
|
|
| |
|
|
| |
|
|
|
Total cost | | $ | 49 | | | $ | (7 | ) | | $ | 99 | | | $ | (5 | ) |
Future benefit accruals for all participants were frozen as of December 31, 2002.
Item 2. Management’s Discussion and Analysis of Financial Condition and Results of Operations
The following should be read in conjunction with the accompanying financial statements and notes.
9
BUSINESS OVERVIEW
Our Company
Universal Hospital Services, Inc. (“we”, “our”, “UHS” or “the Company”) is a leading, nationwide provider of medical equipment outsourcing and services to the health care industry. Our customers include national, regional and local acute care hospitals, alternate site providers (such as nursing homes and home care providers) and medical equipment manufacturers. Our diverse customer base includes more than 3,200 acute care hospitals and approximately 3,150 alternate site providers. We also have extensive and long-standing relationships with over 200 major medical equipment manufacturers and many of the nation’s largest group purchasing organizations (GPOs) and integrated delivery networks (IDNs). All of our services leverage our nationwide network of offices our more than 65 years of experience managing and servicing all aspects of movable medical equipment. These services are paid for by our customers and not directly through reimbursement from governmental or other third-party payors.
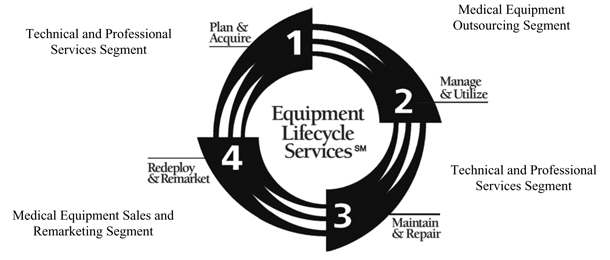
Our operating segments consist of Medical Equipment Outsourcing, Technical and Professional Services, and Medical Equipment Sales and Remarketing. We evaluate the performance of our operating segments based on gross margin. The accounting policies of the individual operating segments are the same as those of the entire company.
Medical Equipment Outsourcing Segment- Manage & Utilize
Our flagship business is our Medical Equipment Outsourcing Segment which accounted for $41.7 million, or approximately 78.1% of our revenues for second quarter of 2005, and $84.9 million, or approximately 78.1% of our revenues for the first half of 2005. We own approximately 156,000 pieces of movable medical equipment, primarily in the categories of respiratory therapy, newborn care, critical care, patient monitors, and bariatric and pressure area management. In our outsourcing programs we provide our customers with the use of movable medical equipment, and we maintain the equipment for our customers by performing preventative maintenance, repairs, cleaning and testing, and maintaining certain reporting records. We also provide prompt replacement of any defective equipment and the
10
flexibility to upgrade their equipment as technology changes. We have three primary outsourcing programs: Supplemental (Peak Needs) Outsourcing; Long Term Outsourcing; and the Asset Management Partnership Program (“AMPP”).
We have contracts in place with many of the leading national Group Purchasing Organizations (“GPOs”) for both the acute care and alternate site markets. We also have agreements with national alternate site providers. We expect much of our future growth in this segment to be driven by our customers outsourcing more of their movable medical equipment needs and taking full advantage of our Long Term Outsourcing and resident-based AMPP programs.
Technical and Professional Services Segment – Plan & Acquire; Maintain & Repair
The Technical and Professional Services segment accounted for $7.4 million, or approximately 13.8%, of our revenues for the second quarter of 2005, and $14.9 million, or approximately 13.7%, of our revenues for the first half of 2005. We leverage our 65 plus years of experience and our extensive equipment database in repairing and maintaining medical equipment. We offer a broad range of inspection, preventative maintenance, repair, logistic and consulting services through our team of over 250 technicians and professionals located in our nationwide network of district offices and service centers. Our technical and professional service offerings are less capital intensive than our Medical Equipment Outsourcing segment, and provide a complementary alternative for customers that wish to own their medical equipment, but lack the expertise, funding or scale to perform maintenance, repair and analytical functions.
While our contracts with GPOs once were solely to provide medical equipment outsourcing services, we have expanded some of our agreements with these organizations to include Technical and Professional Services. We believe this trend will continue as GPOs look to provide their members with services covering the entire medical equipment lifecycle.
Medical Equipment Sales and Remarketing Segment- Redeploy & Remarket
The Medical Equipment Sales and Remarketing segment accounted for $4.3 million, or approximately 8.1%, of our revenues for the second quarter of 2005, and $8.9 million, or approximately 8.2%, of our revenues for the first half of 2005. This segment includes three business activities:
Medical Equipment Remarketing and Disposal. We are one of the nation’s largest buyers and sellers of movable medical equipment, primarily for our own account. Our remarketing and asset disposal programs represent some of our best opportunities for growth in this segment, given our expertise, knowledge, and relationships in this area.
Specialty Medical Equipment Sales and Distribution. We use our national infrastructure to provide sales and distribution to manufacturers of specialty medical equipment. We currently sell product lines in the following areas: patient monitors, rehabilitation products, patient transfer systems, infant security systems and respiratory therapy.
Disposables Sales.We offer our customers single use disposable items. Most of these items are used in connection with our outsourced equipment. We have begun an initiative to limit the number of items we carry, and to more closely tie the items we do carry to our high volume moveable medical equipment provided in our Medical Equipment Outsourcing segment.
11
RESULTS OF OPERATIONS
The following discussion addresses our financial condition as of June 30, 2005, and the results of operations for the three and six months ended June 30, 2005, and 2004, and cash flows for the six months ended June 30, 2005, and 2004. This discussion should be read in conjunction with the financial statements included elsewhere in this report and Management’s Discussion and Analysis and Financial sections included in our 2004 Annual Report on Form 10-K filed with the Securities Exchange Commission.
The following table provides a summary of selected financial data as a percentage of total revenues and also indicates the percentage increase or decrease of this information over the prior comparable period:
| | | | | | | | | | | | | | | | | | |
| | | Percent of Total Revenues
| | | Percent Increase (Decrease)
| |
| | | Three Months Ended
June 30,
| | | Six Months Ended,
June 30,
| | | Qtr 2 2005
Over Qtr 2 2004
| | | Six Months
2005 Over
Six Months 2004
| |
| | | 2005
| | | 2004
| | | 2005
| | | 2004
| | | |
Medical equipment outsourcing | | 78.1 | % | | 78.0 | % | | 78.1 | % | | 79.7 | % | | 8.5 | % | | 8.4 | % |
Technical and professional services | | 13.8 | | | 13.5 | | | 13.7 | | | 11.6 | | | 10.3 | | | 30.3 | |
Medical equipment sales and remarketing | | 8.1 | | | 8.5 | | | 8.2 | | | 8.7 | | | 4.2 | | | 4.5 | |
| | |
|
| |
|
| |
|
| |
|
| |
|
| |
|
|
Total revenues | | 100.0 | | | 100.0 | | | 100.0 | | | 100.0 | | | 8.3 | | | 10.6 | |
| | | | | | |
Cost of Sales | | | | | | | | | | | | | | | | | | |
Cost of medical equipment outsourcing | | 24.8 | | | 23.1 | | | 24.4 | | | 23.5 | | | 15.9 | | | 14.8 | |
Cost of technical and professional services | | 10.7 | | | 9.5 | | | 10.2 | | | 8.0 | | | 22.1 | | | 41.3 | |
Cost of medical equipment sales and remarketing | | 6.5 | | | 6.0 | | | 6.5 | | | 6.4 | | | 18.1 | | | 13.0 | |
Movable medical equipment depreciation | | 17.1 | | | 18.3 | | | 17.0 | | | 18.0 | | | 1.5 | | | 4.4 | |
| | |
|
| |
|
| |
|
| |
|
| |
|
| |
|
|
Total costs of outsourcing, service and sales | | 59.1 | | | 56.9 | | | 58.1 | | | 55.9 | | | 12.5 | | | 15.0 | |
| | |
|
| |
|
| |
|
| |
|
| |
|
| |
|
|
Gross margin | | 40.9 | | | 43.1 | | | 41.9 | | | 44.1 | | | 2.8 | | | 4.9 | |
Selling, general and administrative | | 28.8 | | | 29.0 | | | 27.8 | | | 27.9 | | | 7.5 | | | 10.3 | |
| | |
|
| |
|
| |
|
| |
|
| |
|
| |
|
|
Operating income | | 12.1 | | | 14.1 | | | 14.1 | | | 16.3 | | | (6.9 | ) | | (4.4 | ) |
Interest expense | | 14.6 | | | 15.2 | | | 14.2 | | | 15.2 | | | 3.9 | | | 3.3 | |
| | |
|
| |
|
| |
|
| |
|
| |
|
| |
|
|
Income before income taxes | | (2.4 | ) | | (1.1 | ) | | (0.1 | ) | | 1.1 | | | — | | | — | |
Provision for income taxes | | 0.4 | | | 0.2 | | | 0.4 | | | 0.4 | | | 135.2 | | | 24.1 | |
| | |
|
| |
|
| |
|
| |
|
| |
|
| |
|
|
Net (loss) income | | (2.9 | )% | | (1.3 | )% | | (0.5 | )% | | 0.7 | % | | — | % | | — | % |
12
Comparison of Second Quarter 2005 to Second Quarter 2004
Medical Equipment Outsourcing - Manage & Utilize
| | | | | | | | | | | | | | |
(dollars in millions) | | Three Months Ended June 30,
| | | | | | |
| | 2005
| | | 2004
| | | Change
| | Percent Change
| |
Total Revenue | | $ | 41.7 | | | $ | 38.5 | | | $ | 3.2 | | 8.5 | % |
Cost of Revenue | | | 13.3 | | | | 11.5 | | | | 1.8 | | 15.9 | |
Moveable Medical Equip Depn | | | 9.1 | | | | 9.0 | | | | 0.1 | | 1.5 | |
| | |
|
|
| |
|
|
| |
|
| |
|
|
Gross Margin | | $ | 19.3 | | | $ | 18.0 | | | $ | 1.3 | | 7.2 | % |
| | | | |
Gross Margin % | | | 46.4 | % | | | 46.9 | % | | | | | | |
Total revenue in the Medical Equipment Outsourcing segment rose $3.2 million, or 8.5% to $41.7 million in the second quarter of 2005. This increase was driven by competitive take-aways, re-entry into the bariatrics market (patient handling equipment for obese patients) late in the second quarter of 2004, growth in our acute care customer base increased activity in our AMPP customers, and new technology in our fleet attracting incremental business.
Total cost of revenue in the segment rose $1.8 million, or 15.9% to $13.3 million in the second quarter of 2005. This increase is primarily attributable to higher employee-related costs of $1.0 million, repair of $0.3 million, facilities and occupancy of $0.2 million, and freight of $0.1 million.
Moveable medical equipment depreciation increased $0.1 million, or 1.5% to $9.1 million in the second quarter of 2005. This increase primarily reflects net equipment additions of $1.8 million for the twelve month period from July 1, 2004 through June 30, 2005. Net equipment additions reflect acquisitions and equipment purchases, less depreciation expense and equipment disposals.
Gross Margin percentage for the medical equipment outsourcing segment decreased from 46.9% in the second quarter of 2004 to 46.4% in the second quarter of 2005. This decrease is primarily attributable to higher employee-related costs.
Technical and Professional Services - Plan & Acquire/Maintain & Repair
| | | | | | | | | | | | | | | |
(dollars in millions) | | Three Months Ended June 30,
| | | | | | | |
| | 2005
| | | 2004
| | | Change
| | | Percent Change
| |
Total Revenue | | $ | 7.4 | | | $ | 6.7 | | | $ | 0.7 | | | 10.3 | % |
Cost of Revenue | | | 5.7 | | | | 4.7 | | | | 1.0 | | | 22.1 | |
| | |
|
|
| |
|
|
| |
|
|
| |
|
|
Gross Margin | | $ | 1.7 | | | $ | 2.0 | | | $ | (0.3 | ) | | (17.3 | )% |
| | | | |
Gross Margin % | | | 22.5 | % | | | 30.0 | % | | | | | | | |
Total revenue in the Technical and Professional Services segment rose $0.7 million, or 10.3% to $7.4 million in the second quarter of 2005. This increase was caused by growth in our resident-based programs and manufacturer services as well as the acquisition of certain assets of Cardinal Health, 200, Inc. in 2004, offsetting the loss of revenue from a financially-distressed customer.
13
Total cost of revenue in the segment rose $1.0 million, or 22.1% to $5.7 million in the second quarter of 2005. This increase is primarily attributable to employee-related costs of $0.8 million and repair of $0.4 million, partially offset by lower travel and fleet expenses of $0.2 million.
Gross Margin percentage for the technical and professional services segment decreased from 30.0% in the second quarter of 2004 to 22.5% in the second quarter of 2005. This decrease is primarily due to the loss of revenue from a financially-distressed customer as well as increased staffing costs related to the building of our equipment lifecycle services platform.
Medical Equipment Sales and Remarketing - Redeploy & Remarket
| | | | | | | | | | | | | | | |
(dollars in millions) | | Three Months Ended June 30,
| | | | | | | |
| | 2005
| | | 2004
| | | Change
| | | Percent Change
| |
Total Revenue | | $ | 4.3 | | | $ | 4.1 | | | $ | 0.2 | | | 4.2 | % |
Cost of Revenue | | | 3.5 | | | | 2.9 | | | | 0.6 | | | 18.1 | |
| | |
|
|
| |
|
|
| |
|
|
| |
|
|
Gross Margin | | $ | 0.8 | | | $ | 1.2 | | | $ | (0.4 | ) | | (30.1 | )% |
| | | | |
Gross Margin % | | | 19.5 | % | | | 29.0 | % | | | | | | | |
Total revenue in the Medical Equipment Sales and Remarketing segment rose $0.2 million, or 4.2% to $4.3 million in the second quarter of 2005. This increase was caused by higher equipment sales of $0.6 million, partially offset by reduced sales of disposable items of $0.4 million.
Total cost of revenue in the segment rose $0.6 million, or 18.1% to $3.5 million in the second quarter of 2005. This increase is primarily attributable to higher costs of new equipment sales of $0.5 million and used equipment of $0.3 million, partially offset by reduced costs of disposable goods sold of $0.4 million.
Gross Margin percentage for the medical equipment sales and remarketing segment decreased from 29.0% in the second quarter of 2004 to 19.5% in the second quarter of 2005. During much of the quarter, we moved equipment held for sale into our rental fleet to meet high customer demand which limited company-owned fleet sales opportunities.
Selling, General and Administrative Expenses
Selling, general and administrative expenses rose $1.1 million, or 7.5% to $15.4 million in the second quarter of 2005. The increase was primarily due to higher employee-related costs of $0.6 million, additional amortization of intangible assets of $0.4 million, and $0.2 million of expenses related to preparation for the requirements of Section 404 of the Sarbanes-Oxley Act of 2002. Selling, general and administrative expenses as a percentage of total revenue for the second quarter of 2005, decreased slightly to 28.8% from 29.0% for the same period of 2004.
During the remaining part of 2005, we anticipate that we will incur additional expenses related to preparation for the requirements under Section 404 of the Sarbanes-Oxley Act of 2002. We also expect to continue to spend to build appropriate infrastructure to complete our transition to a lifecycle services company.
14
Interest Expense
Interest expense rose $0.3 million, or 3.9% to $7.8 million in the second quarter of 2005. The increase in interest expense reflects increased borrowing as well as higher interest rates. Average total borrowings increased for the second quarter of 2005 to $299.8 million from $291.8 million for the same period of 2004 primarily due to the timing of acquisitions made in 2004.
Income Taxes
Tax expense for the three months ended June 30, 2005, was $0.2 million representing an increase from income tax expense of $0.1 million for the same period of 2004. Income tax expense relates primarily to valuation allowances established for net operating losses not recognized as well as minimum state taxes.
Net Loss
Net loss rose $0.9 million, or 139.2% to $1.5 million, in the second quarter of 2005. The increase is primarily due to increased selling, general and administrative expenses of $1.1 million, slightly higher interest expense of $0.3 million and higher tax expense of $0.1 million, partially offset by increased gross margin of $0.6 million.
Comparison of the First Six Months of 2005 to the First Six Months of 2004
Medical Equipment Outsourcing - Manage & Utilize
| | | | | | | | | | | | | | |
(dollars in millions) | | Six Months Ended June 30,
| | | | | | |
| | 2005
| | | 2004
| | | Change
| | Percent Change
| |
Total Revenue | | $ | 84.9 | | | $ | 78.4 | | | $ | 6.5 | | 8.4 | % |
Cost of Revenue | | | 26.5 | | | | 23.1 | | | | 3.4 | | 14.8 | |
Moveable Medical Equip Depn | | | 18.4 | | | | 17.7 | | | | 0.7 | | 4.4 | |
| | |
|
|
| |
|
|
| |
|
| |
|
|
Gross Margin | | $ | 40.0 | | | $ | 37.6 | | | $ | 2.4 | | 6.3 | % |
| | | | |
Gross Margin % | | | 47.1 | % | | | 48.0 | % | | | | | | |
Total revenue in the Medical Equipment Outsourcing segment rose $6.5 million, or 8.4% to $84.9 million in the first six months of 2005. This increase was driven by competitive take-aways, re-entry into the bariatrics market late in the second quarter of 2004, growth in our acute care customer base, increased activity in our AMPP customers, new technology in our fleet attracting incremental business, and the effect of the acquisitions of substantially all assets of Advanced Therapeutics of Wisconsin, Inc., and certain assets of Galaxy Medical Products, Inc. in the second quarter of 2004.
Total cost of revenue in the segment rose $3.4 million, or 14.8% to $26.5 million in the first six months of 2005. This increase is primarily attributable to higher employee-related costs of $2.2 million, facilities and occupancy of $0.6 million, and freight of $0.4 million.
15
Moveable medical equipment depreciation increased $0.7 million, or 4.4% to $18.4 million in the first six months of 2005. This increase reflects net equipment additions of $1.8 million for the for the twelve month period from July 1, 2004 through June 30, 2005. Net equipment additions reflect acquisitions and equipment purchases, less depreciation expense and equipment disposals.
Gross Margin percentage for the medical equipment outsourcing segment decreased from 48.0% in the first six months of 2004 to 47.1% in the second quarter of 2005. This decrease is primarily attributable to higher employee-related costs.
Technical and Professional Services - Plan & Acquire/Maintain & Repair
| | | | | | | | | | | | | | |
(dollars in millions) | | Six Months Ended June 30,
| | | | | | |
| | 2005
| | | 2004
| | | Change
| | Percent Change
| |
Total Revenue | | $ | 14.9 | | | $ | 11.4 | | | $ | 3.5 | | 30.3 | % |
Cost of Revenue | | | 11.2 | | | | 7.9 | | | | 3.3 | | 41.5 | |
| | |
|
|
| |
|
|
| |
|
| |
|
|
Gross Margin | | $ | 3.7 | | | $ | 3.5 | | | $ | 0.2 | | 5.5 | % |
| | | | |
Gross Margin % | | | 25.0 | % | | | 30.8 | % | | | | | | |
Total revenue in the Technical and Professional Services segment rose $3.5 million, or 30.3% to $14.9 million in the first six months of 2005. This increase was caused by growth in our resident-based programs and manufacturer services as well as the acquisitions of ACES late in the first quarter of 2004, and certain assets of Cardinal Health, 200, Inc. in the third quarter of 2004, offsetting the loss of revenue from a financially-distressed customer in the second quarter of 2005.
Total cost of revenue in the segment rose $3.3 million, or 41.5% to $11.2 million in the first six months of 2005. This increase is primarily attributable to higher employee-related costs of $2.1 million and repair of $0.8 million, as well as generally higher supplies and parts costs to meet increased customer need.
Gross Margin percentage for the technical and professional services segment decreased from 30.8% in the first six months of 2004 to 25.0% in the second quarter of 2005. This decrease is primarily attributable to the acquisition of the lower margin ACES business late in the first quarter of 2004, the loss of a financially-distressed customer in the second quarter of 2005, and continued investment to develop our equipment lifecycle services platform.
16
Medical Equipment Sales and Remarketing - Redeploy & Remarket
| | | | | | | | | | | | | | | |
(dollars in millions) | | Six Months Ended June 30,
| | | | | | | |
| | 2005
| | | 2004
| | | Change
| | | Percent Change
| |
Total Revenue | | $ | 8.9 | | | $ | 8.5 | | | $ | 0.4 | | | 4.5 | % |
Cost of Revenue | | | 7.1 | | | | 6.3 | | | | 0.8 | | | 13.0 | |
| | |
|
|
| |
|
|
| |
|
|
| |
|
|
Gross Margin | | $ | 1.8 | | | $ | 2.2 | | | $ | (0.4 | ) | | (19.5 | )% |
| | | | |
Gross Margin % | | | 20.2 | % | | | 26.2 | % | | | | | | | |
Total revenue in the Medical Equipment Sales and Remarketing segment rose $0.4 million, or 4.5% to $8.9 million in the first six months of 2005. This increase was caused by higher equipment sales of $1.1 million, partially offset by reduced sales of disposable items of $0.7 million.
Total cost of revenue in the segment rose $0.8 million, or 13.0% to $7.1 million in the first six months of 2005. This increase is primarily attributable to higher costs of new equipment of $0.8 million, used equipment of $0.3 million, repair of $0.2 million, and fleet of $0.2 million, partially offset by reduced costs of disposable goods sold of $0.7 million.
Gross Margin percentage for the medical equipment sales and remarketing segment decreased from 26.2% in the first six months of 2004 to 20.2% in the second quarter of 2005. During much of the first six months of 2005, we moved equipment held for sale into our rental fleet to meet high customer demand which limited company-owned fleet sale opportunities.
Selling, General and Administrative Expenses
Selling, general and administrative expenses rose $2.8 million, or 10.3% to $30.2 million in the first six months of 2005. The increase was primarily due to higher employee-related costs of $1.7 million, additional amortization of intangible assets of $0.8 million, and $0.5 million of expenses related to preparation for the requirements of Section 404 of the Sarbanes-Oxley Act of 2002, partially offset by reduced legal and consulting expenses of $0.4 million. Selling, general and administrative expenses as a percentage of total revenue for the first six months of 2005, decreased slightly to 27.8% from 27.9% for the same period of 2004.
During the remaining part of 2005, we anticipate that we will incur additional expenses related to preparation for the requirements under Section 404 of the Sarbanes-Oxley Act of 2002. We also expect to continue to spend to build appropriate infrastructure to complete our transition to a lifecycle services company.
Interest Expense
Interest expense rose $0.5 million, or 3.3% to $15.4 million in the first six months of 2005. This increase primarily reflects an increase in borrowings under our revolving credit agreement and higher interest rates. Average total borrowings increased for the first six months of 2005 to $298.1 million from $284.3 million for the same period of 2004, primarily due to the timing of acquisitions in 2004.
17
Income Taxes
Tax expense for the six months ended June 30, 2005, was $0.4 million representing an increase from income tax expense of $0.3 million for the same period of 2004. Income tax expense relates primarily to valuation allowances established for net operating losses not recognized as well as minimum state taxes.
Net (Loss) Income
The Company had a net loss of $0.5 million in the first six months of 2005, compared to net income of $0.7 million in the first six months of 2004. The change is primarily due to increased selling, general and administrative expenses of $2.8 million and slightly higher interest expense of $0.5 million, partially offset by increased gross margin of $2.1 million.
Quarterly Financial Information: Seasonality
Quarterly operating results are typically affected by seasonal factors. Historically, our first and fourth quarters are the strongest, reflecting increased hospital utilization during the fall and winter months.
LIQUIDITY AND CAPITAL RESOURCES
Our principal sources of liquidity are expected to be cash flows from operating activities and borrowings under our five-year Amended Credit Agreement that we entered into on May 26, 2005. It is anticipated that our principal uses of liquidity will be to fund capital expenditures related to purchases of movable medical equipment, provide working capital, meet debt service requirements and finance our strategic plans.
We require substantial cash to operate our Medical Equipment Outsourcing programs and service our debt. Our outsourcing programs require us to invest a significant amount of cash in movable medical equipment purchases. To the extent that such expenditures cannot be funded from our operating cash flow, borrowing under our Amended Credit Agreement or other financing sources, we may not be able to conduct our business or grow as currently planned.
If we are unable to generate sufficient cash flow from operations in order to service our debt, we will be forced to take actions such as reducing or delaying capital expenditures, selling assets, restructuring or refinancing our debt or seeking additional equity capital. This, to a certain extent, is subject to general economic, financial, competitive, legislative, regulatory and other factors that are beyond our control. If we are unable to repay our debt at maturity, we may have to obtain alternative financing, which may not be available to us.
Net cash provided by operating activities during the six months ended June 30, 2005, was $20.8 million, compared to $18.5 million in the same period of 2004. This increase is primarily attributable to better working capital management through a smaller increase in accounts receivable, reduced inventory and other operating assets partially offset by a net loss of $0.5 million versus a profit of $0.7 million in the prior year period and the payment of $1.1 million of holdback amounts related to the acquisitions made during 2004. Net cash used in investing activities during the six months ended June 30, 2005, was $17.9 million, compared to $40.1 million in the same period of 2004. This decrease was primarily attributable
18
to the acquisitions of ACES, certain assets of Galaxy Medical Products, Inc., and substantially all the assets of Advanced Therapeutics of Wisconsin, Inc. in the same period of 2004, as well as timing difference related to capital expenditures placed in service in 2003 and paid for in 2004. Net cash used in financing activities during the six months ended June 30, 2005, was $2.9 million, compared to net cash provided by financing activities of $21.6 million to fund capital expenditures in the same period of 2004. This change was primarily attributable to lower net incremental borrowings under our Amended Credit Agreement due to the timing of the acquisition in 2004.
Based on the level of operating performance expected in 2005, we believe our cash from operations, together with additional borrowings under our Amended Credit Agreement, will meet our liquidity needs for the foreseeable future, exclusive of any borrowings that we may make to finance potential acquisitions. However, if during that period or thereafter we are not successful in generating sufficient cash flows from operations or in raising additional capital when required in sufficient amounts and on terms acceptable to us, our business could be adversely affected. Availability under our Amended Credit Agreement as of June 30, 2005, was approximately $68.3 million, representing our borrowing base of $110.3 million, net of outstanding letters of credit of $2.3 million and borrowings of $39.7 million at that date. Our levels of borrowing are further restricted by the financial covenants set forth in our Amended Credit Agreement and the indenture governing the notes, which covenants are described below.
Covenants Under the Indenture Governing the Senior Notes
The indenture governing the notes contains covenants limiting our ability to incur additional debt; pay cash dividends or distributions on our capital stock or repurchase our capital stock or subordinated debt; issue redeemable stock or preferred stock; issue stock of subsidiaries; make certain investments; transfer or sell assets; create liens on our assets to secure debt; enter into transactions with affiliates; and merge or consolidate with another company. These covenants are subject to a number of important limitations and exceptions. See “Description of Notes — Certain Covenants” in Amendment Number 5 to Form S-4 filed on April 15, 2004.
Covenants Under Our Amended Credit Agreement
Our senior secured credit facility is secured by substantially all of our assets and the assets of some of our future subsidiaries, if any, and by a pledge of all of the capital stock of some of our future subsidiaries, if any. Our ability to borrow under the senior secured credit facility is governed by a borrowing base composed of certain of our accounts receivable and equipment inventory.
Our senior secured credit facility contains affirmative covenants relating to prepayment of our loans upon the occurrence of certain events, access to records and personnel; payment of taxes; delivery of financial statements and reports and agreements with landlords; maintenance of corporate existence and conduct of business; payment of obligations; maintenance of books and records, insurance and rights to intellectual property; compliance with laws, including environmental laws and permits; and indemnification of the lenders under the credit facility for certain claims made against them relating to the credit facility.
19
The senior credit facility also contains negative covenants which restrict and limit our ability and the ability of our future subsidiaries, if any, with respect to, among other things:
| | • | | Entering into merger or similar transactions. We and our subsidiaries are generally precluded from forming or acquiring any subsidiary, entering into any merger or acquiring all or substantially all of the assets or stock of any other entity, subject to certain limited exceptions. If we or a subsidiary are permitted to form a subsidiary, that subsidiary will be required to guarantee our obligations under our senior secured credit facility. |
| | • | | Making investments, loans and advances. We and our subsidiaries are generally not permitted to have or make investments, or to have or make loans or advances, in any other entity other than: |
| | • | | extensions of credit in the ordinary course of business; |
| | • | | investments in certain cash equivalent investments, including, without limitation, certain securities maturing within 360 days that are issued or fully guaranteed by the United States government, certain certificates of deposit, eurodollar time deposits and bank deposits, certain repurchase obligations of lenders under our senior secured credit facility and other qualified parties, certain commercial paper, certain securities backed by standby letters of credit and certain specified shares of money market mutual or similar funds; |
| | • | | loans and advances to our or any of our subsidiaries’ officers and employees for travel, entertainment and relocation expenses in the ordinary course of business not to exceed $2,000,000; |
| | • | | investments by us in any of our subsidiaries, and investments among our subsidiaries in each other; |
| | • | | specified investments held by us on May 26, 2005; |
| | • | | specified intercompany indebtedness; |
| | • | | investments (including, without limitation, debt obligations) that we and our subsidiaries receive in connection with the bankruptcy proceedings of our suppliers and customers and in settlement of other disputes arising in the ordinary course of business; |
| | • | | promissory notes we acquire in connection with specified asset sales; |
| | • | | certain permitted acquisitions; and |
| | • | | other additional investments entered into by us and our subsidiaries not exceeding $1,000,000 at any time outstanding. |
20
| | • | | Incurring indebtedness. We and our subsidiaries are generally only entitled to incur or have debt to the extent such debt is: |
| | • | | secured by purchase money security interests and capital leases permitted under our senior secured credit facility: |
| | • | | incurred under the senior secured credit facility; |
| | • | | outstanding under the indenture governing the notes in an amount not to exceed $325 million; |
| | • | | related to unfunded pension fund and other employee benefit plan obligations to the extent they are permitted to remain unfunded under applicable law; |
| | • | | specified existing indebtedness: |
| | • | | (a) owed by us to any of our subsidiaries which is also a guarantor under our senior secured credit facility or (b) owed by any of our subsidiaries to us or any other guarantor under the senior secured credit facility; |
| | • | | incurred under any interest rate agreements or similar agreements; |
| | • | | owed to another entity arising in connection with an acquisition permitted under our senior secured credit facility, not to exceed $10 million at any time outstanding and subject to other specified limitations; |
| | • | | subordinated debt which we owe to JWC Fund I, JWC Fund III or Halifax; and |
| | • | | additional indebtedness owed by us and our subsidiaries not exceeding $4,000,000 in aggregate principal amount at any time outstanding. |
In addition, neither we nor any of our subsidiaries are permitted to incur any indebtedness (other than our obligations under our senior secured credit facility) under any “Credit Facilities” (as defined in the indenture governing the notes), and we and our subsidiaries are prohibited from repaying any amount in respect to certain specified indebtedness.
| | • | | Entering into affiliate transactions. We and our subsidiaries are generally not permitted to enter into transactions with any affiliates that are not on an arm’s length basis. However, this restriction does not apply to: |
| | • | | advances to our or our subsidiaries’ officers or employees to the extent permitted; |
| | • | | restricted payments (including dividends and other distributions) to the extent permitted; |
| | • | | transactions between us and our subsidiaries to the extent permitted; |
| | • | | employment arrangements entered into in the ordinary course of business with our and our subsidiaries’ members of the board of directors and officers; |
21
| | • | | our stockholders’ agreement; and |
| | • | | the payment of management fees to the extent permitted. |
| | • | | Changing our capital structure or the nature of our business. We and our subsidiaries are generally not permitted to: |
| | • | | make any changes in any of our business objectives or operations that could in any way adversely affect the repayment of loans or any of our other obligations under our senior secured credit facility or otherwise be reasonably expected to have a material adverse effect; |
| | • | | make any change in our capital structure, including the issuance or sale of any shares of stock, warrants or other securities convertible into stock, with limited exceptions; |
| | • | | amend our charter or bylaws in a manner that would adversely affect General Electric Capital Corporation or the lenders under our senior secured credit facility or our ability to repay our obligations under our senior secured credit facility; and |
| | • | | engage in any business other than the business we are currently engaged in and other related businesses, including, without limitation, the leasing of medical equipment. |
| | • | | Incurring guaranteed indebtedness. Subject to limited exceptions, neither we nor our subsidiaries are permitted to have or incur guaranteed indebtedness except to the extent such indebtedness is: |
| | • | | incurred by endorsement of items of payment for deposit to our or any of our subsidiaries’ general account; |
| | • | | guaranteed indebtedness incurred for the benefit of us or any of our subsidiaries if the primary obligation is expressly permitted by our senior secured credit facility |
| | • | | certain specified guaranteed indebtedness in existence on May 26, 2005; |
| | • | | any guaranty or other similar agreement in favor of General Electric Capital Corporation in connection with the transactions contemplated by our senior secured credit facility; and |
| | • | | any unsecured guaranty or other similar agreement in favor of the holders of the initial notes, to the extent required by the indenture governing the notes. |
| | • | | Granting liens. We and our subsidiaries are generally only entitled to grant liens, or permit them to exist, to the extent such liens are: |
| | • | | for taxes or assessments or other governmental charges not yet due and payable or which are being contested in accordance with the terms of our senior secured credit facility; |
22
| | • | | pledges or deposits of money securing statutory obligations under workmen’s compensation, unemployment insurance, social security or public liability laws or similar legislation (excluding liens under ERISA); |
| | • | | pledges or deposits of money which secure bids, tenders, contracts (other than contracts for the payment of money) or leases to which we or any of our subsidiaries are a party as lessee made in the ordinary course of business; |
| | • | | inchoate and unperfected workers’, mechanics’ or similar liens arising in the ordinary course of business, so long as they attach only to equipment, fixtures and/or real estate; |
| | • | | carriers’, warehousemen’s, suppliers’ or other similar possessory liens arising in the ordinary course of business and securing liabilities in an outstanding aggregate amount not in excess of $250,000, so long as such liens attach only to inventory; |
| | • | | deposits securing surety, appeal or customs bonds in proceedings to which we or any of our subsidiaries are a party; |
| | • | | any attachment or judgment lien not constituting an event of default under our senior secured credit facility; |
| | • | | zoning restrictions, easements, licenses or other restrictions on the use of any real estate or other minor irregularities with respect to title to real estate, subject to certain limitations; |
| | • | | presently existing or future liens in favor of General Electric Capital Corporation, on behalf of the lenders under our senior secured credit facility; |
| | • | | licenses, leases or subleases granted to other persons not interfering in any material respect with our business or any of our subsidiaries’ businesses; |
| | • | | bankers’ liens, rights of setoff and similar liens incurred on deposits made in the ordinary course of business; |
| | • | | liens arising from precautionary UCC financing statements regarding operating leases; |
| | • | | specified liens in existence on May 26, 2005; |
| | • | | liens created by conditional sale or other title retention agreements (including capital leases) or in connection with purchase money indebtedness with respect to certain equipment and fixtures acquired by us or any of our subsidiaries in the ordinary course of business, involving the incurrence of not more than $10 million and subject to specified exceptions; and |
| | • | | other liens securing indebtedness not in excess of $500,000 at any time outstanding. |
23
In addition, we and our subsidiaries which become guarantors of the senior secured credit facility are prohibited from entering into any agreement which would prevent us from granting a lien to secure the obligations under the senior secured credit facility, subject to certain exceptions.
| | • | | Selling stock and assets. We and our subsidiaries are generally not permitted to dispose of any of our property, business or assets (including, without limitation, receivables and leasehold interests), or in the case of any of our subsidiaries, such subsidiary may not issue or sell any shares of such subsidiary’s capital stock to any person other than to us or any of our wholly-owned subsidiaries, except for: |
| | • | | the disposition of inventory, equipment and leases in the ordinary course of business, other than obsolete or worn out property; |
| | • | | the disposition of obsolete or worn out property in the ordinary course of business for proceeds consisting of not less than (a) 75% cash and (b) indebtedness evidenced by promissory notes; |
| | • | | other dispositions of assets not described above for proceeds consisting of not less than (a) 75% cash and (b) indebtedness evidenced by promissory notes, subject to certain dollar amounts provided that such sales shall not exceed $5 million in any fiscal year; |
| | • | | the lease by us and our subsidiaries (as lessee) and license of real or personal property in the ordinary course of business (so long as such lease is not a capital lease not otherwise permitted by our senior secured credit facility); |
| | • | | specified investments, acquisitions and transfers or dispositions of properties; |
| | • | | the sale or discount of accounts receivable arising in the ordinary course of business in connection with the collection of such receivables; |
| | • | | certain other identified acquisitions and sale-leaseback transactions; |
| | • | | the disposition of real estate by us or any of our subsidiaries; |
| | • | | the sale or issuance of any of our subsidiaries’ capital stock to us or any of our other wholly-owned subsidiaries; and |
| | • | | dispositions of property to us or to any of our wholly-owned subsidiaries. |
| | • | | Engaging in sale-leaseback or similar transactions. Neither we nor any of our subsidiaries are permitted to engage in any sale-leaseback, synthetic lease or similar transaction involving any of our assets unless: |
| | • | | each such sale-leaseback, synthetic lease and each such similar transaction is an arms-length transaction; and |
24
| | • | | the aggregate consideration we and our subsidiaries receive in connection with the disposition of certain rental equipment, wholesale inventory, repair or replacement parts purchased by us or any of our subsidiaries pursuant to such transactions does not exceed $3,000,000. |
| | • | | Canceling our indebtedness. We and our subsidiaries are not permitted to cancel any debt owing to us, except for reasonable consideration negotiated on an arm’s length basis and in the ordinary course of business. |
| | • | | Paying dividends or making other distributions. We and our subsidiaries are generally not permitted to pay dividends or make other distributions except: |
| | • | | dividends and distributions paid to us by any of our subsidiaries; |
| | • | | employee loans and advances permitted under our senior secured credit facility; |
| | • | | payments of management fees pursuant to the management agreements we are party to with J.W. Childs Associates, L.P. and the general partner of Halifax, subject to certain dollar amounts and other limitations; |
| | • | | the redemption or repurchase for fair value in cash of our stock (or options to purchase capital stock) from any of our employees upon the death, disability, retirement or other termination of such employee, subject to certain dollar amounts and other limitations; and |
| | • | | dividends or other distributions in the form of, or with respect to, certain subordinated promissory notes issued to JWC Fund I, JWC Fund III or Halifax, to the extent permitted to be issued pursuant our senior secured credit facility. |
In addition, neither we nor any of our subsidiaries may enter into an agreement or other obligation (other than our senior secured credit facility, the related loan documents and the indenture governing the notes) which could prohibit or require the consent of any person with respect to the payment of dividends or distributions or the making or repayment of intercompany loans by one of our subsidiaries to us.
| | • | | Engaging in speculative transactions. We and our subsidiaries are not permitted to engage in any transaction involving commodity options, futures contracts or similar transactions, except to hedge against fluctuations in commodities prices, the values of foreign currencies receivable, interest swaps, caps or collars. |
| | • | | Amending the terms of our subordinated debt and certain agreements. In general, neither we nor any of our subsidiaries are permitted to amend the following: |
| | • | | the terms of any subordinated debt if the effect of such amendment is to (a) increase the interest rate to the extent interest is payable in cash; (b) change the due dates of principal or interest payments; (c) change any default or event of default provision unless by deletion or making it less restrictive, or any redemption or prepayment provision other than to extend the |
25
date therefore or reduce premiums payable in connection therewith: (d) add any covenant; (e) grant any collateral to secure payment; (f) grant any security; or (g) change any other term resulting in a material increase in the obligations thereunder;
| | • | | the terms of the indenture governing the notes, subject to certain exceptions; and |
| | • | | certain other agreements, including, without limitation, certain stock purchase agreements and repurchase agreements, our stockholders’ agreement, or the management agreements we are party to with J.W. Childs Associates, L.P. and the general partner of Halifax, in each case subject to certain exceptions. |
| | • | | Changing our name, location or fiscal year. We and our subsidiaries are prohibited from changing our name, certain other aspects of our corporate identity or locations of collateral securing our obligations under the senior credit facility and records pertaining to such collateral, in each case without 30 days notice to General Electric Capital Corporation. We and our subsidiaries are also prohibited from changing our fiscal year end from December 31. |
In addition, our senior secured credit facility requires that we comply with the following financial covenants:
| | • | | Minimum interest coverage ratio. We and our subsidiaries must maintain on a consolidated basis at each date set forth below, a ratio of EBITDA (as defined in our senior secured credit facility) to interest expense (as defined in our senior secured credit facility) of not less than 2.00 to 1.0 for the twelve-month periods ending on each June 30, September 30, December 31 and March 31. Our interest coverage ratio for the twelve-month period ending on June 30, 2005, was 2.4 to 1.0. |
| | • | | Maximum total senior secured leverage ratio. We and our subsidiaries must maintain on a consolidated basis at each date set forth below, a ratio of funded senior secured debt (as defined in our senior secured credit facility) to EBITDA (as defined in our senior secured credit facility) of not more than 2.0 to 1.0 as of, and for, each of the twelve-month periods ending on each June 30, September 30, December 31 and March 31. Our total senior secured leverage ratio for the twelve-month period ending on June 30, 2005, was 0.6 to 1.0. |
EBITDA
EBITDA (earnings before interest, taxes, depreciation, and amortization) for the six months ended June 30, 2005, was $36.5 million, representing a $1.3 million, or 3.7% increase from $35.2 million for the same period of 2004. This increase is primarily driven by revenue growth, generating increased gross margin of $2.1 million partially offset by increases in selling, general, and administrative expenses.
EBITDA is not intended to represent an alternative to operating income or cash flows from operating, financing or investing activities (as determined in accordance with generally accepted accounting principles (“GAAP”)) as a measure of performance, and is not representative of funds available for
26
discretionary use due to UHS’ financing obligations. EBITDA, as defined by UHS, may not be calculated consistently among other companies applying similar reporting measures. EBITDA is included because it is a widely accepted financial indicator used by certain investors and financial analysts to assess and compare companies and a version of EBITDA is an integral part of the UHS’ debt covenant calculations. Management believes that EBITDA provides an important perspective on UHS’ ability to service its long-term obligations, UHS’ ability to fund continuing growth, and UHS’ ability to continue as a going concern. A reconciliation of EBITDA to operating cash flows is included below.
The following is a reconciliation of net cash provided by operating activities to EBITDA (dollars in thousands):
| | | | | | | | |
| | | Six Months Ended June 30,
| |
| | | 2005
| | | 2004
| |
Net cash provided by operating activities | | $ | 20,785 | | | $ | 18,533 | |
Changes in operating assets and liabilities | | | 996 | | | | 1,732 | |
Other non-cash expenses | | | (1,145 | ) | | | (346 | ) |
Current income taxes | | | 421 | | | | 339 | |
Interest expense | | | 15,421 | | | | 14,933 | |
| | |
|
|
| |
|
|
|
EBITDA | | $ | 36,478 | | | $ | 35,191 | |
| |
| | | Six Months Ended June 30,
| |
| | | 2005
| | | 2004
| |
Supplemental Information: | | | | | | | | |
| | |
EBITDA | | $ | 36,478 | | | $ | 35,191 | |
Net cash provided by operating activities | | | 20,785 | | | | 18,533 | |
Net cash used in investing activities | | | (17,912 | ) | | | (40,120 | ) |
Net cash (used in) provided by financing activities | | | (2,873 | ) | | | 21,587 | |
Movable medical equipment depreciation | | | 18,420 | | | | 17,650 | |
Non-movable medical equipment depreciation and amortization | | | 2,756 | | | | 1,539 | |
| | |
Other operating data: | | | | | | | | |
| | |
Movable medical equipment owned (approximate units at end of period) | | | 156,000 | | | | 149,000 | |
Offices (at end of period) | | | 77 | | | | 76 | |
Number of outsourcing hospital customers (approximate number at end of period) | | | 3,200 | | | | 3,050 | |
Number of total outsourcing customers (approximate number at end of period) | | | 6,350 | | | | 6,200 | |
27
Safe Harbor Statement under the Private Securities Litigation Reform Act of 1995: We believe statements in this quarterly report looking forward in time involve risks and uncertainties. The following factors, among others, could adversely affect our business, operations and financial condition causing our actual results to differ materially from those expressed in any forward-looking statements:
UHS’ history of net losses and substantial interest expense; UHS’ need for substantial cash to operate and expand its business as planned; UHS’ substantial outstanding debt and debt service obligations; restrictions imposed by the terms of UHS’ debt; a decrease in the number of patients our customers are serving; UHS’ability to effect change in the manner in which healthcare providers traditionally procure medical equipment; the absence of long-term commitments with customers; UHS’ ability to renew contracts with group purchasing organizations and integrated delivery networks; changes in reimbursement rates and policies by third-party payors; the impact of health care reform initiatives; the impact of significant regulation of the health care industry and the need to comply with those regulations; difficulties or delays in our continued expansion into certain of our businesses/geographic markets and developments of new businesses/geographic markets; and additional credit risks in increasing business with home care providers and nursing homes. These and other risk factors are detailed in UHS’ Annual Report on Form 10-K for the year ended December 31, 2004, filed with Securities and Exchange Commission.
Item 3. Quantitative and Qualitative Disclosures about Market Risk
Our primary exposure to market risk is interest rate risk associated with our debt instruments. We use both fixed and variable rate debt as sources of financing. At June 30, 2005, we had approximately $299,851,000 of total debt outstanding, of which $39,676,000 was bearing interest at variable rates approximating 6.1%. A 1 percentage point change in interest rates on variable rate debt would have resulted in interest expense fluctuating approximately $190,700 and $160,700 for the first six months of 2005 and 2004, respectively. We have not entered into, and do not plan to enter into, any derivative financial instruments for trading or speculative purposes. Historically, we have not engaged in hedging activities. As of June 30, 2005, we had no other significant material exposure to market risk.
Item 4. Controls and Procedures
(a).Evaluation of disclosure controls and procedures.
Under the supervision and with the participation of our management, including our Chief Executive Officer and Chief Financial Officer, we evaluated the effectiveness of the design and operation of our disclosure controls and procedures (as defined in Rule 15d-15(e) under the Securities Exchange Act of 1934 as amended (the “Exchange Act”)). Based upon that evaluation, the Chief Executive Officer and Chief Financial Officer concluded that, as of the end of the period covered by this report, our disclosure controls and procedures were effective.
(b).Changes in internal control over financial reporting.
During the second quarter of 2005, there has been no change in our internal control over financial reporting (as defined in Rule 15d-15(f) under the Exchange Act) that has materially affected, or is reasonably likely to materially affect, our internal control over financial reporting.
28
PART II - OTHER INFORMATION
Item 1. Legal Proceedings
Not applicable.
Item 2. Unregistered Sales of Equity Securities and Use of Proceeds
Pursuant to the exercise of outstanding options, on May 17, 2005, we sold common stock to a departing employee for the aggregate purchase price of $416.25.
Such sale was completed pursuant to the exemption from registration provided under Section 4(2) of the Securities Act of 1933, as amended. The proceeds from the sale of such shares were added to our general funds and used for general corporate purposes.
Item 3. Defaults upon Senior Securities
Not applicable.
Item 4. Submission of Matters to a Vote of Security Holders
Not applicable.
Item 5. Other Information
Not applicable.
Item 6. Exhibits
| | |
Number
| | Description
|
| 3.1a | | Certificate of Amendment to Certificate of Incorporation of Universal Hospital Services, Inc.* |
| |
| 3.1b | | Certificate of Incorporation of Universal Hospital Services, Inc. (Incorporated by reference to Exhibit 3.1b to Form S-1/A filed on September 5, 2001). |
| |
| 3.2a | | Amended and Restated Bylaws of Universal Hospital Services, Inc.* |
| |
| 3.3 | | Certification of Elimination of Series B 13% Cumulative Accruing Pay-In-Kind Preferred Stock of Universal Hospital Services, Inc.*** |
| |
| 4.1 | | Form of certificate of common stock (Incorporated by reference to Exhibit 4.1 to Form S-1/A filed on September 5, 2001). |
| |
| 4.2 | | Indenture, dated as of October 17, 2003, by and between Universal Hospital Services, Inc. and Wells Fargo Bank, National Association, as Trustee, relating to the registrant’s 10.125% Senior Notes due 2011 (including Form of Note).* |
| |
| 4.3 | | Form of Amended and Restated Stockholders’ Agreement, dated October 17, 2003, by and among Universal Hospital Services, Inc., J.W. Childs Equity Partners III, L.P., JWC Fund III Co-invest LLC, Halifax Capital Partners, L.P. and the other stockholders of Universal Hospital Services, Inc.* |
| |
| 4.4 | | Exchange and Registration Rights Agreement, dated as of October 17, 2003, among Universal Hospital Services, Inc., Goldman, Sachs & Co,. Credit Suisse First Boston LLC, CIBC World Markets Corp. and Jefferies & Company, Inc.** |
| |
| 4.5 | | 10.125% Senior Notes due 2011 in the aggregate principal amount of $259,880,000.** |
29
| | |
Number
| | Description
|
| 4.6 | | 10.125% Senior Note due 2011 in the aggregate principal amount of $120,000.** |
| |
| 4.7 | | Blanket Issuer Letter of Representations, dated as of October 17, 2003, among Universal Hospital Services, Inc., Wells Fargo Bank, National Association and the Depository Trust Company.** |
| |
| 10.1 | | Amended and Restated Credit Agreement dated May 26, 2005, among Universal Hospital Services, Inc., the other Credit Parties signatory thereto, General Electric Capital Corporation, as Agent, Administrative Agent, Collateral Agent and Lender, the other Lenders signatories thereto from time to time, and GECC Capital Markets Group, Inc., as Sole Lead Arranger and Sole Bookrunner.**** |
| |
| 31.1 | | Rule 13a-14(a)/15d-14(a) Certification of Chief Executive Officer |
| |
| 31.2 | | Rule 13a-14(a)/15d-14(a) Certification of Chief Financial Officer |
| |
| 32.1 | | Certification of Gary D. Blackford Pursuant to 18 U.S.C § 1350, as adopted pursuant to Section 906 of the Sarbanes-Oxley Act of 2002 |
| |
| 32.2 | | Certification of Rex T. Clevenger Pursuant to 18 U.S.C § 1350, as adopted pursuant to Section 906 of the Sarbanes-Oxley Act of 2002 |
| * | Previously filed as an Exhibit to the Quarterly Report on Form 10-Q of Universal Hospital Services, Inc. for the fiscal quarter ended September 30, 2003, and incorporated by reference herein. |
| ** | Previously filed as an Exhibit to the Registrant’s Registration Statement on Form S-4 (File No. 333-111606) and incorporated by reference herein. |
| *** | Previously filed as an Exhibit to Amendment No. 1 to the Registrant’s Registration Statement on Form S-4 (File No. 333-111606) and incorporated by reference herein. |
| **** | Previously filed as an Exhibit to the Current Report on Form 8-K of Universal Hospital Services, Inc. filed on May 31, 2005, and incorporated by reference herein. |
30
SIGNATURES
Pursuant to the requirements of the Securities Exchange Act of 1934, the registrant has duly caused this report to be signed on its behalf by the undersigned thereunto duly authorized.
Date: August 12, 2005
| | |
| Universal Hospital Services, Inc. |
| |
| By | | /s/ Gary D. Blackford
|
| | | Gary D. Blackford, |
| | | President and Chief Executive Officer |
| | | (Principal Executive Officer) |
| |
| By | | /s/ Rex T. Clevenger
|
| | | Rex T. Clevenger, |
| | | Senior Vice President and Chief Financial Officer (Principal Financial Officer) |
31
Universal Hospital Services, Inc.
EXHIBIT INDEX TO REPORT ON FORM 10-Q
| | |
Number
| | Description
|
| 3.1a | | Certificate of Amendment to Certificate of Incorporation of Universal Hospital Services, Inc.* |
| |
| 3.1b | | Certificate of Incorporation of Universal Hospital Services, Inc. (Incorporated by reference to Exhibit 3.1b to Form S-1/A filed on September 5, 2001). |
| |
| 3.2a | | Amended and Restated Bylaws of Universal Hospital Services, Inc.* |
| |
| 3.3 | | Certification of Elimination of Series B 13% Cumulative Accruing Pay-In-Kind Preferred Stock of Universal Hospital Services, Inc.*** |
| |
| 4.1 | | Form of certificate of common stock (Incorporated by reference to Exhibit 4.1 to Form S-1/A filed on September 5, 2001). |
| |
| 4.2 | | Indenture, dated as of October 17, 2003, by and between Universal Hospital Services, Inc. and Wells Fargo Bank, National Association, as Trustee, relating to the registrant’s 10.125% Senior Notes due 2011 (including Form of Note).* |
| |
| 4.3 | | Form of Amended and Restated Stockholders’ Agreement, dated October 17, 2003, by and among Universal Hospital Services, Inc., J.W. Childs Equity Partners III, L.P., JWC Fund III Co-invest LLC, Halifax Capital Partners, L.P. and the other stockholders of Universal Hospital Services, Inc.* |
| |
| 4.4 | | Exchange and Registration Rights Agreement, dated as of October 17, 2003, among Universal Hospital Services, Inc., Goldman, Sachs & Co,. Credit Suisse First Boston LLC, CIBC World Markets Corp. and Jefferies & Company, Inc.** |
| |
| 4.5 | | 10.125% Senior Notes due 2011 in the aggregate principal amount of $259,880,000.** |
| |
| 4.6 | | 10.125% Senior Note due 2011 in the aggregate principal amount of $120,000.** |
| |
| 4.7 | | Blanket Issuer Letter of Representations, dated as of October 17, 2003, among Universal Hospital Services, Inc., Wells Fargo Bank, National Association and the Depository Trust Company.** |
| |
| 10.1 | | Amended and Restated Credit Agreement dated May 26, 2005, among Universal Hospital Services, Inc., the other Credit Parties signatory thereto, General Electric Capital Corporation, as Agent, Administrative Agent, Collateral Agent and Lender, the other Lenders signatories thereto from time to time, and GECC Capital Markets Group, Inc., as Sole Lead Arranger and Sole Bookrunner.**** |
| |
| 31.1 | | Rule 13a-14(a)/15d-14(a) Certification of Chief Executive Officer |
| |
| 31.2 | | Rule 13a-14(a)/15d-14(a) Certification of Chief Financial Officer |
| |
| 32.1 | | Certification of Gary D. Blackford Pursuant to 18 U.S.C § 1350, as adopted pursuant to Section 906 of the Sarbanes-Oxley Act of 2002 |
| |
| 32.2 | | Certification of Rex T. Clevenger Pursuant to 18 U.S.C § 1350, as adopted pursuant to Section 906 of the Sarbanes-Oxley Act of 2002 |
| * | Previously filed as an Exhibit to the Quarterly Report on Form 10-Q of Universal Hospital Services, Inc. for the fiscal quarter ended September 30, 2003, and incorporated by reference herein. |
| ** | Previously filed as an Exhibit to the Registrant’s Registration Statement on Form S-4 (File No. 333-111606) and incorporated by reference herein. |
| *** | Previously filed as an Exhibit to Amendment No. 1 to the Registrant’s Registration Statement on Form S-4 (File No. 333-111606) and incorporated by reference herein. |
| **** | Previously filed as an Exhibit to the Current Report on Form 8-K of Universal Hospital Services, Inc. filed on May 31, 2005, and incorporated by reference herein. |
32