UNITED STATES
SECURITIES AND EXCHANGE COMMISSION
Washington, D.C. 20549
FORM 10-Q
(Mark One)
| x | QUARTERLY REPORT PURSUANT TO SECTION 13 OR 15(d) OF THE SECURITIES EXCHANGE ACT OF 1934 |
For the quarterly period ended September 30, 2005
| ¨ | TRANSITION REPORT PURSUANT TO SECTION 13 OR 15(d) OF THE SECURITIES EXCHANGE ACT OF 1934 |
For the transition period from
Commission file number: 000-20086
UNIVERSAL HOSPITAL SERVICES, INC.
(Exact name of registrant as specified in its charter)
| | |
| Delaware | | 41-0760940 |
(State or other jurisdiction of incorporation or organization) | | (IRS Employer Identification No.) |
7700 France Avenue South, Suite 275
Edina, Minnesota 55435-5228
(Address of principal executive offices)
(Zip Code)
952-893-3200
(Registrant’s telephone number, including area code)
Not Applicable
(Former name, former address and former fiscal year, if changed since last report)
Indicate by check mark whether the registrant (1) has filed all reports required to be filed by Section 13 or 15(d) of the Securities Exchange Act of 1934 during the preceding 12 months (or for such shorter period that the registrant was required to file such reports), and (2) has been subject to such filing requirements for the past 90 days. Yes ¨ No x
Indicate by check mark whether the registrant is an accelerated filer (as defined in Rule 12b-2 of the Exchange Act). Yes ¨ No x
Indicate by check mark whether the registrant is a shell company (as defined in Rule 126-2 of the Exchange Act). Yes ¨ No x
Number of shares of common stock outstanding as of November 10, 2005: 123,437,689.21
PART I - FINANCIAL INFORMATION
Item 1. Financial Statements - Unaudited
Universal Hospital Services, Inc.
Statements of Operations
(dollars in thousands)
(unaudited)
| | | | | | | | | | | | | | | | |
| | | Three Months Ended
September 30,
| | | Nine Months Ended
September 30,
| |
| | | 2005
| | | 2004
| | | 2005
| | | 2004
| |
Medical equipment outsourcing | | $ | 40,742 | | | $ | 38,582 | | | $ | 125,642 | | | $ | 116,936 | |
Technical and professional services | | | 7,546 | | | | 6,735 | | | | 22,401 | | | | 18,135 | |
Medical equipment sales and remarketing | | | 5,075 | | | | 4,291 | | | | 13,990 | | | | 12,824 | |
| | |
|
|
| |
|
|
| |
|
|
| |
|
|
|
Total revenues | | | 53,363 | | | | 49,608 | | | | 162,033 | | | | 147,895 | |
| | | | |
Cost of Sales | | | | | | | | | | | | | | | | |
Cost of medical equipment outsourcing | | | 13,407 | | | | 11,693 | | | | 39,879 | | | | 34,753 | |
Cost of technical and professional services | | | 5,677 | | | | 4,764 | | | | 16,825 | | | | 12,652 | |
Cost of medical equipment sales and remarketing | | | 4,003 | | | | 3,488 | | | | 11,117 | | | | 9,784 | |
Movable medical equipment depreciation | | | 9,631 | | | | 9,259 | | | | 28,051 | | | | 26,909 | |
| | |
|
|
| |
|
|
| |
|
|
| |
|
|
|
Total costs of medical equipment outsourcing, service and sales | | | 32,718 | | | | 29,204 | | | | 95,872 | | | | 84,098 | |
| | |
|
|
| |
|
|
| |
|
|
| |
|
|
|
Gross margin | | | 20,645 | | | | 20,404 | | | | 66,161 | | | | 63,797 | |
| | | | |
Selling, general and administrative | | | 13,771 | | | | 13,956 | | | | 43,986 | | | | 41,351 | |
| | |
|
|
| |
|
|
| |
|
|
| |
|
|
|
Operating income | | | 6,874 | | | | 6,448 | | | | 22,175 | | | | 22,446 | |
| | | | |
Interest expense | | | 7,721 | | | | 7,550 | | | | 23,142 | | | | 22,483 | |
| | |
|
|
| |
|
|
| |
|
|
| |
|
|
|
Loss before income taxes | | | (847 | ) | | | (1,102 | ) | | | (967 | ) | | | (37 | ) |
| | | | |
Provision (benefit) for income taxes | | | 210 | | | | (114 | ) | | | 630 | | | | 225 | |
| | |
|
|
| |
|
|
| |
|
|
| |
|
|
|
Net loss | | $ | (1,057 | ) | | $ | (988 | ) | | | (1,597 | ) | | $ | (262 | ) |
The accompanying notes are an integral part of the unaudited financial statements.
2
Universal Hospital Services, Inc.
Balance Sheets
(dollars in thousands, except share and per share information)
(unaudited)
| | | | | | | | |
| | | September 30,
2005
| | | December 31,
2004
| |
Assets | | | | | | | | |
| | |
Current assets: | | | | | | | | |
Accounts receivable, less allowance for doubtful accounts of $1,500 at September 30, 2005 and December 31, 2004 | | $ | 40,666 | | | $ | 40,644 | |
Inventories | | | 5,255 | | | | 5,229 | |
Deferred income taxes | | | 2,517 | | | | 2,449 | |
Other current assets | | | 2,280 | | | | 3,458 | |
| | |
|
|
| |
|
|
|
Total current assets | | | 50,718 | | | | 51,780 | |
| | |
Property and equipment, net: | | | | | | | | |
Movable medical equipment, net | | | 124,005 | | | | 125,987 | |
Property and office equipment, net | | | 10,242 | | | | 10,042 | |
| | |
|
|
| |
|
|
|
Total property and equipment, net | | | 134,247 | | | | 136,029 | |
| | |
Intangible assets: | | | | | | | | |
Goodwill | | | 37,062 | | | | 37,062 | |
Other, primarily deferred financing costs, net | | | 9,934 | | | | 10,471 | |
Other intangibles, net | | | 9,730 | | | | 11,065 | |
| | |
|
|
| |
|
|
|
Total assets | | $ | 241,691 | | | $ | 246,407 | |
| | |
Liabilities and Shareholders’ Deficiency | | | | | | | | |
| | |
Current liabilities: | | | | | | | | |
Current portion of long-term debt | | $ | 95 | | | $ | 328 | |
Accounts payable | | | 10,374 | | | | 13,406 | |
Accrued compensation | | | 6,215 | | | | 9,276 | |
Accrued interest | | | 11,047 | | | | 4,615 | |
Other accrued expenses | | | 4,442 | | | | 2,594 | |
Book overdrafts | | | 2,366 | | | | 4,691 | |
| | |
|
|
| |
|
|
|
Total current liabilities | | | 34,539 | | | | 34,910 | |
| | |
Long-term debt, less current portion | | | 293,575 | | | | 296,974 | |
Deferred compensation and pension | | | 3,792 | | | | 3,644 | |
Deferred income taxes | | | 4,420 | | | | 3,937 | |
| | |
Commitments and contingencies | | | | | | | | |
| | |
Shareholders’ deficiency: | | | | | | | | |
Common stock, $0.01 par value; 500,000,000 shares authorized, 123,437,689.21 and 123,430,612.96 shares issued and outstanding at September 30, 2005 and December 31, 2004, respectively | | | 1,234 | | | | 1,234 | |
Additional paid in capital | | | 767 | | | | 760 | |
Accumulated deficit | | | (93,606 | ) | | | (92,010 | ) |
Deferred compensation | | | (50 | ) | | | (62 | ) |
Accumulated other comprehensive loss | | | (2,980 | ) | | | (2,980 | ) |
| | |
|
|
| |
|
|
|
Total shareholders’ deficiency | | | (94,635 | ) | | | (93,058 | ) |
| | |
|
|
| |
|
|
|
Total liabilities and shareholders’ deficiency | | $ | 241,691 | | | $ | 246,407 | |
The accompanying notes are an integral part of the unaudited financial statements.
3
Universal Hospital Services, Inc.
Statements of Cash Flows
(dollars in thousands)
(unaudited)
| | | | | | | | |
| | | Nine Months Ended September 30,
| |
| | | 2005
| | | 2004
| |
Cash flows from operating activities: | | | | | | | | |
Net loss | | $ | (1,597 | ) | | $ | (262 | ) |
Adjustments to reconcile net loss to net cash provided by operating activities: | | | | | | | | |
Depreciation | | | 30,990 | | | | 29,089 | |
Amortization of intangibles and deferred financing costs | | | 2,644 | | | | 302 | |
Provision for doubtful accounts | | | 830 | | | | 1,051 | |
Provision for inventory obsolescence | | | 210 | | | | 140 | |
Non-cash stock-based compensation expense | | | 12 | | | | — | |
Gain on sales and disposal of equipment | | | (822 | ) | | | (470 | ) |
Deferred income taxes | | | 415 | | | | — | |
Changes in operating assets and liabilities, net of impact of acquisitions: | | | | | | | | |
Accounts receivable | | | (768 | ) | | | (3,125 | ) |
Inventories and other operating assets | | | 942 | | | | (339 | ) |
Accounts payable and accrued expenses | | | 1,776 | | | | 10,748 | |
| | |
|
|
| |
|
|
|
Net cash provided by operating activities | | | 34,632 | | | | 37,134 | |
| | |
|
|
| |
|
|
|
Cash flows from investing activities: | | | | | | | | |
Movable medical equipment purchases | | | (26,920 | ) | | | (34,271 | ) |
Property and office equipment purchases | | | (3,007 | ) | | | (3,008 | ) |
Proceeds from disposition of movable medical equipment | | | 2,101 | | | | 2,372 | |
Acquisitions | | | — | | | | (15,455 | ) |
Other | | | — | | | | (1,081 | ) |
| | |
|
|
| |
|
|
|
Net cash used in investing activities | | | (27,826 | ) | | | (51,443 | ) |
| | |
|
|
| |
|
|
|
Cash flows from financing activities: | | | | | | | | |
Proceeds under revolving credit facility agreements | | | 71,289 | | | | 75,714 | |
Payments under revolving credit facility agreements | | | (74,921 | ) | | | (58,378 | ) |
Payment of deferred financing cost | | | (856 | ) | | | — | |
Repurchase of Common Stock | | | — | | | | (43 | ) |
Proceeds from issuance of common stock, net of issuance costs | | | 7 | | | | 705 | |
Change in book overdrafts | | | (2,325 | ) | | | (3,689 | ) |
| | |
|
|
| |
|
|
|
Net cash (used in) provided by financing activities | | | (6,806 | ) | | | 14,309 | |
| | |
|
|
| |
|
|
|
Net change in cash and cash equivalents | | | — | | | | — | |
| | |
Cash and cash equivalents at the beginning of period | | | — | | | | — | |
Cash and cash equivalents at the end of period | | | — | | | | — | |
| | |
Supplemental cash flow information: | | | | | | | | |
Interest paid | | | 15,394 | | | | 15,710 | |
| | |
|
|
| |
|
|
|
Movable medical equipment purchases included in accounts payable | | | 4,368 | | | | 4,187 | |
| | |
|
|
| |
|
|
|
Income taxes paid | | | 111 | | | | 61 | |
| | |
|
|
| |
|
|
|
The accompanying notes are an integral part of the unaudited financial statements.
4
Universal Hospital Services, Inc.
NOTES TO UNAUDITED QUARTERLY FINANCIAL STATEMENTS
1. Basis of Presentation
The interim financial statements included in this Form 10-Q have been prepared by the Company without audit, pursuant to the rules and regulations of the Securities and Exchange Commission. Certain information and footnote disclosures normally included in financial statements prepared in accordance with accounting principles generally accepted in the United States of America have been condensed, or omitted, pursuant to such rules and regulations. These condensed financial statements should be read in conjunction with the financial statements and related notes included in the Company’s 2004 Annual Report on Form 10-K filed with the Securities and Exchange Commission.
The interim financial statements presented herein as of September 30, 2005, and for the three and nine months ended September 30, 2005, and 2004, reflect, in the opinion of management, all adjustments necessary for a fair presentation of the financial position and the results of operations and cash flows for the periods presented. These adjustments are all of a normal, recurring nature. The results of operations for any interim period are not necessarily indicative of results for the full year.
The December 31, 2004, balance sheet amounts were derived from audited financial statements, but do not include all disclosures required by accounting principles generally accepted in the United States of America.
2. Recent Accounting Pronouncements
In December 2004, the Financial Accounting Standards Board (“FASB”) issued Statement of Financial Accounting Standards (“SFAS”) No. 153, “Exchanges of Nonmonetary Assets – An Amendment of APB Opinion No. 29.” This statement amends APB Opinion No. 29 and is based on the principle that exchanges of nonmonetary assets should be measured based on the fair value of the assets exchanged. SFAS No. 153 is effective for nonmonetary exchanges occurring in fiscal periods beginning after June 15, 2005. The adoption of this statement, effective July 1, 2005, had no material effect on the our financial condition or results of operations.
On December 16, 2004, the FASB issued SFAS No. 123(R), “Share-Based Payment”, which is a revision of SFAS No.123 and supersedes APB Opinion No. 25. SFAS No. 123(R) requires all share-based payments to employees, including grants of employee stock options, to be valued at fair value on the date of grant, and to be expensed over the applicable vesting period. Pro forma disclosure of the income statement effects of share-based payments is no longer an alternative. SFAS No. 123(R) is effective for private entities (which, by definition, includes the Company) on January 1, 2006. Starting then, we must recognize compensation expense related to all awards that are not fully vested over their applicable vesting period. Compensation expense for these awards will be measured based on the fair value of the awards previously calculated in developing the pro forma disclosures in accordance with the provisions of SFAS No. 123. We are currently assessing the impact of adopting SFAS No. 123(R) to our results of operations.
5
In May 2005, the FASB issued SFAS No. 154, “Accounting Changes and Error Corrections” which replaces APB Opinion No. 20 “Accounting Changes” and SFAS No. 3, “Reporting Accounting Changes in Interim Financial Statements-An Amendment of APB Opinion No. 28.” SFAS No. 154 provides guidance on the accounting for and reporting of accounting changes and error corrections. It establishes retrospective application, or the latest practicable date, as the required method for reporting a change in accounting principle and the reporting of a correction of an error. SFAS No. 154 is effective for accounting changes and corrections of errors made in fiscal years beginning after December 15, 2005. We are currently assessing the impact of adopting SFAS No. 154 on our results of operations and financial condition.
3. Stock Based Compensation
We measure compensation expense for our stock-based compensation plan using the intrinsic value method. Accordingly, compensation cost for stock options granted to employees is measured as the excess, if any, of the value of our stock at the date of the grant over the amount an employee must pay to acquire the stock. Had compensation cost for our stock option plans been determined based on the fair value at the grant date for awards, our net income would have changed to the pro forma amounts indicated below (dollars in thousands):
| | | | | | | | |
| | | Nine Months Ended
Sept 30,
| |
| | | 2005
| | | 2004
| |
Net loss, as reported | | $ | (1,597 | ) | | $ | (262 | ) |
Add: Stock-based employee compensation included in reported net loss | | | 12 | | | | — | |
Less: Total stock-based employee compensation expense under fair value-based method | | | (366 | ) | | | (761 | ) |
| | |
|
|
| |
|
|
|
Pro forma net loss | | $ | (1,951 | ) | | $ | (1,023 | ) |
On November 10, 2005, options to purchase an aggregate of 1,388,200 shares of common stock were offered to 366 employees under the 2003 Stock Option Plan (the “Plan”) effective November 1, 2005. All of the foregoing options were issued with an exercise price of $1.33 per share, the fair market value of a share of common stock on the date of grant as determined by the Board of Directors.
4. Long-Term Debt
Long-term debt consists of the following (dollars in thousands):
| | | | | | | | |
| | | September 30,
2005
| | | December 31,
2004
| |
10.125% senior notes | | $ | 260,000 | | | $ | 260,000 | |
Revolving credit facility | | | 33,575 | | | | 36,974 | |
Capital lease obligations | | | 95 | | | | 328 | |
| | |
|
|
| |
|
|
|
| | | | 293,670 | | | | 297,302 | |
| | |
Less: Current portion of long-term debt | | | (95 | ) | | | (328 | ) |
| | |
|
|
| |
|
|
|
Total long-term debt | | $ | 293,575 | | | $ | 296,974 | |
6
The 10.125% Senior Notes (“Senior Notes”) mature on November 1, 2011. Interest on the Senior Notes accrues at the rate of 10.125% per annum and is payable semiannually on each May 1 and November 1. The Senior Notes are redeemable, at the Company’s option, in whole or in part, on or after November 1, 2007, at specified redemption prices plus accrued interest to the date of redemption. At any time upon an equity offering prior to November 1, 2006, as defined in the indenture governing the Senior Notes, the Company can redeem up to 35% of the Senior Notes, at a purchase price equal to 110.125% of the principal amount plus accrued interest to the dates of purchase. In addition, the Senior Notes have a change of control provision which gives each holder the right to require the Company to purchase all or a portion of such holders’ Senior Notes upon a change in control, as defined in the agreement, at a purchase price equal to 101% of the principal amount plus accrued interest to the date of purchase. The Senior Notes have covenants that restrict the incurrence of additional debt, the payment of dividends and the issuance of preferred stock. The Senior Notes are uncollateralized.
The Company entered into an Amended and Restated Credit Agreement (“Amended Credit Agreement”) with a bank group led by General Electric Capital Corporation. The Amended Credit Agreement allows for borrowing up to $125 million, as defined in the agreement, and terminates in May 2010. Availability under the Amended Credit Agreement as of September 30, 2005, was approximately $74 million, representing our borrowing base of approximately $110 million less borrowings of $34 million and outstanding letters of credit of $2 million at that date. Borrowings under the agreement are collateralized by substantially all the assets of the Company.
Amounts borrowed under the Amended Credit Agreement generally bear interest on a LIBOR-based formula. The interest rate currently is 2.25 percentage points over LIBOR, and the interest rate margin subject to change based upon quarterly leverage ratios.
The Amended Credit Agreement contains certain covenants including restrictions and limitations on dividends, liens, leases, incurrence or guarantees of debt, transactions with affiliates, investments or loans, and mergers, acquisitions, consolidations and asset sales. Furthermore, the Company is required to maintain compliance with certain financial covenants, including a maximum senior debt leverage ratio and a minimum interest coverage ratio. As of September 30, 2005, the Company was in compliance with all covenants under the Amended Credit Agreement.
5. Acquisitions
On March 24, 2004, we completed the acquisition of Affiliated Clinical Engineering Services, Inc. (“ACES”), headquartered in Boston, Massachusetts. The purchase price was approximately $4.2 million. We financed this purchase from borrowings under our revolving credit facility.
On April 15, 2004, we completed the acquisition of certain assets from Galaxy Medical Products, Inc., headquartered in Akron, Ohio. The purchase price was approximately $4.9 million. We financed this purchase from borrowings under our revolving credit facility.
On May 4, 2004, we completed the acquisition of substantially all of the assets of Advanced Therapeutics of Wisconsin, Inc., headquartered in Milwaukee, Wisconsin. The purchase price was approximately $5.1 million. We financed this purchase from borrowings under our revolving credit facility.
7
On August 31, 2004, we completed the acquisition of certain assets of Cardinal Health 200, Inc., headquartered in Naperville, Illinois. The purchase price was approximately $0.9 million. We financed this purchase from borrowings under our revolving credit facility.
The operations of the above acquired companies have been included in the Company’s results of operations since the date of the respective acquisitions. With these acquisitions, the Company also established holdback amounts totaling $1.4 million during 2004, of which $1.1 million has been paid during 2005.
The following summarizes pro forma results of operations, assuming the acquisitions noted above occurred at January 1, 2004 (dollars in thousands):
| | | | | | | | | | | |
| | | Three Months Ended
September 30,
| | | Nine Months Ended
September 30,
|
| | | 2005
| | | 2004
| | | 2005
| | | 2004
|
Total revenues | | 53,363 | | | 49,931 | | | 162,033 | | | 152,087 |
| | |
|
| |
|
| |
|
| |
|
Net (loss) income | | (1,057 | ) | | (988 | ) | | (1,597 | ) | | 213 |
| | |
|
| |
|
| |
|
| |
|
6. Segment Information
Our operating segments consist of Medical Equipment Outsourcing, Technical and Professional Services, and Medical Equipment Sales and Remarketing. Certain operating information on our segments is as follows (dollars in thousands):
| | | | | | | | | | | | | | | | | | | | | | | | |
| | | Three months ended September 30,
|
| | | Medical Equipment
Outsourcing
| | Technical and
Professional
Services
| | Medical
Equipment Sales
and Remarketing
| | Total
|
| | | 2005
| | 2004
| | 2005
| | 2004
| | 2005
| | 2004
| | 2005
| | 2004
|
Revenues. | | $ | 40,742 | | $ | 38,582 | | $ | 7,546 | | $ | 6,735 | | $ | 5,075 | | $ | 4,291 | | $ | 53,363 | | | 49,608 |
| | | | | | | | |
Cost of Revenue | | | 13,407 | | | 11,693 | | | 5,677 | | | 4,764 | | | 4,003 | | | 3,488 | | | 23,087 | | | 19,945 |
Movable Medical Equipment Depreciation | | | 9,631 | | | 9,259 | | | | | | | | | | | | | | | 9,631 | | | 9,259 |
| | |
|
| |
|
| |
|
| |
|
| |
|
| |
|
| |
|
| |
|
|
Gross Margin | | $ | 17,704 | | $ | 17,630 | | $ | 1,869 | | $ | 1,971 | | $ | 1,072 | | $ | 803 | | | 20,645 | | $ | 20,404 |
8
| | | | | | | | | | | | | | | | | | | | | | | | |
| | | Nine months ended September 30,
|
| | | Medical Equipment Outsourcing
| | Technical and
Professional Services
| | Medical Equipment Sales and Remarketing
| | Total
|
| | | 2005
| | 2004
| | 2005
| | 2004
| | 2005
| | 2004
| | 2005
| | 2004
|
Revenues | | $ | 125,642 | | $ | 116,936 | | | 22,401 | | $ | 18,135 | | $ | 13,990 | | $ | 12,824 | | | 162,033 | | $ | 147,895 |
Cost of Revenue | | | 39,879 | | | 34,753 | | | 16,825 | | | 12,652 | | | 11,117 | | | 9,784 | | | 67,821 | | | 57,189 |
Movable Medical Equipment Depreciation | | | 28,051 | | | 26,909 | | | | | | | | | | | | | | | 28,051 | | | 26,909 |
| | |
|
| |
|
| |
|
| |
|
| |
|
| |
|
| |
|
| |
|
|
Gross Margin | | $ | 57,712 | | $ | 55,274 | | $ | 5,576 | | $ | 5,483 | | $ | 2,873 | | $ | 3,040 | | $ | 66,161 | | $ | 63,797 |
7. Pension Plan
The components of net periodic pension costs are as follows:
| | | | | | | | | | | | | | | | |
(dollars in thousands) | | Three months ended
September 30,
| | | Nine months ended
September 30,
| |
| | | 2005
| | | 2004
| | | 2005
| | | 2004
| |
Service cost | | $ | — | | | $ | — | | | $ | — | | | $ | — | |
Interest cost | | | 238 | | | | 220 | | | | 713 | | | | 658 | |
Expected return on plan assets | | | (246 | ) | | | (236 | ) | | | (739 | ) | | | (707 | ) |
Recognized net actuarial loss | | | 58 | | | | 14 | | | | 175 | | | | 42 | |
Amortization of prior service cost | | | — | | | | — | | | | — | | | | — | |
| | |
|
|
| |
|
|
| |
|
|
| |
|
|
|
Total cost | | $ | 50 | | | $ | (2 | ) | | $ | 149 | | | $ | (7 | ) |
Future benefit accruals for all participants were frozen as of December 31, 2002.
Item 2. Management’s Discussion and Analysis of Financial Condition and Results of Operations
The following should be read in conjunction with the accompanying financial statements and notes.
BUSINESS OVERVIEW
Our Company
Universal Hospital Services, Inc. (“we”, “our”, “UHS” or “the Company”) is a leading, nationwide provider of medical equipment outsourcing and services to the health care industry. Our customers include national, regional and local acute care hospitals, alternate site providers (such as nursing homes and home care providers) and medical equipment manufacturers. Our diverse customer base includes more than 3,200 acute care hospitals and approximately 3,150 alternate site providers. We also have extensive and long-standing relationships with over 200 major medical equipment manufacturers and many of the nation’s largest group purchasing organizations (“GPOs”) and integrated delivery networks (“IDNs”). All of our services leverage our nationwide network of offices and our more than 65 years of experience managing and servicing all aspects of movable medical equipment. These services are paid for by our customers and not directly through reimbursement from governmental or other third-party payors.
9
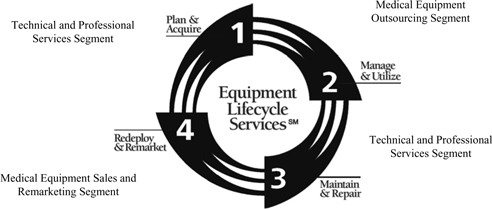
Our operating segments consist of Medical Equipment Outsourcing, Technical and Professional Services, and Medical Equipment Sales and Remarketing. We evaluate the performance of our operating segments based on gross margin. The accounting policies of the individual operating segments are the same as those of the entire company.
Medical Equipment Outsourcing Segment - Manage & Utilize
Our flagship business is our Medical Equipment Outsourcing Segment which accounted for $40.7 million, or approximately 76.3% of our revenues for third quarter of 2005, and $125.6 million, or approximately 77.5% of our revenues for the first nine months of 2005. We own approximately 160,000 pieces of movable medical equipment, primarily in the categories of respiratory therapy, newborn care, critical care, patient monitors, and bariatric and pressure area management. In our outsourcing programs we provide our customers with the use of movable medical equipment, and we maintain the equipment for our customers by performing preventative maintenance, repairs, cleaning and testing, and maintaining certain reporting records. We also provide prompt replacement of any defective equipment and the flexibility to upgrade their equipment as technology changes. We have three primary outsourcing programs: Supplemental (Peak Needs) Outsourcing; Long Term Outsourcing; and the Asset Management Partnership Program (“AMPP”).
We have contracts in place with many of the leading national GPOs for both the acute care and alternate site markets. We also have agreements with national alternate site providers. We expect much of our future growth in this segment to be driven by our customers outsourcing more of their movable medical equipment needs and taking full advantage of our Long Term Outsourcing and resident-based AMPP programs.
Technical and Professional Services Segment – Plan & Acquire; Maintain & Repair
The Technical and Professional Services segment accounted for $7.5 million, or approximately 14.1%, of our
10
revenues for the third quarter of 2005, and $22.4 million, or approximately 13.8%, of our revenues for the first nine months of 2005. We leverage our 65 plus years of experience and our extensive equipment database in repairing and maintaining medical equipment. We offer a broad range of inspection, preventative maintenance, repair, logistic and consulting services through our team of over 250 technicians and professionals located in our nationwide network of district offices and service centers. Our technical and professional service offerings are less capital intensive than our Medical Equipment Outsourcing segment, and provide a complementary alternative for customers that wish to own their medical equipment, but lack the expertise, funding or scale to perform maintenance, repair and analytical functions.
While our contracts with GPOs once were solely to provide medical equipment outsourcing services, we have expanded some of our agreements with these organizations to include Technical and Professional Services. We believe this trend will continue as GPOs look to provide their members with services covering more of the medical equipment lifecycle.
Medical Equipment Sales and Remarketing Segment- Redeploy & Remarket
The Medical Equipment Sales and Remarketing segment accounted for $5.1 million, or approximately 9.5%, of our revenues for the third quarter of 2005, and $14.0 million, or approximately 8.6%, of our revenues for the first nine months of 2005. This segment includes three business activities:
Medical Equipment Remarketing and Disposal.We are one of the nation’s largest buyers and sellers of movable medical equipment, primarily for our own account.
Specialty Medical Equipment Sales and Distribution.We use our national infrastructure to provide sales and distribution to manufacturers of specialty medical equipment. We currently sell product lines in the following areas: patient monitors, rehabilitation products, patient transfer systems, infant security systems and respiratory therapy.
Disposables Sales.We offer our customers single use disposable items. Most of these items are used in connection with our outsourced equipment.
RESULTS OF OPERATIONS
The following discussion addresses our financial condition as of September 30, 2005, and the results of operations for the three and nine months ended September 30, 2005, and 2004, and cash flows for the nine months ended September 30, 2005, and 2004. This discussion should be read in conjunction with the financial statements included elsewhere in this report and the Management’s Discussion and Analysis and Financial section included in our 2004 Annual Report on Form 10-K filed with the Securities and Exchange Commission.
11
The following table provides a summary of selected financial data as a percentage of total revenues and also indicates the percentage increase or decrease of this data over the prior comparable period:
| | | | | | | | | | | | | | | | | | |
| | | Percent of Total Revenues
| | | Percent Increase (Decrease)
| |
| | | Three Months Ended
September 30,
| | | Nine Months Ended,
September 30,
| | | Qtr 3 2005
Over Qtr 3
| | | Nine Months
2005 Over
Nine Months
| |
| | | 2005
| | | 2004
| | | 2005
| | | 2004
| | | 2004
| | | 2004
| |
Medical equipment outsourcing | | 76.4 | % | | 77.8 | % | | 77.6 | % | | 79.1 | % | | 5.6 | % | | 7.4 | % |
Technical and professional services | | 14.1 | | | 13.6 | | | 13.8 | | | 12.3 | | | 12.0 | | | 23.5 | |
Medical equipment sales and remarketing | | 9.5 | | | 8.6 | | | 8.6 | | | 8.6 | | | 18.3 | | | 9.1 | |
| | |
|
| |
|
| |
|
| |
|
| |
|
| |
|
|
Total revenues | | 100.0 | | | 100.0 | | | 100.0 | | | 100.0 | | | 7.6 | | | 9.6 | |
| | | | | | |
Cost of Sales | | | | | | | | | | | | | | | | | | |
Cost of medical equipment outsourcing | | 25.2 | | | 23.6 | | | 24.6 | | | 23.5 | | | 14.7 | | | 14.7 | |
Cost of technical and professional services | | 10.6 | | | 9.6 | | | 10.4 | | | 8.6 | | | 19.2 | | | 33.0 | |
Cost of medical equipment sales and remarketing | | 7.5 | | | 7.0 | | | 6.9 | | | 6.6 | | | 14.8 | | | 13.6 | |
Movable medical equipment depreciation | | 18.0 | | | 18.7 | | | 17.3 | | | 18.2 | | | 4.0 | | | 4.2 | |
| | |
|
| |
|
| |
|
| |
|
| |
|
| |
|
|
Total costs of outsourcing, service and sales | | 61.3 | | | 58.9 | | | 59.2 | | | 56.9 | | | 12.0 | | | 18.6 | |
| | |
|
| |
|
| |
|
| |
|
| |
|
| |
|
|
Gross margin | | 38.7 | | | 41.1 | | | 40.8 | | | 43.1 | | | 1.2 | | | 3.7 | |
Selling, general and administrative | | 25.8 | | | 28.1 | | | 27.1 | | | 27.9 | | | (1.3 | ) | | 6.4 | |
| | |
|
| |
|
| |
|
| |
|
| |
|
| |
|
|
Operating income | | 12.9 | | | 13.0 | | | 13.7 | | | 15.2 | | | 6.6 | | | (1.2 | ) |
Interest expense | | 14.5 | | | 15.2 | | | 14.3 | | | 15.2 | | | 2.3 | | | 2.9 | |
| | |
|
| |
|
| |
|
| |
|
| |
|
| |
|
|
Loss before income taxes | | (1.6 | ) | | (2.2 | ) | | (0.6 | ) | | 0.0 | | | — | | | — | |
Provision for income taxes | | 0.4 | | | (0.2 | ) | | 0.4 | | | 0.2 | | | — | | | — | |
| | |
|
| |
|
| |
|
| |
|
| |
|
| |
|
|
Net loss | | (2.0 | )% | | (2.0 | )% | | (1.0 | )% | | (0.2 | )% | | — | | | — | |
12
Comparison of Third Quarter 2005 to Third Quarter 2004
Medical Equipment Outsourcing – Manage & Utilize
| | | | | | | | | | | | | | |
(dollars in thousands) | | Three months ended
September 30,
| | | | | | |
| | | 2005
| | | 2004
| | | Change
| | % Change
| |
Total Revenue | | $ | 40,742 | | | $ | 38,582 | | | $ | 2,160 | | 5.6 | % |
Cost of Revenue | | | 13,407 | | | | 11,693 | | | | 1,714 | | 14.7 | |
Movable Medical Equipment Depreciation | | | 9,631 | | | | 9,259 | | | | 372 | | 4.0 | |
| | |
|
|
| |
|
|
| |
|
| |
|
|
Gross Margin | | $ | 17,704 | | | $ | 17,630 | | | $ | 74 | | 0.0 | % |
| | | | |
Gross Margin % | | | 43.5 | % | | | 45.7 | % | | | | | | |
Total revenue in the Medical Equipment Outsourcing segment rose $2.2 million, or 5.6%, to $40.7 million in the third quarter of 2005. This increase was driven by growth in our acute care customer base, increased activity in our AMPP customers, and incremental business from new and existing technology in our fleet, offsetting weak hospital census.
Total cost of revenue in the segment rose $1.7 million, or 14.7%, to $13.4 million in the third quarter of 2005. This increase is primarily attributable to higher employee-related costs of $0.6 million, gasoline and other fleet expenses of $0.6 million, facilities and occupancy expenses of $0.3 million, and repair expenses of $0.3 million.
Movable medical equipment depreciation increased $0.4 million, or 4.0%, to $9.6 million in the third quarter of 2005. This increase primarily reflects a slight increase in the average equipment value during the quarter.
Gross margin percentage for the medical equipment outsourcing segment decreased from 45.7% in the third quarter of 2004 to 43.5% in the third quarter of 2005. This decrease is primarily attributable to higher employee-related and fleet costs and lower hospital census.
Technical and Professional Services – Plan & Acquire/Maintain & Repair
| | | | | | | | | | | | | | | |
(dollars in thousands) | | Three months ended
September 30,
| | | | | | | |
| | | 2005
| | | 2004
| | | Change
| | | % Change
| |
Total Revenue | | $ | 7,546 | | | $ | 6,735 | | | $ | 811 | | | 12.0 | % |
Cost of Revenue | | | 5,677 | | | | 4,764 | | | | 913 | | | 19.2 | |
| | |
|
|
| |
|
|
| |
|
|
| |
|
|
Gross Margin | | $ | 1,869 | | | $ | 1,971 | | | $ | (102 | ) | | (5.2 | )% |
| | | | |
Gross Margin % | | | 24.8 | % | | | 29.3 | % | | | | | | | |
Total revenue in the Technical and Professional Services segment rose $0.8 million, or 12.0%, to $7.5 million in the third quarter of 2005. This revenue increase resulted from growth in our supplemental, or response-based, and manufacturer services businesses. These product lines are transactional in nature and such results reflect increased customer demand.
13
Total cost of revenue in the segment rose $0.9 million, or 19.2%, to $5.7 million in the third quarter of 2005. This increase is primarily attributable to greater technician headcount generating higher employee-related costs of $0.7 million and repair costs of $0.4 million, partially offset by other favorable cost variances of $0.2 million.
Gross margin percentage for the technical and professional services segment decreased from 29.3% in the third quarter of 2004 to 24.8% in the third quarter of 2005. This decrease is primarily due to the loss of revenue from a financially-distressed customer as well as increased staffing costs related to the building of our equipment lifecycle services platform. We believe margin levels experienced in 2004 are not sustainable going forward due to competitive reasons.
Medical Equipment Sales and Remarketing – Redeploy & Remarket
| | | | | | | | | | | | | | |
(dollars in thousands) | | Three months ended
September 30,
| | | | | | |
| | | 2005
| | | 2004
| | | Change
| | % Change
| |
Total Revenue | | $ | 5,075 | | | $ | 4,291 | | | $ | 784 | | 18.3 | % |
Cost of Revenue | | | 4,003 | | | | 3,488 | | | | 515 | | 14.8 | |
| | |
|
|
| |
|
|
| |
|
| |
|
|
Gross Margin | | $ | 1,072 | | | $ | 803 | | | $ | 269 | | 33.5 | % |
| | | | |
Gross Margin % | | | 21.1 | % | | | 18.7 | % | | | | | | |
Total revenue in the Medical Equipment Sales and Remarketing segment rose $0.8 million, or 18.3%, to $5.1 million in the third quarter of 2005. This increase was caused by higher new equipment sales of $0.4 million and higher used and brokerage equipment sales of $0.8 million, partially offset by reduced sales of disposable items of $0.4 million.
Total cost of revenue in the segment rose $0.5 million, or 14.8%, to $4.0 million in the third quarter of 2005. This increase is primarily attributable to higher costs of new equipment sales of $0.4 million and used and brokerage equipment of $0.3 million, partially offset by reduced costs of disposable goods sold of $0.3 million.
Gross margin percentage for the medical equipment sales and remarketing segment increased from 18.7% in the third quarter of 2004 to 21.1% in the third quarter of 2005. Margins in this segment will fluctuate based on used equipment availability. As activity in our outsourcing segment slowed from its seasonal peak, more equipment from our Company-owned fleet became available for sale.
Selling, General and Administrative Expenses
Selling, general and administrative expenses declined $0.2 million, or 1.3%, to $13.8 million in the third quarter of 2005 primarily due to continuous improvement efforts coupled with cost controls implemented during the quarter that resulted in reduced employee-related and travel expenses. These cost-saving initiatives more than offset $0.3 million of severance charges related to the realignment of our sales and operations organizations. We anticipate that we will incur additional charges with regard to this realignment in the fourth quarter. Selling, general and administrative expenses as a percentage of total revenue for the third quarter of 2005, decreased to 25.8% from 28.1% for the same period of 2004.
14
Interest Expense
Interest expense rose $0.2 million, or 2.3%, to $7.7 million in the third quarter of 2005. The increase in interest expense reflects increased borrowing as well as higher interest rates. Average total borrowings increased for the third quarter of 2005 to $296.2 million from $289.7 million for the same period of 2004.
Income Taxes
Tax expense for the three months ended September 30, 2005, was $0.2 million versus an income tax benefit of $0.1 million for the same period of 2004. Income tax expense relates primarily to valuation allowances established for net operating losses not recognized as well as minimum state taxes.
Net Loss
Net loss rose $0.1 million, or 7.0% to $1.1 million, in the third quarter of 2005. The increase is primarily due to increased interest expense of $0.2 million and higher tax expense of $0.3 million, partially offset by increased gross margin of $0.2 million and lower selling, general and administrative expenses of $0.2 million. Net loss in 2005 was also impacted by increased worker’s compensation and auto insurance costs $0.7 million offset by lower incentive compensation of $0.9 million.
Comparison of the First Nine Months of 2005 to the First Nine Months of 2004
Medical Equipment Outsourcing – Manage & Utilize
| | | | | | | | | | | | | | |
(dollars in thousands) | | Nine months ended
September 30,
| | | | | | |
| | | 2005
| | | 2004
| | | Change
| | % Change
| |
Total Revenue | | $ | 125,642 | | | $ | 116,936 | | | $ | 8,706 | | 7.4 | % |
Cost of Revenue | | | 39,879 | | | | 34,753 | | | | 5,126 | | 14.7 | |
Movable Medical Equipment Depreciation | | | 28,051 | | | | 26,909 | | | | 1,142 | | 4.2 | |
| | |
|
|
| |
|
|
| |
|
| |
|
|
Gross Margin | | $ | 57,712 | | | $ | 55,274 | | | $ | 2,438 | | 4.4 | % |
| | | | |
Gross Margin % | | | 45.9 | % | | | 47.3 | % | | | | | | |
Total revenue in the Medical Equipment Outsourcing segment rose $8.7 million, or 7.4%, to $125.6 million in the first nine months of 2005. This increase was driven by competitive take-aways, re-entry into the bariatrics market late in the second quarter of 2004, growth in our acute care customer base, increased activity in our AMPP customers, new and existing technology in our fleet attracting incremental business, and the effect of the acquisitions of substantially all of the assets of Advanced Therapeutics of Wisconsin, Inc. and certain assets of Galaxy Medical Products, Inc. in the second quarter of 2004.
Total cost of revenue in the segment rose $5.1 million, or 14.7%, to $39.9 million in the first nine months of 2005. This increase is primarily attributable to higher employee-related costs of $2.7 million, facilities and occupancy costs of $0.7 million, freight costs of $0.6 million, repair costs of $0.6 million, non-movable medical equipment depreciation of $0.3 million, and other costs of $0.2 million.
15
Movable medical equipment depreciation increased $1.1 million, or 4.2%, to $28.1 million in the first nine months of 2005. This increase primarily reflects a slight increase in the average equipment net book value during the nine months ended September 30, 2005.
Gross margin percentage for the medical equipment outsourcing segment decreased from 47.3% in the first nine months of 2004 to 45.9% in the first nine months of 2005. This decrease is primarily attributable to higher employee-related costs and lower hospital census.
Technical and Professional Services – Plan & Acquire/Maintain & Repair
| | | | | | | | | | | | | | |
(dollars in thousands) | | Nine months ended
September 30,
| | | | | | |
| | | 2005
| | | 2004
| | | Change
| | % Change
| |
Total Revenue | | $ | 22,401 | | | $ | 18,135 | | | $ | 4,266 | | 23.5 | % |
Cost of Revenue | | | 16,825 | | | | 12,652 | | | | 4,173 | | 33.0 | |
| | |
|
|
| |
|
|
| |
|
| |
|
|
Gross Margin | | $ | 5,576 | | | $ | 5,483 | | | $ | 93 | | 1.7 | % |
| | | | |
Gross Margin % | | | 24.9 | % | | | 30.2 | % | | | | | | |
Total revenue in the Technical and Professional Services segment rose $4.3 million, or 23.5%, to $22.4 million in the first nine months of 2005. This increase was caused by growth in our supplemental and manufacturer services businesses as well as the acquisitions of Affiliated Clinical Engineering Services, Inc. (“ACES”) late in the first quarter of 2004, and certain assets of Cardinal Health, 200, Inc. in the third quarter of 2004, offsetting the loss of revenue from a financially-distressed customer in the second quarter of 2005.
Total cost of revenue in the segment rose $4.2 million, or 33.0%, to $16.8 million in the first nine months of 2005. This increase is primarily attributable to greater technician headcount generating higher employee-related costs of $2.8 million and repair costs of $1.3 million, as well as generally higher supply and parts costs to meet increased customer need.
Gross margin percentage for the technical and professional services segment decreased from 30.2% in the first nine months of 2004 to 24.9% in the first nine months of 2005. This decrease is primarily attributable to the acquisition of the lower margin ACES business late in the first quarter of 2004, the loss of a financially-distressed customer in the second quarter of 2005, and continued investment to develop our equipment lifecycle services platform. We believe margin levels experienced in 2004 are not sustainable going forward due to competitive reasons.
Medical Equipment Sales and Remarketing – Redeploy & Remarket
| | | | | | | | | | | | | | | |
(dollars in thousands) | | Nine months ended September 30,
| | | | |
| | | 2005
| | | 2004
| | | Change
| | | % Change
| |
Total Revenue | | $ | 13,990 | | | $ | 12,824 | | | $ | 1,166 | | | 9.1 | % |
Cost of Revenue | | | 11,117 | | | | 9,784 | | | | 1,333 | | | 13.6 | |
| | |
|
|
| |
|
|
| |
|
|
| |
|
|
Gross Margin | | $ | 2,873 | | | $ | 3,040 | | | $ | (167 | ) | | (5.5 | )% |
| | | | |
Gross Margin % | | | 20.5 | % | | | 23.7 | % | | | | | | | |
16
Total revenue in the Medical Equipment Sales and Remarketing segment rose $1.2 million, or 9.1%, to $14.0 million in the first nine months of 2005. This revenue increase resulted from higher new equipment sales of $1.3 million and used and brokerage equipment sales of $0.9 million, partially offset by reduced sales of disposable items of $1.1 million.
Total cost of revenue in the segment rose $1.3 million, or 13.6% to $11.1 million in the first nine months of 2005. This increase is primarily attributable to higher costs of new equipment of $1.3 million, used and brokerage equipment of $0.6 million, and repair of $0.3 million, partially offset by reduced costs of disposable goods sold of $1.0 million.
Gross margin percentage for the medical equipment sales and remarketing segment decreased from 23.7% in the first nine months of 2004 to 20.5% in the first nine months of 2005. Margins in this segment will fluctuate based on used equipment availability. During much of the first half of 2005, we moved equipment held for sale into our rental fleet to meet high customer demand which limited company-owned fleet sale opportunities. As activity in our outsourcing segment slowed from its seasonal peak, more equipment from our company-owned fleet became available for sale during the third quarter, partially offsetting the margin contraction.
Selling, General and Administrative Expenses
Selling, general and administrative expenses rose $2.6 million, or 6.4%, to $44.0 million in the first nine months of 2005. The increase was primarily due to higher employee-related costs of $1.7 million, additional amortization of intangible assets of $1.0 million, and $0.6 million of expenses related to preparation for the requirements of Section 404 of the Sarbanes-Oxley Act of 2002, partially offset by reduced legal and consulting expenses of $0.3 million. In addition, we implemented cost controls during the third quarter that resulted in reduced employee-related and travel expenses. These cost-saving initiatives more than offset $0.3 million of severance charges related to the realignment of our sales and operations organizations. We anticipate that we will incur additional charges with regard to this realignment in the fourth quarter. Selling general and administrative expenses as a percentage of total revenue for the first nine months of 2005 decreased to 27.1% from 27.9% for the same period of 2004.
Interest Expense
Interest expense rose $0.7 million, or 2.9%, to $23.1 million in the first nine months of 2005. This increase primarily reflects an increase in borrowings under our revolving credit agreement and higher interest rates. Average total borrowings increased for the first nine months of 2005 to $298.1 million from $284.5 million for the same period of 2004, primarily due to the timing of acquisitions in 2004.
Income Taxes
Tax expense for the nine months ended September 30, 2005, was $0.6 million representing an increase from income tax expense of $0.2 million for the same period of 2004. Income tax expense relates primarily to valuation allowances established for net operating losses not recognized as well as minimum state taxes.
17
Net Loss
Net loss rose $1.3 million, to $1.6 million, in the first nine months of 2005. The change is due to increased selling, general and administrative expenses of $2.6 million, higher interest expense of $0.7 million and higher tax expense of $0.4 million, partially offset by increased gross margin of $2.4 million. Net loss was also impacted by increased worker’s compensation and auto insurance costs $0.7 million offset by lower incentive compensation of $0.3 million.
Seasonality
Quarterly operating results are typically affected by seasonal factors. Historically, our first and fourth quarters are the strongest, reflecting increased hospital utilization during the fall and winter months.
LIQUIDITY AND CAPITAL RESOURCES
Our principal sources of liquidity are expected to be cash flows from operating activities and borrowings under our five-year Amended Credit Agreement that we entered into on May 26, 2005. It is anticipated that our principal uses of liquidity will be to fund capital expenditures related to purchases of movable medical equipment, provide working capital, meet debt service requirements and finance our strategic plans.
We require substantial cash to operate our Medical Equipment Outsourcing programs and service our debt. Our outsourcing programs require us to invest a significant amount of cash in movable medical equipment purchases. To the extent that such expenditures cannot be funded from our operating cash flow, borrowing under our Amended Credit Agreement or other financing sources, we may not be able to conduct our business or grow as currently planned.
If we are unable to generate sufficient cash flow from operations in order to service our debt, we will be forced to take actions such as reducing or delaying capital expenditures, selling assets, restructuring or refinancing our debt or seeking additional equity capital. This, to a certain extent, is subject to general economic, financial, competitive, legislative, regulatory and other factors that are beyond our control. If we are unable to repay our debt at maturity, we may have to obtain alternative financing, which may not be available to us.
Net cash provided by operating activities during the nine months ended September 30, 2005, was $34.6 million, compared to $37.1 million in the same period of 2004. This decrease is primarily attributable to a higher net loss of $1.6 million versus a net loss of $0.3 million in the prior year period and less favorable changes in operating assets and liabilities. Net cash used in investing activities during the nine months ended September 30, 2005, was $27.8 million, compared to $51.4 million in the same period of 2004. This decrease was primarily attributable to the acquisitions of ACES, certain assets of Galaxy Medical Products, Inc., substantially all the assets of Advanced Therapeutics of Wisconsin, Inc., and certain assets of Cardinal Health 200, Inc. in the same period of 2004, as well as timing differences related to equipment placed in service in 2003 and paid for in 2004. Net cash used in financing activities during the nine months ended September 30, 2005, was $6.8 million, compared to net cash provided by financing activities of $14.3 million to fund capital expenditures in the same period of 2004. This change was attributable to net repayments under our Amended Credit Agreement during 2005 compared to net borrowings during 2004.
18
Based on the level of operating performance expected in 2005, we believe our cash from operations, together with additional borrowings under our Amended Credit Agreement, will meet our liquidity needs for the foreseeable future, exclusive of any borrowings that we may make to finance potential acquisitions. However, if during that period or thereafter we are not successful in generating sufficient cash flows from operations or in raising additional capital when required in sufficient amounts and on terms acceptable to us, our business could be adversely affected. Availability under our Amended Credit Agreement as of September 30, 2005, was approximately $74.4 million, representing our borrowing base of $110.3 million, net of outstanding letters of credit of $2.3 million and borrowings of $33.6 million at that date. Our levels of borrowing are further restricted by the financial covenants set forth in our Amended Credit Agreement and the indenture governing our 10.125% Senior Notes, which covenants are described in our second quarter 2005 report on Form 10-Q filed with the Securities and Exchange Commission.
EBITDA
EBITDA (earnings before interest, taxes, depreciation, and amortization) for the nine months ended September 30, 2005, was $54.5 million, representing a $2.7 million, or 5.1% increase from $51.8 million for the same period of 2004. This increase is primarily driven by revenue growth, generating increased gross margin of $2.4 million and other favorable increases of $0.3 million.
EBITDA is not intended to represent an alternative to operating income or cash flows from operating, financing or investing activities (as determined in accordance with generally accepted accounting principles (“GAAP”)) as a measure of performance, and is not representative of funds available for discretionary use due to our financing obligations. EBITDA, as defined by us, may not be calculated consistently among other companies applying similar reporting measures. EBITDA is included because it is a widely accepted financial indicator used by certain investors and financial analysts to assess and compare companies and a version of EBITDA is an integral part of the our debt covenant calculations. Management believes that EBITDA provides an important perspective on our ability to service our long-term obligations, our ability to fund continuing growth, and our ability to continue as a going concern. A reconciliation of operating cash flows to EBITDA is included below (dollars in thousands):
| | | | | | | | |
| | | Nine Months Ended
September 30,
| |
| | | 2005
| | | 2004
| |
Net cash provided by operating activities | | $ | 34,632 | | | $ | 37,134 | |
Changes in operating assets and liabilities | | | (1,950 | ) | | | (7,284 | ) |
Other non-cash expenses | | | (1,955 | ) | | | (721 | ) |
Current income taxes | | | 631 | | | | 225 | |
Interest expense | | | 23,142 | | | | 22,483 | |
| | |
|
|
| |
|
|
|
EBITDA | | $ | 54,500 | | | $ | 51,837 | |
19
| | | | | | | | |
| | | Nine Months Ended
September 30,
| |
Supplemental Information (dollars in thousands): | | 2005
| | | 2004
| |
EBITDA | | $ | 54,500 | | | $ | 51,837 | |
Net cash provided by operating activities | | | 34,632 | | | | 37,134 | |
Net cash used in investing activities | | | (27,826 | ) | | | (51,443 | ) |
Net cash (used in) provided by financing activities | | | (6,806 | ) | | | 14,309 | |
Movable medical equipment depreciation | | | 28,051 | | | | 26,909 | |
Non-movable medical equipment depreciation and amortization | | $ | 5,583 | | | $ | 2,482 | |
| | |
Other operating data: | | | | | | | | |
| | |
Movable medical equipment owned (approximate units at end of period) | | | 160,000 | | | | 151,000 | |
Offices (at end of period) | | | 77 | | | | 76 | |
Number of outsourcing hospital customers (approximate number at end of period) | | | 3,200 | | | | 3,100 | |
Number of total outsourcing customers (approximate number at end of period) | | | 6,350 | | | | 6,.250 | |
Safe Harbor Statement under the Private Securities Litigation Reform Act of 1995: We believe statements in this quarterly report looking forward in time involve risks and uncertainties. The following factors, among others, could adversely affect our business, operations and financial condition causing our actual results to differ materially from those expressed in any forward-looking statements: our history of net losses and substantial interest expense; our need for substantial cash to operate and expand our business as planned; our substantial outstanding debt and debt service obligations; restrictions imposed by the terms of our debt; a decrease in the number of patients our customers are serving; our ability to effect change in the manner in which healthcare providers traditionally procure medical equipment; the absence of long-term commitments with customers; our ability to renew contracts with group purchasing organizations and integrated delivery networks; changes in reimbursement rates and policies by third-party payors; the impact of health care reform initiatives; the impact of significant regulation of the health care industry and the need to comply with those regulations; difficulties or delays in our continued expansion into certain of our businesses/geographic markets and developments of new businesses/geographic markets; and additional credit risks in increasing business with home care providers and nursing homes, and impacts of equipment product recalls or obsolescence. See the risk factor discussion detailed in our Annual Report on Form 10-K for the year ended December 31, 2004, filed with the Securities and Exchange Commission.
Item 3. Quantitative and Qualitative Disclosures about Market Risk
Our primary exposure to market risk is interest rate risk associated with our debt instruments. We use both fixed and variable rate debt as sources of financing. At September 30, 2005, we had approximately $293,670,000 of total debt outstanding, of which $33,575,000 was bearing interest at variable rates approximating 6.2%. A one percentage point change in interest rates on variable rate debt would have resulted in interest expense fluctuating approximately $281,200 and $233,500 for the first nine months
20
of 2005 and 2004, respectively. We have not entered into, and do not plan to enter into, any derivative financial instruments for trading or speculative purposes. Historically, we have not engaged in hedging activities. As of September 30, 2005, we had no other significant material exposure to market risk.
Item 4. Controls and Procedures
| | (a). | Evaluation of disclosure controls and procedures. |
Under the supervision and with the participation of our management, including our Chief Executive Officer and Chief Financial Officer, we evaluated the effectiveness of the design and operation of our disclosure controls and procedures (as defined in Rule 15d-15(e) under the Securities Exchange Act of 1934 as amended (the “Exchange Act”)). Based upon that evaluation, the Chief Executive Officer and Chief Financial Officer concluded that, as of the end of the period covered by this report, our disclosure controls and procedures were effective.
| | (b). | Changes in internal control over financial reporting. |
During the third quarter of 2005, there has been no change in our internal control over financial reporting (as defined in Rule 15d-15(f) under the Exchange Act) that has materially affected, or is reasonably likely to materially affect, our internal control over financial reporting.
PART II - OTHER INFORMATION
Item 1. Legal Proceedings
Not applicable.
Item 2. Unregistered Sales of Equity Securities and Use of Proceeds
Pursuant to the exercise of outstanding options, on August 2, 2005, we sold 1,248.75 shares of common stock to a departing employee for the aggregate purchase price of $1,248.75.
Such sale was completed pursuant to the exemption from registration provided under Section 4(2) of the Securities Act of 1933, as amended. The proceeds from the sale of such shares were added to our general funds and used for general corporate purposes.
Item 3. Defaults upon Senior Securities
Not applicable.
Item 4. Submission of Matters to a Vote of Security Holders
Not applicable.
21
Item 5. Other Information
Not applicable.
Item 6. Exhibits
| | |
Number
| | Description
|
3.1a | | Certificate of Amendment to Certificate of Incorporation of Universal Hospital Services, Inc.* |
| |
3.1b | | Certificate of Incorporation of Universal Hospital Services, Inc. (Incorporated by reference to Exhibit 3.1b to Form S-1/A filed on September 5, 2001). |
| |
3.2a | | Amended and Restated Bylaws of Universal Hospital Services, Inc.* |
| |
3.3 | | Certification of Elimination of Series B 13% Cumulative Accruing Pay-In-Kind Preferred Stock of Universal Hospital Services, Inc.*** |
| |
4.1 | | Form of certificate of common stock (Incorporated by reference to Exhibit 4.1 to Form S-1/A filed on September 5, 2001). |
| |
4.2 | | Indenture, dated as of October 17, 2003, by and between Universal Hospital Services, Inc. and Wells Fargo Bank, National Association, as Trustee, relating to the registrant’s 10.125% Senior Notes due 2011 (including Form of Note).* |
| |
4.3 | | Form of Amended and Restated Stockholders’ Agreement, dated October 17, 2003, by and among Universal Hospital Services, Inc., J.W. Childs Equity Partners III, L.P., JWC Fund III Co-invest LLC, Halifax Capital Partners, L.P. and the other stockholders of Universal Hospital Services, Inc.* |
| |
4.4 | | Exchange and Registration Rights Agreement, dated as of October 17, 2003, among Universal Hospital Services, Inc., Goldman, Sachs & Co,. Credit Suisse First Boston LLC, CIBC World Markets Corp. and Jefferies & Company, Inc.** |
| |
4.5 | | 10.125% Senior Notes due 2011 in the aggregate principal amount of $259,880,000.** |
| |
4.6 | | 10.125% Senior Note due 2011 in the aggregate principal amount of $120,000.** |
| |
4.7 | | Blanket Issuer Letter of Representations, dated as of October 17, 2003, among Universal Hospital Services, Inc., Wells Fargo Bank, National Association and the Depository Trust Company.** |
| |
10.1 | | Form of Non-Qualified Stock Option Agreement for the 2003 Stock Option Plan |
| |
31.1 | | Rule 13a-14(a)/15d-14(a) Certification of Chief Executive Officer |
| |
31.2 | | Rule 13a-14(a)/15d-14(a) Certification of Chief Financial Officer |
| |
32.1 | | Certification of Gary D. Blackford Pursuant to 18 U.S.C § 1350, as adopted pursuant to Section 906 of the Sarbanes-Oxley Act of 2002 |
| |
32.2 | | Certification of Rex T. Clevenger Pursuant to 18 U.S.C § 1350, as adopted pursuant to Section 906 of the Sarbanes-Oxley Act of 2002 |
| |
99.1 | | Risk factors disclosure |
| * | Previously filed as an Exhibit to the Quarterly Report on Form 10-Q of Universal Hospital Services, Inc. for the fiscal quarter ended September 30, 2003, and incorporated by reference herein. |
| ** | Previously filed as an Exhibit to the Registrant’s Registration Statement on Form S-4 (File No. 333-111606) and incorporated by reference herein. |
| *** | Previously filed as an Exhibit to Amendment No. 1 to the Registrant’s Registration Statement on Form S-4 (File No. 333-111606) and incorporated by reference herein. |
22
SIGNATURES
Pursuant to the requirements of the Securities Exchange Act of 1934, the registrant has duly caused this report to be signed on its behalf by the undersigned thereunto duly authorized.
Date: November 14, 2005
| | |
Universal Hospital Services, Inc. |
| |
By | | /s/ Gary D. Blackford
|
| | | Gary D. Blackford, |
| | | President and Chief Executive Officer |
| | | (Principal Executive Officer) |
| |
By | | /s/ Rex T. Clevenger
|
| | | Rex T. Clevenger, |
| | | Senior Vice President and Chief Financial Officer (Principal Financial Officer) |
23
Universal Hospital Services, Inc.
EXHIBIT INDEX TO REPORT ON FORM 10-Q
| | |
Number
| | Description
|
3.1a | | Certificate of Amendment to Certificate of Incorporation of Universal Hospital Services, Inc.* |
| |
3.1b | | Certificate of Incorporation of Universal Hospital Services, Inc. (Incorporated by reference to Exhibit 3.1b to Form S-1/A filed on September 5, 2001). |
| |
3.2a | | Amended and Restated Bylaws of Universal Hospital Services, Inc.* |
| |
3.3 | | Certification of Elimination of Series B 13% Cumulative Accruing Pay-In-Kind Preferred Stock of Universal Hospital Services, Inc.*** |
| |
4.1 | | Form of certificate of common stock (Incorporated by reference to Exhibit 4.1 to Form S-1/A filed on September 5, 2001). |
| |
4.2 | | Indenture, dated as of October 17, 2003, by and between Universal Hospital Services, Inc. and Wells Fargo Bank, National Association, as Trustee, relating to the registrant’s 10.125% Senior Notes due 2011 (including Form of Note).* |
| |
4.3 | | Form of Amended and Restated Stockholders’ Agreement, dated October 17, 2003, by and among Universal Hospital Services, Inc., J.W. Childs Equity Partners III, L.P., JWC Fund III Co-invest LLC, Halifax Capital Partners, L.P. and the other stockholders of Universal Hospital Services, Inc.* |
| |
4.4 | | Exchange and Registration Rights Agreement, dated as of October 17, 2003, among Universal Hospital Services, Inc., Goldman, Sachs & Co,. Credit Suisse First Boston LLC, CIBC World Markets Corp. and Jefferies & Company, Inc.** |
| |
4.5 | | 10.125% Senior Notes due 2011 in the aggregate principal amount of $259,880,000.** |
| |
4.6 | | 10.125% Senior Note due 2011 in the aggregate principal amount of $120,000.** |
| |
4.7 | | Blanket Issuer Letter of Representations, dated as of October 17, 2003, among Universal Hospital Services, Inc., Wells Fargo Bank, National Association and the Depository Trust Company.** |
| |
10.1 | | Form of Non-Qualified Stock Option Agreement for the 2003 Stock Option Plan |
| |
31.1 | | Rule 13a-14(a)/15d-14(a) Certification of Chief Executive Officer |
| |
31.2 | | Rule 13a-14(a)/15d-14(a) Certification of Chief Financial Officer |
| |
32.1 | | Certification of Gary D. Blackford Pursuant to 18 U.S.C § 1350, as adopted pursuant to Section 906 of the Sarbanes-Oxley Act of 2002 |
| |
32.2 | | Certification of Rex T. Clevenger Pursuant to 18 U.S.C § 1350, as adopted pursuant to Section 906 of the Sarbanes-Oxley Act of 2002 |
| |
99.1 | | Risk factors disclosure |
| * | Previously filed as an Exhibit to the Quarterly Report on Form 10-Q of Universal Hospital Services, Inc. for the fiscal quarter ended September 30, 2003, and incorporated by reference herein. |
| ** | Previously filed as an Exhibit to the Registrant’s Registration Statement on Form S-4 (File No. 333-111606) and incorporated by reference herein. |
| *** | Previously filed as an Exhibit to Amendment No. 1 to the Registrant’s Registration Statement on Form S-4 (File No. 333-111606) and incorporated by reference herein. |
24