UNITED STATES
SECURITIES AND EXCHANGE COMMISSION
Washington, D.C. 20549
FORM N-CSR
CERTIFIED SHAREHOLDER REPORT OF REGISTERED
MANAGEMENT INVESTMENT COMPANIES
Investment Company Act file number: 811-06637
The UBS Funds
(Exact name of registrant as specified in charter)
One North Wacker Drive, Chicago, IL 60606-2807
(Address of principal executive offices) (Zip code)
Keith A. Weller, Esq. UBS Asset Management One North Wacker Drive Chicago, IL 60606 |
| (Name and address of agent for service) |
| Copy to: |
Bruce G. Leto, Esq. Stradley Ronon Stevens & Young, LLP 2005 Market Street, Suite 260 Philadelphia, PA 19103-7098 |
Registrant’s telephone number, including area code: 888-793 8637
Date of fiscal year end: June 30
Date of reporting period: June 30, 2022
Item 1. Reports to Stockholders.
| (a) | Copy of the report transmitted to shareholders: |

The UBS Funds
Annual Report | June 30, 2022
Table of contents | Page | ||||||
President's letter | 1 | ||||||
Market commentary | 3 | ||||||
UBS All China Equity Fund | 5 | ||||||
UBS Dynamic Alpha Fund | 12 | ||||||
UBS Global Allocation Fund | 25 | ||||||
UBS Emerging Markets Equity Opportunity Fund | 39 | ||||||
UBS Engage For Impact Fund | 45 | ||||||
UBS International Sustainable Equity Fund | 53 | ||||||
UBS US Dividend Ruler Fund | 62 | ||||||
UBS US Quality Growth At Reasonable Price Fund | 69 | ||||||
UBS U.S. Small Cap Growth Fund | 76 | ||||||
UBS Sustainable Development Bank Bond Fund | 85 | ||||||
UBS Multi Income Bond Fund (formerly, UBS Total Return Bond Fund) | 91 | ||||||
Glossary of terms used in the Portfolio of investments | 102 | ||||||
Explanation of expense disclosure | 103 | ||||||
Statement of assets and liabilities | 106 | ||||||
Statement of operations | 111 | ||||||
Statement of changes in net assets | 115 | ||||||
Financial highlights | 121 | ||||||
Notes to financial statements | 133 | ||||||
Report of independent registered public accounting firm | 165 | ||||||
Federal tax information | 167 | ||||||
General information | 168 | ||||||
Board approval of investment advisory agreements | 169 | ||||||
Trustee and officer information | 175 | ||||||
This page intentionally left blank.
President's letter
August 12, 2022
Dear Shareholder,
While the global economic recovery has continued since I last wrote to you, it once again experienced unexpected challenges to growth, notably the ongoing Russian invasion of Ukraine and the knock-on effects to the economy as well as soaring inflation in the US.
Given the generally low levels of global trade with an already ailing Russian economy, the predominant channel for global economic disruption has been higher oil and natural gas prices, with flat out shortages in continental Europe.
Meanwhile, in the US, the highest consumer price index (CPI) increases since the 70s have forced the Federal Reserve's hand into an accelerated and aggressive tightening cycle (including two 0.75% hikes) which has put the federal funds target range (a key interest rate measure) 2.25% higher than where we started the year, as of this writing.
That said, while there has been the first talk of stagflation in the US in sometime, conversations around when the current tightening cycle will end have already also begun, as the market continues to revise its view and the Fed moves away from direct forward guidance.
A global decoupling is also underway, with Europe facing the most severe challenge to economic growth due to its direct dependence on Russia for natural gas, while in the US, unemployment remains low and wage growth remains strong, supporting economic growth in the face of inflation; meanwhile, China is moving from a tightening cycle to easier economic policy, with the People's Bank of China actually cutting rates and the federal government rolling back some of its restrictive fiscal policies.
And in addition to economic cycle decoupling, the Russian invasion of Ukraine, and the growing fear of energy politicization, is exacerbating the trend of deglobalization that has been underway since the beginning of the COVID-19 pandemic exposed the fragility of international supply chains. Increasing US-China tensions also continues to feed into this reversion from previous decades.
Amid the accompanying volatility and uncertainty generated by all these competing and conflicting scenarios, the need for UBS Asset Management to be 'on the ground' to provide region and country specific insights in order to offer robust, globally diversified investment solutions to our clients, amid competing and conflicting scenarios, remains as important as ever.
We believe our team of investment professionals around the world are well placed to help clients build genuinely diversified portfolios capable of producing results across markets and asset classes in these uncertain and trying times, and there are many unique and compelling opportunities that with the right strategies in the hands of skilled portfolio managers have the potential to deliver better investment outcomes for our clients.
1
President's letter
As always, we thank you for being a part of the UBS family of funds.
Sincerely,

Igor Lasun
President
The UBS Funds
Managing Director
UBS Asset Management (Americas) Inc.
2
The markets in review
Economic headwinds develop
While the global economy continued to expand during the reporting period as a whole, there were signs of potential weakness on the horizon. These included the ongoing challenges from COVID-19 and its variants, elevated and persistent inflation, supply chain bottlenecks, monetary policy tightening, and repercussions from the war in Ukraine. Looking back, third quarter 2021 US annualized gross domestic product ("GDP") was 2.3%. GDP then grew 6.9% over the fourth quarter of the year. The US economy then contracted 1.6% in the first quarter of 2022. This was partially attributable to rising imports and moderating business inventory buildups. Finally, the Commerce Department's initial estimate for second quarter annualized GDP—released after the reporting period ended—was -0.9%.
With US inflation hitting a 40-year high, the Federal Reserve Board (the "Fed") took a number of aggressive actions in an attempt to combat rising prices. The Fed ended its monthly asset purchases in March 2022 and then raised the federal funds rate 0.25% to a range between 0.25% and 0.50% in March 2022, its first rate hike since 2018. The central bank then raised rates 0.50% and 0.75% at its May and June meetings respectively. The latter rate hike was the largest by the Fed since 1994. The Fed also began shrinking its balance sheet, a process called "quantitative tightening." Finally, on July 27, 2022—after the reporting period ended—the Fed raised rates 0.75%, to a range between 2.25% and 2.50%. Overseas, the Bank of England raised rates for a fifth consecutive time at its June 2022 meeting, and the European Central Bank announced a plan to raise rates at its July and September 2022 meetings.
From a global perspective, in its April 2022 World Economic Outlook, the International Monetary Fund ("IMF") said, "Global economic prospects have worsened significantly since our last World Economic Outlook forecast in January [2022]. At the time, we had projected the global recovery to strengthen from the second quarter of this year after a short-lived impact of the Omicron variant. Since then, the outlook has deteriorated, largely because of Russia's invasion of Ukraine—causing a tragic humanitarian crisis in Eastern Europe—and the sanctions aimed at pressuring Russia to end hostilities." The IMF expects US GDP growth to be 3.7% in 2022, versus 5.7% in 2021. Elsewhere, the IMF expects 2022 GDP growth in the eurozone, UK and Japan will be 2.8%, 3.7% and 2.4%, respectively. For comparison purposes, GDP growth in these economies was 5.3%, 7.4% and 1.6%, respectively, in 2021.
Global equities experience a setback
Equities around the globe generated weak returns during the reporting period. The US market was dragged down by elevated inflation, expectations for aggressive Fed rate hikes and concerns whether the central bank could orchestrate a "soft landing" for the economy. Investor sentiment was also negatively impacted by the ongoing fallout from the war in Ukraine. For the 12-months ended June 30, 2022, the S&P 500 Index1 returned -10.62% and entered a bear market (a decline of 20% from a recent high). Outside the US, international developed equities, as measured by the MSCI EAFE Index (net),2 returned -17.77%. Emerging markets equities were even weaker, as the MSCI Emerging Markets Index (net)3 returned -25.28%.
1 The S&P 500 Index is an unmanaged, weighted index composed of 500 widely held common stocks varying in composition and is not available for direct investment. Investors should note that indices do not reflect the deduction of fees and expenses.
2 The MSCI EAFE Index (net) is an index of stocks designed to measure the investment returns of developed economies outside of North America. Net total return indices reinvest dividends after the deduction of withholding taxes, using a tax rate applicable to non-resident institutional investors who do not benefit from double taxation treaties. The index is constructed and managed with a view to being fully investable from the perspective of international institutional investors. Investors should note that indices do not reflect the deduction of fees and expenses.
3 The MSCI Emerging Markets Index (net) is a market capitalization-weighted index composed of different emerging market countries in Europe, Latin America, and the Pacific Basin. Net total return indices reinvest dividends after the deduction of withholding taxes, using a tax rate applicable to non-resident institutional investors who do not benefit from double taxation treaties. The index is constructed and managed with a view to being fully investable from the perspective of international institutional investors. Investors should note that indices do not reflect the deduction of fees and expenses.
3
The markets in review
The fixed income market falls sharply
The global fixed income market also performed poorly, as many central banks pivoted to tightening monetary policy to battle inflation. In the US, short- and long-term US Treasury yields moved sharply higher. For the 12 months ended June 30, 2022, the yield on the US 10-year Treasury rose from 1.45% to 2.98%. 10-year government bond yields outside the US also moved higher. (Bond yields and prices generally move in opposite directions.) For the 12-month reporting period as a whole, the overall US bond market, as measured by the Bloomberg US Aggregate Index,4 returned -10.29%. Returns of riskier fixed income securities also fell sharply. High yield bonds, as measured by the ICE BofAML US High Yield Cash Pay Constrained Index,5 returned -12.66%. Elsewhere, emerging markets debt, as measured by the J.P. Morgan Emerging Markets Bond Index Global (EMBI Global),6 returned -19.25% during the reporting period.
4 The Bloomberg US Aggregate Index is an unmanaged broad based index designed to measure the US dollar-denominated, investment-grade, taxable bond market. The index includes bonds from the Treasury, government-related, corporate, mortgage-backed, asset-backed and commercial mortgage-backed sectors. Investors should note that indices do not reflect the deduction of fees and expenses.
5 The ICE BofAML US High Yield Cash Pay Constrained Index is an unmanaged index of publicly placed, non-convertible, coupon-bearing US dollar denominated, below investment grade corporate debt with a term to maturity of at least one year. The index is market capitalization weighted, so that larger bond issuers have a greater effect on the index's return. However, the representation of any single bond issuer is restricted to a maximum of 2% of the total index. Investors should note that indices do not reflect the deduction of fees and expenses.
6 The J.P. Morgan Emerging Markets Bond Index Global (EMBI Global) is an unmanaged index which is designed to track total returns for US dollar denominated debt instruments issued by emerging market sovereign and quasi-sovereign entities: Brady bonds, loans and Eurobonds. Investors should note that indices do not reflect the deduction of fees and expenses.
4
UBS All China Equity Fund
Portfolio performance
For the 12 months ended June 30, 2022, the UBS All China Equity Fund (the "Fund") returned -27.86%. The Fund's benchmark, the MSCI China All Shares Index (net) (the "Index"), returned -25.48% over the same time period. (Please note that the Fund's returns do not reflect the deduction of taxes that a shareholder would pay on Fund distributions or the redemption of Fund shares, while the Index returns do not reflect the deduction of fees and expenses.)
The Fund's performance was driven primarily by stock selection decisions.
Portfolio performance summary1
What worked:
• Within stock selection, Kweichow Moutai was the top contributor to Fund performance for the 12-month period.
– Moutai's share price recovered due to optimism about reopening post COVID-19 lockdowns. In addition, its first quarter 2022 results showed strong growth in revenues and profits, which were better than expected and indicated that the business remains resilient despite the broad slowdown in consumption in China. The company launched its iMoutai app in late March, reflecting its commitment to increase direct sales, which could help to improve average selling price and profit margins in the longer run. (For details, see "Portfolio highlights.")
• Several other stock selection decisions benefited performance during the reporting period.
– NetEase rose due to solid and better-than-expected first quarter 2022 results, as well as a strong pipeline of games this year. The company's highly anticipated game, Diablo Immortal, was scheduled to launch overseas in June, and the game already had 35 million preregistered users worldwide. NetEase also traded higher based on the resumption of some gaming license approvals, which served as a positive stimulus to the sector. (For details, see "Portfolio highlights.")
– China Resources Land outperformed on the back of the company's good land bank and strong management. We believe the company is likely to gain market share as the highly leveraged private companies weaken.
– The decision not to own NIO Inc., contributed positively to relative performance. We do not own the stock, as we believe competition from electric vehicle (EV) start-ups and traditional original equipment manufacturers (OEMs) will intensify.
– Shares of Anhui Gujing Distillery traded higher, possibly due to investors' expectations that the company would benefit from Shanghai's reopening and economic recovery, given the city's proximity to the company's key sales region of Anhui province.
What didn't work:
• Certain stock selection decisions made a negative contribution to Fund returns during the 12-month period.
– The Fund was underweight to Alibaba Group due to lingering regulatory concerns, weaker consumption, and tougher competition in the e-commerce space, as well as the company's lowered fiscal year 2022 guidance. We still hold Alibaba, as it is trading at an attractive valuation, and we consider it one of the best e-commerce plays in China. (For details, see "Portfolio highlights.")
– Not holding BYD Company detracted from relative performance as the stock rose on the possibility of new business opportunities. BYD also benefited from the fact that capacity and supply chain are seeing a gradual recovery.
1 For a detailed commentary on the market environment in general during the reporting period, see page 3.
5
UBS All China Equity Fund
– Ping An Bank fell due to investor concerns about the spillover effect of the continued weakness in the real estate sector. We continue to hold this stock.
– Jiangsu Hengrui Medicine underperformed during the 12-month period. Market sentiment about China's health care industry was weak due to the continued regulatory pressure. There are also uncertainties about the earnings impact from the government's centralized procurement price cuts. However, we expect the company's newly launched innovative drugs to mitigate any loss in revenue from the price cuts. We continue to hold this stock.
– Jinke Smart Services declined as its parent company, Jinke Property Group, extended the payment deadline of its onshore bond. Property sales were lackluster during the period, and consumer confidence remained weak as people adopted a wait-and-see approach. We continue to hold this stock.
Portfolio highlights
• Tencent is the leading company in China's PC/mobile internet market, and provides services such as instant messaging, online gaming, social community, news and online music. Tencent has established several powerful online service platforms and accumulated a huge number of loyal customers. With its current strong position, we expect the company to ride on the mature business models and consistently grow its business going forward. Fast-growing online games—along with newly emerging mobile games, which is one of the largest revenue-generating segments—will likely contribute most to the company going forward.
• Kweichow Moutai engages in the manufacture and distribution of Moutai liquor series products. Moutai is a Chinese premium liquor brand with strong pricing power and growth visibility. The share price is attractively valued, and the company offers the potential to benefit from state-owned enterprise (SOE) reform.
• Netease is a leading online game company in China. It has a good track record for delivering blockbuster games, and has posted healthy growth for more than 10 years. We believe that Netease continues to have a strong game pipeline and will be able to deliver new revenue streams. The company is well-positioned as a leading player in China's online entertainment sectors, particularly online games and music.
• Alibaba is a large e-commerce company. We believe that e-commerce penetration will continue to grow in China, even in the midst of a retail slowdown. Thus, we consider it a more defensive part of retail sales, and we believe Alibaba has the strongest position in China's e-commerce space.
• China Merchants Bank has the leading retail banking franchise in China. This was built up over many years due to an early focus on the segment while large state-owned enterprise banks were focusing on corporates. We believe China Merchants Bank is well-positioned to benefit from China's growing wealth, which would drive demand for wealth management products and financial advice.
• The Fund did not invest in derivatives during the reporting period.
This letter is intended to assist shareholders in understanding how the Fund performed during the 12 months ended June 30, 2022. The views and opinions in the letter were current as of August 12, 2022. They are not guarantees of future performance or investment results and should not be taken as investment advice. Investment decisions reflect a variety of factors, and we reserve the right to change our views about individual securities, sectors and markets at any time. As a result, the views expressed should not be relied upon as a forecast of the Fund's future investment intent. We encourage you to consult your financial advisor regarding your personal investment program.
Mutual funds are sold by prospectus only. You should read it carefully and consider a fund's investment objectives, risks, charges, expenses and other important information contained in the prospectus before investing. Prospectuses for most of our funds can be obtained from your financial advisor, by calling UBS Funds at 800-647 1568 or by visiting our website at www.ubs.com/am-us.
6
UBS All China Equity Fund
Average annual total returns for periods ended 06/30/22 (unaudited)
1 year | Inception | ||||||||||
Class P1,3 | (27.86 | )% | (28.43 | )% | |||||||
Class P22,3 | N/A | 8.19 | |||||||||
MSCI China All Shares Index (net)4 | (25.48 | ) | (22.60 | ) | |||||||
The annualized gross and net expense ratios, respectively, for each class of shares as in the October 28, 2021 prospectuses were as follows: Class P—17.70% and 1.13% and Class P2—17.70% and 0.30%. Net expenses reflect fee waivers and/or expense reimbursements, if any, pursuant to an agreement that is in effect to cap the expenses. The Trust, with respect to the Fund, and UBS Asset Management (Americas) Inc., the Fund's investment advisor and administrator ("UBS AM (Americas)" or the "Advisor"), have entered into a written agreement pursuant to which the Advisor has agreed to waive a portion of its management fees and/or to reimburse expenses (excluding expenses incurred through investment in other investment companies, interest, taxes, brokerage commissions and extraordinary expenses, such as proxy-related expenses) to the extent necessary so that the Fund's ordinary operating expenses (excluding expenses incurred through investment in other investment companies, interest, taxes, brokerage commissions and extraordinary expenses), through the period ending October 28, 2022, do not exceed 1.10% for Class P shares. The Advisor has also entered into a written agreement pursuant to which the Advisor has agreed to waive a portion of its management fees and retained administration fees, and/or to reimburse expenses (excluding expenses incurred through investment in other investment companies, interest, taxes, brokerage commissions and extraordinary expenses, such as proxy-related expenses) to the extent necessary so that the Fund's ordinary operating expenses (excluding expenses incurred through investment in other investment companies, interest, taxes, brokerage commissions and extraordinary expenses, such as proxy related expenses), through the period ending October 28, 2022, do not exceed 0.30% for Class P2 shares. Pursuant to the written agreement, the Advisor is entitled to be reimbursed for any fees it waives and expenses it reimburses to the extent such reimbursement can be made during the three fiscal years following the date on which such fee waivers and expense reimbursements were made, provided that the reimbursement of the Advisor by the Fund will not cause the Fund to exceed the lesser of any applicable expense limit that is in place for the Fund (i) at the time of the waiver or reimbursement or (ii) at the time of the recoupment. The fee waiver/expense reimbursement agreement may be terminated by the Fund's Board of Trustees at any time and also will terminate automatically upon the expiration or termination of the Fund's advisory contract with the Advisor. Upon termination of the fee waiver/expense reimbursement agreement, however, UBS AM (Americas)'s three year recoupment rights will survive.
1 Inception date of Class P is February 24, 2021.
2 Inception date of Class P2 is April 21, 2022.
3 Class P and Class P2 shares do not bear initial or contingent deferred sales charges or ongoing 12b-1 service and distribution fees, but Class P and Class P2 shares held through advisory programs may be subject to a program fee, which, if included, would have reduced performance.
4 The MSCI China All Shares Index (net) is a free float-adjusted market capitalization weighted index that is designed to measure the equity market performance of developed and emerging markets. Net total return indices reinvest dividends after the deduction of withholding taxes,using a tax rate applicable to non-resident institutional investors who do not benefit from double taxation treaties. The index is constructed and managed with a view to being fully investable from the perspective of international institutional investors. Investors should note that indices do not reflect the deduction of fees and expenses. Inception return for the Index is shown as of the inception date of the oldest share class: February 24, 2021.
Past performance does not predict future performance, and the performance information provided does not reflect the deduction of taxes that a shareholder would pay on Fund distributions or the redemption of Fund shares. The return and principal value of an investment will fluctuate, so that an investor's shares, when redeemed, may be worth more or less than their original cost. Performance results assume reinvestment of all dividends and capital gain distributions at net asset value on the ex-dividend dates. Total returns for periods of less than one year have not been annualized. Current performance may be higher or lower than the performance data quoted. For month-end performance figures, please visit www.ubs.com/us-mutualfundperformance.
7
UBS All China Equity Fund
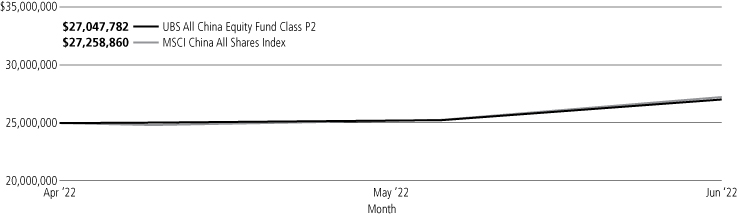
Illustration of an assumed investment of $2,000,000 in Class P shares and $25,000,000 in Class P2 shares (unaudited)
The following graphs depict the performance of UBS All China Equity Fund Class P and Class P2 shares versus the MSCI China All Shares Index from February 24, 2021, the inception date of Class P, and April 21, 2022, the inception date of Class P2, through June 30, 2022. Class P and Class P2 shares may be subject to a program fee, which, if included, would have reduced performance. The performance provided does not reflect the deduction of taxes that a shareholder would pay on Fund distributions or the redemptions of Fund shares. Past performance is no guarantee of future results. Share price and returns will vary with market conditions; investors may realize a gain or a loss upon redemption. It is important to note that UBS All China Equity Fund is a professionally managed portfolio while the Index is not available for investment and is unmanaged. The comparison is shown for illustration purposes only.
UBS All China Equity Fund Class P vs. MSCI China All Shares Index

UBS All China Equity Fund Class P2 vs. MSCI China All Shares Index
8
UBS All China Equity Fund
Portfolio statistics and industry diversification—(unaudited)1
As a percentage of net assets as of June 30, 2022
Top ten holdings
Kweichow Moutai Co. Ltd., Class A | 9.9 | % | |||||
China Merchants Bank Co. Ltd., Class H | 9.1 | ||||||
NetEase, Inc. | 8.9 | ||||||
Tencent Holdings Ltd. | 8.2 | ||||||
Hong Kong Exchanges & Clearing Ltd. | 4.1 | ||||||
Ping An Bank Co. Ltd., Class A | 3.6 | ||||||
Ping An Insurance Group Co. of China Ltd., Class H | 3.5 | ||||||
Yunnan Energy New Material Co. Ltd., Class A | 3.2 | ||||||
Inner Mongolia Yili Industrial Group Co. Ltd., Class A | 2.9 | ||||||
Meituan, Class B | 2.7 | ||||||
Total | 56.1 | % | |||||
Top issuer breakdown by country or territory of origin
China | 90.2 | % | |||||
Hong Kong | 7.2 | ||||||
United States | 3.5 | ||||||
Total | 100.9 | % | |||||
Common stocks | |||||||
Automobiles | 1.4 | % | |||||
Banks | 12.7 | ||||||
Beverages | 12.7 | ||||||
Capital markets | 4.1 | ||||||
Chemicals | 0.5 | ||||||
Construction materials | 0.7 | ||||||
Containers & packaging | 3.2 | ||||||
Diversified consumer services | 0.1 | ||||||
Diversified financial services | 1.1 | ||||||
Entertainment | 9.2 | ||||||
Food products | 3.9 | ||||||
Gas utilities | 0.1 | ||||||
Health care providers & services | 0.1 | ||||||
Household durables | 0.4 | ||||||
Insurance | 4.8 | ||||||
Interactive media & services | 8.2 | ||||||
Internet & direct marketing retail | 5.7 | ||||||
IT services | 1.2 | ||||||
Life sciences tools & services | 5.3 | ||||||
Pharmaceuticals | 6.2 | ||||||
Real estate management & development | 7.5 | ||||||
Semiconductors & semiconductor equipment | 3.8 | ||||||
Software | 0.0 | † | |||||
Textiles, apparel & luxury goods | 0.5 | ||||||
Tobacco | 1.5 | ||||||
Transportation infrastructure | 2.5 | ||||||
Total common stocks | 97.4 | ||||||
Short-term investments | 3.5 | ||||||
Total investments | 100.9 | ||||||
Liabilities in excess of other assets | (0.9 | ) | |||||
Net assets | 100.0 | % | |||||
1 The portfolio is actively managed and its composition will vary over time.
† Amount represents less than 0.05% or (0.05)%
9
UBS All China Equity Fund
Portfolio of investments
June 30, 2022
| Number of shares | Value | ||||||||||
Common stocks: 97.4% | |||||||||||
China: 90.2% | |||||||||||
Alibaba Group Holding Ltd.* | 5,400 | $ | 77,007 | ||||||||
Anhui Conch Cement Co. Ltd., Class H | 6,500 | 28,164 | |||||||||
Anhui Gujing Distillery Co. Ltd., Class B | 5,200 | 81,113 | |||||||||
China Gas Holdings Ltd. | 4,200 | 6,487 | |||||||||
China Jinmao Holdings Group Ltd. | 82,000 | 22,050 | |||||||||
China Merchants Bank Co. Ltd., Class H | 58,500 | 391,402 | |||||||||
China Resources Land Ltd. | 22,000 | 102,615 | |||||||||
Chinasoft International Ltd.* | 52,000 | 53,214 | |||||||||
Country Garden Services Holdings Co. Ltd. | 15,000 | 66,811 | |||||||||
CSPC Pharmaceutical Group Ltd. | 96,000 | 95,305 | |||||||||
Far East Horizon Ltd.1 | 56,000 | 46,959 | |||||||||
Hainan Meilan International Airport Co. Ltd., Class H* | 37,000 | 108,923 | |||||||||
Hangzhou Silan Microelectronics Co. Ltd., Class A | 11,100 | 86,223 | |||||||||
Inner Mongolia Yili Industrial Group Co. Ltd., Class A | 21,600 | 125,677 | |||||||||
JD.com, Inc., Class A | 1,509 | 48,615 | |||||||||
Jiangsu Hengrui Medicine Co. Ltd., Class A | 7,500 | 41,554 | |||||||||
Jinke Smart Services Group Co. Ltd., Class H | 14,800 | 38,100 | |||||||||
Joinn Laboratories China Co. Ltd., Class H2 | 10,700 | 90,135 | |||||||||
Kingsoft Corp. Ltd. | 3,000 | 11,699 | |||||||||
Kweichow Moutai Co. Ltd., Class A | 1,400 | 427,677 | |||||||||
Li Auto, Inc., ADR* | 1,590 | 60,913 | |||||||||
Li Ning Co. Ltd. | 2,500 | 23,162 | |||||||||
Longfor Group Holdings Ltd.2 | 20,000 | 94,434 | |||||||||
LONGi Green Energy Technology Co. Ltd., Class A | 7,840 | 78,034 | |||||||||
Meituan, Class B*,2 | 4,800 | 118,795 | |||||||||
Midea Group Co. Ltd., Class A | 2,100 | 18,944 | |||||||||
NetEase, Inc. | 21,000 | 385,648 | |||||||||
Ping An Bank Co. Ltd., Class A | 70,000 | 156,641 | |||||||||
Ping An Healthcare and Technology Co. Ltd.*,1,2 | 800 | 2,370 | |||||||||
Ping An Insurance Group Co. of China Ltd., Class H | 22,500 | 152,976 | |||||||||
Smoore International Holdings Ltd.1,2 | 21,000 | 64,765 | |||||||||
| Number of shares | Value | ||||||||||
Common stocks—(concluded) | |||||||||||
China—(concluded) | |||||||||||
TAL Education Group, ADR* | 468 | $ | 2,279 | ||||||||
Tencent Holdings Ltd. | 7,900 | 356,803 | |||||||||
Tuya, Inc., ADR* | 400 | 1,048 | |||||||||
Wanhua Chemical Group Co. Ltd., Class A | 1,400 | 20,284 | |||||||||
Wuliangye Yibin Co. Ltd., Class A | 1,300 | 39,214 | |||||||||
Wuxi AppTec Co. Ltd. Class H2 | 5,600 | 74,578 | |||||||||
Wuxi Biologics Cayman, Inc.*,2 | 7,000 | 64,052 | |||||||||
Yihai International Holding Ltd.* | 12,000 | 43,279 | |||||||||
Yunnan Baiyao Group Co. Ltd., Class A | 6,020 | 54,307 | |||||||||
Yunnan Energy New Material Co. Ltd., Class A | 3,700 | 138,426 | |||||||||
3,900,682 | |||||||||||
Hong Kong: 7.2% | |||||||||||
AIA Group Ltd. | 5,200 | 56,362 | |||||||||
Hong Kong Exchanges & Clearing Ltd. | 3,600 | 177,091 | |||||||||
SSY Group Ltd. | 148,000 | 79,028 | |||||||||
312,481 | |||||||||||
| Total common stocks (cost $4,546,449) | 4,213,163 | ||||||||||
Short-term investments: 3.5% | |||||||||||
Investment companies: 3.5% | |||||||||||
| State Street Institutional U.S. Government Money Market Fund, 1.430%3 (cost $151,066) | 151,066 | 151,066 | |||||||||
| Total investments: 100.9% (cost $4,697,515) | 4,364,229 | ||||||||||
Liabilities in excess of other assets: (0.9)% | (40,032 | ) | |||||||||
Net assets: 100.0% | $ | 4,324,197 | |||||||||
For a listing of defined portfolio acronyms that are used throughout the Portfolio of investments as well as the tables that follow, please refer to the Glossary of terms used in the Portfolio of investments.
10
UBS All China Equity Fund
Portfolio of investments
June 30, 2022
Fair valuation summary
The following is a summary of the fair valuations according to the inputs used as of June 30, 2022 in valuing the Fund's investments. In the event a Fund holds investments for which fair value is measured using the NAV per share practical expedient (or its equivalent), a separate column will be added to the fair value hierarchy table; this is intended to permit reconciliation to the amounts presented in the Portfolio of investments:
Description | Unadjusted quoted prices in active markets for identical investments (Level 1) | Other significant observable inputs (Level 2) | Unobservable inputs (Level 3) | Total | |||||||||||||||
Assets | |||||||||||||||||||
Common stocks | $ | 4,213,163 | $ | — | $ | — | $ | 4,213,163 | |||||||||||
Short-term investments | — | 151,066 | — | 151,066 | |||||||||||||||
Total | $ | 4,213,163 | $ | 151,066 | $ | — | $ | 4,364,229 | |||||||||||
At June 30, 2022, there were no transfers in or out of Level 3.
Portfolio footnotes
* Non-income producing security.
1 Security, or portion thereof, was on loan at the period end.
2 Security exempt from registration pursuant to Rule 144A under the Securities Act of 1933. These securities are considered liquid, unless noted otherwise, and may be resold in transactions exempt from registration, normally to qualified institutional buyers. Securities exempt from registration pursuant to Rule 144A, in the amount of $509,129, represented 11.8% of the Fund's net assets at period end.
3 Rates shown reflect yield at June 30, 2022.
See accompanying notes to financial statements.
11
UBS Dynamic Alpha Fund
Portfolio performance
For the 12 months ended June 30, 2022 (the "reporting period"), Class A shares of UBS Dynamic Alpha Fund (the "Fund") returned -5.92% (Class A shares returned -11.13% after the deduction of the maximum sales charge), while Class P shares returned -5.78%. For purposes of comparison, the ICE BofA Merrill Lynch US Treasury 1-5 Year Index retuned -4.61% during the same time period, the MSCI World Index (net) returned -14.34%, and the FTSE One-Month US Treasury Bill Index returned 0.15%. (Class P shares have lower expenses than other share classes of the Fund.) Returns for all share classes over various time periods are shown on page 14; please note that these returns do not reflect the deduction of taxes that a shareholder would pay on Fund distributions or the redemption of Fund shares, while the Index returns do not reflect the deduction of fees and expenses.)
Overall, the Fund delivered a negative return in a challenging market environment of rapidly rising yields and falling equity markets. The Fund fell short of its cash plus goal, but managed to limit overall market declines.
The Fund posted positive performance during the first half of the reporting period, with most of our trades and directional exposures contributing to results. It was a period of reflation, reopening and optimism. Global growth accelerated, yield curves steepened during early months, and inflation expectations increased more than 1%. During this time, equites strongly outperformed bonds and our cyclicals value trades added to performance. Finally, attractively valued emerging market currencies benefited from a weaker US dollar and gradually improving global financial conditions. The Fund was exposed to all those factors.
The second half of the reporting period was less constructive and represented more of a mixed bag for the Fund. With inflation and supply issues already being a concern heading into 2022, these issues were exacerbated with repeated COVID-19 outbreaks in China, along with Russia's invasion of Ukraine, which added geopolitical risks and macroeconomic uncertainty causing equity markets to sell-off. In turn, investors turned more cautious, equity markets experienced severe headwinds, and the US dollar strengthened in anticipation of weaker near-term (global) growth.
Portfolio performance summary1
• The portfolio's strategic allocation to equities and credit detracted from performance.
– Our strategic allocation to global equities delivered negative returns over the reporting period, as global equity markets entered a bear market in 2022, driven by recession worries and higher yields.
– Fixed income was a slight detractor overall as yields rose over the reporting period. An exception was high-yield corporate bonds, which were additive for returns due to narrowing credit spreads.
• Overall, market allocation decisions added to results.
– We maintained an equity overweight for most of the reporting period. Prior to the start of the period, we decided to assume a more neutral stance (at least from a risk [beta] point of view) as we transitioned into second quarter of 2021, as several of our key risk indicators turned more negative. First, economic momentum was peaking and markets historically struggled during such an adjustment period. Second, our behavioral sentiment indicators were softening, as the media increasingly focused on the aforementioned peak in global growth. Lastly, we were concerned that a quick rise in yields could pressure lofty equity valuations.
– Within equities, we maintained a pro-cyclical value positioning for most of the reporting period, with the rationale of further earnings upside from a reopening of the global economy. Most of the trades within this category contributed to performance, such as long Stoxx600 Banks versus Eurostoxx50, long FTSE MIB (Milano Indice di Borsa) Italy versus Stoxx50.
1 For a detailed commentary on the market environment in general during the reporting period, see page 3.
12
UBS Dynamic Alpha Fund
– Other trades that added to performance were the more defensively minded, such as the long UK versus EuroStoxx50 position and the long Topix versus MSCI World trade, which performed especially well in 2022.
– Minor detractors were the long materials trades and the US yield curve steepener trade. Materials underperformed on the back of severe COVID lockdowns in the second quarter of 2022 and an ongoing deceleration of the domestic real estate market. Meanwhile, yield curves flattened on the back of increasing growth worries and a hawkish shift of the US Federal Reserve at year end.
• Overall, active currency positions detracted from results.
– The largest contributor to performance was a short US dollar Norwegian krone trade. This position benefited from hawkish rhetoric from the Norges Bank and a procyclical growth improvement, which similarly, helped long emerging market positions, such as the Brazilian real and Mexican peso against the US dollar, which were additive to performance.
– On the downside, the Fund's short positions in developed commodity currencies, such as the Canadian dollar and New Zealand dollar against the US dollar, were the largest detractors amidst the improved global growth outlook and a rebound in commodity prices.
We used derivatives, specifically futures and forwards, for risk management purposes and as a tool to help enhance returns across various strategies. Derivatives were just one tool, among others, that we used to implement our market allocation strategy. The use of derivatives detracted from Fund Performance.
This letter is intended to assist shareholders in understanding how the Fund performed during the 12 months ended June 30, 2022. The views and opinions in the letter were current as of August 12, 2022. They are not guarantees of future performance or investment results and should not be taken as investment advice. Investment decisions reflect a variety of factors, and we reserve the right to change our views about individual securities, sectors and markets at any time. As a result, the views expressed should not be relied upon as a forecast of the Fund's future investment intent. We encourage you to consult your financial advisor regarding your personal investment program.
Mutual funds are sold by prospectus only. You should read it carefully and consider a fund's investment objectives, risks, charges, expenses and other important information contained in the prospectus before investing. Prospectuses for most of our funds can be obtained from your financial advisor, by calling UBS Funds at 800-647 1568 or by visiting our website at www.ubs.com/am-us.
13
UBS Dynamic Alpha Fund
Average annual total returns for periods ended 06/30/22 (unaudited)
1 year | 5 years | 10 years | |||||||||||||
Before deducting maximum sales charge | |||||||||||||||
Class A1 | (5.92 | )% | 0.83 | % | 1.57 | % | |||||||||
Class P2 | (5.78 | ) | 1.07 | 1.80 | |||||||||||
After deducting maximum sales charge | |||||||||||||||
Class A1 | (11.13 | )% | (0.30 | )% | 0.99 | % | |||||||||
ICE BofA US Treasury 1-5 Year Index3 | (4.61 | ) | 0.91 | 0.89 | |||||||||||
MSCI World Index (net)4 | (14.34 | ) | 7.67 | 9.51 | |||||||||||
FTSE One-Month US Treasury Bill Index5 | 0.15 | 1.02 | 0.57 | ||||||||||||
The annualized gross and net expense ratios, respectively, for each class of shares as in the October 28, 2021 prospectuses were as follows: Class A—2.32% and 1.38%; Class P—2.09% and 1.13%. Net expenses reflect fee waivers and/or expense reimbursements, if any, pursuant to an agreement that is in effect to cap the expenses. The Trust, with respect to the Fund, and UBS Asset Management (Americas) Inc., the Fund's investment advisor and administrator ("UBS AM (Americas)" or the "Advisor"), have entered into a written agreement pursuant to which the Advisor has agreed to waive a portion of its management fees and/or to reimburse expenses (excluding expenses incurred through investment in other investment companies, interest, taxes, brokerage commissions, extraordinary expenses, and dividend expense and security loan fees for securities sold short) to the extent necessary so that the Fund's ordinary operating expenses (excluding expenses incurred through investment in other investment companies, interest, taxes, brokerage commissions, dividend expense and security loan fees for securities sold short, and extraordinary expenses, such as proxy-related expenses), through the period ending October 28, 2022, do not exceed 1.35% for Class A shares and 1.10% for Class P shares. Pursuant to the written agreement, the Advisor is entitled to be reimbursed for any fees it waives and expenses it reimburses to the extent such reimbursement can be made during the three fiscal years following the date on which such fee waivers and expense reimbursements were made, provided that the reimbursement of the Advisor by the Fund will not cause the Fund to exceed the lesser of any applicable expense limit that is in place for the Fund (i) at the time of the waiver or reimbursement or (ii) at the time of the recoupment. The fee waiver/expense reimbursement agreement may be terminated by the Fund's Board of Trustees at any time and also will terminate automatically upon the expiration or termination of the Fund's advisory contract with the Advisor. Upon termination of the fee waiver/expense reimbursement agreement, however, UBS AM (Americas)'s three year recoupment rights will survive.
1 Maximum sales charge for Class A shares is 5.5%. Class A shares bear ongoing 12b-1 service fees.
2 Class P shares do not bear initial or contingent deferred sales charges or ongoing 12b-1 service and distribution fees, but Class P shares held through advisory programs may be subject to a program fee, which, if included, would have reduced performance.
3 The ICE BofA US Treasury 1-5 Year Index is an unmanaged index designed to track US Treasury securities with maturities between 1 and 5 years. Investors should note that indices do not reflect the deduction of fees and expenses.
4 The MSCI World Index (net) is a free float-adjusted market capitalization weighted index that is designed to measure the equity market performance of developed markets. Net total return indices reinvest dividends after the deduction of withholding taxes, using a tax rate applicable to non-resident institutional investors who do not benefit from double taxation treaties. The index is constructed and managed with a view to being fully investable from the perspective of international institutional investors. Investors should note that indices do not reflect the deduction of fees and expenses.
5 The FTSE One-Month US Treasury Bill Index is an unmanaged index representing monthly return equivalents of yield averages of the last one month Treasury Bill issue. Investors should note that indices do not reflect the deduction of fees and expenses.
Past performance does not predict future performance, and the performance information provided does not reflect the deduction of taxes that a shareholder would pay on Fund distributions or the redemption of Fund shares. The return and principal value of an investment will fluctuate, so that an investor's shares, when redeemed, may be worth more or less than their original cost. Performance results assume reinvestment of all dividends and capital gain distributions at net asset value on the ex-dividend dates. Total returns for periods of less than one year have not been annualized. Current performance may be higher or lower than the performance data quoted. For month-end performance figures, please visit www.ubs.com/us-mutualfundperformance.
14
UBS Dynamic Alpha Fund
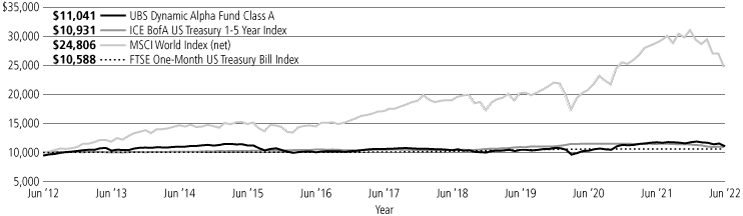
Illustration of an assumed investment of $10,000 in Class A shares (adjusted for 5.5% maximum sales charge) and $2,000,000 in Class P shares (unaudited)
The following graphs depict the performance of UBS Dynamic Alpha Fund Class A and Class P shares versus the ICE BofA US Treasury 1-5 Year Index, the MSCI World Index (net) and the FTSE One-Month US Treasury Bill Index over the 10 years ended June 30, 2022. Class P shares may be subject to a program fee, which, if included, would have reduced performance. The performance provided does not reflect the deduction of taxes that a shareholder would pay on Fund distributions or the redemptions of Fund shares. Past performance is no guarantee of future results. Share price and returns will vary with market conditions; investors may realize a gain or a loss upon redemption. It is important to note that UBS Dynamic Alpha Fund is a professionally managed portfolio while the Indices are not available for investment and are unmanaged. The comparison is shown for illustration purposes only.
UBS Dynamic Alpha Fund Class A vs. ICE BofAML US Treasury 1-5 Year Index, MSCI World Index (net) and FTSE One-Month US Treasury Bill Index
UBS Dynamic Alpha Fund Class P vs. ICE BofAML US Treasury 1-5 Year Index, MSCI World Index (net) and FTSE One-Month US Treasury Bill Index

15
UBS Dynamic Alpha Fund
Portfolio statistics and industry diversification—(unaudited)1,2
As a percentage of net assets as of June 30, 2022
Top ten holdings
| U.S. Treasury Bills, 0.533% due 07/14/22 | 12.4 | % | |||||
| U.S. Treasury Bills, 1.620% due 12/01/22 | 10.9 | ||||||
| U.S. Treasury Notes, 0.250% due 05/31/25 | 3.5 | ||||||
| Bundesobligation, 0.010% due 04/11/25 | 3.4 | ||||||
| U.S. Treasury Notes, 0.375% due 04/30/25 | 1.9 | ||||||
| Canadian Government Bond, 1.500% due 09/01/24 | 1.9 | ||||||
| Ireland Government Bond, 1.000% due 05/15/26 | 1.9 | ||||||
| Japan Government Ten Year Bond, 0.400% due 03/20/25 | 1.7 | ||||||
| New Zealand Government Inflation Linked Bond, 3.000% due 09/20/30 | 1.6 | ||||||
| Canadian Government Bond, 1.000% due 09/01/22 | 1.4 | ||||||
Total | 40.6 | % | |||||
Top five issuer breakdown by country or territory of origin
United States | 50.6 | % | |||||
United Kingdom | 5.4 | ||||||
Germany | 4.4 | ||||||
Canada | 4.0 | ||||||
France | 4.0 | ||||||
Total | 68.4 | % | |||||
Corporate bonds | |||||||
Advertising | 0.1 | % | |||||
Aerospace & defense | 0.1 | ||||||
Agriculture | 0.6 | ||||||
Airlines | 0.2 | ||||||
Apparel | 0.0 | † | |||||
Auto manufacturers | 1.4 | ||||||
Auto parts & equipment | 0.2 | ||||||
Banks | 8.0 | ||||||
Biotechnology | 0.1 | ||||||
Chemicals | 0.7 | ||||||
Commercial services | 0.2 | ||||||
Computers | 0.3 | ||||||
Diversified financial services | 1.2 | ||||||
Electric | 2.6 | ||||||
Engineering & construction | 0.5 | ||||||
Entertainment | 0.2 | ||||||
Gas | 0.8 | ||||||
Healthcare-products | 0.2 | ||||||
Insurance | 2.6 | ||||||
Machinery-diversified | 0.1 | ||||||
Media | 0.3 | ||||||
Miscellaneous manufacturers | 0.2 | ||||||
Oil & gas | 0.9 | ||||||
Pharmaceuticals | 0.2 | ||||||
Pipelines | 0.5 | ||||||
Real estate | 0.2 | ||||||
Real estate investment trusts | 0.6 | ||||||
Retail | 0.1 | ||||||
Semiconductors | 0.2 | ||||||
Software | 0.1 | ||||||
Sovereign | 0.4 | ||||||
Supranationals | 0.4 | ||||||
Telecommunications | 0.3 | ||||||
Transportation | 0.3 | ||||||
Water | 0.4 | ||||||
Total corporate bonds | 25.2 | ||||||
Mortgage-backed securities | 0.0 | † | |||||
Non-U.S. government agency obligations | 23.1 | ||||||
U.S. Treasury obligations | 30.9 | ||||||
Exchange traded funds | 6.9 | ||||||
Short-term investments | 3.1 | ||||||
Investment of cash collateral from securities loaned | 0.6 | ||||||
Total investments | 89.8 | ||||||
Other assets in excess of liabilities | 10.2 | ||||||
Net assets | 100.0 | % | |||||
† Amount represents less than 0.05% or (0.05)%.
1 The portfolio is actively managed and its composition will vary over time.
2 Figures represent the breakdown of direct investments of UBS Dynamic Alpha Fund. Figures would be different if a breakdown of the underlying investment companies and exchange traded funds was included.
16
UBS Dynamic Alpha Fund
Portfolio of investments
June 30, 2022
| Face amount1 | Value | ||||||||||
Corporate bonds: 25.2% | |||||||||||
Australia: 0.9% | |||||||||||
| APA Infrastructure Ltd. 4.200%, due 03/23/252 | 15,000 | $ | 14,874 | ||||||||
| Aurizon Network Pty Ltd. 4.000%, due 06/21/242 | AUD | 30,000 | 20,461 | ||||||||
| Ausgrid Finance Pty Ltd. 3.750%, due 10/30/242 | AUD | 30,000 | 20,312 | ||||||||
| Commonwealth Bank of Australia (fixed, converts to FRN on 10/03/24), 1.936%, due 10/03/292,3 | EUR | 100,000 | 100,687 | ||||||||
| Westpac Banking Corp. 2.000%, due 01/13/23 | 30,000 | 29,849 | |||||||||
| (fixed, converts to FRN on 09/21/27), 5.000%, due 09/21/273,4 | 80,000 | 69,943 | |||||||||
256,126 | |||||||||||
Belgium: 0.4% | |||||||||||
| Resa SA 1.000%, due 07/22/262 | EUR | 100,000 | 99,676 | ||||||||
Bermuda: 0.1% | |||||||||||
| XLIT Ltd. 5.250%, due 12/15/43 | 20,000 | 21,305 | |||||||||
Canada: 0.4% | |||||||||||
| Bank of Nova Scotia 3.450%, due 04/11/25 | 30,000 | 29,604 | |||||||||
| Canadian Pacific Railway Co. 1.350%, due 12/02/24 | 60,000 | 56,442 | |||||||||
| TELUS Corp. 3.750%, due 01/17/25 | CAD | 15,000 | 11,459 | ||||||||
97,505 | |||||||||||
Cayman Islands: 0.7% | |||||||||||
| Amber Circle Funding Ltd. 3.250%, due 12/04/222 | 200,000 | 199,960 | |||||||||
China: 0.1% | |||||||||||
| NXP BV/NXP Funding LLC/NXP USA, Inc. 2.700%, due 05/01/25 | 5,000 | 4,750 | |||||||||
3.150%, due 05/01/27 | 15,000 | 13,920 | |||||||||
18,670 | |||||||||||
France: 2.6% | |||||||||||
| AXA SA (fixed, converts to FRN on 05/28/29), 3.250%, due 05/28/492,3 | EUR | 100,000 | 96,602 | ||||||||
| Credit Agricole SA 1.250%, due 04/14/262 | EUR | 100,000 | 99,904 | ||||||||
| Electricite de France SA 5.625%, due 01/22/24 | 100,000 | 91,550 | |||||||||
| SCOR SE (fixed, converts to FRN on 03/13/29), 5.250%, due 03/13/292,3,4 | 200,000 | 161,250 | |||||||||
| Terega SA 2.200%, due 08/05/252 | EUR | 100,000 | 103,704 | ||||||||
| Face amount1 | Value | ||||||||||
Corporate bonds—(continued) | |||||||||||
France—(concluded) | |||||||||||
| TotalEnergies SE (fixed, converts to FRN on 02/26/25), 2.625%, due 02/26/252,3,4 | EUR | 100,000 | $ | 97,459 | |||||||
| Unibail-Rodamco-Westfield SE (fixed, converts to FRN on 04/25/26), 2.875%, due 01/25/262,3,4 | EUR | 100,000 | 72,441 | ||||||||
722,910 | |||||||||||
Germany: 0.9% | |||||||||||
| ADLER Group SA 1.500%, due 07/26/242,5 | EUR | 100,000 | 60,385 | ||||||||
| Volkswagen International Finance N.V. 1.125%, due 10/02/232 | EUR | 100,000 | 103,716 | ||||||||
| Series NC6, (fixed, converts to FRN on 06/27/24), 3.375%, due 06/27/242,3,4 | EUR | 100,000 | 96,586 | ||||||||
260,687 | |||||||||||
Guernsey: 0.3% | |||||||||||
| Globalworth Real Estate Investments Ltd. 3.000%, due 03/29/252 | EUR | 100,000 | 91,748 | ||||||||
Ireland: 1.0% | |||||||||||
| AerCap Ireland Capital DAC/AerCap Global Aviation Trust 1.650%, due 10/29/24 | 300,000 | 276,999 | |||||||||
Japan: 0.1% | |||||||||||
| Mitsubishi UFJ Financial Group, Inc. 2.665%, due 07/25/22 | 25,000 | 25,005 | |||||||||
Mexico: 0.9% | |||||||||||
| Mexico City Airport Trust 5.500%, due 07/31/472 | 200,000 | 136,100 | |||||||||
| Petroleos Mexicanos 3.750%, due 02/21/242 | EUR | 100,000 | 101,049 | ||||||||
237,149 | |||||||||||
Poland: 0.3% | |||||||||||
| Tauron Polska Energia SA 2.375%, due 07/05/272 | EUR | 100,000 | 86,901 | ||||||||
Spain: 1.6% | |||||||||||
| Banco Santander SA 3.250%, due 04/04/262 | EUR | 100,000 | 102,419 | ||||||||
4.000%, due 01/19/232 | AUD | 200,000 | 138,270 | ||||||||
| Iberdrola International BV (fixed, converts to FRN on 03/26/24), 2.625%, due 12/26/232,3,4 | EUR | 100,000 | 101,128 | ||||||||
| Redexis Gas Finance BV 1.875%, due 04/27/272 | EUR | 100,000 | 96,203 | ||||||||
438,020 | |||||||||||
Supranationals: 0.8% | |||||||||||
| Corp. Andina de Fomento 4.500%, due 06/05/252 | AUD | 35,000 | 23,770 | ||||||||
17
UBS Dynamic Alpha Fund
Portfolio of investments
June 30, 2022
| Face amount1 | Value | ||||||||||
Corporate bonds—(continued) | |||||||||||
Supranationals—(concluded) | |||||||||||
| European Financial Stability Facility 0.500%, due 07/11/252 | EUR | 100,000 | $ | 102,267 | |||||||
| European Investment Bank 2.000%, due 12/15/22 | 100,000 | 99,723 | |||||||||
225,760 | |||||||||||
Switzerland: 0.4% | |||||||||||
| Argentum Netherlands BV for Swiss Life AG (fixed, converts to FRN on 06/16/25), 4.375%, due 06/16/252,3,4 | EUR | 100,000 | 101,809 | ||||||||
United Kingdom: 4.0% | |||||||||||
| AstraZeneca PLC 3.500%, due 08/17/23 | 30,000 | 30,085 | |||||||||
| Aviva PLC (fixed, converts to FRN on 09/29/22), 6.125%, due 09/29/223,4 | GBP | 30,000 | 36,519 | ||||||||
| Barclays PLC (fixed, converts to FRN on 10/06/22), 2.375%, due 10/06/232,3 | GBP | 100,000 | 121,378 | ||||||||
| BAT Capital Corp. 3.557%, due 08/15/27 | 25,000 | 22,871 | |||||||||
| BAT International Finance PLC 0.875%, due 10/13/232 | EUR | 100,000 | 103,480 | ||||||||
| Lloyds Banking Group PLC 2.250%, due 10/16/242 | GBP | 100,000 | 116,894 | ||||||||
| Natwest Group PLC (fixed, converts to FRN on 06/25/23), 4.519%, due 06/25/243 | 200,000 | 199,486 | |||||||||
| Phoenix Group Holdings PLC 4.125%, due 07/20/222 | GBP | 150,000 | 182,630 | ||||||||
| Reynolds American, Inc. 4.450%, due 06/12/25 | 25,000 | 24,850 | |||||||||
| Virgin Money UK PLC (fixed, converts to FRN on 04/24/25), 3.375%, due 04/24/262,3 | GBP | 100,000 | 115,688 | ||||||||
| WPP Finance 2010 3.750%, due 09/19/24 | 25,000 | 24,415 | |||||||||
| Yorkshire Water Finance PLC (fixed, converts to FRN on 03/22/23), 3.750%, due 03/22/462,3 | GBP | 100,000 | 121,702 | ||||||||
1,099,998 | |||||||||||
United States: 9.7% | |||||||||||
| 3M Co. 2.650%, due 04/15/25 | 20,000 | 19,613 | |||||||||
| Air Products and Chemicals, Inc. 2.050%, due 05/15/30 | 20,000 | 17,287 | |||||||||
| Albemarle Corp. 5.450%, due 12/01/44 | 30,000 | 29,359 | |||||||||
| Altria Group, Inc. 4.400%, due 02/14/26 | 13,000 | 12,770 | |||||||||
| Face amount1 | Value | ||||||||||
Corporate bonds—(continued) | |||||||||||
United States—(continued) | |||||||||||
| American Airlines Pass-Through Trust, Series 2014-1, Class B, 4.375%, due 10/01/22 | 31,614 | $ | 31,576 | ||||||||
| Apache Corp. 4.250%, due 01/15/44 | 60,000 | 43,745 | |||||||||
| Apple, Inc. 1.800%, due 09/11/24 | 30,000 | 29,063 | |||||||||
| Aptiv PLC/Aptiv Corp. 2.396%, due 02/18/25 | 50,000 | 47,750 | |||||||||
| AT&T, Inc. 4.350%, due 03/01/29 | 60,000 | 59,078 | |||||||||
| Bank of America Corp. (fixed, converts to FRN on 12/20/22), 3.004%, due 12/20/233 | 90,000 | 89,705 | |||||||||
3.875%, due 08/01/25 | 80,000 | 79,653 | |||||||||
| Baxter International, Inc. 2.600%, due 08/15/26 | 30,000 | 28,069 | |||||||||
| Boeing Co. 2.196%, due 02/04/26 | 20,000 | 18,027 | |||||||||
| Broadcom, Inc. 3.150%, due 11/15/25 | 35,000 | 33,706 | |||||||||
| Chevron Phillips Chemical Co. LLC/Chevron Phillips Chemical Co. LP 3.300%, due 05/01/236 | 120,000 | 119,743 | |||||||||
5.125%, due 04/01/256 | 25,000 | 25,761 | |||||||||
| Citigroup, Inc. 3.875%, due 10/25/23 | 130,000 | 131,332 | |||||||||
4.600%, due 03/09/265 | 20,000 | 20,025 | |||||||||
| Comcast Corp. 3.950%, due 10/15/25 | 35,000 | 35,138 | |||||||||
| Costco Wholesale Corp. 1.600%, due 04/20/30 | 10,000 | 8,435 | |||||||||
| CVS Health Corp. 2.625%, due 08/15/245 | 25,000 | 24,441 | |||||||||
| Dell International LLC/EMC Corp. 5.300%, due 10/01/29 | 60,000 | 59,150 | |||||||||
| EnLink Midstream Partners LP 4.400%, due 04/01/24 | 10,000 | 9,762 | |||||||||
| Enterprise Products Operating LLC 3.900%, due 02/15/245 | 20,000 | 19,975 | |||||||||
| EQT Corp. 3.900%, due 10/01/27 | 20,000 | 18,612 | |||||||||
| Eversource Energy 2.900%, due 03/01/27 | 80,000 | 75,098 | |||||||||
| Exelon Corp. 3.400%, due 04/15/26 | 15,000 | 14,554 | |||||||||
| Ford Motor Credit Co. LLC 3.021%, due 03/06/24 | EUR | 100,000 | 100,407 | ||||||||
| General Electric Co. 6.750%, due 03/15/32 | 6,000 | 6,712 | |||||||||
| General Motors Financial Co., Inc. 4.350%, due 04/09/25 | 90,000 | 88,891 | |||||||||
18
UBS Dynamic Alpha Fund
Portfolio of investments
June 30, 2022
| Face amount1 | Value | ||||||||||
Corporate bonds—(continued) | |||||||||||
United States—(continued) | |||||||||||
| Georgia Power Co., Series A, 2.100%, due 07/30/23 | 25,000 | $ | 24,639 | ||||||||
| Gilead Sciences, Inc. 2.500%, due 09/01/23 | 20,000 | 19,786 | |||||||||
| Goldman Sachs Group, Inc. 1.625%, due 07/27/262 | EUR | 30,000 | 29,574 | ||||||||
3.375%, due 03/27/252 | EUR | 25,000 | 26,569 | ||||||||
3.500%, due 04/01/25 | 80,000 | 78,420 | |||||||||
| Illinois Tool Works, Inc. 2.650%, due 11/15/26 | 45,000 | 43,036 | |||||||||
| John Deere Capital Corp. 2.125%, due 03/07/255 | 20,000 | 19,311 | |||||||||
| JPMorgan Chase & Co. 3.200%, due 01/25/23 | 220,000 | 220,308 | |||||||||
3.625%, due 12/01/27 | 60,000 | 57,601 | |||||||||
| Kinder Morgan, Inc. 5.625%, due 11/15/236 | 35,000 | 35,636 | |||||||||
| Liberty Mutual Group, Inc. 4.569%, due 02/01/296 | 25,000 | 24,581 | |||||||||
| Lincoln National Corp. 3.800%, due 03/01/28 | 70,000 | 66,815 | |||||||||
| Magallanes, Inc. 3.755%, due 03/15/276 | 50,000 | 46,900 | |||||||||
| Mastercard, Inc. 2.000%, due 03/03/25 | 20,000 | 19,246 | |||||||||
| Morgan Stanley 4.000%, due 07/23/25 | 85,000 | 84,928 | |||||||||
4.350%, due 09/08/26 | 20,000 | 19,793 | |||||||||
| MPLX LP 4.250%, due 12/01/27 | 30,000 | 28,949 | |||||||||
| National Rural Utilities Cooperative Finance Corp. 3.700%, due 03/15/29 | 15,000 | 14,378 | |||||||||
| NIKE, Inc. 2.400%, due 03/27/25 | 10,000 | 9,738 | |||||||||
| Oncor Electric Delivery Co. LLC 3.700%, due 11/15/28 | 25,000 | 24,325 | |||||||||
| Oracle Corp. 2.500%, due 04/01/25 | 20,000 | 19,002 | |||||||||
| Paramount Global 4.750%, due 05/15/25 | 33,000 | 33,306 | |||||||||
| Quanta Services, Inc. 0.950%, due 10/01/24 | 50,000 | 46,243 | |||||||||
| Raytheon Technologies Corp. 3.950%, due 08/16/25 | 25,000 | 25,052 | |||||||||
| Southern California Edison Co., Series E, 3.700%, due 08/01/25 | 20,000 | 19,672 | |||||||||
| Southern Co. 3.250%, due 07/01/26 | 35,000 | 33,492 | |||||||||
| Swiss Re Treasury U.S. Corp. 4.250%, due 12/06/426 | 30,000 | 27,742 | |||||||||
| Face amount1 | Value | ||||||||||
Corporate bonds—(concluded) | |||||||||||
United States—(concluded) | |||||||||||
| Target Corp. 1.950%, due 01/15/275 | 15,000 | $ | 13,914 | ||||||||
| Thermo Fisher Scientific, Inc. 1.215%, due 10/18/24 | 20,000 | 18,948 | |||||||||
| TWDC Enterprises 18 Corp. 1.850%, due 07/30/26 | 10,000 | 9,235 | |||||||||
| United Airlines Pass-Through Trust, Series 2016-1, Class B, 3.650%, due 01/07/26 | 32,870 | 29,909 | |||||||||
| Verizon Communications, Inc. 3.376%, due 02/15/25 | 25,000 | 24,814 | |||||||||
| Virginia Electric and Power Co., Series A, 3.800%, due 04/01/28 | 20,000 | 19,549 | |||||||||
| Visa, Inc. 1.900%, due 04/15/27 | 25,000 | 23,060 | |||||||||
| Williams Cos., Inc. 4.300%, due 03/04/24 | 35,000 | 35,151 | |||||||||
| Xcel Energy, Inc. 4.800%, due 09/15/41 | 80,000 | 75,372 | |||||||||
2,646,431 | |||||||||||
| Total corporate bonds (cost $7,598,984) | 6,906,659 | ||||||||||
Mortgage-backed securities: 0.0%† | |||||||||||
Cayman Islands: 0.0%† | |||||||||||
| LNR CDO IV Ltd., Series 2006-1A, Class FFX, 7.592%, due 05/28/436,7,8 | 8,000,000 | 0 | |||||||||
United States: 0.0%† | |||||||||||
| Structured Adjustable Rate Mortgage Loan Trust, Series 2005-7, Class B11, 2.971%, due 04/25/359 | 61,626 | 1 | |||||||||
| Total mortgage-backed securities (cost $8,099,709) | 1 | ||||||||||
Non-U.S. government agency obligations: 23.1% | |||||||||||
Australia: 2.8% | |||||||||||
| Australia Government Bond 2.250%, due 05/21/282 | AUD | 420,000 | 271,551 | ||||||||
2.750%, due 11/21/272 | AUD | 200,000 | 133,578 | ||||||||
5.750%, due 07/15/222 | AUD | 540,000 | 373,264 | ||||||||
778,393 | |||||||||||
Canada: 3.7% | |||||||||||
| Canada Housing Trust No. 1 2.350%, due 09/15/236 | CAD | 120,000 | 92,367 | ||||||||
| Canadian Government Bond 1.000%, due 09/01/22 | CAD | 500,000 | 387,865 | ||||||||
1.500%, due 09/01/24 | CAD | 690,000 | 518,288 | ||||||||
998,520 | |||||||||||
19
UBS Dynamic Alpha Fund
Portfolio of investments
June 30, 2022
| Face amount1 | Value | ||||||||||
Non-U.S. government agency obligations—(continued) | |||||||||||
China: 0.4% | |||||||||||
| China Development Bank 1.250%, due 01/21/232 | GBP | 100,000 | $ | 120,688 | |||||||
Colombia: 0.1% | |||||||||||
| Colombia Government International Bond 8.125%, due 05/21/24 | 30,000 | 31,112 | |||||||||
France: 1.4% | |||||||||||
| Caisse d'Amortissement de la Dette Sociale 1.375%, due 11/25/242 | EUR | 100,000 | 105,139 | ||||||||
| French Republic Government Bond OAT 0.010%, due 03/25/252 | EUR | 260,000 | 264,861 | ||||||||
370,000 | |||||||||||
Germany: 3.4% | |||||||||||
| Bundesobligation 0.010%, due 04/11/252 | EUR | 910,000 | 932,822 | ||||||||
Ireland: 1.9% | |||||||||||
| Ireland Government Bond 1.000%, due 05/15/262 | EUR | 490,000 | 510,016 | ||||||||
Japan: 3.8% | |||||||||||
| Japan Bank for International Cooperation 0.625%, due 05/22/23 | 200,000 | 195,961 | |||||||||
| Japan Government Ten Year Bond 0.400%, due 03/20/25 | JPY | 63,000,000 | 470,076 | ||||||||
| Japanese Government CPI Linked Bond 0.100%, due 03/10/26 | JPY | 48,587,660 | 375,115 | ||||||||
1,041,152 | |||||||||||
Mexico: 0.1% | |||||||||||
| Mexico Government International Bond 8.000%, due 09/24/22 | 30,000 | 30,362 | |||||||||
New Zealand: 2.6% | |||||||||||
| New Zealand Government Bond 0.500%, due 05/15/26 | NZD | 500,000 | 277,257 | ||||||||
| New Zealand Government Inflation Linked Bond 3.000%, due 09/20/302 | NZD | 545,146 | 434,594 | ||||||||
711,851 | |||||||||||
Poland: 0.3% | |||||||||||
| Republic of Poland Government International Bond 0.010%, due 02/10/252 | EUR | 90,000 | 88,704 | ||||||||
Romania: 0.4% | |||||||||||
| Romanian Government International Bond 2.750%, due 02/26/262 | EUR | 100,000 | 98,429 | ||||||||
Spain: 0.7% | |||||||||||
| Spain Government Bond 1.600%, due 04/30/252,6 | EUR | 180,000 | 190,123 | ||||||||
| Face amount1 | Value | ||||||||||
Non-U.S. government agency obligations—(concluded) | |||||||||||
Supranationals: 0.1% | |||||||||||
| European Union 3.000%, due 09/04/262 | EUR | 30,000 | $ | 33,413 | |||||||
United Kingdom: 1.4% | |||||||||||
| Bank of England Euro Note 0.500%, due 04/28/232 | 40,000 | 39,253 | |||||||||
| United Kingdom Gilt 0.500%, due 07/22/222 | GBP | 290,000 | 352,925 | ||||||||
392,178 | |||||||||||
| Total non-U.S. government agency obligations (cost $7,110,404) | 6,327,763 | ||||||||||
U.S. Treasury obligations: 30.9% | |||||||||||
United States: 30.9% | |||||||||||
| U.S. Treasury Bills 0.533%, due 07/14/2210 | 3,400,000 | 3,399,355 | |||||||||
1.620%, due 12/01/2210 | 3,000,000 | 2,979,791 | |||||||||
| U.S. Treasury Notes 0.250%, due 05/31/25 | 1,030,000 | 950,457 | |||||||||
0.375%, due 04/30/25 | 560,000 | 519,728 | |||||||||
1.375%, due 09/30/23 | 320,000 | 313,788 | |||||||||
1.500%, due 02/28/23 | 210,000 | 208,261 | |||||||||
2.750%, due 11/15/23 | 100,000 | 99,699 | |||||||||
| Total U.S. Treasury obligations (cost $8,605,861) | 8,471,079 | ||||||||||
| Number of shares | |||||||||||
Exchange traded funds: 6.9% | |||||||||||
United States: 6.9% | |||||||||||
iShares MSCI USA Value Factor ETF5 | 8,035 | 727,328 | |||||||||
iShares MSCI International Value Factor ETF | 52,125 | 1,156,132 | |||||||||
| Total exchange traded funds (cost $1,670,042) | 1,883,460 | ||||||||||
Short-term investments: 3.1% | |||||||||||
Investment companies: 3.1% | |||||||||||
| State Street Institutional U.S. Government Money Market Fund, 1.430%10 (cost $840,241) | 840,241 | 840,241 | |||||||||
Investment of cash collateral from securities loaned: 0.6% | |||||||||||
Money market funds: 0.6% | |||||||||||
| State Street Navigator Securities Lending Government Money Market Portfolio, 1.535%10 (cost $171,623) | 171,623 | 171,623 | |||||||||
| Total investments: 89.8% (cost $34,096,864) | 24,600,826 | ||||||||||
Other assets in excess of liabilities: 10.2% | 2,779,917 | ||||||||||
Net assets: 100.0% | $ | 27,380,743 | |||||||||
20
UBS Dynamic Alpha Fund
Portfolio of investments
June 30, 2022
For a listing of defined portfolio acronyms that are used throughout the Portfolio of investments as well as the tables that follow, please refer to the Glossary of terms used in the Portfolio of investments.
Futures contracts
| Number of contracts | Currency | Expiration date | Current notional amount | Value | Unrealized appreciation (depreciation) | ||||||||||||||||||||||
Index futures buy contracts: | |||||||||||||||||||||||||||
1 | AUD | S&P ASX Share Price Index 200 Futures | September 2022 | $ | 112,046 | $ | 111,493 | $ | (553 | ) | |||||||||||||||||
1 | CAD | S&P 60 Index Futures | September 2022 | 189,028 | 177,517 | (11,511 | ) | ||||||||||||||||||||
13 | EUR | EURO STOXX 600 Index Futures | September 2022 | 276,977 | 275,737 | (1,240 | ) | ||||||||||||||||||||
119 | EUR | EURO STOXX 600 Bank Index Futures | September 2022 | 801,246 | 773,177 | (28,069 | ) | ||||||||||||||||||||
4 | EUR | FTSE MIB Index Future | September 2022 | 465,824 | 444,498 | (21,326 | ) | ||||||||||||||||||||
9 | GBP | FTSE 100 Index Future | September 2022 | 786,246 | 780,155 | (6,091 | ) | ||||||||||||||||||||
12 | HKD | Hang Seng China Enterprises Index Futures | July 2022 | 567,861 | 580,287 | 12,426 | |||||||||||||||||||||
4 | JPY | Tokyo Price Index Futures | September 2022 | 571,209 | 551,445 | (19,764 | ) | ||||||||||||||||||||
17 | USD | Mini MSCI Emerging Markets (EM) Index Futures | September 2022 | 855,047 | 852,295 | (2,752 | ) | ||||||||||||||||||||
9 | USD | MSCI China A 50 Connect Index Futures | September 2022 | 544,490 | 570,645 | 26,155 | |||||||||||||||||||||
16 | USD | MSCI World Energy Index Futures | September 2022 | 699,699 | 614,920 | (84,779 | ) | ||||||||||||||||||||
11 | USD | MSCI World Materials Index Futures | September 2022 | 560,455 | 524,025 | (36,430 | ) | ||||||||||||||||||||
10 | USD | MSCI World Small Cap Futures | September 2022 | 542,754 | 540,700 | (2,054 | ) | ||||||||||||||||||||
Interest rate futures buy contracts: | |||||||||||||||||||||||||||
2 | CAD | Canadian Bond 10 Year Futures | September 2022 | 199,351 | 192,651 | (6,700 | ) | ||||||||||||||||||||
U.S. Treasury futures buy contracts: | |||||||||||||||||||||||||||
8 | USD | U.S. Treasury Note 10 Year Futures | September 2022 | 963,512 | 948,250 | (15,262 | ) | ||||||||||||||||||||
13 | USD | U.S. Treasury Note 5 Year Futures | September 2022 | 1,475,295 | 1,459,250 | (16,045 | ) | ||||||||||||||||||||
Total | $ | 9,611,040 | $ | 9,397,045 | $ | (213,995 | ) | ||||||||||||||||||||
Index futures sell contracts: | |||||||||||||||||||||||||||
52 | EUR | EURO STOXX 50 Index Futures | September 2022 | $ | (1,902,027 | ) | $ | (1,875,118 | ) | $ | 26,909 | ||||||||||||||||
7 | USD | MSCI World Index Futures | September 2022 | (542,917 | ) | (545,160 | ) | (2,243 | ) | ||||||||||||||||||
Interest rate futures sell contracts: | |||||||||||||||||||||||||||
2 | EUR | EURO BOBL 5 Year Future | September 2022 | (262,300 | ) | (260,290 | ) | 2,010 | |||||||||||||||||||
6 | EUR | EURO 10 Year BUND Futures | September 2022 | (955,159 | ) | (935,484 | ) | 19,675 | |||||||||||||||||||
3 | GBP | United Kingdom Long Gilt Bond Futures | September 2022 | (429,862 | ) | (416,243 | ) | 13,619 | |||||||||||||||||||
U.S. Treasury futures sell contracts: | |||||||||||||||||||||||||||
1 | USD | U.S. Treasury Ultra Bond Futures | September 2022 | (159,282 | ) | (154,344 | ) | 4,938 | |||||||||||||||||||
4 | USD | Ultra U.S. Treasury Note 10 Year Futures | September 2022 | (519,713 | ) | (509,500 | ) | 10,213 | |||||||||||||||||||
Total | $ | (4,771,260 | ) | $ | (4,696,139 | ) | $ | 75,121 | |||||||||||||||||||
Net unrealized appreciation (depreciation) | $ | (138,874 | ) | ||||||||||||||||||||||||
Centrally cleared credit default swap agreements on corporate issues—sell protection11
| Referenced obligations | Notional amount (000) | Maturity date | Payment frequency | Payments received by the Portfolio12 | Upfront payments received (made) | Value | Unrealized appreciation (depreciation) | ||||||||||||||||||||||||
iTraxx Europe Crossover Series 27 Index | EUR | 400 | 06/20/27 | Quarterly | 5.000 | % | $ | (24,871 | ) | $ | (12,441 | ) | $ | (37,312 | ) | ||||||||||||||||
21
UBS Dynamic Alpha Fund
Portfolio of investments
June 30, 2022
Centrally cleared credit default swap agreements on credit indices—sell protection11
| Referenced obligations | Notional amount (000) | Maturity date | Payment frequency | Payments received by the Portfolio12 | Upfront payments received (made) | Value | Unrealized appreciation (depreciation) | ||||||||||||||||||||||||
CDX North America High Yield 38 Index | USD | 1,148 | 06/20/27 | Quarterly | 5.000 | % | $ | 12,607 | $ | (31,594 | ) | $ | (18,987 | ) | |||||||||||||||||
Forward foreign currency contracts
Counterparty | Sell | Purchase | Settlement date | Unrealized appreciation (depreciation) | |||||||||||||||
BOA | GBP | 2,260,000 | USD | 2,829,066 | 07/13/22 | $ | 77,713 | ||||||||||||
BOA | NZD | 4,410,000 | USD | 2,841,341 | 07/13/22 | 87,162 | |||||||||||||
BOA | USD | 2,054,394 | JPY | 274,100,000 | 07/13/22 | (33,312 | ) | ||||||||||||
BOA | USD | 2,556,096 | NOK | 24,250,000 | 07/13/22 | (93,831 | ) | ||||||||||||
CIBC | CNY | 10,290,000 | USD | 1,540,041 | 07/13/22 | 2,910 | |||||||||||||
CIBC | HKD | 865,000 | USD | 110,313 | 07/13/22 | 51 | |||||||||||||
CITI | AUD | 605,000 | USD | 434,722 | 07/13/22 | 17,110 | |||||||||||||
CITI | EUR | 1,175,000 | CHF | 1,186,016 | 07/13/22 | 10,961 | |||||||||||||
CITI | EUR | 4,405,000 | USD | 4,726,827 | 07/13/22 | 108,282 | |||||||||||||
CITI | USD | 852,125 | BRL | 4,100,000 | 07/13/22 | (70,610 | ) | ||||||||||||
CITI | USD | 410,090 | MXN | 8,060,000 | 07/13/22 | (9,859 | ) | ||||||||||||
JPMCB | CHF | 2,485,000 | USD | 2,543,400 | 07/13/22 | (60,833 | ) | ||||||||||||
JPMCB | TWD | 28,300,000 | USD | 966,431 | 07/13/22 | 14,478 | |||||||||||||
MSCI | PHP | 67,100,000 | USD | 1,261,895 | 07/13/22 | 41,657 | |||||||||||||
MSCI | USD | 835,457 | CLP | 681,900,000 | 07/13/22 | (93,512 | ) | ||||||||||||
MSCI | USD | 1,735,994 | COP | 6,658,405,000 | 07/13/22 | (134,436 | ) | ||||||||||||
SSC | CAD | 4,410,000 | USD | 3,509,736 | 07/13/22 | 83,566 | |||||||||||||
SSC | USD | 158,265 | CAD | 205,000 | 07/13/22 | 1,001 | |||||||||||||
SSC | USD | 838,613 | EUR | 800,000 | 07/13/22 | 169 | |||||||||||||
Net unrealized appreciation (depreciation) | $ | (51,333 | ) | ||||||||||||||||
22
UBS Dynamic Alpha Fund
Portfolio of investments
June 30, 2022
Fair valuation summary
The following is a summary of the fair valuations according to the inputs used as of June 30, 2022 in valuing the Fund's investments. In the event a Fund holds investments for which fair value is measured using the NAV per share practical expedient (or its equivalent), a separate column will be added to the fair value hierarchy table; this is intended to permit reconciliation to the amounts presented in the Portfolio of investments:
Description | Unadjusted quoted prices in active markets for identical investments (Level 1) | Other significant observable inputs (Level 2) | Unobservable inputs (Level 3) | Total | |||||||||||||||
Assets | |||||||||||||||||||
Corporate bonds | $ | — | $ | 6,906,659 | $ | — | $ | 6,906,659 | |||||||||||
Mortgage-backed securities | — | 1 | 0 | 1 | |||||||||||||||
Non-U.S. government agency obligations | — | 6,327,763 | — | 6,327,763 | |||||||||||||||
U.S. Treasury obligations | — | 8,471,079 | — | 8,471,079 | |||||||||||||||
Exchange traded funds | 1,883,460 | — | — | 1,883,460 | |||||||||||||||
Short-term investments | — | 840,241 | — | 840,241 | |||||||||||||||
Investment of cash collateral from securities loaned | — | 171,623 | — | 171,623 | |||||||||||||||
Futures contracts | 115,945 | — | — | 115,945 | |||||||||||||||
Forward foreign currency contracts | — | 445,060 | — | 445,060 | |||||||||||||||
Total | $ | 1,999,405 | $ | 23,162,426 | $ | 0 | $ | 25,161,831 | |||||||||||
Liabilities | |||||||||||||||||||
Futures contracts | $ | (254,819 | ) | $ | — | $ | — | $ | (254,819 | ) | |||||||||
Swap agreements | — | (44,035 | ) | — | (44,035 | ) | |||||||||||||
Forward foreign currency contracts | — | (496,393 | ) | — | (496,393 | ) | |||||||||||||
Total | $ | (254,819 | ) | $ | (540,428 | ) | $ | — | $ | (795,247 | ) | ||||||||
At June 30, 2022, there were no transfers in or out of Level 3.
Securities valued using unobservable inputs, i.e. Level 3, were not considered significant to the Fund.
Portfolio footnotes
† Amount represents less than 0.05% or (0.05)%.
1 In U.S. dollars unless otherwise indicated.
2 Security was purchased pursuant to Regulation S under the Securities Act of 1933, which exempts from registration securities offered and sold outside of the United States. Such a security cannot be sold in the United States without either an effective registration statement filed pursuant to the Securities Act of 1933, or pursuant to an exemption from registration.
3 Variable or floating rate security. The interest rate shown is the rate in effect as of period end and changes periodically.
4 Perpetual investment. Date shown reflects the next call date.
5 Security, or portion thereof, was on loan at the period end.
6 Security exempt from registration pursuant to Rule 144A under the Securities Act of 1933. These securities are considered liquid, unless noted otherwise, and may be resold in transactions exempt from registration, normally to qualified institutional buyers. Securities exempt from registration pursuant to Rule 144A, in the amount of $562,853, represented 2.1% of the Fund's net assets at period end.
7 Security fair valued by the Valuation Committee under the direction of the Board of Trustees.
8 Significant unobservable inputs were used in the valuation of this security; i.e. Level 3.
9 Variable or floating rate security for which the interest rate adjusts periodically based on changes in current interest rates and prepayments on the underlying pool of assets. Rate shown is the rate in effect as of period end.
10 Rates shown reflect yield at June 30, 2022.
23
UBS Dynamic Alpha Fund
Portfolio of investments
June 30, 2022
11 If the Fund is a seller of protection and a credit event occurs, as defined under the terms of that particular swap agreement, the Fund will either (i) pay to the buyer of protection an amount equal to the notional amount of the swap and take delivery of the referenced obligation or underlying securities comprising the referenced obligation or (ii) pay a net settlement amount in the form of cash or securities equal to the notional amount of the swap less the recovery value of the referenced obligation or underlying securities comprising the referenced obligation.
12 Payments made or received are based on the notional amount.
See accompanying notes to financial statements.
24
UBS Global Allocation Fund
Portfolio performance
For the 12 months ended June 30, 2022 (the "reporting period"), Class A shares of UBS Global Allocation Fund (the "Fund") returned -14.05% (Class A shares returned -18.78% after the deduction of the maximum sales charge), while Class P shares returned -13.78%. In contrast, the Fund's benchmark, the 60% MSCI All Country World Index (net)/40% Citigroup World Government Bond Index (Hedged in USD), returned -12.90% during the same time period. For comparison purposes, the MSCI All Country World Index (net) returned -15.75% and the FTSE World Government Bond Index (Hedged in USD) returned -9.02%. (Class P shares have lower expenses than other share classes of the Fund. Returns for all share classes over various time periods are shown on page 26; please note that these returns do not reflect the deduction of taxes that a shareholder would pay on Fund distributions or the redemption of Fund shares, while the Index returns do not reflect the deduction of fees and expenses.)
The Fund produced a negative total return during the reporting period. Tactical asset allocation detracted from performance, while security selection contributed to results.
During the review period, we used derivatives for risk management purposes and as a tool to help enhance returns in the portfolio. We used a variety of equity and fixed income options, futures and swaps to implement our tactical asset allocation strategy.
Portfolio performance summary
• Bottom-up security selection contributed to performance.
– US large-cap value and international equity strategies contributed to performance. This offset the negative impact from Emerging Markets Equity Opportunity and US Large Cap Growth strategies.
• Active asset allocation decisions detracted from overall performance.
– Overweights to Chinese equities and US small-caps detracted from returns. Overweights to the energy sector and value stocks contributed to performance.
– Within fixed income, an underweight to government bonds contributed positively to performance. In particular, a short 10 year bund (that is, German government bond) position was additive to returns.
– In foreign exchange, a long position in the Norwegian Krone subtracted from performance. Conversely, short positions in the South Korean won and Taiwanese dollar were additive for returns.
This letter is intended to assist shareholders in understanding how the Fund performed during the 12 months ended June 30, 2022. The views and opinions in the letter were current as of August 12, 2022. They are not guarantees of future performance or investment results and should not be taken as investment advice. Investment decisions reflect a variety of factors, and we reserve the right to change our views about individual securities, sectors and markets at any time. As a result, the views expressed should not be relied upon as a forecast of the Fund's future investment intent. We encourage you to consult your financial advisor regarding your personal investment program.
Mutual funds are sold by prospectus only. You should read it carefully and consider a fund's investment objectives, risks, charges, expenses and other important information contained in the prospectus before investing. Prospectuses for most of our funds can be obtained from your financial advisor, by calling UBS Funds at 800-647 1568 or by visiting our website at www.ubs.com/am-us.
25
UBS Global Allocation Fund
Average annual total returns for periods ended 06/30/22 (unaudited)
1 year | 5 years | 10 years | |||||||||||||
Before deducting maximum sales charge | |||||||||||||||
Class A1 | (14.05 | )% | 3.76 | % | 5.13 | % | |||||||||
Class P2 | (13.78 | ) | 4.02 | 5.42 | |||||||||||
After deducting maximum sales charge | |||||||||||||||
Class A1 | (18.78 | )% | 2.59 | % | 4.54 | % | |||||||||
MSCI All Country World Index (net)3 | (15.75 | ) | 7.00 | 8.76 | |||||||||||
FTSE World Government Bond Index (Hedged in USD)4 | (9.02 | ) | 1.07 | 2.18 | |||||||||||
| 60% MSCI All Country World Index (net)/40% FTSE World Government Bond Index (Hedged in USD)5 | (12.90 | ) | 4.94 | 6.33 | |||||||||||
The annualized gross and net expense ratios, respectively, for each class of shares as in the October 28, 2021 prospectuses were as follows: Class A—1.51% and 1.30%; Class P—1.24% and 1.05%. Net expenses reflect fee waivers and/or expense reimbursements, if any, pursuant to an agreement that is in effect to cap the expenses. The Trust, with respect to the Fund, and UBS Asset Management (Americas) Inc., the Fund's investment advisor and administrator ("UBS AM (Americas)" or the "Advisor"), have entered into a written agreement pursuant to which the Advisor has agreed to waive a portion of its management fees and/or to reimburse expenses (excluding expenses incurred through investment in other investment companies, interest, taxes, brokerage commissions, and extraordinary expenses to the extent necessary so that the Fund's ordinary operating expenses (excluding expenses incurred through investment in other investment companies, interest, taxes, brokerage commissions, and extraordinary expenses, such as proxy-related expenses), through the period ending October 28, 2022, do not exceed 1.20% for Class A shares and 0.95% for Class P shares. Pursuant to the written agreement, the Advisor is entitled to be reimbursed for any fees it waives and expenses it reimburses to the extent such reimbursement can be made during the three fiscal years following the date on which such fee waivers and expense reimbursements were made, provided that the reimbursement of the Advisor by the Fund will not cause the Fund to exceed the lesser of any applicable expense limit that is in place for the Fund (i) at the time of the waiver or reimbursement or (ii) at the time of the recoupment. The fee waiver/expense reimbursement agreement may be terminated by the Fund's Board of Trustees at any time and also will terminate automatically upon the expiration or termination of the Fund's advisory contract with the Advisor. Upon termination of the fee waiver/expense reimbursement agreement, however, UBS AM (Americas)'s three year recoupment rights will survive.
1 Maximum sales charge for Class A shares is 5.5%. Class A shares bear ongoing 12b-1 service fees.
2 Class P shares do not bear initial or contingent deferred sales charges or ongoing 12b-1 service and distribution fees, but Class P shares held through advisory programs may be subject to a program fee, which, if included, would have reduced performance.
3 The MSCI All Country World Index (net) is a free float-adjusted market capitalization weighted index that is designed to measure the equity market performance of developed and emerging markets. Net total return indices reinvest dividends after the deduction of withholding taxes, using a tax rate applicable to non-resident institutional investors who do not benefit from double taxation treaties. The index is constructed and managed with a view to being fully investable from the perspective of international institutional investors. Investors should note that indices do not reflect the deduction of fees and expenses.
4 The FTSE World Government Bond Index (Hedged in USD) is an unmanaged market capitalization-weighted index designed to measure the performance of fixed-rate, local currency, investment-grade sovereign bonds with a one-year minimum maturity and is hedged back to the US dollar. Investors should note that indices do not reflect the deduction of fees and expenses.
5 The 60% MSCI All Country World Index (net)/40% FTSE World Government Bond Index (Hedged in USD) is a unmanaged blended benchmark compiled by the Advisor. Investors should note that indices do not reflect the deduction of fees and expenses.
Prior to August 3, 2015, a 1% redemption fee was imposed on sales or exchanges of any class of shares of the Fund made during the specified holding period.
Past performance does not predict future performance, and the performance information provided does not reflect the deduction of taxes that a shareholder would pay on Fund distributions or the redemption of Fund shares. The return and principal value of an investment will fluctuate, so that an investor's shares, when redeemed, may be worth more or less than their original cost. Performance results assume reinvestment of all dividends and capital gain distributions at net asset value on the ex-dividend dates. Total returns for periods of less than one year have not been annualized. Current performance may be higher or lower than the performance data quoted. For month-end performance figures, please visit www.ubs.com/us-mutualfundperformance.
26
UBS Global Allocation Fund
Illustration of an assumed investment of $10,000 in Class A shares (adjusted for 5.5% maximum sales charge) and $2,000,000 in Class P shares (unaudited)
The following graphs depict the performance of UBS Global Allocation Fund Class A and Class P shares versus the MSCI All Country World Index (net), FTSE World Government Bond Index (Hedged in USD), and the 60% MSCI All Country World Index (net)/40% FTSE World Government Bond Index (Hedged in USD) over the 10 years ended June 30, 2022. Class P shares may be subject to a program fee, which, if included, would have reduced performance. The performance provided does not reflect the deduction of taxes that a shareholder would pay on Fund distributions or the redemptions of Fund shares. Past performance is no guarantee of future results. Share price and returns will vary with market conditions; investors may realize a gain or a loss upon redemption. It is important to note that UBS Global Allocation Fund is a professionally managed portfolio while the Indices are not available for investment and are unmanaged. The comparison is shown for illustration purposes only.
UBS Global Allocation Fund Class A vs. MSCI All Country World Index (net), FTSE World Government Bond Index (Hedged in USD) and 60% MSCI All Country World Index (net)/40% FTSE World Government Bond Index (Hedged in USD)
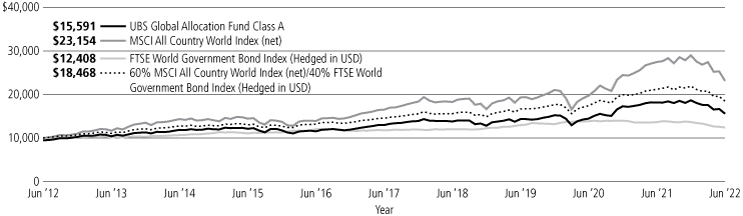
UBS Global Allocation Fund Class P vs. MSCI All Country World Index (net), FTSE World Government Bond Index (Hedged in USD) and 60% MSCI All Country World Index (net)/40% FTSE World Government Bond Index (Hedged in USD)

27
UBS Global Allocation Fund
Portfolio statistics and industry diversification—(unaudited)1
As a percentage of net assets as of June 30, 2022
Top ten fixed income holdings
| UMBS TBA, 2.000% | 1.6 | % | |||||
| New Zealand Government Inflation Linked Bond, 2.000% due 09/20/25 | 1.5 | ||||||
| UMBS TBA, 2.500% | 1.5 | ||||||
| U.S. Treasury Notes, 0.625% due 08/15/30 | 0.5 | ||||||
| U.S. Treasury Notes, 1.375% due 09/30/23 | 0.5 | ||||||
| GNMA TBA, 2.500% | 0.4 | ||||||
| UMBS TBA, 3.000% | 0.4 | ||||||
| U.S. Treasury Notes, 1.625% due 11/30/26 | 0.4 | ||||||
| U.S. Treasury Notes, 1.875% due 10/31/22 | 0.3 | ||||||
| U.S. Treasury Bonds, 2.875% due 05/15/43 | 0.3 | ||||||
Total | 7.4 | % | |||||
Top ten equity holdings
Invesco S&P 500 Equal Weight ETF | 3.5 | % | |||||
Energy Select Sector SPDR Fund | 1.6 | ||||||
AbbVie, Inc. | 1.3 | ||||||
Apple, Inc. | 1.1 | ||||||
Shell PLC | 1.0 | ||||||
Microsoft Corp. | 1.0 | ||||||
Alphabet, Inc., Class A | 0.9 | ||||||
Amazon.com, Inc. | 0.9 | ||||||
Dollar Tree, Inc. | 0.8 | ||||||
Williams Cos., Inc. | 0.7 | ||||||
Total | 12.8 | % | |||||
Top five issuer breakdown by country or territory of origin2
United States | 81.5 | % | |||||
Japan | 3.7 | ||||||
United Kingdom | 2.5 | ||||||
Netherlands | 1.9 | ||||||
New Zealand | 1.5 | ||||||
Total | 91.1 | % | |||||
1 The portfolio is actively managed and its composition will vary over time.
2 Figures represent the direct investments of UBS Global Allocation Fund. If a breakdown of the underlying investment companies and exchange traded funds was included, the country or territory of origin breakdown would be as follows: United States: 61.9%, United Kingdom: 12.5%, China 5.1%, Canada: 4.9% and Japan 3.4%.
28
UBS Global Allocation Fund
Portfolio statistics and industry diversification—(unaudited)1
As a percentage of net assets as of June 30, 2022
Common stocks | |||||||
Aerospace & defense | 0.5 | % | |||||
Airlines | 0.1 | ||||||
Auto components | 0.4 | ||||||
Automobiles | 0.6 | ||||||
Banks | 2.4 | ||||||
Beverages | 0.8 | ||||||
Biotechnology | 2.2 | ||||||
Capital markets | 1.1 | ||||||
Chemicals | 1.5 | ||||||
Construction & engineering | 0.3 | ||||||
Consumer finance | 0.2 | ||||||
Diversified consumer services | 0.1 | ||||||
Diversified financial services | 0.8 | ||||||
Diversified telecommunication services | 0.6 | ||||||
Electric utilities | 0.5 | ||||||
Electrical equipment | 0.4 | ||||||
Electronic equipment, instruments & components | 0.4 | ||||||
Energy equipment & services | 0.1 | ||||||
Entertainment | 0.8 | ||||||
Equity real estate investment trusts | 0.4 | ||||||
Food & staples retailing | 0.2 | ||||||
Food products | 1.2 | ||||||
Health care equipment & supplies | 1.7 | ||||||
Health care providers & services | 0.7 | ||||||
Hotels, restaurants & leisure | 0.8 | ||||||
Household durables | 0.5 | ||||||
Insurance | 1.2 | ||||||
Interactive media & services | 1.2 | ||||||
Internet & direct marketing retail | 1.1 | ||||||
IT services | 1.5 | ||||||
Life sciences tools & services | 0.6 | ||||||
Machinery | 1.1 | ||||||
Media | 0.4 | ||||||
Metals & mining | 0.2 | ||||||
Multiline retail | 0.8 | ||||||
Oil, gas & consumable fuels | 2.4 | ||||||
Personal products | 0.4 | ||||||
Pharmaceuticals | 1.2 | ||||||
Professional services | 0.3 | ||||||
Road & rail | 0.7 | ||||||
Semiconductors & semiconductor equipment | 1.9 | ||||||
Software | 3.3 | ||||||
Specialty retail | 0.3 | ||||||
Technology hardware, storage & peripherals | 1.3 | ||||||
Textiles, apparel & luxury goods | 0.6 | ||||||
Tobacco | 0.5 | ||||||
Trading companies & distributors | 0.8 | ||||||
Wireless telecommunication services | 0.2 | ||||||
Total common stocks | 41.3 | % | |||||
Exchange traded funds | 5.1 | % | |||||
Investment companies | 19.5 | ||||||
Asset-backed securities | 2.1 | ||||||
Mortgage-backed securities | 2.5 | ||||||
Non-U.S. government agency obligations | 4.1 | ||||||
U.S. government agency obligations | 5.0 | ||||||
U.S. Treasury obligations | 3.8 | ||||||
Short-term investments | 17.7 | ||||||
Investment of cash collateral from securities loaned | 0.9 | ||||||
Total investments | 102.0 | ||||||
Liabilities in excess of other assets | (2.0 | ) | |||||
Net assets | 100.0 | % | |||||
29
UBS Global Allocation Fund
Portfolio of investments
June 30, 2022
| Number of shares | Value | ||||||||||
Common stocks: 41.3% | |||||||||||
Australia: 0.2% | |||||||||||
Glencore PLC | 87,107 | $ | 471,963 | ||||||||
Austria: 0.3% | |||||||||||
Erste Group Bank AG | 25,788 | 653,994 | |||||||||
Belgium: 0.1% | |||||||||||
Galapagos N.V.*,1 | 1,099 | 61,086 | |||||||||
Galapagos N.V.* | 1,118 | 62,142 | |||||||||
123,228 | |||||||||||
Canada: 1.0% | |||||||||||
Canadian Pacific Railway Ltd. | 13,083 | 913,838 | |||||||||
Royal Bank of Canada1 | 10,673 | 1,033,470 | |||||||||
1,947,308 | |||||||||||
China: 0.2% | |||||||||||
Prosus N.V.* | 4,602 | 301,320 | |||||||||
Denmark: 0.4% | |||||||||||
Genmab A/S* | 2,181 | 705,843 | |||||||||
France: 0.7% | |||||||||||
Cie Generale des Etablissements Michelin SCA1 | 16,772 | 456,542 | |||||||||
Pernod Ricard SA | 3,255 | 597,962 | |||||||||
Ubisoft Entertainment SA* | 6,197 | 272,105 | |||||||||
1,326,609 | |||||||||||
Germany: 1.1% | |||||||||||
BioNTech SE, ADR | 1,100 | 164,010 | |||||||||
CTS Eventim AG & Co. KGaA* | 9,655 | 505,898 | |||||||||
Infineon Technologies AG | 22,128 | 535,435 | |||||||||
Knorr-Bremse AG | 6,563 | 374,284 | |||||||||
SAP SE | 5,568 | 507,235 | |||||||||
2,086,862 | |||||||||||
Hong Kong: 0.6% | |||||||||||
AIA Group Ltd. | 99,917 | 1,082,982 | |||||||||
India: 0.3% | |||||||||||
HDFC Bank Ltd., ADR | 12,268 | 674,249 | |||||||||
Ireland: 0.4% | |||||||||||
AIB Group PLC | 352,773 | 803,703 | |||||||||
Italy: 0.3% | |||||||||||
PRADA SpA | 113,600 | 636,275 | |||||||||
Japan: 3.1% | |||||||||||
ITOCHU Corp. | 27,400 | 740,535 | |||||||||
JTOWER, Inc.*,1 | 11,200 | 553,066 | |||||||||
Keyence Corp. | 900 | 307,650 | |||||||||
Nippon Telegraph & Telephone Corp. | 38,300 | 1,099,770 | |||||||||
ORIX Corp. | 52,800 | 885,708 | |||||||||
Shin-Etsu Chemical Co. Ltd. | 4,300 | 484,891 | |||||||||
SoftBank Group Corp. | 11,100 | 428,276 | |||||||||
| Number of shares | Value | ||||||||||
Common stocks—(continued) | |||||||||||
Japan—(concluded) | |||||||||||
Sony Group Corp. | 12,300 | $ | 1,005,811 | ||||||||
TechnoPro Holdings, Inc. | 21,100 | 422,529 | |||||||||
5,928,236 | |||||||||||
Netherlands: 1.9% | |||||||||||
Heineken Holding N.V. | 4,896 | 356,332 | |||||||||
Koninklijke Philips N.V. | 20,630 | 444,383 | |||||||||
OCI N.V. | 28,080 | 926,344 | |||||||||
Shell PLC | 73,363 | 1,905,764 | |||||||||
3,632,823 | |||||||||||
South Korea: 0.2% | |||||||||||
SK Hynix, Inc. | 5,334 | 373,840 | |||||||||
Sweden: 0.2% | |||||||||||
Hexpol AB | 37,774 | 321,438 | |||||||||
Switzerland: 1.3% | |||||||||||
Alcon, Inc. | 15,233 | 1,063,988 | |||||||||
Novartis AG | 14,499 | 1,227,931 | |||||||||
Wizz Air Holdings PLC*,2 | 9,998 | 213,472 | |||||||||
2,505,391 | |||||||||||
United Kingdom: 2.2% | |||||||||||
Ashtead Group PLC | 11,417 | 477,950 | |||||||||
British American Tobacco PLC | 22,384 | 958,995 | |||||||||
London Stock Exchange Group PLC | 9,275 | 861,688 | |||||||||
Ocado Group PLC*,1 | 15,741 | 149,690 | |||||||||
Sage Group PLC | 55,161 | 426,252 | |||||||||
Spectris PLC | 13,973 | 461,123 | |||||||||
Unilever PLC | 17,875 | 811,475 | |||||||||
4,147,173 | |||||||||||
United States: 26.8% | |||||||||||
10X Genomics, Inc., Class A* | 1,939 | 87,740 | |||||||||
AbbVie, Inc. | 16,704 | 2,558,385 | |||||||||
Adobe, Inc.* | 451 | 165,093 | |||||||||
AGCO Corp. | 7,231 | 713,700 | |||||||||
Airbnb, Inc., Class A* | 120 | 10,690 | |||||||||
Akamai Technologies, Inc.* | 10,861 | 991,935 | |||||||||
Allstate Corp. | 4,538 | 575,101 | |||||||||
Alphabet, Inc., Class A* | 805 | 1,754,304 | |||||||||
Amazon.com, Inc.* | 16,300 | 1,731,223 | |||||||||
Ameriprise Financial, Inc. | 3,782 | 898,906 | |||||||||
APA Corp. | 22,775 | 794,847 | |||||||||
Apple, Inc. | 15,244 | 2,084,160 | |||||||||
Aptiv PLC* | 4,349 | 387,365 | |||||||||
Bank OZK | 14,477 | 543,322 | |||||||||
Bio-Rad Laboratories, Inc., Class A* | 1,508 | 746,460 | |||||||||
Block, Inc.* | 1,839 | 113,025 | |||||||||
Booking Holdings, Inc.* | 215 | 376,033 | |||||||||
Broadcom, Inc. | 914 | 444,030 | |||||||||
Bunge Ltd. | 12,722 | 1,153,758 | |||||||||
CF Industries Holdings, Inc. | 12,326 | 1,056,708 | |||||||||
Charles Schwab Corp. | 4,816 | 304,275 | |||||||||
30
UBS Global Allocation Fund
Portfolio of investments
June 30, 2022
| Number of shares | Value | ||||||||||
Common stocks—(continued) | |||||||||||
United States—(continued) | |||||||||||
Chegg, Inc.* | 12,553 | $ | 235,745 | ||||||||
Comcast Corp., Class A | 18,870 | 740,459 | |||||||||
ConocoPhillips | 1,485 | 133,368 | |||||||||
Constellation Brands, Inc., Class A | 2,029 | 472,879 | |||||||||
Cooper Cos., Inc. | 1,053 | 329,715 | |||||||||
Dexcom, Inc.* | 3,736 | 278,444 | |||||||||
Dollar Tree, Inc.* | 9,855 | 1,535,902 | |||||||||
Edwards Lifesciences Corp.* | 4,995 | 474,975 | |||||||||
Eli Lilly & Co. | 3,453 | 1,119,566 | |||||||||
Exxon Mobil Corp. | 1,747 | 149,613 | |||||||||
Fidelity National Information Services, Inc. | 6,484 | 594,388 | |||||||||
Ford Motor Co. | 47,936 | 533,528 | |||||||||
Fortinet, Inc.* | 2,840 | 160,687 | |||||||||
Halliburton Co. | 4,581 | 143,660 | |||||||||
HubSpot, Inc.* | 1,314 | 395,054 | |||||||||
Ingersoll Rand, Inc. | 23,209 | 976,635 | |||||||||
IQVIA Holdings, Inc.* | 1,851 | 401,648 | |||||||||
Laboratory Corp. of America Holdings | 3,213 | 752,999 | |||||||||
Lam Research Corp. | 1,022 | 435,525 | |||||||||
Las Vegas Sands Corp.* | 18,909 | 635,153 | |||||||||
LivaNova PLC* | 9,100 | 568,477 | |||||||||
Lowe's Cos., Inc. | 2,916 | 509,338 | |||||||||
Lululemon Athletica, Inc.* | 1,576 | 429,633 | |||||||||
Marsh & McLennan Cos., Inc. | 3,846 | 597,091 | |||||||||
Marvell Technology, Inc. | 8,098 | 352,506 | |||||||||
Match Group, Inc.* | 3,995 | 278,412 | |||||||||
McDonald's Corp. | 1,776 | 438,459 | |||||||||
Meta Platforms, Inc., Class A* | 1,848 | 297,990 | |||||||||
Micron Technology, Inc. | 10,032 | 554,569 | |||||||||
Microsoft Corp. | 7,389 | 1,897,717 | |||||||||
Mondelez International, Inc., Class A | 17,317 | 1,075,213 | |||||||||
NextEra Energy, Inc. | 12,849 | 995,284 | |||||||||
NVIDIA Corp. | 4,782 | 724,903 | |||||||||
Oracle Corp. | 7,311 | 510,820 | |||||||||
Palo Alto Networks, Inc.* | 292 | 144,230 | |||||||||
Pioneer Natural Resources Co. | 513 | 114,440 | |||||||||
Prologis, Inc. | 7,100 | 835,315 | |||||||||
Regal Rexnord Corp. | 6,535 | 741,853 | |||||||||
Salesforce, Inc.* | 3,668 | 605,367 | |||||||||
ServiceNow, Inc.* | 878 | 417,507 | |||||||||
Spirit AeroSystems Holdings, Inc., Class A | 17,369 | 508,912 | |||||||||
Splunk, Inc.* | 5,377 | 475,649 | |||||||||
Synchrony Financial | 13,417 | 370,578 | |||||||||
Take-Two Interactive Software, Inc.* | 6,455 | 790,931 | |||||||||
Tesla, Inc.* | 773 | 520,554 | |||||||||
TransDigm Group, Inc.* | 925 | 496,420 | |||||||||
Union Pacific Corp. | 2,210 | 471,349 | |||||||||
United Rentals, Inc.* | 1,412 | 342,989 | |||||||||
UnitedHealth Group, Inc. | 1,027 | 527,498 | |||||||||
Universal Display Corp. | 1,367 | 138,258 | |||||||||
Verisk Analytics, Inc. | 1,356 | 234,710 | |||||||||
Vertex Pharmaceuticals, Inc.* | 2,537 | 714,901 | |||||||||
Visa, Inc., Class A | 5,597 | 1,101,993 | |||||||||
VMware, Inc., Class A | 5,976 | 681,144 | |||||||||
| Number of shares | Value | ||||||||||
Common stocks—(concluded) | |||||||||||
United States—(concluded) | |||||||||||
Voya Financial, Inc. | 10,253 | $ | 610,361 | ||||||||
Walmart, Inc. | 2,144 | 260,667 | |||||||||
Wells Fargo & Co. | 23,383 | 915,912 | |||||||||
Western Digital Corp.* | 9,287 | 416,336 | |||||||||
Williams Cos., Inc. | 45,382 | 1,416,372 | |||||||||
51,075,661 | |||||||||||
| Total common stocks (cost $75,410,869) | 78,798,898 | ||||||||||
Exchange traded funds: 5.1% | |||||||||||
Energy Select Sector SPDR Fund | 43,098 | 3,081,938 | |||||||||
Invesco S&P 500 Equal Weight ETF1 | 49,339 | 6,622,774 | |||||||||
| Total exchange traded funds (cost $10,020,027) | 9,704,712 | ||||||||||
Investment companies: 19.5% | |||||||||||
PACE High Yield Investments3 | 2,389,810 | 19,261,865 | |||||||||
UBS All China Equity Fund*,3 | 504,084 | 3,195,894 | |||||||||
UBS Emerging Markets Equity Opportunity Fund3 | 1,912,700 | 14,689,532 | |||||||||
| Total investment companies (cost $45,307,989) | 37,147,291 | ||||||||||
| Face amount5 | |||||||||||
Asset-backed securities: 2.1% | |||||||||||
Cayman Islands: 1.0% | |||||||||||
| Ares XLI CLO Ltd., Series 2016-41A, Class CR, 3 mo. USD LIBOR + 1.800%, 2.844%, due 04/15/342,4 | 250,000 | 230,554 | |||||||||
| CIFC Funding Ltd., Series 2017-5A, Class B, 3 mo. USD LIBOR + 1.850%, 2.894%, due 11/16/302,4 | 300,000 | 282,762 | |||||||||
| Dryden 60 CLO Ltd., Series 2018-60A, Class A, 3 mo. USD LIBOR + 1.050%, 2.094%, due 07/15/312,4 | 250,000 | 244,738 | |||||||||
| Series 2018-60A, Class C, 3 mo. USD LIBOR + 2.050%, 3.094%, due 07/15/312,4 | 250,000 | 236,092 | |||||||||
| Highbridge Loan Management Ltd., Series 12A-18, Class B, 3 mo. USD LIBOR + 1.850%, 2.894%, due 07/18/312,4 | 250,000 | 232,486 | |||||||||
| Palmer Square Loan Funding Ltd., Series 2021-1A, Class B, 3 mo. USD LIBOR + 1.800%, 2.863%, due 04/20/292,4 | 250,000 | 236,850 | |||||||||
| Venture XXX CLO Ltd., Series 2017-30A, Class C, 3 mo. USD LIBOR + 1.950%, 2.994%, due 01/15/312,4 | 200,000 | 183,363 | |||||||||
31
UBS Global Allocation Fund
Portfolio of investments
June 30, 2022
| Face amount5 | Value | ||||||||||
Asset-backed securities—(concluded) | |||||||||||
Cayman Islands—(concluded) | |||||||||||
| Voya CLO Ltd., Series 2018-2A, Class C1, 3 mo. USD LIBOR + 1.850%, 2.894%, due 07/15/312,4 | 250,000 | $ | 231,342 | ||||||||
1,878,187 | |||||||||||
United States: 1.1% | |||||||||||
| ACC Trust, Series 2021-1, Class A, 0.740%, due 11/20/232 | 6,898 | 6,891 | |||||||||
| CPS Auto Receivables Trust, Series 2021-A, Class C, 0.830%, due 09/15/262 | 150,000 | 146,776 | |||||||||
| Dell Equipment Finance Trust, Series 2020-1, Class B, 2.980%, due 04/24/232 | 225,000 | 224,657 | |||||||||
| Drive Auto Receivables Trust, Series 2020-2, Class C, 2.280%, due 08/17/26 | 150,000 | 149,346 | |||||||||
| DT Auto Owner Trust, Series 2019-3A, Class C, 2.740%, due 04/15/252 | 34,296 | 34,287 | |||||||||
| Series 2021-1A, Class D, 1.160%, due 11/16/262 | 100,000 | 92,704 | |||||||||
| Enterprise Fleet Financing LLC, Series 2019-3, Class A2, 2.060%, due 05/20/252 | 198,600 | 198,022 | |||||||||
| Series 2020-1, Class A2, 1.780%, due 12/22/252 | 126,655 | 125,745 | |||||||||
| Exeter Automobile Receivables Trust, Series 2018-1A, Class D, 3.530%, due 11/15/232 | 59,433 | 59,498 | |||||||||
| Series 2020-2A, Class C, 3.280%, due 05/15/252 | 122,852 | 122,857 | |||||||||
| Series 2021-1A, Class B, 0.500%, due 02/18/25 | 55,871 | 55,687 | |||||||||
| Series 2021-1A, Class D, 1.080%, due 11/16/26 | 125,000 | 117,732 | |||||||||
| Ocwen Master Advance Receivables Trust, Series 2020-T1, Class AT1, 1.278%, due 08/15/522 | 90,526 | 90,302 | |||||||||
| OneMain Financial Issuance Trust, Series 2020-2A, Class B, 2.210%, due 09/14/352 | 100,000 | 86,994 | |||||||||
| Tesla Auto Lease Trust, Series 2019-A, Class C, 2.680%, due 01/20/23 | 300,000 | 298,982 | |||||||||
| Series 2021-A, Class D, 1.340%, due 03/20/252 | 425,000 | 397,557 | |||||||||
2,208,037 | |||||||||||
| Total asset-backed securities (cost $4,273,407) | 4,086,224 | ||||||||||
| Face amount5 | Value | ||||||||||
Mortgage-backed securities: 2.5% | |||||||||||
United States: 2.5% | |||||||||||
| Angel Oak Mortgage Trust, Series 2020-4, Class A1, 1.469%, due 06/25/652,6 | 38,058 | $ | 36,363 | ||||||||
| Series 2020-5, Class A1, 1.373%, due 05/25/652,6 | 48,705 | 46,557 | |||||||||
| Series 2020-5, Class A2, 1.579%, due 05/25/652,6 | 124,381 | 118,079 | |||||||||
| Series 2020-6, Class A1, 1.261%, due 05/25/652,6 | 32,373 | 30,937 | |||||||||
| Series 2020-R1, Class A1, 0.990%, due 04/25/532,6 | 50,289 | 48,540 | |||||||||
| Series 2021-1, Class A1, 0.909%, due 01/25/662,6 | 74,460 | 69,058 | |||||||||
| Series 2021-2, Class A1, 0.985%, due 04/25/662,6 | 50,905 | 46,300 | |||||||||
| Series 2021-4, Class A1, 1.035%, due 01/20/652,6 | 92,801 | 78,518 | |||||||||
| Series 2021-5, Class A1, 0.951%, due 07/25/662,6 | 101,602 | 90,429 | |||||||||
| Series 2021-8, Class A1, 1.820%, due 11/25/662,6 | 107,271 | 97,002 | |||||||||
| Arbor Multifamily Mortgage Securities Trust, Series 2022-MF4, Class B, 3.403%, due 02/15/552,6 | 200,000 | 174,842 | |||||||||
| BX Commercial Mortgage Trust, Series 2020-VKNG, Class C, 1 mo. USD LIBOR + 1.400%, 2.724%, due 10/15/372,4 | 75,194 | 71,042 | |||||||||
| BX Mortgage Trust, Series 2021-PAC, Class D, 1 mo. USD LIBOR + 1.298%, 2.623%, due 10/15/362,4 | 100,000 | 92,170 | |||||||||
| Citigroup Commercial Mortgage Trust, Series 2019-SMRT, Class C, 4.682%, due 01/10/362 | 345,000 | 340,832 | |||||||||
| COLT Funding LLC, Series 2021-3R, Class A1, 1.051%, due 12/25/642,6 | 74,149 | 68,404 | |||||||||
| COLT Mortgage Loan Trust, Series 2020-2, Class A1, 1.853%, due 03/25/652,6 | 20,517 | 20,248 | |||||||||
| Series 2021-2, Class A1, 0.924%, due 08/25/662,6 | 81,669 | 71,712 | |||||||||
| Series 2021-3, Class A1, 0.956%, due 09/27/662,6 | 81,832 | 70,765 | |||||||||
| CSMC Trust, Series 2020-NQM1, Class A1, 1.208%, due 05/25/652,7 | 101,081 | 95,782 | |||||||||
| DBGS Mortgage Trust, Series 2018-BIOD, Class A, 1 mo. USD LIBOR + 0.803%, 1.993%, due 05/15/352,4 | 91,376 | 90,095 | |||||||||
32
UBS Global Allocation Fund
Portfolio of investments
June 30, 2022
| Face amount5 | Value | ||||||||||
Mortgage-backed securities—(continued) | |||||||||||
United States—(continued) | |||||||||||
| Deephaven Residential Mortgage Trust, Series 2021-2, Class A1, 0.899%, due 04/25/662,6 | 99,244 | $ | 87,653 | ||||||||
| Series 2022-1, Class A1, 2.205%, due 01/25/672,6 | 141,245 | 132,031 | |||||||||
| Extended Stay America Trust, Series 2021-ESH, Class D, 1 mo. USD LIBOR + 2.250%, 3.575%, due 07/15/382,4 | 149,082 | 143,841 | |||||||||
| GCAT Trust, Series 2021-NQM4, Class A1, 1.093%, due 08/25/662,6 | 113,926 | 99,438 | |||||||||
| GS Mortgage Securities Trust, Series 2017-FARM, Class A, 3.659%, due 01/10/432,6 | 100,000 | 93,596 | |||||||||
| Series 2017-GS5, Class B, 4.047%, due 03/10/506 | 100,000 | 94,764 | |||||||||
| GS Mortgage Backed Securities Corp. Trust, Series 2021-NQM1, Class A1, 1.017%, due 07/25/612,6 | 70,189 | 65,425 | |||||||||
| GS Mortgage Backed Securities Trust, Series 2020-NQM1, Class A1, 1.382%, due 09/27/602,6 | 27,577 | 26,548 | |||||||||
| J.P. Morgan Chase Commercial Mortgage Securities Trust, Series 2021-2NU, Class D, 2.146%, due 01/05/402,6 | 125,000 | 100,312 | |||||||||
| MAD Mortgage Trust, Series 2017-330M, Class C, 3.600%, due 08/15/342,6 | 150,000 | 141,928 | |||||||||
| Med Trust, Series 2021-MDLN, Class D, 1 mo. USD LIBOR + 2.000%, 3.325%, due 11/15/382,4 | 200,000 | 190,459 | |||||||||
| MFA Trust, Series 2020-NQM3, Class A1, 1.014%, due 01/26/652,6 | 31,088 | 29,932 | |||||||||
| Series 2021-NQM1, Class A1, 1.153%, due 04/25/652,6 | 39,065 | 36,200 | |||||||||
| Series 2021-NQM2, Class A1, 1.029%, due 11/25/642,6 | 62,081 | 56,273 | |||||||||
| MHC Trust, Series 2021-MHC2, Class D, 1 mo. USD LIBOR + 1.500%, 2.824%, due 05/15/232,4 | 150,000 | 140,960 | |||||||||
| MSC Trust, Series 2021-ILP, Class C, 1 mo. USD LIBOR + 1.377%, 2.702%, due 11/15/232,4 | 299,011 | 282,387 | |||||||||
| New Residential Mortgage Loan Trust, Series 2019-NQM4, Class A1, 2.492%, due 09/25/592,6 | 28,661 | 27,708 | |||||||||
| Series 2020-NQM2, Class A1, 1.650%, due 05/24/602,6 | 24,667 | 23,741 | |||||||||
| Face amount5 | Value | ||||||||||
Mortgage-backed securities—(concluded) | |||||||||||
United States—(concluded) | |||||||||||
| Series 2021-NQ2R, Class A1, 0.941%, due 10/25/582,6 | 77,236 | $ | 74,391 | ||||||||
| Series 2021-NQM3, Class A1, 1.156%, due 11/27/562,6 | 135,990 | 121,004 | |||||||||
| Series 2022-NQM1, Class A1, 2.277%, due 01/25/262,6 | 199,260 | 179,143 | |||||||||
| ONE Mortgage Trust, Series 2021-PARK, Class C, 1 mo. USD LIBOR + 1.100%, 2.424%, due 03/15/362,4 | 200,000 | 188,331 | |||||||||
| Residential Mortgage Loan Trust, Series 2020-2, Class A1, 1.654%, due 05/25/602,6 | 67,153 | 66,382 | |||||||||
| TTAN, Series 2021-MHC, Class D, 1 mo. USD LIBOR + 1.750%, 3.075%, due 03/15/382,4 | 99,745 | 93,983 | |||||||||
| Verus Securitization Trust, Series 2019-4, Class A1, 2.642%, due 11/25/592,7 | 15,373 | 15,288 | |||||||||
| Series 2020-4, Class A1, 1.502%, due 05/25/652,7 | 31,577 | 30,053 | |||||||||
| Series 2020-5, Class A1, 1.218%, due 05/25/652,7 | 40,108 | 38,020 | |||||||||
| Series 2021-5, Class A1, 1.013%, due 09/25/662,6 | 123,944 | 107,813 | |||||||||
| Series 2021-R2, Class A1, 0.918%, due 02/25/642,6 | 52,879 | 51,107 | |||||||||
| Series 2021-R3, Class A1, 1.020%, due 04/25/642,6 | 71,102 | 67,611 | |||||||||
| Vista Point Securitization Trust, Series 2020-1, Class A1, 1.763%, due 03/25/652,6 | 1,107 | 1,105 | |||||||||
| Series 2020-2, Class A1, 1.475%, due 04/25/652,6 | 33,315 | 31,805 | |||||||||
| Wells Fargo Commercial Mortgage Trust, Series 2018-C45, Class AS, 4.405%, due 06/15/516 | 130,000 | 127,773 | |||||||||
| Total mortgage-backed securities (cost $5,126,950) | 4,724,680 | ||||||||||
Non-U.S. government agency obligations: 4.1% | |||||||||||
Australia: 0.1% | |||||||||||
| Australia Government Bond 3.250%, due 04/21/298 | AUD | 310,000 | 210,476 | ||||||||
Austria: 0.0%† | |||||||||||
| Republic of Austria Government Bond 3.150%, due 06/20/448 | EUR | 55,000 | 67,002 | ||||||||
Belgium: 0.1% | |||||||||||
| Kingdom of Belgium Government Bond, Series 71, 3.750%, due 06/22/458 | EUR | 83,000 | 104,327 | ||||||||
33
UBS Global Allocation Fund
Portfolio of investments
June 30, 2022
| Face amount5 | Value | ||||||||||
Non-U.S. government agency obligations—(continued) | |||||||||||
Canada: 0.1% | |||||||||||
| Canadian Government Bond 1.500%, due 09/01/24 | CAD | 120,000 | $ | 90,137 | |||||||
1.500%, due 12/01/31 | CAD | 100,000 | 66,923 | ||||||||
2.000%, due 12/01/51 | CAD | 50,000 | 30,235 | ||||||||
187,295 | |||||||||||
Finland: 0.0%† | |||||||||||
| Finland Government Bond 1.375%, due 04/15/478 | EUR | 20,000 | 17,839 | ||||||||
France: 0.4% | |||||||||||
| French Republic Government Bond OAT 0.000%, due 11/25/318 | EUR | 580,000 | 510,749 | ||||||||
0.500%, due 05/25/408 | EUR | 100,000 | 76,569 | ||||||||
3.250%, due 05/25/458 | EUR | 93,000 | 111,668 | ||||||||
698,986 | |||||||||||
Ireland: 0.1% | |||||||||||
| Ireland Government Bond 1.500%, due 05/15/508 | EUR | 240,000 | 200,295 | ||||||||
2.000%, due 02/18/458 | EUR | 48,000 | 46,615 | ||||||||
246,910 | |||||||||||
Italy: 0.4% | |||||||||||
| Italy Buoni Poliennali Del Tesoro 0.950%, due 12/01/318 | EUR | 170,000 | 145,507 | ||||||||
1.650%, due 03/01/328 | EUR | 60,000 | 54,866 | ||||||||
3.000%, due 08/01/298 | EUR | 240,000 | 253,741 | ||||||||
3.250%, due 09/01/468 | EUR | 210,000 | 209,799 | ||||||||
4.000%, due 02/01/378 | EUR | 129,000 | 143,693 | ||||||||
807,606 | |||||||||||
Japan: 0.6% | |||||||||||
| Japan Government Forty Year Bond 0.500%, due 03/20/59 | JPY | 20,000,000 | 115,242 | ||||||||
| Japan Government Thirty Year Bond 0.300%, due 06/20/46 | JPY | 11,100,000 | 68,749 | ||||||||
| Japan Government Twenty Year Bond 0.400%, due 03/20/36 | JPY | 83,550,000 | 603,256 | ||||||||
| Japanese Government CPI Linked Bond, Series 26, 0.005%, due 03/10/31 | JPY | 51,173,000 | 398,657 | ||||||||
1,185,904 | |||||||||||
New Zealand: 1.5% | |||||||||||
| New Zealand Government Inflation Linked Bond, Series 0925, 2.000%, due 09/20/258,9 | NZD | 3,762,239 | 2,872,234 | ||||||||
Spain: 0.5% | |||||||||||
| Spain Government Bond 1.450%, due 10/31/278 | EUR | 165,000 | 169,841 | ||||||||
1.500%, due 04/30/278 | EUR | 325,000 | 337,408 | ||||||||
3.450%, due 07/30/668 | EUR | 10,000 | 10,872 | ||||||||
4.200%, due 01/31/378 | EUR | 44,000 | 54,393 | ||||||||
| Face amount5 | Value | ||||||||||
Non-U.S. government agency obligations—(concluded) | |||||||||||
Spain—(concluded) | |||||||||||
4.800%, due 01/31/248 | EUR | 296,000 | $ | 328,960 | |||||||
5.150%, due 10/31/448 | EUR | 69,000 | 98,709 | ||||||||
1,000,183 | |||||||||||
United Kingdom: 0.3% | |||||||||||
| United Kingdom Gilt 1.000%, due 04/22/248 | GBP | 90,000 | 107,880 | ||||||||
1.000%, due 01/31/328 | GBP | 70,000 | 75,813 | ||||||||
1.625%, due 10/22/288 | GBP | 144,000 | 171,894 | ||||||||
3.500%, due 01/22/458 | GBP | 90,000 | 125,108 | ||||||||
480,695 | |||||||||||
| Total non-U.S. government agency obligations (cost $8,727,102) | 7,879,457 | ||||||||||
U.S. government agency obligations: 5.0% | |||||||||||
United States: 5.0% | |||||||||||
| FHLMC 2.000%, due 01/01/52 | 346,142 | 300,901 | |||||||||
| FNMA 2.500%, due 08/01/51 | 264,441 | 238,402 | |||||||||
| GNMA II 3.000%, due 10/20/45 | 81,628 | 78,468 | |||||||||
3.000%, due 12/20/45 | 92,891 | 89,294 | |||||||||
| GNMA II TBA 2.000% | 625,000 | 554,349 | |||||||||
| 2.500% | 900,000 | 822,726 | |||||||||
| 3.000% | 250,000 | 235,542 | |||||||||
| UMBS TBA 1.500% | 725,000 | 600,728 | |||||||||
| 2.000% | 3,475,000 | 3,014,406 | |||||||||
| 2.500% | 3,125,000 | 2,808,822 | |||||||||
| 3.000% | 850,000 | 791,266 | |||||||||
| Total U.S. government agency obligations (cost $9,660,226) | 9,534,904 | ||||||||||
U.S. Treasury obligations: 3.8% | |||||||||||
United States: 3.8% | |||||||||||
| U.S. Treasury Bonds 2.500%, due 02/15/46 | 302,000 | 256,075 | |||||||||
2.750%, due 11/15/42 | 201,000 | 179,981 | |||||||||
2.750%, due 08/15/47 | 168,000 | 150,229 | |||||||||
2.875%, due 05/15/43 | 717,000 | 653,814 | |||||||||
3.000%, due 11/15/45 | 47,000 | 43,673 | |||||||||
4.375%, due 02/15/38 | 110,000 | 128,077 | |||||||||
| U.S. Treasury Notes 0.625%, due 08/15/30 | 1,270,000 | 1,052,909 | |||||||||
1.250%, due 08/15/31 | 200,000 | 172,172 | |||||||||
1.375%, due 09/30/23 | 971,000 | 952,149 | |||||||||
1.500%, due 02/28/23 | 226,000 | 224,128 | |||||||||
1.625%, due 11/30/26 | 760,000 | 715,113 | |||||||||
1.625%, due 08/15/29 | 196,000 | 178,452 | |||||||||
1.625%, due 05/15/31 | 350,000 | 312,731 | |||||||||
1.750%, due 05/15/23 | 345,000 | 341,631 | |||||||||
1.875%, due 10/31/22 | 680,000 | 679,423 | |||||||||
34
UBS Global Allocation Fund
Portfolio of investments
June 30, 2022
| Face amount5 | Value | ||||||||||
U.S. Treasury obligations—(concluded) | |||||||||||
United States—(concluded) | |||||||||||
2.000%, due 11/30/22 | 528,000 | $ | 527,175 | ||||||||
2.500%, due 05/15/24 | 321,000 | 318,116 | |||||||||
2.750%, due 07/31/23 | 459,000 | 457,906 | |||||||||
| Total U.S. Treasury obligations (cost $7,915,062) | 7,343,754 | ||||||||||
| Number of shares | |||||||||||
Short-term investments: 17.7% | |||||||||||
Investment companies: 17.7% | |||||||||||
| State Street Institutional U.S. Government Money Market Fund, 1.430%10 (cost $33,796,997) | 33,796,997 | 33,796,997 | |||||||||
| Number of shares | Value | ||||||||||
Investment of cash collateral from securities loaned: 0.9% | |||||||||||
Money market funds: 0.9% | |||||||||||
| State Street Navigator Securities Lending Government Money Market Portfolio, 1.535%10 (cost $1,736,422) | 1,736,422 | $ | 1,736,422 | ||||||||
| Total investments: 102.0% (cost $201,975,051) | 194,753,339 | ||||||||||
Liabilities in excess of other assets: (2.0)% | (3,843,846 | ) | |||||||||
Net assets: 100.0% | $ | 190,909,493 | |||||||||
For a listing of defined portfolio acronyms that are used throughout the Portfolio of investments as well as the tables that follow, please refer to the Glossary of terms used in the Portfolio of investments.
Futures contracts
| Number of contracts | Currency | Expiration date | Current notional amount | Value | Unrealized appreciation (depreciation) | ||||||||||||||||||||||
Index futures buy contracts: | |||||||||||||||||||||||||||
22 | AUD | Share Price Index 200 Futures | September 2022 | $ | 2,465,009 | $ | 2,452,839 | $ | (12,170 | ) | |||||||||||||||||
122 | EUR | EURO Schatz 2 Year Index Futures | September 2022 | 13,970,282 | 13,954,177 | (16,105 | ) | ||||||||||||||||||||
598 | EUR | EURO STOXX 600 Index Futures | September 2022 | 4,026,588 | 3,885,379 | (141,209 | ) | ||||||||||||||||||||
101 | GBP | FTSE 100 Index Future | September 2022 | 8,802,742 | 8,755,079 | (47,663 | ) | ||||||||||||||||||||
14 | JPY | Tokyo Price Index Futures | September 2022 | 2,023,490 | 1,930,056 | (93,434 | ) | ||||||||||||||||||||
63 | USD | Energy Select Sector Index Futures | September 2022 | 5,266,092 | 4,704,210 | (561,882 | ) | ||||||||||||||||||||
52 | USD | MSCI China A 50 Connect Index Futures | September 2022 | 3,107,000 | 3,297,060 | 190,060 | |||||||||||||||||||||
127 | USD | MSCI World Health Care Future | September 2022 | 5,561,698 | 5,902,960 | 341,262 | |||||||||||||||||||||
24 | USD | Russell 1000 Value Index Futures | September 2022 | 1,721,343 | 1,710,840 | (10,503 | ) | ||||||||||||||||||||
56 | USD | Russell 2000 Index Futures | September 2022 | 4,803,079 | 4,782,400 | (20,679 | ) | ||||||||||||||||||||
Interest rate futures buy contracts: | |||||||||||||||||||||||||||
69 | CAD | Canadian Bond 10 Year Futures | September 2022 | $ | 6,854,535 | $ | 6,646,450 | $ | (208,085 | ) | |||||||||||||||||
34 | GBP | Long Gilt Futures | September 2022 | 4,882,594 | 4,717,428 | (165,166 | ) | ||||||||||||||||||||
U.S. Treasury futures buy contracts: | |||||||||||||||||||||||||||
107 | USD | U.S. Treasury Note 10 Year Futures | September 2022 | $ | 12,835,492 | $ | 12,682,844 | $ | (152,648 | ) | |||||||||||||||||
21 | USD | Ultra U.S. Treasury Note 10 Year Futures | September 2022 | 2,719,695 | 2,674,875 | (44,820 | ) | ||||||||||||||||||||
Total | $ | 79,039,639 | $ | 78,096,597 | $ | (943,042 | ) | ||||||||||||||||||||
Index futures sell contracts: | |||||||||||||||||||||||||||
2 | CAD | S&P 60 Index Futures | September 2022 | $ | (378,044 | ) | $ | (355,034 | ) | $ | 23,010 | ||||||||||||||||
436 | EUR | EURO STOXX 50 Index Futures | September 2022 | (15,992,308 | ) | (15,722,142 | ) | 270,166 | |||||||||||||||||||
128 | USD | S&P 500 Index Futures | September 2022 | (24,034,558 | ) | (24,252,800 | ) | (218,242 | ) | ||||||||||||||||||
78 | USD | U.S. MSCI Emerging Markets Index Futures | September 2022 | (3,922,784 | ) | (3,910,530 | ) | 12,254 | |||||||||||||||||||
Interest rate futures sell contracts: | |||||||||||||||||||||||||||
79 | EUR | EURO Bund Futures | September 2022 | $ | (12,514,161 | ) | $ | (12,317,206 | ) | $ | 196,955 | ||||||||||||||||
26 | JPY | Japan Government Bond 10 Year Futures | September 2022 | (2,823,413 | ) | (2,848,541 | ) | (25,128 | ) | ||||||||||||||||||
35
UBS Global Allocation Fund
Portfolio of investments
June 30, 2022
Futures contracts—(concluded)
| Number of contracts | Currency | Expiration date | Current notional amount | Value | Unrealized appreciation (depreciation) | ||||||||||||||||||||||
U.S. Treasury futures sell contracts: | |||||||||||||||||||||||||||
9 | USD | U.S. Treasury Note 5 Year Futures | September 2022 | $ | (1,019,729 | ) | $ | (1,010,250 | ) | $ | 9,479 | ||||||||||||||||
Total | $ | (60,684,997 | ) | $ | (60,416,503 | ) | $ | 268,494 | |||||||||||||||||||
Net unrealized appreciation (depreciation) | $ | (674,548 | ) | ||||||||||||||||||||||||
Centrally cleared credit default swap agreements on credit indices—buy protection11
Referenced obligations | Notional amount (000) | Maturity date | Payment frequency | Payments made by the Portfolio12 | Upfront payments received (made) | Value | Unrealized appreciation (depreciation) | ||||||||||||||||||||||||
CDX Emerging Markets Index Series 35 | USD | 13,100 | 06/20/27 | Quarterly | 1.000 | % | $ | (1,137,994 | ) | $ | 1,309,636 | $ | 171,642 | ||||||||||||||||||
OTC Total return swap agreements
Counterparty | Notional amount (000) | Maturity date | Payment frequency | Payments made by the Portfolio | Payments received by the Portfolio | Upfront payments received (made) | Value | Unrealized appreciation (depreciation) | |||||||||||||||||||||||||||
| JPMCB | USD | 23 | 07/18/22 | Quarterly | J.P. Morgan EMBI Global Core Index | 3 Months SOFR + 0.400% | $ | — | $ | (1,202,655 | ) | $ | (1,202,655 | ) | |||||||||||||||||||||
Forward foreign currency contracts
Counterparty | Sell | Purchase | Settlement date | Unrealized appreciation (depreciation) | |||||||||||||||
BB | GBP | 12,385,000 | USD | 15,158,821 | 08/18/22 | $ | 70,488 | ||||||||||||
BOA | USD | 9,419,476 | AUD | 13,605,000 | 08/18/22 | (25,298 | ) | ||||||||||||
BOA | USD | 5,728,511 | BRL | 30,030,000 | 08/18/22 | (64,842 | ) | ||||||||||||
BOA | USD | 6,498,485 | CLP | 5,682,600,000 | 08/18/22 | (363,857 | ) | ||||||||||||
BOA | USD | 3,944,428 | MXN | 79,290,000 | 08/18/22 | (32,972 | ) | ||||||||||||
BOA | USD | 4,674,724 | NOK | 45,970,000 | 08/18/22 | (3,366 | ) | ||||||||||||
BOA | USD | 1,054,410 | TWD | 31,200,000 | 08/18/22 | (3,736 | ) | ||||||||||||
CIBC | USD | 465,649 | SGD | 650,000 | 08/18/22 | 2,268 | |||||||||||||
CITI | EUR | 995,777 | USD | 1,050,000 | 08/18/22 | 3,333 | |||||||||||||
GS | CNY | 98,515,000 | USD | 14,585,091 | 08/18/22 | (131,084 | ) | ||||||||||||
GS | MYR | 4,388,000 | USD | 997,273 | 08/18/22 | 1,656 | |||||||||||||
HSBC | KRW | 8,436,000,000 | USD | 6,626,657 | 08/18/22 | 124,085 | |||||||||||||
HSBC | NZD | 9,000,000 | CHF | 5,426,118 | 08/18/22 | 81,808 | |||||||||||||
HSBC | PHP | 553,050,000 | USD | 10,490,326 | 08/18/22 | 438,655 | |||||||||||||
JPMCB | TWD | 240,200,000 | USD | 8,153,705 | 08/18/22 | 64,861 | |||||||||||||
36
UBS Global Allocation Fund
Portfolio of investments
June 30, 2022
Forward foreign currency contracts—(concluded)
Counterparty | Sell | Purchase | Settlement date | Unrealized appreciation (depreciation) | |||||||||||||||
JPMCB | USD | 6,065,579 | EUR | 5,625,000 | 08/18/22 | $ | (153,104 | ) | |||||||||||
JPMCB | USD | 6,023,713 | GBP | 4,785,000 | 08/18/22 | (194,268 | ) | ||||||||||||
MSCI | EUR | 6,605,000 | USD | 6,924,041 | 08/18/22 | (18,519 | ) | ||||||||||||
MSCI | IDR | 15,528,800,000 | USD | 1,056,884 | 08/18/22 | 15,254 | |||||||||||||
MSCI | INR | 77,030,000 | USD | 986,047 | 08/18/22 | 13,922 | |||||||||||||
MSCI | USD | 1,263,974 | MYR | 5,540,000 | 08/18/22 | (6,974 | ) | ||||||||||||
MSCI | USD | 1,357,830 | SEK | 13,630,000 | 08/18/22 | (23,223 | ) | ||||||||||||
SSC | CHF | 5,795,000 | USD | 5,794,969 | 08/18/22 | (292,916 | ) | ||||||||||||
SSC | CNY | 9,210,000 | USD | 1,375,653 | 08/18/22 | (137 | ) | ||||||||||||
SSC | EUR | 365,000 | GBP | 311,526 | 08/18/22 | (4,129 | ) | ||||||||||||
SSC | JPY | 225,800,000 | USD | 1,752,974 | 08/18/22 | 84,105 | |||||||||||||
SSC | NZD | 4,580,000 | USD | 2,868,171 | 08/18/22 | 8,952 | |||||||||||||
SSC | USD | 1,221,784 | CAD | 1,580,000 | 08/18/22 | 5,734 | |||||||||||||
SSC | USD | 964,766 | KRW | 1,213,000,000 | 08/18/22 | (29,771 | ) | ||||||||||||
Net unrealized appreciation (depreciation) | $ | (433,075 | ) | ||||||||||||||||
Fair valuation summary
The following is a summary of the fair valuations according to the inputs used as of June 30, 2022 in valuing the Fund's investments. In the event a Fund holds investments for which fair value is measured using the NAV per share practical expedient (or its equivalent), a separate column will be added to the fair value hierarchy table; this is intended to permit reconciliation to the amounts presented in the Portfolio of investments:
Description | Unadjusted quoted prices in active markets for identical investments (Level 1) | Other significant observable inputs (Level 2) | Unobservable inputs (Level 3) | Total | |||||||||||||||
Assets | |||||||||||||||||||
Common stocks | $ | 78,736,756 | $ | 62,142 | $ | — | $ | 78,798,898 | |||||||||||
Exchange traded funds | 9,704,712 | — | — | 9,704,712 | |||||||||||||||
Investment companies | 37,147,291 | — | — | 37,147,291 | |||||||||||||||
Asset-backed securities | — | 4,086,224 | — | 4,086,224 | |||||||||||||||
Mortgage-backed securities | — | 4,724,680 | — | 4,724,680 | |||||||||||||||
Non-U.S. government agency obligations | — | 7,879,457 | — | 7,879,457 | |||||||||||||||
U.S. government agency obligations | — | 9,534,904 | — | 9,534,904 | |||||||||||||||
U.S. Treasury obligations | — | 7,343,754 | — | 7,343,754 | |||||||||||||||
Short-term investments | — | 33,796,997 | — | 33,796,997 | |||||||||||||||
Investment of cash collateral from securities loaned | — | 1,736,422 | — | 1,736,422 | |||||||||||||||
Futures contracts | 1,043,186 | — | — | 1,043,186 | |||||||||||||||
Swap agreements | — | 1,309,636 | — | 1,309,636 | |||||||||||||||
Forward foreign currency contracts | — | 915,121 | — | 915,121 | |||||||||||||||
Total | $ | 126,631,945 | $ | 71,389,337 | $ | — | $ | 198,021,282 | |||||||||||
Liabilities | |||||||||||||||||||
Futures contracts | $ | (1,717,734 | ) | $ | — | $ | — | $ | (1,717,734 | ) | |||||||||
Swap agreements | — | (1,202,655 | ) | — | (1,202,655 | ) | |||||||||||||
37
UBS Global Allocation Fund
Portfolio of investments
June 30, 2022
Description | Unadjusted quoted prices in active markets for identical investments (Level 1) | Other significant observable inputs (Level 2) | Unobservable inputs (Level 3) | Total | |||||||||||||||
Forward foreign currency contracts | $ | — | $ | (1,348,196 | ) | $ | — | $ | (1,348,196 | ) | |||||||||
Total | $ | (1,717,734 | ) | $ | (2,550,851 | ) | $ | — | $ | (4,268,585 | ) | ||||||||
At June 30, 2022, there were no transfers in or out of Level 3.
Portfolio footnotes
* Non-income producing security.
† Amount represents less than 0.05% or (0.05)%.
1 Security, or portion thereof, was on loan at the period end.
2 Security exempt from registration pursuant to Rule 144A under the Securities Act of 1933. These securities are considered liquid, unless noted otherwise, and may be resold in transactions exempt from registration, normally to qualified institutional buyers. Securities exempt from registration pursuant to Rule 144A, in the amount of $8,180,092, represented 4.3% of the Fund's net assets at period end.
3 The table below details the Fund's investment in a fund advised by the same Advisor as the Fund. The Fund does not pay advisory fees that are retained by the Advisor in connection with its investment in other investment companies advised by the Advisor, but may pay other expenses associated with such investments (such as sub-advisory fees paid to other parties, if any).
| Value 06/30/21 | Purchases during the year ended 06/30/22 | Sales during the year ended 06/30/22 | Net realized gain (loss) during the year ended 06/30/22 | Change in net unrealized appreciation (depreciation) during the year ended 06/30/22 | Value 06/30/22 | Net income earned from affiliate for the year ended 06/30/22 | Shares 06/30/22 | ||||||||||||||||||||||||||||
PACE High Yield Investments | $ | — | $ | 24,124,159 | $ | 1,200,000 | $ | (126,674 | ) | $ | (3,535,620 | ) | $ | 19,261,865 | $ | 624,159 | 2,389,810 | ||||||||||||||||||
UBS All China Equity Fund | — | 2,980,000 | — | — | 215,894 | 3,195,894 | — | 504,084 | |||||||||||||||||||||||||||
| UBS Emerging Markets Equity Opportunity Fund | 20,253,259 | 3,015,239 | — | — | (8,578,966 | ) | 14,689,532 | 2,015,239 | 1,912,700 | ||||||||||||||||||||||||||
$ | 20,253,259 | $ | 30,119,398 | $ | 1,200,000 | $ | (126,674 | ) | $ | (11,898,692 | ) | $ | 37,147,291 | $ | 2,639,398 | ||||||||||||||||||||
4 Variable or floating rate security. The interest rate shown is the current rate as of June 30, 2022 and changes periodically.
5 In U.S. dollars unless otherwise indicated.
6 Variable or floating rate security for which the interest rate adjusts periodically based on changes in current interest rates and prepayments on the underlying pool of assets. Rate shown is the rate in effect as of period end.
7 Step bond—coupon rate increases in increments to maturity. The rate disclosed is the rate at the period end; the maturity date disclosed is the ultimate maturity date.
8 Security was purchased pursuant to Regulation S under the Securities Act of 1933, which exempts from registration securities offered and sold outside of the United States. Such a security cannot be sold in the United States without either an effective registration statement filed pursuant to the Securities Act of 1933, or pursuant to an exemption from registration.
9 Debt security whose principal and/or interest payments are adjusted for inflation, unlike debt securities that make fixed principal and interest payments. The interest rate paid by the securities is fixed, while the principal value rises or falls based on changes in an index. Thus, if inflation occurs, the principal and interest payments on the securities are adjusted accordingly to protect investors from inflationary loss. During a deflationary period, the principal and interest payments decrease, although the securities' principal amounts will not drop below their face amounts at maturity. In exchange for the inflation protection, the securities generally pay lower interest rates than typical government securities from the issuer's country. Only if inflation occurs will securities offer a higher real yield than a conventional security of the same maturity.
10 Rates shown reflect yield at June 30, 2022.
11 If the Fund is a buyer of protection and a credit event occurs, as defined under the terms of that particular swap agreement, the Fund will either (i) receive from the seller of protection an amount equal to the notional amount of the swap and deliver the referenced obligation or underlying securities comprising the referenced obligation or (ii) receive a net settlement amount in the form of cash or securities equal to the notional amount of the swap less the recovery value of the referenced obligation or underlying securities comprising the referenced obligation.
12 Payments made or received are based on the notional amount.
See accompanying notes to financial statements.
38
UBS Emerging Markets Equity Opportunity Fund
Portfolio performance
For the 12 months ended June 30, 2022 (the "reporting period"), Class P2 shares of UBS Emerging Markets Equity Opportunity Fund (the "Fund") returned -31.10%, while Class P shares returned -31.71%. The Fund's benchmark, the MSCI Emerging Markets Index (net) (the "Index"), returned -25.28%. Please note that these returns do not reflect the deduction of taxes that a shareholder would pay on Fund distributions or the redemption of Fund shares, while the Index returns do not reflect the deduction of fees and expenses.
The Fund posted a negative return and underperformed its benchmark during the reporting period.
Portfolio performance summary1
What worked:
• On a sector level, stock selection in energy and consumer staples were key contributors.
• On a stock level, our overweight in Bank Mandiri (Indonesia, financials) and Eicher Motors (India, consumer discretionary) were among the top contributors to performance over the reporting period.
• Bank Mandiri outperformed as Indonesia stands to benefit from the rise in commodity prices and as investors looked toward the country's reopening from COVID restrictions. Catalysts for Bank Mandiri include consistent low cost of funds, non-performing loans/provision staying within the range of guidance, and a small but promising pick-up in credit demand. Eicher Motors also outperformed on expectations that its supply bottlenecks are moderating.
What didn't work:
• On a sector level, stock selection within communication services and financials detracted from performance.
• On a stock level, our overweights in Yandex (Russia, communication services) and MercadoLibre (Argentina, consumer discretionary) were among the main headwinds for results over the reporting period.
• Yandex underperformed as all Russian companies were written down to zero following Russia's invasion of Ukraine (Prior to Russia's invasion, this stock represented 1.2% of the Fund in February 2022.) MecadoLibre underperformed along with other growth stocks amid interest rate hikes. We continue to hold both positions. For Yandex, please note that the stock is valued at zero, and currently there is no trading.
• The Fund did not invest in derivatives during the reporting period.
This letter is intended to assist shareholders in understanding how the Fund performed during the 12 months ended June 30, 2022. The views and opinions in the letter were current as of August 12, 2022. They are not guarantees of future performance or investment results and should not be taken as investment advice. Investment decisions reflect a variety of factors, and we reserve the right to change our views about individual securities, sectors and markets at any time. As a result, the views expressed should not be relied upon as a forecast of the Fund's future investment intent. We encourage you to consult your financial advisor regarding your personal investment program.
Mutual funds are sold by prospectus only. You should read it carefully and consider a fund's investment objectives, risks, charges, expenses and other important information contained in the prospectus before investing. Prospectuses for most of our funds can be obtained from your financial advisor, by calling UBS Funds at 800-647 1568 or by visiting our website at www.ubs.com/am-us.
1 For a detailed commentary on the market environment in general during the reporting period, see page 3.
39
UBS Emerging Markets Equity Opportunity Fund
Average annual total returns for periods ended 06/30/22 (unaudited)
1 year | Inception | ||||||||||
Class P1,3 | (31.71 | )% | (0.58 | )% | |||||||
Class P22,3 | (31.10 | ) | (2.41 | ) | |||||||
MSCI Emerging Markets Index (net)3 | (25.28 | ) | (0.90 | ) | |||||||
The annualized gross and net expense ratios, respectively, for each class of shares as in the October 28, 2021 prospectuses were as follows: Class P—1.08% and 1.00%; Class P2—1.06% and 0.12%. Net expenses reflect fee waivers and/or expense reimbursements, if any, pursuant to an agreement that is in effect to cap the expenses. The Trust, with respect to the Fund, and UBS Asset Management (Americas) Inc., the Fund's investment advisor and administrator ("UBS AM (Americas)" or the "Advisor"), have entered into a written agreement pursuant to which the Advisor has agreed to waive a portion of its management fees and/or to reimburse expenses (excluding expenses incurred through investment in other investment companies, interest, taxes, brokerage commissions and extraordinary expenses) to the extent necessary so that the Fund's ordinary operating expenses (excluding expenses incurred through investment in other investment companies, interest, taxes, brokerage commissions and extraordinary expenses, such as proxy-related expenses), through the period ending October 28, 2022, do not exceed 1.00% for Class P shares. The Advisor has also entered into a written agreement pursuant to which the Advisor has agreed to waive a portion of its management fees and retained administration fees, and/or to reimburse expenses (excluding expenses incurred through investment in other investment companies, interest, taxes, brokerage commissions and extraordinary expenses, such as proxy-related expenses) to the extent necessary so that the Fund's ordinary operating expenses (excluding expenses incurred through investment in other investment companies, interest, taxes, brokerage commissions and extraordinary expenses, such as proxy related expenses), through the period ending October 28, 2022, do not exceed 0.40% for Class P2 shares. Pursuant to the written agreement, the Advisor is entitled to be reimbursed for any fees it waives and expenses it reimburses to the extent such reimbursement can be made during the three fiscal years following the date on which such fee waivers and expense reimbursements were made, provided that the reimbursement of the Advisor by the Fund will not cause the Fund to exceed the lesser of any applicable expense limit that is in place for the Fund (i) at the time of the waiver or reimbursement or (ii) at the time of the recoupment. The fee waiver/expense reimbursement agreement may be terminated by the Fund's Board of Trustees at any time and also will terminate automatically upon the expiration or termination of the Fund's advisory contract with the Advisor. Upon termination of the fee waiver/expense reimbursement agreement, however, UBS AM (Americas)'s three year recoupment rights will survive.
1 Inception date of Class P is January 31, 2019.
2 Inception date of Class P2 is June 4, 2018.
3 Class P and Class P2 shares do not bear initial or contingent deferred sales charges or ongoing 12b-1 service and distribution fees, but Class P and Class P2 shares held through advisory programs may be subject to a program fee, which, if included, would have reduced performance.
4 The MSCI Emerging Markets Index (net) is a market capitalization-weighted index composed of different emerging market countries in Europe, Latin America, and the Pacific Basin. Net total return indices reinvest dividends after the deduction of withholding taxes, using a tax rate applicable to nonresident institutional investors who do not benefit from double taxation treaties. The index is constructed and managed with a view to being fully investable from the perspective of international institutional investors. Investors should note that indices do not reflect the deduction of fees and expenses. Inception return for the Index is shown as of the inception date of the oldest share class: June 4, 2018.
Past performance does not predict future performance, and the performance information provided does not reflect the deduction of taxes that a shareholder would pay on Fund distributions or the redemption of Fund shares. The return and principal value of an investment will fluctuate, so that an investor's shares, when redeemed, may be worth more or less than their original cost. Performance results assume reinvestment of all dividends and capital gain distributions at net asset value on the ex-dividend dates. Total returns for periods of less than one year have not been annualized. Current performance may be higher or lower than the performance data quoted. For month-end performance figures, please visit www.ubs.com/us-mutualfundperformance.
40
UBS Emerging Markets Equity Opportunity Fund
Illustration of an assumed investment of $2,000,000 in Class P shares and $25,000,000 in Class P2 shares (unaudited)
The following graphs depict the performance of UBS Emerging Markets Equity Opportunity Fund Class P and Class P2 shares versus the MSCI Emerging Markets Index (net) from January 31, 2019, the inception date of Class P, and June 4, 2018, the inception date of Class P2, through June 30, 2022. Class P and Class P2 shares may be subject to a program fee, which, if included, would have reduced performance. The performance provided does not reflect the deduction of taxes that a shareholder would pay on Fund distributions or the redemptions of Fund shares. Past performance is no guarantee of future results. Share price and returns will vary with market conditions; investors may realize a gain or a loss upon redemption. It is important to note that UBS Emerging Markets Equity Opportunity Fund is a professionally managed portfolio while the Index is not available for investment and is unmanaged. The comparison is shown for illustration purposes only.
UBS Emerging Markets Equity Opportunity Fund Class P vs. MSCI Emerging Markets Index (net)

UBS Emerging Markets Equity Opportunity Fund Class P2 vs. MSCI Emerging Markets Index (net)

41
UBS Emerging Markets Equity Opportunity Fund
Portfolio statistics and industry diversification—(unaudited)1
As a percentage of net assets as of June 30, 2022
Top ten holdings
Taiwan Semiconductor Manufacturing Co. Ltd. | 8.1 | % | |||||
Tencent Holdings Ltd. | 5.5 | ||||||
Reliance Industries Ltd. | 4.7 | ||||||
Samsung Electronics Co. Ltd. | 4.6 | ||||||
China Merchants Bank Co. Ltd., Class H | 4.2 | ||||||
Kweichow Moutai Co. Ltd., Class A | 3.5 | ||||||
China Mengniu Dairy Co. Ltd. | 3.5 | ||||||
JD.com, Inc., Class A | 3.5 | ||||||
Ping An Insurance Group Co. of China Ltd., Class H | 3.5 | ||||||
LONGi Green Energy Technology Co. Ltd., Class A | 3.5 | ||||||
Total | 44.6 | % | |||||
Top five issuer breakdown by country or territory of origin
China | 35.1 | % | |||||
India | 15.9 | ||||||
Taiwan | 12.4 | ||||||
South Korea | 7.7 | ||||||
Indonesia | 6.6 | ||||||
Total | 77.7 | % | |||||
Common stocks | |||||||
Automobiles | 3.2 | % | |||||
Banks | 20.6 | ||||||
Beverages | 3.5 | ||||||
Diversified financial services | 0.9 | ||||||
Food products | 3.5 | ||||||
Household durables | 2.3 | ||||||
Insurance | 3.5 | ||||||
Interactive media & services | 5.6 | ||||||
Internet & direct marketing retail | 10.6 | ||||||
Metals & mining | 3.0 | ||||||
Oil, gas & consumable fuels | 7.8 | ||||||
Personal products | 2.9 | ||||||
Real estate management & development | 2.2 | ||||||
Semiconductors & semiconductor equipment | 19.0 | ||||||
Technology hardware, storage & peripherals | 4.6 | ||||||
Wireless telecommunication services | 0.8 | ||||||
Total common stocks | 94.0 | ||||||
Preferred stocks | 2.1 | ||||||
Short-term investments | 1.7 | ||||||
Total investments | 97.8 | ||||||
Other assets in excess of liabilities | 2.2 | ||||||
Net assets | 100.0 | % | |||||
1 The portfolio is actively managed and its composition will vary over time.
42
UBS Emerging Markets Equity Opportunity Fund
Portfolio of investments
June 30, 2022
| Number of shares | Value | ||||||||||
Common stocks: 94.0% | |||||||||||
Argentina: 2.1% | |||||||||||
MercadoLibre, Inc.* | 18,704 | $ | 11,912,016 | ||||||||
Brazil: 2.0% | |||||||||||
Petroleo Brasileiro SA, ADR | 999,038 | 11,668,764 | |||||||||
China: 35.1% | |||||||||||
China Mengniu Dairy Co. Ltd.* | 4,074,000 | 20,326,388 | |||||||||
China Merchants Bank Co. Ltd., Class H | 3,584,500 | 23,982,547 | |||||||||
Country Garden Services Holdings Co. Ltd. | 2,877,000 | 12,814,287 | |||||||||
JD.com, Inc., Class A | 630,371 | 20,308,634 | |||||||||
Kweichow Moutai Co. Ltd., Class A | 66,767 | 20,396,235 | |||||||||
| LONGi Green Energy Technology Co. Ltd., Class A | 2,004,464 | 19,950,919 | |||||||||
Meituan, Class B*,1 | 789,900 | 19,549,189 | |||||||||
Midea Group Co. Ltd., Class A | 1,438,046 | 12,972,768 | |||||||||
| Ping An Insurance Group Co. of China Ltd., Class H | 2,961,000 | 20,131,691 | |||||||||
Tencent Holdings Ltd. | 708,100 | 31,981,271 | |||||||||
202,413,929 | |||||||||||
Hungary: 1.1% | |||||||||||
OTP Bank Nyrt | 277,833 | 6,184,774 | |||||||||
India: 15.9% | |||||||||||
Axis Bank Ltd.* | 1,390,385 | 11,211,462 | |||||||||
Eicher Motors Ltd. | 516,167 | 18,263,969 | |||||||||
HDFC Bank Ltd. | 1,096,046 | 18,708,664 | |||||||||
Hindustan Unilever Ltd. | 596,722 | 16,854,577 | |||||||||
Reliance Industries Ltd. | 821,152 | 26,989,435 | |||||||||
92,028,107 | |||||||||||
Indonesia: 6.6% | |||||||||||
Bank Central Asia Tbk. PT | 40,040,900 | 19,486,258 | |||||||||
Bank Mandiri Persero Tbk. PT | 34,911,600 | 18,571,870 | |||||||||
38,058,128 | |||||||||||
Mexico: 2.2% | |||||||||||
Grupo Financiero Banorte SAB de CV, Class O | 2,289,200 | 12,769,072 | |||||||||
Russia: 0.0%† | |||||||||||
Sberbank of Russia PJSC*,2,3 | 3,568,865 | 0 | |||||||||
Yandex N.V., Class A*,2,3 | 257,600 | 0 | |||||||||
0 | |||||||||||
| Number of shares | Value | ||||||||||
Common stocks—(concluded) | |||||||||||
Saudi Arabia: 1.4% | |||||||||||
Saudi National Bank | 466,906 | $ | 8,200,502 | ||||||||
South Africa: 6.4% | |||||||||||
Anglo American PLC | 482,216 | 17,240,239 | |||||||||
FirstRand Ltd. | 1,402,615 | 5,377,248 | |||||||||
MTN Group Ltd. | 591,858 | 4,803,622 | |||||||||
Naspers Ltd., N Shares | 65,328 | 9,507,701 | |||||||||
36,928,810 | |||||||||||
South Korea: 7.7% | |||||||||||
Samsung Electronics Co. Ltd. | 605,254 | 26,570,763 | |||||||||
SK Hynix, Inc. | 257,514 | 18,048,193 | |||||||||
44,618,956 | |||||||||||
Taiwan: 12.4% | |||||||||||
MediaTek, Inc. | 746,000 | 16,333,294 | |||||||||
Nanya Technology Corp. | 5,154,000 | 8,562,988 | |||||||||
Taiwan Semiconductor Manufacturing Co. Ltd. | 2,915,000 | 46,665,882 | |||||||||
71,562,164 | |||||||||||
Thailand: 1.1% | |||||||||||
PTT Exploration and Production PCL, NVDR | 1,461,300 | 6,592,486 | |||||||||
| Total common stocks (cost $708,779,227) | 542,937,708 | ||||||||||
Preferred stocks: 2.1% | |||||||||||
Brazil: 2.1% | |||||||||||
| Banco Bradesco SA (cost $14,372,238) | 3,796,759 | 12,478,242 | |||||||||
Short-term investments: 1.7% | |||||||||||
Investment companies: 1.7% | |||||||||||
| State Street Institutional U.S. Government Money Market Fund, 1.430%4 (cost $9,778,122) | 9,778,122 | 9,778,122 | |||||||||
| Total investments: 97.8% (cost $732,929,587) | 565,194,072 | ||||||||||
Other assets in excess of liabilities: 2.2% | 12,427,037 | ||||||||||
Net assets: 100.0% | $ | 577,621,109 | |||||||||
For a listing of defined portfolio acronyms that are used throughout the Portfolio of investments as well as the tables that follow, please refer to the Glossary of terms used in the Portfolio of investments.
43
UBS Emerging Markets Equity Opportunity Fund
Portfolio of investments
June 30, 2022
Fair valuation summary
The following is a summary of the fair valuations according to the inputs used as of June 30, 2022 in valuing the Fund's investments. In the event a Fund holds investments for which fair value is measured using the NAV per share practical expedient (or its equivalent), a separate column will be added to the fair value hierarchy table; this is intended to permit reconciliation to the amounts presented in the Portfolio of investments:
Description | Unadjusted quoted prices in active markets for identical investments (Level 1) | Other significant observable inputs (Level 2) | Unobservable inputs (Level 3) | Total | |||||||||||||||
Assets | |||||||||||||||||||
Common stocks | $ | 542,937,708 | $ | — | $ | 0 | $ | 542,937,708 | |||||||||||
Preferred stocks | 12,478,242 | — | — | 12,478,242 | |||||||||||||||
Short-term investments | — | 9,778,122 | — | 9,778,122 | |||||||||||||||
Total | $ | 555,415,950 | $ | 9,778,122 | $ | 0 | $ | 565,194,072 | |||||||||||
Certain securities in Russia were transferred from level 1 to level 3 with a fair value of $0 during the year ended June 30, 2022 as a result of the Russian invasion of Ukraine, related liquidity concerns and US sanctions. For the year ended June 30, 2022, the Fund recorded a total change in unrealized losses of $29,762,554 in the Statement of Operations related to these securities.
Securities valued using unobservable inputs, i.e. Level 3, were not considered significant to the Fund.
Portfolio footnotes
* Non-income producing security.
† Amount represents less than 0.05% or (0.05)%.
1 Security exempt from registration pursuant to Rule 144A under the Securities Act of 1933. These securities are considered liquid, unless noted otherwise, and may be resold in transactions exempt from registration, normally to qualified institutional buyers. Securities exempt from registration pursuant to Rule 144A, in the amount of $19,549,189, represented 3.4% of the Fund's net assets at period end.
2 Security fair valued by the Valuation Committee under the direction of the Board of Trustees.
3 Significant unobservable inputs were used in the valuation of this security; i.e. Level 3.
4 Rates shown reflect yield at June 30, 2022.
See accompanying notes to financial statements.
44
UBS Engage For Impact Fund
Portfolio performance
For the 12 months ended June 30, 2022, Class P shares of UBS Engage For Impact Fund (the "Fund") returned -21.28%, while the Class P2 shares returned -20.77%. The Fund's benchmark, the MSCI All Country World Index (net) (the "Index"), returned -15.75% over the same time period. (Please note that the Fund's returns do not reflect the deduction of taxes that a shareholder would pay on Fund distributions or the redemption of Fund shares, while the Index returns do not reflect the deduction of fees and expenses.)
The Fund's performance was driven primarily by stock selection.
Portfolio performance summary1
What worked:
• Stock selection within the materials and financials sectors made a positive contribution to Fund performance during the reporting period.
• Several individual stock positions were positive for relative performance during the 12-month period. The largest contributors were:
– Bank Mandiri's stock performed well during the period as management reiterated its 2022 earnings guidance, against a positive local macroeconomic environment, as well as favorable interest rate trends. We believe the bank is on track to achieve return on equity (ROE) in the high teens by 2025.
– CF Industries was a top contributor as shares benefited from strong nitrogen fertilizer prices, particularly as the supply of the feedstock was expected to decrease dramatically given Russian sanctions in first half of 2022.
– Bunge has benefitted from strong demand and tight commodity supplies. They also delivered strong results that continue to show that the transformation of their business over the past 3 years is translating into value creation.
– Evoqua Water Tech traded higher after announcing the acquisition of two subsidiaries of Steris. The move completes Evoqua's water solutions for health care applications, and was well received by the market. We have since exited this security as the company was nearing our estimate of fair value.
– Galp Energia's shares traded strongly during the reporting period as a result of rising energy prices.
What didn't work:
• Stock selection in the health care and consumer discretionary sectors were the largest detractors from performance during the 12-month period. The largest individual detractors were:
– Shoals Technology Group, a small-mid-cap solar components company, underperformed due to delays in its supply chain and concerns over the impact of US regulation limiting Chinese component exports to the solar industry. We sold out of this position during the reporting period.
– Coursera shares detracted due to ongoing concerns around a deceleration in revenue growth, particularly in their Degrees segment. Coursera attributed this to lengthy lead times and seasonality. With 5.5 million new registered learners, we continue to think Coursera remains a beneficiary of the reskilling opportunity over the longer term and we continue to hold this stock.
1 For a detailed commentary on the market environment in general during the reporting period, see page 3.
45
UBS Engage For Impact Fund
– Knorr-Bremse detracted as a succession of missteps dented our investment thesis. A badly perceived attempted acquisition led to another change in management. In addition, supply chain constraints and prolonged lockdowns in China affected near- and mid-term earnings prospects. We exited this position during the reporting period.
– Sweetgreen's shares were negatively impacted by ongoing concerns around food price inflation and elevated costs across its supply chain. However, the company delivered better-than-expected results during the period. We believe Sweetgreen has the potential for positive forward momentum, due to ongoing urban location recovery, strong contributions from new locations and markets, and restaurant profit margin expansion. We continue to hold this stock.
– Orpea detracted after the publication of a book containing allegations of abuse of patients, manipulation of public subvention accounting and connivence with a politician for licensing favors. In addition, a new report showed the complexities of Orpea's financial arrangements and raised doubts over potential tax fraud. Given the controversies surrounding the company, we exited this position.
• As of June 30, 2022, the Fund did not have any exposure to derivatives.
Portfolio highlights
The Engage For Impact Fund is a high conviction, impactful portfolio invested in companies that we believe have an important role to play in achieving the United Nations Sustainable Development Goals (SDGs)—not just through the products and services they sell but also through improvements in their operations and supply chains. The portfolio invests across five impact themes aligned with the SDGs, which are Climate, Health, Food, Water and Empowerment.
As of June 30, 2022, the portfolio's largest exposure was to SDG 2—Zero Hunger (20.3%), SDG 12—Responsible Production and Consumption (17.9%) and SDG 3—Good Health and Well-being (16.4%).
The Fund's top three overweights and their impact case as of June 30, 2022 were:
Bank Mandiri
Impact Theme: Empowerment
Product Impact: SDG 1 (Zero Poverty)
Bank Mandiri is a large bank in Indonesia, where banking penetration rates are low, at approximately one-third of the population. Almost 40% of Mandiri's loans are retail and micro loans. BMRI is the #1 player in e-money accounts/card segments, and is particularly active for physical card-based small payments. Its new retail e-banking app "Livin'" has been downloaded 12 million times, with eight million active users since launch, facilitating banking for digital natives and in remote locations. Bank Mandiri is 60% owned by the government of Indonesia, and aligns its sustainable finance objectives with the Indonesian government's climate pledge and the Finance Authority's (OJK) directives. The bank raised its first green bond ($300 million and eight times oversubscribed) in 2021. Our engagement objectives are to support the company to adopt best-in-class procedures to assess human rights abuse risk in financing, in support of SDGs 8 (target 8.7 and 8.8) as well as SDG 10 (target 10.2). We also considered the impact assessment of the bank's social banking activities, and data privacy and security.
Danone
Impact Theme: Food
Product Impact: SDG 2 (Zero Hunger)
46
UBS Engage For Impact Fund
Danone is the smallest of the three large European food and beverage companies and has a leading position in plant-based products, as well as attractive specialist nutrition businesses. The company currently estimates that 90% of its sales by volume is derived from healthy products, and Danone is among the three top-performing companies according to the Global Access to Nutrition Index.
With the management renewal, we believe the recently announced organic transformation plan will drive improvements at the company through a simplification and delayering of the organization, by giving local management more control, and by breaking down silos between categories. Our engagement focus is on encouraging this industry leader to raise the bar in terms of nutrition, product transparency and marketing to influence its competitors, in support of SDG 2, zero hunger, target 2.2 and SDG 17 on partnership for the goals. This is in collaboration with other investors, as part of the Healthy Markets Coalition.
Alcon
Impact Theme: Health
Product Impact: SDG 3 (Good Health and Well-being)
Alcon is a leader is ophthalmic surgical and vision care markets whose products and services contribute to SDG 3 (Good Health and Well-being). According to the company and based on a World Health Organization ("WHO") study, 80% of all visual impairments are currently preventable, treatable or curable, and Alcon aims to serve these unmet needs. Half of the company's revenues originate from North America and around 20% from Emerging Markets. Alcon is committed to providing affordable eye care for patients globally and develops eye care techniques for consumers in low-income nations. For example, phacoemulsification (phaco) is the preferred procedure for cataract surgery but has historically been less accessible for consumers in low-income regions of the world. In response, Alcon has invested in dedicated Phaco development programs across Russia, China, India, Vietnam, Bangladesh, Indonesia, and Nepal to make Phaco more available to patients in frontier and emerging markets. We have been engaging with the company since 2019 on various governance and human capital-related improvements, which the company delivered on. We are currently targeting for the company to set public diversity improvement targets, in alignment with SDG 10 (Reduce inequalities), targets 10.2, 10.3 and 10.4.
This letter is intended to assist shareholders in understanding how the Fund performed during the 12 months ended June 30, 2022. The views and opinions in the letter were current as of August 12, 2022. They are not guarantees of future performance or investment results and should not be taken as investment advice. Investment decisions reflect a variety of factors, and we reserve the right to change our views about individual securities, sectors and markets at any time. As a result, the views expressed should not be relied upon as a forecast of the Fund's future investment intent. We encourage you to consult your financial advisor regarding your personal investment program.
Mutual funds are sold by prospectus only. You should read it carefully and consider a fund's investment objectives, risks, charges, expenses and other important information contained in the prospectus before investing. Prospectuses for most of our funds can be obtained from your financial advisor, by calling UBS Funds at 800-647 1568 or by visiting our website at www.ubs.com/am-us.
47
UBS Engage For Impact Fund
Average annual total returns for periods ended 06/30/22 (unaudited)
1 year | Inception | ||||||||||
Class P1,3 | (21.28 | )% | 4.17 | % | |||||||
Class P22,3 | (20.77 | ) | (12.91 | ) | |||||||
MSCI All Country World Index (net)4 | (15.75 | ) | 8.13 | ||||||||
The annualized gross and net expense ratios, respectively, for each class of shares as in the October 28, 2021 prospectuses were as follows: Class P—1.69% and 0.85%; Class P2—2.24% and 0.25%. Net expenses reflect fee waivers and/or expense reimbursements, if any, pursuant to an agreement that is in effect to cap the expenses. The Trust, with respect to the Fund, and UBS Asset Management (Americas) Inc., the Fund's investment advisor and administrator ("UBS AM (Americas)" or the "Advisor"), have entered into a written agreement pursuant to which the Advisor has agreed to waive a portion of its management fees and/or to reimburse expenses (excluding expenses incurred through investment in other investment companies, interest, taxes, brokerage commissions and extraordinary expenses) to the extent necessary so that the Fund's ordinary operating expenses (excluding expenses incurred through investment in other investment companies, interest, taxes, brokerage commissions and extraordinary expenses, such as proxy-related expenses), through the period ending October 28, 2022, do not exceed 0.85% for Class P shares. The Advisor has also entered into a written agreement pursuant to which the Advisor has agreed to waive a portion of its management fees and retained administration fees, and/or to reimburse expenses (excluding expenses incurred through investment in other investment companies, interest, taxes, brokerage commissions and extraordinary expenses, such as proxy-related expenses) to the extent necessary so that the Fund's ordinary operating expenses (excluding expenses incurred through investment in other investment companies, interest, taxes, brokerage commissions and extraordinary expenses, such as proxy related expenses), through the period ending October 28, 2022, do not exceed 0.25% for Class P2 shares. Pursuant to the written agreement, the Advisor is entitled to be reimbursed for any fees it waives and expenses it reimburses to the extent such reimbursement can be made during the three fiscal years following the date on which such fee waivers and expense reimbursements were made, provided that the reimbursement of the Advisor by the Fund will not cause the Fund to exceed the lesser of any applicable expense limit that is in place for the Fund (i) at the time of the waiver or reimbursement or (ii) at the time of the recoupment. The fee waiver/expense reimbursement agreement may be terminated by the Fund's Board of Trustees at any time and also will terminate automatically upon the expiration or termination of the Fund's advisory contract with the Advisor. Upon termination of the fee waiver/expense reimbursement agreement, however, UBS AM (Americas)'s three year recoupment rights will survive.
1 Inception date of Class P is October 24, 2018.
2 Inception date of Class P2 is February 23, 2021.
3 Class P and Class P2 shares do not bear initial or contingent deferred sales charges or ongoing 12b-1 service and distribution fees, but Class P and Class P2 shares held through advisory programs may be subject to a program fee, which, if included, would have reduced performance.
4 The MSCI All Country World Index (net) is a free float-adjusted market capitalization weighted index that is designed to measure the equity market performance of developed and emerging markets. Net total return indices reinvest dividends after the deduction of withholding taxes, using a tax rate applicable to non-resident institutional investors who do not benefit from double taxation treaties. The index is constructed and managed with a view to being fully investable from the perspective of international institutional investors. Investors should note that indices do not reflect the deduction of fees and expenses. Inception return for the Index is shown as of the inception date of the oldest share class: October 24, 2018.
Past performance does not predict future performance, and the performance information provided does not reflect the deduction of taxes that a shareholder would pay on Fund distributions or the redemption of Fund shares. The return and principal value of an investment will fluctuate, so that an investor's shares, when redeemed, may be worth more or less than their original cost. Performance results assume reinvestment of all dividends and capital gain distributions at net asset value on the ex-dividend dates. Total returns for periods of less than one year have not been annualized. Current performance may be higher or lower than the performance data quoted. For month-end performance figures, please visit www.ubs.com/us-mutualfundperformance.
48
UBS Engage For Impact Fund
Illustration of an assumed investment of $2,000,000 in Class P shares and $25,000,000 in Class P2 shares (unaudited)
The following graphs depict the performance of UBS Engage For Impact Fund Class P and Class P2 shares versus the MSCI All Country World Index (net) from October 24, 2018, the inception date of Class P, and February 23, 2021, the inception date of Class P2, through June 30, 2022. Class P and Class P2 shares may be subject to a program fee, which, if included, would have reduced performance. The performance provided does not reflect the deduction of taxes that a shareholder would pay on Fund distributions or the redemptions of Fund shares. Past performance is no guarantee of future results. Share price and returns will vary with market conditions; investors may realize a gain or a loss upon redemption. It is important to note that UBS Engage For Impact Fund is a professionally managed portfolio while the Index is not available for investment and is unmanaged. The comparison is shown for illustration purposes only.
UBS Engage For Impact Fund Class P vs. MSCI All Country World Index (net)

UBS Engage For Impact Fund Class P2 vs. MSCI All Country World Index (net)
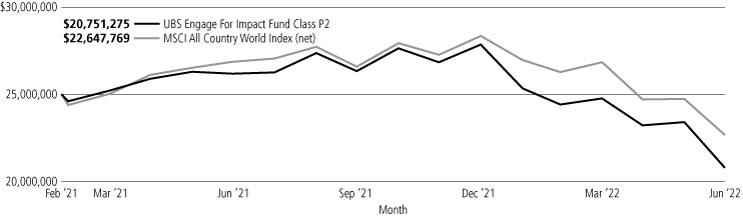
49
UBS Engage For Impact Fund
Portfolio statistics and industry diversification—(unaudited)1
As a percentage of net assets as of June 30, 2022
Top ten holdings
Bank Mandiri Persero Tbk. PT | 4.3 | % | |||||
Danone SA | 4.2 | ||||||
Alcon, Inc. | 3.9 | ||||||
VMware, Inc., Class A | 3.8 | ||||||
China Mengniu Dairy Co. Ltd. | 3.6 | ||||||
Linde PLC | 3.5 | ||||||
Ingersoll Rand, Inc. | 3.5 | ||||||
Spectris PLC | 3.4 | ||||||
Regal Rexnord Corp. | 3.2 | ||||||
Bunge Ltd. | 3.1 | ||||||
Total | 36.5 | % | |||||
Top five issuer breakdown by country or territory of origin
United States | 48.0 | % | |||||
United Kingdom | 7.5 | ||||||
Switzerland | 4.6 | ||||||
Indonesia | 4.3 | ||||||
France | 4.2 | ||||||
Total | 68.6 | % | |||||
Common stocks | |||||||
Auto components | 2.2 | % | |||||
Banks | 8.9 | ||||||
Beverages | 2.5 | ||||||
Biotechnology | 2.5 | ||||||
Chemicals | 9.4 | ||||||
Commercial services & supplies | 1.4 | ||||||
Construction & engineering | 2.7 | ||||||
Consumer finance | 2.5 | ||||||
Diversified consumer services | 1.0 | ||||||
Electric utilities | 2.0 | ||||||
Electrical equipment | 3.2 | ||||||
Electronic equipment, instruments & components | 3.4 | ||||||
Equity real estate investment trusts | 1.9 | ||||||
Food & staples retailing | 1.4 | ||||||
Food products | 12.9 | ||||||
Health care equipment & supplies | 6.1 | ||||||
Health care technology | 0.6 | ||||||
Hotels, restaurants & leisure | 1.1 | ||||||
IT services | 1.7 | ||||||
Life sciences tools & services | 2.4 | ||||||
Machinery | 5.1 | ||||||
Oil, gas & consumable fuels | 2.8 | ||||||
Paper & forest products | 3.0 | ||||||
Professional services | 0.9 | ||||||
Road & rail | 1.5 | ||||||
Semiconductors & semiconductor equipment | 4.8 | ||||||
Software | 7.6 | ||||||
Textiles, apparel & luxury goods | 0.7 | ||||||
Total common stocks | 96.2 | ||||||
Short-term investments | 2.3 | ||||||
Total investments | 98.5 | ||||||
Other assets in excess of liabilities | 1.5 | ||||||
Net assets | 100.0 | % | |||||
1 The portfolio is actively managed and its composition will vary over time.
50
UBS Engage For Impact Fund
Portfolio of investments
June 30, 2022
| Number of shares | Value | ||||||||||
Common stocks: 96.2% | |||||||||||
Austria: 2.4% | |||||||||||
Erste Group Bank AG | 44,662 | $ | 1,132,646 | ||||||||
Brazil: 3.0% | |||||||||||
Suzano SA, ADR | 147,600 | 1,399,248 | |||||||||
Canada: 1.5% | |||||||||||
Canadian Pacific Railway Ltd. | 10,221 | 713,930 | |||||||||
China: 3.6% | |||||||||||
China Mengniu Dairy Co. Ltd.* | 331,000 | 1,651,457 | |||||||||
Denmark: 2.5% | |||||||||||
Genmab A/S* | 3,516 | 1,137,893 | |||||||||
France: 4.2% | |||||||||||
Danone SA | 34,545 | 1,928,088 | |||||||||
Germany: 2.0% | |||||||||||
Infineon Technologies AG | 38,845 | 939,939 | |||||||||
Indonesia: 4.3% | |||||||||||
Bank Mandiri Persero Tbk. PT | 3,774,600 | 2,007,968 | |||||||||
Ireland: 2.1% | |||||||||||
AIB Group PLC | 422,879 | 963,421 | |||||||||
Japan: 3.6% | |||||||||||
JTOWER, Inc.*,1 | 25,400 | 1,254,275 | |||||||||
Recruit Holdings Co. Ltd. | 13,700 | 403,386 | |||||||||
1,657,661 | |||||||||||
Norway: 2.1% | |||||||||||
Mowi ASA | 42,415 | 965,026 | |||||||||
Portugal: 2.8% | |||||||||||
Galp Energia SGPS SA | 108,715 | 1,274,283 | |||||||||
Spain: 2.0% | |||||||||||
Iberdrola SA | 90,753 | 941,155 | |||||||||
Switzerland: 4.6% | |||||||||||
Alcon, Inc. | 26,019 | 1,817,364 | |||||||||
On Holding AG, Class A* | 18,800 | 332,572 | |||||||||
2,149,936 | |||||||||||
United Kingdom: 7.5% | |||||||||||
Biffa PLC2 | 64,422 | 293,922 | |||||||||
Linde PLC | 5,667 | 1,629,432 | |||||||||
Spectris PLC | 47,470 | 1,566,558 | |||||||||
3,489,912 | |||||||||||
| Number of shares | Value | ||||||||||
Common stocks—(concluded) | |||||||||||
United States: 48.0% | |||||||||||
AGCO Corp. | 7,457 | $ | 736,006 | ||||||||
American Well Corp., Class A*,1 | 60,213 | 260,120 | |||||||||
Aptiv PLC* | 11,631 | 1,035,973 | |||||||||
Autodesk, Inc.* | 5,543 | 953,174 | |||||||||
Bio-Rad Laboratories, Inc., Class A* | 1,482 | 733,590 | |||||||||
Bunge Ltd. | 15,862 | 1,438,525 | |||||||||
CF Industries Holdings, Inc. | 12,615 | 1,081,484 | |||||||||
Coursera, Inc.* | 33,492 | 474,917 | |||||||||
Digital Realty Trust, Inc. | 6,786 | 881,026 | |||||||||
Diversey Holdings Ltd.* | 59,306 | 391,420 | |||||||||
Ecolab, Inc. | 8,276 | 1,272,518 | |||||||||
Ingersoll Rand, Inc. | 38,692 | 1,628,159 | |||||||||
LivaNova PLC* | 15,735 | 982,966 | |||||||||
Maravai LifeSciences Holdings, Inc., Class A* | 13,176 | 374,330 | |||||||||
Micron Technology, Inc. | 23,112 | 1,277,631 | |||||||||
Montrose Environmental Group, Inc.* | 9,790 | 330,510 | |||||||||
Primo Water Corp. | 88,056 | 1,178,189 | |||||||||
Regal Rexnord Corp. | 13,196 | 1,498,010 | |||||||||
Roper Technologies, Inc. | 2,050 | 809,033 | |||||||||
SLM Corp. | 72,213 | 1,151,075 | |||||||||
Snowflake, Inc., Class A* | 5,702 | 792,920 | |||||||||
Sprouts Farmers Market, Inc.* | 26,207 | 663,561 | |||||||||
Sweetgreen, Inc., Class A* | 45,500 | 530,075 | |||||||||
VMware, Inc., Class A | 15,325 | 1,746,744 | |||||||||
22,221,956 | |||||||||||
| Total common stocks (cost $51,364,723) | 44,574,519 | ||||||||||
Short-term investments: 2.3% | |||||||||||
Investment companies: 2.3% | |||||||||||
| State Street Institutional U.S. Government Money Market Fund, 1.430%3 (cost $1,069,574) | 1,069,574 | 1,069,574 | |||||||||
| Total investments: 98.5% (cost $52,434,297) | 45,644,093 | ||||||||||
Other assets in excess of liabilities: 1.5% | 674,005 | ||||||||||
Net assets: 100.0% | $ | 46,318,098 | |||||||||
For a listing of defined portfolio acronyms that are used throughout the Portfolio of investments as well as the tables that follow, please refer to the Glossary of terms used in the Portfolio of investments.
51
UBS Engage For Impact Fund
Portfolio of investments
June 30, 2022
Fair valuation summary
The following is a summary of the fair valuations according to the inputs used as of June 30, 2022 in valuing the Fund's investments. In the event a Fund holds investments for which fair value is measured using the NAV per share practical expedient (or its equivalent), a separate column will be added to the fair value hierarchy table; this is intended to permit reconciliation to the amounts presented in the Portfolio of investments:
Description | Unadjusted quoted prices in active markets for identical investments (Level 1) | Other significant observable inputs (Level 2) | Unobservable inputs (Level 3) | Total | |||||||||||||||
Assets | |||||||||||||||||||
Common stocks | $ | 44,574,519 | $ | — | $ | — | $ | 44,574,519 | |||||||||||
Short-term investments | — | 1,069,574 | — | 1,069,574 | |||||||||||||||
Total | $ | 44,574,519 | $ | 1,069,574 | $ | — | $ | 45,644,093 | |||||||||||
At June 30, 2022, there were no transfers in or out of Level 3.
Portfolio footnotes
* Non-income producing security.
1 Security, or portion thereof, was on loan at the period end.
2 Security exempt from registration pursuant to Rule 144A under the Securities Act of 1933. These securities are considered liquid, unless noted otherwise, and may be resold in transactions exempt from registration, normally to qualified institutional buyers. Securities exempt from registration pursuant to Rule 144A, in the amount of $293,922, represented 0.6% of the Fund's net assets at period end.
3 Rates shown reflect yield at June 30, 2022.
See accompanying notes to financial statements.
52
UBS International Sustainable Equity Fund
Portfolio performance
For the 12 months ended June 30, 2022, Class A shares of UBS International Sustainable Equity Fund (the "Fund") returned -19.68% (Class A shares returned -24.12% after the deduction of the maximum sales charge), while Class P shares returned -19.50% and Class P2 shares returned -18.84%. The Fund's benchmark, MSCI ACWI ex-US Index (the "Index"), returned -19.42%. (Class P shares have lower expenses than the other share class in the series. Returns for all share classes over various time periods are shown on page 56; please note that these returns do not reflect the deduction of taxes that a shareholder would pay on Fund distributions or the redemption of Fund shares, while the Index returns do not reflect the deduction of fees and expenses.)
The Fund's performance was due primarily to stock selection.
Portfolio performance summary1
What worked:
• Stock selection in the financials and consumer discretionary sectors added the most value relative to the benchmark.
• Several individual stock positions were positive for relative performance during the 12-month period. The largest contributors were:
– Galp Energia's shares traded strongly during the reporting period as a result of rising commodity prices.
– Bank Central Asia performed well over the period due to accelerating loan growth and an improvement in asset quality.
– Bank Mandiri's share price was boosted as the company reiterated its 2022 earnings guidance, against a positive macroeconomic and interest rate environment. We believe the bank is on track to achieve return on equity (ROE) in the high teens by 2025.
– Equinor also benefited from accommodative commodity prices during the 12-month period.
– Mahindra & Mahindra performed well due to improving agricultural/grain prices and the expectation that the rising prices would lead to a pickup in farm equipment purchases. The company reported strong vehicle sales in both May and June of 2022.
What didn't work:
• Stock selection in the materials and consumer staples sectors detracted the most relative to the benchmark. The largest individual detractors were:
– LG Chem faced several headwinds, including a sharp spike in raw material prices which impacted margins, as well as weaker consumer sentiment due to Russia's invasion of Ukraine, which reduced volumes. We continue to hold this stock.
– LG Household & Health Care's shares declined on the back of the resurgence of COVID-19 infections in China, which led to widespread lockdowns and thereby reduced the company's ability to grow its luxury brands in the Chinese market. We continue to hold this stock.
– MercadoLibre also detracted amid broad weakness in ecommerce stocks. We continue to hold this stock.
1 For a detailed commentary on the market environment in general during the reporting period, see page 3.
53
UBS International Sustainable Equity Fund
– SoftBank Group's shares were under pressure over the period as several companies held in its Vision Fund experienced outsized drawdowns resulting from regulatory headwinds in China.
– Koninklijke Philips' shares were weak, driven by continued investor worries about the impact of the DreamStation 1 recall.
• As of June 30, 2022, the Fund did not have any exposure to derivatives.
Portfolio highlights
Our investment philosophy combines our bottom-up fundamental research with rigorous sustainability analysis. We look for companies that are attractively valued and integrate sustainability factors into their business models to build a competitive advantage.
The investment process for the International Sustainable Equity strategy is driven by a combination of fundamental, ESG (Environmental, Social and Governance) and thematic factors. Through this process, we aim to identify our best investment ideas across sectors and geographies from a stock-specific standpoint.
Please see below for summaries on the top five active weights in the portfolio, as of June 30, 2022:
Barry Callebaut
Barry Callebaut is the world's leading manufacturer of high-quality chocolate and cocoa products, and has been dedicated to this business for more than 150 years. The company operates in more than 40 countries, runs about 60 production facilities, employs a global workforce of more than 12,000 people, and generates annual sales of about $7.1 billion. We see long-term structural growth coming from outsourcing and volume growth, complemented by margin growth through leverage. Barry Callebaut is globally diversified, which gives it a competitive edge over smaller local players and allows for more capacity in innovation. We believe the company has a strong management team that is focused on long-term margin expansion and top line growth, with sustainability embedded in the DNA of the corporate culture. While the shutdown of restaurants and hotels has created short term headwinds for its Gourmet segment, we believe that post-crisis, there will be an opportunity to gain market share with a solid pipeline in food manufacturing. Overall, we view Barry Callebaut as being a recovery winner post-lockdown. In 2016, the company launched Forever Chocolate, with a plan to make sustainable chocolate the norm by 2025 and drive a sustainable cocoa and chocolate supply chain. It aims to have more than 500,000 cocoa farmers lifted out of poverty and have 100% sustainable ingredients in all the company's products. In its fourth annual progress report, Barry Callebaut reported that 143,233 cocoa farmers in its supply chain have moved out of poverty, and also reported an 8.1% reduction in its carbon footprint.
Galp Energia, SGPS
We believe Galp is the best managed integrated multinational energy corporation in Europe, with a high quality portfolio of high-return assets, made of both upstream energy (70% of 2020 revenues) and downstream activities (28%). While Galp is involved in carbon-intensive activities, it is one of the most efficient players, with 9.9 kg CO2e/boe greenhouse gas emissions for its upstream assets in comparison to the industry average of 18.8 kgCO2e/boe greenhouse gas emissions. The company embraces the energy transition, with plans to direct half of its capital expenditures to low carbon projects, and 30% toward renewables by 2025, limiting upstream spending. The company aims to reduce absolute greenhouse gas emissions from operations by 40% by 2030 (versus the 2017 level), and become net carbon neutral by 2050. This includes a large project to improve the energy efficiency of its Sines refinery hub (halving operation emissions by 2030), and allow crude sourcing flexibility and adapt for biofuels production. In terms of energy assets; in 2030 the company is expected to have 12 gigawatts of renewable operating capacity. Finally, Galp is building exposure to green hydrogen, with a first plan for 100 megawatt capacity by 2025.
54
UBS International Sustainable Equity Fund
London Stock Exchange Group (LSE)
London Stock Exchange is a market data and exchanges company, trading at a discount versus its history. The stock has been under pressure recently due to integration challenges with Refinitiv. However, at current levels, we believe we have exposure to the Refinitiv business at a significant discount, and we think there is significant upside opportunity from the combination of Refinitiv's data capabilities and LSE's assets. The trade and post-trade infrastructure that LSE provides generates essential trading data which, when synthesized with Refinitiv's data warehouse, creates value-accretive network effects. Overall, we believe LSE is a good, highly cash generative business with high return on equity. It is also the the first global exchange group to commit to net zero through the Business Ambition for 1.5°C, and is a member of the United Nations Climate Change 'Race to Zero.'
This letter is intended to assist shareholders in understanding how the Fund performed during the 12 months ended June 30, 2022. The views and opinions in the letter were current as of August 12, 2022. They are not guarantees of future performance or investment results and should not be taken as investment advice. Investment decisions reflect a variety of factors, and we reserve the right to change our views about individual securities, sectors and markets at any time. As a result, the views expressed should not be relied upon as a forecast of the Fund's future investment intent. We encourage you to consult your financial advisor regarding your personal investment program.
Mutual funds are sold by prospectus only. You should read it carefully and consider a fund's investment objectives, risks, charges, expenses and other important information contained in the prospectus before investing. Prospectuses for most of our funds can be obtained from your financial advisor, by calling UBS Funds at 800-647 1568 or by visiting our website at www.ubs.com/am-us.
55
UBS International Sustainable Equity Fund
Average annual total returns for periods ended 06/30/22 (unaudited)
1 year | 5 years | 10 years or Inception | |||||||||||||
Before deducting maximum sales charge | |||||||||||||||
Class A1 | (19.68 | )% | 1.95 | % | 5.60 | % | |||||||||
Class P2 | (19.50 | ) | 2.21 | 5.88 | |||||||||||
Class P22,3 | (18.84 | ) | N/A | 1.79 | |||||||||||
After deducting maximum sales charge | |||||||||||||||
Class A1 | (24.12 | )% | 0.80 | % | 5.01 | % | |||||||||
MSCI ACWI ex-US Index4 | (19.42 | ) | 2.50 | 4.83 | |||||||||||
The annualized gross and net expense ratios, respectively, for each class of shares as in the October 28, 2021 prospectuses were as follows: Class A—1.33% and 1.25%; Class P—1.05% and 1.00%; Class P2—1.08% and 0.22%. Net expenses reflect fee waivers and/or expense reimbursements, if any, pursuant to an agreement that is in effect to cap the expenses. UBS Asset Management (Americas) Inc., the Fund's investment advisor and administrator ("UBS AM (Americas)" or the "Advisor"), has agreed irrevocably to waive its fees and reimburse certain expenses (excluding expenses incurred through investment in other investment companies, interest, taxes, brokerage commissions and extraordinary expenses, such as proxy-related expenses) so that the Fund's ordinary operating expenses (excluding expenses incurred through investment in other investment companies, interest, taxes, brokerage commissions and extraordinary expenses, such as proxy-related expenses) do not exceed 1.25% for Class A shares, 1.00% for Class P shares. The Advisor has also entered into a written agreement pursuant to which the Advisor has agreed to waive a portion of its management fees and retained administration fees, and/or to reimburse expenses (excluding expenses incurred through investment in other investment companies, interest, taxes, brokerage commissions and extraordinary expenses, such as proxy-related expenses) to the extent necessary so that the Fund's ordinary operating expenses (excluding expenses incurred through investment in other investment companies, interest, taxes, brokerage commissions and extraordinary expenses, such as proxy related expenses), through the period ending October 28, 2022, do not exceed 0.25% for Class P2 shares. Pursuant to the written agreement, the Advisor is entitled to be reimbursed for any fees it waives and expenses it reimburses to the extent such reimbursement can be made during the three fiscal years following the date on which such fee waivers and expense reimbursements were made, provided that the reimbursement of the Advisor by the Fund will not cause the Fund to exceed the lesser of any applicable expense limit that is in place for the Fund (i) at the time of the waiver or reimbursement or (ii) at the time of the recoupment. The fee waiver/expense reimbursement agreement may be terminated by the Fund's Board of Trustees at any time and also will terminate automatically upon the expiration or termination of the Fund's advisory contract with the Advisor. Upon termination of the fee waiver/expense reimbursement agreement, however, UBS AM (Americas)'s three year recoupment rights will survive.
1 Maximum sales charge for Class A shares is 5.5%. Class A shares bear ongoing 12b-1 service fees.
2 Class P and Class P2 shares do not bear initial or contingent deferred sales charges or ongoing 12b-1 service and distribution fees, but Class P and Class P2 shares held through advisory programs may be subject to a program fee, which, if included, would have reduced performance.
3 Inception date of Class P2 is October 30, 2020.
4 The MSCI ACWI ex USA Index captures large and mid cap representation across 22 of 23 Developed Markets (DM) countries (excluding the US) and 24 Emerging Markets (EM) countries. With 2,270 constituents, the index covers approximately 85% of the global equity opportunity set outside the US. Inception return for the Index is shown for the 10 years ended.
Past performance does not predict future performance, and the performance information provided does not reflect the deduction of taxes that a shareholder would pay on Fund distributions or the redemption of Fund shares. The return and principal value of an investment will fluctuate, so that an investor's shares, when redeemed, may be worth more or less than their original cost. Performance results assume reinvestment of all dividends and capital gain distributions at net asset value on the ex-dividend dates. Total returns for periods of less than one year have not been annualized. Current performance may be higher or lower than the performance data quoted. For month-end performance figures, please visit www.ubs.com/us-mutualfundperformance.
56
UBS International Sustainable Equity Fund
Illustration of an assumed investment of $10,000 in Class A shares (adjusted for 5.5% maximum sales charge), $2,000,000 in Class P shares and $25,000,000 in Class P2 shares (unaudited)
The following graphs depict the performance of UBS International Sustainable Equity Fund Class A and Class P shares versus the MSCI World ex US Index (net) over the 10 years ended June 30, 2022 and from the inception date of October 30, 2020 for the Class P2 shares through June 30, 2022. Class P and Class P2 shares may be subject to a program fee, which, if included, would have reduced performance. The performance provided does not reflect the deduction of taxes that a shareholder would pay on Fund distributions or the redemptions of Fund shares. Past performance is no guarantee of future results. Share price and returns will vary with market conditions; investors may realize a gain or a loss upon redemption. It is important to note that UBS International Sustainable Equity Fund is a professionally managed portfolio while the Index is not available for investment and is unmanaged. The comparison is shown for illustration purposes only.
UBS International Sustainable Equity Fund Class A vs. MSCI World ex USA Index (net)
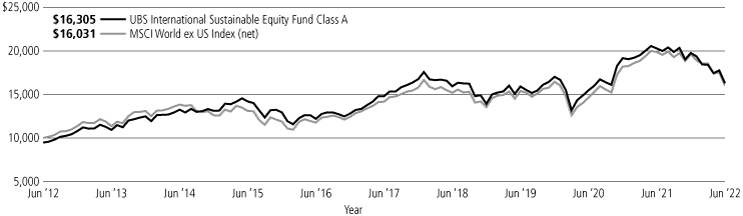
UBS International Sustainable Equity Fund Class P vs. MSCI World ex USA Index (net)
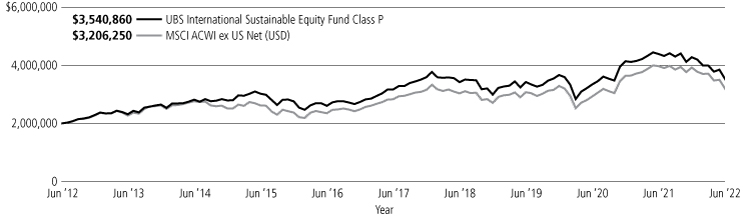
57
UBS International Sustainable Equity Fund
UBS International Sustainable Equity Fund Class P2 vs. MSCI World Free ex USA Index (net)

58
UBS International Sustainable Equity Fund
Portfolio statistics and industry diversification—(unaudited)1
As a percentage of net assets as of June 30, 2022
Top ten holdings
AstraZeneca PLC | 2.8 | % | |||||
Barry Callebaut AG | 2.7 | ||||||
Galp Energia SGPS SA | 2.7 | ||||||
London Stock Exchange Group PLC | 2.4 | ||||||
Danone SA | 2.4 | ||||||
Royal Bank of Canada | 2.4 | ||||||
Novartis AG | 2.3 | ||||||
Sony Group Corp. | 2.1 | ||||||
Ubisoft Entertainment SA | 2.1 | ||||||
Bank Central Asia Tbk. PT | 2.0 | ||||||
Total | 23.9 | % | |||||
Top five issuer breakdown by country or territory of origin
United Kingdom | 15.5 | % | |||||
Japan | 12.6 | ||||||
China | 10.0 | ||||||
France | 8.0 | ||||||
Switzerland | 7.1 | ||||||
Total | 53.2 | % | |||||
Common stocks | |||||||
Auto components | 2.4 | % | |||||
Automobiles | 4.3 | ||||||
Banks | 9.3 | ||||||
Biotechnology | 2.3 | ||||||
Capital markets | 2.4 | ||||||
Chemicals | 2.7 | ||||||
Commercial services & supplies | 1.3 | ||||||
Construction & engineering | 1.4 | ||||||
Diversified financial services | 1.2 | ||||||
Diversified telecommunication services | 2.9 | ||||||
Electrical equipment | 0.9 | ||||||
Electronic equipment, instruments & components | 1.3 | ||||||
Energy equipment & services | 2.0 | ||||||
Entertainment | 3.7 | ||||||
Food products | 7.4 | ||||||
Health care equipment & supplies | 3.2 | ||||||
Household durables | 2.1 | ||||||
Industrial conglomerates | 1.2 | ||||||
Insurance | 7.1 | ||||||
Interactive media & services | 1.2 | ||||||
Internet & direct marketing retail | 3.6 | ||||||
IT services | 2.1 | ||||||
Machinery | 2.5 | ||||||
Oil, gas & consumable fuels | 4.2 | ||||||
Paper & forest products | 1.6 | ||||||
Personal products | 2.0 | ||||||
Pharmaceuticals | 5.1 | ||||||
Professional services | 1.2 | ||||||
Road & rail | 1.0 | ||||||
Semiconductors & semiconductor equipment | 4.3 | ||||||
Software | 4.0 | ||||||
Specialty retail | 0.8 | ||||||
Textiles, apparel & luxury goods | 1.4 | ||||||
Trading companies & distributors | 2.6 | ||||||
Wireless telecommunication services | 1.3 | ||||||
Total common stocks | 98.0 | ||||||
Short-term investments | 0.5 | ||||||
Investment of cash collateral from securities loaned | 4.4 | ||||||
Total investments | 102.9 | ||||||
Liabilities in excess of other assets | (2.9 | ) | |||||
Net assets | 100.0 | % | |||||
1 The portfolio is actively managed and its composition will vary over time.
59
UBS International Sustainable Equity Fund
Portfolio of investments
June 30, 2022
| Number of shares | Value | ||||||||||
Common stocks: 98.0% | |||||||||||
Argentina: 0.7% | |||||||||||
MercadoLibre, Inc.* | 2,446 | $ | 1,557,784 | ||||||||
Australia: 1.3% | |||||||||||
Brambles Ltd. | 355,287 | 2,626,487 | |||||||||
Belgium: 1.0% | |||||||||||
Galapagos N.V.*,1 | 4,699 | 261,186 | |||||||||
Galapagos N.V.* | 34,125 | 1,896,779 | |||||||||
2,157,965 | |||||||||||
Brazil: 2.3% | |||||||||||
Banco Bradesco SA, ADR | 437,090 | 1,424,914 | |||||||||
Suzano SA | 360,600 | 3,423,786 | |||||||||
4,848,700 | |||||||||||
Canada: 3.4% | |||||||||||
Canadian Pacific Railway Ltd. | 29,512 | 2,061,392 | |||||||||
Royal Bank of Canada1 | 51,208 | 4,958,488 | |||||||||
7,019,880 | |||||||||||
China: 10.0% | |||||||||||
Alibaba Group Holding Ltd., ADR* | 30,115 | 3,423,473 | |||||||||
China Mengniu Dairy Co. Ltd.* | 462,000 | 2,305,054 | |||||||||
Li Auto, Inc., ADR* | 73,500 | 2,815,785 | |||||||||
Meituan, Class B*,2 | 102,700 | 2,541,716 | |||||||||
NXP Semiconductors N.V. | 12,613 | 1,867,102 | |||||||||
Ping An Insurance Group Co. of China Ltd., Class H | 565,500 | 3,844,806 | |||||||||
Tencent Holdings Ltd. | 54,100 | 2,443,422 | |||||||||
Zhongsheng Group Holdings Ltd. | 239,500 | 1,689,393 | |||||||||
20,930,751 | |||||||||||
Denmark: 1.3% | |||||||||||
Genmab A/S* | 8,157 | 2,639,873 | |||||||||
Finland: 1.7% | |||||||||||
Metso Outotec Oyj | 478,279 | 3,583,669 | |||||||||
France: 8.0% | |||||||||||
AXA SA | 182,794 | 4,149,167 | |||||||||
Cie Generale des Etablissements Michelin SCA1 | 121,684 | 3,312,300 | |||||||||
Danone SA | 90,336 | 5,041,997 | |||||||||
Ubisoft Entertainment SA* | 97,669 | 4,288,558 | |||||||||
16,792,022 | |||||||||||
Germany: 4.1% | |||||||||||
CTS Eventim AG & Co. KGaA* | 67,842 | 3,554,751 | |||||||||
Infineon Technologies AG | 65,661 | 1,588,810 | |||||||||
Knorr-Bremse AG | 27,044 | 1,542,304 | |||||||||
SAP SE | 21,673 | 1,974,374 | |||||||||
8,660,239 | |||||||||||
India: 4.0% | |||||||||||
Axis Bank Ltd., GDR* | 63,711 | 2,561,183 | |||||||||
Infosys Ltd., ADR | 137,899 | 2,552,510 | |||||||||
Mahindra & Mahindra Ltd., GDR | 245,190 | 3,334,584 | |||||||||
8,448,277 | |||||||||||
| Number of shares | Value | ||||||||||
Common stocks—(continued) | |||||||||||
Indonesia: 3.8% | |||||||||||
Bank Central Asia Tbk. PT | 8,778,300 | $ | 4,272,037 | ||||||||
Bank Mandiri Persero Tbk. PT | 6,730,000 | 3,580,148 | |||||||||
7,852,185 | |||||||||||
Ireland: 1.3% | |||||||||||
AIB Group PLC | 1,165,378 | 2,655,015 | |||||||||
Italy: 2.8% | |||||||||||
Infrastrutture Wireless Italiane SpA1,2 | 214,251 | 2,174,294 | |||||||||
PRADA SpA | 316,800 | 1,774,400 | |||||||||
Prysmian SpA | 68,298 | 1,875,925 | |||||||||
5,824,619 | |||||||||||
Japan: 12.6% | |||||||||||
ITOCHU Corp. | 100,600 | 2,718,899 | |||||||||
NEC Corp. | 49,100 | 1,907,112 | |||||||||
Nippon Telegraph & Telephone Corp. | 137,800 | 3,956,875 | |||||||||
OBIC Business Consultants Co. Ltd. | 93,500 | 3,214,752 | |||||||||
ORIX Corp. | 144,900 | 2,430,663 | |||||||||
Shin-Etsu Chemical Co. Ltd. | 20,700 | 2,334,242 | |||||||||
SoftBank Group Corp. | 69,400 | 2,677,690 | |||||||||
Sony Group Corp. | 54,000 | 4,415,758 | |||||||||
Toyota Motor Corp. | 179,100 | 2,772,037 | |||||||||
26,428,028 | |||||||||||
Netherlands: 1.9% | |||||||||||
ASML Holding N.V. | 3,851 | 1,839,654 | |||||||||
Koninklijke Philips N.V. | 99,926 | 2,152,467 | |||||||||
3,992,121 | |||||||||||
Norway: 2.6% | |||||||||||
Equinor ASA | 88,988 | 3,094,798 | |||||||||
Mowi ASA | 105,904 | 2,409,524 | |||||||||
5,504,322 | |||||||||||
Portugal: 2.7% | |||||||||||
Galp Energia SGPS SA | 483,524 | 5,667,540 | |||||||||
South Korea: 4.0% | |||||||||||
LG Chem Ltd. | 8,336 | 3,312,828 | |||||||||
Samsung Engineering Co. Ltd.* | 181,069 | 3,005,266 | |||||||||
SK Hynix, Inc. | 29,251 | 2,050,093 | |||||||||
8,368,187 | |||||||||||
Switzerland: 7.1% | |||||||||||
Alcon, Inc. | 45,789 | 3,198,251 | |||||||||
Barry Callebaut AG | 2,567 | 5,727,450 | |||||||||
Novartis AG | 57,564 | 4,875,137 | |||||||||
On Holding AG, Class A* | 60,100 | 1,063,169 | |||||||||
14,864,007 | |||||||||||
Taiwan: 0.8% | |||||||||||
Taiwan Semiconductor Manufacturing Co. Ltd., ADR | 20,600 | 1,684,050 | |||||||||
60
UBS International Sustainable Equity Fund
Portfolio of investments
June 30, 2022
| Number of shares | Value | ||||||||||
Common stocks—(concluded) | |||||||||||
United Kingdom: 15.5% | |||||||||||
Ashtead Group PLC | 66,620 | $ | 2,788,910 | ||||||||
AstraZeneca PLC | 44,918 | 5,905,299 | |||||||||
DCC PLC | 40,888 | 2,537,426 | |||||||||
London Stock Exchange Group PLC | 54,500 | 5,063,288 | |||||||||
Prudential PLC | 280,790 | 3,472,746 | |||||||||
RELX PLC | 94,117 | 2,550,298 | |||||||||
Sage Group PLC | 411,773 | 3,181,944 | |||||||||
Spectris PLC | 84,583 | 2,791,325 | |||||||||
Unilever PLC | 91,180 | 4,139,316 | |||||||||
32,430,552 | |||||||||||
United States: 5.1% | |||||||||||
Aon PLC, Class A | 12,807 | 3,453,792 | |||||||||
Aptiv PLC* | 19,506 | 1,737,399 | |||||||||
LivaNova PLC* | 22,899 | 1,430,500 | |||||||||
Schlumberger N.V. | 114,422 | 4,091,731 | |||||||||
10,713,422 | |||||||||||
| Total common stocks (cost $247,733,448) | 205,249,695 | ||||||||||
| Number of shares | Value | ||||||||||
Short-term investments: 0.5% | |||||||||||
Investment companies: 0.5% | |||||||||||
| State Street Institutional U.S. Government Money Market Fund, 1.430%3 (cost $993,057) | 993,057 | $ | 993,057 | ||||||||
Investment of cash collateral from securities loaned: 4.4% | |||||||||||
Money market funds: 4.4% | |||||||||||
| State Street Navigator Securities Lending Government Money Market Portfolio, 1.535%3 (cost $9,308,381) | 9,308,381 | 9,308,381 | |||||||||
| Total investments: 102.9% (cost $258,034,886) | 215,551,133 | ||||||||||
Liabilities in excess of other assets: (2.9)% | (6,111,778 | ) | |||||
Net assets: 100.0% | $ | 209,439,355 | |||||
For a listing of defined portfolio acronyms that are used throughout the Portfolio of investments as well as the tables that follow, please refer to the Glossary of terms used in the Portfolio of investments.
Fair valuation summary
The following is a summary of the fair valuations according to the inputs used as of June 30, 2022 in valuing the Fund's investments. In the event a Fund holds investments for which fair value is measured using the NAV per share practical expedient (or its equivalent), a separate column will be added to the fair value hierarchy table; this is intended to permit reconciliation to the amounts presented in the Portfolio of investments:
Description | Unadjusted quoted prices in active markets for identical investments (Level 1) | Other significant observable inputs (Level 2) | Unobservable inputs (Level 3) | Total | |||||||||||||||
Assets | |||||||||||||||||||
Common stocks | $ | 203,352,916 | $ | 1,896,779 | $ | — | $ | 205,249,695 | |||||||||||
Short-term investments | — | 993,057 | — | 993,057 | |||||||||||||||
Investment of cash collateral from securities loaned | — | 9,308,381 | — | 9,308,381 | |||||||||||||||
Total | $ | 203,352,916 | $ | 12,198,217 | $ | — | $ | 215,551,133 | |||||||||||
At June 30, 2022, there were no transfers in or out of Level 3.
Portfolio footnotes
* Non-income producing security.
1 Security, or portion thereof, was on loan at the period end.
2 Security exempt from registration pursuant to Rule 144A under the Securities Act of 1933. These securities are considered liquid, unless noted otherwise, and may be resold in transactions exempt from registration, normally to qualified institutional buyers. Securities exempt from registration pursuant to Rule 144A, in the amount of $4,716,010, represented 2.3% of the Fund's net assets at period end.
3 Rates shown reflect yield at June 30, 2022.
See accompanying notes to financial statements.
61
UBS US Dividend Ruler Fund
Portfolio performance
For the 12 months ended June 30, 2022 (the "reporting period"), Class P shares of UBS US Dividend Ruler Fund (the "Fund") returned -5.01%. For comparison purposes, the S&P 500 Index (the "Index") returned -10.62%. Please note that the Fund's returns do not reflect the deduction of taxes that a shareholder would pay on the redemption of Fund shares, while index returns do not reflect the deduction of fees and expenses.
Fund overview
The Fund's investment objective is to seek to maximize total return, consisting of capital appreciation and current income. The Fund pursues its objective by focusing on fundamentally attractive dividend-paying stocks.
Portfolio performance summary1
What worked:
• In terms of stock selection, holdings in the industrials, information technology, and consumer discretionary sectors were most additive to performance relative to the S&P 500.
• In terms of sector allocation, the portfolio's underweight to the communication services and consumer discretionary sectors as well as overweight to consumer staples were the largest contributors to relative performance.
• A number of individual holdings were beneficial for absolute performance, including:
– Energy stocks such as EOG Resources were among the strongest performers given the rapid rise in crude oil prices. EOG Resources is one of the highest-quality, low-cost exploration and production companies, with a strong track record of consistent execution and top-tier returns.
– More defensive holdings, such as leading property and casualty insurer Chubb performed well given the increased market volatility. The company's fundamentals also remain healthy, with insurance pricing trends well ahead of loss cost inflation.
– Coca-Cola stock also outperformed. Improved in-restaurant dining demand, resilient at-home consumption, and strong pricing power drove consistent and solid organic sales growth.
What didn't work:
• Stock selection within the energy and health care sectors detracted from relative performance.
• In terms of sector allocation, our overweights to industrials and financials, along with an underweight to real estate, detracted from relative performance.
• A number of individual holdings weighed on absolute performance, including:
– Comcast's shares declined given lowered expectations for broadband subscriber growth and increasing competition from telecom providers. While near-term broadband growth may slow following elevated pandemic-driven demand, we expect Comcast should benefit from further penetration of its broadband business over time, leading to improving profitability. Strong free cash flow generation also supports the company's ability to boost its share buyback program. We continue to hold the stock.
– COVID surges and hospital staffing shortages reduced elective procedure volumes and weighed on Medtronic's shares. The company also experienced temporary setbacks for two key pipeline assets and faced supply chain disruptions. A recovery in hospital procedure volumes and continued share gains in newly launched innovative products should support a rebound in the stock, in our view. We continue to hold the stock.
1 For a detailed commentary on the market environment in general during the reporting period, see page 3.
62
UBS US Dividend Ruler Fund
– JPMorgan Chase's stock fell given the deteriorating macroeconomic environment. In recent quarters, the company increased its credit reserve buildup and temporarily paused its share repurchase program. While the macroeconomic landscape is proving to be volatile and difficult, JPMorgan Chase is one of the best managed and most diversified universal banks and should withstand a downturn relatively well versus peers, in our view. We continue to hold the stock.
• The Fund did not invest in derivatives during the reporting period.
This letter is intended to assist shareholders in understanding how the Fund performed during the 12 months ended June 30, 2022. The views and opinions in the letter were current as of August 12, 2022. They are not guarantees of future performance or investment results and should not be taken as investment advice. Investment decisions reflect a variety of factors, and we reserve the right to change our views about individual securities, sectors and markets at any time. As a result, the views expressed should not be relied upon as a forecast of the Fund's future investment intent. We encourage you to consult your financial advisor regarding your personal investment program.
Mutual funds are sold by prospectus only. You should read it carefully and consider a fund's investment objectives, risks, charges, expenses and other important information contained in the prospectus before investing. Prospectuses for most of our funds can be obtained from your financial advisor, by calling UBS Funds at (800) 647-1568 or by visiting our website at www.ubs.com/am-us.
63
UBS US Dividend Ruler Fund
Average annual total returns for periods ended 06/30/22 (unaudited)
1 Year | Inception | ||||||||||
Class P1,2 | (5.01 | )% | 11.00 | % | |||||||
S&P 500 Index3 | (10.62 | ) | 11.37 | ||||||||
The annualized gross and net expense ratios, respectively, for Class P as in the October 28, 2021 prospectus were as follows: Class P—1.57% and 0.50%. Net expenses reflect fee waivers and/or expense reimbursements, if any, pursuant to an agreement that is in effect to cap the expenses. The Trust, with respect to the Fund, and UBS Asset Management (Americas) Inc., the Fund's investment advisor and administrator ("UBS AM (Americas)" or the "Advisor"), have entered into a written agreement pursuant to which the Advisor has agreed to waive a portion of its management fees and/or to reimburse expenses (excluding expenses incurred through investment in other investment companies, interest, taxes, brokerage commissions and extraordinary expenses, such as proxy-related expenses) to the extent necessary so that the Fund's ordinary operating expenses (excluding expenses incurred through investment in other investment companies, interest, taxes, brokerage commissions and extraordinary expenses, such as proxy-related expenses), through the period ending October 28, 2022, do not exceed 0.50% for Class P shares. Pursuant to the written agreement, the Advisor is entitled to be reimbursed for any fees it waives and expenses it reimburses to the extent such reimbursement can be made during the three fiscal years following the date on which such fee waivers and expense reimbursements were made, provided that the reimbursement of the Advisor by the Fund will not cause the Fund to exceed the lesser of any applicable expense limit that is in place for the Fund (i) at the time of the waiver or reimbursement or (ii) at the time of the recoupment. The fee waiver/expense reimbursement agreement may be terminated by the Fund's Board of Trustees at any time and also will terminate automatically upon the expiration or termination of the Fund's advisory contract with the Advisor. Upon termination of the fee waiver/expense reimbursement agreement, however, UBS AM (Americas)'s three year recoupment rights will survive.
1 Inception date of Class P is July 9, 2020.
2 Class P shares do not bear initial or contingent deferred sales charges or ongoing 12b-1 service and distribution fees, but Class P shares held through advisory programs may be subject to a program fee, which, if included, would have reduced performance.
3 The S&P 500 Index is an unmanaged, weighted index comprising 500 widely held common stocks varying in composition and is not available for direct investment. Investors should note that indices do not reflect the deduction of fees and expenses. Inception return for the Index is shown as of the inception date of Class P: July 9, 2020.
Past performance does not predict future performance, and the performance information provided does not reflect the deduction of taxes that a shareholder would pay on Fund distributions or the redemption of Fund shares. The return and principal value of an investment will fluctuate, so that an investor's shares, when redeemed, may be worth more or less than their original cost. Performance results assume reinvestment of all dividends and capital gain distributions at net asset value on the ex-dividend dates. Total returns for periods of less than one year have not been annualized. Current performance may be higher or lower than the performance data quoted. For month-end performance figures, please visit www.ubs.com/us-mutualfundperformance.
64
UBS US Dividend Ruler Fund
Illustration of an assumed investment of $1,000 in Class P shares (unaudited)
The following graph depicts the performance of UBS US Dividend Ruler Fund Class P shares versus the S&P 500 Index from July 9, 2020, the inception date of Class P, through June 30, 2022. Class P shares may be subject to a program fee, which, if included, would have reduced performance. The performance provided does not reflect the deduction of taxes that a shareholder would pay on Fund distributions or the redemptions of Fund shares. Past performance is no guarantee of future results. Share price and returns will vary with market conditions; investors may realize a gain or a loss upon redemption. It is important to note that UBS US Dividend Ruler Fund is a professionally managed portfolio while the Index is not available for investment and is unmanaged. The comparison is shown for illustration purposes only.
UBS US Dividend Ruler Fund Class P vs. S&P 500 Index
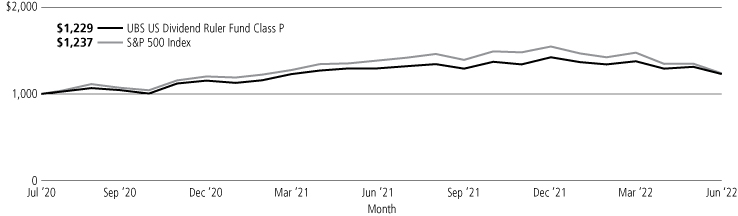
65
UBS US Dividend Ruler Fund
Portfolio statistics and industry diversification—(unaudited)1
As a percentage of net assets as of June 30, 2022
Top ten holdings
Microsoft Corp. | 8.6 | % | |||||
Johnson & Johnson | 4.3 | ||||||
Raytheon Technologies Corp. | 3.6 | ||||||
Coca-Cola Co. | 3.5 | ||||||
UnitedHealth Group, Inc. | 3.5 | ||||||
McDonald's Corp. | 3.4 | ||||||
AbbVie, Inc. | 3.2 | ||||||
Linde PLC | 3.1 | ||||||
Chubb Ltd. | 2.9 | ||||||
Broadcom, Inc. | 2.8 | ||||||
Total | 38.9 | % | |||||
Issuer breakdown by country or territory of origin
United States | 95.6 | % | |||||
United Kingdom | 5.6 | ||||||
Total | 101.2 | % | |||||
Common stocks | |||||||
Aerospace & defense | 3.6 | % | |||||
Air freight & logistics | 2.8 | ||||||
Banks | 5.0 | ||||||
Beverages | 6.0 | ||||||
Biotechnology | 5.0 | ||||||
Capital markets | 4.2 | ||||||
Chemicals | 3.1 | ||||||
Commercial services & supplies | 1.8 | ||||||
Communications equipment | 2.6 | ||||||
Consumer finance | 2.1 | ||||||
Electric utilities | 4.2 | ||||||
Health care equipment & supplies | 2.3 | ||||||
Health care providers & services | 3.5 | ||||||
Hotels, restaurants & leisure | 5.7 | ||||||
Household products | 2.8 | ||||||
Industrial conglomerates | 2.0 | ||||||
Insurance | 5.1 | ||||||
IT services | 4.7 | ||||||
Media | 1.8 | ||||||
Oil, gas & consumable fuels | 4.8 | ||||||
Pharmaceuticals | 4.3 | ||||||
Road & rail | 2.1 | ||||||
Semiconductors & semiconductor equipment | 8.1 | ||||||
Software | 8.6 | ||||||
Specialty retail | 2.5 | ||||||
Total common stocks | 98.7 | ||||||
Short-term investments | 2.5 | ||||||
Investment of cash collateral from securities loaned | 2.5 | ||||||
Total investments | 103.7 | ||||||
Liabilities in excess of other assets | (3.7 | ) | |||||
Net assets | 100.0 | % | |||||
1 The portfolio is actively managed and its composition will vary over time.
66
UBS US Dividend Ruler Fund
Portfolio of investments
June 30, 2022
| Number of shares | Value | ||||||||||
Common stocks: 98.7% | |||||||||||
Aerospace & defense: 3.6% | |||||||||||
Raytheon Technologies Corp. | 44,151 | $ | 4,243,353 | ||||||||
Air freight & logistics: 2.8% | |||||||||||
United Parcel Service, Inc., Class B | 18,161 | 3,315,109 | |||||||||
Banks: 5.0% | |||||||||||
JPMorgan Chase & Co. | 27,531 | 3,100,266 | |||||||||
Truist Financial Corp. | 61,020 | 2,894,178 | |||||||||
5,994,444 | |||||||||||
Beverages: 6.0% | |||||||||||
Coca-Cola Co. | 65,960 | 4,149,544 | |||||||||
Diageo PLC, ADR1 | 16,928 | 2,947,503 | |||||||||
7,097,047 | |||||||||||
Biotechnology: 5.0% | |||||||||||
AbbVie, Inc. | 24,954 | 3,821,955 | |||||||||
Amgen, Inc. | 8,778 | 2,135,687 | |||||||||
5,957,642 | |||||||||||
Capital markets: 4.2% | |||||||||||
BlackRock, Inc. | 4,574 | 2,785,749 | |||||||||
Morgan Stanley | 29,562 | 2,248,486 | |||||||||
5,034,235 | |||||||||||
Chemicals: 3.1% | |||||||||||
Linde PLC | 12,905 | 3,710,575 | |||||||||
Commercial services & supplies: 1.8% | |||||||||||
Republic Services, Inc. | 16,421 | 2,149,016 | |||||||||
Communications equipment: 2.6% | |||||||||||
Cisco Systems, Inc. | 72,957 | 3,110,886 | |||||||||
Consumer finance: 2.1% | |||||||||||
Discover Financial Services | 26,264 | 2,484,049 | |||||||||
Electric utilities: 4.2% | |||||||||||
American Electric Power Co., Inc. | 22,295 | 2,138,982 | |||||||||
NextEra Energy, Inc. | 36,005 | 2,788,948 | |||||||||
4,927,930 | |||||||||||
Health care equipment & supplies: 2.3% | |||||||||||
Medtronic PLC | 30,338 | 2,722,835 | |||||||||
Health care providers & services: 3.5% | |||||||||||
UnitedHealth Group, Inc. | 8,052 | 4,135,749 | |||||||||
Hotels, restaurants & leisure: 5.7% | |||||||||||
McDonald's Corp. | 16,478 | 4,068,089 | |||||||||
Starbucks Corp. | 35,849 | 2,738,505 | |||||||||
6,806,594 | |||||||||||
Household products: 2.8% | |||||||||||
Procter & Gamble Co. | 23,359 | 3,358,791 | |||||||||
Industrial conglomerates: 2.0% | |||||||||||
Honeywell International, Inc. | 13,677 | 2,377,199 | |||||||||
| Number of shares | Value | ||||||||||
Common stocks—(concluded) | |||||||||||
Insurance: 5.1% | |||||||||||
Chubb Ltd. | 17,530 | $ | 3,446,047 | ||||||||
Marsh & McLennan Cos., Inc. | 17,170 | 2,665,643 | |||||||||
6,111,690 | |||||||||||
IT services: 4.7% | |||||||||||
Accenture PLC, Class A | 10,926 | 3,033,604 | |||||||||
Automatic Data Processing, Inc. | 12,074 | 2,536,023 | |||||||||
5,569,627 | |||||||||||
Media: 1.8% | |||||||||||
Comcast Corp., Class A | 53,851 | 2,113,113 | |||||||||
Oil, gas & consumable fuels: 4.8% | |||||||||||
EOG Resources, Inc. | 28,506 | 3,148,202 | |||||||||
Phillips 66 | 31,026 | 2,543,822 | |||||||||
5,692,024 | |||||||||||
Pharmaceuticals: 4.3% | |||||||||||
Johnson & Johnson | 28,612 | 5,078,916 | |||||||||
Road & rail: 2.1% | |||||||||||
Union Pacific Corp. | 11,797 | 2,516,064 | |||||||||
Semiconductors & semiconductor equipment: 8.1% | |||||||||||
Analog Devices, Inc. | 22,358 | 3,266,280 | |||||||||
Broadcom, Inc. | 6,946 | 3,374,436 | |||||||||
Texas Instruments, Inc. | 19,099 | 2,934,562 | |||||||||
9,575,278 | |||||||||||
Software: 8.6% | |||||||||||
Microsoft Corp. | 39,847 | 10,233,905 | |||||||||
Specialty retail: 2.5% | |||||||||||
Home Depot, Inc. | 10,600 | 2,907,262 | |||||||||
Total common stocks | (cost $121,621,878) | 117,223,333 | |||||||||
Short-term investments: 2.5% | |||||||||||
Investment companies: 2.5% | |||||||||||
| State Street Institutional U.S. Government Money Market Fund, 1.430%2 (cost $2,976,106) | 2,976,106 | 2,976,106 | |||||||||
Investment of cash collateral from securities loaned: 2.5% | |||||||||||
Money market funds: 2.5% | |||||||||||
| State Street Navigator Securities Lending Government Money Market Portfolio, 1.535%2 (cost $2,995,493) | 2,995,493 | 2,995,493 | |||||||||
| Total investments: 103.7% (cost $127,593,477) | 123,194,932 | ||||||||||
Liabilities in excess of other assets: (3.7%) | (4,365,590 | ) | |||||||||
Net assets: 100.0% | $ | 118,829,342 | |||||||||
67
UBS US Dividend Ruler Fund
Portfolio of investments
June 30, 2022
For a listing of defined portfolio acronyms that are used throughout the Portfolio of investments as well as the tables that follow, please refer to the Glossary of terms used in the Portfolio of investments.
Fair valuation summary
The following is a summary of the fair valuations according to the inputs used as of June 30, 2022 in valuing the Fund's investments. In the event a Fund holds investments for which fair value is measured using the NAV per share practical expedient (or its equivalent), a separate column will be added to the fair value hierarchy table; this is intended to permit reconciliation to the amounts presented in the Portfolio of investments:
Description | Unadjusted quoted prices in active markets for identical investments (Level 1) | Other significant observable inputs (Level 2) | Unobservable inputs (Level 3) | Total | |||||||||||||||
Assets | |||||||||||||||||||
Common stocks | $ | 117,223,333 | $ | — | $ | — | $ | 117,223,333 | |||||||||||
Short-term investments | — | 2,976,106 | — | 2,976,106 | |||||||||||||||
Investment of cash collateral from securities loaned | — | 2,995,493 | — | 2,995,493 | |||||||||||||||
Total | $ | 117,223,333 | $ | 5,971,599 | $ | — | $ | 123,194,932 | |||||||||||
At June 30, 2022, there were no transfers in or out of Level 3.
Portfolio footnotes
1 Security, or portion thereof, was on loan at the period end.
2 Rates shown reflect yield at June 30, 2022.
See accompanying notes to financial statements.
68
UBS US Quality Growth At Reasonable Price Fund
Portfolio performance
For the 12 months ended June 30, 2022 (the "reporting period"), Class P shares of UBS US Quality Growth At Reasonable Price Fund (the "Fund") returned -16.06%. For comparison purposes, the Russell 1000 Growth Index (the "Index") returned -18.77%. Please note that the Fund's returns do not reflect the deduction of taxes that a shareholder would pay on the redemption of Fund shares, while index returns do not reflect the deduction of fees and expenses.
Fund overview
The Fund's investment objective is to seek to provide capital appreciation. To achieve its investment objective, the Fund invests in, or seeks exposure to, stocks with attractive growth, quality, and valuation profiles.
Portfolio performance summary1
What worked:
• Stock selection within the consumer discretionary, communication services, and information technology sectors were meaningful contributors to performance relative to the Russell 1000 Growth Index.
• Within sectors, our overweight allocations to financials and health care were modest contributors to relative performance.
• A number of individual holdings were beneficial for absolute performance, including:
– Amidst a volatile market environment, defensive stocks such as UnitedHealth Group outperformed. The company's fundamentals remain solid, supported by benign medical costs trends and continued growth in their diversified Optum line of businesses.
– O'Reilly Automotive's shares were also resilient, benefiting from increased professional automotive repair demand as consumers returned to more normal driving activity.
– Costco Wholesale's stock was a solid outperformer. The company's value proposition for consumers amid rising inflation drove consistent sales growth and record-levels of membership retention.
What didn't work:
• Stock selection in the consumer staples sector was a modest detractor from relative performance.
• In terms of sector allocation, overweights to communication services and consumer discretionary, coupled with underweights to consumer staples, energy, and information technology, detracted from relative performance.
• A number of individual holdings weighed on absolute performance, including:
– Amazon.com's shares declined due to fears of consumer weakness and higher-than-expected costs (shipping, labor, warehousing) weighing on quarterly earnings results and forward-looking guidance. While these issues may linger in the near-term, we remain positive on the company's long-term prospects. Amazon.com remains the market leader in e-commerce and cloud computing—two significant secular growth drivers. We continue to hold the stock.
– Meta Platforms stock weakened in 2022 after reporting poor quarterly earnings results. Apple's privacy restriction changes, monetization headwinds to Meta's short-form video product, and decelerating/declining digital advertising budgets weighed on their results. We removed Meta Platforms from the portfolio in June 2022.
1 For a detailed commentary on the market environment in general during the reporting period, see page 3.
69
UBS US Quality Growth At Reasonable Price Fund
– Alphabet's shares outpaced the benchmark, supported by strong results across its Search and Cloud businesses. However, given our overweight to Alphabet and the negative absolute return posted by the stock, the position was a detractor from absolute performance. We continue to hold the stock.
• The Fund did not invest in derivatives during the reporting period.
This letter is intended to assist shareholders in understanding how the Fund performed during the 12 months ended June 30, 2022. The views and opinions in the letter were current as of August 12, 2022. They are not guarantees of future performance or investment results and should not be taken as investment advice. Investment decisions reflect a variety of factors, and we reserve the right to change our views about individual securities, sectors and markets at any time. As a result, the views expressed should not be relied upon as a forecast of the Fund's future investment intent. We encourage you to consult your financial advisor regarding your personal investment program.
Mutual funds are sold by prospectus only. You should read it carefully and consider a fund's investment objectives, risks, charges, expenses and other important information contained in the prospectus before investing. Prospectuses for most of our funds can be obtained from your financial advisor, by calling UBS Funds at (800) 647-1568 or by visiting our website at www.ubs.com/am-us.
70
UBS US Quality Growth At Reasonable Price Fund
Average annual total returns for periods ended 06/30/22 (unaudited)
1 Year | Inception | ||||||||||
Class P1,2 | (16.06 | )% | 5.12 | % | |||||||
Russell 1000 Growth3 | (18.77 | ) | 5.06 | ||||||||
The annualized gross and net expense ratios, respectively, for Class P as in the October 28, 2021 prospectus were as follows: Class P—1.23% and 0.50%. Net expenses reflect fee waivers and/or expense reimbursements, if any, pursuant to an agreement that is in effect to cap the expenses. The Trust, with respect to the Fund, and UBS Asset Management (Americas) Inc., the Fund's investment advisor and administrator ("UBS AM (Americas)" or the "Advisor"), have entered into a written agreement pursuant to which the Advisor has agreed to waive a portion of its management fees and/or to reimburse expenses (excluding expenses incurred through investment in other investment companies, interest, taxes, brokerage commissions and extraordinary expenses) to the extent necessary so that the Fund's ordinary operating expenses (excluding expenses incurred through investment in other investment companies, interest, taxes, brokerage commissions and extraordinary expenses, such as proxy-related expenses), through the period ending October 28, 2022, do not exceed 0.50% for Class P shares. Pursuant to the written agreement, the Advisor is entitled to be reimbursed for any fees it waives and expenses it reimburses to the extent such reimbursement can be made during the three fiscal years following the date on which such fee waivers and expense reimbursements were made, provided that the reimbursement of the Advisor by the Fund will not cause the Fund to exceed the lesser of any applicable expense limit that is in place for the Fund (i) at the time of the waiver or reimbursement or (ii) at the time of the recoupment. The fee waiver/expense reimbursement agreement may be terminated by the Fund's Board of Trustees at any time and also will terminate automatically upon the expiration or termination of the Fund's advisory contract with the Advisor. Upon termination of the fee waiver/expense reimbursement agreement, however, UBS AM (Americas)'s three year recoupment rights will survive.
1 Inception date of Class P is July 9, 2020.
2 Class P shares do not bear initial or contingent deferred sales charges or ongoing 12b-1 service and distribution fees, but Class P shares held through advisory programs may be subject to a program fee, which, if included, would have reduced performance.
3 Russell 1000 Growth Index measures the performance of those Russell 1000 companies with higher price-to-book ratios and higher forecasted growth values. The index was developed with a base value of 200 as of August 31, 1992. Inception return for the Index is shown as of the inception date of Class P: July 9, 2020.
Past performance does not predict future performance, and the performance information provided does not reflect the deduction of taxes that a shareholder would pay on Fund distributions or the redemption of Fund shares. The return and principal value of an investment will fluctuate, so that an investor's shares, when redeemed, may be worth more or less than their original cost. Performance results assume reinvestment of all dividends and capital gain distributions at net asset value on the ex-dividend dates. Total returns for periods of less than one year have not been annualized. Current performance may be higher or lower than the performance data quoted. For month-end performance figures, please visit www.ubs.com/us-mutualfundperformance.
71
UBS US Quality Growth At Reasonable Price Fund
Illustration of an assumed investment of $1,000 in Class P shares (unaudited)
The following graph depicts the performance of UBS US Quality Growth At Reasonable Price Fund Class P shares versus the Russell 1000 Growth Index from July 9, 2020, the inception date of Class P, through June 30, 2022. Class P shares may be subject to a program fee, which, if included, would have reduced performance. The performance provided does not reflect the deduction of taxes that a shareholder would pay on Fund distributions or the redemptions of Fund shares. Past performance is no guarantee of future results. Share price and returns will vary with market conditions; investors may realize a gain or a loss upon redemption. It is important to note that UBS US Quality Growth At Reasonable Price Fund is a professionally managed portfolio while the Index is not available for investment and is unmanaged. The comparison is shown for illustration purposes only.
UBS US Quality Growth At Reasonable Price Fund Class P vs. Russell 1000 Growth Index

72
UBS US Quality Growth At Reasonable Price Fund
Portfolio statistics and industry diversification—(unaudited)1
As a percentage of net assets as of June 30, 2022
Top ten holdings
Microsoft Corp. | 13.4 | % | |||||
Alphabet, Inc., Class A | 9.2 | ||||||
Amazon.com, Inc. | 7.3 | ||||||
Apple, Inc. | 6.7 | ||||||
Visa, Inc., Class A | 4.6 | ||||||
UnitedHealth Group, Inc. | 3.8 | ||||||
Adobe, Inc. | 2.8 | ||||||
Salesforce, Inc. | 2.7 | ||||||
Abbott Laboratories | 2.5 | ||||||
American Tower Corp. | 2.3 | ||||||
Total | 55.3 | % | |||||
Issuer breakdown by country or territory of origin
United States | 100.0 | % | |||||
Common stocks | |||||||
Capital markets | 4.8 | % | |||||
Chemicals | 1.7 | ||||||
Electrical equipment | 0.8 | ||||||
Equity real estate investment trusts | 2.3 | ||||||
Food & staples retailing | 1.7 | ||||||
Health care equipment & supplies | 6.6 | ||||||
Health care providers & services | 3.8 | ||||||
Hotels, restaurants & leisure | 1.3 | ||||||
Industrial conglomerates | 1.9 | ||||||
Interactive media & services | 9.2 | ||||||
Internet & direct marketing retail | 7.3 | ||||||
IT services | 6.6 | ||||||
Life sciences tools & services | 3.0 | ||||||
Machinery | 1.5 | ||||||
Multiline retail | 1.5 | ||||||
Personal products | 1.6 | ||||||
Road & rail | 2.1 | ||||||
Semiconductors & semiconductor equipment | 4.4 | ||||||
Software | 19.9 | ||||||
Specialty retail | 7.3 | ||||||
Technology hardware, storage & peripherals | 6.7 | ||||||
Textiles, apparel & luxury goods | 1.8 | ||||||
Total common stocks | 97.8 | ||||||
Short-term investments | 2.2 | ||||||
Total investments | 100.0 | ||||||
Other assets in excess of liabilities | 0.0 | † | |||||
Net assets | 100.0 | % | |||||
1 The portfolio is actively managed and its composition will vary over time.
† Amount represents less than 0.05% or (0.05)%.
73
UBS US Quality Growth At Reasonable Price Fund
Portfolio of investments
June 30, 2022
| Number of shares | Value | ||||||||||
Common stocks: 97.8% | |||||||||||
Capital markets: 4.8% | |||||||||||
Ameriprise Financial, Inc. | 13,489 | $ | 3,206,065 | ||||||||
Intercontinental Exchange, Inc. | 20,201 | 1,899,702 | |||||||||
S&P Global, Inc. | 8,646 | 2,914,221 | |||||||||
8,019,988 | |||||||||||
Chemicals: 1.7% | |||||||||||
Sherwin-Williams Co. | 12,435 | 2,784,321 | |||||||||
Electrical equipment: 0.8% | |||||||||||
Rockwell Automation, Inc. | 6,757 | 1,346,738 | |||||||||
Equity real estate investment trusts: 2.3% | |||||||||||
American Tower Corp. | 15,110 | 3,861,965 | |||||||||
Food & staples retailing: 1.7% | |||||||||||
Costco Wholesale Corp. | 5,871 | 2,813,853 | |||||||||
Health care equipment & supplies: 6.6% | |||||||||||
Abbott Laboratories | 38,842 | 4,220,183 | |||||||||
Boston Scientific Corp.* | 103,515 | 3,858,004 | |||||||||
Intuitive Surgical, Inc.* | 14,515 | 2,913,306 | |||||||||
10,991,493 | |||||||||||
Health care providers & services: 3.8% | |||||||||||
UnitedHealth Group, Inc. | 12,227 | 6,280,154 | |||||||||
Hotels, restaurants & leisure: 1.3% | |||||||||||
Booking Holdings, Inc.* | 1,241 | 2,170,497 | |||||||||
Industrial conglomerates: 1.9% | |||||||||||
Honeywell International, Inc. | 18,393 | 3,196,887 | |||||||||
Interactive media & services: 9.2% | |||||||||||
Alphabet, Inc., Class A* | 7,078 | 15,424,802 | |||||||||
Internet & direct marketing retail: 7.3% | |||||||||||
Amazon.com, Inc.* | 114,869 | 12,200,236 | |||||||||
IT services: 6.6% | |||||||||||
Fidelity National Information Services, Inc. | 37,228 | 3,412,691 | |||||||||
Visa, Inc., Class A | 38,946 | 7,668,078 | |||||||||
11,080,769 | |||||||||||
Life sciences tools & services: 3.0% | |||||||||||
Danaher Corp. | 10,855 | 2,751,960 | |||||||||
Thermo Fisher Scientific, Inc. | 4,122 | 2,239,400 | |||||||||
4,991,360 | |||||||||||
Machinery: 1.5% | |||||||||||
Parker-Hannifin Corp. | 10,454 | 2,572,207 | |||||||||
| Number of shares | Value | ||||||||||
Common stocks—(concluded) | |||||||||||
Multiline retail: 1.5% | |||||||||||
Dollar General Corp. | 10,026 | $ | 2,460,781 | ||||||||
Personal products: 1.6% | |||||||||||
Estee Lauder Cos., Inc., Class A | 10,175 | 2,591,267 | |||||||||
Road & rail: 2.1% | |||||||||||
Union Pacific Corp. | 16,224 | 3,460,255 | |||||||||
Semiconductors & semiconductor equipment: 4.4% | |||||||||||
Applied Materials, Inc. | 42,026 | 3,823,525 | |||||||||
Texas Instruments, Inc. | 23,152 | 3,557,305 | |||||||||
7,380,830 | |||||||||||
Software: 19.9% | |||||||||||
Adobe, Inc.* | 12,756 | 4,669,461 | |||||||||
Microsoft Corp. | 87,421 | 22,452,336 | |||||||||
Palo Alto Networks, Inc.* | 3,445 | 1,701,623 | |||||||||
Salesforce, Inc.* | 27,165 | 4,483,312 | |||||||||
33,306,732 | |||||||||||
Specialty retail: 7.3% | |||||||||||
Home Depot, Inc. | 11,313 | 3,102,816 | |||||||||
Lowe's Cos., Inc. | 15,892 | 2,775,856 | |||||||||
O'Reilly Automotive, Inc.* | 4,664 | 2,946,529 | |||||||||
TJX Cos., Inc. | 61,154 | 3,415,451 | |||||||||
12,240,652 | |||||||||||
Technology hardware, storage & peripherals: 6.7% | |||||||||||
Apple, Inc. | 82,266 | 11,247,407 | |||||||||
Textiles, apparel & luxury goods: 1.8% | |||||||||||
Nike, Inc., Class B | 28,548 | 2,917,606 | |||||||||
| Total common stocks (cost $185,977,219) | 163,340,800 | ||||||||||
Short-term investments: 2.2% | |||||||||||
Investment companies: 2.2% | |||||||||||
| State Street Institutional U.S. Government Money Market Fund, 1.430%1 (cost $3,629,885) | 3,629,885 | 3,629,885 | |||||||||
| Total investments: 100.0% (cost $189,607,104) | 166,970,685 | ||||||||||
Other assets in excess of liabilities: 0.0%† | 8,733 | ||||||||||
Net assets: 100.0% | $ | 166,979,418 | |||||||||
For a listing of defined portfolio acronyms that are used throughout the Portfolio of investments as well as the tables that follow, please refer to the Glossary of terms used in the Portfolio of investments.
74
UBS US Quality Growth At Reasonable Price Fund
Portfolio of investments
June 30, 2022
Fair valuation summary
The following is a summary of the fair valuations according to the inputs used as of June 30, 2022 in valuing the Fund's investments. In the event a Fund holds investments for which fair value is measured using the NAV per share practical expedient (or its equivalent), a separate column will be added to the fair value hierarchy table; this is intended to permit reconciliation to the amounts presented in the Portfolio of investments:
Description | Unadjusted quoted prices in active markets for identical investments (Level 1) | Other significant observable inputs (Level 2) | Unobservable inputs (Level 3) | Total | |||||||||||||||
Assets | |||||||||||||||||||
Common stocks | $ | 163,340,800 | $ | — | $ | — | $ | 163,340,800 | |||||||||||
Short-term investments | — | 3,629,885 | — | 3,629,885 | |||||||||||||||
Total | $ | 163,340,800 | $ | 3,629,885 | $ | — | $ | 166,970,685 | |||||||||||
At June 30, 2022, there were no transfers in or out of Level 3.
Portfolio footnotes
* Non-income producing security.
† Amount represents less than 0.05% or (0.05)%.
1 Rates shown reflect yield at June 30, 2022.
See accompanying notes to financial statements.
75
UBS U.S. Small Cap Growth Fund
Portfolio performance
For the 12 months ended June 30, 2022, Class A shares of UBS U.S. Small Cap Growth Fund (the "Fund") returned -33.31% (Class A shares returned -36.98% after the deduction of the maximum sales charge), while Class P shares returned -33.13%. The Fund's benchmark, the Russell 2000 Growth Index (the "Index"), returned -33.43% over the same time period. (Class P shares have lower expenses than other share classes of the Fund. Returns for all share classes over various time periods are shown on page 79; please note that the Fund's returns do not reflect the deduction of taxes that a shareholder would pay on Fund distributions or the redemption of Fund shares, while the Index returns do not reflect the deduction of fees and expenses.)
The Fund's performance was driven primarily by stock selection decisions.
Portfolio performance summary1
What worked:
• Within stock selection, Chesapeake Energy was the top contributor to Fund performance for the 12 months ended June 30, 2022.
– Chesapeake Energy is an exploration and production company primarily focused on the Appalachian Basin in northeast Pennsylvania, the Haynesville shale in northwest Louisiana, and the Eagle Ford shale in Texas. Rising energy prices and optimism around the company's capital return policy contributed to returns during the reporting period.
• Several other stock selection decisions benefited performance during the 12-month period.
– Chart Industries is a leading provider of technology, equipment and services related to liquefied natural gas (LNG), hydrogen, biogas, and carbon dioxide capture, among other applications. The stock benefited from early momentum in large LNG projects that the company was preparing, including initial orders for the Plaquemines development. Further, global demand for Chart's offerings could further accelerate as Western Europe seeks to reduce its dependence on Russia for energy following their invasion of Ukraine. (For details, see "Portfolio highlights.")
– Boise Cascade is an integrated wood products manufacturer and building materials distributor. The stock outperformed as the company delivered strong quarterly earnings driven by rising commodity prices and widening profit margins.
– Herc is an equipment rental company to a variety of industrial markets. The stock benefitted after the company revealed a three-year growth plan at its analyst day that included sales, earnings before interest, taxes, depreciation, and amortization (EBITDA), and net capital expenditure (capex) estimates that were above consensus expectations.
– Jack Henry & Associates provides a wide array of products and services that allow financial institutions and corporate entities to process transactions, automate business processes and manage information. The company outperformed during the 12-month period as investor preferences shifted away from higher growth companies to ones with more modest growth expectations and lower valuations. (For details, see "Portfolio highlights.")
• Within sector allocation, the Fund's overweight position to industrials and cash position contributed positively to returns over the 12 months.
1 For a detailed commentary on the market environment in general during the reporting period, see page 3.
76
UBS U.S. Small Cap Growth Fund
What didn't work:
• Certain stock selection decisions made a negative contribution to Fund returns during the reporting period.
– Chegg is a provider of an online education platform. The stock underperformed after the company provided guidance that was materially lower than expectations. Management attributed the guidance cut to enrollment weakness, in particular at community colleges, as students were choosing to work in light of the higher wages they were able to realize in the workplace. We sold the stock during the reporting period.
– Shift4 Payments provides integrated payment processing and technology solutions for merchants. The stock price underperformed due to concerns that a potential recession, combined with high inflation, might negatively impact the company's customers in the hospitality industry. We continue to hold this stock.
– Magnite provides a technology solution to automate the purchase and sale of digital advertising inventory for buyers and sellers. The stock underperformed during the reporting period as macroeconomic headwinds emerged and impacted demand trends in several of the company's end markets. We continue to hold this stock.
– Universal Display is a leader in the research, development and commercialization of organic light-emitting diode technologies and materials. Investors grew concerned that recent COVID-related lockdowns in China would impact demand, as factories were temporarily shut down. We continue to hold this stock.
– Aspen Aerogels is an aerogel technology company that designs, develops and manufactures innovative, high-performance aerogel materials used primarily in the energy infrastructure, building materials, and electric vehicle (EV) markets. Despite reporting better-than-expected quarterly sales, investors grew concerned that margins will be pressured for the next several quarters as new capacity is built out. Aspen also came under pressure after the company announced plans to raise additional capital designed to fund growth, and then pulled the offering from the market citing adverse market conditions. We continue to hold this stock.
• Within sector allocation, The Fund's underweight positions to consumer staples and energy detracted from relative returns for the 12-month period.
• The Fund did not invest in derivatives during the reporting period.
Portfolio highlights
Performance Food markets and distributes food and food-related products. The company operates in the United States, offering foods such as meats, fruits, vegetables, and desserts, as well as paper products, including pizza boxes, disposable napkins, plates, and cups. We believe the company has an opportunity to grow sales both organically and through mergers and acquisitions as it consolidates smaller companies in the industry.
Chart Industries is a leading manufacturer and provider of cryogenic equipment used to produce, distribute and store liquefied natural gas (LNG). The company offers turnkey LNG solutions with a global geographic footprint and is expected to continue to benefit from the energy transition to natural gas and away from coal for power generation. The company has multiple growth drivers including large scale LNG projects, uptake of its hydrogen-related equipment and infrastructure, and accelerating growth in its aftermarket Repair, Service & Leasing and Specialty Products businesses.
Ryman Hospitality Properties specializes in group-oriented and destination hotel assets in urban and resort markets. We believe the company should benefit from increased demand for corporate meetings and events after several years of limited activity during the early stages of the COVID-19 pandemic. Additionally, the company has been making investments in its existing properties to increase the number of rooms available, which can help drive growth over time.
77
UBS U.S. Small Cap Growth Fund
Pure Storage is a leading provider of flash storage arrays for high performance workloads, including server consolidation, desktop virtualization, database and cloud computing. We believe the company is positioned to continue to gain share in the enterprise all-flash array market. The company is also seeking to enable hyperscalers' ambitions and has a partnership with Meta to power its AI/Metaverse ambitions.
Jack Henry & Associates provides core data processing services and ancillary products to banks and credit unions in the US. Jack Henry has been gaining market share and sees a doubling of revenues when existing customers move from on-premises to cloud computing. The company operates a highly recurring business model, with cloud clients signing contracts of seven years or longer. We believe Jack Henry should continue to grow by cross-selling new and existing products to financial institutions who are already customers, gaining new core customers, providing complementary products and services to financial institutions, and through acquisitions.
This letter is intended to assist shareholders in understanding how the Fund performed during the 12 months ended June 30, 2022. The views and opinions in the letter were current as of August 12, 2022. They are not guarantees of future performance or investment results and should not be taken as investment advice. Investment decisions reflect a variety of factors, and we reserve the right to change our views about individual securities, sectors and markets at any time. As a result, the views expressed should not be relied upon as a forecast of the Fund's future investment intent. We encourage you to consult your financial advisor regarding your personal investment program.
Mutual funds are sold by prospectus only. You should read it carefully and consider a fund's investment objectives, risks, charges, expenses and other important information contained in the prospectus before investing. Prospectuses for most of our funds can be obtained from your financial advisor, by calling UBS Funds at 800-647 1568 or by visiting our website at www.ubs.com/am-us.
78
UBS U.S. Small Cap Growth Fund
Average annual total returns for periods ended 06/30/22 (unaudited)
1 year | 5 years | 10 years | |||||||||||||
Before deducting maximum sales charge | |||||||||||||||
Class A1 | (33.31 | )% | 9.29 | % | 11.14 | % | |||||||||
Class P2 | (33.13 | ) | 9.57 | 11.44 | |||||||||||
After deducting maximum sales charge | |||||||||||||||
Class A1 | (36.98 | )% | 8.05 | % | 10.52 | % | |||||||||
Russell 2000 Growth Index3 | (33.43 | ) | 4.80 | 9.30 | |||||||||||
The annualized gross and net expense ratios, respectively, for each class of shares as in the October 28, 2021 prospectuses were as follows: Class A—1.44% and 1.25%; Class P—1.17% and 1.00%. Net expenses reflect fee waivers and/or expense reimbursements, if any, pursuant to an agreement that is in effect to cap the expenses. The Trust, with respect to the Fund, and UBS Asset Management (Americas) Inc. the Fund's investment advisor and administrator ("UBS AM (Americas)" or the "Advisor"), have entered into a written agreement pursuant to which the Advisor has agreed to waive a portion of its management fees and/or to reimburse expenses (excluding expenses incurred through investment in other investment companies, interest, taxes, brokerage commissions, extraordinary expenses, and dividend expense and security loan fees for securities sold short) to the extent necessary so that the Fund's ordinary operating expenses (excluding expenses incurred through investment in other investment companies, interest, taxes, brokerage commissions, dividend expense and security loan fees for securities sold short and extraordinary expenses, such as proxy-related expenses), through the period ending October 28, 2022, do not exceed 1.24% for Class A shares and 0.99% for Class P shares. Pursuant to the written agreement, the Advisor is entitled to be reimbursed for any fees it waives and expenses it reimburses to the extent such reimbursement can be made during the three fiscal years following the date on which such fee waivers and expense reimbursements were made, provided that the reimbursement of the Advisor by the Fund will not cause the Fund to exceed the lesser of any applicable expense limit that is in place for the Fund (i) at the time of the waiver or reimbursement or (ii) at the time of the recoupment. The fee waiver/expense reimbursement agreement may be terminated by the Fund's Board of Trustees at any time and also will terminate automatically upon the expiration or termination of the Fund's advisory contract with the Advisor. Upon termination of the fee waiver/expense reimbursement agreement, however, UBS AM (Americas)'s three year recoupment rights will survive.
1 Maximum sales charge for Class A shares is 5.5%. Class A shares bear ongoing 12b-1 service fees.
2 Class P shares do not bear initial or contingent deferred sales charges or ongoing 12b-1 service and distribution fees, but Class P shares held through advisory programs may be subject to a program fee, which, if included, would have reduced performance.
3 The Russell 2000 Growth Index measures the performance of the small-cap growth segment of the US equity universe. It includes those Russell 2000 Index companies with higher price-to-book ratios and higher forecasted growth values. The Russell 2000 Growth Index is constructed to provide a comprehensive and unbiased barometer for the small-cap growth segment. The Index is completely reconstituted annually to ensure larger stocks do not distort the performance and characteristics of the true small-cap opportunity set and that the represented companies continue to reflect growth characteristics. Investors should note that indices do not reflect the deduction of fees and expenses.
The Fund invests in IPOs which may have a magnified impact on performance.
Past performance does not predict future performance, and the performance information provided does not reflect the deduction of taxes that a shareholder would pay on Fund distributions or the redemption of Fund shares. The return and principal value of an investment will fluctuate, so that an investor's shares, when redeemed, may be worth more or less than their original cost. Performance results assume reinvestment of all dividends and capital gain distributions at net asset value on the ex-dividend dates. Total returns for periods of less than one year have not been annualized. Current performance may be higher or lower than the performance data quoted. For month-end performance figures, please visit www.ubs.com/us-mutualfundperformance.
79
UBS U.S. Small Cap Growth Fund
Illustration of an assumed investment of $10,000 in Class A shares (adjusted for 5.5% maximum sales charge) and $2,000,000 in Class P shares (unaudited)
The following graphs depict the performance of UBS U.S. Small Cap Growth Fund Class A and Class P shares versus the Russell 2000 Growth Index over the 10 years ended June 30, 2022. Class P shares may be subject to a program fee, which, if included, would have reduced performance. The performance provided does not reflect the deduction of taxes that a shareholder would pay on Fund distributions or the redemptions of Fund shares. Past performance is no guarantee of future results. Share price and returns will vary with market conditions; investors may realize a gain or a loss upon redemption. It is important to note that UBS U.S. Small Cap Growth Fund is a professionally managed portfolio while the Index is not available for investment and is unmanaged. The comparison is shown for illustration purposes only.
UBS U.S. Small Cap Growth Fund Class A vs. Russell 2000 Growth Index

UBS U.S. Small Cap Growth Fund Class P vs. Russell 2000 Growth Index

80
UBS U.S. Small Cap Growth Fund
Portfolio statistics and industry diversification—(unaudited)1
As a percentage of net assets as of June 30, 2022
Top ten holdings
Chart Industries, Inc. | 3.1 | % | |||||
Performance Food Group Co. | 2.6 | ||||||
Ryman Hospitality Properties, Inc. | 2.4 | ||||||
Pure Storage, Inc., Class A | 2.1 | ||||||
Jack Henry & Associates, Inc. | 2.1 | ||||||
Medpace Holdings, Inc. | 1.9 | ||||||
Azenta, Inc. | 1.8 | ||||||
Tenable Holdings, Inc. | 1.7 | ||||||
Visteon Corp. | 1.7 | ||||||
R1 RCM, Inc. | 1.7 | ||||||
Total | 21.1 | % | |||||
Top five issuer breakdown by country or territory of origin
United States | 94.2 | % | |||||
Netherlands | 0.9 | ||||||
Switzerland | 0.3 | ||||||
Israel | 0.3 | ||||||
Canada | 0.2 | ||||||
Total | 95.9 | % | |||||
Common stocks | |||||||
Air freight & logistics | 1.6 | % | |||||
Auto components | 1.7 | ||||||
Banks | 6.2 | ||||||
Beverages | 0.9 | ||||||
Biotechnology | 6.9 | ||||||
Building products | 1.2 | ||||||
Chemicals | 0.4 | ||||||
Construction & engineering | 2.8 | ||||||
Electrical equipment | 2.1 | ||||||
Equity real estate investment trusts | 2.4 | ||||||
Food & staples retailing | 2.6 | ||||||
Health care equipment & supplies | 5.3 | ||||||
Health care providers & services | 4.6 | ||||||
Hotels, restaurants & leisure | 7.3 | ||||||
Household durables | 0.9 | ||||||
IT services | 4.8 | ||||||
Life sciences tools & services | 6.0 | ||||||
Machinery | 5.2 | ||||||
Media | 0.6 | ||||||
Multiline retail | 1.3 | ||||||
Oil, gas & consumable fuels | 3.9 | ||||||
Pharmaceuticals | 1.0 | ||||||
Professional services | 2.0 | ||||||
Semiconductors & semiconductor equipment | 4.5 | ||||||
Software | 11.4 | ||||||
Specialty retail | 1.8 | ||||||
Technology hardware, storage & peripherals | 2.1 | ||||||
Textiles, apparel & luxury goods | 1.3 | ||||||
Thrifts & mortgage finance | 0.7 | ||||||
Trading companies & distributors | 2.5 | ||||||
Total common stocks | 96.0 | ||||||
Short-term investments | 3.8 | ||||||
Investment of cash collateral from securities loaned | 5.2 | ||||||
Total investments | 105.0 | ||||||
Liabilities in excess of other assets | (5.0 | ) | |||||
Net assets | 100.0 | % | |||||
1 The portfolio is actively managed and its composition will vary over time.
81
UBS U.S. Small Cap Growth Fund
Portfolio of investments
June 30, 2022
| Number of shares | Value | ||||||||||
Common stocks: 96.0% | |||||||||||
Air freight & logistics: 1.6% | |||||||||||
Forward Air Corp. | 22,297 | $ | 2,050,432 | ||||||||
Auto components: 1.7% | |||||||||||
Visteon Corp.* | 21,585 | 2,235,774 | |||||||||
Banks: 6.2% | |||||||||||
First Bancorp/Southern Pines NC | 54,105 | 1,888,265 | |||||||||
National Bank Holdings Corp., Class A | 35,430 | 1,355,906 | |||||||||
Texas Capital Bancshares, Inc.* | 23,264 | 1,224,617 | |||||||||
Veritex Holdings, Inc. | 60,466 | 1,769,235 | |||||||||
Webster Financial Corp. | 40,113 | 1,690,763 | |||||||||
7,928,786 | |||||||||||
Beverages: 0.9% | |||||||||||
Duckhorn Portfolio, Inc.*,1 | 57,219 | 1,205,032 | |||||||||
Biotechnology: 6.9% | |||||||||||
Allogene Therapeutics, Inc.*,1 | 41,403 | 471,994 | |||||||||
Argenx SE, ADR* | 3,016 | 1,142,702 | |||||||||
CRISPR Therapeutics AG*,1 | 6,565 | 398,955 | |||||||||
Fate Therapeutics, Inc.*,1 | 13,652 | 338,297 | |||||||||
IGM Biosciences, Inc.*,1 | 18,697 | 337,107 | |||||||||
Insmed, Inc.*,1 | 46,250 | 912,050 | |||||||||
Instil Bio, Inc.*,1 | 32,004 | 147,858 | |||||||||
Intellia Therapeutics, Inc.* | 11,302 | 584,991 | |||||||||
Kura Oncology, Inc.* | 46,081 | 844,665 | |||||||||
Kymera Therapeutics, Inc.*,1 | 25,728 | 506,584 | |||||||||
MeiraGTx Holdings PLC* | 41,126 | 311,324 | |||||||||
Nurix Therapeutics, Inc.* | 37,771 | 478,559 | |||||||||
PMV Pharmaceuticals, Inc.*,1 | 24,591 | 350,422 | |||||||||
Relay Therapeutics, Inc.*,1 | 22,665 | 379,639 | |||||||||
Repare Therapeutics, Inc.* | 22,076 | 308,843 | |||||||||
Xencor, Inc.* | 29,876 | 817,706 | |||||||||
Zentalis Pharmaceuticals, Inc.* | 16,589 | 466,151 | |||||||||
8,797,847 | |||||||||||
Building products: 1.2% | |||||||||||
Simpson Manufacturing Co., Inc. | 15,037 | 1,512,873 | |||||||||
Chemicals: 0.4% | |||||||||||
Aspen Aerogels, Inc.* | 50,404 | 497,992 | |||||||||
Construction & engineering: 2.8% | |||||||||||
Ameresco, Inc., Class A* | 37,343 | 1,701,347 | |||||||||
MasTec, Inc.* | 26,013 | 1,864,092 | |||||||||
3,565,439 | |||||||||||
Electrical equipment: 2.1% | |||||||||||
Regal Rexnord Corp. | 18,588 | 2,110,110 | |||||||||
Shoals Technologies Group, Inc., Class A* | 35,678 | 587,973 | |||||||||
2,698,083 | |||||||||||
Equity real estate investment trusts: 2.4% | |||||||||||
Ryman Hospitality Properties, Inc.* | 40,767 | 3,099,515 | |||||||||
| Number of shares | Value | ||||||||||
Common stocks—(continued) | |||||||||||
Food & staples retailing: 2.6% | |||||||||||
Performance Food Group Co.* | 73,445 | $ | 3,377,001 | ||||||||
Health care equipment & supplies: 5.3% | |||||||||||
AtriCure, Inc.* | 38,170 | 1,559,626 | |||||||||
Inspire Medical Systems, Inc.* | 10,243 | 1,871,089 | |||||||||
Silk Road Medical, Inc.* | 34,985 | 1,273,104 | |||||||||
STAAR Surgical Co.* | 28,023 | 1,987,672 | |||||||||
6,691,491 | |||||||||||
Health care providers & services: 4.6% | |||||||||||
Castle Biosciences, Inc.* | 22,173 | 486,697 | |||||||||
LHC Group, Inc.* | 11,005 | 1,713,919 | |||||||||
R1 RCM, Inc.* | 105,078 | 2,202,435 | |||||||||
Surgery Partners, Inc.* | 52,769 | 1,526,079 | |||||||||
5,929,130 | |||||||||||
Hotels, restaurants & leisure: 7.3% | |||||||||||
Bloomin' Brands, Inc. | 87,773 | 1,458,787 | |||||||||
Churchill Downs, Inc. | 8,772 | 1,680,101 | |||||||||
Dave & Buster's Entertainment, Inc.* | 37,551 | 1,230,922 | |||||||||
Planet Fitness, Inc., Class A* | 28,100 | 1,911,081 | |||||||||
Six Flags Entertainment Corp.* | 65,143 | 1,413,603 | |||||||||
Sweetgreen, Inc., Class A*,1 | 5,600 | 65,240 | |||||||||
Wyndham Hotels & Resorts, Inc. | 24,490 | 1,609,483 | |||||||||
9,369,217 | |||||||||||
Household durables: 0.9% | |||||||||||
TopBuild Corp.* | 7,063 | 1,180,651 | |||||||||
IT services: 4.8% | |||||||||||
DigitalOcean Holdings, Inc.* | 43,095 | 1,782,409 | |||||||||
Jack Henry & Associates, Inc. | 14,831 | 2,669,877 | |||||||||
Shift4 Payments, Inc., Class A*,1 | 41,877 | 1,384,454 | |||||||||
Wix.com Ltd.* | 5,812 | 380,976 | |||||||||
6,217,716 | |||||||||||
Life sciences tools & services: 6.0% | |||||||||||
Azenta, Inc. | 32,940 | 2,374,974 | |||||||||
Maravai LifeSciences Holdings, Inc., Class A* | 10,752 | 305,464 | |||||||||
Medpace Holdings, Inc.* | 16,051 | 2,402,353 | |||||||||
NanoString Technologies, Inc.* | 28,056 | 356,311 | |||||||||
NeoGenomics, Inc.* | 41,850 | 341,078 | |||||||||
Repligen Corp.* | 11,762 | 1,910,149 | |||||||||
7,690,329 | |||||||||||
Machinery: 5.2% | |||||||||||
Astec Industries, Inc. | 13,781 | 561,989 | |||||||||
Chart Industries, Inc.* | 24,018 | 4,020,133 | |||||||||
Evoqua Water Technologies Corp.* | 66,031 | 2,146,668 | |||||||||
6,728,790 | |||||||||||
82
UBS U.S. Small Cap Growth Fund
Portfolio of investments
June 30, 2022
| Number of shares | Value | ||||||||||
Common stocks—(continued) | |||||||||||
Media: 0.6% | |||||||||||
Magnite, Inc.* | 84,024 | $ | 746,133 | ||||||||
Multiline retail: 1.3% | |||||||||||
Ollie's Bargain Outlet Holdings, Inc.* | 27,498 | 1,615,507 | |||||||||
Oil, gas & consumable fuels: 3.9% | |||||||||||
Chesapeake Energy Corp.1 | 22,483 | 1,823,371 | |||||||||
Matador Resources Co. | 28,383 | 1,322,364 | |||||||||
Ovintiv, Inc. | 42,668 | 1,885,499 | |||||||||
5,031,234 | |||||||||||
Pharmaceuticals: 1.0% | |||||||||||
Intra-Cellular Therapies, Inc.* | 21,637 | 1,235,040 | |||||||||
Professional services: 2.0% | |||||||||||
KBR, Inc. | 36,232 | 1,753,266 | |||||||||
Sterling Check Corp.*,1 | 48,100 | 784,511 | |||||||||
2,537,777 | |||||||||||
Semiconductors & semiconductor equipment: 4.5% | |||||||||||
Lattice Semiconductor Corp.* | 42,501 | 2,061,299 | |||||||||
MaxLinear, Inc.* | 51,428 | 1,747,523 | |||||||||
Universal Display Corp. | 19,691 | 1,991,548 | |||||||||
5,800,370 | |||||||||||
Software: 11.4% | |||||||||||
Alteryx, Inc., Class A* | 36,311 | 1,758,179 | |||||||||
Clearwater Analytics Holdings, Inc., Class A*,1 | 41,200 | 496,048 | |||||||||
CyberArk Software Ltd.* | 13,400 | 1,714,664 | |||||||||
Elastic N.V.* | 25,813 | 1,746,766 | |||||||||
ForgeRock, Inc., Class A* | 30,900 | 661,878 | |||||||||
HashiCorp, Inc., Class A*,1 | 10,700 | 315,008 | |||||||||
Jamf Holding Corp.*,1 | 72,688 | 1,800,482 | |||||||||
Rapid7, Inc.*,1 | 28,669 | 1,915,089 | |||||||||
Sumo Logic, Inc.* | 43,854 | 328,466 | |||||||||
Tenable Holdings, Inc.* | 49,269 | 2,237,305 | |||||||||
Varonis Systems, Inc.* | 54,326 | 1,592,838 | |||||||||
14,566,723 | |||||||||||
Specialty retail: 1.8% | |||||||||||
Children's Place, Inc.* | 21,214 | 825,649 | |||||||||
National Vision Holdings, Inc.* | 52,187 | 1,435,142 | |||||||||
2,260,791 | |||||||||||
| Number of shares | Value | ||||||||||
Common stocks—(concluded) | |||||||||||
Technology hardware, storage & peripherals: 2.1% | |||||||||||
Pure Storage, Inc., Class A* | 104,898 | $ | 2,696,928 | ||||||||
Textiles, apparel & luxury goods: 1.3% | |||||||||||
PVH Corp. | 5,672 | 322,737 | |||||||||
Tapestry, Inc. | 45,531 | 1,389,606 | |||||||||
1,712,343 | |||||||||||
Thrifts & mortgage finance: 0.7% | |||||||||||
Essent Group Ltd. | 23,619 | 918,779 | |||||||||
Trading companies & distributors: 2.5% | |||||||||||
Boise Cascade Co. | 28,373 | 1,687,910 | |||||||||
Herc Holdings, Inc. | 17,329 | 1,562,209 | |||||||||
3,250,119 | |||||||||||
| Total common stocks (cost $138,687,415) | 123,147,842 | ||||||||||
Short-term investments: 3.8% | |||||||||||
Investment companies: 3.8% | |||||||||||
| State Street Institutional U.S. Government Money Market Fund, 1.430%2 (cost $4,842,840) | 4,842,840 | 4,842,840 | |||||||||
Investment of cash collateral from securities loaned: 5.2% | |||||||||||
Money market funds: 5.2% | |||||||||||
| State Street Navigator Securities Lending Government Money Market Portfolio, 1.535%2 (cost $6,665,131) | 6,665,131 | 6,665,131 | |||||||||
| Total investments: 105.0% (cost $150,195,386) | 134,655,813 | ||||||||||
Liabilities in excess of other assets: (5.0)% | (6,389,285 | ) | |||||||||
Net assets: 100.0% | $ | 128,266,528 | |||||||||
For a listing of defined portfolio acronyms that are used throughout the Portfolio of investments as well as the tables that follow, please refer to the Glossary of terms used in the Portfolio of investments.
83
UBS U.S. Small Cap Growth Fund
Portfolio of investments
June 30, 2022
Fair valuation summary
The following is a summary of the fair valuations according to the inputs used as of June 30, 2022 in valuing the Fund's investments. In the event a Fund holds investments for which fair value is measured using the NAV per share practical expedient (or its equivalent), a separate column will be added to the fair value hierarchy table; this is intended to permit reconciliation to the amounts presented in the Portfolio of investments:
Description | Unadjusted quoted prices in active markets for identical investments (Level 1) | Other significant observable inputs (Level 2) | Unobservable inputs (Level 3) | Total | |||||||||||||||
Common stocks | $ | 123,147,842 | $ | — | $ | — | $ | 123,147,842 | |||||||||||
Short-term investments | — | 4,842,840 | — | 4,842,840 | |||||||||||||||
Investment of cash collateral from securities loaned | — | 6,665,131 | — | 6,665,131 | |||||||||||||||
Total | $ | 123,147,842 | $ | 11,507,971 | $ | — | $ | 134,655,813 | |||||||||||
At June 30, 2022, there were no transfers in or out of Level 3.
Portfolio footnotes
* Non-income producing security.
1 Security, or portion thereof, was on loan at the period end.
2 Rates shown reflect yield at June 30, 2022.
See accompanying notes to financial statements.
84
UBS Sustainable Development Bank Bond Fund
Portfolio performance
For the 12 months ended June 30, 2022 (the "reporting period"), Class P shares of UBS Sustainable Development Bank Bond Fund (the "Fund") returned -8.13%, while Class P2 shares returned -8.08%. For comparison purposes, the Bloomberg U.S. Treasury Index (the "Index") returned -8.90%. The Fund's secondary benchmark, the Solactive UBS Global Multilateral Development Bank Bond USD 40% 1-5 Year 60% 5-10 Year Total Return Index, returned -7.92% during the reporting period. Please note that the Fund's returns do not reflect the deduction of taxes that a shareholder would pay on the redemption of Fund shares, while index returns do not reflect the deduction of fees and expenses.
Fund overview
The Fund seeks current income. Under normal circumstances, the Fund invests at least 80% of its net assets in bonds and/or instruments that provide exposure to bonds issued by development banks. Development banks are financial organizations formed by government entities to promote economic and social development.
The development bank bond market typically follows high-quality US government bonds. As each of the global Multilateral Development Banks ("MDBs") are supranational entities backed by multiple member governments, MDBs historically have a similar credit profile to major sovereign issuers, such as the US government. Consequently, MDB bonds have generally delivered comparable returns to US Treasurys.
In the first half of 2022, financial markets were clearly dominated by inflation worries and its challenge for central banks. The response of the central banks and, thus, the re-pricing of the yield curve, didn't take too long. While in the beginning of the year the US Federal Reserve predicted only three interest rate hikes for whole year 2022, there were three hikes over the first half of the year alone. The US yield curve on average has shifted upwards 1.80% or 180 basis points (bps) over the 12-month reporting period. The two year portion of the curve took the brunt of pain by raising 2.60% or 260 bps. This volatility was also reflected in the implied volatility in option contracts, which rose to levels not seen since the COVID outbreak in 2020.
In this environment, US Treasurys outperformed riskier parts of the US fixed income markets. Sustainable development banks (SDB) showed some resiliency to rising credit spreads and performed in-line with US Treasurys.
Portfolio performance summary
The Fund is passively managed and seeks to minimize tracking error relative to its secondary benchmark (before fees and expenses), which is constructed from a blend of two market indexes designed to measure the performance of the US dollar-denominated multilateral development bank bond market. During the reporting period, the Fund modestly underperformed its secondary benchmark. Transaction costs associated with the management of the Fund's portfolio, as well as fees and expenses, were headwinds for results, and did not totally offset the positive impact from sector positioning. Additionally, US duration positioning was a small detractor from returns. The Fund did not invest in derivatives during the reporting period.
This letter is intended to assist shareholders in understanding how the Fund performed during the 12 months ended June 30, 2022. The views and opinions in the letter were current as of August 12, 2022. They are not guarantees of future performance or investment results and should not be taken as investment advice. Investment decisions reflect a variety of factors, and we reserve the right to change our views about individual securities, sectors and markets at any time. As a result, the views expressed should not be relied upon as a forecast of the Fund's future investment intent. We encourage you to consult your financial advisor regarding your personal investment program.
Mutual funds are sold by prospectus only. You should read it carefully and consider a fund's investment objectives, risks, charges, expenses and other important information contained in the prospectus before investing. Prospectuses for most of our funds can be obtained from your financial advisor, by calling UBS Funds at (800) 647-1568 or by visiting our website at www.ubs.com/am-us.
85
UBS Sustainable Development Bank Bond Fund
Average annual total returns for periods ended 06/30/22 (unaudited)
1 year | Inception | ||||||||||
Class P1,3 | (8.13 | )% | 1.35 | % | |||||||
Class P22,3 | (8.08 | ) | (5.70 | ) | |||||||
Bloomberg U.S. Treasury Index4,6 | (8.90 | ) | 1.43 | ||||||||
| Solactive UBS Global Multilateral Development Bank Bond USD 40% 1-5 Year 60% 5-10 Year Total Return Index5,6 | (7.92 | ) | 1.64 | ||||||||
The annualized gross and net expense ratios, respectively, for each class of shares as in the October 28, 2021 prospectuses were as follows: Class P—0.80% and 0.25%; Class P2—0.68% and 0.15%. Net expenses reflect fee waivers and/or expense reimbursements, if any, pursuant to an agreement that is in effect to cap the expenses. The Trust, with respect to the Fund, and UBS Asset Management (Americas) Inc., the Fund's investment advisor and administrator ("UBS AM (Americas)" or the "Advisor"), have entered into a written agreement pursuant to which the Advisor has agreed to waive a portion of its management fees and/or to reimburse expenses (excluding expenses incurred through investment in other investment companies, interest, taxes, brokerage commissions and extraordinary expenses, such as proxy-related expenses) to the extent necessary so that the Fund's ordinary operating expenses (excluding expenses incurred through investment in other investment companies, interest, taxes, brokerage commissions and extraordinary expenses), through the period ending October 28, 2022, do not exceed 0.25% for Class P shares. The Advisor has also entered into a written agreement pursuant to which the Advisor has agreed to waive a portion of its management fees and retained administration fees, and/or to reimburse expenses (excluding expenses incurred through investment in other investment companies, interest, taxes, brokerage commissions and extraordinary expenses, such as proxy-related expenses) to the extent necessary so that the Fund's ordinary operating expenses (excluding expenses incurred through investment in other investment companies, interest, taxes, brokerage commissions and extraordinary expenses, such as proxy related expenses), through the period ending October 28, 2022, do not exceed 0.15% for Class P2 shares. Pursuant to the written agreement, the Advisor is entitled to be reimbursed for any fees it waives and expenses it reimburses to the extent such reimbursement can be made during the three fiscal years following the date on which such fee waivers and expense reimbursements were made, provided that the reimbursement of the Advisor by the Fund will not cause the Fund to exceed the lesser of any applicable expense limit that is in place for the Fund (i) at the time of the waiver or reimbursement or (ii) at the time of the recoupment. The fee waiver/expense reimbursement agreement may be terminated by the Fund's Board of Trustees at any time and also will terminate automatically upon the expiration or termination of the Fund's advisory contract with the Advisor. Upon termination of the fee waiver/expense reimbursement agreement, however, UBS AM (Americas)'s three year recoupment rights will survive.
1 Inception date of Class P is October 24, 2018.
2 Inception date of Class P2 is October 30, 2020.
3 Class P and Class P2 shares do not bear initial or contingent deferred sales charges or ongoing 12b-1 service and distribution fees, but Class P and Class P2 shares held through advisory programs may be subject to a program fee, which, if included, would have reduced performance.
4 The Bloomberg US Treasury Index measures US dollar-denominated, fixed-rate, nominal debt issued by the US Treasury. Investors should note that indices do not reflect the deduction of fees and expenses.
5 The Solactive UBS Global Multilateral Development Bank Bond USD 40% 1-5 Year 60% 5-10 Year Total Return Index is a composite index, constructed from a blend of two market indexes designed to measure the performance of the US dollar denominated multilateral development bank bond market. Investors should note that indices do not reflect the deduction of fees and expenses.
6 Inception returns for the indices are shown as of the inception date of the oldest share class: October 24, 2018.
Past performance does not predict future performance, and the performance information provided does not reflect the deduction of taxes that a shareholder would pay on Fund distributions or the redemption of Fund shares. The return and principal value of an investment will fluctuate, so that an investor's shares, when redeemed, may be worth more or less than their original cost. Performance results assume reinvestment of all dividends and capital gain distributions at net asset value on the ex-dividend dates. Total returns for periods of less than one year have not been annualized. Current performance may be higher or lower than the performance data quoted. For month-end performance figures, please visit www.ubs.com/us-mutualfundperformance.
86
UBS Sustainable Development Bank Bond Fund
Illustration of an assumed investment of $2,000,000 in Class P shares and $25,000,000 in Class P2 shares (unaudited)
The following graphs depict the performance of UBS Sustainable Development Bank Bond Fund Class P and Class P2 shares versus the Bloomberg U.S. Treasury Index and Solactive UBS Global Multilateral Development Bank Bond USD 40% 1-5 Year 60% 5-10 Year Total Return Index from October 24, 2018, the inception date of Class P, and October 30, 2020, the inception date of Class P2, through June 30, 2022. Class P and Class P2 shares may be subject to a program fee, which, if included, would have reduced performance. The performance provided does not reflect the deduction of taxes that a shareholder would pay on Fund distributions or the redemptions of Fund shares. Past performance is no guarantee of future results. Share price and returns will vary with market conditions; investors may realize a gain or a loss upon redemption. It is important to note that UBS Sustainable Development Bank Bond Fund is a professionally managed portfolio while the Indices are not available for investment and are unmanaged. The comparison is shown for illustration purposes only.
UBS Sustainable Development Bank Bond Fund Class P vs. Bloomberg U.S. Treasury Index and Solactive UBS Global Multilateral Development Bank Bond USD 40% 1-5 Year 60% 5-10 Year Total Return Index

UBS Sustainable Development Bank Bond Fund Class P2 vs. Bloomberg U.S. Treasury Index and Solactive UBS Global Multilateral Development Bank Bond USD 40% 1-5 Year 60% 5-10 Year Total Return Index
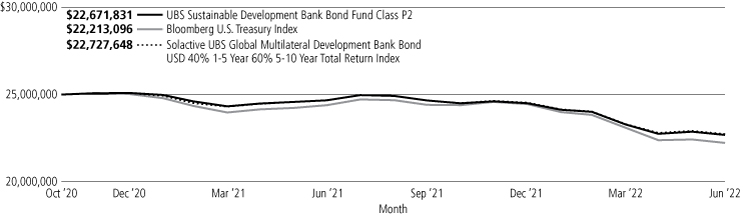
87
UBS Sustainable Development Bank Bond Fund
Portfolio statistics and industry diversification—(unaudited)1
As a percentage of net assets as of June 30, 2022
Top ten holdings
| Inter-American Development Bank, 2.250% due 06/18/29 | 4.6 | % | |||||
| International Bank for Reconstruction & Development, 1.750% due 10/23/29 | 4.4 | ||||||
| Inter-American Development Bank, 1.125% due 01/13/31 | 3.6 | ||||||
| Agence Francaise de Developpement EPIC, 0.625% due 01/22/26 | 3.6 | ||||||
| Inter-American Development Bank, 3.125% due 09/18/28 | 3.2 | ||||||
| International Bank for Reconstruction & Development, 1.625% due 11/03/31 | 3.1 | ||||||
| Inter-American Development Bank, 1.125% due 07/20/28 | 3.0 | ||||||
| Asian Infrastructure Investment Bank, 0.500% due 05/28/25 | 2.9 | ||||||
| African Development Bank, 0.875% due 07/22/26 | 2.7 | ||||||
| International Bank for Reconstruction & Development, 0.750% due 08/26/30 | 2.7 | ||||||
Total | 33.8 | % | |||||
Sector allocation | |||||||
Non-U.S. government agency obligations | 99.0 | % | |||||
Short-term investments | 0.9 | ||||||
Investments of cash collateral from securities loaned | 1.1 | ||||||
Total investments | 101.0 | ||||||
Liabilities in excess of other assets | (1.0 | ) | |||||
Net assets | 100.0 | % | |||||
1 The portfolio is actively managed and its composition will vary over time.
88
UBS Sustainable Development Bank Bond Fund
Portfolio of investments
June 30, 2022
| Face amount | Value | ||||||||||
Non-U.S. government agency obligations: 99.0% | |||||||||||
German Democratic Republic: 0.9% | |||||||||||
| Kreditanstalt fuer Wiederaufbau 0.625%, due 01/22/26 | $ | 750,000 | $ | 687,826 | |||||||
Germany: 1.9% | |||||||||||
| Kreditanstalt fuer Wiederaufbau 2.875%, due 04/03/28 | 1,500,000 | 1,476,405 | |||||||||
Supranationals: 96.2% | |||||||||||
| African Development Bank 0.750%, due 04/03/23 | 300,000 | 295,371 | |||||||||
7.375%, due 04/06/23 | 300,000 | 309,634 | |||||||||
| Series GDIF, 0.875%, due 03/23/26 | 500,000 | 460,010 | |||||||||
| Series GDIF, 0.875%, due 07/22/26 | 2,300,000 | 2,097,140 | |||||||||
| Series GDIF, 2.125%, due 11/16/22 | 300,000 | 299,763 | |||||||||
| Agence Francaise de Developpement EPIC 0.625%, due 01/22/261 | 3,000,000 | 2,734,322 | |||||||||
| Asian Development Bank 0.750%, due 10/08/30 | 600,000 | 494,862 | |||||||||
1.500%, due 03/04/31 | 1,300,000 | 1,134,606 | |||||||||
1.750%, due 09/19/29 | 700,000 | 633,710 | |||||||||
1.875%, due 03/15/29 | 300,000 | 275,982 | |||||||||
1.875%, due 01/24/30 | 700,000 | 641,499 | |||||||||
3.125%, due 09/26/28 | 500,000 | 496,193 | |||||||||
| Asian Infrastructure Investment Bank 0.500%, due 05/28/25 | 2,400,000 | 2,217,443 | |||||||||
0.500%, due 01/27/26 | 1,600,000 | 1,446,982 | |||||||||
| Council of Europe Development Bank 0.875%, due 09/22/26 | 1,500,000 | 1,366,279 | |||||||||
1.375%, due 02/27/25 | 1,300,000 | 1,250,370 | |||||||||
2.500%, due 02/27/24 | 650,000 | 644,024 | |||||||||
| European Bank for Reconstruction & Development 0.500%, due 05/19/25 | 400,000 | 371,134 | |||||||||
0.500%, due 11/25/25 | 500,000 | 456,667 | |||||||||
0.500%, due 01/28/26 | 2,100,000 | 1,915,659 | |||||||||
1.500%, due 02/13/25 | 600,000 | 576,084 | |||||||||
2.750%, due 03/07/23 | 200,000 | 200,021 | |||||||||
| European Investment Bank 0.375%, due 03/26/26 | 100,000 | 90,263 | |||||||||
0.625%, due 07/25/25 | 250,000 | 231,995 | |||||||||
0.625%, due 10/21/27 | 600,000 | 526,103 | |||||||||
1.250%, due 02/14/312 | 1,000,000 | 857,073 | |||||||||
1.875%, due 02/10/25 | 700,000 | 678,895 | |||||||||
2.625%, due 03/15/24 | 225,000 | 223,400 | |||||||||
| IDB Trust Services Ltd. 0.908%, due 06/25/251 | 400,000 | 371,104 | |||||||||
1.809%, due 02/26/251 | 400,000 | 384,700 | |||||||||
2.843%, due 04/25/241 | 1,800,000 | 1,786,500 | |||||||||
3.389%, due 09/26/231 | 800,000 | 800,000 | |||||||||
| Face amount | Value | ||||||||||
Non-U.S. government agency obligations—(continued) | |||||||||||
Supranationals—(continued) | |||||||||||
| Inter-American Development Bank 0.500%, due 05/24/23 | $ | 1,250,000 | $ | 1,223,138 | |||||||
0.625%, due 07/15/25 | 850,000 | 787,166 | |||||||||
0.625%, due 09/16/27 | 1,100,000 | 965,653 | |||||||||
0.875%, due 04/20/26 | 200,000 | 183,676 | |||||||||
1.125%, due 07/20/28 | 2,600,000 | 2,302,742 | |||||||||
1.125%, due 01/13/31 | 3,300,000 | 2,790,524 | |||||||||
1.500%, due 01/13/27 | 500,000 | 465,303 | |||||||||
2.000%, due 06/02/26 | 1,800,000 | 1,721,970 | |||||||||
2.000%, due 07/23/26 | 630,000 | 602,267 | |||||||||
2.250%, due 06/18/29 | 3,800,000 | 3,570,971 | |||||||||
2.375%, due 07/07/27 | 1,285,000 | 1,234,698 | |||||||||
3.000%, due 10/04/23 | 300,000 | 299,750 | |||||||||
3.125%, due 09/18/28 | 2,450,000 | 2,433,040 | |||||||||
| Inter-American Investment Corp. 0.625%, due 02/10/261 | 500,000 | 454,659 | |||||||||
1.750%, due 10/02/241 | 1,400,000 | 1,357,268 | |||||||||
| International Bank for Reconstruction & Development 0.750%, due 11/24/27 | 2,200,000 | 1,934,782 | |||||||||
0.750%, due 08/26/30 | 2,500,000 | 2,064,303 | |||||||||
0.875%, due 05/14/30 | 2,200,000 | 1,845,368 | |||||||||
1.125%, due 09/13/28 | 1,600,000 | 1,413,024 | |||||||||
1.250%, due 02/10/31 | 2,300,000 | 1,965,495 | |||||||||
1.625%, due 11/03/31 | 2,700,000 | 2,361,648 | |||||||||
2.500%, due 03/29/32 | 1,800,000 | 1,686,215 | |||||||||
| Series GDIF, 1.375%, due 04/20/28 | 800,000 | 721,114 | |||||||||
| Series GDIF, 1.750%, due 10/23/29 | 3,760,000 | 3,403,702 | |||||||||
| Series GDIF, 2.500%, due 11/22/27 | 1,300,000 | 1,255,737 | |||||||||
| International Development Association 0.875%, due 04/28/261 | 200,000 | 184,386 | |||||||||
1.000%, due 12/03/301 | 2,300,000 | 1,930,249 | |||||||||
2.750%, due 04/24/231 | 250,000 | 249,513 | |||||||||
| Series GDIF, 0.750%, due 06/10/271 | 1,500,000 | 1,329,201 | |||||||||
| International Finance Corp. 0.375%, due 07/16/25 | 700,000 | 645,449 | |||||||||
0.750%, due 10/08/26 | 1,100,000 | 992,800 | |||||||||
0.750%, due 08/27/30 | 1,250,000 | 1,042,670 | |||||||||
1.375%, due 10/16/24 | 100,000 | 96,237 | |||||||||
2.125%, due 04/07/26 | 875,000 | 842,380 | |||||||||
| Kreditanstalt fuer Wiederaufbau 2.000%, due 05/02/25 | 100,000 | 96,940 | |||||||||
89
UBS Sustainable Development Bank Bond Fund
Portfolio of investments
June 30, 2022
| Face amount | Value | ||||||||||
Non-U.S. government agency obligations—(concluded) | |||||||||||
Supranationals—(concluded) | |||||||||||
| Nordic Investment Bank 0.500%, due 01/21/26 | $ | 800,000 | $ | 729,580 | |||||||
2.875%, due 07/19/23 | 600,000 | 598,524 | |||||||||
74,049,930 | |||||||||||
| Total non-U.S. government agency obligations (cost $82,812,450) | 76,214,161 | ||||||||||
| Number of shares | |||||||||||
Short-term investments: 0.9% | |||||||||||
Investment companies: 0.9% | |||||||||||
| State Street Institutional U.S. Government Money Market Fund, 1.430%3 (cost $680,725) | 680,725 | 680,725 | |||||||||
| Number of shares | Value | ||||||||||
Investment of cash collateral from securities loaned: 1.1% | |||||||||||
Money market funds: 1.1% | |||||||||||
| State Street Navigator Securities Lending Government Money Market Portfolio, 1.535%3 (cost $875,000) | 875,000 | $ | 875,000 | ||||||||
| Total investments: 101.0% (cost $84,368,175) | 77,769,886 | ||||||||||
Liabilities in excess of other assets: (1.0%) | (800,731 | ) | |||||||||
Net assets: 100.0% | $ | 76,969,155 | |||||||||
For a listing of defined portfolio acronyms that are used throughout the Portfolio of investments as well as the tables that follow, please refer to the Glossary of terms used in the Portfolio of investments.
Fair valuation summary
The following is a summary of the fair valuations according to the inputs used as of June 30, 2022 in valuing the Fund's investments. In the event a Fund holds investments for which fair value is measured using the NAV per share practical expedient (or its equivalent), a separate column will be added to the fair value hierarchy table; this is intended to permit reconciliation to the amounts presented in the Portfolio of investments:
Description | Unadjusted quoted prices in active markets for identical investments (Level 1) | Other significant observable inputs (Level 2) | Unobservable inputs (Level 3) | Total | |||||||||||||||
Assets | |||||||||||||||||||
Non-U.S. government agency obligations | $ | — | $ | 76,214,161 | $ | — | $ | 76,214,161 | |||||||||||
Short-term investments | — | 680,725 | — | 680,725 | |||||||||||||||
Investment of cash collateral from securities loaned | — | 875,000 | — | 875,000 | |||||||||||||||
Total | $ | — | $ | 77,769,886 | $ | — | $ | 77,769,886 | |||||||||||
At June 30, 2022, there were no transfers in or out of Level 3.
Portfolio footnotes
1 Security was purchased pursuant to Regulation S under the Securities Act of 1933, which exempts from registration securities offered and sold outside of the United States. Such a security cannot be sold in the United States without either an effective registration statement filed pursuant to the Securities Act of 1933, or pursuant to an exemption from registration.
2 Security, or portion thereof, was on loan at the period end.
3 Rates shown reflect yield at June 30, 2022.
See accompanying notes to financial statements.
90
UBS Multi Income Bond Fund (formerly, UBS Total Return Bond Fund)
Portfolio performance
For the 12 months ended June 30, 2022 (the "reporting period"), Class A shares of UBS Multi Income Bond Fund (formerly, UBS Total Return Bond Fund) returned -13.91% (Class A shares returned -17.14% after the deduction of the maximum sales charge), while Class P shares returned -13.68%. For comparison purposes, the Bloomberg US Aggregate Bond Index (the "Index") returned -10.29%. (Class P shares have lower expenses than the other share class of the Fund. Returns for all share classes over various time periods are shown on page 93; please note that the Fund's returns do not reflect the deduction of taxes that a shareholder would pay on the redemption of Fund shares, while index returns do not reflect the deduction of fees and expenses.)
In June 2022, the Fund was repositioned from a Core Plus strategy to a Multi Income Bond strategy. The Fund was re-named the UBS Multi Income Bond Fund effective June 13, 2022. Due to the timing, the repositioning of the Fund's portfolio created a temporary headwind for performance.
During the reporting period, we used derivatives for risk management purposes and as a tool to help enhance returns across various strategies. A number of credit derivatives, including index (CDX) options, were used to manage the Fund's credit exposure. For active currency management, we utilized foreign exchange (FX) forwards. For managing interest rate exposure, we utilized interest rate futures during the reporting period. Derivatives were just one tool, among others, that we used to implement our overall strategy. Looking at the impact of derivatives in isolation is not very meaningful and could potentially be misleading, as often times they are used as a complement or risk mitigant to other existing positions in the portfolio.
Portfolio performance summary
What worked:
• Active Duration Management: A bias for having a shorter duration relative to the index contributed to performance as rates generally trended higher over the period.
• US Treasury Inflation-Protected Securities (TIPS): These securities contributed to performance as inflation expectations rose, which supported the TIPS market.
• Underweight Investment-Grade Corporate Bonds: An underweight position was additive on a relative basis in a period in which credit spreads, the difference in yield between bonds of a similar maturity but with different credit quality, moved wider, particularly during the second half of the reporting period.
• Underweight Mortgage-Backed Securities (MBS): An underweight contributed positively to relative returns as MBS spreads, the difference in yield between bonds of a similar maturity but with different credit quality, widened over the reporting period.
What didn't work:
• Overweight Securitized: Overweight allocations to securitized sectors including asset-backed securities (ABS), commercial mortgage-backed securities (CMBS) and collateralized mortgage obligations (CMO) detracted as securitized spreads widened.
• High Yield Exposure: The allocation to high yield corporate bonds detracted as their spreads widened, especially during the second quarter of 2022.
91
UBS Multi Income Bond Fund (formerly, UBS Total Return Bond Fund)
Market outlook
In terms of interest rates, we view the 10-year Treasury as likely rangebound, hemmed in by the need for tighter monetary conditions to rein in inflation, but also weaker economic prospects. Fed funds futures continue to project a hawkish path for the policy rate, justified by recent reads on prices. While headline inflation is probable to trend lower, the trajectory of inflation's decline is an unknown. We're dubious the Federal Reserve's (Fed) inflation target of 2% is attainable in short order, continuing to pressure rates higher.
Negative, real economic growth may act as the balance that suppresses rates. Early evidence of demand disruption due to inordinately high prices and higher consumer borrowing rates has been illustrated in recent data releases, including disappointing reads of retail sales and personal spending for May, as well the first quarter's read on personal consumption experiencing a sizable downward revision. Housing metrics have almost uniformly illustrated a slowdown, though little concrete evidence of housing prices slipping has yet appeared in the data and, arguably, a 'healthy cooling' of what was a red-hot market was overdue. Importantly, the labor market remains strong, and the state of consumer balance sheets is robust enough to prevent a severe economic slowdown, in our view.
Our portfolios have benefited from a shorter duration posture throughout 2022 thus far, and we're apt to opportunistically add to this position when rates trend to the lower end of our targets. We believe the yield curve is likely to steepen longer term, catalysed by the Fed's need to actively sell securities as part of its balance sheet reduction. Shorter-term, however, the market will probably grapple with the likelihood and severity of recession which can keep the yield curve flat.
In credit, spreads have grown more attractive, prodded by declining sentiment on risk and expectations that corporate earnings cannot remain as lofty. While we continue to exert caution and selectivity, carefully adding risk to credit has grown more appropriate given increasingly attractive valuations and the likelihood that any recession will remain shallow and short-lived. Second quarter earnings announcements will be closely watched for any wavering on forward outlook.
This letter is intended to assist shareholders in understanding how the Fund performed during the 12 months ended June 30, 2022. The views and opinions in the letter were current as of August 12, 2022. They are not guarantees of future performance or investment results and should not be taken as investment advice. Investment decisions reflect a variety of factors, and we reserve the right to change our views about individual securities, sectors and markets at any time. As a result, the views expressed should not be relied upon as a forecast of the Fund's future investment intent. We encourage you to consult your financial advisor regarding your personal investment program.
Mutual funds are sold by prospectus only. You should read it carefully and consider a fund's investment objectives, risks, charges, expenses and other important information contained in the prospectus before investing. Prospectuses for most of our funds can be obtained from your financial advisor, by calling UBS Funds at (800) 647-1568 or by visiting our website at www.ubs.com/am-us.
92
UBS Multi Income Bond Fund (formerly, UBS Total Return Bond Fund)
Average annual total returns for periods ended 06/30/22 (unaudited)
1 year | 5 years | 10 years or Inception | |||||||||||||
Before deducting maximum sales charge | |||||||||||||||
Class A1 | (13.91 | )% | (0.20 | )% | (0.23 | )% | |||||||||
Class P2 | (13.68 | ) | 0.06 | 1.10 | |||||||||||
After deducting maximum sales charge | |||||||||||||||
Class A3 | (17.14 | )% | (0.96 | )% | (0.88 | )% | |||||||||
Bloomberg US Aggregate Bond Index4 | (10.29 | ) | 0.88 | 1.54 | |||||||||||
The annualized gross and net expense ratios as in the October 28, 2021 prospectuses were as follows: Class A—1.74% and 0.76%; Class P—1.53% and 0.51%. Net expenses reflect fee waivers and/or expense reimbursements, if any, pursuant to an agreement that is in effect to cap the expenses. The Trust, with respect to the Fund, and UBS Asset Management (Americas) Inc., the Fund's investment advisor and administrator ("UBS AM (Americas)" or the "Advisor"), have entered into a written agreement pursuant to which the Advisor has agreed to waive a portion of its management fees and/or to reimburse expenses (excluding expenses incurred through investment in other investment companies, interest, taxes, brokerage commissions and extraordinary expenses) to the extent necessary so that the Fund's ordinary operating expenses (excluding expenses incurred through investment in other investment companies, interest, taxes, brokerage commissions and extraordinary expenses, such as proxy-related expenses), through the period ending October 28, 2022, do not exceed 0.75% for Class A shares and 0.50% for Class P shares. Pursuant to the written agreement, the Advisor is entitled to be reimbursed for any fees it waives and expenses it reimburses to the extent such reimbursement can be made during the three fiscal years following the date on which such fee waivers and expense reimbursements were made, provided that the reimbursement of the Advisor by the Fund will not cause the Fund to exceed the lesser of any applicable expense limit that is in place for the Fund (i) at the time of the waiver or reimbursement or (ii) at the time of the recoupment. The fee waiver/expense reimbursement agreement may be terminated by the Fund's Board of Trustees at any time and also will terminate automatically upon the expiration or termination of the Fund's advisory contract with the Advisor. Upon termination of the fee waiver/expense reimbursement agreement, however, UBS AM (Americas)'s three year recoupment rights will survive.
1 Inception date of Class A is September 29, 2016.
2 Class P shares acquired the assets and liabilities of Fort Dearborn Income Securities, Inc., a closed-end fund ("the Predecessor Fund"), prior to the opening of business on May 23, 2016 (the "Reorganization"). The Predecessor Fund was also managed by the Advisor, and day-to-day management of, and investment decisions for, the Fund and the Predecessor Fund were made by the same portfolio management team until the June 2022 Fund repositioning. The Funds had generally similar investment objectives and strategies until the June 2022 Fund repositioning from a Core Plus to a Multi Income Bond strategy. Therefore the information shown above reflects the historical performance of the Predecessor Fund for periods prior to the Reorganization and may not be representative of performance of the Fund. Class P shares do not bear initial or contingent deferred sales charges or ongoing 12b-1 service and distribution fees, but Class P shares held through advisory programs may be subject to a program fee, which, if included, would have reduced performance.
3 Maximum sales charge for Class A shares is 3.75%. Class A shares bear ongoing 12b-1 service fees.
4 The Bloomberg US Aggregate Bond Index is an unmanaged broad based index designed to measure the US dollar-denominated, investment-grade, taxable bond market. The index includes bonds from the Treasury, government-related, corporate, mortgage-backed, asset backed and commercial mortgage-backed sectors. Investors should note that indices do not reflect the deduction of fees and expenses. Inception return for the Index is for the 10 years ended.
A temporary redemption fee of 2% was imposed on sales of Class P shares of the Fund between May 23, and August 22, 2016.
Past performance does not predict future performance, and the performance information provided does not reflect the deduction of taxes that a shareholder would pay on Fund distributions or the redemption of Fund shares. The return and principal value of an investment will fluctuate, so that an investor's shares, when redeemed, may be worth more or less than their original cost. Performance results assume reinvestment of all dividends and capital gain distributions at net asset value on the ex-dividend dates. Total returns for periods of less than one year have not been annualized. Current performance may be higher or lower than the performance data quoted. For month-end performance figures, please visit www.ubs.com/us-mutualfundperformance.
93
UBS Multi Income Bond Fund (formerly, UBS Total Return Bond Fund)
Illustration of an assumed investment of $10,000 in Class A shares (adjusted for 3.75% maximum sales charge) and $2,000,000 in Class P shares (unaudited)
The following graphs depict the performance of UBS Multi Income Bond Fund Class A and Class P shares versus the Bloomberg US Aggregate Index from the inception date of September 29, 2016 for the Class A shares and for the 10 years ended for Class P shares through June 30, 2022. Class P shares may be subject to a program fee, which, if included, would have reduced performance. The performance provided does not reflect the deduction of taxes that a shareholder would pay on Fund distributions or the redemptions of Fund shares. Past performance is no guarantee of future results. Share price and returns will vary with market conditions; investors may realize a gain or a loss upon redemption. It is important to note that UBS Multi Income Bond Fund is a professionally managed portfolio while the Index is not available for investment and is unmanaged. The comparison is shown for illustration purposes only.
UBS Multi Income Bond Fund Class A vs. Bloomberg US Aggregate Index
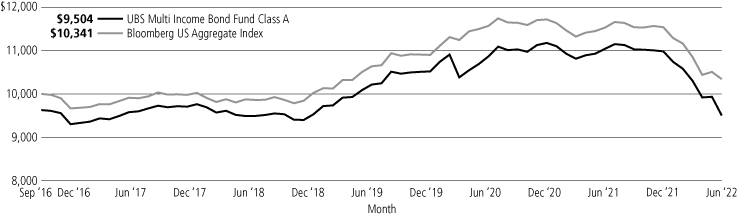
UBS Multi Income Bond Fund Class P vs. Bloomberg US Aggregate Index

94
UBS Multi Income Bond Fund (formerly, UBS Total Return Bond Fund)
Portfolio statistics and industry diversification—(unaudited)1
As a percentage of net assets as of June 30, 2022
Top ten holdings
| U.S. Treasury Bills, 1.583% due 09/22/22 | 5.5 | % | |||||
| Sabine Pass Liquefaction LLC, 5.000% due 03/15/27 | 1.5 | ||||||
| Verizon Communications, Inc., 4.329% due 09/21/28 | 1.5 | ||||||
| BMW US Capital LLC, 2.800% due 04/11/26 | 1.4 | ||||||
| Quanta Services, Inc., 0.950% due 10/01/24 | 1.4 | ||||||
| BX Trust, 2.626% due 10/15/23 | 1.4 | ||||||
| ONE Mortgage Trust, 2.424% due 03/15/36 | 1.3 | ||||||
| JPMorgan Chase & Co., 3.875% due 09/10/24 | 1.3 | ||||||
| EQT Corp., 3.900% due 10/01/27 | 1.3 | ||||||
| Kinder Morgan, Inc., 4.300% due 03/01/28 | 1.2 | ||||||
Total | 17.8 | % | |||||
Top five issuer breakdown by country or territory of origin
United States | 80.8 | % | |||||
United Kingdom | 2.7 | ||||||
Germany | 2.1 | ||||||
Canada | 2.0 | ||||||
Colombia | 1.7 | ||||||
Total | 89.3 | % | |||||
Corporate bonds | |||||||
Airlines | 1.8 | % | |||||
Auto manufacturers | 6.2 | ||||||
Auto parts & equipment | 0.9 | ||||||
Banks | 10.2 | ||||||
Beverages | 0.6 | ||||||
Biotechnology | 1.1 | ||||||
Building materials | 1.2 | ||||||
Chemicals | 2.0 | ||||||
Commercial services | 2.7 | ||||||
Computers | 1.6 | ||||||
Diversified financial services | 5.2 | ||||||
Electric | 2.2 | ||||||
Electrical components & equipment | 0.9 | ||||||
Entertainment | 1.1 | ||||||
Environmental control | 0.4 | ||||||
Food | 0.1 | ||||||
Healthcare-products | 1.1 | ||||||
Home builders | 0.9 | ||||||
Housewares | 0.7 | ||||||
Insurance | 1.5 | ||||||
Internet | 0.8 | ||||||
Lodging | 0.7 | ||||||
Media | 3.1 | ||||||
Mining | 2.4 | ||||||
Miscellaneous manufacturers | 2.1 | ||||||
Oil & gas | 6.4 | ||||||
Packaging & containers | 0.7 | ||||||
Pharmaceuticals | 0.9 | ||||||
Pipelines | 4.4 | ||||||
Real estate | 0.3 | ||||||
Real estate investment trusts | 2.1 | ||||||
Retail | 0.6 | ||||||
Semiconductors | 1.3 | ||||||
Software | 0.9 | ||||||
Telecommunications | 4.5 | ||||||
Transportation | 0.3 | ||||||
Total corporate bonds | 73.9 | ||||||
Asset-backed security | 0.3 | ||||||
Mortgage-backed securities | 10.7 | ||||||
Municipal bonds | 3.1 | ||||||
Non-U.S. government agency obligations | 3.1 | ||||||
U.S. Treasury obligations | 7.1 | ||||||
Short-term investments | 0.2 | ||||||
Investment of cash collateral from securities loaned | 2.1 | ||||||
Total investments | 100.5 | ||||||
Liabilities in excess of other assets | (0.5 | ) | |||||
Net assets | 100.0 | % | |||||
1 The portfolio is actively managed and its composition will vary over time.
95
UBS Multi Income Bond Fund (formerly, UBS Total Return Bond Fund)
Portfolio of investments
June 30, 2022
| Face amount | Value | ||||||||||
Asset-backed security: 0.3% | |||||||||||
United States: 0.3% | |||||||||||
| Invitation Homes Trust, Series 2018-SFR1, Class C, 1 mo. USD LIBOR + 1.250%, 2.773%, due 03/17/371,2 (cost $99,986) | $ | 99,986 | $ | 98,229 | |||||||
Corporate bonds: 73.9% | |||||||||||
Australia: 0.3% | |||||||||||
| Glencore Funding LLC 4.000%, due 04/16/251 | 100,000 | 98,765 | |||||||||
Belgium: 0.6% | |||||||||||
| Anheuser-Busch Cos. LLC/Anheuser-Busch InBev Worldwide, Inc. 4.900%, due 02/01/46 | 165,000 | 155,082 | |||||||||
Brazil: 0.8% | |||||||||||
| Petrobras Global Finance BV 7.375%, due 01/17/27 | 200,000 | 211,848 | |||||||||
Canada: 2.0% | |||||||||||
| NOVA Chemicals Corp. 5.250%, due 06/01/271 | 250,000 | 214,425 | |||||||||
| Rogers Communications, Inc. 5.000%, due 03/15/44 | 60,000 | 55,852 | |||||||||
| Teck Resources Ltd. 3.900%, due 07/15/30 | 300,000 | 275,934 | |||||||||
546,211 | |||||||||||
China: 0.5% | |||||||||||
| Agile Group Holdings Ltd. 5.750%, due 01/02/253 | 200,000 | 68,000 | |||||||||
| NXP BV/NXP Funding LLC/NXP USA, Inc. 3.875%, due 06/18/26 | 65,000 | 62,664 | |||||||||
130,664 | |||||||||||
Colombia: 1.1% | |||||||||||
| Ecopetrol SA 4.125%, due 01/16/25 | 250,000 | 230,694 | |||||||||
5.375%, due 06/26/26 | 70,000 | 64,719 | |||||||||
295,413 | |||||||||||
Germany: 2.1% | |||||||||||
| BMW US Capital LLC 2.800%, due 04/11/261 | 400,000 | 382,515 | |||||||||
| Volkswagen Group of America Finance LLC 4.625%, due 11/13/251 | 200,000 | 199,816 | |||||||||
582,331 | |||||||||||
Ireland: 1.2% | |||||||||||
| AerCap Ireland Capital DAC/AerCap Global Aviation Trust 4.450%, due 04/03/26 | 300,000 | 286,477 | |||||||||
| Avolon Holdings Funding Ltd. 2.875%, due 02/15/251 | 50,000 | 45,991 | |||||||||
332,468 | |||||||||||
| Face amount | Value | ||||||||||
Corporate bonds—(continued) | |||||||||||
Norway: 1.2% | |||||||||||
| Aker BP ASA 2.875%, due 01/15/261 | $ | 350,000 | $ | 330,864 | |||||||
Peru: 0.2% | |||||||||||
| Southern Copper Corp. 6.750%, due 04/16/40 | 40,000 | 45,180 | |||||||||
Qatar: 0.9% | |||||||||||
| QNB Finance Ltd. 2.750%, due 02/12/273 | 250,000 | 235,672 | |||||||||
Singapore: 0.9% | |||||||||||
| BOC Aviation Ltd. 3.250%, due 04/29/253 | 250,000 | 243,953 | |||||||||
United Kingdom: 2.7% | |||||||||||
| Barclays PLC 4.836%, due 05/09/28 | 200,000 | 192,401 | |||||||||
| HSBC Holdings PLC 6.500%, due 09/15/374 | 100,000 | 106,694 | |||||||||
| Lloyds Banking Group PLC 4.582%, due 12/10/25 | 200,000 | 196,094 | |||||||||
| NatWest Group PLC 3.875%, due 09/12/23 | 250,000 | 249,176 | |||||||||
744,365 | |||||||||||
United States: 59.4% | |||||||||||
| Abbott Laboratories 3.750%, due 11/30/26 | 45,000 | 45,234 | |||||||||
| AbbVie, Inc. 4.500%, due 05/14/35 | 100,000 | 97,056 | |||||||||
| AEP Texas, Inc., Series E, 6.650%, due 02/15/33 | 50,000 | 57,419 | |||||||||
| Series G, 4.150%, due 05/01/49 | 50,000 | 42,712 | |||||||||
| Air Lease Corp. 2.875%, due 01/15/26 | 50,000 | 45,895 | |||||||||
| Alabama Power Co. 6.000%, due 03/01/39 | 100,000 | 110,545 | |||||||||
| American International Group, Inc. 2.500%, due 06/30/25 | 50,000 | 47,652 | |||||||||
| Amgen, Inc. 4.663%, due 06/15/51 | 50,000 | 46,760 | |||||||||
| Apple, Inc. 4.650%, due 02/23/46 | 100,000 | 102,941 | |||||||||
| Arconic Corp. 6.000%, due 05/15/251 | 250,000 | 243,826 | |||||||||
| Ardagh Packaging Finance PLC/Ardagh Holdings USA, Inc. 5.250%, due 04/30/251 | 200,000 | 184,999 | |||||||||
| AT&T, Inc. 3.800%, due 12/01/57 | 58,000 | 44,795 | |||||||||
4.300%, due 02/15/30 | 300,000 | 292,770 | |||||||||
96
UBS Multi Income Bond Fund (formerly, UBS Total Return Bond Fund)
Portfolio of investments
June 30, 2022
| Face amount | Value | ||||||||||
Corporate bonds—(continued) | |||||||||||
United States—(continued) | |||||||||||
| Avantor Funding, Inc. 4.625%, due 07/15/281 | $ | 275,000 | $ | 252,092 | |||||||
| Bank of America Corp. 4.200%, due 08/26/24 | 250,000 | 250,478 | |||||||||
6.110%, due 01/29/37 | 125,000 | 134,461 | |||||||||
| Bank of New York Mellon Corp. 1.600%, due 04/24/25 | 100,000 | 94,121 | |||||||||
| Biogen, Inc. 3.250%, due 02/15/51 | 56,000 | 39,201 | |||||||||
4.050%, due 09/15/254 | 100,000 | 98,969 | |||||||||
| Boston Properties LP 2.750%, due 10/01/264 | 210,000 | 195,737 | |||||||||
| Boyd Gaming Corp. 4.750%, due 12/01/27 | 200,000 | 181,000 | |||||||||
| BP Capital Markets America, Inc. 3.017%, due 01/16/27 | 50,000 | 47,637 | |||||||||
| Bristol-Myers Squibb Co. 3.200%, due 06/15/26 | 99,000 | 97,593 | |||||||||
4.125%, due 06/15/394 | 50,000 | 47,755 | |||||||||
| Broadcom, Inc. 3.137%, due 11/15/351 | 300,000 | 227,815 | |||||||||
| CCO Holdings LLC/CCO Holdings Capital Corp. 5.500%, due 05/01/261 | 75,000 | 73,178 | |||||||||
| Charter Communications Operating LLC/Charter Communications Operating Capital 4.200%, due 03/15/28 | 350,000 | 327,005 | |||||||||
| Citigroup, Inc. 5.500%, due 09/13/25 | 300,000 | 308,210 | |||||||||
6.675%, due 09/13/43 | 25,000 | 28,040 | |||||||||
| Comcast Corp. 2.887%, due 11/01/51 | 64,000 | 45,720 | |||||||||
2.937%, due 11/01/56 | 67,000 | 46,558 | |||||||||
3.969%, due 11/01/47 | 38,000 | 32,859 | |||||||||
| ConocoPhillips Co. 3.758%, due 03/15/421 | 250,000 | 218,780 | |||||||||
| Continental Resources, Inc. 4.375%, due 01/15/28 | 250,000 | 235,000 | |||||||||
| Covanta Holding Corp. 4.875%, due 12/01/291 | 150,000 | 122,058 | |||||||||
| DCP Midstream Operating LP 5.375%, due 07/15/25 | 250,000 | 243,125 | |||||||||
| Dell International LLC/EMC Corp. 5.850%, due 07/15/25 | 250,000 | 257,827 | |||||||||
| Delta Air Lines, Inc. 7.000%, due 05/01/251 | 300,000 | 303,657 | |||||||||
| Duke Energy Ohio, Inc. 4.300%, due 02/01/49 | 50,000 | 45,366 | |||||||||
| DuPont de Nemours, Inc. 4.725%, due 11/15/28 | 100,000 | 100,328 | |||||||||
| Enact Holdings, Inc. 6.500%, due 08/15/251 | 250,000 | 235,780 | |||||||||
| Energy Transfer LP 5.400%, due 10/01/47 | 50,000 | 43,869 | |||||||||
5.500%, due 06/01/27 | 50,000 | 50,750 | |||||||||
| Face amount | Value | ||||||||||
Corporate bonds—(continued) | |||||||||||
United States—(continued) | |||||||||||
| EQT Corp. 3.900%, due 10/01/27 | $ | 370,000 | $ | 344,318 | |||||||
| Exelon Corp. 3.400%, due 04/15/26 | 250,000 | 242,574 | |||||||||
4.450%, due 04/15/46 | 50,000 | 45,175 | |||||||||
| Expedia Group, Inc. 3.800%, due 02/15/28 | 250,000 | 227,839 | |||||||||
| FedEx Corp. 4.550%, due 04/01/46 | 50,000 | 44,873 | |||||||||
| Fiserv, Inc. 3.200%, due 07/01/26 | 60,000 | 56,813 | |||||||||
| Ford Motor Credit Co. LLC 4.542%, due 08/01/26 | 300,000 | 274,446 | |||||||||
| Fox Corp. 3.050%, due 04/07/25 | 25,000 | 24,207 | |||||||||
5.576%, due 01/25/49 | 25,000 | 24,387 | |||||||||
| GE Capital International Funding Co. Unlimited Co. 3.373%, due 11/15/254 | 200,000 | 194,439 | |||||||||
| General Electric Co., Series D, 3 mo. USD LIBOR + 3.330%, 5.159%, due 09/15/222,4,5 | 99,000 | 86,744 | |||||||||
| General Motors Co. 6.125%, due 10/01/25 | 100,000 | 103,374 | |||||||||
6.600%, due 04/01/36 | 300,000 | 303,806 | |||||||||
| Gilead Sciences, Inc. 3.650%, due 03/01/26 | 75,000 | 73,654 | |||||||||
4.750%, due 03/01/46 | 50,000 | 47,933 | |||||||||
| GLP Capital LP/GLP Financing II, Inc. 5.250%, due 06/01/25 | 200,000 | 196,138 | |||||||||
| Goldman Sachs Group, Inc. 3.750%, due 02/25/26 | 200,000 | 196,049 | |||||||||
5.150%, due 05/22/45 | 30,000 | 28,495 | |||||||||
| Harley-Davidson Financial Services, Inc. 3.350%, due 06/08/251 | 200,000 | 192,165 | |||||||||
| Hillenbrand, Inc. 5.750%, due 06/15/25 | 200,000 | 204,000 | |||||||||
| Home Depot, Inc. 2.125%, due 09/15/264 | 100,000 | 94,638 | |||||||||
| Illinois Tool Works, Inc. 2.650%, due 11/15/26 | 80,000 | 76,507 | |||||||||
| International Game Technology PLC 6.500%, due 02/15/251 | 300,000 | 298,500 | |||||||||
| International Lease Finance Corp. 5.875%, due 08/15/22 | 120,000 | 120,226 | |||||||||
| iStar, Inc. 4.750%, due 10/01/24 | 200,000 | 188,269 | |||||||||
| JPMorgan Chase & Co. (fixed, converts to FRN on 01/23/28), 3.509%, due 01/23/292 | 150,000 | 140,303 | |||||||||
3.875%, due 09/10/24 | 350,000 | 349,313 | |||||||||
97
UBS Multi Income Bond Fund (formerly, UBS Total Return Bond Fund)
Portfolio of investments
June 30, 2022
| Face amount | Value | ||||||||||
Corporate bonds—(continued) | |||||||||||
United States—(continued) | |||||||||||
| Series I, 3 mo. USD LIBOR + 3.470%, 4.709%, due 10/30/222,5 | $ | 97,000 | $ | 91,956 | |||||||
| Kinder Morgan, Inc. 4.300%, due 03/01/28 | 350,000 | 340,486 | |||||||||
5.550%, due 06/01/45 | 40,000 | 37,672 | |||||||||
| Kroger Co. 6.900%, due 04/15/38 | 25,000 | 29,090 | |||||||||
| Liberty Mutual Group, Inc. 4.250%, due 06/15/231 | 45,000 | 44,967 | |||||||||
4.569%, due 02/01/291 | 155,000 | 152,405 | |||||||||
| Lumen Technologies, Inc. 5.625%, due 04/01/25 | 200,000 | 189,656 | |||||||||
| LYB International Finance BV 4.875%, due 03/15/44 | 50,000 | 45,079 | |||||||||
| Marathon Petroleum Corp. 4.750%, due 09/15/44 | 70,000 | 61,669 | |||||||||
| Masco Corp. 1.500%, due 02/15/28 | 400,000 | 335,603 | |||||||||
| McDonald's Corp. 4.875%, due 12/09/45 | 75,000 | 73,688 | |||||||||
| Meritor, Inc. 4.500%, due 12/15/281 | 250,000 | 240,705 | |||||||||
| MetLife, Inc. 6.400%, due 12/15/36 | 110,000 | 110,579 | |||||||||
| Microsoft Corp. 2.525%, due 06/01/50 | 100,000 | 73,653 | |||||||||
| Morgan Stanley 4.300%, due 01/27/45 | 50,000 | 44,396 | |||||||||
4.350%, due 09/08/26 | 140,000 | 138,553 | |||||||||
| MPLX LP 4.875%, due 06/01/25 | 70,000 | 70,333 | |||||||||
| Newell Brands, Inc. 4.875%, due 06/01/25 | 200,000 | 197,008 | |||||||||
| Olin Corp. 5.125%, due 09/15/27 | 200,000 | 183,835 | |||||||||
| Oncor Electric Delivery Co. LLC 3.750%, due 04/01/45 | 50,000 | 42,918 | |||||||||
| OneMain Finance Corp. 6.875%, due 03/15/25 | 200,000 | 189,552 | |||||||||
| Oracle Corp. 2.800%, due 04/01/27 | 100,000 | 91,201 | |||||||||
4.000%, due 11/15/47 | 50,000 | 37,077 | |||||||||
| Prudential Financial, Inc. 6.625%, due 06/21/40 | 50,000 | 57,668 | |||||||||
| QUALCOMM, Inc. 3.250%, due 05/20/27 | 60,000 | 58,672 | |||||||||
| Quanta Services, Inc. 0.950%, due 10/01/24 | 400,000 | 369,942 | |||||||||
| Rocket Mortgage LLC/Rocket Mortgage Co.-Issuer, Inc. 2.875%, due 10/15/261 | 300,000 | 247,923 | |||||||||
| Sabine Pass Liquefaction LLC 5.000%, due 03/15/27 | 400,000 | 400,968 | |||||||||
| Face amount | Value | ||||||||||
Corporate bonds—(concluded) | |||||||||||
United States—(concluded) | |||||||||||
| Seagate HDD Cayman 5.750%, due 12/01/344 | $ | 80,000 | $ | 70,392 | |||||||
| Sirius XM Radio, Inc. 3.125%, due 09/01/261 | 250,000 | 223,057 | |||||||||
| Southwest Airlines Co. 3.000%, due 11/15/26 | 200,000 | 186,702 | |||||||||
| Sprint Corp. 7.125%, due 06/15/24 | 250,000 | 256,562 | |||||||||
| Toll Brothers Finance Corp. 4.875%, due 03/15/27 | 250,000 | 236,569 | |||||||||
| Union Pacific Corp. 4.050%, due 11/15/45 | 40,000 | 35,200 | |||||||||
| United Rentals North America, Inc. 5.500%, due 05/15/27 | 300,000 | 294,199 | |||||||||
| Verizon Communications, Inc. 4.329%, due 09/21/28 | 400,000 | 397,822 | |||||||||
| Volkswagen Group of America Finance LLC 3.950%, due 06/06/25 | 250,000 | 245,325 | |||||||||
| Walt Disney Co. 4.950%, due 10/15/45 | 50,000 | 50,028 | |||||||||
| WESCO Distribution, Inc. 7.125%, due 06/15/251 | 250,000 | 249,457 | |||||||||
| Yale University, Series 2020, 1.482%, due 04/15/30 | 100,000 | 84,739 | |||||||||
16,214,064 | |||||||||||
| Total corporate bonds (cost $21,186,248) | 20,166,880 | ||||||||||
Mortgage-backed securities: 10.7% | |||||||||||
United States: 10.7% | |||||||||||
| Arbor Multifamily Mortgage Securities Trust, Series 2021-MF3, Class B, 2.511%, due 10/15/541 | 150,000 | 118,421 | |||||||||
| BAMLL Commercial Mortgage Securities Trust, Series 2015-200P, Class D, 3.716%, due 04/14/331,6 | 100,000 | 92,200 | |||||||||
| BBCMS Trust, Series 2015-SRCH, Class B, 4.498%, due 08/10/351 | 135,000 | 127,916 | |||||||||
| BX Commercial Mortgage Trust, Series 2021-SOAR, Class D, 1 mo. USD LIBOR + 1.400%, 2.725%, due 06/15/381,2 | 148,872 | 140,647 | |||||||||
| BX Mortgage Trust, Series 2021-PAC, Class D, 1 mo. USD LIBOR + 1.298%, 2.623%, due 10/15/361,2 | 175,000 | 161,297 | |||||||||
| BX Trust, Series 2021-LGCY, Class D, 1 mo. USD LIBOR + 1.302%, 2.626%, due 10/15/231,2 | 400,000 | 369,435 | |||||||||
98
UBS Multi Income Bond Fund (formerly, UBS Total Return Bond Fund)
Portfolio of investments
June 30, 2022
| Face amount | Value | ||||||||||
Mortgage-backed securities—(concluded) | |||||||||||
United States—(concluded) | |||||||||||
| Extended Stay America Trust, Series 2021-ESH, Class D, 1 mo. USD LIBOR + 2.250%, 3.575%, due 07/15/381,2 | $ | 347,859 | $ | 335,630 | |||||||
| FREMF Mortgage Trust, Series 2017-K64, Class B, 4.131%, due 05/25/501,6 | 50,000 | 48,438 | |||||||||
| GS Mortgage Securities Corp. II, Series 2018-GS10, Class C, 4.555%, due 07/10/516 | 100,000 | 90,873 | |||||||||
| GS Mortgage Securities Trust, Series 2017-GS5, Class B, 4.047%, due 03/10/506 | 200,000 | 189,528 | |||||||||
| Med Trust, Series 2021-MDLN, Class D, 1 mo. USD LIBOR + 2.000%, 3.325%, due 11/15/381,2 | 300,000 | 285,688 | |||||||||
| MHC Commercial Mortgage Trust, Series 2021-MHC, Class D, 1 mo. USD LIBOR + 1.601%, 2.925%, due 04/15/381,2 | 300,000 | 283,053 | |||||||||
| Morgan Stanley Bank of America Merrill Lynch Trust, Series 2017-C34, Class C, 4.315%, due 11/15/526 | 100,000 | 91,534 | |||||||||
| ONE Mortgage Trust, Series 2021-PARK, Class C, 1 mo. USD LIBOR + 1.100%, 2.424%, due 03/15/361,2 | 375,000 | 353,121 | |||||||||
| SLG Office Trust, Series 2021-OVA, Class C, 2.851%, due 07/15/411 | 100,000 | 81,914 | |||||||||
| Starwood Retail Property Trust, Series 2014-STAR, Class C, 1 mo. USD LIBOR + 2.750%, 4.075%, due 11/15/271,2 | 125,000 | 1,523 | |||||||||
| Wells Fargo Commercial Mortgage Trust, Series 2018-C44, Class C, 4.994%, due 05/15/516 | 150,000 | 139,961 | |||||||||
| Total mortgage-backed securities (cost $3,300,214) | 2,911,179 | ||||||||||
Municipal bonds: 3.1% | |||||||||||
California: 1.2% | |||||||||||
| State of California, GO Bonds 7.300%, due 10/01/39 | 250,000 | 323,402 | |||||||||
Hawaii: 0.2% | |||||||||||
| State of Hawaii, GO Bonds, Series FZ, 2.245%, due 08/01/38 | 75,000 | 55,819 | |||||||||
Illinois: 0.2% | |||||||||||
| State of Illinois, GO Bonds, 6.630%, due 02/01/35 | 50,000 | 53,245 | |||||||||
| Face amount | Value | ||||||||||
Municipal bonds—(concluded) | |||||||||||
New York: 0.8% | |||||||||||
| New York State Dormitory Authority, Personal Income Tax, Refunding, Revenue Bonds, Series F, 2.657%, due 02/15/28 | $ | 150,000 | $ | 140,455 | |||||||
| New York State Urban Development Corp., Personal Income Tax, Refunding, Revenue Bonds, Series D-1, 3.150%, due 03/15/27 | 70,000 | 68,039 | |||||||||
208,494 | |||||||||||
Texas: 0.7% | |||||||||||
| City of San Antonio TX Electric & Gas Systems, Revenue Bonds 5.808%, due 02/01/41 | 105,000 | 122,635 | |||||||||
| Texas Transportation Commission, Taxable Refunding, GO Bonds 2.472%, due 10/01/44 | 100,000 | 75,417 | |||||||||
198,052 | |||||||||||
| Total municipal bonds (cost $910,889) | 839,012 | ||||||||||
Non-U.S. government agency obligations: 3.1% | |||||||||||
Colombia: 0.6% | |||||||||||
| Colombia Government International Bond 8.125%, due 05/21/24 | 155,000 | 160,745 | |||||||||
Indonesia: 0.4% | |||||||||||
| Indonesia Government International Bond 6.625%, due 02/17/371 | 100,000 | 109,113 | |||||||||
Mexico: 0.4% | |||||||||||
| Mexico Government International Bond 4.750%, due 03/08/44 | 150,000 | 124,247 | |||||||||
Panama: 0.1% | |||||||||||
| Panama Government International Bond 3.870%, due 07/23/60 | 50,000 | 35,478 | |||||||||
Peru: 0.8% | |||||||||||
| Peruvian Government International Bond 7.350%, due 07/21/25 | 200,000 | 215,787 | |||||||||
Turkey: 0.3% | |||||||||||
| Turkey Government International Bond 6.875%, due 03/17/36 | 100,000 | 72,988 | |||||||||
Uruguay: 0.5% | |||||||||||
| Uruguay Government International Bond 7.625%, due 03/21/36 | 100,000 | 124,987 | |||||||||
| Total non-U.S. government agency obligations (cost $944,258) | 843,345 | ||||||||||
99
UBS Multi Income Bond Fund (formerly, UBS Total Return Bond Fund)
Portfolio of investments
June 30, 2022
| Face amount | Value | ||||||||||
U.S. Treasury obligations: 7.1% | |||||||||||
United States: 7.1% | |||||||||||
| U.S. Treasury Bills 1.583%, due 09/22/227 | $ | 1,500,000 | $ | 1,494,622 | |||||||
1.593%, due 09/22/227 | 300,000 | 298,918 | |||||||||
| U.S. Treasury Inflation Indexed Notes (TIPS) 0.125%, due 01/15/32 | 156,414 | 148,468 | |||||||||
| Total U.S. Treasury obligations (cost $1,941,702) | 1,942,008 | ||||||||||
| Number of shares | |||||||||||
Short-term investments: 0.2% | |||||||||||
Investment companies: 0.2% | |||||||||||
| State Street Institutional U.S. Government Money Market Fund, 1.430%8 (cost $44,629) | 44,629 | 44,629 | |||||||||
| Number of shares | Value | ||||||||||
Investment of cash collateral from securities loaned: 2.1% | |||||||||||
Money market funds: 2.1% | |||||||||||
| State Street Navigator Securities Lending Government Money Market Portfolio, 1.535%8 (cost $572,970) | 572,970 | $ | 572,970 | ||||||||
| Total investments: 100.5% (cost $29,000,896) | 27,418,252 | ||||||||||
Liabilities in excess of other assets: (0.5%) | (147,121 | ) | |||||
Net assets: 100.0% | $ | 27,271,131 | |||||
For a listing of defined portfolio acronyms that are used throughout the Portfolio of investments as well as the tables that follow, please refer to the Glossary of terms used in the Portfolio of investments.
Futures contracts
| Number of contracts | Currency | Expiration date | Current notional amount | Value | Unrealized appreciation (depreciation) | ||||||||||||||||||||||
Interest rate futures buy contracts: | |||||||||||||||||||||||||||
34 | AUD | Australian Bond 3 Year Futures | September 2022 | $ | 2,519,145 | $ | 2,521,917 | $ | 2,772 | ||||||||||||||||||
U.S. Treasury futures buy contracts: | |||||||||||||||||||||||||||
2 | USD | U.S. Treasury Note 10 Year Futures | September 2022 | $ | 230,502 | $ | 237,062 | $ | 6,560 | ||||||||||||||||||
Total | $ | 2,749,647 | $ | 2,758,979 | $ | 9,332 | |||||||||||||||||||||
U.S. Treasury futures sell contracts: | |||||||||||||||||||||||||||
7 | USD | U.S. Long Bond Futures | September 2022 | $ | (953,302 | ) | $ | (970,375 | ) | $ | (17,073 | ) | |||||||||||||||
17 | USD | U.S. Treasury Note 2 Year Futures | September 2022 | (3,543,264 | ) | (3,570,265 | ) | (27,001 | ) | ||||||||||||||||||
22 | USD | U.S. Treasury Note 5 Year Futures | September 2022 | (2,425,983 | ) | (2,469,500 | ) | (43,517 | ) | ||||||||||||||||||
12 | USD | Ultra U.S. Treasury Note 10 Year Futures | September 2022 | (1,509,248 | ) | (1,528,500 | ) | (19,252 | ) | ||||||||||||||||||
Total | $ | (8,431,797 | ) | $ | (8,538,640 | ) | $ | (106,843 | ) | ||||||||||||||||||
Net unrealized appreciation (depreciation) | $ | (97,511 | ) | ||||||||||||||||||||||||
100
UBS Multi Income Bond Fund (formerly, UBS Total Return Bond Fund)
Portfolio of investments
June 30, 2022
Fair valuation summary
The following is a summary of the fair valuations according to the inputs used as of June 30, 2022 in valuing the Fund's investments. In the event a Fund holds investments for which fair value is measured using the NAV per share practical expedient (or its equivalent), a separate column will be added to the fair value hierarchy table; this is intended to permit reconciliation to the amounts presented in the Portfolio of investments:
Description | Unadjusted quoted prices in active markets for identical investments (Level 1) | Other significant observable inputs (Level 2) | Unobservable inputs (Level 3) | Total | |||||||||||||||
Assets | |||||||||||||||||||
Asset-backed security | $ | — | $ | 98,229 | $ | — | $ | 98,229 | |||||||||||
Corporate bonds | — | 20,166,880 | — | 20,166,880 | |||||||||||||||
Mortgage-backed securities | — | 2,911,179 | — | 2,911,179 | |||||||||||||||
Municipal bonds | — | 839,012 | — | 839,012 | |||||||||||||||
Non-U.S. government agency obligations | — | 843,345 | — | 843,345 | |||||||||||||||
U.S. Treasury obligations | — | 1,942,008 | — | 1,942,008 | |||||||||||||||
Short-term investments | — | 44,629 | — | 44,629 | |||||||||||||||
Investment of cash collateral from securities loaned | — | 572,970 | — | 572,970 | |||||||||||||||
Futures contracts | 9,332 | — | — | 9,332 | |||||||||||||||
Total | $ | 9,332 | $ | 27,418,252 | $ | — | $ | 27,427,584 | |||||||||||
Liabilities | |||||||||||||||||||
Futures contracts | $ | (106,843 | ) | $ | — | $ | — | $ | (106,843 | ) | |||||||||
At June 30, 2022, there were no transfers in or out of Level 3.
Portfolio footnotes
1 Security exempt from registration pursuant to Rule 144A under the Securities Act of 1933. These securities are considered liquid, unless noted otherwise, and may be resold in transactions exempt from registration, normally to qualified institutional buyers. Securities exempt from registration pursuant to Rule 144A, in the amount of $7,390,365, represented 27.1% of the Fund's net assets at period end.
2 Variable or floating rate security. The interest rate shown is the rate in effect as of period end and changes periodically.
3 Security was purchased pursuant to Regulation S under the Securities Act of 1933, which exempts from registration securities offered and sold outside of the United States. Such a security cannot be sold in the United States without either an effective registration statement filed pursuant to the Securities Act of 1933, or pursuant to an exemption from registration.
4 Security, or portion thereof, was on loan at the period end.
5 Perpetual investment. Date shown reflects the next call date.
6 Variable or floating rate security for which the interest rate adjusts periodically based on changes in current interest rates and prepayments on the underlying pool of assets. Rate shown is the rate in effect as of period end.
7 Rate shown is the discount rate at the date of purchase unless otherwise noted.
8 Rates shown reflect yield at June 30, 2022.
101
The UBS Funds
Glossary of terms used in the Portfolio of investments
June 30, 2022
Portfolio acronyms
ADR American Depositary Receipt
AGM Assured Guaranty Municipal Corporation
CDO Collateralized Debt Obligation
CLO Collateralized Loan Obligation
COP Certificate of Participation
CPI Consumer Price Index
ETF Exchange Traded Fund
EURIBOR Euro Interbank Offered Rate
FHLMC Federal Home Loan Mortgage Corporation
FNMA Federal National Mortgage Association
FRN Floating Rate Note
GDR Global Depositary Receipt
GNMA Government National Mortgage Association
GO General Obligation
LIBOR London Interbank Offered Rate
NVDR Non-Voting Depository Receipt
OAT Obligation Assimilables du Trésor (French Government Bonds)
OTC Over The Counter
PJSC Private Joint Stock Company
REIT Real Estate Investment Trust
SOFR Secured Overnight Financing Rate
TBA To-Be-Announced Security
TIPS Treasury inflation protected securities
UMBS Uniform Mortgage-Backed Securities
Counterparty abbreviations
BB Barclays Bank PLC
BOA Bank of America NA
CIBC Canadian Imperial Bank of Commerce
CITI Citibank NA
GS Goldman Sachs International
HSBC HSBC Bank PLC
JPMCB JPMorgan Chase Bank
MSCI Morgan Stanley & Co. International PLC
SSC State Street Bank and Trust Co.
Currency abbreviations
AUD Australian Dollar
BRL Brazilian Real
CAD Canadian Dollar
CHF Swiss Franc
CLP Chilean Peso
CNY Chinese Yuan
COP Colombian Peso
EUR Euro
GBP Great Britain Pound
HKD Hong Kong Dollar
IDR Indonesian Rupiah
INR Indian Rupee
JPY Japanese Yen
KRW South Korean Won
MXN Mexican Peso
MYR Malaysian Ringgit
NOK Norwegian Krone
NZD New Zealand Dollar
PHP Philippine Peso
PLN Polish Zloty
RUB Russian Ruble
SEK Swedish Krona
SGD Singapore Dollar
THB Thailand Baht
TWD Taiwan Dollar
USD United States Dollar
See accompanying notes to financial statements.
102
The UBS Funds
June 30, 2022 (unaudited)
Explanation of expense disclosure
As a shareholder of the Funds, you incur two types of costs: (1) transactional costs (as applicable); including sales charges (loads); and (2) ongoing costs, including management fees; service and/or distribution (12b-1) fees (if applicable); and other Fund expenses. This example is intended to help you understand your ongoing costs (in dollars) of investing in each Fund and to compare these costs with the ongoing costs of investing in other mutual funds.
The example below is based on an investment of $1,000 invested at the beginning of the period and held for the entire period, January 31, 2022 to June 30, 2022 (unless otherwise noted).
Actual expenses
The first line for each class of shares in the table below provides information about actual account values and actual expenses. You may use the information in this line, together with the amount you invested, to estimate the expenses that you paid over a period. Simply divide your account value by $1,000 (for example, an $8,600 account value divided by $1,000 = 8.6), then multiply the result by the number in the first line under the heading entitled "Expenses paid during period" to estimate the expenses you paid on your account during this period.
Hypothetical example for comparison purposes
The second line for each class of shares in the table below provides information about hypothetical account values and hypothetical expenses based on that Fund's actual expense ratios for each class of shares and an assumed rate of return of 5% per year before expenses, which is not that Fund's actual return for each class of shares. The hypo- thetical account values and expenses may not be used to estimate the actual ending account balance or expenses you paid for the period. You may use this information to compare the ongoing costs of investing in a Fund and other funds. To do so, compare this 5% hypothetical example with the 5% hypothetical examples that appear in the shareholder reports of other funds.
Please note that the expenses shown in the table are meant to highlight your ongoing costs only and do not reflect any transactional costs (as applicable), such as sales charges (loads). Therefore, the second line in the table for each class of shares is useful in comparing ongoing costs only, and will not help you determine the relative total costs of owning different funds. In addition, if these transactional costs were included, your costs would have been higher.
103
The UBS Funds
June 30, 2022
| Beginning account value January 1, 2022 | Ending account value June 30, 2022 | Expenses paid during period 01/01/22 to 06/30/22* | Expense ratio during the period | ||||||||||||||||||||
UBS All China Equity Fund | |||||||||||||||||||||||
Class P | Actual | $ | 1,000.00 | $ | 889.00 | $ | 5.15 | 1.10 | % | ||||||||||||||
Hypothetical (5% annual return before expenses) | 1,000.00 | 1,019.34 | 5.51 | 1.10 | |||||||||||||||||||
Class P21 | Actual | 1,000.00 | 1,081.90 | 0.61 | 0.30 | ||||||||||||||||||
Hypothetical (5% annual return before expenses) | 1,000.00 | 1,023.31 | 1.51 | 0.30 | |||||||||||||||||||
UBS Dynamic Alpha Fund | |||||||||||||||||||||||
Class A | Actual | 1,000.00 | 939.60 | 6.49 | 1.35 | ||||||||||||||||||
Hypothetical (5% annual return before expenses) | 1,000.00 | 1,018.10 | 6.76 | 1.35 | |||||||||||||||||||
Class P | Actual | 1,000.00 | 939.80 | 5.29 | 1.10 | ||||||||||||||||||
Hypothetical (5% annual return before expenses) | 1,000.00 | 1,019.34 | 5.51 | 1.10 | |||||||||||||||||||
UBS Global Allocation Fund | |||||||||||||||||||||||
Class A | Actual | 1,000.00 | 835.70 | 5.46 | 1.20 | ||||||||||||||||||
Hypothetical (5% annual return before expenses) | 1,000.00 | 1,018.84 | 6.01 | 1.20 | |||||||||||||||||||
Class P | Actual | 1,000.00 | 837.50 | 4.33 | 0.95 | ||||||||||||||||||
Hypothetical (5% annual return before expenses) | 1,000.00 | 1,020.08 | 4.76 | 0.95 | |||||||||||||||||||
UBS Emerging Markets Equity Opportunity Fund | |||||||||||||||||||||||
Class P | Actual | 1,000.00 | 771.00 | 4.39 | 1.00 | ||||||||||||||||||
Hypothetical (5% annual return before expenses) | 1,000.00 | 1,019.84 | 5.01 | 1.00 | |||||||||||||||||||
Class P2 | Actual | 1,000.00 | 774.20 | 1.19 | 0.27 | ||||||||||||||||||
Hypothetical (5% annual return before expenses) | 1,000.00 | 1,023.46 | 1.35 | 0.27 | |||||||||||||||||||
UBS Engage For Impact Fund | |||||||||||||||||||||||
Class P | Actual | 1,000.00 | 742.40 | 3.67 | 0.85 | ||||||||||||||||||
Hypothetical (5% annual return before expenses) | 1,000.00 | 1,020.58 | 4.26 | 0.85 | |||||||||||||||||||
Class P2 | Actual | 1,000.00 | 744.40 | 1.08 | 0.25 | ||||||||||||||||||
Hypothetical (5% annual return before expenses) | 1,000.00 | 1,023.56 | 1.25 | 0.25 | |||||||||||||||||||
UBS International Sustainable Equity Fund | |||||||||||||||||||||||
Class A | Actual | 1,000.00 | 824.60 | 5.66 | 1.25 | ||||||||||||||||||
Hypothetical (5% annual return before expenses) | 1,000.00 | 1,018.60 | 6.26 | 1.25 | |||||||||||||||||||
Class P | Actual | 1,000.00 | 825.80 | 4.53 | 1.00 | ||||||||||||||||||
Hypothetical (5% annual return before expenses) | 1,000.00 | 1,019.84 | 5.01 | 1.00 | |||||||||||||||||||
Class P2 | Actual | 1,000.00 | 829.40 | 1.32 | 0.29 | ||||||||||||||||||
Hypothetical (5% annual return before expenses) | 1,000.00 | 1,023.36 | 1.45 | 0.29 | |||||||||||||||||||
* Expenses are equal to the Fund's annualized net expense ratios, multiplied by the average account value over the period, multiplied by 181 divided by 365 (to reflect the one-half year period).
1 The Class commenced operations on April 21, 2022. Expenses are equal to the Fund's annualized net expense ratio, multiplied by the average account value over the period, multiplied by 71 divided by 365 (to reflect the actual days in the period) for the actual example and 181 divided by 365 (to reflect the one-half year period) for the hypothetical example.
104
The UBS Funds
June 30, 2022
| Beginning account value January 1, 2022 | Ending account value June 30, 2022 | Expenses paid during period 01/01/22 to 06/30/22* | Expense ratio during the period | ||||||||||||||||||||
UBS US Dividend Ruler Fund | |||||||||||||||||||||||
Class P | Actual | $ | 1,000.00 | $ | 864.10 | $ | 2.31 | 0.50 | % | ||||||||||||||
Hypothetical (5% annual return before expenses) | 1,000.00 | 1,022.32 | 2.51 | 0.50 | |||||||||||||||||||
UBS US Quality Growth At Reasonable Price Fund | |||||||||||||||||||||||
Class P | Actual | 1,000.00 | 745.30 | 2.16 | 0.50 | ||||||||||||||||||
Hypothetical (5% annual return before expenses) | 1,000.00 | 1,022.32 | 2.51 | 0.50 | |||||||||||||||||||
UBS U.S. Small Cap Growth Fund | |||||||||||||||||||||||
Class A | Actual | 1,000.00 | 686.10 | 5.18 | 1.24 | ||||||||||||||||||
Hypothetical (5% annual return before expenses) | 1,000.00 | 1,018.65 | 6.21 | 1.24 | |||||||||||||||||||
Class P | Actual | 1,000.00 | 687.10 | 4.14 | 0.99 | ||||||||||||||||||
Hypothetical (5% annual return before expenses) | 1,000.00 | 1,019.89 | 4.96 | 0.99 | |||||||||||||||||||
UBS Sustainable Development Bank Bond Fund | |||||||||||||||||||||||
Class P | Actual | 1,000.00 | 924.80 | 1.19 | 0.25 | ||||||||||||||||||
Hypothetical (5% annual return before expenses) | 1,000.00 | 1,023.56 | 1.25 | 0.25 | |||||||||||||||||||
Class P2 | Actual | 1,000.00 | 925.50 | 0.72 | 0.15 | ||||||||||||||||||
Hypothetical (5% annual return before expenses) | 1,000.00 | 1,024.05 | 0.75 | 0.15 | |||||||||||||||||||
UBS Multi Income Bond Fund | |||||||||||||||||||||||
Class A | Actual | 1,000.00 | 865.50 | 3.47 | 0.75 | ||||||||||||||||||
Hypothetical (5% annual return before expenses) | 1,000.00 | 1,021.08 | 3.76 | 0.75 | |||||||||||||||||||
Class P | Actual | 1,000.00 | 866.70 | 2.31 | 0.50 | ||||||||||||||||||
Hypothetical (5% annual return before expenses) | 1,000.00 | 1,022.32 | 2.51 | 0.50 | |||||||||||||||||||
* Expenses are equal to the Fund's annualized net expense ratios, multiplied by the average account value over the period, multiplied by 181 divided by 365 (to reflect the one-half year period).
105
The UBS Funds
Financial statements
Statement of assets and liabilities—June 30, 2022
| UBS All China Equity Fund | UBS Dynamic Alpha Fund | UBS Global Allocation Fund | |||||||||||||
Assets: | |||||||||||||||
Investments, at cost | |||||||||||||||
Unaffiliated issuers | $ | 4,697,515 | $ | 34,096,864 | $ | 156,667,062 | |||||||||
Affiliated issuers | — | — | 45,307,989 | ||||||||||||
Foreign currency | 12,222 | 1,662,185 | 1,857,503 | ||||||||||||
Investments, at value | |||||||||||||||
Unaffiliated issuers1 | $ | 4,364,229 | $ | 24,600,826 | $ | 157,606,048 | |||||||||
Affiliated issuers | — | — | 37,147,291 | ||||||||||||
Foreign currency | 12,222 | 1,655,603 | 1,836,426 | ||||||||||||
Cash | 27,108 | 7,080 | — | ||||||||||||
Cash collateral on futures | — | 575,142 | 4,046,894 | ||||||||||||
Cash collateral on swap agreements | — | 147,232 | 2,191,752 | ||||||||||||
Cash collateral for forward foreign currency contracts | — | — | 200,000 | ||||||||||||
Due from broker | — | 837,355 | 782,843 | ||||||||||||
Receivable for investments sold | — | — | 1,000,748 | ||||||||||||
Receivable for fund shares sold | — | 2,163 | 1,710 | ||||||||||||
Receivable for interest and dividends | 4,794 | 103,601 | 146,238 | ||||||||||||
Receivable for foreign tax reclaims | — | — | 148,986 | ||||||||||||
Receivable from affiliate | 8,582 | — | — | ||||||||||||
Receivable for variation margin on centrally cleared swap agreements | — | 9,580 | 145,463 | ||||||||||||
Unrealized appreciation on forward foreign currency contracts | — | 445,060 | 915,121 | ||||||||||||
Other assets | 12,740 | 17,282 | 30,690 | ||||||||||||
Total assets | 4,429,675 | 28,400,924 | 206,200,210 | ||||||||||||
Liabilities: | |||||||||||||||
Due to broker | — | — | 181 | ||||||||||||
Payable for cash collateral from securities loaned | — | 171,623 | 1,736,422 | ||||||||||||
Payable for investments purchased | 2,092 | — | 9,639,239 | ||||||||||||
Payable for fund shares redeemed | — | 30,966 | 113,561 | ||||||||||||
Payable to affiliate | — | 17,051 | 119,253 | ||||||||||||
Payable to Trustees | 5,054 | 5,845 | 11,257 | ||||||||||||
Payable to custodian | 1,944 | 11,290 | 232,631 | ||||||||||||
Payable for foreign withholding taxes and foreign capital gains taxes | — | — | 1,681 | ||||||||||||
Payable for variation margin on futures contracts | — | 138,441 | 671,740 | ||||||||||||
OTC swap agreements, at value2 | — | — | 1,202,655 | ||||||||||||
Unrealized depreciation on forward foreign currency contracts | — | 496,393 | 1,348,196 | ||||||||||||
Accrued expenses and other liabilities | 96,388 | 148,572 | 213,901 | ||||||||||||
Total liabilities | 105,478 | 1,020,181 | 15,290,717 | ||||||||||||
Net assets | $ | 4,324,197 | $ | 27,380,743 | $ | 190,909,493 | |||||||||
1 Includes $108,382; $434,990 and $5,498,542, respectively of investments in securities on loan, at value, plus accrued interest and dividends, if any.
2 Net upfront payments made by UBS Global Allocation Fund was $0.
See accompanying notes to financial statements
106
The UBS Funds
Financial statements
Statement of assets and liabilities—June 30, 2022 (continued)
| UBS All China Equity Fund | UBS Dynamic Alpha Fund | UBS Global Allocation Fund | |||||||||||||
Net assets consist of: | |||||||||||||||
Beneficial interest | $ | 4,825,000 | $ | 72,645,386 | $ | 198,200,198 | |||||||||
Distributable earnings (accumulated losses) | (500,803 | ) | (45,264,643 | ) | (7,290,705 | ) | |||||||||
Net assets | $ | 4,324,197 | $ | 27,380,743 | $ | 190,909,493 | |||||||||
Class A | |||||||||||||||
Net assets | $ | — | $ | 16,570,093 | $ | 146,850,418 | |||||||||
Shares outstanding | — | 2,878,155 | 14,005,893 | ||||||||||||
Net asset value and redemption proceeds per share | — | $ | 5.76 | $ | 10.48 | ||||||||||
Maximum offering price per share (NAV per share plus maximum sales charge) | $ | — | $ | 6.10 | $ | 11.09 | |||||||||
Class P | |||||||||||||||
Net assets | $ | 1,128,330 | $ | 10,810,650 | $ | 44,059,075 | |||||||||
Shares outstanding | 178,322 | 1,822,904 | 4,073,710 | ||||||||||||
Net asset value, offering price and redemption value per share | $ | 6.33 | $ | 5.93 | $ | 10.82 | |||||||||
Class P2 | |||||||||||||||
Net assets | $ | 3,195,867 | $ | — | $ | — | |||||||||
Shares outstanding | 504,084 | — | — | ||||||||||||
Net asset value and offering price per share2 | $ | 6.34 | $ | — | $ | — | |||||||||
2 Assumes shares were held a sufficient period or are otherwise not subject to a redemption fee.
See accompanying notes to financial statements
107
The UBS Funds
Financial statements
Statement of assets and liabilities—June 30, 2022 (continued)
| UBS Emerging Markets Equity Opportunity Fund | UBS Engage For Impact Fund | UBS International Sustainable Equity Fund | |||||||||||||
Assets: | |||||||||||||||
Investments, at cost | |||||||||||||||
Unaffiliated issuers | $ | 732,929,587 | $ | 52,434,297 | $ | 258,034,886 | |||||||||
Foreign currency | 11,705,035 | 166,057 | 839,977 | ||||||||||||
Investments, at value | |||||||||||||||
Unaffiliated issuers1 | $ | 565,194,072 | $ | 45,644,093 | $ | 215,551,133 | |||||||||
Foreign currency | 11,626,632 | 164,237 | 823,376 | ||||||||||||
Cash | — | 13,030 | 30,322 | ||||||||||||
Receivable for investments sold | 2,927,971 | — | 2,447,633 | ||||||||||||
Receivable for fund shares sold | 1,112,319 | 583,745 | 951,831 | ||||||||||||
Receivable for interest and dividends | 3,998,460 | 12,185 | 176,549 | ||||||||||||
Receivable for foreign tax reclaims | 22,714 | 41,360 | 644,664 | ||||||||||||
Other assets | 58,659 | 19,022 | 47,987 | ||||||||||||
Total assets | 584,940,827 | 46,477,672 | 220,673,495 | ||||||||||||
Liabilities: | |||||||||||||||
Payable for cash collateral from securities loaned | — | — | 9,308,381 | ||||||||||||
Payable for investments purchased | 3,373,604 | — | 1,392,176 | ||||||||||||
Payable for fund shares redeemed | 2,827,520 | 27,670 | 224,570 | ||||||||||||
Payable to affiliate | 120,733 | 34,169 | 93,089 | ||||||||||||
Payable to Trustees | 24,643 | 6,577 | 12,814 | ||||||||||||
Payable to custodian | 185,995 | 6,902 | 42,316 | ||||||||||||
Payable for foreign withholding taxes and foreign capital gains taxes | 669,469 | 232 | 10,286 | ||||||||||||
Accrued expenses and other liabilities | 117,754 | 84,024 | 150,508 | ||||||||||||
Total liabilities | 7,319,718 | 159,574 | 11,234,140 | ||||||||||||
Net assets | $ | 577,621,109 | $ | 46,318,098 | $ | 209,439,355 | |||||||||
Net assets consist of: | |||||||||||||||
Beneficial interest | $ | 751,528,478 | $ | 52,738,967 | $ | 233,611,468 | |||||||||
Distributable earnings (accumulated losses) | (173,907,369 | ) | (6,420,869 | ) | (24,172,113 | ) | |||||||||
Net assets | $ | 577,621,109 | $ | 46,318,098 | $ | 209,439,355 | |||||||||
Class A | |||||||||||||||
Net assets | $ | — | $ | — | $ | 4,753,890 | |||||||||
Shares outstanding | — | — | 521,182 | ||||||||||||
Net asset value and redemption proceeds per share | — | — | $ | 9.12 | |||||||||||
Maximum offering price per share (NAV per share plus maximum sales charge) | $ | — | $ | — | $ | 9.65 | |||||||||
Class P | |||||||||||||||
Net assets | $ | 132,423,124 | $ | 6,311,889 | $ | 164,377,284 | |||||||||
Shares outstanding | 17,407,624 | 633,054 | 17,964,311 | ||||||||||||
Net asset value, offering price and redemption value per share | $ | 7.61 | $ | 9.97 | $ | 9.15 | |||||||||
Class P2 | |||||||||||||||
Net assets | $ | 445,197,985 | $ | 40,006,209 | $ | 40,308,181 | |||||||||
Shares outstanding | 58,004,714 | 4,004,953 | 4,388,504 | ||||||||||||
Net asset value and offering price per share2 | $ | 7.68 | $ | 9.99 | $ | 9.18 | |||||||||
1 Includes $0; $468,758 and $9,024,540, respectively of investments in securities on loan, at value, plus accrued interest and dividends, if any.
2 Assumes shares were held a sufficient period or are otherwise not subject to a redemption fee.
See accompanying notes to financial statements
108
The UBS Funds
Financial statements
Statement of assets and liabilities—June 30, 2022 (continued)
| UBS US Dividend Ruler Fund | UBS US Quality Growth At Reasonable Price Fund | UBS U.S. Small Cap Growth Fund | |||||||||||||
Assets: | |||||||||||||||
Investments, at cost | |||||||||||||||
Unaffiliated issuers | $ | 127,593,477 | $ | 189,607,104 | $ | 150,195,386 | |||||||||
Investments, at value | |||||||||||||||
Unaffiliated issuers1 | $ | 123,194,932 | $ | 166,970,685 | $ | 134,655,813 | |||||||||
Receivable for investments sold | — | — | 1,039,514 | ||||||||||||
Receivable for fund shares sold | 276,809 | 273,259 | 21,747 | ||||||||||||
Receivable for interest and dividends | 88,882 | 37,307 | 27,890 | ||||||||||||
Other assets | 22,281 | 26,961 | 20,531 | ||||||||||||
Total assets | 123,582,904 | 167,308,212 | 135,765,495 | ||||||||||||
Liabilities: | |||||||||||||||
Payable for cash collateral from securities loaned | 2,995,493 | — | 6,665,131 | ||||||||||||
Payable for investments purchased | 626,410 | — | 569,405 | ||||||||||||
Payable for fund shares redeemed | 985,203 | 160,926 | 63,199 | ||||||||||||
Payable to affiliate | 42,190 | 47,662 | 11,303 | ||||||||||||
Payable to Trustees | 8,669 | 10,445 | 9,615 | ||||||||||||
Payable to custodian | 3,166 | 3,917 | 4,471 | ||||||||||||
Accrued expenses and other liabilities | 92,431 | 105,844 | 175,843 | ||||||||||||
Total liabilities | 4,753,562 | 328,794 | 7,498,967 | ||||||||||||
Net assets | $ | 118,829,342 | $ | 166,979,418 | $ | 128,266,528 | |||||||||
Net assets consist of: | |||||||||||||||
Beneficial interest | $ | 120,693,611 | $ | 190,301,505 | $ | 139,446,257 | |||||||||
Distributable earnings (accumulated losses) | (1,864,269 | ) | (23,322,087 | ) | (11,179,729 | ) | |||||||||
Net assets | $ | 118,829,342 | $ | 166,979,418 | $ | 128,266,528 | |||||||||
Class A | |||||||||||||||
Net assets | $ | — | $ | — | $ | 17,387,307 | |||||||||
Shares outstanding | — | — | 1,189,253 | ||||||||||||
Net asset value and redemption proceeds per share | — | — | $ | 14.62 | |||||||||||
Maximum offering price per share (NAV per share plus maximum sales charge) | $ | — | $ | — | $ | 15.47 | |||||||||
Class P | |||||||||||||||
Net assets | $ | 118,829,342 | $ | 166,979,418 | $ | 110,879,221 | |||||||||
Shares outstanding | 10,042,915 | 15,630,455 | 6,345,239 | ||||||||||||
Net asset value, offering price and redemption value per share2 | $ | 11.83 | $ | 10.68 | $ | 17.47 | |||||||||
1 Includes $2,917,903; $0 and $9,557,317, respectively of investments in securities on loan, at value, plus accrued interest and dividends, if any.
2 Assumes shares were held a sufficient period or are otherwise not subject to a redemption fee.
See accompanying notes to financial statements
109
The UBS Funds
Financial statements
Statement of assets and liabilities—June 30, 2022 (concluded)
| UBS Sustainable Development Bank Bond Fund | UBS Multi Income Bond Fund | ||||||||||
Assets: | |||||||||||
Investments, at cost | |||||||||||
Unaffiliated issuers | $ | 84,368,175 | $ | 29,000,896 | |||||||
Foreign currency | — | 30,547 | |||||||||
Investments, at value | |||||||||||
Unaffiliated issuers1 | $ | 77,769,886 | $ | 27,418,252 | |||||||
Foreign currency | — | 33,762 | |||||||||
Cash | 16,399 | — | |||||||||
Cash collateral on futures | — | 123,503 | |||||||||
Due from broker | — | 112,304 | |||||||||
Receivable for investments sold | — | 534,619 | |||||||||
Receivable for fund shares sold | 179,493 | — | |||||||||
Receivable for interest and dividends | 321,028 | 280,844 | |||||||||
Receivable from affiliate | 11,024 | 90,684 | |||||||||
Receivable for variation margin on centrally cleared swap agreements | — | 38,171 | |||||||||
Other assets | 17,062 | 27,287 | |||||||||
Total assets | 78,314,892 | 28,659,426 | |||||||||
Liabilities: | |||||||||||
Due to broker | — | 4,287 | |||||||||
Payable for cash collateral from securities loaned | 875,000 | 572,970 | |||||||||
Payable for investments purchased | 284,816 | 203,377 | |||||||||
Payable for fund shares redeemed | 93,360 | 54,697 | |||||||||
Payable to Trustees | 7,535 | 5,888 | |||||||||
Payable to custodian | 2,825 | 323,142 | |||||||||
Payable for variation margin on futures contracts | — | 97,389 | |||||||||
Accrued expenses and other liabilities | 82,201 | 126,545 | |||||||||
Total liabilities | 1,345,737 | 1,388,295 | |||||||||
Net assets | $ | 76,969,155 | $ | 27,271,131 | |||||||
Net assets consist of: | |||||||||||
Beneficial interest | $ | 85,113,953 | $ | 33,599,270 | |||||||
Distributable earnings (accumulated losses) | (8,144,798 | ) | (6,328,139 | ) | |||||||
Net assets | $ | 76,969,155 | $ | 27,271,131 | |||||||
Class A | |||||||||||
Net assets | $ | — | $ | 569,584 | |||||||
Shares outstanding | — | 42,915 | |||||||||
Net asset value and redemption proceeds per share | — | $ | 13.27 | ||||||||
Maximum offering price per share (NAV per share plus maximum sales charge) | $ | — | $ | 13.79 | |||||||
Class P | |||||||||||
Net assets | $ | 8,052,152 | $ | 26,701,547 | |||||||
Shares outstanding | 837,044 | 2,010,784 | |||||||||
Net asset value, offering price and redemption value per share | $ | 9.62 | $ | 13.28 | |||||||
Class P2 | |||||||||||
Net assets | $ | 68,917,003 | $ | — | |||||||
Shares outstanding | 7,169,025 | — | |||||||||
Net asset value and offering price per share2 | $ | 9.61 | $ | — | |||||||
1 Includes $864,092 and $671,035, respectively of investments in securities on loan, at value, plus accrued interest and dividends, if any.
2 Assumes shares were held a sufficient period or are otherwise not subject to a redemption fee.
See accompanying notes to financial statements
110
The UBS Funds
Statement of operations
For the year ended June 30, 2022
| UBS All China Equity Fund | UBS Dynamic Alpha Fund | UBS Global Allocation Fund | |||||||||||||
Investment income: | |||||||||||||||
Unaffiliated dividends | $ | 44,882 | $ | 82,309 | $ | 857,237 | |||||||||
Affiliated dividends | — | — | 2,639,398 | ||||||||||||
Interest | 470 | 337,185 | 1,180,016 | ||||||||||||
Securities lending | 189 | 10,623 | 65,677 | ||||||||||||
Foreign tax withheld | (2,326 | ) | (36 | ) | (70,954 | ) | |||||||||
Total income | 43,215 | 430,081 | 4,671,374 | ||||||||||||
Expenses: | |||||||||||||||
Investment management and administration fees | 16,718 | 290,486 | 2,024,389 | ||||||||||||
Service and distribution fees—Class A | — | 47,457 | 446,382 | ||||||||||||
Transfer agency and related services fees—Class A | — | 17,476 | 102,589 | ||||||||||||
Transfer agency and related services fees—Class P | 9,000 | 15,286 | 19,154 | ||||||||||||
Transfer agency and related services fees—Class P2 | 19 | — | — | ||||||||||||
Custody and fund accounting fees | 4,811 | 47,229 | 74,923 | ||||||||||||
Trustees fees | 22,341 | 23,780 | 44,923 | ||||||||||||
Professional services fees | 142,598 | 158,797 | 176,036 | ||||||||||||
Printing and shareholder report fees | 2,211 | 9,790 | 38,958 | ||||||||||||
Federal and state registration fees | 12,654 | 35,064 | 34,103 | ||||||||||||
Interest expense | — | 42 | — | ||||||||||||
Amortization of offering costs | 42,774 | — | — | ||||||||||||
Other expenses | 50,337 | 52,707 | 100,839 | ||||||||||||
Total expenses | 303,463 | 698,114 | 3,062,296 | ||||||||||||
Fee waivers and/or expense reimbursements by Advisor | (287,299 | ) | (305,172 | ) | (418,006 | ) | |||||||||
Net expenses | 16,164 | 392,942 | 2,644,290 | ||||||||||||
Net investment income (loss) | 27,051 | 37,139 | 2,027,084 | ||||||||||||
Net realized gain (loss) on: | |||||||||||||||
Investments in unaffiliated issuers | (86,413 | ) | 2,202 | 7,601,649 | |||||||||||
Investments in affiliated issuers | — | — | (126,674 | ) | |||||||||||
Realized gain received as distribution from affiliated issuers | — | — | 1,606,912 | ||||||||||||
Futures contracts | — | 56,989 | (801,384 | ) | |||||||||||
Swap agreements | — | (45,307 | ) | (1,712,917 | ) | ||||||||||
Forward foreign currency contracts | — | 1,733,114 | 1,740,443 | ||||||||||||
Foreign currency transactions | 1,379 | (386,033 | ) | (239,156 | ) | ||||||||||
Net realized gain (loss) | (85,034 | ) | 1,360,965 | 8,068,873 | |||||||||||
Change in net unrealized appreciation (depreciation) on: | |||||||||||||||
Investments in unaffiliated issuers | (199,495 | ) | (2,814,345 | ) | (28,359,951 | ) | |||||||||
Investments in affiliated issuers | — | — | (11,898,692 | ) | |||||||||||
Futures contracts | — | (41,872 | ) | 170,999 | |||||||||||
Swap agreements | — | (92,249 | ) | (990,903 | ) | ||||||||||
Forward foreign currency contracts | — | (220,652 | ) | (345,789 | ) | ||||||||||
Translation of other assets and liabilities denominated in foreign currency | 11 | 31,300 | (140,169 | ) | |||||||||||
Net change in unrealized appreciation (depreciation) | (199,484 | ) | (3,137,818 | ) | (41,564,505 | ) | |||||||||
Net realized and unrealized gain (loss) | (284,518 | ) | (1,776,853 | ) | (33,495,632 | ) | |||||||||
Net increase (decrease) in net assets resulting from operations | $ | (257,467 | ) | $ | (1,739,714 | ) | $ | (31,468,548 | ) | ||||||
See accompanying notes to financial statements
111
The UBS Funds
Statement of operations
For the year ended June 30, 2022 (continued)
| UBS Emerging Markets Equity Opportunity Fund | UBS Engage For Impact Fund | UBS International Sustainable Equity Fund | |||||||||||||
Investment income: | |||||||||||||||
Unaffiliated dividends | $ | 27,166,896 | $ | 1,016,375 | $ | 6,633,673 | |||||||||
Interest | 24,765 | 2,045 | 1,994 | ||||||||||||
Securities lending | 22,899 | 84,914 | 37,901 | ||||||||||||
Foreign tax withheld | (2,659,755 | ) | (82,442 | ) | (726,403 | ) | |||||||||
Total income | 24,554,805 | 1,020,892 | 5,947,165 | ||||||||||||
Expenses: | |||||||||||||||
Investment management and administration fees | 7,575,100 | 446,065 | 2,892,463 | ||||||||||||
Service and distribution fees—Class A | — | — | 20,161 | ||||||||||||
Transfer agency and related services fees—Class A | — | — | 4,182 | ||||||||||||
Transfer agency and related services fees—Class P | 33,157 | 4,091 | 154,928 | ||||||||||||
Transfer agency and related services fees—Class P2 | 27,609 | 19,951 | 23,771 | ||||||||||||
Custody and fund accounting fees | 966,518 | 23,562 | 211,749 | ||||||||||||
Trustees fees | 109,489 | 26,579 | 58,213 | ||||||||||||
Professional services fees | 129,228 | 133,997 | 138,705 | ||||||||||||
Printing and shareholder report fees | 33,010 | 11,899 | 49,169 | ||||||||||||
Federal and state registration fees | 54,257 | 44,330 | 66,641 | ||||||||||||
Interest expense | 2,127 | — | 3,809 | ||||||||||||
Other expenses | 173,206 | 57,333 | 114,102 | ||||||||||||
Total expenses | 9,103,701 | 767,807 | 3,737,893 | ||||||||||||
Fee waivers and/or expense reimbursements by Advisor | (5,865,086 | ) | (584,271 | ) | (716,726 | ) | |||||||||
Net expenses | 3,238,615 | 183,536 | 3,021,167 | ||||||||||||
Net investment income (loss) | 21,316,190 | 837,356 | 2,925,998 | ||||||||||||
Net realized gain (loss) on: | |||||||||||||||
| Investments in unaffiliated issuers (including foreign capital gain tax expense of $(2,130,736);$0; $0, respectively) | 9,352,771 | 1,077,401 | 36,292,420 | ||||||||||||
Foreign currency transactions | (1,080,943 | ) | (4,899 | ) | (31,911 | ) | |||||||||
Net realized gain (loss) | 8,271,828 | 1,072,502 | 36,260,509 | ||||||||||||
Change in net unrealized appreciation (depreciation) on: | |||||||||||||||
| Investments in unaffiliated issuers (net of change in deferred foreign capital gain taxes of $2,365,505;$0; $0, respectively) | (321,886,649 | ) | (14,326,721 | ) | (98,753,024 | ) | |||||||||
Translation of other assets and liabilities denominated in foreign currency | (57,075 | ) | (4,770 | ) | (67,764 | ) | |||||||||
Net change in unrealized appreciation (depreciation) | (321,943,724 | ) | (14,331,491 | ) | (98,820,788 | ) | |||||||||
Net realized and unrealized gain (loss) | (313,671,896 | ) | (13,258,989 | ) | (62,560,279 | ) | |||||||||
Net increase (decrease) in net assets resulting from operations | $ | (292,355,706 | ) | $ | (12,421,633 | ) | $ | (59,634,281 | ) | ||||||
See accompanying notes to financial statements
112
The UBS Funds
Statement of operations
For the year ended June 30, 2022 (continued)
| UBS US Dividend Ruler Fund | UBS US Quality Growth At Reasonable Price Fund | UBS U.S. Small Cap Growth Fund | |||||||||||||
Investment income: | |||||||||||||||
Unaffiliated dividends | $ | 2,516,515 | $ | 1,276,264 | $ | 1,162,343 | |||||||||
Interest | 5,158 | 6,377 | 10,977 | ||||||||||||
Securities lending | 501 | — | 33,653 | ||||||||||||
Total income | 2,522,174 | 1,282,641 | 1,206,973 | ||||||||||||
Expenses: | |||||||||||||||
Investment management and administration fees | 642,109 | 942,798 | 1,641,218 | ||||||||||||
Service and distribution fees—Class A | — | — | 68,481 | ||||||||||||
Transfer agency and related services fees—Class A | — | — | 26,520 | ||||||||||||
Transfer agency and related services fees—Class P | 56,018 | 82,614 | 137,600 | ||||||||||||
Custody and fund accounting fees | 16,542 | 19,366 | 16,947 | ||||||||||||
Trustees fees | 34,093 | 40,353 | 39,335 | ||||||||||||
Professional services fees | 109,685 | 111,257 | 167,826 | ||||||||||||
Printing and shareholder report fees | 4,491 | 20,731 | 31,530 | ||||||||||||
Federal and state registration fees | 33,269 | 36,142 | 32,840 | ||||||||||||
Interest expense | — | 1,550 | — | ||||||||||||
Amortization of offering costs | 7,427 | 7,111 | — | ||||||||||||
Other expenses | 26,472 | 30,817 | 46,381 | ||||||||||||
Total expenses | 930,106 | 1,292,739 | 2,208,678 | ||||||||||||
Fee waivers and/or expense reimbursements by Advisor | (371,750 | ) | (471,365 | ) | (383,650 | ) | |||||||||
Net expenses | 558,356 | 821,374 | 1,825,028 | ||||||||||||
Net investment income (loss) | 1,963,818 | 461,267 | (618,055 | ) | |||||||||||
Net realized gain (loss) on: | |||||||||||||||
Investments in unaffiliated issuers | 2,252,143 | 1,074,362 | 20,275,446 | ||||||||||||
Net realized gain (loss) | 2,252,143 | 1,074,362 | 20,275,446 | ||||||||||||
Change in net unrealized appreciation (depreciation) on: | |||||||||||||||
Investments in unaffiliated issuers | (12,377,406 | ) | (37,564,158 | ) | (84,066,582 | ) | |||||||||
Net change in unrealized appreciation (depreciation) | (12,377,406 | ) | (37,564,158 | ) | (84,066,582 | ) | |||||||||
Net realized and unrealized gain (loss) | (10,125,263 | ) | (36,489,796 | ) | (63,791,136 | ) | |||||||||
Net increase (decrease) in net assets resulting from operations | $ | (8,161,445 | ) | $ | (36,028,529 | ) | $ | (64,409,191 | ) | ||||||
See accompanying notes to financial statements
113
The UBS Funds
Statement of operations
For the year ended June 30, 2022 (concluded)
| UBS Sustainable Development Bank Bond Fund | UBS Multi Income Bond Fund | ||||||||||
Investment income: | |||||||||||
Interest | 1,099,305 | 834,859 | |||||||||
Securities lending | 994 | 355 | |||||||||
Total income | 1,100,299 | 835,214 | |||||||||
Expenses: | |||||||||||
Investment management and administration fees | 192,223 | 187,546 | |||||||||
Service and distribution fees—Class A | — | 1,756 | |||||||||
Transfer agency and related services fees—Class A | — | 283 | |||||||||
Transfer agency and related services fees—Class P | 5,658 | 24,411 | |||||||||
Transfer agency and related services fees—Class P2 | 24,843 | — | |||||||||
Custody and fund accounting fees | 15,826 | 31,105 | |||||||||
Trustees fees | 31,777 | 21,588 | |||||||||
Professional services fees | 121,499 | 198,412 | |||||||||
Printing and shareholder report fees | 10,023 | 23,961 | |||||||||
Federal and state registration fees | 37,647 | 30,805 | |||||||||
Other expenses | 42,277 | 40,433 | |||||||||
Total expenses | 481,773 | 560,300 | |||||||||
Fee waivers and/or expense reimbursements by Advisor | (337,491 | ) | (395,461 | ) | |||||||
Net expenses | 144,282 | 164,839 | |||||||||
Net investment income (loss) | 956,017 | 670,375 | |||||||||
Net realized gain (loss) on: | |||||||||||
Investments in unaffiliated issuers | (1,498,327 | ) | (1,653,005 | ) | |||||||
Options and swaptions written | — | (4,922 | ) | ||||||||
Futures contracts | — | (630,617 | ) | ||||||||
Swap agreements | — | (10,872 | ) | ||||||||
Forward foreign currency contracts | — | 14,705 | |||||||||
Foreign currency transactions | — | (6,525 | ) | ||||||||
Net realized gain (loss) | (1,498,327 | ) | (2,291,236 | ) | |||||||
Change in net unrealized appreciation (depreciation) on: | |||||||||||
Investments in unaffiliated issuers | (7,101,603 | ) | (2,668,654 | ) | |||||||
Futures contracts | — | (173,316 | ) | ||||||||
Swap agreements | — | (2,618 | ) | ||||||||
Forward foreign currency contracts | — | (12,361 | ) | ||||||||
Translation of other assets and liabilities denominated in foreign currency | — | (1,226 | ) | ||||||||
Net change in unrealized appreciation (depreciation) | (7,101,603 | ) | (2,858,175 | ) | |||||||
Net realized and unrealized gain (loss) | (8,599,930 | ) | (5,149,411 | ) | |||||||
Net increase (decrease) in net assets resulting from operations | $ | (7,643,913 | ) | $ | (4,479,036 | ) | |||||
See accompanying notes to financial statements
114
The UBS Funds
Statement of changes in net assets
UBS All China Equity Fund | UBS Dynamic Alpha Fund | ||||||||||||||||||
For the years ended June 30, | For the years ended June 30, | ||||||||||||||||||
2022 | 20211 | 2022 | 20211 | ||||||||||||||||
From operations: | |||||||||||||||||||
Net investment income (loss) | $ | 27,051 | $ | 6,783 | $ | 37,139 | $ | (90,797 | ) | ||||||||||
Net realized gain (loss) | (85,034 | ) | (105,979 | ) | 1,360,965 | 3,618,601 | |||||||||||||
Net change in unrealized appreciation (depreciation) | (199,484 | ) | (133,800 | ) | (3,137,818 | ) | 1,175,817 | ||||||||||||
Net increase (decrease) in net assets resulting from operations | (257,467 | ) | (232,996 | ) | (1,739,714 | ) | 4,703,621 | ||||||||||||
Total distributions—Class A | — | — | (1,987,394 | ) | — | ||||||||||||||
Total distributions—Class P | (10,340 | ) | — | (1,304,338 | ) | — | |||||||||||||
Total distributions | (10,340 | ) | — | (3,291,732 | ) | — | |||||||||||||
From beneficial interest transactions: | |||||||||||||||||||
Proceeds from shares sold | 4,255,000 | 2,000,000 | 1,925,223 | 1,460,148 | |||||||||||||||
Cost of shares redeemed | (1,430,000 | ) | — | (6,532,257 | ) | (7,646,862 | ) | ||||||||||||
Shares issued on reinvestment of dividends and distributions | — | — | 2,946,277 | — | |||||||||||||||
Net increase (decrease) in net assets from beneficial interest transactions | 2,825,000 | 2,000,000 | (1,660,757 | ) | (6,186,714 | ) | |||||||||||||
Net increase (decrease) in net assets | 2,557,193 | 1,767,004 | (6,692,203 | ) | (1,483,093 | ) | |||||||||||||
Net assets: | |||||||||||||||||||
Beginning of year | 1,767,004 | — | 34,072,946 | 35,556,039 | |||||||||||||||
End of year | $ | 4,324,197 | $ | 1,767,004 | $ | 27,380,743 | $ | 34,072,946 | |||||||||||
1 For the period from February 24, 2021 (commencement of operations) through June 30, 2021.
See accompanying notes to financial statements
115
The UBS Funds
Statement of changes in net assets (continued)
UBS Global Allocation Fund | UBS Emerging Markets Equity Opportunity Fund | ||||||||||||||||||
For the years ended June 30, | For the years ended June 30, | ||||||||||||||||||
2022 | 2021 | 2022 | 2021 | ||||||||||||||||
From operations: | |||||||||||||||||||
Net investment income (loss) | $ | 2,027,084 | $ | 2,206,910 | $ | 21,316,190 | $ | 10,804,930 | |||||||||||
Net realized gain (loss) | 8,068,873 | 29,913,845 | 8,271,828 | 57,445,652 | |||||||||||||||
Net change in unrealized appreciation (depreciation) | (41,564,505 | ) | 22,845,567 | (321,943,724 | ) | 122,770,023 | |||||||||||||
Net increase (decrease) in net assets resulting from operations | (31,468,548 | ) | 54,966,322 | (292,355,706 | ) | 191,020,605 | |||||||||||||
Total distributions—Class A | (30,550,894 | ) | (3,057,684 | ) | — | — | |||||||||||||
Total distributions—Class P | (8,853,140 | ) | (1,019,866 | ) | (21,255,044 | ) | (1,771,622 | ) | |||||||||||
Total distributions—Class P2 | — | — | (57,727,189 | ) | (9,016,015 | ) | |||||||||||||
Total distributions | (39,404,034 | ) | (4,077,550 | ) | (78,982,233 | ) | (10,787,637 | ) | |||||||||||
From beneficial interest transactions: | |||||||||||||||||||
Proceeds from shares sold | 1,953,100 | 3,575,085 | 310,594,064 | 488,581,499 | |||||||||||||||
Cost of shares redeemed | (25,414,029 | ) | (34,517,066 | ) | (463,631,845 | ) | (117,310,941 | ) | |||||||||||
Shares issued on reinvestment of dividends and distributions | 36,087,640 | 3,739,203 | 65,976,764 | 8,182,239 | |||||||||||||||
Net increase (decrease) in net assets from beneficial interest transactions | 12,626,711 | (27,202,778 | ) | (87,061,017 | ) | 379,452,797 | |||||||||||||
Net increase (decrease) in net assets | (58,245,871 | ) | 23,685,994 | (458,398,956 | ) | 559,685,765 | |||||||||||||
Net assets: | |||||||||||||||||||
Beginning of year | 249,155,364 | 225,469,370 | 1,036,020,065 | 476,334,300 | |||||||||||||||
End of year | $ | 190,909,493 | $ | 249,155,364 | $ | 577,621,109 | $ | 1,036,020,065 | |||||||||||
See accompanying notes to financial statements
116
The UBS Funds
Statement of changes in net assets (continued)
UBS Engage For Impact Fund | UBS International Sustainable Equity Fund | ||||||||||||||||||
For the years ended June 30, | For the years ended June 30, | ||||||||||||||||||
2022 | 2021 | 2022 | 2021 | ||||||||||||||||
From operations: | |||||||||||||||||||
Net investment income (loss) | $ | 837,356 | $ | 255,555 | $ | 2,925,998 | $ | 2,697,378 | |||||||||||
Net realized gain (loss) | 1,072,502 | 4,971,813 | 36,260,509 | 23,151,011 | |||||||||||||||
Net change in unrealized appreciation (depreciation) | (14,331,491 | ) | 7,328,710 | (98,820,788 | ) | 51,616,793 | |||||||||||||
Net increase (decrease) in net assets resulting from operations | (12,421,633 | ) | 12,556,078 | (59,634,281 | ) | 77,465,182 | |||||||||||||
Total distributions—Class A | — | — | (730,948 | ) | (93,754 | ) | |||||||||||||
Total distributions—Class P | (942,904 | ) | (300,924 | ) | (30,035,006 | ) | (3,529,498 | ) | |||||||||||
Total distributions—Class P2 | (5,632,936 | ) | — | (4,530,273 | ) | (397,737 | ) | ||||||||||||
Total distributions | (6,575,840 | ) | (300,924 | ) | (35,296,227 | ) | (4,020,989 | ) | |||||||||||
From beneficial interest transactions: | |||||||||||||||||||
Proceeds from shares sold | 20,155,900 | 60,440,196 | 140,515,070 | 225,093,386 | |||||||||||||||
Cost of shares redeemed | (11,354,056 | ) | (48,693,360 | ) | (300,448,590 | ) | (81,050,264 | ) | |||||||||||
Shares issued on reinvestment of dividends and distributions | 6,005,611 | 265,026 | 32,668,089 | 3,628,047 | |||||||||||||||
Net increase (decrease) in net assets from beneficial interest transactions | 14,807,455 | 12,011,862 | (127,265,431 | ) | 147,671,169 | ||||||||||||||
Net increase (decrease) in net assets | (4,190,018 | ) | 24,267,016 | (222,195,939 | ) | 221,115,362 | |||||||||||||
Net assets: | |||||||||||||||||||
Beginning of year | 50,508,116 | 26,241,100 | 431,635,294 | 210,519,932 | |||||||||||||||
End of year | $ | 46,318,098 | $ | 50,508,116 | $ | 209,439,355 | $ | 431,635,294 | |||||||||||
See accompanying notes to financial statements
117
The UBS Funds
Statement of changes in net assets (continued)
UBS US Dividend Ruler Fund | UBS US Quality Growth At Reasonable Price Fund | ||||||||||||||||||
For the years ended June 30, | For the years ended June 30, | ||||||||||||||||||
2022 | 20211 | 2022 | 20211 | ||||||||||||||||
From operations: | |||||||||||||||||||
Net investment income (loss) | $ | 1,963,818 | $ | 675,132 | $ | 461,267 | $ | 196,830 | |||||||||||
Net realized gain (loss) | 2,252,143 | 1,273,902 | 1,074,362 | 2,667,603 | |||||||||||||||
Net change in unrealized appreciation (depreciation) | (12,377,406 | ) | 7,978,861 | (37,564,158 | ) | 14,927,739 | |||||||||||||
Net increase (decrease) in net assets resulting from operations | (8,161,445 | ) | 9,927,895 | (36,028,529 | ) | 17,792,172 | |||||||||||||
Total distributions—Class P | (3,293,706 | ) | (337,013 | ) | (4,820,744 | ) | (250,762 | ) | |||||||||||
Total distributions | (3,293,706 | ) | (337,013 | ) | (4,820,744 | ) | (250,762 | ) | |||||||||||
From beneficial interest transactions: | |||||||||||||||||||
Proceeds from shares sold | 71,850,798 | 84,691,033 | 138,717,101 | 123,322,191 | |||||||||||||||
Cost of shares redeemed | (26,430,377 | ) | (12,605,771 | ) | (51,795,876 | ) | (24,559,546 | ) | |||||||||||
Shares issued on reinvestment of dividends and distributions | 2,883,002 | 304,926 | 4,369,581 | 233,830 | |||||||||||||||
Net increase (decrease) in net assets from beneficial interest transactions | 48,303,423 | 72,390,188 | 91,290,806 | 98,996,475 | |||||||||||||||
Net increase (decrease) in net assets | 36,848,272 | 81,981,070 | 50,441,533 | 116,537,885 | |||||||||||||||
Net assets: | |||||||||||||||||||
Beginning of year | 81,981,070 | — | 116,537,885 | — | |||||||||||||||
End of year | $ | 118,829,342 | $ | 81,981,070 | $ | 166,979,418 | $ | 116,537,885 | |||||||||||
1 For the period from July 9, 2020 (commencement of operations) through June 30, 2021.
See accompanying notes to financial statements
118
The UBS Funds
Statement of changes in net assets (continued)
UBS U.S. Small Cap Growth Fund | UBS Sustainable Development Bank Bond Fund | ||||||||||||||||||
For the years ended June 30, | For the years ended June 30, | ||||||||||||||||||
2022 | 2021 | 2022 | 2021 | ||||||||||||||||
From operations: | |||||||||||||||||||
Net investment income (loss) | $ | (618,055 | ) | $ | (1,385,314 | ) | $ | 956,017 | $ | 647,062 | |||||||||
Net realized gain (loss) | 20,275,446 | 31,012,552 | (1,498,327 | ) | 224,614 | ||||||||||||||
Net change in unrealized appreciation (depreciation) | (84,066,582 | ) | 45,051,897 | (7,101,603 | ) | (1,610,586 | ) | ||||||||||||
Net increase (decrease) in net assets resulting from operations | (64,409,191 | ) | 74,679,135 | (7,643,913 | ) | (738,910 | ) | ||||||||||||
Total distributions—Class A | (6,291,832 | ) | (3,778,671 | ) | — | — | |||||||||||||
Total distributions—Class P | (29,326,529 | ) | (15,336,070 | ) | (178,495 | ) | (741,550 | ) | |||||||||||
Total distributions—Class P2 | — | — | (894,069 | ) | (1,108,472 | ) | |||||||||||||
Total distributions | (35,618,361 | ) | (19,114,741 | ) | (1,072,564 | ) | (1,850,022 | ) | |||||||||||
From beneficial interest transactions: | |||||||||||||||||||
Proceeds from shares sold | 26,374,812 | 63,802,582 | 47,284,643 | 88,763,287 | |||||||||||||||
Cost of shares redeemed | (46,610,413 | ) | (39,173,242 | ) | (45,692,038 | ) | (41,736,626 | ) | |||||||||||
Shares issued on reinvestment of dividends and distributions | 34,291,276 | 18,382,290 | 924,285 | 1,317,020 | |||||||||||||||
Net increase (decrease) in net assets from beneficial interest transactions | 14,055,675 | 43,011,630 | 2,516,890 | 48,343,681 | |||||||||||||||
Net increase (decrease) in net assets | (85,971,877 | ) | 98,576,024 | (6,199,587 | ) | 45,754,749 | |||||||||||||
Net assets: | |||||||||||||||||||
Beginning of year | 214,238,405 | 115,662,381 | 83,168,742 | 37,413,993 | |||||||||||||||
End of year | $ | 128,266,528 | $ | 214,238,405 | $ | 76,969,155 | $ | 83,168,742 | |||||||||||
See accompanying notes to financial statements
119
The UBS Funds
Statement of changes in net assets (concluded)
UBS Multi Income Bond Fund | |||||||||||
For the years ended June 30, | |||||||||||
2022 | 2021 | ||||||||||
From operations: | |||||||||||
Net investment income (loss) | $ | 670,375 | $ | 791,481 | |||||||
Net realized gain (loss) | (2,291,236 | ) | (547,424 | ) | |||||||
Net change in unrealized appreciation (depreciation) | (2,858,175 | ) | 514,088 | ||||||||
Net increase (decrease) in net assets resulting from operations | (4,479,036 | ) | 758,145 | ||||||||
Total distributions—Class A | (10,938 | ) | (11,047 | ) | |||||||
Total distributions—Class P | (578,263 | ) | (695,034 | ) | |||||||
Total distributions | (589,201 | ) | (706,081 | ) | |||||||
From beneficial interest transactions: | |||||||||||
Proceeds from shares sold | 244,295 | 333,021 | |||||||||
Cost of shares redeemed | (3,661,135 | ) | (3,311,690 | ) | |||||||
Shares issued on reinvestment of dividends and distributions | 446,620 | 539,109 | |||||||||
Net increase (decrease) in net assets from beneficial interest transactions | (2,970,220 | ) | (2,439,560 | ) | |||||||
Net increase (decrease) in net assets | (8,038,457 | ) | (2,387,496 | ) | |||||||
Net assets: | |||||||||||
Beginning of year | 35,309,588 | 37,697,084 | |||||||||
End of year | $ | 27,271,131 | $ | 35,309,588 | |||||||
See accompanying notes to financial statements
120
UBS All China Equity Fund
Financial highlights
The table below sets forth financial data for one share of beneficial interest outstanding throughout each period presented.
Class P
| Years ended June 30, 2022 | Period ended June 30, 20211 | ||||||||||
Net asset value, beginning of period | $ | 8.84 | $ | 10.00 | |||||||
Net investment income (loss)3 | 0.03 | 0.03 | |||||||||
Net realized and unrealized gain (loss) | (2.49 | ) | (1.19 | ) | |||||||
Net increase (decrease) from operations | (2.46 | ) | (1.16 | ) | |||||||
Dividends from net investment income | (0.05 | ) | — | ||||||||
Net asset value, end of period | $ | 6.33 | $ | 8.84 | |||||||
Total investment return4 | (27.86 | )% | (11.60 | )% | |||||||
Ratios to average net assets: | |||||||||||
Expenses before fee waivers and/or expense reimbursements | 19.95 | % | 20.92 | %5 | |||||||
Expenses after fee waivers and/or expense reimbursements | 1.10 | % | 1.10 | %5 | |||||||
Net investment income (loss) | 0.46 | % | 1.06 | %5 | |||||||
Supplemental data: | |||||||||||
Net assets, end of period (000's) | $ | 1,128 | $ | 1,767 | |||||||
Portfolio turnover | 13 | % | 6 | % | |||||||
Class P2
| Period ended June 30, 20222 | |||||||
Net asset value, beginning of period | $ | 5.86 | |||||
Net investment income (loss)3 | 0.05 | ||||||
Net realized and unrealized gain (loss) | 0.43 | ||||||
Net increase (decrease) from operations | 0.48 | ||||||
Net asset value, end of period | $ | 6.34 | |||||
Total investment return4 | 8.19 | % | |||||
Expenses before fee waivers and/or expense reimbursements | 7.65 | %5 | |||||
Expenses after fee waivers and/or expense reimbursements | 0.30 | %5 | |||||
Net investment income (loss) | 4.50 | %5 | |||||
Supplemental data: | |||||||
Net assets, end of period (000's) | $ | 3,196 | |||||
Portfolio turnover | 13 | % | |||||
1 For the period from February 24, 2021 (commencement of operations) through June 30, 2021.
2 For the period from April 21, 2022 (commencement of operations) through June 30, 2022.
3 Calculated using the average share method.
4 Total investment return is calculated assuming a $10,000 investment on the first day of each period reported, reinvestment of all dividends and distributions, if any, at net asset value on the ex-dividend dates, and a sale at net asset value on the last day of each period reported. The figures do not include any applicable redemption or program fees; results would be lower if they were included. Total investment return for periods less than one year has not been annualized. Returns do not reflect the deduction of taxes that a shareholder would pay on Fund dividends/distributions or the redemption of Fund shares.
5 Annualized.
See accompanying notes to financial statements
121
UBS Dynamic Alpha Fund
Financial highlights
The table below sets forth financial data for one share of beneficial interest outstanding throughout each year presented.
Class A
Years ended June 30, | |||||||||||||||||||||||
2022 | 2021 | 2020 | 2019 | 2018 | |||||||||||||||||||
Net asset value, beginning of year | $ | 6.83 | $ | 5.98 | $ | 6.36 | $ | 6.38 | $ | 6.52 | |||||||||||||
Net investment income (loss)1 | — | (0.02 | ) | 0.07 | 0.08 | 0.04 | |||||||||||||||||
Net realized and unrealized gain (loss) | (0.37 | ) | 0.87 | (0.15 | ) | (0.04 | ) | (0.18 | ) | ||||||||||||||
Net increase (decrease) from operations | (0.37 | ) | 0.85 | (0.08 | ) | 0.04 | (0.14 | ) | |||||||||||||||
Dividends from net investment income | (0.70 | ) | — | (0.30 | ) | (0.06 | ) | — | |||||||||||||||
Net asset value, end of year | $ | 5.76 | $ | 6.83 | $ | 5.98 | $ | 6.36 | $ | 6.38 | |||||||||||||
Total investment return2 | (5.92 | )% | 14.21 | % | (1.45 | )% | 0.60 | % | (2.15 | )% | |||||||||||||
Ratios to average net assets: | |||||||||||||||||||||||
Expenses before fee waivers and/or expense reimbursements | 2.31 | %3 | 2.29 | %3 | 2.00 | %3 | 2.02 | %3 | 1.69 | % | |||||||||||||
Expenses after fee waivers and/or expense reimbursements | 1.35 | %3 | 1.35 | %3 | 1.35 | %3 | 1.35 | %3 | 1.35 | % | |||||||||||||
Net investment income (loss) | 0.02 | % | (0.36 | )% | 1.06 | % | 1.29 | % | 0.57 | % | |||||||||||||
Supplemental data: | |||||||||||||||||||||||
Net assets, end of year (000's) | $ | 16,570 | $ | 20,671 | $ | 21,273 | $ | 30,025 | $ | 31,066 | |||||||||||||
Portfolio turnover | 9 | % | 27 | % | 62 | % | 32 | % | 31 | % | |||||||||||||
Class P
Years ended June 30, | |||||||||||||||||||||||
2022 | 2021 | 2020 | 2019 | 2018 | |||||||||||||||||||
Net asset value, beginning of year | $ | 7.02 | $ | 6.13 | $ | 6.52 | $ | 6.53 | $ | 6.66 | |||||||||||||
Net investment income (loss)1 | 0.02 | (0.01 | ) | 0.08 | 0.10 | 0.06 | |||||||||||||||||
Net realized and unrealized gain (loss) | (0.39 | ) | 0.90 | (0.15 | ) | (0.04 | ) | (0.19 | ) | ||||||||||||||
Net increase (decrease) from operations | (0.37 | ) | 0.89 | (0.07 | ) | 0.06 | (0.13 | ) | |||||||||||||||
Dividends from net investment income | (0.72 | ) | — | (0.32 | ) | (0.07 | ) | — | |||||||||||||||
Net asset value, end of year | $ | 5.93 | $ | 7.02 | $ | 6.13 | $ | 6.52 | $ | 6.53 | |||||||||||||
Total investment return2 | (5.78 | )% | 14.52 | % | (1.28 | )% | 0.83 | % | (1.80 | )% | |||||||||||||
Ratios to average net assets: | |||||||||||||||||||||||
Expenses before fee waivers and/or expense reimbursements | 2.09 | %3 | 2.06 | %3 | 1.75 | %3 | 1.70 | %3 | 1.43 | % | |||||||||||||
Expenses after fee waivers and/or expense reimbursements | 1.10 | %3 | 1.10 | %3 | 1.10 | %3 | 1.10 | %3 | 1.10 | % | |||||||||||||
Net investment income (loss) | 0.27 | % | (0.11 | )% | 1.31 | % | 1.52 | % | 0.94 | % | |||||||||||||
Supplemental data: | |||||||||||||||||||||||
Net assets, end of year (000's) | $ | 10,811 | $ | 13,402 | $ | 14,283 | $ | 19,357 | $ | 30,647 | |||||||||||||
Portfolio turnover | 9 | % | 27 | % | 62 | % | 32 | % | 31 | % | |||||||||||||
1 Calculated using the average share method.
2 Total investment return is calculated assuming a $10,000 investment on the first day of each year reported, reinvestment of all dividends and distributions, if any, at net asset value on the ex-dividend dates, and a sale at net asset value on the last day of each year reported. The figures do not include any applicable sales charges, redemption or program fees; results would be lower if they were included. Returns do not reflect the deduction of taxes that a shareholder would pay on Fund dividends/distributions or the redemption of Fund shares.
3 Includes interest expense representing less than 0.005%.
See accompanying notes to financial statements
122
UBS Global Allocation Fund
Financial highlights
The table below sets forth financial data for one share of beneficial interest outstanding throughout each year presented.
Class A
Years ended June 30, | |||||||||||||||||||||||
2022 | 2021 | 2020 | 2019 | 2018 | |||||||||||||||||||
Net asset value, beginning of year | $ | 14.61 | $ | 11.82 | $ | 12.56 | $ | 12.08 | $ | 11.52 | |||||||||||||
Net investment income (loss)1 | 0.11 | 0.12 | 0.12 | 0.12 | 0.05 | ||||||||||||||||||
Net realized and unrealized gain (loss) | (1.83 | ) | 2.89 | 0.02 | 0.36 | 0.68 | |||||||||||||||||
Net increase (decrease) from operations | (1.72 | ) | 3.01 | 0.14 | 0.48 | 0.73 | |||||||||||||||||
Dividends from net investment income | (0.16 | ) | (0.07 | ) | (0.35 | ) | — | (0.17 | ) | ||||||||||||||
Distributions from net realized gains | (2.25 | ) | (0.15 | ) | (0.53 | ) | — | — | |||||||||||||||
Total dividends and distributions | (2.41 | ) | (0.22 | ) | (0.88 | ) | — | (0.17 | ) | ||||||||||||||
Net asset value, end of year | $ | 10.48 | $ | 14.61 | $ | 11.82 | $ | 12.56 | $ | 12.08 | |||||||||||||
Total investment return2 | (14.05 | )% | 25.58 | % | 0.79 | % | 3.97 | %3 | 6.34 | % | |||||||||||||
Ratios to average net assets: | |||||||||||||||||||||||
Expenses before fee waivers and/or expense reimbursements | 1.39 | % | 1.41 | % | 1.42 | %4 | 1.40 | %4 | 1.40 | % | |||||||||||||
Expenses after fee waivers and/or expense reimbursements | 1.20 | % | 1.20 | % | 1.20 | %4 | 1.20 | %4 | 1.20 | % | |||||||||||||
Net investment income (loss) | 0.82 | % | 0.85 | % | 1.01 | % | 1.04 | % | 0.39 | % | |||||||||||||
Supplemental data: | |||||||||||||||||||||||
Net assets, end of year (000's) | $ | 146,850 | $ | 192,772 | $ | 174,159 | $ | 209,407 | $ | 159,678 | |||||||||||||
Portfolio turnover | 125 | % | 128 | % | 120 | % | 35 | % | 54 | % | |||||||||||||
Class P
Years ended June 30, | |||||||||||||||||||||||
2022 | 2021 | 2020 | 2019 | 2018 | |||||||||||||||||||
Net asset value, beginning of year | $ | 15.00 | $ | 12.13 | $ | 12.87 | $ | 12.34 | $ | 11.78 | |||||||||||||
Net investment income (loss)1 | 0.14 | 0.15 | 0.16 | 0.16 | 0.08 | ||||||||||||||||||
Net realized and unrealized gain (loss) | (1.87 | ) | 2.97 | 0.02 | 0.37 | 0.68 | |||||||||||||||||
Net increase (decrease) from operations | (1.73 | ) | 3.12 | 0.18 | 0.53 | 0.76 | |||||||||||||||||
Dividends from net investment income | (0.20 | ) | (0.10 | ) | (0.39 | ) | — | (0.20 | ) | ||||||||||||||
Distributions from net realized gains | (2.25 | ) | (0.15 | ) | (0.53 | ) | — | — | |||||||||||||||
Total dividends and distributions | (2.45 | ) | (0.25 | ) | (0.92 | ) | — | (0.20 | ) | ||||||||||||||
Net asset value, end of year | $ | 10.82 | $ | 15.00 | $ | 12.13 | $ | 12.87 | $ | 12.34 | |||||||||||||
Total investment return2 | (13.78 | )% | 25.88 | % | 1.02 | % | 4.21 | %3 | 6.56 | % | |||||||||||||
Ratios to average net assets: | |||||||||||||||||||||||
Expenses before fee waivers and/or expense reimbursements | 1.11 | % | 1.14 | % | 1.14 | %4 | 1.13 | %4 | 1.14 | % | |||||||||||||
Expenses after fee waivers and/or expense reimbursements | 0.95 | % | 0.95 | % | 0.95 | %4 | 0.95 | %4 | 0.95 | % | |||||||||||||
Net investment income (loss) | 1.07 | % | 1.10 | % | 1.27 | % | 1.27 | % | 0.64 | % | |||||||||||||
Supplemental data: | |||||||||||||||||||||||
Net assets, end of year (000's) | $ | 44,059 | $ | 56,383 | $ | 51,311 | $ | 57,803 | $ | 64,009 | |||||||||||||
Portfolio turnover | 125 | % | 128 | % | 120 | % | 35 | % | 54 | % | |||||||||||||
1 Calculated using the average share method.
2 Total investment return is calculated assuming a $10,000 investment on the first day of each year reported, reinvestment of all dividends and distributions, if any, at net asset value on the ex-dividend dates, and a sale at net asset value on the last day of each year reported. The figures do not include any applicable sales charges, redemption or program fees; results would be lower if they were included. Returns do not reflect the deduction of taxes that a shareholder would pay on Fund dividends/distributions or the redemption of Fund shares.
3 During the year, the Fund recorded a gain of $263,116 from affiliated funds that were previously liquidated. If this gain had been excluded, the total return of Class A and Class P would have been 3.89% and 4.13%, respectively.
4 Includes interest expense representing less than 0.005%.
See accompanying notes to financial statements
123
UBS Emerging Markets Equity Opportunity Fund
Financial highlights
The table below sets forth financial data for one share of beneficial interest outstanding throughout each period presented.
Class P
Years ended June 30, | Period ended | ||||||||||||||||||
2022 | 2021 | 2020 | June 30, 20191 | ||||||||||||||||
Net asset value, beginning of period | $ | 12.39 | $ | 9.23 | $ | 9.28 | $ | 8.92 | |||||||||||
Net investment income (loss)2 | 0.20 | 0.09 | 0.19 | 0.21 | |||||||||||||||
Net realized and unrealized gain (loss) | (3.92 | ) | 3.18 | 0.003 | 0.15 | ||||||||||||||
Net increase (decrease) from operations | (3.72 | ) | 3.27 | 0.19 | 0.36 | ||||||||||||||
Dividends from net investment income | (0.12 | ) | (0.11 | ) | (0.24 | ) | — | ||||||||||||
Distributions from net realized gains | (0.94 | ) | — | — | — | ||||||||||||||
Total dividends and distributions | (1.06 | ) | (0.11 | ) | (0.24 | ) | — | ||||||||||||
Net asset value, end of period | $ | 7.61 | $ | 12.39 | $ | 9.23 | $ | 9.28 | |||||||||||
Total investment return4 | (31.71 | )% | 35.51 | % | 1.84 | % | 4.04 | % | |||||||||||
Ratios to average net assets: | |||||||||||||||||||
Expenses before fee waivers and/or expense reimbursements | 1.15 | %7 | 1.08 | % | 1.19 | % | 1.22 | %5 | |||||||||||
Expenses after fee waivers and/or expense reimbursements | 1.00 | %7 | 1.00 | % | 1.04 | % | 1.15 | %5 | |||||||||||
Net investment income (loss) | 1.98 | % | 0.73 | % | 2.14 | % | 5.73 | %5 | |||||||||||
Supplemental data: | |||||||||||||||||||
Net assets, end of period (000's) | $ | 132,423 | $ | 274,359 | $ | 100,543 | $ | 38,465 | |||||||||||
Portfolio turnover | 57 | % | 41 | % | 50 | % | 52 | % | |||||||||||
Class P2
Years ended June 30, | Period ended | ||||||||||||||||||||||
2022 | 2021 | 2020 | 2019 | June 30, 20186 | |||||||||||||||||||
Net asset value, beginning of period | $ | 12.52 | $ | 9.30 | $ | 9.31 | $ | 9.40 | $ | 10.00 | |||||||||||||
Net investment income (loss)2 | 0.30 | 0.18 | 0.26 | 0.19 | 0.03 | ||||||||||||||||||
Net realized and unrealized gains (losses) | (3.96 | ) | 3.22 | 0.003 | (0.23 | ) | (0.63 | ) | |||||||||||||||
Net increase (decrease) from operations | (3.66 | ) | 3.40 | 0.26 | (0.04 | ) | (0.60 | ) | |||||||||||||||
Dividends from net investment income | (0.24 | ) | (0.18 | ) | (0.27 | ) | (0.05 | ) | — | ||||||||||||||
Distributions from net realized gains | (0.94 | ) | — | — | — | — | |||||||||||||||||
Total dividends and distributions | (1.18 | ) | (0.18 | ) | (0.27 | ) | (0.05 | ) | — | ||||||||||||||
Net asset value, end of period | $ | 7.68 | $ | 12.52 | $ | 9.30 | $ | 9.31 | $ | 9.40 | |||||||||||||
Total investment return4 | (31.10 | )% | 36.66 | % | 2.66 | % | (0.46 | )% | (5.90 | )% | |||||||||||||
Ratios to average net assets: | |||||||||||||||||||||||
Expenses before fee waivers and/or expense reimbursements | 1.13 | %7 | 1.06 | % | 1.17 | % | 1.42 | % | 4.39 | %5 | |||||||||||||
Expenses after fee waivers and/or expense reimbursements | 0.19 | %7 | 0.12 | % | 0.22 | % | 0.40 | % | 0.44 | %5 | |||||||||||||
Net investment income (loss) | 2.90 | % | 1.56 | % | 2.88 | % | 2.16 | % | 4.05 | %5 | |||||||||||||
Supplemental data: | |||||||||||||||||||||||
Net assets, end of period (000's) | $ | 445,198 | $ | 761,661 | $ | 375,791 | $ | 186,941 | $ | 94,349 | |||||||||||||
Portfolio turnover | 57 | % | 41 | % | 50 | % | 52 | % | 0 | % | |||||||||||||
1 For the period January 31, 2019 (commencement of operations) through June 30, 2019.
2 Calculated using the average share method.
3 Amount represents less than $0.005 per share.
4 Total investment return is calculated assuming a $10,000 investment on the first day of each period reported, reinvestment of all dividends and distributions, if any, at net asset value on the ex-dividend dates, and a sale at net asset value on the last day of each period reported. The figures do not include any applicable redemption or program fees; results would be lower if they were included. Total investment return for periods less than one year has not been annualized. Returns do not reflect the deduction of taxes that a shareholder would pay on Fund dividends/distributions or the redemption of Fund shares.
5 Annualized.
6 For the period June 4, 2018 (commencement of operations) through June 30, 2018.
7 Includes interest expense representing less than 0.005%.
See accompanying notes to financial statements
124
UBS Engage For Impact Fund
Financial highlights
The table below sets forth financial data for one share of beneficial interest outstanding throughout each period presented.
Class P
Years ended June 30, | Period ended | ||||||||||||||||||
2022 | 2021 | 2020 | June 30, 20191 | ||||||||||||||||
Net asset value, beginning of period | $ | 14.26 | $ | 10.14 | $ | 10.81 | $ | 10.00 | |||||||||||
Net investment income (loss)3 | 0.14 | 0.03 | 0.08 | 0.15 | |||||||||||||||
Net realized and unrealized gain (loss) | (2.82 | ) | 4.19 | (0.45 | ) | 0.67 | |||||||||||||
Net increase (decrease) from operations | (2.68 | ) | 4.22 | (0.37 | ) | 0.82 | |||||||||||||
Dividends from net investment income | (0.08 | ) | (0.02 | ) | (0.11 | ) | (0.01 | ) | |||||||||||
Distributions from net realized gains | (1.53 | ) | (0.08 | ) | (0.19 | ) | — | ||||||||||||
Total dividends and distributions | (1.61 | ) | (0.10 | ) | (0.30 | ) | (0.01 | ) | |||||||||||
Net asset value, end of period | $ | 9.97 | $ | 14.26 | $ | 10.14 | $ | 10.81 | |||||||||||
Total investment return4 | (21.28 | )% | 41.70 | % | (3.77 | )% | 8.27 | % | |||||||||||
Ratios to average net assets: | |||||||||||||||||||
Expenses before fee waivers and/or expense reimbursements | 1.44 | % | 1.69 | % | 2.27 | % | 3.87 | %5 | |||||||||||
Expenses after fee waivers and/or expense reimbursements | 0.85 | % | 0.85 | % | 0.85 | % | 0.85 | %5 | |||||||||||
Net investment income (loss) | 1.04 | % | 0.27 | % | 0.75 | % | 2.13 | %5 | |||||||||||
Supplemental data: | |||||||||||||||||||
Net assets, end of period (000's) | $ | 6,312 | $ | 7,816 | $ | 26,241 | $ | 15,918 | |||||||||||
Portfolio turnover | 39 | % | 78 | % | 43 | % | 67 | % | |||||||||||
Class P2
| Year ended June 30, 2022 | Period ended June 30, 20212 | ||||||||||
Net asset value, beginning of period | $ | 14.29 | $ | 13.64 | |||||||
Net investment income (loss)3 | 0.22 | 0.09 | |||||||||
Net realized and unrealized gain (loss) | (2.82 | ) | 0.56 | ||||||||
Net increase (decrease) from operations | (2.60 | ) | 0.65 | ||||||||
Dividends from net investment income | (0.17 | ) | — | ||||||||
Distributions from net realized gains | (1.53 | ) | — | ||||||||
Total dividends and distributions | (1.70 | ) | — | ||||||||
Net asset value, end of period | $ | 9.99 | $ | 14.29 | |||||||
Total investment return4 | (20.77 | )% | 4.77 | % | |||||||
Expenses before fee waivers and/or expense reimbursements | 1.42 | % | 2.24 | %5 | |||||||
Expenses after fee waivers and/or expense reimbursements | 0.25 | % | 0.25 | %5 | |||||||
Net investment income (loss) | 1.64 | % | 1.80 | %5 | |||||||
Supplemental data: | |||||||||||
Net assets, end of period (000's) | $ | 40,006 | $ | 42,692 | |||||||
Portfolio turnover | 39 | % | 78 | % | |||||||
1 For the period October 24, 2018 (commencement of operations) through June 30, 2019.
2 For the period February 23, 2021 (commencement of operations) through June 30, 2021.
3 Calculated using the average share method.
4 Total investment return is calculated assuming a $10,000 investment on the first day of each period reported, reinvestment of all dividends and distributions, if any, at net asset value on the ex-dividend dates, and a sale at net asset value on the last day of each period reported. The figures do not include any applicable redemption or program fees; results would be lower if they were included. Total investment return for periods less than one year has not been annualized. Returns do not reflect the deduction of taxes that a shareholder would pay on Fund dividends/distributions or the redemption of Fund shares.
5 Annualized.
See accompanying notes to financial statements
125
UBS International Sustainable Equity Fund
Financial highlights
The table below sets forth financial data for one share of beneficial interest outstanding throughout each period presented.
Class A
Years ended June 30, | |||||||||||||||||||||||
2022 | 2021 | 2020 | 2019 | 2018 | |||||||||||||||||||
Net asset value, beginning of year | $ | 12.48 | $ | 9.62 | $ | 10.01 | $ | 10.20 | $ | 9.58 | |||||||||||||
Net investment income (loss)2 | 0.08 | 0.05 | 0.16 | 0.13 | 0.08 | ||||||||||||||||||
Net realized and unrealized gain (loss) | (2.38 | ) | 2.93 | (0.42 | ) | (0.16 | ) | 0.66 | |||||||||||||||
Net increase (decrease) from operations | (2.30 | ) | 2.98 | (0.26 | ) | (0.03 | ) | 0.74 | |||||||||||||||
Dividends from net investment income | (0.12 | ) | (0.12 | ) | (0.13 | ) | (0.06 | ) | (0.12 | ) | |||||||||||||
Distributions from net realized gains | (0.94 | ) | — | — | (0.10 | ) | — | ||||||||||||||||
Total dividends and distributions | (1.06 | ) | (0.12 | ) | (0.13 | ) | (0.16 | ) | (0.12 | ) | |||||||||||||
Net asset value, end of year | $ | 9.12 | $ | 12.48 | $ | 9.62 | $ | 10.01 | $ | 10.20 | |||||||||||||
Total investment return3 | (19.68 | )% | 31.09 | % | (2.73 | )% | (0.14 | )% | 7.67 | % | |||||||||||||
Ratios to average net assets: | |||||||||||||||||||||||
Expenses before fee waivers and/or expense reimbursements | 1.37 | %4 | 1.33 | % | 1.41 | %4 | 1.53 | % | 2.02 | % | |||||||||||||
Expenses after fee waivers and/or expense reimbursements | 1.25 | %4 | 1.25 | % | 1.25 | %4 | 1.25 | % | 1.25 | % | |||||||||||||
Net investment income (loss) | 0.70 | % | 0.45 | % | 1.60 | % | 1.38 | % | 0.79 | % | |||||||||||||
Supplemental data: | |||||||||||||||||||||||
Net assets, end of year (000's) | $ | 4,754 | $ | 9,081 | $ | 7,442 | $ | 9,769 | $ | 8,049 | |||||||||||||
Portfolio turnover | 53 | % | 52 | % | 41 | % | 57 | % | 43 | % | |||||||||||||
Class P
Years ended June 30, | |||||||||||||||||||||||
2022 | 2021 | 2020 | 2019 | 2018 | |||||||||||||||||||
Net asset value, beginning of year | $ | 12.53 | $ | 9.66 | $ | 10.04 | $ | 10.23 | $ | 9.61 | |||||||||||||
Net investment income (loss)2 | 0.09 | 0.09 | 0.18 | 0.17 | 0.14 | ||||||||||||||||||
Net realized and unrealized gain (loss) | (2.37 | ) | 2.93 | (0.41 | ) | (0.18 | ) | 0.63 | |||||||||||||||
Net increase (decrease) from operations | (2.28 | ) | 3.02 | (0.23 | ) | (0.01 | ) | 0.77 | |||||||||||||||
Dividends from net investment income | (0.16 | ) | (0.15 | ) | (0.15 | ) | (0.08 | ) | (0.15 | ) | |||||||||||||
Distributions from net realized gains | (0.94 | ) | — | — | (0.10 | ) | — | ||||||||||||||||
Total dividends and distributions | (1.10 | ) | (0.15 | ) | (0.15 | ) | (0.18 | ) | (0.15 | ) | |||||||||||||
Net asset value, end of year | $ | 9.15 | $ | 12.53 | $ | 9.66 | $ | 10.04 | $ | 10.23 | |||||||||||||
Total investment return3 | (19.50 | )% | 31.40 | % | (2.40 | )% | 0.10 | % | 7.94 | % | |||||||||||||
Ratios to average net assets: | |||||||||||||||||||||||
Expenses before fee waivers and/or expense reimbursements | 1.11 | %4 | 1.05 | % | 1.12 | %4 | 1.26 | % | 1.70 | % | |||||||||||||
Expenses after fee waivers and/or expense reimbursements | 1.00 | %4 | 0.99 | % | 1.00 | %4 | 1.00 | % | 1.00 | % | |||||||||||||
Net investment income (loss) | 0.74 | % | 0.79 | % | 1.82 | % | 1.80 | % | 1.37 | % | |||||||||||||
Supplemental data: | |||||||||||||||||||||||
Net assets, end of year (000's) | $ | 164,377 | $ | 380,983 | $ | 203,078 | $ | 146,616 | $ | 65,750 | |||||||||||||
Portfolio turnover | 53 | % | 52 | % | 41 | % | 57 | % | 43 | % | |||||||||||||
1 For the period October 30, 2020 (commencement of operations) through June 30, 2021.
2 Calculated using the average share method.
3 Total investment return is calculated assuming a $10,000 investment on the first day of each year reported, reinvestment of all dividends and distributions, if any, at net asset value on the ex-dividend dates, and a sale at net asset value on the last day of each year reported. The figures do not include any applicable sales charges, redemption or program fees; results would be lower if they were included. Returns do not reflect the deduction of taxes that a shareholder would pay on Fund dividends/distributions or the redemption of Fund shares.
126
UBS International Sustainable Equity Fund
Financial highlights
Class P2
| Year ended June 30, 2022 | Period ended June 30, 20211 | ||||||||||
Net asset value, beginning of period | $ | 12.59 | $ | 10.05 | |||||||
Net investment income (loss)2 | 0.20 | 0.14 | |||||||||
Net realized and unrealized gain (loss) | (2.41 | ) | 2.55 | ||||||||
Net increase (decrease) from operations | (2.21 | ) | 2.69 | ||||||||
Dividends from net investment income | (0.26 | ) | (0.15 | ) | |||||||
Distributions from net realized gains | (0.94 | ) | — | ||||||||
Total dividends and distributions | (1.20 | ) | (0.15 | ) | |||||||
Net asset value, end of period | $ | 9.18 | $ | 12.59 | |||||||
Total investment return3 | (18.84 | )% | 26.90 | % | |||||||
Ratios to average net assets: | |||||||||||
Expenses before fee waivers and/or expense reimbursements | 1.12 | %4 | 1.08 | %5 | |||||||
Expenses after fee waivers and/or expense reimbursements | 0.25 | %4 | 0.22 | %5 | |||||||
Net investment income (loss) | 1.76 | % | 1.78 | %5 | |||||||
Supplemental data: | |||||||||||
Net assets, end of period (000's) | $ | 40,308 | $ | 41,571 | |||||||
Portfolio turnover | 53 | % | 52 | % | |||||||
4 Includes interest expense representing less than 0.005%.
5 Annualized.
See accompanying notes to financial statements
127
UBS US Dividend Ruler Fund
Financial highlights
The table below sets forth financial data for one share of beneficial interest outstanding throughout each period presented.
Class P
| Year ended June 30, 2022 | Period ended June 30, 20211 | ||||||||||
Net asset value, beginning of period | $ | 12.82 | $ | 10.00 | |||||||
Net investment income (loss)2 | 0.23 | 0.20 | |||||||||
Net realized and unrealized gain (loss) | (0.84 | ) | 2.72 | ||||||||
Net increase (decrease) from operations | (0.61 | ) | 2.92 | ||||||||
Dividends from net investment income | (0.16 | ) | (0.05 | ) | |||||||
Distributions from net realized gains | (0.22 | ) | (0.05 | ) | |||||||
Total dividends and distributions | (0.38 | ) | (0.10 | ) | |||||||
Net asset value, end of period | $ | 11.83 | $ | 12.82 | |||||||
Total investment return3 | (5.01 | )% | 29.37 | % | |||||||
Ratios to average net assets: | |||||||||||
Expenses before fee waivers and/or expense reimbursements | 0.83 | % | 1.57 | %4 | |||||||
Expenses after fee waivers and/or expense reimbursements | 0.50 | % | 0.50 | %4 | |||||||
Net investment income (loss) | 1.76 | % | 1.72 | %4 | |||||||
Supplemental data: | |||||||||||
Net assets, end of period (000's) | $ | 118,829 | $ | 81,981 | |||||||
Portfolio turnover | 29 | % | 24 | % | |||||||
1 For the period from July 9, 2020 (commencement of operations) through June 30, 2021.
2 Calculated using the average share method.
3 Total investment return is calculated assuming a $10,000 investment on the first day of each period reported, reinvestment of all dividends and distributions, if any, at net asset value on the ex-dividend dates, and a sale at net asset value on the last day of each period reported. The figures do not include any applicable redemption or program fees; results would be lower if they were included. Total investment return for periods less than one year has not been annualized. Returns do not reflect the deduction of taxes that a shareholder would pay on Fund dividends/distributions or the redemption of Fund shares.
4 Annualized.
See accompanying notes to financial statements
128
UBS US Quality Growth At Reasonable Price Fund
Financial highlights
The table below sets forth financial data for one share of beneficial interest outstanding throughout each period presented.
Class P
| Year ended June 30, 2022 | Period Ended June 30, 20211 | ||||||||||
Net asset value, beginning of period | $ | 13.10 | $ | 10.00 | |||||||
Net investment income (loss)2 | 0.04 | 0.04 | |||||||||
Net realized and unrealized gain (loss) | (2.05 | ) | 3.10 | ||||||||
Net increase (decrease) from operations | (2.01 | ) | 3.14 | ||||||||
Dividends from net investment income | (0.03 | ) | (0.01 | ) | |||||||
Distributions from net realized gains | (0.38 | ) | (0.03 | ) | |||||||
Total dividends and distributions | (0.41 | ) | (0.04 | ) | |||||||
Net asset value, end of period | $ | 10.68 | $ | 13.10 | |||||||
Total investment return3 | (16.06 | )% | 31.49 | % | |||||||
Ratios to average net assets: | |||||||||||
Expenses before fee waivers and/or expense reimbursements | 0.79 | % | 1.23 | %4 | |||||||
Expenses after fee waivers and/or expense reimbursements | 0.50 | % | 0.50 | %4 | |||||||
Net investment income (loss) | 0.28 | % | 0.32 | %4 | |||||||
Supplemental data: | |||||||||||
Net assets, end of period (000's) | $ | 166,979 | $ | 116,538 | |||||||
Portfolio turnover | 30 | % | 29 | % | |||||||
1 For the period from July 9, 2020 (commencement of operations) through June 30, 2021.
2 Calculated using the average share method.
3 Total investment return is calculated assuming a $10,000 investment on the first day of each period reported, reinvestment of all dividends and distributions, if any, at net asset value on the ex-dividend dates, and a sale at net asset value on the last day of each period reported. The figures do not include any applicable redemption or program fees; results would be lower if they were included. Total investment return for periods less than one year has not been annualized. Returns do not reflect the deduction of taxes that a shareholder would pay on Fund dividends/distributions or the redemption of Fund shares.
4 Annualized.
See accompanying notes to financial statements
129
UBS U.S. Small Cap Growth Fund
Financial highlights
The table below sets forth financial data for one share of beneficial interest outstanding throughout each year presented.
Class A
Years ended June 30, | |||||||||||||||||||||||
2022 | 2021 | 2020 | 2019 | 2018 | |||||||||||||||||||
Net asset value, beginning of year | $ | 28.15 | $ | 19.74 | $ | 19.49 | $ | 20.74 | $ | 21.26 | |||||||||||||
Net investment income (loss)1 | (0.13 | ) | (0.25 | ) | (0.11 | ) | (0.10 | ) | (0.17 | ) | |||||||||||||
Net realized and unrealized gain (loss) | (7.78 | ) | 11.88 | 1.79 | 0.80 | 4.92 | |||||||||||||||||
Net increase (decrease) from operations | (7.91 | ) | 11.63 | 1.68 | 0.70 | 4.75 | |||||||||||||||||
Distributions from net realized gains | (5.62 | ) | (3.22 | ) | (1.43 | ) | (1.95 | ) | (5.27 | ) | |||||||||||||
Net asset value, end of year | $ | 14.62 | $ | 28.15 | $ | 19.74 | $ | 19.49 | $ | 20.74 | |||||||||||||
Total investment return2 | (33.31 | )% | 59.94 | % | 9.33 | % | 5.95 | % | 26.17 | % | |||||||||||||
Ratios to average net assets: | |||||||||||||||||||||||
Expenses before fee waivers and/or expense reimbursements | 1.46 | % | 1.43 | % | 1.60 | %3 | 1.57 | % | 1.66 | % | |||||||||||||
Expenses after fee waivers and/or expense reimbursements | 1.24 | % | 1.24 | % | 1.24 | %3 | 1.24 | % | 1.24 | % | |||||||||||||
Net investment income (loss) | (0.57 | )% | (0.98 | )% | (0.63 | )% | (0.53 | )% | (0.83 | )% | |||||||||||||
Supplemental data: | |||||||||||||||||||||||
Net assets, end of year (000's) | $ | 17,387 | $ | 35,268 | $ | 22,909 | $ | 26,114 | $ | 26,498 | |||||||||||||
Portfolio turnover | 40 | % | 63 | % | 79 | % | 54 | % | 67 | % | |||||||||||||
Class P
Years ended June 30, | |||||||||||||||||||||||
2022 | 2021 | 2020 | 2019 | 2018 | |||||||||||||||||||
Net asset value, beginning of year | $ | 32.44 | $ | 22.37 | $ | 21.84 | $ | 22.89 | $ | 22.92 | |||||||||||||
Net investment income (loss)1 | (0.08 | ) | (0.22 | ) | (0.08 | ) | (0.06 | ) | (0.13 | ) | |||||||||||||
Net realized and unrealized gain (loss) | (9.21 | ) | 13.51 | 2.04 | 0.96 | 5.37 | |||||||||||||||||
Net increase (decrease) from operations | (9.29 | ) | 13.29 | 1.96 | 0.90 | 5.24 | |||||||||||||||||
Dividends from net investment income | (0.06 | ) | — | — | — | — | |||||||||||||||||
Distributions from net realized gains | (5.62 | ) | (3.22 | ) | (1.43 | ) | (1.95 | ) | (5.27 | ) | |||||||||||||
Total dividends and distributions | (5.68 | ) | (3.22 | ) | (1.43 | ) | (1.95 | ) | (5.27 | ) | |||||||||||||
Net asset value, end of year | $ | 17.47 | $ | 32.44 | $ | 22.37 | $ | 21.84 | $ | 22.89 | |||||||||||||
Total investment return2 | (33.13 | )% | 60.29 | % | 9.62 | % | 6.24 | % | 26.50 | % | |||||||||||||
Ratios to average net assets: | |||||||||||||||||||||||
Expenses before fee waivers and/or expense reimbursements | 1.21 | % | 1.16 | % | 1.29 | %3 | 1.30 | % | 1.34 | % | |||||||||||||
Expenses after fee waivers and/or expense reimbursements | 0.99 | % | 0.99 | % | 0.99 | %3 | 0.99 | % | 0.99 | % | |||||||||||||
Net investment income (loss) | (0.31 | )% | (0.74 | )% | (0.37 | )% | (0.27 | )% | (0.58 | )% | |||||||||||||
Supplemental data: | |||||||||||||||||||||||
Net assets, end of year (000's) | $ | 110,879 | $ | 178,971 | $ | 92,754 | $ | 96,485 | $ | 88,845 | |||||||||||||
Portfolio turnover | 40 | % | 63 | % | 79 | % | 54 | % | 67 | % | |||||||||||||
1 Calculated using the average share method.
2 Total investment return is calculated assuming a $10,000 investment on the first day of each year reported, reinvestment of all dividends and distributions, if any, at net asset value on the ex-dividend dates, and a sale at net asset value on the last day of each year reported. The figures do not include any applicable sales charges, redemption or program fees; results would be lower if they were included. Returns do not reflect the deduction of taxes that a shareholder would pay on Fund dividends/distributions or the redemption of Fund shares.
3 Includes interest expense representing less than 0.005%.
See accompanying notes to financial statements
130
UBS Sustainable Development Bank Bond Fund
Financial highlights
The table below sets forth financial data for one share of beneficial interest outstanding throughout each period presented.
Class P
Years ended June 30, | Period ended | ||||||||||||||||||
2022 | 2021 | 2020 | June 30, 20191 | ||||||||||||||||
Net asset value, beginning of period | $ | 10.60 | $ | 11.17 | $ | 10.58 | $ | 10.00 | |||||||||||
Net investment income (loss)3 | 0.10 | 0.13 | 0.21 | 0.19 | |||||||||||||||
Net realized and unrealized gain (loss) | (0.97 | ) | (0.31 | ) | 0.63 | 0.58 | |||||||||||||
Net increase (decrease) from operations | (0.87 | ) | (0.18 | ) | 0.84 | 0.77 | |||||||||||||
Dividends from net investment income | (0.10 | ) | (0.12 | ) | (0.21 | ) | (0.19 | ) | |||||||||||
Distributions from net realized gains | (0.01 | ) | (0.27 | ) | (0.04 | ) | — | ||||||||||||
Total dividends and distributions | (0.11 | ) | (0.39 | ) | (0.25 | ) | (0.19 | ) | |||||||||||
Net asset value, end of period | $ | 9.62 | $ | 10.60 | $ | 11.17 | $ | 10.58 | |||||||||||
Total investment return4 | (8.13 | )% | (1.70 | )% | 8.03 | % | 7.75 | % | |||||||||||
Ratios to average net assets: | |||||||||||||||||||
Expenses before fee waivers and/or expense reimbursements | 0.56 | % | 0.80 | % | 1.07 | %5 | 2.19 | %6 | |||||||||||
Expenses after fee waivers and/or expense reimbursements | 0.25 | % | 0.25 | % | 0.25 | %5 | 0.25 | %6 | |||||||||||
Net investment income (loss) | 1.01 | % | 1.18 | % | 1.94 | % | 2.67 | %6 | |||||||||||
Supplemental data: | |||||||||||||||||||
Net assets, end of period (000's) | $ | 8,052 | $ | 17,510 | $ | 37,414 | $ | 25,235 | |||||||||||
Portfolio turnover | 47 | % | 16 | % | 80 | % | 20 | % | |||||||||||
Class P2
| Year ended June 30, 2022 | Period ended June 30, 20212 | ||||||||||
Net asset value, beginning of period | $ | 10.59 | $ | 11.09 | |||||||
Net investment income (loss)3 | 0.12 | 0.08 | |||||||||
Net realized and unrealized gain (loss) | (0.97 | ) | (0.23 | ) | |||||||
Net increase (decrease) from operations | (0.85 | ) | (0.15 | ) | |||||||
Dividends from net investment income | (0.12 | ) | (0.08 | ) | |||||||
Distributions from net realized gains | (0.01 | ) | (0.27 | ) | |||||||
Total dividends and distributions | (0.13 | ) | (0.35 | ) | |||||||
Net asset value, end of period | $ | 9.61 | $ | 10.59 | |||||||
Total investment return4 | (8.08 | )% | (1.34 | )% | |||||||
Ratios to average net assets: | |||||||||||
Expenses before fee waivers and/or expense reimbursements | 0.56 | % | 0.68 | %6 | |||||||
Expenses after fee waivers and/or expense reimbursements | 0.15 | % | 0.15 | %6 | |||||||
Net investment income (loss) | 1.15 | % | 1.09 | %6 | |||||||
Supplemental data: | |||||||||||
Net assets, end of period (000's) | $ | 68,917 | $ | 65,659 | |||||||
Portfolio turnover | 47 | % | 16 | % | |||||||
1 For the period October 24, 2018 (commencement of operations) through June 30, 2019.
2 For the period October 30, 2020 (commencement of operations) through June 30, 2021.
3 Calculated using the average share method.
4 Total investment return is calculated assuming a $10,000 investment on the first day of each period reported, reinvestment of all dividends and distributions, if any, at net asset value on the ex-dividend dates, and a sale at net asset value on the last day of each period reported. The figures do not include any applicable redemption or program fees; results would be lower if they were included. Total investment return for periods less than one year has not been annualized. Returns do not reflect the deduction of taxes that a shareholder would pay on Fund dividends/distributions or the redemption of Fund shares.
5 Includes interest expense representing less than 0.005%.
6 Annualized.
See accompanying notes to financial statements
131
UBS Multi Income Bond Fund (formerly, UBS Total Return Bond Fund)
Financial highlights
The table below sets forth financial data for one share of beneficial interest outstanding throughout each year presented.
Class A
Years ended June 30, | |||||||||||||||||||||||
2022 | 2021 | 2020 | 2019 | 2018 | |||||||||||||||||||
Net asset value, beginning of year | $ | 15.66 | $ | 15.64 | $ | 15.09 | $ | 14.40 | $ | 14.94 | |||||||||||||
Net investment income (loss)1 | 0.27 | 0.30 | 0.41 | 0.45 | 0.47 | ||||||||||||||||||
Net realized and unrealized gain (loss) | (2.42 | ) | (0.02 | ) | 0.50 | 0.65 | (0.65 | ) | |||||||||||||||
Net increase (decrease) from operations | (2.15 | ) | 0.28 | 0.91 | 1.10 | (0.18 | ) | ||||||||||||||||
Dividends from net investment income | (0.24 | ) | (0.26 | ) | (0.36 | ) | (0.41 | ) | (0.36 | ) | |||||||||||||
Net asset value, end of year | $ | 13.27 | $ | 15.66 | $ | 15.64 | $ | 15.09 | $ | 14.40 | |||||||||||||
Total investment return2 | (13.91 | )% | 1.83 | % | 6.14 | % | 7.63 | % | (1.12 | )% | |||||||||||||
Ratios to average net assets: | |||||||||||||||||||||||
Expenses before fee waivers and/or expense reimbursements | 1.92 | % | 1.73 | % | 1.59 | %3 | 1.68 | %3 | 1.45 | % | |||||||||||||
Expenses after fee waivers and/or expense reimbursements | 0.75 | % | 0.75 | % | 0.75 | %3 | 0.75 | %3 | 0.75 | % | |||||||||||||
Net investment income (loss) | 1.80 | % | 1.90 | % | 2.66 | % | 3.10 | % | 3.22 | % | |||||||||||||
Supplemental data: | |||||||||||||||||||||||
Net assets, end of year (000's) | $ | 570 | $ | 681 | $ | 650 | $ | 488 | $ | 108 | |||||||||||||
Portfolio turnover | 248 | % | 169 | % | 209 | % | 234 | % | 236 | % | |||||||||||||
Class P
Years ended June 30, | |||||||||||||||||||||||
2022 | 2021 | 2020 | 2019 | 2018 | |||||||||||||||||||
Net asset value, beginning of year | $ | 15.67 | $ | 15.65 | $ | 15.10 | $ | 14.41 | $ | 14.94 | |||||||||||||
Net investment income (loss)1 | 0.31 | 0.34 | 0.45 | 0.49 | 0.49 | ||||||||||||||||||
Net realized and unrealized gain (loss) | (2.43 | ) | (0.02 | ) | 0.50 | 0.64 | (0.63 | ) | |||||||||||||||
Net increase (decrease) from operations | (2.12 | ) | 0.32 | 0.95 | 1.13 | (0.14 | ) | ||||||||||||||||
Dividends from net investment income | (0.27 | ) | (0.30 | ) | (0.40 | ) | (0.44 | ) | (0.39 | ) | |||||||||||||
Net asset value, end of year | $ | 13.28 | $ | 15.67 | $ | 15.65 | $ | 15.10 | $ | 14.41 | |||||||||||||
Total investment return2 | (13.68 | )% | 2.07 | % | 6.40 | % | 7.95 | % | (0.88 | )% | |||||||||||||
Ratios to average net assets: | |||||||||||||||||||||||
Expenses before fee waivers and/or expense reimbursements | 1.71 | % | 1.52 | % | 1.38 | %3 | 1.45 | %3 | 1.30 | % | |||||||||||||
Expenses after fee waivers and/or expense reimbursements | 0.50 | % | 0.50 | % | 0.50 | %3 | 0.50 | %3 | 0.50 | % | |||||||||||||
Net investment income (loss) | 2.06 | % | 2.15 | % | 2.92 | % | 3.35 | % | 3.29 | % | |||||||||||||
Supplemental data: | |||||||||||||||||||||||
Net assets, end of year (000's) | $ | 26,702 | $ | 34,629 | $ | 37,048 | $ | 38,949 | $ | 41,245 | |||||||||||||
Portfolio turnover | 248 | % | 169 | % | 209 | % | 234 | % | 236 | % | |||||||||||||
1 Calculated using the average share method.
2 Total investment return is calculated assuming a $10,000 investment on the first day of each year reported, reinvestment of all dividends and distributions, if any, at net asset value on the ex-dividend dates, and a sale at net asset value on the last day of each year reported. The figures do not include any applicable sales charges, redemption or program fees; results would be lower if they were included. Returns do not reflect the deduction of taxes that a shareholder would pay on Fund dividends/distributions or the redemption of Fund shares.
3 Includes interest expense representing less than 0.005%.
See accompanying notes to financial statements
132
The UBS Funds
Notes to financial statements
Organization and significant accounting policies
The UBS Funds (the "Trust") is an open-end management investment company registered with the US Securities and Exchange Commission ("SEC") under the Investment Company Act of 1940 (the "1940 Act"), as amended, currently offering multiple series representing separate investment portfolios. The Trust is a Delaware statutory trust organized on August 13, 1993. The trustees of the Trust have authority to issue an unlimited number of shares of beneficial interest at par value of $0.001 per share.
The Trust has eleven Funds available for investment, each having its own investment objectives and policies: UBS All China Equity Fund, UBS Dynamic Alpha Fund, UBS Global Allocation Fund, UBS Emerging Markets Equity Opportunity Fund, UBS Engage For Impact Fund, UBS International Sustainable Equity Fund, UBS US Dividend Ruler Fund, UBS US Quality Growth At Reasonable Price Fund, UBS U.S. Small Cap Growth Fund, UBS Municipal Bond Fund, UBS Sustainable Development Bank Bond Fund, and UBS Multi Income Bond Fund (formerly, UBS Total Return Bond Fund), (each a "Fund", and collectively, the "Funds"). Each of the Funds is classified as a diversified investment company with the exception of UBS Dynamic Alpha Fund, and UBS Sustainable Development Bank Bond Fund, which are classified as non-diversified for purposes of the 1940 Act.
UBS Asset Management (Americas) Inc. ("UBS AM" or the "Advisor") serves as the investment advisor and administrator for the Funds. UBS Asset Management (US) Inc. ("UBS AM (US)") serves as principal underwriter for the Funds. UBS AM and UBS AM (US) are indirect wholly owned subsidiaries of UBS Group AG. UBS Group AG is an internationally diversified organization with headquarters in Zurich, Switzerland. UBS Group AG operates in many areas of the financial services industry.
The Funds currently offer Class A and Class P shares, with the exception of (1) UBS All China Equity Fund, UBS Emerging Markets Equity Opportunity Fund, UBS Engage For Impact Fund, UBS International Sustainable Equity Fund and UBS Sustainable Development Bank Bond Fund, which currently also offer Class P2 shares and (2) UBS Dividend Ruler Fund and UBS US Quality Growth At Reasonable Price Fund, which currently only offer Class P shares. Each class represents interests in the same assets of the applicable Fund and the classes are identical except for differences in their sales charge structures, ongoing service and distribution charges, fee waiver/expense cap/expense reimbursement arrangements and certain transfer agency and related services expenses. All classes of shares have equal voting privileges except that each class has exclusive voting rights with respect to its service and/or distribution plan, if any. Class P and Class P2 shares have no service or distribution plan.
The Trust accounts separately for the assets, liabilities and operations of each Fund. Expenses directly attributable to each Fund are charged to that Fund's operations; expenses which are applicable to all Funds are allocated among them on a pro rata basis.
In the normal course of business, the Funds may enter into contracts that contain a variety of representations that provide indemnification for certain liabilities. The Funds' maximum exposure under these arrangements is unknown, as this would involve future claims that may be made against the Funds that have not yet occurred. However, the Funds have not had any prior claims or losses pursuant to these contracts and expect the risk of loss to be remote.
Under certain circumstances, shareholders of the Funds may receive payment for redemptions in securities rather than in cash.
The Financial Accounting Standards Board ("FASB") Accounting Standards Codification ("ASC") is the exclusive reference of authoritative US generally accepted accounting principles ("US GAAP") recognized by the FASB to be applied by nongovernmental entities. Rules and interpretive releases of the SEC under authority of federal laws are also sources of authoritative US GAAP for SEC registrants. The Funds' financial statements are prepared in accordance with US GAAP, which may require the use of management estimates and assumptions. Actual results could differ from those estimates.
133
The UBS Funds
Notes to financial statements
In January 2021, the FASB issued Accounting Standards ("FASB") Update No. 2021-01 ("ASU 2021-01"), "Reference Rate Reform (Topic 848)". ASU 2021-01 is an update of ASU 2020-04, which is in response to concerns about structural risks of interbank offered rates, and particularly the risk of cessation of LIBOR; regulators have undertaken reference rate reform initiatives to identify alternative reference rates that are more observable or transaction based and less susceptible to manipulation. ASU 2020-04 provides optional guidance for a limited period of time to ease the potential burden in accounting for (or recognizing the effects of) reference rate reform on financial reporting. ASU 2020-04 is elective and applies to all entities, subject to meeting certain criteria, that have contracts, hedging relationships, and other transactions that reference LIBOR or another reference rate expected to be discontinued because of reference rate reform. The ASU 2021-01 update clarifies that certain optional expedients and exceptions in Topic 848 for contract modifications and hedge accounting apply to derivatives that are affected by the discounting transition. The amendments in this update are effective immediately through December 31, 2022, for all entities. Management is currently evaluating the implications, if any, of the additional requirements and its impact on the Funds' financial statements.
The following is a summary of significant accounting policies:
Investment transactions, investment income and expenses: Investment transactions are recorded on the trade date. Realized gains and losses from investment transactions and foreign exchange transactions are calculated using the identified cost method. Dividend income and expense are recorded net of withholding taxes on the ex-dividend date ("ex-date") except in the case of certain dividends from foreign securities which are recorded as soon after the ex-date as the respective Fund , using reasonable diligence, becomes aware of such dividends. Interest income is recorded on an accrual basis. Discounts are accreted and premiums are amortized as adjustments to interest income and the identified cost of investments.
Income, expenses (excluding class-specific expenses) and realized/unrealized gains/losses are allocated proportionately to each class of shares based upon the relative net asset value of outstanding shares (or the value of dividend eligible shares, as appropriate) of each class at the beginning of the day after adjusting for current capital share activity of the respective classes. Class specific expenses are charged directly to the applicable class of shares.
Dividends and distributions: Dividends and distributions to shareholders are recorded on the ex-dividend date. The amount of dividends from net investment income and distributions from net realized capital gains and/or return of capital are determined in accordance with US federal income tax regulations, which may differ from US GAAP. These "book/tax" differences are either considered temporary or permanent in nature. To the extent these differences are permanent in nature, such amounts are reclassified within the capital accounts based on their federal tax-basis treatment; temporary differences do not require reclassification.
Foreign currency translation: The books and records of the Funds are maintained in US dollars. Foreign currency amounts are translated into US dollars as follows: (1) the foreign currency market value of investment securities and other assets and liabilities stated in foreign currencies are translated into US dollars based on the current exchange rates each business day; and (2) purchases and sales of investment securities and income and expenses are translated at the rate of exchange prevailing on the respective dates of such transactions. The resulting exchange gains and losses are included in the Statement of operations.
The Funds do not generally isolate the effect of fluctuations in foreign exchange rates from the effect of the changes in the market prices of securities. However, the Funds do isolate the effect of fluctuations in foreign exchange rates when determining the realized gain or loss upon the sale or maturity of foreign currency-denominated securities pursuant to US federal income tax regulations. Net realized foreign currency transaction gain (loss) is treated as ordinary income (loss) for income tax reporting purposes.
134
The UBS Funds
Notes to financial statements
Concentration of risk: Investing in securities of foreign issuers and currency transactions may involve certain considerations and risks not typically associated with investments in the United States. These risks include revaluation of currencies, adverse fluctuations in foreign currency values and possible adverse political, social and economic developments, including those particular to a specific industry, country or region, which could cause the securities and their markets to be less liquid and prices more volatile than those of comparable US companies and US government securities. These risks are greater with respect to securities of issuers located in emerging market countries in which some Funds in the Trust invest.
Small capitalization ("small cap") companies may be more vulnerable than larger capitalization ("large cap") companies to adverse business or economic developments. Small cap companies may also have limited product lines, markets or financial resources, and may be dependent on a relatively small management group. Securities of such companies may be less liquid and more volatile than securities of large cap companies or the market averages in general and therefore may involve greater risk than investing in large cap companies. In addition, small cap companies may not be well-known to the investing public, may not have institutional ownership and may have only cyclical, static or moderate growth prospects.
The ability of the issuers of debt securities held by the Funds to meet their obligations may be affected by economic and political developments particular to a specific industry, country, state or region.
Investments in bonds with ratings of BB (Standard & Poor's Financial Services LLC or Fitch Ratings, Inc.) or Ba (Moody's Investors Service, Inc.) or below (commonly referred to as "high yield" bonds), or deemed of equivalent quality, have an increased risk of defaulting or otherwise being unable to honor a financial obligation. These securities are considered to be predominantly speculative with respect to an issuer's capacity to pay interest and repay principal in accordance with the terms of the obligations. Lower-quality bonds are more likely to be subject to an issuer's default or downgrade than investment grade (higher-quality) bonds.
Many financial instruments, financings or other transactions to which a Fund may be a party use or may use a floating rate based on the London Interbank Offered Rate ("LIBOR"). LIBOR is widely used in financial markets. In July 2017, the United Kingdom's financial regulatory body announced that after 2021 it will cease its active encouragement of banks to provide the quotations needed to sustain LIBOR. That announcement suggests that LIBOR may cease to be published or utilized after that time. Various financial industry groups have begun planning for that transition, but the effect of the transition process and its ultimate success cannot yet be determined. The transition process may lead to increased volatility and illiquidity in markets for instruments the terms of which are based on LIBOR. It could also lead to a reduction in the value of some LIBOR-based investments and reduce the effectiveness of new hedges placed against existing LIBOR-based investments. Since the usefulness of LIBOR as a benchmark could deteriorate during the transition period. The willingness and ability of issuers to include enhanced provisions in new and existing contracts or instruments also remains uncertain. Any of these factors may adversely affect a Fund's performance or NAV. Certain LIBOR tenors were discontinued by the end of 2021, while the discontinuation of others have been extended to June 2023.
Certain impacts to public health conditions particular to the coronavirus "COVID-19" outbreak that occurred may have a significant negative impact on the operations and profitability of the issuers of the Funds' investments. The extent of the impact to the financial performance of the Funds will depend on future developments, including (i) the duration and spread of the outbreak, (ii) the restrictions and advisories, (iii) the effects on the financial markets, and (iv) the effects on the economy overall, all of which are highly uncertain and cannot be predicted.
The conflict between Ukraine and the Russian Federation has resulted in significant volatility and uncertainty in financial markets. NATO, EU and G7 member countries have imposed severe and coordinated sanctions against Russia. Restrictive measures have also been imposed by Russia, and some securities traded in that country have materially declined in value and/or may no longer be tradable. These actions have resulted in significant disruptions
135
The UBS Funds
Notes to financial statements
to investing activities and businesses with operations in Russia. The longer-term impact to geopolitical norms, supply chains and investment valuations is uncertain.
Valuation of investments
Each Fund generally calculates its net asset value on days that the New York Stock Exchange ("NYSE") is open. The Fund calculates net asset value as of the close of regular trading on the NYSE (generally, 4:00 p.m., Eastern time). The NYSE normally is not open, and the Fund does not price its shares, on most national holidays and Good Friday. To the extent that the Fund's assets are traded in other markets on days when the NYSE is not open, the value of the Fund's assets may be affected on those days. If trading on the NYSE is halted for the day before 4:00 p.m., Eastern time, the Fund's net asset value per share generally will still be calculated as of the close of regular trading on the NYSE. The time at which the Fund calculates its net asset value and until which purchase, sale or exchange orders are accepted may be changed as permitted by the SEC.
Each Fund calculates its net asset value based on the current market value, where available, for its portfolio investments. The Fund normally obtains market values for its investments from independent pricing sources and broker-dealers. Independent pricing sources may use reported last sale prices, official market closing prices, current market quotations or valuations from computerized "evaluation" systems that derive values based on comparable investments. An evaluation system incorporates parameters such as security quality, maturity and coupon, and/or research and evaluations by its staff, including review of broker-dealer market price quotations, if available, in determining the valuation of the portfolio investments. Investments also may be valued based on appraisals derived from information concerning the investment or similar investments received from recognized dealers in those holdings.
Investments traded in the over-the-counter ("OTC") market and listed on The NASDAQ Stock Market, Inc. ("NASDAQ") normally are valued at the NASDAQ Official Closing Price. Other OTC securities are valued at the last bid price on the valuation date available prior to valuation. Investments which are listed on U.S. and foreign stock exchanges normally are valued at the market closing price, the last sale price on the day the securities are valued or, lacking any sales on such day, at the last available bid price. Investments listed on foreign stock exchanges may be fair valued based on significant events that have occurred subsequent to the close of the foreign markets. In cases where investments are traded on more than one exchange, the investments are valued on the exchange designated as the primary market by UBS AM. If a market value is not readily available from an independent pricing source for a particular investment, that investment is valued at fair value as determined in good faith by or under the direction of the Trust's Board of Trustees (the "Board"). Foreign currency exchange rates are generally determined as of the close of the NYSE.
Certain investments in which the Fund invests are traded in markets that close before 4:00 p.m., Eastern time. Normally, developments that occur between the close of the foreign markets and 4:00 p.m., Eastern time, will not be reflected in the Fund's net asset value. However, if the Fund determines that such developments are so significant that they will materially affect the value of the Fund's investments, the Fund may adjust the previous closing prices to reflect what is believed to be the fair value of these investments as of 4:00 p.m., Eastern time.
Certain Funds may use a systematic fair valuation model provided by an independent third party to value investments principally traded in foreign markets in order to adjust for possible stale pricing that may occur between the close of the foreign exchanges and the time for valuation. The systematic fair valuation model may use calculations based on indices of domestic securities and other appropriate indicators, such as prices of relevant ADRs and futures contracts. If an investment is valued at a "fair value," that value is likely to be different from the last quoted market price for the investment. The use of the fair valuation model may result in securities being transferred between Level 1, Level 2 and Level 3 of the fair valuation hierarchy at the end of the reporting period.
The amortized cost method of valuation, which approximates market value, generally is used to value short-term debt instruments with 60 days or less remaining to maturity, unless the Board determines that this does not represent fair value.
136
The UBS Funds
Notes to financial statements
Investments in open-end investment companies are valued at the daily closing net asset value of the respective investment company. Pursuant to the Fund's use of the practical expedient within ASC Topic 820, Fair Value Measurement, investments in investment companies without publicly published prices are also valued at the daily net asset value.
All investments quoted in foreign currencies are valued daily in U.S. dollars on the basis of the foreign currency exchange rates prevailing at the time such valuation is determined by the Fund's custodian.
Futures contracts are generally valued at the settlement price established each day on the exchange on which they are traded. Forward foreign currency contracts are valued daily using forward exchange rates quoted by independent pricing services.
Swaps are marked-to-market daily based upon values from third-party vendors or quotations from market makers to the extent available. In the event that market quotations are not readily available or deemed unreliable, the swap is valued at fair value as determined in good faith by or under the direction of the Board.
The Board has delegated to the Equities, Fixed Income and Multi-Asset Valuation Committee ("VC") the responsibility for making fair value determinations with respect to the Fund's portfolio holdings. The VC is comprised of representatives of management. The VC provides reports to the Board at each quarterly meeting regarding any investments that have been fair valued, valued pursuant to standing instructions approved by the VC, or where non-vendor pricing sources had been used to make fair value determinations when sufficient information exists during the prior quarter. Fair value determinations are subject to review at least monthly by the VC during scheduled meetings. Pricing decisions, processes, and controls over fair value determinations are subject to internal and external reviews, including annual internal compliance reviews and periodic internal audit reviews.
The types of investments for which such fair value pricing may be necessary include, but are not limited to: foreign investments under some circumstances; securities of an issuer that has entered into a restructuring; investments whose trading has been halted or suspended; fixed income securities that are in default and for which there is no current market value quotation; and investments that are restricted as to transfer or resale. The need to fair value a Fund's portfolio investments may also result from low trading volume in foreign markets or thinly traded domestic investments, and when a security that is subject to a trading limit or collar on the exchange or market on which it is primarily traded reaches the "limit up" or "limit down" price and no trading has taken place at that price. Various factors may be reviewed in order to make a good faith determination of an investment's fair value. These factors include, but are not limited to, fundamental analytical data relating to the investment; the nature and duration of restrictions on disposition of the investment; and the evaluation of forces which influence the market in which the investment is purchased and sold. Valuing investments at fair value involves greater reliance on judgment than valuing investments that have readily available market quotations. Fair value determinations can also involve reliance on quantitative models employed by a fair value pricing service.
US GAAP requires disclosure regarding the various inputs that are used in determining the value of each Fund's investments. These inputs are summarized into the three broad levels listed below:
Level 1—Unadjusted quoted prices in active markets for identical investments.
Level 2—Other significant observable inputs, including but not limited to, quoted prices for similar investments, interest rates, prepayment speeds and credit risks.
Level 3—Unobservable inputs inclusive of the Funds' own assumptions in determining the fair value of investments.
In accordance with the requirements of US GAAP, a fair value hierarchy has been included near the end of each Fund's Portfolio of investments.
137
The UBS Funds
Notes to financial statements
Investments
Asset-backed securities: Certain Funds may invest in asset-backed securities ("ABS"), representing interests in pools of certain types of underlying installment loans, home equity loans, leases of various types of real and personal property and receivables from revolving lines of credit (credit cards). Such assets are securitized through the use of trusts or special purpose corporations. The yield characteristics of ABS differ from those of traditional debt securities. One such major difference is that principal may be prepaid at any time because the underlying obligations generally may be prepaid at any time. ABS may decrease in value as a result of increases in interest rates and may benefit less than other fixed-income securities from declining interest rates because of the risk of prepayment.
Mortgage-backed securities: Certain Funds may invest in mortgage-backed securities ("MBS"), representing direct or indirect interests in pools of underlying mortgage loans that are secured by real property. These securities provide investors with payments consisting of both principal and interest as the mortgages in the underlying mortgage pools are paid.
The timely payment of principal and interest (but not the market value) on MBS issued or guaranteed by Ginnie Mae (formally known as the Government National Mortgage Association or GNMA) is backed by Ginnie Mae and the full faith and credit of the US government. Obligations issued by Fannie Mae (formally known as the Federal National Mortgage Association or FNMA) and Freddie Mac (formally known as the Federal Home Loan Mortgage Company or FHLMC) are historically supported only by the credit of the issuer, but currently are guaranteed by the US government in connection with such agencies being placed temporarily into conservatorship by the US government.
Some MBS are sponsored or issued by private entities. Payments of principal and interest (but not the market value) of such private MBS may be supported by pools of mortgage loans or other MBS that are guaranteed, directly or indirectly, by the US government or one of its agencies or instrumentalities, or they may be issued without any government guarantee of the underlying mortgage assets but with some form of non-government credit enhancement.
Collateralized mortgage obligations ("CMO") are a type of MBS. A CMO is a debt security that may be collateralized by whole mortgage loans or mortgage pass-through securities. The mortgage loans or mortgage pass-through securities are divided into classes or tranches with each class having its own characteristics. Investors typically receive payments out of the interest and principal on the underlying mortgages. The portions of these payments that investors receive, as well as the priority of their rights to receive payments, are determined by the specific terms of the CMO class.
The yield characteristics of MBS differ from those of traditional debt securities. Among the major differences are that interest and principal payments are made more frequently, usually monthly, and that principal may be prepaid at any time because the underlying mortgage loans or other obligations generally may be prepaid at any time. Prepayments on a pool of mortgage loans are influenced by a variety of economic, geographic, social and other factors. Generally, prepayments on fixed-rate mortgage loans will increase during a period of falling interest rates and decrease during a period of rising interest rates. Certain classes of CMOs and other MBS are structured in a manner that makes them extremely sensitive to changes in prepayment rates. Such classes include interest-only ("IO") and principal-only ("PO") classes. IOs are entitled to receive all or a portion of the interest, but none (or only a nominal amount) of the principal payments, from the underlying mortgage assets. If the mortgage assets underlying an IO experience greater than anticipated principal prepayments, then the total amount of interest payments allocable to the IO class, and therefore the yield to investors, generally will be reduced. Conversely, PO classes are entitled to receive all or a portion of the principal payments, but none of the interest, from the underlying mortgage assets. PO classes are purchased at substantial discounts from par, and the yield to investors will be reduced if principal payments are slower than expected.
138
The UBS Funds
Notes to financial statements
Real estate investment trusts: Certain Funds may invest in real estate investment trusts ("REITs"). Distributions from a REIT are initially recorded as dividend income and may subsequently be recharacterized by the REIT at the end of its tax year as a return of capital and/or capital gains. The Fund estimates the character of dividends received from REITs for financial reporting purposes based on the distribution history of each REIT. Once actual distribution characterizations are made available by the REITs, typically after calendar year end, the Fund updates its accounting and/or tax books and records.
Restricted securities: The Funds may invest in securities that are subject to legal or contractual restrictions on resale. These securities generally may be resold in transactions exempt from registration or to the public if the securities are registered. Disposal of these securities may involve time-consuming negotiations and expense, and prompt sale at an acceptable price may be difficult. Information regarding restricted securities, if any, is included in each Fund's portfolio footnotes.
Securities traded on to-be-announced basis: Certain Funds may from time to time purchase, or short sell, securities on a to-be-announced ("TBA") basis. In a TBA transaction, the Fund commits to purchasing securities for which all specific information is not yet known at the time of the trade, particularly the face amount and maturity date of the underlying securities. Securities purchased on a TBA basis are not settled until they are delivered to the Fund, normally 15 to 45 days later. Beginning on the date the Fund enters into a TBA transaction, cash, U.S. government securities or other liquid securities are segregated in an amount equal in value to the purchase price of the TBA security. These transactions are subject to market fluctuations and their current value is determined in the same manner as for other securities.
Short sales: UBS Dynamic Alpha Fund, UBS U.S. Small Cap Growth Fund and UBS Multi Income Bond Fund may engage in short sale transactions in which the Fund sells a security it does not own (or does not have the right to acquire at no added cost), in anticipation of a decline in the security's price.
The Fund must borrow the security to make delivery to the buyer. The initial amount of a short sale is recorded as a liability which is marked to market daily. Fluctuations in the value of this liability are recorded as unrealized appreciation or depreciation on the Statement of operations. The Fund will realize a loss as a result of the short sale if the price of the security increases between the date of the short sale and the date on which the Fund replaces the borrowed security, and the Fund will realize a gain if the security declines in price between those same dates. The Fund segregates collateral, consisting of cash or liquid assets, sufficient to collateralize the market value of the investments sold short. The Fund incurs transaction costs, including dividend expense, borrowing costs and interest expenses in connection with opening, maintaining and closing short sales. These dividends and interest are booked as an expense or liability to the Fund.
Because a Fund's loss on a short sale arises from increases in the value of the investment sold short, such loss, like the potential increase in price of the security sold short, is theoretically unlimited. The Fund's investments held long could also decline in value at the same time the value of the investment sold short increases, thereby increasing the Fund's potential for loss. There is also the risk that the counterparty to a short sale transaction may fail to honor its contract terms, causing a loss to the Fund.
For the period ended June 30, 2022, UBS Dynamic Alpha Fund, UBS U.S. Small Cap Growth Fund and UBS Multi Income Bond Fund did not engage in short sale transactions.
Treasury Inflation Protected Securities: The Funds may purchase Treasury inflation protected securities ("TIPS") which are debt securities issued by the US Treasury. TIPS adjust for inflation based on changes in the published Consumer Price Index ("CPI"). During periods of inflation when the CPI index increases, the principal amount of the debt to which the rate of interest is applied increases, which in turn increases the yield. During periods of deflation when the CPI index decreases, the principal amount of the debt to which the rate of interest is applied decreases,
139
The UBS Funds
Notes to financial statements
which in turn lowers the yield. At maturity, TIPS return the higher of the principal amount at maturity or the initial face amount of the debt.
Derivative instruments
Purchased options: Certain Funds may purchase put and call options, including, but not limited to, options on foreign or US securities, indices, foreign currencies, options on futures contracts and options on swap agreements (commonly referred to as swaptions), in order to gain exposure to or protect against changes in the markets or in an attempt to enhance income or gains. Purchasing call options tends to increase exposure to the underlying instrument. Purchasing put options tends to decrease exposure to the underlying instrument.
The Funds pay a premium which is included on the Statement of assets and liabilities as an investment and subsequently marked to market to reflect the current value of the option. Premiums paid for purchasing options which expire are treated as realized losses. Purchased options are shown as portfolio holdings within the Fund of investments and are included in the Statement of assets and liabilities in investments, at value.
The risk associated with purchasing put and call options is limited to the premium paid. Premiums paid for purchasing options which are exercised or closed are added to the amounts paid or offset against the proceeds on the underlying future, security or currency transaction to determine the realized gain or loss.
Option writing: Certain Funds may write (sell) put and call options, including, but not limited to, options on foreign or US securities, indices, foreign currencies, options on futures contracts and options on swap agreements (commonly referred to as swaptions), in order to gain exposure to or protect against changes in the markets or in an attempt to enhance income or gains.
When a Fund writes a call or a put option, an amount equal to the premium received by the Fund is included on the Fund's Statement of assets and liabilities as a liability. The amount of the liability is subsequently marked-to-market to reflect the current market value of the option written. If an option which the Fund has written either expires on its stipulated expiration date or the Fund enters into a closing purchase transaction, the Fund realizes a gain (or loss if the cost of a closing purchase transaction exceeds the premium received when the option was written) without regard to any unrealized gain or loss on the underlying security or derivative instrument, and the liability related to such option is extinguished. If a call option, which a Fund has written, is exercised, the Fund recognizes a realized gain or loss (long-term or short-term, depending on the holding period of the underlying security) from the sale of the underlying security or derivative instrument and the proceeds from the sale are increased by the premium originally received. If a put option, which a Fund has written, is exercised, the amount of the premium originally received reduces the cost of the security or derivative instrument which the Fund purchases upon exercise of the option.
In writing an option, a Fund bears the market risk of an unfavorable change in the price of the derivative instrument, security, or currency underlying the written option. Exercise of an option written by a Fund could result in the Fund selling or buying a derivative instrument, security or currency at a price different from current market value.
In the normal course of trading activities, the Fund trades and holds certain fair valued derivative contracts that constitute guarantees. Such contracts include written put options, where the Fund will be obligated to purchase securities at specified prices (i.e. the options are exercised by the counterparties). It also includes written swaptions, where the Fund will be obligated to enter into a swap agreement. The maximum payout for these contracts is limited to the number of put option contracts written and the related strike prices, respectively. Maximum payout amounts could be offset by the subsequent sale, if any, of assets obtained via the execution of a payout event.
Written options, if any, are shown as portfolio holdings within the Portfolio of investments and are included in the Statement of assets and liabilities in options and swaptions written, at value. At June 30, 2022, the Funds did not hold any written options.
140
The UBS Funds
Notes to financial statements
Futures contracts: Certain Funds may purchase or sell futures contracts to increase or reduce their exposure to an asset class without purchasing or selling the underlying securities, either as a hedge or to enhance income or realized gains. Generally, a futures contract is a standard binding agreement to buy or sell a specified quantity of an underlying reference asset, such as a specific security or currency, at a specified price at a specified later date.
Upon entering into a futures contract, a Fund is required to deliver to a broker an amount of cash and/or US government securities equal to a certain percentage of the contract amount. This amount is known as the "initial margin". Subsequent payments, known as "variation margin", generally are made or received by a Fund , depending on the daily fluctuations in the value of the underlying futures contracts, except that in the case of certain futures contracts that are held through swap contracts. Such variation margin is recorded for financial statement purposes on a daily basis as an unrealized appreciation or depreciation on futures until the futures contract is closed or expires, at which time the net gain or loss is reclassified to realized gain or loss on futures.
Using futures contracts involves various risks, including market, interest rate and equity risks. Risks of entering into futures contracts include the possibility that there may be an illiquid market or that a change in the value of the contract may not correlate with changes in the value of the underlying securities. To the extent that market prices move in an unexpected direction, there is a risk that a Fund will not achieve the anticipated benefits of the futures contract or may realize a loss.
Futures contracts, if any, are shown as fund holdings within the Portfolio of investments. Variation margin, if applicable, is shown in Variation margin receivable or payable on futures contracts within the Statement of Assets and Liabilities.
Swap agreements: Certain Funds may engage in swap agreements, including, but not limited to, interest rate, credit default and total return swap agreements. A Fund expects to enter into these transactions to preserve a return or spread on a particular investment or to hedge a portion of the portfolio's duration, to protect against any increase in the price of securities the Fund anticipates purchasing at a later date, to gain exposure to certain markets in the most economical way possible or in an attempt to enhance income or gains.
The Funds accrue for interim payments on swap agreements on a daily basis, with the net amount recorded within unrealized appreciation or depreciation of swap agreements. Once interim payments are settled in cash, the net amount is recorded as realized gain or loss on swap agreements, in addition to realized gain or loss recorded upon the termination of swap agreements on the Statement of operations. Fluctuations in the value of swap agreements are recorded for financial statement purposes as unrealized appreciation or depreciation on swap agreements.
Certain Funds may enter into interest rate swap agreements with another party to receive or pay interest (e.g., an exchange of fixed rate payments for floating rate payments) to protect themselves from interest rate fluctuations. This type of swap is an agreement that obligates two parties to exchange a series of cash flows at specified intervals based upon or calculated by reference to a specified interest rate(s) for a specified amount. The payment flows are usually netted against each other, with the difference being paid by one party to the other. Interest rate swap agreements are subject to general market risk, liquidity risk, counterparty risk and interest rate risk.
Credit default swap agreements involve commitments to make or receive payments in the event of a default of a security or other credit event of the referenced obligation. As a buyer, the Fund would make periodic payments to the counterparty, and the Fund would receive payments only upon the occurrence of a default or credit event. If no default or credit event occurs, the Fund will lose its periodic stream of payments over the term of the contract. However, if a default or a credit event does occur, the Fund typically would receive full notional value for the referenced obligation that may have little or no value. As a seller, the Fund would receive periodic payments from the counterparty, and the Fund would make payments only upon the occurrence of a default or a credit event. If no default or credit event occurs, the Fund will gain the periodic stream of payments it received over the term of the
141
The UBS Funds
Notes to financial statements
contract and the counterparty will lose its periodic stream of payments over the term of the contract. However, if a default or credit event occurs, the Fund typically would pay full notional value for the referenced obligation that may have little or no value. Credit default swap agreements may involve greater risks than if the Fund had invested in the referenced obligation directly and are subject to general market risk, liquidity risk and credit risk.
Credit default swap agreements on credit indices involve one party making a stream of payments to another party in exchange for the right to receive a specified return in the event of a write-down, principal shortfall, interest shortfall or default of all or part of the referenced entities comprising the credit index. A credit index is a list of a basket of credit instruments or exposures designed to be representative of some part of the credit market as a whole. These indices are made up of referenced credits that are judged by a poll of dealers to be the most liquid entities in the credit default swap market based on the sector of the index. Components of the indices may include, but are not limited to, investment grade securities, high yield securities, asset backed securities, emerging markets, and/or various credit ratings within each sector. Credit indices are traded using credit default swaps with standardized terms including a fixed spread and standard maturity dates. An index credit default swap references all the names in the index, and if there is a default, the credit event is settled based on that name's weight in the index. The composition of the indices changes periodically, usually every six months, and for most indices, each name has an equal weight in the index. A Fund may use credit default swap agreements on credit indices to hedge a portfolio of credit default swaps or bonds with a credit default swap on indices which is less expensive than it would be to buy many credit default swaps to achieve a similar effect. Credit default swap agreements on credit indices are benchmarks for protecting investors owning bonds against default, and traders use them to speculate on changes in credit quality.
Credit default swap agreements on corporate issues or sovereign issues of an emerging market country involve one party making a stream of payments to another party in exchange for the right to receive a specified return in the event of a default or other credit event. If a credit event occurs and cash settlement is not elected, a variety of other obligations may be delivered in lieu of the specific referenced obligation. The ability to deliver other obligations may result in a cheapest-to-deliver option (the buyer of protection's right to choose the deliverable obligation with the lowest value following a credit event). A Fund may use credit default swap agreements on corporate issues or sovereign issues of an emerging market country to provide a measure of protection against defaults of the issuers (i.e., to reduce risk where the Fund owns or has exposure to the referenced obligation) or to take an active long or short position with respect to the likelihood of a particular issuer's default.
The maximum potential amount of future payments (undiscounted) that a Fund as a seller of protection could be required to make under a credit default swap agreement would be an amount equal to the notional amount of the agreement, which may exceed the amount of the value reflected on the Statement of assets and liabilities. Notional amounts of all credit default swap agreements outstanding as of the period end for which a Fund is the seller of protection are disclosed under the section "Credit default swap agreements on credit indices—sell protection" in the Portfolio of investments. These potential amounts would be partially offset by any recovery values of the respective referenced obligations, upfront payments received upon entering into the agreement, or net amounts received from the settlement of buy protection credit default swap agreements entered into, if any, by a Fund for the same referenced entity or entities.
Total return swap agreements involve commitments to pay or receive interest in exchange for a market-linked return based on a notional amount. To the extent the total return of the security or index underlying the transaction exceeds or falls short of the offsetting interest rate obligation, the Fund will receive a payment from or make a payment to the counterparty, respectively. Total return swap agreements are marked-to-market daily, and the change, if any, is recorded as unrealized appreciation or depreciation. Total return swap agreements are subject to general market risk, liquidity risk, counterparty risk, interest rate risk, credit risk and the risk that there may be unfavorable changes in the underlying investments or instruments.
142
The UBS Funds
Notes to financial statements
The use of swap agreements involves investment techniques, risks, and transaction costs different from those associated with ordinary portfolio security transactions, including assumptions about market conditions, interest rates, and other applicable factors. As a result, the performance of the Fund will be different than if it had used ordinary portfolio security transactions. OTC swap agreements do not involve the delivery of securities and are subject to counterparty risk. If the other party to a swap agreement defaults and fails to consummate the transaction, the Fund's risk of loss will consist of the net amount of interest or other payments that the Fund is contractually entitled to receive. Therefore, the Fund would consider the creditworthiness of the counterparty to a swap agreement in evaluating potential credit risk.
Certain clearinghouses offer clearing for limited types of derivatives transactions, such as interest rate and credit default swap agreements. Centrally cleared swap agreements must be transacted through a futures commission merchant ("FCM") and cleared through a clearinghouse that serves as a central counterparty. The performance of a centrally cleared swap transaction is effectively guaranteed by a central clearinghouse, thereby reducing the Fund's exposure to the credit risk of its original counterparty. The Fund will be required to post specified levels of margin with the clearinghouse or at the instruction of the clearinghouse; the margin required by a clearinghouse may be greater than the margin the Fund would be required to post in an uncleared transaction. Centrally cleared swap agreements, if any, are reported on the Statement of assets and liabilities based on variation margin receivable or payable, if any.
Swap agreements, if any, are shown as portfolio holdings within the Portfolio of investments.
Forward foreign currency contracts: Certain Funds may enter into forward foreign currency contracts as part of their investment objective, for purposes of risk management or to hedge the US dollar value of portfolio securities denominated in a particular currency. Generally, a forward foreign currency contract is a commitment to purchase or sell a foreign currency at a future date at a negotiated forward rate. Non-deliverable forward foreign currency contracts are settled with the counterparty in US dollars, or another fully convertible currency, without the physical delivery of foreign currency.
Fluctuations in the value of open forward foreign currency contracts are recorded daily for book purposes as unrealized appreciation or depreciation on forward foreign currency contracts by the Funds. Realized gains and losses on forward foreign currency contracts include net gains or losses recognized by the Funds on contracts which have been sold or matured.
Risks may arise upon entering into forward foreign currency contracts from the potential inability of counterparties to meet the terms of their contracts and from unanticipated movements in the value of foreign currencies relative to the US dollar or each other.
Derivatives by underlying risk: Investment companies value their derivatives at fair value and recognize changes in fair value through the Statement of operations. Under US GAAP, investment companies do not qualify for hedge accounting. Accordingly, even though a Fund's investments in derivatives may represent economic hedges, they are considered to be non-hedge transactions for purposes of disclosure under US GAAP.
The volume of derivatives as disclosed in each Fund's portfolio of investments is representative of the volume of derivatives outstanding during the period ended June 30, 2022.
Swap agreements, forward foreign currency contracts, swaptions and options written entered into by the Funds may contain credit-risk related contingent features that could be triggered subject to certain circumstances. Such circumstances include agreed upon net asset value thresholds. If triggered, the derivative counterparty could request additional cash margin and/or terminate the derivative contract. The aggregate fair value of the derivative contracts that are in a net liability position that contain these triggers can be found in the Fund's Portfolio of investments. The
143
The UBS Funds
Notes to financial statements
aggregate fair value of assets that are already posted as collateral as of June 30, 2022 is reflected in the Statement of assets and liabilities.
At June 30, 2022, the Fund indicated below had the following derivatives categorized by underlying risk:
Asset derivatives1
| Interest rate risk | Foreign exchange risk | Credit risk | Equity risk | Total value | |||||||||||||||||||
UBS Dynamic Alpha Fund | |||||||||||||||||||||||
Futures contracts | $ | 50,455 | $ | — | $ | — | $ | 65,490 | $ | 115,945 | |||||||||||||
Forward foreign currency contracts | — | 445,060 | — | — | 445,060 | ||||||||||||||||||
Total value | $ | 50,455 | $ | 445,060 | $ | — | $ | 65,490 | $ | 561,005 | |||||||||||||
UBS Global Allocation Fund | |||||||||||||||||||||||
Futures contracts | $ | 206,434 | $ | — | $ | — | $ | 836,752 | $ | 1,043,186 | |||||||||||||
Swap agreements | — | — | 1,309,636 | — | 1,309,636 | ||||||||||||||||||
Forward foreign currency contracts | — | 915,121 | — | — | 915,121 | ||||||||||||||||||
Total value | $ | 206,434 | $ | 915,121 | $ | 1,309,636 | $ | 836,752 | $ | 3,267,943 | |||||||||||||
UBS Multi Income Bond Fund | |||||||||||||||||||||||
Futures contracts | $ | 9,332 | $ | — | $ | — | $ | — | $ | 9,332 | |||||||||||||
1 In the Statement of assets and liabilities, options and swaptions purchased are shown within investments, at value, swap agreements (except centrally cleared swap agreements) are shown within swap agreements, at value, while forward foreign currency contracts are shown using unrealized appreciation on forward foreign currency contracts. Futures contracts are reported in the table above using cumulative appreciation of futures contracts and centrally cleared swap agreements are reported at value, as reported in the futures contracts and centrally cleared swap agreements tables at the end of the Portfolio of investments, respectively, but only the variation margin to be received, if any, is reported within the Statement of assets and liabilities.
Liability derivatives1
| Interest rate risk | Foreign exchange risk | Credit risk | Equity risk | Total value | |||||||||||||||||||
UBS Dynamic Alpha Fund | |||||||||||||||||||||||
Futures contracts | $ | (38,007 | ) | $ | — | $ | — | $ | (216,812 | ) | $ | (254,819 | ) | ||||||||||
Swap agreements | — | — | (44,035 | ) | — | (44,035 | ) | ||||||||||||||||
Forward foreign currency contracts | — | (496,393 | ) | — | — | (496,393 | ) | ||||||||||||||||
Total | $ | (38,007 | ) | $ | (496,393 | ) | $ | (44,035 | ) | $ | (216,812 | ) | $ | (795,247 | ) | ||||||||
UBS Global Allocation Fund | |||||||||||||||||||||||
Futures contracts | $ | (595,847 | ) | $ | — | $ | — | $ | (1,121,887 | ) | $ | (1,717,734 | ) | ||||||||||
Swap agreements | — | — | — | (1,202,655 | ) | (1,202,655 | ) | ||||||||||||||||
Forward foreign currency contracts | — | (1,348,196 | ) | — | — | (1,348,196 | ) | ||||||||||||||||
Total | $ | (595,847 | ) | $ | (1,348,196 | ) | $ | — | $ | (2,324,542 | ) | $ | (4,268,585 | ) | |||||||||
UBS Multi Income Bond Fund | |||||||||||||||||||||||
Futures contracts | $ | (106,843 | ) | $ | — | $ | — | $ | — | $ | (106,843 | ) | |||||||||||
1 In the Statement of assets and liabilities, options and swaptions written are shown within options and swaptions written, at value, swap agreements (except centrally cleared swap agreements) are shown within swap agreements, at value, while forward foreign currency contracts are shown within unrealized depreciation on forward foreign currency contracts. Futures contracts are reported in the table above using cumulative depreciation of futures contracts and centrally cleared swap agreements are reported at value, as reported in the futures contracts and centrally cleared swap agreements are reported at value, as reported in the futures contracts and centrally cleared swap agreements tables at the end of the Portfolio of investments, respectively, but only the variation margin to be paid, if any, is reported within the Statement of assets and liabilities.
144
The UBS Funds
Notes to financial statements
During the period ended June 30, 2022, net realized gain (loss) from derivatives were as follows:
Realized gain (loss)1
| Interest rate risk | Foreign exchange risk | Credit risk | Equity risk | Total value | |||||||||||||||||||
UBS Dynamic Alpha Fund | |||||||||||||||||||||||
Futures contracts | $ | 142,931 | $ | — | $ | — | $ | (85,942 | ) | $ | 56,989 | ||||||||||||
Swap agreements | — | — | (43,069 | ) | — | (43,069 | ) | ||||||||||||||||
Forward foreign currency contracts | — | 1,733,114 | — | — | 1,733,114 | ||||||||||||||||||
Total net realized gains (loss) | $ | 142,931 | $ | 1,733,114 | $ | (43,069 | ) | $ | (85,942 | ) | $ | 1,747,034 | |||||||||||
UBS Global Allocation Fund | |||||||||||||||||||||||
Options and swaptions purchased | $ | — | $ | — | $ | — | $ | (84,600 | ) | $ | (84,600 | ) | |||||||||||
Futures contracts | (624,342 | ) | — | — | (177,042 | ) | (801,384 | ) | |||||||||||||||
Swap agreements | — | — | 13,488 | (1,726,405 | ) | (1,712,917 | ) | ||||||||||||||||
Forward foreign currency contracts | — | 1,740,443 | — | — | 1,740,443 | ||||||||||||||||||
Total net realized gains (loss) | $ | (624,342 | ) | $ | 1,740,443 | $ | 13,488 | $ | (1,988,047 | ) | $ | (858,458 | ) | ||||||||||
UBS Multi Income Bond Fund | |||||||||||||||||||||||
Options and swaptions purchased | $ | 57,179 | $ | — | $ | — | $ | — | $ | 57,179 | |||||||||||||
Options and swaptions written | (4,922 | ) | — | — | — | (4,922 | ) | ||||||||||||||||
Futures contracts | (630,617 | ) | — | — | — | (630,617 | ) | ||||||||||||||||
Swap agreements | (15,406 | ) | — | 1,770 | 2,764 | (10,872 | ) | ||||||||||||||||
Forward foreign currency contracts | — | 14,705 | — | — | 14,705 | ||||||||||||||||||
Total net realized gains (loss) | $ | (593,766 | ) | $ | 14,705 | $ | 1,770 | $ | 2,764 | $ | (574,527 | ) | |||||||||||
1 The net realized gain (loss) is shown in the Statement of operations in net realized gain (loss) on futures contracts, options and swaptions written, swap agreements and forward foreign currency contracts, unless otherwise noted. The net realized gain (loss) on options and swaptions purchased is shown in the Statement of operations in net realized gain (loss) on investments.
During the period ended June 30, 2022, net unrealized appreciation (depreciation) from derivatives were as follows:
Net change in unrealized appreciation (depreciation)1
| Interest rate risk | Foreign exchange risk | Credit risk | Equity risk | Total value | |||||||||||||||||||
UBS Dynamic Alpha Fund | |||||||||||||||||||||||
Futures contracts | $ | 65,209 | $ | — | $ | — | $ | (107,081 | ) | $ | (41,872 | ) | |||||||||||
Swap agreements | — | — | (94,487 | ) | — | (94,487 | ) | ||||||||||||||||
Foreign forward currency contracts | — | (220,652 | ) | — | — | (220,652 | ) | ||||||||||||||||
Net change in appreciation (depreciation) | $ | 43,524 | $ | (220,652 | ) | $ | (94,487 | ) | $ | (85,396 | ) | $ | (357,011 | ) | |||||||||
UBS Global Allocation Fund | |||||||||||||||||||||||
Futures contracts | $ | (330,901 | ) | $ | — | $ | — | $ | 501,900 | $ | 170,999 | ||||||||||||
Swap agreements | — | — | 211,752 | (1,202,655 | ) | (990,903 | ) | ||||||||||||||||
Foreign forward currency contracts | — | (345,789 | ) | — | — | (345,789 | ) | ||||||||||||||||
Net change in appreciation (depreciation) | $ | (330,901 | ) | $ | (345,789 | ) | $ | 211,752 | $ | (700,755 | ) | $ | (1,165,693 | ) | |||||||||
145
The UBS Funds
Notes to financial statements
| Interest rate risk | Foreign exchange risk | Credit risk | Equity risk | Total value | |||||||||||||||||||
UBS Multi Income Bond Fund | |||||||||||||||||||||||
Futures contracts | $ | (173,316 | ) | $ | — | $ | — | $ | — | $ | (173,316 | ) | |||||||||||
Swap agreements | — | — | — | (2,618 | ) | (2,618 | ) | ||||||||||||||||
Foreign forward currency contracts | — | (12,361 | ) | — | — | (12,361 | ) | ||||||||||||||||
Net change in appreciation (depreciation) | $ | (173,316 | ) | $ | (12,361 | ) | $ | — | $ | (2,618 | ) | $ | (188,295 | ) | |||||||||
1 The change in net unrealized appreciation (depreciation) is shown in the Statement of operations in change in net unrealized appreciation (depreciation) on futures contracts, options and swaptions written, swap agreements and forward foreign currency contracts, unless otherwise noted. The change in net unrealized appreciation (depreciation) of options and swaptions purchased is shown in the Statement of operations in change in net unrealized appreciation (depreciation) on investments.
Offsetting of certain derivatives: The Funds typically enter into International Swaps and Derivatives Association, Inc. Master Agreements ("ISDA Master Agreements") or similar master agreements with their OTC derivative contract counterparties in order to, among other things, reduce their credit risk to counterparties. ISDA Master Agreements include provisions for general obligations, representations, collateral and events of default or termination. Under an ISDA Master Agreement, the Funds typically may offset with the counterparty certain derivative financial instrument's payables and/or receivables with collateral held and/or posted and create one single net payment (close-out netting) in the event of default or termination. The Statement of assets and liabilities is presented gross of any netting.
At June 30, 2022, derivative assets and liabilities (by type) on a gross basis and derivatives subject to an enforceable master netting arrangement ("MNA") or similar were as follows:
UBS Dynamic Alpha Fund
Derivative Financial Instruments: | Assets | Liabilities | |||||||||
Total gross amount of derivative assets and liabilities in the Statement of assets and liabilities1 | $ | 561,005 | $ | (795,247 | ) | ||||||
Derivatives not subject to a MNA or similar agreements1 | (115,945 | ) | 298,854 | ||||||||
Total gross amount of assets and liabilities subject to MNA or similar agreements | $ | 445,060 | $ | (496,393 | ) | ||||||
The following tables present the Portfolio's derivative assets and liabilities by counterparty net of amounts available for offset under a MNA and net of the related collateral received/pledged by the Portfolio as of the period end.
Counterparty | Gross amount of assets | Financial instruments and derivatives available for offset | Collateral received2 | Net amount of assets | |||||||||||||||
BOA | $ | 164,875 | $ | (127,143 | ) | $ | — | $ | 37,732 | ||||||||||
CIBC | 2,961 | — | — | 2,961 | |||||||||||||||
CITI | 136,353 | (80,469 | ) | — | 55,884 | ||||||||||||||
JPMCB | 14,478 | (14,478 | ) | — | — | ||||||||||||||
MSCI | 41,657 | (41,657 | ) | — | — | ||||||||||||||
SSC | 84,736 | — | — | 84,736 | |||||||||||||||
Total | $ | 445,060 | $ | (263,747 | ) | $ | — | $ | 181,313 | ||||||||||
146
The UBS Funds
Notes to financial statements
Counterparty | Gross amount of liabilities | Financial instruments and derivatives available for offset | Collateral pledged2 | Net amount of liabilities | |||||||||||||||
BOA | $ | (127,143 | ) | $ | 127,143 | $ | — | $ | — | ||||||||||
CITI | (80,469 | ) | 80,469 | — | — | ||||||||||||||
JPMCB | (60,833 | ) | 14,478 | — | (46,355 | ) | |||||||||||||
MSCI | (227,948 | ) | 41,657 | — | (186,291 | ) | |||||||||||||
Total | $ | (496,393 | ) | $ | 263,747 | $ | — | $ | (232,646 | ) | |||||||||
1 In the Statement of assets and liabilities, options purchased are shown within investments of unaffiliated issuers, as value, swap agreements (except centrally cleared swap agreements) are shown within outstanding swap agreements, at value, while forward foreign currency contracts are shown within unrealized appreciation of forward foreign currency contracts. Futures contracts are reported in the table above using cumulative appreciation on futures contracts and centrally cleared swap agreements, if any, are reported at value, as reported in the futures contracts and centrally cleared swap agreements tables at the end of the Portfolio of investments, respectively, but only the variation margin to be received, if any, is reported within the Statement of assets and liabilities.
2 In some instances, the actual collateral received and/or pledged may be more than the amount shown and may be comprised of cash collateral, non-cash collateral or combination of both.
UBS Global Allocation Fund
Derivative Financial Instruments: | Assets | Liabilities | |||||||||
Total gross amount of derivative assets and liabilities in the Statement of assets and liabilities1 | $ | 3,267,943 | $ | (4,268,585 | ) | ||||||
Derivatives not subject to a MNA or similar agreements | (2,352,822 | ) | 1,717,734 | ||||||||
Total gross amount of assets and liabilities subject to MNA or similar agreements | $ | 915,121 | $ | (2,550,851 | ) | ||||||
The following tables present the Portfolio's derivative liabilities by counterparty net of amounts available for offset under a MNA and net of the related collateral received/pledged by the Portfolio as of the period end.
Counterparty | Gross amount of assets | Financial instruments and derivatives available for offset | Collateral received2 | Net amount of assets | |||||||||||||||
BB | $ | 70,488 | $ | — | $ | — | $ | 70,488 | |||||||||||
CIBC | 2,268 | — | — | 2,268 | |||||||||||||||
CITI | 3,333 | — | — | 3,333 | |||||||||||||||
GS | 1,656 | (1,656 | ) | — | — | ||||||||||||||
HSBC | 644,548 | — | — | 644,548 | |||||||||||||||
JPMCB | 64,861 | �� | (64,861 | ) | — | — | |||||||||||||
MSCI | 29,176 | (29,176 | ) | — | — | ||||||||||||||
MSCI | 98,791 | (98,791 | ) | — | — | ||||||||||||||
Total | $ | 915,121 | $ | (194,484 | ) | $ | — | $ | 720,637 | ||||||||||
147
The UBS Funds
Notes to financial statements
Counterparty | Gross amount of liabilities | Financial instruments and derivatives available for offset | Collateral pledged2 | Net amount of liabilities | |||||||||||||||
BOA | $ | (494,071 | ) | $ | — | $ | — | $ | (494,071 | ) | |||||||||
GS | (131,084 | ) | 1,656 | — | (129,428 | ) | |||||||||||||
JPMCB | (1,550,027 | ) | 64,861 | 1,485,166 | — | ||||||||||||||
MSCI | (48,716 | ) | 29,176 | — | (19,540 | ) | |||||||||||||
SSC | (326,953 | ) | 98,791 | — | (228,162 | ) | |||||||||||||
Total | $ | (2,550,851 | ) | $ | 194,484 | $ | 1,485,166 | $ | (871,201 | ) | |||||||||
1 In the Statement of assets and liabilities, options purchased are shown within investments of unaffiliated issuers, as value, swap agreements (except centrally cleared swap agreements) are shown within outstanding swap agreements, at value, while forward foreign currency contracts are shown within unrealized appreciation of forward foreign currency contracts. Futures contracts are reported in the table above using cumulative appreciation on futures contracts and centrally cleared swap agreements, if any, are reported at value, as reported in the futures contracts and centrally cleared swap agreements tables at the end of the Portfolio of investments, respectively, but only the variation margin to be received, if any, is reported within the Statement of assets and liabilities.
2 In some instances, the actual collateral received and/or pledged may be more than the amount shown and may be comprised of cash collateral, non-cash collateral or combination of both.
At June 30, 2022, derivative assets and liabilities (by type) on a gross basis and derivatives subject to an enforceable master netting arrangement ("MNA") or similar were as follows:
UBS Multi Income Bond Fund
Derivative Financial Instruments: | Assets | Liabilities | |||||||||
Total gross amount of derivative assets and liabilities in the Statement of assets and liabilities1 | $ | 9,332 | $ | (106,843 | ) | ||||||
Derivatives not subject to a MNA or similar agreements | (9,332 | ) | 106,843 | ||||||||
Total gross amount of assets and liabilities subject to MNA or similar agreements | $ | — | $ | — | |||||||
1 In the Statement of assets and liabilities, options purchased are shown within investments of unaffiliated issuers, as value, swap agreements (except centrally cleared swap agreements) are shown within outstanding swap agreements, at value, while forward foreign currency contracts are shown within unrealized appreciation of forward foreign currency contracts. Futures contracts are reported in the table above using cumulative appreciation on futures contracts and centrally cleared swap agreements, if any, are reported at value, as reported in the futures contracts and centrally cleared swap agreements tables at the end of the Portfolio of investments, respectively, but only the variation margin to be received, if any, is reported within the Statement of assets and liabilities.
Investment advisory fees and other transactions with affiliates
The Advisor, a registered investment advisor, provides the Funds with investment management services. As compensation for these services, each Fund pays the Advisor a monthly fee, accrued daily and paid monthly, based on each Fund's respective average daily net assets in accordance with the following per annum schedule:
Fund | $0 to $500 mm | $500 mm to $1.0 billion | $1.0 billion to $1.5 billion | $1.5 billion to $2.0 billion | $2.0 billion to $4.0 billion | $4.0 billion and over | |||||||||||||||||||||
UBS Dynamic Alpha Fund | 0.850 | % | 0.800 | % | 0.750 | % | 0.725 | % | 0.700 | % | 0.680 | % | |||||||||||||||
Fund | $0 to $500 mm | $500 mm to $1.0 billion | $1.0 billion to $1.5 billion | $1.5 billion to $2.0 billion | $2.0 billion to $3.0 billion | $3.0 billion to $6.0 billion | $6.0 billion and over | ||||||||||||||||||||||||
UBS Global Allocation Fund | 0.800 | % | 0.750 | % | 0.700 | % | 0.675 | % | 0.650 | % | 0.630 | % | 0.610 | % | |||||||||||||||||
148
The UBS Funds
Notes to financial statements
Fund | $0 to $250 mm | $250 mm to $500 mm | $500 mm to $750 mm | $750 mm to $1.0 billion | $1.0 billion and over | ||||||||||||||||||
UBS All China Equity Fund | 0.850 | % | 0.825 | % | 0.800 | % | 0.775 | % | 0.750 | % | |||||||||||||
UBS Emerging Markets Equity Opportunity Fund | 0.900 | 0.875 | 0.850 | 0.825 | 0.750 | ||||||||||||||||||
UBS Sustainable Development Bank Bond Fund | 0.150 | 0.145 | 0.140 | 0.135 | 0.130 | ||||||||||||||||||
Fund | $0 to $250 mm | $250 mm to $500 mm | $500 mm to $750 mm | $750 mm to $1.0 billion | $1.0 billion to $1.5 billion | $2.0 billion and over | |||||||||||||||||||||
UBS International Sustainable Equity Fund | 0.800 | % | 0.775 | % | 0.750 | % | 0.725 | % | 0.675 | % | 0.650 | % | |||||||||||||||
| Fund | $0 to $250 mm | $250 mm to $500 mm | $500 mm to $750 mm | $750 mm to $1.0 billion | $1.0 billion to $2.0 billion | $2.0 billion and over | |||||||||||||||||||||
UBS U.S. Small Cap Growth Fund* | 0.850 | % | 0.825 | % | 0.800 | % | 0.775 | % | 0.725 | % | 0.700 | % | |||||||||||||||
Fund | $0 to $250 mm | $250 mm to $500 mm | $500 mm to $750 mm | $750 mm and over | |||||||||||||||
UBS Multi Income Bond Fund** | 0.500 | % | 0.490 | % | 0.480 | % | 0.470 | % | |||||||||||
Fund | $0 to $250 mm | $250 mm and over | |||||||||
UBS Engage For Impact Fund | 0.75 | % | 0.725 | % | |||||||
Fund | All assets | ||||||
UBS US Dividend Ruler Fund | 0.500 | % | |||||
UBS US Quality Growth At Reasonable Price Fund | 0.500 | ||||||
* Prior to June 13, 2022, the investment advisory fee payable to the Advisor, before fee waivers and/or expense reimbursements, by the Fund was: 0.850% on the first $1 billion assets under management and 0.825% on assets under management above $1 billion.
** Prior to June 13, 2022, the investment advisory fee payable to the Advisor, before fee waivers and/or expense reimbursements, by the Fund was: 0.50% on all assets under management.
For UBS All China Equity Fund, UBS Global Allocation Fund, UBS Emerging Markets Equity Opportunity Fund, UBS Engage For Impact Fund, UBS Dynamic Alpha Fund, UBS US Dividend Ruler Fund, UBS US Quality Growth At Reasonable Price Fund, UBS U.S. Small Cap Growth Fund, UBS Sustainable Development Bank Bond Fund, and UBS Multi Income Bond Fund, the Advisor has agreed to waive its fees and/or reimburse expenses (excluding expenses incurred through investment in other investment companies, interest, taxes, brokerage commissions and extraordinary expenses, such as proxy related expenses) to the extent necessary so that the Funds' ordinary operating expenses (excluding expenses incurred through investment in other investment companies, interest, taxes, brokerage commissions, dividend expense and security loan fees for securities sold short and extraordinary expenses, such as proxy related expenses) do not exceed the expense limit of each class of shares as indicated in the following table. For UBS International Sustainable Equity Fund, the Advisor has agreed to waive its fees and reimburse certain expenses (excluding expenses incurred through investment in other investment companies, interest, taxes, brokerage commissions and extraordinary expenses, such as proxy-related expenses) so that the Fund's ordinary operating expenses (excluding expenses incurred through investment in other investment companies, interest, taxes, brokerage commissions and extraordinary expenses, such as proxy-related expenses) do not exceed limit of each class of shares as indicated in the following table. The contractual fee waiver and/or expense reimbursement agreement for each Fund, except UBS International Sustainable Equity Fund, will remain in place through the period ending
149
The UBS Funds
Notes to financial statements
October 28, 2022. The fee waiver and/or expense reimbursement agreement for UBS International Sustainable Equity Fund is irrevocable. Investment advisory fees, including the dollar amount waived or reimbursed, for the period ended June 30, 2022 were as follows:
Fund | Class A expense cap | Class P expense cap | Class P2 expense cap | Amount due to (due from) Advisor | Advisory fees incurred | Fees waived/ expenses reimbursed | |||||||||||||||||||||
UBS All China Equity Fund | 1.35 | % | 1.10 | % | 0.30 | % | $ | (8,821 | ) | $ | 15,362 | $ | (287,299 | ) | |||||||||||||
UBS Dynamic Alpha Fund | 1.35 | 1.10 | — | 11,889 | 266,933 | (305,172 | ) | ||||||||||||||||||||
UBS Global Allocation Fund | 1.20 | 0.95 | — | 76,441 | 1,850,869 | (418,006 | ) | ||||||||||||||||||||
UBS Emerging Markets Equity Opportunity Fund | 1.25 | 1.00 | 0.40 | 109,139 | 6,974,183 | (5,457,979 | ) | ||||||||||||||||||||
UBS Engage For Impact Fund | 1.10 | 0.85 | 0.25 | 31,193 | 405,514 | (584,271 | ) | ||||||||||||||||||||
UBS International Sustainable Equity Fund | 1.25 | 1.00 | 0.25 | 82,146 | 2,642,648 | (691,148 | ) | ||||||||||||||||||||
UBS US Dividend Ruler Fund | N/A | 0.50 | — | 34,629 | 558,356 | (371,750 | ) | ||||||||||||||||||||
UBS US Quality Growth At Reasonable Price Fund | N/A | 0.50 | — | 36,981 | 819,825 | (471,365 | ) | ||||||||||||||||||||
UBS U.S. Small Cap Growth Fund | 1.24 | 0.99 | — | (541 | ) | 1,508,146 | (383,650 | ) | |||||||||||||||||||
UBS Sustainable Development Bank Bond Fund | 0.35 | 0.25 | 0.15 | (15,656 | ) | 128,149 | (332,712 | ) | |||||||||||||||||||
UBS Multi Income Bond Fund | 0.75 | 0.50 | — | (92,512 | ) | 163,083 | (395,461 | ) | |||||||||||||||||||
For UBS All China Equity Fund Class P2, UBS Emerging Markets Equity Opportunity Fund Class P2, UBS Engage For Impact Fund Class P2, UBS International Sustainable Equity Fund Class P2, and UBS Sustainable Development Bank Bond Fund P2, the Advisor has entered into a written agreement pursuant to which the Advisor has agreed to waive all or a portion of its retained management fees. For the period ended June 30, 2022, the advisory fees waived were $3,949, $5,153,076, $345,056, $353,332 and $103,947, respectively. In addition these waivers are included within the fees waived/expenses reimbursed amount disclosed in the table above.
Each Fund, except for UBS International Sustainable Equity Fund, will reimburse the Advisor for expenses it waives or reimburses for a period of three years following such expense waivers or reimbursements, provided that the reimbursement by a Fund of the Advisor will not cause the total operating expense ratio to exceed the contractual limit as then may be in effect for the Fund (with respect to Class P2 shares, such recoupment right only pertains to expenses reimbursed, not UBS AM fees waived). The expenses waived or reimbursed for the period ended June 30, 2022 are subject to repayment through June 30, 2025.
At June 30, 2022, the following Funds had remaining fee waivers and expense reimbursements subject to repayment to the Advisor and respective dates of expiration as follows:
Fund | Fee waivers/ expense reimbursements subject to repayment | Expires June 30, 2023 | Expires June 30, 2024 | Expires June 30, 2025 | |||||||||||||||
UBS All China Equity Fund—Class P | $ | 379,939 | $ | — | $ | 126,7921 | $ | 253,147 | |||||||||||
UBS All China Equity Fund—Class P2 | 30,203 | — | — | 30,2032 | |||||||||||||||
UBS Dynamic Alpha Fund—Class A | 546,110 | 163,867 | 200,016 | 182,227 | |||||||||||||||
UBS Dynamic Alpha Fund—Class P | 363,795 | 109,524 | 131,326 | 122,945 | |||||||||||||||
UBS Global Allocation Fund—Class A | 1,138,444 | 409,362 | 397,866 | 331,216 | |||||||||||||||
UBS Global Allocation Fund—Class P | 293,511 | 103,031 | 103,690 | 86,790 | |||||||||||||||
UBS Emerging Markets Equity Opportunity Fund—Class P | 586,279 | 129,108 | 152,268 | 304,903 | |||||||||||||||
UBS Engage For Impact Fund—Class P | 470,435 | 295,800 | 127,379 | 47,256 | |||||||||||||||
UBS Engage For Impact Fund—Class P2 | 313,203 | — | 121,2443 | 191,959 | |||||||||||||||
UBS US Dividend Ruler Fund—Class P | 791,993 | — | 420,2434 | 371,750 | |||||||||||||||
150
The UBS Funds
Notes to financial statements
Fund | Fee waivers/ expense reimbursements subject to repayment | Expires June 30, 2023 | Expires June 30, 2024 | Expires June 30, 2025 | |||||||||||||||
UBS US Quality Growth At Reasonable Price Fund—Class P | $ | 929,000 | $ | — | $ | 457,6354 | $ | 471,365 | |||||||||||
UBS U.S. Small Cap Growth Fund—Class A | 199,735 | 80,713 | 59,658 | 59,364 | |||||||||||||||
UBS U.S. Small Cap Growth Fund—Class P | 843,688 | 268,927 | 250,475 | 324,286 | |||||||||||||||
UBS Sustainable Development Bank Bond Fund—Class P | 494,121 | 296,902 | 146,863 | 50,356 | |||||||||||||||
UBS Sustainable Development Bank Bond Fund—Class P2 | 290,250 | — | 111,8415 | 178,409 | |||||||||||||||
UBS Multi Income Bond Fund—Class A | 19,939 | 5,271 | 6,484 | 8,184 | |||||||||||||||
UBS Multi Income Bond Fund—Class P | 1,089,329 | 333,503 | 368,549 | 387,277 | |||||||||||||||
1 For the period from February 24, 2021 (commencement of operations) through June 30, 2021.
2 For the period from April 21, 2022 (commencement of operations) through June 30, 2022.
3 For the period from February 23, 2021 (commencement of operations) through June 30, 2021.
4 For the period from July 9, 2020 (commencement of operations) through June 30, 2021.
5 For the period from October 30, 2020 (commencement of operations) through June 30, 2021.
Each Fund pays UBS AM a monthly administration fee that is accrued daily and paid monthly at an annual rate of 0.075% of the average daily net assets of such Fund. For the period ended June 30, 2022, the Funds owed and incurred administrative fees as follows:
Fund | Administrative fees owed | Administrative fees incurred | |||||||||
UBS All China Equity Fund | $ | 239 | $ | 1,356 | |||||||
UBS Dynamic Alpha Fund | 1,721 | 23,553 | |||||||||
UBS Global Allocation Fund | 12,131 | 173,520 | |||||||||
UBS Emerging Markets Equity Opportunity Fund | 11,594 | 600,917 | |||||||||
UBS Engage For Impact Fund | 2,976 | 40,551 | |||||||||
UBS International Sustainable Equity Fund | 10,943 | 249,815 | |||||||||
UBS US Dividend Ruler Fund | 7,561 | 83,753 | |||||||||
UBS US Quality Growth At Reasonable Price Fund | 10,681 | 122,973 | |||||||||
UBS U.S. Small Cap Growth Fund | 8,231 | 133,072 | |||||||||
UBS Sustainable Development Bank Bond Fund | 4,632 | 64,074 | |||||||||
UBS Multi Income Bond Fund | 1,721 | 24,463 | |||||||||
For UBS Emerging Markets Equity Opportunity Fund Class P2, UBS International Sustainable Equity Fund P2 and UBS Sustainable Development Bank Bond Fund Class P2, the Advisor has entered into a written agreement pursuant to which the Advisor has agreed to waive its retained administration fees. For the period ended June 30, 2022, the administration fees waived were $407,108, $25,578 and $4,779, respectively, and such amounts are not subject to future recoupment.
The Funds may invest in shares of certain affiliated investment companies also advised or managed by the Advisor. Investments in affiliated investment companies for the period ended June 30, 2022 have been included near the end of each Fund's Portfolio of investments.
During the period ended June 30, 2022, the Funds listed below paid broker commissions to affiliates of the investment advisor as detailed in the below table. These brokerage commissions are reflected in the Statement of assets
151
The UBS Funds
Notes to financial statements
and liabilities within investments at cost of unaffiliated issuers, and the Statement of operations within net realized gain (loss) on, and/or change in net unrealized appreciation (depreciation) on investments and/or futures contracts.
Fund | UBS Group AG | ||||||
UBS Emerging Markets Equity Opportunity Fund | $ | 32,704 | |||||
UBS Engage For Impact Fund | 236 | ||||||
UBS International Sustainable Equity Fund | 3,215 | ||||||
During the period ended, June 30, 2022, some of the Funds engaged in purchase and sale transactions where an affiliate was underwriter. In such cases, the affiliate underwriter was not compensated and each trade was approved by the Board.
Service and distribution plans
UBS AM (US) is the principal underwriter of each Fund's shares. The Trust has adopted distribution and/or service plans (the "Plans") pursuant to Rule 12b-1 under the 1940 Act for Class A shares. The Plans govern payments made for the expenses incurred in the service and/or distribution of Class A shares. Annual fees under the Plans as a percentage of the average daily net assets of each representative class of each of the Funds are as follows:
Fund | Class A | ||||||
UBS All China Equity Fund | 0.25 | % | |||||
UBS Dynamic Alpha Fund | 0.25 | ||||||
UBS Global Allocation Fund | 0.25 | ||||||
UBS Emerging Markets Equity Opportunity Fund | 0.25 | ||||||
UBS Engage For Impact Fund | 0.25 | ||||||
UBS International Sustainable Equity Fund | 0.25 | ||||||
UBS U.S. Small Cap Growth Fund | 0.25 | ||||||
UBS Sustainable Development Bank Bond Fund | 0.10 | ||||||
UBS Multi Income Bond Fund | 0.25 | ||||||
UBS AM (US) also receives the proceeds of the initial sales charges paid upon purchases of Class A shares and the contingent deferred sales charges paid by shareholders upon certain redemptions of Class A shares. At June 30, 2022, certain Funds owed UBS AM (US) service and/or distribution fees, and for the period ended June 30, 2022, certain Funds were informed by UBS AM (US) that it had earned sales charges as follows:
Fund | Service and/or distribution fees owed | Sales charges earned by distributor | |||||||||
UBS Dynamic Alpha Fund—Class A | $ | 3,441 | $ | — | |||||||
UBS Global Allocation Fund—Class A | 30,681 | 2,250 | |||||||||
UBS U.S. Small Cap Growth Fund—Class A | 3,613 | 1,696 | |||||||||
UBS Multi Income Bond Fund—Class A | 107 | — | |||||||||
Transfer agency and related services fees
UBS Financial Services Inc. provides certain services to the Funds pursuant to a delegation of authority from BNY Mellon Investment Servicing (US) Inc. ("BNY Mellon"), the Funds' transfer agent, and is compensated for these services by BNY Mellon, not the Funds.
152
The UBS Funds
Notes to financial statements
For the period ended June 30, 2022, UBS Financial Services Inc. received from BNY Mellon, not the Funds, total delegated service fees as follows:
Fund | Delegated services Fund fees earned | ||||||
UBS All China Equity Fund | $ | 1 | |||||
UBS Dynamic Alpha Fund | 14,604 | ||||||
UBS Global Allocation Fund | 51,437 | ||||||
UBS Emerging Markets Equity Opportunity Fund | 30,504 | ||||||
UBS Engage For Impact Fund | 10,482 | ||||||
UBS International Sustainable Equity Fund | 22,330 | ||||||
UBS US Dividend Ruler Fund | 30,589 | ||||||
UBS US Quality Growth At Reasonable Price Fund | 44,833 | ||||||
UBS U.S. Small Cap Growth Fund | 5,437 | ||||||
UBS Sustainable Development Bank Bond Fund | 11,758 | ||||||
UBS Multi Income Bond Fund | 903 | ||||||
Securities lending
Each Fund may lend securities up to 331/3% of its total assets to qualified broker-dealers or institutional investors. The loans are initially secured by cash, U.S. government securities and irrevocable letters of credit in an amount at least equal to 102% of the market value of the securities loaned with respect to domestic securities and 105% of the market value of the securities loaned with respect to foreign securities. In the event that the market value of the cash, U.S. government securities, and irrevocable letters of credit securing the loan falls below 100% of the market value for domestic securities, and 103% for foreign securities, the borrower must provide additional cash, U.S. government securities, and irrevocable letters of credit so that the total securing the loan is at least 102% of the market value for domestic securities and 105% of the market value for foreign securities.
Each Fund will regain ownership of loaned securities to exercise certain beneficial rights; however, each Fund may bear the risk of delay in recovery of, or even loss of rights in, the securities loaned should the borrower fail financially. The Fund receives compensation for lending its securities from interest or dividends earned on the cash, U.S. government securities and irrevocable letters of credit held as collateral, net of fee rebates paid to the borrower plus reasonable administrative and custody fees. Cash collateral received is invested in State Street Navigator Securities Lending Government Money Market Fund, which is included in the Fund's Portfolio of investments. State Street Bank and Trust Company serves as the Fund's lending agent.
At June 30, 2022, the following Funds had securities on loan at value, cash collateral and non-cash collateral as follows:
Fund | Value of securities on loan | Cash collateral | Non-cash collateral* | Total collateral | Security types held as non-cash collateral | ||||||||||||||||||
UBS All China Equity Fund | $ | 108,382 | $ | — | $ | 117,686 | $ | 117,686 | U.S. Treasury Notes and U.S. Treasury Bills | ||||||||||||||
UBS Dynamic Alpha Fund | 434,990 | 171,623 | 280,286 | 451,909 | U.S. Treasury Notes and U.S. Treasury Bills | ||||||||||||||||||
UBS Global Allocation Fund | 5,498,542 | 1,736,422 | 3,997,918 | 5,734,340 | U.S. Treasury Notes and U.S. Treasury Bills | ||||||||||||||||||
UBS Engage For Impact Fund | 468,758 | — | 523,412 | 523,412 | U.S. Treasury Notes and U.S. Treasury Bills | ||||||||||||||||||
UBS International Sustainable Equity Fund | 9,024,540 | 9,308,381 | 283,840 | 9,592,221 | U.S. Treasury Notes and U.S. Treasury Bills | ||||||||||||||||||
UBS US Dividend Ruler Fund | 2,917,903 | 2,995,493 | — | 2,995,493 | |||||||||||||||||||
UBS U.S. Small Cap Growth Fund | 9,557,317 | 6,665,131 | 3,520,537 | 10,185,668 | U.S. Treasury Notes and U.S. Treasury Bills | ||||||||||||||||||
153
The UBS Funds
Notes to financial statements
Fund | Value of securities on loan | Cash collateral | Non-cash collateral* | Total collateral | Security types held as non-cash collateral | ||||||||||||||||||
| UBS Sustainable Development Bank Bond Fund | $ | 864,092 | $ | 875,000 | $ | — | $ | 875,000 | |||||||||||||||
UBS Multi Income Bond Fund | 671,035 | 572,970 | 110,348 | 683,318 | U.S. Treasury Notes and U.S. Treasury Bills | ||||||||||||||||||
* These securities are held for the benefit of the Fund at the Fund's custodian. The Fund cannot repledge or resell this collateral. As such, this collateral is excluded from the Statement of assets and liabilities.
The table below represents the disaggregation at June 30, 2022 of the gross amount of recognized liabilities for securities lending transactions. As the securities loaned are subject to termination by the Funds or the borrower at any time, the remaining contractual maturities of the transactions presented below are considered to be overnight and continuous.
Type of securities loaned | Total gross amount of recognized | ||||||||||||||
Fund | Equity securities | Corporate bonds | liabilities for securities lending transactions | ||||||||||||
UBS Dynamic Alpha Fund | $ | — | $ | 171,623 | $ | 171,623 | |||||||||
UBS Global Allocation Fund | 1,736,422 | — | 1,736,422 | ||||||||||||
UBS International Sustainable Equity Fund | 9,308,381 | — | 9,308,381 | ||||||||||||
UBS US Dividend Ruler Fund | 2,995,493 | — | 2,995,493 | ||||||||||||
UBS U.S. Small Cap Growth Fund | 6,665,131 | — | 6,665,131 | ||||||||||||
UBS Sustainable Development Bank Bond Fund | 875,000 | — | 875,000 | ||||||||||||
UBS Multi Income Bond Fund | — | 572,970 | 572,970 | ||||||||||||
Bank line of credit
The Fund participates with other funds managed by UBS AM in a $185 million committed credit facility (the "Committed Credit Facility") with State Street Bank and Trust Company. The Committed Credit Facility is to be utilized for temporary financing until the settlement of sales or purchases of portfolio securities, the repurchase or redemption of shares of a participating Fund at the request of shareholders and other temporary or emergency purposes.
Interest on amounts borrowed is calculated based on the prevailing rates in effect at the time of borrowing. The funds covered by the Committed Credit Facility have agreed to pay commitment fees on the average daily balance of the Committed Credit Facility not utilized. Commitment fees have been allocated among the funds in the Committed Credit Facility as follows: 50% of the allocation is based on the relative asset size of funds and the other 50% of the allocation is based on utilization.
For the period ended June 30, 2022, the following Funds had borrowings as follows:
Fund | Average daily amount of borrowing outstanding | Days outstanding | Interest expense | Weighted average annualized interest rate | |||||||||||||||
UBS Dynamic Alpha Fund | $ | 1,045,127 | 1 | $ | 42 | 1.430 | % | ||||||||||||
UBS Emerging Markets Equity Opportunity Fund | 7,513,125 | 7 | 2,127 | 1.456 | |||||||||||||||
UBS International Sustainable Equity Fund | 4,706,783 | 20 | 3,809 | 1.457 | |||||||||||||||
UBS US Quality Growth At Reasonable Price Fund | 6,398,372 | 4 | 1,550 | 2.180 | |||||||||||||||
154
The UBS Funds
Notes to financial statements
Commission recapture program
Certain Funds participated in a brokerage commission recapture program. These Funds had established commission recapture arrangements with certain participating brokers or dealers. If a Fund's investment manager chose to execute a transaction through a participating broker subject to best price and execution, the broker would rebate a portion of the commission back to the Fund. Any collateral benefit received through participation in the commission recapture program was directed exclusively to the Fund. For the period ended June 30, 2022, there were no recaptured commissions on the Funds. The commission recapture arrangement was terminated on August 10, 2022.
Purchases and sales of securities
For the period ended June 30, 2022, aggregate purchases and sales of portfolio securities, excluding short-term securities, were as follows:
Fund | Purchases | Sales | |||||||||
UBS All China Equity Fund | $ | 3,171,232 | $ | 245,239 | |||||||
UBS Dynamic Alpha Fund | 1,746,304 | 3,951,128 | |||||||||
UBS Global Allocation Fund | 107,903,919 | 152,933,054 | |||||||||
UBS Emerging Markets Equity Opportunity Fund | 443,026,487 | 593,461,907 | |||||||||
UBS Engage For Impact Fund | 29,833,752 | 20,371,825 | |||||||||
UBS International Sustainable Equity Fund | 171,605,221 | 318,173,094 | |||||||||
UBS US Dividend Ruler Fund | 78,535,134 | 31,520,600 | |||||||||
UBS US Quality Growth At Reasonable Price Fund | 134,095,474 | 48,403,539 | |||||||||
UBS U.S. Small Cap Growth Fund | 69,328,400 | 92,361,843 | |||||||||
UBS Sustainable Development Bank Bond Fund | 42,407,888 | 39,100,765 | |||||||||
UBS Multi Income Bond Fund | 80,357,377 | 86,710,517 | |||||||||
155
The UBS Funds
Notes to financial statements
Shares of beneficial interest
There is an unlimited number of $0.001 par value shares of beneficial interest authorized. Transactions in shares of beneficial interest for each of the Funds were as follows:
UBS All China Equity Fund
For the year ended June 30, 2022:
Class P | Class P21 | ||||||||||||||||||
Shares | Amount | Shares | Amount | ||||||||||||||||
Shares sold | 178,322 | $ | 1,275,000 | 504,084 | $ | 2,980,000 | |||||||||||||
Shares repurchased | (200,000 | ) | (1,430,000 | ) | — | — | |||||||||||||
Net increase (decrease) | (21,678 | ) | $ | (155,000 | ) | 504,084 | $ | 2,980,000 | |||||||||||
For the period ended June 30, 2021:
Class P2 | |||||||||||
Shares | Amount | ||||||||||
Shares sold | 200,000 | $ | 2,000,000 | ||||||||
Net increase (decrease) | 200,000 | $ | 2,000,000 | ||||||||
1 For the period from April 21, 2022 (commencement of operations) through June 30, 2022.
2 For the period from February 24, 2021 (commencement of operations) through June 30, 2021.
UBS Dynamic Alpha Fund
For the year ended June 30, 2022:
Class A | Class P | ||||||||||||||||||
Shares | Amount | Shares | Amount | ||||||||||||||||
Shares sold | 25,484 | $ | 152,596 | 271,541 | $ | 1,772,627 | |||||||||||||
Shares repurchased | (455,607 | ) | (2,900,779 | ) | (555,499 | ) | (3,631,478 | ) | |||||||||||
Dividends reinvested | 282,505 | 1,714,805 | 197,351 | 1,231,472 | |||||||||||||||
Net increase (decrease) | (147,618 | ) | $ | (1,033,378 | ) | (86,607 | ) | $ | (627,379 | ) | |||||||||
For the year ended June 30, 2021:
Class A | Class P | ||||||||||||||||||
Shares | Amount | Shares | Amount | ||||||||||||||||
Shares sold | 4,428 | $ | 28,574 | 211,816 | $ | 1,431,574 | |||||||||||||
Shares repurchased | (535,926 | ) | (3,458,032 | ) | (632,905 | ) | (4,188,830 | ) | |||||||||||
Net increase (decrease) | (531,498 | ) | $ | (3,429,458 | ) | (421,089 | ) | $ | (2,757,256 | ) | |||||||||
156
The UBS Funds
Notes to financial statements
UBS Global Allocation Fund
For the year ended June 30, 2022:
Class A | Class P | ||||||||||||||||||
Shares | Amount | Shares | Amount | ||||||||||||||||
Shares sold | 25,173 | $ | 310,380 | 121,149 | $ | 1,642,720 | |||||||||||||
Shares repurchased | (1,506,522 | ) | (19,240,423 | ) | (457,828 | ) | (6,173,606 | ) | |||||||||||
Dividends reinvested | 2,292,309 | 27,920,324 | 650,782 | 8,167,316 | |||||||||||||||
Net increase (decrease) | 810,960 | $ | 8,990,281 | 314,103 | $ | 3,636,430 | |||||||||||||
For the year ended June 30, 2021:
Class A | Class P | ||||||||||||||||||
Shares | Amount | Shares | Amount | ||||||||||||||||
Shares sold | 10,038 | $ | 136,618 | 244,148 | $ | 3,438,467 | |||||||||||||
Shares repurchased | (1,750,164 | ) | (23,572,518 | ) | (781,217 | ) | (10,944,548 | ) | |||||||||||
Dividends reinvested | 202,723 | 2,805,681 | 65,787 | 933,522 | |||||||||||||||
Net increase (decrease) | (1,537,403 | ) | $ | (20,630,219 | ) | (471,282 | ) | $ | (6,572,559 | ) | |||||||||
UBS Emerging Markets Equity Opportunity Fund
For the year ended June 30, 2022:
Class P | Class P2 | ||||||||||||||||||
Shares | Amount | Shares | Amount | ||||||||||||||||
Shares sold | 4,726,455 | $ | 46,248,143 | 27,267,167 | $ | 264,345,921 | |||||||||||||
Shares repurchased | (11,409,617 | ) | (107,816,815 | ) | (35,026,698 | ) | (355,815,030 | ) | |||||||||||
Dividends reinvested | 1,943,668 | 18,562,033 | 4,939,035 | 47,414,731 | |||||||||||||||
Net increase (decrease) | (4,739,494 | ) | $ | (43,006,639 | ) | (2,820,496 | ) | $ | (44,054,378 | ) | |||||||||
For the year ended June 30, 2021:
Class P | Class P2 | ||||||||||||||||||
Shares | Amount | Shares | Amount | ||||||||||||||||
Shares sold | 14,147,551 | $ | 169,320,305 | 26,833,218 | $ | 319,261,194 | |||||||||||||
Shares repurchased | (3,025,956 | ) | (36,095,951 | ) | (6,974,249 | ) | (81,214,990 | ) | |||||||||||
Dividends reinvested | 127,176 | 1,540,098 | 545,332 | 6,642,141 | |||||||||||||||
Net increase (decrease) | 11,248,771 | $ | 134,764,452 | 20,404,301 | $ | 244,688,345 | |||||||||||||
157
The UBS Funds
Notes to financial statements
UBS Engage For Impact Fund
For the year ended June 30, 2022:
Class P | Class P2 | ||||||||||||||||||
Shares | Amount | Shares | Amount | ||||||||||||||||
Shares sold | 360,518 | $ | 4,551,757 | 1,197,563 | $ | 15,604,143 | |||||||||||||
Shares repurchased | (305,970 | ) | (3,636,503 | ) | (620,152 | ) | (7,717,553 | ) | |||||||||||
Dividends reinvested | 30,309 | 387,354 | 440,302 | 5,618,257 | |||||||||||||||
Net increase (decrease) | 84,857 | $ | 1,302,608 | 1,017,713 | $ | 13,504,847 | |||||||||||||
For the period ended June 30, 2021:
Class P | Class P23 | ||||||||||||||||||
Shares | Amount | Shares | Amount | ||||||||||||||||
Shares sold | 1,369,755 | $ | 17,043,521 | 3,075,952 | $ | 43,396,675 | |||||||||||||
Shares repurchased | (3,430,094 | ) | (47,437,737 | ) | (88,712 | ) | (1,255,623 | ) | |||||||||||
Dividends reinvested | 20,418 | 265,026 | — | — | |||||||||||||||
Net increase (decrease) | (2,039,921 | ) | $ | (30,129,190 | ) | 2,987,240 | $ | 42,141,052 | |||||||||||
3 For the period February 23, 2021 (commencement of operations) through June 30, 2021.
UBS International Sustainable Equity Fund
For the year ended June 30, 2022:
Class A | |||||||||||
Shares | Amount | ||||||||||
Shares sold | 38,267 | $ | 437,024 | ||||||||
Shares repurchased | (307,592 | ) | (3,041,390 | ) | |||||||
Dividends reinvested | 62,958 | 671,131 | |||||||||
Net increase (decrease) | (206,367 | ) | $ | (1,933,235 | ) | ||||||
Class P | Class P2 | ||||||||||||||||||
Shares | Amount | Shares | Amount | ||||||||||||||||
Shares sold | 10,793,404 | $ | 124,410,780 | 1,375,046 | $ | 15,667,266 | |||||||||||||
Shares repurchased | (25,816,229 | ) | (289,810,243 | ) | (711,334 | ) | (7,596,957 | ) | |||||||||||
Dividends reinvested | 2,573,269 | 27,482,511 | 422,701 | 4,514,447 | |||||||||||||||
Net increase (decrease) | (12,449,556 | ) | $ | (137,916,952 | ) | 1,086,413 | $ | 12,584,756 | |||||||||||
For the period ended June 30, 2021:
Class A | |||||||||||
Shares | Amount | ||||||||||
Shares sold | 113,209 | $ | 1,201,424 | ||||||||
Shares repurchased | (166,275 | ) | (1,815,013 | ) | |||||||
Dividends reinvested | 7,173 | 84,210 | |||||||||
Net increase (decrease) | (45,893 | ) | $ | (529,379 | ) | ||||||
Class P | Class P21 | ||||||||||||||||||
Shares | Amount | Shares | Amount | ||||||||||||||||
Shares sold | 15,687,291 | $ | 182,719,166 | 3,495,542 | $ | 41,172,796 | |||||||||||||
Shares repurchased | (6,573,685 | ) | (76,443,156 | ) | (226,942 | ) | (2,792,095 | ) | |||||||||||
Dividends reinvested | 267,600 | 3,149,650 | 33,491 | 394,187 | |||||||||||||||
Net increase (decrease) | 9,381,206 | $ | 109,425,660 | 3,302,091 | $ | 38,774,888 | |||||||||||||
4 For the period from October 30, 2020 (commencement of operations) through June 30, 2021.
158
The UBS Funds
Notes to financial statements
UBS US Dividend Ruler Fund
For the year ended June 30, 2022:
Class P | |||||||||||
Shares | Amount | ||||||||||
Shares sold | 5,501,344 | $ | 71,850,798 | ||||||||
Shares repurchased | (2,070,716 | ) | (26,430,377 | ) | |||||||
Dividends reinvested | 219,574 | 2,883,002 | |||||||||
Net increase (decrease) | 3,650,202 | $ | 48,303,423 | ||||||||
For the period ended June 30, 2021:
Class P5 | |||||||||||
Shares | Amount | ||||||||||
Shares sold | 7,444,278 | $ | 84,691,033 | ||||||||
Shares repurchased | (1,078,574 | ) | (12,605,771 | ) | |||||||
Dividends reinvested | 27,009 | 304,926 | |||||||||
Net increase (decrease) | 6,392,713 | $ | 72,390,188 | ||||||||
5 For the period from July 9, 2020 (commencement of operations) through June 30, 2021.
UBS US Quality Growth At Reasonable Price Fund
For the year ended June 30, 2022:
Class P | |||||||||||
Shares | Amount | ||||||||||
Shares sold | 10,682,864 | $ | 138,717,101 | ||||||||
Shares repurchased | (4,268,432 | ) | (51,795,876 | ) | |||||||
Dividends reinvested | 317,326 | 4,369,581 | |||||||||
Net increase (decrease) | 6,731,758 | $ | 91,290,806 | ||||||||
For the period ended June 30, 2021:
Class P5 | |||||||||||
Shares | Amount | ||||||||||
Shares sold | 10,980,973 | $ | 123,322,191 | ||||||||
Shares repurchased | (2,102,969 | ) | (24,559,546 | ) | |||||||
Dividends reinvested | 20,693 | 233,830 | |||||||||
Net increase (decrease) | 8,898,697 | $ | 98,996,475 | ||||||||
5 For the period from July 9, 2020 (commencement of operations) through June 30, 2021.
159
The UBS Funds
Notes to financial statements
UBS U.S. Small Cap Growth Fund
For the year ended June 30, 2022:
Class A | Class P | ||||||||||||||||||
Shares | Amount | Shares | Amount | ||||||||||||||||
Shares sold | 81,350 | $ | 1,691,411 | 1,061,835 | $ | 24,683,401 | |||||||||||||
Shares repurchased | (418,020 | ) | (9,272,176 | ) | (1,434,370 | ) | (37,338,237 | ) | |||||||||||
Dividends reinvested | 272,963 | 5,486,549 | 1,200,697 | 28,804,727 | |||||||||||||||
Net increase (decrease) | (63,707 | ) | $ | (2,094,216 | ) | 828,162 | $ | 16,149,891 | |||||||||||
For the year ended June 30, 2021:
Class A | Class P | ||||||||||||||||||
Shares | Amount | Shares | Amount | ||||||||||||||||
Shares sold | 257,901 | $ | 6,742,911 | 1,935,839 | $ | 57,059,671 | |||||||||||||
Shares repurchased | (295,081 | ) | (7,733,170 | ) | (1,076,007 | ) | (31,440,072 | ) | |||||||||||
Dividends reinvested | 129,889 | 3,329,059 | 510,279 | 15,053,231 | |||||||||||||||
Net increase (decrease) | 92,709 | $ | 2,338,800 | 1,370,111 | $ | 40,672,830 | |||||||||||||
UBS Sustainable Development Bank Bond Fund
For the year ended June 30, 2022:
Class P | Class P2 | ||||||||||||||||||
Shares | Amount | Shares | Amount | ||||||||||||||||
Shares sold | 588,463 | $ | 6,151,254 | 4,009,512 | $ | 41,133,389 | |||||||||||||
Shares repurchased | (1,407,212 | ) | (14,065,763 | ) | (3,126,652 | ) | (31,626,275 | ) | |||||||||||
Dividends reinvested | 3,173 | 32,486 | 87,553 | 891,799 | |||||||||||||||
Net increase (decrease) | (815,576 | ) | $ | (7,882,023 | ) | 970,413 | $ | 10,398,913 | |||||||||||
For the Period ended June 30, 2021:
Class P | Class P24 | ||||||||||||||||||
Shares | Amount | Shares | Amount | ||||||||||||||||
Shares sold | 1,430,661 | $ | 15,750,187 | 6,756,676 | $ | 73,013,100 | |||||||||||||
Shares repurchased | (3,148,022 | ) | (34,747,508 | ) | (660,559 | ) | (6,989,118 | ) | |||||||||||
Dividends reinvested | 19,415 | 214,348 | 102,495 | 1,102,672 | |||||||||||||||
Net increase (decrease) | (1,697,946 | ) | $ | (18,782,973 | ) | 6,198,612 | $ | 67,126,654 | |||||||||||
4 For the period from October 30, 2020 (commencement of operations) through June 30, 2021.
160
The UBS Funds
Notes to financial statements
UBS Multi Income Bond Fund
For the year ended June 30, 2022:
Class A | Class P | ||||||||||||||||||
Shares | Amount | Shares | Amount | ||||||||||||||||
Shares sold | 9,201 | $ | 143,666 | 6,595 | $ | 100,629 | |||||||||||||
Shares repurchased | (10,326 | ) | (155,121 | ) | (235,785 | ) | (3,506,014 | ) | |||||||||||
Dividends reinvested | 573 | 8,521 | 29,410 | 438,099 | |||||||||||||||
Net increase (decrease) | (552 | ) | $ | (2,934 | ) | (199,780 | ) | $ | (2,967,286 | ) | |||||||||
For the year ended June 30, 2021:
Class A | Class P | ||||||||||||||||||
Shares | Amount | Shares | Amount | ||||||||||||||||
Shares sold | 1,735 | $ | 27,000 | 19,241 | $ | 306,021 | |||||||||||||
Shares repurchased | (336 | ) | (5,337 | ) | (210,154 | ) | (3,306,353 | ) | |||||||||||
Dividends reinvested | 531 | 8,349 | 33,709 | 530,760 | |||||||||||||||
Net increase (decrease) | 1,930 | $ | 30,012 | (157,204 | ) | $ | (2,469,572 | ) | |||||||||||
Federal tax status
It is each Fund's policy to comply with all requirements of the Internal Revenue Code applicable to regulated investment companies and to distribute substantially all of its taxable income to its shareholders. In addition, by distributing during each calendar year substantially all of its net investment income, net realized capital gains and certain other amounts, if any, each Fund intends not to be subject to a federal excise tax. Accordingly, no federal income tax provision was required.
The tax character of distributions paid during the fiscal years ended June 30, 2022 and June 30, 2021 were as follows:
2022 | |||||||||||||||||||
| Fund | Distributions paid from tax-exempt income | Distributions paid from ordinary income | Distributions paid from long term realized capital gains | Total distributions paid | |||||||||||||||
UBS All China Equity Fund | $ | — | $ | 10,340 | $ | — | $ | 10,340 | |||||||||||
UBS Dynamic Alpha Fund | — | 3,291,732 | — | 3,291,732 | |||||||||||||||
UBS Global Allocation Fund | — | 16,691,643 | 22,712,391 | 39,404,034 | |||||||||||||||
UBS Emerging Markets Equity Opportunity Fund | — | 22,612,292 | 56,369,941 | 78,982,233 | |||||||||||||||
UBS Engage For Impact Fund | — | 3,471,448 | 3,104,392 | 6,575,840 | |||||||||||||||
UBS International Sustainable Equity Fund | — | 6,376,593 | 28,919,634 | 35,296,227 | |||||||||||||||
UBS US Dividend Ruler Fund | — | 2,912,679 | 381,027 | 3,293,706 | |||||||||||||||
UBS US Quality Growth At Reasonable Price Fund | — | 4,282,213 | 538,531 | 4,820,744 | |||||||||||||||
UBS U.S. Small Cap Growth Fund | — | 14,968,009 | 20,650,352 | 35,618,361 | |||||||||||||||
UBS Sustainable Development Bank Bond Fund | — | 955,117 | 117,447 | 1,072,564 | |||||||||||||||
UBS Multi Income Bond Fund | — | 589,201 | — | 589,201 | |||||||||||||||
161
The UBS Funds
Notes to financial statements
2021 | |||||||||||||||||||
Fund | Distributions paid from tax-exempt income | Distributions paid from ordinary income | Distributions paid from long term realized capital gains | Total distributions paid | |||||||||||||||
UBS Global Allocation Fund | $ | — | $ | 1,410,280 | $ | 2,667,270 | $ | 4,077,550 | |||||||||||
UBS Emerging Markets Equity Opportunity Fund | — | 10,787,637 | — | 10,787,637 | |||||||||||||||
UBS Engage For Impact Fund | — | 65,220 | 235,704 | 300,924 | |||||||||||||||
UBS International Sustainable Equity Fund | — | 4,020,989 | — | 4,020,989 | |||||||||||||||
UBS US Dividend Ruler Fund | — | 337,013 | — | 337,013 | |||||||||||||||
UBS US Quality Growth At Reasonable Price Fund | — | 250,762 | — | 250,762 | |||||||||||||||
UBS U.S. Small Cap Growth Fund | — | 6,327,434 | 12,787,307 | 19,114,741 | |||||||||||||||
UBS Sustainable Development Bank Bond Fund | — | 1,254,524 | 595,498 | 1,850,022 | |||||||||||||||
UBS Multi Income Bond Fund | — | 706,081 | — | 706,081 | |||||||||||||||
For federal income tax purposes, the estimated cost and unrealized appreciation (depreciation) in value of investments, including derivatives, held at June 30, 2022 were as follows:
| Portfolio | Cost of investments | Gross unrealized appreciation | Gross unrealized depreciation | Net unrealized appreciation (depreciation) on investments | |||||||||||||||
UBS All China Equity Fund | $ | 4,697,515 | $ | 161,902 | $ | (495,188 | ) | $ | (333,286 | ) | |||||||||
UBS Dynamic Alpha Fund | 38,487,383 | 178,692 | (14,164,770 | ) | (13,986,078 | ) | |||||||||||||
UBS Global Allocation Fund | 202,852,480 | 13,319,265 | (21,032,170 | ) | (7,712,905 | ) | |||||||||||||
UBS Emerging Markets Equity Opportunity Fund | 738,200,711 | 1,851,389 | (174,858,028 | ) | (173,006,639 | ) | |||||||||||||
UBS Engage For Impact Fund | 52,491,901 | 2,124,676 | (8,972,485 | ) | (6,847,809 | ) | |||||||||||||
UBS International Sustainable Equity Fund | 263,163,497 | 5,457,235 | (53,069,599 | ) | (47,612,364 | ) | |||||||||||||
UBS US Dividend Ruler Fund | 127,695,341 | 4,710,910 | (9,211,319 | ) | (4,500,409 | ) | |||||||||||||
UBS US Quality Growth At Reasonable Price Fund | 190,633,899 | 1,082,761 | (24,745,975 | ) | (23,663,214 | ) | |||||||||||||
UBS U.S. Small Cap Growth Fund | 150,572,138 | 13,634,400 | (29,550,725 | ) | (15,916,325 | ) | |||||||||||||
UBS Sustainable Development Bank Bond Fund | 84,744,458 | — | (6,974,572 | ) | (6,974,572 | ) | |||||||||||||
UBS Multi Income Bond Fund | 29,016,120 | 53,942 | (1,649,038 | ) | (1,595,096 | ) | |||||||||||||
The difference between book and tax basis appreciation (depreciation) on investments is primarily attributed to tax deferral of losses on wash sales, tax treatment of certain derivatives and mark-to-market of passive foreign investment companies.
162
The UBS Funds
Notes to financial statements
At June 30, 2022, the components of accumulated earnings (deficit) on a tax basis were as follows:
| Fund | Undistributed tax-exempt income | Undistributed ordinary income | Undistributed long-term capital gains | Accumulated capital and other losses | Unrealized appreciation (depreciation) | Other temporary differences | Total | ||||||||||||||||||||||||
UBS All China Equity Fund | $ | — | $ | 28,089 | $ | — | $ | (192,527 | ) | $ | (333,284 | ) | $ | (3,081 | ) | $ | (500,803 | ) | |||||||||||||
UBS Dynamic Alpha Fund | — | 806,546 | — | (32,077,596 | ) | (13,993,593 | ) | — | (45,264,643 | ) | |||||||||||||||||||||
UBS Global Allocation Fund | — | — | 8,103,701 | (7,582,253 | ) | (7,812,153 | ) | — | (7,290,705 | ) | |||||||||||||||||||||
UBS Emerging Markets Equity Opportunity Fund | — | 9,887,226 | — | (10,578,089 | ) | (173,197,308 | ) | (19,198 | ) | (173,907,369 | ) | ||||||||||||||||||||
UBS Engage For Impact Fund | — | — | 459,075 | — | (6,852,890 | ) | (27,054 | ) | (6,420,869 | ) | |||||||||||||||||||||
UBS International Sustainable Equity Fund | — | 1,114,577 | 22,387,038 | — | (47,673,728 | ) | — | (24,172,113 | ) | ||||||||||||||||||||||
UBS US Dividend Ruler Fund | — | 1,153,653 | 1,508,155 | — | (4,500,409 | ) | (25,668 | ) | (1,864,269 | ) | |||||||||||||||||||||
UBS US Quality Growth At Reasonable Price Fund | — | — | 1,655,917 | (1,279,949 | ) | (23,663,214 | ) | (34,841 | ) | (23,322,087 | ) | ||||||||||||||||||||
UBS U.S. Small Cap Growth Fund | — | — | 6,491,277 | (1,754,681 | ) | (15,916,325 | ) | — | (11,179,729 | ) | |||||||||||||||||||||
UBS Sustainable Development Bank Bond Fund | — | — | — | (1,153,219 | ) | (6,974,572 | ) | (17,007 | ) | (8,144,798 | ) | ||||||||||||||||||||
UBS Multi Income Bond Fund | — | 351,164 | — | (5,083,378 | ) | (1,595,925 | ) | — | (6,328,139 | ) | |||||||||||||||||||||
Net capital losses recognized by the Funds, may be carried forward indefinitely, and retain their character as short-term and/or long-term losses. These carryforwards are available as a reduction, to the extent provided in regulations, of future realized capital gains. To the extent that such losses are used to offset future net realized capital gains, it is probable these gains will not be distributed.
At June 30, 2022, the following Funds had net capital losses that will be carried forward indefinitely, as follows:
Fund | Short-term losses | Long-term losses | Net capital losses | ||||||||||||
UBS All China Equity Fund | $ | 179,338 | $ | 13,189 | $ | 192,527 | |||||||||
UBS Dynamic Alpha Fund | 18,514,209 | 13,563,387 | 32,077,596 | ||||||||||||
UBS Sustainable Development Bank Bond Fund | 248,799 | 904,420 | 1,153,219 | ||||||||||||
UBS Multi Income Bond Fund | 3,241,266 | 1,842,112 | 5,083,378 | ||||||||||||
Qualified late year losses are deemed to arise on the first business day of a Fund's next taxable year. For the fiscal year ended June 30, 2022, the following Funds incurred and elected to defer qualified late year losses of the following:
Post October capital loss | |||||||||||||||
| Fund | Late year ordinary loss | Short-term losses | Long-term losses | ||||||||||||
UBS Global Allocation Fund | $ | — | $ | 7,306,457 | $ | — | |||||||||
UBS Emerging Markets Equity Opportunity Fund | — | 26,966,905 | (16,388,816 | ) | |||||||||||
UBS US Quality Growth At Reasonable Price Fund | — | 1,279,949 | — | ||||||||||||
UBS U.S. Small Cap Growth Fund | 291,155 | 1,463,526 | — | ||||||||||||
At June 30, 2022, the effect of permanent "book/tax" reclassifications resulted in increases and decreases to components of the Funds' net assets as follows:
| Fund | Distributable earnings (losses) | Beneficial interest | |||||||||
UBS Dynamic Alpha Fund | $ | 1 | $ | (1 | ) | ||||||
UBS Global Allocation Fund | 2 | (2 | ) | ||||||||
UBS US Quality Growth At Reasonable Price Fund | 593 | (593 | ) | ||||||||
UBS Sustainable Development Bank Bond Fund | 1,755 | (1,755 | ) | ||||||||
163
The UBS Funds
Notes to financial statements
These differences are primarily due to the tax treatment of nondeductible excise tax paid and taxable overdistributions.
ASC 740-10 "Income Taxes-Overall" sets forth a minimum threshold for financial statement recognition of the benefit of a tax position taken or expected to be taken. The Funds have conducted an analysis and concluded, as of June 30, 2022, that there are no significant uncertain tax positions taken or expected to be taken that would require recognition in the financial statements. It is each Fund's policy to record any significant foreign tax exposures in the financial statements. The Funds recognize interest and penalties, if any, related to uncertain tax positions as income tax expense in the Statement of operations. During the period ended June 30, 2022, the Funds did not incur any interest or penalties.
Under the applicable foreign tax laws, gains on certain securities held in certain foreign countries may be subject to taxes that will be paid by the Funds.
Each of the tax years in the four year fiscal period ended June 30, 2022 or since inception in the case of UBS All China Equity Fund, UBS US Dividend Ruler Fund and UBS US Quality Growth At Reasonable Price Fund remains subject to examination by the Internal Revenue Service and state taxing authorities.
164
The UBS Funds
Report of independent registered public accounting firm
To the Shareholders and the Board of Trustees of The UBS Funds
Opinion on the Financial Statements
We have audited the accompanying statements of assets and liabilities of The UBS Funds (the "Trust"), (comprising UBS All China Equity Fund, UBS Dynamic Alpha Fund, UBS Global Allocation Fund, UBS Emerging Markets Equity Opportunity Fund, UBS Engage For Impact Fund, UBS International Sustainable Equity Fund, UBS US Dividend Ruler Fund, UBS US Quality Growth At Reasonable Price Fund, UBS U.S. Small Cap Growth Fund, UBS Sustainable Development Bank Bond Fund and UBS Multi Income Bond Fund (formerly, UBS Total Return Bond Fund) (collectively referred to as the "Funds")), including the portfolios of investments, as of June 30, 2022, and the related statements of operations and changes in net assets, and the financial highlights for each of the periods indicated in the table below and the related notes (collectively referred to as the "financial statements"). In our opinion, the financial statements present fairly, in all material respects, the financial position of each of the Funds comprising The UBS Funds at June 30, 2022, and the results of their operations, changes in net assets and financial highlights for each of the periods indicated in the table below, in conformity with U.S. generally accepted accounting principles.
| Funds comprising The UBS Funds | Statement of operations | Statement of changes in net assets | Financial highlights | ||||||||||||
| UBS Dynamic Alpha Fund UBS Global Allocation Fund UBS International Sustainable Equity Fund UBS U.S. Small Cap Growth Fund UBS Multi Income Bond Fund (formerly, UBS Total Return Bond Fund) | For the year ended June 30, 2022 | For each of the two years in the period ended June 30, 2022 | For each of the five years in the period ended June 30, 2022 | ||||||||||||
UBS Emerging Markets Equity Opportunity Fund | For the year ended June 30, 2022 | For each of the two years in the period ended June 30, 2022 | For each of the four years in the period ended June 30, 2022 and the period from June 4, 2018 (commencement of operations) through June 30, 2018 | ||||||||||||
| UBS Engage For Impact Fund UBS Sustainable Development Bank Bond Fund | For the year ended June 30, 2022 | For each of the two years in the period ended June 30, 2022 | For each of the three years in the period ended June 30, 2022 and the period from October 24, 2018 (commencement of operations) through June 30, 2019 | ||||||||||||
UBS All China Equity Fund | For the year ended June 30, 2022 | For the year ended June 30, 2022 and the period from February 24, 2021 (commencement of operations) through June 30, 2021 | |||||||||||||
| UBS US Dividend Ruler Fund UBS US Quality Growth At Reasonable Price Fund | For the year ended June 30, 2022 | For the year ended June 30, 2022 and the period from July 9, 2020 (commencement of operations) through June 30, 2021 | |||||||||||||
Basis for Opinion
These financial statements are the responsibility of the Trust's management. Our responsibility is to express an opinion on each of the Funds' financial statements based on our audits. We are a public accounting firm registered with the Public Company Accounting Oversight Board (United States) ("PCAOB") and are required to be
165
The UBS Funds
Report of independent registered public accounting firm (concluded)
independent with respect to the Trust in accordance with the U.S. federal securities laws and the applicable rules and regulations of the Securities and Exchange Commission and the PCAOB.
We conducted our audits in accordance with the standards of the PCAOB. Those standards require that we plan and perform the audit to obtain reasonable assurance about whether the financial statements are free of material misstatement, whether due to error or fraud. The Trust is not required to have, nor were we engaged to perform, an audit of the Trust's internal control over financial reporting. As part of our audits we are required to obtain an understanding of internal control over financial reporting but not for the purpose of expressing an opinion on the effectiveness of the Trust's internal control over financial reporting. Accordingly, we express no such opinion.
Our audits included performing procedures to assess the risks of material misstatement of the financial statements, whether due to error or fraud, and performing procedures that respond to those risks. Such procedures included examining, on a test basis, evidence regarding the amounts and disclosures in the financial statements. Our procedures included confirmation of securities owned as of June 30, 2022, by correspondence with the custodian and brokers or by other appropriate auditing procedures where replies from brokers were not received. Our audits also included evaluating the accounting principles used and significant estimates made by management, as well as evaluating the overall presentation of the financial statements. We believe that our audits provide a reasonable basis for our opinion.

We have served as the auditor of one or more UBS investment companies since 1978.
New York, New York
August 26, 2022
166
The UBS Funds
Federal tax information (unaudited)
We are required by Subchapter M of the Internal Revenue Code of 1986, as amended, to advise you in writing as to the federal tax status of distributions received by shareholders during the fiscal year. Accordingly, the amount of ordinary dividends paid that qualify for the dividends received deduction for corporate shareholders and the amount of foreign tax credit to be passed through to shareholders are as follows:
Fund | Dividends received deduction | Long-term capital gain | Foreign tax credit | ||||||||||||
UBS Dynamic Alpha Fund | $ | 23 | $ | — | $ | — | |||||||||
UBS Global Allocation Fund | 1,153,937 | 22,712,391 | — | ||||||||||||
UBS Emerging Markets Equity Opportunity Fund | — | 56,369,941 | 4,597,037 | ||||||||||||
UBS Engage For Impact Fund | 446,433 | 3,104,392 | — | ||||||||||||
UBS International Sustainable Equity Fund | — | 28,919,634 | 514,907 | ||||||||||||
UBS US Dividend Ruler Fund | 1,760,795 | 381,027 | — | ||||||||||||
UBS US Quality Growth At Reasonable Price Fund | 840,876 | 538,531 | — | ||||||||||||
UBS U.S. Small Cap Growth Fund | 1,224,912 | 20,650,352 | — | ||||||||||||
UBS Sustainable Development Bank Bond Fund | — | 117,447 | — | ||||||||||||
Also, for the fiscal year ended June 30, 2022, the foreign source income for information reporting purposes for UBS Emerging Markets Equity Opportunity Fund was $21,797,545 and for UBS International Sustainable Equity Fund was $3,612,450.
For the taxable year ended June 30, 2022, the Funds designate the amounts below as the maximum amount that may be considered qualified dividend income for individual shareholders.
Fund | Maximum amount considered qualified income | ||||||
UBS All China Equity Fund | $ | 9,486 | |||||
UBS Dynamic Alpha Fund | 23 | ||||||
UBS Global Allocation Fund | 2,502,716 | ||||||
UBS Emerging Markets Equity Opportunity Fund | 16,041,493 | ||||||
UBS Engage For Impact Fund | 1,376,296 | ||||||
UBS International Sustainable Equity Fund | 6,891,500 | ||||||
UBS US Dividend Ruler Fund | 1,959,285 | ||||||
UBS US Quality Growth At Reasonable Price Fund | 886,606 | ||||||
UBS U.S. Small Cap Growth Fund | 1,254,854 | ||||||
Shareholders should not use the above information to prepare their tax returns. Since the Funds' fiscal year end is not the calendar year end, another notification will be sent with respect to calendar year 2022. Such notification, which will reflect the amount to be used by calendar year taxpayers on their federal income tax returns, will be made in conjunction with Form 1099 DIV and will be mailed in February 2023. Shareholders are advised to consult their own tax advisers with respect to the tax consequences of their investment in each of the Funds.
167
The UBS Funds
General information (unaudited)
Quarterly portfolio schedule
Each Fund filed its complete schedule of portfolio holdings with the US Securities and Exchange Commission ("SEC") for the first and third quarters of each fiscal year as an exhibit to its reports on Form N-PORT. The Funds' Form N-PORT reports are available on the SEC's Web site at http://www.sec.gov. Additionally, you may obtain copies of such portfolio holdings schedules for the first and third quarters of each fiscal year from the funds upon request by calling 1-800-647 1568.
Proxy voting policies, procedures and record
You may obtain a description of the Fund's (1) proxy voting policies, (2) proxy voting procedures and (3) information regarding how the Fund voted any proxies related to portfolio securities during the most recent 12-month period ended June 30 for which an SEC filing has been made, without charge, upon request by contacting the Fund directly at 1-800-647 1568, online on the Fund's Web site: www.ubs.com/ubsam-proxy, or on the EDGAR Database on the SEC's Web site (http://www.sec.gov).
Liquidity Risk Management Program
Pursuant to Rule 22e-4 under the 1940 Act, The UBS Funds (the "Trust") has adopted a liquidity risk management program (the "program") with respect to each of its series (each, a "Fund"). UBS Asset Management (Americas) Inc. ("UBS AM") has been designated by the Trust's Board to administer the program, and UBS AM has delegated the responsibility to carry out certain functions described in the program to an internal group which is comprised of representatives of various investment and non-investment areas of the firm. Liquidity risk is defined as the risk that a Fund could not meet redemption requests without significant dilution of remaining shareholders' interests in that Fund. The program is intended to provide a framework for the assessment, management and periodic review of each Fund's liquidity risks, taking into consideration, as applicable, the Fund's investment strategy and liquidity of portfolio investments during both normal and reasonably foreseeable stressed conditions; short-term and long-term cash flow projections during both normal and reasonably foreseeable stressed conditions; and holdings of cash and cash equivalents, as well as borrowing arrangements and other funding sources. The provisions of the program shall be administered for each Fund in a manner that is appropriately tailored to reflect the Fund's particular liquidity risks. UBS AM's process of determining the degree of liquidity of a Fund's investments is supported by a third-party liquidity assessment vendor. In June 2022, UBS AM provided the Board with a report addressing the operation of the program and assessing its adequacy and effectiveness of implementation (the "report"). The report covered the period from May 2, 2021 through May 1, 2022.
UBS AM's report concluded that the program was reasonably designed to assess and manage each Fund's liquidity risk, including during periods of market volatility and net redemptions. UBS AM reported that the program, including any applicable highly liquid investment minimum ("HLIM"), operated adequately and that the implementation of the program, including any applicable HLIM, was effective to manage each Fund's liquidity risk.
There can be no assurance that the program will achieve its objectives in the future. Please refer to a Fund's prospectus for more information regarding a Fund's exposure to liquidity risk and other risks to which an investment in a Fund may be subject.
168
The UBS Funds
Board approval of investment advisory agreements
At the meeting of the Board of Trustees (the "Board") of The UBS Funds (the "Trust"), held on June 16 and 17, 2022 (the "Meeting"), the Board, including those Trustees who are not "interested persons" (as defined in the Investment Company Act of 1940, as amended (the "1940 Act")) of the Trust or UBS Asset Management (Americas) Inc. (the "Advisor") and its affiliates (together, the "Independent Trustees"), considered the continuation of the investment advisory agreements (the "Advisory Agreements") between the Trust and the Advisor for the UBS Dynamic Alpha Fund, UBS Global Allocation Fund, UBS International Sustainable Equity Fund, UBS U.S. Small Cap Growth Fund, UBS Multi Income Bond Fund, UBS Municipal Bond Fund, UBS Emerging Markets Equity Opportunity Fund, UBS Engage For Impact Fund, UBS All China Equity Fund, UBS US Dividend Ruler Fund, UBS US Quality Growth At Reasonable Price Fund and UBS Sustainable Development Bank Bond Fund (each a "Fund," and together, the "Funds"). Prior to the Meeting, the Independent Trustees' counsel had sent to the Advisor a request detailing the information that the Independent Trustees wished to receive in connection with their consideration of the continuation of the Advisory Agreements. The Independent Trustees met with their independent counsel, as well as an independent consultant engaged by the Board to assist in the annual Advisory Agreement review process on June 10, 2022 and June 16, 2022 to discuss the materials provided to them in response to the information request, including materials prepared by the Advisor, as well as reports prepared by Broadridge Financial Solutions, Inc. ("Broadridge Reports"), an independent statistical compilation company, providing comparative expense information on an actual and contractual basis and comparative performance information for the Funds. The Independent Trustees also reviewed information provided in response to their request for additional information from the Advisor in connection with the Advisory Agreements. The Board also made reference to information and material that had been provided to the Independent Trustees throughout the year at Board meetings.
At the Meeting, the Board considered a number of factors in connection with its deliberations concerning the continuation of the Advisory Agreement for each Fund, including: (i) the nature, extent, and quality of the services provided by the Advisor to the Fund; (ii) the performance of the Fund and the Advisor; (iii) the Fund's expenses, costs of the services to be provided and profits to be realized by the Advisor and its affiliates from the relationship with the Fund; and (iv) whether economies of scale are realized by the Advisor with respect to the Fund, as it grows larger, and the extent to which the economies of scale are reflected in the level of the management fees charged.
Nature, extent, and quality of services.
In considering the nature, extent, and quality of the services provided by the Advisor to a Fund, the Board reviewed the material presented by the Advisor describing the various services provided to each Fund. The Board noted that in addition to investment management services, the Advisor provides each Fund with operational, legal, and compliance support. The Board also considered the scope and depth of the Advisor's organization and the experience and expertise of the professionals currently providing investment management and other services to the Funds. The Board considered that the Advisor was a well-established investment management organization employing investment personnel with significant experience in the investment management industry. The Board also considered the Advisor's in-house research capabilities, as well as other research services available to it, including research services available to the Advisor as a result of securities transactions effected for the Funds and the Advisor's other investment management clients, and noted that the Advisor had extensive global research capabilities. The Board observed that the Advisor has been able to effectively manage, operate and oversee the Fund through the COVID-19 pandemic period and considered how the cybersecurity and business continuity plans of the Advisor and its key service providers have operated in the increased remote working environment.
The Board also evaluated the Advisor's portfolio management process for each Fund, including the use of risk management techniques and the proprietary technologies utilized to structure the Fund's portfolio. The Board noted that various presentations had been made by investment personnel at Board meetings throughout the year concerning the Funds' investment performance and investment strategies, including the derivative strategies utilized by certain Funds.
169
The UBS Funds
Board approval of investment advisory agreements (continued)
The Board also noted and discussed the services that the Advisor and its affiliates provide to the Funds under other agreements with the Trust, including administration services provided by the Advisor, underwriting services provided by UBS Asset Management (US) Inc. ("UBS AM (US)"), and sub-transfer agency services provided by UBS Financial Services Inc. ("UBS Financial Services"). In connection with the non-investment management services, the Board also considered the quarterly reports that the Advisor provides to the Board throughout the year pertaining to brokerage commissions, soft dollars, portfolio valuations, and Rule 12b-1 fees, among others. In addition, the Board considered the presentations provided with respect to distribution strategies for the Funds. The Board noted management's continuing endeavors and expenditures to address areas of heightened concern in the mutual fund industry, including geopolitical concerns, and comply with new regulations applicable to the Fund. After analyzing the services provided by the Advisor to each Fund, both quantitatively and qualitatively, including the impact of these services on investment performance, the Board concluded that the nature, extent, and quality of services provided to each Fund were consistent with the operational requirements of each Fund, and met the needs of the Fund's shareholders.
Performance.
In evaluating the performance of each Fund, the Board analyzed the Broadridge Reports, which compared the performance of each Fund with other funds in its respective peer universe over various time periods. The Board also reviewed the memoranda provided by the Advisor providing an analysis of the markets and the Funds' performance during the past year. In reviewing the Broadridge Reports, the Board noted that for the one-year period ended February 28, 2022, the UBS US Dividend Ruler Fund and UBS US Quality Growth At Reasonable Price Fund had appeared in the top performance quintile of their respective performance universe, and the UBS Dynamic Alpha Fund and the UBS Sustainable Development Bank Bond Fund had appeared in the second performance quintile of their respective performance universe. The Board also noted that for the one-year period ended February 28, 2022, the UBS Global Allocation Fund, UBS U.S. Small Cap Growth Fund, UBS Emerging Markets Equity Opportunity Fund and UBS Multi Income Bond Fund appeared in the fourth performance quintile of its performance universe, and the UBS International Sustainable Equity Fund, UBS Engage For Impact and UBS All China Equity Fund appeared in the fifth performance quintile of their respective performance universe, with each such Fund's annualized total return below the median of its respective performance universe during such period. The Board noted that it had previously approved the liquidation of the UBS Municipal Bond Fund and was being asked to renew the agreement of the UBS Municipal Bond Fund for the limited basis of liquidating the Fund and, therefore, did not analyze comparative performance information in the Broadridge Reports for the UBS Municipal Bond Fund.
At the Board's request, the Advisor further addressed the performance data for the UBS Global Allocation Fund, UBS U.S. Small Cap Growth Fund, UBS Emerging Markets Equity Opportunity Fund, UBS Multi Income Bond Fund, UBS International Sustainable Equity Fund, UBS Engage For Impact Fund and UBS All China Equity Fund, each of which had Class P shares' performance ranking below the 50th percentile within its performance universe for the one-year period ended February 28, 2022.
In explaining the performance of the UBS Global Allocation Fund for the one-year period ended February 28, 2022, the Advisor explained that tactical asset allocation decisions negatively impacted the Fund's relative performance, while security selection and active currency decisions contributed over the period. The Board also noted that the Fund performed relatively better against its peers for the three-year and five-year performance periods appearing in the second quintile for each performance period. The Trustees also noted that the Fund's most recent performance was trending in a positive direction.
In explaining the performance of the UBS U.S. Small Cap Growth Fund for the one-year period ended February 28, 2022, the Advisor noted that while the one-year performance ranked in the 66th percentile within its small-cap growth performance universe, the Fund outperformed its benchmark during the same period by 446 basis points
170
The UBS Funds
Board approval of investment advisory agreements (continued)
(i.e., 4.46%). The Advisor noted that from a sector perspective, an overweight position in the industrials sector and an underweight position in the health care sector were the main contributors to relative performance, while the Fund's underweight position in the materials and energy sectors detracted from relative performance. The Advisor noted the Fund's stronger longer-term performance and that for the year-to-date period ended April 30, 2022, the Fund continued to outperform its benchmark.
In explaining the performance of the UBS Emerging Markets Equity Opportunity Fund for the one-year period ended February 28, 2022, the Advisor reported that in 2021, the regulatory environment in China was a main driver of volatility and that several of the Fund's key holdings were negatively impacted by regulatory changes in China. The Advisor also noted that security selection and sector allocation detracted from the Fund's relative performance.
In explaining the performance of the UBS Multi Income Bond Fund for the one-year period ended February 28, 2022, the Advisor noted security selection within US investment grade corporates in the financials sector and security selection within commercial mortgage-backed securities as primary detractors from the Fund's performance. Compared to peers, the Advisor reported that the Fund's longer duration portfolio detracted from relative performance in the rising interest rate environment as top-performing peers generally held shorter duration assets. However, the Advisor noted that relative to the Fund's benchmark, the Fund's duration management was additive to the Fund's performance. The Advisor reported that the Fund had been strategically underweight duration in the latter half of the year and benefited from this positioning as interest rates began to rise in response to the US Federal Reserve Board of Governors' more hawkish interest rate policy. The Board noted that the Fund had recently been repositioned from a core plus bond strategy to a multi income bond strategy and that the Fund's historical performance reflected its core plus bond strategy and more time would be needed to evaluate the performance of the Fund's repositioned portfolio.
In explaining the performance of the UBS International Sustainable Equity Fund for the one-year period ended February 28, 2022, the Advisor noted that the Fund's relative underperformance was mainly a result of the Fund's positioning in the materials and communication services sectors. The Advisor also noted how the Fund's positioning is impacted as a result of the Fund's sustainable investing strategy and how the Advisor measures whether the Fund is achieving its sustainable investing strategy. The Advisor explained that the Fund's peer universe included funds that did not employ a sustainable investing strategy. The Advisor noted that stock selection in the industrials and information technology sectors contributed positively to performance.
In explaining the performance of the UBS Engage For Impact Fund for the one-year period ended February 28, 2022, the Advisor explained that the majority of the Fund's relative underperformance can be explained by the unusual 'flight to safety' in equity markets that had been especially prevalent during 2020 and 2021. The Advisor explained that this led to strong performance in mega-cap stocks, especially in the technology sector, a sector in which the Fund has historically been underweight. The Advisor also explained differences between the Fund's holdings and the holdings of funds included in its performance universe due to the Fund's impact strategy, and the Board considered how the Advisor measures whether the Fund is achieving its impact strategy. The Advisor also noted that the Fund's underweight to the United States and overweight to Europe had detracted from relative performance due to the slower recovery and the current geopolitical environment.
In explaining the performance of the UBS All China Equity Fund for the one-year period ended February 28, 2022, the Advisor noted that relative underperformance during this period can be attributed to security selection and sector allocation. The Advisor noted that more recently, the Fund had shown improved performance and that for the year-to-date period through April 30, 2022, the Fund outperformed its benchmark by 194 basis points (i.e., 1.94%). The Board noted that the Fund commenced operations on February 23, 2021 and more time would be needed to fully evaluate the Fund's performance.
171
The UBS Funds
Board approval of investment advisory agreements (continued)
In evaluating the performance of the Funds following a sustainable investing focused strategy, the Board also considered how the Advisor evaluates whether a sustainable investing Fund is achieving its sustainable investing mandate. The Board concluded that the Advisor's explanations provided a sound basis for understanding the performance of each Fund that underperformed in comparison to its peer universe. The Board determined, after analyzing the performance data, that the performance of each Fund was acceptable as compared with relevant performance standards, given the investment strategies and risk profile of each Fund, the expectations of the shareholder base and the current market environment.
Fund fees and expenses.
When considering the fees and expenses borne by each Fund, and the reasonableness of the management fees paid to the Advisor in light of the services provided to each Fund, the Board compared the fees charged by the Advisor to each Fund to fees charged to the funds in its peer group for comparable services, as provided in the Broadridge Reports, on both an actual (taking into account expense limitation arrangements) and a contractual basis (assuming all funds in the peer expense group were similar in size to the respective Fund). The Board noted that it was being asked to renew the agreement of the UBS Municipal Bond Fund for the limited basis of liquidating the Fund and, therefore, did not analyze comparative fee information in the Broadridge Reports for the UBS Municipal Bond Fund.
In examining the Broadridge Reports, and in reviewing comparative costs, it was noted that UBS Emerging Markets Equity Opportunity Fund, UBS Engage For Impact Fund, UBS All China Equity Fund, UBS US Dividend Ruler Fund, UBS US Quality Growth At Reasonable Price Fund, and UBS Sustainable Development Bank Bond Fund had a contractual management fee rate lower than or equal to the Broadridge median of its respective expense group. The Board noted that the UBS Dynamic Alpha Fund, UBS Global Allocation Fund, UBS International Sustainable Equity Fund, UBS U.S. Small Cap Growth Fund, and UBS Multi Income Bond Fund had a contractual management fee rate higher than the Broadridge median in its respective Broadridge expense group. The Advisor noted, however, that while such Funds' contractual fee rate was higher than its respective peer expense group median, the UBS Dynamic Alpha Fund and UBS Global Allocation were each in the third quintile of its respective Broadridge expense group. The Advisor also noted, however, that the results of such expense comparisons showed that the actual management fee rate for each Fund, except the UBS International Sustainable Equity Fund and UBS U.S. Small Cap Growth Fund, was equal to or lower than the Broadridge median of the Fund's respective Broadridge expense group. In addition, the Board reviewed the actual total expenses of each Fund and noted that each Fund had total expenses that were lower than the Broadridge median in its respective Broadridge expense group, except for the UBS Dynamic Alpha Fund, UBS Global Allocation Fund and UBS International Sustainable Equity Fund. After reviewing the fee and expense information, the Board asked the Advisor to further discuss the fees and expenses of the UBS International Sustainable Equity Fund, UBS U.S. Small Cap Growth Fund, and UBS Multi Income Bond Fund.
The Advisor first addressed the UBS International Sustainable Equity Fund, which reported contractual management fees, actual management fees, and total expenses that were higher than its Broadridge peer group median. The Advisor highlighted its belief that the Fund's total expense ratio remains competitive with the current expense cap in place, as illustrated by the Fund's Class P actual total expense ranking in the 54th percentile of its peer group.
The Advisor next addressed the UBS U.S. Small Cap Growth Fund, which reported contractual management fees and actual management fees that were higher than its Broadridge peer group median. The Advisor highlighted that the Fund's total expense ratio remains competitive with the current expense cap in place, which the Advisor was proposing to extend for an additional year, as illustrated by the Fund's Class P actual total expense ranking in the 40th percentile of its peer group. The Advisor also noted that due to the waiver associated with the expense cap in place, the Fund's actual management fee was less than one basis point (i.e., 0.01%) above the median of its peer group.
172
The UBS Funds
Board approval of investment advisory agreements (continued)
The Advisor then addressed the UBS Multi Income Bond Fund. The Advisor reported that the combination of the Fund's asset level and the current expense limitation agreement resulted in the Advisor waiving the actual advisory and actual administration fees (both comprising the actual management fee) in their entirety, placing the Fund's Class P shares' actual management fee in the 1st percentile within its Broadridge expense peer group. The Advisor also highlighted that the actual total expenses for the Fund's Class P shares were below the expense peer group median. The Board also considered proposed changes to the UBS Multi Income Bond Fund's expense cap in connection with the Fund's repositioning into a multi-income bond strategy and its anticipated reclassification of its Lipper category.
The Board also received and considered information about the fee rates charged to other funds and accounts that are managed by the Advisor. After discussing the information about the other funds and accounts with the Advisor, the Board determined that the fees charged by the Advisor to the Funds were within a reasonable range, giving effect to differences in services performed for such other funds and accounts as compared to such fee rates. The Board, after reviewing all pertinent material, concluded that the management fee payable under each Fund's Advisory Agreement was fair and reasonable, both on an absolute basis and in comparison, with the fees of other funds identified in its expense group.
Costs and profitability.
The Board considered the costs of providing services to the Funds and the profitability of the Funds to the Advisor and its affiliates by reviewing the profitability analysis provided by the Advisor, including information about its fee revenues and expenses. The Board reviewed the profitability of each Fund to the Advisor and its affiliates, and the compensation that was received for providing services to each Fund. The profitability analysis, which provided information for the last three calendar years, included schedules relating to the revenue and expenses attributable to: (i) the investment advisory and administration services provided by the Advisor; (ii) the distribution and shareholder services provided by UBS AM (US) and UBS Financial Services; (iii) the transfer agency-related services provided by UBS Financial Services; and (iv) all services provided by the Advisor, UBS AM (US), and UBS Financial Services shown on a consolidated basis. In discussing the profitability analysis with the Board, the Advisor, as requested by the Board, provided the Board with a presentation on the methodology utilized in the profitability analysis. The Board noted that the methodology used for the profitability analysis provided to the Board for purposes of its annual review of the Advisory Agreements was reasonable. The Advisor also explained to the Board the reasons for any changes in profitability of each Fund from last calendar year to this calendar year.
The Board also considered "fallout" or ancillary benefits to the Advisor or its affiliates as the result of their relationship with the Funds; for example, the ability to attract other clients due to the Advisor's role as investment advisor to the Funds and the research services available to the Advisor through soft dollar brokerage commissions. The Independent Trustees also considered the ancillary benefits received by the Advisor's affiliates, UBS Securities LLC and UBS Group AG, in the form of commissions for executing securities transactions for the Funds. Upon closely examining the information provided concerning the Advisor's profitability, the Board concluded that the level of profits realized by the Advisor and its affiliates with respect to each Fund, if any, was reasonable in relation to the nature and quality of the services that were provided.
Economies of scale.
The Board also discussed whether economies of scale are realized by the Advisor with respect to each Fund as it grows larger, and the extent to which this is reflected in the level of management fees charged. The Board noted that with respect to most Funds, any actual or potential economies of scale are, or will be, shared with the Fund and its shareholders through existing management fee breakpoints so that as the Fund grows in size, its effective management fee declines. The Board noted that each Fund, except the UBS US Dividend Ruler Fund, UBS US Quality Growth At Reasonable Price Fund, and UBS Municipal Bond Fund had a breakpoint schedule that provided
173
The UBS Funds
Board approval of investment advisory agreements (concluded)
for continuing breakpoint(s) past the current asset level for the Fund. Based on each Fund's fees and expenses and the Advisor's profitability analysis, the Board concluded that any actual or potential economies of scale would be reasonably shared with a Fund and its shareholders.
After full consideration of the factors discussed above, with no single factor identified as being of paramount importance, the Board, including a majority of the Independent Trustees, with the assistance of independent counsel, concluded that the continuation of the Advisory Agreement for each Fund was in the interests of the Fund and its shareholders.
174
The UBS Funds
Trustee and officer information (unaudited)
The Trust is a Delaware statutory trust. Under Delaware law, the Board has overall responsibility for managing the business and affairs of the Trust, including general supervision and review of its investment activities. The trustees appoint the officers of the Trust, who are responsible for administering the day-to-day operations of the Trust and the Funds.
The table below shows, for each trustee and officer, his or her name, address and age, the position held with the Trust, the length of time served as a trustee or officer of the Trust, the trustee's or officer's principal occupations during the last five years, the number of funds in the UBS Family of Funds overseen by the trustee or officer and other directorships held by such trustee.
The Trust's Statement of Additional Information contains additional information about the trustees and is available, without charge, upon request, by calling 1-800-647 1568.
Non-interested Trustees
| Name, address and age | Position(s) held with Trust | Term of office1 and length of time served | Principal occupation(s) during past 5 years | Number of portfolios in fund complex overseen by Trustee | Other directorships held by Trustee | ||||||||||||||||||
| Adela Cepeda; 64 c/o Keith A. Weller, Fund Secretary, UBS AM One North Wacker Drive Chicago, IL 60606 | Chairperson and Trustee | Since October 2021 and 2004, respectively | Ms. Cepeda was a managing director at PFM Financial Advisors LLC (From 2016 to December 2019). From 1995 to 2016, Ms. Cepeda was founder and president of A.C. Advisory, Inc. | Ms. Cepeda is a trustee of three investment companies (consisting of 12 portfolios) for which UBS AM serves as investment advisor or manager. | Ms. Cepeda is a director (since 2012) of BMO Financial Corp. (U.S. holding company for BMO Harris Bank N.A.), director of the Mercer Funds (9 portfolios) (since 2005) and trustee of the Morgan Stanley Pathway Funds (11 portfolios) (since 2008). | ||||||||||||||||||
| Muhammad Gigani; 44 c/o Keith A. Weller, Fund Secretary, UBS AM One North Wacker Drive Chicago, IL 60606 | Trustee | Since January 2021 | Mr. Gigani is a Vice President—Tax of Reyes Holdings, L.L.C. (global food and beverage company) (since 2018). Formerly, Mr. Gigani held various positions at Deloitte Tax, LLP (from 2002 to 2018, most recently serving as a partner (from 2014 to 2018)). Mr. Gigani was a board member of Junior Achievement of Chicago (non-profit) (from 2016 to 2018). Mr. Gigani was also finance chair of Latin United Community Housing Association (non-profit) (from 2016 to 2018). Mr. Gigani is a Certified Public Accountant (CPA). | Mr. Gigani is a trustee of two investment companies (consisting of 12 portfolios) for which UBS AM serves as investment advisor or manager. | Mr. Gigani is a trustee (since July 2021) for The Adler Planetarium (non profit). | ||||||||||||||||||
175
The UBS Funds
Trustee and officer information (unaudited)
Non-interested Trustees (continued)
| Name, address and age | Position(s) held with Trust | Term of office1 and length of time served | Principal occupation(s) during past 5 years | Number of portfolios in fund complex overseen by Trustee | Other directorships held by Trustee | ||||||||||||||||||
| Abbie J. Smith; 69 c/o Keith A. Weller, Fund Secretary, UBS AM One North Wacker Drive Chicago, IL 60606 | Trustee | Since 2009 | Ms. Smith is the Boris and Irene Stern Distinguished Service Professor of Accounting and James S. Ely, III Faculty Fellow in the University of Chicago Booth School of Business (since 1980). Formerly, Ms. Smith was a co-founding partner and Director of Research of Fundamental Investment Advisors, a hedge fund (co-founded in 2004, commenced operations in 2008) (from 2008 to 2010). | Ms. Smith is a trustee of three investment companies (consisting of 12 portfolios) for which UBS AM serves as investment advisor or manager. | Ms. Smith is a director (since 2000) of HNI Corporation (formerly known as HON Industries Inc.) (office furniture) and also a member of the audit committee (since 2017). Ms. Smith is a member (chair (until 2015) of the audit committee and is also a member of the Finance committee of Ryder System Inc. (transportation, logistics and supply-chain management). In addition, Ms. Smith is a trustee/director (since 2000) and a member of the audit and nominating committees of the Dimensional Funds complex and of Dimensional ETF Trust) (a total of 147 series in 5 investment companies). | ||||||||||||||||||
176
The UBS Funds
Trustee and officer information (unaudited)
Officers
| Name, address and age | Position(s) held with Trust | Term of office1 and length of time served | Principal occupation(s) during past 5 years; number of portfolios in fund complex for which person serves as officer | ||||||||||||
| Rose Ann Bubloski***; 54 | Vice President and Assistant Treasurer | Since 2011 | Ms. Bubloski is a director (since 2012) (prior to which she was an associate director (from 2008 to 2012)) and senior manager of fund accounting—US (previously named product control and investment support) of UBS Asset Management (Americas) Inc. and/or UBS Asset Management (US) Inc. ("UBS AM—Americas region.") She is vice president and assistant treasurer of 7 investment companies (consisting of 56 portfolios) for which UBS AM serves as investment advisor or manager. | ||||||||||||
| Franklin P. Dickson*; 44 | Vice President | Since 2017 | Mr. Dickson is an associate director (since 2015) and tax compliance manager (since 2017) (prior to which he was a product controller (from 2015 to 2017) of fund accounting—US (previously named product control and investment support) of UBS AM—Americas region. Mr. Dickson is a vice president of 7 investment companies (consisting of 56 portfolios) for which UBS AM serves as investment advisor or manager. | ||||||||||||
| Mark F. Kemper**; 64 | Vice President and Assistant Secretary | Since 1999 and 2019, respectively | Mr. Kemper is a managing director (since 2006) and general counsel (2004 through 2019 and September 2021 to present) (prior to which he was senior legal counsel (2019-2020 and April 2021 to September 2021), Interim Head of Asia Pacific Legal (2020-2021) and Interim Head of Compliance and Operational Risk Control (2019) of UBS AM—Americas region. He has been Assistant Secretary of UBS AM—Americas region since January 2022 (prior to which he was secretary (from 2004 until January 2022) and assistant secretary of UBS Asset Management Trust Company (since 1993). Mr. Kemper is vice president and assistant secretary of 7 investment companies (consisting of 56 portfolios) for which UBS AM serves as investment advisor or manager. Mr. Kemper is employed by UBS Business Solutions US LLC (since 2017). | ||||||||||||
| Joanne M. Kilkeary***; 54 | Vice President, Treasurer and Principal Accounting Officer | Since 2006 (Vice President) and Since 2017 (Treasurer and Principal Accounting Officer) | Ms. Kilkeary is an executive director (since 2013) (prior to which she was a director (from 2008 to 2013) and head of fund accounting—US (since November 2020) (prior to which she was head of regulatory, tax, audit and board governance for product control and investment support (from 2017 through October 2020) (prior to which she was a senior manager (from 2004 to 2017) of registered fund product control of UBS AM—Americas region). Ms. Kilkeary is a vice president and assistant treasurer of 7 investment companies (consisting of 56 portfolios) for which UBS AM serves as investment advisor or manager. | ||||||||||||
| Igor Lasun*; 43 | President | Since 2018 | Mr. Lasun Is managing director (since March 2021) (prior to which he was an executive director (from 2018 until February 2021) and head of fund development and management for UBS AM—Americas region (since 2018) (prior to which he was a senior fixed income product specialist from 2007 to 2018, and had joined the firm in 2005). In this role, he oversees product development and management for both wholesale and Institutional businesses. Mr. Lasun serves as president of 7 investment companies (consisting of 56 portfolios) for which UBS AM serves as Investment advisor or manager. | ||||||||||||
| Leesa Merrill**; 43 | Chief Compliance Officer | Since May 2022 | Ms. Merrill is a director (since 2014) and served as head of compliance risk (from 2020 to 2022) (prior to which she was a senior compliance officer (from 2004 until 2020) for UBS AM—Americas region. Ms. Merrill serves as chief compliance officer of 6 investment companies (consisting of 56 portfolios) for which UBS AM or one of its affiliates serves as investment advisor or manager. | ||||||||||||
177
The UBS Funds
Trustee and officer information (unaudited)
Officers (concluded)
| Name, address and age | Position(s) held with Trust | Term of office1 and length of time served | Principal occupation(s) during past 5 years; number of portfolios in fund complex for which person serves as officer | ||||||||||||
| Eric Sanders**; 56 | Vice President and Assistant Secretary | Since 2005 | Mr. Sanders is a director and associate general counsel with UBS Business Solutions US LLC (since 2017) and also with UBS AM—Americas region (since 2005). Mr. Sanders is a vice president and assistant secretary of 7 investment companies (consisting of 56 portfolios) for which UBS AM serves as investment advisor or manager. | ||||||||||||
| Philip Stacey**; 37 | Vice President and Assistant Secretary | Since 2018 | Mr. Stacey is an executive director and associate general counsel with UBS Business Solutions US LLC (since 2019) and also with UBS AM—Americas region since 2015. Mr. Stacey is a vice president and assistant secretary of 7 investment companies (consisting of 56 portfolios) for which UBS AM serves as investment advisor or manager. | ||||||||||||
| Keith A. Weller**; 61 | Vice President and Secretary | Since 2004 (Vice President) and Since 2019 (Secretary) | Mr. Weller is an executive director (since 2017), deputy general counsel (since 2019) and Head of Registered Funds Legal (since 2022) (prior to which he was senior associate general counsel) with UBS Business Solutions US LLC and also with UBS AM—Americas region (since 2005) and has been an attorney with affiliated entities since 1995. Mr. Weller is a vice president and assistant secretary of 7 investment companies (consisting of 56 portfolios) for which UBS AM serves as investment advisor or manager and is also involved with other funds for which UBS AM or an affiliate serves as an investment advisor or administrator. | ||||||||||||
* This person's business address is 787 Seventh Avenue, New York, NY 10019
** This person's business address is One North Wacker Drive, Chicago, IL 60606.
*** This person's business address is 1000 Harbor Boulevard, Weehawken, NJ 07086
1 Each trustee holds office for an indefinite term. Officers of the Trust are appointed by the trustees and serve at the pleasure of the Board.
178
PRESORTED
STANDARD
U.S. POSTAGE
PAID
COMPUTERSHARE

UBS Asset Management (Americas) Inc.
787 Seventh Avenue
New York, NY 10019-6028
S1197
| (b) | Copy of each notice transmitted to shareholders in reliance on Rule 30e-3 under the Investment Company Act of 1940, as amended (the "1940 Act"), that contains disclosures specified by paragraph (c)(3) of that rule: Not applicable to the registrant. |
Item 2. Code of Ethics.
The registrant has adopted a code of ethics that applies to its principal executive officer, principal financial officer, principal accounting officer or controller, or persons performing similar functions pursuant to Section 406 of the Sarbanes-Oxley Act of 2002. (The registrant has designated the code of ethics adopted pursuant to Sarbanes-Oxley as a “Code of Conduct” to lessen the risk of confusion with its separate code of ethics adopted pursuant to Rule 17j-1 under the 1940 Act.).
Item 3. Audit Committee Financial Expert.
The registrant’s Board has determined that the following person serving on the registrant’s Audit Committee is an “audit committee financial expert” as defined in item 3 of Form N-CSR: Adela Cepeda. Ms. Cepeda is independent as defined in item 3 of Form N-CSR.
Item 4. Principal Accountant Fees and Services.
| (a) | Audit Fees: |
For the fiscal years ended June 30, 2022 and June 30, 2021, the aggregate Ernst & Young LLP (E&Y) audit fees for professional services rendered to the registrant were approximately $645,211 and $634,022, respectively.
Fees included in the audit fees category are those associated with the annual audits of financial statements and services that are normally provided in connection with statutory and regulatory filings.
| (b) | Audit-Related Fees: |
In each of the fiscal years ended June 30, 2022 and June 30, 2021, the aggregate audit-related fees billed by E&Y for services rendered to the registrant that are reasonably related to the performance of the audits of the financial statements, but not reported as audit fees, were approximately $0 and $31,866 respectively.
Fees included in the audit-related fees category are those associated with the reading and providing of comments on the 2021 and 2020 semiannual financial statements.
There were no audit-related fees required to be approved pursuant to paragraph (c)(7)(ii) of Rule 2-01 of Regulation S-X during the fiscal years indicated above.
| (c) | Tax Fees: |
In each of the fiscal years ended June 30, 2022 and June 30, 2021, the aggregate tax fees billed by E&Y for professional services rendered to the registrant were approximately $139,908 and $118,590, respectively.
Fees included in the tax fees category comprise all services performed by professional staff in the independent accountant’s tax division except those services related to the audits. This category comprises fees for review of tax compliance, tax return preparation and excise tax calculations.
There were no tax fees required to be approved pursuant to paragraph (c)(7)(ii) of Rule 2-01 of Regulation S-X during the fiscal years indicated above.
| (d) | All Other Fees: |
In each of the fiscal years ended June 30, 2022 and June 30, 2021, there were no fees billed by E&Y for products and services, other than the services reported in Item 4(a)-(c) above, rendered to the registrant.
Fees included in all other fees category would consist of services related to internal control reviews, strategy and other consulting, financial information systems design and implementation, consulting on other information systems, and other tax services unrelated to the registrant.
There were no “all other fees” required to be approved pursuant to paragraph (c)(7)(ii) of Rule 2-01 of Regulation S-X during the fiscal years indicated above.
| (e) | (1) Audit Committee Pre-Approval Policies and Procedures: |
The Audit Committee Charter contains the Audit Committee’s pre-approval policies and procedures. Reproduced below is an excerpt from the Audit Committee Charter regarding pre-approval policies and procedures:
To carry out its purposes, the Audit Committee shall have the following duties and powers:
(a) To pre-approve the engagement of, and to recommend to the Board the engagement, retention or termination of, the independent auditors to provide audit, review or attest services to The UBS Funds, and, in connection therewith, to review and evaluate the capabilities and independence of the auditors and receive the auditors’ specific representations as to their independence. In evaluating the auditor’s qualifications, performance and independence, the Committee must, among other things, obtain and review a report by the auditors, at least annually, describing the following items: (i) all relationships between the independent auditors and The UBS Funds, as well as with The UBS Funds' investment advisor or any control affiliate of the investment advisor that provides ongoing services to The UBS Funds; (ii) any material issues raised by the most recent internal quality control review, or peer review, of the audit firm, or by any inquiry or investigation by governmental or professional authorities, within the preceding five years, with respect to one or more independent audits carried out by the firm, and any steps taken to deal with any such issues; and (iii) the audit firm’s internal quality control procedures.
(b) To pre-approve all non-audit services to be provided to The UBS Funds by the independent auditors when, without such pre-approval, the auditors would not be independent of The UBS Funds under applicable federal securities laws, rules or auditing standards.
(c) To pre-approve all non-audit services to be provided by The UBS Funds’ independent auditors to The UBS Funds’ investment advisor or to any entity, that controls, is controlled by or is under common control with The UBS Funds investment advisor (“advisor affiliate”) and that provides ongoing services to The UBS Funds when, without such pre-approval by the Committee, the auditors would not be independent of The UBS Funds under applicable federal securities laws, rules or auditing standards.
(d) To establish, if deemed necessary or appropriate as an alternative to Committee pre-approval of services to be provided by the independent auditors as required by paragraphs (b) and (c) above, policies and procedures to permit such services to be pre-approved by other means, such as by action of a designated member or members of the Committee, subject to subsequent Committee review or oversight.
(e) To consider whether the non-audit services provided by The UBS Funds’ independent auditor to The UBS Funds investment advisor or any advisor affiliate that provides on-going services to The UBS Funds, which services were not pre-approved by the Committee, are compatible with maintaining the auditors’ independence.
Pursuant to Section (d), the Committee has delegated its responsibility to pre-approve the audit and permissible non-audit services required by paragraphs (a), (b) and (c) of Section 4, not exceeding $100,000 (excluding reasonable out-of-pocket expenses) on an annual basis to the Chairperson. All such pre-approvals will be subject to subsequent Committee review or oversight, including being reported to the full Committee on a quarterly basis at the Committee’s next regularly scheduled meeting after pre-approval. The Committee may not delegate to management its responsibility to pre-approve services to be performed by the independent auditor. Requests or applications to provide services that require specific pre-approval by the Committee, or the Chairperson will be submitted by both the Fund’s independent auditors and the Fund’s Treasurer or other designated Fund officer and must include a joint statement as to whether, in their view, the request or application is consistent with U.S. Securities and Exchange Commission rules on auditor independence.
| (e) | (2) Services approved pursuant to paragraph (c)(7)(i)(C) of Rule 2-01 of Regulation S-X: |
Audit-Related Fees:
There were no amounts that were approved by the audit committee pursuant to the de minimis exception for the fiscal years ended June 30, 2022 and June 30, 2021 on behalf of the registrant.
There were no amounts that were required to be approved by the audit committee pursuant to the de minimis exception for the fiscal years ended June 30, 2021 and June 30, 2020 on behalf of the registrant’s service providers that relate directly to the operations and financial reporting of the registrant.
Tax Fees:
There were no amounts that were approved by the audit committee pursuant to the de minimis exception for the fiscal years ended June 30, 2022 and June 30, 2021 on behalf of the registrant.
There were no amounts that were required to be approved by the audit committee pursuant to the de minimis exception for the fiscal years ended June 30, 2022 and June 30, 2021 on behalf of the registrant’s service providers that relate directly to the operations and financial reporting of the registrant.
All Other Fees:
There were no amounts that were approved by the audit committee pursuant to the de minimis exception for the fiscal years ended June 30, 2022 and June 30, 2021 on behalf of the registrant.
There were no amounts that were required to be approved by the audit committee pursuant to the de minimis exception for the fiscal years ended June 30, 2022 and June 30, 2021 on behalf of the registrant’s service providers that relate directly to the operations and financial reporting of the registrant.
| (f) | For the fiscal year ended June 30, 2022, if greater than 50%, specify the percentage of hours spent on the audit of the registrant’s financial statements for the most recent fiscal year that were attributed to work performed by persons who are not full-time, permanent employees of E&Y. According to E&Y, such amount was below 50%, therefore disclosure item not applicable to this filing. |
| (g) | For the fiscal years ended June 30, 2022 and June 30, 2021, the aggregate fees billed by E&Y of $670,848 and $402,196, respectively, for non-audit services rendered on behalf of the registrant (“covered”), its investment adviser (not including any sub-adviser whose role is primarily portfolio management and is subcontracted with or overseen by another investment adviser) and any entity controlling, controlled by, or under common control with the adviser (“non-covered”) that provides ongoing services (or provided during the relevant fiscal period) to the registrant for each of the last two fiscal years of the registrant is shown in the table below: |
| 2022 | 2021 | |||||||
| Covered Services | $ | 139,908 | $ | 150,456 | ||||
| Non-Covered Services | $ | 530,940 | $ | 251,740 | ||||
| (h) | The registrant’s audit committee was not required to consider whether the provision of non-audit services that were rendered to the registrant’s investment adviser (not including any sub-adviser whose role is primarily portfolio management and is subcontracted with or overseen by another investment adviser), and any entity controlling, controlled by, or under common control with the investment adviser that provides ongoing services to the registrant that were not pre-approved pursuant to paragraph (c)(7)(ii) of Rule 2-01 of Regulation S-X is compatible with maintaining the principal accountant’s independence. |
Item 5. Audit Committee of Listed Registrants.
Not applicable to the registrant.
Item 6. Investments.
(a) Included as part of the report to shareholders filed under Item 1 of this form.
(b) Not applicable.
Item 7. Disclosure of Proxy Voting Policies and Procedures for Closed-End Management Investment Companies.
Not applicable to the registrant.
Item 8. Portfolio Managers of Closed-End Management Investment Companies.
Not applicable to the registrant.
Item 9. Purchases of Equity Securities by Closed-End Management Investment Company and Affiliated Purchasers.
Not applicable to the registrant.
Item 10. Submission of Matters to a Vote of Security Holders.
The Nominating, Compensation and Governance Committee will consider nominees recommended by Qualifying Fund Shareholders if an Independent Trustee vacancy on the Board occurs. A Qualifying Fund Shareholder is a shareholder that: (i) owns of record, or beneficially through a financial intermediary, 1/2 of 1% or more of the Trust's outstanding shares and (ii) has been a shareholder of at least 1/2 of 1% of the Trust's total outstanding shares for 12 months or more prior to submitting the recommendation to the Nominating Committee. In order to recommend a nominee, a Qualifying Fund Shareholder should send a letter to the chairperson of the Nominating Committee, Ms. Adela Cepeda, care of Keith A. Weller, the Secretary of The UBS Funds at UBS Asset Management, One North Wacker Drive, Chicago, Illinois 60606, and indicate on the envelope "Nominating Committee." The Qualifying Fund Shareholder's letter should include: (i) the name and address of the Qualifying Fund Shareholder making the recommendation; (ii) the number of shares of each class and series of shares of the Trust which are owned of record and beneficially by such Qualifying Fund Shareholder and the length of time that such shares have been so owned by the Qualifying Fund Shareholder; (iii) a description of all arrangements and understandings between such Qualifying Fund Shareholder and any other person or persons (naming such person or persons) pursuant to which the recommendation is being made; (iv) the name and address of the nominee; and (v) the nominee's resume or curriculum vitae. The Qualifying Fund Shareholder's letter must be accompanied by a written consent of the individual to stand for election if nominated for the Board and to serve if elected by shareholders.
Item 11. Controls and Procedures.
| (a) | The registrant’s principal executive officer and principal financial officer have concluded that the registrant’s disclosure controls and procedures (as defined in Rule 30a-3(c) under the Investment Company Act of 1940, as amended) are effective based on their evaluation of these controls and procedures as of a date within 90 days of the filing date of this document. |
| (b) | The registrant’s principal executive officer and principal financial officer are aware of no changes in the registrant’s internal control over financial reporting that occurred during the period covered by this report that has materially affected, or is reasonably likely to materially affect, the registrant’s internal control over financial reporting. |
Item 12. Disclosure of Securities Lending Activities for Closed-End Management Investment Companies.
Not applicable to the registrant.
Item 13. Exhibits.
| (a) | (1) Code of Ethics as required pursuant to Section 406 of the Sarbanes-Oxley Act of 2002 (and designated by registrant as a “Code of Conduct”) is filed herewith as Exhibit EX-99. CODE ETH. |
| (a) | (2) Certifications of principal executive officer and principal financial officer pursuant to Section 302 of the Sarbanes-Oxley Act of 2002 are attached hereto as Exhibit EX-99. CERT. |
| (a) | (3) Written solicitation to purchase securities under Rule 23c-1 under the Investment Company Act of 1940 sent or given during the period covered by the report by or on behalf of the registrant to 10 or more persons – not applicable to the registrant. |
| (a) | (4) Change in the registrant's independent public accountant – Not applicable to the registrant. |
| (b) | Certifications of principal executive officer and principal financial officer pursuant to Section 906 of the Sarbanes-Oxley Act of 2002 are attached hereto as Exhibit EX-99.906CERT. |
| (c) | Disclosure pursuant to Section 13(r) of the Securities Exchange Act of 1934, as amended, is attached hereto as Exhibit EX-99. IRANNOTICE. |
SIGNATURES
Pursuant to the requirements of the Securities Exchange Act of 1934 and the Investment Company Act of 1940, the registrant has duly caused this report to be signed on its behalf by the undersigned, thereunto duly authorized.
The UBS Funds
| By: | /s/ Igor Lasun | |
| Igor Lasun | ||
| President | ||
| Date: | September 8, 2022 |
Pursuant to the requirements of the Securities Exchange Act of 1934 and the Investment Company Act of 1940, this report has been signed below by the following persons on behalf of the registrant and in the capacities and on the dates indicated.
| By: | /s/ Igor Lasun | |
| Igor Lasun | ||
| President | ||
| Date: | September 8, 2022 |
| By: | /s/ Joanne M. Kilkeary | |
| Joanne M. Kilkeary | ||
| Vice President, Treasurer and Principal Accounting Officer | ||
| Date : | September 8, 2022 |