UNITED STATES
SECURITIES AND EXCHANGE COMMISSION
Washington, D.C. 20549
FORM N-CSR
CERTIFIED SHAREHOLDER REPORT OF REGISTERED
MANAGEMENT INVESTMENT COMPANIES
Investment Company Act file number 811-06640
American Strategic Income Portfolio Inc. II
(Exact name of registrant as specified in charter)
| | |
| 800 Nicollet Mall, Minneapolis, MN | | 55402 |
| (Address of principal executive offices) | | (Zip code) |
Jill M. Stevenson, 800 Nicollet Mall, Minneapolis, MN 55402
(Name and address of agent for service)
Registrant’s telephone number, including area code: 800-677-3863
Date of fiscal year end: August 31
Date of reporting period: August 31, 2011
Form N-CSR is to be used by management investment companies to file reports with the Commission not later than 10 days after the transmission to stockholders of any report that is required to be transmitted to stockholders under Rule 30e-1 under the Investment Company Act of 1940 (17 CFR 270.30e-1). The Commission may use the information provided on Form N-CSR in its regulatory, disclosure review, inspection, and policymaking roles.
A registrant is required to disclose the information specified by Form N-CSR, and the Commission will make this information public. A registrant is not required to respond to the collection of information contained in Form N-CSR unless the Form displays a currently valid Office of Management and Budget (“OMB”) control number. Please direct comments concerning the accuracy of the information collection burden estimate and any suggestions for reducing the burden to Secretary, Securities and Exchange Commission, 450 Fifth Street, NW, Washington, DC 20549-0609. The OMB has reviewed this collection of information under the clearance requirements of 44 U.S.C. Section 3507.

ANNUAL REPORT
August 31, 2011

| | | | |
| ASP | | | | American Strategic
Income Portfolio Inc. |
| | |
| BSP | | | | American Strategic
Income Portfolio Inc. II |
| | |
| CSP | | | | American Strategic
Income Portfolio Inc. III |
| | |
| SLA | | | | American Select
Portfolio Inc. |
First American Mortgage Funds
PRIMARY INVESTMENTS
American Strategic Income Portfolio Inc. (“ASP”), American Strategic Income Portfolio Inc. II (“BSP”), American Strategic Income Portfolio Inc. III (“CSP”), and American Select Portfolio Inc. (“SLA”) (“First American Mortgage Funds” or the “funds”) invest in mortgage-related assets that directly or indirectly represent a participation in or are secured by and payable from mortgage loans. The funds may also invest in U.S. Government securities, corporate debt securities, preferred stock issued by real estate investment trusts, and mortgage servicing rights. The funds borrow through the use of reverse repurchase agreements and credit facilities. Use of borrowing and certain other investments and investment techniques may cause the funds’ net asset value (“NAV”) to fluctuate to a greater extent than would be expected from interest-rate movements alone.
FUND OBJECTIVES
Each fund’s primary objective is to achieve high levels of current income. Each fund’s secondary objective is to seek capital appreciation. As with other mutual funds, there can be no assurance these funds will achieve their objectives.

|
| NOT FDIC INSURED NO BANK GUARANTEE MAY LOSE VALUE |
EXPLANATION OF FINANCIAL STATEMENTS
As a shareholder in one or more of the funds, you receive shareholder reports semiannually. We strive to present this financial information in an easy-to-understand format; however, for many investors, the information contained in this shareholder report may seem very technical. So, we would like to take this opportunity to explain several sections of the shareholder report.
The Schedule of Investments details all of the securities held in the fund and their related dollar values on the last day of the reporting period. Securities are usually presented by type (bonds, common stock, etc.) and by industry classification (healthcare, education, etc.). This information is useful for analyzing how your fund’s assets are invested and seeing where your portfolio manager believes the best opportunities exist to meet your objectives. Holdings are subject to change without notice and do not constitute a recommendation of any individual security. The Notes to Financial Statements provide additional details on how the securities are valued.
The Statement of Assets and Liabilities lists the assets and liabilities of the fund on the last day of the reporting period and presents the fund’s NAV and market price per share. The NAV is calculated by dividing the fund’s net assets (assets minus liabilities) by the number of shares outstanding. The market price is the closing price on the exchange on which the fund’s shares trade. This price, which may be higher or lower than the fund’s NAV, is the price an investor pays or receives when shares of the fund are purchased or sold. The investments, as presented in the Schedule of Investments, comprise substantially all of the fund’s assets. Other assets include cash and receivables for items such as income earned by the fund but not yet received. Liabilities include payables for items such as fund expenses incurred but not yet paid.
The Statement of Operations details the dividends and interest income earned from investments as well as the expenses incurred by the fund during the reporting period. Fund expenses may be reduced through fee waivers or reimbursements. This statement reflects total expenses before any waivers or reimbursements, the amount of waivers and reimbursements (if any), and the net expenses. This statement also shows the net realized and unrealized gains and losses from investments owned during the period. The Notes to Financial Statements provide additional details on investment income and expenses of the fund.
The Statement of Changes in Net Assets describes how the fund’s net assets were affected by its operating results and distributions to shareholders during the reporting period. This statement is important to investors because it shows exactly what caused the fund’s net asset size to change during the period.
The Statement of Cash Flows is required when a fund has a substantial amount of illiquid investments, a substantial amount of the fund’s securities are internally fair valued, or the fund carries some amount of debt. When presented, this statement explains the change in cash during the reporting period. It reconciles net cash provided by and used for operating activities to the net increase or decrease in net assets from operations and classifies cash receipts and payments as resulting from operating, investing, and financing activities.
The Financial Highlights provide a per-share breakdown of the components that affected the fund’s NAV for the current and past reporting periods. It also shows total return, net investment income ratios, expense ratios, and portfolio turnover rates. The net investment income ratios summarize the income earned less expenses, divided by the average net assets. The expense ratios represent the percentage of average net assets that were used to cover operating expenses during the period. The portfolio turnover rate represents the percentage of the fund’s holdings that have changed over the course of the period, and gives an idea of how long the fund holds onto a particular security. A 100% turnover rate implies that an amount equal to the value of the entire portfolio is turned over in a year through the purchase or sale of securities.
The Notes to Financial Statements disclose the organizational background of the fund, its significant accounting policies, federal tax information, fees and compensation paid to affiliates, and significant risks and contingencies.
We hope this guide to your shareholder report will help you get the most out of this important resource.
| | | | | | |
| FIRST AMERICAN MORTGAGE FUNDS | | 2011 ANNUAL REPORT | | | 1 | |
Fund Overviews
Average Annual Total Returns – ASP
Based on NAV for the period ended August 31, 2011
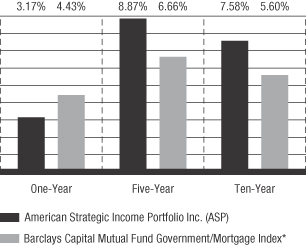
*The Barclays Capital Mutual Fund Government/Mortgage Index is comprised of all U.S. Government agency and Treasury securities and agency mortgage-backed securities. Index performance is for illustrative purposes only and does not reflect any fees or expenses. The index is unmanaged and is not available for direct investment. Although we believe this is the most appropriate benchmark available, it is not a perfect match. The benchmark index is comprised of U.S. Government securities while the fund is comprised primarily of nonsecuritized, illiquid whole loans, which limits the ability of the fund to respond quickly to market changes.
The average annual total returns for the fund are based on the change in its NAV and assume reinvestment of distributions at NAV. NAV-based performance is used to measure investment management results.
• Average annual total returns based on the change in market price for the one-year, five-year, and ten-year periods ended August 31, 2011, were -5.90%, 9.37%, and 7.46%, respectively.
• Market price returns assume that all distributions have been reinvested at actual prices pursuant to the fund’s dividend reinvestment plan. Market price returns reflect any broker commissions or sales charges on dividends reinvested at market price.
• Please remember, you could lose money with this investment. Neither safety of principal nor stability of income is guaranteed. Past performance does not guarantee future results. The investment return and principal value of an investment will fluctuate so that fund shares, when sold, may be worth more or less than their original cost. Closed-end funds, such as this fund, often trade at discounts to NAV. Therefore, you may be unable to realize the full NAV of your shares when you sell.
| | | | |
| 2 | | FIRST AMERICAN MORTGAGE FUNDS | | 2011 ANNUAL REPORT |
Average Annual Total Returns – BSP
Based on NAV for the period ended August 31, 2011
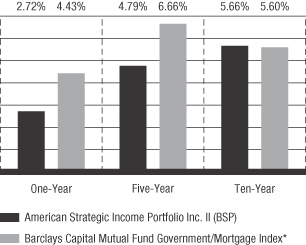
*The Barclays Capital Mutual Fund Government/Mortgage Index is comprised of all U.S. Government agency and Treasury securities and agency mortgage-backed securities. Index performance is for illustrative purposes only and does not reflect any fees or expenses. The index is unmanaged and is not available for direct investment. Although we believe this is the most appropriate benchmark available, it is not a perfect match. The benchmark index is comprised of U.S. Government securities while the fund is comprised primarily of nonsecuritized, illiquid whole loans, which limits the ability of the fund to respond quickly to market changes.
The average annual total returns for the fund are based on the change in its NAV and assume reinvestment of distributions at NAV. NAV-based performance is used to measure investment management results.
• Average annual total returns based on the change in market price for the one-year, five-year, and ten-year periods ended August 31, 2011, were -2.42%, 5.39%, and 5.56%, respectively.
• Market price returns assume that all distributions have been reinvested at actual prices pursuant to the fund’s dividend reinvestment plan. Market price returns reflect any broker commissions or sales charges on dividends reinvested at market price.
• Please remember, you could lose money with this investment. Neither safety of principal nor stability of income is guaranteed. Past performance does not guarantee future results. The investment return and principal value of an investment will fluctuate so that fund shares, when sold, may be worth more or less than their original cost. Closed-end funds, such as this fund, often trade at discounts to NAV. Therefore, you may be unable to realize the full NAV of your shares when you sell.
| | | | | | |
| FIRST AMERICAN MORTGAGE FUNDS | | 2011 ANNUAL REPORT | | | 3 | |
Fund Overviews
Average Annual Total Returns – CSP
Based on NAV for the period ended August 31, 2011
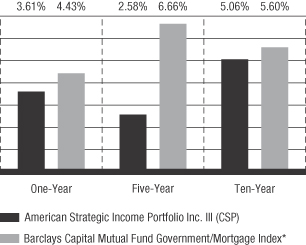
*The Barclays Capital Mutual Fund Government/Mortgage Index is comprised of all U.S. Government agency and Treasury securities and agency mortgage-backed securities. Index performance is for illustrative purposes only and does not reflect any fees or expenses. The index is unmanaged and is not available for direct investment. Although we believe this is the most appropriate benchmark available, it is not a perfect match. The benchmark index is comprised of U.S. Government securities while the fund is comprised primarily of nonsecuritized, illiquid whole loans, which limits the ability of the fund to respond quickly to market changes.
The average annual total returns for the fund are based on the change in its NAV and assume reinvestment of distributions at NAV. NAV-based performance is used to measure investment management results.
• Average annual total returns based on the change in market price for the one-year, five-year, and ten-year periods ended August 31, 2011, were 0.26%, 3.02%, and 5.20%, respectively.
• Market price returns assume that all distributions have been reinvested at actual prices pursuant to the fund’s dividend reinvestment plan. Market price returns reflect any broker commissions or sales charges on dividends reinvested at market price.
• Please remember, you could lose money with this investment. Neither safety of principal nor stability of income is guaranteed. Past performance does not guarantee future results. The investment return and principal value of an investment will fluctuate so that fund shares, when sold, may be worth more or less than their original cost. Closed-end funds, such as this fund, often trade at discounts to NAV. Therefore, you may be unable to realize the full NAV of your shares when you sell.
| | | | |
| 4 | | FIRST AMERICAN MORTGAGE FUNDS | | 2011 ANNUAL REPORT |
Average Annual Total Returns – SLA
Based on NAV for the period ended August 31, 2011
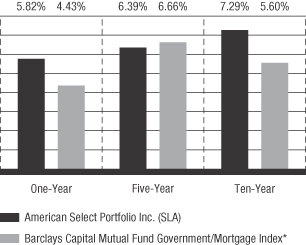
*The Barclays Capital Mutual Fund Government/Mortgage Index is comprised of all U.S. Government agency and Treasury securities and agency mortgage-backed securities. Index performance is for illustrative purposes only and does not reflect any fees or expenses. The index is unmanaged and is not available for direct investment. Although we believe this is the most appropriate benchmark available, it is not a perfect match. The benchmark index is comprised of U.S. Government securities while the fund is comprised primarily of nonsecuritized, illiquid whole loans, which limits the ability of the fund to respond quickly to market changes.
The average annual total returns for the fund are based on the change in its NAV and assume reinvestment of distributions at NAV. NAV-based performance is used to measure investment management results.
• Average annual total returns based on the change in market price for the one-year, five-year, and ten-year periods ended August 31, 2011, were -4.78%, 6.74%, and 7.36%, respectively.
• Market price returns assume that all distributions have been reinvested at actual prices pursuant to the fund’s dividend reinvestment plan. Market price returns reflect any broker commissions or sales charges on dividends reinvested at market price.
• Please remember, you could lose money with this investment. Neither safety of principal nor stability of income is guaranteed. Past performance does not guarantee future results. The investment return and principal value of an investment will fluctuate so that fund shares, when sold, may be worth more or less than their original cost. Closed-end funds, such as this fund, often trade at discounts to NAV. Therefore, you may be unable to realize the full NAV of your shares when you sell.
| | | | | | |
| FIRST AMERICAN MORTGAGE FUNDS | | 2011 ANNUAL REPORT | | | 5 | |
(This page intentionally left blank.)
| | | | |
| 6 | | FIRST AMERICAN MORTGAGE FUNDS | | 2011 ANNUAL REPORT |
Fund Overviews
Investment Advisor
U.S. Bancorp Asset Management, Inc.
Sub-Advisors
Nuveen Asset Management, LLC
Nuveen Fund Advisors, Inc.
Fund Management
John Wenker
of Nuveen Asset Management, LLC is responsible for overall management of the funds. He has 28 years of financial experience.
David Yale
of Nuveen Asset Management, LLC is responsible for management of the mortgage loan component and credit facilities of the funds. He has 30 years of financial experience.
Jason O’Brien, CFA
of Nuveen Asset Management, LLC is responsible for the management of the mortgage-backed securities portion of the funds as of October 2010. He has 18 years of financial experience.
Introduction
During the fiscal year, the commercial real estate markets seemed to begin recovering. Commercial property prices began to recover in many, but not all, markets. The best properties in the best markets have recovered very well, but this recovery has not broadened out to secondary and tertiary markets. We believe broader commercial real estate recovery will be dependent on a better economic environment, job growth and continued recovery in debt capital markets.
Assuming the economy does not experience a double-dip recession, we believe commercial real estate markets will continue a long, slow recovery with the nature of recovery varying depending on property type and individual market dynamics.
Generally, as each fund received loan payoffs throughout the fiscal year, proceeds were recycled into higher credit quality assets, including AAA-rated commercial mortgage-backed securities, Federal National Mortgage Association (“FNMA”) and Federal Home Loan Mortgage Corporation (“FHLMC”) pass-through securities and some investment grade preferred stock of real estate investment trusts (“REIT”).
The funds’ primary risk is credit risk. This comes mainly from the funds’ investments in commercial mortgage loans. The funds have modest residential mortgage exposure, most of which consists of investments in FNMA and FHLMC pass-through securities.
During the fiscal year each fund, other than ASP, renewed its primary credit facility and each fund added an additional credit facility. The overall effect has been to reduce the average cost of borrowing and diversify among more facility providers. The funds pay interest on all their credit facilities at varying spreads over the one-month London Interbank Offering Rate (“LIBOR”). During the fiscal year, one-month LIBOR was fairly stable, ranging from a low of 0.185% to 0.265%.
A level distribution policy was in place for the fiscal year so that a component of each fund’s dividend was return of capital. The level distribution policy was passed by the funds’ Board of Directors in September 2009, with a higher dividend payout starting in December 2009. Each of the funds initially responded well to the policy, but for the last several months the policy appears to have lost its effectiveness. The funds’ Board of Directors eliminated the level distribution policies effective with the October 2011 distributions.
| | | | | | |
| FIRST AMERICAN MORTGAGE FUNDS | | 2011 ANNUAL REPORT | | | 7 | |
Fund Overviews
ASP
For the fiscal year ended August 31, 2011, the fund had a total return of 3.17% based on its NAV. The fund’s benchmark, the Barclays Capital Mutual Fund Government/Mortgage Index, had a return of 4.43% during the period. During the fiscal year, the fund-through the dividend-returned capital to shareholders of $0.3837 per share. This reduced the net assets by approximately 3%.
Historically a significant portion of the return generated by the fund has been income. This held true for this fiscal year as well. Income generated by the commercial mortgage-backed securities, REIT preferred stock and corporate notes was very solid; no scheduled payments were missed. Performance of the whole loans, and income generated by them was also very solid. At the end of the fiscal year, only one loan was in default.
During the fiscal year, four whole loans were paid off with an unpaid principal balance of $4.1 million and a net weighted average coupon of 7.62%. No whole loans were purchased. As of August 31, 2011, there was one commercial loan in default with unpaid principal balance of $3.2 million. No prepayment penalties were collected during the reporting period.
Portfolio Allocation1
As a percentage of total investments on August 31, 2011
| | | | |
Commercial Loans | | | 27 | % |
Preferred Stocks | | | 24 | |
Commercial Mortgage-Backed Securities | | | 22 | |
U.S. Government Agency Mortgage-Backed Securities | | | 11 | |
Multifamily Loans | | | 8 | |
Corporate Note | | | 5 | |
Short-Term Investment | | | 2 | |
Single Family Loans | | | 1 | |
| | | 100 | % |
1Portfolio allocations are subject to change and are not recommendations to buy or sell any security.
| | | | |
| 8 | | FIRST AMERICAN MORTGAGE FUNDS | | 2011 ANNUAL REPORT |
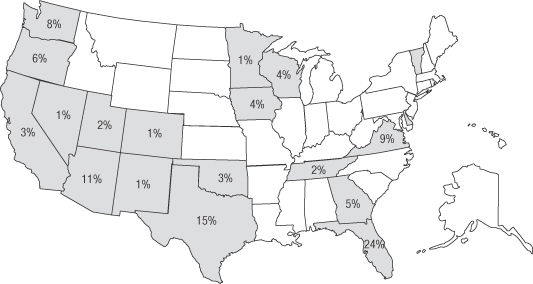
Geographical Distribution
The fund attempts to buy mortgage loans in many parts of the country to help avoid the risks of concentrating in one area. These percentages reflect the fair value of whole loans as of August 31, 2011. Shaded areas without fair values indicate states in which the fund has invested less than 0.50% of its investments.

Delinquent Loan Profile
The tables below show the percentages of single family loans and multifamily and commercial loans in the portfolio that are 30, 60, 90, or 120 or more days delinquent as of August 31, 2011, based on the value outstanding.
| | | | |
Single family loans | | | | |
Current | | | 100.0 | % |
30 Days | | | 0.0 | |
60 Days | | | 0.0 | |
90 Days | | | 0.0 | |
120+ Days | | | 0.0 | |
| | | 100.0 | % |
| | | | |
Multifamily and commercial loans | | | | |
Current | | | 92.1 | % |
30 Days | | | 0.0 | |
60 Days | | | 0.0 | |
90 Days | | | 0.0 | |
120+ Days | | | 7.9 | |
| | | 100.0 | % |
| | | | | | |
| FIRST AMERICAN MORTGAGE FUNDS | | 2011 ANNUAL REPORT | | | 9 | |
Fund Overviews
BSP
For the fiscal year ended August 31, 2011, the fund had a total return of 2.72% based on its NAV. The fund’s benchmark, the Barclays Capital Mutual Fund Government/Mortgage Index, had a return of 4.43% during the period. During the fiscal year, the fund-through the dividend-returned capital to shareholders of $0.5545 per share. This reduced the net assets by approximately 5%.
Historically a significant portion of the return generated by the fund has been income. This held true for this fiscal year as well. Income generated by the commercial mortgage-backed securities, REIT preferred stock and corporate notes was very solid; no scheduled payments were missed. Performance of the whole loans was held back by delinquent loans. This reduced the normally strong income generation of the loan portfolio. We are very focused on trying to resolve these issues, recognizing the commercial real estate markets are in the early stages of recovery.
During the fiscal year, one whole loan paid off with a principal balance of $3.9 million and a coupon of 8.00%. No whole loans were purchased. As of August 31, 2011, there were three multifamily loans, one commercial loan and one single-family loan in default, comprising $29.1 million of unpaid principal balance. No prepayment penalties were collected during the period.
Portfolio Allocation1
As a percentage of total investments on August 31, 2011
| | | | |
Commercial Loans | | | 29 | % |
Multifamily Loans | | | 27 | |
Preferred Stocks | | | 14 | |
Commercial Mortgage-Backed Securities | | | 13 | |
Corporate Notes | | | 9 | |
U.S. Government Agency Mortgage-Backed Securities | | | 7 | |
Short-Term Investment | | | 1 | |
| | | 100 | % |
1Portfolio allocations are subject to change and are not recommendations to buy or sell any security.
| | | | |
| 10 | | FIRST AMERICAN MORTGAGE FUNDS | | 2011 ANNUAL REPORT |
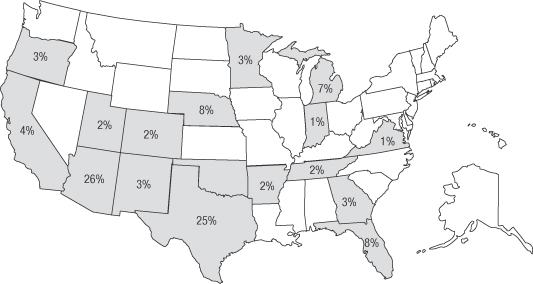
Geographical Distribution
The fund attempts to buy mortgage loans in many parts of the country to help avoid the risks of concentrating in one area. These percentages reflect the fair value of whole loans as of August 31, 2011. Shaded areas without fair values indicate states in which the fund has invested less than 0.50% of its investments.
Delinquent Loan Profile
The tables below show the percentages of single family loans and multifamily and commercial loans in the portfolio that are 30, 60, 90, or 120 or more days delinquent as of August 31, 2011, based on the fair value outstanding.
| | | | |
Single family loans | | | | |
Current | | | 41.7 | % |
30 Days | | | 0.0 | |
60 Days | | | 58.3 | |
90 Days | | | 0.0 | |
120+ Days | | | 0.0 | |
| | | 100.0 | % |
| | | | |
Multifamily and commercial loans | | | | |
Current | | | 83.6 | % |
30 Days | | | 5.4 | |
60 Days | | | 0.0 | |
90 Days | | | 3.4 | |
120+ Days | | | 7.6 | |
| | | 100.0 | % |
| | | | | | |
| FIRST AMERICAN MORTGAGE FUNDS | | 2011 ANNUAL REPORT | | | 11 | |
Fund Overviews
CSP
For the fiscal year ended August 31, 2011, the fund had a total return of 3.61% based on its NAV. The fund’s benchmark, the Barclays Capital Mutual Fund Government/Mortgage Index, had a return of 4.43% during the period. During the fiscal year, the fund-through the dividend-returned capital to shareholders of $0.6189 per share. This reduced the net assets by approximately 7%.
Historically a significant portion of the return generated by the fund has been income. This held true for this fiscal year as well. Income generated by the commercial mortgage-backed securities, REIT preferred stock and corporate notes was very solid; no scheduled payments were missed. Performance of the whole loans was held back by delinquent loans. This significantly reduced income generation in the fund. We are very focused on trying to resolve these issues, which we believe would raise the income levels of the fund. Commercial real estate markets have been through a tough period the last few years. We are hopeful a stronger economic environment will provide opportunities to resolve the problem loans.
During the fiscal year, one whole loan paid off with an unpaid principal balance of $3.5 million and a coupon of 7.00%. One whole loan was purchased with a principal balance of $8,500,000 and coupon of 5.95%. As of August 31, 2011, there were eight commercial loans and seven multifamily loans in default, comprising $68.1 million of unpaid principal balance. There were no prepayment penalties collected during the reporting period. The fund has one property in the real estate owned category.
Portfolio Allocation1
As a percentage of total investments on August 31, 2011
| | | | |
Commercial Loans | | | 40 | % |
Multifamily Loans | | | 22 | |
Preferred Stocks | | | 16 | |
U.S. Government Agency Mortgage-Backed Securities | | | 8 | |
Corporate Notes | | | 8 | |
Commercial Mortgage-Backed Securities | | | 4 | |
Real Estate Owned | | | 1 | |
Short-Term Investment | | | 1 | |
| | | 100 | % |
1Portfolio allocations are subject to change and are not recommendations to buy or sell any security.
| | | | |
| 12 | | FIRST AMERICAN MORTGAGE FUNDS | | 2011 ANNUAL REPORT |
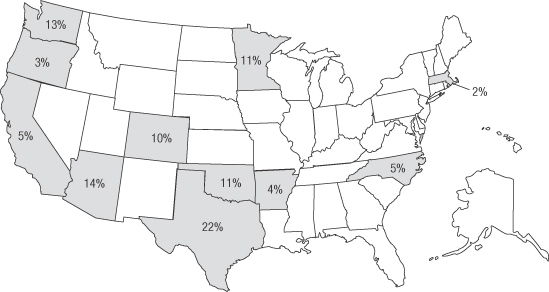
Geographical Distribution
The fund attempts to buy mortgage loans in many parts of the country to help avoid the risks of concentrating in one area. These percentages reflect the fair value of whole loans as of August 31, 2011. Shaded areas without fair values indicate states in which the fund has invested less than 0.50% of its investments.
Delinquent Loan Profile
The table below shows the percentages of multifamily and commercial loans in the portfolio that are 30, 60, 90, or 120 or more days delinquent as of August 31, 2011, based on the fair value outstanding.
| | | | |
Multifamily and commercial loans | | | | |
Current | | | 78.2 | % |
30 Days | | | 1.9 | |
60 Days | | | 0.0 | |
90 Days | | | 0.0 | |
120+ Days | | | 19.9 | |
| | | 100.0 | % |
| | | | | | |
| FIRST AMERICAN MORTGAGE FUNDS | | 2011 ANNUAL REPORT | | | 13 | |
Fund Overviews
SLA
For the fiscal year ended August 31, 2011, the fund had a total return of 5.82% based on its NAV. The fund’s benchmark, the Barclays Capital Mutual Fund Government/Mortgage Index, had a return of 4.43% during the period. During the fiscal year, the fund-through the dividend-returned capital to shareholders of $0.3964 per share. This reduced the net assets by approximately 3%.
Historically a significant portion of the return generated by the fund has been income. This held true for this fiscal year as well. Income generated by the commercial mortgage-backed securities, REIT preferred stock and corporate notes was very solid; no scheduled payments were missed. Performance of the whole loans was fairly stable, although several delinquent loans existed at the end of the fiscal period. Delinquent loans have the effect of reducing income. Our goal is to resolve these issues, while recognizing the limits of the nascent commercial real estate recovery.
During the fiscal year, four whole loans paid off with an unpaid principal balance of $14.0 million and a net weighted average coupon of 7.34%. No whole loans were purchased. As of August 31, 2011, there were four commercial loans and one multifamily loan in default with an unpaid principal balance of $17.7 million. Prepayment penalties from whole loans that were paid off during the reporting period amounted to $12,000.
Portfolio Allocation1
As a percentage of total investments on August 31, 2011
| | | | |
Commercial Loans | | | 36 | % |
Preferred Stocks | | | 18 | |
Multifamily Loans | | | 15 | |
Commercial Mortgage-Backed Securities | | | 12 | |
Corporate Notes | | | 10 | |
U.S. Government Agency Mortgage-Backed Securities | | | 8 | |
Short-Term Investment | | | 1 | |
| | | 100 | % |
1Portfolio allocations are subject to change and are not recommendations to buy or sell any security.
| | | | |
| 14 | | FIRST AMERICAN MORTGAGE FUNDS | | 2011 ANNUAL REPORT |
Geographical Distribution
The fund attempts to buy mortgage loans in many parts of the country to help avoid the risks of concentrating in one area. These percentages reflect the fair value of whole loans as of August 31, 2011. Shaded areas without fair values indicate states in which the fund has invested less than 0.50% of its investments.
Delinquent Loan Profile
The table below shows the percentages of multifamily and commercial loans in the portfolio that are 30, 60, 90, or 120 or more days delinquent as of August 31, 2011, based on the fair value outstanding.
| | | | |
Multifamily and commercial loans | | | | |
Current | | | 88.7 | % |
30 Days | | | 0.0 | |
60 Days | | | 5.2 | |
90 Days | | | 0.0 | |
120+ Days | | | 6.1 | |
| | | 100.0 | % |
| | | | | | |
| FIRST AMERICAN MORTGAGE FUNDS | | 2011 ANNUAL REPORT | | | 15 | |
Fund Overviews
Conclusion
As of this writing, commercial real estate markets are experiencing a fragile recovery. Weak economic conditions, weak job growth and a constrained environment for debt capital present big challenges for the commercial real estate sector. We continue to focus on the credit risk in the funds and are hopeful a slowly improving economy will present opportunities to protect and enhance net asset value.
Thank you for your investment in the funds and your continued trust as we navigate the investment landscape. If you have any questions about the funds, please call us at 800.677.3863.
Sincerely,

John Wenker
Managing Director, Head of Real Assets
Nuveen Asset Management, LLC
| | | | |
| 16 | | FIRST AMERICAN MORTGAGE FUNDS | | 2011 ANNUAL REPORT |
Report of Independent Registered Public Accounting Firm
To the Shareholders and Board of Directors
American Strategic Income Portfolio Inc., American Strategic Income Portfolio Inc. II, American Strategic Income Portfolio Inc. III, and American Select Portfolio Inc.
We have audited the accompanying statements of assets and liabilities of American Strategic Income Portfolio Inc., American Strategic Income Portfolio Inc. II, American Strategic Income Portfolio Inc. III, and American Select Portfolio Inc. (the “funds”), including the schedule of investments, as of August 31, 2011, and the related statements of operations and cash flows for the year then ended, the statements of changes in net assets for each of the two years in the period then ended, and the financial highlights for each of the five years in the period then ended. These financial statements and financial highlights are the responsibility of the funds’ management. Our responsibility is to express an opinion on these financial statements and financial highlights based on our audits.
We conducted our audits in accordance with the standards of the Public Company Accounting Oversight Board (United States). Those standards require that we plan and perform the audit to obtain reasonable assurance about whether the financial statements and financial highlights are free of material misstatement. We were not engaged to perform an audit of the funds’ internal control over financial reporting. Our audits included consideration of internal control over financial reporting as a basis for designing audit procedures that are appropriate in the circumstances, but not for the purpose of expressing an opinion on the effectiveness of the funds’ internal control over financial reporting. Accordingly, we express no such opinion. An audit also includes examining, on a test basis, evidence supporting the amounts and disclosures in the financial statements and financial highlights, assessing the accounting principles used and significant estimates made by management, and evaluating the overall financial statement presentation. Our procedures included confirmation of securities owned as of August 31, 2011, by correspondence with the custodian and brokers, or by other appropriate auditing procedures where replies from brokers were not received. We believe that our audits provide a reasonable basis for our opinion.
In our opinion, the financial statements and financial highlights referred to above present fairly, in all material respects, the financial position of American Strategic Income Portfolio Inc., American Strategic Income Portfolio Inc. II, American Strategic Income Portfolio Inc. III, and American Select Portfolio Inc. at August 31, 2011, the results of its operations and its cash flows for the year then ended, the changes in its net assets for each of the two years in the period then ended, and the financial highlights for each of the five years in the period then ended, in conformity with U.S. generally accepted accounting principles.

Minneapolis, Minnesota
October 26, 2011
| | | | | | |
| FIRST AMERICAN MORTGAGE FUNDS | | 2011 ANNUAL REPORT | | | 17 | |
| | |
| Schedule of Investments | | August 31, 2011 |
American Strategic Income Portfolio (ASP)
| | | | | | | | | | | | | | | | |
DESCRIPTION | | DATE
ACQUIRED | | | PAR | | | COST | | | FAIR
VALUE ¶ | |
| | | | |
(Percentages of each investment category relate to total net assets) | | | | | | | | | | | | | | | | |
| | | | |
Whole Loans ¥ p — 48.7% | | | | | | | | | | | | | | | | |
Commercial Loans — 37.3% | | | | | | | | | | | | | | | | |
Copper Junction, Copper Mountain, CO, 6.38%, 7/1/17 | | | 6/14/07 | | | $ | 1,860,134 | | | $ | 1,860,134 | | | $ | 1,953,141 | |
Hampden Medical Office, Englewood, CO, 7.38%, 10/1/12 | | | 9/9/02 | | | | 1,353,560 | | | | 1,353,560 | | | | 1,162,352 | |
Integrity Plaza Shopping Center, Albuquerque, NM, 7.88%, 7/1/12 | | | 6/11/02 | | | | 1,821,452 | | | | 1,821,452 | | | | 1,839,671 | |
La Costa Meadows Industrial Park I, San Marcos, CA, 6.78%, 7/1/17 � | | | 6/28/07 | | | | 1,250,000 | | | | 1,250,000 | | | | 1,312,500 | |
La Costa Meadows Industrial Park II, San Marcos, CA, 7.53%, 7/1/17 � | | | 6/28/07 | | | | 2,000,000 | | | | 2,000,000 | | | | 2,020,000 | |
Minikahda Mini Storage IV, Minneapolis, MN, 7.15%, 7/1/15 | | | 2/28/06 | | | | 1,609,814 | | | | 1,609,814 | | | | 1,296,377 | |
Naples Boat Club, Naples, FL, 6.43%, 1/1/17 | | | 12/28/06 | | | | 1,574,956 | | | | 1,574,956 | | | | 1,653,703 | |
Palace Court, Santa Fe, NM, 5.38%, 1/1/13 � | | | 10/2/06 | | | | 1,858,913 | | | | 1,858,913 | | | | 1,302,388 | |
Par 3 Office Building, Bend, OR, 6.63%, 8/1/13 � | | | 8/3/06 | | | | 1,900,000 | | | | 1,900,000 | | | | 1,938,000 | |
Perkins Restaurant, Maple Grove, MN, 6.38%, 1/1/18 | | | 12/23/05 | | | | 1,325,743 | | | | 1,325,743 | | | | 1,392,030 | |
Stephens Center, Missoula, MT, 6.88%, 9/1/15 | | | 4/20/06 | | | | 1,725,079 | | | | 1,725,079 | | | | 1,811,333 | |
The Storage Place, Marana, AZ, 6.65%, 1/1/13 ¿ | | | 12/20/07 | | | | 3,197,845 | | | | 3,197,845 | | | | 1,982,664 | |
| | | | | | | | | | | | | | | | |
| | | | | | | | | | | 21,477,496 | | | | 19,664,159 | |
| | | | | | | | | | | | | | | | |
Multifamily Loans — 10.7% | | | | | | | | | | | | | | | | |
Forest Club Apartments, Dallas, TX, 11.88%, 8/1/10 � § | | | 4/19/06 | | | | 1,720,000 | | | | 1,720,000 | | | | 1,581,863 | |
Hunt Club Apartments, Waco, TX, 5.64%, 7/1/11 § | | | 6/3/04 | | | | 1,113,461 | | | | 1,113,461 | | | | 1,060,306 | |
Spring Creek Gardens, Plano, TX, 5.63%, 8/1/15 | | | 12/22/05 | | | | 2,071,579 | | | | 2,068,467 | | | | 2,071,579 | |
Villa Bonita, Chez Royalle, Fitzhugh Apartments I, Dallas, TX, 7.88%, 4/1/12 | | | 2/21/03 | | | | 787,753 | | | | 787,753 | | | | 787,753 | |
Villa Bonita, Chez Royalle, Fitzhugh Apartments II, Dallas, TX, 11.88%, 4/1/12 | | | 2/21/03 | | | | 149,463 | | | | 149,463 | | | | 142,314 | |
| | | | | | | | | | | | | | | | |
| | | | | | | | | | | 5,839,144 | | | | 5,643,815 | |
| | | | | | | | | | | | | | | | |
Single Family Loans — 0.7% | | | | | | | | | | | | | | | | |
American Portfolio, 1 loan, California, 3.00%, 1/1/17 | | | 7/18/95 | | | | 14,194 | | | | 13,520 | | | | 14,095 | |
Anivan, 1 loan, Maryland, 3.00%, 10/1/15 | | | 6/14/96 | | | | 47,913 | | | | 48,223 | | | | 48,123 | |
Bank of New Mexico, 1 loan, New Mexico, 3.75%, 2/1/18 | | | 5/31/96 | | | | 25,348 | | | | 25,348 | | | | 25,905 | |
Bluebonnet Savings & Loan, 4 loans, Texas, 4.50%, 11/24/14 | | | 5/22/92 | | | | 48,021 | | | | 48,021 | | | | 48,389 | |
Fairbanks, 1 loan, Utah, 4.50%, 11/1/18 | | | 5/21/92 | | | | 14,387 | | | | 12,211 | | | | 14,819 | |
Knutson Mortgage Portfolio I, 2 loans, Maine and Montana, 9.52%, 2/3/18 | | | 2/26/92 | | | | 101,333 | | | | 96,694 | | | | 104,373 | |
McClemore, Matrix Funding Corporation, 1 loan, North Carolina, 10.50%, 8/1/19 | | | 9/9/92 | | | | 35,822 | | | | 34,031 | | | | 36,897 | |
Nomura III, 2 loans, California & New York, 5.21%, 8/18/18 | | | 9/29/95 | | | | 46,687 | | | | 42,203 | | | | 48,088 | |
Rand Mortgage Corporation, 1 loan, Texas, 9.50%, 1/1/17 | | | 2/21/92 | | | | 24,076 | | | | 19,734 | | | | 24,798 | |
| | | | | | | | | | | | | | | | |
| | | | | | | | | | | 339,985 | | | | 365,487 | |
| | | | | | | | | | | | | | | | |
| | | | |
Total Whole Loans | | | | | | | | | | | 27,656,625 | | | | 25,673,461 | |
| | | | | | | | | | | | | | | | |
| | | | |
Corporate Note ¥ � — 6.8% | | | | | | | | | | | | | | | | |
Fixed Rate — 6.8% | | | | | | | | | | | | | | | | |
Stratus Properties V, 8.75%, 12/31/14 | | | 6/1/07 | | | | 3,500,000 | | | | 3,500,000 | | | | 3,605,000 | |
| | | | | | | | | | | | | | | | |
| | | | |
U.S. Government Agency Mortgage-Backed Securities — 15.5% | | | | | | | | | | | | | | | | |
Fixed Rate — 15.5% | | | | | | | | | | | | | | | | |
Federal Home Loan Mortgage Corporation, | | | | | | | | | | | | | | | | |
5.50%, 1/1/18, #E93231 a | | | | | | | 228,158 | | | | 231,794 | | | | 248,424 | |
9.00%, 7/1/30, #C40149 | | | | | | | 55,997 | | | | 57,119 | | | | 66,381 | |
5.00%, 5/1/39, #G05430 a | | | | | | | 1,169,616 | | | | 1,198,889 | | | | 1,259,247 | |
Federal National Mortgage Association, | | | | | | | | | | | | | | | | |
6.00%, 10/1/16, #610761 a | | | | | | | 94,691 | | | | 95,528 | | | | 102,848 | |
5.00%, 7/1/18, #724954 a | | | | | | | 722,591 | | | | 722,066 | | | | 783,414 | |
6.50%, 6/1/29, #252497 a | | | | | | | 75,219 | | | | 74,840 | | | | 86,308 | |
7.50%, 3/1/30, #495694 | | | | | | | 35,255 | | | | 34,824 | | | | 39,856 | |
7.50%, 5/1/30, #535289 a | | | | | | | 20,777 | | | | 20,252 | | | | 24,362 | |
8.00%, 5/1/30, #538266 a | | | | | | | 7,083 | | | | 7,016 | | | | 8,330 | |
The accompanying notes are an integral part of the financial statements.
| | | | |
| 18 | | FIRST AMERICAN MORTGAGE FUNDS | | 2011 ANNUAL REPORT |
American Strategic Income Portfolio (ASP)
| | | | | | | | | | | | | | |
DESCRIPTION | | | | PAR/
SHARES | | | COST | | | FAIR
VALUE ¶ | |
| | | | |
6.00%, 5/1/31, #535909 a | | | | $ | 135,011 | | | $ | 135,593 | | | $ | 151,329 | |
6.50%, 11/1/31, #613339 a | | | | | 79,972 | | | | 81,323 | | | | 91,361 | |
5.50%, 7/1/33, #720735 a | | | | | 1,023,372 | | | | 1,013,869 | | | | 1,127,836 | |
5.00%, 7/1/39, #935588 a | | | | | 579,358 | | | | 592,491 | | | | 625,043 | |
4.00%, 12/1/40, #MA0583 a | | | | | 968,188 | | | | 979,181 | | | | 1,004,899 | |
4.00%, 12/1/40, #AB1959 a | | | | | 1,174,473 | | | | 1,171,148 | | | | 1,219,005 | |
4.00%, 1/1/41, #MA0614 a | | | | | 1,269,260 | | | | 1,256,253 | | | | 1,317,386 | |
| | | | | | | | | | | | | | |
| | | | |
Total U.S. Government Agency Mortgage-Backed Securities | | | | | | | | | 7,672,186 | | | | 8,156,029 | |
| | | | | | | | | | | | | | |
| | | | |
Commercial Mortgage-Backed Securities � — 29.2% | | | | | | | | | | | | | | |
Other — 29.2% | | | | | | | | | | | | | | |
Bear Stearns Commercial Mortgage Securities, | | | | | | | | | | | | | | |
5.90%, 9/11/38, Series 2006-PW12, Class A4 r a | | | | | 1,200,000 | | | | 991,455 | | | | 1,327,645 | |
5.69%, 6/11/50, Series 2007-PW17, Class A4 a | | | | | 1,985,000 | | | | 1,778,477 | | | | 2,104,707 | |
5.74%, 9/11/42, Series 2007-T28, Class A4 | | | | | 1,200,000 | | | | 951,282 | | | | 1,335,820 | |
Citigroup/Deutsche Bank Commercial Mortgage Trust, | | | | | | | | | | | | | | |
5.40%, 7/15/44, Series 2005-CD1, Class A4 r | | | | | 2,357,000 | | | | 1,556,658 | | | | 2,574,652 | |
5.89%, 11/15/44, Series 2007-CD5,Class A4 r | | | | | 1,550,000 | | | | 1,452,283 | | | | 1,666,985 | |
GS Mortgage Securities Corporation II, Series 2006-GG8, Class A4, 5.56%, 11/10/39 | | | | | 2,900,000 | | | | 2,064,939 | | | | 3,084,248 | |
LB-UBS Commercial Mortgage Trust, Series 2008-C1, Class A2, 6.31%, 4/15/41 r a | | | | | 1,875,000 | | | | 1,410,813 | | | | 2,039,899 | |
Morgan Stanley Capital I, Series 2007-T27, Class A4, 5.79%, 6/11/42 r | | | | | 1,160,000 | | | | 946,168 | | | | 1,288,359 | |
| | | | | | | | | | | | | | |
| | | | |
Total Commercial Mortgage-Backed Securities | | | | | | | | | 11,152,075 | | | | 15,422,315 | |
| | | | | | | | | | | | | | |
| | | | |
Preferred Stocks — 32.4% | | | | | | | | | | | | | | |
Real Estate Investment Trusts — 32.4% | | | | | | | | | | | | | | |
BRE Properties, Series D x | | | | | 2,400 | | | | 47,688 | | | | 60,300 | |
Developers Diversified Realty, Series H x | | | | | 12,060 | | | | 213,876 | | | | 287,179 | |
Developers Diversified Realty, Series I x | | | | | 1,950 | | | | 35,174 | | | | 46,800 | |
Duke Realty, Series J x | | | | | 2,100 | | | | 52,246 | | | | 50,728 | |
Duke Realty, Series L x | | | | | 8,750 | | | | 167,300 | | | | 214,922 | |
Duke Realty, Series M x | | | | | 26,120 | | | | 532,400 | | | | 660,810 | |
Duke Realty, Series O x | | | | | 20,300 | | | | 479,080 | | | | 538,559 | |
Equity Residential Properties, Series K x | | | | | 10,000 | | | | 557,500 | | | | 594,063 | |
Equity Residential Properties, Series N x | | | | | 28,800 | | | | 557,520 | | | | 725,400 | |
Health Care Properties, Series E x | | | | | 19,000 | | | | 470,630 | | | | 483,550 | |
Health Care Properties, Series F | | | | | 14,000 | | | | 343,700 | | | | 355,250 | |
Kimco Realty, Series G x | | | | | 50,700 | | | | 1,320,735 | | | | 1,306,539 | |
National Retail Properties, Series C x | | | | | 25,000 | | | | 527,500 | | | | 632,975 | |
ProLogis, Series L x | | | | | 35,060 | | | | 801,940 | | | | 792,356 | |
ProLogis, Series M x | | | | | 5,600 | | | | 139,850 | | | | 127,120 | |
ProLogis, Series R x | | | | | 26,975 | | | | 636,199 | | | | 625,483 | |
ProLogis, Series S x | | | | | 3,800 | | | | 79,800 | | | | 88,232 | |
PS Business Parks, Series H x | | | | | 22,060 | | | | 389,700 | | | | 563,412 | |
PS Business Parks, Series I x | | | | | 4,240 | | | | 83,401 | | | | 106,133 | |
PS Business Parks, Series M x | | | | | 12,060 | | | | 248,436 | | | | 306,023 | |
PS Business Parks, Series P x | | | | | 3,750 | | | | 71,887 | | | | 94,571 | |
PS Business Parks, Series R x | | | | | 9,500 | | | | 234,175 | | | | 242,250 | |
Public Storage, Series A x | | | | | 6,000 | | | | 144,291 | | | | 150,840 | |
Public Storage, Series C x | | | | | 5,000 | | | | 100,000 | | | | 126,250 | |
Public Storage, Series E x | | | | | 14,200 | | | | 263,000 | | | | 360,964 | |
Public Storage, Series F x | | | | | 9,300 | | | | 231,105 | | | | 232,500 | |
Public Storage, Series X x | | | | | 3,000 | | | | 74,330 | | | | 75,469 | |
Public Storage, Series Z x | | | | | 11,500 | | | | 282,309 | | | | 289,455 | |
Realty Income, Series D x | | | | | 20,500 | | | | 546,185 | | | | 519,548 | |
| | | | | | |
| FIRST AMERICAN MORTGAGE FUNDS | | 2011 ANNUAL REPORT | | | 19 | |
| | |
| Schedule of Investments | | August 31, 2011 |
American Strategic Income Portfolio (ASP)
| | | | | | | | | | | | | | |
DESCRIPTION | | | | SHARES | | | COST | | | FAIR
VALUE ¶ | |
| | | | |
Realty Income, Series E x | | | | | 37,060 | | | $ | 714,246 | | | $ | 940,397 | |
Regency Centers, Series C x | | | | | 22,060 | | | | 482,737 | | | | 551,500 | |
Regency Centers, Series D | | | | | 10,000 | | | | 249,000 | | | | 246,500 | |
Regency Centers, Series E x | | | | | 24,060 | | | | 483,600 | | | | 585,712 | |
Simon Property Group, Series J x | | | | | 11,000 | | | | 511,500 | | | | 673,062 | |
UDR, Series G | | | | | 41,500 | | | | 995,450 | | | | 1,053,062 | |
Vornado Realty Trust, Series E x | | | | | 4,800 | | | | 121,338 | | | | 122,880 | |
Vornado Realty Trust, Series F | | | | | 20,000 | | | | 503,000 | | | | 507,500 | |
Vornado Realty Trust, Series G x | | | | | 30,000 | | | | 483,000 | | | | 746,250 | |
Weingarten Realty Investors, Series D | | | | | 16,000 | | | | 394,080 | | | | 395,520 | |
Weingarten Realty Investors, Series F x | | | | | 25,500 | | | | 608,175 | | | | 624,750 | |
| | | | | | | | | | | | | | |
| | | | |
Total Preferred Stocks | | | | | | | | | 15,178,083 | | | | 17,104,814 | |
| | | | | | | | | | | | | | |
| | | | |
Total Unaffiliated Investments | | | | | | | | | 65,158,969 | | | | 69,961,619 | |
| | | | | | | | | | | | | | |
| | | | |
Short-Term Investment — 2.3% | | | | | | | | | | | | | | |
First American Prime Obligations Fund, Class Z, 0.04% W | | | | | 1,190,335 | | | | 1,190,335 | | | | 1,190,335 | |
| | | | | | | | | | | | | | |
| | | | |
Total Investments p — 134.9% | | | | | | | | $ | 66,349,304 | | | $ | 71,151,954 | |
| | | | | | | | | | | | | | |
Other Assets and Liabilities, Net — (34.9)% | | | | | | | | | | | | | (18,416,391 | ) |
| | | | | | | | | | | | | | |
Total Net Assets — 100.0% | | | | | | | | | | | | $ | 52,735,563 | |
| | | | | | | | | | | | | | |
| ¶ | Securities are valued in accordance with procedures described in note 2 in Notes to Financial Statements. |
| ¥ | Securities purchased as part of a private placement which have not been registered with the U.S. Securities and Exchange Commission under the Securities Act of 1933 and which are considered to be illiquid. These securities are fair valued in accordance with the board approved valuation procedures. On August 31, 2011, the total fair value of these securities was $29,278,461 or 55.5% of total net assets. See note 2 in Notes to Financial Statements. |
| p | Interest rates on commercial and multifamily loans are the net coupon rates in effect (after reducing the coupon rate by any mortgage servicing fees paid to mortgage servicers) on August 31, 2011. Interest rates and maturity dates disclosed on single family loans represent the weighted average coupon and weighted average maturity for the underlying mortgage loans as of August 31, 2011. |
| � | Interest Only – Represents securities that entitle holders to receive only interest payments on the mortgage. Principal balance on the loan is due at maturity. The interest rate disclosed represents the net coupon rate in effect as of August 31, 2011. |
| ¿ | Loan is currently in default with regards to scheduled interest and/or principal payments. |
| § | Loan has matured and the fund is anticipating payoff or refinancing. Unless disclosed otherwise, the loan continues to make monthly payments. |
| r | Variable Rate Security – The rate shown is the net coupon rate in effect as of August 31, 2011. |
| a | Securities pledged as collateral for outstanding reverse repurchase agreements. On August 31, 2011, securities valued at $13,522,043 were pledged as collateral for the following outstanding reverse repurchase agreements: |
| | | | | | | | | | | | | | | | | | | | | | |
| Amount | | | Acquisition
Date | | | Rate* | | | Due | | | Accrued
Interest | | | Name of Broker
and Description
of Collateral | |
| $ | 7,656,207 | | | | 8/12/2011 | | | | 0.23 | % | | | 9/12/2011 | | | $ | 978 | | | | (1 | ) |
| | 5,005,000 | | | | 6/22/2011 | | | | 1.25 | % | | | 9/22/2011 | | | | 12,339 | | | | (2 | ) |
| | | | | | | | | | | | | | | | | | | | | | |
| $ | 12,661,207 | | | | | | | | | | | | | | | $ | 13,317 | | | | | |
| | | | | | | | | | | | | | | | | | | | | | |
| | * | Interest rate as of August 31, 2011. Rate is based on one-month LIBOR plus a spread and reset monthly. |
Name of broker and description of collateral:
Federal Home Loan Mortgage Corporation, 5.50%, 1/1/18, $228,158 par
Federal Home Loan Mortgage Corporation, 5.00%, 5/1/39, $1,169,616 par
Federal National Mortgage Association, 6.00%, 10/1/16, $94,691 par
Federal National Mortgage Association, 5.00%, 7/1/18, $722,591 par
Federal National Mortgage Association, 6.50%, 6/1/29, $75,219 par
The accompanying notes are an integral part of the financial statements.
| | | | |
| 20 | | FIRST AMERICAN MORTGAGE FUNDS | | 2011 ANNUAL REPORT |
American Strategic Income Portfolio (ASP)
Federal National Mortgage Association, 7.50%, 5/1/30, $20,777 par
Federal National Mortgage Association, 8.00%, 5/1/30, $7,083 par
Federal National Mortgage Association, 6.00%, 5/1/31, $135,011 par
Federal National Mortgage Association, 6.50%, 11/1/31, $79,972 par
Federal National Mortgage Association, 5.50%, 7/1/33, $1,023,372 par
Federal National Mortgage Association, 5.00%, 7/1/39, $579,358 par
Federal National Mortgage Association, 4.00%, 12/1/40, $968,188 par
Federal National Mortgage Association, 4.00%, 12/1/40, $1,174,473 par
Federal National Mortgage Association, 4.00%, 1/1/41, $1,269,260 par
| | (2) | Merrill Lynch, Pierce, Fenner & Smith Incorporated: |
Bear Stearns Commercial Mortgage Securities, Series 2006-PW12, Class A4, 5.90%, 9/11/38, $1,200,000 par
Bear Stearns Commercial Mortgage Securities, Series 2007-PW17, Class A4, 5.69%, 6/11/50, $1,985,000 par
LB-UBS Commercial Mortgage Trust, Series 2008-C1, Class A2, 6.31%, 4/15/41, $1,875,000 par
| | The fund has entered into a lending commitment with Goldman Sachs. The monthly agreement permits the fund to enter into reverse repurchase agreements using U.S. Government Agency Mortgage-Backed Securities as collateral. |
| | The fund has entered into a lending commitment with Merrill Lynch, Pierce, Fenner & Smith Incorporated. The monthly agreement permits the fund to enter into reverse repurchase agreements using Commercial Mortgage-Backed Securities as collateral. |
| x | Securities pledged as collateral for outstanding borrowings under a loan agreement with Bank of America, N.A., London Branch. See note 2 in Notes to Financial Statements. On August 31, 2011, securities valued at $14,546,982 were pledged as collateral for the following outstanding borrowings: |
| | | | | | | | | | |
| Amount | | | Rate* | | | Accrued
Interest | |
| $ | 6,000,000 | | | | 1.09 | % | | $ | 6,342 | |
| | | | | | | | | | |
| | * | Interest rate as of August 31, 2011. Rate is based on one-month LIBOR plus 0.90%. |
Description of collateral:
Preferred Stocks
BRE Properties, Series D, 2,400 shares
Developers Diversified Realty, Series H, 12,060 shares
Developers Diversified Realty, Series I, 1,950 shares
Duke Realty, Series J, 2,100 shares
Duke Realty, Series L, 8,750 shares
Duke Realty, Series M, 26,120 shares
Duke Realty, Series O, 20,300 shares
Equity Residential Properties, Series K, 10,000 shares
Equity Residential Properties, Series N, 28,800 shares
Health Care Properties, Series E, 19,000 shares
Kimco Realty, Series G, 50,700 shares
National Retail Properties, Series C, 25,000 shares
ProLogis, Series L, 35,060 shares
ProLogis, Series M, 5,600 shares
ProLogis, Series R, 26,975 shares
ProLogis, Series S, 3,800 shares
PS Business Parks, Series H, 22,060 shares
PS Business Parks, Series I, 4,240 shares
PS Business Parks, Series M, 12,060 shares
PS Business Parks, Series P, 3,750 shares
PS Business Parks, Series R, 9,500 shares
Public Storage, Series A, 6,000 shares
Public Storage, Series C, 5,000 shares
Public Storage, Series E, 14,200 shares
Public Storage, Series F, 9,300 shares
Public Storage, Series X, 3,000 shares
Public Storage, Series Z, 11,500 shares
Realty Income, Series D, 20,500 shares
Realty Income, Series E, 37,060 shares
Regency Centers, Series C, 22,060 shares
Regency Centers, Series E, 24,060 shares
Simon Property Group, Series J, 11,000 shares
Vornado Realty Trust, Series E, 4,800 shares
Vornado Realty Trust, Series G, 30,000 shares
Weingarten Realty Investors, Series F, 25,500 shares
| | | | | | |
| FIRST AMERICAN MORTGAGE FUNDS | | 2011 ANNUAL REPORT | | | 21 | |
| | |
| Schedule of Investments | | August 31, 2011 |
American Strategic Income Portfolio (ASP)
| W | Investment in affiliated security. This money market fund is advised by U.S. Bancorp Asset Management, Inc., which also serves as advisor for the fund. The rate shown is the annualized seven-day effective yield as of August 31, 2011. |
| p | On August 31, 2011, the cost of investments for federal income tax purposes was $66,351,921. The aggregate gross unrealized appreciation and depreciation of investments, based on this cost, were as follows: |
| | | | |
Gross unrealized appreciation | | $ | 7,355,423 | |
Gross unrealized depreciation | | | (2,555,390 | ) |
| | | | |
Net unrealized appreciation | | $ | 4,800,033 | |
| | | | |
The accompanying notes are an integral part of the financial statements.
| | | | |
| 22 | | FIRST AMERICAN MORTGAGE FUNDS | | 2011 ANNUAL REPORT |
| | |
| Schedule of Investments | | August 31, 2011 |
American Strategic Income Portfolio II (BSP)
| | | | | | | | | | | | | | | | |
DESCRIPTION | | DATE
ACQUIRED | | | PAR | | | COST | | | FAIR
VALUE ¶ | |
| | | | |
(Percentages of each investment category relate to total net assets) | | | | | | | | | | | | | | | | |
| | | | |
Whole Loans ¥ p — 81.2% | | | | | | | | | | | | | | | | |
Commercial Loans — 41.7% | | | | | | | | | | | | | | | | |
5555 East Van Buren I, Phoenix, AZ, 5.68%, 7/1/11 § | | | 6/23/04 | | | $ | 6,052,231 | | | $ | 6,052,231 | | | $ | 3,752,384 | |
5555 East Van Buren II, Phoenix, AZ, 7.13%, 7/1/11 § | | | 8/18/06 | | | | 1,426,201 | | | | 1,426,201 | | | | 884,245 | |
American Mini-Storage, Memphis, TN, 6.80%, 12/1/11 | | | 11/5/07 | | | | 2,980,903 | | | | 2,980,903 | | | | 2,621,007 | |
Bigelow Office Building, Las Vegas, NV, 6.38%, 4/1/17 ß | | | 3/31/97 | | | | 1,066,471 | | | | 1,066,471 | | | | 1,119,795 | |
Hickman Road, Clive, IA, 6.78%, 1/1/13 ß � | | | 12/3/07 | | | | 5,500,000 | | | | 5,500,000 | | | | 5,555,000 | |
Oak Knoll Village Shopping Center, Austin, TX, 6.73%, 10/1/13 ß | | | 9/17/03 | | | | 1,407,556 | | | | 1,407,556 | | | | 1,435,707 | |
Office City Plaza, Houston, TX, 6.43%, 6/1/12 ¿ | | | 5/25/07 | | | | 5,359,040 | | | | 5,452,890 | | | | 4,392,494 | |
Oyster Point Office Park, Newport News, VA, 5.43%, 2/1/13 ß � | | | 1/4/06 | | | | 11,831,854 | | | | 11,831,854 | | | | 11,831,854 | |
PennMont Office Plaza, Albuquerque, NM, 5.88%, 4/1/14 ß � | | | 3/30/06 | | | | 1,406,043 | | | | 1,406,043 | | | | 1,406,043 | |
Perkins – Blaine, Blaine, MN, 6.63%, 1/1/17 ß | | | 12/13/06 | | | | 1,750,231 | | | | 1,750,231 | | | | 1,837,742 | |
Redwood Dental Building, Taylorsville, UT, 7.40%, 7/1/12 ß | | | 6/28/02 | | | | 2,287,049 | | | | 2,287,049 | | | | 2,287,049 | |
Robberson Auto Dealerships, Bend and Prineville, OR, 6.40%, 4/1/17 ß | | | 3/30/07 | | | | 6,838,514 | | | | 6,838,514 | | | | 7,112,054 | |
Signal Butte, Mesa, AZ, 4.93%, 7/1/17 � | | | 6/20/07 | | | | 15,000,000 | | | | 15,002,903 | | | | 9,300,000 | |
Station Square, Pompano Beach, FL, 6.33%, 2/1/14 ß � | | | 1/19/07 | | | | 12,000,000 | | | | 12,000,000 | | | | 11,757,792 | |
Waste Connections Warehouse, Englewood, CO, 6.58%, 3/1/14 ß | | | 2/15/07 | | | | 1,237,184 | | | | 1,237,184 | | | | 1,299,043 | |
| | | | | | | | | | | | | | | | |
| | | | | | | | | | | 76,240,030 | | | | 66,592,209 | |
| | | | | | | | | | | | | | | | |
Multifamily Loans — 39.4% | | | | | | | | | | | | | | | | |
Carolina Square Apartments, Tallahassee, FL, 5.43%, 8/1/12 ß � ¿ | | | 7/20/07 | | | | 7,875,000 | | | | 7,875,000 | | | | 6,966,477 | |
Chardonnay Apartments, Tulsa, OK, 6.40%, 7/1/13 | | | 6/5/03 | | | | 3,713,852 | | | | 3,713,852 | | | | 3,193,240 | |
Lake Point Terrace Apartments I, Madison, WI, 5.90%, 6/1/15 � | | | 7/1/10 | | | | 4,400,000 | | | | 4,400,000 | | | | 4,400,000 | |
Lake Point Terrace Apartments II, Madison, WI, 9.88%, 6/1/15 � | | | 7/1/10 | | | | 550,000 | | | | 550,000 | | | | 550,000 | |
Meadows Point, College Station, TX, 7.93%, 5/1/16 � � | | | 1/24/08 | | | | 5,400,000 | | | | 5,400,000 | | | | 5,400,000 | |
RP-Plaza Development Lot 11, Oxnard, CA, 6.90%, 3/1/12 � | | | 2/23/05 | | | | 2,500,000 | | | | 2,500,000 | | | | 2,144,273 | |
RP-Plaza Development Lot 16, Oxnard, CA, 6.90%, 3/1/12 � | | | 3/1/10 | | | | 2,500,000 | | | | 2,500,000 | | | | 2,144,273 | |
Sapphire Skies I, Cle Elum, WA, 4.93%, 7/1/13 � | | | 12/23/05 | | | | 8,805,908 | | | | 8,805,908 | | | | 7,614,478 | |
Sapphire Skies II, Cle Elum, WA, 7.90%, 7/1/13 � � S | | | 3/20/09 | | | | 3,200,000 | | | | 3,200,000 | | | | 422,893 | |
Sapphire Skies III, Cle Elum, WA, 4.93%, 7/1/13 � | | | 7/13/10 | | | | 6,000,000 | | | | 6,000,000 | | | | 4,669,386 | |
Summit Chase Apartments I, Coral Springs, FL, 6.93%, 4/1/12 ß � | | | 7/7/05 | | | | 9,500,000 | | | | 9,500,000 | | | | 8,847,549 | |
Summit Chase Apartments II, Coral Springs, FL, 9.90%, 4/1/12 � � S | | | 7/7/05 | | | | 6,150,000 | | | | 6,150,000 | | | | 2,856,042 | |
Sussex Club Apartments I, Athens, GA, 6.33%, 5/1/10 � ¿ § | | | 4/17/07 | | | | 8,800,000 | | | | 8,800,000 | | | | 5,456,000 | |
Sussex Club Apartments II, Athens, GA, 6.88%, 5/1/10 � § � S | | | 4/17/07 | | | | 2,298,600 | | | | 2,298,600 | | | | 889,689 | |
Trinity Oaks Apartments I, Dallas, TX, 6.53%, 4/1/09 � ¿ § | | | 3/30/06 | | | | 7,000,000 | | | | 7,000,000 | | | | 4,340,000 | |
Trinity Oaks Apartments II, Dallas, TX, 7.88%, 4/1/09 � § � S | | | 3/30/06 | | | | 1,690,000 | | | | 1,690,000 | | | | 238,687 | |
Vista Bonita Apartments, Denton, TX, 7.15%, 6/1/13 | | | 3/4/05 | | | | 2,626,574 | | | | 2,626,574 | | | | 2,652,839 | |
| | | | | | | | | | | | | | | | |
| | | | | | | | | | | 83,009,934 | | | | 62,785,826 | |
| | | | | | | | | | | | | | | | |
Single Family Loans — 0.1% | | | | | | | | | | | | | | | | |
Merchants Bank, 2 loans, Vermont, 11.31%, 10/15/16 ¿ | | | 12/18/92 | | | | 42,812 | | | | 43,164 | | | | 43,350 | |
PHH U.S. Mortgage, 2 loans, California & Delaware, 6.07%, 3/18/20 | | | 12/30/92 | | | | 136,090 | | | | 132,431 | | | | 140,172 | |
| | | | | | | | | | | | | | | | |
| | | | | | | | | | | 175,595 | | | | 183,522 | |
| | | | | | | | | | | | | | | | |
| | | | |
Total Whole Loans | | | | | | | | | | | 159,425,559 | | | | 129,561,557 | |
| | | | | | | | | | | | | | | | |
| | | | |
Corporate Notes ¥ � — 13.6% | | | | | | | | | | | | | | | | |
Fixed Rate — 13.6% | | | | | | | | | | | | | | | | |
Sarofim South and Bland, 7.00%, 1/1/12 | | | 12/21/07 | | | | 8,511,612 | | | | 8,511,612 | | | | 8,511,612 | |
Stratus Properties II, 8.75%, 12/31/11 | | | 6/14/01 | | | | 5,000,000 | | | | 5,000,000 | | | | 5,000,000 | |
Stratus Properties III, 8.75%, 12/31/13 | | | 12/12/06 | | | | 8,000,000 | | | | 8,000,000 | | | | 8,160,000 | |
| | | | | | | | | | | | | | | | |
| | | | |
Total Corporate Notes | | | | | | | | | | | 21,511,612 | | | | 21,671,612 | |
| | | | | | | | | | | | | | | | |
The accompanying notes are an integral part of the financial statements.
| | | | | | |
| FIRST AMERICAN MORTGAGE FUNDS | | 2011 ANNUAL REPORT | | | 23 | |
| | |
| Schedule of Investments | | August 31, 2011 |
American Strategic Income Portfolio II (BSP)
| | | | | | | | | | | | | | |
DESCRIPTION | | | | PAR/
SHARES | | | COST | | | FAIR
VALUE ¶ | |
| | | | |
U.S. Government Agency Mortgage-Backed Securities a — 9.8% | | | | | | | | | | | | | | |
Fixed Rate — 9.8% | | | | | | | | | | | | | | |
Federal Home Loan Mortgage Corporation, | | | | | | | | | | | | | | |
5.50%, 1/1/18, #E93231 | | | | $ | 1,216,846 | | | $ | 1,236,224 | | | $ | 1,324,931 | |
9.00%, 7/1/30, #C40149 | | | | | 93,329 | | | | 95,198 | | | | 110,634 | |
5.00%, 5/1/39, #G05430 | | | | | 2,489,182 | | | | 2,551,483 | | | | 2,679,937 | |
Federal National Mortgage Association, | | | | | | | | | | | | | | |
6.00%, 10/1/16, #607030 | | | | | 77,032 | | | | 77,224 | | | | 83,668 | |
5.50%, 6/1/17, #648508 | | | | | 119,450 | | | | 119,744 | | | | 129,852 | |
5.00%, 9/1/17, #254486 | | | | | 171,493 | | | | 171,722 | | | | 185,928 | |
5.00%, 11/1/17, #657356 | | | | | 273,404 | | | | 274,141 | | | | 296,417 | |
6.50%, 6/1/29, #252497 | | | | | 501,458 | | | | 498,936 | | | | 575,385 | |
7.50%, 5/1/30, #535289 | | | | | 74,799 | | | | 72,907 | | | | 87,704 | |
8.00%, 5/1/30, #538266 | | | | | 25,500 | | | | 25,257 | | | | 29,991 | |
8.00%, 6/1/30, #253347 | | | | | 89,612 | | | | 88,758 | | | | 105,393 | |
5.00%, 11/1/33, #725027 | | | | | 5,852,460 | | | | 5,974,975 | | | | 6,337,726 | |
5.00%, 7/1/39, #935588 | | | | | 3,476,150 | | | | 3,545,814 | | | | 3,750,259 | |
| | | | | | | | | | | | | | |
| | | | |
Total U.S. Government Agency Mortgage-Backed Securities | | | | | | | | | 14,732,383 | | | | 15,697,825 | |
| | | | | | | | | | | | | | |
| | | | |
Commercial Mortgage-Backed Securities � r — 18.1% | | | | | | | | | | | | | | |
Other — 18.1% | | | | | | | | | | | | | | |
Banc of America Commercial Mortgage, | | | | | | | | | | | | | | |
5.00%, 7/10/45, Series 2005-4, Class A5B a | | | | | 8,060,000 | | | | 5,292,654 | | | | 7,662,304 | |
Bear Stearns Commercial Mortgage Securities, | | | | | | | | | | | | | | |
5.47%, 1/12/45, Series 2007-T26, Class A4 a | | | | | 10,000,000 | | | | 8,515,836 | | | | 10,943,790 | |
Citigroup Commercial Mortgage Trust, | | | | | | | | | | | | | | |
5.89%, 12/10/49, Series 2007-C6, Class A4 | | | | | 3,625,000 | | | | 2,987,264 | | | | 3,910,973 | |
Citigroup/Deutsche Bank Commercial Mortgage Trust, | | | | | | | | | | | | | | |
5.89%, 11/15/44, Series 2007-CD5, Class A4 a | | | | | 5,950,000 | | | | 5,455,111 | | | | 6,399,070 | |
| | | | | | | | | | | | | | |
| | | | |
Total Commercial Mortgage-Backed Securities | | | | | | | | | 22,250,865 | | | | 28,916,137 | |
| | | | | | | | | | | | | | |
| | | | |
Preferred Stocks — 20.1% | | | | | | | | | | | | | | |
Real Estate Investment Trusts x — 20.1% | | | | | | | | | | | | | | |
BRE Properties, Series D | | | | | 7,450 | | | | 148,031 | | | | 187,181 | |
Developers Diversified Realty, Series H | | | | | 6,600 | | | | 117,047 | | | | 157,163 | |
Developers Diversified Realty, Series I | | | | | 6,050 | | | | 109,127 | | | | 145,200 | |
Duke Realty, Series J | | | | | 38,000 | | | | 893,000 | | | | 917,939 | |
Duke Realty, Series L | | | | | 74,260 | | | | 1,529,361 | | | | 1,824,011 | |
Duke Realty, Series M | | | | | 83,200 | | | | 1,704,000 | | | | 2,104,877 | |
Equity Residential Properties, Series K | | | | | 30,000 | | | | 1,680,000 | | | | 1,782,189 | |
Equity Residential Properties, Series N | | | | | 118,000 | | | | 2,244,300 | | | | 2,972,125 | |
Kimco Realty, Series F | | | | | 137,700 | | | | 3,241,375 | | | | 3,485,187 | |
Kimco Realty, Series G | | | | | 39,300 | | | | 1,020,901 | | | | 1,012,761 | |
ProLogis, Series L | | | | | 84,100 | | | | 1,748,225 | | | | 1,900,660 | |
ProLogis, Series M | | | | | 14,360 | | | | 367,561 | | | | 325,972 | |
ProLogis, Series 0 | | | | | 13,459 | | | | 336,475 | | | | 326,381 | |
ProLogis, Series R | | | | | 48,120 | | | | 1,149,478 | | | | 1,115,783 | |
ProLogis, Series S | | | | | 11,700 | | | | 245,700 | | | | 271,662 | |
PS Business Parks, Series H | | | | | 37,600 | | | | 752,000 | | | | 960,304 | |
PS Business Parks, Series I | | | | | 13,200 | | | | 259,644 | | | | 330,413 | |
PS Business Parks, Series M | | | | | 37,600 | | | | 774,560 | | | | 954,100 | |
PS Business Parks, Series O | | | | | 100,000 | | | | 2,415,000 | | | | 2,550,000 | |
PS Business Parks, Series P | | | | | 11,650 | | | | 223,330 | | | | 293,799 | |
Public Storage, Series A | | | | | 40,000 | | | | 977,346 | | | | 1,005,600 | |
Public Storage, Series E | | | | | 13,200 | | | | 264,000 | | | | 335,544 | |
The accompanying notes are an integral part of the financial statements.
| | | | |
| 24 | | FIRST AMERICAN MORTGAGE FUNDS | | 2011 ANNUAL REPORT |
American Strategic Income Portfolio II (BSP)
| | | | | | | | | | | | | | |
DESCRIPTION | | | | SHARES | | | COST | | | FAIR
VALUE ¶ | |
| | | | |
Public Storage, Series F | | | | | 38,000 | | | $ | 900,600 | | | $ | 950,000 | |
Public Storage, Series W | | | | | 38,000 | | | | 906,300 | | | | 953,564 | |
Realty Income, Series D | | | | | 90,000 | | | | 2,281,500 | | | | 2,280,942 | |
Realty Income, Series E | | | | | 37,600 | | | | 812,160 | | | | 954,100 | |
Regency Centers, Series C | | | | | 37,600 | | | | 812,912 | | | | 940,000 | |
Regency Centers, Series E | | | | | 39,200 | | | | 791,840 | | | | 954,277 | |
| | | | | | | | | | | | | | |
| | | | |
Total Preferred Stocks | | | | | | | | | 28,705,773 | | | | 31,991,734 | |
| | | | | | | | | | | | | | |
| | | | |
Total Unaffiliated Investments | | | | | | | | | 246,626,192 | | | | 227,838,865 | |
| | | | | | | | | | | | | | |
| | | | |
Short-Term Investment — 1.1% | | | | | | | | | | | | | | |
First American Prime Obligations Fund, Class Z, 0.04% W | | | | | 1,825,372 | | | | 1,825,372 | | | | 1,825,372 | |
| | | | | | | | | | | | | | |
| | | | |
Total Investments p — 143.9% | | | | | | | | $ | 248,451,564 | | | $ | 229,664,237 | |
| | | | | | | | | | | | | | |
Other Assets and Liabilities, Net — (43.9)% | | | | | | | | | | | | | (70,048,888 | ) |
| | | | | | | | | | | | | | |
Total Net Assets — 100.0% | | | | | | | | | | | | $ | 159,615,349 | |
| | | | | | | | | | | | | | |
| ¶ | Securities are valued in accordance with procedures described in note 2 in Notes to Financial Statements. |
| ¥ | Securities purchased as part of a private placement which have not been registered with the U.S. Securities and Exchange Commission under the Securities Act of 1933 and which are considered to be illiquid. These securities are fair valued in accordance with the board approved valuation procedures. On August 31, 2011, the total fair value of these securities was $151,233,169 or 94.7% of total net assets. See note 2 in Notes to Financial Statements. |
| p | Interest rates on commercial and multifamily loans are the net coupon rates in effect (after reducing the coupon rate by any mortgage servicing fees paid to mortgage servicers) on August 31, 2011. Interest rates and maturity dates disclosed on single family loans represent the weighted average coupon and weighted average maturity for the underlying mortgage loans as of August 31, 2011. For participating loans, the rates are based on the annual cash flow payments expected at the time of purchase. |
| ß | Securities pledged as collateral for outstanding borrowings under a loan agreement with Massachusetts Mutual Life Insurance Company. See note 2 in Notes to Financial Statements. On August 31, 2011, securities valued at $61,456,105 were pledged as collateral for the following outstanding borrowings: |
| | | | | | | | | | |
| Amount | | | Rate* | | | Accrued
Interest | |
| $ | 22,500,000 | | | | 5.00 | % | | $ | 96,875 | |
| | | | | | | | | | |
| | * | Interest rate as of August 31, 2011. Rate is based on one-month LIBOR plus 2.50% subject to a “floor” interest rate of 4.25% and reset monthly. |
Description of collateral:
Whole Loans
Bigelow Office Building, Las Vegas, NV, 6.38%, 4/1/17, $1,066,471 par
Carolina Square Apartments, Tallahassee, FL, 5.43%, 8/1/12, $7,875,000 par
Hickman Road, Clive, IA, 6.78%, 1/1/13, $5,500,000 par
Oak Knoll Village Shopping Center, Austin, TX, 6.73%, 10/1/13, $1,407,556 par
Oyster Point Office Park, Newport News, VA, 5.43%, 2/1/13, $11,831,854 par
PennMont Office Plaza, Albuquerque, NM, 5.88%, 4/1/14, $1,406,043 par
Perkins – Blaine, Blaine, MN, 6.63%, 1/1/17, $1,750,231 par
Redwood Dental Building, Taylorsville, UT, 7.40%, 7/1/12, $2,287,049 par
Robberson Auto Dealerships, Bend and Prineville, OR, 6.40%, 4/1/17, $6,838,514 par
Station Square, Pompano Beach, FL, 6.33%, 2/1/14, $12,000,000 par
Summit Chase Apartments I, Coral Springs, FL, 6.93%, 4/1/12, $9,500,000 par
Waste Connections Warehouse, Englewood, CO, 6.58%, 3/1/14, $1,237,184 par
| � | Interest Only – Represents securities that entitle holders to receive only interest payments on the mortgage. Principal balance on the loan is due at maturity. The interest rate disclosed represents the net coupon rate in effect as of August 31, 2011. |
| ¿ | Loan is currently in default with regards to scheduled interest and/or principal payments. |
| § | Loan has matured and the fund is anticipating payoff or refinancing. Unless disclosed otherwise, the loan continues to make monthly payments. |
| � | Participating Loan – A participating loan is one which contains provisions for the fund to participate in the income stream provided by the property, including net cash flows and capital proceeds. Monthly cash flow proceeds are only required to the extent excess cash flow is generated by the property as determined by the loan documents. |
| | | | | | |
| FIRST AMERICAN MORTGAGE FUNDS | | 2011 ANNUAL REPORT | | | 25 | |
| | |
| Schedule of Investments | | August 31, 2011 |
American Strategic Income Portfolio II (BSP)
| S | The participating loan is not currently making monthly cash flow payments or is making cash flow payments of less than original coupon rate disclosed. |
| a | Securities pledged as collateral for outstanding reverse repurchase agreements. On August 31, 2011, securities valued at $40,702,989 were pledged as collateral for the following outstanding reverse repurchase agreements: |
| | | | | | | | | | | | | | | | | | | | | | |
| Amount | | | Acquisition
Date | | | Rate* | | | Due | | | Accrued
Interest | | | Name of Broker
and Description
of Collateral | |
| $ | 14,907,637 | | | | 8/12/11 | | | | 0.23 | % | | | 9/12/11 | | | $ | 1,905 | | | | (1 | ) |
| | 6,995,000 | | | | 7/13/11 | | | | 1.25 | % | | | 10/13/11 | | | | 12,137 | | | | (2 | ) |
| | 8,860,000 | | | | 7/13/11 | | | | 1.25 | % | | | 10/13/11 | | | | 15,373 | | | | (3 | ) |
| | 5,421,000 | | | | 7/13/11 | | | | 1.25 | % | | | 10/13/11 | | | | 9,406 | | | | (4 | ) |
| | | | | | | | | | | | | | | | | | | | | | |
| $ | 36,183,637 | | | | | | | | | | | | | | | $ | 38,821 | | | | | |
| | | | | | | | | | | | | | | | | | | | | | |
| | * | Interest rate as of August 31, 2011. Rate is based on one-month LIBOR plus a spread and reset monthly. |
Name of broker and description of collateral:
Federal Home Loan Mortgage Corporation, 5.50%, 1/1/18, $1,216,846 par
Federal Home Loan Mortgage Corporation, 9.00%, 7/1/30, $93,329 par
Federal Home Loan Mortgage Corporation, 5.00%, 5/1/39, $2,489,182 par
Federal National Mortgage Association, 6.00%, 10/1/16, $77,032 par
Federal National Mortgage Association, 5.50%, 6/1/17, $119,450 par
Federal National Mortgage Association, 5.00%, 9/1/17, $171,493 par
Federal National Mortgage Association, 5.00%, 11/1/17, $273,404 par
Federal National Mortgage Association, 6.50%, 6/1/29, $501,458 par
Federal National Mortgage Association, 7.50%, 5/1/30, $74,799 par
Federal National Mortgage Association, 8.00%, 5/1/30, $25,500 par
Federal National Mortgage Association, 8.00%, 6/1/30, $89,612 par
Federal National Mortgage Association, 5.00%, 11/1/33, $5,852,460 par
Federal National Mortgage Association, 5.00%, 7/1/39, $3,476,150 par
Banc of America Commercial Mortgage Series 2005-4, Class A5B, 5.00%, 7/10/45, $8,060,000 par
Bear Stearns Commercial Mortgage Securities, Series 2007-T26, Class A4, 5.47%, 1/12/45, $10,000,000 par
Citigroup/Deutsche Bank Commercial Mortgage Trust, Series 2007-CD5, Class A4, 5.89%, 11/15/44, $5,950,000 par
The fund has entered into a lending commitment with Goldman Sachs. The monthly agreement permits the fund to enter into reverse repurchase agreements using U.S. Government Agency Mortgage-Backed Securities as collateral.
The fund has entered into a lending commitment with JP Morgan. The monthly agreement permits the fund to enter into reverse repurchase agreements using Commercial Mortgage-Backed Securities as collateral.
| x | Securities pledged as collateral for outstanding borrowings under a loan agreement with Bank of America, N.A., London Branch. See note 2 in Notes to Financial Statements. On August 31, 2011, securities valued at $31,991,734 were pledged as collateral for the following outstanding borrowings: |
| | | | | | | | | | |
| Amount | | | Rate* | | | Accrued
Interest | |
| $ | 12,000,000 | | | | 1.09 | % | | $ | 10,933 | |
| | | | | | | | | | |
| | * | Interest rate as of August 31, 2011. Rate is based on one-month LIBOR plus 0.90%. |
Description of collateral:
Preferred Stocks
BRE Properties, Series D, 7,450 shares
Developers Diversified Realty, Series H, 6,600 shares
Developers Diversified Realty, Series I, 6,050 shares
Duke Realty, Series J, 38,000 shares
Duke Realty, Series L, 74,260 shares
Duke Realty, Series M, 83,200 shares
Equity Residential Properties, Series K, 30,000 shares
Equity Residential Properties, Series N, 118,000 shares
Kimco Realty, Series F, 137,700 shares
Kimco Realty, Series G, 39,300 shares
ProLogis, Series L, 84,100 shares
ProLogis, Series M, 14,360 shares
The accompanying notes are an integral part of the financial statements.
| | | | |
| 26 | | FIRST AMERICAN MORTGAGE FUNDS | | 2011 ANNUAL REPORT |
American Strategic Income Portfolio II (BSP)
ProLogis, Series O, 13,459 shares
ProLogis, Series R, 48,120 shares
ProLogis, Series S, 11,700 shares
PS Business Parks, Series H, 37,600 shares
PS Business Parks, Series I, 13,200 shares
PS Business Parks, Series M, 37,600 shares
PS Business Parks, Series O, 100,000 shares
PS Business Parks, Series P, 11,650 shares
Public Storage, Series A, 40,000 shares
Public Storage, Series E, 13,200 shares
Public Storage, Series F, 38,000 shares
Public Storage, Series W, 38,000 shares
Realty Income, Series D, 90,000 shares
Realty Income, Series E, 37,600 shares
Regency Centers, Series C, 37,600 shares
Regency Centers, Series E, 39,200 shares
| r | Variable Rate Security – The rate shown is the net coupon rate in effect as of August 31, 2011. |
| W | Investment in affiliated security. This money market fund is advised by U.S. Bancorp Asset Management, Inc., which also serves as advisor for the fund. The rate shown is the annualized seven-day effective yield as of August 31, 2011. |
| p | On August 31, 2011, the cost of investments for federal income tax purposes was $248,509,795. The aggregate gross unrealized appreciation and depreciation of investments, based on this cost, were as follows: |
| | | | |
Gross unrealized appreciation | | $ | 11,764,328 | |
Gross unrealized depreciation | | | (30,609,886 | ) |
| | | | |
Net unrealized depreciation | | $ | (18,845,558 | ) |
| | | | |
| | | | | | |
| FIRST AMERICAN MORTGAGE FUNDS | | 2011 ANNUAL REPORT | | | 27 | |
| | |
| Schedule of Investments | | August 31, 2011 |
American Strategic Income Portfolio III (CSP)
| | | | | | | | | | | | | | | | |
DESCRIPTION | | DATE
ACQUIRED | | | PAR | | | COST | | | FAIR
VALUE ¶ | |
| | | | |
(Percentages of each investment category relate to total net assets) | | | | | | | | | | | | | | | | |
| | | | |
Whole Loans ¥ p — 88.6% | | | | | | | | | | | | | | | | |
Commercial Loans — 57.8% | | | | | | | | | | | | | | | | |
150 North Pantano I, Tucson, AZ, 5.90%, 2/1/10 � § ¿ | | | 1/4/05 | | | $ | 3,525,000 | | | $ | 3,525,000 | | | $ | 2,185,500 | |
150 North Pantano II, Tucson, AZ, 14.88%, 2/1/10 � § ¿ | | | 1/4/05 | | | | 440,000 | | | | 440,259 | | | | 167,890 | |
8324 East Hartford Drive I, Scottsdale, AZ, 4.90%, 5/1/20 � | | | 4/8/04 | | | | 3,220,015 | | | | 3,369,044 | | | | 3,220,015 | |
Academy Spectrum, Colorado Springs, CO, 7.73%, 5/1/09 § ¿ | | | 12/18/02 | | | | 4,959,112 | | | | 5,258,752 | | | | 3,074,650 | |
Allegiance Health, Jackson, MI, 5.88%, 1/1/21 ß | | | 12/28/10 | | | | 8,442,111 | | | | 8,442,111 | | | | 8,864,216 | |
Alliant University, Fresno, CA, 5.90%, 8/1/12 ß | | | 7/12/06 | | | | 2,721,771 | | | | 2,721,771 | | | | 2,721,771 | |
Apple Blossom Convenience Center, Winchester, VA, 6.58%, 8/1/12 ß � | | | 7/9/07 | | | | 2,150,000 | | | | 2,150,000 | | | | 2,171,500 | |
Biltmore Lakes Corporate Center, Phoenix, AZ, 4.88%, 9/1/14 � | | | 8/2/04 | | | | 1,699,365 | | | | 1,699,365 | | | | 1,699,365 | |
Carrier 360 I, Grand Prairie, TX, 4.90%, 1/1/12 ß � | | | 6/28/04 | | | | 3,104,381 | | | | 3,104,381 | | | | 3,104,381 | |
Carrier 360 II, Grand Prairie, TX, 4.88%, 1/1/12 � | | | 12/16/05 | | | | 324,286 | | | | 324,286 | | | | 324,286 | |
Fairview Business Park, Salem, OR, 7.33%, 8/1/11 § ¿ | | | 7/14/06 | | | | 7,337,227 | | | | 7,387,339 | | | | 4,549,081 | |
First Colony Marketplace, Sugar Land, TX, 6.43%, 8/1/12 ß � | | | 8/15/07 | | | | 10,600,000 | | | | 10,600,000 | | | | 10,600,000 | |
France Avenue Business Park II, Brooklyn Center, MN, 7.40%, 10/1/12 ß | | | 9/12/02 | | | | 4,149,084 | | | | 4,149,084 | | | | 4,190,575 | |
France Avenue Business Park II (second), Brooklyn Center, MN, 7.38%, 10/1/12 � | | | 1/17/08 | | | | 600,000 | | | | 600,000 | | | | 606,000 | |
Jilly’s American Grill, Scottsdale, AZ, 6.88%, 9/1/11 � | | | 8/19/05 | | | | 1,810,000 | | | | 1,810,000 | | | | 1,810,000 | |
La Cholla Plaza I, Tucson, AZ, 3.43%, 8/1/09 ß � § r | | | 7/26/06 | | | | 11,135,603 | | | | 11,135,603 | | | | 10,991,331 | |
La Cholla Plaza II, Tucson, AZ, 14.88%, 8/1/09 � § ¿ | | | 7/26/06 | | | | 1,389,396 | | | | 1,389,396 | | | | 717,930 | |
NCH Commercial Pool I, Tucson, AZ, 11.93%, 4/1/10 � § ¿ | | | 3/27/07 | | | | 5,500,000 | | | | 5,500,000 | | | | 50,716 | |
NCH Commercial Pool II, Phoenix, AZ, 11.93%, 1/1/11 � § ¿ | | | 12/4/07 | | | | 14,000,000 | | | | 14,024,837 | | | | 8,680,000 | |
Noah's Ark Self Storage, San Antonio, TX, 6.48%, 9/1/11 � | | | 8/24/07 | | | | 2,350,000 | | | | 2,350,000 | | | | 2,180,485 | |
North Austin Business Center, Austin, TX, 5.65%, 11/1/18 ß | | | 10/29/04 | | | | 3,604,532 | | | | 3,604,532 | | | | 3,784,758 | |
Outlets at Casa Grande I, Casa Grande, AZ, 5.93%, 7/1/13 � | | | 2/27/06 | | | | 3,000,000 | | | | 3,096,243 | | | | 3,000,000 | |
Paradise Boulevard, Albuquerque, NM, 6.50%, 4/1/17 ß � | | | 3/26/07 | | | | 4,600,000 | | | | 4,600,000 | | | | 4,830,000 | |
RealtiCorp Fund III, Orlando/Crystal River, FL, 5.93%, 7/1/14 � | | | 2/28/06 | | | | 3,972,755 | | | | 3,972,755 | | | | 3,972,755 | |
Silver Star Storage, Austin, TX, 6.40%, 4/1/11 § ¿ | | | 3/25/08 | | | | 4,064,101 | | | | 4,064,101 | | | | 3,036,582 | |
Spa Atlantis, Pompano Beach, FL, 6.93%, 8/1/14 � | | | 9/30/05 | | | | 11,000,000 | | | | 11,000,000 | | | | 10,469,129 | |
Tatum Ranch Center, Phoenix, AZ, 6.15%, 10/1/15 ß � | | | 8/25/04 | | | | 3,204,207 | | | | 3,204,207 | | | | 3,204,207 | |
| | | | | | | | | | | | | | | | |
| | | | | | | | | | | 123,523,066 | | | | 104,207,123 | |
| | | | | | | | | | | | | | | | |
Multifamily Loans — 30.8% | | | | | | | | | | | | | | | | |
Avalon Hills I, Omaha, NE, 6.93%, 3/1/12 ß � | | | 3/1/07 | | | | 10,720,000 | | | | 10,720,000 | | | | 10,720,000 | |
Avalon Hills II, Omaha, NE, 9.88%, 3/1/12 � � S | | | 3/1/07 | | | | 2,448,800 | | | | 2,448,800 | | | | 1,982,460 | |
Chateau Club Apartments I, Athens, GA, 6.43%, 12/1/12 � | | | 12/20/07 | | | | 6,000,000 | | | | 6,000,000 | | | | 4,428,966 | |
Chateau Club Apartments II, Athens, GA, 6.88%, 12/1/12 � � S | | | 12/20/07 | | | | 2,991,624 | | | | 2,991,624 | | | | 1,381,984 | |
Country Villa Apartments, West Lafayette, IN, 6.90%, 9/1/13 ß | | | 8/29/03 | | | | 2,357,119 | | | | 2,357,119 | | | | 2,404,262 | |
Courtyards at Mesquite I, Mesquite, TX, 6.53%, 11/1/09 § ¿ | | | 10/14/05 | | | | 7,389,373 | | | | 7,389,373 | | | | 4,581,411 | |
Courtyards at Mesquite II, Mesquite, TX, 7.90%, 11/1/09 � § � S | | | 10/14/05 | | | | 2,850,000 | | | | 2,850,000 | | | | 1,254,405 | |
El Dorado Apartments I, Tucson, AZ, 7.15%, 9/1/12 ß | | | 8/26/04 | | | | 2,451,735 | | | | 2,452,677 | | | | 2,431,456 | |
El Dorado Apartments II, Tucson, AZ, 7.13%, 9/1/12 | | | 8/26/04 | | | | 481,163 | | | | 481,163 | | | | 407,662 | |
Geneva Village Apartments I, West Jordan, UT, 7.00%, 1/1/14 ß | | | 12/24/03 | | | | 981,948 | | | | 981,948 | | | | 1,001,586 | |
Geneva Village Apartments II, West Jordan, UT, 9.88%, 1/1/13 | | | 12/24/03 | | | | 17,540 | | | | 17,540 | | | | 16,711 | |
Good Haven Apartments I, Dallas, TX, 5.43%, 9/1/07 � § ¿ r | | | 8/24/04 | | | | 6,737,000 | | | | 6,737,000 | | | | 3,558,949 | |
Good Haven Apartments II, Dallas, TX, 14.88%, 9/1/07 � § ¿ | | | 8/24/04 | | | | 842,000 | | | | 842,000 | | | | 202,773 | |
Good Haven Apartments III, Dallas, TX, 14.88%, 5/1/09 � § ¿ | | | 7/3/08 | | | | 694,096 | | | | 694,096 | | | | 138,278 | |
Meadowview Village Apartments I, West Jordan, UT, 7.00%, 1/1/14 | | | 12/24/03 | | | | 712,704 | | | | 712,704 | | | | 726,958 | |
Meadowview Village Apartments II, West Jordan, UT, 9.88%, 1/1/13 | | | 12/24/03 | | | | 17,540 | | | | 17,540 | | | | 16,711 | |
Montevista Apartments, Fort Worth, TX, 7.43%, 9/1/12 � � S | | | 8/30/07 | | | | 7,308,000 | | | | 7,308,000 | | | | 5,101,832 | |
NCH Multifamily Pool, Oklahoma City, OK, 11.93%, 11/1/09 � § ¿ | | | 10/17/06 | | | | 4,993,450 | | | | 4,993,450 | | | | 47,348 | |
Parkway Village Apartments I, West Jordan, UT, 7.00%, 1/1/14 | | | 12/24/03 | | | | 669,852 | | | | 669,852 | | | | 683,248 | |
Parkway Village Apartments II, West Jordan, UT, 9.88%, 1/1/13 | | | 12/24/03 | | | | 17,540 | | | | 17,540 | | | | 16,632 | |
Plantation Pines I, Tyler, TX, 6.59%, 2/1/10 ß � § | | | 1/17/07 | | | | 3,328,000 | | | | 3,328,000 | | | | 3,328,000 | |
Plantation Pines II, Tyler, TX, 10.57%, 2/1/10 � § ¿ | | | 1/17/07 | | | | 416,000 | | | | 416,000 | | | | 242,053 | |
RiverPark Land Lot III, Oxnard, CA, 6.90%, 3/1/12 � | | | 10/9/07 | | | | 3,650,000 | | | | 3,650,000 | | | | 3,130,638 | |
The accompanying notes are an integral part of the financial statements.
| | | | |
| 28 | | FIRST AMERICAN MORTGAGE FUNDS | | 2011 ANNUAL REPORT |
American Strategic Income Portfolio III (CSP)
| | | | | | | | | | | | | | | | |
DESCRIPTION | | DATE
ACQUIRED | | | PAR/
SHARES | | | COST | | | FAIR
VALUE ¶ | |
| | | | |
Villas of Woodgate, Lansing, MI, 6.40%, 2/1/12 ß | | | 2/1/07 | | | $ | 3,459,950 | | | $ | 3,459,950 | | | $ | 3,459,950 | |
Whispering Oaks I, Little Rock, AR, 6.93%, 2/1/12 � ¿ | | | 1/10/07 | | | | 5,800,000 | | | | 5,831,627 | | | | 3,596,000 | |
Whispering Oaks II, Little Rock, AR, 9.88%, 2/1/12 � � S | | | 1/10/07 | | | | 2,636,000 | | | | 2,636,000 | | | | 548,768 | |
| | | | | | | | | | | | | | | | |
| | | | | | | | | | | 80,004,003 | | | | 55,409,041 | |
| | | | | | | | | | | | | | | | |
| | | | |
Total Whole Loans | | | | | | | | | | | 203,527,069 | | | | 159,616,164 | |
| | | | | | | | | | | | | | | | |
| | | | |
Corporate Notes ¥ � — 11.7% | | | | | | | | | | | | | | | | |
Fixed Rate — 11.7% | | | | | | | | | | | | | | | | |
Sarofim Brookhaven, 7.00%, 1/1/12 | | | 12/21/07 | | | | 10,040,375 | | | | 10,040,375 | | | | 10,040,375 | |
Stratus Properties IV, 8.75%, 12/31/13 | | | 12/1/06 | | | | 7,000,000 | | | | 7,000,000 | | | | 7,140,000 | |
Stratus Properties VI, 8.75%, 12/31/11 | | | 6/1/07 | | | | 4,000,000 | | | | 4,000,000 | | | | 4,000,000 | |
| | | | | | | | | | | | | | | | |
| | | | |
Total Corporate Notes | | | | | | | | | | | 21,040,375 | | | | 21,180,375 | |
| | | | | | | | | | | | | | | | |
| | | | |
Private Mortgage-Backed Security ¥ Ä — 0.0% | | | | | | | | | | | | | | | | |
Fixed Rate — 0.0% | | | | | | | | | | | | | | | | |
First Gibraltar, Series 1992-MM, Class B, 6.06%, 10/25/21 | | | 7/30/93 | | | | 54,226 | | | | 37,377 | | | | — | |
| | | | | | | | | | | | | | | | |
| | | | |
U.S. Government Agency Mortgage-Backed Securities a — 11.8% | | | | | | | | | | | | | | | | |
Fixed Rate — 11.8% | | | | | | | | | | | | | | | | |
Federal Home Loan Mortgage Corporation, | | | | | | | | | | | | | | | | |
5.50%, 1/1/18, #E93231 | | | | | | | 1,216,846 | | | | 1,236,224 | | | | 1,324,931 | |
9.00%, 7/1/30, #C40149 | | | | | | | 130,660 | | | | 133,277 | | | | 154,888 | |
5.00%, 5/1/39, #G05430 | | | | | | | 3,418,877 | | | | 3,504,446 | | | | 3,680,877 | |
Federal National Mortgage Association, | | | | | | | | | | | | | | | | |
6.00%, 10/1/16, #607030 | | | | | | | 77,032 | | | | 77,225 | | | | 83,668 | |
5.50%, 2/1/17, #623874 | | | | | | | 134,958 | | | | 134,804 | | | | 146,626 | |
5.50%, 6/1/17, #648508 | | | | | | | 119,449 | | | | 119,744 | | | | 129,852 | |
5.00%, 9/1/17, #254486 | | | | | | | 171,493 | | | | 171,723 | | | | 185,928 | |
5.00%, 11/1/17, #657356 | | | | | | | 273,404 | | | | 274,142 | | | | 296,417 | |
6.50%, 6/1/29, #252497 | | | | | | | 351,021 | | | | 349,255 | | | | 402,769 | |
7.50%, 5/1/30, #535289 | | | | | | | 74,799 | | | | 72,907 | | | | 87,704 | |
8.00%, 5/1/30, #538266 | | | | | | | 25,500 | | | | 25,257 | | | | 29,991 | |
8.00%, 6/1/30, #253347 | | | | | | | 80,651 | | | | 79,882 | | | | 94,854 | |
5.00%, 12/1/35, #995317 | | | | | | | 5,074,953 | | | | 5,223,564 | | | | 5,495,751 | |
5.00%, 7/1/39, #935512 | | | | | | | 1,783,789 | | | | 1,817,681 | | | | 1,924,448 | |
5.00%, 7/1/39, #AA9716 | | | | | | | 6,644,095 | | | | 6,819,618 | | | | 7,168,010 | |
| | | | | | | | | | | | | | | | |
| | | | |
Total U.S. Government Agency Mortgage-Backed Securities | | | | | | | | | | | 20,039,749 | | | | 21,206,714 | |
| | | | | | | | | | | | | | | | |
| | | | |
Commercial Mortgage-Backed Securities � r — 5.8% | | | | | | | | | | | | | | | | |
Other — 5.8% | | | | | | | | | | | | | | | | |
Banc of America Commercial Mortgage,
5.00%, 7/10/45, Series 2005-4, Class A5B a | | | | | | | 6,400,000 | | | | 4,202,603 | | | | 6,084,211 | |
Citigroup/Deutsche Bank Commercial Mortgage Trust,
5.89%, 11/15/44, Series 2007-CD5, Class A4 | | | | | | | 2,500,000 | | | | 2,379,825 | | | | 2,688,685 | |
LB-UBS Commercial Mortgage Trust, Series 2008-C1, Class A2, 6.31%, 4/15/41 a | | | | | | | 1,500,000 | | | | 1,042,989 | | | | 1,631,919 | |
| | | | | | | | | | | | | | | | |
| | | | |
Total Commercial Mortgage-Backed Securities | | | | | | | | | | | 7,625,417 | | | | 10,404,815 | |
| | | | | | | | | | | | | | | | |
| | | | |
Preferred Stocks — 22.4% | | | | | | | | | | | | | | | | |
Real Estate Investment Trusts x — 22.4% | | | | | | | | | | | | | | | | |
BRE Properties, Series D | | | | | | | 5,250 | | | | 104,317 | | | | 131,906 | |
Duke Realty, Series J | | | | | | | 56,556 | | | | 1,203,278 | | | | 1,366,184 | |
Equity Residential Properties, Series N | | | | | | | 62,700 | | | | 1,497,705 | | | | 1,579,256 | |
| | | | | | |
| FIRST AMERICAN MORTGAGE FUNDS | | 2011 ANNUAL REPORT | | | 29 | |
| | |
| Schedule of Investments | | August 31, 2011 |
American Strategic Income Portfolio III (CSP)
| | | | | | | | | | | | | | |
DESCRIPTION | | | | SHARES | | | COST | | | FAIR
VALUE ¶ | |
| | | | |
Kimco Realty, Series F | | | | | 163,000 | | | $ | 3,797,000 | | | $ | 4,125,530 | |
Kimco Realty, Series G | | | | | 114,700 | | | | 2,796,559 | | | | 2,955,819 | |
National Retail Properties, Series C | | | | | 10,000 | | | | 253,000 | | | | 253,190 | |
ProLogis, Series L | | | | | 161,320 | | | | 3,718,236 | | | | 3,645,832 | |
ProLogis, Series O | | | | | 9,613 | | | | 240,325 | | | | 233,115 | |
ProLogis, Series S | | | | | 8,300 | | | | 174,300 | | | | 192,718 | |
PS Business Parks, Series H | | | | | 26,520 | | | | 530,400 | | | | 677,321 | |
PS Business Parks, Series I | | | | | 94,300 | | | | 1,634,731 | | | | 2,360,452 | |
PS Business Parks, Series M | | | | | 26,520 | | | | 546,312 | | | | 672,945 | |
PS Business Parks, Series O | | | | | 100,000 | | | | 2,050,000 | | | | 2,550,000 | |
PS Business Parks, Series P | | | | | 8,200 | | | | 157,194 | | | | 206,794 | |
Public Storage, Series A | | | | | 38,000 | | | | 921,909 | | | | 955,320 | |
Public Storage, Series C | | | | | 30,000 | | | | 626,100 | | | | 757,500 | |
Public Storage, Series E | | | | | 9,300 | | | | 186,000 | | | | 236,406 | |
Public Storage, Series H | | | | | 40,000 | | | | 876,000 | | | | 1,018,752 | |
Public Storage, Series L | | | | | 20,000 | | | | 430,000 | | | | 510,980 | |
Public Storage, Series X | | | | | 74,000 | | | | 1,786,319 | | | | 1,861,566 | |
Public Storage, Series Z | | | | | 30,000 | | | | 746,643 | | | | 755,100 | |
Realty Income, Series D | | | | | 97,500 | | | | 2,474,125 | | | | 2,471,021 | |
Realty Income, Series E | | | | | 36,520 | | | | 824,632 | | | | 926,695 | |
Regency Centers, Series D | | | | | 16,000 | | | | 398,400 | | | | 394,400 | |
Vornado Realty Trust, Series E | | | | | 7,400 | | | | 186,598 | | | | 189,440 | |
Vornado Realty Trust, Series F | | | | | 7,800 | | | | 164,970 | | | | 197,925 | |
Vornado Realty Trust, Series H | | | | | 163,000 | | | | 2,771,000 | | | | 4,054,625 | |
Weingarten Realty Investors, Series D | | | | | 79,170 | | | | 1,757,574 | | | | 1,957,082 | |
Weingarten Realty Investors, Series F | | | | | 131,000 | | | | 2,907,400 | | | | 3,209,500 | |
| | | | | | | | | | | | | | |
| | | | |
Total Preferred Stocks | | | | | | | | | 35,761,027 | | | | 40,447,374 | |
| | | | | | | | | | | | | | |
| | | | |
Total Unaffiliated Investments | | | | | | | | | 288,031,014 | | | | 252,855,442 | |
| | | | | | | | | | | | | | |
| | | | |
Real Estate Owned ¥ l — 1.5% | | | | | | | | | | | | | | |
Memphis Medical Building, Memphis, TN | | | | | | | | | 2,318,379 | | | | 2,597,436 | |
| | | | | | | | | | | | | | |
| | | | |
Short-Term Investment — 1.1% | | | | | | | | | | | | | | |
First American Prime Obligations Fund, Class Z, 0.04% W | | | | | 1,986,027 | | | | 1,986,027 | | | | 1,986,027 | |
| | | | | | | | | | | | | | |
| | | | |
Total Investments p — 142.9% | | | | | | | | $ | 292,335,420 | | | $ | 257,438,905 | |
| | | | | | | | | | | | | | |
Other Assets and Liabilities, Net — (42.9)% | | | | | | | | | | | | | (77,393,212 | ) |
| | | | | | | | | | | | | | |
Total Net Assets — 100.0% | | | | | | | | | | | | $ | 180,045,693 | |
| | | | | | | | | | | | | | |
| ¶ | Securities are valued in accordance with procedures described in note 2 in Notes to Financial Statements. |
| ¥ | Securities purchased as part of a private placement which have not been registered with the U.S. Securities and Exchange Commission under the Securities Act of 1933 and which are considered to be illiquid. These securities are fair valued in accordance with the board approved valuation procedures. On August 31, 2011, the total fair value of these securities was $183,393,975 or 101.9% of total net assets. See note 2 in Notes to Financial Statements. |
| p | Interest rates on commercial and multifamily loans are the net coupon rates in effect (after reducing the coupon rate by any mortgage servicing fees paid to mortgage servicers) on August 31, 2011. For participating loans, the rates are based on the annual cash flow payments expected at the time of purchase. |
| ß | Securities pledged as collateral for outstanding borrowings under a loan agreement with Massachusetts Mutual Life Insurance Company. See note 2 in Notes to Financial Statements. On August 31, 2011, securities valued at $77,807,993 were pledged as collateral for the following outstanding borrowings: |
| | | | | | | | | | |
| Amount | | | Rate* | | | Accrued
Interest | |
| $ | 35,000,000 | | | | 5.00 | % | | $ | 4,861 | |
| | | | | | | | | | |
| | * | Interest rate as of August 31, 2011. Rate is based on one-month LIBOR plus 2.50% subject to a “floor” interest rate of 4.25% and reset monthly. |
The accompanying notes are an integral part of the financial statements.
| | | | |
| 30 | | FIRST AMERICAN MORTGAGE FUNDS | | 2011 ANNUAL REPORT |
American Strategic Income Portfolio III (CSP)
Description of collateral:
Whole Loans
Allegiance Health, Jackson, MI, 5.88%, 1/1/21, $8,442,111 par
Alliant University, Fresno, CA, 5.90%, 8/1/12, $2,721,771 par
Apple Blossom Convenience Center, Winchester, VA, 6.58%, 8/1/12, $2,150,000 par
Avalon Hills I, Omaha, NE, 6.93%, 3/1/12, $10,720,000 par
Carrier 360 I, Grand Prairie, TX, 4.90%, 1/1/12, $3,104,381 par
Country Villa Apartments, West Lafayette, IN, 6.90%, 9/1/13, $2,357,119 par
El Dorado Apartments I, Tucson, AZ, 7.15%, 9/1/12, $2,451,735 par
First Colony Marketplace, Sugar Land, TX, 6.43%, 8/1/12, $10,600,000 par
France Avenue Business Park II, Brooklyn Center, MN, 7.40%, 10/1/12, $4,149,084 par
Geneva Village Apartments I, West Jordan, UT, 7.00%, 1/1/14, $981,948 par
La Cholla Plaza I, Tucson, AZ, 3.43%, 8/1/09, $11,135,604 par
North Austin Business Center, Austin, TX, 5.65%, 11/1/18, $3,604,532 par
Paradise Boulevard, Albuquerque, NM, 6.50%, 4/1/17, $4,600,000 par
Plantation Pines I, Tyler, TX, 6.59%, 2/1/10, $3,328,000 par
Tatum Ranch Center, Phoenix, AZ, 6.15%, 10/1/15, $3,204,207 par
Villas of Woodgate, Lansing, MI, 6.40%, 2/1/12, $3,459,950 par
| � | Interest Only – Represents securities that entitle holders to receive only interest payments on the mortgage. Principal balance on the loan is due at maturity. The interest rate disclosed represents the net coupon rate in effect as of August 31, 2011. |
| § | Loan has matured and the fund is anticipating payoff or refinancing. Unless disclosed otherwise, the loan continues to make monthly payments. |
| ¿ | Loan is currently in default with regards to scheduled interest and/or principal payments. |
| r | Variable Rate Security – The rate shown is the net coupon rate in effect as of August 31, 2011. |
| � | Participating Loan – A participating loan is one which contains provisions for the fund to participate in the income stream provided by the property, including net cash flows and capital proceeds. Monthly cash flow proceeds are only required to the extent excess cash flow is generated by the property as determined by the loan documents. |
| S | The participating loan is not currently making monthly cash flow payments or is making cash flow payments of less than original coupon rate disclosed. |
| Ä | Non-Income Producing Security. |
| a | Securities pledged as collateral for outstanding reverse repurchase agreements. On August 31, 2011, securities valued at $28,773,789 were pledged as collateral for the following outstanding reverse repurchase agreements: |
| | | | | | | | | | | | | | | | | | | | | | |
| Amount | | | Acquisition
Date | | | Rate* | | | Due | | | Accrued
Interest | | | Name of Broker
and Description
of Collateral | |
| $ | 20,171,125 | | | | 8/12/11 | | | | 0.23 | % | | | 9/12/11 | | | $ | 2,577 | | | | (1 | ) |
| | 5,555,000 | | | | 7/13/11 | | | | 1.25 | % | | | 10/13/11 | | | | 9,638 | | | | (2 | ) |
| | 1,492,000 | | | | 6/22/11 | | | | 1.25 | % | | | 9/22/11 | | | | 3,678 | | | | (3 | ) |
| | | | | | | | | | | | | | | | | | | | | | |
| $ | 27,218,125 | | | | | | | | | | | | | | | $ | 15,893 | | | | | |
| | | | | | | | | | | | | | | | | | | | | | |
| | * | Interest rate as of August 31, 2011. Rate is based on one-month LIBOR plus a spread and reset monthly. |
Name of broker and description of collateral:
Federal Home Loan Mortgage Corporation, 5.50%, 1/1/18, $1,079,951 par
Federal Home Loan Mortgage Corporation, 9.00%, 7/1/30, $130,660 par
Federal Home Loan Mortgage Corporation, 5.00%, 5/1/39, $3,418,877 par
Federal National Mortgage Association, 6.00%, 10/1/16, $77,032 par
Federal National Mortgage Association, 5.50%, 2/1/17, $134,958 par
Federal National Mortgage Association, 5.50%, 6/1/17, $119,449 par
Federal National Mortgage Association, 5.00%, 9/1/17, $171,493 par
Federal National Mortgage Association, 5.00%, 11/1/17, $273,404 par
Federal National Mortgage Association, 6.50%, 6/1/29, $351,021 par
Federal National Mortgage Association, 7.50%, 5/1/30, $74,799 par
Federal National Mortgage Association, 8.00%, 5/1/30, $25,500 par
Federal National Mortgage Association, 8.00%, 6/1/30, $80,651 par
Federal National Mortgage Association, 5.00%, 12/1/35, $5,074,953 par
Federal National Mortgage Association, 5.00%, 7/1/39, $1,783,789 par
Federal National Mortgage Association, 5.00%, 7/1/39, $6,644,095 par
Banc of America Commercial Mortgage, Series 2005-4, Class A5B, 5.00%, 7/10/45, $6,400,000 par
| | | | | | |
| FIRST AMERICAN MORTGAGE FUNDS | | 2011 ANNUAL REPORT | | | 31 | |
| | |
| Schedule of Investments | | August 31, 2011 |
American Strategic Income Portfolio III (CSP)
| | (3) | Merrill Lynch, Pierce, Fenner & Smith Incorporated: |
LB-UBS Commercial Mortgage Trust, Series 2008-C1, Class A2, 6.31%, 4/15/41, $1,500,000 par
| | The fund has entered into a lending commitment with Goldman Sachs. The monthly agreement permits the fund to enter into reverse repurchase agreements using U.S. Government Agency Mortgage-Backed Securities as collateral. |
| | The fund has entered into a lending commitment with JP Morgan. The monthly agreement permits the fund to enter into reverse repurchase agreements using Commercial Mortgage-Backed Securities as collateral. |
| | The fund has entered into a lending commitment with Merrill Lynch, Pierce, Fenner & Smith Incorporated. The monthly agreement permits the fund to enter into reverse repurchase agreements using Commercial Mortgage-Backed Securities as collateral. |
| x | Securities pledged as collateral for outstanding borrowings under a loan agreement with Bank of America, N.A., London Branch. See note 2 in Notes to Financial Statements. On August 31, 2011, securities valued at $40,447,374 were pledged as collateral for the following outstanding borrowings: |
| | | | | | | | | | |
| Amount | | | Rate* | | | Accrued
Interest | |
| $ | 6,000,000 | | | | 1.05 | % | | $ | 6,475 | |
| | 4,500,000 | | | | 1.09 | % | | | 4,757 | |
| | 6,500,000 | | | | 1.09 | % | | | 6,871 | |
| | | | | | | | | | |
| $ | 17,000,000 | | | | | | | $ | 18,103 | |
| | | | | | | | | | |
| | * | Interest rate as of August 31, 2011. Rate is based on one-month LIBOR plus 0.90%. |
Description of collateral:
Preferred Stocks
BRE Properties, Series D, 5,250 shares
Duke Realty, Series J, 56,556 shares
Equity Residential Properties, Series N, 62,700 shares
Kimco Realty, Series F, 163,000 shares
Kimco Realty, Series G, 114,700 shares
National Retail Properties, Series C, 10,000 shares
ProLogis, Series L, 161,320 shares
ProLogis, Series O, 9,613 shares
ProLogis, Series S, 8,300 shares
PS Business Parks, Series H, 26,520 shares
PS Business Parks, Series I, 94,300 shares
PS Business Parks, Series M, 26,520 shares
PS Business Parks, Series O, 100,000 shares
PS Business Parks, Series P, 8,200 shares
Public Storage, Series A, 38,000 shares
Public Storage, Series C, 30,000 shares
Public Storage, Series E, 9,300 shares
Public Storage, Series H, 40,000 shares
Public Storage, Series L, 20,000 shares
Public Storage, Series X, 74,000 shares
Public Storage, Series Z, 30,000 shares
Realty Income, Series D, 97,500 shares
Realty Income, Series E, 36,520 shares
Regency Centers, Series D, 16,000 shares
Vornado Realty Trust, Series E, 7,400 shares
Vornado Realty Trust, Series F, 7,800 shares
Vornado Realty Trust, Series H, 163,000 shares
Weingarten Realty Investors, Series D, 79,170 shares
Weingarten Realty Investors, Series F, 131,000 shares
| l | Real Estate Owned. See note 2 in the Notes to Financial Statements. |
| W | Investment in affiliated security. This money market fund is advised by U.S. Bancorp Asset Management, Inc., which also serves as advisor for the fund. The rate shown is the annualized seven-day effective yield as of August 31, 2011. |
| p | On August 31, 2011, the cost of investments for federal income tax purposes was $292,345,624. The aggregate gross unrealized appreciation and depreciation of investments, based on this cost, were as follows: |
| | | | |
Gross unrealized appreciation | | $ | 11,178,549 | |
Gross unrealized depreciation | | | (46,085,268 | ) |
| | | | |
Net unrealized depreciation | | $ | (34,906,719 | ) |
| | | | |
The accompanying notes are an integral part of the financial statements.
| | | | |
| 32 | | FIRST AMERICAN MORTGAGE FUNDS | | 2011 ANNUAL REPORT |
| | |
| Schedule of Investments | | August 31, 2011 |
American Select Portfolio (SLA)
| | | | | | | | | | | | | | | | |
DESCRIPTION | | DATE
ACQUIRED | | | PAR | | | COST | | | FAIR
VALUE ¶ | |
| | | | |
(Percentages of each investment category relate to total net assets) | | | | | | | | | | | | | | | | |
| | | | |
Whole Loans ¥ p — 72.6% | | | | | | | | | | | | | | | | |
Commercial Loans — 50.8% | | | | | | | | | | | | | | | | |
12000 Aerospace, Clear Lake, TX, 7.18%, 1/1/15 ß � | | | 12/22/04 | | | $ | 4,939,362 | | | $ | 4,939,362 | | | $ | 4,939,362 | |
ABC Conoco, Aspen, CO, 6.65%, 11/1/11 | | | 10/31/06 | | | | 3,768,258 | | | | 3,768,258 | | | | 2,585,338 | |
Clear Lake Central I, Webster, TX, 4.93%, 2/1/12 ß � | | | 7/27/06 | | | | 6,895,716 | | | | 6,895,716 | | | | 6,599,641 | |
Gallery Row, Tucson, AZ, 11.88%, 10/1/11 � ¿ | | | 9/7/06 | | | | 500,000 | | | | 500,208 | | | | 8,972 | |
George Gee Hummer, Liberty Lake, WA, 6.20%, 1/1/14 ß � | | | 6/30/05 | | | | 2,125,000 | | | | 2,125,000 | | | | 1,898,979 | |
George Gee Pontiac I, Liberty Lake, WA, 6.23%, 1/1/14 ß � | | | 6/30/05 | | | | 4,675,000 | | | | 4,675,000 | | | | 4,180,385 | |
George Gee Pontiac II, Liberty Lake, WA, 6.20%, 1/1/14 � | | | 9/14/06 | | | | 750,000 | | | | 750,000 | | | | 670,228 | |
George Gee Porsche, Liberty Lake, WA, 6.20%, 1/1/14 ß � | | | 9/14/06 | | | | 2,500,000 | | | | 2,500,000 | | | | 2,234,092 | |
Highland Park I, Scottsdale, AZ, 6.77%, 4/1/13 ß | | | 2/23/06 | | | | 9,204,035 | | | | 9,204,035 | | | | 9,204,035 | |
Highland Park II, Scottsdale, AZ, 11.88%, 4/1/13 � | | | 2/23/06 | | | | 1,183,784 | | | | 1,183,784 | | | | 1,015,531 | |
Kolb Plaza I, Tucson, AZ, 6.50%, 8/1/10 � ¿ § | | | 7/18/07 | | | | 3,520,000 | | | | 3,520,000 | | | | 2,182,400 | |
Kolb Plaza II, Tucson, AZ, 9.88%, 8/1/10 � ¿ § | | | 7/18/07 | | | | 440,000 | | | | 440,000 | | | | 138,666 | |
Landmark Bank Center, Euless, TX, 6.85%, 5/1/12 � | | | 7/1/04 | | | | 3,232,851 | | | | 3,232,851 | | | | 3,232,851 | |
Landmark Bank Center II, Euless, TX, 6.88%, 5/1/12 � | | | 6/12/08 | | | | 1,157,576 | | | | 1,157,576 | | | | 1,073,632 | |
Landmark Bank Center III, Euless, TX, 8.88%, 9/1/15 | | | 6/8/10 | | | | 1,316,760 | | | | 1,316,760 | | | | 1,286,932 | |
Mandala Agency Building, Bend, OR, 6.38%, 6/1/17 ß � | | | 5/23/07 | | | | 2,175,000 | | | | 2,175,000 | | | | 2,218,500 | |
Northrop Grumman Campus I, Colorado Springs, CO, 5.68%, 12/1/18 ß � r | | | 11/15/05 | | | | 5,700,000 | | | | 5,700,000 | | | | 5,700,000 | |
Northrop Grumman Campus II, Colorado Springs, CO, 6.38%, 12/1/14 | | | 11/15/05 | | | | 425,659 | | | | 425,659 | | | | 378,371 | |
RL Stowe Portfolio, Belmont, NC & Chattanooga, TN, 6.83%, 11/1/12 � ¿ | | | 10/12/07 | | | | 7,806,202 | | | | 7,806,202 | | | | 4,839,845 | |
Superior Ford Dealership, Plymouth, MN, 6.43%, 7/1/17 ß | | | 6/28/07 | | | | 4,881,109 | | | | 4,881,109 | | | | 5,125,165 | |
Town Square #6, Olympia, WA, 7.40%, 9/1/12 | | | 8/2/02 | | | | 3,443,553 | | | | 3,443,553 | | | | 2,922,096 | |
| | | | | | | | | | | | | | | | |
| | | | | | | | | | | 70,640,073 | | | | 62,435,021 | |
| | | | | | | | | | | | | | | | |
Multifamily Loans — 21.8% | | | | | | | | | | | | | | | | |
Briarhill Apartments I, Eden Prairie, MN, 6.90%, 9/1/15 ß | | | 8/11/03 | | | | 4,141,461 | | | | 4,141,461 | | | | 4,348,534 | |
Briarhill Apartments II, Eden Prairie, MN, 6.88%, 9/1/15 | | | 8/11/03 | | | | 265,335 | | | | 265,335 | | | | 278,602 | |
Highland House Apartments, Dallas, TX, 6.55%, 10/1/13 ß | | | 9/10/07 | | | | 2,675,225 | | | | 2,675,225 | | | | 2,675,225 | |
Keystone Crossings, Springdale, AZ, 8.15%, 7/5/16 � � S | | | 6/27/07 | | | | 4,875,000 | | | | 4,875,000 | | | | 3,843,674 | |
NCH Multifamily Pool II, Oklahoma City, OK, 11.93%, 10/1/10 � ¿ § | | | 10/1/07 | | | | 5,400,000 | | | | 5,409,659 | | | | 3,348,000 | |
Revere Apartments, Revere, MA, 6.28%, 3/1/12 ß | | | 3/8/07 | | | | 1,604,319 | | | | 1,604,319 | | | | 1,603,897 | |
RP Urban Partners Lot 12, Oxnard, CA, 6.90%, 3/1/12 � | | | 2/23/05 | | | | 2,500,000 | | | | 2,500,000 | | | | 2,144,272 | |
RP Urban Partners Lot 17, Oxnard, CA, 6.90%, 3/1/12 � | | | 3/1/10 | | | | 2,500,000 | | | | 2,500,000 | | | | 2,144,273 | |
Sheridan Pond Apartments, Tulsa, OK, 6.43%, 7/1/13 ß | | | 6/5/03 | | | | 6,443,309 | | | | 6,443,309 | | | | 6,443,308 | |
| | | | | | | | | | | | | | | | |
| | | | | | | | | | | 30,414,308 | | | | 26,829,785 | |
| | | | | | | | | | | | | | | | |
| | | | |
Total Whole Loans | | | | | | | | | | | 101,054,381 | | | | 89,264,806 | |
| | | | | | | | | | | | | | | | |
| | | | |
Corporate Notes ¥ � — 13.7% | | | | | | | | | | | | | | | | |
Fixed Rate — 13.7% | | | | | | | | | | | | | | | | |
Sarofim Northwest, 7.00%, 1/1/12 | | | 12/21/07 | | | | 8,181,250 | | | | 8,181,250 | | | | 8,181,250 | |
Stratus Properties I, 8.75%, 12/31/14 | | | 12/28/00 | | | | 5,000,000 | | | | 5,000,000 | | | | 5,150,000 | |
Stratus Properties VII, 8.75%, 12/31/12 | | | 6/1/07 | | | | 3,500,000 | | | | 3,500,000 | | | | 3,535,000 | |
| | | | | | | | | | | | | | | | |
| | | | |
Total Corporate Notes | | | | | | | | | | | 16,681,250 | | | | 16,866,250 | |
| | | | | | | | | | | | | | | | |
| | | | |
U.S. Government Agency Mortgage-Backed Securities a — 11.3% | | | | | | | | | | | | | | | | |
Fixed Rate — 11.3% | | | | | | | | | | | | | | | | |
Federal Home Loan Mortgage Corporation, | | | | | | | | | | | | | | | | |
5.50%, 1/1/18, #E93231 | | | | | | | 684,476 | | | | 695,375 | | | | 745,274 | |
7.50%, 12/1/29, #C00896 | | | | | | | 143,541 | | | | 141,528 | | | | 167,508 | |
5.00%, 5/1/39, #G05430 | | | | | | | 1,709,438 | | | | 1,752,223 | | | | 1,840,438 | |
Federal National Mortgage Association, | | | | | | | | | | | | | | | | |
5.00%, 11/1/17, #657356 | | | | | | | 273,404 | | | | 274,142 | | | | 296,417 | |
The accompanying notes are an integral part of the financial statements.
| | | | | | |
| FIRST AMERICAN MORTGAGE FUNDS | | 2011 ANNUAL REPORT | | | 33 | |
| | |
| Schedule of Investments | | August 31, 2011 |
American Select Portfolio (SLA)
| | | | | | | | | | | | | | |
DESCRIPTION | | | | PAR/
SHARES | | | COST | | | FAIR
VALUE ¶ | |
| | | | |
6.50%, 6/1/29, #252497 | | | | $ | 451,312 | | | $ | 449,042 | | | $ | 517,847 | |
7.50%, 5/1/30, #535289 | | | | | 41,555 | | | | 40,504 | | | | 48,724 | |
8.00%, 5/1/30, #538266 | | | | | 14,167 | | | | 14,032 | | | | 16,661 | |
5.00%, 11/1/33, #725027 | | | | | 2,158,570 | | | | 2,203,757 | | | | 2,337,551 | |
5.00%, 7/1/39, #935588 | | | | | 2,020,326 | | | | 2,060,815 | | | | 2,179,638 | |
4.50%, 3/1/40, #932669 | | | | | 2,549,287 | | | | 2,573,714 | | | | 2,697,630 | |
4.00%, 12/1/40, #MA0583 | | | | | 2,904,564 | | | | 2,935,204 | | | | 3,014,696 | |
| | | | | | | | | | | | | | |
| | | | |
Total U.S. Government Agency Mortgage-Backed Securities | | | | | | | | | 13,140,336 | | | | 13,862,384 | |
| | | | | | | | | | | | | | |
| | | | |
Commercial Mortgage-Backed Securities — 17.6% | | | | | | | | | | | | | | |
Other — 17.6% | | | | | | | | | | | | | | |
Banc of America Commercial Mortgage, | | | | | | | | | | | | | | |
5.00%, 7/10/45, Series 2005-4, Class A5B r a | | | | | 6,400,000 | | | | 4,202,603 | | | | 6,084,211 | |
Bear Stearns Commercial Mortgage Securities, | | | | | | | | | | | | | | |
5.90%, 9/11/38, Series 2006-PW12, Class A4 r a | | | | | 2,100,000 | | | | 1,554,357 | | | | 2,323,379 | |
5.74%, 9/11/42, Series 2007-T28, Class A4 | | | | | 1,456,221 | | | | 1,044,757 | | | | 1,621,041 | |
5.69%, 6/11/50, Series 2007-PW17, Class A4 a | | | | | 3,315,000 | | | | 2,970,101 | | | | 3,514,914 | |
Citigroup/Deutsche Bank Commercial Mortgage Trust, | | | | | | | | | | | | | | |
5.89%, 11/15/44, Series 2007-CD5, Class A4 r | | | | | 2,000,000 | | | | 1,852,519 | | | | 2,150,948 | |
GS Mortgage Securities Corporation II,
5.56%, 11/10/39, Series 2006-GG8, Class A4 | | | | | 3,600,000 | | | | 2,563,373 | | | | 3,828,723 | |
LB-UBS Commercial Mortgage Trust, Series 2008-C1, Class A2, 6.31%, 4/15/41 r a | | | | | 2,000,000 | | | | 1,421,291 | | | | 2,175,892 | |
| | | | | | | | | | | | | | |
| | | | |
Total Commercial Mortgage-Backed Securities | | | | | | | | | 15,609,001 | | | | 21,699,108 | |
| | | | | | | | | | | | | | |
| | | | |
Preferred Stocks — 26.2% | | | | | | | | | | | | | | |
Real Estate Investment Trusts — 26.2% | | | | | | | | | | | | | | |
BRE Properties, Series D x | | | | | 28,600 | | | | 675,354 | | | | 718,575 | |
Developers Diversified Realty, Series H x | | | | | 23,820 | | | | 422,433 | | | | 567,214 | |
Developers Diversified Realty, Series I x | | | | | 3,830 | | | | 69,084 | | | | 91,920 | |
Duke Realty, Series L x | | | | | 17,270 | | | | 330,202 | | | | 424,194 | |
Duke Realty, Series M x | | | | | 47,640 | | | | 952,800 | | | | 1,205,244 | |
Duke Realty, Series O x | | | | | 40,000 | | | | 944,000 | | | | 1,061,200 | |
Equity Residential Properties, Series K x | | | | | 18,000 | | | | 991,800 | | | | 1,069,313 | |
Equity Residential Properties, Series N x | | | | | 49,500 | | | | 950,925 | | | | 1,246,781 | |
Kimco Realty, Series G x | | | | | 136,000 | | | | 3,386,944 | | | | 3,504,720 | |
ProLogis, Series L x | | | | | 114,820 | | | | 2,167,595 | | | | 2,594,932 | |
ProLogis, Series M x | | | | | 18,700 | | | | 460,785 | | | | 424,490 | |
ProLogis, Series O x | | | | | 10,228 | | | | 255,700 | | | | 248,029 | |
ProLogis, Series R x | | | | | 5,000 | | | | 105,000 | | | | 115,938 | |
ProLogis, Series S x | | | | | 7,400 | | | | 155,400 | | | | 171,821 | |
PS Business Parks, Series H x | | | | | 23,820 | | | | 476,400 | | | | 608,363 | |
PS Business Parks, Series I x | | | | | 8,400 | | | | 165,228 | | | | 210,263 | |
PS Business Parks, Series M x | | | | | 23,820 | | | | 490,692 | | | | 604,433 | |
PS Business Parks, Series P x | | | | | 7,400 | | | | 141,858 | | | | 186,619 | |
Public Storage, Series E x | | | | | 38,300 | | | | 914,900 | | | | 973,586 | |
Public Storage, Series M | | | | | 55,000 | | | | 1,399,750 | | | | 1,390,472 | |
Public Storage, Series Q x | | | | | 16,000 | | | | 402,880 | | | | 422,880 | |
Realty Income, Series D x | | | | | 60,000 | | | | 1,521,000 | | | | 1,520,628 | |
Realty Income, Series E x | | | | | 78,820 | | | | 1,895,012 | | | | 2,000,057 | |
Regency Centers, Series C x | | | | | 23,820 | | | | 514,988 | | | | 595,500 | |
Regency Centers, Series E x | | | | | 46,170 | | | | 1,032,215 | | | | 1,123,953 | |
UDR, Series G x | | | | | 95,000 | | | | 2,308,000 | | | | 2,410,625 | |
Vornado Realty Trust, Series G | | | | | 40,000 | | | | 998,000 | | | | 995,000 | |
Vornado Realty Trust, Series H x | | | | | 68,000 | | | | 1,547,000 | | | | 1,691,500 | |
Vornado Realty Trust, Series I | | | | | 24,000 | | | | 596,400 | | | | 600,000 | |
Weingarten Realty Investors, Series D x | | | | | 9,000 | | | | 207,000 | | | | 222,480 | |
The accompanying notes are an integral part of the financial statements.
| | | | |
| 34 | | FIRST AMERICAN MORTGAGE FUNDS | | 2011 ANNUAL REPORT |
American Select Portfolio (SLA)
| | | | | | | | | | | | | | |
DESCRIPTION | | | | SHARES | | | COST | | | FAIR
VALUE ¶ | |
| | | | |
Weingarten Realty Investors, Series E x | | | | | 130,000 | | | $ | 3,201,900 | | | $ | 3,243,500 | |
| | | | | | | | | | | | | | |
| | | | |
Total Preferred Stocks | | | | | | | | | 29,681,245 | | | | 32,244,230 | |
| | | | | | | | | | | | | | |
| | | | |
Total Unaffiliated Investments | | | | | | | | | 176,166,213 | | | | 173,936,778 | |
| | | | | | | | | | | | | | |
| | | | |
Short-Term Investment — 1.4% | | | | | | | | | | | | | | |
First American Prime Obligations Fund, Class Z, 0.04% W | | | | | 1,661,920 | | | | 1,661,920 | | | | 1,661,920 | |
| | | | | | | | | | | | | | |
| | | | |
Total Investments p — 142.8% | | | | | | | | $ | 177,828,133 | | | $ | 175,598,698 | |
| | | | | | | | | | | | | | |
Other Assets and Liabilities, Net — (42.8)% | | | | | | | | | | | | | (52,612,809 | ) |
| | | | | | | | | | | | | | |
Total Net Assets — 100.0% | | | | | | | | | | | | $ | 122,985,889 | |
| | | | | | | | | | | | | | |
| ¶ | Securities are valued in accordance with procedures described in note 2 in Notes to Financial Statements. |
| ¥ | Securities purchased as part of a private placement which have not been registered with the U.S. Securities and Exchange Commission under the Securities Act of 1933 and which are considered to be illiquid. These securities are fair valued in accordance with the board approved valuation procedures. On August 31, 2011, the total fair value of these securities was $106,131,056 or 86.3% of total net assets. See note 2 in Notes to Financial Statements. |
| p | Interest rates on commercial and multifamily loans are the net coupon rates in effect (after reducing the coupon rate by any mortgage servicing fees paid to mortgage servicers) on August 31, 2011. For participating loans, the rates are based on the annual cash flow payments expected at the time of purchase. |
| ß | Securities pledged as collateral for outstanding borrowings under a loan agreement with Massachusetts Mutual Life Insurance Company. See note 2 in Notes to Financial Statements. On August 31, 2011, securities valued at $57,171,123 were pledged as collateral for the following outstanding borrowings: |
| | | | | | | | | | |
| Amount | | | Rate* | | | Accrued
Interest | |
| $ | 15,000,000 | | | | 5.00 | % | | $ | 2,083 | |
| | | | | | | | | | |
| | * | Interest rate as of August 31, 2011. Rate is based on one-month LIBOR plus 2.50% subject to a “floor” interest rate of 4.25% and reset monthly. |
Description of collateral:
Whole Loans
12000 Aerospace, Clear Lake, TX, 7.18%, 1/1/15, $4,939,362 par
Briarhill Apartments I, Eden Prairie, MN, 6.90%, 9/1/15, $4,141,461 par
Clear Lake Central I, Webster, TX, 4.93%, 2/1/12, $6,895,716 par
George Gee Hummer, Liberty Lake, WA, 6.20%, 1/1/14, $2,125,000 par
George Gee Pontiac I, Liberty Lake, WA, 6.23%, 1/1/14, $4,675,000 par
George Gee Porsche, Liberty Lake, WA, 6.20%, 1/1/14, $2,500,000 par
Highland House Apartments, Dallas, TX, 6.55%, 10/1/13, $2,675,225 par
Highland Park I, Scottsdale, AZ, 6.77%, 4/1/13, $9,204,035 par
Mandala Agency Building, Bend, OR, 6.38%, 6/1/17, $2,175,000 par
Northrop Grumman Campus I, Colorado Springs, CO, 5.68%, 12/1/18, $5,700,000 par
Revere Apartments, Revere, MA, 6.28%, 3/1/12, $1,604,319 par
Sheridan Pond Apartments, Tulsa, OK, 6.43%, 7/1/13, $6,443,309 par
Superior Ford Dealership, Plymouth, MN, 6.43%, 7/1/17, $4,881,109 par
| � | Interest Only – Represents securities that entitle holders to receive only interest payments on the mortgage. Principal balance on the loan is due at maturity. The interest rate disclosed represents the net coupon rate in effect as of August 31, 2011. |
| ¿ | Loan is currently in default with regards to scheduled interest and/or principal payments. |
| § | Loan has matured and the fund is anticipating payoff or refinancing. Unless disclosed otherwise, the loan continues to make monthly payments. |
| r | Variable Rate Security – The rate shown is the net coupon rate in effect as of August 31, 2011. |
| � | Participating Loan – A participating loan is one which contains provisions for the fund to participate in the income stream provided by the property, including net cash flows and capital proceeds. Monthly cash flow proceeds are only required to the extent excess cash flow is generated by the property as determined by the loan documents. |
| S | The participating loan is not currently making monthly cash flow payments or is making cash flow payments of less than original coupon rate disclosed. |
| | | | | | |
| FIRST AMERICAN MORTGAGE FUNDS | | 2011 ANNUAL REPORT | | | 35 | |
| | |
| Schedule of Investments | | August 31, 2011 |
American Select Portfolio (SLA)
| a | Securities pledged as collateral for outstanding reverse repurchase agreements. On August 31, 2011, securities valued at $27,960,780 were pledged as collateral for the following outstanding reverse repurchase agreements: |
| | | | | | | | | | | | | | | | | | | | | | |
| Amount | | | Acquisition
Date | | | Rate* | | | Due | | | Accrued
Interest | | | Name of Broker
and Description
of Collateral | |
| $ | 13,184,608 | | | | 8/12/11 | | | | 0.23 | % | | | 9/12/11 | | | $ | 1,685 | | | | (1 | ) |
| | 5,555,000 | | | | 7/13/11 | | | | 1.25 | % | | | 10/13/11 | | | | 9,638 | | | | (2 | ) |
| | 7,329,000 | | | | 6/22/11 | | | | 1.25 | % | | | 9/22/11 | | | | 18,068 | | | | (3 | ) |
| | | | | | | | | | | | | | | | | | | | | | |
| $ | 26,068,608 | | | | | | | | | | | | | | | $ | 29,391 | | | | | |
| | | | | | | | | | | | | | | | | | | | | | |
| | * | Interest rate as of August 31, 2011. Rate is based on one-month LIBOR plus a spread and reset monthly. |
Name of broker and description of collateral:
Federal Home Loan Mortgage Corporation, 5.50%, 1/1/18, $684,476 par
Federal Home Loan Mortgage Corporation, 7.50%, 12/1/29, $143,541 par
Federal Home Loan Mortgage Corporation, 5.00%, 5/1/39, $1,709,438 par
Federal National Mortgage Association, 5.00%, 11/1/17, $273,404 par
Federal National Mortgage Association, 6.50%, 6/1/29, $451,312 par
Federal National Mortgage Association, 7.50%, 5/1/30, $41,555 par
Federal National Mortgage Association, 8.00%, 5/1/30, $14,167 par
Federal National Mortgage Association, 5.00%, 11/1/33, $2,158,570 par
Federal National Mortgage Association, 5.00%, 7/1/39, $2,020,326 par
Federal National Mortgage Association, 4.50%, 3/1/40, $2,549,287 par
Federal National Mortgage Association, 4.00%, 12/1/40, $2,904,564 par
Banc of America Commercial Mortgage, Series 2005-4, Class A5B, 5.00%, 7/10/45, $6,400,000 par
| | (3) | Merrill Lynch, Pierce, Fenner & Smith Incorporated: |
Bear Stearns Commercial Mortgage Securities, Series 2006-PW12, Class A4, 5.90%, 9/11/38, $2,100,000 par
Bear Stearns Commercial Mortgage Securities, Series 2007-PW17, Class A4, 5.69%, 6/11/50, $3,315,000 par
LB-UBS Commercial Mortgage Trust, Series 2008-C1, Class A2, 6.31%, 4/15/41, $2,000,000 par
| | The fund has entered into a lending commitment with Goldman Sachs. The monthly agreement permits the fund to enter into reverse repurchase agreements using U.S. Government Agency Mortgage-Backed Securities as collateral. |
| | The fund has entered into a lending commitment with JP Morgan. The monthly agreement permits the fund to enter into reverse repurchase agreements using Commercial Mortgage-Backed Securities as collateral. |
| | The fund has entered into a lending commitment with Merrill Lynch, Pierce, Fenner & Smith Incorporated. The monthly agreement permits the fund to enter into reverse repurchase agreements using Commercial Mortgage-Backed Securities as collateral. |
| x | Securities pledged as collateral for outstanding borrowings under a loan agreement with Bank of America, N.A., London Branch. See note 2 in Notes to Financial Statements. On August 31, 2011, securities valued at $29,258,758 were pledged as collateral for the following outstanding borrowings: |
| | | | | | | | | | |
| Amount | | | Rate* | | | Accrued
Interest | |
| $ | 12,400,000 | | | | 1.09 | % | | $ | 13,107 | |
| | | | | | | | | | |
| | * | Interest rate as of August 31, 2011. Rate is based on one-month LIBOR plus 0.90%. |
Description of collateral:
Preferred Stocks
BRE Properties, Series D, 28,600 shares
Developers Diversified Realty, Series H, 23,820 shares
Developers Diversified Realty, Series I, 3,830 shares
Duke Realty, Series L, 17,270 shares
Duke Realty, Series M, 47,640 shares
Duke Realty, Series O, 40,000 shares
Equity Residential Properties, Series K, 18,000 shares
Equity Residential Properties, Series N, 49,500 shares
Kimco Realty, Series G, 136,000 shares
ProLogis, Series L, 114,820 shares
ProLogis, Series M, 18,700 shares
ProLogis, Series O, 10,228 shares
ProLogis, Series R, 5,000 shares
ProLogis, Series S, 7,400 shares
The accompanying notes are an integral part of the financial statements.
| | | | |
| 36 | | FIRST AMERICAN MORTGAGE FUNDS | | 2011 ANNUAL REPORT |
American Select Portfolio (SLA)
PS Business Parks, Series H, 23,820 shares
PS Business Parks, Series I, 8,400 shares
PS Business Parks, Series M, 23,820 shares
PS Business Parks, Series P, 7,400 shares
Public Storage, Series E, 38,300 shares
Public Storage, Series Q, 16,000 shares
Realty Income, Series D, 60,000 shares
Realty Income, Series E, 78,820 shares
Regency Centers, Series C, 23,820 shares
Regency Centers, Series E, 46,170 shares
UDR, Series G, 95,000 shares
Vornado Realty Trust, Series H, 68,000 shares
Weingarten Realty Investors, Series D, 9,000 shares
Weingarten Realty Investors, Series E, 130,000 shares
| W | Investment in affiliated security. This money market fund is advised by U.S. Bancorp Asset Management, Inc., which also serves as advisor for the fund. The rate shown is the annualized seven-day effective yield as of August 31, 2011. |
| p | On August 31, 2011, the cost of investments for federal income tax purposes was $177,835,462. The aggregate gross unrealized appreciation and depreciation of investments, based on this cost, were as follows: |
| | | | |
Gross unrealized appreciation | | $ | 10,124,652 | |
Gross unrealized depreciation | | | (12,361,416 | ) |
| | | | |
Net unrealized depreciation | | $ | (2,236,764 | ) |
| | | | |
| | | | | | |
| FIRST AMERICAN MORTGAGE FUNDS | | 2011 ANNUAL REPORT | | | 37 | |
| | |
| Statements of Assets and Liabilities | | August 31, 2011 |
| | | | | | | | | | | | | | | | |
| | | ASP | | | BSP | | | CSP | | | SLA | |
Assets: | | | | | | | | | | | | | | | | |
Unaffiliated investments, at fair value (Cost: $65,158,969,
$246,626,192, $288,031,014, $176,166,213) (note 2) | | $ | 69,961,619 | | | $ | 227,838,865 | | | $ | 252,855,442 | | | $ | 173,936,778 | |
Affiliated money market fund, at fair value (Cost: $1,190,335,
$1,825,372, $1,986,027, $1,661,920) | | | 1,190,335 | | | | 1,825,372 | | | | 1,986,027 | | | | 1,661,920 | |
Real estate owned, at fair value (Cost: $—, $—, $2,318,379, $—) (note 2) | | | — | | | | — | | | | 2,597,436 | | | | — | |
Cash | | | — | | | | — | | | | 60,380 | | | | — | |
Receivable for accrued dividends and interest | | | 340,330 | | | | 1,077,588 | | | | 1,212,057 | | | | 918,024 | |
Prepaid expenses | | | 47,485 | | | | 104,499 | | | | 114,268 | | | | 83,696 | |
Other assets | | | 125,534 | | | | — | | | | 673,394 | | | | 194,588 | |
| | | | | | | | | | | | | | | | |
Total assets | | | 71,665,303 | | | | 230,846,324 | | | | 259,499,004 | | | | 176,795,006 | |
| | | | | | | | | | | | | | | | |
| | | | |
Liabilities: | | | | | | | | | | | | | | | | |
Payable for investments purchased | | | — | | | | — | | | | 23,968 | | | | — | |
Payable under loan agreement (note 2) | | | 6,000,000 | | | | 34,700,000 | | | | 52,000,000 | | | | 27,400,000 | |
Payable for reverse repurchase agreements (note 2) | | | 12,661,207 | | | | 36,183,637 | | | | 27,218,125 | | | | 26,068,608 | |
Bank overdraft | | | 160,018 | | | | 108,376 | | | | — | | | | 137,515 | |
Payable for investment advisory fees | | | 16,259 | | | | 55,245 | | | | 54,285 | | | | 52,197 | |
Payable for administration fees | | | 11,168 | | | | 34,194 | | | | 38,180 | | | | 26,099 | |
Payable for audit fees | | | 49,565 | | | | 49,565 | | | | 49,564 | | | | 49,565 | |
Payable for legal fees | | | 12,782 | | | | 12,783 | | | | 12,711 | | | | 12,782 | |
Payable for transfer agent fees | | | 1,471 | | | | 1,569 | | | | 1,740 | | | | 1,547 | |
Payable for interest expense | | | 13,502 | | | | 59,832 | | | | 37,017 | | | | 31,544 | |
Payable for other expenses | | | 3,768 | | | | 25,774 | | | | 17,721 | | | | 29,260 | |
| | | | | | | | | | | | | | | | |
Total liabilities | | | 18,929,740 | | | | 71,230,975 | | | | 79,453,311 | | | | 53,809,117 | |
| | | | | | | | | | | | | | | | |
Net assets applicable to outstanding capital stock | | $ | 52,735,563 | | | $ | 159,615,349 | | | $ | 180,045,693 | | | $ | 122,985,889 | |
| | | | | | | | | | | | | | | | |
| | | | |
Composition of net assets: | | | | | | | | | | | | | | | | |
Capital stock and additional paid-in capital | | $ | 48,652,004 | | | $ | 187,915,776 | | | $ | 239,635,596 | | | $ | 130,014,277 | |
Distribution in excess of net investment income | | | (5,185 | ) | | | (182,687 | ) | | | (2,138,976 | ) | | | (570,180 | ) |
Accumulated net realized loss on investments | | | (713,906 | ) | | | (9,330,413 | ) | | | (22,554,412 | ) | | | (4,228,773 | ) |
Net unrealized appreciation (depreciation) of investments | | | 4,802,650 | | | | (18,787,327 | ) | | | (34,896,515 | ) | | | (2,229,435 | ) |
| | | | | | | | | | | | | | | | |
| | | | |
Total–representing net assets applicable to capital stock | | $ | 52,735,563 | | | $ | 159,615,349 | | | $ | 180,045,693 | | | $ | 122,985,889 | |
| | | | | | | | | | | | | | | | |
| | | | |
Net asset value and market price of capital stock: | | | | | | | | | | | | | | | | |
Net assets applicable to capital stock | | $ | 52,735,563 | | | $ | 159,615,349 | | | $ | 180,045,693 | | | $ | 122,985,889 | |
Shares outstanding (authorized 1 billion shares of each fund of $0.01 par value) | | | 4,231,331 | | | | 15,985,741 | | | | 21,356,023 | | | | 10,662,195 | |
Net asset value per share | | $ | 12.46 | | | $ | 9.98 | | | $ | 8.43 | | | $ | 11.53 | |
Market price per share | | $ | 11.01 | | | $ | 8.75 | | | $ | 7.57 | | | $ | 10.34 | |
The accompanying notes are an integral part of the financial statements.
| | | | |
| 38 | | FIRST AMERICAN MORTGAGE FUNDS | | 2011 ANNUAL REPORT |
| | |
| Statements of Operations | | For the year ended August 31, 2011 |
| | | | | | | | | | | | | | | | |
| | | ASP | | | BSP | | | CSP | | | SLA | |
Investment Income: | | | | | | | | | | | | | | | | |
Interest from unaffiliated investments | | $ | 3,589,636 | | | $ | 11,594,231 | | | $ | 11,420,357 | | | $ | 9,408,702 | |
Dividends from unaffiliated investments | | | 997,747 | | | | 2,263,435 | | | | 3,080,262 | | | | 2,128,397 | |
Participating income from investments no longer held (note 2) | | | — | | | | — | | | | 476,150 | | | | 221,410 | |
Dividends from affiliated money market fund | | | 847 | | | | 1,498 | | | | 2,686 | | | | 1,579 | |
Net operating loss from real estate owned (note 2) | | | — | | | | — | | | | (312,270 | ) | | | — | |
| | | | | | | | | | | | | | | | |
Total investment income | | | 4,588,230 | | | | 13,859,164 | | | | 14,667,185 | | | | 11,760,088 | |
| | | | | | | | | | | | | | | | |
| | | | |
Expenses (note 3): | | | | | | | | | | | | | | | | |
Investment advisory fees | | | 288,046 | | | | 835,662 | | | | 845,794 | | | | 629,331 | |
Interest expense | | | 558,927 | | | | 2,794,569 | | | | 3,267,865 | | | | 2,073,241 | |
Administration fees | | | 136,382 | | | | 421,620 | | | | 469,280 | | | | 314,665 | |
Custodian fees | | | 11,042 | | | | 34,335 | | | | 38,020 | | | | 25,529 | |
Mortgage servicing fees | | | 34,474 | | | | 106,037 | | | | 118,025 | | | | 83,060 | |
Postage and printing fees | | | 13,547 | | | | 24,272 | | | | 29,542 | | | | 20,529 | |
Transfer agent fees | | | 15,823 | | | | 17,276 | | | | 17,708 | | | | 16,463 | |
Listing fees | | | 23,750 | | | | 25,160 | | | | 25,600 | | | | 23,750 | |
Directors’ fees | | | 81,531 | | | | 81,532 | | | | 81,531 | | | | 81,531 | |
Legal fees | | | 35,406 | | | | 35,406 | | | | 35,541 | | | | 35,406 | |
Audit fees | | | 50,878 | | | | 46,512 | | | | 51,267 | | | | 50,878 | |
Insurance fees | | | 13,970 | | | | 13,738 | | | | 14,090 | | | | 13,893 | |
Pricing fees | | | 20,182 | | | | 20,182 | | | | 20,143 | | | | 20,182 | |
Other expenses | | | 39,016 | | | | 43,813 | | | | 66,196 | | | | 43,467 | |
| | | | | | | | | | | | | | | | |
Total expenses | | | 1,322,974 | | | | 4,500,114 | | | | 5,080,602 | | | | 3,431,925 | |
| | | | | | | | | | | | | | | | |
Less: Fee reimbursements (note 3) | | | (1,210 | ) | | | (2,262 | ) | | | (4,389 | ) | | | (2,129 | ) |
Less: Indirect payments from custodian (note 3) | | | (4 | ) | | | (17 | ) | | | (30 | ) | | | (12 | ) |
| | | | | | | | | | | | | | | | |
Total net expenses | | | 1,321,760 | | | | 4,497,835 | | | | 5,076,183 | | | | 3,429,784 | |
| | | | | | | | | | | | | | | | |
| | | | |
Net investment income | | | 3,266,470 | | | | 9,361,329 | | | | 9,591,002 | | | | 8,330,304 | |
| | | | | | | | | | | | | | | | |
| | | | |
Net realized and unrealized gains (losses) on investments (notes 2 and 4): | | | | | | | | | | | | | | | | |
Net realized gain (loss) on investments | | | 320,539 | | | | 845,001 | | | | (4,313,944 | ) | | | 532,908 | |
Net change in unrealized appreciation or depreciation of investments | | | (1,874,130 | ) | | | (5,386,649 | ) | | | 1,365,925 | | | | (1,615,899 | ) |
| | | | | | | | | | | | | | | | |
| | | | |
Net loss on investments | | | (1,553,591 | ) | | | (4,541,648 | ) | | | (2,948,019 | ) | | | (1,082,991 | ) |
| | | | | | | | | | | | | | | | |
| | | | |
Net increase in net assets resulting from operations | | $ | 1,712,879 | | | $ | 4,819,681 | | | $ | 6,642,983 | | | $ | 7,247,313 | |
| | | | | | | | | | | | | | | | |
The accompanying notes are an integral part of the financial statements.
| | | | | | |
| FIRST AMERICAN MORTGAGE FUNDS | | 2011 ANNUAL REPORT | | | 39 | |
Statements of Changes in Net Assets
| | | | | | | | | | | | | | | | |
| | | ASP | | | BSP | |
| | | Year Ended
8/31/11 | | | Year Ended
8/31/10 | | | Year Ended
8/31/11 | | | Year Ended
8/31/10 | |
Operations: | | | | | | | | | | | | | | | | |
Net investment income | | $ | 3,266,470 | | | $ | 3,616,334 | | | $ | 9,361,329 | | | $ | 10,224,251 | |
Net realized gain (loss) on investments | | | 320,539 | | | | 57,355 | | | | 845,001 | | | | (849,267 | ) |
Net realized loss on real estate owned | | | — | | | | — | | | | — | | | | (845,904 | ) |
Net change in unrealized appreciation or depreciation of investments | | | (1,874,130 | ) | | | 4,983,525 | | | | (5,386,649 | ) | | | 1,307,827 | |
| | | | | | | | | | | | | | | | |
| | | | |
Net increase (decrease) in net assets resulting from operations | | | 1,712,879 | | | | 8,657,214 | | | | 4,819,681 | | | | 9,836,907 | |
| | | | | | | | | | | | | | | | |
| | | | |
Distributions to shareholders (note 2): | | | | | | | | | | | | | | | | |
From net investment income | | | (3,629,236 | ) | | | (3,542,582 | ) | | | (9,244,577 | ) | | | (10,503,778 | ) |
From return of capital | | | (1,623,538 | ) | | | (1,496,933 | ) | | | (8,864,072 | ) | | | (7,959,755 | ) |
| | | | | | | | | | | | | | | | |
Total distributions | | | (5,252,774 | ) | | | (5,039,515 | ) | | | (18,108,649 | ) | | | (18,463,533 | ) |
| | | | | | | | | | | | | | | | |
| | | | |
Capital share transactions: | | | | | | | | | | | | | | | | |
Net proceeds from sale of shares | | | — | | | | — | | | | — | | | | 893 | |
| | | | | | | | | | | | | | | | |
| | | | |
Total increase (decrease) in net assets | | | (3,539,895 | ) | | | 3,617,699 | | | | (13,288,968 | ) | | | (8,625,733 | ) |
| | | | |
Net assets at beginning of period | | | 56,275,458 | | | | 52,657,759 | | | | 172,904,317 | | | | 181,530,050 | |
| | | | | | | | | | | | | | | | |
| | | | |
Net assets at end of period | | $ | 52,735,563 | | | $ | 56,275,458 | | | $ | 159,615,349 | | | $ | 172,904,317 | |
| | | | | | | | | | | | | | | | |
| | | | |
Distributions in excess of net investment income | | $ | (5,185 | ) | | $ | (5,185 | ) | | $ | (182,687 | ) | | $ | (49,724 | ) |
| | | | | | | | | | | | | | | | |
The accompanying notes are an integral part of the financial statements.
| | | | |
| 40 | | FIRST AMERICAN MORTGAGE FUNDS | | 2011 ANNUAL REPORT |
| | | | | | | | | | | | | | |
| CSP | | | SLA | |
Year Ended
8/31/11 | | | Year Ended
8/31/10 | | | Year Ended
8/31/11 | | | Year Ended
8/31/10 | |
| | | | | | | | | | | | | | |
| $ | 9,591,002 | | | $ | 9,198,563 | | | $ | 8,330,304 | | | $ | 8,281,615 | |
| | (4,313,944 | ) | | | (159,853 | ) | | | 532,908 | | | | 254,309 | |
| | — | | | | (1,308,758 | ) | | | — | | | | — | |
| | 1,365,925 | | | | (17,045,053 | ) | | | (1,615,899 | ) | | | 2,431,012 | |
| | | | | | | | | | | | | | |
| | | |
| | 6,642,983 | | | | (9,315,101 | ) | | | 7,247,313 | | | | 10,966,936 | |
| | | | | | | | | | | | | | |
| | | |
| | | | | | | | | | | | | | |
| | (9,591,804 | ) | | | (10,926,078 | ) | | | (8,887,664 | ) | | | (8,810,584 | ) |
| | (13,216,429 | ) | | | (11,433,679 | ) | | | (4,226,836 | ) | | | (4,719,742 | ) |
| | | | | | | | | | | | | | |
| | (22,808,233 | ) | | | (22,359,757 | ) | | | (13,114,500 | ) | | | (13,530,326 | ) |
| | | | | | | | | | | | | | |
| | | |
| | | | | | | | | | | | | | |
| | — | | | | — | | | | — | | | | — | |
| | | | | | | | | | | | | | |
| | | |
| | (16,165,250 | ) | | | (31,674,858 | ) | | | (5,867,187 | ) | | | (2,563,390 | ) |
| | | |
| | 196,210,943 | | | | 227,885,801 | | | | 128,853,076 | | | | 131,416,466 | |
| | | | | | | | | | | | | | |
| | | |
| $ | 180,045,693 | | | $ | 196,210,943 | | | $ | 122,985,889 | | | $ | 128,853,076 | |
| | | | | | | | | | | | | | |
| | | |
| $ | (2,138,976 | ) | | $ | (1,941,132 | ) | | $ | (570,180 | ) | | $ | (570,180 | ) |
| | | | | | | | | | | | | | |
| | | | | | |
| FIRST AMERICAN MORTGAGE FUNDS | | 2011 ANNUAL REPORT | | | 41 | |
| | |
| Statements of Cash Flows | | For the year ended August 31, 2011 |
| | | | | | | | | | | | | | | | |
| | | ASP | | | BSP | | | CSP | | | SLA | |
Cash flows from operating activities: | | | | | | | | | | | | | | | | |
Net increase in net assets resulting from operations | | $ | 1,712,879 | | | $ | 4,819,681 | | | $ | 6,642,983 | | | $ | 7,247,313 | |
Adjustments to reconcile net increase in net assets resulting from
operations to net cash provided by operating activities: | | | | | | | | | | | | | | | | |
Purchases of investments | | | (9,095,178 | ) | | | (26,208,968 | ) | | | (35,313,876 | ) | | | (17,823,955 | ) |
Proceeds from paydowns and sales of investments | | | 8,879,147 | | | | 41,948,904 | | | | 51,720,767 | | | | 23,137,184 | |
Net purchases/sales of short-term investments | | | (73,095 | ) | | | (791,848 | ) | | | 5,437,181 | | | | (366,437 | ) |
Net amortization/accretion of bond discount and premium | | | (98,754 | ) | | | (146,234 | ) | | | (71,186 | ) | | | (159,544 | ) |
Net change in unrealized appreciation or depreciation of investments | | | 1,874,130 | | | | 5,386,649 | | | | (1,365,925 | ) | | | 1,615,899 | |
Net change of REO due to foreclosure | | | — | | | | — | | | | 974,900 | | | | — | |
Net realized gain (loss) on investments | | | (320,539 | ) | | | (845,001 | ) | | | 4,313,944 | | | | (532,908 | ) |
Decrease (increase) in receivable for accrued interest and dividends | | | 29,779 | | | | 286,445 | | | | 163,937 | | | | (36,998 | ) |
Decrease (increase) in prepaid expenses and other assets | | | (118,241 | ) | | | 131,073 | | | | (554,650 | ) | | | (114,022 | ) |
Increase (decrease) in accrued fees and expenses | | | 39,768 | | | | 27,641 | | | | (25,797 | ) | | | 25,531 | |
| | | | | | | | | | | | | | | | |
Net cash provided by operating activities | | | 2,829,896 | | | | 24,608,342 | | | | 31,922,278 | | | | 12,992,063 | |
| | | | | | | | | | | | | | | | |
| | | | |
Cash flows from financing activities: | | | | | | | | | | | | | | | | |
Net payments from borrowings under loan agreement | | | (5,000,000 | ) | | | (11,100,000 | ) | | | (2,400,000 | ) | | | (7,600,000 | ) |
Net proceeds (payments) from reverse repurchase agreements | | | 7,361,207 | | | | 4,817,637 | | | | (6,276,875 | ) | | | 7,889,608 | |
Distributions paid to shareholders | | | (5,252,774 | ) | | | (18,108,649 | ) | | | (22,808,233 | ) | | | (13,114,500 | ) |
| | | | | | | | | | | | | | | | |
Net cash used in financing activities | | | (2,891,567 | ) | | | (24,391,012 | ) | | | (31,485,108 | ) | | | (12,824,892 | ) |
| | | | | | | | | | | | | | | | |
| | | | |
Net increase (decrease) in cash | | | (61,671 | ) | | | 217,330 | | | | 437,170 | | | | 167,171 | |
Bank overdraft at beginning of period | | | (98,347 | ) | | | (325,706 | ) | | | (376,790 | ) | | | (304,686 | ) |
| | | | | | | | | | | | | | | | |
Cash (bank overdraft) at end of period | | $ | (160,018 | ) | | $ | (108,376 | ) | | $ | 60,380 | | | $ | (137,515 | ) |
| | | | | | | | | | | | | | | | |
| | | | |
Supplemental disclosure of cash flow information: | | | | | | | | | | | | | | | | |
Cash paid for interest | | $ | 547,438 | | | $ | 2,751,814 | | | $ | 3,244,207 | | | $ | 2,051,490 | |
| | | | | | | | | | | | | | | | |
The accompanying notes are an integral part of the financial statements.
| | | | |
| 42 | | FIRST AMERICAN MORTGAGE FUNDS | | 2011 ANNUAL REPORT |
Financial Highlights
Per-share data for a share of capital stock outstanding throughout each period and selected information for each period are as follows:
ASP
| | | | | | | | | | | | | | | | | | | | |
| | | Year Ended August 31, | |
| | | 2011 | | | 2010 | | | 2009 | | | 2008 | | | 2007 | |
Per-Share Data | | | | | | | | | | | | | | | | | | | | |
Net asset value, beginning of period | | $ | 13.30 | | | $ | 12.44 | | | $ | 11.72 | | | $ | 11.96 | | | $ | 12.07 | |
| | | | | | | | | | | | | | | | | | | | |
Operations: | | | | | | | | | | | | | | | | | | | | |
Net investment income | | | 0.79 | | | | 0.85 | | | | 0.81 | | | | 0.80 | | | | 0.80 | |
Net realized and unrealized gain (losses) on investments | | | (0.39 | ) | | | 1.20 | | | | 0.70 | | | | (0.26 | ) | | | (0.07 | ) |
| | | | | | | | | | | | | | | | | | | | |
Total from operations | | | 0.40 | | | | 2.05 | | | | 1.51 | | | | 0.54 | | | | 0.73 | |
| | | | | | | | | | | | | | | | | | | | |
Distributions to shareholders: | | | | | | | | | | | | | | | | | | | | |
From net investment income | | | (0.86 | ) | | | (0.84 | ) | | | (0.77 | ) | | | (0.75 | ) | | | (0.84 | ) |
From return of capital | | | (0.38 | ) | | | (0.35 | ) | | | (0.02 | ) | | | (0.03 | ) | | | — | |
| | | | | | | | | | | | | | | | | | | | |
Total distributions | | | (1.24 | ) | | | (1.19 | ) | | | (0.79 | ) | | | (0.78 | ) | | | (0.84 | ) |
| | | | | | | | | | | | | | | | | | | | |
Net asset value, end of period | | $ | 12.46 | | | $ | 13.30 | | | $ | 12.44 | | | $ | 11.72 | | | $ | 11.96 | |
| | | | | | | | | | | | | | | | | | | | |
Market value, end of period | | $ | 11.01 | | | $ | 13.00 | | | $ | 10.75 | | | $ | 9.75 | | | $ | 11.41 | |
| | | | | | | | | | | | | | | | | | | | |
Selected Information | | | | | | | | | | | | | | | | | | | | |
Total return, net asset value 1 | | | 3.17 | % | | | 17.33 | % | | | 13.89 | % | | | 4.62 | % | | | 6.14 | % |
Total return, market value 2 | | | (5.90 | )% | | | 33.60 | % | | | 20.61 | % | | | (8.00 | )% | | | 12.19 | % |
Net assets at end of period (in millions) | | $ | 53 | | | $ | 56 | | | $ | 53 | | | $ | 50 | | | $ | 51 | |
Ratio of expenses to average weekly net assets before fee reimbursements | | | 2.43 | % | | | 2.43 | % | | | 2.81 | % | | | 3.07 | % | | | 3.27 | % |
Ratio of expenses to average weekly net assets after fee reimbursements | | | 2.43 | % | | | 2.43 | % | | | 2.81 | % | | | 3.06 | % | | | 3.26 | % |
Ratio of expenses to average weekly net assets excluding interest expense and
fee reimbursements | | | 1.41 | % | | | 1.29 | % | | | 1.41 | % | | | 1.33 | % | | | 1.33 | % |
Ratio of net investment income to average weekly net assets before
fee reimbursements | | | 6.18 | % | | | 6.65 | % | | | 7.19 | % | | | 6.70 | % | | | 6.56 | % |
Ratio of net investment income to average weekly net assets after
fee reimbursements | | | 6.18 | % | | | 6.65 | % | | | 7.19 | % | | | 6.71 | % | | | 6.57 | % |
Portfolio turnover rate 3 | | | 13 | % | | | 6 | % | | | 22 | % | | | 18 | % | | | 22 | % |
Amount of borrowings outstanding at end of period (in millions) | | $ | 19 | | | $ | 16 | | | $ | 17 | | | $ | 16 | | | $ | 19 | |
Per-share amount of borrowings outstanding at end of period | | $ | 4.41 | | | $ | 3.85 | | | $ | 4.13 | | | $ | 3.81 | | | $ | 4.59 | |
Per-share amount of net assets, excluding borrowings, at end of period | | $ | 16.87 | | | $ | 17.15 | | | $ | 16.57 | | | $ | 15.53 | | | $ | 16.55 | |
Asset coverage ratio 4 | | | 383 | % | | | 445 | % | | | 401 | % | | | 407 | % | | | 360 | % |
| 1 | Assumes reinvestment of distributions at net asset value. |
| 2 | Assumes reinvestment of distributions at actual prices pursuant to the fund’s dividend reinvestment plan. |
| 3 | The portfolio turnover rate for August 31, 2007 has been revised to exclude maturities of investments that had been extended prior to their original maturity dates. |
| 4 | Represents net assets, excluding borrowings, at end of period divided by borrowings outstanding at end of period. |
The accompanying notes are an integral part of the financial statements.
| | | | | | |
| FIRST AMERICAN MORTGAGE FUNDS | | 2011 ANNUAL REPORT | | | 43 | |
Financial Highlights
Per-share data for a share of capital stock outstanding throughout each period and selected information for each period are as follows:
BSP
| | | | | | | | | | | | | | | | | | | | |
| | | Year Ended August 31, | |
| | | 2011 | | | 2010 | | | 2009 | | | 2008 | | | 2007 | |
Per-Share Data | | | | | | | | | | | | | | | | | | | | |
Net asset value, beginning of period | | $ | 10.82 | | | $ | 11.36 | | | $ | 11.51 | | | $ | 12.02 | | | $ | 11.92 | |
| | | | | | | | | | | | | | | | | | | | |
Operations: | | | | | | | | | | | | | | | | | | | | |
Net investment income | | | 0.59 | | | | 0.64 | | | | 0.78 | | | | 0.74 | | | | 0.80 | |
Net realized and unrealized gain (losses) on investments | | | (0.30 | ) | | | (0.02 | ) | | | (0.20 | ) | | | (0.46 | ) | | | 0.14 | |
| | | | | | | | | | | | | | | | | | | | |
Total from operations | | | 0.29 | | | | 0.62 | | | | 0.58 | | | | 0.28 | | | | 0.94 | |
| | | | | | | | | | | | | | | | | | | | |
Distributions to shareholders: | | | | | | | | | | | | | | | | | | | | |
From net investment income | | | (0.58 | ) | | | (0.66 | ) | | | (0.73 | ) | | | (0.69 | ) | | | (0.84 | ) |
From return of capital | | | (0.55 | ) | | | (0.50 | ) | | | — | | | | (0.10 | ) | | | — | |
| | | | | | | | | | | | | | | | | | | | |
Total distributions | | | (1.13 | ) | | | (1.16 | ) | | | (0.73 | ) | | | (0.79 | ) | | | (0.84 | ) |
| | | | | | | | | | | | | | | | | | | | |
Net asset value, end of period | | $ | 9.98 | | | $ | 10.82 | | | $ | 11.36 | | | $ | 11.51 | | | $ | 12.02 | |
| | | | | | | | | | | | | | | | | | | | |
Market value, end of period | | $ | 8.75 | | | $ | 10.14 | | | $ | 9.71 | | | $ | 9.80 | | | $ | 11.32 | |
| | | | | | | | | | | | | | | | | | | | |
Selected Information | | | | | | | | | | | | | | | | | | | | |
Total return, net asset value 1 | | | 2.72 | % | | | 5.64 | % | | | 5.57 | % | | | 2.25 | % | | | 8.06 | % |
Total return, market value 2 | | | (2.42 | )% | | | 16.91 | % | | | 8.04 | % | | | (6.80 | )% | | | 13.18 | % |
Net assets at end of period (in millions) | | $ | 160 | | | $ | 173 | | | $ | 182 | | | $ | 184 | | | $ | 192 | |
Ratio of expenses to average weekly net assets before fee reimbursements | | | 2.68 | % | | | 2.56 | % | | | 2.86 | % | | | 2.95 | % | | | 2.57 | % |
Ratio of expenses to average weekly net assets after fee reimbursements | | | 2.68 | % | | | 2.56 | % | | | 2.86 | % | | | 2.95 | % | | | 2.56 | % |
Ratio of expenses to average weekly net assets excluding interest expense and
fee reimbursements | | | 1.02 | % | | | 0.96 | % | | | 1.06 | % | | | 0.98 | % | | | 0.99 | % |
Ratio of net investment income to average weekly net assets before
fee reimbursements | | | 5.60 | % | | | 5.74 | % | | | 7.23 | % | | | 6.19 | % | | | 6.56 | % |
Ratio of net investment income to average weekly net assets after
fee reimbursements | | | 5.60 | % | | | 5.74 | % | | | 7.23 | % | | | 6.19 | % | | | 6.57 | % |
Portfolio turnover rate 3 | | | 11 | % | | | 9 | % | | | 19 | % | | | 43 | % | | | 30 | % |
Amount of borrowings outstanding at end of period (in millions) | | $ | 71 | | | $ | 77 | | | $ | 71 | | | $ | 63 | | | $ | 73 | |
Per-share amount of borrowings outstanding at end of period | | $ | 4.44 | | | $ | 4.82 | | | $ | 4.44 | | | $ | 3.92 | | | $ | 4.58 | |
Per-share amount of net assets, excluding borrowings, at end of period | | $ | 14.42 | | | $ | 15.64 | | | $ | 15.80 | | | $ | 15.43 | | | $ | 16.60 | |
Asset coverage ratio 4 | | | 325 | % | | | 324 | % | | | 356 | % | | | 394 | % | | | 362 | % |
| 1 | Assumes reinvestment of distributions at net asset value. |
| 2 | Assumes reinvestment of distributions at actual prices pursuant to the fund’s dividend reinvestment plan. |
| 3 | The portfolio turnover rate for August 31, 2007 has been revised to exclude maturities of investments that had been extended prior to their original maturity dates. |
| 4 | Represents net assets, excluding borrowings, at end of period divided by borrowings outstanding at end of period. |
The accompanying notes are an integral part of the financial statements.
| | | | |
| 44 | | FIRST AMERICAN MORTGAGE FUNDS | | 2011 ANNUAL REPORT |
Per-share data for a share of capital stock outstanding throughout each period and selected information for each period are as follows:
CSP
| | | | | | | | | | | | | | | | | | | | |
| | | Year Ended August 31, | |
| | | 2011 | | | 2010 | | | 2009 | | | 2008 | | | 2007 | |
Per-Share Data | | | | | | | | | | | | | | | | | | | | |
Net asset value, beginning of period | | $ | 9.19 | | | $ | 10.67 | | | $ | 11.24 | | | $ | 12.06 | | | $ | 12.04 | |
| | | | | | | | | | | | | | | | | | | | |
Operations: | | | | | | | | | | | | | | | | | | | | |
Net investment income | | | 0.46 | | | | 0.43 | | | | 0.73 | | | | 0.87 | | | | 1.18 | |
Net realized and unrealized gain (losses) on investments | | | (0.15 | ) | | | (0.86 | ) | | | (0.53 | ) | | | (0.72 | ) | | | 0.09 | |
| | | | | | | | | | | | | | | | | | | | |
Total from operations | | | 0.31 | | | | (0.43 | ) | | | 0.20 | | | | 0.15 | | | | 1.27 | |
| | | | | | | | | | | | | | | | | | | | |
Distributions to shareholders: | | | | | | | | | | | | | | | | | | | | |
From net investment income | | | (0.45 | ) | | | (0.51 | ) | | | (0.70 | ) | | | (0.96 | ) | | | (1.18 | ) |
From net realized gain on investments | | | — | | | | — | | | | — | | | | — | | | | (0.07 | ) |
From return of capital | | | (0.62 | ) | | | (0.54 | ) | | | (0.07 | ) | | | (0.01 | ) | | | — | |
| | | | | | | | | | | | | | | | | | | | |
Total distributions | | | (1.07 | ) | | | (1.05 | ) | | | (0.77 | ) | | | (0.97 | ) | | | (1.25 | ) |
| | | | | | | | | | | | | | | | | | | | |
Net asset value, end of period | | $ | 8.43 | | | $ | 9.19 | | | $ | 10.67 | | | $ | 11.24 | | | $ | 12.06 | |
| | | | | | | | | | | | | | | | | | | | |
Market value, end of period | | $ | 7.57 | | | $ | 8.67 | | | $ | 8.83 | | | $ | 9.77 | | | $ | 11.35 | |
| | | | | | | | | | | | | | | | | | | | |
Selected Information | | | | | | | | | | | | | | | | | | | | |
Total return, net asset value 1 | | | 3.61 | % | | | (4.26 | )% | | | 1.98 | % | | | 1.17 | % | | | 10.97 | % |
Total return, market value 2 | | | 0.26 | % | | | 10.25 | % | | | (0.88 | )% | | | (5.78 | )% | | | 12.44 | % |
Net assets at end of period (in millions) | | $ | 180 | | | $ | 196 | | | $ | 228 | | | $ | 240 | | | $ | 257 | |
Ratio of expenses to average weekly net assets before fee reimbursements | | | 2.72 | % | | | 2.52 | % | | | 2.75 | % | | | 2.80 | % | | | 2.29 | % |
Ratio of expenses to average weekly net assets after fee reimbursements | | | 2.72 | % | | | 2.52 | % | | | 2.75 | % | | | 2.80 | % | | | 2.28 | % |
Ratio of expenses to average weekly net assets excluding interest expense and
fee reimbursements | | | 0.97 | % | | | 0.90 | % | | | 1.03 | % | | | 1.00 | % | | | 1.09 | % |
Ratio of net investment income to average weekly net assets before
fee reimbursements | | | 5.23 | % | | | 4.38 | % | | | 6.92 | % | | | 7.34 | % | | | 9.67 | % |
Ratio of net investment income to average weekly net assets after
fee reimbursements | | | 5.23 | % | | | 4.38 | % | | | 6.92 | % | | | 7.34 | % | | | 9.68 | % |
Portfolio turnover rate 3 | | | 13 | % | | | 10 | % | | | 16 | % | | | 5 | % | | | 36 | % |
Amount of borrowings outstanding at end of period (in millions) | | $ | 79 | | | $ | 88 | | | $ | 81 | | | $ | 77 | | | $ | 65 | |
Per-share amount of borrowings outstanding at end of period | | $ | 3.71 | | | $ | 4.12 | | | $ | 3.78 | | | $ | 3.62 | | | $ | 3.04 | |
Per-share amount of net assets, excluding borrowings, at end of period | | $ | 12.14 | | | $ | 13.31 | | | $ | 14.45 | | | $ | 14.86 | | | $ | 15.10 | |
Asset coverage ratio 4 | | | 327 | % | | | 323 | % | | | 383 | % | | | 410 | % | | | 496 | % |
| 1 | Assumes reinvestment of distributions at net asset value. |
| 2 | Assumes reinvestment of distributions at actual prices pursuant to the fund’s dividend reinvestment plan. |
| 3 | The portfolio turnover rate for August 31, 2007 has been revised to exclude maturities of investments that had been extended prior to their original maturity dates. |
| 4 | Represents net assets, excluding borrowings, at end of period divided by borrowings outstanding at end of period. |
| | | | | | |
| FIRST AMERICAN MORTGAGE FUNDS | | 2011 ANNUAL REPORT | | | 45 | |
Financial Highlights
Per-share data for a share of capital stock outstanding throughout each period and selected information for each period are as follows:
SLA
| | | | | | | | | | | | | | | | | | | | |
| | | Year Ended August 31, | |
| | | 2011 | | | 2010 | | | 2009 | | | 2008 | | | 2007 | |
Per-Share Data | | | | | | | | | | | | | | | | | | | | |
Net asset value, beginning of period | | $ | 12.09 | | | $ | 12.33 | | | $ | 12.42 | | | $ | 13.00 | | | $ | 13.12 | |
| | | | | | | | | | | | | | | | | | | | |
Operations: | | | | | | | | | | | | | | | | | | | | |
Net investment income | | | 0.79 | | | | 0.78 | | | | 0.87 | | | | 0.92 | | | | 0.94 | |
Net realized and unrealized gain (losses) on investments | | | (0.12 | ) | | | 0.25 | | | | (0.09 | ) | | | (0.61 | ) | | | 0.08 | |
| | | | | | | | | | | | | | | | | | | | |
Total from operations | | | 0.67 | | | | 1.03 | | | | 0.78 | | | | 0.31 | | | | 1.02 | |
| | | | | | | | | | | | | | | | | | | | |
Distributions to shareholders: | | | | | | | | | | | | | | | | | | | | |
From net investment income | | | (0.83 | ) | | | (0.83 | ) | | | (0.87 | ) | | | (0.84 | ) | | | (1.04 | ) |
From net realized gain on investments | | | — | | | | — | | | | (0.00 | )5 | | | (0.05 | ) | | | (0.10 | ) |
From return of capital | | | (0.40 | ) | | | (0.44 | ) | | | (0.00 | )5 | | | — | | | | — | |
| | | | | | | | | | | | | | | | | | | | |
Total distributions | | | (1.23 | ) | | | (1.27 | ) | | | (0.87 | ) | | | (0.89 | ) | | | (1.14 | ) |
| | | | | | | | | | | | | | | | | | | | |
Net asset value, end of period | | $ | 11.53 | | | $ | 12.09 | | | $ | 12.33 | | | $ | 12.42 | | | $ | 13.00 | |
| | | | | | | | | | | | | | | | | | | | |
Market value, end of period | | $ | 10.34 | | | $ | 12.18 | | | $ | 10.64 | | | $ | 10.64 | | | $ | 12.37 | |
| | | | | | | | | | | | | | | | | | | | |
Selected Information | | | | | | | | | | | | | | | | | | | | |
Total return, net asset value 1 | | | 5.82 | % | | | 8.73 | % | | | 6.93 | % | | | 2.44 | % | | | 8.13 | % |
Total return, market value 2 | | | (4.78 | )% | | | 27.56 | % | | | 9.94 | % | | | (7.06 | )% | | | 11.65 | % |
Net assets at end of period (in millions) | | $ | 123 | | | $ | 129 | | | $ | 131 | | | $ | 132 | | | $ | 139 | |
Ratio of expenses to average weekly net assets before fee reimbursements | | | 2.73 | % | | | 2.75 | % | | | 2.93 | % | | | 3.14 | % | | | 2.73 | % |
Ratio of expenses to average weekly net assets after fee reimbursements | | | 2.73 | % | | | 2.75 | % | | | 2.93 | % | | | 3.14 | % | | | 2.72 | % |
Ratio of expenses to average weekly net assets excluding interest expense and
fee reimbursements | | | 1.08 | % | | | 1.02 | % | | | 1.05 | % | | | 1.02 | % | | | 1.02 | % |
Ratio of net investment income to average weekly net assets before
fee reimbursements | | | 6.68 | % | | | 6.33 | % | | | 7.43 | % | | | 7.24 | % | | | 7.21 | % |
Ratio of net investment income to average weekly net assets after
fee reimbursements | | | 6.68 | % | | | 6.33 | % | | | 7.43 | % | | | 7.24 | % | | | 7.22 | % |
Portfolio turnover rate 3 | | | 10 | % | | | 12 | % | | | 13 | % | | | 19 | % | | | 20 | % |
Amount of borrowings outstanding at end of period (in millions) | | $ | 53 | | | $ | 53 | | | $ | 53 | | | $ | 45 | | | $ | 41 | |
Per-share amount of borrowings outstanding at end of period | | $ | 5.02 | | | $ | 4.99 | | | $ | 5.01 | | | $ | 4.24 | | | $ | 3.88 | |
Per-share amount of net assets, excluding borrowings, at end of period | | $ | 16.55 | | | $ | 17.08 | | | $ | 17.34 | | | $ | 16.66 | | | $ | 16.88 | |
Asset coverage ratio 4 | | | 330 | % | | | 342 | % | | | 346 | % | | | 393 | % | | | 434 | % |
| 1 | Assumes reinvestment of distributions at net asset value. |
| 2 | Assumes reinvestment of distributions at actual prices pursuant to the fund’s dividend reinvestment plan. |
| 3 | The portfolio turnover rate for August 31, 2007 has been revised to exclude maturities of investments that had been extended prior to their original maturity dates. |
| 4 | Represents net assets, excluding borrowings, at end of period divided by borrowings outstanding at end of period. |
| 5 | Amount rounds to less than $0.01 per share. |
The accompanying notes are an integral part of the financial statements.
| | | | |
| 46 | | FIRST AMERICAN MORTGAGE FUNDS | | 2011 ANNUAL REPORT |
Notes to Financial Statements
American Strategic Income Portfolio Inc., American Strategic Income Portfolio Inc. II, American Strategic Income Portfolio Inc. III, and American Select Portfolio Inc. are registered under the Investment Company Act of 1940 (as amended) as diversified, closed-end management investment companies. The funds emphasize investments in mortgage-related assets that directly or indirectly represent a participation in or are secured by and payable from mortgage loans. They may also invest in U.S. Government securities, corporate debt securities, and preferred stock issued by real estate investment trusts. In addition, the funds may borrow using reverse repurchase agreements and credit facilities. Fund shares are listed on the New York Stock Exchange (“NYSE”) under the symbols ASP, BSP, CSP, and SLA, respectively.
Security Valuations
The funds’ investments in whole loans (single family, multifamily, and commercial), are generally not traded in any organized market and therefore, market quotations are not readily available. These investments are valued at fair value according to procedures adopted by the funds’ board of directors. Pursuant to these procedures, these investments are initially fair valued at cost as this approximates fair value and adjusted using a U.S. Bancorp Asset Management, Inc. (“USBAM”) pricing model designed to incorporate, among other things, the present value of the projected stream of cash flows on such investments. The pricing model takes into account a number of relevant factors including the projected rate of prepayments, the delinquency profile, the historical payment record, the expected yield at purchase, changes in prevailing interest rates, and changes in the real or perceived liquidity of whole loans as the case may be. Changes in prevailing interest rates, real or perceived liquidity, yield spreads, and creditworthiness are factored into the pricing model each week. The results of the pricing model may be further subject to price floors given the intrinsic values of the underlying properties subject to the loans and ceilings due to the illiquid nature of the loans. USBAM has modified, and may in the future modify, price floors, price ceilings, and other factors contained in the model in light of changing economic and market conditions. Such modifications will affect the funds’ net asset value.
Certain mortgage loan information is received once a month. This information includes, but is not limited to, the projected rate of prepayments, projected rate and severity of defaults, the delinquency profile, and the historical payment record. Valuations of whole loans are determined no less frequently than weekly. Although USBAM believes the pricing model to be reasonable and appropriate, the actual values that may be realized upon the sale of whole loans can only be determined in negotiations between the funds and third parties.
Security valuations for the funds’ investments (other than whole loans) are generally furnished by an independent pricing service that has been approved by the funds’ board of directors. Investments in equity securities that are traded on a national securities exchange (or reported on the Nasdaq national market system) are stated at the last quoted sales price if readily available for such securities on each business day. For securities traded on the Nasdaq national market system, the funds utilize the Nasdaq Official Closing Price which compares the last trade to the bid/ask price of a security. If the last trade falls within the bid/ask range, then that price will be the closing price. If the last trade is outside the bid/ask range, and falls above the ask, then the ask price will be the closing price. If the last trade is below the bid, then the bid will be the closing price. Other equity securities traded in the over-the-counter market and listed equity securities for which no sale was reported on that date are stated at the last quoted bid price. Investments in open-end funds are valued at their respective net asset values on the valuation date.
Debt obligations exceeding 60 days to maturity are valued by an independent pricing service. The pricing service may employ methodologies that utilize actual market transactions, broker-dealer supplied valuations, or other formula-driven valuation techniques. These techniques generally consider such factors as yields or prices of bonds of comparable quality, type of issue, coupon, maturity, ratings, and general market conditions. Securities for which prices are not available from an independent pricing service, but where an active market exists, are valued using market quotations obtained from one or more dealers that make markets in the securities or from a widely-used quotation system. Debt obligations with 60 days or less remaining until maturity may be valued at their amortized cost which approximates market value.
| | | | | | |
| FIRST AMERICAN MORTGAGE FUNDS | | 2011 ANNUAL REPORT | | | 47 | |
Notes to Financial Statements
The following investment vehicles, when held by a fund, are priced as follows: Exchange listed futures and options on futures are priced at their last sale price on the exchange on which they are principally traded, as determined by USBAM on the day the valuation is made. If there were no sales on that day, futures and options on futures will be valued at the last reported bid price. Options on securities and indices traded on Nasdaq or listed on a stock exchange are valued at the last sale price on Nasdaq or on any exchange on the day the valuation is made. If there were no sales on that day, the options will be valued at the last sale price on the previous valuation date. Last sale prices are obtained from an independent pricing service. Swaps and over-the-counter options on securities and indices are valued at the quotations received from an independent pricing service, if available.
When market quotations are not readily available, securities are internally valued at fair value as determined in good faith by procedures established and approved by the funds’ board of directors. Some of the factors that may be considered in determining fair value are fundamental analytical data relating to the investment; the nature and duration of any restrictions on disposition; trading in similar securities of the same issuer or comparable companies; information from broker-dealers; and an evaluation of the forces that influence the market in which the securities are purchased or sold. If events occur that materially affect the value of securities between the close of trading in those securities and the close of regular trading on the New York Stock Exchange, the securities will be valued at fair value. The use of fair value pricing by a fund may cause the net asset value of its shares to differ significantly from the net asset value that would be calculated without fair value pricing.
In accordance with the valuation procedures adopted by the funds’ board of directors, real estate acquired through foreclosure, if any, is initially valued similar to defaulted multifamily and commercial whole loans. The value is subsequently revised to an estimated market value, as determined by independent third party appraisals, less estimated selling costs.
As of August 31, 2011, the funds held internally fair valued securities as follows:
| | | | | | | | |
Fund | | Fair Value | | | Percentage
of Total Net Assets | |
ASP | | $ | 29,278,461 | | | | 55.5 | % |
BSP | | | 151,233,169 | | | | 94.7 | |
CSP | | | 183,393,975 | | | | 101.9 | |
SLA | | | 106,131,056 | | | | 86.3 | |
Generally accepted accounting principles (“GAAP”) require disclosures regarding the inputs and valuation techniques used to measure fair value and any changes in valuation inputs or technique. These principles establish a three-tier fair value hierarchy for inputs used in measuring fair value. Fair value inputs are summarized in the three broad levels listed below:
Level 1 - Quoted prices in active markets for identical securities.
Level 2 - Other significant observable inputs (including quoted prices for similar securities, with similar interest rates, prepayment speeds, credit risk, etc.).
Level 3 - Significant unobservable inputs (including a fund’s own assumptions in determining the fair value of investments). Generally, the types of securities included in Level 3 of a fund are securities that are not traded in any organized market, or for which there are significant unobservable fair value inputs available such as the funds’ investments in whole loans.
The fair value levels are not necessarily an indication of the risk associated with investing in these investments.
| | | | |
| 48 | | FIRST AMERICAN MORTGAGE FUNDS | | 2011 ANNUAL REPORT |
As of August 31, 2011, each fund’s investments were classified as follows:
| | | | | | | | | | | | | | | | |
Fund | | Level 1 | | | Level 2 | | | Level 3 | | | Total
Fair Value | |
ASP | | | | | | | | | | | | | | | | |
Whole Loans | | $ | — | | | $ | — | | | $ | 25,673,461 | | | $ | 25,673,461 | |
Corporate Note | | | — | | | | — | | | | 3,605,000 | | | | 3,605,000 | |
U.S. Government Agency Mortgage-Backed Securities | | | — | | | | 8,156,029 | | | | — | | | | 8,156,029 | |
Commercial Mortgage-Backed Securities | | | — | | | | 15,422,315 | | | | — | | | | 15,422,315 | |
Preferred Stocks | | | 17,104,814 | | | | — | | | | — | | | | 17,104,814 | |
Short-Term Investment | | | 1,190,335 | | | | — | | | | — | | | | 1,190,335 | |
| | | | | | | | | | | | | | | | |
Total Investments | | $ | 18,295,149 | | | $ | 23,578,344 | | | $ | 29,278,461 | | | $ | 71,151,954 | |
| | | | | | | | | | | | | | | | |
BSP | | | | | | | | | | | | | | | | |
Whole Loans | | $ | — | | | $ | — | | | $ | 129,561,557 | | | $ | 129,561,557 | |
Corporate Notes | | | — | | | | — | | | | 21,671,612 | | | | 21,671,612 | |
U.S. Government Agency Mortgage-Backed Securities | | | — | | | | 15,697,825 | | | | — | | | | 15,697,825 | |
Commercial Mortgage-Backed Securities | | | — | | | | 28,916,137 | | | | — | | | | 28,916,137 | |
Preferred Stocks | | | 31,991,734 | | | | — | | | | — | | | | 31,991,734 | |
Short-Term Investment | | | 1,825,372 | | | | — | | | | — | | | | 1,825,372 | |
| | | | | | | | | | | | | | | | |
Total Investments | | $ | 33,817,106 | | | $ | 44,613,962 | | | $ | 151,233,169 | | | $ | 229,664,237 | |
| | | | | | | | | | | | | | | | |
CSP | | | | | | | | | | | | | | | | |
Whole Loans | | $ | — | | | $ | — | | | $ | 159,616,164 | | | $ | 159,616,164 | |
Corporate Notes | | | — | | | | — | | | | 21,180,375 | | | | 21,180,375 | |
Private Mortgage-Backed Security† | | | — | | | | — | | | | — | | | | — | |
U.S. Government Agency Mortgage-Backed Securities | | | — | | | | 21,206,714 | | | | — | | | | 21,206,714 | |
Commercial Mortgage-Backed Securities | | | — | | | | 10,404,815 | | | | — | | | | 10,404,815 | |
Preferred Stocks | | | 40,447,374 | | | | — | | | | — | | | | 40,447,374 | |
Real Estate Owned | | | — | | | | — | | | | 2,597,436 | | | | 2,597,436 | |
Short-Term Investment | | | 1,986,027 | | | | — | | | | — | | | | 1,986,027 | |
| | | | | | | | | | | | | | | | |
Total Investments | | $ | 42,433,401 | | | $ | 31,611,529 | | | $ | 183,393,975 | | | $ | 257,438,905 | |
| | | | | | | | | | | | | | | | |
SLA | | | | | | | | | | | | | | | | |
Whole Loans | | $ | — | | | $ | — | | | $ | 89,264,806 | | | $ | 89,264,806 | |
Corporate Notes | | | — | | | | — | | | | 16,866,250 | | | | 16,866,250 | |
U.S. Government Agency Mortgage-Backed Securities | | | — | | | | 13,862,384 | | | | — | | | | 13,862,384 | |
Commercial Mortgage-Backed Securities | | | — | | | | 21,699,108 | | | | — | | | | 21,699,108 | |
Preferred Stocks | | | 32,244,230 | | | | — | | | | — | | | | 32,244,230 | |
Short-Term Investment | | | 1,661,920 | | | | — | | | | — | | | | 1,661,920 | |
| | | | | | | | | | | | | | | | |
Total Investments | | $ | 33,906,150 | | | $ | 35,561,492 | | | $ | 106,131,056 | | | $ | 175,598,698 | |
| | | | | | | | | | | | | | | | |
† This category includes one security classified in Level 2 which is valued at zero.
| | | | | | |
| FIRST AMERICAN MORTGAGE FUNDS | | 2011 ANNUAL REPORT | | | 49 | |
Notes to Financial Statements
The following is a reconciliation of Level 3 investments for which significant unobservable inputs were used to determine fair value:
| | | | | | | | | | | | | | | | | | | | |
Fund | | Whole Loans | | | Corporate
Notes | | | Private
Mortgage-
Backed
Security | | | Real Estate
Owned | | | Total
Fair Value | |
ASP | | | | | | | | | | | | | | | | | | | | |
Balance as of August 31, 2010 | | $ | 31,982,607 | | | $ | 3,605,000 | | | $ | — | | | $ | — | | | $ | 35,587,607 | |
Realized gain | | | 2,445 | | | | — | | | | — | | | | — | | | | 2,445 | |
Net change in unrealized appreciation or depreciation | | | (1,772,066 | ) | | | — | | | | — | | | | — | | | | (1,772,066 | ) |
Purchases | | | 10,497,892 | | | | — | | | | — | | | | — | | | | 10,497,892 | |
Sales | | | (15,037,417 | ) | | | — | | | | — | | | | — | | | | (15,037,417 | ) |
| | | | | | | | | | | | | | | | | | | | |
Balance as of August 31, 2011 | | $ | 25,673,461 | | | $ | 3,605,000 | | | $ | — | | | $ | — | | | $ | 29,278,461 | |
| | | | | | | | | | | | | | | | | | | | |
Net change in unrealized appreciation or depreciation during the period of Level 3 investments held as of August 31, 2011 | | $ | (1,741,245 | ) | | $ | — | | | $ | — | | | $ | — | | | $ | (1,741,245 | ) |
| | | | | | | | | | | | | | | | | | | | |
BSP | | | | | | | | | | | | | | | | | | | | |
Balance as of August 31, 2010 | | $ | 140,289,069 | | | $ | 21,751,612 | | | $ | — | | | $ | — | | | $ | 162,040,681 | |
Realized loss | | | (595,439 | ) | | | — | | | | — | | | | — | | | | (595,439 | ) |
Net change in unrealized appreciation or depreciation | | | (4,292,080 | ) | | | (80,000 | ) | | | — | | | | — | | | | (4,372,080 | ) |
Purchases | | | 60,800,082 | | | | 22,023,224 | | | | — | | | | — | | | | 82,823,306 | |
Sales | | | (66,640,075 | ) | | | (22,023,224 | ) | | | — | | | | — | | | | (88,663,299 | ) |
| | | | | | | | | | | | | | | | | | | | |
Balance as of August 31, 2011 | | $ | 129,561,557 | | | $ | 21,671,612 | | | $ | — | | | $ | — | | | $ | 151,233,169 | |
| | | | | | | | | | | | | | | | | | | | |
Net change in unrealized appreciation or depreciation during the period of Level 3 investments held as of August 31, 2011 | | $ | (7,996,881 | ) | | $ | (80,000 | ) | | $ | — | | | $ | — | | | $ | (8,076,881 | ) |
| | | | | | | | | | | | | | | | | | | | |
CSP | | | | | | | | | | | | | | | | | | | | |
Balance as of August 31, 2010 | | $ | 158,210,375 | | | $ | 21,250,375 | | | $ | — | | | $ | 2,460,750 | | | $ | 181,921,500 | |
Accrued discounts/premiums | | | — | | | | — | | | | 1,994 | | | | — | | | | 1,994 | |
Realized loss | | | (6,618,877 | ) | | | — | | | | (9,855 | ) | | | — | | | | (6,628,732 | ) |
Net change in unrealized appreciation or depreciation | | | 3,173,631 | | | | (70,000 | ) | | | 7,861 | | | | (318,759 | ) | | | 2,792,733 | |
Purchases | | | 96,356,502 | | | | 20,080,750 | | | | — | | | | 455,445 | | | | 116,892,697 | |
Sales | | | (91,505,467 | ) | | | (20,080,750 | ) | | | — | | | | — | | | | (111,586,217 | ) |
| | | | | | | | | | | | | | | | | | | | |
Balance as of August 31, 2011 | | $ | 159,616,164 | | | $ | 21,180,375 | | | $ | — | | | $ | 2,597,436 | | | $ | 183,393,975 | |
| | | | | | | | | | | | | | | | | | | | |
Net change in unrealized appreciation or depreciation during the period of Level 3 investments held as of August 31, 2011 | | $ | 1,699,932 | | | $ | (70,000 | ) | | $ | — | | | $ | 459,540 | | | $ | 2,089,472 | |
| | | | | | | | | | | | | | | | | | | | |
SLA | | | | | | | | | | | | | | | | | | | | |
Balance as of August 31, 2010 | | $ | 99,618,855 | | | $ | 16,936,250 | | | $ | — | | | $ | — | | | $ | 116,555,105 | |
Realized loss | | | (1 | ) | | | — | | | | — | | | | — | | | | (1 | ) |
Net change in unrealized appreciation or depreciation | | | (1,449,054 | ) | | | 80,000 | | | �� | — | | | | — | | | | (1,369,054 | ) |
Purchases | | | 43,552,037 | | | | 13,181,250 | | | | — | | | | — | | | | 56,733,287 | |
Sales | | | (52,457,031 | ) | | | (13,331,250 | ) | | | — | | | | — | | | | (65,788,281 | ) |
| | | | | | | | | | | | | | | | | | | | |
Balance as of August 31, 2011 | | $ | 89,264,806 | | | $ | 16,866,250 | | | $ | — | | | $ | — | | | $ | 106,131,056 | |
| | | | | | | | | | | | | | | | | | | | |
Net change in unrealized appreciation or depreciation during the period of Level 3 investments held as of August 31, 2011 | | $ | (1,276,656 | ) | | $ | (70,000 | ) | | $ | — | | | $ | — | | | $ | (1,346,656 | ) |
| | | | | | | | | | | | | | | | | | | | |
| | | | |
| 50 | | FIRST AMERICAN MORTGAGE FUNDS | | 2011 ANNUAL REPORT |
During the fiscal year ended August 31, 2011, the funds recognized no transfers between valuation levels.
Security Transactions and Investment Income
For financial statement purposes, the funds record security transactions on the trade date of the security purchase or sale. Dividend income is recorded on the ex-dividend date. Interest income, including accretion of bond discounts and amortization of bond premiums, is recorded on an accrual basis. Security gains and losses are determined on the basis of identified cost, which is the same basis used for federal income tax purposes. The resulting gain/loss is calculated as the difference between the sales price and the underlying cost of the security on the transaction date.
Distributions to Shareholders
As disclosed in the funds’ August 31, 2009 annual report, the funds’ board of directors adopted a level distribution policy effective with the December 2009 distribution. Distributions under the policy are expected to consist primarily of net investment income and a return of capital, although the exact tax characteristics of the funds’ distributions in any fiscal year would not be known until after the end of the funds’ fiscal year. A return of capital represents a return of a shareholder’s original investment in the fund’s shares, and should not be confused with a dividend yield. The level distribution policy is subject to suspension, revision or termination at any time without notice to shareholders. Under this policy, the funds paid a fixed monthly distribution to shareholders through February 2011, as follows:
| | | | | | | | | | | | | | | | |
| | | ASP | | | BSP | | | CSP | | | SLA | |
Monthly distribution per share | | $ | 0.1090 | | | $ | 0.1050 | | | $ | 0.0980 | | | $ | 0.1160 | |
On February 15, 2011, the funds’ board of directors determined to reduce the fixed monthly distribution effective with the March 2011 distribution, as follows:
| | | | | | | | | | | | | | | | |
| | | ASP | | | BSP | | | CSP | | | SLA | |
Monthly distribution per share | | $ | 0.0979 | | | $ | 0.0838 | | | $ | 0.0800 | | | $ | 0.0890 | |
The funds will provide a notice, as required by Section 19(a) of the Investment Company Act of 1940, as amended, for any distribution that does not consist solely of net investment income. Any such notice will provide information regarding the estimated amounts of the distribution derived from net investment income, net realized capital gains and return of capital. Such notices will be for informational purposes only and the amounts indicated in such notices likely will differ from the ultimate federal income tax characterization of distributions reported to shareholders on Form 1099-DIV after year end.
Distributions are payable in cash or, pursuant to the funds’ dividend reinvestment plans, reinvested in additional shares of the funds’ capital stock. Under each fund’s plan, fund shares will be purchased in the open market unless the market price plus commissions exceeds the net asset value by 5% or more. If, at the close of business on the dividend payment date, the shares purchased in the open market are insufficient to satisfy the dividend reinvestment requirement, the funds will issue new shares at a discount of up to 5% from the current market price.
The funds receive substantial distributions from holdings in real estate investment trusts (“REITs”). Distributions from REITs may be characterized as ordinary income, net capital gain, or a return of capital to the REIT shareholder. The proper characterization of REIT distributions is generally not known until after the end of each calendar year. As such, the funds must use estimates in reporting the character of its income and distributions for financial statement purposes. The actual character of distributions to a fund’s shareholders will be reflected on the Form 1099 received by shareholders after the end of the calendar year. Due to the nature of REIT investments, a portion of the distributions received by a fund shareholder may represent a return of capital.
Federal Taxes
Each fund is treated as a separate taxable entity. Each fund intends to continue to qualify as a regulated investment company (“RIC”) as provided in Subchapter M of the Internal Revenue Code, as amended, and to
| | | | | | |
| FIRST AMERICAN MORTGAGE FUNDS | | 2011 ANNUAL REPORT | | | 51 | |
Notes to Financial Statements
distribute all taxable income, if any, to its shareholders. Accordingly, no provision for federal income taxes is required. Each fund also intends to distribute its taxable net investment income and realized gains, if any, to avoid the payment of any federal excise taxes. As of August 31, 2011, the funds did not have any tax positions that did not meet the “more-likely-than-not” threshold of being sustained by the applicable taxing authority. Generally, tax authorities can examine all the tax returns filed for the last three years.
Net investment income and net realized gains and losses may differ for financial statement and tax purposes because of temporary or permanent book/tax differences. These differences are primarily due to deferred wash sale losses, paydown gains and losses, tax mark-to-market adjustments under Section 311(e) of the Taxpayer relief Act of 1997, tax deductions for real estate owned, and investments in REITs. To the extent these differences are permanent, reclassifications are made to the appropriate capital accounts in the fiscal period that the differences arise.
On the Statement of Assets and Liabilities, the following reclassifications were made:
| | | | | | | | | | | | | | | | |
| | | ASP | | | BSP | | | CSP | | | SLA | |
Undistributed net investment income | | $ | 1,986,304 | | | $ | 8,614,357 | | | $ | 13,019,387 | | | $ | 4,784,196 | |
Accumulated net realized gain (loss) | | | 215,485 | | | | 475,187 | | | | 417,357 | | | | 411,904 | |
Additional paid-in capital (reduction) | | | (2,201,789 | ) | | | (9,089,544 | ) | | | (13,436,744 | ) | | | (5,196,100 | ) |
The character of distributions made during the fiscal period from net investment income or net realized gains may differ from its ultimate characterization for federal income tax purposes. In addition, due to the timing of dividend distributions, the fiscal period in which amounts are distributed may differ from the fiscal period that the income or realized gains or losses were recorded by the funds.
The character of distributions paid during the fiscal years ended August 31, 2011 and August 31, 2010, were as follows:
| | | | | | | | | | | | | | | | |
| | | ASP | | | BSP | |
| | | 8/31/11 | | | 8/31/10 | | | 8/31/11 | | | 8/31/10 | |
Distributions paid from: | | | | | | | | | | | | | | | | |
Ordinary income | | $ | 3,629,236 | | | $ | 3,542,582 | | | $ | 9,244,577 | | | $ | 10,503,778 | |
Return of capital | | | 1,623,538 | | | | 1,496,933 | | | | 8,864,072 | | | | 7,959,755 | |
| | | | | | | | | | | | | | | | |
Total | | $ | 5,252,774 | | | $ | 5,039,515 | | | $ | 18,108,649 | | | $ | 18,463,533 | |
| | | | | | | | | | | | | | | | |
| | |
| | | CSP | | | SLA | |
| | | 8/31/11 | | | 8/31/10 | | | 8/31/11 | | | 8/31/10 | |
Distributions paid from: | | | | | | | | | | | | | | | | |
Ordinary income | | $ | 9,591,804 | | | $ | 10,926,078 | | | $ | 8,887,664 | | | $ | 8,810,584 | |
Return of capital | | | 13,216,429 | | | | 11,433,679 | | | | 4,226,836 | | | | 4,719,742 | |
| | | | | | | | | | | | | | | | |
Total | | $ | 22,808,233 | | | $ | 22,359,757 | | | $ | 13,114,500 | | | $ | 13,530,326 | |
| | | | | | | | | | | | | | | | |
As of August 31, 2011, the components of accumulated earnings (deficits) on a tax basis were as follows:
| | | | | | | | | | | | | | | | |
| | | ASP | | | BSP | | | CSP | | | SLA | |
Accumulated capital and post-October losses | | $ | (711,289 | ) | | $ | (9,272,182 | ) | | $ | (22,258,806 | ) | | $ | (4,221,444 | ) |
Unrealized appreciation (depreciation) | | | 4,800,033 | | | | (18,845,558 | ) | | | (34,906,719 | ) | | | (2,236,764 | ) |
Other accumulated gain (loss) | | | (5,185 | ) | | | (182,687 | ) | | | (2,424,378 | ) | | | (570,180 | ) |
| | | | | | | | | | | | | | | | |
Accumulated earnings (deficits) | | $ | 4,083,559 | | | $ | (28,300,427 | ) | | $ | (59,589,903 | ) | | $ | (7,028,388 | ) |
| | | | | | | | | | | | | | | | |
The difference between book and tax basis unrealized appreciation (depreciation) at August 31, 2011, is attributable to adjustments for REITs, tax deferral of losses on wash sales, and a one-time tax election whereby the funds marked appreciated securities to market creating capital gains that were used to reduce capital loss carryovers and increase tax cost basis.
| | | | |
| 52 | | FIRST AMERICAN MORTGAGE FUNDS | | 2011 ANNUAL REPORT |
For federal income tax purposes, the following funds had capital loss carryovers as of August 31, 2011, which, if not offset by subsequent capital gains, will expire on the funds’ fiscal year-ends as follows:
| | | | | | | | | | | | | | | | | | | | | | | | | | | | | | | | | | | | |
| | | Expiration | |
Fund | | 2012 | | | 2013 | | | 2014 | | | 2015 | | | 2016 | | | 2017 | | | 2018 | | | 2019 | | | Total | |
ASP | | $ | — | | | $ | — | | | $ | — | | | $ | — | | | $ | — | | | $ | 86,500 | | | $ | 624,789 | | | $ | — | | | $ | 711,289 | |
BSP | | | — | | | | — | | | | 2,742,567 | | | | — | | | | 133,712 | | | | 4,187,382 | | | | 2,208,521 | | | | — | | | | 9,272,182 | |
CSP | | | — | | | | — | | | | — | | | | 551,492 | | | | 381,985 | | | | 5,238,593 | | | | 3,813,449 | | | | 8,176,579 | | | | 18,162,098 | |
SLA | | | — | | | | — | | | | — | | | | — | | | | — | | | | 2,950,808 | | | | 1,270,636 | | | | — | | | | 4,221,444 | |
The funds incurred a loss for tax purposes for the period from November 1, 2010 to August 31, 2011. As permitted by tax regulations, the funds intend to elect to defer and treat the losses as arising in the fiscal year ending August 31, 2012. The deferred losses were as follows:
| | | | |
Fund | | Amount | |
ASP | | $ | — | |
BSP | | | — | |
CSP | | | 4,096,708 | |
SLA | | | — | |
Whole Loans
Whole loans may bear a greater risk of loss arising from a default on the part of the borrower of the underlying loans than do traditional mortgage-backed securities. This is because whole loans, unlike most mortgage-backed securities, generally are not backed by any government guarantee or private credit enhancement. Such risk may be greater during a period of declining or stagnant real estate values. The funds may invest in single family, multifamily, and commercial loans. Each fund currently limits its investment in commercial loans to 50% of its total assets. A participating loan is a whole loan which contains provisions for the lender to participate in the income stream provided by the property, including net cash flow and capital proceeds. CSP and SLA received income during the period from participating loans on which the mortgage obligation had previously been fully repaid. An outstanding participating loan agreement may provide excess cash flows and certain appreciation rights after the mortgage obligation has been fully paid and before the sale of the property to a third party.
At August 31, 2011, ASP had one commercial loan representing 3.76% of total net assets and 10.08% of total commercial loans outstanding that were 120 or more days delinquent as to the timely monthly payment of principal and interest. At August 31, 2011, no single family or multifamily loans were 120 or more days delinquent.
At August 31, 2011, BSP had two multifamily loans representing 6.14% of total net assets and 15.60% of total multifamily loans outstanding that were 120 or more days delinquent as to the timely monthly payment of principal and interest. At August 31, 2011, no single family or commercial loans in BSP were 120 or more days delinquent.
At August 31, 2011, CSP had seven multifamily loans representing 6.87% of total net assets and 22.26% of total multifamily loans outstanding and seven commercial loans representing 10.78% of total net assets and 18.64% of total commercial loans outstanding that were 120 or more days delinquent as to the timely monthly payment of principal and interest.
At August 31, 2011, SLA had one multifamily loan representing 2.72% of total net assets and 12.48% of total multifamily loans outstanding and three commercial loans representing 1.89% of total net assets and 3.73% of total commercial loans outstanding that were 120 or more days delinquent as to the timely monthly payment of principal and interest.
The funds may incur certain costs and delays in the event of a foreclosure. Also, there is no assurance that the subsequent sale of the property will produce an amount equal to the sum of the unpaid principal balance of the loan as of the date the borrower went into default, the accrued unpaid interest, and all of the foreclosure expenses. In this case, the funds may suffer a loss.
| | | | | | |
| FIRST AMERICAN MORTGAGE FUNDS | | 2011 ANNUAL REPORT | | | 53 | |
Notes to Financial Statements
Real estate may be acquired through foreclosure or deed in lieu of foreclosure on whole loans or similar obligations. The funds may receive rental or other income as a result of holding real estate. This income would generally fail to meet the test for “qualifying income” set forth in Section 851 of the Internal Revenue Code and could result in adverse tax consequences to the funds. In addition, the funds may incur expenses associated with maintaining or improving any real estate owned. Real estate income is recorded on a net basis in the income section of the funds’ Statement of Operations. Capital improvements are recorded as an addition to the cost basis of the property, which will increase any loss at sale. As of August 31, 2011, CSP held real estate owned through foreclosure as follows:
| | | | | | | | | | | | |
Fund | | 8/31/11
Cost | | | 8/31/11
Value | | | Unrealized
Depreciation | |
CSP | | | | | | | | | | | | |
Memphis Medical Building | | $ | 2,318,379 | | | $ | 2,597,436 | | | $ | 279,055 | |
The net operating income and capital improvements on such real estate owned for the fiscal year ended August 31, 2011 were:
| | | | | | | | | | | | | | | | |
Fund | | Gross Rental
Income | | | Operating
Expenses | | | Net Operating
Income (Loss) | | | Capital
Improvements | |
CSP | | | | | | | | | | | | | | | | |
Memphis Medical Building | | $ | 161,869 | | | $ | 474,139 | | | $ | (312,270 | ) | | $ | 225,530 | |
Certain financial statement line items for CSP have been reclassified in this report due to an adjustment for Memphis Medical Building real estate owned property.
As of and for the fiscal year ended August 31, 2011, ASP, BSP, and SLA owned no real estate.
Mortgage Servicing Rights
The funds may acquire interests in the cash flow from servicing fees through contractual arrangements with mortgage servicers. Mortgage servicing rights, similar to interest-only securities, generate no further cash flow when a mortgage is prepaid or goes into default. Mortgage servicing rights are accounted for on a level-yield basis with recognized income based on the estimated amounts and timing of cash flows. Such estimates are adjusted periodically as the underlying market conditions change. As of and for the year fiscal ended August 31, 2011, the funds held no mortgage servicing rights.
Securities Purchased on a When-Issued Basis
Delivery and payment for securities that have been purchased by the funds on a when-issued or forward-commitment basis can take place a month or more after the transaction date. Such securities do not earn interest, are subject to market fluctuation, and may increase or decrease in value prior to their delivery. Each fund segregates, with its custodian, assets with a market value equal to or greater than the amount of its purchase commitments. The purchase of securities on a when-issued or forward-commitment basis may increase the volatility of a fund’s net asset value if the fund makes such purchases while remaining substantially fully invested. As of August 31, 2011, the funds had no outstanding when-issued or forward-commitment securities.
Borrowings & Reverse Repurchase Agreements
Effective August 1, 2011, BSP, CSP, and SLA entered into loan agreement extensions with Massachusetts Mutual Life Insurance Company (“MMLIC”) under which MMLIC has made term loans to BSP, CSP, and SLA of $16,250,000, $22,750,000, and $9,750,000, respectively, and agreed to make revolving loans to BSP, CSP, and SLA of up to $8,750,000, $12,250,000, and $5,250,000, respectively. Loans made under the loan agreements are secured by whole loans in the portfolio of the respective fund, bear interest at one-month LIBOR plus 2.50% subject to a “floor” interest rate of 4.25%, and mature on July 31, 2013. In addition to principal and interest payments paid by BSP, CSP, and SLA to MMLIC for borrowings outstanding, BSP, CSP, and SLA each pays an annual fee of 1.28% on any unused portion of the respective fund’s revolving loan commitment. The former loans made by MMLIC to ASP have been fully paid off.
Effective July 18, 2011, the funds entered into loan agreements with Bank of America, N.A., London Branch (“BofA”) under which BofA has agreed to make credit facilities available to ASP, BSP, CSP and SLA up to
| | | | |
| 54 | | FIRST AMERICAN MORTGAGE FUNDS | | 2011 ANNUAL REPORT |
$7,000,000, $16,000,000, $20,000,000 and $15,000,000, respectively. Loans made under the loan agreements are secured by the respective fund’s holdings in REIT preferred stock and bear interest at one-month LIBOR plus 0.90%. Each credit facility has an initial term of 180 days and will continue on a revolving basis unless terminated in writing by BofA upon 180 days notice. The funds may borrow and re-borrow under the credit facilities without the payment of any penalties.
The funds may also borrow money by entering into reverse repurchase agreements, which involve the sale of portfolio-eligible securities by the funds, coupled with an agreement to repurchase the securities at a specified date and price. Borrowings may increase volatility of the funds’ net asset values and involve the risk that interest costs on money borrowed may exceed the return on securities purchased with that borrowed money. Each fund is subject to a restriction on borrowing under which each fund must maintain asset coverage of at least 300%. The interest expense incurred on borrowings is recognized as “Interest Expense” in the Statements of Operations. For the fiscal year ended August 31, 2011, the weighted average borrowings outstanding for ASP, BSP, CSP, and SLA were $17,259,688, $74,249,766, $82,270,407, and $53,282,447, respectively, and the weighted average interest rates paid by the funds on such borrowings were 3.03%, 3.25%, 3.40%, and 3.45%, respectively.
Repurchase Agreements
For repurchase agreements entered into with certain broker-dealers, the funds, along with other affiliated registered investment companies, may transfer uninvested cash balances into a joint trading account, the daily aggregate of which is invested in repurchase agreements secured by U.S. Government or agency obligations. Securities pledged as collateral for all individual and joint repurchase agreements are held by the funds’ custodian bank until maturity of the repurchase agreement. All agreements require that the daily market value of the collateral be in excess of the repurchase amount, including accrued interest, to protect the funds in the event of a default. As of August 31, 2011, the funds had no outstanding repurchase agreements.
Deferred Compensation Plan
Under a Deferred Compensation Plan (the “Plan”), non-interested directors of the First American Family of Funds may participate and elect to defer receipt of part or all of their annual compensation. Deferred amounts are treated as though equivalent dollar amounts had been invested in shares of open-end First American Funds, as designated by each director. The Plan was terminated effective December 31, 2010. All amounts in the Plan are 100% vested and accounts under the Plan are obligations of the funds. Deferred amounts remain in the funds until distributed in accordance with the Plan.
Use of Estimates in the Preparation of Financial Statements
The preparation of financial statements, in conformity with GAAP, requires management to make estimates and assumptions that affect the reported amounts of assets and liabilities and the disclosure of contingent assets and liabilities at the date of the financial statements and the results of operations during the reporting period. Actual results could differ from these estimates.
Events Subsequent to Fiscal Year End
Management has evaluated fund related events and transactions that occurred subsequent to August 31, 2011, through the date of issuance of the funds’ financial statements. There were no events or transactions that occurred during this period that materially impacted the amounts or disclosures in the funds’ financial statements.
Investment Advisory Fees
Pursuant to investment advisory agreements with each fund, USBAM, a subsidiary of U.S. Bank National Association (“U.S. Bank”), manages the funds’ assets and furnishes related office facilities, equipment, research, and personnel. For ASP, BSP, and CSP, the agreement provides USBAM with a monthly investment advisory fee in an amount equal to an annualized rate of 0.20% of the respective fund’s average weekly net assets and 4.50% of the daily gross income accrued by such fund during the month (i.e., investment income, including accretion of bond discounts and amortization of premiums, other than gains from the sale of securities or gains from options
| | | | | | |
| FIRST AMERICAN MORTGAGE FUNDS | | 2011 ANNUAL REPORT | | | 55 | |
Notes to Financial Statements
and futures contracts less interest on money borrowed by the funds). The monthly investment advisory fee shall not exceed, in the aggregate, 1/12 of 0.725% of the respective fund’s average weekly net assets during the month (approximately 0.725% on an annual basis). For SLA, the agreement provides USBAM with a monthly investment advisory fee in an amount equal to an annualized rate of 0.50% of the fund’s average weekly net assets. For its fees, USBAM provides investment advice and, in general, conducts the management and investment activities of the funds.
The funds may invest in money market funds that are series of First American Funds, Inc., subject to certain limitations. In order to avoid the payment of duplicative investment advisory fees to USBAM, which acts as the investment advisor to the investing funds and the related money market funds, USBAM will reimburse to each investing fund an amount equal to that portion of USBAM’s investment advisory fee received from the related money market funds that is attributable to the assets of the investing fund. This reimbursement, if any, is included in “Fee reimbursements” in the Statements of Operations.
Nuveen Asset Management, LLC (“NAM”) and Nuveen Fund Advisors, Inc. (“NFA”) each serve as investment sub-advisor to each fund pursuant to separate investment sub-advisory agreements with USBAM. NAM makes investment decisions for the funds, places purchase and sale orders for each fund’s portfolio transactions, and employs the funds’ portfolio managers and the securities analysts that provide research services relating to the funds. NFA provides certain other investment sub-advisory services to the funds, including assisting in the supervision of each fund’s investment program, risk monitoring, managing the forms and level of leverage employed by a fund, assisting in dividend and distribution level determinations, providing tax advice on issues arising in connection with management of a fund’s portfolio, and assisting with pricing of a fund’s portfolio securities.
With respect to each fund, USBAM pays monthly fees to NAM and NFA for the services provided under their respective sub-advisory agreements with USBAM. For ASP, BSP, and CSP, USBAM pays NAM a monthly fee in an amount equal to an annualized rate of 0.10% of the respective fund’s average weekly net assets and 3.00% of the daily gross income accrued by such fund during the month (i.e., investment income, including amortization of discount income, other than gains from the sale of securities or gains received from options and futures contracts less interest on money borrowed by the fund). The monthly investment sub-advisory fee shall not exceed, in the aggregate, 1/12 of 0.45% of the respective fund’s average weekly net assets during the month (approximately 0.45% on an annual basis). For SLA, USBAM pays NAM a monthly fee in an amount equal to an annualized rate of 0.30% of the fund’s average weekly net assets.
For ASP, BSP, and CSP, USBAM pays NFA a monthly fee in an amount equal to 1.50% of the daily gross income accrued by the respective fund during the month (i.e., investment income, including amortization of discount income, other than gains from the sale of securities or gains received from options and futures contracts less interest on money borrowed by the fund). The monthly investment sub-advisory fee shall not exceed, in the aggregate, 1/12 of 0.175% of the respective fund’s average weekly net assets during the month (approximately 0.175% on an annual basis). For SLA, USBAM pays NFA a monthly fee in an amount equal to an annualized rate of 0.10% of the funds average weekly net assets.
Administration Fees
USBAM serves as the funds’ administrator pursuant to administration agreements between USBAM and each fund. Under these agreements, USBAM receives a monthly administration fee from each fund in an amount equal to 0.25% of the fund’s average weekly net assets. For its fee, USBAM provides numerous services to the funds including, but not limited to, handling the general business affairs, financial and regulatory reporting, and various other services.
Pursuant to a sub-administration agreement between USBAM and NFA, USBAM also pays NFA an annual fee, calculated weekly and paid monthly, equal to 0.10% of the average weekly net assets of each fund for certain administrative and other services that NFA provides to the funds.
| | | | |
| 56 | | FIRST AMERICAN MORTGAGE FUNDS | | 2011 ANNUAL REPORT |
Custodian Fees
U.S. Bank serves as each fund’s custodian pursuant to a custodian agreement with the funds. The custodian fee charged to each fund is equal to an annual rate of 0.02% of such fund’s average weekly net assets. These fees are computed weekly and paid monthly.
Under the custodian agreement, interest earned on uninvested cash balances is used to reduce a portion of each fund’s custodian expenses. These credits, if any, are disclosed as “Indirect payments from custodian” in the Statements of Operations. Conversely, the custodian charges a fee for any cash overdrafts incurred, which will increase the fund’s custodian expenses. For the fiscal year ended August 31, 2011, custodian fees for ASP, BSP, CSP, and SLA were increased by $20, $230, $73, and $77 as a result of overdrafts and reduced by $4, $17, $30, and $12 as a result of interest earned, respectively.
Mortgage Servicing Fees
The funds may enter into mortgage servicing agreements with mortgage servicers for whole loans and participation mortgages. For a fee, mortgage servicers maintain loan records, such as insurance and taxes and the proper allocation of payments between principal and interest.
Other Fees and Expenses
In addition to the investment advisory, administrative, custodian, and mortgage servicing fees, the funds are responsible for paying most other operating expenses, including: legal, auditing and accounting services, postage and printing of shareholder reports, transfer agent fees and expenses, listing fees, outside directors’ fees and expenses, insurance, pricing, interest, expenses related to real estate owned, fees to outside parties retained to assist in conducting due diligence, taxes, and other miscellaneous expenses. For the fiscal year ended August 31, 2011, legal fees and expenses of $6,670, $6,670, $6,670, $6,670 for ASP, BSP, CSP, and SLA, respectively, were paid to a law firm of which an Assistant Secretary of the funds is a partner.
Expenses that are directly related to a fund are charged directly to that fund. Other operating expenses of the First American Family of Funds are allocated to the funds on several bases, including evenly across all funds, allocated based on relative net assets of all funds within the First American Family of Funds or a combination of both methods.
Cost of purchases and proceeds from sales of securities and real estate, other than temporary investments in short-term securities, for the fiscal year ended August 31, 2011, were as follows:
| | | | | | | | |
Fund | | Cost of
Purchases | | | Proceeds
from Sales | |
ASP | | $ | 9,095,178 | | | $ | 8,879,147 | |
BSP | | | 26,208,968 | | | | 41,948,904 | |
CSP | | | 35,313,876 | | | | 51,720,767 | |
SLA | | | 17,823,955 | | | | 23,137,184 | |
The funds enter into contracts that contain a variety of indemnifications. The funds’ maximum exposure under these arrangements is unknown. However, the funds have not had prior claims or losses pursuant to these contracts and expect the risk of loss to be remote.
In May 2011, the Financial Accounting Standards Board issued Accounting Standards Update (“ASU”) No. 2011-04 “Amendments to Achieve Common Fair Value Measurement and Disclosure Requirements in U.S. GAAP and IFRSs.” ASU No. 2011-04 requires additional disclosures regarding fair value measurements. Effective for fiscal years beginning after December 15, 2011, and for interim periods within those fiscal years, entities will need to disclose the following:
| | 1) | the amounts of any transfers between Level 1 and Level 2 and the reasons for those transfers, and |
| | | | | | |
| FIRST AMERICAN MORTGAGE FUNDS | | 2011 ANNUAL REPORT | | | 57 | |
Notes to Financial Statements
| | 2) | for Level 3 fair value measurements, quantitative information about the significant unobservable inputs used, a description of the entity’s valuation processes, and a narrative description of the sensitivity of the fair value measurement to changes in the unobservable inputs and the interrelationship between inputs. |
Management has adopted certain components as disclosed in the financial statements. Other components of the standard are not yet applicable and management is in the process of evaluating the implications.
On December 31, 2010, USBAM and its parent company, U.S. Bank sold a portion of USBAM’s asset management business to Nuveen Investments, Inc. (“Nuveen”). Included in the sale was that part of USBAM’s asset management business that advises the First American equity, fixed income, and asset allocation open-end funds, not including the First American money market funds or the First American Closed-End Funds (the “Closed-End Funds”). USBAM continues to serve as investment advisor to the First American money market funds and the Closed-End Funds.
On October 7, 2010, the Closed-End Funds’ board of directors considered and approved new investment sub-advisory agreements between USBAM and each of NAM and NFA, under which NAM and NFA provide certain investment advisory services to the Closed-End Funds. The sub-advisory agreements were submitted to their respective fund’s shareholders for their approval and took effect on January 1, 2011. There were no changes in the funds’ investment objectives, policies, or expenses as a result of the sub-advisory agreements between USBAM and NAM and NFA. John G. Wenker of Nuveen continues to serve as lead portfolio manager of First American Mortgage Funds.
On December 22, 2010, the Regulated Investment Company Modernization Act of 2010 (the “Modernization Act”) became effective. The Modernization Act is the first major piece of legislation affecting RICs since 1986, and it modernizes several of the federal income and excise tax provisions related to RICs. Some highlights of the enacted provisions are as follows:
New capital losses may now be carried forward indefinitely and retain the character of the original loss. Under pre-enactment law, capital losses could be carried forward for eight years, and carried forward as short-term capital, irrespective of the character of the original loss.
The Modernization Act contains simplification provisions, which are aimed at preventing disqualification of a RIC for “inadvertent” failures of the asset diversification and/or qualifying income tests. Additionally, the Modernization Act exempts RICs from the preferential dividend rule and repealed the 60-day designation requirement for certain types of pay-through income and gains.
Finally, the Modernization Act contains several provisions aimed at preserving the character of distributions made by a fiscal year RIC during the portion of its taxable year ending after October 31 or December 31, reducing the circumstances under which a RIC might be required to file amended Forms 1099 to restate previously reported distributions.
On September 23, 2011, USBAM announced that the funds’ board of directors had determined to eliminate the level distribution policies that were in place for each fund. The elimination of the level distribution policies was effective with the October 2011 distributions.
On October 4, 2011, BSP acquired Office City Plaza through foreclosure.
| | | | |
| 58 | | FIRST AMERICAN MORTGAGE FUNDS | | 2011 ANNUAL REPORT |
| | |
| Notice to Shareholders | | (unaudited) |
TERMS AND CONDITIONS OF THE DIVIDEND REINVESTMENT PLAN
As a shareholder, you may choose to participate in the Dividend Reinvestment Plan. It’s a convenient and economical way to buy additional shares of the funds by automatically reinvesting dividends and capital gains. The plan is administered by Computershare Trust Company, N.A. (“Computershare”), the plan agent.
Eligibility/Participation
You may join the plan at any time. Reinvestment of distributions will begin with the next distribution paid, provided your request is received before the record date for that distribution.
If your shares are in certificate form, you may join the plan directly and have your distributions reinvested in additional shares of your funds. To enroll in this plan, call Computershare at 800-543-5523. If your shares are registered in your brokerage firm’s name or another name, ask the holder of your shares how you may participate.
If you are a beneficial owner and wish to join the plan, you must contact your bank, broker or other nominee to arrange participation in the plan on your behalf.
Alternatively, if you are a beneficial owner of our common stock, you may simply request that the number of shares of our common stock you wish to enroll in the plan be re-registered by the bank, broker or other nominee in your own name as record stockholder. You can then directly participate in the plan as described above. You should contact your bank, broker or nominee for information on how to re-register your shares.
Plan Administration
For each fund, beginning no more than three business days before the dividend payment date, Computershare will buy shares of the fund on the NYSE or elsewhere on the open market only when the price of the fund’s shares on the NYSE plus commissions is less than a 5% premium over the fund’s most recently calculated net asset value (“NAV”) per share. If, at the close of business on the dividend payment date, the shares purchased in the open market are insufficient to satisfy the dividend reinvestment requirement, Computershare will accept payment of the dividend, or the remaining portion, in authorized but unissued shares of the fund. These shares will be issued at a per-share price equal to the higher of (a) the NAV per share as of the close of business on the payment date or (b) 95% of the closing market price per share on the payment date.
By participating in the dividend reinvestment plan, you may receive benefits not available to shareholders who elect not to participate. For example, if the market price plus commissions of the funds’ shares is 5% or more above the NAV, you will receive shares at a discount of up to 5% from the current market value. However, if the market price plus commissions is below the NAV, you will receive distributions in shares with an NAV greater than the value of any cash distributions you would have received.
There is no direct charge for reinvestment of dividends and capital gains, since Computershare fees are paid for by the funds. However, if fund shares are purchased in the open market, each participant pays a pro rata portion of the brokerage commissions. Brokerage charges are expected to be lower than those for individual transactions because shares are purchased for all participants in blocks. As long as you continue to participate in the plan, distributions paid on the shares in your account will be reinvested.
Computershare maintains accounts for plan participants holding shares in certificate form and will furnish written confirmation of all transactions, including information you need for tax records. Reinvested shares in your account will be held by Computershare in noncertificated form in your name.
Tax Information
Distributions invested in additional shares of the funds are subject to income tax, to the same extent as if received in cash. When shares are issued by a fund at a discount from market value, shareholders will be treated as having received distributions of an amount equal to the full market value of those shares. Shareholders, as required by the Internal Revenue Service, will receive a Form 1099-DIV regarding the federal tax status of the prior year’s distributions.
| | | | | | |
| FIRST AMERICAN MORTGAGE FUNDS | | 2011 ANNUAL REPORT | | | 59 | |
| | |
| Notice to Shareholders | | (unaudited) |
Plan Withdrawal
If you hold your shares in certificate form, you may terminate your participation in the plan at any time by giving written notice to Computershare or by calling Computershare at 800-426-5523. If your shares are registered in your brokerage firm’s name, you may terminate your participation via verbal or written instructions to your investment professional. Written instructions should include your name and address as they appear on the certificate or account.
If notice is received before the record date, all future distributions will be paid directly to the shareholder of record.
If your shares are issued in certificate form and you discontinue your participation in the plan, you (or your nominee) will receive an additional certificate for all full shares and a check for any fractional shares in your account.
Plan Amendment/Termination
Each fund reserves the right to amend or terminate the plan. Should the plan be amended or terminated, participants will be notified in writing at least 90 days before the record date for such dividend or distribution. The plan may also be amended or terminated by Computershare with at least 90 days written notice to participants in the plan.
Any questions about the plan should be directed to your investment professional or to Computershare Trust Company, N.A., P.O. Box 43078, Providence, RI 02940-3078, 800-426-5523.
TAX INFORMATION
The following per-share information describes the federal tax treatment of distributions made during the fiscal period. Distributions for the calendar year will be reported to you on Form 1099-DIV. Please consult a tax advisor on how to report these distributions at the state and local levels.
Income Distributions (the funds designate the following amounts as ordinary income distributions)
| | | | | | | | | | | | | | | | |
Payable Date | | ASP
Amount | | | BSP
Amount | | | CSP
Amount | | | SLA
Amount | |
September 22, 2010 | | $ | 0.1090 | | | $ | 0.1050 | | | $ | 0.0980 | | | $ | 0.1160 | |
October 20, 2010 | | | 0.1090 | | | | 0.1050 | | | | 0.0980 | | | | 0.1160 | |
November 17, 2010 | | | 0.1090 | | | | 0.1050 | | | | 0.0980 | | | | 0.1160 | |
December 15, 2010 | | | 0.1090 | | | | 0.1050 | | | | 0.0980 | | | | 0.1160 | |
January 12, 2011 | | | 0.1090 | | | | 0.1050 | | | | 0.0980 | | | | 0.1160 | |
February 16, 2011 | | | 0.1090 | | | | 0.1050 | | | | 0.0980 | | | | 0.1160 | |
March 23, 2011 | | | 0.0979 | | | | 0.0838 | | | | 0.0800 | | | | 0.0890 | |
April 20, 2011 | | | 0.0979 | | | | 0.0838 | | | | 0.0800 | | | | 0.0890 | |
May 18, 2011 | | | 0.0979 | | | | 0.0838 | | | | 0.0800 | | | | 0.0890 | |
June 22, 2011 | | | 0.0979 | | | | 0.0838 | | | | 0.0800 | | | | 0.0890 | |
July 20, 2011 | | | 0.0979 | | | | 0.0838 | | | | 0.0800 | | | | 0.0890 | |
August 24, 2011 | | | 0.0979 | | | | 0.0838 | | | | 0.0800 | | | | 0.0890 | |
| | | | | | | | | | | | | | | | |
| | $ | 1.2414 | | | $ | 1.1328 | | | $ | 1.0680 | | | $ | 1.2300 | |
| | | | | | | | | | | | | | | | |
For the fiscal year ended August 31, 2011, each fund designates long-term capital gains, ordinary income, and return of capital with regard to distributions paid during the period as follows:
| | | | | | | | | | | | | | | | |
Fund | | Long-Term
Capital Gains
Distributions
(Tax Basis) (a) | | | Ordinary
Income
Distributions
(Tax Basis) (a) | | | Return of
Capital
(Tax Basis) (a) | | | Total
Distributions
(Tax Basis) (b) | |
ASP | | | 0.0 | % | | | 69.1 | % | | | 30.9 | % | | | 100.0 | % |
BSP | | | 0.0 | | | | 51.1 | | | | 48.9 | | | | 100.0 | |
CSP | | | 0.0 | | | | 42.1 | | | | 57.9 | | | | 100.0 | |
SLA | | | 0.0 | | | | 67.8 | | | | 32.2 | | | | 100.0 | |
| (a) | Based on a percentage of the fund’s total distributions. |
| (b) | Except as noted below, none of the distributions made by these funds are eligible for the dividends received deduction or are characterized as qualified dividend income. |
| | | | |
| 60 | | FIRST AMERICAN MORTGAGE FUNDS | | 2011 ANNUAL REPORT |
Shareholder Notification of Federal Tax Status:
ASP, BSP, CSP, and SLA, designate 0.00%, 0.00%, 0.00%, and 0.00% of ordinary income distributions during the fiscal year ended August 31, 2011 as dividends qualifying for the dividends received deduction available to corporate shareholders, respectively.
In addition, ASP, BSP, CSP, and SLA, designate 0.27%, 0.16%, 0.12%, and 0.11% of the ordinary income distributions from net investment income during the fiscal year ended August 31, 2011 as qualifying dividend income available to individual shareholders under the Jobs and Growth Tax Relief Reconciliation Act of 2003, respectively.
Additional Information Applicable to Foreign Shareholders Only:
The percentage of taxable ordinary income distributions that are designated as interest-related dividends under Internal Revenue Code Section 871(k)(1)(C) for ASP, BSP, CSP, and SLA was 81.24%, 85.38%, 78.11%, and 81.61%, respectively.
The percentage of taxable ordinary income distributions that are designated as short-term capital gain distributions under Internal Revenue Code Section 871(k)(2)(C) for ASP, BSP, CSP, and SLA, was 0.00%, 0.00%, 0.00%, and 0.00%, respectively.
HOW TO OBTAIN A COPY OF THE FUNDS’ PROXY VOTING POLICIES AND PROXY VOTING RECORD
A description of the policies and procedures that the funds use to determine how to vote proxies relating to portfolio securities is available at firstamericanfunds.com and on the website of the U.S. Securities and Exchange Commission (“SEC”) at www.sec.gov. A description of the funds’ policies and procedures is also available without charge upon request by calling 800.677.3863. Information regarding how each fund voted proxies relating to portfolio securities is available on the SEC’s website at www.sec.gov or by calling the funds at 800.677.3863.
FORM N-Q HOLDINGS INFORMATION
The funds are required to file their complete schedule of portfolio holdings for the first and third quarters of each fiscal year with the SEC on Form N-Q. The funds’ Forms N-Q are available without charge (1) upon request by calling 800.677.3863 and (2) on the SEC’s website at www.sec.gov. In addition, you may review and copy the funds’ Forms N-Q at the SEC’s Public Reference Room in Washington D.C. You may obtain information on the operation of the Public Reference Room by calling 800.SEC.0330.
QUARTERLY PORTFOLIO HOLDINGS
The funds will make portfolio holdings information publicly available by posting the information at firstamericanfunds.com on a quarterly basis. The funds will attempt to post such information within 10 business days of the calendar quarter-end.
CERTIFICATIONS
In January 2011, the funds’ Chief Executive Officer submitted to the NYSE his annual certification required under Section 303A.12(a) of the NYSE corporate governance rules. The certifications of the funds’ Principal Executive Officer and Principal Financial Officer required pursuant to Rule 30a-2 under the Investment Company Act of 1940 have been filed with the funds’ Form N-CSR filings and are available on the SEC’s website at www.sec.gov.
APPROVAL OF THE FUND’S INVESTMENT ADVISORY AGREEMENT AND SUB-ADVISORY AGREEMENTS
The Board of Directors of the Fund (the “Board”), which is comprised entirely of independent directors, oversees the management of the Funds and, as required by law, determines annually whether to renew each Fund’s advisory agreement with U.S. Bancorp Asset Management, Inc. (“USBAM”). In addition to determining whether to renew each Fund’s advisory agreement with USBAM (each, an “Agreement”), the Board is also responsible for determining whether to renew sub-advisory agreements (the “Sub-Advisory Agreements”) for each Fund.
At a meeting on June 21-22, 2011, the Board considered information relating to each Agreement, and information relating to USBAM’s sub-advisory agreements with Nuveen Asset Management, LLC (“NAM”) and Nuveen Fund
| | | | | | |
| FIRST AMERICAN MORTGAGE FUNDS | | 2011 ANNUAL REPORT | | | 61 | |
| | |
| Notice to Shareholders | | (unaudited) |
Advisors, Inc. (“NFA”) (each, a “Sub-Advisor” and collectively, the “Sub-Advisors”). In advance of the meeting, the Board received materials relating to the Agreement and the Sub-Advisory Agreements (collectively, the “Agreements”) and had the opportunity to ask questions and request further information in connection with its consideration. The Board approved the Agreements through June 30, 2012.
In considering the Agreements, the Board, advised by independent legal counsel, reviewed and considered the factors it deemed relevant, including: (1) the nature, quality and extent of USBAM’s and the Sub-Advisors’ services to the Funds, (2) the investment performance of each Fund, (3) the profitability of USBAM and the Sub-Advisors related to each Fund, including an analysis of the cost of providing services and comparative expense information, and (4) other benefits that accrue to USBAM and the Sub-Advisors through their respective relationship with each Fund. When reviewing and approving investment company advisory contracts, boards of directors generally also consider the extent to which economies of scale will be realized as the investment company grows and whether fee levels reflect these economies of scale for the benefit of shareholders. The Board determined, however, that because the Funds are closed-end funds which, absent a secondary offering, will not issue additional shares, a consideration of economies of scale was not relevant to its evaluation of the Agreements. In its deliberations, the Board did not identify any single factor which alone was responsible for the Board’s decision to approve the Agreements.
Before approving the Agreements, the independent directors met in executive session with their independent counsel on numerous occasions to consider the materials provided by USBAM and the Sub-Advisors and the terms of the Agreements. Based on its evaluation of those materials, the Board concluded that the Agreements are fair and in the best interests of the Funds’ shareholders. In reaching its conclusions, the Board considered the following:
Nature, Quality and Extent of Investment Advisory Services
The Board examined the nature, quality and extent of the services provided by USBAM to each Fund, and the nature, quality and extent of the services provided by the Sub-Advisors to each Fund. The Board reviewed NAM’s key personnel who provide investment management services to the Funds as well as the fact that NAM and NFA have the authority and responsibility to make and execute investment decisions for each Fund within the framework of the Fund’s investment policies and restrictions, subject to the supervision of USBAM and review by the Board. The Board further considered that NAM and NFA’s duties with respect to the Funds include investment research and security selection, and adherence to (and monitoring compliance with) the Funds’ investment policies and restrictions and the Investment Company Act of 1940.
The Board considered USBAM’s responsibilities with respect to the Funds, which include monitoring the performance of the Sub-Advisors and various organizations providing services to the Funds, including the Funds’ sub-administrator, transfer agent and custodian. Finally, the Board considered USBAM’s representation that the services provided by USBAM under the Agreements are the type of services customarily provided by investment advisors in the fund industry.
Based on the foregoing, the Board concluded that the Fund is likely to benefit from the nature, quality and extent of the services provided by USBAM and the Sub-Advisors under the Agreements.
Investment Performance of the Funds
The Board considered the performance of each Fund on a gross-of-expenses basis, including how the Fund performed versus the median performance of a group of comparable funds selected by an independent data service (the “performance universe”) and how each Fund performed versus its benchmark index for the one-, three- and five-year periods ending February 28, 2011.
American Select Portfolio. The Board noted that the Fund outperformed its benchmark index for all periods, though it underperformed its performance universe median for all periods. The Board considered USBAM’s assertion that the Fund’s performance universe is composed of only eight funds, five of which are First American funds, and that as a result, the Fund’s benchmark index is a better standard against which to measure the Fund’s performance. In light of the Fund’s competitive performance against its benchmark index, the Board concluded it would be in the interest of the Fund and its shareholders to renew the Agreements.
| | | | |
| 62 | | FIRST AMERICAN MORTGAGE FUNDS | | 2011 ANNUAL REPORT |
American Strategic Income Portfolio. The Board noted that the Fund outperformed both its performance universe median and its benchmark index for all periods. In light of the foregoing, the Board concluded it would be in the interest of the Fund and its shareholders to renew the Agreements.
American Strategic Income Portfolio II. The Board noted that the Fund outperformed its benchmark index for all periods, though it underperformed its performance universe median for all periods. The Board considered USBAM’s assertion that the Fund’s performance universe is composed of only eight funds, five of which are First American funds, and that as a result, the Fund’s benchmark index is a better standard against which to measure the Fund’s performance. In light of the Fund’s competitive performance against its benchmark index, the Board concluded it would be in the interest of the Fund and its shareholders to renew the Agreements.
American Strategic Income Portfolio III. The Board noted that the Fund outperformed its benchmark index for the one-year period, although it underperformed its benchmark index for the three- and five-year periods. The Board also noted that the Fund underperformed its performance universe median for all periods. The Board considered USBAM’s assertion that the Fund’s performance universe is composed of only eight funds, five of which are First American funds, and that as a result, the Fund’s benchmark index is a better standard against which to measure the Fund’s performance. The Board also considered USBAM’s assertion that the Fund’s underperformance relative to its benchmark index for the three- and five-year periods was attributable primarily to credit issues regarding certain whole loans held by the Fund. The Board noted that the Fund performed competitively on a net-of-expenses basis against both its performance universe median and its benchmark index in each of the seven one-year periods ended February 28 (or 29), 2002-2008. Further, the Board noted that the Fund outperformed both its benchmark index and performance universe median on a gross-of-expenses basis for the quarter ended March 31, 2011. In light of the Fund’s strong recent performance against its benchmark index, the Board concluded it would be in the interest of the Fund and its shareholders to renew the Agreements.
Costs of Services and Profits Realized by USBAM
The Board reviewed USBAM’s costs in serving as each Fund’s investment manager, including the costs associated with the personnel and systems necessary to manage the Funds. The Board also considered the profitability of USBAM and its affiliates resulting from their relationship with the Funds. The Board compared fee and expense information for the Funds to fee and expense information for comparable funds managed by other advisors. The Board also reviewed advisory fees for other funds advised or sub-advised by USBAM and for other accounts managed by USBAM.
Using information provided by an independent data service, the Board also evaluated each Fund’s advisory fee compared to the median advisory fee for other funds similar in size, character and investment strategy, and each Fund’s total expense ratio compared to the median total expense ratio of comparable funds. The Board noted that, for each Fund, the Fund’s advisory fee was lower than the peer group median advisory fee, though the Fund’s total expense ratio was higher than the peer group median total expense ratio. The Board considered USBAM’s assertion that the Funds incur investment-related expenses, including mortgage servicing fees from the Funds’ investments in whole loans, which other funds in the fund expense group do not incur because they do not invest in whole loans. The Board also considered USBAM’s assertion that, excluding the investment-related expenses, each Fund’s total expenses were lower than its peer group median total expense ratio. The Board concluded that each Fund’s advisory fee and total expense ratio are reasonable in light of the services provided.
Other Benefits to USBAM
In evaluating the benefits that accrue to USBAM through its relationship with the Funds, the Board noted that USBAM and certain of its affiliates serve the Funds in various capacities, including as investment advisor, administrator and custodian, and receive compensation from the Funds in connection with providing services to the Funds. The Board considered that each service provided to the Funds by USBAM or one of its affiliates is pursuant to a written agreement, which the Board evaluates periodically as required by law.
After full consideration of these factors, the Board concluded that approval of the Agreements and the Sub-Advisory Agreements was in the interest of each Fund and its shareholders.
| | | | | | |
| FIRST AMERICAN MORTGAGE FUNDS | | 2011 ANNUAL REPORT | | | 63 | |
| | |
| Notice to Shareholders | | (unaudited) |
Directors and Officers of the Funds
Independent Directors
| | | | | | | | | | |
Name, Address, and
Year of Birth | | Position(s)
Held with
Funds | | Term of Office and
Length of Time Served | | Principal Occupation(s)
During Past 5 Years | | Number of Portfolios
in Fund Complex
Overseen by Director | | Other
Directorships
Held by
Director† |
Roger A. Gibson
P.O. Box 1329
Minneapolis, MN 55440-1329
(1946) | | Director | | Directors serve for a one-year term that expires at the next annual meeting of shareholders. Director of ASP, BSP, CSP, and SLA since August 1998 | | Director, Charterhouse Group, Inc., a private equity firm, since October 2005; Advisor/Consultant, Future FreightTM, a logistics/supply chain company; Director, Towne Airfreight; non-profit board member; prior to retirement in 2005, served in several executive positions for United Airlines, including Vice President and Chief Operating Officer – Cargo | | First American Funds Complex: 10 registered investment companies, including 14 portfolios | | None |
Victoria J. Herget
P.O. Box 1329
Minneapolis, MN 55440-1329
(1951) | | Director | | Directors serve for a one-year term that expires at the next annual meeting of shareholders. Director of ASP, BSP, CSP, and SLA since September 2003 | | Investment consultant and non-profit board member; Board Chair, United Educators Insurance Company | | First American Funds Complex: 10 registered investment companies, including 14 portfolios | | None |
John P. Kayser
P.O. Box 1329
Minneapolis, MN 55440-1329
(1949) | | Director | | Directors serve for a one-year term that expires at the next annual meeting of shareholders. Director of ASP, BSP, CSP, and SLA since October 2006 | | Retired | | First American Funds Complex: 10 registered investment companies, including 14 portfolios | | None |
Leonard W. Kedrowski
P.O. Box 1329
Minneapolis, MN 55440-1329
(1941) | | Chair; Director | | Chair term three years. Directors serve for a one-year term that expires at the next annual meeting of shareholders. Chair of ASP, BSP, CSP, and SLA since January 2011; Director of ASP, BSP, CSP, and SLA since August 1998 | | Owner and President, Executive and Management Consulting, Inc., a management consulting firm; Chief Executive Officer, Blue Earth Internet, a web site development company; Board member, GC McGuiggan Corporation (dba Smyth Companies), a label printer; Member, investment advisory committee, Sisters of the Good Shepherd | | First American Funds Complex: 10 registered investment companies, including 14 portfolios | | None |
Richard K. Riederer
P.O. Box 1329
Minneapolis, MN 55440-1329
(1944) | | Director | | Directors serve for a one-year term that expires at the next annual meeting of shareholders. Director of ASP, BSP, CSP, and SLA since August 2001 | | Owner and Chief Executive Officer, RKR Consultants, Inc., a consulting company providing advice on business strategy, mergers and acquisitions; non-profit board member since 2005 | | First American Funds Complex: 10 registered investment companies, including 14 portfolios | | Cliffs Natural Resources, Inc. (a producer of iron ore pellets and coal) |
Joseph D. Strauss P.O. Box 1329 Minneapolis, MN 55440-1329 (1940) | | Vice Chair; Director | | Directors serve for a one-year term that expires at the next annual meeting of shareholders. Vice Chair of ASP, BSP, CSP, and SLA since January 2011; Director of ASP, BSP, CSP, and SLA since August 1998 | | Attorney At Law, Owner and President, Strauss Management Company, a Minnesota holding company for various organizational management business ventures; Owner, Chairman, and Chief Executive Officer, Community Resource Partnerships, Inc., a corporation engaged in strategic planning, operations management, government relations, transportation planning, and public relations; Chairman, ExcensusTM, LLC, a demographic planning and application development firm | | First American Funds Complex: 10 registered investment companies, including 14 portfolios | | None |
James M. Wade P.O. Box 1329 Minneapolis, MN 55440-1329 (1943) | | Director | | Directors serve for a one-year term that expires at the next annual meeting of shareholders. Director of ASP, BSP, CSP, and SLA since August 2001 | | Owner and President, Jim Wade Homes, a homebuilding company | | First American Funds Complex: 10 registered investment companies, including 14 portfolios | | None |
| † | Includes only directorships in a company with a class of securities registered pursuant to Section 12 of the Securities Exchange Act or subject to the requirements of Section 15(d) of the Securities Exchange Act, or any company registered as an investment company under the Investment Company Act. |
| | | | |
| 64 | | FIRST AMERICAN MORTGAGE FUNDS | | 2011 ANNUAL REPORT |
Officers
| | | | | | |
| Name, Address, and Year of Birth | | Position(s)
Held with
Funds | | Term of Office and Length of Time Served | | Principal Occupation(s) During Past 5 Years |
Joseph M. Ulrey III
U.S. Bancorp Asset Management, Inc. 800 Nicollet Mall
Minneapolis, MN 55402 (1958)* | | President | | Re-elected by the Board annually; President of ASP, BSP, CSP, and SLA since January 2011 | | Chief Executive Officer, U.S. Bancorp Asset Management, Inc., since January 2011; prior thereto, Chief Financial Officer and Head of Technology and Operations, U.S. Bancorp Asset Management, Inc. |
John G. Wenker Nuveen Asset
Management, LLC 800 Nicollet Mall
Minneapolis, MN 55402 (1951)* | | Senior Vice President | | Re-elected by the Board annually; Senior Vice President of ASP, BSP, CSP, and SLA since November 1996 | | Managing Director, Head of Real Assets, Nuveen Asset Management, LLC since January 2011; prior thereto, Managing Director, U.S. Bancorp Asset Management, Inc. |
David A. Yale Nuveen Asset
Management, LLC 800 Nicollet Mall
Minneapolis, MN 55402 (1956)* | | Vice President | | Re-elected by the Board annually; Vice President of ASP, BSP, CSP, and SLA since June 2007 | | Senior Vice President, Portfolio Manager, Nuveen Asset Management, LLC since January 2011; prior thereto, Senior Real Estate Portfolio Manager, U.S. Bancorp Asset Management, Inc. |
Eric J. Thole U.S. Bancorp Asset Management, Inc. 800 Nicollet Mall
Minneapolis, MN 55402 (1972)* | | Vice President | | Re-elected by the Board annually; Vice President of ASP, BSP, CSP, and SLA since January 2011 | | Head of Treasury, Technology, and Operations, U.S. Bancorp Asset Management, Inc., since January 2011; prior thereto, Director of Investment Operations, U.S. Bancorp Asset Management, Inc. |
Jill M. Stevenson U.S. Bancorp Asset Management, Inc. 800 Nicollet Mall
Minneapolis, MN 55402 (1965)* | | Treasurer | | Re-elected by the Board annually; Treasurer of ASP, BSP, CSP, and SLA since January 2011; Assistant Treasurer of ASP, BSP, CSP, and SLA from September 2005 through December 2010 | | Mutual Funds Treasurer, U.S. Bancorp Asset Management, Inc., since January 2011; prior thereto, Mutual Funds Assistant Treasurer, U.S. Bancorp Asset Management, Inc. |
Ruth M. Mayr U.S. Bancorp Asset Management, Inc. 800 Nicollet Mall
Minneapolis, MN 55402 (1959)* | | Chief Compliance Officer | | Re-elected by the Board annually; Chief Compliance Officer of ASP, BSP, CSP, and SLA since January 2011 | | Chief Compliance Officer, U.S. Bancorp Asset Management, Inc., since January 2011; prior thereto, Director of Compliance, U.S. Bancorp Asset Management, Inc. |
Carol A. Sinn U.S. Bancorp Asset Management, Inc. 800 Nicollet Mall
Minneapolis, MN 55402 (1959)* | | Anti-Money Laundering Officer | | Re-elected by the Board annually; Anti-Money Laundering Officer of ASP, BSP, CSP, and SLA since January 2011 | | Senior Business Line Risk Manager, U.S. Bancorp Asset Management, Inc. |
Richard J. Ertel U.S. Bancorp Asset Management, Inc. 800 Nicollet Mall
Minneapolis, MN 55402 (1967)* | | Secretary | | Re-elected by the Board annually; Secretary of ASP, BSP, CSP, and SLA since January 2011; Assistant Secretary of ASP, BSP, CSP, and SLA from June 2006 through December 2010 and from June 2003 through August 2004 | | General Counsel, U.S. Bancorp Asset Management, Inc., since January 2011; prior thereto, Counsel, U.S. Bancorp Asset Management, Inc. |
James D. Alt Dorsey & Whitney LLP 50 South Sixth Street
Suite 1500, Minneapolis, MN 55402
(1951) | | Assistant Secretary | | Re-elected by the Board annually; Assistant Secretary of ASP, BSP, CSP, and SLA since December 2004; Secretary of ASP, BSP, CSP, and SLA from June 2002 through December 2004; Assistant Secretary of ASP, BSP, CSP, and SLA from September 1999 through June 2002 | | Partner, Dorsey & Whitney LLP, a Minneapolis-based law firm |
James R. Arnold U.S. Bancorp Fund
Services, LLC 615 E. Michigan Street Milwaukee, WI 53202
(1957)* | | Assistant Secretary | | Re-elected by the Board annually; Assistant Secretary of ASP, BSP, CSP, and SLA since January 2011 | | Senior Vice President, U.S. Bancorp Fund Services, LLC |
| * | Messrs. Ulrey, Thole, and Ertel, and Mses. Stevenson, Mayr, and Sinn are each officers and/or employees of U.S. Bancorp Asset Management, Inc., which serves as investment adviser and administrator for the funds. Mr. Arnold is an officer of U.S. Bancorp Fund Services, LLC, which is a subsidiary of U.S. Bancorp. |
| | | | | | |
| FIRST AMERICAN MORTGAGE FUNDS | | 2011 ANNUAL REPORT | | | 65 | |
First American Funds’ Privacy Policy
We want you to understand what information we collect and how it’s used.
“Nonpublic personal information” is nonpublic information that we obtain while providing financial products or services to you.
How we collect your information
We obtain nonpublic information about you during the account opening process from the applications and other forms you are asked to complete and from the transactions you make with us. We may also receive nonpublic information about you from companies affiliated with us or from other companies that provide services to you. We do not use nonpublic information received from our affiliates for marketing purposes.
Why we collect your information
We gather nonpublic personal information about you and your accounts so that we can:
| • | | Know who you are and prevent unauthorized access to your information. |
| • | | Comply with the laws and regulations that govern us. |
The types of information we collect
We may collect the following nonpublic personal information about you:
| • | | Information about your identity, such as your name, address, and social security number. |
| • | | Information about your transactions with us. |
| • | | Information you provide on applications, such as your beneficiaries and banking information, if provided to us. |
Confidentiality and security
To protect nonpublic personal information about you, we restrict access to such information to only those employees and authorized agents who need to use the information. We maintain physical, electronic, and procedural safeguards to maintain the confidentiality and security of nonpublic information about you. In addition, we require our service providers to restrict access to nonpublic personal information about you to those employees who need that information in order to provide products or services to you. We also require them to maintain physical, electronic, and procedural safeguards that comply with applicable federal standards and regulations to guard your information.
What information we disclose
We may share some or all of the nonpublic personal information that we collect about you with our affiliated providers of financial services, including our family of funds and their advisor, and with companies that perform marketing services on our behalf.
We’re permitted by law to disclose nonpublic personal information about you to other third parties in certain circumstances. For example, we may disclose nonpublic personal information about you to affiliated and nonaffiliated third parties to assist us in servicing your account (e.g., mailing of fund-related materials) and to government entities (e.g., IRS for tax purposes).
We’ll continue to adhere to the privacy policies and practices described here even after your account is closed or becomes inactive.
Additional rights and protections
You may have other privacy protections under applicable state laws. To the extent that these state laws apply, we will comply with them when we share information about you. This privacy policy does not apply to your relationship with other financial service providers, such as broker-dealers. We may amend this privacy notice at any time, and we will inform you of changes as required by law.
Our pledge applies to products and services offered by
| | |
• First American Funds, Inc. • American Strategic Income Portfolio Inc. • American Strategic Income Portfolio Inc. II • American Strategic Income Portfolio Inc. III • American Select Portfolio Inc. | | • American Municipal Income Portfolio Inc. • Minnesota Municipal Income Portfolio Inc. • First American Minnesota Municipal Income Fund II, Inc. • American Income Fund Inc. |
|
| NOT FDIC INSURED NO BANK GUARANTEE MAY LOSE VALUE |
| | | | |
| 66 | | FIRST AMERICAN MORTGAGE FUNDS | | 2011 ANNUAL REPORT |
BOARD OF DIRECTORS
Leonard Kedrowski
Chairperson of First American Mortgage Funds
Owner and President of Executive and Management Consulting, Inc.
Joseph Strauss
Vice Chairperson of First American Mortgage Funds Owner and President of Strauss Management Company
Roger Gibson
Director of First American Mortgage Funds Director of Charterhouse Group, Inc.
Victoria Herget
Director of First American Mortgage Funds
Investment Consultant; Chair of United Educators Insurance Company; former Managing Director of Zurich Scudder Investments
John Kayser
Director of First American Mortgage Funds
Retired; former Principal of William Blair & Company, LLC
Richard Riederer
Director of First American Mortgage Funds
Owner and Chief Executive Officer of RKR Consultants, Inc.
James Wade
Director of First American Mortgage Funds Owner and President of Jim Wade Homes
First American Mortgage Funds’ Board of Directors is comprised entirely of independent directors.
P.O. Box 1330
Minneapolis, MN 55440-1330
American Strategic Income Portfolio Inc.
American Strategic Income Portfolio Inc. II
American Strategic Income Portfolio Inc. III
American Select Portfolio Inc.
2011 Annual Report
U.S. Bancorp Asset Management, Inc., is a
wholly owned subsidiary of U.S. Bank National
Association, which is a wholly owned subsidiary
of U.S. Bancorp.

| This document is printed on paper containing 10% postconsumer waste. |
10/2011 0144-11 WHOLELOAN-AR
Item 2—Code of Ethics
The registrant has adopted a code of ethics that applies to its principal executive officer and principal financial officer. During the period covered by this report, there were no amendments to the provisions of the registrant’s code of ethics that apply to the registrant’s principal executive officer and principal financial officer and that relate to any element of the code of ethics definition enumerated in this Item. During the period covered by this report, the registrant did not grant any waivers, including implicit waivers, from any provision of its code of ethics that apply to the registrant’s principal executive officer or principal financial officer. The registrant undertakes to provide to any person without charge, upon request, a copy of its code of ethics by calling 1-800-677-3863.
Item 3—Audit Committee Financial Expert
The registrant’s Board of Directors has determined that John P. Kayser and Richard K. Riederer, members of the registrant’s Audit Committee, are each an “audit committee financial expert” and are “independent,” as these terms are defined in this Item.
Item 4—Principal Accountant Fees and Services
| (a) | Audit Fees - Ernst & Young LLP (“E&Y”) billed the registrant audit fees totaling $31,541 in the fiscal year ended August 31, 2011 and $36,163 in the fiscal year ended August 31, 2010, including fees associated with the annual audit, SEC Rule 17f-2 security count filings and filings of the registrant’s Form N-CSR. |
| (b) | Audit-Related Fees - E&Y billed the registrant audit-related fees totaling $1,952 in the fiscal year ended August 31, 2011 and $3,010 in the fiscal year ended August 31, 2010, including fees associated with the semi-annual review of fund disclosures. |
| (c) | Tax Fees - E&Y billed the registrant fees of $5,720 in the fiscal year ended August 31, 2011 and $7,989 in the fiscal year ended August 31, 2010 for tax services, including tax compliance, tax advice and tax planning. Tax compliance, tax advice and tax planning services primarily related to preparation of original and amended tax returns, timely RIC qualification reviews, and tax distribution analysis and planning. |
| (d) | All Other Fees - There were no fees billed by E&Y for other services to the registrant during the fiscal years ended August 31, 2011 and August 31, 2010. |
| (e)(1) | The audit committee’s pre-approval policies and procedures pursuant to paragraph (c)(7) of Rule 2-01 of Regulation S-X are set forth below: |
Audit Committee policy regarding pre-approval of services provided by the Independent Auditor
The Audit Committee of the First American Funds (“Committee”) has responsibility for ensuring that all services performed by the independent audit firm for the funds do not impair the firm’s independence. This review is intended to provide reasonable oversight without removing management from its responsibility for day-to-day operations. In this regard, the Committee should:
| | • | | Understand the nature of the professional services expected to be provided and their impact on auditor independence and audit quality |
| | • | | Examine and evaluate the safeguards put into place by the Company and the auditor to safeguard independence |
| | • | | Meet quarterly with the partner of the independent audit firm |
| | • | | Consider approving categories of service that are not deemed to impair independence for a one-year period |
It is important that a qualitative rather than a mere quantitative evaluation be performed by the Committee in discharging its responsibilities.
Policy for Audit and Non-Audit Services Provided to the Funds
On an annual basis, the Committee will review and consider whether to pre-approve the financial plan for audit fees as well as categories of audit-related and non-audit services that may be performed by the funds’ independent audit firm
directly for the funds. At least annually the Committee will receive a report from the independent audit firm of all audit and non-audit services, which were approved during the year.
The engagement of the independent audit firm for any non-audit service requires the written pre-approval of the Treasurer of the funds and all non-audit services performed by the independent audit firm will be disclosed in the required SEC periodic filings.
In connection with the Committee review and pre-approval responsibilities, the review by the Committee will consist of the following:
Audit Services
The categories of audit services and related fees to be reviewed and considered for pre-approval annually by the Committee or its delegate include the following:
| | • | | Annual Fund financial statement audits |
| | • | | Seed audits (related to new product filings, as required) |
| | • | | SEC and regulatory filings and consents |
Audit-related Services
In addition, the following categories of audit-related services are deemed to be consistent with the role of the independent audit firm and, as such, will be considered for pre-approval by the Committee or its delegate, on an annual basis.
| | • | | Accounting consultations |
| | • | | Fund merger support services |
| | • | | Other accounting related matters |
| | • | | Agreed Upon Procedure Reports |
| | • | | Other Internal Control Reports |
Notwithstanding any annual pre-approval of these categories of services, individual projects with an estimated fee in excess of $25,000 are subject to pre-approval by the Committee Chair or its delegate on a case-by-case basis. Individual projects with an estimated fee in excess of $50,000 are subject to pre-approval by the Committee or its delegate on a case-by-case basis.
Tax Services
The following categories of tax services are deemed to be consistent with the role of the independent audit firm and, as such, will be considered for pre-approval by the Committee or its delegate, on an annual basis.
| | • | | Tax compliance services related to the filing or amendment of the following: |
| | • | | Federal, state and local income tax compliance, and |
| | • | | Sales and use tax compliance |
| | • | | Timely RIC qualification reviews |
| | • | | Tax distribution analysis and planning |
| | • | | Tax authority examination services |
| | • | | Tax appeals support services |
| | • | | Accounting methods studies |
| | • | | Fund merger support services |
| | • | | Tax consulting services and related projects |
Notwithstanding any annual pre-approval of these categories of services, individual projects with an estimated fee in excess of $25,000 are subject to pre-approval by the Committee Chair or its delegate on a case-by-case basis. Individual projects with an estimated fee in excess of $50,000 are subject to pre-approval by the Committee or its delegate on a case-by-case basis.
Other Non-audit Services
The SEC auditor independence rules adopted in response to the Sarbanes-Oxley Act specifically allow certain non-audit services. Because of the nature of these services, none of these services may be commenced by the independent audit firm without the prior approval of the Committee. The Committee may delegate this responsibility to one or more of the Committee members, with the decisions presented to the full Committee at the next scheduled meeting.
Proscribed Services
In accordance with SEC rules on independence, the independent audit firm is prohibited from performing services in the following categories of non-audit services:
| | • | | Accounting and bookkeeping services |
| | • | | Internal audit services |
| | • | | Financial information systems design and implementation |
| | • | | Valuation services supporting the financial statements |
| | • | | Actuarial services supporting the financial statements |
| | • | | Expert services (e.g., litigation support) |
Policy for Pre-approval of Non-Audit Services Provided to Other Entities within the Investment Company Complex
The Committee is also responsible for pre-approving certain non-audit services provided to USBAM, Inc., U.S. Bank N.A., Quasar Distributors, U.S. Bancorp Fund Services, LLC and any other entity under common control with USBAM, Inc., that provides ongoing services to the funds. The only non-audit services provided to these entities which require pre-approval are those services that relate directly to the operations and financial reporting of the funds.
Although the Committee is not required to pre-approve all services provided to USBAM, Inc. and other affiliated service providers, the Committee will annually receive a report from the independent audit firm on the aggregate fees for all services provided to U.S. Bancorp and affiliates.
| (e)(2) | All of the services described in paragraphs (b) through (d) of this Item 4 were pre-approved by the audit committee. |
| (f) | All services performed on the engagement to audit the registrant’s financial statements for the most recent fiscal year end were performed by the principal accountant’s full-time, permanent employees. |
| (g) | The aggregate non-audit fees billed by E&Y to the registrant, the registrant’s investment adviser, and any entity controlling, controlled by, or under common control with the adviser that provides ongoing services to the registrant, totaled $470,000 in the fiscal year ended August 31, 2011 and $345,608 in the fiscal year ended August 31, 2010. |
| (h) | The registrant’s audit committee has determined that the provision of non-audit services to the registrant’s investment adviser, and any entity controlling, controlled by, or under common control with the investment adviser that provides ongoing services to the registrant, that were not pre-approved is compatible with maintaining E&Y’s independence. |
Item 5—Audit Committee of Listed Registrants
| (a) | The registrant has a separately designated standing audit committee established in accordance with Section 3(a)(58)(A) of the Exchange Act. The members of such audit committee are Roger A. Gibson, John P. Kayser, and Richard K. Riederer. Leonard W. Kedrowski, Chair of the Board of Directors, serves ex officio as a non-voting member of such committee. |
Item 6—Schedule of Investments
| (a) | The schedule is included as part of the report to shareholders filed under Item 1 of this Form. |
Item 7—Disclosure of Proxy Voting Policies and Procedures for Closed-End Management Investment Companies
The registrant has delegated the voting of proxies relating to its voting securities to its investment adviser, U.S. Bancorp Asset Management, Inc. (“USBAM”). The proxy voting policies and procedures of USBAM are as follows:
General Principles
USBAM is the investment adviser for the First American family of funds (the “Funds”) and for institutional and other separately managed accounts (collectively, with the Funds, “Client Accounts”). As such, Client Accounts may confer upon USBAM complete discretion to vote proxies. It is USBAM’s duty to vote proxies in the best interests of its clients. In voting proxies, USBAM also seeks to maximize total investment return for its clients.
In the event that USBAM contracts with another investment adviser to act as a sub-adviser for a Client Account, USBAM may delegate proxy voting responsibility to the sub-adviser. Where USBAM has delegated proxy voting responsibility, the sub-adviser will be responsible for developing and adhering to its own proxy voting policies, subject to oversight by USBAM.
USBAM’s Investment Practices Committee (“IPC”), comprised of the firm’s most senior investment professionals, is charged with oversight of the proxy voting policies and procedures. The IPC is responsible for approving the proxy voting policies and procedures, and for oversight of the proxy activities of USBAM’s Operations Department. The Operations Department is responsible for exercising USBAM’s fiduciary duty to vote client proxies and record keeping requirements. USBAM’s Legal Department will fulfill the obligations of reporting under the federal securities laws.
Policies
USBAM has a fiduciary responsibility to vote proxies in the best interests of its clients. Because of the products that make up the core business of USBAM, the probability of USBAM receiving a proxy request is remote.
Procedures
A. Proxy Voting and Conflicts of Interest
As an affiliate of U.S. Bancorp, a large multi-service financial institution, USBAM recognizes that there are circumstances wherein it may have a perceived or real conflict of interest in voting the proxies of issuers or proxy proponents (e.g., a special interest group) who are clients or potential clients of some part of the U.S.
Bancorp enterprise. Directors and officers of such companies may have personal or familial relationships with the U.S. Bancorp enterprise and/or its employees that could give rise to potential conflicts of interest.
USBAM will vote proxies in the best interest of its clients regardless of such real or perceived conflicts of interest. To minimize this risk, the IPC will discuss, in order to provide training, conflict avoidance at least annually to ensure that appropriate parties understand the actual and perceived conflicts of interest proxy voting may face.
If the Operations Department concludes that a material conflict exist for USBAM, it will recommend to the IPC a course of action designed to address the conflict. Such actions could include, but are not limited to:
1. Obtaining instructions from the affected client(s) on how to vote the proxy;
2. Disclosing the conflict to the affected client(s) and seeking their consent to permit USBAM to vote the proxy;
3. Voting in proportion to the other shareholders; or
4. Recusing an IPC member from all discussion or consideration of the matter, if the material conflict is due to such person’s actual or potential conflict of interest;
In addition to all of the above, employees of USBAM must notify USBAM’s Chief Compliance Officer of any direct, indirect or perceived improper influence exerted by any employee, officer or director within the U.S. Bancorp enterprise or Fund complex with regard to how USBAM should vote proxies. The Chief Compliance Officer, or his/her designee, will investigate the allegations and will report the findings to USBAM’s Chief Executive Officer and the General Counsel. If it is determined that improper influence was attempted, appropriate action shall be taken. Such appropriate action may include disciplinary action, notification of the appropriate senior managers within the U.S. Bancorp enterprise, or notification of the appropriate regulatory authorities. In all cases, the IPC shall not consider any improper influence in determining how to vote proxies, and will vote in the best interests of clients.
When a proxy is received, it will be voted by the Head of Investments. To ensure USBAM has met its fiduciary duty to our clients, the Head of Investments will quarterly certify that:
| | • | | There were no proxies received for the First American Open-Ended Mutual Funds (the “Funds”) during the quarter; or, |
| | • | | That the following is accurate of proxy voting occurring during the quarter: |
| | • | | No material conflict(s) of interest existed in connection with a proxy voted for any security held in the Funds; |
| | • | | Any advice received regarding a proxy was not unduly influenced by an individual or group that may have an economic interest in the outcome of the proxy vote; and, |
| | • | | A material conflict of interest occurred in connection with a proxy voted for a security held in the Funds. The certification will also require a description of the material conflict of interest. |
| | • | | If proxies were received and voted against Management recommendation. The certification will require documentation of the reasons for voting against Management recommendation. |
B. Securities Lending
In order to generate incremental revenue, some clients may participate in U.S. Bank’s securities lending program. If a client has elected to participate in the lending program then it will not have the right to vote the proxies of any securities that are on loan as of the shareholder meeting record date. A client, or a Portfolio Manager, may place restrictions on loaning securities and/or recall a security on loan at any time. Such actions must be affected prior to the record date for a meeting if the purpose for the restriction or recall is to secure the vote.
Portfolio Managers and/or Analysts who become aware of upcoming proxy issues relating to any securities in portfolios they manage, or issuers they follow, will consider the desirability of recalling the affected securities that are on loan or restricting the affected securities prior to the record date for the matter. If the proxy issue is determined to be material, and the determination is made prior to the shareholder meeting record date the Portfolio Manager(s) will contact the Securities Lending Department to recall securities on loan or restrict the loaning of any security held in any portfolio they manage, if they determine that it is in the best interest of shareholders to do so. Training regarding the process to recall securities on loan or restrict the loaning of securities is given to all Portfolio Managers and Analysts.
C. Proxy Voting for ERISA Clients
In the event that a proxy voting issue arises for an ERISA client, USBAM is prohibited from voting shares with respect to any issue advanced by a party in interest, such as U.S. Bancorp or any of the Funds.
D. Sub-Adviser Oversight
USBAM is responsible for oversight of the sub-advisers’ proxy voting activities related to Client Accounts. Consistent with its oversight responsibilities, USBAM has adopted the following sub-adviser oversight policies and procedures:
1. Prior to approval of any sub-advisory contract by the Board of Directors of the Funds or USBAM, as applicable, the IPC reviews the sub-adviser’s proxy voting policy to ensure that such policy is designed in the best interests of USBAM’ clients. Thereafter, at least annually, the IPC reviews and approves material changes to a sub-adviser’s policy.
2. On a quarterly basis, the Operations Department will request and review reports from each sub-adviser reflecting any overrides of its policy or conflicts of interest addressed during the previous quarter, and other matters the Operations Department deems appropriate. Any material issues arising from such review will be reported to the IPC and the Board of Directors of the Funds.
E. Proxy Voting Records
As required by Rule 204-2 of the Investment Company Act of 1940, USBAM shall make and retain five types of records relating to proxy voting; (1) proxy voting policies and procedures; (2) proxy statements received for client and fund securities; (3) records of votes cast on behalf of clients and funds; (4) records of written requests for proxy voting information and written responses from the adviser to either a written or oral request; and (5) any documents prepared by the adviser that were material to making a proxy voting decision or that memorialized the basis for the decision.
Sub-adviser shall be responsible for making and retaining all proxy voting records required by the rule and shall provide them to USBAM upon request.
F. Review and Reports
The Operations Department shall maintain a review schedule. The schedule shall include reviews for the proxy voting policy (including the policies of any sub-adviser), the proxy voting record, account maintenance, and other reviews as deemed appropriate by the Operations Department. The schedule shall be reviewed at least annually.
The Operations Department will report to the IPC with respect to all identified conflicts and how they were addressed. These reports will include all Client Accounts, including those that are sub-advised. With respect to the review of votes cast on behalf of investments by the Funds, such review will also be reported to the Board of Directors of the Funds at each of their regularly scheduled meetings.
G. Vote Disclosure to Shareholders
USBAM shall disclose its proxy voting record on the Funds’ website at www.firstamericanfunds.com and/or on the SEC’s website at www.sec.gov. Additionally, shareholders can receive, on request, the voting records for the Funds by calling a toll free number (1-800-677-3863).
First American Funds’ proxy voting policy and procedures will also be made available to the public via the website. No less frequently than annually, a member of the Operations Department will review the website and ensure that the current proxy policy is available on line for all advisers and sub-advisers of First American Funds.
USBAM’s institutional and separately managed account clients can contact their relationship manager for more information on USBAM’s policies and the proxy voting record for their account. The information available includes name of issuer, ticker/CUSIP, shareholder meeting date, description of item and USBAM’s vote.
H. Form N-PX
USBAM will cause Form N-PX to be filed with the Securities and Exchange Commission, and ensure that any other proxy voting-related filings as required by regulation or contract are timely made.
Failure to Comply
The Advisor strives to operate ethically and lawfully and requires all employees to conduct their activities in accordance with Advisor policies and applicable rules and regulations. The Advisor encourages and expects all employees to report any potential or suspected activities that may be considered fraudulent or illegal in nature, or could potentially damage the reputation of the Advisor and/or the Funds. Employees should report such activities to one of the individuals listed below.
USBAM/Fund Chief Compliance Officer
USBAM Chief Executive Officer
USBAM Legal Counsel
Employee’s immediate supervisor or other Advisor senior manager
USBAM does not tolerate any retaliatory action against any individual for good-faith reporting of ethics violations, illegal conduct, suspicious activity or other serious issues. Allegations of retaliation will be appropriately investigated and, if substantiated, appropriate disciplinary action will be taken, up to and including termination. Diligent enforcement of non-retaliation measures is vital to the success of the reporting process because employees must feel they can report problems without fear of reprisals. Employees may report suspected retaliation to USBAM/Fund Chief Compliance Officer; USBAM Chief Executive Officer; employee’s immediate supervisor or other senior manager, or to the USBAM Human Resource Contact.
Failure of an employee to comply with all policies, rules and regulations may lead to disciplinary action. Such actions may include: documenting the incident of non-compliance in the employee’s personnel file, a fine, suspension of trading privileges and termination of employment. Serious violations may result in monetary fines, censure, suspension or result in other sanctions including the loss of certain licenses.
Item 8—Portfolio Managers of Closed-End Management Investment Companies
| (a)(1) | John G. Wenker, David Yale, and Jason J. O’Brien, CFA, co-manage the registrant’s portfolio. Each portfolio manager is employed by Nuveen Asset Management (“NAM”), the sub-adviser to the portfolio. Mr. Wenker is primarily responsible for the day-to-day management of the registrant’s portfolio. Mr. Yale is responsible for management of the mortgage loan component and credit facilities of the portfolio. Mr. O’Brien is responsible for the management of the mortgage-backed securities portion of the portfolio. |
Mr. Wenker, Managing Director, Head of Real Assets, began working in the financial industry in 1983 and joined NAM in January 2011. Prior to joining NAM, he worked for USBAM.
Mr. Yale, Senior Vice President, Portfolio Manager, began working in the financial industry in 1981 and joined NAM in January 2011. Prior to joining NAM, he worked for USBAM.
Mr. O’Brien, Vice President, Portfolio Manager, began working in the financial industry in 1993 and joined NAM in January 2011. Prior to joining NAM, he worked for USBAM.
| (a)(2) | The following table shows, as of the fiscal year ended August 31, 2010, the number of other accounts each portfolio manager managed within each of the following categories and the total assets in the accounts managed within each category. The table also shows the number of accounts and the total assets in the accounts, if any, with respect to which the advisory fee is based on the performance of the account. |
| | | | | | | | | | | | | | |
Portfolio Manager | | Type of Account Managed | | Total
Number
of
Accounts | | Total Assets of
All Accounts | | | Accounts
Subject to
Performance-
Based Fee | | Total Assets
Subject to
Performance-
Based Fee | |
John G. Wenker | | Registered Investment Company | | 5 | | $ | 3.8 billion | | | 0 | | $ | 0 | |
| | Other Pooled Investment Vehicles | | 0 | | $ | 0 | | | 0 | | $ | 0 | |
| | Other Accounts | | 0 | | $ | 0 | | | 0 | | $ | 0 | |
David A. Yale | | Registered Investment Company | | 3 | | $ | 506 million | | | 0 | | $ | 0 | |
| | Other Pooled Investment Vehicles | | 0 | | $ | 0 | | | 0 | | $ | 0 | |
| | Other Accounts | | 0 | | $ | 0 | | | 0 | | $ | 0 | |
Jason J. O’Brien | | Registered Investment Company | | 4 | | $ | 619 million | | | 0 | | $ | 0 | |
| | Other Pooled Investment Vehicles | | 0 | | $ | 0 | | | 0 | | $ | 0 | |
| | Other Accounts | | 0 | | $ | 0 | | | 0 | | $ | 0 | |
Actual or apparent conflicts of interest may arise when a portfolio manager has day-to-day management responsibilities with respect to more than one account. More specifically, portfolio managers who manage multiple accounts are presented a number of potential conflicts, including, among others those discussed below.
The management of multiple accounts may result in a portfolio manager devoting unequal time and attention to the management of each account. NAM seeks to manage such competing interests for the time and attention of portfolio managers by having portfolio managers focus on a particular investment discipline. Most accounts managed by a portfolio manager in a particular investment strategy are managed using the same investment models.
If a portfolio manager identifies a limited investment opportunity which may be suitable for more than one account, an account may not be able to take full advantage of that opportunity due to an allocation of filled purchase or sale orders across all eligible accounts. To deal with these situations, NAM has adopted procedures for allocating limited opportunities across multiple accounts.
With respect to many of its clients’ accounts, NAM determines which broker to use to execute transaction orders, consistent with its duty to seek best execution of the transaction. However, with respect to certain other accounts, NAM may be limited by the client with respect to the selection of brokers or may be instructed to direct trades through a particular broker. In these cases, NAM may place separate, non-simultaneous, transactions for the funds and other accounts which may temporarily affect the market price of the security or the execution of the transaction, or both, to the detriment of the fund or the other accounts.
Some clients are subject to different regulations. As a consequence of this difference in regulatory requirements, some clients may not be permitted to engage in all the investment techniques or transactions or to engage in these transactions to the same extent as the other accounts managed by the portfolio manager. Finally, the appearance of a conflict of interest may arise where NAM has an incentive, such as a performance-based management fee, which relates to the management of some accounts, with respect to which a portfolio manager has day-to-day management responsibilities.
NAM has adopted certain compliance procedures which are designed to address these types of conflicts common among investment managers. However, there is no guarantee that such procedures will detect each and every situation in which a conflict arises.
| (a)(3) | Portfolio manager compensation consists primarily of base pay, an annual cash bonus and long-term incentive payments. |
Base pay. Base pay is determined based upon an analysis of the portfolio manager’s general performance, experience, and market levels of base pay for such position.
Annual cash bonus. The fund’s portfolio managers are eligible for an annual cash bonus determined based upon the particular portfolio manager’s performance, experience and market levels of base pay for such position. The maximum potential annual cash bonus is equal to a multiple of base pay.
A portion of each portfolio manager’s annual cash bonus is based on the fund’s investment performance, generally measured over the past one- and three-year periods unless the portfolio manager’s tenure is shorter. Investment performance for the fund is determined by evaluating the fund’s performance relative to its benchmark(s) and/or Lipper industry peer group.
Bonus amounts can also be influenced by factors other than investment performance. These other factors are more subjective and are based on evaluations by each portfolio manager’s supervisor and reviews submitted by his or her peers. These reviews and evaluations often take into account a number of factors, including the portfolio manager’s effectiveness in communicating investment performance to shareholders and their advisors, his or her contribution to NAM’s investment process and to the execution of investment strategies consistent with risk guidelines, his or her participation in asset growth, and his or her compliance with Nuveen Asset Management’s policies and procedures.
Investment performance is measured on a pre-tax basis, gross of fees for a fund’s results and for its Lipper industry peer group.
Long-term incentive compensation. Certain key employees of Nuveen Investments and its affiliates, including certain portfolio managers, have received equity interests in the parent company of Nuveen Investments which entitle their holders to participate in the appreciation in the value of Nuveen Investments. In addition, certain key employees of NAM, including certain portfolio managers, have received profits interests in NAM which entitle their holders to participate in the firm’s growth over time.
There are generally no differences between the methods used to determine compensation with respect to the fund and the Other Accounts shown in the table above.
| (a)(4) | The following table shows the dollar range of equity securities in the registrant beneficially owned by the portfolio manager as of the fiscal year ended August 31, 2011. |
| | |
Portfolio Manager | | Dollar Range of Equity
Securities Beneficially
Owned in the Registrant |
John G. Wenker | | $10,001 - $50,000 |
David A. Yale | | $0 |
Jason J. O’Brien | | $0 |
Item 9—Purchases of Equity Securities by Closed-End Management Investment Company and Affiliated Purchasers
Neither the registrant nor any “affiliated purchaser,” as defined in Rule 10b-18(a)(3) under the Exchange Act (17 CFR 240.10b-18(a)(3)), purchased any shares or other units of any class of the registrant’s equity securities that is registered pursuant to Section 12 of the Exchange Act (15 U.S.C. 781).
Item 10—Submission of Matters to a Vote of Security Holders
There have been no material changes to the procedures by which shareholders may recommend nominees to the registrant’s Board of Directors, where those changes were implemented after the registrant last provided disclosure in response to the requirements of Item 407(c)(2)(iv) of Regulation S-K (as required by Item 22(b)(15) of Schedule 14A, or this item.
Item 11—Controls and Procedures
| (a) | The registrant’s principal executive officer and principal financial officer have evaluated the effectiveness of the registrant’s disclosure controls and procedures within 90 days of the date of this filing and have concluded that the registrant’s disclosure controls and procedures were effective, as of that date, in ensuring that information required to be disclosed by the registrant in this Form N-CSR was recorded, processed, summarized and reported timely. |
| (b) | There were no changes in the registrant’s internal control over financial reporting that occurred during the second fiscal quarter of the period covered by this report that have materially affected, or are reasonably likely to materially affect, the registrant’s internal control over financial reporting. |
Item 12—Exhibits
| (a)(1) | Not applicable. Registrant’s code of ethics is provided to any person upon request without charge. |
| (a)(2) | Certifications of the principal executive officer and principal financial officer of the registrant as required by Rule 30a-2(a) under the Investment Company Act of 1940 are filed as exhibits hereto. |
| (b) | Certifications of the principal executive officer and principal financial officer of the registrant as required by Rule 30a-2(b) under the Investment Company Act of 1940 are filed as exhibits hereto. |
Signatures
Pursuant to the requirements of the Securities Exchange Act of 1934 and the Investment Company Act of 1940, the registrant has duly caused this report to be signed on its behalf by the undersigned, thereunto duly authorized.
| | |
| American Strategic Income Portfolio Inc. II |
| |
| By: | | /s/ Joseph M. Ulrey III |
| | Joseph M. Ulrey III |
| | President |
Date: October 31, 2011
Pursuant to the requirements of the Securities Exchange Act of 1934 and the Investment Company Act of 1940, this report has been signed below by the following persons on behalf of the registrant and in the capacities and on the dates indicated.
| | |
| By: | | /s/ Joseph M. Ulrey III |
| | Joseph M. Ulrey III |
| | President |
| | |
| Date: October 31, 2011 |
| |
| By: | | /s/ Jill M. Stevenson |
| | Jill M. Stevenson |
| | Treasurer |
Date: October 31, 2011