UNITED STATES
SECURITIES AND EXCHANGE COMMISSION
Washington, D.C. 20549
FORM N-CSR
CERTIFIED SHAREHOLDER REPORT OF REGISTERED
MANAGEMENT INVESTMENT COMPANIES
Investment Company Act file number 811-06640
American Strategic Income Portfolio Inc. II
(Exact name of registrant as specified in charter)
800 Nicollet Mall, Minneapolis, MN | | 55402 |
(Address of principal executive offices) | | (Zip code) |
Charles D. Gariboldi, Jr., 800 Nicollet Mall, Minneapolis, MN 55402
(Name and address of agent for service)
Registrant’s telephone number, including area code: 800-677-3863
Date of fiscal year end: | August 31 |
| |
Date of reporting period: | August 31, 2009 |
Form N-CSR is to be used by management investment companies to file reports with the Commission not later than 10 days after the transmission to stockholders of any report that is required to be transmitted to stockholders under Rule 30e-1 under the Investment Company Act of 1940 (17 CFR 270.30e-1). The Commission may use the information provided on Form N-CSR in its regulatory, disclosure review, inspection, and policymaking roles.
A registrant is required to disclose the information specified by Form N-CSR, and the Commission will make this information public. A registrant is not required to respond to the collection of information contained in Form N-CSR unless the Form displays a currently valid Office of Management and Budget (“OMB”) control number. Please direct comments concerning the accuracy of the information collection burden estimate and any suggestions for reducing the burden to Secretary, Securities and Exchange Commission, 450 Fifth Street, NW, Washington, DC 20549-0609. The OMB has reviewed this collection of information under the clearance requirements of 44 U.S.C. Section 3507.
Item 1. Report to Shareholders

Annual Report
August 31, 2009

ASP
American Strategic
Income Portfolio Inc.
BSP
American Strategic
Income Portfolio Inc. II
CSP
American Strategic
Income Portfolio Inc. III
SLA
American Select
Portfolio Inc.
First American Mortgage Funds
Primary Investments
American Strategic Income Portfolio Inc. ("ASP"), American Strategic Income Portfolio Inc. II ("BSP"), American Strategic Income Portfolio Inc. III ("CSP"), and American Select Portfolio Inc. ("SLA") ("First American Mortgage Funds" or the "funds") invest in mortgage-related assets that directly or indirectly represent a participation in or are secured by and payable from mortgage loans. The funds may also invest in U.S. government securities, corporate debt securities, preferred stock issued by real estate investment trusts, and mortgage servicing rights. The funds borrow through the use of reverse repurchase agreements and credit facilities. Use of borrowing and certain other investments and investment techniques may cause the funds' net asset value ("NAV") to fluctuate to a greater extent than would be expected from interest-rate movements alone.
Fund Objectives
Each fund's primary objective is to achieve high levels of current income. Each fund's secondary objective is to seek capital appreciation. As with other mutual funds, there can be no assurance these funds will achieve their objectives.
Table of Contents
| | 1 | | | Explanation of Financial Statements | |
|
| | 2 | | | Fund Overviews | |
|
| | 18 | | | Schedule of Investments | |
|
| | 36 | | | Statements of Assets and Liabilities | |
|
| | 37 | | | Statements of Operations | |
|
| | 38 | | | Statements of Changes in Net Assets | |
|
| | 40 | | | Statements of Cash Flows | |
|
| | 41 | | | Financial Highlights | |
|
| | 45 | | | Notes to Financial Statements | |
|
| | 55 | | | Report of Independent Registered Public Accounting Firm | |
|
| | 56 | | | Notice to Shareholders | |
|

NOT FDIC INSURED NO BANK GUARANTEE MAY LOSE VALUE
Explanation of FINANCIAL STATEMENTS
As a shareholder in one or more of the funds, you receive shareholder reports semiannually. We strive to present this financial information in an easy-to-understand format; however, for many investors, the information contained in this shareholder report may seem very technical. So, we would like to take this opportunity to explain several sections of the shareholder report.
The Schedule of Investments details all of the securities held in the fund and their related dollar values on the last day of the reporting period. Securities are usually presented by type (bonds, common stock, etc.) and by industry classification (healthcare, education, etc.). This information is useful for analyzing how your fund's assets are invested and seeing where your portfolio manager believes the best opportunities exist to meet your objectives. Holdings are subject to change without notice and do not constitute a recommendation of any individual security. The Notes to Financial Statements provide additional details on how the securities are valued.
The Statement of Assets and Liabilities lists the assets and liabilities of the fund on the last day of the reporting period and presents the fund's net asset value ("NAV") and market price per share. The NAV is calculated by dividing the fund's net assets (assets minus liabilities) by the number of shares outstanding. The market price is the closing price on the exchange on which the fund's shares trade. This price, which may be higher or lower than the fund's NAV, is the price an investor pays or receives when shares of the fund are purchased or sold. The investments, as presented in the Schedule of Investments, comprise substantially all of the fund's assets. Other assets include cash and receivables for items such as income earned by the fund but not yet received. Liabilities include payables for items such as fund expenses incurred but not yet pa id.
The Statement of Operations details the dividends and interest income earned from investments as well as the expenses incurred by the fund during the reporting period. Fund expenses may be reduced through fee waivers or reimbursements. This statement reflects total expenses before any waivers or reimbursements, the amount of waivers and reimbursements (if any), and the net expenses. This statement also shows the net realized and unrealized gains and losses from investments owned during the period. The Notes to Financial Statements provide additional details on investment income and expenses of the fund.
The Statement of Changes in Net Assets describes how the fund's net assets were affected by its operating results and distributions to shareholders during the reporting period. This statement is important to investors because it shows exactly what caused the fund's net asset size to change during the period.
The Statement of Cash Flows is required when a fund has a substantial amount of illiquid investments, a substantial amount of the fund's securities are internally valued, or the fund carries some amount of debt. When presented, this statement explains the change in cash during the reporting period. It reconciles net cash provided by and used for operating activities to the net increase or decrease in net assets from operations and classifies cash receipts and payments as resulting from operating, investing, and financing activities.
The Financial Highlights provide a per-share breakdown of the components that affected the fund's NAV for the current and past reporting periods. It also shows total return, expense ratios, net investment income ratios, and portfolio turnover rates. The net investment income ratios summarize the income earned less expenses, divided by the average net assets. The expense ratios represent the percentage of average net assets that were used to cover operating expenses during the period. The portfolio turnover rate represents the percentage of the fund's holdings that have changed over the course of the period, and gives an idea of how long the fund holds onto a particular security. A 100% turnover rate implies that an amount equal to the value of the entire portfolio is turned over in a year through the purchase or sale of securities.
The Notes to Financial Statements disclose the organizational background of the fund, its significant accounting policies, federal tax information, fees and compensation paid to affiliates, and significant risks and contingencies.
We hope this guide to your shareholder report will help you get the most out of this important resource.
First American Mortgage Funds 2009 Annual Report
1
Fund OVERVIEWS
Average Annual Total Returns – ASP
Based on NAV for the period ended August 31, 2009
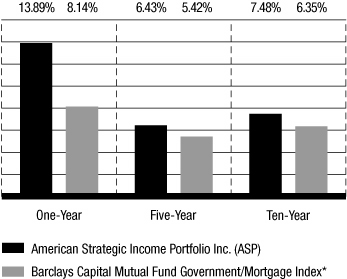
*The Barclays Capital Mutual Fund Government/Mortgage Index is comprised of all U.S. government agency and Treasury securities and agency mortgage-backed securities. Index performance is for illustrative purposes only and does not reflect any fees or expenses. The index is unmanaged and is not available for direct investment. Although we believe this is the most appropriate benchmark available, it is not a perfect match. The benchmark index is comprised of U.S. government securities while the fund is comprised primarily of nonsecuritized, illiquid whole loans, which limits the ability of the fund to respond quickly to market changes.
The average annual total returns for the fund are based on the change in its NAV and assume reinvestment of distributions at NAV. NAV-based performance is used to measure investment management results.
• Average annual total returns based on the change in market price for the one-year, five-year, and ten-year periods ended August 31, 2009, were 20.61%, 4.54%, and 7.35%, respectively.
• Market price returns assume that all distributions have been reinvested at actual prices pursuant to the fund's dividend reinvestment plan. Market price returns reflect any broker commissions or sales charges on dividends reinvested at market price.
• Please remember, you could lose money with this investment. Neither safety of principal nor stability of income is guaranteed. Past performance does not guarantee future results. The investment return and principal value of an investment will fluctuate so that fund shares, when sold, may be worth more or less than their original cost. Closed-end funds, such as this fund, often trade at discounts to NAV. Therefore, you may be unable to realize the full NAV of your shares when you sell.
First American Mortgage Funds 2009 Annual Report
2
Average Annual Total Returns – BSP
Based on NAV for the period ended August 31, 2009
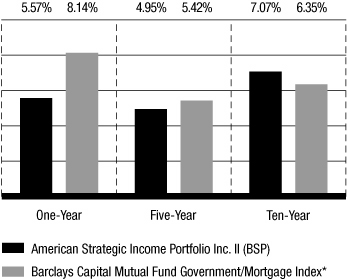
*The Barclays Capital Mutual Fund Government/Mortgage Index is comprised of all U.S. government agency and Treasury securities and agency mortgage-backed securities. Index performance is for illustrative purposes only and does not reflect any fees or expenses. The index is unmanaged and is not available for direct investment. Although we believe this is the most appropriate benchmark available, it is not a perfect match. The benchmark index is comprised of U.S. government securities while the fund is comprised primarily of nonsecuritized, illiquid whole loans, which limits the ability of the fund to respond quickly to market changes.
The average annual total returns for the fund are based on the change in its NAV and assume reinvestment of distributions at NAV. NAV-based performance is used to measure investment management results.
• Average annual total returns based on the change in market price for the one-year, five-year, and ten-year periods ended August 31, 2009, were 8.04%, 2.14%, and 6.84%, respectively.
• Market price returns assume that all distributions have been reinvested at actual prices pursuant to the fund's dividend reinvestment plan. Market price returns reflect any broker commissions or sales charges on dividends reinvested at market price.
• Please remember, you could lose money with this investment. Neither safety of principal nor stability of income is guaranteed. Past performance does not guarantee future results. The investment return and principal value of an investment will fluctuate so that fund shares, when sold, may be worth more or less than their original cost. Closed-end funds, such as this fund, often trade at discounts to NAV. Therefore, you may be unable to realize the full NAV of your shares when you sell.
First American Mortgage Funds 2009 Annual Report
3
Fund OVERVIEWS
Average Annual Total Returns – CSP
Based on NAV for the period ended August 31, 2009
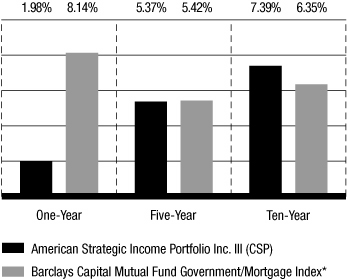
*The Barclays Capital Mutual Fund Government/Mortgage Index is comprised of all U.S. government agency and Treasury securities and agency mortgage-backed securities. Index performance is for illustrative purposes only and does not reflect any fees or expenses. The index is unmanaged and is not available for direct investment. Although we believe this is the most appropriate benchmark available, it is not a perfect match. The benchmark index is comprised of U.S. government securities while the fund is comprised primarily of nonsecuritized, illiquid whole loans, which limits the ability of the fund to respond quickly to market changes.
The average annual total returns for the fund are based on the change in its NAV and assume reinvestment of distributions at NAV. NAV-based performance is used to measure investment management results.
• Average annual total returns based on the change in market price for the one-year, five-year, and ten-year periods ended August 31, 2009, were -0.88%, 2.29%, and 6.56%, respectively.
• Market price returns assume that all distributions have been reinvested at actual prices pursuant to the fund's dividend reinvestment plan. Market price returns reflect any broker commissions or sales charges on dividends reinvested at market price.
• Please remember, you could lose money with this investment. Neither safety of principal nor stability of income is guaranteed. Past performance does not guarantee future results. The investment return and principal value of an investment will fluctuate so that fund shares, when sold, may be worth more or less than their original cost. Closed-end funds, such as this fund, often trade at discounts to NAV. Therefore, you may be unable to realize the full NAV of your shares when you sell.
First American Mortgage Funds 2009 Annual Report
4
Average Annual Total Returns – SLA
Based on NAV for the period ended August 31, 2009
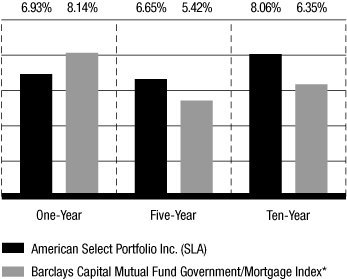
*The Barclays Capital Mutual Fund Government/Mortgage Index is comprised of all U.S. government agency and Treasury securities and agency mortgage-backed securities. Index performance is for illustrative purposes only and does not reflect any fees or expenses. The index is unmanaged and is not available for direct investment. Although we believe this is the most appropriate benchmark available, it is not a perfect match. The benchmark index is comprised of U.S. government securities while the fund is comprised primarily of nonsecuritized, illiquid whole loans, which limits the ability of the fund to respond quickly to market changes.
The average annual total returns for the fund are based on the change in its NAV and assume reinvestment of distributions at NAV. NAV-based performance is used to measure investment management results.
• Average annual total returns based on the change in market price for the one-year, five-year, and ten-year periods ended August 31, 2009, were 9.94%, 4.47%, and 7.93%, respectively.
• Market price returns assume that all distributions have been reinvested at actual prices pursuant to the fund's dividend reinvestment plan. Market price returns reflect any broker commissions or sales charges on dividends reinvested at market price.
• Please remember, you could lose money with this investment. Neither safety of principal nor stability of income is guaranteed. Past performance does not guarantee future results. The investment return and principal value of an investment will fluctuate so that fund shares, when sold, may be worth more or less than their original cost. Closed-end funds, such as this fund, often trade at discounts to NAV. Therefore, you may be unable to realize the full NAV of your shares when you sell.
First American Mortgage Funds 2009 Annual Report
5
(This page intentionally left blank.)
First American Mortgage Funds 2009 Annual Report
6
Fund OVERVIEWS
Fund Management
John Wenker
is primarily responsible for the management of the funds. He has 26 years of financial experience.
Chris Neuharth, CFA,
is responsible for the management of the mortgage-backed securities portion of the funds. He has 28 years of financial experience.
David Yale
is responsible for the acquisition of mortgage loans for the funds. He has 28 years of financial experience.
Introduction
The fiscal year was a tale of two halves. The first half experienced strong volatility in financial markets. Each fund's net asset value ("NAV") fell as spreads widened on the great majority of asset types. Market price suffered as investors required a large risk premium for yield-oriented investment vehicles. The fixed-income and equity markets bottomed in March 2009. Since that time there has been a strong recovery. The funds' NAV and market price participated in the recovery. NAV returns for all four funds were positive for the fiscal year. Market price returns were positive for ASP, BSP, and SLA for the fiscal year. Generally, as we received loan payoffs throughout the fiscal year, proceeds were recycled into higher-credit-quality assets, including AAA-rated commercial mortgage-backed securities, Federal National Mortgage Association ("FNMA") and Federal Home Loan Mortgage Corporation ("FHLMC") pass-through securities, and s ome investment-grade preferred stock of real estate investment trusts. Looking past the financial markets to the underlying fundamentals of the U.S. commercial real estate markets, we see slowing occupancies and slowing net income growth, in keeping with the slowing economy and lack of employment growth. U.S. commercial real estate markets are in a capital-constrained environment.
The funds continued to use leverage, or borrowing, during the period, primarily through the use of secured credit facilities. It is important to keep in mind that the use of leverage involves the risk that interest costs on the money that is borrowed will exceed the return on securities purchased with that money. In addition, leverage may increase the volatility of the funds' NAV and market price. The funds pay interest under credit facilities at 2.625% over the one-month London Interbank Offering Rate ("LIBOR"), with a floor interest rate of 5%. During the fiscal year, the one-month LIBOR fell from 2.48% to 0.26%.
The funds' primary risk is credit risk. This comes mainly from the funds' investments in commercial mortgage loans. The funds have modest residential mortgage exposure, most of which consists of investments in FNMA and FHLMC pass-through securities.
The funds' Board of Directors has adopted a level distribution policy for the funds effective with their December distributions. More information is provided in the section "Questions and Answers Regarding the Level Distribution Policy" on page 56.
First American Mortgage Funds 2009 Annual Report
7
Fund OVERVIEWS
ASP
For the fiscal year ended August 31, 2009, the fund had a total return of 13.89% based on its NAV. The fund's benchmark, the Barclays Capital (formerly Lehman Brothers) Mutual Fund Government/Mortgage Index, had a return of 8.14% during the period. The fund outperformed its benchmark mainly because investments made early in the fiscal year experienced strong performance in the second half.
During the fiscal year, seven whole loans were paid off with an unpaid principal balance of $8.01 million and a net weighted average coupon of 6.25%, and no whole loans were purchased. As of August 31, 2009, there were no multifamily, commercial, or single family loans in default. There were no prepayment penalties collected during the reporting period.
During the fiscal year, the fund paid $0.785 per share in dividends, resulting in an annualized distribution yield of 7.30% based on the August 31, 2009 market price of $10.75. As of August 31, 2009, undistributed net investment income was $0.021 per share.
Portfolio Allocation
As a percentage of total investments on August 31, 2009
| Commercial Loans | | | 38 | % | |
| Commercial Mortgage-Backed Securities | | | 18 | % | |
| Preferred Stocks | | | 16 | % | |
| Multifamily Loans | | | 11 | % | |
| U.S. Government Agency Mortgage-Backed Securities | | | 10 | % | |
| Corporate Notes | | | 5 | % | |
| Short-Term Investments | | | 1 | % | |
| Single Family Loans | | | 1 | % | |
| | | | 100 | % | |
First American Mortgage Funds 2009 Annual Report
8
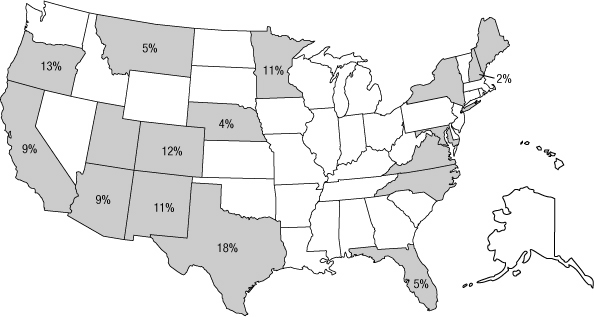
Geographical Distribution
We attempt to buy mortgage loans in many parts of the country to help avoid the risks of concentrating in one area. These percentages reflect the fair value of whole loans and participation mortgages as of August 31, 2009. Shaded areas without fair values indicate states in which the fund has invested less than 0.50% of its assets.
Delinquent Loan Profile
The tables below show the percentages of single family loans and multifamily and commercial loans in the portfolio that are 30, 60, 90, or 120 or more days delinquent as of August 31, 2009, based on the fair value outstanding.
| Single family loans | | | | Multifamily and commercial loans | | | |
| Current | | | 100.0 | % | | Current | | | 100.0 | % | |
| 30 Days | | | 0.0 | % | | 30 Days | | | 0.0 | % | |
| 60 Days | | | 0.0 | % | | 60 Days | | | 0.0 | % | |
| 90 Days | | | 0.0 | % | | 90 Days | | | 0.0 | % | |
| 120+ Days | | | 0.0 | % | | 120+ Days | | | 0.0 | % | |
| | | | 100.0 | % | | | | | 100.0 | % | |
First American Mortgage Funds 2009 Annual Report
9
Fund OVERVIEWS
BSP
For the fiscal year ended August 31, 2009, the fund had a total return of 5.57%, based on its NAV. The fund's benchmark, the Barclays Capital (formerly Lehman Brothers) Mutual Fund Government/Mortgage Index, had a return of 8.14% during the period. The fund underperformed its benchmark mainly because the securitized products that comprise the benchmark index experienced strong performance relative to performance of the whole loans, which account for the majority of the assets of the fund.
During the fiscal year, 10 whole loans were paid off with an unpaid principal balance of $33.41 million and a net weighted average coupon of 6.98%, and one whole loan was purchased with an original principal balance of $3.2 million and a net weighted average coupon of 7.90%. As of August 31, 2009, there was two multifamily and one commercial loan in default, comprising $20,782,395 of unpaid principal balance. Prepayment penalties from whole loans that were paid off during the reporting period amounted to $159,315.
During the fiscal year, the fund paid $0.73 per share in dividends, resulting in an annualized distribution yield of 7.52% based on the August 31, 2009 market price of $9.71. The fund increased its dividend from $0.055 per share to $0.070 per share during the fiscal period. As of August 31, 2009, undistributed net investment income was $0.055 per share.
Portfolio Allocation
As a percentage of total investments on August 31, 2009
| Commercial Loans | | | 32 | % | |
| Multifamily Loans | | | 27 | % | |
| Preferred Stocks | | | 11 | % | |
| Commercial Mortgage-Backed Securities | | | 10 | % | |
| U.S. Government Agency Mortgage-Backed Securities | | | 10 | % | |
| Corporate Notes | | | 9 | % | |
| Short-Term Investments | | | 1 | % | |
| | | | 100 | % | |
First American Mortgage Funds 2009 Annual Report
10
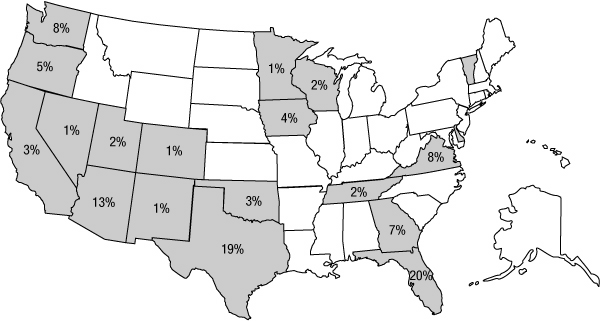
Geographical Distribution
We attempt to buy mortgage loans in many parts of the country to help avoid the risks of concentrating in one area. These percentages reflect the fair value of whole loans and participation mortgages as of August 31, 2009. Shaded areas without fair values indicate states in which the fund has invested less than 0.50% of its assets.
Delinquent Loan Profile
The tables below show the percentages of single family loans and multifamily and commercial loans in the portfolio that are 30, 60, 90, or 120 or more days delinquent as of August 31, 2009, based on the fair value outstanding.
| Single family loans | | | | Multifamily and commercial loans | | | |
| Current | | | 100.0 | % | | Current | | | 89.8 | % | |
| 30 Days | | | 0.0 | % | | 30 Days | | | 3.6 | % | |
| 60 Days | | | 0.0 | % | | 60 Days | | | 0.0 | % | |
| 90 Days | | | 0.0 | % | | 90 Days | | | 0.0 | % | |
| 120+ Days | | | 0.0 | % | | 120+ Days | | | 6.6 | % | |
| | | | 100.0 | % | | | | | 100.0 | % | |
First American Mortgage Funds 2009 Annual Report
11
Fund OVERVIEWS
CSP
For the fiscal year ended August 31, 2009, the fund had a total return of 1.98%, based on its NAV. The fund's benchmark, the Barclays Capital (formerly Lehman Brothers) Mutual Fund Government/Mortgage Index, had a return of 8.14% during the period. The fund underperformed its benchmark mainly because the securitized products that comprise the benchmark index experienced strong performance relative to performance of the whole loans, which account for the majority of the assets of the fund. Delinquency levels for multifamily and commercial loans resulted in a reduction in income generated by the whole loans.
During the fiscal year, four whole loans were paid off with an unpaid principal balance of $22.77 million and a coupon of 6.45%, and no whole loans were purchased. As of August 31, 2009, there was eight commercial loans and five multifamily loans in default, comprising $69,144,455 of unpaid principal balance. There were no prepayment penalties collected during the reporting period.
During the fiscal year, the fund paid $0.765 per share in dividends, resulting in an annualized distributed yield of 8.66% based on the August 31, 2009, market price of $8.83. As of August 31, 2009, distributions in excess of net investment income was ($0.041) per share.
Portfolio Allocation
As a percentage of total investments on August 31, 2009
| Commercial Loans | | | 44 | % | |
| Multifamily Loans | | | 26 | % | |
| Preferred Stocks | | | 13 | % | |
| Corporate Notes | | | 8 | % | |
| U.S. Government Agency Mortgage-Backed Securities | | | 6 | % | |
| Commercial Mortgage-Backed Securities | | | 2 | % | |
| Short-Term Investments | | | 1 | % | |
| | | | 100 | % | |
First American Mortgage Funds 2009 Annual Report
12
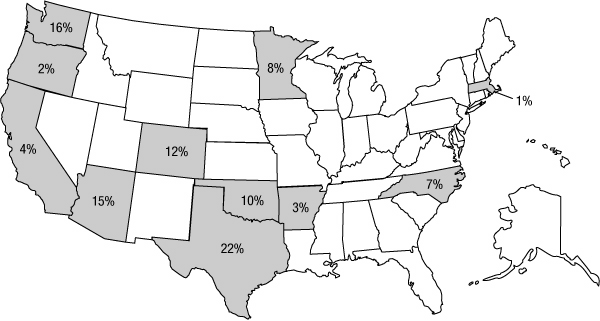
Geographical Distribution
We attempt to buy mortgage loans in many parts of the country to help avoid the risks of concentrating in one area. These percentages reflect the fair value of whole loans and participation mortgages as of August 31, 2009. Shaded areas without fair values indicate states in which the fund has invested less than 0.50% of its assets.

Delinquent Loan Profile
The tables below show the percentages of a private mortgage-backed security and multifamily and commercial loans in the portfolio that are 30, 60, 90, or 120 or more days delinquent as of August 31, 2009, based on the fair value outstanding.
| Private mortgage-backed security | | | | Multifamily and commercial loans | | | |
| Current | | | 100.0 | % | | Current | | | 73.2 | % | |
| 30 Days | | | 0.0 | % | | 30 Days | | | 3.2 | % | |
| 60 Days | | | 0.0 | % | | 60 Days | | | 9.3 | % | |
| 90 Days | | | 0.0 | % | | 90 Days | | | 2.8 | % | |
| 120+ Days | | | 0.0 | % | | 120+ Days | | | 11.5 | % | |
| | | | 100.0 | % | | | | | 100.0 | % | |
First American Mortgage Funds 2009 Annual Report
13
Fund OVERVIEWS
SLA
For the fiscal year ended August 31, 2009, the fund had a total return of 6.93%, based on its NAV. The fund's benchmark, the Barclays Capital (formerly Lehman Brothers) Mutual Fund Government/Mortgage Index, had a return of 8.14% during the period. The fund underperformed its benchmark mainly because the securitized products that comprise the benchmark index experienced strong performance relative to performance of the whole loans, which account for the majority of the assets of the fund.
During the fiscal year, five whole loans were paid off with an unpaid principal balance of $15.55 million and a net weighted average coupon of 7.49%, and no whole loans were purchased. As of August 31, 2009, there was one multifamily and one commercial loan in default, comprising $5,840,000 of unpaid principal balance. Prepayment penalties from whole loans that were paid off during the reporting period amounted to $129,586.
During the fiscal year, the fund paid $0.868 per share in dividends, which included a $0.003 per share long-term capital gain dividend, resulting in an annualized distribution yield of 8.16% based on the August 31, 2009 market price of $10.64. The monthly dividend of the fund was increased from $0.065 per share to $0.075 per share during the fiscal year. As of August 31, 2009, undistributed net investment income was $0.035 per share.
Portfolio Allocation
As a percentage of total investments on August 31, 2009
| Commercial Loans | | | 45 | % | |
| Multifamily Loans | | | 18 | % | |
| Preferred Stocks | | | 10 | % | |
| Commercial Mortgage-Backed Securities | | | 10 | % | |
| Corporate Notes | | | 9 | % | |
| U.S. Government Agency Mortgage-Backed Securities | | | 7 | % | |
| Short-Term Investments | | | 1 | % | |
| | | | 100 | % | |
First American Mortgage Funds 2009 Annual Report
14
Geographical Distribution
We attempt to buy mortgage loans in many parts of the country to help avoid the risks of concentrating in one area. These percentages reflect the fair value of whole loans and participation mortgages as of August 31, 2009. Shaded areas without fair values indicate states in which the fund has invested less than 0.50% of its investments.
Delinquent Loan Profile
The tables below show the percentages of multifamily and commercial loans in the portfolio that are 30, 60, 90, or 120 or more days delinquent as of August 31, 2009, based on the fair value outstanding.
| Multifamily and commercial loans | | | |
| Current | | | 95.3 | % | |
| 30 Days | | | 0.0 | % | |
| 60 Days | | | 0.3 | % | |
| 90 Days | | | 0.0 | % | |
| 120+ Days | | | 4.4 | % | |
| | | | 100 | % | |
First American Mortgage Funds 2009 Annual Report
15
Fund OVERVIEWS
Conclusion
As of this writing, commercial real estate markets are facing increased stress. A weak economic environment, including a growing unemployment rate and significantly more restricted credit environment, poses challenges for the commercial real estate sector. We will continue to diligently manage the credit risk in the funds, and we feel that their current credit profiles, while challenging, are acceptable.
Thank you for your investment in the funds and your continued trust as we navigate the investment landscape. If you have any questions about the funds, please call us at 800.677.FUND.
Sincerely,

John Wenker
Managing Director, Head of Real Estate
FAF Advisors, Inc.
First American Mortgage Funds 2009 Annual Report
16
Valuation of Investments
The funds' investments in whole loans (single family, multifamily, and commercial), participation mortgages, and mortgage servicing rights are generally not traded in any organized market; therefore, market quotations are not readily available. These investments are valued at "fair value" according to procedures adopted by the funds' board of directors. Pursuant to these procedures, whole loan, participation mortgage, and mortgage servicing rights investments are initially valued at cost and their values are subsequently monitored and adjusted pursuant to a pricing model designed by FAF Advisors, Inc., to incorporate, among other things, the present value of the projected stream of cash flows on such investments. The pricing model takes into account a number of relevant factors including the projected rate of prepayments, the delinquency profile, the historical payment record, the expected yield at purchase, changes in prevailin g interest rates, and changes in the real or perceived liquidity of whole loans, participation mortgages, and mortgage servicing rights, as the case may be. The results of the pricing model may be further subject to price floors given the intrinsic values of the underlying properties subject to the loans and ceilings due to the illiquid nature of the investments. Changes in prevailing interest rates, real or perceived liquidity, yield spreads, and creditworthiness are factored into the pricing model each week. Certain mortgage loan information is received on a monthly basis and includes, but is not limited to, the projected rate of prepayments, projected rate and severity of defaults, the delinquency profile, and the historical payment record. Valuations of whole loans, participation mortgages, and mortgage servicing rights are determined no less frequently than weekly.
First American Mortgage Funds 2009 Annual Report
17
Schedule of INVESTMENTS August 31, 2009
American Strategic Income Portfolio (ASP)
| DESCRIPTION | | DATE
ACQUIRED | | PAR | | COST | | FAIR
VALUE (I) | |
| (Percentages of each investment category relate to total net assets) | |
| Whole Loans °° (P) — 66.5% | |
| Commercial Loans — 50.7% | |
| Advance Self Storage, Lincoln, NE, 6.13%, 1/1/11 (B) | | 12/30/05 | | $ | 1,398,635 | | | $ | 1,398,635 | | | $ | 1,412,621 | | |
| Buca Restaurant, Maple Grove, MN, 8.63%, 1/1/11 | | 12/27/00 | | | 819,955 | | | | 819,955 | | | | 828,154 | | |
| Copper Junction, Copper Mountain, CO, 6.38%, 7/1/17 (B) | | 6/14/07 | | | 1,907,444 | | | | 1,907,444 | | | | 1,813,206 | | |
| Hampden Medical Office, Englewood, CO, 7.38%, 10/1/12 | | 9/9/02 | | | 1,510,011 | | | | 1,510,011 | | | | 1,521,926 | | |
| Integrity Plaza Shopping Center, Albuquerque, NM, 7.88%, 7/1/12 (B) | | 6/11/02 | | | 1,916,022 | | | | 1,916,022 | | | | 1,954,346 | | |
| La Costa Meadows Industrial Park I, San Marcos, CA, 6.78%, 7/1/17 (B) ¶ | | 6/28/07 | | | 1,250,000 | | | | 1,250,000 | | | | 1,217,325 | | |
| La Costa Meadows Industrial Park II, San Marcos, CA, 7.53%, 7/1/17 (B) ¶ | | 6/28/07 | | | 2,000,000 | | | | 2,000,000 | | | | 2,020,000 | | |
| Minikahda Mini Storage IV, Minneapolis, MN, 7.15%, 3/1/11 (B) | | 2/28/06 | | | 1,573,435 | | | | 1,573,435 | | | | 1,589,169 | | |
| Naples Boat Club, Naples, FL, 6.43%, 1/1/17 (B) | | 12/28/06 | | | 1,681,591 | | | | 1,681,591 | | | | 1,631,980 | | |
| Orchard Commons, Englewood, CO, 8.63%, 4/1/11 | | 3/28/01 | | | 949,646 | | | | 949,646 | | | | 968,639 | | |
| Palace Court, Santa Fe, NM, 6.68%, 11/1/11 (B) | | 10/2/06 | | | 1,886,177 | | | | 1,886,177 | | | | 1,923,900 | | |
| Par 3 Office Building, Bend, OR, 6.63%, 8/1/13 (B) ¶ | | 8/3/06 | | | 1,900,000 | | | | 1,900,000 | | | | 1,862,885 | | |
| Perkins Restaurant, Maple Grove, MN, 6.38%, 1/1/11 (B) | | 12/23/05 | | | 1,360,908 | | | | 1,360,908 | | | | 1,367,213 | | |
| Rockwood Galleria, Gresham, OR, 7.25%, 2/1/11 (B) | | 1/6/03 | | | 1,491,916 | | | | 1,491,916 | | | | 1,521,755 | | |
| Stephens Center, Missoula, MT, 6.38%, 9/1/10 (B) | | 4/20/06 | | | 1,798,767 | | | | 1,798,767 | | | | 1,816,755 | | |
| The Storage Place, Marana, AZ, 6.65%, 1/1/13 (B) ¶ | | 12/20/07 | | | 3,200,000 | | | | 3,200,000 | | | | 3,251,560 | | |
| | | | 26,644,507 | | | | 26,701,434 | | |
| Multifamily Loans — 14.9% | |
| Forest Club Apartments, Dallas, TX, 11.88%, 8/1/09 ¶ (D) | | 4/19/06 | | | 1,720,000 | | | | 1,720,000 | | | | 1,519,366 | | |
| Franklin Woods Apartments, Franklin, NH, 5.88%, 3/1/10 | | 2/24/95 | | | 707,513 | | | | 707,513 | | | | 712,859 | | |
| Hunt Club Apartments, Waco, TX, 5.64%, 7/1/11 (B) | | 6/3/04 | | | 1,154,710 | | | | 1,154,710 | | | | 1,022,359 | | |
| Park Hollywood, Portland, OR, 7.38%, 6/1/12 (B) | | 5/31/02 | | | 1,088,955 | | | | 1,088,955 | | | | 1,121,624 | | |
| Spring Creek Gardens, Plano, TX, 3.40%, 1/1/09 ¶ (D) r | | 12/22/05 | | | 2,050,000 | | | | 2,053,583 | | | | 1,435,000 | | |
| Vanderbilt Condominiums, Austin, TX, 8.04%, 10/1/09 | | 9/29/99 | | | 1,059,614 | | | | 1,059,614 | | | | 1,059,614 | | |
| Villa Bonita, Chez Royalle, Fitzhugh Apartments I, Dallas, TX, 7.88%, 4/1/10 | | 2/21/03 | | | 814,513 | | | | 814,513 | | | | 814,514 | | |
| Villa Bonita, Chez Royalle, Fitzhugh Apartments II, Dallas, TX, 11.88%, 4/1/10 | | 2/21/03 | | | 151,960 | | | | 151,960 | | | | 142,805 | | |
| | | | 8,750,848 | | | | 7,828,141 | | |
| Single Family Loans — 0.9% | |
| American Portfolio, 1 loan, California, 4.88%, 10/18/15 | | 7/18/95 | | | 18,552 | | | | 17,664 | | | | 19,109 | | |
| Anivan, 1 loan, Maryland, 5.19%, 4/14/12 | | 6/14/96 | | | 67,317 | | | | 67,757 | | | | 69,336 | | |
| Bank of New Mexico, 1 loan, New Mexico, 6.23%, 3/31/10 | | 5/31/96 | | | 31,650 | | | | 31,059 | | | | 32,599 | | |
| Bluebonnet Savings & Loan, 6 loans, Texas, 6.66%, 8/31/10 | | 5/22/92 | | | 94,848 | | | | 86,543 | | | | 97,623 | | |
| Fairbanks, 1 loan, Utah, 5.50%, 9/23/15 | | 5/21/92 | | | 17,609 | | | | 14,927 | | | | 18,137 | | |
| Knutson Mortgage Portfolio I, 2 loans, Maine and Montana, 9.37%, 8/1/17 | | 2/26/92 | | | 123,710 | | | | 117,977 | | | | 127,422 | | |
| McClemore, Matrix Funding Corporation, 1 loan, North Carolina, 10.50%, 9/30/12 | | 9/9/92 | | | 40,720 | | | | 38,684 | | | | 41,942 | | |
| Nomura III, 2 loans, California & New York, 8.20%, 4/29/17 | | 9/29/95 | | | 62,733 | | | | 56,614 | | | | 64,615 | | |
| Rand Mortgage Corporation, 1 loan, Texas, 9.50%, 8/1/17 | | 2/21/92 | | | 30,277 | | | | 24,863 | | | | 31,185 | | |
| | | | 456,088 | | | | 501,968 | | |
| Total Whole Loans | | | 35,851,443 | | | | 35,031,543 | | |
| Corporate Note °° ¶ — 6.8% | |
| Fixed Rate — 6.8% | |
| Stratus Properties V, 6.92%, 12/31/11 | | 6/1/07 | | | 3,500,000 | | | | 3,500,000 | | | | 3,570,000 | | |
| U.S. Government Agency Mortgage-Backed Securities — 13.3% | |
| Fixed Rate — 13.3% | |
| Federal Home Loan Mortgage Corporation, | |
| 5.50%, 1/1/18, #E93231 (A) | | | | | 417,101 | | | | 425,841 | | | | 444,747 | | |
| 9.00%, 7/1/30, #C40149 | | | | | 66,748 | | | | 68,227 | | | | 73,245 | | |
| 5.00%, 5/1/39, #G05430 (A) | | | | | 1,894,905 | | | | 1,945,881 | | | | 1,948,088 | | |
The accompanying notes are an integral part of the financial statements.
First American Mortgage Funds 2009 Annual Report
18
American Strategic Income Portfolio (ASP)
| DESCRIPTION | | | | PAR/
SHARES | | COST | | FAIR
VALUE (I) | |
| Federal National Mortgage Association, | |
| 6.00%, 10/1/16, #610761 (A) | | | | $ | 193,731 | | | $ | 196,117 | | | $ | 207,298 | | |
| 5.00%, 7/1/18, #724954 (A) | | | | | 1,036,400 | | | | 1,035,417 | | | | 1,096,349 | | |
| 6.50%, 6/1/29, #252497 (A) | | | | | 120,827 | | | | 120,151 | | | | 130,708 | | |
| 7.50%, 3/1/30, #495694 | | | | | 56,310 | | | | 55,547 | | | | 60,960 | | |
| 7.50%, 5/1/30, #535289 (A) | | | | | 27,265 | | | | 26,502 | | | | 30,405 | | |
| 8.00%, 5/1/30, #538266 (A) | | | | | 11,289 | | | | 11,170 | | | | 12,769 | | |
| 6.00%, 5/1/31, #535909 (A) | | | | | 224,708 | | | | 225,775 | | | | 238,880 | | |
| 6.50%, 11/1/31, #613339 (A) | | | | | 120,160 | | | | 122,392 | | | | 129,761 | | |
| 5.50%, 7/1/33, #720735 (A) | | | | | 1,571,235 | | | | 1,555,309 | | | | 1,645,777 | | |
| 5.00%, 7/1/39, #935588 (A) | | | | | 973,750 | | | | 997,407 | | | | 1,000,775 | | |
| Total U.S. Government Agency Mortgage-Backed Securities | | | 6,785,736 | | | | 7,019,762 | | |
| Commercial Mortgage-Backed Securities — 23.1% | |
| Other — 23.1% | |
| Bear Stearns Commercial Mortgage Securities, | |
| Series 2006-PW12, Class A4, 5.90%, 9/11/38 ¶ r | | | | | 1,200,000 | | | | 976,033 | | | | 1,126,078 | | |
| Series 2007-PWR17, Class A4, 5.69%, 6/11/50 | | | | | 1,985,000 | | | | 1,767,832 | | | | 1,754,291 | | |
| Series 2007-T28, Class A4, 5.74%, 9/11/42 | | | | | 1,200,000 | | | | 935,262 | | | | 1,111,518 | | |
| Citigroup/Deutsche Bank Commercial Mortgage Trust, | |
| Series 2005-CD1, Class A4, 5.40%, 7/15/44 r | | | | | 2,357,000 | | | | 1,507,995 | | | | 2,280,099 | | |
| Series 2007-CD5, Class A4, 5.89%, 11/15/44 r | | | | | 550,000 | | | | 497,365 | | | | 506,488 | | |
| GS Mortgage Securities Corporation II, Series 2006-GG8, Class A4, 5.56%, 11/10/39 | | | | | 2,900,000 | | | | 2,005,738 | | | | 2,546,654 | | |
| LB-UBS Commercial Mortgage Trust, Series 2008-C1, Class A2, 6.32%, 4/15/41 r | | | | | 1,875,000 | | | | 1,379,492 | | | | 1,783,769 | | |
| Morgan Stanley Capital I, Series 2007-T27, Class A4, 5.80%, 6/13/42 r | | | | | 1,160,000 | | | | 932,264 | | | | 1,067,975 | | |
| Total Commercial Mortgage-Backed Securities | | | 10,001,981 | | | | 12,176,872 | | |
| Preferred Stocks — 21.2% | |
| Real Estate Investment Trusts — 21.2% | |
| AMB Property, Series L | | | | | 26,560 | | | | 597,940 | | | | 512,077 | | |
| AMB Property, Series M | | | | | 5,600 | | | | 139,850 | | | | 112,000 | | |
| BRE Properties, Series C | | | | | 30,150 | | | | 599,080 | | | | 615,663 | | |
| BRE Properties, Series D | | | | | 2,400 | | | | 47,688 | | | | 48,744 | | |
| Developers Diversified Realty, Series G | | | | | 20,000 | | | | 447,000 | | | | 319,000 | | |
| Developers Diversified Realty, Series H | | | | | 12,060 | | | | 247,230 | | | | 176,800 | | |
| Developers Diversified Realty, Series I | | | | | 1,950 | | | | 40,657 | | | | 29,445 | | |
| Duke Realty, Series J | | | | | 2,100 | | | | 52,246 | | | | 36,918 | | |
| Duke Realty, Series L | | | | | 8,750 | | | | 167,300 | | | | 152,512 | | |
| Duke Realty, Series M | | | | | 26,120 | | | | 532,400 | | | | 514,564 | | |
| Duke Realty, Series O | | | | | 20,300 | | | | 479,080 | | | | 461,216 | | |
| Equity Residential Properties, Series N | | | | | 28,800 | | | | 557,520 | | | | 600,192 | | |
| HRPT Properties Trust, Series B | | | | | 8,171 | | | | 212,725 | | | | 179,762 | | |
| National Retail Properties, Series C | | | | | 25,000 | | | | 527,500 | | | | 563,750 | | |
| ProLogis Trust, Series F | | | | | 5,975 | | | | 139,549 | | | | 117,528 | | |
| ProLogis Trust, Series G | | | | | 3,800 | | | | 79,800 | | | | 75,050 | | |
| PS Business Parks, Series H | | | | | 22,060 | | | | 389,700 | | | | 459,289 | | |
| PS Business Parks, Series I | | | | | 4,240 | | | | 83,401 | | | | 86,284 | | |
| PS Business Parks, Series K | | | | | 25,000 | | | | 578,750 | | | | 580,000 | | |
| PS Business Parks, Series M | | | | | 12,060 | | | | 248,436 | | | | 268,094 | | |
| PS Business Parks, Series P | | | | | 3,750 | | | | 71,887 | | | | 76,875 | | |
| Public Storage, Series A | | | | | 6,000 | | | | 144,291 | | | | 131,700 | | |
| Public Storage, Series C | | | | | 5,000 | | | | 100,000 | | | | 107,400 | | |
| Public Storage, Series E | | | | | 14,200 | | | | 263,000 | | | | 313,110 | | |
| Public Storage, Series F | | | | | 9,300 | | | | 231,105 | | | | 197,253 | | |
First American Mortgage Funds 2009 Annual Report
19
Schedule of INVESTMENTS August 31, 2009
American Strategic Income Portfolio (ASP)
| DESCRIPTION | | | | SHARES | | COST | | FAIR
VALUE (I) | |
| Public Storage, Series I | | | | | 12,060 | | | $ | 262,305 | | | $ | 295,470 | | |
| Public Storage, Series K | | | | | 8,000 | | | | 174,000 | | | | 190,880 | | |
| Public Storage, Series X | | | | | 3,000 | | | | 74,330 | | | | 64,200 | | |
| Public Storage, Series Z | | | | | 11,500 | | | | 282,309 | | | | 237,475 | | |
| Realty Income, Series D | | | | | 20,500 | | | | 546,185 | | | | 488,925 | | |
| Realty Income, Series E | | | | | 37,060 | | | | 714,246 | | | | 833,479 | | |
| Regency Centers, Series C | | | | | 22,060 | | | | 482,737 | | | | 483,776 | | |
| Regency Centers, Series E | | | | | 24,060 | | | | 483,600 | | | | 475,666 | | |
| Simon Property Group, Series J | | | | | 11,000 | | | | 511,500 | | | | 626,450 | | |
| Vornado Realty Trust, Series E | | | | | 4,800 | | | | 121,338 | | | | 106,176 | | |
| Vornado Realty Trust, Series G | | | | | 30,000 | | | | 483,000 | | | | 610,200 | | |
| Total Preferred Stocks | | | 11,113,685 | | | | 11,147,923 | | |
| Total Unaffiliated Investments | | | 67,252,845 | | | | 68,946,100 | | |
| Short-Term Investment — 1.6% | |
| First American Prime Obligations Fund, Class Z, 0.19% x | | | | | 837,516 | | | | 837,516 | | | | 837,516 | | |
| Total Investments p — 132.5% | | $ | 68,090,361 | | | $ | 69,783,616 | | |
| Other Assets and Liabilities, Net — (32.5)% | | | | | (17,125,857 | ) | |
| Total Net Assets — 100.0% | | | | | | | | | | | | $ | 52,657,759 | | |
(I) Securities are valued in accordance with procedures described in note 2 in Notes to Financial Statements.
°° Securities purchased as part of a private placement which have not been registered with the Securities and Exchange Commission under the Securities Act of 1933 and which are considered to be illiquid. These securities are fair valued in accordance with the board approved valuation procedures. On August 31, 2009, the total fair value of these securities was $38,601,543 or 73.3% of total net assets. See note 2 in Notes to Financial Statements.
(P) Interest rates on commercial and multifamily loans are the net coupon rates in effect (after reducing the coupon rate by any mortgage servicing fees paid to mortgage servicers) on August 31, 2009. Interest rates and maturity dates disclosed on single family loans represent the weighted average coupon and weighted average maturity for the underlying mortgage loans as of August 31, 2009.
(B) Securities pledged as collateral for outstanding borrowings under a loan agreement with Massachusetts Mutual Life Insurance Company ("MMLIC"). On August 31, 2009, securities valued at $25,526,698 were pledged as collateral for the following outstanding borrowings:
| Amount | | Rate* | | Accrued
Interest | |
| $ | 8,600,000 | | | | 5.00 | % | | $ | 1,194 | | |
| | 2,400,000 | | | | 5.00 | % | | | 333 | | |
| $ | 11,000,000 | | | | | $ | 1,527 | | |
* Interest rate as of August 31, 2009. Rate is based on the London Interbank Offered Rate ("LIBOR") plus 2.625% subject to a "floor" interest rate of 5.00% and reset monthly.
Description of collateral:
Advance Self Storage, Lincoln, NE, 6.13%, 1/1/11, $1,398,635 par
Copper Junction, Copper Mountain, CO, 6.38%, 7/1/17, $1,907,444 par
Hunt Club Apartments, Waco, TX, 5.64%, 7/1/11, $1,154,710 par
Integrity Plaza Shopping Center, Albuquerque, NM, 7.88%, 7/1/12, $1,916,022 par
La Costa Meadows Industrial Park I, San Marcos, CA, 6.78%, 7/1/17, $1,250,000 par
La Costa Meadows Industrial Park II, San Marcos, CA, 7.53%, 7/1/17, $2,000,000 par
Minikahda Mini Storage IV, Minneapolis, MN, 7.15%, 3/1/11, $1,573,435 par
Naples Boat Club, Naples, FL, 6.43%, 1/1/17, $1,681,591 par
Palace Court, Santa Fe, NM, 6.68%, 11/1/11, $1,886,177 par
Par 3 Office Building, Bend, OR, 6.63%, 8/1/13, $1,900,000 par
Park Hollywood, Portland, OR, 7.38%, 6/1/12, $1,088,955 par
Perkins Restaurant, Maple Grove, MN, 6.38%, 1/1/11, $1,360,908 par
Rockwood Galleria, Gresham, OR, 7.25%, 2/1/11, $1,491,916 par
Stephe ns Center, Missoula, MT, 6.38%, 9/1/10, $1,798,767 par
The Storage Place, Marana, AZ, 6.65%, 1/1/13, $3,200,000 par
The accompanying notes are an integral part of the financial statements.
First American Mortgage Funds 2009 Annual Report
20
American Strategic Income Portfolio (ASP)
The fund has entered into a loan agreement with MMLIC under which MMLIC made a term loan to the fund of $8,600,000, which matures on July 31, 2011, and agreed to make revolving loans to the fund of up to $2,400,000. Loans made under the loan agreement are secured by whole loans in the fund's portfolio and bear interest at the one-month LIBOR plus 2.625% with a "floor" interest rate of 5.00%. In addition, the fund pays an annual fee of 1.28% on any unused portion of the fund's revolving loan commitment.
¶ Interest Only – Represents securities that entitle holders to receive only interest payments on the mortgage. Principal balance on the loan is due at maturity. The interest rate disclosed represents the net coupon rate in effect as of August 31, 2009.
(D) Loan has matured and the fund is anticipating payoff or refinancing. Unless disclosed otherwise, the loan continues to make monthly payments.
r Variable Rate Security – The rate shown is the net coupon rate in effect as of August 31, 2009.
(U) Loan is currently in default with regards to scheduled interest and/or principal payments.
(A) Securities pledged as collateral for outstanding reverse repurchase agreements. On August 31, 2009, securities valued at $6,885,557 were pledged as collateral for the following outstanding reverse repurchase agreements:
| Amount | | Acquisition
Date | | Rate* | | Due | | Accrued
Interest | | Name of Broker
and Description
of Collateral | |
| $ | 5,530,000 | | | 8/20/09 | | | 0.42 | % | | 9/21/09 | | $ | 774 | | | | (1 | ) | |
| | 938,000 | | | 8/6/09 | | | 0.42 | % | | 9/8/09 | | | 285 | | | | (2 | ) | |
| $ | 6,468,000 | | | | | | | | | $ | 1,059 | | | | |
* Interest rate as of August 31, 2009. Rate is based on the LIBOR plus a spread and reset monthly.
Name of broker and description of collateral:
(1) Goldman Sachs:
Federal Home Loan Mortgage Corporation, 5.50%, 1/1/18, $417,101 par
Federal Home Loan Mortgage Corporation, 5.00%, 5/1/39, $1,894,905 par
Federal National Mortgage Association, 6.00%, 10/1/16, $193,731 par
Federal National Mortgage Association, 5.00%, 7/1/18, $1,036,400 par
Federal National Mortgage Association, 6.50%, 6/1/29, $120,827 par
Federal National Mortgage Association, 7.50%, 5/1/30, $27,265 par
Federal National Mortgage Association, 8.00%, 5/1/30, $11,289 par
Federal National Mortgage Association, 6.00%, 5/1/31, $224,708 par
Federal National Mortgage Association, 6.50%, 11/1/31, $120,160 par
Federal National Mortgage Association, 5.50%, 7/1/33, $1,571,235 par
(2) Goldman Sachs:
Federal National Mortgage Association, 5.00%, 7/1/39, $973,750 par
The fund has entered into a lending commitment with Goldman Sachs. The monthly agreement permits the fund to enter into reverse repurchase agreements using U.S. government agency mortgage-backed securities as collateral.
x Investment in affiliated security. This money market fund is advised by FAF Advisors, Inc., which also serves as advisor for the fund. The rate quoted is the annualized seven-day yield of the investment at period end. See note 3 in Notes to Financial Statements.
p On August 31, 2009, the cost of investments for federal income tax purposes was $68,102,139. The aggregate gross unrealized appreciation and depreciation of investments, based on this cost, were as follows:
| Gross unrealized appreciation | | $ | 3,511,825 | | |
| Gross unrealized depreciation | | | (1,830,348 | ) | |
| Net unrealized appreciation | | $ | 1,681,477 | | |
First American Mortgage Funds 2009 Annual Report
21
Schedule of INVESTMENTS August 31, 2009
American Strategic Income Portfolio II (BSP)
| DESCRIPTION | | DATE
ACQUIRED | | PAR | | COST | | FAIR
VALUE (I) | |
| (Percentages of each investment category relate to total net assets) | |
| Whole Loans °° (P) — 81.6% | |
| Commercial Loans — 43.8% | |
| 5555 East Van Buren I, Phoenix, AZ, 5.68%, 7/1/11 (B) | | 6/23/04 | | $ | 6,244,991 | | | $ | 6,244,991 | | | $ | 6,335,985 | | |
| 5555 East Van Buren II, Phoenix, AZ, 7.13%, 7/1/11 (B) | | 8/18/06 | | | 1,459,498 | | | | 1,459,498 | | | | 1,488,688 | | |
| American Mini-Storage, Memphis, TN, 6.80%, 12/1/10 (B) ¶ | | 11/5/07 | | | 3,060,000 | | | | 3,060,000 | | | | 3,090,600 | | |
| Bigelow Office Building, Las Vegas, NV, 6.38%, 4/1/17 (B) | | 3/31/97 | | | 1,112,828 | | | | 1,112,828 | | | | 1,065,062 | | |
| Hickman Road, Clive, IA, 6.78%, 1/1/13 (B) ¶ | | 12/3/07 | | | 5,500,000 | | | | 5,500,000 | | | | 5,644,399 | | |
| Oak Knoll Village Shopping Center, Austin, TX, 6.73%, 10/1/13 (B) | | 9/17/03 | | | 1,482,594 | | | | 1,482,594 | | | | 1,514,596 | | |
| Office City Plaza, Houston, TX, 6.43%, 6/1/12 (B) | | 5/25/07 | | | 5,471,981 | | | | 5,471,981 | | | | 5,612,559 | | |
| Oyster Point Office Park, Newport News, VA, 6.68%, 2/1/11 (B) | | 1/4/06 | | | 12,018,210 | | | | 12,018,210 | | | | 12,138,392 | | |
| PennMont Office Plaza, Albuquerque, NM, 6.63%, 4/1/11 (B) | | 3/30/06 | | | 1,431,138 | | | | 1,431,138 | | | | 1,474,251 | | |
| Perkins – Blaine, Blaine, MN, 6.63%, 1/1/17 (B) | | 12/13/06 | | | 1,809,000 | | | | 1,809,000 | | | | 1,744,701 | | |
| Raveneaux Country Club, Spring, TX, 7.93%, 1/1/10 ¶ (U) | | 12/19/05 | | | 8,800,000 | | | | 8,800,000 | | | | 6,257,316 | | |
| Redwood Dental Building, Taylorsville, UT, 7.40%, 7/1/12 (B) | | 6/28/02 | | | 2,413,990 | | | | 2,413,990 | | | | 2,462,270 | | |
| Robberson Auto Dealerships, Bend and Prineville, OR, 6.40%, 4/1/17 (B) | | 3/30/07 | | | 7,118,240 | | | | 7,118,240 | | | | 6,894,222 | | |
| Signal Butte, Mesa, AZ, 6.90%, 7/1/17 (B) ¶ | | 6/20/07 | | | 15,000,000 | | | | 15,000,000 | | | | 11,506,548 | | |
| Station Square, Pompano Beach, FL, 6.33%, 2/1/14 (B) ¶ | | 1/19/07 | | | 12,000,000 | | | | 12,000,000 | | | | 11,032,150 | | |
| Waste Connections Warehouse, Englewood, CO, 6.58%, 3/1/14 (B) | | 2/15/07 | | | 1,268,180 | | | | 1,268,180 | | | | 1,300,045 | | |
| | | | 86,190,650 | | | | 79,561,784 | | |
| Multifamily Loans — 37.7% | |
| Carolina Square Apartments, Tallahassee, FL, 6.63%, 8/1/12 (B) ¶ | | 7/20/07 | | | 7,875,000 | | | | 7,875,000 | | | | 5,512,500 | | |
| Chardonnay Apartments, Tulsa, OK, 6.40%, 7/1/13 (B) | | 6/5/03 | | | 3,844,700 | | | | 3,844,700 | | | | 3,879,016 | | |
| Lake Point Terrace Apartments, Madison, WI, 6.33%, 5/1/17 (U) T | | 4/13/07 | | | 4,970,969 | | | | 4,982,395 | | | | 3,479,678 | | |
| Meadows Point, College Station, TX, 7.93%, 2/1/13 ¶ (C) | | 1/24/08 | | | 5,400,000 | | | | 5,400,000 | | | | 4,951,782 | | |
| RP-Plaza Development, Oxnard, CA, 3.68%, 3/1/10 ¶ r | | 2/23/05 | | | 5,000,000 | | | | 5,000,000 | | | | 4,921,894 | | |
| Sapphire Skies I, Cle Elum, WA, 7.93%, 7/1/11 ¶ (C) | | 12/23/05 | | | 8,805,908 | | | | 8,805,908 | | | | 8,805,908 | | |
| Sapphire Skies II, Cle Elum, WA, 7.90%, 7/1/11 | | 3/20/09 | | | 3,200,000 | | | | 3,200,000 | | | | 3,018,594 | | |
| Summit Chase Apartments I, Coral Springs, FL, 5.93%, 4/1/12 (B) ¶ | | 7/7/05 | | | 9,500,000 | | | | 9,500,000 | | | | 9,500,000 | | |
| Summit Chase Apartments II, Coral Springs, FL, 9.90%, 4/1/12 ¶ (C) (S) | | 7/7/05 | | | 6,150,000 | | | | 6,150,000 | | | | 4,305,000 | | |
| Sussex Club Apartments I, Athens, GA, 6.33%, 5/1/10 ¶ | | 4/17/07 | | | 9,126,000 | | | | 9,126,000 | | | | 9,217,260 | | |
| Sussex Club Apartments II, Athens, GA, 6.88%, 5/1/10 ¶ (C) (S) | | 4/17/07 | | | 2,298,600 | | | | 2,298,600 | | | | 1,609,020 | | |
| Trinity Oaks Apartments I, Dallas, TX, 6.53%, 4/1/09 ¶ (U) (D) | | 3/30/06 | | | 7,000,000 | | | | 7,000,000 | | | | 5,321,811 | | |
| Trinity Oaks Apartments II, Dallas, TX, 7.88%, 4/1/09 ¶ (C) (D) (S) | | 3/30/06 | | | 1,690,000 | | | | 1,690,000 | | | | 1,183,000 | | |
| Vista Bonita Apartments, Denton, TX, 7.90%, 6/1/10 | | 3/4/05 | | | 2,691,393 | | | | 2,691,393 | | | | 2,691,393 | | |
| | | | 77,563,996 | | | | 68,396,856 | | |
| Single Family Loans — 0.1% | |
| Merchants Bank, 2 loans, Vermont, 10.48%, 12/1/20 | | 12/18/92 | | | 52,204 | | | | 52,635 | | | | 53,770 | | |
| PHH U.S. Mortgage, 2 loans, California & Delaware, 8.65%, 1/1/12 | | 12/30/92 | | | 157,778 | | | | 153,007 | | | | 160,259 | | |
| | | | 205,642 | | | | 214,029 | | |
| Total Whole Loans | | | 163,960,288 | | | | 148,172,669 | | |
| Corporate Notes °° ¶ — 12.1% | |
| Fixed Rate — 12.1% | |
| Sarofim South and Bland, 6.90%, 1/1/11 | | 12/21/07 | | | 8,511,612 | | | | 8,511,612 | | | | 8,681,845 | | |
| Stratus Properties II, 6.56%, 12/31/11 | | 6/14/01 | | | 5,000,000 | | | | 5,000,000 | | | | 5,100,000 | | |
| Stratus Properties III, 6.56%, 12/31/11 | | 12/12/06 | | | 8,000,000 | | | | 8,000,000 | | | | 8,160,000 | | |
| Total Corporate Notes | | | 21,511,612 | | | | 21,941,845 | | |
The accompanying notes are an integral part of the financial statements.
First American Mortgage Funds 2009 Annual Report
22
American Strategic Income Portfolio II (BSP)
| DESCRIPTION | | PAR/
SHARES | | COST | | FAIR
VALUE (I) | |
| U.S. Government Agency Mortgage-Backed Securities (A) — 13.9% | |
| Fixed Rate — 13.9% | |
| Federal Home Loan Mortgage Corporation, | |
| 5.50%, 1/1/18, #E93231 | | $ | 2,224,542 | | | $ | 2,271,141 | | | $ | 2,371,987 | | |
| 9.00%, 7/1/30, #C40149 | | | 111,247 | | | | 113,711 | | | | 122,075 | | |
| 5.00%, 5/1/39, #G05430 | | | 4,032,746 | | | | 4,141,233 | | | | 4,145,931 | | |
| Federal National Mortgage Association, | |
| 6.00%, 10/1/16, #607030 | | | 163,275 | | | | 163,845 | | | | 174,709 | | |
| 5.50%, 6/1/17, #648508 | | | 197,185 | | | | 197,840 | | | | 210,440 | | |
| 5.00%, 9/1/17, #254486 | | | 330,531 | | | | 331,119 | | | | 349,960 | | |
| 5.00%, 11/1/17, #657356 | | | 690,937 | | | | 693,403 | | | | 731,551 | | |
| 6.50%, 6/1/29, #252497 | | | 805,512 | | | | 801,004 | | | | 871,385 | | |
| 7.50%, 5/1/30, #535289 | | | 98,156 | | | | 95,407 | | | | 109,458 | | |
| 8.00%, 5/1/30, #538266 | | | 40,639 | | | | 40,211 | | | | 45,971 | | |
| 8.00%, 6/1/30, #253347 | | | 120,220 | | | | 118,951 | | | | 135,992 | | |
| 5.00%, 11/1/33, #725027 | | | 9,671,629 | | | | 9,892,349 | | | | 9,979,346 | | |
| 5.00%, 7/1/39, #935588 | | | 5,842,499 | | | | 5,967,994 | | | | 6,004,651 | | |
| Total U.S. Government Agency Mortgage-Backed Securities | | | | | | | 24,828,208 | | | | 25,253,456 | | |
| Commercial Mortgage-Backed Securities r — 14.3% | |
| Other — 14.3% | |
| Banc of America Commercial Mortgage, Series 2005-4, Class A5B, 5.00%, 7/10/45 | | | 8,060,000 | | | | 5,129,289 | | | | 5,930,408 | | |
| Bear Stearns Commercial Mortgage Securities, Series 2007-T26, Class A4, 5.47%, 1/12/45 | | | 10,000,000 | | | | 8,426,935 | | | | 9,211,934 | | |
| Citigroup Commercial Mortgage Trust, | |
| Series 2007-C6, Class A4, 5.89%, 12/10/49 | | | 3,625,000 | | | | 2,953,963 | | | | 3,151,104 | | |
| Series 2008-C7, Class A4, 6.30%, 12/10/49 | | | 3,500,000 | | | | 2,977,339 | | | | 3,091,074 | | |
Citigroup/Deutsche Bank Commercial Mortgage Trust, Series 2007-CD5, Class A4,
5.89%, 11/15/44 | | | 4,950,000 | | | | 4,476,288 | | | | 4,558,391 | | |
| Total Commercial Mortgage-Backed Securities | | | | | | | 23,963,814 | | | | 25,942,911 | | |
| Preferred Stocks — 15.1% | |
| Real Estate Investment Trusts — 15.1% | |
| AMB Property, Series L | | | 124,600 | | | | 2,792,607 | | | | 2,402,288 | | |
| AMB Property, Series M | | | 14,360 | | | | 367,561 | | | | 287,200 | | |
| AMB Property, Series O | | | 13,459 | | | | 336,475 | | | | 284,321 | | |
| BRE Properties, Series C | | | 94,000 | | | | 1,867,780 | | | | 1,919,480 | | |
| BRE Properties, Series D | | | 7,450 | | | | 148,032 | | | | 151,310 | | |
| Developers Diversified Realty, Series H | | | 37,600 | | | | 770,800 | | | | 551,216 | | |
| Developers Diversified Realty, Series I | | | 6,050 | | | | 126,143 | | | | 91,355 | | |
| Duke Realty, Series J | | | 38,244 | | | | 974,588 | | | | 672,330 | | |
| Duke Realty, Series L | | | 27,260 | | | | 521,211 | | | | 475,142 | | |
| Duke Realty, Series M | | | 83,200 | | | | 1,704,000 | | | | 1,639,040 | | |
| Duke Realty, Series O | | | 63,150 | | | | 1,490,340 | | | | 1,434,768 | | |
| Equity Residential Properties, Series N | | | 129,000 | | | | 2,476,950 | | | | 2,688,360 | | |
| Kimco Realty, Series F | | | 78,000 | | | | 1,823,500 | | | | 1,553,760 | | |
| Kimco Realty, Series G | | | 20,800 | | | | 467,376 | | | | 457,600 | | |
| ProLogis Trust, Series F | | | 26,120 | | | | 630,278 | | | | 513,780 | | |
| ProLogis Trust, Series G | | | 11,700 | | | | 245,700 | | | | 231,075 | | |
| PS Business Parks, Series H | | | 37,600 | | | | 752,000 | | | | 782,832 | | |
| PS Business Parks, Series I | | | 13,200 | | | | 259,644 | | | | 268,620 | | |
| PS Business Parks, Series M | | | 37,600 | | | | 774,560 | | | | 835,848 | | |
| PS Business Parks, Series P | | | 11,650 | | | | 223,330 | | | | 238,825 | | |
| Public Storage, Series A | | | 40,000 | | | | 977,346 | | | | 878,000 | | |
| Public Storage, Series B | | | 22,200 | | | | 543,900 | | | | 522,144 | | |
First American Mortgage Funds 2009 Annual Report
23
Schedule of INVESTMENTS August 31, 2009
American Strategic Income Portfolio II (BSP)
| DESCRIPTION | | SHARES | | COST | | FAIR
VALUE (I) | |
| Public Storage, Series E | | | 28,200 | | | $ | 641,550 | | | $ | 621,810 | | |
| Public Storage, Series I | | | 37,600 | | | | 817,800 | | | | 921,200 | | |
| Public Storage, Series K | | | 24,850 | | | | 540,487 | | | | 592,921 | | |
| Public Storage, Series X | | | 20,000 | | | | 502,366 | | | | 428,000 | | |
| Public Storage, Series Z | | | 20,000 | | | | 497,779 | | | | 413,000 | | |
| Realty Income, Series D | | | 90,000 | | | | 2,281,500 | | | | 2,146,500 | | |
| Realty Income, Series E | | | 37,600 | | | | 812,160 | | | | 845,624 | | |
| Regency Centers, Series C | | | 37,600 | | | | 812,912 | | | | 824,568 | | |
| Regency Centers, Series E | | | 84,200 | | | | 1,912,340 | | | | 1,664,634 | | |
| Total Preferred Stocks | | | | | | | 29,093,015 | | | | 27,337,551 | | |
| Total Unaffiliated Investments | | | | | | | 263,356,937 | | | | 248,648,432 | | |
| Short-Term Investment — 1.2% | |
| First American Prime Obligations Fund, Class Z, 0.19% x | | | 2,200,486 | | | | 2,200,486 | | | | 2,200,486 | | |
| Total Investments p — 138.2% | | | | | | $ | 265,557,423 | | | $ | 250,848,918 | | |
| Other Assets and Liabilities, Net — (38.2)% | | | | | | | | | | | (69,318,868 | ) | |
| Total Net Assets — 100.0% | | $ | 181,530,050 | | |
(I) Securities are valued in accordance with procedures described in note 2 in Notes to Financial Statements.
°° Securities purchased as part of a private placement which have not been registered with the Securities and Exchange Commission under the Securities Act of 1933 and which are considered to be illiquid. These securities are fair valued in accordance with the board approved valuation procedures. On August 31, 2009, the total fair value of these securities was $170,114,514 or 93.7% of total net assets. See note 2 in Notes to Financial Statements.
(P) Interest rates on commercial and multifamily loans are the net coupon rates in effect (after reducing the coupon rate by any mortgage servicing fees paid to mortgage servicers) on August 31, 2009. Interest rates and maturity dates disclosed on single family loans represent the weighted average coupon and weighted average maturity for the underlying mortgage loans as of August 31, 2009. For participating loans the rates are based on the annual cash flow payments at the time of purchase.
(B) Securities pledged as collateral for outstanding borrowings under a loan agreement with Massachusetts Mutual Life Insurance Company ("MMLIC"). On August 31, 2009, securities valued at $92,195,984 were pledged as collateral for the following outstanding borrowings:
| Amount | | Rate* | | Accrued
Interest | |
| $ | 45,100,000 | | | | 5.00 | % | | $ | 6,264 | | |
| | 2,400,000 | | | | 5.00 | % | | | 333 | | |
| $ | 47,500,000 | | | | | $ | 6,597 | | |
* Interest rate as of August 31, 2009. Rate is based on the London Interbank Offered Rate ("LIBOR") plus 2.625% subject to a "floor" interest rate of 5.00% and reset monthly.
Description of collateral:
5555 East Van Buren I, Phoenix, AZ, 5.68%, 7/1/11, $6,244,991 par
5555 East Van Buren II, Phoenix, AZ, 7.13%, 7/1/11, $1,459,498 par
American Mini-Storage, Memphis, TN, 6.80%, 12/1/10, $3,060,000 par
Bigelow Office Building, Las Vegas, NV, 6.38%, 4/1/17, $1,112,828 par
Carolina Square Apartments, Tallahassee, FL, 6.63%, 8/1/12, $7,875,000 par
Chardonnay Apartments, Tulsa, OK, 6.40%, 7/1/13, $3,844,700 par
Hickman Road, Clive, IA, 6.78%, 1/1/13, $5,500,000 par
Oak Knoll Village Shopping Center, Austin, TX, 6.73%, 10/1/13, $1,482,594 par
Office City Plaza, Houston, TX, 6.43%, 6/1/12, $5,471,981 par
Oyster Point Office Park, Newport News, VA, 6.68%, 2/1/11, $12,018,210 par
PennMont Office Plaza, Albuquerque, NM, 6.63%, 4/1/11, $1,431,138 par
Perkins – Blaine, Blaine, MN, 6.63%, 1/1/17, $1,809,000 par
Redwood Dental Building, Taylorsville, UT, 7.40%, 7/1/12, $2,413,990 par
Robb erson Auto Dealerships, Bend and Prineville, OR, 6.40%, 4/1/17, $7,118,240 par
Signal Butte, Mesa, AZ, 6.90%, 7/1/17, $15,000,000 par
Station Square, Pompano Beach, FL, 6.33%, 2/1/14, $12,000,000 par
Summit Chase Apartments I, Coral Springs, FL, 5.93%, 4/1/12, $9,500,000 par
Waste Connections Warehouse, Englewood, CO, 6.58%, 3/1/14, $1,268,180 par
The accompanying notes are an integral part of the financial statements.
First American Mortgage Funds 2009 Annual Report
24
American Strategic Income Portfolio II (BSP)
The fund has entered into a loan agreement with MMLIC under which MMLIC made a term loan to the fund of $45,100,000, which matures on July 31, 2011, and agreed to make revolving loans to the fund of up to $12,900,000. Loans made under the loan agreement are secured by whole loans in the fund's portfolio and bear interest at the one-month LIBOR plus 2.625% with a "floor" interest rate of 5.00%. In addition, the fund pays an annual fee of 1.28% on any unused portion of the fund's revolving loan commitment.
¶ Interest Only – Represents securities that entitle holders to receive only interest payments on the mortgage. Principal balance on the loan is due at maturity. The interest rate disclosed represents the net coupon rate in effect as of August 31, 2009.
(U) Loan is currently in default with regards to scheduled interest and/or principal payments.
T Subsequent to fiscal year end this property was aquired by the fund through foreclosure. See note 2 of Notes to Financial Statements.
(C) Participating Loan – A participating loan is one which contains provisions for the fund to participate in the income stream provided by the property, including net cash flows and capital proceeds. Monthly cash flow proceeds are only required to the extent excess cash flow is generated by the property as determined by the loan documents.
r Variable Rate Security – The rate shown is the net coupon rate in effect as of August 31, 2009.
(D) Loan has matured and the fund is anticipating payoff or refinancing. Unless disclosed otherwise, the loan continues to make monthly payments.
(S) The participating loan is not currently making monthly cash flow payments.
(A) Securities pledged as collateral for outstanding reverse repurchase agreements. On August 31, 2009, securities valued at $25,253,456 were pledged as collateral for the following outstanding reverse repurchase agreements:
| Amount | | Acquisition
Date | | Rate* | | Due | | Accrued
Interest | | Name of Broker
and Description
of Collateral | |
| $ | 15,112,000 | | | 8/6/09 | | | 0.42 | % | | 9/8/09 | | $ | 4,584 | | | | (1 | ) | |
| | 8,349,000 | | | 8/20/09 | | | 0.42 | % | | 9/21/09 | | | 1,169 | | | | (2 | ) | |
| $ | 23,461,000 | | | | | | | | | $ | 5,753 | | | | |
* Interest rate as of August 31, 2009. Rate is based on LIBOR plus a spread and reset monthly.
Name of broker and description of collateral:
(1) Goldman Sachs:
Federal National Mortgage Association, 5.00%, 11/1/33, $9,671,629 par
Federal National Mortgage Association, 5.00%, 7/1/39, $5,842,499 par
(2) Goldman Sachs:
Federal Home Loan Mortgage Corporation, 5.50%, 1/1/18, $2,224,542 par
Federal Home Loan Mortgage Corporation, 9.00%, 7/1/30, $111,247 par
Federal Home Loan Mortgage Corporation, 5.00%, 5/1/39, $4,032,746 par
Federal National Mortgage Association, 6.00%, 10/1/16, $163,275 par
Federal National Mortgage Association, 5.50%, 6/1/17, $197,185 par
Federal National Mortgage Association, 5.00%, 9/1/17, $330,531 par
Federal National Mortgage Association, 5.00%, 11/1/17, $690,937 par
Federal National Mortgage Association, 6.50%, 6/1/29, $805,512 par
Federal National Mortgage Association, 7.50%, 5/1/30, $98,156 par
Federal National Mortgage Association, 8.00%, 5/1/30, $40,639 par
Federal National Mortgage Association, 8.00%, 6/1/30, $120,220 par
The fund has entered into a lending commitment with Goldman Sachs. The monthly agreement permits the fund to enter into reverse repurchase agreements using U.S. government agency mortgage-backed securities as collateral.
x Investment in affiliated security. This money market fund is advised by FAF Advisors, Inc., which also serves as advisor for the fund. The rate quoted is the annualized seven-day yield of the investment at period end. See note 3 in Notes to Financial Statements.
p On August 31, 2009, the cost of investments for federal income tax purposes was $265,621,199. The aggregate gross unrealized appreciation and depreciation of investments, based on this cost, were as follows:
| Gross unrealized appreciation | | $ | 4,263,674 | | |
| Gross unrealized depreciation | | | (19,035,955 | ) | |
| Net unrealized depreciation | | $ | (14,772,281 | ) | |
First American Mortgage Funds 2009 Annual Report
25
Schedule of INVESTMENTS August 31, 2009
American Strategic Income Portfolio III (CSP)
| DESCRIPTION | | DATE
ACQUIRED | | PAR | | COST | | FAIR
VALUE (I) | |
| (Percentages of each investment category relate to total net assets) | |
| Whole Loans °° (P) — 93.4% | |
| Commercial Loans — 55.0% | |
| 150 North Pantano I, Tucson, AZ, 5.90%, 2/1/10 (B) ¶ | | 1/4/05 | | $ | 3,525,000 | | | $ | 3,525,000 | | | $ | 3,525,000 | | |
| 150 North Pantano II, Tucson, AZ, 14.88%, 2/1/10 ¶ | | 1/4/05 | | | 440,000 | | | | 440,000 | | | | 415,987 | | |
| 8324 East Hartford Drive I, Scottsdale, AZ, 7.90%, 5/1/12 (B) | | 4/8/04 | | | 3,682,942 | | | | 3,682,942 | | | | 3,682,942 | | |
| Academy Spectrum, Colorado Springs, CO, 7.73%, 5/1/09 (D) (U) | | 12/18/02 | | | 4,959,112 | | | | 4,959,112 | | | | 3,471,378 | | |
| Alliant University, Fresno, CA, 7.15%, 8/1/11 (B) | | 7/12/06 | | | 2,775,810 | | | �� | 2,775,810 | | | | 2,831,326 | | |
| Apple Blossom Convenience Center, Winchester, VA, 6.58%, 8/1/12 (B) ¶ | | 7/9/07 | | | 2,150,000 | | | | 2,150,000 | | | | 2,208,197 | | |
| Biltmore Lakes Corporate Center, Phoenix, AZ, 6.00%, 9/1/14 (B) | | 8/2/04 | | | 2,878,777 | | | | 2,878,777 | | | | 2,878,046 | | |
| Carrier 360 I, Grand Prairie, TX, 6.40%, 1/1/10 (B) | | 6/28/04 | | | 3,134,004 | | | | 3,134,004 | | | | 3,134,004 | | |
| Carrier 360 II, Grand Prairie, TX, 6.38%, 1/1/10 | | 12/16/05 | | | 326,963 | | | | 326,963 | | | | 326,963 | | |
| Fairview Business Park, Salem, OR, 7.33%, 8/1/11 (B) (U) | | 7/14/06 | | | 7,590,028 | | | | 7,590,028 | | | | 5,313,020 | | |
| First Colony Marketplace, Sugar Land, TX, 6.43%, 9/1/10 (B) ¶ | | 8/15/07 | | | 11,700,000 | | | | 11,700,000 | | | | 11,614,026 | | |
| France Avenue Business Park II, Brooklyn Center, MN, 7.40%, 10/1/12 (B) | | 9/12/02 | | | 4,279,417 | | | | 4,279,417 | | | | 4,469,651 | | |
| France Avenue Business Park II (second), Brooklyn Center, MN, 7.38%, 10/1/12 ¶ | | 1/17/08 | | | 600,000 | | | | 600,000 | | | | 587,940 | | |
| Jilly's American Grill, Scottsdale, AZ, 4.15%, 9/1/09 (B) ¶ r | | 8/19/05 | | | 1,810,000 | | | | 1,810,000 | | | | 1,794,329 | | |
| La Cholla Plaza I, Tucson, AZ, 3.45%, 8/1/09 (B) ¶ r (D) | | 7/26/06 | | | 11,135,604 | | | | 11,135,604 | | | | 10,962,021 | | |
| La Cholla Plaza II, Tucson, AZ, 14.88%, 8/1/09 ¶ (D) (U) | | 7/26/06 | | | 1,389,396 | | | | 1,389,396 | | | | 1,172,169 | | |
| Memphis Medical Building, Memphis, TN, 6.40%, 9/1/12 ¶ (U) T | | 8/22/07 | | | 4,250,000 | | | | 4,250,000 | | | | 2,975,000 | | |
| NCH Commercial Pool I, Tucson, AZ, 11.93%, 4/1/10 ¶ (U) | | 3/27/07 | | | 5,500,000 | | | | 5,500,000 | | | | 3,983,976 | | |
| NCH Commercial Pool II, Phoenix, AZ, 11.93%, 1/1/11 ¶ (U) | | 12/4/07 | | | 14,000,000 | | | | 14,000,000 | | | | 13,939,086 | | |
| Noah's Ark Self Storage, San Antonio, TX, 6.48%, 9/1/10 (B) ¶ | | 8/24/07 | | | 2,400,000 | | | | 2,400,000 | | | | 2,424,000 | | |
| North Austin Business Center, Austin, TX, 5.65%, 11/1/11 (B) | | 10/29/04 | | | 3,805,923 | | | | 3,805,923 | | | | 3,846,645 | | |
| Outlets at Casa Grande I, Casa Grande, AZ, 6.93%, 3/1/11 (B) ¶ (U) | | 2/27/06 | | | 7,300,000 | | | | 7,300,000 | | | | 6,793,084 | | |
| Outlets at Casa Grande II, Casa Grande, AZ, 6.90%, 3/1/11 (B) ¶ (U) | | 4/11/07 | | | 3,500,000 | | | | 3,500,000 | | | | 2,879,707 | | |
| Paradise Boulevard, Albuquerque, NM, 6.50%, 4/1/17 (B) ¶ | | 3/26/07 | | | 4,600,000 | | | | 4,600,000 | | | | 4,454,392 | | |
| RealtiCorp Fund III, Orlando/Crystal River, FL, 6.93%, 7/1/11 ¶ | | 2/28/06 | | | 4,222,755 | | | | 4,222,755 | | | | 4,222,755 | | |
| Shoppes at Jonathan's Landing, Jupiter, FL, 7.95%, 5/1/10 (B) | | 4/12/00 | | | 2,673,139 | | | | 2,673,139 | | | | 2,699,871 | | |
| Silver Star Storage, Austin, TX, 6.40%, 4/1/11 (B) ¶ | | 3/25/08 | | | 4,146,342 | | | | 4,146,342 | | | | 4,229,269 | | |
| Spa Atlantis, Pompano Beach, FL, 6.43%, 4/1/09 ¶ (D) | | 9/30/05 | | | 11,000,000 | | | | 11,000,000 | | | | 11,000,000 | | |
| Tatum Ranch Center, Phoenix, AZ, 6.53%, 9/1/11 (B) | | 8/25/04 | | | 3,461,207 | | | | 3,461,207 | | | | 3,530,431 | | |
| | | | 133,236,419 | | | | 125,365,215 | | |
| Multifamily Loans — 38.4% | |
| Avalon Hills I, Omaha, NE, 6.93%, 3/1/10 (B) ¶ | | 3/1/07 | | | 10,720,000 | | | | 10,720,000 | | | | 10,827,200 | | |
| Avalon Hills II, Omaha, NE, 9.88%, 3/1/10 ¶ (C) (S) | | 3/1/07 | | | 2,448,800 | | | | 2,448,800 | | | | 1,714,160 | | |
| Chateau Club Apartments I, Athens, GA, 6.68%, 12/1/10 ¶ | | 12/20/07 | | | 6,623,000 | | | | 6,623,000 | | | | 4,979,084 | | |
| Chateau Club Apartments II, Athens, GA, 6.88%, 12/1/10 ¶ (C) (S) | | 12/20/07 | | | 2,368,624 | | | | 2,368,624 | | | | 1,658,037 | | |
| Citadel Apartments I, El Paso, TX, 6.53%, 4/1/10 (B) ¶ | | 3/30/07 | | | 10,266,961 | | | | 10,266,961 | | | | 10,266,961 | | |
| Citadel Apartments II, El Paso, TX, 9.88%, 4/1/10 ¶ | | 3/30/07 | | | 499,384 | | | | 499,384 | | | | 466,831 | | |
| Country Villa Apartments, West Lafayette, IN, 6.90%, 9/1/13 (B) | | 8/29/03 | | | 2,432,016 | | | | 2,432,016 | | | | 2,336,173 | | |
| Courtyards at Mesquite I, Mesquite, TX, 6.53%, 11/1/09 (B) (U) | | 10/14/05 | | | 7,389,373 | | | | 7,389,373 | | | | 6,811,283 | | |
| Courtyards at Mesquite II, Mesquite, TX, 7.90%, 11/1/09 ¶ (C) (S) | | 10/14/05 | | | 2,850,000 | | | | 2,850,000 | | | | 1,995,000 | | |
| El Dorado Apartments I, Tucson, AZ, 7.15%, 9/1/12 (B) | | 8/26/04 | | | 2,504,673 | | | | 2,504,673 | | | | 2,604,860 | | |
| El Dorado Apartments II, Tucson, AZ, 7.13%, 9/1/12 | | 8/26/04 | | | 491,476 | | | | 491,476 | | | | 511,135 | | |
| Geneva Village Apartments I, West Jordan, UT, 7.00%, 1/1/14 (B) | | 12/24/03 | | | 1,163,093 | | | | 1,163,093 | | | | 1,203,696 | | |
| Geneva Village Apartments II, West Jordan, UT, 9.88%, 1/1/13 | | 12/24/03 | | | 37,183 | | | | 37,183 | | | | 36,259 | | |
| Good Haven Apartments I, Dallas, TX, 5.43%, 9/1/07 ¶ r (D) (U) | | 8/24/04 | | | 6,737,000 | | | | 6,737,000 | | | | 4,715,900 | | |
| Good Haven Apartments II, Dallas, TX, 14.88%, 9/1/07 ¶ (D) (U) | | 8/24/04 | | | 842,000 | | | | 842,000 | | | | 589,400 | | |
| Good Haven Apartments III, Dallas, TX, 14.88%, 5/1/09 ¶ (D) (U) | | 7/3/08 | | | 694,096 | | | | 694,096 | | | | 485,867 | | |
| Meadowview Village Apartments I, West Jordan, UT, 7.00%, 1/1/14 | | 12/24/03 | | | 844,180 | | | | 844,180 | | | | 869,429 | | |
| Meadowview Village Apartments II, West Jordan, UT, 9.88%, 1/1/13 | | 12/24/03 | | | 37,183 | | | | 37,183 | | | | 36,259 | | |
| Meridian Pointe Apartments, Kalispell, MT, 8.73%, 4/1/12 (B) | | 3/7/97 | | | 1,019,654 | | | | 1,019,654 | | | | 1,050,244 | | |
| Montevista Apartments, Fort Worth, TX, 7.43%, 9/1/12 ¶ (C) | | 8/30/07 | | | 7,308,000 | | | | 7,308,000 | | | | 5,930,027 | | |
| NCH Multifamily Pool, Oklahoma City, OK, 11.93%, 11/1/09 ¶ (U) | | 10/17/06 | | | 4,993,450 | | | | 4,993,450 | | | | 3,684,793 | | |
The accompanying notes are an integral part of the financial statements.
First American Mortgage Funds 2009 Annual Report
26
American Strategic Income Portfolio III (CSP)
| DESCRIPTION | | DATE
ACQUIRED | | PAR | | COST | | FAIR
VALUE (I) | |
| Parkway Village Apartments I, West Jordan, UT, 7.00%, 1/1/14 | | 12/24/03 | | $ | 799,047 | | | $ | 799,047 | | | $ | 823,105 | | |
| Parkway Village Apartments II, West Jordan, UT, 9.88%, 1/1/13 | | 12/24/03 | | | 37,183 | | | | 37,183 | | | | 36,259 | | |
| Plantation Pines I, Tyler, TX, 6.59%, 2/1/10 (B) ¶ | | 1/17/07 | | | 3,328,000 | | | | 3,328,000 | | | | 3,279,178 | | |
| Plantation Pines II, Tyler, TX, 10.57%, 2/1/10 ¶ | | 1/17/07 | | | 416,000 | | | | 416,000 | | | | 315,752 | | |
| RiverPark Land Lot III, Oxnard, CA, 3.68%, 11/1/09 ¶ r | | 10/9/07 | | | 3,650,000 | | | | 3,650,000 | | | | 3,604,959 | | |
| Villas of Woodgate, Lansing, MI, 6.40%, 2/1/12 (B) | | 2/1/07 | | | 3,551,194 | | | | 3,551,194 | | | | 3,126,157 | | |
| Vista Village Apartments I, El Paso, TX, 6.53%, 4/1/10 (B) | | 3/30/07 | | | 6,080,433 | | | | 6,080,433 | | | | 6,080,433 | | |
| Vista Village Apartments II, El Paso, TX, 9.88%, 4/1/10 | | 3/30/07 | | | 349,569 | | | | 349,569 | | | | 326,782 | | |
| Whispering Oaks I, Little Rock, AR, 5.93%, 2/1/12 (B) ¶ | | 1/10/07 | | | 5,800,000 | | | | 5,800,000 | | | | 5,148,119 | | |
| Whispering Oaks II, Little Rock, AR, 9.88%, 2/1/12 ¶ (C) (S) | | 1/10/07 | | | 2,636,000 | | | | 2,636,000 | | | | 1,845,200 | | |
| | | | 98,917,572 | | | | 87,358,542 | | |
| Total Whole Loans | | | 232,153,991 | | | | 212,723,757 | | |
| Corporate Notes °° ¶ — 11.2% | |
| Fixed Rate — 11.2% | |
| Sarofim Brookhaven, 6.90%, 1/1/11 | | 12/21/07 | | | 10,040,375 | | | | 10,040,375 | | | | 10,241,182 | | |
| Stratus Properties IV, 6.56%, 12/31/11 | | 12/1/06 | | | 7,000,000 | | | | 7,000,000 | | | | 7,140,000 | | |
| Stratus Properties VI, 6.92%, 12/31/11 | | 6/1/07 | | | 8,000,000 | | | | 8,000,000 | | | | 8,160,000 | | |
| Total Corporate Notes | | | 25,040,375 | | | | 25,541,182 | | |
| Private Mortgage-Backed Security °° — 0.0% | |
| Fixed Rate — 0.0% | |
| First Gibraltar, Series 1992-MM, Class B, 6.06%, 10/25/21 | | 7/30/93 | | | 93,038 | | | | 58,437 | | | | — | | |
| U.S. Government Agency Mortgage-Backed Securities (A) — 7.5% | |
| Fixed Rate — 7.5% | |
| Federal Home Loan Mortgage Corporation, | |
| 5.50%, 1/1/18, #E93231 | | | | | 2,224,542 | | | | 2,271,140 | | | | 2,371,988 | | |
| 9.00%, 7/1/30, #C40149 | | | | | 155,746 | | | | 159,196 | | | | 170,905 | | |
| 5.00%, 5/1/39, #G05430 | | | | | 5,538,952 | | | | 5,687,959 | | | | 5,694,411 | | |
| Federal National Mortgage Association, | |
| 6.00%, 10/1/16, #607030 | | | | | 163,275 | | | | 163,846 | | | | 174,709 | | |
| 5.50%, 2/1/17, #623874 | | | | | 290,515 | | | | 290,061 | | | | 309,317 | | |
| 5.50%, 6/1/17, #648508 | | | | | 197,185 | | | | 197,840 | | | | 210,440 | | |
| 5.00%, 9/1/17, #254486 | | | | | 330,531 | | | | 331,121 | | | | 349,960 | | |
| 5.00%, 11/1/17, #657356 | | | | | 690,937 | | | | 693,403 | | | | 731,551 | | |
| 6.50%, 6/1/29, #252497 | | | | | 563,858 | | | | 560,703 | | | | 609,969 | | |
| 7.50%, 5/1/30, #535289 | | | | | 98,156 | | | | 95,407 | | | | 109,458 | | |
| 8.00%, 5/1/30, #538266 | | | | | 40,639 | | | | 40,211 | | | | 45,971 | | |
| 8.00%, 6/1/30, #253347 | | | | | 108,198 | | | | 107,055 | | | | 122,393 | | |
| 5.00%, 11/1/33, #725027 | | | | | 3,843,531 | | | | 3,931,245 | | | | 3,965,818 | | |
| 5.00%, 7/1/39, #935512 | | | | | 2,246,927 | | | | 2,292,684 | | | | 2,309,288 | | |
| Total U.S. Government Agency Mortgage-Backed Securities | | | 16,821,871 | | | | 17,176,178 | | |
| Commercial Mortgage-Backed Securities r — 3.5% | |
| Other — 3.5% | |
| Banc of America Commercial Mortgage, Series 2005-4, Class A5B, 5.00%, 7/10/45 | | | | | 6,400,000 | | | | 4,072,885 | | | | 4,709,009 | | |
Citigroup/Deutsche Bank Commercial Mortgage Trust,
Series 2007-CD5, Class A4, 5.89%, 11/15/44 | | | | | 1,100,000 | | | | 994,730 | | | | 1,012,976 | | |
| LB-UBS Commercial Mortgage Trust, Series 2008-C1, Class A2, 6.32%, 4/15/41 | | | | | 2,250,000 | | | | 1,511,666 | | | | 2,140,523 | | |
| Total Commercial Mortgage-Backed Securities | | | 6,579,281 | | | | 7,862,508 | | |
First American Mortgage Funds 2009 Annual Report
27
Schedule of INVESTMENTS August 31, 2009
American Strategic Income Portfolio III (CSP)
| DESCRIPTION | | SHARES | | COST | | FAIR
VALUE (I) | |
| Preferred Stocks — 17.3% | |
| Real Estate Investment Trusts — 17.3% | |
| AMB Property, Series L | | | 164,120 | | | $ | 3,789,361 | | | $ | 3,164,234 | | |
| AMB Property, Series M | | | 41,240 | | | | 950,889 | | | | 824,800 | | |
| AMB Property, Series O | | | 9,613 | | | | 240,325 | | | | 203,075 | | |
| AMB Property, Series P | | | 21,200 | | | | 429,300 | | | | 432,692 | | |
| BRE Properties, Series C | | | 66,300 | | | | 1,317,381 | | | | 1,353,846 | | |
| BRE Properties, Series D | | | 5,250 | | | | 104,318 | | | | 106,627 | | |
| Developers Diversified Realty, Series G | | | 57,600 | | | | 997,080 | | | | 918,720 | | |
| Developers Diversified Realty, Series H | | | 69,320 | | | | 1,234,880 | | | | 1,016,231 | | |
| Developers Diversified Realty, Series I | | | 4,270 | | | | 89,030 | | | | 64,477 | | |
| Duke Realty, Series J | | | 20,956 | | | | 535,385 | | | | 368,406 | | |
| Duke Realty, Series L | | | 19,220 | | | | 367,486 | | | | 335,005 | | |
| Duke Realty, Series M | | | 55,040 | | | | 1,110,800 | | | | 1,084,288 | | |
| Duke Realty, Series O | | | 44,550 | | | | 1,051,380 | | | | 1,012,176 | | |
| Equity Residential Properties, Series N | | | 10,700 | | | | 226,305 | | | | 222,988 | | |
| Kimco Realty, Series F | | | 163,000 | | | | 3,797,000 | | | | 3,246,960 | | |
| Kimco Realty, Series G | | | 114,700 | | | | 2,796,559 | | | | 2,523,400 | | |
| ProLogis Trust, Series F | | | 33,905 | | | | 835,567 | | | | 666,911 | | |
| ProLogis Trust, Series G | | | 8,300 | | | | 174,300 | | | | 163,925 | | |
| PS Business Parks, Series H | | | 26,520 | | | | 530,400 | | | | 552,146 | | |
| PS Business Parks, Series I | | | 94,300 | | | | 1,634,731 | | | | 1,919,005 | | |
| PS Business Parks, Series K | | | 25,000 | | | | 575,000 | | | | 580,000 | | |
| PS Business Parks, Series L | | | 7,000 | | | | 179,550 | | | | 159,250 | | |
| PS Business Parks, Series M | | | 26,520 | | | | 546,312 | | | | 589,540 | | |
| PS Business Parks, Series O | | | 100,000 | | | | 2,050,000 | | | | 2,285,000 | | |
| PS Business Parks, Series P | | | 8,200 | | | | 157,194 | | | | 168,100 | | |
| Public Storage, Series A | | | 38,000 | | | | 921,909 | | | | 834,100 | | |
| Public Storage, Series C | | | 30,000 | | | | 626,100 | | | | 644,400 | | |
| Public Storage, Series E | | | 9,300 | | | | 186,000 | | | | 205,065 | | |
| Public Storage, Series H | | | 40,000 | | | | 876,000 | | | | 918,000 | | |
| Public Storage, Series I | | | 26,520 | | | | 576,810 | | | | 649,740 | | |
| Public Storage, Series K | | | 17,550 | | | | 381,712 | | | | 418,743 | | |
| Public Storage, Series L | | | 20,000 | | | | 430,000 | | | | 442,600 | | |
| Public Storage, Series X | | | 74,000 | | | | 1,786,319 | | | | 1,583,600 | | |
| Public Storage, Series Z | | | 30,000 | | | | 746,643 | | | | 619,500 | | |
| Realty Income, Series D | | | 97,500 | | | | 2,474,125 | | | | 2,325,375 | | |
| Realty Income, Series E | | | 26,520 | | | | 572,832 | | | | 596,435 | | |
| Regency Centers, Series C | | | 26,520 | | | | 573,362 | | | | 581,584 | | |
| Regency Centers, Series E | | | 94,270 | | | | 2,221,248 | | | | 1,863,718 | | |
| Vornado Realty Trust, Series E | | | 7,400 | | | | 186,598 | | | | 163,688 | | |
| Vornado Realty Trust, Series F | | | 7,800 | | | | 164,970 | | | | 160,134 | | |
| Vornado Realty Trust, Series H | | | 163,000 | | | | 2,771,000 | | | | 3,380,620 | | |
| Total Preferred Stocks | | | | | | | 41,216,161 | | | | 39,349,104 | | |
| Total Unaffiliated Investments | | | | | | | 321,870,116 | | | | 302,652,729 | | |
| Short-Term Investment — 1.1% | |
| First American Prime Obligations Fund, Class Z, 0.19% x | | | 2,600,430 | | | | 2,600,430 | | | | 2,600,430 | | |
| Total Investments p — 134.0% | | | | | | $ | 324,470,546 | | | $ | 305,253,159 | | |
| Other Assets and Liabilities, Net — (34.0)% | | | | | | | | | | | (77,367,358 | ) | |
| Total Net Assets — 100.0% | | $ | 227,885,801 | | |
The accompanying notes are an integral part of the financial statements.
First American Mortgage Funds 2009 Annual Report
28
American Strategic Income Portfolio III (CSP)
(I) Securities are valued in accordance with procedures described in note 2 in Notes to Financial Statements.
°° Securities purchased as part of a private placement which have not been registered with the Securities and Exchange Commission under the Securities Act of 1933 and which are considered to be illiquid. These securities are fair valued in accordance with the board approved valuation procedures. On August 31, 2009, the total fair value of these securities was $238,264,939 or 104.6% of total net assets. See note 2 in Notes to Financial Statements.
(P) Interest rates on commercial and multifamily loans are the net coupon rates in effect (after reducing the coupon rate by any mortgage servicing fees paid to mortgage servicers) on August 31, 2009. For participating loans the rates are based on the annual cash flow payments expected at the time of purchase.
(B) Securities pledged as collateral for outstanding borrowings under a loan agreement with Massachusetts Mutual Life Insurance Company ("MMLIC"). On August 31, 2009, securities valued at $136,004,265 were pledged as collateral for the following outstanding borrowings:
| Amount | | Rate* | | Accrued
Interest | |
| $ | 54,400,000 | | | | 5.00 | % | | $ | 7,556 | | |
| | 10,300,000 | | | | 5.00 | % | | | 1,430 | | |
| $ | 64,700,000 | | | | | $ | 8,986 | | |
* Interest rate as of August 31, 2009. Rate is based on the London Interbank Offered Rate ("LIBOR") plus 2.625% subject to a "floor" interest rate of 5.00% and reset monthly.
Description of collateral:
150 North Pantano I, Tucson, AZ, 5.90%, 2/1/10, $3,525,000 par
8324 East Hartford Drive I, Scottsdale, AZ, 7.90%, 5/1/12, $3,682,942 par
Alliant University, Fresno, CA, 7.15%, 8/1/11, $2,775,810 par
Apple Blossom Convenience Center, Winchester, VA, 6.58%, 8/1/12, $2,150,000 par
Avalon Hills I, Omaha, NE, 6.93%, 3/1/10, $10,720,000 par
Biltmore Lakes Corporate Center, Phoenix, AZ, 6.00%, 9/1/14, $2,878,777 par
Carrier 360 I, Grand Prairie, TX, 6.40%, 1/1/10, $3,134,004 par
Citadel Apartments I, El Paso, TX, 6.53%, 4/1/10, $10,266,961 par
Country Villa Apartments, West Lafayette, IN, 6.90%, 9/1/13, $2,432,016 par
Courtyards at Mesquite I, Mesquite, TX, 6.53%, 11/1/09, $7,389,373 par
El Dorado Apartments I, Tucson, AZ, 7.15%, 9/1/12, $2,504,673 par
Fairview Business Park, Salem, OR, 7.33%, 8/1/11, $7,590,028 par
First Colony Marketplace, Sugar Land, TX, 6.43%, 9/1/10, $11,700,000 par
France Av enue Business Park II, Brooklyn Center, MN, 7.40%, 10/1/12, $4,279,417 par
Geneva Village Apartments I, West Jordan, UT, 7.00%, 1/1/14, $1,163,093 par
Jilly's American Grill, Scottsdale, AZ, 4.15%, 9/1/09, $1,810,000 par
La Cholla Plaza I, Tucson, AZ, 3.45%, 8/1/09, $11,135,604 par
Meridian Pointe Apartments, Kalispell, MT, 8.73%, 4/1/12, $1,019,654 par
Noah's Ark Self Storage, San Antonio, TX, 6.48%, 9/1/10, $2,400,000 par
North Austin Business Center, Austin, TX, 5.65%, 11/1/11, $3,805,923 par
Outlets at Casa Grande I, Casa Grande, AZ, 6.93%, 3/1/11, $7,300,000 par
Outlets at Casa Grande II, Casa Grande, AZ, 6.90%, 3/1/11, $3,500,000 par
Paradise Boulevard, Albuquerque, NM, 6.50%, 4/1/17, $4,600,000 par
Plantation Pines I, Tyler, TX, 6.59%, 2/1/10, $3,328,000 par
Shoppes at Jonathan's Landing, Jupiter, FL, 7.95%, 5/1/10, $2,673,139 par
Silver Star Storage, Austin, TX, 6.40%, 4/1/11, $4,146,342 par
Tatum Ranch Center, Phoenix, AZ, 6.53%, 9/1/11, $3,461,207 par
Villa s of Woodgate, Lansing, MI, 6.40%, 2/1/12, $3,551,194 par
Vista Village Apartments I, El Paso, TX, 6.53%, 4/1/10, $6,080,433 par
Whispering Oaks I, Little Rock, AR, 5.93%, 2/1/12, $5,800,000 par
The fund has entered into a loan agreement with MMLIC under which MMLIC made a term loan to the fund of $54,400,000, which matures on July 31, 2011, and agreed to make revolving loans to the fund of up to $15,600,000. Loans made under the loan agreement are secured by whole loans in the fund's portfolio and bear interest at the one-month LIBOR plus 2.625% with a "floor" interest rate of 5.00%. In addition, the fund pays an annual fee of 1.28% on any unused portion of the fund's revolving loan commitment.
¶ Interest Only – Represents securities that entitle holders to receive only interest payments on the mortgage. Principal balance on the loan is due at maturity. The interest rate disclosed represents the net coupon rate in effect as of August 31, 2009.
r Variable Rate Security – The rate shown is the net coupon rate in effect as of August 31, 2009.
First American Mortgage Funds 2009 Annual Report
29
Schedule of INVESTMENTS August 31, 2009
American Strategic Income Portfolio III (CSP)
(D) Loan has matured and the fund is anticipating payoff or refinancing. Unless disclosed otherwise, the loan continues to make monthly payments.
(U) Loan is currently in default with regards to scheduled interest and/or principal payments.
T Subsequent to fiscal year end this property was acquired by the fund through foreclosure. See note 2 of Notes to Financial Statements.
(C) Participating Loan – A participating loan is one which contains provisions for the fund to participate in the income stream provided by the property, including net cash flows and capital proceeds. Monthly cash flow proceeds are only required to the extent excess cash flow is generated by the property as determined by the loan documents.
(S) The participating loan is not currently making monthly cash flow payments.
(A) Securities pledged as collateral for outstanding reverse repurchase agreements. On August 31, 2009, securities valued at $17,176,178 were pledged as collateral for the following outstanding reverse repurchase agreements:
| Amount | | Acquisition
Date | | Rate* | | Due | | Accrued
Interest | | Name of Broker
and Description
of Collateral | |
| $ | 12,173,946 | | | 8/20/09 | | | 0.42 | % | | 9/21/09 | | $ | 1,704 | | | | (1 | ) | |
| | 3,767,000 | | | 8/6/09 | | | 0.42 | % | | 9/8/09 | | | 1,143 | | | | (2 | ) | |
| $ | 15,940,946 | | | | | | | | | $ | 2,847 | | | | |
* Interest rate as of August 31, 2009. Rate is based on LIBOR plus a spread and reset monthly.
Name of broker and description of collateral:
(1) Goldman Sachs:
Federal Home Loan Mortgage Corporation, 5.50%, 1/1/18, $2,224,542 par
Federal Home Loan Mortgage Corporation, 9.00%, 7/1/30, $155,746 par
Federal Home Loan Mortgage Corporation, 5.00%, 5/1/39, $5,538,952 par
Federal National Mortgage Association, 6.00%, 10/1/16, $163,275 par
Federal National Mortgage Association, 5.50%, 2/1/17, $290,515 par
Federal National Mortgage Association, 5.50%, 6/1/17, $197,185 par
Federal National Mortgage Association, 5.00%, 9/1/17, $330,531 par
Federal National Mortgage Association, 5.00%, 11/1/17, $690,937 par
Federal National Mortgage Association, 6.50%, 6/1/29, $563,858 par
Federal National Mortgage Association, 7.50%, 5/1/30, $98,156 par
Federal National Mortgage Association, 8.00%, 5/1/30, $40,639 par
Federal National Mortgage Association, 8.00%, 6/1/30, $108,198 par
Federal National Mortgage Association, 5.00%, 7/1/39, $2,246,9 27 par
(2) Goldman Sachs:
Federal National Mortgage Association, 5.00%, 11/1/33, $3,843,531 par
The fund has entered into a lending commitment with Goldman Sachs. The monthly agreement permits the fund to enter into reverse repurchase agreements using U.S. government agency mortgage-backed securities as collateral.
x Investment in affiliated security. This money market fund is advised by FAF Advisors, Inc., which also serves as advisor for the fund. The rate quoted is the annualized seven-day yield of the investment at period end. See note 3 in Notes to Financial Statements.
p On August 31, 2009, the cost of investments for federal income tax purposes was $332,873,441. The aggregate gross unrealized appreciation and depreciation of investments, based on this cost, were as follows:
| Gross unrealized appreciation | | $ | 4,519,130 | | |
| Gross unrealized depreciation | | | (32,139,412 | ) | |
| Net unrealized depreciation | | $ | (27,620,282 | ) | |
The accompanying notes are an integral part of the financial statements.
First American Mortgage Funds 2009 Annual Report
30
American Select Portfolio (SLA)
| DESCRIPTION | | DATE
ACQUIRED | | PAR | | COST | | FAIR
VALUE (I) | |
| (Percentages of each investment category relate to total net assets) | |
| Whole Loans °° (P) — 88.3% | |
| Commercial Loans — 62.6% | |
| 12000 Aerospace, Clear Lake, TX, 5.43%, 1/1/15 (B) | | 12/22/04 | | $ | 4,945,464 | | | $ | 4,945,464 | | | $ | 4,945,464 | | |
| ABC Conoco, Aspen, CO, 6.65%, 11/1/11 (B) | | 10/31/06 | | | 3,921,180 | | | | 3,921,180 | | | | 3,927,970 | | |
| Cingular Wireless Building, Richardson, TX, 7.03%, 7/1/11 (B) | | 6/21/06 | | | 6,437,608 | | | | 6,437,608 | | | | 6,501,984 | | |
| Clear Lake Central I, Webster, TX, 6.63%, 8/1/11 (B) | | 7/27/06 | | | 7,030,402 | | | | 7,030,402 | | | | 7,171,010 | | |
| Gallery Row, Tucson, AZ, 11.88%, 10/1/11 ¶ | | 9/7/06 | | | 500,000 | | | | 500,000 | | | | 464,923 | | |
| George Gee Hummer, Liberty Lake, WA, 5.88%, 7/1/10 (B) ¶ | | 6/30/05 | | | 2,125,000 | | | | 2,125,000 | | | | 1,795,890 | | |
| George Gee Pontiac I, Liberty Lake, WA, 5.90%, 7/1/10 (B) ¶ | | 6/30/05 | | | 4,675,000 | | | | 4,675,000 | | | | 3,952,154 | | |
| George Gee Pontiac II, Liberty Lake, WA, 5.88%, 7/1/10 ¶ | | 9/14/06 | | | 750,000 | | | | 750,000 | | | | 633,843 | | |
| George Gee Porsche, Liberty Lake, WA, 5.88%, 7/1/10 (B) ¶ | | 9/14/06 | | | 2,500,000 | | | | 2,500,000 | | | | 2,112,811 | | |
| Highland Park I, Scottsdale, AZ, 6.77%, 3/1/11 (B) | | 2/23/06 | | | 9,274,676 | | | | 9,274,676 | | | | 9,367,423 | | |
| Highland Park II, Scottsdale, AZ, 9.88%, 3/1/11 | | 2/23/06 | | | 1,187,953 | | | | 1,187,953 | | | | 1,142,422 | | |
| Kolb Plaza I, Tucson, AZ, 6.50%, 8/1/10 (B) ¶ | | 7/18/07 | | | 3,520,000 | | | | 3,520,000 | | | | 3,237,184 | | |
| Kolb Plaza II, Tucson, AZ, 9.88%, 8/1/10 ¶ (U) | | 7/18/07 | | | 440,000 | | | | 440,000 | | | | 308,000 | | |
| Landmark Bank Center, Euless, TX, 5.85%, 5/1/11 ¶ | | 7/1/04 | | | 3,242,424 | | | | 3,242,424 | | | | 3,242,424 | | |
| Landmark Bank Center II, Euless, TX, 6.88%, 5/1/11 ¶ | | 6/12/08 | | | 1,157,576 | | | | 1,157,576 | | | | 1,037,718 | | |
| Mandala Agency Building, Bend, OR, 6.38%, 6/1/17 (B) ¶ | | 5/23/07 | | | 2,175,000 | | | | 2,175,000 | | | | 2,106,709 | | |
| Northrop Grumman Campus I, Colorado Springs, CO, 5.93%, 12/1/09 (B) ¶ r | | 11/15/05 | | | 5,700,000 | | | | 5,700,000 | | | | 4,855,448 | | |
| Northrop Grumman Campus II, Colorado Springs, CO, 13.88%, 12/1/09 ¶ | | 11/15/05 | | | 500,000 | | | | 500,000 | | | | 394,991 | | |
| Point Plaza, Turnwater, WA, 8.43%, 1/1/11 | | 12/14/00 | | | 5,792,220 | | | | 5,792,220 | | | | 5,908,064 | | |
| RL Stowe Portfolio, Belmont, NC & Chattanooga, TN, 6.83%, 11/1/12 (B) | | 10/12/07 | | | 8,010,325 | | | | 8,010,325 | | | | 8,170,531 | | |
| Superior Ford Dealership, Plymouth, MN, 6.43%, 7/1/17 (B) | | 6/28/07 | | | 5,074,911 | | | | 5,074,911 | | | | 4,845,006 | | |
| Town Square #6, Olympia, WA, 7.40%, 9/1/12 (B) | | 8/2/02 | | | 3,631,728 | | | | 3,631,729 | | | | 3,776,998 | | |
| Victory Packaging, Phoenix, AZ, 8.50%, 1/1/12 (B) | | 12/20/01 | | | 2,326,498 | | | | 2,326,498 | | | | 2,396,293 | | |
| | | | 84,917,966 | | | | 82,295,260 | | |
| Multifamily Loans — 25.7% | |
| Briarhill Apartments I, Eden Prairie, MN, 6.90%, 9/1/15 (B) | | 8/11/03 | | | 4,359,771 | | | | 4,359,771 | | | | 4,396,541 | | |
| Briarhill Apartments II, Eden Prairie, MN, 6.88%, 9/1/15 | | 8/11/03 | | | 438,701 | | | | 438,701 | | | | 454,195 | | |
| Highland House Apartments, Dallas, TX, 6.80%, 10/1/10 (B) ¶ | | 9/10/07 | | | 2,700,000 | | | | 2,700,000 | | | | 2,754,000 | | |
| Hunters Meadow, Colorado Springs, CO, 7.80%, 8/1/12 | | 7/2/02 | | | 5,788,639 | | | | 5,788,639 | | | | 4,400,892 | | |
| Keystone Crossings, Springdale, AZ, 8.15%, 7/1/10 ¶ (C) (S) | | 6/27/07 | | | 4,875,000 | | | | 4,875,000 | | | | 3,412,500 | | |
| NCH Multifamily Pool II, Oklahoma City, OK, 11.93%, 10/1/10 ¶ (U) | | 10/1/07 | | | 5,400,000 | | | | 5,400,000 | | | | 5,053,855 | | |
| Revere Apartments, Revere, MA, 6.28%, 3/1/12 (B) | | 3/8/07 | | | 1,650,997 | | | | 1,650,997 | | | | 1,673,212 | | |
| RP Urban Partners, Oxnard, CA, 3.68%, 3/1/10 ¶ r | | 2/23/05 | | | 5,000,000 | | | | 5,000,000 | | | | 4,921,894 | | |
| Sheridan Pond Apartments, Tulsa, OK, 6.43%, 7/1/13 (B) | | 6/5/03 | | | 6,670,323 | | | | 6,670,323 | | | | 6,768,726 | | |
| | | | 36,883,431 | | | | 33,835,815 | | |
| Total Whole Loans | | | 121,801,397 | | | | 116,131,075 | | |
| Corporate Notes °° ¶ — 13.0% | |
| Fixed Rate — 13.0% | |
| Sarofim Northwest, 6.90%, 1/1/11 | | 12/21/07 | | | 8,181,250 | | | | 8,181,250 | | | | 8,344,875 | | |
| Stratus Properties I, 6.56%, 12/31/11 | | 12/28/00 | | | 5,000,000 | | | | 5,000,000 | | | | 5,100,000 | | |
| Stratus Properties VII, 6.92%, 12/31/11 | | 6/1/07 | | | 3,500,000 | | | | 3,500,000 | | | | 3,570,000 | | |
| Total Corporate Notes | | | 16,681,250 | | | | 17,014,875 | | |
| U.S. Government Agency Mortgage-Backed Securities (A) — 10.0% | |
| Fixed Rate — 10.0% | |
| Federal Home Loan Mortgage Corporation, | |
| 5.50%, 1/1/18, #E93231 | | | | | 1,251,305 | | | | 1,277,515 | | | | 1,334,243 | | |
| 7.50%, 12/1/29, #C00896 | | | | | 210,557 | | | | 207,282 | | | | 235,559 | | |
| 5.00%, 5/1/39, #G05430 | | | | | 2,769,476 | | | | 2,843,979 | | | | 2,847,205 | | |
First American Mortgage Funds 2009 Annual Report
31
Schedule of INVESTMENTS August 31, 2009
American Select Portfolio (SLA)
| DESCRIPTION | | PAR/
SHARES | | COST | | FAIR
VALUE (I) | |
| Federal National Mortgage Association, | |
| 5.00%, 11/1/17, #657356 | | $ | 690,937 | | | $ | 693,403 | | | $ | 731,551 | | |
| 6.50%, 6/1/29, #252497 | | | 724,961 | | | | 720,903 | | | | 784,246 | | |
| 7.50%, 5/1/30, #535289 | | | 54,531 | | | | 53,003 | | | | 60,810 | | |
| 8.00%, 5/1/30, #538266 | | | 22,578 | | | | 22,339 | | | | 25,539 | | |
| 5.00%, 11/1/33, #725027 | | | 3,567,198 | | | | 3,648,607 | | | | 3,680,694 | | |
| 5.00%, 7/1/39, #935588 | | | 3,395,640 | | | | 3,468,578 | | | | 3,489,883 | | |
| Total U.S. Government Agency Mortgage-Backed Securities | | | | | | | 12,935,609 | | | | 13,189,730 | | |
| Commercial Mortgage-Backed Securities — 13.6% | |
| Other — 13.6% | |
| Banc of America Commercial Mortgage, Series 2005-4, Class A5B, 5.00%, 7/10/45 r | | | 6,400,000 | | | | 4,072,885 | | | | 4,709,009 | | |
| Bear Stearns Commercial Mortgage Securities, | |
| Series 2006-PW12, Class A4, 5.72%, 9/11/38 r | | | 2,100,000 | | | | 1,514,008 | | | | 1,970,636 | | |
| Series 2007-T28, Class A4, 5.74%, 9/11/42 | | | 1,456,221 | | | | 1,018,253 | | | | 1,348,846 | | |
| Series 2007-PWR17, Class A4, 5.69%, 6/11/50 | | | 3,315,000 | | | | 2,952,324 | | | | 2,929,711 | | |
Citigroup/Deutsche Bank Commercial Mortgage Trust,
Series 2007-CD5, Class A4, 5.89%, 11/15/44 r | | | 2,000,000 | | | | 1,843,642 | | | | 1,841,774 | | |
| GS Mortgage Securities Corporation II, Series 2006-GG8, Class A4, 5.56%, 11/10/39 | | | 3,600,000 | | | | 2,489,882 | | | | 3,161,364 | | |
| LB-UBS Commercial Mortgage Trust, Series 2008-C1, Class A2, 6.15%, 4/15/41 r | | | 2,000,000 | | | | 1,382,243 | | | | 1,902,687 | | |
| Total Commercial Mortgage-Backed Securities | | | | | | | 15,273,237 | | | | 17,864,027 | | |
| Preferred Stocks — 13.7% | |
| Real Estate Investment Trusts — 13.7% | |
| AMB Property, Series L | | | 114,820 | | | | 2,167,595 | | | | 2,213,730 | | |
| AMB Property, Series M | | | 8,700 | | | | 222,285 | | | | 174,000 | | |
| AMB Property, Series O | | | 10,228 | | | | 255,700 | | | | 216,066 | | |
| BRE Properties, Series C | | | 59,550 | | | | 1,183,259 | | | | 1,216,011 | | |
| BRE Properties, Series D | | | 4,700 | | | | 93,389 | | | | 95,457 | | |
| Developers Diversified Realty, Series H | | | 23,820 | | | | 488,310 | | | | 349,201 | | |
| Developers Diversified Realty, Series I | | | 3,830 | | | | 79,856 | | | | 57,833 | | |
| Duke Realty, Series L | | | 17,270 | | | | 330,202 | | | | 301,016 | | |
| Duke Realty, Series M | | | 47,640 | | | | 952,800 | | | | 938,508 | | |
| Duke Realty, Series O | | | 40,000 | | | | 944,000 | | | | 908,800 | | |
| Equity Residential Properties, Series N | | | 49,500 | | | | 950,925 | | | | 1,031,580 | | |
| Kimco Realty, Series G | | | 78,200 | | | | 1,902,854 | | | | 1,720,400 | | |
| ProLogis Trust, Series F | | | 5,000 | | | | 105,000 | | | | 98,350 | | |
| ProLogis Trust, Series G | | | 7,400 | | | | 155,400 | | | | 146,150 | | |
| PS Business Parks, Series H | | | 23,820 | | | | 476,400 | | | | 495,932 | | |
| PS Business Parks, Series I | | | 8,400 | | | | 165,228 | | | | 170,940 | | |
| PS Business Parks, Series K | | | 50,000 | | | | 1,162,500 | | | | 1,160,000 | | |
| PS Business Parks, Series M | | | 23,820 | | | | 490,692 | | | | 529,519 | | |
| PS Business Parks, Series P | | | 7,400 | | | | 141,858 | | | | 151,700 | | |
| Public Storage, Series E | | | 73,300 | | | | 1,793,750 | | | | 1,616,265 | | |
| Public Storage, Series I | | | 23,820 | | | | 518,085 | | | | 583,590 | | |
| Public Storage, Series K | | | 15,700 | | | | 341,475 | | | | 374,602 | | |
| Realty Income, Series D | | | 60,000 | | | | 1,521,000 | | | | 1,431,000 | | |
| Realty Income, Series E | | | 23,820 | | | | 514,512 | | | | 535,712 | | |
| Regency Centers, Series C | | | 23,820 | | | | 514,988 | | | | 522,373 | | |
| Regency Centers, Series E | | | 46,170 | | | | 1,032,215 | | | | 912,781 | | |
| Total Preferred Stocks | | | | | | | 18,504,278 | | | | 17,951,516 | | |
| Total Unaffiliated Investments | | | | | | | 185,195,771 | | | | 182,151,223 | | |
The accompanying notes are an integral part of the financial statements.
First American Mortgage Funds 2009 Annual Report
32
American Select Portfolio (SLA)
| DESCRIPTION | | SHARES | | COST | | FAIR
VALUE (I) | |
| Short-Term Investment — 1.0% | |
| First American Prime Obligations Fund, Class Z, 0.19% x | | | 1,265,263 | | | $ | 1,265,263 | | | $ | 1,265,263 | | |
| Total Investments p — 139.6% | | | | $ | 186,461,034 | | | $ | 183,416,486 | | |
| Other Assets and Liabilities, Net — (39.6)% | | | | | | | (52,000,020 | ) | |
| Total Net Assets — 100.0% | | $ | 131,416,466 | | |
(I) Securities are valued in accordance with procedures described in note 2 in Notes to Financial Statements.
°° Securities purchased as part of a private placement which have not been registered with the Securities and Exchange Commission under the Securities Act of 1933 and which are considered to be illiquid. These securities are fair valued in accordance with the board approved valuation procedures. On August 31, 2009, the total value of fair valued securities was $133,145,950 or 101.3% of total net assets. See note 2 in Notes to Financial Statements.
(P) Interest rates on commercial and multifamily loans are the net coupon rates in effect (after reducing the coupon rate by any mortgage servicing fees paid to mortgage servicers) on August 31, 2009. For participating loans the rates are based on the annual cash flow payments expected at the time of purchase.
(B) Securities pledged as collateral for outstanding borrowings under a loan agreement with Massachusetts Mutual Life Insurance Company ("MMLIC"). On August 31, 2009, securities valued at $84,755,354 were pledged as collateral for the following outstanding borrowings:
| Amount | | Rate* | | Accrued
Interest | |
| $ | 31,900,000 | | | | 5.00 | % | | $ | 4,430 | | |
| | 9,100,000 | | | | 5.00 | % | | | 1,264 | | |
| $ | 41,000,000 | | | | | $ | 5,694 | | |
* Interest rate as of August 31, 2009. Rate is based on the London Interbank Offered Rate ("LIBOR") plus 2.625% subject to a "floor" interest rate of 5.00% and reset monthly.
Description of collateral:
12000 Aerospace, Clear Lake, TX, 5.43%, 1/1/15, $4,945,464 par
ABC Conoco, Aspen, CO, 6.65%, 11/1/11, $3,921,180 par
Briarhill Apartments I, Eden Prairie, MN, 6.90%, 9/1/15, $4,359,771 par
Cingular Wireless Building, Richardson, TX, 7.03%, 7/1/11, $6,437,608 par
Clear Lake Central I, Webster, TX, 6.63%, 8/1/11, $7,030,402 par
George Gee Hummer, Liberty Lake, WA, 5.88%, 7/1/10, $2,125,000 par
George Gee Pontiac I, Liberty Lake, WA, 5.90%, 7/1/10, $4,675,000 par
George Gee Porsche, Liberty Lake, WA, 5.88%, 7/1/10, $2,500,000 par
Highland House Apartments, Dallas, TX, 6.80%, 10/1/10, $2,700,000 par
Highland Park I, Scottsdale, AZ, 6.77%, 3/1/11, $9,274,676 par
Kolb Plaza I, Tucson, AZ, 6.50%, 8/1/10, $3,520,000 par
Mandala Agency Building, Bend, OR, 6.38%, 6/1/17, $2,175,000 par
Northrop Grumman Campus I, Colorado Springs, CO, 5.93%, 12/1/09, $5,700,000 par
Revere Apartments, Revere, MA, 6.28%, 3/1/12, $1,650,997 par
RL Stowe Portfolio, Belmont, NC & Chattanooga, TN, 6.83%, 11/1/12, $8,010,325 par
Sheridan Pond Apartments, Tulsa, OK, 6.43%, 7/1/13, $6,670,323 par
Superior Ford Dealership, Plymouth, MN, 6.43%, 7/1/17, $5,074,911 par
Town Square #6, Olympia, WA, 7.40%, 9/1/12, $3,631,728 par
Victory Packaging, Phoenix, AZ, 8.50%, 1/1/12, $2,326,498 par | |
The fund has entered into a loan agreement with MMLIC under which MMLIC made a term loan to the fund of $31,900,000, which matures on July 31, 2011, and agreed to make revolving loans to the fund of up to $9,100,000. Loans made under the loan agreement are secured by whole loans in the fund's portfolio and bear interest at the one-month LIBOR plus 2.625% with a "floor" interest rate of 5.00%. In addition, the fund pays an annual fee of 1.28% on any unused portion of the fund's revolving loan commitment.
¶ Interest Only – Represents securities that entitle holders to receive only interest payments on the mortgage. Principal balance on the loan is due at maturity. The interest rate disclosed represents the net coupon rate in effect as of August 31, 2009.
(U) Loan is currently in default with regards to scheduled interest and/or principal payments.
First American Mortgage Funds 2009 Annual Report
33
Schedule of INVESTMENTS August 31, 2009
American Select Portfolio (SLA)
r Variable Rate Security – The rate shown is the net coupon rate in effect as of August 31, 2009.
(C) Participating Loan – A participating loan is one which contains provisions for the fund to participate in the income stream provided by the property, including net cash flows and capital proceeds. Monthly cash flow proceeds are only required to the extent excess cash flow is generated by the property as determined by the loan documents.
(S) The participating loan is not currently making monthly cash flow payments.
(A) Securities pledged as collateral for outstanding reverse repurchase agreements. On August 31, 2009, securities valued at $13,189,730 were pledged as collateral for the following outstanding reverse repurchase agreements:
| Amount | | Acquisition
Date | | Rate* | | Due | | Accrued
Interest | | Name of Broker
and Description
of Collateral | |
| $ | 6,770,000 | | | 8/6/09 | | | 0.42 | % | | 9/8/09 | | $ | 2,054 | | | | (1 | ) | |
| | 5,647,000 | | | 8/20/09 | | | 0.42 | % | | 9/21/09 | | | 791 | | | | (2 | ) | |
| $ | 12,417,000 | | | | | | | | | $ | 2,845 | | | | |
* Interest rate as of August 31, 2009. Rate is based on LIBOR plus a spread and reset monthly.
Name of broker and description of collateral:
(1) Goldman Sachs:
Federal National Mortgage Association, 5.00%, 11/1/33, $3,567,198 par
Federal National Mortgage Association, 5.00%, 7/1/39, $3,395,640 par
(2) Goldman Sachs:
Federal Home Loan Mortgage Corporation, 5.50%, 1/1/18, $1,251,305 par
Federal Home Loan Mortgage Corporation, 7.50%, 12/1/29, $210,557 par
Federal Home Loan Mortgage Corporation, 5.00%, 5/1/39, $2,769,476 par
Federal National Mortgage Association, 5.00%, 11/1/17, $690,937 par
Federal National Mortgage Association, 6.50%, 6/1/29, $724,961 par
Federal National Mortgage Association, 7.50%, 5/1/30, $54,531 par
Federal National Mortgage Association, 8.00%, 5/1/30, $22,578 par
The fund has entered into a lending commitment with Goldman Sachs. The monthly agreement permits the fund to enter into reverse repurchase agreements using U.S. government agency mortgage-backed securities as collateral.
x Investment in affiliated security. This money market fund is advised by FAF Advisors, Inc., which also serves as advisor for the fund. The rate quoted is the annualized seven-day yield of the investment at period end. See Note 3 in Notes to Financial Statements.
p On August 31, 2009, the cost of investments for federal income tax purposes was $186,471,731. The aggregate gross unrealized appreciation and depreciation of investments, based on this cost, were as follows:
| Gross unrealized appreciation | | $ | 4,588,273 | | |
| Gross unrealized depreciation | | | (7,643,518 | ) | |
| Net unrealized depreciation | | $ | (3,055,245 | ) | |
The accompanying notes are an integral part of the financial statements.
First American Mortgage Funds 2009 Annual Report
34
(This page intentionally left blank.)
First American Mortgage Funds 2009 Annual Report
35
Statements of ASSETS AND LIABILITIES August 31, 2009
| | | ASP | | BSP | | CSP | | SLA | |
| Assets: | |
Unaffiliated investments, at fair value (Cost: $67,252,845,
$263,356,937, $321,870,116, $185,195,771) (note 2) | | $ | 68,946,100 | | | $ | 248,648,432 | | | $ | 302,652,729 | | | $ | 182,151,223 | | |
Affiliated money market fund, at fair value (Cost: $837,516,
$2,200,486, $2,600,430, $1,265,263) (note 3) | | | 837,516 | | | | 2,200,486 | | | | 2,600,430 | | | | 1,265,263 | | |
| Receivable for accrued dividends and interest | | | 385,215 | | | | 1,631,647 | | | | 3,363,975 | | | | 1,488,361 | | |
| Prepaid expenses and other assets | | | 100,917 | | | | 474,285 | | | | 557,037 | | | | 326,725 | | |
| Total assets | | | 70,269,748 | | | | 252,954,850 | | | | 309,174,171 | | | | 185,231,572 | | |
| Liabilities: | |
| Payable under loan agreement (note 2) | | | 11,000,000 | | | | 47,500,000 | | | | 64,700,000 | | | | 41,000,000 | | |
| Payable for reverse repurchase agreements (note 2) | | | 6,468,000 | | | | 23,461,000 | | | | 15,940,946 | | | | 12,417,000 | | |
| Bank overdraft | | | 74,948 | | | | 261,551 | | | | 295,175 | | | | 183,652 | | |
| Payable for investment advisory fees (note 3) | | | 22,861 | | | | 73,953 | | | | 85,664 | | | | 55,453 | | |
| Payable for administrative fees (note 3) | | | 11,084 | | | | 38,193 | | | | 48,242 | | | | 27,726 | | |
| Payable for interest expense | | | 2,586 | | | | 12,350 | | | | 11,833 | | | | 8,539 | | |
| Payable for professional fees | | | 18,727 | | | | 18,727 | | | | 18,481 | | | | 18,726 | | |
| Payable for transfer agent fees | | | 3,834 | | | | 4,452 | | | | 4,577 | | | | 4,054 | | |
| Payable for other expenses | | | 9,949 | | | | 54,574 | | | | 183,452 | | | | 99,956 | | |
| Total liabilities | | | 17,611,989 | | | | 71,424,800 | | | | 81,288,370 | | | | 53,815,106 | | |
| Net assets applicable to outstanding capital stock | | $ | 52,657,759 | | | $ | 181,530,050 | | | $ | 227,885,801 | | | $ | 131,416,466 | | |
| Composition of net assets: | |
| Capital stock and additional paid-in capital | | $ | 52,591,719 | | | $ | 204,964,182 | | | $ | 264,305,384 | | | $ | 139,926,118 | | |
| Undistributed (distributions in excess of) net investment income | | | (1,147 | ) | | | 235,784 | | | | (113,993 | ) | | | (3,600 | ) | |
| Accumulated net realized loss on investments (note 5) | | | (1,626,068 | ) | | | (8,961,411 | ) | | | (17,088,203 | ) | | | (5,461,504 | ) | |
| Net unrealized appreciation (depreciation) of investments | | | 1,693,255 | | | | (14,708,505 | ) | | | (19,217,387 | ) | | | (3,044,548 | ) | |
| Total–representing net assets applicable to capital stock | | $ | 52,657,759 | | | $ | 181,530,050 | | | $ | 227,885,801 | | | $ | 131,416,466 | | |
| Net asset value and market price of capital stock: | |
| Net assets applicable to capital stock | | $ | 52,657,759 | | | $ | 181,530,050 | | | $ | 227,885,801 | | | $ | 131,416,466 | | |
| Shares outstanding (authorized 1 billion shares of each fund of $0.01 par value) | | | 4,231,331 | | | | 15,985,741 | | | | 21,356,023 | | | | 10,662,195 | | |
| Net asset value per share | | $ | 12.44 | | | $ | 11.36 | | | $ | 10.67 | | | $ | 12.33 | | |
| Market price per share | | $ | 10.75 | | | $ | 9.71 | | | $ | 8.83 | | | $ | 10.64 | | |
The accompanying notes are an integral part of the financial statements.
First American Mortgage Funds 2009 Annual Report
36
Statements of OPERATIONS For the year ended August 31, 2009
| | | ASP | | BSP | | CSP | | SLA | |
| Investment Income: | |
| Interest from unaffiliated investments | | $ | 3,730,715 | | | $ | 15,023,879 | | | $ | 17,402,142 | | | $ | 11,121,382 | | |
| Dividends from unaffiliated investments | | | 963,934 | | | | 2,425,347 | | | | 3,670,686 | | | | 1,470,249 | | |
| Participating income from investments no longer held | | | — | | | | — | | | | 614,047 | | | | 336,959 | | |
| Dividends from affiliated money market fund | | | 45,157 | | | | 56,483 | | | | 67,440 | | | | 24,085 | | |
| Total investment income | | | 4,739,806 | | | | 17,505,709 | | | | 21,754,315 | | | | 12,952,675 | | |
| Expenses (note 3): | |
| Investment advisory fees | | | 280,547 | | | | 961,858 | | | | 1,253,993 | | | | 624,667 | | |
| Interest expense | | | 663,061 | | | | 3,119,043 | | | | 3,866,392 | | | | 2,353,004 | | |
| Administrative fees | | | 112,939 | | | | 424,937 | | | | 555,952 | | | | 307,029 | | |
| Custodian fees | | | 9,837 | | | | 34,863 | | | | 45,510 | | | | 25,673 | | |
| Mortgage servicing fees | | | 45,863 | | | | 135,674 | | | | 165,974 | | | | 112,493 | | |
| Professional fees | | | 61,441 | | | | 72,546 | | | | 63,740 | | | | 64,269 | | |
| Postage and printing fees | | | 13,034 | | | | 25,654 | | | | 34,014 | | | | 21,815 | | |
| Transfer agent fees | | | 16,136 | | | | 18,406 | | | | 18,850 | | | | 16,713 | | |
| Listing fees | | | 23,682 | | | | 25,060 | | | | 25,979 | | | | 23,686 | | |
| Directors' fees | | | 30,053 | | | | 30,056 | | | | 30,058 | | | | 30,055 | | |
| Insurance fees | | | 11,589 | | | | 11,628 | | | | 11,641 | | | | 11,612 | | |
| Pricing fees | | | 19,749 | | | | 19,750 | | | | 19,783 | | | | 19,007 | | |
| Other expenses | | | 45,920 | | | | 86,809 | | | | 88,876 | | | | 57,842 | | |
| Total expenses | | | 1,333,851 | | | | 4,966,284 | | | | 6,180,762 | | | | 3,667,865 | | |
| Less: Fee reimbursements (note 3) | | | (2,799 | ) | | | (5,384 | ) | | | (4,904 | ) | | | (2,375 | ) | |
| Less: Indirect payments from custodian (note 3) | | | (85 | ) | | | (54 | ) | | | (61 | ) | | | (54 | ) | |
| Total net expenses | | | 1,330,967 | | | | 4,960,846 | | | | 6,175,797 | | | | 3,665,436 | | |
| Net investment income | | | 3,408,839 | | | | 12,544,863 | | | | 15,578,518 | | | | 9,287,239 | | |
| Net realized and unrealized gains (losses) on investments (notes 2 and 4): | |
| Net realized loss on investments | | | (706,602 | ) | | | (2,056,209 | ) | | | (11,409,043 | ) | | | (1,439,055 | ) | |
| Net change in unrealized appreciation or depreciation of investments | | | 3,691,282 | | | | (1,303,151 | ) | | | 112,282 | | | | 358,244 | | |
| Net gain (loss) on investments | | | 2,984,680 | | | | (3,359,360 | ) | | | (11,296,761 | ) | | | (1,080,811 | ) | |
| Net increase in net assets resulting from operations | | $ | 6,393,519 | | | $ | 9,185,503 | | | $ | 4,281,757 | | | $ | 8,206,428 | | |
First American Mortgage Funds 2009 Annual Report
37
Statements of CHANGES IN NET ASSETS
| | | ASP | | BSP | |
| | | Year Ended
8/31/09 | | Year Ended
8/31/08 | | Year Ended
8/31/09 | | Year Ended
8/31/08 | |
| Operations: | |
| Net investment income | | $ | 3,408,839 | | | $ | 3,369,929 | | | $ | 12,544,863 | | | $ | 11,776,714 | | |
| Net realized loss on investments | | | (706,602 | ) | | | (753,484 | ) | | | (2,056,209 | ) | | | (4,382,077 | ) | |
| Net realized loss on real estate owned (note 2) | | | — | | | | — | | | | — | | | | — | | |
| Net change in unrealized appreciation or depreciation of investments | | | 3,691,282 | | | | (351,230 | ) | | | (1,303,151 | ) | | | (2,998,336 | ) | |
| Net increase in net assets resulting from operations | | | 6,393,519 | | | | 2,265,215 | | | | 9,185,503 | | | | 4,396,301 | | |
| Distributions to shareholders (note 2): | |
| From net investment income | | | (3,234,304 | ) | | | (3,165,549 | ) | | | (11,669,592 | ) | | | (10,970,395 | ) | |
| From net realized gain on investments | | | — | | | | — | | | | — | | | | — | | |
| From return of capital | | | (87,291 | ) | | | (134,890 | ) | | | — | | | | (1,578,414 | ) | |
| Total distributions | | | (3,321,595 | ) | | | (3,300,439 | ) | | | (11,669,592 | ) | | | (12,548,809 | ) | |
| Total increase (decrease) in net assets | | | 3,071,924 | | | | (1,035,224 | ) | | | (2,484,089 | ) | | | (8,152,508 | ) | |
| Net assets at beginning of period | | | 49,585,835 | | | | 50,621,059 | | | | 184,014,139 | | | | 192,166,647 | | |
| Net assets at end of period | | $ | 52,657,759 | | | $ | 49,585,835 | | | $ | 181,530,050 | | | $ | 184,014,139 | | |
| Undistributed (distributions in excess of) net investment income | | $ | (1,147 | ) | | $ | 649 | | | $ | 235,784 | | | $ | (1,754 | ) | |
The accompanying notes are an integral part of the financial statements.
First American Mortgage Funds 2009 Annual Report
38
| | | CSP | | SLA | |
| | | Year Ended
8/31/09 | | Year Ended
8/31/08 | | Year Ended
8/31/09 | | Year Ended
8/31/08 | |
| Operations: | |
| Net investment income | | $ | 15,578,518 | | | $ | 18,452,680 | | | $ | 9,287,239 | | | $ | 9,781,977 | | |
| Net realized loss on investments | | | (11,409,043 | ) | | | (4,909,943 | ) | | | (1,439,055 | ) | | | (4,263,798 | ) | |
| Net realized loss on real estate owned (note 2) | | | — | | | | (1,416,458 | ) | | | — | | | | — | | |
| Net change in unrealized appreciation or depreciation of investments | | | 112,282 | | | | (8,958,545 | ) | | | 358,244 | | | | (2,146,712 | ) | |
| Net increase in net assets resulting from operations | | | 4,281,757 | | | | 3,167,734 | | | | 8,206,428 | | | | 3,371,467 | | |
| Distributions to shareholders (note 2): | |
| From net investment income | | | (14,809,841 | ) | | | (20,564,180 | ) | | | (9,218,893 | ) | | | (8,956,245 | ) | |
| From net realized gain on investments | | | — | | | | — | | | | (32,960 | ) | | | (510,399 | ) | |
| From return of capital | | | (1,527,519 | ) | | | (129,811 | ) | | | (4,000 | ) | | | — | | |
| Total distributions | | | (16,337,360 | ) | | | (20,693,991 | ) | | | (9,255,853 | ) | | | (9,466,644 | ) | |
| Total increase (decrease) in net assets | | | (12,055,603 | ) | | | (17,526,257 | ) | | | (1,049,425 | ) | | | (6,095,177 | ) | |
| Net assets at beginning of period | | | 239,941,404 | | | | 257,467,661 | | | | 132,465,891 | | | | 138,561,068 | | |
| Net assets at end of period | | $ | 227,885,801 | | | $ | 239,941,404 | | | $ | 131,416,466 | | | $ | 132,465,891 | | |
| Undistributed (distributions in excess of) net investment income | | $ | (113,993 | ) | | $ | (112,147 | ) | | $ | (3,600 | ) | | $ | 313,286 | | |
First American Mortgage Funds 2009 Annual Report
39
Statements of CASH FLOWS For the year ended August 31, 2009
| | | ASP | | BSP | | CSP | | SLA | |
| Cash flows from operating activities: | |
| Net increase in net assets resulting from operations | | $ | 6,393,519 | | | $ | 9,185,503 | | | $ | 4,281,757 | | | $ | 8,206,428 | | |
Adjustments to reconcile net increase in net assets resulting from operations to net
cash provided by operating activities: | |
| Purchases of investments | | | (17,074,340 | ) | | | (53,851,129 | ) | | | (48,529,018 | ) | | | (30,387,301 | ) | |
| Proceeds from paydowns and sales of investments | | | 13,150,261 | | | | 43,582,367 | | | | 46,999,685 | | | | 21,428,951 | | |
| Net purchases/sales of short-term investments | | | 2,540,035 | | | | 1,262,656 | | | | 565,769 | | | | 1,145,741 | | |
| Net amortization/accretion of bond discount and premium | | | (62,317 | ) | | | (19,252 | ) | | | (7,208 | ) | | | (48,392 | ) | |
| Net change in unrealized appreciation or depreciation of investments | | | (3,691,282 | ) | | | 1,303,151 | | | | (112,282 | ) | | | (358,244 | ) | |
| Net realized loss on investments | | | 706,602 | | | | 2,056,209 | | | | 11,409,043 | | | | 1,439,055 | | |
| Increase in receivable for accrued interest and dividends | | | (15,145 | ) | | | (312,409 | ) | | | (1,489,807 | ) | | | (468,142 | ) | |
| Decrease in prepaid expenses and other assets | | | 29,286 | | | | 184,298 | | | | 221,189 | | | | 132,252 | | |
| Decrease in accrued fees and expenses | | | (4,861 | ) | | | (54,342 | ) | | | (283,769 | ) | | | (72,675 | ) | |
| Net cash provided by operating activities | | | 1,971,758 | | | | 3,337,052 | | | | 13,055,359 | | | | 1,017,673 | | |
| Cash flows from financing activities: | |
| Net proceeds (payments) from borrowings under loan agreement | | | 1,000,000 | | | | (2,500,000 | ) | | | 2,700,000 | | | | 3,000,000 | | |
| Net proceeds from reverse repurchase agreements | | | 338,000 | | | | 10,817,000 | | | | 574,946 | | | | 5,228,000 | | |
| Distributions paid to shareholders | | | (3,321,595 | ) | | | (11,669,592 | ) | | | (16,337,360 | ) | | | (9,255,853 | ) | |
| Net cash used in financing activities | | | (1,983,595 | ) | | | (3,352,592 | ) | | | (13,062,414 | ) | | | (1,027,853 | ) | |
| Net decrease in cash | | | (11,837 | ) | | | (15,540 | ) | | | (7,055 | ) | | | (10,180 | ) | |
| Bank overdraft at beginning of period | | | (63,111 | ) | | | (246,011 | ) | | | (288,120 | ) | | | (173,472 | ) | |
| Bank overdraft at end of period | | $ | (74,948 | ) | | $ | (261,551 | ) | | $ | (295,175 | ) | | $ | (183,652 | ) | |
Supplemental disclosure of cash flow information:
Cash paid for interest | | $ | 669,683 | | | $ | 3,145,400 | | | $ | 3,904,034 | | | $ | 2,369,444 | | |
The accompanying notes are an integral part of the financial statements.
First American Mortgage Funds 2009 Annual Report
40
FINANCIAL HIGHLIGHTS
Per-share data for a share of capital stock outstanding throughout each period and selected information for each period are as follows:
ASP
| | | Year Ended August 31, | | Nine-Month
Fiscal
Period Ended | | Year Ended
November 30, | |
| | | 2009 | | 2008 | | 2007 | | 2006 | | 8/31/05 | | 2004 | |
| Per-Share Data | |
| Net asset value, beginning of period | | $ | 11.72 | | | $ | 11.96 | | | $ | 12.07 | | | $ | 12.36 | | | $ | 12.64 | | | $ | 12.67 | | |
| Operations: | |
| Net investment income | | | 0.81 | | | | 0.80 | | | | 0.80 | | | | 0.82 | | | | 0.55 | | | | 0.94 | | |
| Net realized and unrealized gains (losses) on investments | | | 0.70 | | | | (0.26 | ) | | | (0.07 | ) | | | (0.37 | ) | | | (0.19 | ) | | | (0.10 | ) | |
| Total from operations | | | 1.51 | | | | 0.54 | | | | 0.73 | | | | 0.45 | | | | 0.36 | | | | 0.84 | | |
| Distributions to shareholders: | |
| From net investment income | | | (0.77 | ) | | | (0.75 | ) | | | (0.84 | ) | | | (0.74 | ) | | | (0.62 | ) | | | (0.87 | ) | |
| From return of capital | | | (0.02 | ) | | | (0.03 | ) | | | — | | | | — | | | | (0.02 | ) | | | — | | |
| Total distributions | | | (0.79 | ) | | | (0.78 | ) | | | (0.84 | ) | | | (0.74 | ) | | | (0.64 | ) | | | (0.87 | ) | |
| Net asset value, end of period | | $ | 12.44 | | | $ | 11.72 | | | $ | 11.96 | | | $ | 12.07 | | | $ | 12.36 | | | $ | 12.64 | | |
| Market value, end of period | | $ | 10.75 | | | $ | 9.75 | | | $ | 11.41 | | | $ | 10.94 | | | $ | 11.35 | | | $ | 12.00 | | |
| Selected Information | |
| Total return, net asset value 1 | | | 13.89 | % | | | 4.62 | % | | | 6.14 | % | | | 3.73 | % | | | 2.94 | % 5 | | | 6.85 | % | |
| Total return, market value 2 | | | 20.61 | % | | | (8.00 | )% | | | 12.19 | % | | | 3.18 | % | | | (0.14 | )% 5 | | | 0.48 | % | |
| Net assets at end of period (in millions) | | $ | 53 | | | $ | 50 | | | $ | 51 | | | $ | 51 | | | $ | 52 | | | $ | 54 | | |
Ratio of expenses to average weekly net assets
before fee reimbursements | | | 2.81 | % | | | 3.07 | % | | | 3.27 | % | | | 2.10 | % | | | 1.59 | % 6 | | | 1.41 | % | |
Ratio of expenses to average weekly net assets
after fee reimbursements | | | 2.81 | % | | | 3.06 | % | | | 3.26 | % | | | 2.10 | % | | | 1.59 | % 6 | | | 1.41 | % | |
Ratio of expenses to average weekly net assets
excluding interest expense and fee reimbursements | | | 1.41 | % | | | 1.33 | % | | | 1.33 | % | | | 1.02 | % | | | 1.17 | % 6 | | | 1.13 | % | |
Ratio of net investment income to average weekly net assets
before fee reimbursements | | | 7.19 | % | | | 6.70 | % | | | 6.56 | % | | | 6.76 | % | | | 5.85 | % 6 | | | 7.46 | % | |
Ratio of net investment income to average weekly net assets
after fee reimbursements | | | 7.19 | % | | | 6.71 | % | | | 6.57 | % | | | 6.76 | % | | | 5.85 | % 6 | | | 7.46 | % | |
| Portfolio turnover rate 3 | | | 22 | % | | | 18 | % | | | 22 | % | | | 14 | % | | | 10 | % | | | 26 | % | |
| Amount of borrowings outstanding at end of period (in millions) | | $ | 17 | | | $ | 16 | | | $ | 19 | | | $ | 17 | | | $ | 8 | | | $ | 7 | | |
| Per-share amount of borrowings outstanding at end of period | | $ | 4.13 | | | $ | 3.81 | | | $ | 4.59 | | | $ | 4.01 | | | $ | 1.90 | | | $ | 1.64 | | |
Per-share amount of net assets, excluding borrowings,
at end of period | | $ | 16.57 | | | $ | 15.53 | | | $ | 16.55 | | | $ | 16.08 | | | $ | 14.48 | | | $ | 14.28 | | |
| Asset coverage ratio 4 | | | 401 | % | | | 407 | % | | | 360 | % | | | 401 | % | | | 751 | % | | | 872 | % | |
1 Assumes reinvestment of distributions at net asset value.
2 Assumes reinvestment of distributions at actual prices pursuant to the fund's dividend reinvestment plan.
3 The portfolio turnover rate for August 31, 2007 and August 31, 2006 has been revised to exclude maturities of investments that had been extended prior to their original maturity dates.
4 Represents net assets, excluding borrowings, at end of period divided by borrowings outstanding at end of period.
5 Total return has not been annualized.
6 Annualized.
First American Mortgage Funds 2009 Annual Report
41
FINANCIAL HIGHLIGHTS
Per-share data for a share of capital stock outstanding throughout each period and selected information for each period are as follows:
BSP
| | | Year Ended August 31, | | Three-Month
Fiscal
Period Ended | | Year Ended
May 31, | |
| | | 2009 | | 2008 | | 2007 | | 2006 | | 8/31/05 | | 2005 | |
| Per-Share Data | |
| Net asset value, beginning of period | | $ | 11.51 | | | $ | 12.02 | | | $ | 11.92 | | | $ | 12.15 | | | $ | 12.41 | | | $ | 12.98 | | |
| Operations: | |
| Net investment income | | | 0.78 | | | | 0.74 | | | | 0.80 | | | | 0.93 | | | | 0.23 | | | | 1.06 | | |
| Net realized and unrealized gains (losses) on investments | | | (0.20 | ) | | | (0.46 | ) | | | 0.14 | | | | (0.23 | ) | | | (0.25 | ) | | | (0.59 | ) | |
| Total from operations | | | 0.58 | | | | 0.28 | | | | 0.94 | | | | 0.70 | | | | (0.02 | ) | | | 0.47 | | |
| Distributions to shareholders: | |
| From net investment income | | | (0.73 | ) | | | (0.69 | ) | | | (0.84 | ) | | | (0.93 | ) | | | (0.24 | ) | | | (1.04 | ) | |
| From return of capital | | | — | | | | (0.10 | ) | | | — | | | | — | | | | — | | | | — | | |
| Total distributions | | | (0.73 | ) | | | (0.79 | ) | | | (0.84 | ) | | | (0.93 | ) | | | (0.24 | ) | | | (1.04 | ) | |
| Net asset value, end of period | | $ | 11.36 | | | $ | 11.51 | | | $ | 12.02 | | | $ | 11.92 | | | $ | 12.15 | | | $ | 12.41 | | |
| Market value, end of period | | $ | 9.71 | | | $ | 9.80 | | | $ | 11.32 | | | $ | 10.76 | | | $ | 11.57 | | | $ | 12.00 | | |
| Selected Information | |
| Total return, net asset value 1 | | | 5.57 | % | | | 2.25 | % | | | 8.06 | % | | | 6.02 | % | | | 0.17 | % 5 | | | 3.85 | % | |
| Total return, market value 2 | | | 8.04 | % | | | (6.80 | )% | | | 13.18 | % | | | 1.34 | % | | | (1.59 | )% 5 | | | 1.51 | % | |
| Net assets at end of period (in millions) | | $ | 182 | | | $ | 184 | | | $ | 192 | | | $ | 191 | | | $ | 194 | | | $ | 198 | | |
Ratio of expenses to average weekly net assets
before fee reimbursements | | | 2.86 | % | | | 2.95 | % | | | 2.57 | % | | | 3.01 | % | | | 2.28 | % 6 | | | 1.78 | % | |
Ratio of expenses to average weekly net assets
after fee reimbursements | | | 2.86 | % | | | 2.95 | % | | | 2.56 | % | | | 3.01 | % | | | 2.28 | % 6 | | | 1.78 | % | |
Ratio of expenses to average weekly net assets
excluding interest expense and fee reimbursements | | | 1.06 | % | | | 0.98 | % | | | 0.99 | % | | | 2.05 | % | | | 1.06 | % 6 | | | 1.13 | % | |
Ratio of net investment income to average weekly net assets
before fee reimbursements | | | 7.23 | % | | | 6.19 | % | | | 6.56 | % | | | 7.80 | % | | | 7.36 | % 6 | | | 8.40 | % | |
Ratio of net investment income to average weekly net assets
after fee reimbursements | | | 7.23 | % | | | 6.19 | % | | | 6.57 | % | | | 7.80 | % | | | 7.36 | % 6 | | | 8.40 | % | |
| Portfolio turnover rate 3 | | | 19 | % | | | 43 | % | | | 30 | % | | | 24 | % | | | 8 | % | | | 44 | % | |
| Amount of borrowings outstanding at end of period (in millions) | | $ | 71 | | | $ | 63 | | | $ | 73 | | | $ | 56 | | | $ | 61 | | | $ | 49 | | |
| Per-share amount of borrowings outstanding at end of period | | $ | 4.44 | | | $ | 3.92 | | | $ | 4.58 | | | $ | 3.48 | | | $ | 3.79 | | | $ | 3.09 | | |
Per-share amount of net assets, excluding borrowings,
at end of period | | $ | 15.80 | | | $ | 15.43 | | | $ | 16.60 | | | $ | 15.40 | | | $ | 15.94 | | | $ | 15.50 | | |
| Asset coverage ratio 4 | | | 356 | % | | | 394 | % | | | 362 | % | | | 443 | % | | | 421 | % | | | 502 | % | |
1 Assumes reinvestment of distributions at net asset value.
2 Assumes reinvestment of distributions at actual prices pursuant to the fund's dividend reinvestment plan.
3 The portfolio turnover rate for August 31, 2007 and August 31, 2006 has been revised to exclude maturities of investments that had been extended prior to their original maturity dates.
4 Represents net assets, excluding borrowings, at end of period divided by borrowings outstanding at end of period.
5 Total return has not been annualized.
6 Annualized.
The accompanying notes are an integral part of the financial statements.
First American Mortgage Funds 2009 Annual Report
42
Per-share data for a share of capital stock outstanding throughout each period and selected information for each period are as follows:
CSP
| | | Year Ended August 31, | | Three-Month
Fiscal
Period Ended | | Year Ended
May 31, | |
| | | 2009 | | 2008 | | 2007 | | 2006 | | 8/31/05 | | 2005 | |
| Per-Share Data | |
| Net asset value, beginning of period | | $ | 11.24 | | | $ | 12.06 | | | $ | 12.04 | | | $ | 12.08 | | | $ | 12.14 | | | $ | 12.40 | | |
| Operations: | |
| Net investment income | | | 0.73 | | | | 0.87 | | | | 1.18 | | | | 1.01 | | | | 0.23 | | | | 0.98 | | |
| Net realized and unrealized gains (losses) on investments | | | (0.53 | ) | | | (0.72 | ) | | | 0.09 | | | | (0.26 | ) | | | (0.08 | ) | | | (0.24 | ) | |
| Total from operations | | | 0.20 | | | | 0.15 | | | | 1.27 | | | | 0.75 | | | | 0.15 | | | | 0.74 | | |
| Distributions to shareholders: | |
| From net investment income | | | (0.70 | ) | | | (0.96 | ) | | | (1.18 | ) | | | (0.79 | ) | | | (0.21 | ) | | | (1.00 | ) | |
| From net realized gain on investments | | | — | | | | — | | | | (0.07 | ) | | | — | | | | — | | | | — | | |
| From return of capital | | | (0.07 | ) | | | (0.01 | ) | | | — | | | | — | | | | — | | | | — | | |
| Total distributions | | | (0.77 | ) | | | (0.97 | ) | | | (1.25 | ) | | | (0.79 | ) | | | (0.21 | ) | | | (1.00 | ) | |
| Net asset value, end of period | | $ | 10.67 | | | $ | 11.24 | | | $ | 12.06 | | | $ | 12.04 | | | $ | 12.08 | | | $ | 12.14 | | |
| Market value, end of period | | $ | 8.83 | | | $ | 9.77 | | | $ | 11.35 | | | $ | 11.20 | | | $ | 11.10 | | | $ | 11.79 | | |
| Selected Information | |
| Total return, net asset value 1 | | | 1.98 | % | | | 1.17 | % | | | 10.97 | % | | | 6.45 | % | | | 1.67 | % 5 | | | 6.31 | % | |
| Total return, market value 2 | | | (0.88 | )% | | | (5.78 | )% | | | 12.44 | % | | | 8.60 | % | | | (4.09 | )% 5 | | | 6.64 | % | |
| Net assets at end of period (in millions) | | $ | 228 | | | $ | 240 | | | $ | 257 | | | $ | 257 | | | $ | 258 | | | $ | 259 | | |
Ratio of expenses to average weekly net assets
before fee reimbursements | | | 2.75 | % | | | 2.80 | % | | | 2.29 | % | | | 2.20 | % | | | 2.21 | % 6 | | | 1.90 | % | |
Ratio of expenses to average weekly net assets
after fee reimbursements | | | 2.75 | % | | | 2.80 | % | | | 2.28 | % | | | 2.20 | % | | | 2.21 | % 6 | | | 1.90 | % | |
Ratio of expenses to average weekly net assets
excluding interest expense and fee reimbursements | | | 1.03 | % | | | 1.00 | % | | | 1.09 | % | | | 0.96 | % | | | 1.06 | % 6 | | | 1.12 | % | |
Ratio of net investment income to average weekly net assets
before fee reimbursements | | | 6.92 | % | | | 7.34 | % | | | 9.67 | % | | | 8.39 | % | | | 7.49 | % 6 | | | 8.01 | % | |
Ratio of net investment income to average weekly net assets
after fee reimbursements | | | 6.92 | % | | | 7.34 | % | | | 9.68 | % | | | 8.39 | % | | | 7.49 | % 6 | | | 8.01 | % | |
| Portfolio turnover rate 3 | | | 16 | % | | | 5 | % | | | 36 | % | | | 48 | % | | | 13 | % | | | 48 | % | |
| Amount of borrowings outstanding at end of period (in millions) | | $ | 81 | | | $ | 77 | | | $ | 65 | | | $ | 54 | | | $ | 62 | | | $ | 59 | | |
| Per-share amount of borrowings outstanding at end of period | | $ | 3.78 | | | $ | 3.62 | | | $ | 3.04 | | | $ | 2.54 | | | $ | 2.93 | | | $ | 2.74 | | |
Per-share amount of net assets, excluding borrowings,
at end of period | | $ | 14.45 | | | $ | 14.86 | | | $ | 15.10 | | | $ | 14.58 | | | $ | 14.82 | | | $ | 14.88 | | |
| Asset coverage ratio 4 | | | 383 | % | | | 410 | % | | | 496 | % | | | 575 | % | | | 513 | % | | | 543 | % | |
1 Assumes reinvestment of distributions at net asset value.
2 Assumes reinvestment of distributions at actual prices pursuant to the fund's dividend reinvestment plan.
3 The portfolio turnover rate for August 31, 2007 and August 31, 2006 has been revised to exclude maturities of investments that had been extended prior to their original maturity dates.
4 Represents net assets, excluding borrowings, at end of period divided by borrowings outstanding at end of period.
5 Total return has not been annualized.
6 Annualized.
First American Mortgage Funds 2009 Annual Report
43
FINANCIAL HIGHLIGHTS
Per-share data for a share of capital stock outstanding throughout each period and selected information for each period are as follows:
SLA
| | | Year Ended August 31, | | Nine-Month
Fiscal
Period Ended | | Year Ended
November 30, | |
| | | 2009 | | 2008 | | 2007 | | 2006 | | 8/31/05 | | 2004 | |
| Per-Share Data | |
| Net asset value, beginning of period | | $ | 12.42 | | | $ | 13.00 | | | $ | 13.12 | | | $ | 13.57 | | | $ | 13.14 | | | $ | 13.41 | | |
| Operations: | |
| Net investment income | | | 0.87 | | | | 0.92 | | | | 0.94 | | | | 0.93 | | | | 0.96 | | | | 1.03 | | |
| Net realized and unrealized gains (losses) on investments | | | (0.09 | ) | | | (0.61 | ) | | | 0.08 | | | | (0.15 | ) | | | 0.12 | | | | (0.26 | ) | |
| Total from operations | | | 0.78 | | | | 0.31 | | | | 1.02 | | | | 0.78 | | | | 1.08 | | | | 0.77 | | |
| Distributions to shareholders: | |
| From net investment income | | | (0.87 | ) | | | (0.84 | ) | | | (1.04 | ) | | | (1.09 | ) | | | (0.65 | ) | | | (1.04 | ) | |
| From net realized gain on investments | | | — 5 | | | | (0.05 | ) | | | (0.10 | ) | | | (0.14 | ) | | | — | | | | — | | |
| From return of capital | | | — 5 | | | | — | | | | — | | | | — | | | | — | | | | — | | |
| Total distributions | | | (0.87 | ) | | | (0.89 | ) | | | (1.14 | ) | | | (1.23 | ) | | | (0.65 | ) | | | (1.04 | ) | |
| Net asset value, end of period | | $ | 12.33 | | | $ | 12.42 | | | $ | 13.00 | | | $ | 13.12 | | | $ | 13.57 | | | $ | 13.14 | | |
| Market value, end of period | | $ | 10.64 | | | $ | 10.64 | | | $ | 12.37 | | | $ | 12.12 | | | $ | 12.45 | | | $ | 12.79 | | |
| Selected Information | |
| Total return, net asset value 1 | | | 6.93 | % | | | 2.44 | % | | | 8.13 | % | | | 6.12 | % | | | 8.47 | % 6 | | | 5.97 | % | |
| Total return, market value 2 | | | 9.94 | % | | | (7.06 | )% | | | 11.65 | % | | | 7.86 | % | | | 2.61 | % 6 | | | 1.44 | % | |
| Net assets at end of period (in millions) | | $ | 131 | | | $ | 132 | | | $ | 139 | | | $ | 140 | | | $ | 145 | | | $ | 140 | | |
Ratio of expenses to average weekly net assets
before fee reimbursements | | | 2.93 | % | | | 3.14 | % | | | 2.73 | % | | | 2.17 | % | | | 2.31 | % 7 | | | 1.87 | % | |
Ratio of expenses to average weekly net assets
after fee reimbursements | | | 2.93 | % | | | 3.14 | % | | | 2.72 | % | | | 2.17 | % | | | 2.31 | % 7 | | | 1.87 | % | |
Ratio of expenses to average weekly net assets
excluding interest expense and fee reimbursements | | | 1.05 | % | | | 1.02 | % | | | 1.02 | % | | | 0.89 | % | | | 1.02 | % 7 | | | 1.06 | % | |
Ratio of net investment income to average weekly net assets
before fee reimbursements | | | 7.43 | % | | | 7.24 | % | | | 7.21 | % | | | 7.11 | % | | | 9.77 | % 7 | | | 7.79 | % | |
Ratio of net investment income to average weekly net assets
after fee reimbursements | | | 7.43 | % | | | 7.24 | % | | | 7.22 | % | | | 7.11 | % | | | 9.77 | % 7 | | | 7.79 | % | |
| Portfolio turnover rate 3 | | | 13 | % | | | 19 | % | | | 20 | % | | | 30 | % | | | 35 | % | | | 13 | % | |
| Amount of borrowings outstanding at end of period (in millions) | | $ | 53 | | | $ | 45 | | | $ | 41 | | | $ | 32 | | | $ | 30 | | | $ | 41 | | |
| Per-share amount of borrowings outstanding at end of period | | $ | 5.01 | | | $ | 4.24 | | | $ | 3.88 | | | $ | 2.96 | | | $ | 2.82 | | | $ | 3.87 | | |
Per-share amount of net assets, excluding borrowings,
at end of period | | $ | 17.34 | | | $ | 16.66 | | | $ | 16.88 | | | $ | 16.08 | | | $ | 16.39 | | | $ | 17.01 | | |
| Asset coverage ratio 4 | | | 346 | % | | | 393 | % | | | 434 | % | | | 543 | % | | | 581 | % | | | 439 | % | |
1 Assumes reinvestment of distributions at net asset value.
2 Assumes reinvestment of distributions at actual prices pursuant to the fund's dividend reinvestment plan.
3 The portfolio turnover rate for August 31, 2007 and August 31, 2006 has been revised to exclude maturities of investments that had been extended prior to their original maturity dates.
4 Represents net assets, excluding borrowings, at end of period divided by borrowings outstanding at end of period.
5 Amount rounds to less than $0.01 per share.
6 Total return has not been annualized.
7 Annualized.
The accompanying notes are an integral part of the financial statements.
First American Mortgage Funds 2009 Annual Report
44
Notes to FINANCIAL STATEMENTS
(1) Organization
American Strategic Income Portfolio, Inc. ("ASP"), American Strategic Income Portfolio, Inc. II ("BSP"), American Strategic Income Portfolio, Inc. III ("CSP"), and American Select Portfolio, Inc. ("SLA") (the "funds") are registered under the Investment Company Act of 1940 (as amended) as diversified, closed-end management investment companies. The funds emphasize investments in mortgage-related assets that directly or indirectly represent a participation in or are secured by and payable from mortgage loans. They may also invest in U.S. government securities, corporate debt securities, and preferred stock issued by real estate investment trusts. In addition, the funds may borrow using reverse repurchase agreements and credit facilities. Fund shares are listed on the New York Stock Exchange under the symbols ASP, BSP, CSP, and SLA, respectively.
(2) Summary of Significant Accounting Policies
Security Valuations
The funds' investments in whole loans (single family, multifamily, and commercial), are generally not traded in any organized market and therefore, market quotations are not readily available. These investments are valued at fair value according to procedures adopted by the funds' board of directors. Pursuant to these procedures, these investments are initially fair valued at cost as this approximates fair value and adjusted using a FAF Advisors pricing model designed to incorporate, among other things, the present value of the projected stream of cash flows on such investments. The pricing model takes into account a number of relevant factors including the projected rate of prepayments, the delinquency profile, the historical payment record, the expected yield at purchase, changes in prevailing interest rates, and changes in the real or perceived liquidity of whole loans as the case may be. The results of the pricing model may be further subject to price floors given the intrinsic values of the underlying properties subject to the loans and ceilings due to the illiquid nature of the loans. Changes in prevailing interest rates, real or perceived liquidity, yield spreads, and creditworthiness are factored into the pricing model each week.
Certain mortgage loan information is received once a month. This information includes, but is not limited to, the projected rate of prepayments, projected rate and severity of defaults, the delinquency profile, and the historical payment record. Valuations of whole loans are determined no less frequently than weekly. Although FAF Advisors believes the pricing model to be reasonable and appropriate, the actual values that may be realized upon the sale of whole loans can only be determined in negotiations between the funds and third parties.
Security valuations for the funds' investments (other than whole loans) are generally furnished by an independent pricing service that has been approved by the funds' board of directors. Investments in equity securities that are traded on a national securities exchange (or reported on the Nasdaq national market system) are stated at the last quoted sales price if readily available for such securities on each business day. For securities traded on the Nasdaq national market system, the funds utilize the Nasdaq Official Closing Price which compares the last trade to the bid/ask price of a security. If the last trade falls within the bid/ask range, then that price will be the closing price. If the last trade is outside the bid/ask range, and falls above the ask, the ask price will be the closing price. If the last trade is below the bid, the bid will be the closing price. Other equity securities traded in the over-the-counter marke t and listed equity securities for which no sale was reported on that date are stated at the last quoted bid price. Investments in open-end mutual funds are valued at their respective net asset values on the valuation date.
Debt obligations exceeding 60 days to maturity are valued by an independent pricing service. The pricing service may employ methodologies that utilize actual market transactions, broker-dealer supplied valuations, or other formula-driven valuation techniques. These techniques generally consider such factors as yields or prices of bonds of comparable quality, type of issue, coupon, maturity, ratings, and general market conditions. Securities for which prices are not available from an independent pricing service, but where an active market exists, are valued using market
First American Mortgage Funds 2009 Annual Report
45
Notes to FINANCIAL STATEMENTS
quotations obtained from one or more dealers that make markets in the securities or from a widely-used quotation system. Debt obligations with 60 days or less remaining until maturity may be valued at their amortized cost which approximates market value.
The following investment vehicles, when held by a fund, are priced as follows: Exchange listed futures and options on futures are priced at their last sale price on the exchange on which they are principally traded, as determined by FAF Advisors, Inc. ("FAF Advisors"), on the day the valuation is made. If there were no sales on that day, futures and options on futures will be valued at the last reported bid price. Options on securities and indices traded on Nasdaq or listed on a stock exchange are valued at the last sale price on Nasdaq or on any exchange on the day the valuation is made. If there were no sales on that day, the options will be valued at the last sale price on the previous valuation date. Last sale prices are obtained from an independent pricing service. Forward contracts, swaps, and over-the-counter options on securities and indices are valued at the quotations received from an independent pricing service, if av ailable.
When market quotations are not readily available, securities are valued at fair value as determined in good faith by procedures established and approved by the funds' board of directors. Some of the factors which may be considered in determining fair value are fundamental analytical data relating to the investment; the nature and duration of any restrictions on disposition; trading in similar securities of the same issuer or comparable companies; information from broker-dealers; and an evaluation of the forces that influence the market in which the securities are purchased or sold. If events occur that materially affect the value of securities between the close of trading in those securities and the close of regular trading on the New York Stock Exchange, the securities will be valued at fair value.
The funds adopted Statement of Financial Accounting Standard No. 157, Fair Value Measurements ("FAS 157"), and FASB Staff Position 157-4 ("FSP 157-4"). FSP 157-4 clarifies FAS 157 and requires an entity to evaluate certain factors to determine whether there has been a significant decrease in volume and level of activity for the asset or liability such that recent transactions and quoted prices may not be determinative of fair value and further analysis and adjustment may be necessary to estimate fair value. FSP 157-4 also requires enhanced disclosure regarding the inputs and valuation techniques used to measure fair value in those instances as well as expanded disclosure of valuation levels for major security types. FAS 157 requires the funds to classify its securities based on valuation method, using the following three levels:
Level 1 - Quoted prices in active markets for identical securities.
Level 2 - Other significant observable inputs (including quoted prices for similar securities, with similar interest rates, prepayment speeds, credit risk, etc.).
Level 3 - Significant unobservable inputs (including a funds' own assumptions in determining the fair value of investments). Generally, the types of securities included in Level 3 of a fund are securities that are not traded in any organized market, or for which there are significant unobservable fair value inputs available such as the funds' investments in whole loans.
The valuation levels are not necessarily an indication of the risk associated with investing in these investments.
First American Mortgage Funds 2009 Annual Report
46
As of August 31, 2009, each fund's investments in securities were classified as follows:
| Fund | | Level 1 | | Level 2 | | Level 3 | | Total
Fair Value | |
| ASP | |
| Whole Loans | | $ | — | | | $ | — | | | $ | 35,031,543 | | | $ | 35,031,543 | | |
| Commercial Mortgage-Backed Securities | | | — | | | | 12,176,872 | | | | — | | | | 12,176,872 | | |
| Preferred Stocks | | | 11,147,923 | | | | — | | | | — | | | | 11,147,923 | | |
| U.S. Government Agency Mortgage-Backed Securities | | | — | | | | 7,019,762 | | | | — | | | | 7,019,762 | | |
| Corporate Note | | | — | | | | — | | | | 3,570,000 | | | | 3,570,000 | | |
| Short-Term Investment | | | 837,516 | | | | — | | | | — | | | | 837,516 | | |
| Total Investments | | $ | 11,985,439 | | | $ | 19,196,634 | | | $ | 38,601,543 | | | $ | 69,783,616 | | |
| BSP | |
| Whole Loans | | $ | — | | | $ | — | | | $ | 148,172,669 | | | $ | 148,172,669 | | |
| Preferred Stocks | | | 27,337,551 | | | | — | | | | — | | | | 27,337,551 | | |
| Commercial Mortgage-Backed Securities | | | — | | | | 25,942,911 | | | | — | | | | 25,942,911 | | |
| U.S. Government Agency Mortgage-Backed Securities | | | — | | | | 25,253,456 | | | | — | | | | 25,253,456 | | |
| Corporate Notes | | | — | | | | — | | | | 21,941,845 | | | | 21,941,845 | | |
| Short-Term Investment | | | 2,200,486 | | | | — | | | | — | | | | 2,200,486 | | |
| Total Investments | | $ | 29,538,037 | | | $ | 51,196,367 | | | $ | 170,114,514 | | | $ | 250,848,918 | | |
| CSP | |
| Whole Loans | | $ | — | | | $ | — | | | $ | 212,723,757 | | | $ | 212,723,757 | | |
| Preferred Stocks | | | 39,349,104 | | | | — | | | | — | | | | 39,349,104 | | |
| Corporate Notes | | | — | | | | — | | | | 25,541,182 | | | | 25,541,182 | | |
| U.S. Government Agency Mortgage-Backed Securities | | | — | | | | 17,176,178 | | | | — | | | | 17,176,178 | | |
| Commercial Mortgage-Backed Securities | | | — | | | | 7,862,508 | | | | — | | | | 7,862,508 | | |
| Short-Term Investment | | | 2,600,430 | | | | — | | | | — | | | | 2,600,430 | | |
| Private Mortgage-Backed Security | | | — | | | | — | | | | — | | | | — | | |
| Total Investments | | $ | 41,949,534 | | | $ | 25,038,686 | | | $ | 238,264,939 | | | $ | 305,253,159 | | |
| SLA | |
| Whole Loans | | $ | — | | | $ | — | | | $ | 116,131,075 | | | $ | 116,131,075 | | |
| Preferred Stocks | | | 17,951,516 | | | | — | | | | — | | | | 17,951,516 | | |
| Commercial Mortgage-Backed Securities | | | — | | | | 17,864,027 | | | | — | | | | 17,864,027 | | |
| Corporate Notes | | | — | | | | — | | | | 17,014,875 | | | | 17,014,875 | | |
| U.S. Government Agency Mortgage-Backed Securities | | | — | | | | 13,189,730 | | | | — | | | | 13,189,730 | | |
| Short-Term Investment | | | 1,265,263 | | | | — | | | | — | | | | 1,265,263 | | |
| Total Investments | | $ | 19,216,779 | | | $ | 31,053,757 | | | $ | 133,145,950 | | | $ | 183,416,486 | | |
The following is a reconciliation of Level 3 investments for which significant unobservable inputs were used to determine fair value:
| | | ASP | | BSP | | CSP | | SLA | |
| Balance as of August 31, 2008 | | $ | 46,643,980 | | | $ | 205,914,723 | | | $ | 274,791,933 | | | $ | 152,978,200 | | |
| Accrued discounts/premiums | | | — | | | | — | | | | 2,908 | | | | — | | |
| Realized gain (loss) | | | 8,868 | | | | 230 | | | | (8,278,241 | ) | | | — | | |
| Net change in unrealized appreciation or depreciation | | | 551,218 | | | | (4,739,528 | ) | | | (3,740,734 | ) | | | (3,212,972 | ) | |
| Net purchases (sales) | | | (8,602,523 | ) | | | (31,060,911 | ) | | | (24,510,927 | ) | | | (16,619,278 | ) | |
| Balance as of August 31, 2009 | | $ | 38,601,543 | | | $ | 170,114,514 | | | $ | 238,264,939 | | | $ | 133,145,950 | | |
Net change in unrealized appreciation or depreciation
of Level 3 investments as of August 31, 2009 | | $ | 520,526 | | | $ | (4,916,638 | ) | | $ | (4,295,869 | ) | | $ | (3,131,364 | ) | |
First American Mortgage Funds 2009 Annual Report
47
Notes to FINANCIAL STATEMENTS
Security Transactions and Investment Income
For financial statement purposes, the funds record security transactions on the trade date of the security purchase or sale. Dividend income is recorded on the ex-dividend date. Interest income, including accretion of bond discounts and amortization of bond premiums, is recorded on the accrual basis. Security gains and losses are determined on the basis of identified cost, which is the same basis used for federal income tax purposes.
Whole Loans
Whole loans may bear a greater risk of loss arising from a default on the part of the borrower of the underlying loans than do traditional mortgage-backed securities. This is because whole loans, unlike most mortgage-backed securities, generally are not backed by any government guarantee or private credit enhancement. Such risk may be greater during a period of declining or stagnant real estate values. The funds may invest in single family, multifamily, and commercial loans. Each fund currently limits its investment in commercial loans to 50% of its total assets. A participating loan is a whole loan which contains provisions for the lender to participate in the income stream provided by the property, including net cash flow and capital proceeds.
At August 31, 2009, BSP had 1 multifamily loan representing 1.92% of total net assets and 5.09% of total multifamily loans outstanding and 1 commercial loan representing 3.45% of total net assets and 7.86% of commercial loans outstanding that were 120 or more days delinquent as to the timely monthly payment of principal and interest. At August 31, 2009, no single family loans in BSP were delinquent.
At August 31, 2009, CSP had 3 multifamily loans representing 2.54% of total net assets and 6.63% of total multifamily loans outstanding and 3 commercial loans representing 8.15% of total net assets and 14.82% of total commercial loans outstanding that were 120 or more days delinquent as to the timely monthly payment of principal and interest.
At August 31, 2009, SLA had 1 multifamily loan representing 3.85% of total net assets and 14.94% of total multifamily loans outstanding that were 120 or more days delinquent as to the timely monthly payment of principal and interest.
At August 31, 2009, no loans were delinquent in ASP.
The funds may incur certain costs and delays in the event of a foreclosure. Also, there is no assurance that the subsequent sale of the property will produce an amount equal to the sum of the unpaid principal balance of the loan as of the date the borrower went into default, the accrued unpaid interest, and all of the foreclosure expenses. In this case, the funds may suffer a loss. In accordance with the valuation procedures adopted by the funds' board of directors, real estate acquired through foreclosure, if any, is valued at estimated market value, as determined by independent third party appraisals, less estimated selling costs. As material capital improvements are made to the property, new market value appraisals are obtained.
Real estate may be acquired through foreclosure or deed in lieu of foreclosure on whole loans or similar obligations. The funds may receive rental or other income as a result of holding real estate. In addition, the funds may incur expenses associated with maintaining or improving any real estate owned. Real estate income is recorded on a net basis in the income section of the funds' Statement of Operations. Capital improvements are recorded as an addition to the cost basis of the property, which will increase any loss at sale. As of August 31, 2009, the funds held no real estate owned.
First American Mortgage Funds 2009 Annual Report
48
Subsequent to August 31, 2009, BSP acquired an apartment building and CSP acquired a commercial office building through foreclosure or deed in lieu of foreclosure. In accordance with the valuation procedures adopted by the funds' board of directors, real estate acquired through foreclosure, if any, is initially valued similar to defaulted multifamily and commercial whole loans. This value is subsequently revised to an estimated market value, as determined by independent third party appraisals, less estimated selling costs. As of October 23, 2009, the valuation methodology for these two investments has not changed since the respective fund's fiscal year-end.
Mortgage Servicing Rights
The funds may acquire interests in the cash flow from servicing fees through contractual arrangements with mortgage servicers. Mortgage servicing rights, similar to interest-only securities, generate no further cash flow when a mortgage is prepaid or goes into default. Mortgage servicing rights are accounted for on a level-yield basis with recognized income based on the estimated amounts and timing of cash flows. Such estimates are adjusted periodically as the underlying market conditions change. As of and for the fiscal year ended August 31, 2009, the funds held no mortgage servicing rights.
Borrowings & Reverse Repurchase Agreements
Effective July 11, 2008, the funds entered into loan agreements with Massachusetts Mutual Life Insurance Company ("MMLIC") under which MMLIC made term loans to ASP, BSP, CSP, and SLA of $8,600,000, $45,100,000, $54,400,000, and $31,900,000, respectively, and agreed to make revolving loans to the funds of up to $2,400,000, $12,900,000, $15,600,000, and $9,100,000, respectively. Loans made under the loan agreements are secured by whole loans in the fund's portfolios, bear interest at the one-month London Interbank Offered Rate plus 2.625% subject to a "floor" interest rate of 5.00%, and mature on July 21, 2011. In addition to principal and interest payments paid by each fund to MMLIC for borrowings outstanding, each fund pays an annual fee of 1.28% on any unused portion of the fund's revolving loan commitment.
The funds may also borrow money by entering into reverse repurchase agreements, which involve the sale of portfolio-eligible securities by the funds, coupled with an agreement to repurchase the securities at a specified date and price. Borrowings may increase volatility of the funds' net asset values and involve the risk that interest costs on money borrowed may exceed the return on securities purchased with that borrowed money. Each fund is subject to a restriction on borrowing under which each fund must maintain asset coverage of at least 300%. The interest expense incurred on borrowings is recognized as "Interest Expense" in the Statements of Operations. For the fiscal year ended August 31, 2009, the weighted average borrowings outstanding for ASP, BSP, CSP, and SLA were $14,921,280, $59,545,569, $72,719,815, and $45,365,493, respectively, and the weighted average interest rates paid by the funds on such borrowings were 4.03% , 4.71%, 4.81%, and 4.78%, respectively.
Securities Purchased on a When-Issued Basis
Delivery and payment for securities that have been purchased by the funds on a when-issued or forward-commitment basis can take place a month or more after the transaction date. Such securities do not earn interest, are subject to market fluctuation, and may increase or decrease in value prior to their delivery. Each fund segregates, with its custodian, assets with a market value equal to or greater than the amount of its purchase commitments. The purchase of securities on a when-issued or forward-commitment basis may increase the volatility of a fund's net asset value if
First American Mortgage Funds 2009 Annual Report
49
Notes to FINANCIAL STATEMENTS
the fund makes such purchases while remaining substantially fully invested. As of August 31, 2009, the funds had no outstanding when-issued or forward-commitment securities.
Repurchase Agreements
For repurchase agreements entered into with certain broker-dealers, the funds, along with other affiliated registered investment companies, may transfer uninvested cash balances into a joint trading account, the daily aggregate of which is invested in repurchase agreements secured by U.S. government or agency obligations. Securities pledged as collateral for all individual and joint repurchase agreements are held by the funds' custodian bank until maturity of the repurchase agreement. All agreements require that the daily market value of the collateral be in excess of the repurchase amount, including accrued interest, to protect the funds in the event of a default. As of August 31, 2009, the funds had no outstanding repurchase agreements.
Federal Taxes
Each fund is treated as a separate taxable entity. Each fund intends to continue to qualify as a regulated investment company as provided in Subchapter M of the Internal Revenue Code, as amended, and to distribute all taxable income, if any, to its shareholders. Accordingly, no provision for federal income taxes is required. Each fund also intends to distribute its taxable net investment income and realized gains, if any, to avoid the payment of any federal excise taxes. As of August 31, 2009, the funds did not have any tax positions that did not meet the "more-likely-than-not" threshold of being sustained by the applicable taxing authority. Generally, tax authorities can examine all the tax returns filed for the last three years.
Net investment income and net realized gains and losses may differ for financial statement and tax purposes because of temporary or permanent book/tax differences. These differences are primarily due to deferred wash sale losses, paydown gains and losses, tax mark-to-market adjustments under Section 311(e) of the Taxpayer relief Act of 1997, tax deductions for real estate owned, and investments in REITS. To the extent these differences are permanent, reclassifications are made to the appropriate capital accounts in the fiscal period that the differences arise.
On the Statements of Assets and Liabilities, the following reclassifications were made:
| | | ASP | | BSP | | CSP | | SLA | |
| Undistributed net investment income | | $ | (89,040 | ) | | $ | (637,733 | ) | | $ | 756,996 | | | $ | (381,325 | ) | |
| Accumulated net realized gain (loss) | | | 826,492 | | | | 640,908 | | | | 726,605 | | | | 385,326 | | |
| Additional paid-in capital (reduction) | | | (737,452 | ) | | | (3,175 | ) | | | (1,483,601 | ) | | | (4,001 | ) | |
The character of distributions made during the fiscal period from net investment income or net realized gains may differ from its ultimate characterization for federal income tax purposes. In addition, due to the timing of dividend distributions, the fiscal period in which amounts are distributed may differ from the fiscal period that the income or realized gains or losses were recorded by the funds.
First American Mortgage Funds 2009 Annual Report
50
The character of distributions paid during the fiscal years ended August 31, 2009 and August 31, 2008, were as follows:
| | | ASP | | BSP | |
| | | 8/31/09 | | 8/31/08 | | 8/31/09 | | 8/31/08 | |
| Distributions paid from: | |
| Ordinary income | | $ | 3,234,304 | | | $ | 3,165,549 | | | $ | 11,669,592 | | | $ | 10,970,395 | | |
| Long-term capital gains | | | — | | | | — | | | | — | | | | — | | |
| Return of capital | | | 87,291 | | | | 134,890 | | | | — | | | | 1,578,414 | | |
| Total | | $ | 3,321,595 | | | $ | 3,300,439 | | | $ | 11,669,592 | | | $ | 12,548,809 | | |
| | | CSP | | SLA | |
| | | 8/31/09 | | 8/31/08 | | 8/31/09 | | 8/31/08 | |
| Distributions paid from: | |
| Ordinary income | | $ | 14,809,841 | | | $ | 20,564,180 | | | $ | 9,218,893 | | | $ | 8,956,245 | | |
| Long-term capital gains | | | — | | | | — | | | | 32,960 | | | | 510,399 | | |
| Return of capital | | | 1,527,519 | | | | 129,811 | | | | 4,000 | | | | — | | |
| Total | | $ | 16,337,360 | | | $ | 20,693,991 | | | $ | 9,255,853 | | | $ | 9,466,644 | | |
At August 31, 2009, the components of accumulated earnings (deficit) on a tax basis were as follows:
| | | ASP | | BSP | | CSP | | SLA | |
| Undistributed ordinary income | | $ | — | | | $ | 239,334 | | | $ | — | | | $ | — | | |
| Accumulated capital and post-October losses | | | (1,611,887 | ) | | | (8,897,635 | ) | | | (8,795,701 | ) | | | (5,450,807 | ) | |
| Unrealized appreciation (depreciation) | | | 1,681,477 | | | | (14,772,281 | ) | | | (27,620,282 | ) | | | (3,055,245 | ) | |
| Other accumulated loss | | | (3,550 | ) | | | (3,550 | ) | | | (3,600 | ) | | | (3,600 | ) | |
| Accumulated earnings (deficit) | | $ | 66,040 | | | $ | (23,434,132 | ) | | $ | (36,419,583 | ) | | $ | (8,509,652 | ) | |
The difference between book basis and tax basis unrealized appreciation (depreciation) at August 31, 2009, is attributable to adjustments for REITs, tax deferral of losses on wash sales, and a one-time tax election whereby the funds marked appreciated securities to market creating capital gains that were used to reduce capital loss carryovers and increase tax cost basis.
For federal income tax purposes, the following funds had capital loss carryovers at August 31, 2009, which, if not offset by subsequent capital gains, will expire on the funds' fiscal year-ends as follows:
| | | Expiration | |
| Fund | | 2010 | | 2011 | | 2012 | | 2013 | | 2014 | | 2015 | | 2016 | | 2017 | | Total | |
| ASP | | $ | 267,385 | | | $ | — | | | $ | — | | | $ | — | | | $ | — | | | $ | — | | | $ | — | | | $ | 598,203 | | | $ | 865,588 | | |
| BSP | | | — | | | | — | | | | — | | | | — | | | | 2,858,586 | | | | — | | | | 133,712 | | | | 4,187,382 | | | | 7,179,680 | | |
| CSP | | | — | | | | — | | | | — | | | | — | | | | — | | | | 551,492 | | | | 381,985 | | | | 5,238,593 | | | | 6,172,070 | | |
| SLA | | | — | | | | — | | | | — | | | | — | | | | — | | | | — | | | | — | | | | 3,850,183 | | | | 3,850,183 | | |
First American Mortgage Funds 2009 Annual Report
51
Notes to FINANCIAL STATEMENTS
The funds incurred a loss for tax purposes for the period from November 1, 2008 to August 31, 2009. As permitted by tax regulations, the funds intend to elect to defer and treat the losses as arising in the fiscal year ending August 31, 2010. The deferred losses were as follows:
| Fund | | Amount | |
| ASP | | $ | 746,299 | | |
| BSP | | | 1,717,955 | | |
| CSP | | | 2,623,631 | | |
| SLA | | | 1,600,624 | | |
Distributions to Shareholders
Distributions from net investment income are declared and paid on a monthly basis. Any net realized capital gains on sales of securities for the funds are distributed to shareholders at least annually. These distributions are recorded as of the close of business on the ex-dividend date. Such distributions are payable in cash or, pursuant to the funds' dividend reinvestment plans, reinvested in additional shares of the funds' capital stock. Under each fund's plan, fund shares will be purchased in the open market unless the market price plus commissions exceeds the net asset value by 5% or more. If, at the close of business on the dividend payment date, the shares purchased in the open market are insufficient to satisfy the dividend reinvestment requirement, the funds will issue new shares at a discount of up to 5% from the current market price.
The funds receive substantial distributions from holdings in real estate investment trusts ("REITs"). Distributions from REITs may be characterized as ordinary income, net capital gain, or a return of capital to the REIT shareholder. The proper characterization of REIT distributions is generally not known until after the end of each calendar year. As such, the funds must use estimates in reporting the character of its income and distributions for financial statement purposes. The actual character of distributions to a fund's shareholders will be reflected on the Form 1099 received by shareholders after the end of the calendar year. Due to the nature of REIT investments, a portion of the distributions received by a fund shareholder may represent a return of capital.
Deferred Compensation Plan
Under a Deferred Compensation Plan (the "Plan"), non-interested directors of the First American Family of Funds may participate and elect to defer receipt of part or all of their annual compensation. Deferred amounts are treated as though equivalent dollar amounts had been invested in shares of open-end First American Funds, as designated by each director. All amounts in the Plan are 100% vested and accounts under the Plan are obligations of the funds. Deferred amounts remain in the funds until distributed in accordance with the Plan.
Use of Estimates in the Preparation of Financial Statements
The preparation of financial statements, in conformity with U.S. generally accepted accounting principles, requires management to make estimates and assumptions that affect the reported amounts of assets and liabilities and the disclosure of contingent assets and liabilities at the date of the financial statements and the results of operations during the reporting period. Actual results could differ from these estimates.
Events Subsequent to Fiscal Year End
Management has evaluated fund related events and transactions that occurred subsequent to August 31, 2009, through October 23, 2009, the date of issuance of the funds' financial statements. There were no events or transactions, other than those previously disclosed, that
First American Mortgage Funds 2009 Annual Report
52
occurred during this period that materially impacted the amounts or disclosures in the funds' financial statements.
(3) Expenses
Investment Advisory Fees
Pursuant to investment advisory agreements with each fund (each an "Agreement"), FAF Advisors, a subsidiary of U.S. Bank National Association ("U.S. Bank"), manages the funds' assets and furnishes related office facilities, equipment, research, and personnel. For ASP, BSP, and CSP, the Agreement provides FAF Advisors with a monthly investment advisory fee in an amount equal to an annualized rate of 0.20% of the respective fund's average weekly net assets and 4.50% of the daily gross income accrued by such fund during the month (i.e., investment income, including accretion of bond discounts and amortization of premiums, other than gains from the sale of securities or gains from options and futures contracts less interest on money borrowed by the funds). The monthly investment advisory fee shall not exceed, in the aggregate, 1/12 of 0.725% of the respective fund's average weekly net assets during the month (approximately 0.725% on an annual basis). For SLA, the Agreement provides FAF Advisors with a monthly investment advisory fee in an amount equal to an annualized rate of 0.50% of the fund's average weekly net assets. For its fees, FAF Advisors provides investment advice and, in general, conducts the management and investment activities of the funds.
The funds may invest in money market funds that are a series of First American Funds, Inc., subject to certain limitations. In order to avoid the payment of duplicative investment advisory fees to FAF Advisors, which acts as the investment advisor to these funds and the related money market funds, FAF Advisors will reimburse to each fund an amount equal to the investment advisory fees received from the related money market funds that are attributable to the assets of that fund. These reimbursements, if any, are disclosed as "Fee reimbursements" in the Statement of Operations.
Administrative Fees
FAF Advisors serves as the fund's administrator pursuant to administration agreements between FAF Advisors and each fund. Under these agreements, FAF Advisors receives a monthly administrative fee from each fund in an amount equal to 0.25% of the fund's average weekly net assets. For its fee, FAF Advisors provides numerous services to the funds including, but not limited to, handling the general business affairs, financial and regulatory reporting, and various other services.
Custodian Fees
U.S. Bank serves as each fund's custodian pursuant to a custodian agreement with the funds. The custodian fee charged to each fund is equal to an annual rate of 0.02% of such fund's average weekly net assets. These fees are computed weekly and paid monthly.
Under the custodian agreement, interest earned on uninvested cash balances is used to reduce a portion of each fund's custodian expenses. These credits, if any, are disclosed as "Indirect payments from custodian" in the Statement of Operations. Conversely, the custodian charges a fee for any cash overdrafts incurred, which will increase the fund's custodian expenses. For the fiscal year ended August 31, 2009, custodian fees for ASP, BSP, CSP, and SLA were increased by $8, $7, $8, and $56 as a result of overdrafts and reduced by $85, $54, $61, and $54 as a result of interest earned, respectively.
First American Mortgage Funds 2009 Annual Report
53
Notes to FINANCIAL STATEMENTS
Mortgage Servicing Fees
The funds may enter into mortgage servicing agreements with mortgage servicers for whole loans and participation mortgages. For a fee, mortgage servicers maintain loan records, such as insurance and taxes and the proper allocation of payments between principal and interest.
Other Fees and Expenses
In addition to the investment advisory, administrative, custodian, and mortgage servicing fees, the funds are responsible for paying most other operating expenses, including: legal, auditing and accounting services, postage and printing of shareholder reports, transfer agent fees and expenses, listing fees, outside directors' fees and expenses, insurance, pricing, interest, expenses related to real estate owned, fees to outside parties retained to assist in conducting due diligence, taxes, and other miscellaneous expenses. For the fiscal year ended August 31, 2009, legal fees and expenses of $6,602, $6,602, $6,602, $6,602 for ASP, BSP, CSP, and SLA, respectively, were paid to a law firm of which an Assistant Secretary of the funds is a partner.
Expenses that are directly related to a fund are charged directly to that fund. Other operating expenses of the First American Family of Funds are allocated to the funds on several bases, including evenly across all funds, allocated based on relative net assets of all funds within the First American Family of Funds or a combination of both methods.
(4) Investment Security Transactions
Cost of purchases and proceeds from sales of securities and real estate, other than temporary investments in short-term securities, for the fiscal year ended August 31, 2009, were as follows:
| Fund | | Cost of Purchases | | Proceeds from Sales | |
| ASP | | $ | 17,074,340 | | | $ | 13,150,261 | | |
| BSP | | | 53,851,129 | | | | 43,582,367 | | |
| CSP | | | 48,529,018 | | | | 46,999,685 | | |
| SLA | | | 30,387,301 | | | | 21,428,951 | | |
(5) Indemnifications
The funds enter into contracts that contain a variety of indemnifications. The funds' maximum exposure under these arrangements is unknown. However, the funds have not had prior claims or losses pursuant to these contracts and expect the risk of loss to be remote.
First American Mortgage Funds 2009 Annual Report
54
Report of Independent Registered PUBLIC ACCOUNTING FIRM
The Board of Directors and Shareholders
American Strategic Income Portfolio Inc., American Strategic Income Portfolio Inc. II, American Strategic Income Portfolio Inc. III, and American Select Portfolio Inc.
We have audited the accompanying statements of assets and liabilities of American Strategic Income Portfolio Inc., American Strategic Income Portfolio Inc. II, American Strategic Income Portfolio Inc. III, and American Select Portfolio Inc. (collectively, the "funds") including the schedules of investments, as of August 31, 2009, and the related statements of operations, cash flows, changes in net assets, and the financial highlights for the periods indicated therein. These financial statements and financial highlights are the responsibility of the funds' management. Our responsibility is to express an opinion on these financial statements and financial highlights based on our audits.
We conducted our audits in accordance with the standards of the Public Company Accounting Oversight Board (United States). Those standards require that we plan and perform the audit to obtain reasonable assurance about whether the financial statements and the financial highlights are free of material misstatement. We were not engaged to perform an audit of the funds' internal controls over financial reporting. Our audits included consideration of internal control over financial reporting as a basis for designing audit procedures that are appropriate in the circumstances, but not for the purpose of expressing an opinion on the effectiveness of the funds' internal control over financial reporting. Accordingly, we express no such opinion. An audit also includes examining, on a test basis, evidence supporting the amounts and disclosures in the financial statements and financial highlights, assessing the accounting principles used an d significant estimates made by management, and evaluating the overall financial statement presentation. Our procedures included confirmation of securities owned as of August 31, 2009, by correspondence with the custodian and brokers. We believe that our audits provide a reasonable basis for our opinion.
In our opinion, the financial statements and financial highlights as referred to above present fairly, in all material respects, the financial position of American Strategic Income Portfolio Inc., American Strategic Income Portfolio Inc. II, American Strategic Income Portfolio Inc. III, and American Select Portfolio Inc. at August 31, 2009, the results of their operations, their cash flows, the changes in their net assets, and the financial highlights for the periods indicated therein, in conformity with U.S. generally accepted accounting principles.

Minneapolis, Minnesota
October 23, 2009
First American Mortgage Funds 2009 Annual Report
55
Notice to SHAREHOLDERS (unaudited)
QUESTIONS AND ANSWERS REGARDING THE LEVEL DISTRIBUTION POLICY
The Board of Directors of American Strategic Income Portfolio Inc. (NYSE: ASP), American Strategic Income Portfolio Inc. – II (NYSE: BSP), American Strategic Income Portfolio Inc. – III (NYSE: CSP) and American Select Portfolio Inc. (NYSE: SLA) (each a "Fund" and together the "Funds") has adopted a level distribution policy for the Funds effective with the Funds' December distributions.
Question 1. What is the level distribution policy?
Under the level distribution policy, each Fund will pay shareholders a fixed monthly cash payment, regardless of the amount of income earned or capital gains realized by the Fund. Beginning with the December distribution, which will have a record date of December 2, 2009 and a payable date of December 16, 2009, these fixed monthly distributions are expected to be as follows:
| | | ASP | | BSP | | CSP | | SLA | |
| Monthly distribution per share | | $ | 0.109 | | | $ | 0.105 | | | $ | 0.098 | | | $ | 0.116 | | |
All monthly payments will be subject to the Board of Directors' right to suspend, modify, or terminate the level distribution policy at any time without notice to shareholders. Thus, there can be no assurance that the level distribution policy for any Fund will be maintained in the future or maintained at its current level. In the event that the Funds' taxable income exceeds the amount of annual distributions under the level distribution policy, the Funds' will have to make additional distributions to comply with federal income tax rules.
Question 2. Why did the Board of Directors adopt the level distribution policy?
The Board of Directors adopted the level distribution policy in an effort to reduce the discount between the market price of each Fund's shares and the shares' net asset value, and to provide additional liquidity to shareholders. The level distribution policy raises monthly distributions for each of the Funds above their current levels. Although there is no assurance that these increased distributions will increase any Fund's market price or reduce its discount, there historically has been a correlation between closed-end funds' distribution rates and the discounts at which their shares trade.
Question 3. Will the level distribution policy impact the way the Funds are managed?
Adoption of a level distribution policy is not expected to materially change the portfolio management strategy of the Funds or materially change the makeup of the Funds' portfolios. Nevertheless, the policy may influence investment decisions from time to time. For example, as discussed below in response to Question 5, the payment of level distributions when a Fund has capital loss carry-forwards and current realized capital gains is likely to have a negative tax impact on taxable shareholders. To address this situation, the Funds' advisor may choose to offset realized capital gains by selling a security that it might not otherwise sell and realizing a loss. In addition, as noted in response to Question 4, the Funds' advisor could be forced to sell securities in a declining market to raise cash to meet a Fund's established distribution amount.
Question 4. Are there any disadvantages to the level distribution policy?
The level distribution policy is expected to shrink each Fund's assets. This could increase the Funds' expense ratios (since each Fund's fixed expenses will be spread over a smaller pool of assets) and make the Funds more difficult to manage. In addition, as a Fund's assets shrink, its income can be expected to decrease. As a result, the portion of each monthly distribution that represents net investment income is likely to decrease and the portion that represents a return of capital is likely to increase. Keep in mind, however, that the level distribution policy is subject to suspension, revision
First American Mortgage Funds 2009 Annual Report
56
or termination at any time by the Board of Directors if it determines that such action would be in the best interests of a Fund. This could occur, for example, if the policy has the effect of shrinking a Fund's assets to a level that is determined to be detrimental to Fund shareholders.
The level distribution policy also could adversely affect a Fund's yield. The Funds will need to use all or a portion of amounts received from prepayments, maturing loans and sales of securities in order to make their established distributions. As a result, such amounts will not be available for reinvestment into higher yielding assets, if such assets are available.
The level distribution policy could require the Funds' advisor to sell securities in a declining market to raise cash to meet a Fund's established distribution amount.
While adoption of a level distribution policy may narrow the discount between the market price of each Fund's shares and the shares' net asset value, the suspension or termination of a Fund's level distribution policy could have the effect of abruptly creating a trading discount (if the Fund is trading at or above its net asset value) or widening an existing trading discount.
The level distribution policy may create additional recordkeeping requirements for shareholders and could have a negative tax impact on shareholders as discussed in response to Question 5.
Question 5. Will the level distribution policy have any tax effects on shareholders?
It is expected that distributions under the policy will consist primarily of net investment income and a return of capital to shareholders, although the exact tax characteristics of a Fund's distributions in any fiscal year will not be known until after the end of the Fund's fiscal year. Currently, the Funds do not expect that any significant portion of their distributions in any year will consist of capital gains.
The tax liability for any return of capital that you receive will be deferred until you sell your shares. When you receive a distribution that contains a return of capital component, you will be required to adjust your cost basis in Fund shares by the amount of the return of capital. This adjustment to your cost basis means that, when you sell your shares, you will have a larger capital gain, or a smaller capital loss, than you would have had if capital had not been returned to you. If you hold your shares in a non-taxable account such as an IRA, these basis adjustments may not impact the amount or timing of your personal tax liability. You should consult your tax advisor to address the application of these tax provisions to your investment in the Funds.
Whenever a distribution includes amounts from a source other than net income earned on your Fund's underlying holdings, you will receive a notice, as required by Section 19(a) of the Investment Company Act of 1940 (a "Section 19 notice"). For example, you will receive a Section 19 notice if any portion of a distribution is expected to be categorized as net realized capital gains or a return of capital. Although each Section 19 notice will indicate what the tax characteristics of the distribution are expected to be, this is subject to change depending on a number of factors including the magnitude of income and realized gains for the year. Each Fund will send an IRS Form 1099-DIV to its shareholders following the end of each calendar year indicating how Fund distributions should be reported for federal income tax purposes.
The payment of level distributions when a Fund has capital loss carry-forwards and current realized capital gains may have a negative tax impact on taxable shareholders. In such circumstances, distributions in any year in excess of current income, and to the extent of current realized capital gains, will be taxed at ordinary income tax rates despite the fact that they are attributable to the Fund's capital gains (some of which may have been long-term capital gains that ordinarily would
First American Mortgage Funds 2009 Annual Report
57
Notice to SHAREHOLDERS (unaudited)
have been taxed at more favorable rates). Moreover, notwithstanding the shareholders being treated as if they have received ordinary income, the Fund would still lose its capital loss carry-forwards in the amount of the gains realized. Even though each Fund does have capital loss carry-forwards, the Funds' advisor, to the extent consistent with the Funds' investment objectives, intends to manage each Fund's portfolio in a manner that will minimize net realized long-term capital gains in each fiscal year and thus minimize the impact of these tax provisions. The Funds' advisor will have no control, however, over long-term capital gains distributed by the Funds' REIT investments, which the Funds will have to recognize as such.
Question 6. Are the level distribution payments considered "yield"?
Not necessarily. You should not draw any conclusions about your Fund's investment performance simply based on the magnitude of the distributions you receive. Yield is a measure of the net investment income, relative to the share price, that is distributed to shareholders. A return of capital represents a return of a shareholder's original investment in a Fund's shares; it is not net investment income. Capital gains also are not considered net investment income. Therefore, increasing distributions by including a return of capital and/or capital gains does not increase yield.
TERMS AND CONDITIONS OF THE DIVIDEND REINVESTMENT PLAN
As a shareholder, you may choose to participate in the Dividend Reinvestment Plan. It's a convenient and economical way to buy additional shares of the funds by automatically reinvesting dividends and capital gains. The plan is administered by Computershare Trust Company, N.A. ("Computershare"), the plan agent.
Eligibility/Participation
You may join the plan at any time. Reinvestment of distributions will begin with the next distribution paid, provided your request is received before the record date for that distribution.
If your shares are in certificate form, you may join the plan directly and have your distributions reinvested in additional shares of your funds. To enroll in this plan, call Computershare at 800-543-5523. If your shares are registered in your brokerage firm's name or another name, ask the holder of your shares how you may participate.
If you are a beneficial owner and wish to join the plan, you must contact your bank, broker or other nominee to arrange participation in the plan on your behalf.
Alternatively, if you are a beneficial owner of our common stock, you may simply request that the number of shares of our common stock you wish to enroll in the plan be re-registered by the bank, broker or other nominee in your own name as record stockholder. You can then directly participate in the plan as described above. You should contact your bank, broker or nominee for information on how to re-register your shares.
Plan Administration
For each fund, beginning no more than three business days before the dividend payment date, Computershare will buy shares of the fund on the New York Stock Exchange ("NYSE") or elsewhere on the open market only when the price of the fund's shares on the NYSE plus commissions is less than a 5% premium over the fund's most recently calculated net asset value ("NAV") per share. If, at the close of business on the dividend payment date, the shares purchased in the open market are insufficient to satisfy the dividend reinvestment requirement, Computershare will accept payment of the dividend, or the remaining portion, in authorized but unissued shares of
First American Mortgage Funds 2009 Annual Report
58
the fund. These shares will be issued at a per-share price equal to the higher of (a) the NAV per share as of the close of business on the payment date or (b) 95% of the closing market price per share on the payment date.
By participating in the plan, you may receive benefits not available to shareholders who elect not to participate. For example, if the market price plus commissions of a Fund's shares is 5% or more above the NAV, you will receive shares at a discount of up to 5% from the current market value. However, if the market price plus commissions is below the NAV, you will receive distributions in shares with an NAV greater than the value of any cash distributions you would have received.
There is no direct charge for reinvestment of dividends and capital gains, since Computershare fees are paid for by the funds. However, if fund shares are purchased in the open market, each participant pays a pro rata portion of the brokerage commissions. Brokerage charges are expected to be lower than those for individual transactions because shares are purchased for all participants in blocks. As long as you continue to participate in the plan, distributions paid on the shares in your account will be reinvested.
Computershare maintains accounts for plan participants holding shares in certificate form and will furnish written confirmation of all transactions, including information you need for tax records. Reinvested shares in your account will be held by Computershare in noncertificated form in your name.
Tax Information
Distributions invested in additional shares of the funds are subject to income tax, to the same extent as if received in cash. When shares are issued by a fund at a discount from market value, shareholders will be treated as having received distributions of an amount equal to the full market value of those shares. Shareholders, as required by the Internal Revenue Service, will receive a Form 1099-DIV regarding the federal tax status of the prior year's distributions.
Plan Withdrawal
If you hold your shares in certificate form, you may terminate your participation in the plan at any time by giving written notice to Computershare or by calling Computershare at 800-426-5523. If your shares are registered in your brokerage firm's name, you may terminate your participation via verbal or written instructions to your investment professional. Written instructions should include your name and address as they appear on the certificate or account.
If notice is received before the record date, all future distributions will be paid directly to the shareholder of record.
If your shares are issued in certificate form and you discontinue your participation in the plan, you (or your nominee) will receive an additional certificate for all full shares and a check for any fractional shares in your account.
Plan Amendment/Termination
Each fund reserves the right to amend or terminate the plan. Should the plan be amended or terminated, participants will be notified in writing at least 90 days before the record date for such dividend or distribution. The plan may also be amended or terminated by Computershare with at least 90 days written notice to participants in the plan.
First American Mortgage Funds 2009 Annual Report
59
Notice to SHAREHOLDERS (unaudited)
Any questions about the plan should be directed to your investment professional or to Computershare Trust Company, N.A., P.O. Box 43078, Providence, RI 02940-3078, 800-426-5523.
TAX INFORMATION
The following per-share information describes the federal tax treatment of distributions made during the period ended August 31, 2009. Distributions for the calendar year will be reported to you on Form 1099-DIV. Please consult a tax advisor on how to report these distributions at the state and local levels.
Income Distributions (the funds designate the following amounts as ordinary income distributions)
| Payable Date | | ASP
Amount | | BSP
Amount | | CSP
Amount | | SLA
Amount | |
| September 24, 2008 | | $ | 0.0650 | | | $ | 0.0550 | | | $ | 0.0750 | | | $ | 0.0650 | | |
| October 22, 2008 | | | 0.0650 | | | | 0.0550 | | | | 0.0750 | | | | 0.0725 | | |
| November 26, 2008 | | | 0.0650 | | | | 0.0600 | | | | 0.0650 | | | | 0.0725 | | |
| December 17, 2008 | | | 0.0650 | | | | 0.0600 | | | | 0.0650 | | | | 0.0725 | | |
| January 12, 2009 | | | 0.0650 | | | | 0.0600 | | | | 0.0650 | | | | 0.0725 | | |
| February 18, 2009 | | | 0.0650 | | | | 0.0600 | | | | 0.0650 | | | | 0.0725 | | |
| March 25, 2009 | | | 0.0650 | | | | 0.0600 | | | | 0.0600 | | | | 0.0725 | | |
| April 22, 2009 | | | 0.0650 | | | | 0.0600 | | | | 0.0600 | | | | 0.0725 | | |
| May 20, 2009 | | | 0.0650 | | | | 0.0600 | | | | 0.0600 | | | | 0.0725 | | |
| June 24, 2009 | | | 0.0650 | | | | 0.0650 | | | | 0.0600 | | | | 0.0725 | | |
| July 22, 2009 | | | 0.0650 | | | | 0.0650 | | | | 0.0600 | | | | 0.0725 | | |
| August 26, 2009 | | | 0.0700 | | | | 0.0700 | | | | 0.0550 | | | | 0.0750 | | |
| | | $ | 0.7850 | | | $ | 0.7300 | | | $ | 0.7650 | | | $ | 0.8650 | | |
Long-Term Gain Distribution (the fund designates the following amount as long-term capital gain distribution)
| Payable Date | | SLA
Amount | |
| January 12, 2009 | | $ | 0.0031 | | |
For the fiscal year ended August 31, 2009, each fund designates long-term capital gains, ordinary income, and return of capital with regard to distributions paid during the period as follows:
| Fund | | Long Term
Capital Gains
Distributions
(Tax Basis) (a) | | Ordinary
Income
Distributions
(Tax Basis) (a) | | Return of
Capital
(Tax Basis) (a) | | Total
Distributions
(Tax Basis) (b) | |
| ASP | | | 0.0 | % | | | 97.4 | % | | | 2.6 | % | | | 100.0 | % | |
| BSP | | | 0.0 | | | | 100.0 | | | | 0.0 | | | | 100.0 | | |
| CSP | | | 0.0 | | | | 90.7 | | | | 9.3 | | | | 100.0 | | |
| SLA | | | 0.4 | | | | 99.6 | | | | 0.0 | | | | 100.0 | | |
(a) Based on a percentage of the fund's total distributions.
(b) Except as noted below, none of the distributions made by these funds are eligible for the dividends received deduction or are characterized as qualified dividend income.
Shareholder Notification of Federal Tax Status:
ASP, BSP, CSP, and SLA designate 0.00%, 0.00%, 0.00%, and 0.00% of ordinary income distributions during the fiscal year ended August 31, 2009 as dividends qualifying for the dividends received deduction available to corporate shareholders, respectively.
First American Mortgage Funds 2009 Annual Report
60
In addition, ASP, BSP, CSP, and SLA designate 0.09%, 0.05%, 0.13%, and 0.03% of the ordinary income distributions from net investment income during the fiscal year ended August 31, 2009 as qualifying dividend income available to individual shareholders under the Jobs and Growth Tax Relief Reconciliation Act of 2003, respectively.
Additional Information Applicable to Foreign Shareholders Only:
The percentage of taxable ordinary income distributions that are designated as interest-related dividends under Intenal Revenue Code Section 871(k)(1)(c) for ASP, BSP, CSP, and SLA was 82.60%, 80.56%, 81.72%, and 87.71%, respectively.
The percentage of taxable ordinary income distributions that are designated as short-term capital gain distributions under Internal Revenue Code Section 871(k)(2)(c) for ASP, BSP, CSP, and SLA, was 0.00%, 0.00%, 0.00%, and 0.00%, respectively.
HOW TO OBTAIN A COPY OF THE FUNDS' PROXY VOTING POLICIES AND PROXY VOTING RECORD
A description of the policies and procedures that the funds use to determine how to vote proxies relating to portfolio securities, as well as information regarding how the funds voted proxies relating to portfolio securities is available at firstamericanfunds.com and on the U.S. Securities and Exchange Commission's website at www.sec.gov. A description of the funds' policies and procedures is also available without charge upon request by calling 800.677.FUND.
FORM N-Q HOLDINGS INFORMATION
The funds are required to file their complete schedule of portfolio holdings for the first and third quarters of each fiscal year with the Securities and Exchange Commission on Form N-Q. The funds' Forms N-Q are available without charge (1) upon request by calling 800.677.FUND and (2) on the U.S. Securities and Exchange Commission's website at www.sec.gov. In addition, you may review and copy the funds' Forms N-Q at the Commission's Public Reference Room in Washington D.C. You may obtain information on the operation of the Public Reference Room by calling 800.SEC.0330.
QUARTERLY PORTFOLIO HOLDINGS
The funds will make portfolio holdings information publicly available by posting the information at firstamericanfunds.com on a quarterly basis. The funds will attempt to post such information within 10 business days of the quarter-end.
CERTIFICATIONS
In December 2008, the funds' Chief Executive Officer submitted to the New York Stock Exchange ("NYSE") his annual certification required under Section 303A.12(a) of the NYSE corporate governance rules. The certifications of the funds' Principal Executive Officer and Principal Financial Officer required pursuant to Rule 30a-2 under the 1940 Act have been filed with the funds' Form N-CSR filings and are available on the U.S. Securities and Exchange Commission's website at www.sec.gov.
APPROVAL OF THE FUNDS' INVESTMENT ADVISORY AGREEMENTS
The Board of Directors of the Funds (the "Board"), which is comprised entirely of independent directors, oversees the management of the Funds and, as required by law, determines annually whether to renew each Fund's advisory agreement with FAF Advisors, Inc. ("FAF Advisors").
First American Mortgage Funds 2009 Annual Report
61
Notice to SHAREHOLDERS (unaudited)
At a meeting on May 5-7, 2009, the Board considered information relating to the Funds' investment advisory agreements with FAF Advisors (each an "Agreement" and together the "Agreements"). In advance of the meeting, the Board received materials relating to each Agreement, and had the opportunity to ask questions and request further information in connection with its consideration. At a subsequent meeting on June 16-18, 2009, the Board concluded its consideration of and approved each Agreement through June 30, 2010.
In considering the Agreements, the Board, advised by independent legal counsel, reviewed and analyzed the factors it deemed relevant, including: (1) the nature, quality and extent of FAF Advisors' services to the Funds, (2) the investment performance of each Fund, (3) the profitability of FAF Advisors related to each Fund, including an analysis of FAF Advisors' cost of providing services and comparative expense information, and (4) other benefits that accrue to FAF Advisors through its relationship with the Funds. When reviewing and approving investment company advisory contracts, boards of directors generally also consider the extent to which economies of scale will be realized as the investment company grows and whether fee levels reflect these economies of scale for the benefit of shareholders. The Board noted, however, that because the Funds are closed-end funds their size would increase only as a result of any appreciation of their portfolio holdings and if they issue shares in connection with dividend reinvestments. The Board therefore determined that a consideration of economies of scale was not relevant to its evaluation of the Agreements. In its deliberations, the Board did not identify any single factor which alone was responsible for the Board's decision to approve any Agreement.
Before approving the Agreements, the independent directors met in executive session with their independent counsel on numerous occasions to consider the materials provided by FAF Advisors and the terms of the Agreements. Based on its evaluation of those materials, the Board concluded that each Agreement is fair and in the best interests of the respective Fund's shareholders. In reaching its conclusions, the Board considered the following:
Nature, Quality and Extent of Investment Advisory Services
The Board examined the nature, quality and extent of the services provided by FAF Advisors to the Funds. The Board reviewed FAF Advisors' key personnel who provide investment advisory services to the Funds as well as the fact that, under the Agreements, FAF Advisors has the authority and responsibility to make and execute investment decisions for the Funds within the framework of each Fund's investment policies and restrictions, subject to review by the Board. The Board further considered that FAF Advisors' duties with respect to each Fund include: (i) investment research and security selection, (ii) adherence to (and monitoring compliance with) each Fund's investment policies and restrictions and the Investment Company Act of 1940, and (iii) monitoring the performance of the various organizations providing services to each Fund, including the Funds' sub-administrator, transfer agent and custodian. Finally, the Board considered FAF Advisors' representation that the services provided by FAF Advisors under each Agreement are the type of services customarily provided by investment advisors in the fund industry. The Board also considered compliance reports about FAF Advisors from the Funds' Chief Compliance Officer.
Based on the foregoing, the Board concluded that each Fund is likely to benefit from the nature, quality and extent of the services provided by FAF Advisors under the Agreements.
Investment Performance of the Funds
The Board considered the performance of each Fund on a gross-of-expenses basis, including how each Fund performed versus the median performance of a group of comparable funds selected by an independent data service (the "performance universe") and how each Fund performed versus its
First American Mortgage Funds 2009 Annual Report
62
benchmark index. All periods considered by the Board ended February 28, 2009, unless otherwise noted.
American Select Portfolio. The Board noted that the Fund outperformed its benchmark index for the five- and ten-year periods, though it underperformed its benchmark index for the one- and three-year periods. The Board also noted that the Fund outperformed or performed competitively against its performance universe median for all periods. In light of the foregoing, the Board concluded it would be in the interest of the Fund and its shareholders to renew the Fund's Agreement.
American Strategic Income Portfolio. The Board noted that the Fund outperformed its performance universe median for the one-year period, though it underperformed its performance universe median for the three-, five- and ten-year periods. The Board considered that much of the Fund's underperformance was attributable to its performance in 2008. In support of this, the Board considered that, in connection with last year's review of the Agreement, the Board noted that the Fund had outperformed its benchmark index for the three-, five- and ten-year periods, though it underperformed its benchmark index for the one-year period, and that the Fund had outperformed or had performed competitively against its performance universe for the one-, three-, five- and ten-year periods. The Board considered FAF Advisors' assertion that the Fund's performance universe is composed of only nine funds, five of which are First American funds, and that, as a result, the Fund's benchmark index is a better standard against which to measure the Fund's performance. The Board noted that the Fund outperformed its benchmark index for the five- and ten-year periods, though it underperformed its benchmark index for the one- and three-year periods. The Board considered FAF Advisors' statement that the Fund's underperformance for more recent periods was the result of the recent "flight to quality" into the higher rated securities that comprise the benchmark index. In light of the Fund's longer-term performance compared to its benchmark, the Board concluded it would be in the interest of the Fund and its shareholders to renew the Fund's Agreement.
American Strategic Income Portfolio II. The Board noted that the Fund outperformed or performed competitively against its performance universe median for the one-, three-, five- and ten-year periods. The Board also noted that the Fund outperformed its benchmark index for the five- and ten-year periods, though it underperformed its benchmark index for the one- and three-year periods. In light of the foregoing, the Board concluded it would be in the interest of the Fund and its shareholders to renew the Fund's Agreement.
American Strategic Income Portfolio III. The Board noted that the Fund outperformed or performed competitively against its performance universe median for the one-, three-, five- and ten-year periods. The Board also noted that the Fund outperformed its benchmark index for the five- and ten-year periods, though it underperformed its benchmark index for the one- and three-year periods. In light of the foregoing, the Board concluded it would be in the interest of the Fund and its shareholders to renew the Fund's Agreement.
Costs of Services and Profits Realized by FAF Advisors
The Board reviewed FAF Advisors' costs in serving as the Funds' investment manager, including the costs associated with the personnel and systems necessary to manage the Funds. The Board also considered the profitability of FAF Advisors and its affiliates resulting from their relationship with the Funds. The Board compared fee and expense information for the Funds to fee and expense information for comparable funds managed by other advisors. The Board also reviewed advisory fees for other funds advised or sub-advised by FAF Advisors and for private accounts managed by
First American Mortgage Funds 2009 Annual Report
63
Notice to SHAREHOLDERS (unaudited)
FAF Advisors. The Board found that while the management fees for FAF Advisors' institutional separate accounts are generally lower than the management fees charged by FAF Advisors to funds, funds receive additional services from FAF Advisors that separate accounts do not receive.
Using information provided by an independent data service, the Board also evaluated each Fund's advisory fee compared to the median advisory fee for other funds similar in size, character and investment strategy, and the Funds' total expense ratio compared to the median total expense ratio after waivers of comparable funds. The Board noted that, for each Fund, the Fund's advisory fee was lower than the peer group median advisory fee, though the Fund's total expense ratio was higher than the peer group median total expense ratio. The Board considered FAF Advisors' assertion that the Funds incur investment-related expenses, including mortgage servicing fees from the Funds' investments in whole loans, which other funds in the Funds' expense group do not incur since these funds do not invest in whole loans. The Board noted FAF Advisors' assertion that, excluding the investment-related expenses, each Fund's total expenses were lower than the expense group median. The Board concluded that each Fund's advisory fee and total expense ratio are reasonable in light of the services provided.
Other Benefits to FAF Advisors
In evaluating the benefits that accrue to FAF Advisors through its relationship with the Funds, the Board noted that FAF Advisors and certain of its affiliates serve the Funds in various capacities, including as investment advisor, administrator and custodian, and receive compensation from the Funds in connection with providing services to the Funds. The Board considered that each service provided to the Fund by FAF Advisors or one of its affiliates is pursuant to a written agreement, which the Board evaluates periodically as required by law.
After full consideration of these factors, the Board concluded that approval of the Agreements was in the interest of each Fund and its shareholders.
First American Mortgage Funds 2009 Annual Report
64
Directors and Officers of the Funds
Independent Directors
Name, Address, and
Year of Birth | | Position(s)
Held with
Funds | | Term of Office and
Length of Time Served | | Principal Occupation(s)
During Past 5 Years | | Number of Portfolios
in Fund Complex
Overseen by Director | | Other
Directorships
Held by
Director† | |
Benjamin R. Field III
P.O. Box 1329
Minneapolis, MN 55440-1329
(1938) | | Director | | Directors serve for a one-year term that expires at the next annual meeting of shareholders. Director of ASP, BSP, CSP, and SLA since September 2003 | | Retired | | First American Funds Complex: twelve registered investment companies, including fifty-eight portfolios | | None | |
|
Roger A. Gibson
P.O. Box 1329
Minneapolis, MN 55440-1329
(1946) | | Director | | Directors serve for a one-year term that expires at the next annual meeting of shareholders. Director of ASP, BSP, CSP, and SLA since August 1998 | | Director, Charterhouse Group Inc., a private equity firm, since October 2005; Advisor/Consultant, Future FreightTM, a logistics/supply chain company; Trustee, National Jewish Health; Board Member/Co-founder, Shades of Blue, an aviation-related youth development organization; Vice President and Chief Operating Officer, Cargo-United Airlines, from July 2001 until retirement in November 2005 | | First American Funds Complex: twelve registered investment companies, including fifty-eight portfolios | | None | |
|
Victoria J. Herget
P.O. Box 1329
Minneapolis, MN 55440-1329
(1951) | | Director | | Directors serve for a one-year term that expires at the next annual meeting of shareholders. Director of ASP, BSP, CSP, and SLA since September 2003 | | Investment consultant and non-profit board member since 2001; Board Chair, United Educators Insurance Company | | First American Funds Complex: twelve registered investment companies, including fifty-eight portfolios | | None | |
|
John P. Kayser
P.O. Box 1329
Minneapolis, MN 55440-1329
(1949) | | Director | | Directors serve for a one-year term that expires at the next annual meeting of shareholders. Director of ASP, BSP, CSP, and SLA since October 2006 | | Retired; Principal from 1983 to 2004, William Blair & Company LLC, a Chicago-based investment firm | | First American Funds Complex; twelve registered investment companies, including fifty-eight portfolios | | None | |
|
Leonard W. Kedrowski
P.O. Box 1329
Minneapolis, MN 55440-1329
(1941) | | Director | | Directors serve for a one-year term that expires at the next annual meeting of shareholders. Director of ASP, BSP, CSP, and SLA since August 1998 | | Owner and President, Executive and Management Consulting, Inc., a management consulting firm; Board member, GC McGuiggan Corporation (dba Smyth Companies), a label printer; member, investment advisory committee, Sisters of the Good Shepherd | | First American Funds Complex: twelve registered investment companies, including fifty-eight portfolios | | None | |
|
Richard K. Riederer
P.O. Box 1329
Minneapolis, MN 55440-1329
(1944) | | Director | | Directors serve for a one-year term that expires at the next annual meeting of shareholders. Director of ASP, BSP, CSP, and SLA since August 2001 | | Owner & Chief Executive Officer, RKR Consultants, Inc., a consulting company providing advice on business strategy, mergers and acquisitions, and non-profit board member since 2005 | | First American Funds Complex: twelve registered investment companies, including fifty-eight portfolios | | Cliffs Natural Resources, Inc. (a producer of iron ore pellets and coal) | |
|
Joseph D. Strauss
P.O. Box 1329
Minneapolis, MN 55440-1329
(1940) | | Director | | Directors serve for a one-year term that expires at the next annual meeting of shareholders. Director of ASP, BSP, CSP, and SLA since August 1998 | | Attorney At Law, Owner, and President, Strauss Management Company, a Minnesota holding company for various organizational management business ventures; Owner, Chairman, and Chief Executive Officer, Community Resource Partnerships, Inc., a strategic planning, operations management, government relations, transportation planning, and public relations organization; Owner, Chairman, and Chief Executive Officer, ExcensusTM, LLC, a demographic planning and application development firm | | First American Funds Complex: twelve registered investment companies, including fifty-eight portfolios | | None | |
|
First American Mortgage Funds 2009 Annual Report
65
Notice to SHAREHOLDERS (unaudited)
Independent Directors—concluded
Name, Address, and
Year of Birth | | Position(s)
Held with
Funds | | Term of Office and
Length of Time Served | | Principal Occupation(s)
During Past 5 Years | | Number of Portfolios
in Fund Complex
Overseen by Director | | Other
Directorships
Held by
Director† | |
Virginia L. Stringer
P.O. Box 1329
Minneapolis, MN 55440-1329
(1944) | | Chair; Director | | Directors serve for a one-year term that expires at the next annual meeting of shareholders. Chair of funds' board since 1998. Director of ASP, BSP, CSP, and SLA since August 1998 | | Governance Consultant and non-profit board member; former Owner and President, Strategic Management Resources, Inc., a management consulting firm; Chair, St. Paul Riverfront Corporation, since 2005 | | First American Funds Complex: twelve registered investment companies, including fifty-eight portfolios | | None | |
|
James M. Wade
P.O. Box 1329
Minneapolis, MN 55440-1329
(1943) | | Director | | Directors serve for a one-year term that expires at the next annual meeting of shareholders. Director of ASP, BSP, CSP, and SLA since August 2001 | | Owner and President, Jim Wade Homes, a homebuilding company | | First American Funds Complex: twelve registered investment companies, including fifty-eight portfolios | | None | |
|
†Includes only directorships in a company with a class of securities registered pursuant to Section 12 of the Securities Exchange Act or subject to the requirements of Section 15(d) of the Securities Exchange Act, or any company registered as an investment company under the Investment Company Act.
First American Mortgage Funds 2009 Annual Report
66
Officers
Name, Address, and
Year of Birth | | Position(s)
Held with
Funds | | Term of Office and Length of Time Served | | Principal Occupation(s) During Past 5 Years | |
Thomas S. Schreier, Jr.
FAF Advisors, Inc.
800 Nicollet Mall
Minneapolis, MN 55402
(1962)* | | President | | Re-elected by the Board annually; President of ASP, BSP, CSP, and SLA since February 2001 | | Chief Executive Officer of FAF Advisors, Inc., Chief Investment Officer of FAF Advisors, Inc., since September 2007 | |
|
John G. Wenker
FAF Advisors, Inc.
800 Nicollet Mall
Minneapolis, MN 55402
(1951)* | | Senior Vice President | | Re-elected by the Board annually; Senior Vice President of ASP, BSP, CSP, and SLA since November 1996 | | Managing Director of FAF Advisors, Inc. | |
|
David A. Yale
FAF Advisors, Inc.
800 Nicollet Mall, Minneapolis, MN 55402
(1956)* | | Vice President | | Re-elected by the Board annually; Vice President of ASP, BSP, CSP, and SLA since June 2007 | | Senior Real Estate Portfolio Manager, FAF Advisors, Inc., since August 2006; prior thereto, Senior Vice President, Twin Cities Market Manager, U.S. Bank from July 2005 to August 2006; prior to July 2005, Vice President, ING Investment Management/ReliaStar Investment Research | |
|
Chris J. Neuharth
FAF Advisors, Inc.
800 Nicollet Mall, Minneapolis, MN 55402
(1959)* | | Vice President | | Re-elected by the Board annually; Vice President of ASP, BSP, CSP, and SLA since June 2007 | | Senior Fixed-Income Portfolio Manager, FAF Advisors, Inc. | |
|
Jeffery M. Wilson
FAF Advisors, Inc.
800 Nicollet Mall
Minneapolis, MN 55402
(1956)* | | Vice
President– Administration | | Re-elected by the Board annually; Vice President–Administration of ASP, BSP, CSP, and SLA since March 2000 | | Senior Vice President of FAF Advisors, Inc. | |
|
Charles D. Gariboldi, Jr.
FAF Advisors, Inc.
800 Nicollet Mall
Minneapolis, MN 55402
(1959)* | | Treasurer | | Re-elected by the Board annually; Treasurer of ASP, BSP, CSP, and SLA since December 2004 | | Mutual Funds Treasurer, FAF Advisors, Inc., since October 2004; prior thereto, Vice President of Investment Accounting and Fund Treasurer for Thrivent Financial for Lutherans | |
|
Jill M. Stevenson
FAF Advisors, Inc.
800 Nicollet Mall
Minneapolis, MN 55402
(1965)* | | Assistant Treasurer | | Re-elected by the Board annually; Assistant Treasurer of ASP, BSP, CSP, and SLA since September 2005 | | Mutual Funds Assistant Treasurer, FAF Advisors, Inc., since September 2005; prior thereto, Director and Senior Project Manager, FAF Advisors, Inc. | |
|
David H. Lui
FAF Advisors, Inc.
800 Nicollet Mall
Minneapolis, MN 55402
(1960)* | | Chief Compliance Officer | | Re-elected by the Board annually; Chief Compliance Officer of ASP, BSP, CSP, and SLA since February 2005 | | Chief Compliance Officer, First American Funds and FAF Advisors, Inc., since March 2005; prior thereto, Chief Compliance Officer, Franklin Advisers, Inc. and Chief Compliance Counsel, Franklin Templeton Investments | |
|
Jason K. Mitchell
FAF Advisors, Inc.
800 Nicollet Mall
Minneapolis, MN 55402
(1976)* | | Anti-Money Laundering Officer | | Re-elected by the Board annually; Anti-Money Laundering Officer of ASP, BSP, CSP, and SLA since December 2008 and from September 2006 through August 2008 | | Compliance Manager, FAF Advisors, Inc., since June 2006; prior thereto, Compliance Analyst, FAF Advisors, Inc., from October 2004 to June 2006; prior thereto, Senior Systems Helpdesk Analyst, Wachovia Retirement Services | |
|
Kathleen L. Prudhomme
FAF Advisors, Inc.
800 Nicollet Mall
Minneapolis, MN 55402
(1953)* | | Secretary | | Re-elected by the Board annually; Secretary of ASP, BSP, CSP, and SLA since December 2004; prior thereto, Assistant Secretary of ASP, BSP, CSP, and SLA since September 1999 | | Deputy General Counsel, FAF Advisors, Inc., since November 2004; prior thereto, Partner, Dorsey & Whitney LLP, a Minneapolis based law firm | |
|
James D. Alt
Dorsey & Whitney LLP
50 South Sixth Street
Suite 1500
Minneapolis, MN 55402
(1951) | | Assistant Secretary | | Re-elected by the Board annually; Assistant Secretary of ASP, BSP, CSP, and SLA since December 2004; prior thereto, Secretary of ASP, BSP, CSP, and SLA since June 2002; Assistant Secretary of ASP, BSP, CSP, and SLA from September 1999 to June 2002 | | Partner, Dorsey & Whitney LLP, a Minneapolis based law firm | |
|
First American Mortgage Funds 2009 Annual Report
67
Notice to SHAREHOLDERS (unaudited)
Officers—concluded
Name, Address, and
Year of Birth | | Position(s)
Held with
Funds | | Term of Office and Length of Time Served | | Principal Occupation(s) During Past 5 Years | |
Richard J. Ertel
FAF Advisors, Inc.
800 Nicollet Mall
Minneapolis, MN 55402
(1967)* | | Assistant Secretary | | Re-elected by the Board annually; Assistant Secretary of ASP, BSP, CSP, and SLA since June 2006 and from June 2003 through August 2004 | | Counsel, FAF Advisors, Inc., since May 2006; prior thereto, Counsel, Ameriprise Financial Services, Inc. from September 2004 to May 2006; prior thereto, Counsel, FAF Advisors, Inc. | |
|
Michael W. Kremenak
FAF Advisors, Inc.
800 Nicollet Mall
Minneapolis, MN 55402
(1978)* | | Assistant Secretary | | Re-elected by the Board annually; Assistant Secretary of ASP, BSP, CSP, and SLA since February 2009 | | Counsel, FAF Advisors, Inc., since January 2009; prior thereto, Associate, Skadden, Arps, Slate, Meagher & Flom LLP, a New York City based law firm from September 2005 to January 2009 | |
|
*Messrs. Schreier, Wenker, Yale, Neuharth, Wilson, Gariboldi, Lui, Mitchell, Ertel, and Kremenak, Ms. Stevenson and Ms. Prudhomme are each officers and/or employees of FAF Advisors, Inc., which serves as investment advisor for the funds.
First American Mortgage Funds 2009 Annual Report
68
BOARD OF DIRECTORS
Virginia Stringer
Chairperson of First American Mortgage Funds
Governance Consultant; Chair of Saint Paul Riverfront Corporation;
former Owner and President of Strategic Management Resources, Inc.
Benjamin Field III
Director of First American Mortgage Funds
Retired; former Senior Financial Advisor, Senior Vice President,
Chief Financial Officer, and Treasurer of Bemis Company, Inc.
Roger Gibson
Director of First American Mortgage Funds
Director of Charterhouse Group, Inc.
Victoria Herget
Director of First American Mortgage Funds
Investment Consultant; Chair of United Educators Insurance Company;
former Managing Director of Zurich Scudder Investments
John Kayser
Director of First American Mortgage Funds
Retired; former Principal, Chief Financial Officer, and Chief Administrative
Officer of William Blair & Company, LLC
Leonard Kedrowski
Director of First American Mortgage Funds
Owner and President of Executive and Management Consulting, Inc.
Richard Riederer
Director of First American Mortgage Funds
Owner and Chief Executive Officer of RKR Consultants, Inc.
Joseph Strauss
Director of First American Mortgage Funds
Owner and President of Strauss Management Company
James Wade
Director of First American Mortgage Funds
Owner and President of Jim Wade Homes
First American Mortgage Funds' Board of Directors is comprised entirely of
independent directors.

P.O. Box 1330
Minneapolis, MN 55440-1330
American Strategic Income Portfolio Inc.
American Strategic Income Portfolio Inc. II
American Strategic Income Portfolio Inc. III
American Select Portfolio Inc.
2009 Annual Report
FAF Advisors, Inc., is a wholly owned subsidiary of U.S. Bank National Association, which is a wholly owned subsidiary of U.S. Bancorp.

This document is printed on paper containing 10% postconsumer waste.
10/2009 0285-09 WHOLELOAN-AR
Item 2—Code of Ethics
The registrant has adopted a code of ethics that applies to its principal executive officer and principal financial officer. During the period covered by this report, there were no amendments to the provisions of the registrant’s code of ethics that apply to the registrant’s principal executive officer and principal financial officer and that relate to any element of the code of ethics definition enumerated in this Item. During the period covered by this report, the registrant did not grant any waivers, including implicit waivers, from any provision of its code of ethics. The registrant undertakes to provide to any person without charge, upon request, a copy of its code of ethics by calling 1-800-677-3863.
Item 3—Audit Committee Financial Expert
The registrant’s Board of Directors has determined that Leonard W. Kedrowski, Benjamin R. Field III, John P. Kayser, and Richard K. Riederer, members of the registrant’s Audit Committee, are each an “audit committee financial expert” and are “independent,” as these terms are defined in this Item.
Item 4—Principal Accountant Fees and Services
(a) Audit Fees - Ernst & Young LLP (“E&Y”) billed the registrant audit fees totaling $31,116 in the fiscal year ended August 31, 2009 and $24,816 in the fiscal year ended August 31, 2008, including fees associated with the annual audit, SEC Rule 17f-2 security count filings and filings of the registrant’s Form N-CSR.
(b) Audit-Related Fees — E&Y billed the registrant audit-related fees totaling $11,218 in the fiscal year ended August 31, 2009 and $2,339 in the fiscal year ended August 31, 2008, including fees associated with the semi-annual review of fund disclosures.
(c) Tax Fees - E&Y billed the registrant fees of $5,498 in the fiscal year ended August 31, 2009 and $20,680 in the fiscal year ended August 31, 2008 for tax services, including tax compliance, tax advice and tax planning. Tax compliance, tax advice and tax planning services primarily related to preparation of original and amended tax returns, timely RIC qualification reviews, and tax distribution analysis and planning.
(d) All Other Fees - There were no fees billed by E&Y for other services to the registrant during the fiscal years ended August 31, 2009 and August 31, 2008.
(e)(1) The audit committee’s pre-approval policies and procedures pursuant to paragraph (c)(7) of Rule 2-01 of Regulation S-X are set forth below:
Audit Committee policy regarding pre-approval of services provided by the Independent Auditor
The Audit Committee of the First American Funds (“Committee”) has responsibility for ensuring that all services performed by the independent audit firm for the funds do not impair the firm’s independence. This review is intended to provide reasonable oversight without removing management from its responsibility for day-to-day operations. In this regard, the Committee should:
· Understand the nature of the professional services expected to be provided and their impact on auditor independence and audit quality
· Examine and evaluate the safeguards put into place by the Company and the auditor to safeguard independence
· Meet quarterly with the partner of the independent audit firm
· Consider approving categories of service that are not deemed to impair independence for a one-year period
It is important that a qualitative rather than a mere quantitative evaluation be performed by the Committee in discharging its responsibilities.
Policy for Audit and Non-Audit Services Provided to the Funds
On an annual basis, the Committee will review and consider whether to pre-approve the financial plan for audit fees as well as categories of audit-related and non-audit services that may be performed by the funds’ independent audit firm
directly for the funds. At least annually the Committee will receive a report from the independent audit firm of all audit and non-audit services, which were approved during the year.
The engagement of the independent audit firm for any non-audit service requires the written pre-approval of the Treasurer of the funds and all non-audit services performed by the independent audit firm will be disclosed in the required SEC periodic filings.
In connection with the Committee review and pre-approval responsibilities, the review by the Committee will consist of the following:
Audit Services
The categories of audit services and related fees to be reviewed and considered for pre-approval annually by the Committee or its delegate include the following:
· Annual Fund financial statement audits
· Seed audits (related to new product filings, as required)
· SEC and regulatory filings and consents
Audit-related Services
In addition, the following categories of audit-related services are deemed to be consistent with the role of the independent audit firm and, as such, will be considered for pre-approval by the Committee or its delegate, on an annual basis.
· Accounting consultations
· Fund merger support services
· Other accounting related matters
· Agreed Upon Procedure Reports
· Attestation Reports
· Other Internal Control Reports
Notwithstanding any annual pre-approval of these categories of services, individual projects with an estimated fee in excess of $25,000 are subject to pre-approval by the Committee Chair or its delegate on a case-by-case basis. Individual projects with an estimated fee in excess of $50,000 are subject to pre-approval by the Committee or its delegate on a case-by-case basis.
Tax Services
The following categories of tax services are deemed to be consistent with the role of the independent audit firm and, as such, will be considered for pre-approval by the Committee or its delegate, on an annual basis.
· Tax compliance services related to the filing or amendment of the following:
· Federal, state and local income tax compliance, and
· Sales and use tax compliance
· Timely RIC qualification reviews
· Tax distribution analysis and planning
· Tax authority examination services
· Tax appeals support services
· Accounting methods studies
· Fund merger support services
· Tax consulting services and related projects
Notwithstanding any annual pre-approval of these categories of services, individual projects with an estimated fee in excess of $25,000 are subject to pre-approval by the Committee Chair or its delegate on a case-by-case basis. Individual projects with an estimated fee in excess of $50,000 are subject to pre-approval by the Committee or its delegate on a case-by-case basis.
Other Non-audit Services
The SEC auditor independence rules adopted in response to the Sarbanes-Oxley Act specifically allow certain non-audit services. Because of the nature of these services, none of these services may be commenced by the independent audit firm without the prior approval of the Committee. The Committee may delegate this responsibility to one or more of the Committee members, with the decisions presented to the full Committee at the next scheduled meeting.
Proscribed Services
In accordance with SEC rules on independence, the independent audit firm is prohibited from performing services in the following categories of non-audit services:
· Management functions
· Accounting and bookkeeping services
· Internal audit services
· Financial information systems design and implementation
· Valuation services supporting the financial statements
· Actuarial services supporting the financial statements
· Executive recruitment
· Expert services (e.g., litigation support)
· Investment banking
Policy for Pre-approval of Non-Audit Services Provided to Other Entities within the Investment Company Complex
The Committee is also responsible for pre-approving certain non-audit services provided to FAF Advisors, Inc., U.S. Bank N.A., Quasar Distributors, U.S. Bancorp Fund Services, LLC and any other entity under common control with FAF Advisors, Inc., that provides ongoing services to the funds. The only non-audit services provided to these entities which require pre-approval are those services that relate directly to the operations and financial reporting of the funds.
Although the Committee is not required to pre-approve all services provided to FAF Advisors, Inc. and other affiliated service providers, the Committee will annually receive a report from the independent audit firm on the aggregate fees for all services provided to U.S. Bancorp and affiliates.
(e)(2) All of the services described in paragraphs (b) through (d) of this Item 4 were pre-approved by the audit committee.
(f) All services performed on the engagement to audit the registrant’s financial statements for the most recent fiscal year end were performed by the principal accountant’s full-time, permanent employees.
(g) The aggregate non-audit fees billed by E&Y to the registrant, the registrant’s investment adviser, and any entity controlling, controlled by, or under common control with the adviser that provides ongoing services to the registrant, totaled $175,829 in the fiscal year ended August 31, 2009 and $173,182 in the fiscal year ended August 31, 2008.
(h) The registrant’s audit committee has determined that the provision of non-audit services to the registrant’s investment adviser, and any entity controlling, controlled by, or under common control with the investment adviser that provides ongoing services to the registrant, that were not pre-approved is compatible with maintaining E&Y’s independence.
Item 5—Audit Committee of Listed Registrants
(a) The registrant has a separately designated standing audit committee established in accordance with Section 3(a)(58)(A) of the Exchange Act. The members of such audit committee are Leonard W. Kedrowski, Benjamin R. Field III, John P. Kayser, and Richard K. Riederer. Virginia L. Stringer, Chair of the Board of Directors, serves ex officio as a non-voting member of such committee.
(b) Not applicable.
Item 6—Schedule of Investments
The schedule is included as part of the report to shareholders filed under Item 1 of this Form.
Item 7—Disclosure of Proxy Voting Policies and Procedures for Closed-End Management Investment Companies
The registrant has delegated the voting of proxies relating to its voting securities to its investment adviser, FAF Advisors, Inc. (“FAF Advisors”). The proxy voting policies and procedures of FAF Advisors are as follows:
General Principles
FAF Advisors, Inc. (“FAF Advisors”) is the investment adviser for the First American family of mutual funds (the “Funds”) and for institutional and other separately managed accounts (collectively, with the Funds, “Client Accounts”). As such, Client Accounts may confer upon FAF Advisors complete discretion to vote proxies. It is FAF Advisors’ duty to vote proxies in the best interests of its clients. In voting proxies, FAF Advisors also seeks to maximize total investment return for its clients.
In the event that FAF Advisors contracts with another investment adviser to act as a sub-adviser for a Client Account, FAF Advisors may delegate proxy voting responsibility to the sub-adviser. Where FAF has delegated proxy voting responsibility, the sub-adviser will be responsible for developing and adhering to its own proxy voting policies. FAF Advisors will approve a sub-adviser’s proxy voting policies, and will review these policies at least annually.
FAF Advisors’ Investment Policy Committee (“IPC”), comprised of the firm’s most senior investment professionals, is charged with oversight of the proxy voting policies and procedures. The IPC is responsible for (1) approving the proxy voting policies and procedures, and (2) oversight of the activities of FAF Advisors’ Proxy Voting Administration Committee (“PVAC”). The PVAC is responsible for providing an administrative framework to facilitate and monitor FAF Advisors’ exercise of its fiduciary duty to vote client proxies and fulfill the obligations of reporting and recordkeeping under the federal securities laws.
Policies
The IPC, after reviewing and concluding that such policies are reasonably designed to vote proxies in the best interests of clients, has approved and adopted the proxy voting policies of Institutional Shareholder Services, Inc. (“ISS”), a leading national provider of proxy voting administrative and research services. As a result, such policies set forth FAF Advisors’ positions on recurring proxy issues and criteria for addressing non-recurring issues. These policies are reviewed periodically by ISS, and therefore are subject to change. Even though it has adopted ISS’ policies, FAF Advisors maintains the fiduciary responsibility for all proxy voting decisions.
Procedures
A. Supervision of Proxy Voting Service
The PVAC shall supervise the relationship with FAF Advisors’ proxy voting service, ISS. ISS apprises FAF Advisors of shareholder meeting dates, provides research on proxy proposals and voting recommendations, and casts the actual proxy votes. ISS also serves as FAF Advisors’ proxy voting record keeper and generates reports on how proxies were voted.
B. Conflicts of Interest
As an affiliate of U.S. Bancorp, a large multi-service financial institution, FAF Advisors recognizes that there are circumstances wherein it may have a perceived or real conflict of interest in voting the proxies of issuers or proxy proponents (e.g., a special interest group) who are clients or potential clients of some part of the U.S. Bancorp enterprise. Directors and officers of such companies may have personal or familial relationships with the U.S. Bancorp enterprise and/or its employees that could give rise to potential conflicts of interest.
FAF Advisors will vote proxies in the best interest of its clients regardless of such real or perceived conflicts of interest. By adopting ISS’ policies, FAF Advisors believes the risk related to conflicts will be minimized.
To further minimize this risk, the IPC will review ISS’ conflict avoidance policy at least annually to ensure that it adequately addresses both the actual and perceived conflicts of interest the proxy voting service may face.
In the event that ISS faces a material conflict of interest with respect to a specific vote, the PVAC shall direct ISS how to vote. The PVAC shall receive voting direction from the Head of Equity Research, who will seek voting direction from appropriate investment personnel. Before doing so, however, the PVAC will confirm that FAF Advisors faces no material conflicts of its own with respect to the specific proxy vote.
If the PVAC concludes that a material conflict does exist, it will recommend to the IPC a course of action designed to address the conflict. Such actions could include, but are not limited to:
1. Obtaining instructions from the affected client(s) on how to vote the proxy;
2. Disclosing the conflict to the affected client(s) and seeking their consent to permit FAF Advisors to vote the proxy;
3. Voting in proportion to the other shareholders;
4. Recusing an IPC member from all discussion or consideration of the matter, if the material conflict is due to such person’s actual or potential conflict of interest; or
5. Following the recommendation of a different independent third party.
In addition to all of the above, members of the IPC and the PVAC must notify FAF Advisors’ Chief Compliance Officer of any direct, indirect or perceived improper influence exerted by any employee, officer or director within the U.S. Bancorp enterprise or First American Fund complex with regard to how FAF Advisors should vote proxies. The Chief Compliance Officer will investigate the allegations and will report the findings to FAF Advisors’ Chief Executive Officer and the General Counsel. If it is determined that improper influence was attempted, appropriate action shall be taken. Such appropriate action may include disciplinary action, notification of the appropriate senior managers within the U.S. Bancorp enterprise, or notification of the appropriate regulatory authorities. In all cases, the IPC shall not consider any improper influence in determining how to vote proxies, and will vote in the best interests of clients.
C. Proxy Vote Override
From time to time, a Portfolio Manager may initiate action to override the ISS recommendation for a particular vote. Any such override shall be reviewed by FAF Advisors’ Legal Department for material conflicts. If the Legal Department determines that no material conflicts exist, the approval of one investment professional on the IPC or the Head of Equity Research shall authorize the override. If a material conflict exists the override recommendation will be addressed pursuant to the procedures described above under “Conflicts of Interest.”
D. Securities Lending
In order to generate incremental revenue, some clients may participate in U.S. Bank’s securities lending program. If a client has elected to participate in the lending program then it will not have the right to vote the proxies of any securities that are on loan as of the shareholder meeting record date. A client, or a Portfolio Manager, may place restrictions on loaning securities and/or recall a security on loan at any time. Such actions must be affected prior to the record date for a meeting if the purpose for the restriction or recall is to secure the vote.
Portfolio Managers and/or Analysts who become aware of upcoming proxy issues relating to any securities in portfolios they manage, or issuers they follow, will consider the desirability of recalling the affected securities that are on loan or restricting the affected securities prior to the record date for the matter. If the proxy issue is determined to be material, and the determination is made prior to the shareholder meeting record date the Portfolio Manager(s) will contact the Securities Lending Department to recall securities on loan or restrict the loaning of any security held in any portfolio they manage, if they determine that it is in the best interest of shareholders to do so. Training regarding the process to recall securities on loan or restrict the loaning of securities is given to all Portfolio Managers and Analysts.
E. Proxy Voting for ERISA Clients
In the event that a proxy voting issue arises for an ERISA client, FAF Advisors is prohibited from voting shares with respect to any issue advanced by a party in interest, such as U.S. Bancorp or any of the First American Funds.
F. Proxy Voting Records
As required by Rule 204-2 of the Investment Company Act of 1940, FAF Advisors shall make and retain five types of records relating to proxy voting; (1) proxy voting policies and procedures; (2) proxy statements received for client and fund securities; (3) records of votes cast on behalf of clients and funds; (4) records of written requests for proxy voting information and written responses from the advisor to either a written or oral request; and (5) any documents prepared by the advisor that were material to making a proxy voting decision or that memorialized the basis for the decision. FAF Advisors may rely on ISS to make and retain on our behalf records pertaining to the rule.
Each sub-advisor shall be responsible for making and retaining all proxy voting records required by the rule and shall provide them to FAF Advisors upon request.
G. Fund of Funds Provision
In instances where FAF Advisors provides investment advice to a fund of funds that acquires shares of affiliated funds or three percent or more of the outstanding voting securities of an unaffiliated fund, the acquiring fund shall vote the shares in the same proportion as the vote of all other shareholders of the acquired fund. If compliance with this policy results in a vote of any shares in a manner different than the ISS recommendation, such vote will not require compliance with the Proxy Vote Override procedures set forth above.
H. Review and Reports
The PVAC shall maintain a review schedule. The schedule shall include reviews for the proxy voting policy (including the policies of any sub-advisor), the proxy voting record, account maintenance, and other reviews as deemed appropriate by the PVAC. The PVAC shall review the schedule at least annually.
The PVAC will report to the IPC with respect to all identified conflicts and how they were addressed. These reports will include all Client Accounts, including those that are sub-advised. With respect to the review of votes cast on behalf of investments by the Funds, such review will also be reported to the Board of Directors of the Funds at each of their regularly scheduled meetings.
I. Vote Disclosure to Shareholders
FAF Advisors shall disclose its proxy voting record on the Funds’ website at www.firstamericanfunds.com and/or on the SEC’s website at www.sec.gov. Additionally, shareholders can receive, on request, the voting records for the Funds by calling a toll free number (1-800-677-3863).
FAF Advisors’ institutional and separately managed account clients can contact their relationship manager for more information on FAF Advisors’ policies and the proxy voting record for their account. The information available includes name of issuer, ticker/CUSIP, shareholder meeting date, description of item and FAF Advisors’ vote.
J. Form N-PX
FAF Advisors will cause Form N-PX to be filed with the Securities and Exchange Commission, and ensure that any other proxy voting-related filings as required by regulation or contract are timely made.
U.S. Proxy Voting Guidelines Concise Summary
(Digest of Selected Key Guidelines)
January 15, 2009
1. Operational Items:
Auditor Ratification
Vote FOR proposals to ratify auditors, unless any of the following apply:
· An auditor has a financial interest in or association with the company, and is therefore not independent;
· There is reason to believe that the independent auditor has rendered an opinion which is neither accurate nor indicative of the company’s financial position;
· Poor accounting practices are identified that rise to a serious level of concern, such as: fraud; misapplication of GAAP; and material weaknesses identified in Section 404 disclosures; or
· Fees for non-audit services (“Other” fees) are excessive.
Non-audit fees are excessive if:
· Non-audit (“other”) fees exceed audit fees + audit-related fees + tax compliance/preparation fees
Vote CASE-BY-CASE on shareholder proposals asking companies to prohibit or limit their auditors from engaging in non-audit services.
Vote CASE-BY-CASE on shareholder proposals asking for audit firm rotation, taking into account:
· The tenure of the audit firm;
· The length of rotation specified in the proposal;
· Any significant audit-related issues at the company;
· The number of Audit Committee meetings held each year;
· The number of financial experts serving on the committee; and
· Whether the company has a periodic renewal process where the auditor is evaluated for both audit quality and competitive price.
2. Board of Directors:
Voting on Director(1) Nominees in Uncontested Elections
Vote on director nominees should be determined on a CASE-BY-CASE basis.
Vote AGAINST or WITHHOLD(2) from individual directors who:
· Attend less than 75 percent of the board and committee meetings without a valid excuse, such as illness, service to the nation, work on behalf of the company, or funeral obligations. If the company provides meaningful public or private disclosure explaining the director’s absences, evaluate the information on a CASE-BY-CASE basis taking into account the following factors:
· Degree to which absences were due to an unavoidable conflict;
· Pattern of absenteeism; and
· Other extraordinary circumstances underlying the director’s absence;
· Sit on more than six public company boards;
· Are CEOs of public companies who sit on the boards of more than two public companies besides their own— withhold only at their outside boards.
(1) RiskMetrics’ classification of directors can be found in U.S. Proxy Voting Guidelines Summary.
(2) In general, companies with a plurality vote standard use “Withhold” as the valid opposition vote option in director elections; companies with a majority vote standard use “Against”. However, it will vary by company and the proxy must be checked to determine the valid opposition vote for the particular company.
Vote AGAINST or WITHHOLD from all nominees of the board of directors, (except from new nominees, who should be considered on a CASE-BY-CASE basis) if:
· The company’s proxy indicates that not all directors attended 75% of the aggregate of their board and committee meetings, but fails to provide the required disclosure of the names of the directors involved. If this information cannot be obtained, vote against/withhold from all incumbent directors;
· The company’s poison pill has a dead-hand or modified dead-hand feature. Vote against/withhold every year until this feature is removed;
· The board adopts or renews a poison pill without shareholder approval, does not commit to putting it to shareholder vote within 12 months of adoption (or in the case of an newly public company, does not commit to put the pill to a shareholder vote within 12 months following the IPO), or reneges on a commitment to put the pill to a vote, and has not yet received a withhold/against recommendation for this issue;
· The board failed to act on a shareholder proposal that received approval by a majority of the shares outstanding the previous year (a management proposal with other than a FOR recommendation by management will not be considered as sufficient action taken);
· The board failed to act on a shareholder proposal that received approval of the majority of shares cast for the previous two consecutive years (a management proposal with other than a FOR recommendation by management will not be considered as sufficient action taken);
· The board failed to act on takeover offers where the majority of the shareholders tendered their shares;
· At the previous board election, any director received more than 50 percent withhold/against votes of the shares cast and the company has failed to address the underlying issue(s) that caused the high withhold/against vote;
· The board is classified, and a continuing director responsible for a problematic governance issue at the board/committee level that would warrant a withhold/against vote recommendation is not up for election- any or all appropriate nominees (except new) may be held accountable;
· The board lacks accountability and oversight, coupled with sustained poor performance relative to peers. Sustained poor performance is measured by one- and three-year total shareholder returns in the bottom half of a company’s four-digit GICS industry group (Russell 3000 companies only).
Vote AGAINST or WITHHOLD from Inside Directors and Affiliated Outside Directors (per the Classification of Directors below) when:
· The inside or affiliated outside director serves on any of the three key committees: audit, compensation, or nominating;
· The company lacks an audit, compensation, or nominating committee so that the full board functions as that committee;
· The company lacks a formal nominating committee, even if board attests that the independent directors fulfill the functions of such a committee;
· The full board is less than majority independent.
Vote AGAINST or WITHHOLD from the members of the Audit Committee if:
· The non-audit fees paid to the auditor are excessive;
· The company receives an adverse opinion on the company’s financial statements from its auditor; or
· There is persuasive evidence that the audit committee entered into an inappropriate indemnification agreement with its auditor that limits the ability of the company, or its shareholders, to pursue legitimate legal recourse against the audit firm.
Vote CASE-by-CASE on members of the Audit Committee and/or the full board if poor accounting practices, which rise to a level of serious concern are indentified, such as: fraud; misapplication of GAAP; and material weaknesses identified in Section 404 disclosures.
Examine the severity, breadth, chronological sequence and duration, as well as the company’s efforts at remediation or corrective actions in determining whether negative vote recommendations are warranted against the members of the Audit Committee who are responsible for the poor accounting practices, or the entire board.
Vote AGAINST or WITHHOLD from the members of the Compensation Committee if:
· There is a negative correlation between the chief executive’s pay and company performance (see discussion under Equity Compensation Plans);
· The company reprices underwater options for stock, cash or other consideration without prior shareholder approval, even if allowed in their equity plan;
· The company fails to submit one-time transfers of stock options to a shareholder vote;
· The company fails to fulfill the terms of a burn rate commitment they made to shareholders;
· The company has backdated options (see “Options Backdating” policy);
· The company has poor compensation practices (see “Poor Pay Practices” policy). Poor pay practices may warrant withholding votes from the CEO and potentially the entire board as well.
Vote AGAINST or WITHHOLD from directors, individually or the entire board, for egregious actions or failure to replace management as appropriate.
Independent Chair (Separate Chair/CEO)
Generally vote FOR shareholder proposals requiring that the chairman’s position be filled by an independent director, unless the company satisfies all of the following criteria:
The company maintains the following counterbalancing features:
· Designated lead director, elected by and from the independent board members with clearly delineated and comprehensive duties. (The role may alternatively reside with a presiding director, vice chairman, or rotating lead director; however the director must serve a minimum of one year in order to qualify as a lead director.) The duties should include, but are not limited to, the following:
· presides at all meetings of the board at which the chairman is not present, including executive sessions of the independent directors;
· serves as liaison between the chairman and the independent directors;
· approves information sent to the board;
· approves meeting agendas for the board;
· approves meeting schedules to assure that there is sufficient time for discussion of all agenda items;
· has the authority to call meetings of the independent directors;
· if requested by major shareholders, ensures that he is available for consultation and direct communication;
· Two-thirds independent board;
· All independent key committees;
· Established governance guidelines;
· A company in the Russell 3000 universe must not have exhibited sustained poor total shareholder return (TSR) performance, defined as one- and three-year TSR in the bottom half of the company’s four-digit GICS industry group within the Russell 3000 only), unless there has been a change in the Chairman/CEO position within that time;
· The company does not have any problematic governance or management issues, examples of which include, but are not limited to:
· Egregious compensation practices;
· Multiple related-party transactions or other issues putting director independence at risk;
· Corporate and/or management scandals;
· Excessive problematic corporate governance provisions; or
· Flagrant board or management actions with potential or realized negative impact on shareholders.
Majority Vote Shareholder Proposals
Generally vote FOR precatory and binding resolutions requesting that the board change the company’s bylaws to stipulate that directors need to be elected with an affirmative majority of votes cast, provided it does not conflict
with the state law where the company is incorporated. Binding resolutions need to allow for a carve out for a plurality vote standard when there are more nominees than board seats.
Companies are strongly encouraged to also adopt a post-election policy (also know as a director resignation policy) that provides guidelines so that the company will promptly address the situation of a holdover director.
Performance/Governance Evaluation for Directors
Vote WITHHOLD/AGAINST on all director nominees if the board lacks accountability and oversight, coupled with sustained poor performance relative to peers, measured by one- and three-year total shareholder returns in the bottom half of a company’s four-digit GICS industry group (Russell 3000 companies only).
Evaluate board accountability and oversight at companies that demonstrate sustained poor performance.
Problematic provisions include but are not limited to:
· a classified board structure;
· a supermajority vote requirement;
· majority vote standard for director elections with no carve out for contested elections;
· the inability of shareholders to call special meetings;
· the inability of shareholders to act by written consent;
· a dual-class structure; and/or
· a non-shareholder approved poison pill.
If a company exhibits sustained poor performance coupled with a lack of board accountability and oversight, also take into consideration the company’s five-year total shareholder return and five-year operational metrics in the evaluation.
3. Proxy Contests
Voting for Director Nominees in Contested Elections
Vote CASE-BY-CASE on the election of directors in contested elections, considering the following factors:
· Long-term financial performance of the target company relative to its industry;
· Management’s track record;
· Background to the proxy contest;
· Qualifications of director nominees (both slates);
· Strategic plan of dissident slate and quality of critique against management;
· Likelihood that the proposed goals and objectives can be achieved (both slates);
· Stock ownership positions.
Reimbursing Proxy Solicitation Expenses
Vote CASE-BY-CASE on proposals to reimburse proxy solicitation expenses. When voting in conjunction with support of a dissident slate, vote FOR the reimbursement of all appropriate proxy solicitation expenses associated with the election.
Generally vote FOR shareholder proposals calling for the reimbursement of reasonable costs incurred in connection with nominating one or more candidates in a contested election where the following apply:
· The election of fewer than 50% of the directors to be elected is contested in the election;
· One or more of the dissident’s candidates is elected;
· Shareholders are not permitted to cumulate their votes for directors; and
· The election occurred, and the expenses were incurred, after the adoption of this bylaw.
4. Antitakeover Defenses and Voting Related Issues
Advance Notice Requirements for Shareholder Proposals/Nominations
Vote CASE-BY-CASE on advance notice proposals, giving support to proposals that allow shareholders to submit proposals/nominations reasonably close to the meeting date and within the broadest window possible, recognizing the need to allow sufficient notice for company, regulatory and shareholder review.
To be reasonable, the company’s deadline for shareholder notice of a proposal/ nominations must not be more than 60 days prior to the meeting, with a submittal window of at least 30 days prior to the deadline.
In general, support additional efforts by companies to ensure full disclosure in regard to a proponent’s economic and voting position in the company so long as the informational requirements are reasonable and aimed at providing shareholders with the necessary information to review such proposal.
Poison Pills
Vote FOR shareholder proposals requesting that the company submit its poison pill to a shareholder vote or redeem it UNLESS the company has: (1) A shareholder approved poison pill in place; or (2) The company has adopted a policy concerning the adoption of a pill in the future specifying that the board will only adopt a shareholder rights plan if either:
· Shareholders have approved the adoption of the plan; or
· The board, in exercising its fiduciary responsibilities, determines that it is in the best interest of shareholders under the circumstances to adopt a pill without the delay that would result from seeking stockholder approval (i.e., the “fiduciary out” provision). A poison pill adopted under this “fiduciary out” will be put to a shareholder ratification vote within 12 months of adoption or expire. If the pill is not approved by a majority of the votes cast on this issue, the plan will immediately terminate.
Vote FOR shareholder proposals calling for poison pills to be put to a vote within a time period of less than one year after adoption. If the company has no non-shareholder approved poison pill in place and has adopted a policy with the provisions outlined above, vote AGAINST the proposal. If these conditions are not met, vote FOR the proposal, but with the caveat that a vote within 12 months would be considered sufficient.
Vote CASE-by-CASE on management proposals on poison pill ratification, focusing on the features of the shareholder rights plan. Rights plans should contain the following attributes:
· No lower than a 20% trigger, flip-in or flip-over;
· A term of no more than three years;
· No dead-hand, slow-hand, no-hand or similar feature that limits the ability of a future board to redeem the pill;
· Shareholder redemption feature (qualifying offer clause); if the board refuses to redeem the pill 90 days after a qualifying offer is announced, 10 percent of the shares may call a special meeting or seek a written consent to vote on rescinding the pill.
In addition, the rationale for adopting the pill should be thoroughly explained by the company. In examining the request for the pill, take into consideration the company’s existing governance structure, including: board independence, existing takeover defenses, and any problematic governance concerns.
For management proposals to adopt a poison pill for the stated purpose of preserving a company’s net operating losses (“NOL pills”), the following factors should be considered:
· the trigger (NOL pills generally have a trigger slightly below 5%);
· the value of the NOLs;
· the term;
· shareholder protection mechanisms (sunset provision, causing expiration of the pill upon exhaustion or expiration of NOLs); and
· other factors that may be applicable.
In addition, vote WITHHOLD/AGAINST the entire board of directors, (except new nominees, who should be considered on a CASE-by-CASE basis) if the board adopts or renews a poison pill without shareholder approval, does not commit to putting it to a shareholder vote within 12 months of adoption (or in the case of a newly public
company, does not commit to put the pill to a shareholder vote within 12 months following the IPO), or reneges on a commitment to put the pill to a vote, and has not yet received a withhold recommendation for this issue.
5. Mergers and Corporate Restructurings
Overall Approach
For mergers and acquisitions, review and evaluate the merits and drawbacks of the proposed transaction, balancing various and sometimes countervailing factors including:
· Valuation - Is the value to be received by the target shareholders (or paid by the acquirer) reasonable? While the fairness opinion may provide an initial starting point for assessing valuation reasonableness, emphasis is placed on the offer premium, market reaction and strategic rationale.
· Market reaction - How has the market responded to the proposed deal? A negative market reaction should cause closer scrutiny of a deal.
· Strategic rationale - Does the deal make sense strategically? From where is the value derived? Cost and revenue synergies should not be overly aggressive or optimistic, but reasonably achievable. Management should also have a favorable track record of successful integration of historical acquisitions.
· Negotiations and process - Were the terms of the transaction negotiated at arm’s-length? Was the process fair and equitable? A fair process helps to ensure the best price for shareholders. Significant negotiation “wins” can also signify the deal makers’ competency. The comprehensiveness of the sales process (e.g., full auction, partial auction, no auction) can also affect shareholder value.
· Conflicts of interest - Are insiders benefiting from the transaction disproportionately and inappropriately as compared to non-insider shareholders? As the result of potential conflicts, the directors and officers of the company may be more likely to vote to approve a merger than if they did not hold these interests. Consider whether these interests may have influenced these directors and officers to support or recommend the merger. The change-in-control figure presented in the “RMG Transaction Summary” section of this report is an aggregate figure that can in certain cases be a misleading indicator of the true value transfer from shareholders to insiders. Where such figure appears to be excessive, analyze the underlying assumptions to determine whether a potential conflict exists.
· Governance - Will the combined company have a better or worse governance profile than the current governance profiles of the respective parties to the transaction? If the governance profile is to change for the worse, the burden is on the company to prove that other issues (such as valuation) outweigh any deterioration in governance.
6. State of Incorporation
Reincorporation Proposals
Evaluate management or shareholder proposals to change a company’s state of incorporation on a CASE-BYCASE basis, giving consideration to both financial and corporate governance concerns including the following:
· Reasons for reincorporation;
· Comparison of company’s governance practices and provisions prior to and following the reincorporation; and
· Comparison of corporation laws of original state and destination state
Vote FOR reincorporation when the economic factors outweigh any neutral or negative governance changes.
7. Capital Structure
Common Stock Authorization
Vote CASE-BY-CASE on proposals to increase the number of shares of common stock authorized for issuance. Take into account company-specific factors which include, at a minimum, the following:
· Specific reasons/ rationale for the proposed increase;
· The dilutive impact of the request as determined through an allowable cap generated by RiskMetrics’ quantitative model;
· The board’s governance structure and practices; and
· Risks to shareholders of not approving the request.
Vote FOR proposals to approve increases beyond the allowable cap when a company’s shares are in danger of being delisted or if a company’s ability to continue to operate as a going concern is uncertain.
Preferred Stock
Vote CASE-BY-CASE on proposals to increase the number of shares of preferred stock authorized for issuance. Take into account company-specific factors which include, at a minimum, the following:
· Specific reasons/ rationale for the proposed increase;
· The dilutive impact of the request as determined through an allowable cap generated by RiskMetrics’ quantitative model;
· The board’s governance structure and practices; and
· Risks to shareholders of not approving the request.
Vote AGAINST proposals authorizing the creation of new classes of preferred stock with unspecified voting, conversion, dividend distribution, and other rights (“blank check” preferred stock).
Vote FOR proposals to create “declawed” blank check preferred stock (stock that cannot be used as a takeover defense).
Vote FOR proposals to authorize preferred stock in cases where the company specifies the voting, dividend, conversion, and other rights of such stock and the terms of the preferred stock appear reasonable.
Vote AGAINST proposals to increase the number of blank check preferred stock authorized for issuance when no shares have been issued or reserved for a specific purpose.
8. Executive and Director Compensation
Equity Compensation Plans
Vote CASE-BY-CASE on equity-based compensation plans. Vote AGAINST the equity plan if any of the following factors apply:
· The total cost of the company’s equity plans is unreasonable;
· The plan expressly permits the repricing of stock options/stock appreciation rights (SARs) without prior shareholder approval;
· The CEO is a participant in the proposed equity-based compensation plan and there is a disconnect between CEO pay and the company’s performance where over 50 percent of the year-over-year increase is attributed to equity awards;
· The company’s three year burn rate exceeds the greater of 2% and the mean plus one standard deviation of its industry group;
· The plan provides for the acceleration of vesting of equity awards even though an actual change in control may not occur (e.g., upon shareholder approval of a transaction or the announcement of a tender offer); or
· The plan is a vehicle for poor pay practices.
Poor Pay Practices
Vote AGAINST or WITHHOLD from compensation committee members, CEO, and potentially the entire board, if the company has poor compensation practices. Vote AGAINST equity plans if the plan is a vehicle for poor compensation practices.
The following practices, while not exhaustive, are examples of poor compensation practices that may warrant withhold vote recommendations:
· Egregious employment contracts - Contracts containing multi-year guarantees for salary increases, bonuses and equity compensation;
· Excessive perks/tax reimbursements:
· Overly generous perquisites, which may include, but are not limited to the following: personal use of corporate aircraft, personal security system maintenance and/or installation, car allowances;
· Reimbursement of income taxes on executive perquisites or other payments;
· Perquisites for former executives, such as car allowances, personal use of corporate aircraft or other inappropriate arrangements;
· Abnormally large bonus payouts without justifiable performance linkage or proper disclosure
· Performance metrics that are changed, canceled or replaced during the performance period without adequate explanation of the action and the link to performance;
· Egregious pension/SERP (supplemental executive retirement plan) payouts:
· Inclusion of additional years of service not worked that result in significant payouts;
· Inclusion of performance-based equity awards in the pension calculation;
· New CEO with overly generous new hire package:
· Excessive “make whole” provisions;
· Any of the poor pay practices listed in this policy;
· Excessive severance and/or change in control provisions:
· Inclusion of excessive change in control or severance payments, especially those with a multiple in excess of 3X cash pay;
· Payments upon an executive’s termination in connection with performance failure;
· Change in control payouts without loss of job or substantial diminution of job duties (single-triggered);
· New or materially amended employment or severance agreements that provide for modified single triggers, under which an executive may voluntarily leave for any reason and still receive the change-in-control severance package;
· Liberal change in control definition in individual contracts or equity plans which could result in payments to executives without an actual change in control occurring;
· New or materially amended employment or severance agreements that provide for an excise tax gross-up. Modified gross-ups would be treated in the same manner as full gross-ups;
· Perquisites for former executives such as car allowances, personal use of corporate aircraft or other inappropriate arrangements;
· Dividends or dividend equivalents paid on unvested performance shares or units;
· Poor disclosure practices:
· Unclear explanation of how the CEO is involved in the pay setting process;
· Retrospective performance targets and methodology not discussed;
· Methodology for benchmarking practices and/or peer group not disclosed and explained;
· Internal Pay Disparity:
· Excessive differential between CEO total pay and that of next highest paid named executive officer (NEO);
· Options backdating (covered in a separate policy);
· Other excessive compensation payouts or poor pay practices at the company.
Other Compensation Proposals and Policies
Advisory Vote on Executive Compensation (Say-on-Pay) Management Proposals
Vote CASE-BY-CASE on management proposals for an advisory vote on executive compensation. Vote AGAINST these resolutions in cases where boards have failed to demonstrate good stewardship of investors’ interests regarding executive compensation practices.
For U.S. companies, consider the following factors in the context of each company’s specific circumstances and the board’s disclosed rationale for its practices:
Relative Considerations:
· Assessment of performance metrics relative to business strategy, as discussed and explained in the CD&A;
· Evaluation of peer groups used to set target pay or award opportunities;
· Alignment of company performance and executive pay trends over time (e.g., performance down: pay down);
· Assessment of disparity between total pay of the CEO and other Named Executive Officers (NEOs).
Design Considerations:
· Balance of fixed versus performance-driven pay;
· Assessment of excessive practices with respect to perks, severance packages, supplemental executive pension plans, and burn rates.
Communication Considerations:
· Evaluation of information and board rationale provided in CD&A about how compensation is determined (e.g., why certain elements and pay targets are used, and specific incentive plan goals, especially retrospective goals);
· Assessment of board’s responsiveness to investor input and engagement on compensation issues (e.g., in responding to majority-supported shareholder proposals on executive pay topics).
Employee Stock Purchase Plans— Non-Qualified Plans
Vote CASE-by-CASE on nonqualified employee stock purchase plans. Vote FOR nonqualified employee stock purchase plans with all the following features:
· Broad-based participation (i.e., all employees of the company with the exclusion of individuals with 5 percent or more of beneficial ownership of the company);
· Limits on employee contribution, which may be a fixed dollar amount or expressed as a percent of base salary;
· Company matching contribution up to 25 percent of employee’s contribution, which is effectively a discount of 20 percent from market value;
· No discount on the stock price on the date of purchase since there is a company matching contribution.
Vote AGAINST nonqualified employee stock purchase plans when any of the plan features do not meet the above criteria. If the company matching contribution exceeds 25 percent of employee’s contribution, evaluate the cost of the plan against its allowable cap.
Option Exchange Programs/Repricing Options
Vote CASE-by-CASE on management proposals seeking approval to exchange/reprice options, taking into consideration:
· Historic trading patterns—the stock price should not be so volatile that the options are likely to be back “in-the-money” over the near term;
· Rationale for the re-pricing—was the stock price decline beyond management’s control?
· Is this a value-for-value exchange?
· Are surrendered stock options added back to the plan reserve?
· Option vesting—does the new option vest immediately or is there a black-out period?
· Term of the option—the term should remain the same as that of the replaced option;
· Exercise price—should be set at fair market or a premium to market;
· Participants—executive officers and directors should be excluded.
If the surrendered options are added back to the equity plans for re-issuance, then also take into consideration the company’s total cost of equity plans and its three-year average burn rate.
In addition to the above considerations, evaluate the intent, rationale, and timing of the repricing proposal.
The proposal should clearly articulate why the board is choosing to conduct an exchange program at this point in time. Repricing underwater options after a recent precipitous drop in the company’s stock price demonstrates poor timing. Repricing after a recent decline in stock price triggers additional scrutiny and a potential AGAINST vote on the proposal. At a minimum, the decline should not have happened within the past year. Also, consider the terms of the surrendered options, such as the grant date, exercise price and vesting schedule. Grant dates of surrendered options should be far enough back (two to three years) so as not to suggest that repricings are being done to take advantage of short-term downward price movements. Similarly, the exercise price of surrendered options should be above the 52-week high for the stock price.
Vote FOR shareholder proposals to put option repricings to a shareholder vote.
Other Shareholder Proposals on Compensation
Advisory Vote on Executive Compensation (Say-on-Pay)
Generally, vote FOR shareholder proposals that call for non-binding shareholder ratification of the compensation of the Named Executive Officers and the accompanying narrative disclosure of material factors provided to understand the Summary Compensation Table.
Golden Coffins/Executive Death Benefits
Generally vote FOR proposals calling on companies to adopt a policy of obtaining shareholder approval for any future agreements and corporate policies that could oblige the company to make payments or awards following the death of a senior executive in the form of unearned salary or bonuses, accelerated vesting or the continuation in force of unvested equity grants, perquisites and other payments or awards made in lieu of compensation. This would not apply to any benefit programs or equity plan proposals for which the broad-based employee population is eligible.
Share Buyback Holding Periods
Generally vote AGAINST shareholder proposals prohibiting executives from selling shares of company stock during periods in which the company has announced that it may or will be repurchasing shares of its stock.
Vote FOR the proposal when there is a pattern of abuse by executives exercising options or selling shares during periods of share buybacks.
Stock Ownership or Holding Period Guidelines
Generally vote AGAINST shareholder proposals that mandate a minimum amount of stock that directors must own in order to qualify as a director or to remain on the board. While RMG favors stock ownership on the part of directors, the company should determine the appropriate ownership requirement.
Vote on a CASE-BY-CASE on shareholder proposals asking companies to adopt policies requiring Named Executive Officers to retain 75% of the shares acquired through compensation plans while employed and/or for two years following the termination of their employment, and to report to shareholders regarding this policy. The following factors will be taken into account:
· Whether the company has any holding period, retention ratio, or officer ownership requirements in place. These should consist of:
· Rigorous stock ownership guidelines, or
· A holding period requirement coupled with a significant long-term ownership requirement, or
· A meaningful retention ratio,
· Actual officer stock ownership and the degree to which it meets or exceeds the proponent’s suggested holding period/retention ratio or the company’s own stock ownership or retention requirements.
· Problematic pay practices, current and past, which may promote a short-term versus a long-term focus.
Tax Gross-Up Proposals
Generally vote FOR proposals asking companies to adopt a policy of not providing tax gross-up payments to executives, except where gross-ups are provided pursuant to a plan, policy, or arrangement applicable to management employees of the company, such as a relocation or expatriate tax equalization policy.
9. Corporate Social Responsibility (CSR) Issues
Overall Approach
When evaluating social and environmental shareholder proposals, RMG considers the following factors:
· Whether adoption of the proposal is likely to enhance or protect shareholder value;
· Whether the information requested concerns business issues that relate to a meaningful percentage of the company’s business as measured by sales, assets, and earnings;
· The degree to which the company’s stated position on the issues raised in the proposal could affect its reputation or sales, or leave it vulnerable to a boycott or selective purchasing;
· Whether the issues presented are more appropriately/effectively dealt with through governmental or company-specific action;
· Whether the company has already responded in some appropriate manner to the request embodied in the proposal;
· Whether the company’s analysis and voting recommendation to shareholders are persuasive;
· What other companies have done in response to the issue addressed in the proposal;
· Whether the proposal itself is well framed and the cost of preparing the report is reasonable;
· Whether implementation of the proposal’s request would achieve the proposal’s objectives;
· Whether the subject of the proposal is best left to the discretion of the board;
· Whether the requested information is available to shareholders either from the company or from a publicly available source; and
· Whether providing this information would reveal proprietary or confidential information that would place the company at a competitive disadvantage.
Genetically Modified Ingredients
Generally vote AGAINST proposals asking suppliers, genetic research companies, restaurants and food retail companies to voluntarily label genetically engineered (GE) ingredients in their products and/or eliminate GE ingredients. The cost of labeling and/or phasing out the use of GE ingredients may not be commensurate with the benefits to shareholders and is an issue better left to regulators.
Vote CASE-BY-CASE on proposals asking for a report on the feasibility of labeling products containing GE ingredients taking into account:
· The company’s business and the proportion of it affected by the resolution;
· The quality of the company’s disclosure on GE product labeling, related voluntary initiatives, and how this disclosure compares with industry peer disclosure; and
· Company’s current disclosure on the feasibility of GE product labeling, including information on the related costs.
Generally vote AGAINST proposals seeking a report on the social, health, and environmental effects of genetically modified organisms (GMOs). Studies of this sort are better undertaken by regulators and the scientific community.
Generally vote AGAINST proposals to completely phase out GE ingredients from the company’s products or proposals asking for reports outlining the steps necessary to eliminate GE ingredients from the company’s products. Such resolutions presuppose that there are proven health risks to GE ingredients (an issue better left to regulators) that may outweigh the economic benefits derived from biotechnology.
Pharmaceutical Pricing, Access to Medicines, and Product Reimportation
Generally vote AGAINST proposals requesting that companies implement specific price restraints on pharmaceutical products unless the company fails to adhere to legislative guidelines or industry norms in its product pricing.
Vote CASE-BY-CASE on proposals requesting that the company report on their product pricing policies or their access to medicine policies, considering:
· The nature of the company’s business and the potential for reputational and market risk exposure;
· The existing disclosure of relevant policies;
· Deviation from established industry norms;
· The company’s existing, relevant initiatives to provide research and/or products to disadvantaged consumers;
· Whether the proposal focuses on specific products or geographic regions; and
· The potential cost and scope of the requested report.
Generally vote FOR proposals requesting that companies report on the financial and legal impact of their prescription drug reimportation policies unless such information is already publicly disclosed.
Generally vote AGAINST proposals requesting that companies adopt specific policies to encourage or constrain prescription drug reimportation. Such matters are more appropriately the province of legislative activity and may place the company at a competitive disadvantage relative to its peers.
Gender Identity, Sexual Orientation, and Domestic Partner Benefits
Generally vote FOR proposals seeking to amend a company’s EEO statement or diversity policies to prohibit discrimination based on sexual orientation and/or gender identity, unless the change would result in excessive costs for the company.
Generally vote AGAINST proposals to extend company benefits to, or eliminate benefits from domestic partners. Decisions regarding benefits should be left to the discretion of the company.
Climate Change
Generally vote FOR resolutions requesting that a company disclose information on the impact of climate change on the company’s operations and investments considering whether:
· The company already provides current, publicly-available information on the impacts that climate change may have on the company as well as associated company policies and procedures to address related risks and/or opportunities;
· The company’s level of disclosure is at least comparable to that of industry peers; and
· There are no significant, controversies, fines, penalties, or litigation associated with the company’s environmental performance.
Lobbying Expenditures/Initiatives
Vote CASE-BY-CASE on proposals requesting information on a company’s lobbying initiatives, considering:
· Significant controversies, fines, or litigation surrounding a company’s public policy activities,
· The company’s current level of disclosure on lobbying strategy, and
· The impact that the policy issue may have on the company’s business operations.
Political Contributions and Trade Association Spending
Generally vote AGAINST proposals asking the company to affirm political nonpartisanship in the workplace so long as:
· There are no recent, significant controversies, fines or litigation regarding the company’s political contributions or trade association spending; and
· The company has procedures in place to ensure that employee contributions to company-sponsored political action committees (PACs) are strictly voluntary and prohibits coercion.
Vote AGAINST proposals to publish in newspapers and public media the company’s political contributions. Such publications could present significant cost to the company without providing commensurate value to shareholders.
Vote CASE-BY-CASE on proposals to improve the disclosure of a company’s political contributions and trade association spending, considering:
· Recent significant controversy or litigation related to the company’s political contributions or governmental affairs; and
· The public availability of a company policy on political contributions and trade association spending including information on the types of organizations supported, the business rationale for supporting these organizations, and the oversight and compliance procedures related to such expenditures of corporate assets.
Vote AGAINST proposals barring the company from making political contributions. Businesses are affected by legislation at the federal, state, and local level and barring political contributions can put the company at a competitive disadvantage.
Vote AGAINST proposals asking for a list of company executives, directors, consultants, legal counsels, lobbyists, or investment bankers that have prior government service and whether such service had a bearing on the business of the company. Such a list would be burdensome to prepare without providing any meaningful information to shareholders.
Labor and Human Rights Standards
Generally vote FOR proposals requesting a report on company or company supplier labor and/or human rights standards and policies unless such information is already publicly disclosed.
Vote CASE-BY-CASE on proposals to implement company or company supplier labor and/or human rights standards and policies, considering:
· The degree to which existing relevant policies and practices are disclosed;
· Whether or not existing relevant policies are consistent with internationally recognized standards;
· Whether company facilities and those of its suppliers are monitored and how;
· Company participation in fair labor organizations or other internationally recognized human rights initiatives;
· Scope and nature of business conducted in markets known to have higher risk of workplace labor/human rights abuse;
· Recent, significant company controversies, fines, or litigation regarding human rights at the company or its suppliers;
· The scope of the request; and
· Deviation from industry sector peer company standards and practices.
Sustainability Reporting
Generally vote FOR proposals requesting the company to report on its policies, initiatives, and oversight mechanisms related to social, economic, and environmental sustainability, unless:
· The company already discloses similar information through existing reports or policies such as an Environment, Health, and Safety (EHS) report; a comprehensive Code of Corporate Conduct; and/or a Diversity Report; or
· The company has formally committed to the implementation of a reporting program based on Global Reporting Initiative (GRI) guidelines or a similar standard within a specified time frame.
Item 8—Portfolio Managers of Closed-End Management Investment Companies
(a)(1) John G. Wenker, Chris J. Neuharth, CFA, and David A. Yale co-manage the registrant’s portfolio. Mr. Wenker is primarily responsible for the day-to-day management of the registrant’s portfolio. Mr. Neuharth is responsible for the management of the mortgage-backed securities portion of the portfolio.
Mr. Wenker, Head of Real Estate, began working in the financial industry in 1983 and joined FAF Advisors, Inc. (the “Adviser”) in 1992.
Mr. Neuharth, Senior Fixed-Income Portfolio Manager, began working in the financial industry in 1981 and rejoined the Adviser in 2000.
Mr. Yale, Senior Real Estate Portfolio Manager, began working in the financial industry in 1981 and joined the Adviser in 2006. Prior to joining the Adviser he worked for U.S. Bank, in commercial real estate, ReliaStar/ING, and Prudential.
(a)(2) The following table shows, as of the fiscal year ended August 31, 2009, the number of other accounts each portfolio manager managed within each of the following categories and the total assets in the accounts managed within each category. The table also shows the number of accounts and the total assets in the accounts, if any, with respect to which the advisory fee is based on the performance of the account.
Portfolio Manager | | Type of Account Managed | | Total
Number
of
Accounts | | Total Assets
of All
Accounts | | Accounts
Subject to
Performance-
Based Fee | | Total Assets
Subject to
Performance-
Based Fee | |
| | | | | | | | | | | |
Chris J. Neuharth | | Registered Investment Company | | 8 | | $ | 3.4 billion | | 0 | | $ | 0 | |
| | Other Pooled Investment Vehicles | | 1 | | $ | 1.0 billion | | 0 | | $ | 0 | |
| | Other Accounts | | 11 | | $ | 1.2 billion | | 1 | | $ | 154 million | |
| | | | | | | | | | | |
John G. Wenker | | Registered Investment Company | | 5 | | $ | 1.6 billion | | 0 | | $ | 0 | |
| | Other Pooled Investment Vehicles | | 0 | | $ | 0 | | 0 | | $ | 0 | |
| | Other Accounts | | 0 | | $ | 0 | | 0 | | $ | 0 | |
| | | | | | | | | | | |
David A. Yale | | Registered Investment Company | | 3 | | $ | 564.7 million | | 0 | | $ | 0 | |
| | Other Pooled Investment Vehicles | | 0 | | $ | 0 | | 0 | | $ | 0 | |
| | Other Accounts | | 0 | | $ | 0 | | 0 | | $ | 0 | |
The registrant’s portfolio managers often manage multiple accounts. The Adviser has adopted policies and procedures regarding brokerage and trade allocation and allocation of investment opportunities that it believes are reasonably designed to address potential conflicts of interest associated with managing multiple accounts for multiple clients.
(a)(3) Portfolio manager compensation consists primarily of base pay, an annual cash incentive and long term incentive payments.
Base pay is determined based upon an analysis of the portfolio manager’s general performance, experience, and market levels of base pay for such position.
Portfolio managers are paid an annual incentive based upon investment performance, generally over the past one- and three-year periods unless the portfolio manager’s tenure is shorter. The maximum potential annual cash incentive is equal to a multiple of base pay, determined based upon the particular portfolio manager’s performance and experience, and market levels of base pay for such position.
The portion of the maximum potential annual cash incentive that is paid out is based upon performance relative to a Giliberto-Levy custom benchmark. Generally, the threshold for payment of an annual cash incentive is benchmark performance and the maximum annual cash incentive is attained at a 100 basis point spread over the benchmark for respective time periods.
Investment performance is measured on a pre-tax basis, gross of fees for registrant results and for the Lipper industry peer group.
Long term incentive payments are paid to portfolio managers on an annual basis based upon general performance and expected contributions to the success of the Adviser. Long-term incentive payments are comprised of two components: (i) performance equity units of the Adviser and (ii) U.S. Bancorp options and restricted stock.
There are generally no differences between the methods used to determine compensation with respect to the registrant and the other accounts managed by the registrant’s portfolio managers.
(a)(4) The following table shows the dollar range of equity securities in the registrant beneficially owned by the portfolio manager as of the fiscal year ended August 31, 2009.
Portfolio Manager | | Dollar Range of Equity
Securities Beneficially
Owned in the Registrant | |
| | | |
Chris J. Neuharth | | $0 | |
| | | |
John G. Wenker | | $10,001 – $50,000 | |
| | | |
David A. Yale | | $0 | |
(b) Not applicable.
Item 9—Purchases of Equity Securities by Closed-End Management Investment Company and Affiliated Purchasers
Neither the registrant nor any “affiliated purchaser,” as defined in Rule 10b-18(a)(3) under the Exchange Act (17 CFR 240.10b-18(a)(3)), purchased any shares or other units of any class of the registrant’s equity securities that is registered pursuant to Section 12 of the Exchange Act (15 U.S.C. 781).
Item 10—Submission of Matters to a Vote of Security Holders
There have been no material changes to the procedures by which shareholders may recommend nominees to the registrant’s Board of Directors, where those changes were implemented after the registrant last provided disclosure in response to the requirements of Item 7(d)(2)(ii)(G) of Schedule 14A, or this item.
Item 11—Controls and Procedures
(a) The registrant’s principal executive officer and principal financial officer have evaluated the effectiveness of the registrant’s disclosure controls and procedures within 90 days of the date of this filing and have concluded that the registrant’s disclosure controls and procedures were effective, as of that date, in ensuring that information required to be disclosed by the registrant in this Form N-CSR was recorded, processed, summarized and reported timely.
(b) There were no changes in the registrant’s internal control over financial reporting that occurred during the second fiscal quarter of the period covered by this report that have materially affected, or are reasonably likely to materially affect, the registrant’s internal control over financial reporting.
Item 12—Exhibits
(a)(1) Not applicable. Registrant’s code of ethics is provided to any person upon request without charge.
(a)(2) Certifications of the principal executive officer and principal financial officer of the registrant as required by Rule 30a-2(a) under the Investment Company Act are filed as exhibits hereto.
(a)(3) Not applicable.
(b) Certifications of the principal executive officer and principal financial officer of the registrant as required by Rule 30a-2(b) under the Investment Company Act are filed as exhibits hereto.
Signatures
Pursuant to the requirements of the Securities Exchange Act of 1934 and the Investment Company Act of 1940, the registrant has duly caused this report to be signed on its behalf by the undersigned, thereunto duly authorized.
American Strategic Income Portfolio Inc. II
By: | |
| /s/ Thomas S. Schreier, Jr. | |
| Thomas S. Schreier, Jr. | |
| President | |
| |
Date: October 29, 2009 | |
Pursuant to the requirements of the Securities Exchange Act of 1934 and the Investment Company Act of 1940, this report has been signed below by the following persons on behalf of the registrant and in the capacities and on the dates indicated.
By: | |
| /s/ Thomas S. Schreier, Jr. | |
| Thomas S. Schreier, Jr. | |
| President | |
| |
Date: October 29, 2009 | |
By: | |
| /s/ Charles D. Gariboldi, Jr. | |
| Charles D. Gariboldi, Jr. | |
| Treasurer | |
| |
Date: October 29, 2009 | |