UNITED STATES
SECURITIES AND EXCHANGE COMMISSION
Washington, D.C. 20549
FORM N-CSR
CERTIFIED SHAREHOLDER REPORT OF REGISTERED
MANAGEMENT INVESTMENT COMPANIES
Investment Company Act file number 811-06640
American Strategic Income Portfolio Inc. II
(Exact name of registrant as specified in charter)
800 Nicollet Mall, Minneapolis, MN | | 55402 |
(Address of principal executive offices) | | (Zip code) |
Charles D. Gariboldi, Jr., 800 Nicollet Mall, Minneapolis, MN 55402
(Name and address of agent for service)
Registrant’s telephone number, including area code: 800-677-3863
Date of fiscal year end: August 31
Date of reporting period: August 31, 2007
Form N-CSR is to be used by management investment companies to file reports with the Commission not later than 10 days after the transmission to stockholders of any report that is required to be transmitted to stockholders under Rule 30e-1 under the Investment Company Act of 1940 (17 CFR 270.30e-1). The Commission may use the information provided on Form N-CSR in its regulatory, disclosure review, inspection, and policymaking roles.
A registrant is required to disclose the information specified by Form N-CSR, and the Commission will make this information public. A registrant is not required to respond to the collection of information contained in Form N-CSR unless the Form displays a currently valid Office of Management and Budget (“OMB”) control number. Please direct comments concerning the accuracy of the information collection burden estimate and any suggestions for reducing the burden to Secretary, Securities and Exchange Commission, 450 Fifth Street, NW, Washington, DC 20549-0609. The OMB has reviewed this collection of information under the clearance requirements of 44 U.S.C. Section 3507.
Item 1—Report to Shareholders

Annual Report
August 31, 2007

ASP
American Strategic
Income Portfolio Inc.
BSP
American Strategic
Income Portfolio Inc. II
CSP
American Strategic
Income Portfolio Inc. III
SLA
American Select
Portfolio Inc.
First American Mortgage Funds
Primary Investments
American Strategic Income Portfolio Inc., American Strategic Income Portfolio Inc. II, American Strategic Income Portfolio Inc. III, and American Select Portfolio Inc. ("First American Mortgage Funds" or the "funds") invest in mortgage-related assets that directly or indirectly represent a participation in or are secured by and payable from mortgage loans. The funds may also invest in U.S. government securities, corporate debt securities, preferred stock issued by real estate investment trusts, and mortgage servicing rights. The funds borrow through the use of reverse repurchase agreements and revolving credit facilities. Use of borrowing and certain other investments and investment techniques may cause the funds' net asset value ("NAV") to fluctuate to a greater extent than would be expected from interest-rate movements alone.
Fund Objectives
Each fund's primary objective is to achieve high levels of current income. Each fund's secondary objective is to seek capital appreciation. As with other mutual funds, there can be no assurance these funds will achieve their objectives.
Table of Contents
| | 1 | | | Fund Overviews | |
|
| | 16 | | | Financial Statements | |
|
| | 21 | | | Notes to Financial Statements | |
|
| | 33 | | | Schedule of Investments | |
|
| | 50 | | | Report of Independent Registered Public Accounting Firm | |
|
| | 51 | | | Notice to Shareholders | |
|

NOT FDIC INSURED NO BANK GUARANTEE MAY LOSE VALUE
Fund OVERVIEWS
During the reporting period, fundamentals in the U.S. commercial real estate markets were generally stable to improving. The interest-rate environment was challenging but manageable. The adjustable rate loans in the funds' and the funds' borrowings typically use the one-month London Interbank Offering Rate (LIBOR) as their base rate. During the reporting period, the one-month LIBOR increased from 5.33% to 5.72%. This increase in the LIBOR boosted the funds' income from their adjustable rate loans.
The funds continued to use leverage, or borrowing, during the period, with the one-month LIBOR as the base rate. While the increase in the LIBOR boosted the funds' income, it also raised the funds' interest expenses. It is important to keep in mind that the use of leverage increases interest-rate risk in the funds and will increase the volatility of the funds' NAV and market price.
There has been increased volatility in financial markets during the last several weeks of the fiscal period. Investor concerns about securities using subprime commercial mortgages as collateral have led to a broad repricing of risk and higher required yields for a variety of investments. The funds do not have any direct subprime mortgage exposure and very little residential mortgage exposure, most of which consists of investments in Federal National Mortgage Association (FNMA) and Federal Home Loan Mortgage Corporation (FHLMC) pass-through securities.
First American Mortgage Funds 2007 Annual Report
1
Fund OVERVIEWS continued
Average Annual Total Returns – ASP
Based on NAV for the period ended August 31, 2007
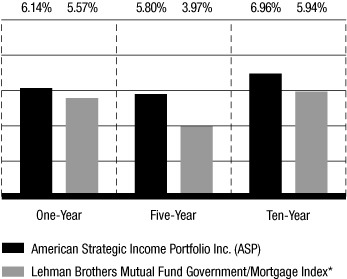
*The Lehman Brothers Mutual Fund Government/Mortgage Index is comprised of all U.S. government agency and Treasury securities and agency mortgage-backed securities. Index performance is for illustrative purposes only and does not reflect any fees or expenses. The index is unmanaged and is not available for direct investment. Although we believe this is the most appropriate benchmark available, it is not a perfect match. The benchmark index is comprised of U.S. government securities while the fund is comprised primarily of nonsecuritized, illiquid whole loans, which limits the ability of the fund to respond quickly to market changes.
The average annual total returns for the fund are based on the change in its NAV and assume reinvestment of distributions at NAV. NAV-based performance is used to measure investment management results.
• Average annual total returns based on the change in market price for the one-year, five-year, and ten-year periods ended August 31, 2007, were 12.19%, 5.96%, and 7.94%, respectively.
• Market price returns assume that all distributions have been reinvested at actual prices pursuant to the fund's dividend reinvestment plan. Market price returns reflect any broker commissions or sales charges on dividends reinvested at market price.
• Please remember, you could lose money with this investment. Neither safety of principal nor stability of income is guaranteed. Past performance does not guarantee future results. The investment return and principal value of an investment will fluctuate so that fund shares, when sold, may be worth more or less than their original cost. Closed-end funds, such as this fund, often trade at discounts to NAV. Therefore, you may be unable to realize the full NAV of your shares when you sell.
First American Mortgage Funds 2007 Annual Report
2
Average Annual Total Returns – BSP
Based on NAV for the period ended August 31, 2007
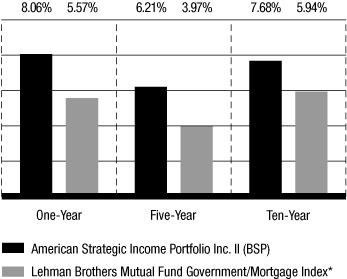
*The Lehman Brothers Mutual Fund Government/Mortgage Index is comprised of all U.S. government agency and Treasury securities and agency mortgage-backed securities. Index performance is for illustrative purposes only and does not reflect any fees or expenses. The index is unmanaged and is not available for direct investment. Although we believe this is the most appropriate benchmark available, it is not a perfect match. The benchmark index is comprised of U.S. government securities while the fund is comprised primarily of nonsecuritized, illiquid whole loans, which limits the ability of the fund to respond quickly to market changes.
The average annual total returns for the fund are based on the change in its NAV and assume reinvestment of distributions at NAV. NAV-based performance is used to measure investment management results.
• Average annual total returns based on the change in market price for the one-year, five-year, and ten-year periods ended August 31, 2007, were 13.18%, 5.49%, and 8.54%, respectively.
• Market price returns assume that all distributions have been reinvested at actual prices pursuant to the fund's dividend reinvestment plan. Market price returns reflect any broker commissions or sales charges on dividends reinvested at market price.
• Please remember, you could lose money with this investment. Neither safety of principal nor stability of income is guaranteed. Past performance does not guarantee future results. The investment return and principal value of an investment will fluctuate so that fund shares, when sold, may be worth more or less than their original cost. Closed-end funds, such as this fund, often trade at discounts to NAV. Therefore, you may be unable to realize the full NAV of your shares when you sell.
First American Mortgage Funds 2007 Annual Report
3
Fund OVERVIEWS continued
Average Annual Total Returns – CSP
Based on NAV for the period ended August 31, 2007
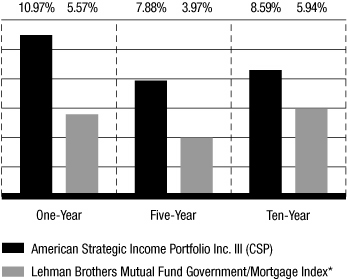
*The Lehman Brothers Mutual Fund Government/Mortgage Index is comprised of all U.S. government agency and Treasury securities and agency mortgage-backed securities. Index performance is for illustrative purposes only and does not reflect any fees or expenses. The index is unmanaged and is not available for direct investment. Although we believe this is the most appropriate benchmark available, it is not a perfect match. The benchmark index is comprised of U.S. government securities while the fund is comprised primarily of nonsecuritized, illiquid whole loans, which limits the ability of the fund to respond quickly to market changes.
The average annual total returns for the fund are based on the change in its NAV and assume reinvestment of distributions at NAV. NAV-based performance is used to measure investment management results.
• Average annual total returns based on the change in market price for the one-year, five-year, and ten-year periods ended August 31, 2007, were 12.44%, 7.14%, and 9.16%, respectively.
• Market price returns assume that all distributions have been reinvested at actual prices pursuant to the fund's dividend reinvestment plan. Market price returns reflect any broker commissions or sales charges on dividends reinvested at market price.
• Please remember, you could lose money with this investment. Neither safety of principal nor stability of income is guaranteed. Past performance does not guarantee future results. The investment return and principal value of an investment will fluctuate so that fund shares, when sold, may be worth more or less than their original cost. Closed-end funds, such as this fund, often trade at discounts to NAV. Therefore, you may be unable to realize the full NAV of your shares when you sell.
First American Mortgage Funds 2007 Annual Report
4
Average Annual Total Returns – SLA
Based on NAV for the period ended August 31, 2007
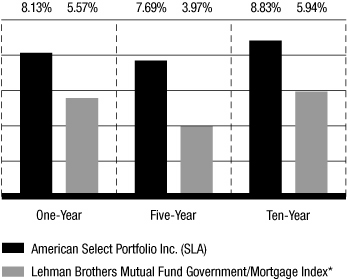
*The Lehman Brothers Mutual Fund Government/Mortgage Index is comprised of all U.S. government agency and Treasury securities and agency mortgage-backed securities. Index performance is for illustrative purposes only and does not reflect any fees or expenses. The index is unmanaged and is not available for direct investment. Although we believe this is the most appropriate benchmark available, it is not a perfect match. The benchmark index is comprised of U.S. government securities while the fund is comprised primarily of nonsecuritized, illiquid whole loans, which limits the ability of the fund to respond quickly to market changes.
The average annual total returns for the fund are based on the change in its NAV and assume reinvestment of distributions at NAV. NAV-based performance is used to measure investment management results.
• Average annual total returns based on the change in market price for the one-year, five-year, and ten-year periods ended August 31, 2007, were 11.65%, 6.55%, and 9.75%, respectively.
• Market price returns assume that all distributions have been reinvested at actual prices pursuant to the fund's dividend reinvestment plan. Market price returns reflect any broker commissions or sales charges on dividends reinvested at market price.
• Please remember, you could lose money with this investment. Neither safety of principal nor stability of income is guaranteed. Past performance does not guarantee future results. The investment return and principal value of an investment will fluctuate so that fund shares, when sold, may be worth more or less than their original cost. Closed-end funds, such as this fund, often trade at discounts to NAV. Therefore, you may be unable to realize the full NAV of your shares when you sell.
First American Mortgage Funds 2007 Annual Report
5
Fund OVERVIEWS–ASP
Fund Management
John Wenker
is primarily responsible for the management of the fund. He has 24 years of financial experience.
Chris Neuharth, CFA,
is responsible for the management of the mortgage-backed securities portion of the fund. He has 26 years of financial experience.
David Yale
is responsible for the acquisition of mortgage loans for the fund. He has 26 years of financial experience.
For the fiscal year ended August 31, 2007, the fund had a total return of 6.14% based on its NAV. The fund's benchmark, the Lehman Brothers Mutual Fund Government/ Mortgage Index, had a return of 5.57% during the period. The fund's outperformance relative to its benchmark is mainly the result of the higher income levels paid by our mortgage investments compared to the securities that comprise the index, as well the stable credit profile of the fund's mortgage portfolio and the positive effect of prepayment penalties.
During the fiscal year, six loans were paid off with an unpaid principal balance of $7.04 million and a net weighted average coupon of 8.01%, and six loans were purchased with an original principal balance of $12.40 million and a net weighted average coupon of 6.80%. As of August 31, 2007, there were no loans in default. Prepayment penalties from loans that were paid off during the reporting period amounted to $136,512.
During the fiscal year, the fund paid $0.8403 per share in dividends, which included a $0.07025 per share special cash dividend, resulting in an annualized distribution yield of 7.36% based on the August 31, 2007, market price of $11.41. As of August 31, 2007, undistributed net investment income was $0.0006 per share. The fund increased its dividend from $0.0600 per share to $0.0650 per share in November 2006.
Portfolio Allocation
As a percentage of total assets on August 31, 2007
| Commercial Loans | | | 45 | % | |
| Multifamily Loans | | | 24 | % | |
| Preferred Stocks | | | 14 | % | |
| U.S. Government Agency Mortgage-Backed Securities | | | 8 | % | |
| Corporate Notes | | | 5 | % | |
| Short-Term Securities | | | 2 | % | |
| Single Family Loans | | | 1 | % | |
| Other Assets | | | 1 | % | |
| | | | 100 | % | |
First American Mortgage Funds 2007 Annual Report
6
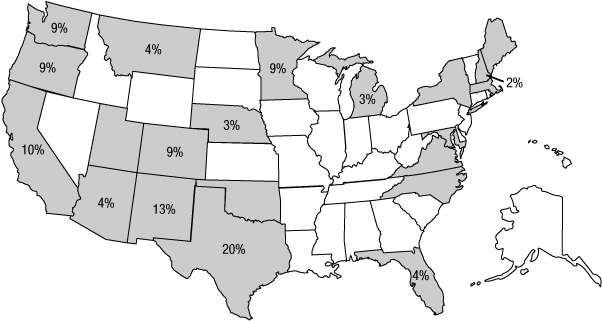
Geographical Distribution
We attempt to buy mortgage loans in many parts of the country to help avoid the risks of concentrating in one area. These percentages reflect the value of whole loans and participation mortgages as of August 31, 2007. Shaded areas without values indicate states in which the fund has invested less than 0.50% of its assets.
Delinquent Loan Profile
The tables below show the percentages of single family loans and multifamily and commercial loans in the portfolio that are 30, 60, 90, or 120 or more days delinquent as of August 31, 2007, based on the value outstanding.
| Single family loans | | Multifamily and commercial loans | |
| Current | | | | | 71.0 | % | | Current | | | 100.0 | % | |
| 30 Days | | | | | 29.0 | % | | 30 Days | | | 0.0 | % | |
| 60 Days | | | | | 0.0 | % | | 60 Days | | | 0.0 | % | |
| 90 Days | | | | | 0.0 | % | | 90 Days | | | 0.0 | % | |
| 120+ Days | | . | | | 0.0 | % | | 120+ Days | | | 0.0 | % | |
First American Mortgage Funds 2007 Annual Report
7
Fund OVERVIEWS–BSP
Fund Management
John Wenker
is primarily responsible for the management of the fund. He has 24 years of financial experience.
Chris Neuharth, CFA,
is responsible for the management of the mortgage-backed securities portion of the fund. He has 26 years of financial experience.
David Yale
is responsible for the acquisition of mortgage loans for the fund. He has 26 years of financial experience.
For the fiscal year ended August 31, 2007, the fund had a total return of 8.06%, based on its NAV. The fund's benchmark, the Lehman Brothers Mutual Fund Government/ Mortgage Index, had a return of 5.57% during the period. The fund's outperformance relative to its benchmark is mainly the result of the higher income levels paid by our mortgage investments compared to the securities that comprise the index, as well as the positive effect of prepayment penalties.
During the fiscal year, 10 loans were paid off with an unpaid principal balance of $41.55 million and a net weighted average coupon of 8.83%, and 12 loans were purchased with an original principal balance of $81.37 million and a net weighted average coupon of 6.57%. As of August 31, 2007, there were no loans in default. Prepayment penalties from loans that were paid off during the reporting period amounted to $1,166,176.
During the fiscal year, the fund paid $0.8407 per share in dividends, which included a $0.02072 per share special cash dividend, resulting in an annualized distribution yield of 7.43% based on the August 31, 2007, market price of $11.32. The fund increased its dividend from $0.0650 per share to $0.0750 per share in May 2007.
Portfolio Allocation
As a percentage of total assets on August 31, 2007
| Commercial Loans | | | 39 | % | |
| Multifamily Loans | | | 35 | % | |
| Preferred Stocks | | | 17 | % | |
| Corporate Notes | | | 5 | % | |
| U.S. Government Agency Mortgage-Backed Securities | | | 3 | % | |
| Other Assets | | | 1 | % | |
| | | | 100 | % | |
First American Mortgage Funds 2007 Annual Report
8
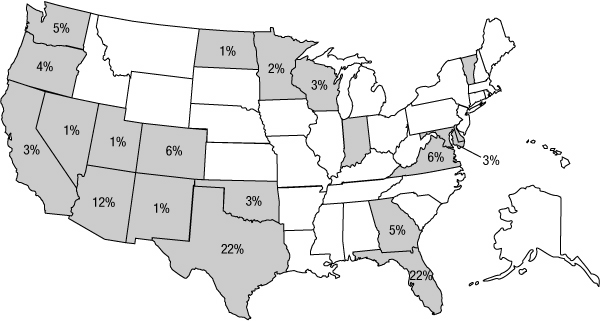
Geographical Distribution
We attempt to buy mortgage loans in many parts of the country to help avoid the risks of concentrating in one area.These percentages reflect the value of whole loans and participation mortgages as of August 31, 2007. Shaded areas without values indicate states in which the fund has invested less than 0.50% of its assets.
Delinquent Loan Profile
The tables below show the percentages of single family loans and multifamily and commercial loans in the portfolio that are 30, 60, 90, or 120 or more days delinquent as of August 31, 2007, based on the value outstanding.
| Single family loans | | Multifamily and commercial loans | |
| Current | | | | | 100.0 | % | | Current | | | 100.0 | % | |
| 30 Days | | | | | 0.0 | % | | 30 Days | | | 0.0 | % | |
| 60 Days | | | | | 0.0 | % | | 60 Days | | | 0.0 | % | |
| 90 Days | | | | | 0.0 | % | | 90 Days | | | 0.0 | % | |
| 120+ Days | | . | | | 0.0 | % | | 120+ Days | | | 0.0 | % | |
First American Mortgage Funds 2007 Annual Report
9
Fund OVERVIEWS–CSP
Fund Management
John Wenker
is primarily responsible for the management of the fund. He has 24 years of financial experience.
Chris Neuharth, CFA,
is responsible for the management of the mortgage-backed securities portion of the fund. He has 26 years of financial experience.
David Yale
is responsible for the acquisition of mortgage loans for the fund. He has 26 years of financial experience.
For the fiscal year ended August 31, 2007, the fund had a total return of 10.97%, based on its NAV. The fund's benchmark, the Lehman Brothers Mutual Fund Government/ Mortgage Index, had a return of 5.57% during the period. The fund's outperformance relative to its benchmark is due to the higher income levels paid by our mortgage investments compared to the securities that comprise the index, as well as the positive effect of prepayment penalties.
During the fiscal year, 19 loans were paid off with an unpaid principal balance of $97.00 million and a net weighted average coupon of 8.74%, and 22 loans were purchased with an original principal balance of $109.08 million and a net weighted average coupon of 7.36%. The fund took possession of a multifamily property that had been in default. Its estimated value represents 1.77% of the fund's net assets as of August 31, 2007; fund management is working to stabilize the property and sell it. As of August 31, 2007, two multifamily loans were in default. The total estimated value of the loans represents 2.06% of the fund's net assets as of August 31, 2007. Prepayment penalties from loans that were paid off during the reporting period amounted to $539,360.
During the fiscal year, the fund paid $1.2480 per share in dividends, which included a $0.26009 per share special cash dividend, a $0.0115 per share short-term capital gain distribution, and a $0.05643 per share long-term capital gain distribution, resulting in an annualized distributed yield of 11.00% based on the August 31, 2007 market price of $11.35. As of August 31, 2007, undistributed net investment income was $0.1452 per share. The fund's dividend was decreased from $0.0800 per share to $0.0650 per share in May 2007 and then increased from $0.0650 per share to $0.0750 per share in July 2007.
Portfolio Allocation
As a percentage of total assets on August 31, 2007
| Commercial Loans | | | 46 | % | |
| Multifamily Loans | | | 28 | % | |
| Preferred Stocks | | | 17 | % | |
| Corporate Notes | | | 5 | % | |
| U.S. Government Agency Mortgage-Backed Securities | | | 2 | % | |
| Real Estate Owned | | | 1 | % | |
| Other Assets | | | 1 | % | |
| | | | 100 | % | |
First American Mortgage Funds 2007 Annual Report
10
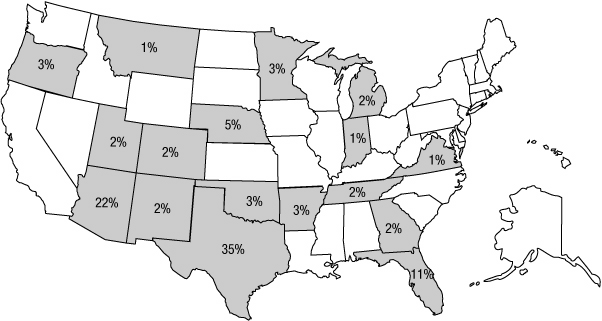
Geographical Distribution
We attempt to buy mortgage loans in many parts of the country to help avoid the risks of concentrating in one area. These percentages reflect the value of whole loans and participation mortgages as of August 31, 2007. Shaded areas without values indicate states in which the fund has invested less than 0.50% of its assets.
Delinquent Loan Profile
The tables below show the percentages of single family loans and a private mortgage-backed security and multifamily and commercial loans in the portfolio that are 30, 60, 90, or 120 or more days delinquent as of August 31, 2007, based on the value outstanding.
Single family loans and a
private mortgage-backed security | | Multifamily and commercial loans | |
| Current | | | | | 100.0 | % | | Current | | | 98.0 | % | |
| 30 Days | | | | | 0.0 | % | | 30 Days | | | 0.0 | % | |
| 60 Days | | | | | 0.0 | % | | 60 Days | | | 0.0 | % | |
| 90 Days | | | | | 0.0 | % | | 90 Days | | | 0.0 | % | |
| 120+ Days | | . | | | 0.0 | % | | 120+ Days | | | 2.0 | % | |
First American Mortgage Funds 2007 Annual Report
11
Fund OVERVIEWS–SLA
Fund Management
John Wenker
is primarily responsible for the management of the fund. He has 24 years of financial experience.
Chris Neuharth, CFA,
is responsible for the management of the mortgage-backed securities portion of the fund. He has 26 years of financial experience.
David Yale
is responsible for the acquisition of mortgage loans for the fund. He has 26 years of financial experience.
For the fiscal year ended August 31, 2007, the fund had a total return of 8.13%, based on its NAV. The fund's benchmark, the Lehman Brothers Mutual Fund Government/ Mortgage Index, had a return of 5.57% during the period. The fund's outperformance relative to its benchmark is due to several factors, including the higher income levels paid by our mortgage investments compared to the securities that comprise the index, as well as the stable credit profile of the fund's mortgage portfolio and the positive effect of prepayment penalties.
During the fiscal year, nine loans were paid off with an unpaid principal balance of $31.26 million and a net weighted average coupon of 8.48%, and 11 loans were purchased with an original principal balance of $28.46 million and a net weighted average coupon of 7.06%. As of August 31, 2007, no multifamily or commercial loans were in default. Prepayment penalties from loans that were paid off during the reporting period amounted to $79,020.
During the fiscal year, the fund paid $1.1405 per share in dividends, which included a $0.08358 per share special cash dividend, a $0.00319 per share short-term capital gain dividend, and a $0.09373 per share long-term capital gain dividend, resulting in an annualized distribution yield of 9.22% based on the August 31, 2007, market price of $12.37. The monthly dividend of the fund was constant at $0.0800 per share. As of August 31, 2007, undistributed net investment income was $0.0004 per share.
Portfolio Allocation
As a percentage of total assets on August 31, 2007
| Commercial Loans | | | 50 | % | |
| Multifamily Loans | | | 24 | % | |
| Preferred Stocks | | | 17 | % | |
| Corporate Notes | | | 5 | % | |
| U.S. Government Agency Mortgage-Backed Securities | | | 3 | % | |
| Short-Term Securities | | | 1 | % | |
| | | | 100 | % | |
First American Mortgage Funds 2007 Annual Report
12
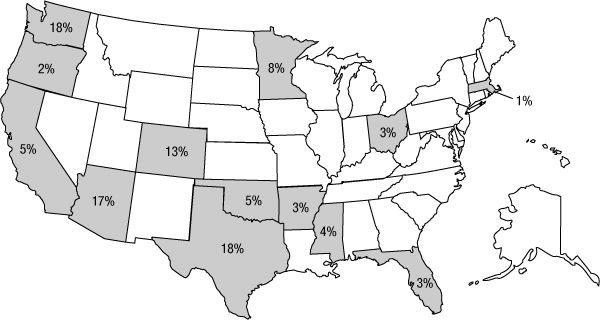
Geographical Distribution
We attempt to buy mortgage loans in many parts of the country to help avoid the risks of concentrating in one area. These percentages reflect the value of whole loans and participation mortgages as of August 31, 2007.
Delinquent Loan Profile
The tables below show the percentages of multifamily and commercial loans in the portfolio that are 30, 60, 90, or 120 or more days delinquent as of August 31, 2007, based on the value outstanding.
| Multifamily and commercial loans | |
| Current | | | 100.0 | % | |
| 30 Days | | | 0.0 | % | |
| 60 Days | | | 0.0 | % | |
| 90 Days | | | 0.0 | % | |
| 120+ Days | | | 0.0 | % | |
First American Mortgage Funds 2007 Annual Report
13
Fund OVERVIEWS continued
As of this writing, commercial real estate markets present a mixed picture. On a positive note, the commercial real estate markets are experiencing a moderately expanding economy, historically low interest rate environment and reasonable levels of new supply. On a more cautious note, further fallout from the subprime mortgage crisis could result in weaker employment growth, weaker spending by American consumers, a more-restrictive credit environment, and ultimately a weaker, or recessionary, economic environment. We will continue to diligently manage the credit risk in the funds, and we feel that their current credit profiles are acceptable.
Thank you for your investment in the funds and your continued trust as we navigate the investment landscape. If you have any questions about the funds, please call us at 800.677.FUND.
Sincerely,

John Wenker
Managing Director, Head of Real Estate
FAF Advisors, Inc.
First American Mortgage Funds 2007 Annual Report
14
Fund OVERVIEWS concluded
Valuation of Investments
The funds' investments in whole loans (single family, multifamily, and commercial), participation mortgages, and mortgage servicing rights are generally not traded in any organized market; therefore, market quotations are not readily available. These investments are valued at "fair value" according to procedures adopted by the funds' board of directors. Pursuant to these procedures, whole loan, participation mortgage, and mortgage servicing rights investments are initially valued at cost and their values are subsequently monitored and adjusted pursuant to a pricing model designed by FAF Advisors, Inc., to incorporate, among other things, the present value of the projected stream of cash flows on such investments. The pricing model takes into account a number of relevant factors including the projected rate of prepayments, the delinquency profile, the historical payment record, the expected yield at purchase, changes in prevailin g interest rates, and changes in the real or perceived liquidity of whole loans, participation mortgages, and mortgage servicing rights, as the case may be. The results of the pricing model may be further subject to price ceilings due to the illiquid nature of the investments. Changes in prevailing interest rates, real or perceived liquidity, yield spreads, and creditworthiness are factored into the pricing model each week. Certain mortgage loan information is received on a monthly basis and includes, but is not limited to, the projected rate of prepayments, projected rate and severity of defaults, the delinquency profile, and the historical payment record. Valuations of whole loans, participation mortgages, and mortgage servicing rights are determined no less frequently than weekly.
First American Mortgage Funds 2007 Annual Report
15
Financial STATEMENTS
Statements of Assets and Liabilities August 31, 2007
| | | American
Strategic
Income
Portfolio
(ASP) | | American
Strategic
Income
Portfolio II
(BSP) | | American
Strategic
Income
Portfolio III
(CSP) | | American
Select
Portfolio
(SLA) | |
| Assets: | |
Investments in unaffiliated securities, at value (cost: $70,185,046, $273,508,632,
$323,988,037, $179,415,918) (note 2) | | $ | 68,538,249 | | | $ | 263,101,614 | | | $ | 315,577,692 | | | $ | 178,159,838 | | |
Investments in affiliated money market fund, at value (cost: $1,342,361, $1,276,848,
$1,428,629, $1,333,793) (note 3) | | | 1,342,361 | | | | 1,276,848 | | | | 1,428,629 | | | | 1,333,793 | | |
| Real estate owned (cost: $0, $0, $6,510,779, $0) (note 2) | | | — | | | | — | | | | 4,550,000 | | | | — | | |
| Cash | | | — | | | | 3,514 | | | | — | | | | — | | |
| Receivable for accrued interest | | | 395,504 | | | | 1,368,916 | | | | 1,865,761 | | | | 964,596 | | |
| Prepaid expenses and other assets | | | 11,030 | | | | 134,348 | | | | 94,142 | | | | 12,049 | | |
| Total assets | | | 70,287,144 | | | | 265,885,240 | | | | 323,516,224 | | | | 180,470,276 | | |
| Liabilities: | |
| Payable for reverse repurchase agreements (note 2) | | | 19,432,934 | | | | 73,224,065 | | | | 64,962,714 | | | | 41,456,112 | | |
| Bank overdraft | | | 47,454 | | | | — | | | | 153,032 | | | | 48,828 | | |
| Payable for investment advisory fees (note 3) | | | 23,932 | | | | 90,513 | | | | 166,471 | | | | 58,122 | | |
| Payable for administrative fees (note 3) | | | 10,703 | | | | 40,271 | | | | 54,688 | | | | 29,061 | | |
| Payable for interest expense | | | 82,571 | | | | 328,198 | | | | 189,657 | | | | 182,692 | | |
| Payable for professional fees | | | 22,827 | | | | 22,935 | | | | 23,478 | | | | 22,865 | | |
| Payable for other expenses | | | 45,664 | | | | 12,611 | | | | 498,523 | | | | 111,528 | | |
| Total liabilities | | | 19,666,085 | | | | 73,718,593 | | | | 66,048,563 | | | | 41,909,208 | | |
| Net assets applicable to outstanding capital stock | | $ | 50,621,059 | | | $ | 192,166,647 | | | $ | 257,467,661 | | | $ | 138,561,068 | | |
| Composition of net assets: | |
| Capital stock and additional paid-in capital | | $ | 53,464,061 | | | $ | 205,593,695 | | | $ | 265,918,796 | | | $ | 139,930,119 | | |
| Undistributed net investment income | | | 2,403 | | | | — | | | | 3,101,431 | | | | 4,512 | | |
| Accumulated net realized loss on investments in securities (note 5) | | | (1,198,608 | ) | | | (3,020,030 | ) | | | (1,181,442 | ) | | | (117,483 | ) | |
| Unrealized depreciation of investments in securities | | | (1,646,797 | ) | | | (10,407,018 | ) | | | (10,371,124 | ) | | | (1,256,080 | ) | |
| Total–representing net assets applicable to capital stock | | $ | 50,621,059 | | | $ | 192,166,647 | | | $ | 257,467,661 | | | $ | 138,561,068 | | |
| Net asset value and market price of capital stock: | |
| Net assets outstanding | | $ | 50,621,059 | | | $ | 192,166,647 | | | $ | 257,467,661 | | | $ | 138,561,068 | | |
| Shares outstanding (authorized 1 billion shares for each fund of $0.01 par value) | | | 4,231,331 | | | | 15,985,741 | | | | 21,356,023 | | | | 10,662,195 | | |
| Net asset value per share | | $ | 11.96 | | | $ | 12.02 | | | $ | 12.06 | | | $ | 13.00 | | |
| Market price per share | | $ | 11.41 | | | $ | 11.32 | | | $ | 11.35 | | | $ | 12.37 | | |
See accompanying Notes to Financial Statements.
First American Mortgage Funds 2007 Annual Report
16
Statements of Operations For the Year Ended August 31, 2007
| | | American
Strategic
Income
Portfolio
(ASP) | | American
Strategic
Income
Portfolio II
(BSP) | | American
Strategic
Income
Portfolio III
(CSP) | | American
Select
Portfolio
(SLA) | |
| Investment income: | |
| Interest from unaffiliated securities | | $ | 4,231,400 | | | $ | 14,820,841 | | | $ | 27,240,616 | | | $ | 11,928,411 | | |
| Dividends from unaffiliated securities | | | 752,392 | | | | 2,659,122 | | | | 3,467,898 | | | | 1,733,381 | | |
| Dividends from affiliated money market fund | | | 101,198 | | | | 217,565 | | | | 307,150 | | | | 161,271 | | |
| Net operating income from real estate owned (note 2) | | | — | | | | 28,103 | | | | 39,375 | | | | — | | |
| Total investment income | | | 5,084,990 | | | | 17,725,631 | | | | 31,055,039 | | | | 13,823,063 | | |
| Expenses (note 3): | |
| Investment advisory fees | | | 285,235 | | | | 1,027,044 | | | | 1,679,974 | | | | 695,344 | | |
| Interest expense | | | 1,005,736 | | | | 3,059,207 | | | | 3,112,436 | | | | 2,381,627 | | |
| Administrative fees | | | 129,264 | | | | 485,462 | | | | 649,395 | | | | 347,672 | | |
| Custodian fees | | | 10,681 | | | | 40,363 | | | | 53,885 | | | | 30,113 | | |
| Mortgage servicing fees | | | 57,948 | | | | 134,649 | | | | 182,595 | | | | 116,724 | | |
| Professional fees | | | 60,379 | | | | 60,635 | | | | 60,875 | | | | 60,506 | | |
| Postage and printing fees | | | 7,554 | | | | 19,801 | | | | 26,761 | | | | 14,815 | | |
| Transfer agent fees | | | 16,020 | | | | 18,794 | | | | 19,476 | | | | 16,914 | | |
| Listing fees | | | 23,750 | | | | 24,375 | | | | 24,375 | | | | 24,375 | | |
| Directors' fees | | | 25,626 | | | | 26,119 | | | | 26,399 | | | | 25,897 | | |
| Other expenses | | | 70,746 | | | | 89,116 | | | | 110,511 | | | | 80,060 | | |
| Total expenses | | | 1,692,939 | | | | 4,985,565 | | | | 5,946,682 | | | | 3,794,047 | | |
| Less: Fee reimbursements (note 3) | | | (3,152 | ) | | | (7,653 | ) | | | (11,042 | ) | | | (7,083 | ) | |
| Less: Indirect payments from the custodian | | | (2,235 | ) | | | (12,150 | ) | | | (23,747 | ) | | | (11,680 | ) | |
| Total net expenses | | | 1,687,552 | | | | 4,965,762 | | | | 5,911,893 | | | | 3,775,284 | | |
| Net investment income | | | 3,397,438 | | | | 12,759,869 | | | | 25,143,146 | | | | 10,047,779 | | |
| Net realized and unrealized gains (losses) on investments in securities (note 4): | |
| Net realized gain (loss) on investments in securities | | | 35,669 | | | | 1,163,381 | | | | (305,760 | ) | | | 76,600 | | |
| Net realized loss on real estate owned (note 2) | | | — | | | | (5,777,852 | ) | | | — | | | | — | | |
| Net change in unrealized appreciation or depreciation of investments in securities | | | (348,738 | ) | | | 6,921,781 | | | | 2,039,731 | | | | 683,804 | | |
| Net gain (loss) on investments | | | (313,069 | ) | | | 2,307,310 | | | | 1,733,971 | | | | 760,404 | | |
| Net increase in net assets resulting from operations | | $ | 3,084,369 | | | $ | 15,067,179 | | | $ | 26,877,117 | | | $ | 10,808,183 | | |
See accompanying Notes to Financial Statements.
First American Mortgage Funds 2007 Annual Report
17
Financial STATEMENTS continued
Statements of Changes in Net Assets
| | | American Strategic
Income Portfolio
(ASP) | | American Strategic
Income Portfolio II
(BSP) | | American Strategic
Income Portfolio III
(CSP) | | American
Select Portfolio
(SLA) | |
| | | Year Ended
8/31/07 | | Year Ended
8/31/06 | | Year Ended
8/31/07 | | Year Ended
8/31/06 | | Year Ended
8/31/07 | | Year Ended
8/31/06 | | Year Ended
8/31/07 | | Year Ended
8/31/06 | |
| Operations: | |
| Net investment income | | $ | 3,397,438 | | | $ | 3,473,952 | | | $ | 12,759,869 | | | $ | 14,907,279 | | | $ | 25,143,146 | | | $ | 21,472,124 | | | $ | 10,047,779 | | | $ | 9,975,934 | | |
| Net realized gain (loss) on investments in securities | | | 35,669 | | | | 42,856 | | | | 1,163,381 | | | | 600,803 | | | | (305,760 | ) | | | 1,726,513 | | | | 76,600 | | | | 1,238,090 | | |
| Net realized loss on real estate owned (note 2) | | | — | | | | — | | | | (5,777,852 | ) | | | — | | | | — | | | | — | | | | — | | | | — | | |
| Net change in unrealized appreciation or depreciation of investments in securities | | | (348,738 | ) | | | (1,597,776 | ) | | | 6,921,781 | | | | (4,372,789 | ) | | | 2,039,731 | | | | (7,119,011 | ) | | | 683,804 | | | | (2,789,509 | ) | |
| Net increase in net assets resulting from operations | | | 3,084,369 | | | | 1,919,032 | | | | 15,067,179 | | | | 11,135,293 | | | | 26,877,117 | | | | 16,079,626 | | | | 10,808,183 | | | | 8,424,515 | | |
| Distributions to shareholders (note 2): | |
| From net investment income | | | (3,555,377 | ) | | | (3,110,029 | ) | | | (13,439,536 | ) | | | (14,866,740 | ) | | | (25,202,031 | ) | | | (16,871,262 | ) | | | (11,126,853 | ) | | | (11,621,793 | ) | |
| From net realized gain on investments in securities | | | — | | | | — | | | | — | | | | — | | | | (1,450,715 | ) | | | (10,037 | ) | | | (1,033,380 | ) | | | (1,531,837 | ) | |
| Total distributions | | | (3,555,377 | ) | | | (3,110,029 | ) | | | (13,439,536 | ) | | | (14,866,740 | ) | | | (26,652,746 | ) | | | (16,881,299 | ) | | | (12,160,233 | ) | | | (13,153,630 | ) | |
| Total increase (decrease) in net assets | | | (471,008 | ) | | | (1,190,997 | ) | | | 1,627,643 | | | | (3,731,447 | ) | | | 224,371 | | | | (801,673 | ) | | | (1,352,050 | ) | | | (4,729,115 | ) | |
| Net assets at beginning of period | | | 51,092,067 | | | | 52,283,064 | | | | 190,539,004 | | | | 194,270,451 | | | | 257,243,290 | | | | 258,044,963 | | | | 139,913,118 | | | | 144,642,233 | | |
| Net assets at end of period | | $ | 50,621,059 | | | $ | 51,092,067 | | | $ | 192,166,647 | | | $ | 190,539,004 | | | $ | 257,467,661 | | | $ | 257,243,290 | | | $ | 138,561,068 | | | $ | 139,913,118 | | |
| Undistributed net investment income | | $ | 2,403 | | | $ | 205,166 | | | $ | — | | | $ | 1,073,832 | | | $ | 3,101,431 | | | $ | 4,897,567 | | | $ | 4,512 | | | $ | 1,744,023 | | |
See accompanying Notes to Financial Statements.
First American Mortgage Funds 2007 Annual Report
18
See accompanying Notes to Financial Statements.
First American Mortgage Funds 2007 Annual Report
19
Financial STATEMENTS concluded
Statements of Cash Flows For the Year Ended August 31, 2007
| | | American
Strategic
Income
Portfolio
(ASP) | | American
Strategic
Income
Portfolio II
(BSP) | | American
Strategic
Income
Portfolio III
(CSP) | | American
Select
Portfolio
(SLA) | |
| Cash flows from operating activities: | |
| Net increase in net assets resulting from operations | | $ | 3,084,369 | | | $ | 15,067,179 | | | $ | 26,877,117 | | | $ | 10,808,183 | | |
Adjustments to reconcile net increase in net assets resulting from operations to
net cash provided by (used in) operating activities: | |
| Purchases of investments | | | (18,274,723 | ) | | | (232,701,844 | ) | | | (279,628,595 | ) | | | (112,237,439 | ) | |
| Proceeds from paydowns and sales of investments in securities | | | 15,685,509 | | | | 205,542,898 | | | | 262,478,837 | | | | 102,489,063 | | |
| Net purchases/sales of short-term securities | | | 280,922 | | | | 9,412,419 | | | | 7,949,138 | | | | 1,697,722 | | |
| Net amortization/accretion of bond discount and premium | | | 1,568 | | | | 10,345 | | | | 5,865 | | | | 5,411 | | |
| Net change in unrealized appreciation or depreciation of investments in securities | | | 348,738 | | | | (6,921,781 | ) | | | (2,039,731 | ) | | | (683,804 | ) | |
| Net realized gain/loss on investments | | | (35,669 | ) | | | 4,614,471 | | | | 305,760 | | | | (76,600 | ) | |
| Increase/decrease in accrued interest receivable | | | (56,554 | ) | | | 710,045 | | | | (785,931 | ) | | | 71,916 | | |
| Increase/decrease in prepaid expenses and other assets | | | (13,238 | ) | | | 31,087 | | | | (96,366 | ) | | | (14,263 | ) | |
| Increase/decrease in accrued fees and expenses | | | 53,905 | | | | 14,716 | | | | 496,593 | | | | 149,566 | | |
| Net cash provided by (used in) operating activities | | | 1,074,827 | | | | (4,220,465 | ) | | | 15,562,687 | | | | 2,209,755 | | |
| Cash flows from financing activities: | |
| Net proceeds for (payments from) reverse repurchase agreements | | | 2,454,431 | | | | 17,612,457 | | | | 10,801,389 | | | | 9,882,704 | | |
| Distributions paid to shareholders | | | (3,555,377 | ) | | | (13,439,536 | ) | | | (26,652,746 | ) | | | (12,160,233 | ) | |
| Net cash provided by (used in) in financing activities | | | (1,100,946 | ) | | | 4,172,921 | | | | (15,851,357 | ) | | | (2,277,529 | ) | |
| Net decrease in cash | | | (26,119 | ) | | | (47,544 | ) | | | (288,670 | ) | | | (67,774 | ) | |
| Cash (bank overdraft) at beginning of period | | | (21,335 | ) | | | 51,058 | | | | 135,638 | | | | 18,946 | | |
| Cash (bank overdraft) at end of period | | $ | (47,454 | ) | | $ | 3,514 | | | $ | (153,032 | ) | | $ | (48,828 | ) | |
Supplemental disclosure of cash flow information:
Cash paid for interest | | $ | 992,124 | | | $ | 3,002,807 | | | $ | 3,157,440 | | | $ | 2,336,617 | | |
See accompanying Notes to Financial Statements.
First American Mortgage Funds 2007 Annual Report
20
Notes to Financial STATEMENTS
(1) Organization
American Strategic Income Portfolio Inc. ("ASP"), American Strategic Income Portfolio Inc. II ("BSP"), American Strategic Income Portfolio Inc. III ("CSP"), and American Select Portfolio Inc. ("SLA") (the "funds") are registered under the Investment Company Act of 1940 (as amended) as diversified, closed-end management investment companies. The funds emphasize investments in mortgage-related assets that directly or indirectly represent a participation in or are secured by and payable from mortgage loans. They may also invest in U.S. government securities, corporate debt securities, preferred stock issued by real estate investment trusts, and mortgage servicing rights. In addition, the funds may borrow using reverse repurchase agreements and revolvi ng credit facilities. Fund shares are listed on the New York Stock Exchange under the symbols ASP, BSP, CSP, and SLA, respectively.
(2) Summary of Significant Accounting Policies
Security Valuations
Security valuations for the funds' investments (other than whole loans, participation mortgages, and mortgage servicing rights) are furnished by an independent pricing service that has been approved by the funds' board of directors. Investments in equity securities that are traded on a national securities exchange (or reported on the Nasdaq national market system) are stated at the last quoted sales price if readily available for such securities on each business day. For securities traded on the Nasdaq national market system, the funds utilize the Nasdaq Official Closing Price which compares the last trade to the bid/ask price of a security. If the last trade falls within the bid/ask range, then that price will be the closing price. If the last trade is outside the bid/ask range, and falls above the ask, the ask price will be the closing price. If the last trade is below the bid, the bid will be the closing price. Other equity s ecurities traded in the over-the-counter market and listed equity securities for which no sale was reported on that date are stated at the last quoted bid price. Debt obligations exceeding 60 days to maturity are valued by an independent pricing service. The pricing service may employ methodologies that utilize actual market transactions, broker-dealer supplied valuations, or other formula-driven valuation techniques. These techniques generally consider such factors as yields or prices of bonds of comparable quality, type of issue, coupon, maturity, ratings, and general market conditions. Securities for which prices are not available from an independent pricing service but where an active market exists are valued using market quotations obtained from one or more dealers that make markets in the securities or from a widely-used quotation system. When market quotations are not readily available, securities are valued at fair value as determined in good faith by procedures established and approved by the funds' board of directors. Some of the factors which may be considered in determining fair value are fundamental analytical data relating to the investment; the nature and duration of any restrictions on disposition; trading in similar securities of the same issuer or comparable companies; information from broker-dealers; and an evaluation of the forces that influence the market in which the security is purchased or sold. If events occur that materially affect the value of securities (including non-U.S. securities) between the close of trading in those securities and the close of regular trading on the New York Stock Exchange, the securities will be valued at fair value. Debt obligations with 60 days or less remaining until maturity may be valued at their amortized cost which approximates market value. Security valuations are performed once a week and at the end of each month.
The funds' investments in whole loans (single family, multifamily, and commercial), participation mortgages, and mortgage servicing rights are generally not traded in any organized market and therefore, market quotations are not readily available. These investments are valued at fair value according to procedures adopted by the funds' board of directors. Pursuant to these procedures, whole loan investments are initially valued at cost and their values are subsequently monitored and
First American Mortgage Funds 2007 Annual Report
21
Notes to Financial STATEMENTS continued
adjusted using a FAF Advisors, Inc. ("FAF Advisors") pricing model designed to incorporate, among other things, the present value of the projected stream of cash flows on such investments. The pricing model takes into account a number of relevant factors including the projected rate of prepayments, the delinquency profile, the historical payment record, the expected yield at purchase, changes in prevailing interest rates, and changes in the real or perceived liquidity of whole loans, participation mortgages or mortgage servicing rights, as the case may be. The results of the pricing model may be further subject to price ceilings due to the illiquid nature of the loans. Changes in prevailing interest rates, real or perceived liquidity, yield spreads, and creditworthiness are factored into the pricing model each week.
Certain mortgage loan information is received once a month. This information includes, but is not limited to, the projected rate of prepayments, projected rate and severity of defaults, the delinquency profile, and the historical payment record. Valuations of whole loans, participation mortgages, and mortgage servicing rights are determined no less frequently than weekly. Although FAF Advisors believes the pricing model to be reasonable and appropriate, the actual values that may be realized upon the sale of whole loans, participation mortgages, and mortgage servicing rights can only be determined in negotiations between the funds and third parties.
As of August 31, 2007, ASP, BSP, CSP, and SLA had fair valued securities with values of $53,003,156, $211,653,571, $252,831,326, and $142,258,657, respectively, or 104.7%, 110.1%, 98.2%, and 102.7% of net assets, respectively.
Security Transactions and Investment Income
For financial statement purposes, the funds record security transactions on the trade date of the security purchase or sale. Dividend income is recorded on the ex-dividend date. Interest income, including accretion of bond discounts and amortization of bond premiums, is recorded on the accrual basis. Security gains and losses are determined on the basis of identified cost, which is the same basis used for federal income tax purposes.
Whole Loans and Participation Mortgages
Whole loans and participation mortgages may bear a greater risk of loss arising from a default on the part of the borrower of the underlying loans than do traditional mortgage-backed securities. This is because whole loans and participation mortgages, unlike most mortgage-backed securities, generally are not backed by any government guarantee or private credit enhancement. Such risk may be greater during a period of declining or stagnant real estate values. The funds may invest in single family, multifamily, and commercial loans. Each fund currently limits its investment in commercial loans to 50% of its total assets.
At August 31, 2007, CSP had two multifamily loans representing 2.06% of net assets and 5.94% of total multifamily loans outstanding that were 120 or more days delinquent as to the timely monthly payment of principal and interest. At August 31, 2007, no single family or commercials loans in CSP were delinquent. At August 31, 2007, no loans were 120 or more days delinquent in ASP, BSP, and SLA.
The funds may incur certain costs and delays in the event of a foreclosure. Also, there is no assurance that the subsequent sale of the property will produce an amount equal to the sum of the unpaid principal balance of the loan as of the date the borrower went into default, the accrued unpaid interest, and all of the foreclosure expenses. In this case, the funds may suffer a loss. In accordance with the valuation procedures adopted by the funds' board of directors, real estate
First American Mortgage Funds 2007 Annual Report
22
acquired through foreclosure, if any, is valued at estimated market value, as determined by independent third party appraisals, less estimated selling costs. As material capital improvements are made to the property, new market value appraisals are obtained.
Real estate may be acquired through foreclosure on whole loans or similar obligations. The funds may receive rental or other income as a result of holding real estate. In addition, the funds may incur expenses associated with maintaining or improving any real estate owned. As of August 31, 2007, CSP held real estate owned through foreclosure as follows:
| CSP | | 8/31/07
Cost | | 8/31/07
Value | | Unrealized
Depreciation | |
| Chateau Club Apartment Building | | $ | 6,510,779 | | | $ | 4,550,000 | | | $ | (1,960,779 | ) | |
BSP recognized a loss of $5,777,852 on two real estate properties sold during the year ended August 31, 2007.
The income and capital improvements for the year ended August 31, 2007 were:
| BSP | | Gross Rental
Income | | Operating
Expenses | | Net Operating
Income
(Loss) | | Capital
Improvements | |
| Hidden Woods Apartment Building | | $ | 965,140 | | | $ | 1,024,582 | | | $ | (59,442 | ) | | $ | 201,529 | | |
| Sussex Club Apartment Building | | | 832,234 | | | | 744,689 | | | | 87,545 | | | | 263,405 | | |
| | | $ | 1,797,374 | | | $ | 1,769,271 | | | $ | 28,103 | | | $ | 464,934 | | |
| CSP | | Gross Rental
Income | | Operating
Expenses | | Net Operating
Income | | Capital
Improvements | |
| Chateau Club Apartment Building | | $ | 113,787 | | | $ | 74,412 | | | $ | 39,375 | | | $ | 10,779 | | |
Real estate income is recorded on a net basis in the income section of the funds' Statement of Operations. Capital improvements are recorded as an addition to the cost basis of the property, which will increase any unrealized depreciation. Total unrealized depreciation on the properties is recorded in the funds' Statements of Assets and Liabilities under the "unrealized depreciation of investments in securities" caption.
As of and for the year ended August 31, 2007, ASP and SLA owned no real estate.
Mortgage Servicing Rights
The fund may acquire interests in the cash flow from servicing fees through contractual arrangements with mortgage services. Mortgage servicing rights, similar to interest-only securities, generate no further cash flow when a mortgage is prepaid or goes into default. Mortgage servicing rights are accounted for on a level-yield basis with recognized income based on the estimated amounts and timing of cash flows. Such estimates are adjusted periodically as the underlying market conditions change. As of and for the year ended August 31, 2007, no fund held mortgage servicing rights.
Reverse Repurchase Agreements
Reverse repurchase agreements involve the sale of portfolio-eligible securities by the funds, coupled with an agreement to repurchase the securities at a specified date and price. Reverse repurchase agreements may increase volatility of the funds' net asset values and involve the risk that interest costs on money borrowed may exceed the return on securities purchased with that borrowed
First American Mortgage Funds 2007 Annual Report
23
Notes to Financial STATEMENTS continued
money. Reverse repurchase agreements are considered to be borrowings by the funds, and are subject to the funds' overall restriction on borrowing under which each fund must maintain asset coverage of at least 300%. For the year ended August 31, 2007, the weighted average borrowings outstanding for ASP, BSP, CSP, and SLA were $16,858,665, $49,048,521, $49,097,300, and $37,639,397, respectively, and the weighted average interest rates paid by the funds on such borrowings were 5.81%, 5.91%, 6.02%, and 5.98%, respectively.
Securities Purchased on a When-Issued Basis
Delivery and payment for securities that have been purchased by the funds on a when-issued or forward-commitment basis can take place a month or more after the transaction date. Such securities do not earn interest, are subject to market fluctuation and may increase or decrease in value prior to their delivery. Each fund segregates, with its custodian, assets with a market value equal to the amount of its purchase commitments. The purchase of securities on a when-issued or forward-commitment basis may increase the volatility of a fund's net asset value if the fund makes such purchases while remaining substantially fully invested. As of August 31, 2007, the funds had no outstanding when-issued or forward-commitment securities.
Repurchase Agreements
For repurchase agreements entered into with certain broker-dealers, the funds, along with other affiliated registered investment companies, may transfer uninvested cash balances into a joint trading account, the daily aggregate of which is invested in repurchase agreements secured by U.S. government or agency obligations. Securities pledged as collateral for all individual and joint repurchase agreements are held by the funds' custodian bank until maturity of the repurchase agreement. All agreements require that the daily market value of the collateral be in excess of the repurchase amount, including accrued interest, to protect the funds in the event of a default. As of August 31, 2007, the funds had no outstanding repurchase agreements.
Federal Taxes
Each fund is treated as a separate taxable entity. Each fund intends to continue to qualify as a regulated investment company as provided in Subchapter M of the Internal Revenue Code, as amended, and to distribute all taxable income, if any, to its shareholders. Accordingly, no provision for federal income taxes is required. Each fund also intends to distribute its taxable net investment income and realized gains, if any, to avoid the payment of any federal excise taxes.
Net investment income and net realized gains and losses may differ for financial statement and tax purposes. These differences are primarily due to deferred wash sales losses, paydown gains and losses, tax mark-to-market adjustments under Section 311(e) of the Taxpayer relief Act of 1997, tax deductions for real estate owned and investments in REITS. The character of distributions made during the fiscal period from net investment income or net realized gains may differ from its ultimate characterization for federal income tax purposes. In addition, due to the timing of dividend distributions, the fiscal period in which amounts are distributed may differ from the fiscal period that income or realized gains or losses were recorded by the funds.
First American Mortgage Funds 2007 Annual Report
24
Due to permanent book-to-tax differences, the following reclassification adjustments have been made on the Statements of Assets and Liabilities:
| | | American Strategic
Income Portfolio
(ASP) | | American Strategic
Income Portfolio II
(BSP) | | American Strategic
Income Portfolio III
(CSP) | | American Select
Portfolio
(SLA) | |
| Undistributed net investment income | | $ | (44,824 | ) | | $ | (394,165 | ) | | $ | (1,737,251 | ) | | $ | (660,437 | ) | |
| Accumulated net realized gain | | | 801,909 | | | | 2,037,179 | | | | (212,749 | ) | | | 660,437 | | |
| Additional paid-in capital (reduction) | | | (757,085 | ) | | | (1,643,014 | ) | | | 1,950,000 | | | | — | | |
The tax character of distributions paid during the fiscal year ended August 31, 2007 and fiscal year ended August 31, 2006, were characterized as follows:
| | | American Strategic
Income Portfolio
(ASP) | | American Strategic
Income Portfolio II
(BSP) | |
| | | Year Ended
8/31/07 | | Year Ended
8/31/06 | | Year Ended
8/31/07 | | Year Ended
8/31/06 | |
| Distributions paid from: | |
| Ordinary income | | $ | 3,555,377 | | | $ | 3,110,029 | | | $ | 13,439,536 | | | $ | 14,866,740 | | |
| Long-term capital gains | | | — | | | | — | | | | — | | | | — | | |
| Total | | $ | 3,555,377 | | | $ | 3,110,029 | | | $ | 13,439,536 | | | $ | 14,866,740 | | |
| | | American Strategic
Income Portfolio III
(CSP) | | American Select
Portfolio
(SLA) | |
| | | Year Ended
8/31/07 | | Year Ended
8/31/06 | | Year Ended
8/31/07 | | Year Ended
8/31/06 | |
| Distributions paid from: | |
| Ordinary income | | $ | 25,604,202 | | | $ | 16,871,262 | | | $ | 11,160,865 | | | $ | 11,621,793 | | |
| Long-term capital gains | | | 1,048,544 | | | | 10,037 | | | | 999,368 | | | | 1,531,837 | | |
| Total | | $ | 26,652,746 | | | $ | 16,881,299 | | | $ | 12,160,233 | | | $ | 13,153,630 | | |
At August 31, 2007, the components of accumulated deficit on a tax basis were as follows:
| | | American Strategic
Income Portfolio
(ASP) | | American Strategic
Income Portfolio II
(BSP) | | American Strategic
Income Portfolio III
(CSP) | | American Select
Portfolio
(SLA) | |
| Undistributed ordinary income | | $ | — | | | $ | — | | | $ | 3,066,843 | | | $ | 4,513 | | |
| Accumulated long-term capital gains | | | — | | | | — | | | | — | | | | 465,947 | | |
| Accumulated capital and post-October losses | | | (1,004,452 | ) | | | (2,858,586 | ) | | | (1,091,077 | ) | | | — | | |
| Unrealized appreciation (depreciation) | | | (1,838,550 | ) | | | (10,568,462 | ) | | | (10,426,901 | ) | | | (1,839,511 | ) | |
| Accumulated deficit | | $ | (2,843,002 | ) | | $ | (13,427,048 | ) | | $ | (8,451,135 | ) | | $ | (1,369,051 | ) | |
The difference between book basis and tax basis unrealized appreciation (depreciation) at August 31, 2007, is attributable to adjustments for REITs, depreciation on REOs, and a one-time tax election whereby the funds marked appreciated securities to market creating capital gains that were used to reduce capital loss carryovers and increase tax cost basis.
First American Mortgage Funds 2007 Annual Report
25
Notes to Financial STATEMENTS continued
Distributions to Shareholders
Distributions from net investment income are declared and paid on a monthly basis. Any net realized capital gains on sales of securities for the funds are distributed to shareholders at least annually. These distributions are recorded as of the close of business on the ex-dividend date. Such distributions are payable in cash or, pursuant to the funds' dividend reinvestment plans, reinvested in additional shares of the funds' capital stock. Under each fund's plan, fund shares will be purchased in the open market unless the market price plus commissions exceeds the net asset value by 5% or more. If, at the close of business on the dividend payment date, the shares purchased in the open market are insufficient to satisfy the dividend reinvestment requirement, the funds will issue new shares at a discount of up to 5% from the current market price.
Deferred Compensation Plan
Under a Deferred Compensation Plan (the "Plan"), non-interested directors of the First American Family of Funds may participate and elect to defer receipt of part or all of their annual compensation. Deferred amounts are treated as though equivalent dollar amounts had been invested in shares of open-end First American Funds, preselected by each Director. All amounts in the Plan are 100% vested and accounts under the Plan are obligations of the funds, until distributed in accordance with the Plan.
Use of Estimates in Preparation of Financial Statements
The preparation of financial statements, in conformity with U.S. generally accepted accounting principles, requires management to make estimates and assumptions that affect the reported amounts of assets and liabilities and the disclosure of contingent assets and liabilities at the date of the financial statements and the results of operations during the reporting period. Actual results could differ from these estimates.
(3) Expenses
Investment Advisory Fees
Pursuant to investment advisory agreements with each fund (each an "Agreement"), FAF Advisors, a subsidiary of U.S. Bank National Association ("U.S. Bank"), manages the funds' assets and furnishes related office facilities, equipment, research, and personnel. For ASP, BSP, and CSP, the Agreement provides FAF Advisors with a monthly investment advisory fee in an amount equal to an annualized rate of 0.20% of the respective fund's average weekly net assets and 4.50% of the daily gross income accrued by such fund during the month (i.e., investment income, including accretion of bond discounts and amortization of premiums, other than gains from the sale of securities or gains from options and futures contracts less interest on money borrowed by the funds). The monthly investment advisory fee shall not exceed, in the aggregate, 1/12 of 0.725% of the respective fund's average weekly net assets during the month (approximately 0.725% on an annual basis). For SLA, the Agreement provides FAF Advisors with a monthly investment advisory fee in an amount equal to an annualized rate of 0.50% of the fund's average weekly net assets. For its fees, FAF Advisors provides investment advice and, in general, conducts the management and investment activities of the funds.
The funds may invest in money market funds that are a series of First American Funds, Inc. ("FAF"), subject to certain limitations. In order to avoid the payment of duplicative investment advisory fees to FAF Advisors, which acts as the investment advisor to these funds and the related money market funds, FAF Advisors will reimburse to each fund an amount equal to the investment advisory fees received from the related money market funds that are attributable to the assets of that fund.
First American Mortgage Funds 2007 Annual Report
26
Administrative Fees
FAF Advisors serves as the funds' administrator pursuant to administration agreements between FAF Advisors and each fund. Under these agreements, FAF Advisors receives a monthly administrative fee from each fund in an amount equal to 0.25% of the fund's average weekly net assets. For its fee, FAF Advisors provides numerous services to the funds including, but not limited to, handling the general business affairs, financial and regulatory reporting, and various other services.
Custodian Fees
U.S. Bank serves as each fund's custodian pursuant to a custodian agreement with the funds. The custodian fee charged to each fund is equal to an annual rate of 0.02% of such fund's average weekly net assets. These fees are computed weekly and paid monthly.
Under the custodian agreement, interest earned on uninvested cash balances is used reduce to portion of each fund's custodian expenses. These credits, if any, are disclosed as "Indirect payments from the custodian" in the Statement of Operations. Conversely, the custodian charges a fee for any cash overdrafts incurred which will increase the fund's custodian expenses. For the fiscal year ended August 31, 2007, custodian fees for ASP, BSP, CSP, and SLA were increased by $302, $1,489, $1,896, and $2,262 as a result of overdrafts and reduced by $2,235, $12,150, $23,747, and $11,680 as a result of interest earned, respectively.
Mortgage Servicing Fees
The funds may enter into mortgage servicing agreements with mortgage servicers for whole loans and participation mortgages. For a fee, mortgage servicers maintain loan records, such as insurance and taxes and the proper allocation of payments between principal and interest.
Other Fees and Expenses
In addition to the investment advisory, administrative, custodian, and mortgage servicing fees, the funds are responsible for paying most other operating expenses, including: legal, auditing and accounting services, postage and printing of shareholder reports, transfer agent fees and expenses, listing fees, outside directors' fees and expenses, insurance, interest, expenses related to real estate owned, fees to outside parties retained to assist in conducting due diligence, taxes, and other miscellaneous expenses. For the fiscal year ended August 31, 2007, legal fees and expenses of $3,998, $4,145, $4,212, $4,088 for ASP, BSP, CSP, and SLA, respectively, were paid to a law firm of which an Assistant Secretary of the funds is a partner.
Expenses that are directly related to a fund are charged directly to that fund. Other operating expenses of the First American Family of Funds are allocated to the funds on several bases, including evenly across all funds, allocated based on relative net assets of all funds within the First American Family of Funds or a combination of both methods.
(4) Investment Security Transactions
Cost of purchases and proceeds from sales of securities and real estate, other than temporary investments in short-term securities, for the year ended August 31, 2007, were as follows:
| | | Cost of Purchases | | Proceeds from Sales | |
| American Strategic Income Portfolio | | $ | 18,274,723 | | | $ | 15,685,509 | | |
| American Strategic Income Portfolio II | | | 232,701,844 | | | | 205,542,898 | | |
| American Strategic Income Portfolio III | | | 279,628,595 | | | | 262,478,837 | | |
| American Select Portfolio | | | 112,237,439 | | | | 102,489,063 | | |
First American Mortgage Funds 2007 Annual Report
27
Notes to Financial STATEMENTS continued
Included in proceeds from sales for ASP, BSP, CSP, and SLA were $136,512, $1,166,176, $539,360, and $79,020, respectively, from prepayment penalties.
(5) Capital Loss Carryover
For federal income tax purposes, the funds had capital loss carryovers at August 31, 2007, the funds' most recently completed fiscal year-end, which, if not offset by subsequent capital gains, will expire on the funds' fiscal year-ends as follows:
| | | Expiration | |
| | | 2008 | | 2009 | | 2010 | | 2011 | | 2012 | | 2013 | | 2014 | | 2015 | | Total | |
American Strategic
Income Portfolio | | $ | — | | | $ | 737,067 | | | $ | 267,385 | | | $ | — | | | $ | — | | | $ | — | | | $ | — | | | $ | — | | | $ | 1,004,452 | | |
American Strategic
Income Portfolio II | | | — | | | | — | | | | — | | | | — | | | | — | | | | — | | | | 2,858,586 | | | | — | | | | 2,858,586 | | |
American Strategic
Income Portfolio III | | | — | | | | — | | | | — | | | | — | | | | — | | | | — | | | | — | | | | 551,492 | | | | 551,492 | | |
| American Select Portfolio | | | — | | | | — | | | | — | | | | — | | | | — | | | | — | | | | — | | | | — | | | | — | | |
American Strategic Income Portfolio had $450,975 of capital loss carryover that expired unused for the year ended August 31, 2007.
American Strategic Income Portfolio III incurred losses of $539,585, for tax purposes, for the period from November 1, 2006 to August 31, 2007. As permitted by tax regulations, the funds intend to elect to defer and treat those losses as arising in the fiscal year ending August 31, 2008.
(6) Indemnifications
The funds enter into contracts that contain a variety of indemnifications. The funds' maximum exposure under these arrangements is unknown. However, the funds have not had prior claims or losses pursuant to these contracts and expect the risk of loss to be remote.
(7) New Accounting Pronouncements
On July 13, 2006, the Financial Accounting Standards Board ("FASB") released FASB Interpretation No. 48, "Accounting for Uncertainty in Income Taxes" ("FIN 48"). FIN 48 provides guidance for how uncertain tax positions should be recognized, measured, presented, and disclosed in the financial statements. FIN 48 requires the evaluation of tax positions taken or expected to be taken in the course of preparing the fund's tax returns to determine whether the tax positions are "more-likely-than-not" of being sustained by the applicable tax authority. Tax positions not deemed to meet a more-likely-than-not threshold would be recorded as a tax expense in the current year. Adoption of FIN 48 is required for fiscal years beginning after Dece mber 15, 2006, and is to be applied to all open tax years as of the effective date. Recent Securities and Exchange Commission guidance allows implementing FIN 48 in fund net asset value calculations as late as the fund's last net asset value calculation in the first required financial statement reporting period. As a result, the funds will incorporate FIN 48 in their semiannual report on February 29, 2008. At this time, management is evaluating the implications of FIN 48 and its impact in the financial statements has not yet been determined.
In September 2006, the FASB issued Statement of Financial Accounting Standards No. 157, "Fair Value measurements" ("FAS 157"). FAS 157 clarifies the definition of fair value for financial reporting, establishes a framework for measuring fair value and requires additional disclosure about the use of fair value measurements. FAS 157 is effective for financial statements issued for fiscal years beginning after November 15, 2007 and interim periods within those fiscal years. As of August 31, 2007, the funds do not believe the adoption of FAS 157 will impact the amounts reported in the financial statements; however, additional disclosures will be required about the
First American Mortgage Funds 2007 Annual Report
28
inputs used to develop the measurements of fair value and the effect of certain measurements reported in the Statement of Operations for the fiscal period.
(8) Financial Highlights
Per-share data for a share of capital stock outstanding throughout each period and selected information for each period are as follows:
American Strategic Income Portfolio
| | | Year Ended August 31, | | Nine-Month
Fiscal Period
Ended | | Year Ended November 30, | |
| | | 2007 | | 2006 | | 8/31/05 | | 2004 | | 2003 | | 2002 | |
| Per-Share Data | | | | | | | | | | | | | | | | | | | | | | | | | |
| Net asset value, beginning of period | | $ | 12.07 | | | $ | 12.36 | | | $ | 12.64 | | | $ | 12.67 | | | $ | 12.61 | | | $ | 12.63 | | |
| Operations: | |
| Net investment income | | | 0.80 | | | | 0.82 | | | | 0.55 | | | | 0.94 | | | | 0.89 | | | | 0.96 | | |
Net realized and unrealized gains
(losses) on investments | | | (0.07 | ) | | | (0.37 | ) | | | (0.19 | ) | | | (0.10 | ) | | | 0.04 | | | | 0.05 | | |
| Total from operations | | | 0.73 | | | | 0.45 | | | | 0.36 | | | | 0.84 | | | | 0.93 | | | | 1.01 | | |
| Distributions to shareholders: | |
| From net investment income | | | (0.84 | ) | | | (0.74 | ) | | | (0.62 | ) | | | (0.87 | ) | | | (0.87 | ) | | | (1.03 | ) | |
| From return of capital | | | — | | | | — | | | | (0.02 | ) | | | — | | | | — | | | | — | | |
| Total distributions | | | (0.84 | ) | | | (0.74 | ) | | | (0.64 | ) | | | (0.87 | ) | | | (0.87 | ) | | | (1.03 | ) | |
| Net asset value, end of period | | $ | 11.96 | | | $ | 12.07 | | | $ | 12.36 | | | $ | 12.64 | | | $ | 12.67 | | | $ | 12.61 | | |
| Market value, end of period | | $ | 11.41 | | | $ | 10.94 | | | $ | 11.35 | | | $ | 12.00 | | | $ | 12.80 | | | $ | 12.05 | | |
| Selected Information | | | | | | | | | | | | | | | | | | | | | | | | | |
| Total return, net asset value (a) | | | 6.14 | % | | | 3.73 | % | | | 2.94 | % (d) | | | 6.85 | % | | | 7.65 | % | | | 8.32 | % | |
| Total return, market value (b) | | | 12.19 | % | | | 3.18 | % | | | (0.14 | )% (d) | | | 0.48 | % | | | 13.92 | % | | | 2.32 | % | |
Net assets at end of period
(in millions) | | $ | 51 | | | $ | 51 | | | $ | 52 | | | $ | 54 | | | $ | 54 | | | $ | 53 | | |
Ratio of expenses to average weekly
net assets before fee reimbursements | | | 3.27 | % | | | 2.10 | % | | | 1.59 | % (e) | | | 1.41 | % | | | 2.00 | % | | | 2.81 | % | |
Ratio of expenses to average weekly net
assets after fee reimbursements | | | 3.26 | % | | | 2.10 | % | | | 1.59 | % (e) | | | 1.41 | % | | | 2.00 | % | | | 2.81 | % | |
Ratio of expenses to average weekly net assets
excluding interest expense and fee reimbursements | | | 1.33 | % | | | 1.02 | % | | | 1.17 | % (e) | | | 1.13 | % | | | 1.39 | % | | | 1.63 | % | |
Ratio of net investment income to average weekly
net assets before fee reimbursements | | | 6.56 | % | | | 6.76 | % | | | 5.85 | % (e) | | | 7.46 | % | | | 7.08 | % | | | 7.56 | % | |
Ratio of net investment income to average weekly
net assets after fee reimbursements | | | 6.57 | % | | | 6.76 | % | | | 5.85 | % (e) | | | 7.46 | % | | | 7.08 | % | | | 7.56 | % | |
| Portfolio turnover rate | | | 24 | % | | | 18 | % | | | 10 | % | | | 26 | % | | | 50 | % | | | 18 | % | |
Amount of borrowings outstanding
at end of period (in millions) | | $ | 19 | | | $ | 17 | | | $ | 8 | | | $ | 7 | | | $ | 16 | | | $ | 17 | | |
Per-share amount of borrowings
outstanding at end of period | | $ | 4.59 | | | $ | 4.01 | | | $ | 1.90 | | | $ | 1.64 | | | $ | 3.69 | | | $ | 3.92 | | |
Per-share amount of net assets, excluding
borrowings, at end of period | | $ | 16.55 | | | $ | 16.08 | | | $ | 14.48 | | | $ | 14.28 | | | $ | 16.36 | | | $ | 16.53 | | |
| Asset coverage ratio (c) | | | 360 | % | | | 401 | % | | | 751 | % | | | 872 | % | | | 443 | % | | | 421 | % | |
(a) Assumes reinvestment of distributions at net asset value.
(b) Assumes reinvestment of distributions at actual prices pursuant to the fund's dividend reinvestment plan.
(c) Represents net assets, excluding borrowings, at end of period divided by borrowings outstanding at end of period.
(d) Total return has not been annualized.
(e) Annualized.
First American Mortgage Funds 2007 Annual Report
29
Notes to Financial STATEMENTS continued
(8) Financial Highlights
Per-share data for a share of capital stock outstanding throughout each period and selected information for each period are as follows:
American Strategic Income Portfolio II
| | | Year Ended August 31, | | Three-Month
Fiscal Period
Ended | | Year Ended May 31, | |
| | | 2007 | | 2006 | | 8/31/05 | | 2005 | | 2004 | | 2003 | |
| Per-Share Data | | | | | | | | | | | | | | | | | | | | | | | | | |
| Net asset value, beginning of period | | $ | 11.92 | | | $ | 12.15 | | | $ | 12.41 | | | $ | 12.98 | | | $ | 13.12 | | | $ | 13.29 | | |
| Operations: | |
| Net investment income | | | 0.80 | | | | 0.93 | | | | 0.23 | | | | 1.06 | | | | 1.12 | | | | 1.12 | | |
Net realized and unrealized gains
(losses) on investments | | | 0.14 | | | | (0.23 | ) | | | (0.25 | ) | | | (0.59 | ) | | | (0.12 | ) | | | (0.15 | ) | |
| Total from operations | | | 0.94 | | | | 0.70 | | | | (0.02 | ) | | | 0.47 | | | | 1.00 | | | | 0.97 | | |
| Distributions to shareholders: | |
| From net investment income | | | (0.84 | ) | | | (0.93 | ) | | | (0.24 | ) | | | (1.04 | ) | | | (1.14 | ) | | | (1.14 | ) | |
| Net asset value, end of period | | $ | 12.02 | | | $ | 11.92 | | | $ | 12.15 | | | $ | 12.41 | | | $ | 12.98 | | | $ | 13.12 | | |
| Market value, end of period | | $ | 11.32 | | | $ | 10.76 | | | $ | 11.57 | | | $ | 12.00 | | | $ | 12.84 | | | $ | 13.70 | | |
| Selected Information | | | | | | | | | | | | | | | | | | | | | | | | | |
| Total return, net asset value (a) | | | 8.06 | % | | | 6.02 | % | | | 0.17 | % (d) | | | 3.85 | % | | | 7.95 | % | | | 7.59 | % | |
| Total return, market value (b) | | | 13.18 | % | | | 1.34 | % | | | (1.59 | )% (d) | | | 1.51 | % | | | 2.16 | % | | | 13.51 | % | |
Net assets at end of period
(in millions) | | $ | 192 | | | $ | 191 | | | $ | 194 | | | $ | 198 | | | $ | 207 | | | $ | 209 | | |
Ratio of expenses to average weekly
net assets before fee reimbursements | | | 2.57 | % | | | 3.01 | % | | | 2.28 | % (e) | | | 1.78 | % | | | 1.77 | % | | | 2.99 | % | |
Ratio of expenses to average weekly
net assets after fee reimbursements | | | 2.56 | % | | | 3.01 | % | | | 2.28 | % (e) | | | 1.78 | % | | | 1.77 | % | | | 2.99 | % | |
Ratio of expenses to average weekly net assets
excluding interest expense and fee reimbursements | | | 0.99 | % | | | 2.05 | % | | | 1.06 | % (e) | | | 1.13 | % | | | 1.18 | % | | | 1.68 | % | |
Ratio of net investment income to average weekly
net assets before fee reimbursements | | | 6.56 | % | | | 7.80 | % | | | 7.36 | % (e) | | | 8.40 | % | | | 8.61 | % | | | 8.52 | % | |
Ratio of net investment income to average weekly
net assets after fee reimbursements | | | 6.57 | % | | | 7.80 | % | | | 7.36 | % (e) | | | 8.40 | % | | | 8.61 | % | | | 8.52 | % | |
| Portfolio turnover rate | | | 86 | % | | | 49 | % | | | 8 | % | | | 44 | % | | | 34 | % | | | 24 | % | |
Amount of borrowings outstanding
at end of period (in millions) | | $ | 73 | | | $ | 56 | | | $ | 61 | | | $ | 49 | | | $ | 63 | | | $ | 73 | | |
Per-share amount of borrowings
outstanding at end of period | | $ | 4.58 | | | $ | 3.48 | | | $ | 3.79 | | | $ | 3.09 | | | $ | 3.94 | | | $ | 4.55 | | |
Per-share amount of net assets, excluding
borrowings, at end of period | | $ | 16.60 | | | $ | 15.40 | | | $ | 15.94 | | | $ | 15.50 | | | $ | 16.92 | | | $ | 17.67 | | |
| Asset coverage ratio (c) | | | 362 | % | | | 443 | % | | | 421 | % | | | 502 | % | | | 429 | % | | | 388 | % | |
(a) Assumes reinvestment of distributions at net asset value.
(b) Assumes reinvestment of distributions at actual prices pursuant to the fund's dividend reinvestment plan.
(c) Represents net assets, excluding borrowings, at end of period divided by borrowings outstanding at end of period.
(d) Total return has not been annualized.
(e) Annualized.
First American Mortgage Funds 2007 Annual Report
30
(8) Financial Highlights
Per-share data for a share of capital stock outstanding throughout each period and selected information for each period are as follows:
American Strategic Income Portfolio III
| | | Year Ended August 31, | | Three-Month
Fiscal Period
Ended | | Year Ended May 31, | |
| | | 2007 | | 2006 | | 8/31/05 | | 2005 | | 2004 | | 2003 | |
| Per-Share Data | | | | | | | | | | | | | | | | | | | | | | | | | |
| Net asset value, beginning of period | | $ | 12.04 | | | $ | 12.08 | | | $ | 12.14 | | | $ | 12.40 | | | $ | 12.52 | | | $ | 12.55 | | |
| Operations: | |
| Net investment income | | | 1.18 | | | | 1.01 | | | | 0.23 | | | | 0.98 | | | | 1.04 | | | | 1.07 | | |
Net realized and unrealized gains
(losses) on investments | | | 0.09 | | | | (0.26 | ) | | | (0.08 | ) | | | (0.24 | ) | | | (0.04 | ) | | | (0.05 | ) | |
| Total from operations | | | 1.27 | | | | 0.75 | | | | 0.15 | | | | 0.74 | | | | 1.00 | | | | 1.02 | | |
| Distributions to shareholders: | |
| From net investment income | | | (1.18 | ) | | | (0.79 | ) | | | (0.21 | ) | | | (1.00 | ) | | | (1.12 | ) | | | (1.05 | ) | |
| From net realized gain on investments | | | (0.07 | ) | | | — | (d) | | | — | | | | — | | | | — | | | | — | | |
| Total distributions | | | (1.25 | ) | | | (0.79 | ) | | | (0.21 | ) | | | (1.00 | ) | | | (1.12 | ) | | | (1.05 | ) | |
| Net asset value, end of period | | $ | 12.06 | | | $ | 12.04 | | | $ | 12.08 | | | $ | 12.14 | | | $ | 12.40 | | | $ | 12.52 | | |
| Market value, end of period | | $ | 11.35 | | | $ | 11.20 | | | $ | 11.10 | | | $ | 11.79 | | | $ | 12.00 | | | $ | 12.67 | | |
| Selected Information | | | | | | | | | | | | | | | | | | | | | | | | | |
| Total return, net asset value (a) | | | 10.97 | % | | | 6.45 | % | | | 1.67 | % (e) | | | 6.31 | % | | | 8.31 | % | | | 8.44 | % | |
| Total return, market value (b) | | | 12.44 | % | | | 8.60 | % | | | (4.09 | )% (e) | | | 6.64 | % | | | 3.49 | % | | | 11.01 | % | |
Net assets at end of period
(in millions) | | $ | 257 | | | $ | 257 | | | $ | 258 | | | $ | 259 | | | $ | 265 | | | $ | 267 | | |
Ratio of expenses to average weekly
net assets before fee reimbursements | | | 2.29 | % | | | 2.20 | % | | | 2.21 | % (f) | | | 1.90 | % | | | 1.68 | % | | | 2.85 | % | |
Ratio of expenses to average weekly
net assets after fee reimbursements | | | 2.28 | % | | | 2.20 | % | | | 2.21 | % (f) | | | 1.90 | % | | | 1.68 | % | | | 2.85 | % | |
Ratio of expenses to average weekly net assets
excluding interest expense and fee reimbursements | | | 1.09 | % | | | 0.96 | % | | | 1.06 | % (f) | | | 1.12 | % | | | 1.13 | % | | | 1.71 | % | |
Ratio of net investment income to average weekly
net assets before fee reimbursements | | | 9.67 | % | | | 8.39 | % | | | 7.49 | % (f) | | | 8.01 | % | | | 8.32 | % | | | 8.55 | % | |
Ratio of net investment income to average weekly
net assets after fee reimbursements | | | 9.68 | % | | | 8.39 | % | | | 7.49 | % (f) | | | 8.01 | % | | | 8.32 | % | | | 8.55 | % | |
| Portfolio turnover rate | | | 87 | % | | | 56 | % | | | 13 | % | | | 48 | % | | | 44 | % | | | 20 | % | |
Amount of borrowings outstanding
at end of period (in millions) | | $ | 65 | | | $ | 54 | | | $ | 62 | | | $ | 59 | | | $ | 75 | | | $ | 63 | | |
Per-share amount of borrowings
outstanding at end of period | | $ | 3.04 | | | $ | 2.54 | | | $ | 2.93 | | | $ | 2.74 | | | $ | 3.53 | | | $ | 2.93 | | |
Per-share amount of net assets, excluding
borrowings, at end of period | | $ | 15.10 | | | $ | 14.58 | | | $ | 14.82 | | | $ | 14.88 | | | $ | 15.93 | | | $ | 15.45 | | |
| Asset coverage ratio (c) | | | 496 | % | | | 575 | % | | | 513 | % | | | 543 | % | | | 451 | % | | | 527 | % | |
(a) Assumes reinvestment of distributions at net asset value.
(b) Assumes reinvestment of distributions at actual prices pursuant to the fund's dividend reinvestment plan.
(c) Represents net assets, excluding borrowings, at end of period divided by borrowings outstanding at end of period.
(d) Amount rounds to $0.00 per share.
(e) Total return has not been annualized.
(f) Annualized.
First American Mortgage Funds 2007 Annual Report
31
Notes to Financial STATEMENTS concluded
(8) Financial Highlights
Per-share data for a share of capital stock outstanding throughout each period and selected information for each period are as follows:
American Select Portfolio
| | | Year Ended August 31, | | Nine-Month
Fiscal Period
Ended | | Year Ended November 30, | |
| | | 2007 | | 2006 | | 8/31/05 | | 2004 | | 2003 | | 2002 | |
| Per-Share Data | | | | | | | | | | | | | | | | | | | | | | | | | |
| Net asset value, beginning of period | | $ | 13.12 | | | $ | 13.57 | | | $ | 13.14 | | | $ | 13.41 | | | $ | 13.48 | | | $ | 13.38 | | |
| Operations: | |
| Net investment income | | | 0.94 | | | | 0.93 | | | | 0.96 | | | | 1.03 | | | | 1.05 | | | | 1.13 | | |
Net realized and unrealized gains
(losses) on investments | | | 0.08 | | | | (0.15 | ) | | | 0.12 | | | | (0.26 | ) | | | (0.04 | ) | | | 0.17 | | |
| Total from operations | | | 1.02 | | | | 0.78 | | | | 1.08 | | | | 0.77 | | | | 1.01 | | | | 1.30 | | |
| Distributions to shareholders: | |
| From net investment income | | | (1.04 | ) | | | (1.09 | ) | | | (0.65 | ) | | | (1.04 | ) | | | (1.08 | ) | | | (1.20 | ) | |
| From net realized gain on investments | | | (0.10 | ) | | | (0.14 | ) | | | — | | | | — | | | | — | | | | — | | |
| Total distributions | | | (1.14 | ) | | | (1.23 | ) | | | (0.65 | ) | | | (1.04 | ) | | | (1.08 | ) | | | (1.20 | ) | |
| Net asset value, end of period | | $ | 13.00 | | | $ | 13.12 | | | $ | 13.57 | | | $ | 13.14 | | | $ | 13.41 | | | $ | 13.48 | | |
| Market value, end of period | | $ | 12.37 | | | $ | 12.12 | | | $ | 12.45 | | | $ | 12.79 | | | $ | 13.64 | | | $ | 12.86 | | |
| Selected Information | | | | | | | | | | | | | | | | | | | | | | | | | |
| Total return, net asset value (a) | | | 8.13 | % | | | 6.12 | % | | | 8.47 | % (d) | | | 5.97 | % | | | 7.72 | % | | | 10.13 | % | |
| Total return, market value (b) | | | 11.65 | % | | | 7.86 | % | | | 2.61 | % (d) | | | 1.44 | % | | | 14.92 | % | | | 3.91 | % | |
Net assets at end of period
(in millions) | | $ | 139 | | | $ | 140 | | | $ | 145 | | | $ | 140 | | | $ | 143 | | | $ | 144 | | |
Ratio of expenses to average weekly
net assets before fee reimbursements | | | 2.73 | % | | | 2.17 | % | | | 2.31 | % (e) | | | 1.87 | % | | | 2.05 | % | | | 2.82 | % | |
Ratio of expenses to average weekly
net assets after fee reimbursements | | | 2.72 | % | | | 2.17 | % | | | 2.31 | % (e) | | | 1.87 | % | | | 2.05 | % | | | 2.82 | % | |
Ratio of expenses to average weekly net assets
excluding interest expense and fee reimbursements | | | 1.02 | % | | | 0.89 | % | | | 1.02 | % (e) | | | 1.06 | % | | | 1.18 | % | | | 1.47 | % | |
Ratio of net investment income to average weekly
net assets before fee reimbursements | | | 7.21 | % | | | 7.11 | % | | | 9.77 | % (e) | | | 7.79 | % | | | 7.79 | % | | | 8.41 | % | |
Ratio of net investment income to average weekly
net assets after fee reimbursements | | | 7.22 | % | | | 7.11 | % | | | 9.77 | % (e) | | | 7.79 | % | | | 7.79 | % | | | 8.41 | % | |
| Portfolio turnover rate | | | 59 | % | | | 32 | % | | | 35 | % | | | 13 | % | | | 38 | % | | | 31 | % | |
Amount of borrowings outstanding
at end of period (in millions) | | $ | 41 | | | $ | 32 | | | $ | 30 | | | $ | 41 | | | $ | 49 | | | $ | 29 | | |
Per-share amount of borrowings
outstanding at end of period | | $ | 3.88 | | | $ | 2.96 | | | $ | 2.82 | | | $ | 3.87 | | | $ | 4.57 | | | $ | 2.67 | | |
Per-share amount of net assets, excluding
borrowings, at end of period | | $ | 16.88 | | | $ | 16.08 | | | $ | 16.39 | | | $ | 17.01 | | | $ | 17.98 | | | $ | 16.15 | | |
| Asset coverage ratio (c) | | | 434 | % | | | 543 | % | | | 581 | % | | | 439 | % | | | 394 | % | | | 604 | % | |
(a) Assumes reinvestment of distributions at net asset value.
(b) Assumes reinvestment of distributions at actual prices pursuant to the fund's dividend reinvestment plan.
(c) Represents net assets, excluding borrowings, at end of period divided by borrowings outstanding at end of period.
(d) Total return has not been annualized.
(e) Annualized.
First American Mortgage Funds 2007 Annual Report
32
Schedule of INVESTMENTS
American Strategic Income Portfolio August 31, 2007
| Description of Security | | Date
Acquired | | Par Value | | Cost | | Value (a) | |
| (Percentages of each investment category relate to net assets) | |
| U.S. Government Agency Mortgage-Backed Securities — 10.8% | |
| Fixed Rate — 10.8% | |
| Federal Home Loan Mortgage Corporation, | |
| 5.50%, 1/1/18, #E93231 (b) | | | | $ | 681,576 | | | $ | 699,282 | | | $ | 679,730 | | |
| 9.00%, 7/1/30, #C40149 | | | | | 96,460 | | | | 98,802 | | | | 104,495 | | |
| Federal National Mortgage Association, | |
| 6.00%, 10/1/16, #610761 (b) | | | | | 354,371 | | | | 359,969 | | | | 358,958 | | |
| 5.00%, 7/1/18, #724954 (b) | | | | | 1,445,528 | | | | 1,443,831 | | | | 1,416,093 | | |
| 6.50%, 6/1/29, #252497 (b) | | | | | 175,716 | | | | 174,633 | | | | 179,806 | | |
| 7.50%, 3/1/30, #495694 | | | | | 159,918 | | | | 157,542 | | | | 165,256 | | |
| 7.50%, 5/1/30, #535289 (b) | | | | | 35,788 | | | | 34,688 | | | | 37,419 | | |
| 8.00%, 5/1/30, #538266 (b) | | | | | 11,717 | | | | 11,581 | | | | 12,348 | | |
| 6.00%, 5/1/31, #535909 (b) | | | | | 338,425 | | | | 340,180 | | | | 340,070 | | |
| 6.50%, 11/1/31, #613339 (b) | | | | | 165,171 | | | | 168,516 | | | | 168,908 | | |
| 5.50%, 7/1/33, #720735 (b) | | | | | 2,064,475 | | | | 2,041,792 | | | | 2,022,101 | | |
| Total U.S. Government Agency Mortgage-Backed Securities | | | 5,530,816 | | | | 5,485,184 | | |
| Corporate Note (c) — 7.1% | |
| Fixed Rate — 7.1% | |
| Stratus Properties V, 6.92%, 12/31/11 | | 6/1/07 | | | 3,500,000 | | | | 3,500,000 | | | | 3,605,000 | | |
| Whole Loans and Participation Mortgages (c) (d) — 97.6% | |
| Commercial Loans — 62.6% | |
| Advance Self Storage, Lincoln, NE, 6.13%, 1/1/11 | | 11/29/00 | | | 1,487,060 | | | | 1,487,060 | | | | 1,494,020 | | |
| Buca Restaurant, Maple Grove, MN, 8.63%, 1/1/11 | | 1/1/05 | | | 861,104 | | | | 861,104 | | | | 878,326 | | |
| Copper Junction, Copper Mountain, CO, 6.38%, 7/1/17 | | 6/14/07 | | | 1,948,589 | | | | 1,948,589 | | | | 1,966,403 | | |
| Dependable Mini-Storage I, Plano, TX, 6.64%, 7/1/11 (b) (e) | | 6/27/06 | | | 2,800,000 | | | | 2,800,000 | | | | 2,857,144 | | |
| Dependable Mini-Storage II, Plano, TX, 11.88%, 7/1/07 (e) | | 6/27/06 | | | 300,000 | | | | 300,000 | | | | 309,000 | | |
| Hampden Medical Office, Englewood, CO, 7.38%, 10/1/12 (b) | | 9/9/02 | | | 1,644,133 | | | | 1,644,133 | | | | 1,484,238 | | |
| Integrity Plaza Shopping Center, Albuquerque, NM, 7.88%, 7/1/12 (b) | | 5/11/04 | | | 1,996,058 | | | | 1,996,054 | | | | 2,075,900 | | |
| La Costa Meadows Industrial Park I, San Marcos, CA, 6.78%, 7/1/17 | | 6/28/07 | | | 1,250,000 | | | | 1,250,000 | | | | 1,296,762 | | |
| La Costa Meadows Industrial Park II, San Marcos, CA, 7.53%, 7/1/17 | | 6/28/07 | | | 2,000,000 | | | | 2,000,000 | | | | 2,060,000 | | |
| Metro Center, Albuquerque, NM, 5.20%, 5/1/09 (b) | | 4/7/04 | | | 2,476,425 | | | | 2,476,425 | | | | 2,455,243 | | |
| Metro Center II, Albuquerque, NM, 7.88%, 5/1/09 | | 3/20/06 | | | 147,591 | | | | 147,591 | | | | 136,442 | | |
| Minikahda Mini Storage IV, Minneapolis, MN, 7.15%, 3/1/11 | | 2/28/06 | | | 1,605,220 | | | | 1,605,220 | | | | 1,653,377 | | |
| Naples Boat Club, Naples, FL, 6.43%, 1/1/17 | | 12/28/06 | | | 1,774,691 | | | | 1,774,691 | | | | 1,805,670 | | |
| Orchard Commons, Englewood, CO, 8.63%, 4/1/11 | | 3/28/01 | | | 971,415 | | | | 971,415 | | | | 1,010,272 | | |
| Palace Court, Santa Fe, NM, 6.68%, 11/1/11 (b) (e) | | 10/2/06 | | | 1,900,000 | | | | 1,900,000 | | | | 1,935,868 | | |
| Par 3 Office Building, Bend, OR, 6.63%, 8/1/13 (b) (e) | | 8/3/06 | | | 1,900,000 | | | | 1,900,000 | | | | 1,896,253 | | |
| Perkins Restaurant, Maple Grove, MN, 6.38%, 1/1/11 (e) | | 12/23/05 | | | 1,391,501 | | | | 1,391,501 | | | | 1,408,431 | | |
| Rockwood Galleria, Gresham, OR, 7.25%, 2/1/11 | | 1/6/03 | | | 1,530,607 | | | | 1,530,607 | | | | 1,584,124 | | |
| Stephens Center, Missoula, MT, 6.38%, 9/1/10 (b) | | 8/21/03 | | | 1,864,911 | | | | 1,864,911 | | | | 1,890,561 | | |
| Voit Office Building, Orange, CA, 8.13%, 9/1/08 | | 8/17/01 | | | 1,458,441 | | | | 1,458,441 | | | | 1,487,610 | | |
| | | | 31,307,742 | | | | 31,685,644 | | |
| Multifamily Loans — 33.5% | |
| Applewood Manor, Duluth, MN, 8.63%, 1/1/08 | | 12/23/93 | | | 588,945 | | | | 586,001 | | | | 496,600 | | |
| Cascade Village, Cascade Township, MI, 5.25%, 12/1/09 (b) | | 11/23/04 | | | 1,564,546 | | | | 1,564,546 | | | | 1,416,632 | | |
| Forest Club Apartments, Dallas, TX, 11.88%, 5/1/08 (e) | | 4/19/06 | | | 1,720,000 | | | | 1,720,000 | | | | 1,612,370 | | |
| Franklin Woods Apartments, Franklin, NH, 5.88%, 3/1/10 | | 2/24/95 | | | 845,919 | | | | 859,324 | | | | 840,641 | | |
| Hunt Club Apartments, Waco, TX, 5.64%, 7/1/11 (b) | | 6/3/04 | | | 1,191,239 | | | | 1,191,239 | | | | 1,174,517 | | |
| Ironwood Apartments, Tucson, AZ, 8.73%, 4/1/08 (e) (f) | | 3/31/06 | | | 2,155,000 | | | | 2,155,000 | | | | 2,155,000 | | |
| Park Hollywood, Portland, OR, 7.38%, 6/1/12 | | 5/31/02 | | | 1,118,082 | | | | 1,118,082 | | | | 1,173,986 | | |
| Spring Creek Gardens, Plano, TX, 8.45%, 1/1/09 (e) (f) | | 12/22/05 | | | 2,050,000 | | | | 2,050,000 | | | | 1,857,286 | | |
| Steel Lake Apartments, Federal Way, WA, 7.98%, 6/1/08 (e) (f) | | 5/31/05 | | | 3,985,000 | | | | 3,985,000 | | | | 3,400,879 | | |
| Vanderbilt Condominiums, Austin, TX, 8.04%, 10/1/09 | | 9/29/99 | | | 1,097,892 | | | | 1,097,892 | | | | 1,087,654 | | |
See accompanying Notes to Schedule of Investments.
First American Mortgage Funds 2007 Annual Report
33
Schedule of INVESTMENTS continued
American Strategic Income Portfolio (continued)
| Description of Security | | Date
Acquired | | Par Value/
Shares | | Cost | | Value (a) | |
| Villa Bonita, Chez Royalle, Fitzhugh Apartments I, Dallas, TX, 8.70%, 3/1/08 (b) (e) (f) | | 2/21/03 | | $ | 837,871 | | | $ | 837,871 | | | $ | 650,635 | | |
| Villa Bonita, Chez Royalle, Fitzhugh Apartments II, Dallas, TX, 9.88%, 3/1/08 (e) | | 2/21/03 | | | 154,597 | | | | 154,597 | | | | 141,717 | | |
| Woodland Garden Apartments, Arlington, WA, 7.38%, 9/1/08 | | 8/26/98 | | | 945,148 | | | | 945,148 | | | | 956,254 | | |
| | | | 18,264,700 | | | | 16,964,171 | | |
| Single Family Loans — 1.5% | |
| Aegis II, 3 loans, midwestern United States, 9.66%, 1/28/14 (g) | | 12/28/95 | | | 8,653 | | | | 7,851 | | | | 8,745 | | |
| American Portfolio, 1 loan, California, 4.88%, 10/18/15 | | 7/18/95 | | | 22,272 | | | | 21,209 | | | | 22,519 | | |
| Anivan, 1 loan, Maryland, 5.19%, 4/14/12 | | 6/14/96 | | | 83,852 | | | | 84,398 | | | | 80,206 | | |
| Bank of New Mexico, 1 loan, New Mexico, 6.23%, 3/31/10 | | 3/1/04 | | | 36,666 | | | | 35,983 | | | | 35,350 | | |
| Bluebonnet Savings and Loan, 7 loans, Texas, 6.66%, 8/31/10 | | 5/22/92 | | | 146,932 | | | | 134,488 | | | | 143,914 | | |
| Bluebonnet Savings and Loan II, 1 loan, Texas, 11.50%, 8/31/10 | | 5/22/92 | | | 1,584 | | | | 1,547 | | | | 1,452 | | |
| CLSI Allison Williams, 1 loan, Texas, 9.38%, 8/1/17 | | 2/28/92 | | | 9,174 | | | | 8,425 | | | | 8,969 | | |
| Cross Roads Savings and Loan, 1 loan, Oklahoma, 6.25%, 1/1/21 | | 1/7/92 | | | 35,909 | | | | 33,951 | | | | 35,519 | | |
| Cross Roads Savings and Loan II, 1 loan, Oklahoma, 8.34%, 1/1/21 (g) | | 1/7/92 | | | 21,605 | | | | 20,314 | | | | 20,861 | | |
| Fairbanks, 1 loan, Utah, 5.50%, 9/23/15 | | 5/21/92 | | | 20,219 | | | | 17,146 | | | | 20,045 | | |
| First Boston Mortgage Pool, 3 loans, United States, 9.04%, 11/5/07 | | 6/23/92 | | | 6,413 | | | | 5,105 | | | | 6,037 | | |
| Knutson Mortgage Portfolio I, 3 loans, midwestern United States, 9.37%, 8/1/17 | | 2/26/92 | | | 144,276 | | | | 137,632 | | | | 148,568 | | |
| McClemore, Matrix Funding Corporation, 1 loan, North Carolina, 10.50%, 9/30/12 | | 9/9/92 | | | 44,886 | | | | 42,634 | | | | 46,233 | | |
| Nomura III, 6 loans, midwestern United States, 8.20%, 4/29/17 | | 9/29/95 | | | 106,612 | | | | 96,296 | | | | 107,805 | | |
| Rand Mortgage Corporation, 2 loans, Texas, 9.50%, 8/1/17 | | 7/1/02 | | | 60,486 | | | | 49,563 | | | | 62,118 | | |
| | | | 696,542 | | | | 748,341 | | |
| Total Whole Loans and Participation Mortgages | | | 50,268,984 | | | | 49,398,156 | | |
| Preferred Stocks — 19.9% | |
| Real Estate Investment Trusts — 19.9% | |
| AMB Property, Series L (b) | | | | | 14,500 | | | | 359,755 | | | | 322,625 | | |
| AMB Property, Series M (b) | | | | | 5,600 | | | | 139,850 | | | | 124,992 | | |
| AMB Property, Series P | | | | | 14,500 | | | | 367,575 | | | | 332,485 | | |
| BRE Properties, Series B (b) | | | | | 20,500 | | | | 539,150 | | | | 519,880 | | |
| BRE Properties, Series C (b) | | | | | 400 | | | | 10,216 | | | | 9,108 | | |
| BRE Properties, Series D (b) | | | | | 400 | | | | 10,180 | | | | 9,064 | | |
| Developers Diversified Realty, Series H | | | | | 4,750 | | | | 122,822 | | | | 112,338 | | |
| Developers Diversified Realty, Series I | | | | | 3,800 | | | | 100,450 | | | | 91,542 | | |
| Duke Realty, Series J (b) | | | | | 2,100 | | | | 52,246 | | | | 47,460 | | |
| Duke Realty, Series K (b) | | | | | 6,200 | | | | 152,826 | | | | 139,500 | | |
| Duke Realty, Series L (b) | | | | | 12,000 | | | | 302,160 | | | | 270,360 | | |
| Duke Realty, Series M (b) | | | | | 2,000 | | | | 50,000 | | | | 47,840 | | |
| Equity Residential Properties, Series N (b) | | | | | 20,100 | | | | 500,946 | | | | 455,265 | | |
| Health Care Properties, Series E (b) | | | | | 10,500 | | | | 274,759 | | | | 246,750 | | |
| Health Care Properties, Series F (b) | | | | | 15,150 | | | | 390,230 | | | | 350,419 | | |
| Hospitality Properties Trust, Series C (b) | | | | | 52,700 | | | | 1,293,720 | | | | 1,185,750 | | |
| HRPT Properties Trust, Series B (b) | | | | | 14,000 | | | | 364,478 | | | | 350,560 | | |
| Kimco Realty, Series F (b) | | | | | 19,400 | | | | 500,619 | | | | 468,510 | | |
| Post Properties, Series B | | | | | 17,800 | | | | 468,112 | | | | 445,000 | | |
| Prologis Trust, Series F (b) | | | | | 6,700 | | | | 167,835 | | | | 158,991 | | |
| Prologis Trust, Series G (b) | | | | | 13,200 | | | | 330,984 | | | | 312,048 | | |
| Public Storage, Series A (b) | | | | | 6,000 | | | | 144,291 | | | | 138,060 | | |
| Public Storage, Series F (b) | | | | | 9,300 | | | | 231,105 | | | | 208,227 | | |
| Public Storage, Series L (b) | | | | | 27,400 | | | | 673,400 | | | | 632,118 | | |
| Public Storage, Series M | | | | | 4,000 | | | | 100,000 | | | | 91,520 | | |
| Public Storage, Series X (b) | | | | | 3,000 | | | | 74,330 | | | | 67,500 | | |
| Public Storage, Series Z (b) | | | | | 11,500 | | | | 282,309 | | | | 254,150 | | |
| Realty Income, Series D (b) | | | | | 20,500 | | | | 546,185 | | | | 504,300 | | |
| Realty Income, Series E (b) | | | | | 27,000 | | | | 679,050 | | | | 625,050 | | |
| Regency Centers, Series C | | | | | 7,500 | | | | 186,000 | | | | 180,150 | | |
| Regency Centers, Series D (b) | | | | | 34,850 | | | | 902,085 | | | | 838,143 | | |
See accompanying Notes to Schedule of Investments.
First American Mortgage Funds 2007 Annual Report
34
American Strategic Income Portfolio (continued)
| Description of Security | | Shares | | Cost | | Value (a) | |
| Vornado Realty Trust, Series E (b) | | | 4,800 | | | $ | 121,338 | | | $ | 112,992 | | |
| Vornado Realty Trust, Series F (b) | | | 7,800 | | | | 199,340 | | | | 174,252 | | |
| Vornado Realty Trust, Series G (b) | | | 8,000 | | | | 200,400 | | | | 178,400 | | |
| Vornado Realty Trust, Series I (b) | | | 2,000 | | | | 46,500 | | | | 44,560 | | |
| Total Preferred Stocks | | | | | | | 10,885,246 | | | | 10,049,909 | | |
| Total Investments in Unaffiliated Securities | | | | | | | 70,185,046 | | | | 68,538,249 | | |
| Short-Term Investment (h) — 2.6% | |
| First American Prime Obligations Fund, Class Z | | | 1,342,361 | | | | 1,342,361 | | | | 1,342,361 | | |
| Total Investments in Securities (i) — 138.0% | | | | | | $ | 71,527,407 | | | $ | 69,880,610 | | |
| Other Assets and Liabilities, Net — (38.0)% | | | | | | | | | | | (19,259,551 | ) | |
| Total Net Assets — 100.0% | | | | | | | | | | $ | 50,621,059 | | |
Notes to Schedule of Investments:
(a) Securities are valued in accordance with procedures described in note 2 in Notes to Financial Statements.
(b) On August 31, 2007, securities valued at $30,861,715 were pledged as collateral for the following outstanding reverse repurchase agreements:
| Amount | | Acquisition
Date | | Rate* | | Due | | Accrued
Interest | | Name of Broker
and Description
of Collateral | |
| $ | 4,991,434 | | | 8/8/07 | | | 5.40 | % | | 9/7/07 | | $ | 17,969 | | | | (1 | ) | |
| | 10,000,000 | | | 8/1/07 | | | 6.20 | % | | 9/4/07 | | | 53,411 | | | | (2 | ) | |
| | 4,088,500 | | | 8/8/07 | | | 6.03 | % | | 9/7/07 | | | 10,186 | | | | (3 | ) | |
| | 353,000 | | | 8/15/07 | | | 6.03 | % | | 9/7/07 | | | 1,005 | | | | (3 | ) | |
| $ | 19,432,934 | | | | | | | | | | | $ | 82,571 | | | | | | |
* Interest rate as of August 31, 2007. Rate is based on the London InterBank Offered Rate (LIBOR) plus a spread and reset monthly.
Name of broker and description of collateral:
(1) Morgan Stanley:
Federal Home Loan Mortgage Corporation, 5.50%, 1/1/18, $681,576 par
Federal National Mortgage Association, 6.00%, 10/1/16, $354,371 par
Federal National Mortgage Association, 5.00%, 7/1/18, $1,445,528 par
Federal National Mortgage Association, 6.50%, 6/1/29, $175,716 par
Federal National Mortgage Association, 7.50%, 5/1/30, $35,788 par
Federal National Mortgage Association, 8.00%, 5/1/30, $11,717 par
Federal National Mortgage Association, 6.00%, 5/1/31, $338,425 par
Federal National Mortgage Association, 6.50%, 11/1/31, $165,171 par
Federal National Mortgage Association, 5.50%, 7/1/33, $2,064,475 par
(2) Morgan Stanley:
Cascade Village, 5.25%, 12/1/09, $1,564,546 par
Dependable Mini-Storage I, 6.64%, 7/1/11, $2,800,000 par
Hampden Medical Office, 7.38%, 10/1/12, $1,644,133 par
Hunt Club Apartments, 5.64%, 7/1/11, $1,191,239 par
Integrity Plaza Shopping Center, 7.88%, 7/1/12, $1,996,058 par
Metro Center, 5.20%, 5/1/09, $2,476,425 par
Palace Court, 6.68%, 11/1/11, $1,900,000 par
Par 3 Office Building, 6.63%, 8/1/13, $1,900,000 par
Stephens Center, 6.38%, 9/1/10, $1,864,911 par
Villa Bonita, Chez Royalle, Fitzhugh Apartments I, 8.70%, 3/1/08, $837,871 par
First American Mortgage Funds 2007 Annual Report
35
Schedule of INVESTMENTS continued
American Strategic Income Portfolio (concluded)
(3) Dresdner Bank:
AMB Property, Series L, 14,500 shares
AMB Property, Series M, 5,600 shares
BRE Properties, Series B, 20,500 shares
BRE Properties, Series C, 400 shares
BRE Properties, Series D, 400 shares
Duke Realty, Series J, 2,100 shares
Duke Realty, Series K, 6,200 shares
Duke Realty, Series L, 12,000 shares
Duke Realty, Series M, 2,000 shares
Equity Residential Properties, Series N, 20,100 shares
Health Care Properties, Series E, 10,500 shares
Health Care Properties, Series F, 10,700 shares
Hospitality Property Trust, Series C, 40,000 shares
HRPT Properties Trust, Series B, 14,000 shares
Kimco Realty, Series F, 19,400 shares
Prologis Trust, Series F, 6,700 shares
Prologis Trust, Series G, 13,200 shares
Public Storage, Series A, 6,000 shares
Public Storage, Series F, 9,300 shares
Public Storage, Series L, 16,400 shares
Public Storage, Se ries X, 3,000 shares
Public Storage, Series Z, 11,500 shares
Realty Income, Series D, 20,500 shares
Realty Income, Series E, 27,000 shares
Regency Centers, Series D, 20,500 shares
Vornado Realty Trust, Series E, 4,800 shares
Vornado Realty Trust, Series F, 7,800 shares
Vornado Realty Trust, Series G, 8,000 shares
Vornado Realty Trust, Series I, 2,000 shares
The fund has entered into a lending commitment with Morgan Stanley. The agreement permits the fund to enter into reverse repurchase agreements up to $10,000,000 using whole loans as collateral. The fund pays a fee of 0.15% to Morgan Stanley on any unused portion of the $10,000,000 lending commitment.
The fund has entered into a lending commitment with Dresdner Bank. The agreement permits the fund to enter into reverse repurchase agreements up to $5,000,000 using preferred stock as collateral. The fund pays a fee of 0.25% to Dresdner Bank on any unused portion of the $5,000,000 lending commitment.
(c) Securities purchased as part of a private placement which have not been registered with the Securities and Exchange Commission under the Securities Act of 1933 and which are considered to be illiquid. These securities are fair valued in accordance with the board approved valuation procedures. On August 31, 2007, the total value of fair valued securities was $53,003,156 or 104.7% of net assets. See note 2 in Notes to Financial Statements.
(d) Interest rates on commercial and multifamily loans are the net coupon rates in effect (after reducing the coupon rate by any mortgage servicing fees paid to mortgage servicers) on August 31, 2007. Interest rates and maturity dates disclosed on single family loans represent the weighted average coupon and weighted average maturity for the underlying mortgage loans as of August 31, 2007.
(e) Interest only – Represents securities that entitle holders to receive only interest payments on the mortgage. Principal balance of the loan is due at maturity. The interest rate disclosed represents the net coupon rate in effect as of August 31, 2007.
(f) Variable Rate Security – The rate shown is the net coupon rate as of August 31, 2007.
(g) Loan or a portion of this loan not current on interest and/or principal payments.
(h) Investment in affiliated security. This money market fund is advised by FAF Advisors, Inc., which also serves as the advisor for the fund.
(i) On August 31, 2007, the cost of investments in securities for federal income tax purposes was $71,719,160. The aggregate gross unrealized appreciation and depreciation of investments in securities, based on this cost, were as follows:
| Gross unrealized appreciation | | $ | 825,048 | | |
| Gross unrealized depreciation | | | (2,663,598 | ) | |
| Net unrealized depreciation | | $ | (1,838,550 | ) | |
First American Mortgage Funds 2007 Annual Report
36
American Strategic Income Portfolio II August 31, 2007
| Description of Security | | Date
Acquired | | Par Value | | Cost | | Value (a) | |
| (Percentages of each investment category relate to net assets) | |
| U.S. Government Agency Mortgage-Backed Securities (b) — 3.9% | |
| Fixed Rate — 3.9% | |
| Federal Home Loan Mortgage Corporation, | |
| 5.50%, 1/1/18, #E93231 | | | | $ | 3,635,072 | | | $ | 3,729,498 | | | $ | 3,625,226 | | |
| 9.00%, 7/1/30, #C40149 | | | | | 160,768 | | | | 164,670 | | | | 174,158 | | |
| Federal National Mortgage Association, | |
| 6.00%, 10/1/16, #607030 | | | | | 253,921 | | | | 255,059 | | | | 257,207 | | |
| 5.50%, 6/1/17, #648508 | | | | | 328,270 | | | | 329,642 | | | | 327,376 | | |
| 5.00%, 9/1/17, #254486 | | | | | 533,728 | | | | 534,915 | | | | 523,878 | | |
| 5.00%, 11/1/17, #657356 | | | | | 1,082,818 | | | | 1,087,630 | | | | 1,062,833 | | |
| 6.50%, 6/1/29, #252497 | | | | | 1,171,439 | | | | 1,164,219 | | | | 1,198,705 | | |
| 7.50%, 4/1/30, #532867 | | | | | 48,208 | | | | 46,725 | | | | 50,406 | | |
| 7.50%, 5/1/30, #535289 | | | | | 128,835 | | | | 124,878 | | | | 134,710 | | |
| 8.00%, 5/1/30, #538266 | | | | | 42,181 | | | | 41,694 | | | | 44,453 | | |
| 8.00%, 6/1/30, #253347 | | | | | 167,690 | | | | 165,750 | | | | 176,722 | | |
| Total U.S. Government Agency Mortgage-Backed Securities | | | 7,644,680 | | | | 7,575,674 | | |
| Corporate Notes (c) — 7.0% | |
| Fixed Rate — 7.0% | |
| Stratus Properties III, 6.56%, 12/31/11 | | 12/12/06 | | | 8,000,000 | | | | 8,000,000 | | | | 8,215,200 | | |
| Stratus Properties II, 6.56%, 12/31/11 | | 6/14/01 | | | 5,000,000 | | | | 5,000,000 | | | | 5,134,500 | | |
| Total Corporate Notes | | | 13,000,000 | | | | 13,349,700 | | |
| Whole Loans and Participation Mortgages (c) (d) — 103.2% | |
| Commercial Loans — 54.3% | |
| 5555 East Van Buren I, Phoenix, AZ, 5.68%, 7/1/11 (b) | | 6/23/04 | | | 6,415,600 | | | | 6,415,600 | | | | 6,364,100 | | |
| 5555 East Van Buren II, Phoenix, AZ, 7.13%, 7/1/11 | | 6/23/04 | | | 1,487,969 | | | | 1,487,969 | | | | 1,535,984 | | |
| Bigelow Office Building, Las Vegas, NV, 6.38%, 4/1/17 (b) | | 3/31/97 | | | 1,153,548 | | | | 1,153,548 | | | | 1,154,181 | | |
| Cypress Point Office Park I, Tampa, FL, 5.30%, 6/1/09 (b) | | 5/19/04 | | | 4,506,585 | | | | 4,506,585 | | | | 4,455,615 | | |
| Cypress Point Office Park II, Tampa, FL, 5.30% 7/1/09 (b) | | 5/19/04 | | | 4,378,408 | | | | 4,378,408 | | | | 4,328,888 | | |
| Hillside Office Park, Elk River, MN, 7.63%, 8/1/08 | | 7/09/98 | | | 829,742 | | | | 829,742 | | | | 843,876 | | |
| LaCosta Centre, Austin, TX, 5.20%, 3/1/09 (b) | | 2/27/04 | | | 4,374,973 | | | | 4,374,973 | | | | 4,348,545 | | |
| Oak Knoll Village Shopping Center, Austin, TX, 6.73%, 10/1/13 (b) | | 9/17/03 | | | 1,547,647 | | | | 1,547,647 | | | | 1,597,794 | | |
| Office City Plaza, Houston, TX, 6.43%, 6/1/12 (b) | | 5/25/07 | | | 5,590,858 | | | | 5,590,858 | | | | 5,681,848 | | |
| Oyster Point Office Park, Newport News, VA, 6.68%, 2/1/11 (b) (f) | | 1/4/06 | | | 12,200,000 | | | | 12,200,000 | | | | 12,487,574 | | |
| PennMont Office Plaza, Albuquerque, NM, 6.63%, 4/1/11 (b) (f) | | 4/30/01 | | | 1,450,000 | | | | 1,450,000 | | | | 1,474,985 | | |
| Perkins - Blaine, Blaine, MN, 6.63%, 1/1/17 | | 12/13/06 | | | 1,825,000 | | | | 1,825,000 | | | | 1,865,511 | | |
| Raveneaux Country Club, Spring, TX, 7.93%, 7/1/07 (e) (f) | | 12/19/05 | | | 8,800,000 | | | | 8,800,000 | | | | 8,800,000 | | |
| Redwood Dental Building, Taylorsville, UT, 7.40%, 7/1/12 (b) | | 6/28/02 | | | 2,522,576 | | | | 2,522,576 | | | | 2,623,479 | | |
| Robberson Auto Dealerships, Bend and Prineville, OR, 6.40%, 4/1/17 | | 3/30/07 | | | 7,362,499 | | | | 7,362,499 | | | | 7,417,650 | | |
| Signal Butte, Mesa AZ, 6.90%, 5/1/10 (b) (f) | | 6/20/07 | | | 15,000,000 | | | | 15,000,000 | | | | 15,698,071 | | |
| Station Square, Pompano Beach, FL, 6.33%, 2/1/14 (b) | | 1/19/07 | | | 12,000,000 | | | | 12,000,000 | | | | 12,057,546 | | |
| Sundance Plaza, Colorado Springs, CO, 7.13%, 11/1/08 | | 10/29/98 | | | 201,449 | | | | 201,449 | | | | 203,490 | | |
| Waste Connections Warehouse, Englewood, CO, 6.58%, 3/1/14 (b) | | 2/15/07 | | | 1,295,018 | | | | 1,295,018 | | | | 1,314,948 | | |
| Woodmen Corporate Center, Colorado Springs, CO, 8.00%, 9/1/08 (b) (e) (f) | | 8/08/05 | | | 9,950,000 | | | | 9,950,000 | | | | 10,019,352 | | |
| | | | 102,891,872 | | | | 104,273,437 | | |
| Multifamily Loans — 48.8% | |
| Adelphi Springs Apartments, Adelphi, MD, 9.93%, 3/1/09 (g) | | 6/27/03 | | | 5,084,592 | | | | 5,084,592 | | | | 3,559,214 | | |
| Carolina Square Apartments, Tallahassee, FL 6.63%, 8/1/12 (b) (e) (f) | | 7/20/07 | | | 7,875,000 | | | | 7,875,000 | | | | 8,056,523 | | |
| Chardonnay Apartments, Tulsa, OK, 6.40%, 7/1/13 (b) | | 6/5/03 | | | 3,958,748 | | | | 3,958,748 | | | | 2,771,124 | | |
| Hadley Avenue Business Center, Oakdale, MN, 8.38%, 1/1/11 (b) | | 12/14/00 | | | 2,222,268 | | | | 2,222,268 | | | | 2,311,159 | | |
| Highland Ridge & Highland Glen Apartments, Oklahoma City, OK, 14.90%, 10/1/08 (f) | | 9/30/04 | | | 3,850,000 | | | | 3,850,000 | | | | 2,695,000 | | |
| Lake Point Terrace Apartments, Madison, WI, 6.33%, 5/1/17 | | 4/13/07 | | | 5,027,789 | | | | 5,027,789 | | | | 5,074,079 | | |
| Misty Woods/Riverfall Square I, Arlington and Dallas, TX, 8.32%, 9/1/06 (e) (f) | | 7/23/03 | | | 7,966,000 | | | | 7,966,000 | | | | 7,368,550 | | |
| Misty Woods/Riverfall Square II, Arlington and Dallas, TX, 9.88%, 9/1/06 (f) (g) | | 7/23/03 | | | 1,591,000 | | | | 1,591,000 | | | | 1,471,675 | | |
| Oakton Terrace Apartments, Adelphi, MD, 9.88%, 8/1/11 (g) | | 6/27/03 | | | 670,141 | | | | 670,141 | | | | 495,527 | | |
See accompanying Notes to Schedule of Investments.
First American Mortgage Funds 2007 Annual Report
37
Schedule of INVESTMENTS continued
American Strategic Income Portfolio II (continued)
| Description of Security | | Date
Acquired | | Par Value/
Shares | | Cost | | Value (a) | |
| Park Hampshire Apartments, Adelphi, MD, 9.90%, 1/1/13 (g) | | 6/27/03 | | $ | 3,111,280 | | | $ | 3,111,280 | | | $ | 2,177,896 | | |
| RP-Plaza Development, Oxnard, CA, 8.73%, 3/1/10 (e) (f) | | 2/23/05 | | | 5,000,000 | | | | 5,000,000 | | | | 5,064,600 | | |
| Sapphire Skies, Cle Elum, WA, 9.00%, 1/1/09 (e) (f) | | 12/23/05 | | | 9,250,000 | | | | 9,250,000 | | | | 9,250,000 | | |
| Summit Chase Apartments I, Coral Springs, FL, 6.68%, 7/1/07 (e) (f) | | 7/7/05 | | | 12,670,000 | | | | 12,670,000 | | | | 12,670,000 | | |
| Summit Chase Apartments II, Coral Springs, FL, 9.90%, 7/1/07 (f) | | 7/7/05 | | | 2,974,000 | | | | 2,974,000 | | | | 2,081,800 | | |
| Sussex Club Apartments I, Athens, GA, 6.33%, 5/1/10 (b) (f) | | 4/17/07 | | | 9,126,000 | | | | 9,126,000 | | | | 9,245,378 | | |
| Sussex Club Apartments II, Athens, GA, 6.88%, 5/1/10 (f) | | 4/17/07 | | | 1,825,000 | | | | 1,825,000 | | | | 1,673,694 | | |
| Timber Ridge Apartments, Houston, TX, 9.88%, 8/1/13 (f) | | 4/23/02 | | | 500,000 | | | | 500,000 | | | | 470,672 | | |
| Trinity Oaks Apartments I, Dallas, TX, 6.53%, 4/1/09 (b) (e) (f) | | 3/30/06 | | | 7,000,000 | | | | 7,000,000 | | | | 6,060,187 | | |
| Trinity Oaks Apartments II, Dallas, TX, 7.88%, 4/1/09 (f) (g) | | 3/30/06 | | | 1,690,000 | | | | 1,690,000 | | | | 1,183,000 | | |
| Vista Bonita Apartments, Denton, TX, 8.48%, 4/1/08 (b) (e) | | 3/4/05 | | | 2,747,895 | | | | 2,747,895 | | | | 1,923,526 | | |
| Windy Meadows, Arlington, TX, 6.93%, 5/1/10 (b) (f) | | 4/27/07 | | | 6,380,000 | | | | 6,380,000 | | | | 6,559,389 | | |
| Winterland Apartments I, Grand Forks, ND, 9.23%, 7/1/12 | | 6/6/97 | | | 539,104 | | | | 539,104 | | | | 566,059 | | |
| Winterland Apartments II, Grand Forks, ND, 9.23%, 7/1/12 | | 6/6/97 | | | 1,033,281 | | | | 1,033,281 | | | | 1,070,233 | | |
| | | | 102,092,098 | | | | 93,799,285 | | |
| Single Family Loans — 0.1% | |
| Merchants Bank, 2 loans, Vermont, 10.48%, 12/1/20 | | 12/18/92 | | | 59,811 | | | | 60,306 | | | | 60,704 | | |
| PHH U.S. Mortgage, 2 loans, California and Delaware, 8.65%, 1/1/12 | | 12/30/92 | | | 176,382 | | | | 171,116 | | | | 170,445 | | |
| | | | 231,422 | | | | 231,149 | | |
| Total Whole Loans and Participation Mortgages | | | 205,215,392 | | | | 198,303,871 | | |
| Preferred Stocks — 22.8% | |
| Real Estate Investment Trusts — 22.8% | |
| AMB Property, Series L (b) | | | | | 62,000 | | | | 1,583,757 | | | | 1,379,500 | | |
| AMB Property, Series M (b) | | | | | 14,360 | | | | 367,561 | | | | 320,515 | | |
| AMB Property, Series O (b) | | | | | 17,500 | | | | 437,500 | | | | 410,375 | | |
| BRE Properties, Series C (b) | | | | | 62,000 | | | | 1,560,500 | | | | 1,411,740 | | |
| BRE Properties, Series D (b) | | | | | 18,148 | | | | 457,465 | | | | 411,234 | | |
| Developers Diversified Realty, Series H | | | | | 63,700 | | | | 1,636,809 | | | | 1,506,505 | | |
| Developers Diversified Realty, Series I | | | | | 31,600 | | | | 823,427 | | | | 761,244 | | |
| Duke Realty, Series J (b) | | | | | 38,244 | | | | 974,588 | | | | 864,314 | | |
| Duke Realty, Series K (b) | | | | | 43,000 | | | | 1,081,863 | | | | 967,500 | | |
| Duke Realty, Series L (b) | | | | | 12,000 | | | | 302,160 | | | | 270,360 | | |
| Duke Realty, Series M (b) | | | | | 8,000 | | | | 200,000 | | | | 191,360 | | |
| Equity Residential Properties, Series N (b) | | | | | 125,000 | | | | 3,136,834 | | | | 2,831,250 | | |
| Health Care Properties, Series E (b) | | | | | 10,000 | | | | 257,000 | | | | 235,000 | | |
| Health Care Properties, Series F (b) | | | | | 46,235 | | | | 1,166,230 | | | | 1,069,416 | | |
| Hospitality Properties Trust, Series C (b) | | | | | 160,000 | | | | 4,000,000 | | | | 3,600,000 | | |
| HRPT Properties, Series C (b) | | | | | 100,000 | | | | 2,500,000 | | | | 2,415,000 | | |
| Kimco Realty, Series B (b) | | | | | 58,000 | | | | 1,406,500 | | | | 1,400,700 | | |
| Prologis Trust, Series F (b) | | | | | 35,120 | | | | 892,477 | | | | 833,398 | | |
| Prologis Trust, Series G (b) | | | | | 43,190 | | | | 1,098,075 | | | | 1,021,012 | | |
| PS Business Parks, Series H (b) | | | | | 35,000 | | | | 868,036 | | | | 799,750 | | |
| PS Business Parks, Series I (b) | | | | | 20,000 | | | | 485,578 | | | | 450,400 | | |
| PS Business Parks, Series M | | | | | 43,180 | | | | 1,077,682 | | | | 1,003,935 | | |
| Public Storage, Series A (b) | | | | | 40,000 | | | | 977,346 | | | | 920,400 | | |
| Public Storage, Series B (b) | | | | | 22,200 | | | | 543,900 | | | | 553,002 | | |
| Public Storage, Series E (b) | | | | | 15,000 | | | | 377,550 | | | | 351,000 | | |
| Public Storage, Series L (b) | | | | | 21,500 | | | | 498,800 | | | | 496,005 | | |
| Public Storage, Series M (b) | | | | | 80,000 | | | | 2,000,000 | | | | 1,830,400 | | |
| Public Storage, Series X (b) | | | | | 20,000 | | | | 497,779 | | | | 442,000 | | |
| Public Storage, Series Z (b) | | | | | 20,000 | | | | 502,366 | | | | 450,000 | | |
| Realty Income, Series D (b) | | | | | 90,000 | | | | 2,281,500 | | | | 2,214,000 | | |
| Realty Income, Series E (b) | | | | | 49,500 | | | | 1,247,400 | | | | 1,145,925 | | |
| Regency Centers, Series C (b) | | | | | 7,500 | | | | 186,000 | | | | 180,150 | | |
| Regency Centers, Series D (b) | | | | | 48,238 | | | | 1,244,275 | | | | 1,160,124 | | |
| Regency Centers, Series E (b) | | | | | 50,000 | | | | 1,245,000 | | | | 1,096,875 | | |
| UDR, Series G (b) | | | | | 120,000 | | | | 3,000,000 | | | | 2,728,800 | | |
See accompanying Notes to Schedule of Investments.
First American Mortgage Funds 2007 Annual Report
38
American Strategic Income Portfolio II (continued)
| Description of Security | | Shares | | Cost | | Value (a) | |
| Vornado Realty Trust, Series F (b) | | | 65,000 | | | $ | 1,611,277 | | | $ | 1,452,100 | | |
| Vornado Realty Trust, Series G (b) | | | 11,000 | | | | 257,950 | | | | 245,300 | | |
| Vornado Realty Trust, Series I (b) | | | 16,000 | | | | 374,000 | | | | 356,480 | | |
| Weingarten Realty Investors, Series F (b) | | | 182,500 | | | | 4,489,375 | | | | 4,095,300 | | |
| Total Preferred Stocks | | | | | | | 47,648,560 | | | | 43,872,369 | | |
| Total Investments in Unaffiliated Securities | | | | | | | 273,508,632 | | | | 263,101,614 | | |
| Short-Term Investment (h) — 0.7% | |
| First American Prime Obligations Fund, Class Z | | | 1,276,848 | | | | 1,276,848 | | | | 1,276,848 | | |
| Total Investments in Securities (i) — 137.6% | | | | | | $ | 274,785,480 | | | $ | 264,378,462 | | |
| Other Assets and Liabilities, Net — (37.6)% | | | | | | | | | | | (72,211,815 | ) | |
| Total Net Assets — 100.0% | | | | | | | | | | $ | 192,166,647 | | |
Notes to Schedule of Investments:
(a) Securities are valued in accordance with procedures described in note 2 in Notes to Financial Statements.
(b) On August 31, 2007, securities valued at $168,710,571 were pledged as collateral for the following outstanding reverse repurchase agreements:
| Amount | | Acquisition
Date | | Rate* | | Due | | Accrued
Interest | | Name of Broker
and Description
of Collateral | |
| $ | 6,709,265 | | | 8/8/07 | | | 5.40 | % | | 9/7/07 | | $ | 24,153 | | | | (1 | ) | |
| | 45,500,000 | | | 8/1/07 | | | 6.20 | % | | 9/4/07 | | | 243,017 | | | | (2 | ) | |
| | 1,000,000 | | | 8/7/07 | | | 6.21 | % | | 9/4/07 | | | 4,309 | | | | (2 | ) | |
| | 19,021,800 | | | 8/8/07 | | | 6.03 | % | | 9/7/07 | | | 54,268 | | | | (3 | ) | |
| | 743,000 | | | 8/15/07 | | | 6.03 | % | | 9/7/07 | | | 2,116 | | | | (3 | ) | |
| | 250,000 | | | 8/24/07 | | | 6.03 | % | | 9/7/07 | | | 335 | | | | (3 | ) | |
| $ | 73,224,065 | | | | | | | | | | | $ | 328,198 | | | | | | |
* Interest rate as of August 31, 2007. Rate is based on the London InterBank Offered Rate (LIBOR) plus a spread and reset monthly.
Name of broker and description of collateral:
(1) Morgan Stanley:
Federal Home Loan Mortgage Corporation, 5.50%, 1/1/18, $3,635,072 par
Federal Home Loan Mortgage Corporation, 9.00%, 7/1/30, $160,768 par
Federal National Mortgage Association, 6.00%, 10/1/16, $253,921 par
Federal National Mortgage Association, 5.50%, 6/1/17, $328,270 par
Federal National Mortgage Association, 5.00%, 9/1/17, $533,728 par
Federal National Mortgage Association, 5.00%, 11/1/17, $1,082,818 par
Federal National Mortgage Association, 6.50%, 6/1/29, $1,171,439 par
Federal National Mortgage Association, 7.50%, 4/1/30, $48,208 par
Federal National Mortgage Association, 7.50%, 5/1/30, $128,835 par
Federal National Mortgage Association, 8.00%, 5/1/30, $42,181 par
Federal National Mortgage Association, 8.00%, 6/1/30, $167,690 par
(2) Morgan Stanley:
5555 East Van Buren I, 5.68%, 7/1/11, $6,415,600 par
Bigelow Office Building, 6.38%, 4/1/17, $1,153,548 par
Carolina Square Apartments, 6.63%, 8/1/12, $7,875,000 par
Chardonnay Apartments, 6.40%, 7/1/13, $3,958,748 par
Cypress Point Office Park I, 5.30%, 6/1/09, $4,506,585 par
Cypress Point Office Park II, 5.30%, 7/1/09, $4,378,408 par
Hadley Avenue Business Center, 8.38%, 1/1/11, $2,222,268 par
LaCosta Centre, 5.20%, 3/1/09, $4,374,973 par
Oak Knoll Village Shopping Center, 6.73%, 10/1/13, $1,547,647 par
Office City Plaza, 6.43%, 6/1/12, $5,590,858 par
Oyster Point Office Park, 6.68%, 2/1/11, $12,200,000 par
PennMont Office Plaza, 6.63%, 4/1/11, $1,450,000 par
Redwood Dental Building, 7.40%, 7/1/12, $2,522,576 par
Signal Butte, 6.90%, 5/1/10, $15,000,000 par
Station Square, 6.33%, 2/1/14, $12,000,000 par
Sussex Club Apartments I, 6.33%, 5 /1/10, $9,126,000 par
Trinity Oaks Apartments I, 6.53%, 4/1/09, $7,000,000 par
First American Mortgage Funds 2007 Annual Report
39
Schedule of INVESTMENTS continued
American Strategic Income Portfolio II (concluded)
Vista Bonita Apartments, 8.48%, 4/1/08, $2,747,895 par
Waste Connections Warehouse, 6.58%, 3/1/14, 1,295,018 par
Windy Meadows, 6.93%, 5/1/10, $6,380,000 par
Woodmen Corporate Center, 8.00%, 9/1/08, $9,950,000 par
(3) Dresdner Bank:
AMB Property, Series L, 62,000 shares
AMB Property, Series M, 14,360 shares
AMB Property, Series O, 17,500 shares
BRE Properties, Series C, 62,000 shares
BRE Properties, Series D, 18,148 shares
Duke Realty, Series J, 38,244 shares
Duke Realty, Series K, 43,000 shares
Duke Realty, Series L, 12,000 shares
Duke Realty, Series M, 8,000 shares
Equity Residential Properties, Series N, 125,000 shares
Health Care Properties, Series E, 10,000 shares
Health Care Properties, Series F, 46,235 shares
Hospitality Properties Trust, Series C, 160,000 shares
HRPT Properties, Series C, 100,000 shares
Kimco Realty, Series B, 58,000 shares
Prologis Trust, Series F, 35,120 shares
Prologis Trust, Series G, 43,190 shares
PS Business Parks, Series H, 35,000 shares
PS Business Parks, Series I, 20,000 shares
Public Storage, Series A, 40,000 shares
Pub lic Storage, Series B, 22,200 shares
Public Storage, Series E, 15,000 shares
Public Storage, Series L, 21,500 shares
Public Storage, Series M, 80,000 shares
Public Storage, Series X, 20,000 shares
Public Storage, Series Z, 20,000 shares
Realty Income, Series D, 90,000 shares
Realty Income, Series E, 49,500 shares
Regency Centers, Series C, 7,500 shares
Regency Centers, Series D, 48,238 shares
Regency Centers, Series E, 50,000 shares
UDR, Series G, 120,000 shares
Vornado Realty Trust, Series F, 65,000 shares
Vornado Realty Trust, Series G, 11,000 shares
Vornado Realty Trust, Series I, 16,000 shares
Weingarten Realty Investors, Series F, 182,500 shares
The fund has entered into a lending commitment with Morgan Stanley. The agreement permits the fund to enter into reverse repurchase agreements up to $70,000,000 using whole loans as collateral. The fund pays a fee of 0.15% to Morgan Stanley on any unused portion of the $70,000,000 lending commitment.
The fund has entered into a lending commitment with Dresdner Bank. The agreement permits the fund to enter into reverse repurchase agreements up to $15,000,000 using preferred stock as collateral. The fund pays a fee of 0.25% to Dresdner Bank on any unused portion of the $15,000,000 lending commitment.
(c) Securities purchased as part of a private placement which have not been registered with the Securities and Exchange Commission under the Securities Act of 1933 and which are considered to be illiquid. These securities are fair valued in accordance with the board approved valuation procedures. On August 31, 2007, the total value of securities was $211,653,571 or 110.1% of net assets See note 2 in Notes to Financials Statements.
(d) Interest rates on commercial and multifamily loans are the net coupon rates (after reducing the coupon rate by any mortgage servicing fees paid to mortgage servicers) in effect on August 31, 2007. Interest rates and maturity dates disclosed on single family loans represent the weighted average coupon and weighted average maturity for the underlying mortgage loans as of August 31, 2007.
(e) Variable Rate Security – The rate shown is the net coupon rate in effect as of August 31, 2007.
(f) Interest only – Represents securities that entitle holders to receive only interest payments on the mortgages. Principal balance of the loan is due at maturity. The interest rate disclosed represents the net coupon rate in effect as of August 31, 2007.
(g) Loan or a portion of this loan not current on interest and/or principal payments.
(h) Investment in affiliated security. This money market fund is advised by FAF Advisors, Inc., which also serves as advisor for the fund.
(i) On August 31, 2007, the cost of investments in securities for federal income tax purposes was $274,946,924. The aggregate gross unrealized appreciation and depreciation of investments in securities, based on this cost, were as follows:
| Gross unrealized appreciation | | $ | 2,736,534 | | |
| Gross unrealized depreciation | | | (13,304,996 | ) | |
| Net unrealized depreciation | | $ | (10,568,462 | ) | |
First American Mortgage Funds 2007 Annual Report
40
American Strategic Income Portfolio III August 31, 2007
| Description of Security | | Date
Acquired | | Par Value | | Cost | | Value (a) | |
| (Percentages of each investment category relate to net assets) | |
| U.S. Government Agency Mortgage-Backed Securities (b) — 3.0% | |
| Fixed Rate — 3.0% | |
| Federal Home Loan Mortgage Corporation, | |
| 5.50%, 1/1/18, #E93231 | | | | $ | 3,635,072 | | | $ | 3,729,498 | | | $ | 3,625,226 | | |
| 9.00%, 7/1/30, #C40149 | | | | | 225,073 | | | | 230,539 | | | | 243,822 | | |
| Federal National Mortgage Association, | |
| 6.00%, 10/1/16, #607030 | | | | | 253,921 | | | | 255,061 | | | | 257,207 | | |
| 5.50%, 2/1/17, #623874 | | | | | 515,710 | | | | 514,686 | | | | 514,686 | | |
| 5.50%, 6/1/17, #648508 | | | | | 328,270 | | | | 329,642 | | | | 327,376 | | |
| 5.00%, 9/1/17, #254486 | | | | | 533,728 | | | | 534,915 | | | | 523,877 | | |
| 5.00%, 11/1/17, #657356 | | | | | 1,082,818 | | | | 1,087,630 | | | | 1,062,833 | | |
| 6.50%, 6/1/29, #252497 | | | | | 820,008 | | | | 814,954 | | | | 839,094 | | |
| 7.50%, 4/1/30, #532867 | | | | | 43,206 | | | | 41,877 | | | | 45,176 | | |
| 7.50%, 5/1/30, #535289 | | | | | 128,835 | | | | 124,877 | | | | 134,710 | | |
| 8.00%, 5/1/30, #538266 | | | | | 42,181 | | | | 41,694 | | | | 44,453 | | |
| 8.00%, 6/1/30, #253347 | | | | | 150,921 | | | | 149,174 | | | | 159,050 | | |
| Total U.S. Government Agency Mortgage-Backed Securities | | | 7,854,547 | | | | 7,777,510 | | |
| Corporate Notes (c) — 6.0% | |
| Fixed Rate — 6.0% | |
| Stratus Properties IV, 6.56%, 12/31/11 | | 12/12/06 | | | 7,000,000 | | | | 7,000,000 | | | | 7,188,300 | | |
| Stratus Properties VI, 6.92%, 12/31/11 | | 6/1/07 | | | 8,000,000 | | | | 8,000,000 | | | | 8,240,000 | | |
| Total Corporate Notes | | | 15,000,000 | | | | 15,428,300 | | |
| Private Mortgage-Backed Security (c) — 0.0% | |
| Fixed Rate — 0.0% | |
| First Gibraltar, Series 1992-MM, Class B, 8.79%, 10/25/21 | | 7/30/93 | | | 132,846 | | | | 75,301 | | | | — | | |
| Whole Loans and Participation Mortgages (c) (d) — 92.2% | |
| Commercial Loans — 57.5% | |
| 150 North Pantano I, Tucson, AZ, 8.40%, 2/1/08 (e) (f) | | 1/7/05 | | | 3,525,000 | | | | 3,525,000 | | | | 3,466,250 | | |
| 150 North Pantano II, Tucson, AZ, 14.88%, 2/1/08 (f) | | 1/7/05 | | | 440,000 | | | | 440,000 | | | | 413,111 | | |
| 8324 East Hartford Drive I, Scottsdale, AZ, 5.15%, 5/1/09 (b) (f) | | 4/8/04 | | | 3,787,979 | | | | 3,787,979 | | | | 3,751,851 | | |
| Academy Spectrum, Colorado Springs, CO, 7.70%, 5/1/09 (b) | | 12/18/02 | | | 5,039,114 | | | | 5,039,114 | | | | 5,139,896 | | |
| Alliant University, Fresno, CA, 7.15%, 8/1/11 (b) (f) | | 7/12/06 | | | 2,800,000 | | | | 2,800,000 | | | | 2,917,338 | | |
| Apple Blossom Convenience Center, Winchester, VA, 6.58%, 8/1/12 (f) | | 7/9/07 | | | 2,150,000 | | | | 2,150,000 | | | | 2,200,635 | | |
| Biltmore Lakes Corporate Center, Phoenix, AZ, 6.00%, 9/1/09 (b) | | 8/2/04 | | | 3,285,503 | | | | 3,285,503 | | | | 3,269,994 | | |
| Carrier 360, Grand Prairie, TX, 5.40%, 7/1/09 (b) | | 6/28/04 | | | 3,289,831 | | | | 3,289,831 | | | | 3,203,595 | | |
| Carrier 360 II, Grand Prairie, TX, 5.88%, 7/1/09 | | 12/16/05 | | | 340,378 | | | | 340,378 | | | | 290,702 | | |
| Fairview Business Park, Salem, OR, 7.33%, 8/1/11(b) (f) | | 7/14/06 | | | 7,600,000 | | | | 7,600,000 | | | | 7,903,809 | | |
| First Colony Marketplace, Sugar Land, TX, 6.43%, 09/01/10 (f) | | 8/15/07 | | | 12,900,000 | | | | 12,900,000 | | | | 13,023,562 | | |
| France Avenue Business Park II, Brooklyn Park, MN, 7.40%, 10/1/12 (b) | | 9/12/02 | | | 4,390,546 | | | | 4,390,546 | | | | 4,610,073 | | |
| Jilly's American Grill, Scottsdale, AZ, 7.70%, 9/1/08 (b) (e) (f) | | 8/19/05 | | | 1,810,000 | | | | 1,810,000 | | | | 1,810,000 | | |
| La Cholla Plaza I, Tucson, AZ, 8.50%, 8/1/09 (b) (e) (f) | | 7/26/06 | | | 13,625,000 | | | | 13,625,000 | | | | 13,625,000 | | |
| La Cholla Plaza II, Tucson, AZ, 14.88%, 8/1/09 (f) | | 7/26/06 | | | 1,700,000 | | | | 1,700,000 | | | | 1,644,903 | | |
| Memphis Medical Building, Memphis, TN, 6.40%, 09/01/12 (f) | | 8/22/07 | | | 4,250,000 | | | | 4,250,000 | | | | 4,294,905 | | |
| NCH Commercial Pool, Tucson, AZ, 11.93%, 4/1/10 (f) | | 3/27/07 | | | 5,500,000 | | | | 5,500,000 | | | | 5,600,239 | | |
| Noah's Ark Self Storage, San Antonio, TX, 6.48%, 09/01/10 (f) | | 8/24/07 | | | 2,400,000 | | | | 2,400,000 | | | | 2,422,215 | | |
| North Austin Business Center, Austin, TX, 5.65%, 11/1/11 (b) | | 11/1/04 | | | 3,984,592 | | | | 3,984,592 | | | | 3,938,507 | | |
| Outlets at Casa Grande, Casa Grande, AZ, 6.93%, 3/1/11 (b) (f) | | 2/27/06 | | | 7,300,000 | | | | 7,300,000 | | | | 7,534,291 | | |
| Outlets at Casa Grande II, Casa Grande, AZ, 6.90%, 3/1/11 (f) | | 4/11/07 | | | 3,500,000 | | | | 3,500,000 | | | | 3,609,328 | | |
| Paradise Boulevard, Albuquerque, NM, 6.50%, 3/1/17 (f) | | 3/26/07 | | | 4,600,000 | | | | 4,600,000 | | | | 4,702,314 | | |
| Preston Trail Village I, Dallas, TX, 8.50%, 12/1/07 (b) (e) (f) | | 11/18/05 | | | 16,850,792 | | | | 16,850,792 | | | | 16,850,792 | | |
| Preston Trail Village II, Dallas, TX, 13.38%, 12/1/07 (f) | | 11/18/05 | | | 2,500,000 | | | | 2,500,000 | | | | 1,864,866 | | |
See accompanying Notes to Schedule of Investments.
First American Mortgage Funds 2007 Annual Report
41
Schedule of INVESTMENTS continued
American Strategic Income Portfolio III (continued)
| Description of Security | | Date
Acquired | | Par Value/
Shares | | Cost | | Value (a) | |
| RealtiCorp Fund III, Orlando/Crystal River, FL, 10.32%, 9/1/07 (e) (f) | | 2/28/06 | | $ | 4,222,755 | | | $ | 4,222,755 | | | $ | 4,222,755 | | |
| Shoppes at Jonathan's Landing, Jupiter, FL, 7.95%, 5/1/10 (b) | | 4/12/00 | | | 2,765,631 | | | | 2,765,631 | | | | 2,848,600 | | |
| Spa Atlantis, Pompano Beach, FL, 8.50%, 10/1/08 (e) (f) | | 9/30/05 | | | 19,281,600 | | | | 19,281,600 | | | | 19,474,416 | | |
| Tatum Ranch Center, Phoenix, AZ, 6.53%, 9/1/11 (b) | | 8/25/04 | | | 3,548,671 | | | | 3,548,671 | | | | 3,423,373 | | |
| | | | 147,387,392 | | | | 148,057,320 | | |
| Multifamily Loans — 34.7% | |
| Avalon Hills I, Omaha, NE, 6.93%, 3/1/10 (b) (f) | | 3/1/07 | | | 10,720,000 | | | | 10,720,000 | | | | 10,952,172 | | |
| Avalon Hills II, Omaha, NE, 9.88%, 3/1/10 (f) | | 3/1/07 | | | 2,144,000 | | | | 2,144,000 | | | | 1,919,814 | | |
| Citadel Apartments I, El Paso, TX, 6.53%, 4/1/10 (f) | | 3/30/07 | | | 10,300,000 | | | | 10,300,000 | | | | 10,403,000 | | |
| Citadel Apartments II, El Paso, TX, 9.88%, 4/1/10 (f) | | 3/30/07 | | | 500,000 | | | | 500,000 | | | | 489,554 | | |
| Country Villa Apartments, West Lafayette, IN, 6.90%, 9/1/13 (b) | | 8/29/03 | | | 2,496,566 | | | | 2,496,566 | | | | 2,593,503 | | |
| Courtyards at Mesquite I, Mesquite, TX, 6.53%, 11/1/09 (b) (f) | | 10/14/05 | | | 7,600,000 | | | | 7,600,000 | | | | 7,648,735 | | |
| Courtyards at Mesquite II, Mesquite, TX, 7.90%, 11/1/09 (f) (g) | | 10/14/05 | | | 2,850,000 | | | | 2,850,000 | | | | 2,042,049 | | |
| El Dorado Apartments I, Tucson, AZ, 7.60%, 9/1/07 (b) (e) | | 8/26/04 | | | 2,550,269 | | | | 2,550,269 | | | | 2,422,756 | | |
| El Dorado Apartments II, Tucson, AZ, 14.90%, 9/1/07 (f) | | 8/26/04 | | | 500,000 | | | | 500,000 | | | | 386,481 | | |
| Geneva Village Apartments I, West Jordan, UT, 7.00%, 1/1/14 (b) | | 12/24/03 | | | 1,319,693 | | | | 1,319,693 | | | | 1,377,984 | | |
| Geneva Village Apartments II, West Jordan, UT, 9.88%, 1/1/13 | | 12/24/03 | | | 53,221 | | | | 53,221 | | | | 52,983 | | |
| Good Haven Apartments I, Dallas, TX, 8.57%, 9/1/07 (e) (f) (g) (h) | | 8/24/04 | | | 6,737,000 | | | | 6,737,000 | | | | 4,715,900 | | |
| Good Haven Apartments II, Dallas, TX, 14.88%, 9/1/07 (f) (g) (h) | | 8/24/04 | | | 842,000 | | | | 842,000 | | | | 589,400 | | |
| Lions Park Apartments I, Elk River, MN, 5.20%, 4/1/09 (b) | | 3/25/04 | | | 3,383,442 | | | | 3,383,442 | | | | 3,343,025 | | |
| Lions Park Apartments II, Elk River, MN, 11.88%, 4/1/09 | | 3/25/04 | | | 98,601 | | | | 98,601 | | | | 96,625 | | |
| Meadowview Village Apartments I, West Jordan, UT, 7.00%, 1/1/14 | | 12/24/03 | | | 957,842 | | | | 957,842 | | | | 1,000,149 | | |
| Meadowview Village Apartments II, West Jordan, UT, 9.88%, 1/1/13 | | 12/24/03 | | | 53,221 | | | | 53,221 | | | | 52,983 | | |
| Meridian Pointe Apartments, Kalispell, MT, 8.73%, 2/1/12 | | 3/7/97 | | | 1,063,636 | | | | 1,063,636 | | | | 1,116,818 | | |
| Montevista Apartments, Fort Worth, TX, 7.43%, 09/01/12 (f) | | 8/30/07 | | | 7,308,000 | | | | 7,308,000 | | | | 5,696,141 | | |
| NCH Multifamily Pool, Oklahoma City, OK, 11.93%, 11/1/09 (f) | | 10/17/06 | | | 5,800,000 | | | | 5,800,000 | | | | 5,877,950 | | |
| Parkway Village Apartments I, West Jordan, UT, 7.00%, 1/1/14 | | 12/24/03 | | | 910,743 | | | | 910,743 | | | | 946,180 | | |
| Parkway Village Apartments II, West Jordan, UT, 9.88%, 1/1/13 | | 12/24/03 | | | 53,221 | | | | 53,221 | | | | 52,983 | | |
| Plantation Pines I, Tyler, TX, 6.59%, 2/1/10 (b) (f) | | 1/17/07 | | | 3,328,000 | | | | 3,328,000 | | | | 3,373,746 | | |
| Plantation Pines II, Tyler, TX, 10.57%, 2/1/10 (f) | | 1/17/07 | | | 416,000 | | | | 416,000 | | | | 378,981 | | |
| Villas of Woodgate, Lansing, MI, 6.40%, 2/1/12 (b) | | 2/1/07 | | | 3,630,571 | | | | 3,630,571 | | | | 3,675,908 | | |
| Vista Village Apartments I, El Paso, TX, 6.53%, 4/1/10 (f) | | 3/30/07 | | | 6,100,000 | | | | 6,100,000 | | | | 6,161,000 | | |
| Vista Village Apartments II, El Paso, TX, 9.88%, 4/1/10 (f) | | 3/30/07 | | | 350,000 | | | | 350,000 | | | | 342,688 | | |
| Westchase Apartments, Austell, GA, 7.50%, 8/1/07 (b) (e) (f) | | 8/12/03 | | | 3,656,617 | | | | 3,656,617 | | | | 3,656,617 | | |
| Whispering Oaks I, Little Rock, AR, 6.25%, 2/1/10 (b) (f) | | 1/10/07 | | | 6,800,000 | | | | 6,800,000 | | | | 6,849,691 | | |
| Whispering Oaks II, Little Rock, AR, 9.88%, 2/1/10 (f) | | 1/10/07 | | | 1,360,000 | | | | 1,360,000 | | | | 1,129,890 | | |
| | | | 93,882,643 | | | | 89,345,706 | | |
| Total Whole Loans and Participation Mortgages | | | 241,270,035 | | | | 237,403,026 | | |
| Preferred Stocks — 21.4% | |
| Real Estate Investment Trusts — 21.4% | |
| AMB Property, Series L (b) | | | | | 97,000 | | | | 2,473,891 | | | | 2,158,250 | | |
| AMB Property, Series M (b) | | | | | 21,240 | | | | 543,889 | | | | 474,077 | | |
| AMB Property, Series O (b) | | | | | 12,500 | | | | 312,500 | | | | 293,125 | | |
| BRE Properties, Series C (b) | | | | | 93,600 | | | | 2,362,220 | | | | 2,131,272 | | |
| BRE Properties, Series D (b) | | | | | 32,918 | | | | 823,501 | | | | 745,922 | | |
| Developers Diversified Realty, Series G | | | | | 400 | | | | 10,380 | | | | 9,968 | | |
| Developers Diversified Realty, Series H | | | | | 63,000 | | | | 1,634,450 | | | | 1,489,950 | | |
| Developers Diversified Realty, Series I | | | | | 59,000 | | | | 1,538,322 | | | | 1,421,310 | | |
| Duke Realty, Series J (b) | | | | | 20,956 | | | | 535,385 | | | | 473,606 | | |
| Duke Realty, Series K (b) | | | | | 94,000 | | | | 2,361,279 | | | | 2,115,000 | | |
| Duke Realty, Series M (b) | | | | | 2,000 | | | | 50,000 | | | | 47,840 | | |
| Equity Residential Properties, Series N (b) | | | | | 125,000 | | | | 3,150,150 | | | | 2,831,250 | | |
| Health Care Properties, Series E (b) | | | | | 14,990 | | | | 385,068 | | | | 352,265 | | |
| Health Care Properties, Series F (b) | | | | | 96,800 | | | | 2,444,530 | | | | 2,238,984 | | |
See accompanying Notes to Schedule of Investments.
First American Mortgage Funds 2007 Annual Report
42
American Strategic Income Portfolio III (continued)
| Description of Security | | Shares | | Cost | | Value (a) | |
| Hospitality Property Trust, Series C (b) | | | 165,000 | | | $ | 4,080,900 | | | $ | 3,712,500 | | |
| HRPT Property Trust, Series C (b) | | | 100,000 | | | | 2,500,000 | | | | 2,415,000 | | |
| Kimco Realty, Series F (b) | | | 113,000 | | | | 2,754,500 | | | | 2,728,950 | | |
| Post Properties, Series B | | | 1,600 | | | | 39,940 | | | | 40,000 | | |
| Prologis Trust, Series F (b) | | | 54,580 | | | | 1,384,051 | | | | 1,295,183 | | |
| Prologis Trust, Series G (b) | | | 65,210 | | | | 1,654,640 | | | | 1,541,564 | | |
| PS Business Parks, Series H (b) | | | 35,000 | | | | 864,224 | | | | 799,750 | | |
| PS Business Parks, Series I (b) | | | 20,000 | | | | 488,475 | | | | 450,400 | | |
| PS Business Parks, Series L | | | 7,000 | | | | 179,550 | | | | 168,000 | | |
| PS Business Parks, Series M | | | 59,610 | | | | 1,487,689 | | | | 1,385,933 | | |
| Public Storage, Series A (b) | | | 38,000 | | | | 921,909 | | | | 874,380 | | |
| Public Storage, Series M (b) | | | 100,000 | | | | 2,500,000 | | | | 2,288,000 | | |
| Public Storage, Series X (b) | | | 30,000 | | | | 746,643 | | | | 663,000 | | |
| Public Storage, Series Z (b) | | | 59,000 | | | | 1,481,818 | | | | 1,327,500 | | |
| Realty Income, Series D (b) | | | 97,500 | | | | 2,474,125 | | | | 2,398,500 | | |
| Realty Income, Series E (b) | | | 74,550 | | | | 1,813,660 | | | | 1,725,833 | | |
| Regency Centers, Series C (b) | | | 68,424 | | | | 1,769,778 | | | | 1,645,597 | | |
| Regency Centers, Series D (b) | | | 72,700 | | | | 1,813,905 | | | | 1,594,856 | | |
| UDR, Series G (b) | | | 120,000 | | | | 3,000,000 | | | | 2,728,800 | | |
| Vornado Realty Trust, Series E (b) | | | 7,400 | | | | 186,598 | | | | 174,196 | | |
| Vornado Realty Trust, Series F (b) | | | 65,000 | | | | 1,605,423 | | | | 1,452,100 | | |
| Vornado Realty Trust, Series G (b) | | | 41,850 | | | | 1,004,886 | | | | 933,255 | | |
| Vornado Realty Trust, Series I (b) | | | 18,000 | | | | 420,500 | | | | 401,040 | | |
| Weingarten Realty Investors, Series F (b) | | | 242,500 | | | | 5,989,375 | | | | 5,441,700 | | |
| Total Preferred Stocks | | | | | | | 59,788,154 | | | | 54,968,856 | | |
| Total Investments in Unaffiliated Securities | | | | | | | 323,988,037 | | | | 315,577,692 | | |
| Real Estate Owned (i) — 1.8% | |
| Chateau Club Apartments, Athens, GA | | | | | | | 6,510,779 | | | | 4,550,000 | | |
| Short-Term Investment (j) — 0.5% | |
| First American Prime Obligations Fund, Class Z | | | 1,428,629 | | | | 1,428,629 | | | | 1,428,629 | | |
| Total Investments in Securities (k) — 124.9% | | | | | | $ | 331,927,445 | | | $ | 321,556,321 | | |
| Other Assets and Liabilities, Net — (24.9)% | | | | | | | | | | | (64,088,660 | ) | |
| Total Net Assets — 100.0% | | | | | | | | | | $ | 257,467,661 | | |
Notes to Schedule of Investments:
(a) Securities are valued in accordance with procedures described in note 2 in Notes to Financial Statements.
(b) On August 31, 2007, securities valued at $184,952,461 were pledged as collateral for the following outstanding reverse repurchase agreements:
Amount | |
Acquisition
Date | |
Rate* | |
Due | |
Accrued
Interest | | Name of Broker
and Description
of Collateral | |
| $ | 7,057,714 | | | 8/8/07 | | | 5.40 | % | | 9/7/07 | | $ | 25,408 | | | | (1 | ) | |
| | 6,000,000 | | | 8/1/07 | | | 6.20 | % | | 9/4/07 | | | 32,046 | | | | (2 | ) | |
| | 13,000,000 | | | 8/14/07 | | | 6.46 | % | | 9/4/07 | | | 42,014 | | | | (2 | ) | |
| | 4,500,000 | | | 8/21/07 | | | 6.38 | % | | 9/4/07 | | | 8,766 | | | | (2 | ) | |
| | 2,500,000 | | | 8/23/07 | | | 6.38 | % | | 9/4/07 | | | 3,987 | | | | (2 | ) | |
| | 7,000,000 | | | 8/29/07 | | | 6.44 | % | | 9/4/07 | | | 3,757 | | | | (2 | ) | |
| | 24,368,000 | | | 8/8/07 | | | 6.03 | % | | 9/7/07 | | | 72,959 | | | | (3 | ) | |
| | 537,000 | | | 8/24/07 | | | 6.03 | % | | 9/7/07 | | | 720 | | | | (3 | ) | |
| $ | 64,962,714 | | | | | | | | | | | $ | 189,657 | | | | | | |
* Interest rate as of August 31, 2007. Rate is based on the London InterBank Offered Rate (LIBOR) plus a spread and reset monthly.
First American Mortgage Funds 2007 Annual Report
43
Schedule of INVESTMENTS continued
American Strategic Income Portfolio III (continued)
Name of broker and description of collateral:
(1) Morgan Stanley:
Federal Home Loan Mortgage Corporation, 5.50%, 1/1/18, $3,635,072 par
Federal Home Loan Mortgage Corporation, 9.00%, 7/1/30, $225,073 par
Federal National Mortgage Association, 6.00%, 10/1/16, $253,921 par
Federal National Mortgage Association, 5.50%, 2/1/17, $515,710 par
Federal National Mortgage Association, 5.50%, 6/1/17, $328,270 par
Federal National Mortgage Association, 5.00%, 9/1/17, $533,728 par
Federal National Mortgage Association, 5.00%, 11/1/17, $1,082,818 par
Federal National Mortgage Association, 6.50%, 6/1/29, $820,008 par
Federal National Mortgage Association, 7.50%, 4/1/30, $43,206 par
Federal National Mortgage Association, 7.50%, 5/1/30, $128,835 par
Federal National Mortgage Association, 8.00%, 5/1/30, $42,181 par
Federal National Mortgage Association, 8.00%, 6/1/30, $150,921 par
(2) Morgan Stanley:
8324 East Hartford Drive I, 5.15%, 5/1/09, $3,787,979 par
Academy Spectrum, 7.70%, 5/1/09, $5,039,114 par
Alliant University, 7.15%, 8/1/11, $2,800,000 par
Avalon Hills I, 6.93%, 3/1/10, $10,720,000 par
Biltmore Lakes Corporate Center, 6.00%, 9/1/09, $3,285,503 par
Carrier 360, 5.40%, 7/1/09, $3,289,831 par
Country Villa Apartments, 6.90%, 9/1/13, $2,496,566 par
Courtyards at Mesquite I, 6.53%, 11/1/09, $7,600,000 par
El Dorado Apartments I, 7.60%, 9/1/07, $2,550,269 par
Fairview Business Park, 7.33%, 8/1/11, $7,600,000 par
France Avenue Business Park II, 7.40%, 10/1/12, $4,390,546 par
Geneva Village Apartments I, 7.00%, 1/1/14, $1,319,693 par
Jilly's American Grill, 7.70%, 9/1/08, $1,810,000 par
La Cholla Plaza I, 8.50%, 8/1/09, $13,625,000 par
Lions Park Apartments I, 5.20%, 4/1/09, $3,383,442 par
North Austin Business Center, 5.65%, 11/ 1/11, $3,984,592 par
Outlets at Casa Grande, 6.93%, 3/1/11, $7,300,000 par
Plantation Pines I, 6.59%, 2/1/10, $3,328,000 par
Preston Trail Village I, 8.50%, 12/1/07, $16,850,792 par
Shoppes at Jonathan's Landing, 7.95%, 5/1/10, $2,765,631 par
Tatum Ranch Center, 6.53%, 9/1/11, $3,548,671 par
Villas of Woodgate, 6.40%, 2/1/12, $3,630,571 par
Westchase Apartments, 7.50%, 8/1/07, $3,656,617 par
Whispering Oaks I, 6.25%, 2/1/10, $6,800,000 par
(3) Dresdner Bank:
AMB Property, Series L, 97,000 shares
AMB Property, Series M, 21,240 shares
AMB Property, Series O, 12,500 shares
BRE Properties, Series C, 93,600 shares
BRE Properties, Series D, 32,918 shares
Duke Realty, Series J, 20,956 shares
Duke Realty, Series K, 94,000 shares
Duke Realty, Series M, 2,000 shares
Equity Residential Properties, Series N, 125,000 shares
Health Care Properties, Series E, 14,990 shares
Health Care Properties, Series F, 96,800 shares
Hospitality Trust, Series C, 165,000 Shares
HRPT Property Trust, Series C, 100,000 shares
Kimco Realty, Series F, 113,000 shares
Prologis Trust, Series F, 54,580 shares
Prologis Trust, Series G, 65,210 shares
PS Business Parks, Series H, 35,000 shares
PS Business Parks, Series I, 20,000 shares
Public Storage, Series A, 38,000 shares
Public Storage, Series M, 100,000 shares
Publi c Storage, Series X, 30,000 shares
Public Storage, Series Z, 59,000 shares
First American Mortgage Funds 2007 Annual Report
44
American Strategic Income Portfolio III (concluded)
Realty Income, Series D, 97,500 shares
Realty Income, Series E, 74,550 shares
Regency Centers, Series C, 68,424 shares
Regency Centers, Series D, 72,700 shares
UDR, Series G, 120,000 shares
Vornado Realty Trust, Series E, 7,400 shares
Vornado Realty Trust, Series F, 65,000 shares
Vornado Realty Trust, Series G, 41,850 shares
Vornado Realty Trust, Series I, 18,000 shares
Weingarten Realty Investors, Series F, 242,500 shares
The fund has entered into a lending commitment with Morgan Stanley. The agreement permits the fund to enter into reverse repurchase agreements up to $90,000,000 using whole loans as collateral. The fund pays a fee of 0.15% to Morgan Stanley on any unused portion of the $90,000,000 lending commitment.
The fund has entered into a lending commitment with Dresdner Bank. The agreement permits the fund to enter into reverse repurchase agreements up to $20,000,000 using preferred stock as collateral. The fund pays a fee of 0.25% to Dresdner Bank on any unused portion of the $20,000,000 lending commitment.
(c) Securities purchased as part of a private placement which have not been registered with the Securities and Exchange Commission under the Securities Act of 1933 and which are considered to be illiquid. These securities are fair valued in accordance with the board approved valuation procedures. On August 31, 2007, the total value of fair valued securities was $252,831,326 or 98.2% of net assets. See note 2 in Notes to Financial Statements.
(d) Interest rates on commercial and multifamily loans are the net coupon rates in effect (after reducing the coupon rate by any mortgage servicing fees paid to mortgage servicers) on August 31, 2007. Interest rates and maturity dates disclosed on single family loans represent the weighed average coupon and weighted average maturity for the underlying mortgage loans as of August 31, 2007.
(e) Variable Rate Security – The rate shown is the net coupon rate in effect as of August 31, 2007.
(f) Interest only – Represents securities that entitle holders to receive only interest payments on the mortgage. Principal balance on the loan is due at maturity. The interest rate disclosed represents the net coupon in effect as of August 31, 2007.
(g) Loan not current on interest and/or principal payments.
(h) Security is in default.
(i) Real estate owned – See note 2 in Notes to Financial Statements.
(j) Investment in affiliated security. This money market fund is advised by FAF Advisors, Inc., which also serves as advisor for the fund. See note 3 in Notes to Financial Statements.
(k) On August 31, 2007, the cost of investments in securities for federal income tax purposes was $331,983,222. The aggregate gross unrealized appreciation and depreciation of investments in securities, based on this cost, were as follows:
| Gross unrealized appreciation | | $ | 3,248,152 | | |
| Gross unrealized depreciation | | | (13,675,053 | ) | |
| Net unrealized depreciation | | $ | (10,426,901 | ) | |
First American Mortgage Funds 2007 Annual Report
45
Schedule of INVESTMENTS continued
American Select Portfolio August 31, 2007
| Description of Security | | Date
Acquired | | Par Value | | Cost | | Value (a) | |
| (Percentages of each investment category relate to net assets) | |
| U.S. Government Agency Mortgage-Backed Securities (b) — 3.3% | |
| Fixed Rate — 3.3% | |
| Federal Home Loan Mortgage Corporation, | |
| 5.50%, 1/1/18, #E93231 | | | | $ | 2,044,728 | | | $ | 2,097,842 | | | $ | 2,039,190 | | |
| 7.50%, 12/1/29, #C00896 | | | | | 292,337 | | | | 287,340 | | | | 305,916 | | |
| Federal National Mortgage Association, | |
| 5.00%, 11/1/17, #657356 | | | | | 1,082,818 | | | | 1,087,628 | | | | 1,062,833 | | |
| 6.50%, 6/1/29, #252497 | | | | | 1,054,295 | | | | 1,047,796 | | | | 1,078,835 | | |
| 7.50%, 5/1/30, #535289 | | | | | 71,575 | | | | 69,376 | | | | 74,839 | | |
| 8.00%, 5/1/30, #538266 | | | | | 23,434 | | | | 23,163 | | | | 24,696 | | |
| Total U.S. Government Agency Mortgage-Backed Securities | | | 4,613,145 | | | | 4,586,309 | | |
| Corporate Notes — 6.3% | |
| Fixed Rate (c) — 6.3% | |
| Stratus Properties I, 6.56%, 12/31/11 | | 12/28/00 | | | 5,000,000 | | | | 5,000,000 | | | | 5,134,500 | | |
| Stratus Properties VII, 6.92%, 12/31/11 | | 6/1/07 | | | 3,500,000 | | | | 3,500,000 | | | | 3,605,000 | | |
| Total Corporate Notes | | | 8,500,000 | | | | 8,739,500 | | |
| Whole Loans and Properties Mortgages (c) (d) — 96.4% | |
| Commercial Loans — 65.7% | |
| 12000 Aerospace, Clear Lake, TX, 5.43%, 1/1/10 (b) | | 12/22/04 | | | 5,092,982 | | | | 5,092,982 | | | | 5,048,220 | | |
| ABC Conoco, Aspen, CO, 6.65%, 11/1/11 (b) | | 10/31/06 | | | 4,053,867 | | | | 4,053,867 | | | | 4,129,685 | | |
| Best Buy, Fullerton, CA, 8.63%, 1/1/11 | | 12/29/00 | | | 1,757,232 | | | | 1,757,232 | | | | 1,827,521 | | |
| Cingular Wireless Building, Richardson, TX, 7.03%, 7/1/11 (b) | | 6/21/06 | | | 6,500,000 | | | | 6,500,000 | | | | 6,695,000 | | |
| Clear Lake Central I, Webster, TX, 6.63%, 8/1/11 (b) (f) | | 7/27/06 | | | 7,100,000 | | | | 7,100,000 | | | | 7,228,733 | | |
| Gallery Row, Tucson, AZ, 11.88%, 10/1/11 (f) | | 9/7/06 | | | 500,000 | | | | 500,000 | | | | 497,628 | | |
| George Gee Hummer, Liberty Lake, WA, 7.23%, 7/1/10 (b) (f) | | 6/30/05 | | | 2,125,000 | | | | 2,125,000 | | | | 2,198,219 | | |
| George Gee Pontiac, Liberty Lake, WA, 7.25%, 7/1/10 (b) (f) | | 6/30/05 | | | 4,675,000 | | | | 4,675,000 | | | | 4,839,176 | | |
| George Gee Pontiac II, Liberty Lake, WA, 7.78%, 7/1/10 (f) | | 9/14/06 | | | 750,000 | | | | 750,000 | | | | 783,175 | | |
| George Gee Porsche, Liberty Lake, WA, 7.78%, 7/1/10 (b) (f) | | 9/14/06 | | | 2,500,000 | | | | 2,500,000 | | | | 2,610,582 | | |
| Highland Park I, Scottsdale, AZ, 6.77%, 3/1/11 (b) | | 2/23/06 | | | 9,464,827 | | | | 9,464,827 | | | | 9,637,664 | | |
| Highland Park II, Scottsdale, AZ, 9.88%, 3/1/11 | | 2/23/06 | | | 1,198,317 | | | | 1,198,317 | | | | 1,049,492 | | |
| Kolb Plaza I, Tucson, AZ, 6.50%, 8/1/10 (f) | | 7/18/07 | | | 3,520,000 | | | | 3,520,000 | | | | 3,560,295 | | |
| Kolb Plaza II, Tucson, AZ, 9.88%, 8/1/10 (f) | | 7/18/07 | | | 440,000 | | | | 440,000 | | | | 397,244 | | |
| Landmark Bank Center, Sarasota, FL, 5.85%, 7/1/09 (b) | | 10/1/04 | | | 4,629,127 | | | | 4,629,127 | | | | 4,507,920 | | |
| Mandala Agency Building, Bend, OR, 6.38%, 6/1/17 (f) | | 5/23/07 | | | 2,175,000 | | | | 2,175,000 | | | | 2,194,510 | | |
| Northrop Grumman Campus I, Colorado Springs, CO, 8.50%, 12/1/08 (b) (e) (f) | | 11/15/05 | | | 5,700,000 | | | | 5,700,000 | | | | 5,814,000 | | |
| Northrop Grumman Campus II, Colorado Springs, CO, 13.88%, 12/1/08 (f) | | 11/15/05 | | | 500,000 | | | | 500,000 | | | | 492,588 | | |
| Oxford Mall, Oxford, MS, 9.25%, 11/1/06 (e) (f) | | 9/24/04 | | | 4,600,000 | | | | 4,600,000 | | | | 4,600,000 | | |
| Peony Promenade, Plymouth, MN, 6.93%, 6/1/13 (b) | | 5/12/03 | | | 4,900,451 | | | | 4,900,451 | | | | 5,099,486 | | |
| Point Plaza, Turnwater, WA, 8.43%, 1/1/11 (b) | | 4/19/04 | | | 5,967,996 | | | | 5,967,996 | | | | 5,986,330 | | |
| Superior Ford Dealership, Plymouth, MN, 6.43%, 7/1/17 | | 6/28/07 | | | 5,243,937 | | | | 5,243,937 | | | | 5,312,223 | | |
| Town Square #6, Olympia, WA, 7.40%, 9/1/12 (b) | | 8/2/02 | | | 3,792,684 | | | | 3,792,684 | | | | 3,979,341 | | |
| Victory Packaging, Phoenix, AZ, 8.53%, 1/1/12 (b) | | 12/20/01 | | | 2,420,068 | | | | 2,420,068 | | | | 2,541,071 | | |
| | | | 89,606,488 | | | | 91,030,103 | | |
| Multifamily Loans — 30.7% | |
| Blossom Corners Apartments I, Orlando, FL, 8.73%, 2/1/09 (e) (f) | | 1/19/06 | | | 3,750,000 | | | | 3,750,000 | | | | 3,825,000 | | |
| Briarhill Apartments I, Eden Prairie, MN, 6.90%, 9/1/15 (b) | | 8/11/03 | | | 4,548,430 | | | | 4,548,430 | | | | 4,728,362 | | |
| Briarhill Apartments II, Eden Prairie, MN, 6.88%, 9/1/15 | | 8/11/03 | | | 591,488 | | | | 591,488 | | | | 608,358 | | |
Centre Court, White Oaks and Green Acres Apartments, North
Canton and Massilon, OH, 8.65%, 1/1/09 (b) | | 12/30/98 | | | 3,560,799 | | | | 3,560,799 | | | | 3,632,015 | | |
See accompanying Notes to Schedule of Investments.
First American Mortgage Funds 2007 Annual Report
46
American Select Portfolio (continued)
| Description of Security | | Date
Acquired | | Par Value/
Shares | | Cost | | Value (a) | |
| El Conquistador Apartments, Tucson, AZ, 7.65%, 4/1/09 (b) | | 3/24/99 | | $ | 2,613,623 | | | $ | 2,613,623 | | | $ | 2,665,895 | | |
| Fountain Villas, Phoenix, AZ, 8.70%, 9/1/08 (e) (f) | | 8/8/05 | | | 1,825,000 | | | | 1,825,000 | | | | 1,825,000 | | |
| Greenwood Residences, Milton, WA, 7.63%, 4/1/08 (b) | | 3/12/98 | | | 2,122,900 | | | | 2,122,900 | | | | 2,144,129 | | |
| Hunters Meadow, Colorado Springs, CO, 7.80%, 8/1/12 (b) | | 7/2/02 | | | 6,033,168 | | | | 6,033,168 | | | | 5,703,962 | | |
| Keystone Crossings, Springdale, AR, 8.15%, 7/1/10 (f) | | 6/27/07 | | | 4,024,000 | | | | 4,024,000 | | | | 3,773,705 | | |
| Revere Apartments, Revere, MA, 6.28%, 5/1/09 (b) | | 4/22/99 | | | 1,692,081 | | | | 1,692,081 | | | | 1,692,240 | | |
| RP Urban Partners, Oxnard, CA, 8.73%, 3/1/10 (e) (f) | | 2/23/05 | | | 5,000,000 | | | | 5,000,000 | | | | 5,064,600 | | |
| Sheridan Pond Apartments, Tulsa, OK, 6.43%, 7/1/13 (b) | | 6/5/03 | | | 6,868,190 | | | | 6,868,190 | | | | 6,825,788 | | |
| | | | 42,629,679 | | | | 42,489,054 | | |
| Total Whole Loans and Participation Mortgages | | | 132,236,167 | | | | 133,519,157 | | |
| Preferred Stocks — 22.6% | |
| Real Estate Investment Trusts — 22.6% | |
| AMB Property, Series M (b) | | | | | 8,700 | | | | 222,285 | | | | 194,184 | | |
| AMB Property, Series O (b) | | | | | 55,000 | | | | 1,375,000 | | | | 1,289,750 | | |
| BRE Properties, Series C (b) | | | | | 68,000 | | | | 1,713,000 | | | | 1,548,360 | | |
| BRE Properties, Series D (b) | | | | | 3,434 | | | | 86,548 | | | | 77,814 | | |
| Developers Diversified Realty, Series H | | | | | 13,437 | | | | 338,536 | | | | 317,785 | | |
| Developers Diversified Realty, Series I | | | | | 52,912 | | | | 1,356,657 | | | | 1,274,650 | | |
| Duke Realty, Series L (b) | | | | | 71,000 | | | | 1,787,780 | | | | 1,599,630 | | |
| EastGroup Properties, Series D (b) | | | | | 70,400 | | | | 1,793,795 | | | | 1,760,000 | | |
| Equity Residential Properties, Series N | | | | | 40,000 | | | | 1,004,000 | | | | 906,000 | | |
| Health Care Properties, Series E (b) | | | | | 3,510 | | | | 90,207 | | | | 82,485 | | |
| Health Care Properties, Series F (b) | | | | | 42,800 | | | | 1,079,840 | | | | 989,964 | | |
| Hospitality Properties Trust, Series C (b) | | | | | 135,000 | | | | 3,318,000 | | | | 3,037,500 | | |
| HRPT Properties Trust, Series C (b) | | | | | 50,000 | | | | 1,250,000 | | | | 1,207,500 | | |
| PS Business Parks, Series H (b) | | | | | 30,000 | | | | 744,036 | | | | 685,500 | | |
| PS Business Parks, Series I (b) | | | | | 16,000 | | | | 388,272 | | | | 360,320 | | |
| PS Business Parks, Series M | | | | | 22,210 | | | | 554,629 | | | | 516,383 | | |
| Public Storage, Series E (b) | | | | | 65,000 | | | | 1,627,750 | | | | 1,521,000 | | |
| Public Storage, Series M (b) | | | | | 68,000 | | | | 1,700,000 | | | | 1,555,840 | | |
| Realty Income, Series D (b) | | | | | 60,000 | | | | 1,521,000 | | | | 1,476,000 | | |
| Realty Income, Series E (b) | | | | | 49,500 | | | | 1,247,400 | | | | 1,145,925 | | |
| Regency Centers, Series D (b) | | | | | 5,888 | | | | 151,779 | | | | 141,606 | | |
| Regency Centers, Series E (b) | | | | | 64,000 | | | | 1,592,900 | | | | 1,404,000 | | |
| UDR, Series G (b) | | | | | 120,000 | | | | 3,000,000 | | | | 2,728,800 | | |
| Vornado Realty Trust, Series F (b) | | | | | 119,400 | | | | 2,983,692 | | | | 2,667,396 | | |
| Vornado Realty Trust, Series I (b) | | | | | 6,000 | | | | 139,500 | | | | 133,680 | | |
| Weingarten Realty Investors, Series F (b) | | | | | 120,000 | | | | 3,000,000 | | | | 2,692,800 | | |
| Total Preferred Stocks | | | 34,066,606 | | | | 31,314,872 | | |
| Total Investments in Unaffiliated Securities | | | 179,415,918 | | | | 178,159,838 | | |
| Short-Term Investment (g) — 0.9% | |
| First American Prime Obligations Fund, Class Z | | | | | 1,333,793 | | | | 1,333,793 | | | | 1,333,793 | | |
| Total Investments in Securities (h) — 129.5% | | $ | 180,749,711 | | | $ | 179,493,631 | | |
| Other Assets and Liabilities, Net — (29.5)% | | | | | | | | | | | | | (40,932,563 | ) | |
| Total Net Assets — 100.0% | | | | | | | | | | | | $ | 138,561,068 | | |
See accompanying Notes to Schedule of Investments.
First American Mortgage Funds 2007 Annual Report
47
Schedule of INVESTMENTS continued
American Select Portfolio (continued)
Notes to Schedule of Investments:
(a) Securities are valued in accordance with procedures described in note 2 in Notes to Financial Statements.
(b) On August 31, 2007, securities valued at $130,594,181 were pledged as collateral for the following outstanding reverse repurchase agreements:
Amount | |
Acquisition
Date | |
Rate* | |
Due | |
Accrued
Interest | | Name of Broker
and Description
of Collateral | |
| $ | 4,393,112 | | | 8/8/07 | | | 5.40 | % | | 9/7/07 | | $ | 15,815 | | | | (1 | ) | |
| | 23,000,000 | | | 8/1/07 | | | 6.20 | % | | 9/4/07 | | | 122,844 | | | | (2 | ) | |
| | 14,063,000 | | | 8/8/07 | | | 6.03 | % | | 9/7/07 | | | 44,033 | | | | (3 | ) | |
| $ | 41,456,112 | | | | | | | | | | | $ | 182,692 | | | | | | |
* Interest rate as of August 31, 2007. Rate is based on the London InterBank Offered Rate (LIBOR) plus a spread and reset monthly.
Name of broker and description of collateral:
(1) Morgan Stanley:
Federal Home Loan Mortgage Corporation, 5.50%, 1/1/18, $2,044,728 par
Federal Home Loan Mortgage Corporation, 7.50%, 12/1/29, $292,337 par
Federal National Mortgage Association, 5.00%, 11/1/17, $1,082,818 par
Federal National Mortgage Association, 6.50%, 6/1/29, $1,054,295 par
Federal National Mortgage Association, 7.50%, 5/1/30, $71,575 par
Federal National Mortgage Association, 8.00%, 5/1/30, $23,434 par
(2) Morgan Stanley:
12000 Aerospace, 5.43%, 1/1/10, $5,092,982 par
ABC Conoco, 6.65%, 11/1/11, $4,053,867 par
Briarhill Apartments I, 6.90%, 9/1/15, $4,548,430 par
Centre Court, White Oaks and Green Acres Apartments, 8.65%, 1/1/09, $3,560,799 par
Cingular Wireless Building, 7.03%, 7/1/11, $6,500,000 par
Clear Lake Central I, 6.63%, 8/1/11 $7,100,000 par
El Conquistador Apartments, 7.65%, 4/1/09, $2,613,623 par
George Gee Hummer, 7.23%, 7/1/10, $2,125,000 par
George Gee Pontiac, 7.25%, 7/1/10, $4,675,000 par
George Gee Porsche, 7.78%, 7/1/10, $2,500,000 par
Greenwood Residences, 7.63%, 4/1/08, $2,122,900 par
Highland Park I, 6.77%, 3/1/11, $9,464,827 par
Hunters Meadow, 7.80%, 8/1/12, $6,033,168 par
Landmark Bank Center, 5.85%, 7/1/09, $4,629,127 par
Northrop Grumman Campus I, 8.50%, 12/1/08, $5,700,000 par
Peony Promenade, 6.93%, 6/1/13, $4,900,451 par
Poi nt Plaza, 8.43%, 1/1/11, $5,967,996 par
Sheridan Pond Apartments, 6.43%, 7/1/13, $6,868,190 par
Town Square #6, 7.40%, 9/1/12, $3,792,684 par
Victory Packaging, 8.53%, 1/1/12, $2,420,068 par
(3) Dresdner Bank:
AMB Property, Series M, 8,700 shares
AMB Property, Series O, 55,000 shares
BRE Properties, Series C, 68,000 shares
BRE Properties, Series D, 3,434 shares
Duke Realty, Series L, 71,000 shares
EastGroup Properties, Series D, 70,400 shares
Health Care Properties, Series E, 3,510 shares
Health Care Properties, Series F, 42,800 shares
Hospitality Properties Trust, Series C, 135,000 shares
HRPT Properties Trust, Series C, 50,000 shares
PS Business Parks, Series H, 30,000 shares
PS Business Parks, Series I, 16,000 shares
Public Storage, Series E, 65,000 shares
Public Storage, Series M, 68,000 shares
Realty Income, Series D, 60,000 shares
Realty Income, Series E, 49,500 shares
Regency Centers, Series D, 5,888 shares
Regency Centers, Series E, 64,000 shares
UDR, Series G, 120,000 shares
Vornado Realty Trust, Series F, 119,400 shares
First American Mortgage Funds 2007 Annual Report
48
American Select Portfolio (concluded)
Vornado Realty Trust, Series I, 6,000 shares
Weingarten Realty Investors, Series F, 120,000 shares
The fund has entered into a lending commitment with Morgan Stanley. The agreement permits the fund to enter into reverse repurchase agreements up to $60,000,000 using whole loans as collateral. The fund pays a fee of 0.15% to Morgan Stanley on any unused portion of the $60,000,000 lending commitment.
The fund has entered into a lending commitment with Dresdner Bank. The agreement permits the fund to enter into reverse repurchase agreements up to $10,000,000 using preferred stock as collateral. The fund pays a fee of 0.25% to Dresdner Bank on any unused portion of the $10,000,000 lending commitment.
(c) Securities purchased as part of a private placement which have not been registered with the Securities and Exchange Commission under the Securities Act of 1933 and which are considered to be illiquid. These securities are fair valued in accordance with the board approved valuation procedures. On August 31, 2007, the total value of fair valued securities was $142,258,657 or 102.7% of net assets. See note 2 in Notes to Financial Statements.
(d) Interest rates on commercial and multifamily loans are the net coupon rates in effect (after reducing the coupon rate by any mortgage servicing fees paid to mortgage servicers) on August 31, 2007.
(e) Variable Rate Security – The rate shown is the net coupon rate in effect on August 31, 2007.
(f) Interest only – Represents securities that entitle holders to receive only interest payments on the mortgage. Principal balance on the loan is due at maturity. The interest rate disclosed represents the net coupon rate in effect as of August 31, 2007.
(g) Investment in affiliated security. This money market fund is advised by FAF Advisors, Inc., which also serves as advisor for the fund.
(h) On August 31, 2007, the cost of investments in securities for federal income tax purposes was $181,333,142. The aggregate gross unrealized appreciation and depreciation of investments in securities, based on this cost, were as follows:
| Gross unrealized appreciation | | $ | 1,984,907 | | |
| Gross unrealized depreciation | | | (3,824,418 | ) | |
| Net unrealized depreciation | | $ | (1,839,511 | ) | |
First American Mortgage Funds 2007 Annual Report
49
Report of INDEPENDENT REGISTERED PUBLIC ACCOUNTING FIRM
The Board of Directors and Shareholders
American Strategic Income Portfolio Inc., American Strategic Income Portfolio Inc. II, American Strategic Income Portfolio Inc. III, and American Select Portfolio Inc.
We have audited the accompanying statements of assets and liabilities of American Strategic Income Portfolio Inc., American Strategic Income Portfolio Inc. II, American Strategic Income Portfolio Inc. III, and American Select Portfolio Inc. (collectively, the "funds") including the schedules of investments, as of August 31, 2007, and the related statements of operations, cash flows, changes in net assets, and the financial highlights for the periods indicated therein. These financial statements and financial highlights are the responsibility of the funds' management. Our responsibility is to express an opinion on these financial statements and financial highlights based on our audits.
We conducted our audits in accordance with the standards of the Public Company Accounting Oversight Board (United States). Those standards require that we plan and perform the audit to obtain reasonable assurance about whether the financial statements and the financial highlights are free of material misstatement. We were not engaged to perform an audit of the funds' internal controls over financial reporting. Our audits included consideration of internal control over financial reporting as a basis for designing audit procedures that are appropriate in the circumstances, but not for the purpose of expressing an opinion on the effectiveness of the funds' internal control over financial reporting. Accordingly, we express no such opinion. An audit also includes examining, on a test basis, evidence supporting the amounts and disclosures in the financial statements and financial highlights, assessing the accounting principles used an d significant estimates made by management, and evaluating the overall financial statement presentation. Our procedures included confirmation of securities owned as of August 31, 2007, by correspondence with the custodian and brokers, or by other appropriate auditing procedures where replies from brokers were not received. We believe that our audits provide a reasonable basis for our opinion.
In our opinion, the financial statements and financial highlights as referred to above present fairly, in all material respects, the financial position of American Strategic Income Portfolio Inc., American Strategic Income Portfolio Inc. II, American Strategic Income Portfolio Inc. III, and American Select Portfolio Inc. at August 31, 2007, the results of their operations, their cash flows, the changes in their net assets, and the financial highlights for the periods indicated therein, in conformity with U.S. generally accepted accounting principles.

Minneapolis, Minnesota
October 19, 2007
First American Mortgage Funds 2007 Annual Report
50
NOTICE TO SHAREHOLDERS (unaudited)
TERMS AND CONDITIONS OF THE DIVIDEND REINVESTMENT PLAN
As a shareholder, you may choose to participate in the Dividend Reinvestment Plan. It's a convenient and economical way to buy additional shares of the funds by automatically reinvesting dividends and capital gains. The plan is administered by Computershare, the plan agent.
Eligibility/Participation
You may join the plan at any time. Reinvestment of distributions will begin with the next distribution paid, provided your request is received at least 10 days before the record date for that distribution.
If your shares are in certificate form, you may join the plan directly and have your distributions reinvested in additional shares of your funds. To enroll in this plan, call Computershare at 800-543-5523. If your shares are registered in your brokerage firm's name or another name, ask the holder of your shares how you may participate.
If you are a beneficial owner and wish to join the Plan, you must contact your bank, broker or other nominee to arrange participation in the Plan on your behalf.
Alternatively, if you are a beneficial owner of our common stock, you may simply request that the number of shares of our common stock you wish to enroll in the Plan be re-registered by the bank, broker or other nominee in your own name as record stockholder. You can then directly participate in the Plan as described above. You should contact your bank, broker or nominee for information on how to re-register your shares.
Plan Administration
For each fund, beginning no more than three business days before the dividend payment date, Computershare will buy shares of the fund on the New York Stock Exchange ("NYSE") or elsewhere on the open market only when the price of the fund's shares on the NYSE plus commissions is less than a 5% premium over the fund's most recently calculated net asset value ("NAV") per share. If, at the close of business on the dividend payment date, the shares purchased in the open market are insufficient to satisfy the dividend reinvestment requirement, Computershare will accept payment of the dividend, or the remaining portion, in authorized but unissued shares of the fund. These shares will be issued at a per-share price equal to the higher of (a) the NAV per share as of the close of business on the payment date or (b) 95% of the closing market price per share on the payment date.
By participating in the dividend reinvestment plan, you may receive benefits not available to shareholders who elect not to participate. For example, if the market price plus commissions of the funds' shares is 5% or more above the NAV, you will receive shares at a discount of up to 5% from the current market value. However, if the market price plus commissions is below the NAV, you will receive distributions in shares with an NAV greater than the value of any cash distributions you would have received.
There is no direct charge for reinvestment of dividends and capital gains, since Computershare fees are paid for by the funds. However, if fund shares are purchased in the open market, each participant pays a pro rata portion of the brokerage commissions. Brokerage charges are expected to be lower than those for individual transactions because shares are purchased for all participants in blocks. As long as you continue to participate in the plan, distributions paid on the shares in your account will be reinvested.
First American Mortgage Funds 2007 Annual Report
51
NOTICE TO SHAREHOLDERS (unaudited) continued
Computershare maintains accounts for plan participants holding shares in certificate form and will furnish written confirmation of all transactions, including information you need for tax records. Reinvested shares in your account will be held by Computershare in noncertificated form in your name.
Tax Information
Distributions invested in additional shares of the funds are subject to income tax, to the same extent as if received in cash. When shares are issued by a fund at a discount from market value, shareholders will be treated as having received distributions of an amount equal to the full market value of those shares. Shareholders, as required by the Internal Revenue Service, will receive a Form 1099-DIV regarding the federal tax status of the prior year's distributions.
Plan Withdrawal
If you hold your shares in certificate form, you may terminate your participation in the plan at any time by giving written notice to Computershare. If your shares are registered in your brokerage firm's name, you may terminate your participation via verbal or written instructions to your investment professional. Written instructions should include your name and address as they appear on the certificate or account.
If notice is received at least 10 days before the record date, all future distributions will be paid directly to the shareholder of record.
If your shares are issued in certificate form and you discontinue your participation in the plan, you (or your nominee) will receive an additional certificate for all full shares and a check for any fractional shares in your account.
Plan Amendment/Termination
Each fund reserves the right to amend or terminate the plan. Should the plan be amended or terminated, participants will be notified in writing at least 90 days before the record date for such dividend or distribution. The plan may also be amended or terminated by Computershare with at least 90 days written notice to participants in the plan.
Any questions about the plan should be directed to your investment professional or to Computershare Trust Company, N.A., P.O. Box 43010, Providence, RI 02940-3010, 800-426-5523.
TAX INFORMATION
The following per-share information describes the federal tax treatment of distributions made during the period ended August 31, 2007. Distributions for the calendar year will be reported to you on Form 1099-DIV. Please consult a tax advisor on how to report these distributions at the state and local levels.
First American Mortgage Funds 2007 Annual Report
52
Income Distributions (the funds designate the following amounts as ordinary income distributions)
| Payable Date | | American Strategic
Income Portfolio (ASP)
Amount | | American Strategic
Income Portfolio II (BSP)
Amount | | American Strategic
Income Portfolio III (CSP)
Amount | | American
Select Portfolio (SLA)
Amount | |
| September 27, 2006 | | $ | 0.06000 | | | $ | 0.06500 | | | $ | 0.08000 | | | $ | 0.08000 | | |
| October 25, 2006 | | | 0.06000 | | | | 0.06500 | | | | 0.08000 | | | | 0.08000 | | |
| November 22, 2006 | | | 0.06500 | | | | 0.06500 | | | | 0.08000 | | | | 0.08000 | | |
| December 27, 2006 | | | 0.06500 | | | | 0.06500 | | | | 0.08000 | | | | 0.08000 | | |
| January 10, 2007 | | | 0.13525 | | | | 0.08572 | | | | 0.35159 | | | | 0.16677 | | |
| February 21, 2007 | | | 0.06500 | | | | 0.06500 | | | | 0.08000 | | | | 0.08000 | | |
| March 28, 2007 | | | 0.06500 | | | | 0.06500 | | | | 0.08000 | | | | 0.08000 | | |
| April 25, 2007 | | | 0.06500 | | | | 0.06500 | | | | 0.08000 | | | | 0.08000 | | |
| May 23, 2007 | | | 0.06500 | | | | 0.07500 | | | | 0.06500 | | | | 0.08000 | | |
| June 27, 2007 | | | 0.06500 | | | | 0.07500 | | | | 0.06500 | | | | 0.08000 | | |
| July 25, 2007 | | | 0.06500 | | | | 0.07500 | | | | 0.07500 | | | | 0.08000 | | |
| August 29, 2007 | | | 0.06500 | | | | 0.07500 | | | | 0.07500 | | | | 0.08000 | | |
| | | $ | 0.84025 | | | $ | 0.84072 | | | $ | 1.19159 | | | $ | 1.04677 | | |
Long-Term Gain Distributions (the funds designate the following amounts as long-term capital gain distributions)
| Payable Date | | American Strategic
Income Portfolio III
Amount | | American
Select Portfolio
Amount | |
| January 10, 2007 | | $ | 0.05643 | | | $ | 0.09373 | | |
Shareholder Notification of Federal Tax Status:
ASP, BSP, CSP, and SLA, designate 0.00%, 0.00%, 0.00%, and 0.00% of ordinary income distributions during the fiscal year ended August 31, 2007 as dividends qualifying for the dividends received deduction available to corporate shareholders, respectively.
In addition, ASP, BSP, CSP, and SLA, designate 0.00%, 0.00%, 0.00%, and 0.00% of the ordinary income distributions from net investment income during the fiscal year ended August 31, 2007 as qualifying dividend income available to individual shareholders under the Jobs and Growth Tax Relief Reconciliation Act of 2003, respectively.
Additional Information Applicable to Foreign Shareholders Only:
The percentage of ordinary income distributions that are designated as interest-related dividends under Intenal Revenue Code Section 871(k)(1)(c) for ASP, BSP, CSP, and SLA was 90.20%, 80.92%, 87.82%, and 87.33%, respectively.
The percentage of ordinary income distributions that are designated as short-term capital gain distributions under Internal Revenue Code Section 871(k)(2)(c) for ASP, BPS, CSP, and SLA,
was 0.00%, 0.00%, 0.00%, and 0.00%, respectively.
PORTFOLIO MANAGER ADDITION
David A. Yale has been appointed a co-manager of the funds, effective April 2007. Mr. Yale joined FAF Advisors as a senior real estate portfolio manager in 2006. Prior to that, Mr. Yale had been in the Commercial Real Estate Department of U.S. Bank since 2005, and at ING Investment Management/ReliaStar Investment Research in the commercial loan area since 1989. Mr. Yale has been in the commercial lending industry since 1981.
First American Mortgage Funds 2007 Annual Report
53
NOTICE TO SHAREHOLDERS (unaudited) continued
John G. Wenker continues to act as the funds' lead portfolio manager. Mr. Wenker has managed the funds since January 1992 and has worked in the financial industry since 1983. Chris J. Neuharth continues to manage the mortgage-backed securities portion of the funds. Mr. Neuharth has acted in that capacity since 2000 and has been in the financial industry since 1981.
HOW TO OBTAIN A COPY OF THE FUNDS' PROXY VOTING POLICIES AND PROXY VOTING RECORD
A description of the policies and procedures that the funds use to determine how to vote proxies relating to portfolio securities, as well as information regarding how the funds voted proxies relating to portfolio securities during the most recent 12 month period ended June 30, is available (1) without charge upon request by calling 800.677.FUND; (2) at www.firstamericanfunds.com; and (3) on the U.S. Securities and Exchange Commission's website at www.sec.gov.
FORM N-Q HOLDINGS INFORMATION
The funds are required to file their complete schedule of portfolio holdings for the first and third quarters of each fiscal year with the Securities and Exchange Commission on Form N-Q. The funds' Forms N-Q are available (1) without charge upon request by calling 800.677.FUND and (2) on the U.S. Securities and Exchange Commission's website at www.sec.gov. In addition, you may review and copy the funds' Forms N-Q at the Commissions Public Reference Room in Washington D.C. You may obtain information on the operation of the Public Reference Room by calling 1-800-SEC-0330.
QUARTERLY PORTFOLIO HOLDINGS
The funds will make portfolio holdings information publicly available by posting the information at firstamericanfunds.com on a quarterly basis. The funds will attempt to post such information within 10 days of the quarter end.
CERTIFICATIONS
In October 2006, the funds' Chief Executive Officer submitted to the New York Stock Exchange ("NYSE") his annual certification required under Section 303A.12(a) of the NYSE corporate governance rules. The certifications of the funds' Principal Executive Officer and Principal Financial Officer required pursuant to Rule 30a-2 under the 1940 Act have been filed with the funds' Form N-CSR filings and are available on the U.S. Securities and Exchange Commission's website at www.sec.gov.
APPROVAL OF THE FUNDS' INVESTMENT ADVISORY AGREEMENTS
The Board of Directors of the funds (the "Board"), which is comprised entirely of independent directors, oversees the management of the funds and, as required by law, determines annually whether to renew the funds' advisory agreements with FAF Advisors, Inc. ("FAF Advisors").
At a meeting on May 1-3, 2007, the Board considered information relating to each fund's investment advisory agreement with FAF Advisors (the "Agreements"). In advance of the meeting, the Board received materials relating to the Agreements, and had the opportunity to ask questions and request further information in connection with their consideration. At a subsequent meeting on June 19-21, 2007, the Board concluded its consideration of and approved the Agreements through June 30, 2008.
In considering each fund's Agreement, the Board reviewed and analyzed the factors it deemed relevant, including: (1) the nature, quality, and extent of FAF Advisors' services to the fund, (2) the investment performance of the fund, (3) the profitability of FAF Advisors related to the fund, including an analysis of FAF Advisors' cost of providing services and comparative expense
First American Mortgage Funds 2007 Annual Report
54
information, and (4) other benefits that accrue to FAF Advisors through its relationship with the fund. When reviewing and approving investment company advisory contracts, boards of directors generally also consider the extent to which economies of scale will be realized as the investment company grows and whether fee levels reflect these economies of scale for the benefit of shareholders. The Board noted, however, that because the funds are closed-end funds their size would increase only as a result of any appreciation of their respective portfolio holdings and when they issue shares in connection with dividend reinvestments. The Board therefore determined that a consideration of economies of scale was not relevant to its evaluation of the Agreements.
Before approving the Agreements, the Board met in executive session with its independent counsel on numerous occasions to consider the materials provided by FAF Advisors and the terms of the Agreements. Based on its evaluation of all material factors, the Board concluded that the Agreements are fair and in the best interests of the respective fund's shareholders. In reaching its conclusions, the Board considered the following:
Nature, Quality, and Extent of Investment Advisory Services
The Board examined the nature, quality, and extent of the services provided by FAF Advisors to each fund. The Board reviewed FAF Advisors' key personnel who provide investment advisory services to the funds as well as the fact that, under each Agreement, FAF Advisors has the authority and responsibility to make and execute investment decisions for the fund within the framework of the fund's investment policies and restrictions, subject to review by the Board. The Board further considered that FAF Advisors' duties with respect to each fund include (i) investment research and security selection, (ii) adherence to (and monitoring compliance with) the fund's investment policies and restrictions and the Investment Company Act of 1940, and (iii) monitoring the performance of the various organizations providing services to the fund, including the fund's sub-administrator, transfer agent and custodian. Finally, the Board considered FAF Advisors' representation that the services provided by FAF Advisors under the Agreement are the type of services customarily provided by investment advisors in the fund industry.
The Board considered compliance reports about FAF Advisors from the funds' Chief Compliance Officer. The Board also considered the information received during its periodic meetings throughout the year with each fund's portfolio management team.
Based on the foregoing, the Board concluded that each fund is likely to benefit from the nature, extent, and quality of the services provided by FAF Advisors under its Agreement.
Investment Performance of the Funds
The Board considered the performance of each fund, including how the fund performed versus the median performance of a group of comparable funds selected by an independent data service (the "performance universe") and how the fund performed versus its benchmark index. All periods considered by the Board ended January 31, 2007.
American Strategic Income Portfolio. The Board noted that the fund outperformed its benchmark for the one-, three-, five- and ten-year periods. The Board also noted that the fund outperformed or performed competitively against its performance universe for the one-, three- and ten-year periods (though it underperformed its performance universe for the five-year period). In light of the fund's strong performance against its benchmark, the Board concluded it would be in the interest of the fund and its shareholders to renew the Agreement.
First American Mortgage Funds 2007 Annual Report
55
NOTICE TO SHAREHOLDERS (unaudited) continued
American Strategic Income Portfolio II. The Board noted that the fund outperformed its benchmark for the one-, three-, five- and ten-year periods and that the fund outperformed or performed competitively against its performance universe for all periods. In light of the fund's strong performance against its benchmark, the Board concluded it would be in the interest of the fund and its shareholders to renew the Agreement.
American Strategic Income Portfolio III. The Board noted that the fund outperformed its benchmark and its performance universe for the one-, three-, five- and ten-year periods. In light of the fund's strong performance against its benchmark and its performance universe, the Board concluded it would be in the interest of the fund and its shareholders to renew the Agreement.
American Select Portfolio. The Board noted that the fund outperformed its benchmark for the one-, three-, five- and ten-year periods and outperformed its performance universe for the three-, five- and ten-year periods (though it underperformed its performance universe during the one-year period). In light of the fund's strong performance against its benchmark, and in light of the fund's strong performance against its performance universe for longer periods, the Board concluded it would be in the interest of the fund and its shareholders to renew the Agreement.
Costs of Services and Profits Realized by FAF Advisors
The Board reviewed FAF Advisors' estimated costs in serving as each fund's investment manager, including the costs associated with the personnel and systems necessary to manage each fund. The Board also considered the reported profitability of FAF Advisors and its affiliates resulting from their relationship with each fund. For each fund, the Board reviewed fee and expense information for the fund as compared to that of other funds and accounts managed by FAF Advisors and of comparable funds managed by other advisers. The Board found that while the management fees for FAF Advisors' institutional separate accounts are lower than the funds' management fees, the funds receive additional services from FAF Advisors that separate accounts do not receive. Using information provided by an independent data service, the Board also evaluated each fund's advisory fee compared to the median advisory fee for other funds similar in size, chara cter and investment strategy (the "peer group median advisory fee"), and each fund's total expense ratio compared to the median total expense ratio of comparable funds (the "peer group median total expense ratio").
American Strategic Income Portfolio. The Board noted that the fund's advisory fee was lower than the peer group median advisory fee and that the fund's total expense ratio was lower than the peer group median total expense ratio. The Board concluded that the fund's advisory fee and total expense ratio are reasonable in light of the services provided.
American Strategic Income Portfolio II. The Board noted that the fund's advisory fee was lower than the peer group median advisory fee and that the fund's total expense ratio was only somewhat higher than the peer group median total expense ratio. The Board concluded that the fund's advisory fee and total expense ratio are reasonable in light of the fund's competitive performance and the services provided.
American Strategic Income Portfolio III. The Board noted that the fund's advisory fee was lower than the peer group median advisory fee and that the fund's total expense ratio was lower than the peer group median total expense ratio. The Board concluded that the fund's advisory fee and total expense ratio are reasonable in light of the services provided.
American Select Portfolio. The Board noted that the fund's advisory fee was lower than the peer group median advisory fee and that the fund's total expense ratio was lower than the peer group
First American Mortgage Funds 2007 Annual Report
56
median total expense ratio. The Board concluded that the fund's advisory fee and total expense ratio are reasonable in light of the services provided.
Other Benefits to FAF Advisors
In evaluating the benefits that accrue to FAF Advisors through its relationship with the funds, the Board noted that FAF Advisors and certain of its affiliates serve the funds in various capacities, including as investment advisor, administrator and custodian, and receive compensation from each fund in connection with providing services to the fund. The Board considered that each service provided to a fund by FAF Advisors or one of its affiliates is pursuant to a written agreement, which the Board evaluates periodically as required by law.
After full consideration of these factors, the Board concluded that approval of each Agreement was in the interest of the respective fund and its shareholders.
First American Mortgage Funds 2007 Annual Report
57
NOTICE TO SHAREHOLDERS (unaudited)
Directors and Officers of the Funds
Independent Directors
Name, Address, and
Year of Birth | | Position(s)
Held with
Funds | | Term of Office and
Length of Time Served | | Principal Occupation(s)
During Past 5 Years | | Number of Portfolios
in Fund Complex
Overseen by Director | | Other
Directorships
Held by
Director† | |
Benjamin R. Field III
P.O. Box 1329
Minneapolis, MN 55440
(1938) | | Director | | Directors serve for a one-year term that expires at the next annual meeting of shareholders. Director of ASP, BSP, CSP, and SLA since September 2003. | | Retired; Senior Financial Advisor, Bemis Company, Inc. from May 2002 through February 2004. | | First American Funds Complex: twelve registered investment companies, including sixty-two portfolios | | None | |
|
Roger A. Gibson
P.O. Box 1329
Minneapolis, MN 55440
(1946) | | Director | | Directors serve for a one-year term that expires at the next annual meeting of shareholders. Director of ASP, BSP, CSP, and SLA since August 1998. | | Director, Charterhouse Group, Inc., a private equity firm, since October 2005; Vice President and Chief Operating Officer, Cargo–United Airlines from July 2001 through July 2004. | | First American Funds Complex: twelve registered investment companies, including sixty-two portfolios | | None | |
|
Victoria J. Herget
P.O. Box 1329
Minneapolis, MN 55440
(1951) | | Director | | Directors serve for a one-year term that expires at the next annual meeting of shareholders. Director of ASP, BSP, CSP, and SLA since September 2003. | | Investment consultant and non-profit board member. | | First American Funds Complex: twelve registered investment companies, including sixty-two portfolios | | None | |
|
John P. Kayser
P.O. Box 1329
Minneapolis, MN 55440
(1949) | | Director | | Directors serve for a one-year term that expires at the next annual meeting of shareholders. Director of ASP, BSP, CSP and SLA since October 2006. | | Retired; Principal from 1983 to 2004 and Chief Financial Officer and Chief Administrative Officer from 1988 to 2002, William Blair & Company, LLC. | | First American Funds Complex: twelve registered investment companies, including sixty-two portfolios | | None | |
|
Leonard W. Kedrowski
P.O. Box 1329
Minneapolis, MN 55440
(1941) | | Director | | Directors serve for a one-year term that expires at the next annual meeting of shareholders. Director of ASP, BSP, CSP, and SLA since August 1998. | | Owner and President, Executive and Management Consulting, Inc., a management consulting firm; Board member, GC McGuiggan Corporation (dba Smyth Companies), a label printer; former Chief Executive Officer, Creative Promotions International, LLC, a promotional award programs and products company, through October 2003; Advisory Board member, Designer Doors, manufacturer of designer doors, through 2002. | | First American Funds Complex: twelve registered investment companies, including sixty-two portfolios | | None | |
|
Richard K. Riederer
P.O. Box 1329
Minneapolis, MN 55440
(1944) | | Director | | Directors serve for a one-year term that expires at the next annual meeting of shareholders. Director of ASP, BSP, CSP, and SLA since August 2001. | | Owner and CEO, RKR Consultants, Inc. and non-profit board member since 2005. | | First American Funds Complex: twelve registered investment companies, including sixty-two portfolios | | Cleveland-Cliffs Inc (a producer of iron ore
pellets) | |
|
Joseph D. Strauss
P.O. Box 1329
Minneapolis, MN 55440
(1940) | | Director | | Directors serve for a one-year term that expires at the next annual meeting of shareholders. Director of ASP, BSP, CSP, and SLA since August 1998. | | Attorney At Law, Owner and President, Strauss Management Company, a Minnesota holding company for various organizational management business ventures; Owner, Chairman, and Chief Executive Officer, Community Resource Partnerships, Inc., a strategic planning, operations management, government relations, transportation planning and public relations organization; Owner, Chairman and Chief Executive Officer, ExcensusTM, LLC, a demographic planning and application development firm since 2001. | | First American Funds Complex: twelve registered investment companies, including sixty-two portfolios | | None | |
|
First American Mortgage Funds 2007 Annual Report
58
Independent Directors (concluded)
Name, Address, and
Year of Birth | | Position(s)
Held with
Funds | | Term of Office and
Length of Time Served | | Principal Occupation(s)
During Past 5 Years | | Number of Portfolios
in Fund Complex
Overseen by Director | | Other
Directorships
Held by
Director† | |
Virginia L. Stringer
P.O. Box 1329
Minneapolis, MN 55440
(1944) | | Chair; Director | | Directors serve for a one-year term that expires at the next annual meeting of shareholders. Chair of funds' board since 1998. Director of ASP, BSP, CSP, and SLA since August 1998. | | Governance consultant and non-profit board member; former Owner and President, Strategic Management Resources, Inc., a management consulting firm; Executive Consultant for State Farm Insurance Company through 2003. | | First American Funds Complex: twelve registered investment companies, including sixty-two portfolios | | None | |
|
James M. Wade
P.O. Box 1329
Minneapolis, MN 55440
(1943) | | Director | | Directors serve for a one-year term that expires at the next annual meeting of shareholders. Director of ASP, BSP, CSP, and SLA since August 2001. | | Owner and President, Jim Wade Homes, a homebuilding company. | | First American Funds Complex: twelve registered investment companies, including sixty-two portfolios | | None | |
|
†Includes only directorships in a company with a class of securities registered pursuant to Section 12 of the Securities Exchange Act or subject to the requirements of Section 15(d) of the Securities Exchange Act, or any company registered as an investment company under the Investment Company Act.
First American Mortgage Funds 2007 Annual Report
59
NOTICE TO SHAREHOLDERS (unaudited) continued
Officers
Name, Address, and
Year of Birth | | Position(s)
Held with
Funds | | Term of Office and Length of Time Served | | Principal Occupation(s) During Past Five Years | |
Thomas S. Schreier, Jr.
FAF Advisors, Inc.
800 Nicollet Mall
Minneapolis, MN 55402
(1962)* | | President | | Re-elected by the Board annually; President of ASP, BSP, CSP, and SLA since February 2001. | | Chief Executive Officer and Chief Investment Officer of FAF Advisors, Inc. | |
|
John G. Wenker
FAF Advisors, Inc.
800 Nicollet Mall
Minneapolis, MN 55402
(1951)* | | Senior Vice President | | Re-elected by the Board annually; Senior Vice President of ASP, BSP, CSP, and SLA since November 1996. | | Managing Director of FAF Advisors, Inc. | |
|
David A. Yale
FAF Advisors, Inc.
800 Nicollet Mall, Minneapolis, MN 55402
(1956)* | | Vice President | | Re-elected by the Board annually; Vice President of ASP, BSP, CSP, and SLA since June 2007. | | Senior Real Estate Portfolio Manager, FAF Advisors, Inc., since August 2006; prior thereto, Senior Vice President, Twin Cities Market Manager, U.S. Bank from July 2005 to August 2006; prior to July 2005, Vice President, ING Investment Management/ReliaStar Investment Research. | |
|
Chris J. Neuharth
FAF Advisors, Inc.
800 Nicollet Mall, Minneapolis, MN 55402
(1959)* | | Vice President | | Re-elected by the Board annually; Vice President of ASP, BSP, CSP, and SLA since June 2007. | | Senior Fixed-Income Portfolio Manager, FAF Advisors, Inc. | |
|
Jeffery M. Wilson
FAF Advisors, Inc.
800 Nicollet Mall
Minneapolis, MN 55402
(1956)* | | Vice President- Administration | | Re-elected by the Board annually; Vice President–Administration of ASP, BSP, CSP, and SLA since March 2000. | | Senior Vice President of FAF Advisors, Inc. | |
|
Charles D. Gariboldi, Jr.
FAF Advisors, Inc.
800 Nicollet Mall
Minneapolis, MN 55402
(1959)* | | Treasurer | | Re-elected by the Board annually; Treasurer of ASP, BSP, CSP, and SLA since December 2004. | | Mutual Funds Treasurer, FAF Advisors, Inc., since October 2004; prior thereto, Vice President for investment accounting and Fund Treasurer of Thrivent Financial for Lutherans. | |
|
Jill M. Stevenson
FAF Advisors, Inc.
800 Nicollet Mall
Minneapolis, MN 55402
(1965)* | | Assistant Treasurer | | Re-elected by the Board annually; Assistant Treasurer of ASP, BSP, CSP, and SLA since September 2005. | | Assistant Treasurer, FAF Advisors, Inc., since September 2005; prior thereto, Director, Senior Project Manager, FAF Advisors, Inc. from May 2003; prior thereto, Vice President, Director of Operations, Paladin Investment Associates, LLC. | |
|
David H. Lui
FAF Advisors, Inc.
800 Nicollet Mall
Minneapolis, MN 55402
(1960)* | | Chief Compliance Officer | | Re-elected by the Board annually; Chief Compliance Officer of ASP, BSP, CSP, and SLA since February 2005. | | Chief Compliance Officer, First American Funds and FAF Advisors, Inc., since February 2005; prior thereto, Chief Compliance Officer, Franklin Advisers, Inc. and Chief Compliance Counsel, Franklin Templeton Investments from March 2004; prior thereto, Vice President, Charles Schwab & Co., Inc. | |
|
Jason K. Mitchell
FAF Advisors, Inc.
800 Nicollet Mall
Minneapolis, MN 55402
(1976)* | | Anti-Money Laundering Officer | | Re-elected by the Board annually: Anti-Money Laundering Officer of ASP, BSP, CSP, and SLA since September 2006. | | Compliance Manager, FAF Advisors, Inc., since June 2006; prior thereto, Compliance Analyst, FAF Advisors, Inc. from October 2004 to June 2006; prior thereto, Senior Systems Helpdesk Analyst, Wachovia Retirement Services from November 2002 to October 2004; prior thereto, Senior Retirement Plan Specialist, PFPC, Inc. | |
|
Kathleen L. Prudhomme
FAF Advisors, Inc.
800 Nicollet Mall
Minneapolis, MN 55402
(1953)* | | Secretary | | Re-elected by the Board annually; Secretary of ASP, BSP, CSP, and SLA since December 2004; prior thereto, Assistant Secretary of ASP, BSP, CSP, and SLA since September 1999. | | Deputy General Counsel, FAF Advisors, Inc., since November 2004; prior thereto, Partner, Dorsey & Whitney LLP, a Minneapolis-based law firm. | |
|
Brett L. Agnew
FAF Advisors, Inc.
800 Nicollet Mall
Minneapolis, MN 55402
(1971)* | | Assistant Secretary | | Re-elected by the Board annually; Assistant Secretary of ASP, BSP, CSP, and SLA since December 2004. | | Counsel, FAF Advisors, Inc., since August 2004; prior thereto, Senior Counsel, Thrivent Financial for Lutherans. | |
|
First American Mortgage Funds 2007 Annual Report
60
Officers (concluded)
Name, Address, and
Year of Birth | | Position(s)
Held with
Funds | | Term of Office and Length of Time Served | | Principal Occupation(s) During Past Five Years | |
James D. Alt
Dorsey & Whitney LLP
50 South Sixth Street
Suite 1500
Minneapolis, MN 55402
(1951) | | Assistant Secretary | | Re-elected by the Board annually; Assistant Secretary of ASP, BSP, CSP, and SLA since December 2004; prior thereto, Secretary of ASP, BSP, CSP, and SLA since June 2002; Assistant Secretary of ASP, BSP, CSP, and SLA from September 1999 to June 2002. | | Partner, Dorsey & Whitney LLP, a Minneapolis-based law firm. | |
|
Richard J. Ertel
FAF Advisors, Inc.
800 Nicollet Mall,
Minneapolis, MN 55042
(1967)* | | Assistant Secretary | | Re-elected by the Board annually, Assistant Secretary of ASP, BSP, CSP, and SLA since June 2006 and from June 2003 through August 2004. | | Counsel, FAF Advisors, Inc., since May 2006; prior thereto, Counsel, Ameriprise Financial Services, Inc. from September 2004 to May 2006; prior thereto, Counsel, FAF Advisors, Inc. from May 2003 to August 2004; prior to May 2003, Associate Counsel, Hartford Life and Accident Insurance Company. | |
|
*Messrs. Schreier, Wenker, Yale, Neuharth, Wilson, Gariboldi, Lui, Mitchell, Agnew, and Ertel, Ms. Stevenson and Ms. Prudhomme are each employees of FAF Advisors, Inc., which serves as investment advisor for the fund.
First American Mortgage Funds 2007 Annual Report
61
(This page has been left blank intentionally.)
(This page has been left blank intentionally.)
(This page has been left blank intentionally.)
Board of DIRECTORS
Virginia Stringer
Chairperson of First American Mortgage Funds
Governance Consultant; former Owner and President of Strategic Management Resources, Inc.
Benjamin Field III
Director of First American Mortgage Funds
Retired; former Senior Financial Advisor, Senior Vice President, Chief Financial Officer,
and Treasurer of Bemis Company, Inc.
Roger Gibson
Director of First American Mortgage Funds
Director of Charterhouse Group, Inc.
Victoria Herget
Director of First American Mortgage Funds
Investment Consultant; former Managing Director of Zurich Scudder Investments
John Kayser
Director of First American Mortgage Funds
Retired; former Principal, Chief Financial Officer, and Chief Administrative Officer of
William Blair & Company, LLC
Leonard Kedrowski
Director of First American Mortgage Funds
Owner and President of Executive and Management Consulting, Inc.
Richard Riederer
Director of First American Mortgage Funds
Owner and Chief Executive Officer of RKR Consultants, Inc.
Joseph Strauss
Director of First American Mortgage Funds
Owner and President of Strauss Management Company
James Wade
Director of First American Mortgage Funds
Owner and President of Jim Wade Homes
First American Mortgage Funds' Board of Directors is comprised entirely of independent directors.

P.O. Box 1330
Minneapolis, MN 55440-1330
American Strategic Income Portfolio Inc.
American Strategic Income Portfolio Inc. II
American Strategic Income Portfolio Inc. III
American Select Portfolio Inc.
2007 Annual Report
FAF Advisors, Inc., is a wholly owned subsidiary of U.S. Bank National Association, which is a wholly owned subsidiary of U.S. Bancorp.

This document is printed on paper containing 10% postconsumer waste.
10/2007 0195-07 WHOLELOAN-AR
Item 2—Code of Ethics
The registrant has adopted a code of ethics that applies to its principal executive officer and principal financial officer. During the period covered by this report, there were no amendments to the provisions of the registrant’s code of ethics that apply to the registrant’s principal executive officer and principal financial officer and that relate to any element of the code of ethics definition enumerated in this Item. During the period covered by this report, the registrant did not grant any waivers, including implicit waivers, from any provision of its code of ethics. The registrant undertakes to provide to any person without charge, upon request, a copy of its code of ethics by calling 1-800-677-3863.
Item 3—Audit Committee Financial Expert
The registrant’s Board of Directors has determined that Leonard W. Kedrowski, Benjamin R. Field III, John P. Kayser, and Richard K. Riederer, members of the registrant’s Audit Committee, are each an “audit committee financial expert” and are “independent,” as these terms are defined in this Item.
Item 4—Principal Accountant Fees and Services
(a) Audit Fees - Ernst & Young LLP (“E&Y”) billed the registrant audit fees totaling $28,430 in the fiscal year ended August 31, 2007 and $35,625 in the fiscal year ended August 31, 2006, including fees associated with the annual audit, SEC Rule 17f-2 security count filings and filings of the registrant’s annual reports on Form N-CSR.
(b) Audit-Related Fees - E&Y billed the registrant audit-related fees totaling $2,340 in the fiscal year ended August 31, 2007 and $2,585 in the fiscal year ended August 31, 2006, including fees for services primarily related to the review of the semi-annual financial statements.
(c) Tax Fees - - E&Y billed the registrant fees of $4,653 in the fiscal year ended August 31, 2007 and $7,337 in the fiscal year ended August 31, 2006 for tax services, including tax compliance, tax advice and tax planning services. Tax compliance, tax advice and tax planning services primarily related to preparation of original and amended tax returns, timely RIC qualification reviews, and tax distribution analysis and planning.
(d) All Other Fees - There were no fees billed by E&Y for other services to the registrant during the fiscal years ended August 31, 2007 and August 31, 2006.
(e)(1) The audit committee’s pre-approval policies and procedures pursuant to paragraph (c)(7) of Rule 2-01 of Regulation S-X are set forth below:
Audit Committee policy regarding pre-approval of services provided by the Independent Auditor
The Audit Committee of the First American Funds (“Committee”) has responsibility for ensuring that all services performed by the independent audit firm for the funds do not impair the firm’s independence. This review is intended to provide reasonable oversight without removing management from its responsibility for day-to-day operations. In this regard, the Committee should:
• Understand the nature of the professional services expected to be provided and their impact on auditor independence and audit quality
• Examine and evaluate the safeguards put into place by the Company and the auditor to safeguard independence
• Meet quarterly with the partner of the independent audit firm
• Consider approving categories of service that are not deemed to impair independence for a one-year period
It is important that a qualitative rather than a mere quantitative evaluation be performed by the Committee in discharging its responsibilities.
Policy for Audit and Non-Audit Services Provided to the Funds
On an annual basis, the Committee will review and consider whether to pre-approve the financial plan for audit fees as well as categories of audit-related and non-audit services that may be performed by the funds’ independent audit firm
directly for the funds. At least annually the Committee will receive a report from the independent audit firm of all audit and non-audit services, which were approved during the year.
The engagement of the independent audit firm for any non-audit service requires the written pre-approval of the Treasurer of the funds and all non-audit services performed by the independent audit firm will be disclosed in the required SEC periodic filings.
In connection with the Committee review and pre-approval responsibilities, the review by the Committee will consist of the following:
Audit Services
The categories of audit services and related fees to be reviewed and considered for pre-approval annually by the Committee or its delegate include the following:
• Annual Fund financial statement audits
• Seed audits (related to new product filings, as required)
• SEC and regulatory filings and consents
Audit-related Services
In addition, the following categories of audit-related services are deemed to be consistent with the role of the independent audit firm and, as such, will be considered for pre-approval by the Committee or its delegate, on an annual basis.
• Accounting consultations
• Fund merger support services
• Other accounting related matters
• Agreed Upon Procedure Reports
• Attestation Reports
• Other Internal Control Reports
Notwithstanding any annual pre-approval of these categories of services, individual projects with an estimated fee in excess of $25,000 are subject to pre-approval by the Committee Chair or its delegate on a case-by-case basis. Individual projects with an estimated fee in excess of $50,000 are subject to pre-approval by the Committee or its delegate on a case-by-case basis.
Tax Services
The following categories of tax services are deemed to be consistent with the role of the independent audit firm and, as such, will be considered for pre-approval by the Committee or its delegate, on an annual basis.
• Tax compliance services related to the filing or amendment of the following:
• Federal, state and local income tax compliance, and
• Sales and use tax compliance
• Timely RIC qualification reviews
• Tax distribution analysis and planning
• Tax authority examination services
• Tax appeals support services
• Accounting methods studies
• Fund merger support services
• Tax consulting services and related projects
Notwithstanding any annual pre-approval of these categories of services, individual projects with an estimated fee in excess of $25,000 are subject to pre-approval by the Committee Chair or its delegate on a case-by-case basis. Individual projects with an estimated fee in excess of $50,000 are subject to pre-approval by the Committee or its delegate on a case-by-case basis.
Other Non-audit Services
The SEC auditor independence rules adopted in response to the Sarbanes-Oxley Act specifically allow certain non-audit services. Because of the nature of these services, none of these services may be commenced by the independent audit firm without the prior approval of the Committee. The Committee may delegate this responsibility to one or more of the Committee members, with the decisions presented to the full Committee at the next scheduled meeting.
Proscribed Services
In accordance with SEC rules on independence, the independent audit firm is prohibited from performing services in the following categories of non-audit services:
• Management functions
• Accounting and bookkeeping services
• Internal audit services
• Financial information systems design and implementation
• Valuation services supporting the financial statements
• Actuarial services supporting the financial statements
• Executive recruitment
• Expert services (e.g., litigation support)
• Investment banking
Policy for Pre-approval of Non-Audit Services Provided to Other Entities within the Investment Company Complex
The Committee is also responsible for pre-approving certain non-audit services provided to FAF Advisors, Inc., U.S. Bank N.A., Quasar Distributors, U.S. Bancorp Fund Services, LLC and any other entity under common control with FAF Advisors, Inc., that provides ongoing services to the funds. The only non-audit services provided to these entities which require pre-approval are those services that relate directly to the operations and financial reporting of the funds.
Although the Committee is not required to pre-approve all services provided to FAF Advisors, Inc. and other affiliated service providers, the Committee will annually receive a report from the independent audit firm on the aggregate fees for all services provided to U.S. Bancorp and affiliates.
(e)(2) All of the services described in paragraphs (b) through (d) of this Item 4 were pre-approved by the audit committee.
(f) All services performed on the engagement to audit the registrant’s financial statements for the most recent fiscal year end were performed by the principal accountant’s full-time, permanent employees.
(g) The aggregate non-audit fees billed by E&Y to the registrant, the registrant’s investment adviser, and any entity controlling, controlled by, or under common control with the adviser that provides ongoing services to the registrant, totaled $44,943 in the fiscal year ended August 31, 2007 and $26,422 in the fiscal year ended August 31, 2006.
(h) The registrant’s audit committee has determined that the provision of non-audit services to the registrant’s investment adviser, and any entity controlling, controlled by, or under common control with the investment adviser that provides ongoing services to the registrant, that were not pre-approved is compatible with maintaining E&Y’s independence.
Item 5—Audit Committee of Listed Registrants
(a) The registrant has a separately designated standing audit committee established in accordance with Section 3(a)(58)(A) of the Securities Exchange Act of 1934 (the “Exchange Act”). The members of such audit committee are Leonard W. Kedrowski, Benjamin R. Field III, John P. Kayser, and Richard K. Riederer. Virginia L. Stringer, Chair of the Board of Directors, serves ex officio as a non-voting member of such committee.
(b) Not applicable.
Item 6—Schedule of Investments
The schedule is included as part of the report to shareholders filed under Item 1 of this Form.
Item 7—Disclosure of Proxy Voting Policies and Procedures for Closed-End Management Investment Companies
The registrant has delegated the voting of proxies relating to its voting securities to its investment advisor, FAF Advisors, Inc. (“FAF Advisors”). The proxy voting policies and procedures of FAF Advisors are as follows:
General Principles
FAF Advisors, Inc. is the investment manager for the First American family of mutual funds and for other separately managed accounts. As such, FAF Advisors has been delegated the authority to vote proxies with respect to the investments held in client accounts, unless the client has specifically retained such authority in writing. It is FAF Advisors’ duty to vote proxies in the best interests of clients. In voting proxies, FAF Advisors also seeks to maximize total investment return for clients.
In the event of a sub-adviser, FAF Advisors may delegate proxy voting to the sub-adviser. Where such delegation exists, the sub-advisor will be responsible for developing and enforcing proxy voting policies. FAF Advisors will review these policies annually.
FAF Advisors’ Investment Policy Committee (“IPC”), comprised of the firm’s most senior investment professionals, is charged with oversight of the proxy voting policies and procedures. The IPC is responsible for (1) approving the proxy voting policies and procedures, and (2) oversight of the activities of FAF Advisors’ Proxy Voting Administration Committee (“PVAC”).
The PVAC is responsible for providing an administrative framework to facilitate and monitor FAF Advisors’ exercise of its fiduciary duty to vote client proxies and fulfill the obligations of reporting and recordkeeping under the federal securities laws.
Policies
The IPC, after reviewing and concluding that such policies are reasonably designed to vote proxies in the best interests of clients, has approved and adopted the proxy voting policies of Institutional Shareholder Services, Inc. (“ISS”), a leading national provider of proxy voting administrative and research services. As a result, such policies set forth FAF Advisors’ positions on recurring proxy issues and criteria for addressing non-recurring issues. These policies are reviewed periodically and therefore are subject to change. Even though it has adopted ISS’ policies, FAF Advisors maintains the fiduciary responsibility for all proxy voting decisions.
Procedures
A. Supervision of Proxy Voting Service
The PVAC shall supervise the relationship with FAF Advisors’ proxy voting service, ISS. ISS apprises FAF Advisors of shareholder meeting dates, forward proxy voting materials, provides research on proxy proposals and voting recommendations
and casts the actual proxy votes. ISS also serves as FAF Advisors’ proxy voting record keeper and generates reports on how proxies were voted.
B. Conflicts of Interest
As an affiliate of U.S. Bancorp, a large, multi-service financial institution, FAF Advisors recognizes that there are numerous situations wherein it may have a perceived or real conflict of interest in voting the proxies of issuers or proxy proponents (e.g., a special interest group) who are clients or potential clients of some part of the U.S. Bancorp enterprise. Directors and officers of such companies may have personal or familial relationships with the U.S. Bancorp enterprise and its employees that could give rise to conflicts of interest.
FAF Advisors will vote proxies in the best interest of its clients regardless of such real or perceived conflicts of interest. By adopting ISS’ policies, FAF Advisors believes the risk related to conflicts will be minimized.
To further minimize this risk, the IPC will review ISS’ conflict avoidance policy annually to insure it adequately addresses both the actual and perceived conflicts of interest the proxy voting service may face.
In the event the PVAC determines that ISS faces a material conflict of interest with respect to a specific vote, the PVAC shall direct ISS how to vote. The PVAC shall receive voting direction from the Head of Equity Research who will seek voting direction from appropriate investment personnel. Before doing so, however, the PVAC will confirm that FAF Advisors faces no material conflicts of the nature discussed above.
If the PVAC concludes a material conflict does exist, it will recommend a course of action designed to address the conflict to the IPC. Such actions could include, but are not limited to:
1. Obtaining instructions from the affected clients on how to vote the proxy;
2. Disclosing the conflict to the affected clients and seeking their consent to permit FAF Advisors to vote the proxy;
3. Voting in proportion to the other shareholders;
4. Recusing an IPC member from all discussion or consideration of the matter, if the material conflict is due to such person’s actual or potential conflict of interest; or
5. Following the recommendation of a different independent third party.
In addition to all of the above, members of the IPC and the PVAC must notify FAF Advisors’ Chief Compliance Officer of any direct, indirect or perceived improper influence made by any employee, officer or director within the U.S. Bancorp enterprise or First American Fund complex with regard to how FAF Advisors should vote proxies. The Chief Compliance Officer will investigate the allegations and will report the findings to the FAF Advisors Chief Executive Officer and the General Counsel. If it is determined that improper influence was attempted, appropriate action shall be taken. Such appropriate action may include disciplinary action, notification of the appropriate senior managers within the U.S. Bancorp enterprise, or notification of the appropriate regulatory authorities. In all cases, the IPC shall not consider any improper influence in determining how to vote proxies and will vote in the best interests of clients.
C. Proxy Vote Override
From time to time, a portfolio manager may initiate action to override the policy for a particular vote. Such override shall be reviewed by Legal for material conflicts. If Legal determines no material conflicts exist, the approval of one investment professional on the IPC or the Head of Equity Research shall authorize the override.
D. Review and Reports
The PVAC shall maintain a review schedule. The schedule shall include reviews for the policy, the proxy voting record, account maintenance, and other reviews as deemed prudent by the PVAC. The PVAC shall review the schedule no less than annually.
The PVAC will report all identified conflicts and how they were addressed to the IPC. These reports will include all funds, including those that are sub-advised.
With respect to the review of votes cast on behalf of investments by the First American family of mutual funds, such review will also be reported to the independent Board of Directors of the First American Funds at each of their regularly scheduled meetings.
E. Vote Disclosure to Shareholders
FAF Advisors shall disclose its proxy voting record on the First American Funds’ website at www.firstamericanfunds.com and on the SEC’s website at www.sec.gov. Additionally, shareholders can receive, on request, the voting records for the First American Fund mutual funds by calling a toll free number (1-800-677-3863).
FAF Advisors’ separately managed account clients can contact their relationship manager for more information on FAF Advisors’ policies and the proxy voting record for their account.
The information that will be available includes, name of issuer; ticker/CUSIP; shareholder meeting date; description of item and FAF Advisors’ vote.
ISS Proxy Voting Guidelines Summary
The following is a concise summary of ISS’s proxy voting policy guidelines.
1. Auditors
Vote FOR proposals to ratify auditors, unless:
• An auditor has a financial interest in or association with the company, and is therefore not independent;
• There is reason to believe that the independent auditor has rendered an opinion which is neither accurate nor indicative of the company’s financial position; or
• Fees for non-audit services are excessive.
2. Board of Directors
Vote CASE-BY-CASE on director nominees, examining, but not limited to, the following factors:
• Composition of the board and key board committees;
• Attendance at board and committee meetings;
• Corporate governance provisions and takeover activity;
• Disclosures under Section 404 of the Sarbanes-Oxley Act;
• Long-term company performance relative to a market and peer index;
• Extent of the director’s investment in the company;
• Existence of related party transactions;
• Whether the chairman is also serving as CEO;
• Whether a retired CEO sits on the board;
• Number of outside boards at which a director serves.
WITHHOLD from individual directors who:
• Attend less than 75 percent of the board and committee meetings without a valid excuse (such as illness, service to the nation, work on behalf of the company);
• Sit on more than six public company boards;
• Are CEOs of public companies who sit on the boards of more than two public companies besides their own (withhold only at their outside boards).
WITHHOLD from the entire board (except for new nominees, who should be considered on a CASE-BY-CASE basis) if:
• The company’s poison pill has a dead-hand or modified dead-hand feature. Withhold every year until this feature is removed;
• The board adopts or renews a poison pill without shareholder approval since the beginning of 2005, does not commit to putting it to shareholder vote within 12 months of adoption or reneges on a commitment to put the pill to a vote and has not yet been withheld from for this issue;
• The board failed to act on a shareholder proposal that received approval by a majority of the shares outstanding the previous year;
• The board failed to act on a shareholder proposal that received approval of the majority of shares cast for the previous two consecutive years;
• The board failed to act on takeover offers where the majority of the shareholders tendered their shares;
• At the previous board election, any director received more than 50 percent withhold votes of the shares cast and the company has failed to address the issue(s) that caused the high withhold rate;
• A Russell 3000 company underperformed its industry group (GICS group). The test will consist of the bottom performers within each industry group (GICS) based on a weighted average TSR. The weightings are as follows: 20 percent weight on 1-year TSR; 30 percent weight on 3-year TSR; and 50 percent weight on 5-year TSR. Company’s response to performance issues will be considered before withholding.
WITHHOLD from inside directors and affiliated outside directors when:
• The inside or affiliated outside director serves on any of the three key committees: audit, compensation, or nominating;
• The company lacks an audit, compensation, or nominating committee so that the full board functions as that committee;
• The full board is less than majority independent.
WITHHOLD from the members of the Audit Committee if:
• The non-audit fees paid to the auditor are excessive;
• A material weakness identified in the Section 404 disclosures rises to a level of serious concern; there are chronic internal control issues and an absence of established effective control mechanisms.
WITHHOLD from the members of the Compensation Committee if:
• There is a negative correlation between chief executive pay and company performance;
• The company fails to submit one-time transfers of stock options to a shareholder vote;
• The company fails to fulfill the terms of a burn rate commitment they made to shareholders;
• The company has poor compensation practices.
WITHHOLD from directors, individually or the entire board, for egregious actions or failure to replace management as appropriate.
Vote AGAINST proposals to classify the board. Vote FOR proposals to repeal classified boards and to elect all directors annually.
Generally vote FOR shareholder proposals requiring the position of chair be filled by an independent director unless there are compelling reasons to recommend against the proposal, such as a counterbalancing governance structure. This should include all of the following:
• Designated lead director, elected by and from the independent board members with clearly delineated and comprehensive duties. (The role may alternatively reside with a presiding director, vice chairman, or rotating lead director; however the director must serve a minimum of one year in order to qualify as a lead director.);
• Two-thirds independent board;
• All-independent key committees;
• Established governance guidelines;
• The company does not under-perform its peers.
Generally vote FOR reasonably crafted shareholders proposals calling for directors to be elected with an affirmative majority of votes cast and/or the elimination of the plurality standard for electing directors (including binding resolutions requesting that the board amend the company’s bylaws), provided the proposal includes a carve-out for a plurality voting standard when there are more director nominees than board seats (e.g., contested elections). Consider voting AGAINST the shareholder proposal if the company has adopted a formal corporate governance policy that present a meaningful alternative to the majority voting standard and provide an adequate response to both new nominees as well as incumbent nominees who fail to receive a majority of votes cast.
At a minimum, a company’s policy should articulate the following elements to adequately address each director nominee who fails to receive an affirmative of majority of votes cast in an election:
• Established guidelines disclosed annually in the proxy statement concerning the process to follow for nominees who receive majority withhold votes;
• The policy needs to outline a clear and reasonable timetable for all decision-making regarding the nominee’s status;
• The policy needs to specify that the process of determining the nominee’s status will be managed by independent directors and must exclude the nominee in question;
• An outline of a range of remedies (for example, acceptance of the resignation, maintaining the director but curing the underlying causes of the withheld votes, etc.);
• The final decision on the nominee’s status should be promptly disclosed via an SEC filing. The policy needs to include the timeframe for disclosure and require a full explanation of how the decision was reached.
In addition, the company should articulate to shareholders why its policy is the best structure for demonstrating accountability to shareholders.
3. Proxy Contests
Vote CASE-BY-CASE on the election of directors in contested elections, considering the following factors:
• Long-term financial performance of the target company relative to its industry;
• Management’s track record;
• Background to the proxy contest;
• Qualifications of director nominees (both slates);
• Strategic plan of dissident slate and quality of critique against management;
• Likelihood that the proposed goals and objectives can be achieved (both slates);
• Stock ownership positions.
Vote CASE-BY-CASE on proposals to reimburse proxy solicitation expenses. When voting in conjunction with support of a dissident slate, vote FOR the reimbursement of all appropriate proxy solicitation expenses associated with the election.
4. Takeover Defenses
Vote FOR shareholder proposals requesting that the company submit its poison pill to a shareholder vote or redeem it UNLESS the company has: (1) A shareholder approved poison pill in place; or (2) The company has adopted a policy concerning the adoption of a pill in the future specifying that the board will only adopt a shareholder rights plan if either:
• Shareholders have approved the adoption of the plan; or
• The board, in its exercise of its fiduciary responsibilities, determines that it is in the best interest of shareholders under the circumstances to adopt a pill without the delay in adoption that would result from seeking stockholder approval (i.e. the “fiduciary out” provision). A poison pill adopted under this fiduciary out will be put to a shareholder ratification vote within twelve months of adoption or expire. If the pill is not approved by a majority of the votes cast on this issue, the plan will immediately terminate.
Vote FOR shareholder proposals calling for poison pills to be put to a vote within a time period of less than one year after adoption. If the company has no non-shareholder approved poison pill in place and has adopted a policy with the provisions outlined above, vote AGAINST the proposal. If these conditions are not met, vote FOR the proposal, but with the caveat that a vote within twelve months would be considered sufficient.
Vote CASE-by-CASE on management proposals on poison pill ratification, focusing on the features of the shareholder rights plan. Rights plans should contain the following attributes:
• No lower than a 20 percent trigger, flip-in or flip-over;
• A term of no more than three years;
• No dead-hand, slow-hand, no-hand or similar feature that limits the ability of a future board to redeem the pill;
• Shareholder redemption feature (qualifying offer clause); if the board refuses to redeem the pill 90 days after a qualifying offer is announced, ten percent of the shares may call a special meeting or seek a written consent to vote on rescinding the pill.
Vote AGAINST proposals to require a supermajority shareholder vote. Vote FOR proposals to lower supermajority vote requirements.
5. Mergers and Corporate Restructurings
For mergers and acquisitions, evaluate the proposed transaction based on these factors:
• Valuation - Is the value to be received by the target shareholders (or paid by the acquirer) reasonable?
• Market reaction - How has the market responded to the proposed deal?
• Strategic rationale - - Does the deal make sense strategically? Cost and revenue synergies should not be overly aggressive or optimistic, but reasonably achievable.
• Negotiations and process - Were the terms of the transaction negotiated at arm’s length? Was the process fair and equitable?
• Conflicts of interest - Are insiders benefiting from the transaction disproportionately and inappropriately as compared to non-insider shareholders? As the result of potential conflicts, the directors and officers of the company may be more likely to vote to approve a merger than if they did not hold these interests.
• Governance - Will the combined company have a better or worse governance profile than the parties to the transaction?
6. State of Incorporation
Vote CASE-BY-CASE on proposals to change a company’s state of incorporation, taking into consideration both financial and corporate governance concerns, including the reasons for reincorporating, a comparison of the governance provisions, comparative economic benefits, and a comparison of the jurisdictional laws. Vote FOR reincorporation when the economic factors outweigh any neutral or negative governance changes.
7. Capital Structure
Vote CASE-BY-CASE on proposals to increase the number of shares of common stock authorized for issuance using a model developed by ISS. Vote FOR proposals to approve increases beyond the allowable increase when a company’s shares are in danger of being de-listed or if a company’s ability to continue to operate as a going concern is uncertain. In addition, for capital requests less than or equal to 300 percent of the current authorized shares that marginally fail the calculated allowable cap (i.e., exceed the allowable cap by no more than 5 percent), on a CASE-BY-CASE basis, vote FOR the increase based on the company’s performance and whether the company’s ongoing use of shares has shown prudence.
Vote AGAINST proposals that increase authorized common stock for the explicit purpose of implementing a non-shareholder approved shareholder rights plan (poison pill).
Vote AGAINST proposals authorizing the creation of new classes of preferred stock with unspecified voting, conversion, dividend distribution, and other rights (“blank check” preferred stock). Vote AGAINST proposals to increase the number of blank check preferred stock authorized for issuance when no shares have been issued or reserved for a specific purpose.
Vote FOR proposals to create “de-clawed” blank check preferred stock (stock that cannot be used as a takeover defense). Vote FOR proposals to authorize preferred stock in cases where the company specifies the voting, dividend, conversion, and other rights of such stock and the terms of the preferred stock appear reasonable. Vote CASE-BY-CASE on proposals to increase the number of blank check preferred shares after analyzing the number of preferred shares available for issue given a company’s industry and performance in terms of shareholder returns.
8. Executive and Director Compensation
Vote CASE-BY-CASE on equity-based compensation plans. Vote AGAINST the plan if:
• The total cost of the company’s equity plans is unreasonable;
• The plan expressly permits the repricing of stock options without prior shareholder approval;
• There is a disconnect between CEO pay and the company’s performance;
• The company’s three year burn rate exceeds the greater of 2 percent and the mean plus 1 standard deviation of its industry group; or
• The plan is a vehicle for poor pay practices.
Vote CASE-BY-CASE on compensation plans for non-employee directors, based on the cost of the plans against the company’s allowable cap. Vote for the plan if ALL of the following qualitative factors in the board’s compensation plan are met and disclosed in the proxy statement:
• Stock ownership guidelines with a minimum of three times the annual cash retainer.
• Vesting schedule or mandatory holding/deferral period: - A minimum vesting of three years for stock options or restricted stock; or - Deferred stock payable at the end of a three-year deferral period.
• A balanced mix between cash and equity. If the mix is heavier on equity, the vesting schedule or deferral period should be more stringent, with the lesser of five years or the term of directorship.
• No retirement/benefits and perquisites for non-employee directors; and
• A table with a detailed disclosure of the cash and equity compensation for each non-employee director for the most recent fiscal year.
Companies should provide better and more transparent disclosure related to CEO pay. Consider withhold votes in the future from the compensation committee and voting against equity plans if compensation disclosure is not improved and a tally sheet is not provided.
Vote CASE-BY-CASE on qualified employee stock purchase plans. Vote FOR plans if:
• Purchase price is at least 85 percent of fair market value;
• Offering period is 27 months or less; and
• The number of shares allocated to the plan is ten percent or less of the outstanding shares.
Vote CASE-by-CASE on nonqualified employee stock purchase plans. Vote FOR plans with:
• Broad-based participation (i.e., all employees with the exclusion of individuals with 5 percent or more of beneficial ownership of the company);
• Limits on employee contribution (a fixed dollar amount or a percentage of base salary);
• Company matching contribution up to 25 percent of employee’s contribution, which is effectively a discount of 20 percent from market value;
• No discount on the stock price on the date of purchase since there is a company matching contribution.
Vote CASE-by-CASE on management proposals seeking approval to exchange/reprice options, taking into consideration historic trading patterns, rationale for the re-pricing, value-for-value exchange treatment of surrendered options, option vesting, term of the option, exercise price and participation. Vote FOR shareholder proposals to put option re-pricing to a shareholder vote.
Vote FOR shareholder proposals to require golden parachutes or executive severance agreements to be submitted for shareholder ratification, unless the proposal requires shareholder approval prior to entering into employment contracts. Vote on a CASE-BY-CASE basis on proposals to ratify or cancel golden parachutes. An acceptable parachute should include:
• A trigger beyond the control of management;
• The amount should not exceed three times base amount (defined as the average annual taxable W-2 compensation during the five years prior to the year in which the change of control occurs;
• Change-in-control payments should be double-triggered, i.e., (1) after a change in the company’s ownership structure has taken place, and (2) termination of the executive as a result of the change in control.
9. Corporate Responsibility
Generally vote AGAINST proposals to phase out the use of animals in product testing unless:
• The company is conducting animal testing programs that are unnecessary or not required by regulation;
• The company is conducting animal testing when suitable alternatives are accepted and used at peer firms;
• The company has been the subject of recent, significant controversy related to its testing programs.
Generally vote FOR proposals seeking a report on the company’s animal welfare standards.
Generally vote AGAINST proposals requesting that companies implement specific price restraints on pharmaceutical products unless the company fails to adhere to legislative guidelines or industry norms in its product pricing. Vote CASE-BY-CASE on proposals requesting that the company evaluate their product pricing considering:
• The existing level of disclosure on pricing policies;
• Deviation from established industry pricing norms;
• The company’s existing initiatives to provide its products to needy consumers;
• Whether the proposal focuses on specific products or geographic regions.
Generally vote FOR proposals requesting that companies report on the financial and legal impact of their policies regarding prescription drug re-importation unless such information is already publicly disclosed. Generally vote AGAINST proposals requesting that companies adopt specific policies to encourage or constrain prescription drug re-importation.
Vote AGAINST proposals asking companies to voluntarily label genetically engineered (GE) ingredients in their products or alternatively to provide interim labeling and eventually eliminate GE ingredients due to the costs and feasibility of labeling and/or phasing out the use of GE ingredients.
Most tobacco-related proposals (such as on second-hand smoke, advertising to youth and spin-offs of tobacco-related business) should be evaluated on a CASE-BY-CASE basis.
Generally vote FOR resolutions requesting that a company discloses its policies related to toxic chemicals. Vote CASE-BY-CASE on resolutions requesting that companies evaluate and disclose the potential financial and legal risks associated with utilizing certain chemicals. Generally vote AGAINST resolutions requiring that a company reformulate its products within a certain timeframe unless such actions are required by law in specific markets.
Generally vote AGAINST request for reports outlining potential environmental damage from drilling in the Arctic National Wildlife Refuge (ANWR) unless:
• New legislation is adopted allowing development and drilling in the ANWR region;
• The company intends to pursue operations in the ANWR; and
• The company has not disclosed an environmental risk report for its ANWR operations.
Vote FOR resolutions requesting that companies report to shareholders on the risks and liabilities associated with CAFOs unless:
• The company has publicly disclosed guidelines for its corporate and contract farming operations, including compliance monitoring; or
• The company does not directly source from CAFOs.
Generally vote FOR proposals requesting a report on greenhouse gas emissions from company operations and/or products unless this information is already publicly disclosed or such factors are not integral to the company’s line of business. Generally vote AGAINST proposals that call for reduction in greenhouse gas emissions by specified amounts or within a restrictive time frame unless the company lags industry standards and has been the subject of recent, significant fines or litigation resulting from greenhouse gas emissions.
Generally vote FOR resolutions requesting that companies outline their preparations to comply with standards established by Kyoto Protocol signator markets unless:
• The company does not maintain operations in Kyoto signatory markets;
• The company already evaluates and substantially discloses such information; or,
• Greenhouse gas emissions do not significantly impact the company’s core businesses.
Vote CASE-BY-CASE on proposals to improve the disclosure of a company’s political contributions considering: any recent significant controversy or litigation related to the company’s political contributions or governmental affairs; and the public availability of a policy on political contributions. Vote AGAINST proposals barring the company from making political contributions.
Vote CASE-BY-CASE on proposals to review ways of linking executive compensation to social factors, such as corporate downsizings, customer or employee satisfaction, community involvement, human rights, environmental performance, predatory lending, and executive/employee pay disparities.
Vote CASE-BY-CASE on proposals calling for companies to report on the risks associated with outsourcing, considering: the risks associated with certain international markets; the utility of such a report; and the existence of a publicly available code of corporate conduct that applies to international operations.
Vote CASE-BY-CASE on requests for reports detailing the company’s operations in a particular country and on proposals to implement certain human rights standards at company facilities or those of its suppliers and to commit to outside, independent monitoring.
10. Mutual Fund Proxies
Vote CASE-BY-CASE on the election of directors and trustees, following the same guidelines for uncontested directors for public company shareholder meetings. However, mutual fund boards do not usually have compensation committees, so do not withhold for the lack of this committee.
Vote CASE-BY-CASE on conversion proposals, considering the following factors:
• Past performance as a closed-end fund;
• Market in which the fund invests;
• Measures taken by the board to address the discount; and
• Past shareholder activism, board activity, and votes on related proposals.
Generally vote AGAINST shareholder proposals that mandate a specific minimum amount of stock that directors must own in order to qualify as a director or to remain on the board.
Vote CASE-BY-CASE on shareholder proposals to reimburse proxy solicitation expenses. When supporting the dissidents, vote FOR the reimbursement of the solicitation expenses.
Vote CASE-BY-CASE on proposals to terminate the investment advisor, considering the following factors:
• Performance of the fund’s net asset value;
• The fund’s history of shareholder relations;
• The performance of other funds under the advisor’s management.
Item 8—Portfolio Managers of Closed-End Management Investment Companies
(a)(1) John G. Wenker is primarily responsible for the day-to-day management of the registrant’s portfolio. Chris J. Neuharth, CFA, is responsible for the management of the mortgage-backed securities portion of the portfolio. David A. Yale is responsible for the acquisition of mortgage loans for the registrant’s portfolio.
Mr. Wenker, Head of Real Estate, joined FAF Advisors, Inc. (the “Advisor”) in 1992. He has 23 years of financial industry experience, including 14 years in portfolio management.
Mr. Neuharth, Senior Fixed-Income Portfolio Manager, rejoined the Advisor in 2000. He has 25 years of financial industry experience, including 21 years in portfolio management.
Mr. Yale, Senior Real Estate Portfolio Manager, joined the Advisor in August 2006. He served as Senior Vice President, Twin Cities Market Manager, for U.S. Bank, N.A. from July 2005 to August 2006. Prior to July 2005, he served as Vice President for ING Investment Management/Reliastar Investment Research. He has 26 years of financial industry experience.
(a)(2) The following table shows, as of the fiscal-year ended August 31, 2006, the number of other accounts each portfolio manager managed within each of the following categories and the total assets in the accounts managed within each category. The table also shows the number of accounts and the total assets in the accounts, if any, with respect to which the advisory fee is based on the performance of the account.
Portfolio Manager | | Type of Account Managed | | Total
Number
of
Accounts | | Total Assets of
All Accounts | | Accounts
Subject to
Performance-
Based Fee | | Total Assets
Subject to
Performance-
Based Fee | |
| | | | | | | | | | | |
Chris J. Neuharth | | Registered Investment Company | | 8 | | $ | 3.6 billion | | 0 | | 0 | |
| | Other Pooled Investment Vehicles | | 1 | | $ | 1.0 billion | | 0 | | 0 | |
| | Other Accounts | | 29 | | $ | 3.8 billion | | 1 | | $ | 173 million | |
| | | | | | | | | | | |
John G. Wenker | | Registered Investment Company | | 10 | | $ | 2.3 billion | | 0 | | 0 | |
| | Other Pooled Investment Vehicles | | 0 | | 0 | | 0 | | 0 | |
| | Other Accounts | | 0 | | 0 | | 0 | | 0 | |
| | | | | | | | | | | |
David A. Yale | | Registered Investment Company | | 3 | | $ | 446.7 million | | 0 | | 0 | |
| | Other Pooled Investment Vehicles | | 0 | | 0 | | 0 | | 0 | |
| | Other Accounts | | 0 | | 0 | | 0 | | 0 | |
| | | | | | | | | | | | | |
The registrant’s portfolio managers often manage multiple accounts. The Advisor has adopted policies and procedures regarding brokerage and trade allocation and allocation of investment opportunities that it believes are reasonably designed to address potential conflicts of interest associated with managing multiple accounts for multiple clients.
(a)(3) Portfolio manager compensation consists primarily of base pay, an annual cash incentive and long term incentive payments.
Base pay is determined based upon an analysis of the portfolio manager’s general performance, experience, and market levels of base pay for such position.
Portfolio managers are paid an annual incentive based upon investment performance, generally over the past one- and three-year periods unless the portfolio manager’s tenure is shorter. The maximum potential annual cash incentive is equal to a multiple of base pay, determined based upon the particular portfolio manager’s performance and experience, and market levels of base pay for such position.
The portion of the maximum potential annual cash incentive that is paid out is based upon performance relative to the portfolio’s benchmark and performance relative to an appropriate Lipper industry peer group. Generally, the threshold for payment of an annual cash incentive is (i) benchmark performance and (ii) median performance versus the peer group, and the maximum annual cash incentive is attained at (i) a spread over the benchmark which the Advisor believes will, over time, deliver top quartile performance and (ii) top quartile performance versus the Lipper industry peer group.
Investment performance is measured on a pre-tax basis, gross of fees for registrant results and for the Lipper industry peer group.
Long term incentive payments are paid to portfolio managers on an annual basis based upon general performance and expected contributions to the success of the Advisor. Long-term incentive payments are comprised of two components: (i) performance equity units of the Advisor and (ii) U.S. Bancorp options and restricted stock.
There are generally no differences between the methods used to determine compensation with respect to the registrant and the other accounts managed by the registrant’s portfolio managers.
(a)(4) The following table shows the dollar range of equity securities in the registrant beneficially owned by the portfolio manager as of the fiscal-year ended August 31, 2007.
Portfolio Manager | | Dollar Range of Equity
Securities Beneficially
Owned in the Registrant | |
| | | |
Chris J. Neuharth | | $0 | |
| | | |
John G. Wenker | | $10,001 - $50,000 | |
| | | |
David A. Yale | | $0 | |
(b) Not applicable.
Item 9—Purchases of Equity Securities by Closed-End Management Investment Company and Affiliated Purchasers
Neither the registrant nor any “affiliated purchaser,” as defined in Rule 10b-18(a)(3) under the Exchange Act, purchased any shares or other units of any class of the registrant’s equity securities that is registered pursuant to Section 12 of the Exchange Act.
Item 10—Submission of Matters to a Vote of Security Holders
There have been no material changes to the procedures by which shareholders may recommend nominees to the registrant’s board of directors, where those changes were implemented after the registrant last provided disclosure in response to the requirements of Item 7(d)(2)(ii)(G) of Schedule 14A, or this Item.
Item 11—Controls and Procedures
(a) The registrant’s principal executive officer and principal financial officer have evaluated the effectiveness of the registrant’s disclosure controls and procedures within 90 days of the date of this filing and have concluded that the registrant’s disclosure controls and procedures were effective, as of that date, in ensuring that information required to be disclosed by the registrant in this Form N-CSR was recorded, processed, summarized and reported timely.
(b) There were no changes in the registrant’s internal control over financial reporting that occurred during the second fiscal quarter of the period covered by this report that have materially affected, or are reasonably likely to materially affect, the registrant’s internal control over financial reporting.
Item 12—Exhibits
(a)(1) Not applicable. Registrant’s code of ethics is provided to any person upon request without charge.
(a)(2) Certifications of the principal executive officer and principal financial officer of the registrant as required by Rule 30a-2(a) under the Investment Company Act of 1940 are filed as exhibits hereto.
(a)(3) Not applicable.
(b) Certifications of the principal executive officer and principal financial officer of the registrant as required by Rule 30a-2(b) under the Investment Company Act of 1940 are filed as exhibits hereto.
Signatures
Pursuant to the requirements of the Securities Exchange Act of 1934 and the Investment Company Act of 1940, the registrant has duly caused this report to be signed on its behalf by the undersigned, thereunto duly authorized.
American Strategic Income Portfolio Inc. II
By: | | |
| | /s/ Thomas S. Schreier, Jr. | |
| | Thomas S. Schreier, Jr. |
| | President |
Date: November 7, 2007
Pursuant to the requirements of the Securities Exchange Act of 1934 and the Investment Company Act of 1940, this report has been signed below by the following persons on behalf of the registrant and in the capacities and on the dates indicated.
By: | | |
| | /s/ Thomas S. Schreier, Jr. | |
| | Thomas S. Schreier, Jr. |
| | President |
Date: November 7, 2007
By: | | |
| | /s/ Charles D. Gariboldi, Jr. | |
| | Charles D. Gariboldi, Jr. |
| | Treasurer |
Date: November 7, 2007