| | OMB APPROVAL |
| | OMB Number: 3235-0570 |
| | Expires: November 30, 2005 |
| | Estimated average burden
hours per response. . . . 5.0 |
UNITED STATES
SECURITIES AND EXCHANGE COMMISSION
Washington, D.C. 20549
FORM N-CSR
CERTIFIED SHAREHOLDER REPORT OF REGISTERED
MANAGEMENT INVESTMENT COMPANIES
Investment Company Act file number 811-6640
American Strategic Income Portfolio Inc. II
(Exact name of registrant as specified in charter)
800 Nicollet Mall, Minneapolis, MN | | 55402 |
(Address of principal executive offices) | | (Zip code) |
Charles D. Gariboldi 800 Nicollet Mall, Minneapolis, MN 55402
(Name and address of agent for service)
Registrant’s telephone number, including area code: 800-677-3863
Date of fiscal year end: May 31
Date of reporting period: May 31, 2005
Form N-CSR is to be used by management investment companies to file reports with the Commission not later than 10 days after the transmission to stockholders of any report that is required to be transmitted to stockholders under Rule 30e-1 under the Investment Company Act of 1940 (17 CFR 270.30e-1). The Commission may use the information provided on Form N-CSR in its regulatory, disclosure review, inspection, and policymaking roles.
A registrant is required to disclose the information specified by Form N-CSR, and the Commission will make this information public. A registrant is not required to respond to the collection of information contained in Form N-CSR unless the Form displays a currently valid Office of Management and Budget (“OMB”) control number. Please direct comments concerning the accuracy of the information collection burden estimate and any suggestions for reducing the burden to Secretary, Securities and Exchange Commission, 450 Fifth Street, NW, Washington, DC 20549-0609. The OMB has reviewed this collection of information under the clearance requirements of 44 U.S.C. Section 3507.
Item 1. Report to Shareholders

AMERICAN STRATEGIC INCOME PORTFOLIO INC. II | |
| |
BSP | |
May 31, 2005
Annual Report

AMERICAN STRATEGIC INCOME PORTFOLIO INC. II
| | Table of Contents |
| | |
2 | | Fund Overview |
| | |
8 | | Financial Statements |
| | |
12 | | Notes to Financial Statements |
| | |
26 | | Schedule of Investments |
| | |
34 | | Report of Independent Registered Public Accounting Firm |
| | |
35 | | Notice to Shareholders |
Primary Investments
American Strategic Income Portfolio Inc. II (the “fund”) invests in mortgage-related assets that directly or indirectly represent a participation in or are secured by and payable from mortgage loans. The fund may also invest in U.S. government securities, corporate debt securities, and preferred stock issued by real estate investment trusts. The fund borrows through the use of reverse repurchase agreements and revolving credit facilities. Use of borrowing and certain other investments and investment techniques may cause the fund’s net asset value (“NAV”) to fluctuate to a greater extent than would be expected from interest-rate movements alone.
Fund Objective
High level of current income. Its secondary objective is to seek capital appreciation. As with other investment companies, there can be no assurance this fund will achieve its objectives.
NOT FDIC INSURED NO BANK GUARANTEE MAY LOSE VALUE
Average Annualized Total Returns
Based on NAV for the period ended May 31, 2005

* The Lehman Brothers Mutual Fund Government/Mortgage Index is comprised of all U.S. government agency and Treasury securities and agency mortgage-backed securities. Developed by Lehman Brothers for comparative use by the mutual fund industry, this index is unmanaged and does not include any fees or expenses in its total return calculations.
The average annualized total returns for the fund are based on the change in its NAV and assume reinvestment of distributions at NAV. NAV-based performance is used to measure investment management results.
• Average annualized total returns based on the change in market price for the one-year, five-year, and ten-year periods ended May 31, 2005, were 1.51%, 10.92%, and 9.79%, respectively. Market price returns assume that all distributions have been reinvested at actual prices pursuant to the fund’s dividend reinvestment plan. Market price returns reflect any broker commissions or sales charges on dividends reinvested at market price.
• Please remember, you could lose money with this investment. Neither safety of principal nor stability of income is guaranteed.
Past performance does not guarantee future results. The investment return and principal value of an investment will fluctuate so that fund shares, when sold, may be worth more or less than their original cost. Closed-end funds, such as this fund, often trade at discounts to NAV. Therefore, you may be unable to realize the full NAV of your shares when you sell.
• The fund uses the Lehman Brothers Mutual Fund Government/Mortgage Index as a benchmark. Although we believe this is the most appropriate benchmark available, it is not a perfect match. The benchmark index is comprised of U.S. government securities while the fund is comprised primarily of nonsecuritized, illiquid whole loans. This limits the ability of the fund to respond quickly to market changes.
1
Fund OVERVIEW
Fund Management
John Wenker is primarily responsible for the management of the fund. He has 22 years of financial experience.
Chris Neuharth, CFA, is responsible for the management of the mortgage-backed securities portion of the fund. He has 24 years of financial experience.
Russ Kappenman, CPA is responsible for the acquisition and management of the whole loans portion of the fund. He has 19 years of financial experience.
For the fiscal year ended May 31, 2005, the fund had a total return of 3.85%, based on its NAV. The fund’s benchmark, the Lehman Brothers Mutual Fund Government/Mortgage Index, had a return of 7.53% during the period.
The underperformance of the fund relative to its benchmark is due to several factors, including the interest-rate environment, higher coupon loans paying off, lower coupon loans being added, and modest credit deterioration within the loan portfolio.
The interest-rate environment was particularly challenging. The 10-year Treasury yield during the fiscal year decreased from 4.70% to 3.98%, or -0.72%. For some time we have been hesitant to add long-term, fixed-rate loans to the portfolio given the low, long-term rate environment. If the yield on the 10-year Treasury were to rise substantially, the value of long-term, fixed-rate loans would deteriorate substantially. As an alternative we have added adjustable rate loans, typically of shorter duration, to the portfolio. The adjustable rate loans typically use the one-month London Interbank
Portfolio Allocation
As a percentage of total assets on May 31, 2005
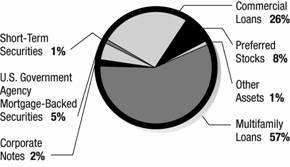
2
Offering Rate (“LIBOR”) as their base rate. During the fiscal year, the one-month LIBOR increased from 1.15% to 3.13%. This had several effects on the loan portfolio. As the one-month LIBOR increases, the rates on the adjustable rate loans increase. This is good from the standpoint of income in the portfolio, but as debt service on a loan increases the debt service coverage decreases. If the debt service coverage decreases enough, the value of the loan is marked down within the pricing model, adversely affecting NAV. In addition, the one-month LIBOR is the base rate for the borrowing used by the fund. As the one-month LIBOR increases, the interest expense of the fund increases, adversely affecting net investment income.
During the fiscal year, 26 loans paid off with an unpaid principal balance of $110.1 million and a weighted average coupon of 7.17%. Also during the fiscal year, 17 loans were purchased with an original principal balance of $839.9 million and a weighted average coupon of 7.26%.
The loan portfolio experienced modest credit deterioration during the fiscal year, with the weighted average debt service coverage dropping from 1.39X to 1.34X. As of the fiscal year-end, there are two multifamily loans that are in default. The combined unpaid principal balance of these loans is $13,225,000, or 5.31% of total assets.
Prepayment penalties received by the fund from loans that paid off during the fiscal year amounted to $1,224,810.
As of this writing, the commercial real-estate markets appear to have stabilized with occupancy levels increasing moderately over the past two quarters. However, rental income has not begun to improve in most markets. Sustained job growth at a level able to push occupancies substantially higher and foster rental growth has not occurred. An abundance of capital in the real-estate debt markets makes the accumulation of appropriate loan products a challenge.
3
During the fiscal year, the fund paid $1.035 per share in dividends resulting in an annualized distribution rate of 8.63% based on the May 31, 2005, market price. The fund decreased the monthly dividend from $0.095 per share to $0.08 per share in November 2004. This reflected the reality of lower income being generated due to the low overall interest-rate environment. As of May 31, 2005 undistributed net investment income was $0.0967 per share.
The fund continued to utilize leverage (or borrowing) during the period. The borrowed money was then invested in higher-yielding mortgage investments, which added to the income levels in the fund. While the use of leverage has resulted in more income for shareholders, it does increase interest-rate risk in the fund and will increase the volatility of the fund’s NAV and market price.
We believe that the fundamental real-estate environment will continue to pose challenges. The weaker real-estate markets could lead to increased levels of default. We will continue to diligently manage the credit risk in the fund and feel that its current credit profile is acceptable. We believe that as the U.S. economy improves there should be increased demand for space and that occupancy levels should rise.
Delinquent Loan Profile
The tables below show the percentages of single family loans and multifamily and commercial loans in the portfolio that are 30, 60, 90, or 120 or more days delinquent as of May 31, 2005, based on the value outstanding.
Single family loans
Current | | 75.7 | % |
30 Days | | 0.0 | % |
60 Days | | 0.0 | % |
90 Days | | 0.0 | % |
120+ Days | | 24.3 | % |
Multifamily and commercial loans
Current | | 95.5 | % |
30 Days | | 0.0 | % |
60 Days | | 0.0 | % |
90 Days | | 0.2 | % |
120+ Days | | 4.3 | % |
4
As you may recall, at a shareholder meeting held on March 15, 2001, the fund’s shareholders approved a revised fundamental investment policy allowing the fund to invest up to 25% of its total assets in investment-grade preferred stock of real estate investment trusts (“REITs”). At the same time, the board of directors further restricted the fund’s investment in these securities to 10% of total assets. This additional investment restriction was nonfundamental, however, meaning that it was subject to change at any time by the board of directors, without shareholder approval. In order to provide the fund with additional investment flexibility, at a meeting held on December 7, 2004, the fund’s board of directors removed this 10% restriction. The fund will continue to be subject to the policy limiting investments in investment-grade preferred stock of REITs to 25% of total assets.
At a meeting held July 20, 2005, the fund’s board of directors, in consultation with U.S. Bancorp Asset Management (“USBAM”), decided not to pursue the previously proposed reorganization of the fund, American Strategic Income Portfolio Inc., American Strategic Income Portfolio Inc. III, and American Select Portfolio Inc. (collectively, the “existing funds”) into the First American Strategic Real Estate Portfolio Inc., a specialty finance company that would elect to be taxed as a REIT. The board of directors and USBAM are currently exploring other options, including the possibility of combining the existing funds into a single closed-end fund that would continue to be registered under the Investment Company Act.
5
Thank you for your investment in the fund and your continued trust as we navigate the investment landscape. If you have any questions about the fund, please call us at 800.677.FUND.
Sincerely,

Mark Jordahl
Chief Investment Officer
U.S. Bancorp Asset Management, Inc.

John Wenker
Managing Director, Head of Real Estate
U.S. Bancorp Asset Management, Inc.
6
Geographical Distribution
We attempt to buy mortgage loans in many parts of the country to help avoid the risks of concentrating in one area. These percentages reflect the value of whole loans and participation mortgages as of May 31, 2005. Shaded areas without values indicate states in which the fund has invested less than 0.50% of its assets.

Valuation of Investments
The fund’s investments in whole loans (single family, multifamily, and commercial) and participation mortgages are generally not traded in any organized market; therefore, market quotations are not readily available. These investments are valued at “fair value” according to procedures adopted by the fund’s board of directors. Pursuant to these procedures, whole loan and participation mortgage investments are initially valued at cost and their values are subsequently monitored and adjusted pursuant to a pricing model designed by USBAM to incorporate, among other things, the present value of the projected stream of cash flows on such investments. The pricing model takes into account a number of relevant factors including the projected rate of prepayments, the delinquency profile, the historical payment record, the expected yield at purchase, changes in prevailing interest rates, and changes in the real or perceived liquidity of whole loans and participation mortgages, as the case may be. The results of the pricing model may be further subject to price ceilings due to the illiquid nature of the investments. Changes in prevailing interest rates, real or perceived liquidity, yield spreads, and creditworthiness are factored into the pricing model each week. Certain mortgage loan information is received on a monthly basis and includes, but is not limited to, the projected rate of prepayments, projected rate and severity of defaults, the delinquency profile, and the historical payment record. Valuations of whole loans and participation mortgages are determined no less frequently than weekly.
7
Financial STATEMENTS
Statement of Assets and Liabilities May 31, 2005
| Assets: | | | |
| Investments in unaffiliated securities, at value* (note 2) | | $ | 245,534,294 | | |
| Investment in affiliated money market fund, at value** (note 2) | | | 1,687,604 | | |
| Cash in bank on demand deposit | | | 865,680 | | |
| Receivable for accrued interest | | | 275,342 | | |
| Prepaid expenses | | | 167,455 | | |
| Other assets | | | 368,517 | | |
| Total assets | | | 248,898,892 | | |
| Liabilities: | | | |
| Payable for investment securities purchased | | | 508,000 | | |
| Payable for reverse repurchase agreements (note 2) | | | 49,366,558 | | |
| Payable for investment advisory fees (note 3) | | | 91,457 | | |
| Payable for administrative fees (note 3) | | | 41,880 | | |
| Payable for interest expense | | | 141,487 | | |
| Payable for reorganization expenses (notes 3 and 6) | | | 181,609 | | |
| Payable for other expenses | | | 120,926 | | |
| Total liabilities | | | 50,451,917 | | |
| Net assets applicable to outstanding capital stock | | $ | 198,446,975 | | |
| Composition of net assets: | | | |
| Capital stock and additional paid-in capital | | $ | 208,503,052 | | |
| Undistributed net investment income | | | 1,546,114 | | |
| Accumulated net realized loss on investments | | | (2,636,667 | ) | |
| Unrealized depreciation of investments | | | (8,965,524 | ) | |
| Total – representing net assets applicable to capital stock | | $ | 198,446,975 | | |
| *Investments in unaffiliated securities, at cost | | $ | 254,499,818 | | |
| **Investment in affiliated money market fund, at cost | | $ | 1,687,604 | | |
| Net asset value and market price of capital stock: | | | |
| Net assets outstanding | | $ | 198,446,975 | | |
Shares outstanding (authorized 1 billion shares of $0.01 par
value) | | | 15,985,741 | | |
| Net asset value per share | | $ | 12.41 | | |
| Market price per share | | $ | 12.00 | | |
See accompanying Notes to Financial Statements.
2005 Annual Report
American Strategic Income Portfolio II
8
Statement of Operations For the Year Ended May 31, 2005
| Investment income: | | | |
| Interest from unaffiliated securities | | $ | 20,004,949 | | |
| Dividends from unaffiliated securities | | | 378,504 | | |
| Dividends from affiliated money market fund | | | 95,344 | | |
| Total investment income | | | 20,478,797 | | |
| Expenses (note 3): | | | |
| Investment advisory fees | | | 1,222,501 | | |
| Interest expense | | | 1,306,396 | | |
| Administrative fees | | | 502,759 | | |
| Custodian fees | | | 40,430 | | |
| Transfer agent fees | | | 34,018 | | |
| Exchange listing and registration fees | | | 38,100 | | |
| Reports to shareholders | | | 58,878 | | |
| Mortgage servicing fees | | | 179,061 | | |
| Directors' fees | | | 11,689 | | |
| Audit and legal fees | | | 101,763 | | |
| Financial advisory and accounting fees | | | 11,787 | | |
| Other expenses | | | 80,597 | | |
| Total expenses | | | 3,587,979 | | |
| Net investment income | | | 16,890,818 | | |
Net realized and unrealized gains (losses) on
investments (note 4): | | | |
| Net realized gain on investments | | | 1,229,106 | | |
Net change in unrealized appreciation or depreciation of
investments | | | (10,543,368 | ) | |
| Net loss on investments | | | (9,314,262 | ) | |
| Net increase in net assets resulting from operations | | $ | 7,576,556 | | |
See accompanying Notes to Financial Statements.
2005 Annual Report
American Strategic Income Portfolio II
9
Financial STATEMENTS continued
Statement of Cash Flows For the Fiscal Year Ended May 31, 2005
| Cash flows from operating activities: | | | |
| Net increase in net assets resulting from operations | | $ | 7,576,556 | | |
Adjustments to reconcile net increase in net assets resulting
from operations to net cash provided by operating activities: | | | | | |
| Purchases of investments | | | (107,084,164 | ) | |
| Proceeds from paydowns and sales of investments | | | 119,925,310 | | |
| Net sales of short-term securities | | | 1,319,191 | | |
| Net amortization of bond discount and premium | | | 6,778 | | |
| Net unrealized depreciation of investments | | | 10,543,368 | | |
| Net realized gain on investments | | | (1,229,106 | ) | |
| Decrease in accrued interest receivable | | | 377,181 | | |
| Decrease in other assets | | | 151,678 | | |
| Increase in accrued fees and expenses | | | 26,899 | | |
| Net cash provided by operating activities | | | 31,613,691 | | |
| Cash flows from financing activities: | | | |
| Net payments for reverse repurchase agreements | | | (13,679,828 | ) | |
| Distributions paid to shareholders | | | (16,545,245 | ) | |
| Net cash used in financing activities | | | (30,225,073 | ) | |
| Net increase in cash | | | 1,388,618 | | |
| Bank overdraft at beginning of period | | | (522,938 | ) | |
| Cash at end of period | | $ | 865,680 | | |
Supplemental disclosure of cash flow information:
Cash paid for interest | | $ | 1,241,101 | | |
See accompanying Notes to Financial Statements.
2005 Annual Report
American Strategic Income Portfolio II
10
Statements of Changes in Net Assets
| | | Year Ended
5/31/05 | | Year Ended
5/31/04 | |
| Operations: | |
| Net investment income | | $ | 16,890,818 | | | $ | 17,882,331 | | |
| Net realized gain on investments | | | 1,229,106 | | | | 806,361 | | |
| Net change in unrealized appreciation or depreciation of investments | | | (10,543,368 | ) | | | (2,836,227 | ) | |
| Net increase in net assets resulting from operations | | | 7,576,556 | | | | 15,852,465 | | |
| Distributions to shareholders (note 2): | |
| From net investment income | | | (16,545,245 | ) | | | (18,204,555 | ) | |
| Capital share transactions (note 2): | |
| Proceeds from 28,452 shares issued from reinvested dividends | | | - | | | | 378,262 | | |
| Total decrease in net assets | | | (8,968,689 | ) | | | (1,973,828 | ) | |
| Net assets at beginning of period | | | 207,415,664 | | | | 209,389,492 | | |
| Net assets at end of period | | $ | 198,446,975 | | | $ | 207,415,664 | | |
| Undistributed net investment income | | $ | 1,546,114 | | | $ | 1,272,973 | | |
See accompanying Notes to Financial Statements.
2005 Annual Report
American Strategic Income Portfolio II
11
Notes to Financial STATEMENTS
| (1) Organization | | American Strategic Income Portfolio Inc. II (the "fund") is registered under the Investment Company Act of 1940 (as amended) as a diversified, closed-end management investment company. The fund emphasizes investments in mortgage-related assets that directly or indirectly represent a participation in or are secured by and payable from mortgage loans. It may also invest in U.S. government securities, corporate debt securities, and preferred stock issued by real estate investment trusts. In addition, the fund may borrow using reverse repurchase agreements and revolving credit facilities. Fund shares are listed on the New York Stock Exchange under the symbol BSP. | |
|
| (2) Summary of Significant Accounting Policies | | Security Valuations | |
|
| | | Security valuations for the fund's investments (other than whole loans and participation mortgages) are furnished by independent pricing services that have been approved by the fund's board of directors. Investments in equity securities that are traded on a national securities exchange are stated at the last quoted sales price if readily available for such securities on each business day. For securities traded on the Nasdaq national market system, the fund utilizes the Nasdaq Official Closing Price which compares the last trade to the bid/ask price of a security. If the last trade is within the bid/ask range, then that price will be the closing price. If the last trade is outside the bid/ask range, and falls above the ask, the ask price will be the closing price. If the last trade is below the bid, the bid will be the closing price. Other equity securities traded in the over-the-counter market and listed equity securiti es for which no sale was reported on that date are stated at the last quoted bid price. Debt obligations exceeding 60 days to maturity are valued by an independent pricing service. The pricing service may employ methodologies that utilize actual market transactions, broker-dealer supplied | |
|
2005 Annual Report
American Strategic Income Portfolio II
12
| valuations, or other formula-driven valuation techniques. These techniques generally consider such factors as yields or prices of bonds of comparable quality, type of issue, coupon, maturity, ratings, and general market conditions. Securities for which prices are not available from an independent pricing service but where an active market exists are valued using market quotations obtained from one or more dealers that make markets in the securities or from a widely used quotation system. When market quotations are not readily available, securities are valued at fair value as determined in good faith by procedures established and approved by the fund's board of directors. Some of the factors which may be considered in determining fair value are fundamental analytical data relating to the investment; the nature and duration of any restrictions on disposition; trading in similar securities of the same issuer or comparable companies; information from broker-dealers; and an evaluation of the forces that influence the market in which the securities are purchased and sold. If events occur that materially affect the value of securities (including non-U.S. securities) between the close of trading in those securities and the close of regular trading on the New York Stock Exchange, the securities will be valued at fair value. Debt obligations with 60 days or less remaining until maturity will be valued at their amortized cost, which approximates market value. Security valuations are performed once a week and at the end of each month. | |
|
| The fund's investments in whole loans (single family, multifamily, and commercial) and participation mortgages are generally not traded in any organized market and, therefore, market quotations are not readily available. These investments are valued at fair value according to procedures adopted by the fund's board of directors. | |
|
2005 Annual Report
American Strategic Income Portfolio II
13
Notes to Financial STATEMENTS continued
| Pursuant to these procedures, whole loan investments are initially valued at cost and their values are subsequently monitored and adjusted using a U.S. Bancorp Asset Management, Inc. ("USBAM") pricing model designed to incorporate, among other things, the present value of the projected stream of cash flows on such investments. The pricing model takes into account a number of relevant factors including the projected rate of prepayments, the delinquency profile, the historical payment record, the expected yield at purchase, changes in prevailing interest rates, and changes in the real or perceived liquidity of whole loans or participation mortgages, as the case may be. The results of the pricing model may be further subject to price ceilings due to the illiquid nature of the loans. Changes in prevailing interest rates, real or perceived liquidity, yield spreads, and creditworthiness are factored into the pricing model eac h week. | |
|
| Certain mortgage loan information is received once a month. This information includes, but is not limited to, the projected rate of prepayments, projected rate and severity of defaults, the delinquency profile, and the historical payment record. Valuations of whole loans and participation mortgages are determined no less frequently than weekly. Although USBAM believes the pricing model to be reasonable and appropriate, the actual values that may be realized upon the sale of whole loans and participation mortgages can only be determined in a negotiation between the fund and third parties. | |
|
| As of May 31, 2005, the fund held fair valued securities with a value of $211,537,989 or 106.6% of net assets. | |
|
| Security Transactions and Investment Income | |
|
| For financial statement purposes, the fund records security transactions on the trade date of the security | |
|
2005 Annual Report
American Strategic Income Portfolio II
14
| purchase or sale. Dividend income is recorded on the ex-dividend date. Interest income, including accretion of bond discounts and amortization of bond premiums, is recorded on an accrual basis. Security gains and losses are determined on the basis of identified cost, which is the same basis used for federal income tax purposes. | |
|
| Whole Loans and Participation Mortgages | |
|
| Whole loans and participation mortgages may bear a greater risk of loss arising from a default on the part of the borrower of the underlying loans than do traditional mortgage-backed securities. This is because whole loans and participation mortgages, unlike most mortgage-backed securities, generally are not backed by any government guarantee or private credit enhancement. Such risk may be greater during a period of declining or stagnant real estate values. In addition, the individual loans underlying whole loans and participation mortgages may be larger than the loans underlying mortgage-backed securities. With respect to participation mortgages, the fund generally will not be able to unilaterally enforce its rights in the event of a default, but rather will be dependent on the cooperation of the other participation holders. | |
|
| The fund does not record past due interest as income until received. The fund may incur certain costs and delays in the event of a foreclosure. Also, there is no assurance that the subsequent sale of the property will produce an amount equal to the sum of the unpaid principal balance of the loan as of the date the borrower went into default, the accrued unpaid interest, and all of the foreclosure expenses. In this case, the fund may suffer a loss. At May 31, 2005, loans representing 4.8% of net assets were 60 days or more delinquent as to the timely monthly payment of principal and interest. Such delinquencies | |
|
2005 Annual Report
American Strategic Income Portfolio II
15
Notes to Financial STATEMENTS continued
| relate to single family whole loans and multifamily whole loans, which represents 7.2% of the total value of single family whole loans and multifamily whole loans outstanding at May 31, 2005. At May 31, 2005, no commercial loans were delinquent. | |
|
| Real estate acquired through foreclosure, if any, is recorded at estimated fair value. The fund may receive rental or other income as a result of holding real estate. In addition, the fund may incur expenses associated with maintaining any real estate owned. On May 31, 2005, the fund owned no real estate. | |
|
| Reverse Repurchase Agreements | |
|
| Reverse repurchase agreements involve the sale of a portfolio-eligible security by the fund, coupled with an agreement to repurchase the security at a specified date and price. Reverse repurchase agreements may increase volatility of the fund's net asset value and involve the risk that interest costs on money borrowed may exceed the return on securities purchased with that borrowed money. Reverse repurchase agreements are considered to be borrowings by the fund, and are subject to the fund's overall restriction on borrowing under which it must maintain asset coverage of at least 300%. For the fiscal year ended May 31, 2005, the weighted average borrowings outstanding were $47,428,939 and the weighted average interest rate was 2.71%. | |
|
| Securities Purchased on a When-Issued Basis | |
|
| Delivery and payment for securities that have been purchased by the fund on a when-issued or forward-commitment basis can take place a month or more after the transaction date. During this period, such securities do not earn interest, are subject to market fluctuation, | |
|
2005 Annual Report
American Strategic Income Portfolio II
16
| and may increase or decrease in value prior to their delivery. The fund segregates, with its custodian, assets with a market value equal to the amount of its purchase commitments. The purchase of securities on a when-issued or forward-commitment basis may increase the volatility of the fund's net asset value if the fund makes such purchases while remaining substantially fully invested. As of May 31, 2005, the fund had outstanding when-issued or forward-commitment securities of $508,000 or 0.3% of net assets. | |
|
| Federal Taxes | |
|
| The fund intends to comply with the requirements of the Internal Revenue Code applicable to regulated investment companies and not be subject to federal income tax. Therefore, no income tax provision is required. The fund also intends to distribute its taxable net investment income and realized gains, if any, to avoid the payment of any federal excise taxes. | |
|
| Net investment income and net realized gains (losses) may differ for financial statement and tax purposes because of temporary or permanent book-to-tax differences. These differences are primarily due to the timing of recognition of income on certain collateralized mortgage-backed securities, post-October losses, and investments in REITs. To the extent these differences are permanent, reclassifications are made to the appropriate equity accounts in the period that the differences arise. | |
|
| On the statement of assets and liabilities, as a result of permanent book-to-tax differences related to investments in REITs and expiring capital loss carryovers, undistributed net investment income has been decreased by $72,432 and accumulated net realized gain has been increased by $175,321, resulting in a net reclassification adjustment to decrease paid-in capital by $102,889. | |
|
2005 Annual Report
American Strategic Income Portfolio II
17
Notes to Financial STATEMENTS continued
| The character of distributions made during the year from net investment income or net realized gains may differ from its ultimate characterization for federal income tax purposes. In addition, due to the timing of dividend distributions, the fiscal year in which amounts are distributed may differ from the year that the income or realized gains or losses were recorded by the fund. | |
|
| The tax character of distributions paid during the fiscal years ended May 31, 2005 and 2004 was as follows: | |
|
| | | 2005 | | 2004 | |
| Distributions paid from ordinary income | | $ | 16,545,245 | | | $ | 18,204,555 | | |
| At May 31, 2005, the components of accumulated deficit on a tax basis were as follows: | |
|
| Undistributed ordinary income | | $ | 1,546,114 | | |
| Accumulated capital and post-October losses | | | (1,324,504 | ) | |
| Unrealized depreciation | | | (10,277,687 | ) | |
| Accumulated deficit | | $ | (10,056,077 | ) | |
| The difference between book basis and tax basis unrealized appreciation and accumulated realized losses at May 31, 2005, is attributable to a one-time tax election whereby the fund marked appreciated securities to market creating capital gains that were used to reduce capital loss carryovers and increase tax cost basis. | |
|
| Distributions to Shareholders | |
|
| Distributions from net investment income are declared and paid on a monthly basis. Any net realized capital gains on sales of securities for the fund are distributed to shareholders at least annually. These distributions are recorded as of the close of business on the ex-dividend date. Such distributions are payable in cash or, pursuant to the fund's dividend reinvestment plan, reinvested in additional shares of the fund's capital stock. Under the | |
|
2005 Annual Report
American Strategic Income Portfolio II
18
| plan, fund shares will be purchased in the open market unless the market price plus commissions exceeds the net asset value by 5% or more. If, at the close of business on the dividend payment date, the shares purchased in the open market are insufficient to satisfy the dividend reinvestment requirement, the fund will issue new shares at a discount of up to 5% from the current market price. | |
|
| Repurchase Agreements | |
|
| For repurchase agreements entered into with certain broker-dealers, the fund, along with other affiliated registered investment companies, may transfer uninvested cash balances into a joint trading account, the daily aggregate of which is invested in repurchase agreements secured by U.S. government or agency obligations. Securities pledged as collateral for all individual and joint repurchase agreements are held by the fund's custodian bank until maturity of the repurchase agreement. Provisions for all agreements ensure that the daily market value of the collateral is in excess of the repurchase amount, including accrued interest, to protect the fund in the event of a default. | |
|
| Use of Estimates in the Preparation of Financial Statements | |
|
| The preparation of financial statements, in conformity with U.S. generally accepted accounting principles, requires management to make estimates and assumptions that affect the reported amount of assets and liabilities and disclosure of contingent assets and liabilities at the date of the financial statements and the results of operations during the reporting period. Actual results could differ from these estimates. | |
|
2005 Annual Report
American Strategic Income Portfolio II
19
Notes to Financial STATEMENTS continued
| | (3 | ) Expenses | | Investment Advisory Fees | |
|
| | | | | Pursuant to an investment advisory agreement (the "Agreement"), USBAM, a subsidiary of U.S. Bank National Association ("U.S. Bank"), manages the fund's assets and furnishes related office facilities, equipment, research, and personnel. The Agreement provides USBAM with a monthly investment advisory fee equal to an annualized rate of 0.20% of the fund's average weekly net assets and 4.50% of the daily gross income accrued by the fund during the month (i.e., investment income, including accretion of bond discounts and amortization of premiums, other than gains from the sale of securities or gains from options and futures contracts less interest on money borrowed by the fund). The monthly investment advisory fee shall not exceed in the aggregate 1/12 of 0.725% of the fund's average weekly net assets during the month (approximately 0.725% on an annual basis). For the fiscal year ended May 31, 2005, the effective invest ment advisory fee incurred by the fund was 0.61%. For its fee, USBAM provides investment advice and, in general, conducts the management and investment activities of the fund. | |
|
| | | | | The fund may invest in related money market funds that are series of First American Funds, Inc. ("FAF"), subject to certain limitations. In order to avoid the payment of duplicative investment advisory fees to USBAM, which acts as the investment advisor to both the fund and the related money market funds, USBAM will reimburse the fund an amount equal to that portion of the investment advisory fee received from the related money market funds that is attributable to the assets of the fund. For financial statement purposes, this reimbursement is recorded as investment income. | |
|
2005 Annual Report
American Strategic Income Portfolio II
20
| Administrative Fees | |
|
| Pursuant to a co-administration agreement (the "Co-Administration Agreement"), USBAM serves as co-administrator for the fund (U.S. Bancorp Fund Services, LLC, a subsidiary of U.S. Bancorp, is also co-administrator but currently has no functional responsibilities related to the fund) and provides administrative services, including legal and shareholder services, to the fund. Under this Co-Administration Agreement, USBAM receives a monthly administrative fee equal to an annualized rate of 0.25% of the fund's average weekly net assets. For its fee, USBAM provides numerous services to the fund including, but not limited to, handling the general business affairs, financial and regulatory reporting, and various other services. Separate from the Co-Administration Agreement, USBAM (from its own resources) has retained SEI Investments Inc. as a sub-administrator to perform, among other services, net asset value calculations. | |
|
| Custodian Fees | |
|
| U.S. Bank serves as the fund's custodian pursuant to a custodian agreement with the fund. The fee for the fund is equal to an annual rate of 0.02% of average weekly net assets. These fees are computed weekly and paid monthly. | |
|
| Mortgage Servicing Fees | |
|
| The fund enters into mortgage servicing agreements with mortgage servicers for whole loans and participation mortgages. For a fee, mortgage servicers maintain loan records, such as insurance and taxes and the proper allocation of payments between principal and interest. | |
|
| Proposed Reorganization Expenses | |
|
| The fund previously filed a proxy statement/registration statement and took certain other steps in connection with | |
|
2005 Annual Report
American Strategic Income Portfolio II
21
Notes to Financial STATEMENTS continued
| a proposed reorganization of the fund, along with American Strategic Income Portfolio Inc. ("ASP"), American Strategic Income Portfolio Inc. III ("CSP"), and American Select Portfolio Inc. ("SLA"), into First American Strategic Real Estate Portfolio Inc., a specialty real estate finance company that would elect to be taxed as a real estate investment trust. As discussed in Note 7, the Board of Directors, in consultation with USBAM, has decided not to pursue this proposed reorganization. As set forth below, certain costs and expenses incurred in connection with the proposed reorganization of the fund (including, but not limited to, the preparation of all necessary registration statements, proxy materials and other documents, preparation for and attendance at board and committee, shareholder, planning, organizational, and other meetings, and costs and expenses of accountants, attorneys, financial advisors and other e xperts engaged in connection with the reorganization) were borne by the fund, ASP, CSP, and SLA (collectively, the "existing funds"). The existing funds as a group bore the first $3,400,000 of such expenses and, subject to certain exceptions, have shared equally with USBAM all transaction expenses in excess of $3,400,000. Such costs and expenses were allocated among the existing funds based on their relative net asset values. Additionally, costs and expenses incurred in connection with the legal representation of USBAM's interests with respect to the reorganization and related matters were borne by USBAM. The existing funds' portion of the costs and expenses related to the reorganization have totaled approximately $4,000,000 through May 31, 2005, $100,000 of which was incurred during the fiscal year ended May 31, 2005. Of these amounts, $1,219,568 and $31,039, respectively, have been allocated to the fund. | |
|
2005 Annual Report
American Strategic Income Portfolio II
22
| | | Other Fees and Expenses | |
|
| | | In addition to the investment advisory, administrative, and custodian fees, the fund is responsible for paying most other operating expenses, including: outside directors' fees and expenses, exchange listing and registration fees, printing and shareholder reports, transfer agent fees and expenses, legal, auditing and accounting services, insurance, interest, expenses related to real estate owned, taxes, and other miscellaneous expenses. | |
|
| (4) Investment Security Transactions | | Cost of purchases and proceeds from paydowns and sales of securities and real estate, other than temporary investments in short-term securities, for the fiscal year ended May 31, 2005, aggregated $107,585,386 and $119,925,310, respectively. Included in proceeds from sales are $1,224,810 from prepayment penalties. | |
|
| (5) Capital Loss Carryover | | For federal income tax purposes, the fund had capital loss carryovers at May 31, 2005, which, if not offset by subsequent capital gains, will expire on the fund's fiscal year-ends as indicated below. | |
|
Capital Loss
Carryover | | Expiration | |
| $ | 1,266,343 | | | | 2006 | | |
| | 58,161 | | | | 2012 | | |
| $ | 1,324,504 | | | | |
| (6) Indemnifications | | The fund enters into contracts that contain a variety of indemnifications. The fund's maximum exposure under these arrangements is unknown. However, the fund has not had prior claims or losses pursuant to these contracts and expects the risk of loss to be remote. | |
|
| (7) Subsequent Events | | At a meeting held June 20-22, 2005, the Board of Directors approved a new administration agreement under which, effective July 1, 2005, USBAM began serving as the sole administrator for the fund. The monthly administrative fee will be the same as under the prior | |
|
2005 Annual Report
American Strategic Income Portfolio II
23
Notes to Financial STATEMENTS continued
| agreement, and will equal an annualized rate of 0.25% of the fund's average weekly net assets. | |
|
| At the same meeting, the Board of Directors approved a change in the fund's year-end from May 31 to August 31. | |
|
| At a meeting held July 20, 2005, the Board of Directors, in consultation with USBAM, decided not to pursue the previously proposed reorganization of the fund, American Strategic Income Portfolio Inc., American Strategic Income Portfolio Inc. III, and American Select Portfolio Inc. (collectively, the "existing funds") into First American Strategic Real Estate Portfolio Inc., a specialty finance company that would elect to be taxed as a real estate investment trust. The Board of Directors and USBAM are currently exploring other options, including the possibility of combining the existing funds into a single closed-end fund that would continue to be registered under the Investment Company Act. | |
|
2005 Annual Report
American Strategic Income Portfolio II
24
| (8) Financial Highlights | | Per-share data for a share of capital stock outstanding throughout each period and selected information for each period are as follows: | |
|
| | | Year Ended May 31, | |
| | | 2005 | | 2004 | | 2003 | | 2002 | | 2001 | |
| Per-Share Data | | | |
| Net asset value, beginning of period | | $ | 12.98 | | | $ | 13.12 | | | $ | 13.29 | | | $ | 13.06 | | | $ | 12.20 | | |
| Operations: | |
| Net investment income | | | 1.06 | | | | 1.12 | | | | 1.12 | | | | 1.13 | | | | 1.06 | | |
Net realized and unrealized gains
(losses) on investments | | | (0.59 | ) | | | (0.12 | ) | | | (0.15 | ) | | | 0.23 | | | | 0.83 | | |
| Total from operations | | | 0.47 | | | | 1.00 | | | | 0.97 | | | | 1.36 | | | | 1.89 | | |
| Distributions to shareholders: | |
| From net investment income | | | (1.04 | ) | | | (1.14 | ) | | | (1.14 | ) | | | (1.13 | ) | | | (1.03 | ) | |
| Net asset value, end of period | | $ | 12.41 | | | $ | 12.98 | | | $ | 13.12 | | | $ | 13.29 | | | $ | 13.06 | | |
| Market value, end of period | | $ | 12.00 | | | $ | 12.84 | | | $ | 13.70 | | | $ | 13.17 | | | $ | 12.30 | | |
| Selected Information | | | |
| Total return, net asset value (a) | | | 3.85 | % | | | 7.95 | % | | | 7.59 | % | | | 10.66 | % | | | 15.97 | % | |
| Total return, market value (b) | | | 1.51 | % | | | 2.16 | % | | | 13.51 | % | | | 16.94 | % | | | 21.98 | % | |
| Net assets at end of period (in millions) | | $ | 198 | | | $ | 207 | | | $ | 209 | | | $ | 212 | | | $ | 208 | | |
Ratio of expenses to average weekly
net assets | | | 1.78 | % | | | 1.77 | % | | | 2.99 | % | | | 2.30 | % | | | 3.37 | % | |
Ratio of expenses to average weekly
net assets excluding interest
expense | | | 1.13 | % | | | 1.18 | % | | | 1.68 | % | | | 1.15 | % | | | 1.19 | % | |
Ratio of net investment income to
average weekly net assets | | | 8.40 | % | | | 8.61 | % | | | 8.52 | % | | | 8.55 | % | | | 8.45 | % | |
| Portfolio turnover rate | | | 44 | % | | | 34 | % | | | 24 | % | | | 46 | % | | | 21 | % | |
Amount of borrowings outstanding
at end of period (in millions) | | $ | 49 | | | $ | 63 | | | $ | 73 | | | $ | 83 | | | $ | 70 | | |
Per-share amount of borrowings
outstanding at end of period | | $ | 3.09 | | | $ | 3.94 | | | $ | 4.55 | | | $ | 5.18 | | | $ | 4.37 | | |
Per-share amount of net assets,
excluding borrowings, at
end of period | | $ | 15.50 | | | $ | 16.92 | | | $ | 17.67 | | | $ | 18.47 | | | $ | 17.43 | | |
| Asset coverage ratio (c) | | | 502 | % | | | 429 | % | | | 388 | % | | | 356 | % | | | 399 | % | |
(a) Assumes reinvestment of distributions at net asset value.
(b) Assumes reinvestment of distributions at actual prices pursuant to the fund's dividend reinvestment plan.
(c) Represents net assets, excluding borrowings, at end of period divided by borrowings outstanding at end of period.
2005 Annual Report
American Strategic Income Portfolio II
25
Schedule of INVESTMENTS
American Strategic Income Portfolio II May 31, 2005
| Description of Security | | Date
Acquired | | Par
Value | | Cost | | Value (a) | |
| (Percentages of each investment category relate to net assets) | |
| U.S. Government Agency Mortgage-Backed Securities - 6.7% | |
| Fixed Rate - 6.7% | |
| FHLMC, 5.50%, 1/1/18 (b) | | | | $ | 6,000,015 | | | $ | 6,188,814 | | | $ | 6,157,515 | | |
| FHLMC, 9.00%, 7/1/30 (b) | | | | | 444,458 | | | | 456,237 | | | | 482,793 | | |
| FNMA, 6.00%, 10/1/16 (b) | | | | | 492,401 | | | | 495,149 | | | | 510,561 | | |
| FNMA, 5.50%, 6/1/17 (b) | | | | | 493,197 | | | | 495,721 | | | | 506,759 | | |
| FNMA, 5.00%, 9/1/17 (b) | | | | | 846,863 | | | | 849,159 | | | | 859,041 | | |
| FNMA, 5.00%, 11/1/17 (i) | | | | | 1,616,296 | | | | 1,625,025 | | | | 1,639,538 | | |
| FNMA, 6.50%, 6/1/29 (b) | | | | | 2,019,318 | | | | 2,005,667 | | | | 2,100,716 | | |
| FNMA, 7.50%, 4/1/30 (b) | | | | | 233,897 | | | | 226,034 | | | | 250,197 | | |
| FNMA, 7.50%, 5/1/30 (b) | | | | | 268,209 | | | | 259,210 | | | | 286,901 | | |
| FNMA, 8.00%, 5/1/30 (b) | | | | | 73,683 | | | | 72,753 | | | | 79,647 | | |
| FNMA, 8.00%, 6/1/30 (b) | | | | | 334,623 | | | | 330,397 | | | | 361,497 | | |
Total U.S. Government
Agency Mortgage-Backed
Securities | | | | | | | | | 13,004,166 | | | | 13,235,165 | | |
| Corporate Note (e) - 2.6% | | | |
| Adjustable Rate (f) - 2.6% | |
Stratus Properties,
7.37%, 7/1/08 | | 06/14/01 | | | 5,000,000 | | | | 5,000,000 | | | | 5,150,000 | | |
| Private Mortgage-Backed Security (e) - 0.1% | | | |
| Fixed Rate - 0.1% | |
RFC 1997-NPC1,
8.31%, 8/27/23 | | 03/27/97 | | | 226,364 | | | | 227,132 | | | | 233,155 | | |
| Whole Loans and Participation Mortgages (c,d,e) - 103.9% | | | |
| Commercial Loans - 32.3% | |
1336 and 1360 Energy
Park Drive,
7.55%, 10/1/08 (b) | | 09/29/98 | | | 2,658,546 | | | | 2,658,546 | | | | 2,764,887 | | |
5555 East Van Buren,
5.68%, 7/1/11 (b) | | 06/23/04 | | | 6,500,000 | | | | 6,500,000 | | | | 6,765,752 | | |
Bigelow Office Building,
8.88%, 4/1/07 (b) | | 03/31/97 | | | 1,222,796 | | | | 1,222,796 | | | | 1,247,252 | | |
Cypress Point Office Park I,
5.30%, 6/1/09 (b) | | 05/19/04 | | | 4,641,000 | | | | 4,641,000 | | | | 4,713,720 | | |
| See accompanying Notes to Investments in Securities. | |
2005 Annual Report
American Strategic Income Portfolio II
26
American Strategic Income Portfolio II
(Continued)
| Description of Security | | Date
Acquired | | Par
Value | | Cost | | Value (a) | |
Cypress Point Office Park II,
5.30%, 7/1/09 (b) | | 05/19/04 | | $ | 4,509,000 | | | $ | 4,509,000 | | | $ | 4,579,652 | | |
Gardenswartz Plaza,
7.40%, 5/1/07 (b) | | 04/02/02 | | | 2,530,798 | | | | 2,530,798 | | | | 2,556,106 | | |
Glen Lakes Health Plaza,
5.40%, 2/1/07 (b) | | 01/15/04 | | | 3,691,429 | | | | 3,691,429 | | | | 3,765,257 | | |
Hadley Avenue Business
Center,
8.38%, 1/1/11 (b) | | 12/14/00 | | | 2,324,867 | | | | 2,324,867 | | | | 2,441,110 | | |
Hillside Office Park,
7.63%, 8/1/08 | | 07/09/98 | | | 883,956 | | | | 883,956 | | | | 919,314 | | |
Katy Plaza II,
9.88%, 1/1/06 | | 01/01/04 | | | 1,785,892 | | | | 1,785,892 | | | | 1,651,719 | | |
La Posada & Casitas I,
7.93%, 11/1/05 (j) | | 11/02/01 | | | 5,680,000 | | | | 5,680,000 | | | | 5,680,000 | | |
LaCosta Centre,
5.20%, 3/1/09 (b) | | 02/27/04 | | | 4,595,562 | | | | 4,595,562 | | | | 4,672,565 | | |
Minikahda Mini Storage III,
8.62%, 8/1/09 (b) | | 09/16/99 | | | 3,885,805 | | | | 3,885,805 | | | | 4,080,095 | | |
Minikahda Mini Storage V,
8.75%, 9/1/09 (b) | | 07/02/01 | | | 2,139,721 | | | | 2,139,721 | | | | 2,246,707 | | |
Oak Knoll Village Shopping
Center,
6.73%, 10/1/13 (b) | | 09/17/03 | | | 1,610,916 | | | | 1,610,916 | | | | 1,691,462 | | |
PennMont Office Plaza,
6.88%, 5/1/06 (b) | | 04/30/01 | | | 1,294,256 | | | | 1,294,256 | | | | 1,307,198 | | |
Rapid Park Parking Lot,
5.15%, 11/1/07 | | 08/07/97 | | | 3,815,424 | | | | 3,815,424 | | | | 3,908,337 | | |
Redwood Dental Building,
7.40%, 7/1/12 (b) | | 06/28/02 | | | 2,626,740 | | | | 2,626,740 | | | | 2,758,077 | | |
Rimrock Plaza,
7.65%, 12/1/08 (b) | | 12/02/98 | | | 2,905,365 | | | | 2,905,365 | | | | 2,992,526 | | |
Stevenson Office Building,
Port Orchard Cinema,
Jensen Industrial Building,
7.88%, 2/1/09 (b) | | 01/21/99 | | | 2,755,383 | | | | 2,755,383 | | | | 2,865,599 | | |
Sundance Plaza,
7.13%, 11/1/08 | | 10/29/98 | | | 521,214 | | | | 521,214 | | | | 542,063 | | |
| | | | 62,578,670 | | | | 64,149,398 | | |
| See accompanying Notes to Investments in Securities. | |
2005 Annual Report
American Strategic Income Portfolio II
27
Schedule of INVESTMENTS continued
American Strategic Income Portfolio II
(Continued)
| Description of Security | | Date
Acquired | | Par
Value | | Cost | | Value (a) | |
| Multifamily Loans - 71.0% | |
Adelphi Springs Apartments,
9.93%, 3/1/09 | | 06/27/03 | | $ | 5,084,592 | | | $ | 5,084,592 | | | $ | 4,208,153 | | |
Alexan at Crescent Place,
10.93%, 4/1/08 | | 03/31/05 | | | 7,000,000 | | | | 7,000,000 | | | | 7,210,000 | | |
Ashley Place Apartments I,
5.78%, 3/31/08 | | 03/31/05 | | | 6,500,000 | | | | 6,500,000 | | | | 6,695,000 | | |
Ashley Place Apartments II,
10.88%, 3/31/08 | | 03/31/05 | | | 320,000 | | | | 320,000 | | | | 329,600 | | |
Autumnwood, Southern Woods,
Hinton Hollow,
7.68%, 6/1/09 (b) | | 05/24/02 | | | 7,075,875 | | | | 7,075,875 | | | | 7,429,669 | | |
Chardonnay Apartments,
6.40%, 7/1/13 (b) | | 06/05/03 | | | 4,070,570 | | | | 4,070,570 | | | | 4,246,512 | | |
Deering Manor,
7.98%, 12/8/22 | | 12/08/92 | | | 1,015,541 | | | | 1,005,386 | | | | 1,015,541 | | |
Forestree Apartments,
6.05%, 6/30/05 (b) (f) (j) | | 06/01/01 | | | 7,725,000 | | | | 7,725,000 | | | | 7,725,000 | | |
Forestree Apartments II,
6.05%, 6/30/05 (f) (j) | | 06/11/03 | | | 1,375,000 | | | | 1,375,000 | | | | 1,375,000 | | |
Glenoaks Apartments,
5.60%, 2/1/08 | | 01/13/05 | | | 6,850,000 | | | | 6,850,000 | | | | 6,046,394 | | |
Hidden Woods Apartments I,
6.68%, 1/1/06 (g) | | 12/18/02 | | | 12,475,000 | | | | 12,475,000 | | | | 8,732,500 | | |
Hidden Woods Apartments II,
11.88%, 1/1/06 (g) | | 12/18/02 | | | 750,000 | | | | 750,000 | | | | 525,000 | | |
Highland Ridge & Highland Glen
Apartments,
14.90%, 10/1/08 | | 09/30/04 | | | 3,850,000 | | | | 3,850,000 | | | | 3,135,561 | | |
Misty Woods/Riverfall Square I,
5.43%, 8/1/06 (b) | | 07/23/03 | | | 7,966,000 | | | | 7,966,000 | | | | 7,728,495 | | |
Misty Woods/Riverfall Square II,
9.88%, 8/1/06 | | 07/23/03 | | | 1,591,000 | | | | 1,591,000 | | | | 1,113,700 | | |
Oakton Terrace Apartments,
9.88%, 8/1/11 (j) | | 06/27/03 | | | 670,141 | | | | 670,141 | | | | 670,141 | | |
Park Hampshire Apartments,
9.90%, 1/1/13 | | 06/27/03 | | | 3,111,280 | | | | 3,111,280 | | | | 2,279,712 | | |
RP - Plaza Development,
5.99%, 3/1/10 (j) | | 02/23/05 | | | 5,000,000 | | | | 5,000,000 | | | | 5,000,000 | | |
Sand Pebble Apartments,
5.77%, 3/1/07 | | 02/09/05 | | | 6,400,000 | | | | 6,400,000 | | | | 6,432,000 | | |
| See accompanying Notes to Investments in Securities. | |
2005 Annual Report
American Strategic Income Portfolio II
28
American Strategic Income Portfolio II
(Continued)
| Description of Security | | Date
Acquired | | Par
Value | | Cost | | Value (a) | |
Scottsdale Park Place,
5.68%, 11/1/07 (j) | | 10/29/04 | | $ | 7,125,000 | | | $ | 7,125,000 | | | $ | 7,125,000 | | |
Seven Oaks Apartments,
12.93%, 8/1/09 | | 07/15/04 | | | 6,144,000 | | | | 6,144,000 | | | | 4,861,025 | | |
Southridge Apartments,
8.43%, 4/1/09 (b) | | 03/22/02 | | | 7,514,906 | | | | 7,514,906 | | | | 5,817,399 | | |
Spring Lake Apartments I,
5.52%, 3/1/07 | | 02/23/05 | | | 7,000,000 | | | | 7,000,000 | | | | 7,140,000 | | |
Spring Lake Apartments II,
9.88%, 3/1/07 | | 02/23/05 | | | 600,000 | | | | 600,000 | | | | 554,282 | | |
Sussex Club Apartments I,
6.68%, 5/1/06 (b) | | 04/08/03 | | | 9,798,000 | | | | 9,798,000 | | | | 8,765,614 | | |
Sussex Club Apartments II,
11.88%, 5/1/06 (j) | | 04/08/03 | | | 612,000 | | | | 612,000 | | | | 612,000 | | |
Timber Ridge Apartments,
9.88%, 8/1/13 | | 04/23/02 | | | 500,000 | | | | 500,000 | | | | 479,820 | | |
Tremont Towers,
6.56%, 5/1/07 (j) | | 04/05/05 | | | 14,000,000 | | | | 14,000,000 | | | | 14,000,000 | | |
Vista Bonita Apartments,
5.87%, 4/1/08 | | 03/04/05 | | | 2,797,276 | | | | 2,797,276 | | | | 2,879,331 | | |
Winterland Apartments I,
9.23%, 7/1/12 | | 06/06/97 | | | 558,007 | | | | 558,007 | | | | 585,908 | | |
Winterland Apartments II,
9.23%, 7/1/12 | | 06/06/97 | | | 1,069,513 | | | | 1,069,513 | | | | 1,122,989 | | |
Woodside Village Apartments I,
5.40%, 10/1/06 (b) | | 09/22/03 | | | 4,210,000 | | | | 4,210,000 | | | | 4,294,200 | | |
Woodside Village Apartments II,
9.88%, 10/1/06 | | 09/22/03 | | | 947,000 | | | | 947,000 | | | | 776,465 | | |
| | | | 151,695,546 | | | | 140,912,011 | | |
| Single Family Loans - 0.6% | | | |
Merchants Bank,
10.48%, 12/1/20 | | 12/18/92 | | | 172,027 | | | | 173,441 | | | | 177,158 | | |
Neslund Properties,
9.88%, 2/1/23 | | 01/27/93 | | | 492,063 | | | | 489,620 | | | | 506,825 | | |
PHH U.S. Mortgage,
8.65%, 1/1/12 | | 12/30/92 | | | 469,485 | | | | 456,862 | | | | 409,442 | | |
| | | | 1,119,923 | | | | 1,093,425 | | |
Total Whole Loans and
Participation Mortgages | | | | | | | | | 215,394,139 | | | | 206,154,834 | | |
| See accompanying Notes to Investments in Securities. | |
2005 Annual Report
American Strategic Income Portfolio II
29
Schedule of INVESTMENTS continued
American Strategic Income Portfolio II
(Continued)
| Description of Security | | Shares | | Cost | | Value (a) | |
| Preferred Stocks - 10.4% | | | |
| Real Estate Investment Trusts - 10.4% | | | |
| AMB Property, Series L | | | 62,000 | | | $ | 1,583,756 | | | $ | 1,577,125 | | |
| AMB Property, Series M | | | 14,360 | | | | 367,561 | | | | 364,744 | | |
| BRE Properties, Series C | | | 50,000 | | | | 1,260,500 | | | | 1,265,500 | | |
| BRE Properties, Series D | | | 18,148 | | | | 457,465 | | | | 457,330 | | |
| Capital Automotive | | | 28,710 | | | | 715,750 | | | | 717,750 | | |
CarrAmerica Realty Corp.,
Series E | | | 13,974 | | | | 367,388 | | | | 361,228 | | |
Developers Diversified Realty,
Series H (h) | | | 59,700 | | | | 1,537,529 | | | | 1,522,350 | | |
Developers Diversified Realty,
Series I | | | 31,600 | | | | 823,427 | | | | 808,960 | | |
| Duke Realty Corp., Series J | | | 38,244 | | | | 974,588 | | | | 965,661 | | |
| Duke Realty Corp., Series K | | | 43,000 | | | | 1,081,863 | | | | 1,062,100 | | |
| Duke Realty Corp., Series L | | | 12,000 | | | | 302,160 | | | | 297,840 | | |
Equity Residential Properties,
Series N | | | 75,000 | | | | 1,897,834 | | | | 1,886,250 | | |
Health Care Properties,
Series E | | | 10,000 | | | | 257,000 | | | | 257,400 | | |
| Prologis Trust, Series F | | | 35,120 | | | | 892,477 | | | | 897,316 | | |
| Prologis Trust, Series G | | | 43,190 | | | | 1,098,075 | | | | 1,094,003 | | |
| PS Business Park, Series H | | | 35,000 | | | | 868,036 | | | | 864,500 | | |
| PS Business Park, Series I | | | 20,000 | | | | 485,577 | | | | 489,000 | | |
| PS Business Park, Series M | | | 43,180 | | | | 1,077,682 | | | | 1,074,750 | | |
| Public Storage, Series A | | | 40,000 | | | | 977,346 | | | | 964,800 | | |
| Public Storage, Series E | | | 15,000 | | | | 377,550 | | | | 376,500 | | |
| Public Storage, Series X | | | 20,000 | | | | 502,366 | | | | 498,000 | | |
| Public Storage, Series Z | | | 20,000 | | | | 497,779 | | | | 484,600 | | |
Regency Centers Corp.,
Series D | | | 32,888 | | | | 859,395 | | | | 841,933 | | |
Vornado Realty Trust,
Series F | | | 65,000 | | | | 1,611,277 | | | | 1,631,500 | | |
| Total Preferred Stocks | | | | | | | 20,874,381 | | | | 20,761,140 | | |
Total Investments in
Unaffiliated Securities | | | | | | | 254,499,818 | | | | 245,534,294 | | |
| Affiliated Money Market Fund (k) - 0.9% | | | |
First American Prime
Obligations Fund, Cl Z | | | 1,687,604 | | | | 1,687,604 | | | | 1,687,604 | | |
Total Investments in
Securities (l) - 124.6% | | | | | | $ | 256,187,422 | | | $ | 247,221,898 | | |
2005 Annual Report
American Strategic Income Portfolio II
30
Notes to Schedule of Investments:
(a) Securities are valued in accordance with procedures described in note 2 in Notes to Financial Statements.
(b) On May 31, 2005, securities valued at $109,050,481 were pledged as collateral for the following outstanding reverse repurchase agreements:
| Amount | | Acquisition
Date | | Rate* | | Due | | Accrued
Interest | | Name of
Broker
and Description
of Collateral | |
| $ | 11,866,558 | | | 5/11/05 | | | 3.07 | % | | 6/10/05 | | $ | 21,251 | | | | (1 | ) | |
| | 34,500,000 | | | 5/2/05 | | | 3.96 | % | | 6/1/05 | | | 113,958 | | | | (2 | ) | |
| | 3,000,000 | | | 5/13/05 | | | 3.97 | % | | 6/1/05 | | | 6,278 | | | | (2 | ) | |
| $ | 49,366,558 | | | | | | | | | | | $ | 141,487 | | | | | | |
*Interest rate as of May 31, 2005. Rates are based on the London InterBank Offered Rate (LIBOR) plus a spread and reset monthly.
Name of broker and description of collateral:
(1) Morgan Stanley:
FHLMC, 5.50%, 1/1/18, $6,000,015 par
FHLMC, 9.00%, 7/1/30, $444,458 par
FNMA, 6.00%, 10/1/16, $492,401 par
FNMA, 5.50%, 6/1/17, $493,197 par
FNMA, 5.00%, 9/1/17, $846,863 par
FNMA, 6.50%, 6/1/29, $2,019,318 par
FNMA, 7.50%, 4/1/30, $233,897 par
FNMA, 7.50%, 5/1/30, $268,209 par
FNMA, 8.00%, 5/1/30, $73,683 par
FNMA, 8.00%, 6/1/30, $334,623 par
(2) Morgan Stanley:
1336 and 1360 Energy Park Drive, 7.55%, 10/1/08, $2,658,546 par
5555 East Van Buren, 5.68%, 7/1/11, $6,500,000 par
Autumnwood, Southern Woods, Hinton Hollow, 7.68%, 6/1/09, $7,075,875 par
Bigelow Office Building, 8.88%, 4/1/07, $1,222,796 par
Chardonnay Apartments, 6.40%, 7/1/13, $4,070,570 par
Cypress Point Office Park I, 5.30%, 6/1/09, $4,641,000 par
Cypress Point Office Park II, 5.30%, 7/1/09, $4,509,000 par
Forestree Apartments, 6.05%, 6/30/05, $7,725,000 par
Gardenswartz Plaza, 7.40%, 5/1/07, $2,530,798 par
Glen Lakes Health Plaza, 5.40%, 2/1/07, $3,691,428 par
Hadley Avenue Business Center, 8.38%, 1/1/11, $2,324,867 par
Misty Woods/Riverfall Square I, 5.43%, 8/1/06, $7,966,000 par
LaCosta Centre, 5.20%, 3/1/09, $4,595,562 par
Minikahda Mini Storage III, 8.62%, 8/1/09, $3,885,805 par
Minikahda Mini Storage V, 8.75%, 9/1/09, $2,139,721 par
Oak Knoll Village Shopping Center, 6.73%, 10/1/13, $1,610,916 par
PennMont Office Plaza, 6.88%, 5/1/06, $1,294,256 par
Redwood Dental Building, 7.40%, 7/1/12, $2,626,740 par
Rimrock Plaza, 7.65%, 12/1/08, $2,905,365 par
Southridge Apartments, 8.43%, 4/1/09, $7,514,906 par
Stevenson Office Building, Port Orchard Cinema, Jensen Industrial Building, 7.88%, 2/1/09,
$2,755,383 par
Sussex Club Apartments I, 6.68%, 5/1/06, $9,798,000 par
Woodside Village Apartments I, 5.40%, 10/1/06, $4,210,000 par
2005 Annual Report
American Strategic Income Portfolio II
31
Schedule of INVESTMENTS continued
The fund has entered into a lending commitment with Morgan Stanley. The agreement permits the fund to enter into reverse repurchase agreements up to $70,000,000 using whole loans as collateral. The fund pays a fee of 0.15% to Morgan Stanley on any unused portion of the $70,000,000 lending commitment.
(c) Interest rates on commercial and multifamily loans are the rates in effect on May 31, 2005. Interest rates and maturity dates disclosed on single family loans represent the weighted average coupon and weighted average maturity for the underlying mortgage loans as of May 31, 2005.
(d) Commercial and multifamily loans are described by the name of the mortgaged property. Pools of single family loans are described by the name of the institution from which the loans were purchased. The geographical location of the mortgaged properties and, in the case of single family, the number of loans, is presented below.
Commercial Loans:
1336 and 1360 Energy Park Drive – St. Paul, MN
5555 East Van Buren – Phoenix, AZ
Bigelow Office Building – Las Vegas, NV
Cypress Point Office Park I – Tampa, FL
Cypress Point Office Park II – Tampa, FL
Gardenswartz Plaza – Santa Fe, NM
Glen Lakes Health Plaza – Austin, TX
Hadley Avenue Business Center – Oakdale, MN
Hillside Office Park – Elk River, MN
Katy Plaza II – Houston, TX
La Posada & Casitas I – Tuscon, AZ
LaCosta Centre – Austin, TX
Minikahda Mini Storage III – St. Paul, MN
Minikahda Mini Storage V – St. Paul, MN
Oak Knoll Village Shopping Center – Austin, TX
PennMont Office Plaza – Albuquerque, NM
Rapid Park Parking Lot – Minneapolis, MN
Redwood Dental Building – Taylorsville, UT
Rimrock Plaza – Billings, MT
Stevenson Office Building, Port Orchard Cinema, Jensen Industrial Building –
Stevenson, Port Orchard, and Arlington, WA
Sundance Plaza – Colorado Springs, CO
Multifamily Loans:
Adelphi Springs Apartments – Adelphi, MD
Alexan at Crescent Place – Riverview, FL
Ashley Place Apartments I – New Port Richey, FL
Ashley Place Apartments II – New Port Richey, FL
Autumnwood, Southern Woods, Hinton Hollow – Knoxville, TN
Chardonnay Apartments – Tulsa, OK
Deering Manor – Nashwauk, MN
Forestree Apartments – Houston, TX
Forestree Apartments II – Houston, TX
Glenoaks Apartments – Glendale, CA
Hidden Woods Apartments I – College Park, GA
Hidden Woods Apartments II – College Park, GA
Highland Ridge & Highland Glen Apartments – Oklahoma City, OK
Misty Woods/Riverfall Square I – Arlington and Dallas, TX
Misty Woods/Riverfall Square II – Arlington and Dallas, TX
Oakton Terrace Apartments – Adelphi, MD
Park Hampshire Apartments – Adelphi, MD
2005 Annual Report
American Strategic Income Portfolio II
32
RP - Plaza Development – Oxnard, CA
Sand Pebble Apartments – El Paso, TX
Scottsdale Park Place – Scottsdale, AZ
Seven Oaks Apartments – Garland, TX
Southridge Apartments – Austin, TX
Spring Lake Apartments I – Anaheim, CA
Spring Lake Apartments II – Anaheim, CA
Sussex Club Apartments I – Athens, GA
Sussex Club Apartments II – Athens, GA
Timber Ridge Apartments – Houston, TX
Tremont Towers – Houston, TX
Vista Bonita Apartments – Denton, TX
Winterland Apartments I – Grand Forks, ND
Winterland Apartments II – Grand Forks, ND
Woodside Village Apartments I – Midwest City, OK
Woodside Village Apartments II – Midwest City, OK
Single Family Loans:
Merchants Bank – 8 loans, Vermont
Neslund Properties – 32 loans, Minnesota
PHH U.S. Mortgage – 5 loans, United States
(e) Securities purchased as part of a private placement which have not been registered with the Securities and Exchange Commission under the Securities Act of 1933 and are considered to be illiquid. These securities are fair valued in accordance with the board approved valuation procedures. On May 31, 2005, the total value of fair valued securities was $211,537,989 or 106.6% of net assets.
(f) Variable Rate Security – The rate shown is the rate in effect as of May 31, 2005.
(g) Security is in default.
(h) This security (or a portion of this security) has been purchased on a when-issued basis. On May 31, 2005, the total cost of this investment was $508,000. See note 2 in Notes to Financial Statements.
(i) Security pledged as collateral for position purchased on a when-issued basis.
(j) Interest only–Represents securities that entitle holders to receive only interest payments on the underlying mortgages. The yield to maturity of an interest only is extremely sensitive to the rate of principal payments on the underlying mortgage assets. A rapid (slow) rate of principal repayments may have an adverse (positive) effect on yield to maturity. The principal amount shown is the notional amount of the underlying mortgages. The interest rate disclosed represents the coupon rate in effect as of May 31, 2005.
(k) Investment in affiliated security. This money market fund is advised by U.S. Bancorp Asset Management, Inc., which also serves as advisor for the fund. See note 3 in Notes to Financial Statements.
(l) On May 31, 2005, the cost of investments in securities for federal income tax purposes was $257,499,585. The aggregate gross unrealized appreciation and depreciation of investments in securities, based on this cost were as follows:
| Gross unrealized appreciation | | $ | 2,248,862 | | |
| Gross unrealized depreciation | | | (12,526,549 | ) | |
| Net unrealized depreciation | | $ | (10,277,687 | ) | |
Abbreviations:
Cl – Class
FHLMC – Federal Home Loan Mortgage Corporation
FNMA – Federal National Mortgage Association
2005 Annual Report
American Strategic Income Portfolio II
33
Report of Independent Registered Public Accounting Firm
The Board of Directors and Shareholders
American Strategic Income Portfolio Inc. II:
We have audited the accompanying statement of assets and liabilities of American Strategic Income Portfolio Inc. II (the "fund"), including the schedule of investments, as of May 31, 2005, and the related statements of operations and cash flows for the year then ended, the statements of changes in net assets for each of the two years in the period then ended, and the financial highlights for each of the five years in the period then ended. These financial statements and financial highlights are the responsibility of the fund's management. Our responsibility is to express an opinion on these financial statements and financial highlights based on our audits.
We conducted our audits in accordance with the standards of the Public Company Accounting Oversight Board (United States). Those standards require that we plan and perform the audit to obtain reasonable assurance about whether the financial statements and the financial highlights are free of material misstatement. We were not engaged to perform an audit of the fund's internal control over financial reporting. Our audits included consideration of internal control over financial reporting as a basis for designing audit procedures that are appropriate in the circumstances, but not for the purpose of expressing an opinion on the effectiveness of the fund's internal control over financial reporting. Accordingly, we express no such opinion. An audit includes examining, on a test basis, evidence supporting the amounts and disclosures in the financial statements and financial highlights, assessing the accounting principles used and significant estimates made by management, and evaluating the overall financial statement presentation. Our procedures included verification by examination of securities held by the custodian as of May 31, 2005 and confirmation of securities not held by the custodian by correspondence with others. We believe that our audits provide a reasonable basis for our opinion.
In our opinion, the financial statements and financial highlights referred to above present fairly, in all material respects, the financial position of American Strategic Income Portfolio Inc. II at May 31, 2005, the results of its operations and its cash flows for the year then ended, the changes in its net assets for each of the two years in the period then ended, and the financial highlights for each of the five years in the period then ended, in conformity with U.S. generally accepted accounting principles.

Minneapolis, Minnesota
July 15, 2005
except for Note 7, as to which the date is
July 20, 2005
2005 Annual Report
American Strategic Income Portfolio II
34
NOTICE TO SHAREHOLDERS (Unaudited)
| | | | | Annual Meeting Results | |
|
| | | | | An annual meeting of the fund's shareholders was held on September 15, 2004. Each matter voted upon at that meeting, as well as the number of votes cast for, against or withheld, the number of abstentions, and the number of broker non-votes with respect to such matters, are set forth below. | |
|
| | (1 | ) | | The fund's shareholders elected the following nine directors: | |
|
| | | Shares
Voted "For" | | Shares Withholding
Authority to Vote | |
| Benjamin R. Field III | | | 15,146,508 | | | | 226,965 | | |
| Mickey P. Foret* | | | 15,123,486 | | | | 249,987 | | |
| Roger A. Gibson | | | 15,128,942 | | | | 244,531 | | |
| Victoria J. Herget | | | 15,146,776 | | | | 226,697 | | |
| Leonard W. Kedrowski | | | 15,141,029 | | | | 232,444 | | |
| Richard K. Riederer | | | 15,147,672 | | | | 225,801 | | |
| Joseph D. Strauss | | | 15,139,874 | | | | 233,599 | | |
| Virginia L. Stringer | | | 15,142,159 | | | | 231,314 | | |
| James M. Wade | | | 15,141,579 | | | | 231,894 | | |
* Mickey P. Foret tendered his resignation from the board of directors, effective May 2005
| | (2 | ) | | The fund's shareholders ratified the selection by the fund's board of directors of Ernst & Young LLP as the independent registered public accounting firm for the fund for the fiscal year ending May 31, 2005. The following votes were cast regarding this matter: | |
|
Shares
Voted "For" | | Shares
Voted "Against" | | Abstentions | | Broker
Non-Votes | |
| | 14,828,751 | | | | 486,509 | | | | 58,213 | | | | - | | |
| Terms and Conditions of the Dividend Reinvestment Plan | |
|
| As a shareholder, you may choose to participate in the Dividend Reinvestment Plan. It's a convenient and | |
|
2005 Annual Report
American Strategic Income Portfolio II
35
NOTICE TO SHAREHOLDERS (Unaudited) continued
| economical way to buy additional shares of the fund by automatically reinvesting dividends and capital gains. The plan is administered by Computershare, the plan agent. | |
|
| Eligibility/Participation | |
|
| You may join the plan at any time. Reinvestment of distributions will begin with the next distribution paid, provided your request is received at least 10 days before the record date for that distribution. | |
|
| If your shares are in certificate form, you may join the plan directly and have your distributions reinvested in additional shares of the fund. To enroll in this plan, call Computershare at 800-543-5523. If your shares are registered in your brokerage firm's name or another name, ask the holder of your shares how you may participate. | |
|
| Banks, brokers, or nominees, on behalf of their beneficial owners who wish to reinvest dividend and capital gains distributions, may participate in the plan by informing Computershare at least 10 days before each share's dividend and/or capital gains distribution. | |
|
| Plan Administration | |
|
| Beginning no more than 5 business days before the dividend payment date, Computershare will buy shares of the fund on the New York Stock Exchange ("NYSE") or elsewhere on the open market only when the price of the fund's shares on the NYSE plus commissions is at less than a 5% premium over the fund's most recently calculated net asset value ("NAV") per share. If, at the close of business on the dividend payment date, the shares purchased in the open market are insufficient to satisfy the dividend reinvestment requirement, Computershare will accept payment of the dividend, or the remaining portion, in authorized but unissued shares of the fund. These | |
|
2005 Annual Report
American Strategic Income Portfolio II
36
| shares will be issued at a per-share price equal to the higher of (a) the NAV per share as of the close of business on the payment date or (b) 95% of the closing market price per share on the payment date. | |
|
| By participating in the dividend reinvestment plan, you may receive benefits not available to shareholders who elect not to participate. For example, if the market price plus commissions of the fund's shares is 5% or more above the NAV, you will receive shares at a discount of up to 5% from the current market value. However, if the market price plus commissions is below the NAV, you will receive distributions in shares with an NAV greater than the value of any cash distributions you would have received. | |
|
| There is no direct charge for reinvestment of dividends and capital gains, since Computershare fees are paid for by the fund. However, if fund shares are purchased in the open market, each participant pays a pro rata portion of the brokerage commissions. Brokerage charges are expected to be lower than those for individual transactions because shares are purchased for all participants in blocks. As long as you continue to participate in the plan, distributions paid on the shares in your account will be reinvested. | |
|
| Computershare maintains accounts for plan participants holding shares in certificate form and will furnish written confirmation of all transactions, including information you need for tax records. Reinvested shares in your account will be held by Computershare in noncertificated form in your name. | |
|
| Tax Information | |
|
| Distributions invested in additional shares of the fund are subject to income tax, to the same extent as if received in | |
|
2005 Annual Report
American Strategic Income Portfolio II
37
NOTICE TO SHAREHOLDERS (Unaudited) continued
| cash. When shares are issued by the fund at a discount from market value, shareholders will be treated as having received distributions of an amount equal to the full market value of those shares. Shareholders, as required by the Internal Revenue Service, will receive Form 1099 regarding the federal tax status of the prior year's distributions. | |
|
| Plan Withdrawal | |
|
| If you hold your shares in certificate form, you may terminate your participation in the plan at any time by giving written notice to Computershare. If your shares are registered in your brokerage firm's name, you may terminate your participation via verbal or written instructions to your investment professional. Written instructions should include your name and address as they appear on the certificate or account. | |
|
| If notice is received at least 10 days before the record date, all future distributions will be paid directly to the shareholder of record. | |
|
| If your shares are issued in certificate form and you discontinue your participation in the plan, you (or your nominee) will receive an additional certificate for all full shares and a check for any fractional shares in your account. | |
|
| Plan Amendment/Termination | |
|
| The fund reserves the right to amend or terminate the plan. Should the plan be amended or terminated, participants will be notified in writing at least 90 days before the record date for such dividend or distribution. The plan may also be amended or terminated by Computershare with at least 90 days written notice to participants in the plan. | |
|
2005 Annual Report
American Strategic Income Portfolio II
38
| Any questions about the plan should be directed to your investment professional or to Computershare Ltd., P.O. Box 43010, Providence, RI 02940-3010, 800-426-5523. | |
|
| Tax Information | |
|
| The following per-share information describes the federal tax treatment of distributions made during the fiscal year. Distributions for the calendar year will be reported to you on Form 1099-DIV. Please consult a tax advisor on how to report these distributions at the state and local levels. | |
|
| Income Distributions (taxable as ordinary dividends, none qualifying for the dividends received deduction or qualifying as qualified dividend income) | |
|
| Payable Date | | Amount | |
| June 23, 2004 | | $ | 0.0950 | | |
| July 28, 2004 | | | 0.0950 | | |
| August 25, 2004 | | | 0.0950 | | |
| September 22, 2004 | | | 0.0950 | | |
| October 27, 2004 | | | 0.0950 | | |
| November 24, 2004 | | | 0.0800 | | |
| December 22, 2004 | | | 0.0800 | | |
| January 7, 2005 | | | 0.0800 | | |
| February 23, 2005 | | | 0.0800 | | |
| March 23, 2005 | | | 0.0800 | | |
| April 27, 2005 | | | 0.0800 | | |
| May 25, 2005 | | | 0.0800 | | |
| Total | | $ | 1.0350 | | |
| How to Obtain a Copy of the Fund's Proxy Voting Policies and Proxy Voting Record | |
|
| A description of the policies and procedures that the fund uses to determine how to vote proxies relating to portfolio securities, as well as information regarding how the fund voted proxies relating to portfolio securities during the most recent 12 month period ended June 30, is available (1) without charge upon request by calling 800.677.FUND; (2) at firstamericanfunds.com; and | |
|
2005 Annual Report
American Strategic Income Portfolio II
39
NOTICE TO SHAREHOLDERS (Unaudited) continued
| (3) on the U.S. Securities and Exchange Commission's website at http://www.sec.gov. | |
|
| Form N-Q Holdings Information | |
|
| The fund is required to file its complete schedule of portfolio holdings for the first and third quarters of each fiscal year with the Securities and Exchange Commission on Form N-Q. The fund's Forms N-Q are available (1) without charge upon request by calling 800.677.FUND and (2) on the U.S. Securities and Exchange Commission's website at http://www.sec.gov. In addition, you may review and copy the fund's Forms N-Q at the Commission's Public Reference Room in Washington D.C. You may obtain information on the operation of the Public Reference Room by calling 1-800-SEC-0330. | |
|
| Certifications | |
|
| In October 2004, the fund's Chief Executive Officer submitted his annual certification to the New York Stock Exchange ("NYSE") pursuant to Section 303A 12(a) of the NYSE Listed Company Manual. The fund's Principal Executive Officer and Principal Financial Officer certifications pursuant to Rule 30a-2 under the 1940 Act are filed with the fund's Form N-CSR filings and are available on the U.S. Securities and Exchange Commission's website at http://www.sec.gov. | |
|
2005 Annual Report
American Strategic Income Portfolio II
40
(This page has been left blank intentionally.)
NOTICE TO SHAREHOLDERS (Unaudited) continued
Directors and Officers of the Fund
Independent Directors
| Name, Address, and Year of Birth | | Position(s)
Held with
Fund | | Term of Office and Length of Time Served | | Principal Occupation(s)
During Past 5 Years | | Number of Portfolios in
Fund Complex
Overseen by Director | | Other
Directorships
Held by
Director† | |
Benjamin R. Field III
P.O. Box 1329
Minneapolis, MN 55440-1329
(1938) | | Director | | Directors serve for a one-year term that expires at the next annual meeting of shareholders. Director of BSP since September 2003. | | Retired; Senior Financial Advisor, Bemis Company, Inc. from May 2002 through March 2003; Senior Vice President, Chief Financial Officer and Treasurer, Bemis, through April 2002. | | First American Funds Complex: eleven registered investment companies, including fifty-six portfolios | | None | |
|
Roger A. Gibson
P.O. Box 1329
Minneapolis, MN 55440-1329
(1946) | | Director | | Directors serve for a one-year term that expires at the next annual meeting of shareholders. Director of BSP since August 1998. | | Retired; Vice President, Cargo–United Airlines, from July 2001 through July 2004; Vice President, North America-Mountain Region, United Airlines, prior to July 2001. | | First American Funds Complex: eleven registered investment companies, including fifty-six portfolios | | None | |
|
Victoria J. Herget
P.O. Box 1329
Minneapolis, MN 55440-1329
(1951) | | Director | | Directors serve for a one-year term that expires at the next annual meeting of shareholders. Director of BSP since September 2003. | | Investment consultant and non-profit board member since 2001; Managing Director of Zurich Scudder Investments, through 2001. | | First American Funds Complex: eleven registered investment companies, including fifty-six portfolios | | None | |
|
Leonard W. Kedrowski
P.O. Box 1329
Minneapolis, MN 55440-1329
(1941) | | Director | | Directors serve for a one-year term that expires at the next annual meeting of shareholders. Director of BSP since August 1998. | | Owner, Executive and Management Consulting, Inc., a management consulting firm; Board member, GC McGuiggan Corporation (dba Smyth Companies), a label printer; former Chief Executive Officer, Creative Promotions International, LLC, a promotional award programs and products company, through October 2003; Advisory Board member, Designer Doors, manufacturer of designer doors, through 2002. | | First American Funds Complex: eleven registered investment companies, including fifty-six portfolios | | None | |
|
Richard K. Riederer
P.O. Box 1329
Minneapolis, MN 55440-1329
(1944) | | Director | | Directors serve for a one-year term that expires at the next annual meeting of shareholders. Director of BSP since August 2001. | | Retired; Director, President, and Chief Executive Officer, Weirton Steel, through 2001. | | First American Funds Complex: eleven registered investment companies, including fifty-six portfolios | | Cleveland-Cliffs Inc. (a producer of iron ore pellets) | |
|
Joseph D. Strauss
P.O. Box 1329
Minneapolis, MN 55440-1329
(1940) | | Director | | Directors serve for a one-year term that expires at the next annual meeting of shareholders. Director of BSP since August 1998. | | Owner and President, Strauss Management Company, a Minnesota holding company for various organizational management business ventures; owner, Chairman, and Chief Executive Officer, Community Resource Partnerships, Inc., a company engaged in strategic planning, operations management, government relations, transportation planning, and public relations; attorney at law; Partner and Chairman, ExcensusTM, LLC, a demographic services company. | | First American Funds Complex: eleven registered investment companies, including fifty-six portfolios | | None | |
|
Virginia L. Stringer
P.O. Box 1329
Minneapolis, MN 55440-1329
(1944) | | Chair; Director | | Directors serve for a one-year term that expires at the next annual meeting of shareholders. Chair term three years, assuming reelection as a director. Chair of BSP's board since 1998; current term expires September 2006. Director of BSP since August 1998. | | Owner and President, Strategic Management Resources, Inc., a management consulting firm; Executive Consultant for State Farm Insurance Cos., through 2003. | | First American Funds Complex: eleven registered investment companies, including fifty-six portfolios | | None | |
|
2005 Annual Report
American Strategic Income Portfolio II
42
2005 Annual Report
American Strategic Income Portfolio II
43
NOTICE TO SHAREHOLDERS (Unaudited) continued
Directors and Officers of the Fund continued
Independent Directors continued
| Name, Address, and Year of Birth | | Position(s)
Held with
Fund | | Term of Office and Length of Time Served | | Principal Occupation(s)
During Past 5 Years | | Number of Portfolios in
Fund Complex
Overseen by Director | | Other
Directorships
Held by
Director† | |
James M. Wade
P.O. Box 1329
Minneapolis, MN 55440-1329
(1943) | | Director | | Directors serve for a one-year term that expires at the next annual meeting of shareholders. Director of BSP since August 2001. | | Owner and President, Jim Wade Homes, a homebuilding company, since 1999. | | First American Funds Complex: eleven registered investment companies, including fifty-six portfolios | | None | |
|
2005 Annual Report
American Strategic Income Portfolio II
44
†Includes only directorships in a company with a class of securities registered pursuant to Section 12 of the Securities Exchange Act or subject to the requirements of Section 15(d) of the Securities Exchange Act, or any company registered as an investment company under the Investment Company Act.
2005 Annual Report
American Strategic Income Portfolio II
45
NOTICE TO SHAREHOLDERS (Unaudited) continued
Directors and Officers of the Fund continued
Officers
| Name, Address, and Year of Birth | | Position(s)
Held with
Fund | | Term of Office and Length of Time Served | | Principal Occupation(s) During Past 5 Years | |
Thomas S. Schreier, Jr.
U.S. Bancorp Asset Management, Inc.
800 Nicollet Mall
Minneapolis, MN 55402
(1962)* | | President | | Re-elected by the Board annually; President of BSP since February 2001. | | Chief Executive Officer of the Advisor since May 2001; prior thereto, Chief Executive Officer of First American Asset Management since December 2000 and of Firstar Investment & Research Management Company ("FIRMCO") since February 2001; Senior Managing Director and Head of Equity Research of U.S. Bancorp Piper Jaffray from October 1998 through December 2000; prior to October 1998, Senior Airline Equity Analyst and a Director in the Equity Research Department of Credit Suisse First Boston. | |
|
John G. Wenker
U.S. Bancorp Asset Management, Inc.
800 Nicollet Mall
Minneapolis, MN 55402
(1953)* | | Senior Vice President | | Re-elected by the Board annually; Senior Vice President of BSP since May 2001. | | Managing Director of U.S. Bancorp Asset Management, Inc., since May 2001; Managing Director of First American Asset Management from 1998 to May 2001; Managing Director of the Fixed Income Department at Piper Jaffray Inc. from 1992 to 1998. | |
|
Mark S. Jordahl
U.S. Bancorp Asset Management, Inc.
800 Nicollet Mall
Minneapolis, MN 55402
(1960)* | | Vice President- Investments | | Re-elected by the Board annually; Vice President–Investments of BSP since September 2001. | | Chief Investment Officer of U.S. Bancorp Asset Management, Inc., since September 2001; President and Chief Investment Officer, ING Investment Management–Americas, September 2000 to June 2001; Senior Vice President and Chief Investment Officer, ReliaStar Financial Corp., January 1998 to September 2000. | |
|
Jeffery M. Wilson
U.S. Bancorp Asset Management, Inc.
800 Nicollet Mall
Minneapolis, MN 55402
(1956)* | | Vice
President- Administration | | Re-elected by the Board annually; Vice President–Administration of BSP since March 2000. | | Senior Vice President of U.S. Bancorp Asset Management, Inc., since May 2001; prior thereto, Senior Vice President of First American Asset Management. | |
|
Russell J. Kappenman
U.S. Bancorp Asset Management, Inc.
800 Nicollet Mall
Minneapolis, MN 55402
(1964)* | | Vice President and Assistant Secretary | | Re-elected by the Board annually; Vice President and Assistant Secretary of BSP since May 2001. | | Managing Director of U.S. Bancorp Asset Management, Inc., since May 2001; Vice President of First American Asset Management from 1998 to May 2001; tax manager and fixed-income analyst with Piper Jaffray Inc. through 1998. | |
|
Troy C. Paulson
U.S. Bancorp Asset Management, Inc.
800 Nicollet Mall,
Minneapolis, MN 55402
(1970)* | | Vice President | | Re-elected by the Board annually; Vice President of BSP since June 2005. | | Vice President of U.S. Bancorp Asset Management, Inc., since May 2003; prior thereto, Assistant Vice President with U.S. Bancorp Piper Jaffray from June 2000 to May 2003. | |
|
Charles D. Gariboldi, Jr.
U.S. Bancorp Asset Management, Inc.
800 Nicollet Mall
Minneapolis, MN 55402
(1959)* | | Treasurer | | Re-elected by the Board annually; Treasurer of BSP since December 2004. | | Mutual Funds Treasurer, U.S. Bancorp Asset Management, Inc., since October 2004; prior thereto, Vice President for investment accounting and Fund Treasurer of Thrivent Financial for Lutherans. | |
|
David H. Lui
U.S. Bancorp Asset Management, Inc.
800 Nicollet Mall,
Minneapolis, MN 55402
(1960)* | | Chief Compliance Officer | | Re-elected by the Board annually; Chief Compliance Officer of BSP since February 2005. | | Chief Compliance Officer, First American Funds and U.S. Bancorp Asset Management, Inc., since February 2005. Prior thereto, Chief Compliance Officer, Franklin Advisers, Inc. and Chief Compliance Counsel, Franklin Templeton Investments from March 2004. Prior to that, Vice President, Charles Schwab & Co., Inc. | |
|
Kathleen L. Prudhomme
U.S. Bancorp Asset Management, Inc.
800 Nicollet Mall,
Minneapolis, MN 55402
(1953)* | | Secretary | | Re-elected by the Board annually; Secretary of BSP since December 2004; prior thereto, Assistant Secretary of BSP since September 1999. | | Deputy General Counsel, U.S. Bancorp Asset Management, Inc., since November 2004; prior thereto, Partner, Dorsey & Whitney LLP, a Minneapolis-based law firm. | |
|
Brett L. Agnew
U.S. Bancorp Asset Management, Inc.
800 Nicollet Mall,
Minneapolis, MN 55402
(1971)* | | Assistant Secretary | | Re-elected by the Board annually; Assistant Secretary of BSP since December 2004. | | Attorney, U.S. Bancorp Asset Management, Inc., since August 2004; 2001-2004, Senior Counsel, Thrivent Financial for Lutherans; prior thereto, Consultant, Principal Financial Group. | |
|
2005 Annual Report
American Strategic Income Portfolio II
46
2005 Annual Report
American Strategic Income Portfolio II
47
NOTICE TO SHAREHOLDERS (Unaudited) continued
Directors and Officers of the Fund continued
Officers continued
| Name, Address, and Year of Birth | | Position(s)
Held with
Fund | | Term of Office and Length of Time Served | | Principal Occupation(s) During Past 5 Years | |
James D. Alt
50 South Sixth Street, Suite 1500
Minneapolis, MN 55402
(1951) | | Assistant Secretary | | Re-elected by the Board annually; Assistant Secretary of BSP since December 2004; prior thereto, Secretary of BSP since June 2002; Assistant Secretary of BSP from September 1999 to June 2002. | | Partner, Dorsey & Whitney LLP, a Minneapolis-based law firm. | |
|
2005 Annual Report
American Strategic Income Portfolio II
48
*Messrs. Schreier, Wenker, Jordahl, Wilson, Kappenman, Paulson, Gariboldi, Lui, and Agnew and Ms. Prudhomme are each employees of U.S. Bancorp Asset Management, Inc., which serves as investment advisor for the fund.
2005 Annual Report
American Strategic Income Portfolio II
49
(This page has been left blank intentionally.)
(This page has been left blank intentionally.)
(This page has been left blank intentionally.)
Board of DIRECTORS
VIRGINIA STRINGER
Chairperson of American Strategic Income Portfolio Inc. II
Owner and President of Strategic Management Resources, Inc.
BENJAMIN FIELD III
Director of American Strategic Income Portfolio Inc. II
Retired; former Senior Vice President, Chief Financial Officer, and
Treasurer of Bemis Company, Inc.
ROGER GIBSON
Director of American Strategic Income Portfolio Inc. II
Retired; former Vice President of Cargo-United Airlines
VICTORIA HERGET
Director of American Strategic Income Portfolio Inc. II
Investment Consultant; former Managing Director of Zurich Scudder Investments
LEONARD KEDROWSKI
Director of American Strategic Income Portfolio Inc. II
Owner and President of Executive and Management Consulting, Inc.
RICHARD RIEDERER
Director of American Strategic Income Portfolio Inc. II
Retired; former President and Chief Executive Officer of Weirton Steel
JOSEPH STRAUSS
Director of American Strategic Income Portfolio Inc. II
Owner and President of Strauss Management Company
JAMES WADE
Director of American Strategic Income Portfolio Inc. II
Owner and President of Jim Wade Homes
American Strategic Income Portfolio Inc. II’s Board of Directors is comprised entirely of independent directors.

AMERICAN STRATEGIC INCOME PORTFOLIO INC. II
2005 Annual Report
U.S. Bancorp Asset Management, Inc., is a wholly owned subsidiary of U.S. Bank National Association, which is a wholly owned subsidiary of U.S. Bancorp.

| This document is printed on paper
containing 10% postconsumer waste. |
7/2005 0168-05 BSP-AR
Item 2—Code of Ethics
(a) The registrant has adopted a code of ethics (designated as the “Code of Ethical Conduct”) that applies to its principal executive officer and principal financial officer.
(b) During the period covered by this report, there were no amendments to the provisions of the Code of Ethical Conduct.
(c) During the period covered by this report, the registrant did not grant any waivers, including implicit waivers, from any provisions of its Code of Ethical Conduct.
(d) The registrant undertakes to furnish a copy of its Code of Ethical Conduct to any person upon request, without charge, by calling 1-800-677-3863.
Item 3—Audit Committee Financial Expert
The registrant’s Board of Directors has determined that Leonard W. Kedrowski, Benjamin R. Field III, and Richard K. Riederer, members of the registrant’s Audit Committee, are each an “audit committee financial expert” and are “independent,” as these terms are defined in this Item.
Item 4—Principal Accountant Fees and Services
(a) Audit Fees - Ernst & Young LLP (“E&Y”) billed the registrant audit fees totaling $35,748 in the fiscal year ended May 31, 2005 and $42,210 in the fiscal year ended May 31, 2004, including fees associated with the annual audit, SEC Rule 17f-2 security count filings and filings of the registrant’s Form N-CSR.
(b) Audit-Related Fees – E&Y billed the registrant audit-related fees totaling $1,726 in the fiscal year ended May 31, 2005 and $10,663 in the fiscal year ended May 31, 2004. These audit-related services related primarily to services provided in connection with the previously announced proposed reorganization of the registrant into a real estate investment trust (which the registrant is no longer pursuing).
(c) Tax Fees - E&Y billed the registrant fees of $7,856 in the fiscal year ended May 31, 2005 and $9,326 in the fiscal year ended May 31, 2004 for tax services, including tax compliance, tax advice and tax planning. Tax compliance, tax advice and tax planning services primarily related to preparation of original and amended tax returns, timely RIC qualification reviews, tax distribution analysis and planning, and tax services provided in connection with the previously proposed reorganization of the registrant (which the registrant is no longer pursuing).
(d) All Other Fees - - There were no fees billed by E&Y for other services to the registrant during the fiscal years ended May 31, 2004 and 2005.
(e)(1) The audit committee’s pre-approval policies and procedures pursuant to paragraph (c)(7) of Rule 2-01 of Regulation S-X are set forth below:
Audit Committee policy regarding pre-approval of services provided by the Independent Auditor
The Audit Committee of the First American Funds (“Committee”) has responsibility for ensuring that all services performed by the independent audit firm for the funds do not impair the firm’s independence. This review is intended to provide reasonable oversight without removing management from its responsibility for day-to-day operations. In this regard, the Committee should:
• Understand the nature of the professional services expected to be provided and their impact on auditor independence and audit quality
• Examine and evaluate the safeguards put into place by the Company and the auditor to safeguard independence
• Meet quarterly with the partner of the independent audit firm
• Consider approving categories of service that are not deemed to impair independence for a one-year period
It is important that a qualitative rather than a mere quantitative evaluation be performed by the Committee in discharging its responsibilities.
Policy for Audit and Non-Audit Services Provided to the Funds
On an annual basis, the Committee will review and consider whether to pre-approve the financial plan for audit fees as well as categories of audit-related and non-audit services that may be performed by the funds’ independent audit firm directly for the funds. At least annually the Committee will receive a report from the independent audit firm of all audit and non-audit services, which were approved during the year.
The engagement of the independent audit firm for any non-audit service requires the written pre-approval of the Treasurer of the funds and all non-audit services performed by the independent audit firm will be disclosed in the required SEC periodic filings.
In connection with the Committee review and pre-approval responsibilities, the review by the Committee will consist of the following:
Audit Services
The categories of audit services and related fees to be reviewed and considered for pre-approval annually by the Committee or its delegate include the following:
• Annual Fund financial statement audits
• Seed audits (related to new product filings, as required)
• SEC and regulatory filings and consents
Audit-related Services
In addition, the following categories of audit-related services are deemed to be consistent with the role of the independent audit firm and, as such, will be considered for pre-approval by the Committee or its delegate, on an annual basis.
• Accounting consultations
• Fund merger support services
• Other accounting related matters
• Agreed Upon Procedure Reports
• Attestation Reports
• Other Internal Control Reports
Notwithstanding any annual pre-approval of these categories of services, individual projects with an estimated fee in excess of $25,000 are subject to pre-approval by the Committee Chair or its delegate on a
case-by-case basis. Individual projects with an estimated fee in excess of $50,000 are subject to pre-approval by the Committee or its delegate on a case-by-case basis.
Tax Services
The following categories of tax services are deemed to be consistent with the role of the independent audit firm and, as such, will be considered for pre-approval by the Committee or its delegate, on an annual basis.
• Tax compliance services related to the filing or amendment of the following:
• Federal, state and local income tax compliance, and
• Sales and use tax compliance
• Timely RIC qualification reviews
• Tax distribution analysis and planning
• Tax authority examination services
• Tax appeals support services
• Accounting methods studies
• Fund merger support services
• Tax consulting services and related projects
Notwithstanding any annual pre-approval of these categories of services, individual projects with an estimated fee in excess of $25,000 are subject to pre-approval by the Committee Chair or its delegate on a case-by-case basis. Individual projects with an estimated fee in excess of $50,000 are subject to pre-approval by the Committee or its delegate on a case-by-case basis.
Other Non-audit Services
The SEC auditor independence rules adopted in response to the Sarbanes-Oxley Act specifically allow certain non-audit services. Because of the nature of these services, none of these services may be commenced by the independent audit firm without the prior approval of the Committee. The Committee may delegate this responsibility to one or more of the Committee members, with the decisions presented to the full Committee at the next scheduled meeting.
Proscribed Services
In accordance with SEC rules on independence, the independent audit firm is prohibited from performing services in the following categories of non-audit services:
• Management functions
• Accounting and bookkeeping services
• Internal audit services
• Financial information systems design and implementation
• Valuation services supporting the financial statements
• Actuarial services supporting the financial statements
• Executive recruitment
•�� Expert services (e.g., litigation support)
• Investment banking
Policy for Pre-approval of Non-Audit Services Provided to Other Entities within the Investment Company Complex
The Committee is also responsible for pre-approving certain non-audit services provided to U.S. Bancorp Asset Management, Inc., U.S. Bank N.A., Quasar Distributors, U.S. Bancorp Fund Services, LLC and any other entity under common control with U.S. Bancorp Asset Management, Inc., that provides ongoing services to the funds. The only non-audit services provided to these entities which require pre-approval are those services that relate directly to the operations and financial reporting of the funds.
Although the Committee is not required to pre-approve all services provided to U.S. Bancorp Asset Management, Inc. and other affiliated service providers, the Committee will annually receive a report from the independent audit firm on the aggregate fees for all services provided to U.S. Bancorp and affiliates.
(e)(2) All of the services described in paragraphs (b) through (d) of this Item 4 that were provided to the registrant on or after May 6, 2003, the effective date of SEC rules relating to the pre-approval of non-audit services, were pre-approved by the audit committee.
(f) All services performed on the engagement to audit the registrant’s financial statements for the most recent fiscal year end were performed by the principal accountant’s full-time, permanent employees.
(g) The aggregate non-audit fees billed by E&Y to the registrant, the registrant’s investment adviser, and any entity controlling, controlled by, or under common control with the adviser that provides ongoing services to the registrant, totaled $27,282 in the fiscal year ended May 31, 2005 and $33,039 in the fiscal year ended May 31, 2004, including services provided prior to May 6, 2003, the effective date of SEC rules relating to the pre-approval of non-audit services.
(h) The registrant’s audit committee has determined that the provision of non-audit services to the registrant’s investment adviser, and any entity controlling, controlled by, or under common control with the investment adviser that provides ongoing services to the registrant, that were not pre-approved and that were rendered on or after May 6, 2003 (the effective date of SEC rules relating to the pre-approval of non-audit services), is compatible with maintaining E&Y’s independence.
Item 5—Audit Committee of Listed Registrants
(a) The registrant has a separately designated standing audit committee established in accordance with Section 3(a)(58)(A) of the Exchange Act. The members of such audit committee are Leonard W. Kedrowski, Benjamin R. Field III, and Richard K. Riederer. Virginia L. Stringer, Chair of the Board of Directors, serves ex officio as a non-voting member of such committee.
(b) Not applicable.
Item 6—Schedule of Investments
The schedule is included as part of the report to shareholders filed under Item 1 of this Form.
Item 7—Disclosure of Proxy Voting Policies and Procedures for Closed-End Management Investment Companies
The registrant has delegated the voting of proxies relating to its voting securities to its investment advisor, U.S. Bancorp Asset Management, Inc. (“USBAM”). The proxy voting policies and procedures of USBAM are as follows:
General Principles
U.S. Bancorp Asset Management, Inc. (“USBAM”) is the investment manager for the First American family of mutual funds and for other separately managed accounts. As such, USBAM has been delegated the authority to vote proxies with respect to the investments held in client accounts, unless the client has specifically retained such authority in writing. It is USBAM’s duty to vote proxies in the best interests of clients in a timely and responsive manner. In voting proxies, USBAM also seeks to maximize total investment return for clients.
USBAM’s Investment Policy Committee, comprised of the firm’s most senior investment professionals, is charged with oversight of the proxy voting policies and procedures. The Investment Policy Committee is responsible for (1) approving the proxy voting policies and procedures, (2) for overseeing the proxy voting process, and (3) for reviewing the proxy voting record on a regular basis.
Policies and Procedures
Policies. The Investment Policy Committee, after reviewing and concluding that such policies are reasonably designed to vote proxies in the best interests of clients, has approved and adopted the proxy voting policies of ISS, a leading national provider of proxy voting administrative and research services. As a result, such policies set forth USBAM’s positions on recurring proxy issues and criteria for addressing non-recurring issues. A summary of these policies is attached. These policies are reviewed periodically and therefore are subject to change. Even though it has adopted ISS’s policies, USBAM maintains the fiduciary responsibility for all proxy voting decisions. In extraordinary situations, the Investment Policy Committee may decide to override a standard policy position for a particular vote, depending on the specific factual circumstances.
Procedures. Responsibility for certain administrative aspects of proxy voting rests with USBAM’s Proxy Voting Administration Committee, which reports to the Investment Policy Committee. The Proxy Voting Administration Committee also supervises the relationship with two outside firms that assist with the process, ISS and ADP Financial Services. These firms apprise USBAM of shareholder meeting dates, forward proxy voting materials, provide USBAM with research on proxy proposals and voting recommendations and cast the actual proxy votes. ISS also serves as USBAM’s proxy voting record keeper and generates reports on how proxies were voted.
Conflicts of Interest. As an affiliate of U.S. Bancorp, currently the eighth largest financial services holding company in the United States, USBAM recognizes that there are numerous situations wherein it may have a theoretical or real conflict of interest in voting the proxies of issuers or proxy proponents (e.g., a special interest group) who are clients or potential clients of some part of the U.S. Bancorp enterprise. Directors and officers of such companies also may have personal or familial relationships with the U.S. Bancorp enterprise and its employees that could give rise to conflicts of interest.
Although USBAM strongly believes that, regardless of such real or theoretical conflicts of interest, it would always vote proxies in its clients’ best interests, by adopting ISS’s policies and generally deferring to ISS’s recommendations, USBAM believes the risk related to conflicts will be minimized.
To further minimize this risk, the Investment Policy Committee has also reviewed ISS’s conflict avoidance policy and has concluded that it adequately addresses both the theoretical and actual conflicts of interest the proxy voting service may face.
In the event an extraordinary situation arises in which (1) the Investment Policy Committee determines it is necessary in clients’ best interests to override a standard policy or (2) it is determined that ISS faces a material conflict of interest with respect to a specific vote, the Investment Policy Committee will direct ISS how to vote. Before doing so, however, the Proxy Voting Administration Committee will confirm that USBAM and the Investment Policy Committee face no material conflicts of the nature discussed above.
If the Proxy Voting Administration Committee concludes a material conflict does exist, it will recommend a course of action designed to address the conflict to the Investment Policy Committee. Such actions could include, but are not limited to:
• Obtaining instructions from the affected clients on how to vote the proxy;
• Disclosing the conflict to the affected clients and seeking their consent to permit USBAM to vote the proxy;
• Voting in proportion to the other shareholders;
• Recusing an Investment Policy Committee member from all discussion or consideration of the matter, if the material conflict is due to such person’s actual or potential conflict of interest; or
• Following the recommendation of a different independent third party.
In addition to all of the above, members of the Investment Policy Committee and the Proxy Voting Administration Committee must notify USBAM’s Chief Compliance Officer of any direct, indirect or perceived improper influence made by any employee, officer or director within the U.S. Bancorp enterprise or First American Fund complex with regard to how USBAM should vote proxies. The Chief Compliance Officer will investigate the allegations and will report the findings to the USBAM Chief Executive Officer and the General Counsel. If it is determined that improper influence was attempted, appropriate action shall be taken. Such appropriate action may include disciplinary action, notification of the appropriate senior managers within the U.S. Bancorp enterprise, or notification of the appropriate regulatory authorities. In all cases, the Investment Policy Committee shall not consider any improper influence in determining how to vote proxies and will vote in the best interests of clients.
Review and Reports
On a calendar quarterly basis, the Proxy Voting Administration Committee will review the proxy voting record to assess a number of matters, including the following:
• Whether proxy statements were timely forwarded to ISS;
• Whether proxy votes were cast on a timely basis;
• Whether proxy votes were cast consistent with the policies; and
• Where the guidelines were overridden, whether such vote was communicated to ISS in a timely manner and voted consistent with the communication.
The Proxy Voting Administration Committee will prepare a report on this review for submission to the Investment Policy Committee. Such report will also review all identified conflicts and how they were addressed during the quarter.
The Investment Policy Committee, on a calendar quarterly basis, will review the report of the Proxy Voting Administration Committee, as well as ISS’s proxy voting policies and conflict of interest policies. The purpose of this review is to ensure USBAM is voting proxies in a timely and responsive manner in the best interests of clients. With respect to the review of votes cast on behalf of investments by
the First American family of mutual funds, such review will also be reported to the independent Board of Directors of the First American Funds.
The actual proxy voting records of the First American Funds will be filed with the U.S. Securities Exchange Commission and will be available to shareholders after June 30, 2004. Such records will be available on the First American Funds’ website at www.firstamericanfunds.com and on the SEC’s website at www.sec.gov.
USBAM’s separately managed account clients should contact their relationship manager for more information on USBAM’s policies and the proxy voting record for their account.
ISS Proxy Voting Guidelines Summary
The following is a concise summary of ISS’s proxy voting policy guidelines.
1. Auditors
Vote FOR proposals to ratify auditors, unless any of the following apply:
• An auditor has a financial interest in or association with the company, and is therefore not independent
• Fees for non-audit services are excessive, or
• There is reason to believe that the independent auditor has rendered an opinion which is neither accurate nor indicative of the company’s financial position.
2. Board of Directors
Voting on Director Nominees in Uncontested Elections
Votes on director nominees should be made on a CASE-BY-CASE basis, examining the following factors: independence of the board and key board committees, attendance at board meetings, corporate governance provisions and takeover activity, long-term company performance, responsiveness to shareholder proposals, any egregious board actions, and any excessive non-audit fees or other potential auditor conflicts.
Classification/Declassification of the Board
Vote AGAINST proposals to classify the board.
Vote FOR proposals to repeal classified boards and to elect all directors annually.
Independent Chairman (Separate Chairman/CEO)
Vote on a CASE-BY-CASE basis shareholder proposals requiring that the positions of chairman and CEO be held separately. Because some companies have governance structures in place that counterbalance a combined position, certain factors should be taken into account in determining whether the proposal warrants support. These factors include the presence of a lead director, board and committee independence, governance guidelines, company performance, and annual review by outside directors of CEO pay.
Majority of Independent Directors/Establishment of Committees
Vote FOR shareholder proposals asking that a majority or more of directors be independent unless the board composition already meets the proposed threshold by ISS’s definition of independence.
Vote FOR shareholder proposals asking that board audit, compensation, and/or nominating committees be composed exclusively of independent directors if they currently do not meet that standard.
3. Shareholder Rights
Shareholder Ability to Act by Written Consent
Vote AGAINST proposals to restrict or prohibit shareholder ability to take action by written consent.
Vote FOR proposals to allow or make easier shareholder action by written consent.
Shareholder Ability to Call Special Meetings
Vote AGAINST proposals to restrict or prohibit shareholder ability to call special meetings.
Vote FOR proposals that remove restrictions on the right of shareholders to act independently of management.
Supermajority Vote Requirements
Vote AGAINST proposals to require a supermajority shareholder vote.
Vote FOR proposals to lower supermajority vote requirements.
Cumulative Voting
Vote AGAINST proposals to eliminate cumulative voting.
Vote proposals to restore or permit cumulative voting on a CASE-BY-CASE basis relative to the company’s other governance provisions.
Confidential Voting
Vote FOR shareholder proposals requesting that corporations adopt confidential voting, use independent vote tabulators and use independent inspectors of election, as long as the proposal includes a provision for proxy contests as follows: In the case of a contested election, management should be permitted to request that the dissident group honor its confidential voting policy. If the dissidents agree, the policy remains in place. If the dissidents will not agree, the confidential voting policy is waived.
Vote FOR management proposals to adopt confidential voting.
4. Proxy Contests
Voting for Director Nominees in Contested Elections
Votes in a contested election of directors must be evaluated on a CASE-BY-CASE basis, considering the factors that include the longterm financial performance, management’s track record, qualifications of director nominees (both slates), and an evaluation of what each side is offering shareholders.
Reimbursing Proxy Solicitation Expenses
Vote CASE-BY-CASE. Where ISS recommends in favor of the dissidents, we also recommend voting for reimbursing proxy solicitation expenses.
5. Poison Pills
Vote FOR shareholder proposals that ask a company to submit its poison pill for shareholder ratification. Review on a CASE-BYCASE basis shareholder proposals to redeem a company’s poison pill and management proposals to ratify a poison pill.
6. Mergers and Corporate Restructurings
Vote CASE-BY-CASE on mergers and corporate restructurings based on such features as the fairness opinion, pricing, strategic rationale, and the negotiating process.
7. Reincorporation Proposals
Proposals to change a company’s state of incorporation should be evaluated on a CASE-BY-CASE basis, giving consideration to both financial and corporate governance concerns, including the reasons for reincorporating, a comparison of the governance provisions, and a comparison of the jurisdictional laws.
Vote FOR reincorporation when the economic factors outweigh any neutral or negative governance changes.
8. Capital Structure
Common Stock Authorization
Votes on proposals to increase the number of shares of common stock authorized for issuance are determined on a CASE-BY-CASE basis using a model developed by ISS.
Vote AGAINST proposals at companies with dual-class capital structures to increase the number of authorized shares of the class of stock that has superior voting rights.
Vote FOR proposals to approve increases beyond the allowable increase when a company’s shares are in danger of being delisted or if a company’s ability to continue to operate as a going concern is uncertain.
Dual-class Stock
Vote AGAINST proposals to create a new class of common stock with superior voting rights.
Vote FOR proposals to create a new class of nonvoting or subvoting common stock if:
• It is intended for financing purposes with minimal or no dilution to current shareholders
• It is not designed to preserve the voting power of an insider or significant shareholder
9. Executive and Director Compensation
Votes with respect to compensation plans should be determined on a CASE-BY-CASE basis. Our methodology for reviewing compensation plans primarily focuses on the transfer of shareholder wealth (the dollar cost of pay plans to shareholders instead of simply focusing on voting power dilution). Using the expanded compensation data disclosed under the SEC’s rules, ISS will value every award type. ISS will include in its analyses an estimated dollar cost for the proposed plan and all continuing plans. This cost, dilution to shareholders’ equity, will also be expressed as a percentage figure for the transfer of shareholder wealth, and will be considered long with dilution to voting power. Once ISS determines the estimated cost of the plan, we compare it to a company-specific dilution cap.
Vote AGAINST equity plans that explicitly permit repricing or where the company has a history of repricing without shareholder approval.
Management Proposals Seeking Approval to Reprice Options
Votes on management proposals seeking approval to reprice options are evaluated on a CASE-BY-CASE basis giving consideration to the following:
• Historic trading patterns
• Rationale for the repricing
• Value-for-value exchange
• Option vesting
• Term of the option
• Exercise price
• Participation
Employee Stock Purchase Plans
Votes on employee stock purchase plans should be determined on a CASE-BY-CASE basis.
Vote FOR employee stock purchase plans where all of the following apply:
• Purchase price is at least 85 percent of fair market value
• Offering period is 27 months or less, and
• Potential voting power dilution (VPD) is ten percent or less.
Vote AGAINST employee stock purchase plans where any of the opposite conditions obtain.
Shareholder Proposals on Compensation
Vote on a CASE-BY-CASE basis for all other shareholder proposals regarding executive and director pay, taking into account company performance, pay level versus peers, pay level versus industry, and long term corporate outlook.
10. Social and Environmental Issues
These issues cover a wide range of topics, including consumer and public safety, environment and energy, general corporate issues, labor standards and human rights, military business, and workplace diversity.
In general, vote CASE-BY-CASE. While a wide variety of factors goes into each analysis, the overall principal guiding all vote recommendations focuses on how the proposal will enhance the economic value of the company.
Item 8—Portfolio Managers of Closed-End Management Investment Companies
Not applicable until first annual report for a fiscal year ending on or after December 31, 2005.
Item 9—Purchases of Equity Securities by Closed-End Management Investment Company and Affiliated Purchasers
Neither the registrant nor any “affiliated purchaser,” as defined in Rule 10b-18(a)(3) under the Exchange Act (17 CFR 240.10b-18(a)(3)), purchased any shares or other units of any class of the registrant’s equity securities that is registered pursuant to Section 12 of the Exchange Act (15 U.S.C. 781).
Item 10—Submission of Matters to a Vote of Security Holders
There have been no material changes to the procedures by which shareholders may recommend nominees to the registrant’s board of directors, where those changes were implemented after the registrant last provided disclosure in response to the requirements of this Item.
Item 11—Controls and Procedures
(a) The registrant’s Principal Executive Officer and Principal Financial Officer have evaluated the registrant’s disclosure controls and procedures within 90 days of the date of this filing and have concluded that the registrant’s disclosure controls and procedures were effective, as of that date, in ensuring that information required to be disclosed by the registrant in this Form N-CSR was recorded, processed, summarized and reported timely.
(b) There were no changes in the registrant’s internal control over financial reporting that occurred during the second fiscal quarter of the period covered by this report that have materially affected, or are reasonably likely to materially affect, the registrant’s internal control over financial reporting.
Item 12 – Exhibits
(a)(1) Not applicable. Registrant’s Code of Ethical Conduct is provided to any person upon request without charge.
(a)(2) Certifications of the principal executive and principal financial officer of the registrant as required by Rule 30a-2(a) under the Investment Company Act are filed as exhibits hereto.
(a)(3) Not applicable.
(b) Certifications of the principal executive and principal financial officer of the registrant as required by Rule 30a-2(b) under the Investment Company Act are filed as exhibits hereto.
Signatures
Pursuant to the requirements of the Securities Exchange Act of 1934 and the Investment Company Act of 1940, the registrant has duly caused this report to be signed on its behalf by the undersigned, thereunto duly authorized.
American Strategic Income Portfolio Inc. II
By:
/s/ Thomas S. Schreier, Jr. | |
Thomas S. Schreier, Jr. |
President |
Date: August 8, 2005
Pursuant to the requirements of the Securities Exchange Act of 1934 and the Investment Company Act of 1940, this report has been signed below by the following persons on behalf of the registrant and in the capacities and on the dates indicated.
By:
/s/ Thomas S. Schreier, Jr. | |
Thomas S. Schreier, Jr. |
President |
Date: August 8, 2005
By:
/s/ Charles D. Gariboldi | |
Charles D. Gariboldi |
Treasurer |
Date: August 8, 2005
