Item 1: Report to Shareholders| Mid-Cap Growth Fund | December 31, 2005 |
The views and opinions in this report were current as of December 31, 2005. They are not guarantees of performance or investment results and should not be taken as investment advice. Investment decisions reflect a variety of factors, and the managers reserve the right to change their views about individual stocks, sectors, and the markets at any time. As a result, the views expressed should not be relied upon as a forecast of the fund’s future investment intent. The report is certified under the Sarbanes-Oxley Act of 2002, which requires mutual funds and other public companies to affirm that, to the best of their knowledge, the information in their financial reports is fairly and accurately stated in all material respects.
REPORTS ON THE WEB
Sign up for our E-mail Program, and you can begin to receive updated fund reports and prospectuses online rather than through the mail. Log in to your account at troweprice.com for more information.
Fellow Shareholders
The stock market moved modestly higher in 2005, keeping alive the modest bull market that emerged from the wreckage of the market crash in 2001. As measured by Russell indexes, mid-caps outperformed both large- and small-caps for the year. Somewhat surprisingly, since one would expect mid-caps’ performance to fall in between that of their larger and smaller counterparts, this was the fourth time mid-caps accomplished this feat since 2000. Perhaps more notably, mid-cap growth stocks lagged for the year but outperformed their value counterparts for the past six months. This suggests the possibility, at least, that the long-awaited shift in market leadership from value to growth may finally be under way.
The Mid-Cap Growth Fund returned 12.81% during the final six months of 2005, surpassing the S&P MidCap 400 Index as well as the aggressive-growth oriented Russell Midcap Growth Index, as shown in the accompanying table. We also outperformed our competitors as tracked by the Lipper Mid-Cap Growth Funds Index. For the year, our 14.82% gain outpaced the S&P, Russell, and Lipper benchmarks. (Returns for Advisor and R Class shares were slightly lower, reflecting their higher expense ratios.)
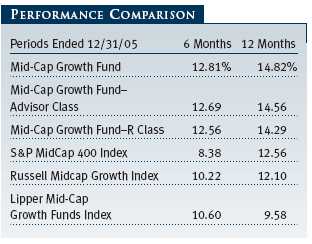
Our results relative to competitor funds remained strong over all periods. The fund ranked in the top 15% of the Lipper mid-cap growth funds category for the one-year period ended December 31, 2005, the top 7% for three and five years, and the top 4% over 10 years. (Based on total return, Lipper ranked the Mid-Cap Growth Fund 79 out of 553, 31 out of 458, 22 out of 348, and 5 out of 126 funds in the category for the 1-, 3-, 5-, and 10-year periods ended December 31, 2005, respectively. Results will vary for other periods, and past performance cannot guarantee future results.)
MARKET ENVIRONMENT
The economy continued to grow at a measured pace over the past year, fast enough to encourage broad corporate earnings gains, but not so rapid to ignite inflation. Hurricane Katrina dealt a shock to the economy, both directly in the form of destruction to the Gulf Coast and indirectly in the form of higher gasoline and natural gas prices resulting from damage to the Gulf’s energy infrastructure. But the storm’s impact proved modest in economic, if not human, terms: growth actually picked up a bit in the second half of the year, with gross domestic product expanding at a 4.1% annualized rate in the third quarter. Payrolls registered healthy increases over the last six months, and the unemployment rate moved down to a modest 4.9%.
As always, some clouds dotted the horizon. The Federal Reserve raised interest rates steadily over the past year, bringing official short-term rates to their highest levels in over four years. While longer-term interest rates proved more stable, the Fed’s policy began to weigh on housing prices at the end of the year as buyers were no longer able to turn to low-interest, adjustable rate loans. Although inflation appeared largely contained to the energy sector, the core inflation rate, which excludes food and energy, crept up a bit starting in October. Certainly, inflation became a popular topic of discussion as record-high gasoline prices caused consumers to reconsider driving patterns and lower their thermostats to save on heating bills.
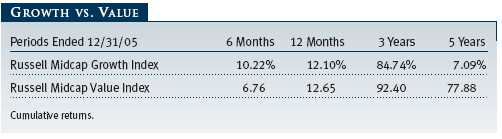
The stock market’s gains were modest in this environment, as investors seemed constrained by the Fed’s rate increases as well as by worries over the impact of high energy prices. Perhaps more notable was the shift in market leadership over the past six months as growth stocks began to perform better than value shares. To some, this signaled the end of a long-term cycle of value dominance, which had been fed by strong performance in traditional value sectors such as energy and weakness in growth-oriented areas such as technology. But if growth shares are to catch up, they have considerable distance to close. As shown in the Growth vs. Value table, the recent outperformance of mid-cap growth stocks remained meager compared with the longer-term dominance of value shares.
PORTFOLIO REVIEW
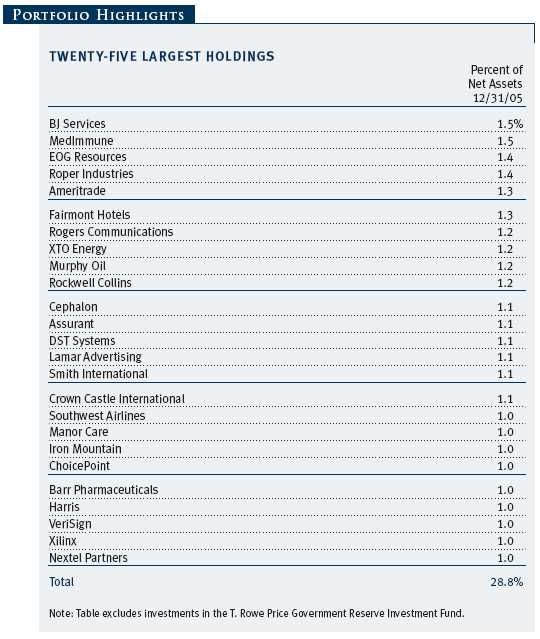
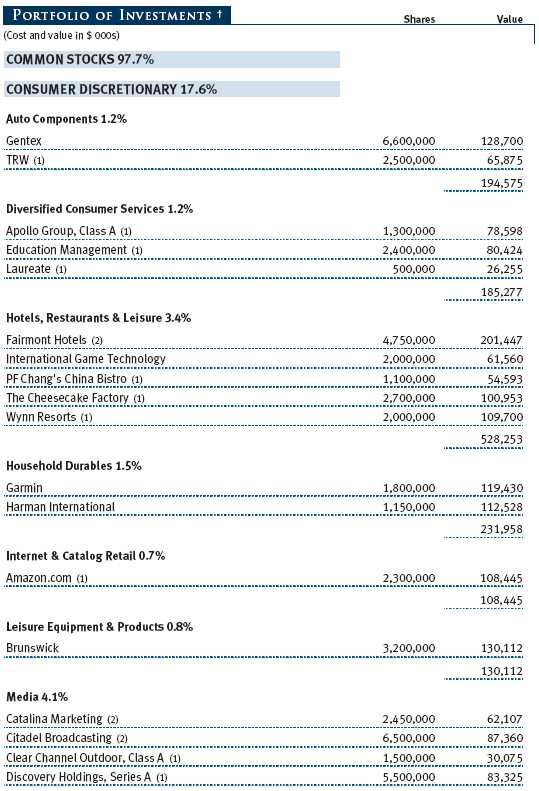
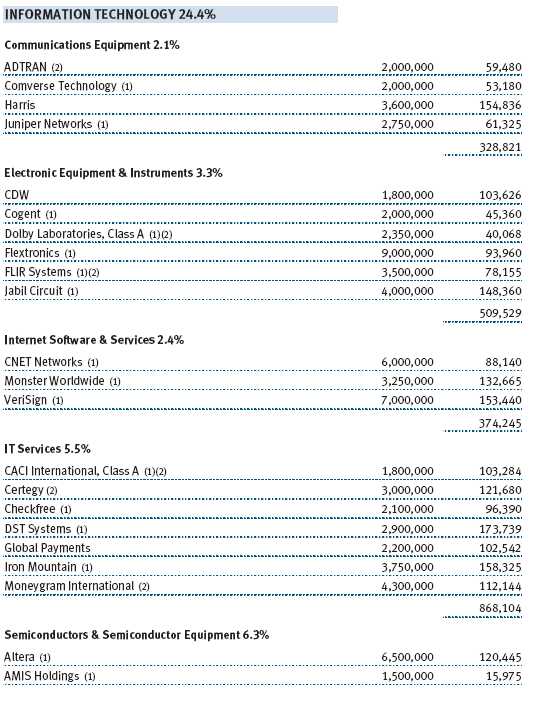
Several of our investment themes played out well in the past six months. Primary among these was our emphasis on biotechnology companies, which we see as the principal drivers of pharmaceutical innovation. Cephalon was an exceptionally good performer as this longtime holding began to convince skeptics that it had a number of promising drugs in development. Amylin and Neurocrine Biosciences also enjoyed good success with their pipelines, while Abgenix moved higher following the announcement of its acquisition by Amgen. Elan (technically classified a pharmaceutical firm) came back substantially in the past six months, although it detracted from the portfolio’s results for the full year. The company had to pull its multiple sclerosis medication Tysabri from the market in March, which caused the stock price to plummet. We took the occasion to increase our position, believing that Elan could enjoy long-term success even without Tysabri. In fact, indications are that Tysabri could be reapproved in the coming year given its unique ability to treat the disease. (Please see the portfolio of investments for a complete listing of the fund’s holdings and the amount each represents in the portfolio.)

Other types of health care holdings also performed well. Pharmacy services provider and longtime holding Omnicare more than doubled over the past year as it completed its acquisition of a former competitor, NeighborCare. On the negative side of the ledger, Kinetic Concepts, which makes wound treatment devices and performed very well for us in 2004, suffered from reimbursement concerns.
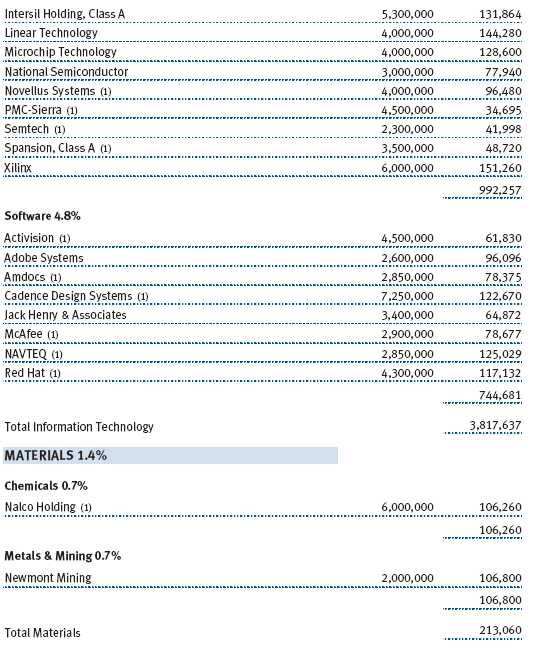
While consumers seem to be pulling in their horns a bit, business investment seems poised to accelerate in 2006. Much of this spending will go to the technology sector, and we have attempted to focus investments on the firms that will benefit the most from business outlays. Software firm Red Hat rebounded from losses last year and was our leading contributor for the six-month period. The firm provides support to businesses for the open source Linux operating system. Iron Mountain, which provides document and information management services, moved higher on strong earnings gains. One laggard among our technology holdings was VeriSign, an Internet software and services firm. Investors punished the company for its entry in 2004 into the wireless ring tone market, which shrank significantly in 2005. We see ring tones as an insignificant part of VeriSign’s long-term business, and we expect the stock to fare better eventually.
While we believe that energy stocks will perform well for us over the long term, we pared back our investments in late 2004 and early 2005 in the belief that stock prices had outstripped fundamentals. This turned out to be a mistake, as energy prices climbed to unanticipated levels after Hurricane Katrina. While we should have owned more of them, energy stocks contributed significantly to our absolute results in 2005. BJ Services, which provides pumping and other services to oil producers, was a notably strong performer, but nearly all our holdings registered gains. Modest declines in the sector over the past few months suggest that we may have simply been early in expecting a pullback in oil prices and energy stocks. However, we believe this is an area with long-term potential, and we intend to remain invested.
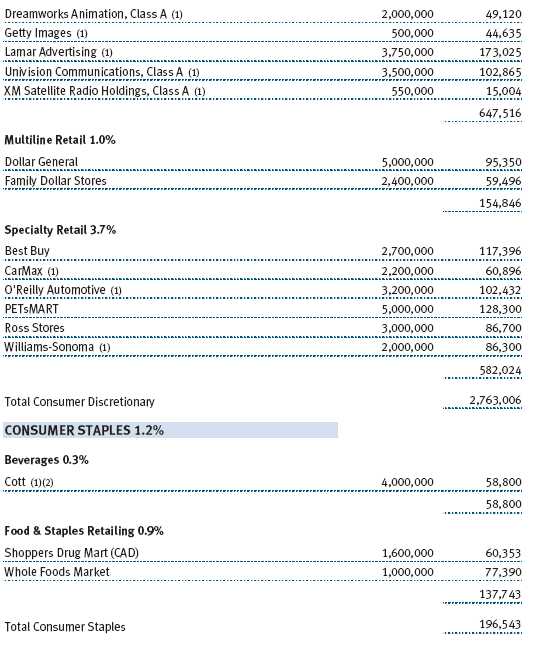
We are excited about the implications of the digitization of the economy, and this has helped guide our investments in several sectors. Over the longer term, we see great potential as digital media becomes ever more pervasive and as consumers replace a wide variety of appliances and other goods with digitized counterparts. Demand for Garmin’s global positioning systems, which may in fact replace our spouses as direction providers, helped the company perform well in 2005, and the stock just missed our list of top contributors for the six-month period.
However, the consumer sectors were weak overall in 2005 as investors worried about the effects of high gasoline and home heating prices on household budgets. We felt the impact in holdings such as Family Dollar Stores and PETsMART. Beverages firm Cott was a particular disappointment. We believe its target market of private-label beverages is a lucrative one, but the company has been unable to execute against its business strategy. Our media holdings were generally weak performers, and we recently liquidated some traditional media positions. However, we added Lamar Advertising, which fits well into our digitization thesis because of its novel use of electronic billboards to capture short-term advertising opportunities, such as entertainment events.
We have a fairly moderate position in financials because we don’t believe this is a good point in the credit cycle as interest rates head higher. Within the sector, we have focused on companies using technology to gain market share, which in turn has led us to the online brokers. E*Trade and Ameritrade performed well for the fund; both made acquisitions in the second half of the year that should allow them to gain new customers at minimal additional cost. We had hoped Refco might be a similar investment given the company’s technological innovation in commodity brokerage, but it proved to be a notable disappointment. Soon after its initial public offering, Refco announced that it had concealed a large loan to its chief executive, calling into serious question the firm’s financial practices. We quickly sold our position upon learning of these revelations, but we still endured a significant loss on the investment.
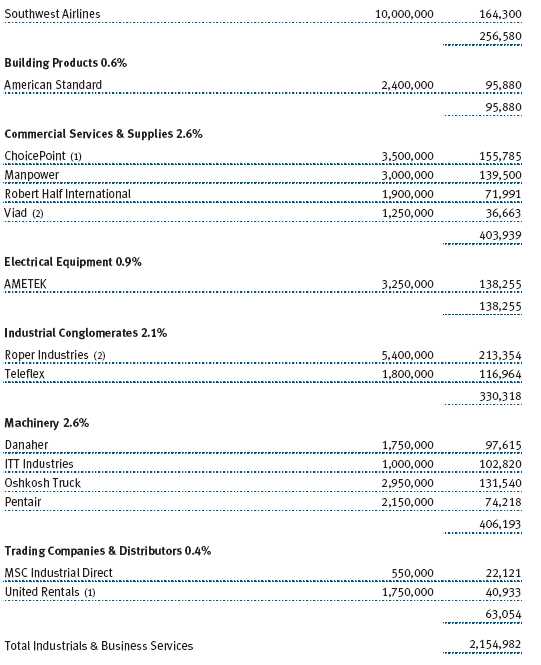
Finally, we would like to mention some recent investments in the industrials sector. We are somewhat unusual among growth managers in our interest in industrials firms, but they have played an important role in our investment strategy for many years. One new purchase we are excited about is AMETEK, which operates in a solid collection of aerospace, energy, and defense businesses that tend to fare well later in an economic cycle. We see in AMETEK many of the same qualities that made longtime holding Danaher a dominant and profitable company: a solid management team poised to leverage a good business model and a solid balance sheet. Overall, we have recently moderated our overweight in the defense sector, trimming our positions in ITT Industries, Alliant Techsystems, and defense communications firm Harris, which was one of our top performers for both the 6- and 12-month periods. We also pared back on growth cyclical investments we made in 2002 and 2003, eliminating holdings in Potash Corp. and Nucor.
INVESTMENT STRATEGY AND OUTLOOK
As we enter 2006, we find a stock market that seems quite reasonably valued, especially given the low interest rate environment of recent years. We are somewhat leery that both the current economic expansion, which started in late 2001, and the bull market, which began a year later, are approaching average durations and that corporate margins are at record highs. We are clearly closer to the tops of both cycles than their lows, but many expansions and bull runs have lasted far longer.
Corporate balance sheets are the most liquid we’ve seen in several decades. Many companies have significant excess cash and face increasing pressure to deploy it. Activist shareholders, some of whom were corporate raiders in a different era and may or may not have long-term shareholder interests in mind, are pressing managements to return cash to their shareholders. For some companies, a “use it or lose it” mentality may be starting to develop. This could spell increased peril for shareholders if managements opt for riskier strategies that later backfire.
Managements and boards of directors have several options for their bursting corporate coffers. One is to reinvest in their businesses to support growth by building new plants or augmenting computer processing capacity, for instance. Business capital spending collapsed in the wake of the stock market bubble and has recovered only modestly in this economic expansion. While the consumer has driven the U.S. economy in recent years, encouraged by low interest rates, rising housing prices, and the availability of cheap credit, we believe that many of the favorable factors driving consumer spending are waning and that business spending will pick up some of the slack. This should result in a more balanced economy in the long run. The decision to reinvest in a business entails moderately elevated risks for shareholders but increases the likelihood that a company will continue to grow in the long term.
Many corporations, however, will choose to employ their cash in a riskier way—acquisitions. Numerous studies have indicated that the majority of acquisitions fail to achieve reasonable returns on invested capital, and the recent trend in formerly acquisitive companies such as Tyco and Cendant splitting themselves into pieces exemplifies the failure of many aggressive acquisition strategies. Nevertheless, activity is picking up, and while some of our portfolio companies will likely err in making risky and value-destroying deals, others are likely to be acquired themselves.
In the last year, we have had more holdings acquired than in the previous several years combined. Western Wireless, Nextel, Nextel Partners, IVAX, and Abgenix, to name several, have been bought or have agreed to be purchased.
If high returns are not available from internal investments or from acquisitions, managements and boards can return cash to shareholders. Lower dividend tax rates have encouraged higher levels of distributions in recent years, and many companies have declared dividends for the first time. Some growth companies, particularly in the technology sector, have been reluctant to pay dividends for fear that this would be perceived as an admission that their growth is stalling. However, many of these companies can reinvest in their businesses and pay reasonable dividends at the same time. This is particularly true of most service companies as they are not especially capital intensive.
Conversely, many of the same companies that are reluctant to pay dividends are aggressive, all-weather share repurchasers (sometimes in order to neutralize the dilution from options programs). We do not see the logic behind an indiscriminate approach to stock buybacks. While we like share repurchases, the stock market is far more volatile than even the most unsteady businesses, so why would managements not take advantage of stock price swings by buying aggressively and opportunistically when prices are low, and conserving cash when prices are high? In any case, repurchasing shares is a far less risky strategy than acquisitions.
Of course, deciding which uses of a company’s cash are in the best interest of its shareholders is not an easy task. Dividends, acquisitions, and share repurchases can all make sense depending on the company’s situation. This is a primary example of why we believe our emphasis on truly knowing companies—which often means paying them several visits—is the best way for us to seek above-market returns. Our team of analysts has helped guide us to the correct conclusions in many cases over the years, and we’re optimistic that we’ll continue to be able to draw these distinctions.
We are often asked whether small- and mid-cap stocks will continue to outperform large-cap stocks. The duration of the current small-/mid-cap cycle, which began in April 1999, is now above average, and many market observers have been calling for a reversal of leadership for several years. While this will inevitably occur, there are several mitigating factors that lead us to question whether a new era of large-cap investing is necessarily upon us. The cycle has been long, but the relative gains have been well below average. Mid-cap valuations are just above parity with large-caps, a level that is not unreasonable given the former’s better balance sheets and growth prospects. Finally, small-/mid-cap cycles often (but not always) end with a burst of speculative activity, and we have not seen this yet. Perhaps we won’t. Edging one’s investment program toward larger-capitalization companies makes sense today, but we still believe that there is a place for mid-caps within one’s portfolio.
The more glaring market anomaly, in our opinion, remains the significant undervaluation of growth relative to value. Growth and value stock leadership tends to alternate over long cycles, and since growth stocks crested at extremely elevated valuations in early 2000, returns from value stocks have vastly exceeded their growth counterparts. Perhaps this reflects a combination of an abiding suspicion of growth in the wake of the broken promises of technology companies and their ensuing collapse as the stock market bubble deflated, memories of the accounting scandals perpetrated by several highflying growth companies of the 1990s, and a sense of vulnerability in the wake of 9/11. Nevertheless, across the market capitalization spectrum, growth stocks now trade at modest and historically narrow premiums to value stocks.
On the margin, we have added companies that are growing a little faster than the portfolio as a whole. To the extent that the market turns strongly toward growth and begins to reward speculative investments, this may in fact disfavor our approach for a period. We have found, however, that these periods of speculative fervor do not last, and that an emphasis on valuation within a growth-oriented approach offers the best chance for superior results over the longer term.
Finally, it is worth reiterating a point that we have mentioned in the past. Our portfolio continues to emphasize well-managed, growing companies with good business models, strong balance sheets, and reasonable valuations that we believe will perform well over the next several years. Our portfolio turnover, which has approximated 30% in recent years, is well below the average of most other mid-cap growth portfolios.
Some have derided our style as plain vanilla, but we take that gibe as a compliment. Our approach is simple, but it is increasingly at odds with the frenetic, data-driven approach practiced by most of the investing world. In effect, we are arbitraging time horizons: while many others choose to focus on near-term events, our longer-term approach allows us to screen out much of the day-to-day noise. While there are bound to be periods when our style is out of sync with the market, it has proved durable over time, and we believe that our long-term philosophy is increasingly an attribute in a short-term world.
We appreciate your continued confidence in T. Rowe Price.
Respectfully submitted,

Brian W.H. Berghuis
President of the fund and chairman of its Investment Advisory Committee

John F. Wakeman
Executive vice president of the fund
January 25, 2006
The committee chairman has day-to-day responsibility for managing the portfolio and works with committee members in developing and executing the fund’s investment program.
RISKS OF STOCK INVESTING
As with all stock and bond mutual funds, the fund’s share price can fall because of weakness in the stock or bond markets, a particular industry, or specific holdings. The financial markets can decline for many reasons, including adverse political or economic developments, changes in investor psychology, or heavy institutional selling. The prospects for an industry or company may deteriorate because of a variety of factors, including disappointing earnings or changes in the competitive environment. In addition, the investment manager’s assessment of companies held in a fund may prove incorrect, resulting in losses or poor performance even in rising markets. The stocks of mid-cap companies entail greater risk and are usually more volatile than the shares of larger companies. In addition, growth stocks can be volatile for several reasons. Since they usually reinvest a high proportion of earnings in their own businesses, they may lack the dividends usually associated with value stocks that can cushion their decline in a falling market. Also, since investors buy these stocks because of their expected superior earnings growth, earnings disappointments often result in sharp price declines.
GLOSSARY
Lipper indexes: Fund benchmarks that consist of a small number of the largest mutual funds in a particular category as tracked by Lipper Inc.
Russell Midcap Growth Index: An unmanaged index that measures the performance of those Russell Midcap companies with higher price-to-book ratios and higher forecasted growth values.
Russell Midcap Value Index: An unmanaged index that measures the performance of those Russell Midcap companies with lower price-to-book ratios and lower forecasted growth values.
S&P 500 Stock Index: An unmanaged index that tracks the stocks of 500 primarily large-cap U.S. companies.
S&P MidCap 400 Index: An unmanaged index that tracks the stocks of 400 U.S. mid-cap companies.

This chart shows the value of a hypothetical $10,000 investment in the fund over the past 10 fiscal year periods or since inception (for funds lacking 10-year records). The result is compared with benchmarks, which may include a broad-based market index and a peer group average or index. Market indexes do not include expenses, which are deducted from fund returns as well as mutual fund averages and indexes.

| AVERAGE ANNUAL COMPOUND TOTAL RETURN |
This table shows how the fund would have performed each year if its actual (or cumulative) returns had been earned at a constant rate.

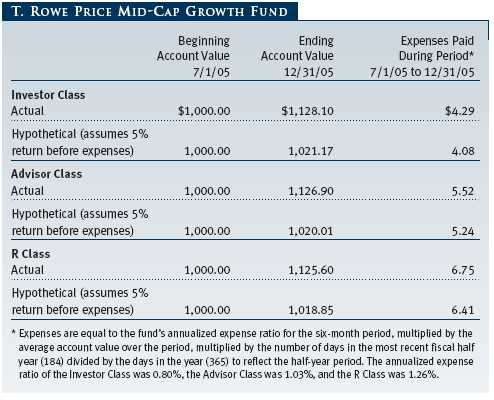
As a mutual fund shareholder, you may incur two types of costs: (1) transaction costs, such as redemption fees or sales loads, and (2) ongoing costs, including management fees, distribution and service (12b-1) fees, and other fund expenses. The following example is intended to help you understand your ongoing costs (in dollars) of investing in the fund and to compare these costs with the ongoing costs of investing in other mutual funds. The example is based on an investment of $1,000 invested at the beginning of the most recent six-month period and held for the entire period.
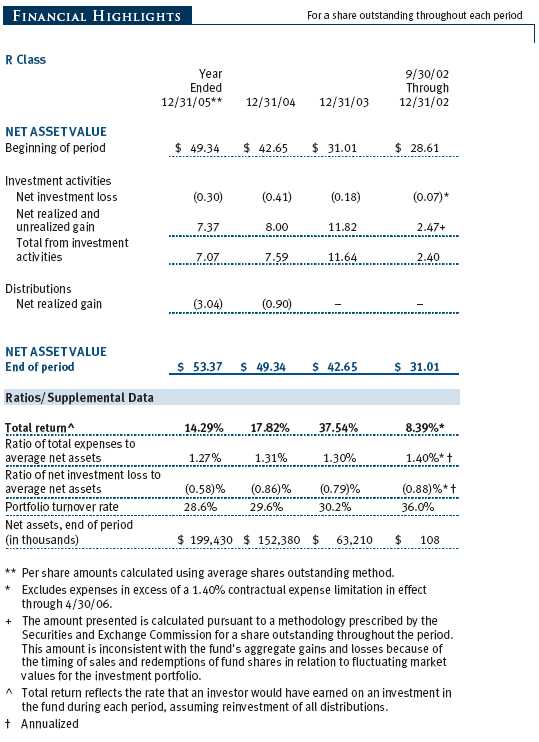
Please note that the fund has three share classes: The original share class (“investor class”) charges no distribution and service (12b-1) fee; Advisor Class shares are offered only through unaffiliated brokers and other financial intermediaries and charge a 0.25% 12b-1 fee; R Class shares are available to retirement plans serviced by intermediaries and charge a 0.50% 12b-1 fee. Each share class is presented separately in the table.
Actual Expenses
The first line of the following table (“Actual”) provides information about actual account values and expenses based on the fund’s actual returns. You may use the information in this line, together with your account balance, to estimate the expenses that you paid over the period. Simply divide your account value by $1,000 (for example, an $8,600 account value divided by $1,000 = 8.6), then multiply the result by the number in the first line under the heading “Expenses Paid During Period” to estimate the expenses you paid on your account during this period.
Hypothetical Example for Comparison Purposes
The information on the second line of the table (“Hypothetical”) is based on hypothetical account values and expenses derived from the fund’s actual expense ratio and an assumed 5% per year rate of return before expenses (not the fund’s actual return). You may compare the ongoing costs of investing in the fund with other funds by contrasting this 5% hypothetical example and the 5% hypothetical examples that appear in the shareholder reports of the other funds. The hypothetical account values and expenses may not be used to estimate the actual ending account balance or expenses you paid for the period.
Note: T. Rowe Price charges an annual small-account maintenance fee of $10, generally for accounts with less than $2,000 ($500 for UGMA/UTMA). The fee is waived for any investor whose T. Rowe Price mutual fund accounts total $25,000 or more, accounts employing automatic investing, and IRAs and other retirement plan accounts that utilize a prototype plan sponsored by T. Rowe Price (although a separate custodial or administrative fee may apply to such accounts). This fee is not included in the accompanying table. If you are subject to the fee, keep it in mind when you are estimating the ongoing expenses of investing in the fund and when comparing the expenses of this fund with other funds.
You should also be aware that the expenses shown in the table highlight only your ongoing costs and do not reflect any transaction costs, such as redemption fees or sales loads. Therefore, the second line of the table is useful in comparing ongoing costs only and will not help you determine the relative total costs of owning different funds. To the extent a fund charges transaction costs, however, the total cost of owning that fund is higher.

The accompanying notes are an integral part of these financial statements.

The accompanying notes are an integral part of these financial statements.
The accompanying notes are an integral part of these financial statements.


The accompanying notes are an integral part of these financial statements.

The accompanying notes are an integral part of these financial statements.


The accompanying notes are an integral part of these financial statements.

The accompanying notes are an integral part of these financial statements.
| NOTES TO FINANCIAL STATEMENTS |
NOTE 1 - SIGNIFICANT ACCOUNTING POLICIES
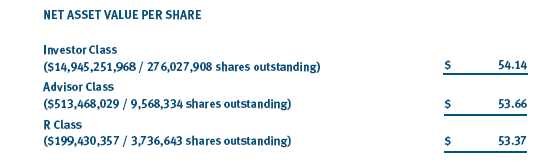
T. Rowe Price Mid-Cap Growth Fund Inc. (the fund) is registered under the Investment Company Act of 1940 (the 1940 Act) as a diversified, open-end management investment company. The fund seeks to provide long-term capital appreciation by investing in mid-cap stocks with potential for above-average earnings growth. The fund has three classes of shares: the Mid-Cap Growth Fund original share class, referred to in this report as the Investor Class, offered since June 30, 1992, the Mid-Cap Growth Fund—Advisor Class (Advisor Class), offered since March 31, 2000, and Mid-Cap Growth Fund—R Class (R Class), offered since September 30, 2002. Advisor Class shares are sold only through unaffiliated brokers and other unaffiliated financial intermediaries, and R Class shares are available to retirement plans serviced by intermediaries. The Advisor Class and R Class each operate under separate Board-approved Rule 12b-1 plans, pursuant to which each class compensates financial intermediaries for distribution, shareholder servicing, and/or certain administrative services. Each class has exclusive voting rights on matters related solely to that class, separate voting rights on matters that relate to all classes, and, in all other respects, the same rights and obligations as the other classes.
The accompanying financial statements were prepared in accordance with accounting principles generally accepted in the United States of America, which require the use of estimates made by fund management. Fund management believes that estimates and security valuations are appropriate; however actual results may differ from those estimates, and the security valuations reflected in the financial statements may differ from the value the fund ultimately realizes upon sale of the securities.
Valuation The fund values its investments and computes its net asset value per share at the close of the New York Stock Exchange (NYSE), normally 4 p.m. ET, each day that the NYSE is open for business. Equity securities listed or regularly traded on a securities exchange or in the over-the-counter market are valued at the last quoted sale price or, for certain markets, the official closing price at the time the valuations are made, except for OTC Bulletin Board securities, which are valued at the mean of the latest bid and asked prices. A security that is listed or traded on more than one exchange is valued at the quotation on the exchange determined to be the primary market for such security. Listed securities not traded on a particular day are valued at the mean of the latest bid and asked prices for domestic securities and the last quoted sale price for international securities.
Debt securities are generally traded in the over-the-counter market. Securities with original maturities of one year or more are valued at prices furnished by dealers who make markets in such securities or by an independent pricing service, which considers yield or price of bonds of comparable quality, coupon, maturity, and type, as well as prices quoted by dealers who make markets in such securities. Securities with original maturities of less than one year are valued at amortized cost in local currency, which approximates fair value when combined with accrued interest.
Investments in mutual funds are valued at the mutual fund’s closing net asset value per share on the day of valuation.
Other investments, including restricted securities, and those for which the above valuation procedures are inappropriate or are deemed not to reflect fair value are stated at fair value as determined in good faith by the T. Rowe Price Valuation Committee, established by the fund’s Board of Directors.
Most foreign markets close before the close of trading on the NYSE. If the fund determines that developments between the close of a foreign market and the close of the NYSE will, in its judgment, materially affect the value of some or all of its portfolio securities, which in turn will affect the fund’s share price, the fund will adjust the previous closing prices to reflect the fair value of the securities as of the close of the NYSE, as determined in good faith by the T. Rowe Price Valuation Committee, established by the fund’s Board of Directors. A fund may also fair value securities in other situations, such as when a particular foreign market is closed but the fund is open. In deciding whether to make fair value adjustments, the fund reviews a variety of factors, including developments in foreign markets, the performance of U.S. securities markets, and the performance of instruments trading in U.S. markets that represent foreign securities and baskets of foreign securities. The fund uses outside pricing services to provide it with closing market prices and information used for adjusting those prices. The fund cannot predict when and how often it will use closing prices and when it will adjust those prices to reflect fair value. As a means of evaluating its fair value process, the fund routinely compares closing market prices, the next day’s opening prices in the same markets, and adjusted prices.
Currency Translation Assets, including investments, and liabilities denominated in foreign currencies are translated into U.S. dollar values each day at the prevailing exchange rate, using the mean of the bid and asked prices of such currencies against U.S. dollars as quoted by a major bank. Purchases and sales of securities, income, and expenses are translated into U.S. dollars at the prevailing exchange rate on the date of the transaction. The effect of changes in foreign currency exchange rates on realized and unrealized security gains and losses is reflected as a component of security gains and losses.
Class Accounting The Advisor Class and R Class each pay distribution, shareholder servicing, and/or certain administrative expenses in the form of Rule 12b-1 fees, in an amount not exceeding 0.25% and 0.50%, respectively, of the class’s average daily net assets. Shareholder servicing, prospectus, and shareholder report expenses incurred by each class are charged directly to the class to which they relate. Expenses common to all classes, investment income, and realized and unrealized gains and losses are allocated to the classes based upon the relative daily net assets of each class.
Rebates and Credits Subject to best execution, the fund may direct certain security trades to brokers who have agreed to rebate a portion of the related brokerage commission to the fund in cash. Commission rebates are reflected as realized gain on securities in the accompanying financial statements and totaled $699,000 for the year ended December 31, 2005. Additionally, the fund earns credits on temporarily uninvested cash balances at the custodian that reduce the fund’s custody charges. Custody expense in the accompanying financial statements is presented before reduction for credits, which are reflected as expenses paid indirectly.
In-Kind Redemptions In accordance with guidelines described in the fund’s prospectus, the fund may distribute portfolio securities rather than cash as payment for a redemption of fund shares (in-kind redemption). For financial reporting purposes, the fund recognizes a gain on in-kind redemptions to the extent the value of the distributed securities on the date of redemption exceeds the cost of those securities. Gains and losses realized on in-kind redemptions are not recognized for tax purposes, and are reclassified from undistributed realized gain (loss) to paid-in capital. During the year ended December 31, 2005, the fund realized $84,827,000 of net gain on $146,967,000 of in-kind redemptions.
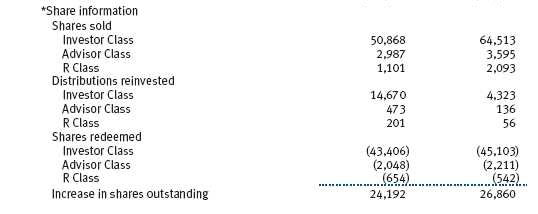
Investment Transactions, Investment Income, and Distributions Income and expenses are recorded on the accrual basis. Dividends received from mutual fund investments are reflected as dividend income; capital gain distributions are reflected as realized gain/loss. Dividend income and capital gain distributions are recorded on the ex-dividend date. Investment transactions are accounted for on the trade date. Realized gains and losses are reported on the identified cost basis. Distributions to shareholders are recorded on the ex-dividend date. Income distributions are declared and paid by each class on an annual basis. Capital gain distributions, if any, are declared and paid by the fund, typically on an annual basis.
NOTE 2 - INVESTMENT TRANSACTIONS
Consistent with its investment objective, the fund engages in the following practices to manage exposure to certain risks or enhance performance. The investment objective, policies, program, and risk factors of the fund are described more fully in the fund’s prospectus and Statement of Additional Information.
Restricted Securities The fund may invest in securities that are subject to legal or contractual restrictions on resale. Although certain of these securities may be readily sold, for example, under Rule 144A, others may be illiquid, their sale may involve substantial delays and additional costs, and prompt sale at an acceptable price may be difficult.
Other Purchases and sales of portfolio securities, other than short-term securities, aggregated $4,440,005,000 and $3,801,151,000, respectively, for the year ended December 31, 2005.
NOTE 3 - FEDERAL INCOME TAXES
No provision for federal income taxes is required since the fund intends to continue to qualify as a regulated investment company under Subchapter M of the Internal Revenue Code and distribute to shareholders all of its taxable income and gains. Federal income tax regulations differ from generally accepted accounting principles; therefore, distributions determined in accordance with tax regulations may differ significantly in amount or character from net investment income and realized gains for financial reporting purposes. Financial reporting records are adjusted for permanent book/tax differences to reflect tax character. Financial records are not adjusted for temporary differences.
Distributions during the year ended December 31, 2005 were characterized as follows for tax purposes:

At December 31, 2005, the tax-basis components of net assets were as follows:

For the year ended December 31, 2005, the fund recorded the following permanent reclassifications to reflect tax character. Reclassifications to paid-in capital relate primarily to redemptions in kind and a tax practice that treats a portion of the proceeds from each redemption of capital shares as a distribution of taxable net investment income and/or realized capital gain. Reclassifications between income and gain relate primarily to the offset of the current net operating loss against realized gains. Results of operations and net assets were not affected by these reclassifications.

At December 31, 2005, the cost of investments for federal income tax purposes was $10,830,349,000.
NOTE 4 - RELATED PARTY TRANSACTIONS
The fund is managed by T. Rowe Price Associates, Inc. (the manager or Price Associates), a wholly owned subsidiary of T. Rowe Price Group, Inc. The investment management agreement between the fund and the manager provides for an annual investment management fee, which is computed daily and paid monthly. The fee consists of an individual fund fee and a group fee. The individual fund fee is equal to 0.35% of the fund’s average daily net assets up to $15 billion, and 0.30% of the fund’s average daily net assets in excess of $15 billion; previously, through April 30, 2005, the individual fund fee had been a flat rate of 0.35% of the fund’s average daily net assets. The group fee rate is calculated based on the combined net assets of certain mutual funds sponsored by Price Associates (the group) applied to a graduated fee schedule, with rates ranging from 0.48% for the first $1 billion of assets to 0.29% for assets in excess of $160 billion. Prior to May 1, 2005, the maximum group fee rate in the graduated fee schedule had been 0.295% for assets in excess of $120 billion. The fund’s group fee is determined by applying the group fee rate to the fund’s average daily net assets. At December 31, 2005, the effective annual group fee rate was 0.31%.
The Advisor Class and R Class are also subject to a contractual expense limitation through the limitation dates indicated in the table below. During the limitation period, the manager is required to waive its management fee and reimburse a class for any expenses, excluding interest, taxes, brokerage commissions, and extraordinary expenses, that would otherwise cause the class’s ratio of total expenses to average net assets (expense ratio) to exceed its expense limitation. Each class is required to repay the manager for expenses previously reimbursed and management fees waived to the extent the class’s net assets have grown or expenses have declined sufficiently to allow repayment without causing the class’s expense ratio to exceed its expense limitation. However, no repayment will be made more than three years after the date of any reimbursement or waiver or later than the repayment dates indicated in the table below.
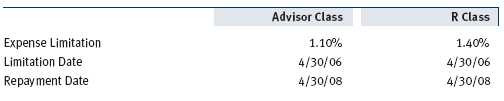
Pursuant to this agreement, at December 31, 2005, there were no amounts subject to repayment. For the year ended December 31, 2005, each class operated below its expense limitation.
In addition, the fund has entered into service agreements with Price Associates and two wholly owned subsidiaries of Price Associates (collectively, Price). Price Associates computes the daily share prices and maintains the financial records of the fund. T. Rowe Price Services, Inc., provides shareholder and administrative services in its capacity as the fund’s transfer and dividend disbursing agent. T. Rowe Price Retirement Plan Services, Inc., provides subaccounting and recordkeeping services for certain retirement accounts invested in the Investor Class and R Class. For the year ended December 31, 2005, expenses incurred pursuant to these service agreements were $82,000 for Price Associates, $3,527,000 for T. Rowe Price Services, Inc., and $6,388,000 for T. Rowe Price Retirement Plan Services, Inc. The total amount payable at period end pursuant to these service agreements is reflected as Due to Affiliates in the accompanying financial statement s.
Additionally, the fund is one of several mutual funds in which certain college savings plans managed by Price Associates may invest. As approved by the fund’s Board of Directors, shareholder servicing costs associated with each college savings plan are borne by the fund in proportion to the average daily value of its shares owned by the college savings plan. For the year ended December 31, 2005, the fund was charged $87,000 for shareholder servicing costs related to the college savings plans, of which $62,000 was for services provided by Price. The amount payable at period end pursuant to this agreement is reflected as Due to Affiliates in the accompanying financial statements. At December 31, 2005, approximately 0.4% of the outstanding shares of the Investor Class were held by college savings plans.
The fund is also one of several mutual funds sponsored by Price Associates (underlying Price funds) in which the T. Rowe Price Retirement Funds (Retirement Funds) may invest. The Retirement Funds do not invest in the underlying Price funds for the purpose of exercising management or control. Pursuant to a special servicing agreement, expenses associated with the operation of the Retirement Funds are borne by each underlying Price fund to the extent of estimated savings to it and in proportion to the average daily value of its shares owned by the Retirement Funds. Expenses allocated under this agreement are reflected as shareholder servicing expense in the accompanying financial statements. For the year ended December 31, 2005, the fund was allocated $641,000 of Retirement Funds’ expenses, of which $492,000 related to services provided by Price. The amount payable at period end pursuant to this agreement is reflected as Due to Affiliates in the accompanying financial statements. At December 31, 2005, approximately 2.3% of the outstanding shares of the Investor Class were held by the Retirement Funds.
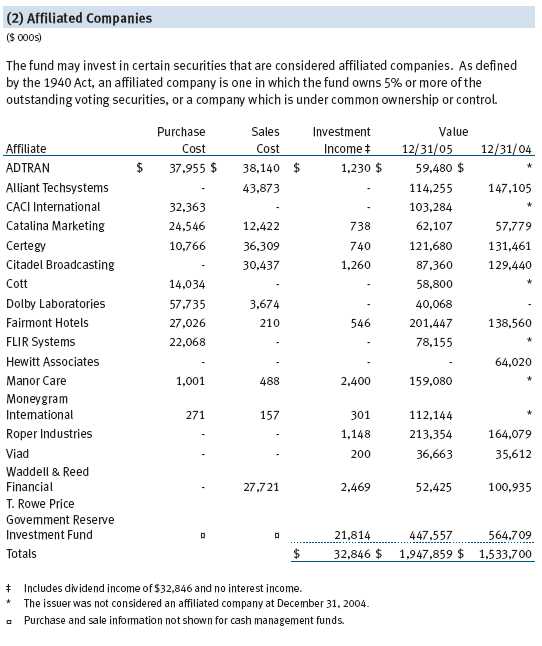
The fund may invest in the T. Rowe Price Reserve Investment Fund and the T. Rowe Price Government Reserve Investment Fund (collectively, the T. Rowe Price Reserve Funds), open-end management investment companies managed by Price Associates and affiliates of the fund. The T. Rowe Price Reserve Funds are offered as cash management options to mutual funds, trusts, and other accounts managed by Price Associates and/or its affiliates, and are not available for direct purchase by members of the public. The T. Rowe Price Reserve Funds pay no investment management fees.
As of December 31, 2005, T. Rowe Price Group, Inc. and/or its wholly owned subsidiaries owned 87,524 shares of the Investor Class, representing less than 1% of the fund’s net assets.
| REPORT OF INDEPENDENT REGISTERED PUBLIC ACCOUNTING FIRM |
To the Board of Directors and Shareholders of T. Rowe Price Mid-Cap Growth Fund, Inc.
In our opinion, the accompanying statement of assets and liabilities, including the portfolio of investments, and the related statements of operations and of changes in net assets and the financial highlights present fairly, in all material respects, the financial position of T. Rowe Price Mid-Cap Growth Fund, Inc. (the “Fund”) at December 31, 2005, the results of its operations for the year then ended, the changes in its net assets for each of the two years in the period then ended and the financial highlights for each of the periods indicated, in conformity with accounting principles generally accepted in the United States of America. These financial statements and financial highlights (hereafter referred to as “financial statements”) are the responsibility of the Fund’s management; our responsibility is to express an opinion on these financial statements based on our audits. We conducted our audits of these financial statements in accordance with the standards of the Public Company Accounting Oversight Board (United States). Those standards require that we plan and perform the audit to obtain reasonable assurance about whether the financial statements are free of material misstatement. An audit includes examining, on a test basis, evidence supporting the amounts and disclosures in the financial statements, assessing the accounting principles used and significant estimates made by management, and evaluating the overall financial statement presentation. We believe that our audits, which included confirmation of securities at December 31, 2005, by correspondence with the custodian and by agreement to the underlying ownership records for the T. Rowe Price Government Reserve Investment Fund, provide a reasonable basis for our opinion.
PricewaterhouseCoopers LLP
Baltimore, Maryland
February 13, 2006
| TAX INFORMATION (UNAUDITED) FOR THE TAX YEAR ENDED 12/31/05 |
We are providing this information as required by the Internal Revenue Code. The amounts shown may differ from those elsewhere in this report because of differences between tax and financial reporting requirements.
The fund’s distributions to shareholders included:
- $32,317,000 from short-term capital gains,
- $893,562,000 from long-term capital gains, subject to the 15% rate gains category.
For taxable non-corporate shareholders, $56,498,000 of the fund’s income represents qualified dividend income subject to the 15% rate category.
For corporate shareholders, $56,498,000 of the fund’s income qualifies for the dividends-received deduction.
| INFORMATION ON PROXY VOTING POLICIES, PROCEDURES, AND RECORDS |
A description of the policies and procedures used by T. Rowe Price funds and portfolios to determine how to vote proxies relating to portfolio securities is available in each fund’s Statement of Additional Information, which you may request by calling 1-800-225-5132 or by accessing the SEC’s Web site, www.sec.gov. The description of our proxy voting policies and procedures is also available on our Web site, www.troweprice.com. To access it, click on the words “Company Info” at the top of our homepage for individual investors. Then, in the window that appears, click on the “Proxy Voting Policy” navigation button in the top left corner.
Each fund’s most recent annual proxy voting record is available on our Web site and through the SEC’s Web site. To access it through our Web site, follow the directions above, then click on the words “Proxy Voting Record” at the bottom of the Proxy Voting Policy page.
| HOW TO OBTAIN QUARTERLY PORTFOLIO HOLDINGS |
The fund files a complete schedule of portfolio holdings with the Securities and Exchange Commission for the first and third quarters of each fiscal year on Form N-Q. The fund’s Form N-Q is available electronically on the SEC’s Web site (www.sec.gov); hard copies may be reviewed and copied at the SEC’s Public Reference Room, 450 Fifth St. N.W., Washington, DC 20549. For more information on the Public Reference Room, call 1-800-SEC-0330.
| ABOUT THE FUND’S DIRECTORS AND OFFICERS |
Your fund is governed by a Board of Directors that meets regularly to review investments, performance, compliance matters, advisory fees, expenses, and other business affairs, and is responsible for protecting the interests of shareholders. The majority of the fund’s directors are independent of T. Rowe Price Associates, Inc. (T. Rowe Price); “inside” directors are officers of T. Rowe Price. The Board of Directors elects the fund’s officers, who are listed in the final table. The business address of each director and officer is 100 East Pratt Street, Baltimore, MD 21202. The Statement of Additional Information includes additional information about the fund directors and is available without charge by calling a T. Rowe Price representative at 1-800-225-5132.
| Independent Directors | |
| |
| Name | |
| (Year of Birth) | |
| Year Elected * | |
| [Number of T. Rowe Price | Principal Occupation(s) During Past 5 Years and Directorships of |
| Portfolios Overseen] | Other Public Companies |
| |
| Jeremiah E. Casey ** | Director, National Life Insurance (2001 to 8/05); Director, The Rouse |
| (1940) | Company, real estate developers (1990 to 2004) |
| 2005 | |
| [59] | |
| |
| Anthony W. Deering | Chairman, Exeter Capital, LLC, a private investment firm (2004 to pres- |
| (1945) | ent); Director, Chairman of the Board, and Chief Executive Officer, The |
| 2001 | Rouse Company, real estate developers (1997 to 2004); Director, |
| [113] | Mercantile Bank (4/03 to present) |
| |
| Donald W. Dick, Jr. | Principal, EuroCapital Advisors, LLC, an acquisition and management |
| (1943) | advisory firm; Chairman, President, and Chief Executive Officer, The |
| 1992 | Haven Group, a custom manufacturer of modular homes (1/04 |
| [113] | to present) |
| |
| David K. Fagin | Chairman and President, Nye Corporation (6/88 to present); Director, |
| (1938) | Canyon Resources Corp. and Golden Star Resources Ltd. (5/00 to |
| 1992 | present) and Pacific Rim Mining Corp. (2/02 to present) |
| [113] | |
| |
| Karen N. Horn | Managing Director and President, Global Private Client Services, Marsh |
| (1943) | Inc. (1999 to 2003); Managing Director and Head of International Private |
| 2003 | Banking, Bankers Trust (1996 to 1999); Director, Eli Lilly and Company |
| [113] | and Georgia Pacific |
| F. Pierce Linaweaver | President, F. Pierce Linaweaver & Associates, Inc., consulting environ- |
| (1934) | mental and civil engineers |
| 2001 | |
| [113] | |
| |
| Theo C. Rodgers *** | President, A&R Development Corporation |
| (1941) | |
| 2005 | |
| [97] | |
| |
| John G. Schreiber | Owner/President, Centaur Capital Partners, Inc., a real estate investment |
| (1946) | company; Partner, Blackstone Real Estate Advisors, L.P.; Director, AMLI |
| 2001 | Residential Properties Trust |
| [113] | |
| * | Each independent director serves until retirement, resignation, or election of a successor. |
| ** | Elected effective October 19, 2005. |
| *** | Elected effective April 1, 2005. |
| Inside Directors | |
| |
| Name | |
| (Year of Birth) | |
| Year Elected * | |
| [Number of T. Rowe Price | Principal Occupation(s) During Past 5 Years and Directorships of |
| Portfolios Overseen] | Other Public Companies |
| |
| James A.C. Kennedy, CFA | Director and Vice President, T. Rowe Price and T. Rowe Price Group, |
| (1953) | Inc.; Director, T. Rowe Price Global Asset Management Limited, |
| 1992 | T. Rowe Price Global Investment Services Limited, and T. Rowe Price |
| [45] | International, Inc. |
| |
| James S. Riepe | Director and Vice President, T. Rowe Price; Vice Chairman of the Board, |
| (1943) | Director, and Vice President, T. Rowe Price Group, Inc.; Chairman of the |
| 1992 | Board and Director, T. Rowe Price Global Asset Management Limited, |
| [113] | T. Rowe Price Global Investment Services Limited, T. Rowe Price |
| | Investment Services, Inc., T. Rowe Price Retirement Plan Services, Inc., |
| | and T. Rowe Price Services, Inc.; Chairman of the Board, Director, |
| | President, and Trust Officer, T. Rowe Price Trust Company; Director, |
| | T. Rowe Price International, Inc.; Chairman of the Board, all funds |
| |
| * Each inside director serves until retirement, resignation, or election of a successor. |
| Officers | |
| |
| Name (Year of Birth) | |
| Title and Fund(s) Served | Principal Occupation(s) |
| |
| P. Robert Bartolo, CPA (1972) | Vice President, T. Rowe Price and T. Rowe Price |
| Vice President, Mid-Cap Growth Fund | Group, Inc.; formerly intern, T. Rowe Price |
| | (to 2001) |
| |
| R. Scott Berg (1972) | Vice President, T. Rowe Price and T. Rowe Price |
| Vice President, Mid-Cap Growth Fund | Group, Inc.; formerly student, Stanford Graduate |
| | School of Business (to 2002); intern, T. Rowe |
| | Price (to 2001) |
| |
| Brian W.H. Berghuis, CFA (1958) | Vice President, T. Rowe Price and T. Rowe Price |
| President, Mid-Cap Growth Fund | Group, Inc. |
| |
| Joseph A. Carrier, CPA (1960) | Vice President, T. Rowe Price, T. Rowe Price |
| Treasurer, Mid-Cap Growth Fund | Group, Inc., T. Rowe Price Investment Services, |
| | Inc., and T. Rowe Price Trust Company |
| |
| Anna M. Dopkin, CFA (1967) | Vice President, T. Rowe Price and T. Rowe Price |
| Vice President, Mid-Cap Growth Fund | Group, Inc. |
| |
| Henry M. Ellenbogen (1971) | Vice President, T. Rowe Price and T. Rowe Price |
| Vice President, Mid-Cap Growth Fund | Group, Inc.; formerly Executive Vice President, |
| | Business Development, HelloAsia (to 2001) |
| |
| Roger L. Fiery III, CPA (1959) | Vice President, T. Rowe Price, T. Rowe Price |
| Vice President, Mid-Cap Growth Fund | Group, Inc., T. Rowe Price International, Inc., |
| | and T. Rowe Price Trust Company |
| |
| John R. Gilner (1961) | Chief Compliance Officer and Vice President, |
| Chief Compliance Officer, Mid-Cap Growth Fund | T. Rowe Price; Vice President, T. Rowe Price |
| | Group, Inc., and T. Rowe Price Investment |
| | Services, Inc. |
| |
| Gregory S. Golczewski (1966) | Vice President, T. Rowe Price and T. Rowe Price |
| Vice President, Mid-Cap Growth Fund | Trust Company |
| |
| Henry H. Hopkins (1942) | Director and Vice President, T. Rowe Price |
| Vice President, Mid-Cap Growth Fund | Investment Services, Inc., T. Rowe Price Services, |
| | Inc., and T. Rowe Price Trust Company; Vice |
| | President, T. Rowe Price, T. Rowe Price Group, |
| | Inc., T. Rowe Price International, Inc., and T. Rowe |
| | Price Retirement Plan Services, Inc. |
| |
| Kris H. Jenner, M.D., D. Phil. (1962) | Vice President, T. Rowe Price and T. Rowe Price |
| Vice President, Mid-Cap Growth Fund | Group, Inc. |
| Patricia B. Lippert (1953) | Assistant Vice President, T. Rowe Price and |
| Secretary, Mid-Cap Growth Fund | T. Rowe Price Investment Services, Inc. |
| |
| Robert J. Marcotte (1962) | Vice President, T. Rowe Price and T. Rowe Price |
| Vice President, Mid-Cap Growth Fund | Group, Inc. |
| |
| Joseph M. Milano, CFA (1972) | Vice President, T. Rowe Price and T. Rowe Price |
| Vice President, Mid-Cap Growth Fund | Group, Inc. |
| |
| Jeffrey Rottinghaus, CPA (1970) | Vice President, T. Rowe Price and T. Rowe Price |
| Vice President, Mid-Cap Growth Fund | Group, Inc.; formerly student, the Wharton |
| | School, University of Pennsylvania (to 2001) |
| |
| John F. Wakeman (1962) | Vice President, T. Rowe Price and T. Rowe Price |
| Executive Vice President, Mid-Cap Growth Fund | Group, Inc. |
| |
| Julie L. Waples (1970) | Vice President, T. Rowe Price |
| Vice President, Mid-Cap Growth Fund | |
| |
| Unless otherwise noted, officers have been employees of T. Rowe Price or T. Rowe Price International for at |
| least five years. | |
Item 2. Code of Ethics.The registrant has adopted a code of ethics, as defined in Item 2 of Form N-CSR, applicable to its principal executive officer, principal financial officer, principal accounting officer or controller, or persons performing similar functions. A copy of this code of ethics is filed as an exhibit to this Form N-CSR. No substantive amendments were approved or waivers were granted to this code of ethics during the period covered by this report.
Item 3. Audit Committee Financial Expert.
The registrant’s Board of Directors/Trustees has determined that Mr. Donald W. Dick Jr. qualifies as an audit committee financial expert, as defined in Item 3 of Form N-CSR. Mr. Dick is considered independent for purposes of Item 3 of Form N-CSR.
Item 4. Principal Accountant Fees and Services.
(a) – (d) Aggregate fees billed to the registrant for the last two fiscal years for professional services rendered by the registrant’s principal accountant were as follows:
| | 2005 | 2004 |
| Audit Fees | $29,371 | $26,406 |
| Audit-Related Fees | 1,889 | 3,602 |
| Tax Fees | 8,343 | 7,161 |
| All Other Fees | 393 | - |
Audit fees include amounts related to the audit of the registrant’s annual financial statements and services normally provided by the accountant in connection with statutory and regulatory filings. Audit-related fees include amounts reasonably related to the performance of the audit of the registrant’s financial statements and specifically include the issuance of a report on internal controls. Tax fees include amounts related to services for tax compliance, tax planning, and tax advice. The nature of these services specifically includes the review of distribution calculations and the preparation of Federal, state, and excise tax returns. All other fees include the registrant’s pro-rata share of amounts for agreed-upon procedures in conjunction with service contract approvals by the registrant’s Board of Directors/Trustees.
(e)(1) The registrant’s audit committee has adopted a policy whereby audit and non-audit services performed by the registrant’s principal accountant for the registrant, its investment adviser, and any entity controlling, controlled by, or under common control with the investment adviser that provides ongoing services to the registrant require pre-approval in advance at regularly scheduled audit committee meetings. If such a service is required between regularly scheduled audit committee meetings, pre-approval may be authorized by one audit committee member with ratification at the next scheduled audit committee meeting. Waiver of pre-approval for audit or non-audit services requiring fees of a de minimis amount is not permitted.
(2) No services included in (b) – (d) above were approved pursuant to paragraph (c)(7)(i)(C) of Rule 2-01 of Regulation S-X.
(f) Less than 50 percent of the hours expended on the principal accountant’s engagement to audit the registrant’s financial statements for the most recent fiscal year were attributed to work performed by persons other than the principal accountant’s full-time, permanent employees.
(g) The aggregate fees billed for the most recent fiscal year and the preceding fiscal year by the registrant’s principal accountant for non-audit services rendered to the registrant, its investment adviser, and any entity controlling, controlled by, or under common control with the investment adviser that provides ongoing services to the registrant were $1,008,000 and $903,000, respectively, and were less than the aggregate fees billed for those same periods by the registrant’s principal accountant for audit services rendered to the T. Rowe Price Funds.
(h) All non-audit services rendered in (g) above were pre-approved by the registrant’s audit committee. Accordingly, these services were considered by the registrant’s audit committee in maintaining the principal accountant’s independence.Item 5. Audit Committee of Listed Registrants.
Not applicable.
Item 6. Schedule of Investments.
Not applicable. The complete schedule of investments is included in Item 1 of this Form N-CSR.
Item 7. Disclosure of Proxy Voting Policies and Procedures for Closed-End Management Investment Companies.
Not applicable.
Item 8. Portfolio Managers of Closed-End Management Investment Companies.
Not applicable.
Item 9. Purchases of Equity Securities by Closed-End Management Investment Company and Affiliated Purchasers.
Not applicable.
Item 10. Submission of Matters to a Vote of Security Holders.
Not applicable.
Item 11. Controls and Procedures.
(a) The registrant’s principal executive officer and principal financial officer have evaluated the registrant’s disclosure controls and procedures within 90 days of this filing and have concluded that the registrant’s disclosure controls and procedures were effective, as of that date, in ensuring that information required to be disclosed by the registrant in this Form N-CSR was recorded, processed, summarized, and reported timely.
(b) The registrant’s principal executive officer and principal financial officer are aware of no change in the registrant’s internal control over financial reporting that occurred during the registrant’s second fiscal quarter covered by this report that has materially affected, or is reasonably likely to materially affect, the registrant’s internal control over financial reporting.
Item 12. Exhibits.
(a)(1) The registrant’s code of ethics pursuant to Item 2 of Form N-CSR is attached.
(2) Separate certifications by the registrant's principal executive officer and principal financial officer, pursuant to Section 302 of the Sarbanes-Oxley Act of 2002 and required by Rule 30a-2(a) under the Investment Company Act of 1940, are attached.
(3) Written solicitation to repurchase securities issued by closed-end companies: not applicable.
(b) A certification by the registrant's principal executive officer and principal financial officer, pursuant to Section 906 of the Sarbanes-Oxley Act of 2002 and required by Rule 30a-2(b) under the Investment Company Act of 1940, is attached.
SIGNATURES |
| |
| |
| | Pursuant to the requirements of the Securities Exchange Act of 1934 and the Investment |
| Company Act of 1940, the registrant has duly caused this report to be signed on its behalf by the |
| undersigned, thereunto duly authorized. |
| |
| T. Rowe Price Mid-Cap Growth Fund, Inc. |
| |
| |
| By | /s/ James S. Riepe |
| | James S. Riepe |
| | Principal Executive Officer |
| |
| Date | February 21, 2006 |
| |
| |
| | Pursuant to the requirements of the Securities Exchange Act of 1934 and the Investment |
| Company Act of 1940, this report has been signed below by the following persons on behalf of |
| the registrant and in the capacities and on the dates indicated. |
| |
| |
| By | /s/ James S. Riepe |
| | James S. Riepe |
| | Principal Executive Officer |
| |
| Date | February 21, 2006 |
| |
| |
| |
| By | /s/ Joseph A. Carrier |
| | Joseph A. Carrier |
| | Principal Financial Officer |
| |
| Date | February 21, 2006 |