| UNITED STATES |
| SECURITIES AND EXCHANGE COMMISSION |
| Washington, D.C. 20549 |
| |
FORM N-CSR |
| |
CERTIFIED SHAREHOLDER REPORT OF REGISTERED |
MANAGEMENT INVESTMENT COMPANIES |
| |
| |
| |
| Investment Company Act File Number: 811-6665 |
|
| |
| T. Rowe Price Mid-Cap Growth Fund, Inc. |
|
| (Exact name of registrant as specified in charter) |
| |
| 100 East Pratt Street, Baltimore, MD 21202 |
|
| (Address of principal executive offices) |
| |
| David Oestreicher |
| 100 East Pratt Street, Baltimore, MD 21202 |
|
| (Name and address of agent for service) |
| |
| |
| Registrant’s telephone number, including area code: (410) 345-2000 |
| |
| |
| Date of fiscal year end: December 31 |
| |
| |
| Date of reporting period: June 30, 2009 |
Item 1: Report to Shareholders| Mid-Cap Growth Fund | June 30, 2009 |

The views and opinions in this report were current as of June 30, 2009. They are not guarantees of performance or investment results and should not be taken as investment advice. Investment decisions reflect a variety of factors, and the managers reserve the right to change their views about individual stocks, sectors, and the markets at any time. As a result, the views expressed should not be relied upon as a forecast of the fund’s future investment intent. The report is certified under the Sarbanes-Oxley Act, which requires mutual funds and other public companies to affirm that, to the best of their knowledge, the information in their financial reports is fairly and accurately stated in all material respects.
REPORTS ON THE WEB
Sign up for our E-mail Program, and you can begin to receive updated fund reports and prospectuses online rather than through the mail. Log in to your account at troweprice.com for more information.
Manager’s Letter
Fellow Shareholders
In our last report, we noted that the final six months of 2008 had been one of the most momentous periods in modern financial and economic history. The extraordinary volatility continued into the first half of 2009. The year began with a nauseating 26% plunge in the broad U.S. market by early March, followed by one of the most powerful rallies in history. Mid-cap growth stocks were especially good performers, outperforming all other U.S. style categories in the first half of the year. While we are pleased to report the fund recorded a healthy gain in this environment, we are well aware of the long road ahead to recover fully from last year’s significant losses.
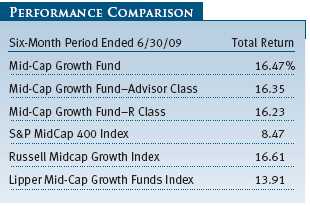
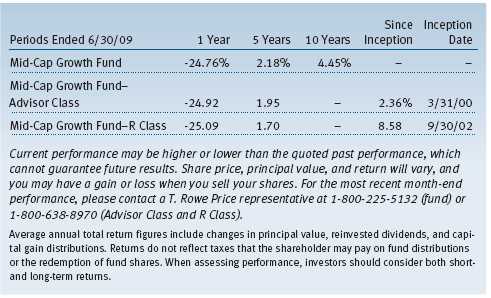
The Mid-Cap Growth Fund finished the six months up 16.47%, a whopping 39.43% above its March 9 low. (Returns for Advisor and R Class shares varied due to their different fee structure. Current performance may be higher or lower than the quoted past performance, which cannot guarantee future results. Share price, principal value, and return will vary, and you may have a gain or loss when you sell your shares. Total return figures include changes in principal value, reinvested dividends, and capital gain distributions.) The fund’s emphasis on growth stocks helped it handily outpace the S&P MidCap 400 Index while the fund performed roughly in line with its growth benchmarks over the period. The fund remained favorably ranked relative to its competitors over all time periods. (Based on cumulative total return, Lipper ranked the Mid-Cap Growth Fund 89 out of 522, 73 out of 457, 30 out of 376, and 23 out of 179 funds in the mid-cap growth funds category for the 1-, 3-, 5-, and 10-year periods ended June 30, 2009, respectively. Results will vary for other time periods. Past performance cannot guarantee future results.)
MARKET ENVIRONMENT
The U.S. economy continued to contract at a shocking pace in the first half of the year, although current evidence suggests the decline moderated significantly as the period ended. Gross domestic product fell at an annualized pace of more than 5% in the first quarter of 2009 and fourth quarter of 2008—the largest half-year drop in economic activity in several decades. Industrial production imploded, most prominently in the auto sector, leaving capacity utilization rates at their lowest levels on record. As businesses closed or scaled back, the unemployment rate shot higher, from 7.2% in December to 9.5% in June, and most experts anticipated that it would continue to rise. Most Americans saw their wealth erode due to a continued sharp decline in housing prices.
We have described previously that we view the “Great Recession,” as some have aptly described it, primarily in terms of a massive and epochal private sector deleveraging. Over the past several years, businesses outside the financials sector have taken necessary steps to reduce debt levels. Beginning in late 2007, financial firms were forced to follow suit—although in a chaotic manner that resembled a 19th century financial panic. The upheaval in the financial system in the fall of 2008 was a result of banks, insurers, hedge funds, and others rushing to disgorge debt from their balance sheets, leading to seized markets and dramatically reduced asset prices. As the deep recession has worn on, once-indomitable American consumers have been forced to deleverage as well, paying down debt and increasing their savings. Indeed, the personal savings rate has risen from almost zero to roughly 7%—a figure that may well grow if the rate were to return to the more sustainable levels of the 1970s and 1980s. In some cases, businesses and individuals are deleveraging voluntarily and out of caution; in others, the process is unfolding through default and bankruptcy.
Deleveraging in the private sector has been accompanied by growing public sector leverage—a process that carries both short-term benefits and long-term perils. Massive monetary and fiscal stimulus appears to have brought the economy back from the brink of disaster. The financial plumbing that is crucial to the global economy seems to be functioning better, thanks to a New Deal-like alphabet soup of government programs (TARP, TALF, TGLP, to stick just to the “Ts”). The $787 billion stimulus package passed in mid-February has just begun to work its way through the system and promises to have a larger effect on growth later this year and next. As leverage shifts from the private to the public sector, so is the focus of growth in the economy. We will discuss the implications of this shift, as well as the dangers posed by growing government debt, in the Investment Strategy and Outlook section on page 6.
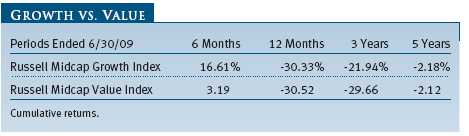
One measure of the epochal nature of the shifts taking place in the economy has been the uniformity of asset price declines in the last year, as well as their partial recovery this spring. The recent rally has been notably broad-based, as investors have discarded their worst-case scenarios for the global economy, but weaker companies have rebounded most as concerns about their viability have diminished. Still, growth stocks handily outperformed value-oriented shares in the past six months. In fact, mid-cap growth stocks, significant laggards in the last half of 2008, outpaced all other style categories, large and small.
PORTFOLIO REVIEW
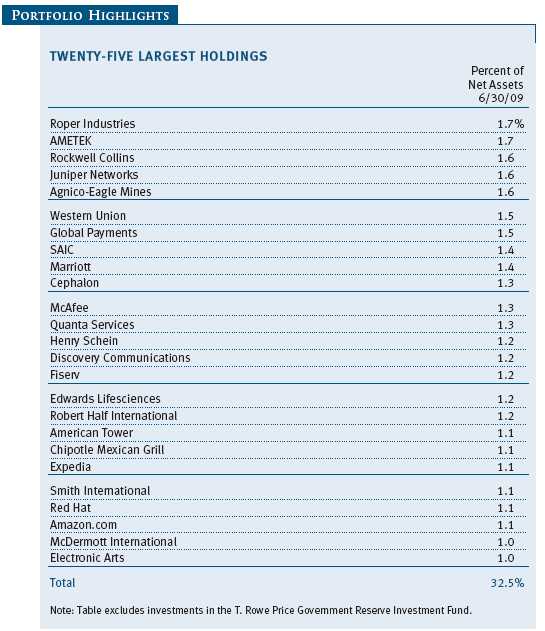
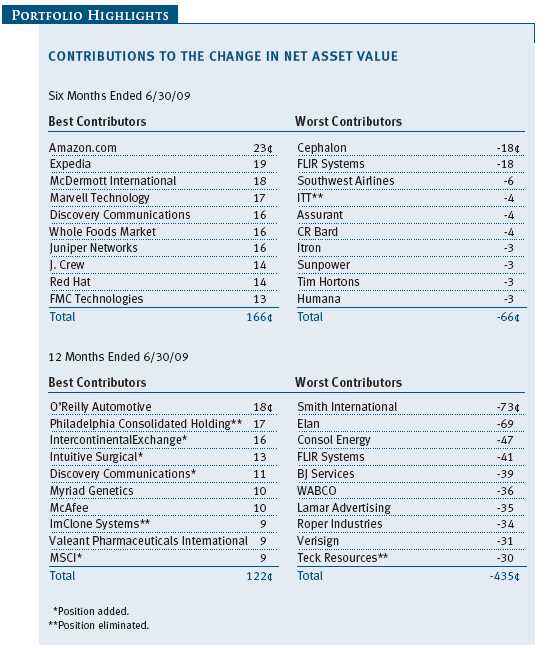
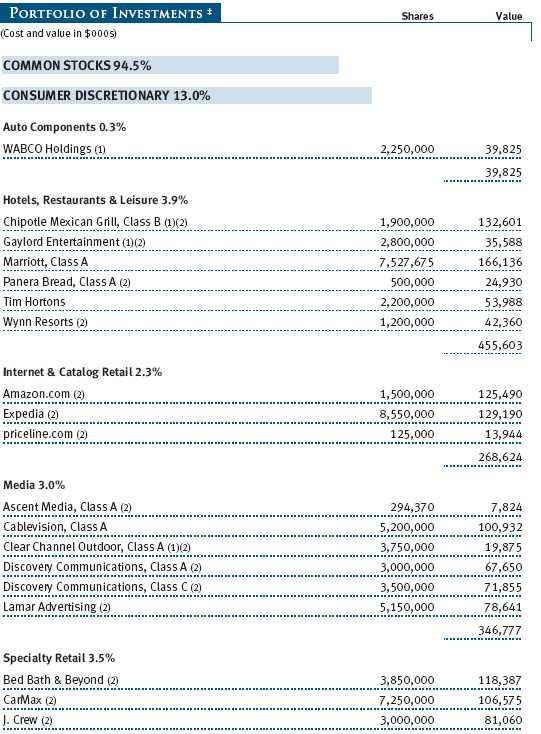
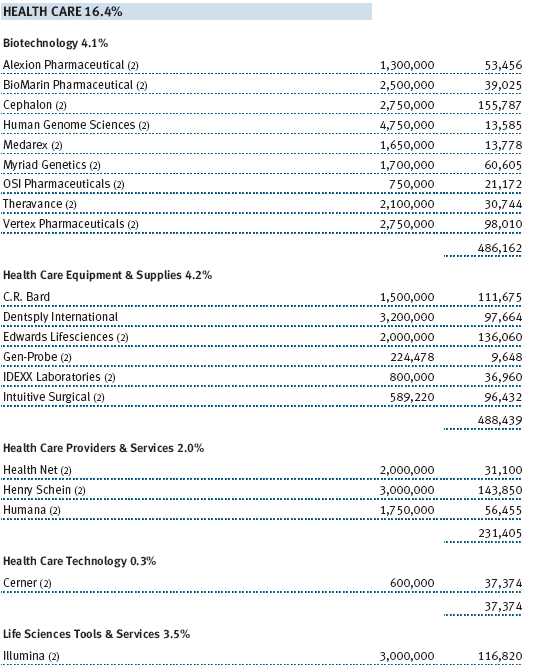
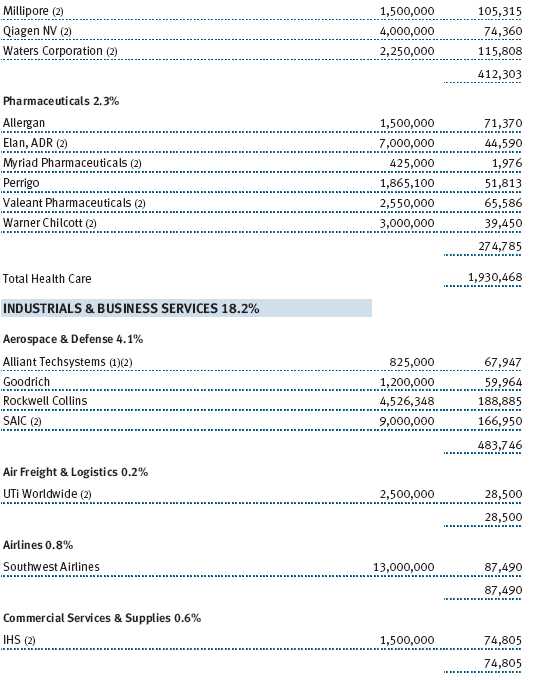
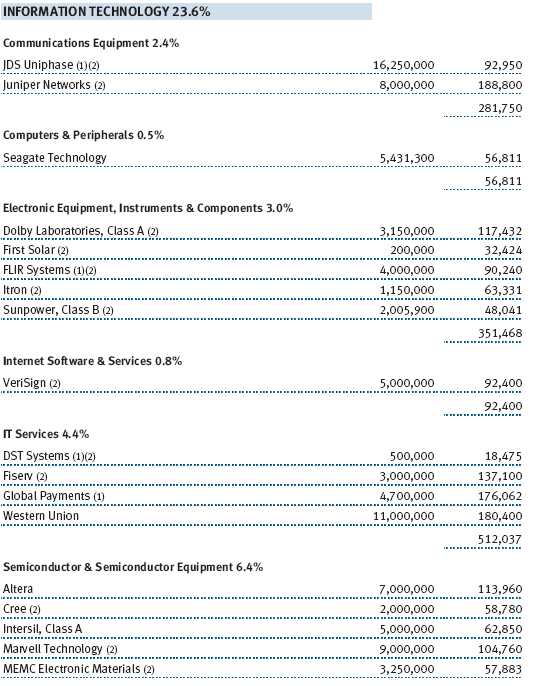
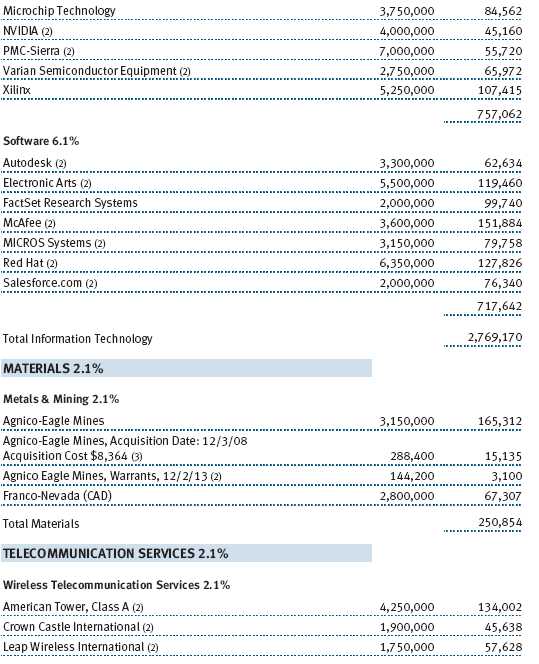
Reflecting the market’s broad-based advance, every sector within the fund gained in the period. Our substantial position in information technology stocks led returns. We still find tech attractive, and it is the largest single segment in the portfolio. For all of our economy’s recent challenges, American technology firms remain worldwide leaders in innovation; unique products and services can still be parlayed into significant enterprises faster and more profitably here than in any other industry. Indeed, technology firms, whose ranks have been trimmed since the bubble years of the late 1990s, are less capital-intensive, more cash-generative, and have stronger balance sheets than companies in most other sectors. The sector has matured in the last decade and is far more attractive: Managements are savvier financially, corporate governance is better, and valuations are reasonable. Standout first-half performers in the fund included semiconductor maker Marvell Technology, software firm Red Hat, and communications equipment manufacturer Juniper Networks. (Please refer to the fund’s portfolio of investments for a complete listing of our holdings and the amount each represents in the portfolio.)
We have a more guarded outlook on the consumer sector, but our results in this area were also strong. Anyone who has visited a mall recently knows that retailers are laboring to lure back newly cautious customers. We suspect this is a struggle that is only beginning. Still, some firms have figured out how to survive, and even thrive, in this changed environment. Amazon.com, a longtime holding, was our top contributor during the period. The company continues to capture market share with its unique mix of technological savvy and customer service, and products such as the Kindle e-book reader are driving additional growth. Online auto dealer CarMax is using its data-driven merchandising to take market share in the used auto business, a market overdue for rationalization. Internet travel company Expedia has benefited from its decision to reduce fees on air travel bookings. Finally, J. Crew bounced back during the period, in part due to favorable publicity flowing from the first lady’s preference for its clothing.
Many of our other top performers in the fund bounced off multiyear lows during the period. This was especially true of McDermott International, an engineering and construction firm serving the energy and power industries. The stock plunged almost 90% from its highs in 2008; though we initiated our position in the company too early in the stock’s descent, we kept buying as it fell to deeply oversold levels and have benefited from its rebound in 2009. The company stands to gain from the massive investment needed to build out the nation’s power infrastructure, in part to incorporate renewable supplies. Furthermore, we believe nuclear power will play a meaningful long-term role in U.S. power generation, and McDermott is well positioned to participate in this area. Another top performer, electronics manufacturer AMETEK, also rebounded from deeply oversold conditions. The company’s strong management team has proven particularly adept at acquiring businesses.
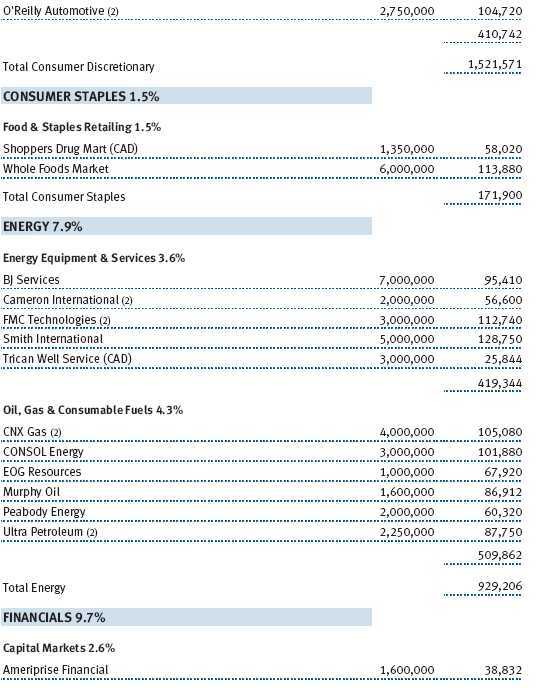
The largest detractors to the fund declined after relatively strong contributions last year. Two holdings, SAIC, a provider of engineering services and technology products, and FLIR Systems, a maker of thermal imaging devices heavily used in Iraq and Afghanistan, fell as investors worried that these beneficiaries of defense spending might grow more slowly under the Obama administration. Some of our major energy holdings were also weak as natural gas prices remained low and oil prices recouped only a small portion of last year’s record climb. CNX Gas was a notable detractor.
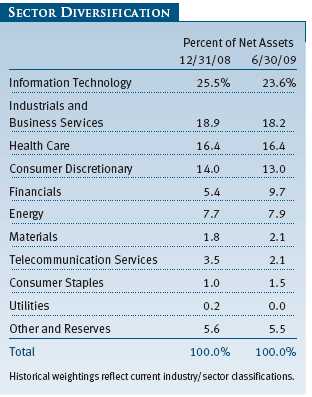
The fund’s financial holdings deserve mention. We had a range of results in the sector, experiencing good performance from services firms, such as IntercontinentalExchange, and poor performance from several insurance holdings, such as Assurant. More notably, however, we made our first investments in commercial banks in a number of years, adding several to the portfolio. We have been leery of lax lending standards for a number of years and have generally avoided credit risk in this portfolio. However, we believe that we are near the bottom of the credit cycle, plus or minus a couple of quarters, and that this is an appropriate time to nibble on the stocks; potential rewards could be outsized, if we are right.
Interestingly, banks are getting back in to the real business of banking—borrowing cheaply from depositors and lending at higher rates to borrowers. One implication of deleveraging has been the collapse of the so-called “shadow banking system,” which allowed borrowers to bypass traditional banks and access credit through securitization. Now that many companies and individuals must turn again to banks for loans, we expect that banks will enjoy higher margins on their lending. Still, we should note that the future shape of the banking system is highly uncertain, and we have made only small investments to date, using a basket approach to diversify our risk.
INVESTMENT STRATEGY AND OUTLOOK
How will the economy recover, and where will the millions of Americans who have lost their jobs find work? While we do not presume to have unique insights into these questions, we note that they have always been asked in times of deep economic distress—and they have always found answers. As historian William Leuchtenburg noted, the Great Depression of the 1930s led many to assume they were witnessing the end of economic growth and the final closing of the American frontier. A popular belief arose that the American population would soon level off or even decline (instead of more than doubling). Thankfully, our problems today are not as profound, but the doomsaying from many quarters is every bit as clamorous.
We are confident that we are not witnessing the end of capitalism, but rather one of the seismic shifts that have characterized our nation’s economic history. In this sense, we do not expect the economy to return to “normal,” if that is defined as the set of growth drivers that were in place several years ago. Instead, we are transitioning from an era that began roughly 30 years ago with the Reagan revolution of the 1980s. The role of government was reduced, trade barriers fell, and markets were deregulated, leading to a golden era for business and capital. Innovation in both industry and finance flourished, and household debt levels began a 30-year climb. For better or worse, this was the golden age of American consumerism. It’s notable that these trends occurred during both Democratic and Republican administrations (indeed, some argue that Jimmy Carter kicked off the deregulation wave with the airlines in 1978).
Over the past decade, however, there have been signs this economic paradigm was fraying. To some extent, growth in recent years has been predicated on “bubble economics”—first in technology stocks and later in housing. Like many systems in decline, the final years have been punctuated by repeated financial scandals, which seemed to grow increasingly tawdry. Economic inequality has reached extremes reminiscent of past gilded ages; and even amid growing affluence, Americans were not able to finance the country’s growing public and private sector debt, which reached historic proportions. Instead, we turned to China, which became a key enabler of the system by buying our debt and allowing Americans to borrow consumption from the future. Inevitably, the bills came due. Last year’s financial collapse is often mistakenly portrayed as a fiasco that might have been avoided, if only for less greedy bankers or less inept regulators. Rather, we suspect that historians will look back on the collapse as the final and inevitable breakdown of a set of contradictions that had become unsustainable.
As a nation, we are in the process of reconstructing our economy and financial system. Where this leads is hard to say, but we can begin to discern its outlines. Generally, it will be characterized by a greater role of government relative to the private sector. Regulation will increase as Americans demand a greater range of safeguards in financial markets, antitrust enforcement, product safety, and many other facets of our society. Finance, especially as it has been practiced in New York and London, will not drive the world economy, and globalization itself may take a back seat to domestic markets. With increased regulation, tighter controls on capital, and consumers constrained by the need to rebuild savings, the economy is likely to be more stable than in the boom years of the late 1980s and 1990s but grow more slowly.
We share the concerns many have expressed about this emerging structure. In particular, government regulation will probably overreach, as it has in the past, and the massive government deficit is worrisome. Congress has rarely demonstrated the resolve to reduce the deficit through either tax increases or spending cuts unless crisis threatens, and we have little faith that it will have the discipline to do so this time. We have somewhat more faith that the Federal Reserve, under Chairman Bernanke, will be able to withdraw the massive monetary stimulus that it has injected into the system. Inflation is a real risk in the intermediate term, but we are probably safe in deferring that discussion until future letters.
As investors, of course, our job is to focus on how the private sector will adapt to this new environment. Firms such as SAIC and FLIR, with a history of government contracting, should do well. Also attractive are companies serving markets that the government is attempting to foster. In past reports, we have described our first steps into the alternative energy field. We are continuing to focus on alternative energy generators, such as First Solar and Sunpower; distributors, such as Quanta Services; and device makers, such as Cree.
Finally, we are mindful that economic tumult can lead to the collapse of old industry structures and allow for the growth of new ones, with new firms on top. We have noted that this may be happening in the financial system, and we are looking for similar opportunities in other sectors as well. We look forward to reporting to you on our progress in this search in six months.
Respectfully submitted,

Brian W.H. Berghuis
President of the fund and chairman of its Investment Advisory Committee

John F. Wakeman
Executive vice president of the fund
July 20, 2009
The committee chairman has day-to-day responsibility for managing the portfolio and works with committee members in developing and executing the fund’s investment program.
RISKS OF STOCK INVESTING
As with all stock and bond mutual funds, the fund’s share price can fall because of weakness in the stock or bond markets, a particular industry, or specific holdings. The financial markets can decline for many reasons, including adverse political or economic developments, changes in investor psychology, or heavy institutional selling. The prospects for an industry or company may deteriorate because of a variety of factors, including disappointing earnings or changes in the competitive environment. In addition, the investment manager’s assessment of companies held in a fund may prove incorrect, resulting in losses or poor performance even in rising markets. The stocks of mid-cap companies entail greater risk and are usually more volatile than the shares of larger companies. In addition, growth stocks can be volatile for several reasons. Since they usually reinvest a high proportion of earnings in their own businesses, they may lack the dividends usually associated with value stocks that can cushion their decline in a falling market. Also, since investors buy these stocks because of their expected superior earnings growth, earnings disappointments often result in sharp price declines.
GLOSSARY
Lipper indexes: Fund benchmarks that consist of a small number of the largest mutual funds in a particular category as tracked by Lipper Inc.
Russell Midcap Growth Index: An unmanaged index that measures the performance of those Russell Midcap companies with higher price-to-book ratios and higher forecasted growth values.
Russell Midcap Value Index: An unmanaged index that measures the performance of those Russell Midcap companies with lower price-to-book ratios and lower forecasted growth values.
S&P MidCap 400 Index: An unmanaged index that tracks the stocks of 400 U.S. mid-cap companies.
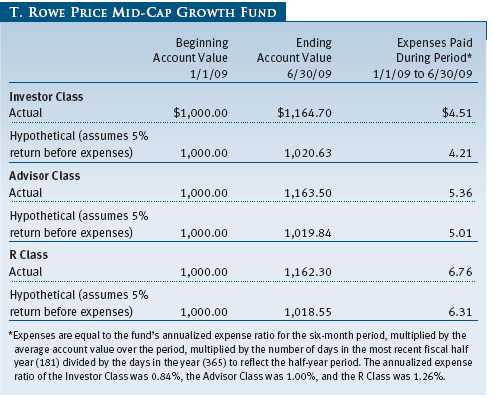
Performance and Expenses
This chart shows the value of a hypothetical $10,000 investment in the fund over the past 10 fiscal year periods or since inception (for funds lacking 10-year records). The result is compared with benchmarks, which may include a broad-based market index and a peer group average or index. Market indexes do not include expenses, which are deducted from fund returns as well as mutual fund averages and indexes.

| AVERAGE ANNUAL COMPOUND TOTAL RETURN |
This table shows how the fund would have performed each year if its actual (or cumulative) returns had been earned at a constant rate.
As a mutual fund shareholder, you may incur two types of costs: (1) transaction costs, such as redemption fees or sales loads, and (2) ongoing costs, including management fees, distribution and service (12b-1) fees, and other fund expenses. The following example is intended to help you understand your ongoing costs (in dollars) of investing in the fund and to compare these costs with the ongoing costs of investing in other mutual funds. The example is based on an investment of $1,000 invested at the beginning of the most recent six-month period and held for the entire period.
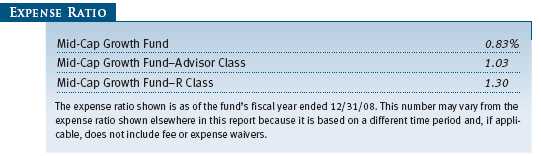
Please note that the fund has three share classes: The original share class (“investor class”) charges no distribution and service (12b-1) fee; Advisor Class shares are offered only through unaffiliated brokers and other financial intermediaries and charge a 0.25% 12b-1 fee; and R Class shares are available to retirement plans serviced by intermediaries and charge a 0.50% 12b-1 fee. Each share class is presented separately in the table.
Actual Expenses
The first line of the following table (“Actual”) provides information about actual account values and expenses based on the fund’s actual returns. You may use the information in this line, together with your account balance, to estimate the expenses that you paid over the period. Simply divide your account value by $1,000 (for example, an $8,600 account value divided by $1,000 = 8.6), then multiply the result by the number in the first line under the heading “Expenses Paid During Period” to estimate the expenses you paid on your account during this period.
Hypothetical Example for Comparison Purposes
The information on the second line of the table (“Hypothetical”) is based on hypothetical account values and expenses derived from the fund’s actual expense ratio and an assumed 5% per year rate of return before expenses (not the fund’s actual return). You may compare the ongoing costs of investing in the fund with other funds by contrasting this 5% hypothetical example and the 5% hypothetical examples that appear in the shareholder reports of the other funds. The hypothetical account values and expenses may not be used to estimate the actual ending account balance or expenses you paid for the period.
Note: T. Rowe Price charges an annual small-account maintenance fee of $10, generally for accounts with less than $2,000 ($500 for UGMA/UTMA). The fee is waived for any investor whose T. Rowe Price mutual fund accounts total $25,000 or more, accounts employing automatic investing, and IRAs and other retirement plan accounts that utilize a prototype plan sponsored by T. Rowe Price (although a separate custodial or administrative fee may apply to such accounts). This fee is not included in the accompanying table. If you are subject to the fee, keep it in mind when you are estimating the ongoing expenses of investing in the fund and when comparing the expenses of this fund with other funds.
You should also be aware that the expenses shown in the table highlight only your ongoing costs and do not reflect any transaction costs, such as redemption fees or sales loads. Therefore, the second line of the table is useful in comparing ongoing costs only and will not help you determine the relative total costs of owning different funds. To the extent a fund charges transaction costs, however, the total cost of owning that fund is higher.
Unaudited

The accompanying notes are an integral part of these financial statements.
Unaudited

The accompanying notes are an integral part of these financial statements.
Unaudited
The accompanying notes are an integral part of these financial statements.
Unaudited


The accompanying notes are an integral part of these financial statements.
Unaudited
The accompanying notes are an integral part of these financial statements.
Unaudited
The accompanying notes are an integral part of these financial statements.
Unaudited
The accompanying notes are an integral part of these financial statements.
Unaudited
| NOTES TO FINANCIAL STATEMENTS |
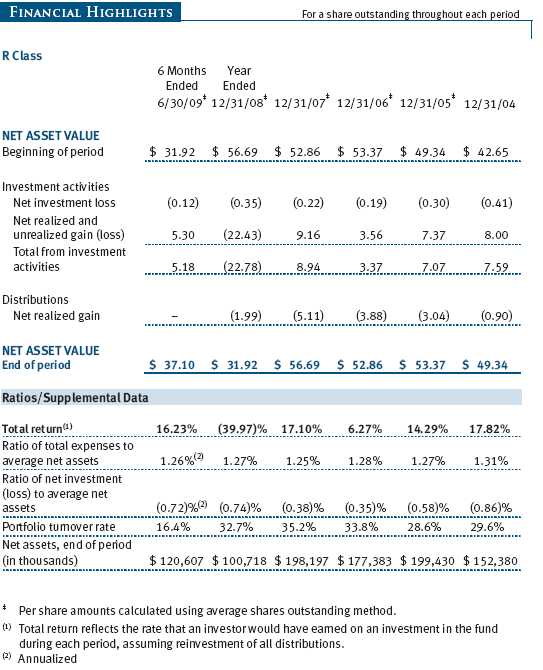
T. Rowe Price Mid-Cap Growth Fund, Inc. (the fund), is registered under the Investment Company Act of 1940 (the 1940 Act) as a diversified, open-end management investment company. The fund seeks to provide long-term capital appreciation by investing in mid-cap stocks with potential for above-average earnings growth. The fund has three classes of shares: the Mid-Cap Growth Fund original share class, referred to in this report as the Investor Class, offered since June 30, 1992; the Mid-Cap Growth Fund—Advisor Class (Advisor Class), offered since March 31, 2000; and the Mid-Cap Growth Fund—R Class (R Class), offered since September 30, 2002. Advisor Class shares are sold only through unaffiliated brokers and other unaffiliated financial intermediaries, and R Class shares are available to retirement plans serviced by intermediaries. The Advisor Class and R Class each operate under separate Board-approved Rule 12b-1 plans, pursuant to which each class compensates financial intermediaries for distribution, shareholder servicing, and/or certain administrative services. Each class has exclusive voting rights on matters related solely to that class, separate voting rights on matters that relate to all classes, and, in all other respects, the same rights and obligations as the other classes.
NOTE 1 - SIGNIFICANT ACCOUNTING POLICIES
Basis of Preparation The accompanying financial statements were prepared in accordance with accounting principles generally accepted in the United States of America, which require the use of estimates made by fund management. Fund management believes that estimates and security valuations are appropriate; however, actual results may differ from those estimates, and the security valuations reflected in the financial statements may differ from the value the fund ultimately realizes upon sale of the securities. Further, fund management believes no events have occurred between June 30, 2009 and August 20, 2009, the date of issuance of the financial statements, that require adjustment of, or disclosure in, the accompanying financial statements.
Investment Transactions, Investment Income, and Distributions Income and expenses are recorded on the accrual basis. Dividends received from mutual fund investments are reflected as dividend income; capital gain distributions are reflected as realized gain/loss. Dividend income and capital gain distributions are recorded on the ex-dividend date. Income tax-related interest and penalties, if incurred, would be recorded as income tax expense. Investment transactions are accounted for on the trade date. Realized gains and losses are reported on the identified cost basis. Distributions to shareholders are recorded on the ex-dividend date. Income distributions are declared and paid by each class on an annual basis. Capital gain distributions, if any, are declared and paid by the fund, typically on an annual basis.
Currency Translation Assets, including investments, and liabilities denominated in foreign currencies are translated into U.S. dollar values each day at the prevailing exchange rate, using the mean of the bid and asked prices of such currencies against U.S. dollars as quoted by a major bank. Purchases and sales of securities, income, and expenses are translated into U.S. dollars at the prevailing exchange rate on the date of the transaction. The effect of changes in foreign currency exchange rates on realized and unrealized security gains and losses is reflected as a component of security gains and losses.
Class Accounting The Advisor Class and R Class each pay distribution, shareholder servicing, and/or certain administrative expenses in the form of Rule 12b-1 fees, in an amount not exceeding 0.25% and 0.50%, respectively, of the class’s average daily net assets. Shareholder servicing, prospectus, and shareholder report expenses incurred by each class are charged directly to the class to which they relate. Expenses common to all classes, investment income, and realized and unrealized gains and losses are allocated to the classes based upon the relative daily net assets of each class.
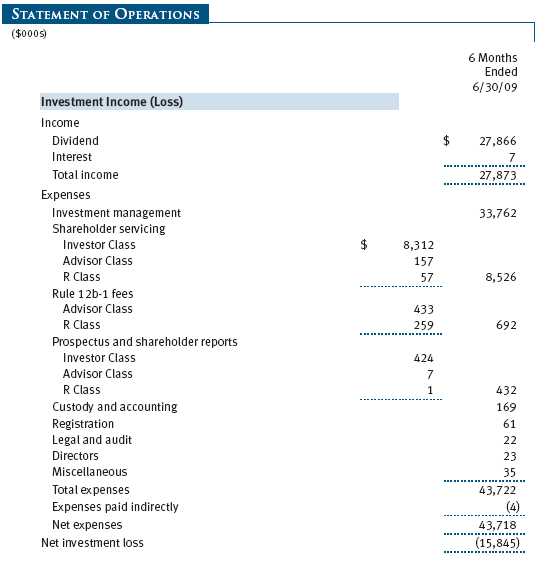
Rebates and Credits Subject to best execution, the fund may direct certain security trades to brokers who have agreed to rebate a portion of the related brokerage commission to the fund in cash. Commission rebates are reflected as realized gain on securities in the accompanying financial statements and totaled $102,000 for the six months ended June 30, 2009. Additionally, the fund earns credits on temporarily uninvested cash balances held at the custodian which reduce the fund’s custody charges. Custody expense in the accompanying financial statements is presented before reduction for credits, which are reflected as expenses paid indirectly.
New Accounting Pronouncement On January 1, 2009, the fund adopted Statement of Financial Accounting Standards No. 161 (FAS 161), Disclosures about Derivative Instruments and Hedging Activities. FAS 161 requires enhanced disclosures about derivative and hedging activities, including how such activities are accounted for and their effect on financial position, performance and cash flows. Adoption of FAS 161 had no impact on the fund’s net assets or results of operations.
NOTE 2 - VALUATION
The fund’s investments are reported at fair value as defined under Statement of Financial Accounting Standards No. 157 (FAS 157), Fair Value Measurements. The fund values its investments and computes its net asset value per share at the close of the New York Stock Exchange (NYSE), normally 4 p.m. ET, each day that the NYSE is open for business.
Valuation Methods Equity securities listed or regularly traded on a securities exchange or in the over-the-counter (OTC) market are valued at the last quoted sale price or, for certain markets, the official closing price at the time the valuations are made, except for OTC Bulletin Board securities, which are valued at the mean of the latest bid and asked prices. A security that is listed or traded on more than one exchange is valued at the quotation on the exchange determined to be the primary market for such security. Listed securities not traded on a particular day are valued at the mean of the latest bid and asked prices for domestic securities and the last quoted sale price for international securities.
Investments in mutual funds are valued at the mutual fund’s closing net asset value per share on the day of valuation.
Other investments, including restricted securities, and those for which the above valuation procedures are inappropriate or are deemed not to reflect fair value are stated at fair value as determined in good faith by the T. Rowe Price Valuation Committee, established by the fund’s Board of Directors.
For valuation purposes, the last quoted prices of non-U.S. equity securities may be adjusted under the circumstances described below. If the fund determines that developments between the close of a foreign market and the close of the NYSE will, in its judgment, materially affect the value of some or all of its portfolio securities, the fund will adjust the previous closing prices to reflect what it believes to be the fair value of the securities as of the close of the NYSE. In deciding whether it is necessary to adjust closing prices to reflect fair value, the fund reviews a variety of factors, including developments in foreign markets, the performance of U.S. securities markets, and the performance of instruments trading in U.S. markets that represent foreign securities and baskets of foreign securities. A fund may also fair value securities in other situations, such as when a particular foreign market is closed but the fund is open. The fund uses outside pricing services to provide it with closing prices and information to evaluate and/or adjust those prices. The fund cannot predict how often it will use closing prices and how often it will determine it necessary to adjust those prices to reflect fair value. As a means of evaluating its security valuation process, the fund routinely compares closing prices, the next day’s opening prices in the same markets, and adjusted prices.
Valuation Inputs Various inputs are used to determine the value of the fund’s investments. These inputs are summarized in the three broad levels listed below:
Level 1 – quoted prices in active markets for identical securities
Level 2 – observable inputs other than Level 1 quoted prices (including, but not limited to, quoted prices for similar securities, interest rates, prepayment speeds, credit risk)
Level 3 – unobservable inputs
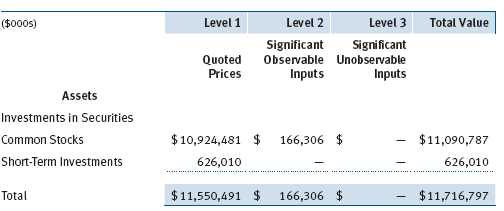
Observable inputs are those based on market data obtained from sources independent of the fund, and unobservable inputs reflect the fund’s own assumptions based on the best information available. The input levels are not necessarily an indication of the risk or liquidity associated with investments at that level. For example, non-U.S. equity securities actively traded in foreign markets generally are reflected in Level 2 despite the availability of closing prices because the fund evaluates and determines whether those closing prices reflect fair value at the close of the NYSE or require adjustment, as described above. The following table summarizes the fund’s investments, based on the inputs used to determine their values on June 30, 2009:
NOTE 3 - OTHER INVESTMENT TRANSACTIONS
Consistent with its investment objective, the fund engages in the following practices to manage exposure to certain risks or to enhance performance. The investment objective, policies, program, and risk factors of the fund are described more fully in the fund’s prospectus and Statement of Additional Information.
Restricted Securities The fund may invest in securities that are subject to legal or contractual restrictions on resale. Prompt sale of such securities at an acceptable price may be difficult and may involve substantial delays and additional costs.
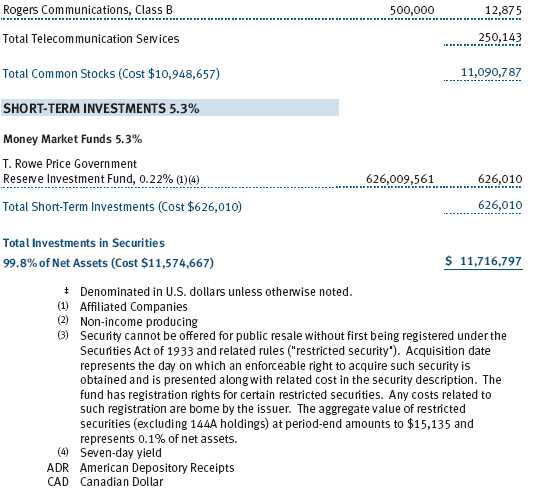
Other Purchases and sales of portfolio securities other than short-term securities aggregated $1,773,178,000 and $1,605,431,000, respectively, for the six months ended June 30, 2009.
NOTE 4 - FEDERAL INCOME TAXES
No provision for federal income taxes is required since the fund intends to continue to qualify as a regulated investment company under Subchapter M of the Internal Revenue Code and distribute to shareholders all of its taxable income and gains. Distributions are determined in accordance with Federal income tax regulations, which differ from generally accepted accounting principles, and, therefore, may differ in amount or character from net investment income and realized gains for financial reporting purposes. Financial reporting records are adjusted for permanent book/tax differences to reflect tax character but are not adjusted for temporary differences. The amount and character of tax-basis distributions and composition of net assets are finalized at fiscal year-end; accordingly, tax-basis balances have not been determined as of June 30, 2009.
In accordance with federal tax regulations, the fund deferred recognition of certain capital loss amounts previously recognized in the prior fiscal year for financial reporting purposes until the current fiscal period for tax purposes. Such deferrals amounted to $234,719,000 and related to net capital losses realized between November 1 and the fund’s fiscal year-end date.
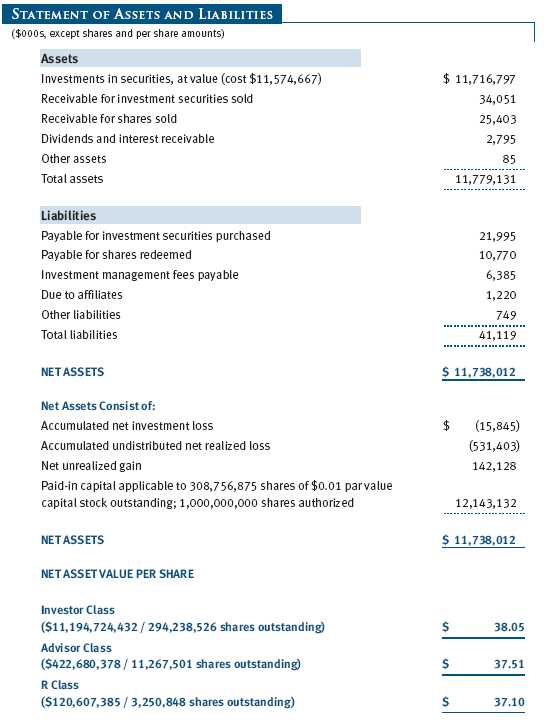
At June 30, 2009, the cost of investments for federal income tax purposes was $11,574,667,000. Net unrealized gain aggregated $142,128,000 at period-end, of which $1,851,752,000 related to appreciated investments and $1,709,624,000 related to depreciated investments.
NOTE 5 - RELATED PARTY TRANSACTIONS
The fund is managed by T. Rowe Price Associates, Inc. (the manager or Price Associates), a wholly owned subsidiary of T. Rowe Price Group, Inc. The investment management agreement between the fund and the manager provides for an annual investment management fee, which is computed daily and paid monthly. The fee consists of an individual fund fee and a group fee. The individual fund fee is equal to 0.35% of the fund’s average daily net assets up to $15 billion and 0.30% of the fund’s average daily net assets in excess of $15 billion. The group fee rate is calculated based on the combined net assets of certain mutual funds sponsored by Price Associates (the group) applied to a graduated fee schedule, with rates ranging from 0.48% for the first $1 billion of assets to 0.285% for assets in excess of $220 billion. The fund’s group fee is determined by applying the group fee rate to the fund’s average daily net assets. At June 30, 2009, the effective annual group fee rate was 0.31%.
In addition, the fund has entered into service agreements with Price Associates and two wholly owned subsidiaries of Price Associates (collectively, Price). Price Associates computes the daily share prices and provides certain other administrative services to the fund. T. Rowe Price Services, Inc., provides shareholder and administrative services in its capacity as the fund’s transfer and dividend disbursing agent. T. Rowe Price Retirement Plan Services, Inc., provides subaccounting and recordkeeping services for certain retirement accounts invested in the Investor Class and R Class. For the six months ended June 30, 2009, expenses incurred pursuant to these service agreements were $62,000 for Price Associates, $1,417,000 for T. Rowe Price Services, Inc., and $3,110,000 for T. Rowe Price Retirement Plan Services, Inc. The total amount payable at period-end pursuant to these service agreements is reflected as Due to Affiliates in the accompanying financial statements.
Additionally, the fund is one of several mutual funds in which certain college savings plans managed by Price Associates may invest. As approved by the fund’s Board of Directors, shareholder servicing costs associated with each college savings plan are borne by the fund in proportion to the average daily value of its shares owned by the college savings plan. For the six months ended June 30, 2009, the fund was charged $93,000 for shareholder servicing costs related to the college savings plans, of which $78,000 was for services provided by Price. The amount payable at period-end pursuant to this agreement is reflected as Due to Affiliates in the accompanying financial statements. At June 30, 2009, approximately 1% of the outstanding shares of the Investor Class were held by college savings plans.
The fund is also one of several mutual funds sponsored by Price Associates (underlying Price funds) in which the T. Rowe Price Spectrum Funds (Spectrum Funds) and T. Rowe Price Retirement Funds (Retirement Funds) may invest. Neither the Spectrum Funds nor the Retirement Funds invest in the underlying Price funds for the purpose of exercising management or control. Pursuant to separate special servicing agreements, expenses associated with the operation of the Spectrum and Retirement Funds are borne by each underlying Price fund to the extent of estimated savings to it and in proportion to the average daily value of its shares owned by the Spectrum and Retirement Funds, respectively. Expenses allocated under these agreements are reflected as shareholder servicing expenses in the accompanying financial statements. For the six months ended June 30, 2009, the fund was allocated $91,000 of Spectrum Funds’ expenses and $1,399,000 of Retirement Funds’ expenses. Of these amounts, $1,073,000 related to services provided by Price. The amount payable at period-end pursuant to this agreement is reflected as Due to Affiliates in the accompanying financial statements. At June 30, 2009, approximately 1% of the outstanding shares of the Investor Class were held by the Spectrum Funds and 11% were held by the Retirement Funds.
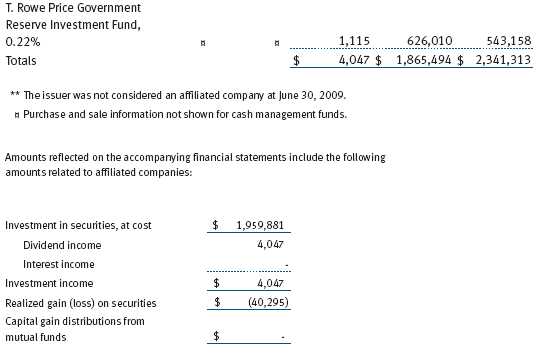
The fund may invest in the T. Rowe Price Reserve Investment Fund and the T. Rowe Price Government Reserve Investment Fund (collectively, the T. Rowe Price Reserve Investment Funds), open-end management investment companies managed by Price Associates and considered affiliates of the fund. The T. Rowe Price Reserve Investment Funds are offered as cash management options to mutual funds, trusts, and other accounts managed by Price Associates and/or its affiliates and are not available for direct purchase by members of the public. The T. Rowe Price Reserve Investment Funds pay no investment management fees.
As of June 30, 2009, T. Rowe Price Group, Inc., and/or its wholly owned subsidiaries owned 68,622 shares of the Investor Class, representing less than 1% of the fund’s net assets.
| INFORMATION ON PROXY VOTING POLICIES, PROCEDURES, AND RECORDS |
A description of the policies and procedures used by T. Rowe Price funds and portfolios to determine how to vote proxies relating to portfolio securities is available in each fund’s Statement of Additional Information, which you may request by calling 1-800-225-5132 or by accessing the SEC’s Web site, www.sec.gov. The description of our proxy voting policies and procedures is also available on our Web site, www.troweprice.com. To access it, click on the words “Our Company” at the top of our corporate homepage. Then, when the next page appears, click on the words “Proxy Voting Policies” on the left side of the page.
Each fund’s most recent annual proxy voting record is available on our Web site and through the SEC’s Web site. To access it through our Web site, follow the directions above, then click on the words “Proxy Voting Records” on the right side of the Proxy Voting Policies page.
| HOW TO OBTAIN QUARTERLY PORTFOLIO HOLDINGS |
The fund files a complete schedule of portfolio holdings with the Securities and Exchange Commission for the first and third quarters of each fiscal year on Form N-Q. The fund’s Form N-Q is available electronically on the SEC’s Web site (www.sec.gov); hard copies may be reviewed and copied at the SEC’s Public Reference Room, 450 Fifth St. N.W., Washington, DC 20549. For more information on the Public Reference Room, call 1-800-SEC-0330.
| APPROVAL OF INVESTMENT MANAGEMENT AGREEMENT |
On March 10, 2009, the fund’s Board of Directors (Board) unanimously approved the investment advisory contract (Contract) between the fund and its investment manager, T. Rowe Price Associates, Inc. (Manager). The Board considered a variety of factors in connection with its review of the Contract, also taking into account information provided by the Manager during the course of the year, as discussed below:
Services Provided by the Manager
The Board considered the nature, quality, and extent of the services provided to the fund by the Manager. These services included, but were not limited to, management of the fund’s portfolio and a variety of related activities, as well as financial and administrative services, reporting, and communications. The Board also reviewed the background and experience of the Manager’s senior management team and investment personnel involved in the management of the fund. The Board concluded that it was satisfied with the nature, quality, and extent of the services provided by the Manager.
Investment Performance of the Fund
The Board reviewed the fund’s average annual total returns over the 1-, 3-, 5-, and 10-year periods as well as the fund’s year-by-year returns and compared these returns with previously agreed upon comparable performance measures and market data, including those supplied by Lipper and Morningstar, which are independent providers of mutual fund data. On the basis of this evaluation and the Board’s ongoing review of investment results, and factoring in the severity of the market turmoil in 2008, the Board concluded that the fund’s performance was satisfactory.
Costs, Benefits, Profits, and Economies of Scale
The Board reviewed detailed information regarding the revenues received by the Manager under the Contract and other benefits that the Manager (and its affiliates) may have realized from its relationship with the fund, including research received under “soft dollar” agreements. The Board noted that soft dollars were not used to pay for third-party, non-broker research during 2008. The Board also received information on the estimated costs incurred and profits realized by the Manager and its affiliates from advising T. Rowe Price mutual funds, as well as estimates of the gross profits realized from managing the fund in particular. The Board concluded that the Manager’s profits were reasonable in light of the services provided to the fund. The Board also considered whether the fund or other funds benefit under the fee levels set forth in the Contract from any economies of scale realized by the Manager. Under the Contract, the fund pays a fee to the Manager composed of two components—a group fee rate based on the aggregate assets of certain T. Rowe Price mutual funds (including the fund) that declines at certain asset levels and an individual fund fee rate that is assessed on the assets of the fund. The Board concluded that the advisory fee structure for the fund continued to provide for a reasonable sharing of benefits from any economies of scale with the fund’s investors.
Fees
The Board reviewed the fund’s management fee rate, operating expenses, and total expense ratio (for the Investor Class, Advisor Class, and R Class) and compared them with fees and expenses of other comparable funds based on information and data supplied by Lipper. The information provided to the Board indicated that the fund’s management fee rate for all three classes and expense ratio for the Investor Class and Advisor Class were at or below the median for comparable funds and that the expense ratio for the R Class was above the median for comparable funds. The Board also reviewed the fee schedules for comparable privately managed accounts of the Manager and its affiliates. Management informed the Board that the Manager’s responsibilities for privately managed accounts are more limited than its responsibilities for the fund and other T. Rowe Price mutual funds that it or its affiliates advise. On the basis of the information provided, the Board concluded that the fees paid by the fund under the Contract were reasonable.
Approval of the Contract
As noted, the Board approved the continuation of the Contract. No single factor was considered in isolation or to be determinative to the decision. Rather, the Board concluded, in light of a weighting and balancing of all factors considered, that it was in the best interests of the fund to approve the continuation of the Contract, including the fees to be charged for services thereunder.
Item 2. Code of Ethics.
A code of ethics, as defined in Item 2 of Form N-CSR, applicable to its principal executive officer, principal financial officer, principal accounting officer or controller, or persons performing similar functions is filed as an exhibit to the registrant’s annual Form N-CSR. No substantive amendments were approved or waivers were granted to this code of ethics during the registrant’s most recent fiscal half-year.
Item 3. Audit Committee Financial Expert.
Disclosure required in registrant’s annual Form N-CSR.
Item 4. Principal Accountant Fees and Services.
Disclosure required in registrant’s annual Form N-CSR.
Item 5. Audit Committee of Listed Registrants.
Not applicable.
Item 6. Investments.
(a) Not applicable. The complete schedule of investments is included in Item 1 of this Form N-CSR.
(b) Not applicable.
Item 7. Disclosure of Proxy Voting Policies and Procedures for Closed-End Management Investment Companies.
Not applicable.
Item 8. Portfolio Managers of Closed-End Management Investment Companies.
Not applicable.
Item 9. Purchases of Equity Securities by Closed-End Management Investment Company and Affiliated Purchasers.
Not applicable.
Item 10. Submission of Matters to a Vote of Security Holders.
Not applicable.
Item 11. Controls and Procedures.
(a) The registrant’s principal executive officer and principal financial officer have evaluated the registrant’s disclosure controls and procedures within 90 days of this filing and have concluded that the registrant’s disclosure controls and procedures were effective, as of that date, in ensuring that information required to be disclosed by the registrant in this Form N-CSR was recorded, processed, summarized, and reported timely.
(b) The registrant’s principal executive officer and principal financial officer are aware of no change in the registrant’s internal control over financial reporting that occurred during the registrant’s second fiscal quarter covered by this report that has materially affected, or is reasonably likely to materially affect, the registrant’s internal control over financial reporting.
Item 12. Exhibits.
(a)(1) The registrant’s code of ethics pursuant to Item 2 of Form N-CSR is filed with the registrant’s annual Form N-CSR.
(2) Separate certifications by the registrant's principal executive officer and principal financial officer, pursuant to Section 302 of the Sarbanes-Oxley Act of 2002 and required by Rule 30a-2(a) under the Investment Company Act of 1940, are attached.
(3) Written solicitation to repurchase securities issued by closed-end companies: not applicable.
(b) A certification by the registrant's principal executive officer and principal financial officer, pursuant to Section 906 of the Sarbanes-Oxley Act of 2002 and required by Rule 30a-2(b) under the Investment Company Act of 1940, is attached.
| | |
SIGNATURES |
| |
| | Pursuant to the requirements of the Securities Exchange Act of 1934 and the Investment |
| Company Act of 1940, the registrant has duly caused this report to be signed on its behalf by the |
| undersigned, thereunto duly authorized. |
| |
| T. Rowe Price Mid-Cap Growth Fund, Inc. |
| |
| |
| |
| By | /s/ Edward C. Bernard |
| | Edward C. Bernard |
| | Principal Executive Officer |
| |
| Date | August 20, 2009 |
| |
| |
| |
| | Pursuant to the requirements of the Securities Exchange Act of 1934 and the Investment |
| Company Act of 1940, this report has been signed below by the following persons on behalf of |
| the registrant and in the capacities and on the dates indicated. |
| |
| |
| By | /s/ Edward C. Bernard |
| | Edward C. Bernard |
| | Principal Executive Officer |
| |
| Date | August 20, 2009 |
| |
| |
| |
| By | /s/ Gregory K. Hinkle |
| | Gregory K. Hinkle |
| | Principal Financial Officer |
| |
| Date | August 20, 2009 |