UNITED STATES
SECURITIES AND EXCHANGE COMMISSION
Washington, D.C. 20549
FORM N-CSR
CERTIFIED SHAREHOLDER REPORT OF REGISTERED
MANAGEMENT INVESTMENT COMPANIES
Investment Company Act File Number: 811-06665
| T. Rowe Price Mid-Cap Growth Fund, Inc. |
|
| (Exact name of registrant as specified in charter) |
| |
| 100 East Pratt Street, Baltimore, MD 21202 |
|
| (Address of principal executive offices) |
| |
| David Oestreicher |
| 100 East Pratt Street, Baltimore, MD 21202 |
|
| (Name and address of agent for service) |
Registrant’s telephone number, including area code: (410) 345-2000
Date of fiscal year end: December 31
Date of reporting period: June 30, 2012
Item 1. Report to Shareholders
| Mid-Cap Growth Fund | June 30, 2012 |
The views and opinions in this report were current as of June 30, 2012. They are not guarantees of performance or investment results and should not be taken as investment advice. Investment decisions reflect a variety of factors, and the managers reserve the right to change their views about individual stocks, sectors, and the markets at any time. As a result, the views expressed should not be relied upon as a forecast of the fund’s future investment intent. The report is certified under the Sarbanes-Oxley Act, which requires mutual funds and other public companies to affirm that, to the best of their knowledge, the information in their financial reports is fairly and accurately stated in all material respects.
REPORTS ON THE WEB
Sign up for our E-mail Program, and you can begin to receive updated fund reports and prospectuses online rather than through the mail. Log in to your account at troweprice.com for more information.
Manager’s Letter
Fellow Shareholders
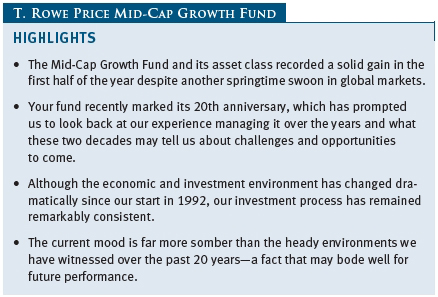
Although mid-cap growth stocks and the broader stock market recorded solid gains in the past six months, investors ended the period with an uneasy sense of déjà vu: 2012 appeared to be replaying the tape of 2011, as a brisk rally early in the year faded in the face of an accelerating European debt crisis, disruption in Asia, a weakening U.S. job market, and political gridlock in Washington. While the focus on these parallels can become all-consuming, we have tried to maintain a longer-term perspective and have been contemplating the more distant past. The end of our reporting period coincided with the 20th anniversary of the fund, which we have managed from its outset. This is not an eternity in our business, perhaps, but close to it! After reviewing the portfolio’s recent performance, we would like to address some of the lessons we have learned in those years and what they may tell us about the coming opportunities and challenges facing our shareholders.
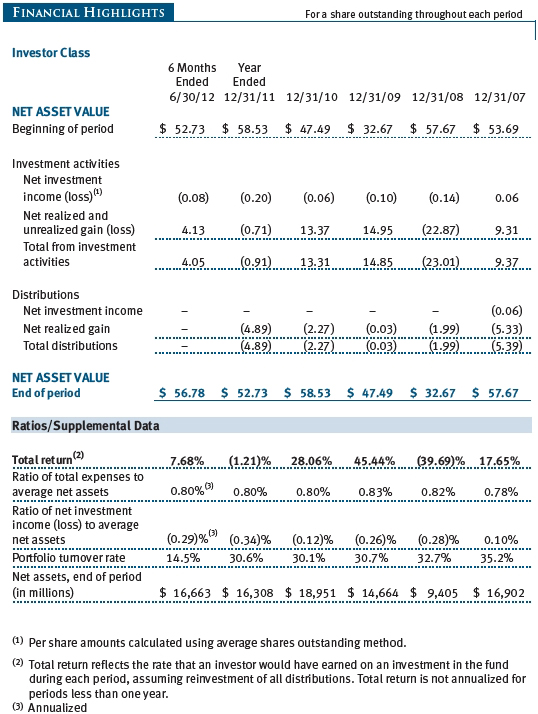
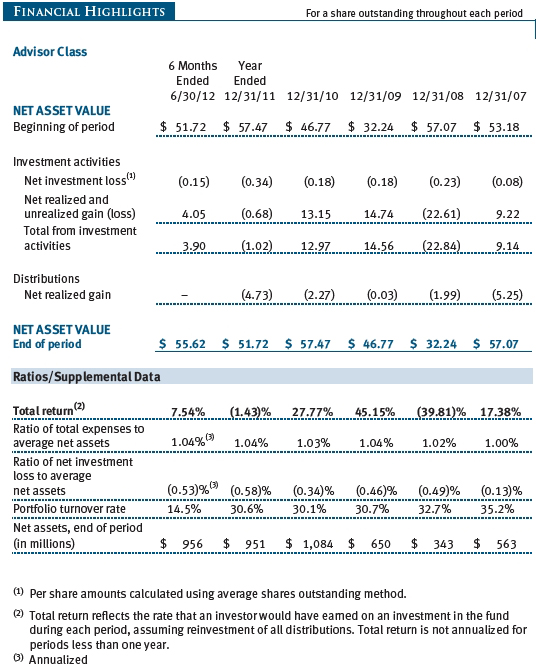
The Mid-Cap Growth Fund returned 7.68% in the first half of our fiscal year ended June 30, 2012. (Returns for Advisor and R Class shares were lower due to their different fee structure.) The fund modestly underperformed its Russell and S&P indices over the past six months while performing roughly in line with its mid-cap growth peers. The fund remained favorably ranked relative to its competitors over all time periods. (Based on cumulative total return, Lipper ranked the Mid-Cap Growth Fund 77 of 386, 77 of 348, 49 of 305, 10 of 199, 4 of 86, and 1 of 25 funds in the mid-cap growth funds category for the 1-, 3-, 5-, 10-, 15-, and 20-year periods ended June 30, 2012, respectively. Past performance cannot guarantee future results.)

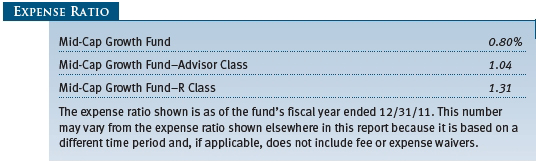
(Annualized returns for the fund were -0.95%, 4.07%, and 9.52% for the 1-, 5-, and 10-year periods ended June 30, 2012, respectively. Current performance may be higher or lower than the quoted past performance, which cannot guarantee future results. Share price, principal value, and return will vary, and you may have a gain or loss when you sell your shares. To obtain the most recent month-end performance, please call 1-800-225-5132 or go to troweprice.com. The fund’s expense ratio was 0.80% as of its fiscal year ended December 31, 2011.)
Two hesitant steps forward and one frightened jump back—this might be the pattern that has best described the global economy and markets over the past few years. In 2011, the Japanese earthquake and tsunami, combined with a sharp rise in oil prices brought about by violent turmoil in North Africa and the Middle East, derailed a promising rally early in the year. This year, thankfully, the unrest has mainly been confined to the realms of economics and politics, and it has weighed on stock prices less heavily. The European debt crisis grew more worrisome in the spring as several additional countries in the region headed back into recession and Greece seemed poised, for a time, to become the first country to leave the eurozone. At the same time, weakening growth in China and other emerging markets threw the health of the rest of the world economy into doubt. As worries about the global economy intensified, stock prices, once again, reversed sharply in May, and nervous investors wondered if another late summer sell-off might be in the cards.

As in 2011, the market pullback could not be blamed entirely on developments overseas. U.S. job growth experienced another springtime slowdown, and the unemployment rate ticked upward in May, the first increase since last June. With job creation still anemic, consumer spending remained constrained. Retail sales declined each month in the second quarter, the first such stretch since 2008. Manufacturing activity also moderated. Optimists saw reason for hope in the housing sector, which finally showed signs of reaching a bottom. Home prices began to rise again in many parts of the country, and home construction ticked up from historic lows. Falling gas prices eased some of the strain on family budgets, but a decline in consumer sentiment gauges indicated that many Americans were not in the mood to take those savings to the mall.
The dog days of summer in the U.S. capitol seemed to, once again, bring out the rabid ineptitude of the nation’s political class, another factor weighing on the markets and economic growth. With last summer’s debt limit showdown still unresolved, Congress and the administration seem to be heading toward a “fiscal cliff” of draconian spending cuts and tax hikes if they do not agree on substantial budget cuts. How or whether they will avoid going over the cliff is highly uncertain and depends a great deal on the close presidential election. Once again, with political gridlock sidelining fiscal policy, nervous investors have turned to the central bank and monetary policy to provide a boost to the economy. However, the Fed has done virtually all it can to stimulate demand (and has taken big risks in doing so). Indeed, Chairman Ben Bernanke has assumed the role of spoilsport, occasionally derailing market advances by testifying that he sees persistently high unemployment and slow growth in the next few years, even with the central bank’s willingness “to take steps as necessary.”
PORTFOLIO REVIEW
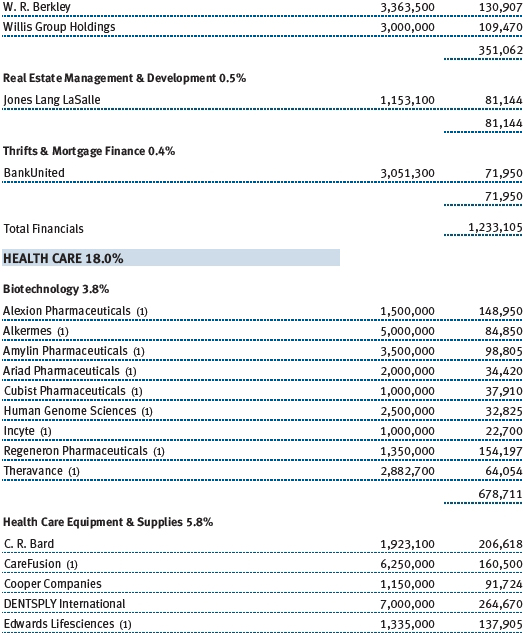
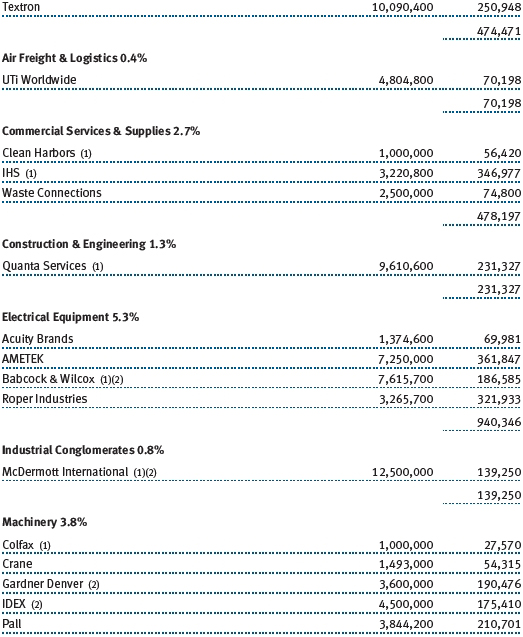
Many of the fund’s holdings performed well, delivering strong profit increases in spite of the sluggish economy’s dampening effect on sales growth. The health care sector, led by biotechnology, was the top contributor. As we have written before, we typically own a diversified basket of biotechnology stocks with the expectation that clinical trial results and other uncertain outcomes will result in a wide range of performance. The portfolio’s leading contributor in the past six months was Regeneron Pharmaceuticals, whose launch of Eylea, a treatment for wet age-related macular degeneration, a common affliction, has exceeded even our own optimistic expectations. Beyond Eylea, the company also has a strong pipeline of drugs in development and solid partnerships with large pharmaceutical companies. Amylin Pharmaceuticals also performed well; its increasingly attractive diabetes franchise proved irresistible to two large pharmaceutical companies that agreed to buy the company at a considerable premium. Alexion Pharmaceuticals generated strong growth from its blood disorder drug Soliris, which was developed to treat a rare blood disease but also has the potential to treat other illnesses. Shares of pharmacy benefits management and health information technology firm SXC Health Solutions advanced during the period after it announced the acquisition of Catalyst Health Solutions, a key competitor. (Please refer to the fund’s portfolio of investments for a complete list of our holdings and the amount each represents in the portfolio.)
Information technology (IT), which constituted 21.9% of the portfolio on June 30, 2012, performed well in spite of a sharp pullback in semiconductor stocks late in the period. Longtime holding Red Hat continues to benefit from the popularity of open-source Linux software, which is attracting budget-conscious IT managers. Software firm Ariba was a top contributor after agreeing to be acquired at a premium by Germany’s SAP.
We have written in previous letters about the reemergence of the United States as an industrial powerhouse. The industrials and business services sector has become an important focus of the fund and is currently its largest weighting. During the period, we trimmed industrial distributor Fastenal into strength and initiated a position in J.B. Hunt Transport Services, a play on the growth of intermodal transportation. In the second quarter, we also added Clean Harbors, a company with a strong track record in specialty waste disposal. Longtime holding IHS, a provider of unique data and analysis, continued to leverage its unequaled collection of databases and industry experts into strong results, helping it become one the largest positions in the fund.
Our overweights in health care, industrials, and information technology correspond with a large underweight in the consumer sector, which now composes roughly one-third of the Russell Midcap Growth Index. One of our recent investment themes has been the renormalization that we expect between companies serving high- and low-end consumers. This thesis has not played out as quickly as we had expected, and valuations of high-end consumer stocks have continued to surge while investors have shunned discounters. The first signs of a reversal may have appeared in the second quarter, however, as low-end chains such as Wal-Mart began to show strength. Nevertheless, Dollar General was one of our leading contributors for the period as the discount retailer continued a pattern of strong execution against a dull industry backdrop.
We have only a small weighting in the materials sector, but poor performance from two holdings weighed on results. Specialty chemicals maker Celanese declined as earnings fell well short of our expectations, and Osisko Mining, a gold mining firm, reported weaker-than-expected results after a fire disrupted production at its key mine plant.

The decline in natural gas prices negatively affected several names within the portfolio. EQT, a natural gas exploration and production company, and Trican Well Service, a driller and fracker, both weighed on returns. CONSOL Energy, a producer of coal and natural gas, also suffered as coal prices fell, cannibalized by cheap gas. Gardner Denver, a diversified industrial company, was also hurt by the slowdown in demand for energy equipment as natural gas prices sagged. With natural gas prices bottoming out in April near $2 per mmBtu—down from $13 in 2008—and oil remaining near $90 per barrel, the gap between the two commodities is as wide as it has been in decades. We expect that this anomaly will self-correct in the long term as users shift from one form of energy to the other.
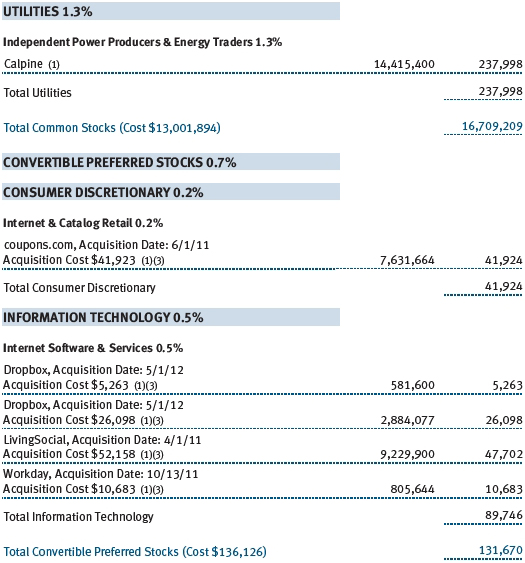
Finally, it is worth highlighting one consumer holding, although our overall results in the sector were mixed. Lately, the moribund initial public offering (IPO) market and stringent public company reporting requirements have led some fast-growing companies to turn to the so-called private-placement market, where institutional investors like us are able to invest in them directly. We have made small investments in several of these companies, our most successful to date being luxury goods maker Michael Kors Holdings. The stock has been a stellar performer since its public debut last December, richly rewarding pre-IPO investors like us. Nevertheless, we would hasten to warn shareholders not to expect such outcomes. While we hope that the pre-public investments we make will provide, on balance, a net positive benefit to the fund’s results over the long term, they will, individually, result in a wide range of outcomes, ranging from the success we have had with Michael Kors to possible failures. However, we are being careful in managing our exposure and risks, and each private holding individually is a very small part of the fund. Privately held companies represented just 0.76% of the fund’s holdings on June 30, 2012.
INVESTMENT STRATEGY AND OUTLOOK: THE LESSONS OF 20 YEARS
On the fund’s 20th anniversary, we would like to reflect on both the investment strategy that we have followed and the lessons we have drawn over the past two decades. When the fund opened to shareholders in the summer of 1992, many of the investment challenges we faced were quite different. We didn’t know it at the time, of course, but we were in roughly the fifth inning of one of the greatest secular bull markets in history; the pullbacks in 1987 and 1991 would turn out to be small blips in the S&P 500’s nearly 1,500% climb from 1982 to 2000. The economy grew at a vigorous annualized rate of 4.5% in the final quarter of 1992, although most Americans were still discouraged that the unemployment rate had reached 7.8% that June (it would fall as low as 3.8% in the following decade). Of course, the global economic and political landscapes were also vastly different, with “Japan, Inc.” seeming a much larger threat to U.S. economic dominance than post-Tiananmen China. Finally, we operated in a different technological milieu: The Internet was still mainly the province of academics; mobile phones were a cumbersome luxury; and the world’s most powerful supercomputer, by one calculation, was roughly as powerful as today’s iPad.
While the environment and the fund’s holdings have changed over two decades—indeed, we described the sale of our final original holding, Danaher, in our letter a year ago—our investment strategy has not. Within a universe of growing mid-cap companies, we focus on four key factors:
The quality of a firm’s management. Over the years, we have met with thousands of company managements. While assessing management prowess is the most subjective of our criteria, we look for teams that we believe have the skills to grow mid-size companies into much larger entities. Furthermore, when we find an exceptional team, we are often willing to follow its alumni into new holdings as they bring their skills to executive roles at other companies.
The long-term viability of its business model. We also look for companies with business models that endow them with advantages over their competitors. These can include franchise brand names, low cost positions, and patent protections, to name but a few. Over the long term, these companies can typically achieve higher margins and greater returns on invested capital.
Whether the company has a solid balance sheet and sufficient cash flow. While most of Wall Street focuses on income statements, we view cash flow statements and balance sheets as more critical. Strong, internally generated cash flow can provide a company with the flexibility to expand its business without drawing upon external capital, acquire other businesses, pay dividends, or repurchase its own stock. The balance sheet is the primary indicator of a company’s financial strength and can provide the wherewithal to survive unforeseen adversity or financial crises, such as 2008–2009. As one of our senior colleagues advised us early in our careers, the balance sheet is not a differentiator 99% of the time, but when it matters, it’s the only thing that matters.
Valuation. The last of these four criteria has often set us apart. Unlike many investors in our asset class, we are not willing to pay whatever is necessary to own these growing companies. Indeed, this is an investment strategy—sometimes referred to as “growth at a reasonable price”—with a long legacy at our firm, and founder Thomas Rowe Price, Jr., is often considered one of its pioneers. For example, although he was an early proponent of growth investing, he grew skeptical of the highflying “Nifty Fifty” stocks of the late 1960s and early 1970s. From the fund’s beginning, we have also been leery of chasing highfliers. While we are willing to pay more for growth, we also realize that Wall Street can be short term and fickle; we prefer to buy companies when their prospects are subject to doubt and tend to sell them when others seem overly confident in their prospects.
Our key competitive advantage is our ability to arbitrage time horizons. In an investment environment dominated by traders focusing on data points and “catalysts,” we focus on a company’s long-term prospects. This is a perspective that has been encouraged by the firm not judging our performance based on how we fare over a quarter or two—an all-too-common time frame for many Wall Street professionals. Our portfolio turnover has typically been less than a third of that of other mid-cap growth funds over the past decade.
We should note that our strategy has worked better in some market environments than in others. In general, we have tended to trail our competitors in momentum-fueled rallies, when investors focus on a small number of rapidly growing companies. The particular factors that have captured investors’ attention have varied considerably over two decades: earnings growth, to be sure, but also sales growth, market share growth, and even market “opportunity” growth. Lately, price momentum and earnings estimate revisions have been the metrics of choice.
The types of momentum stocks that have captured investors’ attention have also varied considerably over the past 20 years: biotechnology firms; emerging markets stocks; waste disposal companies; solar firms; and, most recently, high-end consumer companies, to name a few. While the housing bubble of the last decade had the most far-reaching economic impact, the technology bubble of the late 1990s was, undoubtedly, the most memorable of the manias within our investment universe. While we chronicled the development of the bubble in our letters to shareholders, we did not yet have the term that would define it. In 1995, we noted a “speculative frenzy in technology stocks,” and by 1997, we warned shareholders that the much-hyped “new era” of technology investing did not justify ignoring valuations. In 1998, we described technology, and particularly Internet firms, as the “new Nifty Fifty,” and by the next year, we lamented that the “best investment strategy in 1999 was to invest in companies that lose money.”
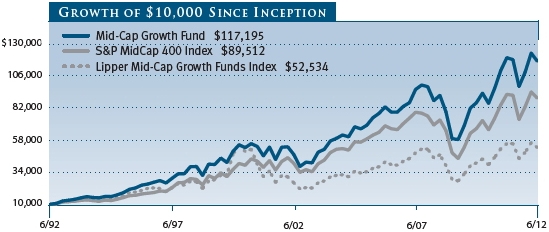
When the party ends—or the punch bowl is taken away, as we sometimes describe it—we have usually fared substantially better than the market as a whole. As reflected in the chart on page 2, the fund’s 16.20% decline in 2000 through 2002 was substantially less than the 52.65% decline of the Lipper Mid-Cap Growth Funds Index.
We are not claiming clairvoyance. In retrospect, our valuation discipline has often led us to leave the party too early, and we have frequently forgone gains by exiting a stock well before it reaches its zenith. Most notably, we seriously lagged our peers and index in 1999. Indeed, on March 6, 2000, this fund and your manager were featured in an article in The Wall Street Journal describing how T. Rowe Price had become a “tradition-bound firm” that had been slow to embrace the growing importance of technology stocks. As the article noted, the fund’s 23.8% gain in 1999 seriously lagged the 72.9% return of the average mid-cap growth fund. Of course, market historians will note that the technology-heavy Nasdaq index peaked within a few days at 5,132, signaling an end to the great bull market of the 1990s. The Mid-Cap Growth Fund proceeded to outperform its peers by over 51% cumulatively over the next five years (a gain of 46.56% for the five years ended December 31, 2005, compared with a loss of 4.47% for the Lipper benchmark). We did not get a request for a follow-up interview.
Lately, our tendency to sell too early has been evident among some high-end retailers that have appreciated significantly after we liquidated or substantially reduced our holdings. Indeed, some might wonder about the fund’s substantial underweight in consumer stocks following the June rebalancing of the Russell Midcap Growth Index, which now allocates roughly a third to that sector. Our short answer is that we assemble the portfolio on a stock-by-stock basis and do not attempt to mirror the sector weightings of our benchmark. Our longer answer might be that we remember what happened after technology stocks reached a weighting of 52% of the Russell index in early 2000. Although benchmarks are a good measure of relative performance over a long period of time, they can prove capricious, and constantly obsessing about them can be counterproductive.
Instead of trying to time highflying momentum stocks, some of our best investments have been lower profile, moderately growing companies that are able to compound earnings over a long period of time. We have found some of these companies in the industrials sector, where a number of firms have been able to grow their earnings at a good rate over many years by employing lean manufacturing techniques and reinvesting their ample cash flows. One source of optimism for us in the coming years is that the scales of the global economy seem to be tilting back in favor of these domestic manufacturers as the wage gap narrows; new technologies favor customized, locally sourced production; transportation costs rise; and domestic energy costs are lower, thanks to the revolution in shale gas extraction technology.
While the current environment bears little resemblance to the one in which the fund began in 1992, it looks even less like the heady years of the late 1990s or even the debt-fueled rally of the last decade. Indeed, the current period seems more like the late 1970s, with many individual investors shunning stocks following years of poor returns amid worries about the fundamental health of the U.S. economy. The grim outlook of that time—markets had been flat for a decade as investors watched their savings eroded by rampant inflation—prompted BusinessWeek to run a cover article in August 1979 entitled “The Death of Equities.” We are seeing articles with similar tones today, and investors are taking them to heart. For a few years now, we have noted the extreme disconnect between rich bond and depressed equity valuations, but nervous investors, unwilling to face another equity bear market, have been withdrawing cash from equities and pouring it into fixed income vehicles with yields that are well below the rate of inflation.
While we are not predicting that we are on the eve of another great bull market like the 1980s and 1990s, depressed investor sentiment and the reasonable valuations it has fostered are a reason for hope. In addition, we suspect that our strategy of avoiding momentum stocks and attempting to focus on quietly competent management teams that are positioning their companies for long-term growth will continue to reward our shareholders over the long run. We thank our shareholders for their participation and patience in this endeavor, and we look forward to reporting to you on our results in the coming years.
Respectfully submitted,

Brian W.H. Berghuis
President of the fund and chairman of its Investment Advisory Committee

John F. Wakeman
Executive vice president of the fund
July 20, 2012
The committee chairman has day-to-day responsibility for managing the portfolio and works with committee members in developing and executing the fund’s investment program.
RISKS OF STOCK INVESTING
As with all stock and bond mutual funds, the fund’s share price can fall because of weakness in the stock or bond markets, a particular industry, or specific holdings. The financial markets can decline for many reasons, including adverse political or economic developments, changes in investor psychology, or heavy institutional selling. The prospects for an industry or company may deteriorate because of a variety of factors, including disappointing earnings or changes in the competitive environment. In addition, the investment manager’s assessment of companies held in a fund may prove incorrect, resulting in losses or poor performance even in rising markets. The stocks of mid-cap companies entail greater risk and are usually more volatile than the shares of larger companies. In addition, growth stocks can be volatile for several reasons. Since they usually reinvest a high proportion of earnings in their own businesses, they may lack the dividends usually associated with value stocks that can cushion their decline in a falling market. Also, since investors buy these stocks because of their expected superior earnings growth, earnings disappointments often result in sharp price declines.
GLOSSARY
Lipper indexes: Fund benchmarks that consist of a small number of the largest mutual funds in a particular category as tracked by Lipper Inc.
Russell Midcap Growth Index: An unmanaged index that measures the performance of those Russell Midcap companies with higher price-to-book ratios and higher forecast growth values.
Russell Midcap Value Index: An unmanaged index that measures the performance of those Russell Midcap companies with lower price-to-book ratios and lower forecast growth values.
S&P 500 Index: An unmanaged index that tracks the stocks of 500 primarily large-cap U.S. companies.
S&P MidCap 400 Index: An unmanaged index that tracks the stocks of 400 U.S. mid-cap companies.

Performance and Expenses
This chart shows the value of a hypothetical $10,000 investment in the fund over the past 10 fiscal year periods or since inception (for funds lacking 10-year records). The result is compared with benchmarks, which may include a broad-based market index and a peer group average or index. Market indexes do not include expenses, which are deducted from fund returns as well as mutual fund averages and indexes.


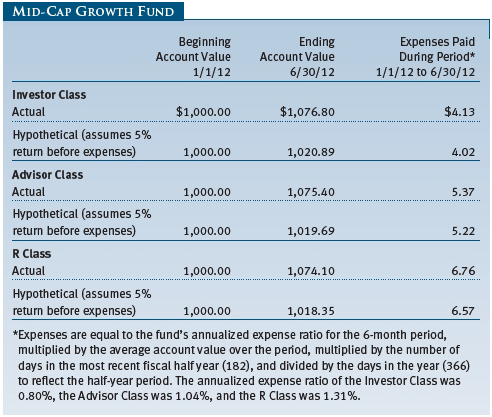
As a mutual fund shareholder, you may incur two types of costs: (1) transaction costs, such as redemption fees or sales loads, and (2) ongoing costs, including management fees, distribution and service (12b-1) fees, and other fund expenses. The following example is intended to help you understand your ongoing costs (in dollars) of investing in the fund and to compare these costs with the ongoing costs of investing in other mutual funds. The example is based on an investment of $1,000 invested at the beginning of the most recent six-month period and held for the entire period.
Please note that the fund has three share classes: The original share class (Investor Class) charges no distribution and service (12b-1) fee, Advisor Class shares are offered only through unaffiliated brokers and other financial intermediaries and charge a 0.25% 12b-1 fee, and R Class shares are available to retirement plans serviced by intermediaries and charge a 0.50% 12b-1 fee. Each share class is presented separately in the table.
Actual Expenses
The first line of the following table (Actual) provides information about actual account values and expenses based on the fund’s actual returns. You may use the information on this line, together with your account balance, to estimate the expenses that you paid over the period. Simply divide your account value by $1,000 (for example, an $8,600 account value divided by $1,000 = 8.6), then multiply the result by the number on the first line under the heading “Expenses Paid During Period” to estimate the expenses you paid on your account during this period.
Hypothetical Example for Comparison Purposes
The information on the second line of the table (Hypothetical) is based on hypothetical account values and expenses derived from the fund’s actual expense ratio and an assumed 5% per year rate of return before expenses (not the fund’s actual return). You may compare the ongoing costs of investing in the fund with other funds by contrasting this 5% hypothetical example and the 5% hypothetical examples that appear in the shareholder reports of the other funds. The hypothetical account values and expenses may not be used to estimate the actual ending account balance or expenses you paid for the period.
Note: T. Rowe Price charges an annual account service fee of $20, generally for accounts with less than $10,000. The fee is waived for any investor whose T. Rowe Price mutual fund accounts total $50,000 or more; accounts electing to receive electronic delivery of account statements, transaction confirmations, prospectuses, and shareholder reports; or accounts of an investor who is a T. Rowe Price Preferred Services, Personal Services, or Enhanced Personal Services client (enrollment in these programs generally requires T. Rowe Price assets of at least $100,000). This fee is not included in the accompanying table. If you are subject to the fee, keep it in mind when you are estimating the ongoing expenses of investing in the fund and when comparing the expenses of this fund with other funds.
You should also be aware that the expenses shown in the table highlight only your ongoing costs and do not reflect any transaction costs, such as redemption fees or sales loads. Therefore, the second line of the table is useful in comparing ongoing costs only and will not help you determine the relative total costs of owning different funds. To the extent a fund charges transaction costs, however, the total cost of owning that fund is higher.
Unaudited
The accompanying notes are an integral part of these financial statements.
Unaudited
The accompanying notes are an integral part of these financial statements.
Unaudited

The accompanying notes are an integral part of these financial statements.
Unaudited


The accompanying notes are an integral part of these financial statements.
Unaudited
The accompanying notes are an integral part of these financial statements.
Unaudited


The accompanying notes are an integral part of these financial statements.
Unaudited


The accompanying notes are an integral part of these financial statements.
Unaudited
| Notes to Financial Statements |
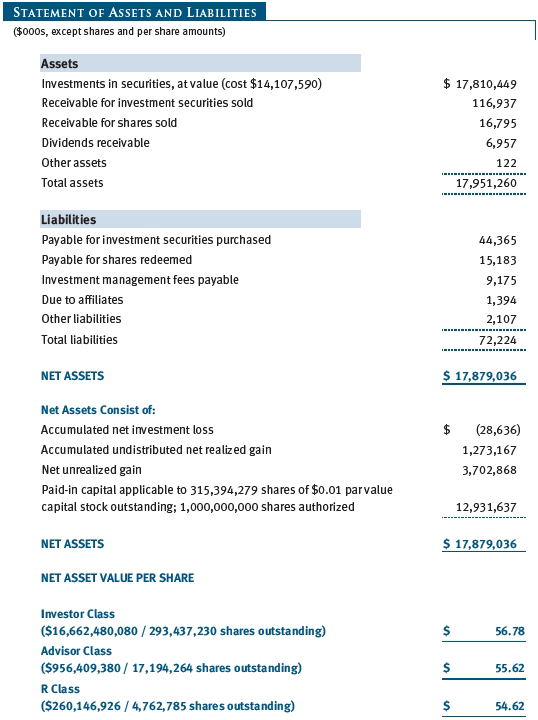
T. Rowe Price Mid-Cap Growth Fund, Inc. (the fund), is registered under the Investment Company Act of 1940 (the 1940 Act) as a diversified, open-end management investment company. The fund seeks to provide long-term capital appreciation by investing in mid-cap stocks with potential for above-average earnings growth. The fund has three classes of shares: the Mid-Cap Growth Fund original share class, referred to in this report as the Investor Class, offered since June 30, 1992; the Mid-Cap Growth Fund–Advisor Class (Advisor Class), offered since March 31, 2000; and the Mid-Cap Growth Fund–R Class (R Class), offered since September 30, 2002. Advisor Class shares are sold only through unaffiliated brokers and other unaffiliated financial intermediaries, and R Class shares are available to retirement plans serviced by intermediaries. The Advisor Class and R Class each operate under separate Board-approved Rule 12b-1 plans, pursuant to which each class compensates financial intermediaries for distribution, shareholder servicing, and/or certain administrative services. Each class has exclusive voting rights on matters related solely to that class; separate voting rights on matters that relate to all classes; and, in all other respects, the same rights and obligations as the other classes.
NOTE 1 - SIGNIFICANT ACCOUNTING POLICIES
Basis of Preparation The accompanying financial statements were prepared in accordance with accounting principles generally accepted in the United States of America (GAAP), which require the use of estimates made by management. Management believes that estimates and valuations are appropriate; however, actual results may differ from those estimates, and the valuations reflected in the accompanying financial statements may differ from the value ultimately realized upon sale or maturity.
Investment Transactions, Investment Income, and Distributions Income and expenses are recorded on the accrual basis. Dividends received from mutual fund investments are reflected as dividend income; capital gain distributions are reflected as realized gain/loss. Dividend income and capital gain distributions are recorded on the ex-dividend date. Income tax-related interest and penalties, if incurred, would be recorded as income tax expense. Investment transactions are accounted for on the trade date. Realized gains and losses are reported on the identified cost basis. Distributions to shareholders are recorded on the ex-dividend date. Income distributions are declared and paid by each class annually. Capital gain distributions, if any, are generally declared and paid by the fund annually.
Currency Translation Assets, including investments, and liabilities denominated in foreign currencies are translated into U.S. dollar values each day at the prevailing exchange rate, using the mean of the bid and asked prices of such currencies against U.S. dollars as quoted by a major bank. Purchases and sales of securities, income, and expenses are translated into U.S. dollars at the prevailing exchange rate on the date of the transaction. The effect of changes in foreign currency exchange rates on realized and unrealized security gains and losses is reflected as a component of security gains and losses.
Class Accounting The Advisor Class and R Class each pay distribution, shareholder servicing, and/or certain administrative expenses in the form of Rule 12b-1 fees, in an amount not exceeding 0.25% and 0.50%, respectively, of the class’s average daily net assets. Shareholder servicing, prospectus, and shareholder report expenses incurred by each class are charged directly to the class to which they relate. Expenses common to all classes, investment income, and realized and unrealized gains and losses are allocated to the classes based upon the relative daily net assets of each class.
Rebates and Credits Subject to best execution, the fund may direct certain security trades to brokers who have agreed to rebate a portion of the related brokerage commission to the fund in cash. Commission rebates are reflected as realized gain on securities in the accompanying financial statements and totaled $242,000 for the six months ended June 30, 2012. Additionally, the fund earns credits on temporarily uninvested cash balances held at the custodian, which reduce the fund’s custody charges. Custody expense in the accompanying financial statements is presented before reduction for credits, which are reflected as expenses paid indirectly.
In-Kind Redemptions In accordance with guidelines described in the fund’s prospectus, the fund may distribute portfolio securities rather than cash as payment for a redemption of fund shares (in-kind redemption). For financial reporting purposes, the fund recognizes a gain on in-kind redemptions to the extent the value of the distributed securities on the date of redemption exceeds the cost of those securities. Gains and losses realized on in-kind redemptions are not recognized for tax purposes and are reclassified from undistributed realized gain (loss) to paid-in capital. During the six months ended June 30, 2012, the fund realized $376,525,000 of net gain on $845,056,000 of in-kind redemptions.
New Accounting Pronouncements In May 2011, the Financial Accounting Standards Board (FASB) issued amended guidance to align fair value measurement and disclosure requirements in U.S. GAAP with International Financial Reporting Standards. The guidance is effective for fiscal years and interim periods beginning on or after December 15, 2011. Adoption had no effect on net assets or results of operations.
In December 2011, the FASB issued amended guidance to enhance disclosure for offsetting assets and liabilities. The guidance is effective for fiscal years and interim periods beginning on or after January 1, 2013. Adoption will have no effect on the fund’s net assets or results of operations.
NOTE 2 - VALUATION
The fund’s financial instruments are reported at fair value as defined by GAAP. The fund determines the values of its assets and liabilities and computes each class’s net asset value per share at the close of the New York Stock Exchange (NYSE), normally 4 p.m. ET, each day that the NYSE is open for business.
Valuation Methods Equity securities listed or regularly traded on a securities exchange or in the over-the-counter (OTC) market are valued at the last quoted sale price or, for certain markets, the official closing price at the time the valuations are made, except for OTC Bulletin Board securities, which are valued at the mean of the latest bid and asked prices. A security that is listed or traded on more than one exchange is valued at the quotation on the exchange determined to be the primary market for such security. Listed securities not traded on a particular day are valued at the mean of the latest bid and asked prices for domestic securities and the last quoted sale price for international securities.
Investments in mutual funds are valued at the mutual fund’s closing net asset value per share on the day of valuation.
Other investments, including restricted securities and private placements, and those financial instruments for which the above valuation procedures are inappropriate or are deemed not to reflect fair value, are stated at fair value as determined in good faith by the T. Rowe Price Valuation Committee, established by the fund’s Board of Directors (the Board). Subject to oversight by the Board, the Valuation Committee develops pricing-related policies and procedures and approves all fair-value determinations. The Valuation Committee regularly makes good faith judgments, using a wide variety of sources and information, to establish and adjust valuations of certain securities as events occur and circumstances warrant. For instance, in determining the fair value of private-equity instruments, the Valuation Committee considers a variety of factors, including the company’s business prospects, its financial performance, strategic events impacting the company, relevant valuations of similar companies, new rounds of financing, and any negotiated transactions of significant size between other investors in the company. Because any fair-value determination involves a significant amount of judgment, there is a degree of subjectivity inherent in such pricing decisions.
For valuation purposes, the last quoted prices of non-U.S. equity securities may be adjusted under the circumstances described below. If the fund determines that developments between the close of a foreign market and the close of the NYSE will, in its judgment, materially affect the value of some or all of its portfolio securities, the fund will adjust the previous closing prices to reflect what it believes to be the fair value of the securities as of the close of the NYSE. In deciding whether it is necessary to adjust closing prices to reflect fair value, the fund reviews a variety of factors, including developments in foreign markets, the performance of U.S. securities markets, and the performance of instruments trading in U.S. markets that represent foreign securities and baskets of foreign securities. A fund may also fair value securities in other situations, such as when a particular foreign market is closed but the fund is open. The fund uses outside pricing services to provide it with closing prices and information to evaluate and/or adjust those prices. The fund cannot predict how often it will use closing prices and how often it will determine it necessary to adjust those prices to reflect fair value. As a means of evaluating its security valuation process, the fund routinely compares closing prices, the next day’s opening prices in the same markets, and adjusted prices. Additionally, trading in the underlying securities of the fund may take place in various foreign markets on certain days when the fund is not open for business and does not calculate a net asset value. As a result, net asset values may be significantly affected on days when shareholders cannot make transactions.
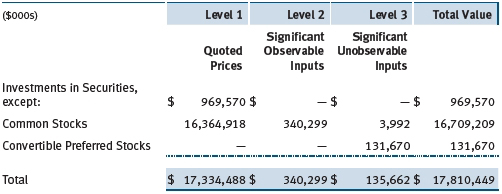
Valuation Inputs Various inputs are used to determine the value of the fund’s financial instruments. These inputs are summarized in the three broad levels listed below:
Level 1 – quoted prices in active markets for identical financial instruments
Level 2 – observable inputs other than Level 1 quoted prices (including, but not limited to, quoted prices for similar financial instruments, interest rates, prepayment speeds, and credit risk)
Level 3 – unobservable inputs
Observable inputs are those based on market data obtained from sources independent of the fund, and unobservable inputs reflect the fund’s own assumptions based on the best information available. The input levels are not necessarily an indication of the risk or liquidity associated with financial instruments at that level. For example, non-U.S. equity securities actively traded in foreign markets generally are reflected in Level 2 despite the availability of closing prices because the fund evaluates and determines whether those closing prices reflect fair value at the close of the NYSE or require adjustment, as described above. The following table summarizes the fund’s financial instruments, based on the inputs used to determine their values on June 30, 2012:
Following is a reconciliation of the fund’s Level 3 holdings for the six months ended June 30, 2012. Gain (loss) reflects both realized and change in unrealized gain (loss) on Level 3 holdings during the period, if any, and is included on the accompanying Statement of Operations. The change in unrealized gain (loss) on Level 3 instruments held at June 30, 2012, totaled $(23,276,000) for the six months ended June 30, 2012.

NOTE 3 - OTHER INVESTMENT TRANSACTIONS
Consistent with its investment objective, the fund engages in the following practices to manage exposure to certain risks and/or to enhance performance. The investment objective, policies, program, and risk factors of the fund are described more fully in the fund’s prospectus and Statement of Additional Information.
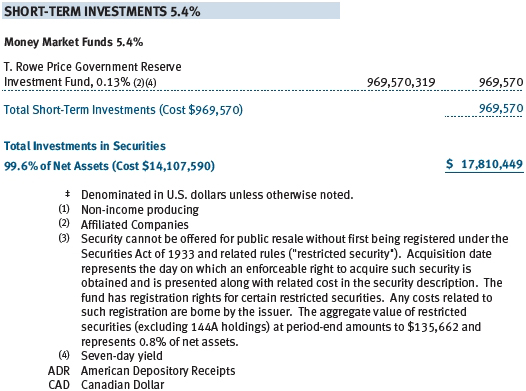
Restricted Securities The fund may invest in securities that are subject to legal or contractual restrictions on resale. Prompt sale of such securities at an acceptable price may be difficult and may involve substantial delays and additional costs.
Other Purchases and sales of portfolio securities other than short-term securities aggregated $2,557,622,000 and $4,045,066,000, respectively, for the six months ended June 30, 2012.
NOTE 4 - FEDERAL INCOME TAXES
No provision for federal income taxes is required since the fund intends to continue to qualify as a regulated investment company under Subchapter M of the Internal Revenue Code and distribute to shareholders all of its taxable income and gains. Distributions determined in accordance with federal income tax regulations may differ in amount or character from net investment income and realized gains for financial reporting purposes. Financial reporting records are adjusted for permanent book/tax differences to reflect tax character but are not adjusted for temporary differences. The amount and character of tax-basis distributions and composition of net assets are finalized at fiscal year-end; accordingly, tax-basis balances have not been determined as of the date of this report.
The fund intends to retain realized gains to the extent of available capital loss carryforwards. Net realized capital losses may be carried forward indefinitely to offset future realized capital gains. As of December 31, 2011, the fund had $7,839,000 of available capital loss carryforwards.
At June 30, 2012, the cost of investments for federal income tax purposes was $14,132,548,000. Net unrealized gain aggregated $3,677,910,000 at period-end, of which $4,414,592,000 related to appreciated investments and $736,682,000 related to depreciated investments.
NOTE 5 - RELATED PARTY TRANSACTIONS
The fund is managed by T. Rowe Price Associates, Inc. (Price Associates), a wholly owned subsidiary of T. Rowe Price Group, Inc. (Price Group). The investment management agreement between the fund and Price Associates provides for an annual investment management fee, which is computed daily and paid monthly. The fee consists of an individual fund fee and a group fee. The individual fund fee is equal to 0.35% of the fund’s average daily net assets up to $15 billion and 0.30% of the fund’s average daily net assets in excess of $15 billion. The group fee rate is calculated based on the combined net assets of certain mutual funds sponsored by Price Associates (the group) applied to a graduated fee schedule, with rates ranging from 0.48% for the first $1 billion of assets to 0.28% for assets in excess of $300 billion. The fund’s group fee is determined by applying the group fee rate to the fund’s average daily net assets. At June 30, 2012, the effective annual group fee rate was 0.30%.
In addition, the fund has entered into service agreements with Price Associates and two wholly owned subsidiaries of Price Associates (collectively, Price). Price Associates computes the daily share prices and provides certain other administrative services to the fund. T. Rowe Price Services, Inc., provides shareholder and administrative services in its capacity as the fund’s transfer and dividend disbursing agent. T. Rowe Price Retirement Plan Services, Inc., provides subaccounting and recordkeeping services for certain retirement accounts invested in the Investor Class and R Class. For the six months ended June 30, 2012, expenses incurred pursuant to these service agreements were $70,000 for Price Associates; $1,352,000 for T. Rowe Price Services, Inc.; and $3,324,000 for T. Rowe Price Retirement Plan Services, Inc. The total amount payable at period-end pursuant to these service agreements is reflected as Due to Affiliates in the accompanying financial statements.
Additionally, the fund is one of several mutual funds in which certain college savings plans managed by Price Associates may invest. As approved by the fund’s Board of Directors, shareholder servicing costs associated with each college savings plan are borne by the fund in proportion to the average daily value of its shares owned by the college savings plan. For the six months ended June 30, 2012, the fund was charged $90,000 for shareholder servicing costs related to the college savings plans, of which $73,000 was for services provided by Price. The amount payable at period-end pursuant to this agreement is reflected as Due to Affiliates in the accompanying financial statements. At June 30, 2012, approximately 1% of the outstanding shares of the Investor Class were held by college savings plans.
The fund is also one of several mutual funds sponsored by Price Associates (underlying Price funds) in which the T. Rowe Price Spectrum Funds (Spectrum Funds) and T. Rowe Price Retirement Funds (Retirement Funds) may invest. Neither the Spectrum Funds nor the Retirement Funds invest in the underlying Price funds for the purpose of exercising management or control. Pursuant to separate special servicing agreements, expenses associated with the operation of the Spectrum and Retirement Funds are borne by each underlying Price fund to the extent of estimated savings to it and in proportion to the average daily value of its shares owned by the Spectrum and Retirement Funds, respectively. Expenses allocated under these agreements are reflected as shareholder servicing expenses in the accompanying financial statements. For the six months ended June 30, 2012, the fund was allocated $67,000 of Spectrum Funds’ expenses and $2,104,000 of Retirement Funds’ expenses. Of these amounts, $1,222,000 related to services provided by Price. The amount payable at period-end pursuant to this agreement is reflected as Due to Affiliates in the accompanying financial statements. At June 30, 2012, approximately 1% of the outstanding shares of the Investor Class were held by the Spectrum Funds and 13% were held by the Retirement Funds.
The fund may invest in the T. Rowe Price Reserve Investment Fund and the T. Rowe Price Government Reserve Investment Fund (collectively, the T. Rowe Price Reserve Investment Funds), open-end management investment companies managed by Price Associates and considered affiliates of the fund. The T. Rowe Price Reserve Investment Funds are offered as cash management options to mutual funds, trusts, and other accounts managed by Price Associates and/or its affiliates and are not available for direct purchase by members of the public. The T. Rowe Price Reserve Investment Funds pay no investment management fees.
| Information on Proxy Voting Policies, Procedures, and Records |
A description of the policies and procedures used by T. Rowe Price funds and portfolios to determine how to vote proxies relating to portfolio securities is available in each fund’s Statement of Additional Information, which you may request by calling 1-800-225-5132 or by accessing the SEC’s website, sec.gov. The description of our proxy voting policies and procedures is also available on our website, troweprice.com. To access it, click on the words “Our Company” at the top of our corporate homepage. Then, when the next page appears, click on the words “Proxy Voting Policies” on the left side of the page.
Each fund’s most recent annual proxy voting record is available on our website and through the SEC’s website. To access it through our website, follow the directions above, then click on the words “Proxy Voting Records” on the right side of the Proxy Voting Policies page.
| How to Obtain Quarterly Portfolio Holdings |
The fund files a complete schedule of portfolio holdings with the Securities and Exchange Commission for the first and third quarters of each fiscal year on Form N-Q. The fund’s Form N-Q is available electronically on the SEC’s website (sec.gov); hard copies may be reviewed and copied at the SEC’s Public Reference Room, 100 F St. N.E., Washington, DC 20549. For more information on the Public Reference Room, call 1-800-SEC-0330.
| Approval of Investment Management Agreement |
On March 6, 2012, the fund’s Board of Directors (Board), including a majority of the fund’s independent directors, approved the continuation of the investment management agreement (Advisory Contract) between the fund and its investment advisor, T. Rowe Price Associates, Inc. (Advisor). In connection with its deliberations, the Board requested, and the Advisor provided, such information as the Board (with advice from independent legal counsel) deemed reasonably necessary. The Board considered a variety of factors in connection with its review of the Advisory Contract, also taking into account information provided by the Advisor during the course of the year, as discussed below:
Services Provided by the Advisor
The Board considered the nature, quality, and extent of the services provided to the fund by the Advisor. These services included, but were not limited to, directing the fund’s investments in accordance with its investment program and the overall management of the fund’s portfolio, as well as a variety of related activities such as financial, investment operations, and administrative services; compliance; maintaining the fund’s records and registrations; and shareholder communications. The Board also reviewed the background and experience of the Advisor’s senior management team and investment personnel involved in the management of the fund, as well as the Advisor’s compliance record. The Board concluded that it was satisfied with the nature, quality, and extent of the services provided by the Advisor.
Investment Performance of the Fund
The Board reviewed the fund’s average annual total returns over the three-month and 1-, 3-, 5-, and 10-year periods, as well as the fund’s year-by-year returns, and compared these returns with a wide variety of previously agreed upon comparable performance measures and market data, including those supplied by Lipper and Morningstar, which are independent providers of mutual fund data.
On the basis of this evaluation and the Board’s ongoing review of investment results, and factoring in the relative market conditions during certain of the performance periods, the Board concluded that the fund’s performance was satisfactory.
Costs, Benefits, Profits, and Economies of Scale
The Board reviewed detailed information regarding the revenues received by the Advisor under the Advisory Contract and other benefits that the Advisor (and its affiliates) may have realized from its relationship with the fund, including any research received under “soft dollar” agreements and commission-sharing arrangements with broker-dealers. The Board considered that the Advisor may receive some benefit from soft-dollar arrangements pursuant to which research is received from broker-dealers that execute the applicable fund’s portfolio transactions. The Board received information on the estimated costs incurred and profits realized by the Advisor from managing T. Rowe Price mutual funds. The Board also reviewed estimates of the profits realized from managing the fund in particular, and the Board concluded that the Advisor’s profits were reasonable in light of the services provided to the fund.
The Board also considered whether the fund benefits under the fee levels set forth in the Advisory Contract from any economies of scale realized by the Advisor. Under the Advisory Contract, the fund pays a fee to the Advisor for investment management services composed of two components—a group fee rate based on the combined average net assets of most of the T. Rowe Price mutual funds (including the fund) that declines at certain asset levels and an individual fund fee rate based on the fund’s average daily net assets—and the fund pays its own expenses of operations. The Board concluded that the advisory fee structure for the fund continued to provide for a reasonable sharing of benefits from any economies of scale with the fund’s investors.
Fees
The Board was provided with information regarding industry trends in management fees and expenses, and the Board reviewed the fund’s management fee rate, operating expenses, and total expense ratio (for the Investor Class, Advisor Class, and R Class) in comparison with fees and expenses of other comparable funds based on information and data supplied by Lipper. The information provided to the Board indicated that the fund’s management fee rate was at or below the median for comparable funds. The information also indicated that the total expense ratio for the Investor Class and Advisor Class was below the median for comparable funds and that the total expense ratio for the R Class was above the median for comparable funds.
The Board also reviewed the fee schedules for institutional accounts and private accounts with similar mandates that are advised or subadvised by the Advisor and its affiliates. Management provided the Board with information about the Advisor’s responsibilities and services provided to institutional account clients, including information about how the requirements and economics of the institutional business are fundamentally different from those of the mutual fund business. The Board considered information showing that the mutual fund business is generally more complex from a business and compliance perspective than the institutional business and that the Advisor generally performs significant additional services and assumes greater risk in managing the fund and other T. Rowe Price mutual funds than it does for institutional account clients.
On the basis of the information provided and the factors considered, the Board concluded that the fees paid by the fund under the Advisory Contract are reasonable.
Approval of the Advisory Contract
As noted, the Board approved the continuation of the Advisory Contract. No single factor was considered in isolation or to be determinative to the decision. Rather, the Board concluded, in light of a weighting and balancing of all factors considered, that it was in the best interests of the fund and its shareholders for the Board to approve the continuation of the Advisory Contract (including the fees to be charged for services thereunder). The independent directors were advised throughout the process by independent legal counsel.
Item 2. Code of Ethics.
A code of ethics, as defined in Item 2 of Form N-CSR, applicable to its principal executive officer, principal financial officer, principal accounting officer or controller, or persons performing similar functions is filed as an exhibit to the registrant’s annual Form N-CSR. No substantive amendments were approved or waivers were granted to this code of ethics during the registrant’s most recent fiscal half-year.
Item 3. Audit Committee Financial Expert.
Disclosure required in registrant’s annual Form N-CSR.
Item 4. Principal Accountant Fees and Services.
Disclosure required in registrant’s annual Form N-CSR.
Item 5. Audit Committee of Listed Registrants.
Not applicable.
Item 6. Investments.
(a) Not applicable. The complete schedule of investments is included in Item 1 of this Form N-CSR.
(b) Not applicable.
Item 7. Disclosure of Proxy Voting Policies and Procedures for Closed-End Management Investment Companies.
Not applicable.
Item 8. Portfolio Managers of Closed-End Management Investment Companies.
Not applicable.
Item 9. Purchases of Equity Securities by Closed-End Management Investment Company and Affiliated Purchasers.
Not applicable.
Item 10. Submission of Matters to a Vote of Security Holders.
Not applicable.
Item 11. Controls and Procedures.
(a) The registrant’s principal executive officer and principal financial officer have evaluated the registrant’s disclosure controls and procedures within 90 days of this filing and have concluded that the registrant’s disclosure controls and procedures were effective, as of that date, in ensuring that information required to be disclosed by the registrant in this Form N-CSR was recorded, processed, summarized, and reported timely.
(b) The registrant’s principal executive officer and principal financial officer are aware of no change in the registrant’s internal control over financial reporting that occurred during the registrant’s second fiscal quarter covered by this report that has materially affected, or is reasonably likely to materially affect, the registrant’s internal control over financial reporting.
Item 12. Exhibits.
(a)(1) The registrant’s code of ethics pursuant to Item 2 of Form N-CSR is filed with the registrant’s annual Form N-CSR.
(2) Separate certifications by the registrant's principal executive officer and principal financial officer, pursuant to Section 302 of the Sarbanes-Oxley Act of 2002 and required by Rule 30a-2(a) under the Investment Company Act of 1940, are attached.
(3) Written solicitation to repurchase securities issued by closed-end companies: not applicable.
(b) A certification by the registrant's principal executive officer and principal financial officer, pursuant to Section 906 of the Sarbanes-Oxley Act of 2002 and required by Rule 30a-2(b) under the Investment Company Act of 1940, is attached.
SIGNATURES
Pursuant to the requirements of the Securities Exchange Act of 1934 and the Investment Company Act of 1940, the registrant has duly caused this report to be signed on its behalf by the undersigned, thereunto duly authorized.
T. Rowe Price Mid-Cap Growth Fund, Inc.
| | By | /s/ Edward C. Bernard |
| | Edward C. Bernard |
| | Principal Executive Officer |
| |
| Date August 16, 2012 | | |
Pursuant to the requirements of the Securities Exchange Act of 1934 and the Investment Company Act of 1940, this report has been signed below by the following persons on behalf of the registrant and in the capacities and on the dates indicated.
| | By | /s/ Edward C. Bernard |
| | Edward C. Bernard |
| | Principal Executive Officer |
| |
| Date August 16, 2012 | | |
| |
| |
| By | /s/ Gregory K. Hinkle |
| | Gregory K. Hinkle |
| | Principal Financial Officer |
| |
| Date August 16, 2012 | | |