| UNITED STATES |
| SECURITIES AND EXCHANGE COMMISSION |
| Washington, D.C. 20549 |
FORM N-CSR |
CERTIFIED SHAREHOLDER REPORT OF REGISTERED |
MANAGEMENT INVESTMENT COMPANIES |
| Investment Company Act File Number: 811-6665 |
| T. Rowe Price Mid-Cap Growth Fund, Inc. |
| (Exact name of registrant as specified in charter) |
| 100 East Pratt Street, Baltimore, MD 21202 |
| (Address of principal executive offices) |
| David Oestreicher |
| 100 East Pratt Street, Baltimore, MD 21202 |
| (Name and address of agent for service) |
| Registrant’s telephone number, including area code: (410) 345-2000 |
| Date of fiscal year end: December 31 |
| Date of reporting period: June 30, 2011 |
Item 1: Report to Shareholders
 |
| Mid-Cap Growth Fund | June 30, 2011 |
The views and opinions in this report were current as of June 30, 2011. They are not guarantees of performance or investment results and should not be taken as investment advice. Investment decisions reflect a variety of factors, and the managers reserve the right to change their views about individual stocks, sectors, and the markets at any time. As a result, the views expressed should not be relied upon as a forecast of the fund’s future investment intent. The report is certified under the Sarbanes-Oxley Act, which requires mutual funds and other public companies to affirm that, to the best of their knowledge, the information in their financial reports is fairly and accurately stated in all material respects.
REPORTS ON THE WEB
Sign up for our E-mail Program, and you can begin to receive updated fund reports and prospectuses online rather than through the mail. Log in to your account at troweprice.com for more information.
Manager’s Letter
Fellow Shareholders
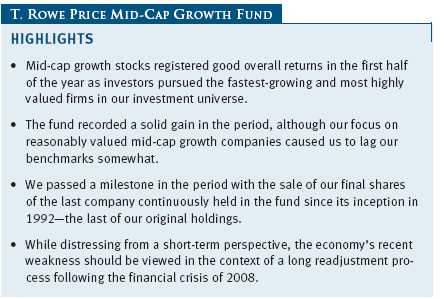
In our last letter, we noted that Wall Street and Main Street appeared to be operating on different planets in 2010 as robust stock gains and corporate profits contrasted with high unemployment and cash-strapped consumers. This pattern continued into 2011, although Wall Street began to adopt Main Street’s grim mood late in the period. Despite a setback in May and early June, stocks recorded decent gains thanks to strong performance in the first four months of the year, and mid-cap growth stocks were once again particularly strong. Investors focused their enthusiasm on the largest and fastest-growing stocks in our investment universe, however, which did not particularly favor our emphasis on medium-sized and reasonably valued growth stocks. We recorded a respectable gain in the period, but modestly lagged our benchmarks and peer group.
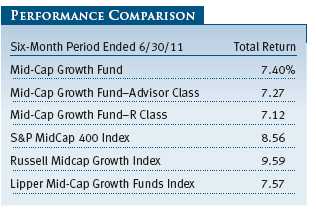
The Mid-Cap Growth Fund finished the six months with a gain of 7.40% for the period. (Returns for Advisor and R Class shares were lower due to their different fee structure.) The fund lagged its benchmarks somewhat but remained favorably ranked relative to its competitors over longer time periods. (Based on cumulative total return, Lipper ranked the Mid-Cap Growth Fund 280 out of 401, 71 out of 354, 49 out of 310, and 9 out of 197 funds in the mid-cap growth funds category for the 1-, 3-, 5-, and 10-year periods ended June 30, 2011. Results will vary for other time periods. Past performance cannot guarantee future results.)
MARKET ENVIRONMENT
As we write this letter, a certain level of unease has settled over the markets, fed by worries over gridlock in Washington, the persistent and perhaps intractable European debt crisis, and weakening economic signals at home. In this sense, sentiment on Main Street and Wall Street have become more aligned, although a transfer of bullishness to Main Street would obviously have been preferable.
The U.S. stock market started the year on a strong note as it appeared that the economic recovery was beginning to accelerate. Robust export markets and a weak U.S. dollar supported strong growth in manufacturing, with some indicators reaching their highest levels in several years. The service sector finally showed signs of vitality as well, and private payrolls began to expand enough to lower the unemployment rate while absorbing new entrants to the workforce. The housing market remained weak, with home construction falling to record lows, but hopes grew that the sector’s decline was leveling off. Corporate profits continued to sprint ahead despite the slow pace of the recovery, helping the market reach a new post-recession high in April. The Federal Reserve’s stimulative policy, and a resurgence in merger and acquisition activity, also boosted sentiment.
The gears failed to catch, however, and investors’ enthusiasm evaporated as the recovery decelerated once again in late spring. Most distressingly, job growth retreated sharply in May and June, and the unemployment rate began to climb again after months of improvement. In a replay of 2010, ominous developments overseas were partially to blame for the slowdown. Political turmoil in North Africa and the Middle East prompted a surge in oil and gasoline prices early in the year, eroding households’ purchasing power and weighing on consumer confidence. The devastating earthquake and tsunami that struck northeastern Japan in March disrupted global manufacturing supply chains, particularly in the auto sector. Finally, the European debt crisis seemed to worsen once again as it became obvious that, sooner or later, Greece and possibly others would default on their sovereign debt.
The S&P 500 finished a volatile six months up 6.02%. Consumer and health care stocks led, while technology and materials shares lagged. Once again, mid-caps’ results did not follow traditional patterns but surpassed other categories, with large- and small-caps lagging. Over the past decade, mid-caps (as measured by the Russell Midcap Index) have returned 108%, besting small-caps (as measured by the Russell 2000), which have returned 84%, and large-caps (as measured by the S&P 500), which were up 31%.
PORTFOLIO REVIEW
Many of our holdings posted strong profit growth and recorded good stock gains in the period. As noted, however, investors proved most interested in the fastest-growing and most highly valued mid-cap companies. This was a “momentum” market, with investors crowding into a small number of highly valued stocks, an environment that typically does not favor our investment approach. In that sense, we were not surprised to lag our benchmarks in the period. We have also positioned the fund for modest but continued economic growth, and investors’ fears in May and early June that the economic recovery might be derailed weighed more on our results than we might have expected.
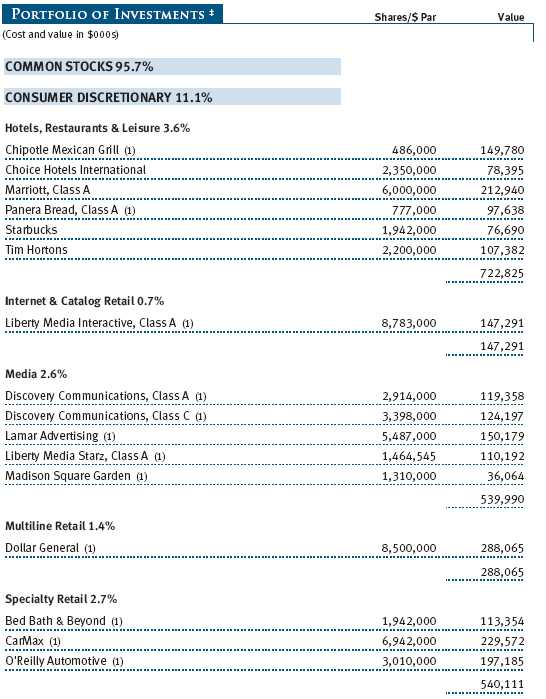
The consumer sector illustrated this pattern well. To be sure, we had a number of strong performers in the segment. Chipotle Mexican Grill was a top contributor for the fund as the fast-growing chain continued to generate superior sales and earnings gains. The stock has more than doubled over the past year—and has risen nearly tenfold off its bear market lows. Investors have also gravitated to retailers serving higher-end consumers, such as Coach and Whole Foods Markets. We trimmed our holdings in both companies as the stocks moved sharply higher. Investor enthusiasm for these companies has almost completely reversed from the deep pessimism when we added to them in 2009. In general, our decision to underweight the consumer sector weighed on our results in the period. However, we remain cautious on the sector as we believe further adjustment is necessary after the credit-induced binge of the middle of the last decade.
As infatuated as investors have become with high-end consumer stocks, they are increasingly skeptical about broad-based consumer spending. Marriott and Choice Hotels International performed poorly due to pessimism about leisure spending. Expedia and Lamar Advertising suffered from more-specific concerns. We share the worries over Expedia’s loss of market share and have sold our position. Conversely, we are maintaining our holdings in billboard operator Lamar, as we do not subscribe to the market’s view that the mobile Web will completely capture motorists’ attention. Traffic jams and the opportunity they present advertisers are likely to survive the Internet age.
Health care holdings performed well in the period, thanks both to investors’ interest in this historically defensive sector as well as some important advances by some of our companies. Valeant Pharmaceuticals International is executing a fast-moving strategy of acquiring products and companies and paring investment spending, which it views as having demonstrated a generally low return on investment. Sadly for the future of pharmaceutical innovation, it is probably right; this strategy is challenging the paradigm of drug development—very profitably for Valeant shareholders. We remain enthusiastic about the prospects for biotechnology firm Regeneron Pharmaceuticals, which does have a powerful drug development pipeline; better still, most of its costs are borne by its partner, pharmaceutical giant Sanofi-Aventis. Regeneron’s lead drug, which targets macular degeneration, is promising, and recently performed well in an important clinical trial, but we view it as only a precursor of the potential output from the company’s innovation engine in the years ahead.
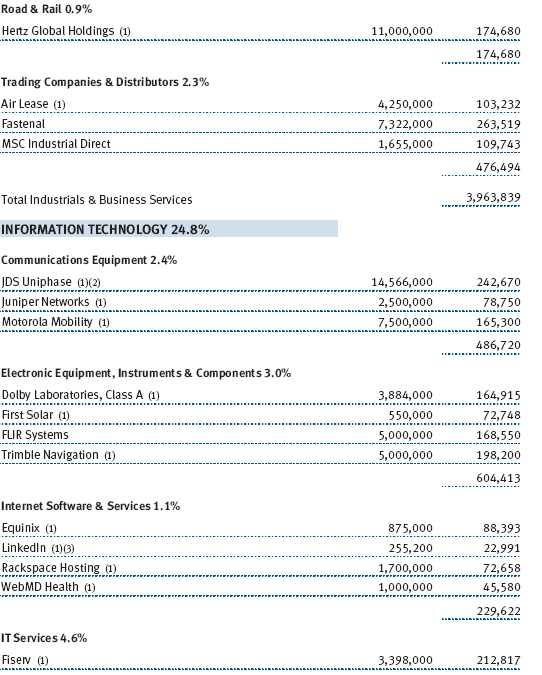
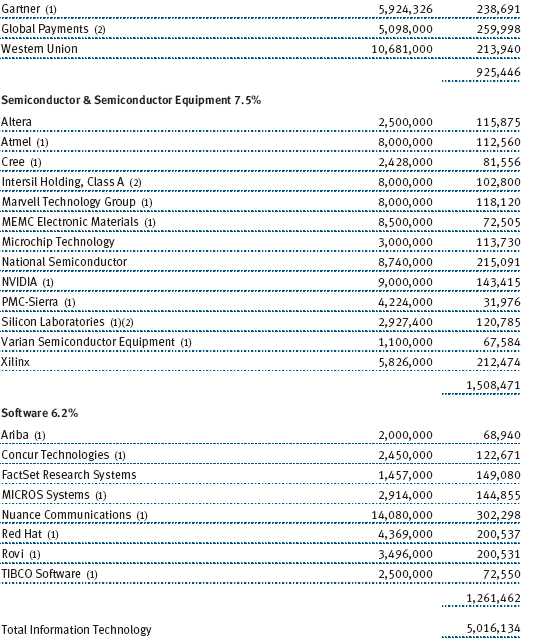
Technology stocks lagged the overall market in the first half of the year, but this important area of emphasis for the fund still had several good contributors during the period. National Semiconductor and Varian Semiconductor Equipment both accepted buyout offers at significant premiums. JDS Uniphase benefited from increased demand for testing equipment from telecommunications companies, although the shares pulled back late in the period following a huge run. The group also included some of our largest detractors, however. Shares of Marvell Technology Group, a semiconductor company, fell as investors fretted about the prospects for some of its largest customers. Cree, a designer and manufacturer of LED lighting, also fell precipitously as demand for its products paused and Chinese competitors muscled into its markets.
The industrials and business services sector is another area of traditional emphasis, and we experienced a similar range of results. Gardner Denver, which manufactures industrial compressors and other equipment, benefited in part from the weak dollar, which boosted its competitive position in overseas markets. Fastener distributor Fastenal also performed well as manufacturing activity continued to expand. With the labor market mired in the doldrums, however, our staffing holdings, Robert Half International and ManpowerGroup, weighed heavily on results.
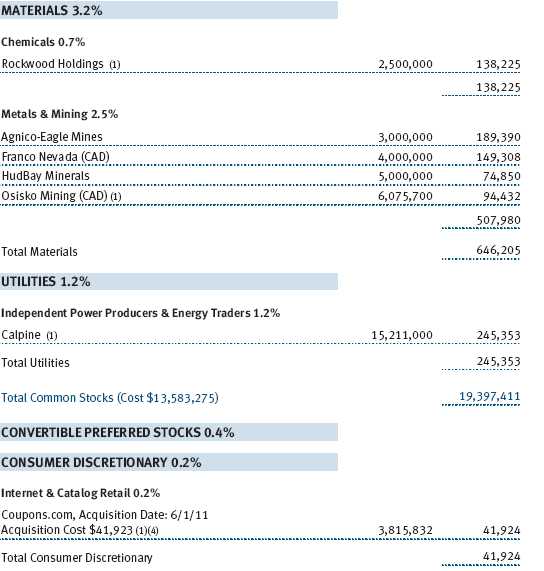
Materials and financials lagged in the period. We are significantly underweight in materials, but our few holdings in the sector performed poorly. Gold miner Agnico-Eagle Mines missed earnings, driven by higher-than-expected cash costs, but we believe the firm can grow production with its unique reserves located in more stable political environments. Canadian mining company Hudbay Minerals faced difficulty shipping its product to customers due to a lack of rail cars, but the company’s production growth has been strong and, unlike many competitors, it enjoys a stable political risk environment. Our few bank holdings weighed on results in the financials sector.
We rarely discuss small trades in our letter, but we passed a milestone recently that merits a mention for the way in which it illustrates our investment process. In early June, we sold our last remaining shares in industrial conglomerate Danaher, the last stock we had held continuously in the fund since its inception in 1992. Danaher was recommended for purchase by Bill Stromberg, an analyst who has since gone on to become our firm’s head of equities. In the years since, despite occasional minor setbacks, Danaher’s astute management team has successfully applied its lean manufacturing processes to an evolving portfolio of well-positioned and mostly industrial businesses, enabling it to become one of the top-performing companies in America. During the nearly 19 years we owned it in our Mid-Cap Growth Fund, Danaher stock generated a compounded annual return of over 20%. (Danaher’s contributions to the Advisor and R Class shares would have varied due to their differing inception dates.) Our long-term investment in Danaher demonstrates the investment potential mid-cap growth companies can offer patient investors. We believe Danaher’s prospects remain bright, but its valuation has moved it to more than twice the upper bound of what we would consider mid-cap.
Danaher’s legacy lives on in the fund, however. Over the years, we have come to appreciate the deep management that has driven Danaher’s success, and when one executive left to lead IDEX, a machinery firm much earlier in its life cycle, we noticed. After researching the company in considerable detail and evaluating IDEX management’s strategy, we initiated a position, which has performed well. Similarly, our interest in machinery firm Gardner Denver, mentioned earlier, was driven by the arrival of a new CEO, another Danaher alumnus, in 2008. While Danaher’s performance for the fund was remarkable and it would be unrealistic to expect either company, or other holdings, to mirror Danaher’s success, identifying great companies early in their life cycles and sticking with them remains a core tenet of T. Rowe Price’s growth stock investing strategy.
INVESTMENT STRATEGY AND OUTLOOK
Although we have a long-term horizon when making investment decisions, our perspective on the markets inevitably has both short- and long-term components. From a shorter-term perspective, we share much of the discomfort that has unsettled investors since late spring. The recent downturn in the labor market has been particularly disappointing and may threaten the near-term profitability of many of our holdings, particularly those serving the consumer. We are struck by the bifurcation in the consumer sector, where high-end retailers are flourishing while mass market retailers are struggling. Our sense is that this is anomalous and unsustainable longer term and that retailers such as Dollar General will eventually recover alongside the fortunes of their shoppers. In the meantime, however, we are keeping a close eye on whether the consumer will be able to gain traction amid high gasoline prices, low real estate prices, and other challenges.
From a longer-term perspective, we are mindful that the recent “soft patch” is entirely to be expected. As we have noted since our first letters following the financial crisis, shocks to the system of the magnitude of 2008 have reverberations that last for years. Most recently, Japan suffered almost two “lost decades” following the collapse of its real estate bubble in the early 1990s. Forceful monetary and fiscal stimulus following the Lehman Brothers collapse in the fall of 2008 probably helped the U.S. avoid repeating the depth of Japan’s downturn, but we are in the midst of a similar long-term adjustment period in the wake of a massive credit bubble. Consumers have made only partial progress in reducing debt levels, while the federal government has made none. Global imbalances persist, with the Chinese producing and saving too much, enabling overconsumption in the U.S. and other developed economies.
Although we suspect the U.S. economy is in the middle of its own disoriented—if not truly “lost”—decade, we are optimistic that the economy will emerge healthier and that good opportunities await patient investors. We remain particularly interested in the beginnings of the manufacturing revival that seems to be taking hold, as stretched supply lines and the cheap dollar encourage global firms to relocate production to the U.S. and to seek domestic suppliers. We also remain interested in the potential for new technologies to create competitive advantages for firms nimble enough to seize them. Finally, we are encouraged that valuations in our market remain reasonable overall, due in part to the shorter-term worries that have periodically disrupted the market’s recovery over the past year.
Respectfully submitted,

Brian W.H. Berghuis
President of the fund and chairman of its Investment Advisory Committee

John F. Wakeman
Executive vice president of the fund
July 21, 2011
The committee chairman has day-to-day responsibility for managing the portfolio and works with committee members in developing and executing the fund’s investment program.
RISKS OF STOCK INVESTING
As with all stock and bond mutual funds, the fund’s share price can fall because of weakness in the stock or bond markets, a particular industry, or specific holdings. The financial markets can decline for many reasons, including adverse political or economic developments, changes in investor psychology, or heavy institutional selling. The prospects for an industry or company may deteriorate because of a variety of factors, including disappointing earnings or changes in the competitive environment. In addition, the investment manager’s assessment of companies held in a fund may prove incorrect, resulting in losses or poor performance even in rising markets. The stocks of mid-cap companies entail greater risk and are usually more volatile than the shares of larger companies. In addition, growth stocks can be volatile for several reasons. Since they usually reinvest a high proportion of earnings in their own businesses, they may lack the dividends usually associated with value stocks that can cushion their decline in a falling market. Also, since investors buy these stocks because of their expected superior earnings growth, earnings disappointments often result in sharp price declines.
GLOSSARY
Lipper indexes: Fund benchmarks that consist of a small number of the largest mutual funds in a particular category as tracked by Lipper Inc.
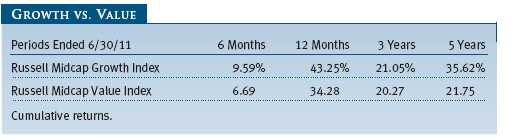
Russell Midcap Growth Index: An unmanaged index that measures the performance of those Russell Midcap companies with higher price-to-book ratios and higher forecasted growth values.
Russell Midcap Value Index: An unmanaged index that measures the performance of those Russell Midcap companies with lower price-to-book ratios and lower forecasted growth values.
S&P 500 Stock Index: An unmanaged index that tracks the stocks of 500 primarily large-cap U.S. companies.
S&P MidCap 400 Index: An unmanaged index that tracks the stocks of 400 U.S. mid-cap companies.
Performance and Expenses
| GROWTH OF $10,000 |
This chart shows the value of a hypothetical $10,000 investment in the fund over the past 10 fiscal year periods or since inception (for funds lacking 10-year records). The result is compared with benchmarks, which may include a broad-based market index and a peer group average or index. Market indexes do not include expenses, which are deducted from fund returns as well as mutual fund averages and indexes.
| FUND EXPENSE EXAMPLE |
As a mutual fund shareholder, you may incur two types of costs: (1) transaction costs, such as redemption fees or sales loads, and (2) ongoing costs, including management fees, distribution and service (12b-1) fees, and other fund expenses. The following example is intended to help you understand your ongoing costs (in dollars) of investing in the fund and to compare these costs with the ongoing costs of investing in other mutual funds. The example is based on an investment of $1,000 invested at the beginning of the most recent six-month period and held for the entire period.
Please note that the fund has three share classes: The original share class (“investor class”) charges no distribution and service (12b-1) fee, Advisor Class shares are offered only through unaffiliated brokers and other financial intermediaries and charge a 0.25% 12b-1 fee, and R Class shares are available to retirement plans serviced by intermediaries and charge a 0.50% 12b-1 fee. Each share class is presented separately in the table.
Actual Expenses
The first line of the following table (“Actual”) provides information about actual account values and expenses based on the fund’s actual returns. You may use the information on this line, together with your account balance, to estimate the expenses that you paid over the period. Simply divide your account value by $1,000 (for example, an $8,600 account value divided by $1,000 = 8.6), then multiply the result by the number on the first line under the heading “Expenses Paid During Period” to estimate the expenses you paid on your account during this period.
Hypothetical Example for Comparison Purposes
The information on the second line of the table (“Hypothetical”) is based on hypothetical account values and expenses derived from the fund’s actual expense ratio and an assumed 5% per year rate of return before expenses (not the fund’s actual return). You may compare the ongoing costs of investing in the fund with other funds by contrasting this 5% hypothetical example and the 5% hypothetical examples that appear in the shareholder reports of the other funds. The hypothetical account values and expenses may not be used to estimate the actual ending account balance or expenses you paid for the period.
Note: T. Rowe Price charges an annual account service fee of $20, generally for accounts with less than $10,000 ($1,000 for UGMA/UTMA). The fee is waived for any investor whose T. Rowe Price mutual fund accounts total $50,000 or more; accounts employing automatic investing; accounts electing to receive electronic delivery of account statements, transaction confirmations, and prospectuses and shareholder reports; accounts of an investor who is a T. Rowe Price Preferred Services, Personal Services, or Enhanced Personal Services client (enrollment in these programs generally requires T. Rowe Price assets of at least $100,000); and IRAs and other retirement plan accounts that utilize a prototype plan sponsored by T. Rowe Price (although a separate custodial or administrative fee may apply to such accounts). This fee is not included in the accompanying table. If you are subject to the fee, keep it in mind when you are estimating the ongoing expenses of investing in the fund and when comparing the expenses of this fund with other funds.
You should also be aware that the expenses shown in the table highlight only your ongoing costs and do not reflect any transaction costs, such as redemption fees or sales loads. Therefore, the second line of the table is useful in comparing ongoing costs only and will not help you determine the relative total costs of owning different funds. To the extent a fund charges transaction costs, however, the total cost of owning that fund is higher.
Unaudited
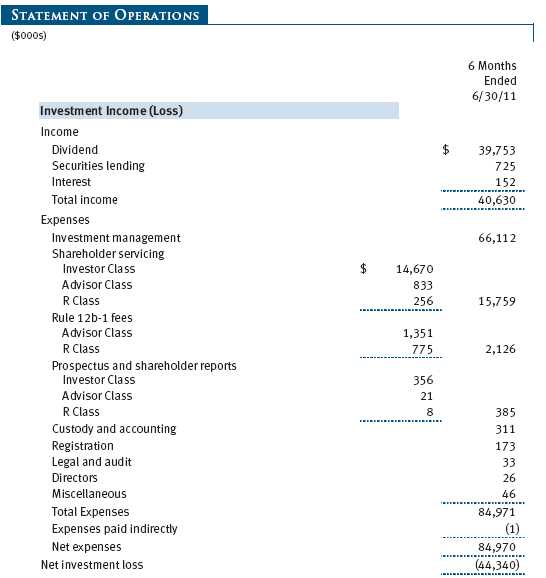
The accompanying notes are an integral part of these financial statements.
Unaudited
The accompanying notes are an integral part of these financial statements.
Unaudited
The accompanying notes are an integral part of these financial statements.
Unaudited
The accompanying notes are an integral part of these financial statements.
Unaudited
The accompanying notes are an integral part of these financial statements.
Unaudited
The accompanying notes are an integral part of these financial statements.
Unaudited
The accompanying notes are an integral part of these financial statements.
Unaudited
| NOTES TO FINANCIAL STATEMENTS |
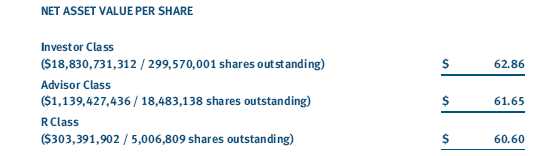
T. Rowe Price Mid-Cap Growth Fund, Inc. (the fund), is registered under the Investment Company Act of 1940 (the 1940 Act) as a diversified, open-end management investment company. The fund seeks to provide long-term capital appreciation by investing in mid-cap stocks with potential for above-average earnings growth. The fund has three classes of shares: the Mid-Cap Growth Fund original share class, referred to in this report as the Investor Class, offered since June 30, 1992; the Mid-Cap Growth Fund—Advisor Class (Advisor Class), offered since March 31, 2000; and the Mid-Cap Growth Fund—R Class (R Class), offered since September 30, 2002. Advisor Class shares are sold only through unaffiliated brokers and other unaffiliated financial intermediaries, and R Class shares are available to retirement plans serviced by intermediaries. The Advisor Class and R Class each operate under separate Board-approved Rule 12b-1 plans, pursuant to which each class compensates financial intermediaries for distribution, shareholder servicing, and/or certain administrative services. Each class has exclusive voting rights on matters related solely to that class; separate voting rights on matters that relate to all classes; and, in all other respects, the same rights and obligations as the other classes.
NOTE 1 - SIGNIFICANT ACCOUNTING POLICIES
Basis of Preparation The accompanying financial statements were prepared in accordance with accounting principles generally accepted in the United States of America (GAAP), which require the use of estimates made by management. Management believes that estimates and valuations are appropriate; however, actual results may differ from those estimates, and the valuations reflected in the accompanying financial statements may differ from the value ultimately realized upon sale or maturity.
Investment Transactions, Investment Income, and Distributions Income and expenses are recorded on the accrual basis. Premiums and discounts on debt securities are amortized for financial reporting purposes. Dividends received from mutual fund investments are reflected as dividend income; capital gain distributions are reflected as realized gain/loss. Dividend income and capital gain distributions are recorded on the ex-dividend date. Income tax-related interest and penalties, if incurred, would be recorded as income tax expense. Investment transactions are accounted for on the trade date. Realized gains and losses are reported on the identified cost basis. Distributions to shareholders are recorded on the ex-dividend date. Income distributions are declared and paid by each class annually. Capital gain distributions, if any, are generally declared and paid by the fund annually.
Currency Translation Assets, including investments, and liabilities denominated in foreign currencies are translated into U.S. dollar values each day at the prevailing exchange rate, using the mean of the bid and asked prices of such currencies against U.S. dollars as quoted by a major bank. Purchases and sales of securities, income, and expenses are translated into U.S. dollars at the prevailing exchange rate on the date of the transaction. The effect of changes in foreign currency exchange rates on realized and unrealized security gains and losses is reflected as a component of security gains and losses.
Class Accounting The Advisor Class and R Class each pay distribution, shareholder servicing, and/or certain administrative expenses in the form of Rule 12b-1 fees, in an amount not exceeding 0.25% and 0.50%, respectively, of the class’s average daily net assets. Shareholder servicing, prospectus, and shareholder report expenses incurred by each class are charged directly to the class to which they relate. Expenses common to all classes, investment income, and realized and unrealized gains and losses are allocated to the classes based upon the relative daily net assets of each class.
Rebates and Credits Subject to best execution, the fund may direct certain security trades to brokers who have agreed to rebate a portion of the related brokerage commission to the fund in cash. Commission rebates are reflected as realized gain on securities in the accompanying financial statements and totaled $268,000 for the six months ended June 30, 2011. Additionally, the fund earns credits on temporarily uninvested cash balances held at the custodian, which reduce the fund’s custody charges. Custody expense in the accompanying financial statements is presented before reduction for credits, which are reflected as expenses paid indirectly.
In-Kind Redemptions In accordance with guidelines described in the fund’s prospectus, the fund may distribute portfolio securities rather than cash as payment for a redemption of fund shares (in-kind redemption). For financial reporting purposes, the fund recognizes a gain on in-kind redemptions to the extent the value of the distributed securities on the date of redemption exceeds the cost of those securities. Gains and losses realized on in-kind redemptions are not recognized for tax purposes and are reclassified from undistributed realized gain (loss) to paid-in capital. During the six months ended June 30, 2011, the fund realized $486,441,000 of net gain on $993,761,000 of in-kind redemptions.
NOTE 2 - VALUATION
The fund’s financial instruments are reported at fair value as defined by GAAP. The fund determines the values of its assets and liabilities and computes each class’s net asset value per share at the close of the New York Stock Exchange (NYSE), normally 4 p.m. ET, each day that the NYSE is open for business.
Valuation Methods Equity securities listed or regularly traded on a securities exchange or in the over-the-counter (OTC) market are valued at the last quoted sale price or, for certain markets, the official closing price at the time the valuations are made, except for OTC Bulletin Board securities, which are valued at the mean of the latest bid and asked prices. A security that is listed or traded on more than one exchange is valued at the quotation on the exchange determined to be the primary market for such security. Listed securities not traded on a particular day are valued at the mean of the latest bid and asked prices for domestic securities and the last quoted sale price for international securities.
Debt securities are generally traded in the OTC market. Securities with remaining maturities of one year or more at the time of acquisition are valued at prices furnished by dealers who make markets in such securities or by an independent pricing service, which considers the yield or price of bonds of comparable quality, coupon, maturity, and type, as well as prices quoted by dealers who make markets in such securities. Securities with remaining maturities of less than one year at the time of acquisition generally use amortized cost in local currency to approximate fair value. However, if amortized cost is deemed not to reflect fair value or the fund holds a significant amount of such securities with remaining maturities of more than 60 days, the securities are valued at prices furnished by dealers who make markets in such securities or by an independent pricing service.
Investments in mutual funds are valued at the mutual fund’s closing net asset value per share on the day of valuation.
Other investments, including restricted securities, and those financial instruments for which the above valuation procedures are inappropriate or are deemed not to reflect fair value are stated at fair value as determined in good faith by the T. Rowe Price Valuation Committee, established by the fund’s Board of Directors.
For valuation purposes, the last quoted prices of non-U.S. equity securities may be adjusted under the circumstances described below. If the fund determines that developments between the close of a foreign market and the close of the NYSE will, in its judgment, materially affect the value of some or all of its portfolio securities, the fund will adjust the previous closing prices to reflect what it believes to be the fair value of the securities as of the close of the NYSE. In deciding whether it is necessary to adjust closing prices to reflect fair value, the fund reviews a variety of factors, including developments in foreign markets, the performance of U.S. securities markets, and the performance of instruments trading in U.S. markets that represent foreign securities and baskets of foreign securities. A fund may also fair value securities in other situations, such as when a particular foreign market is closed but the fund is open. The fund uses outside pricing services to provide it with closing prices and information to evaluate and/or adjust those prices. The fund cannot predict how often it will use closing prices and how often it will determine it necessary to adjust those prices to reflect fair value. As a means of evaluating its security valuation process, the fund routinely compares closing prices, the next day’s opening prices in the same markets, and adjusted prices.
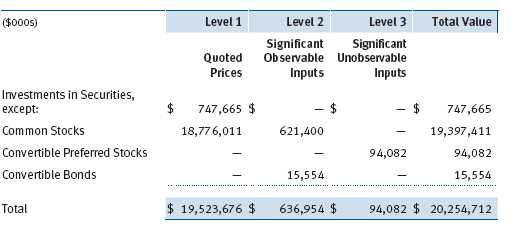
Valuation Inputs Various inputs are used to determine the value of the fund’s financial instruments. These inputs are summarized in the three broad levels listed below:
Level 1 – quoted prices in active markets for identical financial instruments
Level 2 – observable inputs other than Level 1 quoted prices (including, but not limited to, quoted prices for similar financial instruments, interest rates, prepayment speeds, and credit risk)
Level 3 – unobservable inputs
Observable inputs are those based on market data obtained from sources independent of the fund, and unobservable inputs reflect the fund’s own assumptions based on the best information available. The input levels are not necessarily an indication of the risk or liquidity associated with financial instruments at that level. For example, non-U.S. equity securities actively traded in foreign markets generally are reflected in Level 2 despite the availability of closing prices because the fund evaluates and determines whether those closing prices reflect fair value at the close of the NYSE or require adjustment, as described above. The following table summarizes the fund’s financial instruments, based on the inputs used to determine their values on June 30, 2011:
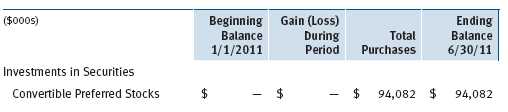
Following is a reconciliation of the fund’s Level 3 holdings for the six months ended June 30, 2011. Gain (loss) reflects both realized and change in unrealized gain (loss) on Level 3 holdings during the period, if any, and is included on the accompanying Statement of Operations. The change in unrealized gain (loss) on Level 3 instruments held at June 30, 2011, totaled $0 for the six months ended June 30, 2011.
NOTE 3 - OTHER INVESTMENT TRANSACTIONS
Consistent with its investment objective, the fund engages in the following practices to manage exposure to certain risks and/or to enhance performance. The investment objective, policies, program, and risk factors of the fund are described more fully in the fund’s prospectus and Statement of Additional Information.
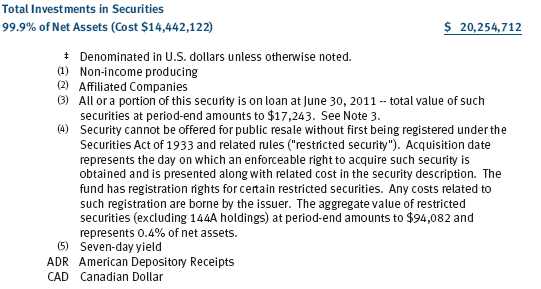
Restricted Securities The fund may invest in securities that are subject to legal or contractual restrictions on resale. Prompt sale of such securities at an acceptable price may be difficult and may involve substantial delays and additional costs.
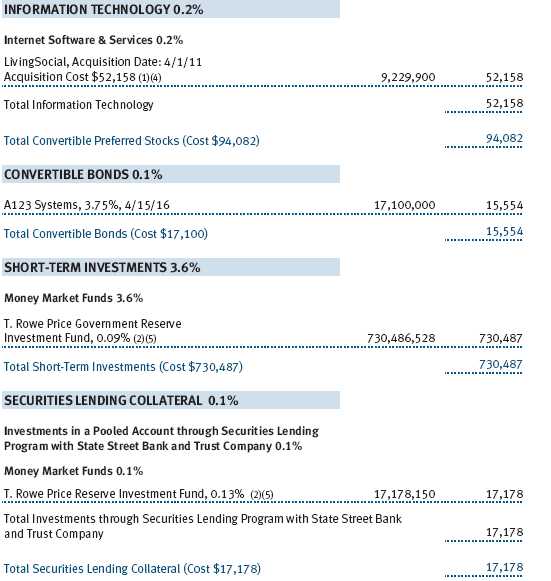
Securities Lending The fund lends its securities to approved brokers to earn additional income. It receives as collateral cash and U.S. government securities valued at 102% to 105% of the value of the securities on loan. Cash collateral is invested by the fund’s lending agent(s) in accordance with investment guidelines approved by management. Although risk is mitigated by the collateral, the fund could experience a delay in recovering its securities and a possible loss of income or value if the borrower fails to return the securities or if collateral investments decline in value. Securities lending revenue recognized by the fund consists of earnings on invested collateral and borrowing fees, net of any rebates to the borrower and compensation to the lending agent. In accordance with GAAP, investments made with cash collateral are reflected in the accompanying financial statements, but collateral received in the form of securities are not. On June 30, 2011, the value of loaned securities was $17,243,000 and cash collateral investments totaled $17,178,000.
American and Global Depository Receipts The fund may invest in American Depository Receipts (ADRs) and/or Global Depository Receipts (GDRs), certificates issued by U.S. and international banks that represent ownership of foreign securities held by the issuing bank. ADRs and GDRs are transferable, trade on established markets, and entitle the holder to all dividends and capital gains paid by the underlying foreign security. Issuing banks generally charge a security administration fee; there were no such fees for the six months ended June 30, 2011.
Other Purchases and sales of portfolio securities other than short-term securities aggregated $3,588,752,000 and $5,000,093,000, respectively, for the six months ended June 30, 2011.
NOTE 4 - FEDERAL INCOME TAXES
No provision for federal income taxes is required since the fund intends to continue to qualify as a regulated investment company under Subchapter M of the Internal Revenue Code and distribute to shareholders all of its taxable income and gains. Distributions determined in accordance with federal income tax regulations may differ in amount or character from net investment income and realized gains for financial reporting purposes. Financial reporting records are adjusted for permanent book/tax differences to reflect tax character but are not adjusted for temporary differences. The amount and character of tax-basis distributions and composition of net assets are finalized at fiscal year-end; accordingly, tax-basis balances have not been determined as of the date of this report.
In accordance with federal tax regulations, the fund recognized capital losses in the current period for tax purposes that had been recognized in the prior fiscal year for financial reporting purposes. Such deferrals relate to net capital losses realized between November 1, 2010 and December 31, 2010, and totaled $3,333,000.
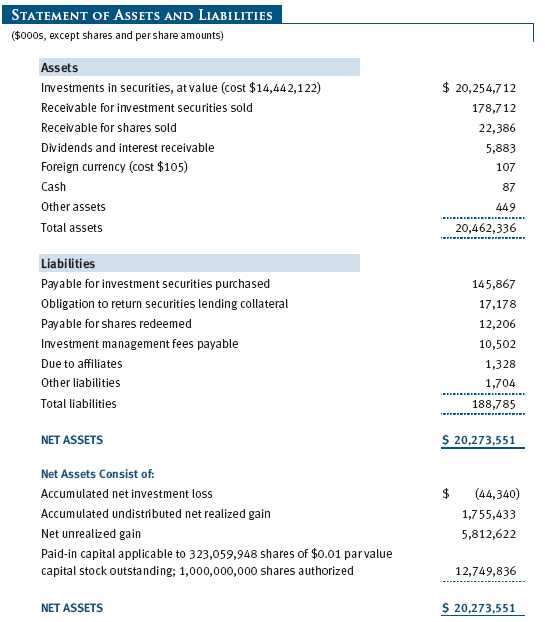
At June 30, 2011, the cost of investments for federal income tax purposes was $14,442,122,000. Net unrealized gain aggregated $5,812,622,000 at period-end, of which $6,150,495,000 related to appreciated investments and $337,873,000 related to depreciated investments.
NOTE 5 - RELATED PARTY TRANSACTIONS
The fund is managed by T. Rowe Price Associates, Inc. (Price Associates), a wholly owned subsidiary of T. Rowe Price Group, Inc. (Price Group). The investment management agreement between the fund and Price Associates provides for an annual investment management fee, which is computed daily and paid monthly. The fee consists of an individual fund fee and a group fee. The individual fund fee is equal to 0.35% of the fund’s average daily net assets up to $15 billion and 0.30% of the fund’s average daily net assets in excess of $15 billion. The group fee rate is calculated based on the combined net assets of certain mutual funds sponsored by Price Associates (the group) applied to a graduated fee schedule, with rates ranging from 0.48% for the first $1 billion of assets to 0.28% for assets in excess of $300 billion. The fund’s group fee is determined by applying the group fee rate to the fund’s average daily net assets. At June 30, 2011, the effective annual group fee rate was 0.30%.
In addition, the fund has entered into service agreements with Price Associates and two wholly owned subsidiaries of Price Associates (collectively, Price). Price Associates computes the daily share prices and provides certain other administrative services to the fund. T. Rowe Price Services, Inc., provides shareholder and administrative services in its capacity as the fund’s transfer and dividend disbursing agent. T. Rowe Price Retirement Plan Services, Inc., provides subaccounting and recordkeeping services for certain retirement accounts invested in the Investor Class and R Class. For the six months ended June 30, 2011, expenses incurred pursuant to these service agreements were $62,000 for Price Associates; $1,595,000 for T. Rowe Price Services, Inc.; and $4,117,000 for T. Rowe Price Retirement Plan Services, Inc. The total amount payable at period-end pursuant to these service agreements is reflected as Due to Affiliates in the accompanying financial statements.
Additionally, the fund is one of several mutual funds in which certain college savings plans managed by Price Associates may invest. As approved by the fund’s Board of Directors, shareholder servicing costs associated with each college savings plan are borne by the fund in proportion to the average daily value of its shares owned by the college savings plan. For the six months ended June 30, 2011, the fund was charged $92,000 for shareholder servicing costs related to the college savings plans, of which $76,000 was for services provided by Price. The amount payable at period-end pursuant to this agreement is reflected as Due to Affiliates in the accompanying financial statements. At June 30, 2011, approximately 1% of the outstanding shares of the Investor Class were held by college savings plans.
The fund is also one of several mutual funds sponsored by Price Associates (underlying Price funds) in which the T. Rowe Price Spectrum Funds (Spectrum Funds) and T. Rowe Price Retirement Funds (Retirement Funds) may invest. Neither the Spectrum Funds nor the Retirement Funds invest in the underlying Price funds for the purpose of exercising management or control. Pursuant to separate special servicing agreements, expenses associated with the operation of the Spectrum and Retirement Funds are borne by each underlying Price fund to the extent of estimated savings to it and in proportion to the average daily value of its shares owned by the Spectrum and Retirement Funds, respectively. Expenses allocated under these agreements are reflected as shareholder servicing expenses in the accompanying financial statements. For the six months ended June 30, 2011, the fund was allocated $89,000 of Spectrum Funds’ expenses and $2,041,000 of Retirement Funds’ expenses. Of these amounts, $1,230,000 related to services provided by Price. The amount payable at period-end pursuant to this agreement is reflected as Due to Affiliates in the accompanying financial statements. At June 30, 2011, approximately 1% of the outstanding shares of the Investor Class were held by the Spectrum Funds and 10% were held by the Retirement Funds.
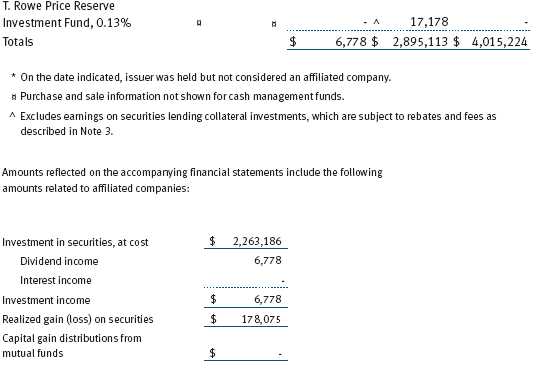
The fund may invest in the T. Rowe Price Reserve Investment Fund and the T. Rowe Price Government Reserve Investment Fund (collectively, the T. Rowe Price Reserve Investment Funds), open-end management investment companies managed by Price Associates and considered affiliates of the fund. The T. Rowe Price Reserve Investment Funds are offered as cash management options to mutual funds, trusts, and other accounts managed by Price Associates and/or its affiliates and are not available for direct purchase by members of the public. The T. Rowe Price Reserve Investment Funds pay no investment management fees.
| INFORMATION ON PROXY VOTING POLICIES, PROCEDURES, AND RECORDS |
A description of the policies and procedures used by T. Rowe Price funds and portfolios to determine how to vote proxies relating to portfolio securities is available in each fund’s Statement of Additional Information, which you may request by calling 1-800-225-5132 or by accessing the SEC’s website, sec.gov. The description of our proxy voting policies and procedures is also available on our website, troweprice.com. To access it, click on the words “Our Company” at the top of our corporate homepage. Then, when the next page appears, click on the words “Proxy Voting Policies” on the left side of the page.
Each fund’s most recent annual proxy voting record is available on our website and through the SEC’s website. To access it through our website, follow the directions above, then click on the words “Proxy Voting Records” on the right side of the Proxy Voting Policies page.
| HOW TO OBTAIN QUARTERLY PORTFOLIO HOLDINGS |
The fund files a complete schedule of portfolio holdings with the Securities and Exchange Commission for the first and third quarters of each fiscal year on Form N-Q. The fund’s Form N-Q is available electronically on the SEC’s website (sec.gov); hard copies may be reviewed and copied at the SEC’s Public Reference Room, 450 Fifth St. N.W., Washington, DC 20549. For more information on the Public Reference Room, call 1-800-SEC-0330.
| APPROVAL OF INVESTMENT MANAGEMENT AGREEMENT |
On March 9, 2011, the fund’s Board of Directors (Board) unanimously approved the continuation of the investment advisory contract (Contract) between the fund and its investment advisor, T. Rowe Price Associates, Inc. (Advisor). The Board considered a variety of factors in connection with its review of the Contract, also taking into account information provided by the Advisor during the course of the year, as discussed below:
Services Provided by the Advisor
The Board considered the nature, quality, and extent of the services provided to the fund by the Advisor. These services included, but were not limited to, management of the fund’s portfolio and a variety of related activities, as well as financial and administrative services, reporting, and communications. The Board also reviewed the background and experience of the Advisor’s senior management team and investment personnel involved in the management of the fund. The Board concluded that it was satisfied with the nature, quality, and extent of the services provided by the Advisor.
Investment Performance of the Fund
The Board reviewed the fund’s average annual total returns over the 1-, 3-, 5-, and 10-year periods, as well as the fund’s year-by-year returns, and compared these returns with a wide variety of previously agreed upon comparable performance measures and market data, including those supplied by Lipper and Morningstar, which are independent providers of mutual fund data. On the basis of this evaluation and the Board’s ongoing review of investment results, and factoring in the relative market conditions during certain of the performance periods, the Board concluded that the fund’s performance was satisfactory.
Costs, Benefits, Profits, and Economies of Scale
The Board reviewed detailed information regarding the revenues received by the Advisor under the Contract and other benefits that the Advisor (and its affiliates) may have realized from its relationship with the fund, including research received under “soft dollar” agreements and commission-sharing arrangements with broker-dealers. The Board considered that the Advisor may receive some benefit from soft-dollar arrangements pursuant to which research is received from broker-dealers that execute the applicable fund’s portfolio transactions. The Board also received information on the estimated costs incurred and profits realized by the Advisor and its affiliates from advising T. Rowe Price mutual funds, as well as estimates of the gross profits realized from managing the fund in particular. The Board concluded that the Advisor’s profits were reasonable in light of the services provided to the fund. The Board also considered whether the fund or other funds benefit under the fee levels set forth in the Contract from any economies of scale realized by the Advisor. Under the Contract, the fund pays a fee to the Advisor composed of two components—a group fee rate based on the aggregate assets of certain T. Rowe Price mutual funds (including the fund) that declines at certain asset levels and an individual fund fee rate that is assessed on the assets of the fund. The Board determined that it would be appropriate to introduce another breakpoint into the group fee rate, effective May 1, 2011, to allow fund shareholders to participate in additional economies of scale. The Board concluded that the advisory fee structure for the fund continued to provide for a reasonable sharing of benefits from any economies of scale with the fund’s investors.
Fees
The Board reviewed the fund’s management fee rate, operating expenses, and total expense ratio (for the Investor Class, Advisor Class, and R Class) and compared them with fees and expenses of other comparable funds based on information and data supplied by Lipper. The information provided to the Board indicated that the fund’s management fee rate was at or below the median for comparable funds. The information also indicated that the total expense ratio for the Investor Class and Advisor Class was below the median for comparable funds, and the total expense ratio for the R Class was above the median for comparable funds. The Board also reviewed the fee schedules for institutional accounts of the Advisor and its affiliates with similar mandates. Management provided the Board with information about the Advisor’s responsibilities and services provided to institutional account clients, which are more limited than its responsibilities for the fund and other T. Rowe Price mutual funds that it advises, and showing that the Advisor performs significant additional services and assumes greater risk for the fund and other T. Rowe Price mutual funds that it advises than it does for institutional account clients. On the basis of the information provided, the Board concluded that the fees paid by the fund under the Contract were reasonable.
Approval of the Contract
As noted, the Board approved the continuation of the Contract. No single factor was considered in isolation or to be determinative to the decision. Rather, the Board was assisted by the advice of independent legal counsel and concluded, in light of a weighting and balancing of all factors considered, that it was in the best interests of the fund to approve the continuation of the Contract (including the fees to be charged for services thereunder).
Item 2. Code of Ethics.
A code of ethics, as defined in Item 2 of Form N-CSR, applicable to its principal executive officer, principal financial officer, principal accounting officer or controller, or persons performing similar functions is filed as an exhibit to the registrant’s annual Form N-CSR. No substantive amendments were approved or waivers were granted to this code of ethics during the registrant’s most recent fiscal half-year.
Item 3. Audit Committee Financial Expert.
Disclosure required in registrant’s annual Form N-CSR.
Item 4. Principal Accountant Fees and Services.
Disclosure required in registrant’s annual Form N-CSR.
Item 5. Audit Committee of Listed Registrants.
Not applicable.
Item 6. Investments.
(a) Not applicable. The complete schedule of investments is included in Item 1 of this Form N-CSR.
(b) Not applicable.
Item 7. Disclosure of Proxy Voting Policies and Procedures for Closed-End Management Investment Companies.
Not applicable.
Item 8. Portfolio Managers of Closed-End Management Investment Companies.
Not applicable.
Item 9. Purchases of Equity Securities by Closed-End Management Investment Company and Affiliated Purchasers.
Not applicable.
Item 10. Submission of Matters to a Vote of Security Holders.
Not applicable.
Item 11. Controls and Procedures.
(a) The registrant’s principal executive officer and principal financial officer have evaluated the registrant’s disclosure controls and procedures within 90 days of this filing and have concluded that the registrant’s disclosure controls and procedures were effective, as of that date, in ensuring that information required to be disclosed by the registrant in this Form N-CSR was recorded, processed, summarized, and reported timely.
(b) The registrant’s principal executive officer and principal financial officer are aware of no change in the registrant’s internal control over financial reporting that occurred during the registrant’s second fiscal quarter covered by this report that has materially affected, or is reasonably likely to materially affect, the registrant’s internal control over financial reporting.
Item 12. Exhibits.
(a)(1) The registrant’s code of ethics pursuant to Item 2 of Form N-CSR is filed with the registrant’s annual Form N-CSR.
(2) Separate certifications by the registrant's principal executive officer and principal financial officer, pursuant to Section 302 of the Sarbanes-Oxley Act of 2002 and required by Rule 30a-2(a) under the Investment Company Act of 1940, are attached.
(3) Written solicitation to repurchase securities issued by closed-end companies: not applicable.
(b) A certification by the registrant's principal executive officer and principal financial officer, pursuant to Section 906 of the Sarbanes-Oxley Act of 2002 and required by Rule 30a-2(b) under the Investment Company Act of 1940, is attached.
SIGNATURES | |
| Pursuant to the requirements of the Securities Exchange Act of 1934 and the Investment | |
| Company Act of 1940, the registrant has duly caused this report to be signed on its behalf by the | |
| undersigned, thereunto duly authorized. | |
| T. Rowe Price Mid-Cap Growth Fund, Inc. | |
| By | /s/ Edward C. Bernard |
| Edward C. Bernard | |
| Principal Executive Officer | |
| Date | August 17, 2011 |
| Pursuant to the requirements of the Securities Exchange Act of 1934 and the Investment | |
| Company Act of 1940, this report has been signed below by the following persons on behalf of | |
| the registrant and in the capacities and on the dates indicated. | |
| By | /s/ Edward C. Bernard |
| Edward C. Bernard | |
| Principal Executive Officer | |
| Date | August 17, 2011 |
| By | /s/ Gregory K. Hinkle |
| Gregory K. Hinkle | |
| Principal Financial Officer | |
| Date | August 17, 2011 |