UNITED STATES
SECURITIES AND EXCHANGE COMMISSION
Washington, D.C. 20549
FORM N-CSR
CERTIFIED SHAREHOLDER REPORT OF REGISTERED
MANAGEMENT INVESTMENT COMPANIES
Investment Company Act File Number: 811-06650
Lord abbett research fund, inc.
(Exact name of Registrant as specified in charter)
90 Hudson Street, Jersey City, NJ 07302
(Address of principal executive offices) (Zip code)
John T. Fitzgerald, Esq., Vice President & Assistant Secretary
90 Hudson Street, Jersey City, NJ 07302
(Name and address of agent for service)
Registrant’s telephone number, including area code:(888) 522-2388
Date of fiscal year end: 11/30
Date of reporting period: 11/30/2019
| Item 1: | Report(s) to Shareholders. |

LORD ABBETT
ANNUAL REPORT
Lord Abbett
Calibrated Dividend Growth Fund
Growth Opportunities Fund
Small Cap Value Fund
For the fiscal year ended November 30, 2019
Important Information on Paperless Delivery
Beginning in January 2021, as permitted by regulations adopted by the Securities and Exchange Commission, paper copies of each Fund’s shareholder reports like this one will no longer be sent by mail, unless you specifically request paper copies of the reports from the Fund or from your financial intermediary, such as a broker-dealer, investment advisor or bank. Instead, the reports will be made available on Lord Abbett’s website and you will be notified by mail each time a report is posted and provided with a website link to access the report.
If you already elected to receive shareholder reports electronically, you will not be affected by this change and you need not take any action. Shareholders who hold accounts directly with a Fund may elect to receive shareholder reports and other communications from the Fund electronically by signing into your Lord Abbett online account at lordabbett.com and selecting “Log In.” For further information, you may also contact the Funds at (800) 821-5129. Shareholders who hold accounts through a financial intermediary should contact them directly.
You may elect to receive all future reports in paper free of charge by contacting a Fund at (800) 821-5129. Your election to receive reports in paper will apply to all funds held with Lord Abbett. If your fund shares are held through a financial intermediary please contact them directly. Your election applies to all funds held with that intermediary.
Table of Contents
Lord Abbett Research Fund
Lord Abbett Calibrated Dividend Growth Fund,
Lord Abbett Growth Opportunities Fund,
Lord Abbett Small Cap Value Fund
Annual Report
For the fiscal year ended November 30, 2019

From left to right: James L.L. Tullis, Independent Chairman of the Lord Abbett Funds and Douglas B. Sieg Director, President, and Chief Executive Officer of the Lord Abbett Funds.
Dear Shareholders:We are pleased to provide you with this overview of the performance of the Funds for the fiscal year ended November 30, 2019. On this page and the following pages, we discuss the major factors that influenced fiscal year performance. For detailed and more timely information about the Funds, please visit our website at www.lordabbett.com, where you also can access the quarterly commentaries that provide updates on each Fund’s performance and other portfolio related updates.
Thank you for investing in Lord Abbett mutual funds. We value the trust that you place in us and look forward to serving your investment needs in the years to come.
Best regards,

Douglas B. Sieg
Director, President and Chief Executive Officer
Calibrated Dividend Growth Fund
For the fiscal year ended November 30, 2019, the Fund returned 13.59%, reflecting performance at the net asset value (NAV) of Class A shares with all distributions reinvested, compared to its benchmark, the S&P 500® Index1, which returned 16.11% over the same period.
Domestic equity returns were positive over the past year, with large cap stocks, as
represented by the S&P 500® Index,1rising 16.11% during the period, while small cap stocks, as represented by the Russell 2000® Index,2were up 7.51%. Following a tumultuous fourth quarter of 2018, where trade tensions and monetary policy uncertainty sent many investors toward safety, the market staged a strong recovery. After the worst December since 1931, the S&P 500 posted its best January since 1987. Trade tensions continued to
1
dominate headlines, as trade negotiations between the U.S. and China remained volatile throughout the period. Since the beginning of 2019, both the U.S. and China have imposed tariffs of roughly $550 billion and $185 billion on each country’s products, respectively. One of the more notable shifts over the year was the U.S. Federal Reserve’s (the “Fed”) transition to a more dovish policy stance, with Chairman Jerome Powell stating that the Fed would act appropriately to sustain economic growth. Given an uncertain market outlook and muted inflation pressures, the Fed announced its decision to cut interest rates by 25 basis points on July 31, 2019 to a range of 2.00-2.25%. This was the first time that the Fed had cut interest rates since December 2008. The Fed followed that decision with two more 25 basis point rate cuts in September and October, citing “implications of global developments for the economic outlook as well as muted inflation pressures”. After the October rate cut, Fed Chairman Powell signaled a likely pause on future rate cuts, resulting in the market-based probability of a fourth rate cut dipping below 25%. The combination of a dovish Fed, trade pressures, and slowing economic growth resulted in falling rates across the U.S. Treasury yield curve. In fact, in July, the yield on the 10-year U.S. Treasury fell to its lowest level since 2016. Bond yields continued to fall, and in August, the spread between the U.S. 10-year Treasury and the 2-year Treasury temporarily inverted. In September, a large rotation from growth into value took place
and continued through November. Geopolitics also contributed to market volatility. Following a coordinated drone strike on Saudi Arabia in the third quarter, Brent crude oil prices increased 20% in one trading session. Despite the record increase, oil prices retracted their gains within weeks. Investor sentiment was buoyed in November as the market grew optimistic about the possibility of a “phase one” trade deal between the U.S. and China.
Stock selection within the information technology and consumer staples sectors detracted most from relative performance. Within the information technology sector, Xilinx, Inc., a programmable logic semiconductor devices developer, detracted. Shares of Xilinx came under pressure following the ban against Huawei. Xilinx supplies re-programmable integrated semiconductors to a breadth of Chinese companies, including Huawei. IBM Corp., an integrated solutions provider, also detracted from relative performance. While shares of IBM were up for the twelve month period ended November 30, 2019, the total return was less than that of the information technology sector. Shares of IBM dropped off in December 2018 following a Chinese hacking campaign that targeted the company; however, shares rallied in the following months. Within the consumer staples sector, Walgreens Boots Alliance, Inc., a drug store retailer, detracted most from relative performance. Shares of Walgreens fell after the second quarter earnings release, where the company missed earnings estimates and
2
management lowered guidance. The poor results caused the market to question longer term growth.
Conversely, stock selection within the consumer discretionary and financials sectors contributed most to relative performance over the period. Within the consumer discretionary sector, the Fund’s holding of Target Corp., a general merchandise store operator, contributed most. Shares of Target increased following the release of second quarter earnings. The company was able to continue to drive traffic in its stores and through e-commerce, and saw gross margin expansion in the second quarter for the first time in roughly three years. Lowe’s Companies, Inc., a home improvement products retailer, also contributed to relative performance. Shares of Lowe’s initially fell after the company’s poor pricing execution in the first quarter; however, shares rallied following the second quarter earnings release, where the company showed sequential improvement in gross margins. Within the financials sector, S&P Global Inc., an independent ratings, benchmarks, analytics, and data provider, contributed most to relative performance. Shares of S&P Global rose following the company’s continued shareholder-friendly capital allocation plans and, more specifically, the announcement of a 14% dividend increase.
Lord Abbett Growth Opportunities Fund
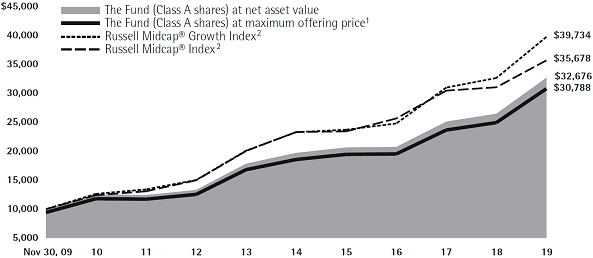
For the fiscal year ended November 30, 2019, the Fund returned 23.48%, reflecting performance at the net asset value (NAV) of Class A shares with all distributions reinvested, compared to its benchmark, the Russell Midcap® Growth Index,3which returned 21.75% over the same period.
Domestic equity returns were positive over the past year, with large cap stocks, as represented by the S&P 500® Index,1rising 16.11% during the period, while small cap stocks, as represented by the Russell 2000® Index,2were up 7.51%. Following a tumultuous fourth quarter of 2018, where trade tensions and monetary policy uncertainty sent many investors toward safety, the market staged a strong recovery. After the worst December since 1931, the S&P 500 posted its best January since 1987. Trade tensions continued to dominate headlines, as trade negotiations between the U.S. and China remained volatile throughout the period. Since the beginning of 2019, the U.S. and China have imposed tariffs of roughly $550 billion and $185 billion on each country’s products, respectively. One of the more notable shifts over the year was the U.S. Federal Reserve’s (the “Fed”) transition to a more dovish policy stance, with Chairman Jerome Powell stating that the Fed would act appropriately to sustain economic growth. Given an uncertain market outlook and muted inflation pressures, the Fed announced its decision to cut interest rates
3
by 25 basis points on July 31, 2019 to a range of 2.00-2.25%. This was the first time that the Fed had cut interest rates since December 2008. The Fed followed that decision with two more 25 basis point rate cuts in September and October, citing “implications of global developments for the economic outlook as well as muted inflation pressures”. After the October rate cut, Fed Chairman Powell signaled a likely pause on future rate cuts, resulting in the market-based probability of a fourth rate cut dipping below 25%. The combination of a dovish Fed, trade pressures, and slowing economic growth resulted in falling rates across the U.S. Treasury yield curve. In fact, in July, the yield on the 10-year U.S. Treasury fell to its lowest level since 2016. Bond yields continued to fall, and in August, the spread between the U.S. 10-year Treasury and the 2-year Treasury temporarily inverted. In September, a large rotation from growth into value took place and continued through November. Geopolitics also contributed to market volatility. Following a coordinated drone strike on Saudi Arabia in the third quarter, Brent crude oil prices increased 20% in one trading session. Despite the record increase, oil prices retracted their gains within weeks. Investor sentiment was buoyed in November as the market grew optimistic about the possibility of a “phase one” trade deal between the U.S. and China.
During the period, security selection in the information technology sector contributed to the Fund’s relative performance. Within the sector, the Fund’s
position in RingCentral, Inc., a provider of enterprise cloud communications solutions, contributed to relative performance. Shares of RingCentral steadily rose as strong execution and its partnership with Avaya Holdings Corp. continued to position RingCentral as a leading Unified Communications-as-a-Service solutions provider. The Fund’s position in Global Payments, Inc., a provider of payment software solutions, also contributed. Shares of Global Payments rose throughout the period as the company slowly shifted its business mix away from domestic independent sales organizations, to the higher growth and higher margin integrated payments channel.
The Fund’s position in TransDigm Group Inc., a producer and designer of aerospace components and systems, also contributed to performance. Investors continued to view TransDigm as one of the best businesses in its industry, as the company maintained strong pricing power, high margins, and significant cash flow. Additionally, TransDigm’s acquisition of Esterline Technology Corporation during the period was expected to be highly accretive.
Security selection in the energy sector detracted from the Fund’s relative performance. Within the energy sector, the Fund’s position in Cimarex Energy Co., an oil and gas exploration company, detracted during the period. Shares of Cimarex declined due to the company’s exposure to Permian gas and oil, which saw prices weaken. Weaker Permian gas and oil prices
4
and lower activity also negatively impacted Parsley Energy, Inc., an oil and natural gas firm, during the period.
The Fund’s position in Healthcare Services Group, Inc., an operator of long-term care and other health care related facilities, detracted from performance, as investors expected earnings growth to slow and margins to decline due to deteriorating fundamentals.
Lord Abbett Small Cap Value Fund
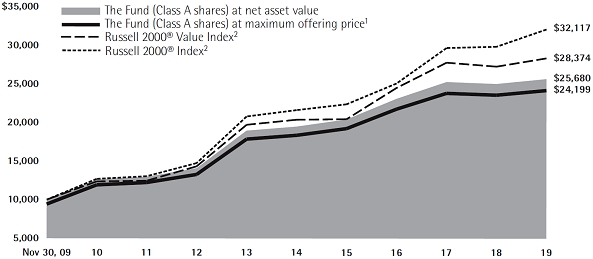
For the fiscal year ended November 30, 2019, the Fund returned 2.56%, reflecting performance at the net asset value (NAV) of Class A shares with all distributions reinvested, compared to its benchmark, the Russell 2000 Value® Index,4which returned 3.96% over the same period.
Domestic equity returns were positive over the past year, with large cap stocks, as represented by the S&P 500® Index,1rising 16.11% during the period, while small cap stocks, as represented by the Russell 2000® Index,2were up 7.51%. Following a tumultuous fourth quarter of 2018, where trade tensions and monetary policy uncertainty sent many investors toward safety, the market staged a strong recovery. After the worst December since 1931, the S&P 500 posted its best January since 1987. Trade tensions continued to dominate headlines, as trade negotiations between the U.S. and China remained volatile throughout the period. Since the beginning of 2019, both the U.S. and China have imposed tariffs of roughly $550
billion and $185 billion on each country’s products, respectively. One of the more notable shifts over the year was the U.S. Federal Reserve’s (the “Fed”) transition to a more dovish policy stance, with Chairman Jerome Powell stating that the Fed would act appropriately to sustain economic growth. Given an uncertain market outlook and muted inflation pressures, the Fed announced its decision to cut interest rates by 25 basis points on July 31, 2019 to a range of 2.00-2.25%. This was the first time that the Fed had cut interest rates since December 2008. The Fed followed that decision with two more 25 basis point rate cuts in September and October, citing “implications of global developments for the economic outlook as well as muted inflation pressures”. After the October rate cut, Fed Chairman Powell signaled a likely pause on future rate cuts, resulting in the market-based probability of a fourth rate cut dipping below 25%. The combination of a dovish Fed, trade pressures, and slowing economic growth resulted in falling rates across the U.S. Treasury yield curve. In fact, in July, the yield on the 10-year U.S. Treasury fell to its lowest level since 2016. Bond yields continued to fall, and in August, the spread between the U.S. 10-year Treasury and the 2-year Treasury temporarily inverted. In September, a large rotation from growth into value took place and continued through November. Geopolitics also contributed to market volatility. Following a coordinated drone strike on Saudi Arabia in the third quarter, Brent crude oil prices increased 20% in one
5
trading session. Despite the record increase, oil prices retracted their gains within weeks. Investor sentiment was buoyed in November as the market grew optimistic about the possibility of a “phase one” trade deal between the U.S. and China.
During the 12-month period ended November 30, 2019, the Fund’s holding of Conduent, Inc., a business process services provider, was the largest detractor from relative performance. The firm’s stock price dropped precipitously after CEO Ashok Vemuri announced his intention to step down. The announcement came after a series of disappointing quarterly results as well as litigation issues with the state of Texas. The Fund’s position in Plantronics, Inc., a headsets, video, and content sharing solutions distributor, also detracted from relative performance. Shares of Plantronics sold off following the firm’s acquisition of Polycom in July of 2018. While shares rose in the immediate aftermath of the deal announcement, there have been several missteps following the acquisition, which weighed on Plantronic’s shares over the remainder of the period. The Fund’s position in Centennial Resource Development also detracted from relative performance. Shares of the oil and natural gas company came under pressure throughout the period as the company faced a series of headwinds. In particular, oil price volatility weighed on the company’s profits, which in turn resulted in
the company announcing a pullback in daily oil production.
Conversely, the Fund’s holding of Cambrex Corp., a small molecule contract development and manufacturing organization that supplies its products and services to pharmaceutical companies, contributed most to relative performance. Shares of Cambrex rose following the news that the firm signed a definitive agreement to be acquired by an affiliate of Permira Funds, a private equity firm. Another contributor during the period was the Fund’s position in Entegris, Inc., a specialty materials supplier to the microelectronics industry. Shares of Entegris rose after the company announced the acquisition of MPD Chemicals, which the market expected would diversify Entegris’ engineered materials portfolio. The Fund’s holding in RenaissanceRe Holdings Ltd., an insurance provider, also contributed to relative performance. Shares of RenaissanceRe Holdings rose following an impressive first quarter, where earnings beat consensus and the firm reported robust top-line growth and strong accident-year results.
Each Fund’s portfolio is actively managed and, therefore, holdings and weightings of particular issuers or particular sector as a percentage of portfolio assets are subject to change. Sectors may include many industries.
6
1 The S&P 500®Index is widely regarded as the standard for measuring large cap U.S. stock market performance and includes a representative sample of leading companies in leading industries.
2 The Russell 2000®Index measures the performance of the 2,000 smallest companies in the Russell 3000® Index, which represents approximately 10% of the total market capitalization of the Russell 3000® Index.
3 The Russell Midcap®Growth Index measures the performance of those Russell Midcap® companies with higher price-to-book ratios and higher forecasted growth values.
4 The Russell 2000 Value®Index measures the performance of those stocks of the Russell 2000® Index with lower price-to-book ratios and lower relative forecasted growth rates. Indexes are unmanaged, do not reflect the deduction of fees or expenses, and an investor cannot invest directly in an index.
Unless otherwise specified, indexes reflect total return, with all dividends reinvested. Indexes are unmanaged, do not reflect the deduction of fees or expenses, and are not available for direct investment.
Important Performance and Other Information
Performance data quoted in the following pages reflect past performance and are no guarantee of future results. Current performance may be higher or lower than the performance quoted. The investment return and principal value of an investment in the Funds will fluctuate so that shares, on any given day or when redeemed, may be worth more or less than their original cost. You can obtain performance data current to the most recent month end by calling Lord Abbett at 888-522-2388 or referring to www.lordabbett.com.
Except where noted, comparative Fund performance does not account for the deduction of sales charges and would be different if sales charges were included. Each Fund offers classes of shares with distinct pricing options. For a full description of the differences in pricing alternatives, please see each Fund’s prospectus.
During certain periods shown, expense waivers and reimbursements were in place for Calibrated Dividend Growth Fund. Without such expense waivers and reimbursements, the Fund’s returns would have been lower.
The annual commentary above discusses the views of the Funds’ management and various portfolio holdings of the Funds as of November 30, 2019. These views and portfolio holdings may have changed after this date. Information provided in the commentary is not a recommendation to buy or sell securities. Because the Funds’ portfolio is actively managed and may change significantly, the Funds may no longer own the securities described above or may have otherwise changed their positions in the securities. For more recent information about the Funds’ portfolio holdings, please visit www.lordabbett.com.
A Note about Risk:See Notes to Financial Statements for a discussion of investment risks. For a more detailed discussion of the risks associated with each Fund, please see each Fund’s prospectus.
Mutual funds are not insured by the FDIC, are not deposits or other obligations of, or guaranteed by, banks, and are subject to investment risks including possible loss of principal amount invested.
7
Calibrated Dividend Growth Fund
Investment Comparison
Below is a comparison of a $10,000 investment in Class A shares with the same investment in the S&P 500® Index, assuming reinvestment of all dividends and distributions. The performance of other classes will be greater than or less than the performance shown in the graph below due to different sales loads and expenses applicable to such classes. The graph and performance table below do not reflect the deduction of taxes that a shareholder would pay on Fund distributions or the redemption of Fund shares. During certain periods, expenses of the Fund have been waived or reimbursed by Lord Abbett; without such waiver or reimbursement of expenses, the Fund’s returns would have been lower.Past performance is no guarantee of future results.

Average Annual Total Returns at Maximum Applicable
Sales Charge for the Periods Ended November 30, 2019
| | 1 Year | 5 Years | 10 Years | Life of Class | |
| Class A3 | 7.06% | 8.25% | 10.90% | – | |
| Class C4 | 11.72% | 8.73% | 10.76% | – | |
| Class F5 | 13.81% | 9.76% | 11.78% | – | |
| Class F36 | 13.90% | – | – | 12.14% | |
| Class I5 | 13.87% | 9.82% | 11.86% | – | |
| Class P5 | 13.36% | 9.33% | 11.36% | – | |
| Class R25 | 13.16% | 9.16% | 11.20% | – | |
| Class R35 | 13.31% | 9.28% | 11.32% | – | |
| Class R47 | 13.54% | – | – | 11.42% | |
| Class R57 | 13.87% | – | – | 11.71% | |
| Class R67 | 13.97% | – | – | 11.81% | |
8
1 Reflects the deduction of the maximum initial sales charge of 5.75%.
2 Performance for the unmanaged index does not reflect any fees or expenses. The performance of each index is not necessarily representative of the Fund’s performance.
3 Total return, which is the percentage change in net asset value, after deduction of the maximum initial sales charge of 5.75% applicable to Class A shares, with all dividends and distributions reinvested for the periods shown ended November 30, 2019, is calculated using the SEC-required uniform method to compute such return.
4 The 1% CDSC for Class C shares normally applies before the first anniversary of the purchase date. Performance for other periods is at net asset value.
5 Performance is at net asset value.
6 Commenced operations and performance for the Class began on April 4, 2017. Performance is at net asset value.
7 Commenced operations and performance for the Class began on June 30, 2015. Performance is at net asset value.
9
Growth Opportunities Fund
Investment Comparison
Below is a comparison of a $10,000 investment in Class A shares with the same investment in both the Russell Midcap® Growth Index and the Russell Midcap® Index, assuming reinvestment of all dividends and distributions. The performance of other classes will be greater than or less than the performance shown in the graph below due to different sales loads and expenses applicable to such classes. The graph and performance table below do not reflect the deduction of taxes that a shareholder would pay on Fund distributions or the redemption of Fund shares. During certain periods, expenses of the Fund have been waived or reimbursed by Lord Abbett; without such waiver or reimbursement of expenses, the Fund’s returns would have been lower.Past performance is no guarantee of future results.
Average Annual Total Returns at Maximum Applicable
Sales Charge for the Periods Ended November 30, 2019
| | 1 Year | 5 Years | 10 Years | Life of Class | |
| Class A3 | 16.37% | 9.35% | 11.90% | – | |
| Class C4 | 21.58% | 9.83% | 11.79% | – | |
| Class F5 | 23.69% | 10.82% | 12.79% | – | |
| Class F36 | 23.90% | – | – | 17.04% | |
| Class I5 | 23.81% | 10.94% | 12.90% | – | |
| Class P5 | 23.23% | 10.42% | 12.40% | – | |
| Class R25 | 23.13% | 10.27% | 12.23% | – | |
| Class R35 | 23.18% | 10.38% | 12.34% | – | |
| Class R47 | 23.48% | – | – | 10.05% | |
| Class R57 | 23.79% | – | – | 10.34% | |
| Class R67 | 23.86% | – | – | 10.44% | |
1 Reflects the deduction of the maximum initial sales charge of 5.75%.
2 Performance for each unmanaged index does not reflect any fees or expenses. The performance of each index is not necessarily representative of the Fund’s performance.
3 Total return, which is the percentage change in net asset value, after deduction of the maximum initial sales charge of 5.75% applicable to Class A shares, with all dividends and distributions reinvested for the periods shown ended November 30, 2019, is calculated using the SEC-required uniform method to compute such return.
4 The 1% CDSC for Class C shares normally applies before the first anniversary of the purchase date. Performance for other periods is at net asset value.
5 Performance is at net asset value.
6 Commenced operations and performance for the Class began on April 4, 2017. Performance is at net asset value.
7 Commenced operations and performance for the Class began on June 30, 2015. Performance is at net asset value.
10
Small Cap Value Fund
Investment Comparison
Below is a comparison of a $10,000 investment in Class A shares with the same investment in both the Russell 2000® Value Index and the Russell 2000®Index, assuming reinvestment of all dividends and distributions. The performance of other classes will be greater than or less than the performance shown in the graph below due to different sales loads and expenses applicable to such classes. The graph and performance table below do not reflect the deduction of taxes that a shareholder would pay on Fund distributions or the redemption of Fund shares.Past performance is no guarantee of future results.
Average Annual Total Returns at Maximum Applicable
Sales Charge for the Periods Ended November 30, 2019
| | 1 Year | 5 Years | 10 Years | Life of Class | |
| Class A3 | -3.35% | 4.42% | 9.24% | – | |
| Class C4 | 1.10% | 4.89% | 9.11% | – | |
| Class F5 | 2.70% | 5.83% | 10.08% | – | |
| Class F36 | 2.88% | – | – | 3.94% | |
| Class I5 | 2.85% | 5.94% | 10.19% | – | |
| Class P5 | 2.41% | 5.47% | 9.70% | – | |
| Class R25 | 2.25% | 5.31% | 9.53% | – | |
| Class R35 | 2.33% | 5.43% | 9.66% | – | |
| Class R47 | 2.55% | – | – | 5.12% | |
| Class R57 | 2.85% | – | – | 5.39% | |
| Class R67 | 2.89% | – | – | 5.48% | |
1 Reflects the deduction of the maximum initial sales charge of 5.75%.
2 Performance for each unmanaged index does not reflect any fees or expenses. The performance of each index is not necessarily representative of the Fund’s performance.
3 Total return, which is the percentage change in net asset value, after deduction of the maximum initial sales charge of 5.75% applicable to Class A shares, with all dividends and distributions reinvested for the periods shown ended November 30, 2019, is calculated using the SEC-required uniform method to compute such return.
4 The 1% CDSC for Class C shares normally applies before the first anniversary of the purchase date. Performance for other periods is at net asset value.
5 Performance is at net asset value.
6 Commenced operations and performance for the Class began on April 4, 2017. Performance is at net asset value.
7 Commenced operations and performance for the Class began on June 30, 2015. Performance is at net asset value.
11
Expense Example
As a shareholder of the Fund, you incur two types of costs: (1) transaction costs, including sales charges (loads) on purchase payments (these charges vary among the share classes); and (2) ongoing costs, including management fees; distribution and service (12b-1) fees (these charges vary among the share classes); and other Fund expenses. This Example is intended to help you understand your ongoing costs (in dollars) of investing in the Fund and to compare these costs with the ongoing costs of investing in other mutual funds.
The Example is based on an investment of $1,000 invested at the beginning of the period and held for the entire period (June 1, 2019 through November 30, 2019).
Actual Expenses
For each class of the Fund, the first line of the table on the following page provides information about actual account values and actual expenses. You may use the information in this line, together with the amount you invested, to estimate the expenses that you paid over the period. Simply divide your account value by $1,000 (for example, an $8,600 account value divided by $1,000 = 8.6), then multiply the result by the number in the first line under the heading titled “Expenses Paid During Period 6/1/19 – 11/30/19” to estimate the expenses you paid on your account during this period.
Hypothetical Example for Comparison Purposes
For each class of the Fund, the second line of the table on the following page provides information about hypothetical account values and hypothetical expenses based on the Fund’s actual expense ratio and an assumed rate of return of 5% per year before expenses, which is not the Fund’s actual return. The hypothetical account values and expenses may not be used to estimate the actual ending account balance or expenses you paid for the period. You may use this information to compare the ongoing costs of investing in the Fund and other funds. To do so, compare this 5% hypothetical example with the 5% hypothetical examples that appear in the shareholder reports of the other funds.
12
Calibrated Dividend Growth Fund
Please note that the expenses shown in the table are meant to highlight your ongoing costs only and do not reflect any transactional costs, such as sales charges (loads). Therefore, the second line of the table is useful in comparing ongoing costs only, and will not help you determine the relative total costs of owning different funds. In addition, if these transactional costs were included, your costs would have been higher.
| | | Beginning
Account
Value | | Ending
Account
Value | | Expenses
Paid During
Period† | |
| | | 6/1/19 | | 11/30/19 | | 6/1/19 –
11/30/19 | |
| Class A | | | | | | | |
| Actual | | $1,000.00 | | $1,129.00 | | $5.07 | |
| Hypothetical (5% Return Before Expenses) | | $1,000.00 | | $1,020.31 | | $4.81 | |
| Class C | | | | | | | |
| Actual | | $1,000.00 | | $1,124.60 | | $9.05 | |
| Hypothetical (5% Return Before Expenses) | | $1,000.00 | | $1,016.55 | | $8.59 | |
| Class F | | | | | | | |
| Actual | | $1,000.00 | | $1,130.30 | | $3.74 | |
| Hypothetical (5% Return Before Expenses) | | $1,000.00 | | $1,021.56 | | $3.55 | |
| Class F3 | | | | | | | |
| Actual | | $1,000.00 | | $1,130.60 | | $3.31 | |
| Hypothetical (5% Return Before Expenses) | | $1,000.00 | | $1,021.96 | | $3.14 | |
| Class I | | | | | | | |
| Actual | | $1,000.00 | | $1,130.40 | | $3.74 | |
| Hypothetical (5% Return Before Expenses) | | $1,000.00 | | $1,021.56 | | $3.55 | |
| Class P | | | | | | | |
| Actual | | $1,000.00 | | $1,127.40 | | $6.13 | |
| Hypothetical (5% Return Before Expenses) | | $1,000.00 | | $1,019.30 | | $5.82 | |
| Class R2 | | | | | | | |
| Actual | | $1,000.00 | | $1,126.80 | | $6.93 | |
| Hypothetical (5% Return Before Expenses) | | $1,000.00 | | $1,018.55 | | $6.58 | |
| Class R3 | | | | | | | |
| Actual | | $1,000.00 | | $1,127.60 | | $6.40 | |
| Hypothetical (5% Return Before Expenses) | | $1,000.00 | | $1,019.05 | | $6.07 | |
| Class R4 | | | | | | | |
| Actual | | $1,000.00 | | $1,128.40 | | $5.07 | |
| Hypothetical (5% Return Before Expenses) | | $1,000.00 | | $1,020.31 | | $4.81 | |
| Class R5 | | | | | | | |
| Actual | | $1,000.00 | | $1,130.40 | | $3.74 | |
| Hypothetical (5% Return Before Expenses) | | $1,000.00 | | $1,021.56 | | $3.55 | |
| Class R6 | | | | | | | |
| Actual | | $1,000.00 | | $1,130.60 | | $3.31 | |
| Hypothetical (5% Return Before Expenses) | | $1,000.00 | | $1,021.96 | | $3.14 | |
† For each class of the Fund, net expenses are equal to the annualized expense ratio for such class (0.95% for Class A, 1.70% for Class C, 0.70% for Class F, 0.62% for Class F3, 0.70% for Class I, 1.15% for Class P, 1.30% for Class R2, 1.20% for Class R3, 0.95% for Class R4, 0.70% for Class R5 and 0.62% for Class R6) multiplied by the average account value over the period, multiplied by 183/365 (to reflect one-half year period).
13
Portfolio Holdings Presented by Sector
November 30, 2019
| Sector* | | %** |
| Communication Services | | | 6.59 | |
| Consumer Discretionary | | | 9.16 | |
| Consumer Staples | | | 16.56 | |
| Energy | | | 4.05 | |
| Financials | | | 8.02 | |
| Health Care | | | 9.64 | |
| Industrials | | | 17.56 | |
| Information Technology | | | 13.57 | |
| Materials | | | 6.01 | |
| Utilities | | | 8.67 | |
| Repurchase Agreement | | | 0.17 | |
| Total | | | 100.00 | |
| | | |
| * | | A sector may comprise several industries. |
| ** | | Represents percent of total investments. |
14
Growth Opportunities Fund
Please note that the expenses shown in the table are meant to highlight your ongoing costs only and do not reflect any transactional costs, such as sales charges (loads). Therefore, the second line of the table is useful in comparing ongoing costs only, and will not help you determine the relative total costs of owning different funds. In addition, if these transactional costs were included, your costs would have been higher.
| | | Beginning
Account
Value | | Ending
Account
Value | | Expenses
Paid During
Period† | |
| | | 6/1/19 | | 11/30/19 | | 6/1/19 –
11/30/19 | |
| Class A | | | | | | | |
| Actual | | $1,000.00 | | $1,125.30 | | $ 6.18 | |
| Hypothetical (5% Return Before Expenses) | | $1,000.00 | | $1,019.25 | | $ 5.87 | |
| Class C | | | | | | | |
| Actual | | $1,000.00 | | $1,120.70 | | $10.15 | |
| Hypothetical (5% Return Before Expenses) | | $1,000.00 | | $1,015.49 | | $ 9.65 | |
| Class F | | | | | | | |
| Actual | | $1,000.00 | | $1,126.00 | | $ 5.38 | |
| Hypothetical (5% Return Before Expenses) | | $1,000.00 | | $1,020.00 | | $ 5.11 | |
| Class F3 | | | | | | | |
| Actual | | $1,000.00 | | $1,126.90 | | $ 4.59 | |
| Hypothetical (5% Return Before Expenses) | | $1,000.00 | | $1,020.76 | | $ 4.36 | |
| Class I | | | | | | | |
| Actual | | $1,000.00 | | $1,126.90 | | $ 4.85 | |
| Hypothetical (5% Return Before Expenses) | | $1,000.00 | | $1,020.51 | | $ 4.61 | |
| Class P | | | | | | | |
| Actual | | $1,000.00 | | $1,123.80 | | $ 7.24 | |
| Hypothetical (5% Return Before Expenses) | | $1,000.00 | | $1,018.25 | | $ 6.88 | |
| Class R2 | | | | | | | |
| Actual | | $1,000.00 | | $1,123.50 | | $ 8.04 | |
| Hypothetical (5% Return Before Expenses) | | $1,000.00 | | $1,017.50 | | $ 7.64 | |
| Class R3 | | | | | | | |
| Actual | | $1,000.00 | | $1,123.50 | | $ 7.51 | |
| Hypothetical (5% Return Before Expenses) | | $1,000.00 | | $1,018.00 | | $ 7.13 | |
| Class R4 | | | | | | | |
| Actual | | $1,000.00 | | $1,125.30 | | $ 6.18 | |
| Hypothetical (5% Return Before Expenses) | | $1,000.00 | | $1,019.25 | | $ 5.87 | |
| Class R5 | | | | | | | |
| Actual | | $1,000.00 | | $1,126.30 | | $ 4.85 | |
| Hypothetical (5% Return Before Expenses) | | $1,000.00 | | $1,020.51 | | $ 4.61 | |
| Class R6 | | | | | | | |
| Actual | | $1,000.00 | | $1,127.00 | | $ 4.59 | |
| Hypothetical (5% Return Before Expenses) | | $1,000.00 | | $1,020.76 | | $ 4.36 | |
† For each class of the Fund, net expenses are equal to the annualized expense ratio for such class (1.16% for Class A, 1.91% for C, 1.01% for Class F, 0.86% for Class F3, 0.91% for Class I, 1.36% for Class P, 1.51% for Class R2, 1.41% for Class R3, 1.16% for Class R4, 0.91% for Class R5 and 0.86% for Class R6) multiplied by the average account value over the period, multiplied by 183/365 (to reflect one-half year period).
15
Portfolio Holdings Presented by Sector
November 30, 2019
| Sector* | | %** |
| Communication Services | | | 2.17 | |
| Consumer Discretionary | | | 15.66 | |
| Consumer Staples | | | 3.38 | |
| Energy | | | 0.95 | |
| Financials | | | 6.59 | |
| Health Care | | | 15.99 | |
| Industrials | | | 19.05 | |
| Information Technology | | | 30.10 | |
| Materials | | | 3.30 | |
| Real Estate | | | 2.00 | |
| Repurchase Agreement | | | 0.81 | |
| Total | | | 100.00 | |
| | | |
| * | | A sector may comprise several industries. |
| ** | | Represents percent of total investments. |
16
Small Cap Value Fund
Please note that the expenses shown in the table are meant to highlight your ongoing costs only and do not reflect any transactional costs, such as sales charges (loads). Therefore, the second line of the table is useful in comparing ongoing costs only, and will not help you determine the relative total costs of owning different funds. In addition, if these transactional costs were included, your costs would have been higher.
| | | Beginning
Account
Value | | Ending
Account
Value | | Expenses
Paid During
Period† | |
| | | 6/1/19 | | 11/30/19 | | 6/1/19 –
11/30/19 | |
| Class A | | | | | | | |
| Actual | | $1,000.00 | | $1,104.20 | | $ 6.33 | |
| Hypothetical (5% Return Before Expenses) | | $1,000.00 | | $1,019.05 | | $ 6.07 | |
| Class C | | | | | | | |
| Actual | | $1,000.00 | | $1,100.30 | | $10.27 | |
| Hypothetical (5% Return Before Expenses) | | $1,000.00 | | $1,015.29 | | $ 9.85 | |
| Class F | | | | | | | |
| Actual | | $1,000.00 | | $1,105.10 | | $ 5.54 | |
| Hypothetical (5% Return Before Expenses) | | $1,000.00 | | $1,019.80 | | $ 5.32 | |
| Class F3 | | | | | | | |
| Actual | | $1,000.00 | | $1,106.10 | | $ 4.59 | |
| Hypothetical (5% Return Before Expenses) | | $1,000.00 | | $1,020.71 | | $ 4.41 | |
| Class I | | | | | | | |
| Actual | | $1,000.00 | | $1,105.70 | | $ 5.01 | |
| Hypothetical (5% Return Before Expenses) | | $1,000.00 | | $1,020.31 | | $ 4.81 | |
| Class P | | | | | | | |
| Actual | | $1,000.00 | | $1,103.00 | | $ 7.38 | |
| Hypothetical (5% Return Before Expenses) | | $1,000.00 | | $1,018.05 | | $ 7.08 | |
| Class R2 | | | | | | | |
| Actual | | $1,000.00 | | $1,102.50 | | $ 8.17 | |
| Hypothetical (5% Return Before Expenses) | | $1,000.00 | | $1,017.30 | | $ 7.84 | |
| Class R3 | | | | | | | |
| Actual | | $1,000.00 | | $1,103.20 | | $ 7.64 | |
| Hypothetical (5% Return Before Expenses) | | $1,000.00 | | $1,017.80 | | $ 7.33 | |
| Class R4 | | | | | | | |
| Actual | | $1,000.00 | | $1,104.20 | | $ 6.33 | |
| Hypothetical (5% Return Before Expenses) | | $1,000.00 | | $1,019.05 | | $ 6.07 | |
| Class R5 | | | | | | | |
| Actual | | $1,000.00 | | $1,105.60 | | $ 4.96 | |
| Hypothetical (5% Return Before Expenses) | | $1,000.00 | | $1,020.36 | | $ 4.76 | |
| Class R6 | | | | | | | |
| Actual | | $1,000.00 | | $1,105.60 | | $ 4.59 | |
| Hypothetical (5% Return Before Expenses) | | $1,000.00 | | $1,020.71 | | $ 4.41 | |
† For each class of the Fund, net expenses are equal to the annualized expense ratio for such class (1.20% for Class A, 1.95% for C, 1.05% for Class F, 0.87% for Class F3, 0.95% for Class I, 1.40% for Class P, 1.55% for Class R2, 1.45% for Class R3, 1.20% for Class R4, 0.94% for Class R5 and 0.87% for Class R6) multiplied by the average account value over the period, multiplied by 183/365 (to reflect one-half year period).
17
Portfolio Holdings Presented by Sector
November 30, 2019
| Sector* | | %** |
| Communication Services | | | 2.48 | |
| Consumer Discretionary | | | 10.05 | |
| Consumer Staples | | | 2.32 | |
| Energy | | | 4.96 | |
| Financials | | | 29.62 | |
| Health Care | | | 3.77 | |
| Industrials | | | 18.49 | |
| Information Technology | | | 7.62 | |
| Materials | | | 5.72 | |
| Real Estate | | | 8.40 | |
| Utilities | | | 6.36 | |
| Repurchase Agreement | | | 0.21 | |
| Total | | | 100.00 | |
| | | |
| * | | A sector may comprise several industries. |
| ** | | Represents percent of total investments. |
18
Schedule of Investments
CALIBRATED DIVIDEND GROWTH FUNDNovember 30, 2019
| Investments | | Shares | | | Fair
Value
(000) | |
| COMMON STOCKS 99.27% | | | | | | | | |
| | | | | | | | | |
| Aerospace & Defense 5.36% | | | | | | | | |
| General Dynamics Corp. | | | 149,600 | | | $ | 27,188 | |
| L3Harris Technologies, Inc. | | | 168,200 | | | | 33,824 | |
| Northrop Grumman Corp. | | | 103,500 | | | | 36,408 | |
| United Technologies Corp. | | | 258,000 | | | | 38,272 | |
| Total | | | | | | | 135,692 | |
| | | | | | | | | |
| Banks 0.40% | | | | | | | | |
| Prosperity Bancshares, Inc. | | | 143,500 | | | | 10,081 | |
| | | | | | | | | |
| Beverages 3.89% | | | | | | | | |
| Coca-Cola Co. (The) | | | 798,879 | | | | 42,660 | |
| PepsiCo, Inc. | | | 409,802 | | | | 55,664 | |
| Total | | | | | | | 98,324 | |
| | | | | | | | | |
| Biotechnology 1.01% | | | | | | | | |
| AbbVie, Inc. | | | 291,507 | | | | 25,574 | |
| | | | | | | | | |
| Capital Markets 2.86% | | | | | | | | |
| Ameriprise Financial, Inc. | | | 184,500 | | | | 30,234 | |
| S&P Global, Inc. | | | 126,600 | | | | 33,505 | |
| T. Rowe Price Group, Inc. | | | 70,000 | | | | 8,649 | |
| Total | | | | | | | 72,388 | |
| | | | | | | | | |
| Chemicals 5.00% | | | | | | | | |
| Air Products & Chemicals, Inc. | | | 141,600 | | | | 33,465 | |
| Ecolab, Inc. | | | 136,300 | | | | 25,443 | |
| PPG Industries, Inc. | | | 241,386 | | | | 31,100 | |
| Sherwin-Williams Co. (The) | | | 62,650 | | | | 36,533 | |
| Total | | | | | | | 126,541 | |
| | | | | | | | | |
| Commercial Services & Supplies 0.83% | |
| Healthcare Services Group, Inc. | | | 198,300 | | | | 4,987 | |
| Waste Management, Inc. | | | 141,200 | | | | 15,943 | |
| Total | | | | | | | 20,930 | |
| | | | | | | | | |
| Diversified Telecommunication Services 4.33% | |
| AT&T, Inc. | | | 1,437,264 | | | | 53,725 | |
| Verizon Communications, Inc. | | | 926,600 | | | | 55,818 | |
| Total | | | | | | | 109,543 | |
| Investments | | Shares | | | Fair
Value
(000) | |
| Electric: Utilities 5.85% | | | | | | | | |
| Duke Energy Corp. | | | 437,100 | | | $ | 38,539 | |
| Edison International | | | 387,300 | | | | 26,762 | |
| NextEra Energy, Inc. | | | 184,600 | | | | 43,163 | |
| Southern Co. (The) | | | 639,600 | | | | 39,649 | |
| Total | | | | | | | 148,113 | |
| | | | | | | | | |
| Electrical Equipment 0.79% | | | | | | | | |
| Hubbell, Inc. | | | 136,300 | | | | 20,039 | |
| | | | | | | | | |
| Food & Staples Retailing 5.80% | | | | | | | | |
| Costco Wholesale Corp. | | | 137,300 | | | | 41,164 | |
| Sysco Corp. | | | 429,100 | | | | 34,564 | |
| Walgreens Boots Alliance, Inc. | | | 277,519 | | | | 16,540 | |
| Walmart, Inc. | | | 457,770 | | | | 54,516 | |
| Total | | | | | | | 146,784 | |
| | | | | | | | | |
| Food Products 1.00% | | | | | | | | |
| Flowers Foods, Inc. | | | 74,600 | | | | 1,606 | |
| General Mills, Inc. | | | 442,700 | | | | 23,605 | |
| Total | | | | | | | 25,211 | |
| | | | | | | | | |
| Gas Utilities 0.64% | | | | | | | | |
| UGI Corp. | | | 370,500 | | | | 16,135 | |
| | | | | | | | | |
| Health Care Equipment & Supplies 5.71% | |
| Abbott Laboratories | | | 832,500 | | | | 71,137 | |
| Becton, Dickinson & Co. | | | 73,300 | | | | 18,948 | |
| Medtronic plc (Ireland)(a) | | | 489,103 | | | | 54,481 | |
| Total | | | | | | | 144,566 | |
| | | | | | | | | |
| Health Care Providers & Services 0.94% | |
| AmerisourceBergen Corp. | | | 271,300 | | | | 23,850 | |
| | | | | | | | | |
| Hotels, Restaurants & Leisure 1.43% | | | | | | | | |
| Cracker Barrel Old Country Store, Inc. | | | 78,200 | | | | 12,023 | |
| McDonald’s Corp. | | | 124,626 | | | | 24,237 | |
| Total | | | | | | | 36,260 | |
| | | | | | | | | |
| Household Products 3.81% | | | | | | | | |
| Kimberly-Clark Corp. | | | 204,315 | | | | 27,856 | |
| Procter & Gamble Co. (The) | | | 562,200 | | | | 68,622 | |
| Total | | | | | | | 96,478 | |
| | See Notes to Financial Statements. | 19 |
Schedule of Investments (continued)
CALIBRATED DIVIDEND GROWTH FUNDNovember 30, 2019
| Investments | | Shares | | | Fair
Value
(000) | |
| Industrial Conglomerates 2.13% | | | | | | | | |
| 3M Co. | | | 185,817 | | | $ | 31,546 | |
| Carlisle Cos., Inc. | | | 143,600 | | | | 22,399 | |
| Total | | | | | | | 53,945 | |
| | | | | | | | | |
| Information Technology Services 6.14% | |
| Accenture plc Class A (Ireland)(a) | | | 197,000 | | | | 39,628 | |
| Automatic Data Processing, Inc. | | | 211,700 | | | | 36,154 | |
| International Business Machines Corp. | | | 218,600 | | | | 29,391 | |
| Visa, Inc. Class A | | | 272,400 | | | | 50,261 | |
| Total | | | | | | | 155,434 | |
| | | | | | | | | |
| Insurance 4.71% | | | | | | | | |
| American Financial Group, Inc. | | | 132,100 | | | | 14,493 | |
| Chubb Ltd. (Switzerland)(a) | | | 288,800 | | | | 43,747 | |
| Prudential Financial, Inc. | | | 156,900 | | | | 14,689 | |
| RenaissanceRe Holdings Ltd. | | | 113,100 | | | | 21,300 | |
| Travelers Cos., Inc. (The) | | | 183,500 | | | | 25,088 | |
| Total | | | | | | | 119,317 | |
| | | | | | | | | |
| Machinery 4.49% | | | | | | | | |
| Cummins, Inc. | | | 166,200 | | | | 30,391 | |
| Dover Corp. | | | 224,100 | | | | 24,983 | |
| Illinois Tool Works, Inc. | | | 168,300 | | | | 29,340 | |
| Stanley Black & Decker, Inc. | | | 182,500 | | | | 28,787 | |
| Total | | | | | | | 113,501 | |
| | | | | | | | | |
| Media 2.23% | | | | | | | | |
| Comcast Corp. Class A | | | 1,276,200 | | | | 56,344 | |
| | | | | | | | | |
| Metals & Mining 0.98% | | | | | | | | |
| Nucor Corp. | | | 439,600 | | | | 24,776 | |
| | | | | | | | | |
| Multi-Line Retail 1.50% | | | | | | | | |
| Target Corp. | | | 303,600 | | | | 37,953 | |
| | | | | | | | | |
| Multi-Utilities 2.13% | | | | | | | | |
| CMS Energy Corp. | | | 433,300 | | | | 26,561 | |
| WEC Energy Group, Inc. | | | 307,300 | | | | 27,242 | |
| Total | | | | | | | 53,803 | |
| Investments | | Shares | | | Fair
Value
(000) | |
| Oil, Gas & Consumable Fuels 4.03% | | | | | | | | |
| Chevron Corp. | | | 526,062 | | | $ | 61,618 | |
| Exxon Mobil Corp. | | | 252,400 | | | | 17,196 | |
| Occidental Petroleum Corp. | | | 305,097 | | | | 11,767 | |
| ONEOK, Inc. | | | 160,100 | | | | 11,375 | |
| Total | | | | | | | 101,956 | |
| | | | | | | | | |
| Pharmaceuticals 1.92% | | | | | | | | |
| Johnson & Johnson | | | 353,623 | | | | 48,620 | |
| | | | | | | | | |
| Road & Rail 3.87% | | | | | | | | |
| CSX Corp. | | | 161,300 | | | | 11,539 | |
| J.B. Hunt Transport Services, Inc. | | | 201,700 | | | | 23,321 | |
| Union Pacific Corp. | | | 358,100 | | | | 63,022 | |
| Total | | | | | | | 97,882 | |
| | | | | | | | | |
| Semiconductors & Semiconductor Equipment 4.15% | |
| Microchip Technology, Inc. | | | 283,467 | | | | 26,799 | |
| QUALCOMM, Inc. | | | 183,326 | | | | 15,317 | |
| Texas Instruments, Inc. | | | 315,300 | | | | 37,902 | |
| Xilinx, Inc. | | | 270,400 | | | | 25,088 | |
| Total | | | | | | | 105,106 | |
| | | | | | | | | |
| Software 3.19% | | | | | | | | |
| Microsoft Corp. | | | 534,100 | | | | 80,852 | |
| | | | | | | | | |
| Specialty Retail 4.22% | | | | | | | | |
| Lowe’s Cos., Inc. | | | 449,075 | | | | 52,681 | |
| Ross Stores, Inc. | | | 184,900 | | | | 21,476 | |
| TJX Cos., Inc. (The) | | | 535,100 | | | | 32,711 | |
| Total | | | | | | | 106,868 | |
| | | | | | | | | |
| Textiles, Apparel & Luxury Goods 1.95% | |
| NIKE, Inc. Class B | | | 528,300 | | | | 49,391 | |
| | | | | | | | | |
| Tobacco 1.98% | | | | | | | | |
| Philip Morris International, Inc. | | | 602,700 | | | | 49,982 | |
Total Common Stocks
(cost $2,112,312,118) | | | | | | | 2,512,239 | |
| 20 | See Notes to Financial Statements. | |
Schedule of Investments (concluded)
CALIBRATED DIVIDEND GROWTH FUNDNovember 30, 2019
| Investments | | Principal
Amount
(000) | | | Fair
Value
(000) | |
| SHORT-TERM INVESTMENT 0.17% | | | | | | | | |
| | | | | | | | | |
| Repurchase Agreement | | | | | | | | |
Repurchase Agreement dated 11/29/2019, 0.85% due 12/2/2019 with Fixed Income Clearing Corp. collateralized by $4,360,000 of U.S. Treasury Note at 1.125% due 9/30/2021 value: $4,324,588; proceeds: $4,236,322
(cost $4,236,022) | | $ | 4,236 | | | $ | 4,236 | |
Total Investments in Securities 99.44%
(cost $2,116,548,140) | | | | | | | 2,516,475 | |
| Cash and Other Assets inExcess of Liabilities(b)0.56% | | | 14,230 | |
| Net Assets 100.00% | | | | | | $ | 2,530,705 | |
| (a) | | Foreign security traded in U.S. dollars. |
| (b) | | Cash and Other Assets in Excess of Liabilities include net unrealized appreciation on futures contracts as follows: |
| Open Futures Contracts at November 30, 2019: | | | |
| Type | | Expiration | | Contracts | | Position | | Notional
Amount | | Notional
Value | | | Unrealized
Appreciation |
| E-Mini S&P 500 INDEX | | December 2019 | | 76 | | Long | | $11,718,572 | | | $11,946,060 | | | | $227,488 |
| | | | | | | | | | | | | | | | |
| The following is a summary of the inputs used as of November 30, 2019 in valuing the Fund’s investments carried at fair value(1): |
| Investment Type(2) | | Level 1
(000) | | | Level 2
(000) | | | Level 3
(000) | | | Total
(000) | |
| Common Stocks | | $ | 2,512,239 | | | $ | – | | | $ | – | | | $ | 2,512,239 | |
| Short-Term Investment | | | | | | | | | | | | | | | | |
| Repurchase Agreement | | | – | | | | 4,236 | | | | – | | | | 4,236 | |
| Total | | $ | 2,512,239 | | | $ | 4,236 | | | $ | – | | | $ | 2,516,475 | |
| | | | | | | | | | | | | | | | | |
| Other Financial Instruments | | | | | | | | | | | | | | | | |
| Futures Contracts | | | | | | | | | | | | | | | | |
| Assets | | $ | 227 | | | $ | – | | | $ | – | | | $ | 227 | |
| Liabilities | | | – | | | | – | | | | – | | | | – | |
| Total | | $ | 227 | | | $ | – | | | $ | – | | | $ | 227 | |
| (1) | | Refer to Note 2(i) for a description of fair value measurements and the three-tier hierarchy of inputs. |
| (2) | | See Schedule of Investments for fair values in each industry and identification of foreign issuers and/or geography. |
| | See Notes to Financial Statements. | 21 |
Schedule of Investments
GROWTH OPPORTUNITIES FUNDNovember 30, 2019
| Investments | | | Shares | | | | Fair
Value
(000) | |
| COMMON STOCKS 99.05% |
| | | | | | | | | |
| Aerospace & Defense 5.19% |
| CAE, Inc. (Canada)(a) | | | 344,493 | | | $ | 9,270 | |
| L3Harris Technologies, Inc. | | | 75,441 | | | | 15,171 | |
| TransDigm Group, Inc. | | | 34,333 | | | | 19,470 | |
| Total | | | | | | | 43,911 | |
| | | | | | | | | |
| Air Freight & Logistics 0.58% |
| Expeditors International of Washington, Inc. | | | 66,160 | | | | 4,946 | |
| | | | | | | | | |
| Banks 0.75% | | | | | | | | |
| First Republic Bank | | | 58,012 | | | | 6,376 | |
| | | | | | | | | |
| Beverages 1.40% | | | | | | | | |
| Brown-Forman Corp. Class B | | | 174,716 | | | | 11,849 | |
| | | | | | | | | |
| Biotechnology 3.24% | | | | | | | | |
| Amarin Corp. plc ADR* | | | 143,027 | | | | 3,042 | |
| BioMarin Pharmaceutical, Inc.* | | | 73,082 | | | | 5,898 | |
| Myovant Sciences Ltd. (United Kingdom)*(a) | | | 140,905 | | | | 2,510 | |
| Natera, Inc.* | | | 124,785 | | | | 4,553 | |
| Neurocrine Biosciences, Inc.* | | | 69,970 | | | | 8,159 | |
| Sarepta Therapeutics, Inc.* | | | 29,056 | | | | 3,269 | |
| Total | | | | | | | 27,431 | |
| | | | | | | | | |
| Building Products 1.12% | | | | | | | | |
| Allegion plc (Ireland)(a) | | | 79,316 | | | | 9,520 | |
| | | | | | | | | |
| Capital Markets 2.60% | | | | | | | | |
| MarketAxess Holdings, Inc. | | | 19,940 | | | | 8,052 | |
| Moody’s Corp. | | | 22,329 | | | | 5,061 | |
| MSCI, Inc. | | | 34,456 | | | | 8,931 | |
| Total | | | | | | | 22,044 | |
| | | | | | | | | |
| Chemicals 0.49% | | | | | | | | |
| FMC Corp. | | | 41,993 | | | | 4,114 | |
| | | | | | | | | |
| Commercial Services & Supplies 1.60% |
| Cintas Corp. | | | 29,979 | | | | 7,706 | |
| Healthcare Services Group, Inc. | | | 231,508 | | | | 5,823 | |
| Total | | | | | | | 13,529 | |
| Investments | | Shares | | | Fair
Value
(000) | |
| Construction Materials 1.46% |
| Vulcan Materials Co. | | | 86,966 | | | $ | 12,338 | |
| | | | | | | | | |
| Consumer Finance 0.65% | | | | | | | | |
| SLM Corp. | | | 640,445 | | | | 5,463 | |
| | | | | | | | | |
| Containers & Packaging 1.35% | | | | | | | | |
| Avery Dennison Corp. | | | 64,797 | | | | 8,447 | |
| Ball Corp. | | | 44,908 | | | | 2,967 | |
| Total | | | | | | | 11,414 | |
| | | | | | | | | |
| Diversified Consumer Services 0.94% | | | | | | | | |
| Service Corp. International | | | 179,859 | | | | 7,917 | |
| | | | | | | | | |
| Electrical Equipment 2.92% | | | | | | | | |
| AMETEK, Inc. | | | 140,223 | | | | 13,884 | |
| Hubbell, Inc. | | | 73,714 | | | | 10,837 | |
| Total | | | | | | | 24,721 | |
| | | | | | | | | |
| Electronic Equipment, Instruments & Components 1.75% |
| Keysight Technologies, Inc.* | | | 80,108 | | | | 8,574 | |
| Trimble, Inc.* | | | 154,844 | | | | 6,276 | |
| Total | | | | | | | 14,850 | |
| | | | | | | | | |
| Equity Real Estate Investment Trusts 2.00% |
| SBA Communications Corp. | | | 71,486 | | | | 16,904 | |
| | | | | | | | | |
| Health Care Equipment & Supplies 5.08% |
| ABIOMED, Inc.* | | | 26,685 | | | | 5,235 | |
| Align Technology, Inc.* | | | 42,585 | | | | 11,811 | |
| DexCom, Inc.* | | | 27,043 | | | | 6,147 | |
| Edwards Lifesciences Corp.* | | | 12,199 | | | | 2,988 | |
| Insulet Corp.* | | | 28,158 | | | | 5,229 | |
| Teleflex, Inc. | | | 32,859 | | | | 11,610 | |
| Total | | | | | | | 43,020 | |
| | | | | | | | | |
| Health Care Providers & Services 2.41% |
| Centene Corp.* | | | 265,657 | | | | 16,065 | |
| Guardant Health, Inc.* | | | 56,138 | | | | 4,360 | |
| Total | | | | | | | 20,425 | |
| 22 | See Notes to Financial Statements. |
Schedule of Investments (continued)
GROWTH OPPORTUNITIES FUNDNovember 30, 2019
| Investments | | Shares | | | Fair
Value
(000) | |
| Hotels, Restaurants & Leisure 4.58% |
| Aramark | | | 339,104 | | | $ | 14,798 | |
| Chipotle Mexican Grill, Inc.* | | | 11,588 | | | | 9,432 | |
| Norwegian Cruise Line Holdings Ltd.* | | | 128,249 | | | | 6,879 | |
| Vail Resorts, Inc. | | | 31,519 | | | | 7,649 | |
| Total | | | | | | | 38,758 | |
| | | | | | | | | |
| Household Products 1.30% |
| Church & Dwight Co., Inc. | | | 156,515 | | | | 10,994 | |
| | | | | | | | | |
| Industrial Conglomerates 1.08% |
| Roper Technologies, Inc. | | | 25,427 | | | | 9,163 | |
| | | | | | | | | |
| Information Technology Services 13.22% |
| Euronet Worldwide, Inc.* | | | 61,840 | | | | 9,721 | |
| Fidelity National Information Services, Inc. | | | 206,441 | | | | 28,520 | |
| FleetCor Technologies, Inc.* | | | 51,549 | | | | 15,821 | |
| Genpact Ltd. | | | 272,356 | | | | 11,085 | |
| Global Payments, Inc. | | | 180,221 | | | | 32,638 | |
| Square, Inc. Class A* | | | 23,373 | | | | 1,615 | |
| Twilio, Inc. Class A* | | | 50,819 | | | | 5,249 | |
| Wix.com Ltd. (Israel)*(a) | | | 60,362 | | | | 7,297 | |
| Total | | | | | | | 111,946 | |
| | | | | | | | | |
| Insurance 2.58% | | | | | | | | |
| Axis Capital Holdings Ltd. | | | 86,551 | | | | 5,122 | |
| Goosehead Insurance, Inc. Class A | | | 164,821 | | | | 6,679 | |
| RenaissanceRe Holdings Ltd. | | | 53,109 | | | | 10,002 | |
| Total | | | | | | | 21,803 | |
| | | | | | | | | |
| Interactive Media & Services 2.17% |
| IAC/InterActiveCorp.* | | | 58,010 | | | | 12,919 | |
| Twitter, Inc.* | | | 175,716 | | | | 5,431 | |
| Total | | | | | | | 18,350 | |
| | | | | | | | | |
| Internet & Direct Marketing Retail 0.02% |
| RealReal, Inc. (The)* | | | 11,997 | | | | 206 | |
| Investments | | Shares | | | Fair
Value
(000) | |
| Life Sciences Tools & Services 3.42% |
| 10X Genomics, Inc. Class A* | | | 29,750 | | | $ | 1,931 | |
| Agilent Technologies, Inc. | | | 92,872 | | | | 7,501 | |
| Charles River Laboratories International, Inc.* | | | 68,078 | | | | 9,888 | |
| Illumina, Inc.* | | | 12,272 | | | | 3,937 | |
| Mettler-Toledo International, Inc.* | | | 7,975 | | | | 5,737 | |
| Total | | | | | | | 28,994 | |
| | | | | | | | | |
| Machinery 2.39% | | | | | | | | |
| Fortive Corp. | | | 127,713 | | | | 9,217 | |
| Stanley Black & Decker, Inc. | | | 70,114 | | | | 11,060 | |
| Total | | | | | | | 20,277 | |
| | | | | | | | | |
| Multi-Line Retail 3.50% | | | | | | | | |
| Dollar General Corp. | | | 125,401 | | | | 19,733 | |
| Dollar Tree, Inc.* | | | 108,363 | | | | 9,911 | |
| Total | | | | | | | 29,644 | |
| | | | | | | | | |
| Oil, Gas & Consumable Fuels 0.95% |
| Cimarex Energy Co. | | | 98,164 | | | | 4,512 | |
| Parsley Energy, Inc. Class A | | | 234,490 | | | | 3,513 | |
| Total | | | | | | | 8,025 | |
| | | | | | | | | |
| Personal Products 0.68% | | | | | | | | |
| Shiseido Co., Ltd.(b) | | JPY | 79,952 | | | | 5,776 | |
| | | | | | | | | |
| Pharmaceuticals 1.81% | | | | | | | | |
| Elanco Animal Health, Inc.* | | | 129,951 | | | | 3,601 | |
| Zoetis, Inc. | | | 97,528 | | | | 11,754 | |
| Total | | | | | | | 15,355 | |
| | | | | | | | | |
| Professional Services 1.70% | | | | | | | | |
| CoStar Group, Inc.* | | | 23,542 | | | | 14,428 | |
| | | | | | | | | |
| Road & Rail 2.44% | | | | | | | | |
| J.B. Hunt Transport Services, Inc. | | | 80,212 | | | | 9,274 | |
| Lyft, Inc. Class A* | | | 17,733 | | | | 869 | |
| Old Dominion Freight Line, Inc. | | | 37,197 | | | | 7,127 | |
| Saia, Inc.* | | | 35,482 | | | | 3,367 | |
| Total | | | | | | | 20,637 | |
| | See Notes to Financial Statements. | 23 |
Schedule of Investments (continued)
GROWTH OPPORTUNITIES FUNDNovember 30, 2019
| Investments | | | Shares | | | | Fair
Value
(000) | |
| Semiconductors & Semiconductor Equipment 5.60% |
| Advanced Micro Devices, Inc.* | | | 255,391 | | | $ | 9,998 | |
| Analog Devices, Inc. | | | 96,630 | | | | 10,914 | |
| Lam Research Corp. | | | 49,390 | | | | 13,179 | |
| Marvell Technology Group Ltd. | | | 167,496 | | | | 4,417 | |
| Xilinx, Inc. | | | 95,955 | | | | 8,903 | |
| Total | | | | | | | 47,411 | |
| | | | | | | | | |
| Software 9.48% | | | | | | | | |
| Anaplan, Inc.* | | | 85,655 | | | | 4,619 | |
| Datadog, Inc. Class A* | | | 1,744 | | | | 71 | |
| New Relic, Inc.* | | | 84,670 | | | | 5,759 | |
| Palo Alto Networks, Inc.* | | | 52,949 | | | | 12,031 | |
| RingCentral, Inc. Class A* | | | 121,947 | | | | 21,032 | |
| ServiceNow, Inc.* | | | 43,848 | | | | 12,411 | |
| Slack Technologies, Inc. Class A* | | | 121,796 | | | | 2,780 | |
| Splunk, Inc.* | | | 105,162 | | | | 15,692 | |
| Zendesk, Inc.* | | | 74,788 | | | | 5,908 | |
| Total | | | | | | | 80,303 | |
| | | | | | | | | |
| Specialty Retail 5.63% | | | | | | | | |
| Burlington Stores, Inc.* | | | 79,158 | | | | 17,811 | |
| O’Reilly Automotive, Inc.* | | | 45,829 | | | | 20,269 | |
| Tractor Supply Co. | | | 101,293 | | | | 9,566 | |
| Total | | | | | | | 47,646 | |
| | | | | | | | | |
| Textiles, Apparel & Luxury Goods 0.97% |
| Carter’s, Inc. | | | 79,859 | | | | 8,250 | |
Total Common Stocks
(cost $603,618,809) | | | | | | | 838,738 | |
| Investments | | Principal
Amount
(000) | | | Fair
Value
(000) | |
| SHORT-TERM INVESTMENT 0.81% |
| |
| Repurchase Agreement | | | | | | | | |
Repurchase Agreement dated 11/29/2019, 0.85% due 12/2/2019 with Fixed Income Clearing Corp. collateralized by $7,065,000 of U.S. Treasury Note at 1.125% due 9/30/2021; value: $7,007,618; proceeds: $6,866,269
(cost $6,865,783) | | $ | 6,866 | | | $ | 6,866 | |
Total Investments inSecurities 99.86%
(cost $610,484,592) | | | | | | | 845,604 | |
| Other Assets in Excess of Liabilities 0.14% | | | | 1,149 | |
| Net Assets 100.00% | | | | | | $ | 846,753 | |
| ADR | | American Depositary Receipt. |
| JPY | | Japanese Yen |
| * | | Non-income producing security. |
| (a) | | Foreign security traded in U.S. dollars. |
| (b) | | Investment in non-U.S. dollar denominated securities. |
| 24 | See Notes to Financial Statements. |
Schedule of Investments (concluded)
GROWTH OPPORTUNITIES FUNDNovember 30, 2019
The following is a summary of the inputs used as of November 30, 2019 in valuing the Fund’s investments carried at fair value(1):
| Investment Type(2) | | Level 1
(000) | | | Level 2
(000) | | | Level 3
(000) | | | Total
(000) | |
| Common Stocks | | $ | 838,738 | | | $ | – | | | $ | – | | | $ | 838,738 | |
| Short-Term Investments | | | | | | | | | | | | | | | | |
| Repurchase Agreement | | | – | | | | 6,866 | | | | – | | | | 6,866 | |
| Total | | $ | 838,738 | | | $ | 6,866 | | | $ | – | | | $ | 845,604 | |
| (1) | | Refer to Note 2(i) for a description of fair value measurements and the three-tier hierarchy of inputs. |
| (2) | | See Schedule of Investments for fair values in each industry and identification of foreign issuers and/or geography. |
| | See Notes to Financial Statements. | 25 |
Schedule of Investments
SMALL CAP VALUE FUNDNovember 30, 2019
| Investments | | Shares | | | Fair
Value
(000) | |
| COMMON STOCKS 100.01% | | | | | | | | |
| | | | | | | | | |
| Aerospace & Defense 1.44% | | | | | | | | |
| Triumph Group, Inc. | | | 399,054 | | | $ | 11,058 | |
| | | | | | | | | |
| Airlines 1.22% | | | | | | | | |
| Hawaiian Holdings, Inc. | | | 309,600 | | | | 9,378 | |
| | | | | | | | | |
| Auto Components 2.87% | | | | | | | | |
| Dorman Products, Inc.* | | | 137,995 | | | | 10,256 | |
| LCI Industries | | | 110,217 | | | | 11,734 | |
| Total | | | | | | | 21,990 | |
| | | | | | | | | |
| Banks 15.46% | | | | | | | | |
| Bank of Hawaii Corp. | | | 155,700 | | | | 14,030 | |
| BankUnited, Inc. | | | 340,400 | | | | 11,935 | |
| Columbia Banking System, Inc. | | | 253,000 | | | | 9,887 | |
| First Merchants Corp. | | | 226,600 | | | | 9,175 | |
| Opus Bank | | | 441,126 | | | | 11,341 | |
| Prosperity Bancshares, Inc. | | | 133,500 | | | | 9,378 | |
| Renasant Corp. | | | 223,800 | | | | 7,923 | |
| Sterling Bancorp | | | 654,600 | | | | 13,367 | |
| TCF Financial Corp. | | | 349,759 | | | | 14,861 | |
| Valley National Bancorp | | | 998,157 | | | | 11,559 | |
| Webster Financial Corp. | | | 105,500 | | | | 5,137 | |
| Total | | | | | | | 118,593 | |
| | | | | | | | | |
| Capital Markets 6.18% | | | | | | | | |
| Brightsphere Investment Group, Inc.* | | | 1,081,733 | | | | 10,417 | |
| Federated Investors, Inc. Class B | | | 173,100 | | | | 5,802 | |
| Golub Capital BDC, Inc. | | | 417,624 | | | | 7,668 | |
| Moelis & Co. Class A | | | 118,100 | | | | 3,892 | |
| TPG Specialty Lending, Inc. | | | 377,580 | | | | 8,152 | |
| Victory Capital Holdings, Inc. Class A | | | 556,500 | | | | 11,464 | |
| Total | | | | | | | 47,395 | |
| Investments | | Shares | | | Fair
Value
(000) | |
| Chemicals 4.97% | | | | | | | | |
| AdvanSix, Inc.* | | | 317,130 | | | $ | 6,416 | |
| Chase Corp. | | | 100,800 | | | | 11,859 | |
| PolyOne Corp. | | | 310,484 | | | | 9,790 | |
| Valvoline, Inc. | | | 443,200 | | | | 10,038 | |
| Total | | | | | | | 38,103 | |
| | | | | | | | | |
| Commercial Services & Supplies 1.66% | |
| Steelcase, Inc. Class A | | | 703,500 | | | | 12,747 | |
| | | | | | | | | |
| Communications Equipment 0.87% | | | | | | | | |
| Plantronics, Inc. | | | 262,100 | | | | 6,642 | |
| | | | | | | | | |
| Construction & Engineering 4.09% | | | | | | | | |
| Arcosa, Inc. | | | 198,353 | | | | 7,777 | |
| Comfort Systems USA, Inc. | | | 172,520 | | | | 8,816 | |
| EMCOR Group, Inc. | | | 165,901 | | | | 14,754 | |
| Total | | | | | | | 31,347 | |
| | | | | | | | | |
| Electric: Utilities 3.38% | | | | | | | | |
| IDACORP, Inc. | | | 106,464 | | | | 11,184 | |
| Portland General Electric Co. | | | 265,200 | | | | 14,721 | |
| Total | | | | | | | 25,905 | |
| | | | | | | | | |
| Electronic Equipment, Instruments & Components 4.34% | |
| Avnet, Inc. | | | 277,300 | | | | 11,272 | |
| Littelfuse, Inc. | | | 43,900 | | | | 7,964 | |
| Tech Data Corp.* | | | 96,795 | | | | 14,025 | |
| Total | | | | | | | 33,261 | |
| | | | | | | | | |
| Energy Equipment & Services 1.55% | | | | | | | | |
| Cactus, Inc. Class A | | | 237,700 | | | | 7,176 | |
| Oceaneering International, Inc.* | | | 350,200 | | | | 4,696 | |
| Total | | | | | | | 11,872 | |
| 26 | See Notes to Financial Statements. |
Schedule of Investments (continued)
SMALL CAP VALUE FUNDNovember 30, 2019
| Investments | | Shares | | | Fair
Value
(000) | |
| Equity Real Estate Investment Trusts 7.34% | |
| First Industrial Realty Trust, Inc. | | | 272,200 | | | $ | 11,590 | |
| Highwoods Properties, Inc. | | | 265,700 | | | | 12,900 | |
| Outfront Media, Inc. | | | 268,390 | | | | 6,704 | |
| STAG Industrial, Inc. | | | 395,700 | | | | 12,263 | |
| Weingarten Realty Investors | | | 402,900 | | | | 12,828 | |
| Total | | | | | | | 56,285 | |
| | | | | | | | | |
| Food Products 0.84% | | | | | | | | |
| Sanderson Farms, Inc. | | | 38,773 | | | | 6,420 | |
| | | | | | | | | |
| Health Care Equipment & Supplies 1.49% | |
| Natus Medical, Inc.* | | | 358,297 | | | | 11,462 | |
| | | | | | | | | |
| Health Care Providers & Services 1.00% | |
| AMN Healthcare Services, Inc.* | | | 129,600 | | | | 7,707 | |
| | | | | | | | | |
| Hotels, Restaurants & Leisure 0.96% | |
| Cracker Barrel Old Country Store, Inc. | | | 47,900 | | | | 7,364 | |
| | | | | | | | | |
| Household Products 1.48% | | | | | | | | |
| Spectrum Brands Holdings, Inc. | | | 182,141 | | | | 11,387 | |
| | | | | | | | | |
| Information Technology Services 2.43% | |
| CACI International, Inc. Class A* | | | 32,900 | | | | 7,874 | |
| MAXIMUS, Inc. | | | 144,500 | | | | 10,787 | |
| Total | | | | | | | 18,661 | |
| | | | | | | | | |
| Insurance 7.08% | | | | | | | | |
| Argo Group International Holdings Ltd. | | | 196,800 | | | | 12,946 | |
| Axis Capital Holdings Ltd. | | | 197,200 | | | | 11,670 | |
| Hanover Insurance Group, Inc. (The) | | | 83,200 | | | | 11,309 | |
| ProSight Global, Inc.* | | | 431,843 | | | | 7,415 | |
| RenaissanceRe Holdings Ltd. | | | 58,010 | | | | 10,925 | |
| Total | | | | | | | 54,265 | |
| Investments | | Shares | | | Fair
Value
(000) | |
| Leisure Products 2.09% | | | | | | | | |
| Malibu Boats, Inc. Class A* | | | 404,751 | | | $ | 16,004 | |
| | | | | | | | | |
| Life Sciences Tools & Services 1.28% | |
| Syneos Health, Inc.* | | | 179,000 | | | | 9,829 | |
| | | | | | | | | |
| Machinery 5.40% | | | | | | | | |
| Alamo Group, Inc. | | | 128,590 | | | | 14,762 | |
| Columbus McKinnon Corp. | | | 353,800 | | | | 14,534 | |
| Crane Co. | | | 145,990 | | | | 12,128 | |
| Total | | | | | | | 41,424 | |
| | | | | | | | | |
| Media 2.48% | | | | | | | | |
| Entercom Communications Corp. Class A | | | 1,897,100 | | | | 8,973 | |
| Nexstar Media Group, Inc. Class A | | | 38,900 | | | | 4,190 | |
| Scholastic Corp. | | | 157,700 | | | | 5,856 | |
| Total | | | | | | | 19,019 | |
| | | | | | | | | |
| Metals & Mining 0.77% | | | | | | | | |
| Lundin Mining Corp.(a) | | CAD | 1,084,100 | | | | 5,868 | |
| | | | | | | | | |
| Multi-Utilities 2.99% | | | | | | | | |
| Avista Corp. | | | 191,548 | | | | 9,056 | |
| NorthWestern Corp. | | | 194,300 | | | | 13,906 | |
| Total | | | | | | | 22,962 | |
| | | | | | | | | |
| Oil, Gas & Consumable Fuels 3.43% | |
| Par Pacific Holdings, Inc.* | | | 492,866 | | | | 12,268 | |
| Parsley Energy, Inc. Class A | | | 452,897 | | | | 6,784 | |
| WPX Energy, Inc.* | | | 733,745 | | | | 7,220 | |
| Total | | | | | | | 26,272 | |
| | | | | | | | | |
| Professional Services 1.64% | | | | | | | | |
| ICF International, Inc. | | | 140,396 | | | | 12,598 | |
| | | | | | | | | |
| Real Estate Management & Development 1.08% | |
| Marcus & Millichap, Inc.* | | | 225,909 | | | | 8,304 | |
| | See Notes to Financial Statements. | 27 |
Schedule of Investments (concluded)
SMALL CAP VALUE FUNDNovember 30, 2019
| Investments | | Shares | | | Fair
Value
(000) | |
| Road & Rail 3.08% | | | | | | | | |
| Landstar System, Inc. | | | 112,728 | | | $ | 12,559 | |
| Saia, Inc.* | | | 116,175 | | | | 11,025 | |
| Total | | | | | | | 23,584 | |
| | | | | | | | | |
| Specialty Retail 3.08% | | | | | | | | |
| Urban Outfitters, Inc.* | | | 479,519 | | | | 12,304 | |
| Williams-Sonoma, Inc. | | | 163,228 | | | | 11,328 | |
| Total | | | | | | | 23,632 | |
| | | | | | | | | |
| Textiles, Apparel & Luxury Goods 1.07% | |
| Skechers U.S.A., Inc. Class A* | | | 204,171 | | | | 8,212 | |
| | | | | | | | | |
| Thrifts & Mortgage Finance 0.97% | |
| Essent Group Ltd. | | | 135,800 | | | | 7,421 | |
Total Common Stocks
(cost $696,869,855) | | | | | | | 766,971 | |
| Investments | | Principal
Amount
(000) | | | Fair
Value
(000) | |
| SHORT-TERM INVESTMENT 0.21% | | | | | | | | |
| | | | | | | | | |
| Repurchase Agreement | | | | | | | | |
Repurchase Agreement dated 11/29/2019, 0.85% due 12/2/2019 with Fixed Income Clearing Corp. collateralized by $1,630,000 of U.S. Treasury Note at 1.125% due 9/30/2021; value: $1,616,761; proceeds: $1,584,325
(cost $1,584,212) | | $ | 1,584 | | | $ | 1,584 | |
Total Investments in Securities 100.22%
(cost $698,454,067) | | | | | | | 768,555 | |
| Liabilities in Excess of Other Assets (0.22)% | | | | | | | (1,656 | ) |
| Net Assets 100.00% | | | | | | $ | 766,899 | |
| CAD | | Canadian Dollar |
| * | | Non-income producing security. |
| (a) | | Investment in non-U.S. dollar denominated securities. |
The following is a summary of the inputs used as of November 30, 2019 in valuing the Fund’s investments carried at fair value(1):
| Investment Type(2) | | Level 1
(000) | | | Level 2
(000) | | | Level 3
(000) | | | Total
(000) |
| Common Stocks | | $ | 766,971 | | | $ | – | | | $ | – | | | $ | 766,971 |
| Short-Term Investment | | | | | | | | | | | | | | | |
| Repurchase Agreement | | | – | | | | 1,584 | | | | – | | | | 1,584 |
| Total | | $ | 766,971 | | | $ | 1,584 | | | $ | – | | | $ | 768,555 |
| (1) | | Refer to Note 2(i) for a description of fair value measurements and the three-tier hierarchy of inputs. |
| (2) | | See Schedule of Investments for fair values in each industry and identification of foreign issuers and/or geography. |
| 28 | See Notes to Financial Statements. |
Statements of Assets and Liabilities
November 30, 2019
| | | Calibrated
Dividend
Growth Fund | | | Growth
Opportunities
Fund | | | Small Cap
Value Fund | |
| ASSETS: | | | | | | | | | |
| Investments in securities, at cost | | $ | 2,116,548,140 | | | $ | 610,484,592 | | | $ | 698,454,067 | |
| Investments in securities, at fair value | | $ | 2,516,475,144 | | | $ | 845,603,622 | | | $ | 768,555,493 | |
| Cash | | | 5 | | | | – | | | | – | |
| Deposits with brokers for futures collateral | | | 478,800 | | | | – | | | | – | |
| Receivables: | | | | | | | | | | | | |
| Investment securities sold | | | 11,979,111 | | | | 2,630,268 | | | | – | |
| Interest and dividends | | | 6,925,376 | | | | 579,472 | | | | 1,134,825 | |
| Capital shares sold | | | 2,551,122 | | | | 1,248,788 | | | | 427,965 | |
| From advisor (See Note 3) | | | 24,013 | | | | – | | | | – | |
| Prepaid expenses and other assets | | | 129,251 | | | | 78,978 | | | | 78,341 | |
| Total assets | | | 2,538,562,822 | | | | 850,141,128 | | | | 770,196,624 | |
| LIABILITIES: | | | | | | | | | | | | |
| Payables: | | | | | | | | | | | | |
| Capital shares reacquired | | | 1,428,059 | | | | 2,482,921 | | | | 2,113,660 | |
| Investment securities purchased | | | 3,910,219 | | | | – | | | | – | |
| Management fee | | | 1,112,997 | | | | 516,962 | | | | 476,177 | |
| 12b-1 distribution plan | | | 529,861 | | | | 113,007 | | | | 95,698 | |
| Directors’ fees | | | 283,682 | | | | 91,360 | | | | 285,858 | |
| Fund administration | | | 82,805 | | | | 27,571 | | | | 25,396 | |
| Variation margin on futures contracts | | | 109,395 | | | | – | | | | – | |
| Accrued expenses | | | 400,694 | | | | 156,615 | | | | 301,226 | |
| Total liabilities | | | 7,857,712 | | | | 3,388,436 | | | | 3,298,015 | |
| Commitments and contingent liabilities | | | | | | | | | | | | |
| NET ASSETS | | $ | 2,530,705,110 | | | $ | 846,752,692 | | | $ | 766,898,609 | |
| COMPOSITION OF NET ASSETS: | | | | | | | | | | | | |
| Paid-in capital | | $ | 2,023,769,646 | | | $ | 570,846,026 | | | $ | 581,077,084 | |
| Total distributable earnings | | | 506,935,464 | | | | 275,906,666 | | | | 185,821,525 | |
| Net Assets | | $ | 2,530,705,110 | | | $ | 846,752,692 | | | $ | 766,898,609 | |
| | See Notes to Financial Statements. | 29 |
Statements of Assets and Liabilities (concluded)
November 30, 2019
| | | Calibrated
Dividend
Growth Fund | | | Growth
Opportunities
Fund | | | Small Cap
Value Fund | |
| Net assets by class: | | | | | | | | | | | | |
| Class A Shares | | $ | 1,731,882,346 | | | $ | 385,587,830 | | | $ | 267,863,991 | |
| Class C Shares | | $ | 216,647,201 | | | $ | 26,860,091 | | | $ | 9,231,312 | |
| Class F Shares | | $ | 296,992,955 | | | $ | 23,271,394 | | | $ | 10,522,473 | |
| Class F3 Shares | | $ | 205,183,038 | | | $ | 7,985,506 | | | $ | 29,679,037 | |
| Class I Shares | | $ | 42,808,706 | | | $ | 374,814,405 | | | $ | 411,532,125 | |
| Class P Shares | | $ | 1,136,549 | | | $ | 3,285,592 | | | $ | 20,819,255 | |
| Class R2 Shares | | $ | 1,044,619 | | | $ | 748,256 | | | $ | 602,593 | |
| Class R3 Shares | | $ | 16,221,366 | | | $ | 15,907,579 | | | $ | 5,713,097 | |
| Class R4 Shares | | $ | 5,503,788 | | | $ | 1,021,875 | | | $ | 2,750,336 | |
| Class R5 Shares | | $ | 272,129 | | | $ | 88,697 | | | $ | 55,298 | |
| Class R6 Shares | | $ | 13,012,413 | | | $ | 7,181,467 | | | $ | 8,129,092 | |
| Outstanding shares by class: | | | | | | | | | | | | |
| Class A Shares (538.125, 198 and 378 million shares of common stock authorized, $.001 par value) | | | 105,716,996 | | | | 15,440,333 | | | | 15,321,712 | |
| Class C Shares (40, 40 and 30 million shares of common stock authorized, $.001 par value) | | | 13,420,582 | | | | 1,491,394 | | | | 1,121,512 | |
| Class F Shares (144.375, 66 and 63 million shares of common stock authorized, $.001 par value) | | | 18,095,787 | | | | 891,985 | | | | 595,793 | |
| Class F3 Shares (88.125, 66 and 63 million shares of common stock authorized, $.001 par value) | | | 12,341,974 | | | | 276,694 | | | | 1,375,244 | |
| Class I Shares (144.375, 66 and 315 million shares of common stock authorized, $.001 par value) | | | 2,586,041 | | | | 13,064,526 | | | | 19,186,889 | |
| Class P Shares (20, 20 and 50 million shares of common stock authorized, $.001 par value) | | | 68,966 | | | | 135,569 | | | | 1,271,349 | |
| Class R2 Shares (30, 30 and 30 million shares of common stock authorized, $.001 par value) | | | 63,115 | | | | 31,750 | | | | 37,346 | |
| Class R3 Shares (30, 43.5 and 82.75 million shares of common stock authorized, $.001 par value) | | | 995,727 | | | | 659,699 | | | | 347,143 | |
| Class R4 Shares (30, 43.5 and 82.75 million shares of common stock authorized, $.001 par value) | | | 336,336 | | | | 40,917 | | | | 157,245 | |
| Class R5 Shares (30, 43.5 and 82.75 million shares of common stock authorized, $.001 par value) | | | 16,446 | | | | 3,089 | | | | 2,575 | |
| Class R6 Shares (30, 43.5 and 82.75 million shares of common stock authorized, $.001 par value) | | | 782,883 | | | | 248,877 | | | | 376,797 | |
Net asset value, offering and redemption price per share
(Net assets divided by outstanding shares): | | | | | | | | | | | | |
| Class A Shares-Net asset value | | | $16.38 | | | | $24.97 | | | | $17.48 | |
Class A Shares-Maximum offering price
(Net asset value plus sales charge of 5.75%) | | | $17.38 | | | | $26.49 | | | | $18.55 | |
| Class C Shares-Net asset value | | | $16.14 | | | | $18.01 | | | | $8.23 | |
| Class F Shares-Net asset value | | | $16.41 | | | | $26.09 | | | | $17.66 | |
| Class F3 Shares-Net asset value | | | $16.62 | | | | $28.86 | | | | $21.58 | |
| Class I Shares-Net asset value | | | $16.55 | | | | $28.69 | | | | $21.45 | |
| Class P Shares-Net asset value | | | $16.48 | | | | $24.24 | | | | $16.38 | |
| Class R2 Shares-Net asset value | | | $16.55 | | | | $23.57 | | | | $16.14 | |
| Class R3 Shares-Net asset value | | | $16.29 | | | | $24.11 | | | | $16.46 | |
| Class R4 Shares-Net asset value | | | $16.36 | | | | $24.97 | | | | $17.49 | |
| Class R5 Shares-Net asset value | | | $16.55 | | | | $28.71 | | | | $21.47 | |
| Class R6 Shares-Net asset value | | | $16.62 | | | | $28.86 | | | | $21.57 | |
| 30 | See Notes to Financial Statements. |
Statements of Operations
For the Year Ended November 30, 2019
| | | Calibrated
Dividend
Growth Fund | | | Growth
Opportunities
Fund | | | Small Cap
Value Fund | |
| Investment income: | | | | | | | | | | | | |
| Dividends (net of foreign withholding taxes of $0, $4,964 and $52,021, respectively) | | $ | 60,904,625 | | | $ | 6,109,789 | | | $ | 11,597,088 | |
| Interest income | | | 148,654 | | | | 123,933 | | | | 128,078 | |
| Total investment income | | | 61,053,279 | | | | 6,233,722 | | | | 11,725,166 | |
| Expenses: | | | | | | | | | | | | |
| Management fee | | | 12,820,661 | | | | 6,082,419 | | | | 6,054,404 | |
| 12b-1 distribution plan-Class A | | | 4,073,922 | | | | 886,825 | | | | 723,826 | |
| 12b-1 distribution plan-Class C | | | 2,203,215 | | | | 269,098 | | | | 100,329 | |
| 12b-1 distribution plan-Class F | | | 254,870 | | | | 20,748 | | | | 12,377 | |
| 12b-1 distribution plan-Class P | | | 5,253 | | | | 13,250 | | | | 103,412 | |
| 12b-1 distribution plan-Class R2 | | | 6,605 | | | | 4,810 | | | | 4,207 | |
| 12b-1 distribution plan-Class R3 | | | 77,368 | | | | 82,089 | | | | 28,895 | |
| 12b-1 distribution plan-Class R4 | | | 12,182 | | | | 2,359 | | | | 6,108 | |
| Shareholder servicing | | | 1,942,581 | | | | 556,644 | | | | 768,039 | |
| Fund administration | | | 948,625 | | | | 324,396 | | | | 322,901 | |
| Registration | | | 210,359 | | | | 136,296 | | | | 140,213 | |
| Reports to shareholders | | | 196,988 | | | | 49,704 | | | | 44,613 | |
| Professional | | | 58,987 | | | | 54,317 | | | | 115,564 | |
| Directors’ fees | | | 73,289 | | | | 25,052 | | | | 26,925 | |
| Custody | | | 55,898 | | | | 24,178 | | | | 23,198 | |
| Other | | | 271,971 | | | | 157,762 | | | | 161,426 | |
| Gross expenses | | | 23,212,774 | | | | 8,689,947 | | | | 8,636,437 | |
| Expense reductions (See Note 9) | | | (73,811 | ) | | | (14,646 | ) | | | (19,714 | ) |
| Fees waived and expenses reimbursed (See Note 3) | | | (254,870 | ) | | | – | | | | – | |
| Net expenses | | | 22,884,093 | | | | 8,675,301 | | | | 8,616,723 | |
| Net investment income (loss) | | | 38,169,186 | | | | (2,441,579 | ) | | | 3,108,443 | |
| Net realized and unrealized gain (loss): | | | | | | | | | | | | |
| Net realized gain on investments | | | 112,523,546 | | | | 53,981,317 | | | | 126,368,408 | |
| Net realized gain on futures contracts | | | 1,105,881 | | | | – | | | | – | |
| Net realized gain on foreign currency exchange contracts | | | – | | | | 652 | | | | – | |
| Net realized loss on foreign currency related transactions | | | – | | | | (1,532 | ) | | | (911 | ) |
| Net change in unrealized appreciation/depreciation on investments | | | 150,982,927 | | | | 120,331,650 | | | | (115,718,266 | ) |
| Net change in unrealized appreciation/depreciation on futures contracts | | | 156,723 | | | | – | | | | – | |
| Net realized and unrealized gain | | | 264,769,077 | | | | 174,312,087 | | | | 10,649,231 | |
| Net Increase in Net Assets Resulting From Operations | | $ | 302,938,263 | | | $ | 171,870,508 | | | $ | 13,757,674 | |
| | See Notes to Financial Statements. | 31 |
Statements of Changes in Net Assets
| | | Calibrated Dividend Growth Fund |
| INCREASE (DECREASE) IN NET ASSETS | | For the Year Ended
November 30, 2019 | | | For the Year Ended
November 30, 2018 | |
| Operations: | | | | | | | | |
| Net investment income (loss) | | $ | 38,169,186 | | | $ | 36,874,367 | |
| Net realized gain on investments, futures contracts, forward currency exchange contracts and foreign currency related transactions | | | 113,629,427 | | | | 155,963,291 | |
| Net change in unrealized appreciation/depreciation on investments and futures contracts | | | 151,139,650 | | | | (84,281,671 | ) |
| Net increase in net assets resulting from operations | | | 302,938,263 | | | | 108,555,987 | |
| Distributions to shareholders: | | | | | | | | |
| Class A | | | (130,513,086 | ) | | | (126,545,657 | ) |
| Class B | | | – | | | | (132,851 | ) |
| Class C | | | (16,917,446 | ) | | | (20,135,957 | ) |
| Class F | | | (19,671,929 | ) | | | (19,052,991 | ) |
| Class F3 | | | (15,450,282 | ) | | | (13,955,362 | ) |
| Class I | | | (3,380,561 | ) | | | (3,375,520 | ) |
| Class P | | | (116,117 | ) | | | (131,367 | ) |
| Class R2 | | | (94,801 | ) | | | (95,594 | ) |
| Class R3 | | | (1,318,084 | ) | | | (1,554,876 | ) |
| Class R4 | | | (354,368 | ) | | | (244,666 | ) |
| Class R5 | | | (19,224 | ) | | | (16,214 | ) |
| Class R6 | | | (939,273 | ) | | | (1,038,985 | ) |
| Class T | | | – | | | | (797 | ) |
| Total distributions to shareholders | | | (188,775,171 | ) | | | (186,280,837 | ) |
| Capital share transactions (Net of share conversions) (See Note 14): | | | | | | |
| Net proceeds from sales of shares | | | 401,687,035 | | | | 322,788,033 | |
| Reinvestment of distributions | | | 178,925,882 | | | | 176,723,182 | |
| Cost of shares reacquired | | | (530,484,394 | ) | | | (529,436,900 | ) |
| Net increase (decrease) in net assets resulting from capital share transactions | | | 50,128,523 | | | | (29,925,685 | ) |
| Net increase (decrease) in net assets | | | 164,291,615 | | | | (107,650,535 | ) |
| NET ASSETS: | | | | | | | | |
| Beginning of year | | $ | 2,366,413,495 | | | $ | 2,474,064,030 | |
| End of year | | $ | 2,530,705,110 | | | $ | 2,366,413,495 | |
| 32 | See Notes to Financial Statements. |
| Growth Opportunities Fund | | | Small Cap Value Fund |
For the Year Ended
November 30, 2019 | | | For the Year Ended
November 30, 2018 | | | For the Year Ended
November 30, 2019 | | | For the Year Ended
November 30, 2018 | |
| | | | | | | | | | | | | | | |
| $ | (2,441,579 | ) | | $ | (3,103,488 | ) | | $ | 3,108,443 | | | $ | (2,103,000 | ) |
| | | | | | | | | | | | | | | |
| | 53,980,437 | | | | 36,546,136 | | | | 126,367,497 | | | | 141,269,867 | |
| | | | | | | | | | | | | | | |
| | 120,331,650 | | | | (1,411,098 | ) | | | (115,718,266 | ) | | | (135,048,489 | ) |
| | 171,870,508 | | | | 32,031,550 | | | | 13,757,674 | | | | 4,118,378 | |
| | | | | | | | | | | | | | | |
| | (17,630,577 | ) | | | (28,549,207 | ) | | | (47,826,419 | ) | | | (47,222,302 | ) |
| | – | | | | (86,592 | ) | | | – | | | | (31,048 | ) |
| | (1,847,374 | ) | | | (4,578,110 | ) | | | (2,989,801 | ) | | | (5,116,270 | ) |
| | (1,005,180 | ) | | | (1,671,970 | ) | | | (3,017,435 | ) | | | (2,930,151 | ) |
| | (313,063 | ) | | | (453,908 | ) | | | (4,096,535 | ) | | | (3,523,248 | ) |
| | (17,104,054 | ) | | | (409,334 | ) | | | (58,302,292 | ) | | | (66,476,918 | ) |
| | (149,527 | ) | | | (224,141 | ) | | | (4,024,562 | ) | | | (4,514,604 | ) |
| | (48,322 | ) | | | (122,850 | ) | | | (104,944 | ) | | | (88,595 | ) |
| | (934,613 | ) | | | (1,768,118 | ) | | | (954,955 | ) | | | (984,885 | ) |
| | (45,753 | ) | | | (86,785 | ) | | | (274,383 | ) | | | (435,819 | ) |
| | (3,310 | ) | | | (4,974 | ) | | | (1,680 | ) | | | (37,155 | ) |
| | (426,423 | ) | | | (4,845,357 | ) | | | (2,546,155 | ) | | | (2,448,692 | ) |
| | – | | | | – | | | | – | | | | – | |
| | (39,508,196 | ) | | | (42,801,346 | ) | | | (124,139,161 | ) | | | (133,809,687 | ) |
| | | | | | | | | | | | | | | |
| | 113,552,901 | | | | 430,451,999 | | | | 75,346,316 | | | | 109,697,863 | |
| | 38,593,114 | | | | 40,908,912 | | | | 116,454,976 | | | | 126,612,036 | |
| | (230,110,952 | ) | | | (183,918,203 | ) | | | (230,129,392 | ) | | | (351,422,496 | ) |
| | | | | | | | | | | | | | | |
| | (77,964,937 | ) | | | 287,442,708 | | | | (38,328,100 | ) | | | (115,112,597 | ) |
| | 54,397,375 | | | | 276,672,912 | | | | (148,709,587 | ) | | | (244,803,906 | ) |
| | | | | | | | | | | | | | | |
| $ | 792,355,317 | | | $ | 515,682,405 | | | $ | 915,608,196 | | | $ | 1,160,412,102 | |
| $ | 846,752,692 | | | $ | 792,355,317 | | | $ | 766,898,609 | | | $ | 915,608,196 | |
| | See Notes to Financial Statements. | 33 |
Financial Highlights
CALIBRATED DIVIDEND GROWTH FUND
| | | | | Per Share Operating Performance: |
| | | | | Investment Operations: | | Distributions to
shareholders from: |
| | | Net asset
value,
beginning
of period | | Net
invest-
ment
income(a) | | Net
realized
and
unrealized
gain (loss) | | Total
from
invest-
ment
opera-
tions | | Net
investment
income | | Net
realized
gain | | Total
distri-
butions |
| Class A | | | | | | | | | | | | | | | | | | | | | | | | | | | | |
| 11/30/2019 | | | $15.75 | | | | $0.25 | | | $ | 1.64 | | | $ | 1.89 | | | | $(0.23 | ) | | | $(1.03 | ) | | | $(1.26 | ) |
| 11/30/2018 | | | 16.26 | | | | 0.24 | | | | 0.48 | | | | 0.72 | | | | (0.24 | ) | | | (0.99 | ) | | | (1.23 | ) |
| 11/30/2017 | | | 14.82 | | | | 0.25 | | | | 2.43 | | | | 2.68 | | | | (0.27 | ) | | | (0.97 | ) | | | (1.24 | ) |
| 11/30/2016 | | | 14.42 | | | | 0.27 | | | | 1.38 | | | | 1.65 | | | | (0.25 | ) | | | (1.00 | ) | | | (1.25 | ) |
| 11/30/2015 | | | 16.97 | | | | 0.26 | | | | (0.46 | ) | | | (0.20 | ) | | | (0.26 | ) | | | (2.09 | ) | | | (2.35 | ) |
| Class C | | | | | | | | | | | | | | | | | | | | | | | | | | | | |
| 11/30/2019 | | | 15.54 | | | | 0.13 | | | | 1.62 | | | | 1.75 | | | | (0.12 | ) | | | (1.03 | ) | | | (1.15 | ) |
| 11/30/2018 | | | 16.06 | | | | 0.12 | | | | 0.47 | | | | 0.59 | | | | (0.12 | ) | | | (0.99 | ) | | | (1.11 | ) |
| 11/30/2017 | | | 14.64 | | | | 0.14 | | | | 2.41 | | | | 2.55 | | | | (0.16 | ) | | | (0.97 | ) | | | (1.13 | ) |
| 11/30/2016 | | | 14.27 | | | | 0.17 | | | | 1.35 | | | | 1.52 | | | | (0.15 | ) | | | (1.00 | ) | | | (1.15 | ) |
| 11/30/2015 | | | 16.81 | | | | 0.15 | | | | (0.45 | ) | | | (0.30 | ) | | | (0.15 | ) | | | (2.09 | ) | | | (2.24 | ) |
| Class F | | | | | | | | | | | | | | | | | | | | | | | | | | | | |
| 11/30/2019 | | | 15.77 | | | | 0.29 | | | | 1.63 | | | | 1.92 | | | | (0.25 | ) | | | (1.03 | ) | | | (1.28 | ) |
| 11/30/2018 | | | 16.26 | | | | 0.28 | | | | 0.49 | | | | 0.77 | | | | (0.27 | ) | | | (0.99 | ) | | | (1.26 | ) |
| 11/30/2017 | | | 14.80 | | | | 0.28 | | | | 2.44 | | | | 2.72 | | | | (0.29 | ) | | | (0.97 | ) | | | (1.26 | ) |
| 11/30/2016 | | | 14.41 | | | | 0.31 | | | | 1.35 | | | | 1.66 | | | | (0.27 | ) | | | (1.00 | ) | | | (1.27 | ) |
| 11/30/2015 | | | 16.96 | | | | 0.29 | | | | (0.47 | ) | | | (0.18 | ) | | | (0.28 | ) | | | (2.09 | ) | | | (2.37 | ) |
| Class F3 | | | | | | | | | | | | | | | | | | | | | | | | | | | | |
| 11/30/2019 | | | 15.96 | | | | 0.30 | | | | 1.66 | | | | 1.96 | | | | (0.27 | ) | | | (1.03 | ) | | | (1.30 | ) |
| 11/30/2018 | | | 16.45 | | | | 0.30 | | | | 0.48 | | | | 0.78 | | | | (0.28 | ) | | | (0.99 | ) | | | (1.27 | ) |
| 4/4/2017 to 11/30/2017(c) | | | 14.66 | | | | 0.24 | | | | 1.70 | | | | 1.94 | | | | (0.15 | ) | | | – | | | | (0.15 | ) |
| Class I | | | | | | | | | | | | | | | | | | | | | | | | | | | | |
| 11/30/2019 | | | 15.91 | | | | 0.29 | | | | 1.65 | | | | 1.94 | | | | (0.27 | ) | | | (1.03 | ) | | | (1.30 | ) |
| 11/30/2018 | | | 16.41 | | | | 0.29 | | | | 0.48 | | | | 0.77 | | | | (0.28 | ) | | | (0.99 | ) | | | (1.27 | ) |
| 11/30/2017 | | | 14.93 | | | | 0.33 | | | | 2.42 | | | | 2.75 | | | | (0.30 | ) | | | (0.97 | ) | | | (1.27 | ) |
| 11/30/2016 | | | 14.52 | | | | 0.31 | | | | 1.38 | | | | 1.69 | | | | (0.28 | ) | | | (1.00 | ) | | | (1.28 | ) |
| 11/30/2015 | | | 17.07 | | | | 0.30 | | | | (0.46 | ) | | | (0.16 | ) | | | (0.30 | ) | | | (2.09 | ) | | | (2.39 | ) |
| Class P | | | | | | | | | | | | | | | | | | | | | | | | | | | | |
| 11/30/2019 | | | 15.83 | | | | 0.22 | | | | 1.65 | | | | 1.87 | | | | (0.19 | ) | | | (1.03 | ) | | | (1.22 | ) |
| 11/30/2018 | | | 16.34 | | | | 0.21 | | | | 0.48 | | | | 0.69 | | | | (0.21 | ) | | | (0.99 | ) | | | (1.20 | ) |
| 11/30/2017 | | | 14.88 | | | | 0.22 | | | | 2.44 | | | | 2.66 | | | | (0.23 | ) | | | (0.97 | ) | | | (1.20 | ) |
| 11/30/2016 | | | 14.47 | | | | 0.24 | | | | 1.39 | | | | 1.63 | | | | (0.22 | ) | | | (1.00 | ) | | | (1.22 | ) |
| 11/30/2015 | | | 17.02 | | | | 0.24 | | | | (0.47 | ) | | | (0.23 | ) | | | (0.23 | ) | | | (2.09 | ) | | | (2.32 | ) |
| 34 | See Notes to Financial Statements. |
| | | | | Ratios to Average Net Assets: | | Supplemental Data: |
| | | | | | | |
Net
asset
value,
end of
period | | Total
return(b)
(%) | | Total
expenses
after
waivers
and/or
reimbursements
(%) | | Total
expenses
(%) | | Net
invest-
ment
income
(%) | | Net
assets,
end of
period
(000) | | Portfolio
turnover
rate
(%) |
| | | | | | | | | | | | | | | | | | | | | | | | | | | |
| | $16.38 | | | | 13.59 | | | | 0.95 | | | | 0.95 | | | | 1.62 | | | | $1,731,882 | | | | 51 | |
| | 15.75 | | | | 4.72 | | | | 0.94 | | | | 0.97 | | | | 1.57 | | | | 1,627,633 | | | | 51 | |
| | 16.26 | | | | 19.35 | | | | 0.92 | | | | 1.04 | | | | 1.70 | | | | 1,671,580 | | | | 58 | |
| | 14.82 | | | | 12.60 | | | | 0.85 | | | | 1.06 | | | | 1.92 | | | | 1,604,257 | | | | 70 | |
| | 14.42 | | | | (1.34 | ) | | | 0.85 | | | | 1.07 | | | | 1.80 | | | | 1,498,459 | | | | 58 | |
| | | | | | | | | | | | | | | | | | | | | | | | | | | |
| | 16.14 | | | | 12.72 | | | | 1.70 | | | | 1.70 | | | | 0.87 | | | | 216,647 | | | | 51 | |
| | 15.54 | | | | 3.90 | | | | 1.70 | | | | 1.73 | | | | 0.81 | | | | 230,385 | | | | 51 | |
| | 16.06 | | | | 18.57 | | | | 1.66 | | | | 1.79 | | | | 0.96 | | | | 295,025 | | | | 58 | |
| | 14.64 | | | | 11.71 | | | | 1.60 | | | | 1.81 | | | | 1.19 | | | | 291,842 | | | | 70 | |
| | 14.27 | | | | (2.03 | ) | | | 1.60 | | | | 1.82 | | | | 1.06 | | | | 245,055 | | | | 58 | |
| | | | | | | | | | | | | | | | | | | | | | | | | | | |
| | 16.41 | | | | 13.81 | | | | 0.70 | | | | 0.80 | | | | 1.87 | | | | 296,993 | | | | 51 | |
| | 15.77 | | | | 5.00 | | | | 0.70 | | | | 0.82 | | | | 1.82 | | | | 241,282 | | | | 51 | |
| | 16.26 | | | | 19.71 | | | | 0.70 | | | | 0.89 | | | | 1.92 | | | | 245,916 | | | | 58 | |
| | 14.80 | | | | 12.72 | | | | 0.70 | | | | 0.91 | | | | 2.18 | | | | 266,399 | | | | 70 | |
| | 14.41 | | | | (1.20 | ) | | | 0.70 | | | | 0.92 | | | | 1.95 | | | | 99,737 | | | | 58 | |
| | | | | | | | | | | | | | | | | | | | | | | | | | | |
| | 16.62 | | | | 13.90 | | | | 0.63 | | | | 0.63 | | | | 1.95 | | | | 205,183 | | | | 51 | |
| | 15.96 | | | | 5.07 | | | | 0.62 | | | | 0.65 | | | | 1.91 | | | | 188,484 | | | | 51 | |
| | 16.45 | | | | 13.31 | (d) | | | 0.59 | (e) | | | 0.70 | (e) | | | 2.34 | (e) | | | 176,087 | | | | 58 | |
| | | | | | | | | | | | | | | | | | | | | | | | | | | |
| | 16.55 | | | | 13.87 | | | | 0.70 | | | | 0.70 | | | | 1.87 | | | | 42,809 | | | | 51 | |
| | 15.91 | | | | 4.93 | | | | 0.69 | | | | 0.72 | | | | 1.82 | | | | 42,698 | | | | 51 | |
| | 16.41 | | | | 19.77 | | | | 0.66 | | | | 0.79 | | | | 2.17 | | | | 43,186 | | | | 58 | |
| | 14.93 | | | | 12.86 | | | | 0.60 | | | | 0.81 | | | | 2.18 | | | | 18,315 | | | | 70 | |
| | 14.52 | | | | (1.09 | ) | | | 0.60 | | | | 0.82 | | | | 2.05 | | | | 15,507 | | | | 58 | |
| | | | | | | | | | | | | | | | | | | | | | | | | | | |
| | 16.48 | | | | 13.36 | | | | 1.15 | | | | 1.15 | | | | 1.42 | | | | 1,137 | | | | 51 | |
| | 15.83 | | | | 4.48 | | | | 1.15 | | | | 1.17 | | | | 1.36 | | | | 1,663 | | | | 51 | |
| | 16.34 | | | | 19.16 | | | | 1.12 | | | | 1.24 | | | | 1.50 | | | | 1,794 | | | | 58 | |
| | 14.88 | | | | 12.40 | | | | 1.05 | | | | 1.26 | | | | 1.71 | | | | 1,782 | | | | 70 | |
| | 14.47 | | | | (1.56 | ) | | | 1.05 | | | | 1.27 | | | | 1.60 | | | | 1,834 | | | | 58 | |
| | See Notes to Financial Statements. | 35 |
Financial Highlights (concluded)
CALIBRATED DIVIDEND GROWTH FUND
| | | | | Per Share Operating Performance: |
| | | | | Investment Operations: | | Distributions to
shareholders from: |
| | | Net asset
value,
beginning
of period | | Net
invest-
ment
income(a) | | Net
realized
and
unrealized
gain (loss) | | Total
from
invest-
ment
opera-
tions | | Net
investment
income | | Net
realized
gain | | Total
distri-
butions |
| Class R2 | | | | | | | | | | | | | | | | | | | | | | | | | | | | |
| 11/30/2019 | | | $15.90 | | | | $0.19 | | | $ | 1.67 | | | $ | 1.86 | | | | $(0.18 | ) | | | $(1.03 | ) | | | $(1.21 | ) |
| 11/30/2018 | | | 16.40 | | | | 0.19 | | | | 0.49 | | | | 0.68 | | | | (0.19 | ) | | | (0.99 | ) | | | (1.18 | ) |
| 11/30/2017 | | | 14.93 | | | | 0.20 | | | | 2.46 | | | | 2.66 | | | | (0.22 | ) | | | (0.97 | ) | | | (1.19 | ) |
| 11/30/2016 | | | 14.52 | | | | 0.22 | | | | 1.38 | | | | 1.60 | | | | (0.19 | ) | | | (1.00 | ) | | | (1.19 | ) |
| 11/30/2015 | | | 17.05 | | | | 0.21 | | | | (0.46 | ) | | | (0.25 | ) | | | (0.19 | ) | | | (2.09 | ) | | | (2.28 | ) |
| Class R3 | | | | | | | | | | | | | | | | | | | | | | | | | | | | |
| 11/30/2019 | | | 15.67 | | | | 0.21 | | | | 1.63 | | | | 1.84 | | | | (0.19 | ) | | | (1.03 | ) | | | (1.22 | ) |
| 11/30/2018 | | | 16.19 | | | | 0.20 | | | | 0.47 | | | | 0.67 | | | | (0.20 | ) | | | (0.99 | ) | | | (1.19 | ) |
| 11/30/2017 | | | 14.75 | | | | 0.22 | | | | 2.42 | | | | 2.64 | | | | (0.23 | ) | | | (0.97 | ) | | | (1.20 | ) |
| 11/30/2016 | | | 14.36 | | | | 0.24 | | | | 1.36 | | | | 1.60 | | | | (0.21 | ) | | | (1.00 | ) | | | (1.21 | ) |
| 11/30/2015 | | | 16.91 | | | | 0.23 | | | | (0.46 | ) | | | (0.23 | ) | | | (0.23 | ) | | | (2.09 | ) | | | (2.32 | ) |
| Class R4 | | | | | | | | | | | | | | | | | | | | | | | | | | | | |
| 11/30/2019 | | | 15.74 | | | | 0.25 | | | | 1.63 | | | | 1.88 | | | | (0.23 | ) | | | (1.03 | ) | | | (1.26 | ) |
| 11/30/2018 | | | 16.25 | | | | 0.25 | | | | 0.48 | | | | 0.73 | | | | (0.25 | ) | | | (0.99 | ) | | | (1.24 | ) |
| 11/30/2017 | | | 14.81 | | | | 0.26 | | | | 2.42 | | | | 2.68 | | | | (0.27 | ) | | | (0.97 | ) | | | (1.24 | ) |
| 11/30/2016 | | | 14.42 | | | | 0.31 | | | | 1.34 | | | | 1.65 | | | | (0.26 | ) | | | (1.00 | ) | | | (1.26 | ) |
| 6/30/2015 to 11/30/2015(f) | | | 14.37 | | | | 0.11 | | | | 0.01 | | | | 0.12 | | | | (0.07 | ) | | | – | | | | (0.07 | ) |
| Class R5 | | | | | | | | | | | | | | | | | | | | | | | | | | | | |
| 11/30/2019 | | | 15.90 | | | | 0.29 | | | | 1.66 | | | | 1.95 | | | | (0.27 | ) | | | (1.03 | ) | | | (1.30 | ) |
| 11/30/2018 | | | 16.40 | | | | 0.29 | | | | 0.48 | | | | 0.77 | | | | (0.28 | ) | | | (0.99 | ) | | | (1.27 | ) |
| 11/30/2017 | | | 14.93 | | | | 0.28 | | | | 2.46 | | | | 2.74 | | | | (0.30 | ) | | | (0.97 | ) | | | (1.27 | ) |
| 11/30/2016 | | | 14.52 | | | | 0.34 | | | | 1.35 | | | | 1.69 | | | | (0.28 | ) | | | (1.00 | ) | | | (1.28 | ) |
| 6/30/2015 to 11/30/2015(f) | | | 14.46 | | | | 0.13 | | | | 0.01 | | | | 0.14 | | | | (0.08 | ) | | | – | | | | (0.08 | ) |
| Class R6 | | | | | | | | | | | | | | | | | | | | | | | | | | | | |
| 11/30/2019 | | | 15.96 | | | | 0.30 | | | | 1.66 | | | | 1.96 | | | | (0.27 | ) | | | (1.03 | ) | | | (1.30 | ) |
| 11/30/2018 | | | 16.44 | | | | 0.30 | | | | 0.49 | | | | 0.79 | | | | (0.28 | ) | | | (0.99 | ) | | | (1.27 | ) |
| 11/30/2017 | | | 14.95 | | | | 0.31 | | | | 2.45 | | | | 2.76 | | | | (0.30 | ) | | | (0.97 | ) | | | (1.27 | ) |
| 11/30/2016 | | | 14.52 | | | | 0.43 | | | | 1.28 | | | | 1.71 | | | | (0.28 | ) | | | (1.00 | ) | | | (1.28 | ) |
| 6/30/2015 to 11/30/2015(f) | | | 14.46 | | | | 0.13 | | | | 0.01 | | | | 0.14 | | | | (0.08 | ) | | | – | | | | (0.08 | ) |
| (a) | Calculated using average shares outstanding during the period. |
| (b) | Total return for Classes A and C does not consider the effects of sales loads and assumes the reinvestment of all distributions. Total return for all other classes assumes the reinvestment of all distributions. |
| (c) | Commenced on April 4, 2017. |
| (d) | Not annualized. |
| (e) | Annualized. |
| (f) | Commenced on June 30, 2015. |
| 36 | See Notes to Financial Statements. |
| | | | | Ratios to Average Net Assets: | | Supplemental Data: |
| | | | | | | |
Net
asset
value,
end of
period | | Total
return(b)
(%) | | Total
expenses
after
waivers
and/or
reimbursements
(%) | | Total
expenses
(%) | | Net
invest-
ment
income
(%) | | Net
assets,
end of
period
(000) | | Portfolio
turnover
rate
(%) |
| | | | | | | | | | | | | | | | | | | | | | | | | | | |
| | $16.55 | | | | 13.16 | | | | 1.30 | | | | 1.30 | | | | 1.26 | | | $ | 1,045 | | | | 51 | |
| | 15.90 | | | | 4.38 | | | | 1.30 | | | | 1.32 | | | | 1.22 | | | | 1,267 | | | | 51 | |
| | 16.40 | | | | 19.01 | | | | 1.27 | | | | 1.39 | | | | 1.37 | | | | 1,335 | | | | 58 | |
| | 14.93 | | | | 12.16 | | | | 1.20 | | | | 1.41 | | | | 1.57 | | | | 1,010 | | | | 70 | |
| | 14.52 | | | | (1.69 | ) | | | 1.20 | | | | 1.42 | | | | 1.44 | | | | 1,108 | | | | 58 | |
| | | | | | | | | | | | | | | | | | | | | | | | | | | |
| | 16.29 | | | | 13.31 | | | | 1.20 | | | | 1.20 | | | | 1.37 | | | | 16,221 | | | | 51 | |
| | 15.67 | | | | 4.48 | | | | 1.19 | | | | 1.22 | | | | 1.31 | | | | 17,079 | | | | 51 | |
| | 16.19 | | | | 19.10 | | | | 1.14 | | | | 1.27 | | | | 1.47 | | | | 21,399 | | | | 58 | |
| | 14.75 | | | | 12.32 | | | | 1.09 | | | | 1.30 | | | | 1.69 | | | | 23,998 | | | | 70 | |
| | 14.36 | | | | (1.57 | ) | | | 1.08 | | | | 1.30 | | | | 1.57 | | | | 22,189 | | | | 58 | |
| | | | | | | | | | | | | | | | | | | | | | | | | | | |
| | 16.36 | | | | 13.54 | | | | 0.95 | | | | 0.95 | | | | 1.62 | | | | 5,504 | | | | 51 | |
| | 15.74 | | | | 4.75 | | | | 0.94 | | | | 0.97 | | | | 1.61 | | | | 4,331 | | | | 51 | |
| | 16.25 | | | | 19.42 | | | | 0.93 | | | | 1.04 | | | | 1.71 | | | | 2,171 | | | | 58 | |
| | 14.81 | | | | 12.60 | | | | 0.84 | | | | 1.06 | | | | 2.14 | | | | 316 | | | | 70 | |
| | 14.42 | | | | 0.85 | (d) | | | 0.85 | (e) | | | 1.07 | (e) | | | 1.85 | (e) | | | 10 | | | | 58 | |
| | | | | | | | | | | | | | | | | | | | | | | | | | | |
| | 16.55 | | | | 13.87 | | | | 0.70 | | | | 0.70 | | | | 1.89 | | | | 272 | | | | 51 | |
| | 15.90 | | | | 5.00 | | | | 0.69 | | | | 0.72 | | | | 1.84 | | | | 248 | | | | 51 | |
| | 16.40 | | | | 19.71 | | | | 0.66 | | | | 0.79 | | | | 1.88 | | | | 201 | | | | 58 | |
| | 14.93 | | | | 12.86 | | | | 0.59 | | | | 0.81 | | | | 2.38 | | | | 314 | | | | 70 | |
| | 14.52 | | | | 0.98 | (d) | | | 0.60 | (e) | | | 0.82 | (e) | | | 2.11 | (e) | | | 10 | | | | 58 | |
| | | | | | | | | | | | | | | | | | | | | | | | | | | |
| | 16.62 | | | | 13.97 | | | | 0.63 | | | | 0.63 | | | | 1.95 | | | | 13,012 | | | | 51 | |
| | 15.96 | | | | 5.06 | | | | 0.62 | | | | 0.65 | | | | 1.89 | | | | 11,344 | | | | 51 | |
| | 16.44 | | | | 19.84 | | | | 0.62 | | | | 0.73 | | | | 2.05 | | | | 13,163 | | | | 58 | |
| | 14.95 | | | | 13.03 | | | | 0.49 | | | | 0.70 | | | | 2.99 | | | | 235 | | | | 70 | |
| | 14.52 | | | | 0.98 | (d) | | | 0.49 | (e) | | | 0.70 | (e) | | | 2.22 | (e) | | | 10 | | | | 58 | |
| | See Notes to Financial Statements. | 37 |
Financial Highlights
GROWTH OPPORTUNITIES FUND
| | | | | Per Share Operating Performance: | | | | |
| | | | | Investment Operations: | | Distributions to
shareholders
from: | | |
| | | Net asset
value,
beginning
of period | | Net
investment
income
(loss)(a) | | Net
realized and
unrealized
gain (loss) | | Total from
investment
operations | | Net
realized
gain | | Net asset
value,
end of
period |
| Class A | | | | | | | | | | | | | | | | | | | | | | | | |
| 11/30/2019 | | | $21.46 | | | | $(0.09 | ) | | | $4.74 | | | $ | 4.65 | | | | $(1.14 | ) | | | $24.97 | |
| 11/30/2018 | | | 22.21 | | | | (0.11 | ) | | | 1.20 | | | | 1.09 | | | | (1.84 | ) | | | 21.46 | |
| 11/30/2017 | | | 18.91 | | | | (0.09 | ) | | | 3.97 | | | | 3.88 | | | | (0.58 | ) | | | 22.21 | |
| 11/30/2016 | | | 21.48 | | | | (0.07 | ) | | | 0.04 | | | | (0.03 | ) | | | (2.54 | ) | | | 18.91 | |
| 11/30/2015 | | | 23.75 | | | | (0.10 | ) | | | 1.09 | | | | 0.99 | | | | (3.26 | ) | | | 21.48 | |
| Class C | | | | | | | | | | | | | | | | | | | | | | | | |
| 11/30/2019 | | | 15.93 | | | | (0.19 | ) | | | 3.41 | | | | 3.22 | | | | (1.14 | ) | | | 18.01 | |
| 11/30/2018 | | | 17.08 | | | | (0.20 | ) | | | 0.89 | | | | 0.69 | | | | (1.84 | ) | | | 15.93 | |
| 11/30/2017 | | | 14.78 | | | | (0.18 | ) | | | 3.06 | | | | 2.88 | | | | (0.58 | ) | | | 17.08 | |
| 11/30/2016 | | | 17.48 | | | | (0.16 | ) | | | – | | | | (0.16 | ) | | | (2.54 | ) | | | 14.78 | |
| 11/30/2015 | | | 20.06 | | | | (0.21 | ) | | | 0.89 | | | | 0.68 | | | | (3.26 | ) | | | 17.48 | |
| Class F | | | | | | | | | | | | | | | | | | | | | | | | |
| 11/30/2019 | | | 22.33 | | | | (0.06 | ) | | | 4.96 | | | | 4.90 | | | | (1.14 | ) | | | 26.09 | |
| 11/30/2018 | | | 23.00 | | | | (0.08 | ) | | | 1.25 | | | | 1.17 | | | | (1.84 | ) | | | 22.33 | |
| 11/30/2017 | | | 19.54 | | | | (0.06 | ) | | | 4.10 | | | | 4.04 | | | | (0.58 | ) | | | 23.00 | |
| 11/30/2016 | | | 22.08 | | | | (0.04 | ) | | | 0.04 | | | | – | | | | (2.54 | ) | | | 19.54 | |
| 11/30/2015 | | | 24.29 | | | | (0.07 | ) | | | 1.12 | | | | 1.05 | | | | (3.26 | ) | | | 22.08 | |
| Class F3 | | | | | | | | | | | | | | | | | | | | | | | | |
| 11/30/2019 | | | 24.53 | | | | (0.02 | ) | | | 5.49 | | | | 5.47 | | | | (1.14 | ) | | | 28.86 | |
| 11/30/2018 | | | 25.05 | | | | (0.04 | ) | | | 1.36 | | | | 1.32 | | | | (1.84 | ) | | | 24.53 | |
| 4/4/2017 to 11/30/2017(c) | | | 21.60 | | | | – | | | | 3.45 | | | | 3.45 | | | | – | | | | 25.05 | |
| Class I | | | | | | | | | | | | | | | | | | | | | | | | |
| 11/30/2019 | | | 24.41 | | | | (0.04 | ) | | | 5.46 | | | | 5.42 | | | | (1.14 | ) | | | 28.69 | |
| 11/30/2018 | | | 24.95 | | | | (0.05 | ) | | | 1.35 | | | | 1.30 | | | | (1.84 | ) | | | 24.41 | |
| 11/30/2017 | | | 21.12 | | | | (0.06 | ) | | | 4.47 | | | | 4.41 | | | | (0.58 | ) | | | 24.95 | |
| 11/30/2016 | | | 23.63 | | | | (0.03 | ) | | | 0.06 | | | | 0.03 | | | | (2.54 | ) | | | 21.12 | |
| 11/30/2015 | | | 25.75 | | | | (0.05 | ) | | | 1.19 | | | | 1.14 | | | | (3.26 | ) | | | 23.63 | |
| Class P | | | | | | | | | | | | | | | | | | | | | | | | |
| 11/30/2019 | | | 20.90 | | | | (0.13 | ) | | | 4.61 | | | | 4.48 | | | | (1.14 | ) | | | 24.24 | |
| 11/30/2018 | | | 21.72 | | | | (0.15 | ) | | | 1.17 | | | | 1.02 | | | | (1.84 | ) | | | 20.90 | |
| 11/30/2017 | | | 18.54 | | | | (0.12 | ) | | | 3.88 | | | | 3.76 | | | | (0.58 | ) | | | 21.72 | |
| 11/30/2016 | | | 21.15 | | | | (0.11 | ) | | | 0.04 | | | | (0.07 | ) | | | (2.54 | ) | | | 18.54 | |
| 11/30/2015 | | | 23.48 | | | | (0.14 | ) | | | 1.07 | | | | 0.93 | | | | (3.26 | ) | | | 21.15 | |
| Class R2 | | | | | | | | | | | | | | | | | | | | | | | | |
| 11/30/2019 | | | 20.39 | | | | (0.16 | ) | | | 4.48 | | | | 4.32 | | | | (1.14 | ) | | | 23.57 | |
| 11/30/2018 | | | 21.26 | | | | (0.18 | ) | | | 1.15 | | | | 0.97 | | | | (1.84 | ) | | | 20.39 | |
| 11/30/2017 | | | 18.19 | | | | (0.15 | ) | | | 3.80 | | | | 3.65 | | | | (0.58 | ) | | | 21.26 | |
| 11/30/2016 | | | 20.83 | | | | (0.13 | ) | | | 0.03 | | | | (0.10 | ) | | | (2.54 | ) | | | 18.19 | |
| 11/30/2015 | | | 23.20 | | | | (0.17 | ) | | | 1.06 | | | | 0.89 | | | | (3.26 | ) | | | 20.83 | |
| 38 | See Notes to Financial Statements. |
| | | Ratios to Average Net Assets: | | Supplemental Data: |
| | | | | |
Total
return(b)
(%) | | Total
expenses
(%) | | Net
investment
income (loss)
(%) | | Net assets,
end of
period
(000) | | Portfolio
turnover
rate
(%) |
| | | | | | | | | | | | | | | | | | | |
| | 23.48 | | | | 1.16 | | | | (0.39 | ) | | | $385,588 | | | | 27 | |
| | 5.41 | | | | 1.18 | | | | (0.51 | ) | | | 333,638 | | | | 55 | |
| | 21.17 | | | | 1.26 | | | | (0.43 | ) | | | 348,028 | | | | 73 | |
| | 0.37 | | | | 1.29 | | | | (0.39 | ) | | | 356,816 | | | | 117 | |
| | 4.78 | | | | 1.28 | | | | (0.46 | ) | | | 409,626 | | | | 97 | |
| | | | | | | | | | | | | | | | | | | |
| | 22.58 | | | | 1.91 | | | | (1.14 | ) | | | 26,860 | | | | 27 | |
| | 4.61 | | | | 1.93 | | | | (1.27 | ) | | | 26,130 | | | | 55 | |
| | 20.28 | | | | 2.00 | | | | (1.17 | ) | | | 42,858 | | | | 73 | |
| | (0.39 | ) | | | 2.03 | | | | (1.14 | ) | | | 50,084 | | | | 117 | |
| | 4.00 | | | | 2.02 | | | | (1.20 | ) | | | 61,670 | | | | 97 | |
| | | | | | | | | | | | | | | | | | | |
| | 23.69 | | | | 1.01 | | | | (0.24 | ) | | | 23,271 | | | | 27 | |
| | 5.53 | | | | 1.03 | | | | (0.36 | ) | | | 20,840 | | | | 55 | |
| | 21.36 | | | | 1.11 | | | | (0.29 | ) | | | 21,021 | | | | 73 | |
| | 0.52 | | | | 1.14 | | | | (0.23 | ) | | | 22,020 | | | | 117 | |
| | 4.95 | | | | 1.13 | | | | (0.31 | ) | | | 21,956 | | | | 97 | |
| | | | | | | | | | | | | | | | | | | |
| | 23.90 | | | | 0.86 | | | | (0.08 | ) | | | 7,986 | | | | 27 | |
| | 5.73 | | | | 0.85 | | | | (0.18 | ) | | | 6,804 | | | | 55 | |
| | 15.97 | (d) | | | 0.87 | (e) | | | 0.01 | (e) | | | 6,105 | | | | 73 | |
| | | | | | | | | | | | | | | | | | | |
| | 23.81 | | | | 0.91 | | | | (0.15 | ) | | | 374,814 | | | | 27 | |
| | 5.67 | | | | 0.91 | | | | (0.20 | ) | | | 373,708 | | | | 55 | |
| | 21.47 | | | | 1.03 | | | | (0.30 | ) | | | 5,258 | | | | 73 | |
| | 0.62 | | | | 1.04 | | | | (0.14 | ) | | | 94,899 | | | | 117 | |
| | 5.07 | | | | 1.03 | | | | (0.19 | ) | | | 101,063 | | | | 97 | |
| | | | | | | | | | | | | | | | | | | |
| | 23.23 | | | | 1.36 | | | | (0.58 | ) | | | 3,286 | | | | 27 | |
| | 5.19 | | | | 1.38 | | | | (0.71 | ) | | | 2,789 | | | | 55 | |
| | 20.94 | | | | 1.46 | | | | (0.62 | ) | | | 2,642 | | | | 73 | |
| | 0.17 | | | | 1.49 | | | | (0.59 | ) | | | 2,517 | | | | 117 | |
| | 4.56 | | | | 1.48 | | | | (0.66 | ) | | | 3,998 | | | | 97 | |
| | | | | | | | | | | | | | | | | | | |
| | 23.13 | | | | 1.51 | | | | (0.75 | ) | | | 748 | | | | 27 | |
| | 5.00 | | | | 1.53 | | | | (0.87 | ) | | | 865 | | | | 55 | |
| | 20.73 | | | | 1.60 | | | | (0.78 | ) | | | 1,415 | | | | 73 | |
| | 0.01 | | | | 1.64 | | | | (0.74 | ) | | | 1,012 | | | | 117 | |
| | 4.42 | | | | 1.63 | | | | (0.80 | ) | | | 941 | | | | 97 | |
| | See Notes to Financial Statements. | 39 |
Financial Highlights (concluded)
GROWTH OPPORTUNITIES FUND
| | | | | Per Share Operating Performance: | | | | |
| | | | | Investment Operations: | | Distributions to
shareholders
from: | | |
| | | Net asset
value,
beginning
of period | | Net
investment
income
(loss)(a) | | Net
realized and
unrealized
gain (loss) | | Total from
investment
operations | | Net
realized
gain | | Net asset
value,
end of
period |
| Class R3 | | | | | | | | | | | | | | | | | | | | | | | | |
| 11/30/2019 | | | $20.81 | | | | $(0.14 | ) | | $ | 4.58 | | | $ | 4.44 | | | | $(1.14 | ) | | | $24.11 | |
| 11/30/2018 | | | 21.64 | | | | (0.16 | ) | | | 1.17 | | | | 1.01 | | | | (1.84 | ) | | | 20.81 | |
| 11/30/2017 | | | 18.49 | | | | (0.13 | ) | | | 3.86 | | | | 3.73 | | | | (0.58 | ) | | | 21.64 | |
| 11/30/2016 | | | 21.11 | | | | (0.11 | ) | | | 0.03 | | | | (0.08 | ) | | | (2.54 | ) | | | 18.49 | |
| 11/30/2015 | | | 23.44 | | | | (0.15 | ) | | | 1.08 | | | | 0.93 | | | | (3.26 | ) | | | 21.11 | |
| Class R4 | | | | | | | | | | | | | | | | | | | | | | | | |
| 11/30/2019 | | | 21.46 | | | | (0.09 | ) | | | 4.74 | | | | 4.65 | | | | (1.14 | ) | | | 24.97 | |
| 11/30/2018 | | | 22.21 | | | | (0.11 | ) | | | 1.20 | | | | 1.09 | | | | (1.84 | ) | | | 21.46 | |
| 11/30/2017 | | | 18.91 | | | | (0.08 | ) | | | 3.96 | | | | 3.88 | | | | (0.58 | ) | | | 22.21 | |
| 11/30/2016 | | | 21.48 | | | | (0.02 | ) | | | (0.01 | ) | | | (0.03 | ) | | | (2.54 | ) | | | 18.91 | |
| 6/30/2015 to 11/30/2015(f) | | | 22.27 | | | | (0.04 | ) | | | (0.75 | ) | | | (0.79 | ) | | | – | | | | 21.48 | |
| Class R5 | | | | | | | | | | | | | | | | | | | | | | | | |
| 11/30/2019 | | | 24.43 | | | | (0.04 | ) | | | 5.46 | | | | 5.42 | | | | (1.14 | ) | | | 28.71 | |
| 11/30/2018 | | | 24.97 | | | | (0.06 | ) | | | 1.36 | | | | 1.30 | | | | (1.84 | ) | | | 24.43 | |
| 11/30/2017 | | | 21.13 | | | | (0.04 | ) | | | 4.46 | | | | 4.42 | | | | (0.58 | ) | | | 24.97 | |
| 11/30/2016 | | | 23.64 | | | | (0.02 | ) | | | 0.05 | | | | 0.03 | | | | (2.54 | ) | | | 21.13 | |
| 6/30/2015 to 11/30/2015(f) | | | 24.48 | | | | (0.02 | ) | | | (0.82 | ) | | | (0.84 | ) | | | – | | | | 23.64 | |
| Class R6 | | | | | | | | | | | | | | | | | | | | | | | | |
| 11/30/2019 | | | 24.53 | | | | (0.03 | ) | | | 5.50 | | | | 5.47 | | | | (1.14 | ) | | | 28.86 | |
| 11/30/2018 | | | 25.05 | | | | (0.07 | ) | | | 1.39 | | | | 1.32 | | | | (1.84 | ) | | | 24.53 | |
| 11/30/2017 | | | 21.18 | | | | – | | | | 4.45 | | | | 4.45 | | | | (0.58 | ) | | | 25.05 | |
| 11/30/2016 | | | 23.65 | | | | 0.01 | | | | 0.06 | | | | 0.07 | | | | (2.54 | ) | | | 21.18 | |
| 6/30/2015 to 11/30/2015(f) | | | 24.48 | | | | (0.01 | ) | | | (0.82 | ) | | | (0.83 | ) | | | – | | | | 23.65 | |
| (a) | Calculated using average shares outstanding during the period. |
| (b) | Total return for Classes A and C does not consider the effects of sales loads and assumes the reinvestment of all distributions. Total return for all other classes assumes the reinvestment of all distributions. |
| c) | Commenced on April 4, 2017. |
| (d) | Not annualized. |
| (e) | Annualized. |
| (f) | Commenced on June 30, 2015. |
| 40 | See Notes to Financial Statements. |
| | | Ratios to Average Net Assets: | | Supplemental Data: |
| | | | | | | | | |
Total
return(b)
(%) | | Total
expenses
(%) | | Net
investment
income (loss)
(%) | | Net assets,
end of
period
(000) | | Portfolio
turnover
rate
(%) |
| | | | | | | | | | | | | | | | | | | |
| | 23.18 | | | | 1.41 | | | | (0.64 | ) | | | $15,908 | | | | 27 | |
| | 5.15 | | | | 1.43 | | | | (0.76 | ) | | | 17,397 | | | | 55 | |
| | 20.83 | | | | 1.49 | | | | (0.67 | ) | | | 20,300 | | | | 73 | |
| | 0.12 | | | | 1.53 | | | | (0.63 | ) | | | 24,927 | | | | 117 | |
| | 4.56 | | | | 1.52 | | | | (0.71 | ) | | | 28,251 | | | | 97 | |
| | | | | | | | | | | | | | | | | | | |
| | 23.48 | | | | 1.16 | | | | (0.40 | ) | | | 1,022 | | | | 27 | |
| | 5.41 | | | | 1.18 | | | | (0.51 | ) | | | 896 | | | | 55 | |
| | 21.17 | | | | 1.23 | | | | (0.40 | ) | | | 1,036 | | | | 73 | |
| | 0.37 | | | | 1.27 | | | | (0.12 | ) | | | 107 | | | | 117 | |
| | (3.55 | )(d) | | | 1.25 | (e) | | | (0.49 | )(e) | | | 10 | | | | 97 | |
| | | | | | | | | | | | | | | | | | | |
| | 23.79 | | | | 0.91 | | | | (0.14 | ) | | | 89 | | | | 27 | |
| | 5.67 | | | | 0.93 | | | | (0.26 | ) | | | 71 | | | | 55 | |
| | 21.51 | | | | 0.99 | | | | (0.17 | ) | | | 67 | | | | 73 | |
| | 0.63 | | | | 1.00 | | | | (0.11 | ) | | | 10 | | | | 117 | |
| | (3.43 | )(d) | | | 1.00 | (e) | | | (0.24 | )(e) | | | 10 | | | | 97 | |
| | | | | | | | | | | | | | | | | | | |
| | 23.86 | | | | 0.86 | | | | (0.11 | ) | | | 7,181 | | | | 27 | |
| | 5.73 | | | | 0.86 | | | | (0.30 | ) | | | 9,218 | | | | 55 | |
| | 21.60 | | | | 0.87 | | | | (0.01 | ) | | | 66,144 | | | | 73 | |
| | 0.81 | | | | 0.86 | | | | 0.04 | | | | 52 | | | | 117 | |
| | (3.39 | )(d) | | | 0.86 | (e) | | | (0.10 | )(e) | | | 10 | | | | 97 | |
| | See Notes to Financial Statements. | 41 |
Financial Highlights
SMALL CAP VALUE FUND
| | | | | Per Share Operating Performance: |
| | | | | Investment operations: | | Distributions to
shareholders from: |
| | | Net asset
value,
beginning
of period | | Net
invest-
ment
income
(loss)(a) | | Net
realized
and
unrealized
gain (loss) | | Total
from
invest-
ment
opera-
tions | | Net
investment
income | | Net
realized
gain | | Total
distri-
butions |
| Class A | | | | | | | | | | | | | | | | | | | | | | | | | | | | |
| 11/30/2019 | | $ | 20.46 | | | $ | 0.04 | | | $ | 0.04 | | | $ | 0.08 | | | $ | – | | | | $(3.06 | ) | | | $(3.06 | ) |
| 11/30/2018 | | | 23.63 | | | | (0.07 | ) | | | (0.17 | ) | | | (0.24 | ) | | | – | | | | (2.93 | ) | | | (2.93 | ) |
| 11/30/2017 | | | 24.64 | | | | (0.01 | ) | | | 2.11 | | | | 2.10 | | | | – | | | | (3.11 | ) | | | (3.11 | ) |
| 11/30/2016 | | | 27.17 | | | | (0.02 | ) | | | 2.55 | | | | 2.53 | | | | – | | | | (5.06 | ) | | | (5.06 | ) |
| 11/30/2015 | | | 33.61 | | | | (0.04 | ) | | | 1.33 | | | | 1.29 | | | | – | | | | (7.73 | ) | | | (7.73 | ) |
| Class C | | | | | | | | | | | | | | | | | | | | | | | | | | | | |
| 11/30/2019 | | | 11.50 | | | | (0.04 | ) | | | (0.17 | )(i) | | | (0.21 | ) | | | – | | | | (3.06 | ) | | | (3.06 | ) |
| 11/30/2018 | | | 14.67 | | | | (0.13 | ) | | | (0.11 | ) | | | (0.24 | ) | | | – | | | | (2.93 | ) | | | (2.93 | ) |
| 11/30/2017 | | | 16.55 | | | | (0.11 | ) | | | 1.34 | | | | 1.23 | | | | – | | | | (3.11 | ) | | | (3.11 | ) |
| 11/30/2016 | | | 20.13 | | | | (0.13 | ) | | | 1.61 | | | | 1.48 | | | | – | | | | (5.06 | ) | | | (5.06 | ) |
| 11/30/2015 | | | 27.04 | | | | (0.18 | ) | | | 1.00 | | | | 0.82 | | | | – | (c) | | | (7.73 | ) | | | (7.73 | ) |
| Class F | | | | | | | | | | | | | | | | | | | | | | | | | | | | |
| 11/30/2019 | | | 20.61 | | | | 0.06 | | | | 0.05 | | | | 0.11 | | | | – | | | | (3.06 | ) | | | (3.06 | ) |
| 11/30/2018 | | | 23.75 | | | | (0.04 | ) | | | (0.17 | ) | | | (0.21 | ) | | | – | | | | (2.93 | ) | | | (2.93 | ) |
| 11/30/2017 | | | 24.72 | | | | 0.02 | | | | 2.12 | | | | 2.14 | | | | – | | | | (3.11 | ) | | | (3.11 | ) |
| 11/30/2016 | | | 27.20 | | | | 0.01 | | | | 2.57 | | | | 2.58 | | | | – | | | | (5.06 | ) | | | (5.06 | ) |
| 11/30/2015 | | | 33.66 | | | | – | (c) | | | 1.33 | | | | 1.33 | | | | (0.06 | ) | | | (7.73 | ) | | | (7.79 | ) |
| Class F3 | | | | | | | | | | | | | | | | | | | | | | | | | | | | |
| 11/30/2019 | | | 24.39 | | | | 0.12 | | | | 0.13 | | | | 0.25 | | | | – | | | | (3.06 | ) | | | (3.06 | ) |
| 11/30/2018 | | | 27.54 | | | | – | (c) | | | (0.19 | ) | | | (0.19 | ) | | | (0.03 | ) | | | (2.93 | ) | | | (2.96 | ) |
| 4/4/2017 to 11/30/2017(e) | | | 25.41 | | | | 0.05 | | | | 2.08 | | | | 2.13 | | | | – | | | | – | | | | – | |
| Class I | | | | | | | | | | | | | | | | | | | | | | | | | | | | |
| 11/30/2019 | | | 24.28 | | | | 0.10 | | | | 0.13 | | | | 0.23 | | | | – | | | | (3.06 | ) | | | (3.06 | ) |
| 11/30/2018 | | | 27.44 | | | | (0.02 | ) | | | (0.19 | ) | | | (0.21 | ) | | | (0.02 | ) | | | (2.93 | ) | | | (2.95 | ) |
| 11/30/2017 | | | 28.06 | | | | 0.05 | | | | 2.44 | | | | 2.49 | | | | – | | | | (3.11 | ) | | | (3.11 | ) |
| 11/30/2016 | | | 30.13 | | | | 0.03 | | | | 2.96 | | | | 2.99 | | | | – | | | | (5.06 | ) | | | (5.06 | ) |
| 11/30/2015 | | | 36.46 | | | | 0.03 | | | | 1.47 | | | | 1.50 | | | | (0.10 | ) | | | (7.73 | ) | | | (7.83 | ) |
| Class P | | | | | | | | | | | | | | | | | | | | | | | | | | | | |
| 11/30/2019 | | | 19.42 | | | | 0.01 | | | | 0.01 | | | | 0.02 | | | | – | | | | (3.06 | ) | | | (3.06 | ) |
| 11/30/2018 | | | 22.61 | | | | (0.11 | ) | | | (0.15 | ) | | | (0.26 | ) | | | – | | | | (2.93 | ) | | | (2.93 | ) |
| 11/30/2017 | | | 23.75 | | | | (0.05 | ) | | | 2.02 | | | | 1.97 | | | | – | | | | (3.11 | ) | | | (3.11 | ) |
| 11/30/2016 | | | 26.43 | | | | (0.07 | ) | | | 2.45 | | | | 2.38 | | | | – | | | | (5.06 | ) | | | (5.06 | ) |
| 11/30/2015 | | | 32.95 | | | | (0.10 | ) | | | 1.31 | | | | 1.21 | | | | – | | | | (7.73 | ) | | | (7.73 | ) |
| Class R2 | | | | | | | | | | | | | | | | | | | | | | | | | | | | |
| 11/30/2019 | | | 19.21 | | | | (0.01 | ) | | | – | (c) | | | (0.01 | ) | | | – | | | | (3.06 | ) | | | (3.06 | ) |
| 11/30/2018 | | | 22.43 | | | | (0.14 | ) | | | (0.15 | ) | | | (0.29 | ) | | | – | | | | (2.93 | ) | | | (2.93 | ) |
| 11/30/2017 | | | 23.62 | | | | (0.09 | ) | | | 2.01 | | | | 1.92 | | | | – | | | | (3.11 | ) | | | (3.11 | ) |
| 11/30/2016 | | | 26.33 | | | | (0.09 | ) | | | 2.44 | | | | 2.35 | | | | – | | | | (5.06 | ) | | | (5.06 | ) |
| 11/30/2015 | | | 32.90 | | | | (0.14 | ) | | | 1.30 | | | | 1.16 | | | | – | | | | (7.73 | ) | | | (7.73 | ) |
| 42 | See Notes to Financial Statements. |
| | | | | | | Ratios to Average Net Assets: | | Supplemental Data: |
| | | | | |
Net
asset
value,
end of
period | | Total
return(b)
(%) | | Total
expenses
(%) | | Net
invest-
ment
income (loss)
(%) | | Net
assets,
end of
period
(000) | | Portfolio
turnover
rate
(%) |
| | | | | | | | | | | | | | | | | | | | | | | |
| | $17.48 | | | | 2.56 | | | | 1.20 | | | | 0.25 | | | | $267,864 | | | | 95 | |
| | 20.46 | | | | (0.97 | ) | | | 1.18 | | | | (0.33 | ) | | | 327,333 | | | | 42 | |
| | 23.63 | | | | 9.43 | | | | 1.18 | | | | (0.05 | ) | | | 385,542 | | | | 56 | |
| | 24.64 | | | | 13.14 | | | | 1.21 | | | | (0.11 | ) | | | 416,989 | | | | 44 | |
| | 27.17 | | | | 4.76 | | | | 1.21 | | | | (0.15 | ) | | | 456,843 | | | | 44 | |
| | | | | | | | | | | | | | | | | | | | | | | |
| | 8.23 | | | | 1.81 | | | | 1.95 | | | | (0.50 | ) | | | 9,231 | | | | 95 | |
| | 11.50 | | | | (1.70 | ) | | | 1.93 | | | | (1.08 | ) | | | 11,331 | | | | 42 | |
| | 14.67 | | | | 8.64 | | | | 1.93 | | | | (0.76 | ) | | | 25,985 | | | | 56 | |
| | 16.55 | | | | 12.32 | | | | 1.96 | | | | (0.86 | ) | | | 33,269 | | | | 44 | |
| | 20.13 | | | | 3.97 | | | | 1.96 | | | | (0.91 | ) | | | 35,312 | | | | 44 | |
| | | | | | | | | | | | | | | | | | | | | | | |
| | 17.66 | | | | 2.70 | | | | 1.05 | | | | 0.35 | | | | 10,522 | | | | 95 | |
| | 20.61 | | | | (0.81 | ) | | | 1.03 | | | | (0.18 | ) | | | 21,981 | | | | 42 | |
| | 23.75 | | | | 9.58 | | | | 1.03 | | | | 0.09 | | | | 23,759 | | | | 56 | |
| | 24.72 | | | | 13.35 | | | | 1.06 | | | | 0.04 | | | | 35,213 | | | | 44 | |
| | 27.20 | | | | 4.90 | | | | 1.06 | | | | (0.01 | ) | | | 24,246 | | | | 44 | |
| | | | | | | | | | | | | | | | | | | | | | | |
| | 21.58 | | | | 2.88 | | | | 0.86 | | | | 0.59 | | | | 29,679 | | | | 95 | |
| | 24.39 | | | | (0.62 | ) | | | 0.84 | | | | – | (d) | | | 33,319 | | | | 42 | |
| | 27.54 | | | | 8.38 | (f) | | | 0.84 | (g) | | | 0.30 | (g) | | | 32,548 | | | | 56 | |
| | | | | | | | | | | | | | | | | | | | | | | |
| | 21.45 | | | | 2.85 | | | | 0.95 | | | | 0.50 | | | | 411,532 | | | | 95 | |
| | 24.28 | | | | (0.72 | ) | | | 0.92 | | | | (0.08 | ) | | | 466,928 | | | | 42 | |
| | 27.44 | | | | 9.70 | | | | 0.93 | | | | 0.19 | | | | 621,900 | | | | 56 | |
| | 28.06 | | | | 13.43 | | | | 0.96 | | | | 0.14 | | | | 679,954 | | | | 44 | |
| | 30.13 | | | | 5.01 | | | | 0.96 | | | | 0.09 | | | | 736,890 | | | | 44 | |
| | | | | | | | | | | | | | | | | | | | | | | |
| | 16.38 | | | | 2.41 | | | | 1.40 | | | | 0.05 | | | | 20,819 | | | | 95 | |
| | 19.42 | | | | (1.17 | ) | | | 1.38 | | | | (0.54 | ) | | | 25,895 | | | | 42 | |
| | 22.61 | | | | 9.21 | | | | 1.38 | | | | (0.26 | ) | | | 35,174 | | | | 56 | |
| | 23.75 | | | | 12.90 | | | | 1.42 | | | | (0.31 | ) | | | 46,606 | | | | 44 | |
| | 26.43 | | | | 4.57 | | | | 1.42 | | | | (0.36 | ) | | | 58,957 | | | | 44 | |
| | | | | | | | | | | | | | | | | | | | | | | |
| | 16.14 | | | | 2.25 | | | | 1.55 | | | | (0.09 | ) | | | 603 | | | | 95 | |
| | 19.21 | | | | (1.33 | ) | | | 1.53 | | | | (0.68 | ) | | | 656 | | | | 42 | |
| | 22.43 | | | | 9.03 | | | | 1.53 | | | | (0.41 | ) | | | 682 | | | | 56 | |
| | 23.62 | | | | 12.81 | | | | 1.57 | | | | (0.42 | ) | | | 381 | | | | 44 | |
| | 26.33 | | | | 4.38 | | | | 1.56 | | | | (0.55 | ) | | | 288 | | | | 44 | |
| | See Notes to Financial Statements. | 43 |
Financial Highlights (concluded)
SMALL CAP VALUE FUND
| | | | | Per Share Operating Performance: |
| | | | | Investment operations: | | Distributions to
shareholders from: |
| | | Net asset
value,
beginning
of period | | Net
invest-
ment
income
(loss)(a) | | Net
realized
and
unrealized
gain (loss) | | Total
from
invest-
ment
opera-
tions | | Net
investment
income | | Net
realized
gain | | Total
distri-
butions |
| Class R3 | | | | | | | | | | | | | | | | | | | | | | | | | | | | |
| 11/30/2019 | | | $19.50 | | | $ | – | (c) | | $ | 0.02 | | | $ | 0.02 | | | $ | – | | | | $(3.06 | ) | | | $(3.06 | ) |
| 11/30/2018 | | | 22.70 | | | | (0.11 | ) | | | (0.16 | ) | | | (0.27 | ) | | | – | | | | (2.93 | ) | | | (2.93 | ) |
| 11/30/2017 | | | 23.84 | | | | (0.06 | ) | | | 2.03 | | | | 1.97 | | | | – | | | | (3.11 | ) | | | (3.11 | ) |
| 11/30/2016 | | | 26.51 | | | | (0.07 | ) | | | 2.46 | | | | 2.39 | | | | – | | | | (5.06 | ) | | | (5.06 | ) |
| 11/30/2015 | | | 33.04 | | | | (0.10 | ) | | | 1.30 | | | | 1.20 | | | | – | | | | (7.73 | ) | | | (7.73 | ) |
| Class R4 | | | | | | | | | | | | | | | | | | | | | | | | | | | | |
| 11/30/2019 | | | 20.47 | | | | 0.05 | | | | 0.03 | | | | 0.08 | | | | – | | | | (3.06 | ) | | | (3.06 | ) |
| 11/30/2018 | | | 23.64 | | | | (0.07 | ) | | | (0.17 | ) | | | (0.24 | ) | | | – | | | | (2.93 | ) | | | (2.93 | ) |
| 11/30/2017 | | | 24.65 | | | | (0.02 | ) | | | 2.12 | | | | 2.10 | | | | – | | | | (3.11 | ) | | | (3.11 | ) |
| 11/30/2016 | | | 27.17 | | | | (0.05 | ) | | | 2.59 | | | | 2.54 | | | | – | | | | (5.06 | ) | | | (5.06 | ) |
| 6/30/2015 to 11/30/2015(h) | | | 27.41 | | | | (0.03 | ) | | | (0.21 | ) | | | (0.24 | ) | | | – | | | | – | | | | – | |
| Class R5 | | | | | | | | | | | | | | | | | | | | | | | | | | | | |
| 11/30/2019 | | | 24.31 | | | | 0.13 | | | | 0.09 | | | | 0.22 | | | | – | | | | (3.06 | ) | | | (3.06 | ) |
| 11/30/2018 | | | 27.47 | | | | (0.03 | ) | | | (0.17 | ) | | | (0.20 | ) | | | (0.03 | ) | | | (2.93 | ) | | | (2.96 | ) |
| 11/30/2017 | | | 28.08 | | | | 0.03 | | | | 2.47 | | | | 2.50 | | | | – | | | | (3.11 | ) | | | (3.11 | ) |
| 11/30/2016 | | | 30.14 | | | | 0.04 | | | | 2.96 | | | | 3.00 | | | | – | | | | (5.06 | ) | | | (5.06 | ) |
| 6/30/2015 to 11/30/2015(h) | | | 30.37 | | | | – | (c) | | | (0.23 | ) | | | (0.23 | ) | | | – | | | | – | | | | – | |
| Class R6 | | | | | | | | | | | | | | | | | | | | | | | | | | | | |
| 11/30/2019 | | | 24.38 | | | | 0.11 | | | | 0.14 | | | | 0.25 | | | | – | | | | (3.06 | ) | | | (3.06 | ) |
| 11/30/2018 | | | 27.53 | | | | – | (c) | | | (0.19 | ) | | | (0.19 | ) | | | (0.03 | ) | | | (2.93 | ) | | | (2.96 | ) |
| 11/30/2017 | | | 28.12 | | | | 0.07 | | | | 2.45 | | | | 2.52 | | | | – | | | | (3.11 | ) | | | (3.11 | ) |
| 11/30/2016 | | | 30.15 | | | | 0.07 | | | | 2.96 | | | | 3.03 | | | | – | | | | (5.06 | ) | | | (5.06 | ) |
| 6/30/2015 to 11/30/2015(h) | | | 30.37 | | | | 0.01 | | | | (0.23 | ) | | | (0.22 | ) | | | – | | | | – | | | | – | |
| (a) | Calculated using average shares outstanding during the period. |
| (b) | Total return for Classes A and C does not consider the effects of sales loads and assumes the reinvestment of all distributions. Total return for all other classes assumes the reinvestment of all distributions. |
| (c) | Amount less than $0.01. |
| (d) | Amount is less than 0.01%. |
| (e) | Commenced on April 4, 2017. |
| (f) | Not annualized. |
| (g) | Annualized. |
| (h) | Commenced on June 30, 2015. |
| (i) | Realized and unrealized gain (loss) per share does not correlate to the aggregate of the net realized and unrealized gain (loss) in the Statement of Operations for the period ended November 30, 2019, primarily due to the timing of the sales and repurchases of the Fund’s shares in relation to fluctuating market values of the Fund’s portfolio. |
| 44 | See Notes to Financial Statements. |
| | | | | Ratios to Average Net Assets: | | Supplemental Data: |
| | | | | | | |
Net
asset
value,
end of
period | | Total
return(b)
(%) | | Total
expenses
(%) | | Net
invest-
ment
income (loss)
(%) | | Net
assets,
end of
period
(000) | | Portfolio
turnover
rate
(%) |
| | | | | | | | | | | | | | | | | | | | | | | |
| | $16.46 | | | | 2.33 | | | | 1.45 | | | | 0.01 | | | $ | 5,713 | | | | 95 | |
| | 19.50 | | | | (1.16 | ) | | | 1.43 | | | | (0.54 | ) | | | 6,080 | | | | 42 | |
| | 22.70 | | | | 9.17 | | | | 1.42 | | | | (0.29 | ) | | | 7,728 | | | | 56 | |
| | 23.84 | | | | 12.89 | | | | 1.44 | | | | (0.33 | ) | | | 7,238 | | | | 44 | |
| | 26.51 | | | | 4.52 | | | | 1.44 | | | | (0.39 | ) | | | 6,395 | | | | 44 | |
| | | | | | | | | | | | | | | | | | | | | | | |
| | 17.49 | | | | 2.55 | | | | 1.20 | | | | 0.28 | | | | 2,750 | | | | 95 | |
| | 20.47 | | | | (0.96 | ) | | | 1.18 | | | | (0.33 | ) | | | 1,851 | | | | 42 | |
| | 23.64 | | | | 9.43 | | | | 1.18 | | | | (0.08 | ) | | | 3,448 | | | | 56 | |
| | 24.65 | | | | 13.19 | | | | 1.19 | | | | (0.20 | ) | | | 1,234 | | | | 44 | |
| | 27.17 | | | | (0.88 | )(f) | | | 1.16 | (g) | | | (0.23 | )(g) | | | 10 | | | | 44 | |
| | | | | | | | | | | | | | | | | | | | | | | |
| | 21.47 | | | | 2.85 | | | | 0.93 | | | | 0.64 | | | | 55 | | | | 95 | |
| | 24.31 | | | | (0.74 | ) | | | 0.92 | | | | (0.10 | ) | | | 13 | | | | 42 | |
| | 27.47 | | | | 9.73 | | | | 0.92 | | | | 0.12 | | | | 345 | | | | 56 | |
| | 28.08 | | | | 13.46 | | | | 0.94 | | | | 0.17 | | | | 15 | | | | 44 | |
| | 30.14 | | | | (0.76 | )(f) | | | 0.90 | (g) | | | 0.02 | (g) | | | 10 | | | | 44 | |
| | | | | | | | | | | | | | | | | | | | | | | |
| | 21.57 | | | | 2.89 | | | | 0.86 | | | | 0.54 | | | | 8,129 | | | | 95 | |
| | 24.38 | | | | (0.62 | ) | | | 0.84 | | | | – | (d) | | | 20,220 | | | | 42 | |
| | 27.53 | | | | 9.79 | | | | 0.84 | | | | 0.28 | | | | 23,145 | | | | 56 | |
| | 28.12 | | | | 13.58 | | | | 0.85 | | | | 0.27 | | | | 28,895 | | | | 44 | |
| | 30.15 | | | | (0.72 | )(f) | | | 0.83 | (g) | | | 0.09 | (g) | | | 10 | | | | 44 | |
| | See Notes to Financial Statements. | 45 |
Notes to Financial Statements
Lord Abbett Research Fund, Inc. (the “Company”) is registered under the Investment Company Act of 1940, as amended (the “Act”), as a diversified, open-end management investment company and was incorporated under Maryland law on April 6, 1992. The Company consists of the following three funds (separately, a “Fund” and collectively, the “Funds”) and their respective classes: Lord Abbett Calibrated Dividend Growth Fund (“Calibrated Dividend Growth Fund”), Lord Abbett Growth Opportunities Fund (“Growth Opportunities Fund”) and Lord Abbett Small-Cap Value Series (“Small Cap Value Fund”).
Calibrated Dividend Growth Fund’s investment objective is to seek current income and capital appreciation. Growth Opportunities Fund’s investment objective is capital appreciation. Small Cap Value Fund’s investment objective is long-term capital appreciation. Each Fund has eleven active classes of shares at November 30, 2019: Class A, C, F, F3, I, P, R2, R3, R4, R5 and R6, each with different expenses and dividends. A front-end sales charge is normally added to the net asset value (“NAV”) for Class A shares. There is no front-end sales charge in the case of Class C, F, F3, I, P, R2, R3, R4, R5 and R6 shares, although there may be a contingent deferred sales charge (“CDSC”) in certain cases as follows: Class A shares purchased without a sales charge and redeemed before the first day of the month in which the one-year anniversary of the purchase falls (subject to certain exceptions as set forth in each Fund’s prospectus); and Class C shares redeemed before the first anniversary of purchase. Class C shares automatically convert into Class A shares on the 25th day of the month (or, if the 25th is not a business day, the next business day thereafter) following the tenth anniversary of the month on which the purchase order was accepted. The Funds’ Class P shares are closed to substantially all new investors, with certain exceptions as set forth in the Funds’ prospectus.
The preparation of the financial statements in conformity with accounting principles generally accepted in the United States of America (“U.S. GAAP”) requires management to make certain estimates and assumptions that affect the reported amounts of assets and liabilities and disclosure of contingent assets and liabilities at the date of the financial statements and the reported amounts of increases and decreases in net assets from operations during the reporting period. Actual results could differ from those estimates. Each Fund is considered an investment company under U.S. GAAP and follows the accounting and reporting guidance applicable to investment companies.
| 2. | SIGNIFICANT ACCOUNTING POLICIES |
| (a) | Investment Valuation–Under procedures approved by the Funds’ Board of Directors (the “Board”), Lord, Abbett & Co. LLC (“Lord Abbett”), the Funds’ investment manager, has formed a Pricing Committee to administer the pricing and valuation of portfolio investments and to ensure that prices utilized reasonably reflect fair value. Among other things, these procedures allow the Funds to utilize independent pricing services, quotations from securities and financial instrument dealers and other market sources to determine fair value. |
| | |
| | Securities actively traded on any recognized U.S. or non-U.S. exchange or on The NASDAQ Stock Market LLC are valued at the last sale price or official closing price on the exchange or system on which they are principally traded. Events occurring after the close of trading on non-U.S. exchanges may result in adjustments to the valuation of foreign securities to reflect their fair value as of the close of regular trading on the New York Stock Exchange. Each Fund may utilize an independent fair valuation service in adjusting the valuations of foreign securities. Unlisted equity securities are valued at the last quoted sale price or, if no sale price is available, at the mean between the most recently quoted bid and asked prices. Exchange |
46
Notes to Financial Statements (continued)
| | traded options and futures contracts are valued at the last quoted sale price in the market where they are principally traded. If no sale has occurred, the mean between the most recently quoted bid and asked prices is used. |
| | |
| | Securities for which prices are not readily available are valued at fair value as determined by the Pricing Committee. The Pricing Committee considers a number of factors, including observable and unobservable inputs, when arriving at fair value. The Pricing Committee may use related or comparable assets or liabilities, recent transactions, market multiples, book values and other relevant information to determine the fair value of portfolio investments. The Board or a designated committee thereof regularly reviews fair value determinations made by the Pricing Committee and may employ techniques such as reviewing related market activity, reviewing inputs and assumptions, and retrospectively comparing prices of subsequent purchases and sales transactions to fair value determinations made by the Pricing Committee. |
| | |
| | Short-term securities with 60 days or less remaining to maturity are valued using the amortized cost method, which approximates fair value. |
| | |
| (b) | Security Transactions–Security transactions are recorded as of the date that the securities are purchased or sold (trade date). Realized gains and losses on sales of portfolio securities are calculated using the identified-cost method. Realized and unrealized gains (losses) are allocated to each class of shares based upon the relative proportion of net assets at the beginning of the day. |
| | |
| (c) | Investment Income–Dividend income is recorded on the ex-dividend date. Interest income is recorded on the accrual basis as earned. Discounts are accreted and premiums are amortized using the effective interest method and are included in Interest income on the Statements of Operations. Withholding taxes on foreign dividends have been provided for in accordance with the applicable country’s tax rules and rates. Investment income is allocated to each class of shares based upon the relative proportion of net assets at the beginning of the day. |
| | |
| (d) | Income Taxes–It is the policy of each Fund to meet the requirements of Subchapter M of the Internal Revenue Code applicable to regulated investment companies and to distribute substantially all taxable income and capital gains to its shareholders. Therefore, no income tax provision is required. |
| | |
| | Each Fund files U.S. federal and various state and local tax returns. No income tax returns are currently under examination. The statute of limitations on each Fund’s filed U.S. federal tax returns remains open for the fiscal years ended November 30, 2016 through November 30, 2019. The statutes of limitations on the Company’s state and local tax returns may remain open for an additional year depending upon the jurisdiction. |
| | |
| (e) | Expenses–Expenses incurred by the Company that do not specifically relate to an individual fund are generally allocated to the Funds within the Company on a pro rata basis by relative net assets. Expenses, excluding class-specific expenses, are allocated to each class of shares based upon the relative proportion of net assets at the beginning of the day. Class A, C, F, P, R2, R3 and R4 shares bear their class-specific share of all expenses and fees relating to the Funds’ 12b-1 Distribution Plan. |
| | |
| (f) | Foreign Transactions–The books and records of each Fund are maintained in U.S. dollars and transactions denominated in foreign currencies are recorded in each Fund’s records at the rate prevailing when earned or recorded. Asset and liability accounts that are denominated in foreign currencies are adjusted daily to reflect current exchange rates and any unrealized gain |
47
Notes to Financial Statements (continued)
| | (loss) if applicable, is included in Net change in unrealized appreciation/depreciation on translation of assets and liabilities denominated in foreign currencies in each Fund’s Statement of Operations. The resultant exchange gains and losses upon settlement of such transactions, if applicable, are included in Net realized gain on foreign currency related transactions in each Fund’s Statement of Operations. The Funds do not isolate that portion of the results of operations arising as a result of changes in the foreign exchange rates from the changes in market prices of the securities. |
| | |
| | The Funds use foreign currency exchange contracts to facilitate transactions in foreign-denominated securities. Losses from these transactions may arise from changes in the value of the foreign currency or if the counterparties do not perform under the contracts’ terms. |
| | |
| (g) | Futures Contracts–Each Fund may purchase and sell index futures contracts to manage cash, or as a substitute position in lieu of holding the underlying asset on which the instrument is based. At the time of entering into a futures transaction, an investor is required to deposit and maintain a specified amount of cash or eligible securities called “initial margin.” Subsequent payments made or received by each Fund called “variation margin” are made on a daily basis as the market price of the futures contract fluctuates. The Funds will record an unrealized gain (loss) based on the amount of variation margin. When a contract is closed, a realized gain (loss) is recorded equal to the difference between the opening and closing value of the contract. |
| | |
| (h) | Repurchase Agreements–Each Fund may enter into repurchase agreements with respect to securities. A repurchase agreement is a transaction in which a Fund acquires a security and simultaneously commits to resell that security to the seller (a bank or securities dealer) at an agreed-upon price on an agreed-upon date. Each Fund requires at all times that the repurchase agreement be collateralized by cash, or by securities of the U.S. Government, its agencies, its instrumentalities, or U.S. Government sponsored enterprises having a value equal to, or in excess of, the value of the repurchase agreement (including accrued interest). If the seller of the agreement defaults on its obligation to repurchase the underlying securities at a time when the fair value of these securities has declined, a Fund may incur a loss upon disposition of the securities. |
| | |
| (i) | Fair Value Measurements–Fair value is defined as the price that each Fund would receive upon selling an investment or transferring a liability in an orderly transaction to an independent buyer in the principal or most advantageous market of the investment. A three-tier hierarchy is used to maximize the use of observable market data and minimize the use of unobservable inputs and to establish classification of fair value measurements for disclosure purposes. Inputs refer broadly to the assumptions that market participants would use in pricing the asset or liability, including assumptions about risk—for example, the risk inherent in a particular valuation technique used to measure fair value (such as a pricing model) and/or the risk inherent in the inputs to the valuation technique. Inputs may be observable or unobservable. Observable inputs reflect the assumptions market participants would use in pricing the asset or liability. Observable inputs are based on market data obtained from sources independent of the reporting entity. Unobservable inputs reflect the reporting entity’s own assumptions about the assumptions market participants would use in pricing the asset or liability. Unobservable inputs are based on the best information available in the circumstances. The three-tier hierarchy classification is determined based on the lowest level of inputs that is significant to the fair value measurement, and is summarized in the three broad Levels listed below: |
| | · | Level 1 – | unadjusted quoted prices in active markets for identical investments; |
48
Notes to Financial Statements (continued)
| | · | Level 2 – | other significant observable inputs (including quoted prices for similar investments, interest rates, prepayment speeds, credit risk, etc.); and |
| | | |
| | · | Level 3 – | significant unobservable inputs (including each Fund’s own assumptions in determining the fair value of investments). |
| | A summary of inputs used in valuing each Fund’s investments and other financial instruments as of November 30, 2019 and, if applicable, Level 3 rollforwards for the fiscal year then ended is included in each Fund’s Schedule of Investments. |
| | |
| | Changes in valuation techniques may result in transfers into or out of an assigned level within the three-tier hierarchy. The inputs or methodology used for valuing securities are not necessarily an indication of the risk associated with investing in those securities. |
| 3. | MANAGEMENT FEE AND OTHER TRANSACTIONS WITH AFFILIATES |
Management Fee
The Company has a management agreement with Lord Abbett, pursuant to which Lord Abbett provides each Fund with investment management services and executive and other personnel, provides office space and pays for ordinary and necessary office and clerical expenses relating to research and statistical work and supervision of each Fund’s investment portfolio.
The management fee for Calibrated Dividend Growth Fund is based on the Fund’s average daily net assets at the following annual rates:
| First $2 billion | .55% |
| Over $2 billion | .49% |
The management fee for Growth Opportunities Fund is based on the Fund’s average daily net assets at the following annual rates:
| First $1 billion | .75% |
| Next $1 billion | .65% |
| Next $1 billion | .60% |
| Over $3 billion | .58% |
The management fee for Small Cap Value Fund is based on the Fund’s average daily net assets at the following annual rates:
| First $2 billion | .75% |
| Over $2 billion | .70% |
For the fiscal year ended November 30, 2019, the effective management fee, net of waivers, was based on each Fund’s average daily net assets at the following annualized rates:
| | Net Effective |
| | Management Fee |
| Calibrated Dividend Growth Fund | 0.54% |
| Growth Opportunities Fund | 0.75% |
| Small Cap Value Fund | 0.75% |
In addition, Lord Abbett provides certain administrative services to the Funds pursuant to an Administrative Services Agreement in return for a fee at an annual rate of .04% of each Fund’s average daily net assets.
49
Notes to Financial Statements (continued)
12b-1 Distribution Plan
Each Fund has adopted a distribution plan with respect to Class A, C, F, P, R2, R3 and R4 shares pursuant to Rule 12b-1 under the Act, which provides for the payment of ongoing distribution and service fees to Lord Abbett Distributor LLC (the “Distributor”), an affiliate of Lord Abbett. The following annual rates have been authorized by the Board pursuant to the plan:
| Fees* | Class A | Class C | Class F(1)(2) | Class P | Class R2 | Class R3 | Class R4 |
| Service | .25% | .25% | – | .25% | .25% | .25% | .25% |
| Distribution | – | .75% | .10% | .20% | .35% | .25% | – |
| * | The Funds may designate a portion of the aggregate fee as attributable to service activities for purposes of calculating Financial Industry Regulatory Authority, Inc. (“FINRA”) sales charge limitations. |
| (1) | The Class F Share Rule 12b-1 fee may be designated as a service fee in limited circumstances as described in the Funds’ prospectus. |
| (2) | For the fiscal year ended November 30, 2019 and continuing through March 31, 2020, the Distributor has contractually agreed to waive Calibrated Dividend Growth Fund’s 0.10% Rule 12b-1 fee for Class F. This agreement may be terminated only by the Fund’s Board of Directors. |
Class F3, Class I, Class R5 and Class R6 shares do not have a distribution plan.
Commissions
Distributor received the following commissions on sales of shares of the Funds, after concessions were paid to authorized dealers, for the fiscal year ended November 30, 2019:
| | | Distributor
Commissions | | Dealers’
Concessions |
| Calibrated Dividend Growth Fund | | | $295,196 | | | $1,703,856 |
| Growth Opportunities Fund | | | 50,097 | | | 275,121 |
| Small Cap Value Fund | | | 34,457 | | | 183,353 |
Distributor received the following amount of CDSCs for the fiscal year ended November 30, 2019:
| | | Class A | | Class C |
| Calibrated Dividend Growth Fund | | | $10,100 | | | $10,769 |
| Growth Opportunities Fund | | | 577 | | | 1,062 |
| Small Cap Value Fund | | | 1,929 | | | 449 |
Other Related Parties
As of November 30, 2019, the percentages of Growth Opportunities Fund’s and Small Cap Value Fund’s outstanding shares owned by each Fund of Funds were as follows:
| Underlying Funds |
| Fund of Funds | | Growth
Opportunities Fund | | Small Cap
Value Fund |
| Alpha Strategy Fund | | | – | | | 22.02% |
| Multi-Asset Balanced Opportunities Fund | | | 32.22% | | | – |
| Multi-Asset Income Fund | | | 7.64% | | | – |
One Director and certain of the Funds’ officers have an interest in Lord Abbett.
| 4. | DISTRIBUTIONS AND CAPITAL LOSS CARRYFORWARDS |
Dividends from net investment income, if any, are declared and paid at least quarterly for Calibrated Dividend Growth Fund and annually for Growth Opportunities Fund and Small Cap Value Fund. Taxable net realized gains from investment transactions, reduced by allowable capital loss carryforwards, if any, are declared and distributed to shareholders at least annually. The capital loss carryforward amount, if any, is available to offset future net capital gains. Dividends and
50
Notes to Financial Statements (continued)
distributions to shareholders are recorded on the ex-dividend date. The amounts of dividends and distributions from net investment income and net realized capital gains are determined in accordance with federal income tax regulations, which may differ from U.S. GAAP. These book/tax differences are either considered temporary or permanent in nature. To the extent these differences are permanent in nature, such amounts are reclassified within the components of net assets based on their federal tax basis treatment; temporary differences do not require reclassification. Dividends and distributions, which exceed earnings and profits for tax purposes, are reported as a tax return of capital.
The tax character of distributions paid during the fiscal years ended November 30, 2019 and November 30, 2018 were as follows:
| Calibrated Dividend Growth Fund | | | Growth Opportunities Fund | |
| | | Year Ended
11/30/2019 | | | Year Ended
11/30/2018 | | | Year Ended
11/30/2019 | | | Year Ended
11/30/2018 | |
| Distributions paid from: | | | | | | | | | | | | | | | | |
| Ordinary income | | $ | 70,041,461 | | | $ | 114,861,886 | | | $ | 8,156,688 | | | $ | 10,054,491 | |
| Net long-term capital gains | | | 118,733,710 | | | | 71,418,951 | | | | 31,351,508 | | | | 32,746,855 | |
| Total distributions paid | | $ | 188,775,171 | | | $ | 186,280,837 | | | $ | 39,508,196 | | | $ | 42,801,346 | |
| | | | | | | | | | | | | | | | | |
| | | Small Cap Value Fund | | | | | | | | | |
| | | Year Ended
11/30/2019 | | | Year Ended
11/30/2018 | | | | | | | | | |
| Distributions paid from: | | | | | | | | | | | | | | | | |
| Ordinary income | | $ | 7,597,559 | | | $ | 589,565 | | | | | | | | | |
| Net long-term capital gains | | | 116,541,602 | | | | 133,220,122 | | | | | | | | | |
| Total distributions paid | | $ | 124,139,161 | | | $ | 133,809,687 | | | | | | | | | |
Subsequent to the Funds’ fiscal year ended November 30, 2019, distributions were paid on December 18, 2019 to shareholders of record on December 17, 2019. The approximate amounts were as follows:
| | | Ordinary
Distributions | | | Net Short-Term
Capital Gains | | | Net Long-Term
Capital Gains |
| Calibrated Dividend Growth Fund | | | – | | | | $1,453,000 | | | | $106,130,000 |
| Growth Opportunities Fund | | | – | | | | – | | | | 43,464,000 |
| Small Cap Value Fund | | | 2,989,000 | | | | – | | | | 113,166,000 |
As of November 30, 2019, the components of accumulated gains on a tax-basis were as follows:
| | | Calibrated
Dividend
Growth Fund | | | Growth
Opportunities
Fund | | | Small Cap
Value Fund | |
| Undistributed ordinary income – net | | $ | 9,724,235 | | | $ | – | | | $ | 2,987,995 | |
| Undistributed long-term capital gains | | | 106,123,359 | | | | 43,463,848 | | | | 113,165,682 | |
| Total undistributed earnings | | | 115,847,594 | | | | 43,463,848 | | | | 116,153,677 | |
| Temporary differences | | | (283,682 | ) | | | (1,156,502 | ) | | | (285,858 | ) |
| Unrealized gains – net | | | 391,371,552 | | | | 233,599,320 | | | | 69,953,706 | |
| Total accumulated gains – net | | $ | 506,935,464 | | | $ | 275,906,666 | | | $ | 185,821,525 | |
At each Fund’s election, certain losses incurred within the taxable year (Qualified Late-Year Losses) are deemed to arise on the first business day of the Fund’s next taxable year. Growth Opportunities Fund incurred and will elect to defer late-year ordinary losses during fiscal 2019 of $1,065,142.
51
Notes to Financial Statements (continued)
As of November 30, 2019, the aggregate unrealized security gains and losses on investments and other financial instruments based on cost for U.S. federal income tax purposes were as follows:
| | | Calibrated
Dividend
Growth Fund | | | Growth
Opportunities
Fund | | | Small Cap
Value Fund | |
| Tax cost | | $ | 2,125,331,080 | | | $ | 612,004,302 | | | $ | 698,601,787 | |
| Gross unrealized gain | | | 427,025,958 | | | | 260,999,841 | | | | 98,678,447 | |
| Gross unrealized loss | | | (35,654,406 | ) | | | (27,400,521 | ) | | | (28,724,741 | ) |
| Net unrealized security gain | | $ | 391,371,552 | | | $ | 233,599,320 | | | $ | 69,953,706 | |
The difference between book-basis and tax-basis unrealized gains (losses) is attributable to the tax treatment of futures and wash sales.
Permanent items identified during the fiscal year ended November 30, 2019 have been reclassified among the components of net assets based on their tax basis treatment as follows:
| | | Total Distributable
Earnings (Loss | ) | | Paid-in Capital | |
| Growth Opportunities Fund | | $ | (4,046,702 | ) | | $ | 4,046,702 | |
| Small Cap Value Fund | | | (13,201,370 | ) | | | 13,201,370 | |
The permanent differences are attributable primarily to the tax treatment of certain distributions.
| 5. | PORTFOLIO SECURITIES TRANSACTIONS |
Purchases and sales of investment securities (excluding short-term investments) for the fiscal year ended November 30, 2019 were as follows:
| | | Purchases | | | Sales | |
| Calibrated Dividend Growth Fund | | $ | 1,214,607,720 | | | $ | 1,316,712,617 | |
| Growth Opportunities Fund | | | 217,825,082 | | | | 330,811,057 | |
| Small Cap Value Fund | | | 759,585,224 | | | | 902,489,180 | |
There were no purchases or sales of U.S. Government securities for the fiscal year ended November 30, 2019.
Each Fund is permitted to purchase and sell securities (“cross-trade”) from and to other Lord Abbett funds or client accounts pursuant to procedures approved by the Board in compliance with Rule 17a-7 under the Act (the “Rule”). Each cross-trade is executed at a fair market price in compliance with provisions of the Rule. For the period ended November 30, 2019, the following Funds engaged in cross-trades:
| Fund | | Purchases | | | Sales | | | Gain/Loss | |
| Calibrated Dividend Growth Fund | | $ | 6,067,192 | | | $ | 16,096,164 | | | $ | 2,422,524 | |
| Growth Opportunities Fund | | | – | | | | 18,184,407 | | | | 699,136 | |
| Small Cap Value Fund | | | 1,981,000 | | | | 7,694,209 | | | | (439,251 | ) |
| 6. | DISCLOSURES ABOUT DERIVATIVE INSTRUMENTS AND HEDGING ACTIVITIES |
Calibrated Dividend Growth Fund entered into E-Mini S&P 500 Index futures contracts for the fiscal year ended November 30, 2019 (as described in note 2(g)) to manage cash. The Fund bears the risk that the underlying index will move unexpectedly, in which case the Fund may realize a loss. There is minimal counterparty credit risk to the Fund since futures are exchange traded and the
52
Notes to Financial Statements (continued)
exchange’s clearinghouse, as counterparty to all exchange traded futures, guarantees futures against default.
As of November 30, 2019, the Fund had futures contracts with unrealized appreciation of $227,488. Amounts of $1,105,881 and $156,723 are included in the Statement of Operations related to futures contracts under the captions Net realized gain on futures contracts and Net change in unrealized appreciation/depreciation on futures contracts, respectively. The average number of futures contracts throughout the period was 74.
| 7. | DISCLOSURES ABOUT OFFSETTING ASSETS AND LIABILITIES |
The Financial Accounting Standards Board (“FASB”) requires disclosures intended to help better assess the effect or potential effect of offsetting arrangements on a fund’s financial position. The following tables illustrate gross and net information about recognized assets and liabilities eligible for offset in the Statement of Assets and Liabilities; and disclose such amounts subject to an enforceable master netting agreement or similar agreement, by counterparty. A master netting agreement is an agreement between a fund and a counterparty which provides for the net settlement of amounts owed under all contracts traded under that agreement, as well as cash collateral, through a single payment by one party to the other in the event of default on or termination of any one contract. The Funds’ accounting policy with respect to balance sheet offsetting is that, absent an event of default by the counterparty or a termination of the agreement, the master netting agreement does not result in an offset of reported amounts of financial assets and liabilities in the Statement of Assets and Liabilities across transactions between the Funds and the applicable counterparty:
| | | | | | Calibrated Dividend Growth Fund | |
| Description | | Gross Amounts of
Recognized Assets | | | Gross Amounts
Offset in the
Statement of Assets
and Liabilities | | | Net Amounts of
Assets Presented
in the Statement of
Assets and Liabilities | |
| Repurchase Agreement | | $ | 4,236,022 | | | $ | – | | | $ | 4,236,022 | |
| Total | | $ | 4,236,022 | | | $ | – | | | $ | 4,236,022 | |
| | | Net Amounts of | | | Amounts Not Offset in the
Statement of Assets and Liabilities | | | | |
| Counterparty | | Assets Presented
in the Statement of
Assets and Liabilities | | | Financial
Instruments | | | Cash
Collateral
Received(a) | | | Securities
Collateral
Received(a) | | | Net
Amount(b) | |
| Fixed Income Clearing Corp. | | $ | 4,236,022 | | | $ | – | | | $ | – | | | $ | (4,236,022 | ) | | $ | – | |
| Total | | $ | 4,236,022 | | | $ | – | | | $ | – | | | $ | (4,236,022 | ) | | $ | – | |
| | | | | | | Growth Opportunities Fund | |
| Description | | Gross Amounts of
Recognized Assets | | | Gross Amounts
Offset in the
Statement of Assets
and Liabilities | | | Net Amounts of
Assets Presented
in the Statement of
Assets and Liabilities | |
| Repurchase Agreement | | $ | 6,865,783 | | | $ | – | | | $ | 6,865,783 | |
| Total | | $ | 6,865,783 | | | $ | – | | | $ | 6,865,783 | |
53
Notes to Financial Statements (continued)
| Growth Opportunities Fund |
| | | Net Amounts of | | | Amounts Not Offset in the
Statement of Assets and Liabilities | | | | |
| Counterparty | | Assets Presented
in the Statement of
Assets and Liabilities | | | Financial
Instruments | | | Cash
Collateral
Received(a) | | | Securities
Collateral
Received(a) | | | Net
Amount(b) | |
| Fixed Income Clearing Corp. | | $ | 6,865,783 | | | $ | – | | | $ | – | | | $ | (6,865,783 | ) | | $ | – | |
| Total | | $ | 6,865,783 | | | $ | – | | | $ | – | | | $ | (6,865,783 | ) | | $ | – | |
| | | | | | | Small Cap Value Fund | |
| Description | | Gross Amounts of
Recognized Assets | | | Gross Amounts
Offset in the
Statement of Assets
and Liabilities | | | Net Amounts of
Assets Presented
in the Statement of
Assets and Liabilities | |
| Repurchase Agreement | | $ | 1,584,212 | | | $ | – | | | $ | 1,584,212 | |
| Total | | $ | 1,584,212 | | | $ | – | | | $ | 1,584,212 | |
| | | Net Amounts of | | | Amounts Not Offset in the
Statement of Assets and Liabilities | | | | |
| Counterparty | | Assets Presented
in the Statement of
Assets and Liabilities | | | Financial
Instruments | | | Cash
Collateral
Received(a) | | | Securities
Collateral
Received(a) | | |
Net
Amount(b) | |
| Fixed Income Clearing Corp. | | $ | 1,584,212 | | | $ | – | | | $ | – | | | $ | (1,584,212 | ) | | $ | – | |
| Total | | $ | 1,584,212 | | | $ | – | | | $ | – | | | $ | (1,584,212 | ) | | $ | – | |
| (a) | Collateral disclosed is limited to an amount not to exceed 100% of the net amount of assets presented in the Statements of Assets and Liabilities, for each respective counterparty. |
| (b) | Net amount represents the amount owed to the Fund by the counterparty as of November 30, 2019. |
| 8. | DIRECTORS’ REMUNERATION |
The Company’s officers and the one Director who are associated with Lord Abbett do not receive any compensation from the Company for serving in such capacities. Independent Directors’ fees are allocated among all Lord Abbett-sponsored funds based on the net assets of each Fund. There is an equity-based plan available to all Independent Directors under which Independent Directors must defer receipt of a portion of, and may elect to defer receipt of an additional portion of, Directors’ fees. The deferred amounts are treated as though equivalent dollar amounts had been invested in the Funds. Such amounts and earnings accrued thereon are included in Directors’ fees on the Statements of Operations and in Directors’ fees payable on the Statements of Assets and Liabilities and are not deductible for U.S. federal income tax purposes until such amounts are paid.
The Company has entered into an arrangement with its transfer agent and custodian, whereby credits realized as a result of uninvested cash balances are used to reduce a portion of each Fund’s expenses.
For the period ended December 20, 2018, the Funds and certain other funds managed by Lord Abbett (collectively, the “Participating Funds”) entered into a syndicated line of credit facility with various lenders for $1.06 billion (the “Syndicated Facility”), whereas State Street Bank and Trust Company (“SSB”) participates as a lender and as agent for the lenders. The Participating Funds are
54
Notes to Financial Statements (continued)
subject to graduated borrowing limits of one-third of Fund net assets (if Fund net assets are less than $750 million), $250 million, $300 million, $350 million, or $1 billion, based on past borrowings and likelihood of future borrowings, among other factors.
For the period December 21, 2018 through August 7, 2019, the Participating Funds entered into a Syndicated Facility with various lenders for $1.1 billion whereas SSB participated as a lender and as agent for the lenders. The Participating Funds were subject to graduated borrowing limits of one-third of Fund net assets (if Fund net assets are less than $750 million), $250 million, $300 million, $350 million, or $1 billion, based on past borrowings and likelihood of future borrowings, among other factors.
Effective August 8, 2019, the Participating Funds entered into a Syndicated Facility with various lenders for $1.17 billion whereas SSB participates as a lender and as agent for the lenders. The Participating Funds are subject to graduated borrowing limits of one-third of Fund net assets (if net assets are less than $750 million), $250 million, $300 million, $500 million, or $1 billion, based on past borrowings and likelihood of future borrowings, among other factors.
For the period ended August 7, 2019, the Participating Funds entered into an additional line of credit facility with SSB for $250 million (the “Bilateral Facility” and together with the Syndicated Facility, the “Facilities”). Under the Bilateral Facility, each Participating Fund may borrow up to the lesser of $250 million or one-third of Fund net assets.
Effective August 8, 2019, the Participating Funds entered into a Bilateral Facility with SSB for $330 million ($250 million committed and $80 million uncommitted). Under the Bilateral Facility, the Participating Funds are subject to graduated borrowing limits of one-third of Fund net assets (if net assets are less than $750 million), $250 million, $300 million, or $330 million, based on past borrowings and likelihood of future borrowings, among other factors.
The Facilities are to be used for temporary or emergency purposes as an additional source of liquidity to satisfy redemptions.
For the fiscal year ended November 30, 2019, the Funds did not utilize the Facilities.
| 11. | INTERFUND LENDING PROGRAM |
Pursuant to an exemptive order issued by the U.S. Securities and Exchange Commission (“SEC exemptive order”) certain registered open-end management investment companies managed by Lord Abbett, including each Fund, participate in a joint lending and borrowing program (the “Interfund Lending Program”). The SEC exemptive order allows the Funds to borrow money from and lend money to each other for temporary or emergency purposes subject to the limitations and conditions.
For the fiscal year ended November 30, 2019, The Funds did not participate as a borrower or lender in the Interfund Lending Program
| 12. | CUSTODIAN AND ACCOUNTING AGENT |
SSB is the Company’s custodian and accounting agent. SSB performs custodial, accounting and recordkeeping functions relating to portfolio transactions and calculating each Fund’s NAV.
Each Fund is subject to the general risks and considerations associated with equity investing. The value of the Funds’ investments will fluctuate in response to movements in the equity securities
55
Notes to Financial Statements (continued)
markets in general and to the changing prospects of individual companies and/or sectors in which the Funds invest.
Calibrated Dividend Growth Fund invests primarily in equity securities of large and mid-sized company stocks that have a history of growing their dividends, but there is no guarantee that a company will pay a dividend. Also, equity securities may experience significant volatility. Such securities may fall sharply in response to adverse events affecting overall markets, a particular industry or sector, or an individual company’s financial condition. If the Fund’s fundamental research and quantitative analysis fail to produce the intended result, the Fund may suffer losses or underperform its benchmark or other funds with the same investment objective or similar strategies, even in a favorable market. Large and mid-sized company stocks each may perform differently than the market as a whole and other types of stocks. This is because different types of stocks tend to shift in and out of favor depending on market and economic conditions. Mid-sized company stocks may be less able to weather economic shifts or other adverse developments than those of larger, more established companies. Securities of mid-sized companies tend to be more sensitive to changing economic, market, and industry conditions and tend to be less liquid than equity securities of larger companies, especially over the short term. The securities of mid-sized companies may be less well-known and less widely held and trade less frequently and in more limited volume than the securities of large cap company stocks. Mid-sized companies also may fall out of favor relative to larger companies in certain market cycles, causing the Fund to incur losses or underperform.
Growth Opportunities Fund has particular risks associated with growth stocks. Growth companies may grow faster than other companies, which may result in more volatility in their stock prices. In addition, if the Fund’s assessment of a company’s potential for growth or market conditions is wrong, it could suffer losses or produce poor performance relative to other funds, even in a favorable market. Growth stocks often are more sensitive to market fluctuations than other securities because their market prices are highly sensitive to future earnings expectations. The Fund invests largely in mid-sized company stocks, which may be less able to weather economic shifts or other adverse developments than those of larger, more established companies. Due to the Fund’s investment exposure to American Depositary Receipts and foreign companies and emerging markets, the Fund may experience increased market, liquidity, currency, political, information, and other risks. As compared with companies organized and operated in the U.S., these companies may be more vulnerable to economic, political and social instability and subject to less government supervision, lack of transparency, inadequate regulatory and accounting standards, and foreign taxes. The securities of foreign companies also may be subject to inadequate exchange control regulations, the imposition of economic sanctions or other government restrictions, higher transaction and other costs, and delays in settlement to the extent they are traded on non-U.S. exchanges or markets.
Small Cap Value Fund has particular risks associated with small company value stocks. Small company value stocks may perform differently than the market as a whole and other types of stocks, such as large company stocks or growth stocks. The market may fail to recognize the intrinsic value of particular value stocks for a long time. In addition, small cap company stocks may be more volatile and less liquid than large cap company stocks, especially over the short term. The securities of small companies may be less well-known and less widely held and trade less frequently and in more limited volume than the securities of large cap company stocks. Small companies also may fall out of favor relative to larger companies in certain market cycles, causing the Fund to incur losses or underperform. Also, if the Fund’s assessment of a company’s value or prospects for
56
Notes to Financial Statements (continued)
exceeding earnings expectations or market conditions is wrong, the Fund could suffer losses or produce poor performance relative to other funds, even in a favorable market.
These factors can affect each Fund’s performance.
| 14. | SUMMARY OF CAPITAL TRANSACTIONS |
Transactions in shares of capital stock were as follows:
| | | | | | Year Ended | | | | | | Year Ended | |
| Calibrated Dividend Growth Fund | | November 30, 2019 | | | November 30, 2018 | |
| Class A Shares | | Shares | | | Amount | | | Shares | | | Amount | |
| Shares sold | | | 13,265,950 | | | $ | 198,198,665 | | | | 9,564,783 | | | $ | 148,269,160 | |
| Converted from Class B* | | | – | | | | – | | | | 41,382 | | | | 640,360 | |
| Converted from Class C** | | | 1,113,778 | | | | 17,297,915 | | | | 2,374,618 | | | | 35,951,239 | |
| Reinvestment of distributions | | | 9,147,008 | | | | 126,629,997 | | | | 8,003,118 | | | | 123,083,883 | |
| Shares reacquired | | | (21,119,867 | ) | | | (316,406,189 | ) | | | (19,451,024 | ) | | | (301,099,074 | ) |
| Increase | | | 2,406,869 | | | $ | 25,720,388 | | | | 532,877 | | | $ | 6,845,568 | |
| | | | | | | | | | | | | | | | | |
| Class B Shares | | | | | | | | | | | | | | | | |
| Shares sold | | | – | | | $ | – | | | | 97 | | | $ | 1,486 | |
| Reinvestment of distributions | | | – | | | | – | | | | 8,492 | | | | 129,500 | |
| Shares reacquired | | | – | | | | – | | | | (103,069 | ) | | | (1,592,684 | ) |
| Converted to Class A* | | | – | | | | – | | | | (41,656 | ) | | | (640,360 | ) |
| Decrease | | | – | | | $ | – | | | | (136,136 | ) | | $ | (2,102,058 | ) |
| | | | | | | | | | | | | | | | | |
| Class C Shares | | | | | | | | | | | | | | | | |
| Shares sold | | | 2,154,758 | | | $ | 31,384,476 | | | | 1,895,073 | | | $ | 29,074,479 | |
| Reinvestment of distributions | | | 1,155,376 | | | | 15,642,010 | | | | 1,224,896 | | | | 18,582,786 | |
| Shares reacquired | | | (3,582,649 | ) | | | (52,607,279 | ) | | | (4,263,692 | ) | | | (64,936,886 | ) |
| Converted to Class A** | | | (1,130,097 | ) | | | (17,297,915 | ) | | | (2,408,079 | ) | | | (35,951,239 | ) |
| Decrease | | | (1,402,612 | ) | | $ | (22,878,708 | ) | | | (3,551,802 | ) | | $ | (53,230,860 | ) |
| | | | | | | | | | | | | | | | | |
| Class F Shares | | | | | | | | | | | | | | | | |
| Shares sold | | | 7,819,311 | | | $ | 118,138,746 | | | | 4,928,487 | | | $ | 76,783,071 | |
| Reinvestment of distributions | | | 1,142,528 | | | | 15,851,735 | | | | 998,965 | | | | 15,362,516 | |
| Shares reacquired | | | (6,169,310 | ) | | | (91,736,443 | ) | | | (5,749,088 | ) | | | (88,577,607 | ) |
| Increase | | | 2,792,529 | | | $ | 42,254,038 | | | | 178,364 | | | $ | 3,567,980 | |
| | | | | | | | | | | | | | | | | |
| Class F3 Shares | | | | | | | | | | | | | | | | |
| Shares sold | | | 2,438,430 | | | $ | 37,587,629 | | | | 3,299,250 | | | $ | 51,617,144 | |
| Reinvestment of distributions | | | 1,098,016 | | | | 15,450,243 | | | | 896,358 | | | | 13,954,493 | |
| Shares reacquired | | | (3,005,386 | ) | | | (46,256,348 | ) | | | (3,090,657 | ) | | | (48,475,625 | ) |
| Increase | | | 531,060 | | | $ | 6,781,524 | | | | 1,104,951 | | | $ | 17,096,012 | |
| | | | | | | | | | | | | | | | | |
| Class I Shares | | | | | | | | | | | | | | | | |
| Shares sold | | | 652,609 | | | $ | 10,022,276 | | | | 693,453 | | | $ | 10,788,500 | |
| Reinvestment of distributions | | | 236,493 | | | | 3,310,251 | | | | 212,647 | | | | 3,301,777 | |
| Shares reacquired | | | (987,600 | ) | | | (14,864,681 | ) | | | (853,756 | ) | | | (13,336,426 | ) |
| Increase (decrease) | | | (98,498 | ) | | $ | (1,532,154 | ) | | | 52,344 | | | $ | 753,851 | |
57
Notes to Financial Statements (continued)
| | | | | Year Ended | | | | | Year Ended | |
| Calibrated Dividend Growth Fund | | November 30, 2019 | | | November 30, 2018 | |
| Class P Shares | | Shares | | | Amount | | | Shares | | | Amount | |
| Shares sold | | | 19,513 | | | $ | 309,655 | | | | 7,262 | | | $ | 112,972 | |
| Reinvestment of distributions | | | 8,400 | | | | 116,116 | | | | 8,497 | | | | 131,367 | |
| Shares reacquired | | | (63,943 | ) | | | (953,522 | ) | | | (20,543 | ) | | | (317,028 | ) |
| Decrease | | | (36,030 | ) | | $ | (527,751 | ) | | | (4,784 | ) | | $ | (72,689 | ) |
| | | | | | | | | | | | | | | | | |
| Class R2 Shares | | | | | | | | | | | | | | | | |
| Shares sold | | | 8,714 | | | $ | 131,325 | | | | 15,101 | | | $ | 237,870 | |
| Reinvestment of distributions | | | 6,593 | | | | 91,668 | | | | 5,154 | | | | 79,990 | |
| Shares reacquired | | | (31,868 | ) | | | (484,204 | ) | | | (21,942 | ) | | | (344,941 | ) |
| Decrease | | | (16,561 | ) | | $ | (261,211 | ) | | | (1,687 | ) | | $ | (27,081 | ) |
| | | | | | | | | | | | | | | | | |
| Class R3 Shares | | | | | | | | | | | | | | | | |
| Shares sold | | | 131,270 | | | $ | 1,975,761 | | | | 151,488 | | | $ | 2,326,640 | |
| Reinvestment of distributions | | | 96,058 | | | | 1,318,002 | | | | 101,583 | | | | 1,554,078 | |
| Shares reacquired | | | (321,304 | ) | | | (4,673,031 | ) | | | (485,532 | ) | | | (7,508,595 | ) |
| Decrease | | | (93,976 | ) | | $ | (1,379,268 | ) | | | (232,461 | ) | | $ | (3,627,877 | ) |
| | | | | | | | | | | | | | | | | |
| Class R4 Shares | | | | | | | | | | | | | | | | |
| Shares sold | | | 101,345 | | | $ | 1,496,275 | | | | 178,316 | | | $ | 2,824,470 | |
| Reinvestment of distributions | | | 12,949 | | | | 179,880 | | | | 8,801 | | | | 135,280 | |
| Shares reacquired | | | (53,131 | ) | | | (808,074 | ) | | | (45,503 | ) | | | (701,194 | ) |
| Increase | | | 61,163 | | | $ | 868,081 | | | | 141,614 | | | $ | 2,258,556 | |
| | | | | | | | | | | | | | | | | |
| Class R5 Shares | | | | | | | | | | | | | | | | |
| Shares sold | | | 15,788 | | | $ | 244,153 | | | | 2,845 | | | $ | 44,524 | |
| Reinvestment of distributions | | | 1,372 | | | | 19,225 | | | | 1,045 | | | | 16,214 | |
| Shares reacquired | | | (16,325 | ) | | | (255,566 | ) | | | (510 | ) | | | (7,860 | ) |
| Increase | | | 835 | | | $ | 7,812 | | | | 3,380 | | | $ | 52,878 | |
| | | | | | | | | | | | | | | | | |
| Class R6 Shares | | | | | | | | | | | | | | | | |
| Shares sold | | | 143,955 | | | $ | 2,198,074 | | | | 150,613 | | | $ | 2,387,419 | |
| Reinvestment of distributions | | | 22,483 | | | | 316,755 | | | | 25,105 | | | | 390,501 | |
| Shares reacquired | | | (94,534 | ) | | | (1,439,057 | ) | | | (265,217 | ) | | | (4,207,467 | ) |
| Increase (decrease) | | | 71,904 | | | $ | 1,075,772 | | | | (89,499 | ) | | $ | (1,429,547 | ) |
| | | | | | | | | | | | | | | | | |
| Class T Shares(a) | | | | | | | | | | | | | | | | |
| Reinvestment of distributions | | | – | | | $ | – | | | | 52 | | | $ | 797 | |
| Shares reacquired | | | – | | | | – | | | | (726 | ) | | | (11,215 | ) |
| Decrease | | | – | | | $ | – | | | | (674 | ) | | $ | (10,418 | ) |
| | | | | | | | | | | | | | | | | |
| | | | | | Year Ended | | | | | | Year Ended | |
| Growth Opportunities Fund | | November 30, 2019 | | | | November 30, 2018 | |
| Class A Shares | | | Shares | | | | Amount | | | | Shares | | | | Amount | |
| Shares sold | | | 1,441,334 | | | $ | 31,844,210 | | | | 1,117,733 | | | $ | 23,744,866 | |
| Converted from Class B* | | | – | | | | – | | | | 19,551 | | | | 413,459 | |
| Converted from Class C** | | | 84,683 | | | | 1,928,758 | | | | 595,880 | | | | 12,758,686 | |
| Reinvestment of distributions | | | 912,312 | | | | 16,969,000 | | | | 1,352,643 | | | | 27,391,072 | |
| Shares reacquired | | | (2,546,474 | ) | | | (56,209,914 | ) | | | (3,208,919 | ) | | | (68,644,074 | ) |
| Decrease | | | (108,145 | ) | | $ | (5,467,946 | ) | | | (123,112 | ) | | $ | (4,335,991 | ) |
58
Notes to Financial Statements (continued)
| | | | | | Year Ended | | | | | | Year Ended | |
| Growth Opportunities Fund | | November 30, 2019 | | | November 30, 2018 | |
| Class B Shares | | Shares | | | Amount | | | Shares | | | Amount | |
| Shares sold | | | – | | | $ | – | | | | 627 | | | $ | 9,532 | |
| Reinvestment of distributions | | | – | | | | – | | | | 5,113 | | | | 77,461 | |
| Shares reacquired | | | – | | | | – | | | | (26,901 | ) | | | (419,189 | ) |
| Converted to Class A* | | | – | | | | – | | | | (26,052 | ) | | | (413,459 | ) |
| Decrease | | | – | | | $ | – | | | | (47,213 | ) | | $ | (745,655 | ) |
| | | | | | | | | | | | | | | | | |
| Class C Shares | | | | | | | | | | | | | | | | |
| Shares sold | | | 311,257 | | | $ | 4,698,466 | | | | 210,656 | | | $ | 3,357,443 | |
| Reinvestment of distributions | | | 132,290 | | | | 1,787,234 | | | | 293,555 | | | | 4,444,397 | |
| Shares reacquired | | | (475,328 | ) | | | (7,575,270 | ) | | | (573,755 | ) | | | (9,117,339 | ) |
| Converted to Class A** | | | (117,080 | ) | | | (1,928,758 | ) | | | (799,528 | ) | | | (12,758,686 | ) |
| Decrease | | | (148,861 | ) | | $ | (3,018,328 | ) | | | (869,072 | ) | | $ | (14,074,185 | ) |
| | | | | | | | | | | | | | | | | |
| Class F Shares | | | | | | | | | | | | | | | | |
| Shares sold | | | 218,306 | | | $ | 5,138,976 | | | | 294,901 | | | $ | 6,576,505 | |
| Reinvestment of distributions | | | 50,756 | | | | 984,663 | | | | 70,550 | | | | 1,484,368 | |
| Shares reacquired | | | (310,292 | ) | | | (7,003,254 | ) | | | (345,995 | ) | | | (7,632,722 | ) |
| Increase (decrease) | | | (41,230 | ) | | $ | (879,615 | ) | | | 19,456 | | | $ | 428,151 | |
| | | | | | | | | | | | | | | | | |
| Class F3 Shares | | | | | | | | | | | | | | | | |
| Shares sold | | | 67,826 | | | $ | 1,776,429 | | | | 87,083 | | | $ | 2,105,485 | |
| Reinvestment of distributions | | | 14,609 | | | | 313,063 | | | | 19,636 | | | | 453,200 | |
| Shares reacquired | | | (83,059 | ) | | | (2,125,037 | ) | | | (73,131 | ) | | | (1,773,062 | ) |
| Increase (decrease) | | | (624 | ) | | $ | (35,545 | ) | | | 33,588 | | | $ | 785,623 | |
| | | | | | | | | | | | | | | | | |
| Class I Shares | | | | | | | | | | | | | | | | |
| Shares sold | | | 2,495,874 | | | $ | 65,138,657 | | | | 16,083,365 | | | $ | 387,364,241 | |
| Reinvestment of distributions | | | 802,630 | | | | 17,104,054 | | | | 17,657 | | | | 405,765 | |
| Shares reacquired | | | (5,543,677 | ) | | | (143,674,473 | ) | | | (1,002,090 | ) | | | (25,027,130 | ) |
| Increase (decrease) | | | (2,245,173 | ) | | $ | (61,431,762 | ) | | | 15,098,932 | | | $ | 362,742,876 | |
| | | | | | | | | | | | | | | | | |
| Class P Shares | | | | | | | | | | | | | | | | |
| Shares sold | | | 34,169 | | | $ | 755,915 | | | | 35,038 | | | $ | 736,937 | |
| Reinvestment of distributions | | | 8,270 | | | | 149,527 | | | | 11,343 | | | | 224,141 | |
| Shares reacquired | | | (40,299 | ) | | | (864,756 | ) | | | (34,584 | ) | | | (712,645 | ) |
| Increase | | | 2,140 | | | $ | 40,686 | | | | 11,797 | | | $ | 248,433 | |
| | | | | | | | | | | | | | | | | |
| Class R2 Shares | | | | | | | | | | | | | | | | |
| Shares sold | | | 8,872 | | | $ | 179,594 | | | | 20,702 | | | $ | 418,663 | |
| Reinvestment of distributions | | | 1,851 | | | | 32,602 | | | | 2,441 | | | | 47,109 | |
| Shares reacquired | | | (21,417 | ) | | | (454,426 | ) | | | (47,280 | ) | | | (969,066 | ) |
| Decrease | | | (10,694 | ) | | $ | (242,230 | ) | | | (24,137 | ) | | $ | (503,294 | ) |
| | | | | | | | | | | | | | | | | |
| Class R3 Shares | | | | | | | | | | | | | | | | |
| Shares sold | | | 93,356 | | | $ | 2,020,611 | | | | 173,747 | | | $ | 3,656,647 | |
| Reinvestment of distributions | | | 51,923 | | | | 934,613 | | | | 89,679 | | | | 1,765,770 | |
| Shares reacquired | | | (321,521 | ) | | | (6,910,891 | ) | | | (365,422 | ) | | | (7,604,134 | ) |
| Decrease | | | (176,242 | ) | | $ | (3,955,667 | ) | | | (101,996 | ) | | $ | (2,181,717 | ) |
59
Notes to Financial Statements (continued)
| | | | | | Year Ended | | | | | | Year Ended | |
| Growth Opportunities Fund | | November 30, 2019 | | | November 30, 2018 | |
| Class R4 Shares | | Shares | | | Amount | | | Shares | | | Amount | |
| Shares sold | | | 17,504 | | | $ | 400,483 | | | | 28,961 | | | $ | 611,931 | |
| Reinvestment of distributions | | | 2,442 | | | | 45,424 | | | | 3,002 | | | | 60,800 | |
| Shares reacquired | | | (20,766 | ) | | | (479,311 | ) | | | (36,871 | ) | | | (798,431 | ) |
| Decrease | | | (820 | ) | | $ | (33,404 | ) | | | (4,908 | ) | | $ | (125,700 | ) |
| | | | | | | | | | | | | | | | | |
| Class R5 Shares | | | | | | | | | | | | | | | | |
| Shares sold | | | 70 | | | $ | 1,755 | | | | 70 | | | $ | 1,706 | |
| Reinvestment of distributions | | | 155 | | | | 3,310 | | | | 216 | | | | 4,974 | |
| Shares reacquired | | | (35 | ) | | | (904 | ) | | | (84 | ) | | | (2,072 | ) |
| Increase | | | 190 | | | $ | 4,161 | | | | 202 | | | $ | 4,608 | |
| | | | | | | | | | | | | | | | | |
| Class R6 Shares | | | | | | | | | | | | | | | | |
| Shares sold | | | 59,784 | | | $ | 1,597,805 | | | | 90,571 | | | $ | 2,203,729 | |
| Reinvestment of distributions | | | 12,582 | | | | 269,624 | | | | 197,134 | | | | 4,549,855 | |
| Shares reacquired | | | (199,297 | ) | | | (4,812,716 | ) | | | (2,552,875 | ) | | | (61,554,025 | ) |
| Decrease | | | (126,931 | ) | | $ | (2,945,287 | ) | | | (2,265,170 | ) | | $ | (54,800,441 | ) |
| | | | | | | | | | | | | | | | | |
| | | | | | | Year Ended | | | | | | | Year Ended | |
| Small Cap Value Fund | | | November 30, 2019 | | | | November 30, 2018 | |
| Class A Shares | | | Shares | | | | Amount | | | | Shares | | | | Amount | |
| Shares sold | | | 1,872,830 | | | $ | 30,449,408 | | | | 1,907,096 | | | $ | 40,459,499 | |
| Converted from Class B* | | | – | | | | – | | | | 7,278 | | | | 154,543 | |
| Converted from Class C** | | | 20,815 | | | | 347,602 | | | | 530,941 | | | | 11,294,936 | |
| Reinvestment of distributions | | | 2,835,361 | | | | 43,352,661 | | | | 2,122,813 | | | | 43,199,241 | |
| Shares reacquired | | | (5,403,532 | ) | | | (90,867,447 | ) | | | (4,888,357 | ) | | | (102,744,350 | ) |
| Decrease | | | (674,526 | ) | | $ | (16,717,776 | ) | | | (320,229 | ) | | $ | (7,636,131 | ) |
| | | | | | | | | | | | | | | | | |
| Class B Shares | | | | | | | | | | | | | | | | |
| Shares sold | | | – | | | $ | – | | | | 595 | | | $ | 6,998 | |
| Reinvestment of distributions | | | – | | | | – | | | | 2,677 | | | | 30,735 | |
| Shares reacquired | | | – | | | | – | | | | (1,244 | ) | | | (7,559 | ) |
| Converted to Class A* | | | – | | | | – | | | | (12,635 | ) | | | (154,543 | ) |
| Decrease | | | – | | | $ | – | | | | (10,607 | ) | | $ | (124,369 | ) |
| | | | | | | | | | | | | | | | | |
| Class C Shares | | | | | | �� | | | | | | | | | | |
| Shares sold | | | 194,085 | | | $ | 1,489,452 | | | | 249,312 | | | $ | 3,021,075 | |
| Reinvestment of distributions | | | 396,674 | | | | 2,875,880 | | | | 431,544 | | | | 4,971,382 | |
| Shares reacquired | | | (410,144 | ) | | | (3,198,475 | ) | | | (525,877 | ) | | | (6,289,010 | ) |
| Converted to Class A** | | | (44,009 | ) | | | (347,602 | ) | | | (941,107 | ) | | | (11,294,936 | ) |
| Increase (decrease) | | | 136,606 | | | $ | 819,255 | | | | (786,128 | ) | | $ | (9,591,489 | ) |
| | | | | | | | | | | | | | | | | |
| Class F Shares | | | | | | | | | | | | | | | | |
| Shares sold | | | 254,965 | | | $ | 4,279,563 | | | | 445,655 | | | $ | 9,620,419 | |
| Reinvestment of distributions | | | 117,876 | | | | 1,818,819 | | | | 86,039 | | | | 1,760,362 | |
| Shares reacquired | | | (843,596 | ) | | | (14,088,571 | ) | | | (465,642 | ) | | | (9,888,209 | ) |
| Increase (decrease) | | | (470,755 | ) | | $ | (7,990,189 | ) | | | 66,052 | | | $ | 1,492,572 | |
| | | | | | | | | | | | | | | | | |
| Class F3 Shares | | | | | | | | | | | | | | | | |
| Shares sold | | | 318,431 | | | $ | 6,545,913 | | | | 472,047 | | | $ | 11,872,217 | |
| Reinvestment of distributions | | | 217,669 | | | | 4,096,535 | | | | 145,769 | | | | 3,523,248 | |
| Shares reacquired | | | (527,165 | ) | | | (10,950,316 | ) | | | (433,525 | ) | | | (10,995,865 | ) |
| Increase (decrease) | | | 8,935 | | | $ | (307,868 | ) | | | 184,291 | | | $ | 4,399,600 | |
60
Notes to Financial Statements (concluded)
| | | | | Year Ended | | | | | Year Ended | |
| Small Cap Value Fund | | November 30, 2019 | | | November 30, 2018 | |
| Class I Shares | | Shares | | | Amount | | | Shares | | | Amount | |
| Shares sold | | | 1,207,504 | | | $ | 24,818,399 | | | | 1,488,324 | | | $ | 37,748,638 | |
| Reinvestment of distributions | | | 3,059,039 | | | | 57,265,207 | | | | 2,716,431 | | | | 65,411,652 | |
| Shares reacquired | | | (4,313,649 | ) | | | (87,640,851 | ) | | | (7,632,482 | ) | | | (199,694,714 | ) |
| Decrease | | | (47,106 | ) | | $ | (5,557,245 | ) | | | (3,427,727 | ) | | $ | (96,534,424 | ) |
| | | | | | | | | | | | | | | | | |
| Class P Shares | | | | | | | | | | | | | | | | |
| Shares sold | | | 119,222 | | | $ | 1,867,060 | | | | 136,528 | | | $ | 2,781,696 | |
| Reinvestment of distributions | | | 280,453 | | | | 4,024,498 | | | | 233,430 | | | | 4,514,543 | |
| Shares reacquired | | | (462,062 | ) | | | (7,275,449 | ) | | | (591,755 | ) | | | (12,043,520 | ) |
| Decrease | | | (62,387 | ) | | $ | (1,383,891 | ) | | | (221,797 | ) | | $ | (4,747,281 | ) |
| | | | | | | | | | | | | | | | | |
| Class R2 Shares | | | | | | | | | | | | | | | | |
| Shares sold | | | 16,534 | | | $ | 250,082 | | | | 7,849 | | | $ | 153,888 | |
| Reinvestment of distributions | | | 5,341 | | | | 75,630 | | | | 2,941 | | | | 56,344 | |
| Shares reacquired | | | (18,679 | ) | | | (289,601 | ) | | | (7,054 | ) | | | (137,879 | ) |
| Increase | | | 3,196 | | | $ | 36,111 | | | | 3,736 | | | $ | 72,353 | |
| | | | | | | | | | | | | | | | | |
| Class R3 Shares | | | | | | | | | | | | | | | | |
| Shares sold | | | 40,700 | | | $ | 644,215 | | | | 54,627 | | | $ | 1,112,392 | |
| Reinvestment of distributions | | | 66,178 | | | | 954,955 | | | | 50,531 | | | | 981,827 | |
| Shares reacquired | | | (71,500 | ) | | | (1,134,977 | ) | | | (133,808 | ) | | | (2,725,526 | ) |
| Increase (decrease) | | | 35,378 | | | $ | 464,193 | | | | (28,650 | ) | | $ | (631,307 | ) |
| | | | | | | | | | | | | | | | | |
| Class R4 Shares | | | | | | | | | | | | | | | | |
| Shares sold | | | 85,350 | | | $ | 1,369,430 | | | | 34,336 | | | $ | 729,957 | |
| Reinvestment of distributions | | | 16,872 | | | | 258,148 | | | | 21,145 | | | | 430,311 | |
| Shares reacquired | | | (35,377 | ) | | | (599,075 | ) | | | (110,947 | ) | | | (2,250,893 | ) |
| Increase (decrease) | | | 66,845 | | | $ | 1,028,503 | | | | (55,466 | ) | | $ | (1,090,625 | ) |
| | | | | | | | | | | | | | | | | |
| Class R5 Shares | | | | | | | | | | | | | | | | |
| Shares sold | | | 1,939 | | | $ | 40,248 | | | | 343 | | | $ | 8,522 | |
| Reinvestment of distributions | | | 90 | | | | 1,680 | | | | 1,542 | | | | 37,155 | |
| Shares reacquired | | | (2 | ) | | | (43 | ) | | | (13,907 | ) | | | (365,788 | ) |
| Increase (decrease) | | | 2,027 | | | $ | 41,885 | | | | (12,022 | ) | | $ | (320,111 | ) |
| | | | | | | | | | | | | | | | | |
| Class R6 Shares | | | | | | | | | | | | | | | | |
| Shares sold | | | 177,734 | | | $ | 3,592,546 | | | | 88,285 | | | $ | 2,223,254 | |
| Reinvestment of distributions | | | 92,024 | | | | 1,730,963 | | | | 70,138 | | | | 1,695,236 | |
| Shares reacquired | | | (722,250 | ) | | | (14,084,587 | ) | | | (169,793 | ) | | | (4,319,875 | ) |
| Decrease | | | (452,492 | ) | | $ | (8,761,078 | ) | | | (11,370 | ) | | $ | (401,385 | ) |
| * | Automatic conversion of Class B shares occurred on the 25th day of the month (or, if the 25th day was not a business day, the next business day thereafter) following the eighth anniversary of the day on which the purchase order was accepted. Class B shares were closed on April 25, 2018. |
| ** | Automatic conversion of Class C shares occurs on the 25th day of the month (or, if the 25th day was not a business day, the next business day thereafter) following the tenth anniversary of the day on which the purchase order was accepted. |
| (a) | Closed on July 24, 2018. |
61
Report of Independent Registered Public Accounting Firm
To the shareholders and the Board of Directors of Lord Abbett Research Fund, Inc.
Opinion on the Financial Statements and Financial Highlights
We have audited the accompanying statements of assets and liabilities of Lord Abbett Research Fund, Inc. (the “Company”) comprising the Lord Abbett Calibrated Dividend Growth Fund, Lord Abbett Growth Opportunities Fund, and Lord Abbett Small-Cap Value Series, including the schedules of investments as of November 30, 2019, the related statements of operations for the year then ended, the statements of changes in net assets for each of the two years in the period then ended, the financial highlights for each of the five years in the period then ended, and the related notes. In our opinion, the financial statements and financial highlights present fairly, in all material respects, the financial position of each of the funds constituting the Lord Abbett Research Fund, Inc. as of November 30, 2019, and the results of their operations for the year then ended, the changes in their net assets for each of the two years in the period then ended, and the financial highlights for each of the five years in the period then ended in conformity with accounting principles generally accepted in the United States of America.
Basis for Opinion
These financial statements and financial highlights are the responsibility of the Company’s management. Our responsibility is to express an opinion on the Company’s financial statements and financial highlights based on our audits. We are a public accounting firm registered with the Public Company Accounting Oversight Board (United States) (PCAOB) and are required to be independent with respect to the Company in accordance with the U.S. federal securities laws and the applicable rules and regulations of the Securities and Exchange Commission and the PCAOB.
We conducted our audits in accordance with the standards of the PCAOB. Those standards require that we plan and perform the audit to obtain reasonable assurance about whether the financial statements and financial highlights are free of material misstatement, whether due to error or fraud. The Company is not required to have, nor were we engaged to perform, an audit of its internal control over financial reporting. As part of our audits we are required to obtain an understanding of internal control over financial reporting but not for the purpose of expressing an opinion on the effectiveness of the Company’s internal control over financial reporting. Accordingly, we express no such opinion.
Our audits included performing procedures to assess the risks of material misstatement of the financial statements and financial highlights, whether due to error or fraud, and performing procedures that respond to those risks. Such procedures included examining, on a test basis, evidence regarding the amounts and disclosures in the financial statements and financial highlights. Our audits also included evaluating the accounting principles used and significant estimates made by management, as well as evaluating the overall presentation of the financial statements and financial highlights. Our procedures included confirmation of securities owned as of November 30, 2019, by correspondence with the custodian and brokers; when replies were not received from brokers, we performed other auditing procedures. We believe that our audits provide a reasonable basis for our opinion.
DELOITTE & TOUCHE LLP
New York, New York
January 17, 2020
We have served as the auditor of one or more Lord Abbett Family of Funds’ investment companies since 1932.
62
Supplemental Proxy Information (unaudited)
A joint special meeting of shareholders of each Fund was held on August 26, 2019. The joint special meeting was held for the purpose of electing members of each Fund’s Board of Directors. Shareholders elected the following ten (10) Directors at the joint special meeting:
| • | Eric C. Fast |
| • | Evelyn E. Guernsey |
| • | Julie A. Hill |
| • | Kathleen M. Lutito |
| • | James M. McTaggart |
| • | Charles O. Prince |
| • | Karla M. Rabusch |
| • | Mark A. Schmid |
| • | Douglas B. Sieg |
| • | James L.L. Tullis |
The results of the proxy solicitation on the preceding matter were as follows:
Lord Abbett Research Fund, Inc.
| | Nominee Votes | | Votes For | | Votes Withheld |
| | Eric C. Fast | | 189,135,484.980 | | 7,341,863.062 |
| | Evelyn E. Guernsey | | 189,500,061.281 | | 6,977,286.761 |
| | Julie A. Hill | | 189,251,320.257 | | 7,226,027.785 |
| | Kathleen M. Lutito | | 189,567,090.773 | | 6,910,257.269 |
| | James M. McTaggart | | 189,200,041.825 | | 7,277,306.217 |
| | Charles O. Prince | | 189,237,648.457 | | 7,239,699.585 |
| | Karla M. Rabusch | | 189,284,681.018 | | 7,192,667.024 |
| | Mark A. Schmid | | 189,760,099.253 | | 6,717,248.789 |
| | Douglas B. Sieg | | 189,640,712.594 | | 6,836,635.448 |
| | James L.L. Tullis | | 188,821,219.478 | | 7,656,128.564 |
63
Basic Information About Management
The Board is responsible for the management of the business and affairs of the Company in accordance with the laws of the State of Maryland. The Board elects officers who are responsible for the day-to-day operations of each Fund and who execute policies authorized by the Board. The Board also approves an investment adviser to each Fund and continues to monitor the cost and quality of the services the investment adviser provides, and annually considers whether to renew the contract with the investment adviser. Generally, each Director holds office until his/her successor is elected and qualified or until his/her earlier resignation or removal, as provided in the Company’s organizational documents.
Lord Abbett, a Delaware limited liability company, is each Fund’s investment adviser. Designated Lord Abbett personnel are responsible for the day-to-day management of the Funds.
Interested Directors
Mr. Sieg is affiliated with Lord Abbett and is an “interested person” of the Company as defined in the Act. Mr. Sieg is director/trustee of each of the 12 investment companies in the Lord Abbett Family of Funds, which consist of 57 investment portfolios. Mr. Sieg is an officer of the Lord Abbett Family of Funds.
Name, Address and
Year of Birth | | Current Position and
Length of Service
with the Company | | Principal Occupation and Other Directorships
During the Past Five Years |
| | | | | |
Douglas B. Sieg
Lord, Abbett & Co. LLC
90 Hudson Street
Jersey City, NJ 07302
(1969) | | Director since 2016;
President and Chief Executive Officer since 2018 | | Principal Occupation: Managing Partner (since 2018) and was formerly Head of Client Services, joined Lord Abbett in 1994. Other Directorships: None. |
Independent Directors
The following Independent Directors also are directors/trustees of each of the 12 investment companies in the Lord Abbett Family of Funds, which consist of 57 investment portfolios.
Name, Address and
Year of Birth | | Current Position and
Length of Service
with the Company | | Principal Occupation and Other Directorships
During the Past Five Years |
| | | | | |
Eric C. Fast
Lord, Abbett & Co. LLC
c/o Legal Dept.
90 Hudson Street
Jersey City, NJ 07302
(1949) | | Director since 2014 | | Principal Occupation:Chief Executive Officer of Crane Co., an industrial products company (2001–2014). Other Directorships:Currently serves as director of Automatic Data Processing, Inc. (since 2007) and Regions Financial Corporation (since 2010). Previously served as a director of Crane Co. (1999–2014). |
| | | | | |
Evelyn E. Guernsey
Lord, Abbett & Co. LLC
c/o Legal Dept.
90 Hudson Street
Jersey City, NJ 07302
(1955) | | Director since 2011 | | Principal Occupation:None. Other Directorships:None. |
64
Basic Information About Management (continued)
Name, Address and
Year of Birth | | Current Position and
Length of Service
with the Company | | Principal Occupation and Other Directorships
During the Past Five Years |
| | | | | |
Julie A. Hill
Lord, Abbett & Co. LLC
c/o Legal Dept.
90 Hudson Street
Jersey City, NJ 07302
(1946) | | Director since 2004 | | Principal Occupation:Owner and CEO of The Hill Company, a business consulting firm (since 1998). Other Directorships:Currently serves as director of Anthem, Inc., a health benefits company (since 1994). |
| | | | | |
Kathleen M. Lutito
Lord, Abbett & Co. LLC
c/o Legal Dept.
90 Hudson Street
Jersey City, NJ 07302
(1963) | | Director since 2017 | | Principal Occupation:President and Chief Investment Officer of CenturyLink Investment Management Company (since 2006). Other Directorships:None. |
| | | | | |
James M. McTaggart
Lord, Abbett & Co. LLC
c/o Legal Dept.
90 Hudson Street
Jersey City, NJ 07302
(1947) | | Director since 2012 | | Principal Occupation:Independent management advisor and consultant (since 2012). Other Directorships:Blyth, Inc., a home products company (2004–2015). |
| | | | | |
Charles O. Prince
Lord, Abbett & Co. LLC
c/o Legal Dept.
90 Hudson Street
Jersey City, NJ 07302
(1950) | | Director since 2019 | | Principal Occupation:None. Formerly Chairman and Chief Executive Officer, Citigroup, Inc. Other Directorships:Currently serves as director of Johnson & Johnson (2006–Present). Previously served as director of Xerox Corporation (2008-2018). |
| | | | | |
Karla M. Rabusch
Lord, Abbett & Co. LLC
c/o Legal Dept.
90 Hudson Street
Jersey City, NJ 07302
(1959) | | Director since 2017 | | Principal Occupation:President and Director of Wells Fargo Funds Management, LLC (2003–2017); President of Wells Fargo Funds (2003–2016). Other Directorships:None. |
| | | | | |
Mark A. Schmid
Lord, Abbett & Co. LLC
c/o Legal Dept.
90 Hudson Street
Jersey City, NJ 07302
(1959) | | Director since 2016 | | Principal Occupation:Vice President and Chief Investment Officer of the University of Chicago (since 2009). Other Directorships:None. |
| | | | | |
James L.L. Tullis
Lord, Abbett & Co. LLC
c/o Legal Dept.
90 Hudson Street
Jersey City, NJ 07302
(1947) | | Director since 2006;
Chairman since 2017 | | Principal Occupation:Chairman of Tullis Health Investors – FL LLC (since 2018); CEO of Tullis-Dickerson and Co. Inc., a venture capital management firm (1990–2016). Other Directorships:Currently serves as director of Crane Co. (since 1998), Alphatec Spine, Inc. (since 2018), and electroCore, Inc. (since 2018). |
65
Basic Information About Management (continued)
Officers
None of the officers listed below have received compensation from the Company. All of the officers of the Company also may be officers of the other Lord Abbett Funds and maintain offices at 90 Hudson Street, Jersey City, NJ 07302. Unless otherwise indicated, the position(s) and title(s) listed under the “Principal Occupation During the Past Five Years” column indicate each officer’s position(s) and title(s) with Lord Abbett. Each officer serves for an indefinite term (i.e., until his or her death, resignation, retirement, or removal).
Name and
Year of Birth | | Current Position
with the Company | | Length of Service
of Current
Position | | Principal Occupation
During the Past Five Years |
| | | | | | | |
Douglas B. Sieg
(1969) | | President and Chief Executive Officer | | Elected as President and Chief Executive Officer in 2018 | | Managing Partner of Lord Abbett (since 2018) and was formerly Head of Client Services, joined Lord Abbett in 1994. |
| | | | | | | |
Jackson C. Chan
(1964) | | AML Compliance Officer | | Elected in 2018 | | Deputy Chief Compliance Officer and Director of Regulatory Affairs, joined Lord Abbett in 2014. |
| | | | | | | |
Pamela P. Chen
(1978) | | Vice President, Assistant Secretary and Privacy Officer | | Elected as Vice President and Assistant Secretary in 2018 and Privacy Officer in 2019 | | Associate General Counsel, joined Lord Abbett in 2017 and was formerly Special Counsel at Schulte, Roth & Zabel LLP (2005–2017). |
| | | | | | | |
John T. Fitzgerald
(1975) | | Vice President and Assistant Secretary | | Elected in 2018 | | Deputy General Counsel, joined Lord Abbett in 2018 and was formerly Deputy Head of U.S. Funds Legal, Executive Director and Assistant General Counsel at JPMorgan Chase (2005–2018). |
| | | | | | | |
Vito A. Fronda
(1969) | | Treasurer | | Elected in 2018 | | Partner and Director of Fund Treasury and Tax, joined Lord Abbett in 2003. |
| | | | | | | |
Bernard J. Grzelak
(1971) | | Chief Financial Officer and Vice President | | Elected in 2017 | | Partner and Chief Operating Officer, Global Funds and Risk, joined Lord Abbett in 2003. |
| | | | | | | |
Linda Y. Kim
(1980) | | Vice President and Assistant Secretary | | Elected in 2016 | | Counsel, joined Lord Abbett in 2015 and was formerly an Associate at Stroock & Stroock & Lavan LLP (2007–2015). |
| | | | | | | |
Joseph M. McGill
(1962) | | Chief Compliance Officer | | Elected in 2014 | | Partner and Chief Compliance Officer, joined Lord Abbett in 2014. |
66
Basic Information About Management (concluded)
Name and
Year of Birth | | Current Position
with the Company | | Length of Service
of Current
Position | | Principal Occupation
During the Past Five Years |
| | | | | | | |
Amanda S. Ryan
(1978) | | Vice President and Assistant Secretary | | Elected in 2018 | | Counsel, joined Lord Abbett in 2016 and was formerly a Director and Corporate Counsel at PGIM Investments (2012–2016). |
| | | | | | | |
Lawrence B. Stoller
(1963) | | Vice President, Secretary and Chief Legal Officer | | Elected as Vice President and Secretary in 2007 and Chief Legal Officer in 2019 | | Partner and General Counsel, joined Lord Abbett in 2007. |
Please call 888-522-2388 for a copy of the statement of additional information, which contains further information about the Company’s Directors. It is available free upon request.
67
Householding
The Company has adopted a policy that allows it to send only one copy of each Fund’s prospectus, proxy material, annual report and semiannual report to certain shareholders residing at the same “household.” This reduces Fund expenses, which benefits you and other shareholders. If you need additional copies or do not want your mailings to be “householded,” please call Lord Abbett at 888-522-2388 or send a written request with your name, the name of your fund or funds and your account number or numbers to Lord Abbett Family of Funds, P.O. Box 219336, Kansas City, MO 64121.
Proxy Voting Policies, Procedures and Records
A description of the policies and procedures that Lord Abbett uses to vote proxies related to each Fund’s portfolio securities, and information on how Lord Abbett voted each Fund’s proxies during the 12-month period ended June 30 are available without charge, upon request, (i) by calling 888-522-2388; (ii) on Lord Abbett’s Website at www.lordabbett.com; and (iii) on the Securities and Exchange Commission’s (“SEC”) Website at www.sec.gov.
Shareholder Reports and Quarterly Portfolio Disclosure
The Funds are required to file their complete schedule of portfolio holdings with the SEC for their first and third fiscal quarters as an attachment to Form N-PORT. Copies of the filings are available without charge, upon request on the SEC’s Website at www.sec.gov and may be available by calling Lord Abbett at 888-522-2388.
Tax Information
The percentages below reflect the portion of ordinary income distributions that are eligible for the corporate dividend received deduction (DRD) and qualified dividend income (QDI) for individual shareholders:
| Fund Name | | DRD | | QDI | |
| Calibrated Dividend Growth Fund | | 91% | | 93% | |
| Growth Opportunities Fund | | 58% | | 59% | |
| Small Cap Value Fund | | 94% | | 100% | |
Additionally, of the distributions paid to shareholders during the fiscal year ended November 30, 2019, the following amounts represent short-term capital gains and long-term capital gains:
| Fund Name | | Short-term
Capital Gains | | Long-term
Capital Gains | |
| Calibrated Dividend Growth Fund | | $ | 36,181,505 | | $ | 117,089,445 | |
| Growth Opportunities Fund | | | 8,159,867 | | | 31,348,329 | |
| Small Cap Value Fund | | | 7,600,191 | | | 116,538,970 | |
68

 | We Recycle |
| This document is printed on recycled paper. |
| |
| |
| Go Paperless! |
| Visit www.lordabbett.com to learn how to receive all your shareholder communications online. |
This report, when not used for the general information of shareholders of the Fund, is to be distributed only if preceded or accompanied by a current fund prospectus. Lord Abbett mutual fund shares are distributed by
LORD ABBETT DISTRIBUTOR LLC. | | Lord Abbett Research Fund, Inc. Lord Abbett Calibrated Dividend Growth Fund Lord Abbett Growth Opportunities Fund Lord Abbett Small-Cap Value Series | LARF-2
(01/20) |
| | (a) | In accordance with applicable requirements, the Registrant adopted a Sarbanes-Oxley Code of Ethics on June 19, 2003 that applies to the principal executive officer and senior financial officers of the Registrant (“Code of Ethics”). The Code of Ethics was in effect during the fiscal year ended November 30, 2019 (the “Period”). |
| | | |
| | (b) | Not applicable. |
| | | |
| | (c) | The Registrant has not amended the Code of Ethics as described in Form N-CSR during the Period. |
| | | |
| | (d) | The Registrant has not granted any waiver, including an implicit waiver, from a provision of the Code of Ethics as described in Form N-CSR during the Period. |
| | | |
| | (e) | Not applicable. |
| | | |
| | (f) | See Item 12(a)(1) concerning the filing of the Code of Ethics. |
| Item 3: | Audit Committee Financial Expert. |
| | |
| | The Registrant’s board of directors has determined that each of the following independent directors who are members of the audit committee is an audit committee financial expert: Evelyn E. Guernsey, Karla M. Rabusch and Mark A. Schmid. Each of these persons is independent within the meaning of the Form N-CSR. |
| | |
| Item 4: | Principal Accountant Fees and Services. |
In response to sections (a), (b), (c) and (d) of Item 4, the aggregate fees billed to the Registrant for the fiscal years ended November 30, 2019 and 2018 by the Registrant’s principal accounting firm, Deloitte & Touche LLP, the member firms of Deloitte Touche Tohmatsu and their respective affiliates (collectively, “Deloitte”) were as follows:
| | | Fiscal year ended: |
| | | 2019 | | 2018 |
| Audit Fees {a} | | $ | 127,400 | | | $ | 123,800 | |
| Audit-Related Fees | | | - 0 - | | | | - 0 - | |
| Total audit and audit-related fees | | | 127,400 | | | | 123,800 | |
| | | | | | | | | |
| Tax Fees {b} | | | 16,337 | | | | 25,839 | |
| All Other Fees | | | - 0 - | | | | - 0 - | |
| | | | | | | | | |
| Total Fees | | $ | 143,737 | | | $ | 149,639 | |
{a} Consists of fees for audits of the Registrant’s annual financial statements.
{b} Fees for the fiscal year ended November 30, 2019 and 2018 consist of fees for preparing the U.S. Income Tax Return for Regulated Investment Companies, New Jersey Corporation Business Tax Return, New Jersey Annual Report Form, U.S. Return of Excise Tax on Undistributed Income of Investment Companies, IRS Forms 1099-MISC and 1096 Annual Summary and Transmittal of U.S. Information Returns.
(e) (1) Pursuant to Rule 2-01(c) (7) of Regulation S-X, the Registrant’s Audit Committee has adopted pre-approval policies and procedures. Such policies and procedures generally provide that the Audit Committee must pre-approve:
| · | any audit, audit-related, tax, and other services to be provided to the Lord Abbett Funds, including the Registrant, and |
| · | any audit-related, tax, and other services to be provided to the Registrant’s investment adviser and any entity controlling, controlled by or under common control with the investment adviser that provides ongoing services to one or more Funds comprising the Registrant if the engagement relates directly to operations and financial reporting of a Fund, by the independent auditor to assure that the provision of such services does not impair the auditor’s independence. |
The Audit Committee has delegated pre-approval authority to its Chairman, subject to a fee limit of $10,000 per event, and not to exceed $25,000 annually. The Chairman will report any pre-approval decisions to the Audit Committee at its next scheduled meeting. Unless a type of service to be provided by the independent auditor has received general pre-approval, it must be pre-approved by the Audit Committee. Any proposed services exceeding pre-approved cost levels will require specific pre-approval by the Audit Committee.
(e) (2) The Registrant’s Audit Committee has approved 100% of the services described in this Item 4 (b) through (d).
(f) Not applicable.
(g) The aggregate non-audit fees billed by Deloitte for services rendered to the Registrant are shown above in the response to Item 4 (a), (b), (c) and (d) as “All Other Fees”.
The aggregate non-audit fees billed by Deloitte for services rendered to the Registrant’s investment adviser, Lord, Abbett & Co. LLC (“Lord Abbett”), for the fiscal years ended November 30, 2019 and 2018 were:
| | | Fiscal year ended: |
| | | 2019 | | 2018 |
| All Other Fees {a} | | $ | 215,383 | | | $ | 200,339 | |
{a} Consist of fees for Independent Services Auditors’ Report on Controls Placed in Operation and Tests of Operating Effectiveness related to Lord Abbett’s Asset Management Services (“SOC-1 Report”).
The aggregate non-audit fees billed by Deloitte for services rendered to entities under the common control of Lord Abbett for the fiscal years ended November 30, 2019 and 2018 were:
| | | Fiscal year ended: |
| | | 2019 | | 2018 |
| All Other Fees | | $ | - 0 - | | | $ | - 0 - | |
(h) The Registrant’s Audit Committee has considered the provision of non-audit services that were rendered to the Registrant’s investment adviser, and any entity controlling, controlled by or under common control with the investment adviser that provides ongoing services to the Registrant, that were not pre-approved pursuant to Rule 2-01 (c)(7)(ii) of Regulation S-X and has determined that the provision of such services is compatible with maintaining Deloitte’s independence.
| Item 5: | Audit Committee of Listed Registrants. |
| | |
| | Not applicable. |
| | |
| Item 6: | Investments. |
| | |
| | Not applicable. |
| | |
| Item 7: | Disclosure of Proxy Voting Policies and Procedures for Closed-End Management Investment Companies. |
| | |
| | Not applicable. |
| | |
| Item 8: | Portfolio Managers of Closed-End Management Investment Companies. |
| | |
| | Not applicable. |
| | |
| Item 9: | Purchases of Equity Securities by Closed-End Management Investment Company and Affiliated Purchasers. |
| | |
| | Not applicable. |
| | |
| Item 10: | Submission of Matters to a Vote of Security Holders. |
| | |
| | Not applicable. |
| | |
| Item 11: | Controls and Procedures. |
| | | |
| | (a) | Based on their evaluation of the Registrant’s disclosure controls and procedures (as defined in Rule 30a-3(c) under the Investment Company Act of 1940) as of a date within 90 days prior to the filing date of this report, the Chief Executive Officer and Chief Financial Officer of the Registrant have concluded that such disclosure controls and procedures are reasonably designed and effective to |
| | | ensure that material information relating to the Registrant, including its consolidated subsidiaries, is made known to them by others within those entities. |
| | | |
| | (b) | There were no changes in the Registrant’s internal control over financial reporting (as defined in Rule 30a-3(d) under the Investment Company Act of 1940) that occurred during the period covered by this report that have materially affected, or are reasonably likely to materially affect, the Registrant’s internal control over financial reporting. |
| | | |
| | (a)(1) | The Lord Abbett Family of Funds Sarbanes Oxley Code of Ethics for the Principal Executive Officer and Senior Financial Officers is attached hereto as part of Ex-99. CODEETH. |
| | | |
| | (a)(2) | Certification of each Principal Executive Officer and Principal Financial Officer of the Registrant as required by Rule 30a-2 under the Investment Company Act of 1940 is attached hereto as a part of EX-99.CERT. |
| | | |
| | (b) | Certification of each Principal Executive Officer and Principal Financial Officer of the Registrant as required by Section 906 of the Sarbanes-Oxley Act of 2002 is provided as a part of EX-99.906CERT. |
SIGNATURES
Pursuant to the requirements of the Securities Exchange Act of 1934 and the Investment Company Act of 1940, the Registrant has duly caused this report to be signed on its behalf by the undersigned, thereunto duly authorized.
| | | LORD ABBETT RESEARCH FUND, inc. |
| | | |
| | By: | /s/Douglas B. Sieg |
| | | Douglas B. Sieg |
| | | President and Chief Executive Officer |
Date: January 17, 2020
| | By: | /s/Bernard J. Grzelak |
| | | Bernard J. Grzelak |
| | | Chief Financial Officer and Vice President |
Date: January 17, 2020
Pursuant to the requirements of the Securities Exchange Act of 1934 and the Investment Company Act of 1940, this report has been signed below by the following persons on behalf of the Registrant and in the capacities and on the dates indicated.
| | By: | /s/Douglas B. Sieg |
| | | Douglas B. Sieg |
| | | President and Chief Executive Officer |
Date:January 17, 2020
| | By: | /s/Bernard J. Grzelak |
| | | Bernard J. Grzelak |
| | | Chief Financial Officer and Vice President |
Date:January 17, 2020