UNITED STATES
SECURITIES AND EXCHANGE COMMISSION
Washington, D.C. 20549
FORM N-CSR
CERTIFIED SHAREHOLDER REPORT OF REGISTERED
MANAGEMENT INVESTMENT COMPANIES
Investment Company Act File Number: 811-06650
LORD ABBETT RESEARCH FUND, INC.
(Exact name of Registrant as specified in charter)
90 Hudson Street, Jersey City, NJ 07302
(Address of principal executive offices) (Zip code)
John T. Fitzgerald, Esq., Vice President & Assistant Secretary
90 Hudson Street, Jersey City, NJ 07302
(Name and address of agent for service)
Registrant’s telephone number, including area code:(800) 201-6984
Date of fiscal year end: 11/30
Date of reporting period: 11/30/2018
| Item 1: | Report(s) to Shareholders. |

LORD ABBETT
ANNUAL REPORT
Lord Abbett
Calibrated Dividend Growth Fund
Growth Opportunities Fund
Small Cap Value Fund
For the fiscal year ended November 30, 2018
Important Information on Paperless Delivery
Beginning in January 2021, as permitted by regulations adopted by the Securities and Exchange Commission, paper copies of the Fund’s shareholder reports like this one will no longer be sent by mail, unless you specifically request paper copies of the reports from the Fund or from your financial intermediary, such as a broker-dealer, investment advisor or bank. Instead, the reports will be made available on Lord Abbett’s website and you will be notified by mail each time a report is posted and provided with a website link to access the report.
If you already elected to receive shareholder reports electronically, you will not be affected by this change and you need not take any action. Shareholders who hold accounts directly with the Fund may elect to receive shareholder reports and other communications from the Fund electronically by signing into your Lord Abbett online account at lordabbett.com and selecting “Log In.” For further information, you may also contact the Funds at (800) 821-5129. Shareholders who hold accounts through a financial intermediary should contact them directly.
You may elect to receive all future reports in paper free of charge by contacting the Fund at (800) 821-5129. Your election to receive reports in paper will apply to all funds held with Lord Abbett. If your fund shares are held through a financial intermediary please contact them directly. Your election applies to all funds held with that intermediary.
Table of Contents
Lord Abbett Research Fund
Lord Abbett Calibrated Dividend Growth Fund,
Lord Abbett Growth Opportunities Fund,
Lord Abbett Small Cap Value Fund
Annual Report
For the fiscal year ended November 30, 2018
 From left to right: James L.L. Tullis, Independent Chairman of the Lord Abbett Funds and Douglas B. Sieg Director, President, and Chief Executive Officer of the Lord Abbett Funds. | | Dear Shareholders:We are pleased to provide you with this overview of the performance of the Funds for the fiscal year ended November 30, 2018. On this page and the following pages, we discuss the major factors that influenced fiscal year performance. For detailed and more timely information about the Funds, please visit our website at www.lordabbett.com, where you also can access the quarterly commentaries that provide updates on each Fund’s performance and other portfolio related updates. Thank you for investing in Lord Abbett mutual funds. We value the trust that you place in us and look forward to serving your investment needs in the years to come. Best regards,  Douglas B. Sieg Director, President and Chief Executive Officer |
| | | |
Lord Abbett Calibrated Dividend Growth Fund
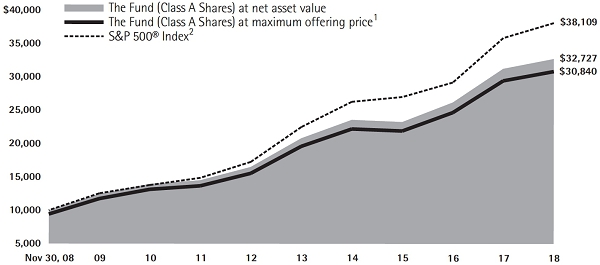
For the fiscal year ended November 30, 2018, the Fund returned 4.72%, reflecting performance at the net asset value (NAV) of Class A shares with all distributions reinvested, compared to its benchmark, the S&P 500® Index1, which returned 6.27% over the same period.
Domestic equity returns were positive over the past year, with large cap stocks, as
represented by the S&P 500® Index1, rising 6.27% during the period, while small cap stocks, as represented by the Russell 2000® Index2, were up 0.57%. During the period, there were several market-moving events. Notably, in December 2017, Congress passed the largest rewrite of the U.S. tax code in decades. The tax bill reduced the corporate tax rate from 35% to 21% and allowed for a one-time repatriation tax of 15.5%, rather than the standard repatriation tax rate of 35%. In June 2018,
1
the White House announced its intent to impose additional tariffs on $200 billion worth of Chinese goods on top of the $50 billion previously announced. The aggressive U.S. trade posture continued into the third quarter with trade tensions mounting between the U.S. and China. While the impact has yet to fully be realized, many corporations anticipate that the retaliatory tariffs will weigh on profits. Trade discussions between Mexico, Canada, and the U.S., however, took a more favorable turn as the negotiations resulted in a revised version of the North American Free Trade Agreement (NAFTA) called the U.S.-Mexico-Canada Agreement. In December 2017, the Federal Reserve (the “Fed”) raised its target for short-term interest rates by 0.25%, to a range of 1.25%-1.50%, and indicated that it was targeting three rate hikes in 2018. The Fed followed with rate hikes of 0.25% at each of its March, June and September meetings, raising the target range to 2.00%-2.25%. Amid rising concerns surrounding escalating trade tensions, slowing growth, and increasing interest rates, the Nasdaq experienced the largest monthly drop since 2008 in October 2018. Following the prior month’s volatility, domestic equity markets rallied in November 2018 and partially reversed October’s losses. Despite the sell-off, the U.S. economy continued to expand by more than 2% during each quarter of the trailing 12-month period, with domestic GDP growth ranging between 2.2% and 4.2% from the third quarter of 2017 to the third quarter of 2018. The 4.2% GDP growth in the second quarter marked the
strongest growth rate since the third quarter of 2014.
Stock selection within the industrials sector, and stock selection as well as a sector underweight in the information technology sector, detracted from relative performance over the period. Within the industrials sector, the Fund’s holding of 3M Company, a diversified technology company, detracted most from relative performance. Shares of the firm sold off after the company missed third quarter profits and lowered the full year earnings guidance. An overweight position in Northrop Grumman Corp. also detracted from relative performance. Shares of the government and commercial security company recently came under pressure as investors may have grown wary of the implications of the escalating trade war on the firm’s profits. Additionally, within the information technology sector, International Business Machines (“IBM”) Corp., an integrated technology company, detracted from relative performance. Shares fell after the market priced in some doubt about the $34 billion deal between IBM and Red Hat.
Conversely, stock selection within the consumer staples and communication services sectors contributed positively to relative performance during the period. Within the consumer staples sector, Costco Wholesale Corp., a multinational membership-only warehouse chain, contributed positively to relative performance. Shares of the company rose as the firm consistently beat total and U.S. core same-store sales on a year over year basis, which was fueled in part by the firm’s continued investment in the digital and e-commerce space. Walgreens Boots Alliance,
2
Inc., a pharmacy-led health and wellbeing company, also contributed positively to relative performance. Shares of Walgreens Boots Alliance rose throughout the year on the back of several minority stake investments, including Birchbox as well as a rumored offer to Humana Inc. Within the communication services sector, an overweight position in Verizon Communications, Inc., a communication and entertainment company, contributed most to relative performance. The company benefited from continued investment in its mobile 5G network.
Lord Abbett Growth Opportunities Fund
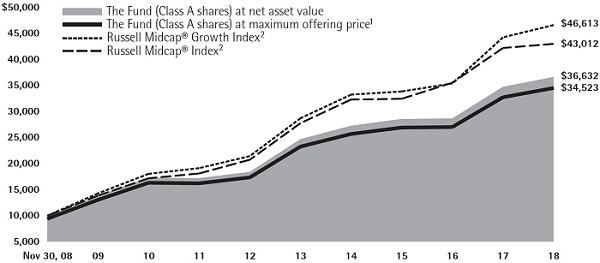
For the fiscal year ended November 30, 2018, the Fund returned 5.41%, reflecting performance at the net asset value (NAV) of Class A shares with all distributions reinvested, compared to its benchmark, the Russell Midcap® Growth Index,3which returned 5.32% over the same period.
Domestic equity returns were positive over the past year, with large cap stocks, as represented by the S&P 500® Index,1rising 6.27% during the period, while small cap stocks, as represented by the Russell 2000® Index,2were up 0.57%. During the period, there were several market-moving events. Notably, in December 2017, Congress passed the largest rewrite of the U.S. tax code in decades. The tax bill reduced the corporate tax rate from 35% to 21% and allowed for a one-time repatriation tax of 15.5%, rather than the standard repatriation tax rate of 35%. In June 2018, the White House announced its intent to impose additional tariffs on $200 billion worth of Chinese
goods, on top of the $50 billion previously announced. The aggressive U.S. trade posture continued into September with trade tensions mounting between the U.S. and China. While the impact has yet to fully be realized, many corporations anticipate that the retaliatory tariffs will weigh on profits. Trade discussions between Mexico, Canada, and the U.S., however, took a more favorable turn as the negotiations resulted in a revised version of the North American Free Trade Agreement (NAFTA) called the U.S.-Mexico-Canada Agreement. In December 2017, the Federal Reserve (the “Fed”) raised its target for short-term interest rates by 0.25%, to a range of 1.25%-1.50%, and indicated that it was targeting three rate hikes in 2018. The Fed followed with rate hikes of 0.25% at each of its March [13a], June and September meetings, raising the target range to 2.00%-2.25%. Amid rising concerns surrounding escalating trade tensions, slowing growth, and increasing interest rates, the Nasdaq experienced the largest monthly drop since 2008 in October 2018. Despite the sell-off, the U.S. economy continued to expand over the trailing 12-month period.
During the period, security selection in the consumer discretionary and health care sectors were the largest contributors to the Fund’s performance relative to its benchmark. Within the consumer discretionary sector, the Fund’s position in Burlington Stores, Inc., an apparel and assorted home products retailer, contributed during the period. Shares of Burlington rose throughout the period as the company exhibited consistent performance, growing earnings and
3
revenue at a fast pace. The Fund’s position in Ulta Beauty, Inc., a cosmetics beauty retailer, also contributed to performance. Ulta continued to increase its market share gains as its differentiated approach to specialty beauty products and ability to retain and attract clients with innovative marketing initiatives likely benefited its shares over the past 12 months.
Within the health care sector, the Fund’s position in Centene Corp., a provider of programs and services related to government-sponsored healthcare, contributed to performance. Shares of Centene appreciated as the corporation derived significant cost synergies from its acquisition of Fidelis Care, Inc., and produced positive enrollment and margin trends in its health care insurance exchange business.
During the period, security selection in the energy and information technology sectors detracted from the Fund’s relative performance. Within the energy sector, the Fund’s position in Cimarex Energy Co., an oil and gas exploration company, detracted during the period. Shares of Cimarex came under pressure as headwinds within the Permian Basin caused differentials between oil and gas prices to increase, impacting Cimarex’s cash flow. Parsley Energy, Inc., an oil and natural gas firm, also detracted as investors’ increasing concerns over a supply glut in oil and a slowdown in global economic growth caused Western Texas Intermediate prices to plummet.
Within the information technology sector, the Fund’s position in Palo Alto Networks, Inc., a provider of network security solutions, detracted from
performance as the company saw both its Chairman & CEO, and its CFO, retire.
Lord Abbett Small Cap Value Fund
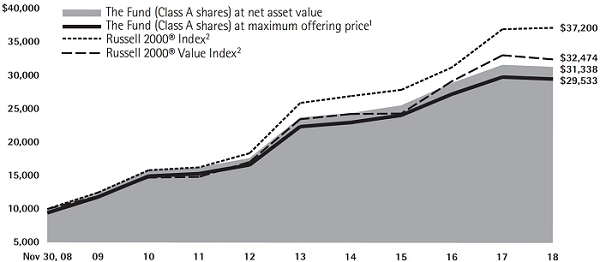
For the fiscal year ended November 30, 2018, the Fund returned -0.97%, reflecting performance at the net asset value (NAV) of Class A shares with all distributions reinvested, compared to its benchmark, the Russell 2000® Index,2which returned 0.57% over the same period.
During the period, there were several market-moving events. Notably, in December 2017, Congress passed the largest rewrite of the U.S. tax code in decades. The tax bill reduced the corporate tax rate from 35% to 21% and allowed for a one-time repatriation tax of 15.5%, rather than the standard repatriation tax rate of 35%. In June 2018, the White House announced its intent to impose additional tariffs on $200 billion worth of Chinese goods, on top of the $50 billion previously announced. The aggressive U.S. trade posture continued into September with trade tensions mounting between the U.S. and China. While the impact has yet to fully be realized, many corporations anticipate that the retaliatory tariffs will weigh on profits. In December 2017, the Federal Reserve (the “Fed”) raised its target for short-term interest rates by 0.25%, to a range of 1.25%-1.50%, and indicated that it was targeting three rate hikes in 2018. The Fed followed with rate hikes of 0.25% at each of its March, June and September meetings, raising the target range to 2.00%-2.25%. As the Fed continued to raise rates, the U.S. Treasury yield curve
4
flattened through the year, with the yield on 10-year U.S. Treasury securities (“Treasuries”) reaching above 3.2% in November and the yield on 2-year Treasuries reaching 2.98%. Amid rising concerns surrounding escalating trade tensions, slowing global growth, and increasing interest rates, the Nasdaq experienced the largest monthly drop since 2008 in October. Additionally, in October and November of 2018, both the investment grade and high yield market experienced a sell-off due to a number of idiosyncratic risks and concerns over slower growth and rising inflation. Despite the sell-off, the U.S. economy continued to expand by more than 2% during each quarter of the trailing 12-month period, with domestic GDP growth ranging between 2.2% and 4.2% from the third quarter of 2017 to the third quarter of 2018. The 4.2% GDP growth in the second quarter marked the strongest growth rate since the third quarter of 2014. Inflation, as measured by the Consumer Price Index (CPI), continued to rise, gaining 2.5% year over year, which was mostly pushed higher by oil prices. However, oil prices have since receded significantly due to oversupply.
During the period, stock selection in the industrials sector detracted from the Fund’s relative performance. Within the industrials sector, the Fund’s position in Dycom Industries, Inc., a provider of specialty contracting services to the telecommunications infrastructure industry, detracted from relative performance. Shares of Dycom fell following the company’s first quarter financial results, which fell short of analyst
estimates on both earnings and revenue, in addition to fiscal year 2019 guidance which fell below analyst estimates. In addition, shares of Dycom were challenged following the company’s second quarter financial results, which included a further decrease in fiscal year guidance. The Fund’s holding of shares of Milacron Holdings Corp., a manufacturer and distributor of injection molding, extrusion, blow molding, hot runner solutions, and process control systems, also detracted from relative performance during the period. Shares of Milacron came under pressure following weaker than expected third quarter financial results, due to uncertainty and disruption as a result of U.S.-China tariffs, resulting in a decline in new orders.
Security selection in the information technology sector also detracted from the Fund’s relative performance. Within the information technology sector the Fund’s position in Conduent, Inc., a business process services company specializing in transaction-intensive processing, analytics, and automation, detracted. Shares of Conduent came under pressure following the company’s third quarter fiscal year financial results, which missed analyst consensus estimates on revenue and EBITDA, with lowered guidance as a result.
Conversely, stock selection in the consumer discretionary sector contributed to the Fund’s relative performance. Within the consumer discretionary sector, the Fund’s position in Advance Auto Parts, an automotive aftermarket parts provider, contributed. Shares of Advance Auto Parts rose due to strong second quarter financial results, which included raised 2018
5
guidance. Due to improved free cash flow expectations, Advance Auto Parts management also expressed its intent to repurchase $600 million of shares. Wolverine World Wide, Inc., a manufacturer and marketer of branded footwear and performance leathers, also contributed. Shares of Wolverine World Wide rose following its first quarter financial results, which included earnings and revenue which surpassed analyst estimates as well as raised guidance.
Security selection within the health care sector also contributed to relative
performance during the period. Within the health care sector, the Fund’s position in Encompass Health Corporation, a provider of inpatient rehabilitative healthcare services, contributed. Shares of Encompass rose following strong second quarter financial results, which included raised guidance by management.
Each Fund’s portfolio is actively managed and, therefore, its holdings and the weightings of a particular issuer or particular sector as a percentage of portfolio assets are subject to change. Sectors may include many industries.
1 The S&P 500® Index is widely regarded as the standard for measuring large cap U.S. stock market performance and includes a representative sample of leading companies in leading industries.
2 The Russell 2000® Index measures the performance of the 2,000 smallest companies in the Russell 3000® Index, which represents approximately 10% of the total market capitalization of the Russell 3000® Index.
3 The Russell Midcap® Growth Index measures the performance of those Russell Midcap® companies with higher price-to-book ratios and higher forecasted growth values.
Unless otherwise specified, indexes reflect total return, with all dividends reinvested. Indexes are unmanaged, do not reflect the deduction of fees or expenses, and are not available for direct investment.
Important Performance and Other Information
Performance data quoted in the following pages reflect past performance and are no guarantee of future results. Current performance may be higher or lower than the performance quoted. The investment return and principal value of an investment in the Funds will fluctuate so that shares, on any given day or when redeemed, may be worth more or less than their original cost. You can obtain performance data current to the most recent month end by calling Lord Abbett at 888-522-2388 or referring to www.lordabbett.com.
Except where noted, comparative Fund performance does not account for the deduction of sales charges and would be different if sales charges were included. Each Fund offers classes of shares with distinct pricing options. For a full description of the differences in pricing alternatives, please see each Fund’s prospectus.
During certain periods shown, expense waivers and reimbursements were in place for Calibrated Dividend Growth Fund. Without such expense waivers and reimbursements, the Fund’s returns would have been lower.
The annual commentary above discusses the views of the Funds’ management and various portfolio holdings of the Funds as of November 30, 2018. These views and portfolio holdings may have changed after this date. Information provided in the commentary is not a recommendation to buy or sell securities. Because the Funds’ portfolio is actively managed and may change significantly, the Funds may no longer own the securities described above or may have otherwise changed their positions in the securities. For more recent information about the Funds’ portfolio holdings, please visit www.lordabbett.com.
A Note about Risk:See Notes to Financial Statements for a discussion of investment risks. For a more detailed discussion of the risks associated with each Fund, please see each Fund’s prospectus.
Mutual funds are not insured by the FDIC, are not deposits or other obligations of, or guaranteed by, banks, and are subject to investment risks including possible loss of principal amount invested.
6
Calibrated Dividend Growth Fund
Investment Comparison
Below is a comparison of a $10,000 investment in Class A shares with the same investment in the S&P 500® Index, assuming reinvestment of all dividends and distributions. The performance of other classes will be greater than or less than the performance shown in the graph below due to different sales loads and expenses applicable to such classes. The graph and performance table below do not reflect the deduction of taxes that a shareholder would pay on Fund distributions or the redemption of Fund shares. During certain periods, expenses of the Fund have been waived or reimbursed by Lord Abbett; without such waiver or reimbursement of expenses, the Fund’s returns would have been lower.Past performance is no guarantee of future results.
Average Annual Total Returns at Maximum Applicable
Sales Charge for the Periods Ended November 30, 2018
| | | 1 Year | | 5 Years | | 10 Years | | Life of Class | |
| Class A3 | | -1.29% | | 8.19% | | 11.92% | | – | |
| Class C4 | | 2.94% | | 8.68% | | 11.80% | | – | |
| Class F5 | | 5.00% | | 9.69% | | 12.84% | | – | |
| Class F36 | | 5.07% | | – | | – | | 11.09% | |
| Class I5 | | 4.93% | | 9.76% | | 12.92% | | – | |
| Class P5 | | 4.48% | | 9.26% | | 12.41% | | – | |
| Class R25 | | 4.38% | | 9.10% | | 12.26% | | – | |
| Class R35 | | 4.48% | | 9.23% | | 12.37% | | – | |
| Class R47 | | 4.75% | | – | | – | | 10.81% | |
| Class R57 | | 5.00% | | – | | – | | 11.08% | |
| Class R67 | | 5.06% | | – | | – | | 11.19% | |
7
1 Reflects the deduction of the maximum initial sales charge of 5.75%.
2 Performance for the unmanaged index does not reflect any fees or expenses. The performance of each index is not necessarily representative of the Fund’s performance.
3 Total return, which is the percentage change in net asset value, after deduction of the maximum initial sales charge of 5.75% applicable to Class A shares, with all dividends and distributions reinvested for the periods shown ended November 30, 2018, is calculated using the SEC-required uniform method to compute such return.
4 The 1% CDSC for Class C shares normally applies before the first anniversary of the purchase date. Performance for other periods is at net asset value.
5 Performance is at net asset value.
6 Commenced operations and performance for the Class began on April 4, 2017. Performance is at net asset value.
7 Commenced operations and performance for the Class began on June 30, 2015. Performance is at net asset value.
8
Growth Opportunities Fund
Investment Comparison
Below is a comparison of a $10,000 investment in Class A shares with the same investment in both the Russell Midcap® Growth Index and the Russell Midcap®Index, assuming reinvestment of all dividends and distributions. The performance of other classes will be greater than or less than the performance shown in the graph below due to different sales loads and expenses applicable to such classes. The graph and performance table below do not reflect the deduction of taxes that a shareholder would pay on Fund distributions or the redemption of Fund shares. During certain periods, expenses of the Fund have been waived or reimbursed by Lord Abbett; without such waiver or reimbursement of expenses, the Fund’s returns would have been lower.Past performance is no guarantee of future results.
Average Annual Total Returns at Maximum Applicable
Sales Charge for the Periods Ended November 30, 2018
| | | 1 Year | | 5 Years | | 10 Years | | Life of Class | |
| Class A3 | | -0.63% | | 6.93% | | 13.19% | | – | |
| Class C4 | | 3.67% | | 7.40% | | 13.09% | | – | |
| Class F5 | | 5.53% | | 8.37% | | 14.10% | | – | |
| Class F36 | | 5.73% | | – | | – | | 13.09% | |
| Class I5 | | 5.67% | | 8.48% | | 14.21% | | – | |
| Class P5 | | 5.19% | | 7.99% | | 13.70% | | – | |
| Class R25 | | 5.00% | | 7.82% | | 13.52% | | – | |
| Class R35 | | 5.15% | | 7.94% | | 13.65% | | – | |
| Class R47 | | 5.41% | | – | | – | | 6.41% | |
| Class R57 | | 5.67% | | – | | – | | 6.69% | |
| Class R67 | | 5.73% | | – | | – | | 6.80% | |
1 Reflects the deduction of the maximum initial sales charge of 5.75%.
2 Performance for each unmanaged index does not reflect any fees or expenses. The performance of each index is not necessarily representative of the Fund’s performance.
3 Total return, which is the percentage change in net asset value, after deduction of the maximum initial sales charge of 5.75% applicable to Class A shares, with all dividends and distributions reinvested for the periods shown ended November 30, 2018, is calculated using the SEC-required uniform method to compute such return.
4 The 1% CDSC for Class C shares normally applies before the first anniversary of the purchase date. Performance for other periods is at net asset value.
5 Performance is at net asset value.
6 Commenced operations and performance for the Class began on April 4, 2017. Performance is at net asset value.
7 Commenced operations and performance for the Class began on June 30, 2015. Performance is at net asset value.
9
Small Cap Value Fund
Investment Comparison
Below is a comparison of a $10,000 investment in Class A shares with the same investment in both the Russell 2000® Index and the Russell 2000® Value Index, assuming reinvestment of all dividends and distributions. The performance of other classes will be greater than or less than the performance shown in the graph below due to different sales loads and expenses applicable to such classes. The graph and performance table below do not reflect the deduction of taxes that a shareholder would pay on Fund distributions or the redemption of Fund shares.Past performance is no guarantee of future results.
Average Annual Total Returns at Maximum Applicable
Sales Charge for the Periods Ended November 30, 2018
| | | 1 Year | | 5 Years | | 10 Years | | Life of Class | |
| Class A3 | | -6.65% | | 4.47% | | 11.44% | | – | |
| Class C4 | | -2.48% | | 4.95% | | 11.30% | | – | |
| Class F5 | | -0.81% | | 5.88% | | 12.30% | | – | |
| Class F36 | | -0.62% | | – | | – | | 4.58% | |
| Class I5 | | -0.72% | | 5.98% | | 12.41% | | – | |
| Class P5 | | -1.17% | | 5.51% | | 11.90% | | – | |
| Class R25 | | -1.33% | | 5.35% | | 11.73% | | – | |
| Class R35 | | -1.16% | | 5.49% | | 11.87% | | – | |
| Class R47 | | -0.96% | | – | | – | | 5.89% | |
| Class R57 | | -0.74% | | – | | – | | 6.15% | |
| Class R67 | | -0.62% | | – | | – | | 6.25% | |
1 Reflects the deduction of the maximum initial sales charge of 5.75%.
2 Performance for each unmanaged index does not reflect any fees or expenses. The performance of each index is not necessarily representative of the Fund’s performance.
3 Total return, which is the percentage change in net asset value, after deduction of the maximum initial sales charge of 5.75% applicable to Class A shares, with all dividends and distributions reinvested for the periods shown ended November 30, 2018, is calculated using the SEC-required uniform method to compute such return.
4 The 1% CDSC for Class C shares normally applies before the first anniversary of the purchase date. Performance for other periods is at net asset value.
5 Performance is at net asset value.
6 Commenced operations and performance for the Class began on April 4, 2017. Performance is at net asset value.
7 Commenced operations and performance for the Class began on June 30, 2015. Performance is at net asset value.
10
Expense Example
As a shareholder of the Fund, you incur two types of costs: (1) transaction costs, including sales charges (loads) on purchase payments (these charges vary among the share classes); and (2) ongoing costs, including management fees; distribution and service (12b-1) fees (these charges vary among the share classes); and other Fund expenses. This Example is intended to help you understand your ongoing costs (in dollars) of investing in the Fund and to compare these costs with the ongoing costs of investing in other mutual funds.
The Example is based on an investment of $1,000 invested at the beginning of the period and held for the entire period (June 1, 2018 through November 30, 2018).
Actual Expenses
For each class of the Fund, the first line of the table on the following page provides information about actual account values and actual expenses. You may use the information in this line, together with the amount you invested, to estimate the expenses that you paid over the period. Simply divide your account value by $1,000 (for example, an $8,600 account value divided by $1,000 = 8.6), then multiply the result by the number in the first line under the heading titled “Expenses Paid During Period 6/1/18 – 11/30/18” to estimate the expenses you paid on your account during this period.
Hypothetical Example for Comparison Purposes
For each class of the Fund, the second line of the table on the following page provides information about hypothetical account values and hypothetical expenses based on the Fund’s actual expense ratio and an assumed rate of return of 5% per year before expenses, which is not the Fund’s actual return. The hypothetical account values and expenses may not be used to estimate the actual ending account balance or expenses you paid for the period. You may use this information to compare the ongoing costs of investing in the Fund and other funds. To do so, compare this 5% hypothetical example with the 5% hypothetical examples that appear in the shareholder reports of the other funds.
11
Calibrated Dividend Growth Fund
Please note that the expenses shown in the table are meant to highlight your ongoing costs only and do not reflect any transactional costs, such as sales charges (loads). Therefore, the second line of the table is useful in comparing ongoing costs only, and will not help you determine the relative total costs of owning different funds. In addition, if these transactional costs were included, your costs would have been higher.
| | | Beginning
Account
Value | | Ending
Account
Value | | Expenses
Paid During
Period† | |
| | | 6/1/18 | | 11/30/18 | | 6/1/18 –
11/30/18 | |
| Class A | | | | | | | |
| Actual | | $1,000.00 | | $1,057.30 | | $4.85 | |
| Hypothetical (5% Return Before Expenses) | | $1,000.00 | | $1,020.36 | | $4.76 | |
| Class C | | | | | | | |
| Actual | | $1,000.00 | | $1,053.80 | | $8.70 | |
| Hypothetical (5% Return Before Expenses) | | $1,000.00 | | $1,016.60 | | $8.54 | |
| Class F | | | | | | | |
| Actual | | $1,000.00 | | $1,059.40 | | $3.56 | |
| Hypothetical (5% Return Before Expenses) | | $1,000.00 | | $1,021.61 | | $3.50 | |
| Class F3 | | | | | | | |
| Actual | | $1,000.00 | | $1,059.20 | | $3.20 | |
| Hypothetical (5% Return Before Expenses) | | $1,000.00 | | $1,021.96 | | $3.14 | |
| Class I | | | | | | | |
| Actual | | $1,000.00 | | $1,058.70 | | $3.56 | |
| Hypothetical (5% Return Before Expenses) | | $1,000.00 | | $1,021.61 | | $3.50 | |
| Class P | | | | | | | |
| Actual | | $1,000.00 | | $1,056.60 | | $5.88 | |
| Hypothetical (5% Return Before Expenses) | | $1,000.00 | | $1,019.35 | | $5.77 | |
| Class R2 | | | | | | | |
| Actual | | $1,000.00 | | $1,055.50 | | $6.65 | |
| Hypothetical (5% Return Before Expenses) | | $1,000.00 | | $1,018.60 | | $6.53 | |
| Class R3 | | | | | | | |
| Actual | | $1,000.00 | | $1,056.20 | | $6.13 | |
| Hypothetical (5% Return Before Expenses) | | $1,000.00 | | $1,019.10 | | $6.02 | |
| Class R4 | | | | | | | |
| Actual | | $1,000.00 | | $1,058.00 | | $4.85 | |
| Hypothetical (5% Return Before Expenses) | | $1,000.00 | | $1,020.36 | | $4.76 | |
| Class R5 | | | | | | | |
| Actual | | $1,000.00 | | $1,059.40 | | $3.56 | |
| Hypothetical (5% Return Before Expenses) | | $1,000.00 | | $1,021.61 | | $3.50 | |
| Class R6 | | | | | | | |
| Actual | | $1,000.00 | | $1,059.30 | | $3.20 | |
| Hypothetical (5% Return Before Expenses) | | $1,000.00 | | $1,021.96 | | $3.14 | |
| † | For each class of the Fund, net expenses are equal to the annualized expense ratio for such class (0.94% for Class A, 1.69% for Class C, 0.69% for Class F, 0.62% for Class F3, 0.69% for Class I, 1.14% for Class P, 1.29% for Class R2, 1.19% for Class R3, 0.94% for Class R4, 0.69% for Class R5 and 0.62% for Class R6 ) multiplied by the average account value over the period, multiplied by 183/365 (to reflect one-half year period). |
12
Portfolio Holdings Presented by Sector
November 30, 2018
| Sector* | %** |
| Communication Services | | 4.44 | |
| Consumer Discretionary | | 9.48 | |
| Consumer Staples | | 16.34 | |
| Energy | | 5.03 | |
| Financials | | 6.60 | |
| Health Care | | 12.11 | |
| Industrials | | 20.49 | |
| Information Technology | | 12.09 | |
| Materials | | 4.92 | |
| Utilities | | 8.03 | |
| Repurchase Agreement | | 0.47 | |
| Total | | 100.00 | |
| * | | A sector may comprise several industries. |
| ** | | Represents percent of total investments. |
13
Growth Opportunities Fund
Please note that the expenses shown in the table are meant to highlight your ongoing costs only and do not reflect any transactional costs, such as sales charges (loads). Therefore, the second line of the table is useful in comparing ongoing costs only, and will not help you determine the relative total costs of owning different funds. In addition, if these transactional costs were included, your costs would have been higher.
| | | Beginning
Account
Value | | Ending
Account
Value | | Expenses
Paid During
Period† | |
| | | 6/1/18 | | 11/30/18 | | 6/1/18 –
11/30/18 | |
| Class A | | | | | | | |
| Actual | | $1,000.00 | | $1,010.80 | | $5.85 | |
| Hypothetical (5% Return Before Expenses) | | $1,000.00 | | $1,019.25 | | $5.87 | |
| Class C | | | | | | | |
| Actual | | $1,000.00 | | $1,007.00 | | $9.61 | |
| Hypothetical (5% Return Before Expenses) | | $1,000.00 | | $1,015.49 | | $9.65 | |
| Class F | | | | | | | |
| Actual | | $1,000.00 | | $1,011.30 | | $5.09 | |
| Hypothetical (5% Return Before Expenses) | | $1,000.00 | | $1,020.00 | | $5.11 | |
| Class F3 | | | | | | | |
| Actual | | $1,000.00 | | $1,012.40 | | $4.29 | |
| Hypothetical (5% Return Before Expenses) | | $1,000.00 | | $1,020.81 | | $4.31 | |
| Class I | | | | | | | |
| Actual | | $1,000.00 | | $1,012.00 | | $4.59 | |
| Hypothetical (5% Return Before Expenses) | | $1,000.00 | | $1,020.51 | | $4.61 | |
| Class P | | | | | | | |
| Actual | | $1,000.00 | | $1,009.70 | | $6.85 | |
| Hypothetical (5% Return Before Expenses) | | $1,000.00 | | $1,018.25 | | $6.88 | |
| Class R2 | | | | | | | |
| Actual | | $1,000.00 | | $1,008.90 | | $7.60 | |
| Hypothetical (5% Return Before Expenses) | | $1,000.00 | | $1,017.50 | | $7.64 | |
| Class R3 | | | | | | | |
| Actual | | $1,000.00 | | $1,009.20 | | $7.10 | |
| Hypothetical (5% Return Before Expenses) | | $1,000.00 | | $1,018.00 | | $7.13 | |
| Class R4 | | | | | | | |
| Actual | | $1,000.00 | | $1,010.80 | | $5.85 | |
| Hypothetical (5% Return Before Expenses) | | $1,000.00 | | $1,019.25 | | $5.87 | |
| Class R5 | | | | | | | |
| Actual | | $1,000.00 | | $1,012.00 | | $4.59 | |
| Hypothetical (5% Return Before Expenses) | | $1,000.00 | | $1,020.51 | | $4.61 | |
| Class R6 | | | | | | | |
| Actual | | $1,000.00 | | $1,012.40 | | $4.29 | |
| Hypothetical (5% Return Before Expenses) | | $1,000.00 | | $1,020.81 | | $4.31 | |
| † | For each class of the Fund, net expenses are equal to the annualized expense ratio for such class (1.16% for Class A, 1.91% for C, 1.01% for Class F, 0.85% for Class F3, 0.91% for Class I, 1.36% for Class P, 1.51% for Class R2, 1.41% for Class R3, 1.16% for Class R4, 0.91% for Class R5 and 0.85% for Class R6) multiplied by the average account value over the period, multiplied by 183/365 (to reflect one-half year period). |
14
Portfolio Holdings Presented by Sector
November 30, 2018
| Sector* | %** |
| Consumer Discretionary | | 15.81 | |
| Consumer Staples | | 2.61 | |
| Energy | | 1.26 | |
| Financials | | 7.85 | |
| Health Care | | 16.32 | |
| Industrials | | 16.61 | |
| Information Technology | | 30.76 | |
| Materials | | 5.34 | |
| Real Estate | | 1.69 | |
| Repurchase Agreement | | 1.75 | |
| Total | | 100.00 | |
| * | | A sector may comprise several industries. |
| ** | | Represents percent of total investments. |
15
Small Cap Value Fund
Please note that the expenses shown in the table are meant to highlight your ongoing costs only and do not reflect any transactional costs, such as sales charges (loads). Therefore, the second line of the table is useful in comparing ongoing costs only, and will not help you determine the relative total costs of owning different funds. In addition, if these transactional costs were included, your costs would have been higher.
| | | Beginning
Account
Value | | Ending
Account
Value | | Expenses
Paid During
Period† | |
| | | 6/1/18 | | 11/30/18 | | 6/1/18 –
11/30/18 | |
| Class A | | | | | | | | | |
| Actual | | $1,000.00 | | $ | 957.00 | | | $5.74 | |
| Hypothetical (5% Return Before Expenses) | | $1,000.00 | | $ | 1,019.20 | | | $5.92 | |
| Class C | | | | | | | | | |
| Actual | | $1,000.00 | | $ | 952.80 | | | $9.40 | |
| Hypothetical (5% Return Before Expenses) | | $1,000.00 | | $ | 1,015.44 | | | $9.70 | |
| Class F | | | | | | | | | |
| Actual | | $1,000.00 | | $ | 957.70 | | | $5.01 | |
| Hypothetical (5% Return Before Expenses) | | $1,000.00 | | $ | 1,019.95 | | | $5.17 | |
| Class F3 | | | | | | | | | |
| Actual | | $1,000.00 | | $ | 958.70 | | | $4.17 | |
| Hypothetical (5% Return Before Expenses) | | $1,000.00 | | $ | 1,020.81 | | | $4.31 | |
| Class I | | | | | | | | | |
| Actual | | $1,000.00 | | $ | 958.20 | | | $4.52 | |
| Hypothetical (5% Return Before Expenses) | | $1,000.00 | | $ | 1,020.46 | | | $4.66 | |
| Class P | | | | | | | | | |
| Actual | | $1,000.00 | | $ | 955.70 | | | $6.72 | |
| Hypothetical (5% Return Before Expenses) | | $1,000.00 | | $ | 1,018.20 | | | $6.93 | |
| Class R2 | | | | | | | | | |
| Actual | | $1,000.00 | | $ | 955.20 | | | $7.45 | |
| Hypothetical (5% Return Before Expenses) | | $1,000.00 | | $ | 1,017.45 | | | $7.69 | |
| Class R3 | | | | | | | | | |
| Actual | | $1,000.00 | | $ | 955.90 | | | $6.96 | |
| Hypothetical (5% Return Before Expenses) | | $1,000.00 | | $ | 1,017.95 | | | $7.18 | |
| Class R4 | | | | | | | | | |
| Actual | | $1,000.00 | | $ | 957.00 | | | $5.74 | |
| Hypothetical (5% Return Before Expenses) | | $1,000.00 | | $ | 1,019.20 | | | $5.92 | |
| Class R5 | | | | | | | | | |
| Actual | | $1,000.00 | | $ | 958.20 | | | $4.52 | |
| Hypothetical (5% Return Before Expenses) | | $1,000.00 | | $ | 1,020.51 | | | $4.66 | |
| Class R6 | | | | | | | | | |
| Actual | | $1,000.00 | | $ | 958.70 | | | $4.17 | |
| Hypothetical (5% Return Before Expenses) | | $1,000.00 | | $ | 1,020.81 | | | $4.31 | |
| † | For each class of the Fund, net expenses are equal to the annualized expense ratio for such class (1.17% for Class A, 1.92% for C, 1.02% for Class F, 0.85% for Class F3, 0.92% for Class I, 1.37% for Class P, 1.52% for Class R2, 1.42% for Class R3, 1.17% for Class R4, 0.92% for Class R5 and 0.85% for Class R6) multiplied by the average account value over the period, multiplied by 183/365 (to reflect one-half year period). |
16
Portfolio Holdings Presented by Sector
November 30, 2018
| Sector* | %** |
| Communication Services | | 1.03 | |
| Consumer Discretionary | | 9.64 | |
| Consumer Staples | | 4.59 | |
| Energy | | 2.10 | |
| Financials | | 14.93 | |
| Health Care | | 15.18 | |
| Industrials | | 18.19 | |
| Information Technology | | 17.02 | |
| Materials | | 9.44 | |
| Real Estate | | 3.14 | |
| Utilities | | 2.73 | |
| Repurchase Agreement | | 2.01 | |
| Total | | 100.00 | |
| * | | A sector may comprise several industries. |
| ** | | Represents percent of total investments. |
17
Schedule of Investments
CALIBRATED DIVIDEND GROWTH FUNDNovember 30, 2018
| Investments | | Shares | | | Fair
Value
(000) | |
| COMMON STOCKS 99.35% | | | | | | | | |
| | | | | | | | | |
| Aerospace & Defense 5.43% | | | | | | | | |
| General Dynamics Corp. | | | 86,100 | | | $ | 15,919 | |
| Harris Corp. | | | 165,100 | | | | 23,601 | |
| Lockheed Martin Corp. | | | 105,261 | | | | 31,624 | |
| Northrop Grumman Corp. | | | 104,000 | | | | 27,028 | |
| Raytheon Co. | | | 173,300 | | | | 30,386 | |
| Total | | | | | | | 128,558 | |
| | | | | | | | | |
| Air Freight & Logistics 1.16% | | | | | | | | |
| CH Robinson Worldwide, Inc. | | | 110,900 | | | | 10,239 | |
| FedEx Corp. | | | 75,300 | | | | 17,244 | |
| Total | | | | | | | 27,483 | |
| | | | | | | | | |
| Banks 0.67% | | | | | | | | |
| Commerce Bancshares, Inc. | | | 156,135 | | | | 9,839 | |
| Cullen/Frost Bankers, Inc. | | | 59,000 | | | | 5,919 | |
| Total | | | | | | | 15,758 | |
| | | | | | | | | |
| Beverages 4.05% | | | | | | | | |
| Coca-Cola Co. (The) | | | 1,116,879 | | | | 56,291 | |
| PepsiCo, Inc. | | | 325,102 | | | | 39,643 | |
| Total | | | | | | | 95,934 | |
| | | | | | | | | |
| Biotechnology 1.73% | | | | | | | | |
| AbbVie, Inc. | | | 434,707 | | | | 40,980 | |
| | | | | | | | | |
| Capital Markets 2.13% | | | | | | | | |
| Ameriprise Financial, Inc. | | | 160,200 | | | | 20,786 | |
| S&P Global, Inc. | | | 41,600 | | | | 7,607 | |
| T. Rowe Price Group, Inc. | | | 222,500 | | | | 22,108 | |
| Total | | | | | | | 50,501 | |
| | | | | | | | | |
| Chemicals 3.86% | | | | | | | | |
| Air Products & Chemicals, Inc. | | | 55,000 | | | | 8,848 | |
| Ecolab, Inc. | | | 156,200 | | | | 25,069 | |
| PPG Industries, Inc. | | | 264,686 | | | | 28,938 | |
| Sherwin-Williams Co. (The) | | | 67,450 | | | | 28,603 | |
| Total | | | | | | | 91,458 | |
| Investments | | Shares | | | Fair
Value
(000) | |
| Commercial Services & Supplies 1.10% | | | | | | | |
| Cintas Corp. | | | 25,600 | | | $ | 4,797 | |
| Waste Management, Inc. | | | 225,600 | | | | 21,150 | |
| Total | | | | | | | 25,947 | |
| | | | | | | | | |
| Diversified Telecommunication Services 4.44% |
| AT&T, Inc. | | | 1,424,964 | | | | 44,516 | |
| Verizon Communications, Inc. | | | 1,002,700 | | | | 60,463 | |
| Total | | | | | | | 104,979 | |
| | | | | | | | | |
| Electric: Utilities 5.32% | | | | | | | | |
| Alliant Energy Corp. | | | 463,500 | | | | 21,038 | |
| Duke Energy Corp. | | | 276,200 | | | | 24,463 | |
| Edison International | | | 264,300 | | | | 14,621 | |
| Evergy, Inc. | | | 207,400 | | | | 12,313 | |
| Eversource Energy | | | 393,000 | | | | 26,858 | |
| NextEra Energy, Inc. | | | 85,300 | | | | 15,500 | |
| Xcel Energy, Inc. | | | 209,500 | | | | 10,988 | |
| Total | | | | | | | 125,781 | |
| | | | | | | | | |
| Electrical Equipment 1.02% | | | | | | | | |
| Emerson Electric Co. | | | 75,700 | | | | 5,111 | |
| Hubbell, Inc. | | | 172,400 | | | | 18,992 | |
| Total | | | | | | | 24,103 | |
| | | | | | | | | |
| Food & Staples Retailing 6.41% | | | | | | | | |
| Costco Wholesale Corp. | | | 208,500 | | | | 48,222 | |
| Sysco Corp. | | | 490,100 | | | | 33,033 | |
| Walgreens Boots Alliance, Inc. | | | 389,619 | | | | 32,989 | |
| Walmart, Inc. | | | 383,970 | | | | 37,494 | |
| Total | | | | | | | 151,738 | |
| | | | | | | | | |
| Food Products 1.83% | | | | | | | | |
| Flowers Foods, Inc. | | | 572,800 | | | | 11,336 | |
| Hormel Foods Corp. | | | 197,400 | | | | 8,901 | |
| J.M. Smucker Co. (The) | | | 103,800 | | | | 10,848 | |
| Kellogg Co. | | | 190,500 | | | | 12,125 | |
| Total | | | | | | | 43,210 | |
| 18 | See Notes to Financial Statements. |
Schedule of Investments (continued)
CALIBRATED DIVIDEND GROWTH FUNDNovember 30, 2018
| Investments | | Shares | | | Fair
Value
(000) | |
| Gas Utilities 0.57% | | | | | | |
| UGI Corp. | | | 235,600 | | | $ | 13,535 | |
| | | | | | | | | |
| Health Care Equipment & Supplies 5.86% | | | | | | | | |
| Abbott Laboratories | | | 536,900 | | | | 39,757 | |
| Becton, Dickinson & Co. | | | 104,700 | | | | 26,463 | |
| Medtronic plc (Ireland)(a) | | | 618,503 | | | | 60,323 | |
| West Pharmaceutical Services, Inc. | | | 111,400 | | | | 12,205 | |
| Total | | | | | | | 138,748 | |
| | | | | | | | | |
| Health Care Providers & Services 2.65% | | | | | | | | |
| AmerisourceBergen Corp. | | | 260,000 | | | | 23,114 | |
| CVS Health Corp. | | | 493,000 | | | | 39,539 | |
| Total | | | | | | | 62,653 | |
| | | | | | | | | |
| Hotels, Restaurants & Leisure 2.68% | | | | | | | | |
| McDonald’s Corp. | | | 336,126 | | | | 63,363 | |
| | | | | | | | | |
| Household Products 4.02% | | | | | | | | |
| Church & Dwight Co., Inc. | | | 95,200 | | | | 6,301 | |
| Clorox Co. (The) | | | 162,000 | | | | 26,830 | |
| Kimberly-Clark Corp. | | | 241,515 | | | | 27,864 | |
| Procter & Gamble Co. (The) | | | 361,200 | | | | 34,137 | |
| Total | | | | | | | 95,132 | |
| | | | | | | | | |
| Industrial Conglomerates 3.25% | | | | | | | | |
| 3M Co. | | | 218,117 | | | | 45,351 | |
| Roper Technologies, Inc. | | | 106,200 | | | | 31,604 | |
| Total | | | | | | | 76,955 | |
| | | | | | | | | |
| Information Technology Services 4.47% | | | | | | | | |
| Accenture plc Class A(Ireland)(a) | | | 229,500 | | | | 37,757 | |
| Automatic Data Processing, Inc. | | | 251,400 | | | | 37,061 | |
| International Business Machines Corp. | | | 248,600 | | | | 30,894 | |
| Total | | | | | | | 105,712 | |
| Investments | | Shares | | | Fair
Value
(000) | |
| Insurance 3.79% | | | | | | | | |
| Chubb Ltd. (Switzerland)(a) | | | 219,700 | | | $ | 29,383 | |
| RenaissanceRe Holdings Ltd. | | | 72,100 | | | | 9,561 | |
| Torchmark Corp. | | | 203,800 | | | | 17,610 | |
| Travelers Cos., Inc. (The) | | | 253,900 | | | | 33,101 | |
| Total | | | | | | | 89,655 | |
| | | | | | | | | |
| Machinery 2.92% | | | | | | | | |
| Caterpillar, Inc. | | | 223,800 | | | | 30,363 | |
| Cummins, Inc. | | | 166,600 | | | | 25,167 | |
| Pentair plc(United Kingdom)(a) | | | 111,100 | | | | 4,744 | |
| Stanley Black & Decker, Inc. | | | 67,500 | | | | 8,832 | |
| Total | | | | | | | 69,106 | |
| | | | | | | | | |
| Metals & Mining 1.04% | | | | | | | | |
| Nucor Corp. | | | 408,600 | | | | 24,684 | |
| | | | | | | | | |
| Multi-Line Retail 1.28% | | | | | | | | |
| Target Corp. | | | 427,600 | | | | 30,342 | |
| | | | | | | | | |
| Multi-Utilities 2.13% | | | | | | | | |
| Consolidated Edison, Inc. | | | 156,300 | | | | 12,559 | |
| Dominion Energy, Inc. | | | 508,500 | | | | 37,883 | |
| Total | | | | | | | 50,442 | |
| | | | | | | | | |
| Oil, Gas & Consumable Fuels 5.02% | | | | | | | | |
| Chevron Corp. | | | 550,462 | | | | 65,472 | |
| Exxon Mobil Corp. | | | 129,100 | | | | 10,264 | |
| Occidental Petroleum Corp. | | | 465,297 | | | | 32,696 | |
| ONEOK, Inc. | | | 169,300 | | | | 10,400 | |
| Total | | | | | | | 118,832 | |
| | | | | | | | | |
| Pharmaceuticals 1.85% | | | | | | | | |
| Johnson & Johnson | | | 297,723 | | | | 43,735 | |
| | | | | | | | | |
| Professional Services 0.91% | | | | | | | | |
| Robert Half International, Inc. | | | 348,700 | | | | 21,560 | |
| | See Notes to Financial Statements. | 19 |
Schedule of Investments (continued)
CALIBRATED DIVIDEND GROWTH FUNDNovember 30, 2018
| Investments | | Shares | | | Fair
Value
(000) | |
| Road & Rail 3.84% | | | | | | | | |
| CSX Corp. | | | 144,500 | | | $ | 10,495 | |
| J.B. Hunt Transport Services, Inc. | | | 200,600 | | | | 21,336 | |
| Union Pacific Corp. | | | 383,400 | | | | 58,959 | |
| Total | | | | | | | 90,790 | |
| | | | | | | | | |
| Semiconductors & Semiconductor Equipment 4.05% |
| Microchip Technology, Inc. | | | 110,467 | | | | 8,285 | |
| QUALCOMM, Inc. | | | 612,126 | | | | 35,662 | |
| Texas Instruments, Inc. | | | 520,100 | | | | 51,932 | |
| Total | | | | | | | 95,879 | |
| | | | | | | | | |
| Software 3.54% | | | | | | | | |
| CDK Global, Inc. | | | 348,900 | | | | 17,585 | |
| Microsoft Corp. | | | 597,900 | | | | 66,301 | |
| Total | | | | | | | 83,886 | |
| | | | | | | | | |
| Specialty Retail 3.39% | | | | | | | | |
| Lowe’s Cos., Inc. | | | 522,675 | | | | 49,325 | |
| TJX Cos., Inc. (The) | | | 630,200 | | | | 30,785 | |
| Total | | | | | | | 80,110 | |
| | | | | | | | | |
| Textiles, Apparel & Luxury Goods 2.12% | | | | | | | | |
| NIKE, Inc. Class B | | | 668,000 | | | | 50,180 | |
| | | | | | | | | |
| Trading Companies & Distributors 0.82% | | | | | | | | |
| Fastenal Co. | | | 327,600 | | | | 19,414 | |
Total Common Stocks
(cost $2,102,199,423) | | | | | | | 2,351,143 | |
| Investments | | Principal
Amount
(000) | | | Fair
Value
(000) | |
| SHORT-TERM INVESTMENT 0.47% | | | | | | | | |
| | | | | | | | | |
| Repurchase Agreement | | | | | | | | |
Repurchase Agreement dated 11/30/2018, 1.25% due 12/3/2018 with Fixed Income Clearing Corp. collateralized by $11,865,000 of U.S. Treasury Note at 1.50% due 3/31/2023; value: $11,235,135; proceeds: $11,014,670
(cost $11,013,523) | | $ | 11,014 | | | $ | 11,014 | |
Total Investments in Securities 99.82%
(cost $2,113,212,946) | | | | | | | 2,362,157 | |
| Other Assets in Excessof Liabilities(b)0.18% | | | | | | | 4,256 | |
| Net Assets 100.00% | | | | | | $ | 2,366,413 | |
| (a) | | Foreign security traded in U.S. dollars. |
| (b) | | Other Assets in Excess of Liabilities include net unrealized appreciation on futures contracts as follows: |
Open Futures Contracts at November 30, 2018:
| Type | | Expiration | | Contracts | | Position | | Notional
Amount | | Notional
Value | | Unrealized
Appreciation | |
| E-Mini S&P 500 Index | | December 2018 | | 69 | | Long | | $9,445,370 | | $9,516,135 | | $70,765 | |
| 20 | See Notes to Financial Statements. |
Schedule of Investments (concluded)
CALIBRATED DIVIDEND GROWTH FUNDNovember 30, 2018
The following is a summary of the inputs used as of November 30, 2018 in valuing the Fund’s investments carried at fair value(1):
| Investment Type(2)(3) | | Level 1
(000) | | | Level 2
(000) | | | Level 3
(000) | | | Total
(000) | |
| Common Stocks | | $ | 2,351,143 | | | $ | – | | | $ | – | | | $ | 2,351,143 | |
| Short-Term Investment | | | | | | | | | | | | | | | | |
| Repurchase Agreement | | | – | | | | 11,014 | | | | – | | | | 11,014 | |
| Total | | $ | 2,351,143 | | | $ | 11,014 | | | $ | – | | | $ | 2,362,157 | |
| |
| Other Financial Instruments | | | | | | | | | | | | | | | | |
| Futures Contracts | | | | | | | | | | | | | | | | |
| Assets | | $ | 71 | | | $ | – | | | $ | – | | | $ | 71 | |
| Liabilities | | | – | | | | – | | | | – | | | | – | |
| Total | | $ | 71 | | | $ | – | | | $ | – | | | $ | 71 | |
| (1) | | Refer to Note 2(i) for a description of fair value measurements and the three-tier hierarchy of inputs. |
| (2) | | See Schedule of Investments for fair values in each industry and identification of foreign issuers and/or geography. |
| (3) | | There were no Level 1/Level 2 transfers during the fiscal year ended November 30, 2018. |
| | See Notes to Financial Statements. | 21 |
Schedule of Investments
GROWTH OPPORTUNITIES FUNDNovember 30, 2018
| Investments | | Shares | | | Fair
Value
(000) | |
| COMMON STOCKS 98.25% | | | | | | |
| |
| Aerospace & Defense 1.54% | | | | | | | | |
| TransDigm Group, Inc.* | | | 33,814 | | | $ | 12,229 | |
| | | | | | | | | |
| Air Freight & Logistics 0.97% | | | | | | | | |
| Expeditors International of Washington, Inc. | | | 100,940 | | | | 7,681 | |
| | | | | | | | | |
| Banks 1.43% | | | | | | | | |
| First Republic Bank | | | 55,612 | | | | 5,514 | |
| Western Alliance Bancorp* | | | 123,367 | | | | 5,782 | |
| Total | | | | | | | 11,296 | |
| | | | | | | | | |
| Beverages 1.36% | | | | | | | | |
| Brown-Forman Corp. Class B | | | 225,345 | | | | 10,753 | |
| | | | | | | | | |
| Biotechnology 3.92% | | | | | | | | |
| Amarin Corp. plc ADR* | | | 93,071 | | | | 1,675 | |
| AnaptysBio, Inc.* | | | 36,311 | | | | 2,708 | |
| BioMarin Pharmaceutical, Inc.* | | | 94,696 | | | | 9,094 | |
| Myovant Sciences Ltd.(United Kingdom)*(a) | | | 202,618 | | | | 3,740 | |
| Neurocrine Biosciences, Inc.* | | | 50,772 | | | | 4,482 | |
| Sarepta Therapeutics, Inc.* | | | 33,576 | | | | 4,347 | |
| Vertex Pharmaceuticals, Inc.* | | | 27,930 | | | | 5,050 | |
| Total | | | | | | | 31,096 | |
| | | | | | | | | |
| Building Products 1.45% | | | | | | | | |
| Allegion plc (Ireland)(a) | | | 125,512 | | | | 11,496 | |
| | | | | | | | | |
| Capital Markets 4.11% | | | | | | | | |
| E*TRADE Financial Corp. | | | 157,290 | | | | 8,225 | |
| MarketAxess Holdings, Inc. | | | 32,288 | | | | 7,030 | |
| Moody’s Corp. | | | 68,868 | | | | 10,955 | |
| MSCI, Inc. | | | 40,430 | | | | 6,351 | |
| Total | | | | | | | 32,561 | |
| | | | | | | | | |
| Chemicals 1.81% | | | | | | | | |
| Ashland Global Holdings, Inc. | | | 65,483 | | | | 5,362 | |
| Axalta Coating Systems Ltd.* | | | 148,288 | | | | 3,712 | |
| FMC Corp. | | | 63,315 | | | | 5,239 | |
| Total | | | | | | | 14,313 | |
| Investments | | Shares | | | Fair
Value
(000) | |
| Commercial Services & Supplies 2.02% |
| Cintas Corp. | | | 35,029 | | | $ | 6,564 | |
| Healthcare Services Group, Inc. | | | 200,702 | | | | 9,473 | |
| Total | | | | | | | 16,037 | |
| | | | | | | | | |
| Communications Equipment 1.15% | | | | | | | | |
| Palo Alto Networks, Inc.* | | | 52,539 | | | | 9,087 | |
| | | | | | | | | |
| Construction Materials 1.40% | | | | | | | | |
| Vulcan Materials Co. | | | 104,923 | | | | 11,091 | |
| | | | | | | | | |
| Consumer Finance 0.80% | | | | | | | | |
| SLM Corp.* | | | 613,965 | | | | 6,305 | |
| | | | | | | | | |
| Containers & Packaging 2.13% | | | | | | | | |
| Avery Dennison Corp. | | | 101,444 | | | | 9,779 | |
| Owens-Illinois, Inc.* | | | 385,202 | | | | 7,084 | |
| Total | | | | | | | 16,863 | |
| | | | | | | | | |
| Diversified Consumer Services 1.01% | | | | | | | | |
| Service Corp. International | | | 172,422 | | | | 7,966 | |
| | | | | | | | | |
| Electrical Equipment 2.23% | | | | | | | | |
| AMETEK, Inc. | | | 134,427 | | | | 9,871 | |
| Hubbell, Inc. | | | 70,666 | | | | 7,785 | |
| Total | | | | | | | 17,656 | |
| | | | | | | | | |
| Electronic Equipment, Instruments & Components 1.44% |
| Keysight Technologies, Inc.* | | | 93,344 | | | | 5,771 | |
| Trimble, Inc.* | | | 148,442 | | | | 5,645 | |
| Total | | | | | | | 11,416 | |
| | | | | | | | | |
| Equity Real Estate Investment Trusts 1.69% | | | | | | | | |
| SBA Communications Corp.* | | | 78,364 | | | | 13,385 | |
| | | | | | | | | |
| Health Care Equipment & Supplies 4.60% | | | | | | | | |
| ABIOMED, Inc.* | | | 14,452 | | | | 4,808 | |
| Align Technology, Inc.* | | | 27,837 | | | | 6,399 | |
| Edwards Lifesciences Corp.* | | | 82,358 | | | | 13,343 | |
| Insulet Corp.* | | | 24,317 | | | | 2,041 | |
| Teleflex, Inc. | | | 35,857 | | | | 9,876 | |
| Total | | | | | | | 36,467 | |
| 22 | See Notes to Financial Statements. |
Schedule of Investments (continued)
GROWTH OPPORTUNITIES FUNDNovember 30, 2018
| Investments | | Shares | | | Fair
Value
(000) | |
| Health Care Providers & Services 2.15% | | | | | | | | |
| Centene Corp.* | | | 102,300 | | | $ | 14,552 | |
| Guardant Health, Inc.* | | | 69,711 | | | | 2,491 | |
| Total | | | | | | | 17,043 | |
| | | | | | | | | |
| Hotels, Restaurants & Leisure 4.32% | | | | | | | | |
| Aramark | | | 304,293 | | | | 11,581 | |
| Hilton Worldwide Holdings, Inc. | | | 104,586 | | | | 7,900 | |
| Norwegian Cruise Line Holdings Ltd.* | | | 122,945 | | | | 6,310 | |
| Vail Resorts, Inc. | | | 30,216 | | | | 8,436 | |
| Total | | | | | | | 34,227 | |
| | | | | | | | | |
| Household Durables 0.40% | | | | | | | | |
| Mohawk Industries, Inc.* | | | 24,869 | | | | 3,185 | |
| | | | | | | | | |
| Household Products 1.25% | | | | | | | | |
| Church & Dwight Co., Inc. | | | 150,041 | | | | 9,931 | |
| | | | | | | | | |
| Industrial Conglomerates 1.46% | | | | | | | | |
| Roper Technologies, Inc. | | | 38,825 | | | | 11,554 | |
| | | | | | | | | |
| Information Technology Services 9.64% | | | | | | | | |
| DXC Technology Co. | | | 88,832 | | | | 5,600 | |
| Euronet Worldwide, Inc.* | | | 72,298 | | | | 8,503 | |
| Fidelity National Information Services, Inc. | | | 110,467 | | | | 11,925 | |
| FleetCor Technologies, Inc.* | | | 35,773 | | | | 6,918 | |
| Global Payments, Inc. | | | 140,364 | | | | 15,694 | |
| GoDaddy, Inc. Class A* | | | 129,947 | | | | 8,480 | |
| Square, Inc. Class A* | | | 22,406 | | | | 1,565 | |
| Total System Services, Inc. | | | 95,662 | | | | 8,358 | |
| Worldpay, Inc. Class A* | | | 109,144 | | | | 9,366 | |
| Total | | | | | | | 76,409 | |
| | | | | | | | | |
| Insurance 1.52% | | | | | | | | |
| Goosehead Insurance, Inc. Class A* | | | 212,950 | | | | 5,413 | |
| RenaissanceRe Holdings Ltd. | | | 50,159 | | | | 6,652 | |
| Total | | | | | | | 12,065 | |
| Investments | | Shares | | | Fair
Value
(000) | |
| Interactive Media & Services 1.76% | | | | | | | | |
| IAC/InterActiveCorp.* | | | 55,610 | | | $ | 9,896 | |
| Twitter, Inc.* | | | 129,093 | | | | 4,060 | |
| Total | | | | | | | 13,956 | |
| | | | | | | | | |
| Internet & Direct Marketing Retail 0.48% | | | | | | | | |
| GrubHub, Inc.* | | | 48,874 | | | | 3,826 | |
| | | | | | | | | |
| Life Sciences Tools & Services 3.98% | | | | | | | | |
| Agilent Technologies, Inc. | | | 119,690 | | | | 8,659 | |
| Charles River Laboratories International, Inc.* | | | 74,468 | | | | 10,042 | |
| Illumina, Inc.* | | | 11,765 | | | | 3,971 | |
| Mettler-Toledo International, Inc.* | | | 13,949 | | | | 8,881 | |
| Total | | | | | | | 31,553 | |
| | | | | | | | | |
| Machinery 4.18% | | | | | | | | |
| Fortive Corp. | | | 173,595 | | | | 13,205 | |
| IDEX Corp. | | | 78,514 | | | | 10,788 | |
| Stanley Black & Decker, Inc. | | | 69,914 | | | | 9,148 | |
| Total | | | | | | | 33,141 | |
| | | | | | | | | |
| Multi-Line Retail 2.70% | | | | | | | | |
| Dollar General Corp. | | | 120,217 | | | | 13,343 | |
| Dollar Tree, Inc.* | | | 92,555 | | | | 8,031 | |
| Total | | | | | | | 21,374 | |
| | | | | | | | | |
| Oil, Gas & Consumable Fuels 1.26% | | | | | | | | |
| Cimarex Energy Co. | | | 74,285 | | | | 6,090 | |
| Parsley Energy, Inc. Class A* | | | 192,410 | | | | 3,873 | |
| Total | | | | | | | 9,963 | |
| | | | | | | | | |
| Pharmaceuticals 1.66% | | | | | | | | |
| Elanco Animal Health, Inc.* | | | 124,579 | | | | 4,162 | |
| Zoetis, Inc. | | | 95,874 | | | | 9,000 | |
| Total | | | | | | | 13,162 | |
| | | | | | | | | |
| Professional Services 0.99% | | | | | | | | |
| CoStar Group, Inc.* | | | 21,284 | | | | 7,862 | |
| | See Notes to Financial Statements. | 23 |
Schedule of Investments (continued)
GROWTH OPPORTUNITIES FUNDNovember 30, 2018
| Investments | | Shares | | | Fair
Value
(000) | |
| Road & Rail 1.76% | | | | | | | | |
| Genesee & Wyoming, Inc. Class A* | | | 78,823 | | | $ | 6,564 | |
| J.B. Hunt Transport Services, Inc. | | | 69,623 | | | | 7,405 | |
| Total | | | | | | | 13,969 | |
| | | | | | | | | |
| Semiconductors & Semiconductor Equipment 5.71% |
| Advanced Micro Devices, Inc.* | | | 234,718 | | | | 5,000 | |
| Analog Devices, Inc. | | | 90,197 | | | | 8,291 | |
| Lam Research Corp. | | | 49,837 | | | | 7,822 | |
| MACOM Technology Solutions Holdings, Inc.* | | | 134,636 | | | | 2,393 | |
| Marvell Technology Group Ltd. | | | 180,456 | | | | 2,907 | |
| Microchip Technology, Inc. | | | 56,721 | | | | 4,254 | |
| Skyworks Solutions, Inc. | | | 56,855 | | | | 4,137 | |
| Universal Display Corp. | | | 43,573 | | | | 4,002 | |
| Xilinx, Inc. | | | 69,923 | | | | 6,466 | |
| Total | | | | | | | 45,272 | |
| | | | | | | | | |
| Software 10.18% | | | | | | | | |
| Anaplan, Inc.* | | | 92,179 | | | | 2,581 | |
| New Relic, Inc.* | | | 62,578 | | | | 5,456 | |
| PTC, Inc.* | | | 53,164 | | | | 4,598 | |
| Red Hat, Inc.* | | | 77,065 | | | | 13,761 | |
| RingCentral, Inc. Class A* | | | 108,559 | | | | 9,000 | |
| ServiceNow, Inc.* | | | 102,102 | | | | 18,916 | |
| Splunk, Inc.* | | | 108,345 | | | | 12,105 | |
| Ultimate Software Group, Inc. (The)* | | | 53,806 | | | | 14,201 | |
| Total | | | | | | | 80,618 | |
| | | | | | | | | |
| Specialty Retail 6.09% | | | | | | | | |
| Burlington Stores, Inc.* | | | 86,485 | | | | 14,336 | |
| O’Reilly Automotive, Inc.* | | | 40,277 | | | | 13,967 | |
| Tractor Supply Co. | | | 97,103 | | | | 9,238 | |
| Ulta Salon, Cosmetics & Fragrance, Inc.* | | | 35,879 | | | | 10,684 | |
| Total | | | | | | | 48,225 | |
| Investments | | Shares | | | Fair
Value
(000) | |
| Technology Hardware, Storage & Peripherals 0.88% |
| NetApp, Inc. | | | 104,562 | | | $ | 6,992 | |
| | | | | | | | | |
| Textiles, Apparel & Luxury Goods 0.82% | | | | | | | |
| Carter’s, Inc. | | | 70,137 | | | | 6,488 | |
Total Common Stocks
(cost $663,725,741) | | | | | | | 778,513 | |
| | | Principal
Amount
(000) | | | | |
| SHORT-TERM INVESTMENT 1.76% | | | | | | | | |
| | | | | | | | | |
| Repurchase Agreement | | | | | | | | |
Repurchase Agreement dated 11/30/2018, 1.25% due 12/3/2018 with Fixed Income Clearing Corp. collateralized by $14,215,000 of U.S. Treasury Note at 2.625% due 2/28/2023; value: $14,176,108; proceeds: $13,895,413
(cost $13,893,966) | | $ | 13,894 | | | $ | 13,894 | |
Total Investments in Securities 100.01%
(cost $677,619,707) | | | | | | | 792,407 | |
| Liabilities in Excess of Other Assets (0.01)% | | | | | | | (52 | ) |
| Net Assets 100.00% | | | | | | $ | 792,355 | |
| ADR | | American Depositary Receipt. |
| * | | Non-income producing security. |
| (a) | | Foreign security traded in U.S. dollars. |
| 24 | See Notes to Financial Statements. |
Schedule of Investments (concluded)
GROWTH OPPORTUNITIES FUNDNovember 30, 2018
The following is a summary of the inputs used as of November 30, 2018 in valuing the Fund’s investments carried at fair value(1):
| Investment Type(2)(3) | | Level 1
(000) | | | Level 2
(000) | | | Level 3
(000) | | | Total
(000) | |
| Common Stocks | | $ | 778,513 | | | $ | – | | | $ | – | | | $ | 778,513 | |
| Short-Term Investment | | | | | | | | | | | | | | | | |
| Repurchase Agreement | | | – | | | | 13,894 | | | | – | | | | 13,894 | |
| Total | | $ | 778,513 | | | $ | 13,894 | | | $ | – | | | $ | 792,407 | |
| (1) | | Refer to Note 2(i) for a description of fair value measurements and the three-tier hierarchy of inputs. |
| (2) | | See Schedule of Investments for fair values in each industry and identification of foreign issuers and/or geography. |
| (3) | | There were no Level 1/Level 2 transfers during the fiscal year ended November 30, 2018. |
| | See Notes to Financial Statements. | 25 |
Schedule of Investments
SMALL CAP VALUE FUNDNovember 30, 2018
| Investments | | Shares | | | Fair
Value
(000) | |
| COMMON STOCKS 98.25% | | | | | | |
| | | | | | | |
| Aerospace & Defense 2.29% | | | | | | |
| Teledyne Technologies, Inc.* | | | 93,194 | | | $ | 20,930 | |
| | | | | | | | | |
| Banks 10.39% | | | | | | | | |
| CenterState Bank Corp. | | | 757,318 | | | | 18,941 | |
| First Merchants Corp. | | | 506,153 | | | | 21,279 | |
| Renasant Corp. | | | 341,952 | | | | 12,498 | |
| Seacoast Banking Corp. of Florida* | | | 558,321 | | | | 16,191 | |
| Western Alliance Bancorp* | | | 299,432 | | | | 14,034 | |
| Wintrust Financial Corp. | | | 157,843 | | | | 12,209 | |
| Total | | | | | | | 95,152 | |
| | | | | | | | | |
| Beverages 2.86% | | | | | | | | |
| Cott Corp. | | | 1,763,665 | | | | 26,190 | |
| | | | | | | | | |
| Building Products 2.76% | | | | | | | | |
| Advanced Drainage Systems, Inc. | | | 285,608 | | | | 7,788 | |
| Gibraltar Industries, Inc.* | | | 482,491 | | | | 17,447 | |
| Total | | | | | | | 25,235 | |
| | | | | | | | | |
| Capital Markets 0.49% | | | | | | | | |
| BrightSphere InvestmentGroup plc (United Kingdom)(a) | | | 343,304 | | | | 4,521 | |
| | | | | | | | | |
| Chemicals 3.20% | | | | | | | | |
| PolyOne Corp. | | | 372,084 | | | | 12,509 | |
| Valvoline, Inc. | | | 794,349 | | | | 16,753 | |
| Total | | | | | | | 29,262 | |
| | | | | | | | | |
| Commercial Services & Supplies 0.95% | | | | | | | | |
| SP Plus Corp.* | | | 286,477 | | | | 8,683 | |
| | | | | | | | | |
| Communications Equipment 1.64% | | | | | | | | |
| Plantronics, Inc. | | | 329,237 | | | | 15,069 | |
| | | | | | | | | |
| Construction & Engineering 3.51% | | | | | | | | |
| Dycom Industries, Inc.* | | | 94,904 | | | | 6,289 | |
| EMCOR Group, Inc. | | | 168,201 | | | | 12,255 | |
| Primoris Services Corp. | | | 562,905 | | | | 13,594 | |
| Total | | | | | | | 32,138 | |
| Investments | | Shares | | | Fair
Value
(000) | |
| Containers & Packaging 3.43% | | | | | | | | |
| AptarGroup, Inc. | | | 164,785 | | | $ | 17,146 | |
| Berry Global Group, Inc.* | | | 283,321 | | | | 14,257 | |
| Total | | | | | | | 31,403 | |
| | | | | | | | | |
| Electric: Utilities 2.74% | | | | | | | | |
| IDACORP, Inc. | | | 255,125 | | | | 25,064 | |
| | | | | | | | | |
| Electronic Equipment, Instruments & Components 4.35% |
| Belden, Inc. | | | 164,479 | | | | 9,175 | |
| FLIR Systems, Inc. | | | 263,854 | | | | 12,100 | |
| Littelfuse, Inc. | | | 96,980 | | | | 18,557 | |
| Total | | | | | | | 39,832 | |
| | | | | | | | | |
| Entertainment 1.04% | | | | | | | | |
| IMAX Corp. (Canada)*(a) | | | 511,959 | | | | 9,502 | |
| | | | | | | | | |
| Equity Real Estate Investment Trusts 3.15% | | | | | | | | |
| First Industrial Realty Trust, Inc. | | | 633,885 | | | | 20,322 | |
| Pebblebrook Hotel Trust | | | 243,611 | | | | 8,507 | |
| Total | | | | | | | 28,829 | |
| | | | | | | | | |
| Food & Staples Retailing 1.74% | | | | | | | | |
| Sprouts Farmers Market, Inc.* | | | 693,581 | | | | 15,966 | |
| | | | | | | | | |
| Health Care Equipment & Supplies 4.94% | | | | | | |
| Avanos Medical, Inc.* | | | 214,548 | | | | 10,236 | |
| Hill-Rom Holdings, Inc. | | | 164,813 | | | | 15,980 | |
| Integra LifeSciences Holdings Corp.* | | | 183,412 | | | | 9,837 | |
| LivaNova plc(United Kingdom)*(a) | | | 90,650 | | | | 9,173 | |
| Total | | | | | | | 45,226 | |
| | | | | | | | | |
| Health Care Providers & Services 1.46% | | | | | | | |
| Encompass Health Corp. | | | 111,986 | | | | 8,423 | |
| Molina Healthcare, Inc.* | | | 35,280 | | | | 4,929 | |
| Total | | | | | | | 13,352 | |
| 26 | See Notes to Financial Statements. |
Schedule of Investments (continued)
SMALL CAP VALUE FUNDNovember 30, 2018
| Investments | | Shares | | | Fair
Value
(000) | |
| Hotels, Restaurants & Leisure 3.64% | | | | | | | | |
| Churchill Downs, Inc. | | | 40,321 | | | $ | 11,200 | |
| Denny’s Corp.* | | | 671,010 | | | | 11,099 | |
| Dunkin’ Brands Group, Inc. | | | 149,614 | | | | 11,071 | |
| Total | | | | | | | 33,370 | |
| | | | | | | | | |
| Information Technology Services 4.73% | | | | | | | | |
| Booz Allen Hamilton Holding Corp. | | | 472,509 | | | | 24,245 | |
| Conduent, Inc.* | | | 1,484,648 | | | | 19,033 | |
| Total | | | | | | | 43,278 | |
| | | | | | | | | |
| Insurance 4.08% | | | | | | | | |
| Argo Group International Holdings Ltd. | | | 322,318 | | | | 22,343 | |
| Goosehead Insurance, Inc. Class A* | | | 143,534 | | | | 3,649 | |
| RenaissanceRe Holdings Ltd. | | | 85,810 | | | | 11,379 | |
| Total | | | | | | | 37,371 | |
| | | | | | | | | |
| Life Sciences Tools & Services 7.83% | | | | | | | | |
| Cambrex Corp.* | | | 358,876 | | | | 17,165 | |
| Charles River Laboratories International, Inc.* | | | 168,730 | | | | 22,753 | |
| Codexis, Inc.* | | | 718,119 | | | | 15,741 | |
| Syneos Health, Inc.* | | | 310,141 | | | | 16,041 | |
| Total | | | | | | | 71,700 | |
| | | | | | | | | |
| Machinery 7.65% | | | | | | | | |
| Columbus McKinnon Corp. | | | 464,954 | | | | 16,180 | |
| Crane Co. | | | 166,590 | | | | 14,388 | |
| Federal Signal Corp. | | | 1,138,510 | | | | 26,710 | |
| Milacron Holdings Corp.* | | | 896,342 | | | | 12,773 | |
| Total | | | | | | | 70,051 | |
| | | | | | | | | |
| Metals & Mining 1.56% | | | | | | | | |
| Reliance Steel & Aluminum Co. | | | 177,544 | | | | 14,283 | |
| | | | | | | | | |
| Oil, Gas & Consumable Fuels 2.10% | | | | | | | | |
| Centennial Resource Development, Inc. Class A* | | | 707,884 | | | | 10,987 | |
| Parsley Energy, Inc. Class A* | | | 410,697 | | | | 8,267 | |
| Total | | | | | | | 19,254 | |
| Investments | | Shares | | | Fair
Value
(000) | |
| Paper & Forest Products 1.28% | | | | | | |
| Neenah, Inc. | | | 170,401 | | | $ | 11,737 | |
| | | | | | | | | |
| Pharmaceuticals 0.99% | | | | | | | | |
| Catalent, Inc.* | | | 228,553 | | | | 9,062 | |
| | | | | | | | | |
| Professional Services 1.09% | | | | | | | | |
| ICF International, Inc. | | | 142,396 | | | | 9,972 | |
| | | | | | | | | |
| Semiconductors & Semiconductor Equipment 2.36% |
| Brooks Automation, Inc. | | | 404,178 | | | | 12,271 | |
| Entegris, Inc. | | | 318,038 | | | | 9,350 | |
| Total | | | | | | | 21,621 | |
| | | | | | | | | |
| Software 3.98% | | | | | | | | |
| Altair Engineering, Inc. Class A* | | | 365,925 | | | | 11,823 | |
| FireEye, Inc.* | | | 752,629 | | | | 15,060 | |
| Paylocity Holding Corp.* | | | 142,070 | | | | 9,530 | |
| Total | | | | | | | 36,413 | |
| | | | | | | | | |
| Specialty Retail 0.53% | | | | | | | | |
| Advance Auto Parts, Inc. | | | 27,525 | | | | 4,892 | |
| | | | | | | | | |
| Textiles, Apparel & Luxury Goods 5.49% | | | | | | | |
| Oxford Industries, Inc. | | | 159,505 | | | | 12,822 | |
| Steven Madden Ltd. | | | 442,966 | | | | 14,277 | |
| Wolverine World Wide, Inc. | | | 669,307 | | | | 23,158 | |
| Total | | | | | | | 50,257 | |
Total Common Stocks
(cost $713,795,053) | | | | | | | 899,615 | |
| | See Notes to Financial Statements. | 27 |
Schedule of Investments (concluded)
SMALL CAP VALUE FUNDNovember 30, 2018
| Investments | | Principal
Amount
(000) | | | Fair
Value
(000) | |
| SHORT-TERM INVESTMENT 2.02% | | | | | | | | |
| | | | | | | | | |
| Repurchase Agreement | | | | | | | | |
Repurchase Agreement dated 11/30/2018, 1.25% due 12/3/2018 with Fixed Income Clearing Corp. collateralized by $18,860,000 of U.S. Treasury Note at 2.625% due 2/28/2023; value: $18,808,399; proceeds: $18,437,226
(cost $18,435,306) | | $ | 18,435 | | | $ | 18,435 | |
Total Investments in Securities 100.27%
(cost $732,230,359) | | | | | | | 918,050 | |
| Liabilities in Excess of Cash and Other Assets (0.27)% | | | | | | | (2,442 | ) |
| Net Assets 100.00% | | | | | | $ | 915,608 | |
| * | | Non-income producing security. |
| (a) | | Foreign security traded in U.S. dollars. |
The following is a summary of the inputs used as of November 30, 2018 in valuing the Fund’s investments carried at fair value(1):
| Investment Type(2)(3) | | Level 1
(000) | | | Level 2
(000) | | | Level 3
(000) | | | Total
(000) | |
| Common Stocks | | $ | 899,615 | | | $ | – | | | $ | – | | | $ | 899,615 | |
| Short-Term Investment | | | | | | | | | | | | | | | | |
| Repurchase Agreement | | | – | | | | 18,435 | | | | – | | | | 18,435 | |
| Total | | $ | 899,615 | | | $ | 18,435 | | | $ | – | | | $ | 918,050 | |
| (1) | | Refer to Note 2(i) for a description of fair value measurements and the three-tier hierarchy of inputs. |
| (2) | | See Schedule of Investments for fair values in each industry and identification of foreign issuers and/or geography. |
| (3) | | There were no Level 1/Level 2 transfers during the fiscal year ended November 30, 2018. |
| 28 | See Notes to Financial Statements. |
Statements of Assets and Liabilities
November 30, 2018
| | | Calibrated
Dividend
Growth Fund | | | Growth
Opportunities
Fund | | | Small Cap
Value Fund | |
| ASSETS: | | | | | | | | | | | | |
| Investments in securities, at cost | | $ | 2,113,212,946 | | | $ | 677,619,707 | | | $ | 732,230,359 | |
| Investments in securities, at fair value | | $ | 2,362,157,023 | | | $ | 792,407,087 | | | $ | 918,050,051 | |
| Cash | | | – | | | | – | | | | 235,923 | |
| Deposits with brokers for futures collateral | | | 414,000 | | | | – | | | | – | |
| Receivables: | | | | | | | | | | | | |
| Interest and dividends | | | 6,275,561 | | | | 630,122 | | | | 747,273 | |
| Investment securities sold | | | 1,890,551 | | | | 1,827,415 | | | | – | |
| Capital shares sold | | | 2,794,517 | | | | 287,154 | | | | 368,973 | |
| Variation margin for futures contracts | | | 48,543 | | | | – | | | | – | |
| From advisor (See Note 3) | | | 19,283 | | | | – | | | | – | |
| Prepaid expenses and other assets | | | 70,920 | | | | 58,668 | | | | 57,842 | |
| Total assets | | | 2,373,670,398 | | | | 795,210,446 | | | | 919,460,062 | |
| LIABILITIES: | | | | | | | | | | | | |
| Payables: | | | | | | | | | | | | |
| Capital shares reacquired | | | 2,903,892 | | | | 682,258 | | | | 2,224,344 | |
| Investment securities purchased | | | 1,903,798 | | | | 1,261,037 | | | | 224,283 | |
| Management fee | | | 1,032,167 | | | | 480,120 | | | | 569,285 | |
| Directors’ fees | | | 364,422 | | | | 116,169 | | | | 405,395 | |
| 12b-1 distribution plan | | | 507,141 | | | | 102,776 | | | | 112,105 | |
| Fund administration | | | 76,207 | | | | 25,606 | | | | 30,362 | |
| Accrued expenses | | | 469,276 | | | | 187,163 | | | | 286,092 | |
| Total liabilities | | | 7,256,903 | | | | 2,855,129 | | | | 3,851,866 | |
| NET ASSETS | | $ | 2,366,413,495 | | | $ | 792,355,317 | | | $ | 915,608,196 | |
| COMPOSITION OF NET ASSETS: | | | | | | | | | | | | |
| Paid-in capital | | $ | 1,973,641,123 | | | $ | 644,764,261 | | | $ | 606,203,814 | |
| Total distributable earnings | | | 392,772,372 | | | | 147,591,056 | | | | 309,404,382 | |
| Net Assets | | $ | 2,366,413,495 | | | $ | 792,355,317 | | | $ | 915,608,196 | |
| | See Notes to Financial Statements. | 29 |
Statements of Assets and Liabilities (concluded)
November 30, 2018
| | | Calibrated
Dividend
Growth Fund | | | Growth
Opportunities
Fund | | | Small Cap
Value Fund | |
| | | | | | | | | | | | | |
| Net assets by class: | | | | | | | | | | | | |
| Class A Shares | | $ | 1,627,632,967 | | | $ | 333,638,373 | | | $ | 327,333,160 | |
| Class C Shares | | $ | 230,385,194 | | | $ | 26,129,991 | | | $ | 11,330,632 | |
| Class F Shares | | $ | 241,282,005 | | | $ | 20,839,840 | | | $ | 21,981,354 | |
| Class F3 Shares | | $ | 188,484,269 | | | $ | 6,803,726 | | | $ | 33,319,484 | |
| Class I Shares | | $ | 42,697,727 | | | $ | 373,707,576 | | | $ | 466,928,241 | |
| Class P Shares | | $ | 1,662,529 | | | $ | 2,788,703 | | | $ | 25,895,112 | |
| Class R2 Shares | | $ | 1,266,851 | | | $ | 865,280 | | | $ | 655,861 | |
| Class R3 Shares | | $ | 17,079,042 | | | $ | 17,397,047 | | | $ | 6,080,127 | |
| Class R4 Shares | | $ | 4,330,956 | | | $ | 895,608 | | | $ | 1,850,531 | |
| Class R5 Shares | | $ | 248,199 | | | $ | 70,820 | | | $ | 13,322 | |
| Class R6 Shares | | $ | 11,343,756 | | | $ | 9,218,353 | | | $ | 20,220,372 | |
| Outstanding shares by class: | | | | | | | | | | | | |
| Class A Shares (400, 100 and 300 million shares of common stock authorized, $.001 par value) | | | 103,310,127 | | | | 15,548,478 | | | | 15,996,238 | |
| Class C Shares (40, 20 and 20 million shares of common stock authorized, $.001 par value) | | | 14,823,194 | | | | 1,640,255 | | | | 984,906 | |
| Class F Shares (100, 30 and 30 million shares of common stock authorized, $.001 par value) | | | 15,303,258 | | | | 933,215 | | | | 1,066,548 | |
| Class F3 Shares (30, 30 and 30 million shares of common stock authorized, $.001 par value) | | | 11,810,914 | | | | 277,318 | | | | 1,366,309 | |
| Class I Shares (100, 30 and 200 million shares of common stock authorized, $.001 par value) | | | 2,684,539 | | | | 15,309,699 | | | | 19,233,995 | |
| Class P Shares (20, 20 and 50 million shares of common stock authorized, $.001 par value) | | | 104,996 | | | | 133,429 | | | | 1,333,736 | |
| Class R2 Shares (30, 30 and 30 million shares of common stock authorized, $.001 par value) | | | 79,676 | | | | 42,444 | | | | 34,150 | |
| Class R3 Shares (30, 30 and 30 million shares of common stock authorized, $.001 par value) | | | 1,089,703 | | | | 835,941 | | | | 311,765 | |
| Class R4 Shares (30, 30 and 30 million shares of common stock authorized, $.001 par value) | | | 275,173 | | | | 41,737 | | | | 90,400 | |
| Class R5 Shares (30, 30 and 30 million shares of common stock authorized, $.001 par value) | | | 15,611 | | | | 2,899 | | | | 548 | |
| Class R6 Shares (30, 30 and 30 million shares of common stock authorized, $.001 par value) | | | 710,979 | | | | 375,808 | | | | 829,289 | |
Net asset value, offering and redemption price per share
(Net assets divided by outstanding shares): | | | | | | | | | | | | |
| Class A Shares-Net asset value | | | $15.75 | | | | $21.46 | | | | $20.46 | |
Class A Shares-Maximum offering price
(Net asset value plus sales charge of 5.75%) | | | $16.71 | | | | $22.77 | | | | $21.71 | |
| Class C Shares-Net asset value | | | $15.54 | | | | $15.93 | | | | $11.50 | |
| Class F Shares-Net asset value | | | $15.77 | | | | $22.33 | | | | $20.61 | |
| Class F3 Shares-Net asset value | | | $15.96 | | | | $24.53 | | | | $24.39 | |
| Class I Shares-Net asset value | | | $15.91 | | | | $24.41 | | | | $24.28 | |
| Class P Shares-Net asset value | | | $15.83 | | | | $20.90 | | | | $19.42 | |
| Class R2 Shares-Net asset value | | | $15.90 | | | | $20.39 | | | | $19.21 | |
| Class R3 Shares-Net asset value | | | $15.67 | | | | $20.81 | | | | $19.50 | |
| Class R4 Shares-Net asset value | | | $15.74 | | | | $21.46 | | | | $20.47 | |
| Class R5 Shares-Net asset value | | | $15.90 | | | | $24.43 | | | | $24.31 | |
| Class R6 Shares-Net asset value | | | $15.96 | | | | $24.53 | | | | $24.38 | |
| 30 | See Notes to Financial Statements. | |
Statements of Operations
For the Year Ended November 30, 2018
| | | Calibrated
Dividend
Growth Fund | | | Growth
Opportunities
Fund | | | Small Cap
Value Fund | |
| Investment income: | | | | | | | | | | | | |
| Dividends (net of foreign withholding taxes of $0, $0 and $67,691, respectively) | | $ | 59,951,070 | | | $ | 4,956,726 | | | $ | 8,977,290 | |
| Interest and other | | | 98,171 | | | | 102,590 | | | | 170,649 | |
| Interest earned from Interfund Lending (See Note 11) | | | – | | | | – | | | | 960 | |
| Total investment income | | | 60,049,241 | | | | 5,059,316 | | | | 9,148,899 | |
| Expenses: | | | | | | | | | | | | |
| Management fee | | | 13,490,878 | | | | 5,551,203 | | | | 8,146,064 | |
| 12b-1 distribution plan-Class A | | | 4,064,421 | | | | 859,933 | | | | 891,496 | |
| 12b-1 distribution plan-Class B | | | 4,242 | | | | 1,775 | | | | 341 | |
| 12b-1 distribution plan-Class C | | | 2,596,262 | | | | 346,030 | | | | 180,709 | |
| 12b-1 distribution plan-Class F | | | 233,227 | | | | 21,165 | | | | 23,101 | |
| 12b-1 distribution plan-Class P | | | 7,447 | | | | 11,775 | | | | 142,044 | |
| 12b-1 distribution plan-Class R2 | | | 7,824 | | | | 7,224 | | | | 3,876 | |
| 12b-1 distribution plan-Class R3 | | | 90,746 | | | | 94,094 | | | | 35,500 | |
| 12b-1 distribution plan-Class R4 | | | 9,940 | | | | 2,521 | | | | 5,784 | |
| 12b-1 distribution plan-Class T | | | 18 | | | | – | | | | – | |
| Shareholder servicing | | | 1,934,510 | | | | 603,301 | | | | 956,580 | |
| Fund administration | | | 955,296 | | | | 296,064 | | | | 434,457 | |
| Registration | | | 230,067 | | | | 153,013 | | | | 162,980 | |
| Reports to shareholders | | | 198,879 | | | | 55,448 | | | | 62,678 | |
| Professional | | | 75,495 | | | | 53,534 | | | | 60,670 | |
| Directors’ fees | | | 78,216 | | | | 24,026 | | | | 36,857 | |
| Custody | | | 54,487 | | | | 15,016 | | | | 21,279 | |
| Other | | | 108,059 | | | | 75,544 | | | | 103,877 | |
| Gross expenses | | | 24,140,014 | | | | 8,171,666 | | | | 11,268,293 | |
| Expense reductions (See Note 9) | | | (45,200 | ) | | | (8,862 | ) | | | (16,394 | ) |
| Fees waived and expenses reimbursed (See Note 3) | | | (919,940 | ) | | | – | | | | – | |
| Net expenses | | | 23,174,874 | | | | 8,162,804 | | | | 11,251,899 | |
| Net investment income (loss) | | | 36,874,367 | | | | (3,103,488 | ) | | | (2,103,000 | ) |
| Net realized and unrealized gain (loss): | | | | | | | | | | | | |
| Net realized gain on investments | | | 154,496,740 | | | | 36,545,816 | | | | 141,269,867 | |
| Net realized gain on futures contracts | | | 1,410,577 | | | | – | | | | – | |
| Net realized gain on foreign currency related transactions | | | 55,974 | | | | 320 | | | | – | |
| Net change in unrealized appreciation/depreciation on investments | | | (83,847,853 | ) | | | (1,411,098 | ) | | | (135,048,489 | ) |
| Net change in unrealized appreciation/depreciation on futures contracts | | | (433,818 | ) | | | – | | | | – | |
| Net realized and unrealized gain | | | 71,681,620 | | | | 35,135,038 | | | | 6,221,378 | |
| Net Increase in Net Assets Resulting From Operations | | $ | 108,555,987 | | | $ | 32,031,550 | | | $ | 4,118,378 | |
| | See Notes to Financial Statements. | 31 |
Statements of Changes in Net Assets
| | | Calibrated Dividend Growth Fund |
| INCREASE (DECREASE) IN NET ASSETS | | For the Year Ended November 30, 2018 | | | For the Year Ended November 30, 2017 | |
| Operations: | | | | | | | | | | |
| Net investment income (loss) | | | $ | 36,874,367 | | | | $ | 38,410,812 | |
| Net realized gain on investments, futures contracts and foreign currency related transactions | | | | 155,963,291 | | | | | 143,219,517 | |
| Net change in unrealized appreciation/depreciation on investments and futures contracts | | | | (84,281,671 | ) | | | | 233,515,110 | |
| Net increase in net assets resulting from operations | | | | 108,555,987 | | | | | 415,145,439 | |
| Distributions to shareholders from:(1) | | | | | | | | | | |
| Class A | | | | (126,545,657 | ) | | | | (133,221,728 | ) |
| Class B | | | | (132,851 | ) | | | | (886,696 | ) |
| Class C | | | | (20,135,957 | ) | | | | (22,437,229 | ) |
| Class F | | | | (19,052,991 | ) | | | | (25,555,628 | ) |
| Class F3 | | | | (13,955,362 | ) | | | | (6,114 | ) |
| Class I | | | | (3,375,520 | ) | | | | (1,434,487 | ) |
| Class P | | | | (131,367 | ) | | | | (143,288 | ) |
| Class R2 | | | | (95,594 | ) | | | | (82,488 | ) |
| Class R3 | | | | (1,554,876 | ) | | | | (1,942,531 | ) |
| Class R4 | | | | (244,666 | ) | | | | (42,946 | ) |
| Class R5 | | | | (16,214 | ) | | | | (25,337 | ) |
| Class R6 | | | | (1,038,985 | ) | | | | (168,535 | ) |
| Class T | | | | (797 | ) | | | | (43 | ) |
| Total distributions to shareholders | | | | (186,280,837 | ) | | | | (185,947,050 | ) |
| Capital share transactions (Net of share conversions) (See Note 14): | | | | | | | | | | |
| Net proceeds from sales of shares | | | | 322,788,033 | | | | | 816,611,495 | |
| Reinvestment of distributions | | | | 176,723,182 | | | | | 174,564,862 | |
| Cost of shares reacquired | | | | (529,436,900 | ) | | | | (967,316,028 | ) |
| Net increase (decrease) in net assets resulting from capital share transactions | | | | (29,925,685 | ) | | | | 23,860,329 | |
| Net increase (decrease) in net assets | | | | (107,650,535 | ) | | | | 253,058,718 | |
| NET ASSETS: | | | | | | | | | | |
| Beginning of year | | | $ | 2,474,064,030 | | | | $ | 2,221,005,312 | |
| End of year | | | $ | 2,366,413,495 | | | | $ | 2,474,064,030 | |
| Undistributed (distributions in excess of) net investment income(2) | | | $ | – | | | | $ | – | |
| (1) | The SEC eliminated the requirement to disclose the source of distributions paid in 2018. For the year ended November 30, 2017, the source of distributions was as follows: |
| | – | Calibrated Dividend Growth net investment income - Class A $(29,033,647), Class B $(69,254), Class C $(3,174,643), Class F $(7,220,751), Class F3 $(6,114), Class I $(248,829), Class P $(27,066), Class R2 $(16,969), Class R3 $(344,531), Class R4 $(22,303), Class R5 $(4,917), Class R6 $(153,496) and Class T $(43). Net realized gain - Class A $(104,188,081), Class B $(817,442), Class C $(19,262,586), Class F $(18,334,877), Class I $(1,185,658), Class P $(116,222), Class R2 $(65,519), Class R3 $(1,598,000), Class R4 $(20,643), Class R5 $(20,420), and Class R6 $(15,039). |
| | – | For Growth Opportunities Fund, the 2017 dollar amounts represents net realized gain. |
| | – | For Small Cap Value Fund, the 2017 dollar amounts represents net realized gain. |
| (2) | The SEC eliminated the requirement to disclose undistributed (distributions in excess of) net investment income in 2018. For the year ended November 30, 2017, the undistributed (distributions in excess of) net investment income was as follows: |
| | – | Calibrated Dividend Fund $7,358,267, Growth Opportunities Fund $(109,641) and Small Cap Value Fund $165,189. |
| 32 | See Notes to Financial Statements. | |
| Growth Opportunities Fund | | | Small Cap Value Fund | |
For the Year Ended
November 30, 2018 | | | For the Year Ended
November 30, 2017 | | | For the Year Ended
November 30, 2018 | | | For the Year Ended
November 30, 2017 | |
| | | | | | | | | | | | | | | |
| $ | (3,103,488 | ) | | $ | (2,357,473 | ) | | $ | (2,103,000 | ) | | $ | 798,611 | |
| | | | | | | | | | | | | | | |
| | 36,546,136 | | | | 47,988,279 | | | | 141,269,867 | | | | 133,292,790 | |
| | | | | | | | | | | | | | | |
| | (1,411,098 | ) | | | 54,237,626 | | | | (135,048,489 | ) | | | (28,233,811 | ) |
| | 32,031,550 | | | | 99,868,432 | | | | 4,118,378 | | | | 105,857,590 | |
| | | | | | | | | | | | | | | |
| | (28,549,207 | ) | | | (10,895,019 | ) | | | (47,222,302 | ) | | | (52,171,970 | ) |
| | (86,592 | ) | | | (130,964 | ) | | | (31,048 | ) | | | (192,744 | ) |
| | (4,578,110 | ) | | | (1,937,165 | ) | | | (5,116,270 | ) | | | (6,241,995 | ) |
| | (1,671,970 | ) | | | (662,692 | ) | | | (2,930,151 | ) | | | (4,698,343 | ) |
| | (453,908 | ) | | | – | | | | (3,523,248 | ) | | | – | |
| | (409,334 | ) | | | (2,607,713 | ) | | | (66,476,918 | ) | | | (74,890,188 | ) |
| | (224,141 | ) | | | (77,855 | ) | | | (4,514,604 | ) | | | (6,099,904 | ) |
| | (122,850 | ) | | | (32,656 | ) | | | (88,595 | ) | | | (49,795 | ) |
| | (1,768,118 | ) | | | (763,399 | ) | | | (984,885 | ) | | | (967,254 | ) |
| | (86,785 | ) | | | (3,534 | ) | | | (435,819 | ) | | | (155,713 | ) |
| | (4,974 | ) | | | (268 | ) | | | (37,155 | ) | | | (1,722 | ) |
| | (4,845,357 | ) | | | (1,431 | ) | | | (2,448,692 | ) | | | (3,289,718 | ) |
| | – | | | | – | | | | – | | | | – | |
| | (42,801,346 | ) | | | (17,112,696 | ) | | | (133,809,687 | ) | | | (148,759,346 | ) |
| | | | | | | | | | | | | | | |
| | 430,451,999 | | | | 181,056,187 | | | | 109,697,863 | | | | 236,136,556 | |
| | 40,908,912 | | | | 16,255,134 | | | | 126,612,036 | | | | 138,506,665 | |
| | (183,918,203 | ) | | | (320,236,471 | ) | | | (351,422,496 | ) | | | (422,153,613 | ) |
| | | | | | | | | | | | | | | |
| | 287,442,708 | | | | (122,925,150 | ) | | | (115,112,597 | ) | | | (47,510,392 | ) |
| | 276,672,912 | | | | (40,169,414 | ) | | | (244,803,906 | ) | | | (90,412,148 | ) |
| | | | | | | | | | | | | | | |
| $ | 515,682,405 | | | $ | 555,851,819 | | | $ | 1,160,412,102 | | | $ | 1,250,824,250 | |
| $ | 792,355,317 | | | $ | 515,682,405 | | | $ | 915,608,196 | | | $ | 1,160,412,102 | |
| | | | | | | | | | | | | | | |
| $ | – | | | $ | – | | | $ | – | | | $ | – | |
| | See Notes to Financial Statements. | 33 |
Financial Highlights
CALIBRATED DIVIDEND GROWTH FUND
| | | | | | Per Share Operating Performance: |
| | | | | | Investment operations: | | Distributions to
shareholders from: |
| | | Net asset
value,
beginning
of period | | Net
invest-
ment
income(a) | | Net
realized
and
unrealized
gain (loss) | | Total
from
invest-
ment
opera-
tions | | Net
investment
income | | Net
realized
gain | | Total
distri-
butions |
| Class A | | | | | | | | | | | | | | | | | | | | | | | | | | | | |
| 11/30/2018 | | | $16.26 | | | | $0.24 | | | | $ 0.48 | | | | $ 0.72 | | | | $(0.24 | ) | | | $(0.99 | ) | | | $(1.23 | ) |
| 11/30/2017 | | | 14.82 | | | | 0.25 | | | | 2.43 | | | | 2.68 | | | | (0.27 | ) | | | (0.97 | ) | | | (1.24 | ) |
| 11/30/2016 | | | 14.42 | | | | 0.27 | | | | 1.38 | | | | 1.65 | | | | (0.25 | ) | | | (1.00 | ) | | | (1.25 | ) |
| 11/30/2015 | | | 16.97 | | | | 0.26 | | | | (0.46 | ) | | | (0.20 | ) | | | (0.26 | ) | | | (2.09 | ) | | | (2.35 | ) |
| 11/30/2014 | | | 15.57 | | | | 0.25 | | | | 1.75 | | | | 2.00 | | | | (0.24 | ) | | | (0.36 | ) | | | (0.60 | ) |
| | | | | | | | | | | | | | | | | | | | | | | | | | | | | |
| Class C | | | | | | | | | | | | | | | | | | | | | | | | | | | | |
| 11/30/2018 | | | 16.06 | | | | 0.12 | | | | 0.47 | | | | 0.59 | | | | (0.12 | ) | | | (0.99 | ) | | | (1.11 | ) |
| 11/30/2017 | | | 14.64 | | | | 0.14 | | | | 2.41 | | | | 2.55 | | | | (0.16 | ) | | | (0.97 | ) | | | (1.13 | ) |
| 11/30/2016 | | | 14.27 | | | | 0.17 | | | | 1.35 | | | | 1.52 | | | | (0.15 | ) | | | (1.00 | ) | | | (1.15 | ) |
| 11/30/2015 | | | 16.81 | | | | 0.15 | | | | (0.45 | ) | | | (0.30 | ) | | | (0.15 | ) | | | (2.09 | ) | | | (2.24 | ) |
| 11/30/2014 | | | 15.44 | | | | 0.14 | | | | 1.72 | | | | 1.86 | | | | (0.13 | ) | | | (0.36 | ) | | | (0.49 | ) |
| | | | | | | | | | | | | | | | | | | | | | | | | | | | | |
| Class F | | | | | | | | | | | | | | | | | | | | | | | | | | | | |
| 11/30/2018 | | | 16.26 | | | | 0.28 | | | | 0.49 | | | | 0.77 | | | | (0.27 | ) | | | (0.99 | ) | | | (1.26 | ) |
| 11/30/2017 | | | 14.80 | | | | 0.28 | | | | 2.44 | | | | 2.72 | | | | (0.29 | ) | | | (0.97 | ) | | | (1.26 | ) |
| 11/30/2016 | | | 14.41 | | | | 0.31 | | | | 1.35 | | | | 1.66 | | | | (0.27 | ) | | | (1.00 | ) | | | (1.27 | ) |
| 11/30/2015 | | | 16.96 | | | | 0.29 | | | | (0.47 | ) | | | (0.18 | ) | | | (0.28 | ) | | | (2.09 | ) | | | (2.37 | ) |
| 11/30/2014 | | | 15.56 | | | | 0.28 | | | | 1.74 | | | | 2.02 | | | | (0.26 | ) | | | (0.36 | ) | | | (0.62 | ) |
| | | | | | | | | | | | | | | | | | | | | | | | | | | | | |
| Class F3 | | | | | | | | | | | | | | | | | | | | | | | | | | | | |
| 11/30/2018 | | | 16.45 | | | | 0.30 | | | | 0.48 | | | | 0.78 | | | | (0.28 | ) | | | (0.99 | ) | | | (1.27 | ) |
| 4/4/2017 to 11/30/2017(c) | | | 14.66 | | | | 0.24 | | | | 1.70 | | | | 1.94 | | | | (0.15 | ) | | | – | | | | (0.15 | ) |
| | | | | | | | | | | | | | | | | | | | | | | | | | | | | |
| Class I | | | | | | | | | | | | | | | | | | | | | | | | | | | | |
| 11/30/2018 | | | 16.41 | | | | 0.29 | | | | 0.48 | | | | 0.77 | | | | (0.28 | ) | | | (0.99 | ) | | | (1.27 | ) |
| 11/30/2017 | | | 14.93 | | | | 0.33 | | | | 2.42 | | | | 2.75 | | | | (0.30 | ) | | | (0.97 | ) | | | (1.27 | ) |
| 11/30/2016 | | | 14.52 | | | | 0.31 | | | | 1.38 | | | | 1.69 | | | | (0.28 | ) | | | (1.00 | ) | | | (1.28 | ) |
| 11/30/2015 | | | 17.07 | | | | 0.30 | | | | (0.46 | ) | | | (0.16 | ) | | | (0.30 | ) | | | (2.09 | ) | | | (2.39 | ) |
| 11/30/2014 | | | 15.66 | | | | 0.30 | | | | 1.75 | | | | 2.05 | | | | (0.28 | ) | | | (0.36 | ) | | | (0.64 | ) |
| | | | | | | | | | | | | | | | | | | | | | | | | | | | | |
| Class P | | | | | | | | | | | | | | | | | | | | | | | | | | | | |
| 11/30/2018 | | | 16.34 | | | | 0.21 | | | | 0.48 | | | | 0.69 | | | | (0.21 | ) | | | (0.99 | ) | | | (1.20 | ) |
| 11/30/2017 | | | 14.88 | | | | 0.22 | | | | 2.44 | | | | 2.66 | | | | (0.23 | ) | | | (0.97 | ) | | | (1.20 | ) |
| 11/30/2016 | | | 14.47 | | | | 0.24 | | | | 1.39 | | | | 1.63 | | | | (0.22 | ) | | | (1.00 | ) | | | (1.22 | ) |
| 11/30/2015 | | | 17.02 | | | | 0.24 | | | | (0.47 | ) | | | (0.23 | ) | | | (0.23 | ) | | | (2.09 | ) | | | (2.32 | ) |
| 11/30/2014 | | | 15.62 | | | | 0.23 | | | | 1.74 | | | | 1.97 | | | | (0.21 | ) | | | (0.36 | ) | | | (0.57 | ) |
| | | | | | | | | | | | | | | | | | | | | | | | | | | | | |
| Class R2 | | | | | | | | | | | | | | | | | | | | | | | | | | | | |
| 11/30/2018 | | | 16.40 | | | | 0.19 | | | | 0.49 | | | | 0.68 | | | | (0.19 | ) | | | (0.99 | ) | | | (1.18 | ) |
| 11/30/2017 | | | 14.93 | | | | 0.20 | | | | 2.46 | | | | 2.66 | | | | (0.22 | ) | | | (0.97 | ) | | | (1.19 | ) |
| 11/30/2016 | | | 14.52 | | | | 0.22 | | | | 1.38 | | | | 1.60 | | | | (0.19 | ) | | | (1.00 | ) | | | (1.19 | ) |
| 11/30/2015 | | | 17.05 | | | | 0.21 | | | | (0.46 | ) | | | (0.25 | ) | | | (0.19 | ) | | | (2.09 | ) | | | (2.28 | ) |
| 11/30/2014 | | | 15.65 | | | | 0.20 | | | | 1.75 | | | | 1.95 | | | | (0.19 | ) | | | (0.36 | ) | | | (0.55 | ) |
| 34 | See Notes to Financial Statements. | |
| | | | | Ratios to Average Net Assets: | | Supplemental Data: |
| | | | | | | |
Net
asset
value,
end of
period | | Total
return(b)
(%) | | Total
expenses
after
waivers
and/or
reimbursements
(%) | | Total
expenses
(%) | | Net
invest-
ment
income
(%) | | Net
assets,
end of
period
(000) | | Portfolio
turnover
rate
(%) |
| | | | | | | | | | | | | | | | | | | | | |
| | $15.75 | | | 4.72 | | | 0.94 | | | 0.97 | | | 1.57 | | | $1,627,633 | | | 51 | |
| | 16.26 | | | 19.35 | | | 0.92 | | | 1.04 | | | 1.70 | | | 1,671,580 | | | 58 | |
| | 14.82 | | | 12.60 | | | 0.85 | | | 1.06 | | | 1.92 | | | 1,604,257 | | | 70 | |
| | 14.42 | | | (1.34 | ) | | 0.85 | | | 1.07 | | | 1.80 | | | 1,498,459 | | | 58 | |
| | 16.97 | | | 13.28 | | | 0.85 | | | 1.07 | | | 1.62 | | | 1,663,444 | | | 73 | |
| | | | | | | | | | | | | | | | | | | | | |
| | 15.54 | | | 3.90 | | | 1.70 | | | 1.73 | | | 0.81 | | | 230,385 | | | 51 | |
| | 16.06 | | | 18.57 | | | 1.66 | | | 1.79 | | | 0.96 | | | 295,025 | | | 58 | |
| | 14.64 | | | 11.71 | | | 1.60 | | | 1.81 | | | 1.19 | | | 291,842 | | | 70 | |
| | 14.27 | | | (2.03 | ) | | 1.60 | | | 1.82 | | | 1.06 | | | 245,055 | | | 58 | |
| | 16.81 | | | 12.42 | | | 1.59 | | | 1.81 | | | 0.87 | | | 272,167 | | | 73 | |
| | | | | | | | | | | | | | | | | | | | | |
| | 15.77 | | | 5.00 | | | 0.70 | | | 0.82 | | | 1.82 | | | 241,282 | | | 51 | |
| | 16.26 | | | 19.71 | | | 0.70 | | | 0.89 | | | 1.92 | | | 245,916 | | | 58 | |
| | 14.80 | | | 12.72 | | | 0.70 | | | 0.91 | | | 2.18 | | | 266,399 | | | 70 | |
| | 14.41 | | | (1.20 | ) | | 0.70 | | | 0.92 | | | 1.95 | | | 99,737 | | | 58 | |
| | 16.96 | | | 13.46 | | | 0.70 | | | 0.92 | | | 1.77 | | | 123,836 | | | 73 | |
| | | | | | | | | | | | | | | | | | | | | |
| | 15.96 | | | 5.07 | | | 0.62 | | | 0.65 | | | 1.91 | | | 188,484 | | | 51 | |
| | 16.45 | | | 13.31 | (d) | | 0.59 | (e) | | 0.70 | (e) | | 2.34 | (e) | | 176,087 | | | 58 | |
| | | | | | | | | | | | | | | | | | | | | |
| | 15.91 | | | 4.93 | | | 0.69 | | | 0.72 | | | 1.82 | | | 42,698 | | | 51 | |
| | 16.41 | | | 19.77 | | | 0.66 | | | 0.79 | | | 2.17 | | | 43,186 | | | 58 | |
| | 14.93 | | | 12.86 | | | 0.60 | | | 0.81 | | | 2.18 | | | 18,315 | | | 70 | |
| | 14.52 | | | (1.09 | ) | | 0.60 | | | 0.82 | | | 2.05 | | | 15,507 | | | 58 | |
| | 17.07 | | | 13.54 | | | 0.60 | | | 0.82 | | | 1.89 | | | 17,061 | | | 73 | |
| | | | | | | | | | | | | | | | | | | | | |
| | 15.83 | | | 4.48 | | | 1.15 | | | 1.17 | | | 1.36 | | | 1,663 | | | 51 | |
| | 16.34 | | | 19.16 | | | 1.12 | | | 1.24 | | | 1.50 | | | 1,794 | | | 58 | |
| | 14.88 | | | 12.40 | | | 1.05 | | | 1.26 | | | 1.71 | | | 1,782 | | | 70 | |
| | 14.47 | | | (1.56 | ) | | 1.05 | | | 1.27 | | | 1.60 | | | 1,834 | | | 58 | |
| | 17.02 | | | 13.03 | | | 1.05 | | | 1.27 | | | 1.42 | | | 2,714 | | | 73 | |
| | | | | | | | | | | | | | | | | | | | | |
| | 15.90 | | | 4.38 | | | 1.30 | | | 1.32 | | | 1.22 | | | 1,267 | | | 51 | |
| | 16.40 | | | 19.01 | | | 1.27 | | | 1.39 | | | 1.37 | | | 1,335 | | | 58 | |
| | 14.93 | | | 12.16 | | | 1.20 | | | 1.41 | | | 1.57 | | | 1,010 | | | 70 | |
| | 14.52 | | | (1.69 | ) | | 1.20 | | | 1.42 | | | 1.44 | | | 1,108 | | | 58 | |
| | 17.05 | | | 12.86 | | | 1.20 | | | 1.42 | | | 1.26 | | | 1,940 | | | 73 | |
| | See Notes to Financial Statements. | 35 |
Financial Highlights (concluded)
CALIBRATED DIVIDEND GROWTH FUND
| | | | | | Per Share Operating Performance: |
| | | | | | Investment operations: | | Distributions to
shareholders from: |
| | | Net asset
value,
beginning
of period | | Net
invest-
ment
income(a) | | Net
realized
and
unrealized
gain (loss) | | Total
from
invest-
ment
opera-
tions | | Net
investment
income | | Net
realized
gain | | Total
distri-
butions |
| Class R3 | | | | | | | | | | | | | | | | | | | | | | | | | | | | |
| 11/30/2018 | | | $16.19 | | | | $0.20 | | | | $ 0.47 | | | | $ 0.67 | | | | $(0.20 | ) | | | $(0.99 | ) | | | $(1.19 | ) |
| 11/30/2017 | | | 14.75 | | | | 0.22 | | | | 2.42 | | | | 2.64 | | | | (0.23 | ) | | | (0.97 | ) | | | (1.20 | ) |
| 11/30/2016 | | | 14.36 | | | | 0.24 | | | | 1.36 | | | | 1.60 | | | | (0.21 | ) | | | (1.00 | ) | | | (1.21 | ) |
| 11/30/2015 | | | 16.91 | | | | 0.23 | | | | (0.46 | ) | | | (0.23 | ) | | | (0.23 | ) | | | (2.09 | ) | | | (2.32 | ) |
| 11/30/2014 | | | 15.52 | | | | 0.22 | | | | 1.74 | | | | 1.96 | | | | (0.21 | ) | | | (0.36 | ) | | | (0.57 | ) |
| | | | | | | | | | | | | | | | | | | | | | | | | | | | | |
| Class R4 | | | | | | | | | | | | | | | | | | | | | | | | | | | | |
| 11/30/2018 | | | 16.25 | | | | 0.25 | | | | 0.48 | | | | 0.73 | | | | (0.25 | ) | | | (0.99 | ) | | | (1.24 | ) |
| 11/30/2017 | | | 14.81 | | | | 0.26 | | | | 2.42 | | | | 2.68 | | | | (0.27 | ) | | | (0.97 | ) | | | (1.24 | ) |
| 11/30/2016 | | | 14.42 | | | | 0.31 | | | | 1.34 | | | | 1.65 | | | | (0.26 | ) | | | (1.00 | ) | | | (1.26 | ) |
| 6/30/2015 to 11/30/2015(f) | | | 14.37 | | | | 0.11 | | | | 0.01 | | | | 0.12 | | | | (0.07 | ) | | | – | | | | (0.07 | ) |
| | | | | | | | | | | | | | | | | | | | | | | | | | | | | |
| Class R5 | | | | | | | | | | | | | | | | | | | | | | | | | | | | |
| 11/30/2018 | | | 16.40 | | | | 0.29 | | | | 0.48 | | | | 0.77 | | | | (0.28 | ) | | | (0.99 | ) | | | (1.27 | ) |
| 11/30/2017 | | | 14.93 | | | | 0.28 | | | | 2.46 | | | | 2.74 | | | | (0.30 | ) | | | (0.97 | ) | | | (1.27 | ) |
| 11/30/2016 | | | 14.52 | | | | 0.34 | | | | 1.35 | | | | 1.69 | | | | (0.28 | ) | | | (1.00 | ) | | | (1.28 | ) |
| 6/30/2015 to 11/30/2015(f) | | | 14.46 | | | | 0.13 | | | | 0.01 | | | | 0.14 | | | | (0.08 | ) | | | – | | | | (0.08 | ) |
| | | | | | | | | | | | | | | | | | | | | | | | | | | | | |
| Class R6 | | | | | | | | | | | | | | | | | | | | | | | | | | | | |
| 11/30/2018 | | | 16.44 | | | | 0.30 | | | | 0.49 | | | | 0.79 | | | | (0.28 | ) | | | (0.99 | ) | | | (1.27 | ) |
| 11/30/2017 | | | 14.95 | | | | 0.31 | | | | 2.45 | | | | 2.76 | | | | (0.30 | ) | | | (0.97 | ) | | | (1.27 | ) |
| 11/30/2016 | | | 14.52 | | | | 0.43 | | | | 1.28 | | | | 1.71 | | | | (0.28 | ) | | | (1.00 | ) | | | (1.28 | ) |
| 6/30/2015 to 11/30/2015(f) | | | 14.46 | | | | 0.13 | | | | 0.01 | | | | 0.14 | | | | (0.08 | ) | | | – | | | | (0.08 | ) |
| (a) | Calculated using average shares outstanding during the period. |
| (b) | Total return for Classes A and C does not consider the effects of sales loads and assumes the reinvestment of all distributions. Total return for all other classes assumes the reinvestment of all distributions. |
| (c) | Commenced on April 4, 2017. |
| (d) | Not annualized. |
| (e) | Annualized. |
| (f) | Commenced on June 30, 2015. |
| 36 | See Notes to Financial Statements. | |
| | | | | Ratios to Average Net Assets: | | Supplemental Data: |
| | | | | | | |
Net
asset
value,
end of
period | | Total
return(b)
(%) | | Total
expenses
after
waivers
and/or
reimbursements
(%) | | Total
expenses
(%) | | Net
invest-
ment
income
(%) | | Net
assets,
end of
period
(000) | | Portfolio
turnover
rate
(%) |
| | | | | | | | | | | | | | | | | | | | | |
| | $15.67 | | | 4.48 | | | 1.19 | | | 1.22 | | | 1.31 | | | $17,079 | | | 51 | |
| | 16.19 | | | 19.10 | | | 1.14 | | | 1.27 | | | 1.47 | | | 21,399 | | | 58 | |
| | 14.75 | | | 12.32 | | | 1.09 | | | 1.30 | | | 1.69 | | | 23,998 | | | 70 | |
| | 14.36 | | | (1.57 | ) | | 1.08 | | | 1.30 | | | 1.57 | | | 22,189 | | | 58 | |
| | 16.91 | | | 13.05 | | | 1.09 | | | 1.31 | | | 1.38 | | | 23,187 | | | 73 | |
| | | | | | | | | | | | | | | | | | | | | |
| | 15.74 | | | 4.75 | | | 0.94 | | | 0.97 | | | 1.61 | | | 4,331 | | | 51 | |
| | 16.25 | | | 19.42 | | | 0.93 | | | 1.04 | | | 1.71 | | | 2,171 | | | 58 | |
| | 14.81 | | | 12.60 | | | 0.84 | | | 1.06 | | | 2.14 | | | 316 | | | 70 | |
| | 14.42 | | | 0.85 | (d) | | 0.85 | (e) | | 1.07 | (e) | | 1.85 | (e) | | 10 | | | 58 | |
| | | | | | | | | | | | | | | | | | | | | |
| | 15.90 | | | 5.00 | | | 0.69 | | | 0.72 | | | 1.84 | | | 248 | | | 51 | |
| | 16.40 | | | 19.71 | | | 0.66 | | | 0.79 | | | 1.88 | | | 201 | | | 58 | |
| | 14.93 | | | 12.86 | | | 0.59 | | | 0.81 | | | 2.38 | | | 314 | | | 70 | |
| | 14.52 | | | 0.98 | (d) | | 0.60 | (e) | | 0.82 | (e) | | 2.11 | (e) | | 10 | | | 58 | |
| | | | | | | | | | | | | | | | | | | | | |
| | 15.96 | | | 5.06 | | | 0.62 | | | 0.65 | | | 1.89 | | | 11,344 | | | 51 | |
| | 16.44 | | | 19.84 | | | 0.62 | | | 0.73 | | | 2.05 | | | 13,163 | | | 58 | |
| | 14.95 | | | 13.03 | | | 0.49 | | | 0.70 | | | 2.99 | | | 235 | | | 70 | |
| | 14.52 | | | 0.98 | (d) | | 0.49 | (e) | | 0.70 | (e) | | 2.22 | (e) | | 10 | | | 58 | |
| | See Notes to Financial Statements. | 37 |
Financial Highlights
GROWTH OPPORTUNITIES FUND
| | | | | | Per Share Operating Performance: | | | |
| | | | | | Investment operations: | | Distributions to
shareholders
from: | | | |
| | | Net asset
value,
beginning
of period | | Net
investment
income
(loss)(a) | | Net
realized and
unrealized
gain (loss) | | Total from
investment
operations | | Net
realized
gain | | Net asset
value,
end of
period |
| Class A | | | | | | | | | | | | | | | | | | | | | | | | |
| 11/30/2018 | | | $22.21 | | | | $(0.11 | ) | | | $1.20 | | | | $ 1.09 | | | | $(1.84 | ) | | | $21.46 | |
| 11/30/2017 | | | 18.91 | | | | (0.09 | ) | | | 3.97 | | | | 3.88 | | | | (0.58 | ) | | | 22.21 | |
| 11/30/2016 | | | 21.48 | | | | (0.07 | ) | | | 0.04 | | | | (0.03 | ) | | | (2.54 | ) | | | 18.91 | |
| 11/30/2015 | | | 23.75 | | | | (0.10 | ) | | | 1.09 | | | | 0.99 | | | | (3.26 | ) | | | 21.48 | |
| 11/30/2014 | | | 25.70 | | | | (0.09 | ) | | | 2.40 | | | | 2.31 | | | | (4.26 | ) | | | 23.75 | |
| | | | | | | | | | | | | | | | | | | | | | | | | |
| Class C | | | | | | | | | | | | | | | | | | | | | | | | |
| 11/30/2018 | | | 17.08 | | | | (0.20 | ) | | | 0.89 | | | | 0.69 | | | | (1.84 | ) | | | 15.93 | |
| 11/30/2017 | | | 14.78 | | | | (0.18 | ) | | | 3.06 | | | | 2.88 | | | | (0.58 | ) | | | 17.08 | |
| 11/30/2016 | | | 17.48 | | | | (0.16 | ) | | | – | | | | (0.16 | ) | | | (2.54 | ) | | | 14.78 | |
| 11/30/2015 | | | 20.06 | | | | (0.21 | ) | | | 0.89 | | | | 0.68 | | | | (3.26 | ) | | | 17.48 | |
| 11/30/2014 | | | 22.49 | | | | (0.21 | ) | | | 2.04 | | | | 1.83 | | | | (4.26 | ) | | | 20.06 | |
| | | | | | | | | | | | | | | | | | | | | | | | | |
| Class F | | | | | | | | | | | | | | | | | | | | | | | | |
| 11/30/2018 | | | 23.00 | | | | (0.08 | ) | | | 1.25 | | | | 1.17 | | | | (1.84 | ) | | | 22.33 | |
| 11/30/2017 | | | 19.54 | | | | (0.06 | ) | | | 4.10 | | | | 4.04 | | | | (0.58 | ) | | | 23.00 | |
| 11/30/2016 | | | 22.08 | | | | (0.04 | ) | | | 0.04 | | | | – | | | | (2.54 | ) | | | 19.54 | |
| 11/30/2015 | | | 24.29 | | | | (0.07 | ) | | | 1.12 | | | | 1.05 | | | | (3.26 | ) | | �� | 22.08 | |
| 11/30/2014 | | | 26.15 | | | | (0.06 | ) | | | 2.46 | | | | 2.40 | | | | (4.26 | ) | | | 24.29 | |
| | | | | | | | | | | | | | | | | | | | | | | | | |
| Class F3 | | | | | | | | | | | | | | | | | | | | | | | | |
| 11/30/2018 | | | 25.05 | | | | (0.04 | ) | | | 1.36 | | | | 1.32 | | | | (1.84 | ) | | | 24.53 | |
| 4/4/2017 to 11/30/2017(c) | | | 21.60 | | | | – | | | | 3.45 | | | | 3.45 | | | | – | | | | 25.05 | |
| | | | | | | | | | | | | | | | | | | | | | | | | |
| Class I | | | | | | | | | | | | | | | | | | | | | | | | |
| 11/30/2018 | | | 24.95 | | | | (0.05 | ) | | | 1.35 | | | | 1.30 | | | | (1.84 | ) | | | 24.41 | |
| 11/30/2017 | | | 21.12 | | | | (0.06 | ) | | | 4.47 | | | | 4.41 | | | | (0.58 | ) | | | 24.95 | |
| 11/30/2016 | | | 23.63 | | | | (0.03 | ) | | | 0.06 | | | | 0.03 | | | | (2.54 | ) | | | 21.12 | |
| 11/30/2015 | | | 25.75 | | | | (0.05 | ) | | | 1.19 | | | | 1.14 | | | | (3.26 | ) | | | 23.63 | |
| 11/30/2014 | | | 27.45 | | | | (0.04 | ) | | | 2.60 | | | | 2.56 | | | | (4.26 | ) | | | 25.75 | |
| | | | | | | | | | | | | | | | | | | | | | | | | |
| Class P | | | | | | | | | | | | | | | | | | | | | | | | |
| 11/30/2018 | | | 21.72 | | | | (0.15 | ) | | | 1.17 | | | | 1.02 | | | | (1.84 | ) | | | 20.90 | |
| 11/30/2017 | | | 18.54 | | | | (0.12 | ) | | | 3.88 | | | | 3.76 | | | | (0.58 | ) | | | 21.72 | |
| 11/30/2016 | | | 21.15 | | | | (0.11 | ) | | | 0.04 | | | | (0.07 | ) | | | (2.54 | ) | | | 18.54 | |
| 11/30/2015 | | | 23.48 | | | | (0.14 | ) | | | 1.07 | | | | 0.93 | | | | (3.26 | ) | | | 21.15 | |
| 11/30/2014 | | | 25.49 | | | | (0.13 | ) | | | 2.38 | | | | 2.25 | | | | (4.26 | ) | | | 23.48 | |
| | | | | | | | | | | | | | | | | | | | | | | | | |
| Class R2 | | | | | | | | | | | | | | | | | | | | | | | | |
| 11/30/2018 | | | 21.26 | | | | (0.18 | ) | | | 1.15 | | | | 0.97 | | | | (1.84 | ) | | | 20.39 | |
| 11/30/2017 | | | 18.19 | | | | (0.15 | ) | | | 3.80 | | | | 3.65 | | | | (0.58 | ) | | | 21.26 | |
| 11/30/2016 | | | 20.83 | | | | (0.13 | ) | | | 0.03 | | | | (0.10 | ) | | | (2.54 | ) | | | 18.19 | |
| 11/30/2015 | | | 23.20 | | | | (0.17 | ) | | | 1.06 | | | | 0.89 | | | | (3.26 | ) | | | 20.83 | |
| 11/30/2014 | | | 25.27 | | | | (0.16 | ) | | | 2.35 | | | | 2.19 | | | | (4.26 | ) | | | 23.20 | |
| 38 | See Notes to Financial Statements. | |
| | | Ratios to Average Net Assets: | | Supplemental Data: |
| | | | | |
Total
return(b)
(%) | | Total
expenses
(%) | | Net
investment
income (loss)
(%) | | Net assets,
end of
period
(000) | | Portfolio
turnover
rate
(%) |
| | | | | | | | | | | | | | |
| 5.41 | | | 1.18 | | | (0.51 | ) | | $333,638 | | | 55 | |
| 21.17 | | | 1.26 | | | (0.43 | ) | | 348,028 | | | 73 | |
| 0.37 | | | 1.29 | | | (0.39 | ) | | 356,816 | | | 117 | |
| 4.78 | | | 1.28 | | | (0.46 | ) | | 409,626 | | | 97 | |
| 10.41 | | | 1.31 | | | (0.41 | ) | | 419,614 | | | 207 | |
| | | | | | | | | | | | | | |
| 4.61 | | | 1.93 | | | (1.27 | ) | | 26,130 | | | 55 | |
| 20.28 | | | 2.00 | | | (1.17 | ) | | 42,858 | | | 73 | |
| (0.39 | ) | | 2.03 | | | (1.14 | ) | | 50,084 | | | 117 | |
| 4.00 | | | 2.02 | | | (1.20 | ) | | 61,670 | | | 97 | |
| 9.63 | | | 2.02 | | | (1.11 | ) | | 62,897 | | | 207 | |
| | | | | | | | | | | | | | |
| 5.53 | | | 1.03 | | | (0.36 | ) | | 20,840 | | | 55 | |
| 21.36 | | | 1.11 | | | (0.29 | ) | | 21,021 | | | 73 | |
| 0.52 | | | 1.14 | | | (0.23 | ) | | 22,020 | | | 117 | |
| 4.95 | | | 1.13 | | | (0.31 | ) | | 21,956 | | | 97 | |
| 10.60 | | | 1.13 | | | (0.24 | ) | | 20,503 | | | 207 | |
| | | | | | | | | | | | | | |
| 5.73 | | | 0.85 | | | (0.18 | ) | | 6,804 | | | 55 | |
| 15.97 | (f) | | 0.87 | (d) | | 0.01 | (d) | | 6,105 | | | 73 | |
| | | | | | | | | | | | | | |
| 5.67 | | | 0.91 | | | (0.20 | ) | | 373,708 | | | 55 | |
| 21.47 | | | 1.03 | | | (0.30 | ) | | 5,258 | | | 73 | |
| 0.62 | | | 1.04 | | | (0.14 | ) | | 94,899 | | | 117 | |
| 5.07 | | | 1.03 | | | (0.19 | ) | | 101,063 | | | 97 | |
| 10.70 | | | 1.03 | | | (0.16 | ) | | 200,573 | | | 207 | |
| | | | | | | | | | | | | | |
| 5.19 | | | 1.38 | | | (0.71 | ) | | 2,789 | | | 55 | |
| 20.94 | | | 1.46 | | | (0.62 | ) | | 2,642 | | | 73 | |
| 0.17 | | | 1.49 | | | (0.59 | ) | | 2,517 | | | 117 | |
| 4.56 | | | 1.48 | | | (0.66 | ) | | 3,998 | | | 97 | |
| 10.23 | | | 1.48 | | | (0.58 | ) | | 4,521 | | | 207 | |
| | | | | | | | | | | | | | |
| 5.00 | | | 1.53 | | | (0.87 | ) | | 865 | | | 55 | |
| 20.73 | | | 1.60 | | | (0.78 | ) | | 1,415 | | | 73 | |
| 0.01 | | | 1.64 | | | (0.74 | ) | | 1,012 | | | 117 | |
| 4.42 | | | 1.63 | | | (0.80 | ) | | 941 | | | 97 | |
| 10.06 | | | 1.63 | | | (0.72 | ) | | 1,063 | | | 207 | |
| | See Notes to Financial Statements. | 39 |
Financial Highlights (concluded)
GROWTH OPPORTUNITIES FUND
| | | | | Per Share Operating Performance: | | |
| | | | | Investment operations: | | Distributions to
shareholders
from: | | |
| | | Net asset
value,
beginning
of period | | Net
investment
income
(loss)(a) | | Net
realized and
unrealized
gain (loss) | | Total from
investment
operations | | Net
realized
gain | | Net asset
value,
end of
period |
| Class R3 | | | | | | | | | | | | | | | | | | | | | | | | |
| 11/30/2018 | | | $21.64 | | | | $(0.16 | ) | | | $ 1.17 | | | | $ 1.01 | | | | $(1.84 | ) | | | $20.81 | |
| 11/30/2017 | | | 18.49 | | | | (0.13 | ) | | | 3.86 | | | | 3.73 | | | | (0.58 | ) | | | 21.64 | |
| 11/30/2016 | | | 21.11 | | | | (0.11 | ) | | | 0.03 | | | | (0.08 | ) | | | (2.54 | ) | | | 18.49 | |
| 11/30/2015 | | | 23.44 | | | | (0.15 | ) | | | 1.08 | | | | 0.93 | | | | (3.26 | ) | | | 21.11 | |
| 11/30/2014 | | | 25.47 | | | | (0.14 | ) | | | 2.37 | | | | 2.23 | | | | (4.26 | ) | | | 23.44 | |
| | | | | | | | | | | | | | | | | | | | | | | | | |
| Class R4 | | | | | | | | | | | | | | | | | | | | | | | | |
| 11/30/2018 | | | 22.21 | | | | (0.11 | ) | | | 1.20 | | | | 1.09 | | | | (1.84 | ) | | | 21.46 | |
| 11/30/2017 | | | 18.91 | | | | (0.08 | ) | | | 3.96 | | | | 3.88 | | | | (0.58 | ) | | | 22.21 | |
| 11/30/2016 | | | 21.48 | | | | (0.02 | ) | | | (0.01 | ) | | | (0.03 | ) | | | (2.54 | ) | | | 18.91 | |
| 6/30/2015 to 11/30/2015(e) | | | 22.27 | | | | (0.04 | ) | | | (0.75 | ) | | | (0.79 | ) | | | – | | | | 21.48 | |
| | | | | | | | | | | | | | | | | | | | | | | | | |
| Class R5 | | | | | | | | | | | | | | | | | | | | | | | | |
| 11/30/2018 | | | 24.97 | | | | (0.06 | ) | | | 1.36 | | | | 1.30 | | | | (1.84 | ) | | | 24.43 | |
| 11/30/2017 | | | 21.13 | | | | (0.04 | ) | | | 4.46 | | | | 4.42 | | | | (0.58 | ) | | | 24.97 | |
| 11/30/2016 | | | 23.64 | | | | (0.02 | ) | | | 0.05 | | | | 0.03 | | | | (2.54 | ) | | | 21.13 | |
| 6/30/2015 to 11/30/2015(e) | | | 24.48 | | | | (0.02 | ) | | | (0.82 | ) | | | (0.84 | ) | | | – | | | | 23.64 | |
| | | | | | | | | | | | | | | | | | | | | | | | | |
| Class R6 | | | | | | | | | | | | | | | | | | | | | | | | |
| 11/30/2018 | | | 25.05 | | | | (0.07 | ) | | | 1.39 | | | | 1.32 | | | | (1.84 | ) | | | 24.53 | |
| 11/30/2017 | | | 21.18 | | | | – | | | | 4.45 | | | | 4.45 | | | | (0.58 | ) | | | 25.05 | |
| 11/30/2016 | | | 23.65 | | | | 0.01 | | | | 0.06 | | | | 0.07 | | | | (2.54 | ) | | | 21.18 | |
| 6/30/2015 to 11/30/2015(e) | | | 24.48 | | | | (0.01 | ) | | | (0.82 | ) | | | (0.83 | ) | | | – | | | | 23.65 | |
| (a) | Calculated using average shares outstanding during the period. |
| (b) | Total return for Classes A and C does not consider the effects of sales loads and assumes the reinvestment of all distributions. Total return for all other classes assumes the reinvestment of all distributions. |
| (c) | Commenced on April 4, 2017. |
| (d) | Annualized. |
| (e) | Commenced on June 30, 2015. |
| (f) | Not annualized. |
| 40 | See Notes to Financial Statements. | |
| | | Ratios to Average Net Assets: | | Supplemental Data: |
| | | | | |
Total
return(b)
(%) | | Total
expenses
(%) | | Net
investment
income (loss)
(%) | | Net assets,
end of
period
(000) | | Portfolio
turnover
rate
(%) |
| | | | | | | | | | | | | | | | | | | |
| | 5.15 | | | | 1.43 | | | | (0.76 | ) | | | $17,397 | | | | 55 | |
| | 20.83 | | | | 1.49 | | | | (0.67 | ) | | | 20,300 | | | | 73 | |
| | 0.12 | | | | 1.53 | | | | (0.63 | ) | | | 24,927 | | | | 117 | |
| | 4.56 | | | | 1.52 | | | | (0.71 | ) | | | 28,251 | | | | 97 | |
| | 10.15 | | | | 1.53 | | | | (0.62 | ) | | | 29,999 | | | | 207 | |
| | | | | | | | | | | | | | | | | | | |
| | 5.41 | | | | 1.18 | | | | (0.51 | ) | | | 896 | | | | 55 | |
| | 21.17 | | | | 1.23 | | | | (0.40 | ) | | | 1,036 | | | | 73 | |
| | 0.37 | | | | 1.27 | | | | (0.12 | ) | | | 107 | | | | 117 | |
| | (3.55 | )(f) | | | 1.25 | (d) | | | (0.49 | )(d) | | | 10 | | | | 97 | |
| | | | | | | | | | | | | | | | | | | |
| | 5.67 | | | | 0.93 | | | | (0.26 | ) | | | 71 | | | | 55 | |
| | 21.51 | | | | 0.99 | | | | (0.17 | ) | | | 67 | | | | 73 | |
| | 0.63 | | | | 1.00 | | | | (0.11 | ) | | | 10 | | | | 117 | |
| | (3.43 | )(f) | | | 1.00 | (d) | | | (0.24 | )(d) | | | 10 | | | | 97 | |
| | | | | | | | | | | | | | | | | | | |
| | 5.73 | | | | 0.86 | | | | (0.30 | ) | | | 9,218 | | | | 55 | |
| | 21.60 | | | | 0.87 | | | | (0.01 | ) | | | 66,144 | | | | 73 | |
| | 0.81 | | | | 0.86 | | | | 0.04 | | | | 52 | | | | 117 | |
| | (3.39 | )(f) | | | 0.86 | (d) | | | (0.10 | )(d) | | | 10 | | | | 97 | |
| | See Notes to Financial Statements. | 41 |
Financial Highlights
SMALL CAP VALUE FUND
| | | | | Per Share Operating Performance: |
| | | | | Investment operations: | | Distributions to
shareholders from: |
| | | Net asset
value,
beginning
of period | | Net
invest-
ment
income
(loss)(a) | | Net
realized
and
unrealized
gain (loss) | | Total
from
invest-
ment
opera-
tions | | Net
investment
income | | Net
realized
gain | | Total
distri-
butions |
| Class A | | | | | | | | | | | | | | | | | | | | | | | | | | | | |
| 11/30/2018 | | | $23.63 | | | | $(0.07 | ) | | | $(0.17 | ) | | | $(0.24 | ) | | $ | – | | | | $(2.93 | ) | | | $(2.93 | ) |
| 11/30/2017 | | | 24.64 | | | | (0.01 | ) | | | 2.11 | | | | 2.10 | | | | – | | | | (3.11 | ) | | | (3.11 | ) |
| 11/30/2016 | | | 27.17 | | | | (0.02 | ) | | | 2.55 | | | | 2.53 | | | | – | | | | (5.06 | ) | | | (5.06 | ) |
| 11/30/2015 | | | 33.61 | | | | (0.04 | ) | | | 1.33 | | | | 1.29 | | | | – | | | | (7.73 | ) | | | (7.73 | ) |
| 11/30/2014 | | | 42.09 | | | | (0.01 | ) | | | 0.94 | | | | 0.93 | | | | – | | | | (9.41 | ) | | | (9.41 | ) |
| | | | | | | | | | | | | | | | | | | | | | | | | | | | | |
| Class C | | | | | | | | | | | | | | | | | | | | | | | | | | | | |
| 11/30/2018 | | | 14.67 | | | | (0.13 | ) | | | (0.11 | ) | | | (0.24 | ) | | | – | | | | (2.93 | ) | | | (2.93 | ) |
| 11/30/2017 | | | 16.55 | | | | (0.11 | ) | | | 1.34 | | | | 1.23 | | | | – | | | | (3.11 | ) | | | (3.11 | ) |
| 11/30/2016 | | | 20.13 | | | | (0.13 | ) | | | 1.61 | | | | 1.48 | | | | – | | | | (5.06 | ) | | | (5.06 | ) |
| 11/30/2015 | | | 27.04 | | | | (0.18 | ) | | | 1.00 | | | | 0.82 | | | | – | (c) | | | (7.73 | ) | | | (7.73 | ) |
| 11/30/2014 | | | 35.89 | | | | (0.19 | ) | | | 0.75 | | | | 0.56 | | | | – | | | | (9.41 | ) | | | (9.41 | ) |
| | | | | | | | | | | | | | | | | | | | | | | | | | | | | |
| Class F | | | | | | | | | | | | | | | | | | | | | | | | | | | | |
| 11/30/2018 | | | 23.75 | | | | (0.04 | ) | | | (0.17 | ) | | | (0.21 | ) | | | – | | | | (2.93 | ) | | | (2.93 | ) |
| 11/30/2017 | | | 24.72 | | | | 0.02 | | | | 2.12 | | | | 2.14 | | | | – | | | | (3.11 | ) | | | (3.11 | ) |
| 11/30/2016 | | | 27.20 | | | | 0.01 | | | | 2.57 | | | | 2.58 | | | | – | | | | (5.06 | ) | | | (5.06 | ) |
| 11/30/2015 | | | 33.66 | | | | – | (c) | | | 1.33 | | | | 1.33 | | | | (0.06 | ) | | | (7.73 | ) | | | (7.79 | ) |
| 11/30/2014 | | | 42.10 | | | | 0.07 | | | | 0.92 | | | | 0.99 | | | | (0.02 | ) | | | (9.41 | ) | | | (9.43 | ) |
| | | | | | | | | | | | | | | | | | | | | | | | | | | | | |
| Class F3 | | | | | | | | | | | | | | | | | | | | | | | | | | | | |
| 11/30/2018 | | | 27.54 | | | | – | (c) | | | (0.19 | ) | | | (0.19 | ) | | | (0.03 | ) | | | (2.93 | ) | | | (2.96 | ) |
| 4/4/2017 to 11/30/2017(e) | | | 25.41 | | | | 0.05 | | | | 2.08 | | | | 2.13 | | | | – | | | | – | | | | – | |
| | | | | | | | | | | | | | | | | | | | | | | | | | | | | |
| Class I | | | | | | | | | | | | | | | | | | | | | | | | | | | | |
| 11/30/2018 | | | 27.44 | | | | (0.02 | ) | | | (0.19 | ) | | | (0.21 | ) | | | (0.02 | ) | | | (2.93 | ) | | | (2.95 | ) |
| 11/30/2017 | | | 28.06 | | | | 0.05 | | | | 2.44 | | | | 2.49 | | | | – | | | | (3.11 | ) | | | (3.11 | ) |
| 11/30/2016 | | | 30.13 | | | | 0.03 | | | | 2.96 | | | | 2.99 | | | | – | | | | (5.06 | ) | | | (5.06 | ) |
| 11/30/2015 | | | 36.46 | | | | 0.03 | | | | 1.47 | | | | 1.50 | | | | (0.10 | ) | | | (7.73 | ) | | | (7.83 | ) |
| 11/30/2014 | | | 44.83 | | | | 0.10 | | | | 1.01 | | | | 1.11 | | | | (0.07 | ) | | | (9.41 | ) | | | (9.48 | ) |
| | | | | | | | | | | | | | | | | | | | | | | | | | | | | |
| Class P | | | | | | | | | | | | | | | | | | | | | | | | | | | | |
| 11/30/2018 | | | 22.61 | | | | (0.11 | ) | | | (0.15 | ) | | | (0.26 | ) | | | – | | | | (2.93 | ) | | | (2.93 | ) |
| 11/30/2017 | | | 23.75 | | | | (0.05 | ) | | | 2.02 | | | | 1.97 | | | | – | | | | (3.11 | ) | | | (3.11 | ) |
| 11/30/2016 | | | 26.43 | | | | (0.07 | ) | | | 2.45 | | | | 2.38 | | | | – | | | | (5.06 | ) | | | (5.06 | ) |
| 11/30/2015 | | | 32.95 | | | | (0.10 | ) | | | 1.31 | | | | 1.21 | | | | – | | | | (7.73 | ) | | | (7.73 | ) |
| 11/30/2014 | | | 41.50 | | | | (0.06 | ) | | | 0.92 | | | | 0.86 | | | | – | | | | (9.41 | ) | | | (9.41 | ) |
| | | | | | | | | | | | | | | | | | | | | | | | | | | | | |
| Class R2 | | | | | | | | | | | | | | | | | | | | | | | | | | | | |
| 11/30/2018 | | | 22.43 | | | | (0.14 | ) | | | (0.15 | ) | | | (0.29 | ) | | | – | | | | (2.93 | ) | | | (2.93 | ) |
| 11/30/2017 | | | 23.62 | | | | (0.09 | ) | | | 2.01 | | | | 1.92 | | | | – | | | | (3.11 | ) | | | (3.11 | ) |
| 11/30/2016 | | | 26.33 | | | | (0.09 | ) | | | 2.44 | | | | 2.35 | | | | – | | | | (5.06 | ) | | | (5.06 | ) |
| 11/30/2015 | | | 32.90 | | | | (0.14 | ) | | | 1.30 | | | | 1.16 | | | | – | | | | (7.73 | ) | | | (7.73 | ) |
| 11/30/2014 | | | 41.51 | | | | (0.11 | ) | | | 0.91 | | | | 0.80 | | | | – | | | | (9.41 | ) | | | (9.41 | ) |
| 42 | See Notes to Financial Statements. | |
| | | | | Ratios to Average Net Assets: | | Supplemental Data: |
| | | | | | | |
Net
asset
value,
end of
period | | Total
return(b)
(%) | | Total
expenses
(%) | | Net
invest-
ment
income (loss)
(%) | | Net
assets,
end of
period
(000) | | Portfolio
turnover
rate
(%) |
| | | | | | | | | | | | | | | | | | | | | | | |
| | $20.46 | | | | (0.97 | ) | | | 1.18 | | | | (0.33 | ) | | $ | 327,333 | | | | 42 | |
| | 23.63 | | | | 9.43 | | | | 1.18 | | | | (0.05 | ) | | | 385,542 | | | | 56 | |
| | 24.64 | | | | 13.14 | | | | 1.21 | | | | (0.11 | ) | | | 416,989 | | | | 44 | |
| | 27.17 | | | | 4.76 | | | | 1.21 | | | | (0.15 | ) | | | 456,843 | | | | 44 | |
| | 33.61 | | | | 2.79 | | | | 1.24 | | | | (0.02 | ) | | | 732,067 | | | | 31 | |
| | | | | | | | | | | | | | | | | | | | | | | |
| | 11.50 | | | | (1.70 | ) | | | 1.93 | | | | (1.08 | ) | | | 11,331 | | | | 42 | |
| | 14.67 | | | | 8.64 | | | | 1.93 | | | | (0.76 | ) | | | 25,985 | | | | 56 | |
| | 16.55 | | | | 12.32 | | | | 1.96 | | | | (0.86 | ) | | | 33,269 | | | | 44 | |
| | 20.13 | | | | 3.97 | | | | 1.96 | | | | (0.91 | ) | | | 35,312 | | | | 44 | |
| | 27.04 | | | | 2.09 | | | | 1.94 | | | | (0.72 | ) | | | 40,536 | | | | 31 | |
| | | | | | | | | | | | | | | | | | | | | | | |
| | 20.61 | | | | (0.81 | ) | | | 1.03 | | | | (0.18 | ) | | | 21,981 | | | | 42 | |
| | 23.75 | | | | 9.58 | | | | 1.03 | | | | 0.09 | | | | 23,759 | | | | 56 | |
| | 24.72 | | | | 13.35 | | | | 1.06 | | | | 0.04 | | | | 35,213 | | | | 44 | |
| | 27.20 | | | | 4.90 | | | | 1.06 | | | | (0.01 | ) | | | 24,246 | | | | 44 | |
| | 33.66 | | | | 2.96 | | | | 1.04 | | | | 0.20 | | | | 30,238 | | | | 31 | |
| | | | | | | | | | | | | | | | | | | | | | | |
| | 24.39 | | | | (0.62 | ) | | | 0.84 | | | | – | (d) | | | 33,319 | | | | 42 | |
| | 27.54 | | | | 8.38 | (f) | | | 0.84 | (g) | | | 0.30 | (g) | | | 32,548 | | | | 56 | |
| | | | | | | | | | | | | | | | | | | | | | | |
| | 24.28 | | | | (0.72 | ) | | | 0.92 | | | | (0.08 | ) | | | 466,928 | | | | 42 | |
| | 27.44 | | | | 9.70 | | | | 0.93 | | | | 0.19 | | | | 621,900 | | | | 56 | |
| | 28.06 | | | | 13.43 | | | | 0.96 | | | | 0.14 | | | | 679,954 | | | | 44 | |
| | 30.13 | | | | 5.01 | | | | 0.96 | | | | 0.09 | | | | 736,890 | | | | 44 | |
| | 36.46 | | | | 3.08 | | | | 0.95 | | | | 0.27 | | | | 1,000,533 | | | | 31 | |
| | | | | | | | | | | | | | | | | | | | | | | |
| | 19.42 | | | | (1.17 | ) | | | 1.38 | | | | (0.54 | ) | | | 25,895 | | | | 42 | |
| | 22.61 | | | | 9.21 | | | | 1.38 | | | | (0.26 | ) | | | 35,174 | | | | 56 | |
| | 23.75 | | | | 12.90 | | | | 1.42 | | | | (0.31 | ) | | | 46,606 | | | | 44 | |
| | 26.43 | | | | 4.57 | | | | 1.42 | | | | (0.36 | ) | | | 58,957 | | | | 44 | |
| | 32.95 | | | | 2.62 | | | | 1.40 | | | | (0.18 | ) | | | 100,846 | | | | 31 | |
| | | | | | | | | | | | | | | | | | | | | | | |
| | 19.21 | | | | (1.33 | ) | | | 1.53 | | | | (0.68 | ) | | | 656 | | | | 42 | |
| | 22.43 | | | | 9.03 | | | | 1.53 | | | | (0.41 | ) | | | 682 | | | | 56 | |
| | 23.62 | | | | 12.81 | | | | 1.57 | | | | (0.42 | ) | | | 381 | | | | 44 | |
| | 26.33 | | | | 4.38 | | | | 1.56 | | | | (0.55 | ) | | | 288 | | | | 44 | |
| | 32.90 | | | | 2.44 | | | | 1.56 | | | | (0.35 | ) | | | 154 | | | | 31 | |
| | See Notes to Financial Statements. | 43 |
Financial Highlights (concluded)
SMALL CAP VALUE FUND
| | | | | Per Share Operating Performance: |
| | | | | Investment operations: | | Distributions to
shareholders from: |
| | | Net asset
value,
beginning
of period | | Net
invest-
ment
income
(loss)(a) | | Net
realized
and
unrealized
gain (loss) | | Total
from
invest-
ment
opera-
tions | | Net
investment
income | | Net
realized
gain | | Total
distri-
butions |
| Class R3 | | | | | | | | | | | | | | | | | | | | | | | | | | | | |
| 11/30/2018 | | | $22.70 | | | | $(0.11 | ) | | | $(0.16 | ) | | | $(0.27 | ) | | $ | – | | | | $(2.93 | ) | | | $(2.93 | ) |
| 11/30/2017 | | | 23.84 | | | | (0.06 | ) | | | 2.03 | | | | 1.97 | | | | – | | | | (3.11 | ) | | | (3.11 | ) |
| 11/30/2016 | | | 26.51 | | | | (0.07 | ) | | | 2.46 | | | | 2.39 | | | | – | | | | (5.06 | ) | | | (5.06 | ) |
| 11/30/2015 | | | 33.04 | | | | (0.10 | ) | | | 1.30 | | | | 1.20 | | | | – | | | | (7.73 | ) | | | (7.73 | ) |
| 11/30/2014 | | | 41.60 | | | | (0.06 | ) | | | 0.91 | | | | 0.85 | | | | – | | | | (9.41 | ) | | | (9.41 | ) |
| | | | | | | | | | | | | | | | | | | | | | | | | | | | | |
| Class R4 | | | | | | | | | | | | | | | | | | | | | | | | | | | | |
| 11/30/2018 | | | 23.64 | | | | (0.07 | ) | | | (0.17 | ) | | | (0.24 | ) | | | – | | | | (2.93 | ) | | | (2.93 | ) |
| 11/30/2017 | | | 24.65 | | | | (0.02 | ) | | | 2.12 | | | | 2.10 | | | | – | | | | (3.11 | ) | | | (3.11 | ) |
| 11/30/2016 | | | 27.17 | | | | (0.05 | ) | | | 2.59 | | | | 2.54 | | | | – | | | | (5.06 | ) | | | (5.06 | ) |
| 6/30/2015 to 11/30/2015(h) | | | 27.41 | | | | (0.03 | ) | | | (0.21 | ) | | | (0.24 | ) | | | – | | | | – | | | | – | |
| | | | | | | | | | | | | | | | | | | | | | | | | | | | | |
| Class R5 | | | | | | | | | | | | | | | | | | | | | | | | | | | | |
| 11/30/2018 | | | 27.47 | | | | (0.03 | ) | | | (0.17 | ) | | | (0.20 | ) | | | (0.03 | ) | | | (2.93 | ) | | | (2.96 | ) |
| 11/30/2017 | | | 28.08 | | | | 0.03 | | | | 2.47 | | | | 2.50 | | | | – | | | | (3.11 | ) | | | (3.11 | ) |
| 11/30/2016 | | | 30.14 | | | | 0.04 | | | | 2.96 | | | | 3.00 | | | | – | | | | (5.06 | ) | | | (5.06 | ) |
| 6/30/2015 to 11/30/2015(h) | | | 30.37 | | | | – | (c) | | | (0.23 | ) | | | (0.23 | ) | | | – | | | | – | | | | – | |
| | | | | | | | | | | | | | | | | | | | | | | | | | | | | |
| Class R6 | | | | | | | | | | | | | | | | | | | | | | | | | | | | |
| 11/30/2018 | | | 27.53 | | | | – | (c) | | | (0.19 | ) | | | (0.19 | ) | | | (0.03 | ) | | | (2.93 | ) | | | (2.96 | ) |
| 11/30/2017 | | | 28.12 | | | | 0.07 | | | | 2.45 | | | | 2.52 | | | | – | | | | (3.11 | ) | | | (3.11 | ) |
| 11/30/2016 | | | 30.15 | | | | 0.07 | | | | 2.96 | | | | 3.03 | | | | – | | | | (5.06 | ) | | | (5.06 | ) |
| 6/30/2015 to 11/30/2015(h) | | | 30.37 | | | | 0.01 | | | | (0.23 | ) | | | (0.22 | ) | | | – | | | | – | | | | – | |
| (a) | Calculated using average shares outstanding during the period. |
| (b) | Total return for Classes A and C does not consider the effects of sales loads and assumes the reinvestment of all distributions. Total return for all other classes assumes the reinvestment of all distributions. |
| (c) | Amount less than $0.01. |
| (d) | Amount is less than .01%. |
| (e) | Commenced on April 4, 2017. |
| (f) | Not annualized. |
| (g) | Annualized. |
| (h) | Commenced on June 30, 2015. |
| 44 | See Notes to Financial Statements. | |
| | | | | Ratios to Average Net Assets: | | Supplemental Data: |
| | | | | | | |
Net
asset
value,
end of
period | | Total
return(b)
(%) | | Total
expenses
(%) | | Net
invest-
ment
income (loss)
(%) | | Net
assets,
end of
period
(000) | | Portfolio
turnover
rate
(%) |
| | | | | | | | | | | | | | | | | | | | | | | |
| | $19.50 | | | | (1.16 | ) | | | 1.43 | | | | (0.54 | ) | | $ | 6,080 | | | | 42 | |
| | 22.70 | | | | 9.17 | | | | 1.42 | | | | (0.29 | ) | | | 7,728 | | | | 56 | |
| | 23.84 | | | | 12.89 | | | | 1.44 | | | | (0.33 | ) | | | 7,238 | | | | 44 | |
| | 26.51 | | | | 4.52 | | | | 1.44 | | | | (0.39 | ) | | | 6,395 | | | | 44 | |
| | 33.04 | | | | 2.59 | | | | 1.42 | | | | (0.19 | ) | | | 8,266 | | | | 31 | |
| | | | | | | | | | | | | | | | | | | | | | | |
| | 20.47 | | | | (0.96 | ) | | | 1.18 | | | | (0.33 | ) | | | 1,851 | | | | 42 | |
| | 23.64 | | | | 9.43 | | | | 1.18 | | | | (0.08 | ) | | | 3,448 | | | | 56 | |
| | 24.65 | | | | 13.19 | | | | 1.19 | | | | (0.20 | ) | | | 1,234 | | | | 44 | |
| | 27.17 | | | | (0.88 | )(f) | | | 1.16 | (g) | | | (0.23 | )(g) | | | 10 | | | | 44 | |
| | | | | | | | | | | | | | | | | | | | | | | |
| | 24.31 | | | | (0.74 | ) | | | 0.92 | | | | (0.10 | ) | | | 13 | | | | 42 | |
| | 27.47 | | | | 9.73 | | | | 0.92 | | | | 0.12 | | | | 345 | | | | 56 | |
| | 28.08 | | | | 13.46 | | | | 0.94 | | | | 0.17 | | | | 15 | | | | 44 | |
| | 30.14 | | | | (0.76 | )(f) | | | 0.90 | (g) | | | 0.02 | (g) | | | 10 | | | | 44 | |
| | | | | | | | | | | | | | | | | | | | | | | |
| | 24.38 | | | | (0.62 | ) | | | 0.84 | | | | – | (d) | | | 20,220 | | | | 42 | |
| | 27.53 | | | | 9.79 | | | | 0.84 | | | | 0.28 | | | | 23,145 | | | | 56 | |
| | 28.12 | | | | 13.58 | | | | 0.85 | | | | 0.27 | | | | 28,895 | | | | 44 | |
| | 30.15 | | | | (0.72 | )(f) | | | 0.83 | (g) | | | 0.09 | (g) | | | 10 | | | | 44 | |
| | See Notes to Financial Statements. | 45 |
Notes to Financial Statements
Lord Abbett Research Fund, Inc. (the “Company”) is registered under the Investment Company Act of 1940, as amended (the “Act”), as a diversified, open-end management investment company and was incorporated under Maryland law on April 6, 1992. The Company consists of the following three funds (separately, a “Fund” and collectively, the “Funds”) and their respective classes: Lord Abbett Calibrated Dividend Growth Fund (“Calibrated Dividend Growth Fund”), Lord Abbett Growth Opportunities Fund (“Growth Opportunities Fund”) and Lord Abbett Small-Cap Value Series (“Small Cap Value Fund”).
Calibrated Dividend Growth Fund’s investment objective is to seek current income and capital appreciation. Growth Opportunities Fund’s investment objective is capital appreciation. Small Cap Value Fund’s investment objective is long-term capital appreciation. Each Fund has eleven active classes of shares at November 30, 2018: Class A, C, F, F3, I, P, R2, R3, R4, R5 and R6, each with different expenses and dividends. A front-end sales charge is normally added to the net asset value (“NAV”) for Class A shares. There is no front-end sales charge in the case of Class C, F, F3, I, P, R2, R3, R4, R5 and R6 shares, although there may be a contingent deferred sales charge (“CDSC”) in certain cases as follows: Class A shares purchased without a sales charge and redeemed before the first day of the month in which the one-year anniversary of the purchase falls (subject to certain exceptions as set forth in each Fund’s prospectus); and Class C shares redeemed before the first anniversary of purchase. Effective April 30, 2018, Class C shares will convert automatically into Class A shares on the 25th day of the month (or, if the 25th is not a business day, the next business day thereafter) following the tenth anniversary of the month on which the purchase order was accepted. The Funds’ Class P shares are closed to substantially all new investors, with certain exceptions as set forth in the Funds’ prospectus. On April 25, 2018, the Funds’ remaining Class B shares converted to Class A Shares. The Funds no longer issue Class T shares for purchase.
The preparation of the financial statements in conformity with accounting principles generally accepted in the United States of America (“U.S. GAAP”) requires management to make certain estimates and assumptions that affect the reported amounts of assets and liabilities and disclosure of contingent assets and liabilities at the date of the financial statements and the reported amounts of increases and decreases in net assets from operations during the reporting period. Actual results could differ from those estimates. Each Fund is considered an investment company under U.S. GAAP and follows the accounting and reporting guidance applicable to investment companies.
| 2. | SIGNIFICANT ACCOUNTING POLICIES |
| (a) | Investment Valuation–Under procedures approved by the Funds’ Board of Directors (the “Board”), Lord, Abbett & Co. LLC (“Lord Abbett”), the Funds’ investment manager, has formed a Pricing Committee to administer the pricing and valuation of portfolio investments and to ensure that prices utilized reasonably reflect fair value. Among other things, these procedures allow the Funds to utilize independent pricing services, quotations from securities and financial instrument dealers and other market sources to determine fair value. |
| | |
| | Securities actively traded on any recognized U.S. or non-U.S. exchange or on The NASDAQ Stock Market LLC are valued at the last sale price or official closing price on the exchange or system on which they are principally traded. Events occurring after the close of trading on non-U.S. exchanges may result in adjustments to the valuation of foreign securities to reflect their fair value as of the close of regular trading on the New York Stock Exchange. Each Fund may utilize an independent fair valuation service in adjusting the valuations of foreign |
46
Notes to Financial Statements (continued)
| | securities. Unlisted equity securities are valued at the last quoted sale price or, if no sale price is available, at the mean between the most recently quoted bid and asked prices. Exchange traded options and futures contracts are valued at the last quoted sale price in the market where they are principally traded. If no sale has occurred, the mean between the most recently quoted bid and asked prices is used. |
| | |
| | Securities for which prices are not readily available are valued at fair value as determined by the Pricing Committee. The Pricing Committee considers a number of factors, including observable and unobservable inputs, when arriving at fair value. The Pricing Committee may use related or comparable assets or liabilities, recent transactions, market multiples, book values and other relevant information to determine the fair value of portfolio investments. The Board or a designated committee thereof regularly reviews fair value determinations made by the Pricing Committee and may employ techniques such as reviewing related market activity, reviewing inputs and assumptions, and retrospectively comparing prices of subsequent purchases and sales transactions to fair value determinations made by the Pricing Committee. |
| | |
| | Short-term securities with 60 days or less remaining to maturity are valued using the amortized cost method, which approximates fair value. |
| | |
| (b) | Security Transactions–Security transactions are recorded as of the date that the securities are purchased or sold (trade date). Realized gains and losses on sales of portfolio securities are calculated using the identified-cost method. Realized and unrealized gains (losses) are allocated to each class of shares based upon the relative proportion of net assets at the beginning of the day. |
| | |
| (c) | Investment Income–Dividend income is recorded on the ex-dividend date. Interest income is recorded on the accrual basis as earned. Discounts are accreted and premiums are amortized using the effective interest method and are included in Interest and other income on the Statements of Operations. Withholding taxes on foreign dividends have been provided for in accordance with the applicable country’s tax rules and rates. Investment income is allocated to each class of shares based upon the relative proportion of net assets at the beginning of the day. |
| | |
| (d) | Income Taxes–It is the policy of each Fund to meet the requirements of Subchapter M of the Internal Revenue Code applicable to regulated investment companies and to distribute substantially all taxable income and capital gains to its shareholders. Therefore, no income tax provision is required. |
| | |
| | Each Fund files U.S. federal and various state and local tax returns. No income tax returns are currently under examination. The statute of limitations on each Fund’s filed U.S. federal tax returns remains open for the fiscal years ended November 30, 2015 through November 30, 2018. The statutes of limitations on the Company’s state and local tax returns may remain open for an additional year depending upon the jurisdiction. |
| | |
| (e) | Expenses–Expenses incurred by the Company that do not specifically relate to an individual fund are generally allocated to the Funds within the Company on a pro rata basis by relative net assets. Expenses, excluding class-specific expenses, are allocated to each class of shares based upon the relative proportion of net assets at the beginning of the day. Class A, C, F, P, R2, R3 and R4 shares bear their class-specific share of all expenses and fees relating to the Funds’ 12b-1 Distribution Plan. |
| | |
| (f) | Foreign Transactions–The books and records of each Fund are maintained in U.S. dollars and transactions denominated in foreign currencies are recorded in each Fund’s records at the rate |
47
Notes to Financial Statements (continued)
| | prevailing when earned or recorded. Asset and liability accounts that are denominated in foreign currencies are adjusted daily to reflect current exchange rates and any unrealized gain (loss), if applicable, is included in Net change in unrealized appreciation/depreciation on and translation of assets and liabilities denominated in foreign currencies in each Fund’s Statement of Operations. The resultant exchange gains and losses upon settlement of such transactions, if applicable, are included in Net realized gain on foreign currency related transactions in each Fund’s Statement of Operations. The Funds do not isolate that portion of the results of operations arising as a result of changes in the foreign exchange rates from the changes in market prices of the securities. |
| | |
| | The Funds use foreign currency exchange contracts to facilitate transactions in foreign-denominated securities. Losses from these transactions may arise from changes in the value of the foreign currency or if the counterparties do not perform under the contracts’ terms. |
| | |
| (g) | Futures Contracts–Each Fund may purchase and sell index futures contracts to manage cash, or as a substitute position in lieu of holding the underlying asset on which the instrument is based. At the time of entering into a futures transaction, an investor is required to deposit and maintain a specified amount of cash or eligible securities called “initial margin.” Subsequent payments made or received by each Fund called “variation margin” are made on a daily basis as the market price of the futures contract fluctuates. The Funds will record an unrealized gain (loss) based on the amount of variation margin. When a contract is closed, a realized gain (loss) is recorded equal to the difference between the opening and closing value of the contract. |
| | |
| (h) | Repurchase Agreements–Each Fund may enter into repurchase agreements with respect to securities. A repurchase agreement is a transaction in which a fund acquires a security and simultaneously commits to resell that security to the seller (a bank or securities dealer) at an agreed-upon price on an agreed-upon date. Each Fund requires at all times that the repurchase agreement be collateralized by cash, or by securities of the U.S. Government, its agencies, its instrumentalities, or U.S. Government sponsored enterprises having a value equal to, or in excess of, the value of the repurchase agreement (including accrued interest). If the seller of the agreement defaults on its obligation to repurchase the underlying securities at a time when the fair value of these securities has declined, a Fund may incur a loss upon disposition of the securities. |
| | |
| (i) | Fair Value Measurements–Fair value is defined as the price that each Fund would receive upon selling an investment or transferring a liability in an orderly transaction to an independent buyer in the principal or most advantageous market of the investment. A three-tier hierarchy is used to maximize the use of observable market data and minimize the use of unobservable inputs and to establish classification of fair value measurements for disclosure purposes. Inputs refer broadly to the assumptions that market participants would use in pricing the asset or liability, including assumptions about risk—for example, the risk inherent in a particular valuation technique used to measure fair value (such as a pricing model) and/or the risk inherent in the inputs to the valuation technique. Inputs may be observable or unobservable. Observable inputs reflect the assumptions market participants would use in pricing the asset or liability. Observable inputs are based on market data obtained from sources independent of the reporting entity. Unobservable inputs reflect the reporting entity’s own assumptions about the assumptions market participants would use in pricing the asset or liability. Unobservable inputs are based on the best information available in the circumstances. The three-tier hierarchy classification is determined based on the lowest level of inputs that is significant to the fair value measurement, and is summarized in the three broad Levels listed below: |
48
Notes to Financial Statements (continued)
| • | Level 1 – | unadjusted quoted prices in active markets for identical investments; |
| | | |
| • | Level 2 – | other significant observable inputs (including quoted prices for similar investments, interest rates, prepayment speeds, credit risk, etc.); and |
| | | |
| • | Level 3 – | significant unobservable inputs (including each Fund’s own assumptions in determining the fair value of investments). |
| | A summary of inputs used in valuing each Fund’s investments and other financial instruments as of November 30, 2018 and, if applicable, Level 1/Level 2 transfers and Level 3 rollforwards for the fiscal year then ended is included in each Fund’s Schedule of Investments. |
| | |
| | Changes in valuation techniques may result in transfers into or out of an assigned level within the three-tier hierarchy. All transfers between different levels within the three-tier hierarchy are deemed to have occurred as of the beginning of the reporting period. The inputs or methodology used for valuing securities are not necessarily an indication of the risk associated with investing in those securities. |
| 3. | MANAGEMENT FEE AND OTHER TRANSACTIONS WITH AFFILIATES |
Management Fee
The Company has a management agreement with Lord Abbett, pursuant to which Lord Abbett provides each Fund with investment management services and executive and other personnel, provides office space and pays for ordinary and necessary office and clerical expenses relating to research and statistical work and supervision of each Fund’s investment portfolio.
The management fee for Calibrated Dividend Growth Fund is based on the Fund’s average daily net assets at the following annual rates:
| Effective April 1, 2018 | | | Prior to April 1, 2018 | |
| First $2 billion | | | .55 | % | | First $1 billion | | | .65 | % |
| Over $2 billion | | | .49 | % | | Next $1 billion | | | .60 | % |
| | | | | | | Over $2 billion | | | .55 | % |
The management fee for Growth Opportunities Fund is based on the Fund’s average daily net assets at the following annual rates:
| First $1 billion | | | .75 | % | | | | | | |
| Next $1 billion | | | .65 | % | | | | | | |
| Next $1 billion | | | .60 | % | | | | | | |
| Over $3 billion | | | .58 | % | | | | | | |
The management fee for Small Cap Value Fund is based on the Fund’s average daily net assets at the following annual rates:
| First $2 billion | | | .75 | % | | | | | | |
| Over $2 billion | | | .70 | % | | | | | | |
For the fiscal year ended November 30, 2018, the effective management fee, net of waivers, was based on each Fund’s average daily net assets at the following annualized rates:
| | | Net Effective
Management Fee |
| Calibrated Dividend Growth Fund | | | 0.54% |
| Growth Opportunities Fund | | | 0.75% |
| Small Cap Value Fund | | | 0.75% |
49
Notes to Financial Statements (continued)
In addition, Lord Abbett provides certain administrative services to each Fund pursuant to an Administrative Services Agreement in return for a fee at an annual rate of .04% of each Fund’s average daily net assets.
For the period December 1, 2017 through March 31, 2018, Lord Abbett & Co. LLC had contractually agreed to waive its fees and reimburse expenses to the extent necessary to limit total annual operating expenses, excluding the 12b-1 fees, to the following annual rates:
| Calibrated Dividend Growth Fund* |
| Classes | | | |
| A, C, F, I, P, R2, R3, R4 and R5 | | | .70 | % |
| F3 and R6 | | | .60 | % |
| * | Effective April 1, 2018, Lord Abbett discontinued these waivers and reimbursements. |
12b-1 Distribution Plan
Each Fund has adopted a distribution plan with respect to Class A, B, C, F, P, R2, R3, R4 and T shares pursuant to Rule 12b-1 under the Act, which provides for the payment of ongoing distribution and service fees to Lord Abbett Distributor LLC (the “Distributor”), an affiliate of Lord Abbett. The following annual rates have been authorized by the Board pursuant to the plan:
| Fees* | | Class A | | Class B(1) | | Class C | | Class F(2)(3) | | Class P | | Class R2 | | Class R3 | | Class R4 | | Class T(4) |
| Service | | .25% | | .25% | | .25% | | – | | .25% | | .25% | | .25% | | .25% | | .25% |
| Distribution | | – | | .75% | | .75% | | .10% | | .20% | | .35% | | .25% | | – | | – |
| * | The Funds may designate a portion of the aggregate fee as attributable to service activities for purposes of calculating Financial Industry Regulatory Authority, Inc. (“FINRA”) sales charge limitations. |
| (1) | Class B closed April 25, 2018. |
| (2) | The Class F Share Rule 12b-1 fee may be designated as a service fee in limited circumstances as described in the Funds’ prospectus. |
| (3) | For the fiscal year ended November 30, 2018 and continuing through March 31, 2019, the Distributor has contractually agreed to waive Calibrated Dividend Growth Fund’s 0.10% Rule 12b-1 fee for Class F. This agreement may be terminated only by the Fund’s Board of Directors. |
| (4) | Class T closed on July 24, 2018. |
Class F3, Class I, Class R5 and Class R6 shares do not have a distribution plan.
Commissions
Distributor received the following commissions on sales of shares of the Funds, after concessions were paid to authorized dealers, for the fiscal year ended November 30, 2018:
| | | Distributor
Commissions | | | Dealers’
Concessions | | |
| Calibrated Dividend Growth Fund | | | $306,275 | | | | $1,626,269 | | |
| Growth Opportunities Fund | | | 32,410 | | | | 175,209 | | |
| Small Cap Value Fund | | | 50,362 | | | | 278,959 | | |
| | | | | | | | |
Distributor received the following amount of CDSCs for the fiscal year ended November 30, 2018: |
| | | | | | | | |
| | | Class A | | | Class C | | |
| Calibrated Dividend Growth Fund | | | $7,998 | | | | $15,791 | | |
| Growth Opportunities Fund | | | 3,850 | | | | 2,414 | | |
| Small Cap Value Fund | | | 931 | | | | 1,961 | | |
50
Notes to Financial Statements (continued)
Other Related Parties
As of November 30, 2018, the percentages of Growth Opportunities Fund’s and Small Cap Value Fund’s outstanding shares owned by each Fund of Funds were as follows:
| | | Underlying Funds |
| Fund of Funds | | Growth
Opportunities Fund | | Small Cap
Value Fund |
| Alpha Strategy Fund | | – | | 20.67% |
| Multi-Asset Balanced Opportunities Fund | | 16.46% | | – |
| Multi-Asset Global Opportunity Fund | | 1.37% | | – |
| Multi-Asset Growth Fund | | 15.74% | | – |
| Multi-Asset Income Fund | | 9.44% | | – |
One Director and certain of the Funds’ officers have an interest in Lord Abbett.
| 4. | DISTRIBUTIONS AND CAPITAL LOSS CARRYFORWARDS |
Dividends from net investment income, if any, are declared and paid at least quarterly for Calibrated Dividend Growth Fund and annually for Growth Opportunities Fund and Small Cap Value Fund. Taxable net realized gains from investment transactions, reduced by allowable capital loss carryforwards, if any, are declared and distributed to shareholders at least annually. The capital loss carryforward amount, if any, is available to offset future net capital gains. Dividends and distributions to shareholders are recorded on the ex-dividend date. The amounts of dividends and distributions from net investment income and net realized capital gains are determined in accordance with federal income tax regulations, which may differ from U.S. GAAP. These book/tax differences are either considered temporary or permanent in nature. To the extent these differences are permanent in nature, such amounts are reclassified within the components of net assets based on their federal tax basis treatment; temporary differences do not require reclassification. Dividends and distributions, which exceed earnings and profits for tax purposes, are reported as a tax return of capital.
The tax character of distributions paid during the fiscal year ended November 30, 2018 and fiscal year ended November 30, 2017 were as follows:
| | | Calibrated Dividend Growth Fund | | | Growth Opportunities Fund | |
| | | Year Ended
11/30/2018 | | | Year Ended
11/30/2017 | | | Year Ended
11/30/2018 | | | Year Ended
11/30/2017 | |
| Distributions paid from: | | | | | | | | | | | | | | | | |
| Ordinary income | | $ | 114,861,886 | | | $ | 58,094,504 | | | $ | 10,054,491 | | | $ | – | |
| Net long-term capital gains | | | 71,418,951 | | | | 127,852,546 | | | | 32,746,855 | | | | 17,112,696 | |
| Total distributions paid | | $ | 186,280,837 | | | $ | 185,947,050 | | | $ | 42,801,346 | | | $ | 17,112,696 | |
| | | | | | | | | | | | | | | | | |
| | | | Small Cap Value Fund | | | | | | | | | |
| | | Year Ended
11/30/2018 | | | Year Ended
11/30/2017 | | | | | | | | | |
| Distributions paid from: | | | | | | | | | | | | | | | | |
| Ordinary income | | $ | 589,565 | | | $ | 3,952,464 | | | | | | | | | |
| Net long-term capital gains | | | 133,220,122 | | | | 144,806,882 | | | | | | | | | |
| Total distributions paid | | $ | 133,809,687 | | | $ | 148,759,346 | | | | | | | | | |
51
Notes to Financial Statements (continued)
Subsequent to the Funds’ fiscal year ended November 30, 2018, distributions were paid on December 18, 2018 to shareholders of record on December 17, 2018. The approximate amounts were as follows:
| | | Net Short-Term
Capital Gain | | | Net Long-Term
Capital Gains | |
| Calibrated Dividend Growth Fund | | $ | 36,182,000 | | | $ | 117,090,000 | |
| Growth Opportunities Fund | | | 8,160,000 | | | | 31,349,000 | |
| Small Cap Value Fund | | | 7,601,000 | | | | 116,539,000 | |
As of November 30, 2018, the components of accumulated gains on a tax-basis were as follows:
| | | Calibrated
Dividend
Growth Fund | | | Growth
Opportunities
Fund | | | Small Cap
Value Fund | |
| Undistributed ordinary income – net | | | $ 40,231,678 | | | $ | 8,156,688 | | | $ | 7,597,559 | |
| Undistributed long-term capital gains | | | 118,733,710 | | | | 31,338,391 | | | | 116,536,732 | |
| Total undistributed earnings | | | 158,965,388 | | | | 39,495,079 | | | | 124,134,291 | |
| Temporary differences | | | (364,422 | ) | | | (5,372,796 | ) | | | (405,395 | ) |
| Unrealized gains – net | | | 234,171,406 | | | | 113,468,773 | | | | 185,675,486 | |
| Total accumulated gains – net | | | $392,772,372 | | | $ | 147,591,056 | | | $ | 309,404,382 | |
| | | | | | | | | | | | | |
At each Fund’s election, certain losses incurred within the taxable year (Qualified Late-Year Losses) are deemed to arise on the first business day of the Fund’s next taxable year. Growth Opportunities Fund incurred and will elect to defer late-year ordinary and post-October capital losses during fiscal 2018 of $2,766,586 and $2,490,041, respectively. As of November 30, 2018, the aggregate unrealized security gains and losses on investments and other financial instruments based on cost for U.S. federal income tax purposes were as follows: |
| | | | | | | | | | | | | |
| | | Calibrated
Dividend
Growth Fund | | | Growth
Opportunities
Fund | | | Small Cap
Value Fund | |
| Tax cost | | $ | 2,128,056,382 | | | $ | 678,938,314 | | | $ | 732,374,565 | |
| Gross unrealized gain | | | 292,938,066 | | | | 148,597,771 | | | | 219,521,666 | |
| Gross unrealized loss | | | (58,766,660 | ) | | | (35,128,998 | ) | | | (33,846,180 | ) |
| Net unrealized security gain | | $ | 234,171,406 | | | $ | 113,468,773 | | | $ | 185,675,486 | |
The difference between book-basis and tax-basis unrealized gains (losses) is attributable to the tax treatment of certain securities, futures contracts and wash sales.
Permanent items identified during the fiscal year ended November 30, 2018 have been reclassified among the components of net assets based on their tax basis treatment as follows:
| | | Total Distributable
Earnings | | | Paid-in Capital | |
| Calibrated Dividend Growth Fund | | $ | (3,833,963 | ) | | $ | 3,833,963 | |
| Small Cap Value Fund | | | (15,008,341 | ) | | | 15,008,341 | |
The permanent differences are attributable to the tax treatment of long-term capital gain distributions.
52
Notes to Financial Statements (continued)
| 5. | PORTFOLIO SECURITIES TRANSACTIONS |
Purchases and sales of investment securities (excluding short-term investments) for the fiscal year ended November 30, 2018 were as follows:
| | | Purchases | | | Sales | |
| Calibrated Dividend Growth Fund | | | $1,203,595,850 | | | | $1,379,949,808 | |
| Growth Opportunities Fund | | | 632,069,288 | | | | 397,536,178 | |
| Small Cap Value Fund | | | 446,931,386 | | | | 692,725,690 | |
There were no purchases or sales of U.S. Government securities for the fiscal year ended November 30, 2018.
Each Fund is permitted to purchase and sell securities (“cross-trade”) from and to other Lord Abbett funds or client accounts pursuant to procedures approved by the Board in compliance with Rule 17a-7 under the Act (the “Rule”). Each cross-trade is executed at a fair market price in compliance with provisions of the Rule. For the fiscal year ended November, 30 2018, the following Funds engaged in cross-trades:
| Fund | | Purchases | | | Sales | | | Gain | |
| Calibrated Dividend Growth Fund | | | $ 4,406,296 | | | | $10,583,378 | | | | $1,184,537 | |
| Growth Opportunities Fund | | | 24,354,483 | | | | 2,424,311 | | | | 814,529 | |
| Small Cap Value Fund | | | – | | | | 810,201 | | | | 385,358 | |
| 6. | DISCLOSURES ABOUT DERIVATIVE INSTRUMENTS AND HEDGING ACTIVITIES |
Calibrated Dividend Growth Fund entered into E-Mini S&P 500 Index futures contracts for the fiscal year ended November 30, 2018 (as described in note 2(g)) to manage cash. The Fund bears the risk that the underlying index will move unexpectedly, in which case the Fund may realize a loss. There is minimal counterparty credit risk to the Fund since futures are exchange traded and the exchange’s clearinghouse, as counterparty to all exchange traded futures, guarantees futures against default.
As of November 30, 2018, the Fund had futures contracts with unrealized appreciation of $70,765. Amounts of $1,410,577 and $(433,818) are included in the Statement of Operations related to futures contracts under the captions Net realized gain on futures contracts and Net change in unrealized appreciation/depreciation on futures contracts, respectively. The average number of futures contracts throughout the period was 72.
| 7. | DISCLOSURES ABOUT OFFSETTING ASSETS AND LIABILITIES |
The Financial Accounting Standards Board (“FASB”) requires disclosures intended to help better assess the effect or potential effect of offsetting arrangements on a fund’s financial position. The following tables illustrate gross and net information about recognized assets and liabilities eligible for offset in the statement of assets and liabilities, and disclose such amounts subject to an enforceable master netting agreement or similar agreement, by counterparty. A master netting agreement is an agreement between a fund and a counterparty which provides for the net settlement of amounts owed under all contracts traded under that agreement, as well as cash collateral, through a single payment by one party to the other in the event of default on or termination of any one contract. The Funds’ accounting policy with respect to balance sheet offsetting is that, absent an event of default by the counterparty or a termination of the agreement, the master netting agreement does not result in an offset of reported amounts of
53
Notes to Financial Statements (continued)
financial assets and liabilities in the Statement of Assets and Liabilities across transactions between the Funds and the applicable counterparty:
| | | | | | Calibrated Dividend Growth Fund | |
| | | | | | Gross Amounts | | | Net Amounts of | |
| | | | | | Offset in the | | | Assets Presented | |
| | | Gross Amounts of | | | Statement of Assets | | | in the Statement of | |
| Description | | Recognized Assets | | | and Liabilities | | | Assets and Liabilities | |
| Repurchase Agreement | | | $11,013,523 | | | $ | – | | | | $11,013,523 | |
| Total | | | $11,013,523 | | | $ | – | | | | $11,013,523 | |
| | | | | | Amounts Not Offset in the | | | | |
| | | Net Amounts of | | | Statement of Assets and Liabilities | | | | |
| | | Assets Presented | | | | | | Cash | | | Securities | | | | |
| | | in the Statement of | | | Financial | | | Collateral | | | Collateral | | | Net | |
| Counterparty | | Assets and Liabilities | | | Instruments | | | Received(a) | | | Received(a) | | | Amount(b) | |
| Fixed Income Clearing Corp. | | | $11,013,523 | | | $ | – | | | $ | – | | | | $(11,013,523 | ) | | $ | – | |
| Total | | | $11,013,523 | | | $ | – | | | $ | – | | | | $(11,013,523 | ) | | $ | – | |
| | | | | | Growth Opportunities Fund | |
| | | | | | Gross Amounts | | | Net Amounts of | |
| | | | | | Offset in the | | | Assets Presented | |
| | | Gross Amounts of | | | Statement of Assets | | | in the Statement of | |
| Description | | Recognized Assets | | | and Liabilities | | | Assets and Liabilities | |
| Repurchase Agreement | | | $13,893,966 | | | $ | – | | | | $13,893,966 | |
| Total | | | $13,893,966 | | | $ | – | | | | $13,893,966 | |
| | | | | | Amounts Not Offset in the | | | | |
| | | Net Amounts of | | | Statement of Assets and Liabilities | | | | |
| | | Assets Presented | | | | | | Cash | | | Securities | | | | |
| | | in the Statement of | | | Financial | | | Collateral | | | Collateral | | | Net | |
| Counterparty | | Assets and Liabilities | | | Instruments | | | Received(a) | | | Received(a) | | | Amount(b) | |
| Fixed Income Clearing Corp. | | | $13,893,966 | | | $ | – | | | $ | – | | | | $(13,893,966 | ) | | $ | – | |
| Total | | | $13,893,966 | | | $ | – | | | $ | – | | | | $(13,893,966 | ) | | $ | – | |
| | | | | | Small Cap Value Fund | |
| | | | | | Gross Amounts | | | Net Amounts of | |
| | | | | | Offset in the | | | Assets Presented | |
| | | Gross Amounts of | | | Statement of Assets | | | in the Statement of | |
| Description | | Recognized Assets | | | and Liabilities | | | Assets and Liabilities | |
| Repurchase Agreement | | | $18,435,306 | | | $ | – | | | | $18,435,306 | |
| Total | | | $18,435,306 | | | $ | – | | | | $18,435,306 | |
| | | | | | Amounts Not Offset in the | | | | |
| | | Net Amounts of | | | Statement of Assets and Liabilities | | | | |
| | | Assets Presented | | | | | | Cash | | | Securities | | | | |
| | | in the Statement of | | | Financial | | | Collateral | | | Collateral | | | Net | |
| Counterparty | | Assets and Liabilities | | | Instruments | | | Received(a) | | | Received(a) | | | Amount(b) | |
| Fixed Income Clearing Corp. | | | $18,435,306 | | | $ | – | | | $ | – | | | | $(18,435,306 | ) | | $ | – | |
| Total | | | $18,435,306 | | | $ | – | | | $ | – | | | | $(18,435,306 | ) | | $ | – | |
| (a) | Collateral disclosed is limited to an amount not to exceed 100% of the net amount of assets presented in the Statements of Assets and Liabilities, for each respective counterparty. |
| (b) | Net amount represents the amount owed to the Fund by the counterparty as of November 30, 2018. |
54
Notes to Financial Statements (continued)
| 8. | DIRECTORS’ REMUNERATION |
The Company’s officers and the one Director who are associated with Lord Abbett do not receive any compensation from the Company for serving in such capacities. Independent Directors’ fees are allocated among all Lord Abbett-sponsored funds based on the net assets of each Fund. There is an equity-based plan available to all Independent Directors under which Independent Directors must defer receipt of a portion of, and may elect to defer receipt of an additional portion of, Directors’ fees. The deferred amounts are treated as though equivalent dollar amounts had been invested in the Funds. Such amounts and earnings accrued thereon are included in Directors’ fees on the Statements of Operations and in Directors’ fees payable on the Statements of Assets and Liabilities and are not deductible for U.S. federal income tax purposes until such amounts are paid.
The Company has entered into an arrangement with its transfer agent and custodian, whereby credits realized as a result of uninvested cash balances are used to reduce a portion of each Fund’s expenses.
During the period ended August 8, 2018, the Funds and certain other funds managed by Lord Abbett (collectively, the “Participating Funds”) participated in a syndicated line of credit facility with various lenders for $600 million (the “Facility”), whereas State Street Bank and Trust Company (“SSB”) participates as a lender and as agent for the lenders. The Facility is to be used for temporary or emergency purposes as an additional source of liquidity to satisfy redemptions. The Participating Funds are subject to graduated borrowing limits of one-third of Fund assets (if Fund assets are less than $750 million), $250 million, $300 million, or $350 million, based on past borrowings and likelihood of future borrowings. During the period ended August 8, 2018, the Funds did not utilize the Facility.
Effective August 9, 2018, the Participating Funds entered into an amended syndicated line of credit facility with various lenders for $1.06 billion (the “Syndicated Facility”), whereas SSB participates as a lender and as agent for the lenders. Under the Syndicated Facility, the Participating Funds are subject to graduated borrowing limits of one-third of Fund assets (if Fund assets are less than $750 million), $250 million, $300 million, $350 million, or $1 billion, based on past borrowings and likelihood of future borrowings. Also effective August 9, 2018, the Participating Funds entered into an additional line of credit facility with SSB for $250 million (the “Bilateral Facility,” and together with the Syndicated Facility, the “Facilities”). Under the Bilateral Facility, each Participating Fund may borrow up to the lesser of $250 million or one-third of Fund assets. The Facilities are to be used for temporary or emergency purposes to satisfy redemption requests and manage liquidity. For the period from August 9, 2018 through November 30, 2018, the Funds did not utilize the Facilities.
Effective December 21, 2018, the Participating Funds entered into an amended Syndicated Facility with various lenders for $1.1 billion based on the same terms as described above.
| 11. | INTERFUND LENDING PROGRAM |
Pursuant to an exemptive order issued by the U.S. Securities and Exchange Commission (“SEC exemptive order”), certain registered open-end management investment companies managed by Lord Abbett, including each Fund, participate in a joint lending and borrowing program (the “Interfund Lending Program”). The SEC exemptive order allows the Funds to borrow money from and lend money to each other for temporary or emergency purposes subject to the limitations and conditions.
55
Notes to Financial Statements (continued)
During the fiscal year ended November 30, 2018, Small Cap Value Fund participated as a lender in the Interfund Lending Program. For the period in which the loan was outstanding, the average amount loaned, interest rate and interest income were as follows:
| | | | | | Average | | | Interest | |
| Fund | | Average Loan | | | Interest Rate | | | Income* | |
| Small Cap Value Fund | | $ | 15,717,832 | | | | 2.23% | | | $ | 960 | |
| * | included in the Statement of Operations. |
There were no interfund loans outstanding as of November 30, 2018.
| 12. | CUSTODIAN AND ACCOUNTING AGENT |
SSB is the Company’s custodian and accounting agent. SSB performs custodial, accounting and recordkeeping functions relating to portfolio transactions and calculating each Fund’s NAV.
Each Fund is subject to the general risks and considerations associated with equity investing. The value of the Funds’ investments will fluctuate in response to movements in the equity securities markets in general and to the changing prospects of individual companies and/or sectors in which the Funds invest.
Calibrated Dividend Growth Fund invests primarily in equity securities of large and mid-sized company stocks that have a history of growing their dividends, but there is no guarantee that a company will pay a dividend. Also, equity securities may experience significant volatility. Such securities may fall sharply in response to adverse events affecting overall markets, a particular industry or sector, or an individual company’s financial condition. If the Fund’s fundamental research and quantitative analysis fail to produce the intended result, the Fund may suffer losses or underperform its benchmark or other funds with the same investment objective or similar strategies, even in a favorable market. Large and mid-sized company stocks each may perform differently than the market as a whole and other types of stocks. This is because different types of stocks tend to shift in and out of favor depending on market and economic conditions. Mid-sized company stocks may be less able to weather economic shifts or other adverse developments than those of larger, more established companies. Securities of mid-sized companies tend to be more sensitive to changing economic, market, and industry conditions and tend to be less liquid than equity securities of larger companies, especially over the short term. The securities of mid-sized companies may be less well-known and less widely held and trade less frequently and in more limited volume than the securities of large cap company stocks. Mid-sized companies also may fall out of favor relative to larger companies in certain market cycles, causing the Fund to incur losses or underperform.
Growth Opportunities Fund has particular risks associated with growth stocks. Growth companies may grow faster than other companies, which may result in more volatility in their stock prices. In addition, if the Fund’s assessment of a company’s potential for growth or market conditions is wrong, it could suffer losses or produce poor performance relative to other funds, even in a favorable market. Growth stocks often are more sensitive to market fluctuations than other securities because their market prices are highly sensitive to future earnings expectations. The Fund invests largely in mid-sized company stocks, which may be less able to weather economic shifts or other adverse developments than those of larger, more established companies. Due to the Fund’s investment exposure to American Depositary Receipts and foreign companies and emerging markets, the Fund may experience increased market, liquidity, currency, political, information, and other risks. As compared with companies organized and operated in the U.S., these companies may
56
Notes to Financial Statements (continued)
be more vulnerable to economic, political and social instability and subject to less government supervision, lack of transparency, inadequate regulatory and accounting standards, and foreign taxes. The securities of foreign companies also may be subject to inadequate exchange control regulations, the imposition of economic sanctions or other government restrictions, higher transaction and other costs, and delays in settlement to the extent they are traded on non-U.S. exchanges or markets.
Small Cap Value Fund has particular risks associated with small company value stocks. Small company value stocks may perform differently than the market as a whole and other types of stocks, such as large company stocks or growth stocks. The market may fail to recognize the intrinsic value of particular value stocks for a long time. In addition, small cap company stocks may be more volatile and less liquid than large cap company stocks, especially over the short term. The securities of small companies may be less well-known and less widely held and trade less frequently and in more limited volume than the securities of large cap company stocks. Small companies also may fall out of favor relative to larger companies in certain market cycles, causing the Fund to incur losses or underperform. Also, if the Fund’s assessment of a company’s value or prospects for exceeding earnings expectations or market conditions is wrong, the Fund could suffer losses or produce poor performance relative to other funds, even in a favorable market.
These factors can affect each Fund’s performance.
| 14. | SUMMARY OF CAPITAL TRANSACTIONS |
Transactions in shares of capital stock were as follows:
| | | | | | Year Ended | | | | | | Year Ended | |
| Calibrated Dividend Growth Fund | | November 30, 2018 | | | November 30, 2017 | |
| Class A Shares | | Shares | | | Amount | | | Shares | | | Amount | |
| Shares sold | | | 9,564,783 | | | $ | 148,269,160 | | | | 17,237,493 | | | $ | 251,584,654 | |
| Converted from Class B* | | | 41,382 | | | | 640,360 | | | | 582,931 | | | | 8,663,706 | |
| Converted from Class C** | | | 2,374,618 | | | | 35,951,239 | | | | – | | | | – | |
| Reinvestment of distributions | | | 8,003,118 | | | | 123,083,883 | | | | 9,118,133 | | | | 129,936,297 | |
| Shares reacquired | | | (19,451,024 | ) | | | (301,099,074 | ) | | | (32,446,147 | ) | | | (476,362,769 | ) |
| Increase (decrease) | | | 532,877 | | | $ | 6,845,568 | | | | (5,507,590 | ) | | $ | (86,178,112 | ) |
| | | | | | | | | | | | | | | | | |
| Class B Shares | | | | | | | | | | | | | | | | |
| Shares sold | | | 97 | | | $ | 1,486 | | | | 49,879 | | | $ | 699,438 | |
| Reinvestment of distributions | | | 8,492 | | | | 129,500 | | | | 61,469 | | | | 861,943 | |
| Shares reacquired | | | (103,069 | ) | | | (1,592,684 | ) | | | (241,372 | ) | | | (3,468,972 | ) |
| Converted to Class A* | | | (41,656 | ) | | | (640,360 | ) | | | (588,356 | ) | | | (8,663,706 | ) |
| Decrease | | | (136,136 | ) | | $ | (2,102,058 | ) | | | (718,380 | ) | | $ | (10,571,297 | ) |
| | | | | | | | | | | | | | | | | |
| Class C Shares | | | | | | | | | | | | | | | | |
| Shares sold | | | 1,895,073 | | | $ | 29,074,479 | | | | 3,975,066 | | | $ | 57,135,338 | |
| Reinvestment of distributions | | | 1,224,896 | | | | 18,582,786 | | | | 1,381,438 | | | | 19,391,944 | |
| Shares reacquired | | | (4,263,692 | ) | | | (64,936,886 | ) | | | (6,914,871 | ) | | | (100,426,539 | ) |
| Converted to Class A** | | | (2,408,079 | ) | | | (35,951,239 | ) | | | – | | | | – | |
| Decrease | | | (3,551,802 | ) | | $ | (53,230,860 | ) | | | (1,558,367 | ) | | $ | (23,899,257 | ) |
| | | | | | | | | | | | | | | | | |
| Class F Shares | | | | | | | | | | | | | | | | |
| Shares sold | | | 4,928,487 | | | $ | 76,783,071 | | | | 17,987,904 | | | $ | 262,930,478 | |
| Reinvestment of distributions | | | 998,965 | | | | 15,362,516 | | | | 1,505,452 | | | | 21,517,225 | |
| Shares reacquired | | | (5,749,088 | ) | | | (88,577,607 | ) | | | (22,363,267 | ) | | | (337,755,491 | ) |
| Increase (decrease) | | | 178,364 | | | $ | 3,567,980 | | | | (2,869,911 | ) | | $ | (53,307,788 | ) |
57
Notes to Financial Statements (continued)
| | | | | | Year Ended | | | | | | Year Ended | |
| Calibrated Dividend Growth Fund | | November 30, 2018 | | | November 30, 2017 | |
| Class F3 Shares(a) | | Shares | | | Amount | | | Shares | | | Amount | |
| Shares sold | | | 3,299,250 | | | $ | 51,617,144 | | | | 11,232,483 | | | $ | 174,648,835 | |
| Reinvestment of distributions | | | 896,358 | | | | 13,954,493 | | | | 403 | | | | 6,114 | |
| Shares reacquired | | | (3,090,657 | ) | | | (48,475,625 | ) | | | (526,923 | ) | | | (8,325,245 | ) |
| Increase | | | 1,104,951 | | | $ | 17,096,012 | | | | 10,705,963 | | | $ | 166,329,704 | |
| | | | | | | | | | | | | | | | | |
| Class I Shares | | | | | | | | | | | | | | | | |
| Shares sold | | | 693,453 | | | $ | 10,788,500 | | | | 2,428,229 | | | $ | 37,767,714 | |
| Reinvestment of distributions | | | 212,647 | | | | 3,301,777 | | | | 41,535 | | | | 599,260 | |
| Shares reacquired | | | (853,756 | ) | | | (13,336,426 | ) | | | (1,063,997 | ) | | | (15,843,954 | ) |
| Increase | | | 52,344 | | | $ | 753,851 | | | | 1,405,767 | | | $ | 22,523,020 | |
| | | | | | | | | | | | | | | | | |
| Class P Shares | | | | | | | | | | | | | | | | |
| Shares sold | | | 7,262 | | | $ | 112,972 | | | | 10,671 | | | $ | 157,661 | |
| Reinvestment of distributions | | | 8,497 | | | | 131,367 | | | | 10,013 | | | | 143,288 | |
| Shares reacquired | | | (20,543 | ) | | | (317,028 | ) | | | (30,683 | ) | | | (451,261 | ) |
| Decrease | | | (4,784 | ) | | $ | (72,689 | ) | | | (9,999 | ) | | $ | (150,312 | ) |
| | | | | | | | | | | | | | | | | |
| Class R2 Shares | | | | | | | | | | | | | | | | |
| Shares sold | | | 15,101 | | | $ | 237,870 | | | | 25,087 | | | $ | 368,410 | |
| Reinvestment of distributions | | | 5,154 | | | | 79,990 | | | | 4,561 | | | | 65,568 | |
| Shares reacquired | | | (21,942 | ) | | | (344,941 | ) | | | (15,927 | ) | | | (235,943 | ) |
| Increase (decrease) | | | (1,687 | ) | | $ | (27,081 | ) | | | 13,721 | | | $ | 198,035 | |
| | | | | | | | | | | | | | | | | |
| Class R3 Shares | | | | | | | | | | | | | | | | |
| Shares sold | | | 151,488 | | | $ | 2,326,640 | | | | 948,859 | | | $ | 13,528,461 | |
| Reinvestment of distributions | | | 101,583 | | | | 1,554,078 | | | | 136,629 | | | | 1,934,494 | |
| Shares reacquired | | | (485,532 | ) | | | (7,508,595 | ) | | | (1,390,780 | ) | | | (19,877,067 | ) |
| Decrease | | | (232,461 | ) | | $ | (3,627,877 | ) | | | (305,292 | ) | | $ | (4,414,112 | ) |
| | | | | | | | | | | | | | | | | |
| Class R4 Shares | | | | | | | | | | | | | | | | |
| Shares sold | | | 178,316 | | | $ | 2,824,470 | | | | 160,139 | | | $ | 2,398,411 | |
| Reinvestment of distributions | | | 8,801 | | | | 135,280 | | | | 1,622 | | | | 23,302 | |
| Shares reacquired | | | (45,503 | ) | | | (701,194 | ) | | | (49,519 | ) | | | (736,067 | ) |
| Increase | | | 141,614 | | | $ | 2,258,556 | | | | 112,242 | | | $ | 1,685,646 | |
| | | | | | | | | | | | | | | | | |
| Class R5 Shares | | | | | | | | | | | | | | | | |
| Shares sold | | | 2,845 | | | $ | 44,524 | | | | 4,721 | | | $ | 69,099 | |
| Reinvestment of distributions | | | 1,045 | | | | 16,214 | | | | 1,766 | | | | 25,337 | |
| Shares reacquired | | | (510 | ) | | | (7,860 | ) | | | (15,316 | ) | | | (224,123 | ) |
| Increase (decrease) | | | 3,380 | | | $ | 52,878 | | | | (8,829 | ) | | $ | (129,687 | ) |
| | | | | | | | | | | | | | | | | |
| Class R6 Shares | | | | | | | | | | | | | | | | |
| Shares sold | | | 150,613 | | | $ | 2,387,419 | | | | 1,024,192 | | | $ | 15,312,996 | |
| Reinvestment of distributions | | | 25,105 | | | | 390,501 | | | | 4,025 | | | | 60,047 | |
| Shares reacquired | | | (265,217 | ) | | | (4,207,467 | ) | | | (243,427 | ) | | | (3,608,597 | ) |
| Increase (decrease) | | | (89,499 | ) | | $ | (1,429,547 | ) | | | 784,790 | | | $ | 11,764,446 | |
| | | | | | | | | | | | | | | | | |
| Class T Shares(b)(c) | | | | | | | | | | | | | | | | |
| Shares sold | | | – | | | $ | – | | | | 671.42 | | | $ | 10,000 | |
| Reinvestment of distributions | | | 52 | | | | 797 | | | | 3 | | | | 43 | |
| Shares reacquired | | | (726 | ) | | | (11,215 | ) | | | – | | | | – | |
| Increase (decrease) | | | (674 | ) | | $ | (10,418 | ) | | | 674.42 | | | $ | 10,043 | |
58
Notes to Financial Statements (continued)
| | | | | | Year Ended | | | | | | Year Ended | |
| Growth Opportunities Fund | | November 30, 2018 | | | November 30, 2017 | |
| Class A Shares | | Shares | | | Amount | | | Shares | | | Amount | |
| Shares sold | | | 1,117,733 | | | $ | 23,744,866 | | | | 3,107,623 | | | $ | 59,892,861 | |
| Converted from Class B* | | | 19,551 | | | | 413,459 | | | | 102,853 | | | | 2,052,568 | |
| Converted from Class C** | | | 595,880 | | | | 12,758,686 | | | | – | | | | – | |
| Reinvestment of distributions | | | 1,352,643 | | | | 27,391,072 | | | | 571,623 | | | | 10,512,159 | |
| Shares reacquired | | | (3,208,919 | ) | | | (68,644,074 | ) | | | (6,978,684 | ) | | | (136,343,135 | ) |
| Decrease | | | (123,112 | ) | | $ | (4,335,991 | ) | | | (3,196,585 | ) | | $ | (63,885,547 | ) |
| | | | | | | | | | | | | | | | | |
| Class B Shares | | | | | | | | | | | | | | | | |
| Shares sold | | | 627 | | | $ | 9,532 | | | | 50,624 | | | $ | 740,876 | |
| Reinvestment of distributions | | | 5,113 | | | | 77,461 | | | | 8,729 | | | | 124,395 | |
| Shares reacquired | | | (26,901 | ) | | | (419,189 | ) | | | (109,454 | ) | | | (1,624,179 | ) |
| Converted to Class A* | | | (26,052 | ) | | | (413,459 | ) | | | (133,172 | ) | | | (2,052,568 | ) |
| Decrease | | | (47,213 | ) | | $ | (745,655 | ) | | | (183,273 | ) | | $ | (2,811,476 | ) |
| | | | | | | | | | | | | | | | | |
| Class C Shares | | | | | | | | | | | | | | | | |
| Shares sold | | | 210,656 | | | $ | 3,357,443 | | | | 748,931 | | | $ | 11,107,676 | |
| Reinvestment of distributions | | | 293,555 | | | | 4,444,397 | | | | 123,280 | | | | 1,755,502 | |
| Shares reacquired | | | (573,755 | ) | | | (9,117,339 | ) | | | (1,750,658 | ) | | | (26,371,397 | ) |
| Converted to Class A** | | | (799,528 | ) | | | (12,758,686 | ) | | | – | | | | – | |
| Decrease | | | (869,072 | ) | | $ | (14,074,185 | ) | | | (878,447 | ) | | $ | (13,508,219 | ) |
| | | | | | | | | | | | | | | | | |
| Class F Shares | | | | | | | | | | | | | | | | |
| Shares sold | | | 294,901 | | | $ | 6,576,505 | | | | 928,094 | | | $ | 18,826,012 | |
| Reinvestment of distributions | | | 70,550 | | | | 1,484,368 | | | | 31,764 | | | | 604,144 | |
| Shares reacquired | | | (345,995 | ) | | | (7,632,722 | ) | | | (1,172,967 | ) | | | (24,760,632 | ) |
| Increase (decrease) | | | 19,456 | | | $ | 428,151 | | | | (213,109 | ) | | $ | (5,330,476 | ) |
| | | | | | | | | | | | | | | | | |
| Class F3 Shares(a) | | | | | | | | | | | | | | | | |
| Shares sold | | | 87,083 | | | $ | 2,105,485 | | | | 257,490 | | | $ | 6,082,466 | |
| Reinvestment of distributions | | | 19,636 | | | | 453,200 | | | | – | | | | – | |
| Shares reacquired | | | (73,131 | ) | | | (1,773,062 | ) | | | (13,760 | ) | | | (332,437 | ) |
| Increase | | | 33,588 | | | $ | 785,623 | | | | 243,730 | | | $ | 5,750,029 | |
| | | | | | | | | | | | | | | | | |
| Class I Shares | | | | | | | | | | | | | | | | |
| Shares sold | | | 16,083,365 | | | $ | 387,364,241 | | | | 198,370 | | | $ | 4,700,296 | |
| Reinvestment of distributions | | | 17,657 | | | | 405,765 | | | | 116,695 | | | | 2,405,064 | |
| Shares reacquired | | | (1,002,090 | ) | | | (25,027,130 | ) | | | (4,597,336 | ) | | | (98,636,421 | ) |
| Increase (decrease) | | | 15,098,932 | | | $ | 362,742,876 | | | | (4,282,271 | ) | | $ | (91,531,061 | ) |
| | | | | | | | | | | | | | | | | |
| Class P Shares | | | | | | | | | | | | | | | | |
| Shares sold | | | 35,038 | | | $ | 736,937 | | | | 26,829 | | | $ | 504,213 | |
| Reinvestment of distributions | | | 11,343 | | | | 224,141 | | | | 4,318 | | | | 77,812 | |
| Shares reacquired | | | (34,584 | ) | | | (712,645 | ) | | | (45,267 | ) | | | (858,589 | ) |
| Increase (decrease) | | | 11,797 | | | $ | 248,433 | | | | (14,120 | ) | | $ | (276,564 | ) |
| | | | | | | | | | | | | | | | | |
| Class R2 Shares | | | | | | | | | | | | | | | | |
| Shares sold | | | 20,702 | | | $ | 418,663 | | | | 32,972 | | | $ | 616,559 | |
| Reinvestment of distributions | | | 2,441 | | | | 47,109 | | | | 445 | | | | 7,861 | |
| Shares reacquired | | | (47,280 | ) | | | (969,066 | ) | | | (22,494 | ) | | | (431,475 | ) |
| Increase (decrease) | | | (24,137 | ) | | $ | (503,294 | ) | | | 10,923 | | | $ | 192,945 | |
59
Notes to Financial Statements (continued)
| | | | | | Year Ended | | | | | | Year Ended | |
| Growth Opportunities Fund | | November 30, 2018 | | | November 30, 2017 | |
| Class R3 Shares | | Shares | | | Amount | | | Shares | | | Amount | |
| Shares sold | | | 173,747 | | | $ | 3,656,647 | | | | 655,643 | | | $ | 12,360,568 | |
| Reinvestment of distributions | | | 89,679 | | | | 1,765,770 | | | | 42,481 | | | | 762,964 | |
| Shares reacquired | | | (365,422 | ) | | | (7,604,134 | ) | | | (1,108,396 | ) | | | (21,111,528 | ) |
| Decrease | | | (101,996 | ) | | $ | (2,181,717 | ) | | | (410,272 | ) | | $ | (7,987,996 | ) |
| | | | | | | | | | | | | | | | | |
| Class R4 Shares | | | | | | | | | | | | | | | | |
| Shares sold | | | 28,961 | | | $ | 611,931 | | | | 49,084 | | | $ | 980,095 | |
| Reinvestment of distributions | | | 3,002 | | | | 60,800 | | | | 192 | | | | 3,534 | |
| Shares reacquired | | | (36,871 | ) | | | (798,431 | ) | | | (8,272 | ) | | | (172,838 | ) |
| Increase (decrease) | | | (4,908 | ) | | $ | (125,700 | ) | | | 41,004 | | | $ | 810,791 | |
| | | | | | | | | | | | | | | | | |
| Class R5 Shares | | | | | | | | | | | | | | | | |
| Shares sold | | | 70 | | | $ | 1,706 | | | | 2,226 | | | $ | 48,226 | |
| Reinvestment of distributions | | | 216 | | | | 4,974 | | | | 13 | | | | 268 | |
| Shares reacquired | | | (84 | ) | | | (2,072 | ) | | | (2 | ) | | | (46 | ) |
| Increase | | | 202 | | | $ | 4,608 | | | | 2,237 | | | $ | 48,448 | |
| | | | | | | | | | | | | | | | | |
| Class R6 Shares | | | | | | | | | | | | | | | | |
| Shares sold | | | 90,571 | | | $ | 2,203,729 | | | | 3,063,013 | | | $ | 65,196,339 | |
| Reinvestment of distributions | | | 197,134 | | | | 4,549,855 | | | | 69 | | | | 1,431 | |
| Shares reacquired | | | (2,552,875 | ) | | | (61,554,025 | ) | | | (424,557 | ) | | | (9,593,794 | ) |
| Increase (decrease) | | | (2,265,170 | ) | | $ | (54,800,441 | ) | | | 2,638,525 | | | $ | 55,603,976 | |
| | | | | | | | | | | | | | | | | |
| | | | | | | | Year Ended | | | | | | | | Year Ended | |
| Small Cap Value Fund | | | November 30, 2018 | | | | November 30, 2017 | |
| Class A Shares | | | Shares | | | | Amount | | | | Shares | | | | Amount | |
| Shares sold | | | 1,907,096 | | | $ | 40,459,499 | | | | 2,848,708 | | | $ | 63,220,197 | |
| Converted from Class B* | | | 7,278 | | | | 154,543 | | | | 34,584 | | | | 768,795 | |
| Converted from Class C** | | | 530,941 | | | | 11,294,936 | | | | – | | | | – | |
| Reinvestment of distributions | | | 2,122,813 | | | | 43,199,241 | | | | 2,155,965 | | | | 47,474,350 | |
| Shares reacquired | | | (4,888,357 | ) | | | (102,744,350 | ) | | | (5,645,718 | ) | | | (125,667,461 | ) |
| Decrease | | | (320,229 | ) | | $ | (7,636,131 | ) | | | (606,461 | ) | | $ | (14,204,119 | ) |
| | | | | | | | | | | | | | | | | |
| Class B Shares | | | | | | | | | | | | | | | | |
| Shares sold | | | 595 | | | $ | 6,998 | | | | 13,191 | | | $ | 180,418 | |
| Reinvestment of distributions | | | 2,677 | | | | 30,735 | | | | 13,980 | | | | 192,080 | |
| Shares reacquired | | | (1,244 | ) | | | (7,559 | ) | | | (23,295 | ) | | | (319,725 | ) |
| Converted to Class A* | | | (12,635 | ) | | | (154,543 | ) | | | (55,602 | ) | | | (768,795 | ) |
| Decrease | | | (10,607 | ) | | $ | (124,369 | ) | | | (51,726 | ) | | $ | (716,022 | ) |
| | | | | | | | | | | | | | | | | |
| Class C Shares | | | | | | | | | | | | | | | | |
| Shares sold | | | 249,312 | | | $ | 3,021,075 | | | | 622,784 | | | $ | 8,678,374 | |
| Reinvestment of distributions | | | 431,544 | | | | 4,971,382 | | | | 350,214 | | | | 4,822,452 | |
| Shares reacquired | | | (525,877 | ) | | | (6,289,010 | ) | | | (1,212,197 | ) | | | (16,750,657 | ) |
| Converted to Class A** | | | (941,107 | ) | | | (11,294,936 | ) | | | – | | | | – | |
| Decrease | | | (786,128 | ) | | $ | (9,591,489 | ) | | | (239,199 | ) | | $ | (3,249,831 | ) |
| | | | | | | | | | | | | | | | | |
| Class F Shares | | | | | | | | | | | | | | | | |
| Shares sold | | | 445,655 | | | $ | 9,620,419 | | | | 1,947,911 | | | $ | 43,352,495 | |
| Reinvestment of distributions | | | 86,039 | | | | 1,760,362 | | | | 165,961 | | | | 3,667,732 | |
| Shares reacquired | | | (465,642 | ) | | | (9,888,209 | ) | | | (2,538,046 | ) | | | (56,470,571 | ) |
| Increase (decrease) | | | 66,052 | | | $ | 1,492,572 | | | | (424,174 | ) | | $ | (9,450,344 | ) |
60
Notes to Financial Statements (concluded)
| | | | | | Year Ended | | | | | | Year Ended | |
| Small Cap Value Fund | | November 30, 2018 | | | November 30, 2017 | |
| Class F3 Shares(a) | | Shares | | | Amount | | | Shares | | | Amount | |
| Shares sold | | | 472,047 | | | $ | 11,872,217 | | | | 1,261,229.34 | | | $ | 32,616,408 | |
| Reinvestment of distributions | | | 145,769 | | | | 3,523,248 | | | | – | | | | – | |
| Shares reacquired | | | (433,525 | ) | | | (10,995,865 | ) | | | (79,211 | ) | | | (2,107,269 | ) |
| Increase | | | 184,291 | | | $ | 4,399,600 | | | | 1,182,018.34 | | | $ | 30,509,139 | |
| | | | | | | | | | | | | | | | | |
| Class I Shares | | | | | | | | | | | | | | | | |
| Shares sold | | | 1,488,324 | | | $ | 37,748,638 | | | | 1,561,316 | | | $ | 40,645,907 | |
| Reinvestment of distributions | | | 2,716,431 | | | | 65,411,652 | | | | 2,813,713 | | | | 71,805,967 | |
| Shares reacquired | | | (7,632,482 | ) | | | (199,694,714 | ) | | | (5,943,698 | ) | | | (153,423,955 | ) |
| Decrease | | | (3,427,727 | ) | | $ | (96,534,424 | ) | | | (1,568,669 | ) | | $ | (40,972,081 | ) |
| | | | | | | | | | | | | | | | | |
| Class P Shares | | | | | | | | | | | | | | | | |
| Shares sold | | | 136,528 | | | $ | 2,781,696 | | | | 204,030 | | | $ | 4,353,817 | |
| Reinvestment of distributions | | | 233,430 | | | | 4,514,543 | | | | 288,814 | | | | 6,099,754 | |
| Shares reacquired | | | (591,755 | ) | | | (12,043,520 | ) | | | (899,537 | ) | | | (19,140,572 | ) |
| Decrease | | | (221,797 | ) | | $ | (4,747,281 | ) | | | (406,693 | ) | | $ | (8,687,001 | ) |
| | | | | | | | | | | | | | | | | |
| Class R2 Shares | | | | | | | | | | | | | | | | |
| Shares sold | | | 7,849 | | | $ | 153,888 | | | | 17,609 | | | $ | 371,262 | |
| Reinvestment of distributions | | | 2,941 | | | | 56,344 | | | | 1,589 | | | | 33,320 | |
| Shares reacquired | | | (7,054 | ) | | | (137,879 | ) | | | (4,919 | ) | | | (105,160 | ) |
| Increase | | | 3,736 | | | $ | 72,353 | | | | 14,279 | | | $ | 299,422 | |
| | | | | | | | | | | | | | | | | |
| Class R3 Shares | | | | | | | | | | | | | | | | |
| Shares sold | | | 54,627 | | | $ | 1,112,392 | | | | 252,076 | | | $ | 5,395,083 | |
| Reinvestment of distributions | | | 50,531 | | | | 981,827 | | | | 45,516 | | | | 965,405 | |
| Shares reacquired | | | (133,808 | ) | | | (2,725,526 | ) | | | (260,754 | ) | | | (5,542,580 | ) |
| Increase (decrease) | | | (28,650 | ) | | $ | (631,307 | ) | | | 36,838 | | | $ | 817,908 | |
| | | | | | | | | | | | | | | | | |
| Class R4 Shares | | | | | | | | | | | | | | | | |
| Shares sold | | | 34,336 | | | $ | 729,957 | | | | 111,698 | | | $ | 2,475,270 | |
| Reinvestment of distributions | | | 21,145 | | | | 430,311 | | | | 6,998 | | | | 154,166 | |
| Shares reacquired | | | (110,947 | ) | | | (2,250,893 | ) | | | (22,883 | ) | | | (506,088 | ) |
| Increase (decrease) | | | (55,466 | ) | | $ | (1,090,625 | ) | | | 95,813 | | | $ | 2,123,348 | |
| | | | | | | | | | | | | | | | | |
| Class R5 Shares | | | | | | | | | | | | | | | | |
| Shares sold | | | 343 | | | $ | 8,522 | | | | 12,378 | | | $ | 312,089 | |
| Reinvestment of distributions | | | 1,542 | | | | 37,155 | | | | 67 | | | | 1,722 | |
| Shares reacquired | | | (13,907 | ) | | | (365,788 | ) | | | (425 | ) | | | (11,186 | ) |
| Increase (decrease) | | | (12,022 | ) | | $ | (320,111 | ) | | | 12,020 | | | $ | 302,625 | |
| | | | | | | | | | | | | | | | | |
| Class R6 Shares | | | | | | | | | | | | | | | | |
| Shares sold | | | 88,285 | | | $ | 2,223,254 | | | | 1,334,357 | | | $ | 34,535,236 | |
| Reinvestment of distributions | | | 70,138 | | | | 1,695,236 | | | | 128,605 | | | | 3,289,717 | |
| Shares reacquired | | | (169,793 | ) | | | (4,319,875 | ) | | | (1,649,809 | ) | | | (42,108,389 | ) |
| Decrease | | | (11,370 | ) | | $ | (401,385 | ) | | | (186,847 | ) | | $ | (4,283,436 | ) |
| * | Automatic conversion of Class B shares occurred on the 25th day of the month (or, if the 25th day was not a business day, the next business day thereafter) following the eighth anniversary of the day on which the purchase order was accepted. Class B shares were closed on April 25, 2018. |
| ** | Automatic conversion of Class C shares occurs on the 25th day of the month (or, if the 25th day was not a business day, the next business day thereafter) following the tenth anniversary of the day on which the purchase order was accepted. |
| (a) | Commenced on April 4, 2017. |
| (b) | Commenced on July 28, 2017. |
| (c) | Closed on July 24, 2018. |
61
Report of Independent Registered Public Accounting Firm
To the shareholders and the Directors of Lord Abbett Research Fund, Inc.:
Opinion on the Financial Statements and Financial Highlights
We have audited the accompanying statements of assets and liabilities of Lord Abbett Research Fund, Inc. (the “Company”) comprising the Lord Abbett Calibrated Dividend Growth Fund, Lord Abbett Growth Opportunities Fund, and Lord Abbett Small-Cap Value Series, including the schedules of investments as of November 30, 2018, the related statements of operations for the year then ended, the statements of changes in net assets for each of the two years in the period then ended, the financial highlights for each of the five years in the period then ended, and the related notes. In our opinion, the financial statements and financial highlights present fairly, in all material respects, the financial position of each of the funds constituting the Lord Abbett Research Fund, Inc. as of November 30, 2018, and the results of their operations for the year then ended, the changes in their net assets for each of the two years in the period then ended, and the financial highlights for each of the five years in the period then ended in conformity with accounting principles generally accepted in the United States of America.
Basis for Opinion
These financial statements and financial highlights are the responsibility of the Company’s management. Our responsibility is to express an opinion on the Company’s financial statements and financial highlights based on our audits. We are a public accounting firm registered with the Public Company Accounting Oversight Board (United States) (PCAOB) and are required to be independent with respect to the Company in accordance with the U.S. federal securities laws and the applicable rules and regulations of the Securities and Exchange Commission and the PCAOB.
We conducted our audits in accordance with the standards of the PCAOB. Those standards require that we plan and perform the audit to obtain reasonable assurance about whether the financial statements and financial highlights are free of material misstatement, whether due to error or fraud. The Company is not required to have, nor were we engaged to perform, an audit of its internal control over financial reporting. As part of our audits we are required to obtain an understanding of internal control over financial reporting but not for the purpose of expressing an opinion on the effectiveness of the Company’s internal control over financial reporting. Accordingly, we express no such opinion.
Our audits included performing procedures to assess the risks of material misstatement of the financial statements and financial highlights, whether due to error or fraud, and performing procedures that respond to those risks. Such procedures included examining, on a test basis, evidence regarding the amounts and disclosures in the financial statements and financial highlights. Our audits also included evaluating the accounting principles used and significant estimates made by management, as well as evaluating the overall presentation of the financial statements and financial highlights. Our procedures included confirmation of securities owned as of November 30, 2018, by correspondence with the custodian and brokers; when replies were not received from brokers, we performed other auditing procedures. We believe that our audits provide a reasonable basis for our opinion.
DELOITTE & TOUCHE LLP
New York, New York
January 18, 2019
We have served as the auditor of one or more Lord Abbett Family of Funds’ investment companies since 1932.
62
Basic Information About Management
The Board is responsible for the management of the business and affairs of the Company in accordance with the laws of the State of Maryland. The Board elects officers who are responsible for the day-to-day operations of each Fund and who execute policies authorized by the Board. The Board also approves an investment adviser to each Fund and continues to monitor the cost and quality of the services the investment adviser provides, and annually considers whether to renew the contract with the adviser. Generally, each Director holds office until his/her successor is elected and qualified or until his/her earlier resignation or removal, as provided in the Company’s organizational documents.
Lord Abbett, a Delaware limited liability company, is each Fund’s investment adviser. Designated Lord Abbett personnel are responsible for the day-to-day management of the Funds.
Interested Directors
Mr. Sieg is affiliated with Lord Abbett and is an “interested person” of the Company as defined in the Act. Mr. Sieg is director/trustee of each of the 13 investment companies in the Lord Abbett Family of Funds, which consist of 61 portfolios or series. Mr. Sieg is an officer of the Lord Abbett Family of Funds.
Name, Address and
Year of Birth | | Current Position and
Length of Service
with the Company | | Principal Occupation and Other Directorships
During the Past Five Years |
Douglas B. Sieg
Lord, Abbett & Co. LLC
90 Hudson Street
Jersey City, NJ 07302 | | Director since 2016;
President and Chief
Executive Officer
since 2018 | | Principal Occupation:Managing Partner (since 2018) and was formerly Head of Client Services, joined Lord Abbett in 1994. |
| (1969) | | | | Other Directorships:None. |
Independent Directors
The following Independent Directors also are directors/trustees of each of the 13 investment companies in the Lord Abbett Family of Funds, which consist of 61 portfolios or series.
Name, Address and
Year of Birth | | Current Position and
Length of Service
with the Company | | Principal Occupation and Other Directorships
During the Past Five Years |
Eric C. Fast
Lord, Abbett & Co. LLC
c/o Legal Dept.
90 Hudson Street
Jersey City, NJ 07302
(1949) | | Director since 2014 | | Principal Occupation:Chief Executive Officer of Crane Co., an industrial products company (2001–2014).
Other Directorships:Currently serves as director of Automatic Data Processing, Inc. (since 2007) and Regions Financial Corporation (since 2010). Previously served as a director of Crane Co. (1999–2014). |
| | | | | |
Evelyn E. Guernsey
Lord, Abbett & Co. LLC
c/o Legal Dept.
90 Hudson Street
Jersey City, NJ 07302
(1955) | | Director since 2011 | | Principal Occupation:CEO, Americas of J.P. Morgan Asset Management (2004–2010).
Other Directorships:None. |
63
Basic Information About Management (continued)
Name, Address and
Year of Birth | | Current Position and
Length of Service
with the Company | | Principal Occupation and Other Directorships
During the Past Five Years |
Julie A. Hill
Lord, Abbett & Co. LLC
c/o Legal Dept.
90 Hudson Street
Jersey City, NJ 07302
(1946) | | Director since 2004 | | Principal Occupation:Owner and CEO of The Hill Company, a business consulting firm (since 1998).
Other Directorships:Currently serves as director of Anthem, Inc., a health benefits company (since 1994). |
| | | | | |
Kathleen M. Lutito
Lord, Abbett & Co. LLC
c/o Legal Dept.
90 Hudson Street
Jersey City, NJ 07302
(1963) | | Director since 2017 | | Principal Occupation:President and Chief Investment Officer of CenturyLink Investment Management Company (since 2006).
Other Directorships:None |
| | | | | |
James M. McTaggart
Lord, Abbett & Co. LLC
c/o Legal Dept.
90 Hudson Street
Jersey City, NJ 07302
(1947) | | Director since 2012 | | Principal Occupation:Independent management advisor and consultant (since 2012); Vice President, CRA International, Inc. (doing business as Charles River Associates), a global management consulting firm (2009–2012); Founder and Chairman of Marakon Associates, Inc., a strategy consulting firm (1978–2009); and Officer and Director of Trinsum Group, a holding company (2007–2009). Other Directorships:Blyth, Inc., a home products company (2004–2015). |
| | | | | |
Karla M. Rabusch
Lord, Abbett & Co. LLC
c/o Legal Dept.
90 Hudson Street
Jersey City, NJ 07302
(1959) | | Director since 2017 | | Principal Occupation:President and Director of Wells Fargo Funds Management, LLC (2003–2017); President of Wells Fargo Funds (2003–2016).
Other Directorships:None. |
| | | | | |
Mark A. Schmid
Lord, Abbett & Co. LLC
c/o Legal Dept.
90 Hudson Street
Jersey City, NJ 07302
(1959) | | Director since 2016 | | Principal Occupation:Vice President and Chief Investment Officer of the University of Chicago (since 2009).
Other Directorships:None. |
| | | | | |
James L.L. Tullis
Lord, Abbett & Co. LLC
c/o Legal Dept.
90 Hudson Street
Jersey City, NJ 07302
(1947) | | Director since 2006;
Chairman since 2017 | | Principal Occupation:CEO of Tullis-Dickerson and Co. Inc., a venture capital management firm (since 1990); CEO of Tullis Health Investors Inc. (since 2012).
Other Directorships:Currently serves as director of Crane Co. (since 1998). |
64
Basic Information About Management (continued)
Officers
None of the officers listed below have received compensation from the Company. All of the officers of the Company also may be officers of the other Lord Abbett Funds and maintain offices at 90 Hudson Street, Jersey City, NJ 07302. Unless otherwise indicated, the position(s) and title(s) listed under the “Principal Occupation During the Past Five Years” column indicates each officer’s position(s) and title(s) with Lord Abbett. Each officer serves for an indefinite term (i.e., until his or her death, resignation, retirement, or removal).
Name and
Year of Birth | | Current Position
with the Company | | Length of Service
of Current
Position | | Principal Occupation
During the Past Five Years |
Douglas B. Sieg
(1969) | | President and Chief Executive Officer | | Elected in 2018 | | Managing Partner of Lord Abbett (since 2018) and was formerly Head of Client Services, joined Lord Abbett in 1994. |
| | | | | | | |
Robert A. Lee
(1969) | | Executive Vice President | | Elected in 2016 | | Partner and Chief Investment Officer, and was formerly Deputy Chief Investment Officer and Director of Taxable Fixed Income, joined Lord Abbett in 1997. |
| | | | | | | |
David J. Linsen
(1974) | | Executive Vice President | | Elected in 2008 | | Partner and Director of Equities, joined Lord Abbett in 2001. |
| | | | | | | |
Marc Pavese
(1972) | | Executive Vice President | | Elected in 2016 | | Partner and Portfolio Manager, joined Lord Abbett in 2008. |
| | | | | | | |
Walter H. Prahl
(1958) | | Executive Vice President | | Elected in 2012 | | Partner and Director, joined Lord Abbett in 1997. |
| | | | | | | |
Eli Rabinowich
(1975) | | Executive Vice President | | Elected in 2018 | | Portfolio Manager, joined Lord Abbett in 2018 and was formerly a Portfolio Manager, Partner, and Analyst at Pzena Investment Management (2004–2018). |
| | | | | | | |
Jeffrey Rabinowitz
(1972) | | Executive Vice President | | Elected in 2017 | | Portfolio Manager, joined Lord Abbett in 2017 and was formerly Managing Director and Portfolio Manager/Technology Analyst at Jennison Associates LLC (2014–2017) and Managing Director and Portfolio Manager/Technology Analyst for U.S. Growth Equity at Goldman Sachs Asset Management (1999–2014). |
65
Basic Information About Management (continued)
Name and
Year of Birth | | Current Position
with the Company | | Length of Service
of Current
Position | | Principal Occupation
During the Past Five Years |
Pamela P. Chen
(1978) | | Vice President and Assistant Secretary and Privacy Officer | | Elected in 2018 | | Associate General Counsel, joined Lord Abbett in 2017 and was formerly Special Counsel at Schulte, Roth & Zabel LLP(2005–2017). |
| | | | | | | |
John T. Fitzgerald
(1975) | | Vice President and Assistant Secretary | | Elected in 2018 | | Deputy General Counsel, joined Lord Abbett in 2018 and was formerly Deputy Head of U.S. Funds Legal, Executive Director and Assistant General Counsel at JPMorgan Chase (2005–2018). |
| | | | | | | |
Bernard J. Grzelak
(1971) | | Chief Financial Officer and Vice President | | Elected in 2017 | | Partner, Chief Operating Officer, and Global Funds and Risk Officer, joined Lord Abbett in 2003. |
| | | | | | | |
John C. Hardy
(1981) | | Vice President | | Elected in 2018 | | Portfolio Manager, joined Lord Abbett in 2011. |
| | | | | | | |
Linda Y. Kim
(1980) | | Vice President and Assistant Secretary | | Elected in 2016 | | Counsel, joined Lord Abbett in 2015 and was formerly an Associate at Stroock & Stroock & Lavan LLP (2007–2015). |
| | | | | | | |
Joseph M. McGill
(1962) | | Chief Compliance Officer | | Elected in 2014 | | Partner and Chief Compliance Officer, joined Lord Abbett in 2014 and was formerly Managing Director and the Chief Compliance Officer at UBS Global Asset Management (2003–2013). |
| | | | | | | |
A. Edward Oberhaus, III
(1959) | | Vice President | | Elected in 1996 | | Partner and Director, joined Lord Abbett in 1983. |
| | | | | | | |
Amanda S. Ryan
(1978) | | Vice President and Assistant Secretary | | Elected in 2018 | | Counsel, joined Lord Abbett in 2016 and was formerly a Director and Corporate Counsel at PGIM Investments (2012–2016). |
66
Basic Information About Management (concluded)
Name and
Year of Birth | | Current Position
with the Company | | Length of Service
of Current
Position | | Principal Occupation
During the Past Five Years |
Lawrence B. Stoller
(1963) | | Vice President, Secretary and Chief Legal Officer | | Elected in 2007 | | Partner and General Counsel, joined Lord Abbett in 2007. |
| | | | | | | |
Jackson C. Chan
(1964) | | AML Compliance Officer | | Elected in 2018 | | Deputy Chief Compliance Officer and Director of Regulatory Affairs, joined Lord Abbett in 2014 and was formerly Director at UBS Global Asset Management (2005–2014). |
| | | | | | | |
Vito A. Fronda
(1969) | | Treasurer | | Elected in 2018 | | Partner and Director of Taxation, joined Lord Abbett in 2003. |
Please call 888–522–2388 for a copy of the statement of additional information, which contains further information about the Company’s Directors. It is available free upon request.
67
Householding
The Company has adopted a policy that allows it to send only one copy of each Fund’s prospectus, proxy material, annual report and semiannual report to certain shareholders residing at the same “household.” This reduces Fund expenses, which benefits you and other shareholders. If you need additional copies or do not want your mailings to be “householded,” please call Lord Abbett at 888-522-2388 or send a written request with your name, the name of your fund or funds and your account number or numbers to Lord Abbett Family of Funds, P.O. Box 219336, Kansas City, MO 64121.
Proxy Voting Policies, Procedures and Records
A description of the policies and procedures that Lord Abbett uses to vote proxies related to each Fund’s portfolio securities, and information on how Lord Abbett voted each Fund’s proxies during the 12-month period ended June 30 are available without charge, upon request, (i) by calling 888-522-2388; (ii) on Lord Abbett’s Website at www.lordabbett.com; and (iii) on the Securities and Exchange Commission’s (“SEC”) Website at www.sec.gov.
Shareholder Reports and Quarterly Portfolio Disclosure
The Funds are required to file their complete schedule of portfolio holdings with the SEC for their first and third fiscal quarters on Form N-Q. Copies of the filings are available without charge, upon request on the SEC’s Website at www.sec.gov and may be available by calling Lord Abbett at 888-522-2388. You can also obtain copies of Form N-Q by visiting the SEC’s Public Reference Room in Washington, DC (information on the operation of the Public Reference Room may be obtained by calling 800-SEC-0330).
Tax Information
The percentages below reflect the portion of ordinary income distributions that are eligible for the corporate dividend received deduction (DRD) and qualified dividend income (QDI) for individual shareholders:
| Fund Name | DRD | QDI |
| Calibrated Dividend Growth Fund | 59% | 60% |
| Growth Opportunities Fund | 41% | 43% |
| Small Cap Value Fund | 100% | 100% |
Additionally, of the distributions paid to shareholders during the fiscal year ended November 30, 2018, the following amounts represent short-term capital gains and long-term capital gains:
| | Short-term | Long-term |
| Fund Name | Capital gains | Capital Gains |
| Calibrated Dividend Growth Fund | $78,292,285 | $ 71,418,951 |
| Growth Opportunities Fund | 10,054,491 | 32,746,855 |
| Small Cap Value Fund | – | 133,220,122 |
68


This report, when not used for the general information of
shareholders of the Fund, is to be distributed only if preceded
or accompanied by a current fund prospectus. Lord Abbett mutual fund shares are distributed by
LORD ABBETT DISTRIBUTOR LLC. | | Lord Abbett Research Fund, Inc. Lord Abbett Calibrated Dividend Growth Fund Lord Abbett Growth Opportunities Fund Lord Abbett Small-Cap Value Series | LARF-2
(01/19) |
| (a) | In accordance with applicable requirements, the Registrant adopted a Sarbanes-Oxley Code of Ethics on June 19, 2003 that applies to the principal executive officer and senior financial officers of the Registrant (“Code of Ethics”). The Code of Ethics was in effect during the fiscal year ended November 30, 2018 (the “Period”). |
| (c) | The Registrant has not amended the Code of Ethics as described in Form N-CSR during the Period. |
| (d) | The Registrant has not granted any waiver, including an implicit waiver, from a provision of the Code of Ethics as described in Form N-CSR during the Period. |
| (f) | See Item 12(a)(1) concerning the filing of the Code of Ethics. |
| Item 3: | Audit Committee Financial Expert. |
| | |
The Registrant’s board of directors has determined that each of the following independent directors who are members of the audit committee is an audit committee financial expert: Evelyn E. Guernsey, Karla M. Rabusch and Mark A. Schmid. Each of these persons is independent within the meaning of the Form N-CSR.
| Item 4: | Principal Accountant Fees and Services. |
| | |
In response to sections (a), (b), (c) and (d) of Item 4, the aggregate fees billed to the Registrant for the fiscal years ended November 30, 2018 and 2017 by the Registrant’s principal accounting firm, Deloitte & Touche LLP, the member firms of Deloitte Touche Tohmatsu and their respective affiliates (collectively, “Deloitte”) were as follows:
| | Fiscal year ended: |
| | 2018 | 2017 |
| Audit Fees {a} | $123,800 | $123,800 |
| Audit-Related Fees | - 0 - | - 0 - |
| Total audit and audit-related fees | 123,800 | 123,800 |
| | | |
| Tax Fees {b} | 25,839 | 25,734 |
| All Other Fees | - 0 - | - 0 - |
| | | |
| Total Fees | $149,639 | $149,534 |
{a} Consists of fees for audits of the Registrant’s annual financial statements.
{b} Fees for the fiscal year ended November 30, 2018 and 2017 consist of fees for preparing the U.S. Income Tax Return for Regulated Investment Companies, New Jersey Corporation Business Tax Return, New Jersey Annual Report Form, U.S. Return of Excise Tax on Undistributed Income of Investment Companies, IRS Forms 1099-MISC and 1096 Annual Summary and Transmittal of U.S. Information Returns.
(e) (1) Pursuant to Rule 2-01(c) (7) of Regulation S-X, the Registrant’s Audit Committee has adopted pre-approval policies and procedures. Such policies and procedures generally provide that the Audit Committee must pre-approve:
| · | any audit, audit-related, tax, and other services to be provided to the Lord Abbett Funds, including the Registrant, and |
| · | any audit-related, tax, and other services to be provided to the Registrant’s investment adviser and any entity controlling, controlled by or under common control with the investment adviser that provides ongoing services to one or more Funds comprising the Registrant if the engagement relates directly to operations and financial reporting of a Fund, by the independent auditor to assure that the provision of such services does not impair the auditor’s independence. |
The Audit Committee has delegated pre-approval authority to its Chairman, subject to a fee limit of $10,000 per event, and not to exceed $25,000 annually. The Chairman will report any pre-approval decisions to the Audit Committee at its next scheduled meeting. Unless a type of service to be provided by the independent auditor has received general pre-approval, it must be pre-approved by the Audit Committee. Any proposed services exceeding pre-approved cost levels will require specific pre-approval by the Audit Committee.
(e) (2) The Registrant’s Audit Committee has approved 100% of the services described in this Item 4 (b) through (d).
(f) Not applicable.
(g) The aggregate non-audit fees billed by Deloitte for services rendered to the Registrant are shown above in the response to Item 4 (a), (b), (c) and (d) as “All Other Fees”.
The aggregate non-audit fees billed by Deloitte for services rendered to the Registrant’s investment adviser, Lord, Abbett & Co. LLC (“Lord Abbett”), for the fiscal years ended November 30, 2018 and 2017 were:
| | Fiscal year ended: |
| | 2018 | 2017 |
| All Other Fees {a} | $200,339 | $201,416 |
{a} Consist of fees for Independent Services Auditors’ Report on Controls Placed in Operation and Tests of Operating Effectiveness related to Lord Abbett’s Asset Management Services (“SOC-1 Report”).
The aggregate non-audit fees billed by Deloitte for services rendered to entities under the common control of Lord Abbett for the fiscal years ended November 30, 2018 and 2017 were:
| | Fiscal year ended: |
| | 2018 | 2017 |
| All Other Fees | $ - 0 - | $ - 0 - |
(h) The Registrant’s Audit Committee has considered the provision of non-audit services that were rendered to the Registrant’s investment adviser, and any entity controlling, controlled by or under common control with the investment adviser that provides ongoing services to the Registrant, that were not pre-approved pursuant to Rule 2-01 (c)(7)(ii) of Regulation S-X and has determined that the provision of such services is compatible with maintaining Deloitte’s independence.
| Item 5: | Audit Committee of Listed Registrants. |
| | |
| | Not applicable. |
| | |
| Item 6: | Investments. |
| | |
| | Not applicable. |
| | |
| Item 7: | Disclosure of Proxy Voting Policies and Procedures for Closed-End Management Investment Companies. |
| | |
| | Not applicable. |
| | |
| Item 8: | Portfolio Managers of Closed-End Management Investment Companies. |
| | |
| | Not applicable. |
| | |
| Item 9: | Purchases of Equity Securities by Closed-End Management Investment Company and Affiliated Purchasers. |
| | |
| | Not applicable. |
| | |
| Item 10: | Submission of Matters to a Vote of Security Holders. |
| | |
| | Not applicable. |
| | |
| Item 11: | Controls and Procedures. |
| | |
| (a) | Based on their evaluation of the Registrant’s disclosure controls and procedures (as defined in Rule 30a-3(c) under the Investment Company Act of 1940) as of a date within 90 days prior to the filing date of this report, the Chief Executive Officer and Chief Financial Officer of the Registrant have concluded that such |
| | | disclosure controls and procedures are reasonably designed and effective to ensure that material information relating to the Registrant, including its consolidated subsidiaries, is made known to them by others within those entities. |
| | | |
| (b) | There were no changes in the Registrant’s internal control over financial reporting (as defined in Rule 30a-3(d) under the Investment Company Act of 1940) that occurred during the second fiscal quarter of the period covered by this report that have materially affected, or are reasonably likely to materially affect, the Registrant’s internal control over financial reporting. |
| (a)(1) | The Lord Abbett Family of Funds Sarbanes Oxley Code of Ethics for the Principal Executive Officer and Senior Financial Officers is attached hereto as part of Ex-99. CODEETH. |
| | | |
| | (a)(2) | Certification of each Principal Executive Officer and Principal Financial Officer of the Registrant as required by Rule 30a-2 under the Investment Company Act of 1940 is attached hereto as a part of EX-99.CERT. |
| (b) | Certification of each Principal Executive Officer and Principal Financial Officer of the Registrant as required by Section 906 of the Sarbanes-Oxley Act of 2002 is provided as a part of EX-99.906CERT. |
SIGNATURES
Pursuant to the requirements of the Securities Exchange Act of 1934 and the Investment Company Act of 1940, the Registrant has duly caused this report to be signed on its behalf by the undersigned, thereunto duly authorized.
| | | LORD ABBETT RESEARCH FUND, inc. |
| | | |
| | By: | /s/ Douglas B. Sieg |
| | | Douglas B. Sieg |
| | | President and Chief Executive Officer |
| | | |
| Date: January 18, 2019 | | |
| | | |
| | By: | /s/ Bernard J. Grzelak |
| | | Bernard J. Grzelak |
| | | Chief Financial Officer and Vice President |
| | | |
| Date: January 18, 2019 | | |
Pursuant to the requirements of the Securities Exchange Act of 1934 and the Investment Company Act of 1940, this report has been signed below by the following persons on behalf of the Registrant and in the capacities and on the dates indicated.
| | By: | /s/ Douglas B. Sieg |
| | | Douglas B. Sieg |
| | | President and Chief Executive Officer |
| | | |
| Date:January 18, 2019 | | |
| | | |
| | By: | /s/ Bernard J. Grzelak |
| | | Bernard J. Grzelak |
| | | Chief Financial Officer and Vice President |
| | | |
| Date:January 18, 2019 | | |