UNITED STATES
SECURITIES AND EXCHANGE COMMISSION
Washington, D.C. 20549
FORM N-CSR
CERTIFIED SHAREHOLDER REPORT OF REGISTERED
MANAGEMENT INVESTMENT COMPANIES
Investment Company Act File Number: 811-06650
Lord abbett research fund, inc.
(Exact name of Registrant as specified in charter)
90 Hudson Street, Jersey City, NJ 07302
(Address of principal executive offices) (Zip code)
Brooke A. Fapohunda, Esq., Vice President & Assistant Secretary
90 Hudson Street, Jersey City, NJ 07302
(Name and address of agent for service)
Registrant’s telephone number, including area code: (800) 201-6984
Date of fiscal year end: 11/30
Date of reporting period: 11/30/2015
| Item 1: | Report(s) to Shareholders. |

2015 LORD ABBETT
ANNUAL REPORT
Lord Abbett
Calibrated Dividend Growth Fund
Growth Opportunities Fund
Small Cap Value Fund
For the fiscal year ended November 30, 2015
Table of Contents
Lord Abbett Research Fund
Lord Abbett Calibrated Dividend Growth Fund,
Lord Abbett Growth Opportunities Fund,
Lord Abbett Small Cap Value Fund
Annual Report
For the fiscal year ended November 30, 2015

Daria L. Foster, Director, President and Chief Executive Officer of the Lord Abbett Funds, and E. Thayer Bigelow, Independent Chairman of the Lord Abbett Funds.
Dear Shareholders: We are pleased to provide you with this overview of the performance of the Funds for the fiscal year ended November 30, 2015. On this page and the following pages, we discuss the major factors that influenced fiscal year performance. For detailed and more timely information about the Funds, please visit our website at www.lordabbett.com, where you also can access the quarterly commentaries that provide updates on each Fund’s performance and other portfolio related updates.
Thank you for investing in Lord Abbett mutual funds. We value the trust that you place in us and look forward to serving your investment needs in the years to come.
Best regards,

Daria L. Foster
Director, President and Chief Executive Officer
Lord Abbett Calibrated Dividend Growth Fund
For the fiscal year ended November 30, 2015, the Fund returned -1.34%, reflecting performance at the net asset value (NAV) of Class A shares, with all distributions reinvested, compared to its benchmark, the S&P 500® Index1, which returned 2.75% over the same period.
Domestic equity markets advanced over the past year, with the S&P 500®
Index1 rising 2.75% during the trailing 12-month period. Despite this general move upward, there were a few periods of short-term volatility, most notably in January 2015, when the S&P 500® declined 3.0% in total return terms, and in August 2015, when the index dropped 6.0%, its greatest monthly loss in three years. One of the prevailing market themes during the trailing 12-month period was the continued weakness in energy prices, with
1
oil, in particular, plunging 60% from a June 2014 high to a six-year low in March 2015. Finally, the real U.S. gross domestic product (GDP) initially was reported to have contracted by 0.2% in the first quarter of 2015; however, that figure was later revised up, to a modest 0.6% expansion. In the second quarter of 2015, real GDP advanced 3.9%, while the second estimate from the Bureau of Economic Analysis indicated that real GDP increased 2.1% in the third quarter of 2015.
Among sectors, stock selection within industrials was a detractor from the Fund’s performance relative to its benchmark during the period. Within industrials, one of the largest detractors was Norfolk Southern Corp., a railroad and freight transportation company. A strengthening U.S. dollar continued to place pressure on coal exports, and domestic utilities have faced competition from low natural gas prices, decreasing the demand for coal. Also detracting from performance was an overweight position in Caterpillar Inc., a manufacturer of construction and mining equipment, and other heavy machinery. Caterpillar faced a challenging macro environment, given a downturn in machinery demand across Latin America, Asia, Africa, and the Middle East.
The Fund’s stock selection in the information technology sector also detracted from relative performance. Within information technology, an overweight position in Qualcomm Inc., a wireless technology company, detracted.
Investors showed concern over potential declines in royalty rates, Android delays, and expected cost cutting. Similarly, an overweight allocation to IBM Corp., a technology company, detracted from performance relative to the benchmark. While IBM made progress in its transition to higher value segments and saw growth in several strategic areas, it was not sufficient enough to offset the pressures in its legacy businesses.
Strong stock selection within the utilities sector was the primary contributor to relative performance over the trailing 12 months. Within the utilities sector, an overweight position in SCANA Corp., a regulated electric and natural gas utility company, contributed to relative performance. Shares of SCANA advanced after South Carolina’s Public Service Commission approved the company’s revised construction and capital cost schedules. Also contributing to performance was an overweight position in Excel Energy, Inc., a public utility company. Improved electric and gas margins had a positive impact on Excel’s earnings per share during the period.
The price of oil fell considerably during the period; as such, strong stock selection and an underweight in the energy sector also contributed to performance relative to the Fund’s benchmark.
2
Lord Abbett Growth Opportunities Fund
For the fiscal year ended November 30, 2015, the Growth Opportunities Fund returned 4.78%, reflecting performance at the net asset value (NAV) of Class A Shares, with all distributions reinvested, compared to its benchmark, the Russell Midcap® Growth Index2, which returned 1.82% over the same period.
Domestic equity markets advanced over the past year, with the S&P 500® Index1 rising 2.75% during the trailing 12-month period. Despite this general move upwards, there were a few periods of short-term volatility, most notably in January 2015, when the S&P 500® Index1 declined 3.0%, and, in August 2015, when the index dropped 6.0%, its greatest monthly loss in three years. One of the prevailing market themes during the trailing 12-month period was the continued weakness in energy prices, with oil in particular plunging 60% from a June 2014 high to a six year low in March of 2015. Finally, the real U.S. gross domestic product (GDP) initially was reported to have contracted by 0.2% in the first quarter of 2015; however, that figure was later revised up to a modest 0.6% expansion. In the second quarter of 2015, real GDP advanced 3.9%, while the second estimate from the Bureau of Economic Analysis indicated that real GDP increased 2.1% in the third quarter of 2015.
Among sectors, security selection in the consumer discretionary sector was the
leading contributor to the Fund’s relative performance during the period. Within this sector, the Fund’s holdings of Expedia, Inc., an online travel company, contributed most. Expedia completed a number of notable acquisitions during the 12-month period, including several that offered immediate cost-saving synergies. Another contributor within the consumer discretionary sector was the Fund’s position in AutoZone Inc., a retailer and distributor of automotive replacement parts. Shares of AutoZone outpaced the broader market (as measured by the S&P 500 Index1) throughout much of 2015, as strong management execution helped the company to capitalize on a favorable industry backdrop for aftermarket auto part retailers.
Security selection in the information technology sector was another contributor to Fund relative performance during the period. Within this sector, the Fund’s holdings of Activision Blizzard, Inc., a developer and publisher of video games, contributed most. Activision made a surprise acquisition of mobile game developer, King Digital, that investors believed would position Activision as one of the top mobile game companies in the world and be immediately accretive. Another contributor within the information technology sector was the Fund’s position in Vantiv, Inc., an electronic payment processing service. After a few quarters of reporting in-line earnings and revenue, Vantiv beat consensus estimates
3
on both metrics in the third quarter of 2015 and raised its forward guidance.
The largest detractor from the Fund’s relative performance during the period was security selection in the consumer staples sector. Within this sector, the Fund’s holdings of Rite Aid Corp., a retail drugstore chain, detracted most. Shares of Rite Aid suffered as a slowdown in “front of the store” sales that began in the second quarter of 2015 persisted through September. Another detractor within the consumer staples sector was the Fund’s position in Whole Foods Market, Inc., a retailer of natural and organic foods and grocer. Whole Foods struggled with competitive pressures throughout the 12-month period, leading to a notable deceleration in sales.
Security selection in the materials sector also detracted from Fund relative performance during the period. Within this sector, the Fund’s holdings of Owens-Illinois, Inc., a manufacturer of glass containers, detracted most. Shares of Owens-Illinois faced some pressure after the company lowered forward guidance following its third quarter 2015 earnings release. Another detractor within the materials sector was the Fund’s position in Huntsman Corp., a manufacturer of chemical products. Huntsman faced some macro pressures related to continued oil price weakness and slowing economic growth in China.
Lord Abbett Small Cap Value Fund
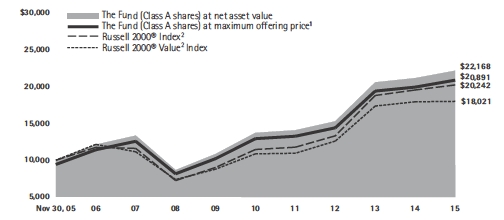
For the fiscal year ended November 30, 2015, the Fund returned 4.76%, reflecting performance at the net asset value (NAV) of Class A shares, with all distributions reinvested, compared to its benchmark, the Russell 2000® Index3, which returned 3.51% over the same period.
Domestic equity markets advanced over the past year, with the S&P 500® Index1 rising 2.75% during the trailing 12-month period. Despite this general move upwards, there were a few periods of short-term volatility, most notably in January 2015 when the S&P 500® Index1 declined 3.0% in total return terms, and in August 2015, when the index dropped 6.0%, its greatest monthly loss in three years. One of the prevailing market themes during the trailing 12-month period was the continued weakness in energy prices, with oil, in particular, plunging 60% from June 2014 to March 2015, when it reached a six-year low. Finally, the real U.S. gross domestic product (GDP) initially was reported to have contracted by 0.2% in the first quarter of 2015; however, that figure was later revised up to a modest 0.6% expansion. In the second quarter of 2015, real GDP advanced 3.9%, while the advanced estimate from the Bureau of Economic Analysis indicated that real GDP increased 1.5% in the third quarter of 2015.
During the period, stock selection in the financials and consumer discretionary sectors contributed most to the Fund’s
4
relative outperformance. Within the financials sector, shares of HCC Insurance Holdings, Inc., a specialty insurer, immediately increased following the announcement that the company would be acquired at a premium by Tokio Marine Holdings, Inc. Western Alliance Bancorporation, a bank holding company, also contributed to performance as the firm experienced strong annualized loan growth and tax rates below expectations.
A significant contributor to the Fund’s relative performance was consumer discretionary holding Core-Mark Holding Company, Inc. Shares of this marketer of convenience retail industry supply solutions increased during the period as the market seemed to reward the company’s increased sales guidance related to its tobacco product contract wins.
During the period, stock selection in the health care and information technology sectors detracted from the Fund’s relative outperformance. Within the health care sector, shares of ExamWorks Group, Inc., a provider of independent medical examinations and medical-related services, detracted from relative performance, possibly because of slowing revenue growth and legislative headwinds in the United Kingdom. The Fund’s holdings of HealthSouth Corp., an owner and operator of inpatient rehabilitation hospitals, also detracted from the Fund’s performance.
Within the information technology sector, shares of Rovi Corporation, a digital entertainment technology company
detracted from relative performance. The market may have reacted poorly to potential future patent issues.
Each Fund’s portfolio is actively managed and, therefore, its holdings and the weightings of a particular issuer or particular sector as a percentage of portfolio assets are subject to change. Sectors may include many industries.
1 The S&P 500® Index is widely regarded as the standard for measuring large cap U.S. stock market performance and includes a representative sample of leading companies in leading industries.
2 The Russell Midcap® Growth Index measures the performance of those Russell Midcap companies with higher price-to-book ratios and higher forecasted growth values.
3 The Russell 2000® Index measures the performance of the 2,000 smallest companies in the Russell 3000 Index, which represents approximately 10% of the total market capitalization of the Russell 3000 Index.
Unless otherwise specified, indexes reflect total return, with all dividends reinvested. Indexes are unmanaged, do not reflect the deduction of fees or expenses, and are not available for direct investment.
Important Performance and Other Information Performance data quoted in the following pages reflect past performance and are no guarantee of future results. Current performance may be higher or lower than the performance quoted. The investment return and principal value of an investment in the Funds will fluctuate so that shares, on any given day or when redeemed, may be worth more or less than their original cost. You can obtain performance data current to the most recent month end by calling Lord Abbett at 888-522-2388 or referring to www.lordabbett.com.
Except where noted, comparative Fund performance does not account for the deduction of sales charges and would be different if sales charges were included. Each Fund offers classes of shares with distinct pricing options. For a full description of the differences in pricing alternatives, please see each Fund’s prospectus.
5
During certain periods shown, expense waivers and reimbursements were in place. Without such expense waivers and reimbursements, the Funds’ returns would have been lower.
The annual commentary above discusses the views of the Funds’ management and various portfolio holdings of the Funds as of November 30, 2015. These views and portfolio holdings may have changed after this date. Information provided in the commentary is not a recommendation to buy or sell securities. Because the Funds’ portfolio is actively managed and may change significantly, the Funds may no longer own the securities described above or may have
otherwise changed their positions in the securities. For more recent information about the Funds’ portfolio holdings, please visit www.lordabbett.com.
A Note about Risk: See Notes to Financial Statements for a discussion of investment risks. For a more detailed discussion of the risks associated with each Fund, please see each Fund’s prospectus.
Mutual funds are not insured by the FDIC, are not deposits or other obligations of, or guaranteed by, banks, and are subject to investment risks including possible loss of principal amount invested.
6
Calibrated Dividend Growth Fund
Investment Comparison
Below is a comparison of a $10,000 investment in Class A shares with the same investment in both the S&P 500® Index and the S&P 900® 10-Year Dividend Growth Index, assuming reinvestment of all dividends and distributions. The performance of other classes will be greater than or less than the performance shown in the graph below due to different sales loads and expenses applicable to such classes. The graph and performance table below do not reflect the deduction of taxes that a shareholder would pay on Fund distributions or the redemption of Fund shares. During certain periods, expenses of the Fund have been waived or reimbursed by Lord Abbett; without such waiver or reimbursement of expenses, the Fund’s returns would have been lower. Past performance is no guarantee of future results.
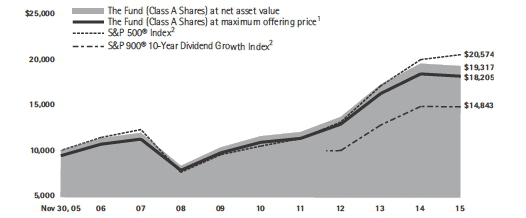
The S&P 900® 10-Year Dividend Growth Index is a custom index that, along with changes in the Fund’s investment strategy, the Fund began disclosing in its prospectus effective September 27, 2012. The graph shows the index’s performance from that date.
Average Annual Total Returns at Maximum Applicable
Sales Charge for the Periods Ended November 30, 2015 |
| | 1 Year | 5 Years | 10 Years | Life of Class | |
| Class A3 | -7.04% | 9.46% | 6.17% | – | |
| Class B4 | -6.34% | 9.71% | 6.23% | – | |
| Class C5 | -2.88% | 10.01% | 6.09% | – | |
| Class F6 | -1.20% | 10.99% | – | 5.96% | |
| Class I7 | -1.09% | 11.07% | 7.14% | – | |
| Class P7 | -1.56% | 10.59% | 6.66% | – | |
| Class R26 | -1.69% | 10.45% | – | 5.52% | |
| Class R36 | -1.57% | 10.56% | – | 5.55% | |
| Class R48 | – | – | – | 0.85% | * |
| Class R58 | – | – | – | 0.98% | * |
| Class R68 | – | – | – | 0.98% | * |
1 Reflects the deduction of the maximum initial sales charge of 5.75%.
2 Performance for each unmanaged index does not reflect any fees or expenses. The performance of each index is not necessarily representative of the Fund’s performance.
3 Total return, which is the percentage change in net asset value, after deduction of the maximum initial sales charge of 5.75% applicable to Class A shares, with all dividends and distributions reinvested for the periods shown ended November 30, 2015, is calculated using the SEC-required uniform method to compute such return.
4 Performance reflects the deduction of a CDSC of 5% for 1 year, 2% for 5 years and 0% for 10 years. Class B shares automatically
convert to Class A shares after approximately 8 years. (There is no initial sales charge for automatic conversions.) All returns for periods greater than 8 years reflect this conversion.
5 The 1% CDSC for Class C shares normally applies before the first anniversary of the purchase date. Performance for other periods is at net asset value.
6 Commenced operations and performance for the Class began on September 28, 2007. Performance is at net asset value.
7 Performance is at net asset value.
8 Commenced operations and performance for the Class began on June 30, 2015. Performance is at net asset value.
* Since share Class has existed for less than one year, average annual returns are not provided.
7
Growth Opportunities Fund
Investment Comparison
Below is a comparison of a $10,000 investment in Class A shares with the same investment in both the Russell Midcap® Growth Index and the Russell Midcap® Index, assuming reinvestment of all dividends and distributions. The performance of other classes will be greater than or less than the performance shown in the graph below due to different sales loads and expenses applicable to such classes. The graph and performance table below do not reflect the deduction of taxes that a shareholder would pay on Fund distributions or the redemption of Fund shares. During certain periods, expenses of the Fund have been waived or reimbursed by Lord Abbett; without such waiver or reimbursement of expenses, the Fund’s returns would have been lower. Past performance is no guarantee of future results.

| Average Annual Total Returns at Maximum Applicable | |
| Sales Charge for the Periods Ended November 30, 2015 | |
| | 1 Year | 5 Years | 10 Years | Life of Class | |
| Class A3 | -1.25% | 9.22% | 7.79% | – | |
| Class B4 | -0.31% | 9.54% | 7.88% | – | |
| Class C5 | 3.13% | 9.79% | 7.72% | – | |
| Class F6 | 4.95% | 10.76% | – | 7.44% | |
| Class I7 | 5.07% | 10.87% | 8.80% | – | |
| Class P7 | 4.56% | 10.37% | 8.31% | – | |
| Class R26 | 4.42% | 10.21% | – | 6.91% | |
| Class R36 | 4.56% | 10.33% | – | 7.03% | |
| Class R48 | – | – | – | -3.55% | * |
| Class R58 | – | – | – | -3.43% | * |
| Class R68 | – | – | – | -3.39% | * |
1 Reflects the deduction of the maximum initial sales charge of 5.75%.
2 Performance for each unmanaged index does not reflect any fees or expenses. The performance of each index is not necessarily representative of the Fund’s performance.
3 Total return, which is the percentage change in net asset value, after deduction of the maximum initial sales charge of 5.75% applicable to Class A shares, with all dividends and distributions reinvested for the periods shown ended November 30, 2015, is calculated using the SEC-required uniform method to compute such return.
4 Performance reflects the deduction of a CDSC of 5% for 1 year, 2% for 5 years and 0% for 10 years. Class B shares automatically convert to Class A shares after approximately 8
years. (There is no initial sales charge for automatic conversions.) All returns for periods greater than 8 years reflect this conversion.
5 The 1% CDSC for Class C shares normally applies before the first anniversary of the purchase date. Performance for other periods is at net asset value.
6 Commenced operations and performance for the Class began on September 28, 2007. Performance is at net asset value.
7 Performance is at net asset value.
8 Commenced operations and performance for the Class began on June 30, 2015. Performance is at net asset value.
* Since share Class has existed for less than one year, average annual returns are not provided.
8
Small Cap Value Fund
Investment Comparison
Below is a comparison of a $10,000 investment in Class A shares with the same investment in both the Russell 2000® Index and the Russell 2000® Value Index, assuming reinvestment of all dividends and distributions. The performance of other classes will be greater than or less than the performance shown in the graph below due to different sales loads and expenses applicable to such classes. The graph and performance table below do not reflect the deduction of taxes that a shareholder would pay on Fund distributions or the redemption of Fund shares. Past performance is no guarantee of future results.
| Average Annual Total Returns at Maximum Applicable | |
| Sales Charge for the Periods Ended November 30, 2015 | |
| | 1 Year | 5 Years | 10 Years | Life of Class | |
| Class A3 | -1.26% | 8.76% | 7.65% | – | |
| Class B4 | 0.25% | 9.04% | 7.68% | – | |
| Class C5 | 3.22% | 9.27% | 7.53% | – | |
| Class F6 | 4.90% | 10.24% | – | 6.41% | |
| Class I7 | 5.01% | 10.36% | 8.60% | – | |
| Class P7 | 4.57% | 9.87% | 8.12% | – | |
| Class R28 | 4.38% | 9.69% | – | 7.73% | |
| Class R38 | 4.52% | 9.84% | – | 7.85% | |
| Class R49 | – | – | – | -0.88% | * |
| Class R59 | – | – | – | -0.76% | * |
| Class R69 | – | – | – | -0.72% | * |
1 Reflects the deduction of the maximum initial sales charge of 5.75%.
2 Performance for each unmanaged index does not reflect any fees or expenses. The performance of each index is not necessarily representative of the Fund’s performance.
3 Total return, which is the percentage change in net asset value, after deduction of the maximum initial sales charge of 5.75% applicable to Class A shares, with all dividends and distributions reinvested for the periods shown ended November 30, 2015, is calculated using the SEC-required uniform method to compute such return.
4 Performance reflects the deduction of a CDSC of 5% for 1 year, 2% for 5 years and 0% for 10 years. Class B shares automatically convert to Class A shares after approximately 8 years. (There is no initial sales charge for automatic conversions.)
All returns for periods greater than 8 years reflect this conversion.
5 The 1% CDSC for Class C shares normally applies before the first anniversary of the purchase date. Performance for other periods is at net asset value.
6 Class F shares commenced operations and performance for the Class began on September 28, 2007. Performance is at net asset value.
7 Performance is at net asset value.
8 Class R2 and R3 shares commenced operations on March 24, 2008 and performance for the Class began March 31, 2008. Performance is at net asset value.
9 Commenced operations and performance for the Class began on June 30, 2015. Performance is at net asset value.
* Since share Class has existed for less than one year, average annual returns are not provided.
9
Expense Example
As a shareholder of the Fund, you incur two types of costs: (1) transaction costs, including sales charges (loads) on purchase payments (these charges vary among the share classes); and (2) ongoing costs, including management fees; distribution and service (12b-1) fees (these charges vary among the share classes); and other Fund expenses. This Example is intended to help you understand your ongoing costs (in dollars) of investing in the Fund and to compare these costs with the ongoing costs of investing in other mutual funds.
The Example is based on an investment of $1,000 invested at the beginning of the period and held for the entire period (June 1, 2015 through November 30, 2015).
Actual Expenses
For each class of the Fund, the first line of the table on the following page provides information about actual account values and actual expenses. You may use the information in this line, together with the amount you invested, to estimate the expenses that you paid over the period. Simply divide your account value by $1,000 (for example, an $8,600 account value divided by $1,000 = 8.6), then multiply the result by the number in the first line under the heading titled “Expenses Paid During Period 6/1/15 – 11/30/15” to estimate the expenses you paid on your account during this period.
Hypothetical Example for Comparison Purposes
For each class of the Fund, the second line of the table on the following page provides information about hypothetical account values and hypothetical expenses based on the Fund’s actual expense ratio and an assumed rate of return of 5% per year before expenses, which is not the Fund’s actual return. The hypothetical account values and expenses may not be used to estimate the actual ending account balance or expenses you paid for the period. You may use this information to compare the ongoing costs of investing in the Fund and other funds. To do so, compare this 5% hypothetical example with the 5% hypothetical examples that appear in the shareholder reports of the other funds.
10
Calibrated Dividend Growth Fund
Please note that the expenses shown in the table are meant to highlight your ongoing costs only and do not reflect any transactional costs, such as sales charges (loads). Therefore, the second line of the table is useful in comparing ongoing costs only, and will not help you determine the relative total costs of owning different funds. In addition, if these transactional costs were included, your costs would have been higher.
| | | Beginning | | Ending | | Expenses |
| | | Account | | Account | | Paid During |
| | | Value | | Value | | Period† |
| | | | | | | | | 6/1/15 – |
| | | 6/1/15 | | 11/30/15 | | 11/30/15 |
| Class A | | | | | | | | | |
| Actual | | $ | 1,000.00 | | | $ | 979.60 | | | | $4.22 | |
| Hypothetical (5% Return Before Expenses) | | $ | 1,000.00 | | | $ | 1,020.81 | | | | $4.31 | |
| Class B | | | | | | | | | | | | |
| Actual | | $ | 1,000.00 | | | $ | 975.20 | | | | $7.92 | |
| Hypothetical (5% Return Before Expenses) | | $ | 1,000.00 | | | $ | 1,017.05 | | | | $8.09 | |
| Class C | | | | | | | | | | | | |
| Actual | | $ | 1,000.00 | | | $ | 975.50 | | | | $7.92 | |
| Hypothetical (5% Return Before Expenses) | | $ | 1,000.00 | | | $ | 1,017.05 | | | | $8.09 | |
| Class F | | | | | | | | | | | | |
| Actual | | $ | 1,000.00 | | | $ | 979.70 | | | | $3.47 | |
| Hypothetical (5% Return Before Expenses) | | $ | 1,000.00 | | | $ | 1,021.56 | | | | $3.55 | |
| Class I | | | | | | | | | | | | |
| Actual | | $ | 1,000.00 | | | $ | 980.40 | | | | $2.98 | |
| Hypothetical (5% Return Before Expenses) | | $ | 1,000.00 | | | $ | 1,022.06 | | | | $3.04 | |
| Class P | | | | | | | | | | | | |
| Actual | | $ | 1,000.00 | | | $ | 977.90 | | | | $5.21 | |
| Hypothetical (5% Return Before Expenses) | | $ | 1,000.00 | | | $ | 1,019.80 | | | | $5.32 | |
| Class R2 | | | | | | | | | | | | |
| Actual | | $ | 1,000.00 | | | $ | 977.90 | | | | $5.95 | |
| Hypothetical (5% Return Before Expenses) | | $ | 1,000.00 | | | $ | 1,019.05 | | | | $6.07 | |
| Class R3 | | | | | | | | | | | | |
| Actual | | $ | 1,000.00 | | | $ | 978.30 | | | | $5.41 | |
| Hypothetical (5% Return Before Expenses) | | $ | 1,000.00 | | | $ | 1,019.60 | | | | $5.52 | |
| Class R4 | | | | | | | | | | | | |
| Actual | | $ | 1,000.00 | | | $ | 1,008.50 | | | | $3.66 | |
| Hypothetical (5% Return Before Expenses) | | $ | 1,000.00 | | | $ | 1,017.31 | | | | $3.68 | |
| Class R5 | | | | | | | | | | | | |
| Actual | | $ | 1,000.00 | | | $ | 1,009.80 | | | | $2.53 | |
| Hypothetical (5% Return Before Expenses) | | $ | 1,000.00 | | | $ | 1,018.44 | | | | $2.54 | |
| Class R6 | | | | | | | | | | | | |
| Actual | | $ | 1,000.00 | | | $ | 1,009.80 | | | | $2.06 | |
| Hypothetical (5% Return Before Expenses) | | $ | 1,000.00 | | | $ | 1,018.95 | | | | $2.07 | |
| | |
| † | For each class of the Fund, net expenses are equal to the annualized expense ratio for such class (0.85% for Class A, 1.60% for Classes B and C, 0.70% for Class F, 0.60% for Class I, 1.05% for Class P, 1.20% for Class R2, 1.09% for Class R3, 0.87% for Class R4, 0.60% for Class R5 and 0.49% for Class R6) multiplied by the average account value over the period, multiplied by 183/365 (to reflect one-half year period for Classes A, B, C, F, I, P, R2 and R3) and multiplied by 153/365 (to reflect the period from June 30, 2015, commencement of operations, to November 30, 2015, for Classes R4, R5 and R6). |
11
Portfolio Holdings Presented by Sector
November 30, 2015
| Sector* | | %** |
| Consumer Discretionary | | | 12.71 | % |
| Consumer Staples | | | 19.90 | % |
| Energy | | | 6.69 | % |
| Financials | | | 5.58 | % |
| Health Care | | | 10.64 | % |
| Industrials | | | 19.33 | % |
| Information Technology | | | 8.06 | % |
| Materials | | | 5.83 | % |
| Telecommunication Services | | | 4.51 | % |
| Utilities | | | 6.39 | % |
| Repurchase Agreement | | | 0.36 | % |
| Total | | | 100.00 | % |
| * | | A sector may comprise several industries. |
| ** | | Represents percent of total investments. |
12
Growth Opportunities Fund
Please note that the expenses shown in the table are meant to highlight your ongoing costs only and do not reflect any transactional costs, such as sales charges (loads). Therefore, the second line of the table is useful in comparing ongoing costs only, and will not help you determine the relative total costs of owning different funds. In addition, if these transactional costs were included, your costs would have been higher.
| | | Beginning | | Ending | | Expenses |
| | | Account | | Account | | Paid During |
| | | Value | | Value | | Period† |
| | | | | | | | | 6/1/15 – |
| | | 6/1/15 | | 11/30/15 | | 11/30/15 |
| Class A | | | | | | | | | | | | |
| Actual | | $ | 1,000.00 | | | $ | 963.20 | | | | $ 6.35 | |
| Hypothetical (5% Return Before Expenses) | | $ | 1,000.00 | | | $ | 1,018.60 | | | | $ 6.53 | |
| Class B | | | | | | | | | | | | |
| Actual | | $ | 1,000.00 | | | $ | 959.90 | | | | $ 9.97 | |
| Hypothetical (5% Return Before Expenses) | | $ | 1,000.00 | | | $ | 1,014.89 | | | | $10.25 | |
| Class C | | | | | | | | | | | | |
| Actual | | $ | 1,000.00 | | | $ | 959.40 | | | | $ 9.97 | |
| Hypothetical (5% Return Before Expenses) | | $ | 1,000.00 | | | $ | 1,014.89 | | | | $10.25 | |
| Class F | | | | | | | | | | | | |
| Actual | | $ | 1,000.00 | | | $ | 963.80 | | | | $ 5.61 | |
| Hypothetical (5% Return Before Expenses) | | $ | 1,000.00 | | | $ | 1,019.35 | | | | $ 5.77 | |
| Class I | | | | | | | | | | | | |
| Actual | | $ | 1,000.00 | | | $ | 964.50 | | | | $ 5.12 | |
| Hypothetical (5% Return Before Expenses) | | $ | 1,000.00 | | | $ | 1,019.85 | | | | $ 5.27 | |
| Class P | | | | | | | | | | | | |
| Actual | | $ | 1,000.00 | | | $ | 962.20 | | | | $ 7.33 | |
| Hypothetical (5% Return Before Expenses) | | $ | 1,000.00 | | | $ | 1,017.60 | | | | $ 7.54 | |
| Class R2 | | | | | | | | | | | | |
| Actual | | $ | 1,000.00 | | | $ | 961.70 | | | | $ 8.07 | |
| Hypothetical (5% Return Before Expenses) | | $ | 1,000.00 | | | $ | 1,016.85 | | | | $ 8.29 | |
| Class R3 | | | | | | | | | | | | |
| Actual | | $ | 1,000.00 | | | $ | 962.20 | | | | $ 7.53 | |
| Hypothetical (5% Return Before Expenses) | | $ | 1,000.00 | | | $ | 1,017.40 | | | | $ 7.74 | |
| Class R4 | | | | | | | | | | | | |
| Actual | | $ | 1,000.00 | | | $ | 964.50 | | | | $ 5.15 | |
| Hypothetical (5% Return Before Expenses) | | $ | 1,000.00 | | | $ | 1,015.72 | | | | $ 5.28 | |
| Class R5 | | | | | | | | | | | | |
| Actual | | $ | 1,000.00 | | | $ | 965.70 | | | | $ 4.12 | |
| Hypothetical (5% Return Before Expenses) | | $ | 1,000.00 | | | $ | 1,016.77 | | | | $ 4.23 | |
| Class R6 | | | | | | | | | | | | |
| Actual | | $ | 1,000.00 | | | $ | 966.10 | | | | $ 3.54 | |
| Hypothetical (5% Return Before Expenses) | | $ | 1,000.00 | | | $ | 1,017.35 | | | | $ 3.64 | |
| | |
| † | For each class of the Fund, net expenses are equal to the annualized expense ratio for such class (1.29% for Class A, 2.03% for Classes B and C, 1.14% for Class F, 1.04% for Class I, 1.49% for Class P, 1.64% for Class R2, 1.53% for Class R3, 1.25% for Class R4, 1.00% for Class R5 and 0.86% for Class R6) multiplied by the average account value over the period, multiplied by 183/365 (to reflect one-half year period for classes A, B, C, F, I, P, R2 and R3) and multiplied by 153/365 (to reflect the period from June 30, 2015, commencement of operations, to November 30, 2015, for Classes R4, R5 and R6). |
13
Portfolio Holdings Presented by Sector
November 30, 2015
| Sector* | | %** |
| Consumer Discretionary | | | 21.25 | % |
| Consumer Staples | | | 8.69 | % |
| Financials | | | 8.18 | % |
| Health Care | | | 17.57 | % |
| Industrials | | | 15.85 | % |
| Information Technology | | | 23.25 | % |
| Materials | | | 4.72 | % |
| Repurchase Agreement | | | 0.49 | % |
| Total | | | 100.00 | % |
| | | |
| * | | A sector may comprise several industries. |
| ** | | Represents percent of total investments. |
14
Small Cap Value Fund
Please note that the expenses shown in the table are meant to highlight your ongoing costs only and do not reflect any transactional costs, such as sales charges (loads). Therefore, the second line of the table is useful in comparing ongoing costs only, and will not help you determine the relative total costs of owning different funds. In addition, if these transactional costs were included, your costs would have been higher.
| | | Beginning | | Ending | | Expenses |
| | | Account | | Account | | Paid During |
| | | Value | | Value | | Period† |
| | | | | | | | | 6/1/15 – |
| | | 6/1/15 | | 11/30/15 | | 11/30/15 |
| Class A | | | | | | | | | | | | |
| Actual | | $ | 1,000.00 | | | $ | 1,003.70 | | | | $5.98 | |
| Hypothetical (5% Return Before Expenses) | | $ | 1,000.00 | | | $ | 1,019.10 | | | | $6.02 | |
| Class B | | | | | | | | | | | | |
| Actual | | $ | 1,000.00 | | | $ | 1,000.00 | | | | $9.73 | |
| Hypothetical (5% Return Before Expenses) | | $ | 1,000.00 | | | $ | 1,015.34 | | | | $9.80 | |
| Class C | | | | | | | | | | | | |
| Actual | | $ | 1,000.00 | | | $ | 999.50 | | | | $9.67 | |
| Hypothetical (5% Return Before Expenses) | | $ | 1,000.00 | | | $ | 1,015.39 | | | | $9.75 | |
| Class F | | | | | | | | | | | | |
| Actual | | $ | 1,000.00 | | | $ | 1,004.10 | | | | $5.22 | |
| Hypothetical (5% Return Before Expenses) | | $ | 1,000.00 | | | $ | 1,019.85 | | | | $5.27 | |
| Class I | | | | | | | | | | | | |
| Actual | | $ | 1,000.00 | | | $ | 1,004.70 | | | | $4.72 | |
| Hypothetical (5% Return Before Expenses) | | $ | 1,000.00 | | | $ | 1,020.36 | | | | $4.76 | |
| Class P | | | | | | | | | | | | |
| Actual | | $ | 1,000.00 | | | $ | 1,002.70 | | | | $6.98 | |
| Hypothetical (5% Return Before Expenses) | | $ | 1,000.00 | | | $ | 1,018.10 | | | | $7.03 | |
| Class R2 | | | | | | | | | | | | |
| Actual | | $ | 1,000.00 | | | $ | 1,001.50 | | | | $7.73 | |
| Hypothetical (5% Return Before Expenses) | | $ | 1,000.00 | | | $ | 1,017.35 | | | | $7.79 | |
| Class R3 | | | | | | | | | | | | |
| Actual | | $ | 1,000.00 | | | $ | 1,002.30 | | | | $7.08 | |
| Hypothetical (5% Return Before Expenses) | | $ | 1,000.00 | | | $ | 1,018.00 | | | | $7.13 | |
| Class R4 | | | | | | | | | | | | |
| Actual | | $ | 1,000.00 | | | $ | 991.20 | | | | $4.84 | |
| Hypothetical (5% Return Before Expenses) | | $ | 1,000.00 | | | $ | 1,016.10 | | | | $4.90 | |
| Class R5 | | | | | | | | | | | | |
| Actual | | $ | 1,000.00 | | | $ | 992.40 | | | | $3.76 | |
| Hypothetical (5% Return Before Expenses) | | $ | 1,000.00 | | | $ | 1,017.19 | | | | $3.81 | |
| Class R6 | | | | | | | | | | | | |
| Actual | | $ | 1,000.00 | | | $ | 992.80 | | | | $3.47 | |
| Hypothetical (5% Return Before Expenses) | | $ | 1,000.00 | | | $ | 1,017.48 | | | | $3.51 | |
| | |
| † | For each class of the Fund, net expenses are equal to the annualized expense ratio for such class (1.19% for Class A, 1.94% for Class B, 1.93% for Class C, 1.04% for Class F, 0.94% for Class I, 1.39% for Class P, 1.54% for Class R2, 1.41% for Class R3, 1.16% for Class R4, 0.90% for Class R5 and 0.83% for Class R6) multiplied by the average account value over the period, multiplied by 183/365 (to reflect one-half year period for Classes A, B, C, F, I, P, R2 and R3) and multiplied by 153/365 (to reflect the period from June 30, 2015, commencement of operations, to November 30, 2015, for Classes R4, R5 and R6). |
15
Portfolio Holdings Presented by Sector
November 30, 2015
| Sector* | | %** |
| Consumer Discretionary | | | 11.23 | % |
| Consumer Staples | | | 5.71 | % |
| Energy | | | 4.76 | % |
| Financials | | | 27.39 | % |
| Health Care | | | 7.44 | % |
| Industrials | | | 11.84 | % |
| Information Technology | | | 18.86 | % |
| Materials | | | 8.53 | % |
| Telecommunication Services | | | 0.93 | % |
| Utilities | | | 2.53 | % |
| Repurchase Agreement | | | 0.78 | % |
| Total | | | 100.00 | % |
| | | |
| * | | A sector may comprise several industries. |
| ** | | Represents percent of total investments. |
16
Schedule of Investments
CALIBRATED DIVIDEND GROWTH FUND November 30, 2015
| Investments | | Shares | | | Fair
Value
(000) | |
| COMMON STOCKS 99.35% | | | | | | | | |
| | | | | | | | | |
| Aerospace & Defense 7.04% | | | | | | | | |
| General Dynamics Corp. | | | 204,100 | | | $ | 29,892 | |
| Lockheed Martin Corp. | | | 166,061 | | | | 36,394 | |
| Northrop Grumman Corp. | | | 112,100 | | | | 20,891 | |
| Raytheon Co. | | | 65,900 | | | | 8,174 | |
| United Technologies Corp. | | | 402,900 | | | | 38,699 | |
| Total | | | | | | | 134,050 | |
| | | | | | | | | |
| Air Freight & Logistics 2.44% | | | | | | | | |
| FedEx Corp. | | | 292,835 | | | | 46,426 | |
| | | | | | | | | |
| Auto Components 1.00% | | | | | | | | |
| Johnson Controls, Inc. | | | 413,900 | | | | 19,039 | |
| | | | | | | | | |
| Banks 0.32% | | | | | | | | |
| People’s United Financial, Inc. | | | 367,100 | | | | 6,149 | |
| | | | | | | | | |
| Beverages 3.10% | | | | | | | | |
| Coca-Cola Co. (The) | | | 680,479 | | | | 29,002 | |
| PepsiCo, Inc. | | | 300,602 | | | | 30,108 | |
| Total | | | | | | | 59,110 | |
| | | | | | | | | |
| Biotechnology 2.06% | | | | | | | | |
| AbbVie, Inc. | | | 675,007 | | | | 39,252 | |
| | | | | | | | | |
| Capital Markets 0.97% | | | | | | | | |
| SEI Investments Co. | | | 123,300 | | | | 6,706 | |
| T. Rowe Price Group, Inc. | | | 154,500 | | | | 11,765 | |
| Total | | | | | | | 18,471 | |
| | | | | | | | | |
| Chemicals 5.46% | | | | | | | | |
| Air Products & Chemicals, Inc. | | | 35,200 | | | | 4,819 | |
| Ecolab, Inc. | | | 42,600 | | | | 5,076 | |
| International Flavors & Fragrances, Inc. | | | 43,000 | | | | 5,160 | |
| Monsanto Co. | | | 364,349 | | | | 34,672 | |
| PPG Industries, Inc. | | | 116,686 | | | | 12,338 | |
| Sherwin-Williams Co. (The) | | | 99,100 | | | | 27,359 | |
| Valspar Corp. (The) | | | 172,166 | | | | 14,546 | |
| Total | | | | | | | 103,970 | |
| Investments | | Shares | | | Fair
Value
(000) | |
| Communications Equipment 2.04% | | | | | | | | |
| Harris Corp. | | | 26,300 | | | $ | 2,186 | |
| QUALCOMM, Inc. | | | 750,926 | | | | 36,638 | |
| Total | | | | | | | 38,824 | |
| | | | | | | | | |
| Containers & Packaging 0.36% | | | | | | | | |
| Bemis Co., Inc. | | | 144,000 | | | | 6,785 | |
| | | | | | | | | |
| Diversified Telecommunication Services 4.49% | | | | | | | | |
| AT&T, Inc. | | | 1,258,664 | | | | 42,379 | |
| Verizon Communications, Inc. | | | 950,100 | | | | 43,182 | |
| Total | | | | | | | 85,561 | |
| | | | | | | | | |
| Electric: Utilities 3.84% | | | | | | | | |
| Edison International | | | 346,700 | | | | 20,580 | |
| Eversource Energy | | | 67,300 | | | | 3,429 | |
| NextEra Energy, Inc. | | | 268,267 | | | | 26,789 | |
| Westar Energy, Inc. | | | 108,000 | | | | 4,609 | |
| Xcel Energy, Inc. | | | 493,900 | | | | 17,613 | |
| Total | | | | | | | 73,020 | |
| | | | | | | | | |
| Electrical Equipment 0.44% | | | | | | | | |
| Emerson Electric Co. | | | 166,088 | | | | 8,304 | |
| | | | | | | | | |
| Energy Equipment & Services 0.40% | | | | | | | | |
| Helmerich & Payne, Inc. | | | 129,708 | | | | 7,556 | |
| | | | | | | | | |
| Food & Staples Retailing 8.22% | | | | | | | | |
| Costco Wholesale Corp. | | | 145,400 | | | | 23,470 | |
| CVS Health Corp. | | | 472,800 | | | | 44,486 | |
| Sysco Corp. | | | 116,300 | | | | 4,780 | |
| Wal-Mart Stores, Inc. | | | 292,670 | | | | 17,221 | |
| Walgreens Boots Alliance, Inc. | | | 790,719 | | | | 66,444 | |
| Total | | | | | | | 156,401 | |
| | | | | | | | | |
| Food Products 1.71% | | | | | | | | |
| Archer-Daniels-Midland Co. | | | 449,100 | | | | 16,387 | |
| General Mills, Inc. | | | 280,900 | | | | 16,225 | |
| Total | | | | | | | 32,612 | |
| | See Notes to Financial Statements. | 17 |
Schedule of Investments (continued)
CALIBRATED DIVIDEND GROWTH FUND November 30, 2015
| Investments | | Shares | | | Fair
Value
(000) | |
| Gas Utilities 0.49% | | | | | | | | |
| UGI Corp. | | | 269,250 | | | $ | 9,335 | |
| | | | | | | | | |
| Health Care Equipment & Supplies 3.66% | | | | | | | | |
| Becton, Dickinson & Co. | | | 122,300 | | | | 18,376 | |
| C.R. Bard, Inc. | | | 87,097 | | | | 16,271 | |
| Medtronic plc (Ireland)(a) | | | 464,703 | | | | 35,011 | |
| Total | | | | | | | 69,658 | |
| | | | | | | | | |
| Health Care Providers & Services 2.37% | | | | | | | | |
| AmerisourceBergen Corp. | | | 106,700 | | | | 10,525 | |
| Cardinal Health, Inc. | | | 398,252 | | | | 34,588 | |
| Total | | | | | | | 45,113 | |
| | | | | | | | | |
| Hotels, Restaurants & Leisure 3.07% | | | | | | | | |
| Darden Restaurants, Inc. | | | 232,500 | | | | 13,059 | |
| McDonald’s Corp. | | | 353,826 | | | | 40,393 | |
| Yum! Brands, Inc. | | | 68,400 | | | | 4,960 | |
| Total | | | | | | | 58,412 | |
| | | | | | | | | |
| Household Durables 0.26% | | | | | | | | |
| Leggett & Platt, Inc. | | | 106,300 | | | | 4,954 | |
| | | | | | | | | |
| Household Products 3.88% | | | | | | | | |
| Colgate-Palmolive Co. | | | 273,200 | | | | 17,944 | |
| Kimberly-Clark Corp. | | | 273,515 | | | | 32,589 | |
| Procter & Gamble Co. (The) | | | 311,400 | | | | 23,305 | |
| Total | | | | | | | 73,838 | |
| | | | | | | | | |
| Industrial Conglomerates 4.51% | | | | | | | | |
| 3M Co. | | | 451,610 | | | | 70,713 | |
| Roper Technologies, Inc. | | | 77,800 | | | | 15,054 | |
| Total | | | | | | | 85,767 | |
| | | | | | | | | |
| Information Technology Services 3.76% | | | | | | | | |
| Accenture plc Class A (Ireland)(a) | | | 179,300 | | | | 19,225 | |
| Automatic Data Processing, Inc. | | | 106,900 | | | | 9,221 | |
| International Business Machines Corp. | | | 309,700 | | | | 43,178 | |
| Total | | | | | | | 71,624 | |
| Investments | | Shares | | | Fair
Value
(000) | |
| Insurance 4.27% | | | | | | | | |
| ACE Ltd. (Switzerland)(a) | | | 470,221 | | | $ | 54,005 | |
| Aflac, Inc. | | | 209,965 | | | | 13,698 | |
| Hanover Insurance Group, Inc. (The) | | | 67,200 | | | | 5,685 | |
| Old Republic International Corp. | | | 419,700 | | | | 7,958 | |
| Total | | | | | | | 81,346 | |
| | | | | | | | | |
| Leisure Products 1.62% | | | | | | | | |
| Hasbro, Inc. | | | 420,932 | | | | 30,766 | |
| | | | | | | | | |
| Machinery 3.50% | | | | | | | | |
| Cummins, Inc. | | | 96,500 | | | | 9,686 | |
| Illinois Tool Works, Inc. | | | 50,900 | | | | 4,784 | |
| Parker-Hannifin Corp. | | | 260,600 | | | | 27,274 | |
| Stanley Black & Decker, Inc. | | | 228,200 | | | | 24,910 | |
| Total | | | | | | | 66,654 | |
| | | | | | | | | |
| Multi-Line Retail 0.74% | | | | | | | | |
| Target Corp. | | | 194,500 | | | | 14,101 | |
| | | | | | | | | |
| Multi-Utilities 2.04% | | | | | | | | |
| Consolidated Edison, Inc. | | | 299,900 | | | | 18,639 | |
| SCANA Corp. | | | 342,351 | | | | 20,246 | |
| Total | | | | | | | 38,885 | |
| | | | | | | | | |
| Oil, Gas & Consumable Fuels 6.28% | | | | | | | | |
| Chevron Corp. | | | 727,762 | | | | 66,459 | |
| EOG Resources, Inc. | | | 130,734 | | | | 10,907 | |
| Occidental Petroleum Corp. | | | 413,897 | | | | 31,287 | |
| ONEOK, Inc. | | | 367,800 | | | | 10,843 | |
| Total | | | | | | | 119,496 | |
| | | | | | | | | |
| Pharmaceuticals 2.51% | | | | | | | | |
| Johnson & Johnson | | | 472,723 | | | | 47,858 | |
| | | | | | | | | |
| Professional Services 0.93% | | | | | | | | |
| Robert Half International, Inc. | | | 346,700 | | | | 17,744 | |
| | | | | | | | | |
| Road & Rail 0.42% | | | | | | | | |
| Ryder System, Inc. | | | 120,500 | | | | 7,948 | |
| 18 | See Notes to Financial Statements. | |
Schedule of Investments (concluded)
CALIBRATED DIVIDEND GROWTH FUND November 30, 2015
| Investments | | Shares | | | Fair
Value
(000) | |
| Semiconductors & Semiconductor Equipment 2.23% | |
| Analog Devices, Inc. | | | 191,200 | | | $ | 11,784 | |
| Microchip Technology, Inc. | | | 635,167 | | | | 30,666 | |
| Total | | | | | | | 42,450 | |
| | | | | | | | | |
| Specialty Retail 4.30% | | | | | | | | |
| Gap, Inc. (The) | | | 273,500 | | | | 7,311 | |
| Lowe’s Cos., Inc. | | | 777,375 | | | | 59,547 | |
| Ross Stores, Inc. | | | 289,200 | | | | 15,041 | |
| Total | | | | | | | 81,899 | |
| | | | | | | | | |
| Textiles, Apparel & Luxury Goods 1.69% | | | | | | | | |
| NIKE, Inc. Class B | | | 242,600 | | | | 32,091 | |
| | | | | | | | | |
| Tobacco 2.93% | | | | | | | | |
| Altria Group, Inc. | | | 183,015 | | | | 10,542 | |
| Reynolds American, Inc. | | | 979,100 | | | | 45,283 | |
| Total | | | | | | | 55,825 | |
Total Common Stocks
(cost $1,842,675,784) | | | | | | | 1,891,294 | |
| Investments | | Principal
Amount
(000) | | | Fair
Value
(000) | |
| SHORT-TERM INVESTMENT 0.36% | | | | | | | | |
| | | | | | | | | |
| Repurchase Agreement | | | | | | | | |
Repurchase Agreement dated 11/30/2015, Zero Coupon due 12/1/2015 with Fixed Income Clearing Corp. collateralized by $7,015,000 of U.S. Treasury Note at 1.50% due 10/31/2019; value: $7,023,769; proceeds: $6,885,960
(cost $6,885,960) | | $ | 6,886 | | | $ | 6,886 | |
Total Investments in Securities 99.71%
(cost $1,849,561,744) | | | | | | | 1,898,180 | |
| Cash and Other Assets in Excess of Liabilities(b) 0.29% | | | | | | | 5,495 | |
| Net Assets 100.00% | | | | | | $ | 1,903,675 | |
| (a) | | Foreign security traded in U.S. dollars. |
| (b) | | Cash and Other Assets in Excess of Liabilities include net unrealized appreciation on futures contracts as follows: |
Open Futures Contracts at November 30, 2015:
| Type | | Expiration | | Contracts | | Position | | Fair Value | | Unrealized
Appreciation |
| E- Mini S&P 500 Index | | December 2015 | | 73 | | Long | | $7,591,270 | | $334,756 |
The following is a summary of the inputs used as of November 30, 2015 in valuing the Fund’s investments carried at fair value(1):
| | | Level 1 | | | Level 2 | | | Level 3 | | | Total | |
| Investment Type(2)(3) | | (000) | | | (000) | | | (000) | | | (000) | |
| Common Stocks | | $ | 1,891,294 | | | $ | – | | | $ | – | | | $ | 1,891,294 | |
| Repurchase Agreement | | | – | | | | 6,886 | | | | – | | | | 6,886 | |
| Total | | $ | 1,891,294 | | | $ | 6,886 | | | $ | – | | | $ | 1,898,180 | |
| | | | | | | | | | | | | | | | | |
| Other Financial Instruments | | | | | | | | | | | | | | | | |
| Futures Contracts | | | | | | | | | | | | | | | | |
| Assets | | $ | 335 | | | $ | – | | | $ | – | | | $ | 335 | |
| Liabilities | | | – | | | | – | | | | – | | | | – | |
| Total | | $ | 335 | | | $ | – | | | $ | – | | | $ | 335 | |
| (1) | Refer to Note 2(i) for a description of fair value measurements and the three-tier hierarchy of inputs. |
| (2) | See Schedule of Investments for fair values in each industry and identification of foreign issuers and/or geography. |
| (3) | There were no Level 1/Level 2 transfers during the fiscal year ended November 30, 2015. |
| | See Notes to Financial Statements. | 19 |
Schedule of Investments
GROWTH OPPORTUNITIES FUND November 30, 2015
| Investments | | Shares | | | Fair
Value
(000) | |
| COMMON STOCKS 99.63% | | | | | | | | |
| | | | | | | | | |
| Aerospace & Defense 0.68% | | | | | | | | |
| TransDigm Group, Inc.* | | | 18,270 | | | $ | 4,287 | |
| | | | | | | | | |
| Airlines 1.17% | | | | | | | | |
| United Continental Holdings, Inc.* | | | 132,825 | | | | 7,402 | |
| | | | | | | | | |
| Auto Components 1.65% | | | | | | | | |
| Delphi Automotive plc (United Kingdom)(a) | | | 118,826 | | | | 10,442 | |
| | | | | | | | | |
| Beverages 3.33% | | | | | | | | |
| Brown-Forman Corp. Class B | | | 78,255 | | | | 8,024 | |
| Dr. Pepper Snapple Group, Inc. | | | 84,363 | | | | 7,572 | |
| Monster Beverage Corp.* | | | 35,898 | | | | 5,550 | |
| Total | | | | | | | 21,146 | |
| | | | | | | | | |
| Biotechnology 2.29% | | | | | | | | |
| BioMarin Pharmaceutical, Inc.* | | | 65,170 | | | | 6,215 | |
| Incyte Corp.* | | | 48,994 | | | | 5,597 | |
| Medivation, Inc.* | | | 64,566 | | | | 2,730 | |
| Total | | | | | | | 14,542 | |
| | | | | | | | | |
| Building Products 2.25% | | | | | | | | |
| Fortune Brands Home & Security, Inc. | | | 165,454 | | | | 9,095 | |
| Lennox International, Inc. | | | 37,901 | | | | 5,152 | |
| Total | | | | | | | 14,247 | |
| | | | | | | | | |
| Capital Markets 0.90% | | | | | | | | |
| Affiliated Managers Group, Inc.* | | | 32,118 | | | | 5,692 | |
| | | | | | | | | |
| Chemicals 4.04% | | | | | | | | |
| Axalta Coating Systems Ltd.* | | | 86,974 | | | | 2,524 | |
| International Flavors & Fragrances, Inc. | | | 55,510 | | | | 6,662 | |
| RPM International, Inc. | | | 171,959 | | | | 8,079 | |
| Sherwin-Williams Co. (The) | | | 30,251 | | | | 8,351 | |
| Total | | | | | | | 25,616 | |
| Investments | | Shares | | | Fair
Value
(000) | |
| Commercial Services & Supplies 1.01% | | | | | | | | |
| Tyco International plc | | | 180,936 | | | $ | 6,389 | |
| | | | | | | | | |
| Containers & Packaging 0.68% | | | | | | | | |
| Owens-Illinois, Inc.* | | | 224,132 | | | | 4,324 | |
| | | | | | | | | |
| Distributors 0.62% | | | | | | | | |
| LKQ Corp.* | | | 134,439 | | | | 3,965 | |
| | | | | | | | | |
| Diversified Financial Services 3.33% | | | | | | | | |
| Intercontinental Exchange, Inc. | | | 48,818 | | | | 12,685 | |
| Moody’s Corp. | | | 81,678 | | | | 8,422 | |
| Total | | | | | | | 21,107 | |
| | | | | | | | | |
| Electrical Equipment 1.96% | | | | | | | | |
| AMETEK, Inc. | | | 139,801 | | | | 7,893 | |
| Rockwell Automation, Inc. | | | 42,985 | | | | 4,575 | |
| Total | | | | | | | 12,468 | |
| | | | | | | | | |
| Electronic Equipment, Instruments & Components 1.82% | |
| Amphenol Corp. Class A | | | 151,543 | | | | 8,343 | |
| Fitbit, Inc. Class A* | | | 110,878 | | | | 3,184 | |
| Total | | | | | | | 11,527 | |
| | | | | | | | | |
| Food Products 4.01% | | | | | | | | |
| Hershey Co. (The) | | | 89,724 | | | | 7,744 | |
| Kellogg Co. | | | 91,582 | | | | 6,298 | |
| McCormick & Co., Inc. | | | 76,879 | | | | 6,606 | |
| Mead Johnson Nutrition Co. | | | 59,746 | | | | 4,815 | |
| Total | | | | | | | 25,463 | |
| | | | | | | | | |
| Health Care Equipment & Supplies 5.39% | | | | | | | | |
| Align Technology, Inc.* | | | 116,714 | | | | 7,789 | |
| C.R. Bard, Inc. | | | 32,971 | | | | 6,160 | |
| Cooper Cos., Inc. (The) | | | 38,886 | | | | 5,687 | |
| IDEXX Laboratories, Inc.* | | | 107,546 | | | | 7,616 | |
| NuVasive, Inc.* | | | 40,488 | | | | 2,111 | |
| Sirona Dental Systems, Inc.* | | | 44,329 | | | | 4,809 | |
| Total | | | | | | | 34,172 | |
| 20 | See Notes to Financial Statements. | |
Schedule of Investments (continued)
GROWTH OPPORTUNITIES FUND November 30, 2015
| Investments | | Shares | | | Fair
Value
(000) | |
| Health Care Providers & Services 5.16% | | | | | | | | |
| AmerisourceBergen Corp. | | | 54,231 | | | $ | 5,349 | |
| Centene Corp.* | | | 131,473 | | | | 7,593 | |
| Diplomat Pharmacy, Inc.* | | | 129,937 | | | | 4,565 | |
| Envision Healthcare Holdings, Inc.* | | | 174,327 | | | | 4,794 | |
| Henry Schein, Inc.* | | | 44,066 | | | | 6,895 | |
| Universal Health Services, Inc. Class B | | | 29,315 | | | | 3,562 | |
| Total | | | | | | | 32,758 | |
| | | | | | | | | |
| Health Care Technology 1.26% | | | | | | | | |
| Cerner Corp.* | | | 133,727 | | | | 7,970 | |
| | | | | | | | | |
| Hotels, Restaurants & Leisure 4.60% | | | | | | | | |
| Chipotle Mexican Grill, Inc.* | | | 7,733 | | | | 4,482 | |
| Hilton Worldwide Holdings, Inc. | | | 335,484 | | | | 7,790 | |
| Norwegian Cruise Line Holdings Ltd.* | | | 137,847 | | | | 7,918 | |
| Panera Bread Co. Class A* | | | 27,295 | | | | 4,962 | |
| Starwood Hotels & Resorts Worldwide, Inc. | | | 56,239 | | | | 4,040 | |
| Total | | | | | | | 29,192 | |
| | | | | | | | | |
| Household Durables 1.05% | | | | | | | | |
| Mohawk Industries, Inc.* | | | 34,795 | | | | 6,636 | |
| | | | | | | | | |
| Household Products 0.85% | | | | | | | | |
| Church & Dwight Co., Inc. | | | 63,102 | | | | 5,412 | |
| | | | | | | | | |
| Industrial Conglomerates 1.59% | | | | | | | | |
| Roper Technologies, Inc. | | | 51,992 | | | | 10,060 | |
| | | | | | | | | |
| Information Technology Services 6.63% | | | | | | | | |
| Alliance Data Systems Corp.* | | | 44,174 | | | | 12,671 | |
| Booz Allen Hamilton Holding Corp. | | | 177,190 | | | | 5,395 | |
| Fidelity National Information Services, Inc. | | | 73,469 | | | | 4,678 | |
| Fiserv, Inc.* | | | 104,998 | | | | 10,105 | |
| Vantiv, Inc. Class A* | | | 174,558 | | | | 9,201 | |
| Total | | | | | | | 42,050 | |
| Investments | | Shares | | | Fair
Value
(000) | |
| Internet & Catalog Retail 0.93% | | | | | | | | |
| Expedia, Inc. | | | 48,020 | | | $ | 5,912 | |
| | | | | | | | | |
| Internet Software & Services 4.04% | | | | | | | | |
| Akamai Technologies, Inc.* | | | 79,321 | | | | 4,569 | |
| CoStar Group, Inc.* | | | 40,369 | | | | 8,447 | |
| LinkedIn Corp. Class A* | | | 42,519 | | | | 10,337 | |
| Pandora Media, Inc.* | | | 162,900 | | | | 2,248 | |
| Total | | | | | | | 25,601 | |
| | | | | | | | | |
| Leisure Products 0.98% | | | | | | | | |
| Hasbro, Inc. | | | 85,153 | | | | 6,224 | |
| | | | | | | | | |
| Life Sciences Tools & Services 1.39% | | | | | | | | |
| Mettler-Toledo International, Inc.* | | | 25,754 | | | | 8,828 | |
| | | | | | | | | |
| Machinery 3.47% | | | | | | | | |
| IDEX Corp. | | | 97,105 | | | | 7,652 | |
| Ingersoll-Rand plc | | | 67,171 | | | | 3,941 | |
| Middleby Corp. (The)* | | | 33,103 | | | | 3,642 | |
| Wabtec Corp. | | | 84,709 | | | | 6,787 | |
| Total | | | | | | | 22,022 | |
| | | | | | | | | |
| Multi-Line Retail 2.58% | | | | | | | | |
| Dollar General Corp. | | | 137,819 | | | | 9,015 | |
| Dollar Tree, Inc.* | | | 97,878 | | | | 7,386 | |
| Total | | | | | | | 16,401 | |
| | | | | | | | | |
| Personal Products 0.50% | | | | | | | | |
| Coty, Inc. Class A | | | 114,024 | | | | 3,168 | |
| | | | | | | | | |
| Pharmaceuticals 2.09% | | | | | | | | |
| Perrigo Co. plc (Ireland)(a) | | | 31,886 | | | | 4,764 | |
| Zoetis, Inc. | | | 182,255 | | | | 8,511 | |
| Total | | | | | | | 13,275 | |
| | | | | | | | | |
| Professional Services 1.22% | | | | | | | | |
| Towers Watson & Co. Class A | | | 34,173 | | | | 4,597 | |
| Verisk Analytics, Inc.* | | | 41,953 | | | | 3,144 | |
| Total | | | | | | | 7,741 | |
| | See Notes to Financial Statements. | 21 |
Schedule of Investments (continued)
GROWTH OPPORTUNITIES FUND November 30, 2015
| Investments | | Shares | | | Fair
Value
(000) | |
| Real Estate Investment Trusts 1.51% | | | | | | | | |
| Equinix, Inc. | | | 32,212 | | | $ | 9,551 | |
| | | | | | | | | |
| Real Estate Management & Development 2.46% | | | | | | | | |
| CBRE Group, Inc. Class A* | | | 263,888 | | | | 9,888 | |
| Realogy Holdings Corp.* | | | 137,979 | | | | 5,700 | |
| Total | | | | | | | 15,588 | |
| | | | | | | | | |
| Road & Rail 0.91% | | | | | | | | |
| J.B. Hunt Transport Services, Inc. | | | 73,479 | | | | 5,749 | |
| | | | | | | | | |
| Semiconductors & Semiconductor Equipment 2.73% | |
| Cavium, Inc.* | | | 100,441 | | | | 6,741 | |
| Freescale Semiconductor Ltd.* | | | 102,574 | | | | 3,991 | |
| Microchip Technology, Inc. | | | 135,854 | | | | 6,559 | |
| Total | | | | | | | 17,291 | |
| | | | | | | | | |
| Software 8.07% | | | | | | | | |
| Activision Blizzard, Inc. | | | 294,333 | | | | 11,085 | |
| FireEye, Inc.* | | | 112,909 | | | | 2,583 | |
| Red Hat, Inc.* | | | 153,010 | | | | 12,457 | |
| ServiceNow, Inc.* | | | 115,044 | | | | 10,010 | |
| Splunk, Inc.* | | | 71,458 | | | | 4,252 | |
| Tableau Software, Inc. Class A* | | | 49,212 | | | | 4,775 | |
| Workday, Inc. Class A* | | | 71,800 | | | | 6,010 | |
| Total | | | | | | | 51,172 | |
| | | | | | | | | |
| Specialty Retail 7.59% | | | | | | | | |
| Advance Auto Parts, Inc. | | | 29,765 | | | | 4,844 | |
| AutoZone, Inc.* | | | 16,914 | | | | 13,257 | |
| L Brands, Inc. | | | 110,287 | | | | 10,522 | |
| Tiffany & Co. | | | 55,322 | | | | 4,408 | |
| Tractor Supply Co. | | | 85,405 | | | | 7,631 | |
| Ulta Salon, Cosmetics & Fragrance, Inc.* | | | 44,931 | | | | 7,503 | |
| Total | | | | | | | 48,165 | |
| Investments | | Shares | | | Fair
Value
(000) | |
| Textiles, Apparel & Luxury Goods 1.26% | | | | | | | | |
| lululemon athletica, Inc. (Canada)*(a) | | | 82,411 | | | $ | 3,941 | |
| Under Armour, Inc. Class A* | | | 47,108 | | | | 4,062 | |
| Total | | | | | | | 8,003 | |
| | | | | | | | | |
| Trading Companies & Distributors 1.63% | | | | | | | | |
| HD Supply Holdings, Inc.* | | | 223,991 | | | | 7,085 | |
| United Rentals, Inc.* | | | 41,046 | | | | 3,229 | |
| Total | | | | | | | 10,314 | |
Total Common Stocks
(cost $553,570,223) | | | | | | | 631,872 | |
| | | | | | | | |
| | | Principal
Amount
(000) | | | | | |
| SHORT-TERM INVESTMENT 0.49% | | | | | | | | |
| | | | | | | | | |
| Repurchase Agreement | | | | | | | | |
Repurchase Agreement dated 11/30/2015, Zero Coupon due 12/1/2015 with Fixed Income Clearing Corp. collateralized by $3,110,000 of U.S. Treasury Note at 2.25% due 11/30/2017; value: $3,191,638; proceeds: $3,128,412
(cost $3,128,412) | | $ | 3,128 | | | | 3,128 | |
Total Investments in Securities 100.12%
(cost $556,698,635) | | | | | | | 635,000 | |
| Liabilities in Excess of Cash and Other Assets (0.12)% | | | | | | | (775 | ) |
| Net Assets 100.00% | | | | | | $ | 634,225 | |
| * | | Non-income producing security. |
| (a) | | Foreign security traded in U.S. dollars. |
| 22 | See Notes to Financial Statements. | |
Schedule of Investments (concluded)
GROWTH OPPORTUNITIES FUND November 30, 2015
The following is a summary of the inputs used as of November 30, 2015 in valuing the Fund’s investments carried at fair value(1):
| | | Level 1 | | | Level 2 | | | Level 3 | | | Total | |
| Investment Type(2)(3) | | (000) | | | (000) | | | (000) | | | (000) | |
| Common Stocks | | $ | 631,872 | | | $ | – | | | $ | – | | | $ | 631,872 | |
| Repurchase Agreement | | | – | | | | 3,128 | | | | – | | | | 3,128 | |
| Total | | $ | 631,872 | | | $ | 3,128 | | | $ | – | | | $ | 635,000 | |
| (1) | Refer to Note 2(i) for a description of fair value measurements and the three-tier hierarchy of inputs. |
| (2) | See Schedule of Investments for fair values in each industry and identification of foreign issuers and/or geography. |
| (3) | There were no Level 1/Level 2 transfers during the fiscal year ended November 30, 2015. |
| | See Notes to Financial Statements. | 23 |
Schedule of Investments
SMALL CAP VALUE FUND November 30, 2015
| Investments | | Shares | | | Fair
Value
(000) | |
| COMMON STOCKS 99.24% | | | | | | | | |
| | | | | | | | | |
| Aerospace & Defense 2.59% | | | | | | | | |
| Hexcel Corp. | | | 455,800 | | | $ | 21,463 | |
| Teledyne Technologies, Inc.* | | | 137,269 | | | | 12,699 | |
| Total | | | | | | | 34,162 | |
| | | | | | | | | |
| Auto Components 0.51% | | | | | | | | |
| Gentherm, Inc.* | | | 134,020 | | | | 6,814 | |
| | | | | | | | | |
| Banks 13.90% | | | | | | | | |
| Columbia Banking System, Inc. | | | 413,000 | | | | 14,678 | |
| First Merchants Corp. | | | 756,524 | | | | 20,577 | |
| PrivateBancorp, Inc. | | | 721,900 | | | | 31,843 | |
| Renasant Corp. | | | 645,109 | | | | 23,566 | |
| Signature Bank* | | | 149,200 | | | | 23,596 | |
| South State Corp. | | | 484,349 | | | | 38,075 | |
| Western Alliance Bancorp* | | | 805,347 | | | | 31,239 | |
| Total | | | | | | | 183,574 | |
| | | | | | | | | |
| Building Products 2.06% | | | | | | | | |
| Advanced Drainage Systems, Inc. | | | 328,811 | | | | 8,816 | |
| Patrick Industries, Inc.* | | | 442,822 | | | | 18,346 | |
| Total | | | | | | | 27,162 | |
| | | | | | | | | |
| Capital Markets 0.02% | | | | | | | | |
| Ares Management LP | | | 21,753 | | | | 306 | |
| | | | | | | | | |
| Chemicals 2.84% | | | | | | | | |
| Minerals Technologies, Inc. | | | 371,700 | | | | 22,874 | |
| PolyOne Corp. | | | 408,100 | | | | 14,684 | |
| Total | | | | | | | 37,558 | |
| | | | | | | | | |
| Commercial Services & Supplies 0.77% | | | | | | | | |
| Multi-Color Corp. | | | 163,300 | | | | 10,208 | |
| | | | | | | | | |
| Communications Equipment 1.46% | | | | | | | | |
| ARRIS Group, Inc.* | | | 631,956 | | | | 19,319 | |
| Investments | | Shares | | | Fair
Value
(000) | |
| Construction & Engineering 4.73% | | | | | | | | |
| AECOM* | | | 743,897 | | | $ | 23,678 | |
| EMCOR Group, Inc. | | | 386,300 | | | | 19,470 | |
| Primoris Services Corp. | | | 838,000 | | | | 19,341 | |
| Total | | | | | | | 62,489 | |
| | | | | | | | | |
| Containers & Packaging 3.38% | | | | | | | | |
| AptarGroup, Inc. | | | 247,800 | | | | 18,456 | |
| Berry Plastics Group, Inc.* | | | 483,600 | | | | 17,584 | |
| Multi Packaging Solutions International Ltd.* | | | 506,773 | | | | 8,569 | |
| Total | | | | | | | 44,609 | |
| | | | | | | | | |
| Distributors 1.45% | | | | | | | | |
| Core-Mark Holding Co., Inc. | | | 224,600 | | | | 19,156 | |
| | | | | | | | | |
| Diversified Telecommunication Services 0.94% | | | | | | | | |
| Cogent Communications Holdings, Inc. | | | 368,395 | | | | 12,363 | |
| | | | | | | | | |
| Electric: Utilities 2.53% | | | | | | | | |
| IDACORP, Inc. | | | 490,500 | | | | 33,374 | |
| | | | | | | | | |
| Electronic Equipment, Instruments & Components 2.68% | |
| Cognex Corp. | | | 270,947 | | | | 10,052 | |
| Littelfuse, Inc. | | | 233,100 | | | | 25,305 | |
| Total | | | | | | | 35,357 | |
| | | | | | | | | |
| Food & Staples Retailing 1.49% | | | | | | | | |
| Casey’s General Stores, Inc. | | | 124,400 | | | | 14,464 | |
| United Natural Foods, Inc.* | | | 118,329 | | | | 5,196 | |
| Total | | | | | | | 19,660 | |
| | | | | | | | | |
| Food Products 2.52% | | | | | | | | |
| Diamond Foods, Inc.* | | | 280,800 | | | | 11,367 | |
| Pinnacle Foods, Inc. | | | 503,600 | | | | 21,927 | |
| Total | | | | | | | 33,294 | |
| 24 | See Notes to Financial Statements. | |
Schedule of Investments (continued)
SMALL CAP VALUE FUND November 30, 2015
| Investments | | Shares | | | Fair
Value
(000) | |
| Health Care Equipment & Supplies 3.55% | | | | | | | | |
| STERIS plc (United Kingdom)(a) | | | 382,855 | | | $ | 29,242 | |
| West Pharmaceutical Services, Inc. | | | 280,500 | | | | 17,686 | |
| Total | | | | | | | 46,928 | |
| | | | | | | | | |
| Health Care Providers & Services 3.89% | | | | | | | | |
| ExamWorks Group, Inc.* | | | 537,700 | | | | 14,206 | |
| HealthSouth Corp. | | | 638,300 | | | | 22,462 | |
| MEDNAX, Inc.* | | | 205,400 | | | | 14,659 | |
| Total | | | | | | | 51,327 | |
| | | | | | | | | |
| Hotels, Restaurants & Leisure 2.00% | | | | | | | | |
| Cheesecake Factory, Inc. (The) | | | 296,500 | | | | 13,974 | |
| Denny’s Corp.* | | | 1,289,600 | | | | 12,432 | |
| Total | | | | | | | 26,406 | |
| | | | | | | | | |
| Household Durables 1.69% | | | | | | | | |
| Helen of Troy Ltd.* | | | 216,000 | | | | 22,337 | |
| | | | | | | | | |
| Household Products 1.70% | | | | | | | | |
| WD-40 Co. | | | 227,839 | | | | 22,504 | |
| | | | | | | | | |
| Information Technology Services 6.99% | | | | | | | | |
| Acxiom Corp.* | | | 655,744 | | | | 15,017 | |
| Booz Allen Hamilton Holding Corp. | | | 716,661 | | | | 21,822 | |
| Cardtronics, Inc.* | | | 374,100 | | | | 14,070 | |
| Jack Henry & Associates, Inc. | | | 288,800 | | | | 22,925 | |
| MAXIMUS, Inc. | | | 326,805 | | | | 18,546 | |
| Total | | | | | | | 92,380 | |
| | | | | | | | | |
| Insurance 3.33% | | | | | | | | |
| Allied World Assurance Co. Holdings AG (Switzerland)(a) | | | 333,500 | | | | 12,113 | |
| RenaissanceRe Holdings Ltd. | | | 287,300 | | | | 31,821 | |
| Total | | | | | | | 43,934 | |
| | | | | | | | | |
| Machinery 1.21% | | | | | | | | |
| Barnes Group, Inc. | | | 413,573 | | | | 15,931 | |
| Investments | | Shares | | | Fair
Value
(000) | |
| Marine 0.49% | | | | | | | | |
| Kirby Corp.* | | | 100,269 | | | $ | 6,477 | |
| | | | | | | | | |
| Media 1.21% | | | | | | | | |
| AMC Networks, Inc. Class A* | | | 196,853 | | | | 16,006 | |
| | | | | | | | | |
| Metals & Mining 1.00% | | | | | | | | |
| Reliance Steel & Aluminum Co. | | | 224,500 | | | | 13,203 | |
| | | | | | | | | |
| Oil, Gas & Consumable Fuels 4.76% | | | | | | | | |
| Carrizo Oil & Gas, Inc.* | | | 655,500 | | | | 26,469 | |
| Parsley Energy, Inc. Class A* | | | 862,300 | | | | 16,944 | |
| Rice Energy, Inc.* | | | 934,617 | | | | 12,599 | |
| RSP Permian, Inc.* | | | 241,055 | | | | 6,841 | |
| Total | | | | | | | 62,853 | |
| | | | | | | | | |
| Paper & Forest Products 1.31% | | | | | | | | |
| KapStone Paper and Packaging Corp. | | | 712,100 | | | | 17,283 | |
| | | | | | | | | |
| Real Estate Investment Trusts 7.07% | | | | | | | | |
| CoreSite Realty Corp. | | | 408,400 | | | | 23,920 | |
| First Industrial Realty Trust, Inc. | | | 1,126,930 | | | | 25,750 | |
| Physicians Realty Trust | | | 1,352,221 | | | | 21,649 | |
| Retail Opportunity Investments Corp. | | | 1,208,900 | | | | 22,111 | |
| Total | | | | | | | 93,430 | |
| | | | | | | | | |
| Real Estate Management & Development 1.86% | | | | | | | | |
| Kennedy-Wilson Holdings, Inc. | | | 658,600 | | | | 17,190 | |
| Marcus & Millichap, Inc.* | | | 223,877 | | | | 7,345 | |
| Total | | | | | | | 24,535 | |
| | | | | | | | | |
| Semiconductors & Semiconductor Equipment 4.47% | |
| Cypress Semiconductor Corp.* | | | 1,524,364 | | | | 16,493 | |
| Synaptics, Inc.* | | | 265,533 | | | | 23,837 | |
| Teradyne, Inc. | | | 898,400 | | | | 18,669 | |
| Total | | | | | | | 58,999 | |
| | See Notes to Financial Statements. | 25 |
Schedule of Investments (concluded)
SMALL CAP VALUE FUND November 30, 2015
| Investments | | Shares | | | Fair
Value
(000) | |
| Software 0.94% | | | | | | | | |
| Mentor Graphics Corp. | | | 664,400 | | | $ | 12,444 | |
| | | | | | | | | |
| Specialty Retail 3.87% | | | | | | | | |
| American Eagle Outfitters, Inc. | | | 483,200 | | | | 7,523 | |
| Express, Inc.* | | | 653,600 | | | | 10,941 | |
| Francesca’s Holdings Corp.* | | | 1,256,600 | | | | 18,761 | |
| Penske Automotive Group, Inc. | | | 298,000 | | | | 13,905 | |
| Total | | | | | | | 51,130 | |
| | | | | | | | | |
| Technology Hardware, Storage & Peripherals 2.32% | | | | | |
| Electronics for Imaging, Inc.* | | | 624,900 | | | | 30,670 | |
| | | | | | | | | |
| Textiles, Apparel & Luxury Goods 0.49% | | | | | | | | |
| Steven Madden Ltd.* | | | 203,133 | | | | 6,480 | |
| | | | | | | | | |
| Thrifts & Mortgage Finance 1.22% | | | | | | | | |
| Essent Group Ltd.* | | | 649,600 | | | | 16,058 | |
Total Common Stocks
(cost $953,550,152) | | | | | | | 1,310,720 | |
| Investments | | Principal
Amount
(000) | | | Fair
Value
(000) | |
| SHORT-TERM INVESTMENT 0.78% | | | | | | | | |
| | | | | | | | | |
| Repurchase Agreement | | | | | | | | |
Repurchase Agreement dated 11/30/2015, Zero Coupon due 12/1/2015 with Fixed Income Clearing Corp. collateralized by $10,245,000 of U.S. Treasury Note at 2.25% due 11/30/2017; value: $10,513,931; proceeds: $10,303,378
(cost $10,303,378) | | $ | 10,303 | | | $ | 10,303 | |
Total Investments in Securities 100.02%
(cost $963,853,530) | | | | | | | 1,321,023 | |
| Liabilities in Excess of Cash & Other Assets (0.02)% | | | | | | | (237 | ) |
| Net Assets 100.00% | | | | | | $ | 1,320,786 | |
| * | | Non-income producing security. |
| (a) | | Foreign security traded in U.S. dollars. |
The following is a summary of the inputs used as of November 30, 2015 in valuing the Fund’s investments carried at fair value(1):
| | | Level 1 | | | Level 2 | | | Level 3 | | | Total | |
| Investment Type(2)(3) | | (000) | | | (000) | | | (000) | | | (000) | |
| Common Stocks | | $ | 1,310,720 | | | $ | – | | | $ | – | | | $ | 1,310,720 | |
| Repurchase Agreement | | | – | | | | 10,303 | | | | – | | | | 10,303 | |
| Total | | $ | 1,310,720 | | | $ | 10,303 | | | $ | – | | | $ | 1,321,023 | |
| (1) | Refer to Note 2(i) for a description of fair value measurements and the three-tier hierarchy of inputs. |
| (2) | See Schedule of Investments for fair values in each industry and identification of foreign issuers and/or geography. |
| (3) | There were no Level 1/Level 2 transfers during the fiscal year ended November 30, 2015. |
| 26 | See Notes to Financial Statements. | |
Statements of Assets and Liabilities
November 30, 2015
| | | Calibrated | | | Growth | | | | |
| | | Dividend | | | Opportunities | | | Small Cap | |
| | | Growth Fund | | | Fund | | | Value Fund | |
| ASSETS: | | | | | | | | | | | | |
| Investments in securities, at cost | | $ | 1,849,561,744 | | | $ | 556,698,635 | | | $ | 963,853,530 | |
| Investments in securities, at fair value | | $ | 1,898,180,474 | | | $ | 634,999,697 | | | $ | 1,321,023,167 | |
| Deposits with brokers for futures collateral | | | 335,800 | | | | – | | | | – | |
| Cash | | | 1,134,169 | | | | 515,273 | | | | 1,697,043 | |
| Receivables: | | | | | | | | | | | | |
| Investment securities sold | | | 1,856,282 | | | | – | | | | 1,905,039 | |
| Dividends | | | 5,528,067 | | | | 371,037 | | | | 702,757 | |
| Capital shares sold | | | 616,089 | | | | 562,497 | | | | 491,651 | |
| From advisor (See Note 3) | | | 305,996 | | | | – | | | | – | |
| Prepaid expenses and other assets | | | 69,208 | | | | 73,287 | | | | 72,767 | |
| Total assets | | | 1,908,026,085 | | | | 636,521,791 | | | | 1,325,892,424 | |
| LIABILITIES: | | | | | | | | | | | | |
| Payables: | | | | | | | | | | | | |
| Investment securities purchased | | | – | | | | 968,400 | | | | – | |
| Capital shares reacquired | | | 1,855,705 | | | | 377,079 | | | | 3,144,879 | |
| 12b-1 distribution plan | | | 525,402 | | | | 164,552 | | | | 177,835 | |
| Management fee | | | 984,812 | | | | 390,749 | | | | 817,075 | |
| Directors’ fees | | | 313,085 | | | | 105,928 | | | | 458,097 | |
| Fund administration | | | 62,914 | | | | 20,840 | | | | 43,577 | |
| Variation margin | | | 36,899 | | | | – | | | | – | |
| To affiliates (See Note 3) | | | – | | | | 6,364 | | | | 32,558 | |
| Accrued expenses | | | 572,436 | | | | 262,685 | | | | 432,455 | |
| Total liabilities | | | 4,351,253 | | | | 2,296,597 | | | | 5,106,476 | |
| NET ASSETS | | $ | 1,903,674,832 | | | $ | 634,225,194 | | | $ | 1,320,785,948 | |
| COMPOSITION OF NET ASSETS: | | | | | | | | | | | | |
| Paid-in capital | | $ | 1,726,866,401 | | | $ | 483,440,384 | | | $ | 736,217,862 | |
| Undistributed (distributions in excess of) net investment income | | | 5,639,444 | | | | (105,928 | ) | | | (1,228,326 | ) |
| Accumulated net realized gain on investments and futures contracts | | | 122,215,501 | | | | 72,589,676 | | | | 228,626,775 | |
| Net unrealized appreciation on investments and futures contracts | | | 48,953,486 | | | | 78,301,062 | | | | 357,169,637 | |
| Net Assets | | $ | 1,903,674,832 | | | $ | 634,225,194 | | | $ | 1,320,785,948 | |
| | See Notes to Financial Statements. | 27 |
Statements of Assets and Liabilities (concluded)
November 30, 2015
| | | Calibrated | | | Growth | | | | |
| | | Dividend | | | Opportunities | | | Small Cap | |
| | | Growth Fund | | | Fund | | | Value Fund | |
| Net assets by class: | | | | | | | | | | | | |
| Class A Shares | | $ | 1,498,458,513 | | | $ | 409,625,690 | | | $ | 456,842,946 | |
| Class B Shares | | $ | 19,756,332 | | | $ | 6,691,281 | | | $ | 1,826,569 | |
| Class C Shares | | $ | 245,054,678 | | | $ | 61,670,378 | | | $ | 35,312,102 | |
| Class F Shares | | $ | 99,737,266 | | | $ | 21,956,082 | | | $ | 24,245,806 | |
| Class I Shares | | $ | 15,506,823 | | | $ | 101,062,656 | | | $ | 736,889,513 | |
| Class P Shares | | $ | 1,834,152 | | | $ | 3,997,581 | | | $ | 58,956,861 | |
| Class R2 Shares | | $ | 1,107,945 | | | $ | 941,148 | | | $ | 287,654 | |
| Class R3 Shares | | $ | 22,188,840 | | | $ | 28,251,413 | | | $ | 6,394,733 | |
| Class R4 Shares | | $ | 10,086 | | | $ | 9,646 | | | $ | 9,913 | |
| Class R5 Shares | | $ | 10,096 | | | $ | 9,657 | | | $ | 9,924 | |
| Class R6 Shares | | $ | 10,101 | | | $ | 9,662 | | | $ | 9,927 | |
| Outstanding shares by class: | | | | | | | | | | | | |
| Class A Shares (400, 100 and 300 million shares of common stock authorized, $.001 par value) | | | 103,933,160 | | | | 19,067,880 | | | | 16,815,198 | |
| Class B Shares (30, 30 and 30 million shares of common stock authorized, $.001 par value) | | | 1,383,302 | | | | 382,650 | | | | 90,840 | |
| Class C Shares (40, 20 and 20 million shares of common stock authorized, $.001 par value) | | | 17,177,527 | | | | 3,527,749 | | | | 1,754,203 | |
| Class F Shares (30, 30 and 30 million shares of common stock authorized, $.001 par value) | | | 6,921,903 | | | | 994,309 | | | | 891,307 | |
| Class I Shares (100, 30 and 200 million shares of common stock authorized, $.001 par value) | | | 1,067,828 | | | | 4,276,536 | | | | 24,456,923 | |
| Class P Shares (20, 20 and 50 million shares of common stock authorized, $.001 par value) | | | 126,728 | | | | 188,979 | | | | 2,231,074 | |
| Class R2 Shares (30, 30 and 30 million shares of common stock authorized, $.001 par value) | | | 76,321 | | | | 45,184 | | | | 10,924 | |
| Class R3 Shares (30, 30 and 30 million shares of common stock authorized, $.001 par value) | | | 1,545,646 | | | | 1,338,414 | | | | 241,216 | |
| Class R4 Shares (30, 30 and 30 million shares of common stock authorized, $.001 par value) | | | 699.36 | | | | 449 | | | | 364.83 | |
| Class R5 Shares (30, 30 and 30 million shares of common stock authorized, $.001 par value) | | | 695.447 | | | | 408.50 | | | | 329.27 | |
| Class R6 Shares (30, 30 and 30 million shares of common stock authorized, $.001 par value) | | | 695.447 | | | | 408.50 | | | | 329.27 | |
| Net asset value, offering and redemption price per share (Net assets divided by outstanding shares): | | | | | | | | | | | | |
| Class A Shares-Net asset value | | | $14.42 | | | | $21.48 | | | | $27.17 | |
| Class A Shares-Maximum offering price (Net asset value plus sales charge of 5.75%) | | | $15.30 | | | | $22.79 | | | | $28.83 | |
| Class B Shares-Net asset value | | | $14.28 | | | | $17.49 | | | | $20.11 | |
| Class C Shares-Net asset value | | | $14.27 | | | | $17.48 | | | | $20.13 | |
| Class F Shares-Net asset value | | | $14.41 | | | | $22.08 | | | | $27.20 | |
| Class I Shares-Net asset value | | | $14.52 | | | | $23.63 | | | | $30.13 | |
| Class P Shares-Net asset value | | | $14.47 | | | | $21.15 | | | | $26.43 | |
| Class R2 Shares-Net asset value | | | $14.52 | | | | $20.83 | | | | $26.33 | |
| Class R3 Shares-Net asset value | | | $14.36 | | | | $21.11 | | | | $26.51 | |
| Class R4 Shares-Net asset value | | | $14.42 | | | | $21.48 | | | | $27.17 | |
| Class R5 Shares-Net asset value | | | $14.52 | | | | $23.64 | | | | $30.14 | |
| Class R6 Shares-Net asset value | | | $14.52 | | | | $23.65 | | | | $30.15 | |
| 28 | See Notes to Financial Statements. |
Statements of Operations
For the Year Ended November 30, 2015
| | | Calibrated | | | Growth | | | | |
| | | Dividend | | | Opportunities | | | Small Cap | |
| | | Growth Fund | | | Fund | | | Value Fund | |
| Investment income: | | | | | | | | | | | | |
| Dividends | | $ | 53,776,447 | | | $ | 5,672,972 | | | $ | 16,004,397 | |
| Total investment income | | | 53,776,447 | | | | 5,672,972 | | | | 16,004,397 | |
| Expenses: | | | | | | | | | | | | |
| Management fee | | | 12,639,671 | | | | 5,206,943 | | | | 11,407,329 | |
| 12b-1 distribution plan-Class A | | | 3,942,976 | | | | 1,055,104 | | | | 1,324,252 | |
| 12b-1 distribution plan-Class B | | | 268,057 | | | | 93,252 | | | | 25,563 | |
| 12b-1 distribution plan-Class C | | | 2,618,174 | | | | 626,285 | | | | 374,212 | |
| 12b-1 distribution plan-Class F | | | 116,533 | | | | 21,389 | | | | 26,615 | |
| 12b-1 distribution plan-Class P | | | 9,784 | | | | 19,323 | | | | 360,359 | |
| 12b-1 distribution plan-Class R2 | | | 6,707 | | | | 6,009 | | | | 1,470 | |
| 12b-1 distribution plan-Class R3 | | | 111,144 | | | | 149,699 | | | | 35,244 | |
| 12b-1 distribution plan-Class R4 | | | 11 | | | | 10 | | | | 10 | |
| Shareholder servicing | | | 2,324,186 | | | | 1,077,296 | | | | 1,529,418 | |
| Fund administration | | | 811,350 | | | | 277,704 | | | | 608,391 | |
| Subsidy (See Note 3) | | | – | | | | 156,319 | | | | 475,477 | |
| Registration | | | 151,567 | | | | 108,195 | | | | 124,700 | |
| Reports to shareholders | | | 189,983 | | | | 79,013 | | | | 55,162 | |
| Professional | | | 93,569 | | | | 57,843 | | | | 59,943 | |
| Custody | | | 72,609 | | | | 23,417 | | | | 43,806 | |
| Directors’ fees | | | 57,714 | | | | 19,997 | | | | 46,260 | |
| Other | | | 268,070 | | | | 110,941 | | | | 212,816 | |
| Gross expenses | | | 23,682,105 | | | | 9,088,739 | | | | 16,711,027 | |
| Expense reductions (See Note 9) | | | (1,945 | ) | | | (550 | ) | | | (1,237 | ) |
| Fees waived and expenses reimbursed (See Note 3) | | | (4,436,533 | ) | | | – | | | | – | |
| Net expenses | | | 19,243,627 | | | | 9,088,189 | | | | 16,709,790 | |
| Net investment income (loss) | | | 34,532,820 | | | | (3,415,217 | ) | | | (705,393 | ) |
| Net realized and unrealized gain (loss): | | | | | | | | | | | | |
| Net realized gain on investments | | | 127,234,717 | | | | 82,108,893 | | | | 277,559,730 | |
| Net realized gain on futures contracts | | | 216,897 | | | | – | | | | – | |
| Net change in unrealized appreciation/depreciation on investments | | | (192,894,334 | ) | | | (40,512,324 | ) | | | (199,535,571 | ) |
| Net change in unrealized appreciation/depreciation on futures contracts | | | (24,518 | ) | | | – | | | | – | |
| Net realized and unrealized gain (loss) | | | (65,467,238 | ) | | | 41,596,569 | | | | 78,024,159 | |
| Net Increase (Decrease) in Net Assets Resulting From Operations | | $ | (30,934,418 | ) | | $ | 38,181,352 | | | $ | 77,318,766 | |
| | See Notes to Financial Statements. | 29 |
Statements of Changes in Net Assets
| | | Calibrated Dividend Growth Fund | |
| | | For the Year Ended | | | For the Year Ended | |
| INCREASE (DECREASE) IN NET ASSETS | | November 30, 2015 | | | November 30, 2014 | |
| Operations: | | | | | | | | |
| Net investment income (loss) | | $ | 34,532,820 | | | $ | 31,080,506 | |
| Net realized gain on investments and futures contracts | | | 127,451,614 | | | | 262,144,241 | |
| Net change in unrealized appreciation/depreciation on investments and futures contracts | | | (192,918,852 | ) | | | (38,934,966 | ) |
| Net increase (decrease) in net assets resulting from operations | | | (30,934,418 | ) | | | 254,289,781 | |
| Distributions to shareholders from: | | | | | | | | |
| Net investment income | | | | | | | | |
| Class A | | | (27,983,658 | ) | | | (24,669,258 | ) |
| Class B | | | (262,342 | ) | | | (302,522 | ) |
| Class C | | | (2,748,716 | ) | | | (2,143,502 | ) |
| Class F | | | (2,238,638 | ) | | | (1,732,449 | ) |
| Class I | | | (343,540 | ) | | | (316,200 | ) |
| Class P | | | (34,223 | ) | | | (34,032 | ) |
| Class R2 | | | (13,524 | ) | | | (28,736 | ) |
| Class R3 | | | (359,701 | ) | | | (295,287 | ) |
| Class R4 | | | (47 | ) | | | – | |
| Class R5 | | | (53 | ) | | | – | |
| Class R6 | | | (53 | ) | | | – | |
| Net realized gain | | | | | | | | |
| Class A | | | (204,826,515 | ) | | | (37,788,080 | ) |
| Class B | | | (4,165,693 | ) | | | (998,547 | ) |
| Class C | | | (33,942,472 | ) | | | (5,449,033 | ) |
| Class F | | | (15,357,019 | ) | | | (2,218,615 | ) |
| Class I | | | (2,112,318 | ) | | | (491,483 | ) |
| Class P | | | (331,949 | ) | | | (54,267 | ) |
| Class R2 | | | (235,751 | ) | | | (56,915 | ) |
| Class R3 | | | (2,853,161 | ) | | | (490,397 | ) |
| Total distributions to shareholders | | | (297,809,373 | ) | | | (77,069,323 | ) |
| Capital share transactions (Net of share conversions) (See Note 13): | | | | | | | | |
| Net proceeds from sales of shares | | | 248,530,649 | | | | 283,228,973 | |
| Reinvestment of distributions | | | 280,775,978 | | | | 72,663,418 | |
| Cost of shares reacquired | | | (434,878,158 | ) | | | (474,468,116 | ) |
| Net increase (decrease) in net assets resulting from capital share transactions | | | 94,428,469 | | | | (118,575,725 | ) |
| Net increase (decrease) in net assets | | | (234,315,322 | ) | | | 58,644,733 | |
| NET ASSETS: | | | | | | | | |
| Beginning of year | | $ | 2,137,990,154 | | | $ | 2,079,345,421 | |
| End of year | | $ | 1,903,674,832 | | | $ | 2,137,990,154 | |
| Undistributed (distributions in excess of) net investment income | | $ | 5,639,444 | | | $ | 5,091,119 | |
| 30 | See Notes to Financial Statements. |
| Growth Opportunities Fund | | | Small Cap Value Fund | |
| For the Year Ended | | | For the Year Ended | | | For the Year Ended | | | For the Year Ended | |
| November 30, 2015 | | | November 30, 2014 | | | November 30, 2015 | | | November 30, 2014 | |
| | | | | | | | | | | | | | | |
| $ | (3,415,217 | ) | | $ | (3,077,924 | ) | | $ | (705,393 | ) | | $ | 3,047,315 | |
| | 82,108,893 | | | | 100,561,752 | | | | 277,559,730 | | | | 418,545,725 | |
| | | | | | | | | | | | | | | |
| | (40,512,324 | ) | | | (30,625,027 | ) | | | (199,535,571 | ) | | | (347,141,765 | ) |
| | | | | | | | | | | | | | | |
| | 38,181,352 | | | | 66,858,801 | | | | 77,318,766 | | | | 74,451,275 | |
| | | | | | | | | | | | | | | |
| | | | | | | | | | | | | | | |
| | – | | | | – | | | | – | | | | – | |
| | – | | | | – | | | | – | | | | – | |
| | – | | | | – | | | | (6 | ) | | | – | |
| | – | | | | – | | | | (54,315 | ) | | | (16,608 | ) |
| | – | | | | – | | | | (2,585,855 | ) | | | (2,802,819 | ) |
| | – | | | | – | | | | – | | | | – | |
| | – | | | | – | | | | – | | | | – | |
| | – | | | | – | | | | – | | | | – | |
| | – | | | | – | | | | – | | | | – | |
| | – | | | | – | | | | – | | | | – | |
| | – | | | | – | | | | – | | | | – | |
| | | | | | | | | | | | | | | |
| | (57,428,805 | ) | | | (70,611,286 | ) | | | (164,374,083 | ) | | | (277,385,635 | ) |
| | (1,794,480 | ) | | | (2,979,709 | ) | | | (932,213 | ) | | | (1,291,461 | ) |
| | (10,132,069 | ) | | | (11,867,750 | ) | | | (11,496,541 | ) | | | (11,631,329 | ) |
| | (2,750,031 | ) | | | (2,873,511 | ) | | | (6,958,715 | ) | | | (9,415,420 | ) |
| | (25,446,921 | ) | | | (15,316,480 | ) | | | (209,206,414 | ) | | | (380,080,796 | ) |
| | (612,034 | ) | | | (784,615 | ) | | | (23,611,893 | ) | | | (38,645,196 | ) |
| | (148,110 | ) | | | (242,327 | ) | | | (37,049 | ) | | | (61,099 | ) |
| | (4,140,062 | ) | | | (5,534,389 | ) | | | (1,927,189 | ) | | | (2,185,459 | ) |
| | (102,452,512 | ) | | | (110,210,067 | ) | | | (421,184,273 | ) | | | (723,515,822 | ) |
| | | | | | | | | | | | | | | |
| | 93,134,440 | | | | 170,709,125 | | | | 182,854,784 | | | | 316,849,341 | |
| | 97,697,767 | | | | 104,620,269 | | | | 390,788,738 | | | | 672,761,954 | |
| | (242,241,142 | ) | | | (146,498,937 | ) | | | (824,913,240 | ) | | | (1,884,401,765 | ) |
| | | | | | | | | | | | | | | |
| | (51,408,935 | ) | | | 128,830,457 | | | | (251,269,718 | ) | | | (894,790,470 | ) |
| | (115,680,095 | ) | | | 85,479,191 | | | | (595,135,225 | ) | | | (1,543,855,017 | ) |
| | | | | | | | | | | | | | | |
| $ | 749,905,289 | | | $ | 664,426,098 | | | $ | 1,915,921,173 | | | $ | 3,459,776,190 | |
| $ | 634,225,194 | | | $ | 749,905,289 | | | $ | 1,320,785,948 | | | $ | 1,915,921,173 | |
| $ | (105,928 | ) | | $ | (103,286 | ) | | $ | (1,228,326 | ) | | $ | 2,162,722 | |
| | See Notes to Financial Statements. | 31 |
Financial Highlights
CALIBRATED DIVIDEND GROWTH FUND
| | | | | Per Share Operating Performance: |
| | | | | Investment operations: | | Distributions to
shareholders from: |
| | | | | | | | | Total | | | | | | |
| | | | | | | Net | | from | | | | | | |
| | | Net asset | | Net | | realized | | invest- | | | | | | |
| | | value, | | invest- | | and | | ment | | Net | | Net | | Total |
| | | beginning | | ment | | Unrealized | | Opera- | | investment | | realized | | distri- |
| | | of period | | income(a) | | gain (loss) | | tions | | income | | gain | | butions |
| Class A | | | | | | | | | | | | | | | | | | | | | | | | | | | | |
| 11/30/2015 | | | $16.97 | | | | $0.26 | | | | $(0.46 | ) | | | $(0.20 | ) | | | $(0.26 | ) | | | $(2.09 | ) | | | $(2.35 | ) |
| 11/30/2014 | | | 15.57 | | | | 0.25 | | | | 1.75 | | | | 2.00 | | | | (0.24 | ) | | | (0.36 | ) | | | (0.60 | ) |
| 11/30/2013 | | | 12.66 | | | | 0.24 | | | | 3.00 | | | | 3.24 | | | | (0.33 | ) | | | – | | | | (0.33 | ) |
| 11/30/2012 | | | 11.43 | | | | 0.29 | | | | 1.27 | | | | 1.56 | | | | (0.33 | ) | | | – | | | | (0.33 | ) |
| 11/30/2011 | | | 11.26 | | | | 0.29 | | | | 0.17 | | | | 0.46 | | | | (0.29 | ) | | | – | | | | (0.29 | ) |
| | | | | | | | | | | | | | | | | | | | | | | | | | | | | |
| Class B | | | | | | | | | | | | | | | | | | | | | | | | | | | | |
| 11/30/2015 | | | 16.82 | | | | 0.15 | | | | (0.46 | ) | | | (0.31 | ) | | | (0.14 | ) | | | (2.09 | ) | | | (2.23 | ) |
| 11/30/2014 | | | 15.44 | | | | 0.13 | | | | 1.74 | | | | 1.87 | | | | (0.13 | ) | | | (0.36 | ) | | | (0.49 | ) |
| 11/30/2013 | | | 12.55 | | | | 0.14 | | | | 2.97 | | | | 3.11 | | | | (0.22 | ) | | | – | | | | (0.22 | ) |
| 11/30/2012 | | | 11.33 | | | | 0.20 | | | | 1.26 | | | | 1.46 | | | | (0.24 | ) | | | – | | | | (0.24 | ) |
| 11/30/2011 | | | 11.16 | | | | 0.21 | | | | 0.17 | | | | 0.38 | | | | (0.21 | ) | | | – | | | | (0.21 | ) |
| | | | | | | | | | | | | | | | | | | | | | | | | | | | | |
| Class C | | | | | | | | | | | | | | | | | | | | | | | | | | | | |
| 11/30/2015 | | | 16.81 | | | | 0.15 | | | | (0.45 | ) | | | (0.30 | ) | | | (0.15 | ) | | | (2.09 | ) | | | (2.24 | ) |
| 11/30/2014 | | | 15.44 | | | | 0.14 | | | | 1.72 | | | | 1.86 | | | | (0.13 | ) | | | (0.36 | ) | | | (0.49 | ) |
| 11/30/2013 | | | 12.57 | | | | 0.14 | | | | 2.97 | | | | 3.11 | | | | (0.24 | ) | | | – | | | | (0.24 | ) |
| 11/30/2012 | | | 11.35 | | | | 0.20 | | | | 1.27 | | | | 1.47 | | | | (0.25 | ) | | | – | | | | (0.25 | ) |
| 11/30/2011 | | | 11.18 | | | | 0.21 | | | | 0.17 | | | | 0.38 | | | | (0.21 | ) | | | – | | | | (0.21 | ) |
| | | | | | | | | | | | | | | | | | | | | | | | | | | | | |
| Class F | | | | | | | | | | | | | | | | | | | | | | | | | | | | |
| 11/30/2015 | | | 16.96 | | | | 0.29 | | | | (0.47 | ) | | | (0.18 | ) | | | (0.28 | ) | | | (2.09 | ) | | | (2.37 | ) |
| 11/30/2014 | | | 15.56 | | | | 0.28 | | | | 1.74 | | | | 2.02 | | | | (0.26 | ) | | | (0.36 | ) | | | (0.62 | ) |
| 11/30/2013 | | | 12.65 | | | | 0.27 | | | | 2.99 | | | | 3.26 | | | | (0.35 | ) | | | – | | | | (0.35 | ) |
| 11/30/2012 | | | 11.43 | | | | 0.31 | | | | 1.27 | | | | 1.58 | | | | (0.36 | ) | | | – | | | | (0.36 | ) |
| 11/30/2011 | | | 11.25 | | | | 0.32 | | | | 0.18 | | | | 0.50 | | | | (0.32 | ) | | | – | | | | (0.32 | ) |
| | | | | | | | | | | | | | | | | | | | | | | | | | | | | |
| Class I | | | | | | | | | | | | | | | | | | | | | | | | | | | | |
| 11/30/2015 | | | 17.07 | | | | 0.30 | | | | (0.46 | ) | | | (0.16 | ) | | | (0.30 | ) | | | (2.09 | ) | | | (2.39 | ) |
| 11/30/2014 | | | 15.66 | | | | 0.30 | | | | 1.75 | | | | 2.05 | | | | (0.28 | ) | | | (0.36 | ) | | | (0.64 | ) |
| 11/30/2013 | | | 12.73 | | | | 0.30 | | | | 3.00 | | | | 3.30 | | | | (0.37 | ) | | | – | | | | (0.37 | ) |
| 11/30/2012 | | | 11.50 | | | | 0.30 | | | | 1.30 | | | | 1.60 | | | | (0.37 | ) | | | – | | | | (0.37 | ) |
| 11/30/2011 | | | 11.33 | | | | 0.32 | | | | 0.18 | | | | 0.50 | | | | (0.33 | ) | | | – | | | | (0.33 | ) |
| | | | | | | | | | | | | | | | | | | | | | | | | | | | | |
| Class P | | | | | | | | | | | | | | | | | | | | | | | | | | | | |
| 11/30/2015 | | | 17.02 | | | | 0.24 | | | | (0.47 | ) | | | (0.23 | ) | | | (0.23 | ) | | | (2.09 | ) | | | (2.32 | ) |
| 11/30/2014 | | | 15.62 | | | | 0.23 | | | | 1.74 | | | | 1.97 | | | | (0.21 | ) | | | (0.36 | ) | | | (0.57 | ) |
| 11/30/2013 | | | 12.70 | | | | 0.22 | | | | 3.00 | | | | 3.22 | | | | (0.30 | ) | | | – | | | | (0.30 | ) |
| 11/30/2012 | | | 11.46 | | | | 0.27 | | | | 1.28 | | | | 1.55 | | | | (0.31 | ) | | | – | | | | (0.31 | ) |
| 11/30/2011 | | | 11.29 | | | | 0.28 | | | | 0.16 | | | | 0.44 | | | | (0.27 | ) | | | – | | | | (0.27 | ) |
| 32 | See Notes to Financial Statements. |
| | | | | Ratios to average net assets: | | Supplemental Data: |
| | | | | | | |
| | | | | Total | | | | | | | | |
| | | | | expenses | | | | | | | | |
| Net | | | | after | | | | Net | | Net | | |
| asset | | | | waivers | | | | invest- | | assets, | | Portfolio |
| value, | | Total | | and/or | | Total | | ment | | end of | | turnover |
| end of | | return(b) | | reimbursements | | expenses | | income | | period | | rate |
| period | | (%) | | (%) | | (%) | | (%) | | (000) | | (%) |
| | | | | | | | | | | | | | | | | | | | | | | | | | | |
| | $14.42 | | | | (1.34 | ) | | | 0.85 | | | | 1.07 | | | | 1.80 | | | | $1,498,459 | | | | 57.79 | |
| | 16.97 | | | | 13.28 | | | | 0.85 | | | | 1.07 | | | | 1.62 | | | | 1,663,444 | | | | 73.33 | |
| | 15.57 | | | | 26.09 | | | | 0.85 | | | | 1.18 | | | | 1.73 | | | | 1,646,617 | | | | 54.87 | (c) |
| | 12.66 | | | | 13.77 | | | | 1.23 | | | | 1.31 | | | | 2.33 | | | | 848,026 | | | | 102.89 | |
| | 11.43 | | | | 4.03 | | | | 1.30 | | | | 1.30 | | | | 2.45 | | | | 898,508 | | | | 22.87 | |
| | 14.28 | | | | (2.10 | ) | | | 1.60 | | | | 1.82 | | | | 1.04 | | | | 19,756 | | | | 57.79 | |
| | 16.82 | | | | 12.43 | | | | 1.60 | | | | 1.82 | | | | 0.85 | | | | 33,641 | | | | 73.33 | |
| | 15.44 | | | | 25.14 | | | | 1.60 | | | | 1.93 | | | | 1.00 | | | | 43,235 | | | | 54.87 | (c) |
| | 12.55 | | | | 13.04 | | | | 1.90 | | | | 1.98 | | | | 1.67 | | | | 31,891 | | | | 102.89 | |
| | 11.33 | | | | 3.36 | | | | 1.95 | | | | 1.95 | | | | 1.78 | | | | 39,643 | | | | 22.87 | |
| | 14.27 | | | | (2.03 | ) | | | 1.60 | | | | 1.82 | | | | 1.06 | | | | 245,055 | | | | 57.79 | |
| | 16.81 | | | | 12.42 | | | | 1.59 | | | | 1.81 | | | | 0.87 | | | | 272,167 | | | | 73.33 | |
| | 15.44 | | | | 25.14 | | | | 1.60 | | | | 1.91 | | | | 0.97 | | | | 232,350 | | | | 54.87 | (c) |
| | 12.57 | | | | 13.06 | | | | 1.88 | | | | 1.98 | | | | 1.67 | | | | 61,096 | | | | 102.89 | |
| | 11.35 | | | | 3.39 | | | | 1.94 | | | | 1.95 | | | | 1.82 | | | | 57,695 | | | | 22.87 | |
| | 14.41 | | | | (1.20 | ) | | | 0.70 | | | | 0.92 | | | | 1.95 | | | | 99,737 | | | | 57.79 | |
| | 16.96 | | | | 13.46 | | | | 0.70 | | | | 0.92 | | | | 1.77 | | | | 123,836 | | | | 73.33 | |
| | 15.56 | | | | 26.31 | | | | 0.70 | | | | 1.02 | | | | 1.86 | | | | 96,398 | | | | 54.87 | (c) |
| | 12.65 | | | | 13.97 | | | | 0.98 | | | | 1.08 | | | | 2.57 | | | | 14,857 | | | | 102.89 | |
| | 11.43 | | | | 4.39 | | | | 1.05 | | | | 1.06 | | | | 2.70 | | | | 8,251 | | | | 22.87 | |
| | 14.52 | | | | (1.09 | ) | | | 0.60 | | | | 0.82 | | | | 2.05 | | | | 15,507 | | | | 57.79 | |
| | 17.07 | | | | 13.54 | | | | 0.60 | | | | 0.82 | | | | 1.89 | | | | 17,061 | | | | 73.33 | |
| | 15.66 | | | | 26.41 | | | | 0.60 | | | | 0.92 | | | | 2.06 | | | | 34,361 | | | | 54.87 | (c) |
| | 12.73 | | | | 14.08 | | | | 0.97 | | | | 0.98 | | | | 2.54 | | | | 3,497 | | | | 102.89 | |
| | 11.50 | | | | 4.37 | | | | 0.95 | | | | 0.95 | | | | 2.72 | | | | 100,317 | | | | 22.87 | |
| | 14.47 | | | | (1.56 | ) | | | 1.05 | | | | 1.27 | | | | 1.60 | | | | 1,834 | | | | 57.79 | |
| | 17.02 | | | | 13.03 | | | | 1.05 | | | | 1.27 | | | | 1.42 | | | | 2,714 | | | | 73.33 | |
| | 15.62 | | | | 25.81 | | | | 1.05 | | | | 1.38 | | | | 1.55 | | | | 2,355 | | | | 54.87 | (c) |
| | 12.70 | | | | 13.60 | | | | 1.35 | | | | 1.43 | | | | 2.22 | | | | 1,638 | | | | 102.89 | |
| | 11.46 | | | | 4.00 | | | | 1.40 | | | | 1.41 | | | | 2.35 | | | | 1,910 | | | | 22.87 | |
| | See Notes to Financial Statements. | 33 |
Financial Highlights (continued)
CALIBRATED DIVIDEND GROWTH FUND
| | | | | Per Share Operating Performance: |
| | | | | Investment operations: | | Distributions to
shareholders from: |
| | | | | | | | | Total | | | | | | |
| | | | | | | Net | | from | | | | | | |
| | | Net asset | | Net | | realized | | invest- | | | | | | |
| | | value, | | invest- | | and | | ment | | Net | | Net | | Total |
| | | beginning | | ment | | unrealized | | opera- | | investment | | realized | | distri- |
| | | of period | | income(a) | | gain (loss) | | tions | | income | | gain | | butions |
| Class R2 | | | | | | | | | | | | | | | | | | | | | | | | | | | | |
| 11/30/2015 | | | $17.05 | | | | $0.21 | | | | $(0.46 | ) | | | $(0.25 | ) | | | $(0.19 | ) | | | $(2.09 | ) | | | $(2.28 | ) |
| 11/30/2014 | | | 15.65 | | | | 0.20 | | | | 1.75 | | | | 1.95 | | | | (0.19 | ) | | | (0.36 | ) | | | (0.55 | ) |
| 11/30/2013 | | | 12.73 | | | | 0.23 | | | | 2.98 | | | | 3.21 | | | | (0.29 | ) | | | – | | | | (0.29 | ) |
| 11/30/2012 | | | 11.49 | | | | 0.26 | | | | 1.28 | | | | 1.54 | | | | (0.30 | ) | | | – | | | | (0.30 | ) |
| 11/30/2011 | | | 11.31 | | | | 0.28 | | | | 0.15 | | | | 0.43 | | | | (0.25 | ) | | | – | | | | (0.25 | ) |
| | | | | | | | | | | | | | | | | | | | | | | | | | | | | |
| Class R3 | | | | | | | | | | | | | | | | | | | | | | | | | | | | |
| 11/30/2015 | | | 16.91 | | | | 0.23 | | | | (0.46 | ) | | | (0.23 | ) | | | (0.23 | ) | | | (2.09 | ) | | | (2.32 | ) |
| 11/30/2014 | | | 15.52 | | | | 0.22 | | | | 1.74 | | | | 1.96 | | | | (0.21 | ) | | | (0.36 | ) | | | (0.57 | ) |
| 11/30/2013 | | | 12.62 | | | | 0.22 | | | | 2.98 | | | | 3.20 | | | | (0.30 | ) | | | – | | | | (0.30 | ) |
| 11/30/2012 | | | 11.40 | | | | 0.26 | | | | 1.27 | | | | 1.53 | | | | (0.31 | ) | | | – | | | | (0.31 | ) |
| 11/30/2011 | | | 11.24 | | | | 0.28 | | | | 0.15 | | | | 0.43 | | | | (0.27 | ) | | | – | | | | (0.27 | ) |
| | | | | | | | | | | | | | | | | | | | | | | | | | | | | |
| Class R4 | | | | | | | | | | | | | | | | | | | | | | | | | | | | |
| 6/30/2015 to 11/30/2015(d) | | | 14.37 | | | | 0.11 | | | | 0.01 | (e) | | | 0.12 | | | | (0.07 | ) | | | – | | | | – | |
| | | | | | | | | | | | | | | | | | | | | | | | | | | | | |
| Class R5 | | | | | | | | | | | | | | | | | | | | | | | | | | | | |
| 6/30/2015 to 11/30/2015(d) | | | 14.46 | | | | 0.13 | | | | 0.01 | (e) | | | 0.14 | | | | (0.08 | ) | | | – | | | | – | |
| | | | | | | | | | | | | | | | | | | | | | | | | | | | | |
| Class R6 | | | | | | | | | | | | | | | | | | | | | | | | | | | | |
| 6/30/2015 to 11/30/2015(d) | | | 14.46 | | | | 0.13 | | | | 0.01 | (e) | | | 0.14 | | | | (0.08 | ) | | | – | | | | – | |
| (a) | Calculated using average shares outstanding during the period. |
| (b) | Total return for Classes A, B and C does not consider the effects of sales loads and assumes the reinvestments of all distributions. Total return for all other classes assumes the reinvestment of all distributions. |
| (c) | Excludes purchases and sales of securities in connection with the acquisition of Lord Abbett Classic Stock Fund on November 22, 2013. |
| (d) | Commenced on June 30, 2015. |
| (e) | The per share amount does not represent the net realized and unrealized gain (loss) as presented on the Statements of Operations for the period due to the timing of sales of Fund shares and the amount of per share realized and unrealized gains and losses. |
| (f) | Not annualized. |
| (g) | Annualized. |
| 34 | See Notes to Financial Statements. |
| | | | | Ratios to average net assets: | | Supplemental Data: |
| | | | | |
| | | | | |
| | | | | |
| | | | | Total | | | | | | | | |
| | | | | expenses | | | | | | | | |
| Net | | | | after | | | | Net | | Net | | |
| asset | | | | waivers | | | | invest- | | assets, | | Portfolio |
| value, | | Total | | and/or | | Total | | ment | | end of | | turnover |
| end of | | return(b) | | reimbursements | | expenses | | income | | period | | rate |
| period | | (%) | | (%) | | (%) | | (%) | | (000) | | (%) |
| | | | | | | | | | | | | | | | | | | | | | | | | | | |
| $ | 14.52 | | | | (1.69 | ) | | | 1.20 | | | | 1.42 | | | | 1.44 | | | $ | 1,108 | | | | 57.79 | |
| | 17.05 | | | | 12.86 | | | | 1.20 | | | | 1.42 | | | | 1.26 | | | | 1,940 | | | | 73.33 | |
| | 15.65 | | | | 25.64 | | | | 1.20 | | | | 1.52 | | | | 1.57 | | | | 2,442 | | | | 54.87 | (c) |
| | 12.73 | | | | 13.46 | | | | 1.46 | | | | 1.55 | | | | 2.10 | | | | 112 | | | | 102.89 | |
| | 11.49 | | | | 3.90 | | | | 1.54 | | | | 1.55 | | | | 2.43 | | | | 103 | | | | 22.87 | |
| | | | | | | | | | | | | | | | | | | | | | | | | | | |
| | 14.36 | | | | (1.57 | ) | | | 1.08 | | | | 1.30 | | | | 1.57 | | | | 22,189 | | | | 57.79 | |
| | 16.91 | | | | 13.05 | | | | 1.09 | | | | 1.31 | | | | 1.38 | | | | 23,187 | | | | 73.33 | |
| | 15.52 | | | | 25.79 | | | | 1.10 | | | | 1.42 | | | | 1.57 | | | | 21,587 | | | | 54.87 | (c) |
| | 12.62 | | | | 13.57 | | | | 1.38 | | | | 1.48 | | | | 2.15 | | | | 3,980 | | | | 102.89 | |
| | 11.40 | | | | 3.91 | | | | 1.45 | | | | 1.45 | | | | 2.35 | | | | 3,135 | | | | 22.87 | |
| | | | | | | | | | | | | | | | | | | | | | | | | | | |
| | 14.42 | | | | 0.85 | (f) | | | 0.85 | (g) | | | 1.07 | (g) | | | 1.85 | (g) | | | 10 | | | | 57.79 | |
| | | | | | | | | | | | | | | | | | | | | | | | | | | |
| | 14.52 | | | | 0.98 | (f) | | | 0.60 | (g) | | | 0.82 | (g) | | | 2.11 | (g) | | | 10 | | | | 57.79 | |
| | | | | | | | | | | | | | | | | | | | | | | | | | | |
| | 14.52 | | | | 0.98 | (f) | | | 0.49 | (g) | | | 0.70 | (g) | | | 2.22 | (g) | | | 10 | | | | 57.79 | |
| | See Notes to Financial Statements. | 35 |
Financial Highlights (continued)
GROWTH OPPORTUNITIES FUND
| | | | | Per Share Operating Performance: | | |
| | | | | | | | | | | Distributions to | | |
| | | | | | | | | | | shareholders | | |
| | | | | Investment operations: | | from: | | |
| | | Net asset | | | | Net | | | | | | Net asset |
| | | value, | | Net | | realized and | | Total from | | Net | | value, |
| | | beginning of | | investment | | unrealized | | investment | | realized | | end of |
| | | period | | loss(a) | | gain | | operations | | gain | | period |
| Class A | | | | | | | | | | | | | | | | | | | | | | | | |
| 11/30/2015 | | | $23.75 | | | | $(0.10 | ) | | | $1.09 | | | | $0.99 | | | | $(3.26 | ) | | | $21.48 | |
| 11/30/2014 | | | 25.70 | | | | (0.09 | ) | | | 2.40 | | | | 2.31 | | | | (4.26 | ) | | | 23.75 | |
| 11/30/2013 | | | 19.16 | | | | (0.12 | ) | | | 6.66 | | | | 6.54 | | | | – | (c) | | | 25.70 | |
| 11/30/2012 | | | 21.30 | | | | (0.09 | ) | | | 1.12 | | | | 1.03 | | | | (3.17 | ) | | | 19.16 | |
| 11/30/2011 | | | 21.44 | | | | (0.14 | ) | | | – | | | | (0.14 | ) | | | – | | | | 21.30 | |
| | | | | | | | | | | | | | | | | | | | | | | | | |
| Class B | | | | | | | | | | | | | | | | | | | | | | | | |
| 11/30/2015 | | | 20.06 | | | | (0.21 | ) | | | 0.90 | | | | 0.69 | | | | (3.26 | ) | | | 17.49 | |
| 11/30/2014 | | | 22.50 | | | | (0.22 | ) | | | 2.04 | | | | 1.82 | | | | (4.26 | ) | | | 20.06 | |
| 11/30/2013 | | | 16.88 | | | | (0.22 | ) | | | 5.84 | | | | 5.62 | | | | – | (c) | | | 22.50 | |
| 11/30/2012 | | | 19.27 | | | | (0.19 | ) | | | 0.97 | | | | 0.78 | | | | (3.17 | ) | | | 16.88 | |
| 11/30/2011 | | | 19.52 | | | | (0.26 | ) | | | 0.01 | | | | (0.25 | ) | | | – | | | | 19.27 | |
| | | | | | | | | | | | | | | | | | | | | | | | | |
| Class C | | | | | | | | | | | | | | | | | | | | | | | | |
| 11/30/2015 | | | 20.06 | | | | (0.21 | ) | | | 0.89 | | | | 0.68 | | | | (3.26 | ) | | | 17.48 | |
| 11/30/2014 | | | 22.49 | | | | (0.21 | ) | | | 2.04 | | | | 1.83 | | | | (4.26 | ) | | | 20.06 | |
| 11/30/2013 | | | 16.87 | | | | (0.23 | ) | | | 5.85 | | | | 5.62 | | | | – | (c) | | | 22.49 | |
| 11/30/2012 | | | 19.26 | | | | (0.19 | ) | | | 0.97 | | | | 0.78 | | | | (3.17 | ) | | | 16.87 | |
| 11/30/2011 | | | 19.51 | | | | (0.26 | ) | | | 0.01 | | | | (0.25 | ) | | | – | | | | 19.26 | |
| | | | | | | | | | | | | | | | | | | | | | | | | |
| Class F | | | | | | | | | | | | | | | | | | | | | | | | |
| 11/30/2015 | | | 24.29 | | | | (0.07 | ) | | | 1.12 | | | | 1.05 | | | | (3.26 | ) | | | 22.08 | |
| 11/30/2014 | | | 26.15 | | | | (0.06 | ) | | | 2.46 | | | | 2.40 | | | | (4.26 | ) | | | 24.29 | |
| 11/30/2013 | | | 19.44 | | | | (0.06 | ) | | | 6.77 | | | | 6.71 | | | | – | (c) | | | 26.15 | |
| 11/30/2012 | | | 21.52 | | | | (0.04 | ) | | | 1.13 | | | | 1.09 | | | | (3.17 | ) | | | 19.44 | |
| 11/30/2011 | | | 21.61 | | | | (0.09 | ) | | | – | | | | (0.09 | ) | | | – | | | | 21.52 | |
| | | | | | | | | | | | | | | | | | | | | | | | | |
| Class I | | | | | | | | | | | | | | | | | | | | | | | | |
| 11/30/2015 | | | 25.75 | | | | (0.05 | ) | | | 1.19 | | | | 1.14 | | | | (3.26 | ) | | | 23.63 | |
| 11/30/2014 | | | 27.45 | | | | (0.04 | ) | | | 2.60 | | | | 2.56 | | | | (4.26 | ) | | | 25.75 | |
| 11/30/2013 | | | 20.38 | | | | (0.04 | ) | | | 7.11 | | | | 7.07 | | | | – | (c) | | | 27.45 | |
| 11/30/2012 | | | 22.38 | | | | (0.04 | ) | | | 1.21 | | | | 1.17 | | | | (3.17 | ) | | | 20.38 | |
| 11/30/2011 | | | 22.45 | | | | (0.07 | ) | | | – | | | | (0.07 | ) | | | – | | | | 22.38 | |
| | | | | | | | | | | | | | | | | | | | | | | | | |
| Class P | | | | | | | | | | | | | | | | | | | | | | | | |
| 11/30/2015 | | | 23.48 | | | | (0.14 | ) | | | 1.07 | | | | 0.93 | | | | (3.26 | ) | | | 21.15 | |
| 11/30/2014 | | | 25.49 | | | | (0.13 | ) | | | 2.38 | | | | 2.25 | | | | (4.26 | ) | | | 23.48 | |
| 11/30/2013 | | | 19.02 | | | | (0.13 | ) | | | 6.60 | | | | 6.47 | | | | – | (c) | | | 25.49 | |
| 11/30/2012 | | | 21.19 | | | | (0.11 | ) | | | 1.11 | | | | 1.00 | | | | (3.17 | ) | | | 19.02 | |
| 11/30/2011 | | | 21.35 | | | | (0.17 | ) | | | 0.01 | | | | (0.16 | ) | | | – | | | | 21.19 | |
| 36 | See Notes to Financial Statements. |
| | | Ratios to Average Net Assets: | | Supplemental Data: |
| | | |
| | | |
| | | |
| | | Total expenses | | | | | | | | |
| | | after | | | | Net | | Net assets, | | Portfolio |
| Total | | waivers and/or | | Total | | investment | | end of | | turnover |
| return(b) | | reimbursements | | expenses | | loss | | period | | rate |
| (%) | | (%) | | (%) | | (%) | | (000) | | (%) |
| | | | | | | | | | | | | | | | | | | | | | | |
| | 4.78 | | | | 1.28 | | | | 1.28 | | | | (0.46 | ) | | | $409,626 | | | | 96.81 | |
| | 10.41 | | | | 1.31 | | | | 1.31 | | | | (0.41 | ) | | | 419,614 | | | | 207.44 | |
| | 34.16 | | | | 1.40 | | | | 1.40 | | | | (0.51 | ) | | | 428,573 | | | | 118.03 | |
| | 6.96 | | | | 1.42 | | | | 1.44 | | | | (0.48 | ) | | | 351,427 | | | | 145.62 | |
| | (0.65 | ) | | | 1.45 | | | | 1.46 | | | | (0.64 | ) | | | 389,211 | | | | 121.66 | |
| | | | | | | | | | | | | | | | | | | | | | | |
| | 4.05 | | | | 2.02 | | | | 2.02 | | | | (1.20 | ) | | | 6,691 | | | | 96.81 | |
| | 9.57 | | | | 2.03 | | | | 2.03 | | | | (1.12 | ) | | | 11,184 | | | | 207.44 | |
| | 33.40 | | | | 2.05 | | | | 2.05 | | | | (1.12 | ) | | | 16,020 | | | | 118.03 | |
| | 6.22 | | | | 2.07 | | | | 2.09 | | | | (1.14 | ) | | | 18,614 | | | | 145.62 | |
| | (1.28 | ) | | | 2.09 | | | | 2.11 | | | | (1.27 | ) | | | 29,129 | | | | 121.66 | |
| | | | | | | | | | | | | | | | | | | | | | | |
| | 4.00 | | | | 2.02 | | | | 2.02 | | | | (1.20 | ) | | | 61,670 | | | | 96.81 | |
| | 9.63 | | | | 2.02 | | | | 2.02 | | | | (1.11 | ) | | | 62,897 | | | | 207.44 | |
| | 33.34 | | | | 2.04 | | | | 2.04 | | | | (1.15 | ) | | | 62,815 | | | | 118.03 | |
| | 6.28 | | | | 2.06 | | | | 2.08 | | | | (1.12 | ) | | | 51,427 | | | | 145.62 | |
| | (1.28 | ) | | | 2.06 | | | | 2.08 | | | | (1.25 | ) | | | 58,336 | | | | 121.66 | |
| | | | | | | | | | | | | | | | | | | | | | | |
| | 4.95 | | | | 1.13 | | | | 1.13 | | | | (0.31 | ) | | | 21,956 | | | | 96.81 | |
| | 10.60 | | | | 1.13 | | | | 1.13 | | | | (0.24 | ) | | | 20,503 | | | | 207.44 | |
| | 34.54 | | | | 1.15 | | | | 1.15 | | | | (0.27 | ) | | | 17,739 | | | | 118.03 | |
| | 7.20 | | | | 1.17 | | | | 1.19 | | | | (0.23 | ) | | | 13,652 | | | | 145.62 | |
| | (0.42 | ) | | | 1.20 | | | | 1.22 | | | | (0.41 | ) | | | 14,594 | | | | 121.66 | |
| | | | | | | | | | | | | | | | | | | | | | | |
| | 5.07 | | | | 1.03 | | | | 1.03 | | | | (0.19 | ) | | | 101,063 | | | | 96.81 | |
| | 10.70 | | | | 1.03 | | | | 1.03 | | | | (0.16 | ) | | | 200,573 | | | | 207.44 | |
| | 34.67 | | | | 1.06 | | | | 1.06 | | | | (0.16 | ) | | | 99,819 | | | | 118.03 | |
| | 7.29 | | | | 1.07 | | | | 1.09 | | | | (0.18 | ) | | | 78,051 | | | | 145.62 | |
| | (0.31 | ) | | | 1.10 | | | | 1.12 | | | | (0.30 | ) | | | 61,928 | | | | 121.66 | |
| | | | | | | | | | | | | | | | | | | | | | | |
| | 4.56 | | | | 1.48 | | | | 1.48 | | | | (0.66 | ) | | | 3,998 | | | | 96.81 | |
| | 10.23 | | | | 1.48 | | | | 1.48 | | | | (0.58 | ) | | | 4,521 | | | | 207.44 | |
| | 34.04 | | | | 1.51 | | | | 1.51 | | | | (0.57 | ) | | | 4,723 | | | | 118.03 | |
| | 6.83 | | | | 1.53 | | | | 1.54 | | | | (0.60 | ) | | | 5,017 | | | | 145.62 | |
| | (0.75 | ) | | | 1.55 | | | | 1.57 | | | | (0.74 | ) | | | 8,074 | | | | 121.66 | |
| | See Notes to Financial Statements. | 37 |
Financial Highlights (continued)
GROWTH OPPORTUNITIES FUND
| | | | | | | Per Share Operating Performance: | | |
| | | | | | | | | | | Distributions to | | |
| | | | | | | | | | | shareholders | | |
| | | | | Investment operations: | | from: | | |
| | | Net asset | | | | Net | | | | | | Net asset |
| | | value, | | Net | | realized and | | Total from | | Net | | value, |
| | | beginning of | | investment | | unrealized | | investment | | realized | | end of |
| | | period | | loss(a) | | gain (loss) | | operations | | gain | | period |
| Class R2 | | | | | | | | | | | | | | | | | | | | | | | | |
| 11/30/2015 | | | $23.20 | | | | $(0.17 | ) | | | $1.06 | | | | $0.89 | | | | $(3.26 | ) | | | $20.83 | |
| 11/30/2014 | | | 25.27 | | | | (0.16 | ) | | | 2.35 | | | | 2.19 | | | | (4.26 | ) | | | 23.20 | |
| 11/30/2013 | | | 18.88 | | | | (0.16 | ) | | | 6.55 | | | | 6.39 | | | | – | (c) | | | 25.27 | |
| 11/30/2012 | | | 21.09 | | | | (0.14 | ) | | | 1.10 | | | | 0.96 | | | | (3.17 | ) | | | 18.88 | |
| 11/30/2011 | | | 21.28 | | | | (0.21 | ) | | | 0.02 | | | | (0.19 | ) | | | – | | | | 21.09 | |
| | | | | | | | | | | | | | | | | | | | | | | | | |
| Class R3 | | | | | | | | | | | | | | | | | | | | | | | | |
| 11/30/2015 | | | 23.44 | | | | (0.15 | ) | | | 1.08 | | | | 0.93 | | | | (3.26 | ) | | | 21.11 | |
| 11/30/2014 | | | 25.47 | | | | (0.14 | ) | | | 2.37 | | | | 2.23 | | | | (4.26 | ) | | | 23.44 | |
| 11/30/2013 | | | 19.01 | | | | (0.15 | ) | | | 6.61 | | | | 6.46 | | | | – | (c) | | | 25.47 | |
| 11/30/2012 | | | 21.19 | | | | (0.12 | ) | | | 1.11 | | | | 0.99 | | | | (3.17 | ) | | | 19.01 | |
| 11/30/2011 | | | 21.36 | | | | (0.18 | ) | | | 0.01 | | | | (0.17 | ) | | | – | | | | 21.19 | |
| | | | | | | | | | | | | | | | | | | | | | | | | |
| Class R4 | | | | | | | | | | | | | | | | | | | | | | | | |
| 6/30/2015 to 11/30/2015(d) | | | 22.27 | | | | (0.04 | ) | | | (0.75 | )(e) | | | (0.79 | ) | | | – | | | | 21.48 | |
| | | | | | | | | | | | | | | | | | | | | | | | | |
| Class R5 | | | | | | | | | | | | | | | | | | | | | | | | |
| 6/30/2015 to 11/30/2015(d) | | | 24.48 | | | | (0.02 | ) | | | (0.82 | )(e) | | | (0.84 | ) | | | – | | | | 23.64 | |
| | | | | | | | | | | | | | | | | | | | | | | | | |
| Class R6 | | | | | | | | | | | | | | | | | | | | | | | | |
| 6/30/2015 to 11/30/2015(d) | | | 24.48 | | | | (0.01 | ) | | | (0.82 | )(e) | | | (0.83 | ) | | | – | | | | 23.65 | |
| (a) | Calculated using average shares outstanding during the period. |
| (b) | Total return for Classes A, B and C does not consider the effects of sales loads and assumes the reinvestments of all distributions. Total return for all other classes assumes the reinvestment of all distributions. |
| (c) | Amount less than $0.01. |
| (d) | Commenced on June 30, 2015. |
| (e) | The per share amount does not represent the net realized and unrealized gain (loss) as presented on the Statements of Operations for the period due to the timing of sales of Fund shares and the amount of per share realized and unrealized gains and losses. |
| (f) | Not annualized. |
| (g) | Annualized. |
| 38 | See Notes to Financial Statements. |
| | | Ratios to Average Net Assets: | | Supplemental Data: |
| | | |
| | | |
| | | |
| | | Total expenses | | | | | | | | |
| | | after | | | | Net | | Net assets, | | Portfolio |
| Total | | waivers and/or | | Total | | investment | | end of | | turnover |
| return(b) | | reimbursements | | expenses | | loss | | period | | rate |
| (%) | | (%) | | (%) | | (%) | | (000) | | (%) |
| | | | | | | | | | | | | | | | | | | | | | | |
| | 4.42 | | | | 1.63 | | | | 1.63 | | | | (0.80 | ) | | $ | 941 | | | | 96.81 | |
| | 10.06 | | | | 1.63 | | | | 1.63 | | | | (0.72 | ) | | | 1,063 | | | | 207.44 | |
| | 33.87 | | | | 1.66 | | | | 1.66 | | | | (0.73 | ) | | | 1,436 | | | | 118.03 | |
| | 6.70 | | | | 1.67 | | | | 1.69 | | | | (0.74 | ) | | | 1,515 | | | | 145.62 | |
| | (0.94 | ) | | | 1.70 | | | | 1.72 | | | | (0.92 | ) | | | 1,505 | | | | 121.66 | |
| | | | | | | | | | | | | | | | | | | | | | | |
| | 4.56 | | | | 1.52 | | | | 1.52 | | | | (0.71 | ) | | | 28,251 | | | | 96.81 | |
| | 10.15 | | | | 1.53 | | | | 1.53 | | | | (0.62 | ) | | | 29,999 | | | | 207.44 | |
| | 34.01 | | | | 1.55 | | | | 1.55 | | | | (0.65 | ) | | | 33,301 | | | | 118.03 | |
| | 6.78 | | | | 1.57 | | | | 1.58 | | | | (0.63 | ) | | | 31,535 | | | | 145.62 | |
| | (0.80 | ) | | | 1.59 | | | | 1.61 | | | | (0.81 | ) | | | 26,291 | | | | 121.66 | |
| | | | | | | | | | | | | | | | | | | | | | | |
| | (3.55 | )(f) | | | 1.25 | (g) | | | 1.25 | (g) | | | (0.49 | )(g) | | | 10 | | | | 96.81 | |
| | | | | | | | | | | | | | | | | | | | | | | |
| | (3.43 | )(f) | | | 1.00 | (g) | | | 1.00 | (g) | | | (0.24 | )(g) | �� | | 10 | | | | 96.81 | |
| | | | | | | | | | | | | | | | | | | | | | | |
| | (3.39 | )(f) | | | 0.86 | (g) | | | 0.86 | (g) | | | (0.10 | )(g) | | | 10 | | | | 96.81 | |
| | See Notes to Financial Statements. | 39 |
Financial Highlights (continued)
SMALL CAP VALUE FUND
| | | | | Per Share Operating Performance: |
| | | | | Investment operations: | | Distributions to
shareholders from: |
| | | | | | | | | Total | | | | | | |
| | | | | Net | | Net | | from | | | | | | |
| | | Net asset | | invest- | | realized | | invest- | | | | | | |
| | | value, | | ment | | and | | ment | | Net | | Net | | Total |
| | | beginning | | income | | unrealized | | opera- | | investment | | realized | | distri- |
| | | of period | | (loss)(a) | | gain (loss) | | tions | | income | | gain | | butions |
| Class A | | | | | | | | | | | | | | | | | | | | | | | | | | | | |
| 11/30/2015 | | | $33.61 | | | $ | (0.04 | ) | | $ | 1.33 | | | $ | 1.29 | | | $ | – | | | $ | (7.73 | ) | | $ | (7.73 | ) |
| 11/30/2014 | | | 42.09 | | | | (0.01 | ) | | | 0.94 | | | | 0.93 | | | | – | | | | (9.41 | ) | | | (9.41 | ) |
| 11/30/2013 | | | 32.24 | | | | 0.02 | | | | 10.81 | | | | 10.83 | | | | (0.24 | ) | | | (0.74 | ) | | | (0.98 | ) |
| 11/30/2012 | | | 29.68 | | | | 0.18 | | | | 2.38 | | | | 2.56 | | | | – | | | | – | | | | – | |
| 11/30/2011 | | | 28.93 | | | | (0.07 | ) | | | 0.82 | | | | 0.75 | | | | – | (c) | | | – | | | | – | (c) |
| | | | | | | | | | | | | | | | | | | | | | | | | | | | | |
| Class B | | | | | | | | | | | | | | | | | | | | | | | | | | | | |
| 11/30/2015 | | | 27.02 | | | | (0.19 | ) | | | 1.01 | | | | 0.82 | | | | – | | | | (7.73 | ) | | | (7.73 | ) |
| 11/30/2014 | | | 35.87 | | | | (0.20 | ) | | | 0.76 | | | | 0.56 | | | | – | | | | (9.41 | ) | | | (9.41 | ) |
| 11/30/2013 | | | 27.57 | | | | (0.19 | ) | | | 9.23 | | | | 9.04 | | | | – | | | | (0.74 | ) | | | (0.74 | ) |
| 11/30/2012 | | | 25.56 | | | | (0.04 | ) | | | 2.05 | | | | 2.01 | | | | – | | | | – | | | | – | |
| 11/30/2011 | | | 25.09 | | | | (0.25 | ) | | | 0.72 | | | | 0.47 | | | | – | | | | – | | | | – | |
| | | | | | | | | | | | | | | | | | | | | | | | | | | | | |
| Class C | | | | | | | | | | | | | | | | | | | | | | | | | | | | |
| 11/30/2015 | | | 27.04 | | | | (0.18 | ) | | | 1.00 | | | | 0.82 | | | | – | (c) | | | (7.73 | ) | | | (7.73 | ) |
| 11/30/2014 | | | 35.89 | | | | (0.19 | ) | | | 0.75 | | | | 0.56 | | | | – | | | | (9.41 | ) | | | (9.41 | ) |
| 11/30/2013 | | | 27.63 | | | | (0.21 | ) | | | 9.26 | | | | 9.05 | | | | (0.05 | ) | | | (0.74 | ) | | | (0.79 | ) |
| 11/30/2012 | | | 25.61 | | | | (0.03 | ) | | | 2.05 | | | | 2.02 | | | | – | | | | – | | | | – | |
| 11/30/2011 | | | 25.14 | | | | (0.24 | ) | | | 0.71 | | | | 0.47 | | | | – | | | | – | | | | – | |
| | | | | | | | | | | | | | | | | | | | | | | | | | | | | |
| Class F | | | | | | | | | | | | | | | | | | | | | | | | | | | | |
| 11/30/2015 | | | 33.66 | | | | – | (c) | | | 1.33 | | | | 1.33 | | | | (0.06 | ) | | | (7.73 | ) | | | (7.79 | ) |
| 11/30/2014 | | | 42.10 | | | | 0.07 | | | | 0.92 | | | | 0.99 | | | | (0.02 | ) | | | (9.41 | ) | | | (9.43 | ) |
| 11/30/2013 | | | 32.26 | | | | 0.09 | | | | 10.81 | | | | 10.90 | | | | (0.32 | ) | | | (0.74 | ) | | | (1.06 | ) |
| 11/30/2012 | | | 29.64 | | | | 0.26 | | | | 2.36 | | | | 2.62 | | | | – | | | | – | | | | – | |
| 11/30/2011 | | | 28.90 | | | | – | (c) | | | 0.80 | | | | 0.80 | | | | (0.06 | ) | | | – | | | | (0.06 | ) |
| | | | | | | | | | | | | | | | | | | | | | | | | | | | | |
| Class I | | | | | | | | | | | | | | | | | | | | | | | | | | | | |
| 11/30/2015 | | | 36.46 | | | | 0.03 | | | | 1.47 | | | | 1.50 | | | | (0.10 | ) | | | (7.73 | ) | | | (7.83 | ) |
| 11/30/2014 | | | 44.83 | | | | 0.10 | | | | 1.01 | | | | 1.11 | | | | (0.07 | ) | | | (9.41 | ) | | | (9.48 | ) |
| 11/30/2013 | | | 34.28 | | | | 0.14 | | | | 11.49 | | | | 11.63 | | | | (0.34 | ) | | | (0.74 | ) | | | (1.08 | ) |
| 11/30/2012 | | | 31.46 | | | | 0.30 | | | | 2.52 | | | | 2.82 | | | | – | | | | – | | | | – | |
| 11/30/2011 | | | 30.67 | | | | 0.03 | | | | 0.85 | | | | 0.88 | | | | (0.09 | ) | | | – | | | | (0.09 | ) |
| | | | | | | | | | | | | | | | | | | | | | | | | | | | | |
| Class P | | | | | | | | | | | | | | | | | | | | | | | | | | | | |
| 11/30/2015 | | | 32.95 | | | | (0.10 | ) | | | 1.31 | | | | 1.21 | | | | – | | | | (7.73 | ) | | | (7.73 | ) |
| 11/30/2014 | | | 41.50 | | | | (0.06 | ) | | | 0.92 | | | | 0.86 | | | | – | | | | (9.41 | ) | | | (9.41 | ) |
| 11/30/2013 | | | 31.79 | | | | (0.03 | ) | | | 10.66 | | | | 10.63 | | | | (0.18 | ) | | | (0.74 | ) | | | (0.92 | ) |
| 11/30/2012 | | | 29.31 | | | | 0.13 | | | | 2.35 | | | | 2.48 | | | | – | | | | – | | | | – | |
| 11/30/2011 | | | 28.62 | | | | (0.11 | ) | | | 0.80 | | | | 0.69 | | | | – | | | | – | | | | – | |
| 40 | See Notes to Financial Statements. |
| | | | | Ratios to average net assets: | | Supplemental Data: |
| | | | | | | |
| | | | | | | |
| | | | | | | |
| Net | | | | | | Net | | Net | | |
| asset | | | | | | invest- | | assets, | | Portfolio |
| value, | | Total | | Total | | ment | | end of | | turnover |
| end of | | return(b) | | expenses | | income | | period | | rate |
| period | | (%) | | (%) | | (%) | | (000) | | (%) |
| | | | | | | | | | | | | | | | | | | | | | | |
| $ | 27.17 | | | | 4.76 | | | | 1.21 | | | | (0.15 | ) | | $ | 456,843 | | | | 43.70 | |
| | 33.61 | | | | 2.79 | | | | 1.24 | | | | (0.02 | ) | | | 732,067 | | | | 30.70 | |
| | 42.09 | | | | 34.52 | | | | 1.23 | | | | 0.05 | | | | 1,253,920 | | | | 71.13 | |
| | 32.24 | | | | 8.63 | | | | 1.23 | | | | 0.57 | | | | 1,247,956 | | | | 28.91 | |
| | 29.68 | | | | 2.60 | | | | 1.23 | | | | (0.22 | ) | | | 1,470,064 | | | | 41.95 | |
| | | | | | | | | | | | | | | | | | | | | | | |
| | 20.11 | | | | 3.97 | | | | 1.97 | | | | (0.92 | ) | | | 1,827 | | | | 43.70 | |
| | 27.02 | | | | 2.06 | | | | 1.95 | | | | (0.73 | ) | | | 3,280 | | | | 30.70 | |
| | 35.87 | | | | 33.64 | | | | 1.92 | | | | (0.61 | ) | | | 4,938 | | | | 71.13 | |
| | 27.57 | | | | 7.82 | | | | 1.93 | | | | (0.15 | ) | | | 6,406 | | | | 28.91 | |
| | 25.56 | | | | 1.87 | | | | 1.92 | | | | (0.91 | ) | | | 9,612 | | | | 41.95 | |
| | | | | | | | | | | | | | | | | | | | | | | |
| | 20.13 | | | | 3.97 | | | | 1.96 | | | | (0.91 | ) | | | 35,312 | | | | 43.70 | |
| | 27.04 | | | | 2.09 | | | | 1.94 | | | | (0.72 | ) | | | 40,536 | | | | 30.70 | |
| | 35.89 | | | | 33.56 | | | | 1.93 | | | | (0.65 | ) | | | 44,246 | | | | 71.13 | |
| | 27.63 | | | | 7.89 | | | | 1.92 | | | | (0.12 | ) | | | 37,988 | | | | 28.91 | |
| | 25.61 | | | | 1.87 | | | | 1.92 | | | | (0.90 | ) | | | 41,597 | | | | 41.95 | |
| | | | | | | | | | | | | | | | | | | | | | | |
| | 27.20 | | | | 4.90 | | | | 1.06 | | | | (0.01 | ) | | | 24,246 | | | | 43.70 | |
| | 33.66 | | | | 2.96 | | | | 1.04 | | | | 0.20 | | | | 30,238 | | | | 30.70 | |
| | 42.10 | | | | 34.81 | | | | 1.03 | | | | 0.24 | | | | 46,280 | | | | 71.13 | |
| | 32.26 | | | | 8.84 | | | | 1.03 | | | | 0.83 | | | | 52,084 | | | | 28.91 | |
| | 29.64 | | | | 2.76 | | | | 1.04 | | | | 0.01 | | | | 32,597 | | | | 41.95 | |
| | | | | | | | | | | | | | | | | | | | | | | |
| | 30.13 | | | | 5.01 | | | | 0.96 | | | | 0.09 | | | | 736,890 | | | | 43.70 | |
| | 36.46 | | | | 3.08 | | | | 0.95 | | | | 0.27 | | | | 1,000,533 | | | | 30.70 | |
| | 44.83 | | | | 34.93 | | | | 0.93 | | | | 0.35 | | | | 1,923,378 | | | | 71.13 | |
| | 34.28 | | | | 8.96 | | | | 0.93 | | | | 0.88 | | | | 1,862,546 | | | | 28.91 | |
| | 31.46 | | | | 2.84 | | | | 0.93 | | | | 0.09 | | | | 1,855,748 | | | | 41.95 | |
| | | | | | | | | | | | | | | | | | | | | | | |
| | 26.43 | | | | 4.57 | | | | 1.42 | | | | (0.36 | ) | | | 58,957 | | | | 43.70 | |
| | 32.95 | | | | 2.62 | | | | 1.40 | | | | (0.18 | ) | | | 100,846 | | | | 30.70 | |
| | 41.50 | | | | 34.32 | | | | 1.38 | | | | (0.09 | ) | | | 174,584 | | | | 71.13 | |
| | 31.79 | | | | 8.46 | | | | 1.38 | | | | 0.42 | | | | 192,603 | | | | 28.91 | |
| | 29.31 | | | | 2.41 | | | | 1.38 | | | | (0.37 | ) | | | 231,655 | | | | 41.95 | |
| | See Notes to Financial Statements. | 41 |
Financial Highlights (concluded)
SMALL CAP VALUE FUND
| | | | | Per Share Operating Performance: |
| | | | | Investment operations: | | Distributions to
shareholders from: |
| | | | | | | | | Total | | | | | | |
| | | | | Net | | Net | | from | | | | | | |
| | | Net asset | | invest- | | realized | | invest- | | | | | | |
| | | value, | | ment | | and | | ment | | Net | | Net | | Total |
| | | beginning | | income | | unrealized | | opera- | | investment | | realized | | distri- |
| | | of period | | (loss)(a) | | gain (loss) | | tions | | income | | gain | | butions |
| Class R2 | | | | | | | | | | | | | | | | | | | | | | | | | | | | |
| 11/30/2015 | | | $32.90 | | | | $(0.14 | ) | | | $ 1.30 | | | | $ 1.16 | | | | $ – | | | | $(7.73 | ) | | | $(7.73 | ) |
| 11/30/2014 | | | 41.51 | | | | (0.11 | ) | | | 0.91 | | | | 0.80 | | | | – | | | | (9.41 | ) | | | (9.41 | ) |
| 11/30/2013 | | | 31.81 | | | | 0.01 | | | | 10.57 | | | | 10.58 | | | | (0.14 | ) | | | (0.74 | ) | | | (0.88 | ) |
| 11/30/2012 | | | 29.37 | | | | 0.09 | | | | 2.35 | | | | 2.44 | | | | – | | | | – | | | | – | |
| 11/30/2011 | | | 28.72 | | | | (0.11 | ) | | | 0.76 | | | | 0.65 | | | | – | | | | – | | | | – | |
| | | | | | | | | | | | | | | | | | | | | | | | | | | | | |
| Class R3 | | | | | | | | | | | | | | | | | | | | | | | | | | | | |
| 11/30/2015 | | | 33.04 | | | | (0.10 | ) | | | 1.30 | | | | 1.20 | | | | – | | | | (7.73 | ) | | | (7.73 | ) |
| 11/30/2014 | | | 41.60 | | | | (0.06 | ) | | | 0.91 | | | | 0.85 | | | | – | | | | (9.41 | ) | | | (9.41 | ) |
| 11/30/2013 | | | 31.85 | | | | (0.05 | ) | | | 10.70 | | | | 10.65 | | | | (0.16 | ) | | | (0.74 | ) | | | (0.90 | ) |
| 11/30/2012 | | | 29.38 | | | | 0.12 | | | | 2.35 | | | | 2.47 | | | | – | | | | – | | | | – | |
| 11/30/2011 | | | 28.69 | | | | (0.11 | ) | | | 0.80 | | | | 0.69 | | | | – | | | | – | | | | – | |
| | | | | | | | | | | | | | | | | | | | | | | | | | | | | |
| Class R4 | | | | | | | | | | | | | | | | | | | | | | | | | | | | |
| 6/30/2015 to 11/30/2015(d) | | | 27.41 | | | | (0.03 | ) | | | (0.21 | )(e) | | | (0.24 | ) | | | – | | | | – | | | | – | |
| | | | | | | | | | | | | | | | | | | | | | | | | | | | | |
| Class R5 | | | | | | | | | | | | | | | | | | | | | | | | | | | | |
| 6/30/2015 to 11/30/2015(d) | | | 30.37 | | | | – | (c) | | | (0.23 | )(e) | | | (0.23 | ) | | | – | | | | – | | | | – | |
| | | | | | | | | | | | | | | | | | | | | | | | | | | | | |
| Class R6 | | | | | | | | | | | | | | | | | | | | | | | | | | | | |
| 6/30/2015 to 11/30/2015(d) | | | 30.37 | | | | 0.01 | | | | (0.23 | )(e) | | | (0.22 | ) | | | – | | | | – | | | | – | |
| (a) | Calculated using average shares outstanding during the period. |
| (b) | Total return for Classes A, B and C does not consider the effects of sales loads and assumes the reinvestments of all distributions. Total return for all other classes assumes the reinvestment of all distributions. |
| (c) | Amount less than $0.01. |
| (d) | Commenced on June 30, 2015. |
| (e) | The per share amount does not represent the net realized and unrealized gain (loss) as presented on the Statements of Operations for the period due to the timing of sales of Fund shares and the amount of per share realized and unrealized gains and losses. |
| (f) | Not annualized. |
| (g) | Annualized. |
| 42 | See Notes to Financial Statements. |
| | | | | Ratios to average net assets: | | Supplemental Data: |
| | | | | | | |
| | | | | | | |
| | | | | | | |
| Net | | | | | | Net | | Net | | |
| asset | | | | | | invest- | | assets, | | Portfolio |
| value, | | Total | | Total | | ment | | end of | | turnover |
| end of | | return(b) | | expenses | | income | | period | | rate |
| period | | (%) | | (%) | | (%) | | (000) | | (%) |
| | | | | | | | | | | | | | | | | | | | | | | |
| $ | 26.33 | | | | 4.38 | | | | 1.56 | | | | (0.55 | ) | | $ | 288 | | | | 43.70 | |
| | 32.90 | | | | 2.44 | | | | 1.56 | | | | (0.35 | ) | | | 154 | | | | 30.70 | |
| | 41.51 | | | | 34.08 | | | | 1.53 | | | | 0.04 | | | | 268 | | | | 71.13 | |
| | 31.81 | | | | 8.31 | | | | 1.53 | | | | 0.28 | | | | 6,910 | | | | 28.91 | |
| | 29.37 | | | | 2.26 | | | | 1.56 | | | | (0.38 | ) | | | 7,205 | | | | 41.95 | |
| | | | | | | | | | | | | | | | | | | | | | | |
| | 26.51 | | | | 4.52 | | | | 1.44 | | | | (0.39 | ) | | | 6,395 | | | | 43.70 | |
| | 33.04 | | | | 2.59 | | | | 1.42 | | | | (0.19 | ) | | | 8,266 | | | | 30.70 | |
| | 41.60 | | | | 34.30 | | | | 1.42 | | | | (0.14 | ) | | | 12,162 | | | | 71.13 | |
| | 31.85 | | | | 8.41 | | | | 1.42 | | | | 0.39 | | | | 11,635 | | | | 28.91 | |
| | 29.38 | | | | 2.41 | | | | 1.42 | | | | (0.37 | ) | | | 10,907 | | | | 41.95 | |
| | | | | | | | | | | | | | | | | | | | | | | |
| | 27.17 | | | | (0.88 | )(f) | | | 1.16 | (g) | | | (0.23 | )(g) | | | 10 | | | | 43.70 | |
| | | | | | | | | | | | | | | | | | | | | | | |
| | 30.14 | | | | (0.76 | )(f) | | | 0.90 | (g) | | | 0.02 | (g) | | | 10 | | | | 43.70 | |
| | | | | | | | | | | | | | | | | | | | | | | |
| | 30.15 | | | | (0.72 | )(f) | | | 0.83 | (g) | | | 0.09 | (g) | | | 10 | | | | 43.70 | |
| | See Notes to Financial Statements. | 43 |
Notes to Financial Statements
Lord Abbett Research Fund, Inc. (the “Company”) is registered under the Investment Company Act of 1940, as amended (the “Act”), as a diversified, open-end management investment company and was incorporated under Maryland law on April 6, 1992. The Company consists of the following three funds (separately, a “Fund” and collectively, the “Funds”) and their respective classes: Lord Abbett Calibrated Dividend Growth Fund (“Calibrated Dividend Growth Fund”), Lord Abbett Growth Opportunities Fund (“Growth Opportunities Fund”) and Lord Abbett Small-Cap Value Series (“Small Cap Value Fund”).
Calibrated Dividend Growth Fund’s investment objective is to seek current income and capital appreciation. Growth Opportunities Fund’s investment objective is capital appreciation. Small Cap Value Fund’s investment objective is long-term capital appreciation. Each Fund has eleven classes of shares: Class A, B, C, F, I, P, R2, R3, R4, R5 and R6, each with different expenses and dividends. Classes R4, R5 and R6 shares commenced on June 30, 2015. A front-end sales charge is normally added to the net asset value (“NAV”) for Class A shares. There is no front-end sales charge in the case of Class B, C, F, I, P, R2, R3, R4, R5 and R6 shares, although there may be a contingent deferred sales charge (“CDSC”) in certain cases as follows: Class A shares purchased without a sales charge and redeemed before the first day of the month in which the one-year anniversary of the purchase falls (subject to certain exceptions as set forth in each Fund’s prospectus); Class B shares redeemed before the sixth anniversary of purchase; and Class C shares redeemed before the first anniversary of purchase. Class B shares will automatically convert to Class A shares on the 25th day of the month (or, if the 25th day is not a business day, the next business day thereafter) following the eighth anniversary of the day on which the purchase order was accepted. The Funds no longer issue Class B shares for purchase. The Funds’ Class P shares are closed to substantially all investors, with certain exceptions as set forth in the Funds’ prospectus.
The preparation of the financial statements in conformity with accounting principles generally accepted in the United States of America (“U.S. GAAP”) requires management to make certain estimates and assumptions that affect the reported amounts of assets and liabilities and disclosure of contingent assets and liabilities at the date of the financial statements and the reported amounts of increases and decreases in net assets from operations during the reporting period. Actual results could differ from those estimates. The Fund is considered an investment company under U.S. GAAP and follows the accounting and reporting guidance applicable to investment companies.
| 2. | SIGNIFICANT ACCOUNTING POLICIES |
| | |
| (a) | Investment Valuation–Under procedures approved by the Funds’ Board of Directors (the “Board”), Lord, Abbett & Co. LLC (“Lord Abbett”), the Funds’ investment manager, has formed a Pricing Committee to administer the pricing and valuation of portfolio investments and to ensure that prices utilized reasonably reflect fair value. Among other things, these procedures allow the Funds to utilize independent pricing services, quotations from securities and financial instrument dealers and other market sources to determine fair value. |
| | |
| | Securities actively traded on any recognized U.S. or non-U.S. exchange or on The NASDAQ Stock Market LLC are valued at the last sale price or official closing price on the exchange or system on which they are principally traded. Events occurring after the close of trading on non-U.S. exchanges may result in adjustments to the valuation of foreign securities to reflect their fair value as of the close of regular trading on the New York Stock Exchange. Each Fund |
44
Notes to Financial Statements (continued)
| | may utilize an independent fair valuation service in adjusting the valuations of foreign securities. Unlisted equity securities are valued at the last quoted sale price or, if no sale price is available, at the mean between the most recently quoted bid and asked prices. Exchange traded options and futures contracts are valued at the last sale price in the market where they are principally traded. If no sale has occurred, the mean between the most recently quoted bid and asked prices is used. |
| | |
| | Securities for which prices are not readily available are valued at fair value as determined by the Pricing Committee. The Pricing Committee considers a number of factors, including observable and unobservable inputs, when arriving at fair value. The Pricing Committee may use related or comparable assets or liabilities, recent transactions, market multiples, book values and other relevant information to determine the fair value of portfolio investments. The Board or a designated committee thereof regularly reviews fair value determinations made by the Pricing Committee and employs techniques such as reviewing related market activity, reviewing inputs and assumptions, and retrospectively comparing prices of subsequent purchases and sales transactions to fair value determinations made by the Pricing Committee. |
| | |
| | Short-term securities with 60 days or less remaining to maturity are valued using the amortized cost method, which approximates fair value. |
| | |
| (b) | Security Transactions–Security transactions are recorded as of the date that the securities are purchased or sold (trade date). Realized gains and losses on sales of portfolio securities are calculated using the identified-cost method. Realized and unrealized gains (losses) are allocated to each class of shares based upon the relative proportion of net assets at the beginning of the day. |
| | |
| (c) | Investment Income–Dividend income is recorded on the ex- dividend date. Interest income is recorded on the accrual basis as earned. Discounts are accreted and premiums are amortized using the effective interest method and are included in Interest and other income on the Statements of Operations. Withholding taxes on foreign dividends have been provided for in accordance with the applicable country’s tax rules and rates. Investment income is allocated to each class of shares based upon the relative proportion of net assets at the beginning of the day. |
| | |
| (d) | Income Taxes–It is the policy of each Fund to meet the requirements of Subchapter M of the Internal Revenue Code applicable to regulated investment companies and to distribute substantially all taxable income and capital gains to its shareholders. Therefore, no income tax provision is required. |
| | |
| | Each Fund files U.S. federal and various state and local tax returns. No income tax returns are currently under examination. The statute of limitations on each Fund’s filed U.S. federal tax returns remains open for the fiscal years ended November 30, 2012 through November 30, 2015. The statutes of limitations on the Company’s state and local tax returns may remain open for an additional year depending upon the jurisdiction. |
| | |
| (e) | Expenses–Expenses incurred by the Company that do not specifically relate to an individual fund are generally allocated to the funds within the Company on a pro rata basis by relative net assets. Expenses, excluding class-specific expenses, are allocated to each class of shares based upon the relative proportion of net assets at the beginning of the day. Class A, B, C, F, P, R2, R3 and R4 shares bear their class-specific share of all expenses and fees relating to the Funds’ 12b-1 Distribution Plan. |
45
Notes to Financial Statements (continued)
| (f) | Foreign Transactions–The books and records of each Fund are maintained in U.S. dollars and transactions denominated in foreign currencies are recorded in each Fund’s records at the rate prevailing when earned or recorded. Asset and liability accounts that are denominated in foreign currencies are adjusted daily to reflect current exchange rates and any unrealized gain (loss) is included in Net change in unrealized appreciation/depreciation on futures contracts in each Fund’s Statement of Operations. The resultant exchange gains and losses upon settlement of such transactions are included in Net realized gain on futures contracts in each Fund’s Statement of Operations. The Funds do not isolate that portion of the results of operations arising as a result of changes in the foreign exchange rates from the changes in market prices of the securities. |
| | |
| | The Funds use foreign currency exchange contracts to facilitate transactions in foreign-denominated securities. Losses from these transactions may arise from changes in the value of the foreign currency or if the counterparties do not perform under the contracts’ terms. |
| | |
| (g) | Futures Contracts–Each Fund may purchase and sell index futures contracts to manage cash, or as a substitute position in lieu of holding the underlying asset on which the instrument is based. At the time of entering into a futures transaction, an investor is required to deposit and maintain a specified amount of cash or eligible securities called “initial margin.” Subsequent payments made or received by each Fund called “variation margin” are made on a daily basis as the market price of the futures contract fluctuates. The Funds will record an unrealized gain (loss) based on the amount of variation margin. When a contract is closed, a realized gain (loss) is recorded equal to the difference between the opening and closing value of the contract. |
| | |
| (h) | Repurchase Agreements–Each Fund may enter into repurchase agreements with respect to securities. A repurchase agreement is a transaction in which a fund acquires a security and simultaneously commits to resell that security to the seller (a bank or securities dealer) at an agreed-upon price on an agreed-upon date. Each Fund requires at all times that the repurchase agreement be collateralized by cash, or by securities of the U.S. Government, its agencies, its instrumentalities, or U.S. Government sponsored enterprises having a value equal to, or in excess of, the value of the repurchase agreement (including accrued interest). If the seller of the agreement defaults on its obligation to repurchase the underlying securities at a time when the fair value of these securities has declined, a Fund may incur a loss upon disposition of the securities. |
| | |
| (i) | Fair Value Measurements–Fair value is defined as the price that each Fund would receive upon selling an investment or transferring a liability in an orderly transaction to an independent buyer in the principal or most advantageous market of the investment. A three-tier hierarchy is used to maximize the use of observable market data and minimize the use of unobservable inputs and to establish classification of fair value measurements for disclosure purposes. Inputs refer broadly to the assumptions that market participants would use in pricing the asset or liability, including assumptions about risk – for example, the risk inherent in a particular valuation technique used to measure fair value (such as a pricing model) and/or the risk inherent in the inputs to the valuation technique. Inputs may be observable or unobservable. Observable inputs reflect the assumptions market participants would use in pricing the asset or liability. Observable inputs are based on market data obtained from sources independent of the reporting entity. Unobservable inputs reflect the reporting entity’s own assumptions about the assumptions market participants would use in pricing the asset or |
46
Notes to Financial Statements (continued)
liability. Unobservable inputs are based on the best information available in the circumstances. The three-tier hierarchy of inputs is summarized in the three broad Levels listed below:
| • | Level 1 – | unadjusted quoted prices in active markets for identical investments; |
| | | |
| • | Level 2 – | other significant observable inputs (including quoted prices for similar investments, interest rates, prepayment speeds, credit risk, etc.); and |
| | | |
| • | Level 3 – | significant unobservable inputs (including each Fund’s own assumptions in determining the fair value of investments). |
A summary of inputs used in valuing each Fund’s investments and other financial instruments as of November 30, 2015 and, if applicable, Level 1/Level 2 transfers and Level 3 rollforwards for the fiscal year then ended is included in each Fund’s Schedule of Investments.
Changes in valuation techniques may result in transfers into or out of an assigned level within the three-tier hierarchy. All transfers between different levels within the three-tier hierarchy are deemed to have occurred as of the beginning of the reporting period. The inputs or methodology used for valuing securities are not necessarily an indication of the risk associated with investing in those securities.
| 3. | MANAGEMENT FEE AND OTHER TRANSACTIONS WITH AFFILIATES |
Management Fee
The Company has a management agreement with Lord Abbett, pursuant to which Lord Abbett supplies each Fund with investment management services and executive and other personnel, provides office space and pays for ordinary and necessary office and clerical expenses relating to research and statistical work and supervision of each Fund’s investment portfolio.
The management fee is based on each Fund’s average daily net assets at the following annual rates:
| Calibrated Dividend Growth Fund |
| First $1 billion | | .65% |
| Next $1 billion | | .60% |
| Over $2 billion | | .55% |
| | | |
| Growth Opportunities Fund | | |
| First $1 billion | | .75% |
| Next $1 billion | | .65% |
| Next $1 billion | | .60% |
| Over $3 billion | | .58% |
| | | |
| Small Cap Value Fund | | |
| First $2 billion | | .75% |
| Over $2 billion | | .70% |
For the fiscal year ended November 30, 2015, the effective management fee, net of waivers, was based on each Fund’s average daily net assets at the following annualized rates:
| | | Net Effective |
| | | Management Fee |
| Calibrated Dividend Growth Fund | | .40% |
| Growth Opportunities Fund | | .75% |
| Small Cap Value Fund | | .75% |
47
Notes to Financial Statements (continued)
In addition, Lord Abbett provides certain administrative services to each Fund pursuant to an Administrative Services Agreement in return for a fee at an annual rate of ..04% of each Fund’s average daily net assets.
For the fiscal year ended November 30, 2015 and continuing through March 31, 2016, Lord Abbett has contractually agreed to waive its fees and reimburse expenses for Calibrated Dividend Growth Fund to the extent necessary to limit total net annual operating expenses, excluding 12b-1 fees, to an annual rate of .60% for each class, other than class R6. For Class R6 shares, Lord Abbett has contractually agreed to waive its fees and reimburse expenses to the extent necessary to limit total net annual operating expenses to an annual rate of .49%. These agreements may be terminated only upon the approval of the Board.
Each Fund, along with certain other funds managed by Lord Abbett (collectively, the “Underlying Funds”), have entered into a Servicing Arrangement with certain “Fund of Funds” managed by Lord Abbett, pursuant to which each Underlying Fund pays a portion of the expenses (excluding management fees and distribution and service fees) of each Fund of Funds in proportion to the average daily value of the Underlying Fund shares owned by each Fund of Funds. Amounts paid pursuant to the Servicing Arrangement, if applicable, are included in Subsidy expense on each Fund’s Statement of Operations and Payable to affiliates on each Fund’s Statement of Assets and Liabilities.
As of November 30, 2015, the percentages of Growth Opportunities Fund’s and Small Cap Value Fund’s outstanding shares owned by each Fund of Funds were as follows:
| | | | Underlying Funds |
| | | Growth | | Small Cap |
| Fund of Funds | | Opportunities Fund | | Value Fund |
| Lord Abbett Alpha Strategy Fund | | – | | 18.44% |
| Lord Abbett Diversified Equity Strategy Fund | | 5.82% | | – |
12b-1 Distribution Plan
Each Fund has adopted a distribution plan with respect to Class A, B, C, F, P, R2, R3 and R4 shares pursuant to Rule 12b-1 under the Act, which provides for the payment of ongoing distribution and service fees to Lord Abbett Distributor LLC (the “Distributor”), an affiliate of Lord Abbett. The following annual rates have been authorized by the Board pursuant to the plan:
| Fees* | Class A | Class B | Class C | Class F | Class P | Class R2 | Class R3 | Class R4 |
| Service | .25% | .25% | .25% | – | .25% | .25% | .25% | .25% |
| Distribution | – | .75% | .75% | .10% | .20% | .35% | .25% | – |
| * | The Funds may designate a portion of the aggregate fee as attributable to service activities for purposes of calculating Financial Industry Regulatory Authority, Inc. (“FINRA”) sales charge limitations. |
Class I, R5 and R6 shares do not have a distribution plan.
Commissions
Distributor received the following commissions on sales of shares of the Funds, after concessions were paid to authorized dealers, for the fiscal year ended November 30, 2015:
| | | Distributor | | Dealers’ |
| | | Commissions | | Concessions |
| Calibrated Dividend Growth Fund | | $471,468 | | $2,492,938 |
| Growth Opportunities Fund | | 72,840 | | 405,134 |
| Small Cap Value Fund | | 40,797 | | 220,135 |
48
Notes to Financial Statements (continued)
Distributor received the following amount of CDSCs for the fiscal year ended November 30, 2015:
| | | Class A | | Class C | |
| Calibrated Dividend Growth Fund | | $15,660 | | $20,790 | |
| Growth Opportunities Fund | | 4,498 | | 6,917 | |
| Small Cap Value Fund | | 725 | | 2,913 | |
A Director and certain of the Company’s officers have an interest in Lord Abbett.
| 4. | DISTRIBUTIONS AND CAPITAL LOSS CARRYFORWARDS |
Dividends from net investment income, if any, are declared and paid at least quarterly for Calibrated Dividend Growth Fund and annually for Growth Opportunities Fund and Small Cap Value Fund. Taxable net realized gains from investment transactions, reduced by allowable capital loss carryforwards, if any, are declared and distributed to shareholders at least annually. The capital loss carryforward amount, if any, is available to offset future net capital gains. Dividends and distributions to shareholders are recorded on the ex-dividend date. The amounts of dividends and distributions from net investment income and net realized capital gains are determined in accordance with federal income tax regulations, which may differ from accounting principles generally accepted in the United States of America. These book/tax differences are either considered temporary or permanent in nature. To the extent these differences are permanent in nature, such amounts are reclassified within the components of net assets based on their federal tax basis treatment; temporary differences do not require reclassification. Dividends and distribution that exceed earnings and profits for tax purposes are reported as a tax return of capital.
Subsequent to the Funds’ fiscal year ended November 30, 2015, distributions were declared on December 11, 2015 and paid on December 18, 2015 to shareholders of record on December 17, 2015. The approximate amounts were as follows:
| | | Net Short-Term | | Net Long-Term |
| | | Capital Gain | | Capital Gains |
| Calibrated Dividend Growth Fund | | $45,918,000 | | $ 83,708,000 |
| Growth Opportunities Fund | | 18,124,000 | | 57,344,000 |
| Small Cap Value Fund | | – | | 228,988,000 |
The tax character of distributions paid during the fiscal years ended November 30, 2015 and 2014 was as follows:
| Calibrated Dividend Growth Fund | | Growth Opportunities Fund |
| | | Year Ended | | Year Ended | | Year Ended | | Year Ended |
| | | 11/30/2015 | | 11/30/2014 | | 11/30/2015 | | 11/30/2014 |
| Distributions paid from: | | | | | | | | |
| Ordinary income | | $ 98,318,814 | | $29,521,986 | | $ 24,867,023 | | $ 22,156,966 |
| Net long-term capital gains | | 199,490,559 | | 47,547,337 | | 77,585,489 | | 88,053,101 |
| Total distributions paid | | $297,809,373 | | $77,069,323 | | $102,452,512 | | $110,210,067 |
| | | | | | | | | |
| | | Small Cap Value Fund | | | | |
| | | Year Ended | | Year Ended | | | | |
| | | 11/30/2015 | | 11/30/2014 | | | | |
| Distributions paid from: | | | | | | | | |
| Ordinary income | | $ 59,212,520 | | $ 71,403,938 | | | | |
| Net long-term capital gains | | 361,971,753 | | 652,111,884 | | | | |
| Total distributions paid | | $421,184,273 | | $723,515,822 | | | | |
49
Notes to Financial Statements (continued)
As of November 30, 2015, the components of accumulated gains on a tax-basis were as follows:
| | | Calibrated | | | Growth | | | | |
| | | Dividend | | Opportunities | | | Small Cap | |
| | | Growth Fund | | | Fund | | | Value Fund | |
| Undistributed ordinary income – net | | $ | 51,858,137 | | | $ | 18,122,622 | | | $ | – | |
| Undistributed long-term capital gains | | | 83,699,941 | | | | 57,341,387 | | | | 228,984,115 | |
| Total undistributed earnings | | | 135,558,078 | | | | 75,464,009 | | | | 228,984,115 | |
| Temporary differences | | | (313,085 | ) | | | (105,928 | ) | | | (1,228,326 | ) |
| Unrealized gains – net | | | 41,563,438 | | | | 75,426,729 | | | | 356,812,297 | |
| Total accumulated gains – net | | $ | 176,808,431 | | | $ | 150,784,810 | | | $ | 584,568,086 | |
At each Funds’ election, certain losses incurred within the taxable year (Qualified Late-Year Losses) are deemed to arise on the first business day of the Fund’s next taxable year. Small Cap Value Fund incurred and will elect to defer late-year ordinary losses of $770,229 during fiscal 2015.
As of November 30, 2015, the aggregate unrealized security gains and losses based on cost for U.S. federal income tax purposes were as follows:
| | | Calibrated | | | Growth | | | | |
| | | Dividend | | Opportunities | | | Small Cap | |
| | | Growth Fund | | | Fund | | | Value Fund | |
| Tax cost | | $ | 1,856,617,036 | | | $ | 559,572,968 | | | $ | 964,210,870 | |
| Gross unrealized gain | | | 152,535,896 | | | | 91,990,738 | | | | 376,179,100 | |
| Gross unrealized loss | | | (110,972,458 | ) | | | (16,564,009 | ) | | | (19,366,803 | ) |
| Net unrealized security gain | | $ | 41,563,438 | | | $ | 75,426,729 | | | $ | 356,812,297 | |
The difference between book-basis and tax-basis unrealized gains (losses) is attributable to the tax treatment of certain securities and wash sales.
Permanent items identified during the fiscal year ended November 30, 2015 have been reclassified among the components of net assets based on their tax basis treatment as follows:
| | Undistributed | | | | | | |
| | (Distributions | | | | | | |
| | in Excess of) | | Accumulated | | | |
| | Net Investment | | Net Realized | | | |
| | | Income | | | Gain | | Paid-in Capital |
| Growth Opportunities Fund | | $ | 3,412,575 | | | $ | (3,412,575 | ) | | $ | – |
| Small Cap Value Fund | | | (45,479 | ) | | | (48,633,047 | ) | | | 48,678,526 |
The permanent differences are attributable to tax treatment of certain securities, certain distributions and net investment loss.
| 5. | PORTFOLIO SECURITIES TRANSACTIONS |
Purchases and sales of investment securities (excluding short-term investments) for the fiscal year ended November 30, 2015 were as follows:
| | | Purchases | | Sales |
| Calibrated Dividend Growth Fund | | $1,160,020,971 | | $1,327,016,691 |
| Growth Opportunities Fund | | 666,390,738 | | 827,159,294 |
| Small Cap Value Fund | | 652,687,843 | | 1,295,087,584 |
There were no purchases or sales of U.S. Government securities for the fiscal year ended November 30, 2015.
50
Notes to Financial Statements (continued)
| 6. | DISCLOSURES ABOUT DERIVATIVE INSTRUMENTS AND HEDGING ACTIVITIES |
Calibrated Dividend Growth Fund entered into E-Mini S&P 500 Index futures contracts for the fiscal year ended November 30, 2015 (as described in note 2(g)) to manage cash. The Fund bears the risk that the underlying index will move unexpectedly, in which case the Fund may realize a loss. There is minimal counterparty credit risk to the Fund since futures are exchange traded and the exchange’s clearinghouse, as counterparty to all exchange traded futures, guarantees futures against default.
As of November 30, 2015, the Fund had futures contracts with unrealized appreciation of $334,756, which is included in the Fund’s Schedule of Investments. Only the current day’s variation margin is reported within the Statements of Assets and Liabilities. Amounts of $216,897 and ($24,518) are included in the Statement of Operations related to futures contracts under the captions Net realized gain on futures contracts and Net change in unrealized appreciation/depreciation on futures contracts, respectively. The average number of futures contracts throughout the period was 78.
| 7. | DISCLOSURES ABOUT OFFSETTING ASSETS AND LIABILITIES |
The Financial Accounting Standards Board (“FASB”) requires disclosures intended to help better assess the effect or potential effect of offsetting arrangements on a fund’s financial position. The following tables illustrate gross and net information about recognized assets and liabilities eligible for offset in the statement of assets and liabilities; and disclose such amounts subject to an enforceable master netting agreement or similar agreement, by counterparty. A master netting agreement is an agreement between a fund and a counterparty which provides for the net settlement of amounts owed under all contracts traded under that agreement, as well as cash collateral, through a single payment by one party to the other in the event of default on or termination of any one contract. The Funds’ accounting policy with respect to balance sheet offsetting is that, absent an event of default by the counterparty or a termination of the agreement, the master netting agreement does not result in an offset of reported amounts of financial assets and liabilities in the statement of assets and liabilities across transactions between the Funds and the applicable counterparty:
| | | | | Calibrated Dividend Growth Fund |
| | | | | Gross Amounts | | Net Amounts of |
| | | | | Offset in the | | Assets Presented |
| | | Gross Amounts of | | Statement of Assets | | in the Statement of |
| Description | | Recognized Assets | | and Liabilities | | Assets and Liabilities |
| Repurchase Agreement | | $6,885,960 | | $ – | | $6,885,960 |
| Total | | $6,885,960 | | $ – | | $6,885,960 |
| | | | | | | | | | | |
| | | | | Amounts Not Offset in the | | |
| | | Net Amounts of | | Statement of Assets and Liabilities | | |
| | | Assets Presented | | | | Cash | | Securities | | |
| | | in the Statement of | | Financial | | Collateral | | Collateral | | Net |
| Counterparty | | Assets and Liabilities | | Instruments | | Received(a) | | Received(a) | | Amount(b) |
| Fixed Income Clearing Corp. | $6,885,960 | | $ – | | $ – | | $(6,885,960) | | $ – |
| Total | | $6,885,960 | | $ – | | $ – | | $(6,885,960) | | $ – |
51
Notes to Financial Statements (continued)
| | | | | Growth Opportunities Fund |
| | | | | Gross Amounts | | Net Amounts of |
| | | | | Offset in the | | Assets Presented |
| | | Gross Amounts of | | Statement of Assets | | in the Statement of |
| Description | | Recognized Assets | | and Liabilities | | Assets and Liabilities |
| Repurchase Agreement | | $3,128,412 | | $ – | | $3,128,412 |
| Total | | $3,128,412 | | $ – | | $3,128,412 |
| | | | | | | |
| | | | | Amounts Not Offset in the | | |
| | | Net Amounts of | | Statement of Assets and Liabilities | | |
| | | Assets Presented | | | | Cash | | Securities | | |
| | | in the Statement of | | Financial | | Collateral | | Collateral | | Net |
| Counterparty | | Assets and Liabilities | | Instruments | | Received(a) | | Received(a) | | Amount(b) |
| Fixed Income Clearing Corp. | $3,128,412 | | $ – | | $ – | | $(3,128,412) | | $ – |
| Total | | $3,128,412 | | $ – | | $ – | | $(3,128,412) | | $ – |
| |
| | | | | | | Small Cap Value Fund |
| | | | | Gross Amounts | | Net Amounts of |
| | | | | Offset in the | | Assets Presented |
| | | Gross Amounts of | | Statement of Assets | | in the Statement of |
| Description | | Recognized Assets | | and Liabilities | | Assets and Liabilities |
| Repurchase Agreement | | $10,303,378 | | $ – | | $10,303,378 |
| Total | | $10,303,378 | | $ – | | $10,303,378 |
| | | | | | | |
| | | | | Amounts Not Offset in the | | |
| | | Net Amounts of | | Statement of Assets and Liabilities | | |
| | | Assets Presented | | | | Cash | | Securities | | |
| | | in the Statement of | | Financial | | Collateral | | Collateral | | Net |
| Counterparty | | Assets and Liabilities | | Instruments | | Received(a) | | Received(a) | | Amount(b) |
| Fixed Income Clearing Corp. | $10,303,378 | | $ – | | $ – | | $(10,303,378) | | $ – |
| Total | | $10,303,378 | | $ – | | $ – | | $(10,303,378) | | $ – |
| (a) | Collateral disclosed is limited to an amount not to exceed 100% of the net amount of assets (liabilities) presented in the Statements of Assets and Liabilities, for each respective counterparty. |
| (b) | Net amount represents the amount owed to the Fund by the counterparty as of November 30, 2015. |
| 8. | DIRECTORS’ REMUNERATION |
The Company’s officers and a Director, who are associated with Lord Abbett, do not receive any compensation from the Company for serving in such capacities. Independent Directors’ fees are allocated among all Lord Abbett-sponsored funds based on the net assets of each fund. There is an equity-based plan available to all Independent Directors under which Independent Directors must defer receipt of a portion of, and may elect to defer receipt of an additional portion of, Directors’ fees. The deferred amounts are treated as though equivalent dollar amounts had been invested in the funds. Such amounts and earnings accrued thereon are included in Directors’ fees on the Statements of Operations and in Directors’ fees payable on the Statements of Assets and Liabilities and are not deductible for U.S. federal income tax purposes until such amounts are paid.
The Company has entered into an arrangement with its transfer agent and custodian, whereby credits realized as a result of uninvested cash balances are used to reduce a portion of each Fund’s expenses.
52
Notes to Financial Statements (continued)
Effective August 31, 2015, the Funds and certain other funds managed by Lord Abbett (collectively, the “Participating Funds”) entered into a syndicated line of credit facility with various lenders for $550 million (the “Facility”), whereas State Street Bank and Trust Company (“SSB”) participates as a lender and as agent for the lenders. The Facility is to be used for temporary or emergency purposes as an additional source of: liquidity to satisfy redemptions. The Participating Funds are subject to graduated borrowing limits of one-third of Fund assets (if Fund assets are less than $750 million), $250 million, $300 million, or $350 million, based on past borrowings and likelihood of future borrowings. The Facility will continue through August 29, 2016. As of November 30, 2015, there were no loans outstanding pursuant to this Facility.
Prior to August 31, 2015, the Funds and certain other funds managed by Lord Abbett participated in a $500 million unsecured revolving credit facility with SSB (the “SSB Facility”).
During the fiscal year ended November 30, 2015, Small Cap Value Fund utilized the SSB Facility from January 1, 2015 through January 5, 2015 with borrowing ranging from $40,000,000 to $55,000,000. The average interest rate during the period was 1.24%, and total interest paid amounted to $7,061, which is included in other expenses in the Statement of Operations. On January 6, 2015, Small Cap Value Fund fully repaid its borrowings to the Facility.
| 11. | CUSTODIAN AND ACCOUNTING AGENT |
SSB is the Company’s custodian and accounting agent. SSB performs custodial, accounting and recordkeeping functions relating to portfolio transactions and calculating each Fund’s NAV.
Each Fund is subject to the general risks and considerations associated with equity investing. The value of the Funds’ investments will fluctuate in response to movements in the equity securities markets in general and to the changing prospects of individual companies and/or sectors in which the Funds invest.
Calibrated Dividend Growth Fund invests primarily in equity securities of large and mid-sized company stocks that have a history of growing their dividends, but there is no guarantee that a company will pay a dividend. If the Fund’s fundamental research and quantitative analysis fail to produce the intended result, the Fund may suffer losses or underperform its benchmark or other funds with the same investment objective or similar strategies, even in a rising market. Large and mid-sized company stocks each may perform differently than the market as a whole and other types of stocks. This is because different types of stocks tend to shift in and out of favor depending on market and economic conditions. Mid-sized company stocks may be less able to weather economic shifts or other adverse developments than those of larger, more established companies.
Growth Opportunities Fund has particular risks associated with growth stocks. Growth companies may grow faster than other companies, which may result in more volatility in their stock prices. In addition, if the Fund’s assessment of a company’s potential for growth or market conditions is wrong, it could suffer losses or produce poor performance relative to other funds, even in a rising market. The Fund invests largely in mid-sized company stocks, which may be less able to weather economic shifts or other adverse developments than those of larger, more established companies. Due to the Fund’s investment exposure to American Depositary Receipts and foreign companies and markets, the Fund may experience increased market, liquidity, currency, political, information and other risks.
53
Notes to Financial Statements (continued)
Small Cap Value Fund has particular risks associated with small company value stocks. Small company value stocks may perform differently than the market as a whole and other types of stocks, such as large company stocks or growth stocks. The market may fail to recognize the intrinsic value of particular value stocks for a long time. In addition, small cap company stocks may be more volatile and less liquid than large cap company stocks. Also, if the Fund’s assessment of a company’s value or prospects for exceeding earnings expectations or market conditions is wrong, the Fund could suffer losses or produce poor performance relative to other funds, even in a rising market.
These factors can affect each Fund’s performance.
| 13. | SUMMARY OF CAPITAL TRANSACTIONS |
Transactions in shares of capital stock were as follows:
| | | | | Year Ended | | | | | Year Ended | |
| Calibrated Dividend Growth Fund | | November 30, 2015 | | | November 30, 2014 | |
| Class A Shares | | Shares | | | Amount | | | Shares | | | Amount | |
| Shares sold | | | 10,151,968 | | | $ | 149,821,700 | | | | 10,435,506 | | | $ | 163,894,620 | |
| Converted from Class B* | | | 524,416 | | | | 7,641,833 | | | | 454,918 | | | | 7,143,531 | |
| Reinvestment of distributions | | | 15,316,996 | | | | 227,422,676 | | | | 3,950,509 | | | | 60,909,892 | |
| Shares reacquired | | | (20,091,802 | ) | | | (295,057,682 | ) | | | (22,582,694 | ) | | | (353,777,010 | ) |
| Increase (decrease) | | | 5,901,578 | | | $ | 89,828,527 | | | | (7,741,761 | ) | | $ | (121,828,967 | ) |
| | | | | | | | | | | | | | | | | |
| Class B Shares | | | | | | | | | | | | | | | | |
| Shares sold | | | 44,353 | | | $ | 653,866 | | | | 71,500 | | | $ | 1,110,182 | |
| Reinvestment of distributions | | | 284,443 | | | | 4,192,361 | | | | 80,297 | | | | 1,219,537 | |
| Shares reacquired | | | (415,917 | ) | | | (6,025,978 | ) | | | (493,300 | ) | | | (7,671,588 | ) |
| Converted to Class A* | | | (529,614 | ) | | | (7,641,833 | ) | | | (458,921 | ) | | | (7,143,531 | ) |
| Decrease | | | (616,735 | ) | | $ | (8,821,584 | ) | | | (800,424 | ) | | $ | (12,485,400 | ) |
| | | | | | | | | | | | | | | | | |
| Class C Shares | | | | | | | | | | | | | | | | |
| Shares sold | | | 3,158,542 | | | $ | 46,427,064 | | | | 3,510,726 | | | $ | 54,519,614 | |
| Reinvestment of distributions | | | 2,077,102 | | | | 30,566,928 | | | | 404,325 | | | | 6,155,807 | |
| Shares reacquired | | | (4,245,568 | ) | | | (61,609,993 | ) | | | (2,777,112 | ) | | | (43,352,827 | ) |
| Increase | | | 990,076 | | | $ | 15,383,999 | | | | 1,137,939 | | | $ | 17,322,594 | |
| | | | | | | | | | | | | | | | | |
| Class F Shares | | | | | | | | | | | | | | | | |
| Shares sold | | | 2,609,477 | | | $ | 38,695,419 | | | | 3,414,640 | | | $ | 53,999,366 | |
| Reinvestment of distributions | | | 953,341 | | | | 14,150,137 | | | | 204,642 | | | | 3,159,441 | |
| Shares reacquired | | | (3,942,873 | ) | | | (57,510,434 | ) | | | (2,513,449 | ) | | | (39,345,508 | ) |
| Increase (decrease) | | | (380,055 | ) | | $ | (4,664,878 | ) | | | 1,105,833 | | | $ | 17,813,299 | |
| | | | | | | | | | | | | | | | | |
| Class I Shares | | | | | | | | | | | | | | | | |
| Shares sold | | | 371,127 | | | $ | 5,569,829 | | | | 254,026 | | | $ | 4,017,629 | |
| Reinvestment of distributions | | | 45,157 | | | | 673,327 | | | | 19,017 | | | | 293,984 | |
| Shares reacquired | | | (347,669 | ) | | | (5,135,748 | ) | | | (1,468,119 | ) | | | (22,812,745 | ) |
| Increase (decrease) | | | 68,615 | | | $ | 1,107,408 | | | | (1,195,076 | ) | | $ | (18,501,132 | ) |
| | | | | | | | | | | | | | | | | |
| Class P Shares | | | | | | | | | | | | | | | | |
| Shares sold | | | 13,242 | | | $ | 195,693 | | | | 32,133 | | | $ | 493,965 | |
| Reinvestment of distributions | | | 24,527 | | | | 366,145 | | | | 5,707 | | | | 88,255 | |
| Shares reacquired | | | (70,477 | ) | | | (1,046,724 | ) | | | (29,218 | ) | | | (458,092 | ) |
| Increase (decrease) | | | (32,708 | ) | | $ | (484,886 | ) | | | 8,622 | | | $ | 124,128 | |
54
Notes to Financial Statements (continued)
| | | | | Year Ended | | | | | Year Ended | |
| Calibrated Dividend Growth Fund | | November 30, 2015 | | | November 30, 2014 | |
| Class R2 Shares | | Shares | | | Amount | | | Shares | | | Amount | |
| Shares sold | | | 35,322 | | | $ | 520,365 | | | | 31,447 | | | $ | 495,310 | |
| Reinvestment of distributions | | | 13,194 | | | | 197,668 | | | | 3,337 | | | | 51,585 | |
| Shares reacquired | | | (85,939 | ) | | | (1,295,646 | ) | | | (77,073 | ) | | | (1,243,776 | ) |
| Decrease | | | (37,423 | ) | | $ | (577,613 | ) | | | (42,289 | ) | | $ | (696,881 | ) |
| | | | | | | | | | | | | | | | | |
| Class R3 Shares | | | | | | | | | | | | | | | | |
| Shares sold | | | 453,086 | | | $ | 6,616,713 | | | | 299,877 | | | $ | 4,698,287 | |
| Reinvestment of distributions | | | 216,769 | | | | 3,206,583 | | | | 51,115 | | | | 784,917 | |
| Shares reacquired | | | (495,755 | ) | | | (7,195,953 | ) | | | (370,414 | ) | | | (5,806,570 | ) |
| Increase (decrease) | | | 174,100 | | | $ | 2,627,343 | | | | (19,422 | ) | | $ | (323,366 | ) |
| | | | | | | | | | | | | | | | | |
| Class R4 Shares(a) | | | | | | | | | | | | | | | | |
| Shares sold | | | 695.89 | | | $ | 10,000 | | | | – | | | $ | – | |
| Reinvestment of distributions | | | 3.47 | | | | 47 | | | | – | | | | – | |
| Increase | | | 699.36 | | | $ | 10,047 | | | | – | | | $ | – | |
| | | | | | | | | | | | | | | | | |
| Class R5 Shares(a) | | | | | | | | | | | | | | | | |
| Shares sold | | | 691.563 | | | $ | 10,000 | | | | – | | | $ | – | |
| Reinvestment of distributions | | | 3.884 | | | | 53 | | | | – | | | | – | |
| Increase | | | 695.447 | | | $ | 10,053 | | | | – | | | $ | – | |
| | | | | | | | | | | | | | | | | |
| Class R6 Shares(a) | | | | | | | | | | | | | | | | |
| Shares sold | | | 691.563 | | | $ | 10,000 | | | | – | | | $ | – | |
| Reinvestment of distributions | | | 3.884 | | | | 53 | | | | – | | | | – | |
| Increase | | | 695.447 | | | $ | 10,053 | | | | – | | | $ | – | |
| | | | | | Year Ended | | | | | | Year Ended | |
| Growth Opportunities Fund | | November 30, 2015 | | | November 30, 2014 | |
| Class A Shares | | Shares | | | Amount | | | Shares | | | Amount | |
| Shares sold | | | 2,232,400 | | | $ | 48,695,601 | | | | 1,609,429 | | | $ | 36,467,154 | |
| Converted from Class B* | | | 107,884 | | | | 2,326,941 | | | | 134,612 | | | | 3,030,864 | |
| Reinvestment of distributions | | | 2,682,312 | | | | 55,228,791 | | | | 3,126,877 | | | | 68,353,491 | |
| Shares reacquired | | | (3,602,773 | ) | | | (77,603,195 | ) | | | (3,895,806 | ) | | | (88,477,588 | ) |
| Increase | | | 1,419,823 | | | $ | 28,648,138 | | | | 975,112 | | | $ | 19,373,921 | |
| | | | | | | | | | | | | | | | | |
| Class B Shares | | | | | | | | | | | | | | | | |
| Shares sold | | | 18,252 | | | $ | 321,496 | | | | 21,200 | | | $ | 401,523 | |
| Reinvestment of distributions | | | 102,000 | | | | 1,721,767 | | | | 152,279 | | | | 2,830,871 | |
| Shares reacquired | | | (162,990 | ) | | | (2,894,908 | ) | | | (169,472 | ) | | | (3,290,702 | ) |
| Converted to Class A* | | | (131,997 | ) | | | (2,326,941 | ) | | | (158,730 | ) | | | (3,030,864 | ) |
| Decrease | | | (174,735 | ) | | $ | (3,178,586 | ) | | | (154,723 | ) | | $ | (3,089,172 | ) |
| | | | | | | | | | | | | | | | | |
| Class C Shares | | | | | | | | | | | | | | | | |
| Shares sold | | | 662,098 | | | $ | 11,677,876 | | | | 457,434 | | | $ | 8,774,537 | |
| Reinvestment of distributions | | | 525,937 | | | | 8,872,558 | | | | 551,584 | | | | 10,248,424 | |
| Shares reacquired | | | (795,929 | ) | | | (14,041,729 | ) | | | (666,220 | ) | | | (12,825,370 | ) |
| Increase | | | 392,106 | | | $ | 6,508,705 | | | | 342,798 | | | $ | 6,197,591 | |
55
Notes to Financial Statements (continued)
| | | | | Year Ended | | | | | Year Ended | |
| Growth Opportunities Fund | | November 30, 2015 | | | November 30, 2014 | |
| Class F Shares | | Shares | | | Amount | | | Shares | | | Amount | |
| Shares sold | | | 352,739 | | | $ | 7,856,043 | | | | 432,236 | | | $ | 10,131,595 | |
| Reinvestment of distributions | | | 113,626 | | | | 2,400,931 | | | | 105,481 | | | | 2,354,330 | |
| Shares reacquired | | | (316,095 | ) | | | (6,968,309 | ) | | | (371,942 | ) | | | (8,534,653 | ) |
| Increase | | | 150,270 | | | $ | 3,288,665 | | | | 165,775 | | | $ | 3,951,272 | |
| | | | | | | | | | | | | | | | | |
| Class I Shares | | | | | | | | | | | | | | | | |
| Shares sold | | | 612,051 | | | $ | 14,652,268 | | | | 4,298,345 | | | $ | 107,281,743 | |
| Reinvestment of distributions | | | 1,091,832 | | | | 24,664,495 | | | | 608,970 | | | | 14,389,956 | |
| Shares reacquired | | | (5,217,871 | ) | | | (126,918,414 | ) | | | (753,795 | ) | | | (18,408,493 | ) |
| Increase (decrease) | | | (3,513,988 | ) | | $ | (87,601,651 | ) | | | 4,153,520 | | | $ | 103,263,206 | |
| | | | | | | | | | | | | | | | | |
| Class P Shares | | | | | | | | | | | | | | | | |
| Shares sold | | | 54,360 | | | $ | 1,171,709 | | | | 29,829 | | | $ | 672,726 | |
| Reinvestment of distributions | | | 30,106 | | | | 611,458 | | | | 36,223 | | | | 783,859 | |
| Shares reacquired | | | (88,059 | ) | | | (1,876,966 | ) | | | (58,753 | ) | | | (1,311,707 | ) |
| Increase (decrease) | | | (3,593 | ) | | $ | (93,799 | ) | | | 7,299 | | | $ | 144,878 | |
| | | | | | | | | | | | | | | | | |
| Class R2 Shares | | | | | | | | | | | | | | | | |
| Shares sold | | | 14,595 | | | $ | 301,318 | | | | 19,884 | | | $ | 438,214 | |
| Reinvestment of distributions | | | 3,021 | | | | 60,503 | | | | 5,909 | | | | 126,513 | |
| Shares reacquired | | | (18,258 | ) | | | (393,537 | ) | | | (36,789 | ) | | | (818,898 | ) |
| Decrease | | | (642 | ) | | $ | (31,716 | ) | | | (10,996 | ) | | $ | (254,171 | ) |
| | | | | | | | | | | | | | | | | |
| Class R3 Shares | | | | | | | | | | | | | | | | |
| Shares sold | | | 393,812 | | | $ | 8,428,129 | | | | 291,377 | | | $ | 6,541,633 | |
| Reinvestment of distributions | | | 204,007 | | | | 4,137,264 | | | | 255,910 | | | | 5,532,825 | |
| Shares reacquired | | | (539,017 | ) | | | (11,544,084 | ) | | | (575,045 | ) | | | (12,831,526 | ) |
| Increase (decrease) | | | 58,802 | | | $ | 1,021,309 | | | | (27,758 | ) | | $ | (757,068 | ) |
| | | | | | | | | | | | | | | | | |
| Class R4 Shares(a) | | | | | | | | | | | | | | | | |
| Shares sold | | | 449 | | | $ | 10,000 | | | | – | | | $ | – | |
| Increase | | | 449 | | | $ | 10,000 | | | | – | | | $ | – | |
| | | | | | | | | | | | | | | | | |
| Class R5 Shares(a) | | | | | | | | | | | | | | | | |
| Shares sold | | | 408.50 | | | $ | 10,000 | | | | – | | | $ | – | |
| Increase | | | 408.50 | | | $ | 10,000 | | | | – | | | $ | – | |
| | | | | | | | | | | | | | | | | |
| Class R6 Shares(a) | | | | | | | | | | | | | | | | |
| Shares sold | | | 408.50 | | | $ | 10,000 | | | | – | | | $ | – | |
| Increase | | | 408.50 | | | $ | 10,000 | | | | – | | | $ | – | |
| | | | | | Year Ended | | | | | | Year Ended | |
| Small Cap Value Fund | | November 30, 2015 | | | November 30, 2014 | |
| Class A Shares | | Shares | | | Amount | | | Shares | | | Amount | |
| Shares sold | | | 2,283,854 | | | $ | 61,093,030 | | | | 3,759,950 | | | $ | 124,944,203 | |
| Converted from Class B* | | | 29,578 | | | | 787,345 | | | | 28,855 | | | | 953,745 | |
| Reinvestment of distributions | | | 5,765,942 | | | | 150,548,762 | | | | 7,687,485 | | | | 251,918,889 | |
| Shares reacquired | | | (13,044,825 | ) | | | (347,890,148 | ) | | | (19,484,529 | ) | | | (648,755,948 | ) |
| Decrease | | | (4,965,451 | ) | | $ | (135,461,011 | ) | | | (8,008,239 | ) | | $ | (270,939,111 | ) |
56
Notes to Financial Statements (continued)
| | | | | Year Ended | | | | | Year Ended | |
| Small Cap Value Fund | | November 30, 2015 | | | November 30, 2014 | |
| Class B Shares | | Shares | | | Amount | | | Shares | | | Amount | |
| Shares sold | | | 3,795 | | | $ | 74,194 | | | | 6,084 | | | $ | 166,647 | |
| Reinvestment of distributions | | | 45,917 | | | | 893,548 | | | | 46,768 | | | | 1,240,293 | |
| Shares reacquired | | | (40,484 | ) | | | (799,751 | ) | | | (33,360 | ) | | | (896,999 | ) |
| Converted to Class A* | | | (39,796 | ) | | | (787,345 | ) | | | (35,762 | ) | | | (953,745 | ) |
| Decrease | | | (30,568 | ) | | $ | (619,354 | ) | | | (16,270 | ) | | $ | (443,804 | ) |
| | | | | | | | | | | | | | | | | |
| Class C Shares | | | | | | | | | | | | | | | | |
| Shares sold | | | 296,089 | | | $ | 5,910,649 | | | | 243,252 | | | $ | 6,544,557 | |
| Reinvestment of distributions | | | 444,216 | | | | 8,653,319 | | | | 315,798 | | | | 8,381,268 | |
| Shares reacquired | | | (485,263 | ) | | | (9,783,690 | ) | | | (292,841 | ) | | | (7,850,904 | ) |
| Increase | | | 255,042 | | | $ | 4,780,278 | | | | 266,209 | | | $ | 7,074,921 | |
| | | | | | | | | | | | | | | | | |
| Class F Shares | | | | | | | | | | | | | | | | |
| Shares sold | | | 306,877 | | | $ | 8,382,613 | | | | 333,879 | | | $ | 11,059,928 | |
| Reinvestment of distributions | | | 186,176 | | | | 4,861,060 | | | | 214,774 | | | | 7,035,990 | |
| Shares reacquired | | | (499,989 | ) | | | (13,418,569 | ) | | | (749,787 | ) | | | (25,562,792 | ) |
| Decrease | | | (6,936 | ) | | $ | (174,896 | ) | | | (201,134 | ) | | $ | (7,466,874 | ) |
| | | | | | | | | | | | | | | | | |
| Class I Shares | | | | | | | | | | | | | | | | |
| Shares sold | | | 3,235,185 | | | $ | 95,987,080 | | | | 4,469,996 | | | $ | 161,085,330 | |
| Reinvestment of distributions | | | 6,932,724 | | | | 200,286,377 | | | | 10,248,517 | | | | 363,309,951 | |
| Shares reacquired | | | (13,152,272 | ) | | | (393,578,320 | ) | | | (30,180,591 | ) | | | (1,106,879,576 | ) |
| Decrease | | | (2,984,363 | ) | | $ | (97,304,863 | ) | | | (15,462,078 | ) | | $ | (582,484,295 | ) |
| | | | | | | | | | | | | | | | | |
| Class P Shares | | | | | | | | | | | | | | | | |
| Shares sold | | | 326,546 | | | $ | 8,959,437 | | | | 319,328 | | | $ | 10,464,958 | |
| Reinvestment of distributions | | | 927,870 | | | | 23,605,012 | | | | 1,200,647 | | | | 38,636,814 | |
| Shares reacquired | | | (2,083,556 | ) | | | (54,886,046 | ) | | | (2,666,223 | ) | | | (87,697,893 | ) |
| Decrease | | | (829,140 | ) | | $ | (22,321,597 | ) | | | (1,146,248 | ) | | $ | (38,596,121 | ) |
| | | | | | | | | | | | | | | | | |
| Class R2 Shares | | | | | | | | | | | | | | | | |
| Shares sold | | | 14,128 | | | $ | 371,782 | | | | 3,745 | | | $ | 123,362 | |
| Reinvestment of distributions | | | 666 | | | | 16,905 | | | | 1,657 | | | | 53,303 | |
| Shares reacquired | | | (8,550 | ) | | | (224,135 | ) | | | (7,172 | ) | | | (225,790 | ) |
| Increase (decrease) | | | 6,244 | | | $ | 164,552 | | | | (1,770 | ) | | $ | (49,125 | ) |
| | | | | | | | | | | | | | | | | |
| Class R3 Shares | | | | | | | | | | | | | | | | |
| Shares sold | | | 78,390 | | | $ | 2,045,999 | | | | 74,816 | | | $ | 2,460,356 | |
| Reinvestment of distributions | | | 75,351 | | | | 1,923,755 | | | | 67,724 | | | | 2,185,446 | |
| Shares reacquired | | | (162,705 | ) | | | (4,332,581 | ) | | | (184,728 | ) | | | (6,531,863 | ) |
| Decrease | | | (8,964 | ) | | $ | (362,827 | ) | | | (42,188 | ) | | $ | (1,886,061 | ) |
| | | | | | | | | | | | | | | | | |
| Class R4 Shares(a) | | | | | | | | | | | | | | | | |
| Shares sold | | | 364.83 | | | $ | 10,000 | | | | – | | | $ | – | |
| Increase | | | 364.83 | | | $ | 10,000 | | | | – | | | $ | – | |
| | | | | | | | | | | | | | | | | |
| Class R5 Shares(a) | | | | | | | | | | | | | | | | |
| Shares sold | | | 329.27 | | | $ | 10,000 | | | | – | | | $ | – | |
| Increase | | | 329.27 | | | $ | 10,000 | | | | – | | | $ | – | |
57
Notes to Financial Statements (concluded)
| | | | | Year Ended | | | | | Year Ended | |
| Small Cap Value Fund | | November 30, 2015 | | | November 30, 2014 | |
| Class R6 Shares(a) | | Shares | | | Amount | | | Shares | | | Amount | |
| Shares sold | | | 329.27 | | | $ | 10,000 | | | | – | | | $ | – | |
| Increase | | | 329.27 | | | $ | 10,000 | | | | – | | | $ | – | |
| * | Automatic conversion of Class B shares occurs on the 25th day of the month (or, if the 25th day is not a business day, the next business day thereafter) following the eighth anniversary of the day on which the purchase order was accepted. |
| (a) | Shares commenced at the close of business on June 30, 2015. |
58
Report of Independent Registered Public Accounting Firm
To the Board of Directors of Lord Abbett Research Fund, Inc. and the Shareholders of Small Cap Value Fund, Lord Abbett Calibrated Dividend Growth Fund, and Lord Abbett Growth Opportunities Fund:
We have audited the accompanying statements of assets and liabilities, including the schedules of investments, of Lord Abbett Research Fund, Inc. comprising the Small Cap Value Fund, Lord Abbett Calibrated Dividend Growth Fund, and Lord Abbett Growth Opportunities Fund (collectively, the “Funds”), as of November 30, 2015, and the related statements of operations for the year then ended, the statements of changes in net assets for each of the two years in the period then ended, and the financial highlights for the periods presented. These financial statements and financial highlights are the responsibility of the Funds’ management. Our responsibility is to express an opinion on these financial statements and financial highlights based on our audits.
We conducted our audits in accordance with the standards of the Public Company Accounting Oversight Board (United States). Those standards require that we plan and perform the audit to obtain reasonable assurance about whether the financial statements and financial highlights are free of material misstatement. The Funds are not required to have, nor were we engaged to perform, an audit of their internal control over financial reporting. Our audits included consideration of internal control over financial reporting as a basis for designing audit procedures that are appropriate in the circumstances, but not for the purpose of expressing an opinion on the effectiveness of the Funds’ internal control over financial reporting. Accordingly, we express no such opinion. An audit also includes examining, on a test basis, evidence supporting the amounts and disclosures in the financial statements, assessing the accounting principles used and significant estimates made by management, as well as evaluating the overall financial statement presentation. Our procedures included confirmation of securities owned as of November 30, 2015, by correspondence with the custodian and brokers; where replies were not received from brokers, we performed other auditing procedures. We believe that our audits provide a reasonable basis for our opinion.
In our opinion, the financial statements and financial highlights referred to above present fairly, in all material respects, the financial position of each of the portfolios constituting the Lord Abbett Research Fund, Inc. as of November 30, 2015, the results of their operations for the year then ended, the changes in their net assets for each of the two years in the period then ended, and the financial highlights for the periods presented, in conformity with accounting principles generally accepted in the United States of America.
DELOITTE & TOUCHE LLP
New York, New York
January 15, 2016
59
Supplemental Proxy Information
A joint special meeting of shareholders of Calibrated Dividend Growth Fund, Growth Opportunities Fund, and Small Cap Value Fund was held on November 5, 2015, and, with respect to Small Cap Value Fund, was adjourned to December 8, 2015. The joint special meeting was held for shareholders of each Fund to vote on the following matters:
| | 1. | To amend the Fund’s fundamental restrictions related to borrowing and lending to enable the Fund to participate in an interfund lending program; and |
| | | |
| | 2. | To ratify the selection of Deloitte & Touche LLP as independent registered public accounting firm for the Fund’s current fiscal year. |
The results of the proxy solicitation on the preceding matter were as follows:
1. To approve the amendment to the fundamental investment restrictions of the Fund as described in the proxy statement:
(a) Amend the fundamental investment restriction with respect to Borrowing
| | | Votes For | | Votes
Against | | Abstain | | Broker
Non-Votes |
| Calibrated Dividend Growth Fund | | 47,083,934 | | 2,516,259 | | 4,217,862 | | 15,093,737 |
| Growth Opportunities Fund | | 11,829,745 | | 507,117 | | 597,386 | | 3,663,637 |
| Small Cap Value Fund | | 18,654,865 | | 830,392 | | 1,010,632 | | 4,924,720 |
1. To approve the amendment to the fundamental investment restrictions of the Fund as described in the proxy statement:
(b) Amend the fundamental investment restriction with respect to Lending
| | | Votes For | | Votes
Against | | Abstain | | Broker
Non-Votes |
| Calibrated Dividend Growth Fund | | 47,071,138 | | 2,523,705 | | 4,223,212 | | 15,093,737 |
| Growth Opportunities Fund | | 11,821,206 | | 518,134 | | 594,908 | | 3,663,637 |
| Small Cap Value Fund | | 18,648,333 | | 843,039 | | 1,004,517 | | 4,924,720 |
2. To ratify the selection of Deloitte & Touche LLP as the Fund’s independent registered public accounting firm for the Fund’s current fiscal year
| | | Votes For | | Votes
Against | | Abstain | | Broker
Non-Votes |
| Calibrated Dividend Growth Fund | | 63,788,797 | | 1,186,608 | | 3,936,387 | | – |
| Growth Opportunities Fund | | 15,756,464 | | 269,263 | | 572,158 | | – |
| Small Cap Value Fund | | 23,861,702 | | 597,762 | | 961,145 | | – |
60
Basic Information About Management
The Board is responsible for the management of the business and affairs of the Company in accordance with the laws of the State of Maryland. The Board elects officers who are responsible for the day-to-day operations of the Funds and who execute policies authorized by the Board. The Board also approves an investment adviser to each Fund and continues to monitor the cost and quality of the services the investment adviser provides, and annually considers whether to renew the contract with the adviser. Generally, each Director holds office until his/her successor is elected and qualified or until his/her earlier resignation or removal, as provided in the Company’s organizational documents.
Lord Abbett, a Delaware limited liability company, is the Fund’s investment adviser. Designated Lord Abbett personnel are responsible for the day-to-day management of the Funds.
Interested Director
Ms. Foster is affiliated with Lord Abbett and is an “interested person” of the Company as defined in the Act. Ms. Foster is a director/trustee and officer of each of the 12 investment companies in the Lord Abbett Family of Funds, which consist of 58 portfolios or series.
Name, Address and
Year of Birth | | Current Position and
Length of Service
with the Company | | Principal Occupation and Other Directorships
During the Past Five Years |
| | | | | |
Daria L. Foster
Lord, Abbett & Co. LLC
90 Hudson Street
Jersey City, NJ 07302
(1954) | | Director and President
since 2006; Chief
Executive Officer since 2012 | | Principal Occupation: Managing Partner of Lord Abbett, joined Lord Abbett in 1990. Other Directorships: None. |
Independent Directors
The following Independent Directors also are directors/trustees of each of the 12 investment companies in the Lord Abbett Family of Funds, which consist of 58 portfolios or series.
Name, Address and
Year of Birth | | Current Position and
Length of Service
with the Company | | Principal Occupation and Other Directorships
During the Past Five Years |
| | | | | |
E. Thayer Bigelow
Lord, Abbett & Co. LLC
c/o Legal Dept.
90 Hudson Street
Jersey City, NJ 07302
(1941) | | Director since 1996;
Chairman since 2013 | | Principal Occupation: Managing General Partner, Bigelow Media, LLC (since 2000); Senior Adviser, Time Warner Inc. (1998 - 2000). Other Directorships: Currently serves as director of Crane Co. (since 1984) and Huttig Building Products Inc. (since 1998). Previously served as a director of R.H. Donnelley Inc. (2009 - 2010). |
| | | | | |
Robert B. Calhoun, Jr.
Lord, Abbett & Co. LLC
c/o Legal Dept.
90 Hudson Street
Jersey City, NJ 07302
(1942) | | Director since 1998 | | Principal Occupation: Senior Advisor of Monitor Clipper Partners, a private equity investment fund (since 1997); President of Clipper Asset Management Corp. (1991 - 2009). Other Directorships: None. |
61
Basic Information About Management (continued)
Name, Address and
Year of Birth | | Current Position and
Length of Service
with the Company | | Principal Occupation and Other Directorships
During the Past Five Years |
| | | | | |
Eric C. Fast
Lord, Abbett & Co. LLC
c/o Legal Dept.
90 Hudson Street
Jersey City, NJ 07302
(1949) | | Director since 2014 | | Principal Occupation: Chief Executive Officer of Crane Co., an industrial products company (2001 - 2014). Other Directorships: Currently serves as director of Automatic Data Processing, Inc. (since 2007) and Regions Financial Corporation (since 2010). Previously served as a director of Crane Co. (1999 - 2014). |
| | | | | |
Evelyn E. Guernsey
Lord, Abbett & Co. LLC
c/o Legal Dept.
90 Hudson Street
Jersey City, NJ 07302
(1955) | | Director since 2011 | | Principal Occupation: CEO, Americas of J.P. Morgan Asset Management (2004 - 2010). Other Directorships: None. |
| | | | | |
Julie A. Hill
Lord, Abbett & Co. LLC
c/o Legal Dept.
90 Hudson Street
Jersey City, NJ 07302
(1946) | | Director since 2004 | | Principal Occupation: Owner and CEO of The Hill Company, a business consulting firm (since 1998). Other Directorships: Currently serves as director of Anthem, Inc., a health benefits company (since 1994). |
| | | | | |
Franklin W. Hobbs
Lord, Abbett & Co. LLC
c/o Legal Dept.
90 Hudson Street
Jersey City, NJ 07302
(1947) | | Director since 2001 | | Principal Occupation: Advisor of One Equity Partners, a private equity firm (since 2004). Other Directorships: Currently serves as director and Chairman of the Board of Ally Financial Inc., a financial services firm (since 2009), and as director of Molson Coors Brewing Company (since 2002). |
| | | | | |
James M. McTaggart
Lord, Abbett & Co. LLC
c/o Legal Dept.
90 Hudson Street
Jersey City, NJ 07302
(1947) | | Director since 2012 | | Principal Occupation: Independent management advisor and consultant (since 2012); Vice President, CRA International, Inc. (doing business as Charles River Associates), a global management consulting firm (2009 - 2012); Founder and Chairman of Marakon Associates, Inc., a strategy consulting firm (1978 - 2009); and Officer and Director of Trinsum Group, a holding company (2007 - 2009). Other Directorships: Currently serves as director of Blyth, Inc., a home products company (since 2004). |
| | | | | |
James L.L. Tullis
Lord, Abbett & Co. LLC
c/o Legal Dept.
90 Hudson Street
Jersey City, NJ 07302
(1947) | | Director since 2006 | | Principal Occupation: CEO of Tullis-Dickerson and Co. Inc., a venture capital management firm (since 1990); CEO of Tullis Health Investors Inc. (since 2012). Other Directorships: Currently serves as director of Crane Co. (since 1998). |
62
Basic Information About Management (continued)
Officers
None of the officers listed below have received compensation from the Company. All of the officers of the Company also may be officers of the other Lord Abbett Funds and maintain offices at 90 Hudson Street, Jersey City, NJ 07302. Unless otherwise indicated, the position(s) and title(s) listed under the “Principal Occupation During the Past Five Years” column indicate each officer’s position(s) and title(s) with Lord Abbett. Each officer serves for an indefinite term (i.e., until his or her death, resignation, retirement, or removal).
Name and
Year of Birth | | Current Position
with the Company | | Length of Service
of Current
Position | | Principal Occupation
During the Past Five Years |
Daria L. Foster
(1954) | | President and Chief Executive Officer | | Elected as President in 2006 and Chief Executive Officer in 2012 | | Managing Partner of Lord Abbett, joined Lord Abbett in 1990. |
Robert I. Gerber
(1954) | | Executive Vice President | | Elected in 2007 | | Partner and Chief Investment Officer, joined Lord Abbett in 1997. |
Thomas B. Maher
(1967) | | Executive Vice President | | Elected in 2013 | | Partner and Portfolio Manager, joined Lord Abbett in 2003. |
Justin C. Maurer (1969) | | Executive Vice President | | Elected in 2013 | | Partner and Portfolio Manager, joined Lord Abbett in 2001. |
Walter H. Prahl (1958) | | Executive Vice President | | Elected in 2012 | | Partner and Director, joined Lord Abbett in 1997. |
Frederick J. Ruvkun
(1957) | | Executive Vice President | | Elected in 2012 | | Partner and Portfolio Manager, joined Lord Abbett in 2006. |
Paul J. Volovich
(1973) | | Executive Vice President | | Elected in 2004 | | Partner and Portfolio Manager, joined Lord Abbett in 1997. |
John W. Ashbrook (1964) | | Vice President and Assistant Secretary | | Elected in 2014 | | Assistant General Counsel, joined Lord Abbett in 2008. |
Joan A. Binstock (1954) | | Chief Financial Officer and Vice President | | Elected in 1999 | | Partner and Chief Financial and Operations Officer, joined Lord Abbett in 1999. |
Brooke A. Fapohunda
(1975) | | Vice President and Assistant Secretary | | Elected in 2014 | | Deputy General Counsel, joined Lord Abbett in 2006. |
John K. Forst
(1960) | | Vice President and Assistant Secretary | | Elected in 2005 | | Partner and Deputy Genera Counsel, joined Lord Abbett in 2004. |
Anthony W. Hipple (1964) | | Vice President | | Elected in 2014 | | Portfolio Manager, joined Lord Abbett in 2002. |
63
Basic Information About Management (concluded)
Name and
Year of Birth | | Current Position
with the Company | | Length of Service
of Current
Position | | Principal Occupation
During the Past Five Years |
Lawrence H. Kaplan
(1957) | | Vice President and Secretary | | Elected in 1997 | | Partner and General Counsel, joined Lord Abbett in 1997. |
David J. Linsen
(1974) | | Vice President | | Elected in 2008 | | Partner and Director, joined Lord Abbett in 2001. |
Joseph M. McGill
(1962) | | Chief Compliance Officer | | Elected in 2014 | | Chief Compliance Officer, joined Lord Abbett in 2014 and was formerly Managing Director and the Chief Compliance Officer at UBS Global Asset Management (2003 - 2013). |
A. Edward Oberhaus, III
(1959) | | Vice President | | Elected in 1996 | | Partner and Director, joined Lord Abbett in 1983. |
Lawrence B. Stoller
(1963) | | Vice President and Assistant Secretary | | Elected in 2007 | | Partner and Senior Deputy General Counsel, joined Lord Abbett in 2007. |
Scott S. Wallner
(1955) | | AML Compliance Officer | | Elected in 2011 | | Assistant General Counsel, joined Lord Abbett in 2004. |
Bernard J. Grzelak
(1971) | | Treasurer | | Elected in 2003 | | Partner and Director of Fund Administration, joined Lord Abbett in 2003. |
Please call 888-522-2388 for a copy of the statement of additional information, which contains further information about the Company’s Directors. It is available free upon request.
64
Householding
The Company has adopted a policy that allows it to send only one copy of each Fund’s prospectus, proxy material, annual report and semiannual report to certain shareholders residing at the same “household.” This reduces Fund expenses, which benefits you and other shareholders. If you need additional copies or do not want your mailings to be “householded,” please call Lord Abbett at 888-522-2388 or send a written request with your name, the name of your fund or funds and your account number or numbers to Lord Abbett Family of Funds, P.O. Box 219336, Kansas City, MO 64121.
Proxy Voting Policies, Procedures and Records
A description of the policies and procedures that Lord Abbett uses to vote proxies related to each Fund’s portfolio securities, and information on how Lord Abbett voted each Fund’s proxies during the 12-month period ended June 30 are available without charge, upon request, (i) by calling 888-522-2388; (ii) on Lord Abbett’s Website at www.lordabbett.com; and (iii) on the Securities and Exchange Commission’s (“SEC”) Website at www.sec.gov.
Shareholder Reports and Quarterly Portfolio Disclosure
The Funds are required to file their complete schedule of portfolio holdings with the SEC for their first and third fiscal quarters on Form N-Q. Copies of the filings are available without charge, upon request on the SEC’s Website at www.sec.gov and may be available by calling Lord Abbett at 888-522-2388. You can also obtain copies of Form N-Q by visiting the SEC’s Public Reference Room in Washington, DC (information on the operation of the Public Reference Room may be obtained by calling 800-SEC-0330).
Tax Information
The percentages below reflect the portion of ordinary income distributions that are eligible for the corporate dividend received deduction (DRD) and qualified dividend income (QDI) for individual shareholders:
| Fund Name | | DRD | | QDI | |
| Calibrated Dividend Growth Fund | | 55% | | 55% | |
| Growth Opportunities Fund | | 23% | | 23% | |
| Small Cap Value Fund | | 41% | | 42% | |
Additionally, of the distributions paid to shareholders during the fiscal year ended November 30, 2015, the following amounts represent short-term capital gains and long-term capital gains:
| Fund Name | | Short-Term
Capital Gains | | Long-Term
Capital Gains | |
| Calibrated Dividend Growth Fund | | $64,334,319 | | $199,490,559 | |
| Growth Opportunities Fund | | 24,867,023 | | 77,585,489 | |
| Small Cap Value Fund | | 56,573,039 | | 361,971,753 | |
| | | | | | |
65

| | | We Recycle | | |
 | | This document is printed on recycled paper. | | |
| | | | |
| | | | |
| | Go Paperless! | | |
| | | Visit www.lordabbett.com to learn how to receive all your shareholder communications online. | |
This report, when not used for the general information of shareholders of the Fund, is to be distributed only if preceded or accompanied by a current fund prospectus. Lord Abbett mutual fund shares are distributed by LORD ABBETT DISTRIBUTOR LLC. | | Lord Abbett Research Fund, Inc. Lord Abbett Calibrated Dividend Growth Fund Lord Abbett Growth Opportunities Fund Lord Abbett Small-Cap Value Series | | LARF-2
(01/16) |
| (a) | In accordance with applicable requirements, the Registrant adopted a Sarbanes-Oxley Code of Ethics on June 19, 2003 that applies to the principal executive officer and senior financial officers of the Registrant (“Code of Ethics”). The Code of Ethics was in effect during the fiscal year ended November 30, 2015 (the “Period”). |
| (c) | The Registrant has not amended the Code of Ethics as described in Form N-CSR during the Period. |
| (d) | The Registrant has not granted any waiver, including an implicit waiver, from a provision of the Code of Ethics as described in Form N-CSR during the Period. |
| (f) | See Item 12(a)(1) concerning the filing of the Code of Ethics. |
| Item 3: | Audit Committee Financial Expert. |
The Registrant’s board of directors has determined that each of the following independent directors who are members of the audit committee is an audit committee financial expert: E. Thayer Bigelow and Robert B. Calhoun, Jr. Each of these persons is independent within the meaning of the Form N-CSR.
| Item 4: | Principal Accountant Fees and Services. |
In response to sections (a), (b), (c) and (d) of Item 4, the aggregate fees billed to the Registrant for the fiscal years ended November 30, 2015 and 2014 by the Registrant’s principal accounting firm, Deloitte & Touche LLP, the member firms of Deloitte Touche Tohmatsu and their respective affiliates (collectively, “Deloitte”) were as follows:
| | | Fiscal year ended: | |
| | | 2015 | | | 2014 | |
| Audit Fees {a} | | $ | 126,500 | | | $ | 126,100 | |
| Audit-Related Fees | | | - 0 - | | | | - 0 - | |
| Total audit and audit-related fees | | | 126,500 | | | | 126,100 | |
| | | | | | | | | |
| Tax Fees {b} | | | 25,546 | | | | 24,882 | |
| All Other Fees | | | - 0 - | | | | - 0 - | |
| | | | | | | | | |
| Total Fees | | $ | 152,046 | | | $ | 150,982 | |
{a} Consists of fees for audits of the Registrant’s annual financial statements.
{b} Fees for the fiscal year ended November 30, 2015 and 2014 consist of fees for preparing the U.S. Income Tax Return for Regulated Investment Companies, New Jersey Corporation Business Tax Return, New Jersey Annual Report Form, U.S. Return of Excise Tax on Undistributed Income of Investment Companies, IRS Forms 1099-MISC and 1096 Annual Summary and Transmittal of U.S. Information Returns.
(e) (1) Pursuant to Rule 2-01(c) (7) of Regulation S-X, the Registrant’s Audit Committee has adopted pre-approval policies and procedures. Such policies and procedures generally provide that the Audit Committee must pre-approve:
| · | any audit, audit-related, tax, and other services to be provided to the Lord Abbett Funds, including the Registrant, and |
| · | any audit-related, tax, and other services to be provided to the Registrant’s investment adviser and any entity controlling, controlled by or under common control with the investment adviser that provides ongoing services to one or more Funds comprising the Registrant if the engagement relates directly to operations and financial reporting of a Fund, by the independent auditor to assure that the provision of such services does not impair the auditor’s independence. |
The Audit Committee has delegated pre-approval authority to its Chairman, subject to a fee limit of $10,000 per event, and not to exceed $25,000 annually. The Chairman will report any pre-approval decisions to the Audit Committee at its next scheduled meeting. Unless a type of service to be provided by the independent auditor has received general pre-approval, it must be pre-approved by the Audit Committee. Any proposed services exceeding pre-approved cost levels will require specific pre-approval by the Audit Committee.
(e) (2) The Registrant’s Audit Committee has approved 100% of the services described in this Item 4 (b) through (d).
(f) Not applicable.
(g) The aggregate non-audit fees billed by Deloitte for services rendered to the Registrant are shown above in the response to Item 4 (a), (b), (c) and (d) as “All Other Fees”.
The aggregate non-audit fees billed by Deloitte for services rendered to the Registrant’s investment adviser, Lord, Abbett & Co. LLC (“Lord Abbett”), for the fiscal years ended November 30, 2015 and 2014 were:
| | | Fiscal year ended: | |
| | | 2015 | | | 2014 | |
| All Other Fees {a} | | $ | 185,031 | | | $ | 185,734 | |
{a} Consist of fees for Independent Services Auditors’ Report on Controls Placed in Operation and Tests of Operating Effectiveness related to Lord Abbett’s Asset Management Services (“SOC-1 Report”).
The aggregate non-audit fees billed by Deloitte for services rendered to entities under the common control of Lord Abbett for the fiscal years ended November 30, 2015 and 2014 were:
| | | Fiscal year ended: | |
| | | 2015 | | | 2014 | |
| All Other Fees | | $ | - 0 - | | | $ | - 0 - | |
(h) The Registrant’s Audit Committee has considered the provision of non-audit services that were rendered to the Registrant’s investment adviser, and any entity controlling, controlled by or under common control with the investment adviser that provides ongoing services to the Registrant, that were not pre-approved pursuant to Rule 2-01 (c)(7)(ii) of Regulation S-X and has determined that the provision of such services is compatible with maintaining Deloitte’s independence.
| Item 5: | Audit Committee of Listed Registrants. |
Not applicable.
Not applicable.
| Item 7: | Disclosure of Proxy Voting Policies and Procedures for Closed-End Management Investment Companies. |
Not applicable.
| Item 8: | Portfolio Managers of Closed-End Management Investment Companies. |
Not applicable.
| Item 9: | Purchases of Equity Securities by Closed-End Management Investment Company and Affiliated Purchasers. |
Not applicable.
| Item 10: | Submission of Matters to a Vote of Security Holders. |
Not applicable.
| Item 11: | Controls and Procedures. |
| (a) | Based on their evaluation of the Registrant’s disclosure controls and procedures (as defined in Rule 30a-3(c) under the Investment Company Act of 1940) as of a date within 90 days prior to the filing date of this report, the Chief Executive Officer and Chief Financial Officer of the Registrant have concluded that such disclosure controls and procedures are reasonably designed and effective to ensure that material information relating to the Registrant, including its consolidated subsidiaries, is made known to them by others within those entities. |
| (b) | There were no changes in the Registrant’s internal control over financial reporting (as defined in Rule 30a-3(d) under the Investment Company Act of 1940) that occurred during the second fiscal quarter of the period covered by this report that have materially affected, or are reasonably likely to materially affect, the Registrant’s internal control over financial reporting. |
| (a)(1) | The Lord Abbett Family of Funds Sarbanes Oxley Code of Ethics for the Principal Executive Officer and Senior Financial Officers is attached hereto as part of Ex-99. CODEETH. |
| (a)(2) | Certification of each Principal Executive Officer and Principal Financial Officer of the Registrant as required by Rule 30a-2 under the Investment Company Act of 1940 is attached hereto as a part of EX-99.CERT. |
| (b) | Certification of each Principal Executive Officer and Principal Financial Officer of the Registrant as required by Section 906 of the Sarbanes-Oxley Act of 2002 is provided as a part of EX-99.906CERT. |
SIGNATURES
Pursuant to the requirements of the Securities Exchange Act of 1934 and the Investment Company Act of 1940, the Registrant has duly caused this report to be signed on its behalf by the undersigned, thereunto duly authorized.
| | | | |
| | | LORD ABBETT RESEARCH FUND, INC. |
| | | | |
| | By: | /s/ Daria L. Foster | |
| | | Daria L. Foster | |
| | | President and Chief Executive Officer | |
Date: January 20, 2016
| | By: | /s/ Joan A. Binstock | |
| | | Joan A. Binstock | |
| | | Chief Financial Officer and Vice President | |
Date: January 20, 2016
Pursuant to the requirements of the Securities Exchange Act of 1934 and the Investment Company Act of 1940, this report has been signed below by the following persons on behalf of the Registrant and in the capacities and on the dates indicated.
| | By: | /s/ Daria L. Foster | |
| | | Daria L. Foster | |
| | | President and Chief Executive Officer | |
Date: January 20, 2016
| | By: | /s/ Joan A. Binstock | |
| | | Joan A. Binstock | |
| | | Chief Financial Officer and Vice President | |
Date: January 20, 2016