The following is a reconciliation of investments with unobservable inputs (Level 3) that were used in determining fair value:
The Company has a management agreement with Lord Abbett, pursuant to which Lord Abbett supplies the Fund with investment management services and executive and other personnel, provides office space and pays for ordinary and necessary office and clerical expenses relating to research and statistical work and supervision of the Fund’s investment portfolio.
The management fee is based on the Fund’s average daily net assets at the following annual rate:
For the fiscal year ended November 30, 2012, the effective management fee, net of waivers, was at an annualized rate of .66% of the Fund’s average daily net assets.
Effective September 27, 2012 and continuing through March 31, 2014, Lord Abbett has contractually agreed to waive all or a portion of its management fee and administrative fee, and if
Notes to Financial Statements (continued)
necessary, reimburse the Fund’s other expenses to the extent necessary so that the total net annual operating expenses for each class, excluding 12b-1 fees, do not exceed an annual rate of .60%. This agreement may be terminated only upon the approval of the Board.
For the period December 1, 2011 through September 26, 2012, Lord Abbett contractually agreed to waive all or a portion of its management fee and, if necessary, reimburse the Fund’s other expenses to the extent necessary so that the total annual operating expenses for each class, excluding 12b-1 fees, did not exceed an annual rate of .95%.
In addition, Lord Abbett provides certain administrative services to the Fund pursuant to an Administrative Services Agreement in return for a fee at an annual rate of .04% of the Fund’s average daily net assets.
The Fund, along with certain other funds managed by Lord Abbett (collectively, the “Underlying Funds”), has entered into a Servicing Arrangement with Lord Abbett Balanced Strategy Fund, Lord Abbett Diversified Income Strategy Fund and Lord Abbett Growth & Income Strategy Fund of Lord Abbett Investment Trust (each, a “Fund of Funds”), pursuant to which each Underlying Fund pays a portion of the expenses (excluding management fees and distribution and service fees) of each Fund of Funds in proportion to the average daily value of the Underlying Fund shares owned by each Fund of Funds. Amounts paid pursuant to the Servicing Arrangement are included in Subsidy expense on the Fund’s Statement of Operations.
As of November 30, 2012, the Fund had no outstanding shares owned by any of the Lord Abbett Fund of Funds.
12b-1 Distribution Plan
The Fund has adopted a distribution plan with respect to Class A, B, C, F, P, R2 and R3 shares pursuant to Rule 12b-1 under the Act, which provides for the payment of ongoing distribution and service fees to Lord Abbett Distributor LLC (the “Distributor”), an affiliate of Lord Abbett. The fees are accrued daily at annual rates based upon the Fund’s average daily net assets as follows:
| | | | | | | | | | | | | | |
Fees* | | Class A(1) | | Class B | | Class C | | Class F | | Class P | | Class R2 | | Class R3 |
| | | | | | | | | | | | | | | |
Service | | .25% | | .25% | | .25% | | – | | .25% | | .25% | | .25% |
Distribution | | – | | .75% | | .75% | | .10% | | .20% | | .35% | | .25% |
| |
* | The Fund may designate a portion of the aggregate fee as attributable to service activities for purposes of calculating Financial Industry Regulatory Authority, Inc. (“FINRA”) sales charge limitations. |
(1) | Effective with the Fund’s prospectus dated September 27, 2012, Class A 12b-1 fees are accrued at an annual rate of .25% (.25% service, .00% distribution). Formerly, Class A 12b-1 fees were accrued at an annual rate of .35% (.25% service, .10% distribution). |
Class I shares do not have a distribution plan.
Commissions
Distributor received the following commissions on sales of shares of the Fund, after concessions were paid to authorized dealers, for the fiscal year ended November 30, 2012:
| | |
Distributor
Commissions | | Dealers’
Concessions |
| | | |
$437,250 | | $2,338,064 |
Distributor received CDSCs of $2,390 and $11,309 for Class A and Class C shares, respectively, for the fiscal year ended November 30, 2012.
For the fiscal year ended November 30, 2012, two Directors and certain of the Fund’s officers had an interest in Lord Abbett.
28
Notes to Financial Statements (continued)
| | |
4. | DISTRIBUTIONS AND CAPITAL LOSS CARRYFORWARDS | |
Dividends from net investment income, if any, are declared and paid at least quarterly. Taxable net realized gains from investment transactions, reduced by allowable capital loss carryforwards, if any, are declared and distributed to shareholders at least annually. The capital loss carryforward amount, if any, is available to offset future net capital gains. Dividends and distributions to shareholders are recorded on the ex-dividend date. The amounts of dividends and distributions from net investment income and net realized capital gains are determined in accordance with federal income tax regulations, which may differ from accounting principles generally accepted in the United States of America. These book/tax differences are either considered temporary or permanent in nature. To the extent these differences are permanent in nature, such amounts are reclassified within the components of net assets based on their federal tax basis treatment; temporary differences do not require reclassification. Dividends and distributions, which exceed earnings and profits for tax purposes, are reported as a tax return of capital.
Subsequent to the Fund’s fiscal year ended November 30, 2012, a net investment income distribution of approximately $6,805,000 was declared by the Fund on December 12, 2012. The distribution was paid on December 18, 2012 to shareholders of record on December 17, 2012.
The tax character of distributions paid during the fiscal years ended November 30, 2012 and 2011 was as follows:
| | | | | | | |
| | Year Ended
11/30/2012 | | Year Ended
11/30/2011 | |
| | | | | | |
Distributions paid from: | | | | | | | |
Ordinary income | | $ | 27,765,262 | | $ | 34,959,073 | |
| | | | | | | | |
Total distributions paid | | $ | 27,765,262 | | $ | 34,959,073 | |
| | | | | | | | |
As of November 30, 2012, the components of accumulated losses on a tax-basis were as follows:
| | | | |
Undistributed ordinary income – net | | $ | 10,152,209 | |
| | | | | |
Total undistributed earnings | | $ | 10,152,209 | |
Capital loss carryforwards* | | | (61,232,365 | ) |
Temporary differences | | | (704,927 | ) |
Unrealized gains – net | | | 24,763,442 | |
| | | | | |
Total accumulated losses – net | | $ | (27,021,641 | ) |
| | | | | |
| |
* | As of November 30, 2012, the Fund had a capital loss carryforward of $61,232,365 set to expire in 2017. |
In accordance with the Regulated Investment Company Modernization Act of 2010, the Fund will carryforward capital losses incurred in taxable years beginning after December 22, 2010 (“post-enactment losses”) indefinitely. Post-enactment losses will also retain their character as either short-term or long-term and be utilized before any pre-enactment losses.
At the Fund’s election, certain losses incurred within the taxable year (Qualified Late-Year Losses) are deemed to arise on the first business day of the Fund’s next taxable year. The Fund incurred and will elect to defer post-October capital losses of $563,101 during fiscal 2012.
As of November 30, 2012, the aggregate unrealized security gains and losses based on cost for U.S. federal income tax purposes were as follows:
| | | | |
Tax cost | | $ | 937,683,427 | |
| | | | | |
Gross unrealized gain | | | 36,646,765 | |
Gross unrealized loss | | | (11,880,871 | ) |
| | | | | |
Net unrealized security gain | | $ | 24,765,894 | |
| | | | | |
29
Notes to Financial Statements (continued)
The difference between book-basis and tax-basis unrealized gains (losses) is attributable to the tax treatment of wash sales.
Permanent items identified during the fiscal year ended November 30, 2012 have been reclassified among the components of net assets based on their tax basis treatment as follows:
| | | | | |
Undistributed
Net Investment
Income | | Accumulated
Net Realized
Loss | |
| | | | |
| $8,266,082 | | | $(8,266,082 | ) |
The permanent differences are attributable to the tax treatment of amortization, certain securities and foreign currency transactions.
| | |
5. | PORTFOLIO SECURITIES TRANSACTIONS | |
Purchases and sales of investment securities (excluding short-term investments) for the fiscal year ended November 30, 2012 were as follows:
| | | | | |
Purchases | | Sales | |
| | | | |
| $1,058,840,158 | | | $1,314,402,673 | |
There were no purchases or sales of U.S. Government securities for the fiscal year ended November 30, 2012.
| | |
6. | DIRECTORS’ REMUNERATION | |
For the fiscal year ended November 30, 2012, the Company’s officers and the two Directors who were associated with Lord Abbett did not receive any compensation from the Company for serving in such capacities. Independent Directors’ fees are allocated among all Lord Abbett-sponsored funds based on the net assets of each fund. There is an equity-based plan available to all Independent Directors under which Independent Directors must defer receipt of a portion of, and may elect to defer receipt of an additional portion of Directors’ fees. The deferred amounts are treated as though equivalent dollar amounts had been invested in the funds. Such amounts and earnings accrued thereon are included in Directors’ fees on the Statement of Operations and in Directors’ fees payable on the Statement of Assets and Liabilities and are not deductible for U.S. federal income tax purposes until such amounts are paid.
The Company has entered into an arrangement with its transfer agent and custodian, whereby credits realized as a result of uninvested cash balances are used to reduce a portion of the Fund’s expenses.
On April 2, 2012, the Fund and certain other funds managed by Lord Abbett (the “participating funds”) entered into an unsecured revolving credit facility (“Facility”) with State Street Bank and Trust Company (“SSB”), to be used for temporary or emergency purposes as an additional source of liquidity to fund redemptions of investor shares. The Facility is renewed annually under terms that depend on market conditions at the time of the renewal. The amounts available under the Facility are (i) the lesser of either $250,000,000 or 33.33% of total assets per participating fund and (ii) $350,000,000 in the aggregate for all participating funds. The annual fee to maintain the Facility is .09% of the amount available under the Facility. Each participating fund pays its pro rata share
30
Notes to Financial Statements (continued)
based on the net assets of each participating fund. This amount is included in Other expenses on the Fund’s Statement of Operations. Any borrowings under this Facility will bear interest at current market rates as set forth in the credit agreement. As of November 30, 2012, there were no loans outstanding pursuant to this Facility.
For the period February 3, 2011 through April 1, 2012, the Fund and certain other funds managed by Lord Abbett had an amount of $200,000,000 available under a Facility from SSB with an annual fee to maintain the Facility of .125% of the amount available under the Facility.
| | |
9. | CUSTODIAN AND ACCOUNTING AGENT | |
SSB is the Company’s custodian and accounting agent. SSB performs custodial, accounting and recordkeeping functions relating to portfolio transactions and calculating the Fund’s NAV.
The Fund is subject to the general risks and considerations associated with equity investing. The Fund invests primarily in equity securities of large and mid-sized company stocks that have a history of growing their dividends, but there is no guarantee that a company will pay a dividend. The value of investments in equity securities will fluctuate in response to general economic conditions and to changes in the prospects of particular companies and/or sectors in the economy. If the Fund’s fundamental research and quantitative analysis fail to produce the intended result, the Fund may suffer losses or underperform its benchmark or other funds with the same investment objective or similar strategies, even in a risking market.
Large and mid-sized company stocks each may perform differently than the market as a whole and other types of stocks. This is because different types of stocks tend to shift in and out of favor depending on market and economic conditions. Mid-sized company stocks may be less able to weather economic shifts or other adverse developments than those of larger, more established companies.
The Fund’s exposure to foreign companies and ADRs presents increased market, liquidity, currency, political and other risks.
The Fund changed its investment strategy on September 27, 2012. The Fund’s performance achieved during the initial period after this change may not be replicated over longer periods and may not be indicative of how the Fund will perform in the future.
These factors can affect the Fund’s performance.
| | |
11. | SUMMARY OF CAPITAL TRANSACTIONS | |
Transactions in shares of capital stock were as follows:
| | | | | | | | | | | | | |
| | Year Ended
November 30, 2012 | | Year Ended
November 30, 2011 | |
| | | | | | |
| | | | | | | | | | | | | |
Class A Shares | | Shares | | Amount | | Shares | | Amount | |
| | | | | | | | | | |
Shares sold | | | 9,786,518 | | $ | 119,298,611 | | | 13,155,188 | | $ | 155,438,811 | |
Converted from Class B* | | | 443,964 | | | 5,481,067 | | | 326,083 | | | 3,826,559 | |
Reinvestment of distributions | | | 2,017,555 | | | 24,395,455 | | | 1,959,045 | | | 22,776,857 | |
Shares reacquired | | | (23,862,375 | ) | | (294,327,940 | ) | | (19,739,273 | ) | | (232,591,700 | ) |
| | | | | | | | | | | | | | |
Decrease | | | (11,614,338 | ) | $ | (145,152,807 | ) | | (4,298,957 | ) | $ | (50,549,473 | ) |
| | | | | | | | | | | | | | |
31
Notes to Financial Statements (concluded)
| | | | | | | | | | | | | |
| | Year Ended
November 30, 2012 | | Year Ended
November 30, 2011 | |
| | | | | | |
| | | | | | | | | | | | | |
Class B Shares | | Shares | | Amount | | Shares | | Amount | |
| | | | | | | | | | |
Shares sold | | | 132,932 | | $ | 1,591,225 | | | 166,229 | | $ | 1,934,352 | |
Reinvestment of distributions | | | 62,397 | | | 746,199 | | | 68,428 | | | 790,647 | |
Shares reacquired | | | (704,111 | ) | | (8,576,564 | ) | | (772,390 | ) | | (9,073,985 | ) |
Converted to Class A* | | | (447,770 | ) | | (5,481,067 | ) | | (328,795 | ) | | (3,826,559 | ) |
| | | | | | | | | | | | | | |
Decrease | | | (956,552 | ) | $ | (11,720,207 | ) | | (866,528 | ) | $ | (10,175,545 | ) |
| | | | | | | | | | | | | | |
| | | | | | | | | | | | | |
Class C Shares | | | | | | | | | | | | | |
| | | | | | | | | | | | | | |
Shares sold | | | 1,023,093 | | $ | 12,467,625 | | | 1,383,685 | | $ | 16,204,809 | |
Reinvestment of distributions | | | 80,045 | | | 961,424 | | | 70,505 | | | 813,946 | |
Shares reacquired | | | (1,323,484 | ) | | (16,061,981 | ) | | (1,414,225 | ) | | (16,441,022 | ) |
| | | | | | | | | | | | | | |
Increase (decrease) | | | (220,346 | ) | $ | (2,632,932 | ) | | 39,965 | | $ | 577,733 | |
| | | | | | | | | | | | | | |
| | | | | | | | | | | | | |
Class F Shares | | | | | | | | | | | | | |
| | | | | | | | | | | | | | |
Shares sold | | | 799,173 | | $ | 9,734,827 | | | 512,134 | | $ | 6,108,309 | |
Reinvestment of distributions | | | 21,868 | | | 266,301 | | | 13,877 | | | 160,877 | |
Shares reacquired | | | (368,922 | ) | | (4,489,802 | ) | | (460,929 | ) | | (5,420,105 | ) |
| | | | | | | | | | | | | | |
Increase | | | 452,119 | | $ | 5,511,326 | | | 65,082 | | $ | 849,081 | |
| | | | | | | | | | | | | | |
| | | | | | | | | | | | | |
Class I Shares | | | | | | | | | | | | | |
| | | | | | | | | | | | | | |
Shares sold | | | 169,278 | | $ | 2,129,225 | | | 3,663,505 | | $ | 44,111,064 | |
Reinvestment of distributions | | | 47,277 | | | 543,683 | | | 806,331 | | | 9,509,020 | |
Shares reacquired | | | (8,664,123 | ) | | (102,242,419 | ) | | (25,586,373 | ) | | (296,928,444 | ) |
| | | | | | | | | | | | | | |
Decrease | | | (8,447,568 | ) | $ | (99,569,511 | ) | | (21,116,537 | ) | $ | (243,308,360 | ) |
| | | | | | | | | | | | | | |
| | | | | | | | | | | | | |
Class P Shares | | | | | | | | | | | | | |
| | | | | | | | | | | | | | |
Shares sold | | | 17,479 | | $ | 214,388 | | | 24,339 | | $ | 286,402 | |
Reinvestment of distributions | | | 3,935 | | | 47,633 | | | 4,105 | | | 47,846 | |
Shares reacquired | | | (59,024 | ) | | (724,221 | ) | | (55,875 | ) | | (649,636 | ) |
| | | | | | | | | | | | | | |
Decrease | | | (37,610 | ) | $ | (462,200 | ) | | (27,431 | ) | $ | (315,388 | ) |
| | | | | | | | | | | | | | |
| | | | | | | | | | | | | |
Class R2 Shares | | | | | | | | | | | | | |
| | | | | | | | | | | | | | |
Shares sold | | | 3,413 | | $ | 41,890 | | | 7,136 | | $ | 77,046 | |
Reinvestment of distributions | | | 56 | | | 679 | | | 54 | | | 628 | |
Shares reacquired | | | (3,601 | ) | | (43,946 | ) | | (907 | ) | | (11,148 | ) |
| | | | | | | | | | | | | | |
Increase (decrease) | | | (132 | ) | $ | (1,377 | ) | | 6,283 | | $ | 66,526 | |
| | | | | | | | | | | | | | |
| | | | | | | | | | | | | |
Class R3 Shares | | | | | | | | | | | | | |
| | | | | | | | | | | | | | |
Shares sold | | | 95,790 | | $ | 1,164,667 | | | 129,743 | | $ | 1,528,610 | |
Reinvestment of distributions | | | 7,458 | | | 90,210 | | | 5,279 | | | 60,830 | |
Shares reacquired | | | (62,854 | ) | | (764,245 | ) | | (48,477 | ) | | (579,838 | ) |
| | | | | | | | | | | | | | |
Increase | | | 40,394 | | $ | 490,632 | | | 86,545 | | $ | 1,009,602 | |
| | | | | | | | | | | | | | |
| |
* | Automatic conversion of Class B shares occurs on the 25th day of the month (or, if the 25th is not a business day, the next business day thereafter) following the eighth anniversary of the day on which the purchase order was accepted. |
32
Report of Independent Registered Public Accounting Firm
To the Board of Directors of Lord Abbett Research Fund, Inc. and the Shareholders of Lord Abbett Calibrated Dividend Growth Fund:
We have audited the accompanying statement of assets and liabilities, including the schedule of investments, of the Lord Abbett Calibrated Dividend Growth Fund, one of the four portfolios constituting the Lord Abbett Research Fund, Inc. (the “Company”) as of November 30, 2012, and the related statement of operations for the year then ended, the statements of changes in net assets for each of the two years in the period then ended, and the financial highlights for each of the five years in the period then ended. These financial statements and financial highlights are the responsibility of the Company’s management. Our responsibility is to express an opinion on these financial statements and financial highlights based on our audits.
We conducted our audits in accordance with the standards of the Public Company Accounting Oversight Board (United States). Those standards require that we plan and perform the audits to obtain reasonable assurance about whether the financial statements and financial highlights are free of material misstatement. The Company is not required to have, nor were we engaged to perform, an audit of its internal control over financial reporting. Our audits included consideration of internal control over financial reporting as a basis for designing audit procedures that are appropriate in the circumstances, but not for the purpose of expressing an opinion on the effectiveness of the Company’s internal control over financial reporting. Accordingly, we express no such opinion. An audit also includes examining, on a test basis, evidence supporting the amounts and disclosures in the financial statements, assessing the accounting principles used and significant estimates made by management, as well as evaluating the overall financial statement presentation. Our procedures included confirmation of securities owned as of November 30, 2012, by correspondence with the custodian and brokers; where replies were not received from brokers, we performed other auditing procedures. We believe that our audits provide a reasonable basis for our opinion.
In our opinion, such financial statements and financial highlights referred to above present fairly, in all material respects, the financial position of Lord Abbett Calibrated Dividend Growth Fund, one of the four portfolios of the Lord Abbett Research Fund, Inc. as of November 30, 2012, the results of its operations for the year then ended, the changes in its net assets for each of the two years in the period then ended, and the financial highlights for each of the five years in the period then ended, in conformity with accounting principles generally accepted in the United States of America.
DELOITTE & TOUCHE LLP
New York, New York
January 28, 2013
33
Basic Information About Management
The Board is responsible for the management of the business and affairs of the Company in accordance with the laws of the State of Maryland. The Board elects officers who are responsible for the day-to-day operations of the Company and who execute policies authorized by the Board. The Board also approves an investment adviser to the Company and continues to monitor the cost and quality of the services the investment adviser provides, and annually considers whether to renew the contract with the adviser. Generally, each Director holds office until his/her successor is elected and qualified or until his/her earlier resignation or removal, as provided in the Company’s organizational documents.
Lord Abbett, a Delaware limited liability company, is the Company’s investment adviser. Designated Lord Abbett personnel are responsible for the day-to-day management of the Funds.
Interested Director
The following Director is affiliated with Lord Abbett and is an “interested person” of the Company as defined in the Act. Ms. Foster is director/trustee of each of the 13 Lord Abbett-sponsored funds, which consist of 56 portfolios or series.
| | | | |
| | | | |
Name, Address and
Year of Birth | | Current Position and
Length of Service
with the Company | | Principal Occupation and Other Directorships
During the Past Five Years |
| | | | | |
Daria L. Foster
Lord, Abbett & Co. LLC
90 Hudson Street
Jersey City, NJ 07302
(1954) | | Director and President since 2006; Chief Executive Officer since 2012 | | Principal Occupation: Managing Partner of Lord Abbett (since 2007), and was formerly Director of Marketing and Client Service, joined Lord Abbett in 1990. |
| | | |
| | | Other Directorships: None. |
Independent Directors
The following Independent Directors also are directors/trustees of each of the 13 Lord Abbett-sponsored funds, which consist of 56 portfolios or series.
| | | | |
Name, Address and
Year of Birth | | Current Position and
Length of Service
with the Company | | Principal Occupation and Other Directorships
During the Past Five Years |
| | | | | |
E. Thayer Bigelow
Lord, Abbett & Co. LLC
c/o Legal Dept.
90 Hudson Street
Jersey City, NJ 07302
(1941) | | Director since 1996; Chairman since 2013 | | Principal Occupation: Managing General Partner, Bigelow Media, LLC (since 2000); Senior Adviser, Time Warner Inc. (1998 - 2000). |
| | | |
| | | Other Directorships: Currently serves as director of Crane Co. (since 1984) and Huttig Building Products Inc. (since 1998). Previously served as a director of R.H. Donnelley Inc. (2009 - 2010). |
| | | | |
Robert B. Calhoun, Jr.
Lord, Abbett & Co. LLC
c/o Legal Dept.
90 Hudson Street
Jersey City, NJ 07302
(1942) | | Director since 1998 | | Principal Occupation: Senior Advisor of Monitor Clipper Partners, a private equity investment fund (since 1997); President of Clipper Asset Management Corp. (1991 - 2009). |
| | | |
| | | Other Directorships: Previously served as a director of Interstate Bakeries Corp. (1991 - 2008). |
34
Basic Information About Management (continued)
| | | | |
Name, Address and
Year of Birth | | Current Position and
Length of Service
with the Company | | Principal Occupation and Other Directorships
During the Past Five Years |
| | | | | |
Evelyn E. Guernsey
Lord, Abbett & Co. LLC
c/o Legal Dept.
90 Hudson Street
Jersey City, NJ 07302
(1955) | | Director since 2011 | | Principal Occupation: CEO, Americas of J.P. Morgan Asset Management (2004 - 2010). |
| | | |
| | | Other Directorships: None. |
| | | | |
Julie A. Hill
Lord, Abbett & Co. LLC
c/o Legal Dept.
90 Hudson Street
Jersey City, NJ 07302
(1946) | | Director since 2004 | | Principal Occupation: Owner and CEO of The Hill Company, a business consulting firm (since 1998). |
| | | |
| | | Other Directorships: Currently serves as director of Lend Lease Corporation Limited, an international retail and residential property group (since 2006), and WellPoint, Inc., a health benefits company (since 1994). |
| | | | |
Franklin W. Hobbs
Lord, Abbett & Co. LLC
c/o Legal Dept.
90 Hudson Street
Jersey City, NJ 07302
(1947) | | Director since 2001 | | Principal Occupation: Advisor of One Equity Partners, a private equity firm (since 2004). |
| | | |
| | | Other Directorships: Currently serves as director and Chairman of the Board of Ally Financial Inc., a financial services firm (since 2009), and as director of Molson Coors Brewing Company (since 2002). |
| | | | |
James M. McTaggart
Lord, Abbett & Co. LLC
c/o Legal Dept.
90 Hudson Street
Jersey City, NJ 07302
(1947) | | Director since 2012 | | Principal Occupation: Independent management advisor and consultant (since 2012); Vice President, CRA International, Inc. (doing business as Charles River Associates), a global management consulting firm (2009 - 2012); Founder and Chairman of Marakon Associates, Inc., a strategy consulting firm (1978 - 2009); and Officer and Director of Trinsum Group, a holding company (2007 - 2009). |
| | | |
| | | Other Directorships: Currently serves as director of Blyth, Inc., a home products company (since 2004). |
| | | | |
James L.L. Tullis
Lord, Abbett & Co. LLC
c/o Legal Dept.
90 Hudson Street
Jersey City, NJ 07302
(1947) | | Director since 2006 | | Principal Occupation: CEO of Tullis-Dickerson and Co. Inc., a venture capital management firm (since 1990). |
| | | |
| | | Other Directorships: Currently serves as director of Crane Co. (since 1998). Previously served as a director of Synageva BioPharma Corp., a biopharmaceutical company (2009 - 2011). |
Officers
None of the officers listed below have received compensation from the Company. All of the officers of the Company also may be officers of the other Lord Abbett-sponsored funds and maintain offices at 90 Hudson Street, Jersey City, NJ 07302. Unless otherwise indicated, the position(s) and title(s) listed under the “Principal Occupation During the Past Five Years” column indicate each officer’s position(s) and title(s) with Lord Abbett.
35
Basic Information About Management (continued)
| | | | | | |
Name and
Year of Birth | | Current Position
with the Company | | Length of Service
of Current
Position | | Principal Occupation
During the Past Five Years |
| | | | | | | |
Daria L. Foster
(1954) | | President and Chief Executive Officer | | Elected as President in 2006 and Chief Executive Officer in 2012 | | Managing Partner of Lord Abbett (since 2007), and was formerly Director of Marketing and Client Service, joined Lord Abbett in 1990. |
| | | | | | |
Robert P. Fetch
(1953) | | Executive Vice President | | Elected in 1997 | | Partner and Director, joined Lord Abbett in 1995. |
| | | | | | |
Daniel H. Frascarelli
(1954) | | Executive Vice President | | Elected in 2005 | | Partner and Director, joined Lord Abbett in 1990. |
| | | | | | |
Robert I. Gerber
(1954) | | Executive Vice President | | Elected in 2007 | | Partner and Chief Investment Officer (since 2007), joined Lord Abbett in 1997 as Director of Taxable Fixed Income Management. |
| | | | | | |
Gerard S. E. Heffernan, Jr.
(1963) | | Executive Vice President | | Elected in 2009 | | Partner and Director, joined Lord Abbett in 1998. |
| | | | | | |
Walter H. Prahl
(1958) | | Executive Vice President | | Elected in 2012 | | Partner and Director, joined Lord Abbett in 1997. |
| | | | | | |
Frederick J. Ruvkun
(1957) | | Executive Vice President | | Elected in 2012 | | Partner and Director, joined Lord Abbett in 2006. |
| | | | | | |
Paul J. Volovich
(1973) | | Executive Vice President | | Elected in 2004 | | Partner and Director, joined Lord Abbett in 1997. |
| | | | | | |
James W. Bernaiche
(1956) | | Chief Compliance Officer | | Elected in 2004 | | Partner and Chief Compliance Officer, joined Lord Abbett in 2001. |
| | | | | | |
Joan A. Binstock
(1954) | | Chief Financial Officer and Vice President | | Elected in 1999 | | Partner and Chief Operations Officer, joined Lord Abbett in 1999. |
| | | | | | |
John K. Forst
(1960) | | Vice President and Assistant Secretary | | Elected in 2005 | | Deputy General Counsel, joined Lord Abbett in 2004. |
| | | | | | |
Lawrence H. Kaplan
(1957) | | Vice President and Secretary | | Elected in 1997 | | Partner and General Counsel, joined Lord Abbett in 1997. |
| | | | | | |
David J. Linsen
(1974) | | Vice President | | Elected in 2008 | | Partner and Director, joined Lord Abbett in 2001. |
| | | | | | |
A. Edward Oberhaus, III
(1959) | | Vice President | | Elected in 1996 | | Partner and Director, joined Lord Abbett in 1983. |
| | | | | | |
Thomas R. Phillips
(1960) | | Vice President and Assistant Secretary | | Elected in 2008 | | Partner and Deputy General Counsel, joined Lord Abbett in 2006. |
| | | | | | |
Randy M. Reynolds
(1972) | | Vice President | | Elected in 2008 | | Portfolio Manager, joined Lord Abbett in 1999. |
36
Basic Information About Management (concluded)
| | | | | | |
Name and
Year of Birth | | Current Position
with the Company | | Length of Service
of Current
Position | | Principal Occupation
During the Past Five Years |
| | | | | | | |
Lawrence B. Stoller
(1963) | | Vice President and Assistant Secretary | | Elected in 2007 | | Partner and Senior Deputy General Counsel, joined Lord Abbett in 2007. |
| | | | | | |
Scott S. Wallner
(1955) | | AML Compliance Officer | | Elected in 2011 | | Assistant General Counsel, joined Lord Abbett in 2004. |
| | | | | | |
Bernard J. Grzelak
(1971) | | Treasurer | | Elected in 2003 | | Partner and Director of Fund Administration, joined Lord Abbett in 2003. |
Please call 888-522-2388 for a copy of the statement of additional information (“SAI”), which contains further information about the Company’s Directors. It is available free upon request.
37
Householding
The Company has adopted a policy that allows it to send only one copy of the Fund’s prospectus, proxy material, annual report and semiannual report to certain shareholders residing at the same “household.” This reduces Fund expenses, which benefits you and other shareholders. If you need additional copies or do not want your mailings to be “householded,” please call Lord Abbett at 888-522-2388 or send a written request with your name, the name of your fund or funds and your account number or numbers to Lord Abbett Family of Funds, P.O. Box 219336, Kansas City, MO 64121.
Proxy Voting Policies, Procedures and Records
A description of the policies and procedures that Lord Abbett uses to vote proxies related to the Fund’s portfolio securities, and information on how Lord Abbett voted the Fund’s proxies during the 12-month period ended June 30 are available without charge, upon request, (i) by calling 888-522-2388; (ii) on Lord Abbett’s Website at www.lordabbett.com; and (iii) on the Securities and Exchange Commission’s (“SEC”) Website at www.sec.gov.
Shareholder Reports and Quarterly Portfolio Disclosure
The Fund is required to file its complete schedule of portfolio holdings with the SEC for its first and third fiscal quarters on Form N-Q. Copies of the filings are available without charge, upon request on the SEC’s Website at www.sec.gov and may be available by calling Lord Abbett at 888-522-2388. You can also obtain copies of Form N-Q by visiting the SEC’s Public Reference Room in Washington, DC (information on the operation of the Public Reference Room may be obtained by calling 800-SEC-0330).
| | |
| Tax Information | |
| | |
| 58.02% of the ordinary income distributions paid by the Fund during the fiscal year ended November 30, 2012 is qualified dividend income. For corporate shareholders, only 51.11% of the Fund’s ordinary income distributions qualified for the dividends received deduction. | |
| | |
| For foreign shareholders, 55.91% of the distributions paid by the Fund represents interest related dividends. | |
| | |
38


| | | | |
This report, when not used for the general information of shareholders of the Fund, is to be distributed only if preceded or accompanied by a current fund prospectus. | | Lord Abbett Research Fund, Inc. | | |
| | | | |
Lord Abbett mutual fund shares are distributed by
LORD ABBETT DISTRIBUTOR LLC. | | Lord Abbett Calibrated Dividend Growth Fund
(formerly, Lord Abbett Capital Structure Fund) | | LAAMF-2-1112
(01/13) |

2 0 1 2
L O R D A B B E T T
A N N U A L
R E P O R T
Lord Abbett
Growth Opportunities Fund
For the fiscal year ended November 30, 2012
|
| |
|
Lord Abbett Research Fund |
Lord Abbett Growth Opportunities Fund
Annual Report |
For the fiscal year ended November 30, 2012 |
Dear Shareholders: We are pleased to provide you with this overview of the performance of the Lord Abbett Growth Opportunities Fund for the fiscal year ended November 30, 2012. On this page and the following pages, we discuss the major factors that influenced fiscal year performance. For detailed and more timely information about the Fund, please visit our Website at www.lordabbett.com, where you also can access the quarterly commentaries that provide updates on the Fund’s performance and other portfolio related updates.
Thank you for investing in Lord Abbett mutual funds. We value the trust that you place in us and look forward to serving your investment needs in the years to come.
|
Best regards, |
|

|
Daria L. Foster |
Director, President and Chief Executive Officer |
| |
For the fiscal year ended November 30, 2012, the Fund returned 6.96%, reflecting performance at the net asset value (NAV) of Class A shares, with all distributions reinvested, compared to its benchmark, the Russell Midcap® Growth Index,1 which returned 12.06% over the same period.
During the 12-month period, equity markets shuffled through changing interpretations of the same unsettling concerns: what would be the outcome of the precarious budgetary situation in Europe, and would the Federal Reserve continue to provide quantitative support for the U. S. Economy?
Within the first two weeks of the period, worries that European leaders had not taken sufficient action to stem the debt crisis, and news that the Federal Reserve would delay any near-term quantitative easing, sent equity markets down sharply. These concerns were soon mitigated as the economic outlook for the United States began to improve before the 2011 calendar year ended. Unemployment benefits dropped to their lowest point in three-and-a-half years while investments made by businesses strengthened.
In May 2012, however, markets once again came under pressure from a rising tide of anxiety regarding the European debt crisis. Fearing the demise of the European Union, and facing the threat of global recession, European Central Bank president Mario Draghi made a pledge to keep the Eurozone solvent and the U.S. Fed announced a third round of quantitative easing. These actions supported a rally that
1
|
| |
|
brought equity markets into positive territory for the period. |
Despite the Fund showing positive absolute performance for the year, it lagged the index significantly. Security-specific issues within the health care and information technology sectors were the most notable detractors from relative performance.
The Fund’s overweight and security selection within the information technology sector detracted from relative Fund performance during the period. MICROS Systems, Inc., a manufacturer of enterprise hardware and software used in hotels and restaurants globally, was among the largest detractors. The company’s business was adversely affected by sluggish consumer spending and economic headwinds in Europe. Cypress Semiconductor Corp., a manufacturer of programmable semiconductors and mixed-signal chips used in both consumer and commercial applications, also saw its shares fall. The firm reported a year-over-year decline in revenue during the period, citing macroeconomic concerns by businesses globally and slower growth in China as the cause.
Within the health care sector, the Fund’s underweight and security selection also detracted from relative Fund performance. Vertex Pharmaceuticals Inc., a bio pharmaceutical company that manufactures drugs globally for the treatment of serious diseases, saw shares fall towards the end of the period. The company came under pressure as competitors released a viable alternative to Vertex’s Hepatitis-C treatment. Edwards Lifesciences Corp., a maker of artificial heart valves, also detracted from relative Fund performance, predominantly owing to a sharp decline in early October 2012 after preliminary sales came in below expectations. The results were attributed to austerity measures in Europe and limited insurance reimbursements in the United States.
Security selection within the financials sector contributed the most to relative Fund performance during the period. Shares of asset manager Affiliated Managers Group, Inc. were among the strongest contributors to relative Fund performance within the sector, as net asset inflows continued to support strong revenue growth. Credit ratings agency Moody’s Corporation also contributed to relative Fund performance, as strengthening global bond issuance contributed to rising revenues during the period.
Within the consumer staples sector, security selection was also a contributor to relative Fund performance during the period. The natural foods supermarket chain, Whole Foods Market, Inc., saw its shares rise throughout the period as sales, most notably same-store sales, continued to grow at a rapid pace. Shares of Dr. Pepper Snapple Group also rose, as the manufacturer and distributor of nonalcoholic beverages reported better than expected earnings following a significant improvement in profit margins.
The Fund’s portfolio is actively managed and, therefore, its holdings and the weightings of a particular issuer or particular sector as a percentage of portfolio assets are subject to change. Sectors may include many industries.
2
|
| |
|
1 The Russell Midcap® Growth Index measures the performance of those Russell Midcap companies with higher price-to-book ratios and higher forecasted growth values. The stocks are also members of the Russell 1000 Growth Index. |
Unless otherwise specified, indexes reflect total return, with all dividends reinvested. Indexes are unmanaged, do not reflect the deduction of fees or expenses, and are not available for direct investment.
Important Performance and Other Information Performance data quoted in the following pages reflect past performance and are no guarantee of future results. Current performance may be higher or lower than the performance quoted. The investment return and principal value of an investment in the Fund will fluctuate so that shares, on any given day or when redeemed, may be worth more or less than their original cost. You can obtain performance data current to the most recent month end by calling Lord Abbett at 888–522–2388 or referring to www.lordabbett.com.
Except where noted, comparative Fund performance does not account for the deduction of sales charges and would be different if sales charges were included. The Fund offers several classes of shares with distinct pricing options. For a full description of the differences in pricing alternatives, please see the Fund’s prospectus.
During certain periods shown, expense waivers and reimbursements were in place. Without such expense waivers and reimbursements, the Fund’s returns would have been lower.
The annual commentary above discusses the views of the Fund’s management and various portfolio holdings of the Fund as of November 30, 2012. These views and portfolio holdings may have changed after this date. Information provided in the commentary is not a recommendation to buy or sell securities. Because the Fund’s portfolio is actively managed and may change significantly, the Fund may no longer own the securities described above or may have otherwise changed its positions in the securities. For more recent information about the Fund’s portfolio holdings, please visit www.lordabbett.com.
A Note about Risk: See Notes to Financial Statements for a discussion of investment risks. For a more detailed discussion of the risks associated with the Fund, please see the Fund’s prospectus.
Mutual funds are not insured by the FDIC, are not deposits or other obligations of, or guaranteed by, banks, and are subject to investment risks including possible loss of principal amount invested.
3
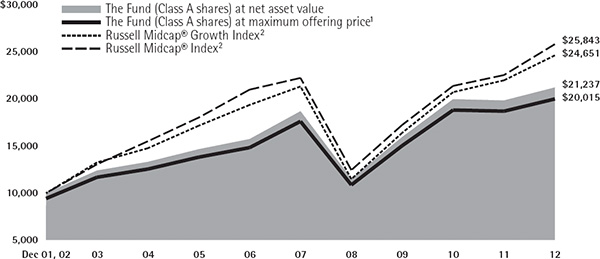
Below is a comparison of a $10,000 investment in Class A shares with the same investment in the Russell Midcap® Growth Index and the Russell Midcap® Index, assuming reinvestment of all dividends and distributions. The performance of other classes will be greater than or less than the performance shown in the graph below due to different sales loads and expenses applicable to such classes. The graph and performance table below do not reflect the deduction of taxes that a shareholder would pay on Fund distributions or the redemption of Fund shares. During certain periods, expenses of the Fund have been waived or reimbursed by Lord Abbett; without such waiver or reimbursement of expenses, the Fund’s returns would have been lower. Past performance is no guarantee of future results.
Average Annual Total Returns at Maximum Applicable
Sales Charge for the Periods Ended November 30, 2012
| | | | | | | | | |
| | 1 Year | | 5 Years | | 10 Years | | Life of Class | |
Class A3 | | 0.81% | | 1.37% | | 7.19% | | – | |
Class B4 | | 1.84% | | 1.62% | | 7.27% | | – | |
Class C5 | | 5.41% | | 1.91% | | 7.13% | | – | |
Class F6 | | 7.20% | | 2.82% | | – | | 2.75% | |
Class I7 | | 7.29% | | 2.92% | | 8.19% | | – | |
Class P7 | | 6.83% | | 2.46% | | 7.72% | | – | |
Class R28 | | 6.70% | | 2.32% | | – | | 2.26% | |
Class R39 | | 6.78% | | 2.43% | | – | | 2.37% | |
|
1 Reflects the deduction of the maximum initial sales charge of 5.75%. |
2 Performance for each unmanaged index does not reflect any fees or expenses. The performance of each index is not necessarily representative of the Fund’s performance. |
3 Total return, which is the percentage change in net asset value, after deduction of the maximum initial sales charge of 5.75% applicable to Class A shares, with all dividends and distributions reinvested for the periods shown ended November 30, 2012, is calculated using the SEC-required uniform method to compute such return. |
4 Performance reflects the deduction of a CDSC of 5% for 1 year, 2% for 5 years and 0% for 10 years. Class B shares automatically convert to Class A shares after approximately 8 years. (There is no initial sales charge for automatic conversions.) All returns for periods greater than 8 years reflect this conversion. |
5 The 1% CDSC for Class C shares normally applies before the first anniversary of the purchase date. Performance for other periods is at net asset value. |
6 Class F shares commenced operations and performance for the Class began on September 28, 2007. Performance is at net asset value. |
7 Performance is at net asset value. |
8 Class R2 shares commenced operations and performance for the Class began on September 28, 2007. Performance is at net asset value. |
9 Class R3 shares commenced operations and performance for the Class began on September 28, 2007. Performance is at net asset value. |
4
As a shareholder of the Fund, you incur two types of costs: (1) transaction costs, including sales charges (loads) on purchase payments (these charges vary among the share classes); and (2) ongoing costs, including management fees; distribution and service (12b-1) fees (these charges vary among the share classes); and other Fund expenses. This Example is intended to help you understand your ongoing costs (in dollars) of investing in the Fund and to compare these costs with the ongoing costs of investing in other mutual funds.
The Example is based on an investment of $1,000 invested at the beginning of the period and held for the entire period (June 1, 2012 through November 30, 2012).
Actual Expenses
For each class of the Fund, the first line of the table on the following page provides information about actual account values and actual expenses. You may use the information in this line, together with the amount you invested, to estimate the expenses that you paid over the period. Simply divide your account value by $1,000 (for example, an $8,600 account value divided by $1,000 = 8.6), then multiply the result by the number in the first line under the heading titled “Expenses Paid During Period 6/1/12 – 11/30/12” to estimate the expenses you paid on your account during this period.
Hypothetical Example for Comparison Purposes
For each class of the Fund, the second line of the table on the following page provides information about hypothetical account values and hypothetical expenses based on the Fund’s actual expense ratio and an assumed rate of return of 5% per year before expenses, which is not the Fund’s actual return. The hypothetical account values and expenses may not be used to estimate the actual ending account balance or expenses you paid for the period. You may use this information to compare the ongoing costs of investing in the Fund and other funds. To do so, compare this 5% hypothetical example with the 5% hypothetical examples that appear in the shareholder reports of the other funds.
5
|
| |
|
Please note that the expenses shown in the table are meant to highlight your ongoing costs only and do not reflect any transactional costs, such as sales charges (loads). Therefore, the second line of the table is useful in comparing ongoing costs only, and will not help you determine the relative total costs of owning different funds. In addition, if these transactional costs were included, your costs would have been higher. |
| | | | | | | | | | | | | | | | |
| | Beginning
Account
Value | | Ending
Account
Value | | Expenses
Paid During
Period† | |
| | | | | | | |
| | 6/1/12 | | 11/30/12 | | 6/1/12 -
11/30/12 | |
| | | | | | | |
Class A | | | | | | | | | | |
Actual | | | $ | 1,000.00 | | | | $ | 1,044.70 | | | | $ | 7.31 | | |
Hypothetical (5% Return Before Expenses) | | | $ | 1,000.00 | | | | $ | 1,017.86 | | | | $ | 7.21 | | |
Class B | | | | | | | | | | | | | | | | |
Actual | | | $ | 1,000.00 | | | | $ | 1,040.70 | | | | $ | 10.56 | | |
Hypothetical (5% Return Before Expenses) | | | $ | 1,000.00 | | | | $ | 1,014.63 | | | | $ | 10.43 | | |
Class C | | | | | | | | | | | | | | | | |
Actual | | | $ | 1,000.00 | | | | $ | 1,041.40 | | | | $ | 10.56 | | |
Hypothetical (5% Return Before Expenses) | | | $ | 1,000.00 | | | | $ | 1,014.67 | | | | $ | 10.43 | | |
Class F | | | | | | | | | | | | | | | | |
Actual | | | $ | 1,000.00 | | | | $ | 1,045.70 | | | | $ | 6.03 | | |
Hypothetical (5% Return Before Expenses) | | | $ | 1,000.00 | | | | $ | 1,019.11 | | | | $ | 5.96 | | |
Class I | | | | | | | | | | | | | | | | |
Actual | | | $ | 1,000.00 | | | | $ | 1,046.20 | | | | $ | 5.52 | | |
Hypothetical (5% Return Before Expenses) | | | $ | 1,000.00 | | | | $ | 1,019.60 | | | | $ | 5.45 | | |
Class P | | | | | | | | | | | | | | | | |
Actual | | | $ | 1,000.00 | | | | $ | 1,043.90 | | | | $ | 7.82 | | |
Hypothetical (5% Return Before Expenses) | | | $ | 1,000.00 | | | | $ | 1,017.35 | | | | $ | 7.72 | | |
Class R2 | | | | | | | | | | | | | | | | |
Actual | | | $ | 1,000.00 | | | | $ | 1,043.10 | | | | $ | 8.58 | | |
Hypothetical (5% Return Before Expenses) | | | $ | 1,000.00 | | | | $ | 1,016.60 | | | | $ | 8.47 | | |
Class R3 | | | | | | | | | | | | | | | | |
Actual | | | $ | 1,000.00 | | | | $ | 1,043.40 | | | | $ | 8.02 | | |
Hypothetical (5% Return Before Expenses) | | | $ | 1,000.00 | | | | $ | 1,017.13 | | | | $ | 7.92 | | |
| |
† | For each class of the Fund, net expenses are equal to the annualized expense ratio for such class (1.43% for Class A, 2.07% for Classes B and C, 1.18% for Class F, 1.08% for Class I, 1.53% for Class P, 1.68% for Class R2 and 1.57% for Class R3) multiplied by the average account value over the period, multiplied by 183/366 (to reflect one-half year period). |
|
| |
|
Portfolio Holdings Presented by Sector |
November 30, 2012 |
| | | | |
Sector* | | %** | |
Consumer Discretionary | | 25.07 | % | |
Consumer Staples | | 3.88 | % | |
Energy | | 7.19 | % | |
Financials | | 9.96 | % | |
Health Care | | 12.46 | % | |
| | | | |
Sector* | | %** | |
Industrials | | 12.39 | % | |
Information Technology | | 20.51 | % | |
Materials | | 6.75 | % | |
Telecommunication Services | | 1.79 | % | |
Total | | 100.00 | % | |
| |
* | A sector may comprise several industries. |
** | Represents percent of total investments. |
6
|
Schedule of Investments |
November 30, 2012 |
| | | | | | | |
Investments | | | Shares | | | Fair
Value
(000) | |
| | | | | | | | |
COMMON STOCKS 100.33% | | | | | | | |
| | | | | | | |
Aerospace & Defense 1.06% | | | | | | | |
BE Aerospace, Inc.* | | | 123,957 | | $ | 5,871 | |
| | | | | | | |
| | | | | | | |
Auto Components 1.41% | | | | | | | |
BorgWarner, Inc.* | | | 117,264 | | | 7,775 | |
| | | | | | | |
| | | | | | | |
Automobiles 1.38% | | | | | | | |
Harley-Davidson, Inc. | | | 161,962 | | | 7,606 | |
| | | | | | | |
| | | | | | | |
Beverages 1.01% | | | | | | | |
Dr. Pepper Snapple
Group, Inc. | | | 124,226 | | | 5,571 | |
| | | | | | | |
| | | | | | | |
Biotechnology 2.58% | | | | | | | |
ARIAD Pharmaceuticals, Inc.* | | | 144,967 | | | 3,242 | |
Incyte Corp.* | | | 165,858 | | | 2,919 | |
Onyx Pharmaceuticals, Inc.* | | | 47,531 | | | 3,587 | |
Vertex Pharmaceuticals, Inc.* | | | 111,987 | | | 4,456 | |
| | | | | | | |
Total | | | | | | 14,204 | |
| | | | | | | |
| | | | | | | |
Building Products 0.81% | | | | | | | |
Lennox International, Inc. | | | 84,691 | | | 4,454 | |
| | | | | | | |
| | | | | | | |
Capital Markets 2.15% | | | | | | | |
Affiliated Managers Group,
Inc.* | | | 56,900 | | | 7,333 | |
Eaton Vance Corp. | | | 142,534 | | | 4,544 | |
| | | | | | | |
Total | | | | | | 11,877 | |
| | | | | | | |
| | | | | | | |
Chemicals 4.77% | | | | | | | |
Airgas, Inc. | | | 31,119 | | | 2,756 | |
Ashland, Inc. | | | 105,216 | | | 7,462 | |
Celanese Corp. Series A | | | 127,697 | | | 5,241 | |
CF Industries Holdings, Inc. | | | 16,723 | | | 3,579 | |
FMC Corp. | | | 130,641 | | | 7,245 | |
| | | | | | | |
Total | | | | | | 26,283 | |
| | | | | | | |
| | | | | | | |
Commercial Banks 0.76% | | | | | | | |
Signature Bank* | | | 59,472 | | | 4,173 | |
| | | | | | | |
| | | | | | | |
Investments | | | Shares | | | Fair
Value
(000) | |
| | | | | | | | |
Communications Equipment 1.34% | | | | | | | |
Ciena Corp.* | | | 227,114 | | $ | 3,379 | |
F5 Networks, Inc.* | | | 42,588 | | | 3,990 | |
| | | | | | | |
Total | | | | | | 7,369 | |
| | | | | | | |
| | | | | | | |
Computers & Peripherals 2.45% | | | | | | | |
NCR Corp.* | | | 269,806 | | | 6,457 | |
NetApp, Inc.* | | | 222,622 | | | 7,059 | |
| | | | | | | |
Total | | | | | | 13,516 | |
| | | | | | | |
| | | | | | | |
Construction Materials 0.58% | | | | | | | |
Vulcan Materials Co. | | | 60,661 | | | 3,205 | |
| | | | | | | |
| | | | | | | |
Containers & Packaging 1.42% | | | | | | | |
Berry Plastics Group, Inc.* | | | 182,109 | | | 2,715 | |
Rock-Tenn Co. Class A | | | 78,476 | | | 5,104 | |
| | | | | | | |
Total | | | | | | 7,819 | |
| | | | | | | |
| | | | | | | |
Diversified Financial Services 2.58% | | | | | | | |
IntercontinentalExchange,
Inc.* | | | 50,484 | | | 6,672 | |
Moody’s Corp. | | | 155,851 | | | 7,571 | |
| | | | | | | |
Total | | | | | | 14,243 | |
| | | | | | | |
| | | | | | | |
Electrical Equipment 3.68% | | | | | | | |
AMETEK, Inc. | | | 251,843 | | | 9,401 | |
Eaton Corp.* | | | 98,060 | | | 5,115 | |
Rockwell Automation, Inc. | | | 72,836 | | | 5,772 | |
| | | | | | | |
Total | | | | | | 20,288 | |
| | | | | | | |
| | | | | | | |
Electronic Equipment, Instruments
& Components 0.91% | | | | | | | |
Jabil Circuit, Inc. | | | 263,217 | | | 5,001 | |
| | | | | | | |
| | | | | | | |
Energy Equipment & Services 4.66% | | | | | | | |
Atwood Oceanics, Inc.* | | | 107,069 | | | 4,925 | |
Cameron International Corp.* | | | 89,561 | | | 4,832 | |
FMC Technologies, Inc.* | | | 121,527 | | | 4,966 | |
Helmerich & Payne, Inc. | | | 96,591 | | | 5,042 | |
Oceaneering International,
Inc. | | | 112,112 | | | 5,906 | |
| | | | | | | |
Total | | | | | | 25,671 | |
| | | | | | | |
| | |
| See Notes to Financial Statements. | 7 |
|
Schedule of Investments (continued) |
November 30, 2012 |
| | | | | | | |
Investments | | | Shares | | | Fair
Value
(000) | |
| | | | | | | | |
Food & Staples Retailing 1.53% | | | | | | | |
Whole Foods Market, Inc. | | | 90,507 | | $ | 8,450 | |
| | | | | | | |
| | | | | | | |
Food Products 0.90% | | | | | | | |
Green Mountain Coffee
Roasters, Inc.* | | | 135,903 | | | 4,984 | |
| | | | | | | |
| | | | | | | |
Health Care Equipment & Supplies 2.05% | | | | | | | |
Hologic, Inc.* | | | 275,976 | | | 5,266 | |
IDEXX Laboratories, Inc.* | | | 64,427 | | | 6,022 | |
| | | | | | | |
Total | | | | | | 11,288 | |
| | | | | | | |
| | | | | | | |
Health Care Providers & Services 3.64% | | | | | | | |
Catamaran Corp.* | | | 159,828 | | | 7,782 | |
DaVita, Inc.* | | | 57,140 | | | 6,171 | |
Henry Schein, Inc.* | | | 67,049 | | | 5,415 | |
Team Health Holdings, Inc.* | | | 25,100 | | | 703 | |
| | | | | | | |
Total | | | | | | 20,071 | |
| | | | | | | |
| | | | | | | |
Hotels, Restaurants & Leisure 3.72% | | | | | | | |
Marriott International, Inc.
Class A | | | 108,603 | | | 3,941 | |
Panera Bread Co. Class A* | | | 31,245 | | | 5,015 | |
Starwood Hotels & Resorts
Worldwide, Inc. | | | 96,275 | | | 5,195 | |
Wynn Resorts Ltd. | | | 56,440 | | | 6,344 | |
| | | | | | | |
Total | | | | | | 20,495 | |
| | | | | | | |
| | | | | | | |
Household Durables 0.43% | | | | | | | |
Mohawk Industries, Inc.* | | | 27,880 | | | 2,397 | |
| | | | | | | |
| | | | | | | |
Household Products 0.45% | | | | | | | |
Clorox Co. (The) | | | 32,259 | | | 2,463 | |
| | | | | | | |
| | | | | | | |
Information Technology Services 2.49% | | | | | | | |
Alliance Data Systems Corp.* | | | 45,022 | | | 6,415 | |
Teradata Corp.* | | | 123,111 | | | 7,323 | |
| | | | | | | |
Total | | | | | | 13,738 | |
| | | | | | | |
| | | | | | | |
Insurance 1.53% | | | | | | | |
Endurance Specialty
Holdings Ltd. | | | 116,223 | | | 4,672 | |
Hartford Financial Services
Group, Inc. (The) | | | 177,413 | | | 3,758 | |
| | | | | | | |
Total | | | | | | 8,430 | |
| | | | | | | |
| | | | | | | |
Investments | | | Shares | | | Fair
Value
(000) | |
| | | | | | | | |
Internet & Catalog Retail 0.95% | | | | | | | |
Expedia, Inc. | | | 84,323 | | $ | 5,216 | |
| | | | | | | |
| | | | | | | |
Internet Software & Services 1.94% | | | | | | | |
IAC/InterActiveCorp. | | | 60,805 | | | 2,867 | |
LinkedIn Corp. Class A* | | | 35,549 | | | 3,844 | |
VeriSign, Inc.* | | | 116,610 | | | 3,980 | |
| | | | | | | |
Total | | | | | | 10,691 | |
| | | | | | | |
| | | | | | | |
Life Sciences Tools & Services 1.79% | | | | | | | |
Agilent Technologies, Inc. | | | 257,972 | | | 9,878 | |
| | | | | | | |
| | | | | | | |
Machinery 2.60% | | | | | | | |
Flowserve Corp. | | | 34,455 | | | 4,774 | |
IDEX Corp. | | | 144,316 | | | 6,487 | |
SPX Corp. | | | 45,214 | | | 3,080 | |
| | | | | | | |
Total | | | | | | 14,341 | |
| | | | | | | |
| | | | | | | |
Media 1.21% | | | | | | | |
Discovery Communications,
Inc. Class A* | | | 110,630 | | | 6,683 | |
| | | | | | | |
| | | | | | | |
Multi-Line Retail 2.03% | | | | | | | |
Dollar General Corp.* | | | 97,577 | | | 4,879 | |
Macy’s, Inc. | | | 163,232 | | | 6,317 | |
| | | | | | | |
Total | | | | | | 11,196 | |
| | | | | | | |
| | | | | | | |
Oil, Gas & Consumable Fuels 2.56% | | | | | | | |
Concho Resources, Inc.* | | | 77,265 | | | 6,201 | |
Continental Resources, Inc.* | | | 45,472 | | | 3,124 | |
Range Resources Corp. | | | 74,691 | | | 4,782 | |
| | | | | | | |
Total | | | | | | 14,107 | |
| | | | | | | |
| | | | | | | |
Pharmaceuticals 2.45% | | | | | | | |
Perrigo Co. | | | 43,306 | | | 4,482 | |
Watson Pharmaceuticals,
Inc.* | | | 102,333 | | | 9,006 | |
| | | | | | | |
Total | | | | | | 13,488 | |
| | | | | | | |
| | | | | | | |
Professional Services 0.69% | | | | | | | |
IHS, Inc. Class A* | | | 41,030 | | | 3,780 | |
| | | | | | | |
| | |
8 | See Notes to Financial Statements. | |
|
Schedule of Investments (concluded) |
November 30, 2012 |
| | | | | | | |
Investments | | | Shares | | | Fair
Value
(000) | |
| | | | | | | | |
Real Estate Investment Trusts 1.26% | | | | | | | |
Weyerhaeuser Co. | | | 251,537 | | $ | 6,932 | |
| | | | | | | |
| | | | | | | |
Real Estate Management
& Development 1.71% | | | | | | | |
CBRE Group, Inc. Class A* | | | 393,399 | | | 7,447 | |
Realogy Holdings Corp.* | | | 52,511 | | | 1,980 | |
| | | | | | | |
Total | | | | | | 9,427 | |
| | | | | | | |
| | | | | | | |
Road & Rail 2.41% | | | | | | | |
Hertz Global Holdings, Inc.* | | | 324,535 | | | 5,076 | |
Kansas City Southern | | | 104,999 | | | 8,205 | |
| | | | | | | |
Total | | | | | | 13,281 | |
| | | | | | | |
| | | | | | | |
Semiconductors & Semiconductor
Equipment 4.87% | | | | | | | |
Altera Corp. | | | 144,929 | | | 4,694 | |
Analog Devices, Inc. | | | 117,476 | | | 4,769 | |
Avago Technologies Ltd.
(Singapore)(a) | | | 179,615 | | | 6,304 | |
NVIDIA Corp. | | | 229,846 | | | 2,754 | |
Skyworks Solutions, Inc.* | | | 123,382 | | | 2,795 | |
Xilinx, Inc. | | | 159,556 | | | 5,529 | |
| | | | | | | |
Total | | | | | | 26,845 | |
| | | | | | | |
| | | | | | | |
Software 6.58% | | | | | | | |
ANSYS, Inc.* | | | 70,808 | | | 4,697 | |
Citrix Systems, Inc.* | | | 112,168 | | | 6,860 | |
Concur Technologies, Inc.* | | | 21,119 | | | 1,388 | |
Fortinet, Inc.* | | | 155,206 | | | 3,101 | |
MICROS Systems, Inc.* | | | 148,776 | | | 6,466 | |
Red Hat, Inc.* | | | 144,871 | | | 7,157 | |
TIBCO Software, Inc.* | | | 199,262 | | | 4,991 | |
Workday, Inc. Class A* | | | 32,116 | | | 1,609 | |
| | | | | | | |
Total | | | | | | 36,269 | |
| | | | | | | |
| | | | | | | |
Investments | | | Shares | | | Fair
Value
(000) | |
| | | | | | | | |
Specialty Retail 9.74% | | | | | | | |
Bed Bath & Beyond, Inc.* | | | 145,850 | | $ | 8,564 | |
Dick’s Sporting Goods, Inc. | | | 143,670 | | | 7,544 | |
DSW, Inc. Class A | | | 76,609 | | | 5,212 | |
GNC Holdings, Inc. Class A | | | 63,897 | | | 2,245 | |
Limited Brands, Inc. | | | 114,712 | | | 5,982 | |
Ross Stores, Inc. | | | 101,071 | | | 5,753 | |
Tiffany & Co. | | | 58,321 | | | 3,440 | |
Tractor Supply Co. | | | 73,203 | | | 6,560 | |
Urban Outfitters, Inc.* | | | 162,421 | | | 6,123 | |
Williams-Sonoma, Inc. | | | 49,778 | | | 2,253 | |
| | | | | | | |
Total | | | | | | 53,676 | |
| | | | | | | |
| | | | | | | |
Textiles, Apparel & Luxury Goods 4.28% | | | | | | | |
Hanesbrands, Inc.* | | | 136,887 | | | 4,942 | |
Ralph Lauren Corp. | | | 36,539 | | | 5,740 | |
Under Armour, Inc. Class A* | | | 87,816 | | | 4,551 | |
VF Corp. | | | 52,023 | | | 8,350 | |
| | | | | | | |
Total | | | | | | 23,583 | |
| | | | | | | |
| | | | | | | |
Trading Companies & Distributors 1.18% | | | | | | | |
W.W. Grainger, Inc. | | | 33,531 | | | 6,506 | |
| | | | | | | |
| | | | | | | |
Wireless Telecommunication Services 1.79% | | | | | | | |
SBA Communications Corp.
Class A* | | | 143,758 | | | 9,893 | |
| | | | | | | |
Total Common Stocks 100.33%
(cost $464,393,218) | | | | | | 553,034 | |
| | | | | | | |
Liabilities in Excess of
Other Assets (0.33)% | | | | | | (1,795 | ) |
�� | | | | | | | |
Net Assets 100.00% | | | | | $ | 551,239 | |
| | | | | | | |
| |
* | Non-income producing security. |
(a) | Foreign security traded in U.S. dollars. |
| | |
| See Notes to Financial Statements. | 9 |
|
Statement of Assets and Liabilities |
November 30, 2012 |
| | | | |
ASSETS: | | | | |
Investments in securities, at fair value (cost $464,393,218) | | $ | 553,033,701 | |
Receivables: | | | | |
Investment securities sold | | | 5,177,581 | |
Capital shares sold | | | 450,372 | |
Interest and dividends | | | 293,348 | |
Prepaid expenses and other assets | | | 51,002 | |
| | | | | |
Total assets | | | 559,006,004 | |
| | | | | |
LIABILITIES: | | | | |
Payables: | | | | |
Investment securities purchased | | | 5,739,032 | |
Capital shares reacquired | | | 910,763 | |
Management fee | | | 339,367 | |
12b-1 distribution fees | | | 183,382 | |
To bank | | | 155,517 | |
Directors’ fees | | | 87,833 | |
Fund administration | | | 18,100 | |
To affiliates (See Note 3) | | | 14,919 | |
Accrued expenses and other liabilities | | | 318,089 | |
| | | | | |
Total liabilities | | | 7,767,002 | |
| | | | | |
NET ASSETS | | $ | 551,239,002 | |
| | | | | |
COMPOSITION OF NET ASSETS: | | | | |
Paid-in capital | | $ | 467,707,857 | |
Accumulated net investment loss | | | (3,298,671 | ) |
Accumulated net realized loss on investments | | | (1,810,667 | ) |
Net unrealized appreciation on investments | | | 88,640,483 | |
| | | | | |
Net Assets | | $ | 551,239,002 | |
| | | | | |
| | |
10 | See Notes to Financial Statements. | |
|
Statement of Assets and Liabilities (concluded) |
November 30, 2012 |
| | | | |
Net assets by class: | | | | |
Class A Shares | | $ | 351,427,084 | |
Class B Shares | | $ | 18,614,143 | |
Class C Shares | | $ | 51,426,576 | |
Class F Shares | | $ | 13,652,471 | |
Class I Shares | | $ | 78,050,826 | |
Class P Shares | | $ | 5,017,421 | |
Class R2 Shares | | $ | 1,515,047 | |
Class R3 Shares | | $ | 31,535,434 | |
Outstanding shares by class: | | | | |
Class A Shares (100 million shares of common stock authorized, $.001 par value) | | | 18,343,561 | |
Class B Shares (30 million shares of common stock authorized, $.001 par value) | | | 1,103,017 | |
Class C Shares (20 million shares of common stock authorized, $.001 par value) | | | 3,048,334 | |
Class F Shares (30 million shares of common stock authorized, $.001 par value) | | | 702,150 | |
Class I Shares (30 million shares of common stock authorized, $.001 par value) | | | 3,828,961 | |
Class P Shares (20 million shares of common stock authorized, $.001 par value) | | | 263,801 | |
Class R2 Shares (30 million shares of common stock authorized, $.001 par value) | | | 80,238 | |
Class R3 Shares (30 million shares of common stock authorized, $.001 par value) | | | 1,658,653 | |
Net asset value, offering and redemption price per share
(Net assets divided by outstanding shares): | | | | |
Class A Shares-Net asset value | | $ | 19.16 | |
Class A Shares-Maximum offering price
(Net asset value plus sales charge of 5.75%) | | $ | 20.33 | |
Class B Shares-Net asset value | | $ | 16.88 | |
Class C Shares-Net asset value | | $ | 16.87 | |
Class F Shares-Net asset value | | $ | 19.44 | |
Class I Shares-Net asset value | | $ | 20.38 | |
Class P Shares-Net asset value | | $ | 19.02 | |
Class R2 Shares-Net asset value | | $ | 18.88 | |
Class R3 Shares-Net asset value | | $ | 19.01 | |
| | |
| See Notes to Financial Statements. | 11 |
|
Statement of Operations |
For the Year Ended November 30, 2012 |
| | | | |
Investment income: | | | | |
Dividends (net of foreign withholding taxes of $5,745) | | $ | 5,684,320 | |
Interest | | | 263 | |
| | | | | |
Total investment income | | | 5,684,583 | |
| | | | | |
Expenses: | | | | |
Management fee | | | 4,668,740 | |
12b-1 distribution plan-Class A | | | 1,300,603 | |
12b-1 distribution plan-Class B | | | 242,898 | |
12b-1 distribution plan-Class C | | | 549,358 | |
12b-1 distribution plan-Class F | | | 13,754 | |
12b-1 distribution plan-Class P | | | 30,510 | |
12b-1 distribution plan-Class R2 | | | 10,534 | |
12b-1 distribution plan-Class R3 | | | 154,243 | |
Shareholder servicing | | | 1,296,253 | |
Fund administration | | | 243,532 | |
Subsidy (See Note 3) | | | 130,967 | |
Registration | | | 92,490 | |
Reports to shareholders | | | 87,029 | |
Professional | | | 50,592 | |
Custody | | | 26,985 | |
Directors’ fees | | | 19,378 | |
Other | | | 19,467 | |
| | | | | |
Gross expenses | | | 8,937,333 | |
Expense reductions (See Note 7) | | | (357 | ) |
Management fee waived (See Note 3) | | | (100,673 | ) |
| | | | | |
Net expenses | | | 8,836,303 | |
| | | | | |
Net investment loss | | | (3,151,720 | ) |
| | | | | |
Net realized and unrealized gain: | | | | |
Net realized gain on investments | | | 4,522,726 | |
Net change in unrealized appreciation/depreciation on investments | | | 36,142,849 | |
| | | | | |
Net realized and unrealized gain | | | 40,665,575 | |
| | | | | |
Net Increase in Net Assets Resulting From Operations | | $ | 37,513,855 | |
| | | | | |
| | |
12 | See Notes to Financial Statements. | |
Statements of Changes in Net Assets
| | | | | | | |
DECREASE IN NET ASSETS | | For the Year Ended
November 30, 2012 | | For the Year Ended
November 30, 2011 | |
Operations: | | | | | | | |
Net investment loss | | $ | (3,151,720 | ) | $ | (4,721,663 | ) |
Net realized gain on investments | | | 4,522,726 | | | 111,427,805 | |
Net change in unrealized appreciation/depreciation on
investments | | | 36,142,849 | | | (112,009,147 | ) |
| | | | | | | | |
Net increase (decrease) in net assets resulting
from operations | | | 37,513,855 | | | (5,303,005 | ) |
| | | | | | | | |
Distributions to shareholders from: | | | | | | | |
Net realized gain | | | | | | | |
Class A | | | (57,249,604 | ) | | – | |
Class B | | | (4,741,520 | ) | | – | |
Class C | | | (9,503,812 | ) | | – | |
Class F | | | (2,098,553 | ) | | – | |
Class I | | | (8,753,376 | ) | | – | |
Class P | | | (1,190,196 | ) | | – | |
Class R2 | | | (246,617 | ) | | – | |
Class R3 | | | (4,051,050 | ) | | – | |
| | | | | | | | |
Total distributions to shareholders | | | (87,834,728 | ) | | – | |
| | | | | | | | |
Capital share transactions (Net of share conversions) (See Note 11): | | | | | | | |
Net proceeds from sales of shares | | | 152,188,571 | | | 172,578,308 | |
Reinvestment of distributions | | | 80,781,206 | | | – | |
Cost of shares reacquired | | | (220,478,222 | ) | | (231,477,767 | ) |
| | | | | | | | |
Net increase (decrease) in net assets resulting
from capital share transactions | | | 12,491,555 | | | (58,899,459 | ) |
| | | | | | | | |
Net decrease in net assets | | | (37,829,318 | ) | | (64,202,464 | ) |
| | | | | | | | |
NET ASSETS: | | | | | | | |
Beginning of year | | $ | 589,068,320 | | $ | 653,270,784 | |
| | | | | | | | |
End of year | | $ | 551,239,002 | | $ | 589,068,320 | |
| | | | | | | | |
Accumulated net investment loss | | $ | (3,298,671 | ) | $ | (78,927 | ) |
| | | | | | | | |
| | |
| See Notes to Financial Statements. | 13 |
Financial Highlights
| | | | | | | | | | | | | | | | |
| | Class A Shares | |
| | | |
| | Year Ended 11/30 | |
| | | |
| | 2012 | | 2011 | | 2010 | | 2009 | | 2008 | |
Per Share Operating Performance | | | | | | | | | | | | | | | | |
Net asset value, beginning of year | | | $21.30 | | | $21.44 | | | $17.13 | | | $12.93 | | | $23.84 | |
| | | | | | | | | | | | | | | | |
Investment operations: | | | | | | | | | | | | | | | | |
Net investment loss(a) | | | (.09 | ) | | (.14 | ) | | (.12 | ) | | (.08 | ) | | (.15 | ) |
Net realized and unrealized gain (loss) | | | 1.12 | | | – | | | 4.43 | | | 4.84 | | | (7.91 | ) |
| | | | | | | | | | | | | | | | |
Total from investment operations | | | 1.03 | | | (.14 | ) | | 4.31 | | | 4.76 | | | (8.06 | ) |
| | | | | | | | | | | | | | | | |
Distributions to shareholders from: | | | | | | | | | | | | | | | | |
Net realized gain | | | (3.17 | ) | | – | | | – | | | (.56 | ) | | (2.85 | ) |
| | | | | | | | | | | | | | | | |
Net asset value, end of year | | | $19.16 | | | $21.30 | | | $21.44 | | | $17.13 | | | $12.93 | |
| | | | | | | | | | | | | | | | |
Total Return(b) | | | 6.96 | % | | (.65 | )% | | 25.16 | % | | 38.43 | % | | (38.34 | )% |
Ratios to Average Net Assets: | | | | | | | | | | | | | | | | |
|
Expenses, excluding expense reductions
and including management fee
waived and expenses reimbursed | | | 1.42 | % | | 1.45 | % | | 1.47 | % | | 1.55 | % | | 1.55 | % |
|
Expenses, including expense reductions,
management fee waived and
expenses reimbursed | | | 1.42 | % | | 1.45 | % | | 1.47 | % | | 1.55 | % | | 1.55 | % |
|
Expenses, excluding expense reductions,
management fee waived and
expenses reimbursed | | | 1.44 | % | | 1.46 | % | | 1.50 | % | | 1.61 | % | | 1.57 | % |
Net investment loss | | | (.48 | )% | | (.64 | )% | | (.61 | )% | | (.57 | )% | | (.79 | )% |
|
Supplemental Data: | | | | | | | | | | | | | | | | |
| | | | | | | | | | | | | | | | | |
Net assets, end of year (000) | | $351,427 | | $389,211 | | $454,561 | | $414,930 | | $337,981 | |
Portfolio turnover rate | | | 145.62 | % | | 121.66 | % | | 103.81 | % | | 80.21 | % | | 123.95 | % |
| | | | | | | | | | | | | | | | | |
| |
(a) | Calculated using average shares outstanding during the year. |
(b) | Total return does not consider the effects of sales loads and assumes the reinvestment of all distributions. |
| |
14 | See Notes to Financial Statements. |
Financial Highlights (continued)
| | | | | | | | | | | | | | | | |
| | Class B Shares | |
| | | |
| | Year Ended 11/30 | |
| | | |
| | 2012 | | 2011 | | 2010 | | 2009 | | 2008 | |
Per Share Operating Performance | | | | | | | | | | | | | | | | |
Net asset value, beginning of year | | | $19.27 | | | $19.52 | | | $15.70 | | | $11.97 | | | $22.41 | |
| | | | | | | | | | | | | | | | |
Investment operations: | | | | | | | | | | | | | | | | |
Net investment loss(a) | | | (.19 | ) | | (.26 | ) | | (.22 | ) | | (.16 | ) | | (.25 | ) |
Net realized and unrealized gain (loss) | | | .97 | | | .01 | | | 4.04 | | | 4.45 | | | (7.34 | ) |
| | | | | | | | | | | | | | | | |
Total from investment operations | | | .78 | | | (.25 | ) | | 3.82 | | | 4.29 | | | (7.59 | ) |
| | | | | | | | | | | | | | | | |
Distributions to shareholders from: | | | | | | | | | | | | | | | | |
Net realized gain | | | (3.17 | ) | | – | | | – | | | (.56 | ) | | (2.85 | ) |
| | | | | | | | | | | | | | | | |
Net asset value, end of year | | | $16.88 | | | $19.27 | | | $19.52 | | | $15.70 | | | $11.97 | |
| | | | | | | | | | | | | | | | |
Total Return(b) | | | 6.22 | % | | (1.28 | )% | | 24.33 | % | | 37.55 | % | | (38.73 | )% |
Ratios to Average Net Assets: | | | | | | | | | | | | | | | | |
|
Expenses, excluding expense reductions
and including management fee
waived and expenses reimbursed | | | 2.07 | % | | 2.09 | % | | 2.12 | % | | 2.20 | % | | 2.20 | % |
|
Expenses, including expense reductions,
management fee waived and
expenses reimbursed | | | 2.07 | % | | 2.09 | % | | 2.12 | % | | 2.20 | % | | 2.20 | % |
|
Expenses, excluding expense reductions,
management fee waived and
expenses reimbursed | | | 2.09 | % | | 2.11 | % | | 2.15 | % | | 2.27 | % | | 2.22 | % |
Net investment loss | | | (1.14 | )% | | (1.27 | )% | | (1.28 | )% | | (1.22 | )% | | (1.44 | )% |
|
Supplemental Data: | | | | | | | | | | | | | | | | |
| | | | | | | | | | | | | | | | | |
Net assets, end of year (000) | | $18,614 | | $29,129 | | $43,822 | | $51,703 | | $48,147 | |
Portfolio turnover rate | | | 145.62 | % | | 121.66 | % | | 103.81 | % | | 80.21 | % | | 123.95 | % |
| | | | | | | | | | | | | | | | | |
| |
(a) | Calculated using average shares outstanding during the year. |
(b) | Total return does not consider the effects of sales loads and assumes the reinvestment of all distributions. |
| | |
| See Notes to Financial Statements. | 15 |
Financial Highlights (continued)
| | | | | | | | | | | | | | | | |
| | Class C Shares | |
| | | |
| | Year Ended 11/30 | |
| | | |
| | 2012 | | 2011 | | 2010 | | 2009 | | 2008 | |
Per Share Operating Performance | | | | | | | | | | | | | | | | |
Net asset value, beginning of year | | | $19.26 | | | $19.51 | | | $15.69 | | | $11.96 | | | $22.40 | |
| | | | | | | | | | | | | | | | |
Investment operations: | | | | | | | | | | | | | | | | |
Net investment loss(a) | | | (.19 | ) | | (.26 | ) | | (.22 | ) | | (.16 | ) | | (.25 | ) |
Net realized and unrealized gain (loss) | | | .97 | | | .01 | | | 4.04 | | | 4.45 | | | (7.34 | ) |
| | | | | | | | | | | | | | | | |
Total from investment operations | | | .78 | | | (.25 | ) | | 3.82 | | | 4.29 | | | (7.59 | ) |
| | | | | | | | | | | | | | | | |
Distributions to shareholders from: | | | | | | | | | | | | | | | | |
Net realized gain | | | (3.17 | ) | | – | | | – | | | (.56 | ) | | (2.85 | ) |
| | | | | | | | | | | | | | | | |
Net asset value, end of year | | | $16.87 | | | $19.26 | | | $19.51 | | | $15.69 | | | $11.96 | |
| | | | | | | | | | | | | | | | |
Total Return(b) | | | 6.28 | % | | (1.28 | )% | | 24.35 | % | | 37.58 | % | | (38.75 | )% |
Ratios to Average Net Assets: | | | | | | | | | | | | | | | | |
|
Expenses, excluding expense reductions
and including management fee
waived and expenses reimbursed | | | 2.06 | % | | 2.06 | % | | 2.12 | % | | 2.20 | % | | 2.20 | % |
|
Expenses, including expense reductions,
management fee waived and
expenses reimbursed | | | 2.06 | % | | 2.06 | % | | 2.12 | % | | 2.20 | % | | 2.20 | % |
|
Expenses, excluding expense reductions,
management fee waived and
expenses reimbursed | | | 2.08 | % | | 2.08 | % | | 2.15 | % | | 2.26 | % | | 2.23 | % |
Net investment loss | | | (1.12 | )% | | (1.25 | )% | | (1.27 | )% | | (1.22 | )% | | (1.44 | )% |
|
Supplemental Data: | | | | | | | | | | | | | | | | |
| | | | | | | | | | | | | | | | | |
Net assets, end of year (000) | | $51,427 | | $58,336 | | $64,376 | | $63,732 | | $45,385 | |
Portfolio turnover rate | | | 145.62 | % | | 121.66 | % | | 103.81 | % | | 80.21 | % | | 123.95 | % |
| | | | | | | | | | | | | | | | | |
| |
(a) | Calculated using average shares outstanding during the year. |
(b) | Total return does not consider the effects of sales loads and assumes the reinvestment of all distributions. |
| |
16 | See Notes to Financial Statements. |
Financial Highlights (continued)
| | | | | | | | | | | | | | | | |
| | Class F Shares | |
| | | |
| | Year Ended 11/30 | |
| | | |
| | 2012 | | 2011 | | 2010 | | 2009 | | 2008 | |
Per Share Operating Performance | | | | | | | | | | | | | | | | |
Net asset value, beginning of year | | | $21.52 | | | $21.61 | | | $17.22 | | | $12.96 | | | $23.85 | |
| | | | | | | | | | | | | | | | |
Investment operations: | | | | | | | | | | | | | | | | |
Net investment loss(a) | | | (.04 | ) | | (.09 | ) | | (.06 | ) | | (.05 | ) | | (.09 | ) |
Net realized and unrealized gain (loss) | | | 1.13 | | | – | | | 4.45 | | | 4.87 | | | (7.95 | ) |
| | | | | | | | | | | | | | | | |
Total from investment operations | | | 1.09 | | | (.09 | ) | | 4.39 | | | 4.82 | | | (8.04 | ) |
| | | | | | | | | | | | | | | | |
Distributions to shareholders from: | | | | | | | | | | | | | | | | |
Net realized gain | | | (3.17 | ) | | – | | | – | | | (.56 | ) | | (2.85 | ) |
| | | | | | | | | | | | | | | | |
Net asset value, end of year | | | $19.44 | | | $21.52 | | | $21.61 | | | $17.22 | | | $12.96 | |
| | | | | | | | | | | | | | | | |
Total Return(b) | | | 7.20 | % | | (.42 | )% | | 25.49 | % | | 38.82 | % | | (38.22 | )% |
Ratios to Average Net Assets: | | | | | | | | | | | | | | | | |
|
Expenses, excluding expense reductions
and including management fee
waived and expenses reimbursed | | | 1.17 | % | | 1.20 | % | | 1.21 | % | | 1.30 | % | | 1.30 | % |
|
Expenses, including expense reductions,
management fee waived and
expenses reimbursed | | | 1.17 | % | | 1.20 | % | | 1.21 | % | | 1.30 | % | | 1.30 | % |
|
Expenses, excluding expense reductions,
management fee waived and
expenses reimbursed | | | 1.19 | % | | 1.22 | % | | 1.24 | % | | 1.34 | % | | 1.36 | % |
Net investment loss | | | (.23 | )% | | (.41 | )% | | (.32 | )% | | (.35 | )% | | (.53 | )% |
|
Supplemental Data: | | | | | | | | | | | | | | | | |
| | | | | | | | | | | | | | | | | |
Net assets, end of year (000) | | $13,652 | | $14,594 | | $11,051 | | $2,362 | | $359 | |
Portfolio turnover rate | | | 145.62 | % | | 121.66 | % | | 103.81 | % | | 80.21 | % | | 123.95 | % |
| | | | | | | | | | | | | | | | | |
| |
(a) | Calculated using average shares outstanding during the year. |
(b) | Total return assumes the reinvestment of all distributions. |
| | |
| See Notes to Financial Statements. | 17 |
Financial Highlights (continued)
| | | | | | | | | | | | | | | | |
| | Class I Shares | |
| | | |
| | Year Ended 11/30 | |
| | | |
| | 2012 | | 2011 | | 2010 | | 2009 | | 2008 | |
Per Share Operating Performance | | | | | | | | | | | | | | | | �� |
Net asset value, beginning of year | | | $22.38 | | | $22.45 | | | $17.87 | | | $13.42 | | | $24.56 | |
| | | | | | | | | | | | | | | | |
Investment operations: | | | | | | | | | | | | | | | | |
Net investment loss(a) | | | (.04 | ) | | (.07 | ) | | (.05 | ) | | (.03 | ) | | (.08 | ) |
Net realized and unrealized gain (loss) | | | 1.21 | | | – | | | 4.63 | | | 5.04 | | | (8.21 | ) |
| | | | | | | | | | | | | | | | |
Total from investment operations | | | 1.17 | | | (.07 | ) | | 4.58 | | | 5.01 | | | (8.29 | ) |
| | | | | | | | | | | | | | | | |
Distributions to shareholders from: | | | | | | | | | | | | | | | | |
Net realized gain | | | (3.17 | ) | | – | | | – | | | (.56 | ) | | (2.85 | ) |
| | | | | | | | | | | | | | | | |
Net asset value, end of year | | | $20.38 | | | $22.38 | | | $22.45 | | | $17.87 | | | $13.42 | |
| | | | | | | | | | | | | | | | |
Total Return(b) | | | 7.29 | % | | (.31 | )% | | 25.63 | % | | 38.91 | % | | (38.12 | )% |
Ratios to Average Net Assets: | | | | | | | | | | | | | | | | |
|
Expenses, excluding expense reductions
and including management fee
waived and expenses reimbursed | | | 1.07 | % | | 1.10 | % | | 1.11 | % | | 1.20 | % | | 1.20 | % |
|
Expenses, including expense reductions,
management fee waived and
expenses reimbursed | | | 1.07 | % | | 1.10 | % | | 1.11 | % | | 1.20 | % | | 1.20 | % |
|
Expenses, excluding expense reductions,
management fee waived and
expenses reimbursed | | | 1.09 | % | | 1.12 | % | | 1.15 | % | | 1.25 | % | | 1.23 | % |
Net investment loss | | | (.18 | )% | | (.30 | )% | | (.25 | )% | | (.22 | )% | | (.41 | )% |
|
Supplemental Data: | | | | | | | | | | | | | | | | |
| | | | | | | | | | | | | | | | | |
Net assets, end of year (000) | | $78,051 | | $61,928 | | $54,970 | | $42,775 | | $23,175 | |
Portfolio turnover rate | | | 145.62 | % | | 121.66 | % | | 103.81 | % | | 80.21 | % | | 123.95 | % |
| | | | | | | | | | | | | | | | | |
| |
(a) | Calculated using average shares outstanding during the year. |
(b) | Total return assumes the reinvestment of all distributions. |
| |
18 | See Notes to Financial Statements. |
Financial Highlights (continued)
| | | | | | | | | | | | | | | | |
| | Class P Shares | |
| | | |
| | Year Ended 11/30 | |
| | | |
| | 2012 | | 2011 | | 2010 | | 2009 | | 2008 | |
Per Share Operating Performance | | | | | | | | | | | | | | | | |
Net asset value, beginning of year | | | $21.19 | | | $21.35 | | | $17.07 | | | $12.90 | | | $23.82 | |
| | | | | | | | | | | | | | | | |
Investment operations: | | | | | | | | | | | | | | | | |
Net investment loss(a) | | | (.11 | ) | | (.17 | ) | | (.14 | ) | | (.09 | ) | | (.17 | ) |
Net realized and unrealized gain (loss) | | | 1.11 | | | .01 | | | 4.42 | | | 4.82 | | | (7.90 | ) |
| | | | | | | | | | | | | | | | |
Total from investment operations | | | 1.00 | | | (.16 | ) | | 4.28 | | | 4.73 | | | (8.07 | ) |
| | | | | | | | | | | | | | | | |
Distributions to shareholders from: | | | | | | | | | | | | | | | | |
Net realized gain | | | (3.17 | ) | | – | | | – | | | (.56 | ) | | (2.85 | ) |
| | | | | | | | | | | | | | | | |
Net asset value, end of year | | | $19.02 | | | $21.19 | | | $21.35 | | | $17.07 | | | $12.90 | |
| | | | | | | | | | | | | | | | |
Total Return(b) | | | 6.83 | % | | (.75 | )% | | 25.07 | % | | 38.28 | % | | (38.42 | )% |
Ratios to Average Net Assets: | | | | | | | | | | | | | | | | |
|
Expenses, excluding expense reductions
and including management fee
waived and expenses reimbursed | | | 1.53 | % | | 1.55 | % | | 1.57 | % | | 1.65 | % | | 1.65 | % |
|
Expenses, including expense reductions,
management fee waived and
expenses reimbursed | | | 1.53 | % | | 1.55 | % | | 1.57 | % | | 1.65 | % | | 1.65 | % |
|
Expenses, excluding expense reductions,
management fee waived and
expenses reimbursed | | | 1.54 | % | | 1.57 | % | | 1.60 | % | | 1.72 | % | | 1.67 | % |
Net investment loss | | | (.60 | )% | | (.74 | )% | | (.73 | )% | | (.66 | )% | | (.88 | )% |
|
Supplemental Data: | | | | | | | | | | | | | | | | |
| | | | | | | | | | | | | | | | | |
Net assets, end of year (000) | | $5,017 | | $8,074 | | $8,477 | | $9,185 | | $8,945 | |
Portfolio turnover rate | | | 145.62 | % | | 121.66 | % | | 103.81 | % | | 80.21 | % | | 123.95 | % |
| | | | | | | | | | | | | | | | | |
| |
(a) | Calculated using average shares outstanding during the year. |
(b) | Total return assumes the reinvestment of all distributions. |
| | |
| See Notes to Financial Statements. | 19 |
Financial Highlights (continued)
| | | | | | | | | | | | | | | | |
| | Class R2 Shares | |
| | | |
| | Year Ended 11/30 | |
| | | |
| | 2012 | | 2011 | | 2010 | | 2009 | | 2008 | |
Per Share Operating Performance | | | | | | | | | | | | | | | | |
Net asset value, beginning of year | | | $21.09 | | | $21.28 | | | $17.04 | | | $12.90 | | | $23.83 | |
| | | | | | | | | | | | | | | | |
Investment operations: | | | | | | | | | | | | | | | | |
Net investment loss(a) | | | (.14 | ) | | (.21 | ) | | (.16 | ) | | (.13 | ) | | (.16 | ) |
Net realized and unrealized gain (loss) | | | 1.10 | | | .02 | | | 4.40 | | | 4.83 | | | (7.92 | ) |
| | | | | | | | | | | | | | | | |
Total from investment operations | | | .96 | | | (.19 | ) | | 4.24 | | | 4.70 | | | (8.08 | ) |
| | | | | | | | | | | | | | | | |
Distributions to shareholders from: | | | | | | | | | | | | | | | | |
Net realized gain | | | (3.17 | ) | | – | | | – | | | (.56 | ) | | (2.85 | ) |
| | | | | | | �� | | | | | | | | | |
Net asset value, end of year | | | $18.88 | | | $21.09 | | | $21.28 | | | $17.04 | | | $12.90 | |
| | | | | | | | | | | | | | | | |
Total Return(b) | | | 6.70 | % | | (.94 | )% | | 24.88 | % | | 38.04 | % | | (38.45 | )% |
Ratios to Average Net Assets: | | | | | | | | | | | | | | | | |
|
Expenses, excluding expense reductions
and including management fee
waived and expenses reimbursed | | | 1.67 | % | | 1.70 | % | | 1.71 | % | | 1.80 | % | | 1.75 | % |
|
Expenses, including expense reductions,
management fee waived and
expenses reimbursed | | | 1.67 | % | | 1.70 | % | | 1.71 | % | | 1.80 | % | | 1.75 | % |
|
Expenses, excluding expense reductions,
management fee waived and
expenses reimbursed | | | 1.69 | % | | 1.72 | % | | 1.75 | % | | 1.83 | % | | 1.81 | % |
Net investment loss | | | (.74 | )% | | (.92 | )% | | (.86 | )% | | (.84 | )% | | (.93 | )% |
|
Supplemental Data: | | | | | | | | | | | | | | | | |
| | | | | | | | | | | | | | | | | |
Net assets, end of year (000) | | $1,515 | | $1,505 | | $1,330 | | $1,118 | | $119 | |
Portfolio turnover rate | | | 145.62 | % | | 121.66 | % | | 103.81 | % | | 80.21 | % | | 123.95 | % |
| | | | | | | | | | | | | | | | | |
| |
(a) | Calculated using average shares outstanding during the year. |
(b) | Total return assumes the reinvestment of all distributions. |
| |
20 | See Notes to Financial Statements. |
Financial Highlights (concluded)
| | | | | | | | | | | | | | | | |
| | Class R3 Shares | |
| | | |
| | Year Ended 11/30 | |
| | | |
| | 2012 | | 2011 | | 2010 | | 2009 | | 2008 | |
Per Share Operating Performance | | | | | | | | | | | | | | | | |
Net asset value, beginning of year | | | $21.19 | | | $21.36 | | | $17.09 | | | $12.91 | | | $23.84 | |
| | | | | | | | | | | | | | | | |
Investment operations: | | | | | | | | | | | | | | | | |
Net investment loss(a) | | | (.12 | ) | | (.18 | ) | | (.13 | ) | | (.12 | ) | | (.14 | ) |
Net realized and unrealized gain (loss) | | | 1.11 | | | .01 | | | 4.40 | | | 4.86 | | | (7.94 | ) |
| | | | | | | | | | | | | | | | |
Total from investment operations | | | .99 | | | (.17 | ) | | 4.27 | | | 4.74 | | | (8.08 | ) |
| | | | | | | | | | | | | | | | |
Distributions to shareholders from: | | | | | | | | | | | | | | | | |
Net realized gain | | | (3.17 | ) | | – | | | – | | | (.56 | ) | | (2.85 | ) |
| | | | | | | | | | | | | | | | |
Net asset value, end of year | | | $19.01 | | | $21.19 | | | $21.36 | | | $17.09 | | | $12.91 | |
| | | | | | | | | | | | | | | | |
Total Return(b) | | | 6.78 | % | | (.80 | )% | | 24.99 | % | | 38.33 | % | | (38.43 | )% |
Ratios to Average Net Assets: | | | | | | | | | | | | | | | | |
|
Expenses, excluding expense reductions
and including management fee
waived and expenses reimbursed | | | 1.57 | % | | 1.59 | % | | 1.60 | % | | 1.70 | % | | 1.65 | % |
|
Expenses, including expense reductions,
management fee waived and
expenses reimbursed | | | 1.57 | % | | 1.59 | % | | 1.60 | % | | 1.70 | % | | 1.65 | % |
|
Expenses, excluding expense reductions,
management fee waived and
expenses reimbursed | | | 1.58 | % | | 1.61 | % | | 1.64 | % | | 1.72 | % | | 1.70 | % |
Net investment loss | | | (.63 | )% | | (.81 | )% | | (.70 | )% | | (.76 | )% | | (.82 | )% |
|
Supplemental Data: | | | | | | | | | | | | | | | | |
| | | | | | | | | | | | | | | | | |
Net assets, end of year (000) | | $31,535 | | $26,291 | | $14,684 | | $2,182 | | $85 | |
Portfolio turnover rate | | | 145.62 | % | | 121.66 | % | | 103.81 | % | | 80.21 | % | | 123.95 | % |
| | | | | | | | | | | | | | | | | |
| |
(a) | Calculated using average shares outstanding during the year. |
(b) | Total return assumes the reinvestment of all distributions. |
| | |
| See Notes to Financial Statements. | 21 |
Notes to Financial Statements
Lord Abbett Research Fund, Inc. (the “Company”) is registered under the Investment Company Act of 1940, as amended (the “Act”), as a diversified, open-end management investment company and was incorporated under Maryland law on April 6, 1992. The Company currently consists of four separate funds. This report covers one of the funds and its classes: Lord Abbett Growth Opportunities Fund (the “Fund”).
The Fund’s investment objective is capital appreciation. The Fund has eight classes of shares: Class A, B, C, F, I, P, R2 and R3, each with different expenses and dividends. A front-end sales charge is normally added to the net asset value (���NAV”) for Class A shares. There is no front-end sales charge in the case of Class B, C, F, I, P, R2 and R3 shares, although there may be a contingent deferred sales charge (“CDSC”) in certain cases as follows: Class A shares purchased without a sales charge and redeemed before the first day of the month in which the one-year anniversary of the purchase falls (subject to certain exceptions as set forth in the Fund’s prospectus); Class B shares redeemed before the sixth anniversary of purchase; and Class C shares redeemed before the first anniversary of purchase. Class B shares will automatically convert to Class A shares on the 25th day of the month (or, if the 25th day is not a business day, the next business day thereafter) following the eighth anniversary of the day on which the purchase order was accepted. The Fund no longer issues Class B shares for purchase. The Fund’s Class P shares are closed to substantially all investors, with certain exceptions as set forth in the Fund’s prospectus.
The preparation of the financial statements in conformity with accounting principles generally accepted in the United States of America requires management to make certain estimates and assumptions that affect the reported amounts of assets and liabilities and disclosure of contingent assets and liabilities at the date of the financial statements and the reported amounts of increases and decreases in net assets from operations during the reporting period. Actual results could differ from those estimates.
| | |
2. | SIGNIFICANT ACCOUNTING POLICIES | |
| |
(a) | Investment Valuation–Under procedures approved by the Fund’s Board of Directors (the “Board”), Lord, Abbett & Co. LLC (“Lord Abbett”), the Fund’s investment manager, has formed a Pricing Committee to administer the pricing and valuation of portfolio investments and to ensure that prices utilized reasonably reflect fair value. Among other things, these procedures allow the Fund to utilize independent pricing services, quotations from securities and financial instrument dealers and other market sources to determine fair value. |
| |
| Securities actively traded on any recognized U.S. or non-U.S. exchange or on The NASDAQ Stock Market LLC are valued at the last sale price or official closing price on the exchange or system on which they are principally traded. Events occurring after the close of trading on non-U.S. exchanges may result in adjustments to the valuation of foreign securities to reflect their fair value as of the close of regular trading on the New York Stock Exchange LLC. The Fund may rely on an independent fair valuation service in adjusting the valuations of foreign securities. Unlisted equity securities are valued at the last quoted sale price or, if no sale price is available, at the mean between the most recently quoted bid and asked prices. |
| |
| Securities for which prices are not readily available are valued at fair value as determined by the Pricing Committee and approved by the Board. The Pricing Committee considers a number of factors, including observable and unobservable inputs, when arriving at fair value. The |
22
Notes to Financial Statements (continued)
| |
| Pricing Committee may use related or comparable assets or liabilities, recent transactions, market multiples, book values and other relevant information to determine fair value of portfolio investments. The Board or a designated committee thereof regularly reviews fair value determinations made by the Pricing Committee and employs techniques such as reviewing related market activity, reviewing inputs and assumptions, and retrospectively comparing prices of subsequent purchases and sales transactions to fair value determinations made by the Pricing Committee. |
| |
| Short-term securities with 60 days or less remaining to maturity are valued using the amortized cost method, which approximates fair value. |
| |
(b) | Security Transactions—Security transactions are recorded as of the date that the securities are purchased or sold (trade date). Realized gains and losses on sales of portfolio securities are calculated using the identified-cost method. Realized and unrealized gains (losses) are allocated to each class of shares based upon the relative proportion of net assets at the beginning of the day. |
| |
(c) | Investment Income–Dividend income is recorded on the ex-dividend date. Interest income is recorded on the accrual basis as earned. Discounts are accreted and premiums are amortized using the effective interest method and are included in Interest income on the Statement of Operations. Withholding taxes on foreign dividends have been provided for in accordance with the applicable country’s tax rules and rates. Investment income is allocated to each class of shares based upon the relative proportion of net assets at the beginning of the day. |
| |
(d) | Income Taxes–It is the policy of the Fund to meet the requirements of Subchapter M of the Internal Revenue Code applicable to regulated investment companies and to distribute substantially all taxable income and capital gains to its shareholders. Therefore, no income tax provision is required. |
| |
| The Fund files U.S. federal and various state and local tax returns. No income tax returns are currently under examination. The statute of limitations on the Fund’s filed U.S. federal tax returns remains open for the fiscal years ended November 30, 2009 through November 30, 2012. The statutes of limitations on the Company’s state and local tax returns may remain open for an additional year depending upon the jurisdiction. |
| |
(e) | Expenses–Expenses incurred by the Company that do not specifically relate to an individual fund are generally allocated to the Funds within the Company on a pro rata basis by relative net assets. Expenses, excluding class-specific expenses, are allocated to each class of shares based upon the relative proportion of net assets at the beginning of the day. Class A, B, C, F, P, R2 and R3 shares bear their class-specific share of all expenses and fees relating to the Fund’s 12b-1 Distribution Plan. |
| |
(f) | Foreign Transactions–The books and records of the Fund are maintained in U.S. dollars and transactions denominated in foreign currencies are recorded in the Fund’s records at the rate prevailing when earned or recorded. Asset and liability accounts that are denominated in foreign currencies are adjusted daily to reflect current exchange rates and any unrealized gain (loss) is included in Net change in unrealized appreciation/depreciation on investments on the Fund’s Statement of Operations. The resultant exchange gains and losses upon settlement of such transactions are included in Net realized gain on investments on the Fund’s Statement of Operations. The Fund does not isolate that portion of the results of operations arising as a result of changes in the foreign exchange rates from the changes in market prices of the securities. |
23
Notes to Financial Statements (continued)
| | | |
(g) | Repurchase Agreements–The Fund may enter into repurchase agreements with respect to securities. A repurchase agreement is a transaction in which a fund acquires a security and simultaneously commits to resell that security to the seller (a bank or securities dealer) at an agreed-upon price on an agreed-upon date. The Fund requires at all times that the repurchase agreement be collateralized by cash, or by securities of the U.S. Government, its agencies, its instrumentalities, or U.S. Government sponsored enterprises having a value equal to, or in excess of, the value of the repurchase agreement (including accrued interest). If the seller of the agreement defaults on its obligation to repurchase the underlying securities at a time when the fair value of these securities has declined, the Fund may incur a loss upon disposition of the securities. |
| | | |
(h) | Fair Value Measurements–Fair value is defined as the price that the Fund would receive upon selling an investment or transferring a liability in an orderly transaction to an independent buyer in the principal or most advantageous market of the investment. A three-tier hierarchy is used to maximize the use of observable market data and minimize the use of unobservable inputs and to establish classification of fair value measurements for disclosure purposes. Inputs refer broadly to the assumptions that market participants would use in pricing the asset or liability, including assumptions about risk—for example, the risk inherent in a particular valuation technique used to measure fair value (such as a pricing model) and/or the risk inherent in the inputs to the valuation technique. Inputs may be observable or unobservable. Observable inputs reflect the assumptions market participants would use in pricing the asset or liability. Observable inputs are based on market data obtained from sources independent of the reporting entity. Unobservable inputs reflect the reporting entity’s own assumptions about the assumptions market participants would use in pricing the asset or liability. Unobservable inputs are based on the best information available in the circumstances. The three-tier hierarchy of inputs is summarized in the three broad Levels listed below: |
| | | |
| • | Level 1 – | unadjusted quoted prices in active markets for identical investments; |
| | | |
| • | Level 2 – | other significant observable inputs (including quoted prices for similar investments, interest rates, prepayment speeds, credit risk, etc.); and |
| | | |
| • | Level 3 – | significant unobservable inputs (including the Fund’s own assumptions in determining the fair value of investments). |
| | | |
| Changes in valuation techniques may result in transfers into or out of an assigned level within the three-tier hierarchy. All transfers between different levels within the three-tier hierarchy are deemed to have occurred as of the beginning of the reporting period. The inputs or methodology used for valuing securities are not necessarily an indication of the risk associated with investing in those securities. |
| | | |
| The following is a summary of the inputs used as of November 30, 2012 in valuing the Fund’s investments carried at fair value: |
| | | | | | | | | | | | | | |
| Investment Type* | | Level 1
(000 | ) | Level 2
(000 | ) | Level 3
(000 | ) | Total
(000 | ) |
| | | | | | | | | | |
| Common Stocks | | | $553,034 | | | $– | | | $– | | | $553,034 | |
| | | | | | | | | | | | | | |
| Total | | | $553,034 | | | $– | | | $– | | | $553,034 | |
| | | | | | | | | | | | | | |
| | |
| * | See Schedule of Investments for fair values in each industry and identification of foreign issuers and/or geography. |
24
Notes to Financial Statements (continued)
| | |
3. | MANAGEMENT FEE AND OTHER TRANSACTIONS WITH AFFILIATES | |
Management Fee
The Company has a management agreement with Lord Abbett, pursuant to which Lord Abbett supplies the Fund with investment management services and executive and other personnel, provides office space and pays for ordinary and necessary office and clerical expenses relating to research and statistical work and supervision of the Fund’s investment portfolio.
The Fund’s management fee is based on the Fund’s average daily net assets. Effective April 1, 2012, the management agreement was amended, resulting in the following annual rates:
| | | | |
| | Effective
April 1, 2012 | | Prior to
April 1, 2012 |
| | | | | |
First $1 billion | | .75% | | .80% |
Next $1 billion | | .70% | | .75% |
Next $1 billion | | .65% | | .70% |
Over $3 billion | | .60% | | .65% |
For the fiscal year ended November 30, 2012 and continuing through March 31, 2014, Lord Abbett has contractually agreed to waive all or a portion of its management fee and administrative fee and, if necessary, reimburse the Fund’s other expenses to the extent necessary so that the net annual operating expenses for each class, excluding 12b-1 fees, do not exceed an annual rate of 1.10%. This agreement may be terminated only upon the approval of the Board.
For the period December 31, 2011 through March 31, 2012, Lord Abbett had contractually agreed to waive an additional annualized .05% of its management fee. Effective April 1, 2012, the contractual waiver was discontinued.
For the fiscal year ended November 30, 2012, the effective management fee, net of waivers, was at an annualized rate of .75% of the Fund’s average daily net assets.
In addition, Lord Abbett provides certain administrative services to the Fund pursuant to an Administrative Services Agreement in return for a fee at an annual rate of .04% of the Fund’s average daily net assets.
The Fund, along with certain other funds managed by Lord Abbett (collectively, the “Underlying Funds”), has entered into a Servicing Arrangement with Lord Abbett Balanced Strategy Fund and Lord Abbett Diversified Equity Strategy Fund of Lord Abbett Investment Trust (each, a “Fund of Funds”), pursuant to which each Underlying Fund pays a portion of the expenses (excluding management fees and distribution and service fees) of each Fund of Funds in proportion to the average daily value of the Underlying Fund shares owned by each Fund of Funds. Amounts paid pursuant to the Servicing Arrangement are included in Subsidy expense on the Fund’s Statement of Operations and Payable to affiliates on the Fund’s Statement of Assets and Liabilities.
As of November 30, 2012, the percentages of the Fund’s outstanding shares owned by Lord Abbett Balanced Strategy Fund and Lord Abbett Diversified Equity Strategy Fund were 2.44% and 3.04%, respectively.
12b-1 Distribution Plan
The Fund has adopted a distribution plan with respect to Class A, B, C, F, P, R2 and R3 shares pursuant to Rule 12b-1 under the Act, which provides for the payment of ongoing distribution and service fees to Lord Abbett Distributor LLC (the “Distributor”), an affiliate of Lord Abbett. The fees are accrued daily at annual rates based upon the Fund’s average daily net assets as follows:
25
Notes to Financial Statements (continued)
| | | | | | | | | | | | | | |
Fees* | | Class A | | Class B | | Class C | | Class F | | Class P | | Class R2 | | Class R3 |
| | | | | | | | | | | | | | | |
Service | | .25% | | .25% | | .25% | | – | | .25% | | .25% | | .25% |
Distribution | | .10% | | .75% | | .75% | | .10% | | .20% | | .35% | | .25% |
| |
* | The Fund may designate a portion of the aggregate fee as attributable to service activities for purposes of calculating Financial Industry Regulatory Authority, Inc. (“FINRA”) sales charge limitations. |
Class I shares do not have a distribution plan.
Commissions
Distributor received the following commissions on sales of shares of the Fund, after concessions were paid to authorized dealers, for the fiscal year ended November 30, 2012:
| | |
Distributor
Commissions | | Dealers’
Concessions |
| | | |
$80,105 | | $435,463 |
Distributor received CDSCs of $2,389 and $4,392 for Class A and Class C shares, respectively, for the fiscal year ended November 30, 2012.
For the fiscal year ended November 30, 2012, two Directors and certain of the Fund’s officers had an interest in Lord Abbett.
| | |
4. | DISTRIBUTIONS AND CAPITAL LOSS CARRYFORWARDS | |
Dividends from net investment income, if any, are declared and paid at least annually. Taxable net realized gains from investment transactions, reduced by allowable capital loss carryforwards, if any, are declared and distributed to shareholders at least annually. The capital loss carryforward amount, if any, is available to offset future net capital gains. Dividends and distributions to shareholders are recorded on the ex-dividend date. The amounts of dividends and distributions from net investment income and net realized capital gains are determined in accordance with federal income tax regulations, which may differ from accounting principles generally accepted in the United States of America. These book/tax differences are either considered temporary or permanent in nature. To the extent these differences are permanent in nature, such amounts are reclassified within the components of net assets based on their federal tax basis treatment; temporary differences do not require reclassification. Dividends and distributions, which exceed earnings and profits for tax purposes, are reported as a tax return of capital.
The tax character of distributions paid during the fiscal years ended November 30, 2012 and 2011 was as follows:
| | | | | |
| | Year Ended
11/30/2012 | | Year Ended
11/30/2011 | |
| | | | | | |
Distributions paid from: | | | | | |
Net long-term capital gains | | $87,834,728 | | $– | |
| | | | | | |
Total distributions paid | | $87,834,728 | | $– | |
| | | | | | |
Subsequent to the Fund’s fiscal year ended November 30, 2012, a long-term capital gain distribution of approximately $112,000 was declared by the Fund on December 12, 2012. The distribution was paid on December 18, 2012 to shareholders of record on December 17, 2012.
26
Notes to Financial Statements (continued)
As of November 30, 2012, the components of accumulated gains on a tax-basis were as follows:
| | | | |
Undistributed long-term capital gains | | $ | 109,562 | |
| | | | | |
Total undistributed earnings | | $ | 109,562 | |
Temporary differences | | | (3,298,671 | ) |
Unrealized gains–net | | | 86,720,254 | |
| | | | | |
Total accumulated gains–net | | $ | 83,531,145 | |
| | | | | |
At the Fund’s election, certain losses incurred within the taxable year (Qualified Late-Year Losses) are deemed to arise on the first business day of the Fund’s next taxable year. The Fund incurred and will elect to defer late-year ordinary losses of $3,210,838 during fiscal 2012.
As of November 30, 2012, the aggregate unrealized security gains and losses based on cost for U.S. federal income tax purposes were as follows:
| | | | |
Tax cost | | $ | 466,313,447 | |
| | | | | |
Gross unrealized gain | | | 99,750,644 | |
Gross unrealized loss | | | (13,030,390 | ) |
| | | | | |
Net unrealized security gain | | $ | 86,720,254 | |
| | | | | |
The difference between book-basis and tax-basis unrealized gains (losses) is attributable to wash sales.
Permanent items identified during the fiscal year ended November 30, 2012 have been reclassified among the components of net assets based on their tax basis treatment as follows:
| | |
Accumulated
Net Investment
Loss | | Accumulated
Net Realized
Loss |
| | | |
$(68,024 | ) | $68,024 |
The permanent differences are attributable to the tax treatment of certain securities and distributions received.
| | |
5. | PORTFOLIO SECURITIES TRANSACTIONS | |
Purchases and sales of investment securities (excluding short-term investments) for the fiscal year ended November 30, 2012 were as follows:
| | |
Purchases | | Sales |
| | | |
$880,319,144 | | $958,159,478 |
There were no purchases or sales of U.S. Government securities for the fiscal year ended November 30, 2012.
| | |
6. | DIRECTORS’ REMUNERATION | |
For the fiscal year ended November 30, 2012, the Company’s officers and the two Directors who were associated with Lord Abbett did not receive any compensation from the Company for serving in such capacities. Independent Directors’ fees are allocated among all Lord Abbett-sponsored funds based on the net assets of each fund. There is an equity-based plan available to all Independent Directors under which Independent Directors must defer receipt of a portion of, and may elect to defer receipt of an additional portion of Directors’ fees. The deferred amounts are treated as though equivalent dollar amounts had been invested in the funds. Such amounts and earnings accrued thereon are included in Directors’ fees on the Statement of Operations and in
27
Notes to Financial Statements (continued)
Directors’ fees payable on the Statement of Assets and Liabilities and are not deductible for U.S. federal income tax purposes until such amounts are paid.
The Company has entered into an arrangement with its transfer agent and custodian, whereby credits realized as a result of uninvested cash balances are used to reduce a portion of the Fund’s expenses.
On April 2, 2012, the Fund and certain other funds managed by Lord Abbett (the “participating funds”) entered into an unsecured revolving credit facility (“Facility”) with State Street Bank and Trust Company (“SSB”), to be used for temporary or emergency purposes as an additional source of liquidity to fund redemptions of investor shares. The Facility is renewed annually under terms that depend on market conditions at the time of the renewal. The amounts available under the Facility are (i) the lesser of either $250,000,000 or 33.33% of total assets per participating fund and (ii) $350,000,000 in the aggregate for all participating funds. The annual fee to maintain the Facility is .09% of the amount available under the Facility. Each participating fund pays its pro rata share based on the net assets of each participating fund. This amount is included in Other expenses on the Fund’s Statement of Operations. Any borrowings under this Facility will bear interest at current market rates as set forth in the credit agreement. As of November 30, 2012, there were no loans outstanding pursuant to this Facility nor was the Facility utilized at any time during the fiscal year ended November 30, 2012.
For the period February 3, 2011 through April 1, 2012, the Fund and certain other funds managed by Lord Abbett had an amount of $200,000,000 available under a Facility from SSB with an annual fee to maintain the Facility of .125% of the amount available under the Facility.
| | |
9. | CUSTODIAN AND ACCOUNTING AGENT | |
SSB is the Company’s custodian and accounting agent. SSB performs custodial, accounting and recordkeeping functions relating to portfolio transactions and calculating the Fund’s NAV.
The Fund is subject to the general risks and considerations associated with equity investing. The value of an investment will fluctuate in response to movements in the equity securities market in general, and to the changing prospects of individual companies in which the Fund invests. The Fund has particular risks associated with growth stocks. Growth companies may grow faster than other companies, which may result in more volatility in their stock prices. In addition, if the Fund’s assessment of a company’s potential for growth or market conditions is wrong, it could suffer losses or produce poor performance relative to other funds, even in a rising market. The Fund invests largely in mid-sized company stocks, which may be less able to weather economic shifts or other adverse developments than those of larger, more established companies.
These factors can affect the Fund’s performance.
28
Notes to Financial Statements (concluded)
| | |
11. | SUMMARY OF CAPITAL TRANSACTIONS | |
Transactions in shares of capital stock were as follows:
| | | | | | | | | | | | | |
| | Year Ended
November 30, 2012 | | Year Ended
November 30, 2011 | |
| | | | | | |
Class A Shares | | Shares | | Amount | | Shares | | Amount | |
| | | | | | | | | | |
Shares sold | | | 2,210,958 | | $ | 42,057,029 | | | 3,077,795 | | $ | 72,555,058 | |
Converted from Class B* | | | 350,232 | | | 6,672,835 | | | 312,175 | | | 6,967,069 | |
Reinvestment of distributions | | | 3,162,088 | | | 52,964,981 | | | – | | | – | |
Shares reacquired | | | (5,652,178 | ) | | (106,041,742 | ) | | (6,318,770 | ) | | (139,782,898 | ) |
| | | | | | | | | | | | | | |
Increase (decrease) | | | 71,100 | | $ | (4,346,897 | ) | | (2,928,800 | ) | $ | (60,260,771 | ) |
| | | | | | | | | | | | | | |
|
Class B Shares | | | | | | | | | | | | | |
| | | | | | | | | | |
Shares sold | | | 65,014 | | $ | 1,069,266 | | | 59,728 | | $ | 1,239,607 | |
Reinvestment of distributions | | | 302,024 | | | 4,485,056 | | | – | | | – | |
Shares reacquired | | | (379,536 | ) | | (6,392,126 | ) | | (449,034 | ) | | (9,262,289 | ) |
Converted to Class A* | | | (396,198 | ) | | (6,672,835 | ) | | (344,041 | ) | | (6,967,069 | ) |
| | | | | | | | | | | | | | |
Decrease | | | (408,696 | ) | $ | (7,510,639 | ) | | (733,347 | ) | $ | (14,989,751 | ) |
| | | | | | | | | | | | | | |
|
Class C Shares | | | | | | | | | | | | | |
| | | | | | | | | | |
Shares sold | | | 413,471 | | $ | 6,813,059 | | | 537,376 | | $ | 11,176,985 | |
Reinvestment of distributions | | | 545,825 | | | 8,100,035 | | | – | | | – | |
Shares reacquired | | | (939,393 | ) | | (15,786,152 | ) | | (809,005 | ) | | (16,510,812 | ) |
| | | | | | | | | | | | | | |
Increase (decrease) | | | 19,903 | | $ | (873,058 | ) | | (271,629 | ) | $ | (5,333,827 | ) |
| | | | | | | | | | | | | | |
|
Class F Shares | | | | | | | | | | | | | |
| | | | | | | | | | |
Shares sold | | | 356,321 | | $ | 6,914,155 | | | 438,014 | | $ | 10,076,671 | |
Reinvestment of distributions | | | 98,972 | | | 1,678,575 | | | – | | | – | |
Shares reacquired | | | (431,241 | ) | | (8,308,596 | ) | | (271,341 | ) | | (5,975,330 | ) |
| | | | | | | | | | | | | | |
Increase | | | 24,052 | | $ | 284,134 | | | 166,673 | | $ | 4,101,341 | |
| | | | | | | | | | | | | | |
|
Class I Shares | | | | | | | | | | | | | |
| | | | | | | | | | |
Shares sold | | | 4,047,981 | | $ | 81,054,289 | | | 2,094,748 | | $ | 46,313,790 | |
Reinvestment of distributions | | | 460,054 | | | 8,175,152 | | | – | | | – | |
Shares reacquired | | | (3,446,344 | ) | | (69,514,625 | ) | | (1,776,401 | ) | | (40,441,214 | ) |
| | | | | | | | | | | | | | |
Increase | | | 1,061,691 | | $ | 19,714,816 | | | 318,347 | | $ | 5,872,576 | |
| | | | | | | | | | | | | | |
|
Class P Shares | | | | | | | | | | | | | |
| | | | | | | | | | |
Shares sold | | | 46,480 | | $ | 884,459 | | | 130,176 | | $ | 2,917,641 | |
Reinvestment of distributions | | | 71,450 | | | 1,189,634 | | | – | | | – | |
Shares reacquired | | | (235,159 | ) | | (4,461,801 | ) | | (146,203 | ) | | (3,303,252 | ) |
| | | | | | | | | | | | | | |
Decrease | | | (117,229 | ) | $ | (2,387,708 | ) | | (16,027 | ) | $ | (385,611 | ) |
| | | | | | | | | | | | | | |
|
Class R2 Shares | | | | | | | | | | | | | |
| | | | | | | | | | |
Shares sold | | | 51,623 | | $ | 977,694 | | | 57,144 | | $ | 1,289,718 | |
Reinvestment of distributions | | | 8,265 | | | 136,785 | | | – | | | – | |
Shares reacquired | | | (51,020 | ) | | (961,310 | ) | | (48,279 | ) | | (1,011,558 | ) |
| | | | | | | | | | | | | | |
Increase | | | 8,868 | | $ | 153,169 | | | 8,865 | | $ | 278,160 | |
| | | | | | | | | | | | | | |
|
Class R3 Shares | | | | | | | | | | | | | |
| | | | | | | | | | |
Shares sold | | | 654,968 | | $ | 12,418,620 | | | 1,202,894 | | $ | 27,008,838 | |
Reinvestment of distributions | | | 243,302 | | | 4,050,988 | | | – | | | – | |
Shares reacquired | | | (480,362 | ) | | (9,011,870 | ) | | (649,689 | ) | | (15,190,414 | ) |
| | | | | | | | | | | | | | |
Increase | | | 417,908 | | $ | 7,457,738 | | | 553,205 | | $ | 11,818,424 | |
| | | | | | | | | | | | | | |
| |
* | Automatic conversion of Class B shares occurs on the 25th day of the month (or, if the 25th is not a business day, the next business day thereafter) following the eighth anniversary of the day on which the purchase order was accepted. |
29
Report of Independent Registered Public Accounting Firm
To the Board of Directors of Lord Abbett Research Fund, Inc. and the Shareholders of Lord Abbett Growth Opportunities Fund:
We have audited the accompanying statement of assets and liabilities, including the schedule of investments, of the Lord Abbett Growth Opportunities Fund, one of the four portfolios constituting the Lord Abbett Research Fund, Inc. (the “Company”) as of November 30, 2012, and the related statement of operations for the year then ended, the statements of changes in net assets for each of the two years in the period then ended, and the financial highlights for each of the five years in the period then ended. These financial statements and financial highlights are the responsibility of the Company’s management. Our responsibility is to express an opinion on these financial statements and financial highlights based on our audits.
We conducted our audits in accordance with the standards of the Public Company Accounting Oversight Board (United States). Those standards require that we plan and perform the audits to obtain reasonable assurance about whether the financial statements and financial highlights are free of material misstatement. The Company is not required to have, nor were we engaged to perform, an audit of its internal control over financial reporting. Our audits included consideration of internal control over financial reporting as a basis for designing audit procedures that are appropriate in the circumstances, but not for the purpose of expressing an opinion on the effectiveness of the Company’s internal control over financial reporting. Accordingly, we express no such opinion. An audit also includes examining, on a test basis, evidence supporting the amounts and disclosures in the financial statements, assessing the accounting principles used and significant estimates made by management, as well as evaluating the overall financial statement presentation. Our procedures included confirmation of securities owned as of November 30, 2012, by correspondence with the custodian and brokers; where replies were not received from brokers, we performed other auditing procedures. We believe that our audits provide a reasonable basis for our opinion.
In our opinion, such financial statements and financial highlights referred to above present fairly, in all material respects, the financial position of Lord Abbett Growth Opportunities Fund, one of the four portfolios of the Lord Abbett Research Fund, Inc. as of November 30, 2012, the results of its operations for the year then ended, the changes in its net assets for each of the two years in the period then ended, and the financial highlights for each of the five years in the period then ended, in conformity with accounting principles generally accepted in the United States of America.
DELOITTE & TOUCHE LLP
New York, New York
January 28, 2013
30
Basic Information About Management
The Board of Directors (the “Board”) is responsible for the management of the business and affairs of the Company in accordance with the laws of the State of Maryland. The Board elects officers who are responsible for the day-to-day operations of the Company and who execute policies authorized by the Board. The Board also approves an investment adviser to the Company and continues to monitor the cost and quality of the services the investment adviser provides, and annually considers whether to renew the contract with the adviser. Generally, each Director holds office until his/her successor is elected and qualified or until his/her earlier resignation or removal, as provided in the Company’s organizational documents.
Lord Abbett, a Delaware limited liability company, is the Company’s investment adviser. Designated Lord Abbett personnel are responsible for the day-to-day management of the Funds.
Interested Director
The following Director is affiliated with Lord Abbett and is an “interested person” of the Company as defined in the Act. Ms. Foster is director/trustee of each of the 13 Lord Abbett-sponsored funds, which consist of 56 portfolios or series.
| | | | |
Name, Address and
Year of Birth | | Current Position and
Length of Service
with the Company | | Principal Occupation and Other Directorships
During the Past Five Years |
| | | | | |
Daria L. Foster
Lord, Abbett & Co. LLC
90 Hudson Street
Jersey City, NJ 07302
(1954) | | Director and President since 2006; Chief Executive Officer since 2012 | | Principal Occupation: Managing Partner of Lord Abbett (since 2007), and was formerly Director of Marketing and Client Service, joined Lord Abbett in 1990. |
| | | |
| | | Other Directorships: None. |
Independent Directors
The following Independent Directors also are directors/trustees of each of the 13 Lord Abbett-sponsored funds, which consist of 56 portfolios or series.
| | | | |
Name, Address and
Year of Birth | | Current Position and
Length of Service
with the Company | | Principal Occupation and Other Directorships
During the Past Five Years |
| | | | | |
E. Thayer Bigelow
Lord, Abbett & Co. LLC
c/o Legal Dept.
90 Hudson Street
Jersey City, NJ 07302
(1941) | | Director since 1996; Chairman since 2013 | | Principal Occupation: Managing General Partner, Bigelow Media, LLC (since 2000); Senior Adviser, Time Warner Inc. (1998 - 2000). |
| | | |
| | | Other Directorships: Currently serves as director of Crane Co. (since 1984) and Huttig Building Products Inc. (since 1998). Previously served as a director of R.H. Donnelley Inc. (2009 - 2010). |
| | | | |
Robert B. Calhoun, Jr.
Lord, Abbett & Co. LLC
c/o Legal Dept.
90 Hudson Street
Jersey City, NJ 07302
(1942) | | Director since 1998 | | Principal Occupation: Senior Advisor of Monitor Clipper Partners, a private equity investment fund (since 1997); President of Clipper Asset Management Corp. (1991 - 2009). |
| | | |
| | | Other Directorships: Previously served as a director of Interstate Bakeries Corp. (1991 - 2008). |
31
Basic Information About Management (continued)
| | | | |
Name, Address and
Year of Birth | | Current Position and
Length of Service
with the Company | | Principal Occupation and Other Directorships
During the Past Five Years |
| | | | | |
Evelyn E. Guernsey
Lord, Abbett & Co. LLC
c/o Legal Dept.
90 Hudson Street
Jersey City, NJ 07302
(1955) | | Director since 2011 | | Principal Occupation: CEO, Americas of J.P. Morgan Asset Management (2004 - 2010). |
| | | |
| | | Other Directorships: None. |
| | | |
| | | | |
Julie A. Hill
Lord, Abbett & Co. LLC
c/o Legal Dept.
90 Hudson Street
Jersey City, NJ 07302
(1946) | | Director since 2004 | | Principal Occupation: Owner and CEO of The Hill Company, a business consulting firm (since 1998). |
| | | |
| | | Other Directorships: Currently serves as director of Lend Lease Corporation Limited, an international retail and residential property group (since 2006), and WellPoint, Inc., a health benefits company (since 1994). |
| | | | |
Franklin W. Hobbs
Lord, Abbett & Co. LLC
c/o Legal Dept.
90 Hudson Street
Jersey City, NJ 07302
(1947) | | Director since 2001 | | Principal Occupation: Advisor of One Equity Partners, a private equity firm (since 2004). |
| | | |
| | | Other Directorships: Currently serves as director and Chairman of the Board of Ally Financial Inc., a financial services firm (since 2009), and as director of Molson Coors Brewing Company (since 2002). |
| | | | |
James M. McTaggart
Lord, Abbett & Co. LLC
c/o Legal Dept.
90 Hudson Street
Jersey City, NJ 07302
(1947) | | Director since 2012 | | Principal Occupation: Independent management advisor and consultant (since 2012); Vice President, CRA International, Inc. (doing business as Charles River Associates), a global management consulting firm (2009 - 2012); Founder and Chairman of Marakon Associates, Inc., a strategy consulting firm (1978 - 2009); and Officer and Director of Trinsum Group, a holding company (2007 - 2009).
Other Directorships: Currently serves as director of Blyth, Inc., a home products company (since 2004). |
| | | | |
James L.L. Tullis
Lord, Abbett & Co. LLC
c/o Legal Dept.
90 Hudson Street
Jersey City, NJ 07302
(1947) | | Director since 2006 | | Principal Occupation: CEO of Tullis-Dickerson and Co. Inc., a venture capital management firm (since 1990).
Other Directorships: Currently serves as director of Crane Co. (since 1998). Previously served as a director of Synageva BioPharma Corp., a biopharmaceutical company (2009 - 2011). |
32
Basic Information About Management (continued)
Officers
None of the officers listed below have received compensation from the Company. All of the officers of the Company also may be officers of the other Lord Abbett-sponsored funds and maintain offices at 90 Hudson Street, Jersey City, NJ 07302. Unless otherwise indicated, the position(s) and title(s) listed under the “Principal Occupation During the Past Five Years” column indicate each officer’s position(s) and title(s) with Lord Abbett.
| | | | | | |
Name and
Year of Birth | | Current Position
with the Company | | Length of Service
of Current
Position | | Principal Occupation
During the Past Five Years |
| | | | | | | |
Daria L. Foster
(1954) | | President and Chief Executive Officer | | Elected as President in 2006 and Chief Executive Officer in 2012 | | Managing Partner of Lord Abbett (since 2007), and was formerly Director of Marketing and Client Service, joined Lord Abbett in 1990. |
| | | | | | |
Robert P. Fetch
(1953) | | Executive Vice President | | Elected in 1997 | | Partner and Director, joined Lord Abbett in 1995. |
| | | | | | |
Daniel H. Frascarelli
(1954) | | Executive Vice President | | Elected in 2005 | | Partner and Director, joined Lord Abbett in 1990. |
| | | | | | |
Robert I. Gerber
(1954) | | Executive Vice President | | Elected in 2007 | | Partner and Chief Investment Officer (since 2007), joined Lord Abbett in 1997 as Director of Taxable Fixed Income Management. |
| | | | | | |
Gerard S. E. Heffernan, Jr.
(1963) | | Executive Vice President | | Elected in 2009 | | Partner and Director, joined Lord Abbett in 1998. |
| | | | | | |
Walter H. Prahl
(1958) | | Executive Vice President | | Elected in 2012 | | Partner and Director, joined Lord Abbett in 1997. |
| | | | | | |
Frederick J. Ruvkun
(1957) | | Executive Vice President | | Elected in 2012 | | Partner and Director, joined Lord Abbett in 2006. |
| | | | | | |
Paul J. Volovich
(1973) | | Executive Vice President | | Elected in 2004 | | Partner and Director, joined Lord Abbett in 1997. |
| | | | | | |
James W. Bernaiche
(1956) | | Chief Compliance Officer | | Elected in 2004 | | Partner and Chief Compliance Officer, joined Lord Abbett in 2001. |
| | | | | | |
Joan A. Binstock
(1954) | | Chief Financial Officer and Vice President | | Elected in 1999 | | Partner and Chief Operations Officer, joined Lord Abbett in 1999. |
| | | | | | |
John K. Forst
(1960) | | Vice President and Assistant Secretary | | Elected in 2005 | | Deputy General Counsel, joined Lord Abbett in 2004. |
33
Basic Information About Management (concluded)
| | | | | | |
Name and
Year of Birth | | Current Position
with the Company | | Length of Service
of Current
Position | | Principal Occupation
During the Past Five Years |
| | | | | | | |
Lawrence H. Kaplan
(1957) | | Vice President and Secretary | | Elected in 1997 | | Partner and General Counsel, joined Lord Abbett in 1997. |
| | | | | | |
David J. Linsen
(1974) | | Vice President | | Elected in 2008 | | Partner and Director, joined Lord Abbett in 2001. |
| | | | | | |
A. Edward Oberhaus, III
(1959) | | Vice President | | Elected in 1996 | | Partner and Director, joined Lord Abbett in 1983. |
| | | | | | |
Thomas R. Phillips
(1960) | | Vice President and Assistant Secretary | | Elected in 2008 | | Partner and Deputy General Counsel, joined Lord Abbett in 2006. |
| | | | | | |
Randy M. Reynolds
(1972) | | Vice President | | Elected in 2008 | | Portfolio Manager, joined Lord Abbett in 1999. |
| | | | | | |
Lawrence B. Stoller
(1963) | | Vice President and Assistant Secretary | | Elected in 2007 | | Partner and Senior Deputy General Counsel, joined Lord Abbett in 2007. |
| | | | | | |
Scott S. Wallner
(1955) | | AML Compliance Officer | | Elected in 2011 | | Assistant General Counsel, joined Lord Abbett in 2004. |
| | | | | | |
Bernard J. Grzelak
(1971) | | Treasurer | | Elected in 2003 | | Partner and Director of Fund Administration, joined Lord Abbett in 2003. |
Please call 888–522–2388 for a copy of the statement of additional information (“SAI”), which contains further information about the Company’s Directors. It is available free upon request.
34
Householding
The Company has adopted a policy that allows it to send only one copy of the Fund’s prospectus, proxy material, annual report and semiannual report to certain shareholders residing at the same “household.” This reduces Fund expenses, which benefits you and other shareholders. If you need additional copies or do not want your mailings to be “householded,” please call Lord Abbett at 888–522–2388 or send a written request with your name, the name of your fund or funds and your account number or numbers to Lord Abbett Family of Funds, P.O. Box 219336, Kansas City, MO 64121.
Proxy Voting Policies, Procedures and Records
A description of the policies and procedures that Lord Abbett uses to vote proxies related to the Fund’s portfolio securities, and information on how Lord Abbett voted the Fund’s proxies during the 12-month period ended June 30 are available without charge, upon request, (i) by calling 888–522–2388; (ii) on Lord Abbett’s Website at www.lordabbett.com; and (iii) on the Securities and Exchange Commission’s (“SEC”) Website at www.sec.gov.
Shareholder Reports and Quarterly Portfolio Disclosure
The Fund is required to file its complete schedule of portfolio holdings with the SEC for its first and third fiscal quarters on Form N-Q. Copies of the filings are available without charge, upon request on the SEC’s Website at www.sec.gov and may be available by calling Lord Abbett at 888–522–2388. You can also obtain copies of Form N-Q by visiting the SEC’s Public Reference Room in Washington, DC (information on the operation of the Public Reference Room may be obtained by calling 800-SEC-0330).
| | |
| Tax Information | |
| | |
| Of the distributions paid to shareholders during the fiscal year ended November 30, 2012, $87,834,728 represents long-term capital gains. | |
| | |
35


| | | |
This report, when not used for the general information of shareholders of the Fund, is to be distributed only if preceded or accompanied by a current fund prospectus. | | | |
| | Lord Abbett Research Fund, Inc. | |
Lord Abbett Mutual Fund shares are distributed by | | | LAGOF-2-1112 |
LORD ABBETT DISTRIBUTOR LLC. | | Lord Abbett Growth Opportunities Fund | (01/13) |
| | | |

2 0 1 2
L O R D A B B E T T
A N N U A L
R E P O R T
Lord Abbett
Classic Stock Fund
Small Cap Value Fund
For the fiscal year ended November 30, 2012
|
| |
|
Lord Abbett Research Fund
Lord Abbett Classic Stock Fund
and Lord Abbett Small Cap Value Fund
Annual Report |
For the fiscal year ended November 30, 2012 |
Dear Shareholders: We are pleased to provide you with this overview of the performance of the Funds for the fiscal year ended November 30, 2012. On this page and the following pages, we discuss the major factors that influenced fiscal year performance. For detailed and more timely information about the Funds, please visit our Website at www.lordabbett.com, where you also can access the quarterly commentaries that provide updates on each Fund’s performance and other portfolio related updates.
Thank you for investing in Lord Abbett mutual funds. We value the trust that you place in us and look forward to serving your investment needs in the years to come.
|
Best regards, |
|

|
Daria L. Foster |
Director, President and Chief Executive Officer |
| |
Classic Stock Fund
For the fiscal year ended November 30, 2012, the Fund returned 13.89%, reflecting performance at the net asset value (NAV) of Class A shares, with all distributions reinvested, compared to its benchmark, the Russell 1000® Index,1 which returned 16.19% over the same period.
Although the Fund posted a double-digit return, the 12-month period was a challenging and volatile environment for active managers. The market rose during the first four months of the fiscal period, as strong employment reports and increased housing activity provided evidence of an improving economy. Unfortunately, the risk-off environment returned during April and May of 2012 and the Fund’s cyclical positioning resulted in underperformance. Macroeconomic concerns about Europe and the slowdown of China’s economy caused investors to favor defensive sectors and dividend-paying stocks during this risk-off period. Despite volatility surrounding the election and the political debate about the “fiscal cliff,” the stock market generally resumed its rise during the latter part of the fiscal year, mainly driven by a continuation of positive housing trends and earnings reports that exceeded the low expectations of investors.
Stock selection and an overweight position within the energy sector detracted from the Fund’s relative performance during the period as the energy sector was the weakest performing group within the index. Shares of Hess Corp. and Occidental Petroleum, two integrated oil and gas
1
|
| |
|
companies, were affected by the decline in crude oil prices, and concerns about production shortfalls. Stock selection within the materials sector also detracted from relative performance. Cliffs Natural Resources, Inc. a global producer of iron ore and metallurgical coal used in steel production, was hurt by declining iron ore prices and higher labor, mining and maintenance costs during the period. |
The Fund’s relative performance benefited from an underweight in the utilities sector, as it was one of the weaker performing sectors during the period. Contributing to the Fund’s relative performance was stock selection within the information technology and health care sectors. Within information technology, shares of Apple, Inc., producer of the iPhone, and Qualcomm, Inc., a semiconductor company that produces components for the iPhone and other smartphone devices, both benefited from strong sales of the new iPhone 5. Within the health care sector, one of the top contributors in the Fund was Pfizer Inc. Shares of Pfizer Inc., a global biopharmaceutical company, rose upon positive news in the company’s pipeline, specifically the Food and Drug Administration (FDA) approved a drug called Bosulif which treats chronic myelogenous leukemia, and a drug Inlyta received European approval as a second line treatment for kidney cancer patients.
Small Cap Value Fund
For the fiscal year ended November 30, 2012, the Fund returned 8.63%, reflecting performance at the net asset value (NAV) of Class A shares, with all distributions reinvested, compared to its benchmark, the Russell 2000® Value Index,2 which returned 15.05% over the same period.
A strong performance by domestic equities was overshadowed by persistent economic uncertainty during the 12-month period. Investors were forced to weigh the negative impacts of the European sovereign debt crisis, decelerating growth in China, and the fragile U.S. economy against the positive effects of global monetary easing and signs of a U.S. housing recovery. As the period came to a close, investors’ focus shifted towards Washington, D.C. as lawmakers attempted to negotiate a deal that would avert the impending “fiscal cliff.” In an environment dominated by macroeconomic headlines, which proved challenging for active money managers, the Fund underperformed the index during the period by 6.42%. Performance lagged most notably in the second quarter of 2012, which accounted for most of the Fund’s overall underperformance on a relative basis.
A pair of consumer discretionary holdings Express, Inc. and Crocs, Inc. were among the notable detractors to the Fund’s overall relative performance during the period. Shares of Express, a specialty retailer, were under pressure as
2
|
| |
|
management lowered guidance for three consecutive quarters. The lowered guidance was attributed to fashion misses and a decline in store traffic. Due to fundamental concerns, we exited the position in October 2012. Overseas headwinds, particularly in Japan, negatively impacted casual footwear, apparel, and accessories producer Crocs. Slowing sales in Japan, the company’s largest market outside of the United States, coupled with increased costs due to retail expansion, caused management to lower its guidance. Two other notable detractors, Key Energy Services, Inc. and Superior Energy Services, Inc., can be found within the energy sector. Oil-field services provider Key Energy Services, experienced diminishing activity levels as oil-field service demand declined as a result of deteriorating natural gas prices. The company twice lowered guidance, citing pricing pressures and lower utilization as reasons for the revisions. Despite solid growth in Key’s international business, weakness in North America continued to be a drag on share price. Similarly, oil-field services provider Superior Energy Services, Inc. experienced declining activity levels because lower commodity prices negatively impacted the company’s profits. As underutilization in the North American market continued to outweigh growth in the company’s international business, management twice lowered guidance during the period. |
Among the largest contributors to the Fund’s relative performance were information technology holdings Fleetcor Technologies, Inc. and MAXIMUS, Inc. Shares of Fleetcor Technologies, a specialized payment product and services provider, rallied during the period in which management announced three straight quarters of positive earnings surprises. Performance was fueled by a string of successful acquisitions, including Allstar Business Solutions Ltd. in the United Kingdom, CTF Technology in Brazil, and a Russian fuel card company. Shares of MAXIMUS, a provider of consulting services for government health and human services agencies, rallied following the Supreme Court’s decision to uphold the Affordable Care Act in late June 2012. Investors believed an expansion in Medicaid would have a direct, positive impact for the largest vendor of Medicaid enrollment services. Evidence of this impact could be seen with key contract awards in Minnesota and Illinois. Two more notable contributors to the Fund’s relative performance included health care holding Par Pharmaceutical Cos., Inc. and industrials holding RSC Holdings, Inc. In July of 2012 Par Pharmaceutical, a pharmaceutical company, entered into a definitive merger agreement with private equity firm TPG Capital, L.P., which offered a significant market premium for the developer of branded and generic pharmaceuticals. Shares of RSC Holdings Inc., an equipment rental provider, rallied
3
|
| |
|
significantly in December 2011 on news the company agreed to be acquired by United Rentals, Inc. The merger was approved by shareholders and closed in late April of 2012. |
|
Each Fund’s portfolio is actively managed and, therefore, its holdings and the weightings of a particular issuer or particular sector as a percentage of portfolio assets are subject to change. Sectors may include many industries. |
|
1 The Russell 1000® Index measures the performance of the 1,000 largest companies in the Russell 3000 Index, which represents approximately 90% of the total market capitalization of the Russell 3000 Index. |
|
2 The Russell 2000® Value Index measures the performance of those Russell 2000 companies with lower price-to-book ratios and lower forecasted growth values. |
|
Unless otherwise specified, indexes reflect total return, with all dividends reinvested. Indexes are unmanaged, do not reflect the deduction of fees or expenses, and are not available for direct investment. |
|
Important Performance and Other Information Performance data quoted in the following pages reflect past performance and are no guarantee of future results. Current performance may be higher or lower than the performance quoted. The investment return and principal value of an investment in the Fund will fluctuate so that shares, on any given day or when redeemed, may be worth more or less than their original cost. You can obtain performance data current to the most recent month end by calling Lord Abbett at 888–522–2388 or referring to www.lordabbett.com. |
|
Except where noted, comparative Fund performance does not account for the deduction of sales charges and would be different if sales charges were included. Each Fund offers several classes of shares with distinct pricing options. For a full description of the differences in pricing alternatives, please see each Fund’s prospectus. |
|
During certain periods shown, expense waivers and reimbursements were in place for Classic Stock Fund. Without such expense waivers and reimbursements, the Fund’s returns would have been lower. |
|
The annual commentary above discusses the views of the Funds’ management and various portfolio holdings of the Funds as of November 30, 2012. These views and portfolio holdings may have changed after this date. Information provided in the commentary is not a recommendation to buy or sell securities. Because the Funds’ portfolios are actively managed and may change significantly, the Funds may no longer own the securities described above or may have otherwise changed their positions in the securities. For more recent information about the Funds’ portfolio holdings, please visit www.lordabbett.com. |
|
A Note about Risk: See Notes to Financial Statements for a discussion of investment risks. For a more detailed discussion of the risks associated with the Fund, please see each Fund’s prospectus. |
|
Mutual funds are not insured by the FDIC, are not deposits or other obligations of, or guaranteed by, banks, and are subject to investment risks including possible loss of principal amount invested. |
4
|
Classic Stock Fund |
| |
Investment Comparison |
Below is a comparison of a $10,000 investment in Class A shares with the same investment in the Russell 1000® Index and the S&P 500® Index, assuming reinvestment of all dividends and distributions. The performance of other classes will be greater than or less than the performance shown in the graph below due to different sales loads and expenses applicable to such classes. The graph and performance table below do not reflect the deduction of taxes that a shareholder would pay on Fund distributions or the redemption of Fund shares. During certain periods, expenses of the Fund have been waived or reimbursed by Lord Abbett; without such waiver or reimbursement of expenses, the Fund’s returns would have been lower. Past performance is no guarantee of future results.
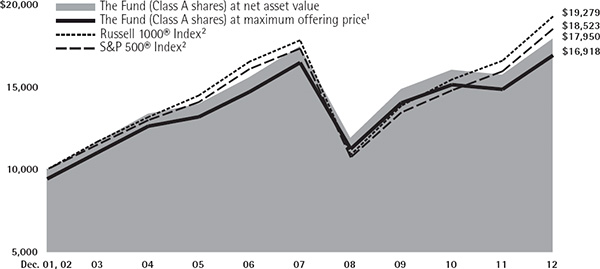
Average Annual Total Returns at Maximum Applicable
Sales Charge for the Periods Ended November 30, 2012
| | | | | | | | | |
| | 1 Year | | 5 Years | | 10 Years | | Life of Class | |
Class A3 | | 7.35% | | -0.65% | | 5.40% | | – | |
Class B4 | | 8.12% | | -0.50% | | 5.48% | | – | |
Class C5 | | 12.15% | | -0.12% | | 5.34% | | – | |
Class F6 | | 14.18% | | 0.78% | | – | | 0.43% | |
Class I7 | | 14.30% | | 0.89% | | 6.40% | | – | |
Class P7 | | 13.77% | | 0.43% | | 5.94% | | – | |
Class R28 | | 13.56% | | 0.47% | | – | | 0.11% | |
Class R39 | | 13.69% | | 0.39% | | – | | 0.04% | |
|
1 Reflects the deduction of the maximum initial sales charge of 5.75%. |
2 Performance for each unmanaged index does not reflect any fees or expenses. The performance of each index is not necessarily representative of the Fund’s performance. |
3 Total return, which is the percentage change in net asset value, after deduction of the maximum initial sales charge of 5.75% applicable to Class A shares, with all dividends and distributions reinvested for the periods shown ended November 30, 2012, is calculated using the SEC-required uniform method to compute such return. |
4 Performance reflects the deduction of a CDSC of 5% for 1 year, 2% for 5 years and 0% for 10 years. Class B shares automatically convert to Class A shares after approximately 8 years. (There is no initial sales charge for automatic conversions.) All returns for periods greater than 8 years reflect this conversion. |
5 The 1% CDSC for Class C shares normally applies before the first anniversary of the purchase date. Performance for other periods is at net asset value. |
6 Class F shares commenced operations and performance for the Class began on September 28, 2007. Performance is at net asset value. |
7 Performance is at net asset value. |
8 Class R2 shares commenced operations and performance for the Class began on September 28, 2007. Performance is at net asset value. |
9 Class R3 shares commenced operations and performance for the Class began on September 28, 2007. Performance is at net asset value. |
5
|
Small Cap Value Fund |
| |
Investment Comparison |
Below is a comparison of a $10,000 investment in Class A shares with the same investment in both the Russell 2000® Value Index and the Russell 2000® Index, assuming reinvestment of all dividends and distributions. The performance of other classes will be greater than or less than the performance shown in the graph below due to different sales loads and expenses applicable to such classes. The graph and performance table below do not reflect the deduction of taxes that a shareholder would pay on Fund distributions or the redemption of Fund shares. Past performance is no guarantee of future results.
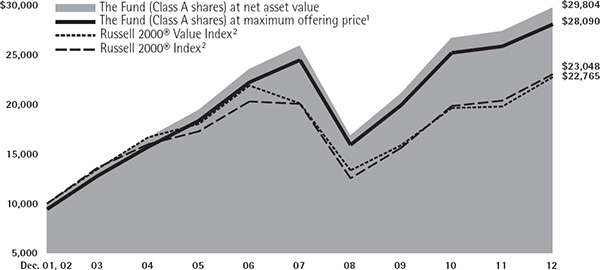
Average Annual Total Returns at Maximum Applicable
Sales Charge for the Periods Ended November 30, 2012
| | | | | | | | | |
| | 1 Year | | 5 Years | | 10 Years | | Life of Class | |
Class A3 | | 2.38% | | 1.58% | | 10.88% | | – | |
Class B4 | | 2.82% | | 1.72% | | 10.94% | | – | |
Class C5 | | 6.89% | | 2.08% | | 10.78% | | – | |
Class F6 | | 8.84% | | 2.99% | | – | | 2.59% | |
Class I7 | | 8.96% | | 3.09% | | 11.89% | | – | |
Class P7 | | 8.46% | | 2.63% | | 11.39% | | – | |
Class R28 | | 8.31% | | – | | – | | 4.62% | |
Class R39 | | 8.41% | | – | | – | | 4.72% | |
|
1 Reflects the deduction of the maximum initial sales charge of 5.75%. |
2 Performance for each unmanaged index does not reflect any fees or expenses. The performance of each index is not necessarily representative of the Fund’s performance. |
3 Total return, which is the percentage change in net asset value, after deduction of the maximum initial sales charge of 5.75% applicable to Class A shares, with all dividends and distributions reinvested for the periods shown ended November 30, 2012, is calculated using the SEC-required uniform method to compute such return. |
4 Performance reflects the deduction of a CDSC of 5% for 1 year, 2% for 5 years and 0% for 10 years. Class B shares automatically convert to Class A shares after approximately 8 years. (There is no initial sales charge for automatic conversions.) |
All returns for periods greater than 8 years reflect this conversion. |
5 The 1% CDSC for Class C shares normally applies before the first anniversary of the purchase date. Performance for other periods is at net asset value. |
6 Class F shares commenced operations and performance for the Class began on September 28, 2007. Performance is at net asset value. |
7 Performance is at net asset value. |
8 Class R2 shares commenced operations on March 24, 2008 and performance for the Class began March 31, 2008. Performance is at net asset value. |
9 Class R3 shares commenced operations on March 24, 2008 and performance for the Class began March 31, 2008. Performance is at net asset value. |
6
As a shareholder of a Fund, you incur two types of costs: (1) transaction costs, including sales charges (loads) on purchase payments (these charges vary among the share classes); and (2) ongoing costs, including management fees; distribution and service (12b-1) fees (these charges vary among the share classes); and other Fund expenses. This Example is intended to help you understand your ongoing costs (in dollars) of investing in the Funds and to compare these costs with the ongoing costs of investing in other mutual funds.
The Example is based on an investment of $1,000 invested at the beginning of the period and held for the entire period (June 1, 2012 through November 30, 2012).
Actual Expenses
For each class of each Fund, the first line of the tables on the following pages provides information about actual account values and actual expenses. You may use the information in this line, together with the amount you invested, to estimate the expenses that you paid over the period. Simply divide your account value by $1,000 (for example, an $8,600 account value divided by $1,000 = 8.6), then multiply the result by the number in the first line under the heading titled “Expenses Paid During Period 6/1/12 – 11/30/12” to estimate the expenses you paid on your account during this period.
Hypothetical Example for Comparison Purposes
For each class of each Fund, the second line of the tables on the following pages provides information about hypothetical account values and hypothetical expenses based on the Fund’s actual expense ratio and an assumed rate of return of 5% per year before expenses, which is not each Fund’s actual return. The hypothetical account values and expenses may not be used to estimate the actual ending account balance or expenses you paid for the period. You may use this information to compare the ongoing costs of investing in each Fund and other funds. To do so, compare this 5% hypothetical example with the 5% hypothetical examples that appear in the shareholder reports of the other funds.
7
Please note that the expenses shown in the table are meant to highlight your ongoing costs only and do not reflect any transactional costs, such as sales charges (loads). Therefore, the second line of the table is useful in comparing ongoing costs only, and will not help you determine the relative total costs of owning different funds. In addition, if these transactional costs were included, your costs would have been higher.
| | | | | | | | | | | | | | | | |
| | Beginning
Account
Value | | Ending
Account
Value | | Expenses
Paid During
Period† | |
| | | | | | | |
| | 6/1/12 | | 11/30/12 | | 6/1/12 –
11/30/12 | |
| | | | | | | |
Class A | | | | | | | | | | |
Actual | | | $ | 1,000.00 | | | | $ | 1,085.60 | | | | $ | 5.11 | | |
Hypothetical (5% Return Before Expenses) | | | $ | 1,000.00 | | | | $ | 1,020.11 | | | | $ | 4.95 | | |
Class B | | | | | | | | | | | | | | | | |
Actual | | | $ | 1,000.00 | | | | $ | 1,082.00 | | | | $ | 8.48 | | |
Hypothetical (5% Return Before Expenses) | | | $ | 1,000.00 | | | | $ | 1,016.87 | | | | $ | 8.22 | | |
Class C | | | | | | | | | | | | | | | | |
Actual | | | $ | 1,000.00 | | | | $ | 1,081.80 | | | | $ | 8.43 | | |
Hypothetical (5% Return Before Expenses) | | | $ | 1,000.00 | | | | $ | 1,016.92 | | | | $ | 8.17 | | |
Class F | | | | | | | | | | | | | | | | |
Actual | | | $ | 1,000.00 | | | | $ | 1,086.90 | | | | $ | 3.81 | | |
Hypothetical (5% Return Before Expenses) | | | $ | 1,000.00 | | | | $ | 1,021.35 | | | | $ | 3.69 | | |
Class I | | | | | | | | | | | | | | | | |
Actual | | | $ | 1,000.00 | | | | $ | 1,087.60 | | | | $ | 3.29 | | |
Hypothetical (5% Return Before Expenses) | | | $ | 1,000.00 | | | | $ | 1,021.85 | | | | $ | 3.18 | | |
Class P | | | | | | | | | | | | | | | | |
Actual | | | $ | 1,000.00 | | | | $ | 1,084.70 | | | | $ | 5.63 | | |
Hypothetical (5% Return Before Expenses) | | | $ | 1,000.00 | | | | $ | 1,019.60 | | | | $ | 5.45 | | |
Class R2 | | | | | | | | | | | | | | | | |
Actual | | | $ | 1,000.00 | | | | $ | 1,084.30 | | | | $ | 6.41 | | |
Hypothetical (5% Return Before Expenses) | | | $ | 1,000.00 | | | | $ | 1,018.86 | | | | $ | 6.21 | | |
Class R3 | | | | | | | | | | | | | | | | |
Actual | | | $ | 1,000.00 | | | | $ | 1,084.70 | | | | $ | 5.84 | | |
Hypothetical (5% Return Before Expenses) | | | $ | 1,000.00 | | | | $ | 1,019.38 | | | | $ | 5.65 | | |
| |
† | For each class of the Fund, net expenses are equal to the annualized expense ratio for such class (0.98% for Class A, 1.63% for Class B, 1.62% for Class C, 0.73% for Class F, 0.63% for Class I, 1.08% for Class P, 1.23% for Class R2 and 1.12% for Class R3) multiplied by the average account value over the period, multiplied by 183/366 (to reflect one-half year period). |
| |
| |
|
Portfolio Holdings Presented by Sector |
November 30, 2012 |
| | | |
Sector* | | %** | |
Consumer Discretionary | | 9.28% | |
Consumer Staples | | 7.87% | |
Energy | | 12.42% | |
Financials | | 15.86% | |
Health Care | | 10.89% | |
Industrials | | 10.87% | |
| | | |
Sector* | | %** | |
Information Technology | | 20.20% | |
Materials | | 5.64% | |
Telecommunication Services | | 2.99% | |
Utilities | | 1.42% | |
Short-Term Investment | | 2.56% | |
Total | | 100.00% | |
| |
* | A sector may comprise several industries. |
** | Represents percent of total investments. |
8
Please note that the expenses shown in the table are meant to highlight your ongoing costs only and do not reflect any transactional costs, such as sales charges (loads). Therefore, the second line of the table is useful in comparing ongoing costs only, and will not help you determine the relative total costs of owning different funds. In addition, if these transactional costs were included, your costs would have been higher.
| | | | | | | | | | | | | | | | |
| | Beginning
Account
Value | | Ending
Account
Value | | Expenses
Paid During
Period† | |
| | | | | | | |
| | 6/1/12 | | 11/30/12 | | 6/1/12 –
11/30/12 | |
| | | | | | | |
Class A | | | | | | | | | | |
Actual | | | $ | 1,000.00 | | | | $ | 1,058.40 | | | | $ | 6.33 | | |
Hypothetical (5% Return Before Expenses) | | | $ | 1,000.00 | | | | $ | 1,018.84 | | | | $ | 6.21 | | |
Class B | | | | | | | | | | | | | | | | |
Actual | | | $ | 1,000.00 | | | | $ | 1,054.30 | | | | $ | 9.91 | | |
Hypothetical (5% Return Before Expenses) | | | $ | 1,000.00 | | | | $ | 1,015.34 | | | | $ | 9.72 | | |
Class C | | | | | | | | | | | | | | | | |
Actual | | | $ | 1,000.00 | | | | $ | 1,055.00 | | | | $ | 9.92 | | |
Hypothetical (5% Return Before Expenses) | | | $ | 1,000.00 | | | | $ | 1,015.37 | | | | $ | 9.72 | | |
Class F | | | | | | | | | | | | | | | | |
Actual | | | $ | 1,000.00 | | | | $ | 1,059.40 | | | | $ | 5.30 | | |
Hypothetical (5% Return Before Expenses) | | | $ | 1,000.00 | | | | $ | 1,019.84 | | | | $ | 5.20 | | |
Class I | | | | | | | | | | | | | | | | |
Actual | | | $ | 1,000.00 | | | | $ | 1,060.00 | | | | $ | 4.79 | | |
Hypothetical (5% Return Before Expenses) | | | $ | 1,000.00 | | | | $ | 1,020.34 | | | | $ | 4.70 | | |
Class P | | | | | | | | | | | | | | | | |
Actual | | | $ | 1,000.00 | | | | $ | 1,057.60 | | | | $ | 7.10 | | |
Hypothetical (5% Return Before Expenses) | | | $ | 1,000.00 | | | | $ | 1,018.09 | | | | $ | 6.96 | | |
Class R2 | | | | | | | | | | | | | | | | |
Actual | | | $ | 1,000.00 | | | | $ | 1,056.80 | | | | $ | 7.87 | | |
Hypothetical (5% Return Before Expenses) | | | $ | 1,000.00 | | | | $ | 1,017.34 | | | | $ | 7.72 | | |
Class R3 | | | | | | | | | | | | | | | | |
Actual | | | $ | 1,000.00 | | | | $ | 1,057.40 | | | | $ | 7.30 | | |
Hypothetical (5% Return Before Expenses) | | | $ | 1,000.00 | | | | $ | 1,017.88 | | | | $ | 7.16 | | |
| |
† | For each class of the Fund, net expenses are equal to the annualized expense ratio for such class (1.23% for Class A, 1.93% for Classes B and C, 1.03% for Class F, 0.93% for Class I, 1.38% for Class P, 1.53% for Class R2 and 1.42% for Class R3) multiplied by the average account value over the period, multiplied by 183/366 (to reflect one-half year period). |
| |
| |
|
Portfolio Holdings Presented by Sector |
November 30, 2012 |
| | | |
Sector* | | %** | |
Consumer Discretionary | | 11.16% | |
Consumer Staples | | 1.85% | |
Energy | | 5.72% | |
Financials | | 24.92% | |
Health Care | | 9.45% | |
Industrials | | 21.10% | |
| | | |
Sector* | | %** | |
Information Technology | | 13.10% | |
Materials | | 9.51% | |
Utilities | | 2.67% | |
Short-Term Investment | | 0.52% | |
Total | | 100.00% | |
| |
* | A sector may comprise several industries. |
** | Represents percent of total investments. |
9
|
Schedule of Investments |
CLASSIC STOCK FUND November 30, 2012 |
| | | | | | | |
Investments | | | Shares | | | Fair
Value
(000) | |
| | | | | | | | |
COMMON STOCKS 97.41% | | | | | | | |
| | | | | | | |
Aerospace & Defense 3.30% | | | | | | | |
Boeing Co. (The) | | | 55,796 | | $ | 4,145 | |
Honeywell International, Inc. | | | 100,300 | | | 6,151 | |
Precision Castparts Corp. | | | 35,600 | | | 6,529 | |
United Technologies Corp. | | | 98,700 | | | 7,907 | |
| | | | | | | |
Total | | | | | | 24,732 | |
| | | | | | | |
| | | | | | | |
Automobiles 0.78% | | | | | | | |
Ford Motor Co. | | | 508,300 | | | 5,820 | |
| | | | | | | |
| | | | | | | |
Beverages 2.37% | | | | | | | |
Coca-Cola Co. (The) | | | 197,300 | | | 7,482 | |
PepsiCo, Inc. | | | 147,000 | | | 10,321 | |
| | | | | | | |
Total | | | | | | 17,803 | |
| | | | | | | |
| | | | | | | |
Biotechnology 1.35% | | | | | | | |
Celgene Corp.* | | | 15,700 | | | 1,234 | |
Gilead Sciences, Inc.* | | | 65,424 | | | 4,907 | |
Vertex Pharmaceuticals, Inc.* | | | 100,000 | | | 3,979 | |
| | | | | | | |
Total | | | | | | 10,120 | |
| | | | | | | |
| | | | | | | |
Capital Markets 3.20% | | | | | | | |
Franklin Resources, Inc. | | | 11,600 | | | 1,531 | |
Goldman Sachs Group, Inc.
(The) | | | 91,400 | | | 10,766 | |
Morgan Stanley | | | 259,500 | | | 4,378 | |
State Street Corp. | | | 18,400 | | | 818 | |
T. Rowe Price Group, Inc. | | | 100,800 | | | 6,519 | |
| | | | | | | |
Total | | | | | | 24,012 | |
| | | | | | | |
| | | | | | | |
Chemicals 3.38% | | | | | | | |
Celanese Corp. Series A | | | 108,300 | | | 4,445 | |
Dow Chemical Co. (The) | | | 215,100 | | | 6,494 | |
E.I. du Pont de Nemours
& Co. | | | 22,200 | | | 958 | |
LyondellBasell Industries NV
Class A (Netherlands)(a) | | | 120,400 | | | 5,987 | |
Monsanto Co. | | | 69,645 | | | 6,379 | |
Mosaic Co. (The) | | | 20,100 | | | 1,086 | |
| | | | | | | |
Total | | | | | | 25,349 | |
| | | | | | | |
| | | | | | | |
Investments | | | Shares | | | Fair
Value
(000) | |
| | | | | | | | |
Commercial Banks 4.97% | | | | | | | |
Fifth Third Bancorp | | | 330,000 | | $ | 4,831 | |
PNC Financial Services
Group, Inc. (The) | | | 87,100 | | | 4,890 | |
Regions Financial Corp. | | | 466,200 | | | 3,110 | |
SunTrust Banks, Inc. | | | 127,000 | | | 3,448 | |
U.S. Bancorp | | | 231,600 | | | 7,471 | |
Wells Fargo & Co. | | | 409,500 | | | 13,518 | |
| | | | | | | |
Total | | | | | | 37,268 | |
| | | | | | | |
| | | | | | | |
Communications Equipment 2.88% | | | | | | | |
Cisco Systems, Inc. | | | 266,600 | | | 5,042 | |
QUALCOMM, Inc. | | | 259,700 | | | 16,522 | |
| | | | | | | |
Total | | | | | | 21,564 | |
| | | | | | | |
| | | | | | | |
Computers & Peripherals 7.21% | | | | | | | |
Apple, Inc. | | | 79,100 | | | 46,295 | |
EMC Corp.* | | | 243,100 | | | 6,034 | |
Hewlett-Packard Co. | | | 78,351 | | | 1,018 | |
NetApp, Inc.* | | | 22,700 | | | 720 | |
| | | | | | | |
Total | | | | | | 54,067 | |
| | | | | | | |
| | | | | | | |
Construction & Engineering 0.60% | | | | | | | |
Fluor Corp. | | | 84,100 | | | 4,464 | |
| | | | | | | |
| | | | | | | |
Consumer Finance 1.44% | | | | | | | |
Capital One Financial Corp. | | | 187,200 | | | 10,783 | |
| | | | | | | |
| | | | | | | |
Containers & Packaging 0.51% | | | | | | | |
Rock-Tenn Co. Class A | | | 59,200 | | | 3,850 | |
| | | | | | | |
| | | | | | | |
Diversified Financial Services 3.11% | | | | | | | |
Bank of America Corp. | | | 489,821 | | | 4,830 | |
Citigroup, Inc. | | | 205,380 | | | 7,100 | |
JPMorgan Chase & Co. | | | 277,828 | | | 11,413 | |
| | | | | | | |
Total | | | | | | 23,343 | |
| | | | | | | |
| | | | | | | |
Diversified Telecommunication Services 2.99% | | | | | | | |
AT&T, Inc. | | | 265,802 | | | 9,072 | |
CenturyLink, Inc. | | | 139,600 | | | 5,422 | |
Verizon Communications,
Inc. | | | 179,000 | | | 7,897 | |
| | | | | | | |
Total | | | | | | 22,391 | |
| | | | | | | |
| | |
10 | See Notes to Financial Statements. | |
|
Schedule of Investments (continued) |
CLASSIC STOCK FUND November 30, 2012 |
| | | | | | | |
Investments | | | Shares | | | Fair
Value
(000) | |
| | | | | | | | |
Electric: Utilities 0.70% | | | | | | | |
Duke Energy Corp. | | | 36,522 | | $ | 2,331 | |
NextEra Energy, Inc. | | | 42,432 | | | 2,915 | |
| | | | | | | |
Total | | | | | | 5,246 | |
| | | | | | | |
| | | | | | | |
Electrical Equipment 1.29% | | | | | | | |
Eaton Corp. | | | 26,700 | | | 1,393 | |
Emerson Electric Co. | | | 164,778 | | | 8,277 | |
| | | | | | | |
Total | | | | | | 9,670 | |
| | | | | | | |
| | | | | | | |
Energy Equipment & Services 2.07% | | | | | | | |
National Oilwell Varco, Inc. | | | 55,000 | | | 3,757 | |
Schlumberger Ltd. | | | 139,575 | | | 9,996 | |
Weatherford International
Ltd. (Switzerland)*(a) | | | 168,400 | | | 1,753 | |
| | | | | | | |
Total | | | | | | 15,506 | |
| | | | | | | |
| | | | | | | |
Food & Staples Retailing 1.09% | | | | | | | |
CVS Caremark Corp. | | | 134,848 | | | 6,272 | |
Wal-Mart Stores, Inc. | | | 26,500 | | | 1,908 | |
| | | | | | | |
Total | | | | | | 8,180 | |
| | | | | | | |
| | | | | | | |
Food Products 0.58% | | | | | | | |
Kellogg Co. | | | 78,200 | | | 4,337 | |
| | | | | | | |
| | | | | | | |
Health Care Providers & Services 3.09% | | | | | | | |
Catamaran Corp.* | | | 89,200 | | | 4,343 | |
Express Scripts Holding Co.* | | | 218,300 | | | 11,756 | |
UnitedHealth Group, Inc. | | | 129,600 | | | 7,049 | |
| | | | | | | |
Total | | | | | | 23,148 | |
| | | | | | | |
| | | | | | | |
Hotels, Restaurants & Leisure 2.56% | | | | | | | |
Carnival Corp. | | | 42,300 | | | 1,635 | |
Hyatt Hotels Corp. Class A* | | | 57,139 | | | 2,086 | |
Marriott International, Inc.
Class A | | | 79,378 | | | 2,881 | |
MGM Resorts International* | | | 513,900 | | | 5,216 | |
Starwood Hotels & Resorts
Worldwide, Inc. | | | 43,100 | | | 2,326 | |
Wynn Resorts Ltd. | | | 45,200 | | | 5,080 | |
| | | | | | | |
Total | | | | | | 19,224 | |
| | | | | | | |
| | | | | | | |
Investments | | | Shares | | | Fair
Value
(000) | |
| | | | | | | | |
Household Products 2.94% | | | | | | | |
Colgate-Palmolive Co. | | | 75,755 | | $ | 8,220 | |
Procter & Gamble Co. (The) | | | 197,997 | | | 13,826 | |
| | | | | | | |
Total | | | | | | 22,046 | |
| | | | | | | |
| | | | | | | |
Industrial Conglomerates 1.21% | | | | | | | |
General Electric Co. | | | 428,700 | | | 9,058 | |
| | | | | | | |
| | | | | | | |
Information Technology Services 2.09% | | | | | | | |
International Business | | | | | | | |
Machines Corp. | | | 56,900 | | | 10,815 | |
MasterCard, Inc. Class A | | | 10,000 | | | 4,887 | |
| | | | | | | |
Total | | | | | | 15,702 | |
| | | | | | | |
| | | | | | | |
Insurance 2.38% | | | | | | | |
Chubb Corp. (The) | | | 78,100 | | | 6,013 | |
MetLife, Inc. | | | 127,300 | | | 4,225 | |
Prudential Financial, Inc. | | | 100,300 | | | 5,228 | |
RenaissanceRe Holdings Ltd. | | | 28,400 | | | 2,350 | |
| | | | | | | |
Total | | | | | | 17,816 | |
| | | | | | | |
| | | | | | | |
Internet & Catalog Retail 0.17% | | | | | | | |
Amazon.com, Inc.* | | | 5,100 | | | 1,285 | |
| | | | | | | |
| | | | | | | |
Internet Software & Services 3.09% | | | | | | | |
eBay, Inc.* | | | 38,700 | | | 2,044 | |
Google, Inc. Class A* | | | 25,100 | | | 17,529 | |
Monster Worldwide, Inc.* | | | 659,804 | | | 3,590 | |
| | | | | | | |
Total | | | | | | 23,163 | |
| | | | | | | |
| | | | | | | |
Machinery 1.73% | | | | | | | |
Caterpillar, Inc. | | | 36,100 | | | 3,077 | |
Dover Corp. | | | 77,200 | | | 4,909 | |
PACCAR, Inc. | | | 112,600 | | | 4,948 | |
| | | | | | | |
Total | | | | | | 12,934 | |
| | | | | | | |
| | | | | | | |
Media 1.49% | | | | | | | |
Interpublic Group of Cos.,
Inc. (The) | | | 71,936 | | | 778 | |
Time Warner, Inc. | | | 72,700 | | | 3,439 | |
Walt Disney Co. (The) | | | 139,837 | | | 6,944 | |
| | | | | | | |
Total | | | | | | 11,161 | |
| | | | | | | |
| | |
| See Notes to Financial Statements. | 11 |
|
Schedule of Investments (continued) |
CLASSIC STOCK FUND November 30, 2012 |
| | | | | | | |
Investments | | | Shares | | | Fair
Value
(000) | |
| | | | | | | | |
Metals & Mining 1.74% | | | | | | | �� |
Cliffs Natural Resources, Inc. | | | 61,100 | | $ | 1,757 | |
Freeport-McMoRan Copper
& Gold, Inc. | | | 161,530 | | | 6,301 | |
Reliance Steel &
Aluminum Co. | | | 48,000 | | | 2,707 | |
United States Steel Corp. | | | 107,300 | | | 2,314 | |
| | | | | | | |
Total | | | | | | 13,079 | |
| | | | | | | |
| | | | | | | |
Multi-Line Retail 1.06% | | | | | | | |
Macy’s, Inc. | | | 58,200 | | | 2,252 | |
Target Corp. | | | 89,657 | | | 5,660 | |
| | | | | | | |
Total | | | | | | 7,912 | |
| | | | | | | |
| | | | | | | |
Multi-Utilities 0.73% | | | | | | | |
Dominion Resources, Inc. | | | 62,600 | | | 3,199 | |
PG&E Corp. | | | 54,700 | | | 2,240 | |
| | | | | | | |
Total | | | | | | 5,439 | |
| | | | | | | |
| | | | | | | |
Oil, Gas & Consumable Fuels 10.34% | | | | | | | |
Anadarko Petroleum Corp. | | | 90,700 | | | 6,638 | |
Apache Corp. | | | 44,300 | | | 3,415 | |
Cabot Oil & Gas Corp. | | | 56,200 | | | 2,647 | |
Chevron Corp. | | | 113,210 | | | 11,965 | |
Continental Resources, Inc.* | | | 44,500 | | | 3,057 | |
Devon Energy Corp. | | | 38,261 | | | 1,977 | |
EOG Resources, Inc. | | | 24,700 | | | 2,905 | |
EQT Corp. | | | 25,900 | | | 1,556 | |
Exxon Mobil Corp. | | | 172,915 | | | 15,241 | |
Hess Corp. | | | 134,200 | | | 6,658 | |
Marathon Petroleum Corp. | | | 44,100 | | | 2,626 | |
Newfield Exploration Co.* | | | 22,844 | | | 556 | |
Noble Energy, Inc. | | | 22,900 | | | 2,239 | |
Occidental Petroleum Corp. | | | 56,900 | | | 4,279 | |
Range Resources Corp. | | | 44,618 | | | 2,856 | |
Southwestern Energy Co.* | | | 56,600 | | | 1,965 | |
Suncor Energy, Inc.
(Canada)(a) | | | 213,593 | | | 6,965 | |
| | | | | | | |
Total | | | | | | 77,545 | |
| | | | | | | |
| | | | | | | |
Investments | | | Shares | | | Fair
Value
(000) | |
| | | | | | | | |
Pharmaceuticals 6.45% | | | | | | | |
Abbott Laboratories | | | 56,800 | | $ | 3,692 | |
Eli Lilly & Co. | | | 99,200 | | | 4,865 | |
Johnson & Johnson | | | 222,000 | | | 15,480 | |
Merck & Co., Inc. | | | 203,200 | | | 9,002 | |
Pfizer, Inc. | | | 611,800 | | | 15,307 | |
| | | | | | | |
Total | | | | | | 48,346 | |
| | | | | | | |
| | | | | | | |
Real Estate Investment Trusts 0.75% | | | | | | | |
Host Hotels & Resorts, Inc. | | | 384,761 | | | 5,652 | |
| | | | | | | |
| | | | | | | |
Road & Rail 2.75% | | | | | | | |
Hertz Global Holdings, Inc.* | | | 392,900 | | | 6,145 | |
Union Pacific Corp. | | | 117,800 | | | 14,463 | |
| | | | | | | |
Total | | | | | | 20,608 | |
| | | | | | | |
| | | | | | | |
Semiconductors & Semiconductor
Equipment 2.27% | | | | | | | |
Broadcom Corp. Class A* | | | 119,300 | | | 3,863 | |
Intel Corp. | | | 277,500 | | | 5,431 | |
Micron Technology, Inc.* | | | 531,500 | | | 3,178 | |
Texas Instruments, Inc. | | | 154,300 | | | 4,547 | |
| | | | | | | |
Total | | | | | | 17,019 | |
| | | | | | | |
| | | | | | | |
Software 2.65% | | | | | | | |
Activision Blizzard, Inc. | | | 26,426 | | | 302 | |
Informatica Corp.* | | | 93,900 | | | 2,523 | |
Microsoft Corp. | | | 163,200 | | | 4,344 | |
Oracle Corp. | | | 240,400 | | | 7,717 | |
VMware, Inc. Class A* | | | 54,676 | | | 4,973 | |
| | | | | | | |
Total | | | | | | 19,859 | |
| | | | | | | |
| | | | | | | |
Specialty Retail 2.55% | | | | | | | |
Dick’s Sporting Goods, Inc. | | | 136,373 | | | 7,161 | |
Home Depot, Inc. (The) | | | 184,100 | | | 11,979 | |
| | | | | | | |
Total | | | | | | 19,140 | |
| | | | | | | |
| | | | | | | |
Textiles, Apparel & Luxury Goods 0.67% | | | | | | | |
Coach, Inc. | | | 43,900 | | | 2,539 | |
PVH Corp. | | | 21,600 | | | 2,475 | |
| | | | | | | |
Total | | | | | | 5,014 | |
| | | | | | | |
| | |
12 | See Notes to Financial Statements. | |
|
Schedule of Investments (concluded) |
CLASSIC STOCK FUND November 30, 2012 |
| | | | | | | |
Investments | | | Shares | | | Fair
Value
(000) | |
| | | | | | | | |
Tobacco 0.88% | | | | | | | |
Altria Group, Inc. | | | 195,100 | | $ | 6,596 | |
| | | | | | | |
Total Common Stocks (cost $524,248,915) | | | | | | 730,251 | |
| | | | | | | |
| | | | | | | |
Investments | | | Principal
Amount
(000) | | | Fair
Value
(000) | |
| | | | | | | | |
SHORT-TERM INVESTMENT 2.56% | | | | | | | |
| | | | | | | |
Repurchase Agreement | | | | | | | |
Repurchase Agreement
dated 11/30/2012, 0.01%
due 12/3/2012 with Fixed
Income Clearing Corp.
collateralized by
$18,730,000 of Federal
National Mortgage Assoc.
at 4.625% due 10/15/2013;
value: $19,552,453;
proceeds: $19,165,289
(cost $19,165,273) | | $ | 19,165 | | $ | 19,165 | |
| | | | | | | |
Total Investments in Securities 99.97% (cost $543,414,188) | | | | | | 749,416 | |
| | | | | | | |
Other Assets in Excess of Liabilities 0.03% | | | | | | 215 | |
| | | | | | | |
Net Assets 100.00% | | | | | $ | 749,631 | |
| | | | | | | |
| |
* | Non-income producing security. |
(a) | Foreign security traded in U.S. dollars. |
| | |
| See Notes to Financial Statements. | 13 |
|
Schedule of Investments |
SMALL CAP VALUE FUND November 30, 2012 |
| | | | | | | |
Investments | | | Shares | | | Fair
Value
(000) | |
| | | | | | | | |
COMMON STOCKS 98.36% | | | | | | | |
| | | | | | | |
Aerospace & Defense 1.63% | | | | | | | |
Hexcel Corp.* | | | 1,024,873 | | $ | 26,493 | |
Moog, Inc. Class A* | | | 796,762 | | | 29,289 | |
| | | | | | | |
Total | | | | | | 55,782 | |
| | | | | | | |
| | | | | | | |
Air Freight & Logistics 1.23% | | | | | | | |
Atlas Air Worldwide | | | | | | | |
Holdings, Inc.* | | | 469,600 | | | 20,324 | |
Hub Group, Inc. Class A* | | | 672,945 | | | 21,783 | |
| | | | | | | |
Total | | | | | | 42,107 | |
| | | | | | | |
| | | | | | | |
Capital Markets 0.48% | | | | | | | |
Stifel Financial Corp.* | | | 542,700 | | | 16,509 | |
| | | | | | | |
| | | | | | | |
Chemicals 4.88% | | | | | | | |
Cabot Corp. | | | 1,937,900 | | | 73,117 | |
Innophos Holdings, Inc. | | | 590,100 | | | 28,272 | |
Koppers Holdings, Inc.(a) | | | 1,045,200 | | | 36,989 | |
Olin Corp. | | | 1,369,500 | | | 28,390 | |
| | | | | | | |
Total | | | | | | 166,768 | |
| | | | | | | |
| | | | | | | |
Commercial Banks 10.78% | | | | | | | |
BBCN Bancorp, Inc. | | | 2,301,600 | | | 26,192 | |
Boston Private Financial
Holdings, Inc. | | | 2,304,100 | | | 21,267 | |
City National Corp. | | | 709,000 | | | 34,521 | |
Columbia Banking
System, Inc. | | | 1,559,876 | | | 26,924 | |
CVB Financial Corp. | | | 2,835,800 | | | 28,812 | |
First Financial Bancorp | | | 1,790,400 | | | 26,015 | |
National Penn
Bancshares, Inc. | | | 3,959,000 | | | 37,492 | |
PacWest Bancorp | | | 1,453,600 | | | 36,209 | |
Signature Bank* | | | 582,574 | | | 40,873 | |
Susquehanna Bancshares,
Inc. | | | 3,114,500 | | | 32,017 | |
SVB Financial Group* | | | 543,300 | | | 30,001 | |
Texas Capital Bancshares,
Inc.* | | | 624,654 | | | 28,134 | |
| | | | | | | |
Total | | | | | | 368,457 | |
| | | | | | | |
| | | | | | | |
Investments | | | Shares | | | Fair
Value
(000) | |
| | | | | | | | |
Commercial Services & Supplies 0.53% | | | | | | | |
Tetra Tech, Inc.* | | | 698,600 | | $ | 17,996 | |
| | | | | | | |
| | | | | | | |
Construction & Engineering 3.20% | | | | | | | |
Chicago Bridge & Iron
Co. NV (Netherlands)(b) | | | 976,900 | | | 39,691 | |
EMCOR Group, Inc. | | | 1,322,300 | | | 43,438 | |
URS Corp. | | | 695,000 | | | 26,188 | |
| | | | | | | |
Total | | | | | | 109,317 | |
| | | | | | | |
| | | | | | | |
Containers & Packaging 1.81% | | | | | | | |
AptarGroup, Inc. | | | 455,900 | | | 21,733 | |
Greif, Inc. Class A | | | 230,021 | | | 9,438 | |
Silgan Holdings, Inc. | | | 689,754 | | | 30,680 | |
| | | | | | | |
Total | | | | | | 61,851 | |
| | | | | | | |
| | | | | | | |
Electric: Utilities 0.58% | | | | | | | |
IDACORP, Inc. | | | 462,600 | | | 19,758 | |
| | | | | | | |
| | | | | | | |
Electrical Equipment 1.61% | | | | | | | |
II-VI, Inc.* | | | 1,568,530 | | | 26,838 | |
Regal Beloit Corp. | | | 404,560 | | | 28,218 | |
| | | | | | | |
Total | | | | | | 55,056 | |
| | | | | | | |
| | | | | | | |
Electronic Equipment, Instruments &
Components 5.57% | | | | | | | |
Anixter International, Inc. | | | 558,702 | | | 34,126 | |
Cognex Corp. | | | 661,600 | | | 23,699 | |
Coherent, Inc.* | | | 716,200 | | | 33,124 | |
Littelfuse, Inc. | | | 798,353 | | | 46,073 | |
Rogers Corp.* | | | 496,835 | | | 22,074 | |
ScanSource, Inc.* | | | 1,063,827 | | | 31,436 | |
| | | | | | | |
Total | | | | | | 190,532 | |
| | | | | | | |
| | | | | | | |
Energy Equipment & Services 5.08% | | | | | | | |
Bristow Group, Inc. | | | 458,369 | | | 23,881 | |
C&J Energy Services, Inc.* | | | 1,269,100 | | | 25,344 | |
Forum Energy
Technologies, Inc.* | | | 991,000 | | | 25,013 | |
GulfMark Offshore, Inc.
Class A* | | | 754,477 | | | 23,645 | |
Hornbeck Offshore
Services, Inc.* | | | 637,800 | | | 22,942 | |
| | |
14 | See Notes to Financial Statements. | |
|
Schedule of Investments (continued) |
SMALL CAP VALUE FUND November 30, 2012 |
| | | | | | | |
Investments | | | Shares | | | Fair
Value
(000) | |
| | | | | | | | |
Energy Equipment & Services (continued) | | | | | | | |
Key Energy Services, Inc.* | | | 1,332,000 | | $ | 8,911 | |
Superior Energy Services,
Inc.* | | | 2,154,826 | | | 43,764 | |
| | | | | | | |
Total | | | | | | 173,500 | |
| | | | | | | |
| | | | | | | |
Food & Staples Retailing 0.01% | | | | | | | |
United Natural Foods, Inc.* | | | 7,600 | | | 393 | |
| | | | | | | |
| | | | | | | |
Food Products 0.93% | | | | | | | |
Dole Food Co., Inc.* | | | 795,326 | | | 9,130 | |
Sanderson Farms, Inc. | | | 473,700 | | | 22,724 | |
| | | | | | | |
Total | | | | | | 31,854 | |
| | | | | | | |
| | | | | | | |
Gas Utilities 2.06% | | | | | | | |
Laclede Group, Inc. (The) | | | 592,900 | | | 24,137 | |
New Jersey Resources Corp. | | | 556,300 | | | 22,574 | |
South Jersey Industries, Inc. | | | 476,900 | | | 23,831 | |
| | | | | | | |
Total | | | | | | 70,542 | |
| | | | | | | |
| | | | | | | |
Health Care Equipment & Supplies 1.65% | | | | | | | |
Haemonetics Corp.* | | | 399,000 | | | 32,331 | |
West Pharmaceutical
Services, Inc. | | | 446,300 | | | 24,114 | |
| | | | | | | |
Total | | | | | | 56,445 | |
| | | | | | | |
| | | | | | | |
Health Care Providers & Services 5.95% | | | | | | | |
Centene Corp.* | | | 723,224 | | | 31,757 | |
Community Health
Systems, Inc.* | | | 907,700 | | | 26,741 | |
Emeritus Corp.* | | | 1,024,600 | | | 23,176 | |
Hanger, Inc.* | | | 417,982 | | | 10,913 | |
HealthSouth Corp.* | | | 1,183,800 | | | 26,032 | |
IPC The Hospitalist Co., Inc.* | | | 476,021 | | | 17,970 | |
MEDNAX, Inc.* | | | 502,800 | | | 39,721 | |
VCA Antech, Inc.* | | | 1,308,700 | | | 27,195 | |
| | | | | | | |
Total | | | | | | 203,505 | |
| | | | | | | |
| | | | | | | |
Hotels, Restaurants & Leisure 2.66% | | | | | | | |
Cheesecake Factory, Inc.
(The) | | | 913,400 | | | 31,229 | |
| | | | | | | |
Investments | | | Shares | | | Fair
Value
(000) | |
| | | | | | | | |
Orient-Express Hotels Ltd.
Class A* | | | 3,049,526 | | $ | 37,601 | |
Ryman Hospitality
Properties | | | 665,592 | | | 22,111 | |
| | | | | | | |
Total | | | | | | 90,941 | |
| | | | | | | |
| | | | | | | |
Household Products 0.88% | | | | | | | |
Spectrum Brands
Holdings, Inc.* | | | 629,700 | | | 30,118 | |
| | | | | | | |
| | | | | | | |
Information Technology Services 5.21% | | | | | | | |
ExlService Holdings, Inc.* | | | 1,131,200 | | | 30,373 | |
FleetCor Technologies, Inc.* | | | 989,324 | | | 51,633 | |
Jack Henry & Associates,
Inc. | | | 1,140,500 | | | 44,331 | |
MAXIMUS, Inc. | | | 819,878 | | | 51,644 | |
| | | | | | | |
Total | | | | | | 177,981 | |
| | | | | | | |
| | | | | | | |
Insurance 4.57% | | | | | | | |
Alterra Capital Holdings
Ltd. | | | 1,962,280 | | | 45,917 | |
Navigators Group, Inc.
(The)*(a) | | | 773,400 | | | 40,534 | |
Selective Insurance
Group, Inc. | | | 1,541,000 | | | 28,786 | |
Validus Holdings Ltd. | | | 1,151,100 | | | 40,818 | |
| | | | | | | |
Total | | | | | | 156,055 | |
| | | | | | | |
| | | | | | | |
Life Sciences Tools & Services 1.01% | | | | | | | |
PAREXEL International
Corp.* | | | 1,071,200 | | | 34,589 | |
| | | | | | | |
| | | | | | | |
Machinery 2.61% | | | | | | | |
Kennametal, Inc. | | | 468,000 | | | 17,840 | |
Titan International, Inc. | | | 1,764,300 | | | 35,868 | |
TriMas Corp.* | | | 1,364,655 | | | 35,345 | |
| | | | | | | |
Total | | | | | | 89,053 | |
| | | | | | | |
| | | | | | | |
Marine 0.76% | | | | | | | |
Kirby Corp.* | | | 451,100 | | | 26,110 | |
| | | | | | | |
| | | | | | | |
Media 1.00% | | | | | | | |
Cinemark Holdings, Inc. | | | 1,256,700 | | | 34,182 | |
| | | | | | | |
| | |
| See Notes to Financial Statements. | 15 |
|
Schedule of Investments (continued) |
SMALL CAP VALUE FUND November 30, 2012 |
| | | | | | | |
Investments | | | Shares | | | Fair
Value
(000) | |
| | | | | | | | |
Metals & Mining 2.71% | | | | | | | |
Compass Minerals
International, Inc. | | | 390,500 | | $ | 29,834 | |
Reliance Steel &
Aluminum Co. | | | 659,100 | | | 37,174 | |
RTI International
Metals, Inc.* | | | 1,034,122 | | | 25,646 | |
| | | | | | | |
Total | | | | | | 92,654 | |
| | | | | | | |
| | | | | | | |
Oil, Gas & Consumable Fuels 0.59% | | | | | | | |
Sanchez Energy Corp.* | | | 1,094,100 | | | 19,989 | |
| | | | | | | |
| | | | | | | |
Pharmaceuticals 0.72% | | | | | | | |
Medicines Co. (The)* | | | 1,152,000 | | | 24,733 | |
| | | | | | | |
| | | | | | | |
Professional Services 0.45% | | | | | | | |
TrueBlue, Inc.* | | | 1,089,953 | | | 15,532 | |
| | | | | | | |
| | | | | | | |
Real Estate Investment Trusts 5.86% | | | | | | | |
Alexandria Real Estate
Equities, Inc. | | | 324,600 | | | 22,047 | |
Brandywine Realty Trust | | | 2,487,500 | | | 29,676 | |
Duke Realty Corp. | | | 1,917,500 | | | 25,886 | |
EPR Properties | | | 815,700 | | | 36,992 | |
Mack-Cali Realty Corp. | | | 943,800 | | | 23,859 | |
Pebblebrook Hotel Trust | | | 1,729,000 | | | 36,050 | |
Weingarten Realty
Investors | | | 949,900 | | | 25,818 | |
| | | | | | | |
Total | | | | | | 200,328 | |
| | | | | | | |
| | | | | | | |
Real Estate Management &
Development 0.45% | | | | | | | |
Kennedy-Wilson Holdings,
Inc. | | | 1,162,200 | | | 15,225 | |
| | | | | | | |
| | | | | | | |
Road & Rail 4.26% | | | | | | | |
Avis Budget Group, Inc.* | | | 1,465,500 | | | 27,756 | |
Genesee & Wyoming, Inc.
Class A* | | | 330,826 | | | 24,134 | |
Heartland Express, Inc. | | | 222,815 | | | 3,059 | |
Knight Transportation, Inc. | | | 1,555,000 | | | 23,372 | |
Ryder System, Inc. | | | 976,300 | | | 45,954 | |
Werner Enterprises, Inc. | | | 976,200 | | | 21,174 | |
| | | | | | | |
Total | | | | | | 145,449 | |
| | | | | | | |
| | | | | | | |
Investments | | | Shares | | | Fair
Value
(000) | |
| | | | | | | | |
Semiconductors & Semiconductor
Equipment 2.17% | | | | | | | |
Hittite Microwave Corp.* | | | 612,500 | | $ | 37,167 | |
Teradyne, Inc.* | | | 2,374,000 | | | 37,129 | |
| | | | | | | |
Total | | | | | | 74,296 | |
| | | | | | | |
| | | | | | | |
Specialty Retail 6.69% | | | | | | | |
Ascena Retail Group, Inc.* | | | 1,515,022 | | | 30,452 | |
Children’s Place Retail
Stores, Inc. (The)* | | | 516,500 | | | 25,107 | |
DSW, Inc. Class A | | | 347,500 | | | 23,640 | |
Genesco, Inc.* | | | 387,900 | | | 21,463 | |
Group 1 Automotive, Inc. | | | 342,400 | | | 20,804 | |
Men’s Wearhouse, Inc. (The) | | | 832,100 | | | 26,993 | |
Penske Automotive Group,
Inc. | | | 1,609,800 | | | 46,894 | |
Rent-A-Center, Inc. | | | 954,700 | | | 33,185 | |
| | | | | | | |
Total | | | | | | 228,538 | |
| | | | | | | |
| | | | | | | |
Textiles, Apparel & Luxury Goods 0.68% | | | | | | | |
Crocs, Inc.* | | | 1,751,800 | | | 23,386 | |
| | | | | | | |
| | | | | | | |
Thrifts & Mortgage Finance 2.51% | | | | | | | |
EverBank Financial Corp. | | | 1,714,100 | | | 25,334 | |
People’s United Financial,
Inc. | | | 1,875,748 | | | 22,865 | |
ViewPoint Financial Group,
Inc. | | | 1,057,677 | | | 21,630 | |
Washington Federal, Inc. | | | 991,200 | | | 15,929 | |
| | | | | | | |
Total | | | | | | 85,758 | |
| | | | | | | |
| | | | | | | |
Trading Companies & Distributors 4.59% | | | | | | | |
Applied Industrial
Technologies, Inc. | | | 639,700 | | | 25,607 | |
Beacon Roofing Supply,
Inc.* | | | 784,100 | | | 24,182 | |
GATX Corp. | | | 833,050 | | | 35,097 | |
TAL International Group,
Inc. | | | 1,196,600 | | | 40,744 | |
WESCO International, Inc.* | | | 480,700 | | | 31,077 | |
| | | | | | | |
Total | | | | | | 156,707 | |
| | | | | | | |
Total Common Stocks
(cost $2,655,797,078) | | | | | | 3,361,996 | |
| | | | | | | |
| | |
16 | See Notes to Financial Statements. | |
|
Schedule of Investments (concluded) |
SMALL CAP VALUE FUND November 30, 2012 |
| | | | | | | |
Investments | | | Principal
Amount
(000) | | | Fair
Value
(000) | |
| | | | | | | | |
SHORT-TERM INVESTMENT 0.51% | | | | | | | |
| | | | | | | |
Repurchase Agreement | | | | | | | |
Repurchase Agreement
dated 11/30/2012, 0.01%
due 12/3/2012 with Fixed
Income Clearing Corp.
collateralized by
$17,265,000 of Federal
National Mortgage Assoc.
at 4.625% due 10/15/2013;
value: $18,023,123;
proceeds: $17,666,418
(cost $17,666,403) | | $ | 17,666 | | $ | 17,666 | |
| | | | | | | |
Total Investments in Securities 98.87% (cost $2,673,463,481) | | | | | | 3,379,662 | |
| | | | | | | |
Other Assets in Excess of Liabilities 1.13% | | | | | | 38,468 | |
| | | | | | | |
Net Assets 100.00% | | | | | $ | 3,418,130 | |
| | | | | | | |
| |
* | Non-income producing security. |
(a) | Affiliated issuer (holding represents 5% or more of the underlying issuer’s outstanding voting shares). (See Note 9). |
(b) | Foreign security traded in U.S. dollars. |
| | |
| See Notes to Financial Statements. | 17 |
|
Statements of Assets and Liabilities |
November 30, 2012 |
| | | | | | | |
| | | Classic
Stock Fund | | | Small Cap
Value Fund | |
ASSETS: | | | | | | | |
Investments in unaffiliated issuers, at cost | | $ | 543,414,188 | | $ | 2,619,138,057 | |
Investments in affiliated issuers, at cost | | | – | | | 54,325,424 | |
| | | | | | | | |
Investments in unaffiliated issuers, at fair value | | $ | 749,415,618 | | $ | 3,302,138,920 | |
Investments in affiliated issuers, at fair value | | | – | | | 77,523,522 | |
Receivables: | | | | | | | |
Investment securities sold | | | – | | | 43,537,987 | |
Interest and dividends | | | 2,266,660 | | | 10,024,294 | |
Capital shares sold | | | 1,240,635 | | | 1,194,356 | |
From advisor (See Note 3) | | | 195,320 | | | – | |
Prepaid expenses and other assets | | | 31,082 | | | 82,851 | |
| | | | | | | | |
Total assets | | | 753,149,315 | | | 3,434,501,930 | |
| | | | | | | | |
LIABILITIES: | | | | | | | |
Payables: | | | | | | | |
Investment securities purchased | | | 1,130,309 | | | 8,880,550 | |
Capital shares reacquired | | | 1,284,050 | | | 3,277,619 | |
Management fee | | | 426,248 | | | 2,008,159 | |
12b-1 distribution fees | | | 213,756 | | | 456,510 | |
Directors’ fees | | | 114,122 | | | 394,889 | |
Fund administration | | | 24,357 | | | 110,068 | |
To affiliate (See Note 3) | | | 43,167 | | | 57,495 | |
Accrued expenses and other liabilities | | | 281,874 | | | 1,186,333 | |
| | | | | | | | |
Total liabilities | | | 3,517,883 | | | 16,371,623 | |
| | | | | | | | |
NET ASSETS | | $ | 749,631,432 | | $ | 3,418,130,307 | |
| | | | | | | | |
COMPOSITION OF NET ASSETS: | | | | | | | |
Paid-in capital | | $ | 584,538,076 | | $ | 2,608,816,126 | |
Undistributed net investment income | | | 7,811,208 | | | 23,933,507 | |
Accumulated net realized gain (loss) on investments | | | (48,719,267 | ) | | 79,181,713 | |
Net unrealized appreciation on investments | | | 206,001,415 | | | 706,198,961 | |
| | | | | | | | |
Net Assets | | $ | 749,631,432 | | $ | 3,418,130,307 | |
| | | | | | | | |
| | |
18 | See Notes to Financial Statements. | |
|
Statements of Assets and Liabilities (concluded) |
November 30, 2012 |
| | | | | | | |
| | Classic
Stock Fund | | Small Cap
Value Fund | |
| | | | | | | |
Net assets by class: | | | | | | | |
Class A Shares | | $ | 479,347,829 | | $ | 1,247,956,284 | |
Class B Shares | | $ | 21,344,492 | | $ | 6,406,146 | |
Class C Shares | | $ | 66,417,466 | | $ | 37,988,353 | |
Class F Shares | | $ | 23,322,535 | | $ | 52,084,489 | |
Class I Shares | | $ | 140,405,098 | | $ | 1,862,546,385 | |
Class P Shares | | $ | 1,069,189 | | $ | 192,602,991 | |
Class R2 Shares | | $ | 2,448,439 | | $ | 6,910,185 | |
Class R3 Shares | | $ | 15,276,384 | | $ | 11,635,474 | |
Outstanding shares by class: | | | | | | | |
Class A Shares (200 million and 300 million shares of
common stock authorized, $.001 par value) | | | 15,678,266 | | | 38,705,466 | |
Class B Shares (30 million shares of common stock
authorized, $.001 par value) | | | 734,806 | | | 232,381 | |
Class C Shares (20 million shares of common stock
authorized, $.001 par value) | | | 2,281,829 | | | 1,374,988 | |
Class F Shares (30 million shares of common stock
authorized, $.001 par value) | | | 764,457 | | | 1,614,518 | |
Class I Shares (30 million and 200 million shares of
common stock authorized, $.001 par value) | | | 4,576,525 | | | 54,332,695 | |
Class P Shares (20 million and 50 million shares of
common stock authorized, $.001 par value) | | | 34,797 | | | 6,058,068 | |
Class R2 Shares (30 million shares of common stock
authorized, $.001 par value) | | | 80,603 | | | 217,199 | |
Class R3 Shares (30 million shares of common stock
authorized, $.001 par value) | | | 505,410 | | | 365,268 | |
Net asset value, offering and redemption price per share
(Net assets divided by outstanding shares): | | | | | | | |
Class A Shares-Net asset value | | | $30.57 | | | $32.24 | |
Class A Shares-Maximum offering price
(Net asset value plus sales charge of 5.75%) | | | $32.44 | | | $34.21 | |
Class B Shares-Net asset value | | | $29.05 | | | $27.57 | |
Class C Shares-Net asset value | | | $29.11 | | | $27.63 | |
Class F Shares-Net asset value | | | $30.51 | | | $32.26 | |
Class I Shares-Net asset value | | | $30.68 | | | $34.28 | |
Class P Shares-Net asset value | | | $30.73 | | | $31.79 | |
Class R2 Shares-Net asset value | | | $30.38 | | | $31.81 | |
Class R3 Shares-Net asset value | | | $30.23 | | | $31.85 | |
| | | | | | | | |
| | |
| See Notes to Financial Statements. | 19 |
|
Statements of Operations |
For the Year Ended November 30, 2012 |
| | | | | | | |
| | Classic
Stock Fund | | Small Cap
Value Fund | |
Investment income: | | | | | | | |
Dividends from unaffiliated issuers (net of foreign withholding
taxes of $97,078 and $45,682, respectively) | | $ | 16,914,846 | | $ | 65,220,373 | |
Dividends from affiliated issuers | | | – | | | 1,064,040 | |
Interest | | | 1,694 | | | 4,230 | |
| | | | | | | | |
Total investment income | | | 16,916,540 | | | 66,288,643 | |
| | | | | | | | |
Expenses: | | | | | | | |
Management fee | | | 5,923,351 | | | 26,709,093 | |
12b-1 distribution plan-Class A | | | 1,722,162 | | | 4,109,378 | |
12b-1 distribution plan-Class B | | | 242,429 | | | 82,437 | |
12b-1 distribution plan-Class C | | | 683,767 | | | 406,235 | |
12b-1 distribution plan-Class F | | | 25,424 | | | 41,196 | |
12b-1 distribution plan-Class P | | | 7,401 | | | 981,612 | |
12b-1 distribution plan-Class R2 | | | 15,121 | | | 44,083 | |
12b-1 distribution plan-Class R3 | | | 79,386 | | | 66,059 | |
Shareholder servicing | | | 1,179,000 | | | 4,869,570 | |
Professional | | | 52,028 | | | 73,081 | |
Reports to shareholders | | | 69,511 | | | 166,577 | |
Fund administration | | | 338,477 | | | 1,469,091 | |
Custody | | | 23,250 | | | 54,228 | |
Directors’ fees | | | 27,755 | | | 117,692 | |
Registration | | | 112,733 | | | 179,323 | |
Subsidy (See Note 3) | | | 396,770 | | | 392,414 | |
Other | | | 26,627 | | | 95,855 | |
| | | | | | | | |
Gross expenses | | | 10,925,192 | | | 39,857,924 | |
Expense reductions (See Note 7) | | | (450 | ) | | (2,535 | ) |
Management fee waived (See Note 3) | | | (2,818,036 | ) | | – | |
| | | | | | | | |
Net expenses | | | 8,106,706 | | | 39,855,389 | |
| | | | | | | | |
Net investment income | | | 8,809,834 | | | 26,433,254 | |
| | | | | | | | |
Net realized and unrealized gain: | | | | | | | |
Net realized gain on investments in unaffiliated issuers | | | 61,654,170 | | | 202,983,802 | |
Net realized gain on investments in affiliated issuers | | | – | | | 3,387,879 | |
Net change in unrealized appreciation/depreciation on investments | | | 46,445,685 | | | 79,002,408 | |
| | | | | | | | |
Net realized and unrealized gain | | | 108,099,855 | | | 285,374,089 | |
| | | | | | | | |
Net Increase in Net Assets Resulting From Operations | | $ | 116,909,689 | | $ | 311,807,343 | |
| | | | | | | | |
| | |
20 | See Notes to Financial Statements. | |
Statements of Changes in Net Assets
| | | | | | | |
| | Classic Stock Fund | |
DECREASE IN NET ASSETS | | For the Year Ended
November 30, 2012 | | For the Year Ended
November 30, 2011 | |
Operations: | | | | | | | |
Net investment income | | $ | 8,809,834 | | $ | 7,641,238 | |
Net realized gain on investments | | | 61,654,170 | | | 20,516,793 | |
Net change in unrealized appreciation/depreciation
on investments | | | 46,445,685 | | | (46,616,390 | ) |
| | | | | | | | |
Net increase (decrease) in net assets resulting
from operations | | | 116,909,689 | | | (18,458,359 | ) |
| | | | | | | | |
Distributions to shareholders from: | | | | | | | |
Net investment income | | | | | | | |
Class A | | | (3,879,710 | ) | | (2,116,930 | ) |
Class B | | | (8,380 | ) | | – | |
Class C | | | (54,359 | ) | | – | |
Class F | | | (279,130 | ) | | (289,959 | ) |
Class I | | | (3,839,223 | ) | | (2,380,907 | ) |
Class P | | | (14,360 | ) | | (7,511 | ) |
Class R2 | | | (16,707 | ) | | (5,019 | ) |
Class R3 | | | (105,127 | ) | | (35,708 | ) |
| | | | | | | | |
Total distributions to shareholders | | | (8,196,996 | ) | | (4,836,034 | ) |
| | | | | | | | |
Capital share transactions (Net of share conversions) (See Note 12): | | | | | | | |
Net proceeds from sales of shares | | | 86,009,975 | | | 184,377,138 | |
Reinvestment of distributions | | | 7,552,277 | | | 4,605,127 | |
Cost of shares reacquired | | | (419,917,158 | ) | | (279,604,725 | ) |
| | | | | | | | |
Net decrease in net assets resulting from capital
share transactions | | | (326,354,906 | ) | | (90,622,460 | ) |
| | | | | | | | |
Net decrease in net assets | | | (217,642,213 | ) | | (113,916,853 | ) |
| | | | | | | | |
NET ASSETS: | | | | | | | |
Beginning of year | | $ | 967,273,645 | | $ | 1,081,190,498 | |
| | | | | | | | |
End of year | | $ | 749,631,432 | | $ | 967,273,645 | |
| | | | | | | | |
Undistributed net investment income | | $ | 7,811,208 | | $ | 7,237,919 | |
| | | | | | | | |
| | |
| See Notes to Financial Statements. | 21 |
Statements of Changes in Net Assets (concluded)
| | | | | | | |
| | Small Cap Value Fund | |
| | | |
DECREASE IN NET ASSETS | | For the Year Ended
November 30, 2012 | | For the Year Ended
November 30, 2011 | |
Operations: | | | | | | | |
Net investment income (loss) | | $ | 26,433,254 | | $ | (3,537,495 | ) |
Net realized gain on investments in affiliated and
unaffiliated issuers | | | 206,371,681 | | | 200,156,212 | |
Net change in unrealized appreciation/depreciation
on investments | | | 79,002,408 | | | (101,615,052 | ) |
| | | | | | | | |
Net increase in net assets resulting from operations | | | 311,807,343 | | | 95,003,665 | |
| | | | | | | | |
Distributions to shareholders from: | | | | | | | |
Net investment income | | | | | | | |
Class A | | | – | | | (77,931 | ) |
Class F | | | – | | | (57,552 | ) |
Class I | | | – | | | (4,795,036 | ) |
| | | | | | | | |
Total distributions to shareholders | | | – | | | (4,930,519 | ) |
| | | | | | | | |
Capital share transactions (Net of share conversions) (See Note 12): | | | | | | | |
Net proceeds from sales of shares | | | 566,164,388 | | | 868,324,020 | |
Reinvestment of distributions | | | – | | | 4,629,503 | |
Cost of shares reacquired | | | (1,119,226,837 | ) | | (995,392,612 | ) |
| | | | | | | | |
Net decrease in net assets resulting from capital
share transactions | | | (553,062,449 | ) | | (122,439,089 | ) |
| | | | | | | | |
Net decrease in net assets | | | (241,255,106 | ) | | (32,365,943 | ) |
| | | | | | | | |
NET ASSETS: | | | | | | | |
Beginning of year | | $ | 3,659,385,413 | | $ | 3,691,751,356 | |
| | | | | | | | |
End of year | | $ | 3,418,130,307 | | $ | 3,659,385,413 | |
| | | | | | | | |
Undistributed (distributions in excess of)
net investment income | | $ | 23,933,507 | | $ | (337,712 | ) |
| | | | | | | | |
| | |
22 | See Notes to Financial Statements. | |
|
Financial Highlights |
CLASSIC STOCK FUND |
| | | | | | | | | | | | | | | | |
| | Class A Shares | |
| | | |
| | Year Ended 11/30 | |
| | | |
| | 2012 | | 2011 | | 2010 | | 2009 | | 2008 | |
Per Share Operating Performance | | | | | | | | | | | | | | | | |
Net asset value, beginning of year | | | $27.06 | | | $27.67 | | | $25.81 | | | $20.90 | | | $32.95 | |
| | | | | | | | | | | | | | | | |
Investment operations: | | | | | | | | | | | | | | | | |
Net investment income(a) | | | .31 | | | .18 | | | .11 | | | .18 | | | .21 | |
Net realized and unrealized gain (loss) | | | 3.41 | | | (.69 | ) | | 1.91 | | | 4.95 | | | (9.98 | ) |
| | | | | | | | | | | | | | | | |
Total from investment operations | | | 3.72 | | | (.51 | ) | | 2.02 | | | 5.13 | | | (9.77 | ) |
| | | | | | | | | | | | | | | | |
Distributions to shareholders from: | | | | | | | | | | | | | | | | |
Net investment income | | | (.21 | ) | | (.10 | ) | | (.16 | ) | | (.22 | ) | | (.15 | ) |
Net realized gain | | | – | | | – | | | – | | | – | | | (2.13 | ) |
| | | | | | | | | | | | | | | | |
Total distributions | | | (.21 | ) | | (.10 | ) | | (.16 | ) | | (.22 | ) | | (2.28 | ) |
| | | | | | | | | | | | | | | | |
Net asset value, end of year | | | $30.57 | | | $27.06 | | | $27.67 | | | $25.81 | | | $20.90 | |
| | | | | | | | | | | | | | | | |
|
Total Return(b) | | | 13.89 | % | | (1.86 | )% | | 7.87 | % | | 24.84 | % | | (31.78 | )% |
Ratios to Average Net Assets: | | | | | | | | | | | | | | | | |
|
Expenses, excluding expense reductions
and including management fee
waived and expenses reimbursed | | | .98 | % | | .98 | % | | .98 | % | | 1.15 | % | | 1.30 | % |
|
Expenses, including expense reductions,
management fee waived and
expenses reimbursed | | | .98 | % | | .98 | % | | .98 | % | | 1.15 | % | | 1.30 | % |
|
Expenses, excluding expense reductions,
management fee waived and
expenses reimbursed | | | 1.31 | % | | 1.29 | % | | 1.30 | % | | 1.37 | % | | 1.33 | % |
|
Net investment income | | | 1.04 | % | | .64 | % | | .42 | % | | .84 | % | | .77 | % |
| | | | | | | | | | | | | | | | |
Supplemental Data: | | | | | | | | | | | | | | | | |
| | | | | | | | | | | | | | | | | |
Net assets, end of year (000) | | | $479,348 | | | $498,545 | | | $569,479 | | | $595,557 | | | $494,847 | |
Portfolio turnover rate | | | 12.89 | % | | 27.97 | % | | 24.10 | % | | 55.20 | % | | 36.96 | % |
| | | | | | | | | | | | | | | | | |
| |
(a) | Calculated using average shares outstanding during the year. |
(b) | Total return does not consider the effects of sales loads and assumes the reinvestment of all distributions. |
| | |
| See Notes to Financial Statements. | 23 |
|
Financial Highlights (continued) |
CLASSIC STOCK FUND |
| | | | | | | | | | | | | | | | |
| | Class B Shares | |
| | | |
| | Year Ended 11/30 | |
| | | |
| | 2012 | | 2011 | | 2010 | | 2009 | | 2008 | |
Per Share Operating Performance | | | | | | | | | | | | | | | | |
Net asset value, beginning of year | | | $25.68 | | | $26.33 | | | $24.58 | | | $19.86 | | | $31.47 | |
| | | | | | | | | | | | | | | | |
Investment operations: | | | | | | | | | | | | | | | | |
Net investment income (loss)(a) | | | .11 | | | (.01 | ) | | (.06 | ) | | .04 | | | .03 | |
Net realized and unrealized gain (loss) | | | 3.27 | | | (.64 | ) | | 1.82 | | | 4.72 | | | (9.51 | ) |
| | | | | | | | | | | | | | | | |
Total from investment operations | | | 3.38 | | | (.65 | ) | | 1.76 | | | 4.76 | | | (9.48 | ) |
| | | | | | | | | | | | | | | | |
Distributions to shareholders from: | | | | | | | | | | | | | | | | |
Net investment income | | | (.01 | ) | | – | | | (.01 | ) | | (.04 | ) | | – | |
Net realized gain | | | – | | | – | | | – | | | – | | | (2.13 | ) |
| | | | | | | | | | | | | | | | |
Total distributions | | | (.01 | ) | | – | | | (.01 | ) | | (.04 | ) | | (2.13 | ) |
| | | | | | | | | | | | | | | | |
Net asset value, end of year | | | $29.05 | | | $25.68 | | | $26.33 | | | $24.58 | | | $19.86 | |
| | | | | | | | | | | | | | | | |
|
Total Return(b) | | | 13.12 | % | | (2.47 | )% | | 7.16 | % | | 24.04 | % | | (32.23 | )% |
Ratios to Average Net Assets: | | | | | | | | | | | | | | | | |
|
Expenses, excluding expense reductions
and including management fee
waived and expenses reimbursed | | | 1.63 | % | | 1.62 | % | | 1.63 | % | | 1.80 | % | | 1.95 | % |
|
Expenses, including expense reductions,
management fee waived and
expenses reimbursed | | | 1.63 | % | | 1.62 | % | | 1.63 | % | | 1.80 | % | | 1.95 | % |
|
Expenses, excluding expense reductions,
management fee waived and
expenses reimbursed | | | 1.96 | % | | 1.93 | % | | 1.95 | % | | 2.02 | % | | 1.98 | % |
|
Net investment income (loss) | | | .37 | % | | (.03 | )% | | (.25 | )% | | .19 | % | | .11 | % |
| | | | | | | | | | | | | | | | |
Supplemental Data: | | | | | | | | | | | | | | | | |
| | | | | | | | | | | | | | | | | |
Net assets, end of year (000) | | | $21,344 | | | $25,829 | | | $35,937 | | | $46,267 | | | $43,374 | |
Portfolio turnover rate | | | 12.89 | % | | 27.97 | % | | 24.10 | % | | 55.20 | % | | 36.96 | % |
| | | | | | | | | | | | | | | | | |
| |
(a) | Calculated using average shares outstanding during the year. |
(b) | Total return does not consider the effects of sales loads and assumes the reinvestment of all distributions. |
| | |
24 | See Notes to Financial Statements. | |
|
Financial Highlights (continued) |
CLASSIC STOCK FUND |
| | | | | | | | | | | | | | | | |
| | Class C Shares | |
| | | |
| | Year Ended 11/30 | |
| | | |
| | 2012 | | 2011 | | 2010 | | 2009 | | 2008 | |
Per Share Operating Performance | | | | | | | | | | | | | | | | |
Net asset value, beginning of year | | | $25.74 | | | $26.39 | | | $24.66 | | | $19.94 | | | $31.59 | |
| | | | | | | | | | | | | | | | |
Investment operations: | | | | | | | | | | | | | | | | |
Net investment income (loss)(a) | | | .11 | | | – | (b) | | (.06 | ) | | .04 | | | .03 | |
Net realized and unrealized gain (loss) | | | 3.28 | | | (.65 | ) | | 1.82 | | | 4.74 | | | (9.55 | ) |
| | | | | | | | | | | | | | | | |
Total from investment operations | | | 3.39 | | | (.65 | ) | | 1.76 | | | 4.78 | | | (9.52 | ) |
| | | | | | | | | | | | | | | | |
Distributions to shareholders from: | | | | | | | | | | | | | | | | |
Net investment income | | | (.02 | ) | | – | | | (.03 | ) | | (.06 | ) | | – | (b) |
Net realized gain | | | – | | | – | | | – | | | – | | | (2.13 | ) |
| | | | | | | | | | | | | | | | |
Total distributions | | | (.02 | ) | | – | | | (.03 | ) | | (.06 | ) | | (2.13 | ) |
| | | | | | | | | | | | | | | | |
Net asset value, end of year | | | $29.11 | | | $25.74 | | | $26.39 | | | $24.66 | | | $19.94 | |
| | | | | | | | | | | | | | | | |
|
Total Return(c) | | | 13.15 | % | | (2.46 | )% | | 7.15 | % | | 24.08 | % | | (32.24 | )% |
Ratios to Average Net Assets: | | | | | | | | | | | | | | | | |
|
Expenses, excluding expense reductions
and including management fee
waived and expenses reimbursed | | | 1.62 | % | | 1.61 | % | | 1.63 | % | | 1.80 | % | | 1.95 | % |
|
Expenses, including expense reductions,
management fee waived and
expenses reimbursed | | | 1.62 | % | | 1.61 | % | | 1.63 | % | | 1.80 | % | | 1.95 | % |
|
Expenses, excluding expense reductions,
management fee waived and
expenses reimbursed | | | 1.95 | % | | 1.92 | % | | 1.95 | % | | 2.02 | % | | 1.98 | % |
|
Net investment income (loss) | | | .40 | % | | .00 | %(d) | | (.23 | )% | | .18 | % | | .12 | % |
| | | | | | | | | | | | | | | | |
Supplemental Data: | | | | | | | | | | | | | | | | |
| | | | | | | | | | | | | | | | | |
Net assets, end of year (000) | | | $66,417 | | | $69,263 | | | $87,126 | | | $89,787 | | | $65,200 | |
Portfolio turnover rate | | | 12.89 | % | | 27.97 | % | | 24.10 | % | | 55.20 | % | | 36.96 | % |
| | | | | | | | | | | | | | | | | |
| |
(a) | Calculated using average shares outstanding during the year. |
(b) | Amount is less than $.01. |
(c) | Total return does not consider the effects of sales loads and assumes the reinvestment of all distributions. |
(d) | Amount is less than .01%. |
| | |
| See Notes to Financial Statements. | 25 |
|
Financial Highlights (continued) |
CLASSIC STOCK FUND |
| | | | | | | | | | | | | | | | |
| | Class F Shares | |
| | | |
| | Year Ended 11/30 | |
| | | |
| | 2012 | | 2011 | | 2010 | | 2009 | | 2008 | |
Per Share Operating Performance | | | | | | | | | | | | | | | | |
Net asset value, beginning of year | | | $27.01 | | | $27.62 | | | $25.76 | | | $20.88 | | | $32.96 | |
| | | | | | | | | | | | | | | | |
Investment operations: | | | | | | | | | | | | | | | | |
Net investment income(a) | | | .37 | | | .23 | | | .19 | | | .22 | | | .32 | |
Net realized and unrealized gain (loss) | | | 3.41 | | | (.66 | ) | | 1.89 | | | 4.96 | | | (10.02 | ) |
| | | | | | | | | | | | | | | | |
Total from investment operations | | | 3.78 | | | (.43 | ) | | 2.08 | | | 5.18 | | | (9.70 | ) |
| | | | | | | | | | | | | | | | |
Distributions to shareholders from: | | | | | | | | | | | | | | | | |
Net investment income | | | (.28 | ) | | (.18 | ) | | (.22 | ) | | (.30 | ) | | (.25 | ) |
Net realized gain | | | – | | | – | | | – | | | – | | | (2.13 | ) |
| | | | | | | | | | | | | | | | |
Total distributions | | | (.28 | ) | | (.18 | ) | | (.22 | ) | | (.30 | ) | | (2.38 | ) |
| | | | | | | | | | | | | | | | |
Net asset value, end of year | | | $30.51 | | | $27.01 | | | $27.62 | | | $25.76 | | | $20.88 | |
| | | | | | | | | | | | | | | | |
|
Total Return(b) | | | 14.18 | % | | (1.61 | )% | | 8.14 | % | | 25.19 | % | | (31.64 | )% |
Ratios to Average Net Assets: | | | | | | | | | | | | | | | | |
|
Expenses, excluding expense reductions
and including management fee
waived and expenses reimbursed | | | .73 | % | | .73 | % | | .73 | % | | .86 | % | | 1.05 | % |
|
Expenses, including expense reductions,
management fee waived and
expenses reimbursed | | | .73 | % | | .73 | % | | .73 | % | | .86 | % | | 1.04 | % |
|
Expenses, excluding expense reductions,
management fee waived and
expenses reimbursed | | | 1.06 | % | | 1.04 | % | | 1.05 | % | | 1.10 | % | | 1.11 | % |
|
Net investment income | | | 1.28 | % | | .81 | % | | .73 | % | | .96 | % | | 1.25 | % |
| | | | | | | | | | | | | | | | |
Supplemental Data: | | | | | | | | | | | | | | | | |
| | | | | | | | | | | | | | | | | |
Net assets, end of year (000) | | | $23,323 | | | $26,568 | | | $45,605 | | | $10,723 | | | $2,453 | |
Portfolio turnover rate | | | 12.89 | % | | 27.97 | % | | 24.10 | % | | 55.20 | % | | 36.96 | % |
| | | | | | | | | | | | | | | | | |
| |
(a) | Calculated using average shares outstanding during the year. |
(b) | Total return assumes the reinvestment of all distributions. |
| | |
26 | See Notes to Financial Statements. | |
|
Financial Highlights (continued) |
CLASSIC STOCK FUND |
| | | | | | | | | | | | | | | | |
| | Class I Shares | |
| | | |
| | Year Ended 11/30 | |
| | | |
| | 2012 | | 2011 | | 2010 | | 2009 | | 2008 | |
Per Share Operating Performance | | | | | | | | | | | | | | | | |
Net asset value, beginning of year | | | $27.17 | | | $27.78 | | | $25.90 | | | $20.99 | | | $33.08 | |
| | | | | | | | | | | | | | | | |
Investment operations: | | | | | | | | | | | | | | | | |
Net investment income(a) | | | .38 | | | .29 | | | .21 | | | .26 | | | .31 | |
Net realized and unrealized gain (loss) | | | 3.45 | | | (.70 | ) | | 1.91 | | | 4.96 | | | (10.01 | ) |
| | | | | | | | | | | | | | | | |
Total from investment operations | | | 3.83 | | | (.41 | ) | | 2.12 | | | 5.22 | | | (9.70 | ) |
| | | | | | | | | | | | | | | | |
Distributions to shareholders from: | | | | | | | | | | | | | | | | |
Net investment income | | | (.32 | ) | | (.20 | ) | | (.24 | ) | | (.31 | ) | | (.26 | ) |
Net realized gain | | | – | | | – | | | – | | | – | | | (2.13 | ) |
| | | | | | | | | | | | | | | | |
Total distributions | | | (.32 | ) | | (.20 | ) | | (.24 | ) | | (.31 | ) | | (2.39 | ) |
| | | | | | | | | | | | | | | | |
Net asset value, end of year | | | $30.68 | | | $27.17 | | | $27.78 | | | $25.90 | | | $20.99 | |
| | | | | | | | | | | | | | | | |
|
Total Return(b) | | | 14.30 | % | | (1.52 | )% | | 8.25 | % | | 25.28 | % | | (31.53 | )% |
Ratios to Average Net Assets: | | | | | | | | | | | | | | | | |
|
Expenses, excluding expense reductions
and including management fee
waived and expenses reimbursed | | | .63 | % | | .63 | % | | .63 | % | | .79 | % | | .95 | % |
|
Expenses, including expense reductions,
management fee waived and
expenses reimbursed | | | .63 | % | | .63 | % | | .63 | % | | .79 | % | | .95 | % |
|
Expenses, excluding expense reductions,
management fee waived and
expenses reimbursed | | | .97 | % | | .94 | % | | .95 | % | | 1.01 | % | | .98 | % |
|
Net investment income | | | 1.31 | % | | 1.01 | % | | .79 | % | | 1.17 | % | | 1.13 | % |
| | | | | | | | | | | | | | | | |
Supplemental Data: | | | | | | | | | | | | | | | | |
| | | | | | | | | | | | | | | | | |
Net assets, end of year (000) | | | $140,405 | | | $327,603 | | | $328,620 | | | $264,418 | | | $174,231 | |
Portfolio turnover rate | | | 12.89 | % | | 27.97 | % | | 24.10 | % | | 55.20 | % | | 36.96 | % |
| | | | | | | | | | | | | | | | | |
| |
(a) | Calculated using average shares outstanding during the year. |
(b) | Total return assumes the reinvestment of all distributions. |
| | |
| See Notes to Financial Statements. | 27 |
|
Financial Highlights (continued) |
CLASSIC STOCK FUND |
| | | | | | | | | | | | | | | | |
| | Class P Shares | |
| | | |
| | Year Ended 11/30 | |
| | | |
| | 2012 | | 2011 | | 2010 | | 2009 | | 2008 | |
Per Share Operating Performance | | | | | | | | | | | | | | | | |
Net asset value, beginning of year | | | $27.17 | | | $27.78 | | | $25.91 | | | $20.96 | | | $33.05 | |
| | | | | | | | | | | | | | | | |
Investment operations: | | | | | | | | | | | | | | | | |
Net investment income(a) | | | .25 | | | .15 | | | .08 | | | .17 | | | .18 | |
Net realized and unrealized gain (loss) | | | 3.47 | | | (.69 | ) | | 1.92 | | | 4.97 | | | (10.01 | ) |
| | | | | | | | | | | | | | | | |
Total from investment operations | | | 3.72 | | | (.54 | ) | | 2.00 | | | 5.14 | | | (9.83 | ) |
| | | | | | | | | | | | | | | | |
Distributions to shareholders from: | | | | | | | | | | | | | | | | |
Net investment income | | | (.16 | ) | | (.07 | ) | | (.13 | ) | | (.19 | ) | | (.13 | ) |
Net realized gain | | | – | | | – | | | – | | | – | | | (2.13 | ) |
| | | | | | | | | | | | | | | | |
Total distributions | | | (.16 | ) | | (.07 | ) | | (.13 | ) | | (.19 | ) | | (2.26 | ) |
| | | | | | | | | | | | | | | | |
Net asset value, end of year | | | $30.73 | | | $27.17 | | | $27.78 | | | $25.91 | | | $20.96 | |
| | | | | | | | | | | | | | | | |
|
Total Return(b) | | | 13.77 | % | | (1.97 | )% | | 7.74 | % | | 24.75 | % | | (31.85 | )% |
Ratios to Average Net Assets: | | | | | | | | | | | | | | | | |
|
Expenses, excluding expense reductions
and including management fee
waived and expenses reimbursed | | | 1.08 | % | | 1.08 | % | | 1.08 | % | | 1.27 | % | | 1.40 | % |
|
Expenses, including expense reductions,
management fee waived and
expenses reimbursed | | | 1.08 | % | | 1.08 | % | | 1.08 | % | | 1.27 | % | | 1.40 | % |
|
Expenses, excluding expense reductions,
management fee waived and
expenses reimbursed | | | 1.42 | % | | 1.39 | % | | 1.40 | % | | 1.47 | % | | 1.43 | % |
|
Net investment income | | | .85 | % | | .53 | % | | .30 | % | | .76 | % | | .66 | % |
|
Supplemental Data: | | | | | | | | | | | | | | | | |
| | | | | | | | | | | | | | | | | |
Net assets, end of year (000) | | | $1,069 | | | $2,389 | | | $3,107 | | | $4,226 | | | $4,635 | |
Portfolio turnover rate | | | 12.89 | % | | 27.97 | % | | 24.10 | % | | 55.20 | % | | 36.96 | % |
| | | | | | | | | | | | | | | | | |
| |
(a) | Calculated using average shares outstanding during the year. |
(b) | Total return assumes the reinvestment of all distributions. |
| | |
28 | See Notes to Financial Statements. | |
|
Financial Highlights (continued) |
CLASSIC STOCK FUND |
| | | | | | | | | | | | | | | | |
| | Class R2 Shares | |
| | | |
| | Year Ended 11/30 | |
| | | |
| | 2012 | | 2011 | | 2010 | | 2009 | | 2008 | |
Per Share Operating Performance | | | | | | | | | | | |
Net asset value, beginning of year | | | $26.91 | | | $27.56 | | | $25.78 | | | $20.91 | | | $32.93 | |
| | | | | | | | | | | | | | | | |
Investment operations: | | | | | | | | | | | | | | | | |
Net investment income(a) | | | .23 | | | .13 | | | .07 | | | .12 | | | .28 | |
Net realized and unrealized gain (loss) | | | 3.40 | | | (.70 | ) | | 1.88 | | | 5.04 | | | (9.96 | ) |
| | | | | | | | | | | | | | | | |
Total from investment operations | | | 3.63 | | | (.57 | ) | | 1.95 | | | 5.16 | | | (9.68 | ) |
| | | | | | | | | | | | | | | | |
Distributions to shareholders from: | | | | | | | | | | | | | | | | |
Net investment income | | | (.16 | ) | | (.08 | ) | | (.17 | ) | | (.29 | ) | | (.21 | ) |
Net realized gain | | | – | | | – | | | – | | | – | | | (2.13 | ) |
| | | | | | | | | | | | | | | | |
Total distributions | | | (.16 | ) | | (.08 | ) | | (.17 | ) | | (.29 | ) | | (2.34 | ) |
| | | | | | | | | | | | | | | | |
Net asset value, end of year | | | $30.38 | | | $26.91 | | | $27.56 | | | $25.78 | | | $20.91 | |
| | | | | | | | | | | | | | | | |
| | | | | | | | | | | | | | | | |
Total Return(b) | | | 13.56 | % | | (2.09 | )% | | 7.61 | % | | 25.03 | % | | (31.57 | )% |
Ratios to Average Net Assets: | | | | | | | | | | | | | | | | |
|
Expenses, excluding expense reductions
and including management fee
waived and expenses reimbursed | | | 1.23 | % | | 1.23 | % | | 1.22 | % | | 1.21 | % | | 1.04 | % |
|
Expenses, including expense reductions,
management fee waived and
expenses reimbursed | | | 1.23 | % | | 1.23 | % | | 1.22 | % | | 1.21 | % | | 1.04 | % |
|
Expenses, excluding expense reductions,
management fee waived and
expenses reimbursed | | | 1.56 | % | | 1.54 | % | | 1.55 | % | | 1.56 | % | | 1.07 | % |
|
Net investment income | | | .79 | % | | .46 | % | | .25 | % | | .50 | % | | 1.04 | % |
|
Supplemental Data: | | | | | | | | | | | | | | | | |
| | | | | | | | | | | | | | | | | |
Net assets, end of year (000) | | | $2,448 | | | $2,771 | | | $1,749 | | | $730 | | | $7 | |
Portfolio turnover rate | | | 12.89 | % | | 27.97 | % | | 24.10 | % | | 55.20 | % | | 36.96 | % |
| | | | | | | | | | | | | | | | | |
| |
(a) | Calculated using average shares outstanding during the year. |
(b) | Total return assumes the reinvestment of all distributions. |
| | |
| See Notes to Financial Statements. | 29 |
|
Financial Highlights (concluded) |
CLASSIC STOCK FUND |
| | | | | | | | | | | | | | | | |
| | Class R3 Shares | |
| | | |
| | Year Ended 11/30 | |
| | | |
| | 2012 | | 2011 | | 2010 | | 2009 | | 2008 | |
Per Share Operating Performance | | | | | | | | | | | | | | | | |
Net asset value, beginning of year | | | $26.78 | | | $27.42 | | | $25.64 | | | $20.82 | | | $32.94 | |
| | | | | | | | | | | | | | | | |
Investment operations: | | | | | | | | | | | | | | | | |
Net investment income(a) | | | .26 | | | .16 | | | .08 | | | .16 | | | .22 | |
Net realized and unrealized gain (loss) | | | 3.38 | | | (.70 | ) | | 1.88 | | | 4.92 | | | (9.99 | ) |
| | | | | | | | | | | | | | | | |
Total from investment operations | | | 3.64 | | | (.54 | ) | | 1.96 | | | 5.08 | | | (9.77 | ) |
| | | | | | | | | | | | | | | | |
Distributions to shareholders from: | | | | | | | | | | | | | | | | |
Net investment income | | | (.19 | ) | | (.10 | ) | | (.18 | ) | | (.26 | ) | | (.22 | ) |
Net realized gain | | | – | | | – | | | – | | | – | | | (2.13 | ) |
| | | | | | | | | | | | | | | | |
Total distributions | | | (.19 | ) | | (.10 | ) | | (.18 | ) | | (.26 | ) | | (2.35 | ) |
| | | | | | | | | | | | | | | | |
Net asset value, end of year | | | $30.23 | | | $26.78 | | | $27.42 | | | $25.64 | | | $20.82 | |
| | | | | | | | | | | | | | | | |
|
Total Return(b) | | | 13.69 | % | | (2.00 | )% | | 7.71 | % | | 24.70 | % | | (31.86 | )% |
Ratios to Average Net Assets: | | | | | | | | | | | | | | | | |
|
Expenses, excluding expense reductions
and including expenses assumed,
management fee waived and
expenses reimbursed | | | 1.12 | % | | 1.13 | % | | 1.12 | % | | 1.21 | % | | 1.42 | % |
|
Expenses, including expense reductions,
management fee waived and
expenses reimbursed | | | 1.12 | % | | 1.13 | % | | 1.12 | % | | 1.21 | % | | 1.42 | % |
|
Expenses, excluding expense reductions,
management fee waived and
expenses reimbursed | | | 1.46 | % | | 1.44 | % | | 1.45 | % | | 1.49 | % | | 1.48 | % |
|
Net investment income | | | .89 | % | | .56 | % | | .32 | % | | .70 | % | | .88 | % |
|
Supplemental Data: | | | | | | | | | | | | | | | | |
| | | | | | | | | | | | | | | | | |
Net assets, end of year (000) | | | $15,276 | | | $14,304 | | | $9,567 | | | $2,238 | | | $321 | |
Portfolio turnover rate | | | 12.89 | % | | 27.97 | % | | 24.10 | % | | 55.20 | % | | 36.96 | % |
| | | | | | | | | | | | | | | | | |
| |
(a) | Calculated using average shares outstanding during the year. |
(b) | Total return assumes the reinvestment of all distributions. |
| | |
30 | See Notes to Financial Statements. | |
|
Financial Highlights |
SMALL CAP VALUE FUND |
| | | | | | | | | | | | | | | | |
| | Class A Shares | |
| | | |
| | Year Ended 11/30 | |
| | | |
| | 2012 | | 2011 | | 2010 | | 2009 | | 2008 | |
Per Share Operating Performance | | | | | | | | | | | | | | | | |
Net asset value, beginning of year | | | $29.68 | | | $28.93 | | | $22.87 | | | $18.32 | | | $33.10 | |
| | | | | | | | | | | | | | | | |
Investment operations: | | | | | | | | | | | | | | | | |
Net investment income (loss)(a) | | | .18 | | | (.07 | ) | | – | (b) | | (.02 | ) | | .04 | |
Net realized and unrealized gain (loss) | | | 2.38 | | | .82 | | | 6.06 | | | 4.62 | | | (9.97 | ) |
| | | | | | | | | | | | | | | | |
Total from investment operations | | | 2.56 | | | .75 | | | 6.06 | | | 4.60 | | | (9.93 | ) |
| | | | | | | | | | | | | | | | |
Distributions to shareholders from: | | | | | | | | | | | | | | | | |
Net investment income | | | – | | | – | (b) | | – | | | (.05 | ) | | (.04 | ) |
Net realized gain | | | – | | | – | | | – | | | – | | | (4.81 | ) |
| | | | | | | | | | | | | | | | |
Total distributions | | | – | | | – | (b) | | – | | | (.05 | ) | | (4.85 | ) |
| | | | | | | | | | | | | | | | |
Net asset value, end of year | | | $32.24 | | | $29.68 | | | $28.93 | | | $22.87 | | | $18.32 | |
| | | | | | | | | | | | | | | | |
|
Total Return(c) | | | 8.63 | % | | 2.60 | % | | 26.50 | % | | 25.15 | % | | (34.96 | )% |
Ratios to Average Net Assets: | | | | | | | | | | | | | | | | |
Expenses, including expense reductions | | | 1.23 | % | | 1.23 | % | | 1.25 | % | | 1.24 | % | | 1.23 | % |
|
Expenses, excluding expense reductions | | | 1.23 | % | | 1.23 | % | | 1.25 | % | | 1.24 | % | | 1.23 | % |
|
Net investment income (loss) | | | .57 | % | | (.22 | )% | | (.01 | )% | | (.08 | )% | | .17 | % |
|
Supplemental Data: | | | | | | | | | | | | | | | | |
| | | | | | | | | | | | | | | | | |
Net assets, end of year (000) | | | $1,247,956 | | | $1,470,064 | | | $1,608,846 | | | $1,393,870 | | | $1,216,253 | |
Portfolio turnover rate | | | 28.91 | % | | 41.95 | % | | 42.28 | % | | 68.63 | % | | 77.87 | % |
| | | | | | | | | | | | | | | | | |
| |
(a) | Calculated using average shares outstanding during the year. |
(b) | Amount is less than $.01. |
(c) | Total return does not consider the effects of sales loads and assumes the reinvestment of all distributions. |
| | |
| See Notes to Financial Statements. | 31 |
|
Financial Highlights (continued) |
SMALL CAP VALUE FUND |
| | | | | | | | | | | | | | | | |
| | Class B Shares | |
| | | |
| | Year Ended 11/30 | |
| | | |
| | 2012 | | 2011 | | 2010 | | 2009 | | 2008 | |
Per Share Operating Performance | | | | | | | | | | | | | | | | |
Net asset value, beginning of year | | | $25.56 | | | $25.09 | | | $19.97 | | | $16.07 | | | $29.78 | |
| | | | | | | | | | | | | | | | |
Investment operations: | | | | | | | | | | | | | | | | |
Net investment loss(a) | | | (.04 | ) | | (.25 | ) | | (.17 | ) | | (.12 | ) | | (.12 | ) |
Net realized and unrealized gain (loss) | | | 2.05 | | | .72 | | | 5.29 | | | 4.02 | | | (8.78 | ) |
| | | | | | | | | | | | | | | | |
Total from investment operations | | | 2.01 | | | .47 | | | 5.12 | | | 3.90 | | | (8.90 | ) |
| | | | | | | | | | | | | | | | |
Distributions to shareholders from: | | | | | | | | | | | | | | | | |
Net realized gain | | | – | | | – | | | – | | | – | | | (4.81 | ) |
| | | | | | | | | | | | | | | | |
Net asset value, end of year | | | $27.57 | | | $25.56 | | | $25.09 | | | $19.97 | | | $16.07 | |
| | | | | | | | | | | | | | | | |
|
Total Return(b) | | | 7.82 | % | | 1.87 | % | | 25.64 | % | | 24.27 | % | | (35.41 | )% |
Ratios to Average Net Assets: | | | | | | | | | | | | | | | | |
|
Expenses, including expense reductions | | | 1.93 | % | | 1.92 | % | | 1.95 | % | | 1.94 | % | | 1.93 | % |
|
Expenses, excluding expense reductions | | | 1.93 | % | | 1.92 | % | | 1.95 | % | | 1.94 | % | | 1.93 | % |
|
Net investment loss | | | (.15 | )% | | (.91 | )% | | (.73 | )% | | (.73 | )% | | (.54 | )% |
|
Supplemental Data: | | | | | | | | | | | | | | | | |
| | | | | | | | | | | | | | | | | |
Net assets, end of year (000) | | | $6,406 | | | $9,612 | | | $14,612 | | | $15,917 | | | $25,955 | |
Portfolio turnover rate | | | 28.91 | % | | 41.95 | % | | 42.28 | % | | 68.63 | % | | 77.87 | % |
| | | | | | | | | | | | | | | | | |
| |
(a) | Calculated using average shares outstanding during the year. |
(b) | Total return does not consider the effects of sales loads and assumes the reinvestment of all distributions. |
| | |
32 | See Notes to Financial Statements. | |
|
Financial Highlights (continued) |
SMALL CAP VALUE FUND |
| | | | | | | | | | | | | | | | |
| | Class C Shares | |
| | | |
| | Year Ended 11/30 | |
| | | |
| | 2012 | | 2011 | | 2010 | | 2009 | | 2008 | |
Per Share Operating Performance | | | | | | | | | | | | | | | | |
Net asset value, beginning of year | | | $25.61 | | | $25.14 | | | $20.01 | | | $16.10 | | | $29.83 | |
| | | | | | | | | | | | | | | | |
Investment operations: | | | | | | | | | | | | | | | | |
Net investment loss(a) | | | (.03 | ) | | (.24 | ) | | (.17 | ) | | (.13 | ) | | (.12 | ) |
Net realized and unrealized gain (loss) | | | 2.05 | | | .71 | | | 5.30 | | | 4.04 | | | (8.80 | ) |
| | | | | | | | | | | | | | | | |
Total from investment operations | | | 2.02 | | | .47 | | | 5.13 | | | 3.91 | | | (8.92 | ) |
| | | | | | | | | | | | | | | | |
Distributions to shareholders from: | | | | | | | | | | | | | | | | |
Net realized gain | | | – | | | – | | | – | | | – | | | (4.81 | ) |
| | | | | | | | | | | | | | | | |
Net asset value, end of year | | | $27.63 | | | $25.61 | | | $25.14 | | | $20.01 | | | $16.10 | |
| | | | | | | | | | | | | | | | |
|
Total Return(b) | | | 7.89 | % | | 1.87 | % | | 25.64 | % | | 24.29 | % | | (35.42 | )% |
Ratios to Average Net Assets: | | | | | | | | | | | | | | | | |
|
Expenses, including expense reductions | | | 1.92 | % | | 1.92 | % | | 1.95 | % | | 1.94 | % | | 1.93 | % |
|
Expenses, excluding expense reductions | | | 1.92 | % | | 1.92 | % | | 1.95 | % | | 1.94 | % | | 1.93 | % |
|
Net investment loss | | | (.12 | )% | | (.90 | )% | | (.72 | )% | | (.77 | )% | | (.53 | )% |
| | | | | | | | | | | | | | | | |
Supplemental Data: | | | | | | | | | | | | | | | | |
| | | | | | | | | | | | | | | | | |
Net assets, end of year (000) | | | $37,988 | | | $41,597 | | | $46,980 | | | $46,275 | | | $46,307 | |
Portfolio turnover rate | | | 28.91 | % | | 41.95 | % | | 42.28 | % | | 68.63 | % | | 77.87 | % |
| | | | | | | | | | | | | | | | | |
| |
(a) | Calculated using average shares outstanding during the year. |
(b) | Total return does not consider the effects of sales loads and assumes the reinvestment of all distributions. |
| | |
| See Notes to Financial Statements. | 33 |
|
Financial Highlights (continued) |
SMALL CAP VALUE FUND |
| | | | | | | | | | | | | | | | |
| | Class F Shares | |
| | | |
| | Year Ended 11/30 | |
| | | |
| | 2012 | | 2011 | | 2010 | | 2009 | | 2008 | |
Per Share Operating Performance | | | | | | | | | | | | | | | | |
Net asset value, beginning of year | | | $29.64 | | | $28.90 | | | $22.80 | | | $18.30 | | | $33.11 | |
| | | | | | | | | | | | | | | | |
Investment operations: | | | | | | | | | | | | | | | | |
Net investment income(a) | | | .26 | | | – | (b) | | .05 | | | – | (b) | | .08 | |
Net realized and unrealized gain (loss) | | | 2.36 | | | .80 | | | 6.05 | | | 4.62 | | | (9.95 | ) |
| | | | | | | | | | | | | | | | |
Total from investment operations | | | 2.62 | | | .80 | | | 6.10 | | | 4.62 | | | (9.87 | ) |
| | | | | | | | | | | | | | | | |
Distributions to shareholders from: | | | | | | | | | | | | | | | | |
Net investment income | | | – | | | (.06 | ) | | – | | | (.12 | ) | | (.13 | ) |
Net realized gain | | | – | | | – | | | – | | | – | | | (4.81 | ) |
| | | | | | | | | | | | | | | | |
Total distributions | | | – | | | (.06 | ) | | – | | | (.12 | ) | | (4.94 | ) |
| | | | | | | | | | | | | | | | |
Net asset value, end of year | | | $32.26 | | | $29.64 | | | $28.90 | | | $22.80 | | | $18.30 | |
| | | | | | | | | | | | | | | | |
|
Total Return(c) | | | 8.84 | % | | 2.76 | % | | 26.75 | % | | 25.39 | % | | (34.82 | )% |
Ratios to Average Net Assets: | | | | | | | | | | | | | | | | |
|
Expenses, including expense reductions | | | 1.03 | % | | 1.04 | % | | 1.05 | % | | 1.03 | % | | 1.04 | % |
|
Expenses, excluding expense reductions | | | 1.03 | % | | 1.04 | % | | 1.05 | % | | 1.03 | % | | 1.04 | % |
|
Net investment income (loss) | | | .83 | % | | .01 | % | | .19 | % | | (.02 | )% | | .32 | % |
| | | | | | | | | | | | | | | | |
Supplemental Data: | | | | | | | | | | | | | | | | |
| | | | | | | | | | | | | | | | | |
Net assets, end of year (000) | | | $52,084 | | | $32,597 | | | $27,236 | | | $22,387 | | | $1,425 | |
Portfolio turnover rate | | | 28.91 | % | | 41.95 | % | | 42.28 | % | | 68.63 | % | | 77.87 | % |
| | | | | | | | | | | | | | | | | |
| |
(a) | Calculated using average shares outstanding during the year. |
(b) | Amount is less than $.01. |
(c) | Total return assumes the reinvestment of all distributions. |
| | |
34 | See Notes to Financial Statements. | |
|
Financial Highlights (continued) |
SMALL CAP VALUE FUND |
| | | | | | | | | | | | | | | | |
| | Class I Shares | |
| | | |
| | Year Ended 11/30 | |
| | | |
| | 2012 | | 2011 | | 2010 | | 2009 | | 2008 | |
Per Share Operating Performance | | | | | | | | | | | | | | | | |
Net asset value, beginning of year | | | $31.46 | | | $30.67 | | | $24.17 | | | $19.38 | | | $34.75 | |
| | | | | | | | | | | | | | | | |
Investment operations: | | | | | | | | | | | | | | | | |
Net investment income(a) | | | .30 | | | .03 | | | .08 | | | .05 | | | .13 | |
Net realized and unrealized gain (loss) | | | 2.52 | | | .85 | | | 6.42 | | | 4.87 | | | (10.55 | ) |
| | | | | | | | | | | | | | | | |
Total from investment operations | | | 2.82 | | | .88 | | | 6.50 | | | 4.92 | | | (10.42 | ) |
| | | | | | | | | | | | | | | | |
Distributions to shareholders from: | | | | | | | | | | | | | | | | |
Net investment income | | | – | | | (.09 | ) | | – | | | (.13 | ) | | (.14 | ) |
Net realized gain | | | – | | | – | | | – | | | – | | | (4.81 | ) |
| | | | | | | | | | | | | | | | |
Total distributions | | | – | | | (.09 | ) | | – | | | (.13 | ) | | (4.95 | ) |
| | | | | | | | | | | | | | | | |
Net asset value, end of year | | | $34.28 | | | $31.46 | | | $30.67 | | | $24.17 | | | $19.38 | |
| | | | | | | | | | | | | | | | |
|
Total Return(b) | | | 8.96 | % | | 2.84 | % | | 26.89 | % | | 25.55 | % | | (34.77 | )% |
Ratios to Average Net Assets: | | | | | | | | | | | | | | | | |
|
Expenses, including expense reductions | | | .93 | % | | .93 | % | | .95 | % | | .94 | % | | .93 | % |
|
Expenses, excluding expense reductions | | | .93 | % | | .93 | % | | .95 | % | | .94 | % | | .93 | % |
|
Net investment income | | | .88 | % | | .09 | % | | .30 | % | | .21 | % | | .48 | % |
| | | | | | | | | | | | | | | | |
Supplemental Data: | | | | | | | | | | | | | | | | |
| | | | | | | | | | | | | | | | | |
Net assets, end of year (000) | | | $1,862,546 | | | $1,855,748 | | | $1,692,837 | | | $1,231,291 | | | $942,604 | |
Portfolio turnover rate | | | 28.91 | % | | 41.95 | % | | 42.28 | % | | 68.63 | % | | 77.87 | % |
| | | | | | | | | | | | | | | | | |
| |
(a) | Calculated using average shares outstanding during the year. |
(b) | Total return assumes the reinvestment of all distributions. |
| | |
| See Notes to Financial Statements. | 35 |
|
Financial Highlights (continued) |
SMALL CAP VALUE FUND |
| | | | | | | | | | | | | | | | |
| | Class P Shares | |
| | | |
| | Year Ended 11/30 | |
| | | |
| | 2012 | | 2011 | | 2010 | | 2009 | | 2008 | |
Per Share Operating Performance | | | | | | | | | | | | | | | | |
Net asset value, beginning of year | | | $29.31 | | | $28.62 | | | $22.66 | | | $18.15 | | | $32.84 | |
| | | | | | | | | | | | | | | | |
Investment operations: | | | | | | | | | | | | | | | | |
Net investment income (loss)(a) | | | .13 | | | (.11 | ) | | (.04 | ) | | (.05 | ) | | .01 | |
Net realized and unrealized gain (loss) | | | 2.35 | | | .80 | | | 6.00 | | | 4.57 | | | (9.89 | ) |
| | | | | | | | | | | | | | | | |
Total from investment operations | | | 2.48 | | | .69 | | | 5.96 | | | 4.52 | | | (9.88 | ) |
| | | | | | | | | | | | | | | | |
Distributions to shareholders from: | | | | | | | | | | | | | | | | |
Net investment income | | | – | | | – | | | – | | | (.01 | ) | | – | |
Net realized gain | | | – | | | – | | | – | | | – | | | (4.81 | ) |
| | | | | | | | | | | | | | | | |
Total distributions | | | – | | | – | | | – | | | (.01 | ) | | (4.81 | ) |
| | | | | | | | | | | | | | | | |
Net asset value, end of year | | | $31.79 | | | $29.31 | | | $28.62 | | | $22.66 | | | $18.15 | |
| | | | | | | | | | | | | | | | |
|
Total Return(b) | | | 8.46 | % | | 2.41 | % | | 26.30 | % | | 24.94 | % | | (35.04 | )% |
Ratios to Average Net Assets: | | | | | | | | | | | | | | | | |
|
Expenses, including expense reductions | | | 1.38 | % | | 1.38 | % | | 1.40 | % | | 1.39 | % | | 1.38 | % |
|
Expenses, excluding expense reductions | | | 1.38 | % | | 1.38 | % | | 1.40 | % | | 1.39 | % | | 1.38 | % |
|
Net investment income (loss) | | | .42 | % | | (.37 | )% | | (.16 | )% | | (.23 | )% | | .02 | % |
| | | | | | | | | | | | | | | | |
Supplemental Data: | | | | | | | | | | | | | | | | |
| | | | | | | | | | | | | | | | | |
Net assets, end of year (000) | | | $192,603 | | | $231,655 | | | $295,973 | | | $261,914 | | | $227,658 | |
Portfolio turnover rate | | | 28.91 | % | | 41.95 | % | | 42.28 | % | | 68.63 | % | | 77.87 | % |
| | | | | | | | | | | | | | | | | |
| |
(a) | Calculated using average shares outstanding during the year. |
(b) | Total return assumes the reinvestment of all distributions. |
| | |
36 | See Notes to Financial Statements. | |
|
Financial Highlights (continued) |
SMALL CAP VALUE FUND |
| | | | | | | | | | | | | | | | | |
| | Class R2 Shares | |
| | | |
| | Year Ended 11/30 | | 3/24/2008 (a)
to
11/30/2008 | |
| | | | |
| | 2012 | | 2011 | | 2010 | | 2009 | | |
Per Share Operating Performance | | | | | | | | | | | | | | | | | |
Net asset value, beginning of period | | | $29.37 | | | $28.72 | | | $22.77 | | | $18.29 | | | $25.99 | | |
| | | | | | | | | | | | | | | | | |
Investment operations: | | | | | | | | | | | | | | | | | |
Net investment income (loss)(b) | | | .09 | | | (.11 | ) | | (.11 | ) | | (.10 | ) | | (.02 | ) | |
Net realized and unrealized gain (loss) | | | 2.35 | | | .76 | | | 6.06 | | | 4.62 | | | (7.68 | ) | |
| | | | | | | | | | | | | | | | | |
Total from investment operations | | | 2.44 | | | .65 | | | 5.95 | | | 4.52 | | | (7.70 | ) | |
| | | | | | | | | | | | | | | | | |
Distributions to shareholders from: | | | | | | | | | | | | | | | | | |
Net investment income | | | – | | | – | | | – | | | (.04 | ) | | – | | |
| | | | | | | | | | | | | | | | | |
Net asset value, end of period | | | $31.81 | | | $29.37 | | | $28.72 | | | $22.77 | | | $18.29 | | |
| | | | | | | | | | | | | | | | | |
|
Total Return(c) | | | 8.31 | % | | 2.26 | % | | 26.13 | % | | 24.77 | % | | (29.63 | )%(d) | |
Ratios to Average Net Assets: | | | | | | | | | | | | | | | | | |
|
Expenses, including expense reductions | | | 1.53 | % | | 1.56 | % | | 1.54 | % | | 1.52 | % | | 1.03 | %(d) | |
|
Expenses, excluding expense reductions | | | 1.53 | % | | 1.56 | % | | 1.54 | % | | 1.52 | % | | 1.04 | %(d) | |
|
Net investment income (loss) | | | .28 | % | | (.38 | )% | | (.41 | )% | | (.48 | )% | | (.07 | )%(d) | |
| | | | | | | | | | | | | | | | | |
Supplemental Data: | | | | | | | | | | | | | | | | | |
| | | | | | | | | | | | | | | | | | |
Net assets, end of period (000) | | | $6,910 | | | $7,205 | | | $78 | | | $86 | | | $14 | | |
Portfolio turnover rate | | | 28.91 | % | | 41.95 | % | | 42.28 | % | | 68.63 | % | | 77.87 | % | |
| | | | | | | | | | | | | | | | | | |
| |
(a) | Commencement of operations was 3/24/2008, SEC effective date was 9/14/2007 and date shares first became available to the public was 4/1/2008. |
(b) | Calculated using average shares outstanding during the period. |
(c) | Total return assumes the reinvestment of all distributions. |
(d) | Not annualized. |
| | |
| See Notes to Financial Statements. | 37 |
|
Financial Highlights (concluded) |
SMALL CAP VALUE FUND |
| | | | | | | | | | | | | | | | | |
| | Class R3 Shares | |
| | | |
| | Year Ended 11/30 | | 3/24/2008 (a)
to
11/30/2008 | |
| | | | |
| | 2012 | | 2011 | | 2010 | | 2009 | | |
Per Share Operating Performance | | | | | | | | | | | | | | | | | |
Net asset value, beginning of period | | | $29.38 | | | $28.69 | | | $22.73 | | | $18.29 | | | $25.99 | | |
| | | | | | | | | | | | | | | | | |
Investment operations: | | | | | | | | | | | | | | | | | |
Net investment income (loss)(b) | | | .12 | | | (.11 | ) | | (.04 | ) | | (.06 | ) | | .02 | | |
Net realized and unrealized gain (loss) | | | 2.35 | | | .80 | | | 6.00 | | | 4.60 | | | (7.72 | ) | |
| | | | | | | | | | | | | | | | | |
Total from investment operations | | | 2.47 | | | .69 | | | 5.96 | | | 4.54 | | | (7.70 | ) | |
| | | | | | | | | | | | | | | | | |
Distributions to shareholders from: | | | | | | | | | | | | | | | | | |
Net investment income | | | – | | | – | | | – | | | (.10 | ) | | – | | |
| | | | | | | | | | | | | | | | | |
Net asset value, end of period | | | $31.85 | | | $29.38 | | | $28.69 | | | $22.73 | | | $18.29 | | |
| | | | | | | | | | | | | | | | | |
|
Total Return(c) | | | 8.41 | % | | 2.41 | % | | 26.22 | % | | 24.94 | % | | (29.63 | )%(d) | |
Ratios to Average Net Assets: | | | | | | | | | | | | | | | | | |
|
Expenses, including expense reductions | | | 1.42 | % | | 1.42 | % | | 1.45 | % | | 1.44 | % | | 1.00 | %(d) | |
|
Expenses, excluding expense reductions | | | 1.42 | % | | 1.42 | % | | 1.45 | % | | 1.44 | % | | 1.00 | %(d) | |
|
Net investment income (loss) | | | .39 | % | | (.37 | )% | | (.16 | )% | | .30 | % | | .07 | %(d) | |
| | | | | | | | | | | | | | | | | |
Supplemental Data: | | | | | | | | | | | | | | | | | |
| | | | | | | | | | | | | | | | | | |
Net assets, end of period (000) | | | $11,635 | | | $10,907 | | | $5,190 | | | $1,995 | | | $1,090 | | |
Portfolio turnover rate | | | 28.91 | % | | 41.95 | % | | 42.28 | % | | 68.63 | % | | 77.87 | % | |
| | | | | | | | | | | | | | | | | | |
| |
(a) | Commencement of operations was 3/24/2008, SEC effective date was 9/14/2007 and date shares first became available to the public was 4/1/2008. |
(b) | Calculated using average shares outstanding during the period. |
(c) | Total return assumes the reinvestment of all distributions. |
(d) | Not annualized. |
| | |
38 | See Notes to Financial Statements. | |
Notes to Financial Statements
Lord Abbett Research Fund, Inc. (the “Company”) is registered under the Investment Company Act of 1940, as amended (the “Act”), as a diversified, open-end management investment company and was incorporated under Maryland law on April 6, 1992. The Company currently consists of four separate funds. This report covers the following two funds (separately, a “Fund” and collectively, the “Funds”) and their respective classes: Lord Abbett Classic Stock Fund (“Classic Stock Fund”) and Small-Cap Value Series (“Small Cap Value Fund”).
Classic Stock Fund’s investment objective is growth of capital and growth of income consistent with reasonable risk. Small Cap Value Fund’s investment objective is long-term capital appreciation. Each Fund has eight classes of shares: Class A, B, C, F, I, P, R2 and R3, each with different expenses and dividends. A front-end sales charge is normally added to the net asset value (“NAV”) for Class A shares. There is no front-end sales charge in the case of Class B, C, F, I, P, R2 and R3 shares, although there may be a contingent deferred sales charge (“CDSC”) in certain cases as follows: Class A shares purchased without a sales charge and redeemed before the first day of the month in which the one-year anniversary of the purchase falls (subject to certain exceptions as set forth in the Funds’ prospectus); Class B shares redeemed before the sixth anniversary of purchase; and Class C shares redeemed before the first anniversary of purchase. Class B shares will automatically convert to Class A shares on the 25th day of the month (or, if the 25th day is not a business day, the next business day thereafter) following the eighth anniversary of the day on which the purchase order was accepted. Small Cap Value Fund is open to certain new investors on a limited basis as set forth in the Fund’s prospectus. The Funds no longer issue Class B shares for purchase. The Funds’ Class P shares are closed to substantially all investors, with certain exceptions as set forth in the Funds’ prospectus.
The preparation of the financial statements in conformity with accounting principles generally accepted in the United States of America requires management to make certain estimates and assumptions that affect the reported amounts of assets and liabilities and disclosure of contingent assets and liabilities at the date of the financial statements and the reported amounts of increases and decreases in net assets from operations during the reporting period. Actual results could differ from those estimates.
| | |
2. | SIGNIFICANT ACCOUNTING POLICIES | |
| |
(a) | Investment Valuation–Under procedures approved by the Funds’ Board of Directors (the “Board”), Lord, Abbett & Co. LLC (“Lord Abbett”), each Fund’s investment manager, has formed a Pricing Committee to administer the pricing and valuation of portfolio investments and to ensure that prices utilized reasonably reflect fair value. Among other things, these procedures allow the Funds to utilize independent pricing services, quotations from securities and financial instrument dealers and other market sources to determine fair value. |
| |
| Securities actively traded on any recognized U.S. or non-U.S. exchange or on The NASDAQ Stock Market LLC are valued at the last sale price or official closing price on the exchange or system on which they are principally traded. Events occurring after the close of trading on non-U.S. exchanges may result in adjustments to the valuation of foreign securities to reflect their fair value as of the close of regular trading on the New York Stock Exchange LLC. Each Fund may rely on an independent fair valuation service in adjusting the valuations of foreign securities. Unlisted equity securities are valued at the last quoted sale price or, if no sale price is available, at the mean between the most recently quoted bid and asked prices. |
39
Notes to Financial Statements (continued)
| |
| Securities for which prices are not readily available are valued at fair value as determined by the Pricing Committee and approved by the Board. The Pricing Committee considers a number of factors, including observable and unobservable inputs, when arriving at fair value. The Pricing Committee may use related or comparable assets or liabilities, recent transactions, market multiples, book values and other relevant information to determine fair value of portfolio investments. The Board or a designated committee thereof regularly reviews fair value determinations made by the Pricing Committee and employs techniques such as reviewing related market activity, reviewing inputs and assumptions, and retrospectively comparing prices of subsequent purchases and sales transactions to fair value determinations made by the Pricing Committee. |
| |
| Short-term securities with 60 days or less remaining to maturity are valued using the amortized cost method, which approximates fair value. |
| |
(b) | Security Transactions–Security transactions are recorded as of the date that the securities are purchased or sold (trade date). Realized gains and losses on sales of portfolio securities are calculated using the identified-cost method. Realized and unrealized gains (losses) are allocated to each class of shares based upon the relative proportion of net assets at the beginning of the day. |
| |
(c) | Investment Income–Dividend income is recorded on the ex-dividend date. Interest income is recorded on the accrual basis as earned. Discounts are accreted and premiums are amortized using the effective interest method and are included in Interest income on the Statements of Operations. Withholding taxes on foreign dividends have been provided for in accordance with the applicable country’s tax rules and rates. Investment income is allocated to each class of shares based upon the relative proportion of net assets at the beginning of the day. |
| |
(d) | Income Taxes–It is the policy of each Fund to meet the requirements of Subchapter M of the Internal Revenue Code applicable to regulated investment companies and to distribute substantially all taxable income and capital gains to its shareholders. Therefore, no income tax provision is required. |
| |
| Each Fund files U.S. federal and various state and local tax returns. No income tax returns are currently under examination. The statute of limitations on the Funds’ filed U.S. federal tax returns remains open for the fiscal years ended November 30, 2009 through November 30, 2012. The statutes of limitations on the Company’s state and local tax returns may remain open for an additional year depending upon the jurisdiction. |
| |
(e) | Expenses–Expenses incurred by the Company that do not specifically relate to an individual fund are generally allocated to the Funds within the Company on a pro rata basis by relative net assets. Expenses, excluding class-specific expenses, are allocated to each class of shares based upon the relative proportion of net assets at the beginning of the day. Class A, B, C, F, P, R2 and R3 shares bear their class-specific share of all expenses and fees relating to the Funds’ 12b-1 Distribution Plan. |
| |
(f) | Foreign Transactions–The books and records of each Fund are maintained in U.S. dollars and transactions denominated in foreign currencies are recorded in each Fund’s records at the rate prevailing when earned or recorded. Asset and liability accounts that are denominated in foreign currencies are adjusted daily to reflect current exchange rates and any unrealized gain (loss) is included in Net change in unrealized appreciation/depreciation on investments on each Fund’s Statement of Operations. The resultant exchange gains and losses upon settlement of |
40
Notes to Financial Statements (continued)
| | | |
| such transactions are included in Net realized gain on investments in unaffiliated issuers on each Fund’s Statement of Operations. Each Fund does not isolate that portion of the results of operations arising as a result of changes in the foreign exchange rates from the changes in market prices of the securities. |
| | | |
(g) | Repurchase Agreements–Each Fund may enter into repurchase agreements with respect to securities. A repurchase agreement is a transaction in which a Fund acquires a security and simultaneously commits to resell that security to the seller (a bank or securities dealer) at an agreed-upon price on an agreed-upon date. Each Fund requires at all times that the repurchase agreement be collateralized by cash, or by securities of the U.S. Government, its agencies, its instrumentalities, or U.S. Government sponsored enterprises having a value equal to, or in excess of, the value of the repurchase agreement (including accrued interest). If the seller of the agreement defaults on its obligation to repurchase the underlying securities at a time when the fair value of these securities has declined, a Fund may incur a loss upon disposition of the securities. |
| | | |
(h) | Fair Value Measurements–Fair value is defined as the price that each Fund would receive upon selling an investment or transferring a liability in an orderly transaction to an independent buyer in the principal or most advantageous market of the investment. A three-tier hierarchy is used to maximize the use of observable market data and minimize the use of unobservable inputs and to establish classification of fair value measurements for disclosure purposes. Inputs refer broadly to the assumptions that market participants would use in pricing the asset or liability, including assumptions about risk – for example, the risk inherent in a particular valuation technique used to measure fair value (such as a pricing model) and/or the risk inherent in the inputs to the valuation technique. Inputs may be observable or unobservable. Observable inputs reflect the assumptions market participants would use in pricing the asset or liability. Observable inputs are based on market data obtained from sources independent of the reporting entity. Unobservable inputs reflect the reporting entity’s own assumptions about the assumptions market participants would use in pricing the asset or liability. Unobservable inputs are based on the best information available in the circumstances. The three-tier hierarchy of inputs is summarized in the three broad Levels listed below: |
| | | |
| • | Level 1 – | unadjusted quoted prices in active markets for identical investments; |
| | | |
| • | Level 2 – | other significant observable inputs (including quoted prices for similar investments, interest rates, prepayment speeds, credit risk, etc.); and |
| | | |
| • | Level 3 – | significant unobservable inputs (including each Fund’s own assumptions in determining the fair value of investments). |
| | | |
| Changes in valuation techniques may result in transfers into or out of an assigned level within the three-tier hierarchy. All transfers between different levels within the three-tier hierarchy are deemed to have occurred as of the beginning of the reporting period. The inputs or methodology used for valuing securities are not necessarily an indication of the risk associated with investing in those securities. |
41
Notes to Financial Statements (continued)
The following is a summary of the inputs used as of November 30, 2012 in valuing each Fund’s investments carried at fair value:
| | | | | | | | | | | | | | | | | | | | | | | | | | |
| | Classic Stock Fund | | | Small Cap Value Fund | |
| | | | | | | |
| | | | | | | | | | | | | | | | | | |
Investment Type* | | Level 1
(000) | | Level 2
(000) | | Level 3
(000) | | Total
(000) | | | Level 1
(000) | | Level 2
(000) | | Level 3
(000) | | Total
(000) | |
| | | | | | | | | | | | | | | | | | | |
Common Stocks | | | $730,251 | | $ | – | | | $– | | | $730,251 | | | | $3,361,996 | | $ | – | | | $– | | | $3,361,996 | |
Short Term Investment | | | – | | | 19,165 | | | – | | | 19,165 | | | | – | | | 17,666 | | | – | | | 17,666 | |
| | | | | | | | | | | | | | | | | | | | | | | | | | | |
Total | | | $730,251 | | $ | 19,165 | | | $– | | | $749,416 | | | | $3,361,996 | | $ | 17,666 | | | $– | | | $3,379,662 | |
| | | | | | | | | | | | | | | | | | | | | | | | | | | |
| |
* | See Schedule of Investments for fair values in each industry and identification of foreign issuers and/or geography. |
| | |
3. | MANAGEMENT FEE AND OTHER TRANSACTIONS WITH AFFILIATES | |
Management Fee
The Company has a management agreement with Lord Abbett, pursuant to which Lord Abbett supplies each Fund with investment management services and executive and other personnel, provides office space and pays for ordinary and necessary office and clerical expenses relating to research and statistical work and supervision of each Fund’s investment portfolio.
The management fee is based on each Fund’s average daily net assets at the following annual rates:
| | |
Classic Stock Fund | | |
First $1 billion | | .70% |
Next $1 billion | | .65% |
Over $2 billion | | .60% |
For the fiscal year ended November 30, 2012, the effective management fee, net of waivers, with respect to Classic Stock Fund, was at an annualized rate of .37% of the Fund’s average daily net assets.
| | |
Small Cap Value Fund |
First $2 billion | | .75% |
Over $2 billion | | .70% |
For the fiscal year ended November 30, 2012, the effective management fee with respect to Small Cap Value Fund, was at an annualized rate of .73% of the Fund’s average daily net assets.
For the fiscal year ended November 30, 2012, and continuing through March 31, 2014, Lord Abbett has contractually agreed to waive all or a portion of its management fee and administrative fee and, if necessary, reimburse Classic Stock Fund’s other expenses to the extent necessary so that the total net annual operating expenses for each class, excluding 12b-1 fees, do not exceed an annual rate of .63%. This agreement may be terminated only upon approval of the Board.
In addition, Lord Abbett provides certain administrative services to each Fund pursuant to an Administrative Services Agreement in return for a fee at an annual rate of .04% of each Fund’s average daily net assets.
Classic Stock Fund and Small Cap Value Fund, along with certain other funds managed by Lord Abbett (collectively, the “Underlying Funds”), have entered into a Servicing Arrangement with Lord Abbett Alpha Strategy Fund of Lord Abbett Securities Trust and Lord Abbett Balanced Strategy Fund, Lord Abbett Diversified Equity Strategy Fund and Lord Abbett Growth & Income Strategy Fund of Lord Abbett Investment Trust (each, a “Fund of Funds) pursuant to which each Underlying Fund pays a portion of the expenses (excluding management fee and distribution and service fees)
42
Notes to Financial Statements (continued)
of each Fund of Funds in proportion to the average daily value of the Underlying Fund shares owned by each Fund of Funds. Amounts paid pursuant to the Servicing Arrangement are included in Subsidy expense on each Fund’s Statement of Operations and Payable to affiliates on each Fund’s Statement of Assets and Liabilities.
As of November 30, 2012, the percentages of Classic Stock Fund’s outstanding shares owned by Lord Abbett Diversified Equity Strategy Fund and Lord Abbett Growth & Income Strategy Fund were 4.75% and 10.27%, respectively.
As of November 30, 2012, the percentage of Small Cap Value Fund’s outstanding shares owned by Lord Abbett Alpha Strategy Fund was 4.83%.
12b-1 Distribution Plan
Each Fund has adopted a distribution plan with respect to Class A, B, C, F, P, R2 and R3 shares pursuant to Rule 12b-1 under the Act, which provides for the payment of ongoing distribution and service fees to Lord Abbett Distributor LLC (the “Distributor”), an affiliate of Lord Abbett. The fees are accrued daily at annual rates based upon each Fund’s average daily net assets as follows:
| | | | | | | | | | | | | | |
Fees* | | Class A | | Class B | | Class C | | Class F | | Class P | | Class R2 | | Class R3 |
| | | | | | | | | | | | | | | |
Service | | .25% | | .25% | | .25% | | – | | .25% | | .25% | | .25% |
Distribution | | .10% | (1) | .75% | | .75% | | .10% | | .20% | | .35% | | .25% |
| |
* | The Fund may designate a portion of the aggregate fee as attributable to service activities for purposes of calculating Financial Industry Regulatory Authority, Inc. (“FINRA”) sales charge limitations. |
(1) | Small Cap Value Fund’s Class A distribution fee is .05%. |
Class I shares do not have a distribution plan.
Commissions
Distributor received the following commissions on sales of shares of the Funds, after concessions were paid to authorized dealers, for the fiscal year ended November 30, 2012:
| | | | |
| | Distributor
Commissions | | Dealers’
Concessions |
| | | | | |
Classic Stock Fund | | $139,206 | | $749,490 |
Small Cap Value Fund | | 10,727 | | 59,845 |
Distributor received the following amount of CDSCs for the fiscal year ended November 30, 2012:
| | | | |
| | Class A | | Class C |
| | | | | |
Classic Stock Fund | | $4,726 | | $4,897 |
Small Cap Value Fund | | 1,059 | | 831 |
For the fiscal year ended November 30, 2012, two Directors and certain of the Fund’s officers had an interest in Lord Abbett.
| | |
4. | DISTRIBUTIONS AND CAPITAL LOSS CARRYFORWARDS | |
Dividends from net investment income, if any, are declared and paid at least annually. Taxable net realized gains from investment transactions, reduced by allowable capital loss carryforwards, if any, are declared and distributed to shareholders at least annually. The capital loss carryforward amount, if any, is available to offset future net capital gains. Dividends and distributions to shareholders are recorded on the ex-dividend date. The amounts of dividends and distributions from net investment income and net realized capital gains are determined in accordance with federal income tax regulations, which may differ from accounting principles generally accepted in the United States of America. These book/tax differences are either considered temporary or
43
Notes to Financial Statements (continued)
permanent in nature. To the extent these differences are permanent in nature, such amounts are reclassified within the components of net assets based on their federal tax basis treatment; temporary differences do not require reclassification. Dividends and distributions, which exceed earnings and profits for tax purposes, are reported as a tax return of capital.
Subsequent to the funds’ fiscal year ended November 30, 2012, distributions were declared on December 12, 2012 and paid on December 18, 2012 to shareholders of record on December 17, 2012. The approximate amounts were as follows:
| | | | | | |
| | Net Investment
Income | | Long-Term
Capital Gains |
| | | | | |
Classic Stock Fund | | $ | 9,031,000 | | $ | – |
Small Cap Value Fund | | | 29,342,000 | | | 74,952,000 |
The tax character of distributions paid during the fiscal years ended November 30, 2012 and 2011 was as follows:
| | | | | | | | | |
| | Classic Stock Fund | | Small Cap Value Fund | |
| | | | | | |
| | Year Ended
11/30/2012 | | Year Ended
11/30/2011 | | Year Ended
11/30/2012 | | Year Ended
11/30/2011 | |
| | | | | | | | | | |
Distributions paid from: | | | | | | | | | |
Ordinary income | | $8,196,996 | | $4,836,034 | | $– | | $4,930,519 | |
| | | | | | | | | | |
Total distributions paid | | $8,196,996 | | $4,836,034 | | $– | | $4,930,519 | |
| | | | | | | | | | |
In accordance with the Regulated Investment Company Modernization Act of 2010, each Fund will carryforward capital losses incurred in taxable years beginning after December 22, 2010 (“post-enactment losses”) indefinitely. Post-enactment losses will also retain their character as either short-term or long-term and be utilized before any pre-enactment losses.
As of November 30, 2012, the components of accumulated gains on a tax-basis were as follows:
| | | | | | | |
| | Classic Stock Fund | | Small Cap Value Fund | |
| | | | | | |
Undistributed ordinary income – net | | $ | 7,925,330 | | $ | 24,328,396 | |
Undistributed long-term capital gains | | | – | | | 74,963,243 | |
| | | | | | | | |
Total undistributed earnings | | $ | 7,925,330 | | $ | 99,291,639 | |
Capital loss carryforwards* | | | (46,856,685 | ) | | – | |
Temporary differences | | | (114,122 | ) | | (394,889 | ) |
Unrealized gains – net | | | 204,138,833 | | | 710,417,431 | |
| | | | | | | | |
Total accumulated gains – net | | $ | 165,093,356 | | $ | 809,314,181 | |
| | | | | | | | |
| |
* | As of November 30, 2012, the capital loss carryforwards, along with the related expiration dates, were as follows: |
| | | | | | | |
| | 2017 | | 2018 | | Total | |
| | | | | | | | |
Classic Stock Fund | | $39,856,129 | | $7,000,556 | | $46,856,685 | |
As of November 30, 2012, the aggregate unrealized security gains and losses based on cost for U.S. federal income tax purposes were as follows:
| | | | | | | |
| | Classic Stock Fund | | Small Cap Value Fund | |
| | | | | | |
Tax cost | | $ | 545,276,770 | | $ | 2,669,245,011 | |
| | | | | | | | |
Gross unrealized gain | | | 229,204,863 | | | 791,871,910 | |
Gross unrealized loss | | | (25,066,015 | ) | | (81,454,479 | ) |
| | | | | | | | |
Net unrealized security gain | | $ | 204,138,848 | | $ | 710,417,431 | |
| | | | | | | | |
44
Notes to Financial Statements (continued)
The difference between book-basis and tax-basis unrealized gains (losses) is attributable to the tax treatment of certain securities and wash sales.
Permanent items identified during the fiscal year ended November 30, 2012 have been reclassified among the components of net assets based on their tax basis treatment as follows:
| | | | | | | | | | |
| | Undistributed
Net Investment
Income | | Accumulated
Net Realized
Gain (Loss) | | Paid-in
Capital | |
| | | | | | | | |
Classic Stock Fund | | $ | (39,549 | ) | $ | 39,549 | | $ | – | |
Small Cap Value Fund | | | (2,162,035 | ) | | 2,162,087 | | | (52 | ) |
The permanent differences are primarily attributable to the tax treatment of certain distributions received.
| | |
5. | PORTFOLIO SECURITIES TRANSACTIONS | |
Purchases and sales of investment securities (excluding short-term investments) for the fiscal year ended November 30, 2012 were as follows:
| | | | | | | |
| | Purchases | | Sales | |
| | | | | | |
Classic Stock Fund | | $ | 106,876,894 | | $ | 439,214,796 | |
Small Cap Value Fund | | | 1,044,390,257 | | | 1,539,335,490 | |
There were no purchases or sales of U.S. Government securities for the fiscal year ended November 30, 2012.
| | |
6. | DIRECTORS’ REMUNERATION | |
For the fiscal year ended November 30, 2012, the Company’s officers and the two Directors who were associated with Lord Abbett did not receive any compensation from the Company for serving in such capacities. Independent Directors’ fees are allocated among all Lord Abbett-sponsored funds based on the net assets of each fund. There is an equity-based plan available to all Independent Directors under which Independent Directors must defer receipt of a portion of, and may elect to defer receipt of an additional portion of, Directors’ fees. The deferred amounts are treated as though equivalent dollar amounts had been invested in the funds. Such amounts and earnings accrued thereon are included in Directors’ fees on the Statements of Operations and in Directors’ fees payable on the Statements of Assets and Liabilities and are not deductible for U.S. federal income tax purposes until such amounts are paid.
The Company has entered into an arrangement with its transfer agent and custodian, whereby credits realized as a result of uninvested cash balances are used to reduce a portion of each Fund’s expenses.
On April 2, 2012, the Funds and certain other funds managed by Lord Abbett (the “participating funds”) entered into an unsecured revolving credit facility (“Facility”) with State Street Bank and Trust Company (“SSB”), to be used for temporary or emergency purposes as an additional source of liquidity to fund redemptions of investor shares. The Facility is renewed annually under terms that depend on market conditions at the time of the renewal. The amounts available under the Facility are (i) the lesser of either $250,000,000 or 33.33% of total assets per participating fund and (ii) $350,000,000 in the aggregate for all participating funds. The annual fee to maintain the Facility is .09% of the amount available under the Facility. Each participating fund pays its pro rata share
45
Notes to Financial Statements (continued)
based on the net assets of each participating fund. This amount is included in Other expenses on the Funds’ Statements of Operations. Any borrowings under this Facility will bear interest at current market rates as set forth in the credit agreement. As of November 30, 2012, there were no loans outstanding pursuant to this Facility nor was the Facility utilized at any time during the fiscal year ended November 30, 2012.
For the period February 3, 2011 through April 1, 2012, the Funds and certain other funds managed by Lord Abbett had an amount of $200,000,000 available under a Facility from SSB with an annual fee to maintain the Facility of .125% of the amount available under the Facility.
| | |
9. | TRANSACTIONS WITH AFFILIATED ISSUERS | |
An affiliated issuer is one in which a Fund has ownership of at least 5% of the outstanding voting securities of the underlying issuer at any point during the fiscal year. Small Cap Value Fund had the following transactions with affiliated issuers during the fiscal ended November, 2012:
| | | | | | | | | | | | | | | | | | | | | | |
Affiliated Issuer | | Balance of
Shares Held at
11/30/2011 | | Gross
Additions | | Gross
Sales | | Balance of
Shares Held
at 11/31/2012 | | Value at
11/31/2012 | | Net Realized
Gain (Loss)
12/1/2011 to
11/31/2012(a) | | Dividend
Income
12/1/2011 to
11/31/2012(a) | |
| | | | | | | | | | | | | | | | |
Koppers
Holdings, Inc. | | | 1,203,100 | | | – | | | (157,900 | ) | | 1,045,200 | | $ | 36,989,628 | | $ | 2,509,503 | | $ | 1,064,040 | |
Navigators Group,
Inc. (The) | | | 839,600 | | | – | | | (66,200 | ) | | 773,400 | | | 40,533,894 | | | (138,230 | ) | | – | |
ScanSource, Inc.(b) | | | 1,547,727 | | | 65,800 | | | (549,700 | ) | | 1,063,827 | | | – | | | 1,028,920 | | | – | |
TriMas Corp.(b) | | | 1,734,101 | | | – | | | (369,446 | ) | | 1,364,655 | | | – | | | (12,314 | ) | | – | |
| | | | | | | | | | | | | | | | | | | | | | | |
Total | | | | | | | | | | | | | | $ | 77,523,522 | | $ | 3,387,879 | | $ | 1,064,040 | |
| | | | | | | | | | | | | | | | | | | | | | | |
| |
(a) | Represents realized gains (losses) and dividend income earned only when the issuer was an affiliate of the Fund. |
(b) | No longer an affiliated issuer as of November 30, 2012. |
| | |
10. | CUSTODIAN AND ACCOUNTING AGENT | |
SSB is the Company’s custodian and accounting agent. SSB performs custodial, accounting and recordkeeping functions relating to portfolio transactions and calculating each Fund’s NAV.
Classic Stock Fund is subject to the general risks and considerations associated with equity investing, as well as the particular risks associated with value and growth stocks. This means the value of your investment will fluctuate in response to movements in the equity securities market in general and to the changing prospects of individual companies in which the Fund invests. Large value and growth stocks may perform differently than the market as a whole and differently than each other or other types of stocks, such as small company stocks. This is because different types of stocks tend to shift in and out of favor depending on market and economic conditions. The market may fail to recognize the intrinsic value of particular value stocks for a long time. Growth stocks may be more volatile than other stocks. In addition, if the Fund’s assessment of a company’s value or prospects for exceeding earnings expectations or market conditions is wrong, the Fund could suffer losses or produce poor performance relative to other funds, even in a rising market. Due to its investment exposure to foreign companies and ADRs, the Fund may experience increased market, liquidity, currency, political, information and other risks.
Small Cap Value Fund is subject to the general risks and considerations associated with equity investing, as well as the particular risks associated with small company value stocks. The value of
46
Notes to Financial Statements (continued)
an investment will fluctuate in response to movements in the equity securities market in general and to the changing prospects of individual companies in which the Fund invests. Small company value stocks may perform differently than the market as a whole and other types of stocks, such as large company stocks or growth stocks. The market may fail to recognize the intrinsic value of particular value stocks for a long time. In addition, small cap company stocks may be more volatile and less liquid than large cap company stocks. Also, if a Fund’s assessment of a company’s value or prospects for exceeding earnings expectations or market conditions is wrong, the Fund could suffer losses or produce poor performance relative to other funds, even in a rising market.
These factors can affect each Fund’s performance.
| | |
12. | SUMMARY OF CAPITAL TRANSACTIONS | |
Transactions in shares of beneficial interest were as follows:
| | | | | | | | | | | | | |
Classic Stock Fund | | Year Ended
November 30, 2012 | | Year Ended
November 30, 2011 | |
| | | | | | |
Class A Shares | | Shares | | Amount | | Shares | | Amount | |
| | | | | | | | | | |
Shares sold | | | 1,943,062 | | $ | 57,757,465 | | | 2,892,807 | | $ | 83,581,596 | |
Converted from Class B* | | | 93,609 | | | 2,758,500 | | | 147,085 | | | 4,181,060 | |
Reinvestment of distributions | | | 132,326 | | | 3,445,792 | | | 66,817 | | | 1,944,367 | |
Shares reacquired | | | (4,911,592 | ) | | (142,852,546 | ) | | (5,264,970 | ) | | (150,930,691 | ) |
| | | | | | | | | | | | | | |
Decrease | | | (2,742,595 | ) | $ | (78,890,789 | ) | | (2,158,261 | ) | $ | (61,223,668 | ) |
| | | | | | | | | | | | | | |
| | | | | | | | | | | | | |
Class B Shares | | | | | | | | | | | | | |
| | | | | | | | | | | | | | |
Shares sold | | | 27,251 | | $ | 768,814 | | | 43,728 | | $ | 1,197,154 | |
Reinvestment of distributions | | | 300 | | | 7,478 | | | – | | | – | |
Shares reacquired | | | (200,414 | ) | | (5,664,954 | ) | | (248,041 | ) | | (6,782,204 | ) |
Converted to Class A* | | | (98,179 | ) | | (2,758,500 | ) | | (154,522 | ) | | (4,181,060 | ) |
| | | | | | | | | | | | | | |
Decrease | | | (271,042 | ) | $ | (7,647,162 | ) | | (358,835 | ) | $ | (9,766,110 | ) |
| | | | | | | | | | | | | | |
| | | | | | | | | | | | | |
Class C Shares | | | | | | | | | | | | | |
| | | | | | | | | | | | | | |
Shares sold | | | 224,444 | | $ | 6,293,083 | | | 413,946 | | $ | 11,418,710 | |
Reinvestment of distributions | | | 1,490 | | | 37,170 | | | – | | | – | |
Shares reacquired | | | (634,857 | ) | | (17,809,574 | ) | | (1,024,248 | ) | | (27,771,884 | ) |
| | | | | | | | | | | | | | |
Decrease | | | (408,923 | ) | $ | (11,479,321 | ) | | (610,302 | ) | $ | (16,353,174 | ) |
| | | | | | | | | | | | | | |
| | | | | | | | | | | | | |
Class F Shares | | | | | | | | | | | | | |
| | | | | | | | | | | | | | |
Shares sold | | | 154,428 | | $ | 4,440,608 | | | 547,647 | | $ | 16,011,880 | |
Reinvestment of distributions | | | 7,008 | | | 181,730 | | | 8,072 | | | 233,856 | |
Shares reacquired | | | (380,633 | ) | | (11,010,238 | ) | | (1,223,307 | ) | | (35,970,793 | ) |
| | | | | | | | | | | | | | |
Decrease | | | (219,197 | ) | $ | (6,387,900 | ) | | (667,588 | ) | $ | (19,725,057 | ) |
| | | | | | | | | | | | | | |
| | | | | | | | | | | | | |
Class I Shares | | | | | | | | | | | | | |
| | | | | | | | | | | | | | |
Shares sold | | | 336,859 | | $ | 10,059,335 | | | 1,941,620 | | $ | 57,733,518 | |
Reinvestment of distributions | | | 143,996 | | | 3,751,097 | | | 81,762 | | | 2,380,907 | |
Shares reacquired | | | (7,960,938 | ) | | (232,459,724 | ) | | (1,796,731 | ) | | (49,504,481 | ) |
| | | | | | | | | | | | | | |
Increase (decrease) | | | (7,480,083 | ) | $ | (218,649,292 | ) | | 226,651 | | $ | 10,609,944 | |
| | | | | | | | | | | | | | |
| | | | | | | | | | | | | |
Class P Shares | | | | | | | | | | | | | |
| | | | | | | | | | | | | | |
Shares sold | | | 8,628 | | $ | 251,542 | | | 70,571 | | $ | 2,142,058 | |
Reinvestment of distributions | | | 548 | | | 14,359 | | | 257 | | | 7,511 | |
Shares reacquired | | | (62,311 | ) | | (1,921,211 | ) | | (94,761 | ) | | (2,827,323 | ) |
| | | | | | | | | | | | | | |
Decrease | | | (53,135 | ) | $ | (1,655,310 | ) | | (23,933 | ) | $ | (677,754 | ) |
| | | | | | | | | | | | | | |
47
Notes to Financial Statements (continued)
| | | | | | | | | | | | | |
Classic Stock Fund | | Year Ended
November 30, 2012 | | Year Ended
November 30, 2011 | |
| | | | | | |
Class R2 Shares | | Shares | | Amount | | Shares | | Amount | |
| | | | | | | | | | |
Shares sold | | | 14,321 | | $ | 421,478 | | | 62,965 | | $ | 1,879,793 | |
Reinvestment of distributions | | | 368 | | | 9,524 | | | 148 | | | 4,298 | |
Shares reacquired | | | (37,083 | ) | | (1,089,288 | ) | | (23,576 | ) | | (680,099 | ) |
| | | | | | | | | | | | | | |
Increase (decrease) | | | (22,394 | ) | $ | (658,286 | ) | | 39,537 | | $ | 1,203,992 | |
| | | | | | | | | | | | | | |
| | | | | | | | | | | | | |
Class R3 Shares | | | | | | | | | | | | | |
| | | | | | | | | | | | | | |
Shares sold | | | 207,719 | | $ | 6,017,650 | | | 363,546 | | $ | 10,412,429 | |
Reinvestment of distributions | | | 4,078 | | | 105,127 | | | 1,186 | | | 34,188 | |
Shares reacquired | | | (240,567 | ) | | (7,109,623 | ) | | (179,504 | ) | | (5,137,250 | ) |
| | | | | | | | | | | | | | |
Increase (decrease) | | | (28,770 | ) | $ | (986,846 | ) | | 185,228 | | $ | 5,309,367 | |
| | | | | | | | | | | | | | |
| |
* | Automatic conversion of Class B shares occurs on the 25th day of the month (or, if the 25th day is not a business day, the next business day thereafter) following the eighth anniversary of the day on which the purchase order was accepted. |
| | | | | | | | | | | | | |
Small Cap Value Fund | | Year Ended
November 30, 2012 | | Year Ended
November 30, 2011 | |
| | | | | | |
Class A Shares | | Shares | | Amount | | Shares | | Amount | |
| | | | | | | | | | |
Shares sold | | | 5,713,997 | | $ | 181,265,210 | | | 11,212,546 | | $ | 350,389,029 | |
Converted from Class B* | | | 72,612 | | | 2,334,823 | | | 88,350 | | | 2,770,021 | |
Reinvestment of distributions | | | – | | | – | | | 2,331 | | | 72,490 | |
Shares reacquired | | | (16,613,976 | ) | | (522,964,712 | ) | | (17,374,091 | ) | | (538,985,757 | ) |
| | | | | | | | | | | | | | |
Decrease | | | (10,827,367 | ) | $ | (339,364,679 | ) | | (6,070,864 | ) | $ | (185,754,217 | ) |
| | | | | | | | | | | | | | |
| | | | | | | | | | | | | |
Class B Shares | | | | | | | | | | | | | |
| | | | | | | | | | | | | | |
Shares sold | | | 15,402 | | $ | 429,152 | | | 26,434 | | $ | 708,981 | |
Shares reacquired | | | (74,519 | ) | | (2,022,813 | ) | | (130,520 | ) | | (3,489,732 | ) |
Converted to Class A* | | | (84,622 | ) | | (2,334,823 | ) | | (102,225 | ) | | (2,770,021 | ) |
| | | | | | | | | | | | | | |
Decrease | | | (143,739 | ) | $ | (3,928,484 | ) | | (206,311 | ) | $ | (5,550,772 | ) |
| | | | | | | | | | | | | | |
| | | | | | | | | | | | | |
Class C Shares | | | | | | | | | | | | | |
| | | | | | | | | | | | | | |
Shares sold | | | 29,892 | | $ | 800,198 | | | 29,288 | | $ | 789,684 | |
Shares reacquired | | | (279,264 | ) | | (7,569,382 | ) | | (273,732 | ) | | (7,321,437 | ) |
| | | | | | | | | | | | | | |
Decrease | | | (249,372 | ) | $ | (6,769,184 | ) | | (244,444 | ) | $ | (6,531,753 | ) |
| | | | | | | | | | | | | | |
| | | | | | | | | | | | | |
Class F Shares | | | | | | | | | | | | | |
| | | | | | | | | | | | | | |
Shares sold | | | 994,332 | | $ | 32,099,457 | | | 473,235 | | $ | 15,043,590 | |
Reinvestment of distributions | | | – | | | – | | | 756 | | | 23,438 | |
Shares reacquired | | | (479,727 | ) | | (15,131,390 | ) | | (316,601 | ) | | (9,769,100 | ) |
| | | | | | | | | | | | | | |
Increase | | | 514,605 | | $ | 16,968,067 | | | 157,390 | | $ | 5,297,928 | |
| | | | | | | | | | | | | | |
| | | | | | | | | | | | | |
Class I Shares | | | | | | | | | | | | | |
| | | | | | | | | | | | | | |
Shares sold | | | 9,616,276 | | $ | 319,564,156 | | | 12,961,933 | | $ | 431,213,254 | |
Reinvestment of distributions | | | – | | | – | | | 137,882 | | | 4,533,575 | |
Shares reacquired | | | (14,269,916 | ) | | (480,815,569 | ) | | (9,316,333 | ) | | (303,627,443 | ) |
| | | | | | | | | | | | | | |
Increase (decrease) | | | (4,653,640 | ) | $ | (161,251,413 | ) | | 3,783,482 | | $ | 132,119,386 | |
| | | | | | | | | | | | | | |
48
Notes to Financial Statements (concluded)
| | | | | | | | | | | | | |
Small Cap Value Fund | | Year Ended
November 30, 2012 | | Year Ended
November 30, 2011 | |
| | | | | | |
Class P Shares | | Shares | | Amount | | Shares | | Amount | |
| | | | | | | | | | |
Shares sold | | | 771,469 | | $ | 24,084,374 | | | 1,686,478 | | $ | 52,476,103 | |
Shares reacquired | | | (2,617,286 | ) | | (81,658,131 | ) | | (4,124,330 | ) | | (128,903,450 | ) |
| | | | | | | | | | | | | | |
Decrease | | | (1,845,817 | ) | $ | (57,573,757 | ) | | (2,437,852 | ) | $ | (76,427,347 | ) |
| | | | | | | | | | | | | | |
| | | | | | | | | | | | | |
Class R2 Shares | | | | | | | | | | | | | |
| | | | | | | | | | | | | | |
Shares sold | | | 24,587 | | $ | 780,124 | | | 255,811 | | $ | 8,441,099 | |
Shares reacquired | | | (52,689 | ) | | (1,664,769 | ) | | (13,221 | ) | | (379,031 | ) |
| | | | | | | | | | | | | | |
Increase (decrease) | | | (28,102 | ) | $ | (884,645 | ) | | 242,590 | | $ | 8,062,068 | |
| | | | | | | | | | | | | | |
| | | | | | | | | | | | | |
Class R3 Shares | | | | | | | | | | | | | |
| | | | | | | | | | | | | | |
Shares sold | | | 227,916 | | $ | 7,141,717 | | | 284,904 | | $ | 9,262,280 | |
Shares reacquired | | | (233,944 | ) | | (7,400,071 | ) | | (94,476 | ) | | (2,916,662 | ) |
| | | | | | | | | | | | | | |
Increase (decrease) | | | (6,028 | ) | $ | (258,354 | ) | | 190,428 | | $ | 6,345,618 | |
| | | | | | | | | | | | | | |
| |
* | Automatic conversion of Class B shares occurs on the 25th day of the month (or, if the 25th day is not a business day, the next business day thereafter) following the eighth anniversary of the day on which the purchase order was accepted. |
49
Report of Independent Registered Public Accounting Firm
To the Board of Directors of Lord Abbett Research Fund, Inc. and the Shareholders of Lord Abbett Classic Stock Fund and Small-Cap Value Series:
We have audited the accompanying statements of assets and liabilities, including the schedules of investments, of the Lord Abbett Classic Stock Fund and Small-Cap Value Series (collectively, the “Funds”), two of the four portfolios constituting the Lord Abbett Research Fund, Inc. (the “Company”) as of November 30, 2012, and the related statements of operations for the year then ended, the statements of changes in net assets for each of the two years in the period then ended, and the financial highlights for each of the periods presented. These financial statements and financial highlights are the responsibility of the Company’s management. Our responsibility is to express an opinion on these financial statements and financial highlights based on our audits.
We conducted our audits in accordance with the standards of the Public Company Accounting Oversight Board (United States). Those standards require that we plan and perform the audits to obtain reasonable assurance about whether the financial statements and financial highlights are free of material misstatement. The Company is not required to have, nor were we engaged to perform, an audit of its internal control over financial reporting. Our audits included consideration of internal control over financial reporting as a basis for designing audit procedures that are appropriate in the circumstances, but not for the purpose of expressing an opinion on the effectiveness of the Company’s internal control over financial reporting. Accordingly, we express no such opinion. An audit also includes examining, on a test basis, evidence supporting the amounts and disclosures in the financial statements, assessing the accounting principles used and significant estimates made by management, as well as evaluating the overall financial statement presentation. Our procedures included confirmation of securities owned as of November 30, 2012, by correspondence with the custodian and brokers; where replies were not received from brokers, we performed other auditing procedures. We believe that our audits provide a reasonable basis for our opinion.
In our opinion, such financial statements and financial highlights referred to above present fairly, in all material respects, the financial position of each of the Funds as of November 30, 2012, the results of their operations for the year then ended, the changes in their net assets for each of the two years in the period then ended, and the financial highlights for each of the periods presented, in conformity with accounting principles generally accepted in the United States of America.
DELOITTE & TOUCHE LLP
New York, New York
January 28, 2013
50
Basic Information About Management
The Board of Directors (the “Board”) is responsible for the management of the business and affairs of the Company in accordance with the laws of the State of Maryland. The Board elects officers who are responsible for the day-to-day operations of the Company and who execute policies authorized by the Board. The Board also approves an investment adviser to the Company and continues to monitor the cost and quality of the services the investment adviser provides, and annually considers whether to renew the contract with the adviser. Generally, each Director holds office until his/her successor is elected and qualified or until his/her earlier resignation or removal, as provided in the Company’s organizational documents.
Lord Abbett, a Delaware limited liability company, is the Company’s investment adviser. Designated Lord Abbett personnel are responsible for the day-to-day management of the Funds.
Interested Director
The following Director is affiliated with Lord Abbett and is an “interested person” of the Company as defined in the Act. Ms. Foster is director/trustee of each of the 13 Lord Abbett-sponsored funds, which consist of 56 portfolios or series.
| | | | |
Name, Address and
Year of Birth | | Current Position and
Length of Service
with the Company | | Principal Occupation and Other Directorships
During the Past Five Years |
| | | | | |
Daria L. Foster
Lord, Abbett & Co. LLC 90 Hudson Street Jersey City, NJ 07302 (1954) | | Director and President since 2006; Chief Executive Officer since 2012 | | Principal Occupation: Managing Partner of Lord Abbett (since 2007), and was formerly Director of Marketing and Client Service, joined Lord Abbett in 1990. |
| | | Other Directorships: None. |
| | | |
Independent Directors
The following Independent Directors also are directors/trustees of each of the 13 Lord Abbett-sponsored funds, which consist of 56 portfolios or series.
| | | | |
Name, Address and
Year of Birth | | Current Position and
Length of Service
with the Company | | Principal Occupation and Other Directorships
During the Past Five Years |
| | | | | |
E. Thayer Bigelow
Lord, Abbett & Co. LLC
c/o Legal Dept.
90 Hudson Street
Jersey City, NJ 07302
(1941) | | Director since 1996; Chairman since 2013 | | Principal Occupation: Managing General Partner, Bigelow Media, LLC (since 2000); Senior Adviser, Time Warner Inc. (1998 - 2000). |
| | | |
| | | Other Directorships: Currently serves as director of Crane Co. (since 1984) and Huttig Building Products Inc. (since 1998). Previously served as a director of R.H. Donnelley Inc. (2009 - 2010). |
| | | | |
Robert B. Calhoun, Jr.
Lord, Abbett & Co. LLC
c/o Legal Dept.
90 Hudson Street
Jersey City, NJ 07302
(1942) | | Director since 1998 | | Principal Occupation: Senior Advisor of Monitor Clipper Partners, a private equity investment fund (since 1997); President of Clipper Asset Management Corp. (1991 - 2009). |
| | | |
| | | Other Directorships: Previously served as a director of Interstate Bakeries Corp. (1991 - 2008). |
51
Basic Information About Management (continued)
| | | | |
Name, Address and
Year of Birth | | Current Position and
Length of Service
with the Company | | Principal Occupation and Other Directorships
During the Past Five Years |
| | | | | |
Evelyn E. Guernsey
Lord, Abbett & Co. LLC
c/o Legal Dept.
90 Hudson Street
Jersey City, NJ 07302
(1955) | | Director since 2011 | | Principal Occupation: CEO, Americas of J.P. Morgan Asset Management (2004 - 2010).
Other Directorships: None. |
| | | |
| | | |
| | | |
Julie A. Hill
Lord, Abbett & Co. LLC
c/o Legal Dept.
90 Hudson Street
Jersey City, NJ 07302
(1946) | | Director since 2004 | | Principal Occupation: Owner and CEO of The Hill Company, a business consulting firm (since 1998). |
| | | |
| | | Other Directorships: Currently serves as director of Lend Lease Corporation Limited, an international retail and residential property group (since 2006), and WellPoint, Inc., a health benefits company (since 1994). |
| | | | |
Franklin W. Hobbs
Lord, Abbett & Co. LLC
c/o Legal Dept.
90 Hudson Street
Jersey City, NJ 07302
(1947) | | Director since 2001 | | Principal Occupation: Advisor of One Equity Partners, a private equity firm (since 2004). Other Directorships: Currently serves as director and Chairman of the Board of Ally Financial Inc., a financial services firm (since 2009), and as director of Molson Coors Brewing Company (since 2002). |
| | |
| | |
James M. McTaggart
Lord, Abbett & Co. LLC
c/o Legal Dept.
90 Hudson Street
Jersey City, NJ 07302
(1947) | | Director since 2012 | | Principal Occupation: Independent management advisor and consultant (since 2012); Vice President, CRA International, Inc. (doing business as Charles River Associates), a global management consulting firm (2009 - 2012); Founder and Chairman of Marakon Associates, Inc., a strategy consulting firm (1978 - 2009); and Officer and Director of Trinsum Group, a holding company (2007 - 2009). |
| | | |
| | | Other Directorships: Currently serves as director of Blyth, Inc., a home products company (since 2004). |
| | | | |
James L.L. Tullis
Lord, Abbett & Co. LLC
c/o Legal Dept.
90 Hudson Street
Jersey City, NJ 07302
(1947) | | Director since 2006 | | Principal Occupation: CEO of Tullis-Dickerson and Co. Inc., a venture capital management firm (since 1990). |
| | | |
| | | Other Directorships: Currently serves as director of Crane Co. (since 1998). Previously served as a director of Synageva BioPharma Corp., a biopharmaceutical company (2009 - 2011). |
52
Basic Information About Management (continued)
Officers
None of the officers listed below have received compensation from the Company. All of the officers of the Company also may be officers of the other Lord Abbett-sponsored funds and maintain offices at 90 Hudson Street, Jersey City, NJ 07302. Unless otherwise indicated, the position(s) and title(s) listed under the “Principal Occupation During the Past Five Years” column indicate each officer’s position(s) and title(s) with Lord Abbett.
| | | | | | |
Name and
Year of Birth | | Current Position
with the Company | | Length of Service
of Current
Position | | Principal Occupation
During the Past Five Years |
| | | | | | | |
Daria L. Foster
(1954) | | President and Chief Executive Officer | | Elected as President in 2006 and Chief Executive Officer in 2012 | | Managing Partner of Lord Abbett (since 2007), and was formerly Director of Marketing and Client Service, joined Lord Abbett in 1990. |
| | | | | | |
Robert P. Fetch
(1953) | | Executive Vice President | | Elected in 1997 | | Partner and Director, joined Lord Abbett in 1995. |
| | | | | | |
Daniel H. Frascarelli
(1954) | | Executive Vice President | | Elected in 2005 | | Partner and Director, joined Lord Abbett in 1990. |
| | | | | | |
Robert I. Gerber
(1954) | | Executive Vice President | | Elected in 2007 | | Partner and Chief Investment Officer (since 2007), joined Lord Abbett in 1997 as Director of Taxable Fixed Income Management. |
| | | | | | |
Gerard S. E. Heffernan, Jr.
(1963) | | Executive Vice President | | Elected in 2009 | | Partner and Director, joined Lord Abbett in 1998. |
| | | | | | |
Walter H. Prahl
(1958) | | Executive Vice President | | Elected in 2012 | | Partner and Director, joined Lord Abbett in 1997. |
| | | | | | |
Frederick J. Ruvkun
(1957) | | Executive Vice President | | Elected in 2012 | | Partner and Director, joined Lord Abbett in 2006. |
| | | | | | |
Paul J. Volovich
(1973) | | Executive Vice President | | Elected in 2004 | | Partner and Director, joined Lord Abbett in 1997. |
| | | | | | |
James W. Bernaiche
(1956) | | Chief Compliance Officer | | Elected in 2004 | | Partner and Chief Compliance Officer, joined Lord Abbett in 2001. |
| | | | | | |
Joan A. Binstock
(1954) | | Chief Financial Officer and Vice President | | Elected in 1999 | | Partner and Chief Operations Officer, joined Lord Abbett in 1999. |
| | | | | | |
John K. Forst
(1960) | | Vice President and Assistant Secretary | | Elected in 2005 | | Deputy General Counsel joined Lord Abbett in 2004. |
| | | | | | |
Lawrence H. Kaplan
(1957) | | Vice President and Secretary | | Elected in 1997 | | Partner and General Counsel, joined Lord Abbett in 1997. |
| | | | | | |
David J. Linsen
(1974) | | Vice President | | Elected in 2008 | | Partner and Director, joined Lord Abbett in 2001. |
| | | | | | |
A. Edward Oberhaus, III
(1959) | | Vice President | | Elected in 1996 | | Partner and Director, joined Lord Abbett in 1983. |
53
Basic Information About Management (concluded)
| | | | | | |
Name and
Year of Birth | | Current Position
with the Company | | Length of Service
of Current
Position | | Principal Occupation
During the Past Five Years |
| | | | | | | |
Thomas R. Phillips
(1960) | | Vice President and Assistant Secretary | | Elected in 2008 | | Partner and Deputy General Counsel, joined Lord Abbett in 2006. |
| | | | | | |
Randy M. Reynolds
(1972) | | Vice President | | Elected in 2008 | | Portfolio Manager, joined Lord Abbett in 1999. |
| | | | | | |
Lawrence B. Stoller
(1963) | | Vice President and Assistant Secretary | | Elected in 2007 | | Partner and Senior Deputy General Counsel, joined Lord Abbett in 2007. |
| | | | | | |
Scott S. Wallner
(1955) | | AML Compliance Officer | | Elected in 2011 | | Assistant General Counsel, joined Lord Abbett in 2004. |
| | | | | | |
Bernard J. Grzelak
(1971) | | Treasurer | | Elected in 2003 | | Partner and Director of Fund Administration, joined Lord Abbett in 2003. |
Please call 888–522–2388 for a copy of the statement of additional information (“SAI”), which contains further information about the Company’s Directors. It is available free upon request.
54
Householding
The Company has adopted a policy that allows it to send only one copy of each Fund’s prospectus, proxy material, annual report and semiannual report to certain shareholders residing at the same “household.” This reduces Fund expenses, which benefits you and other shareholders. If you need additional copies or do not want your mailings to be “householded,” please call Lord Abbett at 888–522–2388 or send a written request with your name, the name of your fund or funds and your account number or numbers to Lord Abbett Family of Funds, P.O. Box 219336, Kansas City, MO 64121.
Proxy Voting Policies, Procedures and Records
A description of the policies and procedures that Lord Abbett uses to vote proxies related to each Fund’s portfolio securities, and information on how Lord Abbett voted each Fund’s proxies during the 12-month period ended June 30 are available without charge, upon request, (i) by calling 888–522–2388; (ii) on Lord Abbett’s Website at www.lordabbett.com; and (iii) on the Securities and Exchange Commission’s (“SEC”) Website at www.sec.gov.
Shareholder Reports and Quarterly Portfolio Disclosure
The Funds are required to file their complete schedule of portfolio holdings with the SEC for their first and third fiscal quarters on Form N-Q. Copies of the filings are available without charge, upon request on the SEC’s Website at www.sec.gov and may be available by calling Lord Abbett at 888–522–2388. You can also obtain copies of Form N-Q by visiting the SEC’s Public Reference Room in Washington, DC (information on the operation of the Public Reference Room may be obtained by calling 800-SEC-0330).
| | |
| Tax Information | |
| | |
| 100% of the ordinary income distributions paid by Classic Stock Fund during the fiscal year ended November 30, 2012 is qualified dividend income. For corporate shareholders, 100% of the ordinary income distributions paid by Classic Stock Fund during the fiscal year ended November 30, 2012 qualified for the dividends received deduction. | |
| | |
55


| | | |
This report, when not used for the general information of shareholders of the Fund, is to be distributed only if preceded or accompanied by a current fund prospectus. | |
Lord Abbett Research Fund, Inc.
| |
| | | |
Lord Abbett mutual fund shares are distributed by
LORD ABBETT DISTRIBUTOR LLC. | | Lord Abbett Classic Stock Fund
Small-Cap Value Series | LARF-2-1112
(01/13) |
| | |
| (a) | In accordance with applicable requirements, the Registrant adopted a Sarbanes-Oxley Code of Ethics on June 19, 2003 that applies to the principal executive officer and senior financial officers of the Registrant (“Code of Ethics”). The Code of Ethics was in effect during the fiscal year ended November 20, 2012 (the “Period”). |
| | |
| (b) | Not applicable. |
| | |
| (c) | The Registrant has not amended the Code of Ethics as described in Form N-CSR during the Period. |
| | |
| (d) | The Registrant has not granted any waiver, including an implicit waiver, from a provision of the Code of Ethics as described in Form N-CSR during the Period. |
| | |
| (e) | Not applicable. |
| | |
| (f) | See Item 12(a)(1) concerning the filing of the Code of Ethics. The Registrant will provide a copy of the Code of Ethics to any person without charge, upon request. To obtain a copy, please call Lord Abbett at 888-522-2388. |
| |
Item 3: | Audit Committee Financial Expert. |
| |
| The Registrant’s board of directors has determined that each of the following independent directors who are members of the audit committee is an audit committee financial expert: E. Thayer Bigelow and Robert B. Calhoun Jr. Each of these persons is independent within the meaning of the Form N-CSR. |
| |
Item 4: | Principal Accountant Fees and Services. |
| |
In response to sections (a), (b), (c) and (d) of Item 4, the aggregate fees billed to the Registrant for the fiscal years ended November 30, 2012 and 2011 by the Registrant’s principal accounting firm, Deloitte & Touche LLP, the member firms of Deloitte Touche Tohmatsu and their respective affiliates (collectively, “Deloitte”) were as follows: |
| | | |
| Fiscal year ended: | |
| 2012 | 2011 | |
Audit Fees {a} | $163,000 | $159,000 | |
Audit-Related Fees | - 0 - | - 0 - | |
| | | |
Total audit and audit-related fees | 163,000 | 159,000 | |
| | | |
| | | |
Tax Fees {b} | 31,031 | 30,516 | |
All Other Fees | - 0 - | - 0 - | |
| | | |
| | | |
Total Fees | $194,031 | $189,516 | |
| | | |
________
| |
| {a} Consists of fees for audits of the Registrant’s annual financial statements. |
| |
| {b} Fees for the fiscal year ended November 30, 2012 and 2011 consist of fees for preparing the U.S. Income Tax Return for Regulated Investment Companies, New Jersey Corporation Business Tax Return, New Jersey Annual Report Form, U.S. Return of Excise Tax on Undistributed Income of Investment Companies, IRS Forms 1099-MISC and 1096 Annual Summary and Transmittal of U.S. Information Returns. |
(e) (1) Pursuant to Rule 2-01(c) (7) of Regulation S-X, the Registrant’s Audit Committee has adopted pre-approval policies and procedures. Such policies and procedures generally provide that the Audit Committee must pre-approve:
| | |
| • | any audit, audit-related, tax, and other services to be provided to the Lord Abbett Funds, including the Registrant, and |
| • | any audit-related, tax, and other services to be provided to the Registrant’s investment adviser and any entity controlling, controlled by or under common control with the investment adviser that provides ongoing services to one or more Funds comprising the Registrant if the engagement relates directly to operations and financial reporting of a Fund, by the independent auditor to assure that the provision of such services does not impair the auditor’s independence. |
The Audit Committee has delegated pre-approval authority to its Chairman, subject to a fee limit of $10,000 per event, and not to exceed $25,000 annually. The Chairman will report any pre-approval decisions to the Audit Committee at its next scheduled meeting. Unless a type of service to be provided by the independent auditor has received general pre-approval, it must be pre-approved by the Audit Committee. Any proposed services exceeding pre-approved cost levels will require specific pre-approval by the Audit Committee.
(e) (2) The Registrant’s Audit Committee has approved 100% of the services described in this Item 4 (b) through (d).
(f) Not applicable.
(g) The aggregate non-audit fees billed by Deloitte for services rendered to the Registrant are shown above in the response to Item 4 (a), (b), (c) and (d) as “All Other Fees”.
The aggregate non-audit fees billed by Deloitte for services rendered to the Registrant’s investment adviser, Lord, Abbett & Co. LLC (“Lord Abbett”), for the fiscal years ended November 30, 2012 and 2011 were:
| | | |
| Fiscal year ended: | |
| 2012 | 2011 | |
All Other Fees {a} | $178,975 | $172,220 | |
________
| |
| {a} Consist of fees for Independent Services Auditors’ Report on Controls Placed in Operation and Tests of Operating Effectiveness related to Lord Abbett’s Asset Management Services (“SAS 70 Report”). |
The aggregate non-audit fees billed by Deloitte for services rendered to entities under the common control of Lord Abbett for the fiscal years ended November 30, 2012 and 2011 were:
| | | |
| Fiscal year ended: | |
| 2012 | 2011 | |
All Other Fees | $ - 0 - | $ - 0- | |
________
(h) The Registrant’s Audit Committee has considered the provision of non-audit services that were rendered to the Registrant’s investment adviser, and any entity controlling, controlled by or under common control with the investment adviser that provides ongoing services to the Registrant, that were not pre-approved pursuant to Rule 2-01 (c)(7)(ii) of Regulation S-X and has determined that the provision of such services is compatible with maintaining Deloitte’s independence.
| |
Item 5: | Audit Committee of Listed Registrants. |
| |
| Not applicable. |
| |
Item 6: | Investments. |
| |
| Not applicable. |
| |
Item 7: | Disclosure of Proxy Voting Policies and Procedures for Closed-End Management Investment Companies. |
| |
| Not applicable. |
| |
Item 8: | Portfolio Managers of Closed-End Management Investment Companies. |
| |
| Not applicable. |
| |
Item 9: | Purchases of Equity Securities by Closed-End Management Investment Company and Affiliated Purchasers. |
| |
| Not applicable. |
| |
Item 10: | Submission of Matters to a Vote of Security Holders. |
| |
| Not applicable. |
| |
Item 11: | Controls and Procedures. |
| | |
| (a) | Based on their evaluation of the Registrant’s disclosure controls and procedures (as defined in Rule 30a-3(c) under the Investment Company Act of 1940) as of a date within 90 days prior to the filing date of this report, the Chief Executive Officer and Chief Financial Officer of the Registrant have concluded that such disclosure controls and procedures are reasonably designed and effective to ensure that material information relating to the Registrant, including its consolidated subsidiaries, is made known to them by others within those entities. |
| | |
| (b) | There were no changes in the Registrant’s internal control over financial reporting (as defined in Rule 30a-3(d) under the Investment Company Act of 1940) that occurred during the second fiscal quarter of the period covered by this report that have materially affected, or are reasonably likely to materially affect, the Registrant’s internal control over financial reporting. |
| | |
Item 12: | Exhibits. |
| | |
| (a)(1) | The Lord Abbett Family of Funds Sarbanes Oxley Code of Ethics for the Principal Executive Officer and Senior Financial Officers is attached hereto as part of Ex-99. CODEETH. |
| | |
| (a)(2) | Certification of each Principal Executive Officer and Principal Financial Officer of the Registrant as required by Rule 30a-2 under the Investment Company Act of 1940 is attached hereto as a part of EX-99.CERT. |
| | |
| (b) | Certification of each Principal Executive Officer and Principal Financial Officer of the Registrant as required by Section 906 of the Sarbanes-Oxley Act of 2002 is provided as a part of EX-99.906CERT. |
SIGNATURES
Pursuant to the requirements of the Securities Exchange Act of 1934 and the Investment Company Act of 1940, the Registrant has duly caused this report to be signed on its behalf by the undersigned, thereunto duly authorized.
| | | |
| | LORD ABBETT RESEARCH FUND, INC. |
| | | |
| By: | /s/ Daria L. Foster | |
| | | |
| | Daria L. Foster |
| | President and Chief Executive Officer |
| | | |
Date: January 25, 2013 | | | |
| By: | /s/ Joan A. Binstock | |
| | | |
| | Joan A. Binstock |
| | Chief Financial Officer and Vice President |
| | | |
Date: January 25, 2013 | | | |
Pursuant to the requirements of the Securities Exchange Act of 1934 and the Investment Company Act of 1940, this report has been signed below by the following persons on behalf of the Registrant and in the capacities and on the dates indicated.
| | | |
| By: | /s/ Daria L. Foster | |
| | | |
| | Daria L. Foster |
| | President and Chief Executive Officer |
| | | |
Date: January 25, 2013 | | | |
| By: | /s/ Joan A. Binstock | |
| | | |
| | Joan A. Binstock |
| | Chief Financial Officer and Vice President |
| | | |
Date: January 25, 2013 | | | |