UNITED STATES
SECURITIES AND EXCHANGE COMMISSION
Washington, D.C. 20549
FORM N-CSR
CERTIFIED SHAREHOLDER REPORT OF REGISTERED
MANAGEMENT INVESTMENT COMPANIES
Investment Company Act File Number: 811-06650
LORD ABBETT RESEARCH FUND, INC.
(Exact name of Registrant as specified in charter)
90 Hudson Street, Jersey City, NJ 07302
(Address of principal executive offices) (Zip code)
Thomas R. Phillips, Esq., Vice President & Assistant Secretary
90 Hudson Street, Jersey City, NJ 07302
(Name and address of agent for service)
Registrant’s telephone number, including area code: (800) 201-6984
Date of fiscal year end: 11/30
Date of reporting period: 11/30/11
| Item 1: | Report(s) to Shareholders. |
2011
LORD ABBETT
ANNUAL
REPORT 
Lord Abbett Capital Structure Fund
For the fiscal year ended November 30, 2011

Lord Abbett Research Fund
Lord Abbett Capital Structure Fund
Annual Report
For the fiscal year ended November 30, 2011

From left to right: Robert S. Dow, Director and Chairman of the Lord Abbett Funds; E. Thayer Bigelow, Independent Lead Director of the Lord Abbett Funds; and Daria L. Foster, Director and President of the Lord Abbett Funds.
Dear Shareholders: We are pleased to provide you with this overview of the performance of the Lord Abbett Capital Structure Fund for the fiscal year ended November 30, 2011. On this page and the following pages, we discuss the major factors that influenced fiscal year performance. For detailed and more timely information about the Fund, please visit our Website at www.lordabbett.com, where you also can access the quarterly commentaries that provide updates on the Fund’s performance and other portfolio related updates.
Thank you for investing in Lord Abbett mutual funds. We value the trust that you place in us and look forward to serving your investment needs in the years to come.
Best regards,

Robert S. Dow
Chairman
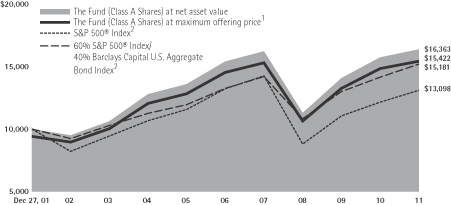
For the fiscal year ended November 30, 2011, the Fund returned 4.03%, reflecting performance at the net asset value (NAV) of Class A shares, with all distributions reinvested, compared to its benchmark, the S&P 500® Index,1 which returned 7.83% over the same period.
For the 12-month period, the Fund’s Class A Shares ranked in the 34th percentile within the Lipper Mixed-Asset Target Allocation Growth Funds category.
During the 12-month period, markets were faced with the headwinds of the sovereign debt crisis in Europe and slower global economic growth. In addition, domestic equity markets (as represented by the S&P 500 Index) outperformed both the fixed-income markets (as represented by the Barclays Capital U.S. Aggregate Bond Index2) and foreign equity markets (as represented by the MSCI EAFE Index3 with Gross Dividends). Within the fixed-income markets, there was a general flight to
1
quality and an aversion to credit risk. As a result, Treasuries and municipal bonds were two of the best performing sectors of the bond market during the period. Despite strong credit fundamentals, the investment-grade and high-yield corporate bond markets underperformed Treasuries. At period-end, the portfolio’s asset allocation was approximately 61% equities, 19% high yield, 5% investment grade, 12% convertibles, 1% bank loans, and 2% cash.
Within the equity portion of the Fund, stock selection, mainly within the consumer discretionary, health care, and consumer staples sectors, detracted from performance. The Fund’s underweight in the consumer staples sector versus the index detracted from performance, as this sector was one of the stronger performers in the S&P 500® Index. Within the investment-grade bonds, the Fund maintained little to no allocation to U.S. Treasuries, as we continue to see better relative value in corporates. During the period, U.S. Treasuries outperformed investment-grade corporates during the flight to quality and aversion to credit risk, which hurt performance.
Although the convertibles market faced a difficult period, the convertibles allocation within the Fund contributed to performance overall. Security selection, particularly within the technology and software sectors, helped performance. Convertible securities are a unique asset class that provides an income stream through yield while also having the potential to participate in equity market upside.
Within the fixed-income portion, the Fund is more oriented to high-yield bonds rather than investment grade. Security selection within high-yield corporates contributed to performance. The breadth of advances was wide as the market continued to see improving fundamentals.
The Fund’s portfolio is actively managed and, therefore, its holdings and the weightings of a particular issuer or particular sector as a percentage of portfolio assets are subject to change. Sectors may include many industries.
1 The S&P 500® Index is widely regarded as the standard for measuring large-cap U.S. stock market performance and includes a representative sample of leading companies in leading industries.
2 The Barclays Capital U.S. Aggregate Bond Index is an unmanaged index composed of securities from the Barclays Capital Government/Corporate Bond Index, Mortgage-Backed Securities Index and the Asset-Backed Securities Index. Total return comprises price appreciation/depreciation and income as a percentage of the original investment. Indexes are rebalanced monthly by market capitalization.
3 The MSCI EAFE Index (Europe, Australasia, Far East) is a free float-adjusted market capitalization index that is designed to measure the equity market performance of developed markets, excluding the United States and Canada. As of May 30, 2011, the MSCI EAFE Index consisted of the following 22 developed market country indexes: Australia, Austria, Belgium, Denmark, Finland, France, Germany, Greece, Hong Kong, Ireland, Israel, Italy, Japan, the Netherlands, New Zealand, Norway, Portugal, Singapore, Spain, Sweden, Switzerland, and the United Kingdom.
2
The MSCI EAFE Index is calculated with both gross and net dividends. The MSCI EAFE Index with Gross Dividends approximates the maximum possible dividend reinvestment. The amount reinvested is the entire dividend distributed to individuals resident in the country of the company, but does not include tax credits. The MSCI EAFE Index with Net Dividends approximates the minimum possible dividend reinvestment. The dividend is reinvested after deduction of withholding tax, applying the rate to non-resident individuals who do not benefit from double taxation treaties. MSCI uses withholding tax rates applicable to Luxembourg holding companies, as Luxembourg applies the highest rates.
Unless otherwise specified, indexes reflect total return, with all dividends reinvested. Indexes are unmanaged, do not reflect the deduction of fees or expenses, and are not available for direct investment.
Important Performance and Other Information
Performance data quoted in the following pages reflect past performance and are no guarantee of future results. Current performance may be higher or lower than the performance quoted. The investment return and principal value of an investment in the Fund will fluctuate so that shares, on any given day or when redeemed, may be worth more or less than their original cost. You can obtain performance data current to the most recent month end by calling Lord Abbett at 888-522-2388 or referring to www.lordabbett.com.
Except where noted, comparative Fund performance does not account for the deduction of sales charges and would be different if sales charges were included. The Fund offers several classes of shares with distinct pricing options. For a full description of the differences in pricing alternatives, please see the Fund’s prospectus.
During certain periods shown, expense waivers and reimbursements were in place. Without such expense waivers and reimbursements, the Fund’s returns would have been lower.
The annual commentary above discusses the views of the Fund’s management and various portfolio holdings of the Fund as of November 30, 2011. These views and portfolio holdings may have changed after this date. Information provided in the commentary is not a recommendation to buy or sell securities. Because the Fund’s portfolio is actively managed and may change significantly, the Fund may no longer own the securities described above or may have otherwise changed its positions in the securities. For more recent information about the Fund’s portfolio holdings, please visit www.lordabbett.com.
A Note about Risk: See Notes to Financial Statements for a discussion of investment risks. For a more detailed discussion of the risks associated with the Fund, please see the Fund’s prospectus.
Mutual funds are not insured by the FDIC, are not deposits or other obligations of, or guaranteed by, banks, and are subject to investment risks including possible loss of principal amount invested.
3
Investment Comparison
Below is a comparison of a $10,000 investment in Class A shares with the same investment in the S&P 500® Index and the 60% S&P 500® Index/40% Barclays Capital U.S. Aggregate Bond Index, assuming reinvestment of all dividends and distributions. The performance of other classes will be greater than or less than the performance shown in the graph below due to different sales loads and expenses applicable to such classes. The graph and performance table below do not reflect the deduction of taxes that a shareholder would pay on Fund distributions or the redemption of Fund shares. During certain periods, expenses of the Fund have been waived or reimbursed by Lord Abbett; without such waiver or reimbursement of expenses, the Fund’s returns would have been lower. Past performance is no guarantee of future results.
Average Annual Total Returns at Maximum Applicable
Sales Charge for the Periods Ended November 30, 2011
| | | | | | | | | | | | |
| | | 1 Year | | | 5 Years | | | Life of Class | |
Class A3 | | | -1.98% | | | | 0.02% | | | | 4.46% | |
Class B4 | | | -0.64% | | | | 0.39% | | | | 4.54% | |
Class C5 | | | 3.39% | | | | 0.56% | | | | 4.43% | |
Class F6 | | | 4.39% | | | | – | | | | -0.13% | |
Class I7 | | | 4.37% | | | | 1.58% | | | | 5.46% | |
Class P8 | | | 4.00% | | | | 1.13% | | | | 5.01% | |
Class R29 | | | 3.90% | | | | – | | | | -0.46% | |
Class R310 | | | 3.91% | | | | – | | | | -0.53% | |
1 Reflects the deduction of the maximum initial sales charge of 5.75%.
2 Performance for each unmanaged index does not reflect any fees or expenses. The performance of each index is not necessarily representative of the Fund’s performance. Performance of each index began on December 27, 2001.
3 Class A shares commenced operations and performance for the Class began on December 27, 2001. Total return, which is the percentage change in net asset value, after deduction of the maximum initial sales charge of 5.75% applicable to Class A shares, with all dividends and distributions reinvested for the periods shown ended November 30, 2011, is calculated using the SEC-required uniform method to compute such return.
4 Class B shares commenced operations and performance for the Class began on December 27, 2001. Performance reflects the deduction of a CDSC of 4% for 1 year, 1% for 5 years and 0% for Life of Class. Class B shares automatically convert to Class A shares after approximately 8 years. (There is no initial sales charge for automatic conversions.)
5 Class C shares commenced operations and performance for the Class began on December 27, 2001. The 1% CDSC for Class C shares normally applies before the first anniversary of the purchase date. Performance is at net asset value.
6 Class F shares commenced operations and performance for the Class began on September 28, 2007. Performance is at net asset value.
7 Class I shares commenced operations and performance for the Class began on December 27, 2001. Performance is at net asset value.
8 Class P shares commenced operations and performance for the Class began on December 27, 2001. Performance is at net asset value.
9 Class R2 shares commenced operations and performance for the Class began on September 28, 2007. Performance is at net asset value.
10 Class R3 shares commenced operations and performance for the Class began on September 28, 2007. Performance is at net asset value.
4
Expense Example
As a shareholder of the Fund, you incur two types of costs: (1) transaction costs, including sales charges (loads) on purchase payments (these charges vary among the share classes); and (2) ongoing costs, including management fees; distribution and service (12b-1) fees (these charges vary among the share classes); and other Fund expenses. This Example is intended to help you understand your ongoing costs (in dollars) of investing in the Fund and to compare these costs with the ongoing costs of investing in other mutual funds.
The Example is based on an investment of $1,000 invested at the beginning of the period and held for the entire period (June 1, 2011 through November 30, 2011).
Actual Expenses
For each class of the Fund, the first line of the table on the following page provides information about actual account values and actual expenses. You may use the information in this line, together with the amount you invested, to estimate the expenses that you paid over the period. Simply divide your account value by $1,000 (for example, an $8,600 account value divided by $1,000 = 8.6), then multiply the result by the number in the first line under the heading titled “Expenses Paid During Period 6/1/11 – 11/30/11” to estimate the expenses you paid on your account during this period.
Hypothetical Example for Comparison Purposes
For each class of the Fund, the second line of the table on the following page provides information about hypothetical account values and hypothetical expenses based on the Fund’s actual expense ratio and an assumed rate of return of 5% per year before expenses, which is not the Fund’s actual return. The hypothetical account values and expenses may not be used to estimate the actual ending account balance or expenses you paid for the period. You may use this information to compare the ongoing costs of investing in the Fund and other funds. To do so, compare this 5% hypothetical example with the 5% hypothetical examples that appear in the shareholder reports of the other funds.
5
Please note that the expenses shown in the table are meant to highlight your ongoing costs only and do not reflect any transactional costs, such as sales charges (loads). Therefore, the second line of the table is useful in comparing ongoing costs only, and will not help you determine the relative total costs of owning different funds. In addition, if these transactional costs were included, your costs would have been higher.
| | | | | | | | | | | | |
| | | Beginning
Account
Value | | | Ending
Account
Value | | | Expenses
Paid During
Period† | |
| | | 6/1/11 | | | 11/30/11 | | | 6/1/11 -
11/30/11 | |
Class A | | | | | | | | | | | | |
Actual | | $ | 1,000.00 | | | $ | 927.80 | | | $ | 6.28 | |
Hypothetical (5% Return Before Expenses) | | $ | 1,000.00 | | | $ | 1,018.50 | | | $ | 6.58 | |
Class B | | | | | | | | | | | | |
Actual | | $ | 1,000.00 | | | $ | 923.90 | | | $ | 9.40 | |
Hypothetical (5% Return Before Expenses) | | $ | 1,000.00 | | | $ | 1,015.22 | | | $ | 9.85 | |
Class C | | | | | | | | | | | | |
Actual | | $ | 1,000.00 | | | $ | 924.20 | | | $ | 9.41 | |
Hypothetical (5% Return Before Expenses) | | $ | 1,000.00 | | | $ | 1,015.27 | | | $ | 9.85 | |
Class F | | | | | | | | | | | | |
Actual | | $ | 1,000.00 | | | $ | 929.00 | | | $ | 5.08 | |
Hypothetical (5% Return Before Expenses) | | $ | 1,000.00 | | | $ | 1,019.75 | | | $ | 5.32 | |
Class I | | | | | | | | | | | | |
Actual | | $ | 1,000.00 | | | $ | 929.10 | | | $ | 4.59 | |
Hypothetical (5% Return Before Expenses) | | $ | 1,000.00 | | | $ | 1,020.21 | | | $ | 4.81 | |
Class P | | | | | | | | | | | | |
Actual | | $ | 1,000.00 | | | $ | 927.50 | | | $ | 6.76 | |
Hypothetical (5% Return Before Expenses) | | $ | 1,000.00 | | | $ | 1,017.99 | | | $ | 7.08 | |
Class R2 | | | | | | | | | | | | |
Actual | | $ | 1,000.00 | | | $ | 927.00 | | | $ | 7.49 | |
Hypothetical (5% Return Before Expenses) | | $ | 1,000.00 | | | $ | 1,017.34 | | | $ | 7.84 | |
Class R3 | | | | | | | | | | | | |
Actual | | $ | 1,000.00 | | | $ | 926.30 | | | $ | 7.00 | |
Hypothetical (5% Return Before Expenses) | | $ | 1,000.00 | | | $ | 1,017.78 | | | $ | 7.33 | |
| † | | For each class of the Fund, net expenses are equal to the annualized expense ratio for such class (1.30% for Class A, 1.95% for Classes B and C, 1.05% for Class F, 0.95% for Class I, 1.40% for Class P, 1.55% for Class R2 and 1.45% for Class R3) multiplied by the average account value over the period, multiplied by 183/365 (to reflect one-half year period). |
Portfolio Holdings Presented by Sector
November 30, 2011
| | | | | | | | | | | | |
| Sector* | | %** | | | | | Sector* | | %** | |
Consumer Discretionary | | | 11.35% | | | | | Information Technology | | | 14.58% | |
Consumer Staples | | | 6.79% | �� | | | | Materials | | | 7.76% | |
Energy | | | 16.04% | | | | | Telecommunication Services | | | 5.52% | |
Financials | | | 12.37% | | | | | Utilities | | | 2.54% | |
Health Care | | | 12.01% | | | | | Short-Term Investment | | | 0.39% | |
Industrials | | | 10.65% | | | | | Total | | | 100.00% | |
| * | | A sector may comprise several industries. |
| ** | | Represents percent of total investments. |
6
Schedule of Investments
November 30, 2011
| | | | | | | | |
| Investments | | Shares
(000) | | | Fair Value | |
| LONG-TERM INVESTMENTS 99.59% | | | | | | | | |
| | |
| COMMON STOCKS 57.70% | | | | | | | | |
| | |
| Aerospace & Defense 1.38% | | | | | | | | |
| DigitalGlobe, Inc.* | | | 35 | | | $ | 521,500 | |
| GeoEye, Inc.* | | | 38 | | | | 712,125 | |
| Hexcel Corp.* | | | 330 | | | | 8,223,600 | |
| Moog, Inc. Class A* | | | 65 | | | | 2,718,300 | |
| United Technologies Corp. | | | 40 | | | | 3,086,980 | |
| | | | | | | | |
| Total | | | | | | | 15,262,505 | |
| | | | | | | | |
| | |
| Airlines 0.26% | | | | | | | | |
| United Continental Holdings, Inc.* | | | 158 | | | | 2,830,275 | |
| | | | | | | | |
| | |
| Auto Components 0.47% | | | | | | | | |
| Cooper-Standard Holdings, Inc.* | | | 135 | | | | 5,197,500 | |
| | | | | | | | |
| | |
| Automobiles 0.26% | | | | | | | | |
| Honda Motor Co., Ltd. ADR | | | 91 | | | | 2,883,315 | |
| | | | | | | | |
| | |
| Beverages 0.72% | | | | | | | | |
| PepsiCo, Inc. | | | 125 | | | | 8,000,000 | |
| | | | | | | | |
| | |
| Biotechnology 0.82% | | | | | | | | |
| Celgene Corp.* | | | 120 | | | | 7,569,600 | |
| Human Genome Sciences, Inc.* | | | 200 | | | | 1,534,000 | |
| | | | | | | | |
| Total | | | | | | | 9,103,600 | |
| | | | | | | | |
| | |
| Capital Markets 0.70% | | | | | | | | |
| Franklin Resources, Inc. | | | 32 | | | | 3,226,240 | |
| State Street Corp. | | | 40 | | | | 1,586,000 | |
| T. Rowe Price Group, Inc. | | | 53 | | | | 3,008,280 | |
| | | | | | | | |
| Total | | | | | | | 7,820,520 | |
| | | | | | | | |
| | |
| Chemicals 2.76% | | | | | | | | |
| Celanese Corp. Series A | | | 85 | | | | 3,951,650 | |
| CF Industries Holdings, Inc. | | | 15 | | | | 2,097,000 | |
| Dow Chemical Co. (The) | | | 135 | | | | 3,740,850 | |
| LyondellBasell Industries NV Class A (Netherlands)(a) | | | 175 | | | | 5,717,250 | |
| Monsanto Co. | | | 80 | | | | 5,876,000 | |
See Notes to Financial Statements.
7
Schedule of Investments (continued)
November 30, 2011
| | | | | | | | |
| Investments | | Shares
(000) | | | Fair Value | |
| Chemicals (continued) | | | | | | | | |
| Mosaic Co. (The) | | | 40 | | | $ | 2,110,400 | |
| Rockwood Holdings, Inc.* | | | 160 | | | | 7,129,600 | |
| | | | | | | | |
| Total | | | | | | | 30,622,750 | |
| | | | | | | | |
| | |
| Commercial Banks 2.38% | | | | | | | | |
| Huntington Bancshares, Inc. | | | 350 | | | | 1,837,500 | |
| PNC Financial Services Group, Inc. (The) | | | 55 | | | | 2,981,550 | |
| Regions Financial Corp. | | | 400 | | | | 1,644,000 | |
| U.S. Bancorp | | | 300 | | | | 7,776,000 | |
| Wells Fargo & Co. | | | 400 | | | | 10,344,000 | |
| Zions Bancorporation | | | 115 | | | | 1,850,350 | |
| | | | | | | | |
| Total | | | | | | | 26,433,400 | |
| | | | | | | | |
| | |
| Communications Equipment 1.11% | | | | | | | | |
| Aruba Networks, Inc.* | | | 220 | | | | 4,642,000 | |
| QUALCOMM, Inc. | | | 140 | | | | 7,672,000 | |
| | | | | | | | |
| Total | | | | | | | 12,314,000 | |
| | | | | | | | |
| | |
| Computers & Peripherals 1.97% | | | | | | | | |
| Apple, Inc.* | | | 38 | | | | 14,523,600 | |
| Fortinet, Inc.* | | | 150 | | | | 3,598,500 | |
| International Business Machines Corp. | | | 20 | | | | 3,760,000 | |
| | | | | | | | |
| Total | | | | | | | 21,882,100 | |
| | | | | | | | |
| | |
| Consumer Finance 0.40% | | | | | | | | |
| Capital One Financial Corp. | | | 100 | | | | 4,466,000 | |
| | | | | | | | |
| | |
| Distributors 0.16% | | | | | | | | |
| Genuine Parts Co. | | | 30 | | | | 1,755,000 | |
| | | | | | | | |
| | |
| Diversified Financial Services 1.44% | | | | | | | | |
| Bank of America Corp. | | | 800 | | | | 4,352,000 | |
| Fannie Mae* | | | 182 | | | | 36,364 | |
| JPMorgan Chase & Co. | | | 375 | | | | 11,613,750 | |
| | | | | | | | |
| Total | | | | | | | 16,002,114 | |
| | | | | | | | |
| | |
| Diversified Telecommunication Services 2.55% | | | | | | | | |
| AT&T, Inc. | | | 335 | | | | 9,708,300 | |
| CenturyLink, Inc. | | | 200 | | | | 7,504,000 | |
| Verizon Communications, Inc. | | | 200 | | | | 7,546,000 | |
See Notes to Financial Statements.
8
Schedule of Investments (continued)
November 30, 2011
| | | | | | | | |
| Investments | | Shares
(000) | | | Fair Value | |
| Diversified Telecommunication Services (continued) | | | | | | | | |
| Windstream Corp. | | | 300 | | | $ | 3,528,000 | |
| | | | | | | | |
| Total | | | | | | | 28,286,300 | |
| | | | | | | | |
| | |
| Electric: Utilities 0.91% | | | | | | | | |
| UniSource Energy Corp. | | | 275 | | | | 10,142,000 | |
| | | | | | | | |
| | |
| Electrical Equipment 1.56% | | | | | | | | |
| A123 Systems, Inc.* | | | 220 | | | | 545,600 | |
| AMETEK, Inc. | | | 53 | | | | 2,270,520 | |
| Cooper Industries plc | | | 27 | | | | 1,499,310 | |
| Emerson Electric Co. | | | 155 | | | | 8,098,750 | |
| Rockwell Automation, Inc. | | | 65 | | | | 4,876,950 | |
| | | | | | | | |
| Total | | | | | | | 17,291,130 | |
| | | | | | | | |
| | |
| Energy Equipment & Services 0.89% | | | | | | | | |
| Cameron International Corp.* | | | 85 | | | | 4,589,150 | |
| Schlumberger Ltd. | | | 70 | | | | 5,273,100 | |
| | | | | | | | |
| Total | | | | | | | 9,862,250 | |
| | | | | | | | |
| | |
| Food & Staples Retailing 1.88% | | | | | | | | |
| CVS Caremark Corp. | | | 115 | | | | 4,466,600 | |
| Ingles Markets, Inc. Class A | | | 415 | | | | 6,399,300 | |
| Wal-Mart Stores, Inc. | | | 170 | | | | 10,013,000 | |
| | | | | | | | |
| Total | | | | | | | 20,878,900 | |
| | | | | | | | |
| | |
| Food Products 1.53% | | | | | | | | |
| Archer-Daniels-Midland Co. | | | 150 | | | | 4,518,000 | |
| H.J. Heinz Co. | | | 75 | | | | 3,948,750 | |
| Kellogg Co. | | | 85 | | | | 4,178,600 | |
| Kraft Foods, Inc. Class A | | | 120 | | | | 4,338,000 | |
| | | | | | | | |
| Total | | | | | | | 16,983,350 | |
| | | | | | | | |
| | |
| Hotels, Restaurants & Leisure 1.68% | | | | | | | | |
| Marriott International, Inc. Class A | | | 120 | | | | 3,674,400 | |
| Marriott Vacations Worldwide Corp.* | | | 13 | | | | 207,740 | |
| McDonald’s Corp. | | | 110 | | | | 10,507,200 | |
| Starwood Hotels & Resorts Worldwide, Inc. | | | 90 | | | | 4,291,200 | |
| | | | | | | | |
| Total | | | | | | | 18,680,540 | |
| | | | | | | | |
See Notes to Financial Statements.
9
Schedule of Investments (continued)
November 30, 2011
| | | | | | | | |
| Investments | | Shares
(000) | | | Fair Value | |
| Household Products 0.87% | | | | | | | | |
| Procter & Gamble Co. (The) | | | 150 | | | $ | 9,685,500 | |
| | | | | | | | |
| | |
| Industrial Conglomerates 0.60% | | | | | | | | |
| 3M Co. | | | 25 | | | | 2,026,000 | |
| General Electric Co. | | | 290 | | | | 4,613,900 | |
| | | | | | | | |
| Total | | | | | | | 6,639,900 | |
| | | | | | | | |
| | |
| Information Technology Services 0.54% | | | | | | | | |
| SAIC, Inc.* | | | 500 | | | | 6,025,000 | |
| | | | | | | | |
| | |
| Insurance 0.54% | | | | | | | | |
| MetLife, Inc. | | | 190 | | | | 5,981,200 | |
| | | | | | | | |
| | |
| Machinery 3.08% | | | | | | | | |
| Actuant Corp. Class A | | | 300 | | | | 6,876,000 | |
| Caterpillar, Inc. | | | 27 | | | | 2,642,760 | |
| Danaher Corp. | | | 180 | | | | 8,708,400 | |
| Dover Corp. | | | 35 | | | | 1,923,950 | |
| Pall Corp. | | | 100 | | | | 5,449,000 | |
| Parker Hannifin Corp. | | | 35 | | | | 2,897,300 | |
| Snap-on, Inc. | | | 110 | | | | 5,643,000 | |
| | | | | | | | |
| Total | | | | | | | 34,140,410 | |
| | | | | | | | |
| | |
| Media 1.91% | | | | | | | | |
| Belo Corp. Class A | | | 340 | | | | 1,989,000 | |
| Charter Communications, Inc. Class A* | | | 30 | | | | 1,586,100 | |
| Comcast Corp. Class A | | | 90 | | | | 2,040,300 | |
| Interpublic Group of Cos., Inc. (The) | | | 375 | | | | 3,517,500 | |
| Omnicom Group, Inc. | | | 65 | | | | 2,806,050 | |
| Time Warner, Inc. | | | 100 | | | | 3,482,000 | |
| Walt Disney Co. (The) | | | 160 | | | | 5,736,000 | |
| | | | | | | | |
| Total | | | | | | | 21,156,950 | |
| | | | | | | | |
| | |
| Metals & Mining 0.46% | | | | | | | | |
| Barrick Gold Corp. (Canada)(a) | | | 75 | | | | 3,966,000 | |
| Titanium Metals Corp. | | | 75 | | | | 1,168,500 | |
| | | | | | | | |
| Total | | | | | | | 5,134,500 | |
| | | | | | | | |
See Notes to Financial Statements.
10
Schedule of Investments (continued)
November 30, 2011
| | | | | | | | | | | | |
| Investments | | | | | | Shares
(000) | | | Fair Value | |
| Multi-Line Retail 1.17% | | | | | | | | | | | | |
| Kohl’s Corp. | | | | | | | 95 | | | $ | 5,111,000 | |
| Target Corp. | | | | | | | 150 | | | | 7,905,000 | |
| | | | | | | | | | | | |
| Total | | | | | | | | | | | 13,016,000 | |
| | | | | | | | | | | | |
| | | | |
| Oil, Gas & Consumable Fuels 9.73% | | | | | | | | | | | | |
| Chevron Corp. | | | | | | | 275 | | | | 28,275,500 | |
| ConocoPhillips | | | | | | | 300 | | | | 21,396,000 | |
| Continental Resources, Inc.* | | | | | | | 145 | | | | 10,235,550 | |
| EOG Resources, Inc. | | | | | | | 85 | | | | 8,817,900 | |
| Exxon Mobil Corp. | | | | | | | 250 | | | | 20,110,000 | |
| Hess Corp. | | | | | | | 100 | | | | 6,022,000 | |
| Marathon Oil Corp. | | | | | | | 125 | | | | 3,495,000 | |
| Petroleo Brasileiro SA ADR | | | | | | | 196 | | | | 4,911,213 | |
| Whiting Petroleum Corp.* | | | | | | | 100 | | | | 4,651,000 | |
| | | | | | | | | | | | |
| Total | | | | | | | | | | | 107,914,163 | |
| | | | | | | | | | | | |
| | | | |
| Pharmaceuticals 5.70% | | | | | | | | | | | | |
| Bristol-Myers Squibb Co. | | | | | | | 235 | | | | 7,689,200 | |
| Johnson & Johnson | | | | | | | 175 | | | | 11,326,000 | |
| Merck & Co., Inc. | | | | | | | 120 | | | | 4,290,000 | |
| Mylan, Inc.* | | | | | | | 893 | | | | 17,447,789 | |
| Pfizer, Inc. | | | | | | | 650 | | | | 13,045,500 | |
| Salix Pharmaceuticals Ltd.* | | | | | | | 70 | | | | 3,089,800 | |
| Teva Pharmaceutical Industries Ltd. ADR | | | | | | | 161 | | | | 6,377,923 | |
| | | | | | | | | | | | |
| Total | | | | | | | | | | | 63,266,212 | |
| | | | | | | | | | | | |
| | | | |
| Real Estate Investment Trusts 0.58% | | | | | | | | | | | | |
| Equity Residential | | | | | | | 32 | | | | 1,777,118 | |
| Plum Creek Timber Co., Inc. | | | | | | | 125 | | | | 4,605,000 | |
| | | | | | | | | | | | |
| Total | | | | | | | | | | | 6,382,118 | |
| | | | | | | | | | | | |
| | | | |
| Road & Rail 0.56% | | | | | | | | | | | | |
| Union Pacific Corp. | | | | | | | 60 | | | | 6,204,600 | |
| | | | | | | | | | | | |
| | | | |
| Semiconductors & Semiconductor Equipment 0.93% | | | | | | | | | | | | |
| Broadcom Corp. Class A* | | | | | | | 90 | | | | 2,731,050 | |
| Intel Corp. | | | | | | | 235 | | | | 5,853,850 | |
See Notes to Financial Statements.
11
Schedule of Investments (continued)
November 30, 2011
| | | | | | | | | | | | | | | | |
| Investments | | | | | | | | Shares
(000) | | | Fair Value | |
| Semiconductors & Semiconductor Equipment (continued) | | | | | | | | | |
| PMC-Sierra, Inc.* | | | | | | | | | | | 300 | | | $ | 1,677,000 | |
| | | | | | | | | | | | | | | | |
| Total | | | | | | | | | | | | | | | 10,261,900 | |
| | | | | | | | | | | | | | | | |
| | | | |
| Software 4.85% | | | | | | | | | | | | | | | | |
| Adobe Systems, Inc.* | | | | | | | | | | | 165 | | | | 4,524,300 | |
| Check Point Software Technologies Ltd. (Israel)*(a) | | | | | | | | | | | 30 | | | | 1,660,200 | |
| Citrix Systems, Inc.* | | | | | | | | | | | 40 | | | | 2,855,600 | |
| Informatica Corp.* | | | | | | | | | | | 80 | | | | 3,596,400 | |
| Microsoft Corp. | | | | | | | | | | | 585 | | | | 14,964,300 | |
| Nuance Communications, Inc.* | | | | | | | | | | | 220 | | | | 5,407,600 | |
| Oracle Corp. | | | | | | | | | | | 250 | | | | 7,837,500 | |
| Sourcefire, Inc.* | | | | | | | | | | | 140 | | | | 4,636,800 | |
| Synchronoss Technologies, Inc.* | | | | | | | | | | | 135 | | | | 4,035,150 | |
| Websense, Inc.* | | | | | | | | | | | 235 | | | | 4,255,850 | |
| | | | | | | | | | | | | | | | |
| Total | | | | | | | | | | | | | | | 53,773,700 | |
| | | | | | | | | | | | | | | | |
| | | | |
| Specialty Retail 0.35% | | | | | | | | | | | | | | | | |
| Home Depot, Inc. (The) | | | | | | | | | | | 100 | | | | 3,922,000 | |
| | | | | | | | | | | | | | | | |
| Total Common Stocks (cost $563,013,381) | | | | | | | | | | | | | | | 640,201,702 | |
| | | | | | | | | | | | | | | | |
| | | | |
| | | Exercise Price | | | Expiration
Date | | | | | | | |
| CONTINGENT VALUE RIGHT 0.01% | | | | | | | | | | | | | | | | |
| | | | |
| Pharmaceuticals | | | | | | | | | | | | | | | | |
| Sanofi* (cost $94,160) | | | – | (b) | | | 12/31/2020 | | | | 40 | | | | 52,000 | |
| | | | | | | | | | | | | | | | |
| | | | |
| | | Interest
Rate | | | Maturity
Date | | | Principal
Amount
(000) | | | | |
| CONVERTIBLE BONDS 6.83% | | | | | | | | | | | | | | | | |
| | | | |
| Automobiles 0.35% | | | | | | | | | | | | | | | | |
| Ford Motor Co. | | | 4.25% | | | | 11/15/2016 | | | | $2,750 | | | | 3,870,625 | |
| | | | | | | | | | | | | | | | |
| | | | |
| Biotechnology 1.57% | | | | | | | | | | | | | | | | |
| BioMarin Pharmaceutical, Inc. | | | 1.875% | | | | 4/23/2017 | | | | 3,100 | | | | 5,529,625 | |
| Gilead Sciences, Inc. | | | 0.625% | | | | 5/1/2013 | | | | 8,500 | | | | 9,785,625 | |
| Vertex Pharmaceuticals, Inc. | | | 3.35% | | | | 10/1/2015 | | | | 2,150 | | | | 2,117,750 | |
| | | | | | | | | | | | | | | | |
| Total | | | | | | | | | | | | | | | 17,433,000 | |
| | | | | | | | | | | | | | | | |
See Notes to Financial Statements.
12
Schedule of Investments (continued)
November 30, 2011
| | | | | | | | | | | | | | | | |
| Investments | | Interest
Rate | | | Maturity
Date | | | Principal
Amount
(000) | | | Fair
Value | |
| Computers & Peripherals 0.95% | | | | | | | | | | | | | | | | |
| EMC Corp. | | | 1.75% | | | | 12/1/2013 | | | $ | 2,600 | | | $ | 3,958,500 | |
| NetApp, Inc. | | | 1.75% | | | | 6/1/2013 | | | | 3,000 | | | | 3,840,000 | |
| SanDisk Corp. | | | 1.50% | | | | 8/15/2017 | | | | 2,300 | | | | 2,685,250 | |
| | | | | | | | | | | | | | | | |
| Total | | | | | | | | | | | | | | | 10,483,750 | |
| | | | | | | | | | | | | | | | |
| | | | |
| Electrical Equipment 0.59% | | | | | | | | | | | | | | | | |
| Roper Industries, Inc. | | | Zero Coupon | | | | 1/15/2034 | | | | 6,150 | | | | 6,572,812 | |
| | | | | | | | | | | | | | | | |
| | | | |
| Energy Equipment & Services 0.15% | | | | | | | | | | | | | | | | |
| SunPower Corp. | | | 4.75% | | | | 4/15/2014 | | | | 2,275 | | | | 1,700,563 | |
| | | | | | | | | | | | | | | | |
| | | | |
| Health Care Providers & Services 0.58% | | | | | | | | | | | | | | | | |
| Five Star Quality Care, Inc. | | | 3.75% | | | | 10/15/2026 | | | | 7,025 | | | | 6,463,000 | |
| | | | | | | | | | | | | | | | |
| | | | |
| Information Technology Services 0.21% | | | | | | | | | | | | | | | | |
| CACI International, Inc. | | | 2.125% | | | | 5/1/2014 | | | | 2,000 | | | | 2,370,000 | |
| | | | | | | | | | | | | | | | |
| | | | |
| Metals & Mining 0.91% | | | | | | | | | | | | | | | | |
| Newmont Mining Corp. | | | 1.25% | | | | 7/15/2014 | | | | 5,000 | | | | 7,806,250 | |
| Newmont Mining Corp. | | | 3.00% | | | | 2/15/2012 | | | | 1,500 | | | | 2,250,000 | |
| | | | | | | | | | | | | | | | |
| Total | | | | | | | | | | | | | | | 10,056,250 | |
| | | | | | | | | | | | | | | | |
| | | |
| Semiconductors & Semiconductor Equipment 0.84% | | | | | | | | | | | | | |
| Intel Corp. | | | 2.95% | | | | 12/15/2035 | | | | 4,500 | | | | 4,837,500 | |
| Xilinx, Inc. | | | 2.625% | | | | 6/15/2017 | | | | 3,500 | | | | 4,506,250 | |
| | | | | | | | | | | | | | | | |
| Total | | | | | | | | | | | | | | | 9,343,750 | |
| | | | | | | | | | | | | | | | |
| | | | |
| Software 0.39% | | | | | | | | | | | | | | | | |
| Symantec Corp. | | | 1.00% | | | | 6/15/2013 | | | | 3,750 | | | | 4,293,750 | |
| | | | | | | | | | | | | | | | |
| | | |
| Wireless Telecommunication Services 0.29% | | | | | | | | | | | | | |
| SBA Communications Corp. | | | 4.00% | | | | 10/1/2014 | | | | 2,175 | | | | 3,194,531 | |
| | | | | | | | | | | | | | | | |
| Total Convertible Bonds (cost $73,386,629) | | | | | | | | | | | | | | | 75,782,031 | |
| | | | | | | | | | | | | | | | |
| | | | |
| | | | | | | | | Shares
(000) | | | | |
| CONVERTIBLE PREFERRED STOCKS 5.39% | | | | | | | | | | | | | | | | |
| | | | |
| Auto Components 0.06% | | | | | | | | | | | | | | | | |
| Cooper-Standard Holdings, Inc. PIK | | | 7.00% | | | | | | | | 4 | | | | 651,840 | |
| | | | | | | | | | | | | | | | |
See Notes to Financial Statements.
13
Schedule of Investments (continued)
November 30, 2011
| | | | | | | | | | | | | | | | |
| Investments | | Interest
Rate | | | | | | Shares
(000) | | | Fair
Value | |
| Automobiles 0.23% | | | | | | | | | | | | | | | | |
| General Motors Co. | | | 4.75% | | | | | | | | 74 | | | $ | 2,509,290 | |
| | | | | | | | | | | | | | | | |
| | | | |
| Capital Markets 0.78% | | | | | | | | | | | | | | | | |
| AMG Capital Trust I | | | 5.10% | | | | | | | | 200 | | | | 8,625,000 | |
| | | | | | | | | | | | | | | | |
| | | | |
| Commercial Banks 0.91% | | | | | | | | | | | | | | | | |
| Fifth Third Bancorp | | | 8.50% | | | | | | | | 40 | | | | 5,638,800 | |
| Wells Fargo & Co. | | | 7.50% | | | | | | | | 4 | | | | 4,479,500 | |
| | | | | | | | | | | | | | | | |
| Total | | | | | | | | | | | | | | | 10,118,300 | |
| | | | | | | | | | | | | | | | |
| | | | |
| Communications Equipment 0.08% | | | | | | | | | | | | | | | | |
| Lucent Technologies Capital Trust I | | | 7.75% | | | | | | | | 1 | | | | 894,600 | |
| | | | | | | | | | | | | | | | |
| | | | |
| Diversified Financial Services 0.53% | | | | | | | | | | | | | | | | |
| Citigroup, Inc. | | | 7.50% | | | | | | | | 70 | | | | 5,897,500 | |
| | | | | | | | | | | | | | | | |
| | | | |
| Electric: Utilities 0.68% | | | | | | | | | | | | | | | | |
| NextEra Energy, Inc. | | | 8.375% | | | | | | | | 150 | | | | 7,575,000 | |
| | | | | | | | | | | | | | | | |
| | | | |
| Food Products 0.65% | | | | | | | | | | | | | | | | |
| Bunge Ltd. | | | 4.875% | | | | | | | | 75 | | | | 7,265,625 | |
| | | | | | | | | | | | | | | | |
| | | | |
| Insurance 0.57% | | | | | | | | | | | | | | | | |
| Hartford Financial Services Group, Inc. (The) | | | 7.25% | | | | | | | | 135 | | | | 2,639,250 | |
| MetLife, Inc. | | | 5.00% | | | | | | | | 61 | | | | 3,708,190 | |
| | | | | | | | | | | | | | | | |
| Total | | | | | | | | | | | | | | | 6,347,440 | |
| | | | | | | | | | | | | | | | |
| | | | |
| Oil, Gas & Consumable Fuels 0.90% | | | | | | | | | | | | | | | | |
| Apache Corp. | | | 6.00% | | | | | | | | 175 | | | | 9,954,000 | |
| | | | | | | | | | | | | | | | |
| Total Convertible Preferred Stocks (cost $61,818,280) | | | | | | | | | | | | 59,838,595 | |
| | | | | | | | | | | | | | | | |
| | | | |
| | | | | | Maturity
Date | | | Principal
Amount
(000) | | | | |
| FLOATING RATE LOANS(c) 0.54% | | | | | | | | | | | | | | | | |
| | | | |
| Diversified Financial Services 0.32% | | | | | | | | | | | | | | | | |
| Nuveen Investments, Inc. 2nd Lien Term Loan | | | 12.50% | | | | 7/31/2015 | | | $ | 3,350 | | | | 3,482,744 | |
| | | | | | | | | | | | | | | | |
| | | | |
| Software 0.22% | | | | | | | | | | | | | | | | |
| Nuance Communications, Inc. Term Loan C | | | 3.25% | | | | 3/31/2016 | | | | 2,468 | | | | 2,458,786 | |
| | | | | | | | | | | | | | | | |
| Total Floating Rate Loans (cost $5,549,809) | | | | | | | | | | | | | | | 5,941,530 | |
| | | | | | | | | | | | | | | | |
See Notes to Financial Statements.
14
Schedule of Investments (continued)
November 30, 2011
| | | | | | | | |
| Investments | | Shares
(000) | | | Fair
Value | |
| FOREIGN COMMON STOCKS(d) 4.23% | | | | | | | | |
| | |
| France 0.46% | | | | | | | | |
| | |
| Automobiles 0.21% | | | | | | | | |
| Renault SA | | | 63 | | | $ | 2,371,202 | |
| | | | | | | | |
| | |
| Electrical Equipment 0.25% | | | | | | | | |
| Alstom SA | | | 79 | | | | 2,747,810 | |
| | | | | | | | |
| Total France | | | | | | | 5,119,012 | |
| | | | | | | | |
| | |
| Germany 1.01% | | | | | | | | |
| | |
| Air Freight & Logistics 0.29% | | | | | | | | |
| Deutsche Post AG Registered Shares | | | 213 | | | | 3,226,576 | |
| | | | | | | | |
| | |
| Household Products 0.31% | | | | | | | | |
| Henkel KGaA | | | 70 | | | | 3,429,157 | |
| | | | | | | | |
| | |
| Software 0.41% | | | | | | | | |
| SAP AG | | | 76 | | | | 4,532,204 | |
| | | | | | | | |
| Total Germany | | | | | | | 11,187,937 | |
| | | | | | | | |
| | |
| Norway 0.40% | | | | | | | | |
| | |
| Commercial Banks | | | | | | | | |
| DnB NOR ASA | | | 432 | | | | 4,417,814 | |
| | | | | | | | |
| | |
| Switzerland 1.36% | | | | | | | | |
| | |
| Chemicals 0.40% | | | | | | | | |
| Syngenta AG Registered Shares* | | | 15 | | | | 4,472,950 | |
| | | | | | | | |
| | |
| Food Products 0.34% | | | | | | | | |
| Nestle SA Registered Shares | | | 68 | | | | 3,816,851 | |
| | | | | | | | |
| | |
| Pharmaceuticals 0.62% | | | | | | | | |
| Roche Holding Ltd. AG | | | 43 | | | | 6,813,783 | |
| | | | | | | | |
| Total Switzerland | | | | | | | 15,103,584 | |
| | | | | | | | |
| | |
| United Kingdom 1.00% | | | | | | | | |
| | |
| Metals & Mining 0.37% | | | | | | | | |
| Anglo American plc | | | 64 | | | | 2,456,230 | |
| Vedanta Resources plc | | | 101 | | | | 1,694,352 | |
| | | | | | | | |
| Total | | | | | | | 4,150,582 | |
| | | | | | | | |
See Notes to Financial Statements.
15
Schedule of Investments (continued)
November 30, 2011
| | | | | | | | | | | | | | | | |
| Investments | | | | | | | | Shares
(000) | | | Fair
Value | |
| United Kingdom (continued) | | | | | | | | | | | | | | | | |
| | | | |
| Wireless Telecommunication Services 0.63% | | | | | | | | | | | | | | | | |
| Vodafone Group plc | | | | | | | | | | | 2,582 | | | $ | 6,989,519 | |
| | | | | | | | | | | | | | | | |
| Total United Kingdom | | | | | | | | | | | | | | | 11,140,101 | |
| | | | | | | | | | | | | | | | |
| Total Foreign Common Stocks (cost $48,417,882) | | | | | | | | | | | | | | | 46,968,448 | |
| | | | | | | | | | | | | | | | |
| | | | |
| | | Interest
Rate | | | Maturity
Date | | | Principal
Amount
(000) | | | | |
| HIGH YIELD CORPORATE BONDS 24.84% | | | | | | | | | | | | | | | | |
| | | | |
| Airlines 0.29% | | | | | | | | | | | | | | | | |
| United Airlines, Inc.† | | | 9.875% | | | | 8/1/2013 | | | $ | 3,150 | | | | 3,236,625 | |
| | | | | | | | | | | | | | | | |
| | | | |
| Auto Components 0.04% | | | | | | | | | | | | | | | | |
| Tomkins LLC/Tomkins, Inc. | | | 9.00% | | | | 10/1/2018 | | | | 405 | | | | 439,425 | |
| | | | | | | | | | | | | | | | |
| | | | |
| Automobiles 0.43% | | | | | | | | | | | | | | | | |
| Chrysler Group LLC/CG Co-Issuer, Inc.† | | | 8.25% | | | | 6/15/2021 | | | | 2,500 | | | | 2,112,500 | |
| TRW Automotive, Inc.† | | | 8.875% | | | | 12/1/2017 | | | | 2,500 | | | | 2,687,500 | |
| | | | | | | | | | | | | | | | |
| Total | | | | | | | | | | | | | | | 4,800,000 | |
| | | | | | | | | | | | | | | | |
| | | | |
| Capital Markets 0.87% | | | | | | | | | | | | | | | | |
| Nuveen Investments, Inc. | | | 10.50% | | | | 11/15/2015 | | | | 7,000 | | | | 6,720,000 | |
| Raymond James Financial, Inc. | | | 8.60% | | | | 8/15/2019 | | | | 2,500 | | | | 2,956,272 | |
| | | | | | | | | | | | | | | | |
| Total | | | | | | | | | | | | | | | 9,676,272 | |
| | | | | | | | | | | | | | | | |
| | | | |
| Chemicals 0.49% | | | | | | | | | | | | | | | | |
| Chemtura Corp. | | | 7.875% | | | | 9/1/2018 | | | | 2,000 | | | | 2,055,000 | |
| INEOS Group Holdings Ltd. (United Kingdom)†(a) | | | 8.50% | | | | 2/15/2016 | | | | 4,250 | | | | 3,336,250 | |
| | | | | | | | | | | | | | | | |
| Total | | | | | | | | | | | | | | | 5,391,250 | |
| | | | | | | | | | | | | | | | |
| | | | |
| Commercial Banks 0.48% | | | | | | | | | | | | | | | | |
| SVB Financial Group | | | 5.375% | | | | 9/15/2020 | | | | 1,625 | | | | 1,645,272 | |
| Zions Bancorporation | | | 7.75% | | | | 9/23/2014 | | | | 3,500 | | | | 3,716,744 | |
| | | | | | | | | | | | | | | | |
| Total | | | | | | | | | | | | | | | 5,362,016 | |
| | | | | | | | | | | | | | | | |
| | | | |
| Commercial Services & Supplies 0.78% | | | | | | | | | | | | | | | | |
| First Data Corp.† | | | 8.25% | | | | 1/15/2021 | | | | 2,500 | | | | 2,175,000 | |
| First Data Corp. | | | 9.875% | | | | 9/24/2015 | | | | 302 | | | | 275,575 | |
| First Data Corp.† | | | 12.625% | | | | 1/15/2021 | | | | 1,349 | | | | 1,119,670 | |
| International Lease Finance Corp. | | | 6.25% | | | | 5/15/2019 | | | | 925 | | | | 823,777 | |
| International Lease Finance Corp. | | | 8.25% | | | | 12/15/2020 | | | | 650 | | | | 648,375 | |
See Notes to Financial Statements.
16
Schedule of Investments (continued)
November 30, 2011
| | | | | | | | | | | | | | | | |
| Investments | | Interest
Rate | | | Maturity
Date | | | Principal
Amount
(000) | | | Fair
Value | |
| Commercial Services & Supplies (continued) | | | | | | | | | | | | | | | | |
| International Lease Finance Corp. | | | 8.75% | | | | 3/15/2017 | | | $ | 2,200 | | | $ | 2,222,000 | |
| Iron Mountain, Inc. | | | 7.75% | | | | 10/1/2019 | | | | 1,375 | | | | 1,426,563 | |
| | | | | | | | | | | | | | | | |
| Total | | | | | | | | | | | | | | | 8,690,960 | |
| | | | | | | | | | | | | | | | |
| | | | |
| Communications Equipment 1.13% | | | | | | | | | | | | | | | | |
| Avaya, Inc.† | | | 7.00% | | | | 4/1/2019 | | | | 3,000 | | | | 2,700,000 | |
| Brocade Communications Systems, Inc. | | | 6.625% | | | | 1/15/2018 | | | | 3,500 | | | | 3,657,500 | |
| Brocade Communications Systems, Inc. | | | 6.875% | | | | 1/15/2020 | | | | 1,950 | | | | 2,076,750 | |
| CommScope, Inc.† | | | 8.25% | | | | 1/15/2019 | | | | 4,250 | | | | 4,122,500 | |
| | | | | | | | | | | | | | | | |
| Total | | | | | | | | | | | | | | | 12,556,750 | |
| | | | | | | | | | | | | | | | |
| | | | |
| Construction Materials 0.11% | | | | | | | | | | | | | | | | |
| New Enterprise Stone & Lime Co. | | | 11.00% | | | | 9/1/2018 | | | | 1,500 | | | | 1,196,250 | |
| | | | | | | | | | | | | | | | |
| | | | |
| Containers & Packaging 1.29% | | | | | | | | | | | | | | | | |
| AEP Industries, Inc. | | | 8.25% | | | | 4/15/2019 | | | | 3,000 | | | | 2,970,000 | |
| Ardagh Packaging Finance plc (Ireland)†(a) | | | 7.375% | | | | 10/15/2017 | | | | 1,200 | | | | 1,224,000 | |
| Ardagh Packaging Finance plc (Ireland)†(a) | | | 9.125% | | | | 10/15/2020 | | | | 1,350 | | | | 1,343,250 | |
| Crown Cork & Seal Co., Inc. | | | 7.375% | | | | 12/15/2026 | | | | 6,000 | | | | 6,150,000 | |
| Sealed Air Corp. | | | 7.875% | | | | 6/15/2017 | | | | 1,500 | | | | 1,569,370 | |
| Sealed Air Corp.† | | | 8.375% | | | | 9/15/2021 | | | | 1,000 | | | | 1,072,500 | |
| | | | | | | | | | | | | | | | |
| Total | | | | | | | | | | | | | | | 14,329,120 | |
| | | | | | | | | | | | | | | | |
| | | | |
| Diversified Financial Services 1.26% | | | | | | | | | | | | | | | | |
| Capital One Capital VI | | | 8.875% | | | | 5/15/2040 | | | | 3,445 | | | | 3,481,352 | |
| New York City Industrial Development Agency† | | | 11.00% | | | | 3/1/2029 | | | | 2,800 | | | | 3,553,928 | |
| RBS Global, Inc./Rexnord LLC | | | 8.50% | | | | 5/1/2018 | | | | 2,000 | | | | 2,060,000 | |
| RBS Global, Inc./Rexnord LLC | | | 11.75% | | | | 8/1/2016 | | | | 3,850 | | | | 4,023,250 | |
| Wachovia Capital Trust III | | | 5.57% | # | | | – | (e) | | | 1,000 | | | | 848,750 | |
| | | | | | | | | | | | | | | | |
| Total | | | | | | | | | | | | | | | 13,967,280 | |
| | | | | | | | | | | | | | | | |
| | | | |
| Diversified Telecommunication Services 1.16% | | | | | | | | | | | | | | | | |
| Clearwire Communications LLC/Clearwire Finance, Inc.† | | | 12.00% | | | | 12/1/2015 | | | | 1,075 | | | | 913,750 | |
| Intelsat Luxembourg SA (Luxembourg)(a) | | | 11.25% | | | | 2/4/2017 | | | | 4,150 | | | | 3,828,375 | |
| SBA Telecommunications, Inc. | | | 8.25% | | | | 8/15/2019 | | | | 2,500 | | | | 2,703,125 | |
| UPCB Finance V Ltd.† | | | 7.25% | | | | 11/15/2021 | | | | 1,600 | | | | 1,568,000 | |
| Windstream Corp. | | | 7.00% | | | | 3/15/2019 | | | | 4,000 | | | | 3,900,000 | |
| | | | | | | | | | | | | | | | |
| Total | | | | | | | | | | | | | | | 12,913,250 | |
| | | | | | | | | | | | | | | | |
See Notes to Financial Statements.
17
Schedule of Investments (continued)
November 30, 2011
| | | | | | | | | | | | | | | | |
| Investments | | Interest
Rate | | | Maturity
Date | | | Principal
Amount
(000) | | | Fair
Value | |
| Electric: Utilities 0.09% | | | | | | | | | | | | | | | | |
| Texas Competitive Electric Holdings Co. LLC/TCEH Finance, Inc.† | | | 11.50% | | | | 10/1/2020 | | | $ | 1,250 | | | $ | 1,043,750 | |
| | | | | | | | | | | | | | | | |
| | | | |
| Energy Equipment & Services 0.15% | | | | | | | | | | | | | | | | |
| Dresser-Rand Group, Inc.† | | | 6.50% | | | | 5/1/2021 | | | | 975 | | | | 962,813 | |
| Transocean, Inc. | | | 6.375% | | | | 12/15/2021 | | | | 700 | | | | 699,622 | |
| | | | | | | | | | | | | | | | |
| Total | | | | | | | | | | | | | | | 1,662,435 | |
| | | | | | | | | | | | | | | | |
| | | | |
| Food Products 0.16% | | | | | | | | | | | | | | | | |
| Blue Merger Sub, Inc.† | | | 7.625% | | | | 2/15/2019 | | | | 2,000 | | | | 1,800,000 | |
| | | | | | | | | | | | | | | | |
| | | | |
| Gas Utilities 0.16% | | | | | | | | | | | | | | | | |
| National Fuel Gas Co. | | | 4.90% | | | | 12/1/2021 | | | | 1,800 | | | | 1,800,693 | |
| | | | | | | | | | | | | | | | |
| | | | |
| Health Care Equipment & Supplies 0.78% | | | | | | | | | | | | | | | | |
| Bausch & Lomb, Inc. | | | 9.875% | | | | 11/1/2015 | | | | 2,500 | | | | 2,618,750 | |
| Bio-Rad Laboratories, Inc. | | | 8.00% | | | | 9/15/2016 | | | | 3,000 | | | | 3,300,000 | |
| Biomet, Inc. | | | 10.00% | | | | 10/15/2017 | | | | 2,500 | | | | 2,706,250 | |
| | | | | | | | | | | | | | | | |
| Total | | | | | | | | | | | | | | | 8,625,000 | |
| | | | | | | | | | | | | | | | |
| | | | |
| Health Care Providers & Services 1.74% | | | | | | | | | | | | | | | | |
| Community Health Systems, Inc.† | | | 8.00% | | | | 11/15/2019 | | | | 1,200 | | | | 1,167,000 | |
| Community Health Systems, Inc. | | | 8.875% | | | | 7/15/2015 | | | | 1,806 | | | | 1,860,180 | |
| HCA, Inc. | | | 7.50% | | | | 2/15/2022 | | | | 3,225 | | | | 3,184,687 | |
| STHI Holding Corp.† | | | 8.00% | | | | 3/15/2018 | | | | 2,500 | | | | 2,543,750 | |
| Tenet Healthcare Corp. | | | 9.25% | | | | 2/1/2015 | | | | 3,500 | | | | 3,635,625 | |
| United Surgical Partners International, Inc. PIK | | | 9.25% | | | | 5/1/2017 | | | | 4,000 | | | | 4,000,000 | |
| Vanguard Health Holding Co. II LLC/Vanguard Holding Co. II, Inc. | | | 8.00% | | | | 2/1/2018 | | | | 3,075 | | | | 2,936,625 | |
| | | | | | | | | | | | | | | | |
| Total | | | | | | | | | | | | | | | 19,327,867 | |
| | | | | | | | | | | | | | | | |
| | | | |
| Hotels, Restaurants & Leisure 1.00% | | | | | | | | | | | | | | | | |
| Caesar’s Entertainment Operating Co., Inc. | | | 5.625% | | | | 6/1/2015 | | | | 2,000 | | | | 1,170,000 | |
| Hyatt Hotels Corp.† | | | 5.75% | | | | 8/15/2015 | | | | 3,000 | | | | 3,207,261 | |
| Marina District Finance Co., Inc. | | | 9.875% | | | | 8/15/2018 | | | | 3,000 | | | | 2,692,500 | |
| River Rock Entertainment Authority (The)(f)(g) | | | 9.75% | | | | 11/1/2011 | | | | 1,700 | | | | 1,283,500 | |
| Station Casinos, Inc.(f) | | | 6.50% | | | | 2/1/2014 | | | | 4,000 | | | | 400 | |
| Wendy’s Co. (The) | | | 10.00% | | | | 7/15/2016 | | | | 1,500 | | | | 1,650,000 | |
| Wyndham Worldwide Corp. | | | 5.75% | | | | 2/1/2018 | | | | 1,000 | | | | 1,055,765 | |
| | | | | | | | | | | | | | | | |
| Total | | | | | | | | | | | | | | | 11,059,426 | |
| | | | | | | | | | | | | | | | |
See Notes to Financial Statements.
18
Schedule of Investments (continued)
November 30, 2011
| | | | | | | | | | | | | | | | |
| Investments | | Interest
Rate | | | Maturity
Date | | | Principal
Amount
(000) | | | Fair
Value | |
| Household Durables 0.17% | | | | | | | | | | | | | | | | |
| Armored AutoGroup, Inc.† | | | 9.25% | | | | 11/1/2018 | | | $ | 1,000 | | | $ | 805,000 | |
| Lennar Corp. | | | 12.25% | | | | 6/1/2017 | | | | 900 | | | | 1,071,000 | |
| | | | | | | | | | | | | | | | |
| Total | | | | | | | | | | | | | | | 1,876,000 | |
| | | | | | | | | | | | | | | | |
| | | |
| Independent Power Producers & Energy Traders 0.31% | | | | | | | | | | | | | |
| AES Corp. (The) | | | 8.00% | | | | 10/15/2017 | | | | 1,500 | | | | 1,620,000 | |
| Mirant Americas Generation LLC | | | 9.125% | | | | 5/1/2031 | | | | 2,000 | | | | 1,790,000 | |
| | | | | | | | | | | | | | | | |
| Total | | | | | | | | | | | | | | | 3,410,000 | |
| | | | | | | | | | | | | | | | |
| | | | |
| Industrial Conglomerates 0.33% | | | | | | | | | | | | | | | | |
| Park-Ohio Industries, Inc. | | | 8.125% | | | | 4/1/2021 | | | | 3,700 | | | | 3,626,000 | |
| | | | | | | | | | | | | | | | |
| | | | |
| Information Technology Services 0.75% | | | | | | | | | | | | | | | | |
| SunGard Data Systems, Inc. | | | 10.25% | | | | 8/15/2015 | | | | 8,000 | | | | 8,280,000 | |
| | | | | | | | | | | | | | | | |
| | | | |
| Internet Software & Services 0.09% | | | | | | | | | | | | | | | | |
| Equinix, Inc. | | | 7.00% | | | | 7/15/2021 | | | | 1,000 | | | | 1,033,750 | |
| | | | | | | | | | | | | | | | |
| | | | |
| Leisure Equipment & Products 0.30% | | | | | | | | | | | | | | | | |
| Speedway Motorsports, Inc. | | | 8.75% | | | | 6/1/2016 | | | | 3,000 | | | | 3,270,000 | |
| | | | | | | | | | | | | | | | |
| | | | |
| Machinery 0.14% | | | | | | | | | | | | | | | | |
| Oshkosh Corp. | | | 8.50% | | | | 3/1/2020 | | | | 1,500 | | | | 1,515,000 | |
| | | | | | | | | | | | | | | | |
| | | | |
| Media 1.84% | | | | | | | | | | | | | | | | |
| Affinion Group, Inc. | | | 11.50% | | | | 10/15/2015 | | | | 4,000 | | | | 3,500,000 | |
| AMC Networks, Inc.† | | | 7.75% | | | | 7/15/2021 | | | | 1,500 | | | | 1,593,750 | |
| CCO Holdings LLC/CCO Holdings Capital Corp. | | | 8.125% | | | | 4/30/2020 | | | | 2,500 | | | | 2,650,000 | |
| Cumulus Media, Inc.† | | | 7.75% | | | | 5/1/2019 | | | | 2,000 | | | | 1,740,000 | |
| DISH DBS Corp. | | | 6.75% | | | | 6/1/2021 | | | | 1,250 | | | | 1,225,000 | |
| EH Holding Corp.† | | | 7.625% | | | | 6/15/2021 | | | | 3,500 | | | | 3,456,250 | |
| Gray Television, Inc. | | | 10.50% | | | | 6/29/2015 | | | | 1,500 | | | | 1,402,500 | |
| Mediacom Communications Corp. | | | 9.125% | | | | 8/15/2019 | | | | 1,500 | | | | 1,571,250 | |
| WMG Acquisition Corp. | | | 9.50% | | | | 6/15/2016 | | | | 1,420 | | | | 1,498,100 | |
| WMG Acquisition Corp.† | | | 11.50% | | | | 10/1/2018 | | | | 1,750 | | | | 1,732,500 | |
| | | | | | | | | | | | | | | | |
| Total | | | | | | | | | | | | | | | 20,369,350 | |
| | | | | | | | | | | | | | | | |
| | | | |
| Metals & Mining 0.97% | | | | | | | | | | | | | | | | |
| Arch Coal, Inc.† | | | 7.25% | | | | 6/15/2021 | | | | 3,000 | | | | 2,925,000 | |
| Cliffs Natural Resources, Inc. | | | 5.90% | | | | 3/15/2020 | | | | 1,500 | | | | 1,580,590 | |
See Notes to Financial Statements.
19
Schedule of Investments (continued)
November 30, 2011
| | | | | | | | | | | | | | | | |
| Investments | | Interest
Rate | | | Maturity
Date | | | Principal
Amount
(000) | | | Fair
Value | |
| Metals & Mining (continued) | | | | | | | | | | | | | | | | |
| FMG Resources (August 2006) Pty Ltd. (Australia)†(a) | | | 6.875% | | | | 2/1/2018 | | | $ | 1,525 | | | $ | 1,406,813 | |
| Mirabela Nickel Ltd. (Australia)†(a) | | | 8.75% | | | | 4/15/2018 | | | | 1,875 | | | | 1,678,125 | |
| Noranda Aluminum Acquisition Corp. PIK | | | 4.659% | # | | | 5/15/2015 | | | | 3,406 | | | | 3,150,429 | |
| | | | | | | | | | | | | | | | |
| Total | | | | | | | | | | | | | | | 10,740,957 | |
| | | | | | | | | | | | | | | | |
| | | | |
| Multi-Utilities 0.38% | | | | | | | | | | | | | | | | |
| Black Hills Corp. | | | 9.00% | | | | 5/15/2014 | | | | 3,650 | | | | 4,175,100 | |
| | | | | | | | | | | | | | | | |
| | | | |
| Oil, Gas & Consumable Fuels 4.22% | | | | | | | | | | | | | | | | |
| Antero Resources Finance Corp.† | | | 7.25% | | | | 8/1/2019 | | | | 1,500 | | | | 1,507,500 | |
| Chaparral Energy, Inc. | | | 8.25% | | | | 9/1/2021 | | | | 5,000 | | | | 4,950,000 | |
| Concho Resources, Inc. | | | 7.00% | | | | 1/15/2021 | | | | 2,000 | | | | 2,090,000 | |
| CONSOL Energy, Inc. | | | 8.25% | | | | 4/1/2020 | | | | 2,500 | | | | 2,700,000 | |
| Continental Resources, Inc. | | | 8.25% | | | | 10/1/2019 | | | | 6,000 | | | | 6,660,000 | |
| El Paso Corp. | | | 7.00% | | | | 6/15/2017 | | | | 1,255 | | | | 1,370,455 | |
| Energy XXI Gulf Coast, Inc. | | | 7.75% | | | | 6/15/2019 | | | | 2,500 | | | | 2,412,500 | |
| Forest Oil Corp. | | | 7.25% | | | | 6/15/2019 | | | | 2,000 | | | | 1,990,000 | |
| IFM US Colonial Pipeline 2 LLC† | | | 6.45% | | | | 5/1/2021 | | | | 3,000 | | | | 3,196,710 | |
| Kodiak Oil & Gas Corp.† | | | 8.125% | | | | 12/1/2019 | | | | 760 | | | | 772,350 | |
| LINN Energy LLC/LINN Energy Finance Corp. | | | 7.75% | | | | 2/1/2021 | | | | 1,850 | | | | 1,859,250 | |
| MEG Energy Corp. (Canada)†(a) | | | 6.50% | | | | 3/15/2021 | | | | 2,200 | | | | 2,222,000 | |
| Oasis Petroleum, Inc. | | | 6.50% | | | | 11/1/2021 | | | | 900 | | | | 879,750 | |
| Oasis Petroleum, Inc.† | | | 7.25% | | | | 2/1/2019 | | | | 3,200 | | | | 3,280,000 | |
| OGX Petroleo e Gas Participacoes SA (Brazil)†(a) | | | 8.50% | | | | 6/1/2018 | | | | 2,775 | | | | 2,664,000 | |
| SandRidge Energy, Inc. | | | 7.50% | | | | 3/15/2021 | | | | 2,100 | | | | 1,932,000 | |
| SM Energy Co.† | | | 6.50% | | | | 11/15/2021 | | | | 1,000 | | | | 1,005,000 | |
| SM Energy Co.† | | | 6.625% | | | | 2/15/2019 | | | | 3,000 | | | | 3,045,000 | |
| Tennessee Gas Pipeline Co. | | | 7.00% | | | | 10/15/2028 | | | | 2,000 | | | | 2,291,000 | |
| | | | | | | | | | | | | | | | |
| Total | | | | | | | | | | | | | | | 46,827,515 | |
| | | | | | | | | | | | | | | | |
| | | | |
| Personal Products 0.20% | | | | | | | | | | | | | | | | |
| Elizabeth Arden, Inc. | | | 7.375% | | | | 3/15/2021 | | | | 2,150 | | | | 2,252,125 | |
| | | | | | | | | | | | | | | | |
| | | | |
| Pharmaceuticals 0.20% | | | | | | | | | | | | | | | | |
| Aristotle Holding, Inc.† | | | 4.75% | | | | 11/15/2021 | | | | 1,470 | | | | 1,488,009 | |
| Mylan, Inc.† | | | 7.875% | | | | 7/15/2020 | | | | 650 | | | | 695,500 | |
| | | | | | | | | | | | | | | | |
| Total | | | | | | | | | | | | | | | 2,183,509 | |
| | | | | | | | | | | | | | | | |
See Notes to Financial Statements.
20
Schedule of Investments (continued)
November 30, 2011
| | | | | | | | | | | | | | | | |
| Investments | | Interest
Rate | | | Maturity
Date | | | Principal
Amount
(000) | | | Fair
Value | |
| Real Estate Management & Development 0.15% | | | | | | | | | | | | | |
| ProLogis | | | 6.875% | | | | 3/15/2020 | | | $ | 1,500 | | | $ | 1,662,321 | |
| | | | | | | | | | | | | | | | |
| | | | |
| Road & Rail 0.29% | | | | | | | | | | | | | | | | |
| Florida East Coast Railway Corp. | | | 8.125% | | | | 2/1/2017 | | | | 2,600 | | | | 2,603,250 | |
| Kansas City Southern de Mexico SA de CV (Mexico)(a) | | | 6.125% | | | | 6/15/2021 | | | | 625 | | | | 646,875 | |
| | | | | | | | | | | | | | | | |
| Total | | | | | | | | | | | | | | | 3,250,125 | |
| | | | | | | | | | | | | | | | |
| | | |
| Semiconductors & Semiconductor Equipment 0.12% | | | | | | | | | | | | | |
| Sensata Technologies BV (Netherlands)†(a) | | | 6.50% | | | | 5/15/2019 | | | | 1,300 | | | | 1,267,500 | |
| | | | | | | | | | | | | | | | |
| | | | |
| Specialty Retail 0.53% | | | | | | | | | | | | | | | | |
| Brookstone Co., Inc.† | | | 13.00% | | | | 10/15/2014 | | | | 1,564 | | | | 1,259,020 | |
| Limited Brands, Inc. | | | 8.50% | | | | 6/15/2019 | | | | 4,000 | | | | 4,640,000 | |
| | | | | | | | | | | | | | | | |
| Total | | | | | | | | | | | | | | | 5,899,020 | |
| | | | | | | | | | | | | | | | |
| | | | |
| Textiles, Apparel & Luxury Goods 0.32% | | | | | | | | | | | | | | | | |
| Polymer Group, Inc.† | | | 7.75% | | | | 2/1/2019 | | | | 3,500 | | | | 3,561,250 | |
| | | | | | | | | | | | | | | | |
| | | | |
| Thrifts & Mortgage Finance 0.00% | | | | | | | | | | | | | | | | |
| Washington Mutual Bank(f) | | | 6.875% | | | | 6/15/2011 | | | | 4,350 | | | | 15,225 | |
| | | | | | | | | | | | | | | | |
| | | | |
| Tobacco 0.11% | | | | | | | | | | | | | | | | |
| Reynolds Group Issuer, Inc./Reynolds Group Issuer LLC/Reynolds Group Issuer Luxembourg SA† | | | 9.25% | | | | 5/15/2018 | | | | 1,375 | | | | 1,258,125 | |
| | | | | | | | | | | | | | | | |
| | | | |
| Transportation Infrastructure 0.13% | | | | | | | | | | | | | | | | |
| Asciano Finance Ltd. (Australia)†(a) | | | 4.625% | | | | 9/23/2020 | | | | 1,500 | | | | 1,435,007 | |
| | | | | | | | | | | | | | | | |
| | | | |
| Wireless Telecommunication Services 0.88% | | | | | | | | | | | | | | | | |
| Intelsat Jackson Holdings SA (Luxembourg)†(a) | | | 7.50% | | | | 4/1/2021 | | | | 2,300 | | | | 2,190,750 | |
| Intelsat Jackson Holdings SA (Luxembourg)(a) | | | 11.25% | | | | 6/15/2016 | | | | 1,000 | | | | 1,042,500 | |
| Sprint Capital Corp. | | | 6.90% | | | | 5/1/2019 | | | | 5,000 | | | | 3,887,500 | |
| Wind Acquisition Finance SA (Italy)†(a) | | | 11.75% | | | | 7/15/2017 | | | | 3,100 | | | | 2,689,250 | |
| | | | | | | | | | | | | | | | |
| Total | | | | | | | | | | | | | | | 9,810,000 | |
| | | | | | | | | | | | | | | | |
| Total High Yield Corporate Bonds (cost $284,056,967) | | | | | | | | | | | | 275,596,248 | |
| | | | | | | | | | | | | | | | |
See Notes to Financial Statements.
21
Schedule of Investments (continued)
November 30, 2011
| | | | | | | | | | | | | | | | |
| Investments | | Interest
Rate | | | | | | Shares
(000) | | | Fair
Value | |
| PREFERRED STOCK 0.02% | | | | | | | | | | | | | | | | |
| Thrifts & Mortgage Finance | | | | | | | | | | | | | | | | |
| Fannie Mae* (cost $3,071,479) | | | Zero Coupon | | | | | | | | 122 | | | $ | 238,485 | |
| | | | | | | | | | | | | | | | |
| | | | |
| | | Exercise Price | | | Expiration
Date | | | | | | | |
| WARRANTS 0.03% | | | | | | | | | | | | | | | | |
| | | | |
| Auto Components 0.02% | | | | | | | | | | | | | | | | |
| Cooper-Standard Holdings, Inc.* | | | $27.33 | | | | 11/27/2017 | | | | 15 | | | | 248,421 | |
| | | | | | | | | | | | | | | | |
| | | | |
| Media 0.01% | | | | | | | | | | | | | | | | |
| Charter Communications, Inc.* | | | 46.86 | | | | 11/30/2014 | | | | 9 | | | | 135,984 | |
| | | | | | | | | | | | | | | | |
| Total Warrants (cost $175,119) | | | | | | | | | | | | | | | 384,405 | |
| | | | | | | | | | | | | | | | |
| Total Long-Term Investments (cost $1,039,583,706) | | | | | | | | | | | | 1,105,003,444 | |
| | | | | | | | | | | | | | | | |
| | | | |
| | | | | | | | | Principal Amount (000) | | | | |
| SHORT-TERM INVESTMENT 0.39% | | | | | | | | | | | | | | | | |
| | | | |
| Repurchase Agreement | | | | | | | | | | | | | | | | |
| Repurchase Agreement dated 11/30/2011, 0.01% due 12/1/2011 with Fixed Income Clearing Corp. collateralized by $4,225,000 of U.S. Treasury Note at 1.75% due 1/31/2014; value: $4,383,438; proceeds: $4,296,839 (cost $4,296,838) | | | | | | | $ | 4,297 | | | | 4,296,838 | |
| | | | | | | | | | | | | | | | |
| Total Investments in Securities 99.98% (cost $1,043,880,544) | | | | | | | | 1,109,300,282 | |
| | | | | | | | | | | | | | | | |
| Foreign Cash and Other Assets in Excess of Liabilities 0.02% | | | | | | | | 261,759 | |
| | | | | | | | | | | | | | | | |
| Net Assets 100.00% | | | | | | | | | | | | | | $ | 1,109,562,041 | |
| | | | | | | | | | | | | | | | |
See Notes to Financial Statements.
22
Schedule of Investments (concluded)
November 30, 2011
| | |
| ADR | | American Depositary Receipt. |
| PIK | | Payment-in-kind. |
| * | | Non-income producing security. |
| † | | Security was purchased pursuant to Rule 144A under the Securities Act of 1933 and, unless registered under such Act or exempted from registration, may only be resold to qualified institutional buyers. |
| # | | Variable rate security. The interest rate represents the rate in effect at November 30, 2011. |
| (a) | | Foreign security traded in U.S. dollars. |
| (b) | | Contingent Value Right entitles the holder to receive cash payments if specified milestones are achieved. |
| (c) | | Floating Rate Loans in which the Fund invests generally pay interest at rates which are periodically re-determined at a margin above the London Interbank Offered Rate (“LIBOR”) or the prime rate offered by major U.S. banks. The rate shown is the rate in effect at November 30, 2011. |
| (d) | | Investment in non-U.S. dollar denominated securities. |
| (e) | | Security is perpetual in nature and has no stated maturity. |
| (f) | | Defaulted security. |
| (g) | | Subsequent to November 30, 2011, new Notes were issued as part of an exchange offer that matures in 2018. |
See Notes to Financial Statements.
23
Statement of Assets and Liabilities
November 30, 2011
| | | | |
ASSETS: | | | | |
Investments in securities, at fair value (cost $1,043,880,544) | | $ | 1,109,300,282 | |
Foreign cash, at value (cost $806,732) | | | 819,240 | |
Receivables: | | | | |
Investment securities sold | | | 31,506,165 | |
Interest and dividends | | | 10,084,970 | |
Capital shares sold | | | 1,101,358 | |
From advisor (See Note 3) | | | 11,216 | |
Prepaid expenses and other assets | | | 87,943 | |
Total assets | | | 1,152,911,174 | |
LIABILITIES: | | | | |
Payables: | | | | |
Investment securities purchased | | | 4,273,925 | |
Capital shares reacquired | | | 37,564,206 | |
Management fee | | | 702,539 | |
12b-1 distribution fees | | | 323,989 | |
Directors’ fees | | | 125,306 | |
Fund administration | | | 37,797 | |
To affiliates (See Note 3) | | | 24,452 | |
Accrued expenses and other liabilities | | | 296,919 | |
Total liabilities | | | 43,349,133 | |
NET ASSETS | | $ | 1,109,562,041 | |
COMPOSITION OF NET ASSETS: | | | | |
Paid-in capital | | $ | 1,245,656,277 | |
Undistributed net investment income | | | 5,567,227 | |
Accumulated net realized loss on investments, futures contracts and foreign currency related transactions | | | (207,091,796 | ) |
Net unrealized appreciation on investments, futures contracts and translation of assets and liabilities denominated in foreign currencies | | | 65,430,333 | |
Net Assets | | $ | 1,109,562,041 | |
See Notes to Financial Statements.
24
Statement of Assets and Liabilities (concluded)
November 30, 2011
| | | | |
| | | | |
Net assets by class: | | | | |
Class A Shares | | $ | 898,507,954 | |
Class B Shares | | $ | 39,643,311 | |
Class C Shares | | $ | 57,694,574 | |
Class F Shares | | $ | 8,251,198 | |
Class I Shares | | $ | 100,317,114 | |
Class P Shares | | $ | 1,910,470 | |
Class R2 Shares | | $ | 102,841 | |
Class R3 Shares | | $ | 3,134,579 | |
Outstanding shares by class: | | | | |
Class A Shares (300 million shares of common stock authorized, $.001 par value) | | | 78,604,581 | |
Class B Shares (30 million shares of common stock authorized, $.001 par value) | | | 3,497,569 | |
Class C Shares (20 million shares of common stock authorized, $.001 par value) | | | 5,081,146 | |
Class F Shares (30 million shares of common stock authorized, $.001 par value) | | | 722,121 | |
Class I Shares (100 million shares of common stock authorized, $.001 par value) | | | 8,722,203 | |
Class P Shares (20 million shares of common stock authorized, $.001 par value) | | | 166,637 | |
Class R2 Shares (30 million shares of common stock authorized, $.001 par value) | | | 8,947 | |
Class R3 Shares (30 million shares of common stock authorized, $.001 par value) | | | 274,878 | |
Net asset value, offering and redemption price per share
(Net assets divided by outstanding shares): | | | | |
Class A Shares-Net asset value | | | $11.43 | |
Class A Shares-Maximum offering price
(Net asset value plus sales charge of 5.75%) | | | $12.13 | |
Class B Shares-Net asset value | | | $11.33 | |
Class C Shares-Net asset value | | | $11.35 | |
Class F Shares-Net asset value | | | $11.43 | |
Class I Shares-Net asset value | | | $11.50 | |
Class P Shares-Net asset value | | | $11.46 | |
Class R2 Shares-Net asset value | | | $11.49 | |
Class R3 Shares-Net asset value | | | $11.40 | |
See Notes to Financial Statements.
25
Statement of Operations
For the Year Ended November 30, 2011
| | | | |
Investment income: | | | | |
Dividends (net of foreign withholding taxes of $377,936) | | $ | 23,549,397 | |
Interest | | | 28,972,198 | |
Total investment income | | | 52,521,595 | |
Expenses: | | | | |
Management fee | | | 10,359,066 | |
12b-1 distribution plan-Class A | | | 3,352,788 | |
12b-1 distribution plan-Class B | | | 462,494 | |
12b-1 distribution plan-Class C | | | 594,049 | |
12b-1 distribution plan-Class F | | | 8,857 | |
12b-1 distribution plan-Class P | | | 9,238 | |
12b-1 distribution plan-Class R2 | | | 264 | |
12b-1 distribution plan-Class R3 | | | 13,438 | |
Shareholder servicing | | | 1,527,871 | |
Fund administration | | | 563,375 | |
Subsidy (See Note 3) | | | 551,066 | |
Reports to shareholders | | | 141,942 | |
Registration | | | 137,081 | |
Professional | | | 54,800 | |
Directors’ fees | | | 9,705 | |
Custody | | | 41,134 | |
Other | | | 44,473 | |
Gross expenses | | | 17,871,641 | |
Expense reductions (See Note 7) | | | (1,133 | ) |
Management fee waived (See Note 3) | | | (49,219 | ) |
Net expenses | | | 17,821,289 | |
Net investment income | | | 34,700,306 | |
Net realized and unrealized gain (loss): | | | | |
Net realized gain on investments, futures contracts and foreign currency related transactions | | | 68,521,367 | |
Net change in unrealized appreciation/depreciation on investments, futures contracts and translation of assets and liabilities denominated in foreign currencies | | | (45,032,615 | ) |
Net realized and unrealized gain | | | 23,488,752 | |
Net Increase in Net Assets Resulting From Operations | | $ | 58,189,058 | |
See Notes to Financial Statements.
26
Statements of Changes in Net Assets
| | | | | | | | |
| DECREASE IN NET ASSETS | | For the Year Ended
November 30, 2011 | | | For the Year Ended
November 30, 2010 | |
Operations: | | | | | | | | |
Net investment income | | $ | 34,700,306 | | | $ | 36,717,619 | |
Net realized gain on investments, futures contracts and foreign currency related transactions | | | 68,521,367 | | | | 24,854,330 | |
Net change in unrealized appreciation/depreciation on investments, futures contracts and translation of assets and liabilities denominated in foreign currencies | | | (45,032,615 | ) | | | 93,553,768 | |
Net increase in net assets resulting from operations | | | 58,189,058 | | | | 155,125,717 | |
Distributions to shareholders from: | | | | | | | | |
Net investment income | | | | | | | | |
Class A | | | (23,181,717 | ) | | | (26,532,498 | ) |
Class B | | | (818,743 | ) | | | (1,130,938 | ) |
Class C | | | (1,076,186 | ) | | | (1,233,119 | ) |
Class F | | | (238,905 | ) | | | (168,005 | ) |
Class I | | | (9,533,991 | ) | | | (9,743,835 | ) |
Class P | | | (47,848 | ) | | | (67,250 | ) |
Class R2 | | | (678 | ) | | | (680 | ) |
Class R3 | | | (61,005 | ) | | | (31,016 | ) |
Total distributions to shareholders | | | (34,959,073 | ) | | | (38,907,341 | ) |
Capital share transactions (Net of share conversions) (See Note 11): | |
Net proceeds from sales of shares | | | 225,689,403 | | | | 179,592,332 | |
Reinvestment of distributions | | | 34,160,651 | | | | 38,022,779 | |
Cost of shares reacquired | | | (561,695,878 | ) | | | (350,504,539 | ) |
Net decrease in net assets resulting from capital share transactions | | | (301,845,824 | ) | | | (132,889,428 | ) |
Net decrease in net assets | | | (278,615,839 | ) | | | (16,671,052 | ) |
NET ASSETS: | | | | | | | | |
Beginning of year | | $ | 1,388,177,880 | | | $ | 1,404,848,932 | |
End of year | | $ | 1,109,562,041 | | | $ | 1,388,177,880 | |
Undistributed net investment income | | $ | 5,567,227 | | | $ | 4,523,522 | |
See Notes to Financial Statements.
27
Financial Highlights
| | | | | | | | | | | | | | | | | | | | |
| | | Class A Shares | |
| | | Year Ended 11/30 | |
| | | 2011 | | | 2010 | | | 2009 | | | 2008 | | | 2007 | |
Per Share Operating Performance | | | | | | | | | | | | | | | | | | | | |
Net asset value, beginning of year | | | $11.26 | | | | $10.35 | | | | $ 8.66 | | | | $13.49 | | | | $13.56 | |
| | | | | | | | | | | | | | | | | | | | |
| | | | | |
Investment operations: | | | | | | | | | | | | | | | | | | | | |
| | | | | |
Net investment income(a) | | | .29 | | | | .28 | | | | .34 | | | | .41 | | | | .37 | |
| | | | | |
Net realized and unrealized gain (loss) | | | .17 | | | | .93 | | | | 1.72 | | | | (4.26 | ) | | | .33 | |
| | | | | | | | | | | | | | | | | | | | |
| | | | | |
Total from investment operations | | | .46 | | | | 1.21 | | | | 2.06 | | | | (3.85 | ) | | | .70 | |
| | | | | | | | | | | | | | | | | | | | |
| | | | | |
Distributions to shareholders from: | | | | | | | | | | | | | | | | | | | | |
| | | | | |
Net investment income | | | (.29 | ) | | | (.30 | ) | | | (.37 | ) | | | (.44 | ) | | | (.35 | ) |
| | | | | |
Net realized gain | | | – | | | | – | | | | – | | | | (.54 | ) | | | (.42 | ) |
| | | | | | | | | | | | | | | | | | | | |
| | | | | |
Total distributions | | | (.29 | ) | | | (.30 | ) | | | (.37 | ) | | | (.98 | ) | | | (.77 | ) |
| | | | | | | | | | | | | | | | | | | | |
Net asset value, end of year | | | $11.43 | | | | $11.26 | | | | $10.35 | | | | $ 8.66 | | | | $13.49 | |
| | | | | | | | | | | | | | | | | | | | |
| | | | | |
Total Return(b) | | | 4.03 | % | | | 11.90 | % | | | 24.58 | % | | | (30.43 | )% | | | 5.27 | % |
| | | | | |
Ratios to Average Net Assets: | | | | | | | | | | | | | | | | | | | | |
| | | | | |
Expenses, excluding expense reductions and including management fee waived | | | 1.30 | % | | | 1.31 | % | | | 1.37 | % | | | 1.32 | % | | | 1.29 | % |
| | | | | |
Expenses, including expense reductions and management fee waived | | | 1.30 | % | | | 1.31 | % | | | 1.37 | % | | | 1.32 | % | | | 1.29 | % |
| | | | | |
Expenses, excluding expense reductions and management fee waived | | | 1.30 | % | | | 1.31 | % | | | 1.37 | % | | | 1.32 | % | | | 1.29 | % |
| | | | | |
Net investment income | | | 2.45 | % | | | 2.64 | % | | | 3.66 | % | | | 3.61 | % | | | 2.68 | % |
| | | | | |
| Supplemental Data: | | | | | | | | | | | | | | | |
Net assets, end of year (000) | | | $898,508 | | | | $933,371 | | | | $974,791 | | | | $852,774 | | | | $1,379,814 | |
| | | | | |
Portfolio turnover rate | | | 22.87 | % | | | 29.52 | % | | | 52.24 | % | | | 54.70 | % | | | 26.32 | % |
| (a) | | Calculated using average shares outstanding during the year. |
| (b) | | Total return does not consider the effects of sales loads and assumes the reinvestment of all distributions. |
See Notes to Financial Statements.
28
Financial Highlights (continued)
| | | | | | | | | | | | | | | | | | | | |
| | | Class B Shares | |
| | | Year Ended 11/30 | |
| | | 2011 | | | 2010 | | | 2009 | | | 2008 | | | 2007 | |
Per Share Operating Performance | | | | | | | | | | | | | | | | | | | | |
Net asset value, beginning of year | | | $11.16 | | | | $10.26 | | | | $ 8.59 | | | | $13.38 | | | | $13.46 | |
| | | | | | | | | | | | | | | | | | | | |
| | | | | |
Investment operations: | | | | | | | | | | | | | | | | | | | | |
| | | | | |
Net investment income(a) | | | .21 | | | | .21 | | | | .27 | | | | .33 | | | | .28 | |
| | | | | |
Net realized and unrealized gain (loss) | | | .17 | | | | .92 | | | | 1.71 | | | | (4.21 | ) | | | .33 | |
| | | | | | | | | | | | | | | | | | | | |
| | | | | |
Total from investment operations | | | .38 | | | | 1.13 | | | | 1.98 | | | | (3.88 | ) | | | .61 | |
| | | | | | | | | | | | | | | | | | | | |
| | | | | |
Distributions to shareholders from: | | | | | | | | | | | | | | | | | | | | |
| | | | | |
Net investment income | | | (.21 | ) | | | (.23 | ) | | | (.31 | ) | | | (.37 | ) | | | (.27 | ) |
| | | | | |
Net realized gain | | | – | | | | – | | | | – | | | | (.54 | ) | | | (.42 | ) |
| | | | | | | | | | | | | | | | | | | | |
| | | | | |
Total distributions | | | (.21 | ) | | | (.23 | ) | | | (.31 | ) | | | (.91 | ) | | | (.69 | ) |
| | | | | | | | | | | | | | | | | | | | |
Net asset value, end of year | | | $11.33 | | | | $11.16 | | | | $10.26 | | | | $ 8.59 | | | | $13.38 | |
| | | | | | | | | | | | | | | | | | | | |
| | | | | |
Total Return(b) | | | 3.36 | % | | | 11.17 | % | | | 23.75 | % | | | (30.86 | )% | | | 4.56 | % |
| | | | | |
Ratios to Average Net Assets: | | | | | | | | | | | | | | | | | | | | |
| | | | | |
Expenses, excluding expense reductions and including management fee waived | | | 1.95 | % | | | 1.96 | % | | | 2.02 | % | | | 1.97 | % | | | 1.94 | % |
| | | | | |
Expenses, including expense reductions and management fee waived | | | 1.95 | % | | | 1.96 | % | | | 2.02 | % | | | 1.97 | % | | | 1.94 | % |
| | | | | |
Expenses, excluding expense reductions and management fee waived | | | 1.95 | % | | | 1.96 | % | | | 2.02 | % | | | 1.97 | % | | | 1.94 | % |
| | | | | |
Net investment income | | | 1.78 | % | | | 1.99 | % | | | 3.00 | % | | | 2.96 | % | | | 2.03 | % |
| | | | | |
| Supplemental Data: | | | | | | | | | | | | | | | |
Net assets, end of year (000) | | | $39,643 | | | | $48,714 | | | | $53,941 | | | | $44,682 | | | | $74,748 | |
| | | | | |
Portfolio turnover rate | | | 22.87 | % | | | 29.52 | % | | | 52.24 | % | | | 54.70 | % | | | 26.32 | % |
| (a) | | Calculated using average shares outstanding during the year. |
| (b) | | Total return does not consider the effects of sales loads and assumes the reinvestment of all distributions. |
See Notes to Financial Statements.
29
Financial Highlights (continued)
| | | | | | | | | | | | | | | | | | | | |
| | | Class C Shares | |
| | | Year Ended 11/30 | |
| | | 2011 | | | 2010 | | | 2009 | | | 2008 | | | 2007 | |
Per Share Operating Performance | | | | | | | | | | | | | | | | | | | | |
Net asset value, beginning of year | | | $11.18 | | | | $10.28 | | | | $ 8.60 | | | | $13.40 | | | | $13.48 | |
| | | | | | | | | | | | | | | | | | | | |
| | | | | |
Investment operations: | | | | | | | | | | | | | | | | | | | | |
| | | | | |
Net investment income(a) | | | .21 | | | | .21 | | | | .28 | | | | .33 | | | | .28 | |
| | | | | |
Net realized and unrealized gain (loss) | | | .17 | | | | .92 | | | | 1.71 | | | | (4.23 | ) | | | .33 | |
| | | | | | | | | | | | | | | | | | | | |
| | | | | |
Total from investment operations | | | .38 | | | | 1.13 | | | | 1.99 | | | | (3.90 | ) | | | .61 | |
| | | | | | | | | | | | | | | | | | | | |
| | | | | |
Distributions to shareholders from: | | | | | | | | | | | | | | | | | | | | |
| | | | | |
Net investment income | | | (.21 | ) | | | (.23 | ) | | | (.31 | ) | | | (.36 | ) | | | (.27 | ) |
| | | | | |
Net realized gain | | | – | | | | – | | | | – | | | | (.54 | ) | | | (.42 | ) |
| | | | | | | | | | | | | | | | | | | | |
| | | | | |
Total distributions | | | (.21 | ) | | | (.23 | ) | | | (.31 | ) | | | (.90 | ) | | | (.69 | ) |
| | | | | | | | | | | | | | | | | | | | |
Net asset value, end of year | | | $11.35 | | | | $11.18 | | | | $10.28 | | | | $ 8.60 | | | | $13.40 | |
| | | | | | | | | | | | | | | | | | | | |
| | | | | |
Total Return(b) | | | 3.39 | % | | | 11.15 | % | | | 23.82 | % | | | (30.90 | )% | | | 4.57 | % |
| | | | | |
Ratios to Average Net Assets: | | | | | | | | | | | | | | | | | | | | |
| | | | | |
Expenses, excluding expense reductions and including management fee waived | | | 1.94 | % | | | 1.96 | % | | | 2.02 | % | | | 1.97 | % | | | 1.94 | % |
| | | | | |
Expenses, including expense reductions and management fee waived | | | 1.94 | % | | | 1.96 | % | | | 2.02 | % | | | 1.97 | % | | | 1.94 | % |
| | | | | |
Expenses, excluding expense reductions and management fee waived | | | 1.95 | % | | | 1.96 | % | | | 2.02 | % | | | 1.97 | % | | | 1.94 | % |
| | | | | |
Net investment income | | | 1.82 | % | | | 1.99 | % | | | 3.02 | % | | | 2.95 | % | | | 2.03 | % |
| | | | | |
| Supplemental Data: | | | | | | | | | | | | | | | |
Net assets, end of year (000) | | $ | 57,695 | | | $ | 56,383 | | | $ | 59,267 | | | $ | 54,081 | | | $ | 99,713 | |
| | | | | |
Portfolio turnover rate | | | 22.87 | % | | | 29.52 | % | | | 52.24 | % | | | 54.70 | % | | | 26.32 | % |
| (a) | | Calculated using average shares outstanding during the year. |
| (b) | | Total return does not consider the effects of sales loads and assumes the reinvestment of all distributions. |
See Notes to Financial Statements.
30
Financial Highlights (continued)
| | | | | | | | | | | | | | | | | | | | |
| | | Class F Shares | |
| | | Year Ended 11/30 | | | 9/28/2007(a) to 11/30/2007 | |
| | | 2011 | | | 2010 | | | 2009 | | | 2008 | | |
Per Share Operating Performance | | | | | | | | | | | | | | | | | | | | |
Net asset value, beginning of period | | | $11.25 | | | | $10.34 | | | | $ 8.65 | | | | $13.49 | | | | $13.83 | |
| | | | | | | | | | | | | | | | | | | | |
| | | | | |
Investment operations: | | | | | | | | | | | | | | | | | | | | |
| | | | | |
Net investment income(b) | | | .32 | | | | .31 | | | | .34 | | | | .43 | | | | .06 | |
| | | | | |
Net realized and unrealized gain (loss) | | | .18 | | | | .93 | | | | 1.75 | | | | (4.25 | ) | | | (.40 | ) |
| | | | | | | | | | | | | | | | | | | | |
| | | | | |
Total from investment operations | | | .50 | | | | 1.24 | | | | 2.09 | | | | (3.82 | ) | | | (.34 | ) |
| | | | | | | | | | | | | | | | | | | | |
| | | | | |
Distributions to shareholders from: | | | | | | | | | | | | | | | | | | | | |
| | | | | |
Net investment income | | | (.32 | ) | | | (.33 | ) | | | (.40 | ) | | | (.48 | ) | | | – | |
| | | | | |
Net realized gain | | | – | | | | – | | | | – | | | | (.54 | ) | | | – | |
| | | | | | | | | | | | | | | | | | | | |
| | | | | |
Total distributions | | | (.32 | ) | | | (.33 | ) | | | (.40 | ) | | | (1.02 | ) | | | – | |
| | | | | | | | | | | | | | | | | | | | |
Net asset value, end of period | | | $11.43 | | | | $11.25 | | | | $10.34 | | | | $ 8.65 | | | | $13.49 | |
| | | | | | | | | | | | | | | | | | | | |
| | | | | |
Total Return(c) | | | 4.39 | % | | | 12.09 | % | | | 25.05 | % | | | (30.31 | )% | | | (2.46 | )%(d) |
| | | | | |
Ratios to Average Net Assets: | | | | | | | | | | | | | | | | | | | | |
| | | | | |
Expenses, excluding expense reductions and including management fee waived | | | 1.05 | % | | | 1.06 | % | | | 1.11 | % | | | 1.10 | % | | | .18 | %(d) |
| | | | | |
Expenses, including expense reductions and management fee waived | | | 1.05 | % | | | 1.06 | % | | | 1.11 | % | | | 1.10 | % | | | .18 | %(d) |
| | | | | |
Expenses, excluding expense reductions and management fee waived | | | 1.06 | % | | | 1.06 | % | | | 1.11 | % | | | 1.10 | % | | | .18 | %(d) |
| | | | | |
Net investment income | | | 2.70 | % | | | 2.91 | % | | | 3.66 | % | | | 4.21 | % | | | .47 | %(d) |
| | | | | |
| Supplemental Data: | | | | | | | | | | | | | | | |
Net assets, end of period (000) | | | $8,251 | | | | $7,395 | | | | $4,238 | | | | $1,194 | | | | $10 | |
| | | | | |
Portfolio turnover rate | | | 22.87 | % | | | 29.52 | % | | | 52.24 | % | | | 54.70 | % | | | 26.32 | % |
| (a) | | Commencement of operations was 9/28/2007, SEC effective date was 9/14/2007 and date shares first became available to the public was 10/1/2007. |
| (b) | | Calculated using average shares outstanding during the period. |
| (c) | | Total return assumes the reinvestment of all distributions. |
See Notes to Financial Statements.
31
Financial Highlights (continued)
| | | | | | | | | | | | | | | | | | | | |
| | | Class I Shares | |
| | | Year Ended 11/30 | |
| | | 2011 | | | 2010 | | | 2009 | | | 2008 | | | 2007 | |
Per Share Operating Performance | | | | | | | | | | | | | | | | | | | | |
Net asset value, beginning of year | | | $11.33 | | | | $10.41 | | | | $ 8.70 | | | | $13.56 | | | | $13.62 | |
| | | | | | | | | | | | | | | | | | | | |
| | | | | |
Investment operations: | | | | | | | | | | | | | | | | | | | | |
| | | | | |
Net investment income(a) | | | .32 | | | | .32 | | | | .36 | | | | .45 | | | | .41 | |
| | | | | |
Net realized and unrealized gain (loss) | | | .18 | | | | .94 | | | | 1.75 | | | | (4.28 | ) | | | .35 | |
| | | | | | | | | | | | | | | | | | | | |
| | | | | |
Total from investment operations | | | .50 | | | | 1.26 | | | | 2.11 | | | | (3.83 | ) | | | .76 | |
| | | | | | | | | | | | | | | | | | | | |
| | | | | |
Distributions to shareholders from: | | | | | | | | | | | | | | | | | | | | |
| | | | | |
Net investment income | | | (.33 | ) | | | (.34 | ) | | | (.40 | ) | | | (.49 | ) | | | (.40 | ) |
| | | | | |
Net realized gain | | | – | | | | – | | | | – | | | | (.54 | ) | | | (.42 | ) |
| | | | | | | | | | | | | | | | | | | | |
| | | | | |
Total distributions | | | (.33 | ) | | | (.34 | ) | | | (.40 | ) | | | (1.03 | ) | | | (.82 | ) |
| | | | | | | | | | | | | | | | | | | | |
Net asset value, end of year | | | $11.50 | | | | $11.33 | | | | $10.41 | | | | $ 8.70 | | | | $13.56 | |
| | | | | | | | | | | | | | | | | | | | |
| | | | | |
Total Return(b) | | | 4.37 | % | | | 12.33 | % | | | 25.13 | % | | | (30.24 | )% | | | 5.67 | % |
| | | | | |
Ratios to Average Net Assets: | | | | | | | | | | | | | | | | | | | | |
| | | | | |
Expenses, excluding expense reductions and including management fee waived | | | .95 | % | | | .96 | % | | | 1.01 | % | | | .97 | % | | | .96 | % |
| | | | | |
Expenses, including expense reductions and management fee waived | | | .95 | % | | | .96 | % | | | 1.01 | % | | | .97 | % | | | .96 | % |
| | | | | |
Expenses, excluding expense reductions and management fee waived | | | .95 | % | | | .96 | % | | | 1.01 | % | | | .97 | % | | | .96 | % |
| | | | | |
Net investment income | | | 2.72 | % | | | 2.98 | % | | | 3.91 | % | | | 3.97 | % | | | 2.98 | % |
| | | | | |
| Supplemental Data: | | | | | | | | | | | | | | | |
Net assets, end of year (000) | | | $100,317 | | | | $337,978 | | | | $309,336 | | | | $197,714 | | | | $271,015 | |
| | | | | |
Portfolio turnover rate | | | 22.87 | % | | | 29.52 | % | | | 52.24 | % | | | 54.70 | % | | | 26.32 | % |
| (a) | | Calculated using average shares outstanding during the year. |
| (b) | | Total return assumes the reinvestment of all distributions. |
See Notes to Financial Statements.
32
Financial Highlights (continued)
| | | | | | | | | | | | | | | | | | | | |
| | | Class P Shares | |
| | | Year Ended 11/30 | |
| | | 2011 | | | 2010 | | | 2009 | | | 2008 | | | 2007 | |
Per Share Operating Performance | | | | | | | | | | | | | | | | | | | | |
Net asset value, beginning of year | | | $11.29 | | | | $10.38 | | | | $ 8.68 | | | | $13.52 | | | | $13.59 | |
| | | | | | | | | | | | | | | | | | | | |
| | | | | |
Investment operations: | | | | | | | | | | | | | | | | | | | | |
| | | | | |
Net investment income(a) | | | .28 | | | | .27 | | | | .33 | | | | .40 | | | | .36 | |
| | | | | |
Net realized and unrealized gain (loss) | | | .16 | | | | .93 | | | | 1.73 | | | | (4.27 | ) | | | .33 | |
| | | | | | | | | | | | | | | | | | | | |
| | | | | |
Total from investment operations | | | .44 | | | | 1.20 | | | | 2.06 | | | | (3.87 | ) | | | .69 | |
| | | | | | | | | | | | | | | | | | | | |
| | | | | |
Distributions to shareholders from: | | | | | | | | | | | | | | | | | | | | |
| | | | | |
Net investment income | | | (.27 | ) | | | (.29 | ) | | | (.36 | ) | | | (.43 | ) | | | (.34 | ) |
| | | | | |
Net realized gain | | | – | | | | – | | | | – | | | | (.54 | ) | | | (.42 | ) |
| | | | | | | | | | | | | | | | | | | | |
| | | | | |
Total distributions | | | (.27 | ) | | | (.29 | ) | | | (.36 | ) | | | (.97 | ) | | | (.76 | ) |
| | | | | | | | | | | | | | | | | | | | |
Net asset value, end of year | | | $11.46 | | | | $11.29 | | | | $10.38 | | | | $ 8.68 | | | | $13.52 | |
| | | | | | | | | | | | | | | | | | | | |
| | | | | |
Total Return(b) | | | 4.00 | % | | | 11.75 | % | | | 24.52 | % | | | (30.50 | )% | | | 5.15 | % |
| | | | | |
Ratios to Average Net Assets: | | | | | | | | | | | | | | | | | | | | |
| | | | | |
Expenses, excluding expense reductions and including management fee waived | | | 1.40 | % | | | 1.41 | % | | | 1.46 | % | | | 1.42 | % | | | 1.39 | % |
| | | | | |
Expenses, including expense reductions and management fee waived | | | 1.40 | % | | | 1.41 | % | | | 1.46 | % | | | 1.42 | % | | | 1.39 | % |
| | | | | |
Expenses, excluding expense reductions and management fee waived | | | 1.41 | % | | | 1.41 | % | | | 1.46 | % | | | 1.42 | % | | | 1.39 | % |
| | | | | |
Net investment income | | | 2.35 | % | | | 2.54 | % | | | 3.54 | % | | | 3.52 | % | | | 2.58 | % |
| | | | | |
| Supplemental Data: | | | | | | | | | | | | | | | |
Net assets, end of year (000) | | | $1,910 | | | | $2,191 | | | | $2,906 | | | | $2,370 | | | | $3,062 | |
| | | | | |
Portfolio turnover rate | | | 22.87 | % | | | 29.52 | % | | | 52.24 | % | | | 54.70 | % | | | 26.32 | % |
| (a) | | Calculated using average shares outstanding during the year. |
| (b) | | Total return assumes the reinvestment of all distributions. |
See Notes to Financial Statements.
33
Financial Highlights (continued)
| | | | | | | | | | | | | | | | | | | | |
| | | Class R2 Shares | |
| | | Year Ended 11/30 | | | 9/28/2007(a) to 11/30/2007 | |
| | | 2011 | | | 2010 | | | 2009 | | | 2008 | | |
Per Share Operating Performance | | | | | | | | | | | | | | | | | | | | |
Net asset value, beginning of period | | | $11.31 | | | | $10.40 | | | | $ 8.70 | | | | $13.48 | | | | $13.83 | |
| | | | | | | | | | | | | | | | | | | | |
| | | | | |
Investment operations: | | | | | | | | | | | | | | | | | | | | |
| | | | | |
Net investment income(b) | | | .28 | | | | .26 | | | | .31 | | | | .44 | | | | .05 | |
| | | | | |
Net realized and unrealized gain (loss) | | | .15 | | | | .92 | | | | 1.75 | | | | (4.27 | ) | | | (.40 | ) |
| | | | | | | | | | | | | | | | | | | | |
| | | | | |
Total from investment operations | | | .43 | | | | 1.18 | | | | 2.06 | | | | (3.83 | ) | | | (.35 | ) |
| | | | | | | | | | | | | | | | | | | | |
| | | | | |
Distributions to shareholders from: | | | | | | | | | | | | | | | | | | | | |
| | | | | |
Net investment income | | | (.25 | ) | | | (.27 | ) | | | (.36 | ) | | | (.41 | ) | | | – | |
| | | | | |
Net realized gain | | | – | | | | – | | | | – | | | | (.54 | ) | | | – | |
| | | | | | | | | | | | | | | | | | | | |
| | | | | |
Total distributions | | | (.25 | ) | | | (.27 | ) | | | (.36 | ) | | | (.95 | ) | | | – | |
| | | | | | | | | | | | | | | | | | | | |
Net asset value, end of period | | | $11.49 | | | | $11.31 | | | | $10.40 | | | | $ 8.70 | | | | $13.48 | |
| | | | | | | | | | | | | | | | | | | | |
| | | | | |
Total Return(c) | | | 3.90 | % | | | 11.56 | % | | | 24.47 | % | | | (30.23 | )% | | | (2.53 | )%(d) |
| | | | | |
Ratios to Average Net Assets: | | | | | | | | | | | | | | | | | | | | |
| | | | | |
Expenses, excluding expense reductions and including management fee waived | | | 1.54 | % | | | 1.55 | % | | | 1.49 | % | | | 1.06 | % | | | .27 | %(d) |
| | | | | |
Expenses, including expense reductions and management fee waived | | | 1.54 | % | | | 1.55 | % | | | 1.49 | % | | | 1.06 | % | | | .27 | %(d) |
| | | | | |
Expenses, excluding expense reductions and management fee waived | | | 1.55 | % | | | 1.56 | % | | | 1.49 | % | | | 1.06 | % | | | .27 | %(d) |
| | | | | |
Net investment income | | | 2.43 | % | | | 2.39 | % | | | 3.34 | % | | | 3.87 | % | | | .37 | %(d) |
| | | | | |
| Supplemental Data: | | | | | | | | | | | | | | | |
Net assets, end of period (000) | | | $103 | | | | $30 | | | | $29 | | | | $7 | | | | $10 | |
| | | | | |
Portfolio turnover rate | | | 22.87 | % | | | 29.52 | % | | | 52.24 | % | | | 54.70 | % | | | 26.32 | % |
| (a) | | Commencement of operations was 9/28/2007, SEC effective date was 9/14/2007 and date shares first became available to the public was 10/1/2007. |
| (b) | | Calculated using average shares outstanding during the period. |
| (c) | | Total return assumes the reinvestment of all distributions. |
See Notes to Financial Statements.
34
Financial Highlights (concluded)
| | | | | | | | | | | | | | | | | | | | |
| | | Class R3 Shares | |
| | | Year Ended 11/30 | | | 9/28/2007(a) to 11/30/2007 | |
| | | 2011 | | | 2010 | | | 2009 | | | 2008 | | |
Per Share Operating Performance | | | | | | | | | | | | | | | | | | | | |
Net asset value, beginning of period | | | $11.24 | | | | $10.33 | | | | $ 8.65 | | | | $13.48 | | | | $13.83 | |
| | | | | | | | | | | | | | | | | | | | |
| | | | | |
Investment operations: | | | | | | | | | | | | | | | | | | | | |
| | | | | |
Net investment income(b) | | | .28 | | | | .27 | | | | .29 | | | | .39 | | | | .05 | |
| | | | | |
Net realized and unrealized gain (loss) | | | .15 | | | | .93 | | | | 1.76 | | | | (4.25 | ) | | | (.40 | ) |
| | | | | | | | | | | | | | | | | | | | |
| | | | | |
Total from investment operations | | | .43 | | | | 1.20 | | | | 2.05 | | | | (3.86 | ) | | | (.35 | ) |
| | | | | | | | | | | | | | | | | | | | |
| | | | | |
Distributions to shareholders from: | | | | | | | | | | | | | | | | | | | | |
| | | | | |
Net investment income | | | (.27 | ) | | | (.29 | ) | | | (.37 | ) | | | (.43 | ) | | | – | |
| | | | | |
Net realized gain | | | – | | | | – | | | | – | | | | (.54 | ) | | | – | |
| | | | | | | | | | | | | | | | | | | | |
| | | | | |
Total distributions | | | (.27 | ) | | | (.29 | ) | | | (.37 | ) | | | (.97 | ) | | | – | |
| | | | | | | | | | | | | | | | | | | | |
Net asset value, end of period | | | $11.40 | | | | $11.24 | | | | $10.33 | | | | $ 8.65 | | | | $13.48 | |
| | | | | | | | | | | | | | | | | | | | |
| | | | | |
Total Return(c) | | | 3.91 | % | | | 11.73 | % | | | 24.46 | % | | | (30.54 | )% | | | (2.53 | )%(d) |
| | | | | |
Ratios to Average Net Assets: | | | | | | | | | | | | | | | | | | | | |
| | | | | |
Expenses, excluding expense reductions and including management fee waived | | | 1.45 | % | | | 1.45 | % | | | 1.50 | % | | | 1.40 | % | | | .25 | %(d) |
| | | | | |
Expenses, including expense reductions and management fee waived | | | 1.45 | % | | | 1.45 | % | | | 1.50 | % | | | 1.40 | % | | | .25 | %(d) |
| | | | | |
Expenses, excluding expense reductions and management fee waived | | | 1.45 | % | | | 1.46 | % | | | 1.50 | % | | | 1.40 | % | | | .25 | %(d) |
| | | | | |
Net investment income | | | 2.35 | % | | | 2.49 | % | | | 3.03 | % | | | 3.65 | % | | | .39 | %(d) |
| | | | | |
| Supplemental Data: | | | | | | | | | | | | | | | |
Net assets, end of period (000) | | | $3,135 | | | | $2,116 | | | | $341 | | | | $42 | | | | $10 | |
| | | | | |
Portfolio turnover rate | | | 22.87 | % | | | 29.52 | % | | | 52.24 | % | | | 54.70 | % | | | 26.32 | % |
| (a) | | Commencement of operations was 9/28/2007, SEC effective date was 9/14/2007 and date shares first became available to the public was 10/1/2007. |
| (b) | | Calculated using average shares outstanding during the period. |
| (c) | | Total return assumes the reinvestment of all distributions. |
See Notes to Financial Statements.
35
Notes to Financial Statements
1. ORGANIZATION
Lord Abbett Research Fund, Inc. (the “Company”) is registered under the Investment Company Act of 1940, as amended (the “Act”), as a diversified, open-end management investment company and was incorporated under Maryland law on April 6, 1992. The Company currently consists of four separate funds. This report covers one of the funds and its classes: Lord Abbett Capital Structure Fund (the “Fund”).
The Fund’s investment objective is to seek current income and capital appreciation. The Fund has eight classes of shares: Class A, B, C, F, I, P, R2 and R3, each with different expenses and dividends. A front-end sales charge is normally added to the net asset value (“NAV”) for Class A shares. There is no front-end sales charge in the case of Class B, C, F, I, P, R2 and R3 shares, although there may be a contingent deferred sales charge (“CDSC”) in certain cases as follows: Class A shares purchased without a sales charge and redeemed before the first day of the month in which the one-year anniversary of the purchase falls (subject to certain exceptions as set forth in the Fund’s prospectus); Class B shares redeemed before the sixth anniversary of purchase; and Class C shares redeemed before the first anniversary of purchase. Class B shares will automatically convert to Class A shares on the 25th day of the month (or, if the 25th day is not a business day, the next business day thereafter) following the eighth anniversary of the day on which the purchase order was accepted. The Fund no longer issues Class B shares for purchase. The Fund’s Class P shares are closed to substantially all investors, with certain exceptions as set forth in the Fund’s prospectus.
The preparation of the financial statements in conformity with accounting principles generally accepted in the United States of America requires management to make certain estimates and assumptions that affect the reported amounts of assets and liabilities and disclosure of contingent assets and liabilities at the date of the financial statements and the reported amounts of increases and decreases in net assets from operations during the reporting period. Actual results could differ from those estimates.
2. SIGNIFICANT ACCOUNTING POLICIES
| (a) | | Investment Valuation–Securities actively traded on any recognized U.S. or non-U.S. exchange or on The NASDAQ Stock Market LLC are valued at the last sale price or official closing price on the exchange or system on which they are principally traded. Events occurring after the close of trading on non-U.S. exchanges may result in adjustments to the valuation of foreign securities to more accurately reflect their fair value as of the close of regular trading on the New York Stock Exchange LLC (“NYSE”). The Fund may rely on an independent fair valuation service in adjusting the valuations of foreign securities. Unlisted equity securities are valued at the last quoted sale price or, if no sale price is available, at the mean between the most recently quoted bid and asked prices. Fixed income securities are valued at the mean between the bid and asked prices on the basis of prices supplied by independent pricing services, which reflect broker/dealer supplied valuations and the independent pricing services’ own electronic data processing techniques. Exchange-traded options and futures contracts are valued at the last sale price in the market where they are principally traded. If no sale has occurred, the mean between the most recently quoted bid and asked prices is used. Floating rate loans are valued at the average of bid and ask quotations obtained from dealers in loans on the basis of prices supplied by independent pricing services. Securities for which market |
36
Notes to Financial Statements (continued)
| | quotations are not readily available are valued at fair value as determined by management and approved in good faith by the Board of Directors. Short-term securities with 60 days or less remaining to maturity are valued using the amortized cost method, which approximates fair value. |
| (b) | | Security Transactions–Security transactions are recorded as of the date that the securities are purchased or sold (trade date). Realized gains and losses on sales of portfolio securities are calculated using the identified-cost method. Realized and unrealized gains (losses) are allocated to each class of shares based upon the relative proportion of net assets at the beginning of the day. |
| (c) | | Investment Income–Dividend income is recorded on the ex-dividend date. Interest income is recorded on the accrual basis as earned. Discounts are accreted and premiums are amortized using the effective interest method and are included in Interest income on the Statement of Operations. Withholding taxes on foreign dividends have been provided for in accordance with the applicable country’s tax rules and rates. Investment income is allocated to each class of shares based upon the relative proportion of net assets at the beginning of the day. |
| (d) | | Income Taxes–It is the policy of the Fund to meet the requirements of Subchapter M of the Internal Revenue Code applicable to regulated investment companies and to distribute substantially all taxable income and capital gains to its shareholders. Therefore, no income tax provision is required. |
The Fund files U.S. federal and various state and local tax returns. No income tax returns are currently under examination. The statute of limitations on the Fund’s filed U.S. federal tax returns remains open for the fiscal years ended November 30, 2008 through November 30, 2011. The statutes of limitations on the Company’s state and local tax returns may remain open for an additional year depending upon the jurisdiction.
| (e) | | Expenses–Expenses incurred by the Company that do not specifically relate to an individual fund are generally allocated to the Funds within the Company on a pro rata basis by relative net assets. Expenses, excluding class-specific expenses, are allocated to each class of shares based upon the relative proportion of net assets at the beginning of the day. Class A, B, C, F, P, R2 and R3 shares bear their class-specific share of all expenses and fees relating to the Fund’s 12b-1 Distribution Plan. |
| (f) | | Foreign Transactions–The books and records of the Fund are maintained in U.S. dollars and transactions denominated in foreign currencies are recorded in the Fund’s records at the rate prevailing when earned or recorded. Asset and liability accounts that are denominated in foreign currencies are adjusted daily to reflect current exchange rates and any unrealized gain (loss) is included in Net change in unrealized appreciation/depreciation on investments, futures contracts and translation of assets and liabilities denominated in foreign currencies on the Fund’s Statement of Operations. The resultant exchange gains and losses upon settlement of such transactions are included in Net realized gain on investments, futures contracts and foreign currency related transactions on the Fund’s Statement of Operations. The Fund does not isolate that portion of the results of operations arising as a result of changes in the foreign exchange rates from the changes in market prices of the securities. |
The Fund uses foreign currency exchange contracts to facilitate transactions in foreign-denominated securities. Losses from these transactions may arise from changes in the value of the foreign currency or if the counterparties do not perform under the contracts’ terms.
37
Notes to Financial Statements (continued)
| (g) | | Futures Contracts–The Fund may purchase and sell futures contracts to enhance returns, to attempt to hedge some of its investment risk, or as a substitute position for holding the underlying asset on which the instrument is based. At the time of entering into a futures transaction, an investor is required to deposit and maintain a specified amount of cash or eligible securities called “initial margin.” Subsequent payments made or received by a Fund called “variation margin” are made on a daily basis as the market price of the futures contract fluctuates. The Fund will record an unrealized gain (loss) based on the amount of variation margin. When a contract is closed, a realized gain (loss) is recorded equal to the difference between the opening and closing value of the contract. As of November 30, 2011, the Fund had no open futures contracts. |
| (h) | | When-Issued or Forward Transactions–The Fund may purchase portfolio securities on a when-issued or forward basis. When-issued or forward transactions involve a commitment by a Fund to purchase securities, with payment and delivery (“settlement”) to take place in the future, in order to secure what is considered to be an advantageous price or yield at the time of entering into the transaction. During the period between purchase and settlement, the fair value of the securities will fluctuate and assets consisting of cash and/or marketable securities (normally short-term U.S. Government or U.S. Government sponsored enterprise securities) marked to market daily in an amount sufficient to make payment at settlement will be segregated at the Fund’s custodian in order to pay for the commitment. At the time the Fund makes the commitment to purchase a security on a when-issued basis, it will record the transaction and reflect the liability for the purchase and fair value of the security in determining its net asset value. The Fund, generally, has the ability to close out a purchase obligation on or before the settlement date rather than take delivery of the security. Under no circumstances will settlement for such securities take place more than 120 days after the purchase date. |
| (i) | | Repurchase Agreements–The Fund may enter into repurchase agreements with respect to securities. A repurchase agreement is a transaction in which a Fund acquires a security and simultaneously commits to resell that security to the seller (a bank or securities dealer) at an agreed-upon price on an agreed-upon date. The Fund requires at all times that the repurchase agreement be collateralized by cash, or by securities of the U.S. Government, its agencies, its instrumentalities, or U.S. Government sponsored enterprises having a value equal to, or in excess of, the value of the repurchase agreement (including accrued interest). If the seller of the agreement defaults on its obligation to repurchase the underlying securities at a time when the fair value of these securities has declined, the Fund may incur a loss upon disposition of the securities. |
| (j) | | Floating Rate Loans–The Fund may invest in floating rate loans, which usually take the form of loan participations and assignments. Loan participations and assignments are agreements to make money available to U.S. or foreign corporations, partnerships or other business entities (the “Borrower”) in a specified amount, at a specified rate and within a specified time. A loan is typically originated, negotiated and structured by a U.S. or foreign bank, insurance company or other financial institution (the “Agent”) for a group of loan investors (“Loan Investors”). The Agent typically administers and enforces the loan on behalf of the other Loan Investors in the syndicate and may hold any collateral on behalf of the Loan Investors. Such loan participations and assignments are typically senior, secured and collateralized in nature. A Fund records an investment when the Borrower withdraws money and records interest as |
38
Notes to Financial Statements (continued)
| | earned. These loans pay interest at rates which are periodically reset by reference to a base lending rate plus a spread. These base lending rates are generally the prime rate offered by a designated U.S. bank or London InterBank Offered Rate (“LIBOR”). |
The loans in which the Fund invests may be subject to some restrictions on resale. For example, the Fund may be contractually obligated to receive approval from the Agent and/or Borrower prior to the sale of these investments. The Fund generally has no right to enforce compliance with the terms of the loan agreement with the Borrower. As a result, the Fund assumes the credit risk of the Borrower, the selling participant and any other persons interpositioned between the Fund and the Borrower (“Intermediate Participants”). In the event that the Borrower, selling participant or Intermediate Participants become insolvent or enter into bankruptcy, the Fund may incur certain costs and delays in realizing payment or may suffer a loss of principal and/or interest.
Unfunded commitments represent the remaining obligation of the Fund to the Borrower. At any point in time, up to the maturity date of the issue, the Borrower may demand the unfunded portion. As of November 30, 2011, the Fund had no unfunded loan commitments.
| (k) | | Fair Value Measurements–Fair value is defined as the price that the Fund would receive upon selling an investment or transferring a liability in an orderly transaction to an independent buyer in the principal or most advantageous market of the investment. A three-tier hierarchy is used to maximize the use of observable market data and minimize the use of unobservable inputs and to establish classification of fair value measurements for disclosure purposes. Inputs refer broadly to the assumptions that market participants would use in pricing the asset or liability, including assumptions about risk – for example, the risk inherent in a particular valuation technique used to measure fair value (such as a pricing model) and/or the risk inherent in the inputs to the valuation technique. Inputs may be observable or unobservable. Observable inputs reflect the assumptions market participants would use in pricing the asset or liability. Observable inputs are based on market data obtained from sources independent of the reporting entity. Unobservable inputs reflect the reporting entity’s own assumptions about the assumptions market participants would use in pricing the asset or liability. Unobservable inputs are based on the best information available in the circumstances. The three-tier hierarchy of inputs is summarized in the three broad Levels listed below: |
| | • | | Level 1 - unadjusted quoted prices in active markets for identical investments; |
| | • | | Level 2 - other significant observable inputs (including quoted prices for similar investments, interest rates, prepayment speeds, credit risk, etc.); and |
| | • | | Level 3 - significant unobservable inputs (including the Fund’s own assumptions in determining the fair value of investments). |
The inputs or methodology used for valuing securities are not necessarily an indication of the risk associated with investing in those securities.
39
Notes to Financial Statements (continued)
The following is a summary of the inputs used as of November 30, 2011 in valuing the Fund’s investments carried at fair value:
| | | | | | | | | | | | | | | | |
| Investment Type* | | Level 1 | | | Level 2 | | | Level 3 | | | Total | |
Common Stocks | | $ | 640,201,702 | | | $ | – | | | $ | – | | | $ | 640,201,702 | |
Contingent Value Right | | | 52,000 | | | | – | | | | – | | | | 52,000 | |
Convertible Bonds | | | – | | | | 75,782,031 | | | | – | | | | 75,782,031 | |
Convertible Preferred Stocks | | | 42,401,530 | | | | 17,437,065 | | | | – | | | | 59,838,595 | |
Floating Rate Loans | | | – | | | | 5,941,530 | | | | – | | | | 5,941,530 | |
Foreign Common Stocks | | | – | | | | 46,968,448 | | | | – | | | | 46,968,448 | |
High Yield Corporate Bonds | | | – | | | | 275,595,848 | | | | 400 | | | | 275,596,248 | |
Preferred Stock | | | 238,485 | | | | – | | | | – | | | | 238,485 | |
Warrants | | | 135,984 | | | | 248,421 | | | | – | | | | 384,405 | |
Repurchase Agreement | | | – | | | | 4,296,838 | | | | – | | | | 4,296,838 | |
Total | | $ | 683,029,701 | | | $ | 426,270,181 | | | $ | 400 | | | $ | 1,109,300,282 | |
| * | | See Schedule of Investments for fair values in each industry. |
As of November 30, 2010, the Fund utilized the last sale or official closing price on the exchange or system on which the foreign securities are principally traded, which resulted in Level 1 inputs for all foreign securities. As of November 30, 2011, the Fund utilized adjusted valuations of foreign securities (as described in Note 2(a)) to more accurately reflect their fair value as of the close of regular trading on the NYSE, which resulted in Level 2 inputs for substantially all foreign securities. Accordingly, the valuations of substantially all foreign securities as of November 30, 2011 were categorized as Level 2 inputs. During the period ended November 30, 2011, substantially all foreign securities held by the Fund that were classified as Level 1 as of November 30, 2010 that remain on the portfolio as of November 30, 2011 were transferred from Level 1 to Level 2.
The following is a reconciliation of investments with unobservable inputs (Level 3) that were used in determining fair value:
| | | | |
| Investment Type | | High Yield Corporate Bonds | |
Balance as of December 1, 2010 | | $ | – | |
Accrued discounts/premiums | | | – | |
Realized gain (loss) | | | – | |
Change in unrealized appreciation/depreciation | | | (1,200 | ) |
Net purchase (sales) | | | – | |
Net transfers in or out of Level 3 | | | 1,600 | |
Balance as of November 30, 2011 | | $ | 400 | |
| (l) | | Disclosures about Derivative Instruments and Hedging Activities–The Fund entered into U.S. Treasury futures contracts during the fiscal year ended November 30, 2011 (as described in note 2(g)) to hedge against changes in interest rates. The Fund bears the risk of interest rates moving unexpectedly, in which case the Fund may not achieve the anticipated benefits of the futures contracts and realize a loss. There is minimal counterparty credit risk to the Fund since futures are exchange traded and the exchange’s clearinghouse, as counterparty to all exchange traded futures, guarantees futures against default. |
40
Notes to Financial Statements (continued)
Amounts of $(746,960) and $257,015 are included on the Statement of Operations related to futures contracts under the captions Net realized gain on investments, futures contracts and foreign currency related transactions and Net change in unrealized appreciation/depreciation on investments, futures contracts and translation of assets and liabilities denominated in foreign currencies, respectively. The average number of futures contracts throughout the period was 115. As of November 30, 2011, the Fund had no open futures contracts.
3. MANAGEMENT FEE AND OTHER TRANSACTIONS WITH AFFILIATES
Management Fee
The Company has a management agreement with Lord, Abbett & Co. LLC (“Lord Abbett”), pursuant to which Lord Abbett supplies the Fund with investment management services and executive and other personnel, provides office space and pays for ordinary and necessary office and clerical expenses relating to research and statistical work and supervision of the Fund’s investment portfolio.
The management fee is based on the Fund’s average daily net assets at the following annual rate:
| | | | |
First $1 billion | | | .75% | |
Next $1 billion | | | .70% | |
Over $2 billion | | | .65% | |
For the fiscal year ended November 30, 2011, the effective management fee, net of waivers, was at an annualized rate of .73% of the Fund’s average daily net assets.
In addition, Lord Abbett provides certain administrative services to the Fund pursuant to an Administrative Services Agreement in return for a fee at an annual rate of .04% of the Fund’s average daily net assets.
For the fiscal year ended November 30, 2011, and continuing through March 31, 2012, Lord Abbett has contractually agreed to waive all or a portion of its management fee and, if necessary, reimburse the Fund’s other expenses to the extent necessary so that the net annual operating expenses for each class, excluding 12b-1 fees, do not exceed an annual rate of .95%. This agreement may be terminated only upon the approval of the Fund’s Board of Directors.
The Fund, along with certain other funds managed by Lord Abbett (collectively, the “Underlying Funds”), has entered into a Servicing Arrangement with Lord Abbett Balanced Strategy Fund, Lord Abbett Diversified Income Strategy Fund and Lord Abbett Growth & Income Strategy Fund of Lord Abbett Investment Trust (each, a “Fund of Funds”), pursuant to which each Underlying Fund pays a portion of the expenses (excluding management fees and distribution and service fees) of each Fund of Funds in proportion to the average daily value of the Underlying Fund shares owned by each Fund of Funds. Amounts paid pursuant to the Servicing Arrangement are included in Subsidy expense on the Fund’s Statement of Operations and Payable to affiliates on the Fund’s Statement of Assets and Liabilities.
As of November 30, 2011, the percentages of the Fund’s outstanding shares owned by Lord Abbett Balanced Strategy Fund, Lord Abbett Diversified Income Strategy Fund and Lord Abbett Growth & Income Strategy Fund were 2.24%, 2.21% and 4.38% respectively.
41
Notes to Financial Statements (continued)
12b-1 Distribution Plan
The Fund has adopted a distribution plan with respect to Class A, B, C, F, P, R2 and R3 shares pursuant to Rule 12b-1 under the Act, which provides for the payment of ongoing distribution and service fees to Lord Abbett Distributor LLC (the “Distributor”), an affiliate of Lord Abbett. The fees are accrued daily at annual rates based upon the Fund’s average daily net assets as follows:
| | | | | | | | | | | | | | | | | | | | | | | | | | | | |
| Fees* | | Class A | | | Class B | | | Class C | | | Class F | | | Class P | | | Class R2 | | | Class R3 | |
Service | | | .25% | | | | .25% | | | | .25% | | | | – | | | | .25% | | | | .25% | | | | .25% | |
Distribution | | | .10% | | | | .75% | | | | .75% | | | | .10% | | | | .20% | | | | .35% | | | | .25% | |
| * | | The Fund may designate a portion of the aggregate fee as attributable to service activities for purposes of calculating Financial Industry Regulatory Authority, Inc. (“FINRA”) sales charge limitations. |
Class I shares do not have a distribution plan.
Commissions
Distributor received the following commissions on sales of shares of the Fund, after concessions were paid to authorized dealers, for the fiscal year ended November 30, 2011:
| | | | |
Distributor Commissions | | Dealers’ Concessions | |
| $586,388 | | $ | 3,093,070 | |
Distributor received CDSCs of $6,641 and $14,082 for Class A and Class C shares, respectively, for the fiscal year ended November 30, 2011.
Two Directors and certain of the Fund’s officers have an interest in Lord Abbett.
4. DISTRIBUTIONS AND CAPITAL LOSS CARRYFORWARDS
Dividends from net investment income, if any, are declared and paid at least quarterly. Taxable net realized gains from investment transactions, reduced by allowable capital loss carryforwards, if any, are declared and distributed to shareholders at least annually. The capital loss carryforward amount, if any, is available to offset future net capital gains. Dividends and distributions to shareholders are recorded on the ex-dividend date. The amounts of dividends and distributions from net investment income and net realized capital gains are determined in accordance with federal income tax regulations, which may differ from accounting principles generally accepted in the United States of America. These book/tax differences are either considered temporary or permanent in nature. To the extent these differences are permanent in nature, such amounts are reclassified within the components of net assets based on their federal tax basis treatment; temporary differences do not require reclassification. Dividends and distributions, which exceed earnings and profits for tax purposes, are reported as a tax return of capital.
The tax character of distributions paid during the fiscal years ended November 30, 2011 and 2010 was as follows:
| | | | | | | | |
| | | 11/30/2011 | | | 11/30/2010 | |
Distributions paid from: | | | | | | | | |
Ordinary income | | $ | 34,959,073 | | | $ | 38,907,341 | |
Total distributions paid | | $ | 34,959,073 | | | $ | 38,907,341 | |
42
Notes to Financial Statements (continued)
As of November 30, 2011, the components of accumulated losses on a tax-basis were as follows:
| | | | |
Undistributed ordinary income – net | | $ | 6,726,836 | |
Total undistributed earnings | | $ | 6,726,836 | |
Capital loss carryforwards* | | | (205,999,501 | ) |
Temporary differences | | | (125,854 | ) |
Unrealized gains – net | | | 63,304,283 | |
Total accumulated losses – net | | $ | (136,094,236 | ) |
| * | | As of November 30, 2011, the capital loss carryforwards, along with the related expiration dates, were as follows: |
| | | | | | | | | | |
| 2016 | | | 2017 | | | Total | |
| | $24,488,728 | | | $ | 181,510,773 | | | $ | 205,999,501 | |
Certain losses incurred after October 31 (“Post-October Losses”) within the taxable year are deemed to arise on the first business day of the Fund’s next taxable year. The Fund incurred and will elect to defer net ordinary losses of $548 during fiscal 2011.
As of November 30, 2011, the aggregate unrealized security gains and losses based on cost for U.S. federal income tax purposes were as follows:
| | | | |
Tax cost | | $ | 1,046,006,594 | |
Gross unrealized gain | | | 151,429,206 | |
Gross unrealized loss | | | (88,135,518 | ) |
Net unrealized security gain | | $ | 63,293,688 | |
The difference between book-basis and tax-basis unrealized gains (losses) is attributable to the tax treatment of premium amortization, wash sales and certain securities.
Permanent items identified during the fiscal year ended November 30, 2011 have been reclassified among the components of net assets based on their tax basis treatment as follows:
| | | | |
Undistributed Net
Investment Income | | Accumulated Net
Realized Loss | |
| $1,302,472 | | $ | (1,302,472 | ) |
The permanent differences are attributable to the tax treatment of premium amortization, foreign currency transactions and certain securities.
On December 22, 2010, the Regulated Investment Company Modernization Act of 2010 (the “Modernization Act”) was signed by the President of the United States. The Modernization Act includes numerous provisions that generally become effective for taxable years beginning after the date of enactment. Management is currently assessing the impact of the Modernization Act as it relates to the Fund.
5. PORTFOLIO SECURITIES TRANSACTIONS
Purchases and sales of investment securities (excluding short-term investments) for the fiscal year ended November 30, 2011 were as follows:
| | | | |
| Purchases | | Sales | |
| $316,615,079 | | $ | 613,322,357 | |
43
Notes to Financial Statements (continued)
There were no purchases or sales of U.S. Government securities for the fiscal year ended November 30, 2011.
6. DIRECTORS’ REMUNERATION
The Company’s officers and the two Directors who are associated with Lord Abbett do not receive any compensation from the Company for serving in such capacities. Outside Directors’ fees are allocated among all Lord Abbett-sponsored funds based on the net assets of each fund. There is an equity-based plan available to all outside Directors under which outside Directors must defer receipt of a portion of, and may elect to defer receipt of an additional portion of Directors’ fees. The deferred amounts are treated as though equivalent dollar amounts had been invested in the funds. Such amounts and earnings accrued thereon are included in Directors’ fees on the Statement of Operations and in Directors’ fees payable on the Statement of Assets and Liabilities and are not deductible for U.S. federal income tax purposes until such amounts are paid.
7. EXPENSE REDUCTIONS
The Company has entered into an arrangement with its transfer agent and custodian, whereby credits realized as a result of uninvested cash balances are used to reduce a portion of the Fund’s expenses.
8. LINE OF CREDIT
The Fund and certain other funds managed by Lord Abbett have available an unsecured revolving credit facility (“Facility”) from State Street Bank and Trust Company (“SSB”), to be used for temporary or emergency purposes as an additional source of liquidity to fund redemptions of investor shares. The Facility is renewed annually under terms that depend on market conditions at the time of the renewal. The amount available under the Facility is $200,000,000.
On February 3, 2011, the Facility was renewed for an annual period by the Fund and certain other funds managed by Lord Abbett. The amount available under the Facility remained the same. The annual fee to maintain the Facility was reduced from .15% to .125% of the amount available under the facility. Each participating fund pays its pro rata share based on the net assets of each participating fund. This amount is included in Other expenses on the Funds’ Statements of Operations. Any borrowings under this Facility will bear interest at current market rates as set forth in the credit agreement. During the fiscal year ended November 30, 2011, a participating fund managed by Lord Abbett utilized the Facility and fully repaid its borrowings. As of November 30, 2011, there were no loans outstanding pursuant to this Facility.
Effective February 3, 2012, the Fund and certain other funds managed by Lord Abbett will enter into a short term extension of the Facility through March 31, 2012.
9. CUSTODIAN AND ACCOUNTING AGENT
SSB is the Company’s custodian and accounting agent. SSB performs custodial, accounting and recordkeeping functions relating to portfolio transactions and calculating the Fund’s NAV.
10. INVESTMENT RISKS
The Fund is subject to the general risks and considerations associated with investing in equity and fixed income securities.
44
Notes to Financial Statements (continued)
The values of the Fund’s equity security holdings and, consequently, the value of an investment in the Fund will fluctuate in response to movements in the equity securities market in general and to the changing prospects of the individual companies involved. With its emphasis on value stocks, the Fund may perform differently than the market as a whole and other types of stocks, such as growth stocks. The market may fail to recognize the intrinsic value of particular value stocks for a long time. Because the Fund is not limited to investing in equity securities, the Fund may have smaller gains in a rising equity securities market than a fund investing solely in equity securities. In addition, if the Fund’s assessment of a company’s value or prospects for market appreciation or market conditions is wrong, the Fund could suffer losses or produce poor performance relative to other funds, even in a rising market.
The values of the Fund’s fixed income holdings, and consequently, the value of an investment in the Fund will change as interest rates fluctuate and in response to market movements. When interest rates rise, the prices of these holdings are likely to decline. There is also the risk that an issuer of a fixed income security will fail to make timely payments of principal or interest to the Fund, a risk that is greater with high yield bonds (sometimes called “junk bonds”) in which the Fund may invest. Some issuers, particularly of high yield bonds, may default as to principal and/or interest payments after the Fund purchases their securities. A default, or concerns in the market about an increase in risk of default, may result in losses to the Fund. High yield bonds are subject to greater price fluctuations, as well as additional risks.
The Fund may invest up to 20% of its assets in foreign securities. The Fund’s exposure to foreign companies (and ADRs) presents increased market, liquidity, currency, political and other risks. The Fund may invest up to 15% of its net assets in senior loans, which are subject to increased credit and liquidity risks. Senior loans are business loans made to borrowers that may be U.S. or foreign corporations, partnerships, or other business entities.
These factors can affect the Fund’s performance.
11. SUMMARY OF CAPITAL TRANSACTIONS
Transactions in shares of capital stock were as follows:
| | | | | | | | | | | | | | | | |
| | | Year Ended
November 30, 2011 | | | Year Ended
November 30, 2010 | |
| Class A Shares | | Shares | | | Amount | | | Shares | | | Amount | |
Shares sold | | | 13,155,188 | | | $ | 155,438,811 | | | | 12,022,101 | | | $ | 129,437,705 | |
Converted from Class B* | | | 326,083 | | | | 3,826,559 | | | | 243,379 | | | | 2,600,784 | |
Reinvestment of distributions | | | 1,959,045 | | | | 22,776,857 | | | | 2,458,430 | | | | 26,038,010 | |
Shares reacquired | | | (19,739,273 | ) | | | (232,591,700 | ) | | | (26,032,315 | ) | | | (279,130,541 | ) |
Decrease | | | (4,298,957 | ) | | $ | (50,549,473 | ) | | | (11,308,405 | ) | | $ | (121,054,042 | ) |
45
Notes to Financial Statements (concluded)
| | | | | | | | | | | | | | | | |
| | | Year Ended
November 30, 2011 | | | Year Ended
November 30, 2010 | |
| Class B Shares | | Shares | | | Amount | | | Shares | | | Amount | |
Shares sold | | | 166,229 | | | $ | 1,934,352 | | | | 366,190 | | | $ | 3,880,348 | |
Reinvestment of distributions | | | 68,428 | | | | 790,647 | | | | 103,511 | | | | 1,087,661 | |
Shares reacquired | | | (772,390 | ) | | | (9,073,985 | ) | | | (1,117,706 | ) | | | (11,936,016 | ) |
Converted to Class A* | | | (328,795 | ) | | | (3,826,559 | ) | | | (245,466 | ) | | | (2,600,784 | ) |
Decrease | | | (866,528 | ) | | $ | (10,175,545 | ) | | | (893,471 | ) | | $ | (9,568,791 | ) |
| | | | |
| Class C Shares | | | | | | | | | | | | |
Shares sold | | | 1,383,685 | | | $ | 16,204,809 | | | | 785,460 | | | $ | 8,434,210 | |
Reinvestment of distributions | | | 70,505 | | | | 813,946 | | | | 89,587 | | | | 943,135 | |
Shares reacquired | | | (1,414,225 | ) | | | (16,441,022 | ) | | | (1,599,215 | ) | | | (17,098,265 | ) |
Increase (decrease) | | | 39,965 | | | $ | 577,733 | | | | (724,168 | ) | | $ | (7,720,920 | ) |
| | | | |
| Class F Shares | | | | | | | | | | | | |
Shares sold | | | 512,134 | | | $ | 6,108,309 | | | | 551,075 | | | $ | 5,858,704 | |
Reinvestment of distributions | | | 13,877 | | | | 160,877 | | | | 10,786 | | | | 114,399 | |
Shares reacquired | | | (460,929 | ) | | | (5,420,105 | ) | | | (314,523 | ) | | | (3,412,001 | ) |
Increase | | | 65,082 | | | $ | 849,081 | | | | 247,338 | | | $ | 2,561,102 | |
| | | | |
| Class I Shares | | | | | | | | | | | | |
Shares sold | | | 3,663,505 | | | $ | 44,111,064 | | | | 2,760,794 | | | $ | 29,717,703 | |
Reinvestment of distributions | | | 806,331 | | | | 9,509,020 | | | | 915,001 | | | | 9,743,781 | |
Shares reacquired | | | (25,586,373 | ) | | | (296,928,444 | ) | | | (3,557,798 | ) | | | (37,313,411 | ) |
Increase (decrease) | | | (21,116,537 | ) | | $ | (243,308,360 | ) | | | 117,997 | | | $ | 2,148,073 | |
| | | | |
| Class P Shares | | | | | | | | | | | | |
Shares sold | | | 24,339 | | | $ | 286,402 | | | | 34,612 | | | $ | 373,214 | |
Reinvestment of distributions | | | 4,105 | | | | 47,846 | | | | 6,121 | | | | 65,014 | |
Shares reacquired | | | (55,875 | ) | | | (649,636 | ) | | | (126,795 | ) | | | (1,368,939 | ) |
Decrease | | | (27,431 | ) | | $ | (315,388 | ) | | | (86,062 | ) | | $ | (930,711 | ) |
| | | | |
| Class R2 Shares | | | | | | | | | | | | |
Shares sold | | | 7,136 | | | $ | 77,046 | | | | 277.000 | | | $ | 2,983 | |
Reinvestment of distributions | | | 54 | | | | 628 | | | | 45.000 | | | | 484 | |
Shares reacquired | | | (907 | ) | | | (11,148 | ) | | | (401.723 | ) | | | (4,210 | ) |
Increase (decrease) | | | 6,283 | | | $ | 66,526 | | | | (79.723 | ) | | $ | (743 | ) |
| | | | |
| Class R3 Shares | | | | | | | | | | | | |
Shares sold | | | 129,743 | | | $ | 1,528,610 | | | | 174,858 | | | $ | 1,887,465 | |
Reinvestment of distributions | | | 5,279 | | | | 60,830 | | | | 2,870 | | | | 30,295 | |
Shares reacquired | | | (48,477 | ) | | | (579,838 | ) | | | (22,364 | ) | | | (241,156 | ) |
Increase | | | 86,545 | | | $ | 1,009,602 | | | | 155,364 | | | $ | 1,676,604 | |
| * | | Automatic conversion of Class B shares occurs on the 25th day of the month (or, if the 25th day is not a business day, the next business day thereafter) following the eighth anniversary of the day on which the purchase order was accepted. |
46
Report of Independent Registered Public Accounting Firm
To the Board of Directors of Lord Abbett Research Fund, Inc. and the Shareholders of the Lord Abbett Capital Structure Fund:
We have audited the accompanying statement of assets and liabilities, including the schedule of investments, of Lord Abbett Capital Structure Fund, one of the portfolios constituting the Lord Abbett Research Fund, Inc. ( the “Company”), as of November 30, 2011, and the related statements of operations for the year then ended, the statements of changes in net assets for each of the two years in the period then ended, and the financial highlights for each of the periods presented. These financial statements and financial highlights are the responsibility of the Company’s management. Our responsibility is to express an opinion on these financial statements and financial highlights based on our audits.
We conducted our audits in accordance with the standards of the Public Company Accounting Oversight Board (United States). Those standards require that we plan and perform the audit to obtain reasonable assurance about whether the financial statements and financial highlights are free of material misstatement. The Company is not required to have, nor were we engaged to perform, an audit of its internal control over financial reporting. Our audits included consideration of internal control over financial reporting as a basis for designing audit procedures that are appropriate in the circumstances, but not for the purpose of expressing an opinion on the effectiveness of the Company’s internal control over financial reporting. Accordingly, we express no such opinion. An audit also includes examining, on a test basis, evidence supporting the amounts and disclosures in the financial statements, assessing the accounting principles used and significant estimates made by management, as well as evaluating the overall financial statement presentation. Our procedures included confirmation of securities owned as of November 30, 2011, by correspondence with the custodian, brokers and agent banks; where replies were not received from brokers, we performed other auditing procedures. We believe that our audits provide a reasonable basis for our opinion.
In our opinion, the financial statements and financial highlights referred to above present fairly, in all material respects, the financial position of the Lord Abbett Capital Structure Fund as of November 30, 2011, the results of its operations for the year then ended, the changes in its net assets for each of the two years in the period then ended, and the financial highlights for each of the periods presented, in conformity with accounting principles generally accepted in the United States of America.
DELOITTE & TOUCHE LLP
New York, New York
January 26, 2012
47
Basic Information About Management
The Board of Directors (the “Board”) is responsible for the management of the business and affairs of the Company in accordance with the laws of the State of Maryland. The Board appoints officers who are responsible for the day-to-day operations of the Company and who execute policies authorized by the Board. The Board also approves an investment adviser to the Company and continues to monitor the cost and quality of the services the investment adviser provides, and annually considers whether to renew the contract with the adviser. Generally, each Director holds office until his/her successor is elected and qualified or until his/her earlier resignation or removal, as provided in the Company’s organizational documents.
Lord, Abbett & Co. LLC (“Lord Abbett”), a limited liability company, is the Company’s investment adviser.
Interested Directors
The following Directors are associated with Lord Abbett and are “interested persons” of the Company as defined in the Act. Mr. Dow and Ms. Foster are officers and directors or trustees of each of the 13 Lord Abbett-sponsored funds, which consist of 57 portfolios or series.
| | | | |
Name, Address and Year of Birth | | Current Position and
Length of Service
with the Company | | Principal Occupation and Other Directorships
During Past Five Years |
| | |
Robert S. Dow Lord, Abbett & Co. LLC 90 Hudson Street Jersey City, NJ 07302 (1945) | | Director and Chairman since 1996 | | Principal Occupation: Senior Partner of Lord Abbett (since 2007) and was formerly Managing Partner (1996 - 2007) and Chief Investment Officer (1995 - 2007), joined Lord Abbett in 1972. Other Directorships: None. |
| | |
Daria L. Foster Lord, Abbett & Co. LLC 90 Hudson Street Jersey City, NJ 07302 (1954) | | Director and President since 2006 | | Principal Occupation: Managing Partner of Lord Abbett (since 2007), and was formerly Director of Marketing and Client Service, joined Lord Abbett in 1990. Other Directorships: None. |
Independent Directors
The following Independent Directors also are directors or trustees of each of the 13 Lord Abbett-sponsored funds, which consist of 57 portfolios or series.
| | | | |
Name, Address and Year of Birth | | Current Position and
Length of Service
with the Company | | Principal Occupation and Other Directorships
During Past Five Years |
| | |
E. Thayer Bigelow Lord, Abbett & Co. LLC c/o Legal Dept. 90 Hudson Street Jersey City, NJ 07302 (1941) | | Director since 1996 | | Principal Occupation: Managing General Partner, Bigelow Media, LLC (since 2000); Senior Adviser, Time Warner Inc. (1998 - 2000). Other Directorships: Currently serves as director of Crane Co. (since 1984) and Huttig Building Products Inc. (since 1998). Previously served as a director of R.H. Donnelley Inc. (2009 - 2010) and Adelphia Communications Inc. (2003 - 2007). |
48
Basic Information About Management (continued)
| | | | |
Name, Address and Year of Birth | | Current Position and
Length of Service with
the Company | | Principal Occupation and Other Directorships
During Past Five Years |
| | |
Robert B. Calhoun, Jr. Lord, Abbett & Co. LLC c/o Legal Dept. 90 Hudson Street Jersey City, NJ 07302 (1942) | | Director since 1998 | | Principal Occupation: Senior Advisor of Monitor Clipper Partners, a private equity investment fund (since 1997); President of Clipper Asset Management Corp. (1991 - 2009). Other Directorships: Previously served as a director of Interstate Bakeries Corp. (1991 - 2008). |
| | |
Evelyn E. Guernsey Lord, Abbett & Co. LLC c/o Legal Dept. 90 Hudson Street Jersey City, NJ 07302 (1955) | | Director since 2011 | | Principal Occupation: CEO, Americas of J.P. Morgan Asset Management (2004 - 2010). Other Directorships: None. |
| | |
Julie A. Hill Lord, Abbett & Co. LLC c/o Legal Dept. 90 Hudson Street Jersey City, NJ 07302 (1946) | | Director since 2004 | | Principal Occupation: Owner and CEO of The Hill Company, a business consulting firm (since 1998). Other Directorships: Currently serves as director of WellPoint, Inc., a health benefits company (since 1994). Previously served as a director of Resources Connection, Inc., a consulting firm (2004 - 2007). |
| | |
Franklin W. Hobbs Lord, Abbett & Co. LLC c/o Legal Dept. 90 Hudson Street Jersey City, NJ 07302 (1947) | | Director since 2001 | | Principal Occupation: Advisor of One Equity Partners, a private equity firm (since 2004). Other Directorships: Currently serves as a director and Chairman of the Board of Ally Financial Inc., a financial services firm (since 2009) and as a director of Molson Coors Brewing Company (since 2002). |
| | |
Thomas J. Neff Lord, Abbett & Co. LLC c/o Legal Dept. 90 Hudson Street Jersey City, NJ 07302 (1937) | | Director since 1992 | | Principal Occupation: Chairman of Spencer Stuart (U.S.), an executive search consulting firm (since 1996). Other Directorships: Currently serves as director of Ace, Ltd. (since 1997). Previously served as a director of Hewitt Associates, Inc. (2004 - 2010). |
| | |
James L.L. Tullis Lord, Abbett & Co. LLC c/o Legal Dept. 90 Hudson Street Jersey City, NJ 07302 (1947) | | Director since 2006 | | Principal Occupation: CEO of Tullis-Dickerson and Co. Inc., a venture capital management firm (since 1990). Other Directorships: Currently serves as director of Crane Co. (since 1998). Previously served as a director of ViaCell, Inc. (2003 - 2007). |
49
Basic Information About Management (continued)
Officers
None of the officers listed below have received compensation from the Company. All of the officers of the Company also may be officers of the other Lord Abbett-sponsored funds and maintain offices at 90 Hudson Street, Jersey City, NJ 07302. Unless otherwise indicated, the position(s) and title(s) listed under the “Principal Occupation During Past Five Years” column indicate each officer’s position(s) and title(s) with Lord Abbett.
| | | | | | |
Name and Year of Birth | | Current Position
with the Company | | Length of Service of Current
Position | | Principal Occupation During Past Five Years |
| | | |
Robert S. Dow (1945) | | Chief Executive Officer and Chairman | | Elected in 1996 | | Senior Partner of Lord Abbett (since 2007), and was formerly Managing Partner (1996 - 2007) and Chief Investment Officer (1995 - 2007), joined Lord Abbett in 1972. |
| | | |
Daria L. Foster (1954) | | President | | Elected in 2006 | | Managing Partner of Lord Abbett (since 2007), and was formerly Director of Marketing and Client Service, joined Lord Abbett in 1990. |
| | | |
Robert P. Fetch (1953) | | Executive Vice President | | Elected in 1997 | | Partner and Director, joined Lord Abbett in 1995. |
| | | |
Daniel H. Frascarelli (1954) | | Executive Vice President | | Elected in 2005 | | Partner and Director, joined Lord Abbett in 1990. |
| | | |
Robert I. Gerber (1954) | | Executive Vice President | | Elected in 2007 | | Partner and Chief Investment Officer (since 2007), joined Lord Abbett in 1997 as Director of Taxable Fixed Income Management. |
| | | |
Gerard S. E. Heffernan, Jr. (1963) | | Executive Vice President | | Elected in 2009 | | Partner and Director, joined Lord Abbett in 1998. |
| | | |
Christopher J. Towle (1957) | | Executive Vice President | | Elected in 2001 | | Partner and Director, joined Lord Abbett in 1987. |
| | | |
Paul J. Volovich (1973) | | Executive Vice President | | Elected in 2004 | | Partner and Director, joined Lord Abbett in 1997. |
| | | |
James W. Bernaiche (1956) | | Chief Compliance Officer | | Elected in 2004 | | Partner and Chief Compliance Officer, joined Lord Abbett in 2001. |
| | | |
Joan A. Binstock (1954) | | Chief Financial Officer and Vice President | | Elected in 1999 | | Partner and Chief Operations Officer, joined Lord Abbett in 1999. |
50
Basic Information About Management (concluded)
| | | | | | |
Name and Year of Birth | | Current Position
with the Company | | Length of Service of Current
Position | | Principal Occupation During Past Five Years |
| | | |
John K. Forst (1960) | | Vice President and Assistant Secretary | | Elected in 2005 | | Deputy General Counsel, joined Lord Abbett in 2004. |
| | | |
Lawrence H. Kaplan (1957) | | Vice President and Secretary | | Elected in 1997 | | Partner and General Counsel, joined Lord Abbett in 1997. |
| | | |
Deepak Khanna (1963) | | Vice President | | Elected in 2008 | | Partner and Portfolio Manager, rejoined Lord Abbett in 2007 from Jennison Associates LLC (2005 - 2007). Mr. Khanna’s former experience at Lord Abbett included Senior Research Analyst — other investment strategies (2000 - 2005). |
| | | |
David J. Linsen (1974) | | Vice President | | Elected in 2008 | | Partner and Director, joined Lord Abbett in 2001. |
| | | |
A. Edward Oberhaus, III (1959) | | Vice President | | Elected in 1996 | | Partner and Director, joined Lord Abbett in 1983. |
| | | |
Todor I. Petrov (1974) | | Vice President | | Elected in 2008 | | Portfolio Manager, joined Lord Abbett in 2003. |
| | | |
Thomas R. Phillips (1960) | | Vice President and Assistant Secretary | | Elected in 2008 | | Partner and Deputy General Counsel, joined Lord Abbett in 2006. |
| | | |
Randy M. Reynolds (1972) | | Vice President | | Elected in 2008 | | Portfolio Manager, joined Lord Abbett in 1999. |
| | | |
Lawrence B. Stoller (1963) | | Vice President and Assistant Secretary | | Elected in 2007 | | Partner and Senior Deputy General Counsel, joined Lord Abbett in 2007 and was formerly an Executive Vice President and the General Counsel at Cohen & Steers Capital Management, Inc. (1999 - 2007). |
| | | |
Francis T. Timons (1969) | | Vice President | | Elected in 2010 | | Portfolio Manager, joined Lord Abbett in 2007 and was formerly a Research Analyst at Robert W. Baird & Co. (2004 - 2007). |
| | | |
Bernard J. Grzelak (1971) | | Treasurer | | Elected in 2003 | | Partner and Director of Fund Administration, joined Lord Abbett in 2003. |
Please call 888-522-2388 for a copy of the statement of additional information (“SAI”), which contains further information about the Company’s Directors. It is available free upon request.
51
Householding
The Company has adopted a policy that allows it to send only one copy of the Fund’s prospectus, proxy material, annual report and semiannual report to certain shareholders residing at the same “household.” This reduces Fund expenses, which benefits you and other shareholders. If you need additional copies or do not want your mailings to be “householded,” please call Lord Abbett at 888-522-2388 or send a written request with your name, the name of your fund or funds and your account number or numbers to Lord Abbett Family of Funds, P.O. Box 219336, Kansas City, MO 64121.
Proxy Voting Policies, Procedures and Records
A description of the policies and procedures that Lord Abbett uses to vote proxies related to the Fund’s portfolio securities, and information on how Lord Abbett voted the Fund’s proxies during the 12-month period ended June 30 are available without charge, upon request, (i) by calling 888-522-2388; (ii) on Lord Abbett’s Website at www.lordabbett.com; and (iii) on the Securities and Exchange Commission’s (“SEC”) Website at www.sec.gov.
Shareholder Reports and Quarterly Portfolio Disclosure
The Fund is required to file its complete schedule of portfolio holdings with the SEC for its first and third fiscal quarters on Form N-Q. Copies of the filings are available without charge, upon request on the SEC’s Website at www.sec.gov and may be available by calling Lord Abbett at 888-522-2388. You can also obtain copies of Form N-Q by visiting the SEC’s Public Reference Room in Washington, DC (information on the operation of the Public Reference Room may be obtained by calling 800-SEC-0330).
Tax Information
56.90% of the ordinary income distributions paid by the Fund during the fiscal year ended November 30, 2011 is qualified dividend income. For corporate shareholders, only 47.67% of the Fund’s ordinary income distributions qualified for the dividends received deduction.
For foreign shareholders 57.00% of the distributions paid by the Fund represents interest related dividends.
52


This report, when not used for the general information of shareholders of the Fund, is to be distributed only if preceded or accompanied by a current fund prospectus.
Lord Abbett mutual fund shares are distributed by LORD ABBETT DISTRIBUTOR LLC.
Lord Abbett Research Fund, Inc.
Lord Abbett Capital Structure Fund
LAAMF-2-1111
(01/12)
2011
LORD ABBETT
ANNUAL
REPORT 
Lord Abbett
Growth Opportunities Fund
For the fiscal year ended November 30, 2011

Lord Abbett Research Fund
Lord Abbett Growth Opportunities Fund
Annual Report
For the fiscal year ended November 30, 2011

From left to right: Robert S. Dow, Director and Chairman of the Lord Abbett Funds; E. Thayer Bigelow, Independent Lead Director of the Lord Abbett Funds; and Daria L. Foster, Director and President of the Lord Abbett Funds.
Dear Shareholders: We are pleased to provide you with this overview of the performance of the Lord Abbett Growth Opportunities Fund for the fiscal year ended November 30, 2011. On this page and the following pages, we discuss the major factors that influenced fiscal year performance. For detailed and more timely information about the Fund, please visit our Website at www.lordabbett.com, where you also can access the quarterly commentaries that provide updates on the Fund’s performance and other portfolio related updates.
Thank you for investing in Lord Abbett mutual funds. We value the trust that you place in us and look forward to serving your investment needs in the years to come.
Best regards,

Robert S. Dow
Chairman
For the fiscal year ended November 30, 2011, the Fund returned -0.65%, reflecting performance at the net asset value (NAV) of Class A shares, with all distributions reinvested, compared to its benchmark, the Russell Midcap® Growth Index,1 which returned 6.07% over the same period.
Despite increased volatility and a sharp equity market downturn in the third quarter of 2011, most broad equity indexes finished the 12-month period in positive territory. The year’s performance was helped by a record-setting October 2011, a month that saw the S&P 500® Index2 post its best monthly return since December 1991. In November 2011, however, markets again sold off on the weight of Europe’s ongoing debt crisis and continued concerns with the inability of U.S. lawmakers to compromise on domestic debt. Over the 12-month period, larger capitalization investments generally performed better than smaller capitalization investments, and growth-oriented investments generally performed better than value-oriented investments.
1
Although we are disappointed in the Fund’s performance over the 12-month period, we have been encouraged by market action during the most recent stock market rally. The Fund’s performance has improved over the last two months of the 12-month period as broad equity indexes began to recover and as investors focused on cyclical companies with strong fundamentals. We believe that this is a potentially attractive environment for us, given our rigorous fundamental research and current tilt toward firms within industries that we believe are positioned to benefit from a domestic economic recovery.
Both our overweight and security positions within the information technology sector detracted from Fund performance during the period. The largest detractor from Fund performance in the sector was online employment search provider Monster Worldwide, whose shares declined owing to a weak job market and competitive pressure. Telecommunications equipment provider Acme Packet also declined due to disappointing earnings and a reduced revenue outlook. Stock selection within the materials sector also detracted from Fund performance. Huntsman Corporation, a global manufacturer and marketer of differentiated chemicals, suffered as fresh economic concerns caused market participants to reallocate into less cyclical companies. Kronos Worldwide, producer of pigments used in the manufacturing process, declined amid economic conditions that resulted in second quarter earnings missing estimates.
Performance was helped by the Fund’s consumer staples holdings, where stock selection was a positive. Shares of Green Mountain Coffee Roasters, the producer of the Keurig brand single cup brewing system, advanced during the period following continued expansion in profitability. Natural foods supermarket chain Whole Foods Market has continued to see its shares rise on market share gains and increasing revenues, with strong same-store sales year-to-date through the company’s third quarter and more than 60 additional stores slated to open by 2014.
While performance within the health care sector was in line with the benchmark, shares of Intuitive Surgical, a manufacturer of robotically assisted surgical equipment and the da Vinci Surgical System, advanced during the period on increased demand. In the industrials sector, shares of Kansas City Southern also appreciated, as the freight rail transporter experienced continued double-digit earnings growth resulting from record freight loads and the highest revenue-per-unit growth in the company’s history.
The Fund’s portfolio is actively managed and, therefore, its holdings and the weightings of a particular issuer or particular sector as a percentage of portfolio assets are subject to change. Sectors may include many industries.
2
1 The Russell Midcap® Growth Index measures the performance of those Russell Midcap companies with higher price-to-book ratios and higher forecasted growth values. The stocks are also members of the Russell 1000 Growth index.
2 The S&P 500® Index is widely regarded as the standard for measuring large-cap U.S. stock market performance and includes a representative sample of leading companies in leading industries.
Unless otherwise specified, indexes reflect total return, with all dividends reinvested. Indexes are unmanaged, do not reflect the deduction of fees or expenses, and are not available for direct investment.
Important Performance and Other Information
Performance data quoted in the following pages reflect past performance and are no guarantee of future results. Current performance may be higher or lower than the performance quoted. The investment return and principal value of an investment in the Fund will fluctuate so that shares, on any given day or when redeemed, may be worth more or less than their original cost. You can obtain performance data current to the most recent month end by calling Lord Abbett at 888-522-2388 or referring to www.lordabbett.com.
Except where noted, comparative Fund performance does not account for the deduction of sales charges and would be different if sales charges were included.
The Fund offers several classes of shares with distinct pricing options. For a full description of the differences in pricing alternatives, please see the Fund’s prospectus.
During certain periods shown, expense waivers and reimbursements were in place. Without such expense waivers and reimbursements, the Fund’s returns would have been lower.
The annual commentary above discusses the views of the Fund’s management and various portfolio holdings of the Fund as of November 30, 2011. These views and portfolio holdings may have changed after this date. Information provided in the commentary is not a recommendation to buy or sell securities. Because the Fund’s portfolio is actively managed and may change significantly, the Fund may no longer own the securities described above or may have otherwise changed its positions in the securities. For more recent information about the Fund’s portfolio holdings, please visit www.lordabbett.com.
A Note about Risk: See Notes to Financial Statements for a discussion of investment risks. For a more detailed discussion of the risks associated with the Fund, please see the Fund’s prospectus.
Mutual funds are not insured by the FDIC, are not deposits or other obligations of, or guaranteed by, banks, and are subject to investment risks including possible loss of principal amount invested.
3
Investment Comparison
Below is a comparison of a $10,000 investment in Class A shares with the same investment in the Russell Midcap® Growth Index and the Russell Midcap® Index, assuming reinvestment of all dividends and distributions. The performance of other classes will be greater than or less than the performance shown in the graph below due to different sales loads and expenses applicable to such classes. The graph and performance table below do not reflect the deduction of taxes that a shareholder would pay on Fund distributions or the redemption of Fund shares. During certain periods, expenses of the Fund have been waived or reimbursed by Lord Abbett; without such waiver or reimbursement of expenses, the Fund’s returns would have been lower. Past performance is no guarantee of future results.
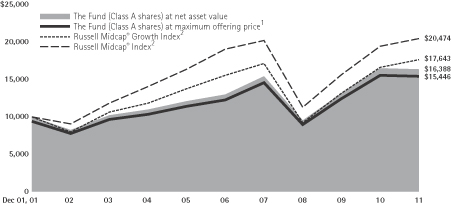
Average Annual Total Returns at Maximum Applicable
Sales Charge for the Periods Ended November 30, 2011
| | | | | | | | | | | | | | | | |
| | | 1 Year | | | 5 Years | | | 10 Years | | | Life of Class | |
Class A3 | | | -6.37% | | | | 3.52% | | | | 4.44% | | | | – | |
Class B4 | | | -5.23% | | | | 3.92% | | | | 4.54% | | | | – | |
Class C5 | | | -1.28% | | | | 4.08% | | | | 4.40% | | | | – | |
Class F6 | | | -0.42% | | | | – | | | | – | | | | 1.72% | |
Class I7 | | | -0.31% | | | | 5.12% | | | | 5.42% | | | | – | |
Class P7 | | | -0.75% | | | | 4.65% | | | | 4.98% | | | | – | |
Class R28 | | | -0.94% | | | | – | | | | – | | | | 1.22% | |
Class R39 | | | -0.80% | | | | – | | | | – | | | | 1.35% | |
1 Reflects the deduction of the maximum initial sales charge of 5.75%.
2 Performance for each unmanaged index does not reflect any fees or expenses. The performance of each index is not necessarily representative of the Fund’s performance.
3 Total return, which is the percentage change in net asset value, after deduction of the maximum initial sales charge of 5.75% applicable to Class A shares, with all dividends and distributions reinvested for the periods shown ended November 30, 2011, is calculated using the SEC-required uniform method to compute such return.
4 Performance reflects the deduction of a CDSC of 4% for 1 year, 1% for 5 years and 0% for 10 years. Class B shares automatically convert to Class A shares after approximately 8 years. (There is no initial sales charge for automatic conversions.) All returns for periods greater than 8 years reflect this conversion.
5 The 1% CDSC for Class C shares normally applies before the first anniversary of the purchase date. Performance is at net asset value.
6 Class F shares commenced operations and performance for the Class began on September 28, 2007. Performance is at net asset value.
7 Performance is at net asset value.
8 Class R2 shares commenced operations and performance for the Class began on September 28, 2007. Performance is at net asset value.
9 Class R3 shares commenced operations and performance for the Class began on September 28, 2007. Performance is at net asset value.
4
Expense Example
As a shareholder of the Fund, you incur two types of costs: (1) transaction costs, including sales charges (loads) on purchase payments (these charges vary among the share classes); and (2) ongoing costs, including management fees; distribution and service (12b-1) fees (these charges vary among the share classes); and other Fund expenses. This Example is intended to help you understand your ongoing costs (in dollars) of investing in the Fund and to compare these costs with the ongoing costs of investing in other mutual funds.
The Example is based on an investment of $1,000 invested at the beginning of the period and held for the entire period (June 1, 2011 through November 30, 2011).
Actual Expenses
For each class of the Fund, the first line of the table on the following page provides information about actual account values and actual expenses. You may use the information in this line, together with the amount you invested, to estimate the expenses that you paid over the period. Simply divide your account value by $1,000 (for example, an $8,600 account value divided by $1,000 = 8.6), then multiply the result by the number in the first line under the heading titled “Expenses Paid During Period 6/1/11 – 11/30/11” to estimate the expenses you paid on your account during this period.
Hypothetical Example for Comparison Purposes
For each class of the Fund, the second line of the table on the following page provides information about hypothetical account values and hypothetical expenses based on the Fund’s actual expense ratio and an assumed rate of return of 5% per year before expenses, which is not the Fund’s actual return. The hypothetical account values and expenses may not be used to estimate the actual ending account balance or expenses you paid for the period. You may use this information to compare the ongoing costs of investing in the Fund and other funds. To do so, compare this 5% hypothetical example with the 5% hypothetical examples that appear in the shareholder reports of the other funds.
5
Please note that the expenses shown in the table are meant to highlight your ongoing costs only and do not reflect any transactional costs, such as sales charges (loads). Therefore, the second line of the table is useful in comparing ongoing costs only, and will not help you determine the relative total costs of owning different funds. In addition, if these transactional costs were included, your costs would have been higher.
| | | | | | | | | | | | |
| | | Beginning
Account
Value | | | Ending
Account
Value | | | Expenses
Paid During
Period† | |
| | | 6/1/11 | | | 11/30/11 | | | 6/1/11 -
11/30/11 | |
Class A | | | | | | | | | | | | |
Actual | | $ | 1,000.00 | | | $ | 855.80 | | | $ | 6.75 | |
Hypothetical (5% Return Before Expenses) | | $ | 1,000.00 | | | $ | 1,017.78 | | | $ | 7.33 | |
Class B | | | | | | | | | | | | |
Actual | | $ | 1,000.00 | | | $ | 853.40 | | | $ | 9.76 | |
Hypothetical (5% Return Before Expenses) | | $ | 1,000.00 | | | $ | 1,014.54 | | | $ | 10.61 | |
Class C | | | | | | | | | | | | |
Actual | | $ | 1,000.00 | | | $ | 853.00 | | | $ | 9.66 | |
Hypothetical (5% Return Before Expenses) | | $ | 1,000.00 | | | $ | 1,014.62 | | | $ | 10.50 | |
Class F | | | | | | | | | | | | |
Actual | | $ | 1,000.00 | | | $ | 857.00 | | | $ | 5.59 | |
Hypothetical (5% Return Before Expenses) | | $ | 1,000.00 | | | $ | 1,019.04 | | | $ | 6.07 | |
Class I | | | | | | | | | | | | |
Actual | | $ | 1,000.00 | | | $ | 857.50 | | | $ | 5.12 | |
Hypothetical (5% Return Before Expenses) | | $ | 1,000.00 | | | $ | 1,019.54 | | | $ | 5.57 | |
Class P | | | | | | | | | | | | |
Actual | | $ | 1,000.00 | | | $ | 855.50 | | | $ | 7.21 | |
Hypothetical (5% Return Before Expenses) | | $ | 1,000.00 | | | $ | 1,017.28 | | | $ | 7.84 | |
Class R2 | | | | | | | | | | | | |
Actual | | $ | 1,000.00 | | | $ | 854.50 | | | $ | 7.90 | |
Hypothetical (5% Return Before Expenses) | | $ | 1,000.00 | | | $ | 1,016.53 | | | $ | 8.59 | |
Class R3 | | | | | | | | | | | | |
Actual | | $ | 1,000.00 | | | $ | 855.50 | | | $ | 7.40 | |
Hypothetical (5% Return Before Expenses) | | $ | 1,000.00 | | | $ | 1,017.09 | | | $ | 8.04 | |
| † | | For each class of the Fund, net expenses are equal to the annualized expense ratio for such class (1.45% for Class A, 2.10% for Class B, 2.08% for Class C, 1.20% for Class F, 1.10% for Class I, 1.55% for Class P, 1.70% for Class R2 and 1.59% for Class R3) multiplied by the average account value over the period, multiplied by 183/365 (to reflect one-half year period). |
Portfolio Holdings Presented by Sector
November 30, 2011
| | | | | | | | | | | | |
| Sector* | | %** | | | | | Sector* | | %** | |
Consumer Discretionary | | | 20.22% | | | | | Industrials | | | 15.82% | |
Consumer Staples | | | 1.52% | | | | | Information Technology | | | 23.10% | |
Energy | | | 14.12% | | | | | Materials | | | 8.51% | |
Financials | | | 6.18% | | | | | Short-Term Investment | | | 0.44% | |
Health Care | | | 10.09% | | | | | Total | | | 100.00% | |
| * | | A sector may comprise several industries. |
| ** | | Represents percent of total investments. |
6
Schedule of Investments
November 30, 2011
| | | | | | | | |
| Investments | | Shares | | | Fair
Value
(000) | |
| COMMON STOCKS 100.28% | |
|
| Aerospace & Defense 0.98% | |
| Spirit AeroSystems Holdings, Inc. Class A* | | | 294,298 | | | $ | 5,742 | |
| | | | | | | | |
|
| Auto Components 2.55% | |
| BorgWarner, Inc.* | | | 123,265 | | | | 8,125 | |
| Gentex Corp. | | | 234,733 | | | | 6,920 | |
| | | | | | | | |
| Total | | | | | | | 15,045 | |
| | | | | | | | |
|
| Automobiles 0.89% | |
| Harley-Davidson, Inc. | | | 142,226 | | | | 5,230 | |
| | | | | | | | |
|
| Biotechnology 0.64% | |
| Onyx Pharmaceuticals, Inc.* | | | 85,527 | | | | 3,772 | |
| | | | | | | | |
|
| Capital Markets 2.97% | |
| Affiliated Managers Group, Inc.* | | | 124,222 | | | | 11,748 | |
| Invesco Ltd. | | | 282,893 | | | | 5,728 | |
| | | | | | | | |
| Total | | | | | | | 17,476 | |
| | | | | | | | |
|
| Chemicals 6.81% | |
| Albemarle Corp. | | | 123,641 | | | | 6,742 | |
| Ashland, Inc. | | | 99,785 | | | | 5,550 | |
| Celanese Corp. Series A | | | 182,980 | | | | 8,507 | |
| Eastman Chemical Co. | | | 143,188 | | | | 5,673 | |
| Innophos Holdings, Inc. | | | 69,638 | | | | 3,430 | |
| Kronos Worldwide, Inc. | | | 185,155 | | | | 3,612 | |
| Westlake Chemical Corp. | | | 156,682 | | | | 6,581 | |
| | | | | | | | |
| Total | | | | | | | 40,095 | |
| | | | | | | | |
|
| Communications Equipment 3.37% | |
| Aruba Networks, Inc.* | | | 208,974 | | | | 4,409 | |
| Ciena Corp.* | | | 202,694 | | | | 2,455 | |
| F5 Networks, Inc.* | | | 57,815 | | | | 6,535 | |
| Finisar Corp.* | | | 180,127 | | | | 3,322 | |
| Riverbed Technology, Inc.* | | | 121,047 | | | | 3,147 | |
| | | | | | | | |
| Total | | | | | | | 19,868 | |
| | | | | | | | |
| Computers & Peripherals 3.95% | |
| Fortinet, Inc.* | | | 157,246 | | | $ | 3,772 | |
| NCR Corp.* | | | 420,437 | | | | 7,354 | |
| SanDisk Corp.* | | | 129,594 | | | | 6,390 | |
| Teradata Corp.* | | | 106,219 | | | | 5,760 | |
| | | | | | | | |
| Total | | | | | | | 23,276 | |
| | | | | | | | |
|
| Construction & Engineering 1.04% | |
| Chicago Bridge & Iron Co. NV (Netherlands)(a) | | | 147,926 | | | | 6,117 | |
| | | | | | | | |
|
| Diversified Financial Services 1.33% | |
| Moody’s Corp. | | | 225,248 | | | | 7,818 | |
| | | | | | | | |
|
| Electrical Equipment 4.88% | |
| AMETEK, Inc. | | | 176,582 | | | | 7,565 | |
| Cooper Industries plc | | | 157,435 | | | | 8,742 | |
| General Cable Corp.* | | | 53,542 | | | | 1,419 | |
| Rockwell Automation, Inc. | | | 146,628 | | | | 11,001 | |
| | | | | | | | |
| Total | | | | | | | 28,727 | |
| | | | | | | | |
|
| Electronic Equipment, Instruments & Components 0.44% | |
| IPG Photonics Corp.* | | | 68,051 | | | | 2,608 | |
| | | | | | | | |
|
| Energy Equipment & Services 6.24% | |
| Atwood Oceanics, Inc.* | | | 91,672 | | | | 3,759 | |
| Cameron International Corp.* | | | 172,782 | | | | 9,328 | |
| CARBO Ceramics, Inc. | | | 21,120 | | | | 3,006 | |
| GulfMark Offshore, Inc. Class A* | | | 100,290 | | | | 4,496 | |
| McDermott International, Inc.* | | | 426,569 | | | | 4,824 | |
| Nabors Industries Ltd.* | | | 366,060 | | | | 6,567 | |
| Superior Energy Services, Inc.* | | | 160,140 | | | | 4,758 | |
| | | | | | | | |
| Total | | | | | | | 36,738 | |
| | | | | | | | |
|
| Food & Staples Retailing 1.11% | |
| Whole Foods Market, Inc. | | | 96,150 | | | | 6,548 | |
| | | | | | | | |
See Notes to Financial Statements.
7
Schedule of Investments (continued)
November 30, 2011
| | | | | | | | |
| Investments | | Shares | | | Fair
Value
(000) | |
| Food Products 0.42% | |
| Green Mountain Coffee Roasters, Inc.* | | | 47,046 | | | $ | 2,467 | |
| | | | | | | | |
|
| Health Care Equipment & Supplies 1.59% | |
| Intuitive Surgical, Inc.* | | | 21,625 | | | | 9,390 | |
| | | | | | | | |
|
| Health Care Providers & Services 3.00% | |
| AmerisourceBergen Corp. | | | 200,161 | | | | 7,436 | |
| Cigna Corp. | | | 120,760 | | | | 5,341 | |
| Mednax, Inc.* | | | 72,723 | | | | 4,902 | |
| | | | | | | | |
| Total | | | | | | | 17,679 | |
| | | | | | | | |
|
| Health Care Technology 1.81% | |
| Allscripts Healthcare Solutions, Inc.* | | | 165,768 | | | | 3,226 | |
SXC Health Solutions
Corp.* | | | 126,145 | | | | 7,420 | |
| | | | | | | | |
| Total | | | | | | | 10,646 | |
| | | | | | | | |
|
| Hotels, Restaurants & Leisure 3.57% | |
| Marriott International, Inc. Class A | | | 143,883 | | | | 4,406 | |
| MGM Resorts International* | | | 655,066 | | | | 6,741 | |
| Starwood Hotels & Resorts Worldwide, Inc. | | | 207,097 | | | | 9,874 | |
| | | | | | | | |
| Total | | | | | | | 21,021 | |
| | | | | | | | |
|
| Household Durables 0.92% | |
| Tempur-Pedic International, Inc.* | | | 98,794 | | | | 5,395 | |
| | | | | | | | |
|
| Insurance 0.49% | |
| Marsh & McLennan Cos., Inc. | | | 96,490 | | | | 2,913 | |
| | | | | | | | |
|
| Life Sciences Tools & Services 2.04% | |
| Agilent Technologies, Inc.* | | | 319,845 | | | | 11,994 | |
| | | | | | | | |
|
| Machinery 5.94% | |
| Chart Industries, Inc.* | | | 73,787 | | | | 4,491 | |
| Dover Corp. | | | 126,164 | | | $ | 6,935 | |
| Eaton Corp. | | | 117,105 | | | | 5,259 | |
| Flowserve Corp. | | | 94,828 | | | | 9,746 | |
| Joy Global, Inc. | | | 93,877 | | | | 8,569 | |
| | | | | | | | |
| Total | | | | | | | 35,000 | |
| | | | | | | | |
|
| Metals & Mining 1.03% | |
| Walter Energy, Inc. | | | 84,988 | | | | 6,094 | |
| | | | | | | | |
|
| Multi-Line Retail 1.64% | |
| Macy’s, Inc. | | | 298,742 | | | | 9,658 | |
| | | | | | | | |
|
| Oil, Gas & Consumable Fuels 7.98% | |
| Concho Resources, Inc.* | | | 74,751 | | | | 7,596 | |
| CONSOL Energy, Inc. | | | 233,637 | | | | 9,729 | |
| Continental Resources, Inc.* | | | 134,871 | | | | 9,520 | |
| Denbury Resources, Inc.* | | | 185,626 | | | | 3,137 | |
| Range Resources Corp. | | | 142,006 | | | | 10,183 | |
| Whiting Petroleum Corp.* | | | 147,572 | | | | 6,864 | |
| | | | | | | | |
| Total | | | | | | | 47,029 | |
| | | | | | | | |
|
| Paper & Forest Products 0.73% | |
| International Paper Co. | | | 151,085 | | | | 4,291 | |
| | | | | | | | |
|
| Pharmaceuticals 1.08% | |
| Watson Pharmaceuticals, Inc.* | | | 98,868 | | | | 6,389 | |
| | | | | | | | |
|
| Professional Services 1.35% | |
| Robert Half International, Inc. | | | 301,078 | | | | 7,975 | |
| | | | | | | | |
|
| Real Estate Management & Development 1.44% | |
| CBRE Group, Inc.* | | | 503,160 | | | | 8,458 | |
| | | | | | | | |
|
| Road & Rail 1.75% | |
| Kansas City Southern* | | | 151,533 | | | | 10,309 | |
| | | | | | | | |
|
| Semiconductors & Semiconductor Equipment 6.25% | |
| Altera Corp. | | | 170,732 | | | | 6,432 | |
| Analog Devices, Inc. | | | 186,668 | | | | 6,507 | |
See Notes to Financial Statements.
8
Schedule of Investments (concluded)
November 30, 2011
| | | | | | | | |
| Investments | | Shares | | | Fair
Value
(000) | |
| Semiconductors & Semiconductor Equipment (continued) | |
| Atmel Corp.* | | | 318,648 | | | $ | 2,826 | |
| Cavium, Inc.* | | | 124,973 | | | | 4,079 | |
| Cypress Semiconductor Corp.* | | | 287,512 | | | | 5,482 | |
| NVIDIA Corp.* | | | 368,012 | | | | 5,752 | |
| Silicon Laboratories, Inc.* | | | 133,145 | | | | 5,755 | |
| | | | | | | | |
| Total | | | | | | | 36,833 | |
| | | | | | | | |
| | |
| Software 9.25% | | | | | | | | |
| ANSYS, Inc.* | | | 82,131 | | | | 5,090 | |
| Ariba, Inc.* | | | 168,215 | | | | 5,105 | |
| BroadSoft, Inc.* | | | 97,388 | | | | 3,416 | |
| Citrix Systems, Inc.* | | | 179,553 | | | | 12,818 | |
| CommVault Systems, Inc.* | | | 84,350 | | | | 4,186 | |
| Informatica Corp.* | | | 63,286 | | | | 2,845 | |
| Nuance Communications, Inc.* | | | 120,317 | | | | 2,958 | |
| Red Hat, Inc.* | | | 209,218 | | | | 10,478 | |
| Synchronoss Technologies, Inc.* | | | 133,299 | | | | 3,984 | |
| TIBCO Software, Inc.* | | | 131,124 | | | | 3,593 | |
| | | | | | | | |
| Total | | | | | | | 54,473 | |
| | | | | | | | |
| | |
| Specialty Retail 7.61% | | | | | | | | |
| Abercrombie & Fitch Co. Class A | | | 48,504 | | | | 2,324 | |
| Dick’s Sporting Goods, Inc.* | | | 214,160 | | | | 8,419 | |
| Limited Brands, Inc. | | | 180,746 | | | | 7,651 | |
| Ross Stores, Inc. | | | 93,900 | | | | 8,365 | |
| Tiffany & Co. | | | 89,067 | | | | 5,971 | |
| Tractor Supply Co. | | | 128,645 | | | | 9,292 | |
| Ulta Salon, Cosmetics & Fragrance, Inc.* | | | 40,251 | | | | 2,803 | |
| | | | | | | | |
| Total | | | | | | | 44,825 | |
| | | | | | | | |
|
| Textiles, Apparel & Luxury Goods 3.19% | |
| Deckers Outdoor Corp.* | | | 38,882 | | | | 4,236 | |
| Hanesbrands, Inc.* | | | 309,305 | | | | 7,618 | |
| PVH Corp. | | | 64,954 | | | $ | 4,410 | |
| Vera Bradley, Inc.* | | | 66,000 | | | | 2,534 | |
| | | | | | | | |
| Total | | | | | | | 18,798 | |
| | | | | | | | |
Total Common Stocks
(cost $538,199,714) | | | | | | | 590,697 | |
| | | | | | | | |
| | |
| | | Principal
Amount
(000) | | | | |
| SHORT-TERM INVESTMENT 0.44% | |
| | |
| Repurchase Agreement | | | | | | | | |
| Repurchase Agreement dated 11/30/2011, 0.01% due 12/1/2011 with Fixed Income Clearing Corp. collateralized by $2,030,000 of Federal Home Loan Bank at 1.750% due 8/22/2012 and $600,000 of Federal Home Loan Bank at 0.875% due 8/22/2012 value: $2,667,488; proceeds: $2,611,262 (cost $2,611,261) | | $ | 2,611 | | | | 2,611 | |
| | | | | | | | |
Total Investments in Securities 100.72%
(cost $540,810,975) | | | | | | | 593,308 | |
| | | | | | | | |
| Liabilities in Excess of Other Assets (0.72%) | | | | | | | (4,240 | ) |
| | | | | | | | |
| Net Assets 100.00% | | | | | | $ | 589,068 | |
| | | | | | | | |
| | |
| * | | Non-income producing security. |
| (a) | | Foreign security traded in U.S. dollars. |
See Notes to Financial Statements.
9
Statement of Assets and Liabilities
November 30, 2011
| | | | |
ASSETS: | | | | |
Investments in securities, at fair value (cost $540,810,975) | | $ | 593,308,609 | |
Receivables: | | | | |
Investment securities sold | | | 4,733,675 | |
Interest and dividends | | | 487,114 | |
Capital shares sold | | | 459,805 | |
Prepaid expenses and other assets | | | 58,430 | |
Total assets | | | 599,047,633 | |
LIABILITIES: | | | | |
Payables: | | | | |
Investment securities purchased | | | 7,472,266 | |
Capital shares reacquired | | | 1,535,267 | |
Management fee | | | 381,886 | |
12b-1 distribution fees | | | 206,606 | |
Directors’ fees | | | 78,927 | |
Fund administration | | | 19,094 | |
To affiliates (See Note 3) | | | 11,163 | |
Accrued expenses and other liabilities | | | 274,104 | |
Total liabilities | | | 9,979,313 | |
NET ASSETS | | $ | 589,068,320 | |
COMPOSITION OF NET ASSETS: | | | | |
Paid-in capital | | $ | 455,216,302 | |
Accumulated net investment loss | | | (78,927 | ) |
Accumulated net realized gain on investments | | | 81,433,311 | |
Net unrealized appreciation on investments | | | 52,497,634 | |
Net Assets | | $ | 589,068,320 | |
See Notes to Financial Statements.
10
Statement of Assets and Liabilities (concluded)
November 30, 2011
| | | | |
| | | | |
Net assets by class: | | | | |
Class A Shares | | $ | 389,211,458 | |
Class B Shares | | $ | 29,129,190 | |
Class C Shares | | $ | 58,335,623 | |
Class F Shares | | $ | 14,593,890 | |
Class I Shares | | $ | 61,928,405 | |
Class P Shares | | $ | 8,073,666 | |
Class R2 Shares | | $ | 1,504,871 | |
Class R3 Shares | | $ | 26,291,217 | |
Outstanding shares by class: | | | | |
Class A Shares ($100 million shares of common stock authorized, $.001 par value) | | | 18,272,461 | |
Class B Shares ($30 million shares of common stock authorized, $.001 par value) | | | 1,511,713 | |
Class C Shares ($20 million shares of common stock authorized, $.001 par value) | | | 3,028,431 | |
Class F Shares ($30 million shares of common stock authorized, $.001 par value) | | | 678,098 | |
Class I Shares ($30 million shares of common stock authorized, $.001 par value) | | | 2,767,270 | |
Class P Shares ($20 million shares of common stock authorized, $.001 par value) | | | 381,030 | |
Class R2 Shares ($30 million shares of common stock authorized, $.001 par value) | | | 71,370 | |
Class R3 Shares ($30 million shares of common stock authorized, $.001 par value) | | | 1,240,745 | |
Net asset value, offering and redemption price per share
(Net assets divided by outstanding shares): | | | | |
Class A Shares-Net asset value | | | $21.30 | |
Class A Shares-Maximum offering price
(Net asset value plus sales charge of 5.75%) | | | $22.60 | |
Class B Shares-Net asset value | | | $19.27 | |
Class C Shares-Net asset value | | | $19.26 | |
Class F Shares-Net asset value | | | $21.52 | |
Class I Shares-Net asset value | | | $22.38 | |
Class P Shares-Net asset value | | | $21.19 | |
Class R2 Shares-Net asset value | | | $21.09 | |
Class R3 Shares-Net asset value | | | $21.19 | |
See Notes to Financial Statements.
11
Statement of Operations
For the Year Ended November 30, 2011
| | | | |
Investment income: | | | | |
Dividends (net of foreign withholding taxes of $6,366) | | $ | 5,453,810 | |
Total investment income | | | 5,453,810 | |
Expenses: | | | | |
Management fee | | | 5,385,941 | |
12b-1 distribution plan-Class A | | | 1,593,408 | |
12b-1 distribution plan-Class B | | | 381,602 | |
12b-1 distribution plan-Class C | | | 628,108 | |
12b-1 distribution plan-Class F | | | 14,956 | |
12b-1 distribution plan-Class P | | | 39,570 | |
12b-1 distribution plan-Class R2 | | | 10,074 | |
12b-1 distribution plan-Class R3 | | | 102,087 | |
Shareholder servicing | | | 1,424,645 | |
Fund administration | | | 269,297 | |
Subsidy (See Note 3) | | | 147,427 | |
Reports to shareholders | | | 93,903 | |
Registration | | | 92,670 | |
Professional | | | 49,368 | |
Custody | | | 20,611 | |
Directors’ fees | | | 4,722 | |
Other | | | 22,801 | |
Gross expenses | | | 10,281,190 | |
Expense reductions (See Note 7) | | | (607 | ) |
Management fee waived (See Note 3) | | | (105,110 | ) |
Net expenses | | | 10,175,473 | |
Net investment loss | | | (4,721,663 | ) |
Net realized and unrealized gain (loss): | | | | |
Net realized gain on investments | | | 111,427,805 | |
Net change in unrealized appreciation/depreciation on investments | | | (112,009,147 | ) |
Net realized and unrealized loss | | | (581,342 | ) |
Net Decrease in Net Assets Resulting From Operations | | $ | (5,303,005 | ) |
See Notes to Financial Statements.
12
Statements of Changes in Net Assets
| | | | | | | | |
| INCREASE (DECREASE) IN NET ASSETS | | For the Year Ended
November 30, 2011 | | | For the Year Ended
November 30, 2010 | |
Operations: | | | | | | | | |
Net investment loss | | $ | (4,721,663 | ) | | $ | (4,301,057 | ) |
Net realized gain on investments | | | 111,427,805 | | | | 79,678,229 | |
Net change in unrealized appreciation/depreciation on investments | | | (112,009,147 | ) | | | 61,350,584 | |
Net increase (decrease) in net assets resulting from operations | | | (5,303,005 | ) | | | 136,727,756 | |
Capital share transactions (Net of share conversions) (See Note 11): | |
Net proceeds from sales of shares | | | 172,578,308 | | | | 100,440,597 | |
Cost of shares reacquired | | | (231,477,767 | ) | | | (171,883,899 | ) |
Net decrease in net assets resulting from capital share transactions | | | (58,899,459 | ) | | | (71,443,302 | ) |
Net increase (decrease) in net assets | | | (64,202,464 | ) | | | 65,284,454 | |
NET ASSETS: | | | | | | | | |
Beginning of year | | $ | 653,270,784 | | | $ | 587,986,330 | |
End of year | | $ | 589,068,320 | | | $ | 653,270,784 | |
Accumulated net investment loss | | $ | (78,927 | ) | | $ | (36,336 | ) |
See Notes to Financial Statements.
13
Financial Highlights
| | | | | | | | | | | | | | | | | | | | |
| | | Class A Shares | |
| | | Year Ended 11/30 | |
| | | 2011 | | | 2010 | | | 2009 | | | 2008 | | | 2007 | |
Per Share Operating Performance | | | | | | | | | | | | | |
Net asset value, beginning of year | | | $21.44 | | | | $17.13 | | | | $12.93 | | | | $23.84 | | | | $22.02 | |
| | | | | | | | | | | | | | | | | | | | |
| | | | | |
Investment operations: | | | | | | | | | | | | | | | | | | | | |
| | | | | |
Net investment loss(a) | | | (.14 | ) | | | (.12 | ) | | | (.08 | ) | | | (.15 | ) | | | (.20 | ) |
| | | | | |
Net realized and unrealized gain (loss) | | | – | | | | 4.43 | | | | 4.84 | | | | (7.91 | ) | | | 4.01 | |
| | | | | | | | | | | | | | | | | | | | |
| | | | | |
Total from investment operations | | | (.14 | ) | | | 4.31 | | | | 4.76 | | | | (8.06 | ) | | | 3.81 | |
| | | | | | | | | | | | | | | | | | | | |
| | | | | |
Distributions to shareholders from: | | | | | | | | | | | | | | | | | | | | |
| | | | | |
Net realized gain | | | – | | | | – | | | | (.56 | ) | | | (2.85 | ) | | | (1.99 | ) |
| | | | | | | | | | | | | | | | | | | | |
Net asset value, end of year | | | $21.30 | | | | $21.44 | | | | $17.13 | | | | $12.93 | | | | $23.84 | |
| | | | | | | | | | | | | | | | | | | | |
| | | | | |
Total Return(b) | | | (.65 | )% | | | 25.16 | % | | | 38.43 | % | | | (38.34 | )% | | | 18.81 | % |
| | | | | |
Ratios to Average Net Assets: | | | | | | | | | | | | | | | | | | | | |
| | | | | |
Expenses, excluding expense reductions and including management fee waived and expenses reimbursed | | | 1.45 | % | | | 1.47 | % | | | 1.55 | % | | | 1.55 | % | | | 1.53 | % |
| | | | | |
Expenses, including expense reductions, management fee waived and expenses reimbursed | | | 1.45 | % | | | 1.47 | % | | | 1.55 | % | | | 1.55 | % | | | 1.53 | % |
| | | | | |
Expenses, excluding expense reductions, management fee waived and expenses reimbursed | | | 1.46 | % | | | 1.50 | % | | | 1.61 | % | | | 1.57 | % | | | 1.54 | % |
| | | | | |
Net investment loss | | | (.64 | )% | | | (.61 | )% | | | (.57 | )% | | | (.79 | )% | | | (.91 | )% |
| | | | | |
| Supplemental Data: | | | | | | | | | | | | | | | |
Net assets, end of year (000) | | | $389,211 | | | | $454,561 | | | | $414,930 | | | | $337,981 | | | | $613,735 | |
| | | | | |
Portfolio turnover rate | | | 121.66 | % | | | 103.81 | % | | | 80.21 | % | | | 123.95 | % | | | 101.25 | % |
| (a) | | Calculated using average shares outstanding during the year. |
| (b) | | Total return does not consider the effects of sales loads and assumes the reinvestment of all distributions. |
See Notes to Financial Statements.
14
Financial Highlights (continued)
| | | | | | | | | | | | | | | | | | | | |
| | | Class B Shares | |
| | | Year Ended 11/30 | |
| | | 2011 | | | 2010 | | | 2009 | | | 2008 | | | 2007 | |
Per Share Operating Performance | | | | | | | | | | | | | |
Net asset value, beginning of year | | | $19.52 | | | | $15.70 | | | | $11.97 | | | | $22.41 | | | | $20.94 | |
| | | | | | | | | | | | | | | | | | | | |
| | | | | |
Investment operations: | | | | | | | | | | | | | | | | | | | | |
| | | | | |
Net investment loss(a) | | | (.26 | ) | | | (.22 | ) | | | (.16 | ) | | | (.25 | ) | | | (.32 | ) |
| | | | | |
Net realized and unrealized gain (loss) | | | .01 | | | | 4.04 | | | | 4.45 | | | | (7.34 | ) | | | 3.78 | |
| | | | | | | | | | | | | | | | | | | | |
| | | | | |
Total from investment operations | | | (.25 | ) | | | 3.82 | | | | 4.29 | | | | (7.59 | ) | | | 3.46 | |
| | | | | | | | | | | | | | | | | | | | |
| | | | | |
Distributions to shareholders from: | | | | | | | | | | | | | | | | | | | | |
| | | | | |
Net realized gain | | | – | | | | – | | | | (.56 | ) | | | (2.85 | ) | | | (1.99 | ) |
| | | | | | | | | | | | | | | | | | | | |
Net asset value, end of year | | | $19.27 | | | | $19.52 | | | | $15.70 | | | | $11.97 | | | | $22.41 | |
| | | | | | | | | | | | | | | | | | | | |
| | | | | |
Total Return(b) | | | (1.28 | )% | | | 24.33 | % | | | 37.55 | % | | | (38.73 | )% | | | 18.04 | % |
| | | | | |
Ratios to Average Net Assets: | | | | | | | | | | | | | | | | | | | | |
| | | | | |
Expenses, excluding expense reductions and including management fee waived and expenses reimbursed | | | 2.09 | % | | | 2.12 | % | | | 2.20 | % | | | 2.20 | % | | | 2.18 | % |
| | | | | |
Expenses, including expense reductions, management fee waived and expenses reimbursed | | | 2.09 | % | | | 2.12 | % | | | 2.20 | % | | | 2.20 | % | | | 2.18 | % |
| | | | | |
Expenses, excluding expense reductions, management fee waived and expenses reimbursed | | | 2.11 | % | | | 2.15 | % | | | 2.27 | % | | | 2.22 | % | | | 2.19 | % |
| | | | | |
Net investment loss | | | (1.27 | )% | | | (1.28 | )% | | | (1.22 | )% | | | (1.44 | )% | | | (1.56 | )% |
| | | | | |
| Supplemental Data: | | | | | | | | | | | | | | | |
Net assets, end of year (000) | | | $29,129 | | | | $43,822 | | | | $51,703 | | | | $48,147 | | | | $101,200 | |
| | | | | |
Portfolio turnover rate | | | 121.66 | % | | | 103.81 | % | | | 80.21 | % | | | 123.95 | % | | | 101.25 | % |
| (a) | | Calculated using average shares outstanding during the year. |
| (b) | | Total return does not consider the effects of sales loads and assumes the reinvestment of all distributions. |
See Notes to Financial Statements.
15
Financial Highlights (continued)
| | | | | | | | | | | | | | | | | | | | |
| | | Class C Shares | |
| | | Year Ended 11/30 | |
| | | 2011 | | | 2010 | | | 2009 | | | 2008 | | | 2007 | |
Per Share Operating Performance | | | | | | | | | | | | | |
Net asset value, beginning of year | | | $19.51 | | | | $15.69 | | | | $11.96 | | | | $22.40 | | | | $20.93 | |
| | | | | | | | | | | | | | | | | | | | |
| | | | | |
Investment operations: | | | | | | | | | | | | | | | | | | | | |
| | | | | |
Net investment loss(a) | | | (.26 | ) | | | (.22 | ) | | | (.16 | ) | | | (.25 | ) | | | (.32 | ) |
| | | | | |
Net realized and unrealized gain (loss) | | | .01 | | | | 4.04 | | | | 4.45 | | | | (7.34 | ) | | | 3.78 | |
| | | | | | | | | | | | | | | | | | | | |
| | | | | |
Total from investment operations | | | (.25 | ) | | | 3.82 | | | | 4.29 | | | | (7.59 | ) | | | 3.46 | |
| | | | | | | | | | | | | | | | | | | | |
| | | | | |
Distributions to shareholders from: | | | | | | | | | | | | | | | | | | | | |
| | | | | |
Net realized gain | | | – | | | | – | | | | (.56 | ) | | | (2.85 | ) | | | (1.99 | ) |
| | | | | | | | | | | | | | | | | | | | |
Net asset value, end of year | | | $19.26 | | | | $19.51 | | | | $15.69 | | | | $11.96 | | | | $22.40 | |
| | | | | | | | | | | | | | | | | | | | |
| | | | | |
Total Return(b) | | | (1.28 | )% | | | 24.35 | % | | | 37.58 | % | | | (38.75 | )% | | | 18.05 | % |
| | | | | |
Ratios to Average Net Assets: | | | | | | | | | | | | | | | | | | | | |
| | | | | |
Expenses, excluding expense reductions and including management fee waived and expenses reimbursed | | | 2.06 | % | | | 2.12 | % | | | 2.20 | % | | | 2.20 | % | | | 2.18 | % |
| | | | | |
Expenses, including expense reductions, management fee waived and expenses reimbursed | | | 2.06 | % | | | 2.12 | % | | | 2.20 | % | | | 2.20 | % | | | 2.18 | % |
| | | | | |
Expenses, excluding expense reductions, management fee waived and expenses reimbursed | | | 2.08 | % | | | 2.15 | % | | | 2.26 | % | | | 2.23 | % | | | 2.19 | % |
| | | | | |
Net investment loss | | | (1.25 | )% | | | (1.27 | )% | | | (1.22 | )% | | | (1.44 | )% | | | (1.56 | )% |
| | | | | |
| Supplemental Data: | | | | | | | | | | | | | | | |
Net assets, end of year (000) | | | $58,336 | | | | $64,376 | | | | $63,732 | | | | $45,385 | | | | $83,891 | |
| | | | | |
Portfolio turnover rate | | | 121.66 | % | | | 103.81 | % | | | 80.21 | % | | | 123.95 | % | | | 101.25 | % |
| (a) | | Calculated using average shares outstanding during the year. |
| (b) | | Total return does not consider the effects of sales loads and assumes the reinvestment of all distributions. |
See Notes to Financial Statements.
16
Financial Highlights (continued)
| | | | | | | | | | | | | | | | | | | | |
| | | Class F Shares | |
| | | Year Ended 11/30 | | | 9/28/2007(a)
to
11/30/2007 | |
| | | 2011 | | | 2010 | | | 2009 | | | 2008 | | |
Per Share Operating Performance | | | | | | | | | | | | | | | | | | | | |
Net asset value, beginning of period | | | $21.61 | | | | $17.22 | | | | $12.96 | | | | $23.85 | | | | $23.81 | |
| | | | | | | | | | | | | | | | | | | | |
| | | | | |
Investment operations: | | | | | | | | | | | | | | | | | | | | |
| | | | | |
Net investment loss(b) | | | (.09 | ) | | | (.06 | ) | | | (.05 | ) | | | (.09 | ) | | | (.03 | ) |
| | | | | |
Net realized and unrealized gain (loss) | | | – | | | | 4.45 | | | | 4.87 | | | | (7.95 | ) | | | .07 | |
| | | | | | | | | | | | | | | | | | | | |
| | | | | |
Total from investment operations | | | (.09 | ) | | | 4.39 | | | | 4.82 | | | | (8.04 | ) | | | .04 | |
| | | | | | | | | | | | | | | | | | | | |
| | | | | |
Distributions to shareholders from: | | | | | | | | | | | | | | | | | | | | |
| | | | | |
Net realized gain | | | – | | | | – | | | | (.56 | ) | | | (2.85 | ) | | | – | |
| | | | | | | | | | | | | | | | | | | | |
Net asset value, end of period | | | $21.52 | | | | $21.61 | | | | $17.22 | | | | $12.96 | | | | $23.85 | |
| | | | | | | | | | | | | | | | | | | | |
| | | | | |
Total Return(c) | | | (.42 | )% | | | 25.49 | % | | | 38.82 | % | | | (38.22 | )% | | | .17 | %(d) |
| | | | | |
Ratios to Average Net Assets: | | | | | | | | | | | | | | | | | | | | |
| | | | | |
Expenses, excluding expense reductions and including management fee waived and expenses reimbursed | | | 1.20 | % | | | 1.21 | % | | | 1.30 | % | | | 1.30 | % | | | .22 | %(d) |
| | | | | |
Expenses, including expense reductions, management fee waived and expenses reimbursed | | | 1.20 | % | | | 1.21 | % | | | 1.30 | % | | | 1.30 | % | | | .22 | %(d) |
| | | | | |
Expenses, excluding expense reductions, management fee waived and expenses reimbursed | | | 1.22 | % | | | 1.24 | % | | | 1.34 | % | | | 1.36 | % | | | .22 | %(d) |
| | | | | |
Net investment loss | | | (.41 | )% | | | (.32 | )% | | | (.35 | )% | | | (.53 | )% | | | (.14 | )%(d) |
| | | | | |
| Supplemental Data: | | | | | | | | | | | | | | | |
Net assets, end of period (000) | | | $14,594 | | | | $11,051 | | | | $2,362 | | | | $359 | | | | $10 | |
| | | | | |
Portfolio turnover rate | | | 121.66 | % | | | 103.81 | % | | | 80.21 | % | | | 123.95 | % | | | 101.25 | % |
| (a) | | Commencement of operations was 9/28/2007, SEC effective date was 9/14/2007 and date shares first became available to the public was 10/1/2007. |
| (b) | | Calculated using average shares outstanding during the period. |
| (c) | | Total return assumes the reinvestment of all distributions. |
See Notes to Financial Statements.
17
Financial Highlights (continued)
| | | | | | | | | | | | | | | | | | | | |
| | | Class I Shares | |
| | | Year Ended 11/30 | |
| | | 2011 | | | 2010 | | | 2009 | | | 2008 | | | 2007 | |
Per Share Operating Performance | | | | | | | | | | | | | | | | | | | | |
Net asset value, beginning of year | | | $22.45 | | | | $17.87 | | | | $13.42 | | | | $24.56 | | | | $22.55 | |
| | | | | | | | | | | | | | | | | | | | |
| | | | | |
Investment operations: | | | | | | | | | | | | | | | | | | | | |
| | | | | |
Net investment loss(a) | | | (.07 | ) | | | (.05 | ) | | | (.03 | ) | | | (.08 | ) | | | (.12 | ) |
| | | | | |
Net realized and unrealized gain (loss) | | | – | | | | 4.63 | | | | 5.04 | | | | (8.21 | ) | | | 4.12 | |
| | | | | | | | | | | | | | | | | | | | |
| | | | | |
Total from investment operations | | | (.07 | ) | | | 4.58 | | | | 5.01 | | | | (8.29 | ) | | | 4.00 | |
| | | | | | | | | | | | | | | | | | | | |
| | | | | |
Distributions to shareholders from: | | | | | | | | | | | | | | | | | | | | |
| | | | | |
Net realized gain | | | – | | | | – | | | | (.56 | ) | | | (2.85 | ) | | | (1.99 | ) |
| | | | | | | | | | | | | | | | | | | | |
Net asset value, end of year | | | $22.38 | | | | $22.45 | | | | $17.87 | | | | $13.42 | | | | $24.56 | |
| | | | | | | | | | | | | | | | | | | | |
| | | | | |
Total Return(b) | | | (.31 | )% | | | 25.63 | % | | | 38.91 | % | | | (38.12 | )% | | | 19.24 | % |
| | | | | |
Ratios to Average Net Assets: | | | | | | | | | | | | | | | | | | | | |
| | | | | |
Expenses, excluding expense reductions and including management fee waived and expenses reimbursed | | | 1.10 | % | | | 1.11 | % | | | 1.20 | % | | | 1.20 | % | | | 1.18 | % |
| | | | | |
Expenses, including expense reductions, management fee waived and expenses reimbursed | | | 1.10 | % | | | 1.11 | % | | | 1.20 | % | | | 1.20 | % | | | 1.18 | % |
| | | | | |
Expenses, excluding expense reductions, management fee waived and expenses reimbursed | | | 1.12 | % | | | 1.15 | % | | | 1.25 | % | | | 1.23 | % | | | 1.19 | % |
| | | | | |
Net investment loss | | | (.30 | )% | | | (.25 | )% | | | (.22 | )% | | | (.41 | )% | | | (.55 | )% |
| | | | | |
| Supplemental Data: | | | | | | | | | | | | | | | |
Net assets, end of year (000) | | | $61,928 | | | | $54,970 | | | | $42,775 | | | | $23,175 | | | | $17,965 | |
| | | | | |
Portfolio turnover rate | | | 121.66 | % | | | 103.81 | % | | | 80.21 | % | | | 123.95 | % | | | 101.25 | % |
| (a) | | Calculated using average shares outstanding during the year. |
| (b) | | Total return assumes the reinvestment of all distributions. |
See Notes to Financial Statements.
18
Financial Highlights (continued)
| | | | | | | | | | | | | | | | | | | | |
| | | Class P Shares | |
| | | Year Ended 11/30 | |
| | | 2011 | | | 2010 | | | 2009 | | | 2008 | | | 2007 | |
Per Share Operating Performance | | | | | | | | | | | | | | | | | | | | |
Net asset value, beginning of year | | | $21.35 | | | | $17.07 | | | | $12.90 | | | | $23.82 | | | | $22.02 | |
| | | | | | | | | | | | | | | | | | | | |
| | | | | |
Investment operations: | | | | | | | | | | | | | | | | | | | | |
| | | | | |
Net investment loss(a) | | | (.17 | ) | | | (.14 | ) | | | (.09 | ) | | | (.17 | ) | | | (.22 | ) |
| | | | | |
Net realized and unrealized gain (loss) | | | .01 | | | | 4.42 | | | | 4.82 | | | | (7.90 | ) | | | 4.01 | |
| | | | | | | | | | | | | | | | | | | | |
| | | | | |
Total from investment operations | | | (.16 | ) | | | 4.28 | | | | 4.73 | | | | (8.07 | ) | | | 3.79 | |
| | | | | | | | | | | | | | | | | | | | |
| | | | | |
Distributions to shareholders from: | | | | | | | | | | | | | | | | | | | | |
| | | | | |
Net realized gain | | | – | | | | – | | | | (.56 | ) | | | (2.85 | ) | | | (1.99 | ) |
| | | | | | | | | | | | | | | | | | | | |
Net asset value, end of year | | | $21.19 | | | | $21.35 | | | | $17.07 | | | | $12.90 | | | | $23.82 | |
| | | | | | | | | | | | | | | | | | | | |
| | | | | |
Total Return(b) | | | (.75 | )% | | | 25.07 | % | | | 38.28 | % | | | (38.42 | )% | | | 18.71 | % |
| | | | | |
Ratios to Average Net Assets: | | | | | | | | | | | | | | | | | | | | |
| | | | | |
Expenses, excluding expense reductions and including management fee waived and expenses reimbursed | | | 1.55 | % | | | 1.57 | % | | | 1.65 | % | | | 1.65 | % | | | 1.63 | % |
| | | | | |
Expenses, including expense reductions, management fee waived and expenses reimbursed | | | 1.55 | % | | | 1.57 | % | | | 1.65 | % | | | 1.65 | % | | | 1.63 | % |
| | | | | |
Expenses, excluding expense reductions, management fee waived and expenses reimbursed | | | 1.57 | % | | | 1.60 | % | | | 1.72 | % | | | 1.67 | % | | | 1.64 | % |
| | | | | |
Net investment loss | | | (.74 | )% | | | (.73 | )% | | | (.66 | )% | | | (.88 | )% | | | (1.01 | )% |
| | | | | |
| Supplemental Data: | | | | | | | | | | | | | | | |
Net assets, end of year (000) | | | $8,074 | | | | $8,477 | | | | $9,185 | | | | $8,945 | | | | $16,699 | |
| | | | | |
Portfolio turnover rate | | | 121.66 | % | | | 103.81 | % | | | 80.21 | % | | | 123.95 | % | | | 101.25 | % |
| (a) | | Calculated using average shares outstanding during the year. |
| (b) | | Total return assumes the reinvestment of all distributions. |
See Notes to Financial Statements.
19
Financial Highlights (continued)
| | | | | | | | | | | | | | | | | | | | |
| | | Class R2 Shares | |
| | | Year Ended 11/30 | | | 9/28/2007(a)
to
11/30/2007 | |
| | | 2011 | | | 2010 | | | 2009 | | | 2008 | | |
Per Share Operating Performance | | | | | | | | | | | | | | | | | | | | |
Net asset value, beginning of period | | | $21.28 | | | | $17.04 | | | | $12.90 | | | | $23.83 | | | | $23.81 | |
| | | | | | | | | | | | | | | | | | | | |
| | | | | |
Investment operations: | | | | | | | | | | | | | | | | | | | | |
| | | | | |
Net investment loss(b) | | | (.21 | ) | | | (.16 | ) | | | (.13 | ) | | | (.16 | ) | | | (.05 | ) |
| | | | | |
Net realized and unrealized gain (loss) | | | .02 | | | | 4.40 | | | | 4.83 | | | | (7.92 | ) | | | .07 | |
| | | | | | | | | | | | | | | | | | | | |
| | | | | |
Total from investment operations | | | (.19 | ) | | | 4.24 | | | | 4.70 | | | | (8.08 | ) | | | .02 | |
| | | | | | | | | | | | | | | | | | | | |
| | | | | |
Distributions to shareholders from: | | | | | | | | | | | | | | | | | | | | |
| | | | | |
Net realized gain | | | – | | | | – | | | | (.56 | ) | | | (2.85 | ) | | | – | |
| | | | | | | | | | | | | | | | | | | | |
Net asset value, end of period | | | $21.09 | | | | $21.28 | | | | $17.04 | | | | $12.90 | | | | $23.83 | |
| | | | | | | | | | | | | | | | | | | | |
| | | | | |
Total Return(c) | | | (.94 | )% | | | 24.88 | % | | | 38.04 | % | | | (38.45 | )% | | | .08 | %(d) |
| | | | | |
Ratios to Average Net Assets: | | | | | | | | | | | | | | | | | | | | |
| | | | | |
Expenses, excluding expense reductions and including management fee waived and expenses reimbursed | | | 1.70 | % | | | 1.71 | % | | | 1.80 | % | | | 1.75 | % | | | .28 | %(d) |
| | | | | |
Expenses, including expense reductions, management fee waived and expenses reimbursed | | | 1.70 | % | | | 1.71 | % | | | 1.80 | % | | | 1.75 | % | | | .28 | %(d) |
| | | | | |
Expenses, excluding expense reductions, management fee waived and expenses reimbursed | | | 1.72 | % | | | 1.75 | % | | | 1.83 | % | | | 1.81 | % | | | .29 | %(d) |
| | | | | |
Net investment loss | | | (.92 | )% | | | (.86 | )% | | | (.84 | )% | | | (.93 | )% | | | (.20 | )%(d) |
| | | | | |
| Supplemental Data: | | | | | | | | | | | | | | | |
Net assets, end of period (000) | | | $1,505 | | | | $1,330 | | | | $1,118 | | | | $119 | | | | $10 | |
| | | | | |
Portfolio turnover rate | | | 121.66 | % | | | 103.81 | % | | | 80.21 | % | | | 123.95 | % | | | 101.25 | % |
| (a) | | Commencement of operations was 9/28/2007, SEC effective date was 9/14/2007 and date shares first became available to the public was 10/1/2007. |
| (b) | | Calculated using average shares outstanding during the period. |
| (c) | | Total return assumes the reinvestment of all distributions. |
See Notes to Financial Statements.
20
Financial Highlights (concluded)
| | | | | | | | | | | | | | | | | | | | |
| | | Class R3 Shares | |
| | | Year Ended 11/30 | | | 9/28/2007(a)
to
11/30/2007 | |
| | | 2011 | | | 2010 | | | 2009 | | | 2008 | | |
Per Share Operating Performance | | | | | | | | | | | | | | | | | | | | |
Net asset value, beginning of period | | | $21.36 | | | | $17.09 | | | | $12.91 | | | | $23.84 | | | | $23.81 | |
| | | | | | | | | | | | | | | | | | | | |
| | | | | |
Investment operations: | | | | | | | | | | | | | | | | | | | | |
| | | | | |
Net investment loss(b) | | | (.18 | ) | | | (.13 | ) | | | (.12 | ) | | | (.14 | ) | | | (.04 | ) |
| | | | | |
Net realized and unrealized gain (loss) | | | .01 | | | | 4.40 | | | | 4.86 | | | | (7.94 | ) | | | .07 | |
| | | | | | | | | | | | | | | | | | | | |
| | | | | |
Total from investment operations | | | (.17 | ) | | | 4.27 | | | | 4.74 | | | | (8.08 | ) | | | .03 | |
| | | | | | | | | | | | | | | | | | | | |
| | | | | |
Distributions to shareholders from: | | | | | | | | | | | | | | | | | | | | |
| | | | | |
Net realized gain | | | – | | | | – | | | | (.56 | ) | | | (2.85 | ) | | | – | |
| | | | | | | | | | | | | | | | | | | | |
Net asset value, end of period | | | $21.19 | | | | $21.36 | | | | $17.09 | | | | $12.91 | | | | $23.84 | |
| | | | | | | | | | | | | | | | | | | | |
| | | | | |
Total Return(c) | | | (.80 | )% | | | 24.99 | % | | | 38.33 | % | | | (38.43 | )% | | | .13 | %(d) |
| | | | | |
Ratios to Average Net Assets: | | | | | | | | | | | | | | | | | | | | |
| | | | | |
Expenses, excluding expense reductions and including expenses assumed, management fee waived and expenses reimbursed | | | 1.59 | % | | | 1.60 | % | | | 1.70 | % | | | 1.65 | % | | | .27 | %(d) |
| | | | | |
Expenses, including expense reductions, management fee waived and expenses reimbursed | | | 1.59 | % | | | 1.60 | % | | | 1.70 | % | | | 1.65 | % | | | .27 | %(d) |
| | | | | |
Expenses, excluding expense reductions, management fee waived and expenses reimbursed | | | 1.61 | % | | | 1.64 | % | | | 1.72 | % | | | 1.70 | % | | | .27 | %(d) |
| | | | | |
Net investment loss | | | (.81 | )% | | | (.70 | )% | | | (.76 | )% | | | (.82 | )% | | | (.18 | )%(d) |
| | | | | |
| Supplemental Data: | | | | | | | | | | | | | | | |
Net assets, end of period (000) | | | $26,291 | | | | $14,684 | | | | $2,182 | | | | $85 | | | | $10 | |
| | | | | |
Portfolio turnover rate | | | 121.66 | % | | | 103.81 | % | | | 80.21 | % | | | 123.95 | % | | | 101.25 | % |
| (a) | | Commencement of operations was 9/28/2007, SEC effective date was 9/14/2007 and date shares first became available to the public was 10/1/2007. |
| (b) | | Calculated using average shares outstanding during the period. |
| (c) | | Total return assumes the reinvestment of all distributions. |
See Notes to Financial Statements.
21
Notes to Financial Statements
1. ORGANIZATION
Lord Abbett Research Fund, Inc. (the “Company”) is registered under the Investment Company Act of 1940, as amended (the “Act”), as a diversified, open-end management investment company and was incorporated under Maryland law on April 6, 1992. The Company currently consists of four separate funds. This report covers one of the funds and its classes: Lord Abbett Growth Opportunities Fund (the “Fund”).
The Fund’s investment objective is capital appreciation. The Fund has eight classes of shares: Class A, B, C, F, I, P, R2 and R3, each with different expenses and dividends. A front-end sales charge is normally added to the net asset value (“NAV”) for Class A shares. There is no front-end sales charge in the case of Class B, C, F, I, P, R2 and R3 shares, although there may be a contingent deferred sales charge (“CDSC”) in certain cases as follows: Class A shares purchased without a sales charge and redeemed before the first day of the month in which the one-year anniversary of the purchase falls (subject to certain exceptions as set forth in the Fund’s prospectus); Class B shares redeemed before the sixth anniversary of purchase; and Class C shares redeemed before the first anniversary of purchase. Class B shares will automatically convert to Class A shares on the 25th day of the month (or, if the 25th day is not a business day, the next business day thereafter) following the eighth anniversary of the day on which the purchase order was accepted. The Fund no longer issues Class B shares for purchase. The Fund’s Class P shares are closed to substantially all investors, with certain exceptions as set forth in the Fund’s prospectus.
The preparation of the financial statements in conformity with accounting principles generally accepted in the United States of America requires management to make certain estimates and assumptions that affect the reported amounts of assets and liabilities and disclosure of contingent assets and liabilities at the date of the financial statements and the reported amounts of increases and decreases in net assets from operations during the reporting period. Actual results could differ from those estimates.
2. SIGNIFICANT ACCOUNTING POLICIES
| (a) | | Investment Valuation–Securities actively traded on any recognized U.S. or non-U.S. exchange or on The NASDAQ Stock Market LLC are valued at the last sale price or official closing price on the exchange or system on which they are principally traded. Events occurring after the close of trading on non-U.S. exchanges may result in adjustments to the valuation of foreign securities to more accurately reflect their fair value as of the close of regular trading on the New York Stock Exchange LLC. The Fund may rely on an independent fair valuation service in adjusting the valuations of foreign securities. Unlisted equity securities are valued at the last quoted sale price or, if no sale price is available, at the mean between the most recently quoted bid and asked prices. Securities for which market quotations are not readily available are valued at fair value as determined by management and approved in good faith by the Board of Directors. Short-term securities with 60 days or less remaining to maturity are valued using the amortized cost method, which approximates fair value. |
| (b) | | Security Transactions–Security transactions are recorded as of the date that the securities are purchased or sold (trade date). Realized gains and losses on sales of portfolio securities are calculated using the identified-cost method. Realized and unrealized gains (losses) are allocated to each class of shares based upon the relative proportion of net assets at the beginning of the day. |
22
Notes to Financial Statements (continued)
| (c) | | Investment Income–Dividend income is recorded on the ex-dividend date. Interest income is recorded on the accrual basis as earned. Discounts are accreted and premiums are amortized using the effective interest method and are included in Interest income on the Statement of Operations. Withholding taxes on foreign dividends have been provided for in accordance with the applicable country’s tax rules and rates. Investment income is allocated to each class of shares based upon the relative proportion of net assets at the beginning of the day. |
| (d) | | Income Taxes–It is the policy of the Fund to meet the requirements of Subchapter M of the Internal Revenue Code applicable to regulated investment companies and to distribute substantially all taxable income and capital gains to its shareholders. Therefore, no income tax provision is required. |
The Fund files U.S. federal and various state and local tax returns. No income tax returns are currently under examination. The statute of limitations on the Fund’s filed U.S. federal tax returns remains open for the fiscal years ended November 30, 2008 through November 30, 2011. The statutes of limitations on the Company’s state and local tax returns may remain open for an additional year depending upon the jurisdiction.
| (e) | | Expenses–Expenses incurred by the Company that do not specifically relate to an individual fund are generally allocated to the Funds within the Company on a pro rata basis by relative net assets. Expenses, excluding class-specific expenses, are allocated to each class of shares based upon the relative proportion of net assets at the beginning of the day. Class A, B, C, F, P, R2 and R3 shares bear their class-specific share of all expenses and fees relating to the Fund’s 12b-1 Distribution Plan. |
| (f) | | Foreign Transactions–The books and records of the Fund are maintained in U.S. dollars and transactions denominated in foreign currencies are recorded in the Fund’s records at the rate prevailing when earned or recorded. Asset and liability accounts that are denominated in foreign currencies are adjusted daily to reflect current exchange rates and any unrealized gain (loss) is included in Net change in unrealized appreciation/depreciation on investments on the Fund’s Statement of Operations. The resultant exchange gains and losses upon settlement of such transactions are included in Net realized gain on investments on the Fund’s Statement of Operations. The Fund does not isolate that portion of the results of operations arising as a result of changes in the foreign exchange rates from the changes in market prices of the securities. |
| (g) | | Repurchase Agreements–The Fund may enter into repurchase agreements with respect to securities. A repurchase agreement is a transaction in which a Fund acquires a security and simultaneously commits to resell that security to the seller (a bank or securities dealer) at an agreed-upon price on an agreed-upon date. The Fund requires at all times that the repurchase agreement be collateralized by cash, or by securities of the U.S. Government, its agencies, its instrumentalities, or U.S. Government sponsored enterprises having a value equal to, or in excess of, the value of the repurchase agreement (including accrued interest). If the seller of the agreement defaults on its obligation to repurchase the underlying securities at a time when the fair value of these securities has declined, the Fund may incur a loss upon disposition of the securities. |
| (h) | | Fair Value Measurements–Fair value is defined as the price that the Fund would receive upon selling an investment or transferring a liability in an orderly transaction to an independent buyer in the principal or most advantageous market of the investment. A |
23
Notes to Financial Statements (continued)
| | three-tier hierarchy is used to maximize the use of observable market data and minimize the use of unobservable inputs and to establish classification of fair value measurements for disclosure purposes. Inputs refer broadly to the assumptions that market participants would use in pricing the asset or liability, including assumptions about risk – for example, the risk inherent in a particular valuation technique used to measure fair value (such as a pricing model) and/or the risk inherent in the inputs to the valuation technique. Inputs may be observable or unobservable. Observable inputs reflect the assumptions market participants would use in pricing the asset or liability. Observable inputs are based on market data obtained from sources independent of the reporting entity. Unobservable inputs reflect the reporting entity’s own assumptions about the assumptions market participants would use in pricing the asset or liability. Unobservable inputs are based on the best information available in the circumstances. The three-tier hierarchy of inputs is summarized in the three broad Levels listed below: |
| | • | | Level 1 - unadjusted quoted prices in active markets for identical investments; |
| | • | | Level 2 - other significant observable inputs (including quoted prices for similar investments, interest rates, prepayment speeds, credit risk, etc.); and |
| | • | | Level 3 - significant unobservable inputs (including the Fund’s own assumptions in determining the fair value of investments). |
The inputs or methodology used for valuing securities are not necessarily an indication of the risk associated with investing in those securities.
The following is a summary of the inputs used as of November 30, 2011 in valuing the Fund’s investments carried at fair value:
| | | | | | | | | | | | | | | | |
| Investment Type* | | Level 1 (000) | | | Level 2 (000) | | | Level 3 (000) | | | Total (000) | |
Common Stocks | | $ | 590,698 | | | $ | – | | | $ | – | | | $ | 590,698 | |
Repurchase Agreement | | | – | | | | 2,611 | | | | – | | | | 2,611 | |
Total | | $ | 590,698 | | | $ | 2,611 | | | $ | – | | | $ | 593,309 | |
| * | | See Schedule of Investments for fair values in each industry. |
3. MANAGEMENT FEE AND OTHER TRANSACTIONS WITH AFFILIATES
Management Fee
The Company has a management agreement with Lord, Abbett & Co. LLC (“Lord Abbett”), pursuant to which Lord Abbett supplies the Fund with investment management services and executive and other personnel, provides office space and pays for ordinary and necessary office and clerical expenses relating to research and statistical work and supervision of the Fund’s investment portfolio.
The management fee is based on the Fund’s average daily net assets at the following annual rate:
| | | | |
First $1 billion | | | .80% | |
Next $1 billion | | | .75% | |
Next $1 billion | | | .70% | |
Over $3 billion | | | .65% | |
24
Notes to Financial Statements (continued)
For the fiscal year ended November 30, 2011, the effective management fee, net of waivers, was at an annualized rate of .78% of the Fund’s average daily net assets.
In addition, Lord Abbett provides certain administrative services to the Fund pursuant to an Administrative Services Agreement in return for a fee at an annual rate of .04% of the Fund’s average daily net assets.
For the fiscal year ended November 30, 2011, and continuing through March 31, 2012, Lord Abbett has contractually agreed to waive all or a portion of its management fee and, if necessary, reimburse the Fund’s other expenses to the extent necessary so that the net annual operating expenses for each class, excluding 12b-1 fees, do not exceed an annual rate of 1.10%. Effective December 31, 2011, and continuing through March 31, 2012, Lord Abbett has contractually agreed to waive an additional annualized .05% of its management fee. These agreements may be terminated only upon the approval of the Fund’s Board of Directors.
The Fund, along with certain other funds managed by Lord Abbett (collectively, the “Underlying Funds”), has entered into a Servicing Arrangement with Lord Abbett Diversified Equity Strategy Fund of Lord Abbett Investment Trust and Lord Abbett Global Allocation Fund of Lord Abbett Global Fund, Inc. (each, a “Fund of Funds”), pursuant to which each Underlying Fund pays a portion of the expenses (excluding management fees and distribution and service fees) of each Fund of Funds in proportion to the average daily value of the Underlying Fund shares owned by each Fund of Funds. Amounts paid pursuant to the Servicing Arrangement are included in Subsidy expense on the Fund’s Statement of Operations and Payable to affiliates on the Fund’s Statement of Assets and Liabilities.
As of November 30, 2011, the percentages of the Fund’s outstanding shares owned by Lord Abbett Diversified Equity Strategy Fund and Lord Abbett Global Allocation Fund were 2.75% and 1.47% respectively.
12b-1 Distribution Plan
The Fund has adopted a distribution plan with respect to Class A, B, C, F, P, R2 and R3 shares pursuant to Rule 12b-1 under the Act, which provides for the payment of ongoing distribution and service fees to Lord Abbett Distributor LLC (the “Distributor”), an affiliate of Lord Abbett. The fees are accrued daily at annual rates based upon the Fund’s average daily net assets as follows:
| | | | | | | | | | | | | | | | | | | | | | | | | | | | |
| Fees* | | Class A | | | Class B | | | Class C | | | Class F | | | Class P | | | Class R2 | | | Class R3 | |
Service | | | .25% | | | | .25% | | | | .25% | | | | – | | | | .25% | | | | .25% | | | | .25% | |
Distribution | | | .10% | | | | .75% | | | | .75% | | | | .10% | | | | .20% | | | | .35% | | | | .25% | |
| * | | The Fund may designate a portion of the aggregate fee as attributable to service activities for purposes of calculating Financial Industry Regulatory Authority, Inc. (“FINRA”) sales charge limitations. |
Class I shares do not have a distribution plan.
Commissions
Distributor received the following commissions on sales of shares of the Fund, after concessions were paid to authorized dealers, for the fiscal year ended November 30, 2011:
| | | | |
Distributor
Commissions | | Dealers’
Concessions | |
| $114,658 | | $ | 624,461 | |
25
Notes to Financial Statements (continued)
Distributor received CDSCs of $2,992 and $8,021 for Class A and Class C shares, respectively, for the fiscal year ended November 30, 2011.
Two Directors and certain of the Fund’s officers have an interest in Lord Abbett.
4. DISTRIBUTIONS AND CAPITAL LOSS CARRYFORWARDS
Dividends from net investment income, if any, are declared and paid at least annually. Taxable net realized gains from investment transactions, reduced by allowable capital loss carryforwards, if any, are declared and distributed to shareholders at least annually. The capital loss carryforward amount, if any, is available to offset future net capital gains. Dividends and distributions to shareholders are recorded on the ex-dividend date. The amounts of dividends and distributions from net investment income and net realized capital gains are determined in accordance with federal income tax regulations, which may differ from accounting principles generally accepted in the United States of America. These book/tax differences are either considered temporary or permanent in nature. To the extent these differences are permanent in nature, such amounts are reclassified within the components of net assets based on their federal tax basis treatment; temporary differences do not require reclassification. Dividends and distributions, which exceed earnings and profits for tax purposes, are reported as a tax return of capital.
Subsequent to the Fund’s fiscal year ended November 30, 2011, a long-term capital gains distribution of approximately $87,835,000 was declared by the Fund on December 14, 2011. The distribution was paid on December 16, 2011 to shareholders of record on December 15, 2011.
As of November 30, 2011, the components of accumulated gains on a tax-basis were as follows:
| | | | |
Undistributed long-term capital gains | | $ | 87,833,390 | |
Total undistributed earnings | | $ | 87,833,390 | |
Temporary differences | | | (2,874,690 | ) |
Unrealized gains–net | | | 48,893,318 | |
Total accumulated gains–net | | $ | 133,852,018 | |
Certain losses incurred after October 31 (“Post-October Losses”) within the taxable year are deemed to arise on the first business day of the Fund’s next taxable year. The Fund incurred and will elect to defer net capital losses of $2,795,763 during fiscal year 2011.
As of November 30, 2011, the aggregate unrealized security gains and losses based on cost for U.S. federal income tax purposes were as follows:
| | | | |
Tax cost | | $ | 544,415,291 | |
Gross unrealized gain | | | 83,878,563 | |
Gross unrealized loss | | | (34,985,245 | ) |
Net unrealized security gain | | $ | 48,893,318 | |
The difference between book-basis and tax-basis unrealized gains (losses) is attributable to wash sales.
26
Notes to Financial Statements (continued)
Permanent items identified during the fiscal year ended November 30, 2011 have been reclassified among the components of net assets based on their tax basis treatment as follows:
| | | | | | | | |
Accumulated Net
Investment Loss | | Accumulated Net
Realized Gain | | | Paid-in Capital | |
| $4,679,072 | | $ | (6,840,043 | ) | | $ | 2,160,971 | |
The permanent differences are attributable to the tax treatment of net investment losses, certain distributions, and certain securities.
On December 22, 2010, the Regulated Investment Company Modernization Act of 2010 (the “Modernization Act”) was signed by the President of the United States. The Modernization Act includes numerous provisions that generally become effective for taxable years beginning after the date of enactment. Management is currently assessing the impact of the Modernization Act as it relates to the Fund.
5. PORTFOLIO SECURITIES TRANSACTIONS
Purchases and sales of investment securities (excluding short-term investments) for the fiscal year ended November 30, 2011 were as follows:
| | | | |
| Purchases | | Sales | |
| $820,665,952 | | $ | 882,399,412 | |
There were no purchases or sales of U.S. Government securities for the fiscal year ended November 30, 2011.
6. DIRECTORS’ REMUNERATION
The Company’s officers and the two Directors who are associated with Lord Abbett do not receive any compensation from the Company for serving in such capacities. Outside Directors’ fees are allocated among all Lord Abbett-sponsored funds based on the net assets of each fund. There is an equity-based plan available to all outside Directors under which outside Directors must defer receipt of a portion of, and may elect to defer receipt of an additional portion of Directors’ fees. The deferred amounts are treated as though equivalent dollar amounts had been invested in the funds. Such amounts and earnings accrued thereon are included in Directors’ fees on the Statement of Operations and in Directors’ fees payable on the Statement of Assets and Liabilities and are not deductible for U.S. federal income tax purposes until such amounts are paid.
7. EXPENSE REDUCTIONS
The Company has entered into an arrangement with its transfer agent and custodian, whereby credits realized as a result of uninvested cash balances are used to reduce a portion of the Fund’s expenses.
27
Notes to Financial Statements (continued)
8. LINE OF CREDIT
The Fund and certain other funds managed by Lord Abbett have available an unsecured revolving credit facility (“Facility”) from State Street Bank and Trust Company (“SSB”), to be used for temporary or emergency purposes as an additional source of liquidity to fund redemptions of investor shares. The Facility is renewed annually under terms that depend on market conditions at the time of the renewal. The amount available under the Facility is $200,000,000.
On February 3, 2011, the Facility was renewed for an annual period by the Fund and certain other funds managed by Lord Abbett. The amount available under the Facility remained the same. The annual fee to maintain the Facility was reduced from .15% to .125% of the amount available under the facility. Each participating fund pays its pro rata share based on the net assets of each participating fund. This amount is included in Other expenses on the Funds’ Statements of Operations. Any borrowings under this Facility will bear interest at current market rates as set forth in the credit agreement. During the fiscal year ended November 30, 2011, a participating fund managed by Lord Abbett utilized the Facility and fully repaid its borrowings. As of November 30, 2011, there were no loans outstanding pursuant to this Facility.
Effective February 3, 2012, the Fund and certain other funds managed by Lord Abbett will enter into a short term extension of the Facility through March 31, 2012.
9. CUSTODIAN AND ACCOUNTING AGENT
SSB is the Company’s custodian and accounting agent. SSB performs custodial, accounting and recordkeeping functions relating to portfolio transactions and calculating the Fund’s NAV.
10. INVESTMENT RISKS
The Fund is subject to the general risks and considerations associated with equity investing. The value of an investment will fluctuate in response to movements in the equity securities market in general, and to the changing prospects of individual companies in which the Fund invests. The Fund has particular risks associated with growth stocks. Growth companies may grow faster than other companies, which may result in more volatility in their stock prices. In addition, if the Fund’s assessment of a company’s potential for growth or market conditions is wrong, it could suffer losses or produce poor performance relative to other funds, even in a rising market. The Fund invests largely in mid-sized company stocks, which may be less able to weather economic shifts or other adverse developments than larger, more established companies.
These factors can affect the Fund’s performance.
28
Notes to Financial Statements (concluded)
11. SUMMARY OF CAPITAL TRANSACTIONS
Transactions in shares of capital stock were as follows:
| | | | | | | | | | | | | | | | |
| | | Year Ended November 30, 2011 | | | Year Ended November 30, 2010 | |
| Class A Shares | | Shares | | | Amount | | | Shares | | | Amount | |
Shares sold | | | 3,077,795 | | | $ | 72,555,058 | | | | 2,954,687 | | | $ | 55,825,409 | |
Converted from Class B* | | | 312,175 | | | | 6,967,069 | | | | 406,020 | | | | 7,658,205 | |
Shares reacquired | | | (6,318,770 | ) | | | (139,782,898 | ) | | | (6,382,181 | ) | | | (119,847,201 | ) |
Decrease | | | (2,928,800 | ) | | $ | (60,260,771 | ) | | | (3,021,474 | ) | | $ | (56,363,587 | ) |
| | | | |
| Class B Shares | | | | | | | | | | | | |
Shares sold | | | 59,728 | | | $ | 1,239,607 | | | | 164,783 | | | $ | 2,802,208 | |
Shares reacquired | | | (449,034 | ) | | | (9,262,289 | ) | | | (769,144 | ) | | | (13,327,711 | ) |
Converted to Class A* | | | (344,041 | ) | | | (6,967,069 | ) | | | (444,512 | ) | | | (7,658,205 | ) |
Decrease | | | (733,347 | ) | | $ | (14,989,751 | ) | | | (1,048,873 | ) | | $ | (18,183,708 | ) |
| | | | |
| Class C Shares | | | | | | | | | | | | |
Shares sold | | | 537,376 | | | $ | 11,176,985 | | | | 643,328 | | | $ | 11,056,493 | |
Shares reacquired | | | (809,005 | ) | | | (16,510,812 | ) | | | (1,405,732 | ) | | | (24,092,411 | ) |
Decrease | | | (271,629 | ) | | $ | (5,333,827 | ) | | | (762,404 | ) | | $ | (13,035,918 | ) |
| | | | |
| Class F Shares | | | | | | | | | | | | |
Shares sold | | | 438,014 | | | $ | 10,076,671 | | | | 447,344 | | | $ | 8,658,142 | |
Shares reacquired | | | (271,341 | ) | | | (5,975,330 | ) | | | (73,101 | ) | | | (1,390,312 | ) |
Increase | | | 166,673 | | | $ | 4,101,341 | | | | 374,243 | | | $ | 7,267,830 | |
| | | | |
| Class I Shares | | | | | | | | | | | | |
Shares sold | | | 2,094,748 | | | $ | 46,313,790 | | | | 228,641 | | | $ | 4,305,691 | |
Shares reacquired | | | (1,776,401 | ) | | | (40,441,214 | ) | | | (173,266 | ) | | | (3,462,347 | ) |
Increase | | | 318,347 | | | $ | 5,872,576 | | | | 55,375 | | | $ | 843,344 | |
| | | | |
| Class P Shares | | | | | | | | | | | | |
Shares sold | | | 130,176 | | | $ | 2,917,641 | | | | 107,715 | | | $ | 2,045,506 | |
Shares reacquired | | | (146,203 | ) | | | (3,303,252 | ) | | | (248,560 | ) | | | (4,524,049 | ) |
Decrease | | | (16,027 | ) | | $ | (385,611 | ) | | | (140,845 | ) | | $ | (2,478,543 | ) |
| | | | |
| Class R2 Shares | | | | | | | | | | | | |
Shares sold | | | 57,144 | | | $ | 1,289,718 | | | | 28,416 | | | $ | 533,759 | |
Shares reacquired | | | (48,279 | ) | | | (1,011,558 | ) | | | (31,488 | ) | | | (584,683 | ) |
Increase (decrease) | | | 8,865 | | | $ | 278,160 | | | | (3,072 | ) | | $ | (50,924 | ) |
| | | | |
| Class R3 Shares | | | | | | | | | | | | |
Shares sold | | | 1,202,894 | | | $ | 27,008,838 | | | | 806,893 | | | $ | 15,213,389 | |
Shares reacquired | | | (649,689 | ) | | | (15,190,414 | ) | | | (247,061 | ) | | | (4,655,185 | ) |
Increase | | | 553,205 | | | $ | 11,818,424 | | | | 559,832 | | | $ | 10,558,204 | |
| * | | Automatic conversion of Class B shares occurs on the 25th day of the month (or, if the 25th day is not a business day, the next business day thereafter) following the eighth anniversary of the day on which the purchase order was accepted. |
29
Report of Independent Registered Public Accounting Firm
To the Board of Directors of Lord Abbett Research Fund, Inc. and the Shareholders of the Lord Abbett Growth Opportunities Fund:
We have audited the accompanying statement of assets and liabilities, including the schedule of investments, of Lord Abbett Growth Opportunities Fund, one of the portfolios constituting the Lord Abbett Research Fund, Inc., (the “Company”) as of November 30, 2011, and the related statement of operations for the year then ended, the statements of changes in net assets for each of the two years in the period then ended, and the financial highlights for each of the periods presented. These financial statements and financial highlights are the responsibility of the Company’s management. Our responsibility is to express an opinion on these financial statements and financial highlights based on our audits.
We conducted our audits in accordance with the standards of the Public Company Accounting Oversight Board (United States). Those standards require that we plan and perform the audit to obtain reasonable assurance about whether the financial statements and financial highlights are free of material misstatement. The Company is not required to have, nor were we engaged to perform, an audit of its internal control over financial reporting. Our audits included consideration of internal control over financial reporting as a basis for designing audit procedures that are appropriate in the circumstances, but not for the purpose of expressing an opinion on the effectiveness of the Company’s internal control over financial reporting. Accordingly, we express no such opinion. An audit also includes examining, on a test basis, evidence supporting the amounts and disclosures in the financial statements, assessing the accounting principles used and significant estimates made by management, as well as evaluating the overall financial statement presentation. Our procedures included confirmation of securities owned as of November 30, 2011, by correspondence with the custodian and brokers; where replies were not received from brokers, we performed other auditing procedures. We believe that our audits provide a reasonable basis for our opinion.
In our opinion, the financial statements and financial highlights referred to above present fairly, in all material respects, the financial position of the Lord Abbett Growth Opportunities Fund, one of the portfolios of Lord Abbett Research Fund, Inc. as of November 30, 2011, the results of its operations for the year then ended, the changes in its net assets for each of the two years in the period then ended, and the financial highlights for each of the periods presented, in conformity with accounting principles generally accepted in the United States of America.
DELOITTE & TOUCHE LLP
New York, New York
January 26, 2012
30
Basic Information About Management
The Board of Directors (the “Board”) is responsible for the management of the business and affairs of the Company in accordance with the laws of the State of Maryland. The Board appoints officers who are responsible for the day-to-day operations of the Company and who execute policies authorized by the Board. The Board also approves an investment adviser to the Company and continues to monitor the cost and quality of the services the investment adviser provides, and annually considers whether to renew the contract with the adviser. Generally, each Director holds office until his/her successor is elected and qualified or until his/her earlier resignation or removal, as provided in the Company’s organizational documents.
Lord, Abbett & Co. LLC (“Lord Abbett”), a limited liability company, is the Company’s investment adviser.
Interested Directors
The following Directors are associated with Lord Abbett and are “interested persons” of the Company as defined in the Act. Mr. Dow and Ms. Foster are officers and directors or trustees of each of the 13 Lord Abbett-sponsored funds, which consist of 57 portfolios or series.
| | | | |
Name, Address and
Year of Birth | | Current Position and
Length of Service
with the Company | | Principal Occupation and Other Directorships
During Past Five Years |
| | |
Robert S. Dow Lord, Abbett & Co. LLC 90 Hudson Street Jersey City, NJ 07302 (1945) | | Director and Chairman since 1996 | | Principal Occupation: Senior Partner of Lord Abbett (since 2007) and was formerly Managing Partner (1996 - 2007) and Chief Investment Officer (1995 - 2007), joined Lord Abbett in 1972. Other Directorships: None. |
| | |
Daria L. Foster Lord, Abbett & Co. LLC 90 Hudson Street Jersey City, NJ 07302 (1954) | | Director and President since 2006 | | Principal Occupation: Managing Partner of Lord Abbett (since 2007), and was formerly Director of Marketing and Client Service, joined Lord Abbett in 1990. Other Directorships: None. |
Independent Directors
The following Independent Directors also are directors or trustees of each of the 13 Lord Abbett-sponsored funds, which consist of 57 portfolios or series.
| | | | |
Name, Address and
Year of Birth | | Current Position and
Length of Service with
the Company | | Principal Occupation and Other Directorships
During Past Five Years |
| | |
E. Thayer Bigelow Lord, Abbett & Co. LLC c/o Legal Dept. 90 Hudson Street Jersey City, NJ 07302 (1941) | | Director since 1996 | | Principal Occupation: Managing General Partner, Bigelow Media, LLC (since 2000); Senior Adviser, Time Warner Inc. (1998 - 2000). Other Directorships: Currently serves as director of Crane Co. (since 1984) and Huttig Building Products Inc. (since 1998). Previously served as a director of R.H. Donnelley Inc. (2009 - 2010) and Adelphia Communications Inc. (2003 - 2007). |
31
Basic Information About Management (continued)
| | | | |
Name, Address and
Year of Birth | | Current Position and
Length of Service with
the Company | | Principal Occupation and Other Directorships
During Past Five Years |
| | |
Robert B. Calhoun, Jr. Lord, Abbett & Co. LLC c/o Legal Dept. 90 Hudson Street Jersey City, NJ 07302 (1942) | | Director since 1998 | | Principal Occupation: Senior Advisor of Monitor Clipper Partners, a private equity investment fund (since 1997); President of Clipper Asset Management Corp. (1991 - 2009). Other Directorships: Previously served as a director of Interstate Bakeries Corp. (1991 - 2008). |
| | |
Evelyn E. Guernsey Lord, Abbett & Co. LLC c/o Legal Dept. 90 Hudson Street Jersey City, NJ 07302 (1955) | | Director since 2011 | | Principal Occupation: CEO, Americas of J.P. Morgan Asset Management (2004 - 2010). Other Directorships: None. |
| | |
Julie A. Hill Lord, Abbett & Co. LLC c/o Legal Dept. 90 Hudson Street Jersey City, NJ 07302 (1946) | | Director since 2004 | | Principal Occupation: Owner and CEO of The Hill Company, a business consulting firm (since 1998). Other Directorships: Currently serves as director of WellPoint, Inc., a health benefits company (since 1994). Previously served as a director of Resources Connection, Inc., a consulting firm (2004 - 2007). |
| | |
Franklin W. Hobbs Lord, Abbett & Co. LLC c/o Legal Dept. 90 Hudson Street Jersey City, NJ 07302 (1947) | | Director since 2001 | | Principal Occupation: Advisor of One Equity Partners, a private equity firm (since 2004). Other Directorships: Currently serves as a director and Chairman of the Board of Ally Financial Inc., a financial services firm (since 2009) and as a director of Molson Coors Brewing Company (since 2002). |
| | |
Thomas J. Neff Lord, Abbett & Co. LLC c/o Legal Dept. 90 Hudson Street Jersey City, NJ 07302 (1937) | | Director since 1992 | | Principal Occupation: Chairman of Spencer Stuart (U.S.), an executive search consulting firm (since 1996). Other Directorships: Currently serves as director of Ace, Ltd. (since 1997). Previously served as a director of Hewitt Associates, Inc. (2004 - 2010). |
| | |
James L.L. Tullis Lord, Abbett & Co. LLC c/o Legal Dept. 90 Hudson Street Jersey City, NJ 07302 (1947) | | Director since 2006 | | Principal Occupation: CEO of Tullis-Dickerson and Co. Inc., a venture capital management firm (since 1990). Other Directorships: Currently serves as director of Crane Co. (since 1998). Previously served as a director of ViaCell, Inc. (2003 - 2007). |
32
Basic Information About Management (continued)
Officers
None of the officers listed below have received compensation from the Company. All of the officers of the Company also may be officers of the other Lord Abbett-sponsored funds and maintain offices at 90 Hudson Street, Jersey City, NJ 07302. Unless otherwise indicated, the position(s) and title(s) listed under the “Principal Occupation During Past Five Years” column indicate each officer’s position(s) and title(s) with Lord Abbett.
| | | | | | |
Name and Year of Birth | | Current Position
with the Company | | Length of Service of Current
Position | | Principal Occupation During Past Five Years |
| | | |
Robert S. Dow (1945) | | Chief Executive Officer and Chairman | | Elected in 1996 | | Senior Partner of Lord Abbett (since 2007), and was formerly Managing Partner (1996 - 2007) and Chief Investment Officer (1995 - 2007), joined Lord Abbett in 1972. |
| | | |
Daria L. Foster (1954) | | President | | Elected in 2006 | | Managing Partner of Lord Abbett (since 2007), and was formerly Director of Marketing and Client Service, joined Lord Abbett in 1990. |
| | | |
Robert P. Fetch (1953) | | Executive Vice President | | Elected in 1997 | | Partner and Director, joined Lord Abbett in 1995. |
| | | |
Daniel H. Frascarelli (1954) | | Executive Vice President | | Elected in 2005 | | Partner and Director, joined Lord Abbett in 1990. |
| | | |
Robert I. Gerber (1954) | | Executive Vice President | | Elected in 2007 | | Partner and Chief Investment Officer (since 2007), joined Lord Abbett in 1997 as Director of Taxable Fixed Income Management. |
| | | |
Gerard S. E. Heffernan, Jr. (1963) | | Executive Vice President | | Elected in 2009 | | Partner and Director, joined Lord Abbett in 1998. |
| | | |
Christopher J. Towle (1957) | | Executive Vice President | | Elected in 2001 | | Partner and Director, joined Lord Abbett in 1987. |
| | | |
Paul J. Volovich (1973) | | Executive Vice President | | Elected in 2004 | | Partner and Director, joined Lord Abbett in 1997. |
| | | |
James W. Bernaiche (1956) | | Chief Compliance Officer | | Elected in 2004 | | Partner and Chief Compliance Officer, joined Lord Abbett in 2001. |
| | | |
Joan A. Binstock (1954) | | Chief Financial Officer and Vice President | | Elected in 1999 | | Partner and Chief Operations Officer, joined Lord Abbett in 1999. |
33
Basic Information About Management (concluded)
| | | | | | |
Name and Year of Birth | | Current Position
with the Company | | Length of Service of Current
Position | | Principal Occupation During Past Five Years |
| | | |
John K. Forst (1960) | | Vice President and Assistant Secretary | | Elected in 2005 | | Deputy General Counsel, joined Lord Abbett in 2004. |
| | | |
Lawrence H. Kaplan (1957) | | Vice President and Secretary | | Elected in 1997 | | Partner and General Counsel, joined Lord Abbett in 1997. |
| | | |
Deepak Khanna (1963) | | Vice President | | Elected in 2008 | | Partner and Portfolio Manager, rejoined Lord Abbett in 2007 from Jennison Associates LLC (2005 - 2007). Mr. Khanna’s former experience at Lord Abbett included Senior Research Analyst – other investment strategies (2000 - 2005). |
| | | |
David J. Linsen (1974) | | Vice President | | Elected in 2008 | | Partner and Director, joined Lord Abbett in 2001. |
| | | |
A. Edward Oberhaus, III (1959) | | Vice President | | Elected in 1996 | | Partner and Director, joined Lord Abbett in 1983. |
| | | |
Todor I. Petrov (1974) | | Vice President | | Elected in 2008 | | Portfolio Manager, joined Lord Abbett in 2003. |
| | | |
Thomas R. Phillips (1960) | | Vice President and Assistant Secretary | | Elected in 2008 | | Partner and Deputy General Counsel, joined Lord Abbett in 2006. |
| | | |
Randy M. Reynolds (1972) | | Vice President | | Elected in 2008 | | Portfolio Manager, joined Lord Abbett in 1999. |
| | | |
Lawrence B. Stoller (1963) | | Vice President and Assistant Secretary | | Elected in 2007 | | Partner and Senior Deputy General Counsel, joined Lord Abbett in 2007 and was formerly an Executive Vice President and the General Counsel at Cohen & Steers Capital Management, Inc. (1999 - 2007). |
| | | |
Francis T. Timons (1969) | | Vice President | | Elected in 2010 | | Portfolio Manager, joined Lord Abbett in 2007 and was formerly a Research Analyst at Robert W. Baird & Co. (2004 - 2007). |
| | | |
Bernard J. Grzelak (1971) | | Treasurer | | Elected in 2003 | | Partner and Director of Fund Administration, joined Lord Abbett in 2003. |
Please call 888-522-2388 for a copy of the statement of additional information (“SAI”), which contains further information about the Company’s Directors. It is available free upon request.
34
Householding
The Company has adopted a policy that allows it to send only one copy of the Fund’s prospectus, proxy material, annual report and semiannual report to certain shareholders residing at the same “household.” This reduces Fund expenses, which benefits you and other shareholders. If you need additional copies or do not want your mailings to be “householded,” please call Lord Abbett at 888-522-2388 or send a written request with your name, the name of your fund or funds and your account number or numbers to Lord Abbett Family of Funds, P.O. Box 219336, Kansas City, MO 64121.
Proxy Voting Policies, Procedures and Records
A description of the policies and procedures that Lord Abbett uses to vote proxies related to the Fund’s portfolio securities, and information on how Lord Abbett voted the Fund’s proxies during the 12-month period ended June 30 are available without charge, upon request, (i) by calling 888-522-2388; (ii) on Lord Abbett’s Website at www.lordabbett.com; and (iii) on the Securities and Exchange Commission’s (“SEC”) Website at www.sec.gov.
Shareholder Reports and Quarterly Portfolio Disclosure
The Fund is required to file its complete schedule of portfolio holdings with the SEC for its first and third fiscal quarters on Form N-Q. Copies of the filings are available without charge, upon request on the SEC’s Website at www.sec.gov and may be available by calling Lord Abbett at 888-522-2388. You can also obtain copies of Form N-Q by visiting the SEC’s Public Reference Room in Washington, DC (information on the operation of the Public Reference Room may be obtained by calling 800-SEC-0330).
35
This page is intentionally left blank.


This report, when not used for the general information of shareholders of the Fund, is to be distributed only if preceded or accompanied by a current fund prospectus.
Lord Abbett mutual fund shares are distributed by LORD ABBETT DISTRIBUTOR LLC.
Lord Abbett Research Fund, Inc.
Lord Abbett Growth Opportunities Fund
LAGOF-2-1111
(01/12)
2011
LORD ABBETT
ANNUAL
REPORT 
Lord Abbett
Classic Stock Fund
Small Cap Value Fund
For the fiscal year ended November 30, 2011

Lord Abbett Research Fund
Lord Abbett Classic Stock Fund
and Lord Abbett Small Cap Value Fund
Annual Report
For the fiscal year ended November 30, 2011

From left to right: Robert S. Dow, Director and Chairman of the Lord Abbett Funds; E. Thayer Bigelow, Independent Lead Director of the Lord Abbett Funds; and Daria L. Foster, Director and President of the Lord Abbett Funds.
Dear Shareholders: We are pleased to provide you with this overview of the performance of the Funds for the fiscal year ended November 30, 2011. On this page and the following pages, we discuss the major factors that influenced fiscal year performance. For detailed and more timely information about the Funds, please visit our Website at www.lordabbett.com, where you also can access the quarterly commentaries that provide updates on each Fund’s performance and other portfolio related updates.
Thank you for investing in Lord Abbett mutual funds. We value the trust that you place in us and look forward to serving your investment needs in the years to come.
Best regards,

Robert S. Dow
Chairman
Classic Stock Fund
For the fiscal year ended November 30, 2011, the Fund returned -1.86%, reflecting performance at the net asset value (NAV) of Class A shares, with all distributions reinvested, compared to its benchmark, the Russell 1000® Index,1 which returned 7.38% over the same period.
During the 12-month period, global economic and geopolitical environment contributed to the erosion of business and consumer confidence in the economy, which resulted in the sell-off of the market following the Standard & Poor’s downgrade of U.S. debt downgrade in August 2011. The continuing challenges involving European sovereign debt and failure of the super-committee in the U.S. Congress created additional market uncertainty. Despite these challenges, positive economic reports have eased investor fears of a double-dip recession in the United States. The renewed belief that the U.S. economy would progress slowly,
1
yet positively, encouraged investors to return to the equity market, resulting in an equity market rally during October. Equity markets again reacted positively late November to news that coordinated efforts by the world’s central banks, including the European Central Bank and the U.S. Federal Reserve, have eased liquidity pressures on European banks.
The Fund’s performance was hurt most by adverse stock selection within the consumer discretionary sector during the period. Cruise company Carnival Corp. suffered as high fuel costs cut into its revenue, along with itinerary changes due to the unrest in the Middle East and North Africa. Shares of Marriott International, Inc., a hotel operator, and shares of casino operator MGM Mirage, Inc. dropped due to investors’ concerns that consumers would cut back on spending due to the uncertain economic environment. In addition, poor stock selection within the information technology sector detracted from Fund performance. Monster Worldwide, Inc., an online employment services company, suffered upon news that unemployment benefits had risen higher than had been anticipated.
Sector weighting within telecommunication services and energy were the largest contributors to Fund performance during the period, both of which were stronger performing sectors. In addition, select holdings contributed to the Fund’s performance. Shares of aerospace manufacturer Goodrich Corp. rose due to high demand for its aircraft equipment from companies that make large commercial aircraft and news that United Technologies Corp. agreed to acquire the company at a significant premium. Union Pacific Corp., a provider of rail transportation services in North America, benefited from increased freight volumes that resulted from the healing economy and from core pricing gains.
Small Cap Value Fund
For the fiscal year ended November 30, 2011, the Fund returned 2.60%, reflecting performance at the net asset value (NAV) of Class A shares, with all distributions reinvested, compared to its benchmark, the Russell 2000® Value Index,2 which returned 0.77% over the same period.
The 12-month period saw extreme volatility in the equity markets, resulting in positive returns. The market was mostly positive for the first five months, reacting to strong corporate earnings. The market took a turn for the worse in May 2011 as investors grappled with a downgrade of U.S. debt, political uncertainty in the United States and Europe, and concerns about economic growth and consumer confidence. The last few months have been choppy, as investors have gained and lost confidence that the European debt crisis would be resolved.
The Fund outperformed during the period due to overall stock selection. Industrials holdings Chicago Bridge & Iron Co. NV and Hexcel Corp. and health care
2
holdings HealthSpring, Inc. and American Medical System Holdings, Inc. were among the best overall contributors to Fund performance. Chicago Bridge & Iron Company N.V., a construction services company, benefited from strong backlog and new awards growth. The company raised its 2011 fiscal year guidance in July. Hexcel Corp., a manufacturer of composites for use in aerospace, space and defense, and industrial applications, beat quarterly expectations throughout the period, aided by strength within commercial aerospace. HealthSpring, Inc., a managed care organization focusing on Medicare, beat quarterly expectations throughout the period. Shares of the company traded at a premium following the October 2011 announcement that it would be acquired by CIGNA Corporation, a global health service organization. Shares of American Medical Systems Holdings Inc., a medical technology solutions company, also traded at a premium following the April announcement that it would be acquired by Endo Pharmaceuticals Holdings Inc., a specialty health care solutions company.
Notable detractors from the overall Fund performance include health care holding Gentiva Health Services, Inc., materials holding Ferro Corp., and consumer discretionary holding Pacific Sunwear of California. Shares of Gentiva Health Services, Inc., a home health care services provider, traded down amid fears of cuts in home health care and Medicare reimbursement rates, which led us to exit the position in August 2011. Ferro Corp., a specialty materials and chemicals producer, started the year off strong after announcing a solid fourth quarter, aided by increased sales and improving margins. First quarter results also slightly beat expectations; however, the company saw a slowdown in demand for its solar product. Second quarter earnings were below expectations due in part to demand shortfall. We exited the position in September 2011, on concerns that these trends would continue. Pacific Sunwear of California, a specialty clothing retailer, lowered its earnings guidance in January for its fiscal fourth quarter due in part to lower than expected holiday sales. In March, the company announced a disappointing outlook for its fiscal first quarter 2011. We exited the position in late March 2011 because we lost confidence in the company’s ability to perform during a difficult retail environment. An underweight within the utilities sector, which was among the best performing sectors within the Russell 2000® Value Index, also detracted from the Fund’s relative performance.
Each Fund’s portfolio is actively managed and, therefore, its holdings and the weightings of a particular issuer or particular sector as a percentage of portfolio assets are subject to change. Sectors may include many industries.
3
1 The Russell 1000® Index measures the performance of the 1,000 largest companies in the Russell 3000 Index, which represents approximately 92% of the total market capitalization of the Russell 3000 Index.
2 The Russell 2000® Value Index measures the performance of those Russell 2000 companies with lower price-to-book ratios and lower forecasted growth values.
Unless otherwise specified, indexes reflect total return, with all dividends reinvested. Indexes are unmanaged, do not reflect the deduction of fees or expenses, and are not available for direct investment.
Important Performance and Other Information
Performance data quoted in the following pages reflect past performance and are no guarantee of future results. Current performance may be higher or lower than the performance quoted. The investment return and principal value of an investment in the Fund will fluctuate so that shares, on any given day or when redeemed, may be worth more or less than their original cost. You can obtain performance data current to the most recent month end by calling Lord Abbett at 888-522-2388 or referring to www.lordabbett.com.
Except where noted, comparative Fund performance does not account for the deduction of sales charges and would be different if sales charges were included. The Fund offers several classes of shares with distinct pricing options. For a full description of the differences in pricing alternatives, please see the Fund’s prospectus.
During certain periods shown, expense waivers and reimbursements were in place for Classic Stock Fund. Without such expense waivers and reimbursements, the Fund’s returns would have been lower.
The annual commentary above discusses the views of the Funds’ management and various portfolio holdings of the Funds as of November 30, 2011. These views and portfolio holdings may have changed after this date. Information provided in the commentary is not a recommendation to buy or sell securities. Because the Funds’ portfolio is actively managed and may change significantly, the Funds may no longer own the securities described above or may have otherwise changed their positions in the securities. For more recent information about the Funds’ portfolio holdings, please visit www.lordabbett.com.
A Note about Risk: See Notes to Financial Statements for a discussion of investment risks. For a more detailed discussion of the risks associated with the Fund, please see the Fund’s prospectus.
Mutual funds are not insured by the FDIC, are not deposits or other obligations of, or guaranteed by, banks, and are subject to investment risks including possible loss of principal amount invested.
4
Classic Stock Fund
Investment Comparison
Below is a comparison of a $10,000 investment in Class A shares with the same investment in the Russell 1000® Index and the S&P 500® Index, assuming reinvestment of all dividends and distributions. The performance of other classes will be greater than or less than the performance shown in the graph below due to different sales loads and expenses applicable to such classes. The graph and performance table below do not reflect the deduction of taxes that a shareholder would pay on Fund distributions or the redemption of Fund shares. During certain periods, expenses of the Fund have been waived or reimbursed by Lord Abbett; without such waiver or reimbursement of expenses, the Fund’s returns would have been lower. Past performance is no guarantee of future results.
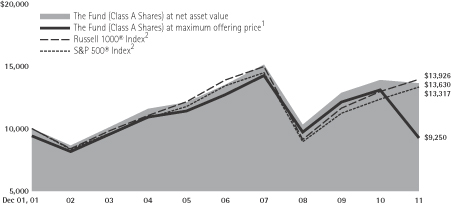
Average Annual Total Returns at Maximum Applicable
Sales Charge for the Periods Ended November 30, 2011
| | | | | | | | | | | | | | | | |
| | | 1 Year | | | 5 Years | | | 10 Years | | | Life of Class | |
Class A3 | | | -7.51% | | | | -0.98% | | | | 2.54% | | | | – | |
Class B4 | | | -6.37% | | | | -0.63% | | | | 2.61% | | | | – | |
Class C5 | | | -2.46% | | | | -0.44% | | | | 2.51% | | | | – | |
Class F6 | | | -1.61% | | | | – | | | | – | | | | -2.61% | |
Class I7 | | | -1.52% | | | | 0.55% | | | | 3.51% | | | | – | |
Class P7 | | | -1.97% | | | | 0.10% | | | | 3.07% | | | | – | |
Class R28 | | | -2.09% | | | | – | | | | – | | | | -2.87% | |
Class R39 | | | -2.00% | | | | – | | | | – | | | | -2.98% | |
1 Reflects the deduction of the maximum initial sales charge of 5.75%.
2 Performance for each unmanaged index does not reflect any fees or expenses. The performance of each index is not necessarily representative of the Fund’s performance.
3 Total return, which is the percentage change in net asset value, after deduction of the maximum initial sales charge of 5.75% applicable to Class A shares, with all dividends and distributions reinvested for the periods shown ended November 30, 2011, is calculated using the SEC-required uniform method to compute such return.
4 Performance reflects the deduction of a CDSC of 4% for 1 year, 1% for 5 years and 0% for 10 years. Class B shares automatically convert to Class A shares after approximately 8 years. (There is no initial sales charge for automatic conversions.) All returns for periods greater than 8 years reflect this conversion.
5 The 1% CDSC for Class C shares normally applies before the first anniversary of the purchase date. Performance is at net asset value.
6 Class F shares commenced operations and performance for the Class began on September 28, 2007. Performance is at net asset value.
7 Performance is at net asset value.
8 Class R2 shares commenced operations and performance for the Class began on September 28, 2007. Performance is at net asset value.
9 Class R3 shares commenced operations and performance for the Class began on September 28, 2007. Performance is at net asset value.
5
Small Cap Value Fund
Investment Comparison
Below is a comparison of a $10,000 investment in Class A shares with the same investment in both the Russell 2000® Value Index and the Russell 2000® Index, assuming reinvestment of all dividends and distributions. The performance of other classes will be greater than or less than the performance shown in the graph below due to different sales loads and expenses applicable to such classes. The graph and performance table below do not reflect the deduction of taxes that a shareholder would pay on Fund distributions or the redemption of Fund shares. Past performance is no guarantee of future results.
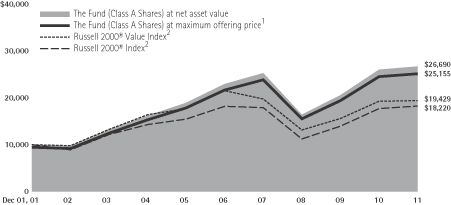
Average Annual Total Returns at Maximum Applicable
Sales Charge for the Periods Ended November 30, 2011
| | | | | | | | | | | | | | | | |
| | | 1 Year | | | 5 Years | | | 10 Years | | | Life of Class | |
Class A3 | | | -3.29% | | | | 1.85% | | | | 9.67% | | | | – | |
Class B4 | | | -2.13% | | | | 2.21% | | | | 9.73% | | | | – | |
Class C5 | | | 1.87% | | | | 2.35% | | | | 9.60% | | | | – | |
Class F6 | | | 2.76% | | | | – | | | | – | | | | 1.15% | |
Class I7 | | | 2.84% | | | | 3.37% | | | | 10.67% | | | | – | |
Class P7 | | | 2.41% | | | | 2.91% | | | | 10.18% | | | | – | |
Class R28 | | | 2.26% | | | | – | | | | – | | | | 3.64% | |
Class R39 | | | 2.41% | | | | – | | | | – | | | | 3.73% | |
1 Reflects the deduction of the maximum initial sales charge of 5.75%.
2 Performance for each unmanaged index does not reflect any fees or expenses. The performance of each index is not necessarily representative of the Fund’s performance.
3 Total return, which is the percentage change in net asset value, after deduction of the maximum initial sales charge of 5.75% applicable to Class A shares, with all dividends and distributions reinvested for the periods shown ended November 30, 2011, is calculated using the SEC-required uniform method to compute such return.
4 Performance reflects the deduction of a CDSC of 4% for 1 year, 1% for 5 years and 0% for 10 years. Class B shares automatically convert to Class A shares after approximately 8 years. (There is no initial sales charge for automatic conversions.) All returns for periods greater than 8 years reflect this conversion.
5 The 1% CDSC for Class C shares normally applies before the first anniversary of the purchase date. Performance is at net asset value.
6 Class F shares commenced operations and performance for the Class began on September 28, 2007. Performance is at net asset value.
7 Performance is at net asset value.
8 Class R2 shares commenced operations on March 24, 2008 and performance for the Class began March 31, 2008. Performance is at net asset value.
9 Class R3 shares commenced operations on March 24, 2008 and performance for the Class began March 31, 2008. Performance is at net asset value.
6
Expense Example
As a shareholder of a Fund, you incur two types of costs: (1) transaction costs, including sales charges (loads) on purchase payments (these charges vary among the share classes); and (2) ongoing costs, including management fees; distribution and service (12b-1) fees (these charges vary among the share classes); and other Fund expenses. This Example is intended to help you understand your ongoing costs (in dollars) of investing in the Funds and to compare these costs with the ongoing costs of investing in other mutual funds.
The Example is based on an investment of $1,000 invested at the beginning of the period and held for the entire period (June 1, 2011 through November 30, 2011).
Actual Expenses
For each class of each Fund, the first line of the tables on the following pages provides information about actual account values and actual expenses. You may use the information in this line, together with the amount you invested, to estimate the expenses that you paid over the period. Simply divide your account value by $1,000 (for example, an $8,600 account value divided by $1,000 = 8.6), then multiply the result by the number in the first line under the heading titled “Expenses Paid During Period 6/1/11 – 11/30/11” to estimate the expenses you paid on your account during this period.
Hypothetical Example for Comparison Purposes
For each class of each Fund, the second line of the tables on the following pages provides information about hypothetical account values and hypothetical expenses based on the Fund’s actual expense ratio and an assumed rate of return of 5% per year before expenses, which is not each Fund’s actual return. The hypothetical account values and expenses may not be used to estimate the actual ending account balance or expenses you paid for the period. You may use this information to compare the ongoing costs of investing in each Fund and other funds. To do so, compare this 5% hypothetical example with the 5% hypothetical examples that appear in the shareholder reports of the other funds.
7
Classic Stock Fund
Please note that the expenses shown in the table are meant to highlight your ongoing costs only and do not reflect any transactional costs, such as sales charges (loads). Therefore, the second line of the table is useful in comparing ongoing costs only, and will not help you determine the relative total costs of owning different funds. In addition, if these transactional costs were included, your costs would have been higher.
| | | | | | | | | | | | |
| | | Beginning
Account
Value | | | Ending
Account
Value | | | Expenses
Paid During
Period† | |
| | | 6/1/11 | | | 11/30/11 | | | 6/1/11 -
11/30/11 | |
Class A | | | | | | | | | | | | |
Actual | | $ | 1,000.00 | | | $ | 889.00 | | | $ | 4.64 | |
Hypothetical (5% Return Before Expenses) | | $ | 1,000.00 | | | $ | 1,020.15 | | | $ | 4.96 | |
Class B | | | | | | | | | | | | |
Actual | | $ | 1,000.00 | | | $ | 886.40 | | | $ | 7.71 | |
Hypothetical (5% Return Before Expenses) | | $ | 1,000.00 | | | $ | 1,016.90 | | | $ | 8.24 | |
Class C | | | | | | | | | | | | |
Actual | | $ | 1,000.00 | | | $ | 886.40 | | | $ | 7.66 | |
Hypothetical (5% Return Before Expenses) | | $ | 1,000.00 | | | $ | 1,016.96 | | | $ | 8.19 | |
Class F | | | | | | | | | | | | |
Actual | | $ | 1,000.00 | | | $ | 890.20 | | | $ | 3.46 | |
Hypothetical (5% Return Before Expenses) | | $ | 1,000.00 | | | $ | 1,021.40 | | | $ | 3.70 | |
Class I | | | | | | | | | | | | |
Actual | | $ | 1,000.00 | | | $ | 890.80 | | | $ | 2.99 | |
Hypothetical (5% Return Before Expenses) | | $ | 1,000.00 | | | $ | 1,021.90 | | | $ | 3.19 | |
Class P | | | | | | | | | | | | |
Actual | | $ | 1,000.00 | | | $ | 888.80 | | | $ | 5.11 | |
Hypothetical (5% Return Before Expenses) | | $ | 1,000.00 | | | $ | 1,019.64 | | | $ | 5.47 | |
Class R2 | | | | | | | | | | | | |
Actual | | $ | 1,000.00 | | | $ | 888.40 | | | $ | 5.82 | |
Hypothetical (5% Return Before Expenses) | | $ | 1,000.00 | | | $ | 1,018.89 | | | $ | 6.23 | |
Class R3 | | | | | | | | | | | | |
Actual | | $ | 1,000.00 | | | $ | 888.50 | | | $ | 5.35 | |
Hypothetical (5% Return Before Expenses) | | $ | 1,000.00 | | | $ | 1,019.42 | | | $ | 5.72 | |
| † | | For each class of the Fund, net expenses are equal to the annualized expense ratio for such class (0.98% for Class A, 1.63% for Class B, 1.62% for Class C, 0.73% for Class F, 0.63% for Class I, 1.08% for Class P, 1.23% for Class R2 and 1.13% for Class R3) multiplied by the average account value over the period, multiplied by 183/365 (to reflect one-half year period). |
Portfolio Holdings Presented by Sector
November 30, 2011
| | | | | | | | | | | | |
| Sector* | | %** | | | | | Sector* | | %** | |
Consumer Discretionary | | | 10.49% | | | | | Information Technology | | | 19.67% | |
Consumer Staples | | | 8.07% | | | | | Materials | | | 6.82% | |
Energy | | | 12.93% | | | | | Telecommunication Services | | | 2.89% | |
Financials | | | 13.42% | | | | | Utilities | | | 1.47% | |
Health Care | | | 11.36% | | | | | Short-Term Investment | | | 0.72% | |
Industrials | | | 12.16% | | | | | Total | | | 100.00% | |
| * | | A sector may comprise several industries. |
| ** | | Represents percent of total investments. |
8
Small Cap Value Fund
Please note that the expenses shown in the table are meant to highlight your ongoing costs only and do not reflect any transactional costs, such as sales charges (loads). Therefore, the second line of the table is useful in comparing ongoing costs only, and will not help you determine the relative total costs of owning different funds. In addition, if these transactional costs were included, your costs would have been higher.
| | | | | | | | | | | | |
| | | Beginning
Account
Value | | | Ending
Account
Value | | | Expenses
Paid During
Period† | |
| | | 6/1/11 | | | 11/30/11 | | | 6/1/11 -
11/30/11 | |
Class A | | | | | | | | | | | | |
Actual | | $ | 1,000.00 | | | $ | 875.80 | | | $ | 5.97 | |
Hypothetical (5% Return Before Expenses) | | $ | 1,000.00 | | | $ | 1,018.72 | | | $ | 6.43 | |
Class B | | | | | | | | | | | | |
Actual | | $ | 1,000.00 | | | $ | 872.70 | | | $ | 9.20 | |
Hypothetical (5% Return Before Expenses) | | $ | 1,000.00 | | | $ | 1,015.24 | | | $ | 9.90 | |
Class C | | | | | | | | | | | | |
Actual | | $ | 1,000.00 | | | $ | 872.60 | | | $ | 9.20 | |
Hypothetical (5% Return Before Expenses) | | $ | 1,000.00 | | | $ | 1,015.24 | | | $ | 9.90 | |
Class F | | | | | | | | | | | | |
Actual | | $ | 1,000.00 | | | $ | 876.70 | | | $ | 5.03 | |
Hypothetical (5% Return Before Expenses) | | $ | 1,000.00 | | | $ | 1,019.73 | | | $ | 5.42 | |
Class I | | | | | | | | | | | | |
Actual | | $ | 1,000.00 | | | $ | 876.80 | | | $ | 4.52 | |
Hypothetical (5% Return Before Expenses) | | $ | 1,000.00 | | | $ | 1,020.23 | | | $ | 4.86 | |
Class P | | | | | | | | | | | | |
Actual | | $ | 1,000.00 | | | $ | 874.90 | | | $ | 6.63 | |
Hypothetical (5% Return Before Expenses) | | $ | 1,000.00 | | | $ | 1,017.97 | | | $ | 7.13 | |
Class R2 | | | | | | | | | | | | |
Actual | | $ | 1,000.00 | | | $ | 874.40 | | | $ | 7.38 | |
Hypothetical (5% Return Before Expenses) | | $ | 1,000.00 | | | $ | 1,017.22 | | | $ | 7.94 | |
Class R3 | | | | | | | | | | | | |
Actual | | $ | 1,000.00 | | | $ | 874.90 | | | $ | 6.82 | |
Hypothetical (5% Return Before Expenses) | | $ | 1,000.00 | | | $ | 1,017.80 | | | $ | 7.33 | |
| † | | For each class of the Fund, net expenses are equal to the annualized expense ratio for such class (1.27% for Class A, 1.96% for Classes B and C, 1.07% for Class F, 0.96% for Class I, 1.41% for Class P, 1.57% for Class R2 and 1.45% for Class R3) multiplied by the average account value over the period, multiplied by 183/365 (to reflect one-half year period). |
Portfolio Holdings Presented by Sector
November 30, 2011
| | | | | | | | | | | | |
| Sector* | | %** | | | | | Sector* | | %** | |
Consumer Discretionary | | | 10.03% | | | | | Information Technology | | | 16.46% | |
Consumer Staples | | | 0.70% | | | | | Materials | | | 9.67% | |
Energy | | | 6.93% | | | | | Utilities | | | 0.89% | |
Financials | | | 19.71% | | | | | Short-Term Investment | | | 1.46% | |
Health Care | | | 7.12% | | | | | Total | | | 100.00% | |
Industrials | | | 27.03% | | | | | | | | | |
| * | | A sector may comprise several industries. |
| ** | | Represents percent of total investments. |
9
Schedule of Investments
CLASSIC STOCK FUND November 30, 2011
| | | | | | | | |
| Investments | | Shares | | | Fair
Value
(000) | |
| COMMON STOCKS 98.68% | |
|
| Aerospace & Defense 4.29% | |
| Boeing Co. (The) | | | 78,596 | | | $ | 5,399 | |
| Goodrich Corp. | | | 79,000 | | | | 9,639 | |
| Honeywell International, Inc. | | | 140,800 | | | | 7,624 | |
| Precision Castparts Corp. | | | 49,900 | | | | 8,221 | |
| United Technologies Corp. | | | 138,900 | | | | 10,640 | |
| | | | | | | | |
| Total | | | | | | | 41,523 | |
| | | | | | | | |
|
| Automobiles 0.61% | |
| Ford Motor Co.* | | | 553,500 | | | | 5,867 | |
| | | | | | | | |
|
| Beverages 2.34% | |
| Coca-Cola Co. (The) | | | 138,900 | | | | 9,338 | |
| PepsiCo, Inc. | | | 207,100 | | | | 13,255 | |
| | | | | | | | |
| Total | | | | | | | 22,593 | |
| | | | | | | | |
|
| Biotechnology 0.79% | |
| Celgene Corp.* | | | 45,200 | | | | 2,851 | |
| Gilead Sciences, Inc.* | | | 61,024 | | | | 2,432 | |
| Human Genome Sciences, Inc.* | | | 302,900 | | | | 2,323 | |
| | | | | | | | |
| Total | | | | | | | 7,606 | |
| | | | | | | | |
|
| Capital Markets 3.07% | |
| Franklin Resources, Inc. | | | 16,000 | | | | 1,613 | |
| Goldman Sachs Group, Inc. (The) | | | 128,500 | | | | 12,318 | |
| Morgan Stanley | | | 365,100 | | | | 5,400 | |
| State Street Corp. | | | 58,700 | | | | 2,328 | |
| T. Rowe Price Group, Inc. | | | 141,600 | | | | 8,037 | |
| | | | | | | | |
| Total | | | | | | | 29,696 | |
| | | | | | | | |
|
| Chemicals 4.58% | |
| Celanese Corp. Series A | | | 152,500 | | | | 7,090 | |
| CF Industries Holdings, Inc. | | | 17,100 | | | | 2,390 | |
| Dow Chemical Co. (The) | | | 350,700 | | | | 9,718 | |
| E.I. du Pont de Nemours & Co. | | | 105,600 | | | | 5,039 | |
| LyondellBasell Industries NV Class A (Netherlands)(a) | | | 108,900 | | | $ | 3,558 | |
| Monsanto Co. | | | 82,845 | | | | 6,085 | |
| Mosaic Co. (The) | | | 157,100 | | | | 8,289 | |
| Potash Corp. of Saskatchewan, Inc. (Canada)(a) | | | 49,500 | | | | 2,145 | |
| | | | | | | | |
| Total | | | | | | | 44,314 | |
| | | | | | | | |
|
| Commercial Banks 4.39% | |
| Fifth Third Bancorp | | | 542,700 | | | | 6,561 | |
| PNC Financial Services Group, Inc. (The) | | | 140,600 | | | | 7,622 | |
| Regions Financial Corp. | | | 699,000 | | | | 2,873 | |
| SunTrust Banks, Inc. | | | 179,100 | | | | 3,247 | |
| U.S. Bancorp | | | 325,900 | | | | 8,447 | |
| Wells Fargo & Co. | | | 528,600 | | | | 13,670 | |
| | | | | | | | |
| Total | | | | | | | 42,420 | |
| | | | | | | | |
|
| Communications Equipment 2.40% | |
| Cisco Systems, Inc. | | | 250,100 | | | | 4,662 | |
| QUALCOMM, Inc. | | | 338,400 | | | | 18,544 | |
| | | | | | | | |
| Total | | | | | | | 23,206 | |
| | | | | | | | |
|
| Computers & Peripherals 6.85% | |
| Apple, Inc.* | | | 114,900 | | | | 43,915 | |
| Dell, Inc.* | | | 555,000 | | | | 8,747 | |
| EMC Corp.* | | | 457,900 | | | | 10,536 | |
| Hewlett-Packard Co. | | | 110,251 | | | | 3,081 | |
| | | | | | | | |
| Total | | | | | | | 66,279 | |
| | | | | | | | |
|
| Construction & Engineering 0.67% | |
| Fluor Corp. | | | 118,300 | | | | 6,485 | |
| | | | | | | | |
| | |
| Consumer Finance 1.12% | | | | | | | | |
Capital One Financial
Corp. | | | 243,200 | | | | 10,861 | |
| | | | | | | | |
|
| Diversified Financial Services 2.07% | |
| Bank of America Corp. | | | 520,648 | | | | 2,832 | |
| Citigroup, Inc. | | | 185,880 | | | | 5,108 | |
See Notes to Financial Statements.
10
Schedule of Investments (continued)
CLASSIC STOCK FUND November 30, 2011
| | | | | | | | |
| Investments | | Shares | | | Fair
Value
(000) | |
| Diversified Financial Services (continued) | |
| JPMorgan Chase & Co. | | | 391,028 | | | $ | 12,110 | |
| | | | | | | | |
| Total | | | | | | | 20,050 | |
| | | | | | | | |
|
| Diversified Telecommunication Services 2.87% | |
| AT&T, Inc. | | | 374,202 | | | | 10,844 | |
| CenturyLink, Inc. | | | 196,700 | | | | 7,380 | |
| Verizon Communications, Inc. | | | 252,100 | | | | 9,512 | |
| | | | | | | | |
| Total | | | | | | | 27,736 | |
| | | | | | | | |
|
| Electric: Utilities 0.67% | |
| NextEra Energy, Inc. | | | 59,832 | | | | 3,317 | |
| Progress Energy, Inc. | | | 59,100 | | | | 3,214 | |
| | | | | | | | |
| Total | | | | | | | 6,531 | |
| | | | | | | | |
|
| Electrical Equipment 1.25% | |
| Emerson Electric Co. | | | 231,878 | | | | 12,116 | |
| | | | | | | | |
|
| Electronic Equipment, Instruments & Components 0.37% | |
| Corning, Inc. | | | 270,803 | | | | 3,594 | |
| | | | | | | | |
|
| Energy Equipment & Services 2.33% | |
| National Oilwell Varco, Inc. | | | 58,000 | | | | 4,159 | |
| Schlumberger Ltd. | | | 196,475 | | | | 14,800 | |
| Weatherford International Ltd. (Switzerland)*(a) | | | 237,000 | | | | 3,593 | |
| | | | | | | | |
| Total | | | | | | | 22,552 | |
| | | | | | | | |
|
| Food & Staples Retailing 1.07% | |
| CVS Caremark Corp. | | | 209,748 | | | | 8,147 | |
| Wal-Mart Stores, Inc. | | | 37,100 | | | | 2,185 | |
| | | | | | | | |
| Total | | | | | | | 10,332 | |
| | | | | | | | |
|
| Food Products 0.94% | |
| Kellogg Co. | | | 184,600 | | | | 9,075 | |
| | | | | | | | |
|
| Health Care Equipment & Supplies 1.04% | |
| Baxter International, Inc. | | | 194,987 | | | | 10,073 | |
| | | | | | | | |
| Health Care Providers & Services 3.06% | |
| Express Scripts, Inc.* | | | 270,500 | | | $ | 12,348 | |
| HCA Holdings, Inc.* | | | 136,100 | | | | 3,318 | |
| UnitedHealth Group, Inc. | | | 241,400 | | | | 11,773 | |
| WellPoint, Inc. | | | 30,200 | | | | 2,131 | |
| | | | | | | | |
| Total | | | | | | | 29,570 | |
| | | | | | | | |
|
| Health Care Technology 0.47% | |
| SXC Health Solutions Corp.* | | | 77,600 | | | | 4,564 | |
| | | | | | | | |
|
| Hotels, Restaurants & Leisure 3.31% | |
| Carnival Corp. | | | 120,300 | | | | 3,994 | |
| Hyatt Hotels Corp. Class A* | | | 109,339 | | | | 3,902 | |
| Marriott International, Inc. Class A | | | 111,778 | | | | 3,423 | |
| MGM Resorts International* | | | 779,600 | | | | 8,022 | |
| Starwood Hotels & Resorts Worldwide, Inc. | | | 89,200 | | | | 4,253 | |
| Wynn Resorts Ltd. | | | 69,600 | | | | 8,391 | |
| | | | | | | | |
| Total | | | | | | | 31,985 | |
| | | | | | | | |
|
| Household Products 2.87% | |
| Colgate-Palmolive Co. | | | 106,455 | | | | 9,741 | |
Procter & Gamble Co.
(The) | | | 278,597 | | | | 17,989 | |
| | | | | | | | |
| Total | | | | | | | 27,730 | |
| | | | | | | | |
|
| Industrial Conglomerates 0.99% | |
| General Electric Co. | | | 603,300 | | | | 9,599 | |
| | | | | | | | |
|
| Information Technology Services 0.54% | |
| MasterCard, Inc. Class A | | | 14,000 | | | | 5,244 | |
| | | | | | | | |
|
| Insurance 1.90% | |
| Chubb Corp. (The) | | | 82,500 | | | | 5,564 | |
| MetLife, Inc. | | | 179,400 | | | | 5,647 | |
| Prudential Financial, Inc. | | | 140,800 | | | | 7,130 | |
| | | | | | | | |
| Total | | | | | | | 18,341 | |
| | | | | | | | |
See Notes to Financial Statements.
11
Schedule of Investments (continued)
CLASSIC STOCK FUND November 30, 2011
| | | | | | | | |
| Investments | | Shares | | | Fair
Value
(000) | |
| Internet & Catalog Retail 0.14% | |
| Amazon.com, Inc.* | | | 7,200 | | | $ | 1,385 | |
| | | | | | | | |
|
| Internet Software & Services 3.05% | |
| Google, Inc. Class A* | | | 37,900 | | | | 22,717 | |
| Monster Worldwide, Inc.* | | | 929,004 | | | | 6,791 | |
| | | | | | | | |
| Total | | | | | | | 29,508 | |
| | | | | | | | |
|
| Machinery 2.16% | |
| Caterpillar, Inc. | | | 50,600 | | | | 4,953 | |
| Dover Corp. | | | 108,600 | | | | 5,970 | |
| Eaton Corp. | | | 78,500 | | | | 3,525 | |
| PACCAR, Inc. | | | 158,700 | | | | 6,438 | |
| | | | | | | | |
| Total | | | | | | | 20,886 | |
| | | | | | | | |
|
| Media 2.24% | |
| Interpublic Group of Cos., Inc. (The) | | | 964,400 | | | | 9,046 | |
| Time Warner, Inc. | | | 189,600 | | | | 6,602 | |
| Walt Disney Co. (The) | | | 167,137 | | | | 5,992 | |
| | | | | | | | |
| Total | | | | | | | 21,640 | |
| | | | | | | | |
|
| Metals & Mining 2.20% | |
| Freeport-McMoRan Copper & Gold, Inc. | | | 227,630 | | | | 9,014 | |
| Newmont Mining Corp. | | | 70,000 | | | | 4,821 | |
| Reliance Steel & Aluminum Co. | | | 67,700 | | | | 3,325 | |
| United States Steel Corp. | | | 150,800 | | | | 4,117 | |
| | | | | | | | |
| Total | | | | | | | 21,277 | |
| | | | | | | | |
|
| Multi-Line Retail 0.94% | |
| Macy’s, Inc. | | | 88,500 | | | | 2,861 | |
| Target Corp. | | | 119,157 | | | | 6,280 | |
| | | | | | | | |
| Total | | | | | | | 9,141 | |
| | | | | | | | |
|
| Multi-Utilities 0.78% | |
| Dominion Resources, Inc. | | | 88,300 | | | | 4,558 | |
| PG&E Corp. | | | 76,800 | | | | 2,983 | |
| | | | | | | | |
| Total | | | | | | | 7,541 | |
| | | | | | | | |
| Oil, Gas & Consumable Fuels 10.52% | |
| Anadarko Petroleum Corp. | | | 107,500 | | | $ | 8,737 | |
| Apache Corp. | | | 62,400 | | | | 6,205 | |
| Cabot Oil & Gas Corp. | | | 39,500 | | | | 3,499 | |
| Chevron Corp. | | | 145,200 | | | | 14,929 | |
Continental Resources,
Inc.* | | | 75,600 | | | | 5,337 | |
| Devon Energy Corp. | | | 54,061 | | | | 3,539 | |
| EOG Resources, Inc. | | | 26,200 | | | | 2,718 | |
| EQT Corp. | | | 36,000 | | | | 2,232 | |
| Exxon Mobil Corp. | | | 243,415 | | | | 19,580 | |
| Hess Corp. | | | 153,600 | | | | 9,250 | |
| Noble Energy, Inc. | | | 32,600 | | | | 3,207 | |
| Occidental Petroleum Corp. | | | 80,200 | | | | 7,932 | |
| Range Resources Corp. | | | 35,400 | | | | 2,539 | |
| Southwestern Energy Co.* | | | 79,800 | | | | 3,036 | |
| Suncor Energy, Inc. (Canada)(a) | | | 300,793 | | | | 9,030 | |
| | | | | | | | |
| Total | | | | | | | 101,770 | |
| | | | | | | | |
|
| Pharmaceuticals 5.94% | |
| Abbott Laboratories | | | 140,600 | | | | 7,670 | |
| Johnson & Johnson | | | 312,500 | | | | 20,225 | |
| Merck & Co., Inc. | | | 286,300 | | | | 10,235 | |
| Pfizer, Inc. | | | 961,700 | | | | 19,301 | |
| | | | | | | | |
| Total | | | | | | | 57,431 | |
| | | | | | | | |
|
| Real Estate Investment Trusts 0.79% | |
Host Hotels & Resorts,
Inc. | | | 541,761 | | | | 7,666 | |
| | | | | | | | |
|
| Road & Rail 2.72% | |
Hertz Global Holdings,
Inc.* | | | 552,900 | | | | 6,253 | |
| Union Pacific Corp. | | | 194,100 | | | | 20,072 | |
| | | | | | | | |
| Total | | | | | | | 26,325 | |
| | | | | | | | |
|
| Semiconductors & Semiconductor Equipment 2.29% | |
| Broadcom Corp. Class A* | | | 108,000 | | | | 3,277 | |
| Intel Corp. | | | 390,700 | | | | 9,732 | |
See Notes to Financial Statements.
12
Schedule of Investments (concluded)
CLASSIC STOCK FUND November 30, 2011
| | | | | | | | |
| Investments | | Shares | | | Fair
Value
(000) | |
| Semiconductors & Semiconductor Equipment (continued) | |
| Micron Technology, Inc.* | | | 747,700 | | | $ | 4,479 | |
| Texas Instruments, Inc. | | | 154,400 | | | | 4,648 | |
| | | | | | | | |
| Total | | | | | | | 22,136 | |
| | | | | | | | |
|
| Software 4.05% | |
| Activision Blizzard, Inc. | | | 36,826 | | | | 458 | |
| Adobe Systems, Inc.* | | | 266,753 | | | | 7,314 | |
| Microsoft Corp. | | | 565,400 | | | | 14,463 | |
| Oracle Corp. | | | 282,900 | | | | 8,869 | |
| VMware, Inc. Class A* | | | 83,400 | | | | 8,063 | |
| | | | | | | | |
| Total | | | | | | | 39,167 | |
| | | | | | | | |
|
| Specialty Retail 2.58% | |
Dick’s Sporting Goods,
Inc.* | | | 362,225 | | | | 14,239 | |
| Home Depot, Inc. (The) | | | 272,400 | | | | 10,684 | |
| | | | | | | | |
| Total | | | | | | | 24,923 | |
| | | | | | | | |
|
| Textiles, Apparel & Luxury Goods 0.61% | |
| Coach, Inc. | | | 61,800 | | | | 3,868 | |
| PVH Corp. | | | 30,200 | | | | 2,050 | |
| | | | | | | | |
| Total | | | | | | | 5,918 | |
| | | | | | | | |
|
| Tobacco 0.81% | |
| Altria Group, Inc. | | | 274,600 | | | | 7,878 | |
| | | | | | | | |
Total Common Stocks
(cost $794,978,085) | | | | | | | 954,534 | |
| | | | | | | | |
| | | | | | | | |
| Investments | | Principal
Amount
(000) | | | Fair
Value
(000) | |
| SHORT-TERM INVESTMENT 0.71% | |
|
| Repurchase Agreement | |
| Repurchase Agreement dated 11/30/2011, 0.01% due 12/1/2011 with Fixed Income Clearing Corp. collateralized by $6,880,000 of Federal Home Loan Bank at 1.75% due 8/22/2012; value: $6,991,800; proceeds: $6,849,983 (cost $6,849,981) | | $ | 6,850 | | | $ | 6,850 | |
| | | | | | | | |
| Total Investments in Securities 99.39% (cost $801,828,066) | | | | | | | 961,384 | |
| | | | | | | | |
| Cash and Other Assets in Excess of Liabilities 0.61% | | | | | | | 5,890 | |
| | | | | | | | |
| Net Assets 100.00% | | | | | | $ | 967,274 | |
| | | | | | | | |
| | |
| * | | Non-income producing security. |
| (a) | | Foreign security traded in U.S. dollars. |
See Notes to Financial Statements.
13
Schedule of Investments
SMALL CAP VALUE FUND November 30, 2011
| | | | | | | | |
| Investments | | Shares | | | Fair
Value
(000) | |
| COMMON STOCKS 97.84% | |
|
| Aerospace & Defense 2.75% | |
| AAR Corp. | | | 1,418,764 | | | $ | 25,907 | |
| Hexcel Corp.* | | | 1,544,173 | | | | 38,481 | |
| Moog, Inc. Class A* | | | 865,262 | | | | 36,185 | |
| | | | | | | | |
| Total | | | | | | | 100,573 | |
| | | | | | | | |
|
| Air Freight & Logistics 1.34% | |
| Atlas Air Worldwide Holdings, Inc.* | | | 615,200 | | | | 25,992 | |
| Hub Group, Inc. Class A* | | | 769,645 | | | | 22,920 | |
| | | | | | | | |
| Total | | | | | | | 48,912 | |
| | | | | | | | |
|
| Capital Markets 0.69% | |
| Stifel Financial Corp.* | | | 800,800 | | | | 25,385 | |
| | | | | | | | |
|
| Chemicals 3.93% | |
| Cabot Corp. | | | 2,109,500 | | | | 69,993 | |
Koppers Holdings,
Inc.(a) | | | 1,203,100 | | | | 39,738 | |
| Olin Corp. | | | 1,794,800 | | | | 34,101 | |
| | | | | | | | |
| Total | | | | | | | 143,832 | |
| | | | | | | | |
|
| Commercial Banks 9.14% | |
| City National Corp. | | | 798,700 | | | | 33,881 | |
| Columbia Banking System, Inc. | | | 1,736,576 | | | | 31,258 | |
| CVB Financial Corp. | | | 3,919,800 | | | | 38,532 | |
| First Financial Bancorp | | | 1,681,100 | | | | 26,696 | |
| IBERIABANK Corp. | | | 756,800 | | | | 37,704 | |
| PacWest Bancorp | | | 1,529,100 | | | | 28,564 | |
| Signature Bank* | | | 719,874 | | | | 42,062 | |
| Susquehanna Bancshares, Inc. | | | 3,553,300 | | | | 28,142 | |
| SVB Financial Group* | | | 629,600 | | | | 29,617 | |
| Texas Capital Bancshares, Inc.* | | | 1,315,354 | | | | 37,961 | |
| | | | | | | | |
| Total | | | | | | | 334,417 | |
| | | | | | | | |
| Commercial Services & Supplies 0.73% | |
| Korn/Ferry International* | | | 1,584,800 | | | $ | 26,672 | |
| | | | | | | | |
|
| Construction & Engineering 2.93% | |
| Chicago Bridge & Iron Co. NV (Netherlands)(b) | | | 1,766,000 | | | | 73,024 | |
| EMCOR Group, Inc. | | | 1,328,100 | | | | 34,039 | |
| | | | | | | | |
| Total | | | | | | | 107,063 | |
| | | | | | | | |
|
| Containers & Packaging 2.63% | |
| AptarGroup, Inc. | | | 564,900 | | | | 28,691 | |
| Greif, Inc. Class A | | | 761,787 | | | | 35,515 | |
| Silgan Holdings, Inc. | | | 824,654 | | | | 32,112 | |
| | | | | | | | |
| Total | | | | | | | 96,318 | |
| | | | | | | | |
|
| Electrical Equipment 1.31% | |
| II-VI, Inc.* | | | 1,168,630 | | | | 22,870 | |
| Regal Beloit Corp. | | | 476,760 | | | | 25,106 | |
| | | | | | | | |
| Total | | | | | | | 47,976 | |
| | | | | | | | |
|
| Electronic Equipment, Instruments & Components 7.31% | |
| Anixter International, Inc.* | | | 757,902 | | | | 46,543 | |
| Cognex Corp. | | | 893,500 | | | | 31,871 | |
| Coherent, Inc.* | | | 796,700 | | | | 40,472 | |
| Elster Group SE ADR* | | | 1,436,300 | | | | 18,499 | |
| Littelfuse, Inc. | | | 1,000,334 | | | | 46,756 | |
| Plexus Corp.* | | | 146,514 | | | | 3,978 | |
| Rogers Corp.* | | | 633,335 | | | | 25,143 | |
| ScanSource, Inc.*(a) | | | 1,547,727 | | | | 54,341 | |
| | | | | | | | |
| Total | | | | | | | 267,603 | |
| | | | | | | | |
|
| Energy Equipment & Services 6.12% | |
| Bristow Group, Inc. | | | 703,169 | | | | 32,388 | |
| C&J Energy Services, Inc.* | | | 920,100 | | | | 18,071 | |
| Complete Production Services, Inc.* | | | 1,184,900 | | | | 41,317 | |
See Notes to Financial Statements.
14
Schedule of Investments (continued)
SMALL CAP VALUE FUND November 30, 2011
| | | | | | | | |
| Investments | | Shares | | | Fair
Value
(000) | |
| Energy Equipment & Services (continued) | |
| GulfMark Offshore, Inc. Class A* | | | 762,077 | | | $ | 34,164 | |
| Key Energy Services, Inc.* | | | 2,511,400 | | | | 37,922 | |
| Lufkin Industries, Inc. | | | 331,100 | | | | 23,203 | |
| Superior Energy Services, Inc.* | | | 1,242,698 | | | | 36,921 | |
| | | | | | | | |
| Total | | | | | | | 223,986 | |
| | | | | | | | |
|
| Food Products 0.70% | |
| Dole Food Co., Inc.* | | | 3,019,226 | | | | 25,513 | |
| | | | | | | | |
|
| Gas Utilities 0.88% | |
| New Jersey Resources Corp. | | | 680,500 | | | | 32,195 | |
| | | | | | | | |
|
| Health Care Equipment & Supplies 1.59% | |
| Haemonetics Corp.* | | | 467,100 | | | | 27,667 | |
| Invacare Corp. | | | 1,489,300 | | | | 30,590 | |
| | | | | | | | |
| Total | | | | | | | 58,257 | |
| | | | | | | | |
|
| Health Care Providers & Services 3.39% | |
| Centene Corp.* | | | 894,524 | | | | 34,627 | |
| HealthSpring, Inc.* | | | 951,200 | | | | 51,955 | |
| Mednax, Inc.* | | | 558,000 | | | | 37,609 | |
| | | | | | | | |
| Total | | | | | | | 124,191 | |
| | | | | | | | |
|
| Hotels, Restaurants & Leisure 2.32% | |
| Cheesecake Factory, Inc. (The)* | | | 1,203,900 | | | | 34,142 | |
| Gaylord Entertainment Co.* | | | 1,196,692 | | | | 25,394 | |
| Orient-Express Hotels Ltd. Class A* | | | 3,510,400 | | | | 25,240 | |
| | | | | | | | |
| Total | | | | | | | 84,776 | |
| | | | | | | | |
|
| Information Technology Services 2.55% | |
| FleetCor Technologies, Inc.* | | | 1,299,624 | | | | 36,909 | |
| MAXIMUS, Inc. | | | 1,359,778 | | | | 56,567 | |
| | | | | | | | |
| Total | | | | | | | 93,476 | |
| | | | | | | | |
| Insurance 3.50% | |
Alterra Capital
Holdings Ltd. | | | 2,235,080 | | | $ | 51,295 | |
| Navigators Group, Inc. (The)*(a) | | | 839,600 | | | | 39,201 | |
| Validus Holdings Ltd. | | | 1,245,900 | | | | 37,489 | |
| | | | | | | | |
| Total | | | | | | | 127,985 | |
| | | | | | | | |
|
| Life Sciences Tools & Services 0.90% | |
| PAREXEL International Corp.* | | | 1,645,600 | | | | 32,994 | |
| | | | | | | | |
|
| Machinery 4.14% | |
| Kennametal, Inc. | | | 801,200 | | | | 30,534 | |
| Titan International, Inc. | | | 1,506,800 | | | | 32,457 | |
| TriMas Corp.*(a) | | | 1,734,101 | | | | 35,393 | |
| WABCO Holdings, Inc.* | | | 716,400 | | | | 33,678 | |
| Watts Water Technologies, Inc. Class A | | | 504,300 | | | | 19,264 | |
| | | | | | | | |
| Total | | | | | | | 151,326 | |
| | | | | | | | |
|
| Marine 0.86% | |
| Kirby Corp.* | | | 491,000 | | | | 31,562 | |
| | | | | | | | |
|
| Metals & Mining 3.04% | |
| Compass Minerals International, Inc. | | | 489,400 | | | | 37,513 | |
| Reliance Steel & Aluminum Co. | | | 961,600 | | | | 47,224 | |
| RTI International Metals, Inc.* | | | 968,622 | | | | 26,443 | |
| | | | | | | | |
| Total | | | | | | | 111,180 | |
| | | | | | | | |
|
| Oil, Gas & Consumable Fuels 0.77% | |
SandRidge Energy,
Inc.* | | | 3,813,707 | | | | 28,031 | |
| | | | | | | | |
|
| Pharmaceuticals 1.18% | |
| Par Pharmaceutical Cos., Inc.* | | | 1,332,000 | | | | 43,170 | |
| | | | | | | | |
See Notes to Financial Statements.
15
Schedule of Investments (continued)
SMALL CAP VALUE FUND November 30, 2011
| | | | | | | | |
| Investments | | Shares | | | Fair
Value
(000) | |
| Professional Services 1.61% | |
| FTI Consulting, Inc.* | | | 778,100 | | | $ | 33,373 | |
| TrueBlue, Inc.* | | | 1,988,400 | | | | 25,590 | |
| | | | | | | | |
| Total | | | | | | | 58,963 | |
| | | | | | | | |
|
| Real Estate Investment Trusts 4.93% | |
| Alexandria Real Estate Equities, Inc. | | | 386,700 | | | | 25,352 | |
| Brandywine Realty Trust | | | 2,791,300 | | | | 24,312 | |
| Duke Realty Corp. | | | 2,047,300 | | | | 23,749 | |
| Entertainment Properties Trust | | | 1,072,400 | | | | 47,936 | |
Pebblebrook Hotel
Trust | | | 2,016,600 | | | | 37,347 | |
| Weingarten Realty Investors | | | 1,054,600 | | | | 21,820 | |
| | | | | | | | |
| Total | | | | | | | 180,516 | |
| | | | | | | | |
|
| Road & Rail 4.89% | |
| Genesee & Wyoming, Inc. Class A* | | | 565,326 | | | | 34,524 | |
| Heartland Express, Inc. | | | 2,494,814 | | | | 34,304 | |
| Knight Transportation, Inc. | | | 2,067,600 | | | | 30,931 | |
| Ryder System, Inc. | | | 1,047,900 | | | | 54,784 | |
| Werner Enterprises, Inc. | | | 1,043,800 | | | | 24,467 | |
| | | | | | | | |
| Total | | | | | | | 179,010 | |
| | | | | | | | |
|
| Semiconductors & Semiconductor Equipment 5.18% | |
| Cabot Microelectronics Corp.* | | | 663,052 | | | | 27,563 | |
| Diodes, Inc.* | | | 1,544,600 | | | | 31,664 | |
| Hittite Microwave Corp.* | | | 586,300 | | | | 31,901 | |
| PMC-Sierra, Inc.* | | | 4,213,500 | | | | 23,554 | |
| Silicon Laboratories, Inc.* | | | 916,600 | | | | 39,615 | |
| Teradyne, Inc.* | | | 2,623,400 | | | | 35,311 | |
| | | | | | | | |
| Total | | | | | | | 189,608 | |
| | | | | | | | |
| Software 1.30% | |
| Jack Henry & Associates, Inc. | | | 1,431,100 | | | $ | 47,527 | |
| | | | | | | | |
|
| Specialty Retail 7.64% | |
| Ascena Retail Group, Inc.* | | | 1,215,261 | | | | 33,444 | |
| Children’s Place Retail Stores, Inc. (The)* | | | 701,000 | | | | 37,763 | |
| Express, Inc. | | | 997,000 | | | | 22,622 | |
| Genesco, Inc.* | | | 782,000 | | | | 46,177 | |
| Jos. A. Bank Clothiers, Inc.* | | | 752,300 | | | | 37,073 | |
| Men’s Wearhouse, Inc. (The) | | | 872,800 | | | | 24,290 | |
| Penske Automotive Group, Inc. | | | 1,919,800 | | | | 38,953 | |
| Rent-A-Center, Inc. | | | 1,092,016 | | | | 39,258 | |
| | | | | | | | |
| Total | | | | | | | 279,580 | |
| | | | | | | | |
|
| Thrifts & Mortgage Finance 1.31% | |
| People’s United Financial, Inc. | | | 2,679,348 | | | | 33,358 | |
| Washington Federal, Inc. | | | 1,106,800 | | | | 14,399 | |
| | | | | | | | |
| Total | | | | | | | 47,757 | |
| | | | | | | | |
|
| Trading Companies & Distributors 6.28% | |
| Applied Industrial Technologies, Inc. | | | 967,000 | | | | 33,391 | |
Beacon Roofing
Supply, Inc.* | | | 1,707,700 | | | | 33,351 | |
| GATX Corp. | | | 1,259,250 | | | | 53,757 | |
| RSC Holdings, Inc.* | | | 3,391,700 | | | | 41,243 | |
| TAL International Group, Inc. | | | 1,313,800 | | | | 34,579 | |
| WESCO International, Inc.* | | | 658,200 | | | | 33,542 | |
| | | | | | | | |
| Total | | | | | | | 229,863 | |
| | | | | | | | |
| Total Common Stocks (cost $2,953,020,985) | | | | | | | 3,580,217 | |
| | | | | | | | |
See Notes to Financial Statements.
16
Schedule of Investments (concluded)
SMALL CAP VALUE FUND November 30, 2011
| | | | | | | | |
| Investments | | Principal
Amount
(000) | | | Fair
Value
(000) | |
| SHORT-TERM INVESTMENT 1.44% | |
|
| Repurchase Agreement | |
| Repurchase Agreement dated 11/30/2011, 0.01% due 12/1/2011 with Fixed Income Clearing Corp. collateralized by $53,900,000 of Federal Home Loan Bank at 0.38% due 8/22/2012; value: $53,967,375; proceeds: $52,905,541 (cost $52,905,526) | | $ | 52,906 | | | $ | 52,906 | |
| | | | | | | | |
| Total Investments in Securities 99.28% (cost $3,005,926,511) | | | | | | | 3,633,123 | |
| | | | | | | | |
| Other Assets in Excess of Liabilities 0.72% | | | | | | | 26,262 | |
| | | | | | | | |
| Net Assets 100.00% | | | | | | $ | 3,659,385 | |
| | | | | | | | |
| | |
| ADR | | American Depositary Receipt. |
| * | | Non-income producing security. |
| (a) | | Affiliated issuer (holding represents 5% or more of the underlying issuer’s outstanding voting shares). (See Note 9). |
| (b) | | Foreign security traded in U.S. dollars. |
See Notes to Financial Statements.
17
Statements of Assets and Liabilities
November 30, 2011
| | | | | | | | |
| | | Classic
Stock Fund | | | Small Cap
Value Fund | |
ASSETS: | | | | | | | | |
Investments in unaffiliated issuers, at cost | | $ | 801,828,066 | | | $ | 2,867,979,398 | |
Investments in affiliated issuers, at cost | | | – | | | | 137,947,113 | |
Investments in unaffiliated issuers, at fair value | | $ | 961,383,883 | | | $ | 3,464,450,051 | |
Investments in affiliated issuers, at fair value | | | – | | | | 168,673,013 | |
Cash | | | 63,113 | | | | – | |
Receivables: | | | | | | | | |
Investment securities sold | | | 6,408,103 | | | | 36,906,403 | |
Interest and dividends | | | 3,314,550 | | | | 4,610,911 | |
Capital shares sold | | | 500,732 | | | | 2,227,156 | |
From advisor (See Note 3) | | | 240,783 | | | | – | |
Prepaid expenses and other assets | | | 46,469 | | | | 116,803 | |
Total assets | | | 971,957,633 | | | | 3,676,984,337 | |
LIABILITIES: | | | | | | | | |
Payables: | | | | | | | | |
Investment securities purchased | | | 2,196,072 | | | | 8,412,556 | |
Capital shares reacquired | | | 1,279,766 | | | | 4,926,423 | |
Management fee | | | 549,992 | | | | 2,133,074 | |
12b-1 distribution fees | | | 231,849 | | | | 520,536 | |
Directors’ fees | | | 101,178 | | | | 337,712 | |
Fund administration | | | 31,428 | | | | 117,193 | |
To affiliates (See Note 3) | | | 41,565 | | | | 31,369 | |
Accrued expenses and other liabilities | | | 252,138 | | | | 1,120,061 | |
Total liabilities | | | 4,683,988 | | | | 17,598,924 | |
NET ASSETS | | $ | 967,273,645 | | | $ | 3,659,385,413 | |
COMPOSITION OF NET ASSETS: | | | | | | | | |
Paid-in capital | | $ | 910,892,982 | | | $ | 3,161,878,627 | |
Undistributed (distributions in excess of) net investment income | | | 7,237,919 | | | | (337,712 | ) |
Accumulated net realized loss on investments and foreign currency related transactions | | | (110,412,986 | ) | | | (129,352,055 | ) |
Net unrealized appreciation on investments and translation of assets and liabilities denominated in foreign currencies | | | 159,555,730 | | | | 627,196,553 | |
Net Assets | | $ | 967,273,645 | | | $ | 3,659,385,413 | |
See Notes to Financial Statements.
18
Statements of Assets and Liabilities (concluded)
November 30, 2011
| | | | | | | | |
| | | Classic Stock Fund | | | Small Cap Value Fund | |
Net assets by class: | | | | | | | | |
Class A Shares | | $ | 498,545,416 | | | $ | 1,470,063,755 | |
Class B Shares | | $ | 25,828,971 | | | $ | 9,612,267 | |
Class C Shares | | $ | 69,263,201 | | | $ | 41,597,063 | |
Class F Shares | | $ | 26,568,197 | | | $ | 32,596,841 | |
Class I Shares | | $ | 327,603,370 | | | $ | 1,855,748,427 | |
Class P Shares | | $ | 2,389,228 | | | $ | 231,654,939 | |
Class R2 Shares | | $ | 2,771,150 | | | $ | 7,204,878 | |
Class R3 Shares | | $ | 14,304,112 | | | $ | 10,907,243 | |
Outstanding shares by class: | | | | | | | | |
Class A Shares (200 million and 300 million shares of common stock authorized, $.001 par value) | | | 18,420,861 | | | | 49,532,833 | |
Class B Shares (30 million shares of common stock authorized, $.001 par value) | | | 1,005,848 | | | | 376,120 | |
Class C Shares (20 million shares of common stock authorized, $.001 par value) | | | 2,690,752 | | | | 1,624,360 | |
Class F Shares (30 million shares of common stock authorized, $.001 par value) | | | 983,654 | | | | 1,099,913 | |
Class I Shares (30 million and 200 million shares of common stock authorized, $.001 par value) | | | 12,056,608 | | | | 58,986,335 | |
Class P Shares (20 million and 50 million shares of common stock authorized, $.001 par value) | | | 87,932 | | | | 7,903,885 | |
Class R2 Shares (30 million shares of common stock authorized, $.001 par value) | | | 102,997 | | | | 245,301 | |
Class R3 Shares (30 million shares of common stock authorized, $.001 par value) | | | 534,180 | | | | 371,296 | |
Net asset value, offering and redemption price per share (Net assets divided by outstanding shares): | | | | | | | | |
Class A Shares-Net asset value | | | $27.06 | | | | $29.68 | |
Class A Shares-Maximum offering price
(Net asset value plus sales charge of 5.75%) | | | $28.71 | | | | $31.49 | |
Class B Shares-Net asset value | | | $25.68 | | | | $25.56 | |
Class C Shares-Net asset value | | | $25.74 | | | | $25.61 | |
Class F Shares-Net asset value | | | $27.01 | | | | $29.64 | |
Class I Shares-Net asset value | | | $27.17 | | | | $31.46 | |
Class P Shares-Net asset value | | | $27.17 | | | | $29.31 | |
Class R2 Shares-Net asset value | | | $26.91 | | | | $29.37 | |
Class R3 Shares-Net asset value | | | $26.78 | | | | $29.38 | |
See Notes to Financial Statements.
19
Statements of Operations
For the Year Ended November 30, 2011
| | | | | | | | |
| | | Classic
Stock Fund | | | Small Cap
Value Fund | |
Investment income: | | | | | | | | |
Dividends from unaffiliated issuers (net of foreign withholding taxes of $112,788 and $45,143, respectively) | | $ | 17,803,688 | | | $ | 38,525,465 | |
Dividends from affiliated issuers | | | – | | | | 1,960,623 | |
Interest | | | 3,095 | | | | 15,529 | |
Total investment income | | | 17,806,783 | | | | 40,501,617 | |
Expenses: | | | | | | | | |
Management fee | | | 7,625,034 | | | | 28,845,643 | |
12b-1 distribution plan-Class A | | | 1,974,287 | | | | 5,037,793 | |
12b-1 distribution plan-Class B | | | 321,806 | | | | 125,098 | |
12b-1 distribution plan-Class C | | | 819,786 | | | | 464,295 | |
12b-1 distribution plan-Class F | | | 40,023 | | | | 30,961 | |
12b-1 distribution plan-Class P | | | 14,130 | | | | 1,220,987 | |
12b-1 distribution plan-Class R2 | | | 15,920 | | | | 23,260 | |
12b-1 distribution plan-Class R3 | | | 66,197 | | | | 44,621 | |
Shareholder servicing | | | 1,335,087 | | | | 5,596,986 | |
Professional | | | 52,251 | | | | 71,763 | |
Reports to shareholders | | | 88,239 | | | | 201,569 | |
Fund administration | | | 438,946 | | | | 1,591,180 | |
Custody | | | 12,497 | | | | 63,527 | |
Directors’ fees | | | 8,006 | | | | 28,613 | |
Registration | | | 128,390 | | | | 165,702 | |
Subsidy (See Note 3) | | | 592,482 | | | | 421,882 | |
Other | | | 34,964 | | | | 109,345 | |
Gross expenses | | | 13,568,045 | | | | 44,043,225 | |
Expense reductions (See Note 7) | | | (814 | ) | | | (4,113 | ) |
Management fee waived (See Note 3) | | | (3,401,686 | ) | | | – | |
Net expenses | | | 10,165,545 | | | | 44,039,112 | |
Net investment income (loss) | | | 7,641,238 | | | | (3,537,495 | ) |
Net realized and unrealized gain (loss): | | | | | | | | |
Net realized gain on investments and foreign currency related transactions in unaffiliated issuers | | | 20,516,793 | | | | 207,778,582 | |
Net realized loss from investments in affiliated issuers | | | – | | | | (7,622,370 | ) |
Net change in unrealized appreciation/depreciation on investments and translation of assets and liabilities denominated in foreign currencies | | | (46,616,390 | ) | | | (101,615,052 | ) |
Net realized and unrealized gain (loss) | | | (26,099,597 | ) | | | 98,541,160 | |
Increase (Decrease) in Net Assets Resulting From Operations | | $ | (18,458,359 | ) | | $ | 95,003,665 | |
See Notes to Financial Statements.
20
Statements of Changes in Net Assets
| | | | | | | | |
| | | Classic Stock Fund | |
| INCREASE (DECREASE) IN NET ASSETS | | For the Year Ended
November 30, 2011 | | | For the Year Ended
November 30, 2010 | |
Operations: | | | | | | | | |
Net investment income | | $ | 7,641,238 | | | $ | 4,641,452 | |
Net realized gain (loss) on investments and foreign currency related transactions | | | 20,516,793 | | | | (6,353,262 | ) |
Net change in unrealized appreciation/depreciation on investments and translation of assets and liabilities denominated in foreign currencies | | | (46,616,390 | ) | | | 81,821,955 | |
Net increase (decrease) in net assets resulting from operations | | | (18,458,359 | ) | | | 80,110,145 | |
Distributions to shareholders from: | | | | | | | | |
Net investment income | | | | | | | | |
Class A | | | (2,116,930 | ) | | | (3,655,628 | ) |
Class B | | | – | | | | (17,245 | ) |
Class C | | | – | | | | (111,594 | ) |
Class F | | | (289,959 | ) | | | (92,128 | ) |
Class I | | | (2,380,907 | ) | | | (2,438,608 | ) |
Class P | | | (7,511 | ) | | | (20,518 | ) |
Class R2 | | | (5,019 | ) | | | (4,815 | ) |
Class R3 | | | (35,708 | ) | | | (17,121 | ) |
Total distributions to shareholders | | | (4,836,034 | ) | | | (6,357,657 | ) |
Capital share transactions (Net of share conversions) (See Note 12): | |
Net proceeds from sales of shares | | | 184,377,138 | | | | 237,299,674 | |
Reinvestment of distributions | | | 4,605,127 | | | | 6,102,899 | |
Cost of shares reacquired | | | (279,604,725 | ) | | | (249,911,507 | ) |
Net decrease in net assets resulting from capital share transactions | | | (90,622,460 | ) | | | (6,508,934 | ) |
Net increase (decrease) in net assets | | | (113,916,853 | ) | | | 67,243,554 | |
NET ASSETS: | | | | | | | | |
Beginning of year | | $ | 1,081,190,498 | | | $ | 1,013,946,944 | |
End of year | | $ | 967,273,645 | | | $ | 1,081,190,498 | |
Undistributed net investment income | | $ | 7,237,919 | | | $ | 4,470,985 | |
See Notes to Financial Statements.
21
Statements of Changes in Net Assets (concluded)
| | | | | | | | |
| | | Small Cap Value Fund | |
| INCREASE (DECREASE) IN NET ASSETS | | For the Year Ended
November 30, 2011 | | | For the Year Ended
November 30, 2010 | |
Operations: | | | | | | | | |
Net investment income (loss) | | $ | (3,537,495 | ) | | $ | 3,440,861 | |
Net realized gain on investments in affiliated and unaffiliated issuers | | | 200,156,212 | | | | 290,044,038 | |
Net change in unrealized appreciation/depreciation on investments | | | (101,615,052 | ) | | | 485,527,770 | |
Net increase in net assets resulting from operations | | | 95,003,665 | | | | 779,012,669 | |
Distributions to shareholders from: | | | | | | | | |
Net investment income | | | | | | | | |
Class A | | | (77,931 | ) | | | – | |
Class F | | | (57,552 | ) | | | – | |
Class I | | | (4,795,036 | ) | | | – | |
Total distributions to shareholders | | | (4,930,519 | ) | | | – | |
Capital share transactions (Net of share conversions) (See Note 12): | |
Net proceeds from sales of shares | | | 868,324,020 | | | | 727,415,003 | |
Reinvestment of distributions | | | 4,629,503 | | | | – | |
Cost of shares reacquired | | | (995,392,612 | ) | | | (788,411,184 | ) |
Net decrease in net assets resulting from capital share transactions | | | (122,439,089 | ) | | | (60,996,181 | ) |
Net increase (decrease) in net assets | | | (32,365,943 | ) | | | 718,016,488 | |
NET ASSETS: | | | | | | | | |
Beginning of year | | $ | 3,691,751,356 | | | $ | 2,973,734,868 | |
End of year | | $ | 3,659,385,413 | | | $ | 3,691,751,356 | |
Undistributed (distributions in excess of) net investment income | | $ | (337,712 | ) | | $ | 3,055,553 | |
See Notes to Financial Statements.
22
Financial Highlights
CLASSIC STOCK FUND
| | | | | | | | | | | | | | | | | | | | |
| | | Class A Shares | |
| | | Year Ended 11/30 | |
| | | 2011 | | | 2010 | | | 2009 | | | 2008 | | | 2007 | |
Per Share Operating Performance | |
Net asset value, beginning of year | | | $27.67 | | | | $25.81 | | | | $20.90 | | | | $32.95 | | | | $30.64 | |
| | | | | | | | | | | | | | | | | | | | |
|
Investment operations: | |
| | | | | |
Net investment income(a) | | | .18 | | | | .11 | | | | .18 | | | | .21 | | | | .16 | |
| | | | | |
Net realized and unrealized gain (loss) | | | (.69 | ) | | | 1.91 | | | | 4.95 | | | | (9.98 | ) | | | 3.40 | |
| | | | | | | | | | | | | | | | | | | | |
| | | | | |
Total from investment operations | | | (.51 | ) | | | 2.02 | | | | 5.13 | | | | (9.77 | ) | | | 3.56 | |
| | | | | | | | | | | | | | | | | | | | |
|
Distributions to shareholders from: | |
| | | | | |
Net investment income | | | (.10 | ) | | | (.16 | ) | | | (.22 | ) | | | (.15 | ) | | | (.17 | ) |
| | | | | |
Net realized gain | | | – | | | | – | | | | – | | | | (2.13 | ) | | | (1.08 | ) |
| | | | | | | | | | | | | | | | | | | | |
| | | | | |
Total distributions | | | (.10 | ) | | | (.16 | ) | | | (.22 | ) | | | (2.28 | ) | | | (1.25 | ) |
| | | | | | | | | | | | | | | | | | | | |
Net asset value, end of year | | | $27.06 | | | | $27.67 | | | | $25.81 | | | | $20.90 | | | | $32.95 | |
| | | | | | | | | | | | | | | | | | | | |
| | | | | |
Total Return(b) | | | (1.86 | )% | | | 7.87 | % | | | 24.84 | % | | | (31.78 | )% | | | 12.05 | % |
|
Ratios to Average Net Assets: | |
| | | | | |
Expenses, excluding expense reductions and including management fee waived and expenses reimbursed | | | .98 | % | | | .98 | % | | | 1.15 | % | | | 1.30 | % | | | 1.30 | % |
| | | | | |
Expenses, including expense reductions, management fee waived and expenses reimbursed | | | .98 | % | | | .98 | % | | | 1.15 | % | | | 1.30 | % | | | 1.30 | % |
| | | | | |
Expenses, excluding expense reductions, management fee waived and expenses reimbursed | | | 1.29 | % | | | 1.30 | % | | | 1.37 | % | | | 1.33 | % | | | 1.31 | % |
| | | | | |
Net investment income | | | .64 | % | | | .42 | % | | | .84 | % | | | .77 | % | | | .50 | % |
|
| Supplemental Data: | |
Net assets, end of year (000) | | | $498,545 | | | | $569,479 | | | | $595,557 | | | | $494,847 | | | | $707,266 | |
| | | | | |
Portfolio turnover rate | | | 27.97 | % | | | 24.10 | % | | | 55.20 | % | | | 36.96 | % | | | 44.97 | % |
| (a) | | Calculated using average shares outstanding during the year. |
| (b) | | Total return does not consider the effects of sales loads and assumes the reinvestment of all distributions. |
See Notes to Financial Statements.
23
Financial Highlights (continued)
CLASSIC STOCK FUND
| | | | | | | | | | | | | | | | | | | | |
| | | Class B Shares | |
| | | Year Ended 11/30 | |
| | | 2011 | | | 2010 | | | 2009 | | | 2008 | | | 2007 | |
Per Share Operating Performance | |
Net asset value, beginning of year | | | $26.33 | | | | $24.58 | | | | $19.86 | | | | $31.47 | | | | $29.34 | |
| | | | | | | | | | | | | | | | | | | | |
| | | | | |
Investment operations: | | | | | | | | | | | | | | | | | | | | |
| | | | | |
Net investment income (loss)(a) | | | (.01 | ) | | | (.06 | ) | | | .04 | | | | .03 | | | | (.05 | ) |
| | | | | |
Net realized and unrealized gain (loss) | | | (.64 | ) | | | 1.82 | | | | 4.72 | | | | (9.51 | ) | | | 3.26 | |
| | | | | | | | | | | | | | | | | | | | |
| | | | | |
Total from investment operations | | | (.65 | ) | | | 1.76 | | | | 4.76 | | | | (9.48 | ) | | | 3.21 | |
| | | | | | | | | | | | | | | | | | | | |
|
Distributions to shareholders from: | |
| | | | | |
Net investment income | | | – | | | | (.01 | ) | | | (.04 | ) | | | – | | | | – | |
| | | | | |
Net realized gain | | | – | | | | – | | | | – | | | | (2.13 | ) | | | (1.08 | ) |
| | | | | | | | | | | | | | | | | | | | |
| | | | | |
Total distributions | | | – | | | | (.01 | ) | | | (.04 | ) | | | (2.13 | ) | | | (1.08 | ) |
| | | | | | | | | | | | | | | | | | | | |
Net asset value, end of year | | | $25.68 | | | | $26.33 | | | | $24.58 | | | | $19.86 | | | | $31.47 | |
| | | | | | | | | | | | | | | | | | | | |
| | | | | |
Total Return(b) | | | (2.47 | )% | | | 7.16 | % | | | 24.04 | % | | | (32.23 | )% | | | 11.29 | % |
|
Ratios to Average Net Assets: | |
| | | | | |
Expenses, excluding expense reductions
and including management fee
waived and expenses reimbursed | | | 1.62 | % | | | 1.63 | % | | | 1.80 | % | | | 1.95 | % | | | 1.95 | % |
| | | | | |
Expenses, including expense reductions, management fee waived and
expenses reimbursed | | | 1.62 | % | | | 1.63 | % | | | 1.80 | % | | | 1.95 | % | | | 1.95 | % |
| | | | | |
Expenses, excluding expense reductions, management fee waived and
expenses reimbursed | | | 1.93 | % | | | 1.95 | % | | | 2.02 | % | | | 1.98 | % | | | 1.96 | % |
| | | | | |
Net investment income (loss) | | | (.03 | )% | | | (.25 | )% | | | .19 | % | | | .11 | % | | | (.15 | )% |
| | | | | |
| Supplemental Data: | | | | | | | | | | | | | | | |
Net assets, end of year (000) | | | $25,829 | | | | $35,937 | | | | $46,267 | | | | $43,374 | | | | $74,005 | |
| | | | | |
Portfolio turnover rate | | | 27.97 | % | | | 24.10 | % | | | 55.20 | % | | | 36.96 | % | | | 44.97 | % |
| (a) | | Calculated using average shares outstanding during the year. |
| (b) | | Total return does not consider the effects of sales loads and assumes the reinvestment of all distributions. |
See Notes to Financial Statements.
24
Financial Highlights (continued)
CLASSIC STOCK FUND
| | | | | | | | | | | | | | | | | | | | |
| | | Class C Shares | |
| | | Year Ended 11/30 | |
| | | 2011 | | | 2010 | | | 2009 | | | 2008 | | | 2007 | |
Per Share Operating Performance | | | | | | | | | | | | | | | | | | | | |
Net asset value, beginning of year | | | $26.39 | | | | $24.66 | | | | $19.94 | | | | $31.59 | | | | $29.44 | |
| | | | | | | | | | | | | | | | | | | | |
| | | | | |
Investment operations: | | | | | | | | | | | | | | | | | | | | |
| | | | | |
Net investment income (loss)(a) | | | – | (b) | | | (.06 | ) | | | .04 | | | | .03 | | | | (.05 | ) |
| | | | | |
Net realized and unrealized gain (loss) | | | (.65 | ) | | | 1.82 | | | | 4.74 | | | | (9.55 | ) | | | 3.28 | |
| | | | | | | | | | | | | | | | | | | | |
| | | | | |
Total from investment operations | | | (.65 | ) | | | 1.76 | | | | 4.78 | | | | (9.52 | ) | | | 3.23 | |
| | | | | | | | | | | | | | | | | | | | |
| | | | | |
Distributions to shareholders from: | | | | | | | | | | | | | | | | | | | | |
| | | | | |
Net investment income | | | – | | | | (.03 | ) | | | (.06 | ) | | | – | (b) | | | – | |
| | | | | |
Net realized gain | | | – | | | | – | | | | – | | | | (2.13 | ) | | | (1.08 | ) |
| | | | | | | | | | | | | | | | | | | | |
| | | | | |
Total distributions | | | – | | | | (.03 | ) | | | (.06 | ) | | | (2.13 | ) | | | (1.08 | ) |
| | | | | | | | | | | | | | | | | | | | |
Net asset value, end of year | | | $25.74 | | | | $26.39 | | | | $24.66 | | | | $19.94 | | | | $31.59 | |
| | | | | | | | | | | | | | | | | | | | |
| | | | | |
Total Return(c) | | | (2.46 | )% | | | 7.15 | % | | | 24.08 | % | | | (32.24 | )% | | | 11.32 | % |
| | | | | |
Ratios to Average Net Assets: | | | | | | | | | | | | | | | | | | | | |
| | | | | |
Expenses, excluding expense reductions
and including management fee waived and expenses reimbursed | | | 1.61 | % | | | 1.63 | % | | | 1.80 | % | | | 1.95 | % | | | 1.95 | % |
| | | | | |
Expenses, including expense reductions, management fee waived and
expenses reimbursed | | | 1.61 | % | | | 1.63 | % | | | 1.80 | % | | | 1.95 | % | | | 1.95 | % |
| | | | | |
Expenses, excluding expense reductions, management fee waived and
expenses reimbursed | | | 1.92 | % | | | 1.95 | % | | | 2.02 | % | | | 1.98 | % | | | 1.96 | % |
| | | | | |
Net investment income (loss) | | | .00 | %(d) | | | (.23 | )% | | | .18 | % | | | .12 | % | | | (.15 | )% |
| | | | | |
| Supplemental Data: | | | | | | | | | | | | | | | |
Net assets, end of year (000) | | | $69,263 | | | | $87,126 | | | | $89,787 | | | | $65,200 | | | | $94,948 | |
| | | | | |
Portfolio turnover rate | | | 27.97 | % | | | 24.10 | % | | | 55.20 | % | | | 36.96 | % | | | 44.97 | % |
| (a) | | Calculated using average shares outstanding during the year. |
| (b) | | Amount is less than $.01. |
| (c) | | Total return does not consider the effects of sales loads and assumes the reinvestment of all distributions. |
| (d) | | Amount is less than .01%. |
See Notes to Financial Statements.
25
Financial Highlights (continued)
CLASSIC STOCK FUND
| | | | | | | | | | | | | | | | | | | | |
| | | Class F Shares | |
| | | Year Ended 11/30 | | | 9/28/2007(a)
to
11/30/2007 | |
| | | 2011 | | | 2010 | | | 2009 | | | 2008 | | |
Per Share Operating Performance | | | | | | | | | | | | | | | | | | | | |
Net asset value, beginning of period | | | $27.62 | | | | $25.76 | | | | $20.88 | | | | $32.96 | | | | $33.52 | |
| | | | | | | | | | | | | | | | | | | | |
| | | | | |
Investment operations: | | | | | | | | | | | | | | | | | | | | |
| | | | | |
Net investment income(b) | | | .23 | | | | .19 | | | | .22 | | | | .32 | | | | .05 | |
| | | | | |
Net realized and unrealized gain (loss) | | | (.66 | ) | | | 1.89 | | | | 4.96 | | | | (10.02 | ) | | | (.61 | ) |
| | | | | | | | | | | | | | | | | | | | |
| | | | | |
Total from investment operations | | | (.43 | ) | | | 2.08 | | | | 5.18 | | | | (9.70 | ) | | | (.56 | ) |
| | | | | | | | | | | | | | | | | | | | |
| | | | | |
Distributions to shareholders from: | | | | | | | | | | | | | | | | | | | | |
| | | | | |
Net investment income | | | (.18 | ) | | | (.22 | ) | | | (.30 | ) | | | (.25 | ) | | | – | |
| | | | | |
Net realized gain | | | – | | | | – | | | | – | | | | (2.13 | ) | | | – | |
| | | | | | | | | | | | | | | | | | | | |
| | | | | |
Total distributions | | | (.18 | ) | | | (.22 | ) | | | (.30 | ) | | | (2.38 | ) | | | – | |
| | | | | | | | | | | | | | | | | | | | |
Net asset value, end of period | | | $27.01 | | | | $27.62 | | | | $25.76 | | | | $20.88 | | | | $32.96 | |
| | | | | | | | | | | | | | | | | | | | |
| | | | | |
Total Return(c) | | | (1.61 | )% | | | 8.14 | % | | | 25.19 | % | | | (31.64 | )% | | | (1.67 | )%(d) |
| | | | | |
Ratios to Average Net Assets: | | | | | | | | | | | | | | | | | | | | |
| | | | | |
Expenses, excluding expense reductions
and including management fee
waived and expenses reimbursed | | | .73 | % | | | .73 | % | | | .86 | % | | | 1.05 | % | | | .18 | %(d) |
| | | | | |
Expenses, including expense reductions, management fee waived and
expenses reimbursed | | | .73 | % | | | .73 | % | | | .86 | % | | | 1.04 | % | | | .18 | %(d) |
| | | | | |
Expenses, excluding expense reductions, management fee waived and
expenses reimbursed | | | 1.04 | % | | | 1.05 | % | | | 1.10 | % | | | 1.11 | % | | | .19 | %(d) |
| | | | | |
Net investment income | | | .81 | % | | | .73 | % | | | .96 | % | | | 1.25 | % | | | .16 | %(d) |
| | | | | |
| Supplemental Data: | | | | | | | | | | | | | | | |
Net assets, end of period (000) | | | $26,568 | | | | $45,605 | | | | $10,723 | | | | $2,453 | | | | $10 | |
| | | | | |
Portfolio turnover rate | | | 27.97 | % | | | 24.10 | % | | | 55.20 | % | | | 36.96 | % | | | 44.97 | % |
| (a) | | Commencement of operations was 9/28/2007, SEC effective date was 9/14/2007 and date shares first became available to the public was 10/1/2007. |
| (b) | | Calculated using average shares outstanding during the period. |
| (c) | | Total return assumes the reinvestment of all distributions. |
See Notes to Financial Statements.
26
Financial Highlights (continued)
CLASSIC STOCK FUND
| | | | | | | | | | | | | | | | | | | | |
| | | Class I Shares | |
| | | Year Ended 11/30 | |
| | | 2011 | | | 2010 | | | 2009 | | | 2008 | | | 2007 | |
Per Share Operating Performance | |
Net asset value, beginning of year | | | $27.78 | | | | $25.90 | | | | $20.99 | | | | $33.08 | | | | $30.76 | |
| | | | | | | | | | | | | | | | | | | | |
| | | | | |
Investment operations: | | | | | | | | | | | | | | | | | | | | |
| | | | | |
Net investment income(a) | | | .29 | | | | .21 | | | | .26 | | | | .31 | | | | .26 | |
| | | | | |
Net realized and unrealized gain (loss) | | | (.70 | ) | | | 1.91 | | | | 4.96 | | | | (10.01 | ) | | | 3.41 | |
| | | | | | | | | | | | | | | | | | | | |
| | | | | |
Total from investment operations | | | (.41 | ) | | | 2.12 | | | | 5.22 | | | | (9.70 | ) | | | 3.67 | |
| | | | | | | | | | | | | | | | | | | | |
|
Distributions to shareholders from: | |
| | | | | |
Net investment income | | | (.20 | ) | | | (.24 | ) | | | (.31 | ) | | | (.26 | ) | | | (.27 | ) |
| | | | | |
Net realized gain | | | – | | | | – | | | | – | | | | (2.13 | ) | | | (1.08 | ) |
| | | | | | | | | | | | | | | | | | | | |
| | | | | |
Total distributions | | | (.20 | ) | | | (.24 | ) | | | (.31 | ) | | | (2.39 | ) | | | (1.35 | ) |
| | | | | | | | | | | | | | | | | | | | |
Net asset value, end of year | | | $27.17 | | | | $27.78 | | | | $25.90 | | | | $20.99 | | | | $33.08 | |
| | | | | | | | | | | | | | | | | | | | |
| | | | | |
Total Return(b) | | | (1.52 | )% | | | 8.25 | % | | | 25.28 | % | | | (31.53 | )% | | | 12.40 | % |
| | | | | |
Ratios to Average Net Assets: | | | | | | | | | | | | | | | | | | | | |
| | | | | |
Expenses, excluding expense reductions and including management fee waived and expenses reimbursed | | | .63 | % | | | .63 | % | | | .79 | % | | | .95 | % | | | .95 | % |
| | | | | |
Expenses, including expense reductions, management fee waived and expenses reimbursed | | | .63 | % | | | .63 | % | | | .79 | % | | | .95 | % | | | .95 | % |
| | | | | |
Expenses, excluding expense reductions, management fee waived and expenses reimbursed | | | .94 | % | | | .95 | % | | | 1.01 | % | | | .98 | % | | | .96 | % |
| | | | | |
Net investment income | | | 1.01 | % | | | .79 | % | | | 1.17 | % | | | 1.13 | % | | | .84 | % |
|
| Supplemental Data: | |
Net assets, end of year (000) | | | $327,603 | | | | $328,620 | | | | $264,418 | | | | $174,231 | | | | $221,345 | |
| | | | | |
Portfolio turnover rate | | | 27.97 | % | | | 24.10 | % | | | 55.20 | % | | | 36.96 | % | | | 44.97 | % |
| (a) | | Calculated using average shares outstanding during the year. |
| (b) | | Total return assumes the reinvestment of all distributions. |
See Notes to Financial Statements.
27
Financial Highlights (continued)
CLASSIC STOCK FUND
| | | | | | | | | | | | | | | | | | | | |
| | | Class P Shares | |
| | | Year Ended 11/30 | |
| | | 2011 | | | 2010 | | | 2009 | | | 2008 | | | 2007 | |
Per Share Operating Performance | | | | | | | | | | | | | | | | | | | | |
Net asset value, beginning of year | | | $27.78 | | | | $25.91 | | | | $20.96 | | | | $33.05 | | | | $30.65 | |
| | | | | | | | | | | | | | | | | | | | |
| | | | | |
Investment operations: | | | | | | | | | | | | | | | | | | | | |
| | | | | |
Net investment income(a) | | | .15 | | | | .08 | | | | .17 | | | | .18 | | | | .12 | |
| | | | | |
Net realized and unrealized gain (loss) | | | (.69 | ) | | | 1.92 | | | | 4.97 | | | | (10.01 | ) | | | 3.42 | |
| | | | | | | | | | | | | | | | | | | | |
| | | | | |
Total from investment operations | | | (.54 | ) | | | 2.00 | | | | 5.14 | | | | (9.83 | ) | | | 3.54 | |
| | | | | | | | | | | | | | | | | | | | |
| | | | | |
Distributions to shareholders from: | | | | | | | | | | | | | | | | | | | | |
| | | | | |
Net investment income | | | (.07 | ) | | | (.13 | ) | | | (.19 | ) | | | (.13 | ) | | | (.06 | ) |
| | | | | |
Net realized gain | | | – | | | | – | | | | – | | | | (2.13 | ) | | | (1.08 | ) |
| | | | | | | | | | | | | | | | | | | | |
| | | | | |
Total distributions | | | (.07 | ) | | | (.13 | ) | | | (.19 | ) | | | (2.26 | ) | | | (1.14 | ) |
| | | | | | | | | | | | | | | | | | | | |
Net asset value, end of year | | | $27.17 | | | | $27.78 | | | | $25.91 | | | | $20.96 | | | | $33.05 | |
| | | | | | | | | | | | | | | | | | | | |
| | | | | |
Total Return(b) | | | (1.97 | )% | | | 7.74 | % | | | 24.75 | % | | | (31.85 | )% | | | 11.93 | % |
| | | | | |
Ratios to Average Net Assets: | | | | | | | | | | | | | | | | | | | | |
| | | | | |
Expenses, excluding expense reductions
and including management fee
waived and expenses reimbursed | | | 1.08 | % | | | 1.08 | % | | | 1.27 | % | | | 1.40 | % | | | 1.40 | % |
| | | | | |
Expenses, including expense reductions,
management fee waived and
expenses reimbursed | | | 1.08 | % | | | 1.08 | % | | | 1.27 | % | | | 1.40 | % | | | 1.40 | % |
| | | | | |
Expenses, excluding expense reductions,
management fee waived and
expenses reimbursed | | | 1.39 | % | | | 1.40 | % | | | 1.47 | % | | | 1.43 | % | | | 1.41 | % |
| | | | | |
Net investment income | | | .53 | % | | | .30 | % | | | .76 | % | | | .66 | % | | | .38 | % |
| | | | | |
| Supplemental Data: | | | | | | | | | | | | | | | |
Net assets, end of year (000) | | | $2,389 | | | | $3,107 | | | | $4,226 | | | | $4,635 | | | | $7,214 | |
| | | | | |
Portfolio turnover rate | | | 27.97 | % | | | 24.10 | % | | | 55.20 | % | | | 36.96 | % | | | 44.97 | % |
| (a) | | Calculated using average shares outstanding during the year. |
| (b) | | Total return assumes the reinvestment of all distributions. |
See Notes to Financial Statements.
28
Financial Highlights (continued)
CLASSIC STOCK FUND
| | | | | | | | | | | | | | | | | | | | |
| | | Class R2 Shares | |
| | | Year Ended 11/30 | | | 9/28/2007(a)
to 11/30/2007 | |
| | | 2011 | | | 2010 | | | 2009 | | | 2008 | | |
Per Share Operating Performance | | | | | | | | | | | | | | | | | |
Net asset value, beginning of period | | | $27.56 | | | | $25.78 | | | | $20.91 | | | | $32.93 | | | | $33.52 | |
| | | | | | | | | | | | | | | | | | | | |
| | | | | |
Investment operations: | | | | | | | | | | | | | | | | | | | | |
| | | | | |
Net investment income(b) | | | .13 | | | | .07 | | | | .12 | | | | .28 | | | | .03 | |
| | | | | |
Net realized and unrealized gain (loss) | | | (.70 | ) | | | 1.88 | | | | 5.04 | | | | (9.96 | ) | | | (.62 | ) |
| | | | | | | | | | | | | | | | | | | | |
| | | | | |
Total from investment operations | | | (.57 | ) | | | 1.95 | | | | 5.16 | | | | (9.68 | ) | | | (.59 | ) |
| | | | | | | | | | | | | | | | | | | | |
| | | | | |
Distributions to shareholders from: | | | | | | | | | | | | | | | | | | | | |
| | | | | |
Net investment income | | | (.08 | ) | | | (.17 | ) | | | (.29 | ) | | | (.21 | ) | | | – | |
| | | | | |
Net realized gain | | | – | | | | – | | | | – | | | | (2.13 | ) | | | – | |
| | | | | | | | | | | | | | | | | | | | |
| | | | | |
Total distributions | | | (.08 | ) | | | (.17 | ) | | | (.29 | ) | | | (2.34 | ) | | | – | |
| | | | | | | | | | | | | | | | | | | | |
Net asset value, end of period | | | $26.91 | | | | $27.56 | | | | $25.78 | | | | $20.91 | | | | $32.93 | |
| | | | | | | | | | | | | | | | | | | | |
| | | | | |
Total Return(c) | | | (2.09 | )% | | | 7.61 | % | | | 25.03 | % | | | (31.57 | )% | | | (1.76 | )%(d) |
| | | | | |
Ratios to Average Net Assets: | | | | | | | | | | | | | | | | | | | | |
| | | | | |
Expenses, excluding expense reductions
and including management fee
waived and expenses reimbursed | | | 1.23 | % | | | 1.22 | % | | | 1.21 | % | | | 1.04 | % | | | .26 | %(d) |
| | | | | |
Expenses, including expense reductions, management fee waived and
expenses reimbursed | | | 1.23 | % | | | 1.22 | % | | | 1.21 | % | | | 1.04 | % | | | .26 | %(d) |
| | | | | |
Expenses, excluding expense reductions, management fee waived and
expenses reimbursed | | | 1.54 | % | | | 1.55 | % | | | 1.56 | % | | | 1.07 | % | | | .26 | %(d) |
| | | | | |
Net investment income | | | .46 | % | | | .25 | % | | | .50 | % | | | 1.04 | % | | | .08 | %(d) |
| | | | | |
| Supplemental Data: | | | | | | | | | | | | | | | |
Net assets, end of period (000) | | | $2,771 | | | | $1,749 | | | | $730 | | | | $7 | | | | $10 | |
| | | | | |
Portfolio turnover rate | | | 27.97 | % | | | 24.10 | % | | | 55.20 | % | | | 36.96 | % | | | 44.97 | % |
| (a) | | Commencement of operations was 9/28/2007, SEC effective date was 9/14/2007 and date shares first became available to the public was 10/1/2007. |
| (b) | | Calculated using average shares outstanding during the period. |
| (c) | | Total return assumes the reinvestment of all distributions. |
See Notes to Financial Statements.
29
Financial Highlights (concluded)
CLASSIC STOCK FUND
| | | | | | | | | | | | | | | | | | | | |
| | | Class R3 Shares | |
| | | Year Ended 11/30 | | | 9/28/2007(a) to 11/30/2007 | |
| | | 2011 | | | 2010 | | | 2009 | | | 2008 | | |
Per Share Operating Performance | | | | | | | | | | | | | | | | | | | | |
Net asset value, beginning of period | | | $27.42 | | | | $25.64 | | | | $20.82 | | | | $32.94 | | | | $33.52 | |
| | | | | | | | | | | | | | | | | | | | |
| | | | | |
Investment operations: | | | | | | | | | | | | | | | | | | | | |
| | | | | |
Net investment income(b) | | | .16 | | | | .08 | | | | .16 | | | | .22 | | | | .03 | |
| | | | | |
Net realized and unrealized gain (loss) | | | (.70 | ) | | | 1.88 | | | | 4.92 | | | | (9.99 | ) | | | (.61 | ) |
| | | | | | | | | | | | | | | | | | | | |
| | | | | |
Total from investment operations | | | (.54 | ) | | | 1.96 | | | | 5.08 | | | | (9.77 | ) | | | (.58 | ) |
| | | | | | | | | | | | | | | | | | | | |
| | | | | |
Distributions to shareholders from: | | | | | | | | | | | | | | | | | | | | |
| | | | | |
Net investment income | | | (.10 | ) | | | (.18 | ) | | | (.26 | ) | | | (.22 | ) | | | – | |
| | | | | |
Net realized gain | | | – | | | | – | | | | – | | | | (2.13 | ) | | | – | |
| | | | | | | | | | | | | | | | | | | | |
| | | | | |
Total distributions | | | (.10 | ) | | | (.18 | ) | | | (.26 | ) | | | (2.35 | ) | | | – | |
| | | | | | | | | | | | | | | | | | | | |
Net asset value, end of period | | | $26.78 | | | | $27.42 | | | | $25.64 | | | | $20.82 | | | | $32.94 | |
| | | | | | | | | | | | | | | | | | | | |
| | | | | |
Total Return(c) | | | (2.00 | )% | | | 7.71 | % | | | 24.70 | % | | | (31.86 | )% | | | (1.73 | )%(d) |
| | | | | |
Ratios to Average Net Assets: | | | | | | | | | | | | | | | | | | | | |
| | | | | |
Expenses, excluding expense reductions
and including management fee
waived and expenses reimbursed | | | 1.13 | % | | | 1.12 | % | | | 1.21 | % | | | 1.42 | % | | | .24 | %(d) |
| | | | | |
Expenses, including expense reductions, management fee waived and
expenses reimbursed | | | 1.13 | % | | | 1.12 | % | | | 1.21 | % | | | 1.42 | % | | | .24 | %(d) |
| | | | | |
Expenses, excluding expense reductions, management fee waived and
expenses reimbursed | | | 1.44 | % | | | 1.45 | % | | | 1.49 | % | | | 1.48 | % | | | .25 | %(d) |
| | | | | |
Net investment income | | | .56 | % | | | .32 | % | | | .70 | % | | | .88 | % | | | .10 | %(d) |
| | | | | |
| Supplemental Data: | | | | | | | | | | | | | | | |
Net assets, end of period (000) | | | $14,304 | | | | $9,567 | | | | $2,238 | | | | $321 | | | | $10 | |
| | | | | |
Portfolio turnover rate | | | 27.97 | % | | | 24.10 | % | | | 55.20 | % | | | 36.96 | % | | | 44.97 | % |
| (a) | | Commencement of operations was 9/28/2007, SEC effective date was 9/14/2007 and date shares first became available to the public was 10/1/2007. |
| (b) | | Calculated using average shares outstanding during the period. |
| (c) | | Total return assumes the reinvestment of all distributions. |
See Notes to Financial Statements.
30
Financial Highlights
SMALL CAP VALUE FUND
| | | | | | | | | | | | | | | | | | | | |
| | | Class A Shares | |
| | | Year Ended 11/30 | |
| | | 2011 | | | 2010 | | | 2009 | | | 2008 | | | 2007 | |
Per Share Operating Performance | | | | | | | | | | | | | |
Net asset value, beginning of year | | | $28.93 | | | | $22.87 | | | | $18.32 | | | | $33.10 | | | | $34.60 | |
| | | | | | | | | | | | | | | | | | | | |
| | | | | |
Investment operations: | | | | | | | | | | | | | | | | | | | | |
| | | | | |
Net investment income (loss)(a) | | | (.07 | ) | | | – | (b) | | | (.02 | ) | | | .04 | | | | .04 | |
| | | | | |
Net realized and unrealized gain (loss) | | | .82 | | | | 6.06 | | | | 4.62 | | | | (9.97 | ) | | | 2.99 | |
| | | | | | | | | | | | | | | | | | | | |
| | | | | |
Total from investment operations | | | .75 | | | | 6.06 | | | | 4.60 | | | | (9.93 | ) | | | 3.03 | |
| | | | | | | | | | | | | | | | | | | | |
| | | | | |
Distributions to shareholders from: | | | | | | | | | | | | | | | | | | | | |
| | | | | |
Net investment income | | | – | (b) | | | – | | | | (.05 | ) | | | (.04 | ) | | | – | |
| | | | | |
Net realized gain | | | – | | | | – | | | | – | | | | (4.81 | ) | | | (4.53 | ) |
| | | | | | | | | | | | | | | | | | | | |
| | | | | |
Total distributions | | | – | (b) | | | – | | | | (.05 | ) | | | (4.85 | ) | | | (4.53 | ) |
| | | | | | | | | | | | | | | | | | | | |
Net asset value, end of year | | | $29.68 | | | | $28.93 | | | | $22.87 | | | | $18.32 | | | | $33.10 | |
| | | | | | | | | | | | | | | | | | | | |
| | | | | |
Total Return(c) | | | 2.60 | % | | | 26.50 | % | | | 25.15 | % | | | (34.96 | )% | | | 10.08 | % |
| | | | | |
Ratios to Average Net Assets: | | | | | | | | | | | | | | | | | | | | |
| | | | | |
Expenses, including expense reductions | | | 1.23 | % | | | 1.25 | % | | | 1.24 | % | | | 1.23 | % | | | 1.23 | % |
| | | | | |
Expenses, excluding expense reductions | | | 1.23 | % | | | 1.25 | % | | | 1.24 | % | | | 1.23 | % | | | 1.23 | % |
| | | | | |
Net investment income (loss) | | | (.22 | )% | | | (.01 | )% | | | (.08 | )% | | | .17 | % | | | .13 | % |
| | | | | |
| Supplemental Data: | | | | | | | | | | | | | | | |
Net assets, end of year (000) | | | $1,470,064 | | | | $1,608,846 | | | | $1,393,870 | | | | $1,216,253 | | | | $2,287,085 | |
| | | | | |
Portfolio turnover rate | | | 41.95 | % | | | 42.28 | % | | | 68.63 | % | | | 77.87 | % | | | 61.44 | % |
| (a) | | Calculated using average shares outstanding during the year. |
| (b) | | Amount is less than $.01. |
| (c) | | Total return does not consider the effects of sales loads and assumes the reinvestment of all distributions. |
See Notes to Financial Statements.
31
Financial Highlights (continued)
SMALL CAP VALUE FUND
| | | | | | | | | | | | | | | | | | | | |
| | | Class B Shares | |
| | | Year Ended 11/30 | |
| | | 2011 | | | 2010 | | | 2009 | | | 2008 | | | 2007 | |
Per Share Operating Performance | | | | | | | | | | | | | | | | | | | | |
Net asset value, beginning of year | | | $25.09 | | | | $19.97 | | | | $16.07 | | | | $29.78 | | | | $31.77 | |
| | | | | | | | | | | | | | | | | | | | |
| | | | | |
Investment operations: | | | | | | | | | | | | | | | | | | | | |
| | | | | |
Net investment loss(a) | | | (.25 | ) | | | (.17 | ) | | | (.12 | ) | | | (.12 | ) | | | (.17 | ) |
| | | | | |
Net realized and unrealized gain (loss) | | | .72 | | | | 5.29 | | | | 4.02 | | | | (8.78 | ) | | | 2.71 | |
| | | | | | | | | | | | | | | | | | | | |
| | | | | |
Total from investment operations | | | .47 | | | | 5.12 | | | | 3.90 | | | | (8.90 | ) | | | 2.54 | |
| | | | | | | | | | | | | | | | | | | | |
| | | | | |
Distributions to shareholders from: | | | | | | | | | | | | | | | | | | | | |
| | | | | |
Net realized gain | | | – | | | | – | | | | – | | | | (4.81 | ) | | | (4.53 | ) |
| | | | | | | | | | | | | | | | | | | | |
Net asset value, end of year | | | $25.56 | | | | $25.09 | | | | $19.97 | | | | $16.07 | | | | $29.78 | |
| | | | | | | | | | | | | | | | | | | | |
| | | | | |
Total Return(b) | | | 1.87 | % | | | 25.64 | % | | | 24.27 | % | | | (35.41 | )% | | | 9.33 | % |
| | | | | |
Ratios to Average Net Assets: | | | | | | | | | | | | | | | | | | | | |
| | | | | |
Expenses, including expense
reductions | | | 1.92 | % | | | 1.95 | % | | | 1.94 | % | | | 1.93 | % | | | 1.93 | % |
| | | | | |
Expenses, excluding expense
reductions | | | 1.92 | % | | | 1.95 | % | | | 1.94 | % | | | 1.93 | % | | | 1.93 | % |
| | | | | |
Net investment loss | | | (.91 | )% | | | (.73 | )% | | | (.73 | )% | | | (.54 | )% | | | (.58 | )% |
| | | | | |
| Supplemental Data: | | | | | | | | | | | | | | | |
Net assets, end of year (000) | | | $9,612 | | | | $14,612 | | | | $15,917 | | | | $25,955 | | | | $58,676 | |
| | | | | |
Portfolio turnover rate | | | 41.95 | % | | | 42.28 | % | | | 68.63 | % | | | 77.87 | % | | | 61.44 | % |
| (a) | | Calculated using average shares outstanding during the year. |
| (b) | | Total return does not consider the effects of sales loads and assumes the reinvestment of all distributions. |
See Notes to Financial Statements.
32
Financial Highlights (continued)
SMALL CAP VALUE FUND
| | | | | | | | | | | | | | | | | | | | |
| | | Class C Shares | |
| | | Year Ended 11/30 | |
| | | 2011 | | | 2010 | | | 2009 | | | 2008 | | | 2007 | |
Per Share Operating Performance | | | | | | | | | | | | | | | | | | | | |
Net asset value, beginning of year | | | $25.14 | | | | $20.01 | | | | $16.10 | | | | $29.83 | | | | $31.82 | |
| | | | | | | | | | | | | | | | | | | | |
| | | | | |
Investment operations: | | | | | | | | | | | | | | | | | | | | |
| | | | | |
Net investment loss(a) | | | (.24 | ) | | | (.17 | ) | | | (.13 | ) | | | (.12 | ) | | | (.17 | ) |
| | | | | |
Net realized and unrealized gain (loss) | | | .71 | | | | 5.30 | | | | 4.04 | | | | (8.80 | ) | | | 2.71 | |
| | | | | | | | | | | | | | | | | | | | |
| | | | | |
Total from investment operations | | | .47 | | | | 5.13 | | | | 3.91 | | | | (8.92 | ) | | | 2.54 | |
| | | | | | | | | | | | | | | | | | | | |
| | | | | |
Distributions to shareholders from: | | | | | | | | | | | | | | | | | | | | |
| | | | | |
Net realized gain | | | – | | | | – | | | | – | | | | (4.81 | ) | | | (4.53 | ) |
| | | | | | | | | | | | | | | | | | | | |
Net asset value, end of year | | | $25.61 | | | | $25.14 | | | | $20.01 | | | | $16.10 | | | | $29.83 | |
| | | | | | | | | | | | | | | | | | | | |
| | | | | |
Total Return(b) | | | 1.87 | % | | | 25.64 | % | | | 24.29 | % | | | (35.42 | )% | | | 9.32 | % |
| | | | | |
Ratios to Average Net Assets: | | | | | | | | | | | | | | | | | | | | |
| | | | | |
Expenses, including expense
reductions | | | 1.92 | % | | | 1.95 | % | | | 1.94 | % | | | 1.93 | % | | | 1.93 | % |
| | | | | |
Expenses, excluding expense
reductions | | | 1.92 | % | | | 1.95 | % | | | 1.94 | % | | | 1.93 | % | | | 1.93 | % |
| | | | | |
Net investment loss | | | (.90 | )% | | | (.72 | )% | | | (.77 | )% | | | (.53 | )% | | | (.58 | )% |
| | | | | |
| Supplemental Data: | | | | | | | | | | | | | | | |
Net assets, end of year (000) | | | $41,597 | | | | $46,980 | | | | $46,275 | | | | $46,307 | | | | $86,971 | |
| | | | | |
Portfolio turnover rate | | | 41.95 | % | | | 42.28 | % | | | 68.63 | % | | | 77.87 | % | | | 61.44 | % |
| (a) | | Calculated using average shares outstanding during the year. |
| (b) | | Total return does not consider the effects of sales loads and assumes the reinvestment of all distributions. |
See Notes to Financial Statements.
33
Financial Highlights (continued)
SMALL CAP VALUE FUND
| | | | | | | | | | | | | | | | | | | | |
| | | Class F Shares | |
| | | Year Ended 11/30 | | | 9/28/2007(a)
to 11/30/2007 | |
| | | 2011 | | | 2010 | | | 2009 | | | 2008 | | |
Per Share Operating Performance | | | | | | | | | | | | | | | | | | | | |
Net asset value, beginning of period | | | $28.90 | | | | $22.80 | | | | $18.30 | | | | $33.11 | | | | $33.61 | |
| | | | | | | | | | | | | | | | | | | | |
| | | | | |
Investment operations: | | | | | | | | | | | | | | | | | | | | |
| | | | | |
Net investment income(b) | | | – | (c) | | | .05 | | | | – | (c) | | | .08 | | | | .01 | |
| | | | | |
Net realized and unrealized gain (loss) | | | .80 | | | | 6.05 | | | | 4.62 | | | | (9.95 | ) | | | (.51 | ) |
| | | | | | | | | | | | | | | | | | | | |
| | | | | |
Total from investment operations | | | .80 | | | | 6.10 | | | | 4.62 | | | | (9.87 | ) | | | (.50 | ) |
| | | | | | | | | | | | | | | | | | | | |
| | | | | |
Distributions to shareholders from: | | | | | | | | | | | | | | | | | | | | |
| | | | | |
Net investment income | | | (.06 | ) | | | – | | | | (.12 | ) | | | (.13 | ) | | | – | |
| | | | | |
Net realized gain | | | – | | | | – | | | | – | | | | (4.81 | ) | | | – | |
| | | | | | | | | | | | | | | | | | | | |
| | | | | |
Total distributions | | | (.06 | ) | | | – | | | | (.12 | ) | | | (4.94 | ) | | | – | |
| | | | | | | | | | | | | | | | | | | | |
Net asset value, end of period | | | $29.64 | | | | $28.90 | | | | $22.80 | | | | $18.30 | | | | $33.11 | |
| | | | | | | | | | | | | | | | | | | | |
| | | | | |
Total Return(d) | | | 2.76 | % | | | 26.75 | % | | | 25.39 | % | | | (34.82 | )% | | | (1.49 | )%(e) |
| | | | | |
Ratios to Average Net Assets: | | | | | | | | | | | | | | | | | | | | |
| | | | | |
Expenses, including expense
reductions | | | 1.04 | % | | | 1.05 | % | | | 1.03 | % | | | 1.04 | % | | | .18 | %(e) |
| | | | | |
Expenses, excluding expense
reductions | | | 1.04 | % | | | 1.05 | % | | | 1.03 | % | | | 1.04 | % | | | .18 | %(e) |
| | | | | |
Net investment income (loss) | | | .01 | % | | | .19 | % | | | (.02 | )% | | | .32 | % | | | .04 | %(e) |
| | | | | |
| Supplemental Data: | | | | | | | | | | | | | | | |
Net assets, end of period (000) | | | $32,597 | | | | $27,236 | | | | $22,387 | | | | $1,425 | | | | $10 | |
| | | | | |
Portfolio turnover rate | | | 41.95 | % | | | 42.28 | % | | | 68.63 | % | | | 77.87 | % | | | 61.44 | % |
| (a) | | Commencement of operations was 9/28/2007, SEC effective date was 9/14/2007 and date shares first became available to the public was 10/1/2007. |
| (b) | | Calculated using average shares outstanding during the period. |
| (c) | | Amount is less than $.01. |
| (d) | | Total return assumes the reinvestment of all distributions. |
See Notes to Financial Statements.
34
Financial Highlights (continued)
SMALL CAP VALUE FUND
| | | | | | | | | | | | | | | | | | | | |
| | | Class I Shares | |
| | | Year Ended 11/30 | |
| | | 2011 | | | 2010 | | | 2009 | | | 2008 | | | 2007 | |
Per Share Operating Performance | | | | | | | | | | | | | |
Net asset value, beginning of year | | | $30.67 | | | | $24.17 | | | | $19.38 | | | | $34.75 | | | | $36.00 | |
| | | | | | | | | | | | | | | | | | | | |
| | | | | |
Investment operations: | | | | | | | | | | | | | | | | | | | | |
| | | | | |
Net investment income(a) | | | .03 | | | | .08 | | | | .05 | | | | .13 | | | | .14 | |
| | | | | |
Net realized and unrealized gain (loss) | | | .85 | | | | 6.42 | | | | 4.87 | | | | (10.55 | ) | | | 3.14 | |
| | | | | | | | | | | | | | | | | | | | |
| | | | | |
Total from investment operations | | | .88 | | | | 6.50 | | | | 4.92 | | | | (10.42 | ) | | | 3.28 | |
| | | | | | | | | | | | | | | | | | | | |
| | | | | |
Distributions to shareholders from: | | | | | | | | | | | | | | | | | | | | |
| | | | | |
Net investment income | | | (.09 | ) | | | – | | | | (.13 | ) | | | (.14 | ) | | | – | |
| | | | | |
Net realized gain | | | – | | | | – | | | | – | | | | (4.81 | ) | | | (4.53 | ) |
| | | | | | | | | | | | | | | | | | | | |
| | | | | |
Total distributions | | | (.09 | ) | | | – | | | | (.13 | ) | | | (4.95 | ) | | | (4.53 | ) |
| | | | | | | | | | | | | | | | | | | | |
Net asset value, end of year | | | $31.46 | | | | $30.67 | | | | $24.17 | | | | $19.38 | | | | $34.75 | |
| | | | | | | | | | | | | | | | | | | | |
| | | | | |
Total Return(b) | | | 2.84 | % | | | 26.89 | % | | | 25.55 | % | | | (34.77 | )% | | | 10.42 | % |
| | | | | |
Ratios to Average Net Assets: | | | | | | | | | | | | | | | | | | | | |
| | | | | |
Expenses, including expense reductions | | | .93 | % | | | .95 | % | | | .94 | % | | | .93 | % | | | .93 | % |
| | | | | |
Expenses, excluding expense reductions | | | .93 | % | | | .95 | % | | | .94 | % | | | .93 | % | | | .93 | % |
| | | | | |
Net investment income | | | .09 | % | | | .30 | % | | | .21 | % | | | .48 | % | | | .43 | % |
| | | | | |
| Supplemental Data: | | | | | | | | | | | | | | | |
Net assets, end of year (000) | | | $1,855,748 | | | | $1,692,837 | | | | $1,231,291 | | | | $942,604 | | | | $1,227,169 | |
| | | | | |
Portfolio turnover rate | | | 41.95 | % | | | 42.28 | % | | | 68.63 | % | | | 77.87 | % | | | 61.44 | % |
| (a) | | Calculated using average shares outstanding during the year. |
| (b) | | Total return assumes the reinvestment of all distributions. |
See Notes to Financial Statements.
35
Financial Highlights (continued)
SMALL CAP VALUE FUND
| | | | | | | | | | | | | | | | | | | | |
| | | Class P Shares | |
| | | Year Ended 11/30 | |
| | | 2011 | | | 2010 | | | 2009 | | | 2008 | | | 2007 | |
Per Share Operating Performance | | | | | | | | | | | | | |
Net asset value, beginning of year | | | $28.62 | | | | $22.66 | | | | $18.15 | | | | $32.84 | | | | $34.40 | |
| | | | | | | | | | | | | | | | | | | | |
| | | | | |
Investment operations: | | | | | | | | | | | | | | | | | | | | |
| | | | | |
Net investment income (loss)(a) | | | (.11 | ) | | | (.04 | ) | | | (.05 | ) | | | .01 | | | | (.01 | ) |
| | | | | |
Net realized and unrealized gain (loss) | | | .80 | | | | 6.00 | | | | 4.57 | | | | (9.89 | ) | | | 2.98 | |
| | | | | | | | | | | | | | | | | | | | |
| | | | | |
Total from investment operations | | | .69 | | | | 5.96 | | | | 4.52 | | | | (9.88 | ) | | | 2.97 | |
| | | | | | | | | | | | | | | | | | | | |
| | | | | |
Distributions to shareholders from: | | | | | | | | | | | | | | | | | | | | |
| | | | | |
Net investment income | | | – | | | | – | | | | (.01 | ) | | | – | | | | – | |
| | | | | |
Net realized gain | | | – | | | | – | | | | – | | | | (4.81 | ) | | | (4.53 | ) |
| | | | | | | | | | | | | | | | | | | | |
| | | | | |
Total distributions | | | – | | | | – | | | | (.01 | ) | | | (4.81 | ) | | | (4.53 | ) |
| | | | | | | | | | | | | | | | | | | | |
Net asset value, end of year | | | $29.31 | | | | $28.62 | | | | $22.66 | | | | $18.15 | | | | $32.84 | |
| | | | | | | | | | | | | | | | | | | | |
| | | | | |
Total Return(b) | | | 2.41 | % | | | 26.30 | % | | | 24.94 | % | | | (35.04 | )% | | | 9.95 | % |
| | | | | |
Ratios to Average Net Assets: | | | | | | | | | | | | | | | | | | | | |
| | | | | |
Expenses, including expense
reductions | | | 1.38 | % | | | 1.40 | % | | | 1.39 | % | | | 1.38 | % | | | 1.38 | % |
| | | | | |
Expenses, excluding expense
reductions | | | 1.38 | % | | | 1.40 | % | | | 1.39 | % | | | 1.38 | % | | | 1.38 | % |
| | | | | |
Net investment income (loss) | | | (.37 | )% | | | (.16 | )% | | | (.23 | )% | | | .02 | % | | | (.03 | )% |
| | | | | |
| Supplemental Data: | | | | | | | | | | | | | | | |
Net assets, end of year (000) | | | $231,655 | | | | $295,973 | | | | $261,914 | | | | $227,658 | | | | $412,127 | |
| | | | | |
Portfolio turnover rate | | | 41.95 | % | | | 42.28 | % | | | 68.63 | % | | | 77.87 | % | | | 61.44 | % |
| (a) | | Calculated using average shares outstanding during the year. |
| (b) | | Total return assumes the reinvestment of all distributions. |
See Notes to Financial Statements.
36
Financial Highlights (continued)
SMALL CAP VALUE FUND
| | | | | | | | | | | | | | | | |
| | | Class R2 Shares | |
| | | Year Ended 11/30 | | | 3/24/2008(a) to 11/30/2008 | |
| | | 2011 | | | 2010 | | | 2009 | | |
Per Share Operating Performance | | | | | | | | | | | | | | | | |
Net asset value, beginning of period | | | $28.72 | | | | $22.77 | | | | $18.29 | | | | $25.99 | |
| | | | | | | | | | | | | | | | |
| | | | |
Investment operations: | | | | | | | | | | | | | | | | |
| | | | |
Net investment loss(b) | | | (.11 | ) | | | (.11 | ) | | | (.10 | ) | | | (.02 | ) |
| | | | |
Net realized and unrealized gain (loss) | | | .76 | | | | 6.06 | | | | 4.62 | | | | (7.68 | ) |
| | | | | | | | | | | | | | | | |
| | | | |
Total from investment operations | | | .65 | | | | 5.95 | | | | 4.52 | | | | (7.70 | ) |
| | | | | | | | | | | | | | | | |
| | | | |
Distributions to shareholders from: | | | | | | | | | | | | | | | | |
| | | | |
Net investment income | | | – | | | | – | | | | (.04 | ) | | | – | |
| | | | | | | | | | | | | | | | |
Net asset value, end of period | | | $29.37 | | | | $28.72 | | | | $22.77 | | | | $18.29 | |
| | | | | | | | | | | | | | | | |
| | | | |
Total Return(c) | | | 2.26 | % | | | 26.13 | % | | | 24.77 | % | | | (29.63 | )%(d) |
| | | | |
Ratios to Average Net Assets: | | | | | | | | | | | | | | | | |
| | | | |
Expenses, including expense
reductions | | | 1.56 | % | | | 1.54 | % | | | 1.52 | % | | | 1.03 | %(d) |
| | | | |
Expenses, excluding expense
reductions | | | 1.56 | % | | | 1.54 | % | | | 1.52 | % | | | 1.04 | %(d) |
| | | | |
Net investment loss | | | (.38 | )% | | | (.41 | )% | | | (.48 | )% | | | (.07 | )%(d) |
| | | | |
| Supplemental Data: | | | | | | | | | | | | |
Net assets, end of period (000) | | | $7,205 | | | | $78 | | | | $86 | | | | $14 | |
| | | | |
Portfolio turnover rate | | | 41.95 | % | | | 42.28 | % | | | 68.63 | % | | | 77.87 | % |
| (a) | | Commencement of operations was 3/24/2008, SEC effective date was 9/14/2007 and date shares first became available to the public was 4/1/2008. |
| (b) | | Calculated using average shares outstanding during the period. |
| (c) | | Total return assumes the reinvestment of all distributions. |
See Notes to Financial Statements.
37
Financial Highlights (concluded)
SMALL CAP VALUE FUND
| | | | | | | | | | | | | | | | |
| | | Class R3 Shares | |
| | | Year Ended 11/30 | | | 3/24/2008(a)
to 11/30/2008 | |
| | | 2011 | | | 2010 | | | 2009 | | |
Per Share Operating Performance | | | | | | | | | | | | | | | | |
Net asset value, beginning of period | | | $28.69 | | | | $22.73 | | | | $18.29 | | | | $25.99 | |
| | | | | | | | | | | | | | | | |
| | | | |
Investment operations: | | | | | | | | | | | | | | | | |
| | | | |
Net investment income (loss)(b) | | | (.11 | ) | | | (.04 | ) | | | (.06 | ) | | | .02 | |
| | | | |
Net realized and unrealized gain (loss) | | | .80 | | | | 6.00 | | | | 4.60 | | | | (7.72 | ) |
| | | | | | | | | | | | | | | | |
| | | | |
Total from investment operations | | | .69 | | | | 5.96 | | | | 4.54 | | | | (7.70 | ) |
| | | | | | | | | | | | | | | | |
| | | | |
Distributions to shareholders from: | | | | | | | | | | | | | | | | |
| | | | |
Net investment income | | | – | | | | – | | | | (.10 | ) | | | – | |
| | | | | | | | | | | | | | | | |
Net asset value, end of period | | | $29.38 | | | | $28.69 | | | | $22.73 | | | | $18.29 | |
| | | | | | | | | | | | | | | | |
| | | | |
Total Return(c) | | | 2.41 | % | | | 26.22 | % | | | 24.94 | % | | | (29.63 | )%(d) |
| | | | |
Ratios to Average Net Assets: | | | | | | | | | | | | | | | | |
| | | | |
Expenses, including expense
reductions | | | 1.42 | % | | | 1.45 | % | | | 1.44 | % | | | 1.00 | %(d) |
| | | | |
Expenses, excluding expense
reductions | | | 1.42 | % | | | 1.45 | % | | | 1.44 | % | | | 1.00 | %(d) |
| | | | |
Net investment income (loss) | | | (.37 | )% | | | (.16 | )% | | | .30 | % | | | .07 | %(d) |
| | | | |
| Supplemental Data: | | | | | | | | | | | | |
Net assets, end of period (000) | | | $10,907 | | | | $5,190 | | | | $1,995 | | | | $1,090 | |
| | | | |
Portfolio turnover rate | | | 41.95 | % | | | 42.28 | % | | | 68.63 | % | | | 77.87 | % |
| (a) | | Commencement of operations was 3/24/2008, SEC effective date was 9/14/2007 and date shares first became available to the public was 4/1/2008. |
| (b) | | Calculated using average shares outstanding during the period. |
| (c) | | Total return assumes the reinvestment of all distributions. |
See Notes to Financial Statements.
38
Notes to Financial Statements
1. ORGANIZATION
Lord Abbett Research Fund, Inc. (the “Company”) is registered under the Investment Company Act of 1940, as amended (the “Act”), as a diversified, open-end management investment company and was incorporated under Maryland law on April 6, 1992. The Company currently consists of four separate funds. This report covers the following two funds (separately, a “Fund” and collectively, the “Funds”) and their respective classes: Lord Abbett Classic Stock Fund (“Classic Stock Fund”) and Small-Cap Value Series (“Small Cap Value Fund”).
Classic Stock Fund’s investment objective is growth of capital and growth of income consistent with reasonable risk. Small Cap Value Fund’s investment objective is long-term capital appreciation. Each Fund has eight classes of shares: Class A, B, C, F, I, P, R2 and R3, each with different expenses and dividends. A front-end sales charge is normally added to the net asset value (“NAV”) for Class A shares. There is no front-end sales charge in the case of Class B, C, F, I, P, R2 and R3 shares, although there may be a contingent deferred sales charge (“CDSC”) in certain cases as follows: Class A shares purchased without a sales charge and redeemed before the first day of the month in which the one-year anniversary of the purchase falls (subject to certain exceptions as set forth in each Fund’s prospectus); Class B shares redeemed before the sixth anniversary of purchase; and Class C shares redeemed before the first anniversary of purchase. Class B shares will automatically convert to Class A shares on the 25th day of the month (or, if the 25th day is not a business day, the next business day thereafter) following the eighth anniversary of the day on which the purchase order was accepted. Small Cap Value Fund is open to certain new investors on a limited basis as set forth in the Fund’s prospectus. The Funds no longer issue Class B shares for purchase. The Funds’ Class P shares are closed to substantially all investors, with certain exceptions as set forth in the Funds’ prospectus.
The preparation of the financial statements in conformity with accounting principles generally accepted in the United States of America requires management to make certain estimates and assumptions that affect the reported amounts of assets and liabilities and disclosure of contingent assets and liabilities at the date of the financial statements and the reported amounts of increases and decreases in net assets from operations during the reporting period. Actual results could differ from those estimates.
2. SIGNIFICANT ACCOUNTING POLICIES
| (a) | | Investment Valuation–Securities actively traded on any recognized U.S. or non-U.S. exchange or on The NASDAQ Stock Market LLC are valued at the last sale price or official closing price on the exchange or system on which they are principally traded. Events occurring after the close of trading on non-U.S. exchanges may result in adjustments to the valuation of foreign securities to more accurately reflect their fair value as of the close of regular trading on the New York Stock Exchange LLC. Each Fund may rely on an independent fair valuation service in adjusting the valuations of foreign securities. Unlisted equity securities are valued at the last quoted sale price or, if no sale price is available, at the mean between the most recently quoted bid and asked prices. Securities for which market quotations are not readily available are valued at fair value as determined by management and approved in good faith by the Board of Directors. Short-term securities with 60 days or less remaining to maturity are valued using the amortized cost method, which approximates fair value. |
39
Notes to Financial Statements (continued)
| (b) | | Security Transactions–Security transactions are recorded as of the date that the securities are purchased or sold (trade date). Realized gains and losses on sales of portfolio securities are calculated using the identified-cost method. Realized and unrealized gains (losses) are allocated to each class of shares based upon the relative proportion of net assets at the beginning of the day. |
| (c) | | Investment Income–Dividend income is recorded on the ex-dividend date. Interest income is recorded on the accrual basis as earned. Discounts are accreted and premiums are amortized using the effective interest method and are included in Interest income on the Statements of Operations. Withholding taxes on foreign dividends have been provided for in accordance with the applicable country’s tax rules and rates. Investment income is allocated to each class of shares based upon the relative proportion of net assets at the beginning of the day. |
| (d) | | Income Taxes–It is the policy of each Fund to meet the requirements of Subchapter M of the Internal Revenue Code applicable to regulated investment companies and to distribute substantially all taxable income and capital gains to its shareholders. Therefore, no income tax provision is required. |
Each Fund files U.S. federal and various state and local tax returns. No income tax returns are currently under examination. The statute of limitations on the Funds’ filed U.S. federal tax returns remains open for the fiscal years ended November 30, 2008 through November 30, 2011. The statutes of limitations on the Company’s state and local tax returns may remain open for an additional year depending upon the jurisdiction.
| (e) | | Expenses–Expenses incurred by the Company that do not specifically relate to an individual fund are generally allocated to the Funds within the Company on a pro rata basis by relative net assets. Expenses, excluding class-specific expenses, are allocated to each class of shares based upon the relative proportion of net assets at the beginning of the day. Class A, B, C, F, P, R2 and R3 shares bear their class-specific share of all expenses and fees relating to the Funds’ 12b-1 Distribution Plan. |
| (f) | | Foreign Transactions–The books and records of each Fund are maintained in U.S. dollars and transactions denominated in foreign currencies are recorded in each Fund’s records at the rate prevailing when earned or recorded. Asset and liability accounts that are denominated in foreign currencies are adjusted daily to reflect current exchange rates and any unrealized gain (loss) is included in Net change in unrealized appreciation/depreciation on investments and translation of assets and liabilities denominated in foreign currencies on each Fund’s Statement of Operations. The resultant exchange gains and losses upon settlement of such transactions are included in Net realized gain on investments and foreign currency related transactions in unaffiliated issuers on each Fund’s Statement of Operations. Each Fund does not isolate that portion of the results of operations arising as a result of changes in the foreign exchange rates from the changes in market prices of the securities. |
| (g) | | Repurchase Agreements–Each Fund may enter into repurchase agreements with respect to securities. A repurchase agreement is a transaction in which a Fund acquires a security and simultaneously commits to resell that security to the seller (a bank or securities dealer) at an agreed-upon price on an agreed-upon date. Each Fund requires at all times that the repurchase agreement be collateralized by cash, or by securities of the U.S. Government, its agencies, its instrumentalities, or U.S. Government sponsored enterprises having a value equal to, or in excess of, the value of the repurchase agreement (including accrued interest). If the |
40
Notes to Financial Statements (continued)
| | seller of the agreement defaults on its obligation to repurchase the underlying securities at a time when the fair value of these securities has declined, a Fund may incur a loss upon disposition of the securities. |
| (h) | | Fair Value Measurements–Fair value is defined as the price that each Fund would receive upon selling an investment or transferring a liability in an orderly transaction to an independent buyer in the principal or most advantageous market of the investment. A three-tier hierarchy is used to maximize the use of observable market data and minimize the use of unobservable inputs and to establish classification of fair value measurements for disclosure purposes. Inputs refer broadly to the assumptions that market participants would use in pricing the asset or liability, including assumptions about risk – for example, the risk inherent in a particular valuation technique used to measure fair value (such as a pricing model) and/or the risk inherent in the inputs to the valuation technique. Inputs may be observable or unobservable. Observable inputs reflect the assumptions market participants would use in pricing the asset or liability. Observable inputs are based on market data obtained from sources independent of the reporting entity. Unobservable inputs reflect the reporting entity’s own assumptions about the assumptions market participants would use in pricing the asset or liability. Unobservable inputs are based on the best information available in the circumstances. The three-tier hierarchy of inputs is summarized in the three broad Levels listed below: |
| | • | | Level 1 - unadjusted quoted prices in active markets for identical investments; |
| | • | | Level 2 - other significant observable inputs (including quoted prices for similar investments, interest rates, prepayment speeds, credit risk, etc.); and |
| | • | | Level 3 - significant unobservable inputs (including each Fund’s own assumptions in determining the fair value of investments). |
The inputs or methodology used for valuing securities are not necessarily an indication of the risk associated with investing in those securities.
The following is a summary of the inputs used as of November 30, 2011 in valuing each Fund’s investments carried at fair value:
| | | | | | | | | | | | | | | | | | | | | | | | | | | | | | | | |
| | | Classic Stock Fund | | | Small Cap Value Fund | |
| Investment Type* | | Level 1
(000) | | | Level 2
(000) | | | Level 3
(000) | | | Total
(000) | | | Level 1
(000) | | | Level 2
(000) | | | Level 3
(000) | | | Total
(000) | |
Common Stocks | | $ | 954,534 | | | $ | – | | | $ | – | | | $ | 954,534 | | | $ | 3,580,217 | | | $ | – | | | $ | – | | | $ | 3,580,217 | |
Repurchase Agreement | | | – | | | | 6,850 | | | | – | | | | 6,850 | | | | – | | | | 52,906 | | | | – | | | | 52,906 | |
Total | | $ | 954,534 | | | $ | 6,850 | | | $ | – | | | $ | 961,384 | | | $ | 3,580,217 | | | $ | 52,906 | | | $ | – | | | $ | 3,633,123 | |
| * | | See Schedule of Investments for fair values in each industry. |
3. MANAGEMENT FEE AND OTHER TRANSACTIONS WITH AFFILIATES
Management Fee
The Company has a management agreement with Lord, Abbett & Co. LLC (“Lord Abbett”), pursuant to which Lord Abbett supplies each Fund with investment management services and executive and other personnel, provides office space and pays for ordinary and necessary office and clerical expenses relating to research and statistical work and supervision of each Fund’s investment portfolio.
41
Notes to Financial Statements (continued)
The management fee is based on each Fund’s average daily net assets at the following annual rates:
| | | | |
Classic Stock Fund: | | | | |
First $1 billion | | | .70% | |
Next $1 billion | | | .65% | |
Over $2 billion | | | .60% | |
For the fiscal year ended November 30, 2011, the effective management fee, net of waivers, with respect to the Classic Stock Fund, was at an annualized rate of .39% of the Fund’s average daily net assets.
| | | | |
Small Cap Value Fund: | | | | |
First $2 billion | | | .75% | |
Over $2 billion | | | .70% | |
For the fiscal year ended November 30, 2011, the effective management fee with respect to the Small Cap Value Fund, was at an annualized rate of .73% of the Fund’s average daily net assets.
In addition, Lord Abbett provides certain administrative services to each Fund pursuant to an Administrative Services Agreement in return for a fee at an annual rate of .04% of each Fund’s average daily net assets.
For the fiscal year ended November 30, 2011, and continuing through March 31, 2012, Lord Abbett has contractually agreed to waive all or a portion of its management fee and, if necessary, reimburse the Classic Stock Fund’s other expenses to the extent necessary so that the net annual operating expenses for each class, excluding 12b-1 fees, do not exceed an annual rate of .63%. This agreement may be terminated only upon approval of the Fund’s Board of Directors.
Classic Stock Fund and Small Cap Value Fund, along with certain other funds managed by Lord Abbett (collectively, the “Underlying Funds”), have entered into a Servicing Arrangement with Lord Abbett Alpha Strategy Fund of Lord Abbett Securities Trust and Lord Abbett Balanced Strategy Fund, Lord Abbett Diversified Equity Strategy Fund and Lord Abbett Growth & Income Strategy Fund of Lord Abbett Investment Trust and Lord Abbett Global Allocation Fund of Lord Abbett Global Fund, Inc. (each a “Fund of Funds”), pursuant to which each Underlying Fund pays a portion of the expenses (excluding management fee and distribution and service fees) of each Fund of Funds in proportion to the average daily value of the Underlying Fund shares owned by each Fund of Funds. Amounts paid pursuant to the Servicing Arrangement are included in Subsidy expense on each Fund’s Statement of Operations and Payable to affiliates on each Fund’s Statement of Assets and Liabilities.
As of November 30, 2011, the percentages of Classic Stock Fund’s outstanding shares owned by Lord Abbett Balanced Strategy Fund, Lord Abbett Diversified Equity Strategy Fund, Lord Abbett Growth & Income Strategy Fund and Lord Abbett Global Allocation Fund were 16.41%, 3.46%, 10.65% and 0.77%, respectively.
As of November 30, 2011, the percentage of Small Cap Value Fund’s outstanding shares owned by Lord Abbett Alpha Strategy Fund was 4.63%.
42
Notes to Financial Statements (continued)
12b-1 Distribution Plan
Each Fund has adopted a distribution plan with respect to Class A, B, C, F, P, R2 and R3 shares pursuant to Rule 12b-1 under the Act, which provides for the payment of ongoing distribution and service fees to Lord Abbett Distributor LLC (the “Distributor”), an affiliate of Lord Abbett. The fees are accrued daily at annual rates based upon each Fund’s average daily net assets as follows:
| | | | | | | | | | | | | | | | | | | | | | | | | | | | |
| Fees* | | Class A | | | Class B | | | Class C | | | Class F | | | Class P | | | Class R2 | | | Class R3 | |
Service | | | .25% | | | | .25% | | | | .25% | | | | – | | | | .25% | | | | .25% | | | | .25% | |
Distribution | | | .10% | (1) | | | .75% | | | | .75% | | | | .10% | | | | .20% | | | | .35% | | | | .25% | |
| * | | The Fund may designate a portion of the aggregate fee as attributable to service activities for purposes of calculating Financial Industry Regulatory Authority, Inc. (“FINRA”) sales charge limitations. |
| (1) | | In the case of Small Cap Value Fund, the Class A Distribution Fee is .05%. |
Class I shares do not have a distribution plan.
Commissions
Distributor received the following commissions on sales of shares of the Funds, after concessions were paid to authorized dealers, for the fiscal year ended November 30, 2011:
| | | | | | | | |
| | | Distributor
Commissions | | | Dealers’
Concessions | |
Classic Stock Fund | | $ | 195,146 | | | $ | 1,043,638 | |
Small Cap Value Fund | | | 26,237 | | | | 138,631 | |
Distributor received the following amount of CDSCs for the fiscal year ended November 30, 2011:
| | | | | | | | |
| | | Class A | | | Class C | |
Classic Stock Fund | | $ | 7,236 | | | $ | 17,753 | |
Small Cap Value Fund | | | 846 | | | | 440 | |
Two Directors and certain of the Company’s and officers have an interest in Lord Abbett.
4. DISTRIBUTIONS AND CAPITAL LOSS CARRYFORWARDS
Dividends from net investment income, if any, are declared and distributed at least annually. Taxable net realized gains from investment transactions, reduced by allowable capital loss carryforwards, if any, are declared and distributed to shareholders at least annually. The capital loss carryforward amount, if any, is available to offset future net capital gains. Dividends and distributions to shareholders are recorded on the ex-dividend date. The amounts of dividends and distributions from net investment income and net realized capital gains are determined in accordance with federal income tax regulations, which may differ from accounting principles generally accepted in the United States of America. These book/tax differences are either considered temporary or permanent in nature. To the extent these differences are permanent in nature, such amounts are reclassified within the components of net assets based on their federal tax basis treatment; temporary differences do not require reclassification. Dividends and distributions, which exceed earnings and profits for tax purposes, are reported as a tax return of capital.
43
Notes to Financial Statements (continued)
The tax character of distributions paid during the fiscal years ended November 30, 2011 and 2010 was as follows:
| | | | | | | | | | | | | | | | |
| | | Classic Stock Fund | | | Small Cap Value Fund | |
| | | Year Ended 11/30/2011 | | | Year Ended 11/30/2010 | | | Year Ended 11/30/2011 | | | Year Ended 11/30/2010 | |
Distributions paid from: | | | | | | | | | | | | | | | | |
Ordinary income | | $ | 4,836,034 | | | $ | 6,357,657 | | | $ | 4,930,519 | | | $ | – | |
Total distributions paid | | $ | 4,836,034 | | | $ | 6,357,657 | | | $ | 4,930,519 | | | $ | – | |
Subsequent to the Classic Stock Fund’s fiscal year ended November 30, 2011, a net investment income distribution of approximately $8,197,000 was declared by the Fund on December 14, 2011. The distribution was paid on December 16, 2011 to shareholders of record on December 15, 2011.
As of November 30, 2011, the components of accumulated gains on a tax-basis were as follows:
| | | | | | | | |
| | | Classic Stock Fund | | | Small Cap Value Fund | |
Undistributed ordinary income – net | | $ | 7,339,097 | | | $ | – | |
Total undistributed earnings | | $ | 7,339,097 | | | $ | – | |
Capital loss carryforwards* | | | (106,249,089 | ) | | | (130,032,352 | ) |
Temporary differences | | | (101,178 | ) | | | (337,712 | ) |
Unrealized gains – net | | | 155,391,833 | | | | 627,876,850 | |
Total accumulated gains – net | | $ | 56,380,663 | | | $ | 497,506,786 | |
| * | | As of November 30, 2011, the capital loss carryforwards, along with the related expiration dates, were as follows: |
| | | | | | | | | | | | | | | | |
| | | 2016 | | | 2017 | | | 2018 | | | Total | |
Classic Stock Fund | | $ | 623,320 | | | $ | 98,625,213 | | | $ | 7,000,556 | | | $ | 106,249,089 | |
Small Cap Value Fund | | | – | | | | 130,032,352 | | | | – | | | | 130,032,352 | |
As of November 30, 2011, the aggregate unrealized security gains and losses based on cost for U.S. federal income tax purposes were as follows:
| | | | | | | | |
| | | Classic Stock Fund | | | Small Cap Value Fund | |
Tax cost | | $ | 805,991,963 | | | $ | 3,005,246,214 | |
Gross unrealized gain | | | 208,583,446 | | | | 739,914,983 | |
Gross unrealized loss | | | (53,191,526 | ) | | | (112,038,133 | ) |
Net unrealized security gain | | $ | 155,391,920 | | | $ | 627,876,850 | |
The difference between book-basis and tax-basis unrealized gains (losses) is attributable to the tax treatment of certain securities and wash sales.
Permanent items identified during the fiscal year ended November 30, 2011 have been reclassified among the components of net assets based on their tax basis treatment as follows:
| | | | | | | | | | | | |
| | | Undistributed
(Distributions in
Excess of) Net
Investment Income | | | Accumulated Net Realized
Loss | | | Paid-in
Capital | |
Classic Stock Fund | | $ | (38,270 | ) | | $ | 38,270 | | | $ | – | |
Small Cap Value Fund | | | 5,074,749 | | | | 3,523,005 | | | | (8,597,754 | ) |
44
Notes to Financial Statements (continued)
The permanent differences are primarily attributable to the tax treatment of net investment losses, certain distributions, and certain securities.
On December 22, 2010, the Regulated Investment Company Modernization Act of 2010 (the “Modernization Act”) was signed by the President of the United States. The Modernization Act includes numerous provisions that generally become effective for taxable years beginning after the date of enactment. Management is currently assessing the impact of the Modernization Act as it relates to the Funds.
5. PORTFOLIO SECURITIES TRANSACTIONS
Purchases and sales of investment securities (excluding short-term investments) for the fiscal year ended November 30, 2011 were as follows:
| | | | | | | | |
| | | Purchases | | | Sales | |
Classic Stock Fund | | $ | 300,123,667 | | | $ | 368,677,794 | |
Small Cap Value Fund | | | 1,620,260,352 | | | | 1,731,536,203 | |
There were no purchases or sales of U.S. Government securities for the fiscal year ended November 30, 2011.
6. DIRECTORS’ REMUNERATION
The Company’s officers and the two Directors who are associated with Lord Abbett do not receive any compensation from the Company for serving in such capacities. Outside Directors’ fees are allocated among all Lord Abbett-sponsored funds based on the net assets of each fund. There is an equity-based plan available to all outside Directors under which outside Directors must defer receipt of a portion of, and may elect to defer receipt of an additional portion of, Directors’ fees. The deferred amounts are treated as though equivalent dollar amounts had been invested in the funds. Such amounts and earnings accrued thereon are included in Directors’ fees on the Statements of Operations and in Directors’ fees payable on the Statements of Assets and Liabilities and are not deductible for U.S. federal income tax purposes until such amounts are paid.
7. EXPENSE REDUCTIONS
The Company has entered into an arrangement with its transfer agent and custodian, whereby credits realized as a result of uninvested cash balances are used to reduce a portion of each Fund’s expenses.
8. LINE OF CREDIT
The Funds and certain other funds managed by Lord Abbett have available an unsecured revolving credit facility (“Facility”) from State Street Bank and Trust Company (“SSB”), to be used for temporary or emergency purposes as an additional source of liquidity to fund redemptions of investor shares. The Facility is renewed annually under terms that depend on market conditions at the time of the renewal. The amount available under the Facility is $200,000,000.
On February 3, 2011, the Facility was renewed for an annual period by the Funds and certain other funds managed by Lord Abbett. The amount available under the Facility remained the same. The annual fee to maintain the Facility was reduced from .15% to .125% of the amount available under
45
Notes to Financial Statements (continued)
the facility. Each participating fund pays its pro rata share based on the net assets of each participating fund. This amount is included in Other expenses on the Funds’ Statements of Operations. Any borrowings under this Facility will bear interest at current market rates as set forth in the credit agreement. During the fiscal year ended November 30, 2011, a participating fund managed by Lord Abbett utilized the Facility and fully repaid its borrowings. As of November 30, 2011, there were no loans outstanding pursuant to this Facility.
Effective February 3, 2012, the Funds and certain other funds managed by Lord Abbett will enter into a short term extension of the Facility through March 31, 2012.
9. TRANSACTIONS WITH AFFILIATED ISSUERS
An affiliated issuer is one in which a Fund has ownership of at least 5% of the outstanding voting securities of the underlying issuer at any point during the fiscal year. Small Cap Value Fund had the following transactions with affiliated issuers during the fiscal year ended November 30, 2011:
| | | | | | | | | | | | | | | | | | | | | | | | | | | | |
| Affiliated Issuer | | Balance of Shares Held at 11/30/2010 | | | Gross
Additions | | | Gross Sales | | | Balance of Shares Held
at 11/30/2011 | | | Value at 11/30/2011 | | | Net Realized Gain (Loss) 12/1/2010 to
11/30/2011(a) | | | Dividend Income 12/1/2010 to
11/30/2011(a) | |
Danvers Bancorp., Inc.(b) | | | 1,355,600 | | | | 50,000 | | | | (1,405,600 | ) | | | – | | | $ | – | | | $ | 6,781,044 | | | $ | – | |
Koppers Holdings, Inc. | | | 1,271,100 | | | | 87,700 | | | | (155,700 | ) | | | 1,203,100 | | | | 39,738,393 | | | | 1,063,206 | | | | 1,142,603 | |
Navigators Group, Inc.(c) | | | 782,600 | | | | 85,400 | | | | (28,400 | ) | | | 839,600 | | | | 39,200,924 | | | | (196,882 | ) | | | – | |
NutriSystem, Inc.(b) | | | 1,363,100 | | | | – | | | | (1,363,100 | ) | | | – | | | | – | | | | (8,317,627 | ) | | | – | |
Olin Corp.(b) | | | 4,145,000 | | | | – | | | | (2,350,200 | ) | | | 1,794,800 | | | | – | | | | (31,312 | ) | | | 818,020 | |
Pacific Sunwear of California, Inc.(b) | | | 5,868,640 | | | | – | | | | (5,868,640 | ) | | | – | | | | – | | | | (6,078,540 | ) | | | – | |
Rogers Corp.(b) | | | 987,435 | | | | 33,300 | | | | (387,400 | ) | | | 633,335 | | | | – | | | | (121,694 | ) | | | – | |
ScanSource, Inc. | | | 1,467,725 | | | | 80,500 | | | | (498 | ) | | | 1,547,727 | | | | 54,340,695 | | | | 4,752 | | | | – | |
Texas Capital Bancshares, Inc.(b) | | | 1,895,554 | | | | – | | | | (580,200 | ) | | | 1,315,354 | | | | – | | | | 292,686 | | | | – | |
TriMas Corp.(c) | | | – | | | | 1,909,900 | | | | (175,799 | ) | | | 1,734,101 | | | | 35,393,001 | | | | (302,827 | ) | | | – | |
TrueBlue, Inc.(b) | | | 2,698,700 | | | | 78,400 | | | | (788,700 | ) | | | 1,988,400 | | | | – | | | | (715,176 | ) | | | – | |
Total | | | | | | | | | | | | | | | | | | $ | 168,673,013 | | | $ | (7,622,370 | ) | | $ | 1,960,623 | |
| (a) | | Represents realized gains (losses) and dividend income earned only when the issuer was an affiliate of the Fund. |
| (b) | | No longer an affiliated issuer as of November 30, 2011. |
| (c) | | Not an affiliated issuer as of November 30, 2010. |
10. CUSTODIAN AND ACCOUNTING AGENT
SSB is the Company’s custodian and accounting agent. SSB performs custodial, accounting and recordkeeping functions relating to portfolio transactions and calculating each Fund’s NAV.
46
Notes to Financial Statements (continued)
11. INVESTMENT RISKS
Classic Stock Fund is subject to the general risks and considerations associated with equity investing, as well as the particular risks associated with value and growth stocks. This means the value of your investment will fluctuate in response to movements in the equity securities market in general and to the changing prospects of individual companies in which the Fund invests. Large value and growth stocks may perform differently than the market as a whole and differently than each other or other types of stocks, such as small company stocks. This is because different types of stocks tend to shift in and out of favor depending on market and economic conditions. The market may fail to recognize the intrinsic value of particular value stocks for a long time. Growth stocks may be more volatile than other stocks. In addition, if the Fund’s assessment of a company’s value or prospects for exceeding earnings expectations or market conditions is wrong, the Fund could suffer losses or produce poor performance relative to other funds, even in a rising market. Due to its investment exposure to foreign companies (and ADRs), the Fund may experience increased market, liquidity, currency, political, information and other risks.
Small Cap Value Fund is subject to the general risks and considerations associated with equity investing, as well as the particular risks associated with small company value stocks. The value of an investment will fluctuate in response to movements in the equity securities market in general and to the changing prospects of individual companies in which the Fund invests. Large company value stocks and small company value stocks may perform differently than the market as a whole and other types of stocks such as growth stocks. The market may fail to recognize the intrinsic value of particular value stocks for a long time. In addition, small company stocks may be more volatile and less liquid than large cap company stocks. Also, if a Fund’s assessment of a company’s value or prospects for exceeding earnings expectations or market conditions is wrong, the Fund could suffer losses or produce poor performance relative to other funds, even in a rising market.
These factors can affect each Fund’s performance.
12. SUMMARY OF CAPITAL TRANSACTIONS
Transactions in shares of capital stock were as follows:
| | | | | | | | | | | | | | | | |
| Classic Stock Fund | | Year Ended
November 30, 2011 | | | Year Ended
November 30, 2010 | |
| Class A Shares | | Shares | | | Amount | | | Shares | | | Amount | |
Shares sold | | | 2,892,807 | | | $ | 83,581,596 | | | | 4,326,423 | | | $ | 113,670,946 | |
Converted from Class B* | | | 147,085 | | | | 4,181,060 | | | | 185,804 | | | | 4,897,041 | |
Reinvestment of distributions | | | 66,817 | | | | 1,944,367 | | | | 135,869 | | | | 3,493,197 | |
Shares reacquired | | | (5,264,970 | ) | | | (150,930,691 | ) | | | (7,139,993 | ) | | | (186,545,730 | ) |
Decrease | | | (2,158,261 | ) | | $ | (61,223,668 | ) | | | (2,491,897 | ) | | $ | (64,484,546 | ) |
| | | | |
| Class B Shares | | | | | | | | | | | | |
Shares sold | | | 43,728 | | | $ | 1,197,154 | | | | 147,314 | | | $ | 3,709,158 | |
Reinvestment of distributions | | | – | | | | – | | | | 625 | | | | 15,396 | |
Shares reacquired | | | (248,041 | ) | | | (6,782,204 | ) | | | (470,652 | ) | | | (11,835,690 | ) |
Converted to Class A* | | | (154,522 | ) | | | (4,181,060 | ) | | | (194,621 | ) | | | (4,897,041 | ) |
Decrease | | | (358,835 | ) | | $ | (9,766,110 | ) | | | (517,334 | ) | | $ | (13,008,177 | ) |
47
Notes to Financial Statements (continued)
| | | | | | | | | | | | | | | | |
| Classic Stock Fund | | Year Ended
November 30, 2011 | | | Year Ended
November 30, 2010 | |
| Class C Shares | | Shares | | | Amount | | | Shares | | | Amount | |
Shares sold | | | 413,946 | | | $ | 11,418,710 | | | | 636,064 | | | $ | 16,135,442 | |
Reinvestment of distributions | | | – | | | | – | | | | 3,291 | | | | 81,175 | |
Shares reacquired | | | (1,024,248 | ) | | | (27,771,884 | ) | | | (979,278 | ) | | | (24,571,413 | ) |
Decrease | | | (610,302 | ) | | $ | (16,353,174 | ) | | | (339,923 | ) | | $ | (8,354,796 | ) |
| | | | |
| Class F Shares | | | | | | | | | | | | |
Shares sold | | | 547,647 | | | $ | 16,011,880 | | | | 1,740,015 | | | $ | 44,496,575 | |
Reinvestment of distributions | | | 8,072 | | | | 233,856 | | | | 1,440 | | | | 36,859 | |
Shares reacquired | | | (1,223,307 | ) | | | (35,970,793 | ) | | | (506,436 | ) | | | (13,179,173 | ) |
Increase (decrease) | | | (667,588 | ) | | $ | (19,725,057 | ) | | | 1,235,019 | | | $ | 31,354,261 | |
| | | | |
| Class I Shares | | | | | | | | | | | | |
Shares sold | | | 1,941,620 | | | $ | 57,733,518 | | | | 1,889,116 | | | $ | 48,822,389 | |
Reinvestment of distributions | | | 81,762 | | | | 2,380,907 | | | | 94,813 | | | | 2,438,608 | |
Shares reacquired | | | (1,796,731 | ) | | | (49,504,481 | ) | | | (362,428 | ) | | | (9,710,018 | ) |
Increase | | | 226,651 | | | $ | 10,609,944 | | | | 1,621,501 | | | $ | 41,550,979 | |
| | | | |
| Class P Shares | | | | | | | | | | | | |
Shares sold | | | 70,571 | | | $ | 2,142,058 | | | | 18,712 | | | $ | 492,274 | |
Reinvestment of distributions | | | 257 | | | | 7,511 | | | | 733 | | | | 18,938 | |
Shares reacquired | | | (94,761 | ) | | | (2,827,323 | ) | | | (70,713 | ) | | | (1,914,581 | ) |
Decrease | | | (23,933 | ) | | $ | (677,754 | ) | | | (51,268 | ) | | $ | (1,403,369 | ) |
| | | | |
| Class R2 Shares | | | | | | | | | | | | |
Shares sold | | | 62,965 | | | $ | 1,879,793 | | | | 42,843 | | | $ | 1,198,512 | |
Reinvestment of distributions | | | 148 | | | | 4,298 | | | | 153 | | | | 3,923 | |
Shares reacquired | | | (23,576 | ) | | | (680,099 | ) | | | (7,848 | ) | | | (201,709 | ) |
Increase | | | 39,537 | | | $ | 1,203,992 | | | | 35,148 | | | $ | 1,000,726 | |
| | | | |
| Class R3 Shares | | | | | | | | | | | | |
Shares sold | | | 363,546 | | | $ | 10,412,429 | | | | 335,020 | | | $ | 8,774,378 | |
Reinvestment of distributions | | | 1,186 | | | | 34,188 | | | | 581 | | | | 14,803 | |
Shares reacquired | | | (179,504 | ) | | | (5,137,250 | ) | | | (73,963 | ) | | | (1,953,193 | ) |
Increase | | | 185,228 | | | $ | 5,309,367 | | | | 261,638 | | | $ | 6,835,988 | |
| * | | Automatic conversion of Class B shares occurs on the 25th day of the month (or, if the 25th day is not a business day, the next business day thereafter) following the eighth anniversary of the day on which the purchase order was accepted. |
| | | | | | | | | | | | | | | | |
| Small Cap Value Fund | | Year Ended
November 30, 2011 | | | Year Ended
November 30, 2010 | |
| Class A Shares | | Shares | | | Amount | | | Shares | | | Amount | |
Shares sold | | | 11,212,546 | | | $ | 350,389,029 | | | | 12,109,351 | | | $ | 322,555,356 | |
Converted from Class B* | | | 88,350 | | | | 2,770,021 | | | | 104,118 | | | | 2,688,898 | |
Reinvestment of distributions | | | 2,331 | | | | 72,490 | | | | – | | | | – | |
Shares reacquired | | | (17,374,091 | ) | | | (538,985,757 | ) | | | (17,548,529 | ) | | | (467,745,400 | ) |
Decrease | | | (6,070,864 | ) | | $ | (185,754,217 | ) | | | (5,335,060 | ) | | $ | (142,501,146 | ) |
48
Notes to Financial Statements (concluded)
| | | | | | | | | | | | | | | | |
| Small Cap Value Fund | | Year Ended
November 30, 2011 | | | Year Ended
November 30, 2010 | |
| Class B Shares | | Shares | | | Amount | | | Shares | | | Amount | |
Shares sold | | | 26,434 | | | $ | 708,981 | | | | 49,215 | | | $ | 1,149,350 | |
Shares reacquired | | | (130,520 | ) | | | (3,489,732 | ) | | | (144,121 | ) | | | (3,358,597 | ) |
Converted to Class A* | | | (102,225 | ) | | | (2,770,021 | ) | | | (119,616 | ) | | | (2,688,898 | ) |
Decrease | | | (206,311 | ) | | $ | (5,550,772 | ) | | | (214,522 | ) | | $ | (4,898,145 | ) |
| | | | |
| Class C Shares | | | | | | | | | | | | |
Shares sold | | | 29,288 | | | $ | 789,684 | | | | 85,219 | | | $ | 1,905,013 | |
Shares reacquired | | | (273,732 | ) | | | (7,321,437 | ) | | | (528,689 | ) | | | (12,019,490 | ) |
Decrease | | | (244,444 | ) | | $ | (6,531,753 | ) | | | (443,470 | ) | | $ | (10,114,477 | ) |
| | | | |
| Class F Shares | | | | | | | | | | | | |
Shares sold | | | 473,235 | | | $ | 15,043,590 | | | | 407,359 | | | $ | 10,816,433 | |
Reinvestment of distributions | | | 756 | | | | 23,438 | | | | – | | | | – | |
Shares reacquired | | | (316,601 | ) | | | (9,769,100 | ) | | | (446,866 | ) | | | (11,713,284 | ) |
Increase (decrease) | | | 157,390 | | | $ | 5,297,928 | | | | (39,507 | ) | | $ | (896,851 | ) |
| | | | |
| Class I Shares | | | | | | | | | | | | |
Shares sold | | | 12,961,933 | | | $ | 431,213,254 | | | | 11,276,782 | | | $ | 321,676,217 | |
Reinvestment of distributions | | | 137,882 | | | | 4,533,575 | | | | – | | | | – | |
Shares reacquired | | | (9,316,333 | ) | | | (303,627,443 | ) | | | (7,017,920 | ) | | | (195,838,186 | ) |
Increase | | | 3,783,482 | | | $ | 132,119,386 | | | | 4,258,862 | | | $ | 125,838,031 | |
| | | | |
| Class P Shares | | | | | | | | | | | | |
Shares sold | | | 1,686,478 | | | $ | 52,476,103 | | | | 2,508,370 | | | $ | 66,035,169 | |
Shares reacquired | | | (4,124,330 | ) | | | (128,903,450 | ) | | | (3,725,964 | ) | | | (96,873,424 | ) |
Decrease | | | (2,437,852 | ) | | $ | (76,427,347 | ) | | | (1,217,594 | ) | | $ | (30,838,255 | ) |
| | | | |
| Class R2 Shares | | | | | | | | | | | | |
Shares sold | | | 255,811 | | | $ | 8,441,099 | | | | 1,885 | | | $ | 49,990 | |
Shares reacquired | | | (13,221 | ) | | | (379,031 | ) | | | (2,937 | ) | | | (79,605 | ) |
Increase (decrease) | | | 242,590 | | | $ | 8,062,068 | | | | (1,052 | ) | | $ | (29,615 | ) |
| | | | |
| Class R3 Shares | | | | | | | | | | | | |
Shares sold | | | 284,904 | | | $ | 9,262,280 | | | | 123,151 | | | $ | 3,227,475 | |
Shares reacquired | | | (94,476 | ) | | | (2,916,662 | ) | | | (30,056 | ) | | | (783,198 | ) |
Increase | | | 190,428 | | | $ | 6,345,618 | | | | 93,095 | | | $ | 2,444,277 | |
| * | | Automatic conversion of Class B shares occurs on the 25th day of the month (or, if the 25th day is not a business day, the next business day thereafter) following the eighth anniversary of the day on which the purchase order was accepted. |
49
Report of Independent Registered Public Accounting Firm
To the Board of Directors of Lord Abbett Research Fund, Inc. and the Shareholders of the Lord Abbett Classic Stock Fund and Lord Abbett Small-Cap Value Series:
We have audited the accompanying statements of assets and liabilities, including the schedules of investments, of Lord Abbett Classic Stock Fund and Lord Abbett Small-Cap Value Series, (collectively the “Funds”), two of the portfolios constituting the Lord Abbett Research Fund, Inc. (the “Company”), as of November 30, 2011, and the related statements of operations for the year then ended, the statements of changes in net assets for each of the two years in the period then ended, and the financial highlights for each of the periods presented. These financial statements and financial highlights are the responsibility of the Company’s management. Our responsibility is to express an opinion on these financial statements and financial highlights based on our audits.
We conducted our audits in accordance with the standards of the Public Company Accounting Oversight Board (United States). Those standards require that we plan and perform the audit to obtain reasonable assurance about whether the financial statements and financial highlights are free of material misstatement. The Company is not required to have, nor were we engaged to perform, an audit of its internal control over financial reporting. Our audits included consideration of internal control over financial reporting as a basis for designing audit procedures that are appropriate in the circumstances, but not for the purpose of expressing an opinion on the effectiveness of the Company’s internal control over financial reporting. Accordingly, we express no such opinion. An audit also includes examining, on a test basis, evidence supporting the amounts and disclosures in the financial statements, assessing the accounting principles used and significant estimates made by management, as well as evaluating the overall financial statement presentation. Our procedures included confirmation of securities owned as of November 30, 2011, by correspondence with the custodian and brokers; where replies were not received from brokers, we performed other auditing procedures. We believe that our audits provide a reasonable basis for our opinion.
In our opinion, the financial statements and financial highlights referred to above present fairly, in all material respects, the financial position of the Funds as of November 30, 2011, the results of their operations for the year then ended, the changes in their net assets for each of the two years in the period then ended, and the financial highlights for each of the periods presented, in conformity with accounting principles generally accepted in the United States of America.
DELOITTE & TOUCHE LLP
New York, New York
January 26, 2012
50
Basic Information About Management
The Board of Directors (the “Board”) is responsible for the management of the business and affairs of the Company in accordance with the laws of the State of Maryland. The Board appoints officers who are responsible for the day-to-day operations of the Company and who execute policies authorized by the Board. The Board also approves an investment adviser to the Company and continues to monitor the cost and quality of the services the investment adviser provides, and annually considers whether to renew the contract with the adviser. Generally, each Director holds office until his/her successor is elected and qualified or until his/her earlier resignation or removal, as provided in the Company’s organizational documents.
Lord, Abbett & Co. LLC (“Lord Abbett”), a limited liability company, is the Company’s investment adviser.
Interested Directors
The following Directors are associated with Lord Abbett and are “interested persons” of the Company as defined in the Act. Mr. Dow and Ms. Foster are officers and directors or trustees of each of the 13 Lord Abbett-sponsored funds, which consist of 57 portfolios or series.
| | | | |
Name, Address and
Year of Birth | | Current Position and
Length of Service
with the Company | | Principal Occupation and Other Directorships
During Past Five Years |
| | |
Robert S. Dow Lord, Abbett & Co. LLC 90 Hudson Street Jersey City, NJ 07302 (1945) | | Director and Chairman since 1996 | | Principal Occupation: Senior Partner of Lord Abbett (since 2007) and was formerly Managing Partner (1996 - 2007) and Chief Investment Officer (1995 - 2007), joined Lord Abbett in 1972. Other Directorships: None. |
| | |
Daria L. Foster Lord, Abbett & Co. LLC 90 Hudson Street Jersey City, NJ 07302 (1954) | | Director and President since 2006 | | Principal Occupation: Managing Partner of Lord Abbett (since 2007), and was formerly Director of Marketing and Client Service, joined Lord Abbett in 1990. Other Directorships: None. |
Independent Directors
The following Independent Directors also are directors or trustees of each of the 13 Lord Abbett-sponsored funds, which consist of 57 portfolios or series.
| | | | |
Name, Address and
Year of Birth | | Current Position and
Length of Service with
the Company | | Principal Occupation and Other Directorships
During Past Five Years |
| | |
E. Thayer Bigelow Lord, Abbett & Co. LLC c/o Legal Dept. 90 Hudson Street Jersey City, NJ 07302 (1941) | | Director since 1996 | | Principal Occupation: Managing General Partner, Bigelow Media, LLC (since 2000); Senior Adviser, Time Warner Inc. (1998 - 2000). Other Directorships: Currently serves as director of Crane Co. (since 1984) and Huttig Building Products Inc. (since 1998). Previously served as a director of R.H. Donnelley Inc. (2009 - 2010) and Adelphia Communications Inc. (2003 - 2007). |
51
Basic Information About Management (continued)
| | | | |
Name, Address and
Year of Birth | | Current Position and
Length of Service with
the Company | | Principal Occupation and Other Directorships
During Past Five Years |
| | |
Robert B. Calhoun, Jr. Lord, Abbett & Co. LLC c/o Legal Dept. 90 Hudson Street Jersey City, NJ 07302 (1942) | | Director since 1998 | | Principal Occupation: Senior Advisor of Monitor Clipper Partners, a private equity investment fund (since 1997); President of Clipper Asset Management Corp. (1991 - 2009). Other Directorships: Previously served as a director of Interstate Bakeries Corp. (1991 - 2008). |
| | |
Evelyn E. Guernsey Lord, Abbett & Co. LLC c/o Legal Dept. 90 Hudson Street Jersey City, NJ 07302 (1955) | | Director since 2011 | | Principal Occupation: CEO, Americas of J.P. Morgan Asset Management (2004 - 2010). Other Directorships: None. |
| | |
Julie A. Hill Lord, Abbett & Co. LLC c/o Legal Dept. 90 Hudson Street Jersey City, NJ 07302 (1946) | | Director since 2004 | | Principal Occupation: Owner and CEO of The Hill Company, a business consulting firm (since 1998). Other Directorships: Currently serves as director of WellPoint, Inc., a health benefits company (since 1994). Previously served as a director of Resources Connection, Inc., a consulting firm (2004 - 2007). |
| | |
Franklin W. Hobbs Lord, Abbett & Co. LLC c/o Legal Dept. 90 Hudson Street Jersey City, NJ 07302 (1947) | | Director since 2001 | | Principal Occupation: Advisor of One Equity Partners, a private equity firm (since 2004). Other Directorships: Currently serves as a director and Chairman of the Board of Ally Financial Inc., a financial services firm (since 2009) and as a director of Molson Coors Brewing Company (since 2002). |
| | |
Thomas J. Neff Lord, Abbett & Co. LLC c/o Legal Dept. 90 Hudson Street Jersey City, NJ 07302 (1937) | | Director since 1992 | | Principal Occupation: Chairman of Spencer Stuart (U.S.), an executive search consulting firm (since 1996). Other Directorships: Currently serves as director of Ace, Ltd. (since 1997). Previously served as a director of Hewitt Associates, Inc. (2004 - 2010). |
| | |
James L.L. Tullis Lord, Abbett & Co. LLC c/o Legal Dept. 90 Hudson Street Jersey City, NJ 07302 (1947) | | Director since 2006 | | Principal Occupation: CEO of Tullis-Dickerson and Co. Inc., a venture capital management firm (since 1990). Other Directorships: Currently serves as director of Crane Co. (since 1998). Previously served as a director of ViaCell, Inc. (2003 - 2007). |
52
Basic Information About Management (continued)
Officers
None of the officers listed below have received compensation from the Company. All of the officers of the Company also may be officers of the other Lord Abbett-sponsored funds and maintain offices at 90 Hudson Street, Jersey City, NJ 07302. Unless otherwise indicated, the position(s) and title(s) listed under the “Principal Occupation During Past Five Years” column indicate each officer’s position(s) and title(s) with Lord Abbett.
| | | | | | |
Name and
Year of Birth | | Current Position
with the Company | | Length of Service
of Current
Position | | Principal Occupation
During Past Five Years |
| | | |
Robert S. Dow (1945) | | Chief Executive Officer and Chairman | | Elected in 1996 | | Senior Partner of Lord Abbett (since 2007), and was formerly Managing Partner (1996 - 2007) and Chief Investment Officer (1995 - 2007), joined Lord Abbett in 1972. |
| | | |
Daria L. Foster (1954) | | President | | Elected in 2006 | | Managing Partner of Lord Abbett (since 2007), and was formerly Director of Marketing and Client Service, joined Lord Abbett in 1990. |
| | | |
Robert P. Fetch (1953) | | Executive Vice President | | Elected in 1997 | | Partner and Director, joined Lord Abbett in 1995. |
| | | |
Daniel H. Frascarelli (1954) | | Executive Vice President | | Elected in 2005 | | Partner and Director, joined Lord Abbett in 1990. |
| | | |
Robert I. Gerber (1954) | | Executive Vice President | | Elected in 2007 | | Partner and Chief Investment Officer (since 2007), joined Lord Abbett in 1997 as Director of Taxable Fixed Income Management. |
| | | |
Gerard S. E. Heffernan, Jr. (1963) | | Executive Vice President | | Elected in 2009 | | Partner and Director, joined Lord Abbett in 1998. |
| | | |
Christopher J. Towle (1957) | | Executive Vice President | | Elected in 2001 | | Partner and Director, joined Lord Abbett in 1987. |
| | | |
Paul J. Volovich (1973) | | Executive Vice President | | Elected in 2004 | | Partner and Director, joined Lord Abbett in 1997. |
| | | |
James W. Bernaiche (1956) | | Chief Compliance Officer | | Elected in 2004 | | Partner and Chief Compliance Officer, joined Lord Abbett in 2001. |
| | | |
Joan A. Binstock (1954) | | Chief Financial Officer and Vice President | | Elected in 1999 | | Partner and Chief Operations Officer, joined Lord Abbett in 1999. |
53
Basic Information About Management (concluded)
| | | | | | |
Name and
Year of Birth | | Current Position
with the Company | | Length of Service
of Current
Position | | Principal Occupation
During Past Five Years |
| | | |
John K. Forst (1960) | | Vice President and Assistant Secretary | | Elected in 2005 | | Deputy General Counsel, joined Lord Abbett in 2004. |
| | | |
Lawrence H. Kaplan (1957) | | Vice President and Secretary | | Elected in 1997 | | Partner and General Counsel, joined Lord Abbett in 1997. |
| | | |
Deepak Khanna (1963) | | Vice President | | Elected in 2008 | | Partner and Portfolio Manager, rejoined Lord Abbett in 2007 from Jennison Associates LLC (2005 - 2007). Mr. Khanna’s former experience at Lord Abbett included Senior Research Analyst - other investment strategies (2000 - 2005). |
| | | |
David J. Linsen (1974) | | Vice President | | Elected in 2008 | | Partner and Director, joined Lord Abbett in 2001. |
| | | |
A. Edward Oberhaus, III (1959) | | Vice President | | Elected in 1996 | | Partner and Director, joined Lord Abbett in 1983. |
| | | |
Todor I. Petrov (1974) | | Vice President | | Elected in 2008 | | Portfolio Manager, joined Lord Abbett in 2003. |
| | | |
Thomas R. Phillips (1960) | | Vice President and Assistant Secretary | | Elected in 2008 | | Partner and Deputy General Counsel, joined Lord Abbett in 2006. |
| | | |
Randy M. Reynolds (1972) | | Vice President | | Elected in 2008 | | Portfolio Manager, joined Lord Abbett in 1999. |
| | | |
Lawrence B. Stoller (1963) | | Vice President and Assistant Secretary | | Elected in 2007 | | Partner and Senior Deputy General Counsel, joined Lord Abbett in 2007 and was formerly an Executive Vice President and the General Counsel at Cohen & Steers Capital Management, Inc. (1999 - 2007). |
| | | |
Francis T. Timons (1969) | | Vice President | | Elected in 2010 | | Portfolio Manager, joined Lord Abbett in 2007 and was formerly a Research Analyst at Robert W. Baird & Co. (2004 - 2007). |
| | | |
Bernard J. Grzelak (1971) | | Treasurer | | Elected in 2003 | | Partner and Director of Fund Administration, joined Lord Abbett in 2003. |
Please call 888-522-2388 for a copy of the statement of additional information (“SAI”), which contains further information about the Company’s Directors. It is available free upon request.
54
Householding
The Company has adopted a policy that allows it to send only one copy of each Fund’s prospectus, proxy material, annual report and semiannual report to certain shareholders residing at the same “household.” This reduces Fund expenses, which benefits you and other shareholders. If you need additional copies or do not want your mailings to be “householded,” please call Lord Abbett at 888-522-2388 or send a written request with your name, the name of your fund or funds and your account number or numbers to Lord Abbett Family of Funds, P.O. Box 219336, Kansas City, MO 64121.
Proxy Voting Policies, Procedures and Records
A description of the policies and procedures that Lord Abbett uses to vote proxies related to each Fund’s portfolio securities, and information on how Lord Abbett voted each Fund’s proxies during the 12-month period ended June 30 are available without charge, upon request, (i) by calling 888-522-2388; (ii) on Lord Abbett’s Website at www.lordabbett.com; and (iii) on the Securities and Exchange Commission’s (“SEC”) Website at www.sec.gov.
Shareholder Reports and Quarterly Portfolio Disclosure
The Funds are required to file their complete schedule of portfolio holdings with the SEC for their first and third fiscal quarters on Form N-Q. Copies of the filings are available without charge, upon request on the SEC’s Website at www.sec.gov and may be available by calling Lord Abbett at 888-522-2388. You can also obtain copies of Form N-Q by visiting the SEC’s Public Reference Room in Washington, DC (information on the operation of the Public Reference Room may be obtained by calling 800-SEC-0330).
Tax Information
100% of the ordinary income distributions paid by the Classic Stock Fund and Small Cap Value Fund during fiscal 2011 is qualified dividend income. For corporate shareholders, 100% of the ordinary income distributions paid by the Classic Stock Fund and Small Cap Value Fund during fiscal 2011 qualified for the dividends received deduction.
55


This report, when not used for the general information of shareholders of the Fund, is to be distributed only if preceded or accompanied by a current fund prospectus.
Lord Abbett mutual fund shares are distributed by LORD ABBETT DISTRIBUTOR LLC.
Lord Abbett Research Fund, Inc.
Lord Abbett Classic Stock Fund
Small-Cap Value Series
LARF-2-1111
(01/12)
| | (a) | In accordance with applicable requirements, the Registrant adopted a Sarbanes-Oxley Code of Ethics on June 19, 2003 that applies to the principal executive officer and senior financial officers of the Registrant (“Code of Ethics”). The Code of Ethics was in effect during the fiscal year ended November 30, 2011 (the “Period”). |
| | (c) | The Registrant has not amended the Code of Ethics as described in Form N-CSR during the Period. |
| | (d) | The Registrant has not granted any waiver, including an implicit waiver, from a provision of the Code of Ethics as described in Form N-CSR during the Period. |
| | (f) | See Item 12(a)(1) concerning the filing of the Code of Ethics. The Registrant will provide a copy of the Code of Ethics to any person without charge, upon request. To obtain a copy, please call Lord Abbett at 888-522-2388. |
| Item 3: | Audit Committee Financial Expert. |
The Registrant’s board of directors has determined that each of the following independent directors who are members of the audit committee is an audit committee financial expert: E. Thayer Bigelow, Robert B. Calhoun Jr., and James L.L. Tullis. Each of these persons is independent within the meaning of the Form N-CSR.
| Item 4: | Principal Accountant Fees and Services. |
In response to sections (a), (b), (c) and (d) of Item 4, the aggregate fees billed to the Registrant for the fiscal years ended November 30, 2011 and 2010 by the Registrant’s principal accounting firm, Deloitte & Touche LLP, the member firms of Deloitte Touche Tohmatsu and their respective affiliates (collectively, “Deloitte”) were as follows:
| | | | |
| | | Fiscal year ended: |
| | | 2011 | | 2010 |
Audit Fees {a} | | $159,000 | | $154,000 |
Audit-Related Fees | | - 0 - | | - 0 - |
| | |
Total audit and audit-related fees | | 159,000 | | 154,000 |
| | |
| | |
Tax Fees {b} | | 30,516 | | 29,658 |
All Other Fees | | - 0 - | | - 0 - |
| | |
| | |
Total Fees | | $189,516 | | $183,658 |
| | |
{a} Consists of fees for audits of the Registrant’s annual financial statements.
{b} Fees for the fiscal year ended November 30, 2011 and 2010 consist of fees for preparing the U.S. Income Tax Return for Regulated Investment Companies, New Jersey Corporation Business Tax Return, New Jersey Annual Report Form, U.S. Return of Excise Tax on Undistributed Income of Investment Companies, IRS Forms 1099-MISC and 1096 Annual Summary and Transmittal of U.S. Information Returns.
(e) (1) Pursuant to Rule 2-01(c) (7) of Regulation S-X, the Registrant’s Audit Committee has adopted pre-approval policies and procedures. Such policies and procedures generally provide that the Audit Committee must pre-approve:
| | • | | any audit, audit-related, tax, and other services to be provided to the Lord Abbett Funds, including the Registrant, and |
| | • | | any audit-related, tax, and other services to be provided to the Registrant’s investment adviser and any entity controlling, controlled by or under common control with the investment adviser that provides ongoing services to one or more Funds comprising the Registrant if the engagement relates directly to operations and financial reporting of a Fund, by the independent auditor to assure that the provision of such services does not impair the auditor’s independence. |
The Audit Committee has delegated pre-approval authority to its Chairman, subject to a fee limit of $10,000 per event, and not to exceed $25,000 annually. The Chairman will report any pre-approval decisions to the Audit Committee at its next scheduled meeting. Unless a type of service to be provided by the independent auditor has received general pre-approval, it must be pre-approved by the Audit Committee. Any proposed services exceeding pre-approved cost levels will require specific pre-approval by the Audit Committee.
(e) (2) The Registrant’s Audit Committee has approved 100% of the services described in this Item 4 (b) through (d).
(f) Not applicable.
(g) The aggregate non-audit fees billed by Deloitte for services rendered to the Registrant are shown above in the response to Item 4 (a), (b), (c) and (d) as “All Other Fees”.
The aggregate non-audit fees billed by Deloitte for services rendered to the Registrant’s investment adviser, Lord, Abbett & Co. LLC (“Lord Abbett”), for the fiscal years ended November 30, 2011 and 2010 were:
| | | | |
| | | Fiscal year ended: |
| | | 2011 | | 2010 |
All Other Fees {a} | | $172,220 | | $171,360 |
{a} Consist of fees for Independent Services Auditors’ Report on Controls Placed in Operation and Tests of Operating Effectiveness related to Lord Abbett’s Asset Management Services (“SAS 70 Report”).
The aggregate non-audit fees billed by Deloitte for services rendered to entities under the common control of Lord Abbett for the fiscal years ended November 30, 2011 and 2010 were:
| | | | | | | | | | |
| | | Fiscal year ended: | | | |
| | | 2011 | | | 2010 | | |
All Other Fees | | $ | - 0 - | | | $ | - 0 - | | |
(h) The Registrant’s Audit Committee has considered the provision of non-audit services that were rendered to the Registrant’s investment adviser, and any entity controlling, controlled by or under common control with the investment adviser that provides ongoing services to the Registrant, that were not pre-approved pursuant to Rule 2-01 (c)(7)(ii) of Regulation S-X and has determined that the provision of such services is compatible with maintaining Deloitte’s independence.
| Item 5: | Audit Committee of Listed Registrants. |
Not applicable.
Not applicable.
| Item 7: | Disclosure of Proxy Voting Policies and Procedures for Closed-End Management Investment Companies. |
Not applicable.
| Item 8: | Portfolio Managers of Closed-End Management Investment Companies. |
Not applicable.
| Item 9: | Purchases of Equity Securities by Closed-End Management Investment Company and Affiliated Purchasers. |
Not applicable.
| Item 10: | Submission of Matters to a Vote of Security Holders. |
Not applicable.
| Item 11: | Controls and Procedures. |
| | (a) | Based on their evaluation of the Registrant’s disclosure controls and procedures (as defined in Rule 30a-3(c) under the Investment Company Act of 1940) as of a date within 90 days prior to the filing date of this report, the Chief Executive Officer and Chief Financial Officer of the Registrant have concluded that such disclosure controls and procedures are reasonably designed and effective to ensure that material information relating to the Registrant, including its consolidated subsidiaries, is made known to them by others within those entities. |
| | (b) | There were no changes in the Registrant’s internal control over financial reporting (as defined in Rule 30a-3(d) under the Investment Company Act of 1940) that occurred during the second fiscal quarter of the period covered by this report that have materially affected, or are reasonably likely to materially affect, the Registrant’s internal control over financial reporting. |
| | | | |
| | |
| | (a)(1) | | Amendments to Code of Ethics – Not applicable. |
| | |
| | (a)(2) | | Certification of each principal executive officer and principal financial officer of the Registrant as required by Rule 30a-2 under the Investment Company Act of 1940 is attached hereto as a part of EX-99.CERT. |
| | |
| | (a)(3) | | Not applicable. |
| | |
| | (b) | | Certification of each principal executive officer and principal financial officer of the Registrant as required by Section 906 of the Sarbanes-Oxley Act of 2002 is provided as a part of EX-99.906CERT. |
SIGNATURES
Pursuant to the requirements of the Securities Exchange Act of 1934 and the Investment Company Act of 1940, the Registrant has duly caused this report to be signed on its behalf by the undersigned, thereunto duly authorized.
| | |
| | LORD ABBETT RESEARCH FUND, INC. |
| |
| By: | | /s/ Robert S. Dow |
| | Robert S. Dow |
| | Chief Executive Officer and Chairman |
Date: January 23, 2012
| | |
| By: | | /s/ Joan A. Binstock |
| | Joan A. Binstock |
| | Chief Financial Officer and Vice President |
Date: January 23, 2012
Pursuant to the requirements of the Securities Exchange Act of 1934 and the Investment Company Act of 1940, this report has been signed below by the following persons on behalf of the Registrant and in the capacities and on the dates indicated.
| | |
| By: | | /s/ Robert S. Dow |
| | Robert S. Dow |
| | Chief Executive Officer and Chairman |
Date: January 23, 2012
| | |
| By: | | /s/ Joan A. Binstock |
| | Joan A. Binstock |
| | Chief Financial Officer and Vice President |
Date: January 23, 2012