UNITED STATES
SECURITIES AND EXCHANGE COMMISSION
Washington, D.C. 20549
FORM N-CSR
CERTIFIED SHAREHOLDER REPORT OF REGISTERED
MANAGEMENT INVESTMENT COMPANIES
Investment Company Act File Number: 811-06650
LORD ABBETT RESEARCH FUND, INC.
(Exact name of Registrant as specified in charter)
90 Hudson Street, Jersey City, NJ 07302
(Address of principal executive offices) (Zip code)
Thomas R. Phillips, Esq., Vice President & Assistant Secretary
90 Hudson Street, Jersey City, NJ 07302
(Name and address of agent for service)
Registrant’s telephone number, including area code: (800) 201-6984
Date of fiscal year end: 11/30
Date of reporting period: 11/30/09
| Item 1: | Reports to Shareholders. |
2009
LORD ABBETT
ANNUAL
REPORT 
Lord Abbett Capital Structure Fund*
For the fiscal year ended November 30, 2009
* Formerly known as America’s Value Fund

Lord Abbett Research Fund
Lord Abbett Capital Structure Fund (formerly, America’s Value Fund)
Annual Report
For the fiscal year ended November 30, 2009

From left to right: Robert S. Dow, Director and Chairman of the Lord Abbett Funds; E. Thayer Bigelow, Independent Lead Director of the Lord Abbett Funds; and Daria L. Foster, Director and President of the Lord Abbett Funds.
Dear Shareholders: We are pleased to provide you with this overview of the Lord Abbett Capital Structure Fund’s performance for the fiscal year ended November 30, 2009. On this page and the following pages, we discuss the major factors that influenced performance. For detailed and more timely information about the Fund, please visit our Website at www.lordabbett.com, where you also can access the quarterly commentaries by the Fund’s portfolio managers.
Thank you for investing in Lord Abbett mutual funds. We value the trust that you place in us and look forward to serving your investment needs in the years to come.
Best regards,

Robert S. Dow
Chairman
Q: What were the overall market conditions during the fiscal year ended November 30, 2009?
A: After a difficult start to the fiscal year ended November 30, 2009, the equity markets (as represented by the S&P 500® Index1) began a slow upward trend during the balance of the period, recovering some of their previous losses. The fiscal year ended with the S&P 500 Index up 25.39%.
Mid cap stocks (as defined by the Russell MidCap® Index2) generally outperformed large cap stocks (as measured by the Russell 1000® Index3) and small cap stocks (as measured by the Russell 2000® Index4). Growth stocks (as represented by the Russell 3000® Growth Index5) generally outperformed value stocks (as represented by the Russell 3000® Value Index 6) for the fiscal year. Overall, most equity asset classes and investing styles trended higher throughout the 12-month fiscal period.
In the fixed-income market, the assumption of credit risk was rewarded in the 12-month period. In general, lower credit-quality securities outperformed those with higher credit-quality ratings. The investment-grade corporate bond market (as
1
measured by the Barclays Capital U.S. Aggregate Bond Index7) returned 11.63%, while high-yield bonds (as measured by the BofA Merrill Lynch High Yield Master II Constrained Index8) returned 64.19%. Specifically, the BofA Merrill Lynch U.S. High Yield CCC-Rated Index9 led major bond indexes with a total return of 107.71%, followed by the BofA Merrill Lynch U.S. High Yield B-Rated Index,9 up 54.08%, and the BofA Merrill Lynch U.S. High Yield BB-Rated Index, 9 up 50.92%. This trend was similar within convertible securities, with lower-rated credits outperforming higher rated by a wide margin.
Q: How did the Capital Structure Fund perform during the fiscal year ended November 30, 2009?
A: The Fund returned 24.58%, reflecting performance at the net asset value (NAV) of Class A shares with all distributions reinvested, compared to its benchmark, the S&P 500 Index, which returned 25.39% over the same period.
Note: The Lord Abbett Capital Structure Fund is not a balanced fund and has the capability to adjust equity and fixed income allocations, based on relative value in the market and the investment team’s proprietary fundamental research.
Q: What were the most significant factors affecting performance?
A: The fiscal year that ended November 30, 2009 began with financial markets in a high state of uncertainty following the financial crisis of 2008. The portfolio was underweight in the information technology sector for much of the year—a position that detracted from performance. Meanwhile, the Fund found investment opportunity in some sectors of the fixed-income market, particularly in the high-yield and investment-grade bond sectors, as reflected in performance.
Equity Portion
On the equity side, in addition to the information technology sector, detractors from performance included the consumer discretionary and financials sectors. Among the individual holdings that performed poorly in the period was financial services holding Bank of America, a provider of banking, investing, and asset management products and services. Other individual stocks where performance was disappointing included utilities holdings Ameren Corporation, a public utility holding company, and NiSource, Inc., an energy holding company.
Contributing to performance on the equity side were the Fund’s holdings in the industrials, telecommunication services, and healthcare sectors. Strong stocks in the period included healthcare holding Mylan Inc. (the Fund’s number-one contributor), a global generic and specialty pharmaceuticals company; information technology holding Microsoft Corporation, a developer and manufacturer of software products; and financials holding JP Morgan Chase & Co., an investment banking and asset management services company.
Bond Portion
The Fund invests in a broad range of fixed-income markets, including high-yield and
2
investment-grade bonds, convertible securities, mortgages, Treasuries, and bank loans. All of the markets in which the Fund participated during the 12-month period added to performance, with high-yield bonds providing the strongest contribution. The Fund’s position in Treasuries was modest throughout the period, reflecting better investment opportunities in corporate bonds.
Among the individual securities contributing to performance were high- yield bond holding Equistar Chemicals LP, a producer of ethylene, propylene and polyethylene and convertible securities holding Freeport-McMoRan, Inc., a metals and mining company.
The Fund’s portfolio is actively managed and, therefore, its holdings and weightings of a particular issuer or sector as a percentage of portfolio assets are subject to change. Sectors may include many industries.
1 The S&P 500® Index is widely regarded as the standard for measuring large cap U.S. stock market performance and includes a representative sample of leading companies in leading industries.
2 The Russell Midcap® Index measures the performance of the 800 smallest companies in the Russell 1000 Index, which represents approximately 25% of the total market capitalization of the Russell 1000 Index.
3 The Russell 1000® Index measures the performance of the 1,000 largest companies in the Russell 3000 Index, which represents approximately 92% of the total market capitalization of the Russell 3000 Index.
4 The Russell 2000® Index is composed of 2,000 securities with market values ranging from $25 million to $275 million. The Growth Index is comprised of securities in the Russell 2000® Index with higher price-to-book ratios and higher forecasted growth.
5 The Russell 3000® Growth Index measures the performance of those Russell 3000® Index companies with higher price-to-book ratios and higher forecasted growth values. The stocks in this index are also members of either the Russell 1000® Growth or the Russell 2000® Growth indexes.
6 The Russell 3000® Value Index measures the performance of those Russell 3000 Index companies with lower price-to-book ratios and lower forecasted growth values. The stocks in this index are also members of either the Russell 1000® Value or the Russell 2000® Value indexes.
7 The Barclays Capital U.S. Aggregate Bond Index represents securities that are U.S. domestic, taxable, nonconvertible, and dollar denominated. The index covers the investment-grade, fixed-rate bond market, with index components for government and corporate securities, mortgage pass-through securities, and asset-backed securities.
8 The BofA Merrill Lynch High Yield Master II Constrained Index is a market value-weighted index of all domestic and Yankee high-yield bonds, including deferred interest bonds and payment-in-kind securities. Issues included in the index have maturities of one year or more and have a credit rating lower than BBB-/Baa3, but are not in default. The BofA Merrill Lynch U.S. High Yield Master II Constrained Index limits any individual issuer to a maximum of 2% benchmark exposure.
9 The BofA Merrill Lynch U.S. High Yield Index tracks the performance of below investment grade U.S. dollar-denominated corporate bonds publicly issued in the U.S. domestic market (includes Yankee bonds). The indexes for CCC, B, BB, and speculative are part of the BofA Merrill Lynch High Yield Index, with the only difference being the addition of a ratings filter.
Unless otherwise indicated, indexes are unmanaged and reflect total returns with all distributions reinvested, but do not reflect the deduction of fees, expenses, or taxes, and are not available for direct investment.
Important Performance and Other Information
Performance data quoted reflect past performance and are no guarantee of future results. Current performance may be higher or lower than the performance quoted. The investment return and principal value of an investment in the Fund will fluctuate so that
3
shares, on any given day or when redeemed, may be worth more or less than their original cost. You can obtain performance data current to the most recent month-end by calling Lord Abbett at 888-522-2388 or referring to our Website at www.lordabbett.com.
Except where noted, comparative Fund performance does not account for the deduction of sales charges and would be different if sales charges were included. The Fund offers additional classes of shares with distinct pricing options. For a full description of the differences in pricing alternatives, please see the Fund’s prospectuses.
The views of the Fund’s management and the portfolio holdings described in this report are as of November 30, 2009; these views and portfolio holdings may have changed subsequent to this date, and they do not guarantee the future performance of the markets or the Fund. Information provided in this report should not be considered a recommendation to purchase or sell securities.
A Note about Risk: See Notes to Financial Statements for a discussion of investment risks. For a more detailed discussion of the risks associated with the Fund, please see the Fund’s prospectuses.
Mutual funds are not insured by the FDIC, are not deposits or other obligations of, or guaranteed by, banks, and are subject to investment risks, including possible loss of principal amount invested.
4
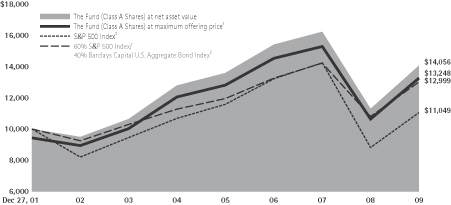
Investment Comparison
Below is a comparison of a $10,000 investment in Class A shares with the same investment in the S&P 500® Index and the 60% S&P 500 Index/40% Barclays Capital U.S. Aggregate Bond Index, assuming reinvestment of all dividends and distributions. The performance of other classes will be greater than or less than the performance shown in the graph below due to different sales loads and expenses applicable to such classes. The graph and performance table below do not reflect the deduction of taxes that a shareholder would pay on fund distributions or the redemption of fund shares. Past performance is no guarantee of future results.
Average Annual Total Returns at Maximum Applicable
Sales Charge for the Periods Ended November 30, 2009
| | | | | | |
| | | 1 Year | | 5 Years | | Life of Class |
Class A3 | | 17.40% | | 0.72% | | 3.61% |
Class B4 | | 19.75% | | 1.10% | | 3.72% |
Class C5 | | 23.82% | | 1.27% | | 3.74% |
Class F6 | | 25.05% | | – | | -7.20% |
Class I7 | | 25.13% | | 2.27% | | 4.76% |
Class P8 | | 24.52% | | 1.82% | | 4.31% |
Class R29 | | 24.47% | | – | | -7.39% |
Class R310 | | 24.46% | | – | | -7.58% |
1 Reflects the deduction of the maximum initial sales charge of 5.75%.
2 Performance for each unmanaged index does not reflect any fees or expenses. The performance of each index is not necessarily representative of the Fund’s performance. Performance of each index began on December 27, 2001.
3 Class A shares commenced operations on December 27, 2001. Total return, which is the percentage change in net asset value, after deduction of the maximum initial sales charge of 5.75% applicable to Class A shares, with all dividends and distributions reinvested for the periods shown ended November 30, 2009, is calculated using the SEC-required uniform method to compute such return.
4 Class B shares commenced operations on December 27, 2001. Performance reflects the deduction of a CDSC of 4% for 1 year, 1% for 5 years and 0% for life of class. Class B shares automatically convert to Class A shares after approximately 8 years. (There is no initial sales charge for automatic conversions.)
5 Class C shares commenced operations on December 27, 2001. The 1% CDSC for Class C shares normally applies before the first anniversary of the purchase date. Performance is at net asset value.
6 Class F shares commenced operations and performance for the Class began on September 28, 2007. Performance is at net asset value.
7 Class I shares commenced operations on December 27, 2001. Performance is at net asset value.
8 Class P shares commenced operations on December 27, 2001. Performance is at net asset value.
9 Class R2 shares commenced operations and performance for the Class began on September 28, 2007. Performance is at net asset value.
10 Class R3 shares commenced operations and performance for the Class began on September 28, 2007. Performance is at net asset value.
5
Expense Example
As a shareholder of the Fund, you incur two types of costs: (1) transaction costs, including sales charges (loads) on purchase payments (these charges vary among the share classes); and (2) ongoing costs, including management fees; distribution and service (12b-1) fees (these charges vary among the share classes); and other Fund expenses. This Example is intended to help you understand your ongoing costs (in dollars) of investing in the Fund and to compare these costs with the ongoing costs of investing in other mutual funds.
The Example is based on an investment of $1,000 invested at the beginning of the period and held for the entire period (June 1, 2009 through November 30, 2009).
Actual Expenses
For each class of the Fund, the first line of the applicable table on the following page provides information about actual account values and actual expenses. You may use the information in this line, together with the amount you invested, to estimate the expenses that you paid over the period. Simply divide your account value by $1,000 (for example, an $8,600 account value divided by $1,000 = 8.6), then multiply the result by the number in the first line under the heading entitled “Expenses Paid During the Period 6/1/09 – 11/30/09” to estimate the expenses you paid on your account during this period.
Hypothetical Example for Comparison Purposes
For each class of the Fund, the second line of the applicable table on the following page provides information about hypothetical account values and hypothetical expenses based on the Fund’s actual expense ratio and an assumed rate of return of 5% per year before expenses, which is not the Fund’s actual return. The hypothetical account values and expenses may not be used to estimate the actual ending account balance or expenses you paid for the period. You may use this information to compare the ongoing costs of investing in the Fund and other funds. To do so, compare this 5% hypothetical example with the 5% hypothetical examples that appear in the shareholder reports of the other funds.
6
Please note that the expenses shown in the table are meant to highlight your ongoing costs only and do not reflect any transactional costs, such as sales charges (loads). Therefore, the second line of the table is useful in comparing ongoing costs only, and will not help you determine the relative total costs of owning different funds. In addition, if these transactional costs were included, your costs would have been higher.
| | | | | | | | | |
| | | Beginning
Account
Value | | Ending
Account
Value | | Expenses
Paid During
Period† |
| | | 6/1/09 | | 11/30/09 | | 6/1/09 -
11/30/09 |
Class A | | | | | | | | | |
Actual | | $ | 1,000.00 | | $ | 1,160.00 | | $ | 7.26 |
Hypothetical (5% Return Before Expenses) | | $ | 1,000.00 | | $ | 1,018.34 | | $ | 6.78 |
Class B | | | | | | | | | |
Actual | | $ | 1,000.00 | | $ | 1,155.40 | | $ | 10.75 |
Hypothetical (5% Return Before Expenses) | | $ | 1,000.00 | | $ | 1,015.08 | | $ | 10.05 |
Class C | | | | | | | | | |
Actual | | $ | 1,000.00 | | $ | 1,155.00 | | $ | 10.75 |
Hypothetical (5% Return Before Expenses) | | $ | 1,000.00 | | $ | 1,015.08 | | $ | 10.05 |
Class F | | | | | | | | | |
Actual | | $ | 1,000.00 | | $ | 1,161.40 | | $ | 5.91 |
Hypothetical (5% Return Before Expenses) | | $ | 1,000.00 | | $ | 1,019.60 | | $ | 5.52 |
Class I | | | | | | | | | |
Actual | | $ | 1,000.00 | | $ | 1,160.90 | | $ | 5.36 |
Hypothetical (5% Return Before Expenses) | | $ | 1,000.00 | | $ | 1,020.10 | | $ | 5.01 |
Class P | | | | | | | | | |
Actual | | $ | 1,000.00 | | $ | 1,158.90 | | $ | 7.79 |
Hypothetical (5% Return Before Expenses) | | $ | 1,000.00 | | $ | 1,017.84 | | $ | 7.28 |
Class R2 | | | | | | | | | |
Actual | | $ | 1,000.00 | | $ | 1,158.80 | | $ | 8.55 |
Hypothetical (5% Return Before Expenses) | | $ | 1,000.00 | | $ | 1,017.12 | | $ | 7.99 |
Class R3 | | | | | | | | | |
Actual | | $ | 1,000.00 | | $ | 1,158.70 | | $ | 8.06 |
Hypothetical (5% Return Before Expenses) | | $ | 1,000.00 | | $ | 1,017.62 | | $ | 7.54 |
| † | | For each class of the Fund, net expenses are equal to the annualized expense ratio for such class (1.34% for Class A, 1.99% for Classes B and C, 1.09% for Class F, 0.99% for Class I, 1.44% for Class P, 1.58% for Class R2 and 1.49% for Class R3) multiplied by the average account value over the period, multiplied by 183/365 (to reflect one-half year period). |
Portfolio Holdings Presented by Sector
November 30, 2009
| | | | | | | | |
| Sector* | | %** | | | | Sector* | | %** |
Consumer Discretionary | | 9.56% | | | | Information Technology | | 14.72% |
Consumer Staples | | 10.31% | | | | Materials | | 6.19% |
Energy | | 11.17% | | | | Telecommunication Services | | 5.87% |
Financial Services | | 14.22% | | | | Utilities | | 5.04% |
Healthcare | | 13.10% | | | | Short-Term Investment | | 0.32% |
Industrials | | 9.50% | | | | Total | | 100.00% |
| * | | A sector may comprise several industries. |
| ** | | Represents percent of total investments. |
7
Schedule of Investments
November 30, 2009
| | | | | |
| Investments | |
Shares
(000) | | Value |
| LONG-TERM INVESTMENTS 98.94% | | | | | |
| | |
| COMMON STOCKS 56.52% | | | | | |
| | |
| Aerospace & Defense 1.61% | | | | | |
| DigitalGlobe, Inc.* | | 80 | | $ | 1,840,800 |
| Hexcel Corp.* | | 300 | | | 3,165,000 |
| Honeywell International, Inc. | | 270 | | | 10,386,900 |
| Lockheed Martin Corp. | | 50 | | | 3,861,500 |
| Moog, Inc. Class A* | | 125 | | | 3,301,250 |
| | | | | |
| Total | | | | | 22,555,450 |
| | | | | |
| | |
| Automobiles 0.30% | | | | | |
| Honda Motor Co., Ltd. ADR | | 138 | | | 4,273,521 |
| | | | | |
| | |
| Beverages 0.71% | | | | | |
| PepsiCo, Inc. | | 160 | | | 9,955,200 |
| | | | | |
| | |
| Biotechnology 1.44% | | | | | |
| Amgen, Inc.* | | 85 | | | 4,789,750 |
| BioMarin Pharmaceutical, Inc.* | | 200 | | | 3,302,000 |
| Celgene Corp.* | | 165 | | | 9,149,250 |
| Genzyme Corp.* | | 60 | | | 3,042,000 |
| | | | | |
| Total | | | | | 20,283,000 |
| | | | | |
| | |
| Capital Markets 1.49% | | | | | |
| Bank of New York Mellon Corp. (The) | | 220 | | | 5,860,800 |
| Franklin Resources, Inc. | | 35 | | | 3,781,050 |
| Morgan Stanley | | 100 | | | 3,158,000 |
| State Street Corp. | | 120 | | | 4,956,000 |
| T. Rowe Price Group, Inc. | | 65 | | | 3,180,450 |
| | | | | |
| Total | | | | | 20,936,300 |
| | | | | |
| | |
| Chemicals 0.97% | | | | | |
| Dow Chemical Co. (The) | | 175 | | | 4,861,500 |
| Monsanto Co. | | 75 | | | 6,056,250 |
| Rockwood Holdings, Inc.* | | 120 | | | 2,701,200 |
| | | | | |
| Total | | | | | 13,618,950 |
| | | | | |
See Notes to Financial Statements.
8
Schedule of Investments (continued)
November 30, 2009
| | | | | |
| Investments | |
Shares
(000) | | Value |
| Commercial Banks 2.03% | | | | | |
| Fifth Third Bancorp | | 300 | | $ | 3,024,000 |
| PNC Financial Services Group, Inc. (The) | | 120 | | | 6,841,200 |
| SunTrust Banks, Inc. | | 135 | | | 3,190,050 |
| U.S. Bancorp | | 350 | | | 8,445,500 |
| Wells Fargo & Co. | | 250 | | | 7,010,000 |
| | | | | |
| Total | | | | | 28,510,750 |
| | | | | |
| | |
| Commercial Services & Supplies 0.29% | | | | | |
| R.R. Donnelley & Sons Co. | | 200 | | | 4,116,000 |
| | | | | |
| | |
| Communications Equipment 1.21% | | | | | |
| JDS Uniphase Corp.* | | 375 | | | 2,771,250 |
| Nokia Corp. ADR | | 329 | | | 4,361,214 |
| QUALCOMM, Inc. | | 220 | | | 9,900,000 |
| | | | | |
| Total | | | | | 17,032,464 |
| | | | | |
| | |
| Computers & Peripherals 2.44% | | | | | |
| Apple, Inc.* | | 60 | | | 11,994,600 |
| Hewlett-Packard Co. | | 250 | | | 12,265,000 |
| International Business Machines Corp. | | 45 | | | 5,685,750 |
| QLogic Corp.* | | 240 | | | 4,305,600 |
| | | | | |
| Total | | | | | 34,250,950 |
| | | | | |
| | |
| Construction Materials 0.35% | | | | | |
| Cemex SAB de CV ADR* | | 436 | | | 4,924,698 |
| | | | | |
| | |
| Consumer Finance 0.37% | | | | | |
| Capital One Financial Corp. | | 135 | | | 5,178,600 |
| | | | | |
| | |
| Distributors 0.51% | | | | | |
| Genuine Parts Co. | | 200 | | | 7,166,000 |
| | | | | |
| | |
| Diversified Financial Services 2.13% | | | | | |
| Bank of America Corp. | | 550 | | | 8,717,500 |
| JPMorgan Chase & Co. | | 500 | | | 21,245,000 |
| | | | | |
| Total | | | | | 29,962,500 |
| | | | | |
| | |
| Diversified Telecommunication Services 3.04% | | | | | |
| AT&T, Inc. | | 800 | | | 21,552,000 |
| CenturyTel, Inc. | | 150 | | | 5,338,500 |
See Notes to Financial Statements.
9
Schedule of Investments (continued)
November 30, 2009
| | | | | |
| Investments | |
Shares
(000) | | Value |
| Diversified Telecommunication Services (continued) | | | | | |
| Qwest Communications International, Inc. | | 2,020 | | $ | 7,373,730 |
| Verizon Communications, Inc. | | 175 | | | 5,505,500 |
| Windstream Corp. | | 300 | | | 2,976,000 |
| | | | | |
| Total | | | | | 42,745,730 |
| | | | | |
| | |
| Electric: Utilities 0.58% | | | | | |
| UniSource Energy Corp. | | 275 | | | 8,200,500 |
| | | | | |
| | |
| Electrical Equipment 0.68% | | | | | |
| Baldor Electric Co. | | 100 | | | 2,575,000 |
| Emerson Electric Co. | | 170 | | | 7,039,700 |
| | | | | |
| Total | | | | | 9,614,700 |
| | | | | |
| | |
| Electronic Equipment, Instruments & Components 0.52% | | | | | |
| Corning, Inc. | | 150 | | | 2,502,000 |
| FLIR Systems, Inc.* | | 165 | | | 4,735,500 |
| | | | | |
| Total | | | | | 7,237,500 |
| | | | | |
| | |
| Energy Equipment & Services 1.03% | | | | | |
| Halliburton Co. | | 200 | | | 5,872,000 |
| Transocean Ltd. (Switzerland)*(a) | | 100 | | | 8,539,000 |
| | | | | |
| Total | | | | | 14,411,000 |
| | | | | |
| | |
| Food & Staples Retailing 2.20% | | | | | |
| CVS Caremark Corp. | | 220 | | | 6,822,200 |
| Ingles Markets, Inc. Class A | | 443 | | | 6,921,677 |
| Kroger Co. (The) | | 125 | | | 2,842,500 |
| SUPERVALU, INC. | | 165 | | | 2,281,950 |
| Wal-Mart Stores, Inc. | | 220 | | | 12,001,000 |
| | | | | |
| Total | | | | | 30,869,327 |
| | | | | |
| | |
| Food Products 3.36% | | | | | |
| Campbell Soup Co. | | 200 | | | 6,994,000 |
| H.J. Heinz Co. | | 325 | | | 13,796,250 |
| Kellogg Co. | | 300 | | | 15,774,000 |
| Kraft Foods, Inc. Class A | | 400 | | | 10,632,000 |
| | | | | |
| Total | | | | | 47,196,250 |
| | | | | |
See Notes to Financial Statements.
10
Schedule of Investments (continued)
November 30, 2009
| | | | | |
| Investments | |
Shares
(000) | | Value |
| Hotels, Restaurants & Leisure 1.47% | | | | | |
| Carnival Corp. Unit* | | 120 | | $ | 3,843,600 |
| Marriott International, Inc. Class A | | 222 | | | 5,699,193 |
| McDonald’s Corp. | | 100 | | | 6,325,000 |
| Starwood Hotels & Resorts Worldwide, Inc. | | 150 | | | 4,803,000 |
| | | | | |
| Total | | | | | 20,670,793 |
| | | | | |
| | |
| Household Products 0.53% | | | | | |
| Procter & Gamble Co. (The) | | 120 | | | 7,482,000 |
| | | | | |
| | |
| Industrial Conglomerates 0.90% | | | | | |
| 3M Co. | | 60 | | | 4,646,400 |
| General Electric Co. | | 500 | | | 8,010,000 |
| | | | | |
| Total | | | | | 12,656,400 |
| | | | | |
| | |
| Information Technology Services 0.76% | | | | | |
| SAIC, Inc.* | | 500 | | | 8,910,000 |
| SRA International, Inc. Class A* | | 100 | | | 1,805,000 |
| | | | | |
| Total | | | | | 10,715,000 |
| | | | | |
| | |
| Insurance 1.53% | | | | | |
| ACE Ltd. (Switzerland)*(a) | | 300 | | | 14,613,000 |
| MetLife, Inc. | | 200 | | | 6,838,000 |
| | | | | |
| Total | | | | | 21,451,000 |
| | | | | |
| | |
| Internet Software & Services 0.22% | | | | | |
| Sohu.com, Inc. (China)*(a) | | 55 | | | 3,038,920 |
| | | | | |
| | |
| Machinery 2.11% | | | | | |
| Actuant Corp. Class A | | 335 | | | 5,470,550 |
| Danaher Corp. | | 120 | | | 8,510,400 |
| Oshkosh Corp. | | 75 | | | 2,979,750 |
| Snap-on, Inc. | | 350 | | | 12,652,500 |
| | | | | |
| Total | | | | | 29,613,200 |
| | | | | |
| | |
| Media 0.48% | | | | | |
| CCH I LLC Class A(b) | | 68 | | | 1,406,831 |
| Charter Communications, Inc. Class A*(c) | | 16 | | | 329,526 |
| Walt Disney Co. (The) | | 165 | | | 4,986,300 |
| | | | | |
| Total | | | | | 6,722,657 |
| | | | | |
See Notes to Financial Statements.
11
Schedule of Investments (continued)
November 30, 2009
| | | | | |
| Investments | |
Shares
(000) | | Value |
| Metals & Mining 0.45% | | | | | |
| Allegheny Technologies, Inc. | | 65 | | $ | 2,211,950 |
| Titanium Metals Corp. | | 150 | | | 1,465,500 |
| United States Steel Corp. | | 60 | | | 2,679,600 |
| | | | | |
| Total | | | | | 6,357,050 |
| | | | | |
| | |
| Multi-Line Retail 1.65% | | | | | |
| J.C. Penney Co., Inc. | | 185 | | | 5,316,900 |
| Kohl’s Corp.* | | 150 | | | 7,971,000 |
| Nordstrom, Inc. | | 60 | | | 2,007,000 |
| Target Corp. | | 170 | | | 7,915,200 |
| | | | | |
| Total | | | | | 23,210,100 |
| | | | | |
| | |
| Multi-Utilities 0.28% | | | | | |
| Ameren Corp. | | 150 | | | 3,898,500 |
| | | | | |
| | |
| Oil, Gas & Consumable Fuels 7.37% | | | | | |
| Chevron Corp. | | 367 | | | 28,664,092 |
| ConocoPhillips | | 360 | | | 18,637,200 |
| Continental Resources, Inc.* | | 80 | | | 3,012,000 |
| EOG Resources, Inc. | | 200 | | | 17,298,000 |
| Exxon Mobil Corp. | | 200 | | | 15,014,000 |
| Hess Corp. | | 128 | | | 7,401,492 |
| Marathon Oil Corp. | | 170 | | | 5,545,400 |
| Petroleo Brasileiro SA ADR | | 115 | | | 5,186,406 |
| XTO Energy, Inc. | | 65 | | | 2,758,600 |
| | | | | |
| Total | | | | | 103,517,190 |
| | | | | |
| | |
| Pharmaceuticals 5.54% | | | | | |
| Bristol-Myers Squibb Co. | | 500 | | | 12,655,000 |
| Johnson & Johnson | | 175 | | | 10,997,000 |
| Merck & Co., Inc. | | 127 | | | 4,605,912 |
| Mylan, Inc.* | | 1,612 | | | 28,806,440 |
| Pfizer, Inc. | | 800 | | | 14,536,000 |
| Teva Pharmaceutical Industries Ltd. ADR | | 118 | | | 6,234,499 |
| | | | | |
| Total | | | | | 77,834,851 |
| | | | | |
| | |
| Road & Rail 1.05% | | | | | |
| Burlington Northern Santa Fe Corp. | | 85 | | | 8,355,500 |
| Union Pacific Corp. | | 100 | | | 6,326,000 |
| | | | | |
| Total | | | | | 14,681,500 |
| | | | | |
See Notes to Financial Statements.
12
Schedule of Investments (continued)
November 30, 2009
| | | | | |
| Investments | |
Shares
(000) | | Value |
| Semiconductors & Semiconductor Equipment 1.15% | | | | | |
| Broadcom Corp. Class A* | | 185 | | $ | 5,402,000 |
| Intel Corp. | | 250 | | | 4,800,000 |
| Micron Technology, Inc.* | | 450 | | | 3,384,000 |
| Taiwan Semiconductor Manufacturing Co., Ltd. ADR | | 251 | | | 2,610,477 |
| | | | | |
| Total | | | | | 16,196,477 |
| | | | | |
| | |
| Software 3.20% | | | | | |
| Adobe Systems, Inc.* | | 200 | | | 7,016,000 |
| Citrix Systems, Inc.* | | 185 | | | 7,063,300 |
| Intuit, Inc.* | | 125 | | | 3,651,250 |
| Microsoft Corp. | | 700 | | | 20,587,000 |
| Oracle Corp. | | 300 | | | 6,624,000 |
| | | | | |
| Total | | | | | 44,941,550 |
| | | | | |
| | |
| Specialty Retail 0.29% | | | | | |
| Home Depot, Inc. (The) | | 150 | | | 4,104,000 |
| | | | | |
| | |
| Textiles, Apparel & Luxury Goods 0.28% | | | | | |
| NIKE, Inc. Class B | | 60 | | | 3,893,400 |
| | | | | |
| Total Common Stocks (cost $763,592,582) | | | | | 794,023,978 |
| | | | | |
| | | | | | | | | |
| | | Interest
Rate | | Maturity
Date | | Principal
Amount
(000) | | |
| CONVERTIBLE BONDS 9.24% | | | | | | | | | |
| | | | |
| Aerospace & Defense 0.57% | | | | | | | | | |
| GenCorp, Inc. | | 2.25% | | 11/15/2024 | | $ | 2,250 | | 1,918,125 |
| L-3 Communications Holdings, Inc. | | 3.00% | | 8/1/2035 | | | 6,000 | | 6,165,000 |
| | | | | | | | | |
| Total | | | | | | | | | 8,083,125 |
| | | | | | | | | |
| | | | |
| Beverages 0.24% | | | | | | | | | |
| Molson Coors Brewing Co. | | 2.50% | | 7/30/2013 | | | 3,000 | | 3,326,250 |
| | | | | | | | | |
| | | | |
| Biotechnology 1.32% | | | | | | | | | |
| BioMarin Pharmaceutical, Inc. | | 2.50% | | 3/29/2013 | | | 4,000 | | 4,690,000 |
| Gilead Sciences, Inc. | | 0.625% | | 5/1/2013 | | | 8,000 | | 10,310,000 |
| Millipore Corp. | | 3.75% | | 6/1/2026 | | | 3,500 | | 3,583,125 |
| | | | | | | | | |
| Total | | | | | | | | | 18,583,125 |
| | | | | | | | | |
See Notes to Financial Statements.
13
Schedule of Investments (continued)
November 30, 2009
| | | | | | | | | | |
| Investments | | Interest
Rate | | Maturity
Date | | Principal
Amount
(000) | | Value |
| Building Products 0.33% | | | | | | | | | | |
| General Cable Corp. | | 1.00% | | 10/15/2012 | | $ | 5,000 | | $ | 4,643,750 |
| | | | | | | | | | |
| | | | |
| Commercial Services & Supplies 0.28% | | | | | | | | | | |
| CRA International, Inc. | | 2.875% | | 6/15/2034 | | | 4,000 | | | 3,885,000 |
| | | | | | | | | | |
| | | | |
| Communications Equipment 0.36% | | | | | | | | | | |
| Ciena Corp. | | 0.25% | | 5/1/2013 | | | 6,500 | | | 5,005,000 |
| | | | | | | | | | |
| | | | |
| Computers & Peripherals 0.37% | | | | | | | | | | |
| SanDisk Corp. | | 1.00% | | 5/15/2013 | | | 6,550 | | | 5,158,125 |
| | | | | | | | | | |
| | | | |
| Electrical Equipment 0.41% | | | | | | | | | | |
| Roper Industries, Inc. | | Zero Coupon | | 1/15/2034 | | | 9,000 | | | 5,816,250 |
| | | | | | | | | | |
| | |
| Electronic Equipment, Instruments & Components 0.34% | | | | | | |
| Itron, Inc. | | 2.50% | | 8/1/2026 | | | 4,000 | | | 4,775,000 |
| | | | | | | | | | |
| | | | |
| Energy Equipment & Services 0.17% | | | | | | | | | | |
| SunPower Corp. | | 4.75% | | 4/15/2014 | | | 2,275 | | | 2,329,031 |
| | | | | | | | | | |
| | | | |
| Healthcare Providers & Services 0.39% | | | | | | | | | | |
| Five Star Quality Care, Inc. | | 3.75% | | 10/15/2026 | | | 7,025 | | | 5,479,500 |
| | | | | | | | | | |
| | | | |
| Information Technology Services 0.55% | | | | | | | | | | |
| Symantec Corp. | | 0.75% | | 6/15/2011 | | | 7,000 | | | 7,665,000 |
| | | | | | | | | | |
| | | | |
| Internet Software & Services 0.35% | | | | | | | | | | |
| Equinix, Inc. | | 2.50% | | 4/15/2012 | | | 4,700 | | | 4,993,750 |
| | | | | | | | | | |
| | | | |
| Media 0.24% | | | | | | | | | | |
| Sinclair Broadcast Group, Inc. | | 6.00% | | 9/15/2012 | | | 4,000 | | | 3,330,000 |
| | | | | | | | | | |
| | | | |
| Metals & Mining 0.99% | | | | | | | | | | |
| ArcelorMittal (Luxembourg)(a) | | 5.00% | | 5/15/2014 | | | 2,000 | | | 2,995,000 |
| Newmont Mining Corp. | | 1.25% | | 7/15/2014 | | | 4,000 | | | 5,390,000 |
| Newmont Mining Corp. | | 3.00% | | 2/15/2012 | | | 1,500 | | | 2,013,750 |
| Placer Dome, Inc. (Canada)(a) | | 2.75% | | 10/15/2023 | | | 2,000 | | | 3,525,000 |
| | | | | | | | | | |
| Total | | | | | | | | | | 13,923,750 |
| | | | | | | | | | |
| | | | |
| Pharmaceuticals 0.85% | | | | | | | | | | |
| Teva Pharmaceutical Finance Co. BV (Israel)(a) | | 1.75% | | 2/1/2026 | | | 10,000 | | | 11,937,500 |
| | | | | | | | | | |
See Notes to Financial Statements.
14
Schedule of Investments (continued)
November 30, 2009
| | | | | | | | | | |
| Investments | | Interest
Rate | | Maturity
Date | | Principal
Amount
(000) | | Value |
| Real Estate Management & Development 0.23% | | | | | | |
| ProLogis | | 2.25% | | 4/1/2037 | | $ | 3,500 | | $ | 3,250,625 |
| | | | | | | | | | |
| | | | |
| Semiconductor Equipment & Products 0.36% | | | | | | | | | | |
| Advanced Micro Devices, Inc. | | 5.75% | | 8/15/2012 | | | 5,150 | | | 5,066,313 |
| | | | | | | | | | |
| | | |
| Semiconductors & Semiconductor Equipment 0.33% | | | | | | | | |
| Intel Corp. | | 2.95% | | 12/15/2035 | | | 5,000 | | | 4,700,000 |
| | | | | | | | | | |
| | | | |
| Software 0.56% | | | | | | | | | | |
| Cadence Design Systems, Inc. | | 1.375% | | 12/15/2011 | | | 2,000 | | | 1,882,500 |
| EMC Corp. | | 1.75% | | 12/1/2011 | | | 5,000 | | | 5,975,000 |
| | | | | | | | | | |
| Total | | | | | | | | | | 7,857,500 |
| | | | | | | | | | |
| Total Convertible Bonds (cost $125,984,411) | | | | | | | | | | 129,808,594 |
| | | | | | | | | | |
| | | | |
| | | | | | | Shares
(000) | | |
| CONVERTIBLE PREFERRED STOCKS 5.03% | | | | | | | | | | |
| | | | |
| Agency/Government Related 0.01% | | | | | | | | | | |
| Fannie Mae | | 8.75% | | | | | 100 | | | 140,000 |
| | | | | | | | | | |
| | | | |
| Commercial Banks 0.95% | | | | | | | | | | |
| Wells Fargo & Co. | | 7.50% | | | | | 15 | | | 13,380,000 |
| | | | | | | | | | |
| | | | |
| Diversified Financial Services 0.93% | | | | | | | | | | |
| AMG Capital Trust I | | 5.10% | | | | | 150 | | | 5,868,750 |
| Bank of America Corp. | | 7.25% | | | | | 9 | | | 7,246,250 |
| | | | | | | | | | |
| Total | | | | | | | | | | 13,115,000 |
| | | | | | | | | | |
| | | | |
| Electric: Utilities 0.29% | | | | | | | | | | |
| FPL Group, Inc. | | 8.375% | | | | | 80 | | | 4,004,000 |
| | | | | | | | | | |
| | | | |
| Food Products 1.06% | | | | | | | | | | |
| Archer Daniels Midland Co. | | 6.25% | | | | | 200 | | | 8,490,000 |
| Bunge Ltd. | | 4.875% | | | | | 75 | | | 6,468,750 |
| | | | | | | | | | |
| Total | | | | | | | | | | 14,958,750 |
| | | | | | | | | | |
| | | | |
| Insurance 0.14% | | | | | | | | | | |
| XL Capital Ltd. | | 10.75% | | | | | 72 | | | 2,028,960 |
| | | | | | | | | | |
See Notes to Financial Statements.
15
Schedule of Investments (continued)
November 30, 2009
| | | | | | | | | | |
| Investments | | Interest
Rate | | | |
Shares
(000) | | Value |
| Metals & Mining 0.25% | | | | | | | | | | |
| Freeport-McMoRan Copper & Gold, Inc. | | 6.75% | | | | | 30 | | $ | 3,547,500 |
| | | | | | | | | | |
| | | | |
| Oil, Gas & Consumable Fuels 0.76% | | | | | | | | | | |
| El Paso Corp. | | 4.99% | | | | | 12 | | | 10,653,000 |
| | | | | | | | | | |
| | | | |
| Pharmaceuticals 0.64% | | | | | | | | | | |
| Mylan, Inc. | | 6.50% | | | | | 8 | | | 8,932,000 |
| | | | | | | | | | |
| Total Convertible Preferred Stocks (cost $76,443,863) | | | | | | | | | | 70,759,210 |
| | | | | | | | | | |
| | | | | Maturity
Date | | Principal
Amount
(000) | | |
| FLOATING RATE LOANS(d) 0.40% | | | | | | | | | | |
| | | | |
| Diversified Financial Services 0.25% | | | | | | | | | | |
| Nuveen Investments, Inc. Second Lien Term Loan | | 12.50% | | 7/31/2015 | | $ | 3,350 | | | 3,456,781 |
| | | | | | | | | | |
| | |
| Electronic Equipment, Instruments & Components 0.15% | | | | | | |
| Palm, Inc. Term Loan B | | 3.79% | | 10/24/2014 | | | 2,500 | | | 2,145,833 |
| | | | | | | | | | |
| Total Floating Rate Loans (cost $5,307,473) | | | | | | | | | | 5,602,614 |
| | | | | | | | | | |
| | | | |
| | | | | | | Shares
(000) | | U.S. $
Value |
| FOREIGN COMMON STOCKS(e) 3.60% | | | | | | | | | | |
| | | | |
| China 0.38% | | | | | | | | | | |
| Transportation Infrastructure | | | | | | | | | | |
| China Zhongwang Holdings Ltd.* | | | | | | | 5,640 | | $ | 5,282,998 |
| | | | | | | | | | |
| | | | |
| France 0.57% | | | | | | | | | | |
| | | | |
| Automobiles 0.29% | | | | | | | | | | |
| Renault SA* | | | | | | | 85 | | | 4,129,327 |
| | | | | | | | | | |
| | | | |
| Commercial Banks 0.28% | | | | | | | | | | |
| BNP Paribas SA | | | | | | | 48 | | | 3,938,246 |
| | | | | | | | | | |
| Total France | | | | | | | | | | 8,067,573 |
| | | | | | | | | | |
| | | | |
| Germany 1.24% | | | | | | | | | | |
| | | | |
| Diversified Telecommunication Services 0.36% | | | | | | | | | | |
| Deutsche Telekom AG Registered Shares | | | | | | | 346 | | | 5,095,952 |
| | | | | | | | | | |
See Notes to Financial Statements.
16
Schedule of Investments (continued)
November 30, 2009
| | | | | | | | | | |
| Investments | | | | | |
Shares
(000) | | U.S. $
Value |
| Germany (continued) | | | | | | | | | | |
| Household Products 0.56% | | | | | | | | | | |
| Henkel KGaA | | | | | | | 183 | | $ | 7,917,829 |
| | | | | | | | | | |
| | | | | | | | | | |
| | | | |
| Metals & Mining 0.32% | | | | | | | | | | |
| ThyssenKrupp AG | | | | | | | 121 | | | 4,424,465 |
| | | | | | | | | | |
| Total Germany | | | | | | | | | | 17,438,246 |
| | | | | | | | | | |
| | | | |
| Greece 0.22% | | | | | | | | | | |
| | | | |
| Commercial Banks | | | | | | | | | | |
| National Bank of Greece SA* | | | | | | | 105 | | | 3,082,217 |
| | | | | | | | | | |
| | | | |
| Switzerland 1.19% | | | | | | | | | | |
| | | | |
| Capital Markets 0.30% | | | | | | | | | | |
| Credit Suisse Group AG Registered Shares | | | | | | | 82 | | | 4,245,109 |
| | | | | | | | | | |
| | | | |
| Food Products 0.33% | | | | | | | | | | |
| Nestle SA Registered Shares | | | | | | | 98 | | | 4,617,158 |
| | | | | | | | | | |
| | | | |
| Pharmaceuticals 0.56% | | | | | | | | | | |
| Roche Holding Ltd. AG | | | | | | | 48 | | | 7,801,735 |
| | | | | | | | | | |
| Total Switzerland | | | | | | | | | | 16,664,002 |
| | | | | | | | | | |
| Total Foreign Common Stocks (cost $50,966,146) | | | | | | | | | | 50,535,036 |
| | | | | | | | | | |
| | | | |
| | | Interest
Rate | | Maturity
Date | | Principal
Amount
(000) | | Value |
| GOVERNMENT SPONSORED ENTERPRISES PASS-THROUGH 0.94% | | | | | | |
| Federal National Mortgage Assoc. (cost $12,573,465) | | 5.50% | | 6/1/2036 | | $ | 12,404 | | $ | 13,221,458 |
| | | | | | | | | | |
| | | | |
| HIGH YIELD CORPORATE BONDS 23.20% | | | | | | | | | | |
| | | | |
| Air Freight & Logistics 0.20% | | | | | | | | | | |
| Park-Ohio Industries, Inc. | | 8.375% | | 11/15/2014 | | | 3,700 | | | 2,853,625 |
| | | | | | | | | | |
| | | | |
| Auto Components 0.14% | | | | | | | | | | |
| Cooper-Standard Automotive, Inc.(f) | | 8.375% | | 12/15/2014 | | | 3,500 | | | 953,750 |
| Goodyear Tire & Rubber Co. (The) | | 10.50% | | 5/15/2016 | | | 950 | | | 1,026,000 |
| | | | | | | | | | |
| Total | | | | | | | | | | 1,979,750 |
| | | | | | | | | | |
| | | | |
| Automobiles 0.25% | | | | | | | | | | |
| Ford Motor Credit Co. LLC | | 8.00% | | 6/1/2014 | | | 3,500 | | | 3,524,129 |
| | | | | | | | | | |
See Notes to Financial Statements.
17
Schedule of Investments (continued)
November 30, 2009
| | | | | | | | | | |
| Investments | | Interest
Rate | | Maturity
Date | | Principal
Amount
(000) | | Value |
| Beverages 0.42% | | | | | | | | | | |
| Constellation Brands, Inc. | | 8.125% | | 1/15/2012 | | $ | 4,000 | | $ | 4,035,000 |
| PepsiCo, Inc. | | 7.90% | | 11/1/2018 | | | 1,500 | | | 1,908,967 |
| | | | | | | | | | |
| Total | | | | | | | | | | 5,943,967 |
| | | | | | | | | | |
| | | | |
| Capital Markets 0.14% | | | | | | | | | | |
| International Lease Finance Corp. | | 6.375% | | 3/25/2013 | | | 2,500 | | | 2,013,880 |
| | | | | | | | | | |
| | | | |
| Chemicals 0.71% | | | | | | | | | | |
| Dow Chemical Co. (The) | | 8.55% | | 5/15/2019 | | | 1,250 | | | 1,479,801 |
| Equistar Chemicals LP(f) | | 7.55% | | 2/15/2026 | | | 3,000 | | | 2,475,000 |
| INEOS Group Holdings plc (United Kingdom)†(a) | | 8.50% | | 2/15/2016 | | | 6,500 | | | 4,322,500 |
| Potash Corp. of Saskatchewan, Inc. (Canada)(a) | | 4.875% | | 3/30/2020 | | | 1,700 | | | 1,731,533 |
| | | | | | | | | | |
| Total | | | | | | | | | | 10,008,834 |
| | | | | | | | | | |
| | | | |
| Commercial Banks 0.22% | | | | | | | | | | |
| Zions Bancorp | | 7.75% | | 9/23/2014 | | | 3,500 | | | 3,118,003 |
| | | | | | | | | | |
| | | | |
| Commercial Services & Supplies 0.21% | | | | | | | | | | |
| Bunge NA Finance LP | | 5.90% | | 4/1/2017 | | | 1,625 | | | 1,638,383 |
| First Data Corp. | | 9.875% | | 9/24/2015 | | | 1,500 | | | 1,342,500 |
| | | | | | | | | | |
| Total | | | | | | | | | | 2,980,883 |
| | | | | | | | | | |
| | | | |
| Communications Equipment 0.25% | | | | | | | | | | |
| Hughes Network Systems LLC | | 9.50% | | 4/15/2014 | | | 3,500 | | | 3,552,500 |
| | | | | | | | | | |
| | | | |
| Construction & Engineering 0.12% | | | | | | | | | | |
| K Hovnanian Enterprises, Inc.† | | 10.625% | | 10/15/2016 | | | 1,675 | | | 1,716,875 |
| | | | | | | | | | |
| | | | |
| Consumer Finance 0.41% | | | | | | | | | | |
| American Express Credit Corp. | | 7.30% | | 8/20/2013 | | | 5,000 | | | 5,684,250 |
| | | | | | | | | | |
| | | | |
| Containers & Packaging 1.20% | | | | | | | | | | |
| Ball Corp. | | 7.375% | | 9/1/2019 | | | 5,000 | | | 5,137,500 |
| Crown Cork & Seal Co., Inc. | | 7.375% | | 12/15/2026 | | | 6,000 | | | 5,520,000 |
| Graphic Packaging International Corp. | | 9.50% | | 8/15/2013 | | | 3,400 | | | 3,502,000 |
| Sealed Air Corp.† | | 7.875% | | 6/15/2017 | | | 2,500 | | | 2,667,910 |
| | | | | | | | | | |
| Total | | | | | | | | | | 16,827,410 |
| | | | | | | | | | |
See Notes to Financial Statements.
18
Schedule of Investments (continued)
November 30, 2009
| | | | | | | | | | | |
| Investments | | Interest
Rate | | | Maturity
Date | | Principal
Amount
(000) | | Value |
| Diversified Financial Services 1.37% | | | | | | | | | | | |
| Ashtead Capital, Inc.† | | 9.00% | | | 8/15/2016 | | $ | 2,025 | | $ | 1,994,625 |
| New York City Industrial Development Agency† | | 11.00% | | �� | 3/1/2029 | | | 2,800 | | | 3,024,140 |
| Raymond James Financial, Inc. | | 8.60% | | | 8/15/2019 | | | 2,500 | | | 2,779,655 |
| RBS Global & Rexnord Corp. | | 8.875% | | | 9/1/2016 | | | 3,000 | | | 2,610,000 |
| RBS Global & Rexnord Corp. | | 9.50% | | | 8/1/2014 | | | 3,500 | | | 3,500,000 |
| RBS Global & Rexnord Corp. | | 11.75% | | | 8/1/2016 | | | 3,000 | | | 2,955,000 |
| Wachovia Capital Trust III | | 5.80% | # | | 3/29/2049 | | | 1,000 | | | 695,000 |
| Wind Acquisition Finance SA (Italy)†(a) | | 11.75% | | | 7/15/2017 | | | 1,500 | | | 1,672,500 |
| | | | | | | | | | | |
| Total | | | | | | | | | | | 19,230,920 |
| | | | | | | | | | | |
| | | | |
| Diversified Telecommunication Services 1.82% | | | | | | | | | | | |
| Cincinnati Bell, Inc. | | 7.00% | | | 2/15/2015 | | | 8,500 | | | 8,223,750 |
| Qwest Capital Funding, Inc. | | 7.90% | | | 8/15/2010 | | | 6,000 | | | 6,112,500 |
| SBA Telecommunications, Inc.† | | 8.25% | | | 8/15/2019 | | | 2,500 | | | 2,612,500 |
| Syniverse Technologies, Inc. | | 7.75% | | | 8/15/2013 | | | 5,000 | | | 4,887,500 |
| Windstream Corp. | | 7.00% | | | 3/15/2019 | | | 4,000 | | | 3,750,000 |
| | | | | | | | | | | |
| Total | | | | | | | | | | | 25,586,250 |
| | | | | | | | | | | |
| | | | |
| Electric: Utilities 2.01% | | | | | | | | | | | |
| Black Hills Corp. | | 9.00% | | | 5/15/2014 | | | 3,650 | | | 4,268,544 |
| Central Illinois Light Co. | | 8.875% | | | 12/15/2013 | | | 3,000 | | | 3,481,401 |
| Edison Mission Energy | | 7.00% | | | 5/15/2017 | | | 2,000 | | | 1,470,000 |
| Edison Mission Energy | | 7.75% | | | 6/15/2016 | | | 7,025 | | | 5,760,500 |
| Illinois Power Co. | | 9.75% | | | 11/15/2018 | | | 2,500 | | | 3,217,093 |
| Northeast Utilities | | 5.65% | | | 6/1/2013 | | | 3,500 | | | 3,648,214 |
| Texas Competitive Electric Holdings Co. LLC | | 10.25% | | | 11/1/2015 | | | 9,000 | | | 6,435,000 |
| | | | | | | | | | | |
| Total | | | | | | | | | | | 28,280,752 |
| | | | | | | | | | | |
| | | | |
| Electrical Equipment 0.29% | | | | | | | | | | | |
| Baldor Electric Co. | | 8.625% | | | 2/15/2017 | | | 4,000 | | | 4,100,000 |
| | | | | | | | | | | |
| | |
| Electronic Equipment, Instruments & Components 0.83% | | | | | | |
| Agilent Technologies, Inc. | | 5.50% | | | 9/14/2015 | | | 3,500 | | | 3,697,782 |
| Emerson Electric Co. | | 5.25% | | | 10/15/2018 | | | 5,000 | | | 5,491,820 |
| Roper Industries, Inc. | | 6.625% | | | 8/15/2013 | | | 2,225 | | | 2,457,708 |
| | | | | | | | | | | |
| Total | | | | | | | | | | | 11,647,310 |
| | | | | | | | | | | |
See Notes to Financial Statements.
19
Schedule of Investments (continued)
November 30, 2009
| | | | | | | | | | |
| Investments | | Interest
Rate | | Maturity
Date | | Principal
Amount
(000) | | Value |
| Energy Equipment & Services 0.05% | | | | | | | | | | |
| Hornbeck Offshore Services, Inc. Series B | | 6.125% | | 12/1/2014 | | $ | 700 | | $ | 657,125 |
| | | | | | | | | | |
| | | | |
| Food & Staples Retailing 0.38% | | | | | | | | | | |
| Duane Reade, Inc.† | | 11.75% | | 8/1/2015 | | | 3,000 | | | 3,247,500 |
| Rite Aid Corp. | | 9.375% | | 12/15/2015 | | | 2,500 | | | 2,106,250 |
| | | | | | | | | | |
| Total | | | | | | | | | | 5,353,750 |
| | | | | | | | | | |
| | | | |
| Food Products 0.23% | | | | | | | | | | |
| Wendy’s/Arby’s Restaurants LLC† | | 10.00% | | 7/15/2016 | | | 3,000 | | | 3,255,000 |
| | | | | | | | | | |
| | | | |
| Healthcare Equipment & Supplies 0.97% | | | | | | | | | | |
| Bio-Rad Laboratories, Inc.† | | 8.00% | | 9/15/2016 | | | 3,500 | | | 3,657,500 |
| Biomet, Inc. | | 10.00% | | 10/15/2017 | | | 3,000 | | | 3,187,500 |
| HCA, Inc. | | 9.125% | | 11/15/2014 | | | 6,450 | | | 6,756,375 |
| | | | | | | | | | |
| Total | | | | | | | | | | 13,601,375 |
| | | | | | | | | | |
| | | | |
| Healthcare Providers & Services 1.06% | | | | | | | | | | |
| Community Health Systems, Inc. | | 8.875% | | 7/15/2015 | | | 7,000 | | | 7,157,500 |
| Tenet Healthcare Corp. | | 9.25% | | 2/1/2015 | | | 3,500 | | | 3,692,500 |
| United Surgical Partners International, Inc. PIK | | 9.25% | | 5/1/2017 | | | 4,000 | | | 4,060,000 |
| | | | | | | | | | |
| Total | | | | | | | | | | 14,910,000 |
| | | | | | | | | | |
| | | | |
| Hotels, Restaurants & Leisure 0.78% | | | | | | | | | | |
| Hyatt Hotels Corp.† | | 5.75% | | 8/15/2015 | | | 3,000 | | | 3,112,146 |
| McDonald’s Corp. | | 5.00% | | 2/1/2019 | | | 1,800 | | | 1,951,927 |
| River Rock Entertainment Authority (The) | | 9.75% | | 11/1/2011 | | | 1,700 | | | 1,572,500 |
| Starwood Hotels & Resorts Worldwide, Inc. | | 7.875% | | 10/15/2014 | | | 4,000 | | | 4,235,000 |
| Station Casinos, Inc.(f) | | 6.50% | | 2/1/2014 | | | 4,000 | | | 60,000 |
| | | | | | | | | | |
| Total | | | | | | | | | | 10,931,573 |
| | | | | | | | | | |
| | | | |
| Household Durables 0.44% | | | | | | | | | | |
| Beazer Homes USA, Inc. | | 8.375% | | 4/15/2012 | | | 875 | | | 818,125 |
| Lennar Corp. | | 12.25% | | 6/1/2017 | | | 2,500 | | | 3,000,000 |
| Whirlpool Corp. | | 8.60% | | 5/1/2014 | | | 2,000 | | | 2,315,030 |
| | | | | | | | | | |
| Total | | | | | | | | | | 6,133,155 |
| | | | | | | | | | |
| | | |
| Independent Power Producers & Energy Traders 1.27% | | | | | | | | |
| AES Corp. (The) | | 8.00% | | 10/15/2017 | | | 2,500 | | | 2,506,250 |
| Dynegy Holdings, Inc. | | 8.375% | | 5/1/2016 | | | 8,000 | | | 7,380,000 |
See Notes to Financial Statements.
20
Schedule of Investments (continued)
November 30, 2009
| | | | | | | | | | | |
| Investments | | Interest
Rate | | | Maturity
Date | | Principal
Amount
(000) | | Value |
| Independent Power Producers & Energy Traders (continued) | | | | | | |
| Mirant Americas Generation LLC | | 9.125% | | | 5/1/2031 | | $ | 7,000 | | $ | 5,985,000 |
| NRG Energy, Inc. | | 7.25% | | | 2/1/2014 | | | 2,000 | | | 2,022,500 |
| | | | | | | | | | | |
| Total | | | | | | | | | | | 17,893,750 |
| | | | | | | | | | | |
| | | | |
| Information Technology Services 0.37% | | | | | | | | | | | |
| SunGard Data Systems, Inc. | | 10.25% | | | 8/15/2015 | | | 5,000 | | | 5,150,000 |
| | | | | | | | | | | |
| | | | |
| Leisure Equipment & Products 0.40% | | | | | | | | | | | |
| Expedia, Inc. | | 8.50% | | | 7/1/2016 | | | 2,250 | | | 2,418,750 |
| Speedway Motorsports, Inc. | | 8.75% | | | 6/1/2016 | | | 3,000 | | | 3,180,000 |
| | | | | | | | | | | |
| Total | | | | | | | | | | | 5,598,750 |
| | | | | | | | | | | |
| | | | |
| Media 1.15% | | | | | | | | | | | |
| Affinion Group, Inc. | | 11.50% | | | 10/15/2015 | | | 4,000 | | | 4,180,000 |
| Barrington Broadcasting Group LLC | | 10.50% | | | 8/15/2014 | | | 3,125 | | | 1,894,531 |
| CBS Corp. | | 8.875% | | | 5/15/2019 | | | 2,500 | | | 2,909,415 |
| Mediacom Broadband LLC | | 8.50% | | | 10/15/2015 | | | 4,175 | | | 4,154,125 |
| Mediacom Communications Corp.† | | 9.125% | | | 8/15/2019 | | | 1,500 | | | 1,530,000 |
| WMG Acquisition Corp.† | | 9.50% | | | 6/15/2016 | | | 1,420 | | | 1,533,600 |
| | | | | | | | | | | |
| Total | | | | | | | | | | | 16,201,671 |
| | | | | | | | | | | |
| | | | |
| Metals & Mining 0.91% | | | | | | | | | | | |
| Aleris International, Inc.(f) | | 10.00% | | | 12/15/2016 | | | 1,800 | | | 11,250 |
| Freeport-McMoRan Copper & Gold, Inc. | | 8.375% | | | 4/1/2017 | | | 5,000 | | | 5,401,180 |
| Noranda Aluminum Acquisition Corp. PIK | | 5.274% | # | | 5/15/2015 | | | 5,343 | | | 3,900,642 |
| Teck Resources Ltd. (Canada)(a) | | 9.75% | | | 5/15/2014 | | | 3,000 | | | 3,386,250 |
| | | | | | | | | | | |
| Total | | | | | | | | | | | 12,699,322 |
| | | | | | | | | | | |
| | | | |
| Multi-Line Retail 0.19% | | | | | | | | | | | |
| Macy’s Retail Holdings, Inc. | | 8.875% | | | 7/15/2015 | | | 2,500 | | | 2,668,750 |
| | | | | | | | | | | |
| | | | |
| Multi-Utilities 0.57% | | | | | | | | | | | |
| NiSource Finance Corp. | | 10.75% | | | 3/15/2016 | | | 3,000 | | | 3,633,078 |
| Williams Cos., Inc. (The) | | 8.125% | | | 3/15/2012 | | | 3,960 | | | 4,364,954 |
| | | | | | | | | | | |
| Total | | | | | | | | | | | 7,998,032 |
| | | | | | | | | | | |
| | | | |
| Oil, Gas & Consumable Fuels 1.73% | | | | | | | | | | | |
| Cameron International Corp. | | 6.375% | | | 7/15/2018 | | | 1,040 | | | 1,135,625 |
| Chesapeake Energy Corp. | | 7.25% | | | 12/15/2018 | | | 2,000 | | | 1,935,000 |
See Notes to Financial Statements.
21
Schedule of Investments (continued)
November 30, 2009
| | | | | | | | | | |
| Investments | | Interest
Rate | | Maturity
Date | | Principal
Amount
(000) | | Value |
| Oil, Gas & Consumable Fuels (continued) | | | | | | |
| Chesapeake Energy Corp. | | 7.625% | | 7/15/2013 | | $ | 2,000 | | $ | 2,035,000 |
| Continental Resources, Inc.† | | 8.25% | | 10/1/2019 | | | 1,700 | | | 1,755,250 |
| El Paso Corp. | | 7.00% | | 6/15/2017 | | | 1,325 | | | 1,305,125 |
| El Paso Corp. | | 7.25% | | 6/1/2018 | | | 3,300 | | | 3,316,269 |
| Forest Oil Corp. | | 7.25% | | 6/15/2019 | | | 2,000 | | | 1,905,000 |
| Quicksilver Resources, Inc. | | 8.25% | | 8/1/2015 | | | 4,300 | | | 4,300,000 |
| Tennessee Gas Pipeline Co. | | 7.00% | | 10/15/2028 | | | 2,000 | | | 2,156,152 |
| Williams Cos., Inc. (The) | | 7.875% | | 9/1/2021 | | | 4,000 | | | 4,472,216 |
| | | | | | | | | | |
| Total | | | | | | | | | | 24,315,637 |
| | | | | | | | | | |
| | | | |
| Personal Products 0.21% | | | | | | | | | | |
| Elizabeth Arden, Inc. | | 7.75% | | 1/15/2014 | | | 3,000 | | | 2,925,000 |
| | | | | | | | | | |
| | | | |
| Pharmaceuticals 0.24% | | | | | | | | | | |
| Warner Chilcott Corp. | | 8.75% | | 2/1/2015 | | | 3,250 | | | 3,371,875 |
| | | | | | | | | | |
| | | | |
| Real Estate Investment Trusts 0.17% | | | | | | | | | | |
| Host Hotels & Resorts LP | | 6.375% | | 3/15/2015 | | | 2,525 | | | 2,392,437 |
| | | | | | | | | | |
| | | |
| Semiconductor Equipment & Products 0.09% | | | | | | | | |
| Analog Devices, Inc. | | 5.00% | | 7/1/2014 | | | 1,125 | | | 1,206,354 |
| | | | | | | | | | |
| | | |
| Semiconductors & Semiconductor Equipment 0.22% | | | | | | | | |
| Advanced Micro Devices, Inc. | | 7.75% | | 11/1/2012 | | | 3,000 | | | 3,067,500 |
| | | | | | | | | | |
| | | | |
| Specialty Retail 0.39% | | | | | | | | | | |
| Brookstone Co., Inc. | | 12.00% | | 10/15/2012 | | | 2,000 | | | 1,290,000 |
| Limited Brands, Inc.† | | 8.50% | | 6/15/2019 | | | 4,000 | | | 4,240,000 |
| | | | | | | | | | |
| Total | | | | | | | | | | 5,530,000 |
| | | | | | | | | | |
| | | | |
| Textiles, Apparel & Luxury Goods 0.19% | | | | | | | | | | |
| Levi Strauss & Co. | | 9.75% | | 1/15/2015 | | | 2,500 | | | 2,631,250 |
| | | | | | | | | | |
| | | | |
| Thrifts & Mortgage Finance 0.00% | | | | | | | | | | |
| Washington Mutual Bank(f) | | 6.875% | | 6/15/2011 | | | 4,350 | | | 32,625 |
| | | | | | | | | | |
| | | |
| Wireless Telecommunication Services 0.60% | | | | | | | | |
| MetroPCS Wireless, Inc. | | 9.25% | | 11/1/2014 | | | 4,000 | | | 4,030,000 |
| Sprint Capital Corp. | | 6.90% | | 5/1/2019 | | | 5,000 | | | 4,387,500 |
| | | | | | | | | | |
| Total | | | | | | | | | | 8,417,500 |
| | | | | | | | | | |
| Total High Yield Corporate Bonds (cost $335,202,562) | | | | | | | | 325,991,769 |
| | | | | | | | | | |
See Notes to Financial Statements.
22
Schedule of Investments (continued)
November 30, 2009
| | | | | | | | | | |
| Investments | | | | | | Shares
(000) | | Value |
| NON-CONVERTIBLE PREFERRED STOCK 0.01% | | | | | | | | |
| | | | |
| Agency/Government Related | | | | | | | | | | |
| Fannie Mae* (cost $3,071,479) | | Zero Coupon | | | | | 122 | | $ | 88,056 |
| | | | | | | | | | |
| | | | |
| | | Exercise
Price | | Expiration
Date | | Shares | | |
| WARRANT 0.00% | | | | | | | | | | |
| | | | |
| Media | | | | | | | | | | |
| Charter Communications, Inc.* (cost $31,210) | | $46.86 | | 11/30/2014 | | | 8,917 | | | 31,210 |
| | | | | | | | | | |
| Total Long-Term Investments (cost $1,373,173,191) | | | | | | | | 1,390,061,925 |
| | | | | | | | | | |
| | | | |
| | | | | | | Principal
Amount
(000) | | |
| SHORT-TERM INVESTMENT 0.32% | | | | | | | | | | |
| | | | |
| Repurchase Agreement | | | | | | | | | | |
| Repurchase Agreement dated 11/30/2009, 0.01% due 12/1/2009 with State Street Bank & Trust Co. collateralized by $4,550,000 of U.S. Treasury Bill at 0.21% due 3/18/2010; value: $4,549,090; proceeds: $4,456,718 (cost $4,456,717) | | | | | | $ | 4,457 | | | 4,456,717 |
| | | | | | | | | | |
| Total Investments in Securities 99.26% (cost $1,377,629,908) | | | | | | 1,394,518,642 |
| | | | | | | | | | |
| Cash and Other Assets in Excess of Liabilities 0.74% | | | | | | | | | | 10,330,290 |
| | | | | | | | | | |
| Net Assets 100.00% | | | | | | | | | $ | 1,404,848,932 |
| | | | | | | | | | |
See Notes to Financial Statements.
23
Schedule of Investments (concluded)
November 30, 2009
| ADR | | American Depositary Receipt. |
| Unit | | More than one class of securities traded together. |
| * | | Non-income producing security. |
| # | | Variable rate security. The interest rate represents the rate at November 30, 2009. |
| † | | Security was purchased pursuant to Rule 144A under the Securities Act of 1933 and, unless registered under the Act or exempted from registration, may only be resold to qualified institutional investors. Unless otherwise noted, 144A securities are deemed to be liquid. |
| (a) | | Foreign security traded in U.S. dollars. |
| (b) | | Restricted security. The Fund acquired 68,210 shares in a private placement on June 11, 2009 for a cost of $1,278,938. The fair value price per share on November 30, 2009 is $20.625. |
| (c) | | Restricted security. The Fund acquired 15,977 shares in a private placement on November 30, 2009 for a cost of $329,526. The fair value price per share on November 30, 2009 is $20.625. |
| (d) | | Floating Rate Loans in which the Fund invests generally pay interest at rates which are periodically re-determined at a margin above the London Inter-Bank Offered Rate (“LIBOR”) or the prime rate offered by major United States banks. The rate shown is the rate in effect at November 30, 2009. |
| (e) | | Investment in non-U.S. dollar denominated securities. |
See Notes to Financial Statements.
24
Statement of Assets and Liabilities
November 30, 2009
| | | | |
ASSETS: | | | | |
Investments in securities, at value (cost $1,377,629,908) | | $ | 1,394,518,642 | |
Cash | | | 76,333 | |
Receivables: | | | | |
Interest and dividends | | | 10,672,054 | |
Investment securities sold | | | 4,630,130 | |
Capital shares sold | | | 1,429,881 | |
Prepaid expenses and other assets | | | 95,909 | |
Total assets | | | 1,411,422,949 | |
LIABILITIES: | | | | |
Payables: | | | | |
Investment securities purchased | | | 2,474,258 | |
Capital shares reacquired | | | 2,335,019 | |
Management fee | | | 815,917 | |
12b-1 distribution fees | | | 356,031 | |
Directors’ fees | | | 126,228 | |
Fund administration | | | 44,396 | |
To affiliates (See Note 3) | | | 35,473 | |
Accrued expenses and other liabilities | | | 386,695 | |
Total liabilities | | | 6,574,017 | |
NET ASSETS | | $ | 1,404,848,932 | |
COMPOSITION OF NET ASSETS: | | | | |
Paid-in capital | | $ | 1,680,391,529 | |
Undistributed net investment income | | | 5,827,995 | |
Accumulated net realized loss on investments and foreign currency related transactions | | | (298,279,772 | ) |
Net unrealized appreciation on investments and translation of assets and liabilities denominated in foreign currencies | | | 16,909,180 | |
Net Assets | | $ | 1,404,848,932 | |
See Notes to Financial Statements.
25
Statement of Assets and Liabilities (concluded)
November 30, 2009
| | | |
Net assets by class: | | | |
Class A Shares | | $ | 974,790,577 |
Class B Shares | | $ | 53,941,096 |
Class C Shares | | $ | 59,267,224 |
Class F Shares | | $ | 4,238,131 |
Class I Shares | | $ | 309,336,431 |
Class P Shares | | $ | 2,906,415 |
Class R2 Shares | | $ | 28,525 |
Class R3 Shares | | $ | 340,533 |
Outstanding shares by class: | | | |
Class A Shares (300 million shares of common stock authorized, $.001 par value) | | | 94,211,943 |
Class B Shares (30 million shares of common stock authorized, $.001 par value) | | | 5,257,568 |
Class C Shares (20 million shares of common stock authorized, $.001 par value) | | | 5,765,349 |
Class F Shares (30 million shares of common stock authorized, $.001 par value) | | | 409,701 |
Class I Shares (100 million shares of common stock authorized, $.001 par value) | | | 29,720,743 |
Class P Shares (20 million shares of common stock authorized, $.001 par value) | | | 280,130 |
Class R2 Shares (30 million shares of common stock authorized, $.001 par value) | | | 2,744 |
Class R3 Shares (30 million shares of common stock authorized, $.001 par value) | | | 32,969 |
Net asset value, offering and redemption price per share
(Net assets divided by outstanding shares): | | | |
Class A Shares-Net asset value | | | $10.35 |
Class A Shares-Maximum offering price
(Net asset value plus sales charge of 5.75%) | | | $10.98 |
Class B Shares-Net asset value | | | $10.26 |
Class C Shares-Net asset value | | | $10.28 |
Class F Shares-Net asset value | | | $10.34 |
Class I Shares-Net asset value | | | $10.41 |
Class P Shares-Net asset value | | | $10.38 |
Class R2 Shares-Net asset value | | | $10.40 |
Class R3 Shares-Net asset value | | | $10.33 |
See Notes to Financial Statements.
26
Statement of Operations
For the Year Ended November 30, 2009
| | | | |
Investment income: | | | | |
Dividends (net of foreign withholding taxes of $184,974) | | $ | 26,340,414 | |
Interest | | | 35,862,245 | |
Total investment income | | | 62,202,659 | |
Expenses: | | | | |
Management fee | | | 9,191,143 | |
12b-1 distribution plan-Class A | | | 3,134,455 | |
12b-1 distribution plan-Class B | | | 479,584 | |
12b-1 distribution plan-Class C | | | 548,933 | |
12b-1 distribution plan-Class F | | | 2,862 | |
12b-1 distribution plan-Class P | | | 11,514 | |
12b-1 distribution plan-Class R2 | | | 101 | |
12b-1 distribution plan-Class R3 | | | 867 | |
Shareholder servicing | | | 1,881,378 | |
Subsidy (See Note 3) | | | 586,287 | |
Fund administration | | | 496,637 | |
Reports to shareholders | | | 158,202 | |
Registration | | | 103,474 | |
Professional | | | 63,253 | |
Directors’ fees | | | 49,848 | |
Custody | | | 37,850 | |
Other | | | 48,349 | |
Gross expenses | | | 16,794,737 | |
Expense reductions (See Note 7) | | | (3,518 | ) |
Net expenses | | | 16,791,219 | |
Net investment income | | | 45,411,440 | |
Net realized and unrealized gain (loss): | | | | |
Net realized loss on investments and foreign currency related transactions | | | (145,541,267 | ) |
Net change in unrealized appreciation/depreciation on investments and translation of assets and liabilities denominated in foreign currencies | | | 380,215,139 | |
Net realized and unrealized gain | | | 234,673,872 | |
Net Increase in Net Assets Resulting From Operations | | $ | 280,085,312 | |
See Notes to Financial Statements.
27
Statements of Changes in Net Assets
| | | | | | | | |
| INCREASE (DECREASE) IN NET ASSETS | | For the Year Ended
November 30, 2009 | | | For the Year Ended
November 30, 2008 | |
Operations: | | | | | | | | |
Net investment income | | $ | 45,411,440 | | | $ | 57,490,559 | |
Net realized loss on investments and foreign currency related transactions | | | (145,541,267 | ) | | | (148,111,879 | ) |
Net change in unrealized appreciation/depreciation on investments and translation of assets and liabilities denominated in foreign currencies | | | 380,215,139 | | | | (447,941,258 | ) |
Net increase (decrease) in net assets resulting
from operations | | | 280,085,312 | | | | (538,562,578 | ) |
Distributions to shareholders from: | | | | | | | | |
Net investment income | | | | | | | | |
Class A | | | (36,274,975 | ) | | | (46,923,783 | ) |
Class B | | | (1,647,951 | ) | | | (2,048,124 | ) |
Class C | | | (1,895,565 | ) | | | (2,622,772 | ) |
Class F | | | (114,438 | ) | | | (31,510 | ) |
Class I | | | (10,061,743 | ) | | | (10,749,540 | ) |
Class P | | | (100,533 | ) | | | (109,398 | ) |
Class R2 | | | (753 | ) | | | (316 | ) |
Class R3 | | | (5,287 | ) | | | (720 | ) |
Net realized gain | | | | | | | | |
Class A | | | – | | | | (55,600,353 | ) |
Class B | | | – | | | | (3,031,913 | ) |
Class C | | | – | | | | (4,022,533 | ) |
Class F | | | – | | | | (394 | ) |
Class I | | | – | | | | (11,018,113 | ) |
Class P | | | – | | | | (127,577 | ) |
Class R2 | | | – | | | | (393 | ) |
Class R3 | | | – | | | | (393 | ) |
Total distributions to shareholders | | | (50,101,245 | ) | | | (136,287,832 | ) |
Capital share transactions (Net of share conversions) (See Note 11): | |
Net proceeds from sales of shares | | | 312,953,012 | | | | 231,129,255 | |
Reinvestment of distributions | | | 48,870,715 | | | | 132,561,287 | |
Cost of shares reacquired | | | (339,821,891 | ) | | | (364,359,193 | ) |
Net increase (decrease) in net assets resulting from capital share transactions | | | 22,001,836 | | | | (668,651 | ) |
Net increase (decrease) in net assets | | | 251,985,903 | | | | (675,519,061 | ) |
NET ASSETS: | | | | | | | | |
Beginning of year | | $ | 1,152,863,029 | | | $ | 1,828,382,090 | |
End of year | | $ | 1,404,848,932 | | | $ | 1,152,863,029 | |
Undistributed net investment income | | $ | 5,827,995 | | | $ | 9,570,339 | |
See Notes to Financial Statements.
28
Financial Highlights
| | | | | | | | | | | | | | | |
| | | Class A Shares | |
| | | Year Ended 11/30 | |
| | | 2009 | | | 2008 | | | 2007 | | | 2006 | | | 2005 | |
Per Share Operating Performance | |
Net asset value, beginning of year | | $ 8.66 | | | $13.49 | | | $13.56 | | | $12.44 | | | $12.12 | |
| | | | | | | | | | | | | | | |
| | | | | |
Investment operations: | | | | | | | | | | | | | | | |
| | | | | |
Net investment income(a) | | .34 | | | .41 | | | .37 | | | .33 | | | .31 | |
| | | | | |
Net realized and unrealized gain (loss) | | 1.72 | | | (4.26 | ) | | .33 | | | 1.29 | | | .43 | |
| | | | | | | | | | | | | | | |
| | | | | |
Total from investment operations | | 2.06 | | | (3.85 | ) | | .70 | | | 1.62 | | | .74 | |
| | | | | | | | | | | | | | | |
| | | | | |
Distributions to shareholders from: | | | | | | | | | | | | | | | |
| | | | | |
Net investment income | | (.37 | ) | | (.44 | ) | | (.35 | ) | | (.36 | ) | | (.35 | ) |
| | | | | |
Net realized gain | | – | | | (.54 | ) | | (.42 | ) | | (.14 | ) | | (.07 | ) |
| | | | | | | | | | | | | | | |
| | | | | |
Total distributions | | (.37 | ) | | (.98 | ) | | (.77 | ) | | (.50 | ) | | (.42 | ) |
| | | | | | | | | | | | | | | |
Net asset value, end of year | | $10.35 | | | $ 8.66 | | | $13.49 | | | $13.56 | | | $12.44 | |
| | | | | | | | | | | | | | | |
| | | | | |
Total Return(b) | | 24.58 | % | | (30.43 | )% | | 5.27 | % | | 13.42 | % | | 6.27 | % |
| | | | | |
Ratios to Average Net Assets: | | | | | | | | | | | | | | | |
| | | | | |
Expenses, including expense reductions | | 1.37 | % | | 1.32 | % | | 1.29 | % | | 1.33 | % | | 1.33 | % |
| | | | | |
Expenses, excluding expense reductions | | 1.37 | % | | 1.32 | % | | 1.29 | % | | 1.33 | % | | 1.34 | % |
| | | | | |
Net investment income | | 3.66 | % | | 3.61 | % | | 2.68 | % | | 2.60 | % | | 2.51 | % |
| | | | | |
| Supplemental Data: | | | | | | | | | | | | | | | |
Net assets, end of year (000) | | $974,791 | | | $852,774 | | | $1,379,814 | | | $1,111,167 | | | $944,488 | |
| | | | | |
Portfolio turnover rate | | 52.24 | % | | 54.70 | % | | 26.32 | % | | 43.85 | % | | 31.65 | % |
| (a) | | Calculated using average shares outstanding during the year. |
| (b) | | Total return does not consider the effects of sales loads and assumes the reinvestment of all distributions. |
See Notes to Financial Statements.
29
Financial Highlights (continued)
| | | | | | | | | | | | | | | |
| | | Class B Shares | |
| | | Year Ended 11/30 | |
| | | 2009 | | | 2008 | | | 2007 | | | 2006 | | | 2005 | |
Per Share Operating Performance | | | | | | | | | | | | | | | |
Net asset value, beginning of year | | $ 8.59 | | | $13.38 | | | $13.46 | | | $12.36 | | | $12.03 | |
| | | | | | | | | | | | | | | |
| | | | | |
Investment operations: | | | | | | | | | | | | | | | |
| | | | | |
Net investment income(a) | | .27 | | | .33 | | | .28 | | | .24 | | | .23 | |
| | | | | |
Net realized and unrealized gain (loss) | | 1.71 | | | (4.21 | ) | | .33 | | | 1.28 | | | .43 | |
| | | | | | | | | | | | | | | |
| | | | | |
Total from investment operations | | 1.98 | | | (3.88 | ) | | .61 | | | 1.52 | | | .66 | |
| | | | | | | | | | | | | | | |
| | | | | |
Distributions to shareholders from: | | | | | | | | | | | | | | | |
| | | | | |
Net investment income | | (.31 | ) | | (.37 | ) | | (.27 | ) | | (.28 | ) | | (.26 | ) |
| | | | | |
Net realized gain | | – | | | (.54 | ) | | (.42 | ) | | (.14 | ) | | (.07 | ) |
| | | | | | | | | | | | | | | |
| | | | | |
Total distributions | | (.31 | ) | | (.91 | ) | | (.69 | ) | | (.42 | ) | | (.33 | ) |
| | | | | | | | | | | | | | | |
Net asset value, end of year | | $10.26 | | | $ 8.59 | | | $13.38 | | | $13.46 | | | $12.36 | |
| | | | | | | | | | | | | | | |
| | | | | |
Total Return(b) | | 23.75 | % | | (30.86 | )% | | 4.56 | % | | 12.62 | % | | 5.66 | % |
| | | | | |
Ratios to Average Net Assets: | | | | | | | | | | | | | | | |
| | | | | |
Expenses, including expense reductions | | 2.02 | % | | 1.97 | % | | 1.94 | % | | 1.98 | % | | 1.98 | % |
| | | | | |
Expenses, excluding expense reductions | | 2.02 | % | | 1.97 | % | | 1.94 | % | | 1.98 | % | | 1.98 | % |
| | | | | |
Net investment income | | 3.00 | % | | 2.96 | % | | 2.03 | % | | 1.95 | % | | 1.86 | % |
| | | | | |
| Supplemental Data: | | | | | | | | | | | | | | | |
Net assets, end of year (000) | | $53,941 | | | $44,682 | | | $74,748 | | | $64,045 | | | $58,380 | |
| | | | | |
Portfolio turnover rate | | 52.24 | % | | 54.70 | % | | 26.32 | % | | 43.85 | % | | 31.65 | % |
| (a) | | Calculated using average shares outstanding during the year. |
| (b) | | Total return does not consider the effects of sales loads and assumes the reinvestment of all distributions. |
See Notes to Financial Statements.
30
Financial Highlights (continued)
| | | | | | | | | | | | | | | |
| | | Class C Shares | |
| | | Year Ended 11/30 | |
| | | 2009 | | | 2008 | | | 2007 | | | 2006 | | | 2005 | |
Per Share Operating Performance | | | | | | | | | | | | | | | |
Net asset value, beginning of year | | $ 8.60 | | | $13.40 | | | $13.48 | | | $12.37 | | | $12.05 | |
| | | | | | | | | | | | | | | |
| | | | | |
Investment operations: | | | | | | | | | | | | | | | |
| | | | | |
Net investment income(a) | | .28 | | | .33 | | | .28 | | | .24 | | | .23 | |
| | | | | |
Net realized and unrealized gain (loss) | | 1.71 | | | (4.23 | ) | | .33 | | | 1.28 | | | .43 | |
| | | | | | | | | | | | | | | |
| | | | | |
Total from investment operations | | 1.99 | | | (3.90 | ) | | .61 | | | 1.52 | | | .66 | |
| | | | | | | | | | | | | | | |
| | | | | |
Distributions to shareholders from: | | | | | | | | | | | | | | | |
| | | | | |
Net investment income | | (.31 | ) | | (.36 | ) | | (.27 | ) | | (.27 | ) | | (.27 | ) |
| | | | | |
Net realized gain | | – | | | (.54 | ) | | (.42 | ) | | (.14 | ) | | (.07 | ) |
| | | | | | | | | | | | | | | |
| | | | | |
Total distributions | | (.31 | ) | | (.90 | ) | | (.69 | ) | | (.41 | ) | | (.34 | ) |
| | | | | | | | | | | | | | | |
Net asset value, end of year | | $10.28 | | | $ 8.60 | | | $13.40 | | | $13.48 | | | $12.37 | |
| | | | | | | | | | | | | | | |
| | | | | |
Total Return(b) | | 23.82 | % | | (30.90 | )% | | 4.57 | % | | 12.68 | % | | 5.62 | % |
| | | | | |
Ratios to Average Net Assets: | | | | | | | | | | | | | | | |
| | | | | |
Expenses, including expense reductions | | 2.02 | % | | 1.97 | % | | 1.94 | % | | 1.98 | % | | 1.98 | % |
| | | | | |
Expenses, excluding expense reductions | | 2.02 | % | | 1.97 | % | | 1.94 | % | | 1.98 | % | | 1.98 | % |
| | | | | |
Net investment income | | 3.02 | % | | 2.95 | % | | 2.03 | % | | 1.95 | % | | 1.86 | % |
| | | | | |
| Supplemental Data: | | | | | | | | | | | | | | | |
Net assets, end of year (000) | | $59,267 | | | $54,081 | | | $99,713 | | | $77,477 | | | $77,374 | |
| | | | | |
Portfolio turnover rate | | 52.24 | % | | 54.70 | % | | 26.32 | % | | 43.85 | % | | 31.65 | % |
| (a) | | Calculated using average shares outstanding during the year. |
| (b) | | Total return does not consider the effects of sales loads and assumes the reinvestment of all distributions. |
See Notes to Financial Statements.
31
Financial Highlights (continued)
| | | | | | | | | |
| | | Class F Shares | |
| | | Year Ended 11/30 | | | 9/28/2007(a)
to 11/30/2007 | |
| | | 2009 | | | 2008 | | |
Per Share Operating Performance | | | | | | | | | |
Net asset value, beginning of period | | $ 8.65 | | | $13.49 | | | $13.83 | |
| | | | | | | | | |
| | | |
Investment operations: | | | | | | | | | |
| | | |
Net investment income(b) | | .34 | | | .43 | | | .06 | |
| | | |
Net realized and unrealized gain (loss) | | 1.75 | | | (4.25 | ) | | (.40 | ) |
| | | | | | | | | |
| | | |
Total from investment operations | | 2.09 | | | (3.82 | ) | | (.34 | ) |
| | | | | | | | | |
| | | |
Distributions to shareholders from: | | | | | | | | | |
| | | |
Net investment income | | (.40 | ) | | (.48 | ) | | – | |
| | | |
Net realized gain | | – | | | (.54 | ) | | – | |
| | | | | | | | | |
| | | |
Total distributions | | (.40 | ) | | (1.02 | ) | | – | |
| | | | | | | | | |
Net asset value, end of period | | $10.34 | | | $ 8.65 | | | $13.49 | |
| | | | | | | | | |
| | | |
Total Return(c) | | 25.05 | % | | (30.31 | )% | | (2.46 | )%(d) |
| | | |
Ratios to Average Net Assets: | | | | | | | | | |
| | | |
Expenses, including expense reductions | | 1.11 | % | | 1.10 | % | | .18 | %(d) |
| | | |
Expenses, excluding expense reductions | | 1.11 | % | | 1.10 | % | | .18 | %(d) |
| | | |
Net investment income | | 3.66 | % | | 4.21 | % | | .47 | %(d) |
| | | |
| Supplemental Data: | | | | | | | | | |
Net assets, end of period (000) | | $4,238 | | | $1,194 | | | $10 | |
| | | |
Portfolio turnover rate | | 52.24 | % | | 54.70 | % | | 26.32 | % |
| (a) | | Commencement of investment operations was 9/28/2007, SEC effective date was 9/14/2007 and date shares first became available to the public was 10/1/2007. |
| (b) | | Calculated using average shares outstanding during the period. |
| (c) | | Total return assumes the reinvestment of all distributions. |
See Notes to Financial Statements.
32
Financial Highlights (continued)
| | | | | | | | | | | | | | | |
| | | Class I Shares | |
| | | Year Ended 11/30 | |
| | | 2009 | | | 2008 | | | 2007 | | | 2006 | | | 2005 | |
Per Share Operating Performance | | | | | | | | | | | | | | | |
Net asset value, beginning of year | | $ 8.70 | | | $13.56 | | | $13.62 | | | $12.50 | | | $12.18 | |
| | | | | | | | | | | | | | | |
| | | | | |
Investment operations: | | | | | | | | | | | | | | | |
| | | | | |
Net investment income(a) | | .36 | | | .45 | | | .41 | | | .37 | | | .35 | |
| | | | | |
Net realized and unrealized gain (loss) | | 1.75 | | | (4.28 | ) | | .35 | | | 1.29 | | | .44 | |
| | | | | | | | | | | | | | | |
| | | | | |
Total from investment operations | | 2.11 | | | (3.83 | ) | | .76 | | | 1.66 | | | .79 | |
| | | | | | | | | | | | | | | |
| | | | | |
Distributions to shareholders from: | | | | | | | | | | | | | | | |
| | | | | |
Net investment income | | (.40 | ) | | (.49 | ) | | (.40 | ) | | (.40 | ) | | (.40 | ) |
| | | | | |
Net realized gain | | – | | | (.54 | ) | | (.42 | ) | | (.14 | ) | | (.07 | ) |
| | | | | | | | | | | | | | | |
| | | | | |
Total distributions | | (.40 | ) | | (1.03 | ) | | (.82 | ) | | (.54 | ) | | (.47 | ) |
| | | | | | | | | | | | | | | |
Net asset value, end of year | | $10.41 | | | $ 8.70 | | | $13.56 | | | $13.62 | | | $12.50 | |
| | | | | | | | | | | | | | | |
| | | | | |
Total Return(b) | | 25.13 | % | | (30.24 | )% | | 5.67 | % | | 13.75 | % | | 6.64 | % |
| | | | | |
Ratios to Average Net Assets: | | | | | | | | | | | | | | | |
| | | | | |
Expenses, including expense reductions | | 1.01 | % | | .97 | % | | .96 | % | | .98 | % | | .99 | % |
| | | | | |
Expenses, excluding expense reductions | | 1.01 | % | | .97 | % | | .96 | % | | .98 | % | | .99 | % |
| | | | | |
Net investment income | | 3.91 | % | | 3.97 | % | | 2.98 | % | | 2.95 | % | | 2.89 | % |
| | | | | |
| Supplemental Data: | | | | | | | | | | | | | | | |
Net assets, end of year (000) | | $309,336 | | | $197,714 | | | $271,015 | | | $10,342 | | | $2,897 | |
| | | | | |
Portfolio turnover rate | | 52.24 | % | | 54.70 | % | | 26.32 | % | | 43.85 | % | | 31.65 | % |
| (a) | | Calculated using average shares outstanding during the year. |
| (b) | | Total return assumes the reinvestment of all distributions. |
See Notes to Financial Statements.
33
Financial Highlights (continued)
| | | | | | | | | | | | | | | |
| | | Class P Shares | |
| | | Year Ended 11/30 | |
| | | 2009 | | | 2008 | | | 2007 | | | 2006 | | | 2005 | |
Per Share Operating Performance | | | | | | | | | | | | | | | |
Net asset value, beginning of year | | $ 8.68 | | | $13.52 | | | $13.59 | | | $12.47 | | | $12.15 | |
| | | | | | | | | | | | | | | |
| | | | | |
Investment operations: | | | | | | | | | | | | | | | |
| | | | | |
Net investment income(a) | | .33 | | | .40 | | | .36 | | | .32 | | | .30 | |
| | | | | |
Net realized and unrealized gain (loss) | | 1.73 | | | (4.27 | ) | | .33 | | | 1.29 | | | .43 | |
| | | | | | | | | | | | | | | |
| | | | | |
Total from investment operations | | 2.06 | | | (3.87 | ) | | .69 | | | 1.61 | | | .73 | |
| | | | | | | | | | | | | | | |
| | | | | |
Distributions to shareholders from: | | | | | | | | | | | | | | | |
| | | | | |
Net investment income | | (.36 | ) | | (.43 | ) | | (.34 | ) | | (.35 | ) | | (.34 | ) |
| | | | | |
Net realized gain | | – | | | (.54 | ) | | (.42 | ) | | (.14 | ) | | (.07 | ) |
| | | | | | | | | | | | | | | |
| | | | | |
Total distributions | | (.36 | ) | | (.97 | ) | | (.76 | ) | | (.49 | ) | | (.41 | ) |
| | | | | | | | | | | | | | | |
Net asset value, end of year | | $10.38 | | | $ 8.68 | | | $13.52 | | | $13.59 | | | $12.47 | |
| | | | | | | | | | | | | | | |
| | | | | |
Total Return(b) | | 24.52 | % | | (30.50 | )% | | 5.15 | % | | 13.31 | % | | 6.17 | % |
| | | | | |
Ratios to Average Net Assets: | | | | | | | | | | | | | | | |
| | | | | |
Expenses, including expense reductions | | 1.46 | % | | 1.42 | % | | 1.39 | % | | 1.43 | % | | 1.43 | % |
| | | | | |
Expenses, excluding expense reductions | | 1.46 | % | | 1.42 | % | | 1.39 | % | | 1.43 | % | | 1.44 | % |
| | | | | |
Net investment income | | 3.54 | % | | 3.52 | % | | 2.58 | % | | 2.50 | % | | 2.42 | % |
| | | | | |
| Supplemental Data: | | | | | | | | | | | | | | | |
Net assets, end of year (000) | | $2,906 | | | $2,370 | | | $3,062 | | | $2,365 | | | $1,337 | |
| | | | | |
Portfolio turnover rate | | 52.24 | % | | 54.70 | % | | 26.32 | % | | 43.85 | % | | 31.65 | % |
| (a) | | Calculated using average shares outstanding during the year. |
| (b) | | Total return assumes the reinvestment of all distributions. |
See Notes to Financial Statements.
34
Financial Highlights (continued)
| | | | | | | | | |
| | | Class R2 Shares | |
| | | Year Ended 11/30 | | | 9/28/2007(a)
to
11/30/2007 | |
| | | 2009 | | | 2008 | | |
Per Share Operating Performance | | | | | | | | | |
Net asset value, beginning of period | | $ 8.70 | | | $13.48 | | | $13.83 | |
| | | | | | | | | |
| | | |
Investment operations: | | | | | | | | | |
| | | |
Net investment income(b) | | .31 | | | .44 | | | .05 | |
| | | |
Net realized and unrealized gain (loss) | | 1.75 | | | (4.27 | ) | | (.40 | ) |
| | | | | | | | | |
| | | |
Total from investment operations | | 2.06 | | | (3.83 | ) | | (.35 | ) |
| | | | | | | | | |
| | | |
Distributions to shareholders from: | | | | | | | | | |
| | | |
Net investment income | | (.36 | ) | | (.41 | ) | | – | |
| | | |
Net realized gain | | – | | | (.54 | ) | | – | |
| | | | | | | | | |
| | | |
Total distributions | | (.36 | ) | | (.95 | ) | | – | |
| | | | | | | | | |
Net asset value, end of period | | $10.40 | | | $ 8.70 | | | $13.48 | |
| | | | | | | | | |
| | | |
Total Return(c) | | 24.47 | % | | (30.23 | )% | | (2.53 | )%(d) |
| | | |
Ratios to Average Net Assets: | | | | | | | | | |
| | | |
Expenses, including expense reductions | | 1.49 | % | | 1.06 | % | | .27 | %(d) |
| | | |
Expenses, excluding expense reductions | | 1.49 | % | | 1.06 | % | | .27 | %(d) |
| | | |
Net investment income | | 3.34 | % | | 3.87 | % | | .37 | %(d) |
| | | |
| Supplemental Data: | | | | | | | | | |
Net assets, end of period (000) | | $29 | | | $7 | | | $10 | |
| | | |
Portfolio turnover rate | | 52.24 | % | | 54.70 | % | | 26.32 | % |
| (a) | | Commencement of investment operations was 9/28/2007, SEC effective date was 9/14/2007 and date shares first became available to the public was 10/1/2007. |
| (b) | | Calculated using average shares outstanding during the period. |
| (c) | | Total return assumes the reinvestment of all distributions. |
See Notes to Financial Statements.
35
Financial Highlights (concluded)
| | | | | | | | | |
| | | Class R3 Shares | |
| | | Year Ended 11/30 | | | 9/28/2007(a)
to 11/30/2007 | |
| | | 2009 | | | 2008 | | |
Per Share Operating Performance | | | | | | | | | |
Net asset value, beginning of period | | $ 8.65 | | | $13.48 | | | $13.83 | |
| | | | | | | | | |
| | | |
Investment operations: | | | | | | | | | |
| | | |
Net investment income(b) | | .29 | | | .39 | | | .05 | |
| | | |
Net realized and unrealized gain (loss) | | 1.76 | | | (4.25 | ) | | (.40 | ) |
| | | | | | | | | |
| | | |
Total from investment operations | | 2.05 | | | (3.86 | ) | | (.35 | ) |
| | | | | | | | | |
| | | |
Distributions to shareholders from: | | | | | | | | | |
| | | |
Net investment income | | (.37 | ) | | (.43 | ) | | – | |
| | | |
Net realized gain | | – | | | (.54 | ) | | – | |
| | | | | | | | | |
| | | |
Total distributions | | (.37 | ) | | (.97 | ) | | – | |
| | | | | | | | | |
Net asset value, end of period | | $10.33 | | | $ 8.65 | | | $13.48 | |
| | | | | | | | | |
| | | |
Total Return(c) | | 24.46 | % | | (30.54 | )% | | (2.53 | )%(d) |
| | | |
Ratios to Average Net Assets: | | | | | | | | | |
| | | |
Expenses, including expense reductions | | 1.50 | % | | 1.40 | % | | .25 | %(d) |
| | | |
Expenses, excluding expense reductions | | 1.50 | % | | 1.40 | % | | .25 | %(d) |
| | | |
Net investment income | | 3.03 | % | | 3.65 | % | | .39 | %(d) |
| | | |
| Supplemental Data: | | | | | | | | | |
Net assets, end of period (000) | | $341 | | | $42 | | | $10 | |
| | | |
Portfolio turnover rate | | 52.24 | % | | 54.70 | % | | 26.32 | % |
| (a) | | Commencement of investment operations was 9/28/2007, SEC effective date was 9/14/2007 and date shares first became available to the public was 10/1/2007. |
| (b) | | Calculated using average shares outstanding during the period. |
| (c) | | Total return assumes the reinvestment of all distributions. |
See Notes to Financial Statements.
36
Notes to Financial Statements
1. ORGANIZATION
Lord Abbett Research Fund, Inc. (the “Company”) is registered under the Investment Company Act of 1940, as amended (the “Act”), as a diversified, open-end management investment company, incorporated under Maryland law on April 6, 1992. The Company currently consists of four separate funds. This report covers one of the funds and its classes: Lord Abbett Capital Structure Fund (the “Fund;” formerly, Lord Abbett America’s Value Fund). Effective July 1, 2009, America’s Value Fund changed its name to Lord Abbett Capital Structure Fund.
The Fund’s investment objective is to seek current income and capital appreciation. The Fund offers eight classes of shares: Class A, B, C, F, I, P, R2 and R3, each with different expenses and dividends. A front-end sales charge is normally added to the net asset value (“NAV”) for Class A shares. There is no front-end sales charge in the case of Class B, C, F, I, P, R2 and R3 shares, although there may be a contingent deferred sales charge (“CDSC”) for certain cases as follows: Class A shares purchased without a sales charge and redeemed before the first day of the month in which the one-year anniversary of the purchase falls (subject to certain exceptions); Class B shares redeemed before the sixth anniversary of purchase; and Class C shares redeemed before the first anniversary of purchase. Class B shares will automatically convert to Class A shares on the 25th day of the month (or, if the 25th is not a business day, the next business day thereafter) following the eighth anniversary of the day on which the purchase order was accepted. The Fund’s Class P shares are closed to substantially all new retirement and benefit plans and fee-based programs, with certain exceptions as set forth in the Fund’s prospectuses. Effective March 31, 2010, the Fund will no longer offer Class B shares.
The preparation of financial statements in conformity with accounting principles generally accepted in the United States of America requires management to make certain estimates and assumptions that affect the reported amounts of assets and liabilities and disclosure of contingent assets and liabilities at the date of the financial statements and the reported amounts of increases and decreases in net assets from operations during the reporting period. Actual results could differ from those estimates.
2. SIGNIFICANT ACCOUNTING POLICIES
| (a) | | Investment Valuation–Securities actively traded on any recognized U.S. or non-U.S. exchange or on The NASDAQ Stock Market LLC are valued at the last sale price or official closing price on the exchange or system on which they are principally traded. Events occurring after the close of trading on non-U.S. exchanges may result in adjustments to the valuation of foreign securities to more accurately reflect their fair value as of the close of regular trading on the New York Stock Exchange LLC. The Fund may rely on an independent fair valuation service in adjusting the valuations of foreign securities. Unlisted equity securities are valued at the last quoted sale price or, if no sale price is available, at the mean between the most recently quoted bid and asked prices. Fixed income securities are valued at the mean between the bid and asked prices on the basis of prices supplied by independent pricing services, which reflect broker/dealer supplied valuations and the independent pricing services’ own electronic data processing techniques. Floating rate loans are valued at the average of bid and asked quotations from dealers in loans on the basis of prices supplied by independent pricing services. Securities for which market quotations are not readily available are valued at fair value as determined by management and approved in good faith by the Board of Directors. Short-term securities with 60 days or less remaining to maturity are valued using the amortized cost method, which approximates current market value. |
37
Notes to Financial Statements (continued)
| (b) | | Security Transactions–Security transactions are recorded as of the date that the securities are purchased or sold (trade date). Realized gains and losses on sales of portfolio securities are calculated using the identified-cost method. Realized and unrealized gains (losses) are allocated to each class of shares based upon the relative proportion of net assets at the beginning of the day. |
| (c) | | Investment Income–Dividend income is recorded on the ex-dividend date. Interest income is recorded on the accrual basis as earned. Discounts are accreted and premiums are amortized using the effective interest method. Withholding taxes on foreign dividends have been provided for in accordance with the applicable country’s tax rules and rates. Investment income is allocated to each class of shares based upon the relative proportion of net assets at the beginning of the day. |
| (d) | | Income Taxes–It is the policy of the Fund to meet the requirements of Subchapter M of the Internal Revenue Code applicable to regulated investment companies and to distribute substantially all taxable income and capital gains to its shareholders. Therefore, no income tax provision is required. |
The Fund files U.S. federal and various state and local tax returns. No income tax returns are currently under examination. The statute of limitations on the Fund’s U.S. federal tax returns remains open for the fiscal years ended November 30, 2006 through November 30, 2009. The statutes of limitations on the Company’s state and local tax returns may remain open for an additional year depending upon the jurisdiction.
| (e) | | Expenses–Expenses incurred by the Company that do not specifically relate to an individual fund are generally allocated to the Funds within the Company on a pro rata basis by relative net assets. Expenses, excluding class-specific expenses, are allocated to each class of shares based upon the relative proportion of net assets at the beginning of the day. Class A, B, C, F, P, R2 and R3 shares bear their class-specific share of all expenses and fees relating to the Fund’s 12b-1 Distribution Plan. |
| (f) | | Foreign Transactions–The books and records of the Fund are maintained in U.S. dollars and transactions denominated in foreign currencies are recorded in the Fund’s records at the rate prevailing when earned or recorded. Asset and liability accounts that are denominated in foreign currencies are adjusted daily to reflect current exchange rates and any unrealized gain (loss) is included in Net change in unrealized appreciation/depreciation on investments and translation of assets and liabilities denominated in foreign currencies on the Fund’s Statement of Operations. The resultant exchange gains and losses upon settlement of such transactions are included in Net realized loss on investments and foreign currency related transactions on the Fund’s Statement of Operations. The Fund does not isolate that portion of the results of operations arising as a result of changes in the foreign exchange rates from the changes in market prices of the securities. |
| (g) | | When-Issued Transactions–The Fund may purchase portfolio securities on a when-issued or forward basis. When-issued or forward transactions involve a commitment by the Fund to purchase securities, with payment and delivery (“settlement”) to take place in the future, in order to secure what is considered to be an advantageous price or yield at the time of entering into the transaction. |
38
Notes to Financial Statements (continued)
| (h) | | Repurchase Agreements–The Fund may enter into repurchase agreements with respect to securities. A repurchase agreement is a transaction in which a Fund acquires a security and simultaneously commits to resell that security to the seller (a bank or securities dealer) at an agreed-upon price on an agreed-upon date. The Fund requires at all times that the repurchase agreement be collateralized by cash, or by securities of the U.S. Government, its agencies, its instrumentalities, or U.S. Government sponsored enterprises having a value equal to, or in excess of, the value of the repurchase agreement (including accrued interest). If the seller of the agreement defaults on its obligation to repurchase the underlying securities at a time when the value of these securities has declined, a Fund may incur a loss upon disposition of the securities. |
| (i) | | Floating Rate Loans–The Fund may invest in floating rate loans, which usually take the form of loan participations and assignments. Loan participations and assignments are agreements to make money available to U.S. or foreign corporations, partnerships or other business entities (the “Borrower”) in a specified amount, at a specified rate and within a specified time. A loan is typically originated, negotiated and structured by a U.S. or foreign bank, insurance company or other financial institution (the “Agent”) for a group of loan investors (“Loan Investors”). The Agent typically administers and enforces the loan on behalf of the other Loan Investors in the syndicate and may hold any collateral on behalf of the Loan Investors. Such loan participations and assignments are typically senior, secured and collateralized in nature. A Fund records an investment when the Borrower withdraws money and records interest as earned. These loans pay interest at rates which are periodically reset by reference to a base lending rate plus a spread. These base lending rates are generally the prime rate offered by a designated U.S. bank or London Interbank Offered Rate (“LIBOR”). |
The loans in which a Fund invests are generally readily marketable, but may be subject to some restrictions on resale. For example, a Fund may be contractually obligated to receive approval from the Agent and/or Borrower prior to the sale of these investments. A Fund generally has no right to enforce compliance with the terms of the loan agreement with the Borrower. As a result, a Fund assumes the credit risk of the Borrower, the selling participant and any other persons interpositioned between the Fund and the Borrower (“Intermediate Participants”). In the event that the Borrower, selling participant or Intermediate Participants becomes insolvent or enters into bankruptcy, the Fund may incur certain costs and delays in realizing payment or may suffer a loss of principal and/or interest.
Unfunded commitments represent the remaining obligation of the Fund to the Borrower. At any point in time, up to the maturity date of the issue, the Borrower may demand the unfunded portion. As of November 30, 2009, the Fund had no unfunded loan commitments.
| (j) | | Fair Value Measurements–In accordance with Financial Accounting Standards Board, Accounting Standards Codification (“ASC”) Topic 820, Fair Value Measurements and Disclosures (formerly SFAS 157), fair value is defined as the price that the Fund would receive upon selling an investment in an orderly transaction to an independent buyer in the principal or most advantageous market of the investment. ASC 820 established a three-tier hierarchy to maximize the use of observable market data and minimize the use of unobservable inputs and to establish classification of fair value measurements for disclosure purposes. Inputs refer broadly to the assumptions that market participants would use in pricing the asset or liability, including assumptions about risk – for example, the risk inherent in a particular valuation |
39
Notes to Financial Statements (continued)
| | technique used to measure fair value (such as a pricing model) and/or the risk inherent in the inputs to the valuation technique. Inputs may be observable or unobservable. Observable inputs reflect the assumptions market participants would use in pricing the asset or liability. Observable inputs are based on market data obtained from sources independent of the reporting entity. Unobservable inputs reflect the reporting entity’s own assumptions about the assumptions market participants would use in pricing the asset or liability. Unobservable inputs are based on the best information available in the circumstances. The three-tier hierarchy of inputs is summarized in the three broad Levels listed below: |
| | • | | Level 1 – quoted prices in active markets for identical investments; |
| | • | | Level 2 – other significant observable inputs (including quoted prices for similar investments, interest rates, prepayment speeds, credit risk, etc.); and |
| | • | | Level 3 – significant unobservable inputs (including the Fund’s own assumptions in determining the fair value of investments). |
The inputs or methodology used for valuing securities are not necessarily an indication of the risk associated with investing in those securities.
The following is a summary of the inputs used as of November 30, 2009 in valuing the Fund’s investments carried at value:
| | | | | | | | | | | | |
| Investment Type* | | Level 1 | | Level 2 | | Level 3 | | Total |
Common Stocks | | $ | 792,287,621 | | $ | – | | $ | 1,736,357 | | $ | 794,023,978 |
Convertible Bonds | | | – | | | 129,808,594 | | | – | | | 129,808,594 |
Convertible Preferred Stocks | | | 47,768,710 | | | 22,990,500 | | | – | | | 70,759,210 |
Floating Rate Loans | | | – | | | 5,602,614 | | | – | | | 5,602,614 |
Foreign Common Stocks | | | 50,535,036 | | | – | | | – | | | 50,535,036 |
Government Sponsored Enterprises Pass-Through | | | – | | | 13,221,458 | | | – | | | 13,221,458 |
High Yield Corporate Bonds | | | – | | | 325,991,769 | | | – | | | 325,991,769 |
Non-Convertible Preferred Stock | | | 88,056 | | | – | | | – | | | 88,056 |
Warrant | | | – | | | – | | | 31,210 | | | 31,210 |
Repurchase Agreement | | | – | | | 4,456,717 | | | – | | | 4,456,717 |
Total | | $ | 890,679,423 | | $ | 502,071,652 | | $ | 1,767,567 | | $ | 1,394,518,642 |
| * | See Schedule of Investments for values in each industry. |
The following is a reconciliation of investment for unobservable inputs (Level 3) that were used in determining fair value:
| | | | | | | | | | | | | | | | | | | | | |
Investment
Type | | Balance as of
December 1,
2008 | | Accrued
discounts/
premiums | | Realized
gain (loss) | | Change in
unrealized
appreciation (depreciation) | | Net
purchase
(sales) | | Net transfers
in or out
of Level 3 | | Balance as of
November 30,
2009 |
Common Stocks | | $ | – | | $ | – | | $ | – | | $ | 127,894 | | $ | 1,608,463 | | $ | – | | $ | 1,736,357 |
Warrant | | | – | | | – | | | – | | | – | | | 31,210 | | | – | | | 31,210 |
Total | | $ | – | | $ | – | | $ | – | | $ | 127,894 | | $ | 1,639,673 | | $ | – | | $ | 1,767,567 |
40
Notes to Financial Statements (continued)
3. MANAGEMENT FEE AND OTHER TRANSACTIONS WITH AFFILIATES
Management Fee
The Company has a management agreement with Lord, Abbett & Co. LLC (“Lord Abbett”), pursuant to which Lord Abbett supplies the Fund with investment management services and executive and other personnel, provides office space and pays for ordinary and necessary office and clerical expenses relating to research and statistical work and supervision of the Fund’s investment portfolio.
The management fee is based on the Fund’s average daily net assets at the following annual rates:
| | |
First $1 billion | | .75% |
Next $1 billion | | .70% |
Over $2 billion | | .65% |
For the fiscal year ended November 30, 2009, the effective management fee paid to Lord Abbett was at an annualized rate of 0.74% of the Fund’s average daily net assets.
Lord Abbett provides certain administrative services to the Fund pursuant to an Administrative Services Agreement at an annual rate of .04% of the Fund’s average daily net assets.
The Fund, along with certain other funds managed by Lord Abbett (collectively, the “Underlying Funds”), has entered into a Servicing Arrangement with Lord Abbett Balanced Strategy Fund, Lord Abbett Diversified Income Strategy Fund and Lord Abbett Growth & Income Strategy Fund of Lord Abbett Investment Trust (each, a “Fund of Funds”), pursuant to which each Underlying Fund pays a portion of the expenses (excluding management fees and distribution and service fees) of the Fund of Funds in proportion to the average daily value of the Underlying Fund shares owned by the Fund of Funds. Amounts paid pursuant to the Servicing Arrangement are included in Subsidy expense on the Fund’s Statement of Operations and Payable to affiliates on the Fund’s Statement of Assets and Liabilities.
As of November 30, 2009, the percentages of the Fund’s outstanding shares owned by Lord Abbett Balanced Strategy Fund, Lord Abbett Diversified Income Strategy Fund and Lord Abbett Growth & Income Strategy Fund were 16.40%, 2.85% and 2.55%, respectively.
12b-1 Distribution Plan
The Fund has adopted a distribution plan with respect to Class A, B, C, F, P, R2 and R3 shares pursuant to Rule 12b-1 under the Act, which provides for the payment of ongoing distribution and service fees to Lord Abbett Distributor LLC (the “Distributor”), an affiliate of Lord Abbett. The fees are accrued daily at annual rates based upon the Fund’s average daily net assets as follows:
| | | | | | | | | | | | | | |
| Fees* | | Class A | | Class B | | Class C | | Class F | | Class P | | Class R2 | | Class R3 |
Service | | .25% | | .25% | | .25% | | – | | .25% | | .25% | | .25% |
Distribution | | .10% | | .75% | | .75% | | .10% | | .20% | | .35% | | .25% |
| * | The Fund may designate a portion of the aggregate fee as attributable to service activities for purposes of calculating Financial Industry Regulatory Authority, Inc. (“FINRA”) sales charge limitations. |
Class I shares do not have a distribution plan.
41
Notes to Financial Statements (continued)
Commissions
Distributor received the following commissions on sales of shares of the Fund, after concessions were paid to authorized dealers, for the fiscal year ended November 30, 2009:
| | | |
Distributor Commissions | | Dealers’ Concessions |
| $ 806,748 | | $ | 4,293,798 |
Distributor received CDSCs of $1,743 and $4,580 for Class A and Class C shares, respectively, for the fiscal year ended November 30, 2009.
Two Directors and certain of the Fund’s officers have an interest in Lord Abbett.
4. DISTRIBUTIONS AND CAPITAL LOSS CARRYFORWARDS
Dividends from net investment income, if any, are declared and paid at least quarterly. Taxable net realized gains from investment transactions, reduced by allowable capital loss carryforwards, if any, are declared and distributed to shareholders at least annually. The capital loss carryforward amount, if any, is available to offset future net capital gains. Dividends and distributions to shareholders are recorded on the ex-dividend date. The amounts of dividends and distributions from net investment income and net realized capital gains are determined in accordance with federal income tax regulations, which may differ from accounting principles generally accepted in the United States of America. These book/tax differences are either considered temporary or permanent in nature. To the extent these differences are permanent in nature, such amounts are reclassified within the components of net assets based on their federal tax basis treatment; temporary differences do not require reclassification. Dividends and distributions, which exceed earnings and profits for tax purposes, are reported as a tax return of capital.
On December 16, 2009, a special net investment income distribution of approximately $1,323,000 was declared by the Fund. The distribution was paid December 18, 2009 to shareholders of record on December 17, 2009.
The tax character of distributions paid during the fiscal years ended November 30, 2009 and 2008 was as follows:
| | | | | | |
| | | Year Ended 11/30/2009 | | Year Ended 11/30/2008 |
Distributions paid from: | | | | | | |
Ordinary income | | $ | 50,101,245 | | $ | 67,876,909 |
Net long-term capital gains | | | – | | | 68,410,923 |
Total distributions paid | | $ | 50,101,245 | | $ | 136,287,832 |
As of November 30, 2009, the components of accumulated losses on a tax-basis were as follows:
| | | | |
Undistributed ordinary income – net | | $ | 7,534,772 | |
Total undistributed earnings | | $ | 7,534,772 | |
Capital loss carryforwards* | | | (293,666,966 | ) |
Temporary differences | | | (4,000,052 | ) |
Unrealized gains – net | | | 14,589,649 | |
Total accumulated losses – net | | $ | (275,542,597 | ) |
| * | As of November 30, 2009, the capital loss carryforwards, along with the related expiration dates, were as follows: |
| | | | | | |
| 2016 | | 2017 | | Total |
| $112,156,193 | | $ | 181,510,773 | | $ | 293,666,966 |
42
Notes to Financial Statements (continued)
Certain losses incurred after October 31 (“Post-October Losses”) within the taxable year are deemed to arise on the first business day of the Fund’s next taxable year. The Fund incurred and will elect to defer net capital losses of $3,863,385 and ordinary losses of $10,439 during fiscal 2009.
As of November 30, 2009, the aggregate unrealized security gains and losses based on cost for U.S. federal income tax purposes were as follows:
| | | | |
Tax cost | | $ | 1,379,949,439 | |
Gross unrealized gain | | | 113,313,892 | |
Gross unrealized loss | | | (98,744,689 | ) |
Net unrealized security gain | | $ | 14,569,203 | |
The difference between book-basis and tax-basis unrealized gains (losses) is attributable to the tax treatment of premium amortization, wash sales and certain securities.
Permanent items identified during the fiscal year ended November 30, 2009, have been reclassified among the components of net assets based on their tax basis treatment as follows:
| | | | |
Undistributed Net Investment Income | | Accumulated Net Realized Loss | |
| $947,461 | | $ | (947,461 | ) |
The permanent difference is attributable to the tax treatment of premium amortization, foreign currency transactions, certain securities and paydown gains and losses.
5. PORTFOLIO SECURITIES TRANSACTIONS
Purchases and sales of investment securities (excluding short-term investments) for the fiscal year ended November 30, 2009 were as follows:
| | | |
| Purchases | | Sales |
| $668,353,972 | | $ | 641,601,130 |
There were no purchases or sales of U.S. Government securities for the fiscal year ended November 30, 2009.
6. DIRECTORS’ REMUNERATION
The Company’s officers and the two Directors who are associated with Lord Abbett do not receive any compensation from the Company for serving in such capacities. Outside Directors’ fees are allocated among all Lord Abbett-sponsored funds based on the net assets of the fund. There is an equity-based plan available to all outside Directors under which outside Directors must defer receipt of a portion of, and may elect to defer receipt of an additional portion of, Directors’ fees. The deferred amounts are treated as though equivalent dollar amounts have been invested in the funds. Such amounts and earnings accrued thereon are included in Directors’ fees on the Statement of Operations and in Directors’ fees payable on the Statement of Assets and Liabilities and are not deductible for U.S. federal income tax purposes until such amounts are paid.
7. EXPENSE REDUCTIONS
The Company has entered into arrangements with its transfer agent and custodian, whereby credits realized as a result of uninvested cash balances are used to reduce a portion of the Fund’s expenses.
43
Notes to Financial Statements (continued)
8. LINE OF CREDIT
The Fund and certain other funds managed by Lord Abbett have available an unsecured revolving credit facility (“Facility”) from State Street Bank and Trust Company (“SSB”), to be used for temporary or emergency purposes as an additional source of liquidity to fund redemptions of investor shares. The Facility is renewed annually under terms that depend on market conditions at the time of the renewal. Accordingly, effective December 4, 2009, the amount available under the Facility remains $200,000,000 and the annual fee to maintain the Facility (of which each participating fund pays its pro rata share based on the net assets of each participating fund) was changed from .125% (.08% prior to December 5, 2008) of the amount available under the Facility to .15%. This amount is included in Other Expenses on the Fund’s Statement of Operations. In connection with the renewal, the Fund paid an upfront commitment fee of .05% on December 4, 2009. Any borrowings under this Facility will bear interest at current market rates as set forth in the credit agreement. As of November 30, 2009, there were no loans outstanding pursuant to this Facility nor was the Facility utilized at any time during the fiscal year ended November 30, 2009.
9. CUSTODIAN AND ACCOUNTING AGENT
SSB is the Company’s custodian and accounting agent. SSB performs custodial, accounting and recordkeeping functions relating to portfolio transactions and calculating the Fund’s NAV.
10. INVESTMENT RISKS
The Fund is subject to the general risks and considerations associated with investing in equity and fixed income securities.
The values of the Fund’s equity security holdings and, consequently, the value of an investment in the Fund will fluctuate in response to movements in the equity securities market in general and to the changing prospects of the individual companies involved. With its emphasis on value stocks, the Fund may perform differently than the market as a whole and other types of stocks, such as growth stocks. The market may fail to recognize the intrinsic value of particular value stocks for a long time. The Fund may invest a significant portion of its assets in mid-sized companies that may be less able to weather economic shifts or other adverse developments than larger, more established companies. Because the Fund is not limited to investing in equity securities, the Fund may have smaller gains in a rising equity securities market than a fund investing solely in equity securities. In addition, if the Fund’s assessment of a company’s value or prospects for market appreciation or market conditions is wrong, the Fund could suffer losses or produce poor performance relative to other funds, even in a rising market.
The values of the Fund’s fixed income holdings, and consequently, the value of an investment in the Fund will change as interest rates fluctuate and in response to market movements. When interest rates rise, the prices of these holdings are likely to decline. There is also the risk that an issuer of a fixed income security will fail to make timely payments of principal or interest to the Fund, a risk that is greater with high yield bonds (sometimes called “junk bonds”) in which the Fund may invest. Some issuers, particularly of high yield bonds, may default as to principal and/or interest payments after the Fund purchases their securities. A default, or concerns in the market about an increase in risk of default, may result in losses to the Fund. High yield bonds are subject to greater price fluctuations, as well as additional risks.
44
Notes to Financial Statements (continued)
The Fund may invest up to 20% of its assets in foreign securities, which present increased market, liquidity, currency, political and other risks. The Fund may invest up to 10% of its net assets in floating rate or adjustable rate senior loans, which are subject to increased credit and liquidity risks. Senior loans are business loans made to borrowers that may be U.S. or foreign corporations, partnerships, or other business entities.
These factors can affect the Fund’s performance.
11. SUMMARY OF CAPITAL TRANSACTIONS
Transactions in shares of capital stock were as follows:
| | | | | | | | | | | | | | |
| | | Year Ended
November 30, 2009 | | | Year Ended
November 30, 2008 | |
| Class A Shares | | Shares | | | Amount | | | Shares | | | Amount | |
Shares sold | | 24,397,409 | | | $ | 219,837,386 | | | 16,775,832 | | | $ | 187,722,200 | |
Converted from Class B* | | 202,513 | | | | 1,823,949 | | | 90,477 | | | | 1,029,497 | |
Reinvestment of distributions | | 3,999,856 | | | | 35,630,378 | | | 8,324,610 | | | | 100,697,725 | |
Shares reacquired | | (32,916,830 | ) | | | (299,560,999 | ) | | (28,966,920 | ) | | | (312,063,560 | ) |
Decrease | | (4,317,052 | ) | | $ | (42,269,286 | ) | | (3,776,001 | ) | | $ | (22,614,138 | ) |
| | | | |
| Class B Shares | | | | | | | | | | | | |
Shares sold | | 1,309,290 | | | $ | 11,729,837 | | | 696,525 | | | $ | 7,660,626 | |
Reinvestment of distributions | | 176,191 | | | | 1,556,980 | | | 395,080 | | | | 4,771,807 | |
Shares reacquired | | (1,232,027 | ) | | | (11,048,955 | ) | | (1,381,455 | ) | | | (14,950,145 | ) |
Converted to Class A* | | (199,978 | ) | | | (1,823,949 | ) | | (91,226 | ) | | | (1,029,497 | ) |
Increase (decrease) | | 53,476 | | | $ | 413,913 | | | (381,076 | ) | | $ | (3,547,209 | ) |
| | | | |
| Class C Shares | | | | | | | | | | | | |
Shares sold | | 1,123,147 | | | $ | 10,087,605 | | | 993,914 | | | $ | 11,232,782 | |
Reinvestment of distributions | | 165,778 | | | | 1,465,722 | | | 417,979 | | | | 5,066,897 | |
Shares reacquired | | (1,812,034 | ) | | | (16,201,048 | ) | | (2,564,442 | ) | | | (28,194,571 | ) |
Decrease | | (523,109 | ) | | $ | (4,647,721 | ) | | (1,152,549 | ) | | $ | (11,894,892 | ) |
| | | | |
| Class F Shares | | | | | | | | | | | | |
Shares sold | | 424,991 | | | $ | 3,694,216 | | | 148,982 | | | $ | 1,739,552 | |
Reinvestment of distributions | | 6,724 | | | | 61,071 | | | 2,647 | | | | 28,469 | |
Shares reacquired | | (160,021 | ) | | | (1,502,234 | ) | | (14,347 | ) | | | (157,929 | ) |
Increase | | 271,694 | | | $ | 2,253,053 | | | 137,282 | | | $ | 1,610,092 | |
| | | | |
| Class I Shares | | | | | | | | | | | | |
Shares sold | | 7,218,667 | | | $ | 66,816,612 | | | 1,782,036 | | | $ | 21,793,074 | |
Reinvestment of distributions | | 1,113,858 | | | | 10,061,704 | | | 1,800,454 | | | | 21,766,442 | |
Shares reacquired | | (1,327,048 | ) | | | (10,957,373 | ) | | (854,216 | ) | | | (8,345,090 | ) |
Increase | | 7,005,477 | | | $ | 65,920,943 | | | 2,728,274 | | | $ | 35,214,426 | |
| | | | |
| Class P Shares | | | | | | | | | | | | |
Shares sold | | 45,886 | | | $ | 413,092 | | | 83,756 | | | $ | 937,406 | |
Reinvestment of distributions | | 10,062 | | | | 89,967 | | | 18,760 | | | | 228,125 | |
Shares reacquired | | (48,927 | ) | | | (442,939 | ) | | (55,868 | ) | | | (644,109 | ) |
Increase | | 7,021 | | | $ | 60,120 | | | 46,648 | | | $ | 521,422 | |
45
Notes to Financial Statements (concluded)
| | | | | | | | | | | | | | |
| | | Year Ended
November 30, 2009 | | | Year Ended
November 30, 2008 | |
| Class R2 Shares | | Shares | | | Amount | | | Shares | | | Amount | |
Shares sold | | 2,977 | | | $ | 26,040 | | | 1 | | | $ | 10 | |
Reinvestment of distributions | | 55 | | | | 491 | | | 59 | | | | 709 | |
Shares reacquired | | (1,071 | ) | | | (9,795 | ) | | – | | | | – | |
Increase | | 1,961 | | | $ | 16,736 | | | 60 | | | $ | 719 | |
| | | | |
| Class R3 Shares | | | | | | | | | | | | |
Shares sold | | 37,897 | | | $ | 348,224 | | | 4,401 | | | $ | 43,605 | |
Reinvestment of distributions | | 469 | | | | 4,402 | | | 96 | | | | 1,113 | |
Shares reacquired | | (10,212 | ) | | | (98,548 | ) | | (405 | ) | | | (3,789 | ) |
Increase | | 28,154 | | | $ | 254,078 | | | 4,092 | | | $ | 40,929 | |
| * | Automatic conversion of Class B shares occurs on the 25th day of the month (or, if the 25th is not a business day, the next business day thereafter) following the eighth anniversary of the day on which the purchase order was accepted. |
12. SUBSEQUENT EVENTS
In accordance with the provisions set forth in ASC Topic 855 (formerly SFAS 165), Subsequent Events, adopted by the Fund as of November 30, 2009, management has evaluated subsequent events existing in the Fund’s financial statements through January 29, 2010. Management has determined that there were no material subsequent events that would require recognition or additional disclosure in the Fund’s financial statements through this date.
13. RECENT ACCOUNTING PRONOUNCEMENTS
In January 2010, the Financial Accounting Standards Board issued Accounting Standards Update 2010-06 “Improving Disclosures about Fair Value Measurements” (“ASU 2010-06”). ASU 2010-06 provides clarifications to existing disclosures required by ASC 820 as well as amends ASC 820 to require certain new disclosures. ASU 2010-06 is substantially effective for interim and annual reporting periods beginning after December 15, 2009. Management is currently evaluating the impact the adoption of ASU 2010-06 will have on the Fund’s financial statement disclosures.
46
Report of Independent Registered Public Accounting Firm
To the Shareholders and Board of Directors of Lord Abbett Research Fund, Inc.:
We have audited the accompanying statement of assets and liabilities, including the schedule of investments, of the Lord Abbett Capital Structure Fund (formerly Lord Abbett America’s Value Fund), one of the portfolios constituting the Lord Abbett Research Fund, Inc. (the “Company”), as of November 30, 2009, and the related statement of operations for the year then ended, the statement of changes in net assets for each of the two years in the period then ended, and the financial highlights for each of the periods presented. These financial statements and financial highlights are the responsibility of the Company’s management. Our responsibility is to express an opinion on these financial statements and financial highlights based on our audits.
We conducted our audits in accordance with the standards of the Public Company Accounting Oversight Board (United States). Those standards require that we plan and perform the audit to obtain reasonable assurance about whether the financial statements and financial highlights are free of material misstatement. The Company is not required to have, nor were we engaged to perform, an audit of its internal control over financial reporting. Our audits included consideration of internal control over financial reporting as a basis for designing audit procedures that are appropriate in the circumstances, but not for the purpose of expressing an opinion on the effectiveness of the Company’s internal control over financial reporting. Accordingly, we express no such opinion. An audit also includes examining, on a test basis, evidence supporting the amounts and disclosures in the financial statements, assessing the accounting principles used and significant estimates made by management, as well as evaluating the overall financial statement presentation. Our procedures included confirmation of securities owned as of November 30, 2009, by correspondence with the custodian, brokers and agent banks; where replies were not received from brokers and agent banks, we performed other auditing procedures. We believe that our audits provide a reasonable basis for our opinion.
In our opinion, the financial statements and financial highlights referred to above present fairly, in all material respects, the financial position of the Lord Abbett Capital Structure Fund of the Lord Abbett Research Fund, Inc. as of November 30, 2009, the results of its operations for the year then ended, the changes in its net assets for each of the two years in the period then ended, and the financial highlights for each of the periods presented, in conformity with accounting principles generally accepted in the United States of America.
DELOITTE & TOUCHE LLP
New York, New York
January 29, 2010
47
Basic Information About Management
The Board of Directors (the “Board”) is responsible for the management of the business and affairs of the Company in accordance with the laws of the State of Maryland. The Board appoints officers who are responsible for the day-to-day operations of the Company and who execute policies authorized by the Board. The Board also approves an investment adviser to the Company and continues to monitor the cost and quality of the services provided by the investment adviser, and annually considers whether to renew the contract with the adviser. Generally, each Director holds office until his/her successor is elected and qualified or until his/her earlier resignation or removal, as provided in the Company’s organizational documents.
Lord, Abbett & Co. LLC (“Lord Abbett”), a Delaware limited liability company, is the Company’s investment adviser.
Interested Directors
The following Directors are partners of Lord Abbett and are “interested persons” of the Company as defined in the Act. Mr. Dow and Ms. Foster are officers, directors, or trustees of each of the 14 Lord Abbett-sponsored funds, which consist of 53 portfolios or series.
| | | | | | |
Name, Address and Year of Birth | | Current Position and
Length of Service
with Company | | Principal Occupation
During Past Five Years | | Other Directorships |
| | | |
Robert S. Dow Lord, Abbett & Co. LLC
90 Hudson Street
Jersey City, NJ 07302
(1945) | | Director and Chairman since 1996 | | Senior Partner (since 2007), Chief Executive Officer (since 1996) and was formerly Managing Partner (1996 - 2007), joined Lord Abbett in 1972. | | N/A |
| | | |
Daria L. Foster Lord, Abbett & Co. LLC
90 Hudson Street
Jersey City, NJ 07302
(1954) | | Director since 2006 | | Managing Partner (since 2007) and was formerly Director of Marketing and Client Service, joined Lord Abbett in 1990. | | N/A |
Independent Directors
The following independent or outside Directors (“Independent Directors”) are also directors or trustees of each of the 14 Lord Abbett-sponsored funds, which consist of 53 portfolios or series.
| | | | | | |
Name, Address and
Year of Birth | | Current Position and
Length of Service
with Company | | Principal Occupation
During Past Five Years | | Other
Directorships |
| | | |
E. Thayer Bigelow Lord, Abbett & Co. LLC
c/o Legal Dept.
90 Hudson Street
Jersey City, NJ 07302
(1941) | | Director since 1996 | | Managing General Partner, Bigelow Media, LLC (since 2000); Senior Adviser, Time Warner Inc. (1998 - 2000). | | Currently serves as director of Crane Co. (since 1984), Huttig Building Products Inc. (since 1998) and R.H. Donnelley Inc. (since 2009). |
48
Basic Information About Management (continued)
| | | | | | |
Name, Address and
Year of Birth | | Current Position and
Length of Service
with Company | | Principal Occupation
During Past Five Years | | Other
Directorships |
| | | |
William H.T. Bush
Lord, Abbett & Co. LLC
c/o Legal Dept.
90 Hudson Street
Jersey City, NJ 07302
(1938) | | Director since 1998 | | Co-founder and Chairman of the Board of the financial advisory firm of Bush- O’Donnell & Company (since 1986). | | Currently serves as director of WellPoint, Inc., a health benefits company (since 2002). |
| | | |
Robert B. Calhoun, Jr. Lord, Abbett & Co. LLC
c/o Legal Dept.
90 Hudson Street
Jersey City, NJ 07302
(1942) | | Director since 1998 | | Senior Advisor of Monitor Clipper Partners, a private equity investment fund (since 1997); President of Clipper Asset Management Corp. (1991 - 2009). | | N/A |
| | | |
Julie A. Hill
Lord, Abbett & Co. LLC
c/o Legal Dept.
90 Hudson Street
Jersey City, NJ 07302
(1946) | | Director since 2004 | | Owner and CEO of The Hill Company, a business consulting firm (since 1998). | | Currently serves as director of WellPoint, Inc., a health benefits company (since 1994) and Lend Lease Corporation Limited (since 2005). |
| | | |
Franklin W. Hobbs
Lord, Abbett & Co. LLC
c/o Legal Dept.
90 Hudson Street
Jersey City, NJ 07302
(1947) | | Director since 2001 | | Advisor of One Equity Partners, a private equity firm (since 2004). | | Currently serves as a director and Chairman of the Board of GMAC Inc., a financial services firm (since 2009) and as a director of Molson Coors Brewing Company (since 2002). |
| | | |
Thomas J. Neff
Lord, Abbett & Co. LLC
c/o Legal Dept.
90 Hudson Street
Jersey City, NJ 07302
(1937) | | Director since 1992 | | Chairman of Spencer Stuart (U.S.), an executive search consulting firm (since 1996). | | Currently serves as director of Ace, Ltd. (since 1997) and Hewitt Associates, Inc. (since 2004). |
| | | |
James L.L. Tullis
Lord, Abbett & Co. LLC
c/o Legal Dept.
90 Hudson Street
Jersey City, NJ 07302
(1947) | | Director since 2006 | | CEO of Tullis-Dickerson and Co. Inc., a venture capital management firm (since 1990). | | Currently serves as director of Crane Co. (since 1998). |
49
Basic Information About Management (continued)
Officers
None of the officers listed below have received compensation from the Company. All of the officers of the Company may also be officers of the other Lord Abbett-sponsored funds and maintain offices at 90 Hudson Street, Jersey City, NJ 07302. Unless otherwise indicated, the titles and positions listed under the “Principal Occupation” column indicate the officer’s position(s) and title(s) with Lord Abbett.
| | | | | | |
Name and
Year of Birth | | Current Position
with Company | | Length of Service
of Current Position | | Principal Occupation
During Past Five Years |
| | | |
Robert S. Dow (1945) | | Chief Executive Officer and Chairman | | Elected in 1996 | | Senior Partner (since 2007), Chief Executive Officer (since 1996) and was formerly Managing Partner (1996 - 2007), joined Lord Abbett in 1972. |
| | | |
Daria L. Foster (1954) | | President | | Elected in 2006 | | Managing Partner (since 2007) and was formerly Director of Marketing and Client Service, joined Lord Abbett in 1990. |
| | | |
Robert P. Fetch (1953) | | Executive Vice President | | Elected in 1997 | | Partner and Director, joined Lord Abbett in 1995. |
| | | |
Daniel H. Frascarelli (1954) | | Executive Vice President | | Elected in 2005 | | Partner and Director, joined Lord Abbett in 1990. |
| | | |
Robert I. Gerber (1954) | | Executive Vice President | | Elected in 2007 | | Partner and Chief Investment Officer (since 2007), joined Lord Abbett in 1997 as Director of Taxable Fixed Income Management. |
| | | |
Gerard S. E. Heffernan, Jr. (1963) | | Executive Vice President | | Elected in 2009 | | Partner and Director, joined Lord Abbett in 1998. |
| | | |
Christopher J. Towle (1957) | | Executive Vice President | | Elected in 2001 | | Partner and Director, joined Lord Abbett in 1987. |
| | | |
Paul J. Volovich (1973) | | Executive Vice President | | Elected in 2004 | | Partner and Director, joined Lord Abbett in 1997. |
| | | |
James W. Bernaiche (1956) | | Chief Compliance Officer | | Elected in 2004 | | Partner and Chief Compliance Officer, joined Lord Abbett in 2001. |
| | | |
Joan A. Binstock (1954) | | Chief Financial Officer and Vice President | | Elected in 1999 | | Partner and Chief Operations Officer, joined Lord Abbett in 1999. |
| | | |
John K. Forst (1960) | | Vice President and Assistant Secretary | | Elected in 2005 | | Deputy General Counsel, joined Lord Abbett in 2004. |
50
Basic Information About Management (concluded)
| | | | | | |
Name and
Year of Birth | | Current Position
with Company | | Length of Service
of Current Position | | Principal Occupation
During Past Five Years |
| | | |
Lawrence H. Kaplan (1957) | | Vice President and Secretary | | Elected in 1997 | | Partner and General Counsel, joined Lord Abbett in 1997. |
| | | |
Deepak Khanna (1963) | | Vice President | | Elected in 2008 | | Portfolio Manager, returned to Lord Abbett in 2007 from Jennison Associates LLC (2005 - 2007). Mr. Khanna’s former experience at Lord Abbett included Senior Research Analyst – other investment strategies (2000 - 2005). |
| | | |
David J. Linsen (1974) | | Vice President | | Elected in 2008 | | Director and Portfolio Manager, joined Lord Abbett in 2001. |
| | | |
Elizabeth O. MacLean (1966) | | Vice President | | Elected in 2008 | | Partner and Portfolio Manager, joined Lord Abbett in 2006 and was formerly a Managing Director/Portfolio Manager at Nomura Corporate Research and Asset Management, Inc. (2000 - 2006). |
| | | |
A. Edward Oberhaus, III (1959) | | Vice President | | Elected in 1996 | | Partner and Director, joined Lord Abbett in 1983. |
| | | |
Todor Petrov (1974) | | Vice President | | Elected in 2008 | | Portfolio Manager, joined Lord Abbett in 2003. |
| | | |
Thomas R. Phillips (1960) | | Vice President and Assistant Secretary | | Elected in 2008 | | Deputy General Counsel, joined Lord Abbett in 2006 and was formerly an attorney at Morgan, Lewis & Bockius LLP. |
| | | |
Randy M. Reynolds (1972) | | Vice President | | Elected in 2008 | | Portfolio Manager, joined Lord Abbett in 1999. |
| | | |
Lawrence B. Stoller (1963) | | Vice President and Assistant Secretary | | Elected in 2007 | | Senior Deputy General Counsel, joined Lord Abbett in 2007 and was formerly an Executive Vice President and General Counsel at Cohen & Steers Capital Management, Inc. (1999 - 2007). |
| | | |
Bernard J. Grzelak (1971) | | Treasurer | | Elected in 2003 | | Partner and Director of Fund Administration, joined Lord Abbett in 2003. |
Please call 888-522-2388 for a copy of the statement of additional information (SAI), which contains further information about the Company’s Directors. It is available free upon request.
51
Householding
The Company has adopted a policy that allows it to send only one copy of the Fund’s prospectus, proxy material, annual report and semiannual report to certain shareholders residing at the same “household.” This reduces Fund expenses, which benefits you and other shareholders. If you need additional copies or do not want your mailings to be “householded,” please call Lord Abbett at 888-522-2388 or send a written request with your name, the name of your fund or funds and your account number or numbers to Lord Abbett Family of Funds, P.O. Box 219336, Kansas City, MO 64121.
Proxy Voting Policies, Procedures and Records
A description of the policies and procedures that Lord Abbett uses to vote proxies related to the Fund’s portfolio securities, and information on how Lord Abbett voted each Fund’s proxies during the 12-month period ended June 30 are available without charge, upon request, (i) by calling 888-522-2388; (ii) on Lord Abbett’s Website at www.lordabbett.com; and (iii) on the Securities and Exchange Commission’s (“SEC”) Website at www.sec.gov.
Shareholder Reports and Quarterly Portfolio Disclosure
The Fund is required to file its complete schedule of portfolio holdings with the SEC for its first and third fiscal quarters on Form N-Q. Copies of the filings are available without charge, upon request on the SEC’s Website at www.sec.gov and may be available by calling Lord Abbett at 888-522-2388. You can also obtain copies of Form N-Q by (i) visiting the SEC’s Public Reference Room in Washington, DC (information on the operation of the Public Reference Room may be obtained by calling 800-SEC-0330); (ii) sending your request and duplicating fee to the SEC’s Public Reference Section, Washington, DC 20549-1520; or (iii) sending your request electronically, after paying a duplicating fee, to publicinfo@sec.gov.
Tax Information
55.88% of the ordinary income distributions paid by the Fund during the fiscal year ended November 30, 2009 is qualified dividend income. For corporate shareholders, only 51.82% of the Fund’s ordinary income distributions qualified for the dividends received deduction.
For foreign shareholders 57.50% of the distributions paid by the Fund represents interest related dividends.
52


This report when not used for the general information of shareholders of the fund, is to be distributed only if preceded or accompanied by a current fund prospectus.
Lord Abbett Mutual Fund shares are distributed by LORD ABBETT DISTRIBUTOR LLC.
Lord Abbett Research Fund, Inc.
Lord Abbett Capital Structure Fund
LAAMF-2-1109
(01/10)
2009
LORD ABBETT
ANNUAL
REPORT 
Lord Abbett
Growth Opportunities Fund
For the fiscal year ended November 30, 2009

Lord Abbett Research Fund
Lord Abbett Growth Opportunities Fund
Annual Report
For the fiscal year ended November 30, 2009

From left to right: Robert S. Dow, Director and Chairman of the Lord Abbett Funds; E. Thayer Bigelow, Independent Lead Director of the Lord Abbett Funds; and Daria L. Foster, Director and President of the Lord Abbett Funds.
Dear Shareholders: We are pleased to provide you with this overview of the Lord Abbett Growth Opportunities Fund’s performance for the fiscal year ended November 30, 2009. On this page and the following pages, we discuss the major factors that influenced performance. For detailed and more timely information about the Fund, please visit our Web site at www.lordabbett.com, where you also can access the quarterly commentaries by the Fund’s portfolio managers.
Thank you for investing in Lord Abbett mutual funds. We value the trust that you place in us and look forward to serving your investment needs in the years to come.
Best regards,

Robert S. Dow
Chairman
Q: What were the overall market conditions during the fiscal year ended November 30, 2009?
A: After a difficult start to the fiscal year ended November 30, 2009, the equity markets (as represented by the S&P 500® Index1) began a slow upward trend during the balance of the period, recovering some of their previous losses. The fiscal year ended with the S&P 500 Index up 25.39%.
Mid cap stocks (as defined by the Russell MidCap® Index2) generally outperformed large cap stocks (as measured by the Russell 1000® Index3) and small cap stocks (as measured by the Russell 2000® Index4). Growth stocks (as represented by the Russell 3000® Growth Index5) generally outperformed value stocks (as represented by the Russell 3000® Value Index 6) for the fiscal year. Overall, most equity asset classes and investing styles trended higher throughout the 12-month fiscal period.
1
Q: How did the Growth Opportunities Fund perform during the fiscal year ended November 30, 2009?
A: The Fund returned 38.43%, reflecting performance at the net asset value (NAV) of Class A shares, with all distributions reinvested, compared to its benchmark, the Russell Midcap® Growth Index,7 which returned 42.83% over the same period.
Q: What were the most significant factors affecting performance?
A: The most significant detractors from the Fund’s performance relative to its benchmark for the 12-month period were the healthcare and consumer staples sectors. Within those sectors, among the individual holdings detracting from performance were consumer staples holding Church & Dwight Co., Inc., a manufacturer of baking soda, and healthcare holding Cephalon Inc., a pharmaceutical company. The portfolio was also underweight H.J. Heinz Co., a food products company, which moved higher in the period.
The most significant contributors to the Fund’s performance relative to its benchmark for the 12-month period were the technology and consumer discretionary sectors. Within those sectors, among the individual holdings that contributed to performance were technology holdings Network Appliance, Inc., a provider of storage and data management solutions, and Cognizant Technology, a custom information technology consulting company. Consumer discretionary holding Starwood Hotels & Resorts Worldwide, Inc., a hotel and leisure company, also added to performance in the period.
The Fund’s portfolio is actively managed and, therefore, its holdings and the weightings of a particular issuer or particular sector as a percentage of portfolio assets are subject to change. Sectors may include many industries.
1 The S&P 500® Index is widely regarded as the standard for measuring large cap U.S. stock market performance and includes a representative sample of leading companies in leading industries.
2 The Russell Midcap® Index measures the performance of the 800 smallest companies in the Russell 1000 Index, which represents approximately 25% of the total market capitalization of the Russell 1000 Index.
3 The Russell 1000® Index measures the performance of the 1,000 largest companies in the Russell 3000 Index, which represents approximately 92% of the total market capitalization of the Russell 3000 Index.
4 The Russell 2000® Index is composed of 2,000 securities with market values ranging from $25 million to $275 million. The Growth Index is comprised of securities in the Russell 2000® Index with higher price-to-book ratios and higher forecasted growth.
5 The Russell 3000® Growth Index measures the performance of those Russell 3000® Index companies with higher price-to-book ratios and higher forecasted growth values. The stocks in this index are also members of either the Russell 1000® Growth or the Russell 2000® Growth indexes.
6 The Russell 3000® Value Index measures the performance of those Russell 3000 Index companies with lower price-to-book ratios and lower forecasted growth values. The stocks in this index are also members of either the Russell 1000® Value or the Russell 2000® Value indexes.
2
7 The Russell Midcap® Growth Index measures the performance of those Russell Midcap companies with higher price to book ratios and higher forecasted growth values. The stocks also are members of the Russell 1000 Growth Index.
Unless otherwise indicated, indexes are unmanaged and reflect total returns with all distributions reinvested, but do not reflect the deduction of fees, expenses, or taxes, and are not available for direct investment.
During certain periods shown, expense reimbursements were in place. Without such expense reimbursements, the Fund’s returns would have been lower.
Important Performance and Other Information
Performance data quoted reflect past performance and are no guarantee of future results. Current performance may be higher or lower than the performance quoted. The investment return and principal value of an investment in the Fund will fluctuate so that shares, on any given day or when redeemed, may be worth more or less than their original cost. You can obtain performance data current to the most recent month-end by calling Lord Abbett at 888-522-2388 or referring to our Website at www.lordabbett.com.
Except where noted, comparative Fund performance does not account for the deduction of sales charges and would be different if sales charges were included. The Fund offers several classes of shares with distinct pricing options. For a full description of the differences in pricing alternatives, please see the Fund’s prospectuses.
The views of the Fund’s management and the portfolio holdings described in this report are as of November 30, 2009; these views and portfolio holdings may have changed subsequent to this date, and they do not guarantee the future performance of the markets or the Fund. Information provided in this report should not be considered a recommendation to purchase or sell securities.
A Note about Risk: See Notes to Financial Statements for a discussion of investment risks. For a more detailed discussion of the risks associated with the Fund, please see the Fund’s prospectuses.
Mutual funds are not insured by the FDIC, are not deposits or other obligations of, or guaranteed by, banks, and are subject to investment risks, including possible loss of principal amount invested.
3
Investment Comparison
Below is a comparison of a $10,000 investment in Class A shares with the same investment in the Russell Midcap® Growth Index and the S&P MidCap 400 Growth Index, assuming reinvestment of all dividends and distributions. The performance of other classes will be greater than or less than the performance shown in the graph below due to different sales loads and expenses applicable to such classes. The graph and performance table below do not reflect the deduction of taxes that a shareholder would pay on fund distributions or the redemption of fund shares. Past performance is no guarantee of future results.
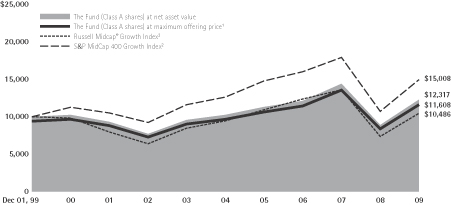
Average Annual Total Returns at Maximum Applicable
Sales Charge for the Periods Ended November 30, 2009
| | | | | | | | |
| | | 1 Year | | 5 Years | | 10 Years | | Life of Class |
Class A3 | | 30.46% | | 2.47% | | 1.50% | | – |
Class B4 | | 33.55% | | 2.87% | | 1.60% | | – |
Class C5 | | 37.58% | | 3.01% | | 1.47% | | – |
Class F6 | | 38.82% | | – | | – | | -6.75% |
Class I7 | | 38.91% | | 4.06% | | 2.44% | | – |
Class P8 | | 38.28% | | 3.58% | | – | | 0.72% |
Class R29 | | 38.04% | | – | | – | | -7.19% |
Class R310 | | 38.33% | | – | | – | | -7.07% |
1 Reflects the deduction of the maximum initial sales charge of 5.75%.
2 Performance for each unmanaged index does not reflect any fees or expenses. The performance of each index is not necessarily representative of the Fund’s performance.
3 Total return, which is the percentage change in net asset value, after deduction of the maximum initial sales charge of 5.75% applicable to Class A shares, with all dividends and distributions reinvested for the periods shown ended November 30, 2009, is calculated using the SEC-required uniform method to compute such return.
4 Performance reflects the deduction of a CDSC of 4% for 1 year, 1% for 5 years and 0% for 10 years. Class B shares automatically convert to Class A shares after approximately 8 years. (There is no initial sales charge for automatic conversions.) All returns for periods greater than 8 years reflect this conversion.
5 The 1% CDSC for Class C shares normally applies before the first anniversary of the purchase date. Performance is at net asset value.
6 Class F shares commenced operations and performance for the Class began on September 28, 2007. Performance is at net asset value.
7 Performance is at net asset value.
8 Class P shares commenced operations and performance for the Class began on August 15, 2000. Performance is at net asset value.
9 Class R2 shares commenced operations and performance for the Class began on September 28, 2007. Performance is at net asset value.
10 Class R3 shares commenced operations and performance for the Class began on September 28, 2007. Performance is at net asset value.
4
Expense Example
As a shareholder of the Fund, you incur two types of costs: (1) transaction costs, including sales charges (loads) on purchase payments (these charges vary among the share classes); and (2) ongoing costs, including management fees; distribution and service (12b-1) fees (these charges vary among the share classes); and other Fund expenses. This Example is intended to help you understand your ongoing costs (in dollars) of investing in the Fund and to compare these costs with the ongoing costs of investing in other mutual funds.
The Example is based on an investment of $1,000 invested at the beginning of the period and held for the entire period (June 1, 2009 through November 30, 2009).
Actual Expenses
For each class of the Fund, the first line of the applicable table on the following page provides information about actual account values and actual expenses. You may use the information in this line, together with the amount you invested, to estimate the expenses that you paid over the period. Simply divide your account value by $1,000 (for example, an $8,600 account value divided by $1,000 = 8.6), then multiply the result by the number in the first line under the heading entitled “Expenses Paid During the Period 6/1/09 – 11/30/09” to estimate the expenses you paid on your account during this period.
Hypothetical Example for Comparison Purposes
For each class of the Fund, the second line of the applicable table on the following page provides information about hypothetical account values and hypothetical expenses based on the Fund’s actual expense ratio and an assumed rate of return of 5% per year before expenses, which is not the Fund’s actual return. The hypothetical account values and expenses may not be used to estimate the actual ending account balance or expenses you paid for the period. You may use this information to compare the ongoing costs of investing in the Fund and other funds. To do so, compare this 5% hypothetical example with the 5% hypothetical examples that appear in the shareholder reports of the other funds.
5
Please note that the expenses shown in the table are meant to highlight your ongoing costs only and do not reflect any transactional costs, such as sales charges (loads). Therefore, the second line of the table is useful in comparing ongoing costs only, and will not help you determine the relative total costs of owning different funds. In addition, if these transactional costs were included, your costs would have been higher.
| | | | | | | | | |
| | | Beginning
Account
Value | | Ending
Account
Value | | Expenses
Paid During
Period† |
| | | 6/1/09 | | 11/30/09 | | 6/1/09 -
11/30/09 |
Class A | | | | | | | | | |
Actual | | $ | 1,000.00 | | $ | 1,176.50 | | $ | 8.46 |
Hypothetical (5% Return Before Expenses) | | $ | 1,000.00 | | $ | 1,017.30 | | $ | 7.84 |
Class B | | | | | | | | | |
Actual | | $ | 1,000.00 | | $ | 1,173.40 | | $ | 11.99 |
Hypothetical (5% Return Before Expenses) | | $ | 1,000.00 | | $ | 1,014.03 | | $ | 11.11 |
Class C | | | | | | | | | |
Actual | | $ | 1,000.00 | | $ | 1,173.50 | | $ | 11.99 |
Hypothetical (5% Return Before Expenses) | | $ | 1,000.00 | | $ | 1,014.03 | | $ | 11.11 |
Class F | | | | | | | | | |
Actual | | $ | 1,000.00 | | $ | 1,178.60 | | $ | 7.10 |
Hypothetical (5% Return Before Expenses) | | $ | 1,000.00 | | $ | 1,018.56 | | $ | 6.58 |
Class I | | | | | | | | | |
Actual | | $ | 1,000.00 | | $ | 1,178.80 | | $ | 6.55 |
Hypothetical (5% Return Before Expenses) | | $ | 1,000.00 | | $ | 1,019.06 | | $ | 6.07 |
Class P | | | | | | | | | |
Actual | | $ | 1,000.00 | | $ | 1,175.60 | | $ | 9.00 |
Hypothetical (5% Return Before Expenses) | | $ | 1,000.00 | | $ | 1,016.78 | | $ | 8.34 |
Class R2 | | | | | | | | | |
Actual | | $ | 1,000.00 | | $ | 1,175.20 | | $ | 9.82 |
Hypothetical (5% Return Before Expenses) | | $ | 1,000.00 | | $ | 1,016.07 | | $ | 9.10 |
Class R3 | | | | | | | | | |
Actual | | $ | 1,000.00 | | $ | 1,176.20 | | $ | 9.27 |
Hypothetical (5% Return Before Expenses) | | $ | 1,000.00 | | $ | 1,016.50 | | $ | 8.59 |
| † | | For each class of the Fund, net expenses are equal to the annualized expense ratio for such class (1.55% for Class A, 2.20% for Classes B and C, 1.30% for Class F, 1.20% for Class I, 1.65% for Class P, 1.80% for Class R2 and 1.70% for Class R3) multiplied by the average account value over the period, multiplied by 183/365 (to reflect one-half year period). |
Portfolio Holdings Presented by Sector
November 30, 2009
| | | | | | | | |
| Sector* | | %** | | | | Sector* | | %** |
Consumer Discretionary | | 22.88% | | | | Producer Durables | | 11.82% |
Consumer Staples | | 1.81% | | | | Technology | | 22.62% |
Energy | | 9.26% | | | | Utilities | | 0.53% |
Financial Services | | 13.40% | | | | Short-Term Investment | | 0.42% |
Healthcare | | 13.24% | | | | Total | | 100.00% |
Materials & Processing | | 4.02% | | | | | | |
| * | | A sector may comprise several industries. |
| ** | | Represents percent of total investments. |
6
Schedule of Investments
November 30, 2009
| | | | | |
| Investments | | Shares | | Value
(000) |
| COMMON STOCKS 99.93% |
|
| Advertising Agencies 0.72% |
| Lamar Advertising Co. Class A* | | 152,884 | | $ | 4,232 |
| | | | | |
|
| Aerospace 0.85% |
| Rockwell Collins, Inc. | | 93,852 | | | 5,017 |
| | | | | |
|
| Asset Management & Custodian 4.22% |
| Affiliated Managers Group, Inc.* | | 62,553 | | | 4,079 |
| BlackRock, Inc. | | 26,787 | | | 6,083 |
| Invesco Ltd. | | 128,774 | | | 2,865 |
| State Street Corp. | | 65,531 | | | 2,706 |
| T. Rowe Price Group, Inc. | | 186,038 | | | 9,103 |
| | | | | |
| Total | | | | | 24,836 |
| | | | | |
|
| Auto Services 0.62% |
| Goodyear Tire & Rubber Co. (The)* | | 267,780 | | | 3,671 |
| | | | | |
|
| Banks: Diversified 2.25% |
| City National Corp. | | 89,178 | | | 3,519 |
| Fifth Third Bancorp | | 260,439 | | | 2,625 |
| KeyCorp | | 663,403 | | | 3,888 |
| SunTrust Banks, Inc. | | 134,552 | | | 3,179 |
| | | | | |
| Total | | | | | 13,211 |
| | | | | |
|
| Beverage: Soft Drinks 0.25% |
| Green Mountain Coffee Roasters, Inc.* | | 23,671 | | | 1,491 |
| | | | | |
|
| Biotechnology 1.89% |
| Alexion Pharmaceuticals, Inc.* | | 89,877 | | | 4,076 |
| Life Technologies Corp.* | | 66,289 | | | 3,300 |
| Onyx Pharmaceuticals, Inc.* | | 130,884 | | | 3,745 |
| | | | | |
| Total | | | | | 11,121 |
| | | | | |
|
| Casinos & Gambling 1.69% |
| International Game Technology | | 224,512 | | | 4,241 |
| | | | | |
| Investments | | Shares | | Value
(000) |
| MGM Mirage* | | 347,613 | | $ | 3,674 |
| WMS Industries, Inc.* | | 52,299 | | | 2,033 |
| | | | | |
| Total | | | | | 9,948 |
| | | | | |
|
| Chemical: Diversified 0.89% |
| Celanese Corp. Series A | | 175,562 | | | 5,225 |
| | | | | |
|
| Coal 1.93% |
| CONSOL Energy, Inc. | | 151,162 | | | 6,941 |
| Walter Energy, Inc. | | 64,584 | | | 4,431 |
| | | | | |
| Total | | | | | 11,372 |
| | | | | |
|
| Commercial Services 1.05% |
| Monster Worldwide, Inc.* | | 175,023 | | | 2,557 |
| Robert Half International, Inc. | | 161,201 | | | 3,600 |
| | | | | |
| Total | | | | | 6,157 |
| | | | | |
|
| Communications Technology 0.48% |
| Juniper Networks, Inc.* | | 108,805 | | | 2,843 |
| | | | | |
|
| Computer Services, Software & Systems 7.87% |
| 3PAR, Inc.* | | 176,790 | | | 1,812 |
| ANSYS, Inc.* | | 131,925 | | | 5,137 |
| Citrix Systems, Inc.* | | 152,280 | | | 5,814 |
| Cognizant Technology Solutions Corp. Class A* | | 218,986 | | | 9,620 |
| Equinix, Inc.* | | 65,204 | | | 6,272 |
| F5 Networks, Inc.* | | 80,744 | | | 3,797 |
| Intuit, Inc.* | | 119,112 | | | 3,479 |
| McAfee, Inc.* | | 55,062 | | | 2,101 |
| Nuance Communications, Inc.* | | 237,582 | | | 3,609 |
| VMware, Inc. Class A* | | 109,699 | | | 4,605 |
| | | | | |
| Total | | | | | 46,246 |
| | | | | |
|
| Computer Technology 3.60% |
| NetApp, Inc.* | | 294,850 | | | 9,087 |
| NVIDIA Corp.* | | 396,747 | | | 5,182 |
| Palm, Inc.* | | 160,293 | | | 1,749 |
| Western Digital Corp.* | | 139,299 | | | 5,132 |
| | | | | |
| Total | | | | | 21,150 |
| | | | | |
See Notes to Financial Statements.
7
Schedule of Investments (continued)
November 30, 2009
| | | | | |
| Investments | | Shares | | Value
(000) |
| Cosmetics 1.43% |
| Avon Products, Inc. | | 140,303 | | $ | 4,805 |
| Estee Lauder Cos., Inc. (The) Class A | | 76,403 | | | 3,578 |
| | | | | |
| Total | | | | | 8,383 |
| | | | | |
|
| Diversified Financial Services 1.53% |
| Capital One Financial Corp. | | 101,034 | | | 3,876 |
| Lazard Ltd. Class A | | 132,669 | | | 5,142 |
| | | | | |
| Total | | | | | 9,018 |
| | | | | |
|
| Diversified Manufacturing Operations 0.54% |
| ITT Corp. | | 61,394 | | | 3,175 |
| | | | | |
|
| Diversified Retail 1.31% |
| Nordstrom, Inc. | | 229,544 | | | 7,678 |
| | | | | |
|
| Education Services 1.20% |
| Apollo Group, Inc. Class A* | | 72,644 | | | 4,146 |
| DeVry, Inc. | | 53,448 | | | 2,903 |
| | | | | |
| Total | | | | | 7,049 |
| | | | | |
|
| Electronic Components 1.06% |
| Amphenol Corp. Class A | | 151,906 | | | 6,259 |
| | | | | |
|
| Electronic Entertainment 0.42% |
| Electronic Arts, Inc.* | | 144,716 | | | 2,444 |
| | | | | |
|
| Engineering & Contracting Services 1.85% |
| Fluor Corp. | | 55,468 | | | 2,356 |
| Nalco Holding Co. | | 234,289 | | | 5,731 |
| URS Corp.* | | 67,495 | | | 2,804 |
| | | | | |
| Total | | | | | 10,891 |
| | | | | |
|
| Fertilizers 0.92% |
| CF Industries Holdings, Inc. | | 12,366 | | | 1,056 |
| Intrepid Potash, Inc.* | | 143,177 | | | 4,358 |
| | | | | |
| Total | | | | | 5,414 |
| | | | | |
|
| Financial Data & Systems 1.31% |
| Alliance Data Systems Corp.* | | 68,276 | | | 4,164 |
| Moody’s Corp. | | 151,327 | | | 3,515 |
| | | | | |
| Total | | | | | 7,679 |
| | | | | |
| | | | | |
| Investments | | Shares | | Value
(000) |
| Healthcare Facilities 0.90% |
| DaVita, Inc.* | | 89,355 | | $ | 5,293 |
| | | | | |
|
| Healthcare Management Services 1.72% |
| CIGNA Corp. | | 137,682 | | | 4,417 |
| Humana, Inc.* | | 136,793 | | | 5,678 |
| | | | | |
| Total | | | | | 10,095 |
| | | | | |
|
| Healthcare Services 1.75% |
| Cerner Corp.* | | 43,383 | | | 3,266 |
| Express Scripts, Inc.* | | 33,389 | | | 2,865 |
| McKesson Corp. | | 66,996 | | | 4,155 |
| | | | | |
| Total | | | | | 10,286 |
| | | | | |
|
| Homebuilding 0.46% |
| NVR, Inc.* | | 3,993 | | | 2,688 |
| | | | | |
|
| Hotel/Motel 2.02% |
| Marriott International, Inc. Class A | | 212,701 | | | 5,471 |
| Starwood Hotels & Resorts Worldwide, Inc. | | 199,559 | | | 6,390 |
| | | | | |
| Total | | | | | 11,861 |
| | | | | |
|
| Insurance: Life 1.03% |
| Principal Financial Group, Inc. | | 239,307 | | | 6,076 |
| | | | | |
|
| Leisure Time 0.70% |
| priceline.com, Inc.* | | 19,153 | | | 4,101 |
| | | | | |
|
| Luxury Items 0.49% |
| Tiffany & Co. | | 67,904 | | | 2,898 |
| | | | | |
|
| Machinery: Industrial 0.52% |
| Kennametal, Inc. | | 135,301 | | | 3,044 |
| | | | | |
|
| Medical & Dental Instruments & Supplies 3.09% |
| C.R. Bard, Inc. | | 44,907 | | | 3,692 |
| Edwards Lifesciences Corp.* | | 53,969 | | | 4,441 |
| Kinetic Concepts, Inc.* | | 84,171 | | | 2,837 |
| ResMed, Inc.* | | 107,648 | | | 5,411 |
| Stryker Corp. | | 35,994 | | | 1,814 |
| | | | | |
| Total | | | | | 18,195 |
| | | | | |
See Notes to Financial Statements.
8
Schedule of Investments (continued)
November 30, 2009
| | | | | |
| Investments | | Shares | | Value
(000) |
| Medical Equipment 0.94% |
| Affymetrix, Inc.* | | 247,632 | | $ | 1,174 |
| Thermo Fisher Scientific, Inc.* | | 92,605 | | | 4,374 |
| | | | | |
| Total | | | | | 5,548 |
| | | | | |
|
| Metal Fabricating 1.21% |
| Precision Castparts Corp. | | 68,691 | | | 7,122 |
| | | | | |
|
| Metals & Minerals: Diversified 0.25% |
| Cliffs Natural Resources, Inc. | | 32,693 | | | 1,440 |
| | | | | |
|
| Miscellaneous: Consumer Staples 0.68% |
| Energizer Holdings, Inc.* | | 70,512 | | | 3,973 |
| | | | | |
|
| Offshore Drilling & Other Services 1.83% |
| Atwood Oceanics, Inc.* | | 111,630 | | | 4,206 |
| Diamond Offshore Drilling, Inc. | | 65,838 | | | 6,554 |
| | | | | |
| Total | | | | | 10,760 |
| | | | | |
|
| Oil: Crude Producers 2.96% |
| Cabot Oil & Gas Corp. | | 74,161 | | | 2,840 |
| Continental Resources, Inc.* | | 75,239 | | | 2,833 |
| Petrohawk Energy Corp.* | | 153,655 | | | 3,433 |
| Range Resources Corp. | | 94,382 | | | 4,448 |
| Southwestern Energy Co.* | | 88,196 | | | 3,877 |
| | | | | |
| Total | | | | | 17,431 |
| | | | | |
|
| Oil Well Equipment & Services 2.56% |
| Cameron International Corp.* | | 161,654 | | | 6,111 |
| Oceaneering International, Inc.* | | 90,335 | | | 4,935 |
| Smith International, Inc. | | 147,749 | | | 4,016 |
| | | | | |
| Total | | | | | 15,062 |
| | | | | |
|
| Pharmaceuticals 2.99% |
| AmerisourceBergen Corp. | | 197,261 | | | 4,870 |
| Vertex Pharmaceuticals, Inc.* | | 106,978 | | | 4,153 |
| | | | | |
| Investments | | Shares | | Value
(000) |
| Warner Chilcott plc Class A (Ireland)*(a) | | 224,884 | | $ | 5,528 |
| Watson Pharmaceuticals, Inc.* | | 81,443 | | | 3,021 |
| | | | | |
| Total | | | | | 17,572 |
| | | | | |
|
| Producer Durables: Miscellaneous 0.54% |
| W.W. Grainger, Inc. | | 32,324 | | | 3,158 |
| | | | | |
|
| Production Technology Equipment 1.36% |
| Lam Research Corp.* | | 141,026 | | | 4,793 |
| Varian Semiconductor Equipment Associates, Inc.* | | 109,534 | | | 3,191 |
| | | | | |
| Total | | | | | 7,984 |
| | | | | |
| | |
| Railroads 1.03% | | | | | |
| Kansas City Southern* | | 210,918 | | | 6,039 |
| | | | | |
|
| Real Estate 0.62% |
| CB Richard Ellis Group, Inc. Class A* | | 320,549 | | | 3,664 |
| �� | | | | |
|
| Real Estate Investment Trusts 0.88% |
| Simon Property Group, Inc. | | 70,892 | | | 5,151 |
| | | | | |
|
| Scientific Instruments: Control & Filter 1.05% |
| Parker Hannifin Corp. | | 59,458 | | | 3,208 |
| Roper Industries, Inc. | | 56,817 | | | 2,957 |
| | | | | |
| Total | | | | | 6,165 |
| | | | | |
|
| Scientific Instruments: Electrical 0.28% |
| AMETEK, Inc. | | 45,127 | | | 1,650 |
| | | | | |
|
| Scientific Instruments: Gauges & Meters 1.24% |
| Agilent Technologies, Inc.* | | 115,088 | | | 3,328 |
| Itron, Inc.* | | 64,746 | | | 3,936 |
| | | | | |
| Total | | | | | 7,264 |
| | | | | |
|
| Securities Brokerage & Services 1.60% |
| IntercontinentalExchange, Inc.* | | 52,309 | | | 5,586 |
| TD Ameritrade Holding Corp.* | | 195,221 | | | 3,834 |
| | | | | |
| Total | | | | | 9,420 |
| | | | | |
See Notes to Financial Statements.
9
Schedule of Investments (continued)
November 30, 2009
| | | | | |
| Investments | | Shares | | Value
(000) |
| Semiconductors & Components 7.91% |
| Altera Corp. | | 165,628 | | $ | 3,483 |
| Analog Devices, Inc. | | 166,007 | | | 4,979 |
| Atheros Communications, Inc.* | | 150,836 | | | 4,294 |
| Avnet, Inc.* | | 131,676 | | | 3,588 |
| Broadcom Corp. Class A* | | 98,177 | | | 2,867 |
| Cree, Inc.* | | 114,518 | | | 5,477 |
| Cypress Semiconductor Corp.* | | 264,762 | | | 2,534 |
| Linear Technology Corp. | | 145,931 | | | 3,936 |
| Marvell Technology Group Ltd.* | | 288,240 | | | 4,445 |
| Microchip Technology, Inc. | | 87,342 | | | 2,293 |
| ON Semiconductor Corp.* | | 562,543 | | | 4,365 |
| Silicon Laboratories, Inc.* | | 100,904 | | | 4,261 |
| | | | | |
| Total | | | | | 46,522 |
| | | | | |
|
| Specialty Retail 9.64% |
| Abercrombie & Fitch Co. Class A | | 125,142 | | | 4,997 |
| American Eagle Outfitters, Inc. | | 302,995 | | | 4,660 |
| Bed Bath & Beyond, Inc.* | | 146,654 | | | 5,479 |
| CarMax, Inc.* | | 281,206 | | | 5,590 |
| Dick’s Sporting Goods, Inc.* | | 173,692 | | | 3,606 |
| Dress Barn, Inc. (The)* | | 177,655 | | | 3,814 |
| GameStop Corp. Class A* | | 169,081 | | | 4,127 |
| Limited Brands, Inc. | | 365,120 | | | 6,057 |
| O’Reilly Automotive, Inc.* | | 99,090 | | | 3,843 |
| Ross Stores, Inc. | | 113,351 | | | 4,985 |
| TJX Companies, Inc. (The) | | 142,424 | | | 5,466 |
| Urban Outfitters, Inc.* | | 129,113 | | | 4,085 |
| | | | | |
| Total | | | | | 56,709 |
| | | | | |
|
| Steel 0.77% |
| United States Steel Corp. | | 101,068 | | | 4,514 |
| | | | | |
|
| Textiles Apparel & Shoes 2.18% |
| Carter’s, Inc.* | | 157,683 | | | 3,430 |
| Coach, Inc. | | 180,486 | | | 6,272 |
| | | | | |
| Investments | | Shares | | Value
(000) |
| Polo Ralph Lauren Corp. | | 40,613 | | $ | 3,121 |
| | | | | |
| Total | | | | | 12,823 |
| | | | | |
|
| Tobacco 0.89% |
| Lorillard, Inc. | | 67,288 | | | 5,242 |
| | | | | |
|
| Transportation: Miscellaneous 0.87% |
| Expeditors International of Washington, Inc. | | 160,159 | | | 5,114 |
| | | | | |
|
| Truckers 2.06% |
| C.H. Robinson Worldwide, Inc. | | 71,276 | | | 3,973 |
| Con-way, Inc. | | 128,572 | | | 3,896 |
| J.B. Hunt Transport Services, Inc. | | 132,912 | | | 4,235 |
| | | | | |
| Total | | | | | 12,104 |
| | | | | |
|
| Utilities: Miscellaneous 0.53% |
| Ormat Technologies, Inc. | | 75,729 | | | 3,118 |
| | | | | |
|
| Wholesale & International Trade 0.50% |
| LKQ Corp.* | | 169,800 | | | 2,960 |
| | | | | |
| Total Common Stocks (cost $484,400,016) | | | | | 587,556 |
| | | | | |
See Notes to Financial Statements.
10
Schedule of Investments (concluded)
November 30, 2009
| | | | | | | |
| Investments | | Principal
Amount
(000) | | Value
(000) | |
| SHORT-TERM INVESTMENT 0.42% | |
| | |
| Repurchase Agreement | | | | | | | |
| Repurchase Agreement dated 11/30/2009, 0.01% due 12/1/2009 with State Street Bank & Trust Co. collateralized by $2,560,000 of U.S. Treasury Bill at 0.15% due 4/15/2010; value: $2,558,976; proceeds: $2,507,114 (cost $2,507,114) | | $ | 2,507 | | $ | 2,507 | |
| | | | | | | |
| Total Investments in Securities 100.35% (cost $486,907,130) | | | | | | 590,063 | |
| | | | | | | |
| Liabilities in Excess of Other Assets (0.35%) | | | | | | (2,077 | ) |
| | | | | | | |
| Net Assets 100.00% | | | | | $ | 587,986 | |
| | | | | | | |
| * | | Non-income producing security. |
| (a) | | Foreign security traded in U.S. dollars. |
See Notes to Financial Statements.
11
Statement of Assets and Liabilities
November 30, 2009
| | | | |
ASSETS: | | | | |
Investments in securities, at value (cost $486,907,130) | | $ | 590,063,327 | |
Receivables: | | | | |
Interest and dividends | | | 839,656 | |
Capital shares sold | | | 527,654 | |
Prepaid expenses and other assets | | | 65,501 | |
Total assets | | | 591,496,138 | |
LIABILITIES: | | | | |
Payables: | | | | |
Investment securities purchased | | | 1,494,944 | |
Capital shares reacquired | | | 830,862 | |
Management fee | | | 393,116 | |
12b-1 distribution fees | | | 227,614 | |
Directors’ fees | | | 82,267 | |
Fund administration | | | 19,771 | |
To affiliates (See Note 3) | | | 68,443 | |
Accrued expenses and other liabilities | | | 392,791 | |
Total liabilities | | | 3,509,808 | |
NET ASSETS | | $ | 587,986,330 | |
COMPOSITION OF NET ASSETS: | | | | |
Paid-in capital | | $ | 587,693,989 | |
Accumulated net investment loss | | | (34,660 | ) |
Accumulated net realized loss on investments | | | (102,829,196 | ) |
Net unrealized appreciation on investments | | | 103,156,197 | |
Net Assets | | $ | 587,986,330 | |
See Notes to Financial Statements.
12
Statement of Assets and Liabilities (concluded)
November 30, 2009
| | | |
Net assets by class: | | | |
Class A Shares | | $ | 414,929,960 |
Class B Shares | | $ | 51,703,206 |
Class C Shares | | $ | 63,731,573 |
Class F Shares | | $ | 2,362,242 |
Class I Shares | | $ | 42,775,291 |
Class P Shares | | $ | 9,184,524 |
Class R2 Shares | | $ | 1,117,502 |
Class R3 Shares | | $ | 2,182,032 |
Outstanding shares by class: | | | |
Class A Shares (100 million shares of common stock authorized, $.001 par value) | | | 24,222,735 |
Class B Shares (30 million shares of common stock authorized, $.001 par value) | | | 3,293,933 |
Class C Shares (20 million shares of common stock authorized, $.001 par value) | | | 4,062,464 |
Class F Shares (30 million shares of common stock authorized, $.001 par value) | | | 137,182 |
Class I Shares (30 million shares of common stock authorized, $.001 par value) | | | 2,393,548 |
Class P Shares (20 million shares of common stock authorized, $.001 par value) | | | 537,902 |
Class R2 Shares (30 million shares of common stock authorized, $.001 par value) | | | 65,577 |
Class R3 Shares (30 million shares of common stock authorized, $.001 par value) | | | 127,708 |
Net asset value, offering and redemption price per share
(Net assets divided by outstanding shares): | | | |
Class A Shares-Net asset value | | | $17.13 |
Class A Shares-Maximum offering price
(Net asset value plus sales charge of 5.75%) | | | $18.18 |
Class B Shares-Net asset value | | | $15.70 |
Class C Shares-Net asset value | | | $15.69 |
Class F Shares-Net asset value | | | $17.22 |
Class I Shares-Net asset value | | | $17.87 |
Class P Shares-Net asset value | | | $17.07 |
Class R2 Shares-Net asset value | | | $17.04 |
Class R3 Shares-Net asset value | | | $17.09 |
See Notes to Financial Statements.
13
Statement of Operations
For the Year Ended November 30, 2009
| | | | |
Investment income: | | | | |
Dividends | | $ | 4,960,600 | |
Interest | | | 354 | |
Total investment income | | | 4,960,954 | |
Expenses: | | | | |
Management fee | | | 4,046,468 | |
12b-1 distribution plan-Class A | | | 1,267,425 | |
12b-1 distribution plan-Class B | | | 486,925 | |
12b-1 distribution plan-Class C | | | 527,568 | |
12b-1 distribution plan-Class F | | | 1,424 | |
12b-1 distribution plan-Class P | | | 37,144 | |
12b-1 distribution plan-Class R2 | | | 3,673 | |
12b-1 distribution plan-Class R3 | | | 6,482 | |
Shareholder servicing | | | 1,772,666 | |
Fund administration | | | 202,323 | |
Subsidy (See Note 3) | | | 117,886 | |
Registration | | | 88,034 | |
Reports to shareholders | | | 59,264 | |
Professional | | | 57,478 | |
Directors’ fees | | | 20,225 | |
Custody | | | 8,422 | |
Other | | | 20,856 | |
Gross expenses | | | 8,724,263 | |
Expense reductions (See Note 7) | | | (1,400 | ) |
Expenses reimbursed by advisor (See Note 3) | | | (322,513 | ) |
Net expenses | | | 8,400,350 | |
Net investment loss | | | (3,439,396 | ) |
Net realized and unrealized gain (loss): | | | | |
Net realized loss on investments | | | (72,411,670 | ) |
Net change in unrealized appreciation/depreciation on investments | | | 240,075,680 | |
Net realized and unrealized gain | | | 167,664,010 | |
Net Increase in Net Assets Resulting From Operations | | $ | 164,224,614 | |
See Notes to Financial Statements.
14
Statements of Changes in Net Assets
| | | | | | | | |
| INCREASE (DECREASE) IN NET ASSETS | | For the Year Ended
November 30, 2009 | | | For the Year Ended
November 30, 2008 | |
Operations: | | | | | | | | |
Net investment loss | | $ | (3,439,396 | ) | | $ | (6,421,022 | ) |
Net realized loss on investments and foreign currency related transactions | | | (72,411,670 | ) | | | (12,656,314 | ) |
Net change in unrealized appreciation/depreciation on investments | | | 240,075,680 | | | | (279,114,470 | ) |
Net increase (decrease) in net assets resulting from operations | | | 164,224,614 | | | | (298,191,806 | ) |
Distributions to shareholders from: | | | | | | | | |
Net realized gain | | | | | | | | |
Class A | | | (14,340,844 | ) | | | (72,993,177 | ) |
Class B | | | (2,217,745 | ) | | | (12,846,667 | ) |
Class C | | | (2,091,932 | ) | | | (10,680,237 | ) |
Class F | | | (15,377 | ) | | | (1,202 | ) |
Class I | | | (971,934 | ) | | | (2,417,829 | ) |
Class P | | | (388,306 | ) | | | (2,028,077 | ) |
Class R2 | | | (5,141 | ) | | | (1,196 | ) |
Class R3 | | | (3,763 | ) | | | (1,196 | ) |
Total distributions to shareholders | | | (20,035,042 | ) | | | (100,969,581 | ) |
Capital share transactions (Net of share conversions) (See Note 11): | |
Net proceeds from sales of shares | | | 98,858,879 | | | | 112,016,824 | |
Reinvestment of distributions | | | 19,316,931 | | | | 96,839,281 | |
Cost of shares reacquired | | | (138,574,482 | ) | | | (179,020,030 | ) |
Net increase (decrease) in net assets resulting from capital share transactions | | | (20,398,672 | ) | | | 29,836,075 | |
Net increase (decrease) in net assets | | | 123,790,900 | | | | (369,325,312 | ) |
NET ASSETS: | |
Beginning of year | | $ | 464,195,430 | | | $ | 833,520,742 | |
End of year | | $ | 587,986,330 | | | $ | 464,195,430 | |
Accumulated net investment loss | | $ | (34,660 | ) | | $ | (552,793 | ) |
See Notes to Financial Statements.
15
Financial Highlights
| | | | | | | | | | | | | | | |
| | | Class A Shares | |
| | | Year Ended 11/30 | |
| | | 2009 | | | 2008 | | | 2007 | | | 2006 | | | 2005 | |
Per Share Operating Performance | | | | | | | | | | | | | | | |
Net asset value, beginning of year | | $12.93 | | | $23.84 | | | $22.02 | | | $21.15 | | | $19.21 | |
| | | | | | | | | | | | | | | |
| | | | | |
Investment operations: | | | | | | | | | | | | | | | |
| | | | | |
Net investment loss(a) | | (.08 | ) | | (.15 | ) | | (.20 | ) | | (.15 | ) | | (.19 | ) |
| | | | | |
Net realized and unrealized gain (loss) | | 4.84 | | | (7.91 | ) | | 4.01 | | | 1.67 | | | 2.13 | |
| | | | | | | | | | | | | | | |
| | | | | |
Total from investment operations | | 4.76 | | | (8.06 | ) | | 3.81 | | | 1.52 | | | 1.94 | |
| | | | | | | | | | | | | | | |
| | | | | |
Distributions to shareholders from: | | | | | | | | | | | | | | | |
| | | | | |
Net realized gain | | (.56 | ) | | (2.85 | ) | | (1.99 | ) | | (.65 | ) | | – | |
| | | | | | | | | | | | | | | |
Net asset value, end of year | | $17.13 | | | $12.93 | | | $23.84 | | | $22.02 | | | $21.15 | |
| | | | | | | | | | | | | | | |
| | | | | |
Total Return(b) | | 38.43 | % | | (38.34 | )% | | 18.81 | % | | 7.35 | % | | 10.10 | % |
| | | | | |
Ratios to Average Net Assets: | | | | | | | | | | | | | | | |
| | | | | |
Expenses, excluding expense reductions and including expenses reimbursed | | 1.55 | % | | 1.55 | % | | 1.53 | % | | 1.54 | % | | 1.55 | % |
| | | | | |
Expenses, including expense reductions and expenses reimbursed | | 1.55 | % | | 1.55 | % | | 1.53 | % | | 1.54 | % | | 1.55 | % |
| | | | | |
Expenses, excluding expense reductions and expenses reimbursed | | 1.61 | % | | 1.57 | % | | 1.54 | % | | 1.56 | % | | 1.59 | % |
| | | | | |
Net investment loss | | (.57 | )% | | (.79 | )% | | (.91 | )% | | (.70 | )% | | (.96 | )% |
| | | | | |
| Supplemental Data: | | | | | | | | | | | | | | | |
Net assets, end of year (000) | | $414,930 | | | $337,981 | | | $613,735 | | | $614,433 | | | $634,059 | |
| | | | | |
Portfolio turnover rate | | 80.21 | % | | 123.95 | % | | 101.25 | % | | 159.86 | % | | 97.35 | % |
| (a) | | Calculated using average shares outstanding during the year. |
| (b) | | Total return does not consider the effects of sales loads and assumes the reinvestment of all distributions. |
See Notes to Financial Statements.
16
Financial Highlights (continued)
| | | | | | | | | | | | | | | |
| | | Class B Shares | |
| | | Year Ended 11/30 | |
| | | 2009 | | | 2008 | | | 2007 | | | 2006 | | | 2005 | |
Per Share Operating Performance | | | | | | | | | | | | | | | |
Net asset value, beginning of year | | $11.97 | | | $22.41 | | | $20.94 | | | $20.27 | | | $18.53 | |
| | | | | | | | | | | | | | | |
| | | | | |
Investment operations: | | | | | | | | | | | | | | | |
| | | | | |
Net investment loss(a) | | (.16 | ) | | (.25 | ) | | (.32 | ) | | (.27 | ) | | (.31 | ) |
| | | | | |
Net realized and unrealized gain (loss) | | 4.45 | | | (7.34 | ) | | 3.78 | | | 1.59 | | | 2.05 | |
| | | | | | | | | | | | | | | |
| | | | | |
Total from investment operations | | 4.29 | | | (7.59 | ) | | 3.46 | | | 1.32 | | | 1.74 | |
| | | | | | | | | | | | | | | |
| | | | | |
Distributions to shareholders from: | | | | | | | | | | | | | | | |
| | | | | |
Net realized gain | | (.56 | ) | | (2.85 | ) | | (1.99 | ) | | (.65 | ) | | – | |
| | | | | | | | | | | | | | | |
Net asset value, end of year | | $15.70 | | | $11.97 | | | $22.41 | | | $20.94 | | | $20.27 | |
| | | | | | | | | | | | | | | |
| | | | | |
Total Return(b) | | 37.55 | % | | (38.73 | )% | | 18.04 | % | | 6.66 | % | | 9.39 | % |
| | | | | |
Ratios to Average Net Assets: | | | | | | | | | | | | | | | |
| | | | | |
Expenses, excluding expense reductions and including expenses reimbursed | | 2.20 | % | | 2.20 | % | | 2.18 | % | | 2.19 | % | | 2.20 | % |
| | | | | |
Expenses, including expense reductions and expenses reimbursed | | 2.20 | % | | 2.20 | % | | 2.18 | % | | 2.19 | % | | 2.20 | % |
| | | | | |
Expenses, excluding expense reductions and expenses reimbursed | | 2.27 | % | | 2.22 | % | | 2.19 | % | | 2.21 | % | | 2.23 | % |
| | | | | |
Net investment loss | | (1.22 | )% | | (1.44 | )% | | (1.56 | )% | | (1.35 | )% | | (1.61 | )% |
| | | | | |
| Supplemental Data: | | | | | | | | | | | | | | | |
Net assets, end of year (000) | | $51,703 | | | $48,147 | | | $101,200 | | | $100,741 | | | $106,809 | |
| | | | | |
Portfolio turnover rate | | 80.21 | % | | 123.95 | % | | 101.25 | % | | 159.86 | % | | 97.35 | % |
| (a) | | Calculated using average shares outstanding during the year. |
| (b) | | Total return does not consider the effects of sales loads and assumes the reinvestment of all distributions. |
See Notes to Financial Statements.
17
Financial Highlights (continued)
| | | | | | | | | | | | | | | |
| | | Class C Shares | |
| | | Year Ended 11/30 | |
| | | 2009 | | | 2008 | | | 2007 | | | 2006 | | | 2005 | |
Per Share Operating Performance | | | | | | | | | | | | | | | |
Net asset value, beginning of year | | $11.96 | | | $22.40 | | | $20.93 | | | $20.26 | | | $18.53 | |
| | | | | | | | | | | | | | | |
| | | | | |
Investment operations: | | | | | | | | | | | | | | | |
| | | | | |
Net investment loss(a) | �� | (.16 | ) | | (.25 | ) | | (.32 | ) | | (.27 | ) | | (.31 | ) |
| | | | | |
Net realized and unrealized gain (loss) | | 4.45 | | | (7.34 | ) | | 3.78 | | | 1.59 | | | 2.04 | |
| | | | | | | | | | | | | | | |
| | | | | |
Total from investment operations | | 4.29 | | | (7.59 | ) | | 3.46 | | | 1.32 | | | 1.73 | |
| | | | | | | | | | | | | | | |
| | | | | |
Distributions to shareholders from: | | | | | | | | | | | | | | | |
| | | | | |
Net realized gain | | (.56 | ) | | (2.85 | ) | | (1.99 | ) | | (.65 | ) | | – | |
| | | | | | | | | | | | | | | |
Net asset value, end of year | | $15.69 | | | $11.96 | | | $22.40 | | | $20.93 | | | $20.26 | |
| | | | | | | | | | | | | | | |
| | | | | |
Total Return(b) | | 37.58 | % | | (38.75 | )% | | 18.05 | % | | 6.66 | % | | 9.34 | % |
| | | | | |
Ratios to Average Net Assets: | | | | | | | | | | | | | | | |
| | | | | |
Expenses, excluding expense reductions and including expenses reimbursed | | 2.20 | % | | 2.20 | % | | 2.18 | % | | 2.19 | % | | 2.20 | % |
| | | | | |
Expenses, including expense reductions and expenses reimbursed | | 2.20 | % | | 2.20 | % | | 2.18 | % | | 2.19 | % | | 2.20 | % |
| | | | | |
Expenses, excluding expense reductions and expenses reimbursed | | 2.26 | % | | 2.23 | % | | 2.19 | % | | 2.21 | % | | 2.23 | % |
| | | | | |
Net investment loss | | (1.22 | )% | | (1.44 | )% | | (1.56 | )% | | (1.35 | )% | | (1.61 | )% |
| | | | | |
| Supplemental Data: | | | | | | | | | | | | | | | |
Net assets, end of year (000) | | $63,732 | | | $45,385 | | | $83,891 | | | $79,485 | | | $83,339 | |
| | | | | |
Portfolio turnover rate | | 80.21 | % | | 123.95 | % | | 101.25 | % | | 159.86 | % | | 97.35 | % |
| (a) | | Calculated using average shares outstanding during the year. |
| (b) | | Total return does not consider the effects of sales loads and assumes the reinvestment of all distributions. |
See Notes to Financial Statements.
18
Financial Highlights (continued)
| | | | | | | | | |
| | | Class F Shares | |
| | | Year Ended 11/30 | | | 9/28/2007(a)
to
11/30/2007 | |
| | | 2009 | | | 2008 | | |
Per Share Operating Performance | | | | | | | | | |
Net asset value, beginning of period | | $12.96 | | | $23.85 | | | $23.81 | |
| | | | | | | | | |
| | | |
Investment operations: | | | | | | | | | |
| | | |
Net investment loss(b) | | (.05 | ) | | (.09 | ) | | (.03 | ) |
| | | |
Net realized and unrealized gain (loss) | | 4.87 | | | (7.95 | ) | | .07 | |
| | | | | | | | | |
| | | |
Total from investment operations | | 4.82 | | | (8.04 | ) | | .04 | |
| | | | | | | | | |
| | | |
Distributions to shareholders from: | | | | | | | | | |
| | | |
Net realized gain | | (.56 | ) | | (2.85 | ) | | – | |
| | | | | | | | | |
Net asset value, end of period | | $17.22 | | | $12.96 | | | $23.85 | |
| | | | | | | | | |
| | | |
Total Return(c) | | 38.82 | % | | (38.22 | )% | | .17 | %(d) |
| | | |
Ratios to Average Net Assets: | | | | | | | | | |
| | | |
Expenses, excluding expense reductions and including expenses reimbursed | | 1.30 | % | | 1.30 | % | | .22 | %(d) |
| | | |
Expenses, including expense reductions expenses reimbursed | | 1.30 | % | | 1.30 | % | | .22 | %(d) |
| | | |
Expenses, excluding expense reductions and expenses reimbursed | | 1.34 | % | | 1.36 | % | | .22 | %(d) |
| | | |
Net investment loss | | (.35 | )% | | (.53 | )% | | (.14 | )%(d) |
| | | |
| Supplemental Data: | | | | | | | | | |
Net assets, end of period (000) | | $2,362 | | | $359 | | | $10 | |
| | | |
Portfolio turnover rate | | 80.21 | % | | 123.95 | % | | 101.25 | % |
| (a) | | Commencement of investment operations was 9/28/2007, SEC effective date was 9/14/2007 and date shares first became available to the public was 10/1/2007. |
| (b) | | Calculated using average shares outstanding during the period. |
| (c) | | Total return assumes the reinvestment of all distributions. |
See Notes to Financial Statements.
19
Financial Highlights (continued)
| | | | | | | | | | | | | | | |
| | | Class I Shares | |
| | | Year Ended 11/30 | |
| | | 2009 | | | 2008 | | | 2007 | | | 2006 | | | 2005 | |
Per Share Operating Performance | | | | | | | | | | | | | | | |
Net asset value, beginning of year | | $13.42 | | | $24.56 | | | $22.55 | | | $21.57 | | | $19.52 | |
| | | | | | | | | | | | | | | |
| | | | | |
Investment operations: | | | | | | | | | | | | | | | |
| | | | | |
Net investment loss(a) | | (.03 | ) | | (.08 | ) | | (.12 | ) | | (.07 | ) | | (.12 | ) |
| | | | | |
Net realized and unrealized gain (loss) | | 5.04 | | | (8.21 | ) | | 4.12 | | | 1.70 | | | 2.17 | |
| | | | | | | | | | | | | | | |
| | | | | |
Total from investment operations | | 5.01 | | | (8.29 | ) | | 4.00 | | | 1.63 | | | 2.05 | |
| | | | | | | | | | | | | | | |
| | | | | |
Distributions to shareholders from: | | | | | | | | | | | | | | | |
| | | | | |
Net realized gain | | (.56 | ) | | (2.85 | ) | | (1.99 | ) | | (.65 | ) | | – | |
| | | | | | | | | | | | | | | |
Net asset value, end of year | | $17.87 | | | $13.42 | | | $24.56 | | | $22.55 | | | $21.57 | |
| | | | | | | | | | | | | | | |
| | | | | |
Total Return(b) | | 38.91 | % | | (38.12 | )% | | 19.24 | % | | 7.73 | % | | 10.50 | % |
| | | | | |
Ratios to Average Net Assets: | | | | | | | | | | | | | | | |
| | | | | |
Expenses, excluding expense reductions and including expenses reimbursed | | 1.20 | % | | 1.20 | % | | 1.18 | % | | 1.19 | % | | 1.20 | % |
| | | | | |
Expenses, including expense reductions and expenses reimbursed | | 1.20 | % | | 1.20 | % | | 1.18 | % | | 1.19 | % | | 1.20 | % |
| | | | | |
Expenses, excluding expense reductions and expenses reimbursed | | 1.25 | % | | 1.23 | % | | 1.19 | % | | 1.22 | % | | 1.23 | % |
| | | | | |
Net investment loss | | (.22 | )% | | (.41 | )% | | (.55 | )% | | (.32 | )% | | (.60 | )% |
| | | | | |
| Supplemental Data: | | | | | | | | | | | | | | | |
Net assets, end of year (000) | | $42,775 | | | $23,175 | | | $17,965 | | | $19,631 | | | $8,901 | |
| | | | | |
Portfolio turnover rate | | 80.21 | % | | 123.95 | % | | 101.25 | % | | 159.86 | % | | 97.35 | % |
| (a) | | Calculated using average shares outstanding during the year. |
| (b) | | Total return assumes the reinvestment of all distributions. |
See Notes to Financial Statements.
20
Financial Highlights (continued)
| | | | | | | | | | | | | | | |
| | | Class P Shares | |
| | | Year Ended 11/30 | |
| | | 2009 | | | 2008 | | | 2007 | | | 2006 | | | 2005 | |
Per Share Operating Performance | | | | | | | | | | | | | | | |
Net asset value, beginning of year | | $12.90 | | | $23.82 | | | $22.02 | | | $21.17 | | | $19.25 | |
| | | | | | | | | | | | | | | |
| | | | | |
Investment operations: | | | | | | | | | | | | | | | |
| | | | | |
Net investment loss(a) | | (.09 | ) | | (.17 | ) | | (.22 | ) | | (.17 | ) | | (.21 | ) |
| | | | | |
Net realized and unrealized gain (loss) | | 4.82 | | | (7.90 | ) | | 4.01 | | | 1.67 | | | 2.13 | |
| | | | | | | | | | | | | | | |
| | | | | |
Total from investment operations | | 4.73 | | | (8.07 | ) | | 3.79 | | | 1.50 | | | 1.92 | |
| | | | | | | | | | | | | | | |
| | | | | |
Distributions to shareholders from: | | | | | | | | | | | | | | | |
| | | | | |
Net realized gain | | (.56 | ) | | (2.85 | ) | | (1.99 | ) | | (.65 | ) | | – | |
| | | | | | | | | | | | | | | |
Net asset value, end of year | | $17.07 | | | $12.90 | | | $23.82 | | | $22.02 | | | $21.17 | |
| | | | | | | | | | | | | | | |
| | | | | |
Total Return(b) | | 38.28 | % | | (38.42 | )% | | 18.71 | % | | 7.24 | % | | 9.97 | % |
| | | | | |
Ratios to Average Net Assets: | | | | | | | | | | | | | | | |
| | | | | |
Expenses, excluding expense reductions and including expenses reimbursed | | 1.65 | % | | 1.65 | % | | 1.63 | % | | 1.64 | % | | 1.65 | % |
| | | | | |
Expenses, including expense reductions and expenses reimbursed | | 1.65 | % | | 1.65 | % | | 1.63 | % | | 1.64 | % | | 1.65 | % |
| | | | | |
Expenses, excluding expense reductions and expenses reimbursed | | 1.72 | % | | 1.67 | % | | 1.64 | % | | 1.66 | % | | 1.68 | % |
| | | | | |
Net investment loss | | (.66 | )% | | (.88 | )% | | (1.01 | )% | | (.79 | )% | | (1.05 | )% |
| | | | | |
| Supplemental Data: | | | | | | | | | | | | | | | |
Net assets, end of year (000) | | $9,185 | | | $8,945 | | | $16,699 | | | $15,856 | | | $17,536 | |
| | | | | |
Portfolio turnover rate | | 80.21 | % | | 123.95 | % | | 101.25 | % | | 159.86 | % | | 97.35 | % |
| (a) | | Calculated using average shares outstanding during the year. |
| (b) | | Total return assumes the reinvestment of all distributions. |
See Notes to Financial Statements.
21
Financial Highlights (continued)
| | | | | | | | | |
| | | Class R2 Shares | |
| | | Year Ended 11/30 | | | 9/28/2007(a)
to
11/30/2007 | |
| | | 2009 | | | 2008 | | |
Per Share Operating Performance | | | | | | | | | |
Net asset value, beginning of period | | $12.90 | | | $23.83 | | | $23.81 | |
| | | | | | | | | |
| | | |
Investment operations: | | | | | | | | | |
| | | |
Net investment loss(b) | | (.13 | ) | | (.16 | ) | | (.05 | ) |
| | | |
Net realized and unrealized gain (loss) | | 4.83 | | | (7.92 | ) | | .07 | |
| | | | | | | | | |
| | | |
Total from investment operations | | 4.70 | | | (8.08 | ) | | .02 | |
| | | | | | | | | |
| | | |
Distributions to shareholders from: | | | | | | | | | |
| | | |
Net realized gain | | (.56 | ) | | (2.85 | ) | | – | |
| | | | | | | | | |
Net asset value, end of period | | $17.04 | | | $12.90 | | | $23.83 | |
| | | | | | | | | |
| | | |
Total Return(c) | | 38.04 | % | | (38.45 | )% | | .08 | %(d) |
| | | |
Ratios to Average Net Assets: | | | | | | | | | |
| | | |
Expenses, excluding expense reductions and including expenses reimbursed | | 1.80 | % | | 1.75 | % | | .28 | %(d) |
| | | |
Expenses, including expense reductions and expenses reimbursed | | 1.80 | % | | 1.75 | % | | .28 | %(d) |
| | | |
Expenses, excluding expense reductions and expenses reimbursed | | 1.83 | % | | 1.81 | % | | .29 | %(d) |
| | | |
Net investment loss | | (.84 | )% | | (.93 | )% | | (.20 | )%(d) |
| | | |
| Supplemental Data: | | | | | | | | | |
Net assets, end of period (000) | | $1,118 | | | $119 | | | $10 | |
| | | |
Portfolio turnover rate | | 80.21 | % | | 123.95 | % | | 101.25 | % |
| (a) | | Commencement of investment operations was 9/28/2007, SEC effective date was 9/14/2007 and date shares first became available to the public was 10/1/2007. |
| (b) | | Calculated using average shares outstanding during the period. |
| (c) | | Total return assumes the reinvestment of all distributions. |
See Notes to Financial Statements.
22
Financial Highlights (concluded)
| | | | | | | | | |
| | | Class R3 Shares | |
| | | Year Ended 11/30 | | | 9/28/2007(a)
to
11/30/2007 | |
| | | 2009 | | | 2008 | | |
Per Share Operating Performance | | | | | | | | | |
Net asset value, beginning of period | | $12.91 | | | $23.84 | | | $23.81 | |
| | | | | | | | | |
| | | |
Investment operations: | | | | | | | | | |
| | | |
Net investment loss(b) | | (.12 | ) | | (.14 | ) | | (.04 | ) |
| | | |
Net realized and unrealized gain (loss) | | 4.86 | | | (7.94 | ) | | .07 | |
| | | | | | | | | |
| | | |
Total from investment operations | | 4.74 | | | (8.08 | ) | | .03 | |
| | | | | | | | | |
| | | |
Distributions to shareholders from: | | | | | | | | | |
| | | |
Net realized gain | | (.56 | ) | | (2.85 | ) | | – | |
| | | | | | | | | |
Net asset value, end of period | | $17.09 | | | $12.91 | | | $23.84 | |
| | | | | | | | | |
| | | |
Total Return(c) | | 38.33 | % | | (38.43 | )% | | .13 | %(d) |
| | | |
Ratios to Average Net Assets: | | | | | | | | | |
| | | |
Expenses, excluding expense reductions and including expenses reimbursed | | 1.70 | % | | 1.65 | % | | .27 | %(d) |
| | | |
Expenses, including expense reductions and expenses reimbursed | | 1.70 | % | | 1.65 | % | | .27 | %(d) |
| | | |
Expenses, excluding expense reductions and expenses reimbursed | | 1.72 | % | | 1.70 | % | | .27 | %(d) |
| | | |
Net investment loss | | (.76 | )% | | (.82 | )% | | (.18 | )%(d) |
| | | |
| Supplemental Data: | | | | | | | | | |
Net assets, end of period (000) | | $2,182 | | | $85 | | | $10 | |
| | | |
Portfolio turnover rate | | 80.21 | % | | 123.95 | % | | 101.25 | % |
| (a) | | Commencement of investment operations was 9/28/2007, SEC effective date was 9/14/2007 and date shares first became available to the public was 10/1/2007. |
| (b) | | Calculated using average shares outstanding during the period. |
| (c) | | Total return assumes the reinvestment of all distributions. |
See Notes to Financial Statements.
23
Notes to Financial Statements
1. ORGANIZATION
Lord Abbett Research Fund, Inc. (the “Company”) is registered under the Investment Company Act of 1940, as amended (the “Act”), as a diversified, open-end management investment company, incorporated under Maryland law on April 6, 1992. The Company currently consists of four separate funds. This report covers one of the funds and its classes: Lord Abbett Growth Opportunities Fund (the “Fund”).
The Fund’s investment objective is capital appreciation. The Fund offers eight classes of shares: Class A, B, C, F, I, P, R2 and R3, each with different expenses and dividends. A front-end sales charge is normally added to the net asset value (“NAV”) for Class A shares. There is no front-end sales charge in the case of Class B, C, F, I, P, R2 and R3 shares, although there may be a contingent deferred sales charge (“CDSC”) for certain cases as follows: Class A shares purchased without a sales charge and redeemed before the first day of the month in which the one-year anniversary of the purchase falls (subject to certain exceptions); Class B shares redeemed before the sixth anniversary of purchase; and Class C shares redeemed before the first anniversary of purchase. Class B shares will automatically convert to Class A shares on the 25 th day of the month (or, if the 25th is not a business day, the next business day thereafter) following the eighth anniversary of the day on which the purchase order was accepted. The Fund’s Class P shares are closed to substantially all new retirement and benefit plans and fee-based programs, with certain exceptions as set forth in the Fund’s prospectuses. Effective March 31, 2010, the Fund will no longer offer Class B shares.
The preparation of financial statements in conformity with accounting principles generally accepted in the United States of America requires management to make certain estimates and assumptions that affect the reported amounts of assets and liabilities and disclosure of contingent assets and liabilities at the date of the financial statements and the reported amounts of increases and decreases in net assets from operations during the reporting period. Actual results could differ from those estimates.
2. SIGNIFICANT ACCOUNTING POLICIES
| (a) | | Investment Valuation–Securities actively traded on any recognized U.S. or non-U.S. exchange or on The NASDAQ Stock Market LLC are valued at the last sale price or official closing price on the exchange or system on which they are principally traded. Events occurring after the close of trading on non-U.S. exchanges may result in adjustments to the valuation of foreign securities to more accurately reflect their fair value as of the close of regular trading on the New York Stock Exchange LLC. The Fund may rely on an independent fair valuation service in adjusting the valuations of foreign securities. Unlisted equity securities are valued at the last quoted sale price or, if no sale price is available, at the mean between the most recently quoted bid and asked prices. Securities for which market quotations are not readily available are valued at fair value as determined by management and approved in good faith by the Board of Directors. Short-term securities with 60 days or less remaining to maturity are valued using the amortized cost method, which approximates current market value. |
| (b) | | Security Transactions–Security transactions are recorded as of the date that the securities are purchased or sold (trade date). Realized gains and losses on sales of portfolio securities are calculated using the identified-cost method. Realized and unrealized gains (losses) are allocated to each class of shares based upon the relative proportion of net assets at the beginning of the day. |
24
Notes to Financial Statements (continued)
| (c) | | Investment Income–Dividend income is recorded on the ex-dividend date. Interest income is recorded on the accrual basis as earned. Discounts are accreted and premiums are amortized using the effective interest method. Withholding taxes on foreign dividends have been provided for in accordance with the applicable country’s tax rules and rates. Investment income is allocated to each class of shares based upon the relative proportion of net assets at the beginning of the day. |
| (d) | | Income Taxes–It is the policy of the Fund to meet the requirements of Subchapter M of the Internal Revenue Code applicable to regulated investment companies and to distribute substantially all taxable income and capital gains to its shareholders. Therefore, no income tax provision is required. |
The Fund files U.S. federal and various state and local tax returns. No income tax returns are currently under examination. The statute of limitations on the Fund’s U.S. federal tax returns remains open for the fiscal years ended November 30, 2006 through November 30, 2009. The statutes of limitations on the Company’s state and local tax returns may remain open for an additional year depending upon the jurisdiction.
| (e) | | Expenses–Expenses incurred by the Company that do not specifically relate to an individual fund are generally allocated to the Funds within the Company on a pro rata basis by relative net assets. Expenses, excluding class-specific expenses, are allocated to each class of shares based upon the relative proportion of net assets at the beginning of the day. Class A, B, C, F, P, R2 and R3 shares bear their class-specific share of all expenses and fees relating to the Fund’s 12b-1 Distribution Plan. |
| (f) | | Foreign Transactions–The books and records of the Fund are maintained in U.S. dollars and transactions denominated in foreign currencies are recorded in the Fund’s records at the rate prevailing when earned or recorded. Asset and liability accounts that are denominated in foreign currencies are adjusted daily to reflect current exchange rates and any unrealized gain (loss) is included in net change in unrealized appreciation/depreciation on investments and translation of assets and liabilities denominated in foreign currencies on the Fund’s Statement of Operations. The resultant exchange gains and losses upon settlement of such transactions are included in Net realized loss on investments and foreign currency related transactions on the Fund’s Statement of Operations. The Fund does not isolate that portion of the results of operations arising as a result of changes in the foreign exchange rates from the changes in market prices of the securities. |
| (g) | | Repurchase Agreements–The Fund may enter into repurchase agreements with respect to securities. A repurchase agreement is a transaction in which a Fund acquires a security and simultaneously commits to resell that security to the seller (a bank or securities dealer) at an agreed-upon price on an agreed-upon date. The Fund requires at all times that the repurchase agreement be collateralized by cash, or by securities of the U.S. Government, its agencies, its instrumentalities, or U.S. Government sponsored enterprises having a value equal to, or in excess of, the value of the repurchase agreement (including accrued interest). If the seller of the agreement defaults on its obligation to repurchase the underlying securities at a time when the value of these securities has declined, a Fund may incur a loss upon disposition of the securities. |
| (h) | | Fair Value Measurements–In accordance with Financial Accounting Standards Board, Accounting Standards Codification (“ASC”) Topic 820, Fair Value Measurements and Disclosures |
25
Notes to Financial Statements (continued)
| | (formerly SFAS 157), fair value is defined as the price that the Fund would receive upon selling an investment in an orderly transaction to an independent buyer in the principal or most advantageous market of the investment. ASC 820 established a three-tier hierarchy to maximize the use of observable market data and minimize the use of unobservable inputs and to establish classification of fair value measurements for disclosure purposes. Inputs refer broadly to the assumptions that market participants would use in pricing the asset or liability, including assumptions about risk – for example, the risk inherent in a particular valuation technique used to measure fair value (such as a pricing model) and/or the risk inherent in the inputs to the valuation technique. Inputs may be observable or unobservable. Observable inputs reflect the assumptions market participants would use in pricing the asset or liability. Observable inputs are based on market data obtained from sources independent of the reporting entity. Unobservable inputs reflect the reporting entity’s own assumptions about the assumptions market participants would use in pricing the asset or liability. Unobservable inputs are based on the best information available in the circumstances. The three-tier hierarchy of inputs is summarized in the three broad Levels listed below: |
| | • | | Level 1 – quoted prices in active markets for identical investments; |
| | • | | Level 2 – other significant observable inputs (including quoted prices for similar investments, interest rates, prepayment speeds, credit risk, etc.); and |
| | • | | Level 3 – significant unobservable inputs (including the Fund’s own assumptions in determining the fair value of investments). |
The inputs or methodology used for valuing securities are not necessarily an indication of the risk associated with investing in those securities.
The following is a summary of the inputs used as of November 30, 2009 in valuing the Fund’s investments carried at value:
| | | | | | | | | | | | |
| Investment Type* | | Level 1 (000) | | Level 2 (000) | | Level 3 (000) | | Total (000) |
Common Stocks | | $ | 587,556 | | $ | – | | $ | – | | $ | 587,556 |
Repurchase Agreement | | | – | | | 2,507 | | | – | | | 2,507 |
Total | | $ | 587,556 | | $ | 2,507 | | $ | – | | $ | 590,063 |
| * | See Schedule of Investments for values in each industry. |
3. MANAGEMENT FEE AND OTHER TRANSACTIONS WITH AFFILIATES
Management Fee
The Company has a management agreement with Lord, Abbett & Co. LLC (“Lord Abbett”), pursuant to which Lord Abbett supplies the Fund with investment management services and executive and other personnel, provides office space and pays for ordinary and necessary office and clerical expenses relating to research and statistical work and supervision of the Fund’s investment portfolio.
The management fee is based on the Fund’s average daily net assets at the following annual rates:
| | |
First $1 billion | | .80% |
Next $1 billion | | .75% |
Next $1 billion | | .70% |
Over $3 billion | | .65% |
26
Notes to Financial Statements (continued)
For the fiscal year ended November 30, 2009, the effective management fee paid to Lord Abbett was at an annualized rate of .80% of the Fund’s average daily net assets.
For the period December 1, 2008 through March 31, 2009, Lord Abbett contractually agreed to reimburse the Fund to the extent necessary so that each class’ total annual operating expenses did not exceed the rates below. Effective April 1, 2009, Lord Abbett voluntarily agreed to reimburse the Fund to the extent necessary so that each class’ total annual operating expenses do not exceed the following:
| | |
| Class | | % of Average Daily Net Assets |
A | | 1.55% |
B | | 2.20% |
C | | 2.20% |
F | | 1.30% |
I | | 1.20% |
P | | 1.65% |
R2 | | 1.80% |
R3 | | 1.70% |
Lord Abbett may discontinue the voluntary reimbursement or change the level of its voluntary reimbursement at any time.
Lord Abbett provides certain administrative services to the Fund pursuant to an Administrative Services Agreement at an annual rate of .04% of the Fund’s average daily net assets.
The Fund, along with certain other funds managed by Lord Abbett (collectively, the “Underlying Funds”), has entered into a Servicing Arrangement with Lord Abbett Diversified Equity Strategy Fund and Lord Abbett Growth & Income Strategy Fund of Lord Abbett Investment Trust and Lord Abbett Global Allocation Fund of Lord Abbett Global Fund, Inc. (each, a “Fund of Funds”), pursuant to which each Underlying Fund pays a portion of the expenses (excluding management fees and distribution and service fees) of the Fund of Funds in proportion to the average daily value of Underlying Fund shares owned by the Fund of Funds. Amounts paid pursuant to the Servicing Arrangement are included in Subsidy expense on the Fund’s Statement of Operations and Payable to affiliates on the Fund’s Statement of Assets and Liabilities.
As of November 30, 2009, the percentages of the Fund’s outstanding shares owned by Lord Abbett Diversified Equity Strategy Fund, Lord Abbett Growth & Income Strategy Fund and Lord Abbett Global Allocation Fund were 2.06%, 2.94% and 1.28%, respectively.
12b-1 Distribution Plan
The Fund has adopted a distribution plan with respect to Class A, B, C, F, P, R2 and R3 shares pursuant to Rule 12b-1 under the Act, which provides for the payment of ongoing distribution and service fees to Lord Abbett Distributor LLC (the “Distributor”), an affiliate of Lord Abbett. The fees are accrued daily at annual rates based upon each Fund’s average daily net assets as follows:
| | | | | | | | | | | | | | | |
| Fees* | | Class A | | | Class B | | Class C | | Class F | | Class P | | Class R2 | | Class R3 |
Service | | .25% | | | .25% | | .25% | | – | | .25% | | .25% | | .25% |
Distribution | | .10% | | | .75% | | .75% | | .10% | | .20% | | .35% | | .25% |
| * | The Fund may designate a portion of the aggregate fee as attributable to service activities for purposes of calculating Financial Industry Regulatory Authority, Inc. (“FINRA”) sales charge limitations. |
Class I shares do not have a distribution plan.
27
Notes to Financial Statements (continued)
Commissions
Distributor received the following commissions on sales of shares of the Fund, after concessions were paid to authorized dealers, for the fiscal year ended November 30, 2009:
| | | |
Distributor
Commissions | | Dealers’
Concessions |
| $111,933 | | $ | 609,384 |
Distributor received CDSCs of $4,186 and $6,552 for Class A and Class C shares, respectively, for the fiscal year ended November 30, 2009.
Two Directors and certain of the Fund’s officers have an interest in Lord Abbett.
4. DISTRIBUTIONS AND CAPITAL LOSS CARRYFORWARDS
Dividends from net investment income, if any, are declared and paid at least annually. Taxable net realized gains from investment transactions, reduced by capital loss carryforwards, if any, are declared and distributed to shareholders at least annually. The capital loss carryforward amount, if any, is available to offset future net capital gains. Dividends and distributions to shareholders are recorded on the ex-dividend date. The amounts of dividends and distributions from net investment income and net realized capital gains are determined in accordance with federal income tax regulations which may differ from accounting principles generally accepted in the United States of America. These book/tax differences are either considered temporary or permanent in nature. To the extent these differences are permanent in nature, such amounts are reclassified within the components of net assets based on their federal tax basis treatment; temporary differences do not require reclassification. Dividends and distributions, which exceed earnings and profits for tax purposes, are reported as a tax return of capital.
The tax character of distributions paid during the fiscal years ended November 30, 2009 and 2008 was as follows:
| | | | | | |
| | | Year Ended 11/30/2009 | | Year Ended 11/30/2008 |
Distributions paid from: | | | | | | |
Ordinary income | | $ | – | | $ | 40,695,443 |
Net long-term capital gains | | | 20,035,042 | | | 60,274,138 |
Total distributions paid | | $ | 20,035,042 | | $ | 100,969,581 |
As of November 30, 2009, the components of accumulated earnings on a tax-basis were as follows:
| | | | |
Capital loss carryforwards* | | | (102,161,515 | ) |
Temporary differences | | | (82,267 | ) |
Unrealized gains – net | | | 102,536,123 | |
Total accumulated gains – net | | $ | 292,341 | |
| * | As of November 30, 2009, the capital loss carryforwards, along with the related expiration dates, were as follows: |
| | | | | | |
| 2016 | | 2017 | | Total |
| $29,568,245 | | $ | 72,593,270 | | $ | 102,161,515 |
28
Notes to Financial Statements (continued)
As of November 30, 2009, the aggregate unrealized security gains and losses based on cost for U.S. federal income tax purposes were as follows:
| | | | |
Tax cost | | $ | 487,527,204 | |
Gross unrealized gain | | | 118,563,329 | |
Gross unrealized loss | | | (16,027,206 | ) |
Net unrealized security gain | | $ | 102,536,123 | |
The difference between book-basis and tax-basis unrealized gains (losses) is attributable to wash sales and certain securities.
Permanent items identified during the fiscal year ended November 30, 2009, have been reclassified among the components of net assets based on their tax basis treatment as follows:
| | | | | | | |
Accumulated
Net Investment
Loss | | Accumulated Net Realized Loss | | Paid-in Capital | |
| $3,957,529 | | $ | 21,427 | | $ | (3,978,956 | ) |
The permanent difference is attributable to the tax treatment of net investment losses and certain distributions received.
5. PORTFOLIO SECURITIES TRANSACTIONS
Purchases and sales of investment securities (excluding short-term investments) for the fiscal year ended November 30, 2009 were as follows:
| | | |
| Purchases | | Sales |
| $403,419,964 | | $ | 436,405,238 |
There were no purchases or sales of U.S. Government securities for the fiscal year ended November 30, 2009.
6. DIRECTORS’ REMUNERATION
The Company’s officers and the two Directors who are associated with Lord Abbett do not receive any compensation from the Company for serving in such capacities. Outside Directors’ fees are allocated among all Lord Abbett-sponsored funds based on the net assets of the fund. There is an equity-based plan available to all outside Directors under which outside Directors must defer receipt of a portion of, and may elect to defer receipt of an additional portion of, Directors’ fees. The deferred amounts are treated as though equivalent dollar amounts have been invested in the funds. Such amounts and earnings accrued thereon are included in Directors’ fees on the Statement of Operations and in Directors’ fees payable on the Statement of Assets and Liabilities and are not deductible for U.S. federal income tax purposes until such amounts are paid.
7. EXPENSE REDUCTIONS
The Company has entered into arrangements with its transfer agent and custodian, whereby credits realized as a result of uninvested cash balances are used to reduce a portion of the Fund’s expenses.
29
Notes to Financial Statements (continued)
8. LINE OF CREDIT
The Fund and certain other funds managed by Lord Abbett have available an unsecured revolving credit facility (“Facility”) from State Street Bank and Trust Company (“SSB”), to be used for temporary or emergency purposes as an additional source of liquidity to fund redemptions of investor shares. The Facility is renewed annually under terms that depend on market conditions at the time of the renewal. Accordingly, effective December 4, 2009, the amount available under the Facility remains $200,000,000 and the annual fee to maintain the Facility (of which each participating fund pays its pro rata share based on the net assets of each participating fund) was changed from .125% (.08% prior to December 5, 2008) of the amount available under the Facility to .15%. This amount is included in Other Expenses on the Fund’s Statement of Operations. In connection with the renewal, the Fund paid an upfront commitment fee of .05% on December 4, 2009. Any borrowings under this Facility will bear interest at current market rates as set forth in the credit agreement. As of November 30, 2009, there were no loans outstanding pursuant to this Facility nor was the Facility utilized at any time during the fiscal year ended November 30, 2009.
9. CUSTODIAN AND ACCOUNTING AGENT
SSB is the Company’s custodian and accounting agent. SSB performs custodial, accounting and recordkeeping functions relating to portfolio transactions and calculating the Fund’s NAV.
10. INVESTMENT RISKS
The Fund is subject to the general risks and considerations associated with equity investing. The value of an investment will fluctuate in response to movements in the equity securities market in general, and to the changing prospects of individual companies in which the Fund invests. The Fund has particular risks associated with growth stocks. Growth companies may grow faster than other companies, which may result in more volatility in their stock prices. In addition, if the Fund’s assessment of a company’s potential for growth or market conditions is wrong, it could suffer losses or produce poor performance relative to other funds, even in a rising market. The Fund invests largely in mid-sized company stocks, which may be less able to weather economic shifts or other adverse developments than larger, more established companies.
These factors can affect the Fund’s performance.
11. SUMMARY OF CAPITAL TRANSACTIONS
Transactions in shares of capital stock were as follows:
| | | | | | | | | | | | | | |
| | | Year Ended
November 30, 2009 | | | Year Ended
November 30, 2008 | |
| Class A Shares | | Shares | | | Amount | | | Shares | | | Amount | |
Shares sold | | 3,877,165 | | | $ | 56,025,950 | | | 3,870,150 | | | $ | 65,683,092 | |
Converted from Class B* | | 381,746 | | | | 5,359,380 | | | 412,582 | | | | 7,751,875 | |
Reinvestment of distributions | | 1,128,844 | | | | 13,986,374 | | | 3,424,588 | | | | 71,231,500 | |
Shares reacquired | | (7,305,370 | ) | | | (101,966,867 | ) | | (7,307,366 | ) | | | (131,136,183 | ) |
Increase (decrease) | | (1,917,615 | ) | | $ | (26,595,163 | ) | | 399,954 | | | $ | 13,530,284 | |
30
Notes to Financial Statements (continued)
| | | | | | | | | | | | | | |
| | | Year Ended
November 30, 2009 | | | Year Ended
November 30, 2008 | |
| Class B Shares | | Shares | | | Amount | | | Shares | | | Amount | |
Shares sold | | 500,693 | | | $ | 6,491,649 | | | 499,675 | | | $ | 8,669,372 | |
Reinvestment of distributions | | 182,332 | | | | 2,082,099 | | | 611,883 | | | | 11,852,174 | |
Shares reacquired | | (996,865 | ) | | | (12,853,743 | ) | | (1,159,637 | ) | | | (19,482,360 | ) |
Converted to Class A* | | (415,128 | ) | | | (5,359,380 | ) | | (444,107 | ) | | | (7,751,875 | ) |
Decrease | | (728,968 | ) | | $ | (9,639,375 | ) | | (492,186 | ) | | $ | (6,712,689 | ) |
| | | | |
| Class C Shares | | | | | | | | | | | | |
Shares sold | | 1,167,445 | | | $ | 14,970,083 | | | 791,889 | | | $ | 13,807,768 | |
Reinvestment of distributions | | 164,095 | | | | 1,872,334 | | | 485,077 | | | | 9,391,105 | |
Shares reacquired | | (1,063,096 | ) | | | (13,396,122 | ) | | (1,227,459 | ) | | | (20,802,973 | ) |
Increase | | 268,444 | | | $ | 3,446,295 | | | 49,507 | | | $ | 2,395,900 | |
| | | | |
| Class F Shares | | | | | | | | | | | | |
Shares sold | | 134,213 | | | $ | 1,705,435 | | | 39,948 | | | $ | 793,966 | |
Reinvestment of distributions | | 1,230 | | | | 15,275 | | | 57 | | | | 1,196 | |
Shares reacquired | | (25,922 | ) | | | (376,956 | ) | | (12,766 | ) | | | (174,447 | ) |
Increase | | 109,521 | | | $ | 1,343,754 | | | 27,239 | | | $ | 620,715 | |
| | | | |
| Class I Shares | | | | | | | | | | | | |
Shares sold | | 781,303 | | | $ | 11,958,450 | | | 964,693 | | | $ | 18,624,220 | |
Reinvestment of distributions | | 75,462 | | | | 971,969 | | | 112,404 | | | | 2,417,818 | |
Shares reacquired | | (190,229 | ) | | | (2,440,817 | ) | | (81,570 | ) | | | (1,581,289 | ) |
Increase | | 666,536 | | | $ | 10,489,602 | | | 995,527 | | | $ | 19,460,749 | |
| | | | |
| Class P Shares | | | | | | | | | | | | |
Shares sold | | 185,954 | | | $ | 2,730,598 | | | 219,532 | | | $ | 4,144,787 | |
Reinvestment of distributions | | 31,137 | | | | 384,852 | | | 93,553 | | | | 1,943,096 | |
Shares reacquired | | (372,475 | ) | | | (5,033,116 | ) | | (320,834 | ) | | | (5,832,503 | ) |
Increase (decrease) | | (155,384 | ) | | $ | (1,917,666 | ) | | (7,749 | ) | | $ | 255,380 | |
| | | | |
| Class R2 Shares | | | | | | | | | | | | |
Shares sold | | 70,079 | | | $ | 970,217 | | | 8,835 | | | $ | 169,006 | |
Reinvestment of distributions | | 21 | | | | 265 | | | 57 | | | | 1,196 | |
Shares reacquired | | (13,762 | ) | | | (188,809 | ) | | (73 | ) | | | (1,482 | ) |
Increase | | 56,338 | | | $ | 781,673 | | | 8,819 | | | $ | 168,720 | |
| | | | |
| Class R3 Shares | | | | | | | | | | | | |
Shares sold | | 269,879 | | | $ | 4,006,497 | | | 6,596 | | | $ | 124,613 | |
Reinvestment of distributions | | 304 | | | | 3,763 | | | 57 | | | | 1,196 | |
Shares reacquired | | (149,071 | ) | | | (2,318,052 | ) | | (477 | ) | | | (8,793 | ) |
Increase | | 121,112 | | | $ | 1,692,208 | | | 6,176 | | | $ | 117,016 | |
| * | Automatic conversion of Class B shares occurs on the 25th day of the month (or, if the 25th is not a business day, the next business day thereafter) following the eighth anniversary of the day on which the purchase order was accepted. |
31
Notes to Financial Statements (concluded)
12. SUBSEQUENT EVENTS
In accordance with the provisions set forth in ASC Topic 855 (formerly SFAS 165), Subsequent Events, adopted by the Fund as of November 30, 2009, management has evaluated subsequent events existing in the Fund’s financial statements through January 29, 2010. Management has determined that there were no material subsequent events that would require recognition or additional disclosure in the Fund’s financial statements through this date.
13. RECENT ACCOUNTING PRONOUNCEMENTS
In January 2010, the Financial Accounting Standards Board issued Accounting Standards Update 2010-06 “Improving Disclosures about Fair Value Measurements” (“ASU 2010-06”). ASU 2010-06 provides clarifications to existing disclosures required by ASC 820 as well as amends ASC 820 to require certain new disclosures. ASU 2010-06 is substantially effective for interim and annual reporting periods beginning after December 15, 2009. Management is currently evaluating the impact the adoption of ASU 2010-06 will have on the Fund’s financial statement disclosures.
32
Report of Independent Registered Public Accounting Firm
To the Shareholders and Board of Directors of Lord Abbett Research Fund, Inc.:
We have audited the accompanying statement of assets and liabilities, including the schedule of investments, of the Lord Abbett Growth Opportunities Fund, one of the portfolios constituting the Lord Abbett Research Fund, Inc. (the “Company”), as of November 30, 2009, and the related statement of operations for the year then ended, the statement of changes in net assets for each of the two years in the period then ended, and the financial highlights for each of the periods presented. These financial statements and financial highlights are the responsibility of the Company’s management. Our responsibility is to express an opinion on these financial statements and financial highlights based on our audits.
We conducted our audits in accordance with the standards of the Public Company Accounting Oversight Board (United States). Those standards require that we plan and perform the audit to obtain reasonable assurance about whether the financial statements and financial highlights are free of material misstatement. The Company is not required to have, nor were we engaged to perform, an audit of its internal control over financial reporting. Our audits included consideration of internal control over financial reporting as a basis for designing audit procedures that are appropriate in the circumstances, but not for the purpose of expressing an opinion on the effectiveness of the Company’s internal control over financial reporting. Accordingly, we express no such opinion. An audit also includes examining, on a test basis, evidence supporting the amounts and disclosures in the financial statements, assessing the accounting principles used and significant estimates made by management, as well as evaluating the overall financial statement presentation. Our procedures included confirmation of securities owned as of November 30, 2009, by correspondence with the custodian and brokers; where replies were not received from brokers, we performed other auditing procedures. We believe that our audits provide a reasonable basis for our opinion.
In our opinion, the financial statements and financial highlights referred to above present fairly, in all material respects, the financial position of the Lord Abbett Growth Opportunities Fund of the Lord Abbett Research Fund, Inc. as of November 30, 2009, the results of its operations for the year then ended, the changes in its net assets for each of the two years in the period then ended, and the financial highlights for each of the periods presented, in conformity with accounting principles generally accepted in the United States of America.
DELOITTE & TOUCHE LLP
New York, New York
January 29, 2010
33
Basic Information About Management
The Board of Directors (the “Board”) is responsible for the management of the business and affairs of the Company in accordance with the laws of the State of Maryland. The Board appoints officers who are responsible for the day-to-day operations of the Company and who execute policies authorized by the Board. The Board also approves an investment adviser to the Company and continues to monitor the cost and quality of the services provided by the investment adviser, and annually considers whether to renew the contract with the adviser. Generally, each Director holds office until his/her successor is elected and qualified or until his/her earlier resignation or removal, as provided in the Company’s organizational documents.
Lord, Abbett & Co. LLC (“Lord Abbett”), a Delaware limited liability company, is the Company’s investment adviser.
Interested Directors
The following Directors are partners of Lord Abbett and are “interested persons” of the Company as defined in the Act. Mr. Dow and Ms. Foster are officers, directors, or trustees of each of the 14 Lord Abbett-sponsored funds, which consist of 53 portfolios or series.
| | | | | | |
Name, Address and Year of Birth | | Current Position and
Length of Service
with Company | | Principal Occupation During Past Five Years | | Other Directorships |
| | | |
Robert S. Dow Lord, Abbett & Co. LLC 90 Hudson Street Jersey City, NJ 07302 (1945) | | Director and Chairman since 1996 | | Senior Partner (since 2007), Chief Executive Officer (since 1996) and was formerly Managing Partner (1996 - 2007), joined Lord Abbett in 1972. | | N/A |
| | | |
Daria L. Foster Lord, Abbett & Co. LLC 90 Hudson Street Jersey City, NJ 07302 (1954) | | Director since 2006 | | Managing Partner (since 2007) and was formerly Director of Marketing and Client Service, joined Lord Abbett in 1990. | | N/A |
Independent Directors
The following independent or outside Directors (“Independent Directors”) are also directors or trustees of each of the 14 Lord Abbett-sponsored funds, which consist of 53 portfolios or series.
| | | | | | |
Name, Address and Year of Birth | | Current Position and
Length of Service
with Company | | Principal Occupation During Past Five Years | | Other
Directorships |
| | | |
E. Thayer Bigelow Lord, Abbett & Co. LLC c/o Legal Dept. 90 Hudson Street Jersey City, NJ 07302 (1941) | | Director since 1996 | | Managing General Partner, Bigelow Media, LLC (since 2000); Senior Adviser, Time Warner Inc. (1998 - 2000). | | Currently serves as director of Crane Co. (since 1984), Huttig Building Products Inc. (since 1998) and R.H. Donnelley Inc. (since 2009). |
34
Basic Information About Management (continued)
| | | | | | |
Name, Address and Year of Birth | | Current Position and
Length of Service
with Company | | Principal Occupation During Past Five Years | | Other
Directorships |
| | | |
William H.T. Bush Lord, Abbett & Co. LLC c/o Legal Dept. 90 Hudson Street Jersey City, NJ 07302 (1938) | | Director since 1998 | | Co-founder and Chairman of the Board of the financial advisory firm of Bush - O’Donnell & Company (since 1986). | | Currently serves as director of WellPoint, Inc., a health benefits company (since 2002). |
| | | |
Robert B. Calhoun, Jr. Lord, Abbett & Co. LLC c/o Legal Dept. 90 Hudson Street Jersey City, NJ 07302 (1942) | | Director since 1998 | | Senior Advisor of Monitor Clipper Partners, a private equity investment fund (since 1997); President of Clipper Asset Management Corp. (1991 - 2009). | | N/A |
| | | |
Julie A. Hill Lord, Abbett & Co. LLC c/o Legal Dept. 90 Hudson Street Jersey City, NJ 07302 (1946) | | Director since 2004 | | Owner and CEO of The Hill Company, a business consulting firm (since 1998). | | Currently serves as director of WellPoint, Inc., a health benefits company (since 1994) and Lend Lease Corporation Limited (since 2005). |
| | | |
Franklin W. Hobbs Lord, Abbett & Co. LLC c/o Legal Dept. 90 Hudson Street Jersey City, NJ 07302 (1947) | | Director since 2001 | | Advisor of One Equity Partners, a private equity firm (since 2004). | | Currently serves as a director and Chairman of the Board of GMAC Inc., a financial services firm (since 2009) and as a director of Molson Coors Brewing Company (since 2002). |
| | | |
Thomas J. Neff Lord, Abbett & Co. LLC c/o Legal Dept. 90 Hudson Street Jersey City, NJ 07302 (1937) | | Director since 1992 | | Chairman of Spencer Stuart (U.S.), an executive search consulting firm (since 1996). | | Currently serves as director of Ace, Ltd. (since 1997) and Hewitt Associates, Inc. (since 2004). |
| | | |
James L.L. Tullis Lord, Abbett & Co. LLC c/o Legal Dept. 90 Hudson Street Jersey City, NJ 07302 (1947) | | Director since 2006 | | CEO of Tullis-Dickerson and Co. Inc., a venture capital management firm (since 1990). | | Currently serves as director of Crane Co. (since 1998). |
35
Basic Information About Management (continued)
Officers
None of the officers listed below have received compensation from the Company. All of the officers of the Company may also be officers of the other Lord Abbett-sponsored funds and maintain offices at 90 Hudson Street, Jersey City, NJ 07302. Unless otherwise indicated, the titles and positions listed under the “Principal Occupation” column indicate the officer’s position(s) and title(s) with Lord Abbett.
| | | | | | |
Name and
Year of Birth | | Current Position
with Company | | Length of Service
of Current Position | | Principal Occupation
During Past Five Years |
| | | |
Robert S. Dow (1945) | | Chief Executive Officer and Chairman | | Elected in 1996 | | Senior Partner (since 2007), Chief Executive Officer (since 1996) and was formerly Managing Partner (1996 - 2007), joined Lord Abbett in 1972. |
| | | |
Daria L. Foster (1954) | | President | | Elected in 2006 | | Managing Partner (since 2007) and was formerly Director of Marketing and Client Service, joined Lord Abbett in 1990. |
| | | |
Robert P. Fetch (1953) | | Executive Vice President | | Elected in 1997 | | Partner and Director, joined Lord Abbett in 1995. |
| | | |
Daniel H. Frascarelli (1954) | | Executive Vice President | | Elected in 2005 | | Partner and Director, joined Lord Abbett in 1990. |
| | | |
Robert I. Gerber (1954) | | Executive Vice President | | Elected in 2007 | | Partner and Chief Investment Officer (since 2007), joined Lord Abbett in 1997 as Director of Taxable Fixed Income Management. |
| | | |
Gerard S. E. Heffernan, Jr. (1963) | | Executive Vice President | | Elected in 2009 | | Partner and Director, joined Lord Abbett in 1998. |
| | | |
Christopher J. Towle (1957) | | Executive Vice President | | Elected in 2001 | | Partner and Director, joined Lord Abbett in 1987. |
| | | |
Paul J. Volovich (1973) | | Executive Vice President | | Elected in 2004 | | Partner and Director, joined Lord Abbett in 1997. |
| | | |
James W. Bernaiche (1956) | | Chief Compliance Officer | | Elected in 2004 | | Partner and Chief Compliance Officer, joined Lord Abbett in 2001. |
| | | |
Joan A. Binstock (1954) | | Chief Financial Officer and Vice President | | Elected in 1999 | | Partner and Chief Operations Officer, joined Lord Abbett in 1999. |
| | | |
John K. Forst (1960) | | Vice President and Assistant Secretary | | Elected in 2005 | | Deputy General Counsel, joined Lord Abbett in 2004. |
36
Basic Information About Management (concluded)
| | | | | | |
Name and
Year of Birth | | Current Position
with Company | | Length of Service
of Current Position | | Principal Occupation
During Past Five Years |
| | | |
Lawrence H. Kaplan (1957) | | Vice President and Secretary | | Elected in 1997 | | Partner and General Counsel, joined Lord Abbett in 1997. |
| | | |
Deepak Khanna (1963) | | Vice President | | Elected in 2008 | | Portfolio Manager, returned to Lord Abbett in 2007 from Jennison Associates LLC (2005 - 2007). Mr. Khanna’s former experience at Lord Abbett included Senior Research Analyst - other investment strategies (2000 - 2005). |
| | | |
David J. Linsen (1974) | | Vice President | | Elected in 2008 | | Director and Portfolio Manager, joined Lord Abbett in 2001. |
| | | |
Elizabeth O. MacLean (1966) | | Vice President | | Elected in 2008 | | Partner and Portfolio Manager, joined Lord Abbett in 2006 and was formerly a Managing Director/Portfolio Manager at Nomura Corporate Research and Asset Management, Inc. (2000 - 2006). |
| | | |
A. Edward Oberhaus, III (1959) | | Vice President | | Elected in 1996 | | Partner and Director, joined Lord Abbett in 1983. |
| | | |
Todor Petrov (1974) | | Vice President | | Elected in 2008 | | Portfolio Manager, joined Lord Abbett in 2003. |
| | | |
Thomas R. Phillips (1960) | | Vice President and Assistant Secretary | | Elected in 2008 | | Deputy General Counsel, joined Lord Abbett in 2006 and was formerly an attorney at Morgan, Lewis & Bockius LLP. |
| | | |
Randy M. Reynolds (1972) | | Vice President | | Elected in 2008 | | Portfolio Manager, joined Lord Abbett in 1999. |
| | | |
Lawrence B. Stoller (1963) | | Vice President and Assistant Secretary | | Elected in 2007 | | Senior Deputy General Counsel, joined Lord Abbett in 2007 and was formerly an Executive Vice President and General Counsel at Cohen & Steers Capital Management, Inc. (1999 - 2007). |
| | | |
Bernard J. Grzelak (1971) | | Treasurer | | Elected in 2003 | | Partner and Director of Fund Administration, joined Lord Abbett in 2003. |
Please call 888-522-2388 for a copy of the statement of additional information (SAI), which contains further information about the Company’s Directors. It is available free upon request.
37
Householding
The Company has adopted a policy that allows it to send only one copy of the Fund’s prospectus, proxy material, annual report and semiannual report to certain shareholders residing at the same “household.” This reduces Fund expenses, which benefits you and other shareholders. If you need additional copies or do not want your mailings to be “householded,” please call Lord Abbett at 888-522-2388 or send a written request with your name, the name of your fund or funds and your account number or numbers to Lord Abbett Family of Funds, P.O. Box 219336, Kansas City, MO 64121.
Proxy Voting Policies, Procedures and Records
A description of the policies and procedures that Lord Abbett uses to vote proxies related to the Fund’s portfolio securities, and information on how Lord Abbett voted each Fund’s proxies during the 12-month period ended June 30 are available without charge, upon request, (i) by calling 888-522-2388; (ii) on Lord Abbett’s Website at www.lordabbett.com; and (iii) on the Securities and Exchange Commission’s (“SEC”) Website at www.sec.gov.
Shareholder Reports and Quarterly Portfolio Disclosure
The Fund is required to file its complete schedule of portfolio holdings with the SEC for its first and third fiscal quarters on Form N-Q. Copies of the filings are available without charge, upon request on the SEC’s Website at www.sec.gov and may be available by calling Lord Abbett at 888-522-2388. You can also obtain copies of Form N-Q by (i) visiting the SEC’s Public Reference Room in Washington, DC (information on the operation of the Public Reference Room may be obtained by calling 800-SEC-0330); (ii) sending your request and duplicating fee to the SEC’s Public Reference Room, Washington, DC 20549-1520; or (iii) sending your request electronically, after paying a duplicating fee, to publicinfo@sec.gov.
Tax Information
All of the distributions paid during the fiscal year ended November 30, 2009 represent long-term capital gains.
38


This report when not used for the general information of shareholders of the fund, is to be distributed only if preceded or accompanied by a current fund prospectus.
Lord Abbett mutual fund shares are distributed by LORD ABBETT DISTRIBUTOR LLC.
Lord Abbett Research Fund, Inc.
Lord Abbett Growth Opportunities Fund
LAGOF-2-1109
(01/10)
2009
LORD ABBETT
ANNUAL
REPORT 
Lord Abbett
Classic Stock Fund*
Small Cap Value Fund
For the fiscal year ended November 30, 2009
* Formerly known as Large Cap Core Fund

Lord Abbett Research Fund
Lord Abbett Classic Stock Fund and
Lord Abbett Small Cap Value Fund
Annual Report
For the fiscal year ended November 30, 2009

From left to right: Robert S. Dow, Director and Chairman of the Lord Abbett Funds; E. Thayer Bigelow, Independent Lead Director of the Lord Abbett Funds; and Daria L. Foster, Director and President of the Lord Abbett Funds.
Dear Shareholders: We are pleased to provide you with this overview of the Lord Abbett Classic Stock Fund’s and the Lord Abbett Small Cap Value Fund’s performance for the fiscal year ended November 30, 2009. On this page and the following pages, we discuss the major factors that influenced performance. For detailed and more timely information about the Funds, please visit our Website at www.lordabbett.com, where you also can access the quarterly commentaries by the Funds’ portfolio managers.
Thank you for investing in Lord Abbett mutual funds. We value the trust that you place in us and look forward to serving your investment needs in the years to come.
Best regards,

Robert S. Dow
Chairman
Q: What were the overall market conditions during the fiscal year ended November 30, 2009?
A: After a difficult start to the fiscal year ended November 30, 2009, the equity markets (as represented by the S&P 500® Index1) began a slow upward trend during the balance of the period, recovering some of their previous losses. The fiscal year ended with the S&P 500 Index up 25.39%.
Mid cap stocks (as defined by the Russell MidCap® Index2) generally outperformed large cap stocks (as measured by the Russell 1000® Index3) and small cap stocks (as measured by the Russell 2000® Index4). Growth stocks (as represented by the Russell 3000® Growth Index5) generally outperformed value stocks (as represented by the Russell 3000® Value Index 6) for the fiscal year. Overall, most equity asset classes and investing styles trended higher throughout the 12-month fiscal period.
1
Lord Abbett Classic Stock Fund (formerly, Large Cap Core Fund)
Q: How did the Classic Stock Fund perform during the fiscal year ended November 30, 2009?
A: The Fund returned 24.84%, reflecting performance at the net asset value (NAV) of Class A shares with all distributions reinvested, compared to its benchmark, the Russell 1000® Index, which returned 27.38% over the same period.
Q: What were the most significant factors affecting performance?
A: The most significant detractors from the Fund’s performance relative to its benchmark for the 12-month period were the technology, financial services, and materials and processing sectors. Among the individual holdings that detracted from performance were producer durables holding General Electric (the Fund’s number-one detractor), a diversified technology, media and financial services company; financial services holding Bank of America, a provider of financial and risk-management products and services; and consumer discretionary holding Wal-Mart Stores Inc., a broadlines discount retailer.
The most significant contributors to the Fund’s performance relative to its benchmark for the 12-month period were the consumer discretionary sector, the utilities sector (owing to an underweight position), and the producer durables sector (owing to an underweight position). Among the individual holdings that contributed to performance were consumer discretionary holdings Wynn Resorts, Inc., a casino resort owner, operator, and developer and Best Buy Co. Inc., a consumer electronics specialty retailer; and financial services holding The Goldman Sachs Group, Inc., a global investment banking and securities firm.
Lord Abbett Small Cap Value Fund
Q: How did the Small Cap Value Fund perform during the fiscal year ended November 30, 2009?
A: The Fund returned 25.15%, reflecting performance at the net asset value (NAV) of Class A shares with all distributions reinvested, compared to its benchmark, the Russell 2000® Value Index,7 which returned 18.98% over the same period.
Q: What were the most significant factors affecting performance?
A: The most significant contributors to the Fund’s performance relative to its benchmark for the 12-month period were the financial services sector (owing to an underweight position), the consumer staples sector, and the consumer discretionary sector. Among the individual holdings that contributed to performance were technology holding Rovi Corporation (the Fund’s number-one contributor), a digital home entertainment solutions provider; consumer discretionary holding Brinker International, Inc., a restaurant operator; and materials and processing holding Reliance Steel & Aluminum (the Fund’s third largest holding), a distributor and processor of steel and aluminum.
The most significant detractors from the Fund’s performance relative to its benchmark for the 12-month period were the healthcare, technology and energy sectors. Among the individual holdings
2
that detracted from performance were materials and processing holding Cabot Corporation (the Fund’s number-one detractor), a provider of chemicals, performance materials, and specialty fluids; producer durables holding Huron Consulting Group, an independent provider of financial and operational consulting services; and consumer discretionary holding Central European Distribution Corporation (CEDC), a distributor of branded vodka in Poland.
Each Fund’s portfolio is actively managed and, therefore, its holdings and the weightings of a particular issuer or particular sector as a percentage of portfolio assets are subject to change. Sectors may include many industries.
1 The S&P 500® Index is widely regarded as the standard for measuring large cap U.S. stock market performance and includes a representative sample of leading companies in leading industries.
2 The Russell Midcap® Index measures the performance of the 800 smallest companies in the Russell 1000 Index, which represents approximately 25% of the total market capitalization of the Russell 1000 Index.
3 The Russell 1000® Index measures the performance of the 1,000 largest companies in the Russell 3000 Index, which represents approximately 92% of the total market capitalization of the Russell 3000 Index.
4 The Russell 2000® Index is composed of 2,000 securities with market values ranging from $25 million to $275 million. The Growth Index is comprised of securities in the Russell 2000® Index with higher price-to-book ratios and higher forecasted growth.
5 The Russell 3000® Growth Index measures the performance of those Russell 3000® Index companies with higher price-to-book ratios and higher forecasted growth values. The stocks in this index are also members of either the Russell 1000® Growth or the Russell 2000® Growth indexes.
6 The Russell 3000® Value Index measures the performance of those Russell 3000 Index companies with lower price-to-book ratios and lower forecasted growth values. The stocks in this index are also members of either the Russell 1000® Value or the Russell 2000® Value indexes.
7 The Russell 2000 Value Index measures the performance of those Russell 2000 companies with lower price-to-book ratios and lower forecasted growth values.
Unless otherwise indicated, indexes are unmanaged and reflect total returns with all distributions reinvested, but do not reflect the deduction of fees, expenses, or taxes, and are not available for direct investment.
During certain periods shown, expense reimbursements were in place for the Classic Stock Fund. Without such expense reimbursements, the Fund’s returns would have been lower.
Important Performance and Other Information
Performance data quoted reflect past performance and are no guarantee of future results. Current performance may be higher or lower than the performance quoted. The investment return and principal value of an investment in the Fund will fluctuate so that shares, on any given day or when redeemed, may be worth more or less than their original cost. You can obtain performance data current to the most recent month-end by calling Lord Abbett at 888-522-2388 or referring to our Website at www.lordabbett.com.
Except where noted, comparative Fund performance does not account for the deduction of sales charges and would be different if sales charges were included. The Funds offer additional classes of shares with distinct pricing options. For a full description of the differences in pricing alternatives, please see each Fund’s prospectus.
The views of each Fund’s management and the portfolio holdings described in this report are as of November 30, 2009; these views and portfolio holdings may have changed subsequent to this date, and they do not guarantee the future performance of the markets or each Fund. Information provided in this report should not be considered a recommendation to purchase or sell securities.
A Note about Risk: See Notes to Financial Statements for a discussion of investment risks. For a more detailed discussion of the risks associated with the Funds, please see each Fund’s prospectus.
Mutual funds are not insured by the FDIC, are not deposits or other obligations of, or guaranteed by, banks, and are subject to investment risks including possible loss of principal amount invested.
3
Classic Stock Fund (formerly, Large Cap Core Fund)
Investment Comparison
Below is a comparison of a $10,000 investment in Class A shares with the same investment in the Russell 1000® Index and the S&P 500® Index, assuming reinvestment of all dividends and distributions. The performance of other classes will be greater than or less than the performance shown in the graph below due to different sales loads and expenses applicable to such classes. The graph and performance table below do not reflect the deduction of taxes that a shareholder would pay on fund distributions or the redemption of fund shares. Past performance is no guarantee of future results.
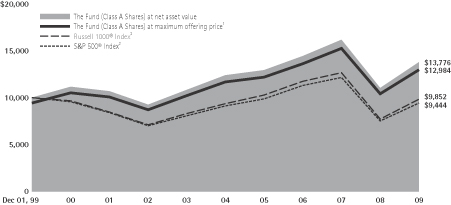
Average Annual Total Returns at Maximum Applicable
Sales Charge for the Periods Ended November 30, 2009
| | | | | | | | |
| | | 1 Year | | 5 Years | | 10 Years | | Life of Class |
Class A3 | | 17.63% | | 0.94% | | 2.65% | | – |
Class B4 | | 20.04% | | 1.30% | | 2.73% | | – |
Class C5 | | 24.08% | | 1.48% | | 2.62% | | – |
Class F6 | | 25.19% | | – | | – | | -7.63% |
Class I7 | | 25.28% | | 2.50% | | 3.57% | | – |
Class P7 | | 24.75% | | 2.04% | | 3.22% | | – |
Class R28 | | 25.03% | | – | | – | | -7.68% |
Class R39 | | 24.70% | | – | | – | | -7.97% |
1 Reflects the deduction of the maximum initial sales charge of 5.75%.
2 Performance for each unmanaged index does not reflect any fees or expenses. The performance of each index is not necessarily representative of the Fund’s performance.
3 Total return, which is the percentage change in net asset value, after deduction of the maximum initial sales charge of 5.75% applicable to Class A shares, with all dividends and distributions reinvested for the periods shown ended November 30, 2009, is calculated using the SEC-required uniform method to compute such return.
4 Performance reflects the deduction of a CDSC of 4% for 1 year, 1% for 5 years and 0% for 10 years. Class B shares automatically convert to Class A shares after approximately 8 years. (There is no initial sales charge for automatic conversions.) All returns for periods greater than 8 years reflect this conversion.
5 The 1% CDSC for Class C shares normally applies before the first anniversary of the purchase date. Performance is at net asset value.
6 Class F shares commenced operations and performance for the Class began on September 28, 2007. Performance is at net asset value.
7 Performance is at net asset value.
8 Class R2 shares commenced operations and performance for the Class began on September 28, 2007. Performance is at net asset value.
9 Class R3 shares commenced operations and performance for the Class began on September 28, 2007. Performance is at net asset value.
4
Small Cap Value Fund
Investment Comparison
Below is a comparison of a $10,000 investment in Class A shares with the same investment in both the Russell 2000® Value Index and the Russell 2000® Index, assuming reinvestment of all dividends and distributions. The performance of other classes will be greater than or less than the performance shown in the graph below due to different sales loads and expenses applicable to such classes. The graph and performance table below do not reflect the deduction of taxes that a shareholder would pay on fund distributions or the redemption of fund shares. Past performance is no guarantee of future results.
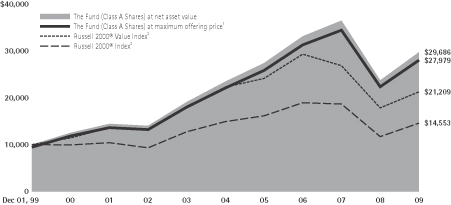
Average Annual Total Returns at Maximum Applicable
Sales Charge for the Periods Ended November 30, 2009
| | | | | | | | |
| | | 1 Year | | 5 Years | | 10 Years | | Life of Class |
Class A3 | | 17.94% | | 3.62% | | 10.84% | | – |
Class B4 | | 20.27% | | 4.01% | | 10.92% | | – |
Class C5 | | 24.29% | | 4.14% | | 10.78% | | – |
Class F6 | | 25.39% | | – | | – | | –9.49% |
Class I7 | | 25.55% | | 5.18% | | 11.88% | | – |
Class P7 | | 24.94% | | 4.72% | | 11.39% | | – |
Class R28 | | 24.77% | | – | | – | | –7.13% |
Class R39 | | 24.94% | | – | | – | | –7.06% |
1 Reflects the deduction of the maximum initial sales charge of 5.75%.
2 Performance for each unmanaged index does not reflect any fees or expenses. The performance of each index is not necessarily representative of the Fund’s performance.
3 Total return, which is the percentage change in net asset value, after deduction of the maximum initial sales charge of 5.75% applicable to Class A shares, with all dividends and distributions reinvested for the periods shown ended November 30, 2009, is calculated using the SEC-required uniform method to compute such return.
4 Performance reflects the deduction of a CDSC of 4% for 1 year, 1% for 5 years and 0% for 10 years. Class B shares automatically convert to Class A shares after approximately 8 years. (There is no initial sales charge for automatic conversions.) All returns for periods greater than 8 years reflect this conversion.
5 The 1% CDSC for Class C shares normally applies before the first anniversary of the purchase date. Performance is at net asset value.
6 Class F shares commenced operations and performance for the Class began on September 28, 2007. Performance is at net asset value.
7 Performance is at net asset value.
8 Class R2 shares commenced operations on March 24, 2008 and performance for the Class began March 31, 2008. Performance is at net asset value.
9 Class R3 shares commenced operations on March 24, 2008 and performance for the Class began March 31, 2008. Performance is at net asset value.
5
Expense Examples
As a shareholder of a Fund, you incur two types of costs: (1) transaction costs, including sales charges (loads) on purchase payments (these charges vary among the share classes); and (2) ongoing costs, including management fees; distribution and service (12b-1) fees (these charges vary among the share classes); and other Fund expenses. This Example is intended to help you understand your ongoing costs (in dollars) of investing in each Fund and to compare these costs with the ongoing costs of investing in other mutual funds.
The Example is based on an investment of $1,000 invested at the beginning of the period and held for the entire period (June 1, 2009 through November 30, 2009).
Actual Expenses
For each class of each Fund, the first line of the applicable table on the following pages provides information about actual account values and actual expenses. You may use the information in this line, together with the amount you invested, to estimate the expenses that you paid over the period. Simply divide your account value by $1,000 (for example, an $8,600 account value divided by $1,000 = 8.6), then multiply the result by the number in the first line under the heading entitled “Expenses Paid During the Period 6/1/09 – 11/30/09” to estimate the expenses you paid on your account during this period.
Hypothetical Example for Comparison Purposes
For each class of each Fund, the second line of the applicable table on the following pages provides information about hypothetical account values and hypothetical expenses based on the Fund’s actual expense ratio and an assumed rate of return of 5% per year before expenses, which is not the Fund’s actual return. The hypothetical account values and expenses may not be used to estimate the actual ending account balance or expenses you paid for the period. You may use this information to compare the ongoing costs of investing in each Fund and other funds. To do so, compare this 5% hypothetical example with the 5% hypothetical examples that appear in the shareholder reports of the other funds.
6
Classic Stock Fund (formerly, Large Cap Core Fund)
Please note that the expenses shown in the table are meant to highlight your ongoing costs only and do not reflect any transactional costs, such as sales charges (loads). Therefore, the second line of the table is useful in comparing ongoing costs only, and will not help you determine the relative total costs of owning different funds. In addition, if these transactional costs were included, your costs would have been higher.
| | | | | | | | | |
| | | Beginning
Account
Value | | Ending
Account
Value | | Expenses
Paid During
Period† |
| | | 6/1/09 | | 11/30/09 | | 6/1/09 - 11/30/09 |
Class A* | | | | | | | | | |
Actual | | $ | 1,000.00 | | $ | 1,161.00 | | $ | 5.58 |
Hypothetical (5% Return Before Expenses) | | $ | 1,000.00 | | $ | 1,019.91 | | $ | 5.22 |
Class B* | | | | | | | | | |
Actual | | $ | 1,000.00 | | $ | 1,157.30 | | $ | 9.09 |
Hypothetical (5% Return Before Expenses) | | $ | 1,000.00 | | $ | 1,016.66 | | $ | 8.49 |
Class C* | | | | | | | | | |
Actual | | $ | 1,000.00 | | $ | 1,157.70 | | $ | 9.09 |
Hypothetical (5% Return Before Expenses) | | $ | 1,000.00 | | $ | 1,016.66 | | $ | 8.49 |
Class F* | | | | | | | | | |
Actual | | $ | 1,000.00 | | $ | 1,162.50 | | $ | 4.23 |
Hypothetical (5% Return Before Expenses) | | $ | 1,000.00 | | $ | 1,021.18 | | $ | 3.95 |
Class I* | | | | | | | | | |
Actual | | $ | 1,000.00 | | $ | 1,163.50 | | $ | 3.69 |
Hypothetical (5% Return Before Expenses) | | $ | 1,000.00 | | $ | 1,021.68 | | $ | 3.45 |
Class P* | | | | | | | | | |
Actual | | $ | 1,000.00 | | $ | 1,160.80 | | $ | 6.12 |
Hypothetical (5% Return Before Expenses) | | $ | 1,000.00 | | $ | 1,019.40 | | $ | 5.72 |
Class R2* | | | | | | | | | |
Actual | | $ | 1,000.00 | | $ | 1,160.70 | | $ | 6.61 |
Hypothetical (5% Return Before Expenses) | | $ | 1,000.00 | | $ | 1,018.97 | | $ | 6.17 |
Class R3* | | | | | | | | | |
Actual | | $ | 1,000.00 | | $ | 1,160.70 | | $ | 6.23 |
Hypothetical (5% Return Before Expenses) | | $ | 1,000.00 | | $ | 1,019.31 | | $ | 5.82 |
| † | | For each class of the Fund, net expenses are equal to the annualized expense ratio for such class (1.03% for Class A, 1.68% for Classes B and C, 0.78% for Class F, 0.68% for Class I, 1.13% for Class P, 1.22% for Class R2 and 1.15% for Class R3) multiplied by the average account value over the period, multiplied by 183/365 (to reflect one-half year period). |
| * | | The annualized expenses of each class have been restated (0.98% for Class A, 1.63% for Classes B and C, 0.73% for Class F, 0.63% for Class I, 1.08% for Class P, 1.22% for Class R2 and 1.13% for Class R3). Had these restated expenses been in place throughout the most recent fiscal half-year, expenses paid during the period would have been: |
| | | | | | |
| | | Actual | | Hypothetical
(5% Return Before Expenses) |
Class A | | $ | 5.31 | | $ | 4.96 |
Class B | | $ | 8.82 | | $ | 8.24 |
Class C | | $ | 8.82 | | $ | 8.24 |
Class F | | $ | 3.96 | | $ | 3.70 |
Class I | | $ | 3.42 | | $ | 3.19 |
Class P | | $ | 5.85 | | $ | 5.47 |
Class R2 | | $ | 6.61 | | $ | 6.17 |
Class R3 | | $ | 6.12 | | $ | 5.72 |
Portfolio Holdings Presented by Sector
November 30, 2009
| | | | | | | | |
| Sector* | | %** | | | | Sector* | | %** |
Consumer Discretionary | | 14.70% | | | | Producer Durables | | 4.81% |
Consumer Staples | | 4.59% | | | | Technology | | 20.31% |
Energy | | 12.49% | | | | Utilities | | 2.24% |
Financial Services | | 20.67% | | | | Short-Term Investment | | 1.08% |
Healthcare | | 10.31% | | | | Total | | 100.00% |
Materials & Processing | | 8.80% | | | | | | |
| * | | A sector may comprise several industries. |
| ** | | Represents percent of total investments. |
7
Small Cap Value Fund
Please note that the expenses shown in the table are meant to highlight your ongoing costs only and do not reflect any transactional costs, such as sales charges (loads). Therefore, the second line of the table is useful in comparing ongoing costs only, and will not help you determine the relative total costs of owning different funds. In addition, if these transactional costs were included, your costs would have been higher.
| | | | | | | | | |
| | | Beginning
Account
Value | | Ending
Account
Value | | Expenses
Paid During
Period† |
| | | 6/1/09 | | 11/30/09 | | 6/1/09 -
11/30/09 |
Class A | | | | | | | | | |
Actual | | $ | 1,000.00 | | $ | 1,135.60 | | $ | 6.53 |
Hypothetical (5% Return Before Expenses) | | $ | 1,000.00 | | $ | 1,018.96 | | $ | 6.17 |
Class B | | | | | | | | | |
Actual | | $ | 1,000.00 | | $ | 1,131.40 | | $ | 10.26 |
Hypothetical (5% Return Before Expenses) | | $ | 1,000.00 | | $ | 1,015.43 | | $ | 9.70 |
Class C | | | | | | | | | |
Actual | | $ | 1,000.00 | | $ | 1,131.80 | | $ | 10.26 |
Hypothetical (5% Return Before Expenses) | | $ | 1,000.00 | | $ | 1,015.43 | | $ | 9.70 |
Class F | | | | | | | | | |
Actual | | $ | 1,000.00 | | $ | 1,137.20 | | $ | 5.46 |
Hypothetical (5% Return Before Expenses) | | $ | 1,000.00 | | $ | 1,019.96 | | $ | 5.17 |
Class I | | | | | | | | | |
Actual | | $ | 1,000.00 | | $ | 1,137.40 | | $ | 4.93 |
Hypothetical (5% Return Before Expenses) | | $ | 1,000.00 | | $ | 1,020.46 | | $ | 4.66 |
Class P | | | | | | | | | |
Actual | | $ | 1,000.00 | | $ | 1,134.70 | | $ | 7.33 |
Hypothetical (5% Return Before Expenses) | | $ | 1,000.00 | | $ | 1,018.20 | | $ | 6.93 |
Class R2 | | | | | | | | | |
Actual | | $ | 1,000.00 | | $ | 1,134.00 | | $ | 8.08 |
Hypothetical (5% Return Before Expenses) | | $ | 1,000.00 | | $ | 1,017.52 | | $ | 7.64 |
Class R3 | | | | | | | | | |
Actual | | $ | 1,000.00 | | $ | 1,134.80 | | $ | 7.60 |
Hypothetical (5% Return Before Expenses) | | $ | 1,000.00 | | $ | 1,017.96 | | $ | 7.18 |
| † | | For each class of the Fund, net expenses are equal to the annualized expense ratio for such class (1.22% for Class A, 1.92% for Classes B and C, 1.02% for Class F, 0.92% for Class I, 1.37% for Class P, 1.51% for Class R2 and 1.42% for Class R3), multiplied by the average account value over the period, multiplied by 183/365 (to reflect one-half year period). |
Portfolio Holdings Presented by Sector
November 30, 2009
| | | | | | | | |
| Sector* | | %** | | | | Sector* | | %** |
Consumer Discretionary | | 10.09% | | | | Producer Durables | | 27.27% |
Consumer Staples | | 3.15% | | | | Technology | | 7.45% |
Energy | | 5.30% | | | | Utilities | | 2.24% |
Financial Services | | 17.41% | | | | Short-Term Investment | | 2.42% |
Healthcare | | 8.13% | | | | Total | | 100.00% |
Materials & Processing | | 16.54% | | | | | | |
| * | | A sector may comprise several industries. |
| ** | | Represents percent of total investments. |
8
Schedule of Investments
CLASSIC STOCK FUND (formerly, Large Cap Core Fund) November 30, 2009
| | | | | |
| Investments | | Shares | | Value
(000) |
| COMMON STOCKS 98.68% |
|
| Aerospace 0.79% |
| Boeing Co. (The) | | 10,596 | | $ | 555 |
| United Technologies Corp. | | 111,200 | | | 7,477 |
| | | | | |
| Total | | | | | 8,032 |
| | | | | |
|
| Asset Management & Custodian 3.42% |
| BlackRock, Inc. | | 19,400 | | | 4,405 |
| Franklin Resources, Inc. | | 51,000 | | | 5,510 |
| State Street Corp. | | 321,100 | | | 13,261 |
| T. Rowe Price Group, Inc. | | 235,600 | | | 11,528 |
| | | | | |
| Total | | | | | 34,704 |
| | | | | |
|
| Banks: Diversified 7.25% |
| Bank of America Corp. | | 1,490,848 | | | 23,630 |
| Fifth Third Bancorp | | 725,800 | | | 7,316 |
| PNC Financial Services Group, Inc. (The) | | 230,800 | | | 13,158 |
| Regions Financial Corp. | | 335,300 | | | 1,965 |
| SunTrust Banks, Inc. | | 128,200 | | | 3,029 |
| U.S. Bancorp | | 350,400 | | | 8,455 |
| Wells Fargo & Co. | | 568,500 | | | 15,941 |
| | | | | |
| Total | | | | | 73,494 |
| | | | | |
|
| Beverage: Soft Drinks 1.40% |
| Coca-Cola Co. (The) | | 143,600 | | | 8,214 |
| PepsiCo, Inc. | | 96,300 | | | 5,992 |
| | | | | |
| Total | | | | | 14,206 |
| | | | | |
|
| Biotechnology 2.59% |
| Amgen, Inc.* | | 229,700 | | | 12,944 |
| Baxter International, Inc. | | 50,587 | | | 2,760 |
| Celgene Corp.* | | 91,700 | | | 5,085 |
| Genzyme Corp.* | | 77,200 | | | 3,914 |
| Myriad Genetics, Inc.* | | 69,400 | | | 1,605 |
| | | | | |
| Total | | | | | 26,308 |
| | | | | |
|
| Casinos & Gambling 0.68% |
| International Game Technology | | 365,200 | | | 6,899 |
| | | | | |
| | | | | |
| Investments | | Shares | | Value
(000) |
| Chemical: Diversified 2.16% |
| Celanese Corp. Series A | | 164,100 | | $ | 4,884 |
| Dow Chemical Co. (The) | | 471,500 | | | 13,098 |
| E.I. du Pont de Nemours & Co. | | 113,500 | | | 3,925 |
| | | | | |
| Total | | | | | 21,907 |
| | | | | |
|
| Commercial Services 0.16% |
| Monster Worldwide, Inc.* | | 111,400 | | | 1,628 |
| | | | | |
|
| Communications Technology 3.01% |
| Cisco Systems, Inc.* | | 667,700 | | | 15,624 |
| QUALCOMM, Inc. | | 331,300 | | | 14,908 |
| | | | | |
| Total | | | | | 30,532 |
| | | | | |
|
| Computer Services, Software & Systems 6.76% |
| Adobe Systems, Inc.* | | 429,653 | | | 15,072 |
| Google, Inc. Class A* | | 40,500 | | | 23,611 |
| Microsoft Corp. | | 784,000 | | | 23,057 |
| Shanda Games Ltd. ADR* | | 62,300 | | | 638 |
| VMware, Inc. Class A* | | 145,900 | | | 6,125 |
| | | | | |
| Total | | | | | 68,503 |
| | | | | |
|
| Computer Technology 5.30% |
| Apple, Inc.* | | 132,400 | | | 26,468 |
| Dell, Inc.* | | 172,500 | | | 2,436 |
| EMC Corp.* | | 493,600 | | | 8,307 |
| Hewlett-Packard Co. | | 336,413 | | | 16,504 |
| | | | | |
| Total | | | | | 53,715 |
| | | | | |
|
| Copper 0.84% |
| Freeport-McMoRan Copper & Gold, Inc.* | | 102,565 | | | 8,492 |
| | | | | |
|
| Diversified Financial Services 7.52% |
| Bank of New York Mellon Corp. (The) | | 108,818 | | | 2,899 |
| Capital One Financial Corp. | | 261,700 | | | 10,039 |
| Goldman Sachs Group, Inc. (The) | | 138,100 | | | 23,430 |
See Notes to Financial Statements.
9
Schedule of Investments (continued)
CLASSIC STOCK FUND (formerly, Large Cap Core Fund) November 30, 2009
| | | | | |
| Investments | | Shares | | Value
(000) |
| Diversified Financial Services (continued) |
| JPMorgan Chase & Co. | | 576,428 | | $ | 24,492 |
| Morgan Stanley | | 488,300 | | | 15,420 |
| | | | | |
| Total | | | | | 76,280 |
| | | | | |
|
| Diversified Manufacturing Operations 1.56% |
| Eaton Corp. | | 76,800 | | | 4,907 |
| General Electric Co. | | 320,100 | | | 5,128 |
| Honeywell International, Inc. | | 151,500 | | | 5,828 |
| | | | | |
| Total | | | | | 15,863 |
| | | | | |
|
| Diversified Media 0.62% |
| Time Warner, Inc. | | 203,800 | | | 6,261 |
| | | | | |
|
| Diversified Retail 3.78% |
| J.C. Penney Co., Inc. | | 202,500 | | | 5,820 |
| Kohl’s Corp.* | | 199,900 | | | 10,623 |
| Macy’s, Inc. | | 98,700 | | | 1,610 |
| Target Corp. | | 355,300 | | | 16,543 |
| Wal-Mart Stores, Inc. | | 69,300 | | | 3,780 |
| | | | | |
| Total | | | | | 38,376 |
| | | | | |
|
| Drug & Grocery Store Chains 0.27% |
| CVS Caremark Corp. | | 89,448 | | | 2,774 |
| | | | | |
|
| Electronic Components 0.51% |
| Corning, Inc. | | 310,203 | | | 5,174 |
| | | | | |
|
| Electronic Entertainment 1.45% |
| Activision Blizzard, Inc.* | | 1,055,126 | | | 12,018 |
| Electronic Arts, Inc.* | | 156,300 | | | 2,640 |
| | | | | |
| Total | | | | | 14,658 |
| | | | | |
|
| Entertainment 0.73% |
| Walt Disney Co. (The) | | 243,837 | | | 7,369 |
| | | | | |
|
| Fertilizers 3.37% |
| Monsanto Co. | | 271,300 | | | 21,907 |
| Potash Corp. of Saskatchewan, Inc. (Canada)(a) | | 109,500 | | | 12,310 |
| | | | | |
| Total | | | | | 34,217 |
| | | | | |
| | | | | |
| Investments | | Shares | | Value
(000) |
| Financial Data & Systems 0.33% |
| MasterCard, Inc. Class A | | 13,900 | | $ | 3,348 |
| | | | | |
| | |
| Foods 0.67% | | | | | |
| Kellogg Co. | | 51,800 | | | 2,724 |
| Kraft Foods, Inc. Class A | | 151,300 | | | 4,022 |
| | | | | |
| Total | | | | | 6,746 |
| | | | | |
|
| Gold 1.13% |
| Barrick Gold Corp. (Canada)(a) | | 267,500 | | | 11,420 |
| | | | | |
|
| Healthcare Services 1.25% |
| Express Scripts, Inc.* | | 132,900 | | | 11,403 |
| Medco Health Solutions, Inc.* | | 20,902 | | | 1,320 |
| | | | | |
| Total | | | | | 12,723 |
| | | | | |
|
| Hotel/Motel 3.46% |
| Hyatt Hotels Corp. Class A* | | 49,639 | | | 1,427 |
| Marriott International, Inc. Class A | | 562,378 | | | 14,464 |
| Starwood Hotels & Resorts Worldwide, Inc. | | 213,800 | | | 6,846 |
| Wynn Resorts Ltd.* | | 190,800 | | | 12,314 |
| | | | | |
| Total | | | | | 35,051 |
| | | | | |
|
| Insurance: Life 0.56% |
| Prudential Financial, Inc. | | 114,500 | | | 5,708 |
| | | | | |
|
| Insurance: Multi-Line 0.94% |
| MetLife, Inc. | | 278,900 | | | 9,536 |
| | | | | |
|
| Leisure Time 1.20% |
| Carnival Corp. Unit* | | 318,300 | | | 10,195 |
| Royal Caribbean Cruises Ltd.* | | 79,100 | | | 1,943 |
| | | | | |
| Total | | | | | 12,138 |
| | | | | |
|
| Medical & Dental Instruments & Supplies 0.24% |
| St. Jude Medical, Inc.* | | 66,900 | | | 2,456 |
| | | | | |
See Notes to Financial Statements.
10
Schedule of Investments (continued)
CLASSIC STOCK FUND (formerly, Large Cap Core Fund) November 30, 2009
| | | | | |
| Investments | | Shares | | Value
(000) |
| Medical Services 0.38% |
| Quest Diagnostics, Inc. | | 65,856 | | $ | 3,816 |
| | | | | |
|
| Metal Fabricating 0.88% |
| Precision Castparts Corp. | | 85,900 | | | 8,906 |
| | | | | |
|
| Oil: Crude Producers 3.83% |
| Apache Corp. | | 76,600 | | | 7,298 |
| Continental Resources, Inc.* | | 81,200 | | | 3,057 |
| Devon Energy Corp. | | 71,561 | | | 4,820 |
| EOG Resources, Inc. | | 60,200 | | | 5,207 |
| Occidental Petroleum Corp. | | 84,900 | | | 6,859 |
| Petrohawk Energy Corp.* | | 80,700 | | | 1,803 |
| Range Resources Corp. | | 37,600 | | | 1,772 |
| Southwestern Energy Co.* | | 84,600 | | | 3,719 |
| XTO Energy, Inc. | | 100,350 | | | 4,259 |
| | | | | |
| Total | | | | | 38,794 |
| | | | | |
|
| Oil: Integrated 6.53% |
| Chevron Corp. | | 125,400 | | | 9,786 |
| ConocoPhillips | | 87,300 | | | 4,520 |
| Exxon Mobil Corp. | | 258,015 | | | 19,369 |
| Hess Corp. | | 216,300 | | | 12,537 |
| Marathon Oil Corp. | | 35,800 | | | 1,168 |
| Suncor Energy, Inc. (Canada)(a) | | 323,393 | | | 11,710 |
| Weatherford International Ltd. (Switzerland)*(a) | | 428,400 | | | 7,154 |
| | | | | |
| Total | | | | | 66,244 |
| | | | | |
|
| Oil Well Equipment & Services 2.10% |
| Schlumberger Ltd. | | 274,400 | | | 17,531 |
| Smith International, Inc. | | 139,300 | | | 3,786 |
| | | | | |
| Total | | | | | 21,317 |
| | | | | |
|
| Personal Care 2.01% |
| Colgate-Palmolive Co. | | 93,055 | | | 7,834 |
| Procter & Gamble Co. (The) | | 201,497 | | | 12,563 |
| | | | | |
| Total | | | | | 20,397 |
| | | | | |
| | | | | |
| Investments | | Shares | | Value
(000) |
| Pharmaceuticals 5.82% |
| Abbott Laboratories | | 198,800 | | $ | 10,833 |
| Gilead Sciences, Inc.* | | 150,924 | | | 6,950 |
| Johnson & Johnson | | 203,200 | | | 12,769 |
| Merck & Co., Inc. | | 377,100 | | | 13,655 |
| Pfizer, Inc. | | 567,600 | | | 10,313 |
| Vertex Pharmaceuticals, Inc.* | | 116,100 | | | 4,507 |
| | | | | |
| Total | | | | | 59,027 |
| | | | | |
|
| Railroads 1.30% |
| Union Pacific Corp. | | 208,800 | | | 13,209 |
| | | | | |
|
| Real Estate Investment Trusts 0.59% |
| Host Hotels & Resorts, Inc. | | 570,600 | | | 6,003 |
| | | | | |
| | |
| Restaurants 0.27% | | | | | |
| Darden Restaurants, Inc. | | 86,200 | | | 2,709 |
| | | | | |
|
| Scientific Instruments: Control & Filter 0.76% |
| Parker Hannifin Corp. | | 142,300 | | | 7,678 |
| | | | | |
|
| Scientific Instruments: Electrical 0.22% |
| Emerson Electric Co. | | 52,878 | | | 2,190 |
| | | | | |
|
| Semiconductors & Components 2.93% |
| Broadcom Corp. Class A* | | 116,100 | | | 3,390 |
| Intel Corp. | | 726,700 | | | 13,953 |
| Micron Technology, Inc.* | | 720,900 | | | 5,421 |
| Taiwan Semiconductor Manufacturing Co., Ltd. ADR | | 258,988 | | | 2,691 |
| Texas Instruments, Inc. | | 166,200 | | | 4,203 |
| | | | | |
| Total | | | | | 29,658 |
| | | | | |
|
| Specialty Retail 3.44% |
| Bed Bath & Beyond, Inc.* | | 120,800 | | | 4,513 |
| Best Buy Co., Inc. | | 240,200 | | | 10,288 |
| Dick’s Sporting Goods, Inc.* | | 532,508 | | | 11,055 |
| Home Depot, Inc. (The) | | 329,700 | | | 9,021 |
| | | | | |
| Total | | | | | 34,877 |
| | | | | |
See Notes to Financial Statements.
11
Schedule of Investments (concluded)
CLASSIC STOCK FUND (formerly, Large Cap Core Fund) November 30, 2009
| | | | | |
| Investments | | Shares | |
Value
(000) |
| Steel 0.40% |
| United States Steel Corp. | | 90,400 | | $ | 4,037 |
| | | | | |
|
| Telecommunications Equipment 0.31% |
| Nokia Corp. ADR | | 236,500 | | | 3,136 |
| | | | | |
|
| Textiles Apparel & Shoes 0.49% |
| Coach, Inc. | | 144,044 | | | 5,006 |
| | | | | |
|
| Tobacco 0.23% |
| Altria Group, Inc. | | 124,200 | | | 2,336 |
| | | | | |
|
| Utilities: Electrical 0.85% |
| Dominion Resources, Inc. | | 86,800 | | | 3,158 |
| FPL Group, Inc. | | 61,232 | | | 3,182 |
| Progress Energy, Inc. | | 58,000 | | | 2,267 |
| | | | | |
| Total | | | | | 8,607 |
| | | | | |
|
| Utilities: Telecommunications 1.39% |
| AT&T, Inc. | | 367,802 | | | 9,909 |
| Verizon Communications, Inc. | | 132,300 | | | 4,162 |
| | | | | |
| Total | | | | | 14,071 |
| | | | | |
| Total Common Stocks (cost $876,185,564) | | | | | 1,000,536 |
| | | | | |
| | | | | | |
| Investments | | Principal
Amount
(000) | | Value
(000) |
| SHORT-TERM INVESTMENT 1.07% |
|
| Repurchase Agreement |
| Repurchase Agreement dated 11/30/2009, 0.01% due 12/1/2009 with State Street Bank & Trust Co. collateralized by $11,115,000 of U.S. Treasury Bill at 0.21% due 3/18/2010; value: $11,112,777; proceeds: $10,892,405 (cost $10,892,402) | | $ | 10,892 | | $ | 10,892 |
| | | | | | |
| Total Investments in Securities 99.75% (cost $887,077,966) | | | | | | 1,011,428 |
| | | | | | |
| Other Assets in Excess of Liabilities 0.25% | | | | | | 2,519 |
| | | | | | |
| Net Assets 100.00% | | | | | $ | 1,013,947 |
| | | | | | |
| ADR | | American Depositary Receipt. |
| Unit | | More than one class of securities traded together. |
| * | | Non-income producing security. |
| (a) | | Foreign security traded in U.S. dollars. |
See Notes to Financial Statements.
12
Schedule of Investments
SMALL CAP VALUE FUND November 30, 2009
| | | | | |
| Investments | | Shares | | Value
(000) |
| COMMON STOCKS 98.11% |
|
| Aerospace 3.34% |
| AAR Corp.* | | 988,564 | | $ | 18,447 |
| Curtiss-Wright Corp. | | 1,975,407 | | | 56,220 |
| Moog, Inc. Class A* | | 931,162 | | | 24,592 |
| | | | | |
| Total | | | | | 99,259 |
| | | | | |
|
| Air Transportation 2.71% |
| Atlas Air Worldwide Holdings, Inc.* | | 1,028,400 | | | 30,132 |
| Bristow Group, Inc.* | | 1,470,644 | | | 50,473 |
| | | | | |
| Total | | | | | 80,605 |
| | | | | |
|
| Auto Parts 1.65% |
| Autoliv, Inc. (Sweden)(a) | | 448,500 | | | 18,214 |
| WABCO Holdings, Inc. | | 1,307,100 | | | 30,887 |
| | | | | |
| Total | | | | | 49,101 |
| | | | | |
|
| Auto Services 1.05% |
| Cooper Tire & Rubber Co. | | 1,749,100 | | | 31,344 |
| | | | | |
|
| Banks: Diversified 7.13% |
| BancorpSouth, Inc. | | 495,000 | | | 11,484 |
| City National Corp. | | 747,600 | | | 29,500 |
| Columbia Banking System, Inc. | | 1,151,700 | | | 16,895 |
| Cullen/Frost Bankers, Inc. | | 370,500 | | | 17,791 |
| Danvers Bancorp, Inc.(b) | | 1,146,500 | | | 15,489 |
| First Horizon National Corp.* | | 492,972 | | | 6,680 |
| PacWest Bancorp | | 1,395,900 | | | 25,685 |
| Signature Bank* | | 784,374 | | | 24,300 |
| SVB Financial Group* | | 666,200 | | | 25,222 |
| Texas Capital Bancshares, Inc.* | | 1,638,454 | | | 23,790 |
| Whitney Holding Corp. | | 1,900,183 | | | 15,297 |
| | | | | |
| Total | | | | | 212,133 |
| | | | | |
| | | | | |
| Investments | | Shares | | Value
(000) |
| Banks: Savings, Thrift & Mortgage Lending 1.33% |
| Washington Federal, Inc. | | 2,072,900 | | $ | 39,489 |
| | | | | |
|
| Biotechnology 0.35% |
| Cypress Bioscience, Inc.*(b) | | 1,982,600 | | | 10,508 |
| | | | | |
|
| Building Materials 1.47% |
| Louisiana-Pacific Corp.* | | 2,652,800 | | | 16,554 |
| Quanex Building Products Corp. | | 1,681,763 | | | 27,261 |
| | | | | |
| Total | | | | | 43,815 |
| | | | | |
|
| Building: Roofing, Wallboard & Plumbing 0.20% |
| Beacon Roofing Supply, Inc.* | | 383,890 | | | 5,900 |
| | | | | |
|
| Chemical: Diversified 1.88% |
| Arch Chemicals, Inc. | | 936,959 | | | 25,120 |
| Cabot Corp. | | 1,342,200 | | | 30,777 |
| | | | | |
| Total | | | | | 55,897 |
| | | | | |
|
| Chemical: Specialty 0.43% |
| Polypore International, Inc.* | | 1,078,658 | | | 12,696 |
| | | | | |
|
| Commercial Finance & Mortgage Companies 2.00% |
| Financial Federal Corp.(b) | | 2,193,548 | | | 59,445 |
| | | | | |
|
| Commercial Services 2.12% |
| MAXIMUS, Inc. | | 695,600 | | | 32,338 |
| TrueBlue, Inc.*(b) | | 2,529,500 | | | 30,759 |
| | | | | |
| Total | | | | | 63,097 |
| | | | | |
|
| Commercial Services: Rental & Leasing 1.83% |
| GATX Corp. | | 1,293,450 | | | 37,342 |
| United Rentals, Inc.* | | 1,838,400 | | | 16,950 |
| | | | | |
| Total | | | | | 54,292 |
| | | | | |
See Notes to Financial Statements.
13
Schedule of Investments (continued)
SMALL CAP VALUE FUND November 30, 2009
| | | | | |
| Investments | | Shares | | Value
(000) |
| Communications Technology 3.09% |
| Anixter International, Inc.* | | 853,302 | | $ | 36,880 |
| Comtech Telecommunications Corp.* | | 615,256 | | | 17,682 |
| QLogic Corp.* | | 2,085,500 | | | 37,414 |
| | | | | |
| Total | | | | | 91,976 |
| | | | | |
|
| Computer Services, Software & Systems 1.01% |
| Rovi Corp.* | | 1,005,124 | | | 29,963 |
| | | | | |
|
| Construction 1.99% |
| Chicago Bridge & Iron Co. NV (Netherlands)(a) | | 2,269,500 | | | 39,921 |
| Granite Construction, Inc. | | 644,100 | | | 19,304 |
| | | | | |
| Total | | | | | 59,225 |
| | | | | |
|
| Consumer Lending 0.46% |
| MGIC Investment Corp.* | | 3,393,300 | | | 13,573 |
| | | | | |
|
| Containers & Packaging 2.60% |
| AptarGroup, Inc. | | 705,331 | | | 25,477 |
| Greif, Inc. Class A | | 594,387 | | | 33,202 |
| Silgan Holdings, Inc. | | 350,277 | | | 18,764 |
| | | | | |
| Total | | | | | 77,443 |
| | | | | |
|
| Diversified Manufacturing Operations 1.17% |
| A. M. Castle & Co. | | 1,015,711 | | | 13,306 |
| Carlisle Cos., Inc. | | 665,770 | | | 21,378 |
| | | | | |
| Total | | | | | 34,684 |
| | | | | |
|
| Diversified Materials & Processing 4.64% |
| Hexcel Corp.*(b) | | 5,818,312 | | | 61,383 |
| Koppers Holdings, Inc.(b) | | 1,271,100 | | | 35,909 |
| Rogers Corp.*(b) | | 1,447,735 | | | 40,768 |
| | | | | |
| Total | | | | | 138,060 |
| | | | | |
|
| Diversified Retail 1.87% |
| Big Lots, Inc.* | | 1,402,800 | | | 32,349 |
| MSC Industrial Direct Co., Inc. Class A | | 436,100 | | | 20,017 |
| | | | | |
| Investments | | Shares | | Value
(000) |
| Rush Enterprises, Inc. Class A* | | 300,000 | | $ | 3,231 |
| | | | | |
| Total | | | | | 55,597 |
| | | | | |
|
| Drug & Grocery Store Chains 0.36% |
| Susser Holdings Corp.*(b) | | 1,014,652 | | | 10,755 |
| | | | | |
|
| Electronic Components 0.91% |
| ScanSource, Inc.* | | 1,168,299 | | | 27,186 |
| | | | | |
| | |
| Electronics 0.66% | | | | | |
| II-VI, Inc.* | | 690,000 | | | 19,651 |
| | | | | |
|
| Financial Data & Systems 1.02% |
| Jack Henry & Associates, Inc. | | 1,326,700 | | | 30,315 |
| | | | | |
|
| Foods 2.81% |
| Herbalife Ltd. | | 664,500 | | | 27,869 |
| NBTY, Inc.* | | 1,385,183 | | | 55,601 |
| | | | | |
| Total | | | | | 83,470 |
| | | | | |
|
| Forms & Bulk Printing Services 0.25% |
| Bowne & Co., Inc. | | 1,214,500 | | | 7,360 |
| | | | | |
|
| Healthcare Management Services 2.14% |
| Centene Corp.* | | 1,608,700 | | | 30,276 |
| Healthspring, Inc.* | | 2,019,000 | | | 33,435 |
| | | | | |
| Total | | | | | 63,711 |
| | | | | |
|
| Healthcare Services 2.15% |
| Gentiva Health Services, Inc.* | | 1,230,600 | | | 29,104 |
| Odyssey HealthCare, Inc.*(b) | | 2,393,066 | | | 34,771 |
| | | | | |
| Total | | | | | 63,875 |
| | | | | |
|
| Insurance: Multi-Line 1.14% |
| Max Capital Group Ltd. | | 1,553,080 | | | 33,842 |
| | | | | |
|
| Insurance: Property-Casualty 1.72% |
| Navigators Group, Inc. (The)* | | 450,700 | | | 21,007 |
See Notes to Financial Statements.
14
Schedule of Investments (continued)
SMALL CAP VALUE FUND November 30, 2009
| | | | | |
| Investments | | Shares | | Value
(000) |
| Insurance: Property-Casualty (continued) |
| Zenith National Insurance Corp. | | 1,056,700 | | $ | 30,211 |
| | | | | |
| Total | | | | | 51,218 |
| | | | | |
|
| Luxury Items 1.52% |
| Fossil, Inc.* | | 1,465,959 | | | 45,225 |
| | | | | |
|
| Machinery: Industrial 2.76% |
| EnPro Industries, Inc.*(b) | | 1,055,900 | | | 24,222 |
| Kennametal, Inc. | | 1,506,800 | | | 33,903 |
| Nordson Corp. | | 241,212 | | | 12,931 |
| Woodward Governor Co. | | 476,800 | | | 11,090 |
| | | | | |
| Total | | | | | 82,146 |
| | | | | |
|
| Medical & Dental Instruments & Supplies 2.77% |
| Cooper Cos., Inc. (The) | | 898,000 | | | 30,074 |
| Invacare Corp. | | 1,234,101 | | | 30,729 |
| Teleflex, Inc. | | 412,614 | | | 21,493 |
| | | | | |
| Total | | | | | 82,296 |
| | | | | |
|
| Medical Equipment 0.76% |
| Greatbatch, Inc.*(b) | | 1,234,800 | | | 22,708 |
| | | | | |
|
| Metal Fabricating 3.31% |
| Kaydon Corp. | | 604,300 | | | 21,489 |
| Reliance Steel & Aluminum Co. | | 1,422,600 | | | 58,156 |
| RTI International Metals, Inc.* | | 942,000 | | | 18,661 |
| | | | | |
| Total | | | | | 98,306 |
| | | | | |
|
| Metals & Minerals: Diversified 0.15% |
| Brush Engineered Materials, Inc.* | | 247,623 | | | 4,383 |
| | | | | |
|
| Oil: Crude Producers 2.56% |
| Arena Resources, Inc.* | | 634,700 | | | 25,953 |
| Comstock Resources, Inc.* | | 638,400 | | | 23,704 |
| Forest Oil Corp.* | | 782,200 | | | 14,330 |
| | | | | |
| Investments | | Shares | | Value
(000) |
| Goodrich Petroleum Corp.* | | 542,823 | | $ | 12,013 |
| | | | | |
| Total | | | | | 76,000 |
| | | | | |
|
| Oil Well Equipment & Services 2.77% |
| Key Energy Services, Inc.* | | 3,169,500 | | | 24,152 |
| Lufkin Industries, Inc. | | 442,399 | | | 26,619 |
| Superior Energy Services, Inc.* | | 1,500,098 | | | 31,712 |
| | | | | |
| Total | | | | | 82,483 |
| | | | | |
|
| Paints & Coatings 0.92% |
| Ferro Corp.(b) | | 4,213,300 | | | 27,260 |
| | | | | |
|
| Railroads 1.96% |
| Genesee & Wyoming, Inc. Class A* | | 815,826 | | | 25,389 |
| Kansas City Southern* | | 1,149,400 | | | 32,907 |
| | | | | |
| Total | | | | | 58,296 |
| | | | | |
|
| Real Estate Investment Trusts 1.95% |
| Alexandria Real Estate Equities, Inc. | | 555,600 | | | 31,319 |
| Entertainment Properties Trust | | 840,700 | | | 26,558 |
| | | | | |
| Total | | | | | 57,877 |
| | | | | |
|
| Scientific Instruments: Control & Filter 1.39% |
| Donaldson Co., Inc. | | 546,800 | | | 23,239 |
| Robbins & Myers, Inc. | | 785,000 | | | 18,047 |
| | | | | |
| Total | | | | | 41,286 |
| | | | | |
|
| Scientific Instruments: Electrical 2.63% |
| Baldor Electric Co. | | 1,934,998 | | | 49,826 |
| Littelfuse, Inc.* | | 1,083,461 | | | 28,365 |
| | | | | |
| Total | | | | | 78,191 |
| | | | | |
|
| Scientific Instruments: Gauges & Meters 0.13% |
| Itron, Inc.* | | 64,167 | | | 3,901 |
| | | | | |
|
| Scientific Instruments: Pollution Control 0.29% |
| Waste Connections, Inc.* | | 269,018 | | | 8,730 |
| | | | | |
See Notes to Financial Statements.
15
Schedule of Investments (concluded)
SMALL CAP VALUE FUND November 30, 2009
| | | | | |
| Investments | | Shares | | Value
(000) |
| Securities Brokerage & Services 0.76% |
| KBW, Inc.* | | 914,100 | | $ | 22,478 |
| | | | | |
|
| Shipping 2.20% |
| Kirby Corp.* | | 1,295,600 | | | 43,208 |
| UTi Worldwide, Inc. | | 1,712,200 | | | 22,378 |
| | | | | |
| Total | | | | | 65,586 |
| | | | | |
|
| Specialty Retail 4.05% |
| AnnTaylor Stores Corp.* | | 1,019,700 | | | 14,255 |
| Children’s Place Retail Stores, Inc. (The)* | | 800,500 | | | 25,552 |
| Dress Barn, Inc. (The)* | | 1,847,561 | | | 39,667 |
| Genesco, Inc.* | | 682,294 | | | 17,835 |
| Gymboree Corp. (The)* | | 335,524 | | | 13,394 |
| Pacific Sunwear of California, Inc.* | | 2,894,300 | | | 9,667 |
| | | | | |
| Total | | | | | 120,370 |
| | | | | |
|
| Steel 1.04% |
| Commercial Metals Co. | | 1,280,000 | | | 20,352 |
| Schnitzer Steel Industries, Inc. Class A | | 234,250 | | | 10,452 |
| | | | | |
| Total | | | | | 30,804 |
| | | | | |
|
| Technology: Miscellaneous 1.46% |
| Plexus Corp.* | | 1,597,954 | | | 43,400 |
| | | | | |
|
| Telecommunications Equipment 0.36% |
| Arris Group, Inc.* | | 1,063,400 | | | 10,623 |
| | | | | |
|
| Transportation: Miscellaneous 1.06% |
| Hub Group, Inc. Class A* | | 1,189,705 | | | 31,468 |
| | | | | |
|
| Truckers 1.58% |
| Heartland Express, Inc. | | 2,617,514 | | | 38,608 |
| Knight Transportation, Inc. | | 501,000 | | | 8,522 |
| | | | | |
| Total | | | | | 47,130 |
| | | | | |
| | | | | | | |
| Investments | | Shares | | Value
(000) | |
| Utilities: Electrical 1.06% | |
| Otter Tail Corp. | | | 1,375,000 | | $ | 31,666 | |
| | | | | | | |
|
| Utilities: Gas Distributors 1.19% | |
| New Jersey Resources Corp. | | | 466,800 | | | 16,445 | |
| Northwest Natural Gas Co. | | | 174,460 | | | 7,481 | |
| UGI Corp. | | | 487,200 | | | 11,439 | |
| | | | | | | |
| Total | | | | | | 35,365 | |
| | | | | | | |
| Total Common Stocks (cost $2,674,179,355) | | | | | | 2,917,463 | |
| | | | | | | |
| | |
| | | Principal
Amount
(000) | | | |
| SHORT-TERM INVESTMENT 2.43% | |
|
| Repurchase Agreement | |
| Repurchase Agreement dated 11/30/2009, 0.01% due 12/1/2009 with State Street Bank & Trust Co. collateralized by $73,780,000 of U.S. Treasury Bill at 0.21% due 3/18/2010; value: $73,765,244; proceeds: $72,314,385 (cost $72,314,365) | | $ | 72,314 | | | 72,314 | |
| | | | | | | |
| Total Investments in Securities 100.54% (cost $2,746,493,720) | | | | | | 2,989,777 | |
| | | | | | | |
| Liabilities in Excess of Other Assets (0.54%) | | | | | | (16,042 | ) |
| | | | | | | |
| Net Assets 100.00% | | | | | $ | 2,973,735 | |
| | | | | | | |
| * | | Non-income producing security. |
| (a) | | Foreign security traded in U.S. dollars. |
| (b) | | Affiliated issuer (holding represents 5% or more of the underlying issuer’s outstanding voting shares). (See Note 10). |
See Notes to Financial Statements.
16
Statements of Assets and Liabilities
November 30, 2009
| | | | | | | | |
| | | Classic Stock Fund* | | | Small Cap
Value Fund | |
ASSETS: | | | | | | | | |
Investments in unaffiliated issuers, at cost | | $ | 887,077,966 | | | $ | 2,340,500,937 | |
Investments in affiliated issuers, at cost | | | – | | | | 405,992,783 | |
Investments in unaffiliated issuers, at value | | $ | 1,011,428,159 | | | $ | 2,615,799,775 | |
Investments in affiliated issuers, at value | | | – | | | | 373,977,780 | |
Receivables: | | | | | | | | |
Interest and dividends | | | 2,640,044 | | | | 2,316,019 | |
Investment securities sold | | | 712,376 | | | | 1,122,135 | |
Capital shares sold | | | 1,437,332 | | | | 1,215,247 | |
From advisor (See Note 3) | | | 251,629 | | | | – | |
Prepaid expenses and other assets | | | 75,541 | | | | 117,221 | |
Total assets | | | 1,016,545,081 | | | | 2,994,548,177 | |
LIABILITIES: | | | | | | | | |
Payables: | | | | | | | | |
Investment securities purchased | | | – | | | | 11,800,235 | |
Capital shares reacquired | | | 1,278,404 | | | | 5,165,493 | |
Management fee | | | 564,736 | | | | 1,805,431 | |
12b-1 distribution fees | | | 280,277 | | | | 600,233 | |
Directors’ fees | | | 102,177 | | | | 346,059 | |
Fund administration | | | 32,348 | | | | 98,620 | |
To affiliates (See Note 3) | | | 27,592 | | | | 23,247 | |
Accrued expenses and other liabilities | | | 312,603 | | | | 973,991 | |
Total liabilities | | | 2,598,137 | | | | 20,813,309 | |
NET ASSETS | | $ | 1,013,946,944 | | | $ | 2,973,734,868 | |
COMPOSITION OF NET ASSETS: | | | | | | | | |
Paid-in capital | | $ | 1,008,026,100 | | | $ | 3,353,911,651 | |
Undistributed (distributions in excess of) net investment income | | | 6,184,524 | | | | (346,059 | ) |
Accumulated net realized loss on investments and foreign currency related transactions | | | (124,613,845 | ) | | | (623,114,559 | ) |
Net unrealized appreciation on investments and translation of assets and liabilities denominated in foreign currencies | | | 124,350,165 | | | | 243,283,835 | |
Net Assets | | $ | 1,013,946,944 | | | $ | 2,973,734,868 | |
| * | Formerly, Large Cap Core Fund |
See Notes to Financial Statements.
17
Statements of Assets and Liabilities (concluded)
November 30, 2009
| | | | | | |
| | | Classic
Stock Fund* | | Small Cap
Value Fund |
Net assets by class: | | | | | | |
Class A Shares | | $ | 595,557,336 | | $ | 1,393,870,100 |
Class B Shares | | $ | 46,266,669 | | $ | 15,917,021 |
Class C Shares | | $ | 89,787,282 | | $ | 46,275,295 |
Class F Shares | | $ | 10,723,256 | | $ | 22,387,336 |
Class I Shares | | $ | 264,418,062 | | $ | 1,231,290,872 |
Class P Shares | | $ | 4,225,999 | | $ | 261,913,716 |
Class R2 Shares | | $ | 729,943 | | $ | 85,692 |
Class R3 Shares | | $ | 2,238,397 | | $ | 1,994,836 |
Outstanding shares by class: | | | | | | |
Class A Shares (200 million and 300 million shares of common stock authorized, respectively, $.001 par value) | | | 23,071,019 | | | 60,938,757 |
Class B Shares (30 million shares of common stock authorized per Fund, $.001 par value) | | | 1,882,017 | | | 796,953 |
Class C Shares (20 million shares of common stock authorized per Fund, $.001 par value) | | | 3,640,977 | | | 2,312,274 |
Class F Shares (30 million shares of common stock authorized per Fund, $.001 par value) | | | 416,223 | | | 982,030 |
Class I Shares (30 million and 200 million shares of common stock authorized, respectively, $.001 par value) | | | 10,208,456 | | | 50,943,991 |
Class P Shares (20 million and 50 million shares of common stock authorized, respectively, $.001 par value) | | | 163,133 | | | 11,559,331 |
Class R2 Shares (30 million shares of common stock authorized per Fund, $.001 par value) | | | 28,312 | | | 3,763 |
Class R3 Shares (30 million shares of common stock authorized per Fund, $.001 par value) | | | 87,314 | | | 87,773 |
Net asset value, offering and redemption price per share
(Net assets divided by outstanding shares): | | | | | | |
Class A Shares-Net asset value | | | $25.81 | | | $22.87 |
Class A shares-Maximum offering price
(Net asset value plus sales charge of 5.75%) | | | $27.38 | | | $24.27 |
Class B Shares-Net asset value | | | $24.58 | | | $19.97 |
Class C Shares-Net asset value | | | $24.66 | | | $20.01 |
Class F Shares-Net asset value | | | $25.76 | | | $22.80 |
Class I Shares-Net asset value | | | $25.90 | | | $24.17 |
Class P Shares-Net asset value | | | $25.91 | | | $22.66 |
Class R2 Shares-Net asset value | | | $25.78 | | | $22.77 |
Class R3 Shares-Net asset value | | | $25.64 | | | $22.73 |
| * | Formerly, Large Cap Core Fund |
See Notes to Financial Statements.
18
Statements of Operations
For the Year Ended November 30, 2009
| | | | | | | | |
| | | Classic Stock
Fund* | | | Small Cap
Value Fund | |
Investment income: | | | | | | | | |
Dividends from unaffiliated issuers (net of foreign withholding taxes of $70,074 and $0, respectively) | | $ | 16,955,924 | | | $ | 27,264,718 | |
Dividends from affiliated issuers | | | – | | | | 3,470,592 | |
Interest | | | 1,227 | | | | 3,287 | |
Total investment income | | | 16,957,151 | | | | 30,738,597 | |
Expenses: | | | | | | | | |
Management fee | | | 5,985,432 | | | | 19,592,452 | |
12b-1 distribution plan-Class A | | | 1,819,710 | | | | 3,796,573 | |
12b-1 distribution plan-Class B | | | 425,648 | | | | 192,696 | |
12b-1 distribution plan-Class C | | | 732,400 | | | | 448,198 | |
12b-1 distribution plan-Class F | | | 7,038 | | | | 15,293 | |
12b-1 distribution plan-Class P | | | 18,443 | | | | 1,078,536 | |
12b-1 distribution plan-Class R2 | | | 1,564 | | | | 186 | |
12b-1 distribution plan-Class R3 | | | 4,160 | | | | 7,505 | |
Shareholder servicing | | | 1,487,196 | | | | 3,307,261 | |
Professional | | | 52,498 | | | | 73,043 | |
Reports to shareholders | | | 81,619 | | | | 194,634 | |
Fund administration | | | 342,082 | | | | 1,062,518 | |
Custody | | | 16,689 | | | | 33,699 | |
Directors’ fees | | | 34,177 | | | | 106,710 | |
Registration | | | 119,635 | | | | 162,572 | |
Subsidy (See Note 3) | | | 543,169 | | | | 359,470 | |
Other | | | 32,116 | | | | 97,739 | |
Gross expenses | | | 11,703,576 | | | | 30,529,085 | |
Expense reductions (See Note 8) | | | (2,376 | ) | | | (7,436 | ) |
Expenses reimbursed by advisor (See Note 3) | | | (1,852,869 | ) | | | – | |
Net expenses | | | 9,848,331 | | | | 30,521,649 | |
Net investment income | | | 7,108,820 | | | | 216,948 | |
Net realized and unrealized gain (loss): | | | | | | | | |
Net realized loss on investments and foreign currency related transactions in unaffiliated issuers | | | (98,307,655 | ) | | | (381,367,305 | ) |
Net realized loss from investments in affiliated issuers | | | – | | | | (44,328,934 | ) |
Net change in unrealized appreciation/depreciation on investments and translation of assets and liabilities denominated in foreign currencies | | | 290,175,757 | | | | 1,032,699,640 | |
Net realized and unrealized gain | | | 191,868,102 | | | | 607,003,401 | |
Net Increase in Net Assets Resulting From Operations | | $ | 198,976,922 | | | $ | 607,220,349 | |
| *Formerly, | Large Cap Core Fund |
See Notes to Financial Statements.
19
Statements of Changes in Net Assets
| | | | | | | | |
| | | Classic Stock Fund* | |
| INCREASE (DECREASE) IN NET ASSETS | | For the Year Ended
November 30, 2009 | | | For the Year Ended
November 30, 2008 | |
Operations: | |
Net investment income | | $ | 7,108,820 | | | $ | 7,672,170 | |
Net realized loss on investments and foreign currency related transactions | | | (98,307,655 | ) | | | (25,113,558 | ) |
Net change in unrealized appreciation/depreciation on investments and translation of assets and liabilities denominated in foreign currencies | | | 290,175,757 | | | | (342,198,180 | ) |
Net increase (decrease) in net assets resulting from operations | | | 198,976,922 | | | | (359,639,568 | ) |
Distributions to shareholders from: | |
Net investment income | | | | | | | | |
Class A | | | (5,401,756 | ) | | | (3,155,079 | ) |
Class B | | | (94,166 | ) | | | – | |
Class C | | | (213,419 | ) | | | (213 | ) |
Class F | | | (35,711 | ) | | | (75 | ) |
Class I | | | (2,611,149 | ) | | | (1,788,108 | ) |
Class P | | | (42,070 | ) | | | (27,794 | ) |
Class R2 | | | (92 | ) | | | (62 | ) |
Class R3 | | | (4,089 | ) | | | (65 | ) |
Net realized gain | | | | | | | | |
Class A | | | – | | | | (45,902,460 | ) |
Class B | | | – | | | | (5,038,767 | ) |
Class C | | | – | | | | (6,414,106 | ) |
Class F | | | – | | | | (641 | ) |
Class I | | | – | | | | (14,754,489 | ) |
Class P | | | – | | | | (467,166 | ) |
Class R2 | | | – | | | | (636 | ) |
Class R3 | | | – | | | | (636 | ) |
Total distributions to shareholders | | | (8,402,452 | ) | | | (77,550,297 | ) |
Capital share transactions (Net of share conversions) (See Note 13): | |
Net proceeds from sales of shares | | | 242,152,444 | | | | 240,750,598 | |
Reinvestment of distributions | | | 8,077,468 | | | | 73,284,004 | |
Cost of shares reacquired | | | (211,925,344 | ) | | | (196,584,191 | ) |
Net increase in net assets resulting from capital share transactions | | | 38,304,568 | | | | 117,450,411 | |
Net increase (decrease) in net assets | | | 228,879,038 | | | | (319,739,454 | ) |
NET ASSETS: | |
Beginning of year | | $ | 785,067,906 | | | $ | 1,104,807,360 | |
End of year | | $ | 1,013,946,944 | | | $ | 785,067,906 | |
Undistributed net investment income | | $ | 6,184,524 | | | $ | 7,476,830 | |
| * | Formerly, Large Cap Core Fund |
See Notes to Financial Statements.
20
Statements of Changes in Net Assets (concluded)
| | | | | | | | |
| | | Small Cap Value Fund | |
| INCREASE (DECREASE) IN NET ASSETS | | For the Year Ended
November 30, 2009 | | | For the Year Ended
November 30, 2008 | |
Operations: | | | | | | | | |
Net investment income | | $ | 216,948 | | | $ | 8,365,255 | |
Net realized loss on investments in affiliated and unaffiliated issuers | | | (425,696,239 | ) | | | (193,928,539 | ) |
Net change in unrealized appreciation/depreciation on investments | | | 1,032,699,640 | | | | (1,200,260,791 | ) |
Net increase (decrease) in net assets resulting from operations | | | 607,220,349 | | | | (1,385,824,075 | ) |
Distributions to shareholders from: | | | | | | | | |
Net investment income | | | | | | | | |
Class A | | | (3,137,149 | ) | | | (2,398,135 | ) |
Class B | | | – | | | | – | |
Class C | | | – | | | | – | |
Class F | | | (9,246 | ) | | | (40 | ) |
Class I | | | (6,356,879 | ) | | | (5,001,838 | ) |
Class P | | | (167,693 | ) | | | – | |
Class R2 | | | (33 | ) | | | – | |
Class R3 | | | (6,917 | ) | | | – | |
Net realized gain | | | | | | | | |
Class A | | | – | | | | (329,757,267 | ) |
Class B | | | – | | | | (9,462,347 | ) |
Class C | | | – | | | | (13,963,606 | ) |
Class F | | | – | | | | (1,441 | ) |
Class I | | | – | | | | (171,217,383 | ) |
Class P | | | – | | | | (60,147,299 | ) |
Class R2 | | | – | | | | – | |
Class R3 | | | – | | | | – | |
Total distributions to shareholders | | | (9,677,917 | ) | | | (591,949,356 | ) |
Capital share transactions (Net of share conversions) (See Note 13): | |
Net proceeds from sales of shares | | | 543,109,742 | | | | 1,077,676,982 | |
Reinvestment of distributions | | | 8,991,931 | | | | 545,622,341 | |
Cost of shares reacquired | | | (637,215,260 | ) | | | (1,202,896,823 | ) |
Cost of redemption in-kind (See Note 6) | | | – | | | | (53,360,378 | ) |
Net increase (decrease) in net assets resulting from capital share transactions | | | (85,113,587 | ) | | | 367,042,122 | |
Net increase (decrease) in net assets | | | 512,428,845 | | | | (1,610,731,309 | ) |
NET ASSETS: | | | | | | | | |
Beginning of year | | $ | 2,461,306,023 | | | $ | 4,072,037,332 | |
End of year | | $ | 2,973,734,868 | | | $ | 2,461,306,023 | |
Undistributed (distributions in excess of) net investment income | | $ | (346,059 | ) | | $ | 7,996,182 | |
See Notes to Financial Statements.
21
Financial Highlights
CLASSIC STOCK FUND (formerly, Large Cap Core Fund)
| | | | | | | | | | | | | | | |
| | | Class A Shares | |
| | | Year Ended 11/30 | |
| | | 2009 | | | 2008 | | | 2007 | | | 2006 | | | 2005 | |
Per Share Operating Performance | | | | | | | | | | | | | | | |
Net asset value, beginning of year | | $20.90 | | | $32.95 | | | $30.64 | | | $28.66 | | | $28.42 | |
| | | | | | | | | | | | | | | |
| | | | | |
Investment operations: | | | | | | | | | | | | | | | |
| | | | | |
Net investment income(a) | | .18 | | | .21 | | | .16 | | | .18 | | | .15 | |
| | | | | |
Net realized and unrealized gain (loss) | | 4.95 | | | (9.98 | ) | | 3.40 | | | 3.00 | | | 1.10 | |
| | | | | | | | | | | | | | | |
| | | | | |
Total from investment operations | | 5.13 | | | (9.77 | ) | | 3.56 | | | 3.18 | | | 1.25 | |
| | | | | | | | | | | | | | | |
| | | | | |
Distributions to shareholders from: | | | | | | | | | | | | | | | |
| | | | | |
Net investment income | | (.22 | ) | | (.15 | ) | | (.17 | ) | | (.10 | ) | | (.17 | ) |
| | | | | |
Net realized gain | | – | | | (2.13 | ) | | (1.08 | ) | | (1.10 | ) | | (.84 | ) |
| | | | | | | | | | | | | | | |
| | | | | |
Total distributions | | (.22 | ) | | (2.28 | ) | | (1.25 | ) | | (1.20 | ) | | (1.01 | ) |
| | | | | | | | | | | | | | | |
Net asset value, end of year | | $25.81 | | | $20.90 | | | $32.95 | | | $30.64 | | | $28.66 | |
| | | | | | | | | | | | | | | |
| | | | | |
Total Return(b) | | 24.84 | % | | (31.78 | )% | | 12.05 | % | | 11.50 | % | | 4.49 | % |
| | | | | |
Ratios to Average Net Assets: | | | | | | | | | | | | | | | |
| | | | | |
Expenses, excluding expense reductions and including expenses reimbursed | | 1.15 | % | | 1.30 | % | | 1.30 | % | | 1.30 | % | | 1.30 | % |
| | | | | |
Expenses, including expense reductions and expenses reimbursed | | 1.15 | % | | 1.30 | % | | 1.30 | % | | 1.30 | % | | 1.30 | % |
| | | | | |
Expenses, excluding expense reductions and expenses reimbursed | | 1.37 | % | | 1.33 | % | | 1.31 | % | | 1.33 | % | | 1.32 | % |
| | | | | |
Net investment income | | .84 | % | | .77 | % | | .50 | % | | .63 | % | | .53 | % |
| | | | | |
| Supplemental Data: | | | | | | | | | | | | | | | |
Net assets, end of year (000) | | $595,557 | | | $494,847 | | | $707,266 | | | $645,539 | | | $523,322 | |
| | | | | |
Portfolio turnover rate | | 55.20 | % | | 36.96 | % | | 44.97 | % | | 39.51 | % | | 44.86 | % |
| (a) | | Calculated using average shares outstanding during the year. |
| (b) | | Total return does not consider the effects of sales loads and assumes the reinvestment of all distributions. |
See Notes to Financial Statements.
22
Financial Highlights (continued)
CLASSIC STOCK FUND (formerly, Large Cap Core Fund)
| | | | | | | | | | | | | | | |
| | | Class B Shares | |
| | | Year Ended 11/30 | |
| | | 2009 | | | 2008 | | | 2007 | | | 2006 | | | 2005 | |
Per Share Operating Performance | |
Net asset value, beginning of year | | $19.86 | | | $31.47 | | | $29.34 | | | $27.56 | | | $27.38 | |
| | | | | | | | | | | | | | | |
|
Investment operations: | |
| | | | | |
Net investment income (loss)(a) | | .04 | | | .03 | | | (.05 | ) | | (.01 | ) | | (.03 | ) |
| | | | | |
Net realized and unrealized gain (loss) | | 4.72 | | | (9.51 | ) | | 3.26 | | | 2.89 | | | 1.05 | |
| | | | | | | | | | | | | | | |
| | | | | |
Total from investment operations | | 4.76 | | | (9.48 | ) | | 3.21 | | | 2.88 | | | 1.02 | |
| | | | | | | | | | | | | | | |
|
Distributions to shareholders from: | |
| | | | | |
Net investment income | | (.04 | ) | | – | | | – | | | – | | | – | (b) |
| | | | | |
Net realized gain | | – | | | (2.13 | ) | | (1.08 | ) | | (1.10 | ) | | (.84 | ) |
| | | | | | | | | | | | | | | |
| | | | | |
Total distributions | | (.04 | ) | | (2.13 | ) | | (1.08 | ) | | (1.10 | ) | | (.84 | ) |
| | | | | | | | | | | | | | | |
Net asset value, end of year | | $24.58 | | | $19.86 | | | $31.47 | | | $29.34 | | | $27.56 | |
| | | | | | | | | | | | | | | |
| | | | | |
Total Return(c) | | 24.04 | % | | (32.23 | )% | | 11.29 | % | | 10.80 | % | | 3.78 | % |
|
Ratios to Average Net Assets: | |
| | | | | |
Expenses, excluding expense reductions and including expenses reimbursed | | 1.80 | % | | 1.95 | % | | 1.95 | % | | 1.95 | % | | 1.95 | % |
| | | | | |
Expenses, including expense reductions and expenses reimbursed | | 1.80 | % | | 1.95 | % | | 1.95 | % | | 1.95 | % | | 1.95 | % |
| | | | | |
Expenses, excluding expense reductions and expenses reimbursed | | 2.02 | % | | 1.98 | % | | 1.96 | % | | 1.98 | % | | 1.97 | % |
| | | | | |
Net investment income (loss) | | .19 | % | | .11 | % | | (.15 | )% | | (.02 | )% | | (.11 | )% |
|
| Supplemental Data: | |
Net assets, end of year (000) | | $46,267 | | | $43,374 | | | $74,005 | | | $78,277 | | | $81,373 | |
| | | | | |
Portfolio turnover rate | | 55.20 | % | | 36.96 | % | | 44.97 | % | | 39.51 | % | | 44.86 | % |
| (a) | | Calculated using average shares outstanding during the year. |
| (b) | | Amount is less than $.01. |
| (c) | | Total return does not consider the effects of sales loads and assumes the reinvestment of all distributions. |
See Notes to Financial Statements.
23
Financial Highlights (continued)
CLASSIC STOCK FUND (formerly, Large Cap Core Fund)
| | | | | | | | | | | | | | | |
| | | Class C Shares | |
| | | Year Ended 11/30 | |
| | | 2009 | | | 2008 | | | 2007 | | | 2006 | | | 2005 | |
Per Share Operating Performance | |
Net asset value, beginning of year | | $19.94 | | | $31.59 | | | $29.44 | | | $27.66 | | | $27.47 | |
| | | | | | | | | | | | | | | |
|
Investment operations: | |
| | | | | |
Net investment income (loss)(a) | | .04 | | | .03 | | | (.05 | ) | | – | (b) | | (.03 | ) |
| | | | | |
Net realized and unrealized gain (loss) | | 4.74 | | | (9.55 | ) | | 3.28 | | | 2.88 | | | 1.06 | |
| | | | | | | | | | | | | | | |
| | | | | |
Total from investment operations | | 4.78 | | | (9.52 | ) | | 3.23 | | | 2.88 | | | 1.03 | |
| | | | | | | | | | | | | | | |
|
Distributions to shareholders from: | |
| | | | | |
Net investment income | | (.06 | ) | | – | (b) | | – | | | – | | | – | (b) |
| | | | | |
Net realized gain | | – | | | (2.13 | ) | | (1.08 | ) | | (1.10 | ) | | (.84 | ) |
| | | | | | | | | | | | | | | |
| | | | | |
Total distributions | | (.06 | ) | | (2.13 | ) | | (1.08 | ) | | (1.10 | ) | | (.84 | ) |
| | | | | | | | | | | | | | | |
Net asset value, end of year | | $24.66 | | | $19.94 | | | $31.59 | | | $29.44 | | | $27.66 | |
| | | | | | | | | | | | | | | |
| | | | | |
Total Return(c) | | 24.08 | % | | (32.24 | )% | | 11.32 | % | | 10.76 | % | | 3.81 | % |
|
Ratios to Average Net Assets: | |
| | | | | |
Expenses, excluding expense reductions and including expenses reimbursed | | 1.80 | % | | 1.95 | % | | 1.95 | % | | 1.95 | % | | 1.95 | % |
| | | | | |
Expenses, including expense reductions and expenses reimbursed | | 1.80 | % | | 1.95 | % | | 1.95 | % | | 1.95 | % | | 1.95 | % |
| | | | | |
Expenses, excluding expense reductions and expenses reimbursed | | 2.02 | % | | 1.98 | % | | 1.96 | % | | 1.98 | % | | 1.97 | % |
| | | | | |
Net investment income (loss) | | .18 | % | | .12 | % | | (.15 | )% | | (.02 | )% | | (.12 | )% |
|
| Supplemental Data: | |
Net assets, end of year (000) | | $89,787 | | | $65,200 | | | $94,948 | | | $86,535 | | | $73,328 | |
| | | | | |
Portfolio turnover rate | | 55.20 | % | | 36.96 | % | | 44.97 | % | | 39.51 | % | | 44.86 | % |
| (a) | | Calculated using average shares outstanding during the year. |
| (b) | | Amount is less than $.01. |
| (c) | | Total return does not consider the effects of sales loads and assumes the reinvestment of all distributions. |
See Notes to Financial Statements.
24
Financial Highlights (continued)
CLASSIC STOCK FUND (formerly, Large Cap Core Fund)
| | | | | | | | | |
| | | Class F Shares | |
| | | Year Ended 11/30 | | | 9/28/2007(a)
to
11/30/2007 | |
| | | 2009 | | | 2008 | | |
Per Share Operating Performance | | | | | | | | | |
Net asset value, beginning of period | | $20.88 | | | $32.96 | | | $33.52 | |
| | | | | | | | | |
| | | |
Investment operations: | | | | | | | | | |
| | | |
Net investment income(b) | | .22 | | | .32 | | | .05 | |
| | | |
Net realized and unrealized gain (loss) | | 4.96 | | | (10.02 | ) | | (.61 | ) |
| | | | | | | | | |
| | | |
Total from investment operations | | 5.18 | | | (9.70 | ) | | (.56 | ) |
| | | | | | | | | |
| | | |
Distributions to shareholders from: | | | | | | | | | |
| | | |
Net investment income | | (.30 | ) | | (.25 | ) | | – | |
| | | |
Net realized gain | | – | | | (2.13 | ) | | – | |
| | | | | | | | | |
| | | |
Total distributions | | (.30 | ) | | (2.38 | ) | | – | |
| | | | | | | | | |
Net asset value, end of period | | $25.76 | | | $20.88 | | | $32.96 | |
| | | | | | | | | |
| | | |
Total Return(c) | | 25.19 | % | | (31.64 | )% | | (1.67 | )%(d) |
| | | |
Ratios to Average Net Assets: | | | | | | | | | |
| | | |
Expenses, excluding expense reductions and including expenses reimbursed | | .86 | % | | 1.05 | % | | .18 | %(d) |
| | | |
Expenses, including expense reductions and expenses reimbursed | | .86 | % | | 1.04 | % | | .18 | %(d) |
| | | |
Expenses, excluding expense reductions and expenses reimbursed | | 1.10 | % | | 1.11 | % | | .19 | %(d) |
| | | |
Net investment income | | .96 | % | | 1.25 | % | | .16 | %(d) |
| | | |
| Supplemental Data: | | | | | | | | | |
Net assets, end of period (000) | | $10,723 | | | $2,453 | | | $10 | |
| | | |
Portfolio turnover rate | | 55.20 | % | | 36.96 | % | | 44.97 | % |
| (a) | | Commencement of investment operations was 9/28/2007, SEC effective date was 9/14/2007 and date shares first became available to the public was 10/1/2007. |
| (b) | | Calculated using average shares outstanding during the period. |
| (c) | | Total return assumes the reinvestment of all distributions. |
See Notes to Financial Statements.
25
Financial Highlights (continued)
CLASSIC STOCK FUND (formerly, Large Cap Core Fund)
| | | | | | | | | | | | | | | |
| | | Class I Shares | |
| | | Year Ended 11/30 | |
| | | 2009 | | | 2008 | | | 2007 | | | 2006 | | | 2005 | |
Per Share Operating Performance | | | | | | | | | | | | | | | |
Net asset value, beginning of year | | $20.99 | | | $33.08 | | | $30.76 | | | $28.74 | | | $28.50 | |
| | | | | | | | | | | | | | | |
| | | | | |
Investment operations: | | | | | | | | | | | | | | | |
| | | | | |
Net investment income(a) | | .26 | | | .31 | | | .26 | | | .29 | | | .24 | |
| | | | | |
Net realized and unrealized gain (loss) | | 4.96 | | | (10.01 | ) | | 3.41 | | | 3.01 | | | 1.11 | |
| | | | | | | | | | | | | | | |
| | | | | |
Total from investment operations | | 5.22 | | | (9.70 | ) | | 3.67 | | | 3.30 | | | 1.35 | |
| | | | | | | | | | | | | | | |
Distributions to shareholders from: | | | | | | | | | | | | | | | |
| | | | | |
Net investment income | | (.31 | ) | | (.26 | ) | | (.27 | ) | | (.18 | ) | | (.27 | ) |
| | | | | |
Net realized gain | | – | | | (2.13 | ) | | (1.08 | ) | | (1.10 | ) | | (.84 | ) |
| | | | | | | | | | | | | | | |
| | | | | |
Total distributions | | (.31 | ) | | (2.39 | ) | | (1.35 | ) | | (1.28 | ) | | (1.11 | ) |
| | | | | | | | | | | | | | | |
Net asset value, end of year | | $25.90 | | | $20.99 | | | $33.08 | | | $30.76 | | | $28.74 | |
| | | | | | | | | | | | | | | |
| | | | | |
Total Return(b) | | 25.28 | % | | (31.53 | )% | | 12.40 | % | | 11.92 | % | | 4.83 | % |
| | | | | |
Ratios to Average Net Assets: | | | | | | | | | | | | | | | |
| | | | | |
Expenses, excluding expense reductions and including expenses reimbursed | | .79 | % | | .95 | % | | .95 | % | | .95 | % | | .95 | % |
| | | | | |
Expenses, including expense reductions and expenses reimbursed | | .79 | % | | .95 | % | | .95 | % | | .95 | % | | .95 | % |
| | | | | |
Expenses, excluding expense reductions and expenses reimbursed | | 1.01 | % | | .98 | % | | .96 | % | | .98 | % | | .98 | % |
| | | | | |
Net investment income | | 1.17 | % | | 1.13 | % | | .84 | % | | .99 | % | | .84 | % |
| | | | | |
| Supplemental Data: | | | | | | | | | | | | | | | |
Net assets, end of year (000) | | $264,418 | | | $174,231 | | | $221,345 | | | $202,879 | | | $135,677 | |
| | | | | |
Portfolio turnover rate | | 55.20 | % | | 36.96 | % | | 44.97 | % | | 39.51 | % | | 44.86 | % |
| (a) | | Calculated using average shares outstanding during the year. |
| (b) | | Total return assumes the reinvestment of all distributions. |
See Notes to Financial Statements.
26
Financial Highlights (continued)
CLASSIC STOCK FUND (formerly, Large Cap Core Fund)
| | | | | | | | | | | | | | | |
| | | Class P Shares | |
| | | Year Ended 11/30 | |
| | | 2009 | | | 2008 | | | 2007 | | | 2006 | | | 2005 | |
Per Share Operating Performance | |
Net asset value, beginning of year | | $20.96 | | | $33.05 | | | $30.65 | | | $28.70 | | | $28.50 | |
| | | | | | | | | | | | | | | |
| | | | | |
Investment operations: | | | | | | | | | | | | | | | |
| | | | | |
Net investment income(a) | | .17 | | | .18 | | | .12 | | | .15 | | | .10 | |
| | | | | |
Net realized and unrealized gain (loss) | | 4.97 | | | (10.01 | ) | | 3.42 | | | 3.01 | | | 1.12 | |
| | | | | | | | | | | | | | | |
| | | | | |
Total from investment operations | | 5.14 | | | (9.83 | ) | | 3.54 | | | 3.16 | | | 1.22 | |
| | | | | | | | | | | | | | | |
| | | | | |
Distributions to shareholders from: | | | | | | | | | | | | | | | |
| | | | | |
Net investment income | | (.19 | ) | | (.13 | ) | | (.06 | ) | | (.11 | ) | | (.18 | ) |
| | | | | |
Net realized gain | | – | | | (2.13 | ) | | (1.08 | ) | | (1.10 | ) | | (.84 | ) |
| | | | | | | | | | | | | | | |
| | | | | |
Total distributions | | (.19 | ) | | (2.26 | ) | | (1.14 | ) | | (1.21 | ) | | (1.02 | ) |
| | | | | | | | | | | | | | | |
Net asset value, end of year | | $25.91 | | | $20.96 | | | $33.05 | | | $30.65 | | | $28.70 | |
| | | | | | | | | | | | | | | |
| | | | | |
Total Return(b) | | 24.75 | % | | (31.85 | )% | | 11.93 | % | | 11.40 | % | | 4.38 | % |
| | | | | |
Ratios to Average Net Assets: | | | | | | | | | | | | | | | |
| | | | | |
Expenses, excluding expense reductions and including expenses reimbursed | | 1.27 | % | | 1.40 | % | | 1.40 | % | | 1.40 | % | | 1.40 | % |
| | | | | |
Expenses, including expense reductions and expenses reimbursed | | 1.27 | % | | 1.40 | % | | 1.40 | % | | 1.40 | % | | 1.40 | % |
| | | | | |
Expenses, excluding expense reductions and expenses reimbursed | | 1.47 | % | | 1.43 | % | | 1.41 | % | | 1.43 | % | | 1.43 | % |
| | | | | |
Net investment income | | .76 | % | | .66 | % | | .38 | % | | .53 | % | | .37 | % |
| | | | | |
| Supplemental Data: | | | | | | | | | | | | | | | |
Net assets, end of year (000) | | $4,226 | | | $4,635 | | | $7,214 | | | $7,314 | | | $6,749 | |
| | | | | |
Portfolio turnover rate | | 55.20 | % | | 36.96 | % | | 44.97 | % | | 39.51 | % | | 44.86 | % |
| (a) | | Calculated using average shares outstanding during the year. |
| (b) | | Total return assumes the reinvestment of all distributions. |
See Notes to Financial Statements.
27
Financial Highlights (continued)
CLASSIC STOCK FUND (formerly, Large Cap Core Fund)
| | | | | | | | | |
| | | Class R2 Shares | |
| | | Year Ended 11/30 | | | 9/28/2007(a)
to
11/30/2007 | |
| | | 2009 | | | 2008 | | |
Per Share Operating Performance | | | | | | | | | |
Net asset value, beginning of period | | $20.91 | | | $32.93 | | | $33.52 | |
| | | | | | | | | |
| | | |
Investment operations: | | | | | | | | | |
| | | |
Net investment income(b) | | .12 | | | .28 | | | .03 | |
| | | |
Net realized and unrealized gain (loss) | | 5.04 | | | (9.96 | ) | | (.62 | ) |
| | | | | | | | | |
| | | |
Total from investment operations | | 5.16 | | | (9.68 | ) | | (.59 | ) |
| | | | | | | | | |
| | | |
Distributions to shareholders from: | | | | | | | | | |
| | | |
Net investment income | | (.29 | ) | | (.21 | ) | | – | |
| | | |
Net realized gain | | – | | | (2.13 | ) | | – | |
| | | | | | | | | |
| | | |
Total distributions | | (.29 | ) | | (2.34 | ) | | – | |
| | | | | | | | | |
Net asset value, end of period | | $25.78 | | | $20.91 | | | $32.93 | |
| | | | | | | | | |
| | | |
Total Return(c) | | 25.03 | % | | (31.57 | )% | | (1.76 | )%(d) |
| | | |
Ratios to Average Net Assets: | | | | | | | | | |
| | | |
Expenses, excluding expense reductions and including expenses reimbursed | | 1.21 | % | | 1.04 | % | | .26 | %(d) |
| | | |
Expenses, including expense reductions and expenses reimbursed | | 1.21 | % | | 1.04 | % | | .26 | %(d) |
| | | |
Expenses, excluding expense reductions and expenses reimbursed | | 1.56 | % | | 1.07 | % | | .26 | %(d) |
| | | |
Net investment income | | .50 | % | | 1.04 | % | | .08 | %(d) |
| | | |
| Supplemental Data: | | | | | | | | | |
Net assets, end of period (000) | | $730 | | | $7 | | | $10 | |
| | | |
Portfolio turnover rate | | 55.20 | % | | 36.96 | % | | 44.97 | % |
| (a) | | Commencement of investment operations was 9/28/2007, SEC effective date was 9/14/2007 and date shares first became available to the public was 10/1/2007. |
| (b) | | Calculated using average shares outstanding during the period. |
| (c) | | Total return assumes the reinvestment of all distributions. |
See Notes to Financial Statements.
28
Financial Highlights (concluded)
CLASSIC STOCK FUND (formerly, Large Cap Core Fund)
| | | | | | | | | |
| | | Class R3 Shares | |
| | | Year Ended 11/30 | | | 9/28/2007(a) to
11/30/2007 | |
| | | 2009 | | | 2008 | | |
Per Share Operating Performance | | | | | | | | | |
Net asset value, beginning of period | | $20.82 | | | $32.94 | | | $33.52 | |
| | | | | | | | | |
| | | |
Investment operations: | | | | | | | | | |
| | | |
Net investment income(b) | | .16 | | | .22 | | | .03 | |
| | | |
Net realized and unrealized gain (loss) | | 4.92 | | | (9.99 | ) | | (.61 | ) |
| | | | | | | | | |
| | | |
Total from investment operations | | 5.08 | | | (9.77 | ) | | (.58 | ) |
| | | | | | | | | |
| | | |
Distributions to shareholders from: | | | | | | | | | |
| | | |
Net investment income | | (.26 | ) | | (.22 | ) | | – | |
| | | |
Net realized gain | | – | | | (2.13 | ) | | – | |
| | | | | | | | | |
| | | |
Total distributions | | (.26 | ) | | (2.35 | ) | | – | |
| | | | | | | | | |
Net asset value, end of period | | $25.64 | | | $20.82 | | | $32.94 | |
| | | | | | | | | |
| | | |
Total Return(c) | | 24.70 | % | | (31.86 | )% | | (1.73 | )%(d) |
| | | |
Ratios to Average Net Assets: | | | | | | | | | |
| | | |
Expenses, excluding expense reductions and including expenses reimbursed | | 1.21 | % | | 1.42 | % | | .24 | %(d) |
| | | |
Expenses, including expense reductions and expenses reimbursed | | 1.21 | % | | 1.42 | % | | .24 | %(d) |
| | | |
Expenses, excluding expense reductions and expenses reimbursed | | 1.49 | % | | 1.48 | % | | .25 | %(d) |
| | | |
Net investment income | | .70 | % | | .88 | % | | .10 | %(d) |
| | | |
| Supplemental Data: | | | | | | | | | |
Net assets, end of period (000) | | $2,238 | | | $321 | | | $10 | |
| | | |
Portfolio turnover rate | | 55.20 | % | | 36.96 | % | | 44.97 | % |
| (a) | | Commencement of investment operations was 9/28/2007, SEC effective date was 9/14/2007 and date shares first became available to the public was 10/1/2007. |
| (b) | | Calculated using average shares outstanding during the period. |
| (c) | | Total return assumes the reinvestment of all distributions. |
See Notes to Financial Statements.
29
Financial Highlights
SMALL CAP VALUE FUND
| | | | | | | | | | | | | | | |
| | | Class A Shares | |
| | | Year Ended 11/30 | |
| | | 2009 | | | 2008 | | | 2007 | | | 2006 | | | 2005 | |
Per Share Operating Performance | | | | | | | | | | |
Net asset value, beginning of year | | $18.32 | | | $33.10 | | | $34.60 | | | $31.40 | | | $29.54 | |
| | | | | | | | | | | | | | | |
| | | | | |
Investment operations: | | | | | | | | | | | | | | | |
| | | | | |
Net investment income (loss)(a) | | (.02 | ) | | .04 | | | .04 | | | (.02 | ) | | (.09 | ) |
| | | | | |
Net realized and unrealized gain (loss) | | 4.62 | | | (9.97 | ) | | 2.99 | | | 6.09 | | | 4.60 | |
| | | | | | | | | | | | | | | |
| | | | | |
Total from investment operations | | 4.60 | | | (9.93 | ) | | 3.03 | | | 6.07 | | | 4.51 | |
| | | | | | | | | | | | | | | |
| | | | | |
Distributions to shareholders from: | | | | | | | | | | | | | | | |
| | | | | |
Net investment income | | (.05 | ) | | (.04 | ) | | – | | | – | | | – | |
| | | | | |
Net realized gain | | – | | | (4.81 | ) | | (4.53 | ) | | (2.87 | ) | | (2.65 | ) |
| | | | | | | | | | | | | | | |
| | | | | |
Total distributions | | (.05 | ) | | (4.85 | ) | | (4.53 | ) | | (2.87 | ) | | (2.65 | ) |
| | | | | | | | | | | | | | | |
Net asset value, end of year | | $22.87 | | | $18.32 | | | $33.10 | | | $34.60 | | | $31.40 | |
| | | | | | | | | | | | | | | |
| | | | | |
Total Return(b) | | 25.15 | % | | (34.96 | )% | | 10.08 | % | | 21.14 | % | | 16.78 | % |
| | | | | |
Ratios to Average Net Assets: | | | | | | | | | | | | | | | |
| | | | | |
Expenses, including expense reductions | | 1.24 | % | | 1.23 | % | | 1.23 | % | | 1.23 | % | | 1.31 | % |
| | | | | |
Expenses, excluding expense reductions | | 1.24 | % | | 1.23 | % | | 1.23 | % | | 1.24 | % | | 1.31 | % |
| | | | | |
Net investment income (loss) | | (.08 | )% | | .17 | % | | .13 | % | | (.06 | )% | | (.31 | )% |
| | | | | |
| Supplemental Data: | | | | | | | | | | | | | | | |
Net assets, end of year (000) | | $1,393,870 | | | $1,216,253 | | | $2,287,085 | | | $2,367,218 | | | $1,714,898 | |
| | | | | |
Portfolio turnover rate | | 68.63 | % | | 77.87 | % | | 61.44 | % | | 71.14 | % | | 71.25 | % |
| (a) | | Calculated using average shares outstanding during the year. |
| (b) | | Total return does not consider the effects of sales loads and assumes the reinvestment of all distributions. |
See Notes to Financial Statements.
30
Financial Highlights (continued)
SMALL CAP VALUE FUND
| | | | | | | | | | | | | | | |
| | | Class B Shares | |
| | | Year Ended 11/30 | |
| | | 2009 | | | 2008 | | | 2007 | | | 2006 | | | 2005 | |
Per Share Operating Performance | | | | | | | | | | | | | | | |
Net asset value, beginning of year | | $16.07 | | | $29.78 | | | $31.77 | | | $29.25 | | | $27.87 | |
| | | | | | | | | | | | | | | |
| | | | | |
Investment operations: | | | | | | | | | | | | | | | |
| | | | | |
Net investment loss(a) | | (.12 | ) | | (.12 | ) | | (.17 | ) | | (.23 | ) | | (.27 | ) |
| | | | | |
Net realized and unrealized gain (loss) | | 4.02 | | | (8.78 | ) | | 2.71 | | | 5.62 | | | 4.30 | |
| | | | | | | | | | | | | | | |
| | | | | |
Total from investment operations | | 3.90 | | | (8.90 | ) | | 2.54 | | | 5.39 | | | 4.03 | |
| | | | | | | | | | | | | | | |
| | | | | |
Distributions to shareholders from: | | | | | | | | | | | | | | | |
| | | | | |
Net realized gain | | – | | | (4.81 | ) | | (4.53 | ) | | (2.87 | ) | | (2.65 | ) |
| | | | | | | | | | | | | | | |
Net asset value, end of year | | $19.97 | | | $16.07 | | | $29.78 | | | $31.77 | | | $29.25 | |
| | | | | | | | | | | | | | | |
| | | | | |
Total Return(b) | | 24.27 | % | | (35.41 | )% | | 9.33 | % | | 20.29 | % | | 15.99 | % |
| | | | | |
Ratios to Average Net Assets: | | | | | | | | | | | | | | | |
| | | | | |
Expenses, including expense reductions | | 1.94 | % | | 1.93 | % | | 1.93 | % | | 1.92 | % | | 1.95 | % |
| | | | | |
Expenses, excluding expense reductions | | 1.94 | % | | 1.93 | % | | 1.93 | % | | 1.93 | % | | 1.95 | % |
| | | | | |
Net investment loss | | (.73 | )% | | (.54 | )% | | (.58 | )% | | (.77 | )% | | (1.03 | )% |
| | | | | |
| Supplemental Data: | | | | | | | | | | | | | | | |
Net assets, end of year (000) | | $15,917 | | | $25,955 | | | $58,676 | | | $71,741 | | | $113,208 | |
| | | | | |
Portfolio turnover rate | | 68.63 | % | | 77.87 | % | | 61.44 | % | | 71.14 | % | | 71.25 | % |
| (a) | | Calculated using average shares outstanding during the year. |
| (b) | | Total return does not consider the effects of sales loads and assumes the reinvestment of all distributions. |
See Notes to Financial Statements.
31
Financial Highlights (continued)
SMALL CAP VALUE FUND
| | | | | | | | | | | | | | | |
| | | Class C Shares | |
| | | Year Ended 11/30 | |
| | | 2009 | | | 2008 | | | 2007 | | | 2006 | | | 2005 | |
Per Share Operating Performance | | | | | | | | | | | | | | | |
Net asset value, beginning of year | | $16.10 | | | $29.83 | | | $31.82 | | | $29.29 | | | $27.90 | |
| | | | | | | | | | | | | | | |
| | | | | |
Investment operations: | | | | | | | | | | | | | | | |
| | | | | |
Net investment loss(a) | | (.13 | ) | | (.12 | ) | | (.17 | ) | | (.22 | ) | | (.26 | ) |
| | | | | |
Net realized and unrealized gain (loss) | | 4.04 | | | (8.80 | ) | | 2.71 | | | 5.62 | | | 4.30 | |
| | | | | | | | | | | | | | | |
| | | | | |
Total from investment operations | | 3.91 | | | (8.92 | ) | | 2.54 | | | 5.40 | | | 4.04 | |
| | | | | | | | | | | | | | | |
| | | | | |
Distributions to shareholders from: | | | | | | | | | | | | | | | |
| | | | | |
Net realized gain | | – | | | (4.81 | ) | | (4.53 | ) | | (2.87 | ) | | (2.65 | ) |
| | | | | | | | | | | | | | | |
Net asset value, end of year | | $20.01 | | | $16.10 | | | $29.83 | | | $31.82 | | | $29.29 | |
| | | | | | | | | | | | | | | |
| | | | | |
Total Return(b) | | 24.29 | % | | (35.42 | )% | | 9.32 | % | | 20.30 | % | | 16.01 | % |
| | | | | |
Ratios to Average Net Assets: | | | | | | | | | | | | | | | |
| | | | | |
Expenses, including expense reductions | | 1.94 | % | | 1.93 | % | | 1.93 | % | | 1.93 | % | | 1.95 | % |
| | | | | |
Expenses, excluding expense reductions | | 1.94 | % | | 1.93 | % | | 1.93 | % | | 1.93 | % | | 1.96 | % |
| | | | | |
Net investment loss | | (.77 | )% | | (.53 | )% | | (.58 | )% | | (.76 | )% | | (.99 | )% |
| | | | | |
| Supplemental Data: | | | | | | | | | | | | | | | |
Net assets, end of year (000) | | $46,275 | | | $46,307 | | | $86,971 | | | $91,715 | | | $91,195 | |
| | | | | |
Portfolio turnover rate | | 68.63 | % | | 77.87 | % | | 61.44 | % | | 71.14 | % | | 71.25 | % |
| (a) | | Calculated using average shares outstanding during the year. |
| (b) | | Total return does not consider the effects of sales loads and assumes the reinvestment of all distributions. |
See Notes to Financial Statements.
32
Financial Highlights (continued)
SMALL CAP VALUE FUND
| | | | | | | | | |
| | | Class F Shares | |
| | | Year Ended 11/30 | | | 9/28/2007(a)
to
11/30/2007 | |
| | | 2009 | | | 2008 | | |
Per Share Operating Performance | |
Net asset value, beginning of period | | $18.30 | | | $33.11 | | | $33.61 | |
| | | | | | | | | |
| | | |
Investment operations: | | | | | | | | | |
| | | |
Net investment income (loss)(b) | | – | (c) | | .08 | | | .01 | |
| | | |
Net realized and unrealized gain (loss) | | 4.62 | | | (9.95 | ) | | (.51 | ) |
| | | | | | | | | |
| | | |
Total from investment operations | | 4.62 | | | (9.87 | ) | | (.50 | ) |
| | | | | | | | | |
| | | |
Distributions to shareholders from: | | | | | | | | | |
| | | |
Net investment income | | (.12 | ) | | (.13 | ) | | – | |
| | | |
Net realized gain | | – | | | (4.81 | ) | | – | |
| | | | | | | | | |
| | | |
Total distributions | | (.12 | ) | | (4.94 | ) | | – | |
| | | | | | | | | |
Net asset value, end of period | | $22.80 | | | $18.30 | | | $33.11 | |
| | | | | | | | | |
| | | |
Total Return(d) | | 25.39 | % | | (34.82 | )% | | (1.49 | )%(e) |
| | | |
Ratios to Average Net Assets: | | | | | | | | | |
| | | |
Expenses, including expense reductions | | 1.03 | % | | 1.04 | % | | .18 | %(e) |
| | | |
Expenses, excluding expense reductions | | 1.03 | % | | 1.04 | % | | .18 | %(e) |
| | | |
Net investment income (loss) | | (.02 | )% | | .32 | % | | .04 | %(e) |
| | | |
| Supplemental Data: | | | | | | | | | |
Net assets, end of period (000) | | $22,387 | | | $1,425 | | | $10 | |
| | | |
Portfolio turnover rate | | 68.63 | % | | 77.87 | % | | 61.44 | % |
| (a) | | Commencement of investment operations was 9/28/2007, SEC effective date was 9/14/2007 and date shares first became available to the public was 10/1/2007. |
| (b) | | Calculated using average shares outstanding during the period. |
| (c) | | Amount is less than $.01. |
| (d) | | Total return assumes the reinvestment of all distributions. |
See Notes to Financial Statements.
33
Financial Highlights (continued)
SMALL CAP VALUE FUND
| | | | | | | | | | | | | | | |
| | | Class I Shares | |
| | | Year Ended 11/30 | |
| | | 2009 | | | 2008 | | | 2007 | | | 2006 | | | 2005 | |
Per Share Operating Performance | | | | | | | | | | | | | | | |
Net asset value, beginning of year | | $19.38 | | | $34.75 | | | $36.00 | | | $32.46 | | | $30.36 | |
| | | | | | | | | | | | | | | |
| | | | | |
Investment operations: | | | | | | | | | | | | | | | |
| | | | | |
Net investment income(a) | | .05 | | | .13 | | | .14 | | | .08 | | | .02 | |
| | | | | |
Net realized and unrealized gain (loss) | | 4.87 | | | (10.55 | ) | | 3.14 | | | 6.33 | | | 4.73 | |
| | | | | | | | | | | | | | | |
| | | | | |
Total from investment operations | | 4.92 | | | (10.42 | ) | | 3.28 | | | 6.41 | | | 4.75 | |
| | | | | | | | | | | | | | | |
| | | | | |
Distributions to shareholders from: | | | | | | | | | | | | | | | |
| | | | | |
Net investment income | | (.13 | ) | | (.14 | ) | | — | | | — | | | — | |
| | | | | |
Net realized gain | | — | | | (4.81 | ) | | (4.53 | ) | | (2.87 | ) | | (2.65 | ) |
| | | | | | | | | | | | | | | |
| | | | | |
Total distributions | | (.13 | ) | | (4.95 | ) | | (4.53 | ) | | (2.87 | ) | | (2.65 | ) |
| | | | | | | | | | | | | | | |
Net asset value, end of year | | $24.17 | | | $19.38 | | | $34.75 | | | $36.00 | | | $32.46 | |
| | | | | | | | | | | | | | | |
| | | | | |
Total Return(b) | | 25.55 | % | | (34.77 | )% | | 10.42 | % | | 21.53 | % | | 17.14 | % |
| | | | | |
Ratios to Average Net Assets: | | | | | | | | | | | | | | | |
| | | | | |
Expenses, including expense reductions | | .94 | % | | .93 | % | | .93 | % | | .93 | % | | .96 | % |
| | | | | |
Expenses, excluding expense reductions | | .94 | % | | .93 | % | | .93 | % | | .93 | % | | .96 | % |
| | | | | |
Net investment income | | .21 | % | | .48 | % | | .43 | % | | .25 | % | | .05 | % |
| | | | | |
| Supplemental Data: | | | | | | | | | | | | | | | |
Net assets, end of year (000) | | $1,231,291 | | | $942,604 | | | $1,227,169 | | | $1,045,397 | | | $632,444 | |
| | | | | |
Portfolio turnover rate | | 68.63 | % | | 77.87 | % | | 61.44 | % | | 71.14 | % | | 71.25 | % |
| (a) | | Calculated using average shares outstanding during the year. |
| (b) | | Total return assumes the reinvestment of all distributions. |
See Notes to Financial Statements.
34
Financial Highlights (continued)
SMALL CAP VALUE FUND
| | | | | | | | | | | | | | | |
| | | Class P Shares | |
| | | Year Ended 11/30 | |
| | | 2009 | | | 2008 | | | 2007 | | | 2006 | | | 2005 | |
Per Share Operating Performance | | | | | | | | | | | | | | | |
Net asset value, beginning of year | | $18.15 | | | $32.84 | | | $34.40 | | | $31.28 | | | $29.47 | |
| | | | | | | | | | | | | | | |
| | | | | |
Investment operations: | | | | | | | | | | | | | | | |
| | | | | |
Net investment income (loss)(a) | | (.05 | ) | | .01 | | | (.01 | ) | | (.06 | ) | | (.11 | ) |
| | | | | |
Net realized and unrealized gain (loss) | | 4.57 | | | (9.89 | ) | | 2.98 | | | 6.05 | | | 4.57 | |
| | | | | | | | | | | | | | | |
| | | | | |
Total from investment operations | | 4.52 | | | (9.88 | ) | | 2.97 | | | 5.99 | | | 4.46 | |
| | | | | | | | | | | | | | | |
| | | | | |
Distributions to shareholders from: | | | | | | | | | | | | | | | |
| | | | | |
Net investment income | | (.01 | ) | | — | | | — | | | — | | | — | |
| | | | | |
Net realized gain | | — | | | (4.81 | ) | | (4.53 | ) | | (2.87 | ) | | (2.65 | ) |
| | | | | | | | | | | | | | | |
| | | | | |
Total distributions | | (.01 | ) | | (4.81 | ) | | (4.53 | ) | | (2.87 | ) | | (2.65 | ) |
| | | | | | | | | | | | | | | |
Net asset value, end of year | | $22.66 | | | $18.15 | | | $32.84 | | | $34.40 | | | $31.28 | |
| | | | | | | | | | | | | | | |
| | | | | |
Total Return(b) | | 24.94 | % | | (35.04 | )% | | 9.95 | % | | 20.95 | % | | 16.68 | % |
| | | | | |
Ratios to Average Net Assets: | | | | | | | | | | | | | | | |
| | | | | |
Expenses, including expense reductions | | 1.39 | % | | 1.38 | % | | 1.38 | % | | 1.38 | % | | 1.41 | % |
| | | | | |
Expenses, excluding expense reductions | | 1.39 | % | | 1.38 | % | | 1.38 | % | | 1.38 | % | | 1.41 | % |
| | | | | |
Net investment income (loss) | | (.23 | )% | | .02 | % | | (.03 | )% | | (.20 | )% | | (.39 | )% |
| | | | | |
| Supplemental Data: | | | | | | | | | | | | | | | |
Net assets, end of year (000) | | $261,914 | | | $227,658 | | | $412,127 | | | $447,775 | | | $328,055 | |
| | | | | |
Portfolio turnover rate | | 68.63 | % | | 77.87 | % | | 61.44 | % | | 71.14 | % | | 71.25 | % |
| (a) | | Calculated using average shares outstanding during the year. |
| (b) | | Total return assumes the reinvestment of all distributions. |
See Notes to Financial Statements.
35
Financial Highlights (continued)
SMALL CAP VALUE FUND
| | | | | | |
| | | Class R2 Shares | |
| | | Year Ended
11/30/2009 | | | 3/24/2008 (a)
to
11/30/2008 | |
Per Share Operating Performance | | | | | | |
Net asset value, beginning of period | | $18.29 | | | $25.99 | |
| | | | | | |
| | |
Investment operations: | | | | | | |
| | |
Net investment loss(b) | | (.10 | ) | | (.02 | ) |
| | |
Net realized and unrealized gain (loss) | | 4.62 | | | (7.68 | ) |
| | | | | | |
| | |
Total from investment operations | | 4.52 | | | (7.70 | ) |
| | | | | | |
| | |
Distributions to shareholders from: | | | | | | |
| | |
Net investment income | | (.04 | ) | | – | |
| | | | | | |
Net asset value, end of period | | $22.77 | | | $18.29 | |
| | | | | | |
| | |
Total Return(c) | | 24.77 | % | | (29.63 | )%(d) |
| | |
Ratios to Average Net Assets: | | | | | | |
| | |
Expenses, including expense reductions | | 1.52 | % | | 1.03 | %(d) |
| | |
Expenses, excluding expense reductions | | 1.52 | % | | 1.04 | %(d) |
| | |
Net investment loss | | (.48 | )% | | (.07 | )%(d) |
| | |
| Supplemental Data: | | | | | | |
Net assets, end of period (000) | | $86 | | | $14 | |
| | |
Portfolio turnover rate | | 68.63 | % | | 77.87 | % |
| (a) | | Commencement of investment operations was 3/24/2008, SEC effective date was 9/14/2007 and date shares first became available to the public was 4/1/2008. |
| (b) | | Calculated using average shares outstanding during the period. |
| (c) | | Total return assumes the reinvestment of all distributions. |
See Notes to Financial Statements.
36
Financial Highlights (concluded)
SMALL CAP VALUE FUND
| | | | | | |
| | | Class R3 Shares | |
| | | Year Ended
11/30/2009 | | | 3/24/2008 (a)
to
11/30/2008 | |
Per Share Operating Performance | | | | | | |
Net asset value, beginning of period | | $18.29 | | | $25.99 | |
| | | | | | |
| | |
Investment operations: | | | | | | |
| | |
Net investment income (loss)(b) | | (.06 | ) | | .02 | |
| | |
Net realized and unrealized gain (loss) | | 4.60 | | | (7.72 | ) |
| | | | | | |
| | |
Total from investment operations | | 4.54 | | | (7.70 | ) |
| | | | | | |
| | |
Distributions to shareholders from: | | | | | | |
| | |
Net investment income | | (.10 | ) | | – | |
| | | | | | |
Net asset value, end of period | | $22.73 | | | $18.29 | |
| | | | | | |
| | |
Total Return(c) | | 24.94 | % | | (29.63 | )%(d) |
| | |
Ratios to Average Net Assets: | | | | | | |
| | |
Expenses, including expense reductions | | 1.44 | % | | 1.00 | %(d) |
| | |
Expenses, excluding expense reductions | | 1.44 | % | | 1.00 | %(d) |
| | |
Net investment income (loss) | | (.30 | )% | | .07 | %(d) |
| | |
| Supplemental Data: | | | | | | |
Net assets, end of period (000) | | $1,995 | | | $1,090 | |
| | |
Portfolio turnover rate | | 68.63 | % | | 77.87 | % |
| (a) | | Commencement of investment operations was 3/24/2008, SEC effective date was 9/14/2007 and date shares first became available to the public was 4/1/2008. |
| (b) | | Calculated using average shares outstanding during the period. |
| (c) | | Total return assumes the reinvestment of all distributions. |
See Notes to Financial Statements.
37
Notes to Financial Statements
1. ORGANIZATION
Lord Abbett Research Fund, Inc. (the “Company”) is registered under the Investment Company Act of 1940, as amended (the “Act”), as a diversified, open-end management investment company, incorporated under Maryland law on April 6, 1992. The Company currently consists of four separate funds. This report covers the following two funds (separately, a “Fund” and collectively, the “Funds”) and their respective classes: Lord Abbett Classic Stock Fund (“Classic Stock Fund”; formerly, Lord Abbett Large-Cap Core Fund (“Large Cap Core Fund”)) and Small-Cap Value Series (“Small Cap Value Fund”). Effective July 1, 2009, Lord Abbett Large Cap Core Fund changed its name to Lord Abbett Classic Stock Fund.
Classic Stock Fund’s investment objective is growth of capital and growth of income consistent with reasonable risk. Small Cap Value Fund’s investment objective is long-term capital appreciation. Each Fund offers eight classes of shares: Class A, B, C, F, I, P, R2 and R3, each with different expenses and dividends. A front-end sales charge is normally added to the net asset value (“NAV”) for Class A shares. There is no front-end sales charge in the case of Class B, C, F, I, P, R2 and R3 shares, although there may be a contingent deferred sales charge (“CDSC”) for certain cases as follows: Class A shares purchased without a sales charge and redeemed before the first day of the month in which the one-year anniversary of the purchase falls (subject to certain exceptions); Class B shares redeemed before the sixth anniversary of purchase; and Class C shares redeemed before the first anniversary of purchase. Class B shares will automatically convert to Class A shares on the 25 th day of the month (or, if the 25th is not a business day, the next business day thereafter) following the eighth anniversary of the day on which the purchase order was accepted. Small Cap Value Fund is open to certain new investors on a limited basis as set forth in the Fund’s prospectus. The Funds’ Class P shares are closed to substantially all new retirement and benefit plans and fee-based programs, with certain exceptions as set forth in the Funds’ prospectuses. Effective March 31, 2010, each of the Funds of the Company will no longer offer Class B shares.
The preparation of financial statements in conformity with accounting principles generally accepted in the United States of America requires management to make certain estimates and assumptions that affect the reported amounts of assets and liabilities and disclosure of contingent assets and liabilities at the date of the financial statements and the reported amounts of increases and decreases in net assets from operations during the reporting period. Actual results could differ from those estimates.
2. SIGNIFICANT ACCOUNTING POLICIES
| (a) | | Investment Valuation–Securities actively traded on any recognized U.S. or non-U.S. exchange or on The NASDAQ Stock Market LLC are valued at the last sale price or official closing price on the exchange or system on which they are principally traded. Events occurring after the close of trading on non-U.S. exchanges may result in adjustments to the valuation of foreign securities to more accurately reflect their fair value as of the close of regular trading on the New York Stock Exchange LLC. Each Fund may rely on an independent fair valuation service in adjusting the valuations of foreign securities. Unlisted equity securities are valued at the last quoted sale price or, if no sale price is available, at the mean between the most recently quoted bid and asked prices. Securities for which market quotations are not readily available are valued at fair value as determined by management and approved in good faith by the Board of Directors. Short-term securities with 60 days or less remaining to maturity are valued using the amortized cost method, which approximates current market value. |
38
Notes to Financial Statements (continued)
| (b) | | Security Transactions–Security transactions are recorded as of the date that the securities are purchased or sold (trade date). Realized gains and losses on sales of portfolio securities are calculated using the identified-cost method. Realized and unrealized gains (losses) are allocated to each class of shares based upon the relative proportion of net assets at the beginning of the day. |
| (c) | | Investment Income–Dividend income is recorded on the ex-dividend date. Interest income is recorded on the accrual basis as earned. Discounts are accreted and premiums are amortized using the effective interest method. Withholding taxes on foreign dividends have been provided for in accordance with the applicable country’s tax rules and rates. Investment income is allocated to each class of shares based upon the relative proportion of net assets at the beginning of the day. |
| (d) | | Income Taxes–It is the policy of each Fund to meet the requirements of Subchapter M of the Internal Revenue Code applicable to regulated investment companies and to distribute substantially all taxable income and capital gains to its shareholders. Therefore, no income tax provision is required. |
Each Fund files U.S. federal and various state and local tax returns. No income tax returns are currently under examination. The statute of limitations on the Funds’ U.S. federal tax returns remains open for the fiscal years ended November 30, 2006 through November 30, 2009. The statutes of limitations on the Company’s state and local tax returns may remain open for an additional year depending upon the jurisdiction.
| (e) | | Expenses–Expenses incurred by the Company that do not specifically relate to an individual fund are generally allocated to the Funds within the Company on a pro rata basis by relative net assets. Expenses, excluding class-specific expenses, are allocated to each class of shares based upon the relative proportion of net assets at the beginning of the day. Class A, B, C, F, P, R2 and R3 shares bear their class-specific share of all expenses and fees relating to the Funds’ 12b-1 Distribution Plan. |
| (f) | | Foreign Transactions-The books and records of the Funds are maintained in U.S. dollars and transactions denominated in foreign currencies are recorded in the Funds’ records at the rate prevailing when earned or recorded. Asset and liability accounts that are denominated in foreign currencies are adjusted daily to reflect current exchange rates and any unrealized gain (loss) is included in net change in unrealized appreciation/depreciation on investments and translation of assets and liabilities denominated in foreign currencies on the Funds’ Statements of Operations. The resultant exchange gains and losses upon settlement of such transactions are included in Net realized loss on investments and foreign currency related transactions on the Funds’ Statements of Operations. The Funds do not isolate that portion of the results of operations arising as a result of changes in the foreign exchange rates from the changes in market prices of the securities. |
| (g) | | Repurchase Agreements–Each Fund may enter into repurchase agreements with respect to securities. A repurchase agreement is a transaction in which a Fund acquires a security and simultaneously commits to resell that security to the seller (a bank or securities dealer) at an agreed-upon price on an agreed-upon date. Each Fund requires at all times that the repurchase agreement be collateralized by cash, or by securities of the U.S. Government, its agencies, its instrumentalities, or U.S. Government sponsored enterprises having a value equal to, or in excess of, the value of the repurchase agreement (including accrued interest). If the |
39
Notes to Financial Statements (continued)
| | seller of the agreement defaults on its obligation to repurchase the underlying securities at a time when the value of these securities has declined, a Fund may incur a loss upon disposition of the securities. |
| (h) | | Fair Value Measurements–In accordance with Financial Accounting Standards Board, Accounting Standards Codification (“ASC”) Topic 820, Fair Value Measurements and Disclosures (formerly SFAS 157), fair value is defined as the price that each Fund would receive upon selling an investment in an orderly transaction to an independent buyer in the principal or most advantageous market of the investment. ASC 820 established a three-tier hierarchy to maximize the use of observable market data and minimize the use of unobservable inputs and to establish classification of fair value measurements for disclosure purposes. Inputs refer broadly to the assumptions that market participants would use in pricing the asset or liability, including assumptions about risk – for example, the risk inherent in a particular valuation technique used to measure fair value (such as a pricing model) and/or the risk inherent in the inputs to the valuation technique. Inputs may be observable or unobservable. Observable inputs reflect the assumptions market participants would use in pricing the asset or liability. Observable inputs are based on market data obtained from sources independent of the reporting entity. Unobservable inputs reflect the reporting entity’s own assumptions about the assumptions market participants would use in pricing the asset or liability. Unobservable inputs are based on the best information available in the circumstances. The three-tier hierarchy of inputs is summarized in the three broad Levels listed below: |
| | • | | Level 1 – quoted prices in active markets for identical investments; |
| | • | | Level 2 – other significant observable inputs (including quoted prices for similar investments, interest rates, prepayment speeds, credit risk, etc.); and |
| | • | | Level 3 – significant unobservable inputs (including each Fund’s own assumptions in determining the fair value of investments). |
The inputs or methodology used for valuing securities are not necessarily an indication of the risk associated with investing in those securities.
The following is a summary of the inputs used as of November 30, 2009 in valuing each Fund’s investments carried at value:
| | | | | | | | | | | | | | | | | | | | | | | | |
| | | Classic Stock Fund | | Small Cap Value Fund |
| Investment Type* | | Level 1 (000) | | Level 2 (000) | | Level 3 (000) | | Total (000) | | Level 1 (000) | | Level 2 (000) | | Level 3 (000) | | Total (000) |
Common Stocks | | $ | 1,000,536 | | $ | – | | $ | – | | $ | 1,000,536 | | $ | 2,917,463 | | $ | – | | $ | – | | $ | 2,917,463 |
Repurchase Agreement | | | – | | | 10,892 | | | – | | | 10,892 | | | – | | | 72,314 | | | – | | | 72,314 |
Total | | $ | 1,000,536 | | $ | 10,892 | | $ | – | | $ | 1,011,428 | | $ | 2,917,463 | | $ | 72,314 | | $ | – | | $ | 2,989,777 |
| * | See Schedule of Investments for values in each industry. |
3. MANAGEMENT FEE AND OTHER TRANSACTIONS WITH AFFILIATES
Management Fee
The Company has a management agreement with Lord, Abbett & Co. LLC (“Lord Abbett”), pursuant to which Lord Abbett supplies each Fund with investment management services and executive and other personnel, provides office space and pays for ordinary and necessary office and clerical expenses relating to research and statistical work and supervision of each Fund’s investment portfolio.
40
Notes to Financial Statements (continued)
The management fee is based on each Fund’s average daily net assets at the following annual rates:
| | |
Classic Stock Fund: | | |
First $1 billion | | .70% |
Next $1 billion | | .65% |
Over $2 billion | | .60% |
For the fiscal year ended November 30, 2009, the effective management fee paid to Lord Abbett, with respect to the Classic Stock Fund, was at an annualized rate of .70% of the Fund’s average daily net assets.
| | |
Small Cap Value Fund: | | |
First $2 billion | | .75% |
Over $2 billion | | .70% |
For the fiscal year ended November 30, 2009, the effective management fee paid to Lord Abbett, with respect to the Small Cap Value Fund, was at an annualized rate of .74% of the Fund’s average daily net assets.
For the period December 1, 2008 through March 31, 2009, Lord Abbett contractually agreed to reimburse Classic Stock Fund’s expenses to the extent necessary so that each class’ total annual operating expenses did not exceed the rates below. Effective April 1, 2009, Lord Abbett voluntarily agreed to reimburse Classic Stock Fund based on the same rates in effect at December 1, 2008. Effective July 1, 2009, Lord Abbett voluntarily agreed to reimburse Classic Stock Fund to the extent necessary so that each class’ total annual operating expenses do not exceed the following annual rates:
| | | | |
| Class | | Effective Date: |
| | | December 1, 2008 | | July 1, 2009 |
| | | % of Average Daily Net Assets |
A | | 1.30% | | .98% |
B | | 1.95% | | 1.63% |
C | | 1.95% | | 1.63% |
F | | 1.05% | | .73% |
I | | .95% | | .63% |
P | | 1.40% | | 1.08% |
R2 | | 1.55% | | 1.23% |
R3 | | 1.45% | | 1.13% |
Lord Abbett may discontinue the voluntary reimbursement or change the level of its voluntary reimbursement at any time for all classes of Classic Stock Fund.
Lord Abbett provides certain administrative services to each Fund pursuant to an Administrative Services Agreement at an annual rate of .04% of each Fund’s average daily net assets.
Classic Stock Fund and Small Cap Value Fund, along with certain other funds managed by Lord Abbett (collectively, the “Underlying Funds”), have entered into a Servicing Arrangement with Lord Abbett Alpha Strategy Fund of Lord Abbett Securities Trust and Lord Abbett Balanced Strategy Fund, Lord Abbett Diversified Equity Strategy Fund and Lord Abbett Growth & Income Strategy Fund of Lord Abbett Investment Trust and Lord Abbett Global Allocation Fund of Lord Abbett Global Fund, Inc. (each a “Fund of Funds”), pursuant to which each Underlying Fund pays a portion of the expenses (excluding management fee and distribution and service fees) of the Fund of Funds in
41
Notes to Financial Statements (continued)
proportion to the average daily value of the Underlying Fund shares owned by the Fund of Funds. Amounts paid pursuant to the Servicing Arrangement are included in Subsidy expense on each Fund’s Statement of Operations and Payable to affiliates on each Fund’s Statement of Assets and Liabilities.
As of November 30, 2009, the percentages of Classic Stock Fund’s outstanding shares owned by Lord Abbett Balanced Strategy Fund, Lord Abbett Diversified Equity Strategy Fund, Lord Abbett Growth & Income Strategy Fund and Lord Abbett Global Allocation Fund were 13.00%, 2.51%, 6.64% and 0.78%, respectively.
As of November 30, 2009, the percentage of Small Cap Value Fund’s outstanding shares owned by Lord Abbett Alpha Strategy Fund was 3.55%.
12b-1 Distribution Plan
Each Fund has adopted a distribution plan with respect to Class A, B, C, F, P, R2 and R3 shares pursuant to Rule 12b-1 under the Act, which provides for the payment of ongoing distribution and service fees to Lord Abbett Distributor LLC (the “Distributor”), an affiliate of Lord Abbett. The fees are accrued daily at annual rates based upon each Fund’s average daily net assets as follows:
| | | | | | | | | | | | | | | |
| Fees* | | Class A | | | Class B | | Class C | | Class F | | Class P | | Class R2 | | Class R3 |
Service | | .25% | | | .25% | | .25% | | – | | .25% | | .25% | | .25% |
Distribution | | .10% | (1) | | .75% | | .75% | | .10% | | .20% | | .35% | | .25% |
| * | The Funds may designate a portion of the aggregate fee as attributable to service activities for purposes of calculating Financial Industry Regulatory Authority, Inc. (“FINRA”) sales charge limitations. |
| (1) | In the case of Small Cap Value Fund, the Class A Distribution Fee is .05%. |
Class I shares do not have a distribution plan.
Commissions
Distributor received the following commissions on sales of shares of the Funds, after concessions were paid to authorized dealers, for the fiscal year ended November 30, 2009:
| | | | | | |
| | | Distributor
Commissions | | Dealers’
Concessions |
Classic Stock Fund | | $ | 362,819 | | $ | 1,956,213 |
Small Cap Value Fund | | | 16,072 | | | 87,479 |
Distributor received the following amount of CDSCs for the fiscal year ended November 30, 2009:
| | | | | | |
| | | Class A | | Class C |
Classic Stock Fund | | $ | 1,871 | | $ | 13,307 |
Small Cap Value Fund | | | 1,450 | | | 2,038 |
Two Directors and certain of the Funds’ officers have an interest in Lord Abbett.
4. DISTRIBUTIONS AND CAPITAL LOSS CARRYFORWARDS
Dividends from net investment income, if any, are declared and paid at least semiannually for Classic Stock Fund and at least annually for Small Cap Value Fund. Effective December 1, 2009, dividends from net investment income, if any, will be declared and paid at least annually for Classic Stock Fund. Taxable net realized gains from investment transactions, reduced by allowable capital loss carryforwards, if any, are declared and distributed to shareholders at least annually. The capital
42
Notes to Financial Statements (continued)
loss carryforward amounts, if any, is available to offset future net capital gains. Dividends and distributions to shareholders are recorded on the ex-dividend date. The amounts of dividends and distributions from net investment income and net realized capital gains are determined in accordance with federal income tax regulations which may differ from accounting principles generally accepted in the United States of America. These book/tax differences are either considered temporary or permanent in nature. To the extent these differences are permanent in nature, such amounts are reclassified within the components of net assets based on their federal tax basis treatment; temporary differences do not require reclassification. Dividends and distributions, which exceed earnings and profits for tax purposes, are reported as a tax return of capital.
On December 16, 2009, a net investment income distribution of approximately $6,358,000 was declared by Classic Stock Fund. The distribution was paid December 18, 2009 to shareholders of record on December 17, 2009.
The tax character of distributions paid during the fiscal years ended November 30, 2009 and 2008, was as follows:
| | | | | | | | | | | | |
| | | Classic Stock Fund | | Small Cap Value Fund |
| | | Year Ended 11/30/2009 | | Year Ended 11/30/2008 | | Year Ended 11/30/2009 | | Year Ended 11/30/2008 |
Distributions paid from: | | | | | | | | | | | | |
Ordinary income | | $ | 8,402,452 | | $ | 12,030,614 | | $ | 9,677,917 | | $ | 129,921,565 |
Net long-term capital gains | | | – | | | 65,519,683 | | | – | | | 462,027,791 |
Total distributions paid | | $ | 8,402,452 | | $ | 77,550,297 | | $ | 9,677,917 | | $ | 591,949,356 |
As of November 30, 2009, the components of accumulated earnings (losses) on a tax-basis were as follows:
| | | | | | | | |
| | | Classic Stock Fund | | | Small Cap Value Fund | |
Undistributed ordinary income – net | | $ | 6,286,701 | | | $ | – | |
Total undistributed earnings | | $ | 6,286,701 | | | $ | – | |
Capital loss carryforwards* | | | (121,940,840 | ) | | | (618,451,133 | ) |
Temporary differences | | | (102,177 | ) | | | (346,059 | ) |
Unrealized gains – net | | | 121,677,160 | | | | 238,620,409 | |
Total accumulated gains (losses) – net | | $ | 5,920,844 | | | $ | (380,176,783 | ) |
| *As | of November 30, 2009, the capital loss carryforwards, along with the related expiration dates, were as follows: |
| | | | | | | | | |
| | | 2016 | | 2017 | | Total |
Classic Stock Fund | | $ | 23,315,627 | | $ | 98,625,213 | | $ | 121,940,840 |
Small Cap Value Fund | | | 189,426,175 | | | 429,024,958 | | | 618,451,133 |
As of November 30, 2009, the aggregate unrealized security gains and losses based on cost for U.S. federal income tax purposes were as follows:
| | | | | | | | |
| | | Classic Stock Fund | | | Small Cap Value Fund | |
Tax cost | | $ | 889,750,971 | | | $ | 2,751,157,146 | |
Gross unrealized gain | | | 159,165,123 | | | | 412,264,232 | |
Gross unrealized loss | | | (37,487,935 | ) | | | (173,643,823 | ) |
Net unrealized security gain | | $ | 121,677,188 | | | $ | 238,620,409 | |
The difference between book-basis and tax-basis unrealized gains (losses) is primarily attributable to wash sales.
43
Notes to Financial Statements (continued)
Permanent items identified during the fiscal year ended November 30, 2009 have been reclassified among the components of net assets based on their tax basis treatment as follows:
| | | | | | | | | | | |
| | | Undistributed
(Distributions
in Excess of) Net Investment
Income | | Accumulated
Net Realized
Loss | | | Paid-in Capital | |
Classic Stock Fund | | $ | 1,326 | | $ | (1,326 | ) | | $ | – | |
Small Cap Value Fund | | | 1,118,728 | | | (16,871 | ) | | | (1,101,857 | ) |
The permanent differences are attributable to the tax treatment of certain distributions paid and received.
5. PORTFOLIO SECURITIES TRANSACTIONS
Purchases and sales of investment securities (excluding short-term investments) for the fiscal year ended November 30, 2009 were as follows:
| | | | | | |
| | | Purchases | | Sales |
Classic Stock Fund | | $ | 513,887,450 | | $ | 464,398,804 |
Small Cap Value Fund | | | 1,770,011,947 | | | 1,789,648,927 |
There were no purchases or sales of U.S. Government securities for the fiscal year ended November 30, 2009.
6. REDEMPTION IN-KIND
In certain circumstances, the Funds may distribute portfolio securities rather than cash as payments for a redemption of Fund shares (“redemption in-kind”). For financial reporting purposes, the Fund recognizes a gain on redemption in-kind to the extent the value of the distributed securities exceeds their costs; each Fund recognizes a loss if the cost exceeds value. During the fiscal year ended November 30, 2008, shareholders of the Small Cap Value Fund redeemed Fund shares in exchange for Fund portfolio securities. The amount is included in Capital share transactions on the Statements of Changes in Net Assets.
7. DIRECTORS’ REMUNERATION
The Company’s officers and the two Directors who are associated with Lord Abbett do not receive any compensation from the Company for serving in such capacities. Outside Directors’ fees are allocated among all Lord Abbett-sponsored funds based on the net assets of each fund. There is an equity-based plan available to all outside Directors under which outside Directors must defer receipt of a portion of, and may elect to defer receipt of an additional portion of, Directors’ fees. The deferred amounts are treated as though equivalent dollar amounts have been invested in the funds. Such amounts and earnings accrued thereon are included in Directors’ fees on the Statement of Operations and in Directors’ fees payable on the Statement of Assets and Liabilities and are not deductible for U.S. federal income tax purposes until such amounts are paid.
8. EXPENSE REDUCTIONS
The Company has entered into arrangements with its transfer agent and custodian, whereby credits realized as a result of uninvested cash balances are used to reduce a portion of each Fund’s expenses.
44
Notes to Financial Statements (continued)
9. LINE OF CREDIT
The Funds and certain other funds managed by Lord Abbett have available an unsecured revolving credit facility (“Facility”) from State Street Bank and Trust Company (“SSB”), to be used for temporary or emergency purposes as an additional source of liquidity to fund redemptions of investor shares. The Facility is renewed annually under terms that depend on market conditions at the time of the renewal. Accordingly, effective December 4, 2009, the amount available under the Facility remains $200,000,000 and the annual fee to maintain the Facility (of which each participating fund pays its pro rata share based on the net assets of each participating fund) was changed from .125% (.08% prior to December 5, 2008) of the amount available under the Facility to .15%. This amount is included in Other Expenses on the Funds’ Statement of Operations. In connection with the renewal, the Funds paid an upfront commitment fee of .05% on December 4, 2009. Any borrowings under this Facility will bear interest at current market rates as set forth in the credit agreement. As of November 30, 2009, there were no loans outstanding pursuant to this Facility nor was the Facility utilized at any time during the fiscal year ended November 30, 2009.
10. TRANSACTIONS WITH AFFILIATED ISSUERS
An affiliated issuer is one in which a Fund has ownership of at least 5% of the outstanding voting securities of the underlying issuer at any point during the fiscal year. Small Cap Value Fund had the following transactions with affiliated issuers during the fiscal year ended November 30, 2009:
| | | | | | | | | | | | | | | | | | | |
| Affiliated Issuer | | Balance of Shares Held at 11/30/2008 | | Gross
Additions | | Gross Sales | | | Balance of
Shares Held
at 11/30/2009 | | Value at 11/30/2009 | | Net Realized Gain (Loss) 12/1/2008 to
11/30/2009(a) | | | Dividend Income 12/1/2008 to
11/30/2009(a) |
AAR Corp.(c) | | 2,331,364 | | – | | (1,342,800 | ) | | 988,564 | | $ | – | | $ | (5,302,430 | ) | | $ | – |
Anixter International, Inc.(c) | | 2,115,002 | | 45,000 | | (1,306,700 | ) | | 853,302 | | | – | | | (10,216,796 | ) | | | – |
Black Hills Corp.(c) | | 1,994,878 | | – | | (1,994,878 | ) | | – | | | – | | | (1,786,326 | ) | | | – |
Boston Beer Co., Inc. (The) Class A(b) (c) | | 412,739 | | 134,200 | | (546,939 | ) | | – | | | – | | | (138,712 | ) | | | – |
Bristow Group,
Inc. (b) (c) | | 1,297,046 | | 198,797 | | (25,199 | ) | | 1,470,644 | | | – | | | (369,482 | ) | | | – |
Carlisle Cos., Inc.(c) | | 3,652,970 | | – | | (2,987,200 | ) | | 665,770 | | | – | | | (9,684,590 | ) | | | – |
Curtiss-Wright Corp(c) | | 2,982,655 | | 17,400 | | (1,024,648 | ) | | 1,975,407 | | | – | | | (7,709,664 | ) | | | 474,265 |
Cypress Bioscience, Inc.(b) | | – | | 1,982,600 | | – | | | 1,982,600 | | | 10,507,780 | | | – | | | | – |
Danvers Bancorp., Inc.(b) | | – | | 1,146,500 | | – | | | 1,146,500 | | | 15,489,215 | | | – | | | | 22,930 |
Enpro Industries, Inc.(b) | | 306,300 | | 749,600 | | – | | | 1,055,900 | | | 24,222,346 | | | – | | | | – |
Ferro Corp.(b) | | – | | 4,213,300 | | – | | | 4,213,300 | | | 27,260,051 | | | – | | | | – |
Financial Federal Corp. | | 2,266,148 | | 38,900 | | (111,500 | ) | | 2,193,548 | | | 59,445,151 | | | (194,612 | ) | | | 1,383,029 |
Greatbatch, Inc.(b) | | – | | 1,234,800 | | – | | | 1,234,800 | | | 22,707,972 | | | – | | | | – |
Hexcel Corp.(b) | | 4,058,829 | | 1,759,483 | | – | | | 5,818,312 | | | 61,383,192 | | | – | | | | – |
Koppers Holdings, Inc. | | 1,141,000 | | 590,200 | | (460,100 | ) | | 1,271,100 | | | 35,908,575 | | | 3,442,237 | | | | 1,308,984 |
Odyssey Healthcare, Inc. | | 2,925,000 | | – | | (531,934 | ) | | 2,393,066 | | | 34,771,249 | | | 1,681,389 | | | | – |
Quanex Building Products Corp.(c) | | 2,467,229 | | 34,594 | | (820,060 | ) | | 1,681,763 | | | – | | | (801,506 | ) | | | 281,384 |
Rogers Corp. | | 1,604,535 | | 6,600 | | (163,400 | ) | | 1,447,735 | | | 40,768,218 | | | (4,949,197 | ) | | | – |
ScanSource, Inc.(c) | | 2,167,999 | | – | | (999,700 | ) | | 1,168,299 | | | – | | | (2,141,897 | ) | | | – |
Skilled Healthcare Group, Inc. Class A(c) | | 1,797,300 | | – | | (1,797,300 | ) | | – | | | – | | | (5,708,468 | ) | | | – |
Susser Holdings Corp. | | 1,093,152 | | – | | (78,500 | ) | | 1,014,652 | | | 10,755,311 | | | (448,880 | ) | | | – |
TrueBlue, Inc.(b) | | – | | 2,529,500 | | – | | | 2,529,500 | | | 30,758,720 | | | – | | | | – |
Total | | | | | | | | | | | $ | 373,977,780 | | $ | (44,328,934 | ) | | $ | 3,470,592 |
| (a) | Represents realized gains (losses) and dividend income earned only when the issuer was an affiliate of the Fund. |
| (b) | Not an affiliated issuer as of November 30, 2008. |
| (c) | No longer an affiliated issuer as of November 30, 2009. |
45
Notes to Financial Statements (continued)
11. CUSTODIAN AND ACCOUNTING AGENT
SSB is the Company’s custodian and accounting agent. SSB performs custodial, accounting and recordkeeping functions relating to portfolio transactions and calculating each Fund’s NAV.
12. INVESTMENT RISKS
Classic Stock Fund is subject to the general risks and considerations associated with equity investing, as well as the particular risks associated with value and growth stocks. This means the value of your investment will fluctuate in response to movements in the equity securities market in general and to the changing prospects of individual companies in which the Fund invests. Large value and growth stocks may perform differently than the market as a whole and differently than each other or other types of stocks, such as small company stocks. This is because different types of stocks tend to shift in and out of favor depending on market and economic conditions. The market may fail to recognize the intrinsic value of particular value stocks for a long time. Growth stocks may be more volatile than other stocks. In addition, if the Fund’s assessment of a company’s value or prospects for exceeding earnings expectations or market conditions is wrong, the Fund could suffer losses or produce poor performance relative to other funds, even in a rising market. Due to its investment in multinational companies the Fund may experience increased market, liquidity, currency, politcal, information and other risks.
Small Cap Value Fund is subject to the general risks and considerations associated with equity investing, as well as the particular risks associated with value stocks. The value of an investment will fluctuate in response to movements in the equity securities market in general and to the changing prospects of individual companies in which the Fund invests. Large company value stocks and small company value stocks may perform differently than the market as a whole and other types of stocks such as growth stocks. The market may fail to recognize the intrinsic value of particular value stocks for a long time. In addition, small cap company stocks may be more volatile and less liquid than large cap company stocks. Also, if a Fund’s assessment of a company’s value or prospects for exceeding earnings expectations or market conditions is wrong, the Fund could suffer losses or produce poor performance relative to other funds, even in a rising market.
These factors can affect each Fund’s performance.
13. SUMMARY OF CAPITAL TRANSACTIONS
Transactions in shares of capital stock were as follows:
| | | | | | | | | | | | | | |
| Classic Stock Fund | |
| | | Year Ended
November 30, 2009 | | | Year Ended
November 30, 2008 | |
| Class A Shares | | Shares | | | Amount | | | Shares | | | Amount | |
Shares sold | | 6,970,404 | | | $ | 151,477,796 | | | 6,145,233 | | | $ | 159,595,132 | |
Converted from Class B* | | 274,301 | | | | 5,912,683 | | | 197,247 | | | | 5,441,049 | |
Reinvestment of distributions | | 252,444 | | | | 5,154,883 | | | 1,563,557 | | | | 47,219,436 | |
Shares reacquired | | (8,106,303 | ) | | | (174,425,425 | ) | | (5,691,420 | ) | | | (150,155,336 | ) |
Increase (decrease) | | (609,154 | ) | | $ | (11,880,063 | ) | | 2,214,617 | | | $ | 62,100,281 | |
46
Notes to Financial Statements (continued)
| | | | | | | | | | | | | | |
| Classic Stock Fund | |
| | | Year Ended
November 30, 2009 | | | Year Ended
November 30, 2008 | |
| Class B Shares | | Shares | | | Amount | | | Shares | | | Amount | |
Shares sold | | 490,412 | | | $ | 10,115,909 | | | 459,358 | | | $ | 12,000,175 | |
Reinvestment of distributions | | 4,153 | | | | 81,238 | | | 148,532 | | | | 4,289,609 | |
Shares reacquired | | (510,237 | ) | | | (10,473,790 | ) | | (568,491 | ) | | | (14,673,345 | ) |
Converted to Class A* | | (286,405 | ) | | | (5,912,683 | ) | | (206,859 | ) | | | (5,441,049 | ) |
Decrease | | (302,077 | ) | | $ | (6,189,326 | ) | | (167,460 | ) | | $ | (3,824,610 | ) |
| | | | |
| Class C Shares | | | | | | | | | | | | |
Shares sold | | 1,248,989 | | | $ | 25,930,987 | | | 965,997 | | | $ | 24,954,020 | |
Reinvestment of distributions | | 7,819 | | | | 153,406 | | | 163,366 | | | | 4,737,589 | |
Shares reacquired | | (885,430 | ) | | | (17,996,500 | ) | | (865,196 | ) | | | (22,126,501 | ) |
Increase | | 371,378 | | | $ | 8,087,893 | | | 264,167 | | | $ | 7,565,108 | |
| | | | |
| Class F Shares | | | | | | | | | | | | |
Shares sold | | 400,767 | | | $ | 7,640,454 | | | 128,943.671 | | | $ | 3,586,318 | |
Reinvestment of distributions | | 1,625 | | | | 33,040 | | | 24.000 | | | | 711 | |
Shares reacquired | | (103,618 | ) | | | (2,369,408 | ) | | (11,819.000 | ) | | | (290,682 | ) |
Increase | | 298,774 | | | $ | 5,304,086 | | | 117,148.671 | | | $ | 3,296,347 | |
| | | | |
| Class I Shares | | | | | | | | | | | | |
Shares sold | | 1,999,017 | | | $ | 43,743,052 | | | 1,378,033 | | | $ | 39,074,820 | |
Reinvestment of distributions | | 127,872 | | | | 2,611,149 | | | 547,148 | | | | 16,540,304 | |
Shares reacquired | | (220,740 | ) | | | (4,551,120 | ) | | (313,103 | ) | | | (7,875,727 | ) |
Increase | | 1,906,149 | | | $ | 41,803,081 | | | 1,612,078 | | | $ | 47,739,397 | |
| | | | |
| Class P Shares | | | | | | | | | | | | |
Shares sold | | 31,965 | | | $ | 694,451 | | | 41,558 | | | $ | 1,102,999 | |
Reinvestment of distributions | | 1,936 | | | | 39,698 | | | 16,324 | | | | 494,955 | |
Shares reacquired | | (91,962 | ) | | | (1,894,415 | ) | | (54,979 | ) | | | (1,442,956 | ) |
Increase (decrease) | | (58,061 | ) | | $ | (1,160,266 | ) | | 2,903 | | | $ | 154,998 | |
| | | | |
| Class R2 Shares | | | | | | | | | | | | |
Shares sold | | 29,612.000 | | | $ | 670,285 | | | 1.061 | | | $ | 22 | |
Reinvestment of distributions | | 4.419 | | | | 92 | | | 23.191 | | | | 699 | |
Shares reaquired | | (1,627.000 | ) | | | (40,666 | ) | | – | | | | – | |
Increase | | 27,989.419 | | | $ | 629,711 | | | 24.252 | | | $ | 721 | |
| | | | |
| Class R3 Shares | | | | | | | | | | | | |
Shares sold | | 78,883 | | | $ | 1,879,510 | | | 15,802.671 | | | $ | 437,112 | |
Reinvestment of distributions | | 195 | | | | 3,962 | | | 23.000 | | | | 701 | |
Shares reacquired | | (7,165 | ) | | | (174,020 | ) | | (723.000 | ) | | | (19,644 | ) |
Increase | | 71,913 | | | $ | 1,709,452 | | | 15,102.671 | | | $ | 418,169 | |
| * | Automatic conversion of Class B shares occurs on the 25th day of the month (or, if the 25th is not a business day, the next business day thereafter) following the eighth anniversary of the day on which the purchase order was accepted. |
47
Notes to Financial Statements (continued)
| | | | | | | | | | | | | | |
| Small Cap Value Fund | | | | | | | | | | | | |
| | | Year Ended
November 30, 2009 | | | Year Ended
November 30, 2008 | |
| Class A Shares | | Shares | | | Amount | | | Shares | | | Amount | |
Shares sold | | 13,284,675 | | | $ | 259,025,601 | | | 17,562,795 | | | $ | 455,552,081 | |
Converted from Class B* | | 586,942 | | | | 10,441,239 | | | 283,182 | | | | 7,073,670 | |
Reinvestment of distributions | | 156,872 | | | | 2,930,390 | | | 11,483,374 | | | | 317,744,963 | |
Shares reacquired | | (19,467,158 | ) | | | (375,538,113 | ) | | (32,041,671 | ) | | | (789,959,346 | ) |
Decrease | | (5,438,669 | ) | | $ | (103,140,883 | ) | | (2,712,320 | ) | | $ | (9,588,632 | ) |
| | | | |
| Class B Shares | | | | | | | | | | | | |
Shares sold | | 89,062 | | | $ | 1,523,210 | | | 165,367 | | | $ | 3,870,722 | |
Reinvestment of distributions | | – | | | | – | | | 311,249 | | | | 7,603,875 | |
Shares reacquired | | (243,067 | ) | | | (4,549,348 | ) | | (510,078 | ) | | | (11,469,878 | ) |
Converted to Class A* | | (664,137 | ) | | | (10,441,239 | ) | | (321,748 | ) | | | (7,073,670 | ) |
Decrease | | (818,142 | ) | | $ | (13,467,377 | ) | | (355,210 | ) | | $ | (7,068,951 | ) |
| | | | |
| Class C Shares | | | | | | | | | | | | |
Shares sold | | 147,659 | | | $ | 2,490,868 | | | 346,543 | | | $ | 8,216,387 | |
Reinvestment of distributions | | 14 | | | | 337 | | | 327,312 | | | | 8,012,610 | |
Shares reacquired | | (710,929 | ) | | | (12,070,964 | ) | | (713,682 | ) | | | (15,718,610 | ) |
Increase (decrease) | | (563,256 | ) | | $ | (9,579,759 | ) | | (39,827 | ) | | $ | 510,387 | |
| | | | |
| Class F Shares | | | | | | | | | | | | |
Shares sold | | 1,088,189 | | | $ | 16,074,936 | | | 84,316.000 | | | $ | 2,321,051 | |
Reinvestment of distributions | | 474 | | | | 8,798 | | | 53.000 | | | | 1,471 | |
Shares reacquired | | (184,536 | ) | | | (3,720,736 | ) | | (6,765.530 | ) | | | (160,366 | ) |
Increase | | 904,127 | | | $ | 12,362,998 | | | 77,603.470 | | | $ | 2,162,156 | |
| | | | |
| Class I Shares | | | | | | | | | | | | |
Shares sold | | 9,980,535 | | | $ | 203,789,939 | | | 19,467,963 | | | $ | 512,061,416 | |
Reinvestment of distributions | | 299,707 | | | | 5,898,235 | | | 5,501,668 | | | | 160,593,678 | |
Shares reacquired | | (7,966,366 | ) | | | (162,542,427 | ) | | (9,617,399 | ) | | | (246,489,177 | ) |
Redemption in-kind | | – | | | | – | | | (2,036,656 | ) | | | (53,360,378 | ) |
Increase | | 2,313,876 | | | $ | 47,145,747 | | | 13,315,576 | | | $ | 372,805,539 | |
| | | | |
| Class P Shares | | | | | | | | | | | | |
Shares sold | | 3,062,515 | | | $ | 59,079,264 | | | 3,656,445 | | | $ | 93,737,986 | |
Reinvestment of distributions | | 8,071 | | | | 149,560 | | | 1,882,863 | | | | 51,665,744 | |
Shares reacquired | | (4,057,487 | ) | | | (78,284,406 | ) | | (5,543,667 | ) | | | (138,827,224 | ) |
Increase (decrease) | | (986,901 | ) | | $ | (19,055,582 | ) | | (4,359 | ) | | $ | 6,576,506 | |
| | | |
| | | | | | | | | Period Ended
November 30, 2008† | |
| Class R2 Shares | | | | | | | | | | | | |
Shares sold | | 3,540.380 | | | $ | 81,773 | | | 782.620 | | | $ | 20,870 | |
Shares reacquired | | (560.000 | ) | | | (13,451 | ) | | – | | | | – | |
Increase | | 2,980.380 | | | $ | 68,322 | | | 782.620 | | | $ | 20,870 | |
48
Notes to Financial Statements (concluded)
| | | | | | | | | | | | | | |
| Small Cap Value Fund | | | | | | | | | | | | |
| | | Year Ended
November 30, 2009 | | | Period Ended
November 30, 2008† | |
| Class R3 Shares | | | | | | | | | | | | |
Shares sold | | 52,867 | | | $ | 1,044,151 | | | 71.721 | | | $ | 1,896,469 | |
Reinvestment of distributions | | 248 | | | | 4,611 | | | – | | | | – | |
Shares reacquired | | (24,939 | ) | | | (495,815 | ) | | (12.124 | ) | | | (272,222 | ) |
Increase | | 28,176 | | | $ | 552,947 | | | 59.597 | | | $ | 1,624,247 | |
| * | Automatic conversion of Class B shares occurs on the 25th day of the month (or, if the 25th is not a business day, the next business day thereafter) following the eighth anniversary of the day on which the purchase order was accepted. |
| † | For the period March 24, 2008 (commencement of investment operations) to November 30, 2008. |
14. SUBSEQUENT EVENTS
In accordance with the provisions set forth in ASC Topic 855 (formerly SFAS 165), Subsequent Events, adopted by the Funds as of November 30, 2009, management has evaluated subsequent events existing in the Funds’ financial statements through January 29, 2010. Management has determined that there were no material subsequent events that would require recognition or additional disclosure in the Funds’ financial statements through this date.
15. RECENT ACCOUNTING PRONOUNCEMENTS
In January 2010, the Financial Accounting Standards Board issued Accounting Standards Update 2010-06 “Improving Disclosures about Fair Value Measurements” (“ASU 2010-06”). ASU 2010-06 provides clarifications to existing disclosures required by ASC 820 as well as amends ASC 820 to require certain new disclosures. ASU 2010-06 is substantially effective for interim and annual reporting periods beginning after December 15, 2009. Management is currently evaluating the impact the adoption of ASU 2010-06 will have on the Funds’ financial statement disclosures.
49
Report of Independent Registered Public Accounting Firm
To the Shareholders and Board of Directors of Lord Abbett Research Fund, Inc.:
We have audited the accompanying statements of assets and liabilities, including the schedules of investments, of the Lord Abbett Classic Stock Fund (formerly Lord Abbett Large-Cap Core Fund) and Small-Cap Value Series, two of the portfolios constituting the Lord Abbett Research Fund, Inc. (the “Company”), as of November 30, 2009, and the related statements of operations for the year then ended, the statements of changes in net assets for each of the two years in the period then ended, and the financial highlights for each of the periods presented. These financial statements and financial highlights are the responsibility of the Company’s management. Our responsibility is to express an opinion on these financial statements and financial highlights based on our audits.
We conducted our audits in accordance with the standards of the Public Company Accounting Oversight Board (United States). Those standards require that we plan and perform the audit to obtain reasonable assurance about whether the financial statements and financial highlights are free of material misstatement. The Company is not required to have, nor were we engaged to perform, an audit of its internal control over financial reporting. Our audits included consideration of internal control over financial reporting as a basis for designing audit procedures that are appropriate in the circumstances, but not for the purpose of expressing an opinion on the effectiveness of the Company’s internal control over financial reporting. Accordingly, we express no such opinion. An audit also includes examining, on a test basis, evidence supporting the amounts and disclosures in the financial statements, assessing the accounting principles used and significant estimates made by management, as well as evaluating the overall financial statement presentation. Our procedures included confirmation of securities owned as of November 30, 2009, by correspondence with the custodian and brokers; where replies were not received from brokers, we performed other auditing procedures. We believe that our audits provide a reasonable basis for our opinion.
In our opinion, the financial statements and financial highlights referred to above present fairly, in all material respects, the financial position of the Lord Abbett Classic Stock Fund and Small-Cap Value Series of the Lord Abbett Research Fund, Inc. as of November 30, 2009, the results of their operations for the year then ended, the changes in their net assets for each of the two years in the period then ended, and the financial highlights for each of the periods presented, in conformity with accounting principles generally accepted in the United States of America.
DELOITTE & TOUCHE LLP
New York, New York
January 29, 2010
50
Basic Information About Management
The Board of Directors (the “Board”) is responsible for the management of the business and affairs of the Company in accordance with the laws of the State of Maryland. The Board appoints officers who are responsible for the day-to-day operations of the Company and who execute policies authorized by the Board. The Board also approves an investment adviser to the Company and continues to monitor the cost and quality of the services provided by the investment adviser, and annually considers whether to renew the contract with the adviser. Generally, each Director holds office until his/her successor is elected and qualified or until his/her earlier resignation or removal, as provided in the Company’s organizational documents.
Lord, Abbett & Co. LLC (“Lord Abbett”), a Delaware limited liability company, is the Company’s investment adviser.
Interested Directors
The following Directors are partners of Lord Abbett and are “interested persons” of the Company as defined in the Act. Mr. Dow and Ms. Foster are officers, directors, or trustees of each of the 14 Lord Abbett-sponsored funds, which consist of 53 portfolios or series.
| | | | | | |
Name, Address and Year of Birth | | Current Position and
Length of Service
with Company | | Principal Occupation
During Past Five Years | | Other Directorships |
| | | |
Robert S. Dow Lord, Abbett & Co. LLC
90 Hudson Street
Jersey City, NJ 07302
(1945) | | Director and Chairman since 1996 | | Senior Partner (since 2007), Chief Executive Officer (since 1996) and was formerly Managing Partner (1996 - 2007), joined Lord Abbett in 1972. | | N/A |
| | | |
Daria L. Foster Lord, Abbett & Co. LLC
90 Hudson Street
Jersey City, NJ 07302
(1954) | | Director since 2006 | | Managing Partner (since 2007) and was formerly Director of Marketing and Client Service, joined Lord Abbett in 1990. | | N/A |
Independent Directors
The following independent or outside Directors (“Independent Directors”) are also directors or trustees of each of the 14 Lord Abbett-sponsored funds, which consist of 53 portfolios or series.
| | | | | | |
Name, Address and
Year of Birth | | Current Position and
Length of Service
with Company | | Principal Occupation
During Past Five Years | | Other
Directorships |
| | | |
E. Thayer Bigelow Lord, Abbett & Co. LLC
c/o Legal Dept.
90 Hudson Street
Jersey City, NJ 07302
(1941) | | Director since 1996 | | Managing General Partner, Bigelow Media, LLC (since 2000); Senior Adviser, Time Warner Inc. (1998 - 2000). | | Currently serves as director of Crane Co. (since 1984), Huttig Building Products Inc. (since 1998) and R.H. Donnelley Inc. (since 2009). |
51
Basic Information About Management (continued)
| | | | | | |
Name, Address and
Year of Birth | | Current Position and
Length of Service
with Company | | Principal Occupation
During Past Five Years | | Other
Directorships |
| | | |
William H.T. Bush
Lord, Abbett & Co. LLC
c/o Legal Dept.
90 Hudson Street
Jersey City, NJ 07302
(1938) | | Director since 1998 | | Co-founder and Chairman of the Board of the financial advisory firm of Bush- O’Donnell & Company (since 1986). | | Currently serves as director of WellPoint, Inc., a health benefits company (since 2002). |
| | | |
Robert B. Calhoun, Jr. Lord, Abbett & Co. LLC
c/o Legal Dept.
90 Hudson Street
Jersey City, NJ 07302
(1942) | | Director since 1998 | | Senior Advisor of Monitor Clipper Partners, a private equity investment fund (since 1997); President of Clipper Asset Management Corp. (1991 - 2009). | | N/A |
| | | |
Julie A. Hill
Lord, Abbett & Co. LLC
c/o Legal Dept.
90 Hudson Street
Jersey City, NJ 07302
(1946) | | Director since 2004 | | Owner and CEO of The Hill Company, a business consulting firm (since 1998). | | Currently serves as director of WellPoint, Inc., a health benefits company (since 1994) and Lend Lease Corporation Limited (since 2005). |
| | | |
Franklin W. Hobbs
Lord, Abbett & Co. LLC
c/o Legal Dept.
90 Hudson Street
Jersey City, NJ 07302
(1947) | | Director since 2001 | | Advisor of One Equity Partners, a private equity firm (since 2004). | | Currently serves as a director and Chairman of the Board of GMAC Inc., a financial services firm (since 2009) and as a director of Molson Coors Brewing Company (since 2002). |
| | | |
Thomas J. Neff
Lord, Abbett & Co. LLC
c/o Legal Dept.
90 Hudson Street
Jersey City, NJ 07302
(1937) | | Director since 1992 | | Chairman of Spencer Stuart (U.S.), an executive search consulting firm (since 1996). | | Currently serves as director of Ace, Ltd. (since 1997) and Hewitt Associates, Inc. (since 2004). |
| | | |
James L.L. Tullis
Lord, Abbett & Co. LLC
c/o Legal Dept.
90 Hudson Street
Jersey City, NJ 07302
(1947) | | Director since 2006 | | CEO of Tullis-Dickerson and Co. Inc., a venture capital management firm (since 1990). | | Currently serves as director of Crane Co. (since 1998). |
52
Basic Information About Management (continued)
Officers
None of the officers listed below have received compensation from the Company. All of the officers of the Company may also be officers of the other Lord Abbett-sponsored funds and maintain offices at 90 Hudson Street, Jersey City, NJ 07302. Unless otherwise indicated, the titles and positions listed under the “Principal Occupation” column indicate the officer’s position(s) and title(s) with Lord Abbett.
| | | | | | |
Name and
Year of Birth | | Current Position
with Company | | Length of Service
of Current Position | | Principal Occupation
During Past Five Years |
| | | |
Robert S. Dow (1945) | | Chief Executive Officer and Chairman | | Elected in 1996 | | Senior Partner (since 2007), Chief Executive Officer (since 1996) and was formerly Managing Partner (1996 - 2007), joined Lord Abbett in 1972. |
| | | |
Daria L. Foster (1954) | | President | | Elected in 2006 | | Managing Partner (since 2007) and was formerly Director of Marketing and Client Service, joined Lord Abbett in 1990. |
| | | |
Robert P. Fetch (1953) | | Executive Vice President | | Elected in 1997 | | Partner and Director, joined Lord Abbett in 1995. |
| | | |
Daniel H. Frascarelli (1954) | | Executive Vice President | | Elected in 2005 | | Partner and Director, joined Lord Abbett in 1990. |
| | | |
Robert I. Gerber (1954) | | Executive Vice President | | Elected in 2007 | | Partner and Chief Investment Officer (since 2007), joined Lord Abbett in 1997 as Director of Taxable Fixed Income Management. |
| | | |
Gerard S. E. Heffernan, Jr. (1963) | | Executive Vice President | | Elected in 2009 | | Partner and Director, joined Lord Abbett in 1998. |
| | | |
Christopher J. Towle (1957) | | Executive Vice President | | Elected in 2001 | | Partner and Director, joined Lord Abbett in 1987. |
| | | |
Paul J. Volovich (1973) | | Executive Vice President | | Elected in 2004 | | Partner and Director, joined Lord Abbett in 1997. |
| | | |
James W. Bernaiche (1956) | | Chief Compliance Officer | | Elected in 2004 | | Partner and Chief Compliance Officer, joined Lord Abbett in 2001. |
| | | |
Joan A. Binstock (1954) | | Chief Financial Officer and Vice President | | Elected in 1999 | | Partner and Chief Operations Officer, joined Lord Abbett in 1999. |
| | | |
John K. Forst (1960) | | Vice President and Assistant Secretary | | Elected in 2005 | | Deputy General Counsel, joined Lord Abbett in 2004. |
53
Basic Information About Management (concluded)
| | | | | | |
Name and
Year of Birth | | Current Position
with Company | | Length of Service
of Current Position | | Principal Occupation
During Past Five Years |
| | | |
Lawrence H. Kaplan (1957) | | Vice President and Secretary | | Elected in 1997 | | Partner and General Counsel, joined Lord Abbett in 1997. |
| | | |
Deepak Khanna (1963) | | Vice President | | Elected in 2008 | | Portfolio Manager, returned to Lord Abbett in 2007 from Jennison Associates LLC (2005 - 2007). Mr. Khanna’s former experience at Lord Abbett included Senior Research Analyst – other investment strategies (2000 - 2005). |
| | | |
David J. Linsen (1974) | | Vice President | | Elected in 2008 | | Director and Portfolio Manager, joined Lord Abbett in 2001. |
| | | |
Elizabeth O. MacLean (1966) | | Vice President | | Elected in 2008 | | Partner and Portfolio Manager, joined Lord Abbett in 2006 and was formerly a Managing Director/Portfolio Manager at Nomura Corporate Research and Asset Management, Inc. (2000 - 2006). |
| | | |
A. Edward Oberhaus, III (1959) | | Vice President | | Elected in 1996 | | Partner and Director, joined Lord Abbett in 1983. |
| | | |
Todor Petrov (1974) | | Vice President | | Elected in 2008 | | Portfolio Manager, joined Lord Abbett in 2003. |
| | | |
Thomas R. Phillips (1960) | | Vice President and Assistant Secretary | | Elected in 2008 | | Deputy General Counsel, joined Lord Abbett in 2006 and was formerly an attorney at Morgan, Lewis & Bockius LLP. |
| | | |
Randy M. Reynolds (1972) | | Vice President | | Elected in 2008 | | Portfolio Manager, joined Lord Abbett in 1999. |
| | | |
Lawrence B. Stoller (1963) | | Vice President and Assistant Secretary | | Elected in 2007 | | Senior Deputy General Counsel, joined Lord Abbett in 2007 and was formerly an Executive Vice President and General Counsel at Cohen & Steers Capital Management, Inc. (1999 - 2007). |
| | | |
Bernard J. Grzelak (1971) | | Treasurer | | Elected in 2003 | | Partner and Director of Fund Administration, joined Lord Abbett in 2003. |
Please call 888-522-2388 for a copy of the statement of additional information (SAI), which contains further information about the Company’s Directors. It is available free upon request.
54
Householding
The Company has adopted a policy that allows it to send only one copy of each Fund’s prospectus, proxy material, annual report and semiannual report to certain shareholders residing at the same “household.” This reduces Fund expenses, which benefits you and other shareholders. If you need additional copies or do not want your mailings to be “householded,” please call Lord Abbett at 888-522-2388 or send a written request with your name, the name of your fund or funds and your account number or numbers to Lord Abbett Family of Funds, P.O. Box 219336, Kansas City, MO 64121.
Proxy Voting Policies, Procedures and Records
A description of the policies and procedures that Lord Abbett uses to vote proxies related to each Fund’s portfolio securities, and information on how Lord Abbett voted each Fund’s proxies during the 12-month period ended June 30 are available without charge, upon request, (i) by calling 888-522-2388; (ii) on Lord Abbett’s Website at www.lordabbett.com; and (iii) on the Securities and Exchange Commission’s (“SEC”) Website at www.sec.gov.
Shareholder Reports and Quarterly Portfolio Disclosure
The Funds are required to file their complete schedule of portfolio holdings with the SEC for their first and third fiscal quarters on Form N-Q. Copies of the filings are available without charge, upon request on the SEC’s Website at www.sec.gov and may be available by calling Lord Abbett at 888-522-2388. You can also obtain copies of Form N-Q by (i) visiting the SEC’s Public Reference Room in Washington, DC (information on the operation of the Public Reference Room may be obtained by calling 800-SEC-0330); (ii) sending your request and duplicating fee to the SEC’s Public Reference Section, Washington, DC 20549-1520; or (iii) sending your request electronically, after paying a duplicating fee, to publicinfo@sec.gov.
Tax Information
100% of the ordinary income distributions paid by the Classic Stock Fund and the Small Cap Value Fund during fiscal 2009 are qualifying dividend income. For corporate shareholders, 100% of the ordinary income distributions paid by the Classic Stock Fund and the Small Cap Value Fund during fiscal 2009 qualified for the dividends received deduction.
55


This report, when not used for the general information of shareholders of the Fund, is to be distributed only if preceded or accompanied by a current fund prospectus.
Lord Abbett mutual fund shares are distributed by LORD ABBETT DISTRIBUTOR LLC.
Lord Abbett Research Fund, Inc.
Lord Abbett Classic Stock Fund
Small-Cap Value Series
LARF-2-1109
(01/10)
| | (a) | In accordance with applicable requirements, the Registrant adopted a Sarbanes-Oxley Code of Ethics on June 19, 2003 that applies to the principal executive officer and senior financial officers of the Registrant (“Code of Ethics”). The Code of Ethics was in effect during the fiscal year ended November 30, 2009 (the “Period”). |
| | (c) | The Registrant has not amended the Code of Ethics as described in Form N-CSR during the Period. |
| | (d) | The Registrant has not granted any waiver, including an implicit waiver, from a provision of the Code of Ethics as described in Form N-CSR during the Period. |
| | (f) | See Item 12(a)(1) concerning the filing of the Code of Ethics. The Registrant will provide a copy of the Code of Ethics to any person without charge, upon request. To obtain a copy, please call Lord Abbett at 888-522-2388. |
| Item 3: | Audit Committee Financial Expert. |
The Registrant’s board of directors has determined that each of the following independent directors who are members of the audit committee is an audit committee financial expert: E. Thayer Bigelow, Robert B. Calhoun Jr., Franklin W. Hobbs, and James L.L. Tullis. Each of these persons is independent within the meaning of the Form N-CSR.
| Item 4: | Principal Accountant Fees and Services. |
In response to sections (a), (b), (c) and (d) of Item 4, the aggregate fees billed to the Registrant for the fiscal years ended November 30, 2009 and 2008 by the Registrant’s principal accounting firm, Deloitte & Touche LLP, the member firms of Deloitte Touche Tohmatsu and their respective affiliates (collectively, “Deloitte”) were as follows:
| | | | | | |
| | | Fiscal year ended: |
| | | 2009 | | 2008 |
Audit Fees {a} | | $ | 151,000 | | $ | 151,000 |
Audit-Related Fees | | | - 0 - | | | - 0 - |
| | | |
Total audit and audit-related fees | | | 151,000 | | | 151,000 |
| | | |
Tax Fees {b} | | | 29,310 | | | 29,382 |
All Other Fees | | | - 0 - | | | - 0 - |
| | | |
Total Fees | | $ | 180,310 | | $ | 180,382 |
| | | |
{a} Consists of fees for audits of the Registrant’s annual financial statements.
{b} Fees for the fiscal year ended November 30, 2009 and 2008 consist of fees for preparing the U.S. Income Tax Return for Regulated Investment Companies, New Jersey Corporation Business Tax Return, New Jersey Annual Report Form, U.S. Return of Excise Tax on Undistributed Income of Investment Companies, IRS Forms 1099-MISC and 1096 Annual Summary and Transmittal of U.S. Information Returns.
(e) (1) Pursuant to Rule 2-01(c) (7) of Regulation S-X, the Registrant’s Audit Committee has adopted pre-approval policies and procedures. Such policies and procedures generally provide that the Audit Committee must pre-approve:
| | • | | any audit, audit-related, tax, and other services to be provided to the Lord Abbett Funds, including the Registrant, and |
| | • | | any audit-related, tax, and other services to be provided to the Registrant’s investment adviser and any entity controlling, controlled by or under common control with the investment adviser that provides ongoing services to one or more Funds comprising the Registrant if the engagement relates directly to operations and financial reporting of a Fund, by the independent auditor to assure that the provision of such services does not impair the auditor’s independence. |
The Audit Committee has delegated pre-approval authority to its Chairman, subject to a fee limit of $10,000 per event, and not to exceed $25,000 annually. The Chairman will report any pre-approval decisions to the Audit Committee at its next scheduled meeting. Unless a type of service to be provided by the independent auditor has received general pre-approval, it must be pre-approved by the Audit Committee. Any proposed services exceeding pre-approved cost levels will require specific pre-approval by the Audit Committee.
(e) (2) The Registrant’s Audit Committee has approved 100% of the services described in this Item 4 (b) through (d).
(f) Not applicable.
(g) The aggregate non-audit fees billed by Deloitte for services rendered to the Registrant are shown above in the response to Item 4 (a), (b), (c) and (d) as “All Other Fees”.
The aggregate non-audit fees billed by Deloitte for services rendered to the Registrant’s investment adviser, Lord, Abbett & Co. LLC (“Lord Abbett”), for the fiscal years ended November 30, 2009 and 2008 were:
| | | | | | |
| | | Fiscal year ended: |
| | | 2009 | | 2008 |
All Other Fees {a} | | $ | 161,385 | | $ | 155,939 |
{a} Consist of fees for Independent Services Auditors’ Report on Controls Placed in Operation and Tests of Operating Effectiveness related to Lord Abbett’s Asset Management Services (“SAS 70 Report”).
The aggregate non-audit fees billed by Deloitte for services rendered to entities under the common control of Lord Abbett for the fiscal years ended November 30, 2009 and 2008 were:
| | | | | | |
| | | Fiscal year ended: |
| | | 2009 | | 2008 |
All Other Fees | | $ | - 0 - | | $ | - 0 - |
(h) The Registrant’s Audit Committee has considered the provision of non-audit services that were rendered to the Registrant’s investment adviser, and any entity controlling, controlled by or under common control with the investment adviser that provides ongoing services to the Registrant, that were not pre-approved pursuant to Rule 2-01 (c)(7)(ii) of Regulation S-X and has determined that the provision of such services is compatible with maintaining Deloitte’s independence.
| Item 5: | Audit Committee of Listed Registrants. |
Not applicable.
Not applicable.
| Item 7: | Disclosure of Proxy Voting Policies and Procedures for Closed-End Management Investment Companies. |
Not applicable.
| Item 8: | Portfolio Managers of Closed-End Management Investment Companies. |
Not applicable.
| Item 9: | Purchases of Equity Securities by Closed-End Management Investment Company and Affiliated Purchasers. |
Not applicable.
| Item 10: | Submission of Matters to a Vote of Security Holders. |
Not applicable.
| | | |
| |
| Item 11: | | | Controls and Procedures. |
| |
| (a | ) | | Based on their evaluation of the Registrant’s disclosure controls and procedures (as defined in Rule 30a-3(c) under the Investment Company Act of 1940) as of a date within 90 days prior to the filing date of this report, the Chief Executive Officer and Chief Financial Officer of the Registrant have concluded that such disclosure controls and procedures are reasonably designed and effective to ensure that material information relating to the Registrant, including its consolidated subsidiaries, is made known to them by others within those entities. |
| |
| (b | ) | | There were no changes in the Registrant’s internal control over financial reporting (as defined in Rule 30a-3(d) under the Investment Company Act of 1940) that occurred during the second fiscal quarter of the period covered by this report that have materially affected, or are reasonably likely to materially affect, the Registrant’s internal control over financial reporting. |
| |
| Item 12: | | | Exhibits. |
| |
| (a | )(1) | | Amendments to Code of Ethics – Not applicable. |
| |
| (a | )(2) | | Certification of each principal executive officer and principal financial officer of the Registrant as required by Rule 30a-2 under the Investment Company Act of 1940 is attached hereto as a part of EX-99.CERT. |
| |
| (a | )(3) | | Not applicable. |
| |
| (b | ) | | Certification of each principal executive officer and principal financial officer of the Registrant as required by Section 906 of the Sarbanes-Oxley Act of 2002 is provided as a part of EX-99.906CERT. |
SIGNATURES
Pursuant to the requirements of the Securities Exchange Act of 1934 and the Investment Company Act of 1940, the Registrant has duly caused this report to be signed on its behalf by the undersigned, thereunto duly authorized.
| | |
| | LORD ABBETT RESEARCH FUND, INC. |
| |
| By: | | /s/ Robert S. Dow |
| | Robert S. Dow |
| | Chief Executive Officer and Chairman |
Date: January 27, 2010
| | |
| By: | | /s/ Joan A. Binstock |
| | Joan A. Binstock |
| | Chief Financial Officer and Vice President |
Date: January 27, 2010
Pursuant to the requirements of the Securities Exchange Act of 1934 and the Investment Company Act of 1940, this report has been signed below by the following persons on behalf of the Registrant and in the capacities and on the dates indicated.
| | |
| By: | | /s/ Robert S. Dow |
| | Robert S. Dow |
| | Chief Executive Officer and Chairman |
Date: January 27, 2010
| | |
| By: | | /s/ Joan A. Binstock |
| | Joan A. Binstock |
| | Chief Financial Officer and Vice President |
Date: January 27, 2010