UNITED STATES
SECURITIES AND EXCHANGE COMMISSION
Washington, D.C. 20549
FORM N-CSR
CERTIFIED SHAREHOLDER REPORT OF REGISTERED
MANAGEMENT INVESTMENT COMPANIES
Investment Company Act file number | 811-06650 |
|
LORD ABBETT RESEARCH FUND, INC. |
(Exact name of registrant as specified in charter) |
|
90 Hudson Street, Jersey City, NJ | | 07302 |
(Address of principal executive offices) | | (Zip code) |
|
Christina T. Simmons, Vice President & Assistant Secretary
90 Hudson Street, Jersey City, NJ 07302 |
(Name and address of agent for service) |
|
Registrant’s telephone number, including area code: | (800) 201-6984 | |
|
Date of fiscal year end: | 11/30 | |
|
Date of reporting period: | 11/30/2006 | |
| | | | | | | | |
Item 1: Report to Shareholders.
LORD ABBETT

2006
Annual
Report
Lord Abbett
Large Cap Core Fund
Small Cap Value Fund
For the fiscal year ended November 30, 2006
Lord Abbett Research Fund
Lord Abbett Large Cap Core Fund and
Lord Abbett Small Cap Value Fund
Annual Report
For the fiscal year ended November 30, 2006
Dear Shareholders: We are pleased to provide you with this overview of the Lord Abbett Large Cap Core Fund's and the Lord Abbett Small Cap Value Fund's performance for the fiscal year ended November 30, 2006. On this page and the following pages, we discuss the major factors that influenced performance. For detailed and more timely information about the Funds, please visit our Website at www.lordabbett.com, where you also can access the quarterly commentaries by the Funds' portfolio managers.
General information about Lord Abbett mutual funds, as well as in-depth discussions of market trends and investment strategies, is also provided in Lord Abbett Insights, a newsletter accompanying your quarterly account statements. We also encourage you to call Lord Abbett at 800-821-5129 and speak to one of our professionals if you would like more information.
Thank you for investing in Lord Abbett mutual funds. We value the trust that you place in us and look forward to serving your investment needs in the years to come.

From left to right: Robert S. Dow, Director and Chairman of the Lord Abbett Funds; E. Thayer Bigelow, Independent Lead Director of the Lord Abbett Funds; and Daria L. Foster, Director and President of the Lord Abbett Funds.
Best regards,
Robert S. Dow
Chairman

Q: What were the overall market conditions during the fiscal year ended November 30, 2006?
A: The stock market gained approximately 14% (including dividends) in the fiscal year ended November 30, 2006 (as measured by the broad S&P Composite 1500® Index1). After beginning the fiscal year with positive momentum, the market entered a period of consolidation in May. The spring sell-off persisted until mid-July. During the market correction, small caps (as measured by the S&P SmallCap 600® Index2) fell more than twice (in percentage terms) as
1
much as large caps. Once positive momentum returned, large capitalized companies led the market higher. For the fiscal year, the S&P 100® Index,3 comprised of large cap stocks, finished up about 15% (on a total return basis), while the small cap index matched the broad market with a gain of roughly 14%. Mid-capitalized companies (as measured by the S&P MidCap® 400 Index4), trailed on average, but still managed to register a total return of near 12% over the period.
Sector leadership rotated much like the preference for capitalization did. Between December 2005 and August 2006, the price of crude oil rose approximately 34% (from about $57 per barrel to approximately $77), pushing energy stock prices higher. With inventories of petroleum plentiful, the price of crude oil began to slide in August. The $0.80 per gallon decline in the cost of gasoline fueled a late-year rally in consumer discretionary stocks. In addition, the lagging technology sector rallied in the final three months of the fiscal year. Defensive sectors such as consumer staples and health care lagged behind the broader market in the final months of the fiscal year.
Performance data quoted in the following pages reflect past performance and are no guarantee of future results. Current performance may be higher or lower than the performance quoted. The investment return and principal value of an investment in the Funds will fluctuate so that shares, on any given day or when redeemed, may be worth more or less than their original cost. You can obtain performance data current to the most recent month-end by calling Lord Abbett at 800-821-5129 or referring to our Website at www.lordabbett.com.
Lord Abbett Large Cap Core Fund
Q: How did the Large Cap Core Fund perform during the fiscal year ended November 30, 2006?
A: The Fund returned 11.5%, reflecting performance at the net asset value (NAV) of Class A shares with all distributions reinvested, compared with its benchmark, the Russell 1000® Index,5 which returned 14.2% over the same period. The Fund's average annual total returns, which reflect performance at the maximum 5.75% sales charge applicable to Class A share investments and include the reinvestment of all distributions, are: 1 year: 5.09%, 5 years: 4.92%, and 10 years: 8.03%.
During certain periods shown, expense reimbursements were in place. Without such expense reimbursements, the Fund's returns would have been lower.
Q: What were the most significant factors affecting performance?
A: The financial services sector was the greatest detractor from the Fund's performance relative to its benchmark for
2
the one-year period. Also detracting from the Fund's relative performance were the healthcare sector and the technology sector.
Three healthcare holdings that hurt performance were UnitedHealth Group Inc., a manager of organized health systems; St. Jude Medical, Inc., a maker of medical devices for the worldwide cardiovascular market; and Boston Scientific Corp., a developer of minimally invasive medical devices.
Among the individual technology holdings that detracted from performance were Qualcomm Inc. (the Fund's number-one detractor), a provider of digital wireless communications products and services, and Motorola, Inc., a supplier of integrated communications solutions and embedded electronic solutions.
The consumer discretionary sector was the strongest contributor to the Fund's performance relative to its benchmark. The Fund benefited from its underweight position in this sector. Other contributors were the utilities sector and the consumer staples sector.
Among the individual holdings that contributed to Fund performance were utilities company Comcast Corp. (the Fund's number-one contributor), which operates hybrid fiber-coaxial broadband cable communications networks, and consumer staples holding Diageo plc, a distiller and marketer of alcoholic beverages.
Three other solid contributors included integrated oils holding ExxonMobil Corp., an operator of petroleum and petrochemicals businesses; materials and processing holding Monsanto Co., a provider of technology-based solutions and agricultural products for growers and downstream customers in the agricultural markets; and healthcare holding Pfizer Inc., a research-based, global pharmaceutical company that discovers, develops, manufactures, and markets medicines for humans and animals.
The Fund's portfolio is actively managed and, therefore, its holdings and the weightings of a particular issuer or particular sector as a percentage of portfolio assets are subject to change. Sectors may include many industries.
Lord Abbett Small Cap Value Fund
Q: How did the Small Cap Value Fund perform during the fiscal year ended November 30, 2006?
A: The Fund returned 21.1%, reflecting performance at the net asset value (NAV) of Class A shares with all distributions reinvested, compared to its benchmark, the Russell 2000® Value Index,6 which returned 21.5% over the same period. The Fund's average annual total returns, which reflect performance at the maximum 5.75% sales charge applicable to Class A share investments and include the reinvestment of all distributions, are: 1 year: 14.16%, 5 years: 16.69%, and 10 years: 15.26%.
3
Q: What were the most significant factors affecting performance?
A: The most significant detractor from the Fund's performance relative to its benchmark was the consumer discretionary sector. (The consumer discretionary sector includes stocks in the consumer durables, apparel, media, hotel, and leisure industries.) In addition, also detracting from performance were the auto and transportation sector (the Fund was hurt by an overweight position in this sector) and the integrated oils sector.
Among individual detractors were consumer discretionary holdings Pacific Sunwear of California, Inc. (the Fund's number-one detractor), which operates a nationwide mall-based specialty retail chain of stores, and Eddie Bauer Holdings, Inc., a retailer of casual clothing, accessories, and home furnishings through retail stores and its catalog.
Other individual detractors from performance included aerospace and defense firm DynCorp International Inc., a provider of a range of mission-critical outsourced technical services to civilian and military government agencies and commercial customers; materials and processing holding Simpson Manufacturing Co., Inc., a maker of masonry connectors and shearwalls; and technology holding Dendrite International, Inc., a supplier of sales force software products and support services to the pharmaceutical industry.
The greatest contributor to Fund performance relative to its benchmark for the 12-month period was the other sector. (This sector includes large, diversified corporations.) In addition, the Fund also benefited from its overall overweight position in the other sector, an underweight position in the financial services sector, and from its overweight position in the technology sector.
Among the contributors to Fund performance were other sector holding Trinity Industries, Inc., a manufacturer of transportation, construction, and industrial products, and technology holding Anixter International Inc. (the Fund's number-one contributor and its largest holding at period end), a distributor of communications and specialty wire and cable products.
Other individual holdings that contributed to Fund performance were three materials and processing sector holdings: Steel Dynamics, Inc., an operator of a flat-rolled steel mini-mill, as well as a cold mill; Carpenter Technology Corp., a maker of stainless steels, titanium, and specialty metal alloys; and Rogers Corp., a manufacturer of specialty materials and components for applications in the communications, computer, imaging, consumer, and transportation markets.
The Fund's portfolio is actively managed and, therefore, its holdings and the weightings of a particular issuer or particular sector as a percentage of
4
portfolio assets are subject to change. Sectors may include many industries.
Note: Class A shares purchased subject to a front end sales charge have no contingent deferred sales charge (CDSC). However, certain purchases of Class A shares made without a front-end sales charge may be subject to a CDSC of 1% if shares are redeemed within 12 months of purchase (24th month if shares were purchased prior to November 1, 2004). Please see section "Your Investment – Purchases" in the prospectus for more information on redemptions that may be subject to a CDSC.
A prospectus contains important information about a fund, including its investment objectives, risks, charges, and ongoing expenses, which an investor should carefully consider before investing. To obtain a prospectus on any Lord Abbett mutual fund, please contact your investment professional or Lord Abbett Distributor LLC at 800-874-3733 or visit our Website at www.LordAbbett.com. Read the prospectus carefully before investing.
1 The S&P Composite 1500® Index combines the S&P 500®, S&P 400® (an index of mid-cap companies), and S&P Small Cap 600® to create a broad market portfolio representing 90% of U.S. equities.
2 The S&P SmallCap 600® Index is a widely accepted benchmark owing to its low turnover and greater liquidity.
3 The S&P 100® Index measures large company U.S. stock market performance. This market capitalization-weighted index is made up of 100 major, blue-chip stocks across diverse industry groups.
4 The S&P MidCap 400® Index measures the performance of the mid-size company segment of the U.S. market.
5 The Russell 1000® Index measures the performance of the 1,000 largest companies in the Russell 3000® Index, which represents approximately 92% of the total market capitalization of the Russell 3000 Index.
6 The Russell 2000® Value Index measures the performance of those Russell 2000® companies with lower price-to-book ratios and lower forecasted growth values.
Indexes are unmanaged, do not reflect the deduction of fees or expenses, and are not available for direct investment.
Important Performance and Other Information
The views of each Fund's management and the portfolio holdings described in this report are as of November 30, 2006; these views and portfolio holdings may have changed subsequent to this date, and they do not guarantee the future performance of the markets or each Fund. Information provided in this report should not be considered a recommendation to purchase or sell securities.
A Note about Risk: See Notes to Financial Statements for a discussion of investment risks. For a more detailed discussion of the risks associated with the Funds, please see the Funds' prospectus.
Performance: Because of ongoing market volatility, each Fund's performance may be subject to substantial fluctuation. Except where noted, comparative fund performance does not account for the deduction of sales charges and would be different if sales charges were included. Each Fund offers additional classes of shares with distinct pricing options. For a full description of the differences in pricing alternatives, please see the prospectus.
Mutual funds are not insured by the FDIC, are not deposits or other obligations of, or guaranteed by banks, and are subject to investment risks including possible loss of principal amount invested.
5
Large Cap Core Fund
Investment Comparison
Below is a comparison of a $10,000 investment in Class A shares with the same investment in the S&P 500® Index and the Russell 1000® Index, assuming reinvestment of all dividends and distributions. The performance of other classes will be greater than or less than the performance shown in the graph below due to different sales loads and expenses applicable to such classes. The graph and performance table below do not reflect the deduction of taxes that a shareholder would pay on fund distributions or the redemption of fund shares. Past performance is no guarantee of future results.

Average Annual Total Return at Maximum Applicable
Sales Charge for the Periods Ended November 30, 2006
| | | 1 Year | | 5 Years | | 10 Years | | Life of Class | |
| Class A3 | | | 5.09 | % | | | 4.92 | % | | | 8.03 | % | | | — | | |
| Class B4 | | | 6.80 | % | | | 5.33 | % | | | 7.95 | % | | | — | | |
| Class C5 | | | 10.76 | % | | | 5.54 | % | | | — | | | | 8.21 | % | |
| Class P6 | | | 11.40 | % | | | 6.12 | % | | | — | | | | 5.89 | % | |
| Class Y7 | | | 11.92 | % | | | 6.56 | % | | | — | | | | 5.18 | % | |
1 Reflects the deduction of the maximum initial sales charge of 5.75%.
2 Performance for each unmanaged index does not reflect transaction costs, management fees or sales charges. The performance of each index is not necessarily representative of the Fund's performance.
3 Total return, which is the percentage change in net asset value, after deduction of the maximum initial sales charge of 5.75% applicable to Class A shares, with all dividends and distributions reinvested for the periods shown ended November 30, 2006, is calculated using the SEC-required uniform method to compute such return.
4 Performance reflects the deduction of a CDSC of 4% for 1 year, 1% for 5 years and 0% for 10 years.
5 Class C shares commenced operations on April 1, 1997. The 1% CDSC for Class C shares normally applies before the first anniversary of the purchase date. Performance is at net asset value.
6 Class P shares commenced operations on April 5, 1999. Performance is at net asset value.
7 Class Y shares commenced operations on May 3, 1999. Performance is at net asset value.
6
Small Cap Value Fund
Investment Comparison
Below is a comparison of a $10,000 investment in Class A shares with the same investment in both the Russell 2000® Index and Russell 2000® Value Index, assuming reinvestment of all dividends and distributions. The performance of other classes will be greater than or less than the performance shown in the graph below due to different sales loads and expenses applicable to such classes. The graph and performance table below do not reflect the deduction of taxes that a shareholder would pay on fund distributions or the redemption of fund shares. Past performance is no guarantee of future results.
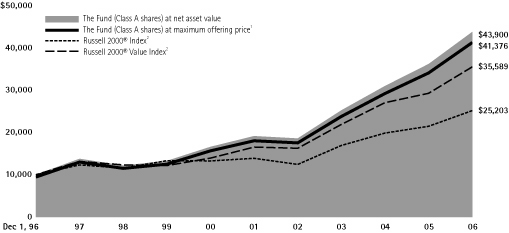
Average Annual Total Return at Maximum Applicable Sales Charge for the Periods Ended November 30, 2006
| | | 1 Year | | 5 Years | | 10 Years | | Life of Class | |
| Class A3 | | | 14.16 | % | | | 16.69 | % | | | 15.26 | % | | | — | | |
| Class B4 | | | 16.29 | % | | | 17.21 | % | | | 15.19 | % | | | — | | |
| Class C5 | | | 20.30 | % | | | 17.37 | % | | | — | | | | 14.99 | % | |
| Class P6 | | | 20.95 | % | | | 17.97 | % | | | — | | | | 16.63 | % | |
| Class Y7 | | | 21.53 | % | | | 18.49 | % | | | — | | | | 14.19 | % | |
1 Reflects the deduction of the maximum initial sales charge of 5.75%.
2 Performance for each unmanaged index does not reflect transaction costs, management fees or sales charges. The performance of each index is not necessarily representative of the Fund's performance.
3 Total return, which is the percentage change in net asset value, after deduction of the maximum initial sales charge of 5.75% applicable to Class A shares, with all dividends and distributions reinvested for the periods shown ended November 30, 2006, is calculated using the SEC-required uniform method to compute such return.
4 Performance reflects the deduction of a CDSC of 4% for 1 year, 1% for 5 years and 0% for 10 years.
5 Class C shares commenced operations on April 1, 1997. The 1% CDSC for Class C shares normally applies before the first anniversary of the purchase date. Performance is at net asset value.
6 Class P shares commenced operations on June 23, 1999. Performance is at net asset value.
7 Class Y shares commenced operations on December 30, 1997. Performance is at net asset value.
7
Expense Examples
As a shareholder of a Fund, you incur two types of costs: (1) transaction costs, including sales charges on purchase payments (these charges vary among the share classes); and (2) ongoing costs, including management fees; distribution and service (12b-1) fees (these charges vary among the share classes); and other Fund expenses. This Example is intended to help you understand your ongoing costs (in dollars) of investing in each Fund and to compare these costs with the ongoing costs of investing in other mutual funds.
The Example is based on an investment of $1,000 invested at the beginning of the period and held for the entire period (June 1, 2006 through November 30, 2006).
Actual Expenses
For each class of each Fund, the first line of the applicable table on the following pages provides information about actual account values and actual expenses. You may use the information in this line, together with the amount you invested, to estimate the expenses that you paid over the period. Simply divide your account value by $1,000 (for example, an $8,600 account value divided by $1,000 = 8.6), then multiply the result by the number in the first line under the heading entitled "Expenses Paid During the Period 6/1/06 – 11/30/06" to estimate the expenses you paid on your account during this period.
Hypothetical Example for Comparison Purposes
For each class of each Fund, the second line of the applicable table on the following pages provides information about hypothetical account values and hypothetical expenses based on the Fund's actual expense ratio and an assumed rate of return of 5% per year before expenses, which is not the Fund's actual return. The hypothetical account values and expenses may not be used to estimate the actual ending account balance or expenses you paid for the period. You may use this information to compare the ongoing costs of investing in each Fund and other funds. To do so, compare this 5% hypothetical example with the 5% hypothetical examples that appear in the shareholder reports of the other funds.
8
Large Cap Core Fund
Please note that the expenses shown in the table are meant to highlight your ongoing costs only and do not reflect any transactional costs, such as sales charges. Therefore, the second line of the table is useful in comparing ongoing costs only, and will not help you determine the relative total costs of owning different funds. In addition, if these transactional costs were included, your costs would have been higher.
| | | Beginning
Account
Value | | Ending
Account
Value | | Expenses
Paid During
Period† | |
| | | 6/1/06 | | 11/30/06 | | 6/1/06 –
11/30/06 | |
| Class A | |
| Actual | | $ | 1,000.00 | | | $ | 1,077.00 | | | $ | 6.77 | | |
| Hypothetical (5% Return Before Expenses) | | $ | 1,000.00 | | | $ | 1,018.55 | | | $ | 6.58 | | |
| Class B | |
| Actual | | $ | 1,000.00 | | | $ | 1,073.50 | | | $ | 10.14 | | |
| Hypothetical (5% Return Before Expenses) | | $ | 1,000.00 | | | $ | 1,015.29 | | | $ | 9.85 | | |
| Class C | |
| Actual | | $ | 1,000.00 | | | $ | 1,073.30 | | | $ | 10.14 | | |
| Hypothetical (5% Return Before Expenses) | | $ | 1,000.00 | | | $ | 1,015.29 | | | $ | 9.85 | | |
| Class P | |
| Actual | | $ | 1,000.00 | | | $ | 1,076.60 | | | $ | 7.29 | | |
| Hypothetical (5% Return Before Expenses) | | $ | 1,000.00 | | | $ | 1,018.05 | | | $ | 7.08 | | |
| Class Y | |
| Actual | | $ | 1,000.00 | | | $ | 1,078.90 | | | $ | 4.95 | | |
| Hypothetical (5% Return Before Expenses) | | $ | 1,000.00 | | | $ | 1,020.31 | | | $ | 4.81 | | |
† For each class of the Fund, expenses are equal to the annualized expense ratio for such class (1.30% for Class A, 1.95% for Classes B and C, 1.40% for Class P and 0.95% for Class Y) multiplied by the average account value over the period, multiplied by 183/365 (to reflect one-half year period).
Portfolio Holdings Presented by Sector
November 30, 2006
| Sector* | | %** | |
| Auto & Transportation | | | 0.76 | % | |
| Consumer Discretionary | | | 8.62 | % | |
| Consumer Staples | | | 15.22 | % | |
| Financial Services | | | 13.17 | % | |
| Healthcare | | | 15.91 | % | |
| Integrated Oils | | | 3.76 | % | |
| Materials & Processing | | | 5.64 | % | |
| Other | | | 2.63 | % | |
| Other Energy | | | 2.71 | % | |
| Producer Durables | | | 5.86 | % | |
| Technology | | | 11.98 | % | |
| Utilities | | | 8.95 | % | |
| Short-Term Investment | | | 4.79 | % | |
| Total | | | 100.00 | % | |
* A sector may comprise several industries.
** Represents percent of total investments.
9
Small Cap Value Fund
Please note that the expenses shown in the table are meant to highlight your ongoing costs only and do not reflect any transactional costs, such as sales charges. Therefore, the second line of the table is useful in comparing ongoing costs only, and will not help you determine the relative total costs of owning different funds. In addition, if these transactional costs were included, your costs would have been higher.
| | | Beginning
Account
Value | | Ending
Account
Value | | Expenses
Paid During
Period† | |
| | | 6/1/06 | | 11/30/06 | | 6/1/06 –
11/30/06 | |
| Class A | |
| Actual | | $ | 1,000.00 | | | $ | 1,063.60 | | | $ | 6.47 | | |
| Hypothetical (5% Return Before Expenses) | | $ | 1,000.00 | | | $ | 1,018.80 | | | $ | 6.33 | | |
| Class B | |
| Actual | | $ | 1,000.00 | | | $ | 1,060.10 | | | $ | 10.07 | | |
| Hypothetical (5% Return Before Expenses) | | $ | 1,000.00 | | | $ | 1,015.32 | | | $ | 9.85 | | |
| Class C | |
| Actual | | $ | 1,000.00 | | | $ | 1,060.00 | | | $ | 10.07 | | |
| Hypothetical (5% Return Before Expenses) | | $ | 1,000.00 | | | $ | 1,015.32 | | | $ | 9.85 | | |
| Class P | |
| Actual | | $ | 1,000.00 | | | $ | 1,062.70 | | | $ | 7.24 | | |
| Hypothetical (5% Return Before Expenses) | | $ | 1,000.00 | | | $ | 1,018.07 | | | $ | 7.08 | | |
| Class Y | |
| Actual | | $ | 1,000.00 | | | $ | 1,065.40 | | | $ | 4.92 | | |
| Hypothetical (5% Return Before Expenses) | | $ | 1,000.00 | | | $ | 1,020.32 | | | $ | 4.81 | | |
† For each class of the Fund, expenses are equal to the annualized expense ratio for such class (1.25% for Class A, 1.95% for Classes B and C, 1.40% for Class P and 0.95% for Class Y) multiplied by the average account value over the period, multiplied by 183/365 (to reflect one-half year period).
Portfolio Holdings Presented by Sector
November 30, 2006
| Sector* | | %** | |
| Auto & Transportation | | | 7.34 | % | |
| Consumer Discretionary | | | 8.45 | % | |
| Consumer Staples | | | 1.26 | % | |
| Financial Services | | | 14.28 | % | |
| Healthcare | | | 5.77 | % | |
| Materials & Processing | | | 19.10 | % | |
| Other | | | 3.58 | % | |
| Other Energy | | | 2.43 | % | |
| Producer Durables | | | 8.34 | % | |
| Technology | | | 13.25 | % | |
| Utilities | | | 10.45 | % | |
| Short-Term Investment | | | 5.75 | % | |
| Total | | | 100.00 | % | |
* A sector may comprise several industries.
** Represents percent of total investments.
10
Schedule of Investments
LARGE CAP CORE FUND November 30, 2006
| Investments | | Shares | | Value
(000) | |
| COMMON STOCKS 95.10% | |
| Aerospace 3.74% | |
| Boeing Co. (The) | | | 144,900 | | | $ | 12,828 | | |
| Lockheed Martin Corp. | | | 140,357 | | | | 12,695 | | |
| Northrop Grumman Corp. | | | 68,200 | | | | 4,565 | | |
| United Technologies Corp. | | | 125,700 | | | | 8,111 | | |
| Total | | | | | | | 38,199 | | |
| Agriculture, Fishing & Ranching 2.22% | |
| Monsanto Co. | | | 471,362 | | | | 22,658 | | |
| Banks 6.90% | |
| Bank of America Corp. | | | 298,948 | | | | 16,098 | | |
Bank of New York Co.,
Inc. (The) | | | 334,200 | | | | 11,877 | | |
| Commerce Bancorp, Inc. | | | 87,400 | | | | 3,038 | | |
| JPMorgan Chase & Co. | | | 202,528 | | | | 9,373 | | |
| Marshall & Ilsley Corp. (The) | | | 19,800 | | | | 907 | | |
PNC Financial Services
Group, Inc. (The) | | | 59,800 | | | | 4,227 | | |
| SunTrust Banks, Inc. | | | 58,100 | | | | 4,744 | | |
| U.S. Bancorp | | | 192,000 | | | | 6,459 | | |
| Wachovia Corp. | | | 84,000 | | | | 4,552 | | |
| Wells Fargo & Co. | | | 259,100 | | | | 9,131 | | |
| Total | | | | | | | 70,406 | | |
| Beverage: Brewers 0.37% | |
| Anheuser-Busch Cos., Inc. | | | 80,200 | | | | 3,810 | | |
| Beverage: Soft Drinks 2.84% | |
| Coca-Cola Co. (The) | | | 252,800 | | | | 11,838 | | |
| PepsiCo, Inc. | | | 276,000 | | | | 17,104 | | |
| Total | | | | | | | 28,942 | | |
Biotechnology Research &
Production 2.55% | |
| Amgen, Inc.* | | | 48,700 | | | | 3,458 | | |
| Baxter Int'l., Inc. | | | 256,887 | | | | 11,493 | | |
| Genentech, Inc.* | | | 52,000 | | | | 4,251 | | |
| ImClone Systems, Inc.* | | | 227,485 | | | | 6,802 | | |
| Total | | | | | | | 26,004 | | |
| Investments | | Shares | | Value
(000) | |
| Chemicals 0.84% | |
| Praxair, Inc. | | | 137,800 | | | $ | 8,599 | | |
| Communications Technology 3.85% | |
| Cisco Systems, Inc.* | | | 338,100 | | | | 9,088 | | |
| Corning, Inc.* | | | 740,300 | | | | 15,961 | | |
| QUALCOMM Inc. | | | 388,700 | | | | 14,223 | | |
| Total | | | | | | | 39,272 | | |
Computer Services, Software &
Systems 2.72% | |
| Microsoft Corp. | | | 525,100 | | | | 15,401 | | |
| Oracle Corp.* | | | 442,300 | | | | 8,417 | | |
| Symantec Corp.* | | | 183,500 | | | | 3,890 | | |
| Total | | | | | | | 27,708 | | |
| Computer Technology 1.87% | |
| Hewlett-Packard Co. | | | 181,913 | | | | 7,179 | | |
Int'l. Business Machines
Corp. | | | 73,000 | | | | 6,710 | | |
| NVIDIA Corp.* | | | 139,200 | | | | 5,149 | | |
| Total | | | | | | | 19,038 | | |
| Consumer Electronics 1.93% | |
| Activision, Inc.* | | | 733,052 | | | | 12,498 | | |
| Electronic Arts Inc.* | | | 129,000 | | | | 7,205 | | |
| Total | | | | | | | 19,703 | | |
| Consumer Products 0.75% | |
| Kimberly-Clark Corp. | | | 114,400 | | | | 7,604 | | |
| Copper 0.25% | |
Freeport-McMoRan
Copper & Gold, Inc. | | | 41,036 | | | | 2,580 | | |
| Diversified Financial Services 2.94% | |
| American Express Co. | | | 57,000 | | | | 3,347 | | |
| Citigroup, Inc. | | | 282,300 | | | | 13,999 | | |
| Morgan Stanley | | | 165,500 | | | | 12,605 | | |
| Total | | | | | | | 29,951 | | |
See Notes to Financial Statements.
11
Schedule of Investments (continued)
LARGE CAP CORE FUND November 30, 2006
| Investments | | Shares | | Value
(000) | |
| Drug & Grocery Store Chains 2.34% | |
| CVS Corp. | | | 328,447 | | | $ | 9,449 | | |
| Kroger Co. (The) | | | 475,100 | | | | 10,196 | | |
| Walgreen Co. | | | 104,500 | | | | 4,231 | | |
| Total | | | | | | | 23,876 | | |
| Drugs & Pharmaceuticals 9.28% | |
| Abbott Laboratories | | | 240,900 | | | | 11,241 | | |
| Allergan, Inc. | | | 18,559 | | | | 2,164 | | |
| Gilead Sciences, Inc.* | | | 172,712 | | | | 11,385 | | |
| Johnson & Johnson | | | 285,500 | | | | 18,817 | | |
| Kos Pharmaceuticals, Inc.* | | | 61,830 | | | | 4,806 | | |
| Merck & Co. Inc. | | | 87,400 | | | | 3,890 | | |
| Novartis AG ADR | | | 338,626 | | | | 19,779 | | |
| Pfizer Inc. | | | 275,600 | | | | 7,576 | | |
| Wyeth | | | 311,500 | | | | 15,039 | | |
| Total | | | | | | | 94,697 | | |
Electrical Equipment &
Components 1.24% | |
| Emerson Electric Co. | | | 145,567 | | | | 12,621 | | |
| Electronics: Medical Systems 1.39% | |
| Medtronic, Inc. | | | 272,800 | | | | 14,221 | | |
Electronics:
Semi-Conductors/Components 1.65% | |
Advanced Micro Devices,
Inc.* | | | 163,400 | | | | 3,524 | | |
| Intel Corp. | | | 263,600 | | | | 5,628 | | |
| Texas Instruments, Inc. | | | 260,400 | | | | 7,695 | | |
| Total | | | | | | | 16,847 | | |
| Electronics: Technology 1.89% | |
| General Dynamics Corp. | | | 140,454 | | | | 10,512 | | |
| Raytheon Co. | | | 172,200 | | | | 8,789 | | |
| Total | | | | | | | 19,301 | | |
| Energy: Miscellaneous 0.34% | |
| Valero Energy Corp. | | | 62,800 | | | | 3,458 | | |
| Investments | | Shares | | Value
(000) | |
Engineering & Contracting
Services 0.78% | |
| Fluor Corp. | | | 90,900 | | | $ | 7,916 | | |
| Entertainment 0.60% | |
| Walt Disney Co. (The) | | | 186,337 | | | | 6,158 | | |
Financial Data Processing Services &
Systems 0.30% | |
Automatic Data
Processing, Inc. | | | 62,800 | | | | 3,029 | | |
| Financial: Miscellaneous 1.27% | |
| Fannie Mae | | | 115,600 | | | | 6,592 | | |
| Freddie Mac | | | 94,100 | | | | 6,320 | | |
| Total | | | | | | | 12,912 | | |
| Foods 3.37% | |
| Campbell Soup Co. | | | 338,295 | | | | 12,879 | | |
| Kellogg Co. | | | 141,500 | | | | 7,044 | | |
| Kraft Foods, Inc. Class A | | | 413,800 | | | | 14,504 | | |
| Total | | | | | | | 34,427 | | |
| Gold 1.54% | |
Barrick Gold Corp.
(Canada)(a) | | | 357,500 | | | | 11,240 | | |
| Newmont Mining Corp. | | | 95,900 | | | | 4,499 | | |
| Total | | | | | | | 15,739 | | |
| Health & Personal Care 1.63% | |
Medco Health Solutions,
Inc.* | | | 242,851 | | | | 12,193 | | |
| WellPoint, Inc.* | | | 58,700 | | | | 4,442 | | |
| Total | | | | | | | 16,635 | | |
| Healthcare Facilities 0.05% | |
| Quest Diagnostics Inc. | | | 10,000 | | | | 532 | | |
| Healthcare Management Services 0.41% | |
| Caremark Rx, Inc. | | | 88,400 | | | | 4,181 | | |
See Notes to Financial Statements.
12
Schedule of Investments (continued)
LARGE CAP CORE FUND November 30, 2006
| Investments | | Shares | | Value
(000) | |
Identification Control & Filter
Devices 0.42% | |
| Parker Hannifin Corp. | | | 51,800 | | | $ | 4,324 | | |
| Insurance: Multi-Line 1.27% | |
| American Int'l. Group, Inc. | | | 115,892 | | | | 8,150 | | |
Hartford Financial Services
Group, Inc. (The) | | | 55,900 | | | | 4,794 | | |
| Total | | | | | | | 12,944 | | |
| Insurance: Property - Casualty 0.49% | |
XL Capital Ltd. Class A
(Bermuda)(a) | | | 70,500 | | | | 5,014 | | |
Machinery: Construction &
Handling 0.45% | |
| Caterpillar Inc. | | | 73,700 | | | | 4,572 | | |
Machinery: Oil Well Equipment &
Services 2.20% | |
| Baker Hughes, Inc. | | | 143,043 | | | | 10,504 | | |
Schlumberger Ltd.
(Netherland Antilles)(a) | | | 174,600 | | | | 11,956 | | |
| Total | | | | | | | 22,460 | | |
Medical & Dental Instruments &
Supplies 0.58% | |
| St. Jude Medical, Inc.* | | | 158,500 | | | | 5,907 | | |
| Zimmer Holdings, Inc.* | | | 70 | | | | 5 | | |
| Total | | | | | | | 5,912 | | |
| Miscellaneous: Consumer Staples 1.05% | |
| Diageo plc ADR | | | 139,181 | | | | 10,757 | | |
| Multi-Sector Companies 2.63% | |
| General Electric Co. | | | 623,800 | | | | 22,008 | | |
| Honeywell Int'l., Inc. | | | 111,400 | | | | 4,788 | | |
| Total | | | | | | | 26,796 | | |
| Oil: Crude Producers 0.16% | |
| XTO Energy, Inc. | | | 32,600 | | | | 1,650 | | |
| Investments | | Shares | | Value
(000) | |
| Oil: Integrated Domestic 0.42% | |
| ConocoPhillips | | | 64,200 | | | $ | 4,321 | | |
| Oil: Integrated International 3.33% | |
| Chevron Corp. | | | 150,500 | | | | 10,884 | | |
| Exxon Mobil Corp. | | | 300,515 | | | | 23,083 | | |
| Total | | | | | | | 33,967 | | |
| Publishing: Miscellaneous 0.01% | |
| Idearc Inc.* | | | 4,880 | | | | 134 | | |
| Retail 3.98% | |
| Best Buy Co., Inc. | | | 125,200 | | | | 6,882 | | |
Federated Department
Stores, Inc. | | | 143,700 | | | | 6,048 | | |
| GameStop Corp.* | | | 38,400 | | | | 2,152 | | |
| Kohl's Corp.* | | | 53,100 | | | | 3,696 | | |
| Target Corp. | | | 99,800 | | | | 5,798 | | |
| Wal-Mart Stores, Inc. | | | 348,800 | | | | 16,080 | | |
| Total | | | | | | | 40,656 | | |
| Shoes 0.71% | |
| NIKE, Inc. Class B | | | 73,500 | | | | 7,273 | | |
| Soaps & Household Chemicals 5.22% | |
| Clorox Co. (The) | | | 90,700 | | | | 5,805 | | |
| Colgate-Palmolive Co. | | | 271,900 | | | | 17,687 | | |
Procter & Gamble Co.
(The) | | | 474,932 | | | | 29,821 | | |
| Total | | | | | | | 53,313 | | |
| Textiles Apparel Manufacturers 0.62% | |
| Coach, Inc.* | | | 146,944 | | | | 6,349 | | |
| Transportation: Miscellaneous 0.76% | |
United Parcel Service, Inc.
Class B | | | 99,900 | | | | 7,784 | | |
| Utilities: Cable TV & Radio 1.83% | |
| Comcast Corp. Class A* | | | 462,507 | | | | 18,630 | | |
See Notes to Financial Statements.
13
Schedule of Investments (concluded)
LARGE CAP CORE FUND November 30, 2006
| Investments | | Shares | | Value
(000) | |
| Utilities: Electrical 4.46% | |
| Dominion Resources, Inc. | | | 100,800 | | | $ | 8,139 | | |
| FPL Group, Inc. | | | 213,832 | | | | 11,397 | | |
| PG&E Corp. | | | 240,217 | | | | 11,033 | | |
| Progress Energy, Inc. | | | 136,700 | | | | 6,530 | | |
| Southern Co. (The) | | | 233,600 | | | | 8,468 | | |
| Total | | | | | | | 45,567 | | |
| Utilities: Gas Pipelines 0.01% | |
| Dynegy Inc. Class A* | | | 10,376 | | | | 70 | | |
| Utilities: Telecommunications 2.65% | |
| AT&T Inc. | | | 401,300 | | | | 13,608 | | |
| BellSouth Corp. | | | 183,700 | | | | 8,191 | | |
| Sprint Nextel Corp. | | | 94,890 | | | | 1,852 | | |
Verizon Communications,
Inc. | | | 97,600 | | | | 3,410 | | |
| Total | | | | | | | 27,061 | | |
Total Common Stocks
(cost $841,287,793) | | | | | | | 970,578 | | |
| | | Principal
Amount
(000) | | Value
(000) | |
| SHORT-TERM INVESTMENT 4.79% | |
| Repurchase Agreement | |
Repurchase Agreement
dated 11/30/2006,
4.65% due 12/1/2006
with State Street Bank &
Trust Co. collateralized
by $48,005,000 of
Federal Home Loan Bank
at 5.25% due 4/15/2016;
value: $49,865,194;
proceeds: $48,890,242
(cost $48,883,928) | | $ | 48,884 | | | $ | 48,884 | | |
Total Investments in Securities 99.89%
(cost $890,171,721) | | | | | 1,019,462 | | |
Other Assets in Excess of
Liabilities 0.11% | | | | | 1,082 | | |
| Net Assets 100.00% | | | | $ | 1,020,544 | | |
ADR American Depositary Receipt.
* Non-income producing security.
(a) Foreign security traded in U.S. dollars.
See Notes to Financial Statements.
14
Schedule of Investments
SMALL CAP VALUE FUND November 30, 2006
| Investments | | Shares | | Value
(000) | |
| COMMON STOCKS 95.78% | |
| Aerospace 3.27% | |
| Curtiss-Wright Corp.(b) | | | 2,509,545 | | | $ | 89,214 | | |
| Moog Inc. Class A* | | | 852,462 | | | | 31,183 | | |
Teledyne Technologies
Inc.* | | | 277,430 | | | | 11,153 | | |
| Total | | | | | | | 131,550 | | |
| Air Transportation 1.55% | |
| AAR Corp.* | | | 1,461,400 | | | | 38,859 | | |
| Bristow Group, Inc.* | | | 103,300 | | | | 3,674 | | |
Frontier Airlines
Holdings*(b) | | | 2,409,400 | | | | 19,757 | | |
| Total | | | | | | | 62,290 | | |
| Auto Parts: After Market 0.90% | |
Commercial Vehicle
Group, Inc.*(b) | | | 1,143,900 | | | | 26,767 | | |
Keystone Automotive
Industries, Inc.* | | | 266,600 | | | | 9,563 | | |
| Total | | | | | | | 36,330 | | |
| Banks 5.01% | |
Alabama National
BanCorp. | | | 610,811 | | | | 41,828 | | |
Cullen/Frost Bankers,
Inc. | | | 1,000,800 | | | | 54,544 | | |
First Midwest Bancorp,
Inc. | | | 934,100 | | | | 34,795 | | |
| Frontier Financial Corp. | | | 313,700 | | | | 9,424 | | |
Provident Bankshares
Corp. | | | 496,800 | | | | 18,317 | | |
| Signature Bank* | | | 517,700 | | | | 16,649 | | |
| Sterling Financial Corp. | | | 208,997 | | | | 4,857 | | |
United Community Banks,
Inc. | | | 342,700 | | | | 11,422 | | |
| West Coast Bancorp | | | 276,800 | | | | 9,547 | | |
| Total | | | | | | | 201,383 | | |
| Investments | | Shares | | Value
(000) | |
Biotechnology Research &
Production 1.23% | |
Cubist Pharmaceuticals,
Inc.* | | | 686,500 | | | $ | 13,977 | | |
| Kensey Nash Corp.*(b) | | | 730,400 | | | | 22,409 | | |
| PRA Int'l.* | | | 449,996 | | | | 13,032 | | |
| Total | | | | | | | 49,418 | | |
| Building: Heating & Plumbing 0.49% | |
| Interline Brands, Inc.* | | | 814,700 | | | | 19,814 | | |
| Building: Materials 1.79% | |
| LSI Industries, Inc.(b) | | | 1,453,070 | | | | 24,833 | | |
NCI Building Systems,
Inc.* | | | 696,729 | | | | 38,445 | | |
Simpson Manufacturing
Co., Inc. | | | 282,323 | | | | 8,744 | | |
| Total | | | | | | | 72,022 | | |
| Communications Technology 6.17% | |
| Anaren, Inc.*(b) | | | 1,369,777 | | | | 28,149 | | |
| Anixter Int'l., Inc.*(b) | | | 2,546,005 | | | | 149,247 | | |
| Black Box Corp. | | | 242,916 | | | | 10,402 | | |
| CommScope, Inc.* | | | 248,100 | | | | 7,485 | | |
Comtech
Telecommunications
Corp.*(b) | | | 1,495,477 | | | | 53,119 | | |
| Total | | | | | | | 248,402 | | |
Computer Services, Software &
Systems 1.07% | |
| Macrovision Corp.* | | | 1,562,335 | | | | 43,199 | | |
| Computer Technology 0.68% | |
| Intermec Inc.* | | | 1,073,725 | | | | 27,219 | | |
Containers & Packaging: Metal &
Glass 0.51% | |
| AptarGroup, Inc. | | | 331,900 | | | | 20,332 | | |
| Copper 0.09% | |
| Mueller Industries, Inc. | | | 109,040 | | | | 3,718 | | |
| Diversified Manufacturing 4.00% | |
| Brady Corp. | | | 1,150,029 | | | | 44,138 | | |
See Notes to Financial Statements.
15
Schedule of Investments (continued)
SMALL CAP VALUE FUND November 30, 2006
| Investments | | Shares | | Value
(000) | |
| CLARCOR, Inc. | | | 960,056 | | | $ | 31,692 | | |
| Hexcel Corp.*(b) | | | 4,725,129 | | | | 84,580 | | |
| Koppers Holdings, Inc. | | | 20,200 | | | | 461 | | |
| Total | | | | | | | 160,871 | | |
| Drug & Grocery Store Chains 1.28% | |
Casey's General Stores,
Inc. | | | 833,600 | | | | 20,748 | | |
| Ruddick Corp. | | | 1,106,086 | | | | 30,838 | | |
| Total | | | | | | | 51,586 | | |
| Drugs & Pharmaceuticals 0.66% | |
Salix Pharmaceuticals,
Ltd.* | | | 1,897,500 | | | | 26,660 | | |
| Electrical & Electronics 1.77% | |
| Plexus Corp.*(b) | | | 2,951,500 | | | | 71,279 | | |
| Electrical Equipment & Components 2.43% | |
| AMETEK, Inc. | | | 619,350 | | | | 20,197 | | |
| Baldor Electric Co. | | | 1,384,600 | | | | 48,101 | | |
| General Cable Corp.* | | | 228,170 | | | | 9,697 | | |
| Genlyte Group Inc. (The)* | | | 231,688 | | | | 19,661 | | |
| Total | | | | | | | 97,656 | | |
| Electronics 2.00% | |
| FLIR Systems, Inc.* | | | 1,627,900 | | | | 52,435 | | |
| II-VI Inc.* | | | 426,620 | | | | 11,015 | | |
| Orbotech, Ltd. (Israel)*(a) | | | 660,500 | | | | 16,876 | | |
| Total | | | | | | | 80,326 | | |
| Electronics: Medical Systems 0.43% | |
| Greatbatch Inc.* | | | 659,700 | | | | 17,159 | | |
Electronics:
Semi-Conductors/Components 0.73% | |
| ANADIGICS, Inc.*(b) | | | 3,060,000 | | | | 29,529 | | |
| Electronics: Technology 1.04% | |
| ScanSource, Inc.*(b) | | | 1,371,817 | | | | 41,868 | | |
Engineering & Contracting
Services 2.17% | |
| Infrasource Services Inc.* | | | 1,402,050 | | | | 30,298 | | |
| Investments | | Shares | | Value
(000) | |
| URS Corp.* | | | 1,293,000 | | | $ | 57,099 | | |
| Total | | | | | | | 87,397 | | |
Financial Data Processing Services &
Systems 0.68% | |
| Jack Henry & Assoc., Inc. | | | 1,258,300 | | | | 27,532 | | |
| Financial Services 0.01% | |
| KBW Inc.* | | | 16,600 | | | | 442 | | |
| Financial: Miscellaneous 1.58% | |
| Financial Federal Corp.(b) | | | 2,300,039 | | | | 63,711 | | |
| Forest Products 0.67% | |
Universal Forest Products,
Inc. | | | 578,874 | | | | 26,999 | | |
| Health & Personal Care 0.47% | |
| Amedisys, Inc.* | | | 486,962 | | | | 19,074 | | |
| Healthcare Facilities 0.57% | |
Radiation Therapy Services,
Inc.* | | | 699,000 | | | | 22,969 | | |
| Healthcare Management Services 0.25% | |
Sierra Health Services,
Inc.* | | | 287,500 | | | | 10,077 | | |
| Household Furnishings 1.16% | |
Ethan Allen Interiors,
Inc. | | | 1,314,100 | | | | 46,624 | | |
Identification Control & Filter
Devices 0.55% | |
| C&D Technologies, Inc. | | | 433,147 | | | | 1,676 | | |
| IDEX Corp. | | | 422,950 | | | | 20,281 | | |
| Total | | | | | | | 21,957 | | |
| Insurance: Multi-Line 1.08% | |
| Hub Int'l. Ltd. (Canada)(a) | | | 1,423,200 | | | | 43,422 | | |
| Insurance: Property - Casualty 1.74% | |
IPC Holdings, Ltd.
(Bermuda)(a) | | | 191,369 | | | | 5,971 | | |
Navigators Group, Inc.
(The)* | | | 525,035 | | | | 24,293 | | |
See Notes to Financial Statements.
16
Schedule of Investments (continued)
SMALL CAP VALUE FUND November 30, 2006
| Investments | | Shares | | Value
(000) | |
| RLI Corp. | | | 359,000 | | | $ | 19,856 | | |
Selective Insurance Group,
Inc. | | | 355,238 | | | | 19,723 | | |
| Total | | | | | | | 69,843 | | |
| Machinery: Industrial/Specialty 1.09% | |
| Nordson Corp. | | | 595,958 | | | | 28,779 | | |
| Woodward Governor Co. | | | 391,242 | | | | 14,941 | | |
| Total | | | | | | | 43,720 | | |
Machinery: Oil Well Equipment &
Services 2.13% | |
| Hanover Compressor Co.* | | | 2,350,020 | | | | 46,413 | | |
| Oil States Int'l., Inc.* | | | 465,000 | | | | 16,186 | | |
Superior Energy Services,
Inc.* | | | 706,598 | | | | 23,014 | | |
| Total | | | | | | | 85,613 | | |
Medical & Dental Instruments &
Supplies 2.25% | |
| Abaxis, Inc.* | | | 882,001 | | | | 17,032 | | |
| Arrow Int'l., Inc. | | | 486,100 | | | | 16,984 | | |
| CONMED Corp.* | | | 700,000 | | | | 15,491 | | |
| ICU Medical, Inc.* | | | 54,300 | | | | 2,194 | | |
| Invacare Corp. | | | 1,104,100 | | | | 25,825 | | |
| Merit Medical Systems, Inc.* | | | 353,614 | | | | 5,661 | | |
| PSS World Medical, Inc.* | | | 346,500 | | | | 7,256 | | |
| Total | | | | | | | 90,443 | | |
| Metal Fabricating 4.82% | |
| Quanex Corp.(b) | | | 2,686,050 | | | | 99,679 | | |
| Shaw Group Inc. (The)* | | | 3,150,000 | | | | 94,154 | | |
| Total | | | | | | | 193,833 | | |
| Metals & Minerals Miscellaneous 1.09% | |
| AMCOL Int'l., Corp.(b) | | | 1,584,348 | | | | 43,982 | | |
Miscellaneous: Materials &
Processing 2.18% | |
| Rogers Corp.*(b) | | | 1,260,080 | | | | 87,550 | | |
| Multi-Sector Companies 3.64% | |
| Carlisle Cos., Inc. | | | 825,700 | | | | 67,617 | | |
| Investments | | Shares | | Value
(000) | |
| Trinity Industries, Inc. | | | 2,083,895 | | | $ | 78,771 | | |
| Total | | | | | | | 146,388 | | |
| Oil: Crude Producers 0.35% | |
| Bronco Drilling Co., Inc.* | | | 718,600 | | | | 13,883 | | |
| Paints & Coatings 1.25% | |
| H.B. Fuller Co. | | | 1,934,902 | | | | 50,443 | | |
| Production Technology Equipment 0.48% | |
| ATMI, Inc.* | | | 593,680 | | | | 19,301 | | |
| Publishing: Miscellaneous 0.11% | |
| Courier Corp. | | | 118,221 | | | | 4,537 | | |
| Railroad Equipment 0.20% | |
| Wabtec Corp. | | | 249,000 | | | | 8,180 | | |
| Railroads 0.63% | |
Genesee & Wyoming,
Inc. Class A* | | | 940,875 | | | | 25,272 | | |
| Real Estate Investment Trusts 1.20% | |
DiamondRock
Hospitality Co. | | | 1,873,700 | | | | 33,164 | | |
Nationwide Health
Properties, Inc. | | | 513,000 | | | | 15,180 | | |
| Total | | | | | | | 48,344 | | |
Rental & Leasing Services:
Commercial 2.57% | |
| GATX Financial Corp. | | | 1,418,600 | | | | 65,511 | | |
Williams Scotsman Int'l.,
Inc.* | | | 1,908,192 | | | | 38,068 | | |
| Total | | | | | | | 103,579 | | |
| Restaurants 3.92% | |
| Benihana, Inc. Class A*(b) | | | 392,246 | | | | 10,983 | | |
Cheesecake Factory, Inc.
(The)* | | | 894,488 | | | | 24,777 | | |
McCormick & Schmick's
Seafood Restaurants Inc.* | | | 61,552 | | | | 1,544 | | |
RARE Hospitality Int'l.,
Inc.* | | | 1,112,988 | | | | 36,027 | | |
See Notes to Financial Statements.
17
Schedule of Investments (concluded)
SMALL CAP VALUE FUND November 30, 2006
| Investments | | Shares | | Value
(000) | |
| Ruby Tuesday, Inc.(b) | | | 3,127,100 | | | $ | 84,401 | | |
| Total | | | | | | | 157,732 | | |
| Retail 1.58% | |
Pacific Sunwear of
California, Inc.* | | | 1,135,950 | | | | 22,355 | | |
| Pantry, Inc. (The)* | | | 256,827 | | | | 12,590 | | |
Rush Enterprises, Inc.
Class A*(b) | | | 1,206,231 | | | | 21,929 | | |
| Susser Holdings Corp.* | | | 338,779 | | | | 6,725 | | |
| Total | | | | | | | 63,599 | | |
| Savings & Loan 0.64% | |
| KNBT Bancorp, Inc. | | | 503,270 | | | | 8,455 | | |
| Webster Financial Corp. | | | 362,000 | | | | 17,293 | | |
| Total | | | | | | | 25,748 | | |
| Services: Commercial 1.34% | |
| Waste Connections, Inc.* | | | 1,338,400 | | | | 54,004 | | |
| Shipping 0.86% | |
| Kirby Corp.* | | | 957,200 | | | | 34,497 | | |
| Steel 0.35% | |
Carpenter Technology
Corp. | | | 129,940 | | | | 13,879 | | |
| Telecommunications Equipment 0.66% | |
| ARRIS Group, Inc.* | | | 786,400 | | | | 9,382 | | |
| C-COR, Inc.* | | | 1,729,554 | | | | 17,295 | | |
| Total | | | | | | | 26,677 | | |
| Textiles Apparel Manufacturers 0.28% | |
| Quiksilver, Inc.* | | | 775,000 | | | | 11,276 | | |
| Truckers 3.32% | |
| Heartland Express, Inc. | | | 3,161,699 | | | | 48,785 | | |
| Knight Transportation, Inc. | | | 1,075,000 | | | | 18,941 | | |
| Werner Enterprises, Inc. | | | 3,535,900 | | | | 65,945 | | |
| Total | | | | | | | 133,671 | | |
| Utilities: Electrical 7.88% | |
| Avista Corp.(b) | | | 3,014,000 | | | | 81,167 | | |
| Black Hills Corp.(b) | | | 2,093,978 | | | | 74,776 | | |
| IDACORP, Inc. | | | 919,800 | | | | 36,783 | | |
| Investments | | Shares | | Value
(000) | |
| PNM Resources, Inc.(b) | | | 4,055,600 | | | $ | 124,507 | | |
| Total | | | | | | | 317,233 | | |
| Utilities: Gas Distributors 2.74% | |
| Nicor, Inc. | | | 990,100 | | | | 49,059 | | |
Piedmont Natural Gas Co.,
Inc. | | | 2,197,700 | | | | 61,250 | | |
| Total | | | | | | | 110,309 | | |
| Wholesalers 0.19% | |
| Houston Wire & Cable Co.* | | | 345,200 | | | | 7,784 | | |
Total Common Stocks
(cost $3,262,039,584) | | | | | | | 3,854,135 | | |
| | | Principal
Amount
(000) | | | |
| SHORT-TERM INVESTMENT 5.84% | |
| Repurchase Agreement | |
Repurchase Agreement
dated 11/30/2006, 4.65%
due 12/1/2006 with
State Street Bank &
Trust Co. collateralized
by $237,730,000 of
Federal Home Loan Bank
at 4.00% to 5.30% due
from 10/27/2011 to
8/14/2013 and
$1,755,000 of Federal
Home Loan Mortgage
Corp. at 5.45% due
11/21/2013; value:
$239,656,031; proceeds:
$234,985,481
(cost $234,955,132) | | $ | 234,955 | | | | 234,955 | | |
Total Investments in Securities 101.62%
(cost $3,496,994,716) | | | | | | | 4,089,090 | | |
Liabilities in Excess of
Other Assets (1.62%) | | | | | | | (65,244 | ) | |
| Net Assets 100.00% | | | | | | $ | 4,023,846 | | |
* Non-income producing security.
(a) Foreign security traded in U.S. dollars.
(b) Affiliated issuer (holding represents 5% or more of the
underlying issuer's outstanding voting shares.) (See Note 9).
See Notes to Financial Statements.
18
Statements of Assets and Liabilities
November 30, 2006
| | | Large Cap
Core Fund | | Small Cap
Value Fund | |
| ASSETS: | |
| Investments in unaffiliated issuers, at cost | | $ | 890,171,721 | | | $ | 2,386,367,515 | | |
| Investments in affiliated issuers, at cost | | | — | | | | 1,110,627,201 | | |
| Investments in unaffiliated issuers, at value | | $ | 1,019,461,797 | | | $ | 2,755,654,925 | | |
| Investments in affiliated issuers, at value | | | — | | | | 1,333,435,512 | | |
| Receivables: | |
| Interest and dividends | | | 1,703,775 | | | | 2,511,698 | | |
| Investment securities sold | | | 3,225,690 | | | | 6,622,562 | | |
| Capital shares sold | | | 2,176,143 | | | | 4,641,107 | | |
| From advisor (See Note 3) | | | 28,984 | | | | — | | |
| Prepaid expenses and other assets | | | 276,903 | | | | 140,482 | | |
| Total assets | | | 1,026,873,292 | | | | 4,103,006,286 | | |
| LIABILITIES: | |
| Payables: | |
| Investment securities purchased | | | 4,058,502 | | | | 71,543,469 | | |
| Capital shares reacquired | | | 942,806 | | | | 3,084,521 | | |
| Management fees | | | 565,189 | | | | 2,303,972 | | |
| 12b-1 distribution fees | | | 311,642 | | | | 874,473 | | |
| Fund administration | | | 32,308 | | | | 127,016 | | |
| Directors' fees | | | 62,519 | | | | 203,601 | | |
| To affiliates (See Note 3) | | | 5,253 | | | | 2,996 | | |
| Accrued expenses and other liabilities | | | 350,937 | | | | 1,020,293 | | |
| Total liabilities | | | 6,329,156 | | | | 79,160,341 | | |
| NET ASSETS | | $ | 1,020,544,136 | | | $ | 4,023,845,945 | | |
| COMPOSITION OF NET ASSETS: | |
| Paid-in capital | | $ | 851,150,675 | | | $ | 2,909,418,876 | | |
| Undistributed (distributions in excess of) net investment income | | | 5,141,056 | | | | (203,601 | ) | |
| Accumulated net realized gain on investments | | | 34,962,329 | | | | 522,534,949 | | |
| Net unrealized appreciation on investments | | | 129,290,076 | | | | 592,095,721 | | |
| Net Assets | | $ | 1,020,544,136 | | | $ | 4,023,845,945 | | |
| Net assets by class: | |
| Class A Shares | | $ | 645,539,082 | | | $ | 2,367,217,863 | | |
| Class B Shares | | $ | 78,276,975 | | | $ | 71,741,328 | | |
| Class C Shares | | $ | 86,535,324 | | | $ | 91,715,149 | | |
| Class P Shares | | $ | 7,314,208 | | | $ | 447,775,035 | | |
| Class Y Shares | | $ | 202,878,547 | | | $ | 1,045,396,570 | | |
| Outstanding shares by class: | |
Class A Shares (200 million shares of common stock
authorized per Fund, $.001 par value) | | | 21,068,770 | | | | 68,417,217 | | |
Class B Shares (30 million shares of common stock
authorized per Fund, $.001 par value) | | | 2,668,381 | | | | 2,258,022 | | |
Class C Shares (20 million shares of common stock
authorized per Fund, $.001 par value) | | | 2,939,194 | | | | 2,882,590 | | |
Class P Shares (20 million shares of common stock
authorized per Fund, $.001 par value) | | | 238,663 | | | | 13,015,309 | | |
Class Y Shares (30 million and 200 million shares of common
stock authorized, respectively, $.001 par value) | | | 6,596,604 | | | | 29,039,289 | | |
Net asset value, offering and redemption price per share
(Net assets divided by outstanding shares): | | | |
| Class A Shares-Net asset value | | $ | 30.64 | | | $ | 34.60 | | |
| Class A Shares-Maximum offering price | |
| (Net asset value plus sales charge of 5.75%) | | $ | 32.51 | | | $ | 36.71 | | |
| Class B Shares-Net asset value | | $ | 29.34 | | | $ | 31.77 | | |
| Class C Shares-Net asset value | | $ | 29.44 | | | $ | 31.82 | | |
| Class P Shares-Net asset value | | $ | 30.65 | | | $ | 34.40 | | |
| Class Y Shares-Net asset value | | $ | 30.76 | | | $ | 36.00 | | |
See Notes to Financial Statements.
19
Statements of Operations
For the Year Ended November 30, 2006
| | | Large Cap
Core Fund | | Small Cap
Value Fund | |
| Investment income: | |
Dividends from unaffiliated issuers (net of foreign
withholding taxes of $58,838 and $54,767 respectively) | | $ | 16,463,363 | | | $ | 23,400,238 | | |
| Dividends from affiliated issuers | | | — | | | | 10,050,934 | | |
| Interest | | | 1,506,543 | | | | 7,985,847 | | |
| Total investment income | | | 17,969,906 | | | | 41,437,019 | | |
| Expenses: | |
| Management fees | | | 6,500,530 | | | | 25,693,773 | | |
| 12b-1 distribution plan-Class A | | | 2,075,929 | | | | 6,412,495 | | |
| 12b-1 distribution plan-Class B | | | 797,350 | | | | 862,329 | | |
| 12b-1 distribution plan-Class C | | | 800,447 | | | | 929,480 | | |
| 12b-1 distribution plan-Class P | | | 32,150 | | | | 1,828,900 | | |
| Shareholder servicing | | | 1,458,241 | | | | 4,399,301 | | |
| Professional | | | 47,093 | | | | 65,617 | | |
| Reports to shareholders | | | 103,561 | | | | 237,115 | | |
| Fund administration | | | 371,481 | | | | 1,411,073 | | |
| Custody | | | 38,743 | | | | 202,272 | | |
| Directors' fees | | | 30,651 | | | | 112,891 | | |
| Registration | | | 168,747 | | | | 398,602 | | |
| Subsidy (See Note 3) | | | 345,459 | | | | 272,168 | | |
| Other | | | 18,045 | | | | 51,946 | | |
| Gross expenses | | | 12,788,427 | | | | 42,877,962 | | |
| Expense reductions (See Note 7) | | | (21,118 | ) | | | (122,545 | ) | |
| Expenses assumed by advisor (See Note 3) | | | (245,299 | ) | | | — | | |
| Net expenses | | | 12,522,010 | | | | 42,755,417 | | |
| Net investment income (loss) | | | 5,447,896 | | | | (1,318,398 | ) | |
| Net realized and unrealized gain: | |
Net realized gain on investments in unaffiliated
issuers and security sold short | | | 35,935,864 | | | | 497,609,756 | | |
| Net realized gain on investments in affiliated issuers | | | — | | | | 25,725,980 | | |
| Net change in unrealized appreciation on investments | | | 59,277,969 | | | | 127,440,592 | | |
| Net realized and unrealized gain | | | 95,213,833 | | | | 650,776,328 | | |
| Net Increase in Net Assets Resulting From Operations | | $ | 100,661,729 | | | $ | 649,457,930 | | |
See Notes to Financial Statements.
20
Statements of Changes in Net Assets
For the Year Ended November 30, 2006
| INCREASE IN NET ASSETS | | Large Cap
Core Fund | | Small Cap
Value Fund | |
| Operations: | |
| Net investment income (loss) | | $ | 5,447,896 | | | $ | (1,318,398 | ) | |
| Net realized gain on investments and security sold short | | | 35,935,864 | | | | 523,335,736 | | |
| Net change in unrealized appreciation on investments | | | 59,277,969 | | | | 127,440,592 | | |
| Net increase in net assets resulting from operations | | | 100,661,729 | | | | 649,457,930 | | |
| Distributions to shareholders from: | |
| Net investment income | |
| Class A | | | (1,904,159 | ) | | | – | | |
| Class P | | | (25,563 | ) | | | – | | |
| Class Y | | | (866,794 | ) | | | – | | |
| Net realized gain | |
| Class A | | | (20,341,586 | ) | | | (157,729,495 | ) | |
| Class B | | | (3,260,788 | ) | | | (11,076,435 | ) | |
| Class C | | | (2,933,006 | ) | | | (8,869,827 | ) | |
| Class P | | | (256,240 | ) | | | (30,469,694 | ) | |
| Class Y | | | (5,264,871 | ) | | | (56,813,206 | ) | |
| Total distributions to shareholders | | | (34,853,007 | ) | | | (264,958,657 | ) | |
| Capital share transactions (See Note 12): | |
| Net proceeds from sales of shares | | | 247,150,357 | | | | 1,424,734,255 | | |
| Reinvestment of distributions | | | 32,333,923 | | | | 231,815,304 | | |
| Cost of shares reacquired | | | (145,197,535 | ) | | | (897,003,856 | ) | |
Net increase in net assets resulting
from capital share transactions | | | 134,286,745 | | | | 759,545,703 | | |
| Net increase in net assets | | | 200,095,467 | | | | 1,144,044,976 | | |
| NET ASSETS: | |
| Beginning of year | | $ | 820,448,669 | | | $ | 2,879,800,969 | | |
| End of year | | $ | 1,020,544,136 | | | $ | 4,023,845,945 | | |
Undistributed (distributions in excess of)
net investment income | | $ | 5,141,056 | | | $ | (203,601 | ) | |
See Notes to Financial Statements.
21
Statements of Changes in Net Assets
For the Year Ended November 30, 2005
| INCREASE IN NET ASSETS | | Large Cap
Core Fund | | Small Cap
Value Fund | |
| Operations: | |
| Net investment income (loss) | | $ | 2,643,564 | | | $ | (7,160,022 | ) | |
| Net realized gain on investments | | | 33,463,546 | | | | 272,935,342 | | |
| Net change in unrealized appreciation (depreciation) on investments | | | (5,174,263 | ) | | | 112,962,890 | | |
| Net increase in net assets resulting from operations | | | 30,932,847 | | | | 378,738,210 | | |
| Distributions to shareholders from: | |
| Net investment income | |
| Class A | | | (1,973,610 | ) | | | – | | |
| Class B | | | (2,424 | ) | | | – | | |
| Class C | | | (1,890 | ) | | | – | | |
| Class P | | | (1,918 | ) | | | – | | |
| Class Y | | | (122,005 | ) | | | – | | |
| Net realized gain | |
| Class A | | | (9,617,715 | ) | | | (86,416,845 | ) | |
| Class B | | | (2,540,980 | ) | | | (18,208,202 | ) | |
| Class C | | | (1,211,051 | ) | | | (8,440,410 | ) | |
| Class P | | | (8,745 | ) | | | (12,919,161 | ) | |
| Class Y | | | (383,255 | ) | | | (27,676,191 | ) | |
| Total distributions to shareholders | | | (15,863,593 | ) | | | (153,660,809 | ) | |
| Capital share transactions (See Note 12): | |
| Net proceeds from sales of shares | | | 422,573,725 | | | | 1,367,850,443 | | |
| Reinvestment of distributions | | | 14,513,229 | | | | 127,382,745 | | |
| Cost of shares reacquired | | | (92,183,858 | ) | | | (508,066,959 | ) | |
Net increase in net assets
resulting from capital share transactions | | | 344,903,096 | | | | 987,166,229 | | |
| Net increase in net assets | | | 359,972,350 | | | | 1,212,243,630 | | |
| NET ASSETS: | |
| Beginning of year | | $ | 460,476,319 | | | $ | 1,667,557,339 | | |
| End of year | | $ | 820,448,669 | | | $ | 2,879,800,969 | | |
Undistributed (distributions in excess of)
net investment income | | $ | 2,489,676 | | | $ | (125,802 | ) | |
See Notes to Financial Statements.
22
Financial Highlights
LARGE CAP CORE FUND
| | | Class A Shares | |
| | | Year Ended 11/30 | |
| | | 2006 | | 2005 | | 2004 | | 2003 | | 2002 | |
| Per Share Operating Performance | |
| Net asset value, beginning of year | | $ | 28.66 | | | $ | 28.42 | | | $ | 24.88 | | | $ | 21.27 | | | $ | 24.75 | | |
| Investment operations: | |
| Net investment income(a) | | | .18 | | | | .15 | | | | .18 | | | | .08 | | | | .04 | | |
| Net realized and unrealized gain (loss) | | | 3.00 | | | | 1.10 | | | | 3.42 | | | | 3.53 | | | | (3.37 | ) | |
| Total from investment operations | | | 3.18 | | | | 1.25 | | | | 3.60 | | | | 3.61 | | | | (3.33 | ) | |
| Distributions to shareholders from: | |
| Net investment income | | | (.10 | ) | | | (.17 | ) | | | (.06 | ) | | | – | | | | – | | |
| Net realized gain | | | (1.10 | ) | | | (.84 | ) | | | – | | | | – | | | | (.15 | ) | |
| Total distributions | | | (1.20 | ) | | | (1.01 | ) | | | (.06 | ) | | | – | | | | (.15 | ) | |
| Net asset value, end of year | | $ | 30.64 | | | $ | 28.66 | | | $ | 28.42 | | | $ | 24.88 | | | $ | 21.27 | | |
| Total Return(b) | | | 11.50 | % | | | 4.49 | % | | | 14.48 | % | | | 16.97 | % | | | (13.52 | )% | |
| Ratios to Average Net Assets: | |
Expenses, including expense reductions
and expenses assumed | | | 1.30 | % | | | 1.30 | % | | | 1.39 | % | | | 1.46 | % | | | 1.45 | % | |
Expenses, excluding expense reductions
and including expenses assumed | | | 1.30 | % | | | 1.30 | % | | | 1.39 | % | | | 1.46 | % | | | 1.45 | % | |
Expenses, excluding expense reductions
and expenses assumed | | | 1.33 | % | | | 1.32 | % | | | 1.41 | % | | | 1.46 | % | | | 1.45 | % | |
| Net investment income | | | .63 | % | | | .53 | % | | | .67 | % | | | .36 | % | | | .16 | % | |
| Supplemental Data: | |
| Net assets, end of year (000) | | $ | 645,539 | | | $ | 523,322 | | | $ | 324,690 | | | $ | 261,231 | | | $ | 201,315 | | |
| Portfolio turnover rate | | | 39.51 | % | | | 44.86 | % | | | 47.14 | % | | | 34.98 | % | | | 74.76 | % | |
See Notes to Financial Statements.
23
Financial Highlights (continued)
LARGE CAP CORE FUND
| | | Class B Shares | |
| | | Year Ended 11/30 | |
| | | 2006 | | 2005 | | 2004 | | 2003 | | 2002 | |
| Per Share Operating Performance | |
| Net asset value, beginning of year | | $ | 27.56 | | | $ | 27.38 | | | $ | 24.07 | | | $ | 20.70 | | | $ | 24.25 | | |
| Investment operations: | |
| Net investment loss(a) | | | (.01 | ) | | | (.03 | ) | | | – | (c) | | | (.06 | ) | | | (.10 | ) | |
| Net realized and unrealized gain (loss) | | | 2.89 | | | | 1.05 | | | | 3.31 | | | | 3.43 | | | | (3.30 | ) | |
| Total from investment operations | | | 2.88 | | | | 1.02 | | | | 3.31 | | | | 3.37 | | | | (3.40 | ) | |
| Distributions to shareholders from: | |
| Net investment income | | | – | | | | – | (c) | | | – | | | | – | | | | – | | |
| Net realized gain | | | (1.10 | ) | | | (.84 | ) | | | – | | | | – | | | | (.15 | ) | |
| Total distributions | | | (1.10 | ) | | | (.84 | ) | | | – | | | | – | | | | (.15 | ) | |
| Net asset value, end of year | | $ | 29.34 | | | $ | 27.56 | | | $ | 27.38 | | | $ | 24.07 | | | $ | 20.70 | | |
| Total Return(b) | | | 10.80 | % | | | 3.78 | % | | | 13.75 | % | | | 16.28 | % | | | (14.10 | )% | |
| Ratios to Average Net Assets: | |
Expenses, including expense reductions
and expenses assumed | | | 1.95 | % | | | 1.95 | % | | | 2.03 | % | | | 2.10 | % | | | 2.06 | % | |
Expenses, excluding expense reductions
and including expenses assumed | | | 1.95 | % | | | 1.95 | % | | | 2.03 | % | | | 2.10 | % | | | 2.06 | % | |
Expenses, excluding expense reductions
and expenses assumed | | | 1.98 | % | | | 1.97 | % | | | 2.05 | % | | | 2.10 | % | | | 2.06 | % | |
| Net investment income (loss) | | | (.02 | )% | | | (.11 | )% | | | .03 | % | | | (.28 | )% | | | (.45 | )% | |
| Supplemental Data: | |
| Net assets, end of year (000) | | $ | 78,277 | | | $ | 81,373 | | | $ | 82,876 | | | $ | 80,542 | | | $ | 70,636 | | |
| Portfolio turnover rate | | | 39.51 | % | | | 44.86 | % | | | 47.14 | % | | | 34.98 | % | | | 74.76 | % | |
See Notes to Financial Statements.
24
Financial Highlights (continued)
LARGE CAP CORE FUND
| | | Class C Shares | |
| | | Year Ended 11/30 | |
| | | 2006 | | 2005 | | 2004 | | 2003 | | 2002 | |
| Per Share Operating Performance | |
| Net asset value, beginning of year | | $ | 27.66 | | | $ | 27.47 | | | $ | 24.15 | | | $ | 20.77 | | | $ | 24.27 | | |
| Investment operations: | |
| Net investment loss(a) | | | – | (c) | | | (.03 | ) | | | – | (c) | | | (.06 | ) | | | (.06 | ) | |
| Net realized and unrealized gain (loss) | | | 2.88 | | | | 1.06 | | | | 3.32 | | | | 3.44 | | | | (3.29 | ) | |
| Total from investment operations | | | 2.88 | | | | 1.03 | | | | 3.32 | | | | 3.38 | | | | (3.35 | ) | |
| Distributions to shareholders from: | |
| Net investment income | | | – | | | | – | (c) | | | – | | | | – | | | | – | | |
| Net realized gain | | | (1.10 | ) | | | (.84 | ) | | | – | | | | – | | | | (.15 | ) | |
| Total distributions | | | (1.10 | ) | | | (.84 | ) | | | – | | | | – | | | | (.15 | ) | |
| Net asset value, end of year | | $ | 29.44 | | | $ | 27.66 | | | $ | 27.47 | | | $ | 24.15 | | | $ | 20.77 | | |
| Total Return(b) | | | 10.76 | % | | | 3.81 | % | | | 13.75 | % | | | 16.27 | % | | | (13.88 | )% | |
| Ratios to Average Net Assets: | |
Expenses, including expense reductions
and expenses assumed | | | 1.95 | % | | | 1.95 | % | | | 2.03 | % | | | 2.10 | % | | | 1.87 | % | |
Expenses, excluding expense reductions
and including expenses assumed | | | 1.95 | % | | | 1.95 | % | | | 2.03 | % | | | 2.10 | % | | | 1.87 | % | |
Expenses, excluding expense reductions
and expenses assumed | | | 1.98 | % | | | 1.97 | % | | | 2.05 | % | | | 2.10 | % | | | 1.87 | % | |
| Net investment income (loss) | | | (.02 | )% | | | (.12 | )% | | | .03 | % | | | (.28 | )% | | | (.26 | )% | |
| Supplemental Data: | |
| Net assets, end of year (000) | | $ | 86,535 | | | $ | 73,328 | | | $ | 39,625 | | | $ | 36,778 | | | $ | 32,109 | | |
| Portfolio turnover rate | | | 39.51 | % | | | 44.86 | % | | | 47.14 | % | | | 34.98 | % | | | 74.76 | % | |
See Notes to Financial Statements.
25
Financial Highlights (continued)
LARGE CAP CORE FUND
| | | Class P Shares | |
| | | Year Ended 11/30 | |
| | | 2006 | | 2005 | | 2004 | | 2003 | | 2002 | |
| Per Share Operating Performance | |
| Net asset value, beginning of year | | $ | 28.70 | | | $ | 28.50 | | | $ | 25.01 | | | $ | 21.37 | | | $ | 24.87 | | |
| Investment operations: | |
| Net investment income(a) | | | .15 | | | | .10 | | | | .17 | | | | .02 | | | | .02 | | |
| Net realized and unrealized gain (loss) | | | 3.01 | | | | 1.12 | | | | 3.42 | | | | 3.62 | | | | (3.37 | ) | |
| Total from investment operations | | | 3.16 | | | | 1.22 | | | | 3.59 | | | | 3.64 | | | | (3.35 | ) | |
| Distributions to shareholders from: | |
| Net investment income | | | (.11 | ) | | | (.18 | ) | | | (.10 | ) | | | – | | | | – | | |
| Net realized gain | | | (1.10 | ) | | | (.84 | ) | | | – | | | | – | | | | (.15 | ) | |
| Total distributions | | | (1.21 | ) | | | (1.02 | ) | | | (.10 | ) | | | – | | | | (.15 | ) | |
| Net asset value, end of year | | $ | 30.65 | | | $ | 28.70 | | | $ | 28.50 | | | $ | 25.01 | | | $ | 21.37 | | |
| Total Return(b) | | | 11.40 | % | | | 4.38 | % | | | 14.39 | % | | | 17.03 | % | | | (13.54 | )% | |
| Ratios to Average Net Assets: | |
Expenses, including expense reductions
and expenses assumed | | | 1.40 | % | | | 1.40 | % | | | 1.48 | % | | | 1.55 | %† | | | 1.51 | % | |
Expenses, excluding expense reductions
and including expenses assumed | | | 1.40 | % | | | 1.40 | % | | | 1.48 | % | | | 1.55 | %† | | | 1.51 | % | |
Expenses, excluding expense reductions
and expenses assumed | | | 1.43 | % | | | 1.43 | % | | | 1.50 | % | | | 1.55 | %† | | | 1.51 | % | |
| Net investment income | | | .53 | % | | | .37 | % | | | .58 | % | | | .27 | %† | | | .10 | % | |
| Supplemental Data: | |
| Net assets, end of year (000) | | $ | 7,314 | | | $ | 6,749 | | | $ | 294 | | | $ | 152 | | | $ | 1 | | |
| Portfolio turnover rate | | | 39.51 | % | | | 44.86 | % | | | 47.14 | % | | | 34.98 | % | | | 74.76 | % | |
See Notes to Financial Statements.
26
Financial Highlights (concluded)
LARGE CAP CORE FUND
| | | Class Y Shares | |
| | | Year Ended 11/30 | |
| | | 2006 | | 2005 | | 2004 | | 2003 | | 2002 | |
| Per Share Operating Performance | |
| Net asset value, beginning of year | | $ | 28.74 | | | $ | 28.50 | | | $ | 24.93 | | | $ | 21.23 | | | $ | 24.61 | | |
| Investment operations: | |
| Net investment income(a) | | | .29 | | | | .24 | | | | .93 | | | | .16 | | | | .13 | | |
| Net realized and unrealized gain (loss) | | | 3.01 | | | | 1.11 | | | | 2.77 | | | | 3.54 | | | | (3.36 | ) | |
| Total from investment operations | | | 3.30 | | | | 1.35 | | | | 3.70 | | | | 3.70 | | | | (3.23 | ) | |
| Distributions to shareholders from: | |
| Net investment income | | | (.18 | ) | | | (.27 | ) | | | (.13 | ) | | | – | | | | – | | |
| Net realized gain | | | (1.10 | ) | | | (.84 | ) | | | – | | | | – | | | | (.15 | ) | |
| Total distributions | | | (1.28 | ) | | | (1.11 | ) | | | (.13 | ) | | | – | | | | (.15 | ) | |
| Net asset value, end of year | | $ | 30.76 | | | $ | 28.74 | | | $ | 28.50 | | | $ | 24.93 | | | $ | 21.23 | | |
| Total Return(b) | | | 11.92 | % | | | 4.83 | % | | | 14.89 | % | | | 17.43 | % | | | (13.19 | )% | |
| Ratios to Average Net Assets: | |
Expenses, including expense reductions
and expenses assumed | | | .95 | % | | | .95 | % | | | .93 | % | | | 1.10 | % | | | 1.06 | % | |
Expenses, excluding expense reductions
and including expenses assumed | | | .95 | % | | | .95 | % | | | .93 | % | | | 1.10 | % | | | 1.06 | % | |
Expenses, excluding expense reductions
and expenses assumed | | | .98 | % | | | .98 | % | | | 1.07 | % | | | 1.10 | % | | | 1.06 | % | |
| Net investment income | | | .99 | % | | | .84 | % | | | 3.35 | % | | | .72 | % | | | .55 | % | |
| Supplemental Data: | |
| Net assets, end of year (000) | | $ | 202,879 | | | $ | 135,677 | | | $ | 12,991 | | | $ | 75 | | | $ | 54 | | |
| Portfolio turnover rate | | | 39.51 | % | | | 44.86 | % | | | 47.14 | % | | | 34.98 | % | | | 74.76 | % | |
† The ratios have been determined on a Fund basis.
(a) Calculated using average shares outstanding during the period.
(b) Total return does not consider the effects of sales loads and assumes the reinvestment of all distributions.
(c) Amount is less than $.01.
See Notes to Financial Statements.
27
Financial Highlights
SMALL CAP VALUE FUND
| | | Class A Shares | |
| | | Year Ended 11/30 | |
| | | 2006 | | 2005 | | 2004 | | 2003 | | 2002 | |
| Per Share Operating Performance | |
| Net asset value, beginning of year | | $ | 31.40 | | | $ | 29.54 | | | $ | 25.66 | | | $ | 20.29 | | | $ | 22.02 | | |
| Investment operations: | |
| Net investment loss(a) | | | (.02 | ) | | | (.09 | ) | | | – | (c) | | | (.10 | ) | | | (.07 | ) | |
| Net realized and unrealized gain (loss) | | | 6.09 | | | | 4.60 | | | | 5.52 | | | | 6.81 | | | | (.48 | ) | |
| Total from investment operations | | | 6.07 | | | | 4.51 | | | | 5.52 | | | | 6.71 | | | | (.55 | ) | |
| Distributions to shareholders from: | |
| Net realized gain | | | (2.87 | ) | | | (2.65 | ) | | | (1.64 | ) | | | (1.34 | ) | | | (1.18 | ) | |
| Net asset value, end of year | | $ | 34.60 | | | $ | 31.40 | | | $ | 29.54 | | | $ | 25.66 | | | $ | 20.29 | | |
| Total Return(b) | | | 21.14 | % | | | 16.78 | % | | | 22.92 | % | | | 35.67 | % | | | (2.72 | )% | |
| Ratios to Average Net Assets: | |
Expenses, including
expense reductions | | | 1.23 | % | | | 1.31 | % | | | 1.39 | % | | | 1.45 | % | | | 1.41 | % | |
Expenses, excluding
expense reductions | | | 1.24 | % | | | 1.31 | % | | | 1.39 | % | | | 1.45 | % | | | 1.41 | % | |
| Net investment loss | | | (.06 | )% | | | (.31 | )% | | | (.03 | )% | | | (.50 | )% | | | (.34 | )% | |
| Supplemental Data: | |
| Net assets, end of year (000) | | $ | 2,367,218 | | | $ | 1,714,898 | | | $ | 939,899 | | | $ | 510,582 | | | $ | 321,243 | | |
| Portfolio turnover rate | | | 71.14 | % | | | 71.25 | % | | | 67.04 | % | | | 66.11 | % | | | 77.12 | % | |
See Notes to Financial Statements.
28
Financial Highlights (continued)
SMALL CAP VALUE FUND
| | | Class B Shares | |
| | | Year Ended 11/30 | |
| | | 2006 | | 2005 | | 2004 | | 2003 | | 2002 | |
| Per Share Operating Performance | |
| Net asset value, beginning of year | | $ | 29.25 | | | $ | 27.87 | | | $ | 24.44 | | | $ | 19.50 | | | $ | 21.33 | | |
| Investment operations: | |
| Net investment loss(a) | | | (.23 | ) | | | (.27 | ) | | | (.18 | ) | | | (.22 | ) | | | (.20 | ) | |
| Net realized and unrealized gain (loss) | | | 5.62 | | | | 4.30 | | | | 5.25 | | | | 6.50 | | | | (.45 | ) | |
| Total from investment operations | | | 5.39 | | | | 4.03 | | | | 5.07 | | | | 6.28 | | | | (.65 | ) | |
| Distributions to shareholders from: | |
| Net realized gain | | | (2.87 | ) | | | (2.65 | ) | | | (1.64 | ) | | | (1.34 | ) | | | (1.18 | ) | |
| Net asset value, end of year | | $ | 31.77 | | | $ | 29.25 | | | $ | 27.87 | | | $ | 24.44 | | | $ | 19.50 | | |
| Total Return(b) | | | 20.29 | % | | | 15.99 | % | | | 22.17 | % | | | 34.78 | % | | | (3.25 | )% | |
| Ratios to Average Net Assets: | |
| Expenses, including expense reductions | | | 1.92 | % | | | 1.95 | % | | | 2.00 | % | | | 2.07 | % | | | 2.04 | % | |
| Expenses, excluding expense reductions | | | 1.93 | % | | | 1.95 | % | | | 2.00 | % | | | 2.07 | % | | | 2.04 | % | |
| Net investment loss | | | (.77 | )% | | | (1.03 | )% | | | (.74 | )% | | | (1.12 | )% | | | (.97 | )% | |
| Supplemental Data: | |
| Net assets, end of year (000) | | $ | 71,741 | | | $ | 113,208 | | | $ | 192,098 | | | $ | 182,437 | | | $ | 153,101 | | |
| Portfolio turnover rate | | | 71.14 | % | | | 71.25 | % | | | 67.04 | % | | | 66.11 | % | | | 77.12 | % | |
See Notes to Financial Statements.
29
Financial Highlights (continued)
SMALL CAP VALUE FUND
| | | Class C Shares | |
| | | Year Ended 11/30 | |
| | | 2006 | | 2005 | | 2004 | | 2003 | | 2002 | |
| Per Share Operating Performance | |
| Net asset value, beginning of year | | $ | 29.29 | | | $ | 27.90 | | | $ | 24.46 | | | $ | 19.52 | | | $ | 21.31 | | |
| Investment operations: | |
| Net investment loss(a) | | | (.22 | ) | | | (.26 | ) | | | (.18 | ) | | | (.22 | ) | | | (.17 | ) | |
| Net realized and unrealized gain (loss) | | | 5.62 | | | | 4.30 | | | | 5.26 | | | | 6.50 | | | | (.44 | ) | |
| Total from investment operations | | | 5.40 | | | | 4.04 | | | | 5.08 | | | | 6.28 | | | | (.61 | ) | |
| Distributions to shareholders from: | |
| Net realized gain | | | (2.87 | ) | | | (2.65 | ) | | | (1.64 | ) | | | (1.34 | ) | | | (1.18 | ) | |
| Net asset value, end of year | | $ | 31.82 | | | $ | 29.29 | | | $ | 27.90 | | | $ | 24.46 | | | $ | 19.52 | | |
| Total Return(b) | | | 20.30 | % | | | 16.01 | % | | | 22.19 | % | | | 34.74 | % | | | (3.07 | )% | |
| Ratios to Average Net Assets: | |
| Expenses, including expense reductions | | | 1.93 | % | | | 1.95 | % | | | 2.00 | % | | | 2.07 | % | | | 1.90 | % | |
| Expenses, excluding expense reductions | | | 1.93 | % | | | 1.96 | % | | | 2.00 | % | | | 2.07 | % | | | 1.90 | % | |
| Net investment loss | | | (.76 | )% | | | (.99 | )% | | | (.74 | )% | | | (1.12 | )% | | | (.83 | )% | |
| Supplemental Data: | |
| Net assets, end of year (000) | | $ | 91,715 | | | $ | 91,195 | | | $ | 89,408 | | | $ | 81,967 | | | $ | 69,121 | | |
| Portfolio turnover rate | | | 71.14 | % | | | 71.25 | % | | | 67.04 | % | | | 66.11 | % | | | 77.12 | % | |
See Notes to Financial Statements.
30
Financial Highlights (continued)
SMALL CAP VALUE FUND
| | | Class P Shares | |
| | | Year Ended 11/30 | |
| | | 2006 | | 2005 | | 2004 | | 2003 | | 2002 | |
| Per Share Operating Performance | |
| Net asset value, beginning of year | | $ | 31.28 | | | $ | 29.47 | | | $ | 25.61 | | | $ | 20.27 | | | $ | 22.01 | | |
| Investment operations: | |
| Net investment income (loss)(a) | | | (.06 | ) | | | (.11 | ) | | | .01 | | | | (.12 | ) | | | (.08 | ) | |
| Net realized and unrealized gain (loss) | | | 6.05 | | | | 4.57 | | | | 5.49 | | | | 6.80 | | | | (.48 | ) | |
| Total from investment operations | | | 5.99 | | | | 4.46 | | | | 5.50 | | | | 6.68 | | | | (.56 | ) | |
| Distributions to shareholders from: | |
| Net realized gain | | | (2.87 | ) | | | (2.65 | ) | | | (1.64 | ) | | | (1.34 | ) | | | (1.18 | ) | |
| Net asset value, end of year | | $ | 34.40 | | | $ | 31.28 | | | $ | 29.47 | | | $ | 25.61 | | | $ | 20.27 | | |
| Total Return(b) | | | 20.95 | % | | | 16.68 | % | | | 22.84 | % | | | 35.48 | % | | | (2.72 | )% | |
| Ratios to Average Net Assets: | |
| Expenses, including expense reductions | | | 1.38 | % | | | 1.41 | % | | | 1.45 | % | | | 1.52 | % | | | 1.49 | % | |
| Expenses, excluding expense reductions | | | 1.38 | % | | | 1.41 | % | | | 1.45 | % | | | 1.52 | % | | | 1.49 | % | |
| Net investment income (loss) | | | (.20 | )% | | | (.39 | )% | | | .03 | % | | | (.57 | )% | | | (.42 | )% | |
| Supplemental Data: | |
| Net assets, end of year (000) | | $ | 447,775 | | | $ | 328,055 | | | $ | 141,389 | | | $ | 47,471 | | | $ | 14,005 | | |
| Portfolio turnover rate | | | 71.14 | % | | | 71.25 | % | | | 67.04 | % | | | 66.11 | % | | | 77.12 | % | |
See Notes to Financial Statements.
31
Financial Highlights (concluded)
SMALL CAP VALUE FUND
| | | Class Y Shares | |
| | | Year Ended 11/30 | |
| | | 2006 | | 2005 | | 2004 | | 2003 | | 2002 | |
| Per Share Operating Performance | |
| Net asset value, beginning of year | | $ | 32.46 | | | $ | 30.36 | | | $ | 26.23 | | | $ | 20.64 | | | $ | 22.30 | | |
| Investment operations: | |
| Net investment income (loss)(a) | | | .08 | | | | .02 | | | | .10 | | | | (.02 | ) | | | .01 | | |
| Net realized and unrealized gain (loss) | | | 6.33 | | | | 4.73 | | | | 5.67 | | | | 6.95 | | | | (.49 | ) | |
| Total from investment operations | | | 6.41 | | | | 4.75 | | | | 5.77 | | | | 6.93 | | | | (.48 | ) | |
| Distributions to shareholders from: | |
| Net realized gain | | | (2.87 | ) | | | (2.65 | ) | | | (1.64 | ) | | | (1.34 | ) | | | (1.18 | ) | |
| Net asset value, end of year | | $ | 36.00 | | | $ | 32.46 | | | $ | 30.36 | | | $ | 26.23 | | | $ | 20.64 | | |
| Total Return(b) | | | 21.53 | % | | | 17.14 | % | | | 23.40 | % | | | 36.10 | % | | | (2.31 | )% | |
| Ratios to Average Net Assets: | |
| Expenses, including expense reductions | | | .93 | % | | | .96 | % | | | 1.00 | % | | | 1.07 | % | | | 1.04 | % | |
| Expenses, excluding expense reductions | | | .93 | % | | | .96 | % | | | 1.00 | % | | | 1.07 | % | | | 1.04 | % | |
| Net investment income (loss) | | | .25 | % | | | .05 | % | | | .38 | % | | | (.12 | )% | | | .03 | % | |
| Supplemental Data: | |
| Net assets, end of year (000) | | $ | 1,045,397 | | | $ | 632,444 | | | $ | 304,763 | | | $ | 149,463 | | | $ | 87,570 | | |
| Portfolio turnover rate | | | 71.14 | % | | | 71.25 | % | | | 67.04 | % | | | 66.11 | % | | | 77.12 | % | |
(a) Calculated using average shares outstanding during the period.
(b) Total return does not consider the effects of sales loads and assumes the reinvestment of all distributions.
(c) Amount is less than $.01.
See Notes to Financial Statements.
32
Notes to Financial Statements
1. ORGANIZATION
Lord Abbett Research Fund, Inc. (the "Company") is registered under the Investment Company Act of 1940 (the "Act") as a diversified open-end management investment company, incorporated under Maryland law on April 6, 1992. The Company currently consists of four separate funds. This report covers the following two funds and their respective classes: Lord Abbett Large-Cap Core Fund ("Large Cap Core Fund") and Lord Abbett Small-Cap Value Series ("Small Cap Value Fund") (collectively, the "Funds").
Large Cap Core Fund's investment objective is to seek growth of capital and growth of income consistent with reasonable risk. Small Cap Value Fund's investment objective is to seek long-term capital appreciation. Each Fund offers five classes of shares: Classes A, B, C, P and Y, each with different expenses and dividends. A front-end sales charge is normally added to the Net Asset Value ("NAV") for Class A shares. There is no front-end sales charge in the case of Classes B, C, P and Y shares, although there may be a contingent deferred sales charge ("CDSC") as follows: certain redemptions of Class A shares made within 12 months (24 months if shares were purchased prior to November 1, 2004) following certain purchases made without a sales charge; Class B shares redeemed before the sixth anniversary of purchase; and Class C shares redeemed before the first anniversary of purchase. Class B shares will convert to Class A shares on the eighth ann iversary of the original purchase of Class B shares. Small Cap Value Fund is open to certain new investors on a limited basis.
The preparation of financial statements in conformity with accounting principles generally accepted in the United States of America requires management to make certain estimates and assumptions that affect the reported amounts of asset and liabilities and disclosure of contingent assets and liabilities at the date of the financial statements and the reported amounts of increases and decreases in net assets from operations during the reporting period. Actual results could differ from those estimates.
2. SIGNIFICANT ACCOUNTING POLICIES
(a) Investment Valuation–Securities traded on any recognized U.S. or non-U.S. exchange or on NASDAQ, Inc. are valued at the last sale price or official closing price on the exchange or system on which they are principally traded. Unlisted equity securities are valued at the last quoted sale price or, if no sale price is available, at the mean between the most recently quoted bid and asked prices. Securities for which market quotations are not readily available are valued at fair value as determined by management and approved in good faith by the Board of Directors. Short-term securities with 60 days or less remaining to maturity are valued using the amortized cost method, which approximates current market value.
(b) Security Transactions-Security transactions are recorded as of the date that the securities are purchased or sold (trade date). Realized gains and losses from sales of portfolio securities are calculated using the identified-cost method. Realized and unrealized gains (losses) are allocated to each class of shares based upon the relative proportion of net assets at the beginning of the day.
(c) Investment Income–Dividend income is recorded on the ex-dividend date. Interest income is recorded on the accrual basis. Discounts are accreted and premiums are amortized using the effective interest method. Withholding taxes on foreign dividends have been provided
33
Notes to Financial Statements (continued)
for in accordance with the Funds' understanding of the applicable country's tax rules and rates. Investment income is allocated to each class of shares based upon the relative proportion of net assets at the beginning of the day.
(d) Federal Taxes–It is the policy of each Fund to meet the requirements of Subchapter M of the Internal Revenue Code applicable to regulated investment companies and to distribute substantially all taxable income and capital gains to its shareholders. Therefore, no Federal income tax provision is required.
(e) Expenses–Expenses incurred by the Company that do not specifically relate to an individual fund are generally allocated to the funds within the Company on a pro-rata basis. Expenses, excluding class-specific expenses, are allocated to each class of shares based upon the relative proportion of net assets at the beginning of the day. Classes A, B, C and P shares bear their class-specific share of all expenses and fees relating to the Funds' respective 12b-1 Distribution Plan.
(f) Repurchase Agreements–Each Fund may enter into repurchase agreements with respect to securities. A repurchase agreement is a transaction in which a fund acquires a security and simultaneously commits to resell that security to the seller (a bank or securities dealer) at an agreed-upon price on an agreed-upon date. Each Fund requires at all times that the repurchase agreement be collateralized by cash, or by securities of the U.S. Government, its agencies, its instrumentalities, or U.S. Government sponsored enterprises having a value equal to, or in excess of, the value of the repurchase agreement (including accrued interest). If the seller of the agreement defaults on its obligation to repurchase the underlying securities at a time when the value of these securities has dec lined, each Fund may incur a loss upon disposition of the securities.
3. MANAGEMENT FEES AND OTHER TRANSACTIONS WITH AFFILIATES
Management Fees
The Company has a management agreement with Lord, Abbett & Co. LLC ("Lord Abbett") pursuant to which Lord Abbett supplies the Fund with investment management services and executive and other personnel, pays the remuneration of officers, provides office space and pays for ordinary and necessary office and clerical expenses relating to research and statistical work and supervision of each Fund's investment portfolio.
The management fees are based on average daily net assets at the following annual rates:
| Large Cap Core Fund: | |
| First $1 billion | | | .70 | % | |
| Next $1 billion | | | .65 | % | |
| Over $2 billion | | | .60 | % | |
For the fiscal year ended November 30, 2006, the effective management fee paid to Lord Abbett was at a rate of .70% of the Fund's average daily net assets.
| Small Cap Value Fund: | |
| First $2 billion | | | .75 | % | |
| Over $2 billion | | | .70 | % | |
34
Notes to Financial Statements (continued)
For the fiscal year ended November 30, 2006, the effective management fee paid to Lord Abbett was at a rate of .73% of the Fund's average daily net assets.
For the fiscal year ended November 30, 2006, Lord Abbett contractually agreed to reimburse the Large Cap Core Fund to the extent necessary so that each class' total annual operating expenses do not exceed the following annual rates:
| Class | | % of Average Daily Net Assets | |
| A | | | 1.30 | % | |
| B | | | 1.95 | % | |
| C | | | 1.95 | % | |
| P | | | 1.40 | % | |
| Y | | | 0.95 | % | |
Lord Abbett provides certain administrative services to each Fund pursuant to an Administrative Services Agreement at an annual rate of .04% of each Fund's average daily net assets.
Large Cap Core Fund, along with certain other funds managed by Lord Abbett (the "Underlying Funds"), has entered into a Servicing Arrangement with Lord Abbett Balanced Strategy Fund, Lord Abbett Diversified Equity Strategy Fund and Lord Abbett World Growth & Income Strategy Fund, each of Lord Abbett Investment Trust (each, a "Fund of Funds"), pursuant to which each Underlying Fund pays a portion of the expenses (excluding management fees and distribution and service fees) of the Fund of Funds in proportion to the average daily value of the Underlying Fund shares owned by the Fund of Fund. In addition, Small Cap Value Fund, along with certain other funds managed by Lord Abbett (the "Underlying Funds") has entered into a Servicing Arrangement with Lord Abbett Alpha Strategy Fund of Lord Abbett Secu rities Trust ("Alpha Strategy Fund"), pursuant to which each Underlying Fund pays a portion of the expenses (excluding management fees and distribution and service fees) of Alpha Strategy Fund in proportion to the average daily value of Underlying Fund shares owned by Alpha Strategy Fund. Amounts paid pursuant to the Servicing Arrangement are included in Subsidy expense on the Fund's Statement of Operations and Payable to affiliates on the Fund's Statement of Assets and Liabilities.
12b-1 Distribution Plans
Each Fund has adopted a distribution plan with respect to Class A, B, C and P shares pursuant to Rule 12b-1 under the Act, which provides for the payment of ongoing distribution and service fees to Lord Abbett Distributor LLC ("Distributor"), an affiliate of Lord Abbett. The fees are accrued daily at annual rates based upon average daily net assets as follows:
| Fee | | Class A | | Class B | | Class C | | Class P | |
| Service | | | .25 | % | | | .25 | % | | | .25 | % | | | .20 | % | |
| Distribution | | | .10 | %(1) | | | .75 | % | | | .75 | % | | | .25 | % | |
| (1) Effective October 1, 2005 the Class A Distribution Fee for Small Cap Value Fund was reduced from .10% of average daily net assets to .05% of average daily net assets. The amount of CDSC collected by each Fund for the year ended November 30, 2006 was as follows: | |
| | | CDSC
Collected | |
| Large Cap Core Fund | | $ | 3,575 | | |
| Small Cap Value Fund | | | 16,093 | | |
Class Y does not have a distribution plan.
35
Notes to Financial Statements (continued)
Commissions
Distributor received the following commissions on sales of shares of the Funds, after concessions were paid to authorized dealers, for the fiscal year ended November 30, 2006:
| | | Distributor
Commissions | | Dealers'
Concessions | |
| Large Cap Core Fund | | $ | 593,578 | | | $ | 3,137,018 | | |
| Small Cap Value Fund | | | 46,178 | | | | 251,471 | | |
Distributor received the following amount of CDSCs for the fiscal year ended November 30, 2006:
| | | Class A | | Class C | |
| Large Cap Core Fund | | $ | 6,552 | | | $ | 9,664 | | |
| Small Cap Value Fund | | | 10,110 | | | | 501 | | |
Two Directors and certain of the Funds' officers have an interest in Lord Abbett.
4. DISTRIBUTIONS AND CAPITAL LOSS CARRYFORWARDS
Dividends from net investment income, if any, are declared and distributed at least semiannually for Large Cap Core Fund and at least annually for Small Cap Value Fund. Taxable net realized gains from investment transactions, reduced by capital loss carryforwards, if any, are declared and distributed to shareholders at least annually. The capital loss carryforward amount, if any, is available to offset future net capital gains. Dividends and distributions to shareholders are recorded on the ex-dividend date. The amount of dividends and distributions from net investment income and net realized capital gains are determined in accordance with Federal income tax regulations which may differ from accounting principles generally accepted in the United States of America. These book/tax differences are either considered temporary or permanent in nature. To the extent these differences are permanent in nature, such amounts are reclassified within the components of net assets based on their federal tax basis treatment; temporary differences do not require reclassification. Dividends and distributions which exceed earnings and profits for tax purposes are reported as a tax return of capital.
Distributions were declared on December 11, 2006, and paid on December 15, 2006 to shareholders of record on December 14, 2006. The approximate amounts are as follows:
| | | Net Investment
Income | | Short-Term
Capital Gain | | Long-Term
Capital Gain | |
| Large Cap Core Fund | | $ | 5,474,000 | | | $ | 1,528,000 | | | $ | 34,680,000 | | |
| Small Cap Value Fund | | | - | | | | 171,279,000 | | | | 353,053,000 | | |
The tax character of distributions paid during the fiscal years ended November 30, 2006 and 2005 are as follows:
| | | Large Cap Core Fund | | Small Cap Value Fund | |
| | | 11/30/2006 | | 11/30/2005 | | 11/30/2006 | | 11/30/2005 | |
| Distributions paid from: | |
| Ordinary income | | $ | 3,349,904 | | | $ | 2,101,847 | | | $ | 69,665,823 | | | $ | 11,599,397 | | |
| Net long-term capital gains | | | 31,503,103 | | | | 13,761,746 | | | | 195,292,834 | | | | 142,061,412 | | |
| Total distributions paid | | $ | 34,853,007 | | | $ | 15,863,593 | | | $ | 264,958,657 | | | $ | 153,660,809 | | |
36
Notes to Financial Statements (continued)
As of November 30, 2006, the components of accumulated earnings on a tax basis are as follows:
| | | Large Cap Core Fund | | Small Cap Value Fund | |
| Undistributed ordinary income – net | | $ | 6,728,519 | | | $ | 171,276,734 | | |
| Undistributed long-term capital gains | | | 34,678,695 | | | | 353,050,695 | | |
| Total undistributed earnings | | $ | 41,407,214 | | | $ | 524,327,429 | | |
| Temporary differences | | | (62,519 | ) | | | (203,601 | ) | |
| Unrealized gains - net | | | 128,048,766 | | | | 590,303,241 | | |
| Total accumulated earnings - net | | $ | 169,393,461 | | | $ | 1,114,427,069 | | |
As of November 30, 2006, the aggregate unrealized security gains and losses based on cost for U.S. Federal income tax purposes are as follows:
| | | Large Cap Core Fund | | Small Cap Value Fund | |
| Tax cost | | $ | 891,413,031 | | | $ | 3,498,787,196 | | |
| Gross unrealized gain | | | 140,808,070 | | | | 609,659,091 | | |
| Gross unrealized loss | | | (12,759,304 | ) | | | (19,355,850 | ) | |
| Net unrealized security gain | | $ | 128,048,766 | | | $ | 590,303,241 | | |
The difference between book-basis and tax-basis unrealized gains (losses) is primarily attributable to wash sales.
Permanent items identified during the year ended November 30, 2006, have been reclassified among the components of net assets based on their tax-basis treatment as follows:
| | | Undistributed/
(Distributions
in Excess of)
Net Investment
Income | | Accumulated
Net Realized
Gain | |
| Small Cap Value Fund | | $ | 1,240,599 | | | $ | (1,240,599 | ) | |
The permanent differences are primarily attributable to the tax treatment of net investment losses.
5. PORTFOLIO SECURITIES TRANSACTIONS
Purchases and sales of investment securities (excluding short-term investments) for the fiscal year ended November 30, 2006 are as follows:
| | | Purchases | | Sales | |
| Large Cap Core Fund | | $ | 447,813,475 | | | $ | 353,654,566 | | |
| Small Cap Value Fund | | | 2,874,396,347 | | | | 2,363,976,514 | | |
There were no purchases or sales of U.S. Government securities for the year ended November 30, 2006.
6. DIRECTORS' REMUNERATION
The Company's officers and the two Directors who are associated with Lord Abbett do not receive any compensation from the Company for serving in such capacities. Outside Directors' fees are allocated among all Lord Abbett-sponsored funds based on the net assets of each fund. There is an equity based plan available to all outside Directors under which outside Directors must defer receipt of a portion of, and may elect to defer receipt of an additional portion of, Directors' fees.
37
Notes to Financial Statements (continued)
The deferred amounts are treated as though equivalent dollar amounts have been invested proportionately in the funds. Such amounts and earnings accrued thereon are included in Directors' fees on the Statements of Operations and in Directors' fees payable on the Statements of Assets and Liabilities and are not deductible for U.S. Federal income tax purposes until such amounts are paid.
7. EXPENSE REDUCTIONS
The Company has entered into arrangements with the Funds' transfer agent and custodian whereby credits realized as a result of uninvested cash balances are used to reduce a portion of each Fund's expenses.
8. LINE OF CREDIT
Each Fund, along with certain other funds managed by Lord Abbett, have available a $250,000,000 unsecured revolving credit facility ("Facility") from a consortium of banks, to be used for temporary or emergency purposes as an additional source of liquidity to fund redemptions of investor shares. Any borrowings under this Facility will bear interest at current market rates as defined in the agreement. The fee for this Facility is at an annual rate of .08%. As of November 30, 2006, there were no loans outstanding pursuant to this Facility nor was the Facility utilized at any time during the year ended November 30, 2006.
9. TRANSACTIONS WITH AFFILIATED ISSUERS
An affiliated issuer is one in which a Fund had ownership of at least 5% of the oustanding voting securities of the underlying issuer at any point during the fiscal year. Small Cap Value Fund had the following transactions with affiliated issuers during the fiscal year ended November 30, 2006:
| Affiliated Issuer | | Balance of
Shares Held
at 11/30/2005 | | Gross
Additions | | Gross
Sales | | Balance of
Shares Held
at 11/30/2006 | | Value
at
11/30/2006 | | Net Realized
Gain (Loss)
12/1/2005
to 11/30/2006(h) | | Dividend
Income
12/1/2005
to 11/30/2006(h) | |
| AMCOL Int'l., Corp. | | | - | | | | 2,090,080 | | | | (505,732 | ) | | | 1,584,348 | | | $ | 43,981,501 | | | $ | 226,172 | | | $ | 227,242 | | |
| ANADIGICS, Inc. | | | - | | | | 3,060,000 | | | | - | | | | 3,060,000 | | | | 29,529,000 | | | | - | | | | - | | |
| Anaren, Inc. | | | - | | | | 1,556,977 | | | | (187,200 | ) | | | 1,369,777 | | | | 28,148,917 | | | | 1,497,305 | | | | - | | |
| Anixter Int'l., Inc. | | | 1,125,000 | | | | 1,704,814 | | | | (283,809 | ) | | | 2,546,005 | | | | 149,246,813 | | | | 5,047,277 | | | | - | | |
| Avista Corp. | | | - | | | | 3,081,900 | | | | (67,900 | ) | | | 3,014,000 | | | | 81,167,020 | | | | 490,084 | | | | 1,315,105 | | |
| Benihana, Inc. Class A | | | - | | | | 508,146 | | | | (115,900 | ) | | | 392,246 | | | | 10,982,888 | | | | 1,163,153 | | | | - | | |
| Black Hills Corp. | | | - | | | | 2,093,978 | | | | - | | | | 2,093,978 | | | | 74,775,954 | | | | - | | | | 1,236,990 | | |
| C&D Technologies, Inc.(a) | | | - | | | | 1,443,447 | | | | (1,010,300 | ) | | | 433,147 | | | | - | (a) | | | (106,614 | ) | | | - | | |
| C-COR, Inc.(a) | | | 2,600,000 | | | | 120,500 | | | | (990,946 | ) | | | 1,729,554 | | | | - | (a) | | | 563,468 | | | | - | | |
Commercial Vehicle
Group, Inc. | | | 1,235,100 | | | | 180,500 | | | | (271,700 | ) | | | 1,143,900 | | | | 26,767,260 | | | | 866,874 | | | | - | | |
Comtech
Telecommunications Corp. | | | - | | | | 1,809,277 | | | | (313,800 | ) | | | 1,495,477 | | | | 53,119,343 | | | | (113,636 | ) | | | - | | |
| Curtiss-Wright Corp.(b) | | | 423,000 | | | | 2,199,545 | | | | (113,000 | ) | | | 2,509,545 | | | | 89,214,325 | | | | - | | | | 150,573 | | |
Ethan Allen
Interiors, Inc.(a) | | | 1,400,000 | | | | 648,000 | | | | (733,900 | ) | | | 1,314,100 | | | | - | (a) | | | (755,032 | ) | | | 694,710 | | |
| Financial Federal Corp.(c) | | | 750,000 | | | | 1,550,039 | | | | - | | | | 2,300,039 | | | | 63,711,080 | | | | - | | | | 607,905 | | |
| Frontier Airlines Holdings(g) | | | 1,669,100 | | | | 1,027,500 | | | | (287,200 | ) | | | 2,409,400 | | | | 19,757,080 | | | | (767,019 | ) | | | - | | |
38
Notes to Financial Statements (continued)
| Affiliated Issuer | | Balance of
Shares Held
at 11/30/2005 | | Gross
Additions | | Gross
Sales | | Balance of
Shares Held
at 11/30/2006 | | Value
at
11/30/2006 | | Net Realized
Gain (Loss)
12/1/2005
to 11/30/2006(h) | | Dividend
Income
12/1/2005
to 11/30/2006(h) | |
| Hexcel Corp. | | | 2,440,000 | | | | 2,343,129 | | | | (58,000 | ) | | | 4,725,129 | | | $ | 84,579,809 | | | $ | - | | | $ | - | | |
| II-VI Inc(a) | | | 1,575,900 | | | | 193,820 | | | | (1,343,100 | ) | | | 426,620 | | | | - | (a) | | | 64,410 | | | | - | | |
| Kensey Nash Corp. | | | 495,000 | | | | 298,200 | | | | (62,800 | ) | | | 730,400 | | | | 22,408,672 | | | | 185,709 | | | | - | | |
| LoJack Corp.(a) | | | - | | | | 972,116 | | | | (972,116 | ) | | | - | | | | - | (a) | | | 247,225 | | | | - | | |
| LSI Industries, Inc. | | | 1,220,080 | | | | 232,990 | | | | - | | | | 1,453,070 | | | | 24,832,966 | | | | - | | | | 692,087 | | |
McCormick & Schmick's
Seafood Restaurants Inc.(a) | | | 620,000 | | | | 230,400 | | | | (788,848 | ) | | | 61,552 | | | | - | (a) | | | 323,965 | | | | - | | |
NCI Building
Systems, Inc.(a) | | | 1,174,440 | | | | 551,289 | | | | (1,029,000 | ) | | | 696,729 | | | | - | (a) | | | 10,802,631 | | | | - | | |
Pacific Sunwear of
California, Inc.(a) | | | - | | | | 3,859,600 | | | | (2,723,650 | ) | | | 1,135,950 | | | | - | (a) | | | (4,073,817 | ) | | | - | | |
| Plexus Corp. | | | - | | | | 2,951,500 | | | | - | | | | 2,951,500 | | | | 71,278,725 | | | | - | | | | - | | |
| PNM Resources, Inc. | | | 1,119,100 | | | | 2,940,900 | | | | (4,400 | ) | | | 4,055,600 | | | | 124,506,920 | | | | (2,404 | ) | | | 2,590,632 | | |
| Quanex Corp.(d) | | | 1,604,900 | | | | 1,264,050 | | | | (182,900 | ) | | | 2,686,050 | | | | 99,679,316 | | | | 4,155,440 | | | | 1,193,925 | | |
| Rogers Corp. | | | 800,480 | | | | 502,500 | | | | (42,900 | ) | | | 1,260,080 | | | | 87,550,359 | | | | 2,125,410 | | | | - | | |
| Ruby Tuesday, Inc. | | | 70,200 | | | | 3,070,000 | | | | (13,100 | ) | | | 3,127,100 | | | | 84,400,429 | | | | 61,921 | | | | 770,150 | | |
Rush Enterprises,
Inc. Class A | | | - | | | | 1,206,231 | | | | - | | | | 1,206,231 | | | | 21,929,280 | | | | - | | | | - | | |
| ScanSource, Inc.(e) | | | 335,360 | | | | 1,036,960 | | | | (503 | ) | | | 1,371,817 | | | | 41,867,855 | | | | - | | | | - | | |
| Steel Technologies, Inc.(a) | | | 1,234,000 | | | | - | | | | (1,234,000 | ) | | | - | | | | - | (a) | | | 1,405,253 | | | | - | | |
| Trinity Industries, Inc.(a)(f) | | | 2,238,190 | | | | 1,187,605 | | | | (1,341,900 | ) | | | 2,083,895 | | | | - | (a) | | | 653,384 | | | | - | | |
Universal Forest
Products, Inc.(a) | | | 985,074 | | | | 109,600 | | | | (515,800 | ) | | | 578,874 | | | | - | (a) | | | 1,920,718 | | | | - | | |
| Werner Enterprises, Inc.(a) | | | 3,389,300 | | | | 1,084,200 | | | | (937,600 | ) | | | 3,535,900 | | | | - | (a) | | | (255,897 | ) | | | 571,615 | | |
| Total | | | | | | | | | | | | | | | | | | $ | 1,333,435,512 | | | $ | 25,725,980 | | | $ | 10,050,934 | | |
(a) No longer an affiliated issuer at November 30, 2006.
(b) 310,000 shares acquired in a 2-for-1 stock split; ex-date April 24, 2006.
(c) 451,400 shares acquired in a 3-for-2 stock split; ex-date February 1, 2006.
(d) 837,200 shares acquired in a 3-for-2 stock split; ex-date April 3, 2006.
(e) 500,060 shares acquired in a 2-for-1 stock split; ex-date June 6, 2006.
(f) 943,545 shares acquired in a 3-for-2 stock split; ex-date June 12, 2006.
(g) Name change from Frontier Airlines, Inc. effective April 3, 2006.
(h) Represents realized gains (losses) and dividend income earned only when the issuer was an affiliate of the Fund.
10. CUSTODIAN AND ACCOUNTING AGENT
State Street Bank & Trust Company ("SSB") is the Company's custodian and accounting agent. SSB performs custodial, accounting and recordkeeping functions, relating to portfolio transactions and calculating each Fund's NAV.
11. INVESTMENT RISKS
Large Cap Core Fund is subject to the general risks and considerations associated with equity investing, as well as the particular risks associated with value and growth stocks. This means the value of your investment will fluctuate in response to movements in the equity securities market in general and to the changing prospects of individual companies in which the Fund invests. Large value and growth stocks may perform differently than the market as a whole and differently than each other or other types of stocks, such as small company stocks. This is because different types of stocks tend to shift in and out of favor depending on market and economic
39
Notes to Financial Statements (continued)
conditions. The market may fail to recognize the intrinsic value of particular value stocks for a long time. Growth stocks may be more volatile than other stocks. In addition, if the Fund's assessment of a company's value or prospects for exceeding earnings expectations or market conditions is wrong, the Fund could suffer losses or produce poor performance relative to other funds, even in a rising market.
Small Cap Value Fund is subject to the general risks and considerations associated with equity investing, as well as the particular risks associated with value stocks. The value of an investment will fluctuate in response to movements in the stock market in general and to the changing prospects of individual companies in which the Fund invests. Large company value stocks and small company value stocks may perform differently than the market as a whole and other types of stocks such as growth stocks. The market may fail to recognize the intrinsic value of particular value stocks for a long time. In addition, small cap company stocks may be more volatile and less liquid than large cap company stocks. Also, if a Fund's assessment of a company's value or prospects for exceeding earnings expectations or market conditions is wrong, the Fund could suffer losses or produce poor performance relative to other funds, even in a rising market.
These factors can affect each Fund's performance.
40
Notes to Financial Statements (continued)
12. SUMMARY OF CAPITAL TRANSACTIONS
Transactions in shares of beneficial interest are as follows:
LARGE CAP CORE FUND
| | | Year Ended
November 30, 2006 | | Year Ended
November 30, 2005 | |
| Class A Shares | | Shares | | Amount | | Shares | | Amount | |
| Shares sold | | | 5,403,015 | | | $ | 155,655,111 | | | | 8,539,454 | | | $ | 237,321,415 | | |
| Reinvestment of distributions | | | 759,427 | | | | 21,271,566 | | | | 398,099 | | | | 11,154,747 | | |
| Shares reacquired | | | (3,351,998 | ) | | | (96,886,894 | ) | | | (2,102,862 | ) | | | (58,764,443 | ) | |
| Increase | | | 2,810,444 | | | $ | 80,039,783 | | | | 6,834,691 | | | $ | 189,711,719 | | |
| Class B Shares | |
| Shares sold | | | 548,560 | | | $ | 15,218,272 | | | | 712,370 | | | $ | 19,130,982 | | |
| Reinvestment of distributions | | | 98,899 | | | | 2,668,307 | | | | 75,608 | | | | 2,050,475 | | |
| Shares reacquired | | | (931,294 | ) | | | (25,791,906 | ) | | | (863,107 | ) | | | (23,175,109 | ) | |
| Decrease | | | (283,835 | ) | | $ | (7,905,327 | ) | | | (75,129 | ) | | $ | (1,993,652 | ) | |
| Class C Shares | |
| Shares sold | | | 893,337 | | | $ | 24,845,864 | | | | 1,513,453 | | | $ | 40,799,481 | | |
| Reinvestment of distributions | | | 73,138 | | | | 1,980,587 | | | | 29,110 | | | | 792,090 | | |
| Shares reacquired | | | (678,501 | ) | | | (18,902,772 | ) | | | (333,961 | ) | | | (8,994,339 | ) | |
| Increase | | | 287,974 | | | $ | 7,923,679 | | | | 1,208,602 | | | $ | 32,597,232 | | |
| Class P Shares | |
| Shares sold | | | 71,533 | | | $ | 2,057,095 | | | | 251,221 | | | $ | 7,063,785 | | |
| Reinvestment of distributions | | | 10,050 | | | | 281,801 | | | | 380 | | | | 10,660 | | |
| Shares reacquired | | | (78,033 | ) | | | (2,273,526 | ) | | | (26,830 | ) | | | (753,670 | ) | |
| Increase | | | 3,550 | | | $ | 65,370 | | | | 224,771 | | | $ | 6,320,775 | | |
| Class Y Shares | |
| Shares sold | | | 1,704,558 | | | $ | 49,374,015 | | | | 4,264,146 | | | $ | 118,258,062 | | |
| Reinvestment of distributions | | | 218,832 | | | | 6,131,662 | | | | 18,045 | | | | 505,257 | | |
| Shares reacquired | | | (46,822 | ) | | | (1,342,437 | ) | | | (18,025 | ) | | | (496,297 | ) | |
| Increase | | | 1,876,568 | | | $ | 54,163,240 | | | | 4,264,166 | | | $ | 118,267,022 | | |
41
Notes to Financial Statements (concluded)
SMALL CAP VALUE FUND
| | | Year Ended
November 30, 2006 | | Year Ended
November 30, 2005 | |
| Class A Shares | | Shares | | Amount | | Shares | | Amount | |
| Shares sold | | | 25,763,878 | | | $ | 821,082,672 | | | | 28,783,311 | | | $ | 809,340,873 | | |
| Reinvestment of distributions | | | 4,855,641 | | | | 140,328,197 | | | | 2,733,321 | | | | 73,389,673 | | |
| Shares reacquired | | | (16,816,750 | ) | | | (537,398,976 | ) | | | (8,715,538 | ) | | | (244,148,846 | ) | |
| Increase | | | 13,802,769 | | | $ | 424,011,893 | | | | 22,801,094 | | | $ | 638,581,700 | | |
| Class B Shares | |
| Shares sold | | | 210,788 | | | $ | 6,014,790 | | | | 320,243 | | | $ | 8,275,530 | | |
| Reinvestment of distributions | | | 318,320 | | | | 8,505,507 | | | | 536,865 | | | | 13,512,897 | | |
| Shares reacquired | | | (2,141,481 | ) | | | (62,290,310 | ) | | | (3,879,512 | ) | | | (103,861,865 | ) | |
| Decrease | | | (1,612,373 | ) | | $ | (47,770,013 | ) | | | (3,022,404 | ) | | $ | (82,073,438 | ) | |
| Class C Shares | |
| Shares sold | | | 248,612 | | | $ | 6,983,271 | | | | 291,459 | | | $ | 7,519,721 | | |
| Reinvestment of distributions | | | 182,474 | | | | 4,881,170 | | | | 174,580 | | | | 4,399,410 | | |
| Shares reacquired | | | (662,289 | ) | | | (19,648,459 | ) | | | (556,908 | ) | | | (14,632,211 | ) | |
| Decrease | | | (231,203 | ) | | $ | (7,784,018 | ) | | | (90,869 | ) | | $ | (2,713,080 | ) | |
| Class P Shares | |
| Shares sold | | | 6,281,520 | | | $ | 199,391,705 | | | | 8,503,486 | | | $ | 237,770,898 | | |
| Reinvestment of distributions | | | 802,192 | | | | 23,087,098 | | | | 316,873 | | | | 8,482,694 | | |
| Shares reacquired | | | (4,556,483 | ) | | | (144,407,463 | ) | | | (3,130,597 | ) | | | (88,475,121 | ) | |
| Increase | | | 2,527,229 | | | $ | 78,071,340 | | | | 5,689,762 | | | $ | 157,778,471 | | |
| Class Y Shares | |
| Shares sold | | | 11,786,788 | | | $ | 391,261,817 | | | | 10,406,969 | | | $ | 304,943,421 | | |
| Reinvestment of distributions | | | 1,835,001 | | | | 55,013,332 | | | | 997,401 | | | | 27,598,071 | | |
| Shares reacquired | | | (4,063,359 | ) | | | (133,258,648 | ) | | | (1,962,109 | ) | | | (56,948,916 | ) | |
| Increase | | | 9,558,430 | | | $ | 313,016,501 | | | | 9,442,261 | | | $ | 275,592,576 | | |
On January 18, 2006, the number of shares of common stock authorized for Lord Abbett Research Fund, Inc. was increased from 1,040,000,000 to 1,220,000,000. As a result, the Class A shares of common stock authorized for Large Cap Core Fund was increased from 20,000,000 to 200,000,000.
13. RECENT ACCOUNTING PRONOUNCEMENTS
In July 2006, the Financial Accounting Standards Board (FASB) issued Interpretation 48, Accounting for Uncertainty in Income Taxes – an interpretation of FASB Statement 109 (FIN 48). FIN 48 clarifies the accounting for income taxes by prescribing the minimum recognition threshold a tax position must meet before being recognized in the financial statements. FIN 48 is effective for fiscal years beginning after December 15, 2006. The Funds will adopt FIN 48 during 2008 and the impact to each Fund's financial statements, if any, is currently being assessed.
In September 2006, Statement of Financial Accounting Standards No.157, Fair Value Measurements (SFAS 157), was issued and is effective for fiscal years beginning after November 15, 2007. SFAS 157 defines fair value, establishes a framework for measuring fair value and expands disclosures about fair value measurements. Management is currently evaluating the impact the adoption of SFAS 157 will have on each Fund's financial statement disclosures.
42
Report of Independent Registered Public Accounting Firm
The Board of Directors and Shareholders of Lord Abbett Research Fund, Inc.:
We have audited the accompanying statements of assets and liabilities, including the schedules of investments, of Lord Abbett Research Fund, Inc. – Lord Abbett Large-Cap Core Fund and Small-Cap Value Series (the "Funds") as of November 30, 2006, and the related statements of operations for the year then ended, the statements of changes in net assets for each of the two years in the period then ended, and the financial highlights for each of the five years in the period then ended. These financial statements and financial highlights are the responsibility of the Funds' management. Our responsibility is to express an opinion on these financial statements and financial highlights based on our audits.
We conducted our audits in accordance with standards of the Public Company Accounting Oversight Board (United States). Those standards require that we plan and perform the audit to obtain reasonable assurance about whether the financial statements and financial highlights are free of material misstatement. The Funds are not required to have, nor were we engaged to perform, an audit of their internal control over financial reporting. Our audits included consideration of internal control over financial reporting as a basis for designing audit procedures that are appropriate in the circumstances, but not for the purpose of expressing an opinion on the effectiveness of the Funds' internal control over financial reporting. Accordingly, we express no such opinion. An audit also includes examining, on a test basis, evidence supporting the amounts and disclosures in the financial statements, assessing the accounting principles used and significant e stimates made by management, as well as evaluating the overall financial statement presentation. Our procedures included confirmation of securities owned as of November 30, 2006 by correspondence with the custodian and brokers; where replies were not received from brokers, we performed other auditing procedures. We believe that our audits provide a reasonable basis for our opinion.
In our opinion, the financial statements and financial highlights referred to above present fairly, in all material respects, the financial position of Lord Abbett Research Fund, Inc. – Lord Abbett Large-Cap Core Fund and Small-Cap Value Series as of November 30, 2006, the results of their operations for the year then ended, the changes in their net assets for each of the two years in the period then ended, and the financial highlights for each of the five years in the period then ended, in conformity with accounting principles generally accepted in the United States of America.
Deloitte & Touche LLP
New York, New York
January 26, 2007
43
Basic Information About Management
The Board of Directors (the "Board") is responsible for the management of the business and affairs of each Fund in accordance with the laws of the State of Maryland. The Board appoints officers who are responsible for the day-to-day operations of each Fund and who execute policies authorized by the Board. The Board also approves an investment adviser to each Fund and continues to monitor the cost and quality of the services provided by the investment adviser, and annually considers whether to renew the contract with the adviser. Generally, each Director holds office until his/her successor is elected and qualified or until his/her earlier resignation or removal, as provided in the Fund's organizational documents.
Lord, Abbett & Co. LLC ("Lord Abbett"), a Delaware limited liability company, is the Funds' investment adviser.
Interested Directors
The following Directors are Partners of Lord Abbett and are "interested persons" of the Funds as defined in the Act. Mr. Dow and Ms. Foster are officers, directors, or trustees of each of the fourteen Lord Abbett-sponsored funds, which consist of 55 portfolios or series.
Name, Address and
Year of Birth | | Current Position
Length of Service
with Fund | | Principal Occupation
During Past Five Years | | Other
Directorships | |
Robert S. Dow
Lord, Abbett & Co. LLC
90 Hudson Street
Jersey City, NJ 07302 (1945) | | Director and Chairman
since 1996 | | Managing Partner and Chief Executive Officer of Lord Abbett since 1996. | | N/A | |
|
Daria L. Foster
Lord, Abbett & Co. LLC 90 Hudson Street
Jersey City, NJ 07302 (1954) | | Director since 2006 | | Partner and Director of Marketing and Client Service of Lord Abbett since 1990. | | N/A | |
|
Independent Directors
The following independent or outside Directors are also directors or trustees of each of the fourteen Lord Abbett-sponsored funds, which consist of 55 portfolios or series.
Name, Address and
Year of Birth | | Current Position
Length of Service
with Fund | | Principal Occupation
During Past Five Years | | Other
Directorships | |
E. Thayer Bigelow
Lord, Abbett & Co. LLC c/o Legal Dept. 90 Hudson Street
Jersey City, NJ 07302 (1941) | | Director since 1996 | | Managing General Partner, Bigelow Media, LLC
(since 2000); Senior Adviser, Time Warner Inc. (1998 - 2000); Acting Chief Executive Officer of Courtroom Television Network (1997 – 1998); President and Chief Executive Officer of Time Warner Cable Programming, Inc. (1991 – 1997). | | Currently serves as director of Adelphia Communications, Inc.; Crane Co.; and Huttig Building Products Inc. | |
|
44
Basic Information About Management (continued)
Name, Address and
Year of Birth | | Current Position
Length of Service
with Fund | | Principal Occupation
During Past Five Years | | Other
Directorships | |
William H.T. Bush
Lord, Abbett & Co. LLC c/o Legal Dept. 90 Hudson Street
Jersey City, NJ 07302 (1938) | | Director since 1998 | | Co-founder and Chairman of the Board of the
financial advisory firm of Bush-O'Donnell & Company (since 1986). | | Currently serves as director of WellPoint, Inc. (since 2002). | |
|
Robert B. Calhoun, Jr. Lord, Abbett & Co. LLC c/o Legal Dept. 90 Hudson Street
Jersey City, NJ 07302 (1942) | | Director since 1998 | | Managing Director of Monitor Clipper Partners (since 1997) and President of Clipper Asset Management Corp. (since 1991), both private equity investment funds. | | Currently serves as director of Avondale, Inc. and Interstate Bakeries Corp. | |
|
Julie A. Hill
Lord, Abbett & Co. LLC c/o Legal Dept. 90 Hudson Street
Jersey City, NJ 07302 (1946) | | Director since 2004 | | Owner and CEO of The Hill Company, a business consulting firm (since 1998); Founder, President and Owner of the Hiram-Hill and Hillsdale Development Company, a residential real estate development firm (1998 - 2000). | | Currently serves as director of WellPoint, Inc.; Resources Connection Inc.; Holcim (U.S.) Inc. (a subsidiary of Holcim Ltd.); and Lend Lease Corporation Limited. | |
|
Franklin W. Hobbs
Lord, Abbett & Co. LLC c/o Legal Dept. 90 Hudson Street
Jersey City, NJ 07302 (1947) | | Director since 2001 | | Advisor of One Equity Partners, a private equity firm (since 2004); Chief Executive Officer of Houlihan Lokey Howard & Zukin, an investment bank (2002 - 2003); Chairman of Warburg Dillon Read, an investment bank (1999 - 2001); Global Head of Corporate Finance of SBC Warburg Dillon Read (1997 - 1999); Chief Executive Officer of Dillon, Read & Co. (1994 - 1997). | | Currently serves as director of Molson Coors Brewing Company. | |
|
Thomas J. Neff
Lord, Abbett & Co. LLC c/o Legal Dept. 90 Hudson Street
Jersey City, NJ 07302 (1937) | | Director since 1992 | | Chairman of Spencer Stuart (U.S.), an executive search consulting firm (since 1996); President of Spencer Stuart (1979-1996). | | Currently serves as director of Ace, Ltd. (since 1997) and Hewitt Associates, Inc. | |
|
James L.L. Tullis
Lord, Abbett & Co. LLC c/o Legal Dept. 90 Hudson Street
Jersey City, NJ 07302 (1947) | | Director since 2006 | | CEO of Tullis-Dickerson and Co. Inc, a venture capital management firm (since 1990). | | Currently serves as director of Crane Co. (since 1998) and Viacell Inc.
(since 2002). | |
|
45
Basic Information About Management (continued)
Officers
None of the officers listed below have received compensation from the Funds. All the officers of the Funds may also be officers of the other Lord Abbett-sponsored funds and maintain offices at 90 Hudson Street, Jersey City, NJ 07302.
Name and
Year of Birth | | Current Position
with Fund | | Length of Service
of Current Position | | Principal Occupation
During Past Five Years | |
Robert S. Dow
(1945) | | Chief Executive Officer and Chairman | | Elected in 1996 | | Managing Partner and Chief Executive Officer of Lord Abbett (since 1996). | |
|
Daria L. Foster
(1954) | | President | | Elected in 2006 | | Partner and Director of Marketing and Client Service of Lord Abbett (since 1990). | |
|
Robert P. Fetch
(1953) | | Executive Vice President | | Elected in 1997 | | Partner and Senior Investment Manager, joined Lord Abbett in 1995. | |
|
| Daniel H. Frascarelli (1954) | | Executive Vice President | | Elected in 2005 | | Partner and Director of Large Cap Core Equity, joined Lord Abbett in 1990. | |
|
Frederick Ruvkun
(1957) | | Executive Vice President | | Elected in 2006 | | Investment Manager, joined Lord Abbett in 2006; formerly served as Managing Director and Leader of the Small Cap Growth Team and a Portfolio Manager of SMID Cap Growth Assets at J & W Seligman & Company. | |
|
| Christopher J. Towle (1957) | | Executive Vice President | | Elected in 2001 | | Partner and Investment Manager, joined Lord Abbett in 1987. | |
|
Edward K. von der Linde
(1960) | | Executive Vice President | | Elected in 2001 | | Partner and Investment Manager, joined Lord Abbett in 1988. | |
|
James Bernaiche
(1956) | | Chief Compliance Officer | | Elected in 2004 | | Chief Compliance Officer, joined Lord Abbett in 2001. | |
|
Joan A. Binstock
(1954) | | Chief Financial Officer and Vice President | | Elected in 1999 | | Partner and Chief Operations Officer, joined Lord Abbett in 1999. | |
|
Evan B. Carpenter
(1972) | | Vice President | | Elected in 2006 | | Research Analyst, joined Lord Abbett in 2003; prior thereto he served as an Equity Research Analyst at Gabelli Asset Management (2000-2003). | |
|
John K. Forst
(1960) | | Vice President and Assistant Secretary | | Elected in 2005 | | Deputy General Counsel, joined Lord Abbett in 2004; Managing Director and Associate General Counsel at New York Life Investment Management LLC (2002-2003). | |
|
46
Basic Information About Management (concluded)
Name and
Year of Birth | | Current Position
with Fund | | Length of Service
of Current Position | | Principal Occupation
During Past Five Years | |
| Lawrence H. Kaplan (1957) | | Vice President and Secretary | | Elected in 1997 | | Partner and General Counsel, joined Lord Abbett in 1997. | |
|
Robert G. Morris
(1944) | | Vice President | | Elected in 1996 | | Partner and Chief Investment Officer, joined Lord Abbett in 1991. | |
|
| A. Edward Oberhaus, III (1959) | | Vice President | | Elected in 1996 | | Partner and Manager of Equity Trading, joined Lord Abbett in 1983. | |
|
| Christina T. Simmons (1957) | | Vice President and Assistant Secretary | | Elected in 2000 | | Assistant General Counsel, joined Lord Abbett in 1999. | |
|
Paul J. Volovich
(1973) | | Vice President | | Elected in 2004 | | Investment Manager, joined Lord Abbett in 1997. | |
|
Bernard J. Grzelak
(1971) | | Treasurer | | Elected in 2003 | | Director of Fund Administration, joined Lord Abbett in 2003; formerly Vice President, Lazard Asset Management LLC (2000-2003). | |
|
Please call 888-522-2388 for a copy of the Statement of Additional Information (SAI), which contains further information about the Funds' Directors. It is available free upon request.
47
Householding
The Company has adopted a policy that allows it to send only one copy of the Funds' Prospectus, proxy material, annual report and semiannual report to certain shareholders residing at the same "household." This reduces Fund expenses, which benefits you and other shareholders. If you need additional copies or do not want your mailings to be "householded," please call Lord Abbett at 800-821-5129 or send a written request with your name, the name of your fund or funds and your account number or numbers to Lord Abbett Family of Funds, P.O. Box 219336, Kansas City, MO 64121.
Proxy Voting Policies, Procedures and Record
A description of the policies and procedures that Lord Abbett uses to vote proxies related to each Fund's portfolio securities, and information on how Lord Abbett voted each Fund's proxies during the 12 month period ended June 30, 2006 are available without charge, upon request, (i) by calling 888-522-2388; (ii) on Lord Abbett's website at www.LordAbbett.com; and (iii) on the Securities and Exchange Commission's ("SEC") website at www.sec.gov.
Shareholder Reports and Quarterly Portfolio Disclosure
The Funds are required to file their complete schedules of portfolio holdings with the SEC for their first and third fiscal quarters on Form N-Q. Copies of the filings are available without charge, upon request on the SEC's website at www.sec.gov and may be available by calling Lord Abbett at 800-821-5129. You can also obtain copies of Form N-Q by (i) visiting the SEC's Public Reference Room in Washington, DC (information on the operation of the Public Reference Room may be obtained by calling 800-SEC-0330); (ii) sending your request and a duplicating fee to the SEC's Public Reference Room, Washington, DC 20549-0102; or (iii) sending your request electronically to publicinfo@sec.gov.
Tax Information
The percentages below reflect the portion of ordinary income distributions that are eligible for the corporate dividend received deduction (DRD) and qualified dividend income (QDI) for individual shareholders.
| Fund Name | | DRD | | QDI | |
| Large Cap Core Fund | | | 100 | % | | | 100 | % | |
| Small Cap Value Fund | | | 22.80 | | | | 22.84 | | |
Additionally, of the distributions paid by the Large Cap Core Fund and the Small Cap Value Fund to shareholders during the fiscal year ended November 30, 2006, $31,503,103 and $195,292,834, respectively, represent long-term capital gains.
48
Lord Abbett Research Fund, Inc.
Lord Abbett Large-Cap Core Fund
Small-Cap Value Series
LARF-2-1106
(01/07)

This report when not used for the general
information of shareholders of the Fund, is to
be distributed only if preceded or accompanied
by a current fund prospectus.
Lord Abbett mutual fund shares are distributed by
LORD ABBETT DISTRIBUTOR LLC.
LORD ABBETT

2006
Annual
Report
Lord Abbett
America's Value Fund
For the fiscal year ended November 30, 2006
Lord Abbett Research Fund
Lord Abbett America's Value Fund
Annual Report
For the fiscal year ended November 30, 2006
Dear Shareholders: We are pleased to provide you with this overview of the Lord Abbett America's Value Fund's performance for the fiscal year ended November 30, 2006. On this page and the following pages, we discuss the major factors that influenced performance. For detailed and more timely information about the Fund, please visit our Website at www.lordabbett.com, where you also can access the quarterly commentaries by the Fund's portfolio managers.
General information about Lord Abbett mutual funds, as well as in-depth discussions of market trends and investment strategies, is also provided in Lord Abbett Insights, a newsletter accompanying your quarterly account statements. We also encourage you to call Lord Abbett at 800-821-5129 and speak to one of our professionals if you would like more information.
Thank you for investing in Lord Abbett mutual funds. We value the trust that you place in us and look forward to serving your investment needs in the years to come.

From left to right: Robert S. Dow, Director and Chairman of the Lord Abbett Funds; E. Thayer Bigelow, Independent Lead Director of the Lord Abbett Funds; and Daria L. Foster, Director and President of the Lord Abbett Funds.
Best regards,

Robert S. Dow
Chairman
Q: What were the overall market conditions during the fiscal year ended November 30, 2006?
A: The stock market gained approximately 14% (including dividends) in the fiscal year ended November 30, 2006 (as measured by the broad S&P Composite 1500® Index1). After beginning the fiscal year with positive momentum, the market entered a period of consolidation in May. The spring sell-off persisted until mid-July. During the market correction, small caps (as measured by the S&P SmallCap 600® Index2) fell more than twice (in percentage terms) as much as large caps. Once positive momentum returned, large capitalized companies led the market higher. For the fiscal year, the S&P 100® Index,3 comprised of large cap stocks, finished up about 15% (on a total return basis), while the small
1
cap index matched the broad market with a gain of roughly 14%. Mid-capitalized companies (as measured by the S&P MidCap 400® Index4) trailed, on average, but still managed to register a total return of near 12% over the period.
Sector leadership rotated, as did the preference for capitalization. Between December 2005 and August 2006, the price of crude oil rose approximately 34% (from about $57 per barrel to approximately $77), pushing energy stock prices higher. With inventories of petroleum plentiful, the price of crude oil began to slide in August. The $0.80 per gallon decline in the cost of gasoline fueled a late-year rally in consumer discretionary stocks. In addition, the lagging technology sector rallied in the final three months of the fiscal year. Defensive sectors such as consumer staples and health care lagged behind the broader market in the final months of the fiscal year.
Elsewhere, the bond markets faced headwinds in the first half of the fiscal year ended November 30, 2006, as tighter U.S. and international monetary policy and better than expected economic data pushed bond yields higher and prices lower. The benchmark 10-year Treasury bond began 2006 yielding 4.39%, and by June 30 had risen to 5.14%. As a result, most sectors of the bond market produced negative returns during the first six months of the period. However, the market changed for bond investors in the second half of the fiscal year. The bond market rallied nearly 6% in price terms as the 10-year Treasury yield fell to 4.46% by November 30, 2006. The reversal was attributed to a number of factors, leading market participants to believe that the Federal Reserve Board (the Fed) would begin lowering interest rates. In August, the Fed decided to hold the fed funds rate (the rate at which banks lend to one another) steady at 5.25%, after increasing it 17 straight times since June 2004. The Fed subsequently held rates steady at its meetings in September and October.
This served as a boost to most asset classes, with high yield, convertible, and investment-grade securities all up more than 6% for the six months ended November 30, 2006. High yield securities also have benefited from benign credit conditions, such as the continued low credit default rates of the past year.
Another contributing factor to the bond market rally, in the U.S. Treasury market in particular, was the evident slowing of the economy. Second quarter 2006 gross domestic product (GDP) came in at 2.6%, sharply lower than the first quarter GDP of 5.6%, while preliminary estimates for third quarter GDP are 2.2%. The downshift in economic activity was supportive of bond prices as investors expected the Fed to be compelled to hold rates steady, or lower them, in order to avert a recession. In addition, benign inflation reports suggest that rate increases to date, in the context of a slowing economy, have been sufficient enough to temper incipient inflationary pressure. The Producer Price Index (PPI) and Consumer Price Index (CPI) each actually fell in October. The energy-dampened CPI
2
decreased by 0.5% for the month and measured 1.3% year over year, and the PPI fell 1.6% during the month, posting a 1.6% annual decline. Excluding food and energy, the core numbers were 0.1% and -0.9%, respectively.
Performance data quoted on the following pages reflect past performance and are no guarantee of future results. Current performance may be higher or lower than the performance quoted. The investment return and principal value of an investment in the Fund will fluctuate so that shares, on any given day or when redeemed, may be worth more or less than their original cost. You can obtain performance data current to the most recent month-end by calling Lord Abbett at 800-821-5129 or referring to our Website at www.lordabbett.com.
Q: How did the America's Value Fund perform during the fiscal year ended November 30, 2006?
A: The Fund returned 13.4%, reflecting performance at the net asset value (NAV) of Class A shares with all distributions reinvested, compared with its benchmark, the S&P 500® Index,5 which returned 14.2% over the same period. The Fund's average annual total returns, which reflect performance at the maximum 5.75% sales charge applicable to Class A share investments and include the reinvestment of all distributions, are: 1 year: 6.89% and since inception (December 27, 2001): 7.87%.
Note: The Lord Abbett America's Value Fund is not a balanced fund and has the capability to adjust equity and fixed income allocations, based on relative value in the market and the investment team's proprietary fundamental research.
Q: What were the most significant factors affecting performance?
Equity Portion
A: The materials sector was the greatest detractor from the Fund's performance relative to its benchmark for the one-year period. In addition, the financials and energy sectors also detracted from performance.
Among the individual holdings that detracted from performance were Bowater Inc., a manufacturer of newsprint, coated and uncoated groundwood papers, bleached kraft pulp, and lumber products; Chemtura Corp., a global manufacturer of specialty chemicals, crop protection, and pool, spa, and home care products; and The Dow Chemical Co., a provider of chemical, plastic, and agricultural products and services.
In addition, two consumer discretionary holdings took away from performance: Dana Corp., a maker of components and systems for worldwide automotive, heavy truck, off-highway, engine, and industrial markets, and Pier 1 Imports, Inc., a retailer of decorative home furnishings, gifts, and related items.
The telecommunications services sector was the strongest contributor to the Fund's performance relative to its benchmark for the one-year period. In addition, the information technology sector (in which the Fund benefited from its underweight position) and the consumer staples sector also contributed to performance.
3
Among the top contributors to performance were AT&T Inc. (the Fund's number-one contributor and its largest holding at period end), a provider of communications services, and consumer staples holding H.J. Heinz Co., a manufacturer of processed food products.
Three other companies were top ranking contributors: consumer discretionary holding OfficeMax Inc., a seller of office products; energy holding Chevron Corp., an integrated energy company; and utilities holding Puget Energy Inc., a provider of electric and gas services to customers principally located in the Puget Sound region of Washington State.
Bond Portion
All sectors in which the Fund participates added to performance in the period. The high-yield bond market made the greatest contribution to performance, followed by the convertible securities and high-grade investment bond markets.
Within the high-yield bond market, the top five individual holdings adding to performance were pharmaceutical firm Warner Chilcott, Inc., a maker of women's health care and urology prescription drugs; auto loan holdings General Motors Acceptance Corp., a global finance company, and Ford Motor Credit Corp., an auto financing firm; theater and entertainment holding AMC Entertainment Inc., owner of 415 theater chains nationwide; and cable company Mediacom Broadband LLC, which provides high-speed Internet service to residential customers nationwide.
Detracting from performance in the high-yield bond market were auto parts and equipment manufacturer Dana Corp.; consumer products company Spectrum Brands (formerly Rayovac), a manufacturer of batteries; and Chiquita Brands International, Inc., a grower and producer of bananas and other fresh produce.
Within the convertible securities market, the top five individual holdings adding to performance were oilfield and equipment services firm Hanover Compressor Co., a provider of compressor equipment for the oil and gas industry; railroad holding CSX Corp., an operator of railroads in the eastern United States; machinery manufacturer AGCO Corp., a maker of agricultural machinery and equipment; telecommunications and integrated services holding Qwest Communications International, Inc., an international provider of high-capacity broadband fiber-optic networks; and hotels holding Hilton Hotels Corp., which operates nearly 2,800 hotels and resorts in more than 80 countries.
Detracting from performance in the convertible securities market were pharmaceutical companies CV Therapeutics, Inc., a developer of small-molecule drugs to treat chronic cardiovascular diseases, and Watson Pharmaceuticals, Inc., a maker of both branded and generic drugs. Also taking away from performance during the period were banking holding The Marshall & Ilsley Corp., a diversified financial services company; software services holdings DST Systems, Inc., a provider of information processing software for the mutual fund industry; and EMC Corp., a provider of data storage and retrieval systems.
4
The portfolio's holding in the investment-grade bond market were mostly profitable in the period and consisted largely of Federal National Mortgage agency bonds.
The Fund's portfolio is actively managed and, therefore, its holdings and weightings of a particular issuer or sector as a percentage of portfolio assets are subject to change. Sectors may include many industries.
Note: Class A shares purchased subject to a front-end sales charge have no contingent deferred sales charge (CDSC). However, certain purchases of Class A shares made without a front-end sales charge may be subject to a CDSC of 1% if shares are redeemed within 12 months of purchase (24th month if shares were purchased prior to November 1, 2004). Please see section "Your Investment – Purchases" in the prospectus for more information on redemptions that may be subject to a CDSC.
A prospectus contains important information about a fund, including its investment objectives, risks, charges, and ongoing expenses, which an investor should carefully consider before investing. To obtain a prospectus on any Lord Abbett mutual fund, please contact your investment professional or Lord Abbett Distributor LLC at 800-874-3733 or visit our Website at www.LordAbbett.com. Read the prospectus carefully before investing.
1 The S&P Composite 1500® Index combines the S&P 500®, S&P 400® (an index of mid-cap companies), and S&P SmallCap 600® to create a broad market portfolio representing 90% of U.S. equities.
2 The S&P SmallCap 600® Index is a widely accepted benchmark owing to its low turnover and greater liquidity.
3 The S&P 100® Index measures large company U.S. stock market performance. This market capitalization-weighted index is made up of 100 major, blue-chip stocks across diverse industry groups.
4 The S&P MidCap 400® Index measures the performance of the mid-size company segment of the U.S. market.
5 The S&P 500® Index is widely regarded as the standard for measuring large-cap U.S. stock market performance, and includes a representative sample of leading companies in leading industries.
Indexes are unmanaged, do not reflect the deduction of fees or expenses, and are not available for direct investment.
Important Performance and Other Information
The views of the Fund's management and the portfolio holdings described in this report are as of November 30, 2006; these views and portfolio holdings may have changed subsequent to this date, and they do not guarantee the future performance of the markets or the Fund. Information provided in this report should not be considered a recommendation to purchase or sell securities.
A Note about Risk: See Notes to Financial Statements for a discussion of investment risks. For a more detailed discussion of the risks associated with the Fund, please see the Fund's prospectus.
Performance: Because of ongoing market volatility, the Fund's performance may be subject to substantial fluctuation. Except where noted, comparative Fund performance does not account for the deduction of sales charges and would be different if sales charges were included. The Fund offers additional classes of shares with distinct pricing options. For a full description of the differences in pricing alternatives, please see the Fund's prospectus.
Mutual funds are not insured by the FDIC, are not deposits or other obligations of, or guaranteed by, banks, and are subject to investment risks, including possible loss of principal amount invested.
5
Investment Comparison
Below is a comparison of a $10,000 investment in Class A shares with the same investment in the S&P 500® Index and the 65% Russell 3000® Value Index/35% Merrill Lynch High Yield Master II Index, assuming reinvestment of all dividends and distributions. The performance of other classes will be greater than or less than the performance shown in the graph below due to different sales loads and expenses applicable to such classes. The graph and performance table below do not reflect the deduction of taxes that a shareholder would pay on fund distributions or the redemption of fund shares. Past performance is no guarantee of future results.

Average Annual Total Return at Maximum Applicable Sales Charge for the Periods Ended November 30, 2006
| | | 1 Year | | Life of Class | |
| Class A3 | | | 6.89 | % | | | 7.87 | % | |
| Class B4 | | | 8.62 | % | | | 8.18 | % | |
| Class C5 | | | 12.68 | % | | | 8.50 | % | |
| Class P6 | | | 13.31 | % | | | 9.10 | % | |
| Class Y7 | | | 13.75 | % | | | 9.55 | % | |
1 Reflects the deduction of the maximum initial sales charge of 5.75%.
2 Performance of each unmanaged index does not reflect transaction costs, management fees or sales charges. The performance of each index is not necessarily representative of the Fund's performance. Performance of each index began on December 27, 2001.
3 Class A shares commenced operations on December 27, 2001. Total return, which is the percentage change in net asset value, after deduction of the maximum initial sales charge of 5.75% applicable to Class A shares, with all dividends and distributions reinvested for the periods shown ended November 30, 2006, is calculated using the SEC-required uniform method to compute such return.
4 Class B shares commenced operations on December 27, 2001. Performance reflects the deduction of a CDSC of 4% for 1 year and 2% for the life of the class.
5 Class C shares commenced operations on December 27, 2001. The 1% CDSC for Class C shares normally applies before the first anniversary of the purchase date. Performance is at net asset value.
6 Class P shares commenced operations on December 27, 2001. Performance is at net asset value.
7 Class Y shares commenced operations on December 27, 2001. Performance is at net asset value.
6
Expense Example
As a shareholder of the Fund, you incur two types of costs: (1) transaction costs, including sales charges on purchase payments (these charges vary among the share classes); and (2) ongoing costs, including management fees; distribution and service (12b-1) fees (these charges vary among the share classes); and other Fund expenses. This Example is intended to help you understand your ongoing costs (in dollars) of investing in the Fund and to compare these costs with the ongoing costs of investing in other mutual funds.
The Example is based on an investment of $1,000 invested at the beginning of the period and held for the entire period (June 1, 2006 through November 30, 2006).
Actual Expenses
For each class of the Fund, the first line of the applicable table on the following page provides information about actual account values and actual expenses. You may use the information in this line, together with the amount you invested, to estimate the expenses that you paid over the period. Simply divide your account value by $1,000 (for example, an $8,600 account value divided by $1,000 = 8.6), then multiply the result by the number in the first line under the heading entitled "Expenses Paid During the Period 6/1/06 – 11/30/06" to estimate the expenses you paid on your account during this period.
Hypothetical Example for Comparison Purposes
For each class of the Fund, the second line of the applicable table on the following page provides information about hypothetical account values and hypothetical expenses based on the Fund's actual expense ratio and an assumed rate of return of 5% per year before expenses, which is not the Fund's actual return. The hypothetical account values and expenses may not be used to estimate the actual ending account balance or expenses you paid for the period. You may use this information to compare the ongoing costs of investing in the Fund and other funds. To do so, compare this 5% hypothetical example with the 5% hypothetical examples that appear in the shareholder reports of the other funds.
7
Please note that the expenses shown in the table are meant to highlight your ongoing costs only and do not reflect any transactional costs, such as sales charges. Therefore, the second line of the table is useful in comparing ongoing costs only, and will not help you determine the relative total costs of owning different funds. In addition, if these transactional costs were included, your costs would have been higher.
| | | Beginning
Account
Value | | Ending
Account
Value | | Expenses
Paid During
Period† | |
| | | 6/1/06 | | 11/30/06 | | 6/1/06 –
11/30/06 | |
| Class A | |
| Actual | | $ | 1,000.00 | | | $ | 1,100.00 | | | $ | 7.05 | | |
| Hypothetical (5% Return Before Expenses) | | $ | 1,000.00 | | | $ | 1,018.33 | | | $ | 6.78 | | |
| Class B | |
| Actual | | $ | 1,000.00 | | | $ | 1,096.30 | | | $ | 10.46 | | |
| Hypothetical (5% Return Before Expenses) | | $ | 1,000.00 | | | $ | 1,015.07 | | | $ | 10.05 | | |
| Class C | |
| Actual | | $ | 1,000.00 | | | $ | 1,097.00 | | | $ | 10.46 | | |
| Hypothetical (5% Return Before Expenses) | | $ | 1,000.00 | | | $ | 1,015.07 | | | $ | 10.05 | | |
| Class P | |
| Actual | | $ | 1,000.00 | | | $ | 1,099.30 | | | $ | 7.58 | | |
| Hypothetical (5% Return Before Expenses) | | $ | 1,000.00 | | | $ | 1,017.83 | | | $ | 7.28 | | |
| Class Y | |
| Actual | | $ | 1,000.00 | | | $ | 1,101.40 | | | $ | 5.27 | | |
| Hypothetical (5% Return Before Expenses) | | $ | 1,000.00 | | | $ | 1,020.08 | | | $ | 5.06 | | |
† For each class of the Fund, expenses are equal to the annualized expense ratio for such class (1.34% for Class A, 1.99% for Classes B and C, 1.44% for Class P and 1.00% for Class Y) multiplied by the average account value over the period, multiplied by 183/365 (to reflect one-half year period).
Portfolio Holdings Presented by Sector
November 30, 2006
| Sector* | | %** | |
| Consumer Discretionary | | | 20.15 | % | |
| Consumer Staples | | | 7.60 | % | |
| Energy | | | 9.61 | % | |
| Financials | | | 16.71 | % | |
| Healthcare | | | 5.26 | % | |
| Industrials | | | 7.57 | % | |
| Information Technology | | | 2.42 | % | |
| Materials | | | 13.56 | % | |
| Telecommunication Services | | | 6.56 | % | |
| Utilities | | | 9.41 | % | |
| Short Term Investment | | | 1.15 | % | |
| Total | | | 100.00 | % | |
* A sector may comprise several industries.
** Represents percent of total investments.
8
Schedule of Investments
November 30, 2006
| Investments | | Shares
(000) | | Value | |
| LONG-TERM INVESTMENTS 98.95% | |
| COMMON STOCKS 65.15% | |
| Chemicals 5.21% | |
| Chemtura Corp. | | | 1,700 | | | $ | 16,459,872 | | |
| Eastman Chemical Co. | | | 501 | | | | 29,761,256 | | |
| Monsanto Co. | | | 409 | | | | 19,651,016 | | |
| Total | | | | | | | 65,872,144 | | |
| Commercial Banks 1.21% | |
| Bank of America Corp. | | | 284 | | | | 15,314,940 | | |
| Commercial Services & Supplies 3.39% | |
| R.R. Donnelley & Sons Co. | | | 831 | | | | 29,305,843 | | |
| Waste Management, Inc. | | | 370 | | | | 13,556,683 | | |
| Total | | | | | | | 42,862,526 | | |
| Communications Equipment 0.99% | |
| Avaya Inc.* | | | 977 | | | | 12,486,571 | | |
| Containers & Packaging 1.61% | |
| Ball Corp. | | | 476 | | | | 20,358,036 | | |
| Diversified Consumer Services 2.22% | |
| ServiceMaster Co. (The) | | | 2,171 | | | | 28,119,630 | | |
| Diversified Telecommunication Services 3.54% | |
| AT&T Inc. | | | 1,066 | | | | 36,141,278 | | |
| Verizon Communications, Inc. | | | 249 | | | | 8,686,084 | | |
| Total | | | | | | | 44,827,362 | | |
| Electric Utilities 4.42% | |
| Ameren Corp. | | | 476 | | | | 26,052,902 | | |
| Puget Energy Inc. | | | 1,204 | | | | 29,904,876 | | |
| Total | | | | | | | 55,957,778 | | |
| Electrical Equipment 1.08% | |
| Hubbell, Inc. Class B | | | 259 | | | | 13,605,530 | | |
| Energy Equipment & Services 3.63% | |
| GlobalSantaFe Corp. (Cayman Islands)(a) | | | 382 | | | | 22,944,000 | | |
See Notes to Financial Statements.
9
Schedule of Investments (continued)
November 30, 2006
| Investments | | Shares
(000) | | Value | |
| Halliburton Co. | | | 680 | | | $ | 22,949,948 | | |
| Total | | | | | | | 45,893,948 | | |
| Food Products 4.54% | |
| H.J. Heinz Co. | | | 552 | | | | 24,527,510 | | |
| Kellogg Co. | | | 460 | | | | 22,898,800 | | |
| Kraft Foods Inc. Class A | | | 287 | | | | 10,045,330 | | |
| Total | | | | | | | 57,471,640 | | |
| Gas Utilities 2.49% | |
| NiSource, Inc. | | | 1,278 | | | | 31,515,480 | | |
| Hotels, Restaurants & Leisure 1.05% | |
| McDonald's Corp. | | | 318 | | | | 13,346,460 | | |
| Household Durables 5.64% | |
| Newell Rubbermaid, Inc. | | | 872 | | | | 24,848,978 | | |
| Snap-on Inc. | | | 395 | | | | 18,762,500 | | |
| Tupperware Brands Corp. | | | 1,306 | | | | 27,715,765 | | |
| Total | | | | | | | 71,327,243 | | |
| Insurance 6.46% | |
| ACE Ltd. (Bermuda)(a) | | | 437 | | | | 24,833,396 | | |
| PartnerRe Ltd. (Bermuda)(a) | | | 269 | | | | 18,761,652 | | |
| Safeco Corp. | | | 215 | | | | 13,004,379 | | |
| XL Capital Ltd. Class A (Bermuda)(a) | | | 354 | | | | 25,190,704 | | |
| Total | | | | | | | 81,790,131 | | |
| Media 2.22% | |
| Clear Channel Communications, Inc. | | | 801 | | | | 28,152,612 | | |
| Multi-Line Retail 1.08% | |
| Federated Department Stores Inc. | | | 324 | | | | 13,647,935 | | |
| Multi-Utilities & Unregulated Power 0.00% | |
| Dynegy Inc. Class A* | | | 1 | | | | 4,142 | | |
| Oil & Gas 3.53% | |
| Chevron Corp. | | | 406 | | | | 29,332,992 | | |
| EOG Resources, Inc. | | | 218 | | | | 15,347,328 | | |
| Total | | | | | | | 44,680,320 | | |
See Notes to Financial Statements.
10
Schedule of Investments (continued)
November 30, 2006
| Investments | | | | | | Shares
(000) | | Value | |
| Paper & Forest Products 3.84% | |
| Bowater, Inc. | | | | | | | | | 1,073 | | | $ | 23,389,220 | | |
| MeadWestvaco Corp. | | | | | | | | | 854 | | | | 25,187,100 | | |
| Total | | | | | | | | | | | | | 48,576,320 | | |
| Pharmaceuticals 3.41% | |
| Bristol-Myers Squibb Co. | | | | | | | | | 1,086 | | | | 26,962,897 | | |
| Mylan Laboratories, Inc. | | | | | | | | | 801 | | | | 16,248,232 | | |
| Total | | | | | | | | | | | | | 43,211,129 | | |
| Specialty Retail 1.92% | |
| OfficeMax, Inc. | | | | | | | | | 516 | | | | 24,273,999 | | |
| Trading Companies & Distributors 1.67% | |
| Genuine Parts Co. | | | | | | | | | 451 | | | | 21,147,390 | | |
| Total Common Stocks (cost $699,117,692) | | | | | | | | | | | | | 824,443,266 | | |
| | | Interest
Rate | | Maturity
Date | | Principal
Amount
(000) | | | |
| CONVERTIBLE BONDS 4.15% | |
| Aerospace & Defense 0.53% | |
| DRS Technologies, Inc.† | | | 2.00 | % | | 2/1/2026 | | $ | 1,500 | | | | 1,546,875 | | |
| EDO Corp. | | | 4.00 | % | | 11/15/2025 | | | 5,500 | | | | 5,218,125 | | |
| Total | | | | | | | | | | | | | 6,765,000 | | |
| Biotechnology 0.59% | |
| CV Therapeutics, Inc. | | | 3.25 | % | | 8/16/2013 | | | 5,000 | | | | 4,218,750 | | |
| Genzyme Corp. | | | 1.25 | % | | 12/1/2023 | | | 3,000 | | | | 3,202,500 | | |
| Total | | | | | | | | | | | | | 7,421,250 | | |
| Diversified Telecommunication Services 0.18% | |
| Qwest Communications Int'l., Inc. | | | 3.50 | % | | 11/15/2025 | | | 1,500 | | | | 2,220,000 | | |
| Electronic Equipment & Instruments 0.26% | |
| Roper Industries, Inc. | | | 1.481 | % | | 1/15/2034 | | | 5,000 | | | | 3,331,250 | | |
| Healthcare Providers & Services 0.16% | |
| Five Star Quality Care, Inc.† | | | 3.75 | % | | 10/15/2026 | | | 2,000 | | | | 2,060,000 | | |
See Notes to Financial Statements.
11
Schedule of Investments (continued)
November 30, 2006
| Investments | | Interest
Rate | | Maturity
Date | | Principal
Amount
(000) | | Value | |
| Hotels, Restaurants & Leisure 0.36% | |
| Hilton Hotels Corp. | | | 3.375 | % | | 4/15/2023 | | $ | 3,000 | | | $ | 4,496,250 | | |
| Media 0.29% | |
| Sinclair Broadcast Group, Inc. | | | 6.00 | % | | 9/15/2012 | | | 4,000 | | | | 3,660,000 | | |
| Metals & Mining 0.22% | |
| Placer Dome, Inc. (Canada)(a) | | | 2.75 | % | | 10/15/2023 | | | 2,000 | | | | 2,797,500 | | |
| Oil & Gas 0.50% | |
| Devon Energy Corp. | | | 4.90 | % | | 8/15/2008 | | | 3,000 | | | | 4,128,750 | | |
| Hanover Compressor Co. | | | 4.75 | % | | 1/15/2014 | | | 1,500 | | | | 2,233,125 | | |
| Total | | | | | | | | | | | | | 6,361,875 | | |
| Pharmaceuticals 0.32% | |
| MGI PHARMA, Inc. | | | 1.682 | % | | 3/2/2024 | | | 6,000 | | | | 4,035,000 | | |
| Road & Rail 0.36% | |
| CSX Corp. | | | Zero Coupon | | | 10/30/2021 | | | 3,500 | | | | 4,532,500 | | |
| Software 0.38% | |
| Cadence Design Systems, Inc. | | | Zero Coupon | | | 8/15/2023 | | | 4,000 | | | | 4,860,000 | | |
| Total Convertible Bonds (cost $47,766,146) | | | | | | | | | | | | | 52,540,625 | | |
| | | | | | | Shares
(000) | | | |
| CONVERTIBLE PREFERRED STOCKS 2.54% | |
| Commercial Banks 0.21% | |
| Marshall & Ilsley Corp. (The) | | | 6.50 | % | | | | | 100 | | | | 2,638,000 | | |
| Electric Utilities 0.47% | |
| CMS Energy Corp. | | | 4.50 | % | | | | | 70 | | | | 6,011,250 | | |
| Energy Equipment & Services 0.77% | |
| El Paso Corp. | | | 4.99 | % | | | | | 8 | | | | 9,715,312 | | |
| Insurance 0.32% | |
| Fortis Insurance N.V. (Netherlands)†(a) | | | 7.75 | % | | | | | 283 | | | | 4,038,127 | | |
| Insurance: Property-Casualty 0.47% | |
| XL Capital Ltd. (Cayman Islands)(a) | | | 7.00 | % | | | | | 230 | | | | 5,993,800 | | |
See Notes to Financial Statements.
12
Schedule of Investments (continued)
November 30, 2006
| Investments | | Interest
Rate | | | | Shares
(000) | | Value | |
| Media 0.30% | |
| Interpublic Group of Cos., Inc. (The) | | | 5.375 | % | | | | | 85 | | | $ | 3,751,900 | | |
| Total Convertible Preferred Stocks (cost $27,452,460) | | | | | | | | | | | | | 32,148,389 | | |
| | | | | | | | | U.S. $
Value | |
| FOREIGN COMMON STOCKS 5.73% | |
| Australia 1.26% | |
| Coca-Cola Amatil Ltd.(b) | | | | | | | | | 2,695 | | | $ | 15,906,854 | | |
| Canada 0.52% | |
| CI Financial Income Fund Unit(b) | | | | | | | | | 286 | | | | 6,566,810 | | |
| Germany 0.51% | |
| Henkel KGaA(b) | | | | | | | | | 52 | | | | 6,494,573 | | |
| United Kingdom 3.44% | |
| Cadbury Schweppes plc(b) | | | | | | | | | 1,391 | | | | 14,318,082 | | |
| Kesa Electricals plc(b) | | | | | | | | | 2,240 | | | | 15,700,942 | | |
| Royal Bank of Scotland Group plc (The)(b) | | | | | | | | | 374 | | | | 13,554,258 | | |
| Total | | | | | | | | | | | | | 43,573,282 | | |
| Total Foreign Common Stocks (cost $66,207,278) | | | | | | | | | | | | | 72,541,519 | | |
| | | | | Maturity
Date | | Principal
Amount
(000) | | Value | |
| GOVERNMENT SPONSORED ENTERPRISE BOND 0.40% | |
Federal Home Loan Mortgage Corp.
(cost $5,073,095) | | | 5.75 | % | | 4/15/2008 | | $ | 5,000 | | | $ | 5,060,195 | | |
| GOVERNMENT SPONSORED ENTERPRISES PASS-THROUGHS 4.62% | |
| Federal National Mortgage Assoc. | | | 6.00 | % | | 11/1/2034 | | | 6,687 | | | | 6,771,055 | | |
| Federal National Mortgage Assoc. | | | 6.00 | % | | 1/1/2035 | | | 8,577 | | | | 8,684,854 | | |
| Federal National Mortgage Assoc. | | | 6.00 | % | | 12/1/2035 | | | 9,039 | | | | 9,142,205 | | |
| Federal National Mortgage Assoc. | | | 6.00 | % | | 4/1/2036 | | | 4,730 | | | | 4,782,997 | | |
| Federal National Mortgage Assoc. | | | 6.50 | % | | 4/1/2035 | | | 6,582 | | | | 6,719,827 | | |
| Federal National Mortgage Assoc. | | | 6.50 | % | | 7/1/2035 | | | 13,831 | | | | 14,138,332 | | |
| Federal National Mortgage Assoc. | | | 6.50 | % | | 9/1/2036 | | | 7,980 | | | | 8,145,777 | | |
| Total Government Sponsored Enterprises Pass-Throughs (cost $58,491,162) | | | | | | | | | | | | | 58,385,047 | | |
See Notes to Financial Statements.
13
Schedule of Investments (continued)
November 30, 2006
| Investments | | Interest
Rate | | Maturity
Date | | Principal
Amount
(000) | | Value | |
| HIGH YIELD CORPORATE BONDS 16.36% | |
| Auto Components 0.26% | |
| Cooper-Standard Automotive, Inc. | | | 8.375 | % | | 12/15/2014 | | $ | 2,500 | | | $ | 1,925,000 | | |
| Stanadyne Corp. | | | 10.00 | % | | 8/15/2014 | | | 1,375 | | | | 1,402,500 | | |
| Total | | | | | | | | | | | | | 3,327,500 | | |
| Automobiles 0.30% | |
| Ford Motor Credit Co. | | | 7.25 | % | | 10/25/2011 | | | 1,250 | | | | 1,222,296 | | |
| Hertz Corp. (The)† | | | 8.875 | % | | 1/1/2014 | | | 2,500 | | | | 2,606,250 | | |
| Total | | | | | | | | | | | | | 3,828,546 | | |
| Chemicals 0.74% | |
| Equistar Chemicals, L.P. | | | 7.55 | % | | 2/15/2026 | | | 3,000 | | | | 2,827,500 | | |
Ineos Group Holdings plc
(United Kingdom)†(a) | | | 8.50 | % | | 2/15/2016 | | | 3,500 | | | | 3,395,000 | | |
| Lyondell Chemical Co. | | | 8.25 | % | | 9/15/2016 | | | 2,575 | | | | 2,690,875 | | |
| Mosaic Co. (The)†(c) | | | 7.625 | % | | 12/1/2016 | | | 450 | | | | 462,375 | | |
| Total | | | | | | | | | | | | | 9,375,750 | | |
| Commercial Services & Supplies 0.07% | |
| FTI Consulting, Inc.† | | | 7.75 | % | | 10/1/2016 | | | 800 | | | | 832,000 | | |
| Consumer Electronics 0.06% | |
| Brookstone Co. Inc. | | | 12.00 | % | | 10/15/2012 | | | 775 | | | | 754,656 | | |
| Consumer Finance 1.18% | |
| Ford Motor Credit Co. | | | 7.375 | % | | 10/28/2009 | | | 4,800 | | | | 4,795,046 | | |
| General Motors Acceptance Corp. | | | 7.25 | % | | 3/2/2011 | | | 9,700 | | | | 10,108,137 | | |
| Total | | | | | | | | | | | | | 14,903,183 | | |
| Containers & Packaging 0.68% | |
| Berry Plastics Corp.† | | | 8.875 | % | | 9/15/2014 | | | 2,500 | | | | 2,534,375 | | |
| Crown Cork & Seal, Inc. | | | 7.375 | % | | 12/15/2026 | | | 4,000 | | | | 3,780,000 | | |
Stone Container Finance Co. of Canada II
(Canada)(a) | | | 7.375 | % | | 7/15/2014 | | | 2,500 | | | | 2,287,500 | | |
| Total | | | | | | | | | | | | | 8,601,875 | | |
| Diversified Financials 0.27% | |
| Ashtead Capital Inc.† | | | 9.00 | % | | 8/15/2016 | | | 3,175 | | | | 3,413,125 | | |
See Notes to Financial Statements.
14
Schedule of Investments (continued)
November 30, 2006
| Investments | | Interest
Rate | | Maturity
Date | | Principal
Amount
(000) | | Value | |
| Diversified Telecommunication Services 2.08% | |
| Cincinnati Bell, Inc. | | | 7.00 | % | | 2/15/2015 | | $ | 10,000 | | | $ | 9,925,000 | | |
| Intelsat Bermuda Ltd. (Bermuda)†(a) | | | 9.25 | % | | 6/15/2016 | | | 2,325 | | | | 2,499,375 | | |
| Qwest Capital Funding, Inc. | | | 7.90 | % | | 8/15/2010 | | | 10,000 | | | | 10,450,000 | | |
| Syniverse Technologies | | | 7.75 | % | | 8/15/2013 | | | 3,500 | | | | 3,421,250 | | |
| Total | | | | | | | | | | | | | 26,295,625 | | |
| Electric Utilities 0.84% | |
| Dynegy Holdings, Inc. | | | 8.375 | % | | 5/1/2016 | | | 5,000 | | | | 5,225,000 | | |
| Reliant Energy, Inc. | | | 9.50 | % | | 7/15/2013 | | | 5,000 | | | | 5,343,750 | | |
| Total | | | | | | | | | | | | | 10,568,750 | | |
| Electronic Equipment & Instruments 0.48% | |
| NXP B.V. (Netherlands)†(a) | | | 9.50 | % | | 10/15/2015 | | | 5,925 | | | | 6,110,156 | | |
| Electronics: Semi-Conductors/Components 0.28% | |
| Freescale Semiconductor, Inc.†(c) | | | 8.875 | % | | 12/15/2014 | | | 3,500 | | | | 3,526,250 | | |
| Energy Equipment & Services 0.19% | |
| Hornbeck Offshore Services, Inc. | | | 6.125 | % | | 12/1/2014 | | | 2,500 | | | | 2,362,500 | | |
| Food Products 0.16% | |
| Landry's Restaurants, Inc. | | | 7.50 | % | | 12/15/2014 | | | 2,075 | | | | 2,028,313 | | |
| Gas Utilities 0.40% | |
| El Paso Corp. | | | 7.00 | % | | 5/15/2011 | | | 5,000 | | | | 5,125,000 | | |
| Healthcare Providers & Services 0.52% | |
| HCA Inc.† | | | 9.125 | % | | 11/15/2014 | | | 2,050 | | | | 2,147,375 | | |
| Tenet Healthcare Corp. | | | 9.25 | % | | 2/1/2015 | | | 4,500 | | | | 4,432,500 | | |
| Total | | | | | | | | | | | | | 6,579,875 | | |
| Hotels, Restaurants & Leisure 0.14% | |
| River Rock Entertainment Authority | | | 9.75 | % | | 11/1/2011 | | | 1,700 | | | | 1,814,750 | | |
| Household Durables 0.28% | |
| Domtar, Inc. (Canada)(a) | | | 7.875 | % | | 10/15/2011 | | | 3,400 | | | | 3,485,000 | | |
| Industrial Conglomerates 0.53% | |
| Allied Waste North America, Inc. | | | 7.25 | % | | 3/15/2015 | | | 3,000 | | | | 3,015,000 | | |
| Park-Ohio Industries, Inc. | | | 8.375 | % | | 11/15/2014 | | | 4,000 | | | | 3,640,000 | | |
| Total | | | | | | | | | | | | | 6,655,000 | | |
See Notes to Financial Statements.
15
Schedule of Investments (continued)
November 30, 2006
| Investments | | Interest
Rate | | Maturity
Date | | Principal
Amount
(000) | | Value | |
| IT Services 0.29% | |
| SunGard Data Systems, Inc. | | | 9.125 | % | | 8/15/2013 | | $ | 3,500 | | | $ | 3,688,125 | | |
| Leisure Equipment & Products 0.07% | |
| Turning Stone Resort Casino† | | | 9.125 | % | | 9/15/2014 | | | 875 | | | | 899,063 | | |
| Media 2.20% | |
| Affinion Group Inc. | | | 11.50 | % | | 10/15/2015 | | | 3,000 | | | | 3,180,000 | | |
| AMC Entertainment, Inc. | | | 11.00 | % | | 2/1/2016 | | | 1,500 | | | | 1,663,125 | | |
| Barrington Broad Co. LLC† | | | 10.50 | % | | 8/15/2014 | | | 5,000 | | | | 5,000,000 | | |
| CCH I LLC/CCH I Capital Co. | | | 11.00 | % | | 10/1/2015 | | | 3,000 | | | | 2,955,000 | | |
| Gaylord Entertainment Co. | | | 8.00 | % | | 11/15/2013 | | | 2,875 | | | | 2,954,063 | | |
| Idearc Inc.† | | | 8.00 | % | | 11/15/2016 | | | 2,325 | | | | 2,374,406 | | |
| Mediacom Broadband LLC Corp. | | | 8.50 | % | | 10/15/2015 | | | 4,175 | | | | 4,201,094 | | |
| Mediacom Communications Corp. | | | 9.50 | % | | 1/15/2013 | | | 2,250 | | | | 2,323,125 | | |
| R.H. Donnelley Corp. | | | 8.875 | % | | 1/15/2016 | | | 3,000 | | | | 3,165,000 | | |
| Total | | | | | | | | | | | | | 27,815,813 | | |
| Metals & Mining 0.23% | |
| Novelis Inc. (Canada)†(a) | | | 8.25 | % | | 2/15/2015 | | | 3,000 | | | | 2,895,000 | | |
| Multi-Utilities & Unregulated Power 0.42% | |
| Mirant Americas Generation LLC | | | 9.125 | % | | 5/1/2031 | | | 5,000 | | | | 5,262,500 | | |
| Oil & Gas 1.00% | |
| Chesapeake Energy Corp. | | | 7.625 | % | | 7/15/2013 | | | 3,500 | | | | 3,666,250 | | |
| Foundation PA Coal Co. | | | 7.25 | % | | 8/1/2014 | | | 2,000 | | | | 2,015,000 | | |
| Houston Exploration Co. (The) | | | 7.00 | % | | 6/15/2013 | | | 2,200 | | | | 2,172,500 | | |
| Williams Cos., Inc. (The) | | | 7.875 | % | | 9/1/2021 | | | 4,500 | | | | 4,826,250 | | |
| Total | | | | | | | | | | | | | 12,680,000 | | |
| Paper & Forest Products 1.05% | |
| Abitibi-Consolidated Inc. (Canada)(a) | | | 8.55 | % | | 8/1/2010 | | | 4,500 | | | | 4,348,125 | | |
| Bowater, Inc. | | | 6.50 | % | | 6/15/2013 | | | 2,000 | | | | 1,795,000 | | |
| Buckeye Technologies, Inc. | | | 8.00 | % | | 10/15/2010 | | | 1,500 | | | | 1,503,750 | | |
| Graphic Packaging Int'l., Corp. | | | 9.50 | % | | 8/15/2013 | | | 3,400 | | | | 3,519,000 | | |
| RBS Global & Rexnod Corp.† | | | 11.75 | % | | 8/1/2016 | | | 2,000 | | | | 2,115,000 | | |
| Total | | | | | | | | | | | | | 13,280,875 | | |
| Pharmaceuticals 0.26% | |
| Warner Chilcott Corp. | | | 8.75 | % | | 2/1/2015 | | | 3,250 | | | | 3,347,500 | | |
See Notes to Financial Statements.
16
Schedule of Investments (concluded)
November 30, 2006
| Investments | | Interest
Rate | | Maturity
Date | | Principal
Amount
(000) | | Value | |
| Telecommunications: Integrated/Services 0.29% | |
| Hughes Network Systems LLC | | | 9.50 | % | | 4/15/2014 | | $ | 3,500 | | | $ | 3,648,750 | | |
| Textiles & Apparel 0.24% | |
| Elizabeth Arden, Inc. | | | 7.75 | % | | 1/15/2014 | | | 3,000 | | | | 3,000,000 | | |
| Utilities 0.37% | |
| Edison Mission Energy | | | 7.75 | % | | 6/15/2016 | | | 4,500 | | | | 4,725,000 | | |
| Wireless Telecommunication Services 0.48% | |
| Dobson Communications Corp. | | | 8.875 | % | | 10/1/2013 | | | 3,000 | | | | 3,037,500 | | |
| Rural Cellular Corp. | | | 9.75 | % | | 1/15/2010 | | | 3,000 | | | | 3,090,000 | | |
| Total | | | | | | | | | | | | | 6,127,500 | | |
| Total High Yield Corporate Bonds (cost $202,514,679) | | | | | | | | | | | | | 206,957,980 | | |
| Total Long-Term Investments (cost $1,106,622,512) | | | | | | | | | | | | | 1,252,077,021 | | |
| SHORT-TERM INVESTMENT 1.15% | |
| Repurchase Agreement | |
Repurchase Agreement dated 11/30/2006,
4.65% due 12/1/2006 with State Street
Bank & Trust Co. collateralized by
$14,800,000 of Federal Home Loan
Mortgage Corp. at 5.45% due 11/21/2013;
value: $14,855,500; proceeds: $14,561,444
(cost $14,559,564) | | | | | | | | | 14,560 | | | | 14,559,564 | | |
| Total Investments in Securities 100.10% (cost $1,121,182,076) | | | | | | | | | | | | | 1,266,636,585 | | |
| Liabilities in Excess of Cash and Other Assets (0.10%) | | | | | | | | | | | | | (1,240,444 | ) | |
| Net Assets 100.00% | | | | | | | | | | | | $ | 1,265,396,141 | | |
* Non-income producing security.
† Security was purchased pursuant to Rule 144A under the Securities Act of 1933 or is a private placement and, unless registered under the Act or exempted from registration, may only be resold to qualified institutional investors. Unless otherwise noted, 144A securities are deemed to be liquid.
(a) Foreign security traded in U.S. dollars.
(b) Investment in non-U.S. dollar denominated securities.
(c) Securities purchased on a when-issued basis.
Unit More than one class of securities traded together.
See Notes to Financial Statements.
17
Statement of Assets and Liabilities
November 30, 2006
| ASSETS: | |
| Investments in securities, at value (cost $1,121,182,076) | | $ | 1,266,636,585 | | |
| Cash | | | 26 | | |
| Receivables: | |
| Interest and dividends | | | 7,063,612 | | |
| Capital shares sold | | | 2,772,761 | | |
| Investment securities sold | | | 2,661,149 | | |
| Prepaid expenses and other assets | | | 85,950 | | |
| Total assets | | | 1,279,220,083 | | |
| LIABILITIES: | |
| Payables: | |
| Investment securities purchased | | | 10,746,020 | | |
| Capital shares reacquired | | | 1,380,489 | | |
| Management fee | | | 730,272 | | |
| 12b-1 distribution fees | | | 405,718 | | |
| Directors' fees | | | 60,622 | | |
| Fund administration | | | 39,502 | | |
| To affiliate (See Note 3) | | | 479 | | |
| Accrued expenses and other liabilities | | | 460,840 | | |
| Total liabilities | | | 13,823,942 | | |
| NET ASSETS | | $ | 1,265,396,141 | | |
| COMPOSITION OF NET ASSETS: | |
| Paid-in capital | | $ | 1,077,716,420 | | |
| Undistributed net investment income | | | 4,358,527 | | |
Accumulated net realized gain on investments and foreign currency
related transactions | | | 37,862,641 | | |
Net unrealized appreciation on investments and translation of
assets and liabilites denominated in foreign currencies | | | 145,458,553 | | |
| Net Assets | | $ | 1,265,396,141 | | |
| Net assets by class: | |
| Class A Shares | | $ | 1,111,167,412 | | |
| Class B Shares | | $ | 64,044,867 | | |
| Class C Shares | | $ | 77,477,090 | | |
| Class P Shares | | $ | 2,364,577 | | |
| Class Y Shares | | $ | 10,342,195 | | |
| Outstanding shares by class: | |
| Class A Shares (200 million shares of common stock authorized, par value $.001) | | | 81,960,795 | | |
| Class B Shares (30 million shares of common stock authorized, par value $.001) | | | 4,758,031 | | |
| Class C Shares (20 million shares of common stock authorized, par value $.001) | | | 5,748,411 | | |
| Class P Shares (20 million shares of common stock authorized, par value $.001) | | | 174,012 | | |
| Class Y Shares (30 million shares of common stock authorized, par value $.001) | | | 759,145 | | |
Net asset value, offering and redemption price per share
(Net assets divided by outstanding shares): | | | | | |
| Class A Shares–Net asset value | | $ | 13.56 | | |
Class A Shares–Maximum offering price
(Net asset value plus sales charge of 5.75%) | | $ | 14.39 | | |
| Class B Shares–Net asset value | | $ | 13.46 | | |
| Class C Shares–Net asset value | | $ | 13.48 | | |
| Class P Shares–Net asset value | | $ | 13.59 | | |
| Class Y Shares–Net asset value | | $ | 13.62 | | |
See Notes to Financial Statements.
18
Statement of Operations
For the Year Ended November 30, 2006
| Investment income: | |
| Dividends (net of foreign withholding taxes of $6,346) | | $ | 25,491,278 | | |
| Interest | | | 19,669,145 | | |
| Total investment income | | | 45,160,423 | | |
| Expenses: | |
| Management fee | | | 8,541,261 | | |
| 12b-1 distribution plan–Class A | | | 3,521,709 | | |
| 12b-1 distribution plan–Class B | | | 590,663 | | |
| 12b-1 distribution plan–Class C | | | 749,330 | | |
| 12b-1 distribution plan–Class P | | | 8,023 | | |
| Shareholder servicing | | | 1,698,952 | | |
| Fund administration | | | 459,500 | | |
| Reports to shareholders | | | 245,093 | | |
| Registration | | | 199,478 | | |
| Custody | | | 51,603 | | |
| Professional | | | 46,565 | | |
| Directors' fees | | | 38,522 | | |
| Subsidy (See Note 3) | | | 21,263 | | |
| Other | | | 25,043 | | |
| Gross expenses | | | 16,197,005 | | |
| Expense reductions (See Note 7) | | | (51,191 | ) | |
| Net expenses | | | 16,145,814 | | |
| Net investment income | | | 29,014,609 | | |
| Net realized and unrealized gain: | |
| Net realized gain on investments and foreign currency related transactions | | | 39,801,673 | | |
Net change in unrealized appreciation on investments and translation
of assets and liabilities denominated in foreign currencies | | | 78,641,959 | | |
| Net realized and unrealized gain | | | 118,443,632 | | |
| Net Increase in Net Assets Resulting From Operations | | $ | 147,458,241 | | |
See Notes to Financial Statements.
19
Statements of Changes in Net Assets
| INCREASE IN NET ASSETS | | For the Year Ended
November 30, 2006 | | For the Year Ended
November 30, 2005 | |
| Operations: | |
| Net investment income | | $ | 29,014,609 | | | $ | 20,118,085 | | |
Net realized gain on investments and foreign
currency related transactions | | | 39,801,673 | | | | 13,097,864 | | |
Net change in unrealized appreciation on investments
and translation of assets and liabilities denominated
in foreign currencies | | | 78,641,959 | | | | 17,055,933 | | |
| Net increase in net assets resulting from operations | | | 147,458,241 | | | | 50,271,882 | | |
| Distributions to shareholders from: | |
| Net investment income | |
| Class A | | | (28,227,771 | ) | | | (18,385,406 | ) | |
| Class B | | | (1,307,120 | ) | | | (881,697 | ) | |
| Class C | | | (1,653,500 | ) | | | (1,150,211 | ) | |
| Class P | | | (47,319 | ) | | | (20,162 | ) | |
| Class Y | | | (195,659 | ) | | | (32,148 | ) | |
| Net realized gain | |
| Class A | | | (10,687,459 | ) | | | (2,781,088 | ) | |
| Class B | | | (661,737 | ) | | | (175,195 | ) | |
| Class C | | | (872,430 | ) | | | (194,771 | ) | |
| Class P | | | (14,730 | ) | | | (2,250 | ) | |
| Class Y | | | (36,181 | ) | | | (3,853 | ) | |
| Total distributions to shareholders | | | (43,703,906 | ) | | | (23,626,781 | ) | |
| Capital share transactions (See Note 11): | |
| Net proceeds from sales of shares | | | 242,357,461 | | | | 623,724,444 | | |
| Reinvestment of distributions | | | 42,084,119 | | | | 22,587,025 | | |
| Cost of shares reacquired | | | (207,273,925 | ) | | | (85,441,018 | ) | |
Net increase in net assets
resulting from capital share transactions | | | 77,167,655 | | | | 560,870,451 | | |
| Net increase in net assets | | | 180,921,990 | | | | 587,515,552 | | |
| NET ASSETS: | |
| Beginning of year | | $ | 1,084,474,151 | | | $ | 496,958,599 | | |
| End of year | | $ | 1,265,396,141 | | | $ | 1,084,474,151 | | |
| Undistributed net investment income | | $ | 4,358,527 | | | $ | 4,989,800 | | |
See Notes to Financial Statements.
20
Financial Highlights
| | | Class A Shares | | 12/19/2001(a) | |
| | | Year Ended 11/30 | | to | |
| | | 2006 | | 2005 | | 2004 | | 2003 | | 11/30/2002 | |
| Per Share Operating Performance | |
| Net asset value, beginning of period | | $ | 12.44 | | | $ | 12.12 | | | $ | 10.29 | | | $ | 9.45 | | | $ | 10.00 | | |
Unrealized appreciation
on investments | | | | | | | | | | | | | | | | | | | .01 | | |
| Net asset value on SEC Effective Date | | | | | | | | | | | | | | | | | | $ | 10.01 | | |
| Investment operations: | |
| Net investment income(b) | | | .33 | | | | .31 | | | | .32 | | | | .31 | | | | .29 | | |
| Net realized and unrealized gain (loss) | | | 1.29 | | | | .43 | | | | 1.74 | | | | .79 | | | | (.80 | ) | |
| Total from investment operations | | | 1.62 | | | | .74 | | | | 2.06 | | | | 1.10 | | | | (.51 | ) | |
| Distributions to shareholders from: | |
| Net investment income | | | (.36 | ) | | | (.35 | ) | | | (.23 | ) | | | (.26 | ) | | | (.05 | ) | |
| Net realized gain | | | (.14 | ) | | | (.07 | ) | | | – | | | | – | | | | – | | |
| Total distributions | | | (.50 | ) | | | (.42 | ) | | | (.23 | ) | | | (.26 | ) | | | (.05 | ) | |
| Net asset value, end of period | | $ | 13.56 | | | $ | 12.44 | | | $ | 12.12 | | | $ | 10.29 | | | $ | 9.45 | | |
| Total Return(c) | | | | | | | | | | | | | | | | | | | .10 | %(d)(e) | |
| Total Return(c) | | | 13.42 | % | | | 6.27 | % | | | 20.29 | % | | | 11.97 | % | | | (5.10 | )%(d)(f) | |
| Ratios to Average Net Assets: | |
Expenses, including expense reductions
and expenses assumed | | | 1.33 | % | | | 1.33 | % | | | 1.35 | % | | | 1.35 | % | | | 1.29 | %(d) | |
Expenses, excluding expense reductions
and including expenses assumed | | | 1.33 | % | | | 1.33 | % | | | 1.35 | % | | | 1.35 | % | | | 1.29 | %(d) | |
Expenses, excluding expense reductions
and expenses assumed | | | 1.33 | % | | | 1.34 | % | | | 1.35 | % | | | 1.46 | % | | | 2.25 | %(d) | |
| Net investment income | | | 2.60 | % | | | 2.51 | % | | | 2.84 | % | | | 3.24 | % | | | 2.99 | %(d) | |
| Supplemental Data: | |
| Net assets, end of period (000) | | $ | 1,111,167 | | | $ | 944,488 | | | $ | 439,703 | | | $ | 128,030 | | | $ | 21,467 | | |
| Portfolio turnover rate | | | 43.85 | % | | | 31.65 | % | | | 21.81 | % | | | 28.71 | % | | | 33.71 | %(d) | |
See Notes to Financial Statements.
21
Financial Highlights (continued)
| | | Class B Shares | | 12/19/2001(a) | |
| | | Year Ended 11/30 | | to | |
| | | 2006 | | 2005 | | 2004 | | 2003 | | 11/30/2002 | |
| Per Share Operating Performance | |
| Net asset value, beginning of period | | $ | 12.36 | | | $ | 12.03 | | | $ | 10.23 | | | $ | 9.40 | | | $ | 10.00 | | |
Unrealized appreciation
on investments | | | | | | | | | | | | | | | | | | | .01 | | |
| Net asset value on SEC Effective Date | | | | | | | | | | | | | | | | | | $ | 10.01 | | |
| Investment operations: | |
| Net investment income(b) | | | .24 | | | | .23 | | | | .25 | | | | .25 | | | | .24 | | |
| Net realized and unrealized gain (loss) | | | 1.28 | | | | .43 | | | | 1.72 | | | | .79 | | | | (.81 | ) | |
| Total from investment operations | | | 1.52 | | | | .66 | | | | 1.97 | | | | 1.04 | | | | (.57 | ) | |
| Distributions to shareholders from: | |
| Net investment income | | | (.28 | ) | | | (.26 | ) | | | (.17 | ) | | | (.21 | ) | | | (.04 | ) | |
| Net realized gain | | | (.14 | ) | | | (.07 | ) | | | – | | | | – | | | | – | | |
| Total distributions | | | (.42 | ) | | | (.33 | ) | | | (.17 | ) | | | (.21 | ) | | | (.04 | ) | |
| Net asset value, end of period | | $ | 13.46 | | | $ | 12.36 | | | $ | 12.03 | | | $ | 10.23 | | | $ | 9.40 | | |
| Total Return(c) | | | | | | | | | | | | | | | | | | | .10 | %(d)(e) | |
| Total Return(c) | | | 12.62 | % | | | 5.66 | % | | | 19.50 | % | | | 11.35 | % | | | (5.69 | )%(d)(f) | |
| Ratios to Average Net Assets: | |
Expenses, including expense reductions
and expenses assumed | | | 1.98 | % | | | 1.98 | % | | | 1.99 | % | | | 1.99 | % | | | 1.85 | %(d) | |
Expenses, excluding expense reductions
and including expenses assumed | | | 1.98 | % | | | 1.98 | % | | | 1.99 | % | | | 1.99 | % | | | 1.85 | %(d) | |
Expenses, excluding expense reductions
and expenses assumed | | | 1.98 | % | | | 1.98 | % | | | 1.99 | % | | | 2.10 | % | | | 2.81 | %(d) | |
| Net investment income | | | 1.95 | % | | | 1.86 | % | | | 2.20 | % | | | 2.60 | % | | | 2.43 | %(d) | |
| Supplemental Data: | |
| Net assets, end of period (000) | | $ | 64,045 | | | $ | 58,380 | | | $ | 27,634 | | | $ | 9,398 | | | $ | 2,283 | | |
| Portfolio turnover rate | | | 43.85 | % | | | 31.65 | % | | | 21.81 | % | | | 28.71 | % | | | 33.71 | %(d) | |
See Notes to Financial Statements.
22
Financial Highlights (continued)
| | | Class C Shares | | 12/19/2001(a) | |
| | | Year Ended 11/30 | | to | |
| | | 2006 | | 2005 | | 2004 | | 2003 | | 11/30/2002 | |
| Per Share Operating Performance | |
| Net asset value, beginning of period | | $ | 12.37 | | | $ | 12.05 | | | $ | 10.25 | | | $ | 9.41 | | | $ | 10.00 | | |
Unrealized appreciation
on investments | | | | | | | | | | | | | | | | | | | .01 | | |
| Net asset value on SEC Effective Date | | | | | | | | | | | | | | | | | | $ | 10.01 | | |
| Investment operations: | |
| Net investment income(b) | | | .24 | | | | .23 | | | | .25 | | | | .24 | | | | .24 | | |
| Net realized and unrealized gain (loss) | | | 1.28 | | | | .43 | | | | 1.73 | | | | .80 | | | | (.79 | ) | |
| Total from investment operations | | | 1.52 | | | | .66 | | | | 1.98 | | | | 1.04 | | | | (.55 | ) | |
| Distributions to shareholders from: | |
| Net investment income | | | (.27 | ) | | | (.27 | ) | | | (.18 | ) | | | (.20 | ) | | | (.05 | ) | |
| Net realized gain | | | (.14 | ) | | | (.07 | ) | | | – | | | | – | | | | – | | |
| Total distributions | | | (.41 | ) | | | (.34 | ) | | | (.18 | ) | | | (.20 | ) | | | (.05 | ) | |
| Net asset value, end of period | | $ | 13.48 | | | $ | 12.37 | | | $ | 12.05 | | | $ | 10.25 | | | $ | 9.41 | | |
| Total Return(c) | | | | | | | | | | | | | | | | | | | .10 | %(d)(e) | |
| Total Return(c) | | | 12.68 | % | | | 5.62 | % | | | 19.50 | % | | | 11.27 | % | | | (5.54 | )%(d)(f) | |
| Ratios to Average Net Assets: | |
Expenses, including expense reductions
and expenses assumed | | | 1.98 | % | | | 1.98 | % | | | 1.99 | % | | | 1.99 | % | | | 1.85 | %(d) | |
Expenses, excluding expense reductions
and including expenses assumed | | | 1.98 | % | | | 1.98 | % | | | 1.99 | % | | | 1.99 | % | | | 1.85 | %(d) | |
Expenses, excluding expense reductions
and expenses assumed | | | 1.98 | % | | | 1.98 | % | | | 1.99 | % | | | 2.10 | % | | | 2.81 | %(d) | |
| Net investment income | | | 1.95 | % | | | 1.86 | % | | | 2.20 | % | | | 2.60 | % | | | 2.43 | %(d) | |
| Supplemental Data: | |
| Net assets, end of period (000) | | $ | 77,477 | | | $ | 77,374 | | | $ | 28,696 | | | $ | 5,902 | | | $ | 2,538 | | |
| Portfolio turnover rate | | | 43.85 | % | | | 31.65 | % | | | 21.81 | % | | | 28.71 | % | | | 33.71 | %(d) | |
See Notes to Financial Statements.
23
Financial Highlights (continued)
| | | Class P Shares | | 12/19/2001(a) | |
| | | Year Ended 11/30 | | to | |
| | | 2006 | | 2005 | | 2004 | | 2003 | | 11/30/2002 | |
| Per Share Operating Performance | |
| Net asset value, beginning of period | | $ | 12.47 | | | $ | 12.15 | | | $ | 10.31 | | | $ | 9.45 | | | $ | 10.00 | | |
Unrealized appreciation
on investments | | | | | | | | | | | | | | | | | | | .01 | | |
| Net asset value on SEC Effective Date | | | | | | | | | | | | | | | | | | $ | 10.01 | | |
| Investment operations: | |
| Net investment income(b) | | | .32 | | | | .30 | | | | .31 | | | | .31 | | | | .28 | | |
| Net realized and unrealized gain (loss) | | | 1.29 | | | | .43 | | | | 1.75 | | | | .80 | | | | (.80 | ) | |
| Total from investment operations | | | 1.61 | | | | .73 | | | | 2.06 | | | | 1.11 | | | | (.52 | ) | |
| Distributions to shareholders from: | |
| Net investment income | | | (.35 | ) | | | (.34 | ) | | | (.22 | ) | | | (.25 | ) | | | (.04 | ) | |
| Net realized gain | | | (.14 | ) | | | (.07 | ) | | | – | | | | – | | | | – | | |
| Total distributions | | | (.49 | ) | | | (.41 | ) | | | (.22 | ) | | | (.25 | ) | | | (.04 | ) | |
| Net asset value, end of period | | $ | 13.59 | | | $ | 12.47 | | | $ | 12.15 | | | $ | 10.31 | | | $ | 9.45 | | |
| Total Return(c) | | | | | | | | | | | | | | | | | | | .10 | %(d)(e) | |
| Total Return(c) | | | 13.31 | % | | | 6.17 | % | | | 20.21 | % | | | 12.03 | % | | | (5.20 | )%(d)(f) | |
| Ratios to Average Net Assets: | |
Expenses, including expense reductions
and expenses assumed | | | 1.43 | % | | | 1.43 | % | | | 1.44 | % | | | 1.44 | % | | | 1.35 | %(d) | |
Expenses, excluding expense reductions
and including expenses assumed | | | 1.43 | % | | | 1.43 | % | | | 1.44 | % | | | 1.44 | % | | | 1.35 | %(d) | |
Expenses, excluding expense reductions
and expenses assumed | | | 1.43 | % | | | 1.44 | % | | | 1.44 | % | | | 1.55 | % | | | 2.31 | %(d) | |
| Net investment income | | | 2.50 | % | | | 2.42 | % | | | 2.75 | % | | | 3.15 | % | | | 2.93 | %(d) | |
| Supplemental Data: | |
| Net assets, end of period (000) | | $ | 2,365 | | | $ | 1,337 | | | $ | 286 | | | $ | 1 | | | $ | 1 | | |
| Portfolio turnover rate | | | 43.85 | % | | | 31.65 | % | | | 21.81 | % | | | 28.71 | % | | | 33.71 | %(d) | |
See Notes to Financial Statements.
24
Financial Highlights (concluded)
| | | Class Y Shares | | 12/19/2001(a) | |
| | | Year Ended 11/30 | | to | |
| | | 2006 | | 2005 | | 2004 | | 2003 | | 11/30/2002 | |
| Per Share Operating Performance | |
| Net asset value, beginning of period | | $ | 12.50 | | | $ | 12.18 | | | $ | 10.33 | | | $ | 9.47 | | | $ | 10.00 | | |
Unrealized appreciation
on investments | | | | | | | | | | | | | | | | | | | .01 | | |
| Net asset value on SEC Effective Date | | | | | | | | | | | | | | | | | | $ | 10.01 | | |
| Investment operations: | |
| Net investment income(b) | | | .37 | | | | .35 | | | | .45 | | | | .34 | | | | .32 | | |
| Net realized and unrealized gain (loss) | | | 1.29 | | | | .44 | | | | 1.66 | | | | .80 | | | | (.80 | ) | |
| Total from investment operations | | | 1.66 | | | | .79 | | | | 2.11 | | | | 1.14 | | | | (.48 | ) | |
| Distributions to shareholders from: | |
| Net investment income | | | (.40 | ) | | | (.40 | ) | | | (.26 | ) | | | (.28 | ) | | | (.06 | ) | |
| Net realized gain | | | (.14 | ) | | | (.07 | ) | | | – | | | | – | | | | – | | |
| Total distributions | | | (.54 | ) | | | (.47 | ) | | | (.26 | ) | | | (.28 | ) | | | (.06 | ) | |
| Net asset value, end of period | | $ | 13.62 | | | $ | 12.50 | | | $ | 12.18 | | | $ | 10.33 | | | $ | 9.47 | | |
| Total Return(c) | | | | | | | | | | | | | | | | | | | .10 | %(d)(e) | |
| Total Return(c) | | | 13.75 | % | | | 6.64 | % | | | 20.72 | % | | | 12.47 | % | | | (4.83 | )%(d)(f) | |
| Ratios to Average Net Assets: | |
Expenses, including expense reductions
and expenses assumed | | | .98 | % | | | .99 | % | | | 1.09 | % | | | .99 | %† | | | .93 | %(d) | |
Expenses, excluding expense reductions
and including expenses assumed | | | .98 | % | | | .99 | % | | | 1.09 | % | | | .99 | %† | | | .93 | %(d) | |
Expenses, excluding expense reductions
and expenses assumed | | | .98 | % | | | .99 | % | | | 1.09 | % | | | 1.10 | %† | | | 1.89 | %(d) | |
| Net investment income | | | 2.95 | % | | | 2.89 | % | | | 3.74 | % | | | 3.60 | %† | | | 3.35 | %(d) | |
| Supplemental Data: | |
| Net assets, end of period (000) | | $ | 10,342 | | | $ | 2,897 | | | $ | 640 | | | $ | 1 | | | $ | 1 | | |
| Portfolio turnover rate | | | 43.85 | % | | | 31.65 | % | | | 21.81 | % | | | 28.71 | % | | | 33.71 | %(d) | |
† The ratios have been determined on a Fund basis.
(a) Commencement of investment operations was 12/19/2001; SEC effective date and date shares first became available to the public was 12/27/2001.
(b) Calculated using average shares outstanding during the period.
(c) Total return does not consider the effects of sales loads and assumes the reinvestment of all distributions.
(d) Not annualized.
(e) Total return for the period 12/19/2001 through 12/26/2001.
(f) Total return for the period 12/27/2001 through 11/30/2002.
See Notes to Financial Statements.
25
Notes to Financial Statements
1. ORGANIZATION
Lord Abbett Research Fund, Inc. (the "Company") is registered under the Investment Company Act of 1940 (the "Act") as a diversified open-end management investment company, incorporated under Maryland law on April 6, 1992. The Company currently consists of four separate funds. This report covers one of the funds and its respective classes—Lord Abbett America's Value Fund (the "Fund").
The Fund's investment objective is to seek current income and capital appreciation. The Fund offers five classes of shares: Classes A, B, C, P, and Y, each with different expenses and dividends. A front-end sales charge is normally added to the Net Asset Value ("NAV") for Class A shares. There is no front-end sales charge in the case of the Classes B, C, P, and Y shares, although there may be a contingent deferred sales charge ("CDSC") as follows: certain redemptions of Class A shares made within 12 months (24 months if shares were purchased prior to November 1, 2004) following certain purchases made without a sales charge; Class B shares redeemed before the sixth anniversary of purchase; and Class C shares redeemed before the first anniversary of purchase. Class B shares will convert to Class A shares on the eighth anniversary of the original purchase of Class B shares.
The preparation of financial statements in conformity with accounting principles generally accepted in the United States of America requires management to make certain estimates and assumptions that affect the reported amounts of assets and liabilities and disclosure of contingent assets and liabilities at the date of the financial statements and the reported amounts of increases and decreases in net assets from operations during the reporting period. Actual results could differ from those estimates.
2. SIGNIFICANT ACCOUNTING POLICIES
(a) Investment Valuation–Securities traded on any recognized U.S. or non-U.S. exchange or on NASDAQ, Inc. are valued at the last sale price or official closing price on the exchange or system on which they are principally traded. Events occurring after the close of trading on non-U.S. exchanges may result in adjustments to the valuation of foreign securities to more accurately reflect their fair value as of the close of regular trading on the New York Stock Exchange. Each Fund may rely on an independent fair valuation service in adjusting the valuations of foreign securities. Unlisted equity securities are valued at the last quoted sale price or, if no sale price is available, at the mean between the most recently quoted bid and asked prices. Fixed income securities are valued at the mean between the bid and asked prices on the basis of prices supplied by independent pricing services, which reflect broker/dealer supplied valuations and electronic data processing techniques. Securities for which market quotations are not readily available are valued at fair value as determined by management and approved in good faith by the Board of Directors. Short-term securities with 60 days or less remaining to maturity are valued using the amortized cost method, which approximates current market value.
(b) Security Transactions–Security transactions are recorded as of the date that the securities are purchased or sold (trade date). Realized gains and losses on sales of portfolio securities are calculated using the identified-cost method. Realized and unrealized gains (losses) are allocated to each class of shares based upon the relative proportion of net assets at the beginning of the day.
26
Notes to Financial Statements (continued)
(c) Investment Income–Dividend income is recorded on the ex-dividend date. Interest income is recorded on the accrual basis. Discounts are accreted and premiums are amortized using the effective interest method. Withholding taxes on foreign dividends have been provided for in accordance with the Fund's understanding of the applicable country's tax rules and rates. Investment income is allocated to each class of shares based upon the relative proportion of net assets at the beginning of the day.
(d) Federal Taxes–It is the policy of the Fund to meet the requirements of Subchapter M of the Internal Revenue Code applicable to regulated investment companies and to distribute substantially all taxable income and capital gains to its shareholders. Therefore, no Federal income tax provision is required.
(e) Expenses–Expenses incurred by the Company that do not specifically relate to an individual fund are generally allocated to the funds within the Company on a pro-rata basis. Expenses, excluding class-specific expenses, are allocated to each class of shares based upon the relative proportion of net assets at the beginning of the day. Classes A, B, C, and P shares bear their class-specific share of all expenses and fees relating to the Fund's 12b-1 Distribution Plan.
(f) Foreign Transactions–The books and records of the Fund are maintained in U.S. dollars and transactions denominated in foreign currencies are recorded in the Fund's records at the rate prevailing when earned or recorded. Asset and liability accounts that are denominated in foreign currencies are adjusted to reflect current exchange rates. The resultant exchange gains and losses are included in Net realized gain on investments and foreign currency related transactions on the Fund's Statement of Operations. The Fund does not isolate that portion of the results of operations arising as a result of changes in the foreign exchange rates from the changes in market prices of the securities.
(g) Repurchase Agreements–The Fund may enter into repurchase agreements with respect to securities. A repurchase agreement is a transaction in which the Fund acquires a security and simultaneously commits to resell that security to the seller (a bank or securities dealer) at an agreed-upon price on an agreed-upon date. The Fund requires at all times that the repurchase agreement be collateralized by cash, or by securities of the U.S. Government, its agencies, its instrumentalities, or U.S. Government sponsored enterprises having a value equal to, or in excess of, the value of the repurchase agreement (including accrued interest). If the seller of the agreement defaults on its obligation to repurchase the underlying securities at a time when the value of these securities has dec lined, the Fund may incur a loss upon disposition of the securities.
(h) When-Issued Transactions–The Fund may purchase portfolio securities on a when-issued or forward basis. When-issued or forward transactions involve a commitment by the Fund to purchase securities, with payment and delivery ("settlement") to take place in the future, in order to secure what is considered to be an advantageous price or yield at the time of entering into the transaction.
3. MANAGEMENT FEE AND OTHER TRANSACTIONS WITH AFFILIATES
Management Fee
The Company has a management agreement with Lord, Abbett & Co. LLC ("Lord Abbett") pursuant to which Lord Abbett supplies the Fund with investment management services and executive and
27
Notes to Financial Statements (continued)
other personnel, pays the remuneration of officers, provides office space and pays for ordinary and necessary office and clerical expenses relating to research and statistical work and supervision of the Fund's investment portfolio.
The management fee is based on average daily net assets at the following annual rates:
| First $1 billion | | | .75 | % | |
| Next $1 billion | | | .70 | % | |
| Over $2 billion | | | .65 | % | |
For the fiscal year ended November 30, 2006, the effective management fee paid to Lord Abbett was at a rate of .74% of the Fund's average daily net assets.
Lord Abbett provides certain administrative services to the Fund pursuant to an Administrative Services Agreement at an annual rate of .04% of the Fund's average daily net assets.
The Fund, along with certain other funds managed by Lord Abbett (the "Underlying Funds") has entered into a Servicing Arrangement with Lord Abbett Income Strategy Fund of Lord Abbett Investment Trust (the "Income Strategy Fund"), pursuant to which each Underlying Fund pays a portion of the expenses (excluding management fees and distribution and service fees) of Income Strategy Fund in proportion to the average daily value of the Underlying Fund shares owned by Income Strategy Fund. Amounts paid pursuant to the Servicing Arrangement are included in Subsidy expense on the Statement of Operations and Payable to affiliate on the Fund's Statement of Assets and Liabilities.
12b-1 Distribution Plan
The Fund has adopted a distribution plan with respect to Class A, B, C and P shares pursuant to Rule 12b-1 under the Act, which provides for the payment of ongoing distribution and service fees to Lord Abbett Distributor LLC ("Distributor"), an affiliate of Lord Abbett. The fees are accrued daily at annual rates based upon average daily net assets as follows:
| Fees | | Class A | | Class B | | Class C | | Class P | |
| Service | | | .25 | % | | | .25 | % | | | .25 | % | | | .20 | % | |
| Distribution | | | .10 | %(1) | | | .75 | % | | | .75 | % | | | .25 | % | |
(1) The amount of CDSC collected by the Fund during the fiscal year ended November 30, 2006 was $12,498.
Class Y does not have a distribution plan.
Commissions
Distributor received the following commissions on sales of shares of the Fund, after concessions were paid to authorized dealers, for the fiscal year ended November 30, 2006:
Distributor
Commissions | | Dealers'
Concessions | |
| $ | 1,121,763 | | | $ | 5,804,626 | | |
Distributor received CDSCs of $3,568 and $10,866 for Class A and Class C shares, respectively, for the year ended November 30, 2006.
Two Directors and certain of the Fund's officers have an interest in Lord Abbett.
28
Notes to Financial Statements (continued)
4. DISTRIBUTIONS AND CAPITAL LOSS CARRYFORWARDS
Dividends from net investment income, if any, are declared and paid at least quarterly. Taxable net realized gains from investment transactions, reduced by capital loss carryforwards, if any, are declared and distributed to shareholders at least annually. The capital loss carryforward amount, if any, is available to offset future net capital gains. Dividends and distributions to shareholders are recorded on the ex-dividend date. The amount of dividends and distributions from net investment income and net realized capital gains are determined in accordance with Federal income tax regulations which may differ from accounting principles generally accepted in the United States of America. These book/tax differences are either considered temporary or permanent in nature. To the extent these differences are permanent in nature, such amounts are reclassified within the components of net assets based on their federal tax basis treatment; temporary d ifferences do not require reclassification. Dividends and distributions which exceed earnings and profits for tax purposes are reported as a tax return on capital.
On December 11, 2006, a net investment income distribution of approximately $7,546,000, a short-term capital gain distribution of approximately $7,748,000 and a long-term capital gain distribution of approximately $31,375,000 were declared by the Fund. The distributions were paid on December 15, 2006 to shareholders of record on December 14, 2006.
The tax character of distributions paid during the fiscal years ended November 30, 2006 and 2005 are as follows:
| | | 11/30/2006 | | 11/30/2005 | |
| Distributions paid from: | |
| Ordinary income | | $ | 36,915,035 | | | $ | 21,762,217 | | |
| Net long-term capital gains | | | 6,788,871 | | | | 1,864,564 | | |
| Total distributions paid | | $ | 43,703,906 | | | $ | 23,626,781 | | |
As of November 30, 2006, the components of accumulated earnings on a tax-basis are as follows:
| Undistributed ordinary income – net | | $ | 12,622,267 | | |
| Undistributed long-term capital gains | | | 31,370,206 | | |
| Total undistributed earnings | | $ | 43,992,473 | | |
| Temporary differences | | | (84,268 | ) | |
| Unrealized gains - net | | | 143,771,516 | | |
| Total accumulated earnings - net | | $ | 187,679,721 | | |
Certain losses incurred after October 31 ("Post-October Losses") within the taxable year are deemed to arise on the first business day of the Fund's next taxable year. The Fund incurred and will elect to defer net ordinary losses of $23,646 during fiscal 2006.
As of November 30, 2006, the aggregate unrealized security gains and losses based on cost for U.S. Federal income tax purposes are as follows:
| Tax cost | | $ | 1,122,869,113 | | |
| Gross unrealized gain | | | 151,461,887 | | |
| Gross unrealized loss | | | (7,694,415 | ) | |
| Net unrealized security gain | | $ | 143,767,472 | | |
The difference between book-basis and tax-basis unrealized gains (losses) is primarily attributable to the tax treatment of amortization and other temporary tax adjustments.
29
Notes to Financial Statements (continued)
Permanent items identified during the year ended November 30, 2006, have been reclassified among the components of net assets based on their tax-basis treatment as follows:
Undistributed
Net Investment
Income | | Accumulated
Net Realized
Gain | |
| $ | 1,785,487 | | | $ | (1,785,487 | ) | |
The permanent difference is primarily attributable to the tax treatment of amortization, investments of certain securities and paydown gains and losses.
5. PORTFOLIO SECURITIES TRANSACTIONS
Purchases and sales of investment securities (excluding short-term investments) for the fiscal year ended November 30, 2006 are as follows:
U.S. Government
Purchases* | | Non-U.S. Government
Purchases | | U.S. Government
Sales* | | Non-U.S. Government
Sales | |
| $ | 55,661,357 | | | $ | 540,498,619 | | | $ | 57,501,578 | | | $ | 437,913,742 | | |
* Includes U.S. Government sponsored enterprises securities.
6. DIRECTORS' REMUNERATION
The Company's officers and the two Directors who are associated with Lord Abbett do not receive any compensation from the Company for serving in such capacities. Outside Directors' fees are allocated among all Lord Abbett-sponsored funds based on the net assets of each fund. There is an equity-based plan available to all outside Directors under which outside Directors must defer receipt of a portion of, and may elect to defer receipt of an additional portion of Directors' fees. The deferred amounts are treated as though equivalent dollar amounts have been invested proportionately in the funds. Such amounts and earnings accrued thereon are included in Directors' fees on the Statement of Operations and in Directors' fees payable on the Statement of Assets and Liabilities and are not deductible for U.S. Federal income tax purposes until such amounts are paid.
7. EXPENSE REDUCTIONS
The Company has entered into arrangements with the Fund's transfer agent and custodian whereby credits realized as a result of uninvested cash balances are used to reduce a portion of the Fund's expenses.
8. LINE OF CREDIT
The Fund, along with certain other funds managed by Lord Abbett, has available a $250,000,000 unsecured revolving credit facility ("Facility") from a consortium of banks, to be used for temporary or emergency purposes as an additional source of liquidity to fund redemptions of investor shares. Any borrowings under this Facility will bear interest at current market rates as defined in the agreement. The fee for this Facility is at an annual rate of .08%. As of November 30, 2006, there were no loans outstanding pursuant to this Facility nor was the Facility utilized at any time during the fiscal year ended November 30, 2006.
30
Notes to Financial Statements (continued)
9. CUSTODIAN AND ACCOUNTING AGENT
State Street Bank & Trust Company ("SSB") is the Company's custodian and accounting agent. SSB performs custodial, accounting and recordkeeping functions, relating to portfolio transactions and calculating the Fund's NAV.
10. INVESTMENT RISKS
The Fund is subject to the general risks and considerations associated with investing in equity and fixed income securities.
The values of the Fund's equity security holdings and, consequently, the value of an investment in the Fund will fluctuate in response to movements in the stock market in general and to the changing prospects of the individual companies involved. With its emphasis on value stocks, the Fund may perform differently than the market as a whole and other types of stocks, such as growth stocks. The market may fail to recognize the intrinsic value of particular value stocks for a long time. The Fund may invest a significant portion of its assets in mid-sized companies that may be less able to weather economic shifts or other adverse developments than larger, more established companies. Because the Fund is not limited to investing in equity securities, the Fund may have smaller gains in a rising stock market than a fund investing solely in equity securities. In addition, if the Fund's assessment of a company's value or prospects for market appreciat ion or market conditions is wrong, the Fund could suffer losses or produce poor performance relative to other funds, even in a rising market.
The values of the Fund's fixed income holdings, and consequently, the value of an investment in the Fund will change as interest rates fluctuate and in response to market movements. When interest rates rise, the prices of these holdings are likely to decline. There is also the risk that an issuer of a fixed income security will fail to make timely payments of principal or interest to the Fund, a risk that is greater with high yield bonds (sometimes called "junk bonds") in which the Fund may invest. Some issuers, particularly of high yield bonds, may default as to principal and/or interest payments after the Fund purchases their securities. A default, or concerns in the market about an increase in risk of default, may result in losses to the Fund. High yield bonds are subject to greater price fluctuations, as well as additional risks.
The Fund may invest up to 20% of its assets in foreign securities, which present increased market, liquidity, currency, political and other risks.
These factors can affect the Fund's performance.
31
Notes to Financial Statements (concluded)
11. SUMMARY OF CAPITAL TRANSACTIONS
Transactions in shares of beneficial interest are as follows:
| | | Year Ended
November 30, 2006 | | Year Ended
November 30, 2005 | |
| Class A Shares | | Shares | | Amount | | Shares | | Amount | |
| Shares sold | | | 16,917,679 | | | $ | 212,134,245 | | | | 43,791,945 | | | $ | 532,741,256 | | |
| Reinvestment of distributions | | | 3,071,032 | | | | 38,091,509 | | | | 1,702,370 | | | | 20,618,748 | | |
| Shares reacquired | | | (13,933,108 | ) | | | (174,694,925 | ) | | | (5,875,391 | ) | | | (71,789,401 | ) | |
| Increase | | | 6,055,603 | | | $ | 75,530,829 | | | | 39,618,924 | | | $ | 481,570,603 | | |
| Class B Shares | |
| Shares sold | | | 855,487 | | | $ | 10,654,098 | | | | 2,829,339 | | | $ | 34,180,396 | | |
| Reinvestment of distributions | | | 146,558 | | | | 1,806,383 | | | | 78,218 | | | | 941,684 | | |
| Shares reacquired | | | (967,752 | ) | | | (12,006,140 | ) | | | (480,386 | ) | | | (5,797,872 | ) | |
| Increase | | | 34,293 | | | $ | 454,341 | | | | 2,427,171 | | | $ | 29,324,208 | | |
| Class C Shares | |
| Shares sold | | | 961,084 | | | $ | 11,982,082 | | | | 4,417,206 | | | $ | 53,369,060 | | |
| Reinvestment of distributions | | | 153,465 | | | | 1,892,955 | | | | 80,272 | | | | 968,185 | | |
| Shares reacquired | | | (1,620,075 | ) | | | (20,168,558 | ) | | | (624,785 | ) | | | (7,590,232 | ) | |
| Increase (decrease) | | | (505,526 | ) | | $ | (6,293,521 | ) | | | 3,872,693 | | | $ | 46,747,013 | | |
| Class P Shares | |
| Shares sold | | | 78,789 | | | $ | 987,312 | | | | 96,441 | | | $ | 1,171,661 | | |
| Reinvestment of distributions | | | 4,983 | | | | 62,047 | | | | 1,843 | | | | 22,410 | | |
| Shares reacquired | | | (16,918 | ) | | | (212,223 | ) | | | (14,624 | ) | | | (177,289 | ) | |
| Increase | | | 66,854 | | | $ | 837,136 | | | | 83,660 | | | $ | 1,016,782 | | |
| Class Y Shares | |
| Shares sold | | | 524,128 | | | $ | 6,599,724 | | | | 183,275 | | | $ | 2,262,071 | | |
| Reinvestment of distributions | | | 18,514 | | | | 231,225 | | | | 2,958 | | | | 35,998 | | |
| Shares reacquired | | | (15,210 | ) | | | (192,079 | ) | | | (7,085 | ) | | | (86,224 | ) | |
| Increase | | | 527,432 | | | $ | 6,638,870 | | | | 179,148 | | | $ | 2,211,845 | | |
12. RECENT ACCOUNTING PRONOUNCEMENTS
In July 2006, the Financial Accounting Standards Board (FASB) issued Interpretation 48, Accounting for Uncertainty in Income Taxes – an interpretation of FASB Statement 109 (FIN 48). FIN 48 clarifies the accounting for income taxes by prescribing the minimum recognition threshold a tax position must meet before being recognized in the financial statements. FIN 48 is effective for fiscal years beginning after December 15, 2006. The Fund will adopt FIN 48 during 2008 and the impact to the Fund's financial statements, if any, is currently being assessed.
In September 2006, Statement of Financial Accounting Standards No.157, Fair Value Measurements (SFAS 157), was issued and is effective for fiscal years beginning after November 15, 2007. SFAS 157 defines fair value, establishes a framework for measuring fair value and expands disclosures about fair value measurements. Management is currently evaluating the impact the adoption of SFAS 157 will have on the Fund's financial statement disclosures.
32
Report of Independent Registered Public Accounting Firm
The Board of Directors and Shareholders of Lord Abbett Research Fund, Inc.:
We have audited the accompanying statement of assets and liabilities, including the schedule of investments, of Lord Abbett Research Fund, Inc. – Lord Abbett America's Value Fund (the "Fund") as of November 30, 2006, and the related statement of operations for the year then ended, the statements of changes in net assets for each of the two years in the period then ended, and the financial highlights for the periods presented. These financial statements and financial highlights are the responsibility of the Fund's management. Our responsibility is to express an opinion on these financial statements and financial highlights based on our audits.
We conducted our audits in accordance with standards of the Public Company Accounting Oversight Board (United States). Those standards require that we plan and perform the audit to obtain reasonable assurance about whether the financial statements and financial highlights are free of material misstatement. The Fund is not required to have, nor were we engaged to perform, an audit of its internal control over financial reporting. Our audits included consideration of internal control over financial reporting as a basis for designing audit procedures that are appropriate in the circumstances, but not for the purpose of expressing an opinion on the effectiveness of the Fund's internal control over financial reporting. Accordingly, we express no such opinion. An audit also includes examining, on a test basis, evidence supporting the amounts and disclosures in the financial statements, assessing the accounting principles used and significant estim ates made by management, as well as evaluating the overall financial statement presentation. Our procedures included confirmation of securities owned as of November 30, 2006 by correspondence with the custodian and brokers; where replies were not received from brokers, we performed other auditing procedures. We believe that our audits provide a reasonable basis for our opinion.
In our opinion, the financial statements and financial highlights referred to above present fairly, in all material respects, the financial position of Lord Abbett Research Fund, Inc. – Lord Abbett America's Value Fund as of November 30, 2006, the results of its operations for the year then ended, the changes in its net assets for each of the two years in the period then ended, and the financial highlights for the periods presented, in conformity with accounting principles generally accepted in the United States of America.
Deloitte & Touche LLP
New York, New York
January 26, 2007
33
Basic Information About Management
The Board of Directors (the "Board") is responsible for the management of the business and affairs of each Fund in accordance with the laws of the State of Maryland. The Board appoints officers who are responsible for the day-to-day operations of each Fund and who execute policies authorized by the Board. The Board also approves an investment adviser to each Fund and continues to monitor the cost and quality of the services provided by the investment adviser, and annually considers whether to renew the contract with the adviser. Generally, each Director holds office until his/her successor is elected and qualified or until his/her earlier resignation or removal, as provided in the Fund's organizational documents.
Lord, Abbett & Co. LLC ("Lord Abbett"), a Delaware limited liability company, is the Funds' investment adviser.
Interested Directors
The following Directors are Partners of Lord Abbett and are "interested persons" of the Funds as defined in the Act. Mr. Dow and Ms. Foster are officers, directors, or trustees of each of the fourteen Lord Abbett-sponsored funds, which consist of 55 portfolios or series.
Name, Address and
Year of Birth | | Current Position
Length of Service
with Fund | | Principal Occupation
During Past Five Years | | Other
Directorships | |
Robert S. Dow
Lord, Abbett & Co. LLC
90 Hudson Street
Jersey City, NJ 07302 (1945) | | Director and Chairman
since 1996 | | Managing Partner and Chief Executive Officer of Lord Abbett since 1996. | | N/A | |
|
Daria L. Foster
Lord, Abbett & Co. LLC 90 Hudson Street
Jersey City, NJ 07302 (1954) | | Director since 2006 | | Partner and Director of Marketing and Client Service of Lord Abbett since 1990. | | N/A | |
|
Independent Directors
The following independent or outside Directors are also directors or trustees of each of the fourteen Lord Abbett-sponsored funds, which consist of 55 portfolios or series.
Name, Address and
Year of Birth | | Current Position
Length of Service
with Fund | | Principal Occupation
During Past Five Years | | Other
Directorships | |
E. Thayer Bigelow
Lord, Abbett & Co. LLC c/o Legal Dept.
90 Hudson Street
Jersey City, NJ 07302 (1941) | | Director since 1996 | | Managing General Partner, Bigelow Media, LLC
(since 2000); Senior Adviser, Time Warner Inc. (1998 - 2000); Acting Chief Executive Officer of Courtroom Television Network (1997 – 1998); President and Chief Executive Officer of Time Warner Cable Programming, Inc. (1991 – 1997). | | Currently serves as director of Adelphia Communications, Inc.; Crane Co.; and Huttig Building Products Inc. | |
|
34
Basic Information About Management (continued)
Name, Address and
Year of Birth | | Current Position
Length of Service
with Fund | | Principal Occupation
During Past Five Years | | Other
Directorships | |
William H.T. Bush
Lord, Abbett & Co. LLC c/o Legal Dept.
90 Hudson Street
Jersey City, NJ 07302 (1938) | | Director since 1998 | | Co-founder and Chairman of the Board of the
financial advisory firm of Bush-O'Donnell & Company (since 1986). | | Currently serves as director of WellPoint, Inc. (since 2002). | |
|
Robert B. Calhoun, Jr. Lord, Abbett & Co. LLC c/o Legal Dept.
90 Hudson Street
Jersey City, NJ 07302 (1942) | | Director since 1998 | | Managing Director of Monitor Clipper Partners (since 1997) and President of Clipper Asset Management Corp. (since 1991), both private equity investment funds. | | Currently serves as director of Avondale, Inc. and Interstate Bakeries Corp. | |
|
Julie A. Hill
Lord, Abbett & Co. LLC c/o Legal Dept.
90 Hudson Street
Jersey City, NJ 07302 (1946) | | Director since 2004 | | Owner and CEO of The Hill Company, a business consulting firm (since 1998); Founder, President and Owner of the Hiram-Hill and Hillsdale Development Company, a residential real estate development firm (1998 - 2000). | | Currently serves as director of WellPoint, Inc.; Resources Connection Inc.; Holcim (U.S.) Inc. (a subsidiary of Holcim Ltd.); and Lend Lease Corporation Limited. | |
|
Franklin W. Hobbs
Lord, Abbett & Co. LLC c/o Legal Dept.
90 Hudson Street
Jersey City, NJ 07302 (1947) | | Director since 2001 | | Advisor of One Equity Partners, a private equity firm (since 2004); Chief Executive Officer of Houlihan Lokey Howard & Zukin, an investment bank (2002 - 2003); Chairman of Warburg Dillon Read, an investment bank (1999 - 2001); Global Head of Corporate Finance of SBC Warburg Dillon Read (1997 - 1999); Chief Executive Officer of Dillon, Read & Co. (1994 - 1997). | | Currently serves as director of Molson Coors Brewing Company. | |
|
Thomas J. Neff
Lord, Abbett & Co. LLC c/o Legal Dept.
90 Hudson Street
Jersey City, NJ 07302 (1937) | | Director since 1992 | | Chairman of Spencer Stuart (U.S.), an executive search consulting firm (since 1996); President of Spencer Stuart (1979-1996). | | Currently serves as director of Ace, Ltd. (since 1997) and Hewitt Associates, Inc. | |
|
James L.L. Tullis
Lord, Abbett & Co. LLC c/o Legal Dept.
90 Hudson Street
Jersey City, NJ 07302 (1947) | | Director since 2006 | | CEO of Tullis-Dickerson and Co. Inc, a venture capital management firm (since 1990). | | Currently serves as director of Crane Co. (since 1998) and Viacell Inc.
(since 2002). | |
|
35
Basic Information About Management (continued)
Officers
None of the officers listed below have received compensation from the Funds. All the officers of the Funds may also be officers of the other Lord Abbett-sponsored funds and maintain offices at 90 Hudson Street, Jersey City, NJ 07302.
Name and
Year of Birth | | Current Position
with Fund | | Length of Service
of Current Position | | Principal Occupation
During Past Five Years | |
Robert S. Dow
(1945) | | Chief Executive Officer and Chairman | | Elected in 1996 | | Managing Partner and Chief Executive Officer of Lord Abbett (since 1996). | |
|
Daria L. Foster
(1954) | | President | | Elected in 2006 | | Partner and Director of Marketing and Client Service of Lord Abbett (since 1990). | |
|
Robert P. Fetch
(1953) | | Executive Vice President | | Elected in 1997 | | Partner and Senior Investment Manager, joined Lord Abbett in 1995. | |
|
| Daniel H. Frascarelli (1954) | | Executive Vice President | | Elected in 2005 | | Partner and Director of Large Cap Core Equity, joined Lord Abbett in 1990. | |
|
Frederick Ruvkun
(1957) | | Executive Vice President | | Elected in 2006 | | Investment Manager, joined Lord Abbett in 2006; formerly served as Managing Director and Leader of the Small Cap Growth Team and a Portfolio Manager of SMID Cap Growth Assets at J & W Seligman & Company. | |
|
| Christopher J. Towle (1957) | | Executive Vice President | | Elected in 2001 | | Partner and Investment Manager, joined Lord Abbett in 1987. | |
|
Edward K. von der Linde
(1960) | | Executive Vice President | | Elected in 2001 | | Partner and Investment Manager, joined Lord Abbett in 1988. | |
|
James Bernaiche
(1956) | | Chief Compliance Officer | | Elected in 2004 | | Chief Compliance Officer, joined Lord Abbett in 2001. | |
|
Joan A. Binstock
(1954) | | Chief Financial Officer and Vice President | | Elected in 1999 | | Partner and Chief Operations Officer, joined Lord Abbett in 1999. | |
|
Evan B. Carpenter
(1972) | | Vice President | | Elected in 2006 | | Research Analyst, joined Lord Abbett in 2003; prior thereto he served as an Equity Research Analyst at Gabelli Asset Management (2000-2003). | |
|
John K. Forst
(1960) | | Vice President and Assistant Secretary | | Elected in 2005 | | Deputy General Counsel, joined Lord Abbett in 2004; Managing Director and Associate General Counsel at New York Life Investment Management LLC (2002-2003). | |
|
36
Basic Information About Management (concluded)
Name and
Year of Birth | | Current Position
with Fund | | Length of Service
of Current Position | | Principal Occupation
During Past Five Years | |
| Lawrence H. Kaplan (1957) | | Vice President and Secretary | | Elected in 1997 | | Partner and General Counsel, joined Lord Abbett in 1997. | |
|
Robert G. Morris
(1944) | | Vice President | | Elected in 1996 | | Partner and Chief Investment Officer, joined Lord Abbett in 1991. | |
|
| A. Edward Oberhaus, III (1959) | | Vice President | | Elected in 1996 | | Partner and Manager of Equity Trading, joined Lord Abbett in 1983. | |
|
| Christina T. Simmons (1957) | | Vice President and Assistant Secretary | | Elected in 2000 | | Assistant General Counsel, joined Lord Abbett in 1999. | |
|
Paul J. Volovich
(1973) | | Vice President | | Elected in 2004 | | Investment Manager, joined Lord Abbett in 1997. | |
|
Bernard J. Grzelak
(1971) | | Treasurer | | Elected in 2003 | | Director of Fund Administration, joined Lord Abbett in 2003; formerly Vice President, Lazard Asset Management LLC (2000-2003). | |
|
Please call 888-522-2388 for a copy of the Statement of Additional Information (SAI), which contains further information about the Funds' Directors. It is available free upon request.
37
Householding
The Company has adopted a policy that allows it to send only one copy of the Fund's Prospectus, proxy material, annual report and semiannual report to certain shareholders residing at the same "household." This reduces Fund expenses, which benefits you and other shareholders. If you need additional copies or do not want your mailings to be "householded," please call Lord Abbett at 800-821-5129 or send a written request with your name, the name of your fund or funds and your account number or numbers to Lord Abbett Family of Funds, P.O. Box 219336, Kansas City, MO 64121.
Proxy Voting Policies, Procedures and Record
A description of the policies and procedures that Lord Abbett uses to vote proxies related to the Fund's portfolio securities, and information on how Lord Abbett voted the Fund's proxies during the 12 month period ended June 30, 2006 are available without charge, upon request, (i) by calling 888-522-2388; (ii) on Lord Abbett's website at www.LordAbbett.com; and (iii) on the Securities and Exchange Commission's ("SEC") website at www.sec.gov.
Shareholder Reports and Quarterly Portfolio Disclosure
The Fund is required to file its complete schedule of portfolio holdings with the SEC for its first and third fiscal quarters on Form N-Q. Copies of the filings will be available without charge, upon request on the SEC's website at www.sec.gov and may be available by calling Lord Abbett at 800-821-5129. You can also obtain copies of Form N-Q by (i) visiting the SEC's Public Reference Room in Washington, DC (information on the operation of the Public Reference Room may be obtained by calling 800-SEC-0330); (ii) sending your request and a duplicating fee to the SEC's Public Reference Room, Washington, DC 20549-0102; or (iii) sending your request electronically to publicinfo@sec.gov.
Tax Information
59.49% of the ordinary income distribution paid by the Fund during the fiscal year ended November 30, 2006 is qualified dividend income. For corporate shareholders, only 58.10% of the Fund's ordinary income distribution qualified for the dividends received deduction.
Additionally, of the distributions paid to shareholders during the fiscal year ended November 30, 2006, $6,788,871 represents long-term capital gains.
38
Lord Abbett Research Fund, Inc.
Lord Abbett America's Value Fund
LAAMF-2-1106
(01/07)

This report when not used for the general
information of shareholders of the fund, is to
be distributed only if preceded or accompanied
by a current fund prospectus.
Lord Abbett mutual fund shares are distributed by
LORD ABBETT DISTRIBUTOR LLC.
LORD ABBETT

2006
Annual
Report
Lord Abbett
Growth Opportunities Fund
For the fiscal year ended November 30, 2006
Lord Abbett Research Fund
Lord Abbett Growth Opportunities Fund
Annual Report
For the fiscal year ended November 30, 2006
Dear Shareholders: We are pleased to provide you with this overview of the Lord Abbett Growth Opportunities Fund's performance for the fiscal year ended November 30, 2006. On this page and the following pages, we discuss the major factors that influenced performance. For detailed and more timely information about the Fund, please visit our Website at www.lordabbett.com, where you also can access the quarterly commentaries by the Fund's portfolio managers.
General information about Lord Abbett mutual funds, as well as in-depth discussions of market trends and investment strategies, is also provided in Lord Abbett Insights, a newsletter accompanying your quarterly account statements. We also encourage you to call Lord Abbett at 800-821-5129 and speak to one of our professionals if you would like more information.
Thank you for investing in Lord Abbett mutual funds. We value the trust that you place in us and look forward to serving your investment needs in the years to come.

From left to right: Robert S. Dow, Director and Chairman of the Lord Abbett Funds; E. Thayer Bigelow, Independent Lead Director of the Lord Abbett Funds; and Daria L. Foster, Director and President of the Lord Abbett Funds.
Best regards,

Robert S. Dow
Chairman
Q: What were the overall market conditions during the fiscal year ended November 30, 2006?
A: The stock market gained approximately 14% (including dividends) in the fiscal year ended November 30, 2006 (as measured by the broad S&P Composite 1500® Index1). After beginning the fiscal year with positive momentum, the market entered a period of consolidation in May. The spring sell-off persisted until mid-July. During the market correction, small caps (as measured by the S&P SmallCap 600® Index2) fell more than twice (in percentage terms) as much as large caps. Once positive momentum returned, large capitalized companies led the market higher. For the fiscal year, the S&P 100® Index,3 comprised of large cap stocks, finished up about 15% (on a total return basis), while the small cap index matched the broad market with a gain of roughly 14%. Mid-capitalized companies (as measured by the S&P MidCap 400® Index4) trailed, on average, but still managed to register a total return of near 12% over the period.
Sector leadership rotated much like the preference for capitalization did. Between December 2005 and August 2006, the price of crude oil rose approximately 34% (from about $57 per barrel to approximately $77),
1
pushing energy stock prices higher. With inventories of petroleum plentiful, the price of crude oil began to slide in August. The $0.80 per gallon decline in the cost of gasoline fueled a late-year rally in consumer discretionary stocks. In addition, the lagging technology sector rallied in the final three months of the fiscal year. Defensive sectors such as consumer staples and health care lagged behind the broader market in the final months of the fiscal year.
Performance data quoted in the following pages reflect past performance and are no guarantee of future results. Current performance may be higher or lower than the performance quoted. The investment return and principal value of an investment in the Fund will fluctuate so that shares, on any given day or when redeemed, may be worth more or less than their original cost. You can obtain performance data current to the most recent month-end by calling Lord Abbett at 800-821-5129 or referring to our Website at www.lordabbett.com.
Q: How did the Growth Opportunities Fund perform during the fiscal year ended November 30, 2006?
A: The Fund returned 7.4%, reflecting performance at the net asset value (NAV) of Class A shares with all distributions reinvested, compared with its benchmark, the Russell Midcap® Growth Index,5 which returned 12.9% over the same period. The Fund's average annual total returns, which reflect performance at the maximum 5.75% sales charge applicable to Class A share investments and include the reinvestment of all distributions, are: 1 year: 1.18%, 5 years: 4.14%, and 10 years: 8.88%.
During certain periods shown, expense reimbursements were in place. Without such expense reimbursements the Fund's returns would have been lower.
Q: What were the most significant factors affecting performance?
A: The most significant detractor from the Fund's performance relative to its benchmark for the 12-month period was the healthcare sector. Two other sectors that hurt performance were the technology sector and the auto and transportation sector.
Among the individual healthcare holdings that took away from the Fund's performance were UnitedHealth Group Inc., (the Fund's number-one detractor), a manager of organized health systems, and Omnicare, Inc., a provider of professional pharmacy, related consulting, and data management services.
Other individual holdings that detracted from performance were technology company Tellabs, Inc., a provider of voice, data, and video transport and network access systems; materials holding Hexcel Corp., a developer of reinforcement products, composite materials, and engineered products; and consumer discretionary holding Tractor Supply Co., an operator of a retail farm store chain.
The greatest contributor to the Fund's performance relative to its benchmark was the other energy sector. (This sector includes oil service companies, as well as smaller exploration and production companies, and independent refiners.) In addition, also contributing to the Fund's performance were the financial services sector and the producer durables sector. (This sector includes capital goods and industrials.)
Among the individual holdings that contributed to performance were MasterCard Inc. (the Fund's number-one contributor), a provider of transaction processing and related services for credit and debit cards, electronic cash, automated teller machines, and travelers checks; Alliance Data Systems Corp., a provider of transaction services, credit services, and marketing services to retail companies; and Intercontinental Exchange Inc., an operator of an electronic commodities trading platform.
Two other holdings that helped Fund performance were technology holding Akamai Technologies, Inc., a provider of
2
Internet content delivery services, and consumer discretionary holding Rogers Communications, Inc., a provider of cell-phone and cable television services.
The Fund's portfolio is actively managed and, therefore, its holdings and the weightings of a particular issuer or particular sector as a percentage of portfolio assets are subject to change. Sectors may include many industries.
Note: Class A shares purchased subject to a front end sales charge have no contingent deferred sales charge (CDSC). However, certain purchases of Class A shares made without a front-end sales charge may be subject to a CDSC (24th month if shares were purchased prior to November 1, 2004). Please see section "Your Investment—Purchases" in the prospectus for more information on redemptions that may be subject to a CDSC.
A prospectus contains important information about a fund, including its investment objectives, risks, charges, and ongoing expenses, which an investor should carefully consider before investing. To obtain a prospectus on any Lord Abbett mutual fund, please contact your investment professional or Lord Abbett Distributor LLC at 800-874-3733 or visit our Website at www.lordabbett.com. Read the prospectus carefully before investing.
1 The S&P Composite 1500® Index combines the S&P 500®, S&P 400® (an index of mid-cap companies), and S&P SmallCap 600® to create a broad market portfolio representing 90% of U.S. equities.
2 The S&P SmallCap 600® Index is a widely accepted benchmark owing to its low turnover and greater liquidity.
3 The S&P 100® Index measures large company U.S. stock market performance. This market capitalization-weighted index is made up of 100 major, blue-chip stocks across diverse industry groups.
4 The S&P MidCap 400® Index measures the performance of the mid-size company segment of the U.S. market.
5 The Russell Midcap® Growth Index measures the performance of those Russell Midcap companies with higher price to book ratios and higher forecasted growth values. The stocks also are members of the Russell 1000® Growth Index.
Indexes are unmanaged, do not reflect the deduction of fees or expenses, and are not available for direct investment.
Important Performance and Other Information
The views of the Fund's management and the portfolio holdings described in this report are as of November 30, 2006; these views and portfolio holdings may have changed subsequent to this date, and they do not guarantee the future performance of the markets or the Fund. Information provided in this report should not be considered a recommendation to purchase or sell securities.
A Note about Risk: See Notes to Financial Statements for a discussion of investment risks. For a more detailed discussion of the risks associated with the Fund, please see the Fund's prospectus.
Performance: Because of ongoing market volatility, the Fund's performance may be subject to substantial fluctuation. Except where noted, comparative Fund performance does not account for the deduction of sales charges and would be different if sales charges were included. The Fund offers additional classes of shares with distinct pricing options. For a full description of the differences in pricing alternatives, please see the Fund's prospectus.
Mutual funds are not insured by the FDIC, are not deposits or other obligations of, or guaranteed by, banks, and are subject to investment risks, including possible loss of principal amount invested.
3
Investment Comparison
Below is a comparison of a $10,000 investment in Class A shares with the same investment in the Russell Midcap® Growth Index and the S&P MidCap 400/Citigroup Growth Index1, assuming reinvestment of all dividends and distributions. The performance of other classes will be greater than or less than the performance shown in the graph below due to different sales loads and expenses applicable to such classes. The graph and performance table below do not reflect the deduction of taxes that a shareholder would pay on fund distributions or the redemption of fund shares. Past performance is no guarantee of future results.
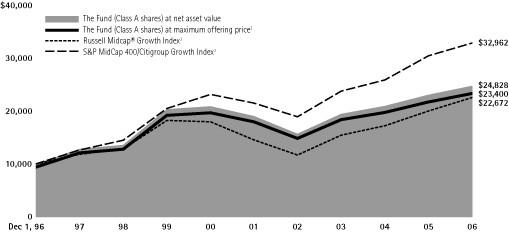
Average Annual Total Return at Maximum Applicable
Sales Charge for the Periods Ended November 30, 2006
| | | 1 Year | | 5 Years | | 10 Years | | Life of Class | |
| Class A4 | | | 1.18 | % | | | 4.14 | % | | | 8.88 | % | | | — | | |
| Class B5 | | | 2.66 | % | | | 4.56 | % | | | — | | | | 9.56 | % | |
| Class C6 | | | 6.66 | % | | | 4.73 | % | | | — | | | | 9.18 | % | |
| Class P7 | | | 7.24 | % | | | 5.31 | % | | | — | | | | 0.88 | % | |
| Class Y8 | | | 7.73 | % | | | 5.71 | % | | | — | | | | 7.96 | % | |
1 The S&P MidCap 400/Citigroup Growth Index was formerly named S&P MidCap 400/Barra Growth Index, which recently experienced some adjustments in the methodology used for performance reporting purposes.
2 Reflects the deduction of the maximum initial sales charge of 5.75%.
3 Performance for each unmanaged index does not reflect transaction costs, management fees or sales charges. The performance of each index is not necessarily representative of the Fund's performance.
4 Total return, which is the percentage change in net asset value, after deduction of the maximum initial sales charge of 5.75% applicable to Class A shares, with all dividends and distributions reinvested for the periods shown ended November 30, 2006, is calculated using the SEC-required uniform method to compute such return.
5 Class B shares commenced operations on October 16, 1998. Performance reflects the deduction of a CDSC of 4% for 1 year, 1% for 5 years and 0% for the life of the class.
6 Class C shares commenced operations on October 19, 1998. The 1% CDSC for Class C shares normally applies before the first anniversary of the purchase date. Performance is at net asset value.
7 Class P shares commenced operations on August 15, 2000. Performance is at net asset value.
8 Class Y shares commenced operations on December 9, 1998. Performance is at net asset value.
4
Expense Example
As a shareholder of the Fund, you incur two types of costs: (1) transaction costs, including sales charges on purchase payments (these charges vary among the share classes); and (2) ongoing costs, including management fees; distribution and service (12b-1) fees (these charges vary among the share classes); and other Fund expenses. This Example is intended to help you understand your ongoing costs (in dollars) of investing in the Fund and to compare these costs with the ongoing costs of investing in other mutual funds.
The Example is based on an investment of $1,000 invested at the beginning of the period and held for the entire period (June 1, 2006 through November 30, 2006).
Actual Expenses
For each class of the Fund, the first line of the applicable table on the following page provides information about actual account values and actual expenses. You may use the information in this line, together with the amount you invested, to estimate the expenses that you paid over the period. Simply divide your account value by $1,000 (for example, an $8,600 account value divided by $1,000 = 8.6), then multiply the result by the number in the first line under the heading entitled "Expenses Paid During the Period 6/1/06 – 11/30/06" to estimate the expenses you paid on your account during this period.
Hypothetical Example for Comparison Purposes
For each class of the Fund, the second line of the applicable table on the following page provides information about hypothetical account values and hypothetical expenses based on the Fund's actual expense ratio and an assumed rate of return of 5% per year before expenses, which is not the Fund's actual return. The hypothetical account values and expenses may not be used to estimate the actual ending account balance or expenses you paid for the period. You may use this information to compare the ongoing costs of investing in the Fund and other funds. To do so, compare this 5% hypothetical example with the 5% hypothetical examples that appear in the shareholder reports of the other funds.
5
Please note that the expenses shown in the table are meant to highlight your ongoing costs only and do not reflect any transactional costs, such as sales charges. Therefore, the second line of the table is useful in comparing ongoing costs only, and will not help you determine the relative total costs of owning different funds. In addition, if these transactional costs were included, your costs would have been higher.
| | | Beginning
Account
Value | | Ending
Account
Value | | Expenses
Paid During
Period† | |
| | | 6/1/06 | | 11/30/06 | | 6/1/06 –
11/30/06 | |
| Class A | |
| Actual | | $ | 1,000.00 | | | $ | 1,073.50 | | | $ | 8.06 | | |
| Hypothetical (5% Return Before Expenses) | | $ | 1,000.00 | | | $ | 1,017.29 | | | $ | 7.84 | | |
| Class B | |
| Actual | | $ | 1,000.00 | | | $ | 1,066.60 | | | $ | 11.40 | | |
| Hypothetical (5% Return Before Expenses) | | $ | 1,000.00 | | | $ | 1,014.03 | | | $ | 11.11 | | |
| Class C | |
| Actual | | $ | 1,000.00 | | | $ | 1,066.60 | | | $ | 11.40 | | |
| Hypothetical (5% Return Before Expenses) | | $ | 1,000.00 | | | $ | 1,014.03 | | | $ | 11.11 | | |
| Class P | |
| Actual | | $ | 1,000.00 | | | $ | 1,072.40 | | | $ | 8.57 | | |
| Hypothetical (5% Return Before Expenses) | | $ | 1,000.00 | | | $ | 1,016.79 | | | $ | 8.34 | | |
| Class Y | |
| Actual | | $ | 1,000.00 | | | $ | 1,077.30 | | | $ | 6.25 | | |
| Hypothetical (5% Return Before Expenses) | | $ | 1,000.00 | | | $ | 1,019.06 | | | $ | 6.07 | | |
† For each class of the Fund, expenses are equal to the annualized expense ratio for such class (1.55% for Class A, 2.20% for Classes B and C, 1.65% for Class P and 1.20% for Class Y) multiplied by the average account value over the period, multiplied by 183/365 (to reflect one-half year period).
Portfolio Holdings Presented by Sector
November 30, 2006
| Sector* | | %** | |
| Auto & Transportation | | | 1.53 | % | |
| Consumer Discretionary | | | 26.63 | % | |
| Consumer Staples | | | 1.78 | % | |
| Financial Services | | | 11.34 | % | |
| Healthcare | | | 16.52 | % | |
| Materials & Processing | | | 4.46 | % | |
| Other | | | 1.83 | % | |
| Other Energy | | | 6.81 | % | |
| Producer Durables | | | 5.73 | % | |
| Technology | | | 17.49 | % | |
| Utilities | | | 1.45 | % | |
| Short-Term Investment | | | 4.43 | % | |
| Total | | | 100.00 | % | |
* A sector may comprise several industries.
** Represents percent of total investments.
6
Schedule of Investments
November 30, 2006
| Investments | | Shares | | Value
(000) | |
| COMMON STOCKS 95.80% | |
| Advertising Agency 2.45% | |
| Lamar Advertising Co.* | | | 337,600 | | | $ | 20,374 | | |
| Aerospace 1.58% | |
| Rockwell Collins, Inc. | | | 217,800 | | | | 13,140 | | |
| Agriculture, Fishing & Ranching 1.62% | |
| Monsanto Co. | | | 280,500 | | | | 13,484 | | |
| Air Transportation 0.56% | |
Expeditors Int'l. of
Washington, Inc. | | | 102,500 | | | | 4,637 | | |
| Banks 1.98% | |
Lazard Ltd. Class A
(Bermuda)(a) | | | 156,500 | | | | 7,108 | | |
| Northern Trust Corp. | | | 164,500 | | | | 9,370 | | |
| Total | | | | | | | 16,478 | | |
| Biotechnology Research & Production 3.55% | |
Alexion Pharmaceuticals,
Inc.* | | | 163,870 | | | | 7,092 | | |
| Celgene Corp.* | | | 105,400 | | | | 5,874 | | |
| Cephalon, Inc.* | | | 146,600 | | | | 10,975 | | |
Human Genome
Sciences, Inc.* | | | 443,698 | | | | 5,555 | | |
| Total | | | | | | | 29,496 | | |
| Casinos & Gambling 2.62% | |
International Game
Technology | | | 312,900 | | | | 13,699 | | |
| WMS Industries, Inc.* | | | 232,700 | | | | 8,093 | | |
| Total | | | | | | | 21,792 | | |
| Chemicals 1.04% | |
| Ecolab, Inc. | | | 194,600 | | | | 8,630 | | |
| Communications Technology 2.52% | |
Atheros Communications,
Inc.* | | | 177,300 | | | | 4,032 | | |
| Harris Corp. | | | 158,800 | | | | 6,687 | | |
| Investments | | Shares | | Value
(000) | |
WebEx Communications,
Inc.* | | | 284,300 | | | $ | 10,206 | | |
| Total | | | | | | | 20,925 | | |
| Computer Services, Software & Systems 7.11% | |
| Akamai Technologies, Inc.* | | | 270,800 | | | | 13,234 | | |
| Citrix Systems, Inc.* | | | 128,100 | | | | 3,682 | | |
Cognizant Technology
Solutions Corp.* | | | 108,200 | | | | 8,825 | | |
| Equinix, Inc.* | | | 153,700 | | | | 11,730 | | |
| F5 Networks Inc.* | | | 140,900 | | | | 10,541 | | |
| Informatica Corp.* | | | 194,950 | | | | 2,349 | | |
| QLogic Corp.* | | | 388,200 | | | | 8,637 | | |
| Total | | | | | | | 58,998 | | |
| Computer Technology 2.80% | |
| Network Appliance, Inc.* | | | 329,800 | | | | 12,932 | | |
| NVIDIA Corp.* | | | 278,300 | | | | 10,294 | | |
| Total | | | | | | | 23,226 | | |
| Consumer Electronics 2.98% | |
| Activision, Inc.* | | | 478,700 | | | | 8,162 | | |
| Electronic Arts, Inc.* | | | 146,400 | | | | 8,176 | | |
| THQ Inc.* | | | 258,000 | | | | 8,398 | | |
| Total | | | | | | | 24,736 | | |
| Cosmetics 0.34% | |
| Bare Escentuals, Inc.* | | | 94,500 | | | | 2,825 | | |
| Diversified Production 2.49% | |
| Danaher Corp. | | | 137,300 | | | | 10,039 | | |
| Dover Corp. | | | 211,700 | | | | 10,649 | | |
| Total | | | | | | | 20,688 | | |
| Drug & Grocery Store Chains 0.74% | |
| Safeway, Inc. | | | 199,700 | | | | 6,153 | | |
| Drugs & Pharmaceuticals 2.79% | |
| Medicines Co. (The)* | | | 168,700 | | | | 4,816 | | |
Medicis Pharmaceuticals
Corp. | | | 218,700 | | | | 8,066 | | |
See Notes to Financial Statements.
7
Schedule of Investments (continued)
November 30, 2006
| Investments | | Shares | | Value
(000) | |
Shire Pharmaceuticals
Group plc ADR | | | 169,400 | | | $ | 10,266 | | |
| Total | | | | | | | 23,148 | | |
| Education Services 1.47% | |
ITT Educational
Services, Inc.* | | | 177,500 | | | | 12,171 | | |
| Electronics 1.54% | |
| Amphenol Corp. | | | 122,100 | | | | 8,319 | | |
| Daktronics, Inc. | | | 124,000 | | | | 4,486 | | |
| Total | | | | | | | 12,805 | | |
| Electronics: | |
| Semi-Conductors/Components 3.57% | |
Freescale Semiconductor,
Inc.* | | | 345,700 | | | | 13,797 | | |
MEMC Electronic
Materials, Inc.* | | | 160,900 | | | | 6,404 | | |
| Xilinx, Inc. | | | 351,000 | | | | 9,406 | | |
| Total | | | | | | | 29,607 | | |
| Entertainment 0.80% | |
Dreamworks Animation
SKG, Inc.* | | | 225,900 | | | | 6,603 | | |
| Finance Companies 0.75% | |
International Securities
Exchange Holdings, Inc. | | | 117,400 | | | | 6,243 | | |
Financial Data Processing Services &
Systems 3.45% | |
Alliance Data Systems
Corp.* | | | 248,600 | | | | 16,087 | | |
| Fiserv, Inc.* | | | 131,100 | | | | 6,701 | | |
| Mastercard, Inc. Class A | | | 57,212 | | | | 5,821 | | |
| Total | | | | | | | 28,609 | | |
| Financial Information Services 1.00% | |
Factset Research Systems,
Inc. | | | 156,800 | | | | 8,292 | | |
| Investments | | Shares | | Value
(000) | |
| Financial Services 0.69% | |
| KBW Inc.* | | | 194,900 | | | $ | 5,190 | | |
| Nymex Holdings Inc.* | | | 4,929 | | | | 570 | | |
| Total | | | | | | | 5,760 | | |
| Healthcare Facilities 0.90% | |
| ICON plc ADR* | | | 201,020 | | | | 7,474 | | |
| Healthcare Management Services 0.53% | |
Pediatrix Medical
Group Inc.* | | | 91,300 | | | | 4,396 | | |
| Hotel/Motel 3.51% | |
| Hilton Hotels Corp. | | | 227,200 | | | | 7,459 | | |
Starwood Hotels &
Resorts Worldwide, Inc. | | | 134,600 | | | | 8,637 | | |
| Wynn Resorts Ltd. | | | 148,500 | | | | 13,046 | | |
| Total | | | | | | | 29,142 | | |
| Leisure Time 0.78% | |
Penn National Gaming,
Inc.* | | | 176,200 | | | | 6,514 | | |
Machinery: Oil Well Equipment &
Services 3.71% | |
| Cameron Int'l. Corp.* | | | 205,500 | | | | 11,163 | | |
| Dril-Quip, Inc.* | | | 176,400 | | | | 7,467 | | |
National-Oilwell Varco
Inc.* | | | 69,800 | | | | 4,642 | | |
| Smith Int'l., Inc. | | | 177,000 | | | | 7,498 | | |
| Total | | | | | | | 30,770 | | |
Medical & Dental Instruments &
Supplies 7.78% | |
| Beckman Coulter, Inc. | | | 159,200 | | | | 9,449 | | |
DENTSPLY International
Inc. | | | 290,400 | | | | 9,272 | | |
Edwards Lifesciences
Corp.* | | | 140,400 | | | | 6,436 | | |
| Henry Schein, Inc.* | | | 299,900 | | | | 15,454 | | |
| Mentor Corp. | | | 173,600 | | | | 8,671 | | |
| Thermo Electron Corp.* | | | 348,600 | | | | 15,279 | | |
| Total | | | | | | | 64,561 | | |
See Notes to Financial Statements.
8
Schedule of Investments (continued)
November 30, 2006
| Investments | | Shares | | Value
(000) | |
| Medical Services 1.01% | |
| Covance Inc.* | | | 139,500 | | | $ | 8,352 | | |
| Metal Fabricating 1.80% | |
| Precision Castparts Corp. | | | 198,400 | | | | 14,971 | | |
| Miscellaneous: Producer Durables 0.66% | |
| BE Aerospace, Inc.* | | | 208,300 | | | | 5,460 | | |
| Multi-Sector Companies 1.83% | |
| Textron, Inc. | | | 156,300 | | | | 15,231 | | |
| Oil: Crude Producers 3.11% | |
| Cabot Oil & Gas Corp. | | | 201,800 | | | | 12,538 | | |
| Range Resources Corp. | | | 426,300 | | | | 13,253 | | |
| Total | | | | | | | 25,791 | | |
| Radio & TV Broadcasters 1.80% | |
Rogers Communications, Inc.
Class B (Canada)(a) | | | 243,500 | | | | 14,905 | | |
| Real Estate Investment Trusts 0.44% | |
| Douglas Emmett, Inc.* | | | 138,600 | | | | 3,645 | | |
| Restaurants 0.49% | |
P.F. Chang's China
Bistro, Inc.* | | | 112,700 | | | | 4,068 | | |
| Retail 5.25% | |
American Eagle Outfitters,
Inc. | | | 88,900 | | | | 4,017 | | |
Dick's Sporting Goods,
Inc.* | | | 183,900 | | | | 9,864 | | |
| Family Dollar Stores, Inc. | | | 219,000 | | | | 6,108 | | |
| J.C. Penney Co., Inc. | | | 101,400 | | | | 7,842 | | |
| Nordstrom, Inc. | | | 94,000 | | | | 4,608 | | |
| O'Reilly Automotive, Inc.* | | | 191,167 | | | | 6,054 | | |
| Tween Brands, Inc.* | | | 120,689 | | | | 5,059 | | |
| Total | | | | | | | 43,552 | | |
| Savings & Loan 1.19% | |
| Hudson City Bancorp, Inc. | | | 743,600 | | | | 9,868 | | |
| Investments | | Shares | | Value
(000) | |
| Securities Brokerage & Services 1.87% | |
IntercontinentalExchange
Inc.* | | | 107,400 | | | $ | 10,552 | | |
Investment Technology
Group* | | | 132,100 | | | | 4,954 | | |
| Total | | | | | | | 15,506 | | |
| Services: Commercial 1.80% | |
Corrections Corp. of
America* | | | 178,650 | | | | 8,120 | | |
| Monster Worldwide, Inc.* | | | 156,600 | | | | 6,835 | | |
| Total | | | | | | | 14,955 | | |
| Shipping 0.39% | |
UTi Worldwide, Inc.
(United Kingdom)(a) | | | 109,700 | | | | 3,269 | | |
| Soaps & Household Chemicals 1.04% | |
Church & Dwight Co.,
Inc. | | | 206,100 | | | | 8,638 | | |
| Telecommunications Equipment 1.01% | |
| American Tower Corp.* | | | 221,300 | | | | 8,381 | | |
| Textiles Apparel Manufacturers 1.33% | |
| Coach, Inc.* | | | 255,600 | | | | 11,044 | | |
| Toys 1.08% | |
| Marvel Entertainment, Inc.* | | | 318,000 | | | | 8,936 | | |
| Truckers 0.58% | |
| Landstar System, Inc. | | | 106,918 | | | | 4,816 | | |
| Utilities: Gas Pipelines 0.01% | |
| Dynegy Inc. Class A* | | | 9,281 | | | | 63 | | |
| Utilities: Telecommunications 1.46% | |
| NII Holdings, Inc.* | | | 128,900 | | | | 8,370 | | |
Time-Warner
Telecommunications, Inc.* | | | 204,400 | | | | 3,728 | | |
| Total | | | | | | | 12,098 | | |
Total Common Stocks
(cost $689,303,963) | | | | | | | 795,226 | | |
See Notes to Financial Statements.
9
Schedule of Investments (concluded)
November 30, 2006
| Investments | | Principal
Amount
(000) | | Value
(000) | |
| SHORT-TERM INVESTMENT 4.44% | |
| Repurchase Agreement | |
Repurchase Agreement
dated 11/30/2006, 4.65%
due 12/1/2006 with State
Street Bank & Trust Co.
collateralized by
$25,485,000 of Federal
Ho me Loan Bank at
5.25% and 5.375% due
4/15/2016 and 9/9/2016
and $11,130,000 of
Federal Home Loan
Mortgage Corp. at 5.80%
due 11/28/2014; value:
$37,621,106; proceeds:
$36,885,582
(cost $36,880,818) | | $ | 36,881 | | | $ | 36,881 | | |
Total Investments in
Securities 100.24%
(cost $726,184,781) | | | | | 832,107 | | |
Liabilities in Excess of
Other Assets (0.24%) | | | | | (1,961 | ) | |
| Net Assets 100.00% | | | | $ | 830,146 | | |
* Non-income producing security.
(a) Foreign security traded in U.S. dollars.
ADR American Depositary Receipt.
See Notes to Financial Statements.
10
Statement of Assets and Liabilities
November 30, 2006
| ASSETS: | |
| Investments in securities, at value (cost $726,184,781) | | $ | 832,106,910 | | |
| Receivables: | |
| Investment securities sold | | | 3,445,151 | | |
| Interest and dividends | | | 1,124,334 | | |
| Capital shares sold | | | 762,432 | | |
| From advisor (See Note 3) | | | 13,474 | | |
| Prepaid expenses and other assets | | | 265,444 | | |
| Total assets | | | 837,717,745 | | |
| LIABILITIES: | |
| Payables: | |
| Investment securities purchased | | | 4,636,570 | | |
| Capital shares reacquired | | | 1,307,033 | | |
| Management fee | | | 536,893 | | |
| 12b-1 distribution fees | | | 323,856 | | |
| Directors' fees | | | 56,245 | | |
| Fund administration | | | 26,960 | | |
| To affiliates (See Note 3) | | | 559 | | |
| Accrued expenses and other liabilities | | | 683,586 | | |
| Total liabilities | | | 7,571,702 | | |
| NET ASSETS | | $ | 830,146,043 | | |
| COMPOSITION OF NET ASSETS: | |
| Paid-in capital | | $ | 647,053,608 | | |
| Accumulated net investment loss | | | (610,990 | ) | |
Accumulated net realized gain on investments and foreign
currency related transactions | | | 77,781,296 | | |
| Net unrealized appreciation on investments | | | 105,922,129 | | |
| Net Assets | | $ | 830,146,043 | | |
| Net assets by class: | |
| Class A Shares | | $ | 614,432,936 | | |
| Class B Shares | | $ | 100,741,462 | | |
| Class C Shares | | $ | 79,485,188 | | |
| Class P Shares | | $ | 15,855,575 | | |
| Class Y Shares | | $ | 19,630,882 | | |
| Outstanding shares by class: | |
| Class A Shares (50 million shares of common stock authorized, $.001 par value) | | | 27,902,248 | | |
| Class B Shares (30 million shares of common stock authorized, $.001 par value) | | | 4,811,157 | | |
| Class C Shares (20 million shares of common stock authorized, $.001 par value) | | | 3,797,097 | | |
| Class P Shares (20 million shares of common stock authorized, $.001 par value) | | | 719,986 | | |
| Class Y Shares (30 million shares of common stock authorized, $.001 par value) | | | 870,595 | | |
Net asset value, offering and redemption price per share
(Net assets divided by outstanding shares): | | | | | |
| Class A Shares-Net asset value | | $ | 22.02 | | |
Class A Shares-Maximum offering price
(Net asset value plus sales charge of 5.75%) | | $ | 23.36 | | |
| Class B Shares-Net asset value | | $ | 20.94 | | |
| Class C Shares-Net asset value | | $ | 20.93 | | |
| Class P Shares-Net asset value | | $ | 22.02 | | |
| Class Y Shares-Net asset value | | $ | 22.55 | | |
See Notes to Financial Statements.
11
Statement of Operations
For the Year Ended November 30, 2006
| Investment income: | |
| Dividends (net of foreign withholding taxes of $2,490) | | $ | 4,747,123 | | |
| Interest | | | 2,527,481 | | |
| Total investment income | | | 7,274,604 | | |
| Expenses: | |
| Management fee | | | 6,861,195 | | |
| 12b-1 distribution plan-Class A | | | 2,238,916 | | |
| 12b-1 distribution plan-Class B | | | 1,052,698 | | |
| 12b-1 distribution plan-Class C | | | 822,971 | | |
| 12b-1 distribution plan-Class P | | | 72,240 | | |
| Shareholder servicing | | | 2,636,251 | | |
| Fund administration | | | 343,060 | | |
| Reports to shareholders | | | 259,692 | | |
| Registration | | | 133,337 | | |
| Custody | | | 63,454 | | |
| Professional | | | 47,286 | | |
| Directors' fees | | | 29,657 | | |
| Subsidy (See Note 3) | | | 23,633 | | |
| Other | | | 20,508 | | |
| Gross expenses | | | 14,604,898 | | |
| Expense reductions (See Note 7) | | | (24,845 | ) | |
| Expenses assumed by advisor (See Note 3) | | | (141,629 | ) | |
| Net expenses | | | 14,438,424 | | |
| Net investment loss | | | (7,163,820 | ) | |
| Net realized and unrealized gain (loss): | |
| Net realized gain on investments and foreign currency related transactions | | | 71,897,230 | | |
| Net change in unrealized depreciation on investments | | | (8,057,753 | ) | |
| Net realized and unrealized gain | | | 63,839,477 | | |
| Net Increase in Net Assets Resulting From Operations | | $ | 56,675,657 | | |
See Notes to Financial Statements.
12
Statements of Changes in Net Assets
| INCREASE (DECREASE) IN NET ASSETS | | For the Year Ended
November 30, 2006 | | For the Year Ended
November 30, 2005 | |
| Operations: | |
| Net investment loss | | $ | (7,163,820 | ) | | $ | (9,117,725 | ) | |
Net realized gain on investments and
foreign currency related transactions | | | 71,897,230 | | | | 86,614,819 | | |
Net change in unrealized appreciation
(depreciation) on investments | | | (8,057,753 | ) | | | 782,332 | | |
| Net increase in net assets resulting from operations | | | 56,675,657 | | | | 78,279,426 | | |
| Distributions to shareholders from: | |
| Net realized gain | |
| Class A | | | (19,486,802 | ) | | | – | | |
| Class B | | | (3,418,682 | ) | | | – | | |
| Class C | | | (2,662,857 | ) | | | – | | |
| Class P | | | (542,311 | ) | | | – | | |
| Class Y | | | (275,140 | ) | | | – | | |
| Total distributions to shareholders | | | (26,385,792 | ) | | | – | | |
| Capital share transactions (See Note 11): | |
| Net proceeds from sales of shares | | | 140,661,387 | | | | 154,082,808 | | |
| Reinvestment of distributions | | | 24,709,953 | | | | – | | |
| Cost of shares reacquired | | | (216,160,088 | ) | | | (184,595,168 | ) | |
Net decrease in net assets resulting
from capital share transactions | | | (50,788,748 | ) | | | (30,512,360 | ) | |
| Net increase (decrease) in net assets | | | (20,498,883 | ) | | | 47,767,066 | | |
| NET ASSETS: | |
| Beginning of year | | $ | 850,644,926 | | | $ | 802,877,860 | | |
| End of year | | $ | 830,146,043 | | | $ | 850,644,926 | | |
| Accumulated net investment loss | | $ | (610,990 | ) | | $ | (1,379,502 | ) | |
See Notes to Financial Statements.
13
Financial Highlights
| | | Class A Shares | |
| | | Year Ended 11/30 | |
| | | 2006 | | 2005 | | 2004 | | 2003 | | 2002 | |
| Per Share Operating Performance | |
| Net asset value, beginning of year | | $ | 21.15 | | | $ | 19.21 | | | $ | 17.88 | | | $ | 14.42 | | | $ | 17.47 | | |
| Investment operations: | |
| Net investment loss(a) | | | (.15 | ) | | | (.19 | ) | | | (.23 | ) | | | (.24 | ) | | | (.23 | ) | |
| Net realized and unrealized gain (loss) | | | 1.67 | | | | 2.13 | | | | 1.56 | | | | 3.70 | | | | (2.82 | ) | |
| Total from investment operations | | | 1.52 | | | | 1.94 | | | | 1.33 | | | | 3.46 | | | | (3.05 | ) | |
| Distributions to shareholders from: | |
| Net realized gain | | | (.65 | ) | | | – | | | | – | | | | – | | | | – | | |
| Net asset value, end of year | | $ | 22.02 | | | $ | 21.15 | | | $ | 19.21 | | | $ | 17.88 | | | $ | 14.42 | | |
| Total Return(b) | | | 7.35 | % | | | 10.10 | % | | | 7.44 | % | | | 23.99 | % | | | (17.46 | )% | |
| Ratios to Average Net Assets: | |
Expenses, including expense reductions
and expenses assumed | | | 1.54 | % | | | 1.55 | % | | | 1.73 | % | | | 1.85 | % | | | 1.80 | % | |
Expenses, excluding expense reductions
and including expenses assumed | | | 1.54 | % | | | 1.55 | % | | | 1.73 | % | | | 1.85 | % | | | 1.80 | % | |
Expenses, excluding expense reductions
and expenses assumed | | | 1.56 | % | | | 1.59 | % | | | 1.73 | % | | | 1.85 | % | | | 1.80 | % | |
| Net investment loss | | | (.70 | )% | | | (.96 | )% | | | (1.27 | )% | | | (1.53 | )% | | | (1.48 | )% | |
| Supplemental Data: | |
| Net assets, end of year (000) | | $ | 614,433 | | | $ | 634,059 | | | $ | 594,524 | | | $ | 430,991 | | | $ | 250,380 | | |
| Portfolio turnover rate | | | 159.86 | % | | | 97.35 | % | | | 90.23 | % | | | 78.58 | % | | | 97.63 | % | |
See Notes to Financial Statements.
14
Financial Highlights (continued)
| | | Class B Shares | |
| | | Year Ended 11/30 | |
| | | 2006 | | 2005 | | 2004 | | 2003 | | 2002 | |
| Per Share Operating Performance | |
| Net asset value, beginning of year | | $ | 20.27 | | | $ | 18.53 | | | $ | 17.35 | | | $ | 14.08 | | | $ | 17.16 | | |
| Investment operations: | |
| Net investment loss(a) | | | (.27 | ) | | | (.31 | ) | | | (.33 | ) | | | (.32 | ) | | | (.32 | ) | |
| Net realized and unrealized gain (loss) | | | 1.59 | | | | 2.05 | | | | 1.51 | | | | 3.59 | | | | (2.76 | ) | |
| Total from investment operations | | | 1.32 | | | | 1.74 | | | | 1.18 | | | | 3.27 | | | | (3.08 | ) | |
| Distributions to shareholders from: | |
| Net realized gain | | | (.65 | ) | | | – | | | | – | | | | – | | | | – | | |
| Net asset value, end of year | | $ | 20.94 | | | $ | 20.27 | | | $ | 18.53 | | | $ | 17.35 | | | $ | 14.08 | | |
| Total Return(b) | | | 6.66 | % | | | 9.39 | % | | | 6.80 | % | | | 23.22 | % | | | (17.95 | )% | |
| Ratios to Average Net Assets: | |
Expenses, including expense reductions
and expenses assumed | | | 2.19 | % | | | 2.20 | % | | | 2.30 | % | | | 2.44 | % | | | 2.43 | % | |
Expenses, excluding expense reductions
and including expenses assumed | | | 2.19 | % | | | 2.20 | % | | | 2.30 | % | | | 2.44 | % | | | 2.43 | % | |
Expenses, excluding expense reductions
and expenses assumed | | | 2.21 | % | | | 2.23 | % | | | 2.30 | % | | | 2.44 | % | | | 2.43 | % | |
| Net investment loss | | | (1.35 | )% | | | (1.61 | )% | | | (1.84 | )% | | | (2.12 | )% | | | (2.10 | )% | |
| Supplemental Data: | |
| Net assets, end of year (000) | | $ | 100,741 | | | $ | 106,809 | | | $ | 104,282 | | | $ | 94,561 | | | $ | 66,623 | | |
| Portfolio turnover rate | | | 159.86 | % | | | 97.35 | % | | | 90.23 | % | | | 78.58 | % | | | 97.63 | % | |
See Notes to Financial Statements.
15
Financial Highlights (continued)
| | | Class C Shares | |
| | | Year Ended 11/30 | |
| | | 2006 | | 2005 | | 2004 | | 2003 | | 2002 | |
| Per Share Operating Performance | |
| Net asset value, beginning of year | | $ | 20.26 | | | $ | 18.53 | | | $ | 17.34 | | | $ | 14.08 | | | $ | 17.15 | | |
| Investment operations: | |
| Net investment loss(a) | | | (.27 | ) | | | (.31 | ) | | | (.33 | ) | | | (.32 | ) | | | (.32 | ) | |
| Net realized and unrealized gain (loss) | | | 1.59 | | | | 2.04 | | | | 1.52 | | | | 3.58 | | | | (2.75 | ) | |
| Total from investment operations | | | 1.32 | | | | 1.73 | | | | 1.19 | | | | 3.26 | | | | (3.07 | ) | |
| Distributions to shareholders from: | |
| Net realized gain | | | (.65 | ) | | | – | | | | – | | | | – | | | | – | | |
| Net asset value, end of year | | $ | 20.93 | | | $ | 20.26 | | | $ | 18.53 | | | $ | 17.34 | | | $ | 14.08 | | |
| Total Return(b) | | | 6.66 | % | | | 9.34 | % | | | 6.86 | % | | | 23.15 | % | | | (17.90 | )% | |
| Ratios to Average Net Assets: | |
Expenses, including expense reductions
and expenses assumed | | | 2.19 | % | | | 2.20 | % | | | 2.30 | % | | | 2.44 | % | | | 2.42 | % | |
Expenses, excluding expense reductions
and including expenses assumed | | | 2.19 | % | | | 2.20 | % | | | 2.30 | % | | | 2.44 | % | | | 2.42 | % | |
Expenses, excluding expense reductions
and expenses assumed | | | 2.21 | % | | | 2.23 | % | | | 2.30 | % | | | 2.44 | % | | | 2.42 | % | |
| Net investment loss | | | (1.35 | )% | | | (1.61 | )% | | | (1.84 | )% | | | (2.12 | )% | | | (2.09 | )% | |
| Supplemental Data: | |
| Net assets, end of year (000) | | $ | 79,485 | | | $ | 83,339 | | | $ | 85,666 | | | $ | 79,415 | | | $ | 55,115 | | |
| Portfolio turnover rate | | | 159.86 | % | | | 97.35 | % | | | 90.23 | % | | | 78.58 | % | | | 97.63 | % | |
See Notes to Financial Statements.
16
Financial Highlights (continued)
| | | Class P Shares | |
| | | Year Ended 11/30 | |
| | | 2006 | | 2005 | | 2004 | | 2003 | | 2002 | |
| Per Share Operating Performance | |
| Net asset value, beginning of year | | $ | 21.17 | | | $ | 19.25 | | | $ | 17.92 | | | $ | 14.47 | | | $ | 17.53 | | |
| Investment operations: | |
| Net investment loss(a) | | | (.17 | ) | | | (.21 | ) | | | (.24 | ) | | | (.25 | ) | | | (.24 | ) | |
| Net realized and unrealized gain (loss) | | | 1.67 | | | | 2.13 | | | | 1.57 | | | | 3.70 | | | | (2.82 | ) | |
| Total from investment operations | | | 1.50 | | | | 1.92 | | | | 1.33 | | | | 3.45 | | | | (3.06 | ) | |
| Distributions to shareholders from: | |
| Net realized gain | | | (.65 | ) | | | – | | | | – | | | | – | | | | – | | |
| Net asset value, end of year | | $ | 22.02 | | | $ | 21.17 | | | $ | 19.25 | | | $ | 17.92 | | | $ | 14.47 | | |
| Total Return(b) | | | 7.24 | % | | | 9.97 | % | | | 7.42 | % | | | 23.84 | % | | | (17.46 | )% | |
| Ratios to Average Net Assets: | |
Expenses, including expense reductions
and expenses assumed | | | 1.64 | % | | | 1.65 | % | | | 1.77 | % | | | 1.89 | % | | | 1.88 | % | |
Expenses, excluding expense reductions
and including expenses assumed | | | 1.64 | % | | | 1.65 | % | | | 1.77 | % | | | 1.89 | % | | | 1.88 | % | |
Expenses, excluding expense reductions
and expenses assumed | | | 1.66 | % | | | 1.68 | % | | | 1.77 | % | | | 1.89 | % | | | 1.88 | % | |
| Net investment loss | | | (.79 | )% | | | (1.05 | )% | | | (1.31 | )% | | | (1.57 | )% | | | (1.55 | )% | |
| Supplemental Data: | |
| Net assets, end of year (000) | | $ | 15,856 | | | $ | 17,536 | | | $ | 12,094 | | | $ | 6,310 | | | $ | 1,620 | | |
| Portfolio turnover rate | | | 159.86 | % | | | 97.35 | % | | | 90.23 | % | | | 78.58 | % | | | 97.63 | % | |
See Notes to Financial Statements.
17
Financial Highlights (concluded)
| | | Class Y Shares | |
| | | Year Ended 11/30 | |
| | | 2006 | | 2005 | | 2004 | | 2003 | | 2002 | |
| Per Share Operating Performance | |
| Net asset value, beginning of year | | $ | 21.57 | | | $ | 19.52 | | | $ | 18.09 | | | $ | 14.56 | | | $ | 17.60 | | |
| Investment operations: | |
| Net investment loss(a) | | | (.07 | ) | | | (.12 | ) | | | (.15 | ) | | | (.20 | ) | | | (.19 | ) | |
| Net realized and unrealized gain (loss) | | | 1.70 | | | | 2.17 | | | | 1.58 | | | | 3.73 | | | | (2.85 | ) | |
| Total from investment operations | | | 1.63 | | | | 2.05 | | | | 1.43 | | | | 3.53 | | | | (3.04 | ) | |
| Distributions to shareholders from: | |
| Net realized gain | | | (.65 | ) | | | – | | | | – | | | | – | | | | – | | |
| Net asset value, end of year | | $ | 22.55 | | | $ | 21.57 | | | $ | 19.52 | | | $ | 18.09 | | | $ | 14.56 | | |
| Total Return(b) | | | 7.73 | % | | | 10.50 | % | | | 7.90 | % | | | 24.24 | % | | | (17.27 | )% | |
| Ratios to Average Net Assets: | |
Expenses, including expense reductions
and expenses assumed | | | 1.19 | % | | | 1.20 | % | | | 1.37 | % | | | 1.44 | %† | | | 1.43 | % | |
Expenses, excluding expense reductions
and including expenses assumed | | | 1.19 | % | | | 1.20 | % | | | 1.37 | % | | | 1.44 | %† | | | 1.43 | % | |
Expenses, excluding expense reductions
and expenses assumed | | | 1.22 | % | | | 1.23 | % | | | 1.37 | % | | | 1.44 | %† | | | 1.43 | % | |
| Net investment loss | | | (.32 | )% | | | (.60 | )% | | | (.80 | )% | | | (1.12 | )%† | | | (1.10 | )% | |
| Supplemental Data: | |
| Net assets, end of year (000) | | $ | 19,631 | | | $ | 8,901 | | | $ | 6,312 | | | $ | 2 | | | $ | 2 | | |
| Portfolio turnover rate | | | 159.86 | % | | | 97.35 | % | | | 90.23 | % | | | 78.58 | % | | | 97.63 | % | |
† The ratios have been determined on a Fund basis.
(a) Calculated using average shares outstanding during the year.
(b) Total return does not consider the effects of sales loads and assumes the reinvestment of all distributions.
See Notes to Financial Statements.
18
Notes to Financial Statements
1. ORGANIZATION
Lord Abbett Research Fund, Inc. (the "Company") is registered under the Investment Company Act of 1940 (the "Act") as a diversified open-end management investment company, incorporated under Maryland law on April 6, 1992. The Company currently consists of four separate funds. This report covers one of the funds and its respective classes - Lord Abbett Growth Opportunities Fund (the "Fund").
The Fund's investment objective is capital appreciation. The Fund offers five classes of shares: Classes A, B, C, P and Y, each with different expenses and dividends. A front-end sales charge is normally added to the Net Asset Value ("NAV") for Class A shares. There is no front-end sales charge in the case of the Classes B, C, P and Y shares, although there may be a contingent deferred sales charge ("CDSC") as follows: certain redemptions of Class A shares made within 12 months (24 months if shares were purchased prior to November 1, 2004) following certain purchases made without a sales charge; Class B shares redeemed before the sixth anniversary of purchase; and Class C shares redeemed before the first anniversary of purchase. Class B shares will convert to Class A shares on the eighth anniversary of the original purchase of Class B shares.
The preparation of financial statements in conformity with accounting principles generally accepted in the United States of America requires management to make certain estimates and assumptions that affect the reported amounts of assets and liabilities and disclosure of contingent assets and liabilities at the date of the financial statements and the reported amounts of increases and decreases in net assets from operations during the reporting period. Actual results could differ from those estimates.
2. SIGNIFICANT ACCOUNTING POLICIES
(a) Investment Valuation–Securities traded on any recognized U.S. or non-U.S. exchange or on NASDAQ, Inc. are valued at the last sale price or official closing price on the exchange or system on which they are principally traded. Unlisted equity securities are valued at the last quoted sale price or, if no sale price is available, at the mean between the most recently quoted bid and asked prices. Securities for which market quotations are not readily available are valued at fair value as determined by management and approved in good faith by the Board of Directors. Short-term securities with 60 days or less remaining to maturity are valued using the amortized cost method, which approximates current market value.
(b) Security Transactions–Security transactions are recorded as of the date that the securities are purchased or sold (trade date). Realized gains and losses on sales of portfolio securities are calculated using the identified-cost method. Realized and unrealized gains (losses) are allocated to each class of shares based upon the relative proportion of net assets at the beginning of the day.
(c) Investment Income–Dividend income is recorded on the ex-dividend date. Interest income is recorded on the accrual basis. Discounts are accreted and premiums are amortized using the effective interest method. Withholding taxes on foreign dividends have been provided for in accordance with the Fund's understanding of the applicable country's tax rules and rates. Investment income is allocated to each class of shares based upon the relative proportion of net assets at the beginning of the day.
(d) Federal Taxes–It is the policy of the Fund to meet the requirements of Subchapter M of the Internal Revenue Code applicable to regulated investment companies and to distribute substantially all taxable income and capital gains to its shareholders. Therefore, no Federal income tax provision is required.
(e) Expenses–Expenses incurred by the Company that do not specifically relate to an individual fund are generally allocated to the funds within the Company on a pro rata basis. Expenses, excluding class-specific expenses, are allocated to each class of shares based upon the relative
19
Notes to Financial Statements (continued)
proportion of net assets at the beginning of the day. Classes A, B, C and P shares bear their class-specific share of all expenses and fees relating to the Fund's 12b-1 Distribution Plan.
(f) Foreign Transactions–The books and records of the Fund are maintained in U.S. dollars and transactions denominated in foreign currencies are recorded in the Fund's records at the rate prevailing when earned or recorded. Asset and liability accounts that are denominated in foreign currencies are adjusted to reflect current exchange rates. The resultant exchange gains and losses are included in Net realized gain (loss) on investments and foreign currency related transactions on the Fund's Statement of Operations. The Fund does not isolate that portion of the results of operations arising as a result of changes in the foreign exchange rates from the changes in market prices of the securities.
(g) Repurchase Agreements–The Fund may enter into repurchase agreements with respect to securities. A repurchase agreement is a transaction in which the Fund acquires a security and simultaneously commits to resell that security to the seller (a bank or securities dealer) at an agreed-upon price on an agreed-upon date. The Fund requires at all times that the repurchase agreement be collateralized by cash, or by securities of the U.S. Government, its agencies, its instrumentalities, or U.S. Government sponsored enterprises having a value equal to, or in excess of, the value of the repurchase agreement (including accrued interest). If the seller of the agreement defaults on its obligation to repurchase the underlying securities at a time when the value of these securities has dec lined, the Fund may incur a loss upon disposition of the securities.
3. MANAGEMENT FEE AND OTHER TRANSACTIONS WITH AFFILIATES
Management Fee
The Company has a management agreement with Lord, Abbett & Co. LLC ("Lord Abbett") pursuant to which Lord Abbett supplies the Fund with investment management services and executive and other personnel, pays the remuneration of officers, provides office space and pays for ordinary and necessary office and clerical expenses relating to research and statistical work and supervision of the Fund's investment portfolio.
The management fee is based on average daily net assets at the following annual rates:
| First $1 billion | | | .80 | % | |
| Next $1 billion | | | .75 | % | |
| Next $1 billion | | | .70 | % | |
| Over $3 billion | | | .65 | % | |
For the fiscal year ended November 30, 2006, the effective management fee paid to Lord Abbett was at a rate of .80% of the Fund's average daily net assets.
For the fiscal year ended November 30, 2006, Lord Abbett has contractually agreed to reimburse the Fund to the extent necessary so that each class' total annual operating expenses did not exceed the following annual rates:
| Class | | % of Average Daily Net Assets | |
| A | | | 1.55 | % | |
| B | | | 2.20 | % | |
| C | | | 2.20 | % | |
| P | | | 1.65 | % | |
| Y | | | 1.20 | % | |
Lord Abbett provides certain administrative services to the Fund pursuant to an Administrative Services Agreement at an annual rate of .04% of the Fund's average daily net assets.
20
Notes to Financial Statements (continued)
The Fund, along with certain other funds managed by Lord Abbett (the "Underlying Funds") has entered into a Servicing Arrangement with Lord Abbett Diversified Equity Strategy Fund and Lord Abbett World Growth & Income Strategy Fund of Lord Abbett Investment Trust (each, a "Fund of Funds"), pursuant to which each Underlying Fund pays a portion of the expenses (excluding management fees and distribution and service fees) of each Fund of Funds in proportion to the average daily value of Underlying Fund shares owned by each Fund of Fund. Amounts paid pursuant to the Servicing Arrangement are included in Subsidy expense on the Fund's Statement of Operations and Payable to affiliates on the Fund's Statement of Assets and Liabilities.
12b-1 Distribution Plans
The Fund has adopted a distribution plan with respect to its Class A, B, C and P of shares pursuant to Rule 12b-1 under the Act, which provides for the payment of ongoing distribution and service fees to Lord Abbett Distributor LLC ("Distributor"), an affiliate of Lord Abbett. The fees are accrued daily at annual rates based upon average daily net assets as follows:
| Fee | | Class A | | Class B | | Class C | | Class P | |
| Service | | | .25 | % | | | .25 | % | | | .25 | % | | | .20 | % | |
| Distribution | | | .10 | %(1) | | | .75 | % | | | .75 | % | | | .25 | % | |
(1) The amount of CDSC collected by the Fund for the year ended November 30, 2006 was $19,476.
Class Y does not have a distribution plan.
Commissions
Distributor received the following commissions on sales of shares of the Fund, after concessions were paid to authorized dealers, for the fiscal year ended November 30, 2006:
Distributor
Commissions | | Dealers'
Concessions | |
| $ | 361,624 | | | $ | 1,924,716 | | |
Distributor received CDSCs of $10,170 and $3,345 for Class A and Class C shares, respectively, for the year ended November 30, 2006.
Two Directors and certain of the Fund's officers have an interest in Lord Abbett.
4. DISTRIBUTIONS AND CAPITAL LOSS CARRYFORWARD
Dividends from net investment income, if any, are declared and paid at least annually. Taxable net realized gains from investment transactions, reduced by capital loss carryforwards, if any, are declared and distributed to shareholders at least annually. The capital loss carryforward amount, if any, is available to offset future net capital gains. Dividends and distributions to shareholders are recorded on the ex-dividend date. The amount of dividends and distributions from net investment income and net realized capital gains are determined in accordance with Federal income tax regulations which may differ from accounting principles generally accepted in the United States of America. These book/tax differences are either considered temporary or permanent in nature. To the extent these differences are permanent in nature, such amounts are reclassified within the components of net assets based on their federal tax basis treatment; temporary di fferences do not require reclassification. Dividends and distributions which exceed earnings and profits for tax purposes are reported as a tax return of capital.
21
Notes to Financial Statements (continued)
On December 11, 2006, a long-term capital gain distribution of approximately $75,500,000 was declared by the Fund. The distribution was paid on December 15, 2006 to shareholders of record on December 14, 2006.
The tax character of distributions paid during the fiscal years ended November 30, 2006 and 2005 are as follows:
| | | 11/30/2006 | | 11/30/2005 | |
| Distributions paid from: | |
| Net long-term capital gains | | $ | 26,385,792 | | | $ | – | | |
| Total distributions paid | | $ | 26,385,792 | | | $ | – | | |
As of November 30, 2006, the components of accumulated earnings on a tax-basis are as follows:
| Undistributed long-term capital gains | | $ | 66,695,458 | | |
| Total undistributed earnings | | $ | 66,695,458 | | |
| Temporary differences | | | 11,193,868 | | |
| Unrealized gains - net | | | 105,203,109 | | |
| Total accumulated earnings - net | | $ | 183,092,435 | | |
As of November 30, 2006, the aggregate unrealized security gains and losses based on cost for U.S. Federal income tax purposes are as follows:
| Tax cost | | $ | 726,903,801 | | |
| Gross unrealized gain | | | 109,774,650 | | |
| Gross unrealized loss | | | (4,571,541 | ) | |
| Net unrealized security gain | | $ | 105,203,109 | | |
The difference between book-basis and tax-basis unrealized gains (losses) is attributable to wash sales.
Permanent items identified during the year ended November 30, 2006, have been reclassified among the components of net assets based on their tax-basis treatment as follows:
Accumulated
Net Investment
Loss | | Paid-in
Capital | |
| $ | 7,932,332 | | | $ | (7,932,332 | ) | |
The permanent difference is primarily attributable to the tax treatment of net investment losses.
5. PORTFOLIO SECURITIES TRANSACTIONS
Purchases and sales of investment securities (excluding short-term investments) for the fiscal year ended November 30, 2006 are as follows:
| Purchases | | Sales | |
| $ | 1,285,043,989 | | | $ | 1,318,286,338 | | |
There were no purchases or sales of U.S. Government securities for the fiscal year ended November 30, 2006.
22
Notes to Financial Statements (continued)
6. DIRECTORS' REMUNERATION
The Company's officers and the two Directors who are associated with Lord Abbett do not receive any compensation from the Fund for serving in such capacities. Outside Directors' fees are allocated among all Lord Abbett-sponsored funds based on the net assets of each fund. There is an equity based plan available to all outside Directors under which outside Directors must defer receipt of a portion of, and may elect to defer receipt of an additional portion of Directors' fees. The deferred amounts are treated as though equivalent dollar amounts have been invested proportionately in the funds. Such amounts and earnings accrued thereon are included in Directors' fees on the Statement of Operations and in Directors' fees payable on the Statement of Assets and Liabilities and are not deductible for U.S. Federal income tax purposes until such amounts are paid.
7. EXPENSE REDUCTIONS
The Company has entered into arrangements with the Fund's transfer agent and custodian whereby credits realized as a result of uninvested cash balances are used to reduce a portion of the Fund's expenses.
8. LINE OF CREDIT
The Fund, along with certain other funds managed by Lord Abbett, has available a $250,000,000 unsecured revolving credit facility ("Facility") from a consortium of banks, to be used for temporary or emergency purposes as an additional source of liquidity to fund redemptions of investor shares. Any borrowings under this Facility will bear interest at current market rates as defined in the agreement. The fee for this Facility is at an annual rate of .08%. As of November 30, 2006, there were no loans outstanding pursuant to this Facility nor was the Facility utilized at any time during the fiscal year ended November 30, 2006.
9. CUSTODIAN AND ACCOUNTING AGENT
State Street Bank & Trust Company ("SSB") is the Company's custodian and accounting agent. SSB performs custodial, accounting and recordkeeping functions, relating to portfolio transactions and calculating the Fund's NAV.
10. INVESTMENT RISKS
The Fund is subject to the general risks and considerations associated with equity investing. The value of an investment will fluctuate in response to movements in the stock market in general, and to the changing prospects of individual companies in which the Fund invests. The Fund has particular risks associated with growth stocks. Growth companies may grow faster than other companies, which may result in more volatility in their stock prices. In addition, if the Fund's assessment of a company's potential for growth or market condition is wrong, it could suffer losses or produce poor performance relative to other funds, even in a rising market. The Fund invests largely in mid-sized company stocks, which may be less able to weather economic shifts or other adverse developments than larger, more established companies.
These factors can affect the Fund's performance.
23
Notes to Financial Statements (concluded)
11. SUMMARY OF CAPITAL TRANSACTIONS
Transactions in shares of beneficial interest are as follows:
| | | Year Ended
November 30, 2006 | | Year Ended
November 30, 2005 | |
| Class A Shares | | Shares | | Amount | | Shares | | Amount | |
| Shares sold | | | 4,398,151 | | | $ | 93,749,387 | | | | 5,446,581 | | | $ | 109,201,116 | | |
| Reinvestment of distributions | | | 891,243 | | | | 18,635,909 | | | | – | | | | – | | |
| Shares reacquired | | | (7,369,417 | ) | | | (155,343,256 | ) | | | (6,412,545 | ) | | | (128,861,895 | ) | |
| Decrease | | | (2,080,023 | ) | | $ | (42,957,960 | ) | | | (965,964 | ) | | $ | (19,660,779 | ) | |
| Class B Shares | |
| Shares sold | | | 668,627 | | | $ | 13,581,367 | | | | 804,467 | | | $ | 15,488,888 | | |
| Reinvestment of distributions | | | 152,001 | | | | 3,041,533 | | | | – | | | | – | | |
| Shares reacquired | | | (1,279,580 | ) | | | (25,851,614 | ) | | | (1,162,326 | ) | | | (22,439,358 | ) | |
| Decrease | | | (458,952 | ) | | $ | (9,228,714 | ) | | | (357,859 | ) | | $ | (6,950,470 | ) | |
| Class C Shares | |
| Shares sold | | | 782,025 | | | $ | 15,882,912 | | | | 865,960 | | | $ | 16,738,495 | | |
| Reinvestment of distributions | | | 110,755 | | | | 2,215,064 | | | | – | | | | – | | |
| Shares reacquired | | | (1,208,564 | ) | | | (24,411,850 | ) | | | (1,377,074 | ) | | | (26,511,868 | ) | |
| Decrease | | | (315,784 | ) | | $ | (6,313,874 | ) | | | (511,114 | ) | | $ | (9,773,373 | ) | |
| Class P Shares | |
| Shares sold | | | 259,079 | | | $ | 5,609,405 | | | | 463,394 | | | $ | 9,289,835 | | |
| Reinvestment of distributions | | | 25,911 | | | | 542,311 | | | | – | | | | – | | |
| Shares reacquired | | | (393,332 | ) | | | (8,384,581 | ) | | | (263,308 | ) | | | (5,287,840 | ) | |
| Increase (decrease) | | | (108,342 | ) | | $ | (2,232,865 | ) | | | 200,086 | | | $ | 4,001,995 | | |
| Class Y Shares | |
| Shares sold | | | 545,463 | | | $ | 11,838,316 | | | | 162,602 | | | $ | 3,364,474 | | |
| Reinvestment of distributions | | | 12,893 | | | | 275,136 | | | | – | | | | – | | |
| Shares reacquired | | | (100,519 | ) | | | (2,168,787 | ) | | | (73,181 | ) | | | (1,494,207 | ) | |
| Increase | | | 457,837 | | | $ | 9,944,665 | | | | 89,421 | | | $ | 1,870,267 | | |
12. RECENT ACCOUNTING PRONOUNCEMENTS
In July 2006, the Financial Accounting Standards Board (FASB) issued Interpretation 48, Accounting for Uncertainty in Income Taxes – an interpretation of FASB Statement 109 (FIN 48). FIN 48 clarifies the accounting for income taxes by prescribing the minimum recognition threshold a tax position must meet before being recognized in the financial statements. FIN 48 is effective for fiscal years beginning after December 15, 2006. The Fund will adopt FIN 48 during 2008 and the impact to the Fund's financial statements, if any, is currently being assessed.
In September 2006, Statement of Financial Accounting Standards No.157, Fair Value Measurements (SFAS 157), was issued and is effective for fiscal years beginning after November 15, 2007. SFAS 157 defines fair value, establishes a framework for measuring fair value and expands disclosures about fair value measurements. Management is currently evaluating the impact the adoption of SFAS 157 will have on the Fund's financial statement disclosures.
24
Report of Independent Registered Public Accounting Firm
The Board of Directors and Shareholders of Lord Abbett Research Fund, Inc.:
We have audited the accompanying statement of assets and liabilities, including the schedule of investments, of Lord Abbett Research Fund, Inc. – Lord Abbett Growth Opportunities Fund (the "Fund") as of November 30, 2006, and the related statement of operations for the year then ended, the statements of changes in net assets for each of the two years in the period then ended, and the financial highlights for each of the five years in the period then ended. These financial statements and financial highlights are the responsibility of the Fund's management. Our responsibility is to express an opinion on these financial statements and financial highlights based on our audits.
We conducted our audits in accordance with standards of the Public Company Accounting Oversight Board (United States). Those standards require that we plan and perform the audit to obtain reasonable assurance about whether the financial statements and financial highlights are free of material misstatement. The Fund is not required to have, nor were we engaged to perform, an audit of its internal control over financial reporting. Our audits included consideration of internal control over financial reporting as a basis for designing audit procedures that are appropriate in the circumstances, but not for the purpose of expressing an opinion on the effectiveness of the Fund's internal control over financial reporting. Accordingly, we express no such opinion. An audit also includes examining, on a test basis, evidence supporting the amounts and disclosures in the financial statements, assessing the accounting principles used and significant estim ates made by management, as well as evaluating the overall financial statement presentation. Our procedures included confirmation of securities owned as of November 30, 2006 by correspondence with the custodian and brokers; where replies were not received from brokers, we performed other auditing procedures. We believe that our audits provide a reasonable basis for our opinion.
In our opinion, the financial statements and financial highlights referred to above present fairly, in all material respects, the financial position of Lord Abbett Research Fund, Inc. – Lord Abbett Growth Opportunities Fund as of November 30, 2006, the results of its operations for the year then ended, the changes in its net assets for each of the two years in the period then ended, and the financial highlights for each of the five years in the period then ended, in conformity with accounting principles generally accepted in the United States of America.
Deloitte & Touche LLP
New York, New York
January 26, 2007
25
Basic Information About Management
The Board of Directors (the "Board") is responsible for the management of the business and affairs of each Fund in accordance with the laws of the State of Maryland. The Board appoints officers who are responsible for the day-to-day operations of each Fund and who execute policies authorized by the Board. The Board also approves an investment adviser to each Fund and continues to monitor the cost and quality of the services provided by the investment adviser, and annually considers whether to renew the contract with the adviser. Generally, each Director holds office until his/her successor is elected and qualified or until his/her earlier resignation or removal, as provided in the Fund's organizational documents.
Lord, Abbett & Co. LLC ("Lord Abbett"), a Delaware limited liability company, is the Funds' investment adviser.
Interested Director
The following Directors are Partners of Lord Abbett and are "interested persons" of the Funds as defined in the Act. Mr. Dow and Ms. Foster are officers, directors, or trustees of each of the fourteen Lord Abbett-sponsored funds, which consist of 55 portfolios or series.
Name, Address and
Year of Birth | | Current Position
Length of Service
with Fund | | Principal Occupation
During Past Five Years | | Other
Directorships | |
Robert S. Dow
Lord, Abbett & Co. LLC
90 Hudson Street
Jersey City, NJ 07302 (1945) | | Director and Chairman
since 1996 | | Managing Partner and Chief Executive Officer of Lord Abbett since 1996. | | N/A | |
|
Daria L. Foster
Lord, Abbett & Co. LLC 90 Hudson Street
Jersey City, NJ 07302 (1954) | | Director since 2006 | | Partner and Director of Marketing and Client Service of Lord Abbett since 1990. | | N/A | |
|
Independent Directors
The following independent or outside Directors are also directors or trustees of each of the fourteen Lord Abbett-sponsored funds, which consist of 55 portfolios or series.
Name, Address and
Year of Birth | | Current Position
Length of Service
with Fund | | Principal Occupation
During Past Five Years | | Other
Directorships | |
E. Thayer Bigelow
Lord, Abbett & Co. LLC c/o Legal Dept.
90 Hudson Street
Jersey City, NJ 07302 (1941) | | Director since 1996 | | Managing General Partner, Bigelow Media, LLC
(since 2000); Senior Adviser, Time Warner Inc. (1998 - 2000); Acting Chief Executive Officer of Courtroom Television Network (1997 – 1998); President and Chief Executive Officer of Time Warner Cable Programming, Inc. (1991 – 1997). | | Currently serves as director of Adelphia Communications, Inc.; Crane Co.; and Huttig Building Products Inc. | |
|
26
Basic Information About Management (continued)
Name, Address and
Year of Birth | | Current Position
Length of Service
with Fund | | Principal Occupation
During Past Five Years | | Other
Directorships | |
William H.T. Bush
Lord, Abbett & Co. LLC c/o Legal Dept.
90 Hudson Street
Jersey City, NJ 07302 (1938) | | Director since 1998 | | Co-founder and Chairman of the Board of the
financial advisory firm of Bush-O'Donnell & Company (since 1986). | | Currently serves as director of WellPoint, Inc. (since 2002). | |
|
Robert B. Calhoun, Jr. Lord, Abbett & Co. LLC c/o Legal Dept.
90 Hudson Street
Jersey City, NJ 07302 (1942) | | Director since 1998 | | Managing Director of Monitor Clipper Partners (since 1997) and President of Clipper Asset Management Corp. (since 1991), both private equity investment funds. | | Currently serves as director of Avondale, Inc. and Interstate Bakeries Corp. | |
|
Julie A. Hill
Lord, Abbett & Co. LLC c/o Legal Dept.
90 Hudson Street
Jersey City, NJ 07302 (1946) | | Director since 2004 | | Owner and CEO of The Hill Company, a business consulting firm (since 1998); Founder, President and Owner of the Hiram-Hill and Hillsdale Development Company, a residential real estate development firm (1998 - 2000). | | Currently serves as director of WellPoint, Inc.; Resources Connection Inc.; Holcim (U.S.) Inc. (a subsidiary of Holcim Ltd.); and Lend Lease Corporation Limited. | |
|
Franklin W. Hobbs
Lord, Abbett & Co. LLC c/o Legal Dept.
90 Hudson Street
Jersey City, NJ 07302 (1947) | | Director since 2001 | | Advisor of One Equity Partners, a private equity firm (since 2004); Chief Executive Officer of Houlihan Lokey Howard & Zukin, an investment bank (2002 - 2003); Chairman of Warburg Dillon Read, an investment bank (1999 - 2001); Global Head of Corporate Finance of SBC Warburg Dillon Read (1997 - 1999); Chief Executive Officer of Dillon, Read & Co. (1994 - 1997). | | Currently serves as director of Molson Coors Brewing Company. | |
|
Thomas J. Neff
Lord, Abbett & Co. LLC c/o Legal Dept.
90 Hudson Street
Jersey City, NJ 07302 (1937) | | Director since 1992 | | Chairman of Spencer Stuart (U.S.), an executive search consulting firm (since 1996); President of Spencer Stuart (1979 - 1996). | | Currently serves as director of Ace, Ltd. (since 1997) and Hewitt Associates, Inc. | |
|
James L.L. Tullis
Lord, Abbett & Co. LLC c/o Legal Dept.
90 Hudson Street
Jersey City, NJ 07302 (1947) | | Director since 2006 | | CEO of Tullis-Dickerson and Co. Inc, a venture capital management firm (since 1990). | | Currently serves as director of Crane Co. (since 1998) and Viacell Inc.
(since 2002). | |
|
27
Basic Information About Management (continued)
Officers
None of the officers listed below have received compensation from the Funds. All the officers of the Funds may also be officers of the other Lord Abbett-sponsored funds and maintain offices at 90 Hudson Street, Jersey City, NJ 07302.
Name and
Year of Birth | | Current Position
with Fund | | Length of Service
of Current Position | | Principal Occupation
During Past Five Years | |
Robert S. Dow
(1945) | | Chief Executive Officer and Chairman | | Elected in 1996 | | Managing Partner and Chief Executive Officer of Lord Abbett (since 1996). | |
|
Daria L. Foster
(1954) | | President | | Elected in 2006 | | Partner and Director of Marketing and Client Service of Lord Abbett (since 1990). | |
|
Robert P. Fetch
(1953) | | Executive Vice President | | Elected in 1997 | | Partner and Senior Investment Manager, joined Lord Abbett in 1995. | |
|
| Daniel H. Frascarelli (1954) | | Executive Vice President | | Elected in 2005 | | Partner and Director of Large Cap Core Equity, joined Lord Abbett in 1990. | |
|
Frederick Ruvkun
(1957) | | Executive Vice President | | Elected in 2006 | | Investment Manager, joined Lord Abbett in 2006; formerly served as Managing Director and Leader of the Small Cap Growth Team and a Portfolio Manager of SMID Cap Growth Assets at J & W Seligman & Company. | |
|
| Christopher J. Towle (1957) | | Executive Vice President | | Elected in 2001 | | Partner and Investment Manager, joined Lord Abbett in 1987. | |
|
Edward K. von der Linde
(1960) | | Executive Vice President | | Elected in 2001 | | Partner and Investment Manager, joined Lord Abbett in 1988. | |
|
James Bernaiche
(1956) | | Chief Compliance Officer | | Elected in 2004 | | Chief Compliance Officer, joined Lord Abbett in 2001. | |
|
Joan A. Binstock
(1954) | | Chief Financial Officer and Vice President | | Elected in 1999 | | Partner and Chief Operations Officer, joined Lord Abbett in 1999. | |
|
Evan B. Carpenter
(1972) | | Vice President | | Elected in 2006 | | Research Analyst, joined Lord Abbett in 2003; prior thereto he served as an Equity Research Analyst at Gabelli Asset Management (2000 - 2003). | |
|
John K. Forst
(1960) | | Vice President and Assistant Secretary | | Elected in 2005 | | Deputy General Counsel, joined Lord Abbett in 2004; Managing Director and Associate General Counsel at New York Life Investment Management LLC (2002 - 2003). | |
|
28
Basic Information About Management (concluded)
Name and
Year of Birth | | Current Position
with Fund | | Length of Service
of Current Position | | Principal Occupation
During Past Five Years | |
| Lawrence H. Kaplan (1957) | | Vice President and Secretary | | Elected in 1997 | | Partner and General Counsel, joined Lord Abbett in 1997. | |
|
Robert G. Morris
(1944) | | Vice President | | Elected in 1996 | | Partner and Chief Investment Officer, joined Lord Abbett in 1991. | |
|
| A. Edward Oberhaus, III (1959) | | Vice President | | Elected in 1996 | | Partner and Manager of Equity Trading, joined Lord Abbett in 1983. | |
|
| Christina T. Simmons (1957) | | Vice President and Assistant Secretary | | Elected in 2000 | | Assistant General Counsel, joined Lord Abbett in 1999. | |
|
Paul J. Volovich
(1973) | | Vice President | | Elected in 2004 | | Investment Manager, joined Lord Abbett in 1997. | |
|
Bernard J. Grzelak
(1971) | | Treasurer | | Elected in 2003 | | Director of Fund Administration, joined Lord Abbett in 2003; formerly Vice President, Lazard Asset Management LLC (2000 - 2003). | |
|
Please call 888-522-2388 for a copy of the Statement of Additional Information (SAI), which contains further information about the Funds' Directors. It is available free upon request.
29
Householding
The Company has adopted a policy that allows it to send only one copy of the Fund's Prospectus, proxy material, annual report and semiannual report to certain shareholders, residing at the same "household." This reduces Fund expenses, which benefits you and other shareholders. If you need additional copies or do not want your mailings to be "householded," please call Lord Abbett at 800-821-5129 or send a written request with your name, the name of your fund or funds and your account number or numbers to Lord Abbett Family of Funds, P.O. Box 219336, Kansas City, MO 64121.
Proxy Voting Policies, Procedures and Record
A description of the policies and procedures that Lord Abbett uses to vote proxies related to the Fund's portfolio securities, and information on how Lord Abbett voted the Fund's proxies during the 12 month period ended June 30, 2006, are available without charge, upon request, (i) by calling 888-522-2388; (ii) on Lord Abbett's website at www.LordAbbett.com; and (iii) on the Securities and Exchange Commission's ("SEC") website at www.sec.gov.
Shareholder Reports and Quarterly Portfolio Disclosure
The Fund is required to file its complete schedule of portfolio holdings with the SEC for its first and third fiscal quarters on Form N-Q. Copies of the filings will be available without charge, upon request on the SEC's website at www.sec.gov and may be available by calling Lord Abbett at 800-821-5129. You can also obtain copies of Form N-Q by (i) visiting the SEC's Public Reference Room in Washington, DC (information on the operation of the Public Reference Room may be obtained by calling 800-SEC-0330); (ii) sending your request and a duplicating fee to the SEC's Public Reference Room, Washington, DC 20549-0102; or (iii) sending your request electronically to publicinfo@sec.gov.
Tax Information
All of the distributions paid to shareholders during the fiscal year ended November 30, 2006 represent long-term capital gains.
30
Lord Abbett Research Fund, Inc.
Lord Abbett Growth Opportunities Fund
LAGOF-2-1106
(1/07)

This report when not used for the general
information of shareholders of the fund, is to
be distributed only if preceded or accompanied
by a current fund prospectus.
Lord Abbett mutual fund shares are distributed by
LORD ABBETT DISTRIBUTOR LLC.
Item 2: Code of Ethics.
(a) In accordance with applicable requirements, the Registrant adopted a Sarbanes-Oxley Code of Ethics on June 19, 2003 that applies to the principal executive officer and senior financial officers of the Registrant (“Code of Ethics”). The Code of Ethics was in effect during the fiscal year ended November 30, 2006 (the “Period”).
(b) Not applicable.
(c) The Registrant has not amended the Code of Ethics as described in Form N-CSR during the Period.
(d) The Registrant has not granted any waiver, including an implicit waiver, from a provision of the Code of Ethics as described in Form N-CSR during the Period.
(e) Not applicable.
(f) See Item 12(a)(1) concerning the filing of the Code of Ethics. The Registrant will provide a copy of the Code of Ethics to any person without charge, upon request. To obtain a copy, please call Lord Abbett at 800-821-5129.
Item 3: Audit Committee Financial Expert.
The Registrant’s Board of Directors has determined that each of the following independent Directors who are members of the audit committee are audit committee financial experts: E. Thayer Bigelow, Robert B. Calhoun, and Franklin W. Hobbs. Each of these persons is independent within the meaning of the Form N-CSR.
Item 4: Principal Accountant Fees and Services.
In response to sections (a), (b), (c) and (d) of Item 4, the aggregate fees billed to the Registrant for the fiscal years ended November 30, 2006 and 2005 by the Registrant’s principal accounting firm, Deloitte & Touche LLP, the member firms of Deloitte Touche Tohmatsu and their respective affiliates (collectively, “Deloitte”) were as follows:
| | Fiscal year ended: | |
| | 2006 | | 2005 | |
Audit Fees {a} | | $ | 140,000 | | $ | 136,000 | |
Audit-Related Fees {b} | | 596 | | 668 | |
Total audit and audit-related fees | | 140,596 | | 136,668 | |
| | | | | |
Tax Fees {c} | | 27,573 | | 27,334 | |
All Other Fees | | -0- | | -0- | |
| | | | | |
Total Fees | | $ | 168,169 | | $ | 164,002 | |
{a} Consists of fees for audits of the Registrant’s annual financial statements.
{b} Consists of the Registrant’s proportionate share of fees for performing certain agreed-upon procedures regarding compliance with the provisions of Rule 17a-7 of the Investment Company Act of 1940 and related Board approved procedures.
{c} Fees for the fiscal year ended November 30, 2006 and 2005 consist of fees for preparing the U.S. Income Tax Return for Regulated Investment Companies, New Jersey Corporation Business Tax Return, New Jersey Annual Report Form, U.S. Return of Excise Tax on Undistributed Income of Investment Companies, IRS Forms 1099-MISC and 1096 Annual Summary and Transmittal of U.S. Information Returns.
(e) (1) Pursuant to Rule 2-01(c) (7) of Regulation S-X, the Registrant’s Audit Committee has adopted pre-approval policies and procedures. Such policies and procedures generally provide that the Audit Committee must pre-approve:
· any audit, audit-related, tax, and other services to be provided to the Lord Abbett Funds, including the Registrant, and
· any audit-related, tax, and other services to be provided to the Registrant’s investment adviser and any entity controlling, controlled by or under common control with the investment adviser that provides ongoing services to one or more Funds comprising the Registrant if the engagement relates directly to operations and financial reporting of a Fund, by the independent auditor to assure that the provision of such services does not impair the auditor’s independence.
The Audit Committee has delegated pre-approval authority to its Chairman, subject to a fee limit of $10,000 per event, and not to exceed $25,000 annually. The Chairman will report any pre-approval decisions to the Audit Committee at its next scheduled meeting. Unless a type of service to be provided by the independent auditor has received general pre-approval, it must be pre-approved by the Audit Committee. Any proposed services exceeding pre-approved cost levels will require specific pre-approval by the Audit Committee.
(e) (2) The Registrant’s Audit Committee has approved 100% of the services described in this Item 4 (b) through (d).
(f) Not applicable.
(g) The aggregate non-audit fees billed by Deloitte for services rendered to the Registrant are shown above in the response to Item 4 (a), (b), (c) and (d) as “All Other Fees”.
The aggregate non-audit fees billed by Deloitte for services rendered to the Registrant’s investment adviser, Lord, Abbett & Co. LLC (“Lord Abbett”), for the fiscal years ended November 30, 2006 and 2005 were:
| | Fiscal year ended: | |
| | 2006 | | 2005 | |
All Other Fees {a} | | $ | 105,500 | | $ | 105,500 | |
| | | | | | | |
{a} Consist of fees for Independent Services Auditors’ Report on Controls Placed in Operation and Tests of Operating Effectiveness related to Lord Abbett’s Asset Management Services (“SAS 70 Report”).
The aggregate non-audit fees billed by Deloitte for services rendered to entities under the common control of Lord Abbett (i.e., Lord Abbett Distributor LLC, the Registrant’s principal underwriter) for the fiscal years ended November 30, 2006 and 2005 were:
| | Fiscal year ended: | |
| | 2006 | | 2005 | |
All Other Fees | | $ | - 0 - | | $ | - 0 - | |
| | | | | | | |
(h) The Registrant’s Audit Committee has considered the provision of non-audit services that were rendered to the Registrant’s investment adviser, and any entity controlling, controlled by or under common control with the investment adviser that provides ongoing services to the Registrant, that were not pre-approved pursuant to Rule 2-01 (c)(7)(ii) of Regulation S-X and has determined that the provision of such services is compatible with maintaining Deloitte’s independence.
Item 5: Audit Committee of Listed Registrants.
Not applicable.
Item 6: Schedule of Investments.
Not applicable.
Item 7: Disclosure of Proxy Voting Policies and Procedures for Closed-End Management Investment Companies.
Not applicable.
Item 8: Portfolio Managers of Closed-End Management Investment Companies.
Not applicable.
Item 9: Purchases of Equity Securities by Closed-End Management Investment Company and Affiliated Purchasers.
Not applicable.
Item 10: Submission of Matters to a Vote of Security Holders.
At the June 22, 2006 meetings of the Nominating and Governance Committees (the “Committee”) of the Boards of each of the Lord Abbett Funds, the Committee adopted policies and procedures for the nomination of independent directors/trustees (“Procedures”). The Procedures provide criteria for the nomination of independent directors/trustees, as well as a process for identifying and evaluating candidates. With respect to shareholder recommendations, it is the Committee’s policy to consider director/trustee nominations recommended by shareholders using the same criteria the Committee uses in considering potential director/trustee nominations from other sources. The Committee believes that directors/trustees must represent all shareholders and not just a limited set of shareholders. A copy of the Procedures may be found at www.LordAbbett.com.
Item 11: Controls and Procedures.
(a) Based on their evaluation of the Registrant’s disclosure controls and procedures (as defined in Rule 30a-3(c) under the Investment Company Act of 1940) as of a date within 90 days prior to the filing date of this report, the Chief Executive Officer and Chief Financial Officer of the Registrant have concluded that such disclosure controls and procedures are reasonably designed and effective to ensure that material information relating to the Registrant, including its consolidated subsidiaries, is made known to them by others within those entities.
(b) There were no significant changes in the Registrant’s internal control over financial reporting (as defined in Rule 30a-3(d) under the Investment Company Act of 1940) that occurred during the second fiscal quarter of the period covered by this report that have materially affected, or are reasonably likely to materially affect, the Registrant’s internal control over financial reporting.
Item 12: Exhibits.
(a)(1) Amendments to Code of Ethics – Not applicable.
(a)(2) Certification of each principal executive officer and principal financial officer of the Registrant as required by Rule 30a-2 under the Act (17 CFR 270.30a-2) is attached hereto as a part of EX-99.CERT.
(a)(3) Not applicable.
(b) Certification of each principal executive officer and principal financial officer of the Registrant as required by Section 906 of the Sarbanes-Oxley Act of 2002 is attached hereto as a part of EX-99.906CERT.
SIGNATURES
Pursuant to the requirements of the Securities Exchange Act of 1934 and the Investment Company Act of 1940, the Registrant has duly caused this report to be signed on its behalf by the undersigned, thereunto duly authorized.
| LORD ABBETT RESEARCH FUND, INC. |
| |
| |
| /s/ Robert S. Dow | |
| Robert S. Dow |
| Chief Executive Officer and Chairman |
| |
| |
| /s/Joan A. Binstock | |
| Joan A. Binstock |
| Chief Financial Officer and Vice President |
| |
Date: January 26, 2007
Pursuant to the requirements of the Securities Exchange Act of 1934 and the Investment Company Act of 1940, this report has been signed below by the following persons on behalf of the Registrant and in the capacities and on the dates indicated.
| LORD ABBETT RESEARCH FUND, INC. |
| |
| |
| /s/ Robert S. Dow | |
| Robert S. Dow |
| Chief Executive Officer and Chairman |
| |
| |
| /s/Joan A. Binstock | |
| Joan A. Binstock |
| Chief Financial Officer and Vice President |
| |
Date: January 26, 2007