UNITED STATES
SECURITIES AND EXCHANGE COMMISSION
Washington, D.C. 20549
FORM N-CSR
CERTIFIED SHAREHOLDER REPORT OF REGISTERED
MANAGEMENT INVESTMENT COMPANIES
Investment Company Act file number | 811-06650 |
|
LORD ABBETT RESEARCH FUND, INC. |
(Exact name of registrant as specified in charter) |
|
90 Hudson Street, Jersey City, NJ | | 07302 |
(Address of principal executive offices) | | (Zip code) |
|
Lawrence B. Stoller, Vice President & Assistant Secretary
90 Hudson Street, Jersey City, NJ 07302 |
(Name and address of agent for service) |
|
Registrant’s telephone number, including area code: | (800) 201-6984 | |
|
Date of fiscal year end: | 11/30 | |
|
Date of reporting period: | 11/30/2007 | |
| | | | | | | | |
Item 1: Report to Shareholders.
2007
LORD ABBETT ANNUAL REPORT

Lord Abbett
Large Cap Core Fund
Small Cap Value Fund
For the fiscal year ended November 30, 2007

Lord Abbett Research Fund
Lord Abbett Large Cap Core Fund and
Lord Abbett Small Cap Value Fund
Annual Report
For the fiscal year ended November 30, 2007
Dear Shareholders: We are pleased to provide you with this overview of the Lord Abbett Large Cap Core Fund's and the Lord Abbett Small Cap Value Fund's performance for the fiscal year ended November 30, 2007. On this page and the following pages, we discuss the major factors that influenced performance. For detailed and more timely information about the Funds, please visit our Website at www.lordabbett.com, where you also can access the quarterly commentaries by the Funds' portfolio managers.
General information about Lord Abbett mutual funds, as well as in-depth discussions of market trends and investment strategies, is also provided in Lord Abbett Insights, a newsletter accompanying your quarterly account statements. We also encourage you to call Lord Abbett at 888-522-2388 and speak to one of our professionals if you would like more information.
Thank you for investing in Lord Abbett mutual funds. We value the trust that you place in us and look forward to serving your investment needs in the years to come.
Best regards,

Robert S. Dow
Chairman

From left to right: Robert S. Dow, Director and Chairman of the Lord Abbett Funds; E. Thayer Bigelow, Independent Lead Director of the Lord Abbett Funds; and Daria L. Foster, Director and President of the Lord Abbett Funds.
Q: What were the overall market conditions during the fiscal year ended November 30, 2007?
A: The equity market, as measured by the S&P 500® Index,1 gained a total return of 7.7% in the fiscal year ended November 30, 2007, but not without considerable volatility along the way. In fact, there were three significant corrections in the fiscal year, including two declines in excess of 9%. In the first correction, in February and March, the S&P 500 dropped nearly 6% due to a sharp sell-off that began in the Shan ghai stock index. Fortunately, the
1
sell-off proved to be short-lived, with the market ultimately establishing a new all-time high in July. The euphoria did not last long, however, as the market's second major correction, which knocked the index down more than 9%, began in mid-July. With a little help from the Federal Reserve Board (the Fed), the market recovered yet again and set another record high in early October. After establishing its second all-time high, the market began to tumble; this time the S&P 500 declined 10% – the first decline of at least 10% in four and a half years. Despite falling precipitously through most of November, the market ended the year with a week that included one of the best back-to-back performances in more than five years.
In the past 12 months the growth indexes (as measured by the S&P Composite Growth Index2) outperformed the value indexes (as measured by the S&P Composite Value Index2) while large cap companies (as measured by the S&P 500 Index) narrowly outpaced the rest of the market. From a style box perspective, the leading investment style for the past 12 months was mid cap growth (as measured by the S&P MidCap 400/Citigroup Growth Index3) with a 12-month total return of 12%, while small cap value (as measured by S&P SmallCap 600/Citigroup Value Index4) trailed all others with a 12-month total return of -4.2%.
At the sector level, eight of the 10 major industry groups in the S&P 500 posted double-digit 12-month total returns, while only two sectors declined in the year. Unfortunately, the sectors that declined – consumer discretionary and financials – account for nearly 30% (on a market-weight basis) of the S&P 500, which cost the market approximately 257 basis points in overall performance.
Lord Abbett Large Cap Core Fund
Q: How did the Large Cap Core Fund perform during the fiscal year ended November 30, 2007?
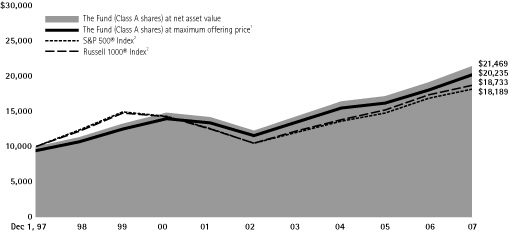
A: The Fund returned 12.05%, reflecting performance at the net asset value (NAV) of Class A shares with all distributions reinvested, compared with its benchmark, the Russell 1000® Index,5 which returned 7.83% over the same period.
Q: What were the most significant factors affecting performance?
A: The greatest contributors to the Fund's performance relative to its benchmark for the one-year period were the healthcare sector, followed by the materials and processing sector and (owing to an underweight position) the financial services sector.
Among the individual holdings that contributed to performance were materials and processing holding Monsanto Co. (the Fund's number-one contributor), a provider of technology-based solutions and agricultural products for growers and downstream customers in the agricultural markets; healthcare holdings Medco Health Solutions, Inc., a
2
pharmacy benefit manager, and Express Scripts, Inc., a full-service pharmacy benefit management and specialty managed care company; consumer discretionary holding GameStop Corp., an operator of specialty electronic game and PC entertainment software stores; and consumer staples holding Procter & Gamble, a worldwide consumer products company.
The worst detractors from the Fund's performance relative to its benchmark were the integrated oils sector (owing to an underweight position), the utilities sector, and (owing to an underweight position) the other energy sector (which includes oil service companies, as well as smaller exploration and production companies, and independent refiners).
Among the individual holdings that detracted from performance were financial services holdings Citigroup Inc. (the Fund's number-one detractor), a diversified financial services holding company; Fannie Mae, a provider of guaranteed mortgage-backed securities to facilitate housing ownership for low to middle-income Americans; and Freddie Mac, a stockholder-owned corporation chartered by Congress in 1970 to create a continuous flow of funds to mortgage lenders; and consumer discretionary holdings Kohl's Corp., an operator of a chain of family-oriented, specialty department stores, and Coach, Inc., a designer of leather goods.
The Fund's portfolio is actively managed and, therefore, its holdings and the weightings of a particular issuer or particular sector as a percentage of portfolio assets are subject to change. Sectors may include many industries.
Lord Abbett Small Cap Value Fund
Q: How did the Small Cap Value Fund perform during the fiscal year ended November 30, 2007?
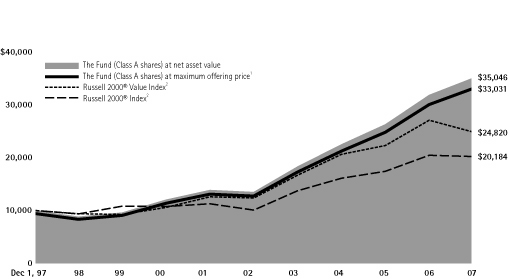
A: The Fund returned 10.08%, reflecting performance at the net asset value (NAV) of Class A shares with all distributions reinvested, compared to its benchmark, the Russell 2000® Value Index,6 which returned -8.22% over the same period.
Q: What were the most significant factors affecting performance?
A: The greatest contributors to the Fund's performance relative to its benchmark for the one-year period were the materials and processing sector, followed by the financial services sector and the producer durables sector.
Among the individual holdings that contributed to performance were materials and processing holdings The Shaw Group Inc. (the Fund's number-one contributor), a provider of engineering and construction services serving the energy and environmental infrastructure market; Quanex Corp., a maker of specialized metal products made from carbon and alloy steel and aluminum; Hexcel Corp., a developer
3
of reinforcement products, composite materials and engineered products; producer durables holding Curtiss-Wright Corp., a manufacturer of precision components and systems; and technology holding FLIR Systems, Inc., a designer of thermal imaging and broadcast camera systems for the commercial and government markets.
The consumer staples sector was the only sector that detracted from performance, owing to the Fund's underweight position.
Among the individual holdings that detracted from performance were materials and processing holdings Rogers Corp. (the Fund's number-one detractor), a manufacturer of specialty materials and components for applications in the communications, computer, imaging, consumer, and transportation markets, and NCI Building Systems, Inc., a designer of engineered building systems and products for the building industry; utilities holding PNM Resources Inc., a generator of electricity to customers in New Mexico; consumer discretionary holding Ruby Tuesday, Inc., an operator of a chain of specialty restaurants; and financial services holding Financial Federal Corp., a provider of installment financing and leasing programs.
The Fund's portfolio is actively managed and, therefore, its holdings and the weightings of a particular issuer or particular sector as a percentage of portfolio assets are subject to change. Sectors may include many industries.
Note: Class A shares purchased subject to a front-end sales charge have no contingent deferred sales charge (CDSC). However, certain purchases of Class A shares made without a front-end sales charge may be subject to a CDSC of 1% if the shares are redeemed within 12 months of the purchase. Please see section "Your Investment – Purchases" in the prospectus for more information on redemptions that may be subject to a CDSC.
A prospectus contains important information about a fund, including its investment objectives, risks, charges, and ongoing expenses, which an investor should carefully consider before investing. To obtain a prospectus on any Lord Abbett mutual fund, please contact your investment professional or Lord Abbett Distributor LLC at 888-522-2388 or visit our Website at www.lordabbett.com. Read the prospectus carefully before investing.
4
1 The S&P 500® Index is widely regarded as the standard for measuring large cap U.S. stock market performance and includes a representative sample of leading companies in leading industries.
2 The S&P Composite 1500® Index combines the S&P 500®, S&P 400® (an index of mid-cap companies), and the S&P SmallCap 600® indexes to create a broad market portfolio representing 90% of U.S. equities. Companies in this index are split into two groups ba sed on factors including price-to-book ratio to create the Composite Growth and Composite Value indexes.
3 The S&P MidCap 400/Citigroup Growth Index measures the performance of growth-oriented, mid-size capitalization U.S. companies. The S&P MidCap 400/Citigroup Growth Index contains those securities in the S&P MidCap 400 Index with higher price-to-book ratios.
4 The S&P Small Cap 600/Citigroup Value Index is designed to provide a comprehensive measure of small-cap U.S. equity value performance. It is an unmanaged float-adjusted market capitalization-weighted index comprised of stocks representing approximately half the market capitalization of the S&P Small Cap 600 Index that have been identified as being on the value end of the growth-value spectrum.
5 The Russell 1000® Index measures the performance of the 1,000 largest companies in the Russell 3000® Index, which represents approximately 92% of the total market capitalization of the Russell 3000 Index.
6 The Russell 2000® Value Index measures the performance of those Russell 2000 companies with lower price-to-book ratios and lower forecasted growth values.
Indexes are unmanaged, do not reflect the deduction of fees or expenses, and are not available for direct investment.
Important Performance and Other Information
Performance data quoted reflect past performance and are no guarantee of future results. Current performance may be higher or lower than the performance quoted. The investment return and principal value of an investment in the Fund will fluctuate so that shares, on any given day or when redeemed, may be worth more or less than their original cost. You can obtain performance data current to the most recent month-end by calling Lord Abbett at 888-522-2388 or referring to our Website at www.lordabbett.com.
Except where noted, comparative Fund performance does not account for the deduction of sales charges and would be different if sales charges were included. The Funds offer additional classes of shares with distinct pricing options. For a full description of the differences in pricing alternatives, please see each Fund's prospectus.
The views of each Fund's management and the portfolio holdings described in this report are as of November 30, 2007; these views and portfolio holdings may have changed subsequent to this date, and they do not guarantee the future performance of the markets or each Fund. Information provided in this report should not be considered a recommendation to purchase or sell securities.
A Note about Risk: See Notes to Financial Statements for a discussion of investment risks. For a more detailed discussion of the risks associated with the Funds, please see each Fund's prospectus.
Mutual funds are not insured by the FDIC, are not deposits or other obligations of, or guaranteed by, banks, and are subject to investment risks including possible loss of principal amount invested.
5
Large Cap Core Fund
Investment Comparison
Below is a comparison of a $10,000 investment in Class A shares with the same investment in the S&P 500® Index and the Russell 1000® Index, assuming reinvestment of all dividends and distributions. The performance of other classes will be greater than or less than the performance shown in the graph below due to different sales loads and expenses applicable to such classes. The graph and performance table below do not reflect the deduction of taxes that a shareholder would pay on fund distributions or the redemption of fund shares. Past performance is no guarantee of future results.
Average Annual Total Return at Maximum Applicable
Sales Charge for the Periods Ended November 30, 2007
| | | 1 Year | | 5 Years | | 10 Years | | Life of Class | |
| Class A3 | | | 5.60 | % | | | 10.50 | % | | | 7.30 | % | | | — | | |
| Class B4 | | | 7.29 | % | | | 10.97 | % | | | 7.23 | % | | | — | | |
| Class C5 | | | 11.32 | % | | | 11.10 | % | | | 7.26 | % | | | — | | |
| Class F6 | | | — | | | | — | | | | — | | | | -1.67 | %* | |
| Class I7 | | | 12.40 | % | | | 12.21 | % | | | — | | | | 6.00 | % | |
| Class P8 | | | 11.93 | % | | | 11.75 | % | | | — | | | | 6.57 | % | |
| Class R29 | | | — | | | | — | | | | — | | | | -1.76 | %* | |
| Class R310 | | | — | | | | — | | | | — | | | | -1.73 | %* | |
1 Reflects the deduction of the maximum initial sales charge of 5.75%.
2 Performance for each unmanaged index does not reflect transaction costs, management fees or sales charges. The performance of each index is not necessarily representative of the Fund's performance.
3 Total return, which is the percentage change in net asset value, after deduction of the maximum initial sales charge of 5.75% applicable to Class A shares, with all dividends and distributions reinvested for the periods shown ended November 30, 2007, is calculated using the SEC-required uniform method to compute such return.
4 Performance reflects the deduction of a CDSC of 4% for 1 year, 1% for 5 years and 0% for 10 years.
5 The 1% CDSC for Class C shares normally applies before the first anniversary of the purchase date. Performance is at net asset value.
6 Class F shares commenced operations on September 28, 2007. The SEC effective date was September 14, 2007. Performance for the class began September 28, 2007. Performance is at net asset value.
7 Effective September 28, 2007, Class Y was renamed Class I. Class I shares commenced operations on May 3, 1999. Performance is at net asset value.
8 Class P shares commenced operations on April 5, 1999. Performance is at net asset value.
9 Class R2 shares commenced operations on September 28, 2007. The SEC effective date was September 14, 2007. Performance for the class began September 28, 2007. Performance is at net asset value.
10 Class R3 shares commenced operations on September 28, 2007. The SEC effective date was September 14, 2007. Performance for the class began September 28, 2007. Performance is at net asset value.
* Because Class F, R2 and R3 shares have existed for less than one year, average annual returns are not provided.
6
Small Cap Value Fund
Investment Comparison
Below is a comparison of a $10,000 investment in Class A shares with the same investment in both the Russell 2000® Index and Russell 2000® Value Index, assuming reinvestment of all dividends and distributions. The performance of other classes will be greater than or less than the performance shown in the graph below due to different sales loads and expenses applicable to such classes. The graph and performance table below do not reflect the deduction of taxes that a shareholder would pay on fund distributions or the redemption of fund shares. Past performance is no guarantee of future results.
Average Annual Total Return at Maximum Applicable Sales Charge for the Periods Ended November 30, 2007
| | | 1 Year | | 5 Years | | 10 Years | | Life of Class | |
| Class A3 | | | 3.75 | % | | | 19.60 | % | | | 12.69 | % | | | — | | |
| Class B4 | | | 5.58 | % | | | 20.13 | % | | | 12.62 | % | | | — | | |
| Class C5 | | | 9.32 | % | | | 20.23 | % | | | 12.64 | % | | | — | | |
| Class F6 | | | — | | | | — | | | | — | | | | -1.49 | %* | |
| Class I7 | | | 10.42 | % | | | 21.43 | % | | | — | | | | 13.81 | % | |
| Class P8 | | | 9.95 | % | | | 20.89 | % | | | — | | | | 15.82 | % | |
1 Reflects the deduction of the maximum initial sales charge of 5.75%.
2 Performance for each unmanaged index does not reflect transaction costs, management fees or sales charges. The performance of each index is not necessarily representative of the Fund's performance.
3 Total return, which is the percentage change in net asset value, after deduction of the maximum initial sales charge of 5.75% applicable to Class A shares, with all dividends and distributions reinvested for the periods shown ended November 30, 2007, is calculated using the SEC-required uniform method to compute such return.
4 Performance reflects the deduction of a CDSC of 4% for 1 year, 1% for 5 years and 0% for 10 years.
5 The 1% CDSC for Class C shares normally applies before the first anniversary of the purchase date. Performance is at net asset value.
6 Class F shares commenced operations on September 28, 2007. The SEC effective date was September 14, 2007. Performance for the class began September 28, 2007. Performance is at net asset value.
7 Effective September 28, 2007, Class Y was renamed Class I. Class I shares commenced operations on December 30, 1997. Performance is at net asset value.
8 Class P shares commenced operations on June 23, 1999. Performance is at net asset value.
* Because Class F shares have existed for less than one year, average annual returns are not provided.
7
Expense Examples
As a shareholder of a Fund, you incur two types of costs: (1) transaction costs, including sales charges on purchase payments (these charges vary among the share classes); and (2) ongoing costs, including management fees; distribution and service (12b-1) fees (these charges vary among the share classes); and other Fund expenses. This Example is intended to help you understand your ongoing costs (in dollars) of investing in each Fund and to compare these costs with the ongoing costs of investing in other mutual funds.
The Example is based on an investment of $1,000 invested at the beginning of the period and held for the entire period (June 1, 2007 through November 30, 2007).
Actual Expenses
For each class of each Fund, the first line of the applicable table on the following pages provides information about actual account values and actual expenses. You may use the information in this line, together with the amount you invested, to estimate the expenses that you paid over the period. Simply divide your account value by $1,000 (for example, an $8,600 account value divided by $1,000 = 8.6), then multiply the result by the number in the first line under the heading entitled "Expenses Paid During the Period 6/1/07 – 11/30/07" to estimate the expenses you paid on your account during this period.
Hypothetical Example for Comparison Purposes
For each class of each Fund, the second line of the applicable table on the following pages provides information about hypothetical account values and hypothetical expenses based on the Fund's actual expense ratio and an assumed rate of return of 5% per year before expenses, which is not the Fund's actual return. The hypothetical account values and expenses may not be used to estimate the actual ending account balance or expenses you paid for the period. You may use this information to compare the ongoing costs of investing in each Fund and other funds. To do so, compare this 5% hypothetical example with the 5% hypothetical examples that appear in the shareholder reports of the other funds.
8
Large Cap Core Fund
Please note that the expenses shown in the table are meant to highlight your ongoing costs only and do not reflect any transactional costs, such as sales charges. Therefore, the second line of the table is useful in comparing ongoing costs only, and will not help you determine the relative total costs of owning different funds. In addition, if these transactional costs were included, your costs would have been higher.
| | | Beginning
Account
Value | | Ending
Account
Value | | Expenses
Paid During
Period† | |
| | | 6/1/07 | | 11/30/07 | | 6/1/07 –
11/30/07 | |
| Class A | |
| Actual | | $ | 1,000.00 | | | $ | 1,017.30 | | | $ | 6.57 | | |
| Hypothetical (5% Return Before Expenses) | | $ | 1,000.00 | | | $ | 1,018.55 | | | $ | 6.58 | | |
| Class B | |
| Actual | | $ | 1,000.00 | | | $ | 1,014.20 | | | $ | 9.85 | | |
| Hypothetical (5% Return Before Expenses) | | $ | 1,000.00 | | | $ | 1,015.30 | | | $ | 9.85 | | |
| Class C | |
| Actual | | $ | 1,000.00 | | | $ | 1,014.10 | | | $ | 9.85 | | |
| Hypothetical (5% Return Before Expenses) | | $ | 1,000.00 | | | $ | 1,015.30 | | | $ | 9.85 | | |
| Class F | |
| Actual | | $ | 1,000.00 | | | $ | 983.30 | | | $ | 1.79 | | |
| Hypothetical (5% Return Before Expenses) | | $ | 1,000.00 | | | $ | 1,023.25 | | | $ | 1.83 | | |
| Class I | |
| Actual | | $ | 1,000.00 | | | $ | 1,019.10 | | | $ | 4.81 | | |
| Hypothetical (5% Return Before Expenses) | | $ | 1,000.00 | | | $ | 1,020.31 | | | $ | 4.81 | | |
| Class P | |
| Actual | | $ | 1,000.00 | | | $ | 1,016.90 | | | $ | 7.08 | | |
| Hypothetical (5% Return Before Expenses) | | $ | 1,000.00 | | | $ | 1,018.06 | | | $ | 7.08 | | |
| Class R2 | |
| Actual | | $ | 1,000.00 | | | $ | 982.40 | | | $ | 2.50 | | |
| Hypothetical (5% Return Before Expenses) | | $ | 1,000.00 | | | $ | 1,022.54 | | | $ | 2.55 | | |
| Class R3 | |
| Actual | | $ | 1,000.00 | | | $ | 982.70 | | | $ | 2.42 | | |
| Hypothetical (5% Return Before Expenses) | | $ | 1,000.00 | | | $ | 1,022.64 | | | $ | 2.46 | | |
† For each class of the Fund, expenses are equal to the annualized expense ratio for such class (1.30% for Class A, 1.95% for Classes B and C, 1.03% for Class F, 0.95% for Class I, 1.40% for Class P, 1.44% for Class R2, and 1.39% for Class R3) multiplied by the average account value over the period, multiplied by 183/365 for Class A, B, C, I and P (to reflect one-half year period) and multiplied by 64/365 for Class F, R2 and R3 (to reflect the period September 28, 2007, commencement of investment operations, to November 30, 2007).
Portfolio Holdings Presented by Sector
November 30, 2007
| Sector* | | %** | |
| Auto & Transportation | | | 0.65 | % | |
| Consumer Discretionary | | | 8.56 | % | |
| Consumer Staples | | | 12.46 | % | |
| Financial Services | | | 12.09 | % | |
| Healthcare | | | 18.05 | % | |
| Integrated Oils | | | 4.17 | % | |
| Materials & Processing | | | 7.21 | % | |
| Other | | | 2.68 | % | |
| Other Energy | | | 2.63 | % | |
| Producer Durables | | | 7.47 | % | |
| Technology | | | 13.64 | % | |
| Utilities | | | 6.92 | % | |
| Short-Term Investment | | | 3.47 | % | |
| Total | | | 100.00 | % | |
* A sector may comprise several industries.
** Represents percent of total investments.
9
Small Cap Value Fund
Please note that the expenses shown in the table are meant to highlight your ongoing costs only and do not reflect any transactional costs, such as sales charges. Therefore, the second line of the table is useful in comparing ongoing costs only, and will not help you determine the relative total costs of owning different funds. In addition, if these transactional costs were included, your costs would have been higher.
| | | Beginning
Account
Value | | Ending
Account
Value | | Expenses
Paid During
Period† | |
| | | 6/1/07 | | 11/30/07 | | 6/1/07 –
11/30/07 | |
| Class A | |
| Actual | | $ | 1,000.00 | | | $ | 1,007.90 | | | $ | 6.19 | | |
| Hypothetical (5% Return Before Expenses) | | $ | 1,000.00 | | | $ | 1,018.89 | | | $ | 6.23 | | |
| Class B | |
| Actual | | $ | 1,000.00 | | | $ | 1,004.40 | | | $ | 9.70 | | |
| Hypothetical (5% Return Before Expenses) | | $ | 1,000.00 | | | $ | 1,015.37 | | | $ | 9.75 | | |
| Class C | |
| Actual | | $ | 1,000.00 | | | $ | 1,004.40 | | | $ | 9.70 | | |
| Hypothetical (5% Return Before Expenses) | | $ | 1,000.00 | | | $ | 1,015.37 | | | $ | 9.75 | | |
| Class F | |
| Actual | | $ | 1,000.00 | | | $ | 985.10 | | | $ | 1.78 | | |
| Hypothetical (5% Return Before Expenses) | | $ | 1,000.00 | | | $ | 1,023.28 | | | $ | 1.81 | | |
| Class I | |
| Actual | | $ | 1,000.00 | | | $ | 1,009.60 | | | $ | 4.69 | | |
| Hypothetical (5% Return Before Expenses) | | $ | 1,000.00 | | | $ | 1,020.39 | | | $ | 4.71 | | |
| Class P | |
| Actual | | $ | 1,000.00 | | | $ | 1,007.40 | | | $ | 6.94 | | |
| Hypothetical (5% Return Before Expenses) | | $ | 1,000.00 | | | $ | 1,018.13 | | | $ | 6.98 | | |
† For each class of the Fund, expenses are equal to the annualized expense ratio for such class (1.23% for Class A, 1.93% for Classes B and C, 1.02% for Class F, 0.93% for Class I and 1.38% for Class P) multiplied by the average account value over the period, multiplied by 183/365 for Class A, B, C, I and P (to reflect one-half year period) and multiplied by 64/365 for Class F (to reflect the period September 28, 2007, commencement of investment operations, to November 30, 2007).
Portfolio Holdings Presented by Sector
November 30, 2007
| Sector* | | %** | |
| Auto & Transportation | | | 5.30 | % | |
| Consumer Discretionary | | | 6.11 | % | |
| Consumer Staples | | | 0.73 | % | |
| Financial Services | | | 8.48 | % | |
| Healthcare | | | 7.75 | % | |
| Materials & Processing | | | 21.49 | % | |
| Other | | | 2.31 | % | |
| Other Energy | | | 4.35 | % | |
| Producer Durables | | | 10.06 | % | |
| Technology | | | 13.60 | % | |
| Utilities | | | 13.40 | % | |
| Short-Term Investment | | | 6.42 | % | |
| Total | | | 100.00 | % | |
* A sector may comprise several industries.
** Represents percent of total investments.
10
Schedule of Investments
LARGE CAP CORE FUND November 30, 2007
| Investments | | Shares | | Value
(000) | |
| COMMON STOCKS 96.84% | |
| Aerospace 4.06% | |
| Boeing Co. (The) | | | 132,900 | | | $ | 12,299 | | |
| Lockheed Martin Corp. | | | 83,390 | | | | 9,229 | | |
| Raytheon Co. | | | 145,500 | | | | 8,999 | | |
| United Technologies Corp. | | | 191,000 | | | | 14,281 | | |
| Total | | | 44,808 | | |
| Agriculture, Fishing & Ranching 2.89% | |
| Monsanto Co. | | | 321,776 | | | | 31,975 | | |
| Banks 4.90% | |
| Bank of America Corp. | | | 205,048 | | | | 9,459 | | |
| JPMorgan Chase & Co. | | | 264,728 | | | | 12,077 | | |
| Marshall & Ilsley Corp. | | | 74,300 | | | | 2,338 | | |
PNC Financial Services
Group, Inc. (The) | | | 114,500 | | | | 8,382 | | |
| SunTrust Banks, Inc. | | | 59,500 | | | | 4,171 | | |
| U.S. Bancorp | | | 191,500 | | | | 6,337 | | |
| Wachovia Corp. | | | 69,200 | | | | 2,976 | | |
| Wells Fargo & Co. | | | 259,600 | | | | 8,419 | | |
| Total | | | | | | | 54,159 | | |
| Beverage: Brewers 0.37% | |
Anheuser-Busch
Companies, Inc. | | | 78,500 | | | | 4,138 | | |
| Beverage: Soft Drinks 3.38% | |
| Coca-Cola Co. (The) | | | 375,600 | | | | 23,325 | | |
| PepsiCo, Inc. | | | 181,700 | | | | 14,023 | | |
| Total | | | | | | | 37,348 | | |
| Biotechnology Research & Production 4.27% | |
| Amgen Inc.* | | | 165,300 | | | | 9,133 | | |
| Baxter International, Inc. | | | 151,387 | | | | 9,064 | | |
| Celgene Corp.* | | | 191,900 | | | | 11,811 | | |
| Genzyme Corp.* | | | 122,500 | | | | 9,179 | | |
| ImClone Systems Inc.* | | | 177,578 | | | | 8,007 | | |
| Total | | | | | | | 47,194 | | |
| Investments | | Shares | | Value
(000) | |
| Chemicals 1.09% | |
| Praxair, Inc. | | | 141,000 | | | $ | 12,039 | | |
| Communications & Media 0.28% | |
| Time Warner, Inc. | | | 178,900 | | | | 3,088 | | |
| Communications Technology 4.11% | |
| Cisco Systems, Inc.* | | | 616,300 | | | | 17,269 | | |
| Corning, Inc. | | | 419,600 | | | | 10,192 | | |
| Harris Corp. | | | 16,801 | | | | 1,055 | | |
| QUALCOMM Inc. | | | 413,300 | | | | 16,854 | | |
| Total | | | 45,370 | | |
Computer Services, Software &
Systems 3.50% | |
| Adobe Systems Inc.* | | | 240,053 | | | | 10,116 | | |
| Microsoft Corp. | | | 514,000 | | | | 17,270 | | |
| Oracle Corp.* | | | 558,800 | | | | 11,277 | | |
| Total | | | 38,663 | | |
| Computer Technology 3.31% | |
| Hewlett-Packard Co. | | | 388,313 | | | | 19,866 | | |
International Business
Machines Corp. | | | 123,000 | | | | 12,937 | | |
| NVIDIA Corp.* | | | 119,850 | | | | 3,780 | | |
| Total | | | 36,583 | | |
| Consumer Electronics 2.74% | |
| Activision, Inc.* | | | 389,313 | | | | 8,623 | | |
| Electronic Arts Inc.* | | | 313,200 | | | | 17,599 | | |
| Yahoo! Inc.* | | | 151,700 | | | | 4,067 | | |
| Total | | | 30,289 | | |
| Copper 0.18% | |
Freeport-McMoRan
Copper & Gold, Inc. | | | 20,265 | | | | 2,005 | | |
| Diversified Financial Services 4.09% | |
| American Express Co. | | | 58,300 | | | | 3,438 | | |
Bank of New York
Mellon Corp. (The) | | | 398,818 | | | | 19,127 | | |
See Notes to Financial Statements.
11
Schedule of Investments (continued)
LARGE CAP CORE FUND November 30, 2007
| Investments | | Shares | | Value
(000) | |
| Diversified Financial Services (continued) | |
| Citigroup, Inc. | | | 210,800 | | | $ | 7,020 | | |
| Merrill Lynch & Co., Inc. | | | 51,800 | | | | 3,105 | | |
| MetLife, Inc. | | | 84,400 | | | | 5,536 | | |
| Morgan Stanley | | | 131,500 | | | | 6,933 | | |
| Total | | | | | | | 45,159 | | |
| Drug & Grocery Store Chains 0.60% | |
| Kroger Co. (The) | | | 165,600 | | | | 4,761 | | |
| Walgreen Co. | | | 50,000 | | | | 1,829 | | |
| Total | | | | | | | 6,590 | | |
| Drugs & Pharmaceuticals 8.25% | |
| Abbott Laboratories | | | 426,500 | | | | 24,528 | | |
Amylin Pharmaceuticals,
Inc.* | | | 93,000 | | | | 3,552 | | |
| Bristol-Myers Squibb Co. | | | 194,700 | | | | 5,769 | | |
| Eli Lilly & Co. | | | 157,000 | | | | 8,313 | | |
| Gilead Sciences, Inc.* | | | 301,424 | | | | 14,028 | | |
| Johnson & Johnson | | | 129,200 | | | | 8,752 | | |
| Merck & Co., Inc. | | | 266,300 | | | | 15,808 | | |
| Pfizer Inc. | | | 241,100 | | | | 5,728 | | |
| Schering-Plough Corp. | | | 150,000 | | | | 4,695 | | |
| Total | | | | | | | 91,173 | | |
| Electrical Equipment & Components 0.91% | |
| Emerson Electric Co. | | | 176,334 | | | | 10,055 | | |
| Electronics: Medical Systems 0.50% | |
| Medtronic, Inc. | | | 108,500 | | | | 5,517 | | |
Electronics:
Semi-Conductors/Components 1.93% | |
Advanced Micro
Devices, Inc.* | | | 45,200 | | | | 441 | | |
| Intel Corp. | | | 648,600 | | | | 16,915 | | |
| Texas Instruments, Inc. | | | 125,200 | | | | 3,953 | | |
| Total | | | | | | | 21,309 | | |
| Electronics: Technology 0.83% | |
| General Dynamics Corp. | | | 103,854 | | | | 9,220 | | |
| Investments | | Shares | | Value
(000) | |
| Energy: Miscellaneous 0.36% | |
| Valero Energy Corp. | | | 61,500 | | | $ | 4,002 | | |
| Entertainment 0.35% | |
| Walt Disney Co. (The) | | | 116,337 | | | | 3,857 | | |
Financial Data Processing Services &
Systems 0.04% | |
| Western Union Co. | | | 20,867 | | | | 472 | | |
| Financial: Miscellaneous 0.69% | |
| Fannie Mae | | | 198,100 | | | | 7,611 | | |
| Foods 3.44% | |
| Campbell Soup Co. | | | 217,195 | | | | 7,976 | | |
| Kellogg Co. | | | 159,000 | | | | 8,592 | | |
| Kraft Foods, Inc. Class A | | | 420,000 | | | | 14,511 | | |
| Wm. Wrigley Jr. Co. | | | 107,600 | | | | 6,886 | | |
| Total | | | | | | | 37,965 | | |
| Gold 1.84% | |
Barrick Gold Corp.
(Canada)(a) | | | 500,600 | | | | 20,279 | | |
| Health & Personal Care 3.57% | |
| CVS Caremark Corp. | | | 450,048 | | | | 18,042 | | |
| Express Scripts, Inc.* | | | 230,000 | | | | 15,582 | | |
Medco Health
Solutions, Inc.* | | | 56,051 | | | | 5,605 | | |
WebMD Health
Corp. Class A* | | | 4,500 | | | | 192 | | |
| Total | | | | | | | 39,421 | | |
| Healthcare Facilities 0.75% | |
| Quest Diagnostics, Inc. | | | 150,356 | | | | 8,279 | | |
Identification Control & Filter
Devices 0.70% | |
Agilent Technologies,
Inc.* | | | 204,400 | | | | 7,732 | | |
See Notes to Financial Statements.
12
Schedule of Investments (continued)
LARGE CAP CORE FUND November 30, 2007
| Investments | | Shares | | Value
(000) | |
| Insurance: Multi-Line 2.41% | |
American International
Group, Inc. | | | 131,492 | | | $ | 7,644 | | |
| Aon Corp. | | | 125,600 | | | | 6,276 | | |
Hartford Financial Services
Group, Inc. (The) | | | 122,800 | | | | 11,705 | | |
| Safeco Corp. | | | 17,300 | | | | 999 | | |
| Total | | | | | | | 26,624 | | |
| Jewelry, Watches & Gemstones 0.10% | |
| Tiffany & Co. | | | 22,900 | | | | 1,063 | | |
| Machinery: Construction & Handling 0.29% | |
| Caterpillar Inc. | | | 44,600 | | | | 3,207 | | |
Machinery: Oil Well Equipment &
Services 2.09% | |
| Baker Hughes, Inc. | | | 79,343 | | | | 6,369 | | |
Schlumberger Ltd.
(Netherlands Antilles)(a) | | | 178,700 | | | | 16,699 | | |
| Total | | | | | | | 23,068 | | |
Medical & Dental Instruments &
Supplies 0.77% | |
| St. Jude Medical, Inc.* | | | 214,600 | | | | 8,530 | | |
| Milling: Fruit & Grain Processing 1.23% | |
Archer Daniels
Midland Co. | | | 374,100 | | | | 13,598 | | |
| Miscellaneous: Consumer Staples 0.40% | |
| Diageo plc ADR | | | 48,781 | | | | 4,419 | | |
| Multi-Sector Companies 2.69% | |
| General Electric Co. | | | 608,100 | | | | 23,284 | | |
Honeywell International,
Inc. | | | 114,000 | | | | 6,455 | | |
| Total | | | | | | | 29,739 | | |
| Oil: Crude Producers 0.19% | |
| XTO Energy Inc. | | | 33,400 | | | | 2,065 | | |
| Oil: Integrated Domestic 0.48% | |
| ConocoPhillips | | | 65,700 | | | | 5,259 | | |
| Investments | | Shares | | Value
(000) | |
| Oil: Integrated International 3.70% | |
| Chevron Corp. | | | 154,000 | | | $ | 13,517 | | |
| ExxonMobil Corp. | | | 307,515 | | | | 27,418 | | |
| Total | | | | | | | 40,935 | | |
| Retail 4.63% | |
| Best Buy Co., Inc. | | | 167,500 | | | | 8,551 | | |
| GameStop Corp. Class A* | | | 325,000 | | | | 18,671 | | |
| Kohl's Corp.* | | | 158,700 | | | | 7,821 | | |
| Macy's, Inc. | | | 74,300 | | | | 2,203 | | |
| Target Corp. | | | 127,000 | | | | 7,628 | | |
| Wal-Mart Stores, Inc. | | | 131,300 | | | | 6,289 | | |
| Total | | | | | | | 51,163 | | |
| Soaps & Household Chemicals 4.31% | |
| Colgate-Palmolive Co. | | | 183,900 | | | | 14,726 | | |
Procter & Gamble
Co. (The) | | | 445,132 | | | | 32,940 | | |
| Total | | | | | | | 47,666 | | |
| Telecommunications Equipment 1.54% | |
| Nokia Corp. ADR | | | 432,300 | | | | 17,002 | | |
| Textiles Apparel Manufacturers 0.49% | |
| Coach, Inc.* | | | 113,144 | | | | 4,202 | | |
| Polo Ralph Lauren Corp. | | | 16,908 | | | | 1,166 | | |
| Total | | | | | | | 5,368 | | |
| Transportation: Miscellaneous 0.65% | |
United Parcel Service, Inc.
Class B | | | 97,700 | | | | 7,198 | | |
| Utilities: Cable TV & Radio 0.22% | |
| Comcast Corp. Class A* | | | 123,260 | | | | 2,491 | | |
| Utilities: Electrical 3.85% | |
| Dominion Resources, Inc. | | | 239,900 | | | | 11,330 | | |
| FPL Group, Inc. | | | 123,432 | | | | 8,611 | | |
| Northeast Utilities | | | 173,100 | | | | 5,467 | | |
| PG&E Corp. | | | 184,417 | | | | 8,533 | | |
| Progress Energy, Inc. | | | 176,100 | | | | 8,597 | | |
| Total | | | | | | | 42,538 | | |
See Notes to Financial Statements.
13
Schedule of Investments (concluded)
LARGE CAP CORE FUND November 30, 2007
| Investments | | Shares | | Value
(000) | |
| Utilities: Telecommunications 2.87% | |
| AT&T Inc. | | | 692,902 | | | $ | 26,476 | | |
| Sprint Nextel Corp. | | | 56,190 | | | | 872 | | |
Verizon Communications,
Inc. | | | 99,900 | | | | 4,317 | | |
| Total | | | | | | | 31,665 | | |
Total Common Stocks
(cost $893,525,736) | | | 1,069,898 | | |
| | | Principal
Amount
(000) | | | |
| SHORT-TERM INVESTMENT 3.48% | |
| Repurchase Agreement | |
Repurchase Agreement
dated 11/30/2007, 4.06%
due 12/3/2007 with State
Street Bank & Trust Co.
collateralized by
$38,190,000 of Federal
Home Loa n Bank at 5.625%
due 6/18/2010; value:
$39,192,488; proceeds:
$38,432,497
(cost $38,419,498) | | $ | 38,419 | | | | 38,419 | | |
Total Investments in Securities 100.32%
(cost $931,945,234) | | | 1,108,317 | | |
Liabilities in Excess of Cash and
Other Assets (0.32%) | | | | | | | (3,510 | ) | |
| Net Assets 100.00% | | | | | | $ | 1,104,807 | | |
ADR American Depositary Receipt.
* Non-income producing security.
(a) Foreign security traded in U.S. dollars.
Industry classifications have not been audited by Deloitte & Touche LLP.
See Notes to Financial Statements.
14
Schedule of Investments
SMALL CAP VALUE FUND November 30, 2007
| Investments | | Shares | | Value
(000) | |
| COMMON STOCKS 93.43% | |
| Aerospace 4.39% | |
| Curtiss-Wright Corp.(b) | | | 2,347,145 | | | $ | 126,605 | | |
| Moog Inc. Class A* | | | 900,062 | | | | 40,575 | | |
Teledyne Technologies
Inc.* | | | 217,400 | | | | 11,787 | | |
| Total | | | | | | | 178,967 | | |
| Air Transportation 2.77% | |
| AAR Corp.* | | | 1,189,264 | | | | 39,270 | | |
| Bristow Group Inc.*(b) | | | 1,335,060 | | | | 73,428 | | |
| Total | | | | | | | 112,698 | | |
| Aluminum 0.36% | |
| Kaiser Aluminum Corp. | | | 205,812 | | | | 14,641 | | |
| Auto Parts: Original Equipment 0.04% | |
| ArvinMeritor, Inc. | | | 173,679 | | | | 1,756 | | |
| Banks 3.14% | |
Cullen/Frost Bankers,
Inc. | | | 1,000,800 | | | | 52,652 | | |
| East West Bancorp, Inc. | | | 231,800 | | | | 6,247 | | |
First Midwest
Bancorp, Inc. | | | 989,200 | | | | 32,347 | | |
Provident Bankshares
Corp. | | | 496,800 | | | | 11,650 | | |
| Signature Bank* | | | 530,308 | | | | 19,648 | | |
| West Coast Bancorp | | | 276,800 | | | | 5,525 | | |
| Total | | | | | | | 128,069 | | |
| Beverage: Brewers 0.13% | |
Boston Beer Co., Inc.
(The) Class A* | | | 164,300 | | | | 5,453 | | |
Biotechnology Research &
Production 1.27% | |
| Kensey Nash Corp.* | | | 323,408 | | | | 8,719 | | |
Martek Biosciences
Corp.* | | | 1,267,615 | | | | 32,780 | | |
OSI Pharmaceuticals,
Inc.* | | | 223,200 | | | | 10,408 | | |
| Total | | | | | | | 51,907 | | |
| Investments | | Shares | | Value
(000) | |
| Building: Heating & Plumbing 0.21% | |
| Interline Brands, Inc.* | | | 352,200 | | | $ | 8,428 | | |
| Building: Materials 0.13% | |
NCI Building Systems,
Inc.* | | | 150,629 | | | | 5,171 | | |
| Building: Miscellaneous 0.14% | |
| Comfort Systems USA, Inc. | | | 498,448 | | | | 5,857 | | |
| Building: Roofing & Wallboard 0.14% | |
Beacon Roofing
Supply, Inc.* | | | 624,100 | | | | 5,748 | | |
| Chemicals 2.97% | |
| A. Schulman, Inc. | | | 430,000 | | | | 9,271 | | |
| Arch Chemicals, Inc. | | | 508,009 | | | | 20,904 | | |
| Cabot Corp. | | | 367,600 | | | | 12,653 | | |
Cabot Microelectronics
Corp.* | | | 915,404 | | | | 34,236 | | |
| Hercules, Inc. | | | 1,939,100 | | | | 37,638 | | |
Polypore International,
Inc.* | | | 366,400 | | | | 6,379 | | |
| Total | | | | | | | 121,081 | | |
| Communications Technology 3.67% | |
| Anaren, Inc.*(b) | | | 1,711,846 | | | | 26,362 | | |
Anixter International,
Inc.* | | | 1,755,705 | | | | 113,243 | | |
Comtech
Telecommunications Corp.* | | | 200,197 | | | | 9,942 | | |
| Total | | | | | | | 149,547 | | |
Computer Services, Software &
Systems 2.06% | |
| Macrovision Corp.* | | | 2,320,078 | | | | 57,816 | | |
| Solera Holdings Inc.* | | | 1,135,200 | | | | 26,121 | | |
| Total | | | | | | | 83,937 | | |
| Computer Technology 1.49% | |
| Intermec, Inc.* | | | 2,819,825 | | | | 60,542 | | |
| Consumer Electronics 0.66% | |
| THQ Inc.* | | | 1,095,000 | | | | 26,773 | | |
See Notes to Financial Statements.
15
Schedule of Investments (continued)
SMALL CAP VALUE FUND November 30, 2007
| Investments | | Shares | | Value
(000) | |
Containers & Packaging: Metal &
Glass 1.04% | |
| AptarGroup, Inc. | | | 896,000 | | | $ | 37,820 | | |
| Greif Inc. Class A | | | 78,500 | | | | 4,637 | | |
| Total | | | | | | | 42,457 | | |
| Diversified Manufacturing 7.46% | |
| Barnes Group Inc. | | | 1,170,000 | | | | 36,223 | | |
| Brady Corp. Class A | | | 657,525 | | | | 26,321 | | |
| CLARCOR, Inc. | | | 605,620 | | | | 21,566 | | |
| Hexcel Corp.* | | | 4,609,829 | | | | 117,412 | | |
| Koppers Holdings, Inc. | | | 465,450 | | | | 17,892 | | |
| Olin Corp.(b) | | | 4,024,183 | | | | 84,267 | | |
| Total | | | | | | | 303,681 | | |
| Drug & Grocery Store Chains 0.59% | |
| Susser Holdings Corp.*(b) | | | 1,020,352 | | | | 24,060 | | |
| Drugs & Pharmaceuticals 4.55% | |
BioMarin Pharmaceutical
Inc.* | | | 862,911 | | | | 23,730 | | |
K-V Pharmaceutical Co.
Class A* | | | 1,300,000 | | | | 36,660 | | |
| Medicines Co. (The)* | | | 1,160,000 | | | | 20,509 | | |
Medicis Pharmaceutical
Corp. | | | 1,429,500 | | | | 38,454 | | |
Onyx Pharmaceuticals,
Inc.* | | | 816,600 | | | | 44,537 | | |
Salix Pharmaceuticals,
Ltd.* | | | 1,900,000 | | | | 21,584 | | |
| Total | | | | | | | 185,474 | | |
| Electrical & Electronics 1.24% | |
| Plexus Corp.* | | | 1,693,700 | | | | 50,404 | | |
| Electrical Equipment & Components 2.34% | |
| AMETEK, Inc. | | | 469,750 | | | | 20,669 | | |
| Baldor Electric Co. | | | 1,679,200 | | | | 56,673 | | |
| CTS Corp. | | | 357,740 | | | | 3,781 | | |
| Franklin Electric Co., Inc. | | | 360,800 | | | | 14,057 | | |
| Total | | | | | | | 95,180 | | |
| Investments | | Shares | | Value
(000) | |
| Electronics 0.35% | |
| FLIR Systems, Inc.* | | | 106,500 | | | $ | 7,320 | | |
Methode Electronics,
Inc. | | | 578,606 | | | | 6,972 | | |
| Total | | | | | | | 14,292 | | |
Electronics:
Semi-Conductors/Components 2.69% | |
| ANADIGICS, Inc.*(b) | | | 3,626,572 | | | | 39,929 | | |
| Micrel, Inc. | | | 1,819,900 | | | | 16,233 | | |
| Microsemi Corp.* | | | 2,331,914 | | | | 53,354 | | |
| Total | | | | | | | 109,516 | | |
| Electronics: Technology 2.08% | |
| Coherent, Inc.* | | | 846,521 | | | | 24,355 | | |
| ScanSource, Inc.*(b) | | | 1,710,864 | | | | 60,359 | | |
| Total | | | | | | | 84,714 | | |
| Engineering & Contracting Services 1.19% | |
| URS Corp.* | | | 840,300 | | | | 48,309 | | |
| Financial: Miscellaneous 1.46% | |
Financial Federal
Corp.(b) | | | 2,696,491 | | | | 59,565 | | |
| Forest Products 0.32% | |
Universal Forest
Products, Inc. | | | 452,474 | | | | 12,945 | | |
| Healthcare Management Services 0.20% | |
American Dental
Partners, Inc.* | | | 400,000 | | | | 7,972 | | |
Identification Control & Filter
Devices 1.06% | |
| IDEX Corp. | | | 497,875 | | | | 17,774 | | |
| Mine Safety Appliance Co. | | | 514,845 | | | | 25,233 | | |
| Total | | | | | | | 43,007 | | |
| Insurance: Multi-Line 0.67% | |
Max Capital Group Ltd.
(Bermuda)(a) | | | 960,000 | | | | 27,177 | | |
See Notes to Financial Statements.
16
Schedule of Investments (continued)
SMALL CAP VALUE FUND November 30, 2007
| Investments | | Shares | | Value
(000) | |
| Insurance: Property - Casualty 1.40% | |
Navigators Group,
Inc. (The)* | | | 482,435 | | | $ | 28,319 | | |
| RLI Corp. | | | 343,725 | | | | 20,496 | | |
Selective Insurance
Group, Inc. | | | 350,376 | | | | 8,266 | | |
| Total | | | | | | | 57,081 | | |
| Machinery: Industrial/Specialty 1.04% | |
| Nordson Corp. | | | 800,058 | | | | 42,243 | | |
Machinery: Oil Well Equipment &
Services 3.05% | |
| CARBO Ceramics Inc. | | | 1,130,098 | | | | 44,865 | | |
| Exterran Holdings, Inc.* | | | 576,081 | | | | 46,109 | | |
Oil States International,
Inc.* | | | 800,000 | | | | 25,368 | | |
Superior Energy
Services, Inc.* | | | 226,898 | | | | 7,919 | | |
| Total | | | | | | | 124,261 | | |
| Machinery: Specialty 0.24% | |
| Flow International Corp.* | | | 1,220,000 | | | | 9,638 | | |
Medical & Dental Instruments &
Supplies 1.71% | |
| Abaxis, Inc.* | | | 362,881 | | | | 12,037 | | |
| Cantel Medical Corp.* | | | 99,600 | | | | 1,762 | | |
| ev3 Inc.* | | | 1,862,700 | | | | 27,270 | | |
| SonoSite, Inc.*(b) | | | 860,000 | | | | 28,569 | | |
| Total | | | | | | | 69,638 | | |
| Metal Fabricating 4.30% | |
| Kaydon Corp. | | | 214,600 | | | | 10,861 | | |
| Quanex Corp.(b) | | | 3,280,022 | | | | 164,132 | | |
| Total | | | | | | | 174,993 | | |
| Metals & Minerals Miscellaneous 0.19% | |
| A.M. Castle & Co. | | | 8,200 | | | | 206 | | |
AMCOL International,
Corp. | | | 202,598 | | | | 7,694 | | |
| Total | | | | | | | 7,900 | | |
| Investments | | Shares | | Value
(000) | |
Miscellaneous: Materials &
Processing 1.98% | |
| Rogers Corp.*(b) | | | 1,827,079 | | | $ | 80,501 | | |
| Multi-Sector Companies 2.31% | |
| Carlisle Cos., Inc. | | | 2,024,270 | | | | 80,586 | | |
| Kaman Corp. | | | 418,116 | | | | 13,338 | | |
| Total | | | | | | | 93,924 | | |
| Oil: Crude Producers 1.30% | |
| Forest Oil Corp.* | | | 447,100 | | | | 21,050 | | |
Petrohawk Energy
Corp.* | | | 1,945,100 | | | | 31,705 | | |
| Total | | | | | | | 52,755 | | |
| Paints & Coatings 0.66% | |
| Ferro Corp. | | | 1,274,054 | | | | 26,997 | | |
| Paper 0.07% | |
Albany International
Corp. Class A | | | 70,795 | | | | 2,738 | | |
| Production Technology Equipment 0.98% | |
| ATMI, Inc.* | | | 1,328,200 | | | | 39,966 | | |
| Publishing: Miscellaneous 0.09% | |
| Courier Corp. | | | 118,221 | | | | 3,886 | | |
| Railroads 0.51% | |
Genesee & Wyoming, Inc.
Class A* | | | 800,075 | | | | 20,962 | | |
| Real Estate Investment Trusts 0.80% | |
| BioMed Realty Trust, Inc. | | | 1,003,400 | | | | 22,657 | | |
| EastGroup Properties, Inc. | | | 211,100 | | | | 9,738 | | |
| Total | | | | | | | 32,395 | | |
Rental & Leasing Services:
Commercial 1.00% | |
| GATX Financial Corp. | | | 1,096,700 | | | | 40,611 | | |
| Restaurants 1.20% | |
| Benihana Inc.* | | | 163,100 | | | | 2,365 | | |
| Benihana Inc. Class A* | | | 326,201 | | | | 4,567 | | |
See Notes to Financial Statements.
17
Schedule of Investments (continued)
SMALL CAP VALUE FUND November 30, 2007
| Investments | | Shares | | Value
(000) | |
| Restaurants (continued) | |
Cheesecake Factory,
Inc. (The)* | | | 598,388 | | | $ | 13,937 | | |
McCormick & Schmick's
Seafood Restaurants,
Inc.* | | | 377,568 | | | | 5,535 | | |
| Ruby Tuesday, Inc. | | | 1,726,492 | | | | 22,634 | | |
| Total | | | | | | | 49,038 | | |
| Retail 1.88% | |
| AnnTaylor Stores Corp.* | | | 240,000 | | | | 7,308 | | |
| Gaiam, Inc. Class A* | | | 840,332 | | | | 19,790 | | |
| Genesco Inc.* | | | 35,100 | | | | 1,088 | | |
Rush Enterprises,
Inc. Class A* | | | 536,841 | | | | 8,461 | | |
Sonic Automotive,
Inc. Class A | | | 1,720,089 | | | | 39,751 | | |
| Total | | | | | | | 76,398 | | |
| Services: Commercial 1.14% | |
| Rollins, Inc. | | | 910,264 | | | | 26,798 | | |
| Waste Connections, Inc.* | | | 617,618 | | | | 19,659 | | |
| Total | | | | | | | 46,457 | | |
| Shipping 0.85% | |
| Kirby Corp.* | | | 720,700 | | | | 34,644 | | |
| Shoes 0.13% | |
| DSW Inc. Class A* | | | 233,100 | | | | 5,242 | | |
| Steel 0.30% | |
Carpenter Technology
Corp. | | | 162,680 | | | | 12,274 | | |
| Textiles Apparel Manufacturers 0.40% | |
| Oxford Industries, Inc. | | | 153,900 | | | | 3,812 | | |
| Quiksilver, Inc.* | | | 1,176,100 | | | | 12,467 | | |
| Total | | | | | | | 16,279 | | |
| Investments | | Shares | | Value
(000) | |
| Truckers 1.12% | |
| Heartland Express, Inc. | | | 2,396,714 | | | $ | 34,824 | | |
Knight
Transportation, Inc. | | | 700,000 | | | | 10,640 | | |
| Total | | | | | | | 45,464 | | |
| Utilities: Electrical 8.60% | |
| Avista Corp. | | | 1,921,900 | | | | 41,090 | | |
| Black Hills Corp.(b) | | | 2,335,078 | | | | 97,279 | | |
| Cleco Corp. | | | 256,300 | | | | 7,161 | | |
| El Paso Electric Co.* | | | 1,024,387 | | | | 26,337 | | |
| IDACORP, Inc. | | | 1,870,700 | | | | 65,774 | | |
| MGE Energy, Inc. | | | 986,090 | | | | 34,582 | | |
| PNM Resources, Inc. | | | 2,512,100 | | | | 55,719 | | |
| Westar Energy, Inc. | | | 855,000 | | | | 22,153 | | |
| Total | | | | | | | 350,095 | | |
| Utilities: Gas Distributors 4.78% | |
New Jersey Resources
Corp. | | | 859,000 | | | | 43,337 | | |
| Nicor, Inc. | | | 976,680 | | | | 41,157 | | |
Northwest Natural
Gas Co. | | | 246,300 | | | | 11,815 | | |
Piedmont Natural
Gas Co., Inc. | | | 2,354,759 | | | | 61,318 | | |
| UGI Corp. | | | 1,400,000 | | | | 37,016 | | |
| Total | | | | | | | 194,643 | | |
| Wholesale & International Trade 0.59% | |
Central Euro
Distribution Corp* | | | 482,718 | | | | 24,136 | | |
Total Common Stocks
(cost $3,393,642,464) | | | 3,804,487 | | |
See Notes to Financial Statements.
18
Schedule of Investments (concluded)
SMALL CAP VALUE FUND November 30, 2007
| Investments | | Principal
Amount
(000) | | Value
(000) | |
| SHORT-TERM INVESTMENT 6.41% | |
| Repurchase Agreement | |
Repurchase Agreement
dated 11/30/2007, 4.06%
due 12/3/2007 with State
Street Bank & Trust Co.
collateralized by
$140,080,000 of Federal
Home Lo an Bank at 4.125%
to 5.25% due from
4/18/2008 to 6/25/2008,
$25,000,000 of
Federal Home Loan
Mortgage Corp. at 3.875%
due 6/15/2008, and
$100,000,000 of Federal
National Mortgage Assoc.
at 4.08% and 6.00% due
6/6/2008 and 5/15/2008;
value: $266,335,547;
proceeds: $261,200,219
(cost $261,111,876) | | $ | 261,112 | | | | 261,112 | | |
Total Investments in Securities 99.84%
(cost $3,654,754,340) | | | 4,065,599 | | |
Cash and Other Assets in
Excess of Liabilities 0.16% | | | | | 6,438 | | |
| Net Assets 100.00% | | | | $ | 4,072,037 | | |
* Non-income producing security.
(a) Foreign security traded in U.S. dollars.
(b) Affiliated issuer (holding represents 5% or more of the underlying issuer's outstanding voting shares). (See Note 9).
Industry classifications have not been audited by Deloitte & Touche LLP.
See Notes to Financial Statements.
19
Statements of Assets and Liabilities
November 30, 2007
| | | Large Cap
Core Fund | | Small Cap
Value Fund | |
| ASSETS: | |
| Investments in unaffiliated issuers, at cost | | $ | 931,945,234 | | | $ | 2,959,787,280 | | |
| Investments in affiliated issuers, at cost | | | – | | | | 694,967,060 | | |
| Investments in unaffiliated issuers, at value | | $ | 1,108,317,822 | | | $ | 3,200,542,027 | | |
| Investments in affiliated issuers, at value | | | – | | | | 865,057,299 | | |
| Cash | | | 4,461 | | | | 634,215 | | |
| Receivables: | |
| Interest and dividends | | | 1,760,518 | | | | 4,109,092 | | |
| Investment securities sold | | | – | | | | 56,931,816 | | |
| Capital shares sold | | | 1,370,579 | | | | 3,215,362 | | |
| From advisor (See Note 3) | | | 32,277 | | | | – | | |
| Prepaid expenses and other assets | | | 72,022 | | | | 187,344 | | |
| Total assets | | | 1,111,557,679 | | | | 4,130,677,155 | | |
| LIABILITIES: | |
| Payables: | |
| Investment securities purchased | | | 3,749,513 | | | | 46,679,869 | | |
| Capital shares reacquired | | | 1,484,545 | | | | 6,549,401 | | |
| Management fees | | | 605,900 | | | | 2,390,385 | | |
| 12b-1 distribution fees | | | 330,777 | | | | 877,012 | | |
| Fund administration | | | 34,814 | | | | 131,954 | | |
| Directors' fees | | | 81,027 | | | | 283,414 | | |
| To affiliates (See Note 3) | | | 89,381 | | | | 90,699 | | |
| Accrued expenses and other liabilities | | | 374,362 | | | | 1,637,089 | | |
| Total liabilities | | | 6,750,319 | | | | 58,639,823 | | |
| NET ASSETS | | $ | 1,104,807,360 | | | $ | 4,072,037,332 | | |
| COMPOSITION OF NET ASSETS: | |
| Paid-in capital | | $ | 852,271,121 | | | $ | 3,072,954,643 | | |
| Undistributed net investment income | | | 4,780,592 | | | | 7,114,013 | | |
| Accumulated net realized gain on investments | | | 71,383,059 | | | | 581,123,690 | | |
| Net unrealized appreciation on investments | | | 176,372,588 | | | | 410,844,986 | | |
| Net Assets | | $ | 1,104,807,360 | | | $ | 4,072,037,332 | | |
See Notes to Financial Statements.
20
Statements of Assets and Liabilities (concluded)
November 30, 2007
| | | Large Cap
Core Fund | | Small Cap
Value Fund | |
| Net assets by class: | |
| Class A Shares | | $ | 707,266,173 | | | $ | 2,287,085,082 | | |
| Class B Shares | | $ | 74,004,655 | | | $ | 58,676,013 | | |
| Class C Shares | | $ | 94,948,215 | | | $ | 86,970,640 | | |
| Class F Shares | | $ | 9,898 | | | $ | 9,917 | | |
| Class I Shares | | $ | 221,344,827 | | | $ | 1,227,168,646 | | |
| Class P Shares | | $ | 7,213,941 | | | $ | 412,127,034 | | |
| Class R2 Shares | | $ | 9,825 | | | | – | | |
| Class R3 Shares | | $ | 9,826 | | | | – | | |
| Outstanding shares by class: | |
Class A Shares (200 million shares of common stock
authorized per Fund, $.001 par value) | | | 21,465,556 | | | | 69,089,746 | | |
Class B Shares (30 million shares of common stock
authorized per Fund, $.001 par value) | | | 2,351,554 | | | | 1,970,305 | | |
Class C Shares (20 million shares of common stock
authorized per Fund, $.001 par value) | | | 3,005,432 | | | | 2,915,357 | | |
Class F Shares (30 million shares of common stock
authorized, $.001 par value) | | | 300.329 | | | | 299.530 | | |
Class I Shares (30 million and 200 million shares of common
stock authorized, respectively, $.001 par value) | | | 6,690,229 | | | | 35,314,539 | | |
Class P Shares (20 million shares of common stock
authorized per Fund, $.001 par value) | | | 218,291 | | | | 12,550,591 | | |
Class R2 Shares (30 million shares of common stock
authorized, $.001 par value) | | | 298.329 | | | | – | | |
Class R3 Shares (30 million shares of common stock
authorized, $.001 par value) | | | 298.329 | | | | – | | |
Net asset value, offering and redemption price per share
(Net assets divided by outstanding shares): | | | |
| Class A Shares-Net asset value | | $ | 32.95 | | | $ | 33.10 | | |
Class A Shares-Maximum offering price
(Net asset value plus sales charge of 5.75%) | | $ | 34.96 | | | $ | 35.12 | | |
| Class B Shares-Net asset value | | $ | 31.47 | | | $ | 29.78 | | |
| Class C Shares-Net asset value | | $ | 31.59 | | | $ | 29.83 | | |
| Class F Shares-Net asset value | | $ | 32.96 | | | $ | 33.11 | | |
| Class I Shares-Net asset value | | $ | 33.08 | | | $ | 34.75 | | |
| Class P Shares-Net asset value | | $ | 33.05 | | | $ | 32.84 | | |
| Class R2 Shares-Net asset value | | $ | 32.93 | | | | – | | |
| Class R3 Shares-Net asset value | | $ | 32.94 | | | | – | | |
See Notes to Financial Statements.
21
Statements of Operations
For the Year Ended November 30, 2007
| | | Large Cap
Core Fund | | Small Cap
Value Fund | |
| Investment income: | |
Dividends from unaffiliated issuers (net of foreign
withholding taxes of $63,709 and $23,029 respectively) | | $ | 18,110,612 | | | $ | 32,918,056 | | |
| Dividends from affiliated issuers | | | – | | | | 13,305,811 | | |
| Interest | | | 1,452,567 | | | | 10,106,867 | | |
| Total investment income | | | 19,563,179 | | | | 56,330,734 | | |
| Expenses: | |
| Management fees | | | 7,607,980 | | | | 30,135,360 | | |
| 12b-1 distribution plan-Class A | | | 2,402,525 | | | | 7,240,288 | | |
| 12b-1 distribution plan-Class B | | | 768,942 | | | | 658,772 | | |
| 12b-1 distribution plan-Class C | | | 914,006 | | | | 896,235 | | |
| 12b-1 distribution plan-Class F | | | 2 | | | | 2 | | |
| 12b-1 distribution plan-Class P | | | 28,113 | | | | 1,930,437 | | |
| 12b-1 distribution plan-Class R2 | | | 10 | | | | – | | |
| 12b-1 distribution plan-Class R3 | | | 8 | | | | – | | |
| Shareholder servicing | | | 1,479,841 | | | | 5,482,279 | | |
| Professional | | | 51,785 | | | | 81,033 | | |
| Reports to shareholders | | | 203,762 | | | | 467,445 | | |
| Fund administration | | | 437,414 | | | | 1,664,878 | | |
| Custody | | | 22,872 | | | | 144,604 | | |
| Directors' fees | | | 43,393 | | | | 165,277 | | |
| Registration | | | 95,043 | | | | 192,978 | | |
| Subsidy (See Note 3) | | | 506,164 | | | | 345,261 | | |
| Other | | | 20,470 | | | | 71,451 | | |
| Gross expenses | | | 14,582,330 | | | | 49,476,300 | | |
| Expense reductions (See Note 7) | | | (27,931 | ) | | | (124,009 | ) | |
| Expenses assumed by advisor (See Note 3) | | | (104,911 | ) | | | – | | |
| Net expenses | | | 14,449,488 | | | | 49,352,291 | | |
| Net investment income | | | 5,113,691 | | | | 6,978,443 | | |
| Net realized and unrealized gain (loss): | |
| Net realized gain on investments in unaffiliated issuers | | | 72,627,795 | | | | 506,618,135 | | |
| Net realized gain on investments in affiliated issuers | | | – | | | | 76,646,030 | | |
| Net change in unrealized appreciation (depreciation) on investments | | | 47,082,512 | | | | (181,250,735 | ) | |
| Net realized and unrealized gain | | | 119,710,307 | | | | 402,013,430 | | |
| Net Increase in Net Assets Resulting From Operations | | $ | 124,823,998 | | | $ | 408,991,873 | | |
See Notes to Financial Statements.
22
Statements of Changes in Net Assets
| | | Large Cap Core Fund | |
| INCREASE IN NET ASSETS | | For the Year Ended
November 30, 2007 | | For the Year Ended
November 30, 2006 | |
| Operations: | |
| Net investment income | | $ | 5,113,691 | | | $ | 5,447,896 | | |
| Net realized gain on investments and security sold short | | | 72,627,795 | | | | 35,935,864 | | |
| Net change in unrealized appreciation on investments | | | 47,082,512 | | | | 59,277,969 | | |
| Net increase in net assets resulting from operations | | | 124,823,998 | | | | 100,661,729 | | |
| Distributions to shareholders from: | |
| Net investment income | |
| Class A | | | (3,660,217 | ) | | | (1,904,159 | ) | |
| Class I | | | (1,804,710 | ) | | | (866,794 | ) | |
| Class P | | | (9,228 | ) | | | (25,563 | ) | |
| Net realized gain | |
| Class A | | | (22,816,945 | ) | | | (20,341,586 | ) | |
| Class B | | | (2,873,210 | ) | | | (3,260,788 | ) | |
| Class C | | | (3,173,231 | ) | | | (2,933,006 | ) | |
| Class I | | | (7,179,058 | ) | | | (5,264,871 | ) | |
| Class P | | | (164,621 | ) | | | (256,240 | ) | |
| Total distributions to shareholders | | | (41,681,220 | ) | | | (34,853,007 | ) | |
| Capital share transactions (Net of share conversions) (See Note 12): | |
| Net proceeds from sales of shares | | | 177,482,034 | | | | 238,102,416 | | |
| Reinvestment of distributions | | | 39,289,922 | | | | 32,333,923 | | |
| Cost of shares reacquired | | | (215,651,510 | ) | | | (136,149,594 | ) | |
Net increase in net assets resulting
from capital share transactions | | | 1,120,446 | | | | 134,286,745 | | |
| Net increase in net assets | | | 84,263,224 | | | | 200,095,467 | | |
| NET ASSETS: | |
| Beginning of year | | $ | 1,020,544,136 | | | $ | 820,448,669 | | |
| End of year | | $ | 1,104,807,360 | | | $ | 1,020,544,136 | | |
| Undistributed net investment income | | $ | 4,780,592 | | | $ | 5,141,056 | | |
See Notes to Financial Statements.
23
Statements of Changes in Net Assets (concluded)
| | | Small Cap Value Fund | |
| INCREASE IN NET ASSETS | | For the Year Ended
November 30, 2007 | | For the Year Ended
November 30, 2006 | |
| Operations: | |
| Net investment income (loss) | | $ | 6,978,443 | | | $ | (1,318,398 | ) | |
| Net realized gain on investments | | | 583,264,165 | | | | 523,335,736 | | |
Net change in unrealized appreciation (depreciation)
on investments | | | (181,250,735 | ) | | | 127,440,592 | | |
| Net increase in net assets resulting from operations | | | 408,991,873 | | | | 649,457,930 | | |
| Distributions to shareholders from: | |
| Net realized gain | |
| Class A | | | (310,163,573 | ) | | | (157,729,495 | ) | |
| Class B | | | (10,198,214 | ) | | | (11,076,435 | ) | |
| Class C | | | (12,975,390 | ) | | | (8,869,827 | ) | |
| Class I | | | (131,798,008 | ) | | | (56,813,206 | ) | |
| Class P | | | (59,201,068 | ) | | | (30,469,694 | ) | |
| Total distributions to shareholders | | | (524,336,253 | ) | | | (264,958,657 | ) | |
| Capital share transactions (Net of share conversions) (See Note 12): | |
| Net proceeds from sales of shares | | | 961,122,181 | | | | 1,378,056,403 | | |
| Reinvestment of distributions | | | 468,851,412 | | | | 231,815,304 | | |
| Cost of shares reacquired | | | (1,266,437,826 | ) | | | (850,326,004 | ) | |
Net increase in net assets resulting
from capital share transactions | | | 163,535,767 | | | | 759,545,703 | | |
| Net increase in net assets | | | 48,191,387 | | | | 1,144,044,976 | | |
| NET ASSETS: | |
| Beginning of year | | $ | 4,023,845,945 | | | $ | 2,879,800,969 | | |
| End of year | | $ | 4,072,037,332 | | | $ | 4,023,845,945 | | |
Undistributed (distributions in excess of)
net investment income | | $ | 7,114,013 | | | $ | (203,601 | ) | |
See Notes to Financial Statements.
24
Financial Highlights
LARGE CAP CORE FUND
| | | Class A Shares | |
| | | Year Ended 11/30 | |
| | | 2007 | | 2006 | | 2005 | | 2004 | | 2003 | |
| Per Share Operating Performance | |
| Net asset value, beginning of year | | $ | 30.64 | | | $ | 28.66 | | | $ | 28.42 | | | $ | 24.88 | | | $ | 21.27 | | |
| Investment operations: | |
| Net investment income(a) | | | .16 | | | | .18 | | | | .15 | | | | .18 | | | | .08 | | |
| Net realized and unrealized gain | | | 3.40 | | | | 3.00 | | | | 1.10 | | | | 3.42 | | | | 3.53 | | |
| Total from investment operations | | | 3.56 | | | | 3.18 | | | | 1.25 | | | | 3.60 | | | | 3.61 | | |
| Distributions to shareholders from: | |
| Net investment income | | | (.17 | ) | | | (.10 | ) | | | (.17 | ) | | | (.06 | ) | | | – | | |
| Net realized gain | | | (1.08 | ) | | | (1.10 | ) | | | (.84 | ) | | | – | | | | – | | |
| Total distributions | | | (1.25 | ) | | | (1.20 | ) | | | (1.01 | ) | | | (.06 | ) | | | – | | |
| Net asset value, end of year $32.95 | | $ | 30.64 | | | $ | 2 | | | | 8.66 | | | $ | 28.42 | | | $ | 24.88 | | |
| Total Return(b) | | | 12.05 | % | | | 11.50 | % | | | 4.49 | % | | | 14.48 | % | | | 16.97 | % | |
| Ratios to Average Net Assets: | |
Expenses, excluding expense
reductions and including
expenses assumed | | | 1.30 | % | | | 1.30 | % | | | 1.30 | % | | | 1.39 | % | | | 1.46 | % | |
Expenses, including expense
reductions and expenses
assumed | | | 1.30 | % | | | 1.30 | % | | | 1.30 | % | | | 1.39 | % | | | 1.46 | % | |
Expenses, excluding expense
reductions and expenses
assumed | | | 1.31 | % | | | 1.33 | % | | | 1.32 | % | | | 1.41 | % | | | 1.46 | % | |
| Net investment income | | | .50 | % | | | .63 | % | | | .53 | % | | | .67 | % | | | .36 | % | |
| Supplemental Data: | |
| Net assets, end of year (000) | | $ | 707,266 | | | $ | 645,539 | | | $ | 523,322 | | | $ | 324,690 | | | $ | 261,231 | | |
| Portfolio turnover rate | | | 44.97 | % | | | 39.51 | % | | | 44.86 | % | | | 47.14 | % | | | 34.98 | % | |
(a) Calculated using average shares outstanding during the period.
(b) Total return does not consider the effects of sales loads and assumes the reinvestment of all distributions.
See Notes to Financial Statements.
25
Financial Highlights (continued)
LARGE CAP CORE FUND
| | | Class B Shares | |
| | | Year Ended 11/30 | |
| | | 2007 | | 2006 | | 2005 | | 2004 | | 2003 | |
| Per Share Operating Performance | |
| Net asset value, beginning of year | | $ | 29.34 | | | $ | 27.56 | | | $ | 27.38 | | | $ | 24.07 | | | $ | 20.70 | | |
| Investment operations: | |
| Net investment loss(a) | | | (.05 | ) | | | (.01 | ) | | | (.03 | ) | | | – | (c) | | | (.06 | ) | |
| Net realized and unrealized gain | | | 3.26 | | | | 2.89 | | | | 1.05 | | | | 3.31 | | | | 3.43 | | |
| Total from investment operations | | | 3.21 | | | | 2.88 | | | | 1.02 | | | | 3.31 | | | | 3.37 | | |
| Distributions to shareholders from: | |
| Net investment income | | | – | | | | – | | | | – | (c) | | | – | | | | – | | |
| Net realized gain | | | (1.08 | ) | | | (1.10 | ) | | | (.84 | ) | | | – | | | | – | | |
| Total distributions | | | (1.08 | ) | | | (1.10 | ) | | | (.84 | ) | | | – | | | | – | | |
| Net asset value, end of year | | $ | 31.47 | | | $ | 29.34 | | | $ | 27.56 | | | $ | 27.38 | | | $ | 24.07 | | |
| Total Return(b) | | | 11.29 | % | | | 10.80 | % | | | 3.78 | % | | | 13.75 | % | | | 16.28 | % | |
| Ratios to Average Net Assets: | |
Expenses, excluding expense
reductions and including
expenses assumed | | | 1.95 | % | | | 1.95 | % | | | 1.95 | % | | | 2.03 | % | | | 2.10 | % | |
Expenses, including expense
reductions and expenses
assumed | | | 1.95 | % | | | 1.95 | % | | | 1.95 | % | | | 2.03 | % | | | 2.10 | % | |
Expenses, excluding expense
reductions and expenses
assumed | | | 1.96 | % | | | 1.98 | % | | | 1.97 | % | | | 2.05 | % | | | 2.10 | % | |
| Net investment income (loss) | | | (.15 | )% | | | (.02 | )% | | | (.11 | )% | | | .03 | % | | | (.28 | )% | |
| Supplemental Data: | |
| Net assets, end of year (000) | | $ | 74,005 | | | $ | 78,277 | | | $ | 81,373 | | | $ | 82,876 | | | $ | 80,542 | | |
| Portfolio turnover rate | | | 44.97 | % | | | 39.51 | % | | | 44.86 | % | | | 47.14 | % | | | 34.98 | % | |
(a) Calculated using average shares outstanding during the period.
(b) Total return does not consider the effects of sales loads and assumes the reinvestment of all distributions.
(c) Amount is less than $.01.
See Notes to Financial Statements.
26
Financial Highlights (continued)
LARGE CAP CORE FUND
| | | Class C Shares | |
| | | Year Ended 11/30 | |
| | | 2007 | | 2006 | | 2005 | | 2004 | | 2003 | |
| Per Share Operating Performance | |
| Net asset value, beginning of year | | $ | 29.44 | | | $ | 27.66 | | | $ | 27.47 | | | $ | 24.15 | | | $ | 20.77 | | |
| Investment operations: | |
| Net investment loss(a) | | | (.05 | ) | | | – | (c) | | | (.03 | ) | | | – | (c) | | | (.06 | ) | |
| Net realized and unrealized gain | | | 3.28 | | | | 2.88 | | | | 1.06 | | | | 3.32 | | | | 3.44 | | |
| Total from investment operations | | | 3.23 | | | | 2.88 | | | | 1.03 | | | | 3.32 | | | | 3.38 | | |
| Distributions to shareholders from: | |
| Net investment income | | | – | | | | – | | | | – | (c) | | | – | | | | – | | |
| Net realized gain | | | (1.08 | ) | | | (1.10 | ) | | | (.84 | ) | | | – | | | | – | | |
| Total distributions | | | (1.08 | ) | | | (1.10 | ) | | | (.84 | ) | | | – | | | | – | | |
| Net asset value, end of year | | $ | 31.59 | | | $ | 29.44 | | | $ | 27.66 | | | $ | 27.47 | | | $ | 24.15 | | |
| Total Return(b) | | | 11.32 | % | | | 10.76 | % | | | 3.81 | % | | | 13.75 | % | | | 16.27 | % | |
| Ratios to Average Net Assets: | |
Expenses, excluding expense
reductions and including
expenses assumed | | | 1.95 | % | | | 1.95 | % | | | 1.95 | % | | | 2.03 | % | | | 2.10 | % | |
Expenses, including expense
reductions and expenses
assumed | | | 1.95 | % | | | 1.95 | % | | | 1.95 | % | | | 2.03 | % | | | 2.10 | % | |
Expenses, excluding expense
reductions and expenses
assumed | | | 1.96 | % | | | 1.98 | % | | | 1.97 | % | | | 2.05 | % | | | 2.10 | % | |
| Net investment income (loss) | | | (.15 | )% | | | (.02 | )% | | | (.12 | )% | | | .03 | % | | | (.28 | )% | |
| Supplemental Data: | |
| Net assets, end of year (000) | | $ | 94,948 | | | $ | 86,535 | | | $ | 73,328 | | | $ | 39,625 | | | $ | 36,778 | | |
| Portfolio turnover rate | | | 44.97 | % | | | 39.51 | % | | | 44.86 | % | | | 47.14 | % | | | 34.98 | % | |
(a) Calculated using average shares outstanding during the period.
(b) Total return does not consider the effects of sales loads and assumes the reinvestment of all distributions.
(c) Amount is less than $.01.
See Notes to Financial Statements.
27
Financial Highlights (continued)
LARGE CAP CORE FUND
| | | Class F Shares | |
| | | 9/28/2007(a)
to
11/30/2007 | |
| Per Share Operating Performance | |
| Net asset value, beginning of period | | $ | 33.52 | | |
| Investment operations: | |
| Net investment income(b) | | | .05 | | |
| Net realized and unrealized loss | | | (.61 | ) | |
| Total from investment operations | | | (.56 | ) | |
| Net asset value, end of period | | $ | 32.96 | | |
| Total Return(c) | | | (1.67 | )%(d) | |
| Ratios to Average Net Assets: | |
| Expenses, excluding expense reductions and including expenses assumed | | | .18 | %(d) | |
| Expenses, including expense reductions and expenses assumed | | | .18 | %(d) | |
| Expenses, excluding expense reductions and expenses assumed | | | .19 | %(d) | |
| Net investment income | | | .16 | %(d) | |
| Supplemental Data: | |
| Net assets, end of period (000) | | $ | 10 | | |
| Portfolio turnover rate | | | 44.97 | % | |
(a) Commencement of investment operations was September 28, 2007; SEC effective date was September 14, 2007 and date shares first became available to the public was October 1, 2007.
(b) Calculated using average shares outstanding during the period.
(c) Total return does not consider the effects of sales loads and assumes the reinvestment of all distributions.
(d) Not annualized.
See Notes to Financial Statements.
28
Financial Highlights (continued)
LARGE CAP CORE FUND
| | | Class I Shares | |
| | | Year Ended 11/30 | |
| | | 2007 | | 2006 | | 2005 | | 2004 | | 2003 | |
| Per Share Operating Performance | |
| Net asset value, beginning of year | | $ | 30.76 | | | $ | 28.74 | | | $ | 28.50 | | | $ | 24.93 | | | $ | 21.23 | | |
| Investment operations: | |
| Net investment income(a) | | | .26 | | | | .29 | | | | .24 | | | | .93 | | | | .16 | | |
| Net realized and unrealized gain | | | 3.41 | | | | 3.01 | | | | 1.11 | | | | 2.77 | | | | 3.54 | | |
| Total from investment operations | | | 3.67 | | | | 3.30 | | | | 1.35 | | | | 3.70 | | | | 3.70 | | |
| Distributions to shareholders from: | |
| Net investment income | | | (.27 | ) | | | (.18 | ) | | | (.27 | ) | | | (.13 | ) | | | – | | |
| Net realized gain | | | (1.08 | ) | | | (1.10 | ) | | | (.84 | ) | | | – | | | | – | | |
| Total distributions | | | (1.35 | ) | | | (1.28 | ) | | | (1.11 | ) | | | (.13 | ) | | | – | | |
| Net asset value, end of year | | $ | 33.08 | | | $ | 30.76 | | | $ | 28.74 | | | $ | 28.50 | | | $ | 24.93 | | |
| Total Return(b) | | | 12.40 | % | | | 11.92 | % | | | 4.83 | % | | | 14.89 | % | | | 17.43 | % | |
| Ratios to Average Net Assets: | |
Expenses, excluding expense
reductions and including
expenses assumed | | | .95 | % | | | .95 | % | | | .95 | % | | | .93 | % | | | 1.10 | % | |
Expenses, including expense
reductions and expenses
assumed | | | .95 | % | | | .95 | % | | | .95 | % | | | .93 | % | | | 1.10 | % | |
Expenses, excluding expense
reductions and expenses
assumed | | | .96 | % | | | .98 | % | | | .98 | % | | | 1.07 | % | | | 1.10 | % | |
| Net investment income | | | .84 | % | | | .99 | % | | | .84 | % | | | 3.35 | % | | | .72 | % | |
| Supplemental Data: | |
| Net assets, end of year (000) | | $ | 221,345 | | | $ | 202,879 | | | $ | 135,677 | | | $ | 12,991 | | | $ | 75 | | |
| Portfolio turnover rate | | | 44.97 | % | | | 39.51 | % | | | 44.86 | % | | | 47.14 | % | | | 34.98 | % | |
(a) Calculated using average shares outstanding during the period.
(b) Total return does not consider the effects of sales loads and assumes the reinvestment of all distributions.
See Notes to Financial Statements.
29
Financial Highlights (continued)
LARGE CAP CORE FUND
| | | Class P Shares | |
| | | Year Ended 11/30 | |
| | | 2007 | | 2006 | | 2005 | | 2004 | | 2003 | |
| Per Share Operating Performance | |
| Net asset value, beginning of year | | $ | 30.65 | | | $ | 28.70 | | | $ | 28.50 | | | $ | 25.01 | | | $ | 21.37 | | |
| Investment operations: | |
| Net investment income(a) | | | .12 | | | | .15 | | | | .10 | | | | .17 | | | | .02 | | |
| Net realized and unrealized gain | | | 3.42 | | | | 3.01 | | | | 1.12 | | | | 3.42 | | | | 3.62 | | |
| Total from investment operations | | | 3.54 | | | | 3.16 | | | | 1.22 | | | | 3.59 | | | | 3.64 | | |
| Distributions to shareholders from: | |
| Net investment income | | | (.06 | ) | | | (.11 | ) | | | (.18 | ) | | | (.10 | ) | | | – | | |
| Net realized gain | | | (1.08 | ) | | | (1.10 | ) | | | (.84 | ) | | | – | | | | – | | |
| Total distributions | | | (1.14 | ) | | | (1.21 | ) | | | (1.02 | ) | | | (.10 | ) | | | – | | |
| Net asset value, end of year | | $ | 33.05 | | | $ | 30.65 | | | $ | 28.70 | | | $ | 28.50 | | | $ | 25.01 | | |
| Total Return(b) | | | 11.93 | % | | | 11.40 | % | | | 4.38 | % | | | 14.39 | % | | | 17.03 | % | |
| Ratios to Average Net Assets: | |
Expenses, excluding expense
reductions and including
expenses assumed | | | 1.40 | % | | | 1.40 | % | | | 1.40 | % | | | 1.48 | % | | | 1.55 | %† | |
Expenses, including expense
reductions and expenses
assumed | | | 1.40 | % | | | 1.40 | % | | | 1.40 | % | | | 1.48 | % | | | 1.55 | %† | |
Expenses, excluding expense
reductions and expenses
assumed | | | 1.41 | % | | | 1.43 | % | | | 1.43 | % | | | 1.50 | % | | | 1.55 | %† | |
| Net investment income | | | .38 | % | | | .53 | % | | | .37 | % | | | .58 | % | | | .27 | %† | |
| Supplemental Data: | |
| Net assets, end of year (000) | | $ | 7,214 | | | $ | 7,314 | | | $ | 6,749 | | | $ | 294 | | | $ | 152 | | |
| Portfolio turnover rate | | | 44.97 | % | | | 39.51 | % | | | 44.86 | % | | | 47.14 | % | | | 34.98 | % | |
† The ratios have been determined on a Fund basis.
(a) Calculated using average shares outstanding during the period.
(b) Total return does not consider the effects of sales loads and assumes the reinvestment of all distributions.
See Notes to Financial Statements.
30
Financial Highlights (continued)
LARGE CAP CORE FUND
| | | Class R2 Shares | |
| | | 9/28/2007(a)
to
11/30/2007 | |
| Per Share Operating Performance | |
| Net asset value, beginning of period | | $ | 33.52 | | |
| Investment operations: | |
| Net investment income(b) | | | .03 | | |
| Net realized and unrealized loss | | | (.62 | ) | |
| Total from investment operations | | | (.59 | ) | |
| Net asset value, end of period | | $ | 32.93 | | |
| Total Return(c) | | | (1.76 | )%(d) | |
| Ratios to Average Net Assets: | |
| Expenses, excluding expense reductions and including expenses assumed | | | .26 | %(d) | |
| Expenses, including expense reductions and expenses assumed | | | .26 | %(d) | |
| Expenses, excluding expense reductions and expenses assumed | | | .26 | %(d) | |
| Net investment income | | | .08 | %(d) | |
| Supplemental Data: | |
| Net assets, end of period (000) | | $ | 10 | | |
| Portfolio turnover rate | | | 44.97 | % | |
(a) Commencement of investment operations was September 28, 2007; SEC effective date was September 14, 2007 and date shares first became available to the public was October 1, 2007.
(b) Calculated using average shares outstanding during the period.
(c) Total return does not consider the effects of sales loads and assumes the reinvestment of all distributions.
(d) Not annualized.
See Notes to Financial Statements.
31
Financial Highlights (concluded)
LARGE CAP CORE FUND
| | | Class R3 Shares | |
| | | 9/28/2007(a)
to
11/30/2007 | |
| Per Share Operating Performance | |
| Net asset value, beginning of period | | $ | 33.52 | | |
| Investment operations: | |
| Net investment income(b) | | | .03 | | |
| Net realized and unrealized loss | | | (.61 | ) | |
| Total from investment operations | | | (.58 | ) | |
| Net asset value, end of period | | $ | 32.94 | | |
| Total Return(c) | | | (1.73 | )%(d) | |
| Ratios to Average Net Assets: | |
| Expenses, excluding expense reductions and including expenses assumed | | | .24 | %(d) | |
| Expenses, including expense reductions and expenses assumed | | | .24 | %(d) | |
| Expenses, excluding expense reductions and expenses assumed | | | .25 | %(d) | |
| Net investment income | | | .10 | %(d) | |
| Supplemental Data: | |
| Net assets, end of period (000) | | $ | 10 | | |
| Portfolio turnover rate | | | 44.97 | % | |
(a) Commencement of investment operations was September 28, 2007; SEC effective date was September 14, 2007 and date shares first became available to the public was October 1, 2007.
(b) Calculated using average shares outstanding during the period.
(c) Total return does not consider the effects of sales loads and assumes the reinvestment of all distributions.
(d) Not annualized.
See Notes to Financial Statements.
32
Financial Highlights
SMALL CAP VALUE FUND
| | | Class A Shares | |
| | | Year Ended 11/30 | |
| | | 2007 | | 2006 | | 2005 | | 2004 | | 2003 | |
| Per Share Operating Performance | |
| Net asset value, beginning of year | | $ | 34.60 | | | $ | 31.40 | | | $ | 29.54 | | | $ | 25.66 | | | $ | 20.29 | | |
| Investment operations: | |
| Net investment income (loss)(a) | | | .04 | | | | (.02 | ) | | | (.09 | ) | | | – | (c) | | | (.10 | ) | |
| Net realized and unrealized gain | | | 2.99 | | | | 6.09 | | | | 4.60 | | | | 5.52 | | | | 6.81 | | |
| Total from investment operations | | | 3.03 | | | | 6.07 | | | | 4.51 | | | | 5.52 | | | | 6.71 | | |
Distributions to shareholders from
net realized gain | | | (4.53 | ) | | | (2.87 | ) | | | (2.65 | ) | | | (1.64 | ) | | | (1.34 | ) | |
| Net asset value, end of year | | $ | 33.10 | | | $ | 34.60 | | | $ | 31.40 | | | $ | 29.54 | | | $ | 25.66 | | |
| Total Return(b) | | | 10.08 | % | | | 21.14 | % | | | 16.78 | % | | | 22.92 | % | | | 35.67 | % | |
| Ratios to Average Net Assets: | |
| Expenses, including expense reductions | | | 1.23 | % | | | 1.23 | % | | | 1.31 | % | | | 1.39 | % | | | 1.45 | % | |
| Expenses, excluding expense reductions | | | 1.23 | % | | | 1.24 | % | | | 1.31 | % | | | 1.39 | % | | | 1.45 | % | |
| Net investment income (loss) | | | .13 | % | | | (.06 | )% | | | (.31 | )% | | | (.03 | )% | | | (.50 | )% | |
| Supplemental Data: | |
| Net assets, end of year (000) | | $ | 2,287,085 | | | $ | 2,367,218 | | | $ | 1,714,898 | | | $ | 939,899 | | | $ | 510,582 | | |
| Portfolio turnover rate | | | 61.44 | % | | | 71.14 | % | | | 71.25 | % | | | 67.04 | % | | | 66.11 | % | |
(a) Calculated using average shares outstanding during the period.
(b) Total return does not consider the effects of sales loads and assumes the reinvestment of all distributions.
(c) Amount is less than $.01.
See Notes to Financial Statements.
33
Financial Highlights (continued)
SMALL CAP VALUE FUND
| | | Class B Shares | |
| | | Year Ended 11/30 | |
| | | 2007 | | 2006 | | 2005 | | 2004 | | 2003 | |
| Per Share Operating Performance | |
| Net asset value, beginning of year | | $ | 31.77 | | | $ | 29.25 | | | $ | 27.87 | | | $ | 24.44 | | | $ | 19.50 | | |
| Investment operations: | |
| Net investment loss(a) | | | (.17 | ) | | | (.23 | ) | | | (.27 | ) | | | (.18 | ) | | | (.22 | ) | |
| Net realized and unrealized gain | | | 2.71 | | | | 5.62 | | | | 4.30 | | | | 5.25 | | | | 6.50 | | |
| Total from investment operations | | | 2.54 | | | | 5.39 | | | | 4.03 | | | | 5.07 | | | | 6.28 | | |
Distributions to shareholders from
net realized gain | | | (4.53 | ) | | | (2.87 | ) | | | (2.65 | ) | | | (1.64 | ) | | | (1.34 | ) | |
| Net asset value, end of year | | $ | 29.78 | | | $ | 31.77 | | | $ | 29.25 | | | $ | 27.87 | | | $ | 24.44 | | |
| Total Return(b) | | | 9.33 | % | | | 20.29 | % | | | 15.99 | % | | | 22.17 | % | | | 34.78 | % | |
| Ratios to Average Net Assets: | |
| Expenses, including expense reductions | | | 1.93 | % | | | 1.92 | % | | | 1.95 | % | | | 2.00 | % | | | 2.07 | % | |
| Expenses, excluding expense reductions | | | 1.93 | % | | | 1.93 | % | | | 1.95 | % | | | 2.00 | % | | | 2.07 | % | |
| Net investment loss | | | (.58 | )% | | | (.77 | )% | | | (1.03 | )% | | | (.74 | )% | | | (1.12 | )% | |
| Supplemental Data: | |
| Net assets, end of year (000) | | $ | 58,676 | | | $ | 71,741 | | | $ | 113,208 | | | $ | 192,098 | | | $ | 182,437 | | |
| Portfolio turnover rate | | | 61.44 | % | | | 71.14 | % | | | 71.25 | % | | | 67.04 | % | | | 66.11 | % | |
(a) Calculated using average shares outstanding during the period.
(b) Total return does not consider the effects of sales loads and assumes the reinvestment of all distributions.
See Notes to Financial Statements.
34
Financial Highlights (continued)
SMALL CAP VALUE FUND
| | | Class C Shares | |
| | | Year Ended 11/30 | |
| | | 2007 | | 2006 | | 2005 | | 2004 | | 2003 | |
| Per Share Operating Performance | |
| Net asset value, beginning of year | | $ | 31.82 | | | $ | 29.29 | | | $ | 27.90 | | | $ | 24.46 | | | $ | 19.52 | | |
| Investment operations: | |
| Net investment loss(a) | | | (.17 | ) | | | (.22 | ) | | | (.26 | ) | | | (.18 | ) | | | (.22 | ) | |
| Net realized and unrealized gain | | | 2.71 | | | | 5.62 | | | | 4.30 | | | | 5.26 | | | | 6.50 | | |
| Total from investment operations | | | 2.54 | | | | 5.40 | | | | 4.04 | | | | 5.08 | | | | 6.28 | | |
Distributions to shareholders from
net realized gain | | | (4.53 | ) | | | (2.87 | ) | | | (2.65 | ) | | | (1.64 | ) | | | (1.34 | ) | |
| Net asset value, end of year | | $ | 29.83 | | | $ | 31.82 | | | $ | 29.29 | | | $ | 27.90 | | | $ | 24.46 | | |
| Total Return(b) | | | 9.32 | % | | | 20.30 | % | | | 16.01 | % | | | 22.19 | % | | | 34.74 | % | |
| Ratios to Average Net Assets: | |
| Expenses, including expense reductions | | | 1.93 | % | | | 1.93 | % | | | 1.95 | % | | | 2.00 | % | | | 2.07 | % | |
| Expenses, excluding expense reductions | | | 1.93 | % | | | 1.93 | % | | | 1.96 | % | | | 2.00 | % | | | 2.07 | % | |
| Net investment loss | | | (.58 | )% | | | (.76 | )% | | | (.99 | )% | | | (.74 | )% | | | (1.12 | )% | |
| Supplemental Data: | |
| Net assets, end of year (000) | | $ | 86,971 | | | $ | 91,715 | | | $ | 91,195 | | | $ | 89,408 | | | $ | 81,967 | | |
| Portfolio turnover rate | | | 61.44 | % | | | 71.14 | % | | | 71.25 | % | | | 67.04 | % | | | 66.11 | % | |
(a) Calculated using average shares outstanding during the period.
(b) Total return does not consider the effects of sales loads and assumes the reinvestment of all distributions.
See Notes to Financial Statements.
35
Financial Highlights (continued)
SMALL CAP VALUE FUND
| | | Class F Shares | |
| | | 9/28/2007(a)
to
11/30/2007 | |
| Per Share Operating Performance | |
| Net asset value, beginning of period | | $ | 33.61 | | |
| Investment operations: | |
| Net investment income(b) | | | .01 | | |
| Net realized and unrealized loss | | | (.51 | ) | |
| Total from investment operations | | | (.50 | ) | |
| Net asset value, end of period | | $ | 33.11 | | |
| Total Return(c) | | | (1.49 | )%(d) | |
| Ratios to Average Net Assets: | |
| Expenses, including expense reductions | | | .18 | %(d) | |
| Expenses, excluding expense reductions | | | .18 | %(d) | |
| Net investment income | | | .04 | %(d) | |
| Supplemental Data: | |
| Net assets, end of period (000) | | $ | 10 | | |
| Portfolio turnover rate | | | 61.44 | % | |
(a) Commencement of investment operations was September 28, 2007; SEC effective date was September 14, 2007 and date shares first became available to the public was October 1, 2007.
(b) Calculated using average shares outstanding during the period.
(c) Total return does not consider the effects of sales loads and assumes the reinvestment of all distributions.
(d) Not annualized.
See Notes to Financial Statements.
36
Financial Highlights (continued)
SMALL CAP VALUE FUND
| | | Class I Shares | |
| | | Year Ended 11/30 | |
| | | 2007 | | 2006 | | 2005 | | 2004 | | 2003 | |
| Per Share Operating Performance | |
| Net asset value, beginning of year | | $ | 36.00 | | | $ | 32.46 | | | $ | 30.36 | | | $ | 26.23 | | | $ | 20.64 | | |
| Investment operations: | |
| Net investment income (loss)(a) | | | .14 | | | | .08 | | | | .02 | | | | .10 | | | | (.02 | ) | |
| Net realized and unrealized gain | | | 3.14 | | | | 6.33 | | | | 4.73 | | | | 5.67 | | | | 6.95 | | |
| Total from investment operations | | | 3.28 | | | | 6.41 | | | | 4.75 | | | | 5.77 | | | | 6.93 | | |
Distributions to shareholders from net
realized gain | | | (4.53 | ) | | | (2.87 | ) | | | (2.65 | ) | | | (1.64 | ) | | | (1.34 | ) | |
| Net asset value, end of year | | $ | 34.75 | | | $ | 36.00 | | | $ | 32.46 | | | $ | 30.36 | | | $ | 26.23 | | |
| Total Return(b) | | | 10.42 | % | | | 21.53 | % | | | 17.14 | % | | | 23.40 | % | | | 36.10 | % | |
| Ratios to Average Net Assets: | |
| Expenses, including expense reductions | | | .93 | % | | | .93 | % | | | .96 | % | | | 1.00 | % | | | 1.07 | % | |
| Expenses, excluding expense reductions | | | .93 | % | | | .93 | % | | | .96 | % | | | 1.00 | % | | | 1.07 | % | |
| Net investment income (loss) | | | .43 | % | | | .25 | % | | | .05 | % | | | .38 | % | | | (.12 | )% | |
| Supplemental Data: | |
| Net assets, end of year (000) | | $ | 1,227,169 | | | $ | 1,045,397 | | | $ | 632,444 | | | $ | 304,763 | | | $ | 149,463 | | |
| Portfolio turnover rate | | | 61.44 | % | | | 71.14 | % | | | 71.25 | % | | | 67.04 | % | | | 66.11 | % | |
(a) Calculated using average shares outstanding during the period.
(b) Total return does not consider the effects of sales loads and assumes the reinvestment of all distributions.
See Notes to Financial Statements.
37
Financial Highlights (concluded)
SMALL CAP VALUE FUND
| | | Class P Shares | |
| | | Year Ended 11/30 | |
| | | 2007 | | 2006 | | 2005 | | 2004 | | 2003 | |
| Per Share Operating Performance | |
| Net asset value, beginning of year | | $ | 34.40 | | | $ | 31.28 | | | $ | 29.47 | | | $ | 25.61 | | | $ | 20.27 | | |
| Investment operations: | |
| Net investment income (loss)(a) | | | (.01 | ) | | | (.06 | ) | | | (.11 | ) | | | .01 | | | | (.12 | ) | |
| Net realized and unrealized gain | | | 2.98 | | | | 6.05 | | | | 4.57 | | | | 5.49 | | | | 6.80 | | |
| Total from investment operations | | | 2.97 | | | | 5.99 | | | | 4.46 | | | | 5.50 | | | | 6.68 | | |
Distributions to shareholders from net
realized gain | | | (4.53 | ) | | | (2.87 | ) | | | (2.65 | ) | | | (1.64 | ) | | | (1.34 | ) | |
| Net asset value, end of year | | $ | 32.84 | | | $ | 34.40 | | | $ | 31.28 | | | $ | 29.47 | | | $ | 25.61 | | |
| Total Return(b) | | | 9.95 | % | | | 20.95 | % | | | 16.68 | % | | | 22.84 | % | | | 35.48 | % | |
| Ratios to Average Net Assets: | |
| Expenses, including expense reductions | | | 1.38 | % | | | 1.38 | % | | | 1.41 | % | | | 1.45 | % | | | 1.52 | % | |
| Expenses, excluding expense reductions | | | 1.38 | % | | | 1.38 | % | | | 1.41 | % | | | 1.45 | % | | | 1.52 | % | |
| Net investment income (loss) | | | (.03 | )% | | | (.20 | )% | | | (.39 | )% | | | .03 | % | | | (.57 | )% | |
| Supplemental Data: | |
| Net assets, end of year (000) | | $ | 412,127 | | | $ | 447,775 | | | $ | 328,055 | | | $ | 141,389 | | | $ | 47,471 | | |
| Portfolio turnover rate | | | 61.44 | % | | | 71.14 | % | | | 71.25 | % | | | 67.04 | % | | | 66.11 | % | |
(a) Calculated using average shares outstanding during the period.
(b) Total return does not consider the effects of sales loads and assumes the reinvestment of all distributions.
See Notes to Financial Statements.
38
Notes to Financial Statements
1. ORGANIZATION
Lord Abbett Research Fund, Inc. (the "Company") is registered under the Investment Company Act of 1940 (the "Act") as a diversified open-end management investment company, incorporated under Maryland law on April 6, 1992. The Company currently consists of four separate funds. This report covers the following two funds and their respective classes: Lord Abbett Large-Cap Core Fund ("Large Cap Core Fund") and Lord Abbett Small-Cap Value Series ("Small Cap Value Fund") (collectively, the "Funds").
Large Cap Core Fund's investment objective is to seek growth of capital and growth of income consistent with reasonable risk. Small Cap Value Fund's investment objective is to seek long-term capital appreciation. Large Cap Core Fund offers eight classes of shares: Classes A, B, C, F, I, P, R2 and R3, each with different expenses and dividends. Small Cap Value Fund offers six classes of shares: Classes A, B, C, F, I and P, each with different expenses and dividends. A front-end sales charge is normally added to the Net Asset Value ("NAV") for Class A shares. There is no front-end sales charge in the case of Classes B, C, F, I, P, R2 and R3 shares, although there may be a contingent deferred sales charge ("CDSC") as follows: certain redemptions of Class A shares made within 12 months following certain purchases made without a sales charge; Class B shares redeemed before the sixth anniversary of purchase; and Class C shares redeemed before the first anniversary of purchase. Class B shares will convert to Class A shares on the eighth anniversary of the original purchase of Class B shares. Small Cap Value Fund is open to certain new investors on a limited basis as set forth in the Fund's prospectus. Effective September 28, 2007, Class Y was renamed Class I. As of October 1, 2007, each Fund's Class P shares were closed to substantially all new retirement and benefit plans and fee-based programs, with certain exceptions as set forth in each Fund's Prospectus.
The preparation of financial statements in conformity with accounting principles generally accepted in the United States of America requires management to make certain estimates and assumptions that affect the reported amounts of assets and liabilities and disclosure of contingent assets and liabilities at the date of the financial statements and the reported amounts of increases and decreases in net assets from operations during the reporting period. Actual results could differ from those estimates.
2. SIGNIFICANT ACCOUNTING POLICIES
(a) Investment Valuation—Securities traded on any recognized U.S. or non-U.S. exchange or on NASDAQ, Inc. are valued at the last sale price or official closing price on the exchange or system on which they are principally traded. Events occurring after the close of trading on non-U.S. exchanges may result in adjustments to the valuation of foreign securities to more accurately reflect their fair value as of the close of regular trading on the New York Stock Exchange. Each Fund may rely on an independent fair valuation service in adjusting the valuations of foreign securities. Unlisted equity securities are valued at the last quoted sale price or, if no sale price is available, at the mean between the most recently quoted bid and asked prices. Securities for which market quotati ons are not readily available are valued at fair value as determined by management and approved in good faith by the Board of Directors. Short-term securities with 60 days or less remaining to maturity are valued using the amortized cost method, which approximates current market value.
(b) Security Transactions—Security transactions are recorded as of the date that the securities are purchased or sold (trade date). Realized gains and losses on sales of portfolio securities are calculated using the identified-cost method. Realized and unrealized gains (losses) are
39
Notes to Financial Statements (continued)
allocated to each class of shares based upon the relative proportion of net assets at the beginning of the day.
(c) Investment Income—Dividend income is recorded on the ex-dividend date. Discounts are accreted and premiums are amortized using the effective interest method. Withholding taxes on foreign dividends have been provided for in accordance with the Funds' understanding of the applicable country's tax rules and rates. Investment income is allocated to each class of shares based upon the relative proportion of net assets at the beginning of the day.
(d) Federal Taxes—It is the policy of each Fund to meet the requirements of Subchapter M of the Internal Revenue Code applicable to regulated investment companies and to distribute substantially all taxable income and capital gains to its shareholders. Therefore, no Federal income tax provision is required.
(e) Expenses—Expenses incurred by the Company that do not specifically relate to an individual fund are generally allocated to the Funds within the Company on a pro rata basis. Expenses, excluding class specific expenses, are allocated to each class of shares based upon the relative proportion of net assets at the beginning of the day. Class A, B, C, F, P, R2 and R3 shares bear their class specific share of all expenses and fees relating to the Funds' 12b-1 Distribution Plan.
(f) Repurchase Agreements—Each Fund may enter into repurchase agreements with respect to securities. A repurchase agreement is a transaction in which a Fund acquires a security and simultaneously commits to resell that security to the seller (a bank or securities dealer) at an agreed-upon price on an agreed-upon date. Each Fund requires at all times that the repurchase agreement be collateralized by cash, or by securities of the U.S. Government, its agencies, its instrumentalities, or U.S. Government sponsored enterprises having a value equal to, or in excess of, the value of the repurchase agreement (including accrued interest). If the seller of the agreement defaults on its obligation to repurchase the underlying securities at a time when the value of these securities has dec lined, the Funds may incur a loss upon disposition of the securities.
3. MANAGEMENT FEES AND OTHER TRANSACTIONS WITH AFFILIATES
Management Fees
The Company has a management agreement with Lord, Abbett & Co. LLC ("Lord Abbett") pursuant to which Lord Abbett supplies each Fund with investment management services and executive and other personnel, pays the remuneration of officers, provides office space and pays for ordinary and necessary office and clerical expenses relating to research and statistical work and supervision of each Fund's investment portfolio.
The management fees are based on average daily net assets at the following annual rates:
| Large Cap Core Fund: | |
| First $1 billion | | | .70 | % | |
| Next $1 billion | | | .65 | % | |
| Over $2 billion | | | .60 | % | |
For the year ended November 30, 2007, the effective management fee paid to Lord Abbett was at a rate of .70% of Large Cap Core Fund's average daily net assets.
| Small Cap Value Fund: | |
| First $2 billion | | | .75 | % | |
| Over $2 billion | | | .70 | % | |
40
Notes to Financial Statements (continued)
For the year ended November 30, 2007, the effective management fee paid to Lord Abbett was at a rate of .72% of Small Cap Value Fund's average daily net assets.
For the period from December 1, 2006 through March 31, 2008, Lord Abbett contractually agreed to reimburse the Large Cap Core Fund to the extent necessary so that each class' total annual operating expenses do not exceed the following annual rates:
| Class | | % of Average Daily Net Assets | |
| A | | | 1.30 | % | |
| B | | | 1.95 | % | |
| C | | | 1.95 | % | |
| F | | | 1.05 | %(1) | |
| I | | | 0.95 | % | |
| P | | | 1.40 | % | |
| R2 | | | 1.55 | %(1) | |
| R3 | | | 1.45 | %(1) | |
(1) The Class F, R2 and R3 shares became effective with the SEC on September 14, 2007.
Lord Abbett provides certain administrative services to the Funds pursuant to an Administrative Services Agreement at an annual rate of .04% of each Fund's average daily net assets.
Large Cap Core Fund, along with certain other funds managed by Lord Abbett (the "Underlying Funds"), has entered into a Servicing Arrangement with Lord Abbett Balanced Strategy Fund, Lord Abbett Diversified Equity Strategy Fund and Lord Abbett Growth & Income Strategy Fund, each of Lord Abbett Investment Trust (each, a "Fund of Funds"), pursuant to which each Underlying Fund pays a portion of the expenses (excluding management fees and distribution and service fees) of the Fund of Funds in proportion to the average daily value of the Underlying Fund shares owned by the Fund of Funds. In addition, Small Cap Value Fund, along with certain other funds managed by Lord Abbett (the "Underlying Funds") has entered into a Servicing Arrangement with Lord Abbett Alpha Strategy Fund of Lord Abbett Securitie s Trust ("Alpha Strategy Fund"), pursuant to which each Underlying Fund pays a portion of the expenses (excluding management fees and distribution and service fees) of Alpha Strategy Fund in proportion to the average daily value of the Underlying Fund shares owned by Alpha Strategy Fund. Amounts paid pursuant to the Servicing Arrangement are included in Subsidy expense on the Funds' Statement of Operations and Payable to affiliates on the Funds' Statement of Assets and Liablities.
12b-1 Distribution Plan
Each Fund has adopted a distribution plan with respect to Class A, B, C, F, P, R2 and R3 shares pursuant to Rule 12b-1 under the Act, which provides for the payment of ongoing distribution and service fees to Lord Abbett Distributor LLC ("Distributor"), an affiliate of Lord Abbett. The fees are accrued daily at annual rates based upon average daily net assets as follows:
| Fees* | | Class A | | Class B | | Class C | | Class F | | Class P | | Class R2 | | Class R3 | |
| Service | | | .25 | % | | | .25 | % | | | .25 | % | | | - | | | | .20 | % | | | .25 | % | | | .25 | % | |
| Distribution | | | .10 | %(1) | | | .75 | % | | | .75 | % | | | .10 | % | | | .25 | % | | | .35 | % | | | .25 | % | |
* Each Fund may designate a portion of the aggregate fee as attributable to service activities for purposes of calculating Financial Industry Regulatory Authority ("FINRA") sales charge limitations.
(1) Effective October 1, 2005 the Class A Distribution Fee for Small Cap Value Fund was reduced from .10% of average daily net assets to .05% of average daily net assets.
Class I does not have a distribution plan.
41
Notes to Financial Statements (continued)
Commissions
Distributor received the following commissions on sales of shares of the Funds, after concessions were paid to authorized dealers, for the year ended November 30, 2007:
| | | Distributor
Commissions | | Dealers'
Concessions | |
| Large Cap Core Fund | | $ | 399,531 | | | $ | 2,080,635 | | |
| Small Cap Value Fund | | | 39,302 | | | | 210,139 | | |
Distributor received the following amount of CDSCs for the year ended November 30, 2007.
| | | Class A | | Class C | |
| Large Cap Core Fund | | $ | 12,310 | | | $ | 9,588 | | |
| Small Cap Value Fund | | | 10,220 | | | | 1,183 | | |
Two Directors and certain of the Funds' officers have an interest in Lord Abbett.
4. DISTRIBUTIONS AND CAPITAL LOSS CARRYFORWARDS
Dividends from net investment income, if any, are declared and distributed at least semiannually for Large Cap Core Fund and at least annually for Small Cap Value Fund. Taxable net realized gains from investment transactions, reduced by capital loss carryforwards, if any, are declared and distributed to shareholders at least annually. The capital loss carryforward amount, if any, is available to offset future net capital gains. Dividends and distributions to shareholders are recorded on the ex-dividend date. The amount of dividends and distributions from net investment income and net realized capital gains are determined in accordance with Federal income tax regulations which may differ from accounting principles generally accepted in the United States of America. These book/tax differences are either considered temporary or permanent in nature. To the extent these differences are permanent in nature, such amounts are reclassified within the components of net assets based on their federal tax basis treatment; temporary differences do not require reclassification. Dividends and distributions, which exceed earnings and profits for tax purposes, are reported as a tax return of capital.
Distributions were declared on December 13, 2007, and paid on December 18, 2007 to shareholders of record on December 17, 2007. The approximate amounts are as follows:
| | | Net Investment
Income | | Short-Term
Capital Gain | | Long-Term
Capital Gain | |
| Large Cap Core Fund | | $ | 4,973,000 | | | $ | 7,057,000 | | | $ | 65,520,000 | | |
| Small Cap Value Fund | | | 7,400,000 | | | | 122,513,000 | | | | 462,034,000 | | |
The tax character of distributions paid during the fiscal years ended November 30, 2007 and 2006 are as follows:
| | | Large Cap Core Fund | | Small Cap Value Fund | |
| | | 11/30/2007 | | 11/30/2006 | | 11/30/2007 | | 11/30/2006 | |
| Distributions paid from: | |
| Ordinary income | | $ | 7,002,236 | | | $ | 3,349,904 | | | $ | 171,281,162 | | | $ | 69,665,823 | | |
| Net long-term capital gains | | | 34,678,984 | | | | 31,503,103 | | | | 353,055,091 | | | | 195,292,834 | | |
| Total distributions paid | | $ | 41,681,220 | | | $ | 34,853,007 | | | $ | 524,336,253 | | | $ | 264,958,657 | | |
42
Notes to Financial Statements (continued)
As of November 30, 2007, the components of accumulated earnings on a tax-basis are as follows:
| | | Large Cap Core Fund | | Small Cap Value Fund | |
| Undistributed ordinary income – net | | $ | 11,916,301 | | | $ | 129,904,710 | | |
| Undistributed long-term capital gains | | | 65,519,683 | | | | 462,027,791 | | |
| Total undistributed earnings | | $ | 77,435,984 | | | $ | 591,932,501 | | |
| Temporary differences | | | (81,027 | ) | | | (283,414 | ) | |
| Unrealized gains - net | | | 175,181,282 | | | | 407,433,602 | | |
| Total accumulated earnings - net | | $ | 252,536,239 | | | $ | 999,082,689 | | |
As of November 30, 2007, the aggregate unrealized security gains and losses based on cost for U.S. Federal income tax purposes are as follows:
| | | Large Cap Core Fund | | Small Cap Value Fund | |
| Tax cost | | $ | 933,136,540 | | | $ | 3,658,165,724 | | |
| Gross unrealized gain | | | 201,538,714 | | | | 560,933,862 | | |
| Gross unrealized loss | | | (26,357,432 | ) | | | (153,500,260 | ) | |
| Net unrealized security gain | | $ | 175,181,282 | | | $ | 407,433,602 | | |
The difference between book-basis and tax-basis unrealized gains (losses) is primarily attributable to wash sales.
Permanent items identified during the fiscal year ended November 30, 2007, have been reclassified among the components of net assets based on their tax basis treatment as follows:
| | | Undistributed
Net Investment
Income | | Accumulated
Net Realized
Gain | |
| Small Cap Value Fund | | $ | 339,171 | | | $ | (339,171 | ) | |
The permanent difference is attributable to the tax treatment of certain distributions received.
5. PORTFOLIO SECURITIES TRANSACTIONS
Purchases and sales of investment securities (excluding short-term investments) for the fiscal year ended November 30, 2007 are as follows:
| | | Purchases | | Sales | |
| Large Cap Core Fund | | $ | 476,985,409 | | | $ | 497,079,251 | | |
| Small Cap Value Fund | | | 2,416,022,576 | | | | 2,867,683,764 | | |
There were no purchases or sales of U.S. Government securities for the year ended November 30, 2007
6. DIRECTORS' REMUNERATION
The Company's officers and the two Directors who are associated with Lord Abbett do not receive any compensation from the Company for serving in such capacities. Outside Directors' fees are allocated among all Lord Abbett-sponsored funds based on the net assets of each fund. There is an equity based plan available to all outside Directors under which outside Directors must defer receipt of a portion of, and may elect to defer receipt of an additional portion of, Directors' fees. The deferred amounts are treated as though equivalent dollar amounts have been invested proportionately in the funds. Such amounts and earnings accrued thereon are included in Directors' fees on the Statement of Operations and in Directors' fees payable on the Statement of Assets and Liabilities and are not deductible for U.S. Federal income tax purposes until such amounts are paid.
43
Notes to Financial Statements (continued)
7. EXPENSE REDUCTIONS
The Company has entered into arrangements with the Funds' transfer agent and custodian whereby credits realized as a result of uninvested cash balances are used to reduce a portion of each Fund's expenses.
8. LINE OF CREDIT
Each Fund, along with certain other funds managed by Lord Abbett, has available a $250,000,000 unsecured revolving credit facility ("Facility") from a consortium of banks, to be used for temporary or emergency purposes as an additional source of liquidity to fund redemptions of investor shares. Any borrowings under this Facility will bear interest at current market rates as defined in the agreement. The fee for this Facility is at an annual rate of .08%. As of November 30, 2007, there were no loans outstanding pursuant to this Facility nor was the Facility utilized at any time during the fiscal year ended November 30, 2007.
9. TRANSACTIONS WITH AFFILIATED ISSUERS
An affiliated issuer is one in which a Fund had ownership of at least 5% of the outstanding voting securities of the underlying issuer at any point during the fiscal year. Small Cap Value Fund had the following transactions with affiliated issuers during the year ended November 30, 2007:
| Affiliated Issuer | | Balance of
Shares Held
at 11/30/2006 | | Gross
Additions | | Gross
Sales | | Balance of
Shares Held
at 11/30/2007 | | Value
at
11/30/2007 | | Net Realized
Gain (Loss)
12/1/2006
to 11/30/2007(c) | | Dividend
Income
12/1/2006
to 11/30/2007(c) | |
| Abaxis, Inc.(a) | | | 882,001 | (b) | | | 273,480 | | | | (792,600 | ) | | | 362,881 | | | $ | - | | | $ | 1,889,214 | | | $ | - | | |
| AMCOL Int'l., Corp.(a) | | | 1,584,348 | | | | 58,400 | | | | (1,440,150 | ) | | | 202,598 | | | | - | | | | 290,092 | | | | 221,809 | | |
| ANADIGICS, Inc. | | | 3,060,000 | | | | 1,536,820 | | | | (970,248 | ) | | | 3,626,572 | | | | 39,928,558 | | | | 8,198,671 | | | | - | | |
| Anaren, Inc. | | | 1,369,777 | | | | 695,169 | | | | (353,100 | ) | | | 1,711,846 | | | | 26,362,428 | | | | 124,461 | | | | - | | |
| Anixter Int'l., Inc.(a) | | | 2,546,005 | | | | 222,700 | | | | (1,013,000 | ) | | | 1,755,705 | | | | - | | | | 34,360,515 | | | | - | | |
| Avista Corp.(a) | | | 3,014,000 | | | | - | | | | (1,092,100 | ) | | | 1,921,900 | | | | - | | | | 2,262,720 | | | | 387,889 | | |
| Benihana, Inc. Class A(a) | | | 392,246 | | | | 60,352 | | | | (126,397 | ) | | | 326,201 | | | | - | | | | 84,814 | | | | - | | |
| Black Hills Corp. | | | 2,093,978 | | | | 241,100 | | | | - | | | | 2,335,078 | | | | 97,279,350 | | | | - | | | | 3,134,151 | | |
| Bristow Group Inc. | | | 103,300 | (b) | | | 1,366,860 | | | | (135,100 | ) | | | 1,335,060 | | | | 73,428,300 | | | | 1,005,486 | | | | - | | |
Commercial Vehicle
Group, Inc.(a) | | | 1,143,900 | | | | - | | | | (1,143,900 | ) | | | - | | | | - | | | | 208,374 | | | | - | | |
Comtech
Telecommunications
Corp.(a) | | | 1,495,477 | | | | 113,420 | | | | (1,408,700 | ) | | | 200,197 | | | | - | | | | 3,814,563 | | | | - | | |
| Curtiss-Wright Corp. | | | 2,509,545 | | | | 148,200 | | | | (310,600 | ) | | | 2,347,145 | | | | 126,605,001 | | | | 7,475,660 | | | | 713,215 | | |
| Financial Federal Corp. | | | 2,300,039 | | | | 396,452 | | | | - | | | | 2,696,491 | | | | 59,565,486 | | | | - | | | | 1,432,539 | | |
| Frontier Airlines Holdings(a) | | | 2,409,400 | | | | - | | | | (2,409,400 | ) | | | - | | | | - | | | | (1,571,741 | ) | | | - | | |
| Hexcel Corp.(a) | | | 4,725,129 | | | | 467,600 | | | | (582,900 | ) | | | 4,609,829 | | | | - | | | | 8,965,390 | | | | - | | |
| Kensey Nash Corp.(a) | | | 730,400 | | | | 16,340 | | | | (423,332 | ) | | | 323,408 | | | | - | | | | (437,698 | ) | | | - | | |
| Koppers Holdings, Inc.(a) | | | 20,200 | | | | 1,101,350 | | | | (656,100 | ) | | | 465,450 | | | | - | | | | 571,026 | | | | 187,229 | | |
| LSI Industries, Inc.(a) | | | 1,453,070 | | | | - | | | | (1,453,070 | ) | | | - | | | | - | | | | 1,156,951 | | | | 318,580 | | |
NCI Building
Systems, Inc.(a) | | | 696,729 | (b) | | | 588,300 | | | | (1,134,400 | ) | | | 150,629 | | | | - | | | | 1,972,231 | | | | - | | |
| Olin Corp. | | | - | (b) | | | 4,024,183 | | | | - | | | | 4,024,183 | | | | 84,266,392 | | | | - | | | | 765,697 | | |
| Plexus Corp.(a) | | | 2,951,500 | | | | 1,125,200 | | | | (2,383,000 | ) | | | 1,693,700 | | | | - | | | | (2,998,417 | ) | | | - | | |
| PNM Resources, Inc.(a) | | | 4,055,600 | | | | 355,800 | | | | (1,899,300 | ) | | | 2,512,100 | | | | - | | | | (2,815,793 | ) | | | 3,812,473 | | |
| Quanex Corp. | | | 2,686,050 | | | | 658,972 | | | | (65,000 | ) | | | 3,280,022 | | | | 164,132,301 | | | | 2,160,252 | | | | 1,550,454 | | |
| Rogers Corp. | | | 1,260,080 | | | | 569,955 | | | | (2,956 | ) | | | 1,827,079 | | | | 80,501,101 | | | | 86,176 | | | | - | | |
44
Notes to Financial Statements (continued)
| Affiliated Issuer | | Balance of
Shares Held
at 11/30/2006 | | Gross
Additions | | Gross
Sales | | Balance of
Shares Held
at 11/30/2007 | | Value
at
11/30/2007 | | Net Realized
Gain (Loss)
12/1/2006
to 11/30/2007(c) | | Dividend
Income
12/1/2006
to 11/30/2007(c) | |
| Ruby Tuesday, Inc.(a) | | | 3,127,100 | | | | - | | | | (1,400,608 | ) | | | 1,726,492 | | | $ | - | | | $ | 1,172,505 | | | $ | 781,775 | | |
Rush Enterprises, Inc.
Class A(a)(d) | | | 1,206,231 | | | | 200,510 | | | | (869,900 | ) | | | 536,841 | | | | - | | | | 3,154,947 | | | | - | | |
| ScanSource, Inc. | | | 1,371,817 | | | | 456,900 | | | | (117,853 | ) | | | 1,710,864 | | | | 60,359,282 | | | | 1,684,637 | | | | - | | |
| SonoSite, Inc. | | | - | (b) | | | 860,000 | | | | - | | | | 860,000 | | | | 28,569,200 | | | | - | | | | - | | |
| Susser Holdings Corp. | | | 338,779 | (b) | | | 780,599 | | | | (99,026 | ) | | | 1,020,352 | | | | 24,059,900 | | | | 708,858 | | | | - | | |
Williams Scotsman
Int'l., Inc.(a) | | | 1,908,192 | | | | 620,292 | | | | (2,528,484 | ) | | | - | | | | - | | | | 3,122,136 | | | | - | | |
| Total | | | | | | | | | | | | | | | | | | $ | 865,057,299 | | | $ | 76,646,030 | | | $ | 13,305,811 | | |
(a) No longer an affiliated issuer as of November 30, 2007.
(b) Not an affiliated issuer as of November 30, 2006.
(c) Represents realized gains (losses) and dividend income earned only when the issuer was an affiliate of the Fund.
(d) 200,510 shares acquired in a 3-for-2 stock split; ex-date October 11, 2007.
10. CUSTODIAN AND ACCOUNTING AGENT
State Street Bank & Trust Company ("SSB") is the Company's custodian and accounting agent. SSB performs custodial, accounting and recordkeeping functions relating to portfolio transactions and calculating each Fund's NAV.
11. INVESTMENT RISKS
Large Cap Core Fund is subject to the general risks and considerations associated with equity investing, as well as the particular risks associated with value and growth stocks. This means the value of your investment will fluctuate in response to movements in the equity securities market in general and to the changing prospects of individual companies in which the Fund invests. Large value and growth stocks may perform differently than the market as a whole and differently than each other or other types of stocks, such as small company stocks. This is because different types of stocks tend to shift in and out of favor depending on market and economic conditions. The market may fail to recognize the intrinsic value of particular value stocks for a long time. Growth stocks may be more volatile than other stocks. In addition, if the Fund's assessment of a company's value or prospects for exceeding earnings expectations or market conditions is wrong, the Fund could suffer losses or produce poor performance relative to other funds, even in a rising market.
Small Cap Value Fund is subject to the general risks and considerations associated with equity investing, as well as the particular risks associated with value stocks. The value of an investment will fluctuate in response to movements in the stock market in general and to the changing prospects of individual companies in which the Fund invests. Large company value stocks and small company value stocks may perform differently than the market as a whole and other types of stocks such as growth stocks. The market may fail to recognize the intrinsic value of particular value stocks for a long time. In addition, small cap company stocks may be more volatile and less liquid than large cap company stocks. Also, if a Fund's assessment of a company's value or prospects for exceeding earnings expectations or market conditions is wrong, the Fund could suffer losses or produce poor performance relative to other funds, even in a rising market.
These factors can affect each Fund's performance.
45
Notes to Financial Statements (continued)
12. SUMMARY OF CAPITAL TRANSACTIONS
Transactions in shares of beneficial interest are as follows:
LARGE CAP CORE FUND
| | | Year Ended
November 30, 2007 | | Year Ended
November 30, 2006 | |
| Class A Shares* | | Shares | | Amount | | Shares | | Amount | |
| Shares sold | | | 3,124,756 | | | $ | 98,045,804 | | | | 5,088,040 | | | $ | 146,607,170 | | |
| Converted from Class B** | | | 265,147 | | | | 8,377,472 | | | | 314,975 | | | | 9,047,941 | | |
| Reinvestment of distributions | | | 850,599 | | | | 25,492,466 | | | | 759,427 | | | | 21,271,566 | | |
| Shares reacquired | | | (3,843,716 | ) | | | (121,315,545 | ) | | | (3,351,998 | ) | | | (96,886,894 | ) | |
| Increase | | | 396,786 | | | $ | 10,600,197 | | | | 2,810,444 | | | $ | 80,039,783 | | |
| Class B Shares* | |
| Shares sold | | | 335,590 | | | $ | 10,089,476 | | | | 548,560 | | | $ | 15,218,272 | | |
| Reinvestment of distributions | | | 83,312 | | | | 2,399,391 | | | | 98,899 | | | | 2,668,307 | | |
| Shares reacquired | | | (458,966 | ) | | | (13,820,894 | ) | | | (603,518 | ) | | | (16,743,965 | ) | |
| Converted to Class A** | | | (276,763 | ) | | | (8,377,472 | ) | | | (327,776 | ) | | | (9,047,941 | ) | |
| Decrease | | | (316,827 | ) | | $ | (9,709,499 | ) | | | (283,835 | ) | | $ | (7,905,327 | ) | |
| Class C Shares | |
| Shares sold | | | 634,390 | | | $ | 19,155,653 | | | | 893,337 | | | $ | 24,845,864 | | |
| Reinvestment of distributions | | | 77,497 | | | | 2,240,453 | | | | 73,138 | | | | 1,980,587 | | |
| Shares reacquired | | | (645,649 | ) | | | (19,489,211 | ) | | | (678,501 | ) | | | (18,902,772 | ) | |
| Increase | | | 66,238 | | | $ | 1,906,895 | | | | 287,974 | | | $ | 7,923,679 | | |
| | | Period Ended
November 30, 2007† | |
| Class F Shares | | Shares | | Amount | |
| Shares sold | | | 300.329 | | | $ | 10,066 | | |
| Increase | | | 300.329 | | | $ | 10,066 | | |
| | | Year Ended
November 30, 2007 | | Year Ended
November 30, 2006 | |
| Class I Shares | | Shares | | Amount | | Shares | | Amount | |
| Shares sold | | | 1,501,843 | | | $ | 46,979,795 | | | | 1,704,558 | | | $ | 49,374,015 | | |
| Reinvestment of distributions | | | 299,558 | | | | 8,983,765 | | | | 218,832 | | | | 6,131,662 | | |
| Shares reacquired | | | (1,707,776 | ) | | | (57,086,951 | ) | | | (46,822 | ) | | | (1,342,437 | ) | |
| Increase (decrease) | | | 93,625 | | | $ | (1,123,391 | ) | | | 1,876,568 | | | $ | 54,163,240 | | |
| Class P Shares | |
| Shares sold | | | 101,611 | | | $ | 3,181,240 | | | | 71,533 | | | $ | 2,057,095 | | |
| Reinvestment of distributions | | | 5,779 | | | | 173,847 | | | | 10,050 | | | | 281,801 | | |
| Shares reacquired | | | (127,762 | ) | | | (3,938,909 | ) | | | (78,033 | ) | | | (2,273,526 | ) | |
| Increase (decrease) | | | (20,372 | ) | | $ | (583,822 | ) | | | 3,550 | | | $ | 65,370 | | |
| | | Period Ended
November 30, 2007† | |
| Class R2 Shares | | Shares | | Amount | |
| Shares sold | | | 298.329 | | | $ | 10,000 | | |
| Increase | | | 298.329 | | | $ | 10,000 | | |
| Class R3 Shares | |
| Shares sold | | | 298.329 | | | $ | 10,000 | | |
| Increase | | | 298.329 | | | $ | 10,000 | | |
* Amounts for the year ended November 30, 2006 have been reclassified to conform with current presentation.
** Automatic conversion of Class B shares occurs approximately eight years after the initial purchase date.
† For the period September 28, 2007 (commencement of investment operations) to November 30, 2007.
46
Notes to Financial Statements (continued)
SMALL CAP VALUE FUND
| | | Year Ended
November 30, 2007 | | Year Ended
November 30, 2006 | |
| Class A Shares* | | Shares | | Amount | | Shares | | Amount | |
| Shares sold | | | 16,498,786 | | | $ | 520,882,163 | | | | 24,279,437 | | | $ | 774,404,820 | | |
| Converted from Class B** | | | 276,794 | | | | 8,815,136 | | | | 1,484,441 | | | | 46,677,852 | | |
| Reinvestment of distributions | | | 9,377,886 | | | | 281,993,037 | | | | 4,855,641 | | | | 140,328,197 | | |
| Shares reacquired | | | (25,480,937 | ) | | | (820,269,541 | ) | | | (16,816,750 | ) | | | (537,398,976 | ) | |
| Increase (decrease) | | | 672,529 | | | $ | (8,579,205 | ) | | | 13,802,769 | | | $ | 424,011,893 | | |
| Class B Shares* | |
| Shares sold | | | 165,668 | | | $ | 4,650,222 | | | | 210,788 | | | $ | 6,014,790 | | |
| Reinvestment of distributions | | | 291,747 | | | | 7,944,282 | | | | 318,320 | | | | 8,505,507 | | |
| Shares reacquired | | | (438,446 | ) | | | (12,577,200 | ) | | | (532,552 | ) | | | (15,612,458 | ) | |
| Converted to Class A** | | | (306,686 | ) | | | (8,815,136 | ) | | | (1,608,929 | ) | | | (46,677,852 | ) | |
| Decrease | | | (287,717 | ) | | $ | (8,797,832 | ) | | | (1,612,373 | ) | | $ | (47,770,013 | ) | |
| Class C Shares | |
| Shares sold | | | 295,439 | | | $ | 8,226,203 | | | | 248,612 | | | $ | 6,983,271 | | |
| Reinvestment of distributions | | | 264,030 | | | | 7,202,992 | | | | 182,474 | | | | 4,881,170 | | |
| Shares reacquired | | | (526,702 | ) | | | (15,236,472 | ) | | | (662,289 | ) | | | (19,648,459 | ) | |
| Increase (decrease) | | | 32,767 | | | $ | 192,723 | | | | (231,203 | ) | | $ | (7,784,018 | ) | |
| | | Period Ended
November 30 ,2007† | |
| Class F Shares | | Shares | | Amount | |
| Shares sold | | | 299.530 | | | $ | 10,067 | | |
| Increase | | | 299.530 | | | $ | 10,067 | | |
| | | Year Ended
November 30, 2007 | | Year Ended
November 30, 2006 | |
| Class I Shares | | Shares | | Amount | | Shares | | Amount | |
| Shares sold | | | 9,203,929 | | | $ | 303,758,370 | | | | 11,786,788 | | | $ | 391,261,817 | | |
| Reinvestment of distributions | | | 3,951,680 | | | | 124,398,880 | | | | 1,835,001 | | | | 55,013,332 | | |
| Shares reacquired | | | (6,880,359 | ) | | | (231,240,499 | ) | | | (4,063,359 | ) | | | (133,258,648 | ) | |
| Increase | | | 6,275,250 | | | $ | 196,916,751 | | | | 9,558,430 | | | $ | 313,016,501 | | |
| Class P Shares | |
| Shares sold | | | 3,941,176 | | | $ | 123,595,156 | | | | 6,281,520 | | | $ | 199,391,705 | | |
| Reinvestment of distributions | | | 1,583,938 | | | | 47,312,221 | | | | 802,192 | | | | 23,087,098 | | |
| Shares reacquired | | | (5,989,832 | ) | | | (187,114,114 | ) | | | (4,556,483 | ) | | | (144,407,463 | ) | |
| Increase (decrease) | | | (464,718 | ) | | $ | (16,206,737 | ) | | | 2,527,229 | | | $ | 78,071,340 | | |
* Amounts for the year ended November 30, 2006 have been reclassified to conform with current presentation.
** Automatic conversion of Class B shares occurs approximately eight years after the initial purchase date.
† For the period September 28, 2007 (commencement of investment operations) to November 30, 2007.
13. RECENT ACCOUNTING PRONOUNCEMENTS
In June 2006, the Financial Accounting Standards Board (FASB) issued Interpretation 48, Accounting for Uncertainty in Income Taxes—an interpretation of FASB Statement 109 (FIN 48). FIN 48 clarifies the accounting for income taxes by prescribing the minimum recognition threshold a tax position must meet before being recognized in the financial statements.
47
Notes to Financial Statements (concluded)
FIN 48 is effective for fiscal years beginning after December 15, 2006. The Funds will adopt FIN 48 no later than May 31, 2008 and the impact to each Fund's financial statements, if any, is currently being assessed.
In September 2006, Statement of Financial Accounting Standards No. 157, Fair Value Measurements (SFAS 157), was issued and is effective for fiscal years beginning after November 15, 2007. SFAS 157 defines fair value, establishes a framework for measuring fair value and expands disclosures about fair value measurements. Management is currently evaluating the impact the adoption of SFAS 157 will have on each Fund's financial statement disclosures.
48
Report of Independent Registered Public Accounting Firm
The Board of Directors and Shareholders of Lord Abbett Research Fund, Inc.:
We have audited the accompanying statement of assets and liabilities, including the schedule of investments, of Lord Abbett Research Fund, Inc. — Lord Abbett Large-Cap Core Fund and Small-Cap Value Series (the "Funds"), as of November 30, 2007, and the related statement of operations for the year then ended, the statements of changes in net assets for each of the two years in the period then ended, and the financial highlights for each of the periods presented. These financial statements and financial highlights are the responsibility of the Funds' management. Our responsibility is to express an opinion on these financial statements and financial highlights based on our audits.
We conducted our audits in accordance with standards of the Public Company Accounting Oversight Board (United States). Those standards require that we plan and perform the audit to obtain reasonable assurance about whether the financial statements and financial highlights are free of material misstatement. The Funds are not required to have, nor were we engaged to perform, an audit of their internal control over financial reporting. Our audits included consideration of internal control over financial reporting as a basis for designing audit procedures that are appropriate in the circumstances, but not for the purpose of expressing an opinion on the effectiveness of the Funds' internal control over financial reporting. Accordingly, we express no such opinion. An audit also includes examining, on a test basis, evidence supporting the amounts and disclosures in the financial statements, assessing the accounting principles used and significant e stimates made by management, as well as evaluating the overall financial statement presentation. Our procedures included confirmation of securities owned as of November 30, 2007 by correspondence with the custodian and brokers; where replies were not received from brokers, we performed other auditing procedures. We believe that our audits provide a reasonable basis for our opinion.
In our opinion, the financial statements and financial highlights referred to above present fairly, in all material respects, the financial position of Lord Abbett Research Fund, Inc. — Lord Abbett Large-Cap Core Fund and Small-Cap Value Series as of November 30, 2007, the results of their operations for the year then ended, the changes in their net assets for each of the two years in the period then ended, and the financial highlights for each of the periods presented, in conformity with accounting principles generally accepted in the United States of America.
Deloitte & Touche LLP
New York, New York
January 24, 2008
49
Basic Information About Management
The Board of Directors (the "Board") is responsible for the management of the business and affairs of each Fund in accordance with the laws of the State of Maryland. The Board appoints officers who are responsible for the day-to-day operations of each Fund and who execute policies authorized by the Board. The Board also approves an investment adviser to each Fund and continues to monitor the cost and quality of the services provided by the investment adviser, and annually considers whether to renew the contract with the adviser. Generally, each Director holds office until his/her successor is elected and qualified or until his/her earlier resignation or removal, as provided in the Company's organizational documents.
Lord, Abbett & Co. LLC ("Lord Abbett"), a Delaware limited liability company, is the Company's investment adviser.
Interested Directors
The following Directors are Partners of Lord Abbett and are "interested persons" of the Company as defined in the Act. Mr. Dow and Ms. Foster are officers, directors, or trustees of each of the fourteen Lord Abbett-sponsored funds, which consist of 55* portfolios or series.
Name, Address and
Year of Birth | | Current Position
Length of Service
with Company | | Principal Occupation
During Past Five Years | | Other
Directorships | |
Robert S. Dow
Lord, Abbett & Co. LLC
90 Hudson Street
Jersey City, NJ 07302
(1945) | | Director and Chairman since 1996 | | Senior Partner since 2007 and Chief Executive Officer of Lord Abbett since 1996; formerly Managing Partner of Lord Abbett (1996 - 2007). | | N/A | |
|
Daria L. Foster
Lord, Abbett & Co. LLC 90 Hudson Street
Jersey City, NJ 07302
(1954) | | Director since 2006 | | Managing Partner since 2007; formerly Director of Marketing and Client Service of Lord Abbett (1990 - 2007). | | N/A | |
|
Independent Directors
The following independent or outside Directors ("Independent Directors") are also directors or trustees of each of the fourteen Lord Abbett-sponsored funds, which consist of 55* portfolios or series.
Name, Address and
Year of Birth | | Current Position
Length of Service
with Company | | Principal Occupation
During Past Five Years | | Other
Directorships | |
E. Thayer Bigelow
Lord, Abbett & Co. LLC c/o Legal Dept.
90 Hudson Street
Jersey City, NJ 07302
(1941) | | Director since 1996 | | Managing General Partner, Bigelow Media, LLC (since 2000); Senior Adviser, Time Warner Inc. (1998 - 2000); Acting Chief Executive Officer of Courtroom Television Network (1997 – 1998); President and Chief Executive Officer of Time Warner Cable Programming, Inc. (1991 – 1997). | | Currently serves as director of Crane Co. and Huttig Building Products Inc. | |
|
* Effective as of the close of business on December 14, 2007, there are 51 portfolios or series.
50
Basic Information About Management (continued)
Name, Address and
Year of Birth | | Current Position
Length of Service
with Company | | Principal Occupation
During Past Five Years | | Other
Directorships | |
William H.T. Bush
Lord, Abbett & Co. LLC c/o Legal Dept.
90 Hudson Street
Jersey City, NJ 07302
(1938) | | Director since 1998 | | Co-founder and Chairman of the Board of the financial advisory firm of Bush-O'Donnell & Company (since 1986). | | Currently serves as director of WellPoint, Inc. (since 2002). | |
|
Robert B. Calhoun, Jr.
Lord, Abbett & Co. LLC
c/o Legal Dept.
90 Hudson Street
Jersey City, NJ 07302
(1942) | | Director since 1998 | | Managing Director of Monitor Clipper Partners (since 1997) and President of Clipper Asset Management Corp. (since 1991), both private equity investment funds. | | Currently serves as director of Avondale, Inc. and Interstate Bakeries Corp. | |
|
Julie A. Hill
Lord, Abbett & Co. LLC
c/o Legal Dept.
90 Hudson Street
Jersey City, NJ 07302
(1946) | | Director since 2004 | | Owner and CEO of The Hill Company, a business consulting firm (since 1998); Founder, President and Owner of the Hiram-Hill and Hillsdale Development Company, a residential real estate development firm (1998 - 2000). | | Currently serves as director of WellPoint, Inc. since 1994 and Lend Lease Corporation Limited since 2005. | |
|
Franklin W. Hobbs
Lord, Abbett & Co. LLC c/o Legal Dept.
90 Hudson Street
Jersey City, NJ 07302
(1947) | | Director since 2001 | | Advisor of One Equity Partners, a private equity firm (since 2004); Chief Executive Officer of Houlihan Lokey Howard & Zukin, an investment bank (2002 - 2003); Chairman of Warburg Dillon Read, an investment bank (1999 - 2001); Global Head of Corporate Finance of SBC Warburg Dillon Read (1997 - 1999); Chief Executive Officer of Dillon, Read & Co. (1994 - 1997). | | Currently serves as director of Molson Coors Brewing Company. | |
|
Thomas J. Neff
Lord, Abbett & Co. LLC
c/o Legal Dept.
90 Hudson Street
Jersey City, NJ 07302
(1937) | | Director since 1992 | | Chairman of Spencer Stuart (U.S.), an executive search consulting firm (since 1996); President of Spencer Stuart (1979 - 1996). | | Currently serves as director of Ace, Ltd. (since 1997) and Hewitt Associates, Inc. | |
|
James L.L. Tullis
Lord, Abbett & Co. LLC
c/o Legal Dept.
90 Hudson Street
Jersey City, NJ 07302
(1947) | | Director since 2006 | | CEO of Tullis-Dickerson and Co. Inc, a venture capital management firm (since 1990). | | Currently serves as director of Crane Co. (since 1998). | |
|
51
Basic Information About Management (continued)
Officers
None of the officers listed below have received compensation from the Company. All the officers of the Company may also be officers of the other Lord Abbett-sponsored funds and maintain offices at 90 Hudson Street, Jersey City, NJ 07302.
Name and
Year of Birth | | Current Position
with Company | | Length of Service
of Current Position | | Principal Occupation
During Past Five Years | |
Robert S. Dow
(1945) | | Chief Executive Officer and Chairman | | Elected in 1996 | | Senior Partner since 2007 and Chief Executive Officer of Lord Abbett since 1996; formerly Managing Partner of Lord Abbett (1996 - 2007). | |
|
Daria L. Foster
(1954) | | President | | Elected in 2006 | | Managing Partner since 2007; formerly Director of Marketing and Client Service of Lord Abbett (1990 - 2007). | |
|
Robert P. Fetch
(1953) | | Executive Vice President | | Elected in 1997 | | Partner and Senior Investment Manager, joined Lord Abbett in 1995. | |
|
Daniel H. Frascarelli
(1954) | | Executive Vice President | | Elected in 2005 | | Partner and Director of Large Cap Core Equity, joined Lord Abbett in 1990. | |
|
Robert I. Gerber
(1954) | | Executive Vice President | | Elected in 2007 | | Partner and Chief Investment Officer; formerly Director of Taxable Fixed Income Management, joined Lord Abbett in 1997. | |
|
Frederick Ruvkun
(1957) | | Executive Vice President | | Elected in 2006 | | Investment Manager, joined Lord Abbett in 2006; formerly served as Managing Director and Leader of the Small Cap Growth Team and a Portfolio Manager of SMID Growth Assets at J & W Seligman & Company. | |
|
Christopher J. Towle
(1957) | | Executive Vice President | | Elected in 2001 | | Partner and Director of High Yield & Convertible Management, joined Lord Abbett in 1987. | |
|
Edward K. von der Linde
(1960) | | Executive Vice President | | Elected in 2001 | | Partner and Investment Manager, joined Lord Abbett in 1988. | |
|
James W. Bernaiche
(1956) | | Chief Compliance Officer | | Elected in 2004 | | Chief Compliance Officer, joined Lord Abbett in 2001. | |
|
52
Basic Information About Management (concluded)
Name and
Year of Birth | | Current Position
with Company | | Length of Service
of Current Position | | Principal Occupation
During Past Five Years | |
Joan A. Binstock
(1954) | | Chief Financial Officer and Vice President | | Elected in 1999 | | Partner and Chief Operations Officer, joined Lord Abbett in 1999. | |
|
Evan B. Carpenter
(1972) | | Vice President | | Elected in 2006 | | Research Analyst, joined Lord Abbett in 2003; prior thereto he served as an Equity Research Analyst at Gabelli Asset Management (2000 - 2003). | |
|
John K. Forst
(1960) | | Vice President and Assistant Secretary | | Elected in 2005 | | Deputy General Counsel, joined Lord Abbett in 2004; Managing Director and Associate General Counsel at New York Life Investment Management LLC (2002 - 2003); attorney at Dechert LLP (2000 - 2002). | |
|
Lawrence H. Kaplan
(1957) | | Vice President and Secretary | | Elected in 1997 | | Partner and General Counsel, joined Lord Abbett in 1997. | |
|
A. Edward Oberhaus, III
(1959) | | Vice President | | Elected in 1996 | | Partner and Director of Equity Trading, joined Lord Abbett in 1983. | |
|
Lawrence B. Stoller
(1963) | | Vice President and Assistant Secretary | | Elected in 2007 | | Senior Deputy General Counsel; joined Lord Abbett in 2007; formerly, Executive Vice President and General Counsel at Cohen & Steers Capital Management, Inc. | |
|
Paul J. Volovich
(1973) | | Vice President | | Elected in 2004 | | Investment Manager, joined Lord Abbett in 1997. | |
|
Bernard J. Grzelak
(1971) | | Treasurer | | Elected in 2003 | | Director of Fund Administration, joined Lord Abbett in 2003; formerly Vice President, Lazard Asset Management LLC. | |
|
Please call 888-522-2388 for a copy of the Statement of Additional Information (SAI), which contains further information about the Funds' Directors. It is available free upon request.
53
Householding
The Company has adopted a policy that allows them to send only one copy of each Fund's Prospectuses, proxy material, annual report and semiannual report to certain shareholders residing at the same "household." This reduces Fund expenses, which benefits you and other shareholders. If you need additional copies or do not want your mailings to be "householded," please call Lord Abbett at 888-522-2388 or send a written request with your name, the name of your fund or funds and your account number or numbers to Lord Abbett Family of Funds, P.O. Box 219336, Kansas City, MO 64121.
Proxy Voting Policies, Procedures and Record
A description of the policies and procedures that Lord Abbett uses to vote proxies related to each Fund's portfolio securities, and information on how Lord Abbett voted each Fund's proxies during the 12-month period ended June 30 are available without charge, upon request, (i) by calling 888-522-2388; (ii) on Lord Abbett's website at www.LordAbbett.com; and (iii) on the Securities and Exchange Commission's ("SEC") website at www.sec.gov.
Shareholder Reports and Quarterly Portfolio Disclosure
The Funds are required to file their complete schedule of portfolio holdings with the SEC for their first and third fiscal quarters on Form N-Q. Copies of the filings are available without charge, upon request on the SEC's website at www.sec.gov and may be available by calling Lord Abbett at 888-522-2388. You can also obtain copies of Form N-Q by (i) visiting the SEC's Public Reference Room in Washington, DC (information on the operation of the Public Reference Room may be obtained by calling 800-SEC-0330); (ii) sending your request and duplicating fee to the SEC's Public Reference Room, Washington, DC 20549-0102; or (iii) sending your request electronically to publicinfo@sec.gov.
Tax Information
100% and 17.36% of the ordinary income distributions paid by the Large Cap Core Fund and the Small Cap Value Fund, respectively, during fiscal 2007 are qualifying dividend income. For corporate shareholders, 100% and 17.04% of the ordinary income distributions paid by the Large Cap Core Fund and the Small Cap Value Fund, respectively, during fiscal 2007 qualified for the dividends received deduction.
Additionally, of the distributions paid to shareholders during the fiscal year ended November 30, 2007, the following amounts represent short-term and long-term capital gains:
| Fund Name | | Short-term
Capital Gains | | Long-term
Capital Gains | |
| Large Cap Core Fund | | $ | 1,528,081 | | | $ | 34,678,984 | | |
| Small Cap Value Fund | | | 171,281,162 | | | | 353,055,091 | | |
54
LARF-2-1107
(01/08)
Lord Abbett Research Fund, Inc.
Lord Abbett Large-Cap Core Fund
Small-Cap Value Series

This report when not used for the general information
of shareholders of the Fund, is to be distributed only if
preceded or accompanied by a current fund prospectus.
Lord Abbett Mutual Fund shares are distributed by
LORD ABBETT DISTRIBUTOR LLC.
2007
LORD ABBETT
ANNUAL REPORT

Lord Abbett
Growth Opportunities Fund
For the fiscal year ended November 30, 2007

Lord Abbett Research Fund
Lord Abbett Growth Opportunities Fund
Annual Report
For the fiscal year ended November 30, 2007
Dear Shareholders: We are pleased to provide you with this overview of the Lord Abbett Growth Opportunities Fund's performance for the fiscal year ended November 30, 2007. On this page and the following pages, we discuss the major factors that influenced performance. For detailed and more timely information about the Fund, please visit our Website at www.lordabbett.com, where you also can access the quarterly commentaries by the Fund's portfolio managers.
General information about Lord Abbett mutual funds, as well as in-depth discussions of market trends and investment strategies, is also provided in Lord Abbett Insights, a newsletter accompanying your quarterly account statements. We also encourage you to call Lord Abbett at 888-522-2388 and speak to one of our professionals if you would like more information.
Thank you for investing in Lord Abbett mutual funds. We value the trust that you place in us and look forward to serving your investment needs in the years to come.
Best regards,

Robert S. Dow
Chairman

From left to right: Robert S. Dow, Director and Chairman of the Lord Abbett Funds; E. Thayer Bigelow, Independent Lead Director of the Lord Abbett Funds; and Daria L. Foster, Director and President of the Lord Abbett Funds.
Q: What were the overall market conditions during the fiscal year ended November 30, 2007?
A: The equity market, as measured by the S&P 500® Index,1 gained a total return of 7.7% in the fiscal year ended November 30, 2007, but not without considerable volatility along the way. In fact, there were three significant corrections in the fiscal year, including two declines in excess of 9%. In the first correction, in February and March, the S&P 500 dropped nearly 6% due to a sharp sell-off that began in the Shan ghai stock index. Fortunately, the sell-off proved to be short-lived, with the market ultimately establishing a new all-time high in July. The euphoria did not last
1
long, however, as the market's second major correction, which knocked the index down more than 9%, began in mid-July. With a little help from the Federal Reserve Board (the Fed), the market recovered yet again and set another record high in early October. After establishing its second all-time high, the market began to tumble; this time the S&P 500 declined 10% – the first decline of at least 10% in four and a half years. Despite falling precipitously through most of November, the market ended the year with a week that included one of the best back-to-back performances in more than five years.
In the past 12 months the growth indexes (as measured by the S&P Composite Growth Index2) outperformed the value indexes (as measured by the S&P Composite Value Index2) while large cap companies (as measured by the S&P 500 Index) narrowly outpaced the rest of the market. From a style box perspective, the leading investment style for the past 12 months was mid cap growth (as measured by the S&P MidCap 400/Citigroup Growth Index3) with a 12-month total return of 12%, while small cap value (as measured by S&P SmallCap 600/Citigroup Value Index4) trailed all others with a 12-month total return of -4.2%.
At the sector level, eight of the 10 major industry groups in the S&P 500 posted double-digit 12-month total returns, while only two sectors declined in the year. Unfortunately, the sectors that declined – consumer discretionary and financials – account for nearly 30% (on a market-weight basis) of the S&P 500, which cost the market approximately 257 basis points in overall performance.
Q: How did the Growth Opportunities Fund perform during the fiscal year ended November 30, 2007?
A: The Fund returned 18.81%, reflecting performance at the net asset value (NAV) of Class A shares with all distributions reinvested, compared with its benchmark, the Russell Midcap® Growth Index,5 which returned 10.13% over the same period.
Q: What were the most significant factors affecting performance?
A: The greatest contributors to the Fund's performance relative to its benchmark for the one-year period were the consumer discretionary sector, followed by the healthcare sector and the materials and processing sector.
Among individual holdings that contributed to performance were materials and processing holdings Monsanto Co. (the Fund's number-one contributor), a provider of technology-based solutions and agricultural products for growers and downstream customers in the agricultural markets, and Precision Castparts Corp., a worldwide manufacturer of complex structural investment castings and airfoil castings used in jet aircraft engines; producer durables holding BE Aerospace, Inc., a manufacturer of interior products for commercial and general aviation aircraft
2
cabins; consumer discretionary holding ITT Educational Services, Inc., a provider of technology-oriented postsecondary degree programs; and other energy holding Cameron International Corp., a maker of oil and gas pressure control equipment.
The worst detractors from the Fund's performance were the utilities sector (owing in part to exposure to telecommunications services holdings), followed by the other sector (diversified corporations) and the other energy sector (which includes oil service companies, as well as smaller exploration and production companies), both owing to underweight positions.
Among the individual holdings that detracted from performance were technology holdings Network Appliance, Inc. (the Fund's number-one detractor), a company that delivers unified storage solutions for data-intensive enterprises; Akamai Technologies, Inc., a provider of global delivery services for Internet content, streaming media, and applications and global Internet traffic management; F5 Networks, Inc., a provider of integrated Internet traffic management solutions; Cognizant Technology Solutions Corp., a supplier of full life-cycle solutions to complex application development, maintenance, and reengineering problems; and healthcare holding Medicis Pharmaceutical Corp., a provider of pharmaceuticals focusing on the treatment of dermatological, pediatric, and podiatric conditions, as well as aesthetics medicine.
The Fund's portfolio is actively managed and, therefore, its holdings and the weightings of a particular issuer or particular sector as a percentage of portfolio assets are subject to change. Sectors may include many industries.
Note: Class A shares purchased subject to a front-end sales charge have no contingent deferred sales charge (CDSC). However, certain purchases of Class A shares made without a front-end sales charge may be subject to a CDSC of 1% if the shares are redeemed within 12 months of the purchase. Please see section "Your Investment – Purchases" in the prospectus for more information on redemptions that may be subject to a CDSC.
A prospectus contains important information about a fund, including its investment objectives, risks, charges, and ongoing expenses, which an investor should carefully consider before investing. To obtain a prospectus on any Lord Abbett mutual fund, please contact your investment professional or Lord Abbett Distributor LLC at 888-522-2388 or visit our Website at www.lordabbett.com. Read the prospectus carefully before investing.
3
1 The S&P 500® Index is widely regarded as the standard for measuring large cap U.S. stock market performance and includes a representative sample of leading companies in leading industries.
2 The S&P Composite 1500® Index combines the S&P 500®, S&P 400® (an index of mid-cap companies), and the S&P SmallCap 600® indexes to create a broad market portfolio representing 90% of U.S. equities. Companies in this index are split into two groups ba sed on factors including price-to-book ratio to create the Composite Growth and Composite Value indexes.
3 The S&P MidCap 400/Citigroup Growth Index measures the performance of growth-oriented, mid-size capitalization U.S. companies. The S&P MidCap 400/Citigroup Growth Index contains those securities in the S&P MidCap 400 Index with higher price-to-book ratios.
4 The S&P Small Cap 600/Citigroup Value Index is designed to provide a comprehensive measure of small-cap U.S. equity value performance. It is an unmanaged float-adjusted market capitalization-weighted index comprised of stocks representing approximately half the market capitalization of the S&P Small Cap 600 Index that have been identified as being on the value end of the growth-value spectrum.
5 The Russell Midcap® Growth Index measures the performance of those Russell Midcap companies with higher price to book ratios and higher forecasted growth values. The stocks also are members of the Russell 1000® Growth Index.
Indexes are unmanaged, do not reflect the deduction of fees or expenses, and are not available for direct investment.
Important Performance and Other Information
Performance data quoted reflect past performance and are no guarantee of future results. Current performance may be higher or lower than the performance quoted. The investment return and principal value of an investment in the Fund will fluctuate so that shares, on any given day or when redeemed, may be worth more or less than their original cost. You can obtain performance data current to the most recent month-end by calling Lord Abbett at 888-522-2388 or referring to our Website at www.lordabbett.com.
Except where noted, comparative Fund performance does not account for the deduction of sales charges and would be different if sales charges were included. The Fund offers additional classes of shares with distinct pricing options. For a full description of the differences in pricing alternatives, please see the Fund's prospectus.
The views of the Fund's management and the portfolio holdings described in this report are as of November 30, 2007; these views and portfolio holdings may have changed subsequent to this date, and they do not guarantee the future performance of the markets or the Fund. Information provided in this report should not be considered a recommendation to purchase or sell securities.
A Note about Risk: See Notes to Financial Statements for a discussion of investment risks. For a more detailed discussion of the risks associated with the Fund, please see the Fund's prospectus.
Mutual funds are not insured by the FDIC, are not deposits or other obligations of, or guaranteed by, banks, and are subject to investment risks, including possible loss of principal amount invested.
4
Investment Comparison
Below is a comparison of a $10,000 investment in Class A shares with the same investment in the Russell Midcap® Growth Index and the S&P MidCap 400/Citigroup Growth Index, assuming reinvestment of all dividends and distributions. The performance of other classes will be greater than or less than the performance shown in the graph below due to different sales loads and expenses applicable to such classes. The graph and performance table below do not reflect the deduction of taxes that a shareholder would pay on fund distributions or the redemption of fund shares. Past performance is no guarantee of future results.
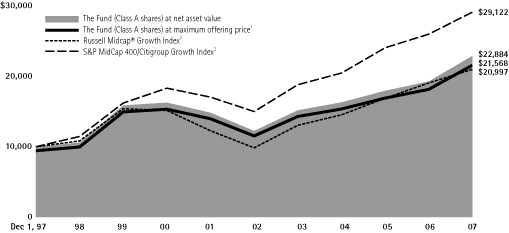
Average Annual Total Return at Maximum Applicable
Sales Charge for the Periods Ended November 30, 2007
| | | 1 Year | | 5 Years | | 10 Years | | Life of Class | |
| Class A3 | | | 12.00 | % | | | 12.01 | % | | | 7.99 | % | | | — | | |
| Class B4 | | | 14.04 | % | | | 12.51 | % | | | — | | | | 10.46 | % | |
| Class C5 | | | 18.05 | % | | | 12.62 | % | | | — | | | | 10.12 | % | |
| Class F6 | | | — | | | | — | | | | — | | | | 0.17 | %* | |
| Class I7 | | | 19.24 | % | | | 13.73 | % | | | — | | | | 9.17 | % | |
| Class P8 | | | 18.71 | % | | | 13.25 | % | | | — | | | | 3.16 | % | |
| Class R29 | | | — | | | | — | | | | — | | | | 0.08 | %* | |
| Class R310 | | | — | | | | — | | | | — | | | | 0.13 | %* | |
1 Reflects the deduction of the maximum initial sales charge of 5.75%.
2 Performance for each unmanaged index does not reflect transaction costs, management fees or sales charges. The performance of each index is not necessarily representative of the Fund's performance.
3 Total return, which is the percentage change in net asset value, after deduction of the maximum initial sales charge of 5.75% applicable to Class A shares, with all dividends and distributions reinvested for the periods shown ended November 30, 2007, is calculated using the SEC-required uniform method to compute such return.
4 Class B shares commenced operations on October 16, 1998. Performance reflects the deduction of a CDSC of 4% for 1 year, 1% for 5 years and 0% for the life of the class.
5 Class C shares commenced operations on October 19, 1998. The 1% CDSC for Class C shares normally applies before the first anniversary of the purchase date. Performance is at net asset value.
6 Class F shares commenced operations on September 28, 2007. The SEC effective date was September 14, 2007. Performance for the class began September 28, 2007. Performance is at net asset value.
7 Effective September 28, 2007, Class Y was renamed Class I. Class I shares commenced operations on December 9, 1998. Performance is at net asset value.
8 Class P shares commenced operations on August 15, 2000. Performance is at net asset value.
9 Class R2 shares commenced operations on September 28, 2007. The SEC effective date was September 14, 2007. Performance for the class began September 28, 2007. Performance is at net asset value.
10 Class R3 shares commenced operations on September 28, 2007. The SEC effective date was September 14, 2007. Performance for the class began September 28, 2007. Performance is at net asset value.
* Because Class F, R2 and R3 shares have existed for less than one year, average annual returns are not provided.
5
Expense Example
As a shareholder of the Fund, you incur two types of costs: (1) transaction costs, including sales charges on purchase payments (these charges vary among the share classes); and (2) ongoing costs, including management fees; distribution and service (12b-1) fees (these charges vary among the share classes); and other Fund expenses. This Example is intended to help you understand your ongoing costs (in dollars) of investing in the Fund and to compare these costs with the ongoing costs of investing in other mutual funds.
The Example is based on an investment of $1,000 invested at the beginning of the period and held for the entire period (June 1, 2007 through November 30, 2007).
Actual Expenses
For each class of the Fund, the first line of the applicable table on the following page provides information about actual account values and actual expenses. You may use the information in this line, together with the amount you invested, to estimate the expenses that you paid over the period. Simply divide your account value by $1,000 (for example, an $8,600 account value divided by $1,000 = 8.6), then multiply the result by the number in the first line under the heading entitled "Expenses Paid During the Period 6/1/07 – 11/30/07" to estimate the expenses you paid on your account during this period.
Hypothetical Example for Comparison Purposes
For each class of the Fund, the second line of the applicable table on the following page provides information about hypothetical account values and hypothetical expenses based on the Fund's actual expense ratio and an assumed rate of return of 5% per year before expenses, which is not the Fund's actual return. The hypothetical account values and expenses may not be used to estimate the actual ending account balance or expenses you paid for the period. You may use this information to compare the ongoing costs of investing in the Fund and other funds. To do so, compare this 5% hypothetical example with the 5% hypothetical examples that appear in the shareholder reports of the other funds.
6
Please note that the expenses shown in the table are meant to highlight your ongoing costs only and do not reflect any transactional costs, such as sales charges. Therefore, the second line of the table is useful in comparing ongoing costs only, and will not help you determine the relative total costs of owning different funds. In addition, if these transactional costs were included, your costs would have been higher.
| | | Beginning
Account
Value | | Ending
Account
Value | | Expenses
Paid During
Period† | |
| | | 6/1/07 | | 11/30/07 | | 6/1/07 –
11/30/07 | |
| Class A | |
| Actual | | $ | 1,000.00 | | | $ | 1,063.30 | | | $ | 7.86 | | |
| Hypothetical (5% Return Before Expenses) | | $ | 1,000.00 | | | $ | 1,017.45 | | | $ | 7.69 | | |
| Class B | |
| Actual | | $ | 1,000.00 | | | $ | 1,060.10 | | | $ | 11.21 | | |
| Hypothetical (5% Return Before Expenses) | | $ | 1,000.00 | | | $ | 1,014.19 | | | $ | 10.96 | | |
| Class C | |
| Actual | | $ | 1,000.00 | | | $ | 1,060.10 | | | $ | 11.21 | | |
| Hypothetical (5% Return Before Expenses) | | $ | 1,000.00 | | | $ | 1,014.19 | | | $ | 10.96 | | |
| Class F | |
| Actual | | $ | 1,000.00 | | | $ | 1,001.70 | | | $ | 2.16 | | |
| Hypothetical (5% Return Before Expenses) | | $ | 1,000.00 | | | $ | 1,022.90 | | | $ | 2.18 | | |
| Class I | |
| Actual | | $ | 1,000.00 | | | $ | 1,065.50 | | | $ | 6.11 | | |
| Hypothetical (5% Return Before Expenses) | | $ | 1,000.00 | | | $ | 1,019.17 | | | $ | 5.97 | | |
| Class P | |
| Actual | | $ | 1,000.00 | | | $ | 1,062.90 | | | $ | 8.38 | | |
| Hypothetical (5% Return Before Expenses) | | $ | 1,000.00 | | | $ | 1,016.95 | | | $ | 8.19 | | |
| Class R2 | |
| Actual | | $ | 1,000.00 | | | $ | 1,000.80 | | | $ | 2.77 | | |
| Hypothetical (5% Return Before Expenses) | | $ | 1,000.00 | | | $ | 1,022.30 | | | $ | 2.80 | | |
| Class R3 | |
| Actual | | $ | 1,000.00 | | | $ | 1,001.30 | | | $ | 2.65 | | |
| Hypothetical (5% Return Before Expenses) | | $ | 1,000.00 | | | $ | 1,022.42 | | | $ | 2.68 | | |
† For each class of the Fund, expenses are equal to the annualized expense ratio for such class (1.52% for Class A, 2.17% for Classes B and C, 1.23% for Class F, 1.18% for Class I, 1.62% for Class P, 1.58% for Class R2 and 1.51% for Class R3) multiplied by the average account value over the period, multiplied by 183/365 for Class A, B, C, I and P (to reflect one-half year period) and mutiplied by 64/365 for Class F, R2 and R3 (to reflect the period September 28, 2007, commencement of investment operations, to November 30, 2007).
Portfolio Holdings Presented by Sector
November 30, 2007
| Sector* | | %** | |
| Auto & Transportation | | | 0.85 | % | |
| Consumer Discretionary | | | 21.38 | % | |
| Consumer Staples | | | 3.74 | % | |
| Financial Services | | | 6.21 | % | |
| Healthcare | | | 20.12 | % | |
| Materials & Processing | | | 4.88 | % | |
| Other | | | 1.24 | % | |
| Sector* | | %** | |
| Other Energy | | | 10.13 | % | |
| Producer Durables | | | 9.60 | % | |
| Technology | | | 14.02 | % | |
| Utilities | | | 0.48 | % | |
| Short-Term Investment | | | 7.35 | % | |
| Total | | | 100.00 | % | |
* A sector may comprise several industries.
** Represents percent of total investments.
7
Schedule of Investments
November 30, 2007
| Investments | | Shares | | Value
(000) | |
| LONG-TERM INVESTMENTS 94.33% | |
| COMMON STOCKS 94.17% | |
| Advertising Agency 1.07% | |
| National CineMedia, Inc. | | | 323,100 | | | $ | 8,943 | | |
| Aerospace 3.37% | |
| Alliant Techsystems Inc.* | | | 106,100 | | | | 12,395 | | |
| Rockwell Collins, Inc. | | | 217,800 | | | | 15,708 | | |
| Total | | | 28,103 | | |
| Agriculture, Fishing & Ranching 0.78% | |
| Monsanto Co. | | | 65,600 | | | | 6,519 | | |
| Banks 1.52% | |
| Northern Trust Corp. | | | 156,400 | | | | 12,667 | | |
| Biotechnology Research & Production 6.34% | |
Alexion
Pharmaceuticals, Inc.* | | | 145,270 | | | | 10,564 | | |
| Celgene Corp.* | | | 244,600 | | | | 15,055 | | |
| Cephalon, Inc.* | | | 70,000 | | | | 5,245 | | |
Charles River Laboratories
International, Inc.* | | | 170,500 | | | | 10,832 | | |
| Genzyme Corp.* | | | 115,200 | | | | 8,632 | | |
Millenium
Pharmaceuticals, Inc.* | | | 172,400 | | | | 2,541 | | |
| Total | | | 52,869 | | |
| Casinos & Gambling 3.02% | |
| MGM Mirage* | | | 91,800 | | | | 7,941 | | |
Scientific Games Corp.
Class A* | | | 212,000 | | | | 6,867 | | |
| WMS Industries, Inc.* | | | 309,800 | | | | 10,347 | | |
| Total | | | 25,155 | | |
| Chemicals 1.23% | |
| Airgas, Inc. | | | 208,000 | | | | 10,292 | | |
| Commercial Information Services 0.51% | |
| Arbitron Inc. | | | 105,900 | | | | 4,220 | | |
| Investments | | Shares | | Value
(000) | |
| Communications Technology 5.29% | |
Atheros
Communications, Inc.* | | | 243,700 | | | $ | 7,187 | | |
| Ciena Corp.* | | | 283,625 | | | | 12,474 | | |
| Harris Corp. | | | 109,100 | | | | 6,848 | | |
| Infinera Corp.* | | | 298,000 | | | | 6,499 | | |
| Juniper Networks, Inc.* | | | 374,000 | | | | 11,115 | | |
| Total | | | 44,123 | | |
Computer Services, Software &
Systems 2.58% | |
| Citrix Systems, Inc.* | | | 222,900 | | | | 8,243 | | |
| Equinix, Inc.* | | | 113,400 | | | | 11,806 | | |
| F5 Networks Inc.* | | | 56,400 | | | | 1,490 | | |
| Total | | | 21,539 | | |
| Computer Technology 1.24% | |
| NVIDIA Corp.* | | | 328,550 | | | | 10,363 | | |
| Consumer Electronics 2.89% | |
| Activision, Inc.* | | | 323,600 | | | | 7,168 | | |
| Electronic Arts Inc.* | | | 119,100 | | | | 6,692 | | |
| SINA Corp. (China)*(a) | | | 122,465 | | | | 5,889 | | |
| Sohu.com Inc. (China)*(a) | | | 75,700 | | | | 4,344 | | |
| Total | | | 24,093 | | |
| Drug & Grocery Store Chains 0.94% | |
| Safeway, Inc. | | | 224,500 | | | | 7,813 | | |
| Drugs & Pharmaceuticals 3.92% | |
BioMarin
Pharmaceutical Inc.* | | | 312,806 | | | | 8,602 | | |
| Elan Corp. plc ADR* | | | 303,500 | | | | 6,990 | | |
| Pharmion Corp.* | | | 141,900 | | | | 9,059 | | |
| Shire plc ADR | | | 60,400 | | | | 4,285 | | |
| United Therapeutics Corp.* | | | 37,500 | | | | 3,753 | | |
| Total | | | 32,689 | | |
| Education Services 1.93% | |
ITT Educational
Services, Inc.* | | | 68,800 | | | | 7,784 | | |
| Strayer Education, Inc. | | | 45,700 | | | | 8,265 | | |
| Total | | | 16,049 | | |
See Notes to Financial Statements.
8
Schedule of Investments (continued)
November 30, 2007
| Investments | | Shares | | Value
(000) | |
| Electrical Equipment & Components 1.16% | |
| AMETEK, Inc. | | | 219,500 | | | $ | 9,658 | | |
| Electronics 1.01% | |
| Amphenol Corp. Class A | | | 193,800 | | | | 8,401 | | |
| Electronics: Medical Systems 2.63% | |
| Hologic, Inc.* | | | 186,100 | | | | 12,355 | | |
| Illumina, Inc.* | | | 164,900 | | | | 9,530 | | |
| Total | | | 21,885 | | |
Electronics: Semi-Conductors/
Components 3.08% | |
| Analog Devices, Inc. | | | 45,000 | | | | 1,385 | | |
MEMC Electronic
Materials, Inc.* | | | 82,700 | | | | 6,416 | | |
National
Semiconductor Corp. | | | 187,700 | | | | 4,291 | | |
| Silicon Laboratories Inc.* | | | 275,300 | | | | 10,224 | | |
| SunPower Corp. Class A* | | | 27,000 | | | | 3,360 | | |
| Total | | | 25,676 | | |
| Engineering & Contracting Services 1.01% | |
Jacobs Engineering
Group Inc.* | | | 100,600 | | | | 8,427 | | |
| Entertainment 0.56% | |
DreamWorks Animation
SKG, Inc. Class A* | | | 176,800 | | | | 4,650 | | |
Financial Data Processing Services &
Systems 0.85% | |
| Fiserv, Inc.* | | | 138,500 | | | | 7,109 | | |
| Foods 0.82% | |
| Wm. Wrigley Jr. Co. | | | 107,100 | | | | 6,854 | | |
| Healthcare Facilities 2.34% | |
| DaVita, Inc.* | | | 156,600 | | | | 9,703 | | |
| ICON plc ADR* | | | 165,581 | | | | 9,821 | | |
| Total | | | 19,524 | | |
| Investments | | Shares | | Value
(000) | |
Identification Control & Filter
Devices 1.18% | |
| Roper Industries, Inc. | | | 154,800 | | | $ | 9,822 | | |
Investment Management
Companies 1.80% | |
| T. Rowe Price Group, Inc. | | | 196,700 | | | | 12,093 | | |
Waddell & Reed Financial,
Inc. Class A | | | 85,200 | | | | 2,912 | | |
| Total | | | 15,005 | | |
| Jewelry, Watches & Gemstones 1.09% | |
| Tiffany & Co. | | | 196,200 | | | | 9,110 | | |
| Leisure Time 1.27% | |
| Life Time Fitness Inc.* | | | 194,500 | | | | 10,565 | | |
Machinery: Oil Well Equipment &
Services 2.42% | |
Cameron
International Corp.* | | | 127,700 | | | | 11,905 | | |
| Smith International Inc. | | | 131,800 | | | | 8,267 | | |
| Total | | | 20,172 | | |
Medical & Dental Instruments &
Supplies 4.11% | |
| Beckman Coulter, Inc. | | | 93,500 | | | | 6,613 | | |
DENTSPLY
International Inc. | | | 263,600 | | | | 11,277 | | |
| Gen-Probe Inc.* | | | 121,200 | | | | 8,107 | | |
Thermo Fisher
Scientific Inc.* | | | 143,600 | | | | 8,277 | | |
| Total | | | 34,274 | | |
| Medical Services 1.15% | |
| Covance Inc.* | | | 109,300 | | | | 9,545 | | |
| Metal Fabricating 1.94% | |
| Precision Castparts Corp. | | | 109,800 | | | | 16,178 | | |
| Miscellaneous: Producer Durables 1.17% | |
| BE Aerospace, Inc.* | | | 208,000 | | | | 9,776 | | |
| Miscellaneous: Technology 0.91% | |
| IHS Inc. Class A* | | | 107,600 | | | | 7,547 | | |
See Notes to Financial Statements.
9
Schedule of Investments (continued)
November 30, 2007
| Investments | | Shares | | Value
(000) | |
| Multi-Sector Companies 1.26% | |
| Textron, Inc. | | | 152,200 | | | $ | 10,509 | | |
| Offshore Drilling 2.40% | |
| Atwood Oceanics, Inc.* | | | 121,200 | | | | 10,575 | | |
Diamond Offshore
Drilling, Inc. | | | 81,200 | | | | 9,454 | | |
| Total | | | 20,029 | | |
| Oil: Crude Producers 5.50% | |
| Cabot Oil & Gas Corp. | | | 180,400 | | | | 6,209 | | |
| Noble Energy, Inc. | | | 115,500 | | | | 8,321 | | |
| Range Resources Corp. | | | 426,300 | | | | 17,342 | | |
| Southwestern Energy Co.* | | | 280,000 | | | | 13,935 | | |
| Total | | | 45,807 | | |
| Radio & TV Broadcasters 0.92% | |
Rogers Communications,
Inc. Class B (Canada)(a) | | | 183,100 | | | | 7,665 | | |
| Retail 4.12% | |
| Amazon.com, Inc.* | | | 68,900 | | | | 6,240 | | |
| GameStop Corp.* | | | 159,400 | | | | 9,157 | | |
| O'Reilly Automotive, Inc.* | | | 203,367 | | | | 6,683 | | |
| TJX Companies, Inc. | | | 164,400 | | | | 4,823 | | |
| Urban Outfitters, Inc.* | | | 285,000 | | | | 7,467 | | |
| Total | | | 34,370 | | |
| Securities Brokerage & Services 2.15% | |
| GFI Group Inc.* | | | 74,100 | | | | 7,216 | | |
IntercontinentalExchange,
Inc.* | | | 64,100 | | | | 10,702 | | |
| Total | | | 17,918 | | |
| Services: Commercial 3.34% | |
Corrections Corp. of
America* | | | 397,700 | | | | 12,134 | | |
Ctrip.com International
Ltd. ADR | | | 54,431 | | | | 3,272 | | |
| FTI Consulting, Inc.* | | | 217,500 | | | | 12,397 | | |
| Total | | | 27,803 | | |
| Investments | | Shares | | Value
(000) | |
| Soaps & Household Chemicals 2.05% | |
| Church & Dwight Co., Inc. | | | 187,100 | | | $ | 10,500 | | |
| Clorox Co. (The) | | | 100,900 | | | | 6,547 | | |
| Total | | | 17,047 | | |
| Telecommunications Equipment 2.89% | |
American Tower Corp.
Class A* | | | 239,100 | | | | 10,889 | | |
Crown Castle
International Corp.* | | | 314,500 | | | | 13,193 | | |
| Total | | | 24,082 | | |
| Textiles Apparel Manufacturers 0.46% | |
Under Armour, Inc.
Class A* | | | 77,300 | | | | 3,840 | | |
| Transportation: Miscellaneous 0.86% | |
Expeditors International
of Washington Inc. | | | 153,400 | | | | 7,198 | | |
| Utilities: Telecommunications 0.49% | |
Time Warner
Telecommunications, Inc.
Class A* | | | 180,800 | | | | 4,055 | | |
| Wholesalers 0.60% | |
| LKQ Corp.* | | | 126,100 | | | | 5,008 | | |
Total Common Stocks
(cost $643,232,857) | | | 784,946 | | |
| | | | | U.S. $
Value
(000) | |
| FOREIGN COMMON STOCK 0.16% | |
| China | |
Alibaba.com Ltd.*(b)
(cost $859,878) | | | 261,500 | | | $ | 1,342 | | |
Total Long-Term Investments
(cost $644,092,735) | | | 786,288 | | |
See Notes to Financial Statements.
10
Schedule of Investments (concluded)
November 30, 2007
| Investments | | Principal
Amount
(000) | | U.S. $
Value
(000) | |
| SHORT-TERM INVESTMENT 7.49% | |
| Repurchase Agreement | |
Repurchase Agreement
dated 11/30/2007,
4.06% due 12/3/2007
with State Street
Bank & Trust Co.
collateralized by
$61,735,000 of Federal
Home Loan Mortgage Corp.
at 4.875% due 2/17/2009;
value: $63,664,219;
proceeds: $62,432,942
(cost $62,411,826) | | $ | 62,412 | | | $ | 62,412 | | |
Total Investments in
Securities 101.82%
(cost $706,504,561) | | | 848,700 | | |
Liabilities in Excess of
Other Assets (1.82%) | | | | | (15,179 | ) | |
| Net Assets 100.00% | | $ | 833,521 | | |
ADR American Depositary Receipt.
* Non-income producing security.
(a) Foreign security traded in U.S. dollars.
(b) Investment in non-U.S. dollar denominated security.
Industry classifications have not been audited by Deloitte & Touche LLP.
See Notes to Financial Statements.
11
Statement of Assets and Liabilities
November 30, 2007
| ASSETS: | |
| Investments in securities, at value (cost $706,504,561) | | $ | 848,699,548 | | |
| Receivables: | |
| Investment securities sold | | | 3,724,563 | | |
| Capital shares sold | | | 802,342 | | |
| Interest and dividends | | | 247,508 | | |
| From advisor (See Note 3) | | | 12 | | |
| Prepaid expenses and other assets | | | 104,781 | | |
| Total assets | | | 853,578,754 | | |
| LIABILITIES: | |
| Payables: | |
| Investment securities purchased | | | 16,822,842 | | |
| Capital shares reacquired | | | 1,616,545 | | |
| Management fee | | | 546,854 | | |
| 12b-1 distribution fees | | | 334,216 | | |
| Directors' fees | | | 68,383 | | |
| Fund administration | | | 27,458 | | |
| To affiliates (See Note 3) | | | 9,746 | | |
| Accrued expenses and other liabilities | | | 631,968 | | |
| Total liabilities | | | 20,058,012 | | |
| NET ASSETS | | $ | 833,520,742 | | |
| COMPOSITION OF NET ASSETS: | |
| Paid-in capital | | $ | 584,086,352 | | |
| Accumulated net investment loss | | | (1,591,206 | ) | |
| Accumulated net realized gain on investments and foreign currency related transactions | | | 108,830,609 | | |
| Net unrealized appreciation on investments | | | 142,194,987 | | |
| Net Assets | | $ | 833,520,742 | | |
| Net assets by class: | |
| Class A Shares | | $ | 613,735,305 | | |
| Class B Shares | | $ | 101,200,386 | | |
| Class C Shares | | $ | 83,890,976 | | |
| Class F Shares | | $ | 10,064 | | |
| Class I Shares | | $ | 17,964,781 | | |
| Class P Shares | | $ | 16,699,208 | | |
| Class R2 Shares | | $ | 10,010 | | |
| Class R3 Shares | | $ | 10,012 | | |
| Outstanding shares by class: | |
| Class A Shares (50 million shares of common stock authorized, $.001 par value) | | | 25,740,396 | | |
| Class B Shares (30 million shares of common stock authorized, $.001 par value) | | | 4,515,087 | | |
| Class C Shares (20 million shares of common stock authorized, $.001 par value) | | | 3,744,513 | | |
| Class F Shares (30 million shares of common stock authorized, $.001 par value) | | | 422 | | |
| Class I Shares (30 million shares of common stock authorized, $.001 par value) | | | 731,485 | | |
| Class P Shares (20 million shares of common stock authorized, $.001 par value) | | | 701,035 | | |
| Class R2 Shares (30 million shares of common stock authorized, $.001 par value) | | | 420 | | |
| Class R3 Shares (30 million shares of common stock authorized, $.001 par value) | | | 420 | | |
Net asset value, offering and redemption price per share
(Net assets divided by outstanding shares): | | | | | |
| Class A Shares–Net asset value | | $ | 23.84 | | |
Class A Shares–Maximum offering price
(Net asset value plus sales charge of 5.75%) | | $ | 25.29 | | |
| Class B Shares–Net asset value | | $ | 22.41 | | |
| Class C Shares–Net asset value | | $ | 22.40 | | |
| Class F Shares–Net asset value | | $ | 23.85 | | |
| Class I Shares–Net asset value | | $ | 24.56 | | |
| Class P Shares–Net asset value | | $ | 23.82 | | |
| Class R2 Shares–Net asset value | | $ | 23.83 | | |
| Class R3 Shares–Net asset value | | $ | 23.84 | | |
See Notes to Financial Statements.
12
Statement of Operations
For the Year Ended November 30, 2007
| Investment income: | |
| Dividends (net of foreign withholding taxes of $16,270) | | $ | 3,394,091 | | |
| Interest | | | 1,743,220 | | |
| Total investment income | | | 5,137,311 | | |
| Expenses: | |
| Management fee | | | 6,640,334 | | |
| 12b-1 distribution plan–Class A | | | 2,132,204 | | |
| 12b-1 distribution plan–Class B | | | 1,014,844 | | |
| 12b-1 distribution plan–Class C | | | 814,659 | | |
| 12b-1 distribution plan–Class F | | | 2 | | |
| 12b-1 distribution plan–Class P | | | 72,836 | | |
| 12b-1 distribution plan–Class R2 | | | 10 | | |
| 12b-1 distribution plan–Class R3 | | | 8 | | |
| Shareholder servicing | | | 2,374,053 | | |
| Fund administration | | | 332,017 | | |
| Reports to shareholders | | | 270,795 | | |
| Registration | | | 84,143 | | |
| Subsidy (See Note 3) | | | 52,994 | | |
| Professional | | | 51,728 | | |
| Directors' fees | | | 32,857 | | |
| Custody | | | 30,626 | | |
| Other | | | 15,777 | | |
| Gross expenses | | | 13,919,887 | | |
| Expense reductions (See Note 7) | | | (31,303 | ) | |
| Expenses assumed by advisor (See Note 3) | | | (74,257 | ) | |
| Net expenses | | | 13,814,327 | | |
| Net investment loss | | | (8,677,016 | ) | |
| Net realized and unrealized gain: | |
| Net realized gain on investments and foreign currency related transactions | | | 114,250,000 | | |
| Net change in unrealized appreciation on investments | | | 36,272,858 | | |
| Net realized and unrealized gain | | | 150,522,858 | | |
| Net Increase in Net Assets Resulting From Operations | | $ | 141,845,842 | | |
See Notes to Financial Statements.
13
Statements of Changes in Net Assets
| INCREASE (DECREASE) IN NET ASSETS | | For the Year Ended
November 30, 2007 | | For the Year Ended
November 30, 2006 | |
| Operations: | |
| Net investment loss | | $ | (8,677,016 | ) | | $ | (7,163,820 | ) | |
Net realized gain on investments and
foreign currency related transactions | | | 114,250,000 | | | | 71,897,230 | | |
Net change in unrealized appreciation
(depreciation) on investments | | | 36,272,858 | | | | (8,057,753 | ) | |
| Net increase in net assets resulting from operations | | | 141,845,842 | | | | 56,675,657 | | |
| Distributions to shareholders from: | |
| Net realized gain | |
| Class A | | | (55,264,297 | ) | | | (19,486,802 | ) | |
| Class B | | | (9,546,014 | ) | | | (3,418,682 | ) | |
| Class C | | | (7,490,738 | ) | | | (2,662,857 | ) | |
| Class I | | | (1,764,000 | ) | | | (275,140 | ) | |
| Class P | | | (1,438,838 | ) | | | (542,311 | ) | |
| Total distributions to shareholders | | | (75,503,887 | ) | | | (26,385,792 | ) | |
| Capital share transactions (Net of share conversions) (See Note 11): | |
| Net proceeds from sales of shares | | | 104,727,803 | | | | 137,536,717 | | |
| Reinvestment of distributions | | | 71,256,786 | | | | 24,709,953 | | |
| Cost of shares reacquired | | | (238,951,845 | ) | | | (213,035,418 | ) | |
Net decrease in net assets resulting
from capital share transactions | | | (62,967,256 | ) | | | (50,788,748 | ) | |
| Net increase (decrease) in net assets | | | 3,374,699 | | | | (20,498,883 | ) | |
| NET ASSETS: | |
| Beginning of year | | $ | 830,146,043 | | | $ | 850,644,926 | | |
| End of year | | $ | 833,520,742 | | | $ | 830,146,043 | | |
| Accumulated net investment loss | | $ | (1,591,206 | ) | | $ | (610,990 | ) | |
See Notes to Financial Statements.
14
Financial Highlights
| | | Class A Shares | |
| | | Year Ended 11/30 | |
| | | 2007 | | 2006 | | 2005 | | 2004 | | 2003 | |
| Per Share Operating Performance | |
| Net asset value, beginning of year | | $ | 22.02 | | | $ | 21.15 | | | $ | 19.21 | | | $ | 17.88 | | | $ | 14.42 | | |
| Investment operations: | |
| Net investment loss(a) | | | (.20 | ) | | | (.15 | ) | | | (.19 | ) | | | (.23 | ) | | | (.24 | ) | |
| Net realized and unrealized gain | | | 4.01 | | | | 1.67 | | | | 2.13 | | | | 1.56 | | | | 3.70 | | |
| Total from investment operations | | | 3.81 | | | | 1.52 | | | | 1.94 | | | | 1.33 | | | | 3.46 | | |
Distributions to shareholders from
net realized gain | | | (1.99 | ) | | | (.65 | ) | | | – | | | | – | | | | – | | |
| Net asset value, end of year | | $ | 23.84 | | | $ | 22.02 | | | $ | 21.15 | | | $ | 19.21 | | | $ | 17.88 | | |
| Total Return(b) | | | 18.81 | % | | | 7.35 | % | | | 10.10 | % | | | 7.44 | % | | | 23.99 | % | |
| Ratios to Average Net Assets: | |
Expenses, excluding expense reductions
and including expenses assumed | | | 1.53 | % | | | 1.54 | % | | | 1.55 | % | | | 1.73 | % | | | 1.85 | % | |
Expenses, including expense reductions
and expenses assumed | | | 1.53 | % | | | 1.54 | % | | | 1.55 | % | | | 1.73 | % | | | 1.85 | % | |
Expenses, excluding expense reductions
and expenses assumed | | | 1.54 | % | | | 1.56 | % | | | 1.59 | % | | | 1.73 | % | | | 1.85 | % | |
| Net investment loss | | | (.91 | )% | | | (.70 | )% | | | (.96 | )% | | | (1.27 | )% | | | (1.53 | )% | |
| Supplemental Data: | |
| Net assets, end of year (000) | | $ | 613,735 | | | $ | 614,433 | | | $ | 634,059 | | | $ | 594,524 | | | $ | 430,991 | | |
| Portfolio turnover rate | | | 101.25 | % | | | 159.86 | % | | | 97.35 | % | | | 90.23 | % | | | 78.58 | % | |
(a) Calculated using average shares outstanding during the period.
(b) Total return does not consider the effects of sales loads and assumes the reinvestment of all distributions.
See Notes to Financial Statements.
15
Financial Highlights (continued)
| | | Class B Shares | |
| | | Year Ended 11/30 | |
| | | 2007 | | 2006 | | 2005 | | 2004 | | 2003 | |
| Per Share Operating Performance | |
| Net asset value, beginning of year | | $ | 20.94 | | | $ | 20.27 | | | $ | 18.53 | | | $ | 17.35 | | | $ | 14.08 | | |
| Investment operations: | |
| Net investment loss(a) | | | (.32 | ) | | | (.27 | ) | | | (.31 | ) | | | (.33 | ) | | | (.32 | ) | |
| Net realized and unrealized gain | | | 3.78 | | | | 1.59 | | | | 2.05 | | | | 1.51 | | | | 3.59 | | |
| Total from investment operations | | | 3.46 | | | | 1.32 | | | | 1.74 | | | �� | 1.18 | | | | 3.27 | | |
Distributions to shareholders from
net realized gain | | | (1.99 | ) | | | (.65 | ) | | | – | | | | – | | | | – | | |
| Net asset value, end of year | | $ | 22.41 | | | $ | 20.94 | | | $ | 20.27 | | | $ | 18.53 | | | $ | 17.35 | | |
| Total Return(b) | | | 18.04 | % | | | 6.66 | % | | | 9.39 | % | | | 6.80 | % | | | 23.22 | % | |
| Ratios to Average Net Assets: | |
Expenses, excluding expense reductions
and including expenses assumed | | | 2.18 | % | | | 2.19 | % | | | 2.20 | % | | | 2.30 | % | | | 2.44 | % | |
Expenses, including expense reductions
and expenses assumed | | | 2.18 | % | | | 2.19 | % | | | 2.20 | % | | | 2.30 | % | | | 2.44 | % | |
Expenses, excluding expense reductions
and expenses assumed | | | 2.19 | % | | | 2.21 | % | | | 2.23 | % | | | 2.30 | % | | | 2.44 | % | |
| Net investment loss | | | (1.56 | )% | | | (1.35 | )% | | | (1.61 | )% | | | (1.84 | )% | | | (2.12 | )% | |
| Supplemental Data: | |
| Net assets, end of year (000) | | $ | 101,200 | | | $ | 100,741 | | | $ | 106,809 | | | $ | 104,282 | | | $ | 94,561 | | |
| Portfolio turnover rate | | | 101.25 | % | | | 159.86 | % | | | 97.35 | % | | | 90.23 | % | | | 78.58 | % | |
(a) Calculated using average shares outstanding during the period.
(b) Total return does not consider the effects of sales loads and assumes the reinvestment of all distributions.
See Notes to Financial Statements.
16
Financial Highlights (continued)
| | | Class C Shares | |
| | | Year Ended 11/30 | |
| | | 2007 | | 2006 | | 2005 | | 2004 | | 2003 | |
| Per Share Operating Performance | |
| Net asset value, beginning of year | | $ | 20.93 | | | $ | 20.26 | | | $ | 18.53 | | | $ | 17.34 | | | $ | 14.08 | | |
| Investment operations: | |
| Net investment loss(a) | | | (.32 | ) | | | (.27 | ) | | | (.31 | ) | | | (.33 | ) | | | (.32 | ) | |
| Net realized and unrealized gain | | | 3.78 | | | | 1.59 | | | | 2.04 | | | | 1.52 | | | | 3.58 | | |
| Total from investment operations | | | 3.46 | | | | 1.32 | | | | 1.73 | | | | 1.19 | | | | 3.26 | | |
Distributions to shareholders from
net realized gain | | | (1.99 | ) | | | (.65 | ) | | | – | | | | – | | | | – | | |
| Net asset value, end of year | | $ | 22.40 | | | $ | 20.93 | | | $ | 20.26 | | | $ | 18.53 | | | $ | 17.34 | | |
| Total Return(b) | | | 18.05 | % | | | 6.66 | % | | | 9.34 | % | | | 6.86 | % | | | 23.15 | % | |
| Ratios to Average Net Assets: | |
Expenses, excluding expense reductions
and including expenses assumed | | | 2.18 | % | | | 2.19 | % | | | 2.20 | % | | | 2.30 | % | | | 2.44 | % | |
Expenses, including expense reductions
and expenses assumed | | | 2.18 | % | | | 2.19 | % | | | 2.20 | % | | | 2.30 | % | | | 2.44 | % | |
Expenses, excluding expense reductions
and expenses assumed | | | 2.19 | % | | | 2.21 | % | | | 2.23 | % | | | 2.30 | % | | | 2.44 | % | |
| Net investment loss | | | (1.56 | )% | | | (1.35 | )% | | | (1.61 | )% | | | (1.84 | )% | | | (2.12 | )% | |
| Supplemental Data: | |
| Net assets, end of year (000) | | $ | 83,891 | | | $ | 79,485 | | | $ | 83,339 | | | $ | 85,666 | | | $ | 79,415 | | |
| Portfolio turnover rate | | | 101.25 | % | | | 159.86 | % | | | 97.35 | % | | | 90.23 | % | | | 78.58 | % | |
(a) Calculated using average shares outstanding during the period.
(b) Total return does not consider the effects of sales loads and assumes the reinvestment of all distributions.
See Notes to Financial Statements.
17
Financial Highlights (continued)
| | | Class F Shares | |
| | | 9/28/2007(a)
to
11/30/2007 | |
| Per Share Operating Performance | |
| Net asset value, beginning of period | | $ | 23.81 | | |
| Investment operations: | |
| Net investment loss(b) | | | (.03 | ) | |
| Net realized and unrealized gain | | | .07 | | |
| Total from investment operations | | | .04 | | |
| Net asset value, end of period | | $ | 23.85 | | |
| Total Return(c) | | | .17 | %(d) | |
| Ratios to Average Net Assets: | |
Expenses, excluding expense reductions
and including expenses assumed | | | .22 | %(d) | |
Expenses, including expense reductions
and expenses assumed | | | .22 | %(d) | |
Expenses, excluding expense reductions
and expenses assumed | | | .22 | %(d) | |
| Net investment loss | | | (.14 | )%(d) | |
| Supplemental Data: | |
| Net assets, end of period (000) | | $ | 10 | | |
| Portfolio turnover rate | | | 101.25 | % | |
(a) Commencement of investment operations was September 28, 2007; SEC effective date was September 14, 2007 and date shares first became available to the public was October 1, 2007.
(b) Calculated using average shares outstanding during the period.
(c) Total return does not consider the effects of sales loads and assumes the reinvestment of all distributions.
(d) Not annualized.
See Notes to Financial Statements.
18
Financial Highlights (continued)
| | | Class I Shares | |
| | | Year Ended 11/30 | |
| | | 2007 | | 2006 | | 2005 | | 2004 | | 2003 | |
| Per Share Operating Performance | |
| Net asset value, beginning of year | | $ | 22.55 | | | $ | 21.57 | | | $ | 19.52 | | | $ | 18.09 | | | $ | 14.56 | | |
| Investment operations: | |
| Net investment loss(a) | | | (.12 | ) | | | (.07 | ) | | | (.12 | ) | | | (.15 | ) | | | (.20 | ) | |
| Net realized and unrealized gain | | | 4.12 | | | | 1.70 | | | | 2.17 | | | | 1.58 | | | | 3.73 | | |
| Total from investment operations | | | 4.00 | | | | 1.63 | | | | 2.05 | | | | 1.43 | | | | 3.53 | | |
Distributions to shareholders from
net realized gain | | | (1.99 | ) | | | (.65 | ) | | | – | | | | – | | | | – | | |
| Net asset value, end of year | | $ | 24.56 | | | $ | 22.55 | | | $ | 21.57 | | | $ | 19.52 | | | $ | 18.09 | | |
| Total Return(b) | | | 19.24 | % | | | 7.73 | % | | | 10.50 | % | | | 7.90 | % | | | 24.24 | % | |
| Ratios to Average Net Assets: | |
Expenses, excluding expense reductions
and including expenses assumed | | | 1.18 | % | | | 1.19 | % | | | 1.20 | % | | | 1.37 | % | | | 1.44 | %† | |
Expenses, including expense reductions
and expenses assumed | | | 1.18 | % | | | 1.19 | % | | | 1.20 | % | | | 1.37 | % | | | 1.44 | %† | |
Expenses, excluding expense reductions
and expenses assumed | | | 1.19 | % | | | 1.22 | % | | | 1.23 | % | | | 1.37 | % | | | 1.44 | %† | |
| Net investment loss | | | (.55 | )% | | | (.32 | )% | | | (.60 | )% | | | (.80 | )% | | | (1.12 | )%† | |
| Supplemental Data: | |
| Net assets, end of year (000) | | $ | 17,965 | | | $ | 19,631 | | | $ | 8,901 | | | $ | 6,312 | | | $ | 2 | | |
| Portfolio turnover rate | | | 101.25 | % | | | 159.86 | % | | | 97.35 | % | | | 90.23 | % | | | 78.58 | % | |
† The ratios have been determined on a Fund basis.
(a) Calculated using average shares outstanding during the period.
(b) Total return does not consider the effects of sales loads and assumes the reinvestment of all distributions.
See Notes to Financial Statements.
19
Financial Highlights (continued)
| | | Class P Shares | |
| | | Year Ended 11/30 | |
| | | 2007 | | 2006 | | 2005 | | 2004 | | 2003 | |
| Per Share Operating Performance | |
| Net asset value, beginning of year | | $ | 22.02 | | | $ | 21.17 | | | $ | 19.25 | | | $ | 17.92 | | | $ | 14.47 | | |
| Investment operations: | |
| Net investment loss(a) | | | (.22 | ) | | | (.17 | ) | | | (.21 | ) | | | (.24 | ) | | | (.25 | ) | |
| Net realized and unrealized gain | | | 4.01 | | | | 1.67 | | | | 2.13 | | | | 1.57 | | | | 3.70 | | |
| Total from investment operations | | | 3.79 | | | | 1.50 | | | | 1.92 | | | | 1.33 | | | | 3.45 | | |
Distributions to shareholders from
net realized gain | | | (1.99 | ) | | | (.65 | ) | | | – | | | | – | | | | – | | |
| Net asset value, end of year | | $ | 23.82 | | | $ | 22.02 | | | $ | 21.17 | | | $ | 19.25 | | | $ | 17.92 | | |
| Total Return(b) | | | 18.71 | % | | | 7.24 | % | | | 9.97 | % | | | 7.42 | % | | | 23.84 | % | |
| Ratios to Average Net Assets: | |
Expenses, excluding expense reductions
and including expenses assumed | | | 1.63 | % | | | 1.64 | % | | | 1.65 | % | | | 1.77 | % | | | 1.89 | % | |
Expenses, including expense reductions
and expenses assumed | | | 1.63 | % | | | 1.64 | % | | | 1.65 | % | | | 1.77 | % | | | 1.89 | % | |
Expenses, excluding expense reductions
and expenses assumed | | | 1.64 | % | | | 1.66 | % | | | 1.68 | % | | | 1.77 | % | | | 1.89 | % | |
| Net investment loss | | | (1.01 | )% | | | (.79 | )% | | | (1.05 | )% | | | (1.31 | )% | | | (1.57 | )% | |
| Supplemental Data: | |
| Net assets, end of year (000) | | $ | 16,699 | | | $ | 15,856 | | | $ | 17,536 | | | $ | 12,094 | | | $ | 6,310 | | |
| Portfolio turnover rate | | | 101.25 | % | | | 159.86 | % | | | 97.35 | % | | | 90.23 | % | | | 78.58 | % | |
(a) Calculated using average shares outstanding during the period.
(b) Total return does not consider the effects of sales loads and assumes the reinvestment of all distributions.
See Notes to Financial Statements.
20
Financial Highlights (continued)
| | | Class R2 Shares | |
| | | 9/28/2007(a)
to
11/30/2007 | |
| Per Share Operating Performance | |
| Net asset value, beginning of period | | $ | 23.81 | | |
| Investment operations: | |
| Net investment loss(b) | | | (.05 | ) | |
| Net realized and unrealized gain | | | .07 | | |
| Total from investment operations | | | .02 | | |
| Net asset value, end of period | | $ | 23.83 | | |
| Total Return(c) | | | .08 | %(d) | |
| Ratios to Average Net Assets: | |
Expenses, excluding expense reductions
and including expenses assumed | | | .28 | %(d) | |
Expenses, including expense reductions
and expenses assumed | | | .28 | %(d) | |
Expenses, excluding expense reductions
and expenses assumed | | | .29 | %(d) | |
| Net investment loss | | | (.20 | )%(d) | |
| Supplemental Data: | |
| Net assets, end of period (000) | | $ | 10 | | |
| Portfolio turnover rate | | | 101.25 | % | |
(a) Commencement of investment operations was September 28, 2007; SEC effective date was September 14, 2007 and date shares first became available to the public was October 1, 2007.
(b) Calculated using average shares outstanding during the period.
(c) Total return does not consider the effects of sales loads and assumes the reinvestment of all distributions.
(d) Not annualized.
See Notes to Financial Statements.
21
Financial Highlights (concluded)
| | | Class R3 Shares | |
| | | 9/28/2007(a)
to
11/30/2007 | |
| Per Share Operating Performance | |
| Net asset value, beginning of period | | $ | 23.81 | | |
| Investment operations: | |
| Net investment loss(b) | | | (.04 | ) | |
| Net realized and unrealized gain | | | .07 | | |
| Total from investment operations | | | .03 | | |
| Net asset value, end of period | | $ | 23.84 | | |
| Total Return(c) | | | .13 | %(d) | |
| Ratios to Average Net Assets: | |
Expenses, excluding expense reductions
and including expenses assumed | | | .27 | %(d) | |
Expenses, including expense reductions
and expenses assumed | | | .27 | %(d) | |
Expenses, excluding expense reductions
and expenses assumed | | | .27 | %(d) | |
| Net investment loss | | | (.18 | )%(d) | |
| Supplemental Data: | |
| Net assets, end of period (000) | | $ | 10 | | |
| Portfolio turnover rate | | | 101.25 | % | |
(a) Commencement of investment operations was September 28, 2007; SEC effective date was September 14, 2007 and date shares first became available to the public was October 1, 2007.
(b) Calculated using average shares outstanding during the period.
(c) Total return does not consider the effects of sales loads and assumes the reinvestment of all distributions.
(d) Not annualized.
See Notes to Financial Statements.
22
Notes to Financial Statements
1. ORGANIZATION
Lord Abbett Research Fund, Inc. (the "Company") is registered under the Investment Company Act of 1940 (the "Act") as a diversified open-end management investment company, incorporated under Maryland law on April 6, 1992. The Company currently consists of four separate funds. This report covers one of the funds and its respective classes - Lord Abbett Growth Opportunities Fund (the "Fund").
The Fund's investment objective is capital appreciation. The Fund offers eight classes of shares: Classes A, B, C, F, I, P, R2 and R3, each with different expenses and dividends. A front-end sales charge is normally added to the Net Asset Value ("NAV") for Class A shares. There is no front-end sales charge in the case of the Classes B, C, F, I, P, R2 and R3 shares, although there may be a contingent deferred sales charge ("CDSC") as follows: certain redemptions of Class A shares made within 12 months following certain purchases made without a sales charge; Class B shares redeemed before the sixth anniversary of purchase; and Class C shares redeemed before the first anniversary of purchase. Class B shares will automatically convert to Class A shares on the eighth anniversary of the original purchase of Class B shares. Effective September 28, 2007, Class Y was renamed Class I. As of October 1, 2007, the Fund's Class P shares were closed to sub stantially all new retirement and benefit plans and fee-based programs, with certain exceptions as set forth in the Fund's Prospectus.
The preparation of financial statements in conformity with accounting principles generally accepted in the United States of America requires management to make certain estimates and assumptions that affect the reported amounts of assets and liabilities and disclosure of contingent assets and liabilities at the date of the financial statements and the reported amounts of increases and decreases in net assets from operations during the reporting period. Actual results could differ from those estimates.
2. SIGNIFICANT ACCOUNTING POLICIES
(a) Investment Valuation–Securities traded on any recognized U.S. or non-U.S. exchange or on NASDAQ, Inc. are valued at the last sale price or official closing price on the exchange or system on which they are principally traded. Events occurring after the close of trading on non-U.S. exchanges may result in adjustments to the valuation of foreign securities to more accurately reflect their fair value as of the close of regular trading on the New York Stock Exchange. The Fund may rely on an independent fair valuation service in adjusting the valuations of foreign securities. Unlisted equity securities are valued at the last quoted sale price or, if no sale price is available, at the mean between the most recently quoted bid and asked prices. Securities for which market quotatio ns are not readily available are valued at fair value as determined by management and approved in good faith by the Board of Directors. Short-term securities with 60 days or less remaining to maturity are valued using the amortized cost method, which approximates current market value.
(b) Security Transactions–Security transactions are recorded as of the date that the securities are purchased or sold (trade date). Realized gains and losses on sales of portfolio securities are calculated using the identified-cost method. Realized and unrealized gains (losses) are allocated to each class of shares based upon the relative proportion of net assets at the beginning of the day.
23
Notes to Financial Statements (continued)
(c) Investment Income–Dividend income is recorded on the ex-dividend date. Interest income is recorded on the accrual basis. Discounts are accreted and premiums are amortized using the effective interest method. Withholding taxes on foreign dividends have been provided for in accordance with the Fund's understanding of the applicable country's tax rules and rates. Investment income is allocated to each class of shares based upon the relative proportion of net assets at the beginning of the day.
(d) Federal Taxes–It is the policy of the Fund to meet the requirements of Subchapter M of the Internal Revenue Code applicable to regulated investment companies and to distribute substantially all taxable income and capital gains to its shareholders. Therefore, no Federal income tax provision is required.
(e) Expenses–Expenses incurred by the Company that do not specifically relate to an individual fund are generally allocated to the Funds within the Company on a pro rata basis. Expenses, excluding class specific expenses, are allocated to each class of shares based upon the relative proportion of net assets at the beginning of the day. Class A, B, C, F, P, R2 and R3 shares bear their class specific share of all expenses and fees relating to the Fund's 12b-1 Distribution Plan.
(f) Foreign Transactions–The books and records of the Fund are maintained in U.S. dollars and transactions denominated in foreign currencies are recorded in the Fund's records at the rate prevailing when earned or recorded. Asset and liability accounts that are denominated in foreign currencies are adjusted to reflect current exchange rates. The resultant exchange gains and losses are included in Net realized gain on investments and foreign currency related transactions on the Fund's Statement of Operations. The Fund does not isolate that portion of the results of operations arising as a result of changes in the foreign exchange rates from the changes in market prices of the securities.
(g) Repurchase Agreements–The Fund may enter into repurchase agreements with respect to securities. A repurchase agreement is a transaction in which the Fund acquires a security and simultaneously commits to resell that security to the seller (a bank or securities dealer) at an agreed-upon price on an agreed-upon date. The Fund requires at all times that the repurchase agreement be collateralized by cash, or by securities of the U.S. Government, its agencies, its instrumentalities, or U.S. Government sponsored enterprises having a value equal to, or in excess of, the value of the repurchase agreement (including accrued interest). If the seller of the agreement defaults on its obligation to repurchase the underlying securities at a time when the value of these securities has dec lined, the Fund may incur a loss upon disposition of the securities.
3. MANAGEMENT FEES AND OTHER TRANSACTIONS WITH AFFILIATES
Management Fees
The Company has a management agreement with Lord, Abbett & Co. LLC ("Lord Abbett") pursuant to which Lord Abbett supplies the Fund with investment management services and executive and other personnel, pays the remuneration of officers, provides office space and pays for ordinary and necessary office and clerical expenses relating to research and statistical work and supervision of the Fund's investment portfolio.
24
Notes to Financial Statements (continued)
The management fee is based on average daily net assets at the following annual rates:
| First $1 billion | | | .80 | % | |
| Next $1 billion | | | .75 | % | |
| Next $1 billion | | | .70 | % | |
| Over $3 billion | | | .65 | % | |
For the year ended November 30, 2007, the effective management fee paid to Lord Abbett was at an annualized rate of .80% of the Fund's average daily net assets.
For the period December 1, 2006 through March 31, 2008, Lord Abbett has contractually agreed to reimburse the Fund to the extent necessary so that each class' total annual operating expenses do not exceed the following annual rates:
| Class | | % of Average Daily Net Assets | |
| A | | | 1.55 | % | |
| B | | | 2.20 | % | |
| C | | | 2.20 | % | |
| F | | | 1.30 | %(1) | |
| I | | | 1.20 | % | |
| P | | | 1.65 | % | |
| R2 | | | 1.80 | %(1) | |
| R3 | | | 1.70 | %(1) | |
(1) The Class F, R2 and R3 shares became effective with the SEC on September 14, 2007.
Lord Abbett provides certain administrative services to the Fund pursuant to an Administrative Services Agreement at an annual rate of .04% of the Fund's average daily net assets.
The Fund, along with certain other funds managed by Lord Abbett (the "Underlying Funds"), has entered into a Servicing Arrangement with Lord Abbett Diversified Equity Strategy Fund and Lord Abbett Growth & Income Strategy Fund of Lord Abbett Investment Trust (each, a "Fund of Funds"), pursuant to which each Underlying Fund pays a portion of the expenses (excluding management fees and distribution and service fees) of each Fund of Funds in proportion to the average daily value of Underlying Fund shares owned by each Fund of Fund. Amounts paid pursuant to the Servicing Arrangement are included in Subsidy Expense on the Fund's Statement of Operations and Payable to affiliates on the Fund's Statement of Assets and Liabilities.
12b-1 Distribution Plan
The Fund has adopted a distribution plan with respect to its Class A, B, C, F, P, R2 and R3 of shares pursuant to Rule 12b-1 under the Act, which provides for the payment of ongoing distribution and service fees to Lord Abbett Distributor LLC ("Distributor"), an affiliate of Lord Abbett. The fees are accrued daily at annual rates based upon average daily net assets as follows:
| Fees* | | Class A | | Class B | | Class C | | Class F | | Class P | | Class R2 | | Class R3 | |
| Service | | | .25 | % | | | .25 | % | | | .25 | % | | | – | | | | .20 | % | | | .25 | % | | | .25 | % | |
| Distribution | | | .10 | % | | | .75 | % | | | .75 | % | | | .10 | % | | | .25 | % | | | .35 | % | | | .25 | % | |
* The Fund may designate a portion of the aggregate fee as attributable to service activities for purposes of calculating Financial Industry Regulatory Authority ("FINRA") sales charge limitations.
Class I does not have a distribution plan.
25
Notes to Financial Statements (continued)
Commissions
Distributor received the following commissions on sales of shares of the Fund, after concessions were paid to authorized dealers, for the year ended November 30, 2007:
Distributor
Commissions | | Dealers'
Concessions | |
| $ | 213,927 | | | $ | 1,134,187 | | |
Distributor received CDSCs of $7,789 and $2,691 for Class A and Class C shares, respectively, for the year ended November 30, 2007.
Two Directors and certain of the Fund's officers have an interest in Lord Abbett.
4. DISTRIBUTIONS AND CAPITAL LOSS CARRYFORWARDS
Dividends from net investment income, if any, are declared and paid at least annually. Taxable net realized gains from investment transactions, reduced by capital loss carryforwards, if any, are declared and distributed to shareholders at least annually. The capital loss carryforward amount, if any, is available to offset future net capital gains. Dividends and distributions to shareholders are recorded on the ex-dividend date. The amount of dividends and distributions from net investment income and net realized capital gains are determined in accordance with Federal income tax regulations which may differ from accounting principles generally accepted in the United States of America. These book/tax differences are either considered temporary or permanent in nature. To the extent these differences are permanent in nature, such amounts are reclassified within the components of net assets based on their federal tax basis treatment; temporary di fferences do not require reclassification. Dividends and distributions, which exceed earnings and profits for tax purposes, are reported as a tax return of capital.
On December 13, 2007, a short-term capital gain distribution of approximately $40,692,000 and a long-term capital gain distribution of approximately $60,274,000 were declared by the Fund. The distributions were paid on December 18, 2007 to shareholders of record on December 17, 2007.
The tax character of distributions paid during the fiscal years ended November 30, 2007 and 2006 are as follows:
| | | 11/30/2007 | | 11/30/2006 | |
| Distributions paid from: | |
| Net long-term capital gains | | $ | 75,503,887 | | | $ | 26,385,792 | | |
| Total distributions paid | | $ | 75,503,887 | | | $ | 26,385,792 | | |
26
Notes to Financial Statements (continued)
As of November 30, 2007, the components of accumulated earnings on a tax-basis are as follows:
| Undistributed ordinary income - net | | $ | 36,054,153 | | |
| Undistributed long-term capital gains | | | 50,678,822 | | |
| Total undistributed earnings | | $ | 86,732,975 | | |
| Temporary differences | | | 21,122,174 | | |
| Unrealized gains - net | | | 141,579,241 | | |
| Total accumulated earnings – net | | $ | 249,434,390 | | |
As of November 30, 2007, the aggregate unrealized security gains and losses based on cost for U.S. Federal income tax purposes are as follows:
| Tax cost | | $ | 707,120,307 | | |
| Gross unrealized gain | | | 148,573,904 | | |
| Gross unrealized loss | | | (6,994,663 | ) | |
| Net unrealized security gain | | $ | 141,579,241 | | |
The difference between book-basis and tax-basis unrealized gains (losses) is attributable to wash sales.
Permanent items identified during the fiscal year ended November 30, 2007, have been reclassified among the components of net assets based on their tax basis treatment as follows:
Accumulated
Net Investment
Loss | | Accumulated
Net Realized
Gain | |
| $ | 7,696,800 | | | $ | (7,696,800 | ) | |
The permanent difference is primarily attributable to the tax treatment of net investment losses.
5. PORTFOLIO SECURITIES TRANSACTIONS
Purchases and sales of investment securities (excluding short-term investments) for the fiscal year ended November 30, 2007 are as follows:
| Purchases | | Sales | |
| $ | 803,773,132 | | | $ | 963,168,020 | | |
There were no purchases or sales of U.S. Government securities for the fiscal year ended November 30, 2007.
6. DIRECTORS' REMUNERATION
The Company's officers and the two Directors who are associated with Lord Abbett do not receive any compensation from the Company for serving in such capacities. Outside Directors' fees are allocated among all Lord Abbett-sponsored funds based on the net assets of each fund. There is an equity based plan available to all outside Directors under which outside Directors must defer receipt of a portion of, and may elect to defer receipt of an additional portion of, Directors' fees. The deferred amounts are treated as though equivalent dollar amounts have been invested proportionately in the funds. Such amounts and earnings accrued thereon are included in Directors' fees on the Statement of Operations and in Directors' fees payable on the Statement
27
Notes to Financial Statements (continued)
of Assets and Liabilities and are not deductible for U.S. Federal income tax purposes until such amounts are paid.
7. EXPENSE REDUCTIONS
The Company has entered into arrangements with the Fund's transfer agent and custodian whereby credits realized as a result of uninvested cash balances are used to reduce a portion of the Fund's expenses.
8. LINE OF CREDIT
The Fund, along with certain other funds managed by Lord Abbett, has available a $250,000,000 unsecured revolving credit facility ("Facility") from a consortium of banks, to be used for temporary or emergency purposes as an additional source of liquidity to fund redemptions of investor shares. Any borrowings under this Facility will bear interest at current market rates as defined in the agreement. The fee for this Facility is at an annual rate of .08%. As of November 30, 2007, there were no loans outstanding pursuant to this Facility nor was the Facility utilized at any time during the fiscal year ended November 30, 2007.
9. CUSTODIAN AND ACCOUNTING AGENT
State Street Bank & Trust Company ("SSB") is the Company's custodian and accounting agent. SSB performs custodial, accounting and recordkeeping functions relating to portfolio transactions and calculating the Fund's NAV.
10. INVESTMENT RISKS
The Fund is subject to the general risks and considerations associated with equity investing. The value of an investment will fluctuate in response to movements in the stock market in general, and to the changing prospects of individual companies in which the Fund invests. The Fund has particular risks associated with growth stocks. Growth companies may grow faster than other companies, which may result in more volatility in their stock prices. In addition, if the Fund's assessment of a company's potential for growth or market condition is wrong, it could suffer losses or produce poor performance relative to other funds, even in a rising market. The Fund invests largely in mid-sized company stocks, which may be less able to weather economic shifts or other adverse developments than larger, more established companies.
These factors can affect the Fund's performance.
28
Notes to Financial Statements (continued)
11. SUMMARY OF CAPITAL TRANSACTIONS
Transactions in shares of beneficial interest are as follows:
| | | Year Ended
November 30, 2007 | | Year Ended
November 30, 2006 | |
| Class A Shares* | | Shares | | Amount | | Shares | | Amount | |
| Shares sold | | | 2,921,931 | | | $ | 64,102,124 | | | | 4,251,322 | | | $ | 90,624,717 | | |
| Converted from Class B** | | | 180,354 | | | | 4,029,782 | | | | 146,829 | | | | 3,124,670 | | |
| Reinvestment of distributions | | | 2,593,981 | | | | 52,995,047 | | | | 891,243 | | | | 18,635,909 | | |
| Shares reacquired | | | (7,858,118 | ) | | | (171,440,080 | ) | | | (7,369,417 | ) | | | (155,343,256 | ) | |
| Decrease | | | (2,161,852 | ) | | $ | (50,313,127 | ) | | | (2,080,023 | ) | | $ | (42,957,960 | ) | |
| Class B Shares* | |
| Shares sold | | | 483,092 | | | $ | 9,996,550 | | | | 668,627 | | | $ | 13,581,367 | | |
| Reinvestment of distributions | | | 450,203 | | | | 8,702,440 | | | | 152,001 | | | | 3,041,533 | | |
| Shares reacquired | | | (1,037,995 | ) | | | (21,439,020 | ) | | | (1,125,675 | ) | | | (22,726,944 | ) | |
| Converted to Class A** | | | (191,370 | ) | | | (4,029,782 | ) | | | (153,905 | ) | | | (3,124,670 | ) | |
| Decrease | | | (296,070 | ) | | $ | (6,769,812 | ) | | | (458,952 | ) | | $ | (9,228,714 | ) | |
| Class C Shares | |
| Shares sold | | | 693,058 | | | $ | 14,260,536 | | | | 782,025 | | | $ | 15,882,912 | | |
| Reinvestment of distributions | | | 334,039 | | | | 6,453,629 | | | | 110,755 | | | | 2,215,064 | | |
| Shares reacquired | | | (1,079,681 | ) | | | (22,349,221 | ) | | | (1,208,564 | ) | | | (24,411,850 | ) | |
| Decrease | | | (52,584 | ) | | $ | (1,635,056 | ) | | | (315,784 | ) | | $ | (6,313,874 | ) | |
| | | Period Ended
November 30, 2007† | |
| Class F Shares | | Shares | | Amount | |
| Shares sold | | | 422 | | | $ | 10,049 | | |
| Increase | | | 422 | | | $ | 10,049 | | |
| | | Year Ended
November 30, 2007 | | Year Ended
November 30, 2006 | |
| Class I Shares | | Shares | | Amount | | Shares | | Amount | |
| Shares sold | | | 531,717 | | | $ | 12,176,447 | | | | 545,463 | | | $ | 11,838,316 | | |
| Reinvestment of distributions | | | 84,080 | | | | 1,763,992 | | | | 12,893 | | | | 275,136 | | |
| Shares reacquired | | | (754,907 | ) | | | (17,728,966 | ) | | | (100,519 | ) | | | (2,168,787 | ) | |
| Increase (decrease) | | | (139,110 | ) | | $ | (3,788,527 | ) | | | 457,837 | | | $ | 9,944,665 | | |
| Class P Shares | |
| Shares sold | | | 186,887 | | | $ | 4,162,097 | | | | 259,079 | | | $ | 5,609,405 | | |
| Reinvestment of distributions | | | 65,672 | | | | 1,341,678 | | | | 25,911 | | | | 542,311 | | |
| Shares reacquired | | | (271,510 | ) | | | (5,994,558 | ) | | | (393,332 | ) | | | (8,384,581 | ) | |
| Decrease | | | (18,951 | ) | | $ | (490,783 | ) | | | (108,342 | ) | | $ | (2,232,865 | ) | |
| | | Period Ended
November 30, 2007† | |
| Class R2 Shares | | Shares | | Amount | |
| Shares sold | | | 420 | | | $ | 10,000 | | |
| Increase | | | 420 | | | $ | 10,000 | | |
| Class R3 Shares | |
| Shares sold | | | 420 | | | $ | 10,000 | | |
| Increase | | | 420 | | | $ | 10,000 | | |
* Amounts for the year ended November 30, 2006 have been reclassified to conform with current presentation.
** Automatic conversion of Class B shares occurs approximately eight years after the initial purchase date.
† For the period September 28, 2007 (commencement of investment operations) to November 30, 2007.
29
Notes to Financial Statements (concluded)
12. RECENT ACCOUNTING PRONOUNCEMENTS
In June 2006, the Financial Accounting Standards Board (FASB) issued Interpretation 48, Accounting for Uncertainty in Income Taxes—an interpretation of FASB Statement 109 (FIN 48). FIN 48 clarifies the accounting for income taxes by prescribing the minimum recognition threshold a tax position must meet before being recognized in the financial statements. FIN 48 is effective for fiscal years beginning after December 15, 2006. The Fund will adopt FIN 48 no later than May 31, 2008 and the impact to the Fund's financial statements, if any, is currently being assessed.
In September 2006, Statement of Financial Accounting Standards No. 157, Fair Value Measurements (SFAS 157), was issued and is effective for fiscal years beginning after November 15, 2007. SFAS 157 defines fair value, establishes a framework for measuring fair value and expands disclosures about fair value measurements. Management is currently evaluating the impact the adoption of SFAS 157 will have on the Fund's financial statement disclosures.
30
Report of Independent Registered Public Accounting Firm
The Board of Directors and Shareholders of Lord Abbett Research Fund, Inc.:
We have audited the accompanying statement of assets and liabilities, including the schedule of investments, of Lord Abbett Research Fund, Inc. – Lord Abbett Growth Opportunities Fund (the "Fund"), as of November 30, 2007, and the related statement of operations for the year then ended, the statements of changes in net assets for each of the two years in the period then ended, and the financial highlights for each of the periods presented. These financial statements and financial highlights are the responsibility of the Fund's management. Our responsibility is to express an opinion on these financial statements and financial highlights based on our audits.
We conducted our audits in accordance with standards of the Public Company Accounting Oversight Board (United States). Those standards require that we plan and perform the audit to obtain reasonable assurance about whether the financial statements and financial highlights are free of material misstatement. The Fund is not required to have, nor were we engaged to perform, an audit of its internal control over financial reporting. Our audits included consideration of internal control over financial reporting as a basis for designing audit procedures that are appropriate in the circumstances, but not for the purpose of expressing an opinion on the effectiveness of the Fund's internal control over financial reporting. Accordingly, we express no such opinion. An audit also includes examining, on a test basis, evidence supporting the amounts and disclosures in the financial statements, assessing the accounting principles used and significant estim ates made by management, as well as evaluating the overall financial statement presentation. Our procedures included confirmation of securities owned as of November 30, 2007 by correspondence with the custodian and brokers; where replies were not received from brokers, we performed other auditing procedures. We believe that our audits provide a reasonable basis for our opinion.
In our opinion, the financial statements and financial highlights referred to above present fairly, in all material respects, the financial position of Lord Abbett Research Fund, Inc. – Lord Abbett Growth Opportunities Fund as of November 30, 2007, the results of its operations for the year then ended, the changes in its net assets for each of the two years in the period then ended, and the financial highlights for each of the periods presented, in conformity with accounting principles generally accepted in the United States of America.
Deloitte & Touche LLP
New York, New York
January 24, 2008
31
Basic Information About Management
The Board of Directors (the "Board") is responsible for the management of the business and affairs of the Fund in accordance with the laws of the State of Maryland. The Board appoints officers who are responsible for the day-to-day operations of the Fund and who execute policies authorized by the Board. The Board also approves an investment adviser to the Fund and continues to monitor the cost and quality of the services provided by the investment adviser, and annually considers whether to renew the contract with the adviser. Generally, each Director holds office until his/her successor is elected and qualified or until his/her earlier resignation or removal, as provided in the Company's organizational documents.
Lord, Abbett & Co. LLC ("Lord Abbett"), a Delaware limited liability company, is the Company's investment adviser.
Interested Directors
The following Directors are Partners of Lord Abbett and are "interested persons" of the Company as defined in the Act. Mr. Dow and Ms. Foster are officers, directors, or trustees of each of the fourteen Lord Abbett-sponsored funds, which consist of 55* portfolios or series.
Name, Address and
Year of Birth | | Current Position
Length of Service
with Company | | Principal Occupation
During Past Five Years | | Other
Directorships | |
Robert S. Dow
Lord, Abbett & Co. LLC
90 Hudson Street
Jersey City, NJ 07302
(1945) | | Director and Chairman since 1996 | | Senior Partner since 2007 and Chief Executive Officer of Lord Abbett since 1996; formerly Managing Partner of Lord Abbett (1996 - 2007). | | N/A | |
|
Daria L. Foster
Lord, Abbett & Co. LLC
90 Hudson Street
Jersey City, NJ 07302
(1954) | | Director since 2006 | | Managing Partner since 2007; formerly Director of Marketing and Client Service of Lord Abbett (1990 - 2007). | | N/A | |
|
Independent Directors
The following independent or outside Directors ("Independent Directors") are also directors or trustees of each of the fourteen Lord Abbett-sponsored funds, which consist of 55* portfolios or series.
Name, Address and
Year of Birth | | Current Position
Length of Service
with Company | | Principal Occupation
During Past Five Years | | Other
Directorships | |
E. Thayer Bigelow
Lord, Abbett & Co. LLC
c/o Legal Dept.
90 Hudson Street
Jersey City, NJ 07302
(1941) | | Director since 1996 | | Managing General Partner, Bigelow Media, LLC (since 2000); Senior Adviser, Time Warner Inc. (1998 - 2000); Acting Chief Executive Officer of Courtroom Television Network (1997 - 1998); President and Chief Executive Officer of Time Warner Cable Programming, Inc. (1991 - 1997). | | Currently serves as director of Crane Co. and Huttig Building Products Inc. | |
|
* Effective as of the close of business on December 14, 2007, there are 51 portfolios or series.
32
Basic Information About Management (continued)
Name, Address and
Year of Birth | | Current Position
Length of Service
with Company | | Principal Occupation
During Past Five Years | | Other
Directorships | |
William H.T. Bush
Lord, Abbett & Co. LLC
c/o Legal Dept.
90 Hudson Street
Jersey City, NJ 07302
(1938) | | Director since 1998 | | Co-founder and Chairman of the Board of the financial advisory firm of Bush-O'Donnell & Company (since 1986). | | Currently serves as director of WellPoint, Inc. (since 2002). | |
|
Robert B. Calhoun, Jr.
Lord, Abbett & Co. LLC
c/o Legal Dept.
90 Hudson Street
Jersey City, NJ 07302
(1942) | | Director since 1998 | | Managing Director of Monitor Clipper Partners (since 1997) and President of Clipper Asset Management Corp. (since 1991), both private equity investment funds. | | Currently serves as director of Avondale, Inc. and Interstate Bakeries Corp. | |
|
Julie A. Hill
Lord, Abbett & Co. LLC
c/o Legal Dept.
90 Hudson Street
Jersey City, NJ 07302
(1946) | | Director since 2004 | | Owner and CEO of The Hill Company, a business consulting firm (since 1998); Founder, President and Owner of the Hiram-Hill and Hillsdale Development Company, a residential real estate development firm (1998 - 2000). | | Currently serves as director of WellPoint, Inc. since 1994 and Lend Lease Corporation Limited since 2005. | |
|
Franklin W. Hobbs
Lord, Abbett & Co. LLC
c/o Legal Dept.
90 Hudson Street
Jersey City, NJ 07302
(1947) | | Director since 2001 | | Advisor of One Equity Partners, a private equity firm (since 2004); Chief Executive Officer of Houlihan Lokey Howard & Zukin, an investment bank (2002 - 2003); Chairman of Warburg Dillon Read, an investment bank (1999 - 2001); Global Head of Corporate Finance of SBC Warburg Dillon Read (1997 - 1999); Chief Executive Officer of Dillon, Read & Co. (1994 - 1997). | | Currently serves as director of Molson Coors Brewing Company. | |
|
Thomas J. Neff
Lord, Abbett & Co. LLC
c/o Legal Dept.
90 Hudson Street
Jersey City, NJ 07302
(1937) | | Director since 1992 | | Chairman of Spencer Stuart (U.S.), an executive search consulting firm (since 1996); President of Spencer Stuart (1979 - 1996). | | Currently serves as director of Ace, Ltd. (since 1997) and Hewitt Associates, Inc. | |
|
James L.L. Tullis
Lord, Abbett & Co. LLC
c/o Legal Dept.
90 Hudson Street
Jersey City, NJ 07302
(1947) | | Director since 2006 | | CEO of Tullis-Dickerson and Co. Inc, a venture capital management firm (since 1990). | | Currently serves as director of Crane Co. (since 1998). | |
|
33
Basic Information About Management (continued)
Officers
None of the officers listed below have received compensation from the Company. All the officers of the Company may also be officers of the other Lord Abbett-sponsored funds and maintain offices at 90 Hudson Street, Jersey City, NJ 07302.
Name and
Year of Birth | | Current Position
with Company | | Length of Service
of Current Position | | Principal Occupation
During Past Five Years | |
Robert S. Dow
(1945) | | Chief Executive Officer and Chairman | | Elected in 1996 | | Senior Partner since 2007 and Chief Executive Officer of Lord Abbett since 1996; formerly Managing Partner of Lord Abbett (1996 - 2007). | |
|
Daria L. Foster
(1954) | | President | | Elected in 2006 | | Managing Partner since 2007; formerly Director of Marketing and Client Service of Lord Abbett (1990 - 2007). | |
|
Robert P. Fetch
(1953) | | Executive Vice President | | Elected in 1997 | | Partner and Senior Investment Manager, joined Lord Abbett in 1995. | |
|
Daniel H. Frascarelli
(1954) | | Executive Vice President | | Elected in 2005 | | Partner and Director of Large Cap Core Equity, joined Lord Abbett in 1990. | |
|
Robert I. Gerber
(1954) | | Executive Vice President | | Elected in 2007 | | Partner and Chief Investment Officer; formerly Director of Taxable Fixed Income Management, joined Lord Abbett in 1997. | |
|
Frederick Ruvkun
(1957) | | Executive Vice President | | Elected in 2006 | | Investment Manager, joined Lord Abbett in 2006; formerly served as Managing Director and Leader of the Small Cap Growth Team and a Portfolio Manager of SMID Growth Assets at J & W Seligman & Company. | |
|
Christopher J. Towle
(1957) | | Executive Vice President | | Elected in 2001 | | Partner and Director of High Yield & Convertible Management, joined Lord Abbett in 1987. | |
|
Edward K. von der Linde
(1960) | | Executive Vice President | | Elected in 2001 | | Partner and Investment Manager, joined Lord Abbett in 1988. | |
|
James W. Bernaiche
(1956) | | Chief Compliance Officer | | Elected in 2004 | | Chief Compliance Officer, joined Lord Abbett in 2001. | |
|
34
Basic Information About Management (concluded)
Name and
Year of Birth | | Current Position
with Company | | Length of Service
of Current Position | | Principal Occupation
During Past Five Years | |
Joan A. Binstock
(1954) | | Chief Financial Officer and Vice President | | Elected in 1999 | | Partner and Chief Operations Officer, joined Lord Abbett in 1999. | |
|
Evan B. Carpenter
(1972) | | Vice President | | Elected in 2006 | | Research Analyst, joined Lord Abbett in 2003; prior thereto he served as an Equity Research Analyst at Gabelli Asset Management (2000 - 2003). | |
|
John K. Forst
(1960) | | Vice President and Assistant Secretary | | Elected in 2005 | | Deputy General Counsel, joined Lord Abbett in 2004; Managing Director and Associate General Counsel at New York Life Investment Management LLC (2002 - 2003); attorney at Dechert LLP (2000 - 2002). | |
|
Lawrence H. Kaplan
(1957) | | Vice President and Secretary | | Elected in 1997 | | Partner and General Counsel, joined Lord Abbett in 1997. | |
|
A. Edward Oberhaus, III
(1959) | | Vice President | | Elected in 1996 | | Partner and Director of Equity Trading, joined Lord Abbett in 1983. | |
|
Lawrence B. Stoller
(1963) | | Vice President and Assistant Secretary | | Elected in 2007 | | Senior Deputy General Counsel; joined Lord Abbett in 2007; formerly, Executive Vice President and General Counsel at Cohen & Steers Capital Management, Inc. | |
|
Paul J. Volovich
(1973) | | Vice President | | Elected in 2004 | | Investment Manager, joined Lord Abbett in 1997. | |
|
Bernard J. Grzelak
(1971) | | Treasurer | | Elected in 2003 | | Director of Fund Administration, joined Lord Abbett in 2003; formerly Vice President, Lazard Asset Management LLC. | |
|
Please call 888-522-2388 for a copy of the Statement of Additional Information (SAI), which contains further information about the Fund's Directors. It is available free upon request.
35
Householding
The Company has adopted a policy that allows it to send only one copy of the Fund's Prospectuses, proxy material, annual report and semiannual report to certain shareholders residing at the same "household." This reduces Fund expenses, which benefits you and other shareholders. If you need additional copies or do not want your mailings to be "householded," please call Lord Abbett at 888-522-2388 or send a written request with your name, the name of your fund or funds and your account number or numbers to Lord Abbett Family of Funds, P.O. Box 219336, Kansas City, MO 64121.
Proxy Voting Policies, Procedures and Record
A description of the policies and procedures that Lord Abbett uses to vote proxies related to the Fund's portfolio securities, and information on how Lord Abbett voted each Fund's proxies during the 12-month period ended June 30 are available without charge, upon request, (i) by calling 888-522-2388; (ii) on Lord Abbett's website at www.LordAbbett.com; and (iii) on the Securities and Exchange Commission's ("SEC") website at www.sec.gov.
Shareholder Reports and Quarterly Portfolio Disclosure
The Fund is required to file its complete schedule of portfolio holdings with the SEC for its first and third fiscal quarters on Form N-Q. Copies of the filings are available without charge, upon request on the SEC's website at www.sec.gov and may be available by calling Lord Abbett at 888-522-2388. You can also obtain copies of Form N-Q by (i) visiting the SEC's Public Reference Room in Washington, DC (information on the operation of the Public Reference Room may be obtained by calling 800-SEC-0330); (ii) sending your request and duplicating fee to the SEC's Public Reference Room, Washington, DC 20549-0102; or (iii) sending your request electronically to publicinfo@sec.gov.
Tax Information
All of the distributions paid to shareholders during the fiscal year ended November 30, 2007 represent long-term capital gains.
36
LAGOF-2-1107
(1/08)
Lord Abbett Research Fund, Inc.
Lord Abbett Growth Opportunities Fund

This report when not used for the general information of shareholders of the fund, is to be distributed only if preceded or accompanied by a current fund prospectus.
Lord Abbett mutual fund shares are distributed by
LORD ABBETT DISTRIBUTOR LLC.
2007
LORD ABBETT
ANNUAL REPORT

Lord Abbett America's Value Fund
For the fiscal year ended November 30, 2007

Lord Abbett Research Fund
Lord Abbett America's Value Fund
Annual Report
For the fiscal year ended November 30, 2007
Dear Shareholders: We are pleased to provide you with this overview of the Lord Abbett America's Value Fund's performance for the fiscal year ended November 30, 2007. On this page and the following pages, we discuss the major factors that influenced performance. For detailed and more timely information about the Fund, please visit our Website at www.lordabbett.com, where you also can access the quarterly commentaries by the Fund's portfolio managers.
General information about Lord Abbett mutual funds, as well as in-depth discussions of market trends and investment strategies, is also provided in Lord Abbett Insights, a newsletter accompanying your quarterly account statements. We also encourage you to call Lord Abbett at 888-522-2388 and speak to one of our professionals if you would like more information.
Thank you for investing in Lord Abbett mutual funds. We value the trust that you place in us and look forward to serving your investment needs in the years to come.
Best regards,

Robert S. Dow
Chairman

From left to right: Robert S. Dow, Director and Chairman of the Lord Abbett Funds; E. Thayer Bigelow, Independent Lead Director of the Lord Abbett Funds; and Daria L. Foster, Director and President of the Lord Abbett Funds.
Q: What were the overall market conditions during the fiscal year ended November 30, 2007?
A: The equity market, as measured by the S&P 500® Index,1 gained a total return of 7.7% in the fiscal year ended November 30, 2007, but not without considerable volatility along the way. In fact, there were three significant corrections in the fiscal year, including two declines in excess of 9%. In the first correction, in February and March, the S&P 500 dropped nearly 6% due to a sharp sell-off that began in the Shan ghai stock index. Fortunately, the sell-off proved to be short-lived, with the market ultimately establishing a new
1
all-time high in July. The euphoria did not last long, however, as the market's second major correction, which knocked the index down more than 9%, began in mid-July. With a little help from the Federal Reserve Board (the Fed), the market recovered yet again and set another record high in early October. After establishing its second all-time high, the market began to tumble; this time the S&P 500 declined 10% – the first decline of at least 10% in four and a half years. Despite falling precipitously through most of November, the equity market ended the year with a week that included one of the best back-to-back performances in more than five years.
In the past 12 months the growth indexes (as measured by the S&P Composite Growth Index2) outperformed the value indexes (as measured by the S&P Composite Value Index2) while large cap companies (as measured by the S&P 500 Index) narrowly outpaced the rest of the market. From a style box perspective, the leading investment style for the past 12 months was mid cap growth (as measured by the S&P MidCap 400/Citigroup Growth Index3) with a 12-month total return of 12%, while small cap value (as measured by S&P SmallCap 600/Citigroup Value Index4) trailed all others with a 12-month total return of -4.2%.
At the sector level, eight of the 10 major industry groups in the S&P 500 posted double-digit 12-month total returns, while only two sectors declined in the year. Unfortunately, the sectors that declined – consumer discretionary and financials – account for nearly 30% (on a market-weight basis) of the S&P 500, which cost the market approximately 257 basis points in overall performance.
The bond market also was volatile during the fiscal year, largely reflecting concerns about an increase in subprime mortgage defaults. By the second half of fiscal year 2007, the possibility of a recession increased as the housing market continued to weaken. Investors' appetite for risk plummeted and spreads widened significantly, causing the Fed to cut its key interest rate in September and again in October. The Fed move prompted a bond market rebound, and, subsequently, convertible and high-yield securities rallied in September and October. After just a short hiatus, however, the market experienced extreme volatility again. High-yield bonds struggled in November from continued pressure in a worsening economic environment. Fed chairman Ben Bernanke helped ease the market conditions during the final week of November by implying that the fed funds rate would be cut once again.
Q: How did the America's Value Fund perform during the fiscal year ended November 30, 2007?
A: The Fund returned 5.27%, reflecting performance at the net asset value (NAV) of Class A shares with all distributions reinvested, compared with its benchmark,
2
the S&P 500 Index, which returned 7.72% over the same period.
Note: The Lord Abbett America's Value Fund is not a balanced fund and has the capability to adjust equity and fixed income allocations, based on relative value in the market and the investment team's proprietary fundamental research.
Q: What were the most significant factors affecting performance?
Equity Portion
A: The most significant detractors from the Fund's performance relative to its benchmark for the one-year period were the consumer discretionary sector (owing to an overweight position), the utilities sector, and the healthcare sector.
Among the individual holdings that detracted from performance were consumer discretionary holdings OfficeMax Inc. (the Fund's number-one detractor), a retailer of office products, and Idearc Inc., a publisher of directories; materials holding AbitibiBowater, Inc., a manufacturer of newsprint, coated and uncoated groundwood papers, bleached kraft pulp, and lumber products; healthcare holding Mylan Laboratories Inc., a developer of generic and branded pharmaceutical products; and utilities holding NiSource Inc., a natural gas and electricity company.
The greatest contributors to the Fund's performance were the financials sector, the energy sector (owing to an underweight position), and consumer staples sector (owing in part to an overweight position).
Among the individual holdings that contributed to performance were materials holding Monsanto Co. (the Fund's number-one contributor), a provider of technology-based solutions and agricultural products for growers and downstream customers in the agricultural markets; energy holdings GlobalSantaFe Corp., an oil field service company (the company recently merged with offshore drilling company Transocean), and Chevron Corp., an integrated energy company; healthcare holding Bristol Myers Squibb, a diversified worldwide health and personal care company that manufactures medicines and other products; and consumer staples Coca-Cola Amatil Ltd., a manufacturer of carbonated soft drinks and other beverages.
Bond Portion
A: The Fund's participation in convertible securities made the greatest contribution to performance, followed by the high-grade investment bond markets and the high-yield bond market.
Within the convertible securities market, the top five individual holdings adding to performance were aerospace/defense holding EDO Corp. (no longer in portfolio), a designer of advanced electronic, information, and electro-mechanical systems; Hilton Hotels Corp. (no longer in portfolio), a global
3
lodging company; railroads holding CSX Corp. (no longer in portfolio), a freight transportation company; and metals and mining holdings Placer Dome, Inc., a supplier of gold, copper, and silver, and Devon Energy Corp., an oil and gas property acquisition, exploration and production company.
Detracting from performance in the convertible securities market were multi-line insurance holding XL Capital Ltd, a liability and property insurance company; telecommunications/integrated services holding Qwest Communications International Inc., a provider of broadband Internet-based data, voice, and image communications; insurance and financial services provider MetLife, Inc.; and software/services holdings Symantec Corp., a provider of Internet security technology; and Electronic Data Systems Corp., a supplier of systems and technology services, business process management, management consulting, and electronic business solutions.
The portfolio's holdings in the investment-grade bond market were all profitable in the period and consisted primarily of Federal National Mortgage agency bonds.
Within the high-yield bond market, the top five individual holdings adding to performance included chemical holding Lyondell Chemical Co., a manufacturer of intermediate and performance chemicals and derivatives; auto parts and equipment holding Cooper-Standard Automotive, Inc., a manufacturer of sealing system products, fluid systems, vibration control applications and related products; Dobson Communications Corp., a wireless telecommunications provider recently acquired by AT&T; and metals and mining holdings Freeport-McMoRan Copper & Gold, Inc., a miner and miller of copper, gold, and silver, and Novelis, Inc. (no longer in portfolio), a producer o f flat-rolled aluminum products.
The greatest detractors from the Fund's performance in the high-yield bond sector were media and cable holding CCH I Holdings LLC (an indirect subsidiary of Charter Communications, Inc.), a broadband communications company; steel producer/products holding Algoma Acquisition Corp. (a subsidiary of Essar Steel Holdings Ltd., which acquired Algoma Steel in June 2007), a sheet steel provider; Bowater Inc., a forest products industry company that recently merged with Abitibi-Consolidated Inc. to become AbitibiBowater; integrated energy holding Verasun Energy, a renewable energy source company; and telecommunications/integrated services holding Intelsat Bermuda Ltd., a provider of satellite communications.
The Fund's portfolio is actively managed and, therefore, its holdings and weightings of a particular issuer or sector as a percentage of portfolio assets are subject to change. Sectors may include many industries.
Note: Class A shares purchased subject to a front-end sales charge have
4
no contingent deferred sales charge (CDSC). However, certain purchases of Class A shares made without a front-end sales charge may be subject to a CDSC of 1% if the shares are redeemed within 12 months of the purchase. Please see section "Your Investment – Purchases" in the prospectus for more information on redemptions that may be subject to a CDSC.
A prospectus contains important information about a fund, including its investment objectives, risks, charges, and ongoing expenses, which an investor should carefully consider before investing. To obtain a prospectus on any Lord Abbett mutual fund, please contact your investment professional or Lord Abbett Distributor LLC at 888-522-2388 or visit our Website at www.lordabbett.com. Read the prospectus carefully before investing.
1 The S&P 500® Index is widely regarded as the standard for measuring large-cap U.S. stock market performance. This popular index includes a representative sample of leading companies in leading industries.
2 The S&P Composite 1500® Index combines the S&P 500®, S&P 400® (an index of mid-cap companies), and the S&P SmallCap 600® indexes to create a broad market portfolio representing 90% of U.S. equities. Companies in this index are split into two groups ba sed on factors including price-to-book ratio to create the Composite Growth and Composite Value indexes.
3 The S&P MidCap 400/Citigroup Growth Index measures the performance of growth-oriented, mid-size capitalization U.S. companies. The S&P MidCap 400/Citigroup Growth Index contains those securities in the S&P MidCap 400 Index with higher price-to-book ratios.
4 The S&P Small Cap 600/Citigroup Value Index is designed to provide a comprehensive measure of small-cap U.S. equity value performance. It is an unmangaged float-adjusted market capitalization-weighted index comprised of stocks representing approximately half the market capitalization of the S&P Small Cap 600 Index that have been identified as being on the value end of the growth-value spectrum.
Indexes are unmanaged, do not reflect the deduction of fees or expenses, and are not available for direct investment.
Important Performance and Other Information
Performance data quoted reflect past performance and are no guarantee of future results. Current performance may be higher or lower than the performance quoted. The investment return and principal value of an investment in the Fund will fluctuate so that shares, on any given day or when redeemed, may be worth more or less than their original cost. You can obtain performance data current to the most recent month-end by calling Lord Abbett at 888-522-2388 or referring to our Website at www.lordabbett.com.
Except where noted, comparative Fund performance does not account for the deduction of sales charges and would be different if sales charges were included. The Fund offers additional classes of shares with distinct pricing options. For a full description of the differences in pricing alternatives, please see the Fund's prospectus.
The views of the Fund's management and the portfolio holdings described in this report are as of November 30, 2007; these views and portfolio holdings may have changed subsequent to this date, and they do not guarantee the future performance of the markets or the Fund. Information provided in this report should not be considered a recommendation to purchase or sell securities.
A Note about Risk: See Notes to Financial Statements for a discussion of investment risks. For a more detailed discussion of the risks associated with the Fund, please see the Fund's prospectus.
Mutual funds are not insured by the FDIC, are not deposits or other obligations of, or guaranteed by, banks, and are subject to investment risks, including possible loss of principal amount invested.
5
Investment Comparison
Below is a comparison of a $10,000 investment in Class A shares with the same investment in the S&P 500® Index, the 65% Russell 3000® Value Index/35% Merrill Lynch High Yield Master II Index, and the 65% Russell 3000 Value Index/35% Merrill Lynch High Yield Master II Constrained Index, assuming reinvestment of all dividends and distributions. The Fund believes that the 65% Russell 3000 Value Index/35% Merrill Lynch High Yield Master II Constrained Index is a more appropriate benchmark for the Fund and therefore will remove the 65% Russell 3000® Value Index/35% Merrill Lynch High Yield Master II Index from the next Annual Report. The performance of other classes will be greater than or less than the performance shown in the graph below due to different sales loads and expenses applicab le to such classes. The graph and performance table below do not reflect the deduction of taxes that a shareholder would pay on fund distributions or the redemption of fund shares. Past performance is no guarantee of future results.

Average Annual Total Return at Maximum Applicable Sales Charge for the Periods Ended November 30, 2007
| | | 1 Year | | 5 Years | | Life of Class | |
| Class A3 | | | -0.80 | % | | | 10.00 | % | | | 7.43 | % | |
| Class B4 | | | 0.58 | % | | | 10.48 | % | | | 7.69 | % | |
| Class C5 | | | 4.57 | % | | | 10.60 | % | | | 7.83 | % | |
| Class F6 | | | — | | | | — | | | | -2.46 | %* | |
| Class I7 | | | 5.67 | % | | | 11.72 | % | | | 8.89 | % | |
| Class P8 | | | 5.15 | % | | | 11.24 | % | | | 8.43 | % | |
| Class R29 | | | — | | | | — | | | | -2.53 | %* | |
| Class R310 | | | — | | | | — | | | | -2.53 | %* | |
1 Reflects the deduction of the maximum initial sales charge of 5.75%.
2 Performance of each unmanaged index does not reflect transaction costs, management fees or sales charges. The performance of each index is not necessarily representative of the Fund's performance. Performance of each index began on December 27, 2001.
3 Class A shares commenced operations on December 27, 2001. Total return, which is the percentage change in net asset value, after deduction of the maximum initial sales charge of 5.75% applicable to Class A shares, with all dividends and distributions reinvested for the periods shown ended November 30, 2007, is calculated using the SEC-required uniform method to compute such return.
4 Class B shares commenced operations on December 27, 2001. Performance reflects the deduction of a CDSC of 4% for 1 year, and 1% for 5 years and life of the class.
5 Class C shares commenced operations on December 27, 2001. The 1% CDSC for Class C shares normally applies before the first anniversary of the purchase date. Performance is at net asset value.
6 Class F shares commenced operations on September 28, 2007. The SEC effective date was September 14, 2007. Performance for the Class began September 28, 2007. Performance is at net asset value.
7 Effective September 28, 2007, Class Y was renamed Class I. Class I shares commenced operations on December 27, 2001. Performance is at net asset value.
8 Class P shares commenced operations on December 27, 2001. Performance is at net asset value.
9 Class R2 shares commenced operations on September 28, 2007. The SEC effective date was September 14, 2007. Performance for the Class began September 28, 2007. Performance is at net asset value.
10 Class R3 shares commenced operations on September 28, 2007. The SEC effective date was September 14, 2007. Performance for the Class began September 28, 2007. Performance is at net asset value.
* Because Class F, R2 and R3 shares have existed for less than one year, average annual returns are not provided.
6
Expense Example
As a shareholder of the Fund, you incur two types of costs: (1) transaction costs, including sales charges on purchase payments (these charges vary among the share classes); and (2) ongoing costs, including management fees; distribution and service (12b-1) fees (these charges vary among the share classes); and other Fund expenses. This Example is intended to help you understand your ongoing costs (in dollars) of investing in the Fund and to compare these costs with the ongoing costs of investing in other mutual funds.
The Example is based on an investment of $1,000 invested at the beginning of the period and held for the entire period (June 1, 2007 through November 30, 2007).
Actual Expenses
For each class of the Fund, the first line of the applicable table on the following page provides information about actual account values and actual expenses. You may use the information in this line, together with the amount you invested, to estimate the expenses that you paid over the period. Simply divide your account value by $1,000 (for example, an $8,600 account value divided by $1,000 = 8.6), then multiply the result by the number in the first line under the heading entitled "Expenses Paid During the Period 6/1/07 – 11/30/07" to estimate the expenses you paid on your account during this period.
Hypothetical Example for Comparison Purposes
For each class of the Fund, the second line of the applicable table on the following page provides information about hypothetical account values and hypothetical expenses based on the Fund's actual expense ratio and an assumed rate of return of 5% per year before expenses, which is not the Fund's actual return. The hypothetical account values and expenses may not be used to estimate the actual ending account balance or expenses you paid for the period. You may use this information to compare the ongoing costs of investing in the Fund and other funds. To do so, compare this 5% hypothetical example with the 5% hypothetical examples that appear in the shareholder reports of the other funds.
7
Please note that the expenses shown in the table are meant to highlight your ongoing costs only and do not reflect any transactional costs, such as sales charges. Therefore, the second line of the table is useful in comparing ongoing costs only, and will not help you determine the relative total costs of owning different funds. In addition, if these transactional costs were included, your costs would have been higher.
| | | Beginning
Account
Value | | Ending
Account
Value | | Expenses
Paid During
Period† | |
| | | 6/1/07 | | 11/30/07 | | 6/1/07 –
11/30/07 | |
| Class A | |
| Actual | | $ | 1,000.00 | | | $ | 956.30 | | | $ | 6.38 | | |
| Hypothetical (5% Return Before Expenses) | | $ | 1,000.00 | | | $ | 1,018.57 | | | $ | 6.58 | | |
| Class B | |
| Actual | | $ | 1,000.00 | | | $ | 952.90 | | | $ | 9.55 | | |
| Hypothetical (5% Return Before Expenses) | | $ | 1,000.00 | | | $ | 1,015.32 | | | $ | 9.85 | | |
| Class C | |
| Actual | | $ | 1,000.00 | | | $ | 953.10 | | | $ | 9.55 | | |
| Hypothetical (5% Return Before Expenses) | | $ | 1,000.00 | | | $ | 1,015.32 | | | $ | 9.85 | | |
| Class F | |
| Actual | | $ | 1,000.00 | | | $ | 975.40 | | | $ | 1.73 | | |
| Hypothetical (5% Return Before Expenses) | | $ | 1,000.00 | | | $ | 1,023.31 | | | $ | 1.77 | | |
| Class I | |
| Actual | | $ | 1,000.00 | | | $ | 958.10 | | | $ | 4.71 | | |
| Hypothetical (5% Return Before Expenses) | | $ | 1,000.00 | | | $ | 1,020.26 | | | $ | 4.86 | | |
| Class P | |
| Actual | | $ | 1,000.00 | | | $ | 955.90 | | | $ | 6.86 | | |
| Hypothetical (5% Return Before Expenses) | | $ | 1,000.00 | | | $ | 1,018.07 | | | $ | 7.08 | | |
| Class R2 | |
| Actual | | $ | 1,000.00 | | | $ | 974.70 | | | $ | 2.61 | | |
| Hypothetical (5% Return Before Expenses) | | $ | 1,000.00 | | | $ | 1,022.42 | | | $ | 2.68 | | |
| Class R3 | |
| Actual | | $ | 1,000.00 | | | $ | 974.70 | | | $ | 2.44 | | |
| Hypothetical (5% Return Before Expenses) | | $ | 1,000.00 | | | $ | 1,022.59 | | | $ | 2.50 | | |
† For each class of the Fund, expenses are equal to the annualized expense ratio for such class (1.30% for Class A, 1.95% for Classes B and C, 1.00% for Class F, 0.96% for Class I, 1.40% for Class P, 1.51% for Class R2, and 1.41% for Class R3) multiplied by the average account value over the period, multiplied by 183/365 for Class A, B, C, I and P (to reflect one-half year period) and multiplied by 64/365 for Class F, R2 and R3 (to reflect the period September 28, 2007, commencement of investment operations, to November 30, 2007).
Portfolio Holdings Presented by Sector
November 30, 2007
| Sector* | | %** | |
| Consumer Discretionary | | | 12.90 | % | |
| Consumer Staples | | | 9.54 | % | |
| Energy | | | 8.40 | % | |
| Financials | | | 21.17 | % | |
| Healthcare | | | 8.00 | % | |
| Industrials | | | 7.28 | % | |
| Sector* | | %** | |
| Information Technology | | | 1.92 | % | |
| Materials | | | 10.30 | % | |
| Telecommunication Services | | | 9.86 | % | |
| Utilities | | | 7.58 | % | |
| Short-Term Investment | | | 3.05 | % | |
| Total | | | 100.00 | % | |
* A sector may comprise several industries.
** Represents percent of total investments.
8
Schedule of Investments
November 30, 2007
| Investments | | Shares
(000) | | Value | |
| LONG-TERM INVESTMENTS 96.55% | |
| COMMON STOCKS 56.98% | |
| Chemicals 3.43% | |
| Chemtura Corp. | | | 2,350 | | | $ | 17,625,750 | | |
| Eastman Chemical Co. | | | 492 | | | | 31,565,636 | | |
| Monsanto Co. | | | 135 | | | | 13,444,761 | | |
| Total | | | | | | | 62,636,147 | | |
| Commercial Banks 1.08% | |
| Bank of America Corp. | | | 389 | | | | 17,926,118 | | |
| Marshall & Ilsley Corp. | | | 58 | | | | 1,814,875 | | |
| Total | | | | | | | 19,740,993 | | |
| Commercial Services & Supplies 2.08% | |
| R.R. Donnelley & Sons Co. | | | 1,037 | | | | 38,031,084 | | |
| Construction Materials 0.66% | |
| KBR, Inc.* | | | 301 | | | | 11,999,120 | | |
| Containers & Packaging 1.34% | |
| Ball Corp. | | | 531 | | | | 24,540,250 | | |
| Diversified Telecommunication Services 7.81% | |
| AT&T, Inc. | | | 1,256 | | | | 47,984,118 | | |
| Embarq Corp. | | | 723 | | | | 36,841,181 | | |
| Verizon Communications, Inc. | | | 411 | | | | 17,767,952 | | |
| Windstream Corp. | | | 3,101 | | | | 40,155,360 | | |
| Total | | | | | | | 142,748,611 | | |
| Electric Utilities 3.65% | |
| Ameren Corp. | | | 777 | | | | 41,825,295 | | |
| Puget Energy, Inc. | | | 531 | | | | 14,905,731 | | |
| Unisource Energy Corp. | | | 324 | | | | 10,024,413 | | |
| Total | | | | | | | 66,755,439 | | |
| Electrical Equipment 1.04% | |
| Hubbell, Inc. Class B | | | 346 | | | | 19,005,780 | | |
See Notes to Financial Statements.
9
Schedule of Investments (continued)
November 30, 2007
| Investments | | Shares
(000) | | Value | |
| Energy Equipment & Services 3.05% | |
| Halliburton Co. | | | 852 | | | $ | 31,192,489 | | |
| Transocean Inc. (Cayman Islands)(a) | | | 180 | | | | 24,667,154 | | |
| Total | | | | | | | 55,859,643 | | |
| Food & Staples Retailing 0.38% | |
| Ingles Markets, Inc. | | | 295 | | | | 7,015,980 | | |
| Food Products 5.30% | |
| H.J. Heinz Co. | | | 775 | | | | 36,662,230 | | |
| Kellogg Co. | | | 310 | | | | 16,752,400 | | |
| Kraft Foods, Inc. Class A | | | 1,258 | | | | 43,453,535 | | |
| Total | | | | | | | 96,868,165 | | |
| Gas Utilities 2.00% | |
| NiSource, Inc. | | | 1,971 | | | | 36,492,780 | | |
| Hotels, Restaurants & Leisure 0.96% | |
| McDonald's Corp. | | | 301 | | | | 17,587,776 | | |
| Household Durables 3.28% | |
| Newell Rubbermaid, Inc. | | | 1,354 | | | | 36,249,408 | | |
| Snap-on, Inc. | | | 484 | | | | 23,672,584 | | |
| Total | | | | | | | 59,921,992 | | |
| Insurance 4.61% | |
| ACE Ltd. (Bermuda)(a) | | | 480 | | | | 28,706,434 | | |
| PartnerRe Ltd. (Bermuda)(a) | | | 302 | | | | 24,927,883 | | |
| Safeco Corp. | | | 209 | | | | 12,038,306 | | |
| XL Capital Ltd. Class A (Bermuda)(a) | | | 317 | | | | 18,536,334 | | |
| Total | | | | | | | 84,208,957 | | |
| Information Technology Services 0.02% | |
| Metavante Technologies, Inc.* | | | 19 | | | | 437,900 | | |
| Leisure Equipment & Products 0.44% | |
| Tyco International Ltd. (Bermuda)(a) | | | 202 | | | | 8,090,208 | | |
See Notes to Financial Statements.
10
Schedule of Investments (continued)
November 30, 2007
| Investments | | Shares
(000) | | Value | |
| Media 1.75% | |
| Idearc Inc. | | | 1,106 | | | $ | 20,925,520 | | |
| Interpublic Group of Cos., Inc. (The)* | | | 1,166 | | | | 11,066,422 | | |
| Total | | | | | | | 31,991,942 | | |
| Multi-Line Retail 0.79% | |
| Macy's, Inc. | | | 486 | | | | 14,420,455 | | |
| Oil & Gas 3.35% | |
| Chevron Corp. | | | 399 | | | | 35,037,784 | | |
| EOG Resources, Inc. | | | 317 | | | | 26,216,426 | | |
| Total | | | | | | | 61,254,210 | | |
| Paper & Forest Products 1.14% | |
| MeadWestvaco Corp. | | | 633 | | | | 20,809,997 | | |
| Paper Products 0.97% | |
| AbitibiBowater, Inc. (Canada)(a) | | | 793 | | | | 17,820,842 | | |
| Pharmaceuticals 4.71% | |
| Bristol-Myers Squibb Co. | | | 1,384 | | | | 41,019,772 | | |
| Mylan Laboratories, Inc. | | | 1,427 | | | | 20,527,450 | | |
| Pfizer Inc. | | | 1,036 | | | | 24,608,232 | | |
| Total | | | | | | | 86,155,454 | | |
| Semiconductor Equipment & Products 0.74% | |
Taiwan Semiconductor
Manufacturing Co. Ltd. ADR | | | 1,371 | | | | 13,602,076 | | |
| Specialty Retail 1.13% | |
| OfficeMax, Inc. | | | 825 | | | | 20,582,208 | | |
| Trading Companies & Distributors 1.27% | |
| Genuine Parts Co. | | | 484 | | | | 23,261,005 | | |
| Total Common Stocks (cost $975,314,793) | | | | | | | 1,041,839,014 | | |
See Notes to Financial Statements.
11
Schedule of Investments (continued)
November 30, 2007
| Investments | | Interest
Rate | | Maturity
Date | | Principal
Amount
(000) | | Value | |
| CONVERTIBLE BONDS 5.39% | |
| Aerospace & Defense 0.22% | |
| DRS Technologies, Inc.† | | | 2.00 | % | | 2/1/2026 | | $ | 3,500 | | | $ | 4,003,125 | | |
| Biotechnology 0.91% | |
| Amgen, Inc. | | | 0.125 | % | | 2/1/2011 | | | 3,000 | | | | 2,846,250 | | |
| Cephalon, Inc. Ser A | | | Zero Coupon | | | 6/15/2033 | | | 3,500 | | | | 4,532,500 | | |
| CV Therapeutics, Inc. | | | 3.25 | % | | 8/16/2013 | | | 5,000 | | | | 4,068,750 | | |
| Genzyme Corp. | | | 1.25 | % | | 12/1/2023 | | | 4,500 | | | | 5,180,625 | | |
| Total | | | | | | | | | | | | | 16,628,125 | | |
| Commercial Services & Supplies 0.26% | |
| CRA International, Inc. | | | 2.875 | % | | 6/15/2034 | | | 3,500 | | | | 4,685,625 | | |
| Diversified Financials 0.24% | |
| Morgan Stanley† | | | 2.00 | % | | 6/28/2012 | | | 3,500 | | | | 4,370,450 | | |
| Diversified Telecommunication Services 0.18% | |
| Qwest Communications International, Inc. | | | 3.50 | % | | 11/15/2025 | | | 2,500 | | | | 3,240,625 | | |
| Food Products 0.26% | |
| Archer Daniels Midland Co.† | | | 0.875 | % | | 2/15/2014 | | | 2,000 | | | | 2,120,000 | | |
| Archer Daniels Midland Co. | | | 0.875 | % | | 2/15/2014 | | | 2,500 | | | | 2,650,000 | | |
| Total | | | | | | | | | | | | | 4,770,000 | | |
| Healthcare Providers & Services 0.32% | |
| Five Star Quality Care, Inc. | | | 3.75 | % | | 10/15/2026 | | | 6,000 | | | | 5,767,500 | | |
| Insurance 0.19% | |
Conseco, Inc.
(Zero Coupon after 9/30/2010)** | | | 3.50 | % | | 9/30/2035 | | | 3,850 | | | | 3,460,188 | | |
| Internet Software & Services 0.40% | |
| Equinix, Inc. | | | 2.50 | % | | 4/15/2012 | | | 3,500 | | | | 4,016,250 | | |
| Symantec Corp. | | | 0.75 | % | | 6/15/2011 | | | 3,000 | | | | 3,330,000 | | |
| Total | | | | | | | | | | | | | 7,346,250 | | |
| Information Technology Services 0.27% | |
| Electronic Data Systems Corp. | | | 3.875 | % | | 7/15/2023 | | | 5,000 | | | | 5,006,250 | | |
See Notes to Financial Statements.
12
Schedule of Investments (continued)
November 30, 2007
| Investments | | Interest
Rate | | Maturity
Date | | Principal
Amount
(000) | | Value | |
| Machinery 0.35% | |
Roper Industries, Inc.
(Zero Coupon after 1/15/2009)** | | | 1.481 | % | | 1/15/2034 | | $ | 8,000 | | | $ | 6,390,000 | | |
| Media 0.20% | |
| Sinclair Broadcast Group, Inc. | | | 6.00 | % | | 9/15/2012 | | | 4,000 | | | | 3,755,000 | | |
| Metals & Mining 0.47% | |
| Newmont Mining Corp.† | | | 1.25 | % | | 7/15/2014 | | | 3,500 | | | | 4,471,250 | | |
| Newmont Mining Corp. | | | 1.25 | % | | 7/15/2014 | | | 500 | | | | 638,750 | | |
| Placer Dome, Inc. (Canada)(a) | | | 2.75 | % | | 10/15/2023 | | | 2,000 | | | | 3,447,500 | | |
| Total | | | | | | | | | | | | | 8,557,500 | | |
| Oil & Gas 0.36% | |
| Devon Energy Corp. | | | 4.90 | % | | 8/15/2008 | | | 4,000 | | | | 6,580,000 | | |
| Pharmaceuticals 0.76% | |
| Gilead Sciences, Inc. | | | 0.625 | % | | 5/1/2013 | | | 3,000 | | | | 4,083,750 | | |
| Teva Pharmaceutical Finance LLC | | | 0.50 | % | | 2/1/2024 | | | 5,000 | | | | 6,168,750 | | |
| Wyeth | | | 4.886 | %# | | 1/15/2024 | | | 3,500 | | | | 3,738,595 | | |
| Total | | | | | | | | | | | | | 13,991,095 | | |
| Total Convertible Bonds (cost $92,165,509) | | | 98,551,733 | | |
| | | | | | | Shares
(000) | | | |
| CONVERTIBLE PREFERRED STOCKS 1.75% | |
| Electric Utilities 0.35% | |
| CMS Energy Corp. | | | 4.50 | % | | | | | 70 | | | | 6,361,250 | | |
| Energy Equipment & Services 0.59% | |
| El Paso Corp. | | | 4.99 | % | | | | | 8 | | | | 10,697,000 | | |
| Insurance 0.59% | |
| Fortis Insurance N.V. (Netherlands)†(a) | | | 7.75 | % | | | | | 283 | | | | 4,543,848 | | |
| MetLife, Inc. | | | 6.375 | % | | | | | 40 | | | | 1,302,400 | | |
| XL Capital Ltd. (Cayman Islands)(a) | | | 7.00 | % | | | | | 230 | | | | 4,926,600 | | |
| Total | | | | | | | | | | | | | 10,772,848 | | |
| Pharmaceuticals 0.22% | |
| Schering-Plough Corp. | | | 6.00 | % | | | | | 15 | | | | 4,080,000 | | |
| Total Convertible Preferred Stocks (cost $26,734,606) | | | 31,911,098 | | |
See Notes to Financial Statements.
13
Schedule of Investments (continued)
November 30, 2007
| Investments | | | | | | Shares
(000) | | U.S. $
Value | |
| FOREIGN COMMON STOCKS 5.81% | |
| Australia 1.27% | |
| Coca-Cola Amatil Ltd.(b) | | | | | | | | | 2,638 | | | $ | 23,295,679 | | |
| Canada 0.45% | |
| CI Financial Income Fund Unit(b) | | | | | | | | | 310 | | | | 8,271,214 | | |
| Germany 0.51% | |
| Henkel KGaA(b) | | | | | | | | | 184 | | | | 9,289,890 | | |
| Greece 0.87% | |
| National Bank of Greece S.A.(b) | | | | | | | | | 236 | | | | 15,870,502 | | |
| United Kingdom 2.71% | |
| Cadbury Schweppes plc(b) | | | | | | | | | 1,795 | | | | 22,991,934 | | |
| Kesa Electricals plc(b) | | | | | | | | | 2,696 | | | | 13,082,499 | | |
| Royal Bank of Scotland Group plc (The)(b) | | | | | | | | | 1,422 | | | | 13,417,336 | | |
| Total | | | | | | | | | | | | | 49,491,769 | | |
| Total Foreign Common Stocks (cost $91,997,027) | | | 106,219,054 | | |
| FOREIGN PREFERRED STOCK 0.23% | |
| Brazil | |
| Companhia Energetica de Minas Gerais(b) (cost $3,602,709) | | | | | | | | | 195 | | | | 4,152,862 | | |
| | | Interest
Rate | | Maturity
Date | | Principal
Amount
(000) | | Value | |
| GOVERNMENT SPONSORED ENTERPRISES BONDS 2.51% | |
Federal Home Loan Mortgage Corp.
(cost $45,565,198) | | | 5.75 | % | | 4/15/2008-3/15/2009 | | $ | 45,000 | | | $ | 45,867,060 | | |
| GOVERNMENT SPONSORED ENTERPRISES PASS-THROUGHS 4.94% | |
| Federal Home Loan Mortgage Corp. | | | 6.50 | % | | 8/1/2037 | | | 9,980 | | | | 10,266,941 | | |
| Federal National Mortgage Assoc. | | | 6.00 | % | | 11/1/2034-10/1/2037 | | | 48,642 | | | | 49,473,639 | | |
| Federal National Mortgage Assoc. | | | 6.50 | % | | 4/1/2035-12/1/2036 | | | 29,770 | | | | 30,653,248 | | |
| Total Government Sponsored Enterprises Pass-Throughs (cost $89,528,952) | | | 90,393,828 | | |
See Notes to Financial Statements.
14
Schedule of Investments (continued)
November 30, 2007
| Investments | | Interest
Rate | | Maturity
Date | | Principal
Amount
(000) | | Value | |
| HIGH YIELD CORPORATE BONDS 15.99% | |
| Aerospace & Defense 0.41% | |
| Hawker Beechcraft Corp.† | | | 9.75 | % | | 4/1/2017 | | $ | 3,500 | | | $ | 3,543,750 | | |
| United Surgical Partners, Inc. PIK | | | 9.25 | % | | 5/1/2017 | | | 4,000 | | | | 3,870,000 | | |
| Total | | | | | | | | | | | | | 7,413,750 | | |
| Auto Components 0.23% | |
| Cooper-Standard Automotive, Inc. | | | 8.375 | % | | 12/15/2014 | | | 3,500 | | | | 2,922,500 | | |
| Stanadyne Corp. | | | 10.00 | % | | 8/15/2014 | | | 1,375 | | | | 1,347,500 | | |
| Total | | | | | | | | | | | | | 4,270,000 | | |
| Automobiles 0.27% | |
| Hertz Corp. (The) | | | 8.875 | % | | 1/1/2014 | | | 5,000 | | | | 5,025,000 | | |
| Chemicals 0.63% | |
| Equistar Chemicals L.P. | | | 7.55 | % | | 2/15/2026 | | | 3,000 | | | | 2,655,000 | | |
| Ineos Group Holdings plc | |
| (United Kingdom)†(a) | | | 8.50 | % | | 2/15/2016 | | | 6,500 | | | | 5,882,500 | | |
| Lyondell Chemical Co. | | | 8.25 | % | | 9/15/2016 | | | 2,575 | | | | 3,032,062 | | |
| Total | | | | | | | | | | | | | 11,569,562 | | |
| Commercial Services & Supplies 0.49% | |
| Aramark Services, Inc. | | | 8.50 | % | | 2/1/2015 | | | 2,775 | | | | 2,799,281 | | |
| FTI Consulting, Inc. | | | 7.75 | % | | 10/1/2016 | | | 1,500 | | | | 1,563,750 | | |
| NOVA Chemicals Corp. (Canada)(a) | | | 7.863 | %# | | 11/15/2013 | | | 4,750 | | | | 4,583,750 | | |
| Total | | | | | | | | | | | | | 8,946,781 | | |
| Consumer Finance 0.83% | |
| Ford Motor Credit Corp. | | | 7.375 | % | | 10/28/2009 | | | 8,500 | | | | 8,051,242 | | |
| GMAC LLC | | | 7.25 | % | | 3/2/2011 | | | 8,000 | | | | 7,090,448 | | |
| Total | | | | | | | | | | | | | 15,141,690 | | |
| Containers & Packaging 0.41% | |
| Berry Plastics Group, Inc. | | | 8.875 | % | | 9/15/2014 | | | 3,000 | | | | 2,910,000 | | |
| Crown Cork & Seal, Inc. | | | 7.375 | % | | 12/15/2026 | | | 5,000 | | | | 4,525,000 | | |
| Total | | | | | | | | | | | | | 7,435,000 | | |
| Diversified Consumer Services 0.22% | |
| Allied Waste North America, Inc. | | | 7.25 | % | | 3/15/2015 | | | 4,000 | | | | 4,000,000 | | |
See Notes to Financial Statements.
15
Schedule of Investments (continued)
November 30, 2007
| Investments | | Interest
Rate | | Maturity
Date | | Principal
Amount
(000) | | Value | |
| Diversified Financials 0.96% | |
| Algoma Acquisition Corp. (Canada)†(a) | | | 9.875 | % | | 6/15/2015 | | $ | 675 | | | $ | 543,375 | | |
| Ashtead Capital, Inc.† | | | 9.00 | % | | 8/15/2016 | | | 3,175 | | | | 2,809,875 | | |
| Ford Capital B.V. (Netherlands)(a) | | | 9.50 | % | | 6/1/2010 | | | 5,000 | | | | 4,737,500 | | |
| RBS Global & Rexnord Corp. | | | 8.875 | % | | 9/1/2016 | | | 3,000 | | | | 2,925,000 | | |
| RBS Global & Rexnord Corp. | | | 9.50 | % | | 8/1/2014 | | | 3,500 | | | | 3,482,500 | | |
| RBS Global & Rexnord Corp. | | | 11.75 | % | | 8/1/2016 | | | 3,000 | | | | 3,015,000 | | |
| Total | | | | | | | | | | | | | 17,513,250 | | |
| Diversified Telecommunication Services 1.66% | |
| Cincinnati Bell, Inc. | | | 7.00 | % | | 2/15/2015 | | | 10,000 | | | | 9,475,000 | | |
| Hughes Network Systems LLC | | | 9.50 | % | | 4/15/2014 | | | 3,500 | | | | 3,543,750 | | |
| Intelsat Bermuda Ltd. (Bermuda)(a) | | | 6.50 | % | | 11/1/2013 | | | 1,500 | | | | 1,125,000 | | |
| Intelsat Bermuda Ltd. (Bermuda)(a) | | | 9.25 | % | | 6/15/2016 | | | 2,325 | | | | 2,380,219 | | |
| Qwest Capital Funding, Inc. | | | 7.90 | % | | 8/15/2010 | | | 6,000 | | | | 6,075,000 | | |
| Syniverse Technologies Inc. | | | 7.75 | % | | 8/15/2013 | | | 5,000 | | | | 4,850,000 | | |
| Windstream Corp. | | | 7.00 | % | | 3/15/2019 | | | 3,000 | | | | 2,857,500 | | |
| Total | | | | | | | | | | | | | 30,306,469 | | |
| Electric Utilities 0.96% | |
| Dynegy Holdings, Inc. | | | 8.375 | % | | 5/1/2016 | | | 8,000 | | | | 7,730,000 | | |
| Edison Mission Energy | | | 7.00 | % | | 5/15/2017 | | | 3,000 | | | | 2,887,500 | | |
| Edison Mission Energy | | | 7.75 | % | | 6/15/2016 | | | 4,500 | | | | 4,567,500 | | |
| Reliant Energy, Inc. | | | 7.875 | % | | 6/15/2017 | | | 2,375 | | | | 2,312,656 | | |
| Total | | | | | | | | | | | | | 17,497,656 | | |
| Electrical Equipment 0.68% | |
| Advanced Micro Devices, Inc. | | | 7.75 | % | | 11/1/2012 | | | 2,500 | | | | 2,312,500 | | |
| Baldor Electric Co. | | | 8.625 | % | | 2/15/2017 | | | 4,500 | | | | 4,635,000 | | |
NXP B.V./NXP Funding LLC
(Netherlands)(a) | | | 9.50 | % | | 10/15/2015 | | | 5,925 | | | | 5,406,563 | | |
| Total | | | | | | | | | | | | | 12,354,063 | | |
| Energy Equipment & Services 0.20% | |
| El Paso Corp. | | | 7.00 | % | | 6/15/2017 | | | 1,325 | | | | 1,334,500 | | |
| Hornbeck Offshore Services, Inc. | | | 6.125 | % | | 12/1/2014 | | | 2,500 | | | | 2,381,250 | | |
| Total | | | | | | | | | | | | | 3,715,750 | | |
See Notes to Financial Statements.
16
Schedule of Investments (continued)
November 30, 2007
| Investments | | Interest
Rate | | Maturity
Date | | Principal
Amount
(000) | | Value | |
| Food & Staples Retailing 0.30% | |
| Landry's Restaurants, Inc. | | | 9.50 | % | | 12/15/2014 | | $ | 2,075 | | | $ | 2,054,250 | | |
| Rite Aid Corp.† | | | 9.375 | % | | 12/15/2015 | | | 4,000 | | | | 3,480,000 | | |
| Total | | | | | | | | | | | | | 5,534,250 | | |
| Food Products 0.22% | |
| Constellation Brands, Inc. | | | 8.125 | % | | 1/15/2012 | | | 4,000 | | | | 4,000,000 | | |
| Healthcare Equipment & Supplies 0.07% | |
| Bausch & Lomb, Inc.† | | | 9.875 | % | | 11/1/2015 | | | 1,350 | | | | 1,370,250 | | |
| Healthcare Providers & Services 0.53% | |
| Community Health Systems | | | 8.875 | % | | 7/15/2015 | | | 2,000 | | | | 2,030,000 | | |
| HCA, Inc. | | | 6.25 | % | | 2/15/2013 | | | 5,000 | | | | 4,375,000 | | |
| Tenet Healthcare Corp. | | | 9.25 | % | | 2/1/2015 | | | 3,500 | | | | 3,246,250 | | |
| Total | | | | | | | | | | | | | 9,651,250 | | |
| Healthcare Technology 0.25% | |
| LVB Acquisition Merger Sub, Inc.† | | | 10.00 | % | | 10/15/2017 | | | 4,575 | | | | 4,649,344 | | |
| Hotels, Restaurants & Leisure 0.27% | |
| River Rock Entertainment Authority | | | 9.75 | % | | 11/1/2011 | | | 1,700 | | | | 1,759,500 | | |
| Station Casinos, Inc. | | | 6.50 | % | | 2/1/2014 | | | 4,000 | | | | 3,260,000 | | |
| Total | | | | | | | | | | | | | 5,019,500 | | |
| Industrial Conglomerates 0.46% | |
| Ball Corp. | | | 6.625 | % | | 3/15/2018 | | | 5,000 | | | | 4,950,000 | | |
| Park-Ohio Industries, Inc. | | | 8.375 | % | | 11/15/2014 | | | 4,000 | | | | 3,485,000 | | |
| Total | | | | | | | | | | | | | 8,435,000 | | |
| Information Technology Services 0.20% | |
| SunGard Data Systems, Inc. | | | 9.125 | % | | 8/15/2013 | | | 3,500 | | | | 3,578,750 | | |
| Media 2.31% | |
| Affinion Group, Inc. | | | 11.50 | % | | 10/15/2015 | | | 3,000 | | | | 3,007,500 | | |
| Barrington Broadcasting Group | | | 10.50 | % | | 8/15/2014 | | | 5,000 | | | | 5,100,000 | | |
| CCH I Holdings LLC | | | 11.75 | % | | 5/15/2014 | | | 3,500 | | | | 2,397,500 | | |
| CCH I LLC | | | 11.00 | % | | 10/1/2015 | | | 3,000 | | | | 2,625,000 | | |
| Gaylord Entertainment Co. | | | 8.00 | % | | 11/15/2013 | | | 2,875 | | | | 2,875,000 | | |
| General Motors Corp. | | | 7.20 | % | | 1/15/2011 | | | 4,500 | | | | 4,196,250 | | |
See Notes to Financial Statements.
17
Schedule of Investments (continued)
November 30, 2007
| Investments | | Interest
Rate | | Maturity
Date | | Principal
Amount
(000) | | Value | |
| Media (continued) | |
| Idearc Inc. | | | 8.00 | % | | 11/15/2016 | | $ | 5,500 | | | $ | 5,170,000 | | |
| Mediacom Broadband LLC Corp. | | | 8.50 | % | | 10/15/2015 | | | 4,175 | | | | 3,736,625 | | |
| Mediacom Communications Corp. | | | 9.50 | % | | 1/15/2013 | | | 2,250 | | | | 2,103,750 | | |
| R.H. Donnelley Corp. | | | 8.875 | % | | 1/15/2016 | | | 3,000 | | | | 2,850,000 | | |
| R.H. Donnelley Corp.† | | | 8.875 | % | | 10/15/2017 | | | 3,700 | | | | 3,505,750 | | |
| Univision Communications, Inc. PIK† | | | 9.75 | % | | 3/15/2015 | | | 5,000 | | | | 4,675,000 | | |
| Total | | | | | | | | | | | | | 42,242,375 | | |
| Metals & Mining 0.60% | |
| Aleris International, Inc. | | | 10.00 | % | | 12/15/2016 | | | 2,500 | | | | 2,112,500 | | |
| Freeport-McMoRan Copper & Gold | | | 8.375 | % | | 4/1/2017 | | | 5,000 | | | | 5,412,500 | | |
| Noranda Aluminum, Inc. PIK† | | | 8.738 | %# | | 5/15/2015 | | | 4,000 | | | | 3,460,000 | | |
| Total | | | | | | | | | | | | | 10,985,000 | | |
| Multi-Utilities & Unregulated Power 0.37% | |
| AES Corp. (The)† | | | 8.00 | % | | 10/15/2017 | | | 2,000 | | | | 2,000,000 | | |
| Mirant Americas Generation LLC | | | 9.125 | % | | 5/1/2031 | | | 5,000 | | | | 4,775,000 | | |
| Total | | | | | | | | | | | | | 6,775,000 | | |
| Oil & Gas 0.81% | |
| Chesapeake Energy Corp. | | | 7.625 | % | | 7/15/2013 | | | 3,500 | | | | 3,631,250 | | |
| Forest Oil Corp.† | | | 7.25 | % | | 6/15/2019 | | | 2,000 | | | | 1,990,000 | | |
| Verasun Energy Corp.† | | | 9.375 | % | | 6/1/2017 | | | 5,000 | | | | 4,125,000 | | |
| Williams Cos., Inc. (The) | | | 7.875 | % | | 9/1/2021 | | | 4,500 | | | | 5,107,500 | | |
| Total | | | | | | | | | | | | | 14,853,750 | | |
| Paper & Forest Products 0.61% | |
| Abitibi-Consolidated, Inc. (Canada)(a) | | | 8.55 | % | | 8/1/2010 | | | 4,500 | | | | 3,937,500 | | |
| AbitibiBowater, Inc. | | | 6.50 | % | | 6/15/2013 | | | 3,500 | | | | 2,520,000 | | |
| Buckeye Technologies, Inc. | | | 8.00 | % | | 10/15/2010 | | | 1,300 | | | | 1,303,250 | | |
| Graphic Packaging International Corp. | | | 9.50 | % | | 8/15/2013 | | | 3,400 | | | | 3,383,000 | | |
| Total | | | | | | | | | | | | | 11,143,750 | | |
| Pharmaceuticals 0.18% | |
| Warner Chilcott Corp. | | | 8.75 | % | | 2/1/2015 | | | 3,250 | | | | 3,363,750 | | |
| Real Estate 0.14% | |
| Host Marriott L.P. | | | 6.375 | % | | 3/15/2015 | | | 2,525 | | | | 2,480,813 | | |
See Notes to Financial Statements.
18
Schedule of Investments (continued)
November 30, 2007
| Investments | | Interest
Rate | | Maturity
Date | | Principal
Amount
(000) | | Value | |
Semiconductors & Semiconductor
Equipment 0.28% | |
| Freescale Semiconductor, Inc. | | | 8.875 | % | | 12/15/2014 | | $ | 5,500 | | | $ | 5,053,125 | | |
| Specialty Retail 0.10% | |
| Brookstone Co., Inc. | | | 12.00 | % | | 10/15/2012 | | | 2,000 | | | | 1,910,000 | | |
| Textiles & Apparel 0.16% | |
| Elizabeth Arden, Inc. | | | 7.75 | % | | 1/15/2014 | | | 3,000 | | | | 2,947,500 | | |
| Wireless Telecommunication Services 0.18% | |
| Dobson Communications Corp. | | | 8.875 | % | | 10/1/2013 | | | 3,000 | | | | 3,240,000 | | |
| Total High Yield Corporate Bonds (cost $303,634,733) | | | 292,422,378 | | |
| | | | | | | Shares
(000) | | | |
| NON-CONVERTIBLE PREFERRED STOCK 0.03% | |
| Financial: Miscellaneous | |
| FreddieMac(c) (cost $575,625) | | | 8.375 | % | | | | | 23 | | | | 587,137 | | |
| | | | | | | Principal
Amount
(000) | | | |
| U.S. TREASURY OBLIGATIONS 2.92% | |
| U.S. Treasury Note | | | 5.00 | % | | 2/15/2011 | | $ | 15,000 | | | | 15,880,080 | | |
| U.S. Treasury Note | | | 5.75 | % | | 8/15/2010 | | | 35,000 | | | | 37,398,060 | | |
| Total U.S. Treasury Obligations (cost $51,479,661) | | | 53,278,140 | | |
| Total Long-Term Investments (cost $1,680,598,813) | | | 1,765,222,304 | | |
See Notes to Financial Statements.
19
Schedule of Investments (concluded)
November 30, 2007
| Investments | | Principal
Amount
(000) | | Value | |
| SHORT-TERM INVESTMENT 3.03% | |
| Repurchase Agreement | |
Repurchase Agreement dated 11/30/2007,
4.06% due 12/3/2007 with State Street
Bank & Trust Co. collateralized by
$33,085,000 of Federal Home Loan Bank at
5.00% and 5.625% due 10/16/2009 and
1/11/2010, $18,000,000 of Federal
Home Loan Mortgage Corp. at 4.875% due
2/9/2010, and $4,397,000 of Federal
National Mortgage Assoc. at 4.75% due
3/12/2010; value: $56,569,345;
proceeds: $55,475,675 (cost $55,456,912) | | $ | 55,457 | | | $ | 55,456,912 | | |
| Total Investments in Securities 99.58% (cost $1,736,055,725) | | | | | 1,820,679,216 | | |
| Cash and Other Assets in Excess of Liabilities 0.42% | | | | | 7,702,874 | | |
| Net Assets 100.00% | | | | $ | 1,828,382,090 | | |
ADR American Depositary Receipt.
PIK Payment-in-kind.
Unit More than one class of securities traded together.
* Non-income producing security.
** Deferred interest debentures pay the stated rate, after which they pay a predetermined interest rate.
† Security was purchased pursuant to Rule 144A under the Securities Act of 1933 or is a private placement and, unless registered under the Act or exempt from registration, may only be resold to qualified institutional investors. Unless otherwise noted, 144A securities are deemed to be liquid.
# Variable rate security. The interest rate represents the rate at November 30, 2007.
(a) Foreign security traded in U.S. dollars.
(b) Investments in non-U.S. dollar denominated securities.
(c) Security purchased on a when-issued basis.
Industry classifications have not been audited by Deloitte & Touche LLP.
See Notes to Financial Statements.
20
Statement of Assets and Liabilities
November 30, 2007
| ASSETS: | |
| Investments in securities, at value (cost $1,736,055,725) | | $ | 1,820,679,216 | | |
| Cash | | | 369,248 | | |
| Receivables: | |
| Interest and dividends | | | 11,991,287 | | |
| Investment securities sold | | | 8,130,509 | | |
| Capital shares sold | | | 3,495,148 | | |
| Prepaid expenses and other assets | | | 97,078 | | |
| Total assets | | | 1,844,762,486 | | |
| LIABILITIES: | |
| Payables: | |
| Investment securities purchased | | | 12,536,836 | | |
| Capital shares reacquired | | | 1,541,189 | | |
| Management fee | | | 1,034,146 | | |
| 12b-1 distribution fees | | | 508,730 | | |
| To affiliates (See Note 3) | | | 99,154 | | |
| Directors' fees | | | 92,982 | | |
| Fund administration | | | 56,867 | | |
| Accrued expenses and other liabilities | | | 510,492 | | |
| Total liabilities | | | 16,380,396 | | |
| NET ASSETS | | $ | 1,828,382,090 | | |
| COMPOSITION OF NET ASSETS: | |
| Paid-in capital | | $ | 1,659,058,344 | | |
| Undistributed net investment income | | | 12,377,655 | | |
| Accumulated net realized gain on investments and foreign currency related transactions | | | 72,310,792 | | |
Net unrealized appreciation on investments and translation of
assets and liabilities denominated in foreign currencies | | | 84,635,299 | | |
| Net Assets | | $ | 1,828,382,090 | | |
| Net assets by class: | |
| Class A Shares | | $ | 1,379,814,317 | | |
| Class B Shares | | $ | 74,747,835 | | |
| Class C Shares | | $ | 99,713,422 | | |
| Class F Shares | | $ | 9,783 | | |
| Class I Shares | | $ | 271,015,381 | | |
| Class P Shares | | $ | 3,061,857 | | |
| Class R2 Shares | | $ | 9,747 | | |
| Class R3 Shares | | $ | 9,748 | | |
| Outstanding shares by class: | |
| Class A Shares (200 million shares of common stock authorized, $.001 par value) | | | 102,304,996 | | |
| Class B Shares (30 million shares of common stock authorized, $.001 par value) | | | 5,585,168 | | |
| Class C Shares (20 million shares of common stock authorized, $.001 par value) | | | 7,441,007 | | |
| Class F Shares (30 million shares of common stock authorized, $.001 par value) | | | 725 | | |
| Class I Shares (30 million shares of common stock authorized, $.001 par value) | | | 19,986,992 | | |
| Class P Shares (20 million shares of common stock authorized, $.001 par value) | | | 226,461 | | |
| Class R2 Shares (30 million shares of common stock authorized, $.001 par value) | | | 723 | | |
| Class R3 Shares (30 million shares of common stock authorized, $.001 par value) | | | 723 | | |
Net asset value, offering and redemption price per share
(Net assets divided by outstanding shares): | | | | | |
| Class A Shares–Net asset value | | $ | 13.49 | | |
Class A Shares–Maximum offering price
(Net asset value plus sales charge of 5.75%) | | $ | 14.31 | | |
| Class B Shares–Net asset value | | $ | 13.38 | | |
| Class C Shares–Net asset value | | $ | 13.40 | | |
| Class F Shares–Net asset value | | $ | 13.49 | | |
| Class I Shares–Net asset value | | $ | 13.56 | | |
| Class P Shares–Net asset value | | $ | 13.52 | | |
| Class R2 Shares–Net asset value | | $ | 13.48 | | |
| Class R3 Shares–Net asset value | | $ | 13.48 | | |
See Notes to Financial Statements.
21
Statement of Operations
For the Year Ended November 30, 2007
| Investment income: | |
| Dividends (net of foreign withholding taxes of $225,240) | | $ | 30,600,593 | | |
| Interest | | | 29,489,766 | | |
| Total investment income | | | 60,090,359 | | |
| Expenses: | |
| Management fee | | | 11,074,687 | | |
| 12b-1 distribution plan-Class A | | | 4,491,663 | | |
| 12b-1 distribution plan-Class B | | | 716,325 | | |
| 12b-1 distribution plan-Class C | | | 909,975 | | |
| 12b-1 distribution plan-Class F | | | 2 | | |
| 12b-1 distribution plan-Class P | | | 12,619 | | |
| 12b-1 distribution plan-Class R2 | | | 10 | | |
| 12b-1 distribution plan-Class R3 | | | 8 | | |
| Shareholder servicing | | | 1,824,237 | | |
| Fund administration | | | 604,268 | | |
| Reports to shareholders | | | 307,515 | | |
| Subsidy (See Note 3) | | | 139,298 | | |
| Registration | | | 129,286 | | |
| Custody | | | 70,219 | | |
| Directors' fees | | | 58,377 | | |
| Professional | | | 55,327 | | |
| Other | | | 27,186 | | |
| Gross expenses | | | 20,421,002 | | |
| Expense reductions (See Note 7) | | | (54,633 | ) | |
| Net expenses | | | 20,366,369 | | |
| Net investment income | | | 39,723,990 | | |
| Net realized and unrealized gain (loss): | |
| Net realized gain on investments and foreign currency related transactions | | | 79,594,206 | | |
Net change in unrealized depreciation on investments and translation
of assets and liabilities denominated in foreign currencies | | | (60,823,254 | ) | |
| Net realized and unrealized gain | | | 18,770,952 | | |
| Net Increase in Net Assets Resulting From Operations | | $ | 58,494,942 | | |
See Notes to Financial Statements.
22
Statements of Changes in Net Assets
| INCREASE IN NET ASSETS | | For the Year Ended
November 30, 2007 | | For the Year Ended
November 30, 2006 | |
| Operations: | |
| Net investment income | | $ | 39,723,990 | | | $ | 29,014,609 | | |
Net realized gain on investments and foreign
currency related transactions | | | 79,594,206 | | | | 39,801,673 | | |
Net change in unrealized appreciation (depreciation)
on investments and translation of assets and
liabilities denominated in foreign currencies | | | (60,823,254 | ) | | | 78,641,959 | | |
| Net increase in net assets resulting from operations | | | 58,494,942 | | | | 147,458,241 | | |
| Distributions to shareholders from: | |
| Net investment income | |
| Class A | | | (32,509,786 | ) | | | (28,227,771 | ) | |
| Class B | | | (1,383,751 | ) | | | (1,307,120 | ) | |
| Class C | | | (1,767,365 | ) | | | (1,653,500 | ) | |
| Class I | | | (1,996,921 | ) | | | (195,659 | ) | |
| Class P | | | (68,311 | ) | | | (47,319 | ) | |
| Net realized gain | | | | | | | | | |
| Class A | | | (34,340,522 | ) | | | (10,687,459 | ) | |
| Class B | | | (1,990,323 | ) | | | (661,737 | ) | |
| Class C | | | (2,396,690 | ) | | | (872,430 | ) | |
| Class I | | | (324,043 | ) | | | (36,181 | ) | |
| Class P | | | (73,205 | ) | | | (14,730 | ) | |
| Total distributions to shareholders | | | (76,850,917 | ) | | | (43,703,906 | ) | |
| Capital share transactions (Net of share conversions) (See Note 11): | |
| Net proceeds from sales of shares | | | 700,738,728 | | | | 241,249,196 | | |
| Reinvestment of distributions | | | 74,382,875 | | | | 42,084,119 | | |
| Cost of shares reacquired | | | (193,779,679 | ) | | | (206,165,660 | ) | |
Net increase in net assets resulting
from capital share transactions | | | 581,341,924 | | | | 77,167,655 | | |
| Net increase in net assets | | | 562,985,949 | | | | 180,921,990 | | |
| NET ASSETS: | |
| Beginning of year | | $ | 1,265,396,141 | | | $ | 1,084,474,151 | | |
| End of year | | $ | 1,828,382,090 | | | $ | 1,265,396,141 | | |
| Undistributed net investment income | | $ | 12,377,655 | | | $ | 4,358,527 | | |
See Notes to Financial Statements.
23
Financial Highlights
| | | Class A Shares | |
| | | Year Ended 11/30 | |
| | | 2007 | | 2006 | | 2005 | | 2004 | | 2003 | |
| Per Share Operating Performance | |
| Net asset value, beginning of year | | $ | 13.56 | | | $ | 12.44 | | | $ | 12.12 | | | $ | 10.29 | | | $ | 9.45 | | |
| Investment operations: | |
| Net investment income(a) | | | .37 | | | | .33 | | | | .31 | | | | .32 | | | | .31 | | |
| Net realized and unrealized gain | | | .33 | | | | 1.29 | | | | .43 | | | | 1.74 | | | | .79 | | |
| Total from investment operations | | | .70 | | | | 1.62 | | | | .74 | | | | 2.06 | | | | 1.10 | | |
| Distributions to shareholders from: | |
| Net investment income | | | (.35 | ) | | | (.36 | ) | | | (.35 | ) | | | (.23 | ) | | | (.26 | ) | |
| Net realized gain | | | (.42 | ) | | | (.14 | ) | | | (.07 | ) | | | – | | | | – | | |
| Total distributions | | | (.77 | ) | | | (.50 | ) | | | (.42 | ) | | | (.23 | ) | | | (.26 | ) | |
| Net asset value, end of year | | $ | 13.49 | | | $ | 13.56 | | | $ | 12.44 | | | $ | 12.12 | | | $ | 10.29 | | |
| Total Return(b) | | | 5.27 | % | | | 13.42 | % | | | 6.27 | % | | | 20.29 | % | | | 11.97 | % | |
| Ratios to Average Net Assets: | |
Expenses, excluding expense reductions
and including expenses assumed | | | 1.29 | % | | | 1.33 | % | | | 1.33 | % | | | 1.35 | % | | | 1.35 | % | |
Expenses, including expense
reductions and expenses assumed | | | 1.29 | % | | | 1.33 | % | | | 1.33 | % | | | 1.35 | % | | | 1.35 | % | |
Expenses, excluding expense
reductions and expenses assumed | | | 1.29 | % | | | 1.33 | % | | | 1.34 | % | | | 1.35 | % | | | 1.46 | % | |
| Net investment income | | | 2.68 | % | | | 2.60 | % | | | 2.51 | % | | | 2.84 | % | | | 3.24 | % | |
| Supplemental Data: | |
| Net assets, end of year (000) | | $ | 1,379,814 | | | $ | 1,111,167 | | | $ | 944,488 | | | $ | 439,703 | | | $ | 128,030 | | |
| Portfolio turnover rate | | | 26.32 | % | | | 43.85 | % | | | 31.65 | % | | | 21.81 | % | | | 28.71 | % | |
(a) Calculated using average shares outstanding during the period.
(b) Total return does not consider the effects of sales loads and assumes the reinvestment of all distributions.
See Notes to Financial Statements.
24
Financial Highlights (continued)
| | | Class B Shares | |
| | | Year Ended 11/30 | |
| | | 2007 | | 2006 | | 2005 | | 2004 | | 2003 | |
| Per Share Operating Performance | |
| Net asset value, beginning of year | | $ | 13.46 | | | $ | 12.36 | | | $ | 12.03 | | | $ | 10.23 | | | $ | 9.40 | | |
| Investment operations: | |
| Net investment income(a) | | | .28 | | | | .24 | | | | .23 | | | | .25 | | | | .25 | | |
| Net realized and unrealized gain | | | .33 | | | | 1.28 | | | | .43 | | | | 1.72 | | | | .79 | | |
| Total from investment operations | | | .61 | | | | 1.52 | | | | .66 | | | | 1.97 | | | | 1.04 | | |
| Distributions to shareholders from: | |
| Net investment income | | | (.27 | ) | | | (.28 | ) | | | (.26 | ) | | | (.17 | ) | | | (.21 | ) | |
| Net realized gain | | | (.42 | ) | | | (.14 | ) | | | (.07 | ) | | | – | | | | – | | |
| Total distributions | | | (.69 | ) | | | (.42 | ) | | | (.33 | ) | | | (.17 | ) | | | (.21 | ) | |
| Net asset value, end of year | | $ | 13.38 | | | $ | 13.46 | | | $ | 12.36 | | | $ | 12.03 | | | $ | 10.23 | | |
| Total Return(b) | | | 4.56 | % | | | 12.62 | % | | | 5.66 | % | | | 19.50 | % | | | 11.35 | % | |
| Ratios to Average Net Assets: | |
Expenses, excluding expense reductions
and including expenses assumed | | | 1.94 | % | | | 1.98 | % | | | 1.98 | % | | | 1.99 | % | | | 1.99 | % | |
Expenses, including expense
reductions and expenses assumed | | | 1.94 | % | | | 1.98 | % | | | 1.98 | % | | | 1.99 | % | | | 1.99 | % | |
Expenses, excluding expense
reductions and expenses assumed | | | 1.94 | % | | | 1.98 | % | | | 1.98 | % | | | 1.99 | % | | | 2.10 | % | |
| Net investment income | | | 2.03 | % | | | 1.95 | % | | | 1.86 | % | | | 2.20 | % | | | 2.60 | % | |
| Supplemental Data: | |
| Net assets, end of year (000) | | $ | 74,748 | | | $ | 64,045 | | | $ | 58,380 | | | $ | 27,634 | | | $ | 9,398 | | |
| Portfolio turnover rate | | | 26.32 | % | | | 43.85 | % | | | 31.65 | % | | | 21.81 | % | | | 28.71 | % | |
(a) Calculated using average shares outstanding during the period.
(b) Total return does not consider the effects of sales loads and assumes the reinvestment of all distributions.
See Notes to Financial Statements.
25
Financial Highlights (continued)
| | | Class C Shares | |
| | | Year Ended 11/30 | |
| | | 2007 | | 2006 | | 2005 | | 2004 | | 2003 | |
| Per Share Operating Performance | |
| Net asset value, beginning of year | | $ | 13.48 | | | $ | 12.37 | | | $ | 12.05 | | | $ | 10.25 | | | $ | 9.41 | | |
| Investment operations: | |
| Net investment income(a) | | | .28 | | | | .24 | | | | .23 | | | | .25 | | | | .24 | | |
| Net realized and unrealized gain | | | .33 | | | | 1.28 | | | | .43 | | | | 1.73 | | | | .80 | | |
| Total from investment operations | | | .61 | | | | 1.52 | | | | .66 | | | | 1.98 | | | | 1.04 | | |
| Distributions to shareholders from: | |
| Net investment income | | | (.27 | ) | | | (.27 | ) | | | (.27 | ) | | | (.18 | ) | | | (.20 | ) | |
| Net realized gain | | | (.42 | ) | | | (.14 | ) | | | (.07 | ) | | | – | | | | – | | |
| Total distributions | | | (.69 | ) | | | (.41 | ) | | | (.34 | ) | | | (.18 | ) | | | (.20 | ) | |
| Net asset value, end of year | | $ | 13.40 | | | $ | 13.48 | | | $ | 12.37 | | | $ | 12.05 | | | $ | 10.25 | | |
| Total Return(b) | | | 4.57 | % | | | 12.68 | % | | | 5.62 | % | | | 19.50 | % | | | 11.27 | % | |
| Ratios to Average Net Assets: | |
Expenses, excluding expense reductions
and including expenses assumed | | | 1.94 | % | | | 1.98 | % | | | 1.98 | % | | | 1.99 | % | | | 1.99 | % | |
Expenses, including expense
reductions and expenses assumed | | | 1.94 | % | | | 1.98 | % | | | 1.98 | % | | | 1.99 | % | | | 1.99 | % | |
Expenses, excluding expense
reductions and expenses assumed | | | 1.94 | % | | | 1.98 | % | | | 1.98 | % | | | 1.99 | % | | | 2.10 | % | |
| Net investment income | | | 2.03 | % | | | 1.95 | % | | | 1.86 | % | | | 2.20 | % | | | 2.60 | % | |
| Supplemental Data: | |
| Net assets, end of year (000) | | $ | 99,713 | | | $ | 77,477 | | | $ | 77,374 | | | $ | 28,696 | | | $ | 5,902 | | |
| Portfolio turnover rate | | | 26.32 | % | | | 43.85 | % | | | 31.65 | % | | | 21.81 | % | | | 28.71 | % | |
(a) Calculated using average shares outstanding during the period.
(b) Total return does not consider the effects of sales loads and assumes the reinvestment of all distributions.
See Notes to Financial Statements.
26
Financial Highlights (continued)
| | | Class F Shares | |
| | | 9/28/2007(a)
to
11/30/2007 | |
| Per Share Operating Performance | |
| Net asset value, beginning of period | | $ | 13.83 | | |
| Investment operations: | |
| Net investment income(b) | | | .06 | | |
| Net realized and unrealized loss | | | (.40 | ) | |
| Total from investment operations | | | (.34 | ) | |
| Net asset value, end of period | | $ | 13.49 | | |
| Total Return(c) | | | (2.46 | )%(d) | |
| Ratios to Average Net Assets: | |
| Expenses, including expense reductions | | | .18 | %(d) | |
| Expenses, excluding expense reductions | | | .18 | %(d) | |
| Net investment income | | | .47 | %(d) | |
| Supplemental Data: | |
| Net assets, end of period (000) | | $ | 10 | | |
| Portfolio turnover rate | | | 26.32 | % | |
(a) Commencement of investment operations was September 28, 2007; SEC effective date was September 14, 2007 and date shares first became available to the public was October 1, 2007.
(b) Calculated using average shares outstanding during the period.
(c) Total return does not consider the effects of sales loads and assumes the reinvestment of all distributions.
(d) Not annualized.
See Notes to Financial Statements.
27
Financial Highlights (continued)
| | | Class I Shares | |
| | | Year Ended 11/30 | |
| | | 2007 | | 2006 | | 2005 | | 2004 | | 2003 | |
| Per Share Operating Performance | |
| Net asset value, beginning of year | | $ | 13.62 | | | $ | 12.50 | | | $ | 12.18 | | | $ | 10.33 | | | $ | 9.47 | | |
| Investment operations: | |
| Net investment income(a) | | | .41 | | | | .37 | | | | .35 | | | | .45 | | | | .34 | | |
| Net realized and unrealized gain | | | .35 | | | | 1.29 | | | | .44 | | | | 1.66 | | | | .80 | | |
| Total from investment operations | | | .76 | | | | 1.66 | | | | .79 | | | | 2.11 | | | | 1.14 | | |
| Distributions to shareholders from: | |
| Net investment income | | | (.40 | ) | | | (.40 | ) | | | (.40 | ) | | | (.26 | ) | | | (.28 | ) | |
| Net realized gain | | | (.42 | ) | | | (.14 | ) | | | (.07 | ) | | | – | | | | – | | |
| Total distributions | | | (.82 | ) | | | (.54 | ) | | | (.47 | ) | | | (.26 | ) | | | (.28 | ) | |
| Net asset value, end of year | | $ | 13.56 | | | $ | 13.62 | | | $ | 12.50 | | | $ | 12.18 | | | $ | 10.33 | | |
| Total Return(b) | | | 5.67 | % | | | 13.75 | % | | | 6.64 | % | | | 20.72 | % | | | 12.47 | % | |
| Ratios to Average Net Assets: | |
Expenses, excluding expense reductions
and including expenses assumed | | | .96 | % | | | .98 | % | | | .99 | % | | | 1.09 | % | | | .99 | %† | |
Expenses, including expense
reductions and expenses assumed | | | .96 | % | | | .98 | % | | | .99 | % | | | 1.09 | % | | | .99 | %† | |
Expenses, excluding expense
reductions and expenses assumed | | | .96 | % | | | .98 | % | | | .99 | % | | | 1.09 | % | | | 1.10 | %† | |
| Net investment income | | | 2.98 | % | | | 2.95 | % | | | 2.89 | % | | | 3.74 | % | | | 3.60 | %† | |
| Supplemental Data: | |
| Net assets, end of year (000) | | $ | 271,015 | | | $ | 10,342 | | | $ | 2,897 | | | $ | 640 | | | $ | 1 | | |
| Portfolio turnover rate | | | 26.32 | % | | | 43.85 | % | | | 31.65 | % | | | 21.81 | % | | | 28.71 | % | |
† The ratios have been determined on a Fund basis.
(a) Calculated using average shares outstanding during the period.
(b) Total return does not consider the effects of sales loads and assumes the reinvestment of all distributions.
See Notes to Financial Statements.
28
Financial Highlights (continued)
| | | Class P Shares | |
| | | Year Ended 11/30 | |
| | | 2007 | | 2006 | | 2005 | | 2004 | | 2003 | |
| Per Share Operating Performance | |
| Net asset value, beginning of year | | $ | 13.59 | | | $ | 12.47 | | | $ | 12.15 | | | $ | 10.31 | | | $ | 9.45 | | |
| Investment operations: | |
| Net investment income(a) | | | .36 | | | | .32 | | | | .30 | | | | .31 | | | | .31 | | |
| Net realized and unrealized gain | | | .33 | | | | 1.29 | | | | .43 | | | | 1.75 | | | | .80 | | |
| Total from investment operations | | | .69 | | | | 1.61 | | | | .73 | | | | 2.06 | | | | 1.11 | | |
| Distributions to shareholders from: | |
| Net investment income | | | (.34 | ) | | | (.35 | ) | | | (.34 | ) | | | (.22 | ) | | | (.25 | ) | |
| Net realized gain | | | (.42 | ) | | | (.14 | ) | | | (.07 | ) | | | – | | | | – | | |
| Total distributions | | | (.76 | ) | | | (.49 | ) | | | (.41 | ) | | | (.22 | ) | | | (.25 | ) | |
| Net asset value, end of year | | $ | 13.52 | | | $ | 13.59 | | | $ | 12.47 | | | $ | 12.15 | | | $ | 10.31 | | |
| Total Return(b) | | | 5.15 | % | | | 13.31 | % | | | 6.17 | % | | | 20.21 | % | | | 12.03 | % | |
| Ratios to Average Net Assets: | |
Expenses, excluding expense reductions
and including expenses assumed | | | 1.39 | % | | | 1.43 | % | | | 1.43 | % | | | 1.44 | % | | | 1.44 | % | |
Expenses, including expense
reductions and expenses assumed | | | 1.39 | % | | | 1.43 | % | | | 1.43 | % | | | 1.44 | % | | | 1.44 | % | |
Expenses, excluding expense
reductions and expenses assumed | | | 1.39 | % | | | 1.43 | % | | | 1.44 | % | | | 1.44 | % | | | 1.55 | % | |
| Net investment income | | | 2.58 | % | | | 2.50 | % | | | 2.42 | % | | | 2.75 | % | | | 3.15 | % | |
| Supplemental Data: | |
| Net assets, end of year (000) | | $ | 3,062 | | | $ | 2,365 | | | $ | 1,337 | | | $ | 286 | | | $ | 1 | | |
| Portfolio turnover rate | | | 26.32 | % | | | 43.85 | % | | | 31.65 | % | | | 21.81 | % | | | 28.71 | % | |
(a) Calculated using average shares outstanding during the period.
(b) Total return does not consider the effects of sales loads and assumes the reinvestment of all distributions.
See Notes to Financial Statements.
29
Financial Highlights (continued)
| | | Class R2 Shares | |
| | | 9/28/2007(a)
to
11/30/2007 | |
| Per Share Operating Performance | |
| Net asset value, beginning of period | | $ | 13.83 | | |
| Investment operations: | |
| Net investment income(b) | | | .05 | | |
| Net realized and unrealized loss | | | (.40 | ) | |
| Total from investment operations | | | (.35 | ) | |
| Net asset value, end of period | | $ | 13.48 | | |
| Total Return(c) | | | (2.53 | )%(d) | |
| Ratios to Average Net Assets: | |
| Expenses, including expense reductions | | | .27 | %(d) | |
| Expenses, excluding expense reductions | | | .27 | %(d) | |
| Net investment income | | | .37 | %(d) | |
| Supplemental Data: | |
| Net assets, end of period (000) | | $ | 10 | | |
| Portfolio turnover rate | | | 26.32 | % | |
(a) Commencement of investment operations was September 28, 2007; SEC effective date was September 14, 2007 and date shares first became available to the public was October 1, 2007.
(b) Calculated using average shares outstanding during the period.
(c) Total return does not consider the effects of sales loads and assumes the reinvestment of all distributions.
(d) Not annualized.
See Notes to Financial Statements.
30
Financial Highlights (concluded)
| | | Class R3 Shares | |
| | | 9/28/2007(a)
to
11/30/2007 | |
| Per Share Operating Performance | |
| Net asset value, beginning of period | | $ | 13.83 | | |
| Investment operations: | |
| Net investment income(b) | | | .05 | | |
| Net realized and unrealized loss | | | (.40 | ) | |
| Total from investment operations | | | (.35 | ) | |
| Net asset value, end of period | | $ | 13.48 | | |
| Total Return(c) | | | (2.53 | )%(d) | |
| Ratios to Average Net Assets: | |
| Expenses, including expense reductions | | | .25 | %(d) | |
| Expenses, excluding expense reductions | | | .25 | %(d) | |
| Net investment income | | | .39 | %(d) | |
| Supplemental Data: | |
| Net assets, end of period (000) | | $ | 10 | | |
| Portfolio turnover rate | | | 26.32 | % | |
(a) Commencement of investment operations was September 28, 2007; SEC effective date was September 14, 2007 and date shares first became available to the public was October 1, 2007.
(b) Calculated using average shares outstanding during the period.
(c) Total return does not consider the effects of sales loads and assumes the reinvestment of all distributions.
(d) Not annualized.
See Notes to Financial Statements.
31
Notes to Financial Statements
1. ORGANIZATION
Lord Abbett Research Fund, Inc. (the "Company") is registered under the Investment Company Act of 1940 (the "Act") as a diversified open-end management investment company, incorporated under Maryland law on April 6, 1992. The Company currently consists of four separate funds. This report covers one of the funds and its respective classes—Lord Abbett America's Value Fund (the "Fund").
The Fund's investment objective is to seek current income and capital appreciation. The Fund offers eight classes of shares: Classes A, B, C, F, I, P, R2 and R3, each with different expenses and dividends. A front-end sales charge is normally added to the Net Asset Value ("NAV") for Class A shares. There is no front-end sales charge in the case of the Classes B, C, F, I, P, R2, and R3 shares, although there may be a contingent deferred sales charge ("CDSC") as follows: certain redemptions of Class A shares made within 12 months following certain purchases made without a sales charge; Class B shares redeemed before the sixth anniversary of purchase; and Class C shares redeemed before the first anniversary of purchase. Class B shares will convert to Class A shares on the eighth anniversary of the original purchase of Class B shares. Effective September 28, 2007, Class Y was renamed Class I. As of October 1, 2007, the Fund's Class P Shares were closed to substantially all new retirement and benefit plans and fee-based programs, with certain exceptions as set forth in the Fund's Prospectus.
The preparation of financial statements in conformity with accounting principles generally accepted in the United States of America requires management to make certain estimates and assumptions that affect the reported amounts of assets and liabilities and disclosure of contingent assets and liabilities at the date of the financial statements and the reported amounts of increases and decreases in net assets from operations during the reporting period. Actual results could differ from those estimates.
2. SIGNIFICANT ACCOUNTING POLICIES
(a) Investment Valuation–Securities traded on any recognized U.S. or non-U.S. exchange or on NASDAQ, Inc. are valued at the last sale price or official closing price on the exchange or system on which they are principally traded. Events occurring after the close of trading on non-U.S. exchanges may result in adjustments to the valuation of foreign securities to more accurately reflect their fair value as of the close of regular trading on the New York Stock Exchange. The Fund may rely on an independent fair valuation service in adjusting the valuations of foreign securities. Unlisted equity securities are valued at the last quoted sale price or, if no sale price is available, at the mean between the most recently quoted bid and asked prices. Fixed income securities are valued a t the mean between the bid and asked prices on the basis of prices supplied by independent pricing services, which reflect broker/dealer supplied valuations and electronic data processing techniques. Securities for which market quotations are not readily available are valued at fair value as determined by management and approved in good faith by the Board of Directors. Short-term securities with 60 days or less remaining to maturity are valued using the amortized cost method, which approximates current market value.
(b) Security Transactions–Security transactions are recorded as of the date that the securities are purchased or sold (trade date). Realized gains and losses on sales of portfolio securities are calculated using the identified-cost method. Realized and unrealized gains (losses) are allocated to each class of shares based upon the relative proportion of net assets at the beginning of the day.
32
Notes to Financial Statements (continued)
(c) Investment Income–Dividend income is recorded on the ex-dividend date. Interest income is recorded on the accrual basis. Discounts are accreted and premiums are amortized using the effective interest method. Withholding taxes on foreign dividends have been provided for in accordance with the Fund's understanding of the applicable country's tax rules and rates. Investment income is allocated to each class of shares based upon the relative proportion of net assets at the beginning of the day.
(d) Federal Taxes–It is the policy of the Fund to meet the requirements of Subchapter M of the Internal Revenue Code applicable to regulated investment companies and to distribute substantially all taxable income and capital gains to its shareholders. Therefore, no Federal income tax provision is required.
(e) Expenses–Expenses incurred by the Company that do not specifically relate to an individual fund are generally allocated to the Funds within the Company on a pro rata basis. Expenses, excluding class specific expenses, are allocated to each class of shares based upon the relative proportion of net assets at the beginning of the day. Class A, B, C, F, P, R2, and R3 shares bear their class specific share of all expenses and fees relating to the Fund's 12b-1 Distribution Plan.
(f) Foreign Transactions–The books and records of the Fund are maintained in U.S. dollars and transactions denominated in foreign currencies are recorded in the Fund's records at the rate prevailing when earned or recorded. Asset and liability accounts that are denominated in foreign currencies are adjusted to reflect current exchange rates. The resultant exchange gains and losses are included in Net realized gain on investments and foreign currency related transactions on the Fund's Statement of Operations. The Fund does not isolate that portion of the results of operations arising as a result of changes in the foreign exchange rates from the changes in market prices of the securities.
(g) When-Issued Transactions–The Fund may purchase portfolio securities on a when-issued or forward basis. When-issued or forward transactions involve a commitment by the Fund to purchase securities, with payment and delivery ("settlement") to take place in the future, in order to secure what is considered to be an advantageous price or yield at the time of entering into the transaction.
(h) Repurchase Agreements–The Fund may enter into repurchase agreements with respect to securities. A repurchase agreement is a transaction in which a Fund acquires a security and simultaneously commits to resell that security to the seller (a bank or securities dealer) at an agreed-upon price on an agreed-upon date. The Fund requires at all times that the repurchase agreement be collateralized by cash, or by securities of the U.S. Government, its agencies, its instrumentalities, or U.S. Government sponsored enterprises having a value equal to, or in excess of, the value of the repurchase agreement (including accrued interest). If the seller of the agreement defaults on its obligation to repurchase the underlying securities at a time when the value of these securities has decli ned, the Fund may incur a loss upon disposition of the securities.
3. MANAGEMENT FEES AND OTHER TRANSACTIONS WITH AFFILIATES
Management Fees
The Company has a management agreement with Lord, Abbett & Co. LLC ("Lord Abbett") pursuant to which Lord Abbett supplies the Fund with investment management services and executive and
33
Notes to Financial Statements (continued)
other personnel, pays the remuneration of officers, provides office space and pays for ordinary and necessary office and clerical expenses relating to research and statistical work and supervision of the Fund's investment portfolio.
The management fee is based on average daily net assets at the following annual rates:
| First $1 billion | | | .75 | % | |
| Next $1 billion | | | .70 | % | |
| Over $2 billion | | | .65 | % | |
For the year ended November 30, 2007, the effective management fee paid to Lord Abbett was at an annualized rate of .73% of the Fund's average daily net assets.
Lord Abbett provides certain administrative services to the Fund pursuant to an Administrative Services Agreement at an annual rate of .04% of the Fund's average daily net assets.
The Fund, along with certain other funds managed by Lord Abbett (the "Underlying Funds"), has entered into a Servicing Arrangement with Lord Abbett Balanced Strategy Fund, Lord Abbett Diversified Equity Strategy Fund, Lord Abbett Diversified Income Strategy Fund, and Lord Abbett Growth & Income Strategy Fund of Lord Abbett Investment Trust, (each, a "Fund of Funds"), pursuant to which each Underlying Fund pays a portion of the expenses (excluding management fees and distribution and service fees) of each Fund of Funds in proportion to the average daily value of the Underlying Fund shares owned by each Fund of Funds. Amounts paid pursuant to the Servicing Arrangement are included in Subsidy expense on the Fund's Statement of Operations and Payable to affiliates on the Fund's Statement of Assets an d Liabilities. Effective December 14, 2007, the Fund has been removed as an authorized Underlying Fund of Diversified Equity Strategy Fund.
12b-1 Distribution Plan
The Fund has adopted a distribution plan with respect to Class A, B, C, F, P, R2 and R3 shares pursuant to Rule 12b-1 under the Act, which provides for the payment of ongoing distribution and service fees to Lord Abbett Distributor LLC ("Distributor"), an affiliate of Lord Abbett. The fees are accrued daily at annual rates based upon average daily net assets as follows:
| Fees* | | Class A | | Class B | | Class C | | Class F | | Class P | | Class R2 | | Class R3 | |
| Service | | | .25 | % | | | .25 | % | | | .25 | % | | | - | | | | .20 | % | | | .25 | % | | | .25 | % | |
| Distribution | | | .10 | % | | | .75 | % | | | .75 | % | | | .10 | % | | | .25 | % | | | .35 | % | | | .25 | % | |
* The Fund may designate a portion of the aggregate fee as attributable to service activities for purposes of calculating Financial Industry Regulatory Authority ("FINRA") sales charge limitations.
Class I does not have a distribution plan.
Commissions
Distributor received the following commissions on sales of shares of the Fund, after concessions were paid to authorized dealers, for the year ended November 30, 2007:
Distributor
Commissions | | Dealers'
Concessions | |
| $ | 1,763,784 | | | $ | 9,163,981 | | |
Distributor received CDSCs of $2,816 and $6,801 for Class A and Class C shares, respectively, for the year ended November 30, 2007.
34
Notes to Financial Statements (continued)
Two Directors and certain of the Fund's officers have an interest in Lord Abbett.
4. DISTRIBUTIONS AND CAPITAL LOSS CARRYFORWARDS
Dividends from net investment income, if any, are declared and paid at least quarterly. Taxable net realized gains from investment transactions, reduced by capital loss carryforwards, if any, are declared and distributed to shareholders at least annually. The capital loss carryforward amount, if any, is available to offset future net capital gains. Dividends and distributions to shareholders are recorded on the ex-dividend date. The amount of dividends and distributions from net investment income and net realized capital gains are determined in accordance with Federal income tax regulations which may differ from accounting principles generally accepted in the United States of America. These book/tax differences are either considered temporary or permanent in nature. To the extent these differences are permanent in nature, such amounts are reclassified within the components of net assets based on their federal tax basis treatment; temporary d ifferences do not require reclassification. Dividends and distributions, which exceed earnings and profits for tax purposes, are reported as a tax return of capital.
On December 13, 2007, a net investment income distribution of approximately $4,848,000, a short-term capital gain distribution of approximately $5,377,000 and a long-term capital gain distribution of approximately $68,424,000 were declared by the Fund. The distributions were paid on December 18, 2007 to shareholders of record on December 17, 2007.
The tax character of distributions paid during the fiscal years ended November 30, 2007 and 2006 are as follows:
| | | 11/30/2007 | | 11/30/2006 | |
| Distributions paid from: | |
| Ordinary income | | $ | 45,473,885 | | | $ | 36,915,035 | | |
| Net long-term capital gains | | | 31,377,032 | | | | 6,788,871 | | |
| Total distributions paid | | $ | 76,850,917 | | | $ | 43,703,906 | | |
As of November 30, 2007, the components of accumulated earnings on a tax-basis are as follows:
| Undistributed ordinary income - net | | $ | 18,121,949 | | |
| Undistributed long-term capital gains | | | 68,410,923 | | |
| Total undistributed earnings | | $ | 86,532,872 | | |
| Temporary differences | | | (93,369 | ) | |
| Unrealized gains - net | | | 82,884,243 | | |
| Total accumulated earnings - net | | $ | 169,323,746 | | |
Certain losses incurred after October 31 ("Post-October Losses") within the taxable year are deemed to arise on the first business day of the Fund's next taxable year. The Fund incurred and will elect to defer net ordinary losses of $387 during fiscal 2007.
As of November 30, 2007, the aggregate unrealized security gains and losses based on cost for U.S. Federal income tax purposes are as follows:
| Tax cost | | $ | 1,737,806,781 | | |
| Gross unrealized gain | | | 183,893,431 | | |
| Gross unrealized loss | | | (101,020,996 | ) | |
| Net unrealized security gain | | $ | 82,872,435 | | |
35
Notes to Financial Statements (continued)
The difference between book-basis and tax-basis unrealized gains (losses) is attributable to the tax treatment of amortization and other temporary tax adjustments.
Permanent items identified during the fiscal year ended November 30, 2007, have been reclassified among the components of net assets based on their tax basis treatment as follows:
Undistributed
Net Investment
Income | | Accumulated
Net Realized
Gain | |
| $ | 6,021,272 | | | $ | (6,021,272 | ) | |
The permanent difference is primarily attributable to the tax treatment of certain securities, amortization, and paydown gains and losses.
5. PORTFOLIO SECURITIES TRANSACTIONS
Purchases and sales of investment securities (excluding short-term investments) for the fiscal year ended November 30, 2007 are as follows:
| Purchases | | Sales | |
| $ | 897,354,786 | | | $ | 388,534,005 | | |
There were no purchases or sales of U.S. Government securities for the year ended November 30, 2007.
6. DIRECTORS' REMUNERATION
The Company's officers and the two Directors who are associated with Lord Abbett do not receive any compensation from the Company for serving in such capacities. Outside Directors' fees are allocated among all Lord Abbett-sponsored funds based on the net assets of each fund. There is an equity based plan available to all outside Directors under which outside Directors must defer receipt of a portion of, and may elect to defer receipt of an additional portion of, Directors' fees. The deferred amounts are treated as though equivalent dollar amounts have been invested proportionately in the funds. Such amounts and earnings accrued thereon are included in Directors' fees on the Statement of Operations and in Directors' fees payable on the Statement of Assets and Liabilities and are not deductible for U.S. Federal income tax purposes until such amounts are paid.
7. EXPENSE REDUCTIONS
The Company has entered into arrangements with the Fund's transfer agent and custodian, whereby credits realized as a result of uninvested cash balances are used to reduce a portion of the Fund's expenses.
8. LINE OF CREDIT
The Fund, along with certain other funds managed by Lord Abbett, has available a $250,000,000 unsecured revolving credit facility ("Facility") from a consortium of banks, to be used for
36
Notes to Financial Statements (continued)
temporary or emergency purposes as an additional source of liquidity to fund redemptions of investor shares. Any borrowings under this Facility will bear interest at current market rates as defined in the agreement. The fee for this Facility is at an annual rate of .08%. As of November 30, 2007, there were no loans outstanding pursuant to this Facility nor was the Facility utilized at any time during the fiscal year ended November 30, 2007.
9. CUSTODIAN AND ACCOUNTING AGENT
State Street Bank & Trust Company ("SSB") is the Company's custodian and accounting agent. SSB performs custodial, accounting and recordkeeping functions relating to portfolio transactions and calculating the Fund's NAV.
10. INVESTMENT RISKS
The Fund is subject to the general risks and considerations associated with investing in equity and fixed income securities.
The values of the Fund's equity security holdings and, consequently, the value of an investment in the Fund will fluctuate in response to movements in the stock market in general and to the changing prospects of the individual companies involved. With its emphasis on value stocks, the Fund may perform differently than the market as a whole and other types of stocks, such as growth stocks. The market may fail to recognize the intrinsic value of particular value stocks for a long time. The Fund may invest a significant portion of its assets in mid-sized companies that may be less able to weather economic shifts or other adverse developments than larger, more established companies. Because the Fund is not limited to investing in equity securities, the Fund may have smaller gains in a rising stock market than a fund investing solely in equity securities. In addition, if the Fund's assessment of a company's value or prospects for market appreciat ion or market conditions is wrong, the Fund could suffer losses or produce poor performance relative to other funds, even in a rising market.
The values of the Fund's fixed income holdings, and consequently, the value of an investment in the Fund will change as interest rates fluctuate and in response to market movements. When interest rates rise, the prices of these holdings are likely to decline. There is also the risk that an issuer of a fixed income security will fail to make timely payments of principal or interest to the Fund, a risk that is greater with high yield bonds (sometimes called "junk bonds") in which the Fund may invest. Some issuers, particularly of high yield bonds, may default as to principal and/or interest payments after the Fund purchases their securities. A default, or concerns in the market about an increase in risk of default, may result in losses to the Fund. High yield bonds are subject to greater price fluctuations, as well as additional risks.
The Fund may invest up to 20% of its assets in foreign securities, which present increased market, liquidity, currency, political and other risks. The Fund may invest up to 10% of its net assets in floating rate or adjustable rate senior loans, which are subject to increased credit and liquidity risks. Senior loans are business loans made to borrowers that may be U.S. or foreign corporations, partnerships, or other business entities.
These factors can affect the Fund's performance.
37
Notes to Financial Statements (continued)
11. SUMMARY OF CAPITAL TRANSACTIONS
Transactions in shares of beneficial interest are as follows:
| | | Year Ended
November 30, 2007 | | Year Ended
November 30, 2006 | |
| Class A Shares* | | Shares | | Amount | | Shares | | Amount | |
| Shares sold | | | 27,086,362 | | | $ | 372,576,291 | | | | 16,829,535 | | | $ | 211,025,980 | | |
| Converted from Class B** | | | 86,789 | | | | 1,192,487 | | | | 88,144 | | | | 1,108,265 | | |
| Reinvestment of distributions | | | 4,867,125 | | | | 65,606,262 | | | | 3,071,032 | | | | 38,091,509 | | |
| Shares reacquired | | | (11,696,075 | ) | | | (160,097,175 | ) | | | (13,933,108 | ) | | | (174,694,925 | ) | |
| Increase | | | 20,344,201 | | | $ | 279,277,865 | | | | 6,055,603 | | | $ | 75,530,829 | | |
| Class B Shares* | |
| Shares sold | | | 1,314,197 | | | $ | 17,949,988 | | | | 855,487 | | | $ | 10,654,098 | | |
| Reinvestment of distributions | | | 235,833 | | | | 3,150,908 | | | | 146,558 | | | | 1,806,383 | | |
| Shares reacquired | | | (635,470 | ) | | | (8,634,286 | ) | | | (878,995 | ) | | | (10,897,875 | ) | |
| Converted to Class A** | | | (87,423 | ) | | | (1,192,487 | ) | | | (88,757 | ) | | | (1,108,265 | ) | |
| Increase | | | 827,137 | | | $ | 11,274,123 | | | | 34,293 | | | $ | 454,341 | | |
| Class C Shares | |
| Shares sold | | | 2,533,081 | | | $ | 34,800,344 | | | | 961,084 | | | $ | 11,982,082 | | |
| Reinvestment of distributions | | | 236,197 | | | | 3,163,296 | | | | 153,465 | | | | 1,892,955 | | |
| Shares reacquired | | | (1,076,682 | ) | | | (14,658,468 | ) | | | (1,620,075 | ) | | | (20,168,558 | ) | |
| Increase (decrease) | | | 1,692,596 | | | $ | 23,305,172 | | | | (505,526 | ) | | $ | (6,293,521 | ) | |
| | | Period Ended
November 30, 2007† | |
| Class F Shares | | Shares | | Amount | |
| Shares sold | | | 725 | | | $ | 10,028 | | |
| Increase | | | 725 | | | $ | 10,028 | | |
| | | Year Ended
November 30, 2007 | | Year Ended
November 30, 2006 | |
| Class I Shares | | Shares | | Amount | | Shares | | Amount | |
| Shares sold | | | 19,778,135 | | | $ | 274,465,086 | | | | 524,128 | | | $ | 6,599,724 | | |
| Reinvestment of distributions | | | 168,102 | | | | 2,320,897 | | | | 18,514 | | | | 231,225 | | |
| Shares reacquired | | | (718,390 | ) | | | (10,045,908 | ) | | | (15,210 | ) | | | (192,079 | ) | |
| Increase | | | 19,227,847 | | | $ | 266,740,075 | | | | 527,432 | | | $ | 6,638,870 | | |
| Class P Shares | |
| Shares sold | | | 66,846 | | | $ | 916,991 | | | | 78,789 | | | $ | 987,312 | | |
| Reinvestment of distributions | | | 10,467 | | | | 141,512 | | | | 4,983 | | | | 62,047 | | |
| Shares reacquired | | | (24,864 | ) | | | (343,842 | ) | | | (16,918 | ) | | | (212,223 | ) | |
| Increase | | | 52,449 | | | $ | 714,661 | | | | 66,854 | | | $ | 837,136 | | |
| | | Period Ended
November 30 ,2007† | |
| Class R2 Shares | | Shares | | Amount | |
| Shares sold | | | 723 | | | $ | 10,000 | | |
| Increase | | | 723 | | | $ | 10,000 | | |
| Class R3 Shares | | | | | |
| Shares sold | | | 723 | | | $ | 10,000 | | |
| Increase | | | 723 | | | $ | 10,000 | | |
* Amounts for the year ended November 30, 2006 have been reclassified to conform with current presentation.
** Automatic conversion of Class B shares occurs approximately eight years after the initial purchase date.
† For the period September 28, 2007 (commencement of investment operations) to November 30, 2007.
38
Notes to Financial Statements (concluded)
12. RECENT ACCOUNTING PRONOUNCEMENTS
In June 2006, the Financial Accounting Standards Board (FASB) issued Interpretation 48, Accounting for Uncertainty in Income Taxes—an interpretation of FASB Statement 109 (FIN 48). FIN 48 clarifies the accounting for income taxes by prescribing the minimum recognition threshold a tax position must meet before being recognized in the financial statements. FIN 48 is effective for fiscal years beginning after December 15, 2006. The Fund will adopt FIN 48 no later than May 31, 2008 and the impact to the Fund's financial statements, if any, is currently being assessed.
In September 2006, Statement of Financial Accounting Standards No. 157, Fair Value Measurements (SFAS 157), was issued and is effective for fiscal years beginning after November 15, 2007. SFAS 157 defines fair value, establishes a framework for measuring fair value and expands disclosures about fair value measurements. Management is currently evaluating the impact the adoption of SFAS 157 will have on the Fund's financial statement disclosures.
39
Report of Independent Registered Public Accounting Firm
The Board of Directors and Shareholders of Lord Abbett Research Fund, Inc.:
We have audited the accompanying statement of assets and liabilities, including the schedule of investments, of Lord Abbett Research Fund, Inc. – Lord Abbett America's Value Fund (the "Fund"), as of November 30, 2007, and the related statement of operations for the year then ended, the statements of changes in net assets for each of the two years in the period then ended, and the financial highlights for each of the periods presented. These financial statements and financial highlights are the responsibility of the Fund's management. Our responsibility is to express an opinion on these financial statements and financial highlights based on our audits.
We conducted our audits in accordance with standards of the Public Company Accounting Oversight Board (United States). Those standards require that we plan and perform the audit to obtain reasonable assurance about whether the financial statements and financial highlights are free of material misstatement. The Fund is not required to have, nor were we engaged to perform, an audit of its internal control over financial reporting. Our audits included consideration of internal control over financial reporting as a basis for designing audit procedures that are appropriate in the circumstances, but not for the purpose of expressing an opinion on the effectiveness of the Fund's internal control over financial reporting. Accordingly, we express no such opinion. An audit also includes examining, on a test basis, evidence supporting the amounts and disclosures in the financial statements, assessing the accounting principles used and significant estim ates made by management, as well as evaluating the overall financial statement presentation. Our procedures included confirmation of securities owned as of November 30, 2007 by correspondence with the custodian and brokers; where replies were not received from brokers, we performed other auditing procedures. We believe that our audits provide a reasonable basis for our opinion.
In our opinion, the financial statements and financial highlights referred to above present fairly, in all material respects, the financial position of Lord Abbett Research Fund, Inc. – Lord Abbett America's Value Fund as of November 30, 2007, the results of its operations for the year then ended, the changes in its net assets for each of the two years in the period then ended, and the financial highlights for each of the periods presented, in conformity with accounting principles generally accepted in the United States of America.
Deloitte & Touche LLP
New York, New York
January 24, 2008
40
Basic Information About Management
The Board of Directors (the "Board") is responsible for the management of the business and affairs of the Fund in accordance with the laws of the State of Maryland. The Board appoints officers who are responsible for the day-to-day operations of the Fund and who execute policies authorized by the Board. The Board also approves an investment adviser to the Fund and continues to monitor the cost and quality of the services provided by the investment adviser, and annually considers whether to renew the contract with the adviser. Generally, each Director holds office until his/her successor is elected and qualified or until his/her earlier resignation or removal, as provided in the Company's organizational documents.
Lord, Abbett & Co. LLC ("Lord Abbett"), a Delaware limited liability company, is the Company's investment adviser.
Interested Directors
The following Directors are Partners of Lord Abbett and are "interested persons" of the Company as defined in the Act. Mr. Dow and Ms. Foster are officers, directors, or trustees of each of the fourteen Lord Abbett-sponsored funds, which consist of 55* portfolios or series.
Name, Address and
Year of Birth | | Current Position
Length of Service
with Company | | Principal Occupation
During Past Five Years | | Other
Directorships | |
Robert S. Dow
Lord, Abbett & Co. LLC
90 Hudson Street
Jersey City, NJ 07302 (1945) | | Director and Chairman since 1996 | | Senior Partner since 2007 and Chief Executive Officer of Lord Abbett since 1996; formerly Managing Partner of Lord Abbett (1996 - 2007). | | N/A | |
|
Daria L. Foster
Lord, Abbett & Co. LLC
90 Hudson Street
Jersey City, NJ 07302
(1954) | | Director since 2006 | | Managing Partner since 2007; formerly Director of Marketing and Client Service of Lord Abbett (1990 - 2007). | | N/A | |
|
Independent Directors
The following independent or outside Directors ("Independent Directors") are also directors or trustees of each of the fourteen Lord Abbett-sponsored funds, which consist of 55* portfolios or series.
Name, Address and
Year of Birth | | Current Position
Length of Service
with Company | | Principal Occupation
During Past Five Years | | Other
Directorships | |
E. Thayer Bigelow
Lord, Abbett & Co. LLC
c/o Legal Dept.
90 Hudson Street
Jersey City, NJ 07302 (1941) | | Director since 1996 | | Managing General Partner, Bigelow Media, LLC (since 2000); Senior Adviser, Time Warner Inc. (1998 - 2000); Acting Chief Executive Officer of Courtroom Television Network (1997 – 1998); President and Chief Executive Officer of Time Warner Cable Programming, Inc. (1991 – 1997). | | Currently serves as director of Crane Co. and Huttig Building Products Inc. | |
|
* Effective as of the close of business on December 14, 2007, there are 51 portfolios or series.
41
Basic Information About Management (continued)
Name, Address and
Year of Birth | | Current Position
Length of Service
with Company | | Principal Occupation
During Past Five Years | | Other
Directorships | |
William H.T. Bush
Lord, Abbett & Co. LLC
c/o Legal Dept.
90 Hudson Street
Jersey City, NJ 07302 (1938) | | Director since 1998 | | Co-founder and Chairman of the Board of the financial advisory firm of Bush-O'Donnell & Company (since 1986). | | Currently serves as director of WellPoint, Inc. (since 2002). | |
|
Robert B. Calhoun, Jr.
Lord, Abbett & Co. LLC
c/o Legal Dept.
90 Hudson Street
Jersey City, NJ 07302 (1942) | | Director since 1998 | | Managing Director of Monitor Clipper Partners (since 1997) and President of Clipper Asset Management Corp. (since 1991), both private equity investment funds. | | Currently serves as director of Avondale, Inc. and Interstate Bakeries Corp. | |
|
Julie A. Hill
Lord, Abbett & Co. LLC
c/o Legal Dept.
90 Hudson Street
Jersey City, NJ 07302 (1946) | | Director since 2004 | | Owner and CEO of The Hill Company, a business consulting firm (since 1998); Founder, President and Owner of the Hiram-Hill and Hillsdale Development Company, a residential real estate development firm (1998 - 2000). | | Currently serves as director of WellPoint, Inc. since 1994 and Lend Lease Corporation Limited since 2005. | |
|
Franklin W. Hobbs
Lord, Abbett & Co. LLC
c/o Legal Dept.
90 Hudson Street
Jersey City, NJ 07302 (1947) | | Director since 2001 | | Advisor of One Equity Partners, a private equity firm (since 2004); Chief Executive Officer of Houlihan Lokey Howard & Zukin, an investment bank (2002 - 2003); Chairman of Warburg Dillon Read, an investment bank (1999 - 2001); Global Head of Corporate Finance of SBC Warburg Dillon Read (1997 - 1999); Chief Executive Officer of Dillon, Read & Co. (1994 - 1997). | | Currently serves as director of Molson Coors Brewing Company. | |
|
Thomas J. Neff
Lord, Abbett & Co. LLC
c/o Legal Dept.
90 Hudson Street
Jersey City, NJ 07302 (1937) | | Director since 1992 | | Chairman of Spencer Stuart (U.S.), an executive search consulting firm (since 1996); President of Spencer Stuart (1979 - 1996). | | Currently serves as director of Ace, Ltd. (since 1997) and Hewitt Associates, Inc. | |
|
James L.L. Tullis
Lord, Abbett & Co. LLC
c/o Legal Dept.
90 Hudson Street
Jersey City, NJ 07302 (1947) | | Director since 2006 | | CEO of Tullis-Dickerson and Co. Inc, a venture capital management firm (since 1990). | | Currently serves as director of Crane Co. (since 1998). | |
|
42
Basic Information About Management (continued)
Officers
None of the officers listed below have received compensation from the Company. All the officers of the Company may also be officers of the other Lord Abbett-sponsored funds and maintain offices at 90 Hudson Street, Jersey City, NJ 07302.
Name and
Year of Birth | | Current Position
with Company | | Length of Service
of Current Position | | Principal Occupation
During Past Five Years | |
Robert S. Dow
(1945) | | Chief Executive Officer and Chairman | | Elected in 1996 | | Senior Partner since 2007 and Chief Executive Officer of Lord Abbett since 1996; formerly Managing Partner of Lord Abbett (1996 - 2007). | |
|
Daria L. Foster
(1954) | | President | | Elected in 2006 | | Managing Partner since 2007; formerly Director of Marketing and Client Service of Lord Abbett (1990 - 2007). | |
|
Robert P. Fetch
(1953) | | Executive Vice President | | Elected in 1997 | | Partner and Senior Investment Manager, joined Lord Abbett in 1995. | |
|
Daniel H. Frascarelli
(1954) | | Executive Vice President | | Elected in 2005 | | Partner and Director of Large Cap Core Equity, joined Lord Abbett in 1990. | |
|
Robert I. Gerber
(1954) | | Executive Vice President | | Elected in 2007 | | Partner and Chief Investment Officer; formerly Director of Taxable Fixed Income Management, joined Lord Abbett in 1997. | |
|
Frederick Ruvkun
(1957) | | Executive Vice President | | Elected in 2006 | | Investment Manager, joined Lord Abbett in 2006; formerly served as Managing Director and Leader of the Small Cap Growth Team and a Portfolio Manager of SMID Growth Assets at J & W Seligman & Company. | |
|
Christopher J. Towle
(1957) | | Executive Vice President | | Elected in 2001 | | Partner and Director of High Yield & Convertible Management, joined Lord Abbett in 1987. | |
|
Edward K. von der Linde
(1960) | | Executive Vice President | | Elected in 2001 | | Partner and Investment Manager, joined Lord Abbett in 1988. | |
|
43
Basic Information About Management (concluded)
Name and
Year of Birth | | Current Position
with Company | | Length of Service
of Current Position | | Principal Occupation
During Past Five Years | |
James W. Bernaiche
(1956) | | Chief Compliance Officer | | Elected in 2004 | | Chief Compliance Officer, joined Lord Abbett in 2001. | |
|
Joan A. Binstock
(1954) | | Chief Financial Officer and Vice President | | Elected in 1999 | | Partner and Chief Operations Officer, joined Lord Abbett in 1999. | |
|
Evan B. Carpenter
(1972) | | Vice President | | Elected in 2006 | | Research Analyst, joined Lord Abbett in 2003; prior thereto he served as an Equity Research Analyst at Gabelli Asset Management (2000 - 2003). | |
|
John K. Forst
(1960) | | Vice President and Assistant Secretary | | Elected in 2005 | | Deputy General Counsel, joined Lord Abbett in 2004; Managing Director and Associate General Counsel at New York Life Investment Management LLC (2002 - 2003); attorney at Dechert LLP (2000 - 2002). | |
|
Lawrence H. Kaplan
(1957) | | Vice President and Secretary | | Elected in 1997 | | Partner and General Counsel, joined Lord Abbett in 1997. | |
|
A. Edward Oberhaus, III
(1959) | | Vice President | | Elected in 1996 | | Partner and Director of Equity Trading, joined Lord Abbett in 1983. | |
|
Lawrence B. Stoller
(1963) | | Vice President and Assistant Secretary | | Elected in 2007 | | Senior Deputy General Counsel; joined Lord Abbett in 2007; formerly, Executive Vice President and General Counsel at Cohen & Steers Capital Management, Inc. | |
|
Paul J. Volovich
(1973) | | Vice President | | Elected in 2004 | | Investment Manager, joined Lord Abbett in 1997. | |
|
Bernard J. Grzelak
(1971) | | Treasurer | | Elected in 2003 | | Director of Fund Administration, joined Lord Abbett in 2003; formerly Vice President, Lazard Asset Management LLC. | |
|
Please call 888-522-2388 for a copy of the Statement of Additional Information (SAI), which contains further information about the Fund's Directors. It is available free upon request.
44
Householding
The Company has adopted a policy that allows it to send only one copy of the Fund's Prospectuses, proxy material, annual report and semiannual report to certain shareholders residing at the same "household." This reduces Fund expenses, which benefits you and other shareholders. If you need additional copies or do not want your mailings to be "householded," please call Lord Abbett at 888-522-2388 or send a written request with your name, the name of your fund or funds and your account number or numbers to Lord Abbett Family of Funds, P.O. Box 219336, Kansas City, MO 64121.
Proxy Voting Policies, Procedures and Record
A description of the policies and procedures that Lord Abbett uses to vote proxies related to the Fund's portfolio securities, and information on how Lord Abbett voted each Fund's proxies during the 12-month period ended June 30 are available without charge, upon request, (i) by calling 888-522-2388; (ii) on Lord Abbett's website at www.LordAbbett.com; and (iii) on the Securities and Exchange Commission's ("SEC") website at www.sec.gov.
Shareholder Reports and Quarterly Portfolio Disclosure
The Fund is required to file its complete schedule of portfolio holdings with the SEC for its first and third fiscal quarters on Form N-Q. Copies of the filings are available without charge, upon request on the SEC's website at www.sec.gov and may be available by calling Lord Abbett at 888-522-2388. You can also obtain copies of Form N-Q by (i) visiting the SEC's Public Reference Room in Washington, DC (information on the operation of the Public Reference Room may be obtained by calling 800-SEC-0330); (ii) sending your request and duplicating fee to the SEC's Public Reference Room, Washington, DC 20549-0102; or (iii) sending your request electronically to publicinfo@sec.gov.
Tax Information
57.53% of the ordinary income distributions paid by the Fund during the fiscal year ended November 30, 2007 is qualified dividend income. For corporate shareholders, only 50.70% of the Fund's ordinary income distributions qualified for the dividends received deduction.
Additionally, of the distributions paid to shareholders during the fiscal year ended November 30, 2007, $7,747,751 and $31,377,032, respectively, represent short-term and long-term capital gains.
45
LAAMF-2-1107
(01/08)
Lord Abbett Research Fund, Inc.
Lord Abbett America's Value Fund

This report when not used for the general information
of shareholders of the fund, is to be distributed only if
preceded or accompanied by a current fund prospectus.
Lord Abbett Mutual Fund shares are distributed by
LORD ABBETT DISTRIBUTOR LLC.
Item 2: Code of Ethics.
(a) In accordance with applicable requirements, the Registrant adopted a Sarbanes-Oxley Code of Ethics on June 19, 2003 that applies to the principal executive officer and senior financial officers of the Registrant (“Code of Ethics”). The Code of Ethics was in effect during the fiscal year ended November 30, 2007 (the “Period”).
(b) Not applicable.
(c) The Registrant has not amended the Code of Ethics as described in Form N-CSR during the Period.
(d) The Registrant has not granted any waiver, including an implicit waiver, from a provision of the Code of Ethics as described in Form N-CSR during the Period.
(e) Not applicable.
(f) See Item 12(a)(1) concerning the filing of the Code of Ethics. The Registrant will provide a copy of the Code of Ethics to any person without charge, upon request. To obtain a copy, please call Lord Abbett at 888-522-2388.
Item 3: Audit Committee Financial Expert.
The Registrant’s board of directors has determined that each of the following independent directors who are members of the audit committee are audit committee financial experts: E. Thayer Bigelow, Robert B. Calhoun, Franklin W. Hobbs and James L.L. Tullis. Each of these persons is independent within the meaning of the Form N-CSR.
Item 4: Principal Accountant Fees and Services.
In response to sections (a), (b), (c) and (d) of Item 4, the aggregate fees billed to the Registrant for the fiscal years ended November 30, 2007 and 2006 by the Registrant’s principal accounting firm, Deloitte & Touche LLP, the member firms of Deloitte Touche Tohmatsu and their respective affiliates (collectively, “Deloitte”) were as follows:
| | Fiscal year ended: | |
| | 2007 | | 2006 | |
Audit Fees {a} | | $ | 145,500 | | $ | 140,000 | |
Audit-Related Fees {b} | | -0- | | 596 | |
Total audit and audit-related fees | | 145,500 | | 140,596 | |
| | | | | |
Tax Fees {c} | | 28,526 | | 27,573 | |
All Other Fees | | -0- | | -0- | |
| | | | | |
Total Fees | | $ | 174,026 | | $ | 168,169 | |
{a} Consists of fees for audits of the Registrant’s annual financial statements.
{b} Consists of the Registrant’s proportionate share of fees for performing certain agreed-upon procedures regarding compliance with the provisions of Rule 17a-7 of the Investment Company Act of 1940 and related Board approved procedures.
{c} Fees for the fiscal year ended November 30, 2007 and 2006 consist of fees for preparing the U.S. Income Tax Return for Regulated Investment Companies, New Jersey Corporation Business Tax Return, New Jersey Annual Report Form, U.S. Return of Excise Tax on Undistributed Income of Investment Companies, IRS Forms 1099-MISC and 1096 Annual Summary and Transmittal of U.S. Information Returns.
(e) (1) Pursuant to Rule 2-01(c) (7) of Regulation S-X, the Registrant’s Audit Committee has adopted pre-approval policies and procedures. Such policies and procedures generally provide that the Audit Committee must pre-approve:
· any audit, audit-related, tax, and other services to be provided to the Lord Abbett Funds, including the Registrant, and
· any audit-related, tax, and other services to be provided to the Registrant’s investment adviser and any entity controlling, controlled by or under common control with the investment adviser that provides ongoing services to one or more Funds comprising the Registrant if the engagement relates directly to operations and financial reporting of a Fund, by the independent auditor to assure that the provision of such services does not impair the auditor’s independence.
The Audit Committee has delegated pre-approval authority to its Chairman, subject to a fee limit of $10,000 per event, and not to exceed $25,000 annually. The Chairman will report any pre-approval decisions to the Audit Committee at its next scheduled meeting. Unless a type of service to be provided by the independent auditor has received general pre-approval, it must be pre-approved by the Audit Committee. Any proposed services exceeding pre-approved cost levels will require specific pre-approval by the Audit Committee.
(e) (2) The Registrant’s Audit Committee has approved 100% of the services described in this Item 4 (b) through (d).
(f) Not applicable.
(g) The aggregate non-audit fees billed by Deloitte for services rendered to the Registrant are shown above in the response to Item 4 (a), (b), (c) and (d) as “All Other Fees”.
The aggregate non-audit fees billed by Deloitte for services rendered to the Registrant’s investment adviser, Lord, Abbett & Co. LLC (“Lord Abbett”), for the fiscal years ended November 30, 2006 and 2005 were:
| | Fiscal year ended: | |
| | 2007 | | 2006 | |
All Other Fees {a} | | $ | 137,700 | | $ | 105,500 | |
| | | | | | | |
{a} Consist of fees for Independent Services Auditors’ Report on Controls Placed in Operation and Tests of Operating Effectiveness related to Lord Abbett’s Asset Management Services (“SAS 70 Report”).
The aggregate non-audit fees billed by Deloitte for services rendered to entities under the common control of Lord Abbett (i.e., Lord Abbett Distributor LLC, the Registrant’s principal underwriter) for the fiscal years ended November 30, 2007 and 2006 were:
| | Fiscal year ended: | |
| | 2007 | | 2006 | |
All Other Fees | | $ | - 0 - | | $ | - 0- | |
| | | | | | | |
(h) The Registrant’s Audit Committee has considered the provision of non-audit services that were rendered to the Registrant’s investment adviser, and any entity controlling, controlled by or under common control with the investment adviser that provides ongoing services to the Registrant, that were not pre-approved pursuant to Rule 2-01 (c)(7)(ii) of Regulation S-X and has determined that the provision of such services is compatible with maintaining Deloitte’s independence.
Item 5: Audit Committee of Listed Registrants.
Not applicable.
Item 6: Schedule of Investments.
Not applicable.
Item 7: Disclosure of Proxy Voting Policies and Procedures for Closed-End Management Investment Companies.
Not applicable.
Item 8: Portfolio Managers of Closed-End Management Investment Companies.
Not applicable.
Item 9: Purchases of Equity Securities by Closed-End Management Investment Company and Affiliated Purchasers.
Not applicable.
Item 10: Submission of Matters to a Vote of Security Holders.
Not applicable.
Item 11: Controls and Procedures.
(a) Based on their evaluation of the Registrant’s disclosure controls and procedures (as defined in Rule 30a-3(c) under the Investment Company Act of 1940) as of a date within 90 days prior to the filing date of this report, the Chief Executive Officer and Chief Financial Officer of the Registrant have concluded that such disclosure controls and procedures are reasonably designed and effective to ensure that material information relating to the Registrant, including its consolidated subsidiaries, is made known to them by others within those entities.
(b) There were no significant changes in the Registrant’s internal control over financial reporting (as defined in Rule 30a-3(d) under the Investment Company Act of 1940) that occurred during the second fiscal quarter of the period covered by this report that have materially affected, or are reasonably likely to materially affect, the Registrant’s internal control over financial reporting.
Item 12: Exhibits.
(a)(1) Amendments to Code of Ethics – Not applicable.
(a)(2) Certification of each principal executive officer and principal financial officer of the Registrant as required by Rule 30a-2 under the Act (17 CFR 270.30a-2) is attached hereto as a part of EX-99.CERT.
(a)(3) Not applicable.
(b) Certification of each principal executive officer and principal financial officer of the Registrant as required by Section 906 of the Sarbanes-Oxley Act of 2002 is attached hereto as a part of EX-99.906CERT.
SIGNATURES
Pursuant to the requirements of the Securities Exchange Act of 1934 and the Investment Company Act of 1940, the Registrant has duly caused this report to be signed on its behalf by the undersigned, thereunto duly authorized.
| LORD ABBETT RESEARCH FUND, INC. |
| |
| |
| /s/ Robert S. Dow | |
| Robert S. Dow |
| Chief Executive Officer and Chairman |
| |
| |
| /s/ Joan A. Binstock | |
| Joan A. Binstock |
| Chief Financial Officer and Vice President |
| |
| |
Date: January 24, 2008 | |
Pursuant to the requirements of the Securities Exchange Act of 1934 and the Investment Company Act of 1940, this report has been signed below by the following persons on behalf of the Registrant and in the capacities and on the dates indicated.
| LORD ABBETT RESEARCH FUND, INC. |
| |
| |
| /s/ Robert S. Dow | |
| Robert S. Dow |
| Chief Executive Officer and Chairman |
| |
| |
| /s/ Joan A. Binstock | |
| Joan A. Binstock |
| Chief Financial Officer and Vice President |
| |
| |
Date: January 24, 2008 | |